/


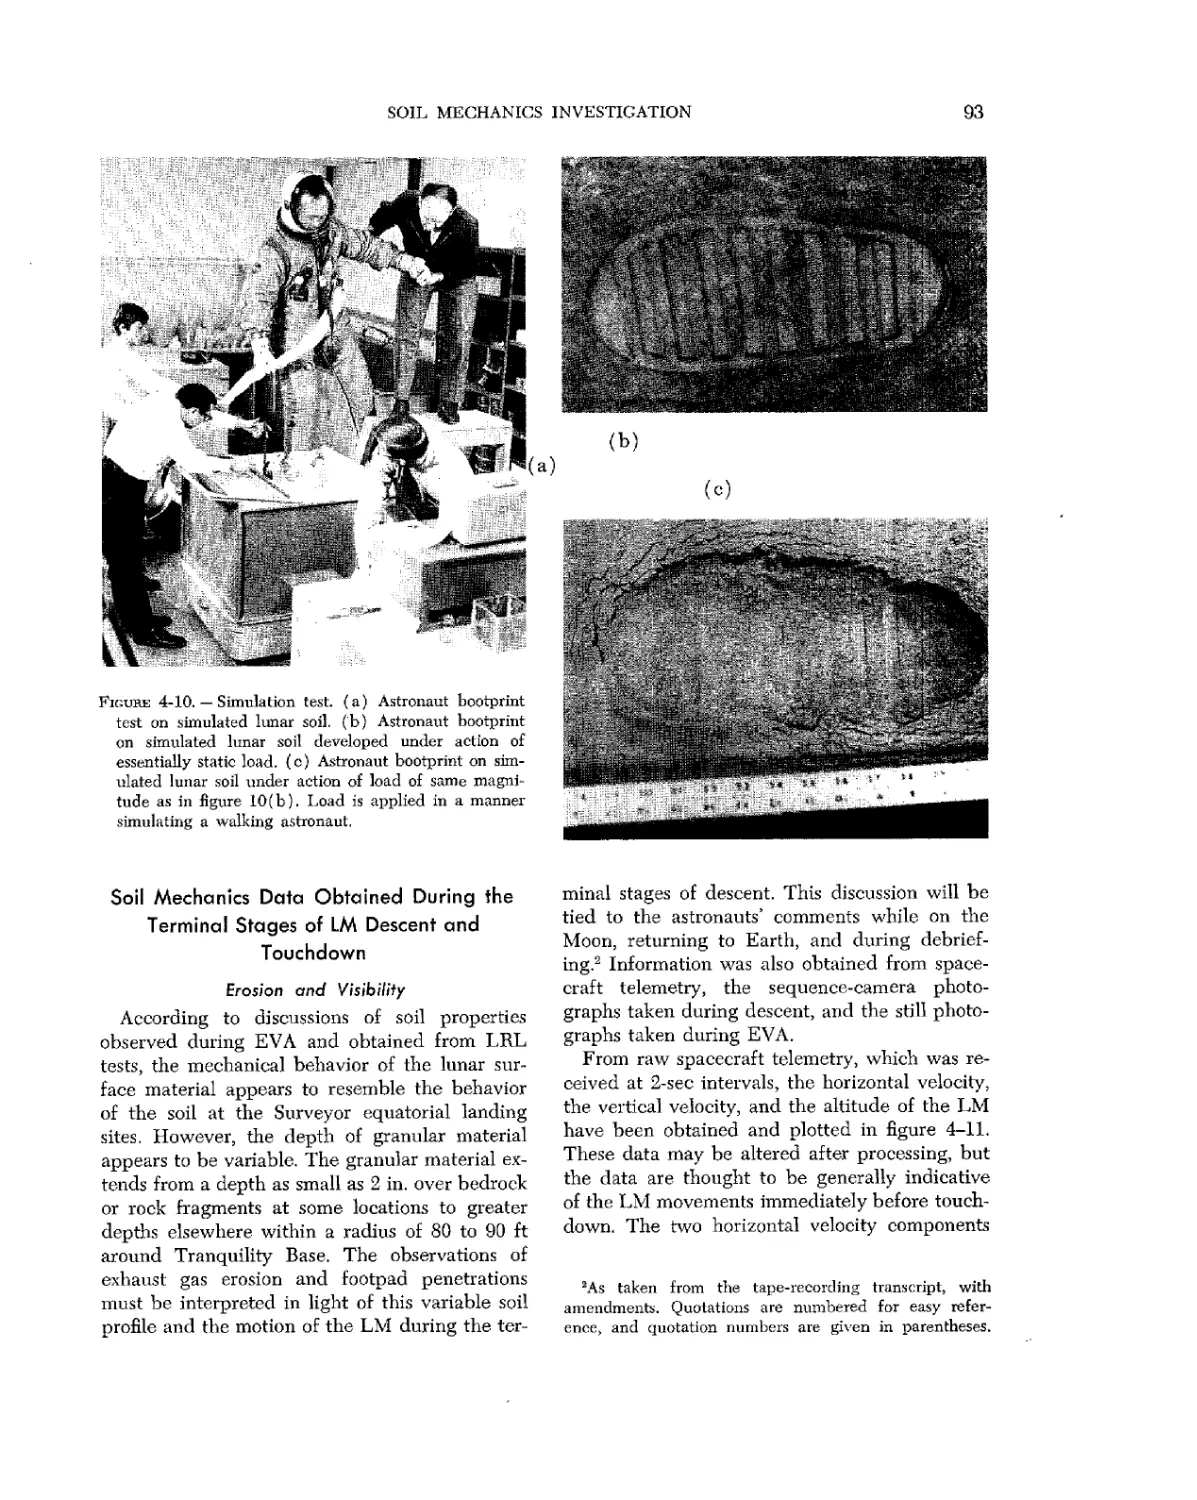


Text
NASA SP-214
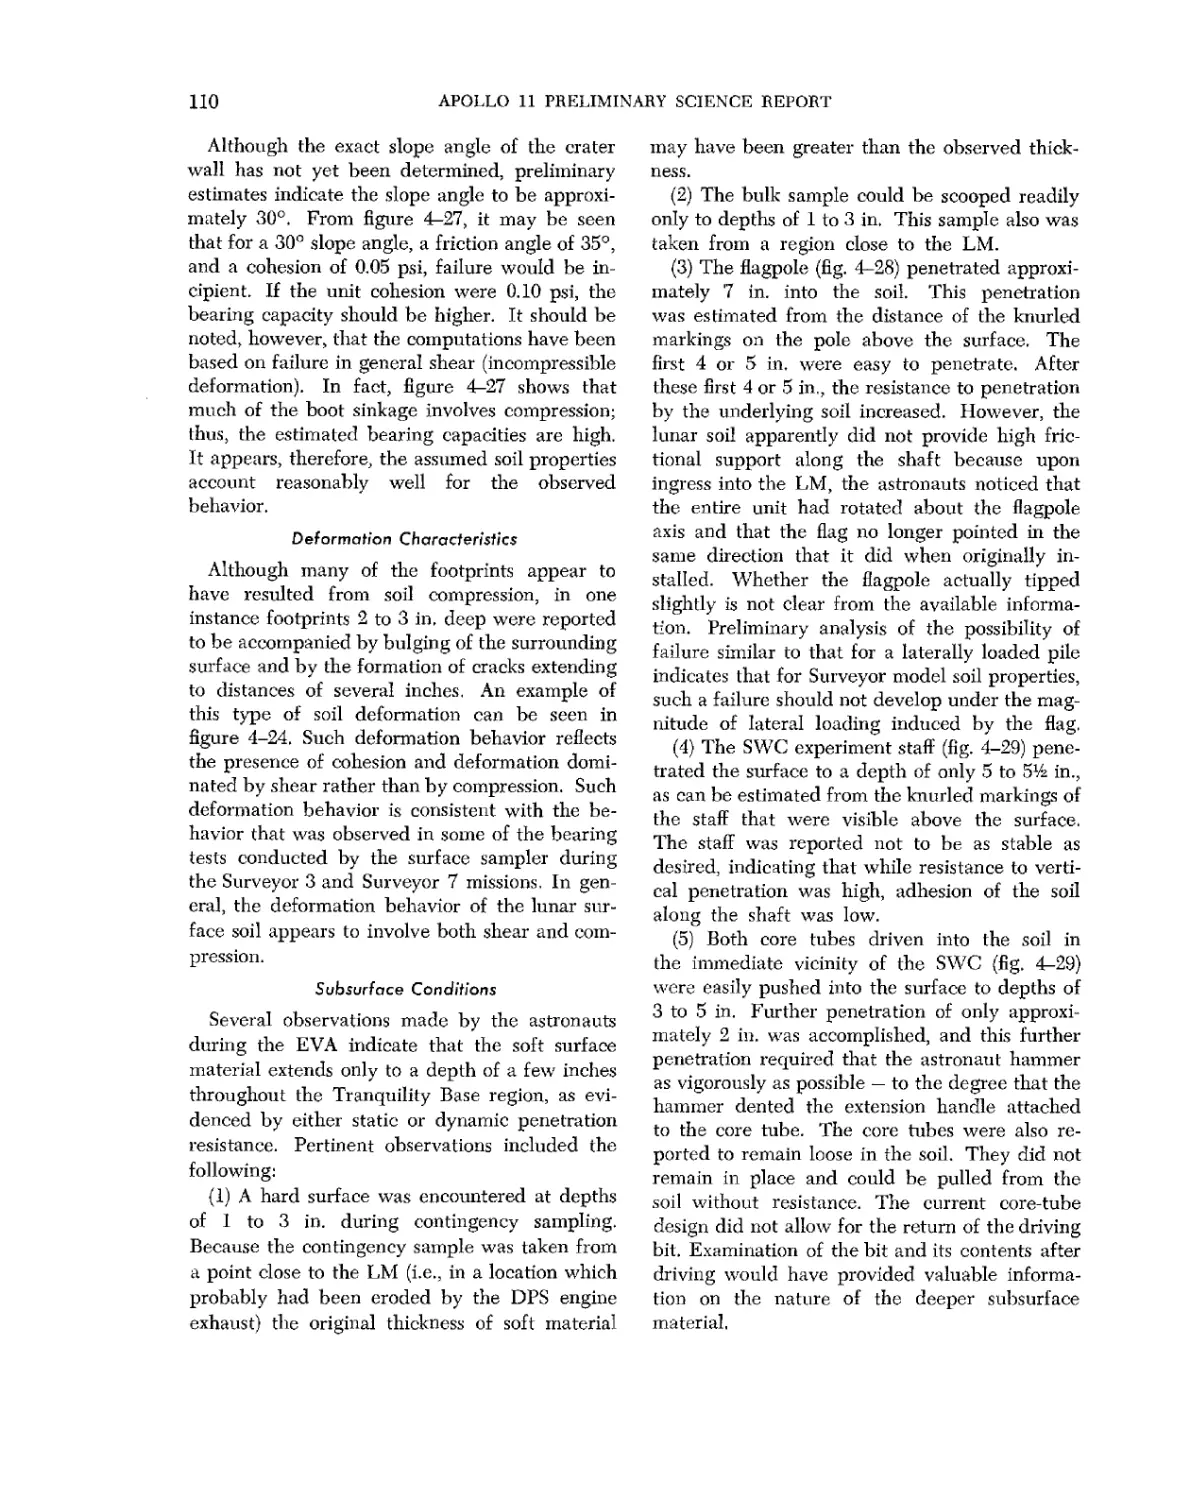
To.
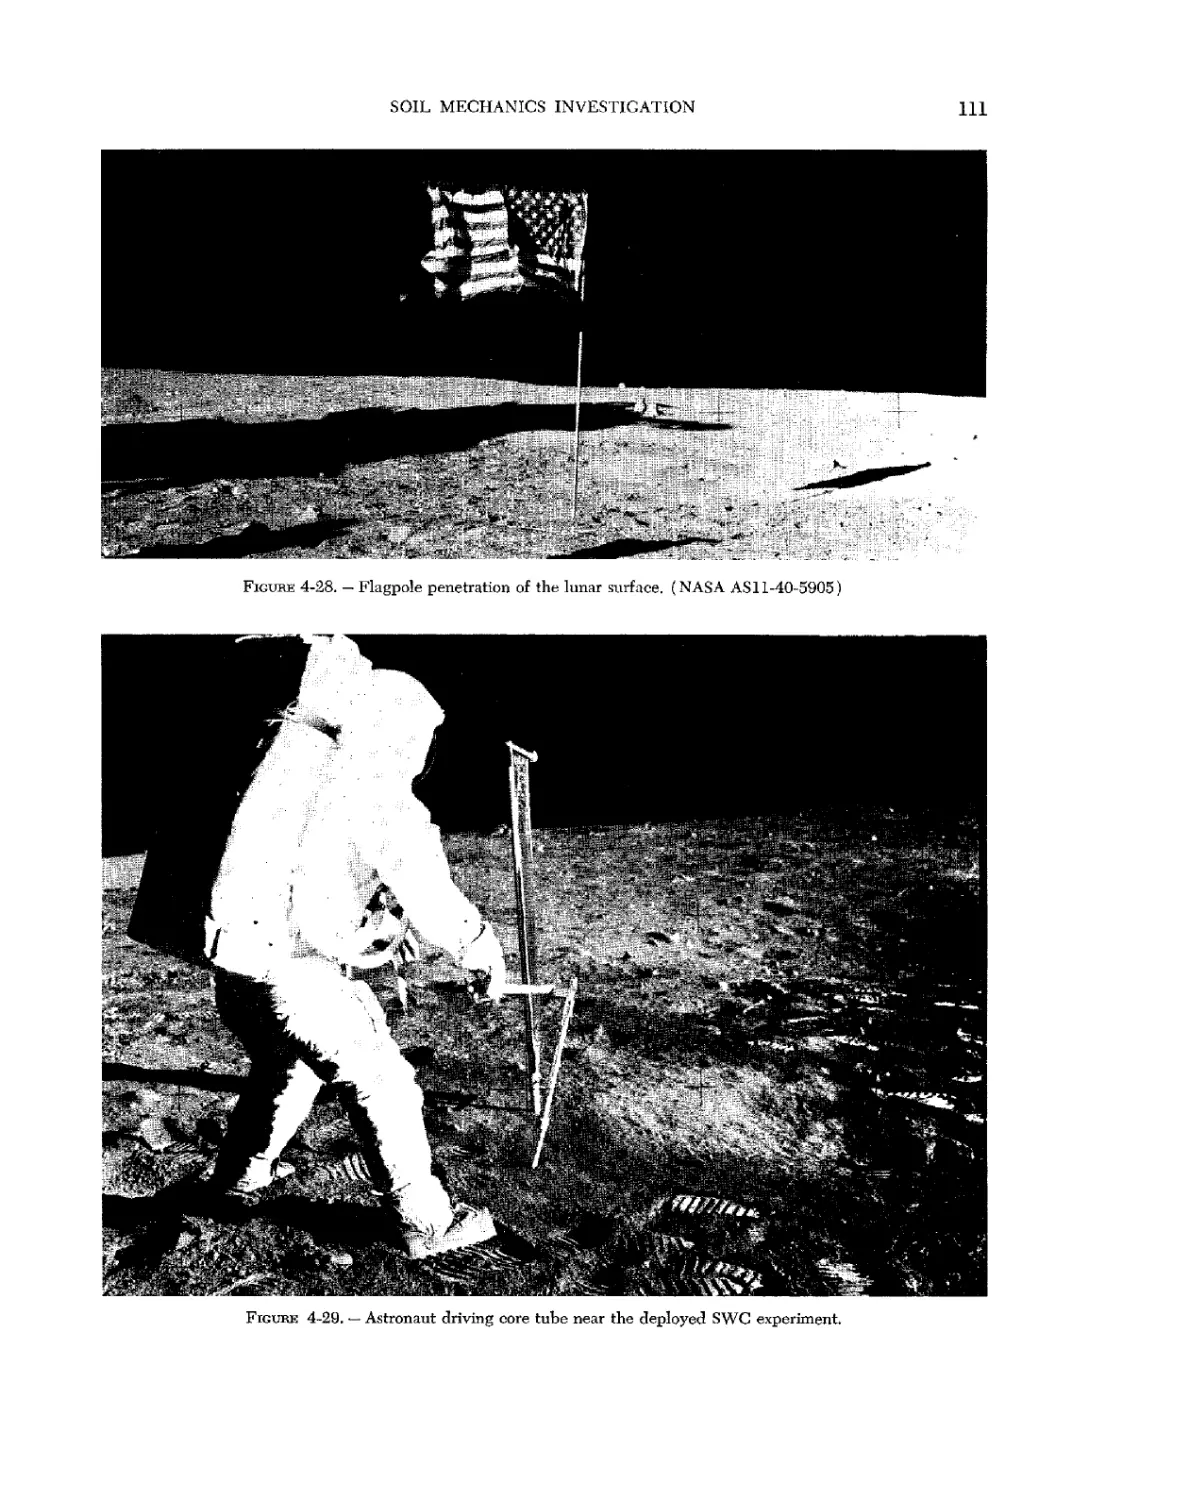
ary
cience
NATIONAL AERONAUTICS
AND SPACE ADMINISTRATION
ACKNOWLEDGMENT
The material submitted for the Lunar Surface Scien-
Scientific Mission of Apollo 11 was reviewed by a NASA
Manned Spacecraft Center Technical Review Board
consisting of the following members: J. M. West (Chair-
(Chairman), P. R. Bell, A. J. Calio, J. W. Harris, H. H. Schmitt,
S. H. Simpkinson, W. K. Stephenson, and D. G. Wiseman.
For sale by the Clearinghouse for Federal Scientific and Technical Information, Springfield, Virginia 22151
CFSTI price $3.00 library of Congress Catalog Cord Number 77-603770
Foreword
Our fiest joubney to the Moon ushered in a new era in which man will no
longer be confined to his home planet, The concept of traveling across the
vastness of space to new worlds has stirred the imagination of men everywhere.
One-sixth of the Earth's population watched as the Apollo 11 astronauts walked
and worked a quarter of a million miles away.
The success of this mission has opened new fields of exploration and
research — research which will lead to a greater understanding of our planet
and provide a new insight into the origin and history of the solar system. The
Apollo 11 mission was only a beginning, however. Subsequent missions will
reflect more ambitious scientific objectives and will include more comprehensive
observations and measurements at a variety of lunar sites.
This document is a preliminary report of the initial scientific observations
resulting from the Apollo 11 mission. We expect that further significant results
will come from more detailed analysis of the returned samples of lunar material,
and from additional study of the photographs and data obtained from the
emplaced experiments. Beyond that, we look forward to increasing international
participation in the exploration of the Moon and neighboring regions of our solar
system.
Thomas O. Paine
Administrator
National Aeronautics and Space Administration
October 31, 1969
iil
Contents
PAGE
INTRODUCTION vii
Robert R, Gilruth and George M. Low
SUMMARY OF SCIENTIFIC RESULTS 1
W. N. Hess and A. J. Calio
1 PHOTOGRAPHIC SUMMARY OF APOLLO 11 MISSION 9
James H. Sasser
2 CREW OBSERVATIONS 35
Edwin E, Aldrin, Jr., Neil A. Armstrong, and Michael Collins
3 GEOLOGIC SETTING OF THE LUNAR SAMPLES RETURNED
BY THE APOLLO 11 MISSION 41
E. M. Shoemaker, N. G. Bailey, R. M. Batson, D. II. Dahlem,
T. H. Foss, M. J. Grolier, E. N. Goddard, M. II. Bait, H. E. Holt,
K. B. Larson, J. J. Rennilson, G. G. Schaber, D. L. Schleicher,
H. H. Schmitt, R. L. Sutton, G. A. Swarm, A. C. Waters, and
M. N. West
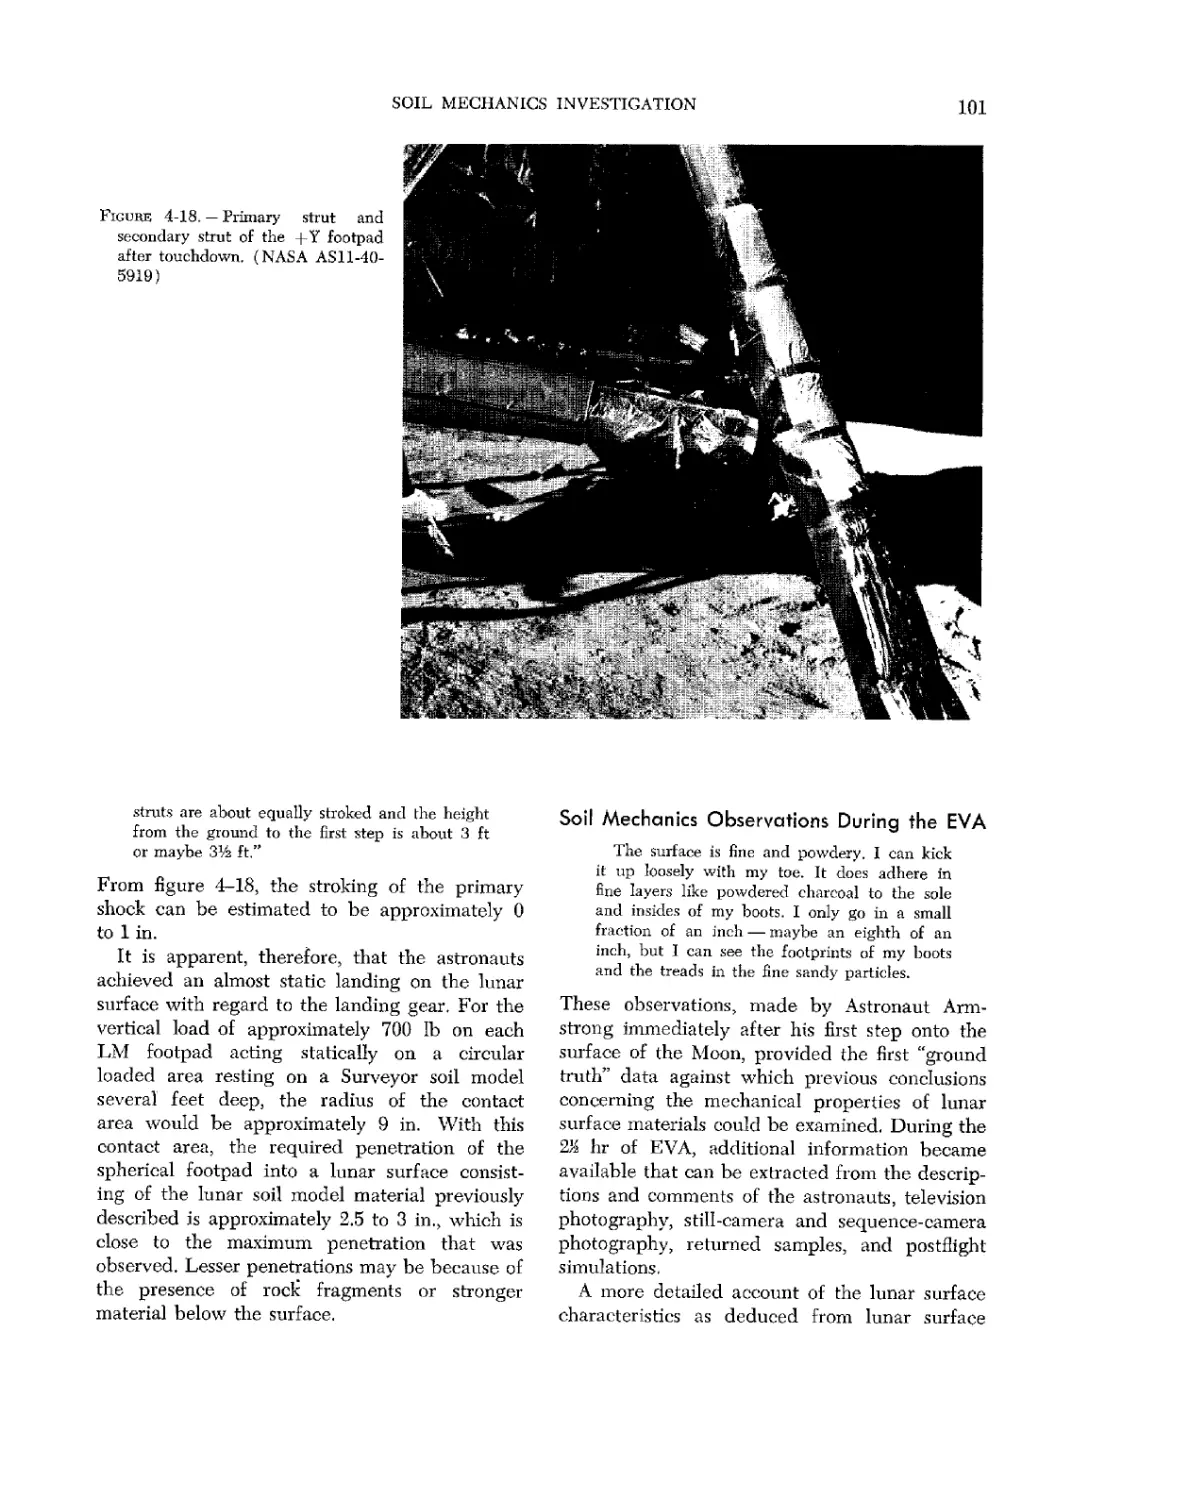
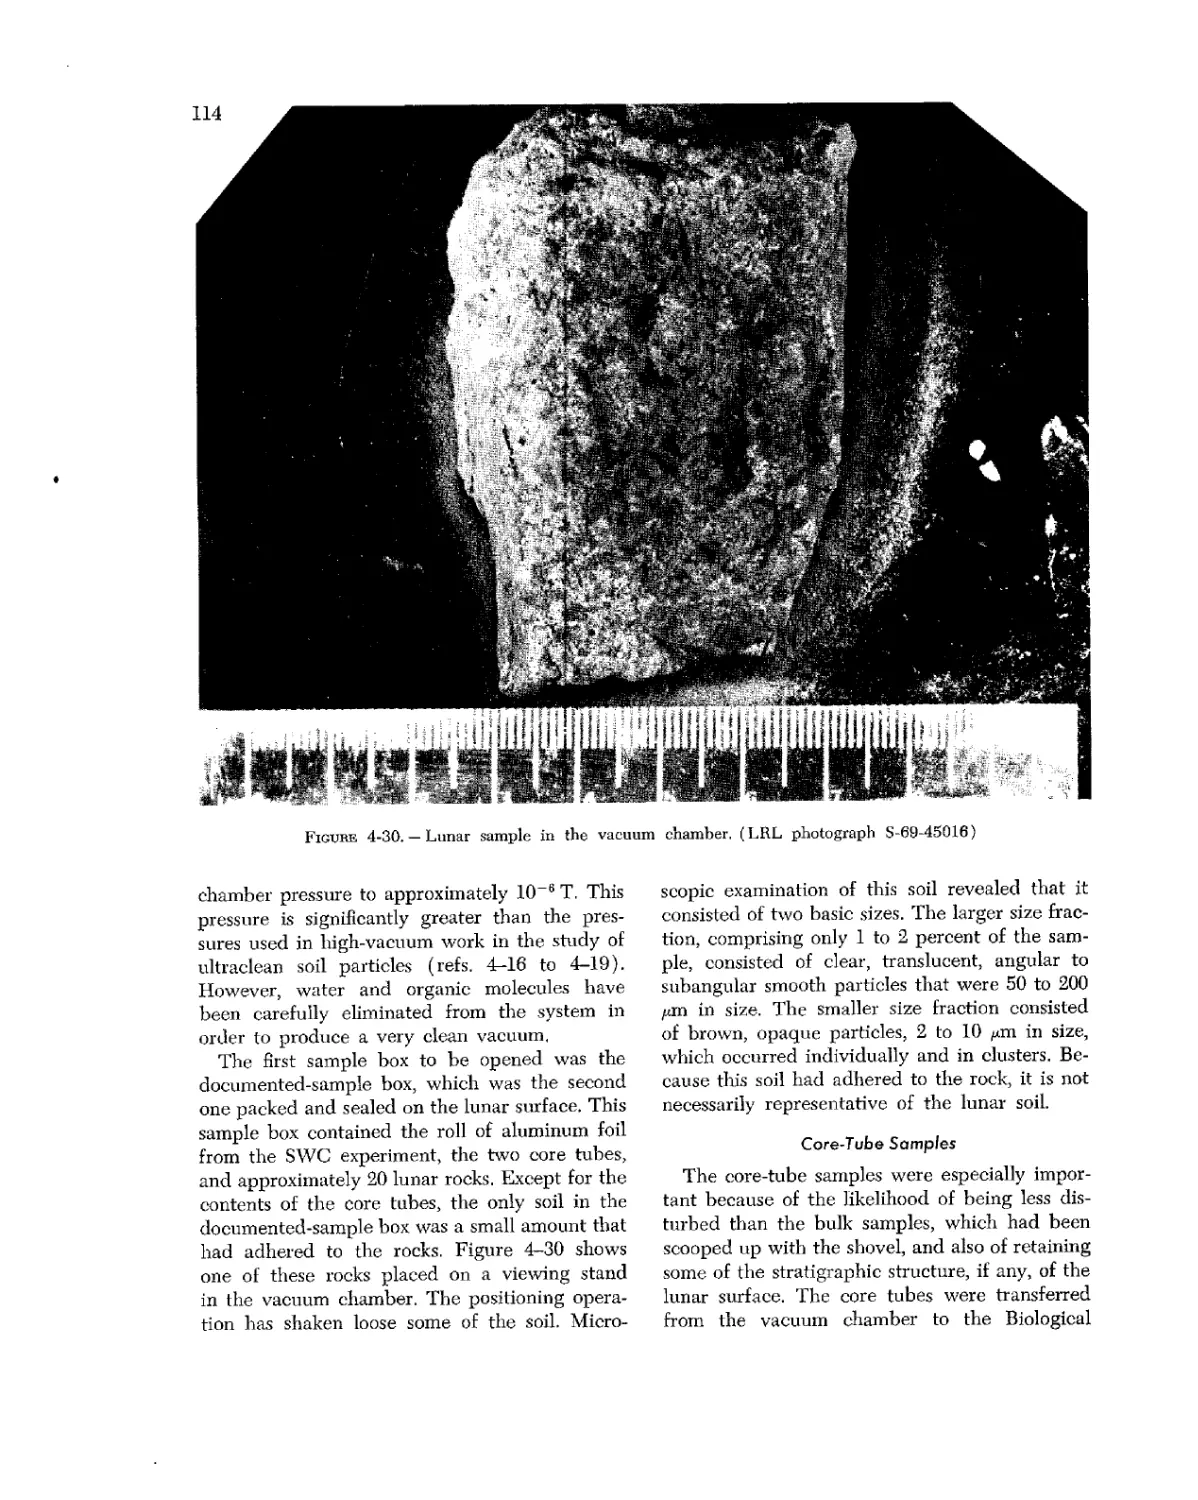
4 APOLLO 11 SOIL MECHANICS INVESTIGATION 85
N. C. Costes, W. D. Carrier, J. K. Mitchell, and R. F. Scott
5 PRELIMINARY EXAMINATION OF LUNAR SAMPLES 123
6 PASSIVE SEISMIC EXPERIMENT 143
Gary V. Latham, Maurice Ewing, Frank Press, George Sutton,
James Dorman, Nafi Toksoz, Ralph Wiggins, Yosio Nakanwra,
John Derr, and Frederick Duennebier
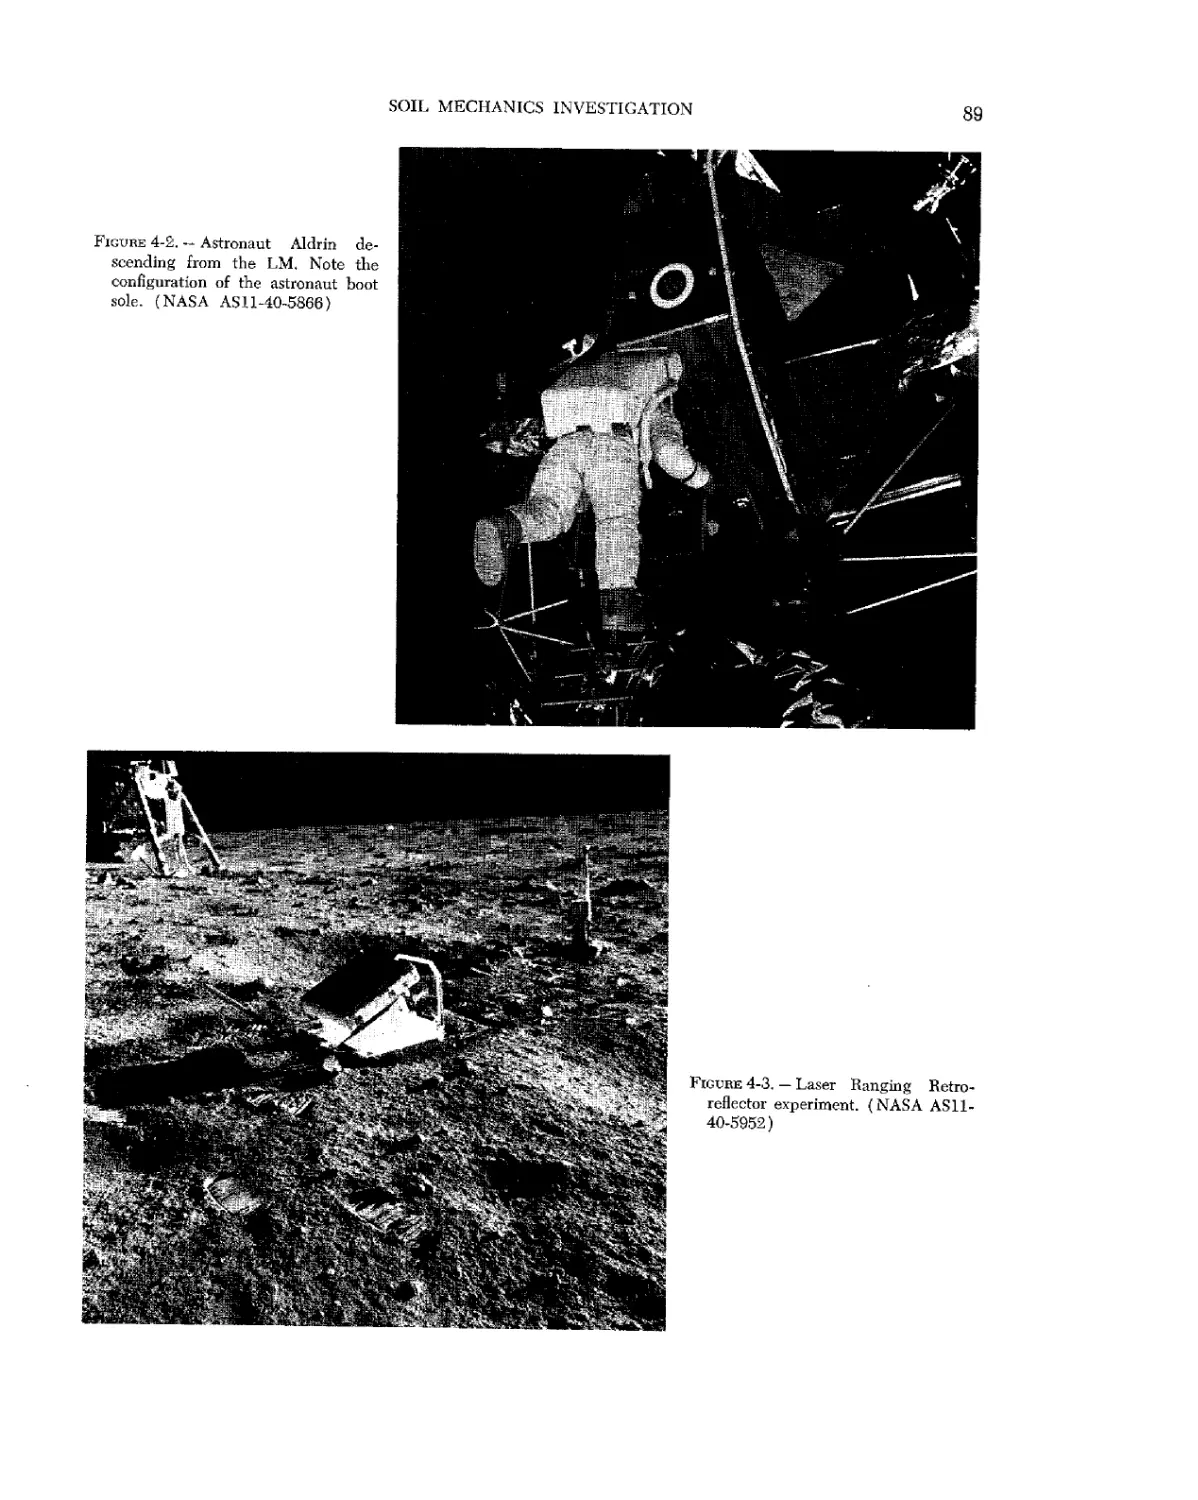
7 LASER RANGING RETROREFLECTOR 163
C. O. Alley, P. L. Bender, R. F. Chang, D. G. Currie, R. H. Dicke,
J. E. Fuller, W. M. Kaula, G. /. F. MacDonald, J. D. Mulholland,
H. H. Plotkin, S. K. Poultney, D. T. Wilkinson, Irvin Winer,
Walter Carrion, Tom Johnson, Paul Spadin, Lloyd Robinson,
E. Joseph Wampler, Donald Wieber, E. Silverberg, C. Steggerda,
J. Mullendore, J. Raijner, W. Williams, Brian Warner,
Harvey Richardson, and B. Bopp
8 THE SOLAR-WIND COMPOSITION EXPERIMENT 183
/. Geiss, P. Eberhardt, P. Signer, F. Buehler, and J. Meister
9 LUNAR SURFACE CLOSEUP STEREOSCOPIC PHOTOGRAPHY 187
10 THE MODIFIED DUST DETECTOR IN THE EARLY
APOLLO SCIENTIFIC EXPERIMENTS PACKAGE 199
/. R. Bates, S. C. Freden, and B. J. O'Brien
APPENDIX A - GLOSSARY OF TERMS 203
APPENDIX B-ACRONYMS 204
Introduction
Robert R. Gilruth and George M. Low
The manned space flight program is dedicated to the exploration and use of
space by man. In the immediate future, men will continue exploring the Moon,
adding greatly to our knowledge of the Moon, the Earth, and the solar system.
It is expected that in Earth orbital laboratories men will conduct experiments
and make observations that are possible only in the space environment.
In standing firmly behind the space science program, it has been necessary
to provide means for man to live and work in "this new ocean." A transportation
system has had to be provided with a navigation system of great precision. An
extensive medical program has been necessary to provide data on man's reaction
to the space environment. The Mercury, Gemini, and early Apollo missions have
produced, step by step, the answers needed for the Apollo 11 lunar landing
mission.
The rapid progress of the program obscured its great problems, The success
of the Apollo 11 mission was solidly based on excellent technology, sound deci-
decisions, and a test program that was carefully planned and executed. To this
foundation was added the skill and bravery of the astronauts, backed up by a
fully trained and highly motivated ground team. It must not be forgotten that
the lunar mission was very complex from all points of view — planning, hard-
hardware, software, and operations. Of necessity, margins were small and even small
deviations in performance or conduct of the mission could have jeopardized
mission success.
In parallel with the emphasis on engineering problems and their solution,
the scientific part of the Apollo 11 mission was planned and executed with great
care. The samples of lunar soil and rocks returned by the astronauts will add
much detailed scientific information. The photographs and observations of the
crew have already answered some questions man has asked for thousands of
years. The emplaced experiments have yielded data unavailable until now. This
report is preliminary and covers only the initial scientific results of the Apollo 11
mission, Much work remains for the large number of scientists involved to under-
understand and interpret the facts that are only partly exposed today.
Summary of Scientific Results
W. N. Hess and A, /. Calio
The scientific objectives of the Apollo 11 mis-
mission, in order of priority, were the following:
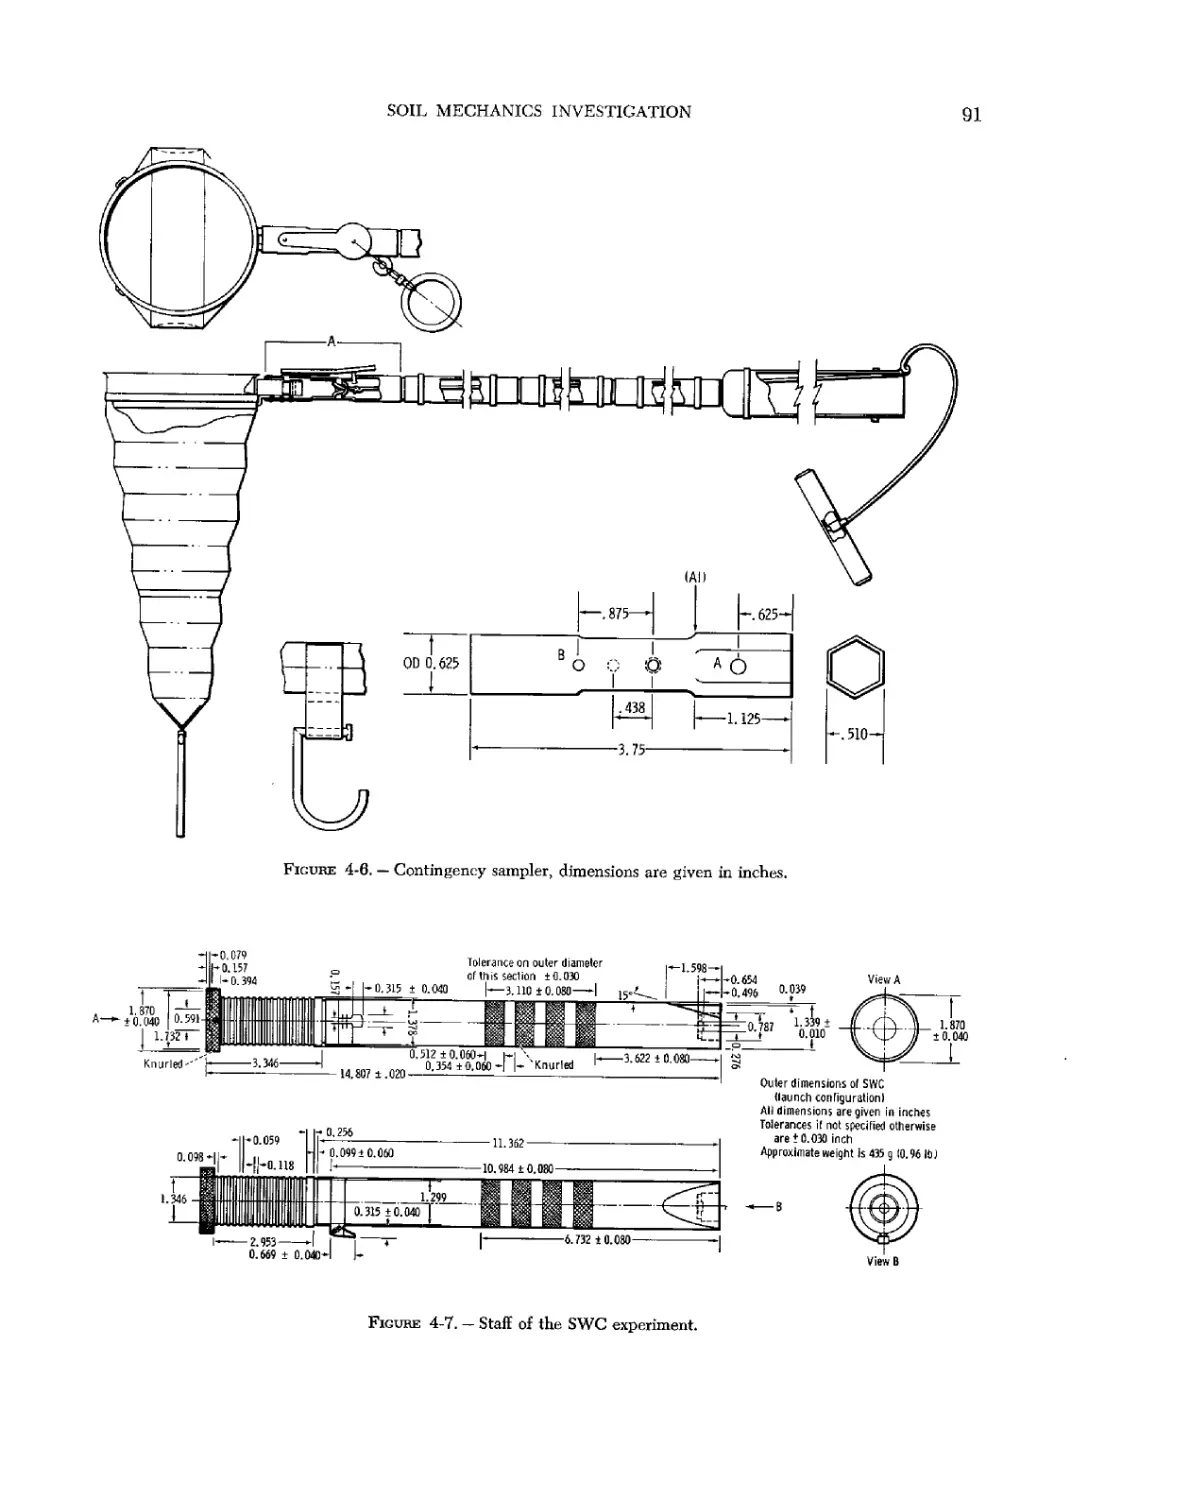
A) To collect early in the extravehicular ac-
activity (EVA) a sample, called the contingency
sample, of approximately 1 kg of lunar surface
material to insure that some lunar material would
be returned to Earth,
B) To fill rapidly one of the two sample re-
return containers with approximately 10 kg of the
lunar material, called the bulk sample, to insure
the return of an adequate amount of material to
meet the needs of the principal investigators,
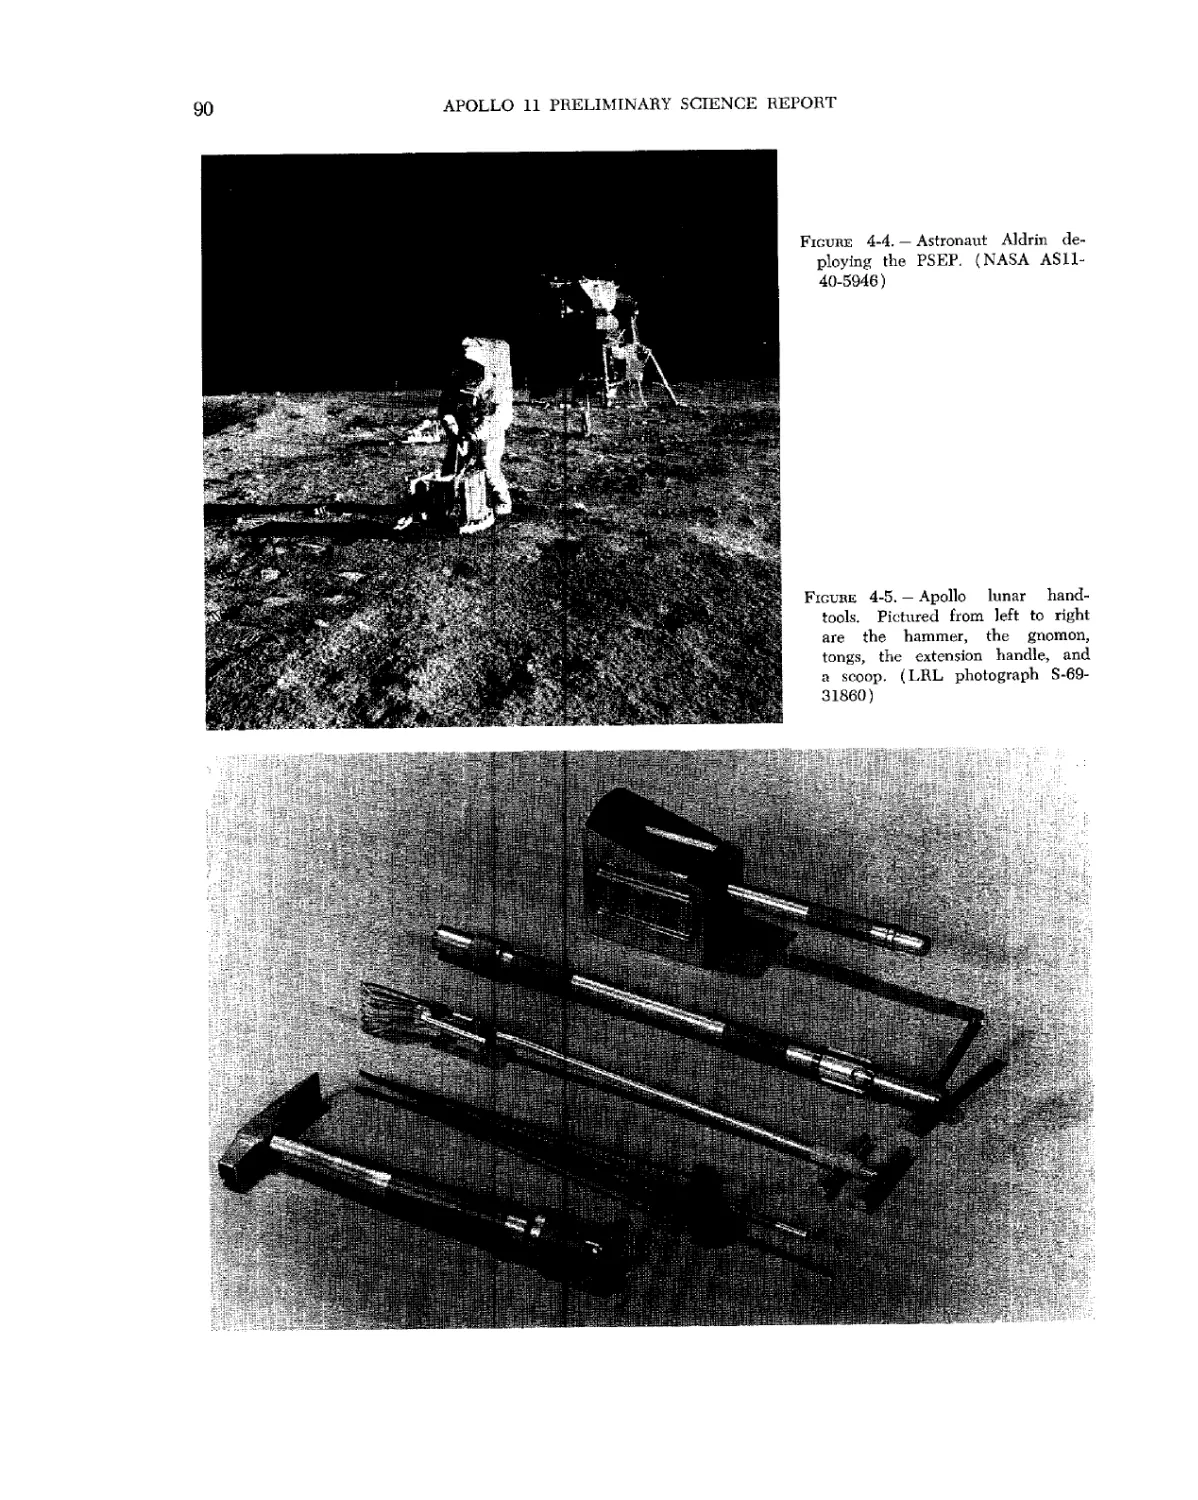
C) To deploy three experiments on the lunar
surface:
(a) A passive seismometer to study lunar
seismic events, the Passive Seismic Experiment
Package (PSEP)
(b) An optical corner reflector to study
lunar librations, the Laser Ranging Retroreflector
(LRRR)
(c) A solar-wind composition (SWC) ex-
experiment to measure the types and energies of
the solar wind on the lunar surface
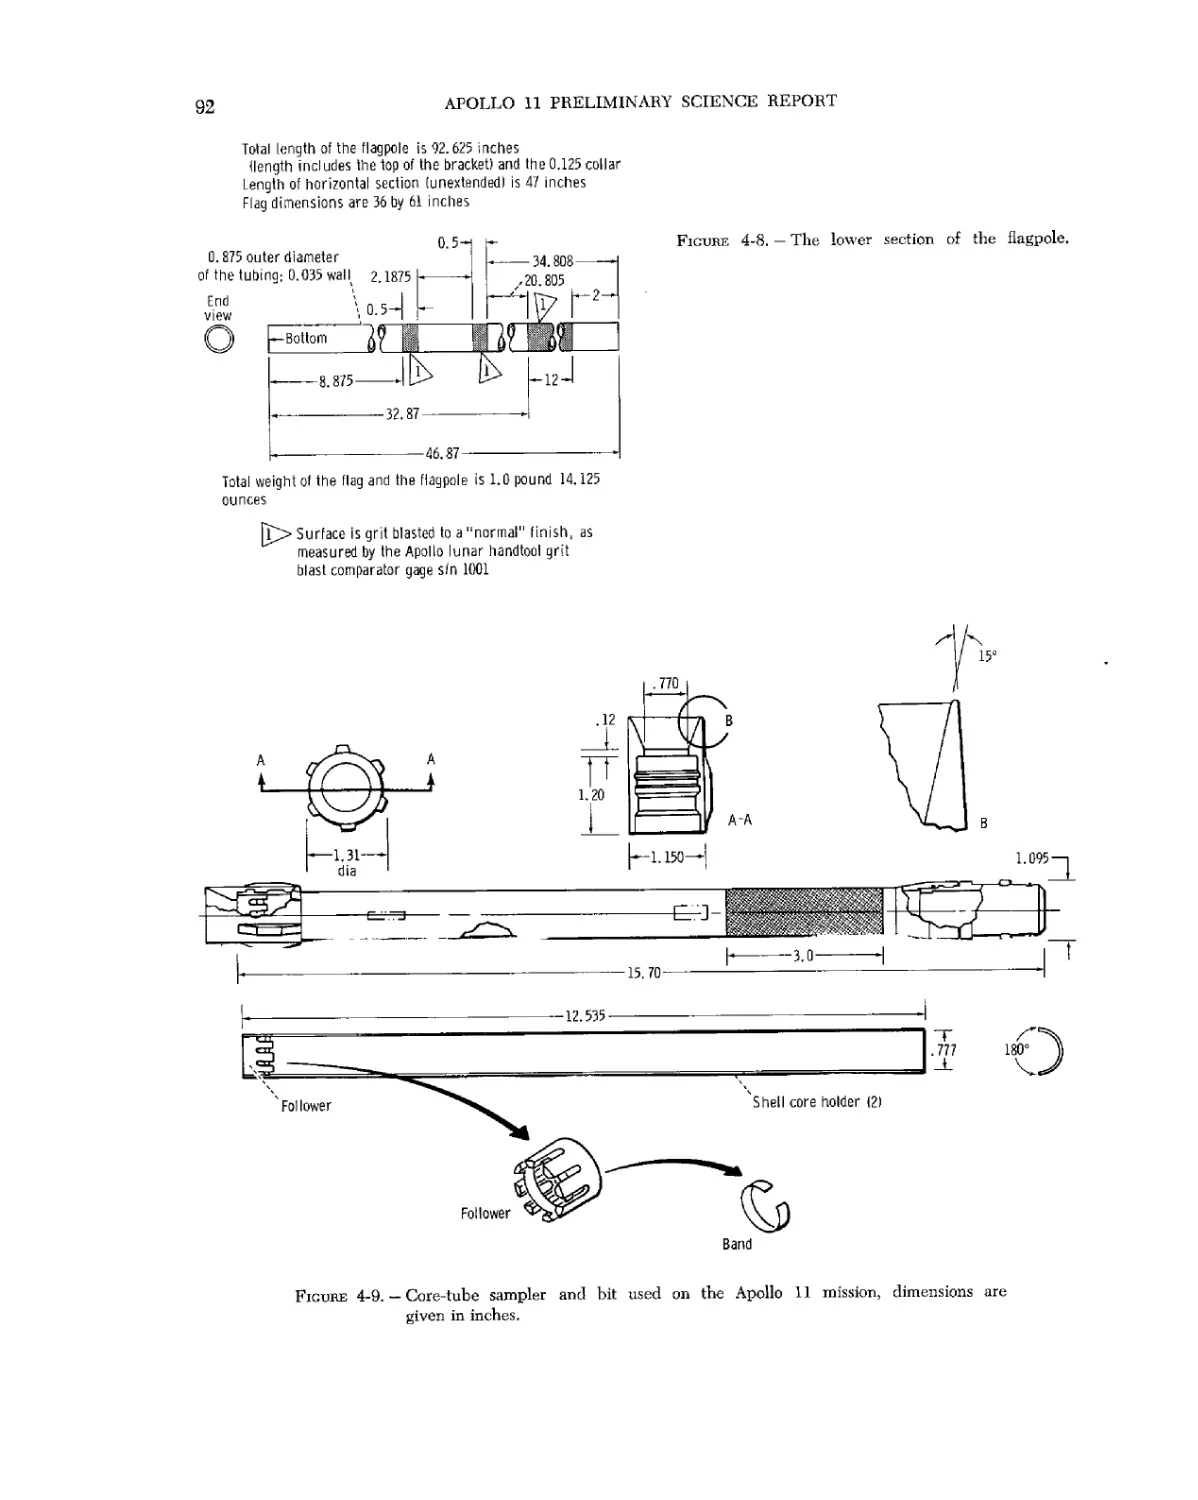
4) To fill the second sample return container
with carefully selected lunar material placed into
the local geologic context, to drive two core tubes
into the surface, and to return the tubes with the
stratigraphically organized material, called the
documented sample.
During these tasks, photographs of the surface
were to be taken using a 70-mm Hasselblad cam-
camera and a closeup stereoscopic camera (the Apollo
Lunar Surface Closeup Camera (ALSCC)). The
scientific tasks and a variety of other tasks were
planned for a 2-hr and 40-min time period.
According to mission plans, the time allotted
for the collection of the documented sample,
which had the lowest priority, would be short-
shortened if time were insufficient. All the scientific
tasks were completed satisfactorily, all instru-
instruments were deployed, and approximately 20 kg
of lunar material were returned to Earth. The
documented-sample period was extremely short,
however, and samples collected during this
period were not carefully photographed in place
or documented in other ways.
Nature of the Lunar Surface
The Apollo 11 lunar module (LM) landed in
the southwestern part of Mare Tranquillitatis,
approximately 50 km from the closest highland
material and approximately 400 m west of a
sharp-rimmed blocky crater approximately 180 m
in diameter. Rays of ejecta from this crater ex-
extend past the landing site. Rays from more dis-
distant craters, including the crater Theophilus, are
also in the landing region.
Surface material at the landing site consists of
unsorted fragmental debris ranging in size from
approximately 1 m to microscopic particles, which
make up the majority of the material. This debris
layer, the regolith, is approximately 5 m thick in
the region near the landing site, as judged by
the blockiness of material near various-sized
craters,
The soil on the lunar surface is weakly cohe-
cohesive, as shown by the ability of the soil to stand
on vertical slopes. The fine grains tend to stick
together, precluding clods of material that crum-
crumpled under the astronauts' boots. The depth of
the astronauts' footprints and the penetration of
the LM landing gear correspond to static bearing
pressures of approximately 1 psi. The surfaces
were relatively soft to depths of 5 to 20 cm. Deeper
than these depths, the resistance of the material
to penetration increases considerably. In general,
the lunar soil at the landing site was similar in
appearance, behavior, and mechanical properties
to the soil encountered at the Surveyor equatorial
APOLLO 11 PRELIMINARY SCIENCE REPORT
landing sites. Although the lunar soil differs con-
considerably in composition and in range of particle
shapes from a terrestrial soil of the same particle-
size distribution, the lunar soil does not appear to
differ significantly from similar terrestrial soil in
mechanical behavior.
Both rounded and angular rocks appear on the
surface in profusion. All degrees of burial are
present, and fillets on the sides of rocks, caused
by the powdery surface material being piled up
by some erosional process, were common. At least
three of the rocks returned to Earth have been
identified in photographs of the lunar surface. On
what appears to be the upper surface of several
rocks, a thin rind of altered material approxi-
approximately 1 mm thick is found. This rind is lighter
colored than the remainder of the rock and ap-
appears to be caused by shattering of mineral grains.
One outstanding feature of the surfaces of the
rocks returned to Earth is the existence of sev-
several glass-lined pits 1 mm or smaller in diameter.
These glass-lined pits appear only on the sur-
surfaces of rocks. (More of these pits are observed
on the top surfaces of rocks with known orienta-
orientations.) Quite clearly, these pits are of external
origin. The glass overlaps of the surface of the
rock and the resulting features clearly resemble
hypervelocity impact craters. However, the pits
do not resemble craters made in the laboratory
by hypervelocity particles, and the origin of the
pits is presently unknown.
The most interesting and unexpected surface
features discovered and photographed by the
astronauts are glassy patches on the lunar sur-
surface that are described by the astronauts as re-
resembling drops of solder. These patches were
observed only inside several raised-rim craters
approximately 1 m in diameter. These glassy
blebs may be formed by low-velocity molten ma-
material splattering into the craters, or they may
be formed from material that has been melted
in place. The section of this document entitled
"Lunar Surface Closeup Stereoscopic Photog-
Photography" presents an interesting theory of the ori-
origin of the blebs, based on radiation heating. This
theory postulates that within the last 100 000
years, the Sun had a superflare or mininova event
that heated the lunar surface to a temperature
that caused material inside the craters to melt,
but did not cause surface material to melt. Ac-
According to the theory, the reason that material
inside the craters melted while surface material
did not is that a focusing effect caused the tem-
temperature inside the craters to increase, This radia-
radiation-heating theory is certainly not yet proved,
but no other plausible theories have been ad-
advanced to explain the blebs' being located only
in the bottoms of craters. None of the blebs
photographed by the astronauts were returned
in the sample containers, and no blebs have
been identified in the samples.
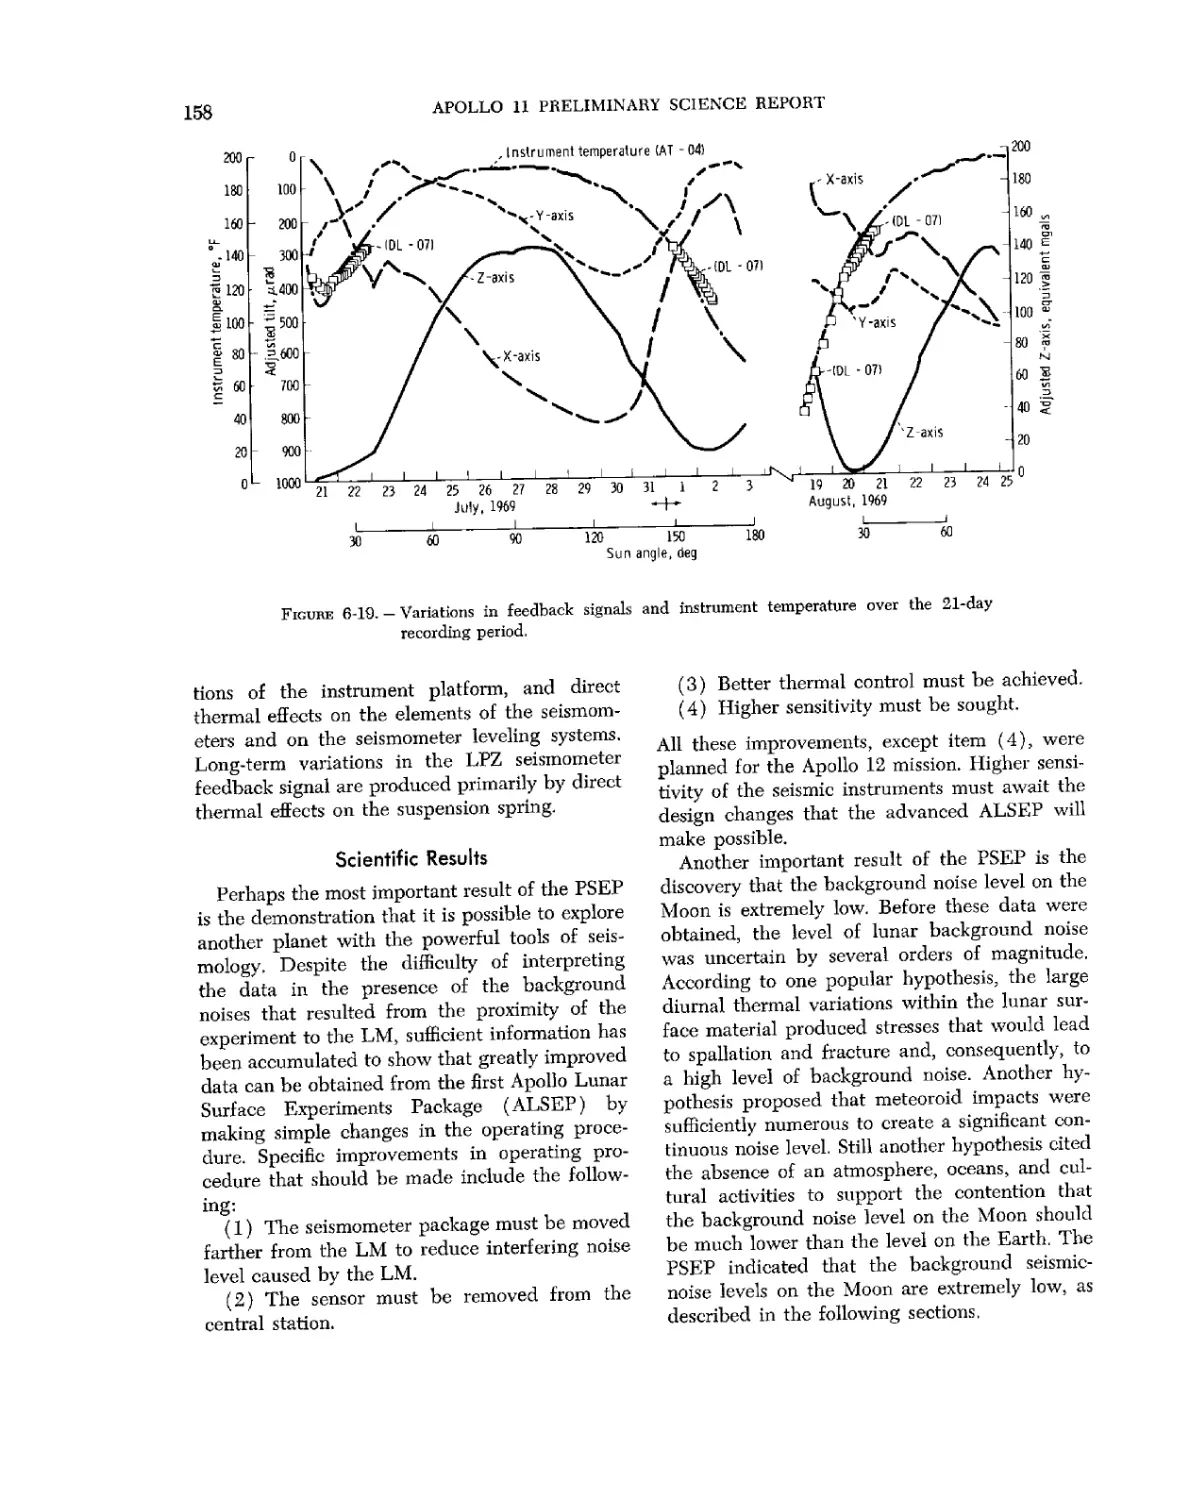
The Passive Seismic Experiment
Since the time of the Ranger 1 mission, scien-
scientists have been trying to land a seismometer on
the surface of the Moon to search for moon-
quakes. Successful operation of a seismometer
is extremely important for understanding of the
internal structure of a planet and to a search for
possible layering or discontinuities. On the Apollo
11 mission, a seismometer was placed on the
surface of the Moon, and the instrument oper-
operated satisfactorily for 21 days. The instrument
contained four separate components. Three long-
period (LP) (approximately 15-sec resonance)
seismometers were alined orthogonally to meas-
measure surface motion both horizontally and verti-
vertically. A single-axis, short-period (SP) seismom-
seismometer, with a resonant period of approximately
1 sec, measured vertical motion. The system had
tilt adjustment motors to level the system upon
command from Earth. The instrument was de-
deployed on the lunar surface approximately 16 m
from the LM and was turned on while the astro-
astronauts were on the lunar surface, Signals were
received when the crewmen climbed the LM
ladder, used a hammer to pound on the core
tubes, and jettisoned equipment, including the
portable life support systems (PLSS).
Actual maximum instrument temperature (ap-
(approximately 190° F) exceeded the planned maxi-
maximum instrument temperature by approximately
50° F. Even at this elevated temperature, the
instrument worked satisfactorily during the first
lunar day and during part of the second. How-
However, near noon of the second lunar day, the
instrument no longer accepted commands from
Earth stations; therefore, the experiment was
terminated.
SUMMARY OF SCIENTIFIC RESULTS
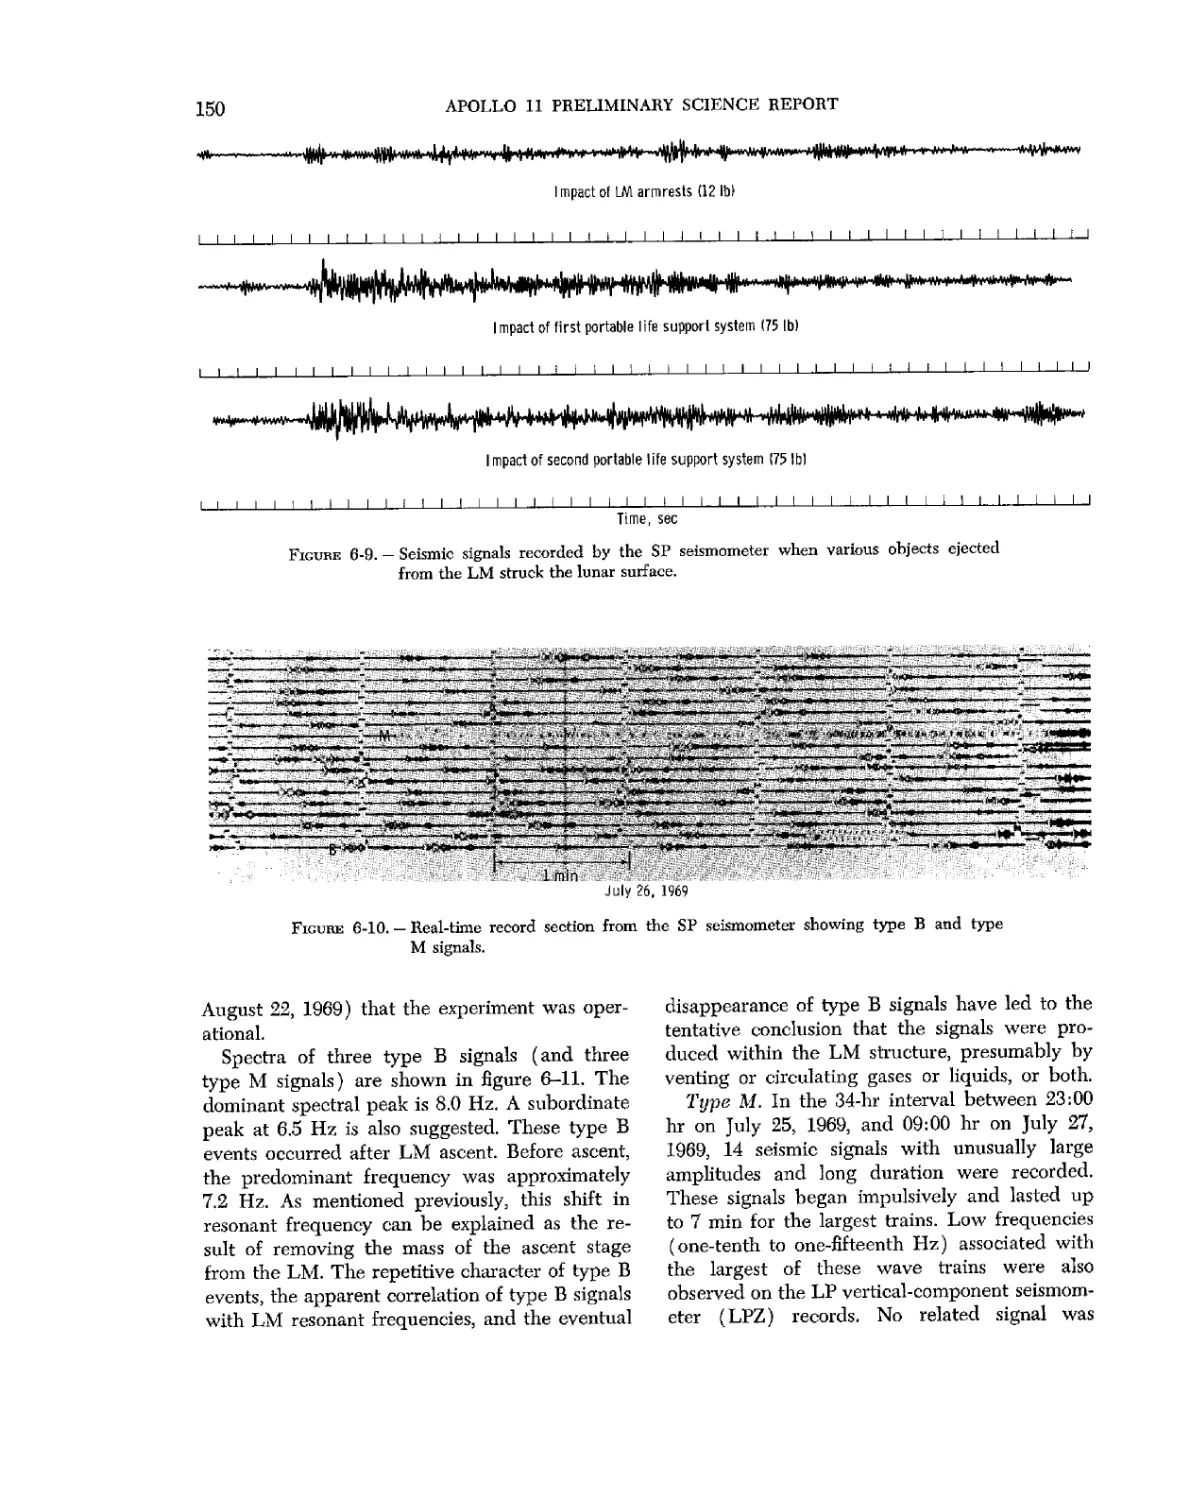
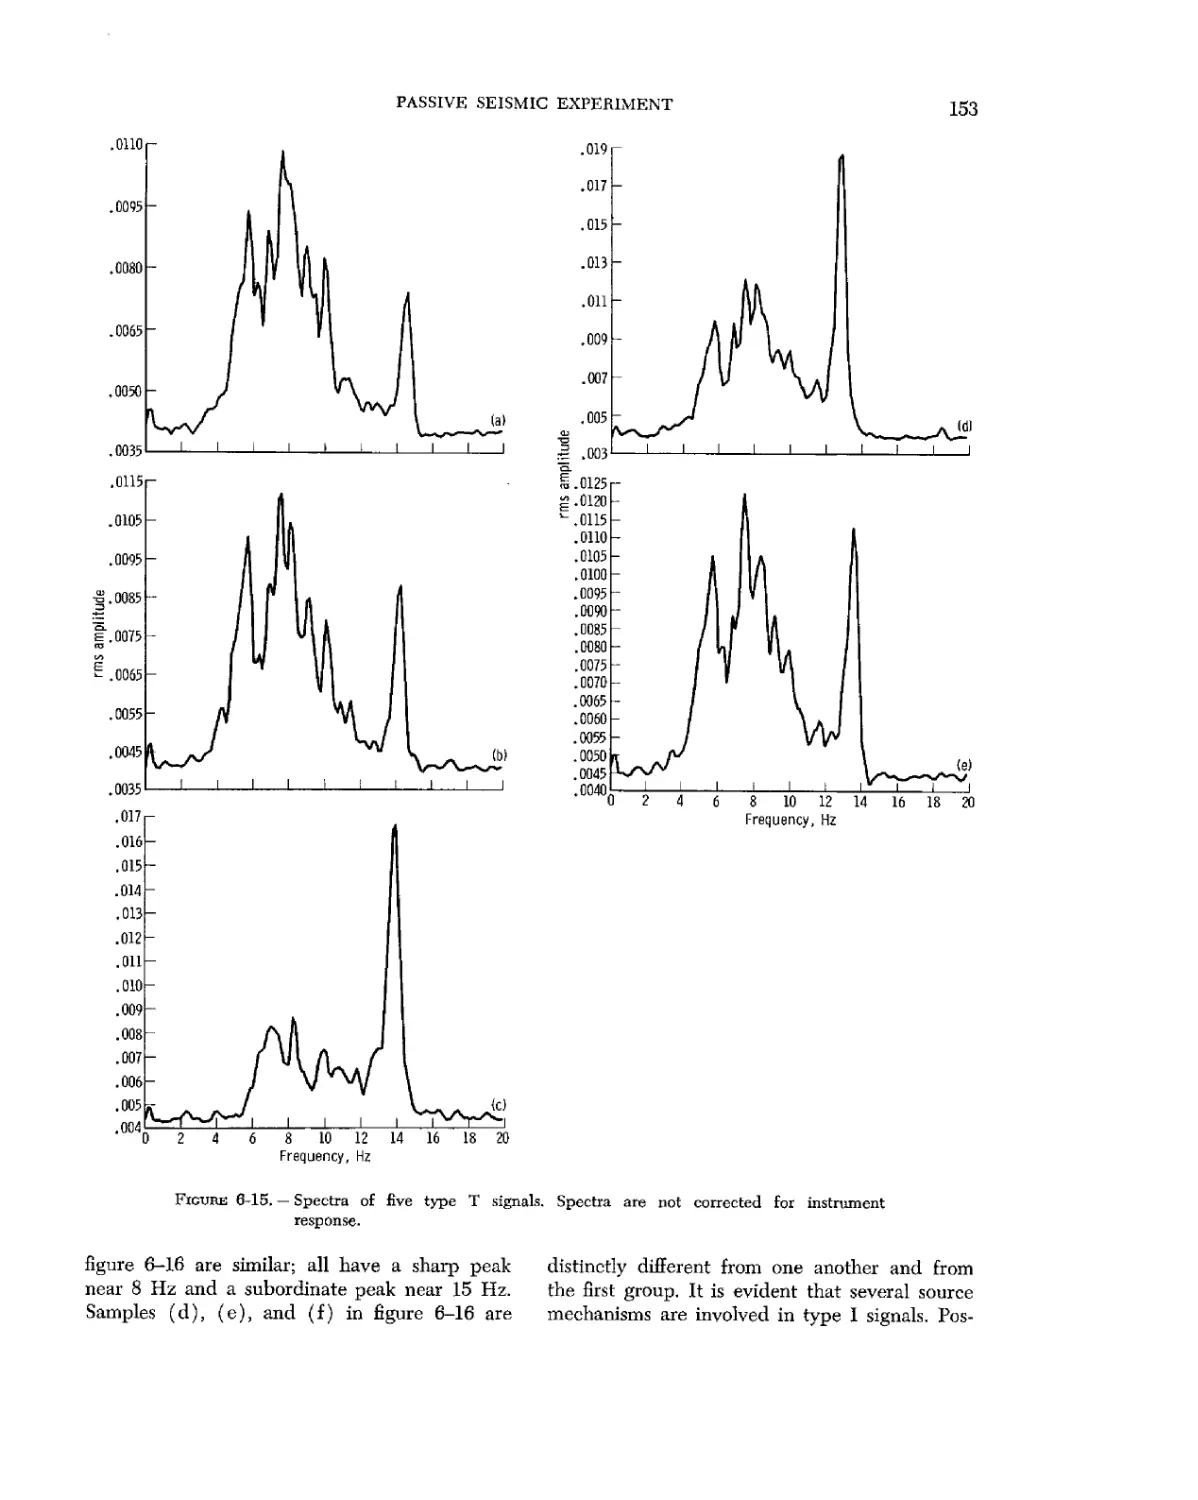
The LM appears to have been a rich source of
seismic noise. One class of repeating signals of
nearly identical structure that was observed
gradually died out over a period of many Earth
days. These signals seem to be related to events
on the LM such as fuel venting, valve chatter,
or other mechanical motion. The signals had a
dominant frequency of 7.2 Hz before LM ascent
and of 8.0 Hz following ascent. These frequen-
frequencies appear to be characteristic frequencies of
the LM structure.
Several events showing dispersion and having
the appearance of surface waves were detected
on the LP seismometers. These wave trains often
occurred simultaneously with a series of pulses
on the SP seismometer. It is not yet certain, but
these waves are probably not the result of real
seismic events but are of instrumental origin.
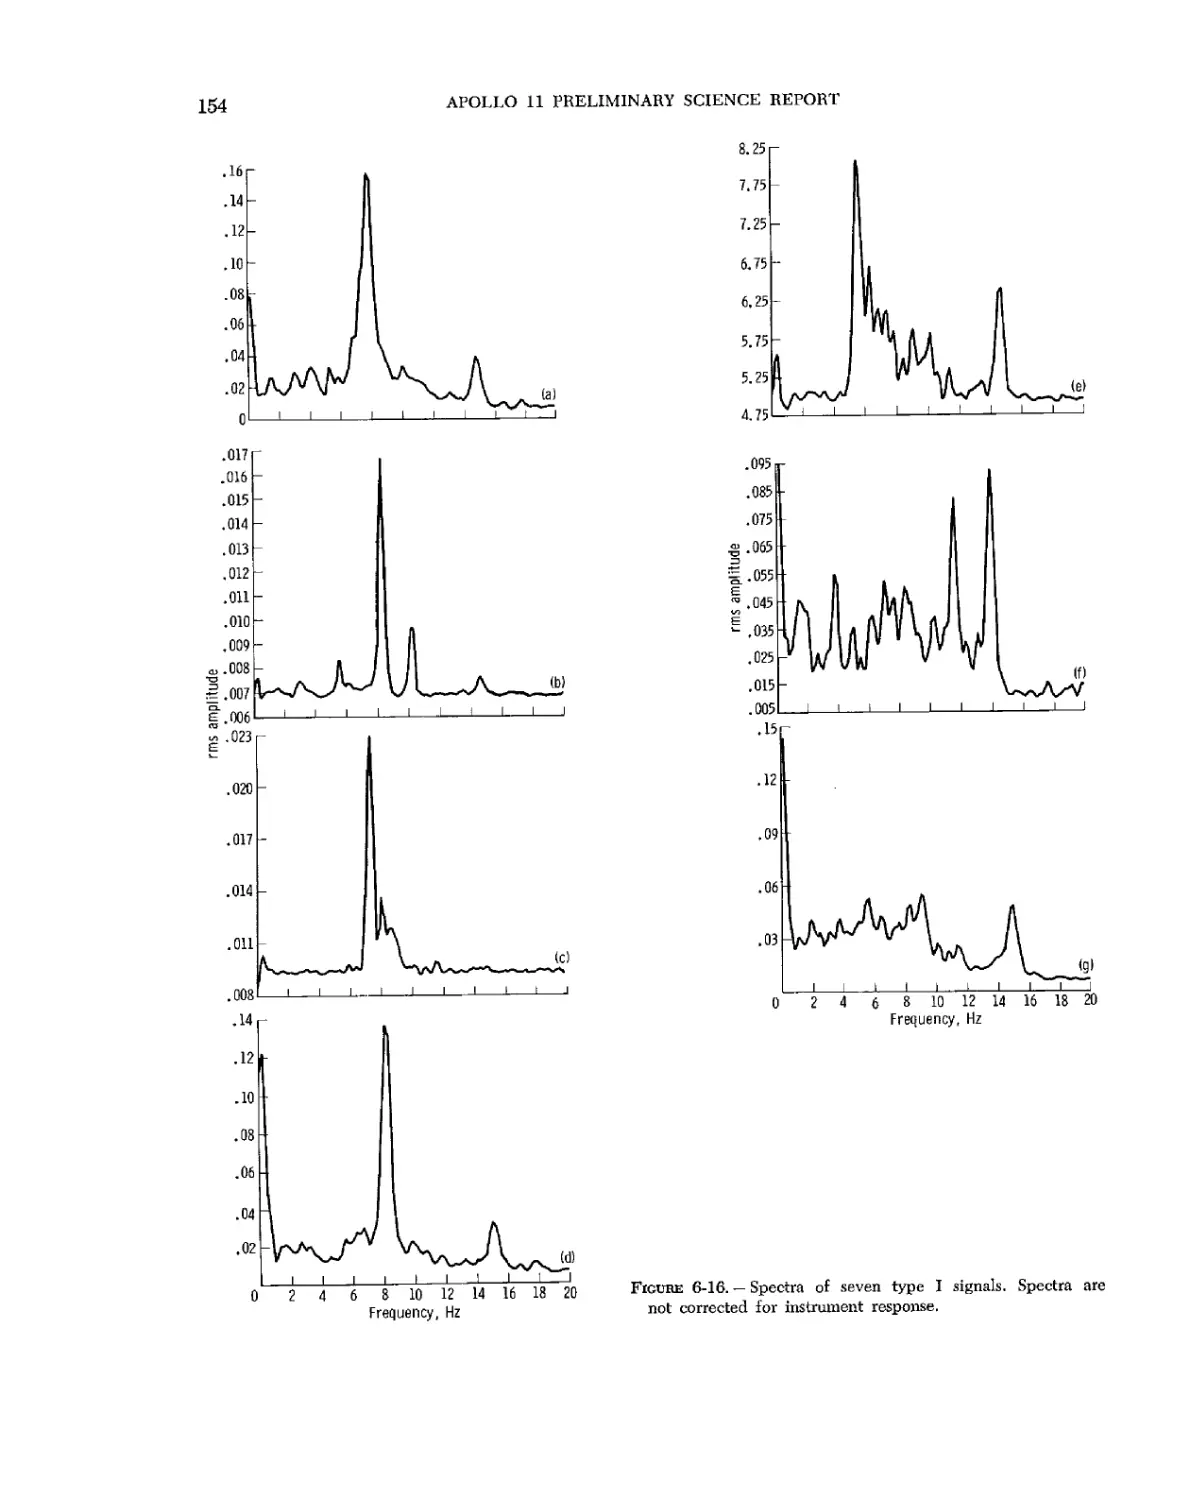
Several other classes of events of unknown
origins were observed. The following are pos-
possible source mechanisms for these observed seis-
seismic signals:
A) Venting gases from the LM and circulat-
circulating fluids within the LM
B) Thermoelastic stress relief within the LM
and the PSEP
C) Meteoroid impacts on the LM, the PSEP,
and the lunar surface
D) Displacement of rock material along steep
crater slopes
E) Moonquakes
F) Instrumental effects
It is unclear whether any of the received sig-
signals were actually of lunar-seismic-event origin.
One of the most important results of the PSEP
is the discovery that the background noise level
on the Moon is extremely low. At frequencies
from 0.1 to 1 Hz, the background seismic-signal
level for vertical surface motions is less than
0.3 m,um. This level is from 100 to 10 000 times
less than average terrestrial background levels
in the frequency range of 0.1 to 0.2 Hz for micro-
seisms. Continuous seismic background signals
from 10 to 30 m/mi were observed on the records
of the horizontal seismometers. These signals
decreased considerably near lunar noon and may
have been due to lunar surface-temperature
changes which tilted the instrument.
Of the many seismic signals recorded, several
were produced by the LM. Many of the signals
may be a result of real seismic events and may
be generated by moonquakes, impact events, or
movement of surface rocks. However, none of
the events can be clearly identified as real, and
none of the observed signals has patterns nor-
normally observed on recordings of seismic activi-
activities occurring on Earth. Clearly, the Moon is not
a very seismic body. Artificial seismic sources,
such as the impact on the lunar surface of the
Saturn IVB stage or the spent LM ascent stage,
will be useful for future lunar seismometers.
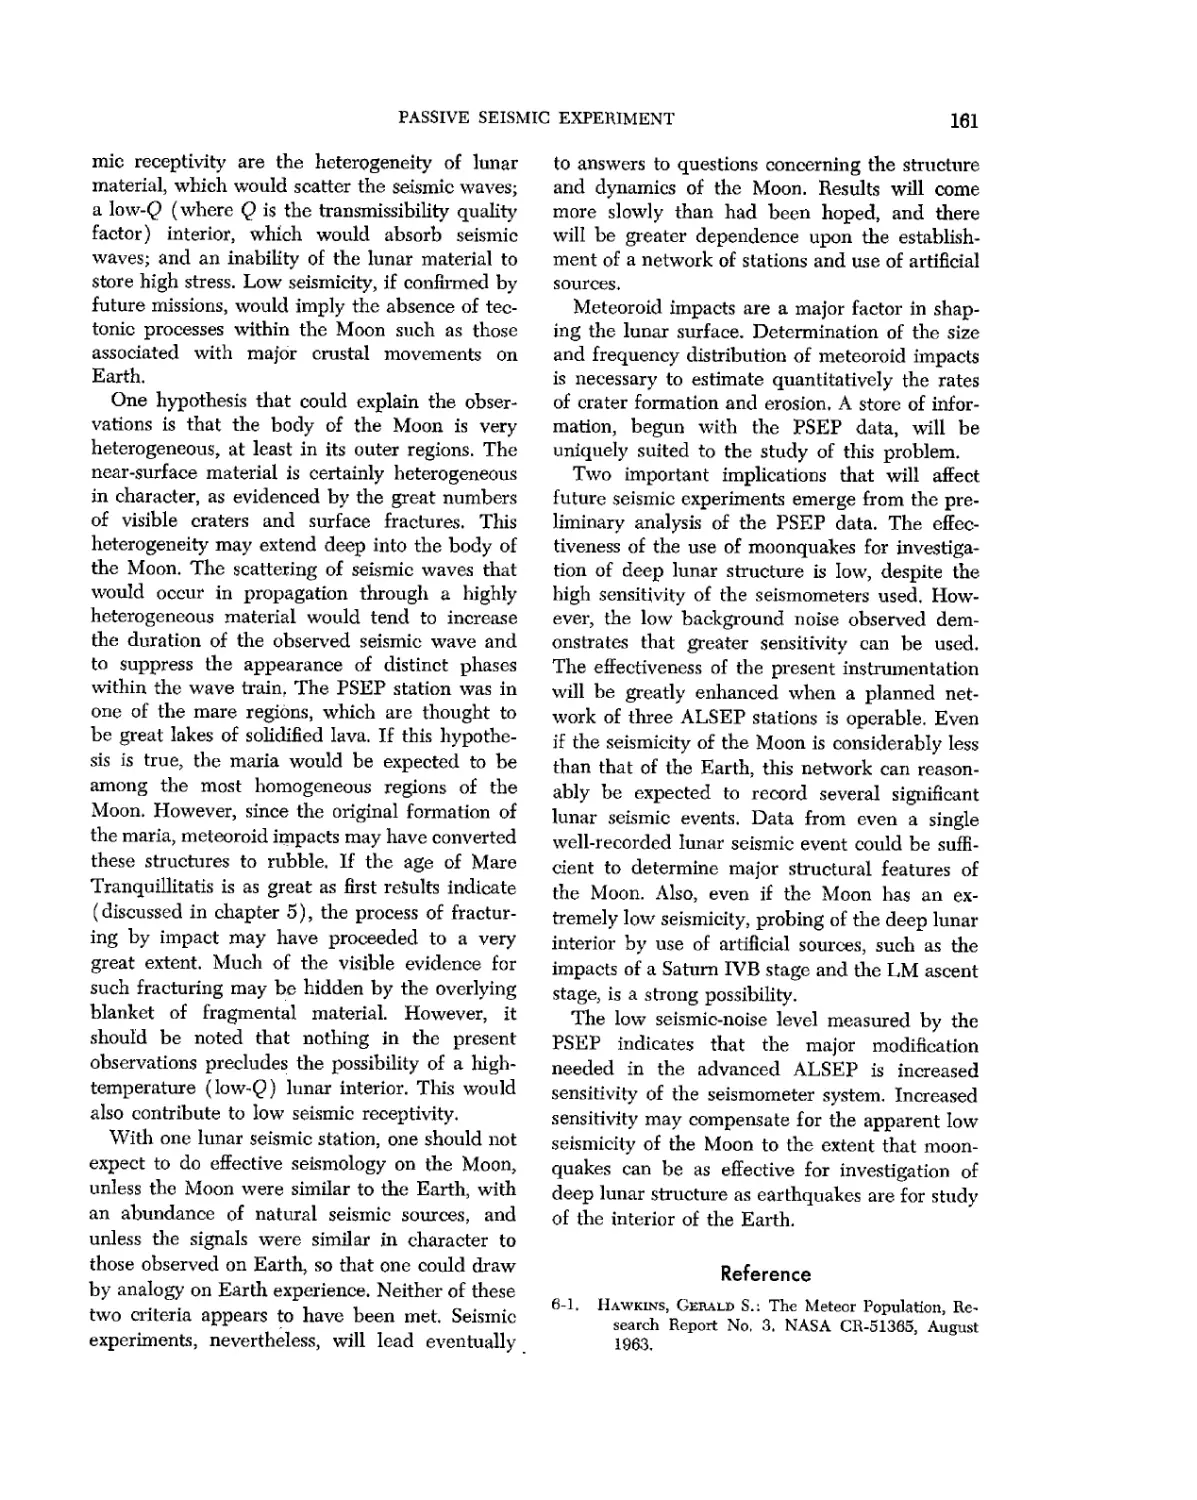
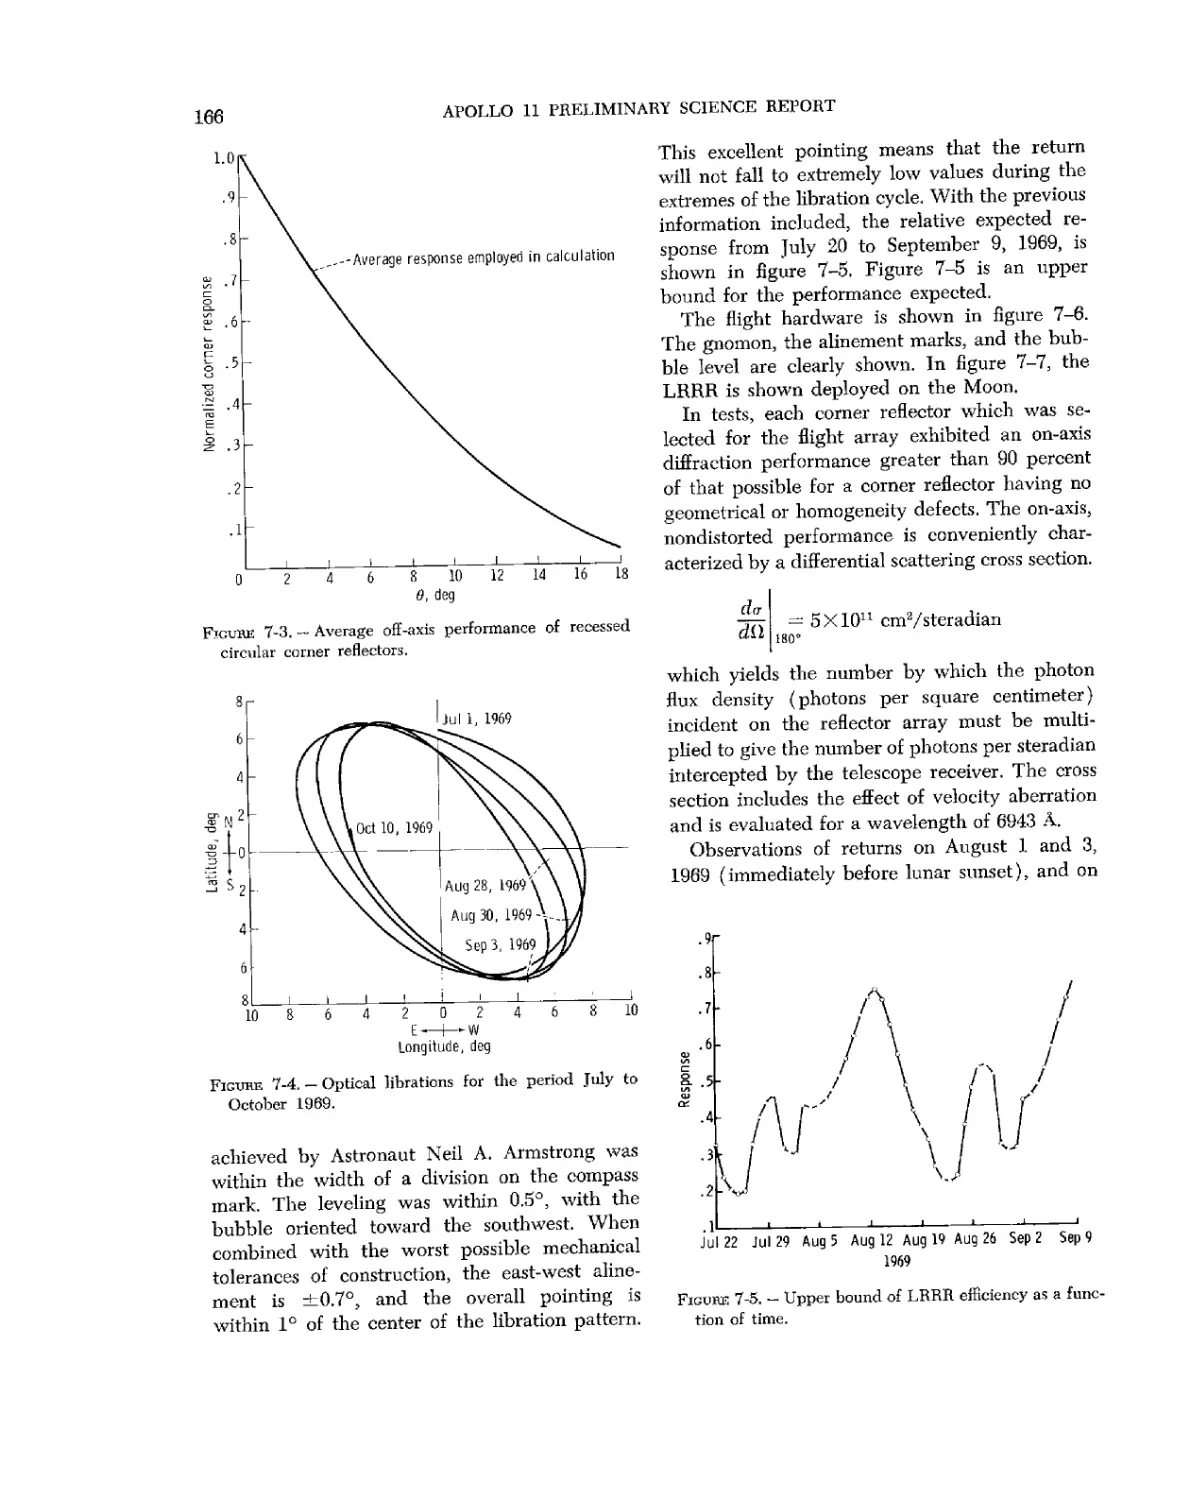
Laser Ranging Retroreflector
The LRRR consists of an array of finely ma-
machined quartz corners deployed on the lunar sur-
surface and aimed at the Earth. The array is used
as a reflector for terrestrial lasers. By measuring
the distance from the laser to the reflector, small
changes in the motion of the Moon or the Earth
can be measured. The goal, when the system is
fully operational, is an uncertainty of 15 cm
F in.). The LRRR will allow studies to be con-
conducted on A) the librations of the Moon, both
in latitude and longitude, B) the recession of
the Moon from the Earth caused either by tidal
dissipation or by a possible change in the gravi-
gravitation constant, and C) the irregular motion of
the Earth, including the Chandler wobble of the
pole. The amplitude of the Chandler wobble
seems to vary in time with relation to major
earthquake events.
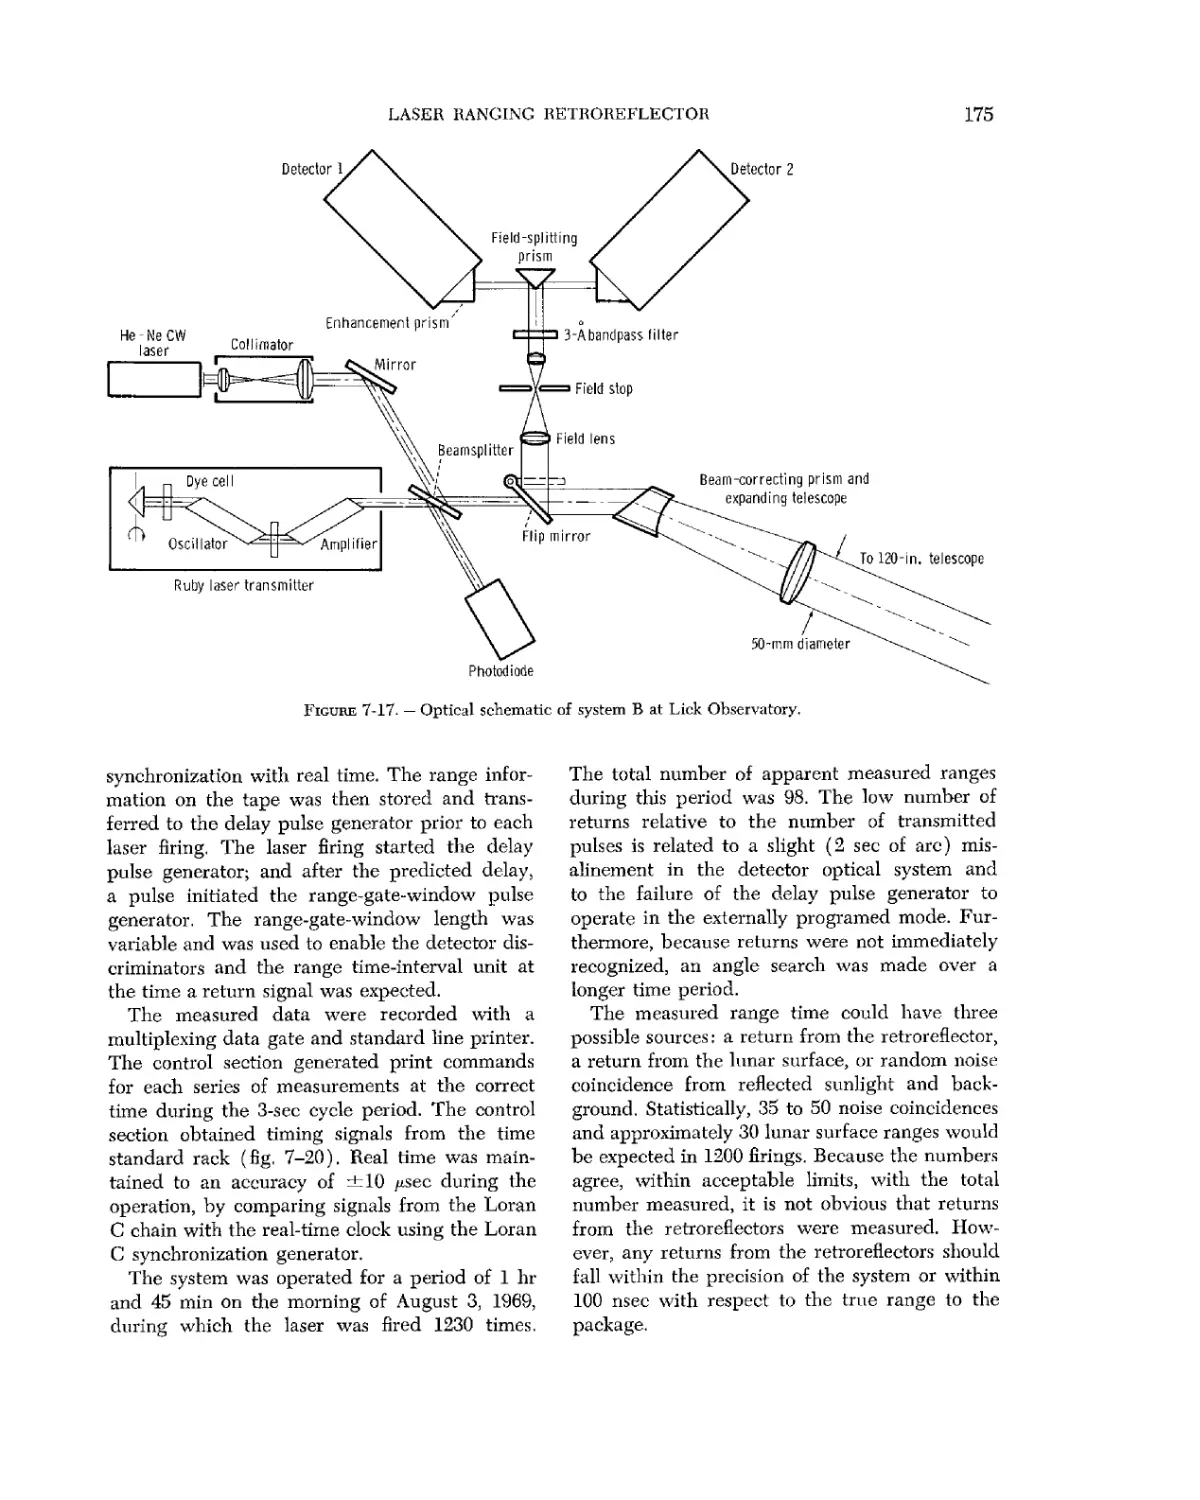
On the same day the LRRR. was deployed satis-
satisfactorily on the surface of the Moon, attempts
were made to range on the reflector from the
Lick Observatory in California and from the
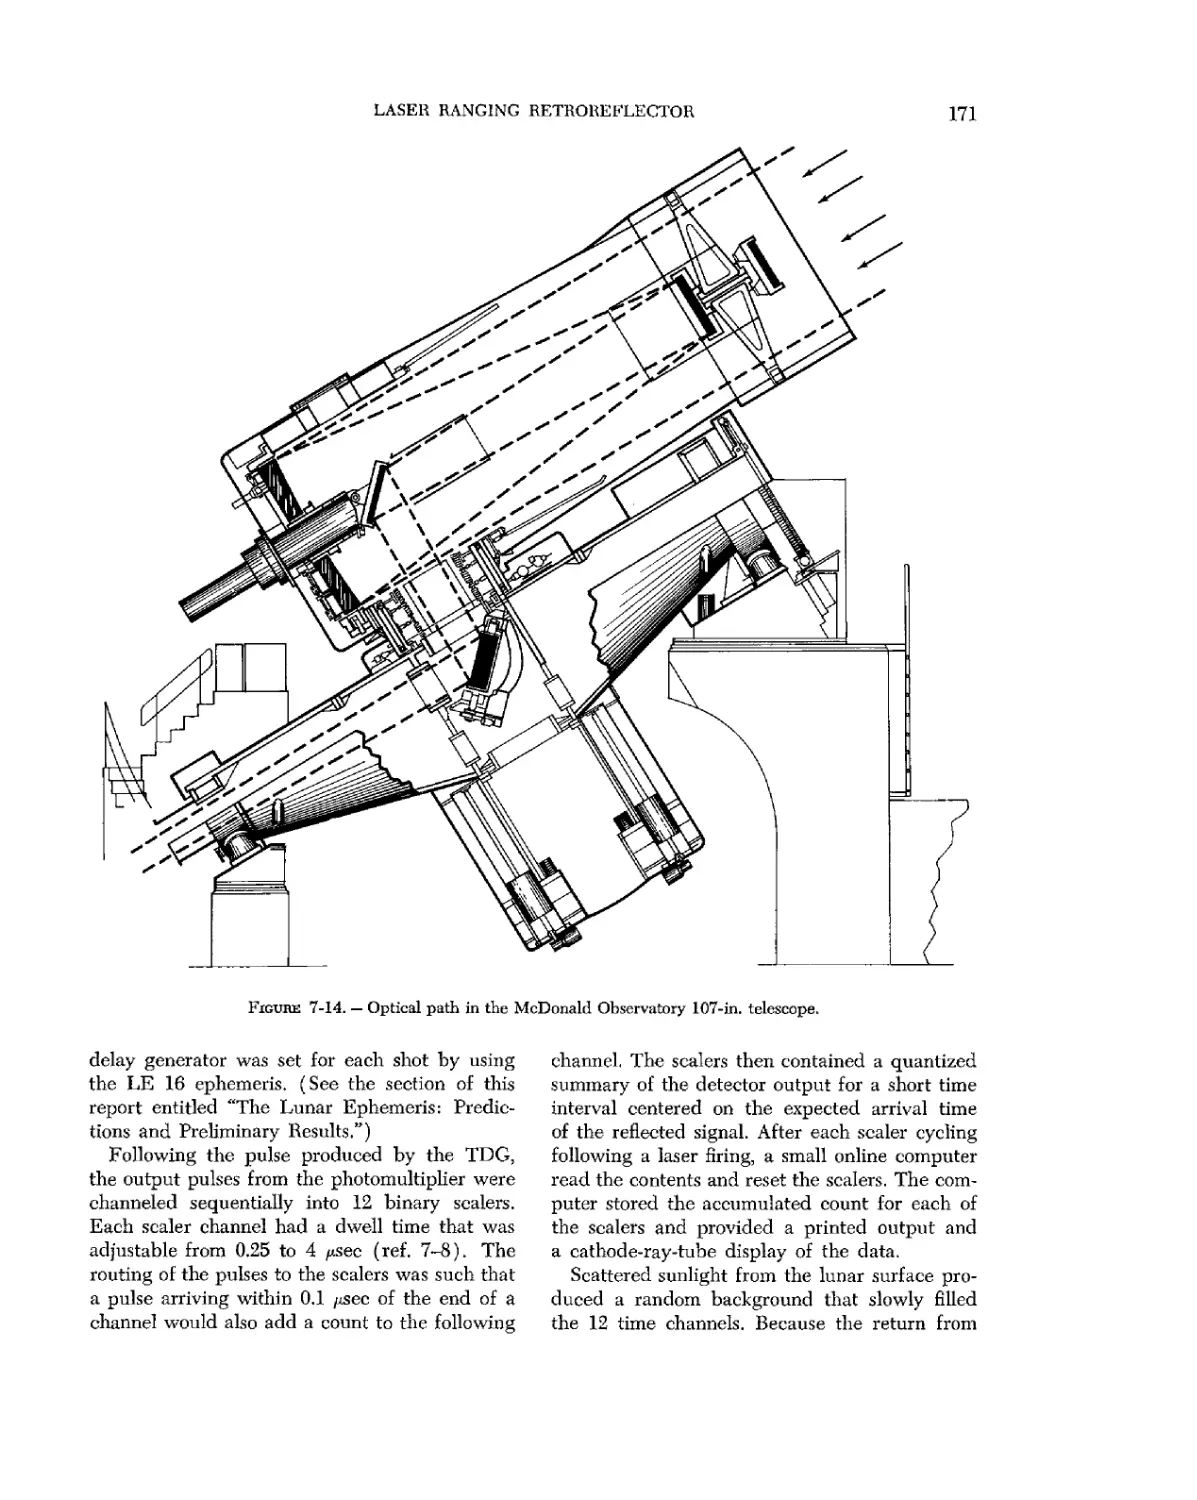
McDonald Observatory in Texas. Some time was
required for the ranging attempts to be success-
successful because, initially, there was some uncertainty
as to the location of the landing site. After a few
days, this problem was solved, but ground-instru-
ground-instrument difficulties and weather problems caused
further delays. In approximately a week, both
observatories had received signals reflected by
the LRRR. The signals, although weak, were
clearly identifiable. By using this technique, the
distance to the Moon from the Earth has been
measured to an accuracy of approximately 4 m.
It should be noted that the distance to the Moon
is actually uncertain to a few hundred meters
APOLLO 11 PRELIMINARY SCIENCE REPORT
because of uncertainties in the velocity of light.
However, the distance expressed in light seconds
is accurate to approximately one part in 108,
which is consistent with the 4-m accuracy dis-
discussed previously.
The LRRR experiment will continue for months
or years before final data are obtained on many
of the detailed measurements to be undertaken.
The Solar-Wind Composition Experiment
For some time, direct measurements have been
made of the solar wind, establishing the presence
of approximately 5 percent helium ions in the
solar-wind stream, which is composed predomi-
predominantly of protons. The solar wind is expected to
contain many heavier ions, probably representa-
representative of solar composition, but no direct measure-
measurements of these heavier species have yet been
made. It now seems quite likely that the rare gas
measured in the powdery lunar samples is of
solar-wind origin, but this rare-gas source may
be confused with other gas sources, The meas-
measured rare gas represents an integration of the
solar wind into the soil over a period of many
millions of years.
An experiment was conducted during the
Apollo 11 mission to measure heavier elements
in the solar wind directly. A thin aluminum foil
of 4000 cm2 was deployed on the surface of the
Moon facing the Sun. The solar-wind particles
were expected to penetrate approximately 10~5
cm into the foil and to be firmly trapped there.
The foil was collected after 77 min, placed inside
one of the sample-return containers, and brought
to the NASA Manned Spacecraft Center (MSC)
Lunar Receiving Laboratory (LRL).
Approximately 1 ft2 of the foil was removed
in the LRL, sterilized by heat at 125° C for 39 hr,
and sent to Switzerland for analysis. Several small
pieces of the foil, each approximately 10 cm2,
were cleaned by ultrasonic methods, and the
noble gases were then extracted for analysis in a
mass spectrometer. Helium, neon, and argon
were found, and their isotopic composition was
measured. The results correspond generally to
solar abundances and are clearly nonterres-
trial. More complete results will be presented
when the major portion of the foil has been
analyzed.
The Lunar Samples
Of the 22 kg of returned lunar material, 11 kg
are rock fragments larger and 11 kg are smaller
than 1 cm in size. This material may be divided
into the following four groups:
Type A — fine-grained vesicular crystalline
igneous rock.
Type B — medium-grained crystalline igneous
rock.
Type C — breccia.
Type D — fines (less than 1 cm in size).
The crystalline rocks contain mineral assem-
assemblages, crystal sizes, and gas cavities, indicating
that the rocks were crystallized from lavas or
near-surface melts. It is uncertain whether the
lavas were impact generated or of internal origin.
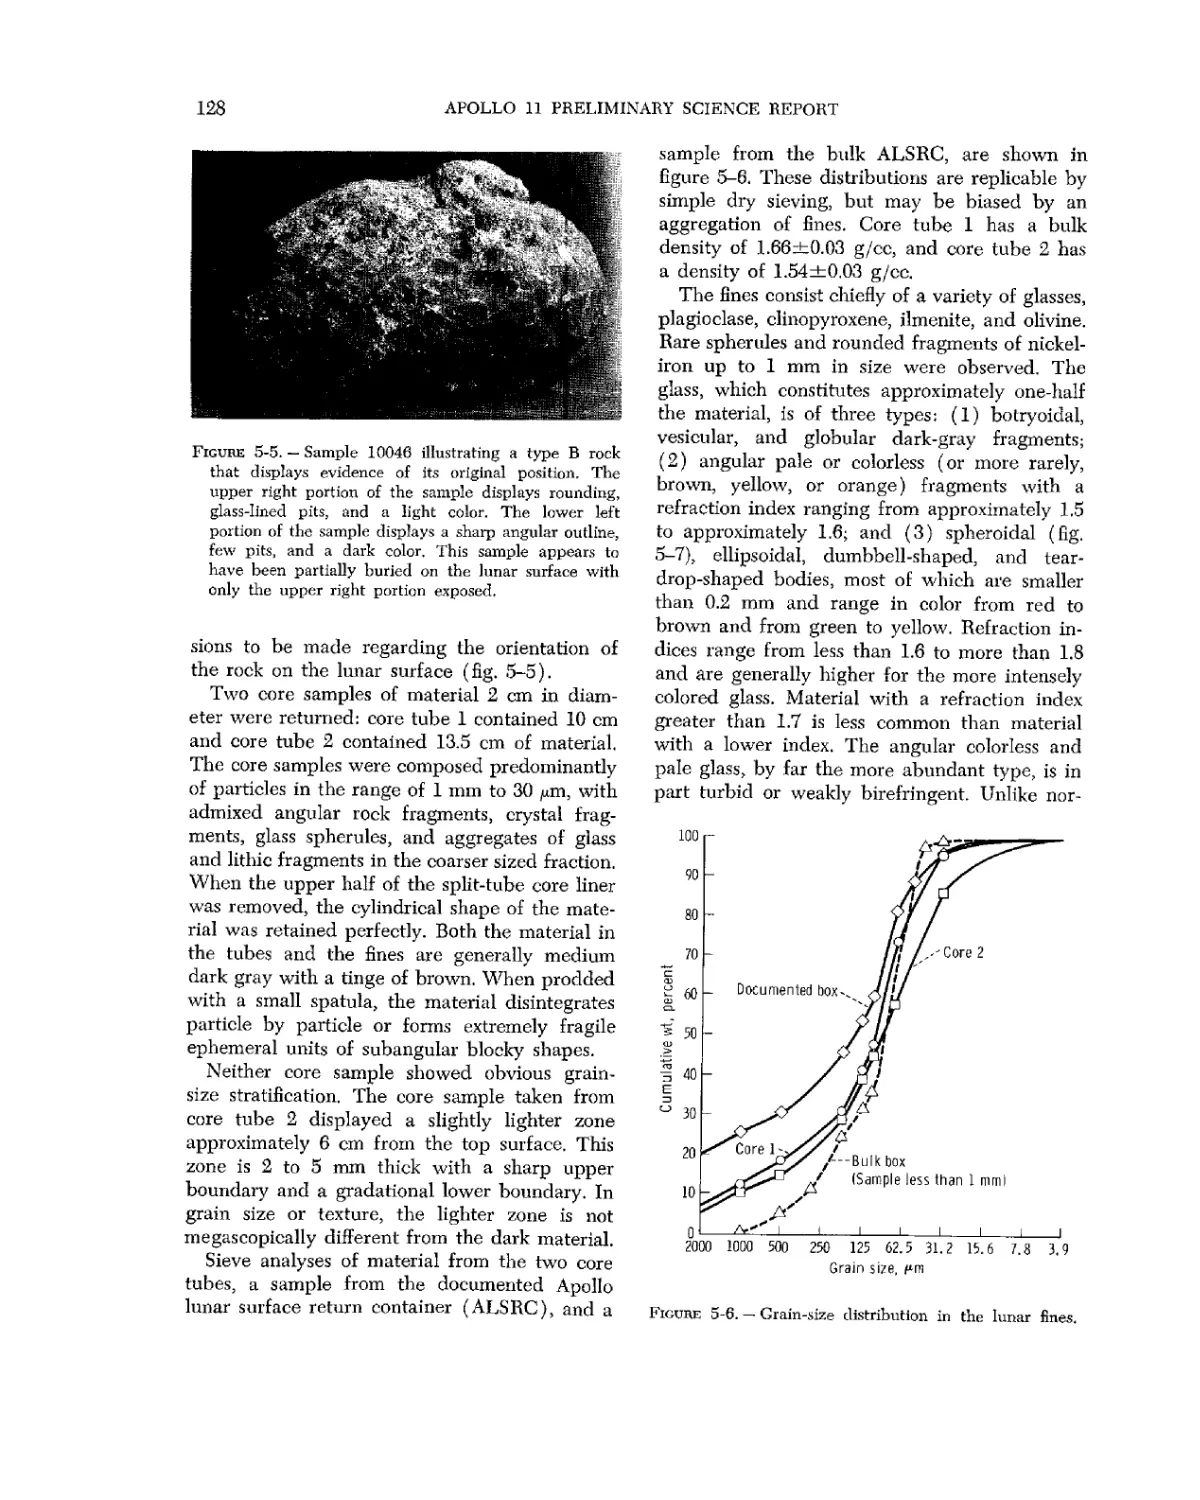
Twenty crystalline rocks were found in the re-
returned sample, 10 rocks of type A and 10 of
type B. Individual rocks weighed up to 919 g.
The type A rocks contain vesicles of 1 to 3 mm
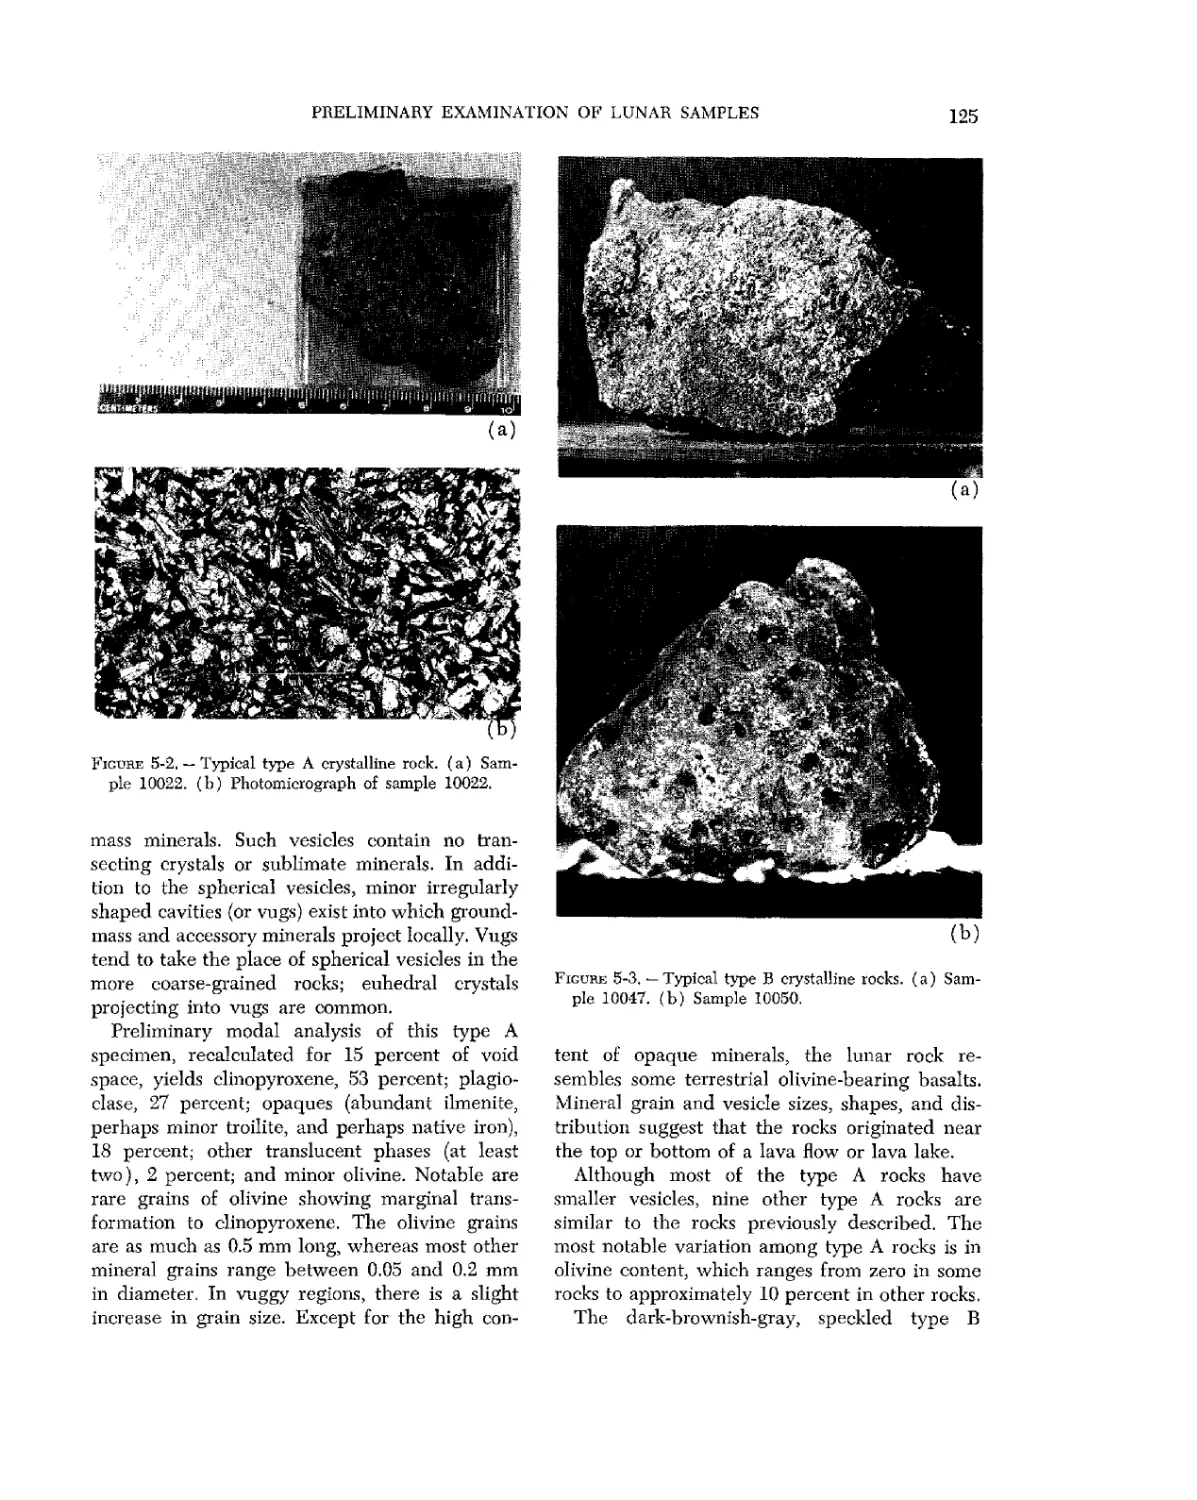
in diameter faced with brilliant crystals. (Most
vesicles are spherical but some are ovate.) There
are also irregular cavities, or vugs, into which
crystals and other groundmass minerals project.
The percentages of the minerals present in type
A rocks are clinopyroxene, 53 percent; plagio-
clase, 27 percent; opaques (including abundant
ilmenite, minor troilite, and native iron), 18 per-
percent; and other translucent phases, and a minor
amount of olivine, 2 percent. Except for the high
content of opaques, which reflects the high iron
and titanium content, the mineralogy and chem-
chemistry of the rocks resemble terrestrial olivine-
bearing basalts.
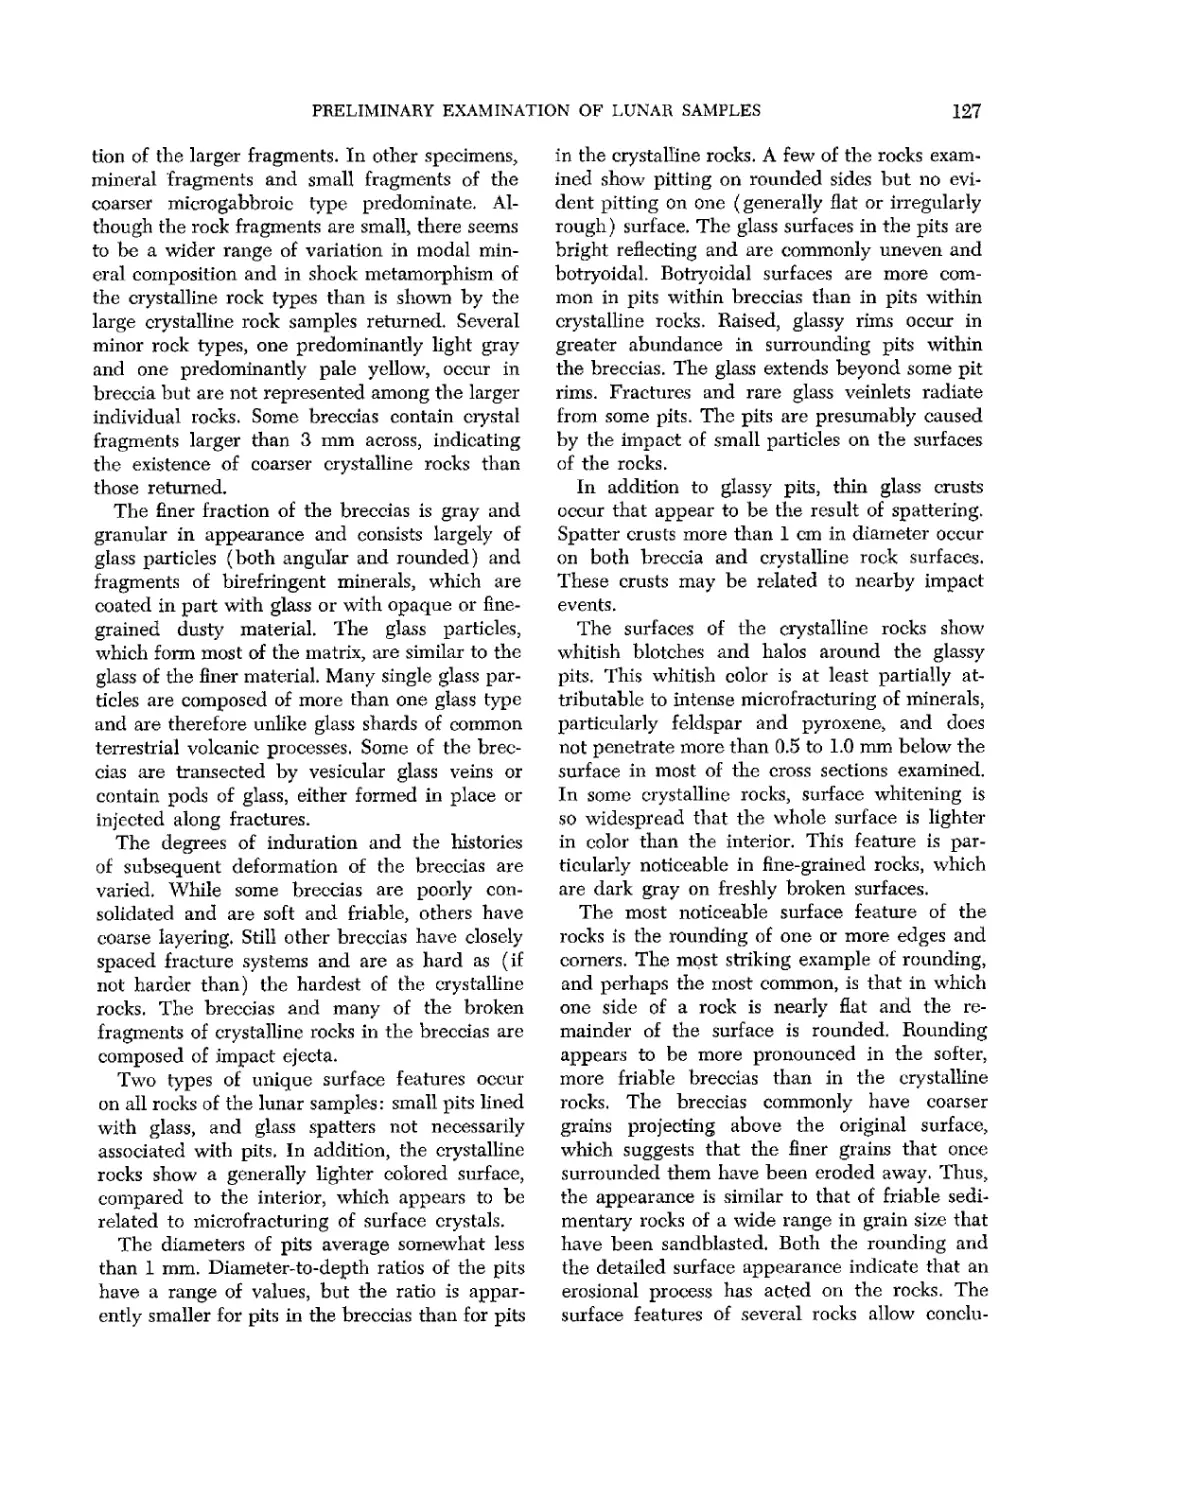
The dark-brownish-gray speckled type B rock
is granular in texture and generally resembles
terrestrial microgabbros. The grain sizes are from
0.2 to 3 mm. The percentages of minerals in type
B rocks are as follows: clinopyroxene, 46 percent;
plagioclase, 31 percent; opaques (mainly ilmen-
ilmenite), 11 percent; cristobalite, 5 percent; and other
minerals, 7 percent. No olivine is present in type
B rocks. Other unidentified minerals have been
found. The complete absence of hydrous mineral
phases in type A or type B rocks and the pres-
presence of free iron places a low limit on the amount
of water present in the melt from which the
rocks crystallized. The water content in the lunar
SUMMARY OF SCIENTIFIC RESULTS
material is considerably lower than the water
content in terrestrial basalts.
All the breccias are mixtures of fragments of
different rock types similar to type A or type B
rocks and are mixtures of angular fragments and
sphericles of glass of a variety of colors and a
variety of indices of refraction. Evidence of
strong shock is present in many type C rocks.
These rocks vary from being very friable and
soft to being as hard as the crystalline rocks.
Evidence points to the breccias being formed
by shock cementing or by lithification of the
powdery lunar surface material. Both techniques
of breccia formation are probably the result of
impact events.
Fines were returned to Earth in the bulk-
sample container and in the core tubes. The core
tubes showed no stratification of fines, and the
material was, in general, similar to the bulk-
sample fines. The type D material consists of a
variety of glasses, plagioclase, clinopyroxene,
ilmenite, and olivine. A few Ni-Fe spherules up
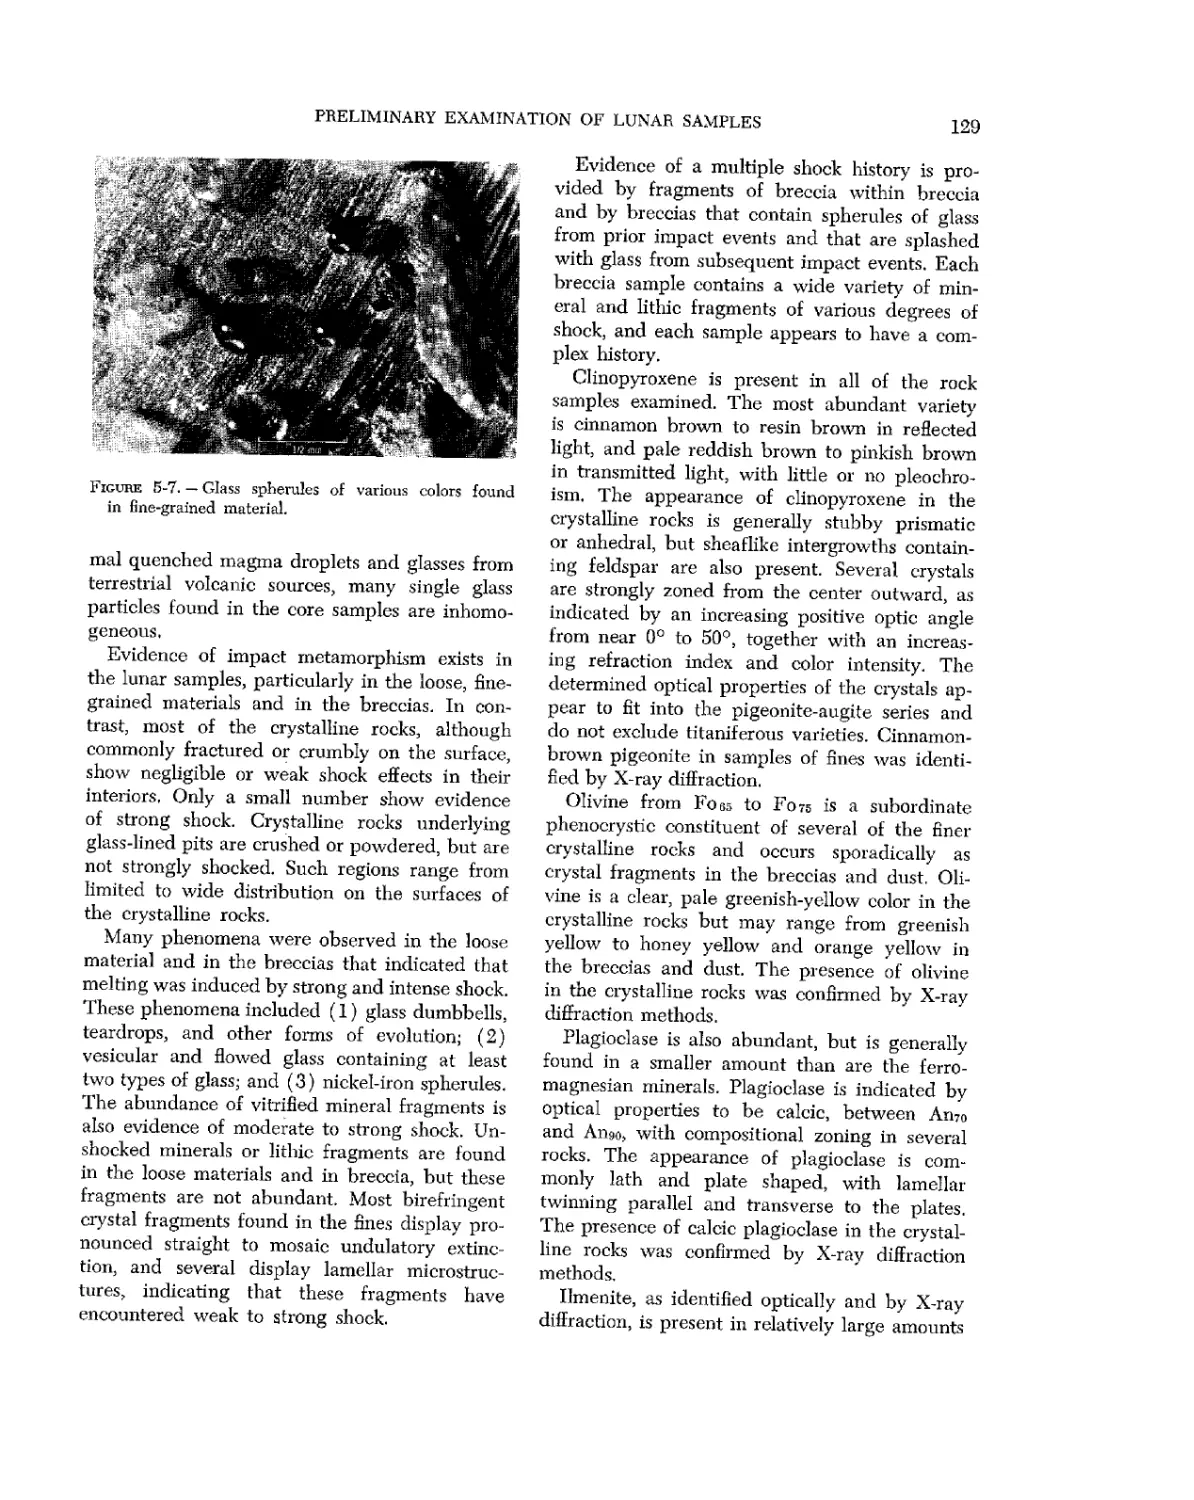
to 1 mm in diameter were found. Glasses, which
make up approximately 50 percent of type D
material, are of three types: A) vesicular, glob-
globular dark-gray fragments; B) pale or colorless
angular fragments with refraction indices of ap-
approximately 1.5 to 1.6; and C) spheroidal, ellip-
ellipsoidal, dumbbell-shaped, and teardrop-shaped
bodies. Most of these glass types are smaller than
0.2 mm and range in color from red to brown to
green to yellow with refraction indices ranging
from 1.55 to 1.8. Unlike most terrestrial magnetic
glasses, many single glass particles are inhomo-
geneous. Like the Ni-Fe spherules, the type 3
rounded glass bodies seem to indicate melting
induced by strong shock. In fact, evidence for
shock is common in the fines and in the breccias.
However, only a few crystalline rocks show evi-
evidence of strong shock in places other than near
the surface pits.
A chemical analysis of several samples of all
four types of glass was made using optical emis-
emission spectroscopy. A few samples were also ana-
analyzed using atomic absorption procedures. All
four types of lunar material samples have been
studied, and all types appear to be quite similar
chemically. There is no similar material common
on Earth. Several of the refractory metals are
very prominent. On Earth, a deposit containing
from 5 to 10 percent titanium is rare and might be
considered a titanium mine. Zirconium, yttrium,
and chromium are also present in amounts sub-
substantially larger than might be expected in
terrestrial basalts.
Another characteristic of the samples is that
they are low in alkali and volatile elements such
as sodium, potassium, rubidium, lead, and bis-
bismuth. Aside from this characteristic and the very
low water content mentioned previously, the
material might be considered to be similar to
terrestrial basalts. Because of the enrichment of
the refractory elements and the depletion of the
volatile elements, it is tempting to consider the
material to be similar to a cinder, being the end
product of a high-temperature environment, to
explain these modifications.
The rare-gas content of lunar samples has
been measured by mass spectroscopy. The con-
content of beryllium, neon, argon, krypton, and
xenon has been measured in several samples.
The total rare-gas content in the fines and brec-
breccias is approximately 0,1 cc/g, which is quite
high. These gases were found in the outside
layer of the crystalline rocks, but the gas content
found inside these rocks was very low. The gases
were found throughout the breccias, further indi-
indicating that the breccias are formed, probably by
shock, from the fines. Quite clearly, most of the
measured rare gas is from the solar wind. Al-
Although no isotopic ratios have been measured
previously for solar rare gases, the values ob-
obtained from the preliminary examination com-
compare well with the values that would theoretically
be expected.
Several of the rocks measured contained radio-
radiogenic 40Ar, which, when coupled with data on
potassium abundance, enables dating of the time
of crystallization of the rocks by using the decay
process
This process gives an age of 3.0±0.7X10D yr,
which shows that the surface of the maria is
older than had been expected.
Age dating can also be accomplished by meas-
measuring the amount of certain isotopes that are
produced by cosmic ray bombardment of the
lunar surface. This technique yields the time
that the rocks within a few feet of the lunar sur-
APOLLO 11 PRELIMINARY SCIENCE REPORT
face have been exposed to cosmic rays. The rocks
studied had cosmic-ray-exposure ages from 20 X
106tol60X106yr.
The organic content of the samples was studied
by two techniques: A) pyrolysis with flame ion-
ization detection and B) mass spectroscopy.
The amount of extractable organic material with
temperatures to 500° C is less than 1 part per
million (ppm). Some organic contaminants were
introduced into the samples by recovery and
processing in the LRL, and it is uncertain whether
an indigenous organic material exists in the
samples.
Several samples have been counted in the LRL
Radiation Counting Laboratory. The gamma
rays measured show the presence of several
cosmic-ray-induced radionuclides and the pres-
presence of thorium, uranium, and potassium. The
uranium and thorium concentrations are near the
concentration values of these elements found in
terrestrial basalts; however, the amount of potas-
potassium present in the lunar samples is lower than
that in terrestrial basalts and is comparable to
the amount found in chondritic meteorites.
Conclusions
The major findings have been as follows:
A) By using a fabric and mineralogy basis,
the rocks can be divided into two genetic groups;
fine- and medium-grained crystalline rocks of
igneous origin and breccias of complex origin.
B) The crystalline rocks, as shown by their
modal mineralogy and bulk chemistry, are differ-
different from terrestrial rock and meteorites.
C) Erosion has occurred on the lunar surface
in view of the fact that most of the lunar rocks
are rounded, and some of the rocks have been
exposed to a process that gives them a surface
appearance similar to sandblasted rocks. There
is no evidence of erosion by surface water.
D) The probable presence of the assemblage
iron-troilite-ilmenite and the absence of any
hydrated phase indicate that the crystalline rocks
were formed under extremely low partial pres-
pressures of oxygen, water, and sulfur. (Pressures
are in the range of equilibrium pressures found
within most meteorites.)
E) The absence of hydrated minerals sug-
suggests that no surface water has existed at Tran-
quility Base at any time since the rocks in this
region were exposed.
F) Evidence of shock or impact metamor-
phism is common in the lunar rocks and fines.
G) All the rocks have glass-lined surface pits
that may have been caused by the impact of
small particles.
(8) The fine material and the breccia contain
large amounts of all the noble gases which have
elemental and isotopic abundances indicative of
origin in the solar wind. The fact that interior
samples of the breccias contain these gases im-
implies that the samples were formed at the lunar
surface from material previously exposed to the
solar wind.
(9) 40 K -40Ar measurements on igneous rocks
show that they crystallized from 3X10⁹ to 4X10⁹
yr ago. The presence of nuclides produced by
cosmic rays shows that the rocks have been
within 1 m of the surface for periods of 20X10e
to 160X106 yr.
A0) The level of indigenous organic material
capable of volatilization or pyrolysis, or both,
appears to be extremely low, that is, considerably
less than 1 ppm.
A1) Chemical analyses of 23 lunar samples
show that all rocks and fines generally are chem-
chemically similar.
A2) The elemental constituents of lunar sam-
samples are the same as those found in terrestrial
igneous rocks and meteorites. However, the fol-
following significant differences in composition
were observed: some refractory elements (for
example, titanium and zirconium) are notably
enriched, and the alkali and some volatile ele-
elements are depleted.
A3) Elements that are enriched in iron me-
meteorites (i.e., nickel, cobalt, and the platinum
group) were not observed; such elements are
probably low in abundance.
A4) Of 12 radioactive species identified, two
were cosmogenic radionuclides of short half life,
namely 52Mn E.7 days) and 48V A6.1 days).
A5) Uranium and thorium concentrations are
near the typical concentrations of these elements
found in terrestrial basalts; however, the potas-
potassium-to-uranium ratio determined for lunar sur-
surface material is much lower than such ratios
determined for terrestrial rocks or meteorites.
A6) No evidence of biological material has
SUMMARY OF SCIENTIFIC RESULTS
been found to date in the lunar samples.
A7) The lunar soil at the landing site is pre-
predominantly fine grained, granular, slightly cohe-
cohesive, and incompressible. The hardness of the
lunar soil increases considerably at a depth of
15 cm. The soil is similar in appearance and be-
behavior to the soil encountered at the Surveyor
equatorial landing sites.
A8) The PSEP deployed on the Moon op-
operated satisfactorily for 21 days and detected
several seismic signals, many of which originated
from astronaut activity or mechanical motions of
the LM. It is uncertain whether any actual lunar
seismic events were detected. The seismic-noise
background is much less on the Moon than on
Earth.
{19) The LRRR was deployed on the Moon
and has been used as a target for Earth-based
lasers. The distance to the Moon has now been
measured to within an accuracy of approximately
4 m. Future studies will be made on the variation
of this distance to study in detail the motion of
the Moon and the Earth.
B0) Preliminary analysis has been made on
part of the aluminum SWC foil. Helium, neon,
and argon have been found in the analysis, and
the isotopic composition of each element has
been measured.
10
APOLLO 11 PRELIMINARY SCIENCE REPORT
gravity escape. At 3:17 g.e.t., the command and
service module (CSM) was separated from the
S-IVB, turned around, and docked with the
LM. The LM was removed from the S-IVB at
4:17 g.e.t.
Provision was made in the flight plan for four
midcourse corrections (using the service module
propulsion system to refine the spacecraft tra-
trajectory); however, the only necessary midcourse
correction took place at 26;45 g.e.t. Lunar-orbit
insertion of the spacecraft began at 75:50 g.e.t.
Figure 1-1. -On July 16, 1969, at 9:32 A.M. e.d.t., Vk
million lb of thrust lifted the Apollo-Saturn V space-
spacecraft carrying Astronauts Neil A. Armstrong, Michael
Collins, and Edwin E. Aldrin, Jr., from the launch
site at Cape Kennedy.
Figure 1-2. — Shortly after translunar
insertion, the astronauts photo-
photographed Tropical Storm Bernice in
the western Pacific Ocean off the
coast of Baja California. (NASA
AS 11-36-5298)
PHOTOGRAPHIC SUMMARY
11
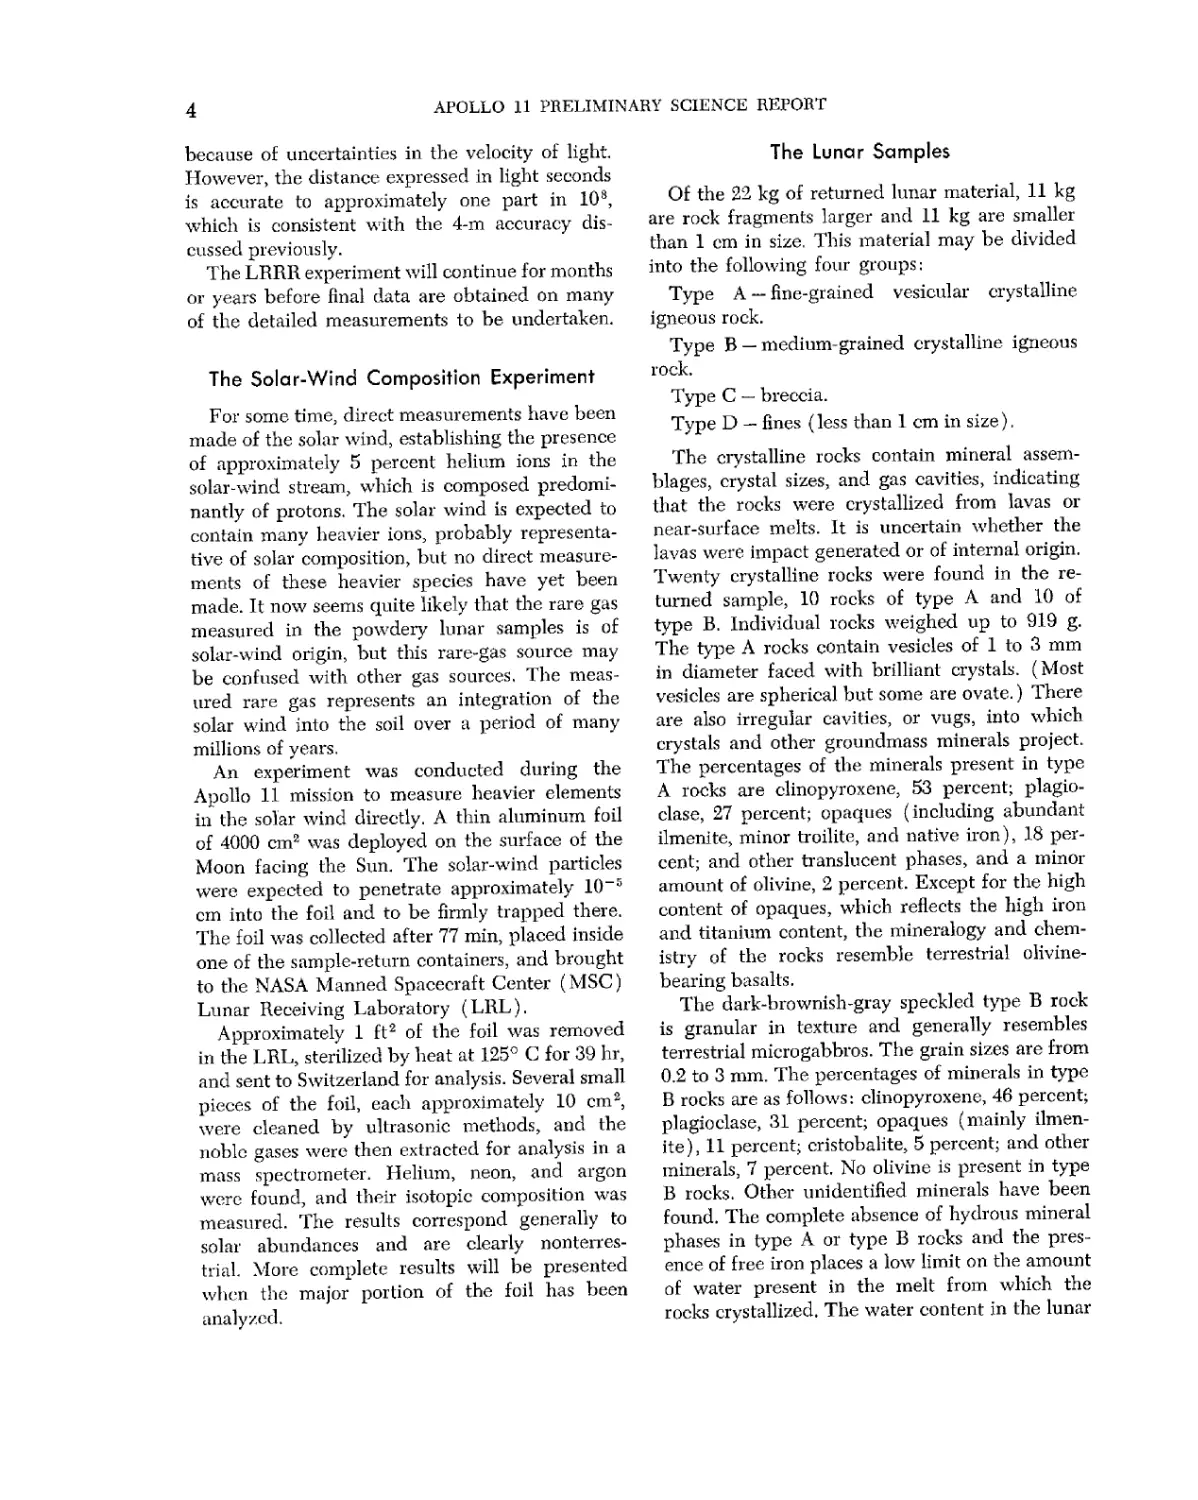
Figure 1-3. — Compare this westward
view (NASA AS11-36-530O) of the
central portion of Baja California,
taken shortly after the spacecraft
left Earth orbit on a trajectory to
the Moon, with the next picture.
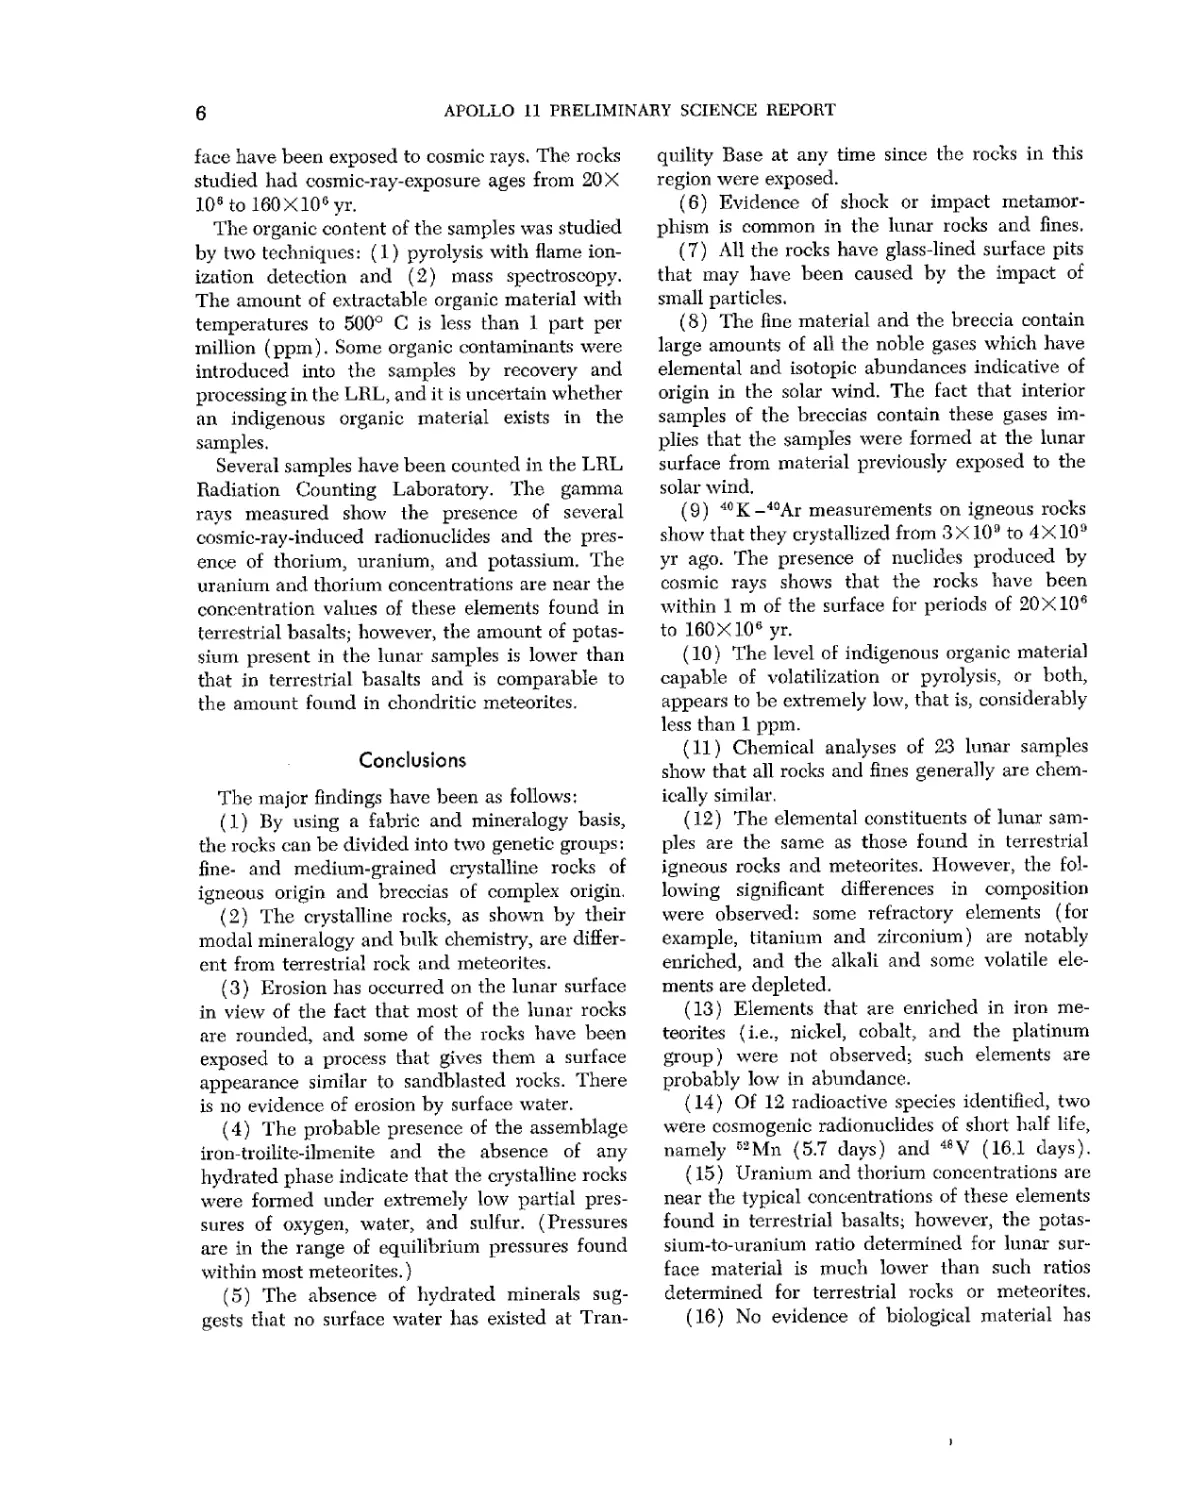
Figure 1-4. — This view (NASA
ASH-36-5308) of the southern
portion of the North American
Continent shows Baja California
again, the coast of southern Cal-
California, and the mountains of
Mexico.
12
APOLLO 11 PRELIMINARY SCIENCE REPORT
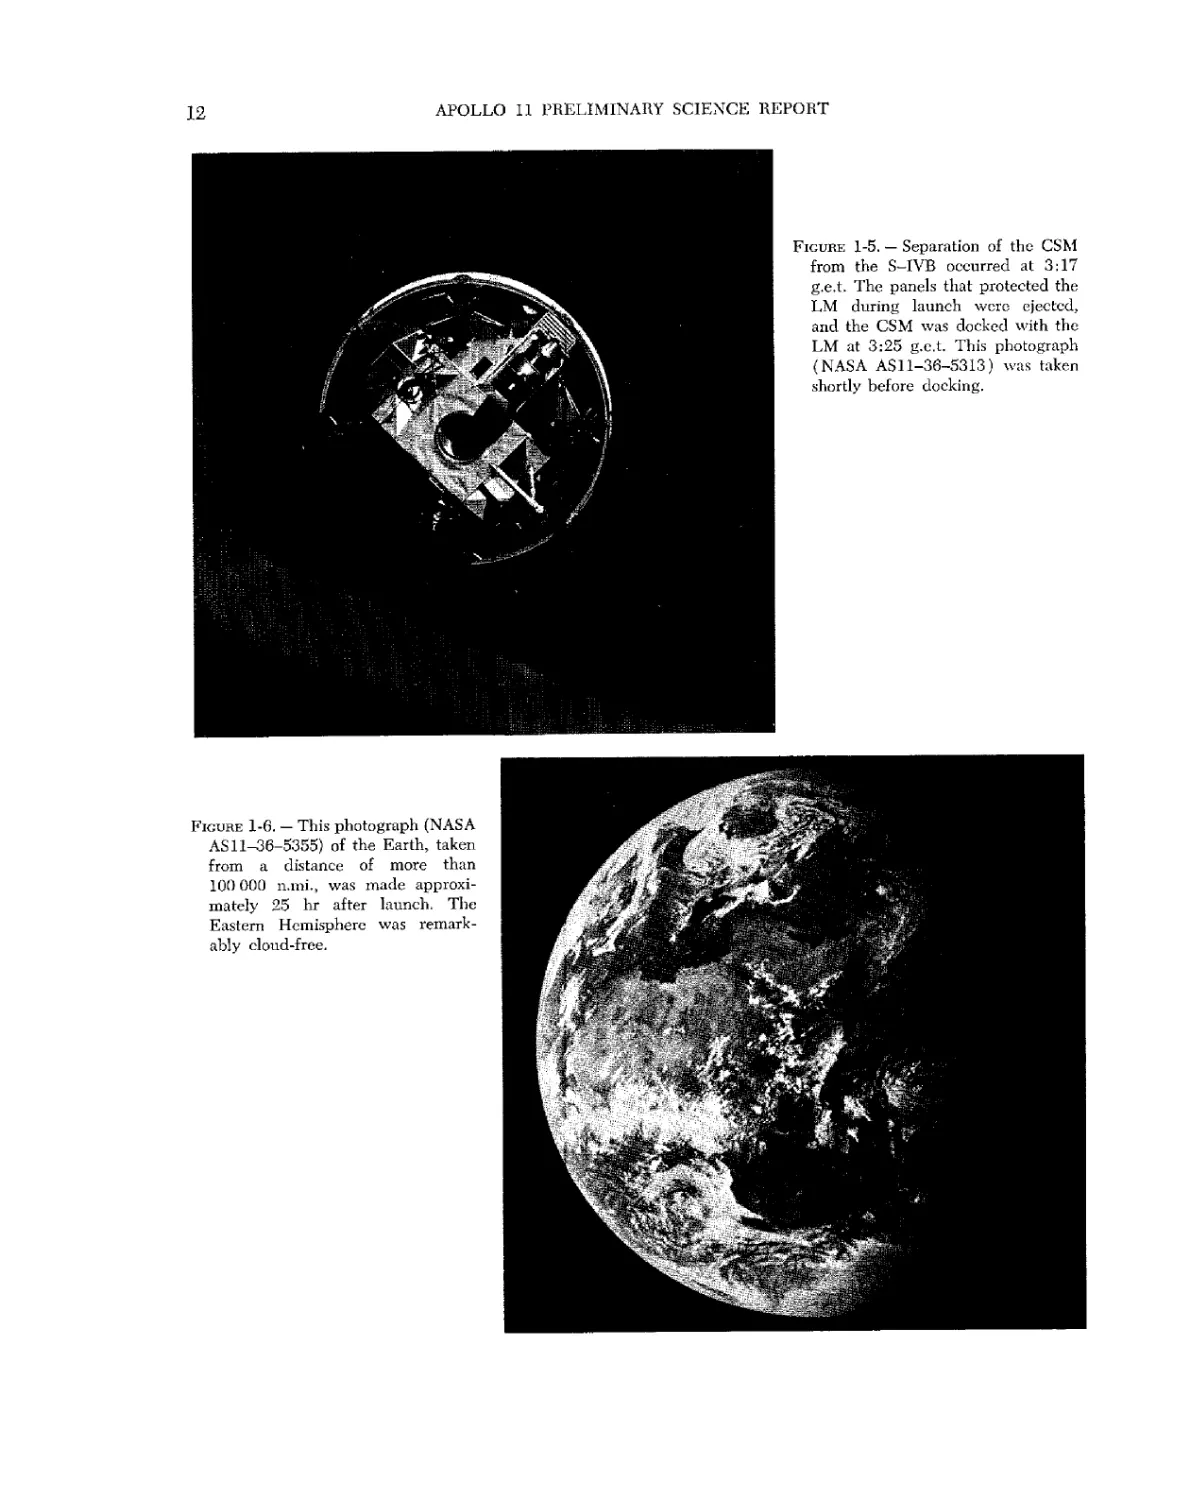
Figure 1-5. — Separation of the CSM
from the S-IVB occurred at 3:17
g.e.t. The panels that protected the
LM during launch were ejected,
and the CSM was docked with the
LM at 3:25 g.e.t. This photograph
(NASA AS11-36-5313) was taken
shortly before docking.
Figure 1-6. - This photograph (NASA
AS 11^36-5355) of the Earth, taken
from a distance of more than
100 000 n.ini., was made approxi-
approximately 25 hr after launch. The
Eastern Hemisphere was remark-
remarkably cloud-free.
PHOTOGRAPHIC SUMMARY
13
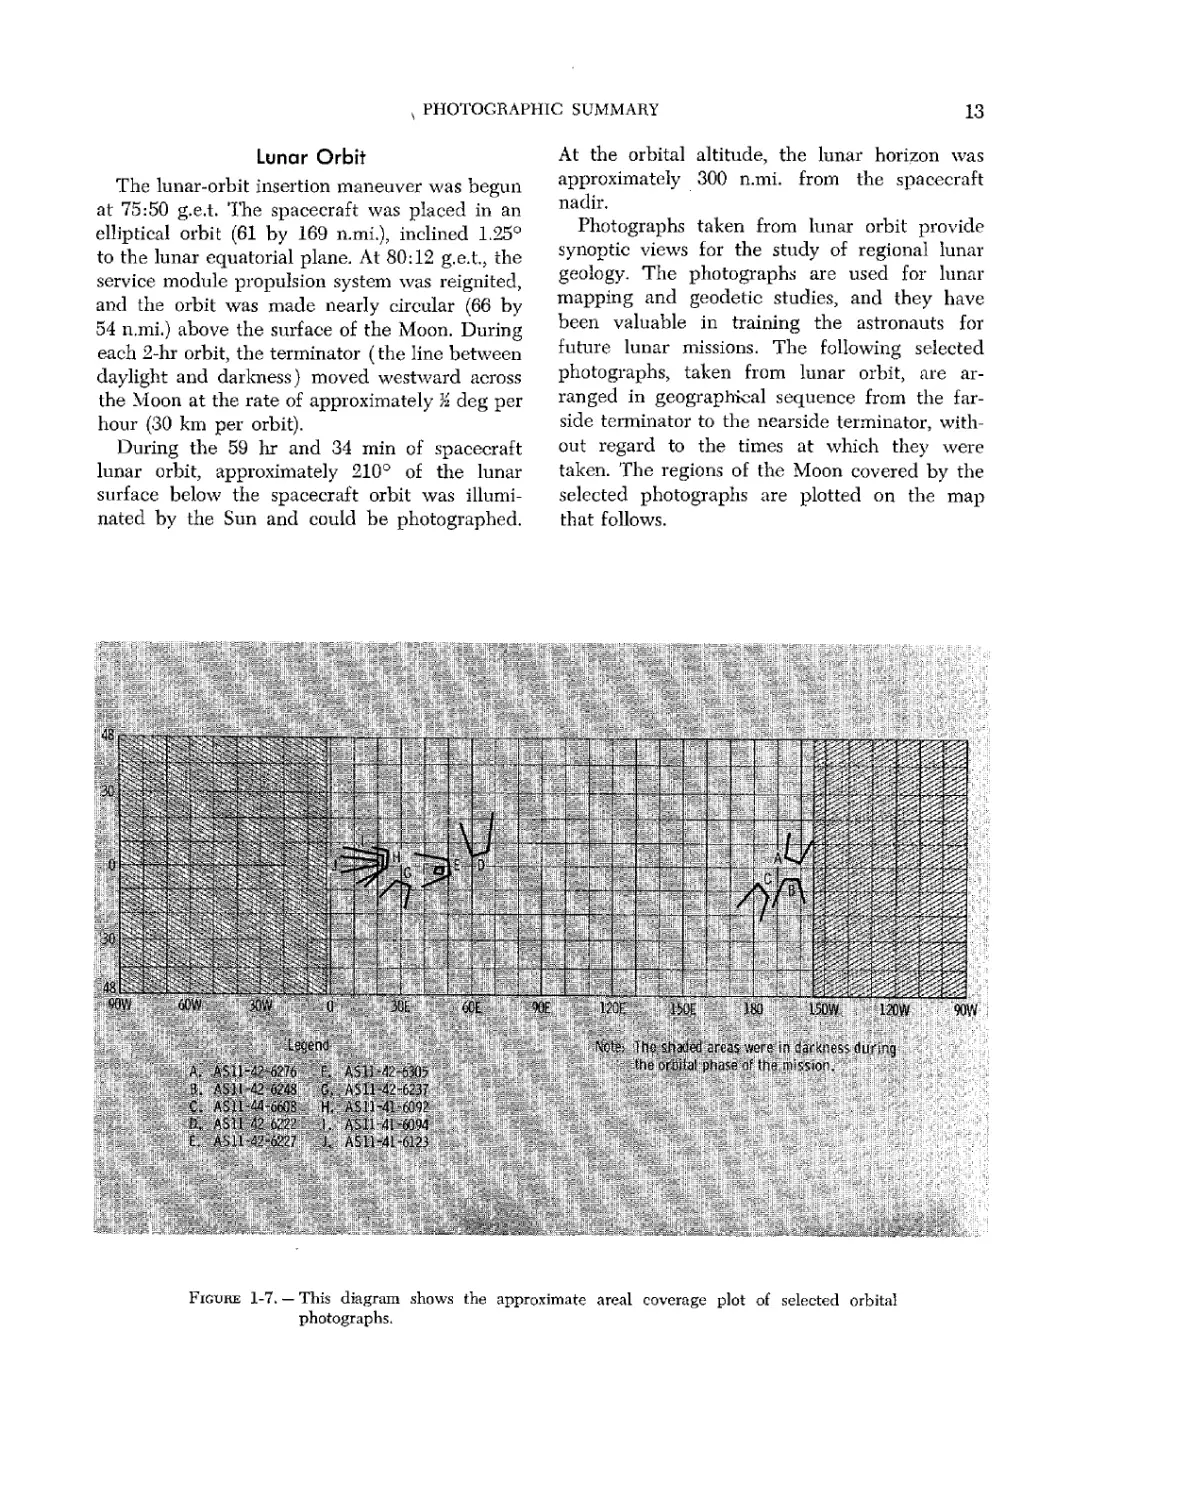
Lunar Orbit
The lunar-orbit insertion maneuver was begun
at 75:50 g.e.t. The spacecraft was placed in an
elliptical orbit F1 by 169 n.mi.), inclined 1.25°
to the lunar equatorial plane. At 80:12 g.e.t., the
service module propulsion system was reignited,
and the orbit was made nearly circular F6 by
54 n.mi.) above the surface of the Moon. During
each 2-hr orbit, the terminator (the line between
daylight and darkness) moved westward across
the Moon at the rate of approximately % deg per
hour C0 km per orbit).
During the 59 hr and 34 min of spacecraft
lunar orbit, approximately 210° of the lunar
surface below the spacecraft orbit was illumi-
illuminated by the Sun and could be photographed.
At the orbital altitude, the lunar horizon was
approximately 300 n.mi. from the spacecraft
nadir.
Photographs taken from lunar orbit provide
synoptic views for the study of regional lunar
geology. The photographs are used for lunar
mapping and geodetic studies, and they have
been valuable in training the astronauts for
future lunar missions. The following selected
photographs, taken from lunar orbit, are ar-
arranged in geographical sequence from the far-
side terminator to the nearside terminator, with-
without regard to the times at which they were
taken. The regions of the Moon covered by the
selected photographs are plotted on the map
that follows.
;!¦ :[:;y;.¦:':-5? ¦;' 1"-!L?gfhd":iI;;.-' .- >'./
¦,¦ ':Pfotfi.:Tt1<p;diadftTareas were in ;dairkness during
;v..\: '¦¦¦-: ithis'oiijjal'ptiase'df the mission.' '
'..' ;:::::;:. ¦:::¦ V :^S:i.i.-42-0?48:;;:'^,il;ASll-42r623?
4?
i- ::;:l.:- A&tl -41 >6094: ¦ ¦¦.-'¦¦
: H A&ll41-6123: ¦¦ ¦: = ;"
¦¦::¦-. ¦¦¦ -.. .:
Figure 1-7. — This diagram shows the approximate areal coverage plot of selected orbital
photographs.
14
APOLLO 11 PRELIMINARY SCIENCE REPORT
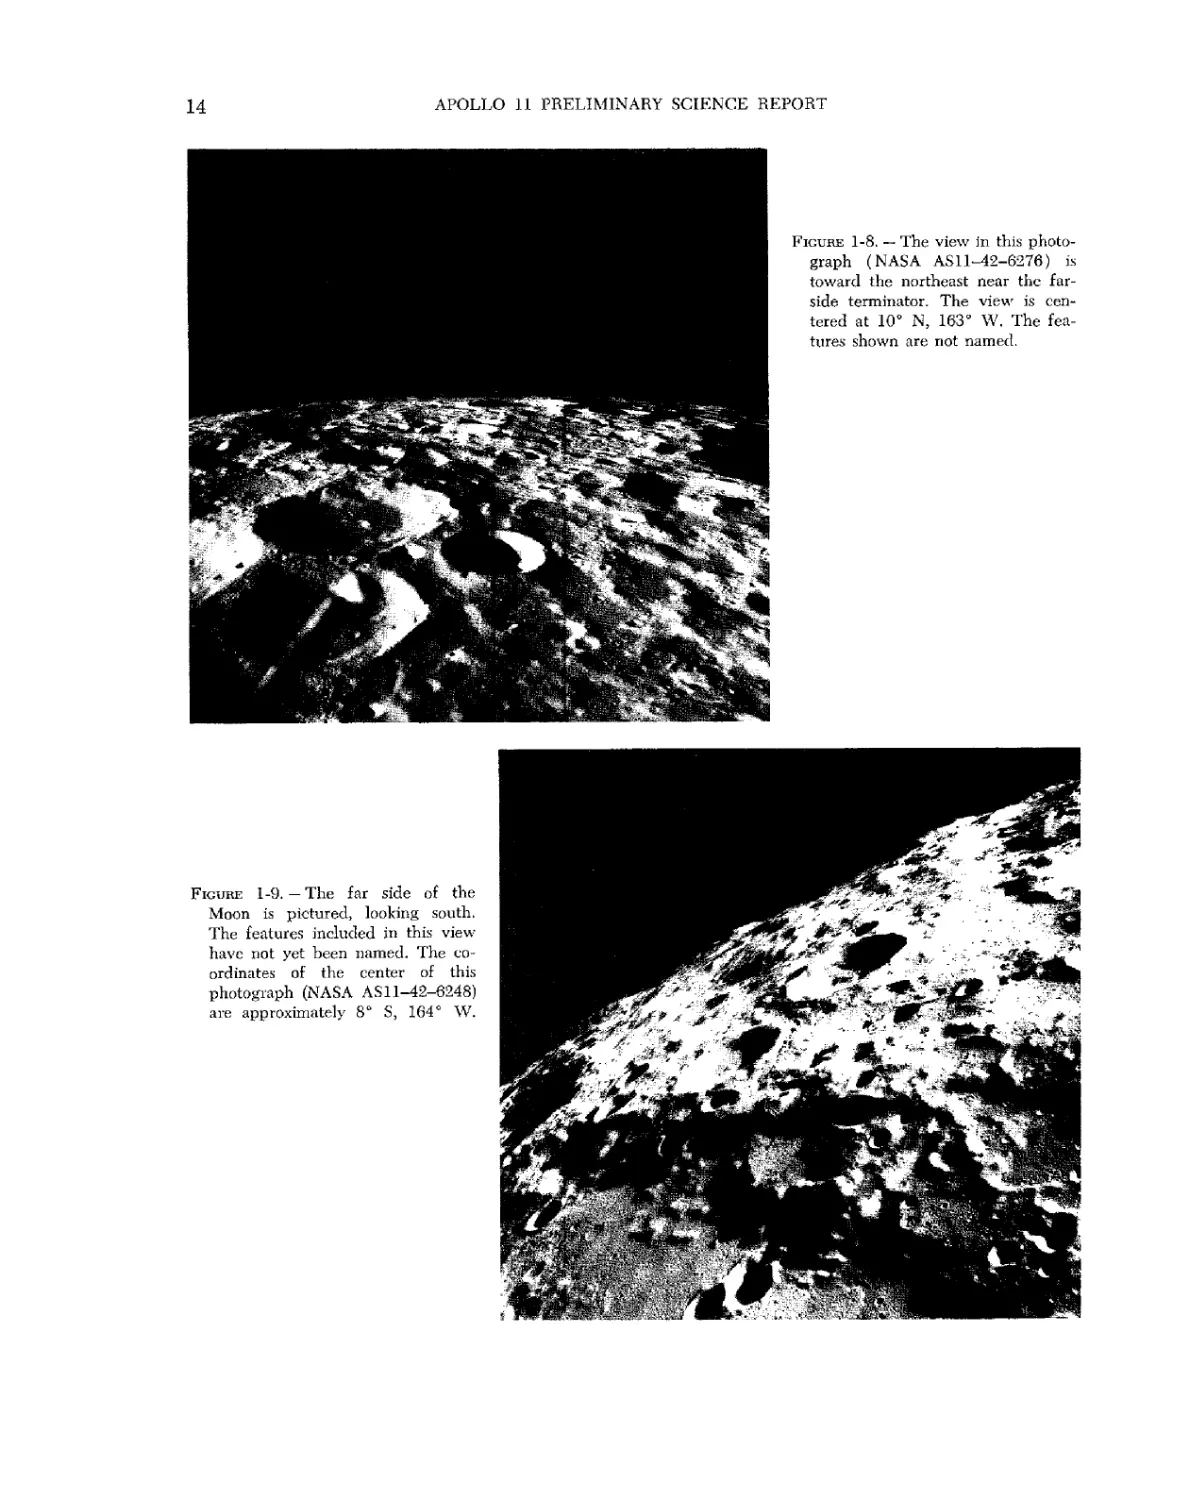
Figure 1-8. — The view in this photo-
photograph (NASA AS11-42-6276) is
toward the northeast near the far-
side terminator. The view is cen-
centered at 10° N, 163° W. The fea-
features shown are not named.
Figure 1-9. — The far side of the
Moon is pictured, looking south.
The features included in this view
have not yet been named. The co-
coordinates of the center of this
photograph (NASA AS11-42-6248)
are approximately 8° S, 164° W.
PHOTOGRAPHIC SUMMARY
15
Figure 1-10. — The center of this
photograph (NASA ASll-44-6608)
is located approximately 10° S, 177°
W, and shows the view to the
southwest from the spacecraft.
Note the smooth mare-type fill in
the valleys in the foreground.
Figure 1-11. — The view looks north-
northwest across Mare Crisium (the Sea
of Crises). The large, dark-floored
crater Firmicus is in the foreground.
The average elevation of the high-
highlands is several thousand meters
above the floor of the mare. (NASA
AS11-42-6222)
* 4.
18
APOLLO 11 PRELIMINARY SCIENCE REPORT
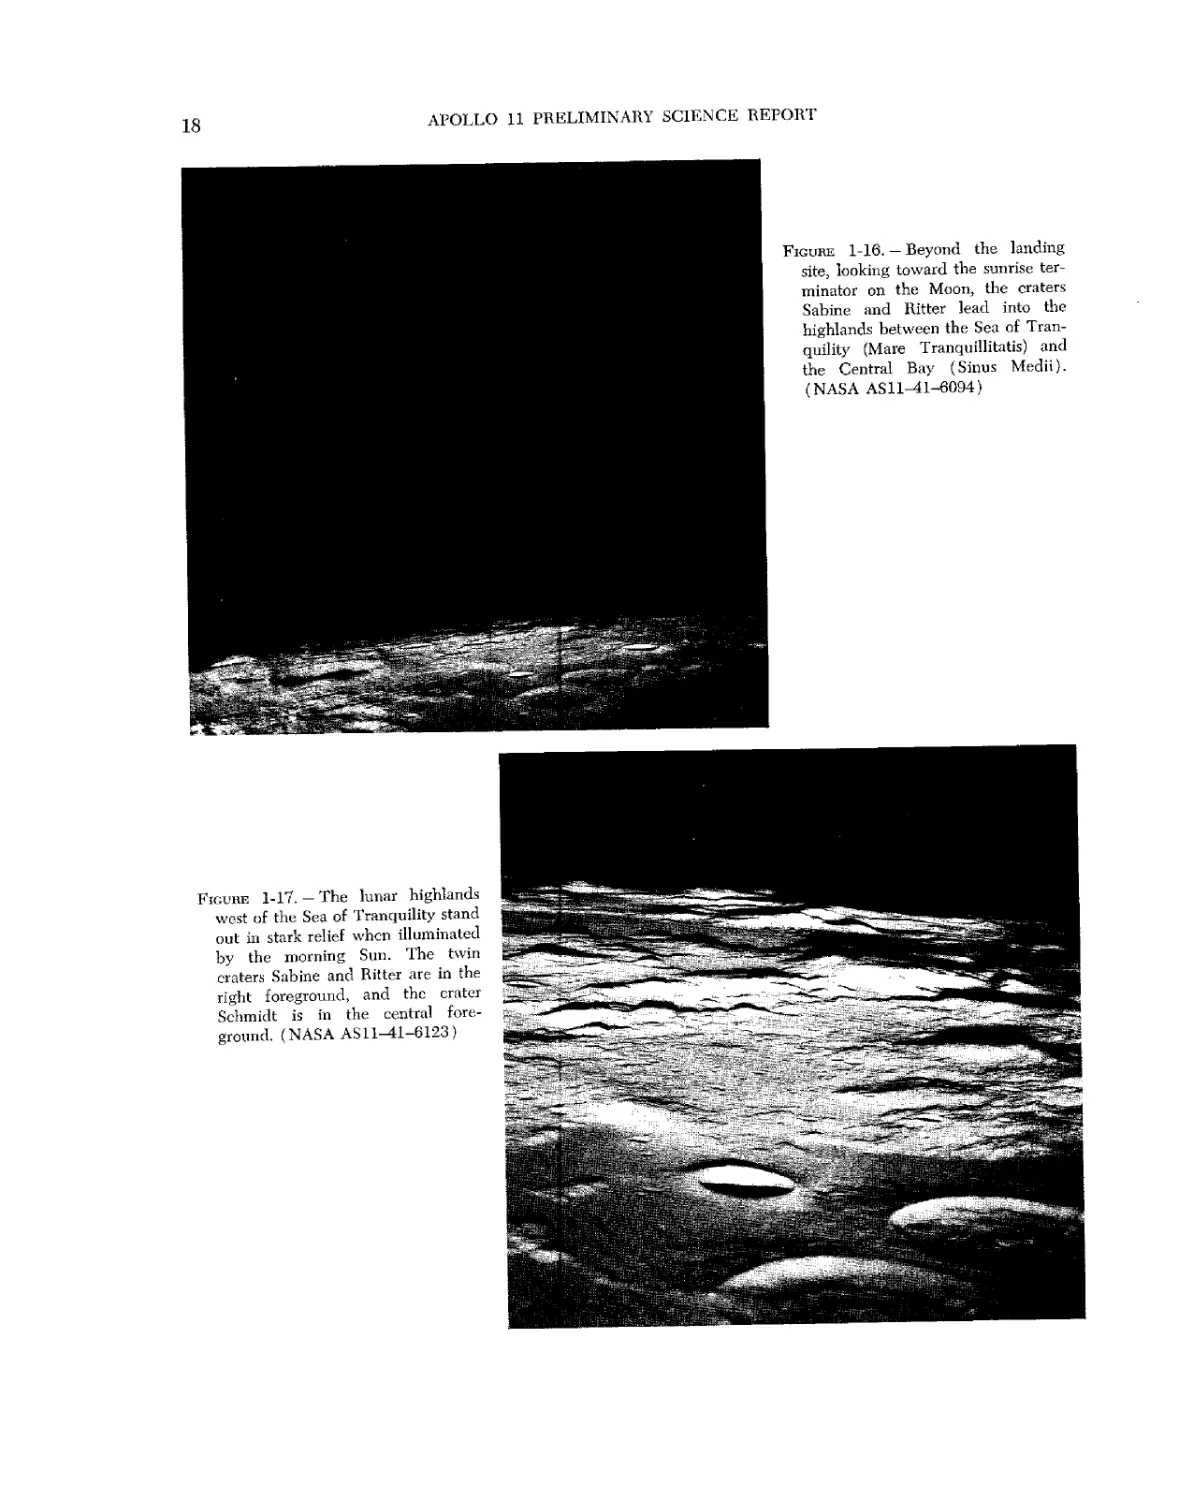
Figure 1-16, — Beyond the landing
site, looking toward the sunrise ter-
terminator on the Moon, the craters
Sabine and Ritter lead into the
highlands between the Sea of Tran-
Tranquility (Mare Tranquillitatis) and
the Central Bay (Sinus Medii).
(NASA AS 11^ 1-6094)
Figure 1-17. — The lunar highlands
west of the Sea of Tranquility stand
out in stark relief when illuminated
by the morning Sun. The twin
craters Sabine and Ritter are in the
right foreground, and the crater
Schmidt is in the central fore-
foreground. (NASA AS11-41-6123)
PHOTOGRAPHIC SUMMARY
19
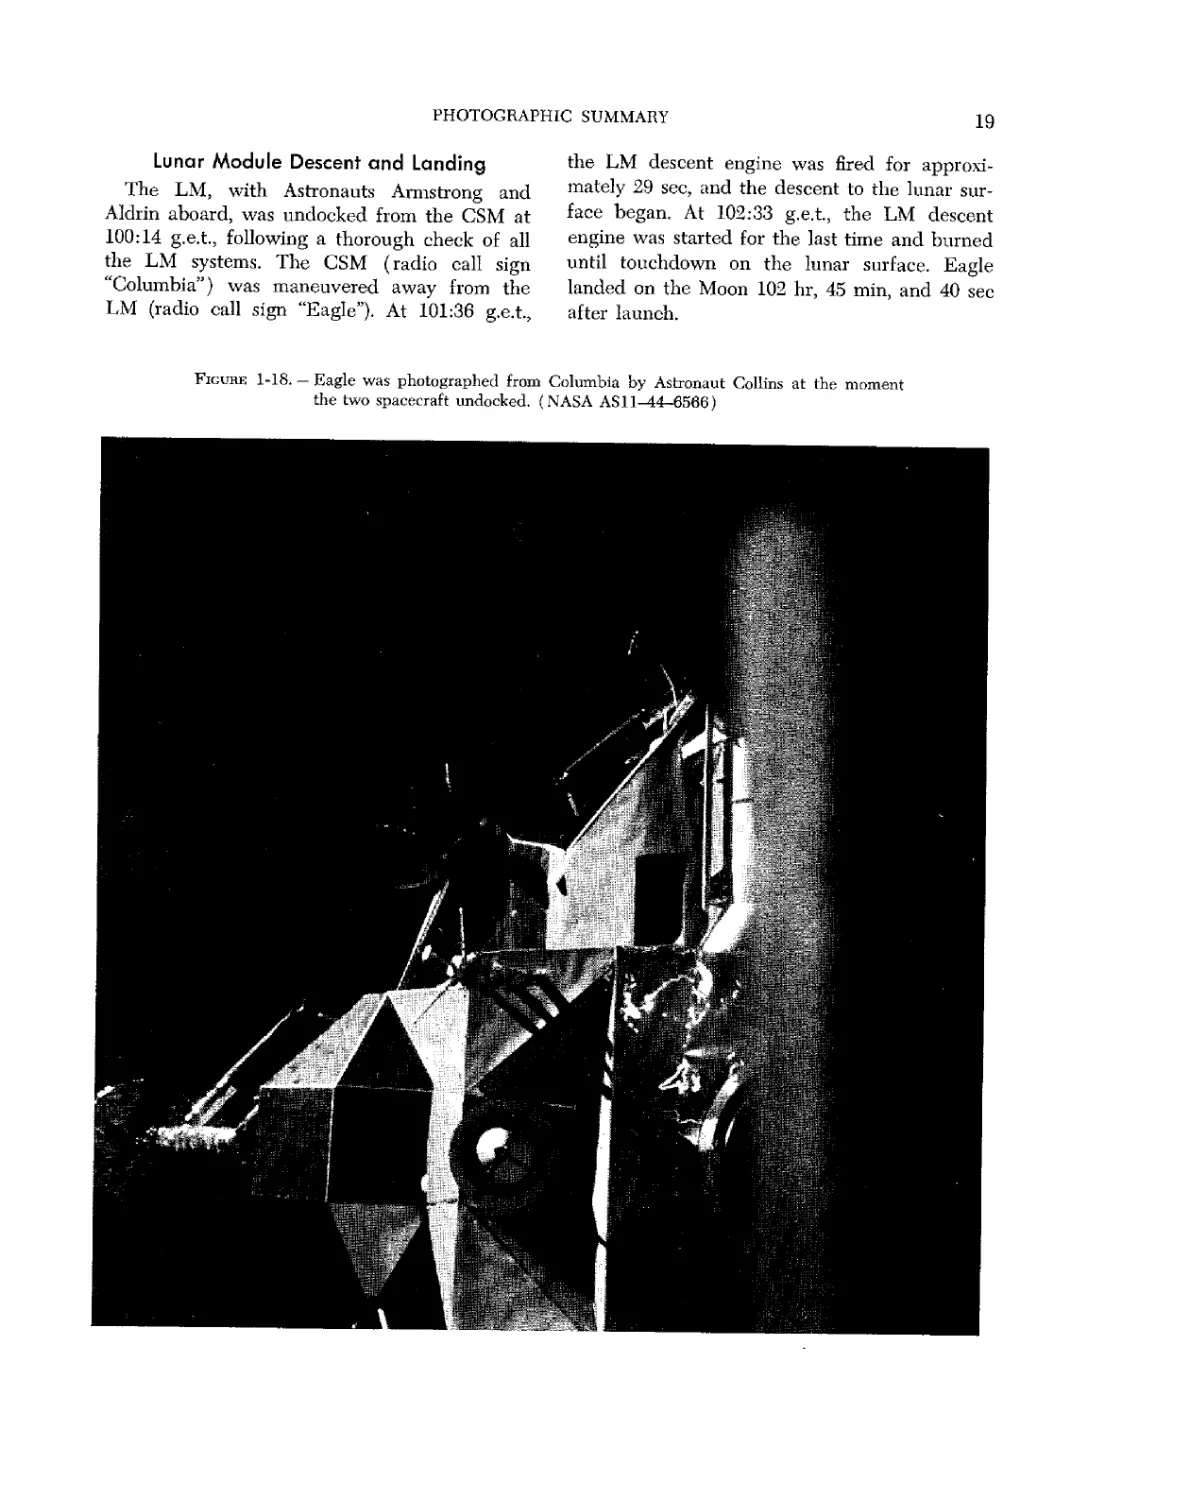
Lunar Module Descent and Landing
The LM, with Astronauts Armstrong and
Aldrin aboard, was undocked from the CSM at
100:14 g.e.t, following a thorough check of all
the LM systems. The CSM (radio call sign
"Columbia") was maneuvered away from the
the LM descent engine was fired for approxi-
approximately 29 sec, and the descent to the lunar sur-
surface began. At 102;33 g.e.t, the LM descent
engine was started for the last time and burned
until touchdown on the lunar surface. Eagle
landed on the Moon 102 hr, 45 min, and 40 sec
LM (radio call sign "Eagle"). At 101:36 g.e.t., after launch.
Figure 1-18. — Eagle was photographed from Columbia by Astronaut Collins at the moment
the two spacecraft undocked. (NASA AS11-44-6566)
20
APOLLO 11 PRELIMINARY SCIENCE REPORT
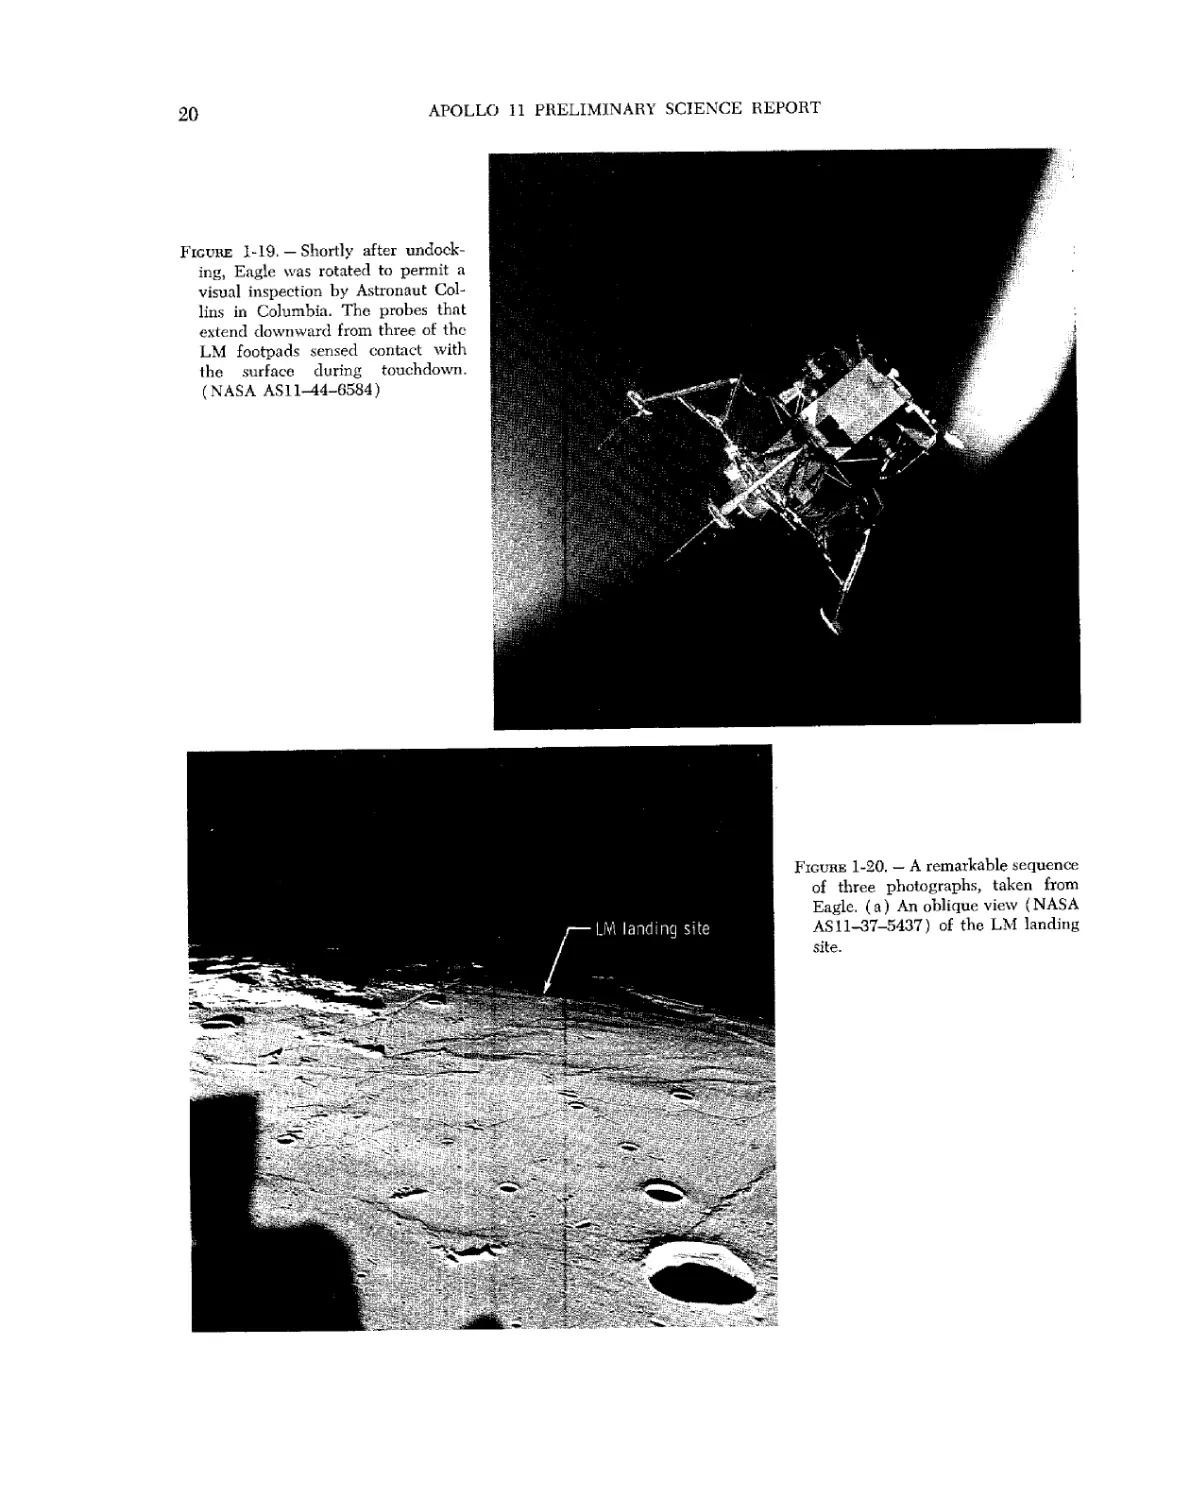
Figure 1-19. — Shortly after undock-
ing, Eagle was rotated to permit a
visual inspection by Astronaut Col-
Collins in Columbia. The probes that
extend downward from three of the
LM footpads sensed contact with
the surface during touchdown.
(NASA AS11-44-6584)
Figure 1-20. — A remarkable sequence
of three photographs, taken from
Eagle. (a) An oblique view (NASA
AS 11-37-5437) of the LM landing
site.
PHOTOGRAPHIC SUMMARY
21
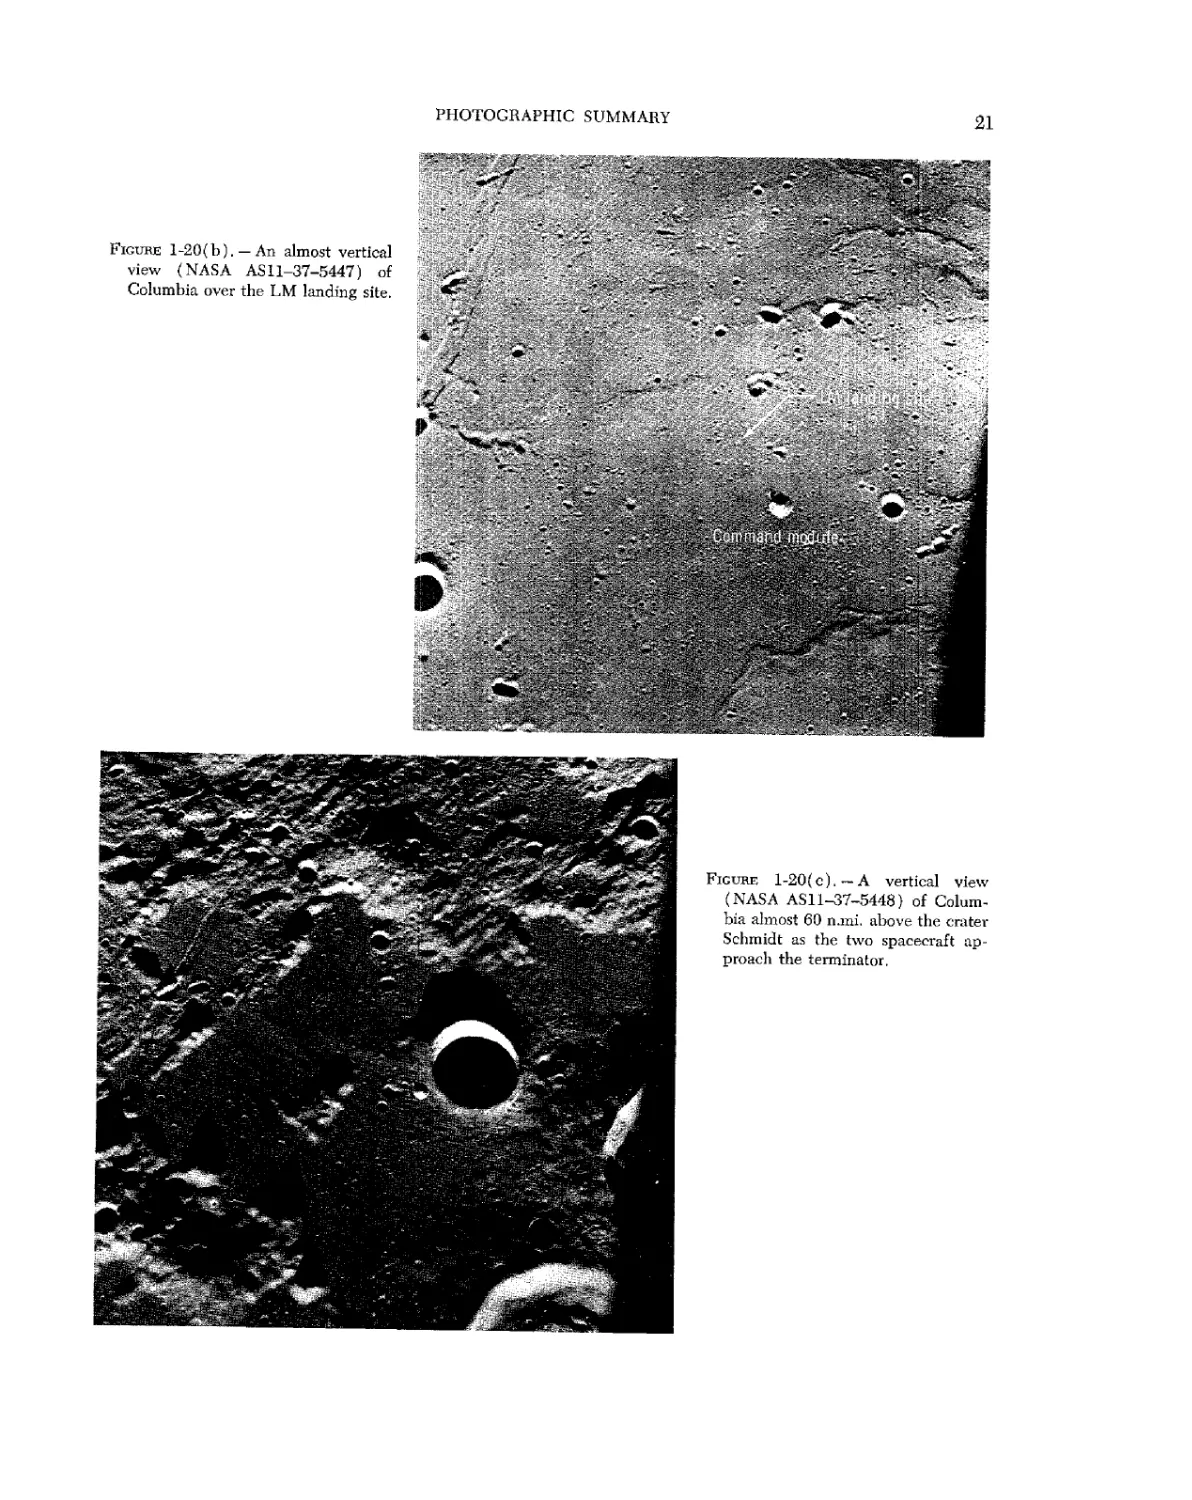
Figuke l-20(b).-An almost vertical
view (NASA AS 11-37-5447) of
Columbia over the LM landing site. ^
.' f
Figure 1-20(c).-A vertical view
(NASA ASll-37-5448) of Colum-
Columbia almost 60 n.mi. above the crater
Schmidt as the two spacecraft ap-
approach the terminator.
22
APOLLO 11 PRELIMINARY SCIENCE REPORT
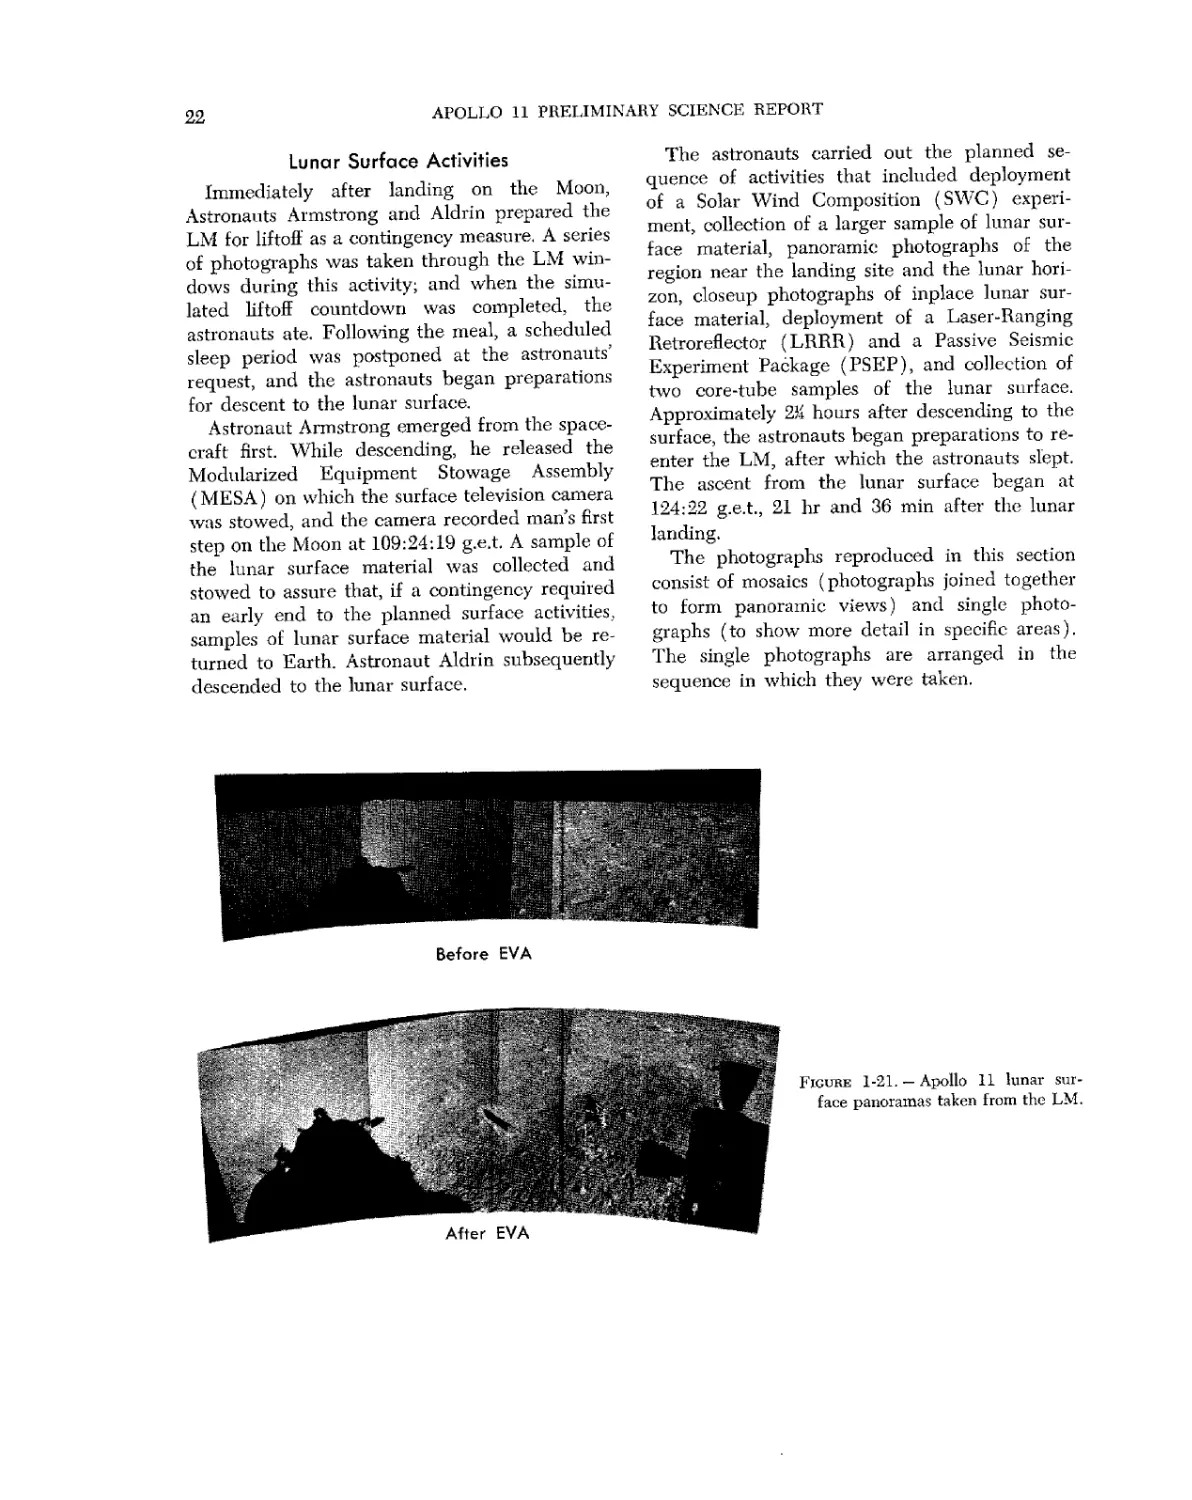
Lunar Surface Activities
Immediately after landing on the Moon,
Astronauts Armstrong and Aldrin prepared the
LM for liftoff as a contingency measure. A series
of photographs was taken through the LM win-
windows during this activity; and when the simu-
simulated liftoff countdown was completed, the
astronauts ate. Following the meal, a scheduled
sleep period was postponed at the astronauts'
request, and the astronauts began preparations
for descent to the lunar surface.
Astronaut Armstrong emerged from the space-
spacecraft first. While descending, he released the
Modularized Equipment Stowage Assembly
(MESA) on which the surface television camera
was stowed, and the camera recorded man's first
step on the Moon at 109:24:19 g.e.t. A sample of
the lunar surface material was collected and
stowed to assure that, if a contingency required
an early end to the planned surface activities,
samples of lunar surface material would be re-
returned to Earth. Astronaut Aldrin subsequently
descended to the lunar surface.
The astronauts carried out the planned se-
sequence of activities that included deployment
of a Solar Wind Composition (SWC) experi-
experiment, collection of a larger sample of lunar sur-
surface material, panoramic photographs of the
region near the landing site and the lunar hori-
horizon, closeup photographs of inplace lunar sur-
surface material, deployment of a Laser-Ranging
Retroreflector (LRRR) and a Passive Seismic
Experiment Package (PSEP), and collection of
two core-tube samples of the lunar surface.
Approximately 2)i hours after descending to the
surface, the astronauts began preparations to re-
enter the LM, after which the astronauts slept.
The ascent from the lunar surface began at
124:22 g.e.t., 21 hr and 36 min after the lunar
landing.
The photographs reproduced in this section
consist of mosaics (photographs joined together
to form panoramic views) and single photo-
photographs (to show more detail in specific areas).
The single photographs are arranged in the
sequence in which they were taken.
Before EVA
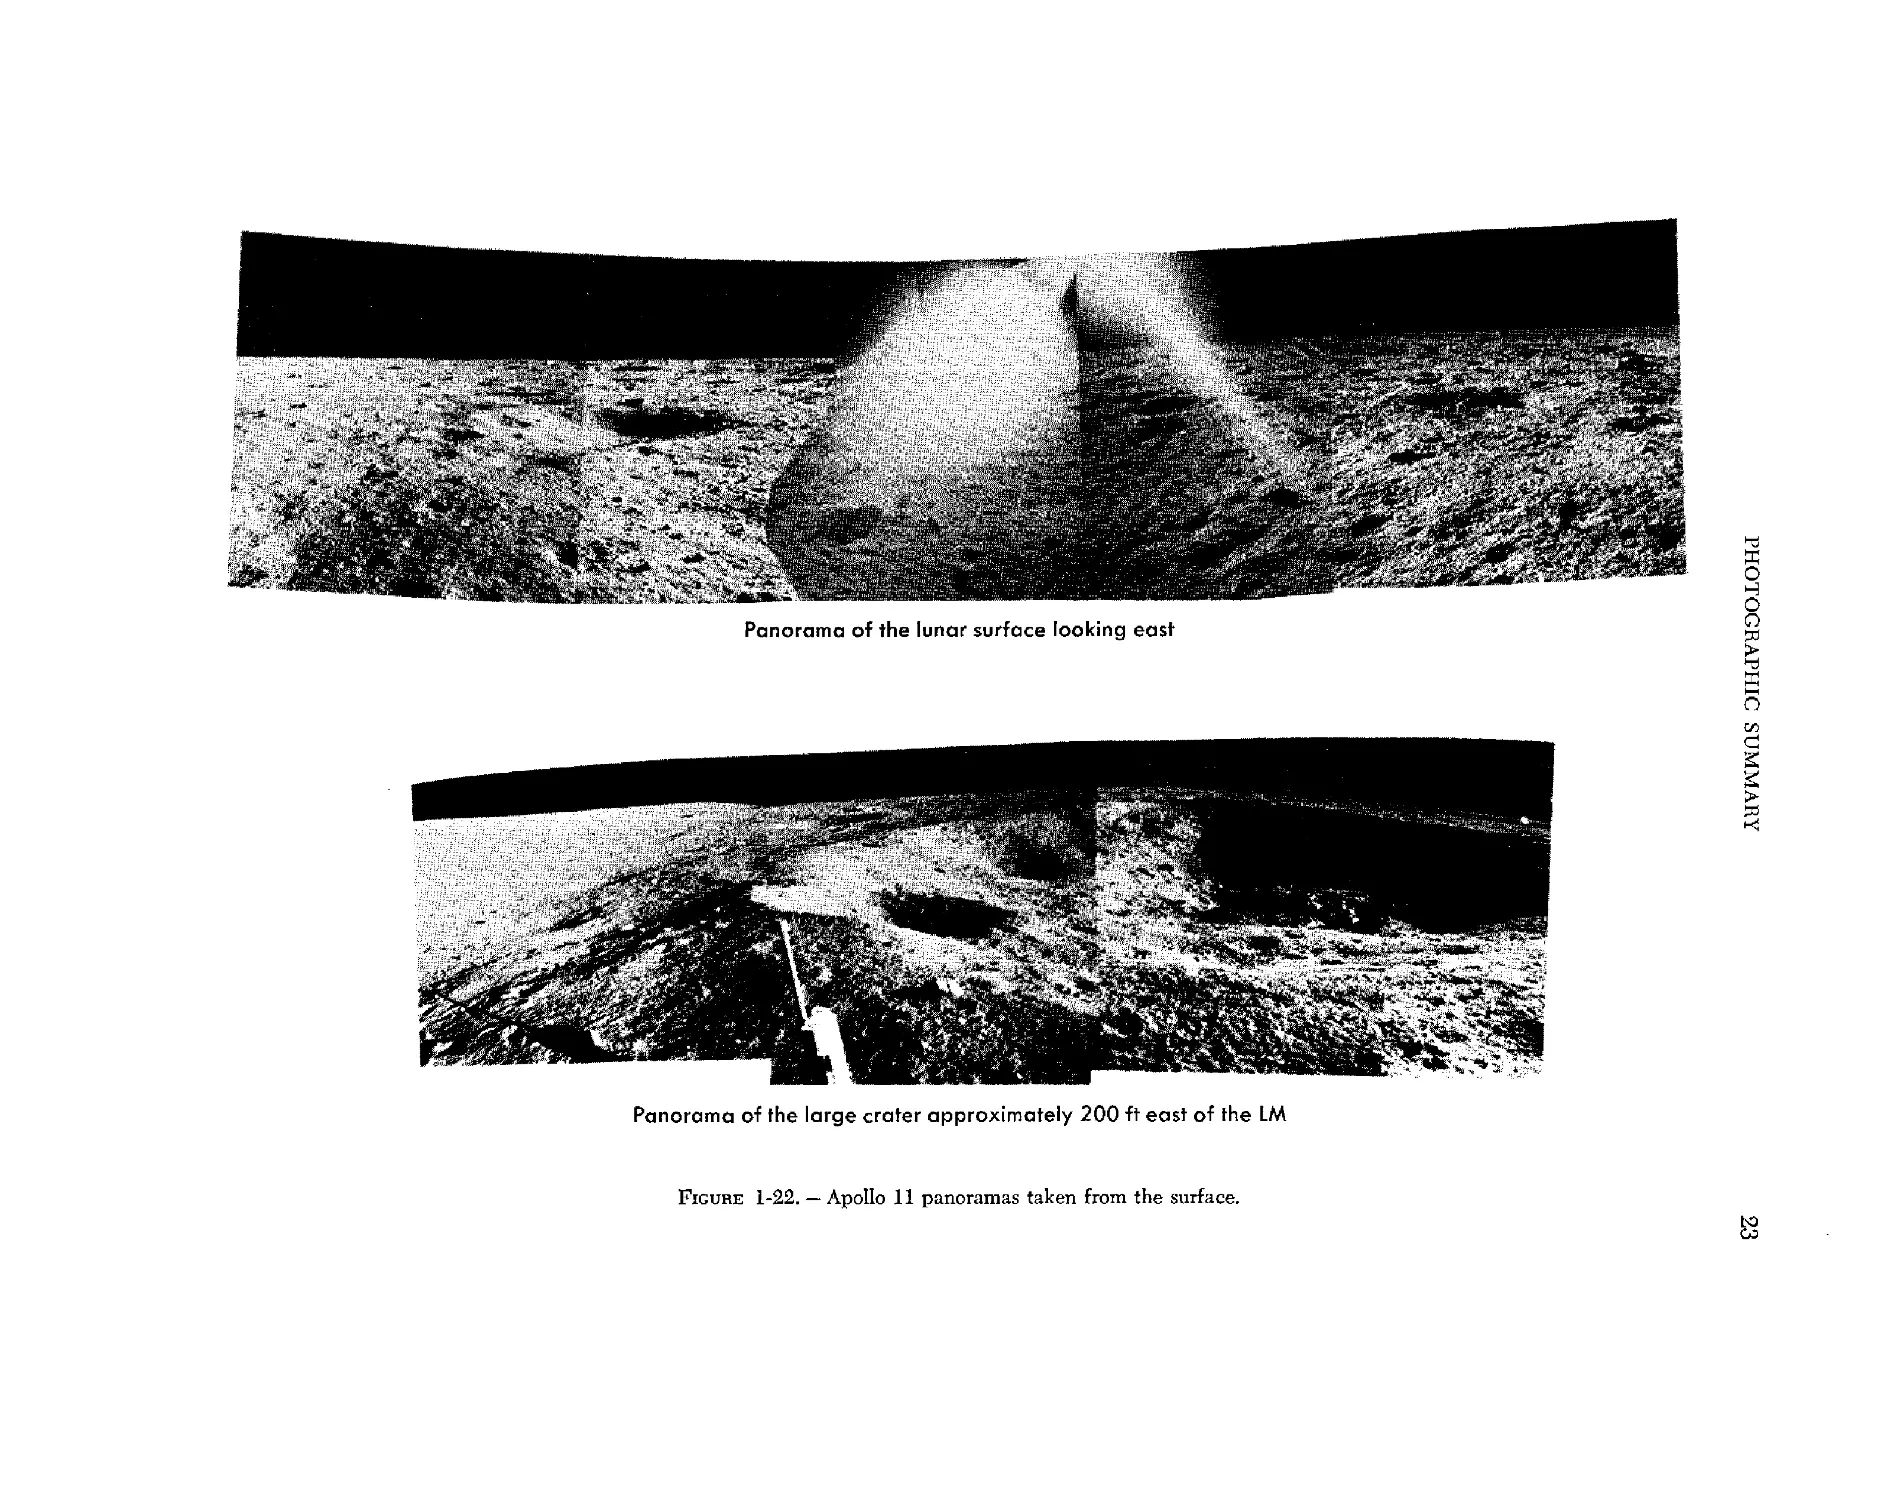
Figure 1-21. — Apollo 11 lunar sur-
surface panoramas taken from the LM.
Panorama of the lunar surface looking east
h3
O
H
8
o
en
Panorama of the large crater approximately 200 ft east of the LM
Figure 1-22. — Apollo 11 panoramas taken from the surface.
26
APOLLO 11 PRELIMINARY SCIENCE REPORT
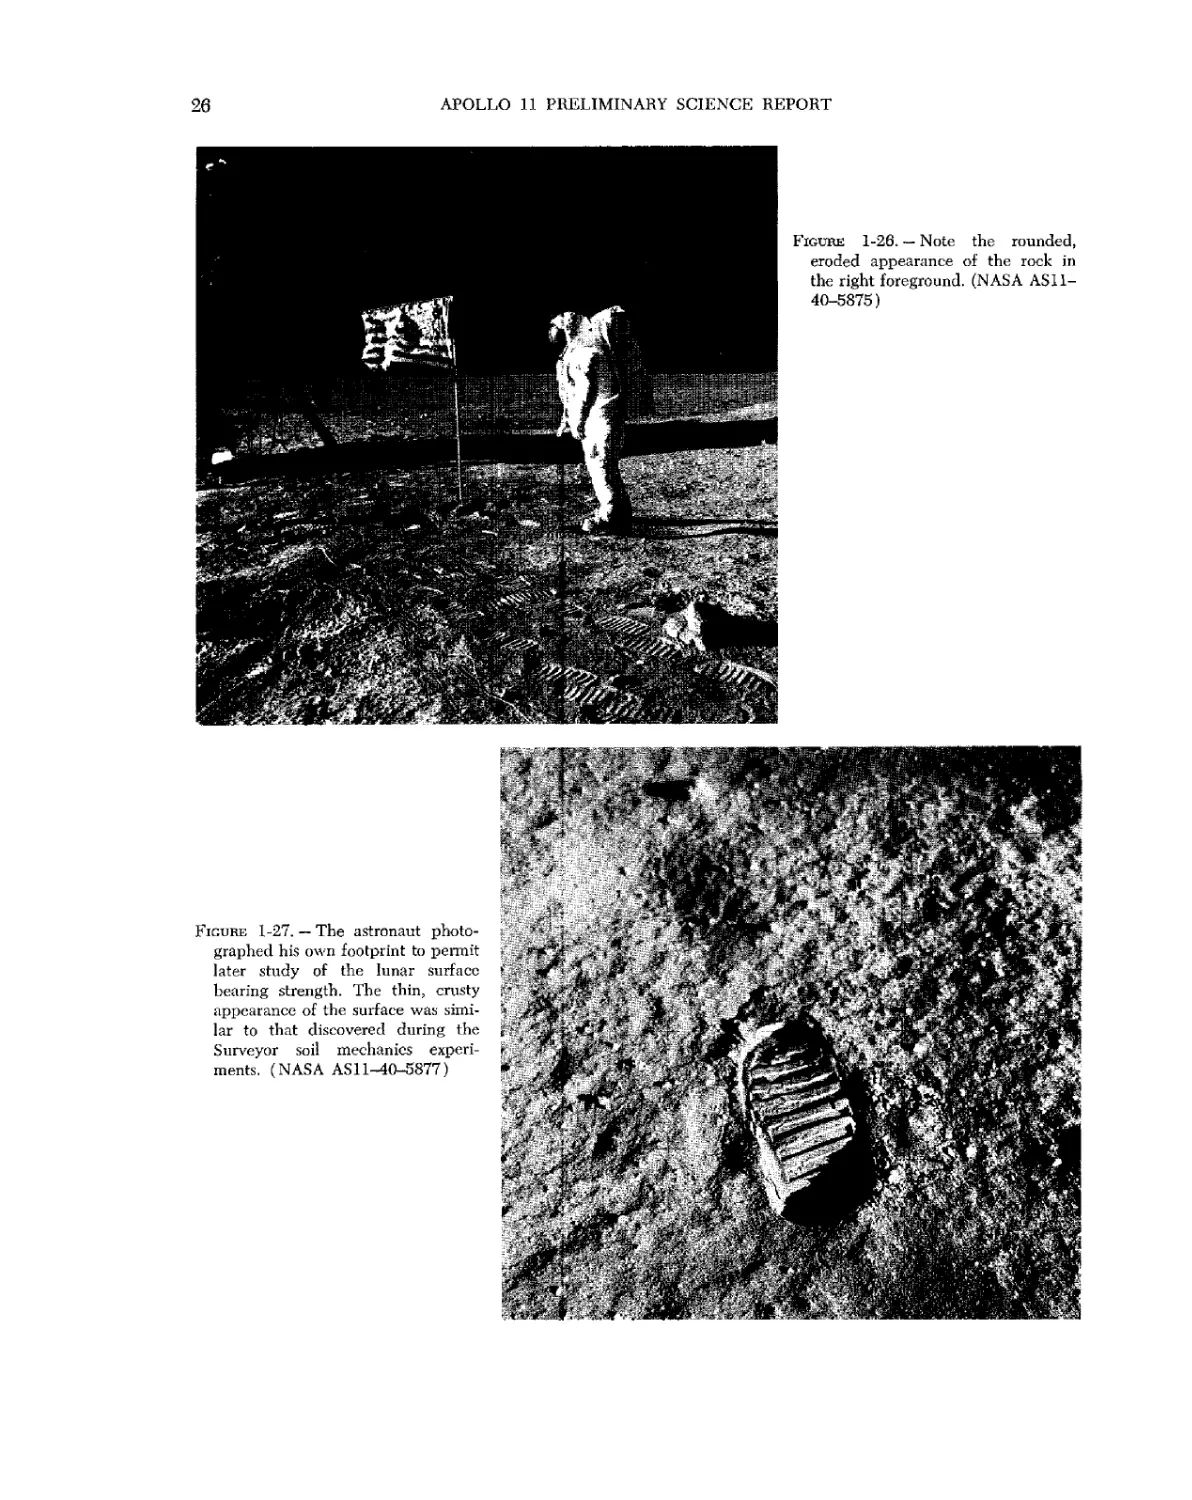
Figure 1-26. — Note the rounded,
eroded appearance of the rock in
the right foreground. (NASA AS11-
40-5875)
Fig i " - II
g I1 I .
1; i i I
t ¦
a ¦ .i
1; ¦ .
?. i
rin i
I
L" "><¦¦? wi
PHOTOGRAPHIC SUMMARY
27
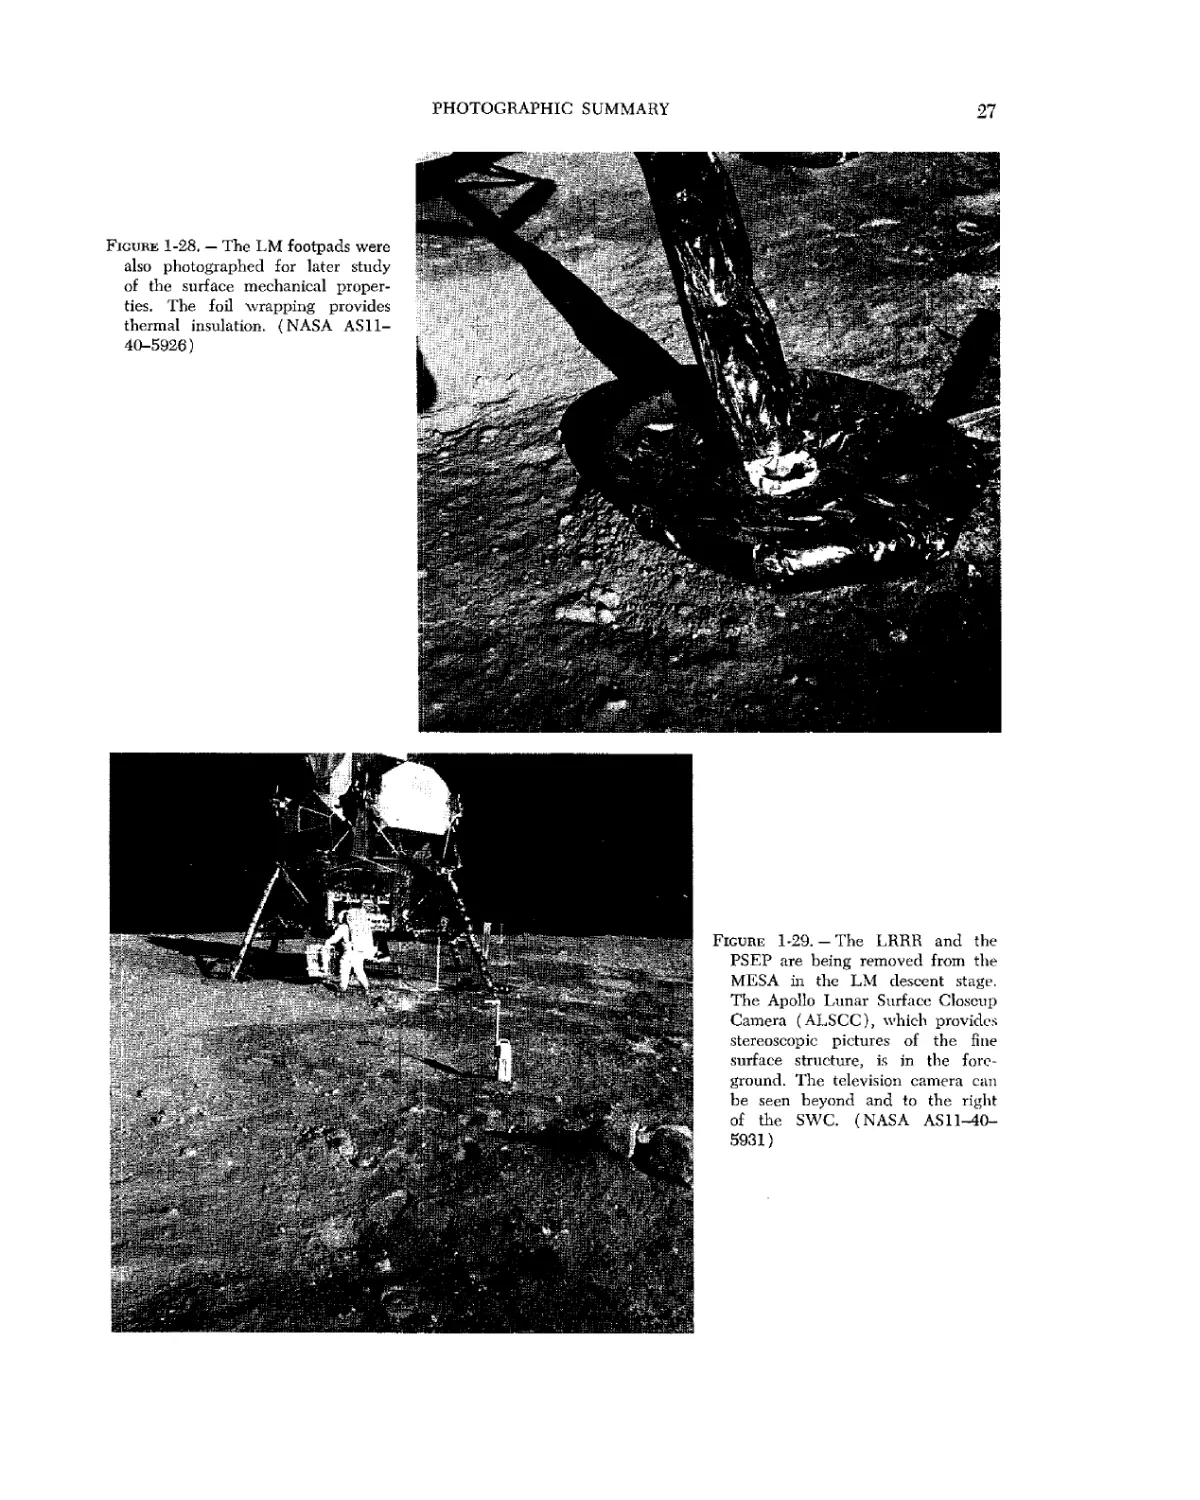
Figure 1-28, — The LM footpads were
also photographed for later study
of the surface mechanical proper-
properties. The foil wrapping provides
thermal insulation. (NASA AS11-
40-5926)
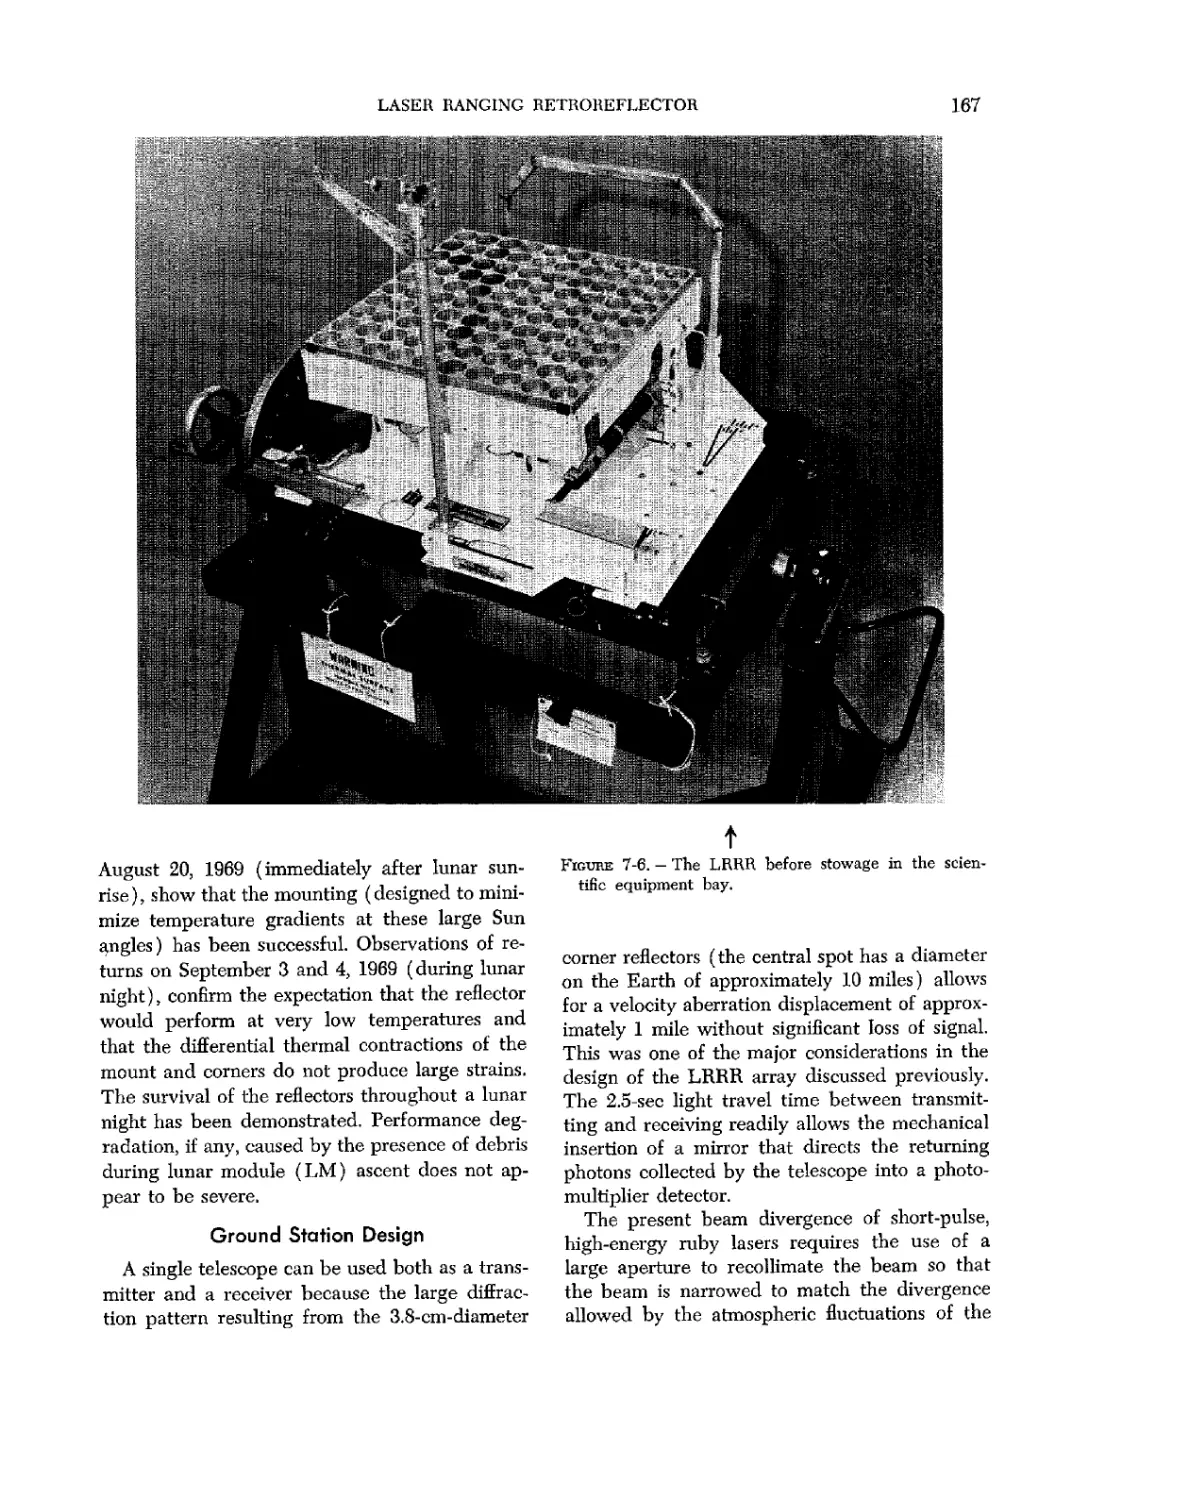
Figure 1-29. -The LRRR and the
PSEP are being removed from the
MESA in the LM descent stage.
The Apollo Lunar Surface Closeup
Camera (ALSCC), which provides
stereoscopic pictures of the fine
surface structure, is in the fore-
foreground. The television camera can
be seen beyond and to the right
of the SWC. (NASA AS 11-40-
5931)
28
APOLLO 11 PRELIMINARY SCIENCE REPORT
Figure 1-30.-The LRRR and the
PSEP are carried to the deploy-
deployment area. The surface was softer
near the rim of the small crater in
the foreground, as can be seen by
the depth of Astronaut Aldrin's
footprints. (NASA AS 11^10-5944)
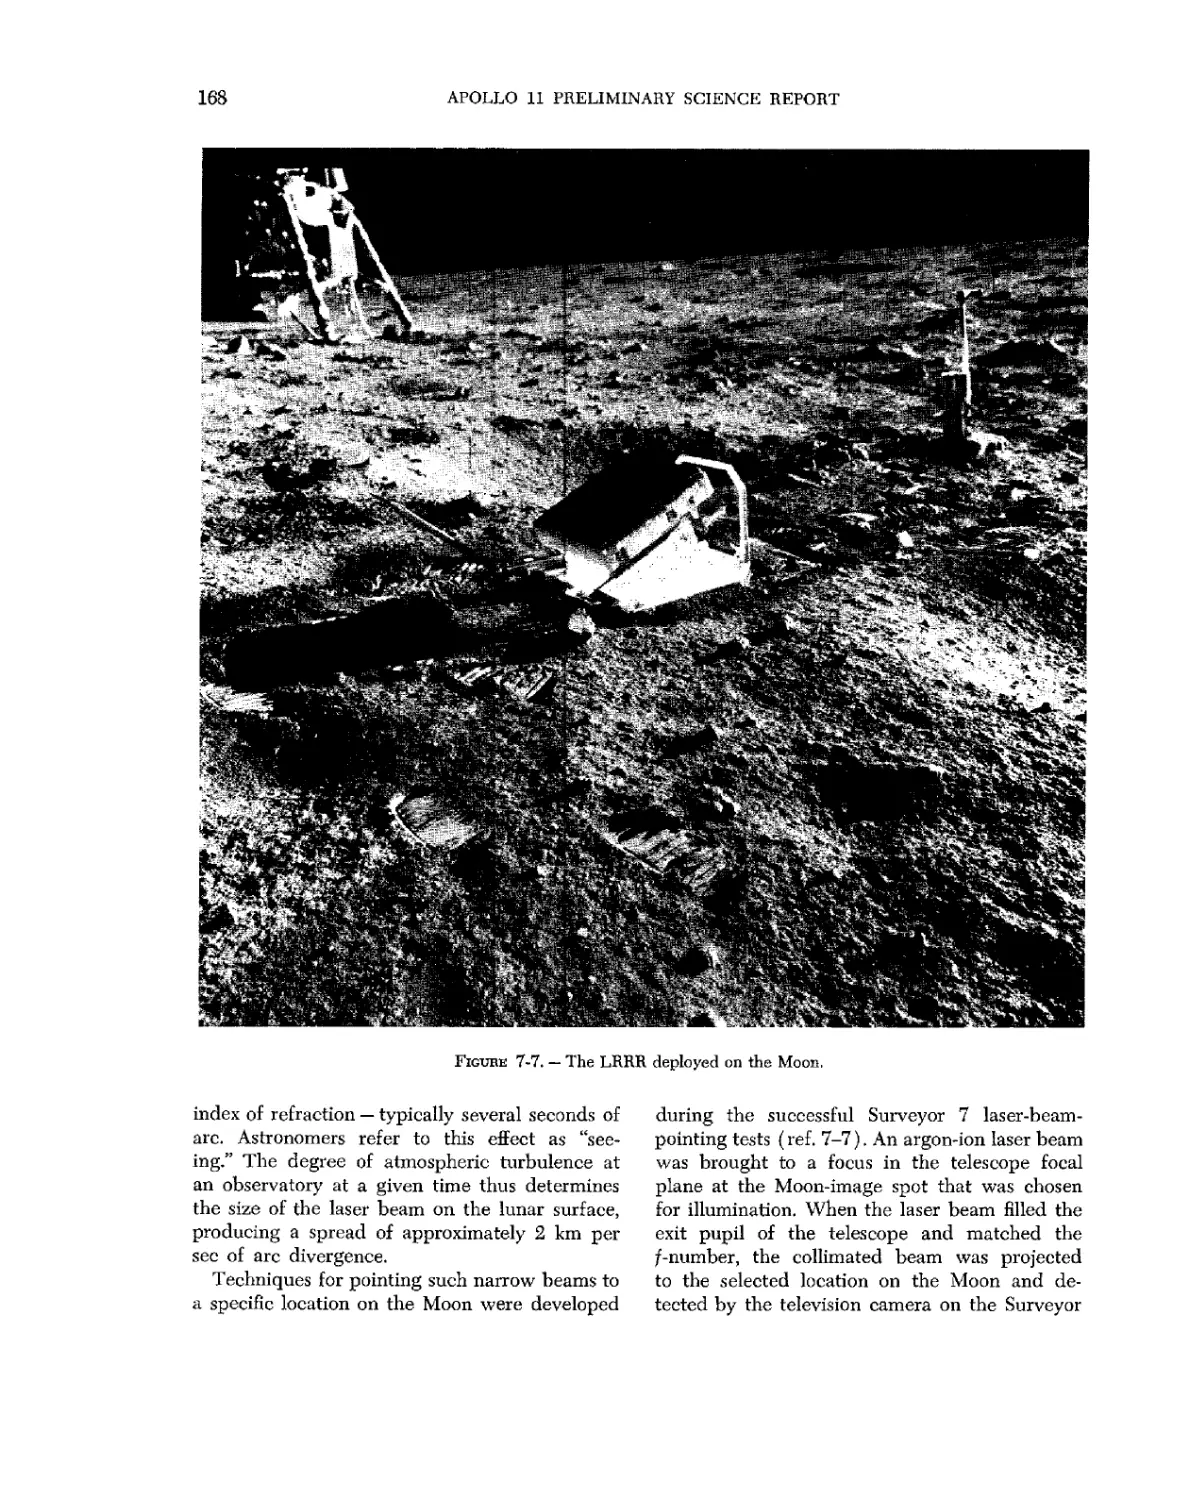
Figdhe 1-31.-The LRRR has been
set up to face the Earth, and the
PSEP is being leveled. The PSEP
was placed behind the large rock
to shield the experiment from the
effects of liftoff. (NASA AS 11-40-
5949)
PHOTOGRAPHIC SUMMARY
29
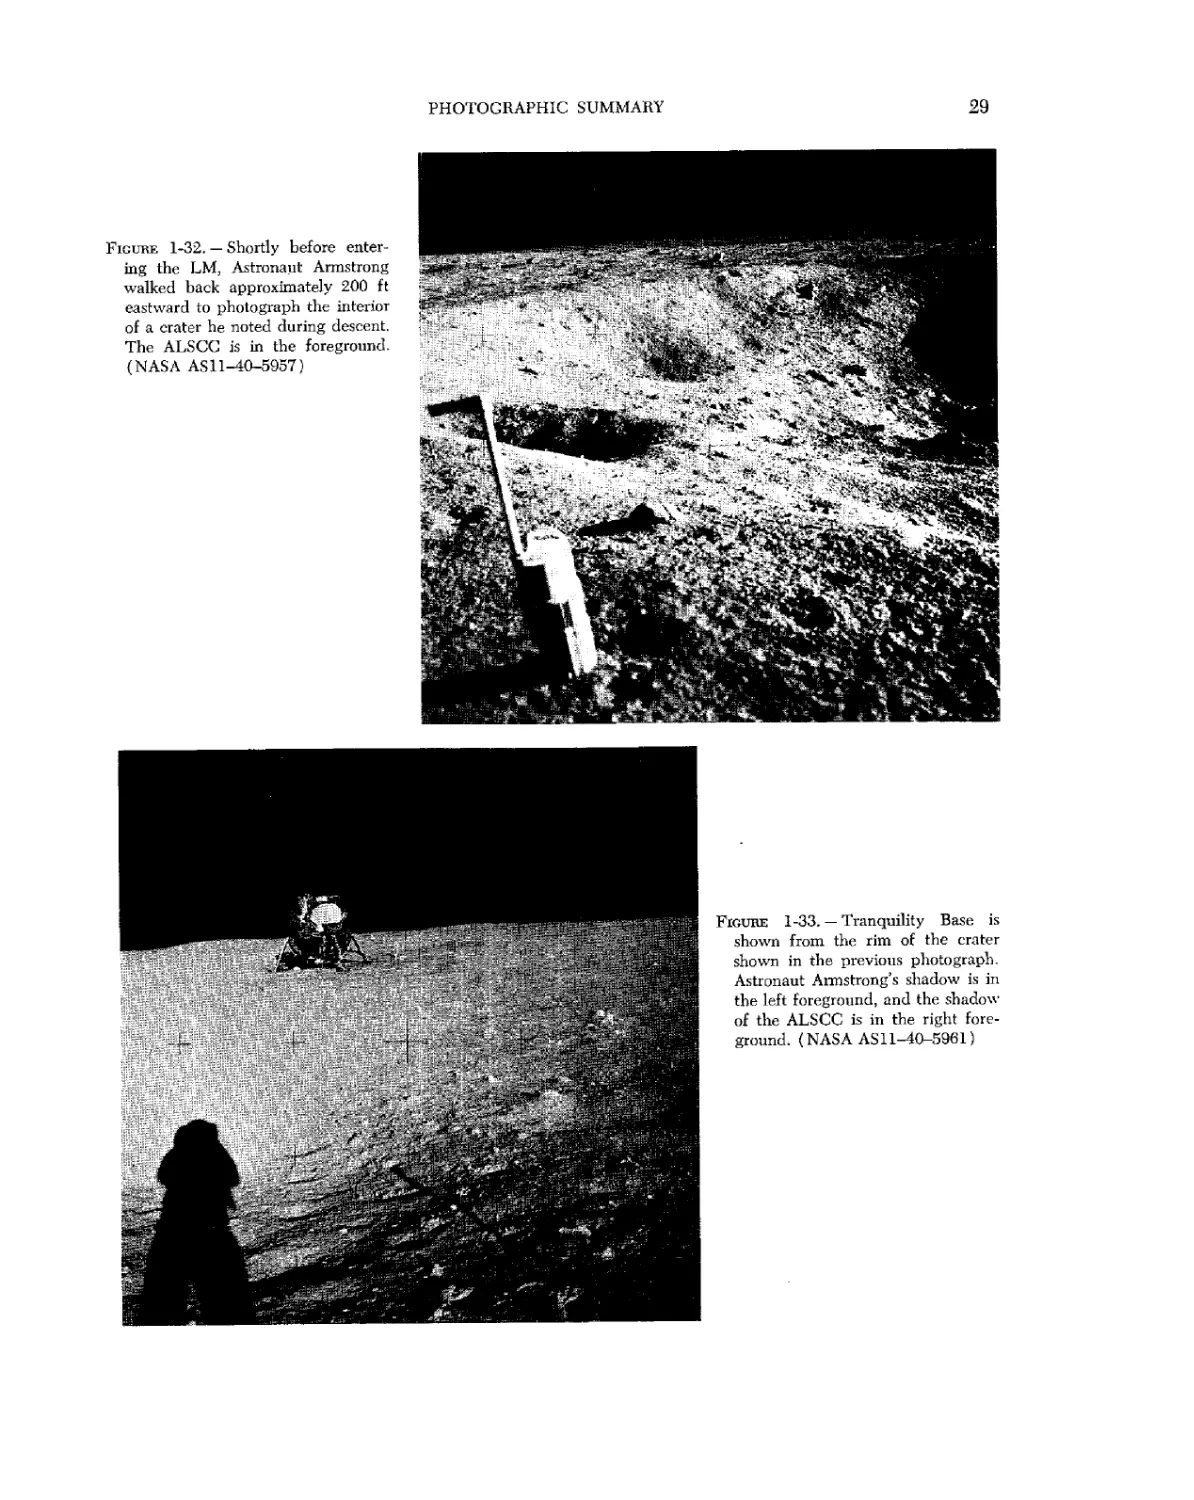
Figure 1-32. — Shortly before enter-
entering the LM, Astronaut Armstrong
walked back approximately 200 ft
eastward to photograph the interior
of a crater he noted during descent.
The ALSCG is in the foreground.
(NASA AS11-40-5957)
Figure 1-33. — Tranquility Base is
shown from the rim of the crater
shown in the previous photograph.
Astronaut Armstrong's shadow is in
the left foreground, and the shadow
of the ALSCC is in the right fore-
foreground. (NASA AS 11-40-5961)
30
APOLLO 11 PRELIMINARY SCIENCE REPORT
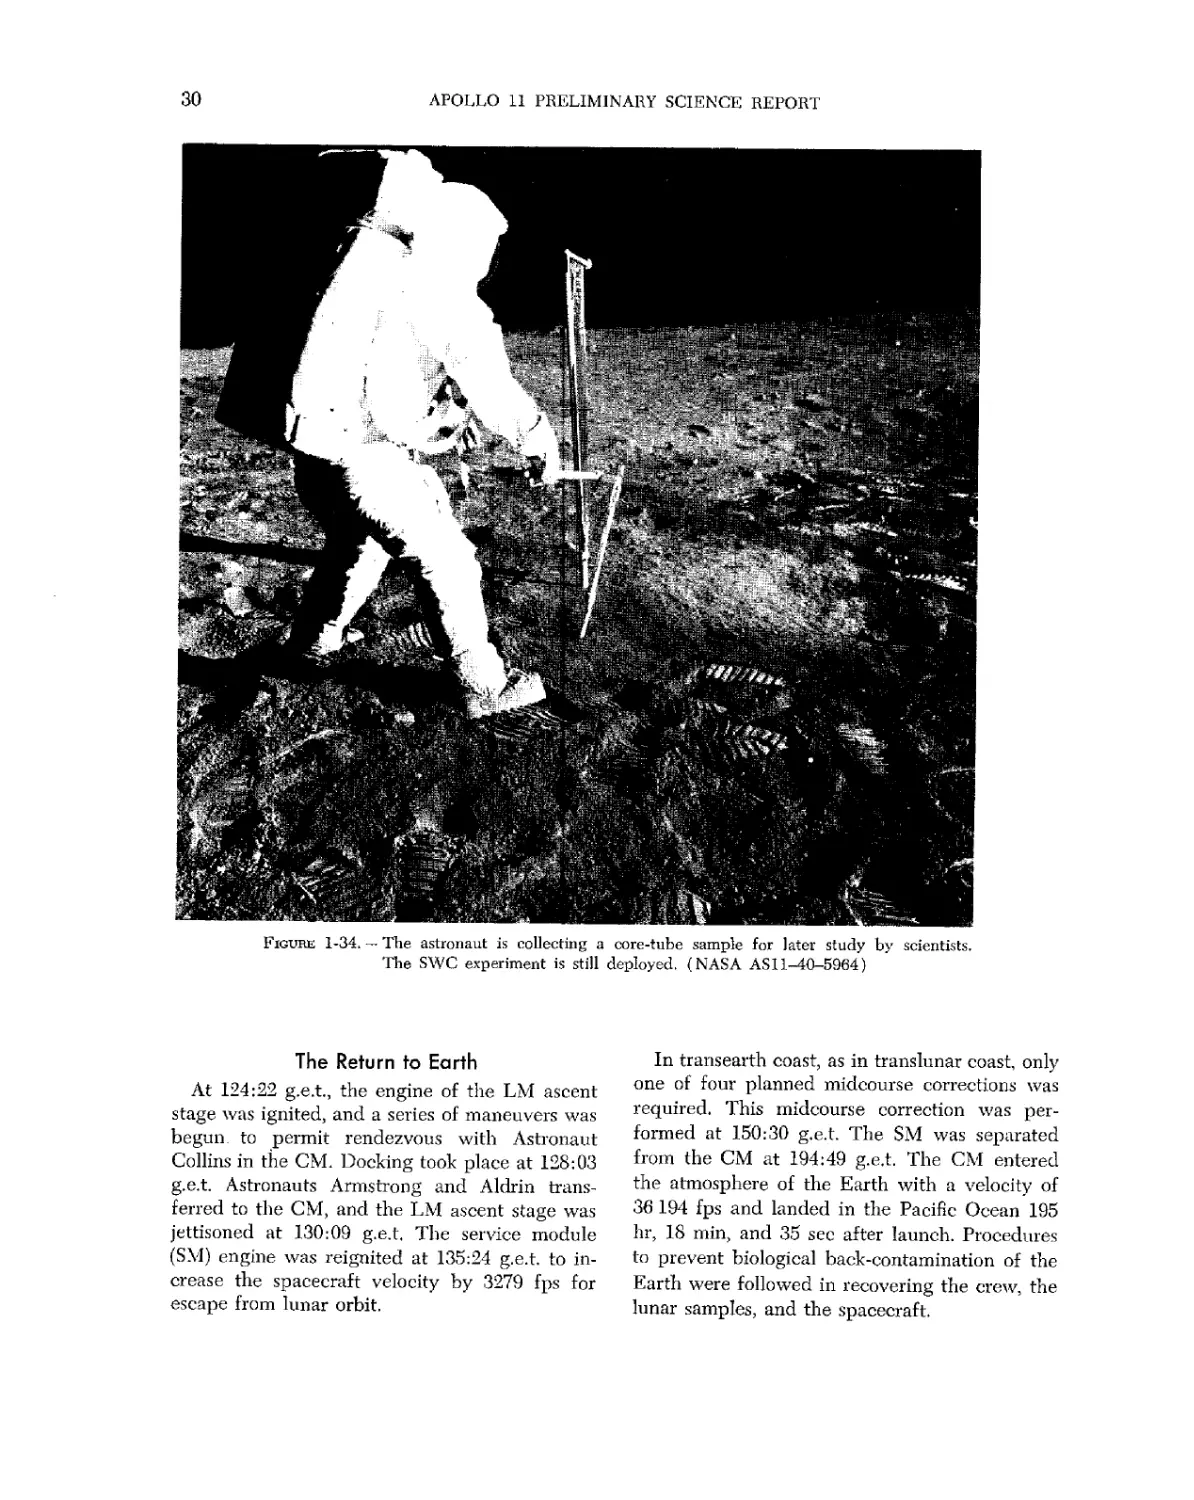
Figure 1-34. — The astronaut is collecting a core-tube sample for later study by scientists.
The SWC experiment is still deployed. (NASA AS11-40-5964)
The Return to Earth
At 124:22 g.e.t, the engine of the LM ascent
stage was ignited, and a series of maneuvers was
begun to permit rendezvous with Astronaut
Collins in the CM. Docking took place at 128:03
g.e.t. Astronauts Armstrong and Aldrin trans-
transferred to the CM, and the LM ascent stage was
jettisoned at 130:09 g.e.t. The service module
(SM) engine was reignited at 135:24 g.e.t. to in-
increase the spacecraft velocity by 3279 fps for
escape from lunar orbit.
In transearth coast, as in translunar coast, only
one of four planned midcourse corrections was
required. This midcourse correction was per-
performed at 150:30 g.e.t. The SM was separated
from the CM at 194:49 g.e.t. The CM entered
the atmosphere of the Earth with a velocity of
36 194 fps and landed in the Pacific Ocean 195
hr, 18 min, and 35 sec after launch. Procedures
to prevent biological back-contamination of the
Earth were followed in recovering the crew, the
lunar samples, and the spacecraft.
PHOTOGRAPHIC SUMMARY
31
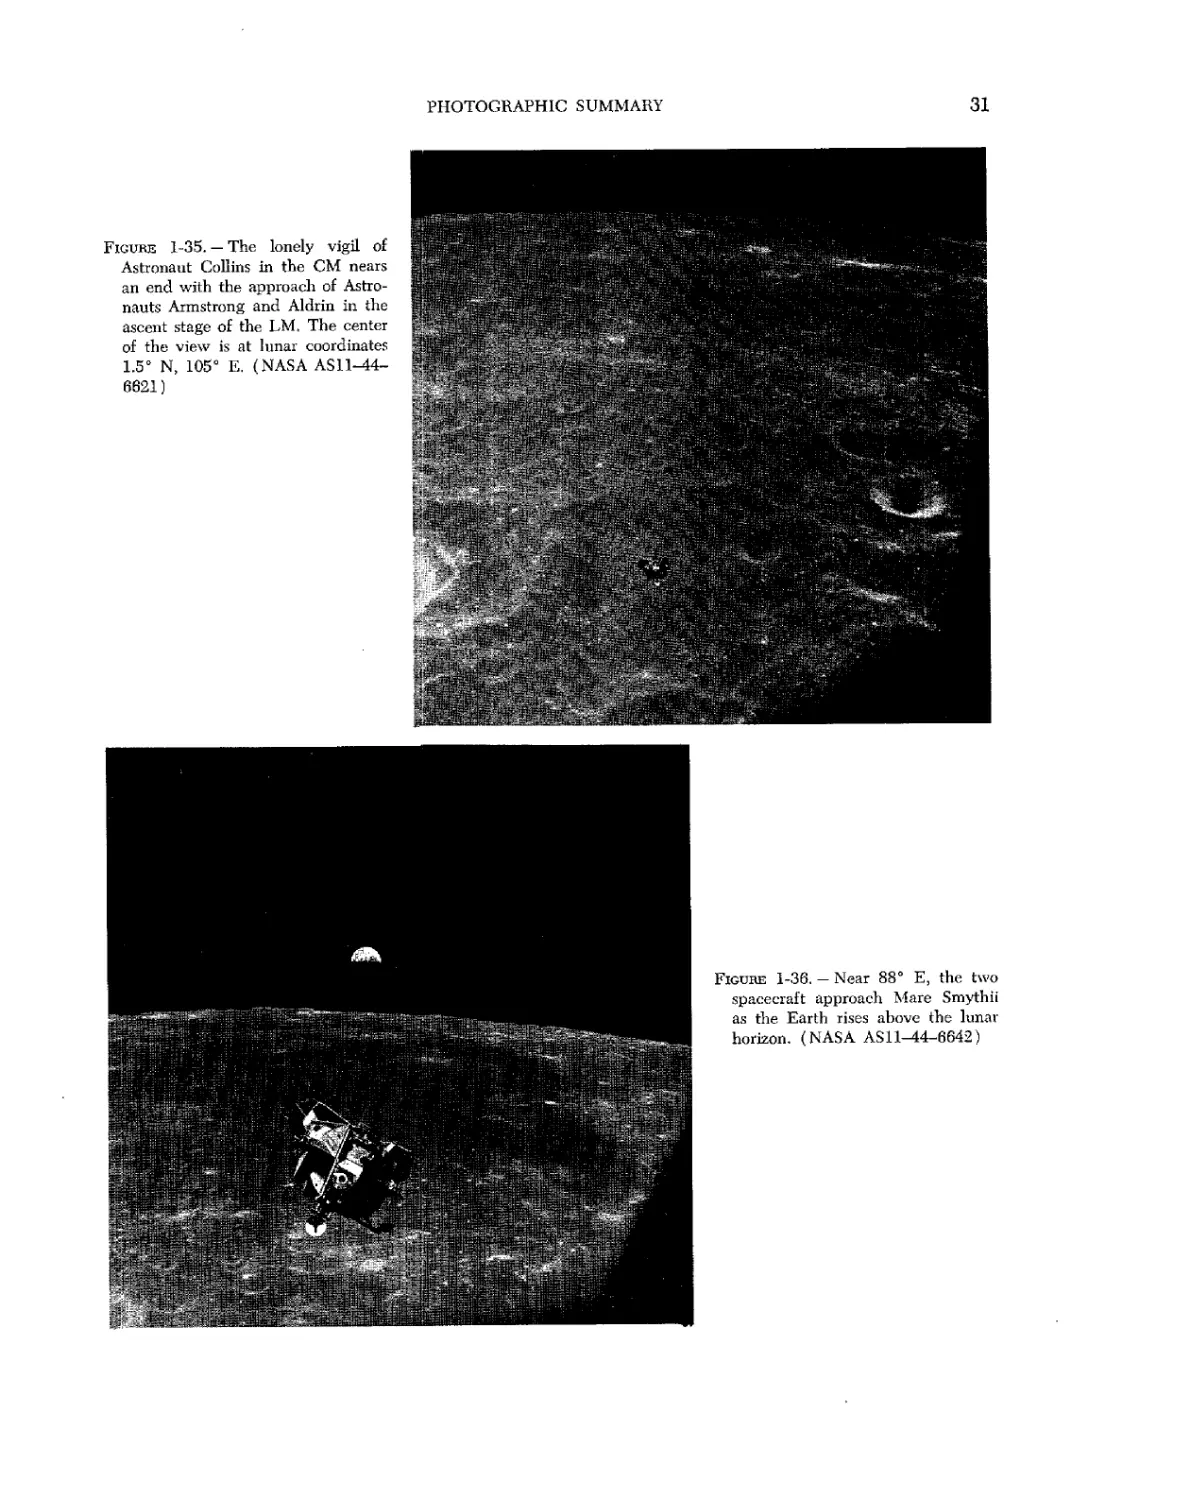
Figure 1-35. — The lonely vigil of
Astronaut Collins in the CM nears
an end with the approach of Astro-
Astronauts Armstrong and Aldrin in the
ascent stage of the LM, The center
of the view is at lunar coordinates
1.5° N, 105° E. (NASA AS 11-44-
6621)
Figuhe 1-36. - Near 88° E, the two
spacecraft approach Mare Smythii
as the Earth rises above the lunar
horizon. (NASA AS11^4-6642)
32
APOLLO 11 PRELIMINARY SCIENCE REPORT
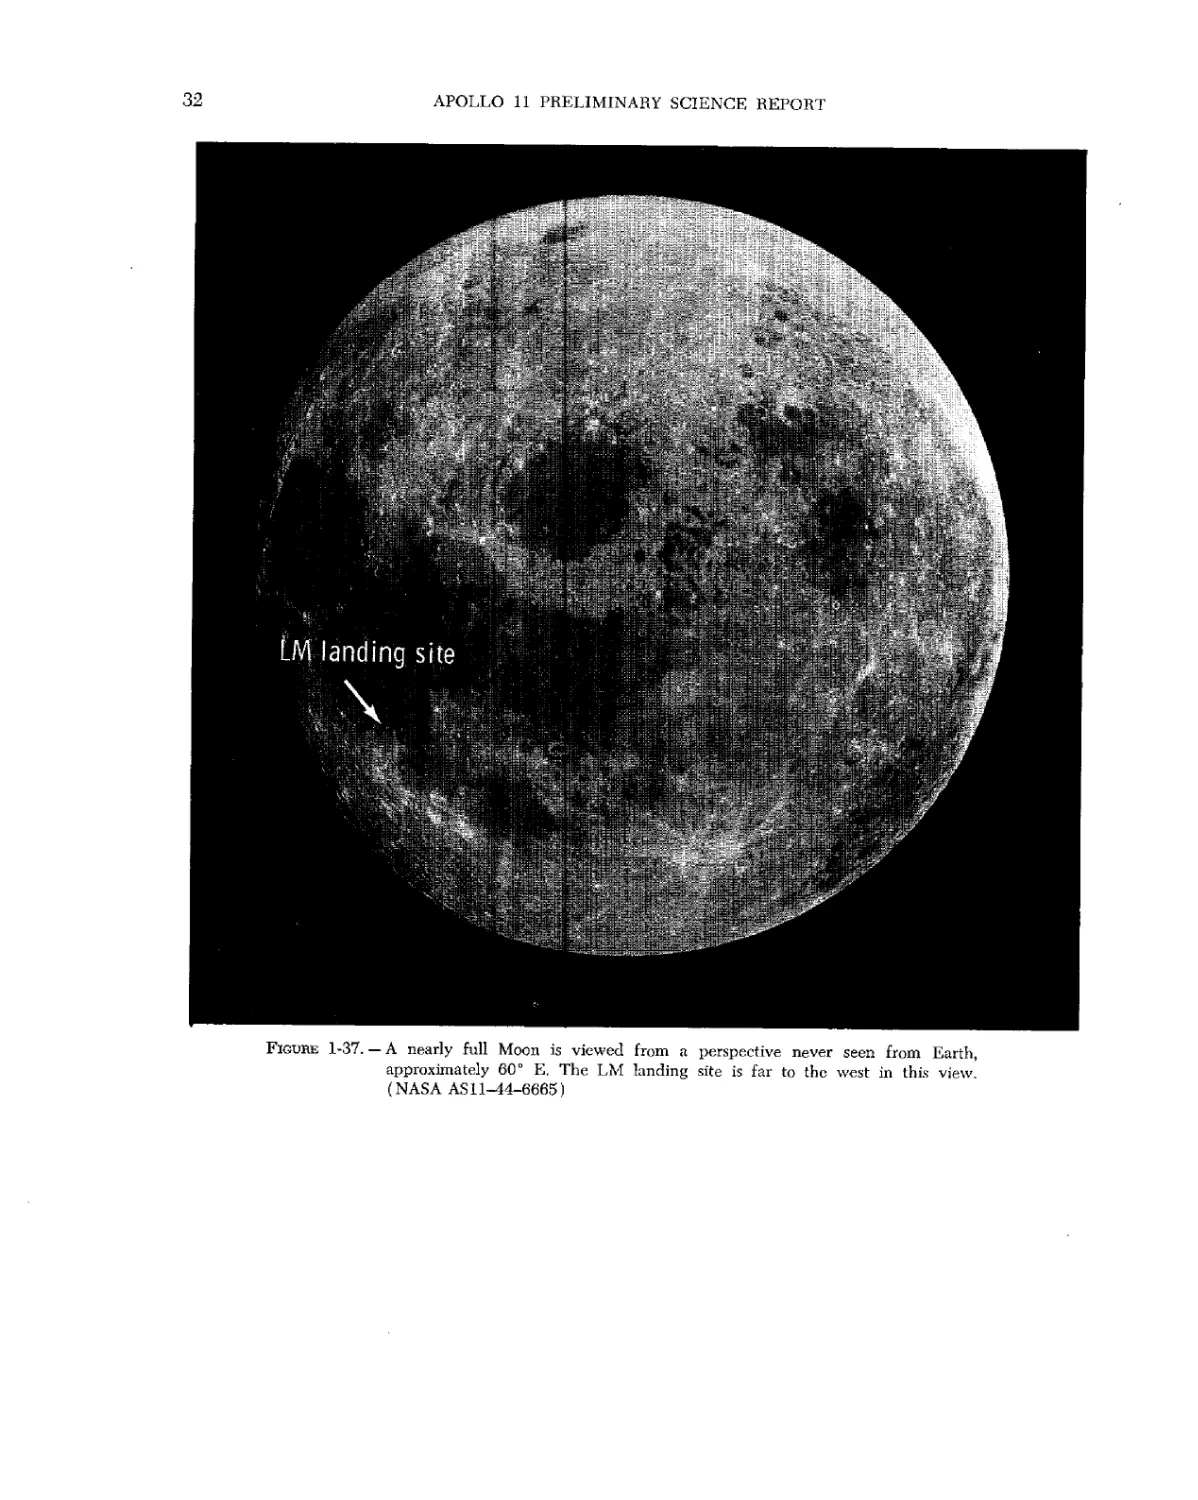
Figure 1-37. — A nearly full Moon is viewed from a perspective never seen from Earth,
approximately 60° E. The LM landing site is far to the west in this view'
(NASA AS 11-44-6665)
PHOTOGRAPHIC SUMMARY
33
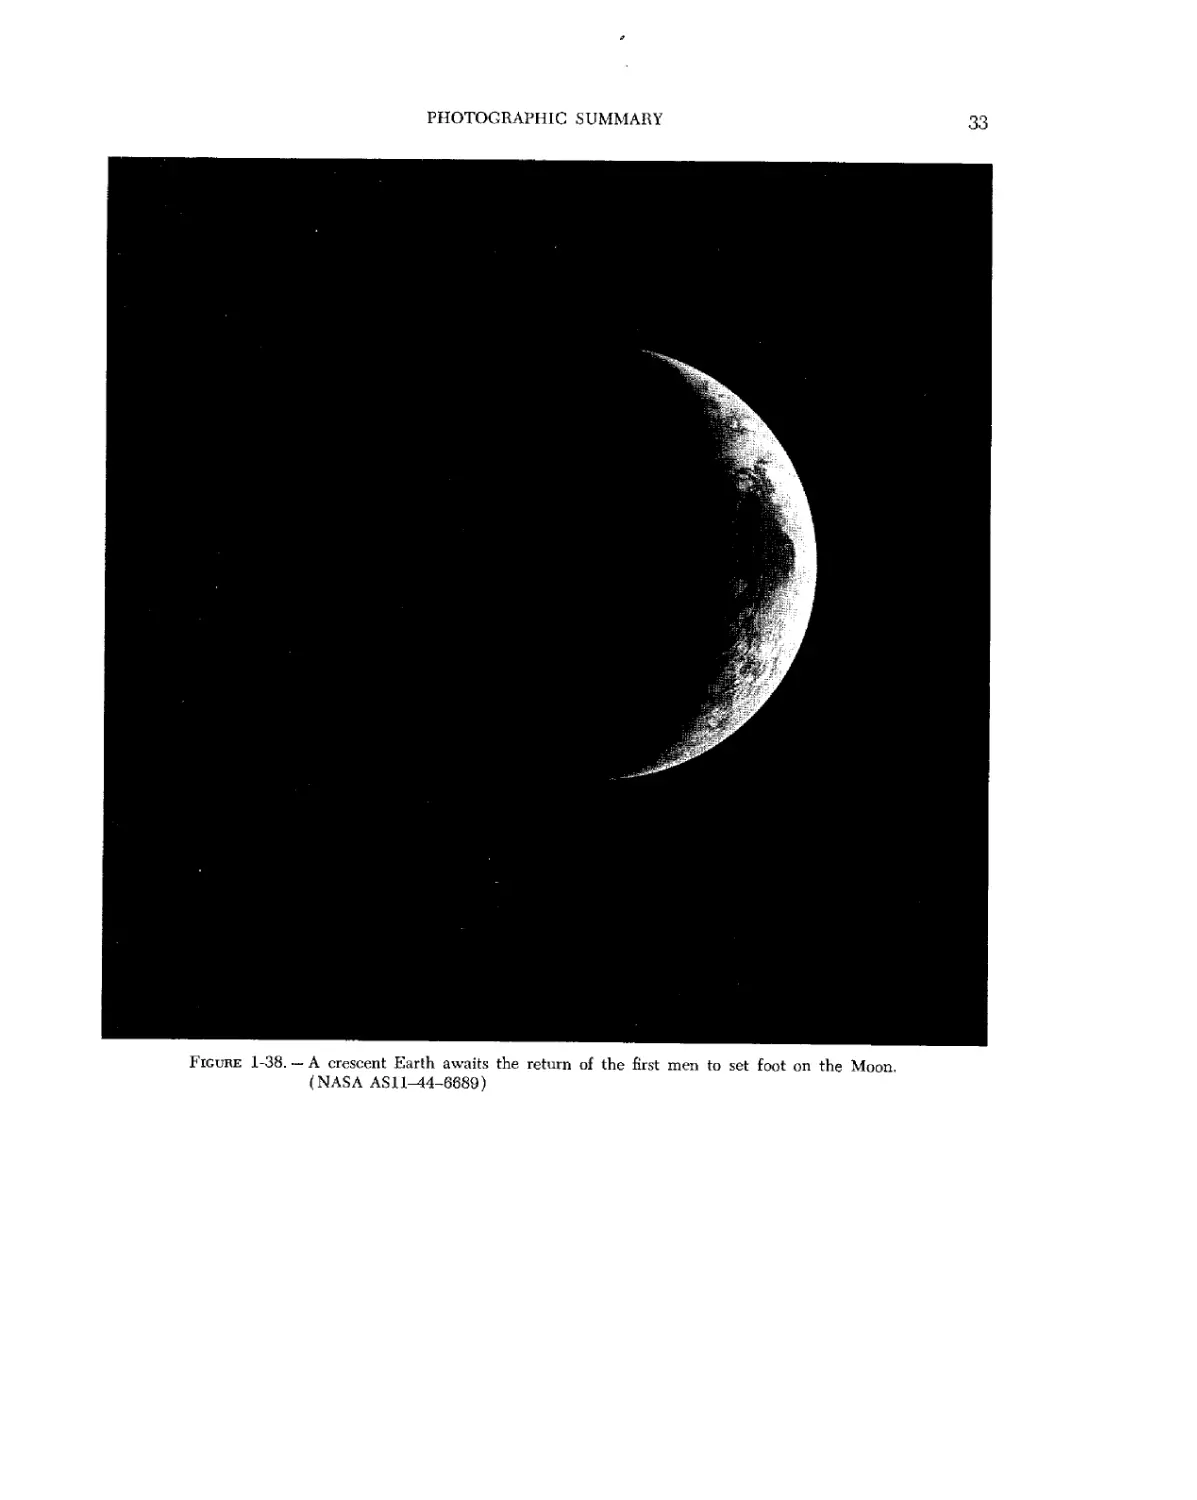
Figure 1-38. — A crescent Earth awaits the return of the first men to set foot on the Moon,
(NASA
2. Crew Observations
Edwin E. Aldrin, Jr., Neil A. Armstrong, and Michael Collins
The Apollo 11 mission offered us our first
opportunity to observe directly the operational
and scientific phenomena associated with land-
landings on the lunar surface. The lunar module
(LM) crew participated in two mission-oriented
geologic field trips and also attended several
tens of hours of briefings dealing with the obser-
observational aspects of the mission. These briefings
included sessions on basic geologic principles,
rock and mineral identification and interpreta-
interpretation, impact geology, Surveyor program results,
lunar surface visibility characteristics, landing
site recognition, and LM landing characteristics.
In addition, considerable planning and simula-
simulation time was devoted to preparation for the
evaluation of extravehicular mobility, a vital
feature to scientific endeavors on the lunar
surface,
Landing and Ascent
We had trained to some extent on the specific
topographic characteristics of the site 2 landing
area to be able to identify our final landing
point, an important requirement for later mis-
missions. Operational problems during the early
visibility phase of final descent prevented obser-
observation of those features that would have enabled
us to locate our final landing point soon after
touchdown. Postmission examination of the de-
descent sequence photography showed several
features we had been trained to recognize;
therefore, we feel that it will be feasible to
locate landing points on future missions.
When we were first able to observe the terrain
ahead of us (at an altitude of about 2000 ft and
about 1 mile uprange), it was clear that we
would land in the vicinity of a blocky rim crater
about 200 yd in diameter. This crater was later
identified as one we had informally called West
Crater during our prelaunch training. The
blocky area just north of West Crater was ini-
initially considered for a landing site because of
its obvious scientific interest; but as we ap-
approached this area, it proved to be too rough
for landing because of the numerous large and
blocky rocks, many larger than 5 or 10 ft in size.
We elected to overfly this area in preference
for the smoother spots a few hundred yards
farther west. As we proceeded west, it was
noted that several relatively open areas existed
between raylike fields of boulders. Our final
approach was chosen to lie between two of these
boulder fields.
The site where we eventually landed was a
relatively smooth area; however, craters varying
in diameter from 1 to perhaps 50 ft were present
in the near vicinity of the touchdown point.
Crater density in this area appeared to be in-
inversely proportional to crater size; for example,
the small-diameter craters were much more
abundant than those having a large diameter.
Several subdued ridges 20 to 30 ft high were
within our field of view but were some distance
from the spacecraft. In addition, a long boulder
field with many boulders averaging at least 2 ft
in diameter was several hundred feet north of
the landing point.
A large amount of fine lunar material ap-
appeared to be moved during the terminal phase
of landing. The streaming dust was first evident
at about 100 ft in altitude and thickened to
about 75 percent loss of visibility at touchdown.
The path of this expelled material was parallel
to the lunar surface, and the material seemed to
travel a great distance (over the horizon) at a
high velocity. The dominant effect of the stream-
streaming dust was to partially obscure and distort the
details of the surface and to make it difficult to
judge the horizontal velocity of the LM. After
the engine was shut down, there was no visual
35
36
APOLLO 11 PRELIMINARY SCIENCE REPORT
evidence that the expelled material was de-
deposited anywhere on top of the surrounding sur-
surface, and no lingering cloud of dust was
observed. No lunar dust was observed later dur-
during liftoff; however, separation debris observed
at this time appeared to have a long flightpath
similar to the path exhibited by the lunar ma-
material that was expelled during the terminal
phase of landing. One piece of debris was
observed to follow below us for several miles
before impacting the surface.
General Surface Characteristics
Co/or
The general color of the surface as viewed
close at hand is comparable to that we observed
from orbit at the same Sun elevation of about
10°. Actually, the surface is pretty much without
color Other than shades of gray. Along the zero
phase angle line (down Sun), the color is a
light, chalky gray with a tan shade. As one looks
toward 90° to the sunline, the color becomes a
darker ashen gray with no apparent tan shades.
At all phase angles, the surfaces of rock frag-
fragments appear to be a lighter gray than their
immediate surroundings; however, where such
fragments are freshly broken, the broken sur-
surfaces are very dark gray, much like country
basalt. Small gradations in color resulting from
very small topographical changes were visible.
Upon looking closely at the surface material
(particularly the fine soil) during our excursion,
we observed a charcoal-gray to gray-cocoa color,
similar to that of a graded lead pencil.
Craters
Many, if not most, of the larger craters in the
immediate vicinity of the LM appeared to be
somewhat elongate secondary craters. Except
for a few of the smaller craters, almost all the
craters we observed had raised rims; however,
no rims were truly sharp. Other than West
Crater, we did not observe a crater whose rim
had a noticeably greater abundance of rock
fragments than its surroundings had. Also, there
were no observed indications of fragments hav-
having rolled down the sides of craters.
The floors of craters near Tranquility Base
generally have about the same fragment concen-
concentration as the rims have. The only exception to
this was the 33-ft-diameter, 15- to 20-ft-deep
crater about 200 ft east of the LM. This crater
had a mound of large rocks grouped slightly off
center that were much larger and more numer-
numerous on the bottom than on the wall or rim of
the crater.
Rock Fragments
Rock fragments of a wide range of size, angu-
angularity, and textural types were observed both
from the LM window and during our extra-
extravehicular activities. Although some rock frag-
fragments were obviously lying on top of the sur-
surface, it was not always possible to judge their
depth of burial. In one case, a relatively angular
fragment resembling a distributor cap was found
to have most of its volume extending about a
foot underground, with a flat shelf at ground
level around the exposed part. In another in-
instance, a rock about 1 ft high, 1/2 ft long, and
J2 ft thick was apparently standing on edge,
although its depth of burial was unknown. In
the course of our use of the scoop, we encoun-
encountered rocks buried under several inches of soil.
The major textural types of the rock fragments
we observed were as follows: plain, even-
grained basaltlike rocks; obviously vesicular
basaltlike rocks; basaltic-appearing rocks with
1 to 5 percent small white minerals; and rocks
consisting of aggregated smaller fragments. In
some instances, loosely aggregated clods of soil
were difficult to distinguish from rock fragments
until they were disturbed and broken up.
Some of the rocks that appeared to be vesicu-
vesicular at first glance were actually not vesicular.
Instead, they were surficially pitted by what
appeared to be small impact craters.
In addition to the rock fragments, we
observed smaller pieces of material that had a
metallic luster and resembled blobs of solder
splattered on an irregular surface. These pieces
of material were concentrated in scattered
aggregates at the bottoms of six or eight 3- or
4-ft-diameter craters. Elsewhere, several ex-
examples of lunar material that seemed to be
transparent crystals were observed on the sur-
surface. These crystallike materials resembled
quartz crystals and appeared to be opaque from
some views and translucent from other views.
There were also small sparkly fragments that
CREW OBSERVATIONS
37
resembled biotite; however, these fragments
could not be examined closely. It was not pos-
possible to collect samples of these unusual mate-
materials at the time they were observed, and during
the sampling periods, none of these materials
were found. The solderlike material was photo-
photographed, however, using the closeup stereo-
stereoscopic camera.
So/7 Characteristics
The fine surface material is a powdery, graph-
itelike substance that seems to be dominantly
sand to silt size. When this material is in con-
contact with rock, it makes the rock slippery. This
phenomenon was checked on a fairly smooth,
sloped rock. When the powdery material was
placed on the rocks, the boot sole slipped easily
on the rock, and the slipping was sufficient to
cause some instability of movement. Otherwise,
traction was generally good in the loose, pow-
powdery material.
Unexpected differences in the consistency and
softness of this top layer were noticed at loca-
locations having minor changes in surface topog-
topography. These differences were manifested in sig-
significantly different footprint depths. These depth
differences indicated that there may be different
depths of surface material covering the more
resistive subsurface, particularly on the rims of
small craters.
When the surface near the LM was viewed
following touchdown, the topography that had
been observed prior to touchdown had changed
little. Although there was no crater, the lunar
surface directly under the engine bell had a
singed and baked appearance. The baking ap-
appeared to have made the surface material more
cohesive and perhaps made it flow together to
give a strong streaked pattern radiating from
below the bell. However, the impact of small
objects thrown on this material indicated that
the material was about as loosely bound as the
material away from the LM. The streaks, or ray
texture, when viewed down Sun were much
darker than the rest of the surface. Any erosion
that existed in this area was clearly radially out-
outward. However, this erosion was not obvious to
us beyond the limits of the landing gear. No
redeposition of material was observed away
from the LM except possibly for the powder
observed in the cavities of some rock fragments
close to the spacecraft. Also, the soil under the
LM showed no evidence of disruptive outgass-
ing of injected engine gases.
Visual examination of the LM and of the lunar
surface beneath the LM showed no effects from
fluids that had vented from the LM. A slight
amount of vapor that may have escaped from a
boiler was observed at the top of the LM.
Surface penetrability decreases quickly within
the first few inches of the surface. The first evi-
evidence of this decrease was the 2- to 3-in. pene-
penetration of the LM footpads and the rather shal-
shallow trenching by the landing probes. When
specifically probed more than 4 or 5 in., the sur-
surface was found to be quite firm. This firmness
was clearly evident during deployment of the
staffs of the U.S. flag and the Solar Wind Com-
Composition Experiment. Probing of the initial 4 or
5 in. of the surface was relatively easy; however,
6 to 8 in. was as far as the flagstaff would pene-
penetrate the surface. The surface penetration by the
core tubes was no greater than 8 or 9 in., even
when the sampler extension was hammered hard
enough to be significantly dented. In contrast,
the soil offered very little lateral support to the
staffs and core tubes when they were left to
stand by themselves. There were no rocks under
the core tubes during the driving operations.
The material at the bottom of the core sample
appeared to be darker than the surface material,
and this material packed in the tube and ad-
adhered to the sides of the tube in the same man-
manner as wet sand or silt.
When kicked or scuffed, lunar material moved
away radially. The ballistic trajectory patterns
of this kicked material depended upon the angle
of impact of the boot. Most of the particles had
the same angle of departure and velocity so that
a large proportion of the particles impacted the
same distance from their source. In the lunar
environment, a cloud of kicked material did not
settle slowly as would have occurred if material
were kicked on Earth. The material disturbed
by our walking or kicking was generally dark
when contrasted with undisturbed material
nearby.
Summarizing the vertical soil profile of lunar
materials as we observed it, the following zones
can be defined in order of increasing depth:
38
APOLLO 11 PRELIMINARY SCIENCE REPORT
A) A very thin (less than one-eighth in.)
light-gray to tannish-gray dusty zone
B) A thin (about one-fourth in.) dark-gray
caked zone that will crack 5 to 6 in. away from
where force is applied
C) A 2- to 6-in.-thick zone of soft, dark-gray
to cocoa-gray, slightly cohesive sandy-to-silty
material that will hold slopes of probably 70°
D) A zone that is gradational with zone 3
and is similar to zone 3 except for a marked
increase in firmness and resistance to penetra-
penetration
Zone 3 is the only zone with a thickness that
clearly varies with topography, being thickest
on the rims of small craters. There was, how-
however, no noticeable thickening of zone 3 on the
rim of the large crater just east of the LM. The
distribution of rock fragments was not notice-
noticeably different among the soil zones, except for
an apparently lower concentration in zones 1 to
3 on the rims of the small craters.
Sampling Operations
Contingency Sample
The contingency sample was obtained by
taking several partial scoops of soil from zones
1, 2, and 3 in the area in front of quad IV of
the LM. There was noticeable difficulty in
scooping deeper than about 2 or 3 in. because
of an increase in soil firmness. An effort was
made to include several small rock fragments in
the sample. All the sample was taken from an
area that did not appear to have been disturbed
by the descent engine gases.
Bulk Sample
The bulk sample was obtained in front of
quad IV and the +Y landing gear of the LM.
This sample consists largely of scoops of soil
from zones 1, 2, and 3 to a depth of about 3 in.
and of randomly selected rock fragments from
the surface. In some instances it was not pos-
possible to scoop more than 1 or 2 in. below the
surface; however, there appeared to be no hard
layer at that depth.
Documented Sample
The documented sample was taken very rap-
rapidly, and no attempt was made to actually docu-
document the samples by voice or photography.
However, an effort was made to select as wide
a variety of samples as possible. The first few
rocks were collected from the surface and sub-
subsurface 15 to 20 ft north of the LM. In an
attempt to avoid the effects of the descent
engine gases, the rest of the rocks were col-
collected in the area between the LM and the
double elongate crater to the southwest of the
LM and in the area between the LM and the
Early Apollo Scientific Experiments Package
site to the south of the LM.
Core-Tube Sampler
The core-tube samples were taken approxi-
approximately 10 ft apart about 20 ft northwest of the
LM. This area had been generally disturbed by
previous operations; however, the samples were
not taken directly in footprints.
Photographic Operations
The 70-mm Hasselblad photographs generally
were taken using the recommended exposure
settings. In some instances on the lunar surface,
however, we interpolated between these set-
settings. When exposure conditions were marginal
or when a large amount of film remained, we
used a range of exposures. Focus settings were
selected to give as good a focus as possible at
the object of interest, rather than using the pre-
preselected focus detents.
Physiological Effects
Distances on the lunar surface are deceiving.
A large boulder field located north of the LM
did not appear to be too far away when viewed
from the LM cockpit. However, on the surface
we did not come close to this field, although we
traversed about 100 ft toward it. The flag, the
television camera, and the experiments, although
deployed a reasonable distance away from the
LM and deployed according to plan, appeared
to be immediately outside the window when
viewed from the LM cockpit. Because distance
judgment is related to the accuracy of size esti-
estimation, it is evident that these skills may require
refinement in the lunar environment.
The lunar gravity field also has differing
effects on Earth-learned skills. Although the
CREW OBSERVATIONS
39
gravitational pull on the Moon is known to be
one-sixth of the gravitational pull on the Earth,
objects seem to weigh approximately one-tenth
of their Earth weight. The mass of an object
makes the object easy to handle in the reduced
lunar atmosphere and gravitational field. Once
moving, objects continue moving, although their
movements appear to be significantly slower in
the lunar environment. However, personal ma-
maneuvering on the lunar surface gives the impres-
impression that the gravitational pull is similar to
Earth gravity; that is, suited mobility on the
Moon does not seem to be much different from
unsuited mobility on the Earth.
Finally, the absence of any natural vertical
features, coupled with the poor definition of the
horizon and the weak gravity indication at the
feet of an observer, causes difficulty in identifi-
identification of level areas when looking down at the
surface. The ability to discern level areas is
further complicated by the fact that, when a
lunar observer is wearing a spacesuit, the center
of mass of the lunar observer is higher and far-
farther back than the normal center of mass of an
observer on Earth.
Walking in the up-Sun direction posed no
problem, although the light was very bright
with the Sun shining directly into the visor.
While walking in the down-Sun direction, most
objects were visible, but the contrast was
washed out. Varying shapes, sizes, and glints
were more easily identified in the cross-Sun
directions.
Although Tranquility Base is a relatively
smooth area, the operation of a mobile vehicle
in this area would require careful planning.
Steep slopes, deep holes, and ridges cover the
surface. Special consideration must be given to
these characteristics when designing a mobile
vehicle that will operate in such an environment.
Solar Corona Observations
During translunar flight, we observed that the
solar corona had no noticeable structure or
variation in color. The change in illuminosity
with radius was similar to that of zodiacal light,
especially of long-time-exposure photographs of
zodiacal light. Because illuminosity decreased
evenly with radius, any estimate of the coronal
diameter would depend on how closely one were
looking at the illumination; if one were looking
very closely, the corona might have a diameter
of two, or maybe three, lunar diameters.
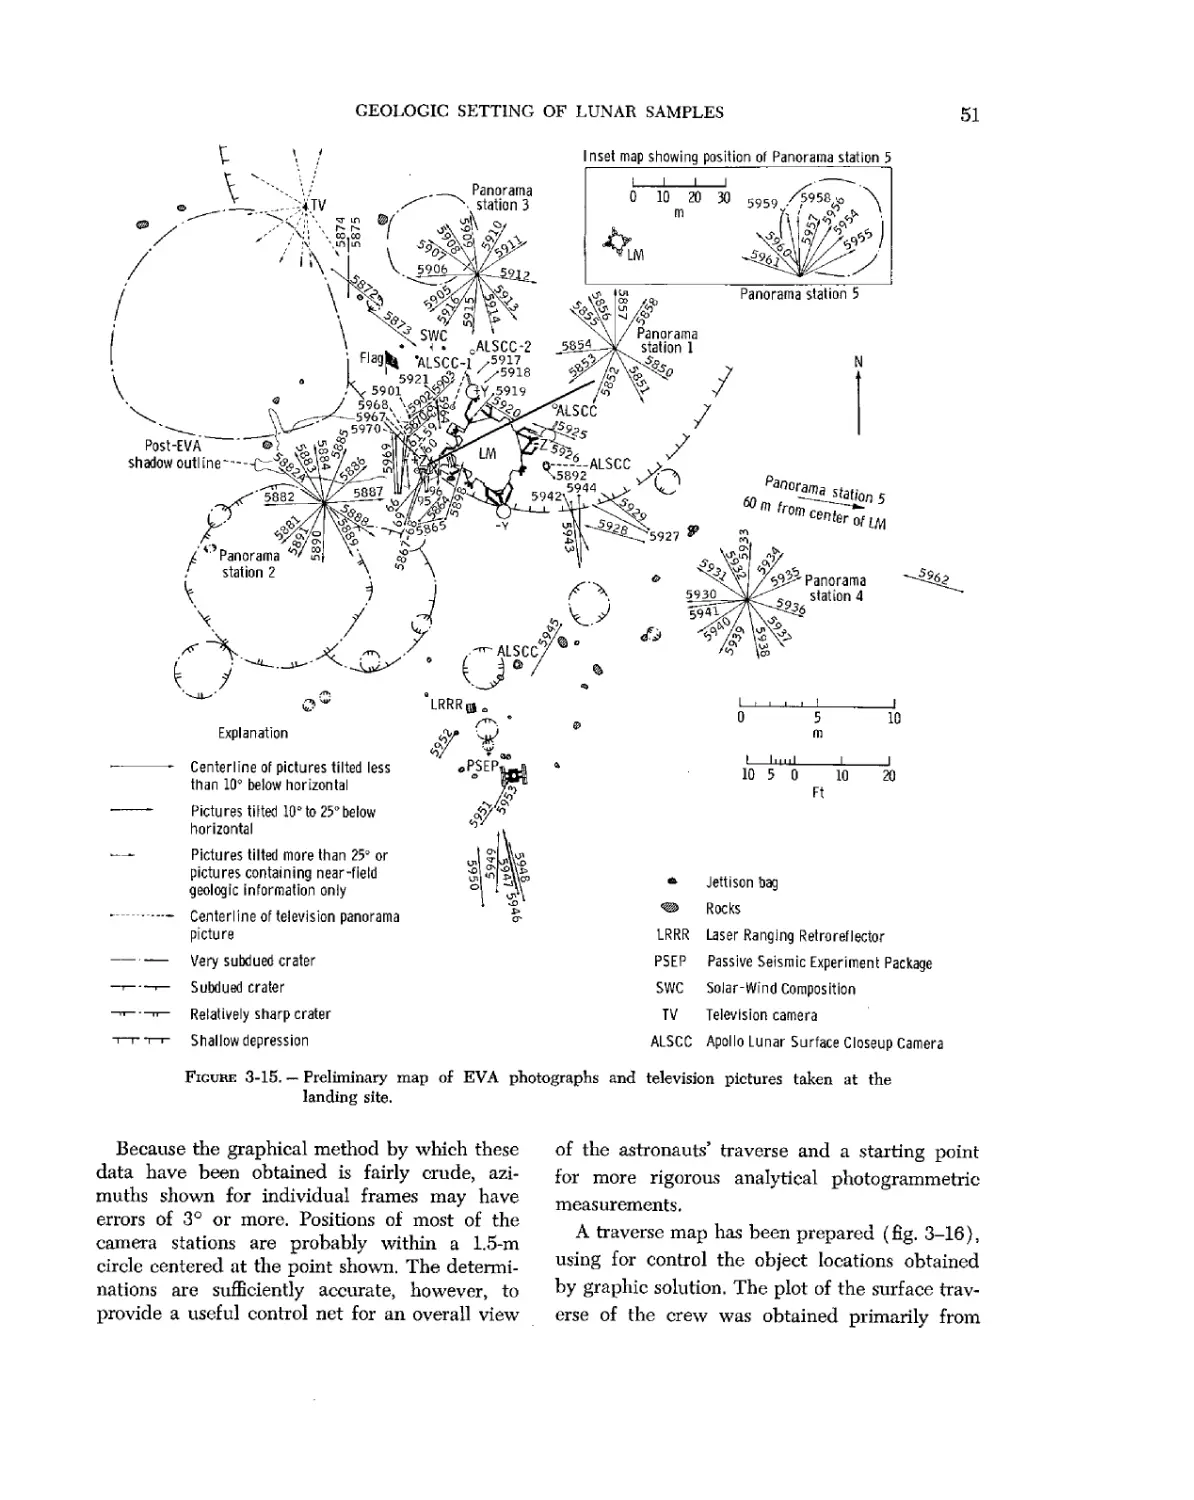
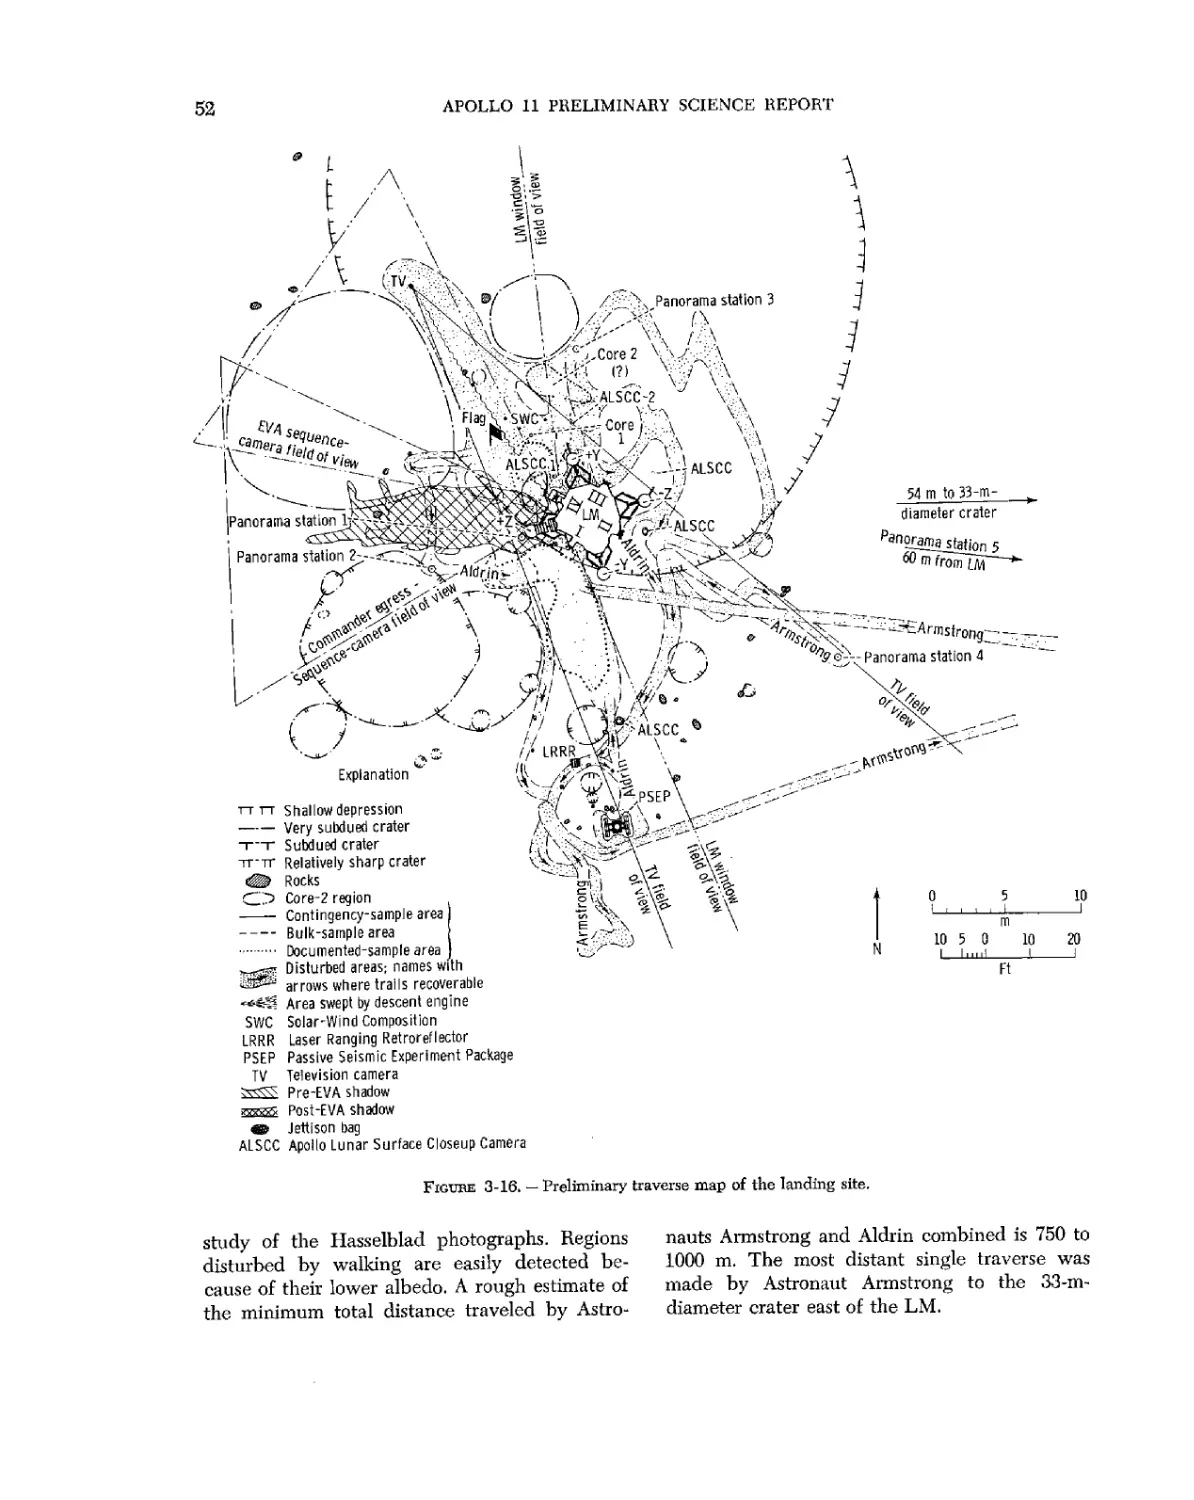
42
APOLLO 11 PRELIMINARY SCIENCE REPORT
concerning the positions, sizes, and orientation
of features on the lunar surface around the lunar
module (LM) are being extracted from the
photographs by methods that are necessarily
laborious. With further work, it is expected that
a fairly detailed picture of the topography and
geology of the landing site will be recovered and
that the original positions on the lunar surface
of additional returned specimens will be lo-
located. When this has been accomplished, a full
interpretive report on the geology will be pre-
prepared.
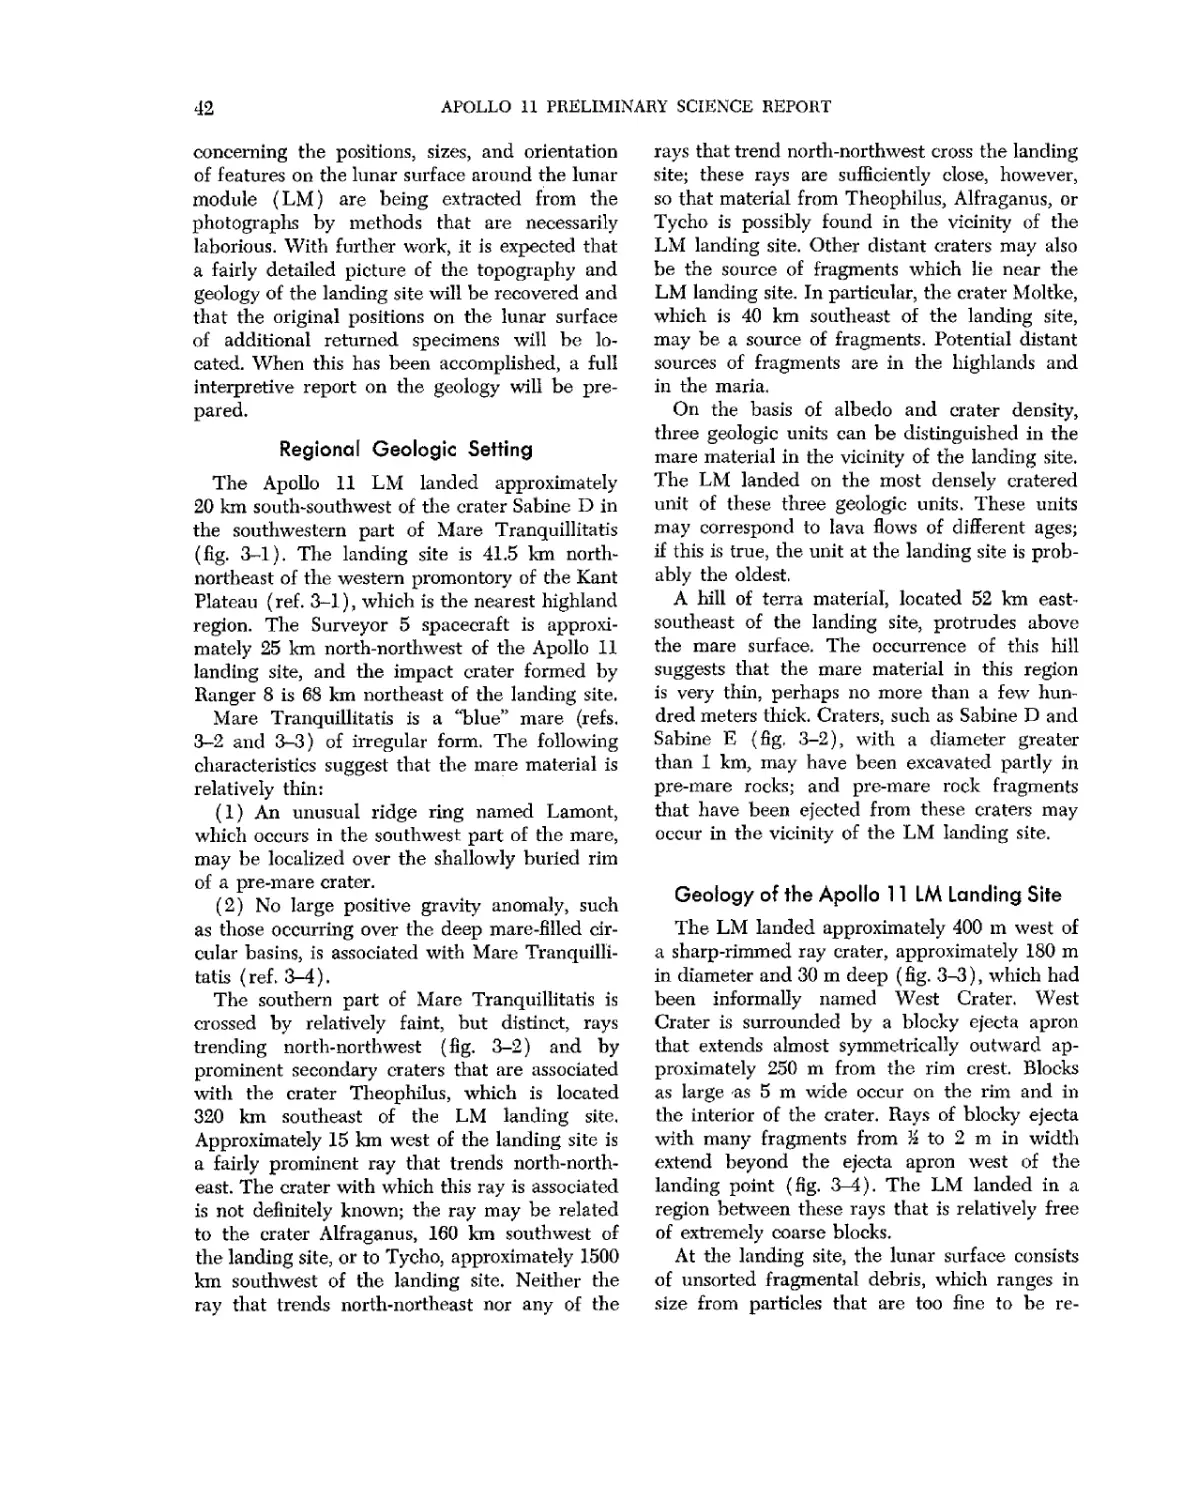
Regional Geologic Setting
The Apollo 11 LM landed approximately
20 km south-southwest of the crater Sabine D in
the southwestern part of Mare Tranquillitatis
(fig. 3-1). The landing site is 41.5 km north-
northeast of the western promontory of the Kant
Plateau (ref. 3-1), which is the nearest highland
region. The Surveyor 5 spacecraft is approxi-
approximately 25 km north-northwest of the Apollo 11
landing site, and the impact crater formed by
Ranger 8 is 68 km northeast of the landing site.
Mare Tranquillitatis is a "blue" mare (refs,
3-2 and 3-3) of irregular form, The following
characteristics suggest that the mare material is
relatively thin:
A) An unusual ridge ring named Lamont,
which occurs in the southwest part of the mare,
may be localized over the shallowly buried rim
of a pre-mare crater.
B) No large positive gravity anomaly, such
as those occurring over the deep mare-filled cir-
circular basins, is associated with Mare Tranquilli-
Tranquillitatis (ref 3-4).
The southern part of Mare Tranquillitatis is
crossed by relatively faint, but distinct, rays
trending north-north west (fig. 3-2) and by
prominent secondary craters that are associated
with the crater Theophilus, which is located
320 km southeast of the LM landing site.
Approximately 15 km west of the landing site is
a fairly prominent ray that trends north-north-
north-northeast. The crater with which this ray is associated
is not definitely known; the ray may be related
to the crater Alfraganus, 160 Ion southwest of
the landing site, or to Tycho, approximately 1500
km southwest of the landing site. Neither the
ray that trends north-northeast nor any of the
rays that trend north-northwest cross the landing
site; these rays are sufficiently close, however,
so that material from Theophilus, Alfraganus, or
Tycho is possibly found in the vicinity of the
LM landing site. Other distant craters may also
be the source of fragments which lie near the
LM landing site. In particular, the crater Moltke,
which is 40 km southeast of the landing site,
may be a source of fragments. Potential distant
sources of fragments are in the highlands and
in the maria.
On the basis of albedo and crater density,
three geologic units can be distinguished in the
mare material in the vicinity of the landing site.
The LM landed on the most densely cratered
unit of these three geologic units. These units
may correspond to lava flows of different ages;
if this is true, the unit at the landing site is prob-
probably the oldest.
A hill of terra material, located 52 km east-
southeast of the landing site, protrudes above
the mare surface. The occurrence of this hill
suggests that the mare material in this region
is very thin, perhaps no more than a few hun-
hundred meters thick. Craters, such as Sabine D and
Sabine E (fig, 3-2), with a diameter greater
than 1 km, may have been excavated partly in
pre-mare rocks; and pre-mare rock fragments
that have been ejected from these craters may
occur in the vicinity of the LM landing site.
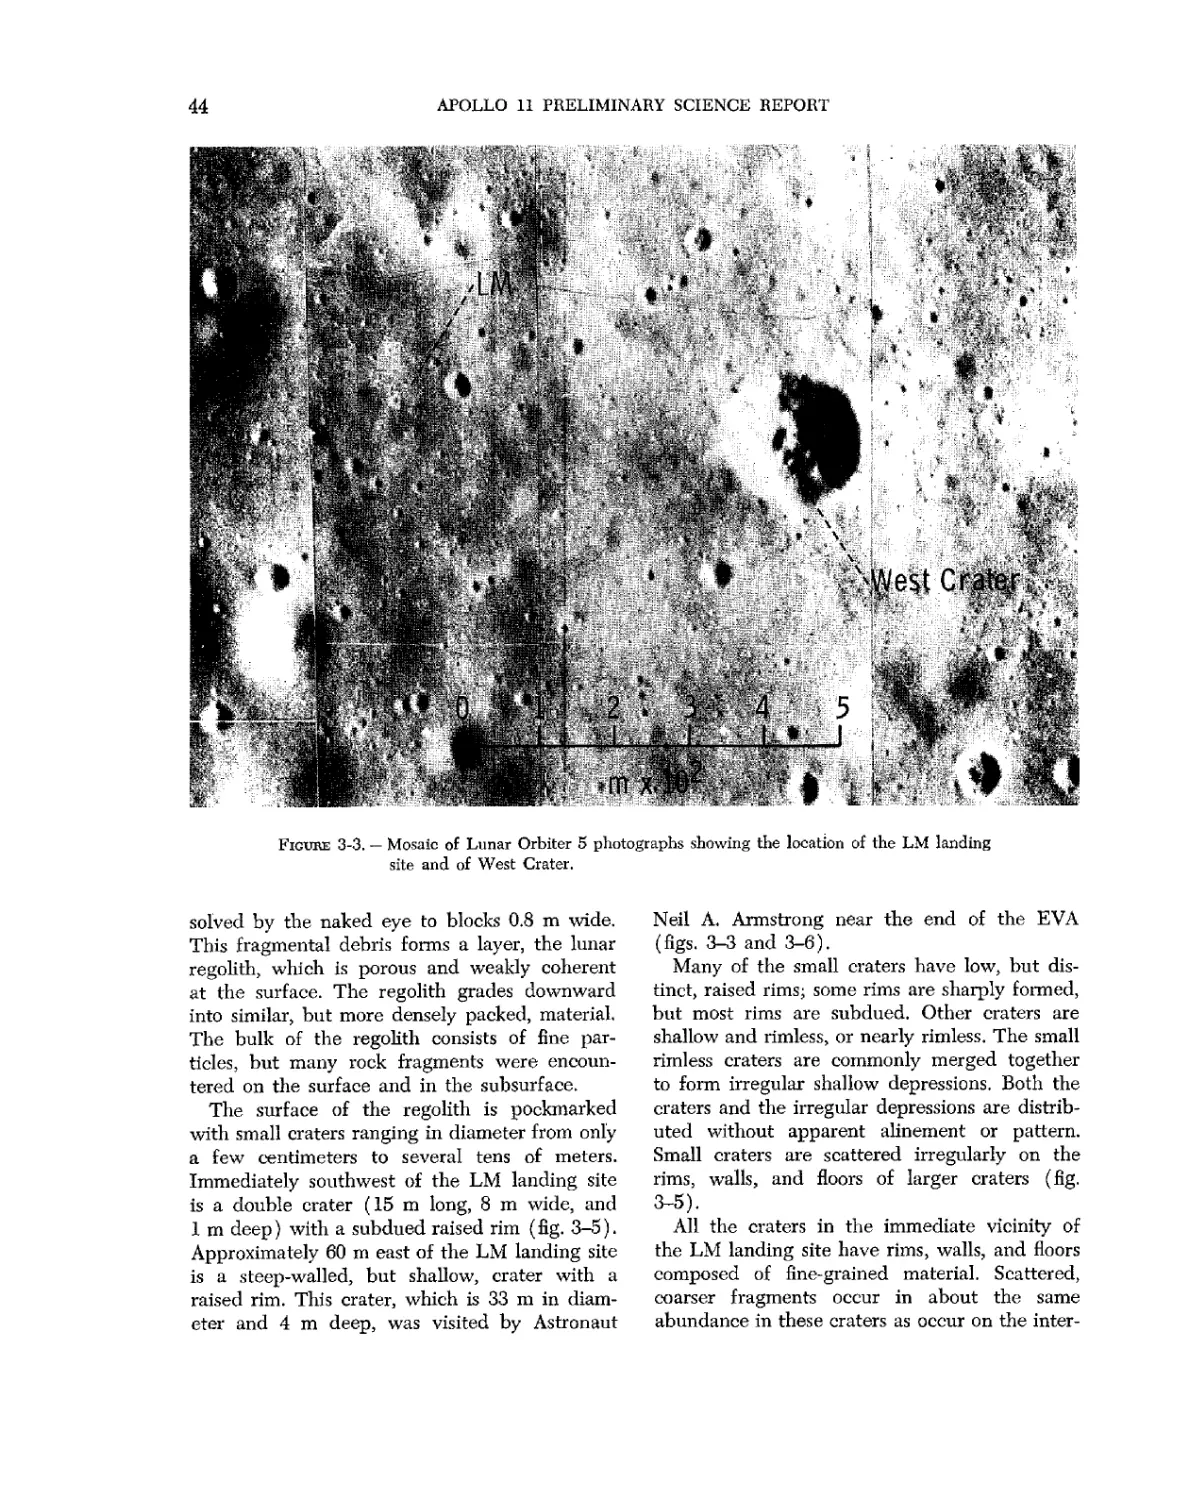
Geology of the Apollo 11 LM Landing Site
The LM landed approximately 400 m west of
a sharp-rimmed ray crater, approximately 180 m
in diameter and 30 m deep (fig. 3-3), which had
been informally named West Crater. West
Crater is surrounded by a blocky ejecta apron
that extends almost symmetrically outward ap-
approximately 250 m from the rim crest. Blocks
as large as 5 m wide occur on the rim and in
the interior of the crater. Rays of blocky ejecta
with many fragments from J-i to 2 m in width
extend beyond the ejecta apron west of the
landing point (fig. 3-4). The LM landed in a
region between these rays that is relatively free
of extremely coarse blocks.
At the landing site, the lunar surface consists
of unsorted fragmental debris, which ranges in
size from particles that are too fine to be re-
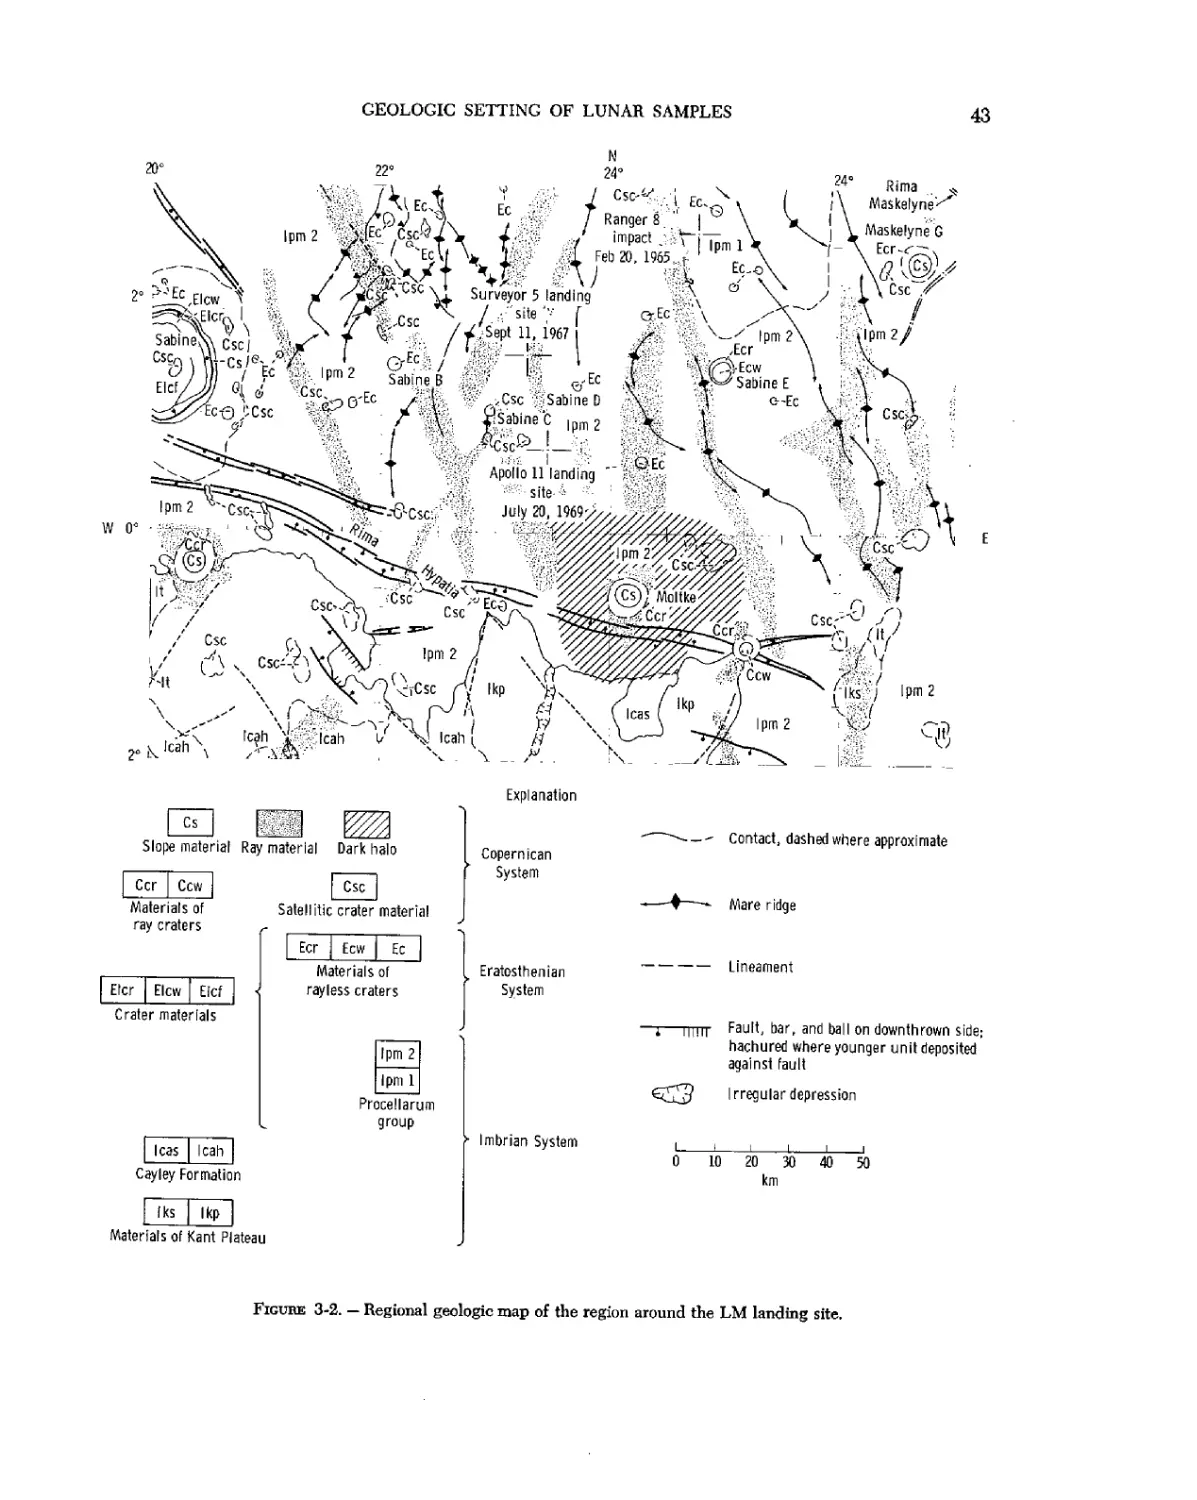
GEOLOGIC SETTING OF LUNAR SAMPLES
43
ifW
Surveyor 5 landing
/ .•.¦"site '¦¦- f
'. /f^Sept 11, 1967
>Csc JSSabiie D
Sabine C |p
W 0°
if
flta*j Ipm 2
Icah
^
Cs
Slope material Ray material Dark halo
Ccr
Ccw
Csc
Materials of
ray craters
Satellite crater material
Elcr
Elcw
Etcf
Crater materials
Ecr Ecw
Ec
Materials of
rayless craters
Ipm 2
Ipm 1
Procellarum
group
1 leas
Icah
Cayley Formation
Iks
Ikp
Materials of Kant Plateau
Copernican
System
Eratosthenian
System
- — - Contact, dashed where approximate
Mare ridge
Lineament
Fault, bar, and ball on downthrown side;
hachured where younger unit deposited
against fault
Irregular depression
Imbrian System
10 20 30 40 50
km
Figube 3-2. — Regional geologic map of the region around the LM landing site.
44
APOLLO 11 PRELIMINARY SCIENCE REPORT
*
.v..
-'¦V
Ficube 3-3. — Mosaic of Lunar Orbiter 5 photographs showing the location of the LM landing
site and of West Crater.
solved by the naked eye to blocks 0.8 m wide.
This fragmental debris forms a layer, the lunar
regolith, which is porous and weakly coherent
at the surface. The regolith grades downward
into similar, but more densely packed, material.
The bulk of the regolith consists of fine par-
particles, but many rock fragments were encoun-
encountered on the surface and in the subsurface.
The surface of the regolith is pockmarked
with small craters ranging in diameter from only
a few centimeters to several tens of meters.
Immediately southwest of the LM landing site
is a double crater A5 m long, 8 m wide, and
1 m deep) with a subdued raised rim (fig. 3-5).
Approximately 60 m east of the LM landing site
is a steep-walled, but shallow, crater with a
raised rim. This crater, which is 33 m in diam-
diameter and 4 m deep, was visited by Astronaut
Neil A. Armstrong near the end of the EVA
(figs. 3-3 and 3-6).
Many of the small craters have low, but dis-
distinct, raised rims; some rims are sharply formed,
but most rims are subdued. Other craters are
shallow and rimless, or nearly rimless. The small
rimless craters are commonly merged together
to form irregular shallow depressions. Both the
craters and the irregular depressions are distrib-
distributed without apparent alinement or pattern.
Small craters are scattered irregularly on the
rims, walls, and floors of larger craters (fig.
3-5).
All the craters in the immediate vicinity of
the LM landing site have rims, walls, and floors
composed of fine-grained material. Scattered,
coarser fragments occur in about the same
abundance in these craters as occur on the inter-
GEOLOGIC SETTING OF LUNAR SAMPLES
45
if^
Figure 3-4. - Hasselblad photograph ASll-37-5468 taken from the LM window and showing
a ray of coarse blocks north of the LM landing site.
Figure 3-5. - Mosaic of Hasselblad photographs taken from the LM window showing the
double crater located southwest of the LM landing site.
Figure 3-6. - Mosaic of Hasselblad photographs showing the 33-m-diameter crater east of the
LM landing site.
46
APOLLO 11 PRELIMINARY SCIENCE REPORT
crater areas. These craters are approximately
1 m or less in depth; they have evidently been
excavated entirely in the regolith.
In the 33-m-diameter crater east of the LM
landing site, the crater walls and rim have the
same texture as the regolith has elsewhere; how-
however, a pile of blocks occurs on the floor of the
crater (fig. 3-6). The crater floor probably lies
close to the base of the regolith. Several craters
of about the same size as the 33-m-diameter
crater (with steep walls and shallow, flat floors
or floors with central humps) occur in the region
around the landing site (fig. 3-3). Judging from
the depths of these craters, the thickness of the
regolith is estimated to range from 3 to 6 m.
An unexpected discovery made by Astronaut
Armstrong was the presence of blebs of material
with specular surfaces. These blebs of material
partially covered 2- to 10-cnvdiameter areas in
the bottom of six or eight 1-m-diameter raised-
rim craters. Astronaut Armstrong observed these
apparently glassy blebs, which resembled drops
of solder (fig. 3-7), only in craters. The form of
the blebs suggests they had been formed by the
splashing of molten material traveling at low
velocity. The distribution of the blebs suggests
that they are natural features on the lunar sur-
surface; however, the possibility exists that the
blebs are artifacts that were produced by the
landing of the LM.
In addition to craters, the surface of the rego-
regolith is marked by small, shallow troughs (fig.
CxtiM
Figure 3-7. — Closeup stereophotograph AS11-45-6704A showing glassy blebs on the lunar
GEOLOGIC SETTING OF LUNAR SAMPLES
47
3-11). By using photographs taken 19 m south-
southeast and 12 m north of the center of the LM
landing site, a preliminary study was made of
the troughs. Most of the troughs are a fraction
of a centimeter to a centimeter deep, approxi-
approximately M to 3 cm wide, and 3 to 50 cm long;
three of these troughs that were observed are
2 to 3 m long. The troughs are located 3 to 5 cm
apart in areas in which they are prominent. One
set of troughs trends northwest; another set
(which is comparable to the northwest-trending
troughs in abundance, but are more dispersed in
orientation) trends northeast to north-northeast.
A few troughs were observed that trend in
other directions. Troughs of similar appearance
were noted in many other photographs, but the
orientations of these other troughs have not yet
been determined.
Coarse fragments are scattered in the vicinity
¦ . "jaM shadow¦;• Coarse rock
fragment
Explanation
10046—J
Based on stereo coverage
from photos AS11-39-5791
and AS11-39-5786
1 1 1
0
1
1 1 1
5
Ft
1 l
i
1A
I
0 12 3
Approximate scale
Contour interval: 5 cm
10'
10"
s
lio3
10'
10
0
Surveyor 1
Surveyor 3
Surveyor 5
Surveyor 6
Surveyor 7
Apollo 11
Figure 3-8. — Topographic map of part of the lunar
surface visible from both windows of the LM show-
showing the distribution of rock fragments.
1 2 4 8 1.6 3.2 6.2 12.8 25.6 51.2 1 2 4
I mm i cm | m |
Particle size
Figure 3-9. — Cumulative size-frequency distribution of
rock fragments coarser than 3.2 cm at the LM landing
site, compared with size and frequency of rock frag-
fragments at Surveyor landing sites.
of the LM landing site in approximately the
same or somewhat greater abundance than is
found at the Surveyor 1 landing site (figs. 3-8
to 3—10) (ref. 3-5). These coarse fragments are
distinctly more abundant in these two sites than
they are at other Surveyor landing sites on the
maria, including the Surveyor 5 landing site,
which is northwest of the LM landing site. Simi-
Similar to the Apollo 11 LM, Surveyor 1 landed near
a fresh blocky rim crater but beyond the apron
of coarse blocky ejecta. It may be inferred that
many rock fragments in the immediate vicinity
48
APOLLO 11 PRELIMINARY SCIENCE REPORT
Figure 3-10. — Hasselblad photograph ASll-40-5851 of the region south of the LM landing
site from which selected rocks were collected by Astronaut Armstrong.
Figure 3-11. - Hasselblad photograph AS11-40-5913
showing part of the lunar surface marked by linear
troughs. —>
of the spacecraft, at both the Surveyor 1 and the
Apollo 11 landing sites, were derived from the
nearby blocky rim crater. Fragments derived
from West Crater may have come from depths
as great as 30 m beneath the mare surface.
The fine-grained matrix of the regolith con-
consists chiefly of microscopic particles. The rego-
regolith is weak and easily trenched to depths of
several centimeters. Surface material was easily
dislodged when kicked. When the flagpole for
the U.S. flag and the core tubes were pressed
into the surface, they penetrated with ease to
a depth of 10 to 12 cm. At that depth, the
GEOLOGIC SETTING OF LUNAR SAMPLES
49
regolith was not sufficiently strong, however, to
hold the core tubes upright; a hammer was
needed to drive them to depths of 15 to 20 cm.
At several places, rocks were encountered in the
subsurface by the tubes, rods, and scoop that
were pressed into the subsurface.
The astronauts' boots left prints approximately
3 mm to 3 cm deep in the fine-grained regolith
material (fig. 3-12). Smooth molds of the boot
treads were preserved in the bootprints, and
angles of 70° were maintained in the walls of
the bootprints. The fine-grained surficial material
tended to break into slabs, cracking as far as
12 to 15 cm from the edges of the footprints.
The finest fraction of the regolith adhered
weakly to boots, gloves, spacesuits, handtools,
and rocks on the lunar surface. On repeated con-
contact, the coating on the boots thickened until
Figure 3-12. - Hasselblad photograph AS1I-40-5877
showing an astronaut's bootprint in the lunar surface.
boot color was completely obscured. When the
fine particles of the regolith were brushed off,
a stain was left on the spacesuits.
In places where fine-grained material was
kicked by the astronauts, the freshly exposed
material was conspicuously darker than the un-
undisturbed surface. As at the Surveyor landing
sites, the subsurface material probably lies at
depths no greater than a millimeter from the
surface. The existence of a thin surface layer of
lighter colored material at widely scattered
localities indicates that some widespread process
of surface-material alteration is taking place on
the Moon.
Fillets of fine-grained material are banked
against the sides of most rock fragments. The
fillets were observed at least as far as 70 m from
the LM, and most of the fillets are almost cer-
certainly natural features of the surface. On sloping
surfaces, Astronaut Armstrong observed that the
fillets were larger on the uphill sides of rocks
than on the downhill sides of rocks. The sides
of rocks are ballistic traps, and the fillets have
probably been formed by the trapping of low-
velocity secondary particles. Asymmetric devel-
development of fillets around rocks on slopes may be
partly caused by preferential downhill transport
of material by ballistic processes and partly
caused by downhill creep or flow of the fine-
finegrained material.
Disturbances of the Lunar Surface Produced
by Landing of the LM
During the landing of the LM, the lunar sur-
surface was moderately disturbed by the LM de-
descent-propulsion-system engine blast and by
contact of the landing gear with the surface.
After the LM had descended to within 30 m of
the surface, a sheet of fine dust was observed to
move radially away from the center of the
rocket plume. Particles composing this sheet, in
general, traveled close to the surface and were
deflected by the larger rocks.
The descent propulsion system continued to
fire a short time after landing; thus, the area
beneath the rocket engine is darkened and has a
strongly swept appearance. No detectable crater
was formed beneath the rocket engine, but a
thin, coherent crust appears to have developed.
50
APOLLO 11 PRELIMINARY SCIENCE REPORT
Figure 3-13. - Hasselblad photograph AS11-40-5921
showing the lunar surface beneath the LM descent
propulsion system.
Figuhe 3-14. - Hasselblad photograph AS11-40-5918
showing the swept ground adjacent to the -f Y foot-
footpad of the LM.
The crust is locally offset or broken (fig. 3-13).
The upper surface of the crust is marked by a
large number of fine grooves and ridges that
are alined radially with respect to a surface
point lying approximately beneath the center of
the rocket engine. The radial pattern of grooves
and ridges extends at least several meters past
the +Y footpad to the north of the LM (fig.
3-14), in the direction from which the LM
approached immediately prior to landing. In
other directions, the swept ground does not
appear to extend much past the footpads.
Probes that extended below the footpads dug
only a short distance into the surface and were
dragged to the south during the landing. The
footpads skidded along the surface (fig. 3-14)
and dug in no more than a few centimeters at
the leading edge. A small mound of fine-grained
material piled up at the leading edge of each
footpad.
Surface Traverse and Sampling Activities
of the Astronauts
The surface traverse and sampling activities
of the astronauts have been reconstructed from
clues provided by the voice transcript, from re-
review and analysis of the lunar television pic-
pictures, from analysis of the 16-mm pictures taken
with a time-sequence camera mounted in the
LM cockpit, and from detailed study of photo-
photographs taken with Hasselblad cameras before,
during, and after the EVA.
The camera stations for Hasselblad survey
panoramas taken on the EVA were located by
photographic triangulation from mosaics. Hori-
Horizontal angles between the LM footpads were
measured on the photographs as a function of
the known field of view, and the angles were
drawn on tracing paper. The paper was then
manipulated over a scale drawing of the LM
until the lines intersected the appropriate pads
at the proper place. Once the panorama loca-
locations had been determined, azimuths were meas-
measured from two or more panoramas to conspicu-
conspicuous features on the surface, and the positions of
the features were plotted by triangulation to
produce the map of figure 3-15. Individual pho-
photographs were located, and their orientations
were measured by similar methods, using for
control both the LM footpads and other features
on the lunar surface that had been located by
triangulation from the panoramas.
GEOLOGIC SETTING OF LUNAR SAMPLES
51
Inset map showing position of Panorama station 5
Explanation
Centerline of pictures tilted less
than 10° below horizontal
Pictures tilted 10° to 25°below
horizontal
Pictures tilted more than 25° or
pictures containing near-field
geologic information only
Centerline of television panorama
picture
Very subdued crater
Subdued crater
Relatively sharp crater
Shallow depression
1 ,
0
1
1 1 1 1
5
m
i i
i
10
i
10 5
0 10
Ft
20
• Jettison bag
•® Rocks
LRRR Laser Ranging Retroreflector
PSEP Passive Seismic Experiment Package
SWC Solar-Wind Composition
TV Television camera
ALSCC Apollo Lunar Surface Closeup Camera
Figure 3-15. — Preliminary map of EVA photographs and television pictures taken at the
landing site.
Because the graphical method by which these
data have been obtained is fairly crude, azi-
azimuths shown for individual frames may have
errors of 3° or more. Positions of most of the
camera stations are probably within a 1.5-m
circle centered at the point shown. The determi-
determinations are sufficiently accurate, however, to
provide a useful control net for an overall view
of the astronauts' traverse and a starting point
for more rigorous analytical photogrammetric
measurements.
A traverse map has been prepared (fig. 3-16),
using for control the object locations obtained
by graphic solution. The plot of the surface trav-
traverse of the crew was obtained primarily from
52
APOLLO 11 PRELIMINARY SCIENCE REPORT
\
\
J
^
|Panorama station he-
Panorama station
tt tt Shallow depression
Very subdued crater
"i—r Subdued crater
tt-tt Relatively sharp crater
^^ Rocks
d'^> Core-2 region
— Contingency-sample area
Bulk-sample area
Docuimented-sample area
^^ Disturbed areas; names with
®^ arrows where trails recoverable
10
10
1
5
In
0
ill
m
in
i
20
i
Ft
S Area swept by descent engine
SWC Solar-Wind Composition
LRRR Laser Ranging Retroreflector
PSEP Passive Seismic Experiment Package
TV Television camera
P re-EVA shadow
Post-EVA shadow
m Jettison bag
ALSCC Apollo Lunar Surface Closeup Camera
Figure 3-16. — Preliminary traverse map of the landing site.
study of the Hasselblad photographs. Regions
disturbed by walking are easily detected be-
because of their lower albedo, A rough estimate of
the minimum total distance traveled by Astro-
Astronauts Armstrong and Aldrin combined is 750 to
1000 m. The most distant single traverse was
made by Astronaut Armstrong to the 33-m-
diameter crater east of the LM.
GEOLOGIC SETTING OF LUNAR SAMPLES
53
1 1* .
Figure 3-17. — Enlargement of 16-mm sequence-camera photographs (magazine K) showing
Astronaut Armstrong immediately prior to and immediately after scooping up
two rock samples in the first of two contingency sample scoops, (a) Imme-
Immediately prior to scooping. The larger rock F cm in width) has been identified
as LRL specimen 10022 (fig. 3-23). (b) Immediately after scooping. Note the
scoop mark where the two rocks had been lying on the lunar surface.
54
APOLLO 11 PRELIMINARY SCIENCE REPORT
Figure 3-18. — Enlargement of 16-mm sequence-camera photographs (magazine K) showing
Astronaut Armstrong immediately prior to and immediately after taking the
second contingency sample scoop, (a) Immediately prior to second scooping.
Note LRL specimen 10023 below the scoop, (b) Immediately after second
scooping. Note LRL specimen 10023 is missing, and a shallow scoop mark is
visible.
GEOLOGIC SETTING OF LUNAR SAMPLES
55
Sampling Log
Contingency Sample
The contingency sample was collected in full
view of the sequence camera immediately north-
northwest of the LM, and the collection time was
approximately 3 min and 35 sec. The sample
bag was filled with two scoops of sample having
a total weight of approximately 1.4 kg. From
study of the sequence film data (figs. 3-17 and
3-18), the regions that were scooped have been
accurately located on a pre-EVA LM window
photograph. Both scoops included small surface
rock fragments that were visible from the LM
windows prior to sampling (fig. 3-19).
Bulk Sample
Astronaut Armstrong required 14 min to col-
collect approximately 16 kg of bulk sample, from
the beginning of sampling to searing of the
Sample Return Container (SRC). Of that time,
5 min were spent in sealing the SRC. Astronaut
Armstrong went out of the television field of
view three times during bulk sampling; he tra-
traversed twice to the left of the field of view for
a total of 1 min and 11 sec and once to the
right of the field of view for 35 sec. At least 17
or 18 scoop motions were made in full view of
the television camera, and at least five scoop
motions were made within the field of view of
the sequence camera (fig. 3-20). The total num-
number of scoops was 22 or 23. Nine trips back to
the Modularized Equipment Stowage Assembly
(MESA) were made to empty the scoop, An
average of 2/2 scoop motions was required to fill
the scoop.
Documented Samples
A total of 5 min and 50 sec was spent by
Astronaut Aldrin in obtaining the two core-tube
samples, both of which were taken in the vicinity
of the Solar Wind Composition Experiment. The
driving of the first core was documented by the
television camera and by two individual Hassel-
Hasselblad photographs. The second core-tube location
specimen 10022)
M 10028?)
Figure 3-19. — Hasselblad photograph AS11-39-5777 taken from the LM window showing rocks
A, B, C, and D, which were collected in the contingency sample scoops.
58
APOLLO 11 PRELIMINARY SCIENCE REPORT
Figure 3-22 — Enlargement from Hasselblad photograph
AS 11-40-5857 showing the rocks that were sampled
in the second contingency sample scoop. The rocks
have been tentatively identified as LRL specimens
10023 and 10032.
0 1 2
cm
Approximate scale
Figure 3-23. — Approximate orientation of LRL speci-
specimen 10022 in lunar coordinates.
lected in the second contingency sample scoop,
has a characteristic deep depression 1.2 to 1.5
cm in diameter on its exposed face. This de-
depression facilitates identification and orientation.
Measurement of the rock from the Hasselblad
photographs indicates that the exposed part is
approximately 5 cm long. The LRL specimens
10021 and 10023 were studied as possible
matches because they were the only two remain-
remaining rocks in the contingency sample that were
large enough. The LRL specimen 10021 was re-
rejected because it does not contain a sufficiently
deep depression of the proper size A.2 cm) to
match that observed on the sampled rock. The
LRL specimen 10023, however, contains a deep
pit of the appropriate size. An approximate ori-
orientation of LRL specimen 10023 with respect to
its position on the lunar surface is shown in
figure 3-24.
Less than 5 cm from rock C is a small rock
1% cm wide (rock D on figs. 3-19 and 3-22) that
was almost certainly collected in the second con-
contingency sample scoop but is too small to be
clearly resolved in the 16-mm sequence-camera
photographs. On the basis of size and shape,
this rock has been tentatively correlated with
LRL specimen 10032, which is the 12th largest
fragment in the contingency sample.
Bulk Sample
During collection of the bulk sample, five
separate scoop marks were made within view of
the EVA sequence camera. The location of these
marks on the lunar surface has been verified (fig.
3-20). At least two small rocks, 1 to 2 cm wide,
were included in scoops 4 and 5 (fig. 3-20) but
are too poorly resolved to be identified in the
photographs. Larger rocks collected in the bulk
sample include three or four rocks approxi-
approximately 10 cm wide, five rocks approximately
5 cm wide, and 15 or more rocks that range
from 1 to 5 cm wide. Thus far, only one rock
10 cm wide has been located and oriented.
A subrotmded, equidimensional rock was de-
determined to be missing from a point approxi-
approximately 4 m from the +Z footpad at a 250°
azimuth (fig. 3-25). The rock was located by
comparison of pre-EVA and post-EVA LM win-
window photographs. (For an example, see fig.
3-26.) A study of figure 3-27, taken after bulk
sampling, verified that the rock had been re-
removed by the bulk sampling scoop. A scoop
mark is clearly visible in figure 3-27 in the posi-
position that the rock had occupied. Measurement
GEOLOGIC SETTING OF LUNAR SAMPLES
59
intersection
of surface
with flat side
0
1
cm
Approximate scale
I
o
j
2
(a)
1
cm
Approximate scale
(b)
Figure 3-24. — Orientation diagram of LRL specimen 10023. (a) The specimen is shown as
viewed from the southeast. The rounded surface and the approximate inter-
intersection of the rock surface with the lunar surface is shown. Orientation of the
specimen in lunar coordinates is shown. At top is LRL photograph S-69-45394.
(b) This diagram shows the flat, northwest face of the sample and the approxi-
approximate intersection of the rock surface with the lunar surface. Orientation of the
specimen in lunar coordinates is shown. At top is LRL photograph S-69-45392.
of the specimen by comparison with bootprints
shows that it is 10 cm wide. The LRL photo-
photographs were searched for the larger rocks col-
collected in the bulk sample. The northeast face of
the rock as seen in photograph AS 11-40-5853
(fig. 3-28) was readily identified in the LRL
photograph S-69^5610 of LRL specimen 10046
(fig. 3-28).
Documented Sample
Several rocks in the documented sampling
area south of the +Z footpad have been found
to be missing, moved, stepped on, or possibly
sampled. As yet, no definite correlations between
missing rocks and LRL specimens have been
made, but it is possible that several larger speci-
specimens will be found after closer study.
The pre-EVA and post-EVA LM window
photographs show the southeastern part of the
sampling area (figs. 3-29 and 3-30). Missing
rocks, labeled E, F, and G in figure 3-29, are
clearly visible in photograph AS 11-40-5945
taken during the EVA (fig. 3-31). Rock E ap-
appears to have been stepped on and broken, while
rocks F and G have definitely been removed
from their original position. Several small elon-
elongate depressions near rocks F and G may be
seen in the post-EVA photograph (fig. 3-30).
60
APOLLO 11 PRELIMINARY SCIENCE REPORT
Figure 3-25. — Enlargement from Hasselblad photo-
photograph ASl 1-40-5853 showing undisturbed rocks and
LRL specimen 10046.
Figure 3-26. — Enlargement from Hasselblad photo-
photograph AS11-37-5502 showing the disturbed rocks and
changes that occurred during EVA. X
Photograph ic
panorama station^
Tipped on
Moved east--
V
"Pressed in
^\ ..Sample (LRL1
^'specimen W
. -'-*Scoop mark.
GEOLOGIC SETTING OF LUNAR SAMPLES
61
These depressions may have been formed by the
dragging of the specimens across the surface as
they were being collected. Rock F, which is ap-
approximately 20 cm across, apparently was not
returned in the documented sample container,
and it is suspected that this rock corresponds to
a large fragment picked up with the sampling
tongs and then dropped by Astronaut Armstrong
in this vicinity during documented sampling.1
With more detailed study, there is a good possi-
possibility that rock G can be correlated with an LRL
specimen.
Rock Fragments
Individual specimens of returned rock have
been studied by the Lunar Geology Experiment
'Personal communication from Astronaut Armstrong,
Aug. 27, 1989.
Figure 3-27. - Hassolblad photograph AS11-40-5887,
which was taken from the second panorama-photo-
panorama-photograph station, showing the region from which LRL
specimen 10048 was taken.
team by comparing Hasselblad photographs of
the rocks in their original positions on the lunar
surface and photographs of the rocks taken in
the LRL. The purpose of these studies was to
determine the local geologic environment of
each specimen and the relationship of each
specimen to other rocks and materials at the
sample locality. From the field geologic relations
and the hand specimen characteristics of each
rock, an attempt has been made to extract the
data that bear on geologic processes that have
62
APOLLO 11 PRELIMINARY SCIENCE REPORT
*»-•¦
"r
- • **•*:
2 3
cm
Figube 3-28. - Hasselblad photograph AS 11-40-5853
and LRL photograph S-69-45610 of LRL specimen
10046 showing the lunar orientation of the specimen.
affected the specimen and to extract data on the
geologic history of the specimen.
The data presented have been derived en-
entirely from photographs and have been obtained
independently from mineralogical and other in-
investigations conducted in the LRL. Each re-
returned rock specimen is considered to be a
geologic entity with a unique history, and the
specimen is investigated as a whole, as it was
collected on the Moon, rather than analyzed for
its components. Of particular interest are the
diverse surfaces of each rock, from which much
can be learned about the history of the rock
after it became a fragment in the lunar regolith.
Figure 3-29. - Hasselblad photograph AS11-39-5147
taken from the LM window looking south. This photo-
photograph shows rocks F and G, which were probably
moved during the documented sampling period.
Figube 3-30. - Hasselblad photograph AS11-39-5794
taken from the LM window looking south showing the
region where rocks F and G are missing.
By studying many rocks from this standpoint,
the processes may be elucidated by which the
lunar regolith and its constituent fragments were
formed.
Rock fragments at the Apollo 11 LM landing
site have a wide variety of shapes, and most of
the fragments are embedded to varying degrees
GEOLOGIC SETTING OF LUNAR SAMPLES
63
iF-.-i"-
-m ¦ : int.
Figure 3-31, — A section of Hasselblad photograph
AS11-40-5945 showing the detail of rocks F and G.
in the fine matrix of the regolith. A majority of
the rocks are rounded to subrounded on their
upper surfaces, but angular fragments of irreg-
irregular shape are also abundant. A few rocks are
rectangular slabs with a faint platy structure.
Many of the rounded rocks, when collected,
were found to be flat or of irregular angular
shape on the bottom, The exposed part of one
unusual rock, which was not collected, was de-
described by Astronaut Armstrong as resembling
a distributor cap. When this rock was dislodged
with a kick, the sculptured "cap" was found to
be the top of a much bigger rock, the buried
part of which was larger in lateral dimensions
and angular in form.
The rocks sampled are of two basic types:
A) rocks with crystalline textures of fine- to
medium-grain size and B) aggregates of clastic
material. The most abundant of the returned
crystalline rocks are fine-grained rocks with
vesicular or platy textures that resemble ter-
terrestrial basalts. During his traverse on the Moon,
Astronaut Armstrong called these rocks basalts
and commented on the vesicles in some of them.
One of the best examples of these basaltlike
materials is LRL specimen 10022, which is de-
described in a later section of this report.
Subordinate in number to the basaltlike speci-
specimens are medium-grained roclcs that are com-
composed dominantly of dark-colored minerals plus
a white mineral, which may be plagioclase.
When interpreted in terms of terrestrial rocks,
these lunar rocks resemble diabases and gabbros
(LRL specimen 10047), and feldspathic pyrox-
enites or peridotites (LRL specimen 10044). The
grain size of these specimens is 0.5 to 2 mm. The
texture, as revealed under stereoscopic examina-
examination of the photographs, consists of large
amounts of a euhedral dark-colored mineral,
which may be clino-pyroxene, with two cleav-
cleavages at about right angles and a white cleavable
mineral, which may be plagioclase. Some rocks
contain rounded dark-colored minerals sur-
surrounded by jackets of the plagioclaselike and
pyroxenelike minerals. In LRL specimen 10044,
moreover, a stratiform banding is visible, al-
although it is difficult to distinguish from exfolia-
exfoliation shells that are present in the same specimen.
These features are similar to the textures and
banding found in specimens from mafic plutonic
complexes on Earth.
Aggregates of weakly to strongly indurated
clastic materials, which are composed mostly of
rough-surfaced spheroidal to angular grains and
of clasts ranging from less than 0.1 to more than
1 cm in diameter, constitute about half of the
returned rocks. These rocks appear to have been
formed by induration of the lunar regolith mate-
material. Microbreccia is an appropriate term for
them. Typical specimens, which are described
in a following section of this report, are LRL
specimens 10023 and 10046. In two of the rocks
studied, the material appears to show stratifica-
stratification (at the small scale of the specimen). Many
rounded grains are too small for their true char-
character to be identified in photographs. Some
specimens appear to be composites, perhaps
made by cementation of silt-sized particles;
others appear to be rock fragments.
Minute deep pits, ranging from a fraction of
a millimeter to approximately 2 mm in diameter,
occur on the rounded surfaces of most rocks.
These pits were observed by Astronaut Arm-
Armstrong, who recognized that they had been pro-
produced on the surface of the rocks and that they
were distinguishable from vesicles. Many of
these pits are lined with glass. They are present
on two microbreccia specimens (LRL specimens
10023 and 10046) that have been identified in
64
APOLLO 11 PRELIMINARY SCIENCE REPORT
photographs taken on the lunar surface and for
which the orientation of the rocks at the time
they were collected is known. The pits are found
primarily on the upper sides of these specimens;
therefore, they clearly have been produced by a
process acting on the exposed surface. The pits
do not resemble impact craters produced in the
laboratory, and their origin has not been deter-
determined.
On the rounded surfaces of some rocks, a thin,
altered rind has developed. The rind, which has
been observed on both the crystalline rocks and
the microbreccias, is characteristically approxi-
approximately Vi to 1 mm thick. On freshly broken
faces, the rind is observed as a thin, light-colored
zone. The rind appears to be caused in part by
the shattering of mineral grains. Halos of light-
colored material, which is similar to the rind in
appearance, occur around the pits on many
specimens.
The rounding of the exposed upper surfaces
of many rocks suggests that processes of erosion
that lead to gradual rounding are taking place
on the lunar surface. Several processes may be
involved. On some rounded rock surfaces, indi-
individual clasts and grains (of which the rocks are
composed) and glassy linings of the pits on the
rock surfaces have been left -in raised relief by
general wearing away or ablation of the surface.
Rocks that exhibit this differential erosion most
prominently are microbreccia. The ablation may
be caused primarily by small-particle bombard-
bombardment of the surface.
Exfoliation is another major process of round-
rounding. The rounded forms that characterize the top
surfaces of some of the rocks collected are clearly
caused by the peeling off of closely spaced ex-
exfoliation shells. Examples of rocks rounded by
exfoliation are LRL specimens 10044 and 10047.
The curved shells passing completely around the
specimen cross the mineral banding of the strati-
stratiform rock (LRL specimen 10044) without devi-
deviation and round off the corners of the rock. The
distributor-cap form observed by Astronaut
Armstrong may have developed by exfoliation
and could have been produced by spalling of
the free surfaces of the rock as a result of one or
more energetic impacts on the top surface.
The following paragraphs provide descriptions
of LRL specimens 10022, 10023, 10032, 10046,
and 10047 and tentative identification of the
regions of the lunar surface from which the
samples were selected.
Geologic Specimen Descriptions
LRL Specimen 10022
Geologic environment. LRL specimen 10022
is the third largest fragment collected in the
contingency sample. The specimen has been
tentatively identified in photographs of the
lunar surface, pending confirmation by photo-
grammetric measurements. The photographic
coverage of the specimen locality is good. Photo-
Photographs AS11-39-5773, AS11-39-5774, and ASH-
39-5777, taken from the LM windows, provide
stereoscopic coverage of the locality, but only
with a short stereographic base. Photograph
AS11-40-5857, taken from near the foot of the
spacecraft ladder (panorama 1), also shows the
specimen.
A region approximately 1.1 by 2.4 m sur-
surrounding LRL specimen 10022 was studied from
the photographs. The specimen is located ap-
approximately 2.5 m north of the center of the
spacecraft +Z footpad. Parts of the locality are
obscured by shadows cast by the +Y landing
struts of the spacecraft. The region studied is
relatively level, with no pronounced topographic
features (fig. 3-32). Areas enclosed by the
break-in-slope symbol in figure 3-32 are coa-
coalescing, subdued depressions. Located approxi-
approximately 4 cm northeast of LRL specimen 10022
is a sharp irregular depression approximately 10
cm across, which is the only depression of this
type in the region studied. Elongate troughs
measuring a fraction of a centimeter deep, Ja to
2 cm wide, and 3 to 20 cm long are prominent
features at this locality. While most of the largest
troughs trend northeast, another set of troughs
trends northwest. Examination of photographs
taken during the EVA indicates that similar
troughs are present at least as far as 60 m from
the LM
Approximately 280 fragments between & and
2 cm, and 11 fragments (including LRL speci-
specimen 10022) between 2 and 8 cm wide, are
scattered over the region studied. Of the 11
larger fragments, LRL specimen 10022 and one
smaller fragment are angular; the other nine
GEOLOGIC SETTING OF LUNAR SAMPLES
65
LRL^r^-i^ LM shadow N%VW , ( ^ -'^~ '-- ~.
specimen' - .-_ - ' ~\ , ^''T^fjb
-10022--"—¦_.cJ '>-" - -\ s*"^'^""
N
Approximate
i
O>
25 50 100
cm
Approximate scale
Explanation
Rock fragments; many rocks shown
probably aggregates of fine-grained
material
Fillet of fine-grained material on the
side of a rock fragment; boundaries
show break in slope away from fragment
Sharp, irregular depression
The break in slope at margin of subdued
depression; hachures point downslope
Axes of shallow troughs
Figure 3-32. - Hasselblad photograph AS11-39-5777
and map showing the region around LRL specimens
10022 and 10028 that was studied.
fragments are rounded. The 11 larger fragments
appear to be randomly scattered over the region
studied. Fragments 1 to 1% cm wide are con-
concentrated more heavily than average in two
areas within subdued depressions located west
and northwest of the center of figure 3-32.
Of the 11 fragments larger than 2 cm wide,
five rest on the surface, and as many as one-third
to one-half of the other six appear to be buried.
The extent to which fragments smaller than 2
cm wide are buried appears to vary uniformly
from almost total burial to no burial.
All the larger fragments have fillets of fine-
finegrained material banked against the sides that
are observable in the photographs. The fillets
are approximately 1 to 1% cm high on the four
largest fragments and are proportionately smaller
on the other seven fragments.
The 11 fragments that measure larger than 2
cm wide have no apparent relationship to sur-
surrounding features, except for their own fillets.
The clusters of small fragments lying in the west
and northwest sectors of the center of the map
area may be remnants of low-velocity impact
projectiles that formed the craters,
LRL specimen 10022 lay within a level part
of the region, approximately 30 cm from the
edge of the nearest subdued depression. No ap-
apparent relationship exists between the specimen
and the subdued depressions. It is conceivable
that the sharp irregular depression 4 cm to the
northeast of LRL specimen 10022 is a secondary
crater from which the specimen skipped. How-
However, the presence of a fillet of fine-grained
material against the specimen suggests that it
had been in place for an appreciable length of
time, probably sufficiently long for any secondary
crater that may have been caused by the speci-
specimen to be more subdued than the sharp depres-
depression by surface processes.
LRL specimen 10022 is roughly tabular in
form and was slightly embedded in the regolith,
tilted southeast at a low angle to the surface.
The exposed part of the specimen is angular,
and the unexposed part is rounded (fig. 3-33).
The fillet of fine-grained material was approxi-
approximately 1 cm high and 1% cm wide, and the fillet
covered the southern part of the upper surface
of the rock. Little of the rock lay below the gen-
general level of the surrounding surface. The fillet-
rock contact is mai'ked by a light-colored zone
approximately one-third cm wide on the re-
recovered specimen (fig. 3-33).
The fragment nearest LRL specimen 10022,
located 2 cm south of LRL specimen 10022,
was also collected in the contingency sample
and has been tentatively identified as LRL
specimen 10028. LRL specimen 10022 is one of
two crystalline rocks of significant size in the
contingency sample and is dissimilar in appear-
66
APOLLO 11 PRELIMINARY SCIENCE REPORT
0 1 2
cm
Approximate
(a)
f.: .
l
cm
Approximate
(b)
Figure 3-33. - LRL photographs S-69-45209 and S-69-
45210 of LRL specimen 10022. (a) LRL photograph
S-69-45209. (b) LRL photograph S-69-45210.
ance to LRL specimen 10028 and to all the other
fragments in the contingency sample. LRL spec-
specimen 10022 is the most angular of the 11 largest
fragments in the region studied, which suggests
that LRL specimen 10022 may have been in its
photographed position on the lunar surface for a
shorter period of time than other fragments of
comparable size. However, the crystalline na-
nature of the specimen suggests that it may be
more resistant to erosion, which may also ac-
account for its higher degree of angularity. The
more rounded, buried part of the specimen sug-
suggests that the underside was at one time the
upper surface and that the underside has been
exposed to lunar surface erosion processes for a
longer time than the present upper side.
Description. LRL specimen 10022 is a smaller
B by 4 by 6 cm) specimen of fresh-appearing
vesicular lava and is similar in vesicularity> tex-
texture, and crystallinity to many terrestrial basalts.
Smooth-walled vesicles ranging from 0.1 to 4
mm in diameter occupy approximately 15 per-
percent of the rock by volume. Some vesicles are
well oriented into vesicle trains; the vesicles
flatten and partially merge, near one edge of
the specimen, into an incipient zone of platy
jointing. Except where several vesicles have
merged into vuglike cavities, the majority of the
vesicles are either nearly spherical or have been
pulled into prolate spheroids that are apparently
oriented by flow. The vesicle walls appear to be
smooth, but slight modification shows that at
least some of them are coated by a botryoidal
substance with a vitreous luster.
Although the minerals are extremely fine-
finegrained, the apparently intergranular to dikty-
taxitic texture typical of basalt lava can be seen
in the photographs. The texture appears identi-
identical to that of many fresh olivine basalts from the
Oregon Cascades. Microlites appear to have been
oriented by flow, and the flow lines deviate
around many of the vesicles in the same pattern
common to terrestrial basalts.
The outside of this specimen shows a higher
albedo than the interior. This condition was pos-
possibly caused by the opening up of the cleavages,
grain boundaries, and tiny incipient cracks in
the rock. This whitish rind, which is barely no-
noticeable on the edges of the broken surface in
LRL photograph S-69-45380, penetrates the
rock to a depth of approximately 1 mm. Pits
filled with glassy material and small fractures
containing glassy materials occur on the surface
of the specimen.
LRL Specimens 7 0023 and 10032
Geologic environment. LRL specimen 10023
was collected approximately 4 m west of the
+Y footpad. LRL specimen 10032 is believed
to have been collected within a few centimeters
of LRL specimen 10023. A region approximately
2.5 by 3 m and centered on the rock (fig. 3-34)
was studied to determine the geologic environ-
environment of these specimens. The region is gently
rolling with several broad, subdued, and irregu-
irregular depressions and four well-defined circular
GEOLOGIC SETTING OF LUNAR SAMPLES
67
¦ v._ V/.,, >>;--j5';sp"ecime,n 'v^vspecimen-- >^o,--"- .
¦ v)' V-iV¦u^tr-10023"-*:Av ioo32(?)..- -,v:v
0 10 20 40 60
N cm
Approximate scale
Explanation
*"m. Rock fragments; many rocks shown
probably aggregates of fine-grained
material
™r. Fillet of fine-grained material on the side
of a rock fragment; boundaries show the
break in slope away from the fragment
<O Sharp, irregular depression
T"" The break in slope at margin of subdued
depression; hachures point down-
slope
-=/ Axes of shallow troughs
Figure 3-34. - Hasselblad photograph AS11-39-5774
and map showing the region around LB.L specimens
10023 and 10032 that was studied.
craters. One circular crater has a distinct raised
rim around three-quarters of its circumference.
LRL specimens 10023 and 10032 are embedded
on the western edge of a subdued, irregular de-
depression in a part of the surface that slopes
gently to the east.
Two well-defined sets of linear features ex-
extend across the region studied. The first set con-
consists of both slightly curved and straight troughs
that range in length from approximately 2 cm to
approximately 10 to 15 cm and trend in a north-
northeasterly direction. This set is best seen when
figure 3-34 is viewed obliquely from the upper
right-hand corner.
Within the northeast set of lineations, a north-
trending zone approximately 15 to 20 cm has
wide straight troughs that trend northeast and
curved troughs that trend in a northerly direc-
direction. This zone is most noticeable when figure
3-34 is viewed obliquely from the upper left-
hand corner. The north-trending zone is on part
of the surface that slopes gently toward the west,
where the lower angle of lighting enhances the
detectability of subtle breaks in slope.
The second set of linear features may be seen
in the Hasselblad photographs as ridges, narrow
troughs, and subtle tonal differences that trend
in a northwesterly direction. These features can
be seen best by viewing figure 3-34 obliquely
from the upper right-hand and lower left-hand
corners.
Approximately 1000 fragments between Yi and
1 cm wide, 35 fragments between 1 and 6 cm
wide, and two fragments 15 cm wide are scat-
scattered over the region studied. LRL specimen
10023 is the third largest fragment in the area.
Most fragments of intermediate size are angular,
but LRL specimen 10023 is rounded on the side
facing the LM. One of the two largest fragments
is very rounded, and the other has a prominent
flat face, The small fragments are locally con-
concentrated in low areas and are absent from
higher areas. In addition, the number of small
fragments tends to decrease toward the south
and southeast.
Most larger fragments A to 20 cm wide) do
not appear to be related to the depression in the
surface. However, fragments measuring 1 to 3
cm wide that surround the two sharper depres-
depressions in the southwest part of the region could
be pieces of projectiles that caused the two de-
depressions. Impact of the larger rock in the north-
northwest part of the region studied could have
APOLLO 11 PRELIMINARY SCIENCE REPORT
formed the depression that lies immediately to
the right of the rock.
Most small fragments rest on the surface or
are buried only slightly, as suggested by the
relatively long, sharp shadows they cast. The
intermediate and large fragments A to 15 cm
wide) have fillets or embankments of fine-
finegrained material around their visible sides.
On the two largest fragments and on LRL
specimen 10023, the fillets appear to be better
developed or perhaps restricted to the south-
southeast faces. The fillets have gradational bound-
boundaries that change to sharp boundaries as they
are traced from left to right around the south-
southeast faces of the rocks. The distribution of the
fillet is especially well shown on the large rock
near the western edge of the region studied.
Examination of stereophotographs ASll-40-5856
and AS11-40-5857 shows that the southeast face
of the rock, which appears to overhang the lunar
surface slightly, has a fillet that extends approxi-
approximately two-thirds up the face and ends abruptly
at the southwest corner of the rock.
These relationships suggest that the fillets
were either formed from or enhanced by mate-
material moving toward the northwest, that is, paral-
parallel to the northwest set of lineations. Possibly
both the fillets and the northwest-trending line-
lineations have been partly formed from or en-
enhanced by fine-grained material swept along the
lunar surface by the effluent of the LM descent
propulsion system.
Neither LRL specimen 10023 nor LRL speci-
specimen 10032 has any evident genetic relationship
to the local depressions and craters or to either
large or small fragments in the region studied.
Like the other large fragments, LRL specimen
10023 has a well-developed fillet on the south-
southeast face. If the fillets are of natural origin, the
presence of the fillet on the LRL specimen 10023
indicates that the specimen was located in the
position in which it was found for at least the
period of time that was required for the fillet to
be formed. However, if the fillets near the LM
have been built largely during the landing by
the descent engine effects, then LRL specimen
10023 could have been emplaced fairly recently.
Description. LRL specimen 10023 has an ovoid
shape and is tapered at one end, with a broadly
rounded side and a nearly flat side. The specimen
Front t^'\
end
Top view
0
1
cm
(a)
Explanation
Breccia fragments showing light-colored crystals
Light-colored crystals and crystal aggregates
Irregular depressions
Fractures
Faint layering
Shadowed area
Pit
Scarp; hachures indicate downside
Figube 3-35. — Photographs and maps of LRL specimen
10023. (a) LRL photograph S-69-45394 and map
showing the view from southwest of the specimen.
GEOLOGIC SETTING OF LUNAR SAMPLES
69
is approximately 5.5 cm long, 2 to 3 cm wide, and
1.5 to 2 cm thick. Part of the rounded side is
covered with fine dust, but the flat side is fairly
free of dust and reveals that the specimen is a
fine-grained clastic rock with scattered sub-
rounded rock fragments of up to 5 mm in diam-
diameter.
The rounded ovoid shape of the specimen
(fig. 3-35(a)) is irregular in detail, In the cen-
central part of the rounded side, a broad depression
is formed by many coalescing, shallow, and ir-
irregular cavities and round pits. Adjacent to this
depression, toward the tapered "front" end,
round deep pits are abundant and so closely
spaced that some pits intersect others and indi-
indicate more than one generation of pitting. Fewer
of these pits were evident near the edges of the
specimen, and none could be identified from the
photograph of the flat side of the specimen.
Bottom and partial side view
L I I
0
1
cm
(b)
The flat side of the specimen (fig. 3-35{b)) is
marked by two parallel flat surfaces separated
by an irregular longitudinal scarp approximately
Ja to 1 mm high. A few small cavities are present,
but no round pits of the type found on the
rounded side appear. An irregular fracture pat-
pattern occurs on the flat side. The fractures are
short, discontinuous, and largely filled with dust.
On the rounded side of the rock, near the
tapered end, is a set of short fractures, 3 to 9
Oblique view of front, top,and right side
i i i
0 1 2
cm
(c)
Figdre 3-35 (continued). — (b) LRL photograph S-69-
45393 and map of the flat side of the specimen.
Figure 3-35 (concluded).- (c) LRL photograph S-69-
45387 and map showing the pits on the rounded side
of the specimen.
70
APOLLO 11 PRELIMINARY SCIENCE REPORT
mm long. These fractures are largely dust filled
and do not appear to penetrate far into the
rock. On a few sides and corners, short, curved
fractures exist, which may be exfoliation fea-
features.
The numerous pits on the rounded side of the
specimen (fig. 3-35(c)) range in size from ap-
approximately 0.3 to 2.3 mm. Most of these pits
are deep, but some of the larger ones are shallow
and bowl shaped. Many have raised rims, and
some of the rims are surrounded by narrow,
whitish halos. The larger pits grade in shape
into irregular cavities and depressions. Cavities
appear to be a composite of merged pits of
various sizes. On the edges and flat side of the
rock, the irregular cavities are few and small
(mostly less than 1 mm long), and they appear
to be caused by the dropping out of one or more
lithic fragments or mineral grains.
LRL specimen 10023 is a fine-grained clastic
rock containing widely and irregularly scattered,
subangular rock fragments. The average grain
size of the distinguishable fine material is ap-
approximately 0.2 mm. The rock fragments range
from 0.5 to 4 mm and are mostly concentrated
near the tapered end of the specimen, although
fairly large fragments appear in other parts of
the specimen. Most of the fine material consists
of medium-gray, angular to subangular grains.
Scattered through this matrix are white grains,
many of them tabular or lath shaped, which re-
resemble crystals and cleavage fragments. A few
white grains appear to be curved and others are
Y-shaped, which gives them the appearance of
shards. These white grains range in size from
0.2 to 1 mm in length. Some of the larger laths
show partial separation along apparent cleavage
planes.
The larger rock fragments or clasts all seem to
be fine-grained crystalline rocks with the texture
of basalt. Randomly oriented, lath-shaped white
"crystals" compose 40 to 60 percent of these
rocks and are enclosed by a matrix of smaller
gray minerals. The average grain size of the
crystals is approximately 0.5 mm. Although many
of the rock clasts are elongate, there appears to
be no preferred orientation.
A faint layering that is essentially parallel to
the flat face of the rock can be traced on the
lower sides of the specimen. The layers are 1 mm
or less in thickness and seem to be marked by
alternating coarser and finer textures. Some of
the elongate white grains appear to be concen-
concentrated along thin layers and are oriented parallel
to the planar structure.
LRL specimen 10032 is bounded by numerous
irregular faces that show no apparent control
by joints or other platy structures. Most faces
are remarkably fresh with only slightly rounded
edges and corners. One face, however (fig.
3-36(a)), is smoothly undulating with more
rounded edges and corners, and this face is
therefore assumed to have been the top as the
specimen rested on the lunar surface. This ori-
orientation is consistent with the correlation of
LRL specimen 10032 with rock D in figures
3-19 and 3-22. The specimen has a pointed end,
which is believed to have been oriented toward
the LM landing site. No evidence remains of an
apron or fillet of fine particles having been
banked up against the sides of the specimen.
Irregular vesicles ranging in size from approx-
approximately 0.2 to 1 mm wide are unevenly scattered
throughout the rock, but most are concentrated
in two zones 5 to 6 mm apart, as shown in figure
3-36(b). Most of these vesicles show a parallel
elongation and form a distinct lineation that is
interpreted to represent the direction of flow of
lava. Two larger, nearly spherical vesicles 1 and
2 mm wide appear on two of the faces. Most of
the vesicles seem to be lined with smooth spec-
specular material, but in a few vesicles, small crys-
crystals are visible on the walls.
LRL specimen 10023 is a breccia of small
subangular lithic fragments in an extremely fine-
finegrained matrix. The specimen strongly resembles
the material of the regolith, as photographed by
the Apollo Lunar Stereo Closeup Camera, ex-
except that this specimen is strongly indurated.
The shape and distribution of pits suggest that
the rounded side of the specimen was formerly
the top surface and that the flat side was the
bottom surface. However, the specimen was not
oriented with the flat side down at the time it
was collected; both the rounded and the flat
sides were partially buried in the regolith. Prob-
Probably the rock had not been in its last position on
the lunar surface for a substantially long period
of time.
Description. LRL specimen 10032 is a small
GEOLOGIC SETTING OF LUNAR SAMPLES
71
Explanation
'' Light-colored crystals and crystal aggregates
Y Light-colored crystal aggregates
[A] Nearly complete dust cover
H§ Shadowed area
O Irregular pits
© Small pits with white halos
' Small vesicles I?)
—' Small fractures
Small, bright spherules
Figure 3-36. — Photographs and maps of LRL specimen
10032. (a) LRL photograph S-69-46010 and map of
the top of the specimen.
irregular rock fragment, approximately 2 cm long,
1 cm wide, and % cm thick (the 12th largest from
the contingency sample), whose location has been
Bottom and end view
.5
cm
(b)
Figure 3-36 (continued).- (b) LRL photograph S-69-
46007 and map of the bottom and end of the specimen.
tentatively identified on the lunar surface. Study
of the specimen has been based on LRL photo-
photographs S-69-46006 to S-69-46015, in which the
specimen is enlarged approximately six times.
The different views are stereoscopic.
On the assumed top of the specimen, a few
scattered small, round pits appear that seem dif-
different from the vesicles. These pits are 0.2 to
0.4 mm wide and several are surrounded by a
74
APOLLO 11 PRELIMINARY SCIENCE REPORT
smaller fragments are buried varies uniformly
from almost total burial to no burial.
All but one of the larger fragments have fillets
yt
Far wall of double crater
Edge of defiladg^^S^.>
-—-r~' .;¦*?*?$'¦ ¦', '/¦'•
Approximate „
i i i i i i
0 10 20 30 40 50
cm
Approximate scale
Explanation
LRL specimen 10046
Rounded rock fragment
Angular rock fragment
Rock fragment
Fillet of fine-grained material on the side of
a rock fragment: boundaries show the break
in slope away from the fragment
The break in slope at the margin of a subdued
depression of a crater; hachures point downslope
Axis of shallow trough
of fine-grained material banked against the sides
that are observable in the photographs. The
fillets are approximately 1 to 2 cm high on the
large fragments. No correlation between the
height of the fillets and the angularity of the
rocks has been established.
The relatively large, angular fragments ap-
appear from the LM window partial panoramas to
be more abundant in the vicinity of the 2-m-
diameter crater (upper left, fig. 3-37). The pos-
possibility exists that the angular blocks were ejected
from within the regolith (from the 2-m-diameter
crater) and that the rounded fragments have
been exposed at the lunar surface for a longer
period of time. It is also possible that the angular
fragments are more resistant to lunar surface
erosive processes than are the rounded frag-
fragments.
The LRL specimen 10046 is unique among the
rocks in the small block field. Photographs and
maps of this specimen are shown in figure 3-38.
The specimen is only slightly embedded in the
regolith (no more than 1 or 2 cm) and is the
only rounded fragment that protrudes markedly
above the surface. The specimen is the only
large fragment of equant shape. The fillet ex-
extends approximately 1 cm high on the specimen.
The lack of burial and low fillet of the specimen
suggest that it has been in its present position
for a short period of time. However, the large
number of pits on the lunar top surface of the
specimen (fig. 3-38(e)) suggests that the upper
surface of the specimen has been subjected to
lunar surface processes for a long period of time.
Description. LRL specimen 10046 is a large
rounded rock that was collected in the bulk
sample. Six stereoscopic orthogonal views of the
specimen were photographed. Arbitrary num-
numbers and relative orientations have been assigned
to the respective faces as follows:
Figure 3-37. - Hasselblad photograph AS11-40-5853
and map showing the region around LRL specimen
10046 that was studied.
Face no. Figure no. Photographs
S-69^5614 to S-69-45616
S-69-45611 to S-69-45613 and
S-69-45623 to S-69^5625
S-69-45609 iand S-69-45610
S-69-45617 to S-69-45619 and
S-69-45629 to S-69-45631
5 (top) 3-38(e) S-69-45620 to S-69-45622
6 (bottom) 3-38(f) S-69-45626 to S-69^5628
1 (front) 3-38(a)
2 (right side) 3-38(b)
3 (rear) 3-38(c)
4 (left side) 3-38(d)
GEOLOGIC SETTING OF LUNAR SAMPLES
75
V ; '
Explanation
|_J Large, lightclast
-'? Small, light clasts
I A] Heavy dust coating on the surface
[j[] Moderate dust coating on the surface
[c] Light dust coating on the surface
j^g Shadowed area
--— Fracture
Subtle trough or base of subtle scarp; probably
the eroded edge of a resistant internal layer; in
places, light-colored clasts are alined along
adjacent ridges
?? Irregular cavity
o Pit, commonly with raised rim and tight-colored halo
Figure 3-38. — Photographs and maps of LRL specimen
10046. (a) LRL photograph S-69-45616 and map of
the front (face 1) of the specimen.
l:ace 2 (right sidel
1
cm
(b)
Figure 3-38 (continued). - (b) LRL photograph S-69-
45613 and map of the right side (face 2) of the spec-
specimen.
LRL specimen 10046 was oriented before col-
collection (fig. 3-28) with face 1 to the southwest,
face 2 to the southeast, face 3 to the northeast,
face 4 to the northwest, and faces 5 and 6 as
the top and bottom, respectively. Fine particles
partly obscure faces 1, 3, 4, and 6.
LRL specimen 10046 is roughly ovoid, meas-
measures approximately 10 by 8 by 7.5 cm, and has
three approximately orthogonal flattened sides
(faces 3, 4, and 6). Face 1 is a relatively smooth,
convex surface with a deep irregular indentation
in the upper right corner. Face 2 is smoothly
76
APOLLO 11 PRELIMINARY SCIENCE REPORT
Face 3 (rear)
1
cm
Ic)
Figure 3-38 (continued). ~ (c) LRL photograph S-69-
45609 and map of the rear (face 3) of the specimen.
rounded on the top and left sides and is irregu-
irregularly broken at the bottom and the right sides.
Face 3 is virtually flat but has sharp irregular
indentations scattered over it. Face 4 is a rough,
broken surface that is largely coated with fine
particles. The lunar top surface of the specimen
(face 5) is gently domed, smooth on a coarse
scale, and densely pitted on a fine scale. The
lunar bottom surface of the specimen is vir-
virtually planar and is heavily covered with fine
particles.
Subtle troughs and ridges, which are approxi-
approximately parallel with the base of the specimen,
are visible on faces 1, 2, 3, and 4. These troughs
and ridges are probably the eroded edges of a
series of resistant layers that are most easily
Face 4 (left side)
i. ,i i i
0 1 2
cm
(d)
Figche 3-38 (continued). - (d) LRL photograph S-69-
45619 and map of the left side (face 4) of the spec-
specimen.
visible where the rock surfaces are obliquely
lighted. The stratiform appearance of the speci-
specimen is enhanced by a very slight sorting of fine
and coarse clasts in alternate layers and by the
discontinuous local alinement of light-colored
clasts.
A fracture system, which is most strongly de-
developed on the lunar south and is displayed on
faces 1, 2, and 6, cuts the specimen. One series
of fractures can be traced approximately parallel
with the base across face 2. Another set of arcu-
GEOLOGIC SETTING OF LUNAR SAMPLES
77
Face 5 (top)
lull 1 J
cm
(el
Face 6 (bottom)
cm
Figure 3-38 (continued).— (e) LRL photograph S-69-
45622 and map of the lunar top (face 5) of the spec-
specimen.
ate fractures oriented from vertical to almost
horizontal can be seen in faces 1 and 2. The
orientation of the two arcuate fractures con-
concentric with face 2 suggests that the fractures
may be the inner boundaries of exfoliation shells.
Shallow circular pits that occur on the lunar
top surface of the specimen appear less fre-
frequently on other faces of the specimen, The pits
range in size from less than % to 3 mm in diam-
diameter. Most of the pits have a specular lining,
which is generally of either a botryoidal or a
Figure 3-38 (concluded).- (f) LRL photograph S-69-
45628 and map of the lunar bottom (face 6) of the
specimen.
radially ridged form. The pits commonly have
raised rims with subdued to sharp profiles.
Raised rims are commonly bounded by steep
or reversed (undercut) outer slopes. Some of
the sharp-rimmed pits have light-colored halos
with diameters four times as great as the pit.
The pits are unevenly distributed on the six
faces of LRL specimen 10046. They are most
abundant on the lunar top surface of the speci-
specimen and occur with decreasing abundance on
faces 2, 1, 6 (bottom), 3, and 4. On the top
78
APOLLO 11 PRELIMINARY SCIENCE REPORT
surface, the pits are closely spaced, and some
pits are superimposed on other pits. In some
cases, old pits are almost totally destroyed by
superposition of younger pits. On the top surface
and on faces 1 and 2, the number of pits in-
increases rapidly with decreasing diameter between
a 3-mm and a /2-mm pit diameter, Too few pits
are visible on faces 3 and 4 to judge the size-
frequency distribution. On the bottom, which is
largely coated with fine particles, only large
pits are easily detected. Pits of a given size tend
to cluster; that is, several pits of approximately
the same size and degree of freshness tend to be
found in proximity.
Irregular cavities are present on faces 2, 3, 4,
and 5. These cavities range in size from 1 to 4
mm on the surface of the specimen and vary
from very shallow to very deep. In some cases,
the bottom and sides of the cavities are in
shadow in all available photographs. The edges
of these cavities range from irregular to smooth
and from sharp-edged to subdued. The visible
interiors of the cavities are commonly specular.
On faces 2 and 4, some of the deep cavities are
rounded in outline and interconnected. In sev-
several cases, the cavities are alined and tapered as
though drawn out. Most of the irregular cavities
occur in the rock matrix, but a few occur in
large litliic clasts. These latter cavities may be
vesicles.
The surface in which greatest pitting is evi-
evident is bounded in part by a short scarp (pos-
(possibly 1 mm high) that defines a fairly con-
continuous cap or rind on the rock. A cross section
of the cap is revealed in the scarp. The upper
surface of the cap is lighter gray than the sur-
surrounding sides of the rock and, except for pitting,
exhibits no throughgoing structures. In a cross
section, the cap exhibits a fine-textured hackly
appearance, and microfractures that occur in
the cap do not persist into the rock below.
Major fractures penetrating the body of the rock
do not cut the cap.
The rock is an aggregate of clasts consisting
of approximately 10- to 20-percent recognizable
irregular lithic fragments and possibly crystal
fragments in a very fine-grained heterogeneous
matrix. The average grain size of the matrix is
less than 0.1 mm. The matrix consists predomi-
predominantly of medium-gray grains with scattered
light- and dark-gray clasts. Light-gray angular
clasts occur bimodally both within the matrix
and as coarse clasts. As a matrix constituent,
these clasts range in size from less than 0.1 mm
to approximately 1.5 mm. Coarse clasts of light-
gray material range in diameter from approxi-
approximately 5 mm to 3 cm.
The coarse, light-gray clasts are angular and
irregular but are equant or rarely tabular in
form. The clasts have sharp contacts with the
matrix. Some of the finer clasts are dull, some
are highly reflective, and some appear to be
fragments of single crystals. One fragment on
face 1 resembles a zoned feldspar with an
altered core and twinned rim. At least two types
of rock are represented in the larger light-gray
clasts. One is a very fine-grained vesicular rock
that is well represented by large clasts on face
4. The other rock is crystalline with an average
grain size of approximately 0.3 mm.
Dark-gray clasts are scattered throughout the
matrix but are the least abundant of the three
photometrically distinguishable components. In-
Individual grains range from less than 0.1 to
0.2 mm, but locally they are spatially concen-
concentrated to form an irregular, subrounded aggre-
aggregate of several millimeters in width (lower center
of face 1).
In a few cases, light-gray clasts stand in relief
above the surrounding matrix, which suggests
that these clasts are more resistant to processes
of erosion occurring on the Moon. In contrast,
aggregates of dark-gray clasts (face 1) appear to
erode in negative relief.
LB.L specimen 10046 is a mierobreccia. The
general character and distribution of its com-
component fragments are similar to those exhibited
by photographs of the unconsolidated surface
material taken by the lunar closeup camera. This
similarity suggests that the specimen may have
been derived by a process of induration of the
unconsolidated surface material. The subtle
stratification that is visible on three faces of the
rock may have been produced by the process
of induration, or it may indicate a sedimentary
layering process. The external form of the speci-
specimen has probably been influenced by at least
four separate processes: A) fracturing of the
body rock, B) exfoliation, C) pitting, and D)
surface erosion (or ablation).
GEOLOGIC SETTING OF LUNAR SAMPLES
79
LRL specimen 10046 has a complex history of
movement on the lunar surface, and this history
is reflected in its surface form. The most angular
face (face 3) is oriented toward the northeast,
and the least angular face (face 6) is on the
bottom. The lack of pitting on face 3 indicates
that this face was probably the bottom of the
specimen at one time, leaving faces 1 and 6
exposed to processes of pitting. At some time
in the recent past, possibly at the time one of
the nearby craters was formed, the rock was
reoriented. This reorientation exposed face 3
to erosion. The general rounding of the surface,
the fracturing of the body of the rock, and the
fact that three faces of the rock are relatively
angular suggest that the reorienting process may
have happened more than once and that the
process may have happened at irregular inter-
intervals of time.
LRL Specimen 10047
Description. LRL specimen 10047, which is a
small rock from the bulk sample box, was col-
collected within 8 m of the LM from a region on
either the northwest or the southwest side of
the LM landing site. The specimen has not yet
been identified in photographs of the lunar
surface. The specimen has an unusually angular
shape, except for one side that appears to have
been rounded off by lunar erosional processes,
and the rounded side is assumed in this descrip-
description to be the top side. The maximum dimensions
are approximately 5.5 cm in length, 4 cm in
width, and 3.3 cm in thickness. Although much
of the specimen is covered by a thin, dark-
colored coating of fine particles, a finely crystal-
crystalline texture shows on parts of most faces, and a
faint but definite primary foliation shows on the
top and one end of the specimen.
This study is based on LRL photographs
S-69-45632 to S-69-45655. A total of 24 photo-
photographs, in which the rock was enlarged approxi-
approximately three times its original size, gave excel-
excellent stereoscopic coverage and good definition
of the structural and textural features (fig. 3-39).
As viewed from the top (LRL photographs
S-69-45644 to S~69-45646), LRL specimen 10047
is roughly rectangular in shape. This shape is
apparently controlled by a conjugate system of
small, irregular joints; but the unusual angu-
Top view
0 1 2
cm
Explanation
(a)
<J
??
White crystals
White crystal aggregates
Black, shiny, crystal clots or segregations
Ovoid grains
Heavy dust coating on surface
Moderate dust coating on surface
tight dust coating on surface
Shadow
Small, round pits
Small pits with white halos
Irregular cavities or vugs
Irregular fractures
Figure 3-39. — Photographs and maps of LRL specimen
10047. (a) LRL photograph S-69-45644 and map of
the top of the specimen.
80
APOLLO 11 PRELIMINARY SCIENCE REPORT
Front
(b)
Figure 3-39 (continued).-(b) LRL photograph S-69-
45649 and map of the bottom of the specimen.
larity (exhibited on the other faces) is caused by
another system of joints that intersects the first
system at angles of 20° to 45° and by the occur-
occurrence of irregular fractures. The bottom of the
specimen (LRL photographs S-69-45649 to S-
69-45651), with faces meeting at an angle of
approximately 70°, exhibits the most angular
edge. This edge may have been embedded in
the regolith to a depth of 1 to 2 cm. Other
edges are considerably more rounded, particu-
particularly those that bound the top surface.
Two types of small fractures appear on vari-
various faces, particularly on the rounded top of
the rock. One type consists of fairly straight,
short A to 2 cm) fractures that are roughly
parallel to the faces of the rock. Most fractures
ss Bottom
Front end
i
1
cm
Figure 3-39 (continued).- (c) LRL photograph S-69-
45647 and map of the front of the specimen.
are partially filled with fine particles. The second
type consists of curved fractures that are roughly
parallel to the rounded ends and edges of the
rock. In detail, these fractures are irregular,
partly open, and bordered in part by crumbly
granular material. The fractures appear to bound
GEOLOGIC SETTING OF LUNAR SAMPLES
Side view
(d)
Figure 3-39 (continued). - (d) LRL photograph S-69-
45633 and map of the side of the specimen.
a series of exfoliation shells that are most prom-
prominent on the rounded top.
Scattered over the various faces of the speci-
specimen are irregular cavities or vugs that are 0.5
to 2.5 cm long. The cavities are most abundant
on one of the bottom faces. Small crystals can
be seen projecting from the cavity walls at vari-
various angles. Because of their extreme irregularity
in shape and distribution, these vugs do not
appear to be ordinary vesicles; they resemble
cavities formed by leaching or by removal of
some unknown mineral or mineral aggregates.
The crystals projecting from the walls seem to be
integral to the fabric of the rock, rather than
having been deposited in the vugs.
Small pits 0.2 to 1.5 mm in diameter are irregu-
irregularly scattered over the top surface of the speci-
specimen, and a few pits appear on the sides of the
Side view
L
1
cm
(e)
Figube 3-39 (continued). - (e) LRL photograph S-69-
45638 and map of the side of the specimen.
specimen. Some of the pits are steep sided as
though drilled, while others are conical with
raised rims. Several of the pits are surrounded by
a white halo that seems to be composed of an
array of white mineral grains with a slightly
raised outer margin.
The texture of LRL specimen 10047 is best
seen on a side face that is shown by LRL photo-
photographs S-69-45632 to S-69-45634 and is sketched
on LRL photograph S-69-45633. The rock ap-
appears to be holocrystalline with an average grain
size of approximately 0.5 mm, although some
crystals are slightly more than 1 mm in length.
At least two components can be recognized.
White, lath-shaped to stubby rectangular crys-
82
APOLLO 11 PRELIMINARY SCIENCE REPORT
Bottom
Rear end
i
1
cm
(f)
Figure 3-39 (concluded). — (f) LRL photograph S-6
45652 and map of the rear of the specimen.
tals resembling plagioclase make up approxi-
approximately 50 percent of the rock. The distribution
of the crystals gives the rock a slightly diabasic
texture. The crystals range from 0.3 to 1.2 mm
long, and many are grouped into aggregates as
large as 2 mm in diameter. Some of these aggre-
aggregates exhibit a faint cleavage that is typical of
plagioelase, especially on a relatively fresh
broken surface such as that shown in LRL photo-
photograph S-69-45561.
Surrounding the white crystals is a more finely
granular matrix of dark-gray to nearly black
minerals of approximately 0.2- to 0.5-mm grain
size. Many of these minerals appear as stubby
subhedral prisms that exhibit brightly reflectant
crystal and cleavage faces. Locally, these dark
grains are grouped in aggregates or clots up to
2 mm in diameter. Whether the dark grains rep-
represent one mineral or more than one mineral
cannot be discerned from the photographs.
Fresh broken surfaces shown in LRL photo-
photograph S-69-45561 exhibit, on the top and upper
sides, a thin surface crust approximately 1 mm
or less thick of high albedo, in contrast to the
darker tone of the fresh interior. The extreme
whiteness that characterizes the surface of the
crystals, resembling plagioclase, and the rela-
relatively high reflectivity of other grains are ap-
apparently caused by a lunar weathering process.
Shock metamorphism, a process by which the
minerals on the surface may have been minutely
shattered by the impacts of many small particles
on the rock, seem to be the most reasonable
explanation for the formation of this crust. Shock
effects may also account for the white halos that
are evident around many of the round pits.
On the rounded top and on one end of LRL
specimen 10047, the white crystals and aggre-
aggregates exhibit a crude but distinct foliation, which
trends roughly parallel to the long dimension
of the top surface and dips at a steep angle to
this surface. Many of the lath-shaped crystals
are oriented almost parallel with the foliation
and, along with crystal aggregates, are concen-
concentrated in crude layers. This foliation is similar
to primary flow structures in both extrusive and
intrusive terrestrial igneous rocks.
The textural features and general appearance
of LRL specimen 10047 strongly suggest an
igneous origin, but the medium-grain size could
be characteristic of either a thick lava flow or a
small intrusive body such as a dike. The faint
foliation indicates the small intrusive body to be
the better choice. The specimen resembles a
terrestrial diabasic basalt or fine-grained gabbro.
GEOLOGIC SETTING OF LUNAR SAMPLES
83
References
3-1. Milton, D. J.: Geologic Map of Theophjlus Quad-
Quadrangle of the Moon: Geologic Atlas of the Moon,
Scale 1:1,000,000. U.S.G.S. Map 1-546 (LAG 78),
1968.
3-2. Heacock, R. L.; Kuiper, G. P.; Shoemakeb, E. M.;
Uhey, H. C; and Whitaker, E. A.: Interpreta-
Interpretation of Ranger VII Records: Ranger VII, Part II,
Experimenters' Analyses and Interpretations. TR
32-700, Jet Propulsion Laboratory, Calif. Inst.
Tech., 1965, pp. 9-73.
3-3. McCohd, T. B.: Color Differences on the Lunar
Surface. J. Geophys. Res., vol. 74, no. 12, 1969,
pp. 3131-3142.
3-4. Mulleh, P. M.; and Sjoghen, W. L.: Mascons:
Lunar Mass Concentrations. Science, vol. 161,
1969, pp. 680-684.
3-5. Shoemaker, E. M.; Morris, E, C; Batson, R, M.;
Holt, H. E.; Lai*so>j, K. B.; Montgomery, D. R.;
Rennilson, J. J.; and Whitakeb, E. A.: Tele-
Television Observations from Surveyor, TR 32-1265,
Jet Propulsion Laboratory, Calif. Inst. Tech.,
1969, pp. 21-136.
4. Apollo 11 Soil Mechanics Investigation
N. C. Costes, W. D. Carrier, J. K. Mitchell, and R. F. Scott
The Apollo 11 lunar landing mission afforded
man the first opportunity for direct collection of
data relating to the physical characteristics and
mechanical behavior of the surface materials of
an extraterrestrial body by other than remote
means. In particular, the first manned lunar land-
landing provided a unique capability for acquiring
information that would aid in the accomplish-
accomplishment of the following broad objectives:
A) To enhance the scientific understanding of
the nature and origin of the materials, and the
mechanisms and processes responsible for the
present morphology and consistency of the lunar
surface
B) To provide engineering data on the inter-
interaction of manned systems and manned operations
with the lunar surface, thereby aiding in the
evaluation of the Apollo 11 mission, and in the
planning of future lunar surface scientific inves-
investigations and related engineering tasks support-
supporting these activities
To obtain this information, the Apollo Pro-
Program Office directed that a Soil Mechanics Inves-
Investigation be included in the scientific experiments
planned for the Apollo 11 mission. The investi-
investigator team was charged with the responsibility
for the systematic acquisition and analysis of
lunar soil mechanics data to insure maximum
return of geotechnical information from each
facet of the planned lunar surface operations.
Specific scientific objectives of the Soil Me-
Mechanics Investigation at the Apollo 11 landing
site included the following:
A) To verify lunar soil models previously
formulated from Earth-based observations and
laboratory investigations and from lunar orbiting
and unmanned lunar landing missions
B) To determine the extent of variability in
lunar soil properties with depth and lateral posi-
position
C) To aid in the interpretation of geological
observations, sampling, and general documenta-
documentation of maria features
In addition, the Soil Mechanics Investigation
was aimed toward the following engineering ob-
objectives:
A) To obtain information relating to the inter-
interaction of the lunar module (LM) with the lunar
surface during landing and to lunar soil erosion
caused by the spacecraft engine exhaust
B) To provide a basis for altering mission
plans because of unexpected conditions
C) To assess the effect of lunar soil proper-
properties on astronaut and surface vehicle mobility
D) To obtain at least qualitative information
needed for the deployment, installation, opera-
operation, and maintenance of scientific and engineer-
engineering stations and equipment to be used in extended
lunar exploration
Knowledge of Lunar Surface Mechanical
Properties Before Flight
No attempt will be made in this section to give
a complete history of the development of the
state of knowledge of the lunar surface mechan-
mechanical properties. The purpose of this discussion is
to provide a background for better evaluation of
the results of the mission and to make compari-
comparisons between the properties that have been de-
deduced from various sources. Using these com-
comparisons, the reliability of different sets of meas-
measurements can be assessed, and the suitability of
the techniques used prior to Apollo 11 can be
evaluated.
Several sources of preflight information about
lunar surface mechanical properties exist. These
sources of information include ground-based
visual observations, thermal measurements, radio
and radar measurements, the lunar surface pho-
85
APOLLO 11 PRELIMINARY SCIENCE REPORT
tographs obtained by the U.S. Ranger and Lunar
Orbiter spacecraft, the data from landings of the
Soviet Luna 9 and Luna 13 spacecraft, and the
direct estimates of the lunar surface properties
derived from the five soft landings of the U.S.
Surveyor spacecraft.
The results of the Surveyor spacecraft tests
and analyses led to the construction of a lunar
soil model of an essentially incompressible,
slightly cohesive soil that is composed primarily
of grains ranging in size from silt to fine sand.
The lunar soil behaved in a manner similar to
the behavior of terrestrial soils with a density of
approximately 1.5 g/cc. A cohesion of approxi-
approximately 0.1 psi and a friction angle of 35° to 37°
(in the normal pressure range of a few psi) satis-
satisfactorily represented the mechanical properties
observations made of the lunar material to a
depth of several inches. Where the soil extends
to depths greater than several inches, an increase
in strength with depth was observed. In places,
the soil may overlie rock fragments that are only
a few inches or less beneath the surface. (More
information can be found in refs. 4-1 to 4-11.)
Postulated Soil Behavior During Descent and
Touchdown of the LM
On the basis of the previously discussed lunar
soil model, various soils have been postulated
and used for calculations related to the descent
and landing of the LM on the lunar surface.
Some of these computations have been con-
concerned with the dynamics of the landing;1 for
example, from computations, LM footpad pene-
penetrations of 4 to 6 in. were expected in a simul-
simultaneous four-point touchdown at a vertical
downward velocity of 3 fps and at zero lateral
velocity, if the lunar soil extended to a depth of
one or two times the footpad diameter (i.e., 3 to
6 ft).
The effect of the descent propulsion system
(DPS) engine exhaust on the soil surface has
also been studied from several viewpoints. If the
lunar surface is considered to consist of soil
grains in the postulated size range, but is taken
to be impervious to gas flow, calculations by
Hutton (ref. 4-12) indicated the extent of lunar
soil surface erosion that may be anticipated in a
'E. M. Shipley, personal communication, 1968.
nominal descent. For the soil model considered,
Hutton found that erosion would begin during a
vertical descent to the surface when the exit
plane of the DPS engine nozzle was approxi-
approximately 25 ft above the surface. Hutton also
found that following a vertical descent, the final
erosional crater that would develop beneath the
engine after landing and engine shutdown would
be approximately 3 to 4 in. deep and 5 to 6 ft
in diameter. This erosional crater formed by the
flow of exhaust gases over the lunar surface
would be ring shaped, and the maximum crater
depth would occur some distance from the center
of the crater. The effect of the blowing surface
material on the visibility from the LM was also
examined.
By considering the lunar soil to be a medium
that is permeable to gas flow and has a perme-
permeability in the range appropriate for the grain size
of the lunar soil model material and by ignoring
the erosion mechanism, Scott and Ko (ref. 4—13)
examined the mechanics of compressible gas
flow through the soil medium under lunar sur-
surface conditions. On analysis of the Surveyor test
results and of postflight tests, scaled to the LM,
Scott and Ko found that a vertical descent (or
steady engine firing in one position) followed by
a rapid shutdown of the engine could give rise
to gas pressures inside the soil that would exceed
the lunar weight of the soil overburden. Thus,
shutdown could be followed by a venting of the
gas through the surface soil, accompanied by
upward ejection of the surface soil. The extent
and amount of soil removed by such explosive
outgassing depend, for any given soil and engine,
considerably upon the flightpath and the engine-
shutdown pressure transients. A slow vertical de-
descent and a rapid decay at shutdown would
produce the largest quantity of ejected soil
material.
Postulated Soil Behavior During Lunar Surface
Extravehicular Activity
Calculations based upon the adopted lunar
soil model indicated that during the lunar sur-
surface extravehicular activities (EVA), the astro-
astronauts' boots should not sink more than approxi-
approximately 1 to 2 in. into the lunar surface if the
lunar soil extended to a depth of a few inches
to several feet. Traction on the lunar surface was
SOIL MECHANICS INVESTIGATION
87
anticipated to be good. No difficulties in obtain-
obtaining surface soil samples, driving core tubes, or
installing staffs in the ground were expected if
the soil was sufficiently deep. Mobility problems
might be expected only if an astronaut attempted
to descend or ascend crater walls with slope
angles greater than approximately 15°.
Data Sources for the Investigation
The Soil Mechanics Investigation was included
at a late phase of the Apollo 11 mission planning;
consequently, the main guideline given to the
investigator team was that no special soil me-
mechanics testing or sampling devices were to be
added to the hardware already planned for the
mission. Accordingly, the following were the
main sources from which soil mechanics data
could be extracted:
A) Real-time astronaut observations, descrip-
descriptions, and comments during the mission
B) Real-time television during the lunar sur-
surface EVA
C) Sequence camera, still camera, and close-
up stereoscopic camera photography
D) Spacecraft flight mechanics telemetry
data
E) Various objects of known geometry and
dead weight that came in contact with the lunar
surface during the mission and subjected the lunar
soil to either a static or dynamic loading; such
objects included the LM, the astronauts, and
the Early Apollo Scientific Experiments Package
(EASEP) instrument units
F) The Apollo lunar handtools
G) Various poles and shafts inserted into the
lunar surface in the course of the EVA, including
the contingency sampler handle, the Solar Wind
Composition (SWC) experiment staff, the flag-
flagpole, and the core tubes
(8) Astronaut technical, photographic, and
scientific debriefings
(9) Preliminary examination of Earth-re-
Earth-returned lunar soil and rock samples at the Lunar
Receiving Laboratory (LRL)
Figure 4-1 shows the LM footpad geometry
and the strut force-stroking characteristics. If the
LM rests on a level lunar surface and the LM
weight is equally distributed among the four
footpads, each footpad exerts a static vertical
force of approximately 700 lb on the lunar sur-
surface.
Figure 4-2 shows the configuration of the
astronaut boot sole. In lunar gravity, the weight
of the suited astronaut is approximately 64 lb.
The area of a flat boot sole, not considering the
ribs of the sole, is approximately 65 in,2
Because the astronauts were essential in con-
conducting the investigation and providing real-time
evaluation, especially with regard to unexpected
results, special effort was made to delineate, dur-
during astronaut training, simple tasks and observa-
observations yielding meaningful soil mechanics infor-
information, as well as expected behavior of lunar
soil under various loading conditions.
The EASEP instrument units are shown in
figures 4-3 and 4-4. In lunar gravity, the weights
of the Laser Ranging Retroreflector (LRRR)
and the Passive Seismic Experiment Package
(PSEP) are 8.7 and 18.7 lb, respectively. The
bearing areas of the pallets on which these two
instrument packages rest are 708.5 and 732.1 in.2,
respectively, The Apollo lunar handtools are
shown in figure 4-5. These tools are described
in detail in the report concerning lunar geology.
The bottom sections of the shafts mentioned in
item 7 of the list of soil mechanics data sources
are shown in figures 4—6 to 4-9.
In addition to the data obtained from the
Apollo 11 mission, preflight data were available
from simulation studies performed by the investi-
investigator team on soils having physical and me-
mechanical characteristics similar to those indicated
by the results obtained from the Surveyor mis-
missions. These test results have been documented
and reports are being prepared by N. C. Costes
et al. (George C. Marshall Space Flight Center),
J. K. Mitchell et al. (University of California,
Berkeley), and R. F. Scott and T. D. Lu (Cali-
(California Institute of Technology, Pasadena). In
addition to laboratory tests performed to deter-
determine the basic mechanical properties and phys-
physical characteristics of the simulated lunar soil,
an effort was made to ascertain the behavior of
the material under conditions expected during
EVA. These conditions included the development
of footprints by standing or walking astronauts,
scooping, sampling, or penetrating the soil with
shafts and Apollo lunar handtool mockups. Fig-
Figure 4-10(a) shows a simulation test. Figure
APOLLO 11 PRELIMINARY SCIENCE REPORT
Primary
strut
Load
4500 Ib
10"
Load
16" 4"
5000 Ib
Load-stroke curves
9500 Ib
i Primary
32"
S troke
4500 Ib
i
500 1b 12" stroke
Secondary
Forward
\7
View looking down
Secondary strut
View looking down/right side
Volume of
pad excursion
Figure 4-1. — Lunar module footpad geometry and load-stroke curves for the primary and
secondary struts.
4-10(b) shows astronaut bootprints developed
under essentially static loading conditions, and
figure 4-10(c) shows astronaut bootprints devel-
developed under loading of the same magnitude ap-
applied in a manner simulating an astronaut walk-
walking. From such tests, inferences were made on
the material behavior of the lunar soil during
EVA, taking into account the effect of lunar
gravity. The results appear to agree reasonably
well with the behavior of the material actually
observed during the EVA. Based on the current
data, postflight terrestrial simulations are planned
to gain further insight into the physical charac-
characteristics and mechanical behavior of lunar sur-
surface materials.
SOIL MECHANICS INVESTIGATION
89
Figure 4-2. - Astronaut Aldrin de-
descending from the LM. Note the
configuration of the astronaut boot
sole. (NASA AS 11-40-5866)
Figure 4-3. - Laser Ranging Retro-
reflector experiment. (NASA AS11-
40-5952)
90
APOLLO 11 PRELIMINARY SCIENCE REPORT
Figure 4-4. - Astronaut Aldrin de-
deploying the PSEP. (NASA AS 11-
40-5946)
I I I
I 1! '¦¦¦ hand-
.1 111 right
i li - lomon,
1 ' ' , and
¦ ,' S-69-
SOIL MECHANICS INVESTIGATION
91
Figure 4-6. — Contingency sampler, dimensions are given in inches.
Tolerance on outer diameter
.° of this ssciion +0.030
g -[ 1-0.315 i 0.040 1—3.110+0.080—-I 15.^
-1.598
Knurled-'
14.807 ±.020
0,512 + 0.060*1 M \ L 3.622 + 0.OS0 *
0.354 ±0.060-I I— Knurled '
View A
0.098*11
t
1.346-
* 0.059
HI-0.118
-0.256
- 0.099 + 0.060
-11.362-
-10.984+ 0.080-
0.315 ±0,040 ["'
Outer dimensions ol SWC
(launch configuration!
Ali dimensions are given in inches
Tolerances it not specified otherwise
are+ 0.030 inch
Approximate weight is 435 g 10.96 16)
-2.953 -I I *~
0.669 ± 0.040*1 \~
-6.732 * 0.080 -
ViewB
Figure 4-7. - Staff of the SWC experiment.
92
APOLLO 11 PRELIMINARY SCIENCE REPORT
Total length of the flagpole is 92.625 inches
(length includes the top of the bracket) and the 0.125 collar
Length of horizontal section lunextended) is 47 inches
Flag dimensions are 36 by 61 inches
0.875 outer diameter
of the tubing; 0.035 wall^ 2.1875
—Bottom
-8.875-
— 34.808—
,20.805
-32.87-
-46.87-
Total weight of the flag and the flagpole is 1.0 pound 14.125
ounces
Surface is grit blasted to a "normal" finish, as
measured by the Apollo lunar handtool grit
blast comparator gage sin 1001
Figure 4-8. — The lower section of the flagpole.
Follower
-12.535-
. 777 180'
Shell core holder B)
Follower
Band
Figure 4-9. — Core-tube sampler and bit used on the Apollo 11 mission, dimensions are
given in inches.
SOIL MECHANICS INVESTIGATION
93
Figure 4-10. — Simulation test, (a) Astronaut boot] in
test on simulated lunar soil, (b) Astronaut boot) in
on simulated lunar soil developed under action i
essentially static load, (c) Astronaut bootprint on si r
ulated lunar soil under action of load of same m<
tude as in figure 10(b). Load is applied in a manner
simulating a walking astronaut.
Soil Mechanics Data Obtained During the
Terminal Stages of LM Descent and
Touchdown
Erosion and Visibiliiy
According to discussions of soil properties
observed during EVA and obtained from LRL
tests, the mechanical behavior of the lunar sur-
surface material appears to resemble the behavior
of the soil at the Surveyor equatorial landing
sites. However, the depth of granular material
appears to be variable. The granular material ex-
extends from a depth as small as 2 in. over bedrock
or rock fragments at some locations to greater
depths elsewhere within a radius of 80 to 90 ft
around Tranquility Base. The observations of
exhaust gas erosion and footpad penetrations
must be interpreted in light of this variable soil
profile and the motion of the LM during the ter-
terminal stages of descent. This discussion will be
tied to the astronauts' comments while on the
Moon, returning to Earth, and during debrief-
debriefing.2 Information was also obtained from space-
spacecraft telemetry, the sequence-camera photo-
photographs taken during descent, and the still photo-
photographs taken during EVA.
From raw spacecraft telemetry, which was re-
received at 2-sec intervals, the horizontal velocity,
the vertical velocity, and the altitude of the LM
have been obtained and plotted in figure 4—11.
These data may be altered after processing, but
the data are thought to be generally indicative
of the LM movements immediately before touch-
touchdown. The two horizontal velocity components
2As taken from the tape-recording transcript, with
amendments. Quotations are numbered for easy refer-
reference, and quotation numbers are given in parentheses.
94
APOLLO 11 PRELIMINARY SCIENCE REPORT
When lunar module is on the surface,
the altimeter indicates 10-ft altitude
-lo
JU
14
38 42
-1
22 26 30 34
Time, 102.45, g.e.t.
Figure 4-11. — Descent of the LM: altitude and veloci-
velocities versus time.
38
34
- 30
|26
§ 22
18
14
10
- O
_
o
o
o
°
-
1 1 1 1
o
° o ° o °
o
o
1 1 1 1 1 t A
110 100 90 80 70 60 50 40 30 20 10 0
Horizontal distance, ft
Figure 4-12. — Descent of the LM: altitude versus hor-
horizontal distance.
are not given separately. This information has
been plotted in a different form in figure 4-12
to show the vertical trace of the flightpath. From
figures 4-11 and 4-12, the actual touchdown time
of the LM footpads, not the LM probes, has been
determined to be 102:45:42 g.e.t. D:17:42
e.d.t.), although selection of the time is compli-
complicated by the relatively long interval between
data points and by the fact that the telemetry
reading made immediately before touchdown is
successively repeated after touchdown. However,
if 102:45:42 g.e.t. is taken to be the touchdown
time, the spacecraft had a relatively low vertical
velocity of approximately 1 fps at touchdown
and a high lateral velocity between 3 and 4 fps,
compared to nominal values of 3 and 0 fps, re-
respectively. From the photographs taken of the
footpads and contact probes following touch-
touchdown (figs. 4-13(a) and 4-13(b)); it appears
that the lateral velocity was to the left of the
spacecraft or in the negative y-direction, slightly
southeast
During descent, the following comment (quo-
(quotation 1) was made: "Forward . . . forward 40 ft,
down 2M, picking up some dust." During the
scientific debriefing, Astronaut Neil A. Arm-
Armstrong qualified the in-flight remark by observing
that he noticed "substantial haziness" at approxi-
approximately 100 ft. Astronaut Edwin E. Aldrin, Jr.,
said he first "saw evidence of disturbed material
at about 240 ft." On the Moon (at 110:39 g.e.t.),
Astronaut Aldrin made the following observa-
observations (quotation 2):
There's one picture taken at the right rear of
the spacecraft looking at the skirt of the descent
stage. A slight darkening of the surface color —
a rather minimum amount of radiating or etch-
etching away or erosion of the surface, even though,
on descent, both of us remarked that we could
see a large amount of very fine dust particles
moving out.
From these remarks, the first observations of sur-
surface erosion appear to have been made when the
footpads were at an altitude of approximately
90 to 240 ft above the surface. (The altimeter
records 10 ft when the spacecraft is on the sur-
surface.) From the sequence-camera film, the first
visible surface-soil disturbance occurred when
the spacecraft was moving across a crater on the
flightpath. This crater, which is approximately
200 ft from the LM landing site, is the one men-
mentioned in the comment (quotation 3) which was
made by Armstrong at 151:41 g.e.t.:
... I took a stroll back to a crater behind us
that was maybe 70 or 80 ft in diameter and 12
or 20 ft deep. ... It had rocks in the bottom.
We were essentially showing no bedrock at least
in the walls of the crater at that depth.
SOIL MECHANICS INVESTIGATION
95
Figure 4-13. — Footpads of the LM.
(a) The +Y footpad (NASA
ASl 1-40-5920). (b) The -Z foot-
footpad (NASA AS 11-40-5926).
96
APOLLO 11 PRELIMINARY SCIENCE REPORT
The erosion would, of course, be affected by
the surface geometry of the crater. However,
from the telemetry data, the altitude of the LM
above the crater was approximately 100 ft, Quo-
Quotation 1 presumably indicates a time at which
erosion was strongly developed. The height at
which erosion first became noticeable is greater
than the predicted height B5 ft) at which ero-
erosion should become noticeable, if based on the
lunar soil model. Accordingly it is possible that
the material being moved was a surface layer
possessing less cohesion than the underlying
layer (and less cohesion than the lunar soil
model size), unless the initial erosion was
strongly affected by the crater geometry. On
the other hand, the height at which erosion
became noticeable confirms that the surface ma-
material possesses some cohesion because a co-
hesionless soil of the same size range as the
lunar soil would be moved by the LM exhaust
gas at a much higher elevation, (This greater
elevation would be approximately 1000 ft,
although the astronauts would probably not rec-
recognize surface effects at 1000 ft even if erosion
were occurring.)
From figures 4-11 and 4-12 (and the 16-mm
sequence film), descent appears to have stopped
for approximately 10 see ("flare?") when the
footpads were 9 or 10 ft off the lunar surface.
The appearance of the ground adjacent to the
LM at this descent stoppage is shown in figures
4-14(a) and 4-14(b). As shown in these figures,
soil transport by the LM DPS engine exhaust is
fully developed, and except for the interruptions
in the flow caused by rocks, the surface is
obscured. During the postflight debriefing, Astro-
Astronaut Armstrong reported (quotation 4) that the
appearance of the surface was "very much like
looking through a thin ground fog. The visibility
is probably degraded about 75 percent." Arm-
Armstrong also noted some difficulty in obtaining a
visual reference for lateral control of the space-
spacecraft motion because of the high velocity at
which the particles were moving. Consequently,
some of the comments made by the astronauts
indicate that the blowing dust was "transparent,"
and other comments give evidence of obscura-
obscuration. From the sequence-camera film, the lunar
surface seems to be concealed by the blowing
dust sheet for the final "H ,-^ P,0 sec of descent.
(a)
(b)
Figure 4-14. — Sequence-camera film frames, (a) Frame
from sequence-camera film showing initiation of ero-
erosion during LM descent, (b) Frame from sequence-
camera film showing fully developed erosion during
LM descent.
The distance from the ground zero under the
DPS engine nozzle to the farthest point visible
in figure 14(a) is several hundred feet. There-
Therefore, probably erosion effects and certainly the
eroded soil extended to much greater distances.
The following is a subjective impression of this
erosion that was given by Astronaut Aldrin at
151:25 g.e.t. (quotation 5):
I took a number of samples of rocks off the sur-
surface and several that were just subsurface and
about 15 to 20 ft north of the LM and then I
recalled that that area had been probably swept
pretty well by the exhaust of the descent engine.
In the scientific debriefing, the astronauts ob-
observed that the eroded material traveled a great
SOIL MECHANICS INVESTIGATION
97
Figure 4-15. — Lunar surface under
the DPS engine exhaust nozzle.
(NASA AS 11-40-5921)
distance, even to the point of obscuring their
horizon.
The relatively high lateral velocity of the
spacecraft in the few seconds before touchdown
means that erosion was never as fully developed
at one place as would occur under the nominal
vertical descent conditions. Concerning this lat-
lateral velocity, the astronauts reported the fol-
following:
Aldrin (quotation 6): "I wonder if that right
under the engine is where the probe might have
hit."
Aldrin (quotation 7): "Neil, look at the
minus [y?] strut, the direction of travel there,
traveling from right to left."
Aldrin (quotation 8): "This one over here
underneath the ascent [descent?] engine where
the probe first hit."
However, some surface effects were visible
after touchdown as is evident by the following
remarks:
Armstrong (quotation 9): "The descent en-
engine did not leave a crater of any size. There's
about 1-ft clearance on the ground. We're
essentially on a very level place here. I can see
some evidence of rays emanating from the
descent engine, but very insignificant amount."
Aldrin (quotation 10): "There's no crater
there at all from the engine."
Armstrong (at 110:39 g.e.t.) (quotation
11): "There's no evidence of problem under-
underneath the LM due to engine exhaust or drain-
drainage of any kind."
The amount of observed erosion seems to have
been very small. Quotation 9 mentions that the
height of the DPS engine nozzle from the lunar
surface was approximately 1 ft. To better esti-
estimate the height of the engine nozzle above the
lunar surface, a measurement of the shadow
length on the surface of spacecraft components
(including the rocket engine bell) was made
from the photographs taken by the astronauts.
From this measurement, the height of the engine
nozzle above the lunar surface was estimated to
be 18 to 20 in. For the distance which the shock
absorbers of the landing legs are estimated to
have stroked (discussed later), the distance
from the nozzle to a level, rigid lunar surface is
considered to be approximately 17 in. Because
98
APOLLO 11 PRELIMINARY SCIENCE REPORT
the footpads penetrated approximately 1 to 3 in.
into the lunar surface, the nozzle height above
an undisturbed, level lunar surface would be
14 to 16 in. An observed height of approximately
1 ft would indicate that the lunar surface below
the nozzle was 2 to 4 in. higher than a level lunar
surface. However, the estimated height of 18 to
20 in. can be interpreted to mean that 4 to 6 in. of
erosion had occurred. The lunar surface may not,
however, have been level at this location before
the landing. Figure 4-15 shows the surface in
the vicinity of the nozzle. From the photograph,
it is apparent that some soil must have been
removed by the exhaust gas.
Confirmation of this removal might be inferred
from the following remark made by Astronaut
Armstrong on the small depth of penetration of
his boots near the LM footpad (at 109:24:20
g.e.t.) (quotation 12):
The surface is fine and powdery. I can kick it
up loosely with my toe. It does adhere in fine
layers like powdered charcoal to the sole and
insides of my boots. I only go in a small fraction
of an inch — maybe an eighth of an inch, but
I can see the footprints of my boots and the
treads in the fine sandy particles.
The Surveyor spacecraft landings demon-
demonstrated that, although the lunar surface and the
underlying lunar soil are dark, the lunar surface
is lighter in color than the underlying soil. Thus,
any disturbance of the surface is manifested by
a dark appearance of the disturbed area. Quo-
Quotation 2, quotation 9, and the following quotation
indicate that the descent engine caused some
disturbance.
CAPCOM (at 114:21 g.e.t., with the astro-
astronauts inside the LM after EVA) (quotation
13): "Next topic here relates to the rays which
[luminate?] from the DPS engine burning area.
We were wondering if the rays [luminating?]
from the — beneath the engine are any darker
or lighter than the surrounding surface."
Tranquility Base (quotation 14): "The ones
that I saw back in the back end of the space-
spacecraft appeared to be a good bit darker, and of
course, viewed from the aft end, well, they did
have the Sun shining directly on them. It
seemed as though the material had been baked
somewhat — and also scattered in a radially
outward direction, but in that particular area,
this feature didn't extend more than about 2,
maybe 3 ft from the skirt of the engine. I
wouldn't say it was necessarily material that
had been uncovered. I think some of the mate-
material might have been baked. . . . Now, in other
areas, before we started traveling around out
front, why we could see that small erosion had
taken place in a radially outward direction, but
it had left no significant mark on the surface,
other than just having eroded it away. Now it
was different right under the skirt itself. It
seems as though the surface had been baked in
a streak fashion . . . but that didn't extend very
far."
Erosion rays appear in figure 4-15. It is also
observed in figures 4-15 and 4-16 that the — Y
footpad probe touched the surface under the
DPS engine (quotations 6 and 8), approximately
10 to 12 ft from the final footpad location. Be-
Because the probe is approximately 5 ft long, a
general lateral to vertical velocity ratio of 2:1 or
2.5:1 is confirmed. However, a point of interest
is that the trench left by the — Y probe near the
engine is substantially wider and deeper than is
the probe or the mark left by the — Y probe near
the footpad. It is concluded that the first disturb-
disturbance of the soil by the probe, which was fol-
followed by engine exhaust impingement on the
soil, weakened the soil and permitted more ero-
erosion to occur in the vicinity of the first contact
of the probe. An indication of exhaust-flow chan-
channeling in the trench made by the probe exists.
None of the grooves left by the other probes has
this appearance; grooves left by other probes are
generally of uniform width and uniform depth.
The combination of the lateral component of
the LM velocity in the few seconds before touch-
touchdown and before the engine shutdown transient
probably caused little pressurizing of the soil by
the exhaust gas in any specific area. Postshut-
down gas-venting effects from the soil would
therefore be expected to be minimal. Quotation
11 indicates that the astronauts did not observe
any gas-venting effects during EVA, and Astro-
Astronaut Aldrin made the following comment (quo-
(quotation 15):
It was reported beforehand that we would prob-
probably see an outgassing from the surface after
actual engine shutdown, but, as I recall, I was
unable to verify that.
However, in an examination of the sequence-
camera film, although there is difficulty in corre-
SOIL MECHANICS INVESTIGATION
99
Figure 4-16. - The -Y footpad.
(NASA AS-11-40-5865)
lating events on the film with spacecraft events,
such as engine shutdown, a change in the erosion
pattern appears to occur at approximately the
same time as engine shutdown. Figures 4-17(a)
and 4-17(b), from the last few frames in the
film, show this transient effect, which may be
caused by either a change in the engine behavior
or by an outgassing effect. In figure 4-15 (in the
lower right corner and in the bottom of the pho-
photograph ), numerous fractures appear in the lunar
surface in the region that was disturbed by DPS
engine exhaust. Because the firing of a rocket
engine against a slightly cohesive soil in a vac-
vacuum results in a "plucking" type of erosion in
Figure 4-17. - Two of last
frames from the sequence camera at LM touchdown.
100
APOLLO 11 PRELIMINARY SCIENCE REPORT
which soil chunks are plucked out of the surface
and ejected (ref. 4-14), these fractures could be
an indication of incipient erosion of this type of
plucking erosion. In addition, venting of the ex-
exhaust gases from the soil surface after engine
shutdown also causes removal of the soil in
chunks or lumps when the soil is cohesive; there-
therefore, the cracks may be evidence of venting.
Astronaut Aldrin also remarked after touchdown
that he observed some rocks that were fractured,
possibly from the DPS engine exhaust.
Because the rocks returned have been found
to vary from being moderately hard to fracture
to being hard to fracture, it would seem unlikely
that any rock fragments were broken by the DPS
engine exhaust effects. Aldrin probably observed
soil clods or chunks that were removed by the
exhaust stream. It is not possible at present to
determine the cause of the fracturing.
During ascent from the lunar surface, the LM
descent stage is left, allowing the ascent engine
exhaust to impinge on the descent stage first. Soil
erosion is, therefore, minimized until the ascent
stage has reached an altitude that will allow the
exhaust to impinge on the lunar surface. Appar-
Apparently little or no erosion took place during the
ascent, as evidenced by the following exchange:
CAPCOM (quotation 16): "Did you notice
— was there any indication of any dust cloud
as you lifted off? Over."
Armstrong (quotation 17): "Not very much.
There was quite a bit of Kapton3 and parts of
the LM went out in all directions and usually
in the same distance as far as I can tell, but I
can't remember seeing anything of a dust cloud."
In addition, the solar panels and the dust de-
detector on the PSEP equipment, which were situ-
situated approximately 60 ft from the LM, showed
no signs of degradation from the lunar soil that
was blown away during the ascent.
Touchdown and P&netration
The low vertical velocity and the high lateral
velocity of the LM at touchdown resulted in
lower penetrations of the footpads into the lunar
surface and less stroking of the shock absorbers
than would be expected for a nominal landing.
'Kapton is an insulating material that was used in the
construction of the LM,
With respect to footpad penetration, the astro-
astronauts made several comments.
Armstrong (quotation 18): "I'm at the foot
of the ladder. The LM footpads are only de-
depressed in the surface about 1 or 2 in."
Armstrong (at 110:39 g.e.t.) (quotation 19):
"I don't note any abnormalities in the LM. The
pads seem to be in good shape."
Aldrin (quotation 20): "It's very surprising,
the surprising lack of penetration of all four of
the footpads. I'd say if we were to try and deter-
determine just how far below the surface they would
have penetrated, you'd measure 2 or 3 in.,
wouldn't you say, Neil?"
Aldrin (at 110:50 g.e.t.) {quotation 21);
"We are back at the — Z strut now. The stereo-
pair we are taking illustrate [the] very little
force at impact we actually had."
From these comments, it is apparent that the
range of footpad penetrations was 1 to 3 in. into
the lunar material that remained after most of
the DPS engine erosion of the surface had
occurred. This range is confirmed by the depths
of penetration visible in figures 4-13(a) and
4-13(b). In these photographs, it also appears
that some soil may have been deposited against
the footpad-to-ground contact region as a result
of rocket engine erosion after touchdown.
Alternatively, the soil that was plowed up by the
footpad in its lateral motion may have been
eroded by the DPS engine exhaust after touch-
touchdown.
The descent ladder on the LM is attached to
the fixed portion of the landing gear, and the
footpad, by compressing the shock absorber, can
move with respect to the ladder. This movement
decreases the distance from the bottom step of
the ladder to the footpad. With no compression
of the shock absorber, the distance is approxi-
approximately 3 ft. The astronauts' remarks show that
hardly any stroking of either the primary or the
secondary shock-absorbing struts occurred.
Armstrong (at 109:20 g.e.t.) (quotation 22):
It's not even collapsed too far, but it's adequate
to get back up ... it takes a pretty good little
jump."
Armstrong (quotation 23): "That's a good
step. About a 3 footer,"
CAPCOM (quotation 24): "Can you esti-
estimate the stroke of the primary and secondary
struts?"
Tranquility Base (quotation 25): "All the
SOIL MECHANICS INVESTIGATION
101
Figure 4-18, — Primary strut and
secondary strut of the +Y footpad
after touchdown. (NASA AS11-40-
5919)
struts are about equally stroked and the height
from the ground to the first step is about 3 ft
or maybe 3% ft,"
From figure 4-18, the stroking of the primary
shock can be estimated to be approximately 0
to 1 in.
It is apparent, therefore, that the astronauts
achieved an almost static landing on the lunar
surface with regard to the landing gear. For the
vertical load of approximately 700 Ib on each
LM footpad acting statically on a circular
loaded area resting on a Surveyor soil model
several feet deep, the radius of the contact
area would be approximately 9 in. With this
contact area, the required penetration of the
spherical footpad into a lunar surface consist-
consisting of the lunar soil model material previously
described is approximately 2.5 to 3 in., which is
close to the maximum penetration that was
observed. Lesser penetrations may be because of
the presence of rock fragments or stronger
material below the surface.
Soil Mechanics Observations During the EVA
The surface is fine and powdery. I can kick
it up loosely with my toe. It does adhere in
fine layers like powdered charcoal to the sole
and insides of my boots. I only go in a small
fraction of an inch — maybe an eighth of an
inch, but I can see the footprints of my boots
and the treads in the fine sandy particles.
These observations, made by Astronaut Arm-
Armstrong immediately after his first step onto the
surface of the Moon, provided the first "ground
truth" data against which previous conclusions
concerning the mechanical properties of lunar
surface materials could be examined. During the
2% hr of EVA, additional information became
available that can be extracted from the descrip-
descriptions and comments of the astronauts, television
photography, still-camera and sequence-camera
photography, returned samples, and postflight
simulations,
A more detailed account of the lunar surface
characteristics as deduced from lunar surface
102
APOLLO 11 PRELIMINARY SCIENCE REPORT
EVA is given in the following sections of this
report.
Genera/ Characteristics of ihe Landing Siie
The LM landed in a field of small, elongate, and
circular craters located at 0.67° N and 23.49° E;
a point approximately 130 m north and 600 m
west of West Crater, a relatively fresh, sharp-
rimmed ray crater that is approximately 200 m
in diameter, The crater is surrounded by ejecta
containing blocks ranging to more than 3 m in
size and extending 100 to 200 m from the crater
rim. Several hundred feet to the right of the LM,
in a northerly direction, there is a boulder field
with boulders a meter or larger in size. A hill was
estimated to be from % to 1 mile west of the LM.
The LM attitude on the surface was tilted to
the east 4.5° from the vertical and yawed left
(to the south) approximately 13°. The imme-
immediate region around the LM was relatively free
of rocks and was covered with craters varying
from approximately 100 ft to less than 1 ft in
diameter. Figure 4-19 is a plan view of the land-
landing site indicating major crater locations, other
topographical features, and astronaut activities.
Figure 4-20 is a photographic mosaic showing a
panoramic view of the landing site.
Although photographs show the surface at the
landing site to be relatively smooth, the real-
realtime impression of the crewmen was that the
site was very rough with many slopes, holes, and
ridges, and that the general topography con-
consisted of undulations 1 m or larger in amplitude.
Further conclusions regarding the lunar terrain
roughness characteristics at the landing site
await the construction of detailed topographic
maps.
Description of the Surface Material
The ground mass at the Apollo 11 LM landing
site is a fine-grained, granular material, consist-
consisting of bulky grains in the silt to fine-sand particle
size range. Larger rock particles, to 4 ft in size
and varying in shape and type, were distributed
throughout this material. Some of the rocks were
lying on top of the surface, others were partially
buried, and others were partially exposed with
the top part of the rock flat with the surface. The
only evidence of possible bedrock was in West
Crater. On the basis of observations of craters,
the astronauts reported absence of layering in
the subsurface material. On the surface, local
variations in coarse particle sizes did seem to
exist.
The color of the returned fine-grained material
was medium-dark-gray (N-3 to N-4 on the Geo-
Geological Society of America (GSA) color scale).
However, on the lunar surface, the color and
brightness of the material appeared to change
with the Sun angle and with the viewing angle. At
higher Sun angles, the color of the material was
toward the brown end of the spectrum, whereas
at low Sun angles, the color of the material was
toward the slate-gray end of the spectrum. The
down-Sun region was extremely bright and ap-
appeared to be light tan, whereas when the astro-
astronauts proceeded back toward the cross-Sun re-
region, the brightness of the surface diminished,
the surface color began to fade, and the material
began to appear more grayish-cocoa. In the
shadow, the lunar surface appeared to be very
dark. Although the astronauts were able to see
into the shadow, visibility was low. Regions dis-
disturbed by the spacecraft landing and the astro-
astronaut activities were considerably darker than the
undisturbed area, as may be seen in figure 4-21.
The degree of darkening that developed as a
result of disturbance appears to be a function of
the phase angle; i.e., angle between the Sun, the
point being observed, and the observer. It has
not yet been established conclusively whether
this darkening is caused by a change in surface
texture; i.e., particle sizes and roughness, as a
result of disturbance, or because the material
underlying a thin surface layer is actually darker.
A similar darkening phenomenon was observed
at the Surveyor landing sites and is discussed in
detail in the Surveyor reports.
The fine-grained surface material had a pow-
powdery appearance and was easily kicked free as
the astronauts moved on the surface. The par-
particles moved along ballistic trajectories according
to a definite pattern that seemed to depend on
the angle of impact of the boot with the lunar
surface. A small amount of material landed in a
linear pattern, but most of the material landed in
regions that were generally radially away from
the boots. Kicking at the same angle with differ-
different forces did not seem to make too great a
SOIL MECHANICS INVESTIGATION
103
Panorama station 1
I ^T-^-C^
Panorama station
t tt Shallow depression
¦ Very subdued crater
-r—r Subdued crater
¦n—rr Relatively sharp crater
<^ Rocks
d^> Core-2 region
Contingency-sample area
Bulk-sample area
Documented-sample area
*^*r: Disturbed areas; names with
sS^2 arrows where trails recoverable
-**tf Area swept by descent engine
SWC Solar-Wind Composition
LRRR Laser Ranging Retroreflector
PSEP Passive Seismic Experiment Package
TV Television camera
Pre-EVA shadow
Post-EVA shadow
<jp Jettison bag
ALSCC Apollo Lunar Surface Closeup Camera
u
1 1
10
1
5
In
, ,
0
III
!>
1
m
10
i
10
i
?n
i
Figuhe 4-19. — Preliminary traverse map of the Apollo 11 LM landing site.
difference in extending the pattern. The dis-
distribution of particles that struck the surface ap-
appeared to be uniform, and, apparently, the mate-
material did not move in its finest particulate size, but
tended to form clods approximately 5 to 10 mm
in size. As expected, and as was the situation
104
APOLLO 11 PRELIMINARY SCIENCE REPORT
Figure 4-20. - Photo mosaic showing the panorama of the landing site.
4-21. - Region in the vicinity of Tranquility Base showing the darker region that has
been disturbed by astronaut activities and the lighter colored, undisturbed
region. (NASA ASl 1-37-5516)
SOIL MECHANICS INVESTIGATION
105
with the surface soil erosion caused by the DPS
engine exhaust, kicking of the surface material
did not leave a residual, lingering dust cloud to
settle slowly to the surface.
Adhesive Characteristics
The loose, powdery, fine-grained surface mate-
material exhibited adhesive characteristics, as a result
of which the material tended to stick to any
object with which it came into contact, including
the astronauts' boots and spacesuits, the tele-
television cable, the Lunar Equipment Conveyor
(LEC), and the corners of the solar panels of
the PSEP that came into contact with the surface
during deployment of the seismometer. The larg-
largest particles that adhered to the spacesuit were
of fine-sand size. The majority of the particles
fell off the spacesuits when the LM strut was
kicked by the astronauts. However, discoloration
of the fabric meant that some of the particles
must have continued to adhere. Figure 4-22
shows Astronaut Aldrin and the substantial dis-
discoloration of his boots and spacesuit.
Adherence of the fine, powdery material to
the television cable and the LEC imposed some
operational problems. First, when the television
cable was coated with this dust, the cable
blended with the lunar terrain and was not easily
discerned by Armstrong who repeatedly be-
became entangled in the cable. Second, as the
LEC was operated, the powdery material adher-
adhering to it was carried into the spacecraft cabin,
posing a housekeeping problem. As the LEC
went through the pulleys, sufficient fine-grained
material collected in the pulleys so that they
Figure 4-22. — Astronaut Aldrin showing boots and suit
discoloration caused by adhering lunar soil. (En-
(Enlargement from NASA AS11-40-5903)
tended to bind. Armstrong commented, "You
can actually feel the gritty material getting
caught up in the rollers of the pulley." Then the
material that was shaken off came out on the
106
APOLLO 11 PRELIMINARY SCIENCE REPORT
downward side of the pulley, and Armstrong
further remarked:
The part of the LEC that was coining down
would rain powder on top of me, the MESA
(Modularized Equipment Stowage Assembly),
and the SRC's (Sample Return Containers) so
that we all looked like chimney sweeps.
The fine, powdery material also adhered to
lunar rock samples that were brought back to
Earth and left a trace of fine dust that coated the
core tubes that were returned to the LRL. This
material adhesion, however, was not of sufficient
magnitude to offer any resistance to pulling of
objects inserted into the lunar surface, such as
the SWC experiment staff, the flagpole, or the
core tubes.
Slipping of Dust-Covered Objects in Contact
With Each Other
The thin layer of material that adhered to the
soles of the astronauts' boots produced a ten-
tendency to slip on the LM ladder after EVA.
Similarly, the powdery coating of the rocks on
the lunar surface was observed to make the
rocks slippery. Study of particle shapes in re-
returned lunar samples has indicated a substantial
proportion of small (±50 fim) spherical particles.
The suggestion has been made that these small
spherical particles might behave in a manner
similar to ball bearings, giving rise to slipping
tendencies. The observed behavior is not un-
unusual, however; a fine terrestrial dust, when con-
confined between two relatively hard surfaces, such
as the astronaut boot and the spacecraft ladder
rung or the astronaut boot and a rock surface,
will also produce the same tendency to slip.
This slipping tendency disappears when a rela-
relatively solid body is moving in a large mass of
soil, as was the general case with the crew who
experienced no serious mobility problems in
walking, jumping, or loping; and reported that
adequate traction existed for starting, turning,
and stopping. The fact that the soil may contain
small spherical particles is relatively unimportant
with regard to this slipping tendency.
Deformation ancf Strength Character/sties
The nature of the data provided by the LM
landing and EVA dictated that analyses of the
strength and the deformation characteristics of
the lunar soil in the vicinity of Tranquility Base
must be primarily descriptive and qualitative
rather than quantitative. This is because no force
or deformation measuring devices were used
during the lunar surface activities. In general,
however, the soil behavior appears to have been
consistent with the behavior that would be ex-
expected for a soil having properties characteristic
of the soils studied at the Surveyor equatorial
landing sites. These properties were previously
summarized in this report.
Cohesion
The tendency of the fine-grained material to
form clods indicates that the material possesses a
small, but finite, amount of cohesion. In some
situations, soil clumps could not be distinguished
from rock fragments; however, when these soil
clumps were stepped on, they tended to crumble.
According to the astronauts, such clods of fine-
finegrained material constituted about 10 percent of
the blocky material that protruded above the
surface. Other evidence of the slightly cohesive
nature of the lunar soil was given by the follow-
following observations:
A) Initially loose and fluffy material readily
compacted under a load and retained the detail
of a deformed shape, as seen in figures 4-23 to
4-25. As a result, astronaut mobility on previ-
previously traversed surfaces was enhanced.
B) The material could stand unsupported at a
height of at least a few inches on vertical slopes,
C) During the bulk-sample collection, it was
observed that as the scoop cut through the lunar
soil, the remaining material left a sharp, solid
edge. The material that went into the scoop,
however, crumbled with no evidence of aggre-
aggregation of the particles.
D) The holes made by the core tubes ap-
appeared to remain intact upon the removal of the
tubes.
E) When the core tubes were rotated to an
inverted position to keep the core sample from
coming out, there was no tendency for the mate-
material to pour out. According to Aldrin when
the core-tube bit was removed, "The surface
seemed to separate again without any tendency
for the material to flow or move." The material
SOIL MECHANICS INVESTIGATION
107
AS 11 -40-5876)
(NASA
Figure 4-24.— Same surface as shown in figure 4-23
after having been stepped on by an astronaut. Note
the bulged and cracked region in front and to the
sides of the footprint. (NASA AS 11-40-5877)
Fzgure 4-25. - Typical astronaut footprints on the lunar surface in the vicinity of the flagpole,
(Enlargement from NASA AS 11-40-5874)
108
APOLLO 11 PRELIMINARY SCIENCE REPORT
collected at the bottom of the core tube had an
appearance similar to that of a moist terrestrial
soil. According to Aldrin:
It was adhering or had the cohesive prop-
property that wet sand would have. Once it was sep-
separated from the cutter, there was no tendency
at all for it to flake or to flow.
Frktionai Characteristics
Although the surface layer behaved as if it
were loose and readily deformable when tmcon-
flned, confinement of the soil led to a signifi-
significant increase in resistance to deformation — a
characteristic of soils deriving a large portion
of their strength from interparticle friction. Rele-
Relevant material properties can be assessed from the
observations in the following paragraphs.
A) Relatively small footpad penetrations of 1
to 3 in. were observed. As noted previously, the
landing was essentially static. For penetrations
in the 1- to 3-in. range, the static bearing pres-
pressures exerted by the LM on the lunar surface
would be in the range of 2.1 to 0.8 psi. For a
Surveyor soil model with a density of 1.5 g/cc,
a cohesion of 0.1 psi, and a friction angle of 35°,
the bearing capacity would be 9.1 psi for the LM
footpad contact area, corresponding to a 1-in.
penetration, and 11.5 psi for the LM footpad
contact area, corresponding to a 3-in. penetra-
penetration. These values are based on the following
equation for ultimate bearing capacity quit on
level ground, according to the Terzaghi theory
for incompressible deformation under a strip
footing adjusted for a circular loaded area:
guit=1.2cNc+0.4ByNY+1.2DyNa D-1)
where y is the unit weight of the soil, B is the
diameter of the loaded area, c is the unit co-
cohesion of the soil, D is the depth of the footing,
and Nc, N-y, and Ng are bearing capacity factors
that depend on the angle of internal friction $
of the soil.
On this basis, the pressures applied by the LM
footpads are seen to be several times less than
the probable ultimate bearing capacity, and,
therefore, the small observed values of footpad
sinkage would be expected. Because of the small
magnitude of lunar gravity, the relatively small
width of the loaded area, and the shallow depth
below the surface at which the load is applied,
the first term of equation D-1) accounts for the
greatest portion of the bearing capacity. Thus
the cohesion, in spite of its small value, is a key
characteristic of the lunar soil with regard to the
ability of the soil to support bearing loads. In
the analysis discussed previously, if a unit cohe-
cohesion of 0.05 psi had been assumed rather than
0.1 psi, the corresponding bearing capacities
would have been reduced to 6,2 and 8.6 psi.
B) The depth of astronaut footprints was rela-
relatively small. Typical footprints shown in figure
4-25 correspond to sinkages of the order of one-
half inch. From the known weight of a space-
suited astronaut, approximately 64 lb in lunar
gravity, and one boot sole area, approximately
65 in.2, the static bearing pressure when the
astronaut weight was applied on one boot was
approximately 1 psi. From the known boot di-
dimensions, 13 in. in length and an average width
of 5% in., the boot may be assumed to behave as a
strip footing. Using the soil model previously
discussed, bearing capacities of 3.8 psi and 6.3
psi are computed for unit cohesions of 0.05 psi
and 0.10 psi, respectively. Again, the applied
stresses are well below the ultimate bearing
capacity. It is important to recognize that while
the first term, the cohesion term, of the bearing
capacity equation D—1) dominates, the value of
Nc increases almost exponentially with increases
in the friction angle. Thus, only because the
lunar soil is dominantly frictional in nature can
the cohesion term assume larger values (rela-
(relatively) for the small unit cohesion.
C) The bearing strength of the material sup-
supporting the PSEP (fig. 4-4) appeared to increase
with increased confinement. Both the PSEP and
the Laser Ranging Retroreflector (LRRR) exper-
experiment were placed on essentially soft material.
Thus, the crewmen could "jiggle the packages
down and get them reasonably set into the sand."
However, once the PSEP pallet was firmly set
into the lunar soil, the astronauts experienced
considerable difficulty in "getting it to sink down a
little more on one side," in an attempt to change
the slope of the PSEP.
D) The soft spots encountered during EVA
were observed by both astronauts to be located at
the rims of fresh craters only a few feet in diam-
diameter that consisted of loose, very fine-grained
material with essentially no large rock fragments
SOIL MECHANICS INVESTIGATION
109
Figuhe 4-26. — Astronaut footprints
at the top edge of a soft-rimmed
crater. (NASA AS 11-40-5946)
present. The astronauts commented that if a man
stepped on the ejecta of such craters away from
the crater rim, his foot might sink only a few
inches. However, close to the rim (especially on
the upper edge of the inside- slope), where the
material is loose and relatively unconfined, the
foot might sink as much as 6 to 8 in. Astronaut
footprints left at the soft rim of such a crater can
he seen in figure 4—26.
Close examination of this photograph (fig. 4-
26) suggests that failure was incipient on the
crater slope adjacent to the deep footprint (closest
to the crater edge in the foreground). The com-
combined weight of the astronaut and the EASEP
package, which he was carrying while walking
by the crater rim, produced a unit bearing pres-
pressure of 1.4 psi on one boot area in the lunar grav-
gravity field. By using Meyerhofs bearing capacity
factors (ref. 4-15) for foundations on slopes, the
relationships shown in figure 4-27 may be devel-
developed for different values of slope angle, friction
angle, and cohesion, and for the boot dimensions
given previously.
30 35 4Q
Friction angle, deg
45
Figube 4-27. — Bearing capacities under astronaut boot
adjacent to slopes, for various soil conditions.
110
APOLLO 11 PRELIMINARY SCIENCE REPORT
Although the exact slope angle of the crater
wall has not yet been determined, preliminary
estimates indicate the slope angle to be approxi-
approximately 30°. From figure 4-27, it may be seen
that for a 30° slope angle, a friction angle of 35°,
and a cohesion of 0.05 psi, failure would be in-
incipient. If the unit cohesion were 0.10 psi, the
bearing capacity should be higher. It should be
noted, however, that the computations have been
based on failure in general shear (incompressible
deformation). In fact, figure 4—27 shows that
much of the boot sinkage involves compression;
thus, the estimated bearing capacities are high.
It appears, therefore, the assumed soil properties
account reasonably well for the observed
behavior.
Deformation Characteristics
Although many of the footprints appear to
have resulted from soil compression, in one
instance footprints 2 to 3 in, deep were reported
to be accompanied by bulging of the surrounding
surface and by the formation of cracks extending
to distances of several inches. An example of
this type of soil deformation can be seen in
figure 4-24, Such deformation behavior reflects
the presence of cohesion and deformation domi-
dominated by shear rather than by compression. Such
deformation behavior is consistent with the be-
behavior that was observed in some of the bearing
tests conducted by the surface sampler during
the Surveyor 3 and Surveyor 7 missions. In gen-
general, the deformation behavior of the lunar sur-
surface soil appears to involve both shear and com-
compression.
Subsurface Conditions
Several observations made by the astronauts
during the EVA indicate that the soft surface
material extends only to a depth of a few inches
throughout the Tranquility Base region, as evi-
evidenced by either static or dynamic penetration
resistance. Pertinent observations included the
following:
A) A hard surface was encountered at depths
of 1 to 3 in. during contingency sampling.
Because the contingency sample was taken from
a point close to the LM (i.e., in a location which
probably had been eroded by the DPS engine
exhaust) the original thickness of soft material
may have been greater than the observed thick-
thickness.
B) The bulk sample could be scooped readily
only to depths of 1 to 3 in. This sample also was
taken from a region close to the LM.
C) The flagpole (fig. 4-28) penetrated approxi-
approximately 7 in. into the soil. This penetration
was estimated from the distance of the knurled
markings on the pole above the surface. The
first 4 or 5 in. were easy to penetrate. After
these first 4 or 5 in., the resistance to penetration
by the underlying soil increased. However, the
lunar soil apparently did not provide high fric-
tional support along the shaft because upon
ingress into the LM, the astronauts noticed that
the entire unit had rotated about the flagpole
axis and that the flag no longer pointed in the
same direction that it did when originally in-
installed. Whether the flagpole actually tipped
slightly is not clear from the available informa-
information. Preliminary analysis of the possibility of
failure similar to that for a laterally loaded pile
indicates that for Surveyor model soil properties,
such a failure should not develop under the mag-
magnitude of lateral loading induced by the flag,
D) The SWC experiment staff (fig. 4-29) pene-
penetrated the surface to a depth of only 5 to 5XA in.,
as can be estimated from the knurled markings of
the staff that were visible above the surface.
The staff was reported not to be as stable as
desired, indicating that while resistance to verti-
vertical penetration was high, adhesion of the soil
along the shaft was low.
E) Both core tubes driven into the soil in
the immediate vicinity of the SWC (fig. 4-29)
were easily pushed into the surface to depths of
3 to 5 in. Further penetration of only approxi-
approximately 2 in. was accomplished, and this further
penetration required that the astronaut hammer
as vigorously as possible — to the degree that the
hammer dented the extension handle attached
to the core tube. The core tubes were also re-
reported to remain loose in the soil. They did not
remain in place and could be pulled from the
soil without resistance. The current core-tube
design did not allow for the return of the driving
bit. Examination of the bit and its contents after
driving would have provided valuable informa-
information on the nature of the deeper subsurface
material,
SOIL MECHANICS INVESTIGATION
111
Figure 4-28. - Flagpole penetration of the lunar surface. (NASA ASl 1-40-5905)
Figube 4-29. — Astronaut driving core tube near the deployed SWC experiment.
112
APOLLO 11 PRELIMINARY SCIENCE REPORT
F) Only one observation suggested that the
soft layer in the immediate vicinity of the LM
extended to a depth of more than 6 in. Follow-
Following collection of the contingency sample, Arm-
Armstrong commented that he could push the sampler
handle approximately 6 to 8 in. or more into the
surface. It is not clear, however, whether this was
indicative of a deep soft layer. Photographs ob-
obtained with the sequence camera indicate that
the sample holder was pushed into the ground
in the same region where the contingency sample
had been collected. Thus, the sampler holder
may have penetrated soil that had been previ-
previously loosened by sampling activities.
Discussion
Whether the high resistance to penetration
was due to bedrock, heavily consolidated
soil, or a layer of rubble cannot be determined
from the available data. The astronauts made
the following comments:
Various tools were pushed into the ground to
various depths on numerous occasions. Experi-
Experience was always the same on this wide variety.
On some occasions, rock would be hit and it
was clearly evident when that occurred. When
buried rocks were hit, it was known that a rock
had been hit. In most other instances, it was
quite different. The tool would just go in, the
force would keep getting higher and higher,
and suddenly it just wouldn't go further.
In discussing the resistance exhibited by the
subsurface material to core-tube driving, both
astronauts excluded the possibility of the core
tubes hitting a rock layer or rock fragments.
Under the impact of successive blows of the
same intensity on the core tube, the correspond-
corresponding core-tube penetrations appeared to decrease
exponentially. Also, no discontinuity appeared to
exist in the material hardness. The material was
more compact and more cohesive as the tube
was driven in deeper.
Data obtained with the surface sampler during
the Surveyor 3 and Surveyor 7 missions indicate
that the density and strength of the lunar soil in-
increases with depth. This fact and the fact that
ultimate bearing capacity increases with depth
mean that resistance to penetration should in-
increase with depth of penetration.
From the results of tests on a lunar soil simu-
simulant (ground basalt) reported by Mitchell et al.
(final report on NASA contract NAS 8-21432), it
was deduced that the resistance to penetration
by flat-ended rods pushed into the actual lunar
soil should increase by approximately 3 psi for
each inch of penetration if the bulk density of
the soil was the same as that of the core-tube
lunar soil samples returned to Earth. (See follow-
following sections.)
Data from simulations by space-suited astro-
astronauts under reduced gravity conditions have
established that an astronaut should be able to
exert a downward force of approximately 20 lb
on the lunar surface. By using these data and
by assuming no significant increase in the
strength or density of the lunar soil, table 4—1
has been prepared to compare values of observed
lunar surface penetrations with predicted values.
In the computations, it has been assumed that
the penetrators, although hollow, became
plugged at a shallow depth of penetration and
subsequently behaved as flat-ended penetrators.
From the results listed in table 4—1, it appears
that the resistance to penetration of the lunar
soil can be accounted for in each instance with-
without postulating the presence of an overconsoli-
dated layer, a cemented layer, or bedrock. It does
not follow, however, that such a layer did not
exist at any or all of the locations. This could
Table 4-1. Comparison of observed and predicted lunar surface penetrations
Penetralor
Contingency sampler handle
Flagpole
Core tube
SWC staff
Diameter,
in.
0.625
0.875
1.31
1.34
Area,
infi
0.31
0.60
1.35
1.41
Depth of
penetration,
in.
>6to8
7
3 to 5
5 to 5.5
Predicted penetration
to 20-lb resistance,
in.
21.5
11
5
4.75
SOIL MECHANICS INVESTIGATION
113
only be determined by additional subsurface
exploration; i.e., by digging down several inches.
The high resistance to driving of the core
tubes into the lunar surface to depths greater
than approximately 6 in. cannot be accounted
for by tlie previous arguments because core-tube
driving involves dynamic penetration. It may be
noted, however, that the hammer used to drive
the core tube had a mass of only 827.4 g. In addi-
addition, Astronaut Aldrin reported that he was un-
unable to strike the core tube as hard as he would
have liked because of the need to steady the tube
with one hand, resulting in a restraint on his
freedom of movement.
Astronaut and Lunar-Roving-Vehicle
Mobility Considerations
As expected, the soil conditions at the landing
area did not pose serious restraints on astronaut
mobility. The lunar surface provided adequate
bearing strength for standing, walking, loping,
and jumping; and sufficient traction for starting,
turning, and stopping. The %-g lunar gravity
conditions provided a pleasant environment in
which to work and to maneuver objects. The
astronauts quickly adapted to it. As Aldrin com-
commented,
When your feet are On the surface, you can do
fairly vigorous sideways movements such as
leaning and swinging your arms without a tend-
tendency to bounce yourself up off the surface and
lose your traction.
Walking on the surface tended to compact the
loose, virgin material. Accordingly, crew mobility
was enhanced in previously walked-on regions.
Also, from the appearance of the footprints left
on the surface, the boot ribs appeared to increase
traction.
Confidence in walking on virgin areas was
lowered by two factors: A) the tendency to slip
when the boot was in contact with dust-covered
rocks and B) the variability in the softness char-
characteristics of the lunar surface with little appar-
apparent change in the local surface topography. How-
However, these factors did not seriously hinder EVA
or astronaut performance on the lunar surface.
As expected, small, fresh crater walls having
slope angles of 15° or less could be readily nego-
negotiated by the astronauts, although it appeared
that going straight down and straight up the
slopes would be preferable to sideways traversing
of these slopes. As Aldrin commented, "The
footing is not secure because of the varying
thickness of unstable material which tends to
slide in an unpredictable fashion."
The material on the rims and the walls of
larger sized craters, with crater-wall slope angles
ranging to approximately 35°, appeared to the
astronauts to be more compact and more stable
than the material on the craters that were tra-
traversed. Both astronauts remarked that if time
had permitted, they would have ventured to the
bottoms of these craters.
Commenting on potential problems in the
operation of a lunar roving vehicle on the lunar
surface, the astronauts remarked that the main
concern would not be the consistency and me-
mechanical behavior of the soil, but rather the gen-
general topography, and roughness characteristics of
the lunar surface, the human tendency to under-
underestimate distances, and the poor ability to dis-
discern the local vertical and to have a good defini-
definition of the horizon. All these factors would tend
to restrict the operational speed of a lunar roving
vehicle. However, no insurmountable problems
appear to exist.
Soil Mechanics Observations at the LRL
The Soil Mechanics Team observed the prop-
properties of the lunar soil from the documented,
core-tube, bulk, and contingency samples in the
vacuum chamber and in nitrogen cabinets. In
addition, the team performed a specific-gravity
test and determined the density and resistance
to penetration of fine-grained lunar material
placed loosely in a container and also compacted
in layers.
Vacuum Chamber
The outsides of the sample boxes were cleaned,
and the boxes were then introduced into a spe-
special vacuum chamber, which is equipped with a
set of spacesuit-type arm-length gloves that per-
permit a technician to process and handle the
samples under vacuum conditions. The gloves
consist of an inner set and an outer set separated
by low-pressure nitrogen gas (at 1 to 2 /u.m) that
continually leaks into the chamber, limiting the
Figure 4-30. — Lunar sample in the vacuum chamber. (LRL photograph S-69-45016)
chamber pressure to approximately 10 6 T. This
pressure is significantly greater than the pres-
pressures used in high-vacuum work in the study of
ultraclean soil particles (refs. 4-16 to 4-19).
However, water and organic molecules have
been carefully eliminated from the system in
order to produce a very clean vacuum.
The first sample box to be opened was the
documented-sample box, which was the second
one packed and sealed on the lunar surface. This
sample box contained the roll of aluminum foil
from the SWC experiment, the two core tubes,
and approximately 20 lunar rocks. Except for the
contents of the core tubes, the only soil in the
documented-sample box was a small amount that
had adhered to the rocks. Figure 4-30 shows
one of these rocks placed on a viewing stand
in the vacuum chamber. The positioning opera-
operation has shaken loose some of the soil. Micro-
Microscopic examination of this soil revealed that it
consisted of two basic sizes. The larger size frac-
fraction, comprising only 1 to 2 percent of the sam-
sample, consisted of clear, translucent, angular to
subangular smooth particles that were 50 to 200
/xm in size. The smaller size fraction consisted
of brown, opaque particles, 2 to 10 ^m in size,
which occurred individually and in clusters. Be-
Because this soil had adhered to the rock, it is not
necessarily representative of the lunar soil.
Core-Tube Samples
The core-tube samples were especially impor-
important because of the likelihood of being less dis-
disturbed than the bulk samples, which had been
scooped up with the shovel, and also of retaining
some of the stratigraphic structure, if any, of the
lunar surface. The core tubes were transferred
from the vacuum chamber to the Biological
SOIL MECHANICS INVESTIGATION
115
Preparation Laboratory (BPL), where they were
placed in one of the stainless-steel cabinets and
surrounded by dry, sterile nitrogen gas at slightly
less than atmospheric pressure. Core tube 2 con-
contained a sample (fig. 4-31) 2.0 cm in diameter,
13.5 cm in length, and weighing 65.1 g, giving an
average bulk density of 1.54 ±0.03 g/cc. The
sample consists of a fine-grained granular ma-
material which was remarkably uniform in color,
charcoal-gray with a slight brown tinge. There
were fine reflecting surfaces over approximately
10 percent of the surface area, which gave the
sample a sparkly appearance.
The phenomenon of the color difference be-
between the surface and subsurface material ob-
observed by the astronauts and during Surveyor
experiments was not confirmed in the core-tube
samples. The sample had some cohesion and,
therefore, retained its cylindrical shape after the
top half of the split tube had been removed (fig.
4-32). In probing the sample, the action of the
spatula indicated that the soil cohesion was slight,
but was sufficient to hold small clumps of fines to-
together. There appeared to be no variation in
structure with length along the sample. A very
slight color difference between the upper half
and the lower half of the sample suggested some
stratification, but probing revealed no discernible
differences in the mechanical properties of the
two halves.
About half of the sample, a total of 26.73 g,
was removed along the length of the core (fig.
4-32) and placed in a nest of sieves. At this
point it was found that the soil sample did not
consist of fine particles only but contained a
range of particle sizes. The larger particles were
angular, dark, and glassy; some of the larger
particles had vesicles in them. The very fine par-
particles tended to form, break, and re-form lumps
when shaken, as though the soil were slightly
damp (fig. 4-33); although the grain-size distri-
distribution curve (fig. 4-34) indicates a fine, silty
sand with a gravel trace, the aggregation of very
fine particles during sieving may have biased the
results toward the coarser size range.
Core tube 1 (fig. 4-35) contained a smaller
sample, which was 2.0 cm in diameter, 10.0 cm
in length, weighing 52.0 g, and giving an average
bulk density of 1-66 ± 0.03 g/cc (fig. 4-36).
The surface color of the soil was essentially the
same as that of the soil in core tube 2. However,
this sample contained numerous small cracks and
voids that were not taken into account when
computing its average bulk density. The soil was
found to have the same consistency as the sample
in core tube 2. Its grain-size distribution was
determined by sieving, and the results have been
plotted in figure 4-34.
For both core samplers, the core bit was flared
inward at 15°, i.e., in the opposite direction from
most terrestrial samplers. Thus, the soil was
probably deformed considerably during sam-
sampling and the measured bulk densities are not
necessarily indicative of the inplace lunar soil
bulk density.
A specific-gravity test was performed on the
material that had been removed from the core
tubes for the sieve analyses. By using a gas com-
comparison pycnometer, the total volume of the
individual grains was determined to be 15.75 cc;
and the total weight was 49.12 g. These values
yield a specific gravity of 3.1, which is consider-
considerably higher than the typical value of 2.7 for ter-
terrestrial soils. The difference is partially attributed
to the large amount of titanium oxide F percent)
found in the core-tube soil sample.
Having determined the specific gravity of the
solid particles, the void ratio e of the soil in the
core tubes can be calculated from the following
equation:
e = %-l D-2)
where G is the specific gravity of solids, ya is the
density of water, and y is the bulk density of the
soil.
Substituting in equation D-2) the measured
values of G and y for the soil samples in core tube
1 and core tube 2, and letting y<o=l g/cc, the
void ratio ei for the soil in core tube 1 is 0.87,
and the void ratio &> for the soil in core tube 2
is 1.01.
Similarly, the porosity n can be determined
from the following expression:
n~
l + e
D-3)
By using equation D-3) the porosity «i of the
soil in core tube 1 is 46.5 percent and the porosity
ri2 of the soil in core tube 2 is 50.1 percent.
116
APOLLO 11 PRELIMINARY SCIENCE REPORT
Figure 4-31. - First core tube (core tube 2) opened in the Biological Preparation Labora-
Laboratory. (LRL photograph S-69-45930)
Figure 4-32. ~ Core tube 2 after dissection. (LRL pho-
photograph S-69-45536)
Figure 4-33. - Soil retained on sieve 140 @.105 mm)
from core-tube-2 sample. (LRL photograph S-69-
45107)
SOIL MECHANICS INVESTIGATION
117
10
Bulk sample
(less than 1-mm
material)
Core tube 1
' (s/n 2007)
1 0.1
Sieve opening, mm
0.01
18 35
200 400
140 325
Sand -
Sieve no.
FicunE 4-34. — Grain-size distribution curves of returned
lunar soil samples.
Figure 4-35. — Lunar soil sample contained in core
tube 1. (LRL photograph S-69-45048)
Contingency Sample
The contingency sample was the first surface
sample that was collected on the Moon within
minutes after he stepped off the LM footpad.
Armstrong scooped up the lunar material in fish-
fishnet style, discarded the contingency-sampler
handle, folded over the open end of the Teflon
bag, and put the sample bag into a pocket that
was sewn to the outside of his spacesuit. This
sample was given the name contingency sample
because if the mission had been terminated, at
least 500 g of lunar material would have been
returned to Earth.
The contingency-sample bag was not vacuum
sealed, as were the bulk-sample boxes and the
documented-sample boxes, and the bag was ex-
exposed to the atmosphere in the LM. However,
the behavior of the soil in the contingency sam-
sample was essentially the same as the behavior of
other soil samples.
Although no specific-gravity determinations
were made on the fine-grained material, several
of the rocks were analyzed by the Preliminary
Examination Team by means of a gas comparison
pycnometer. Specific-gravity values ranging from
3.2 to 3,4 were obtained; these were slightly
higher than the value obtained by the Soil Me-
Mechanics Team for the specific gravity of the soil
from the core tubes. However, it should be noted
that the volume of the rocks tested varied from
Figuhe 4-36. — Soil particles from the gas reaction sam-
sample. (LRL photograph S-69-45181)
2.5 to 5 cc, Previous experience with the type of
pycnometer used has shown that at least 10 cc
are necessary for accurate results; thus, the spe-
specific gravity value for the rocks should not be
considered definitive.
Gas Reaction Sample
The gas reaction sample consisted of fines
taken from the bottom of the documented-sample
box. This sample was examined microscopically
and revealed the presence of small spherical par-
particles mentioned previously. Although some me-
metallic spheres were found, these particles con-
118
APOLLO 11 PRELIMINARY SCIENCE REPORT
sisted primarily of glasses. Selected glass spheres
and mineral grains are shown in figure 4-36; the
background in the photograph is an aluminum
pan. The lunar soil grain shape can be seen to
vary within a wide range from angular to well
rounded.
Bulk Sample
The bulk sample was collected by Astronaut
Armstrong during EVA after the contingency
sample and prior to collection of the documented
sample. The bulk sample consisted of rock and
soil samples that were scooped up from the lunar
surface and were sealed in a separate vacuum
box. The bulk-sample box remained sealed in
another part of the vacuum chamber in the LRL
while the documented-sample box was opened
and its contents were examined.
While the documented samples were being
processed, a leak developed in one of the vac-
vacuum gloves; as a consequence, the bulk-sample
box, which had retained its integrity, was
moved to the cabinets in the Biological Prep-
Preparation Laboratory. There the bulk sample was
processed in dry, sterile nitrogen at atmospheric
pressure.
The relative ease of working in these cabinets,
and the capability to sustain simultaneous oper-
operations by several operators, provided an oppor-
opportunity to perform simple tests that would have
been impossible to perform in the vacuum cham-
chamber. These tests were the determination of the
bulk densities of loosely deposited and compacted
lunar soil as well as the resistance to penetration
of the soil at these densities. Although more ex-
extensive testing would have been preferred, under
the circumstances the data are extremely valu-
valuable.
Before performing these tests, the Soil Me-
Mechanics Team observed the processing of the bulk
sample, beginning with the separation of the
30 lb of rock and soil into three sizes of fractions
(coarser than 10 mm, coarser than 1 mm, and
finer than 1-mm size). As the sample was being
transferred from the box to the set of sieves, using
the scoop, clean, smooth vertical walls approxi-
approximately 3 in. deep and similar in appearance to
the trenches dug in the lunar surface by Surveyor
3 and Surveyor 7 were cut in the soil mass. This
characteristic behavior indicates the significant
amount of cohesion of the lunar soil, which ap-
apparently is unaffected by exposure to nitrogen
gas at atmospheric pressure. However, it should
be noted that the atmosphere in the cabinets is
not pure nitrogen, but contains oxygen, water
vapor, and organic molecules. On the other hand,
because the minerals in the soils and on the
rocks were found by geologists to be remarkably
unw,eathered, it is, therefore, to be expected that
long-term exposure of the lunar materials to the
atmosphere in the nitrogen cabinets will alter
their properties.
The cohesion and the dark charcoal-gray
brownish color of the lunar soil masked the pres-
presence of even sizable rocks within the soil mass.
When a scoopful of soil that appeared to consist
of only fine-grained material was placed on the
10-mm sieve, several fragments approximately 3
cm in size were retained as the soil fell through
the sieve mesh. This masking property may ex-
explain why only few rocks appeared to have been
excavated by Surveyor 3 and Surveyor 7. On the
other hand, the lunar soil does not appear to be
significantly adhesive; in most cases, it formed
only a fine dust layer on stainless-steel tools,
although in some instances removal of lunar soil
that had adhered to the sides of the sieve could
only be accomplished by scraping off the soil.
Penetration tests were performed on the soil
fraction with grains finer than 1 mm in size.
The grain-size distribution of this soil is shown
in figure 4—34. The soil was first placed as loosely
as possible into a sample can (with a height of
5.1 cm and a diameter of 8.85 cm), and its bulk
density was determined to be 1.36±0.01 g/cc.
This density corresponds to a void ratio of 1.28
and a porosity of 56 percent (table 4—II). The
minimum density of the lunar soil at M g should
be less than this value, because a looser soil
structure would develop as a result of the adhe-
adhesive forces acting between the soil particles.
Taele 4—II. Packing characteristics of loosely
deposited and compacted lunar soil
Slate
Loose
Compacted
Density,
g/cc
1.36+0.01
1.80+0.01
Void ratio''
1.28
.72
Porosity,
percent*
56.0
41.8
"Calculated from measured specific gravity of 3.1.
SOIL MECHANICS INVESTIGATION
119
A simple penetrometer was pushed into the
surface of the loose soil sample five times. In
four tests, the Jt-in.-diameter penetrometer did
not meet with sufficient resistance to compress
the spring. During the fifth test, the back end of
the penetrometer (with an area of 0.416 in.2)
was used and the force and penetration were
measured. Pertinent data are shown in table
4—III and in figure 4-37. In all five tests the soil
failed in a punching mode, as can be seen in
figure 4-38.
In a second series of tests the soil was placed
in the sample can in several layers and was com-
compacted by rodding, tapping, and compressing. In
this dense state the bulk density of the soil was
determined to be 1.77±0.01 g/cc, corresponding
to a void ratio of 0.75 and a porosity of 42.8 per-
percent. Six penetration tests were conducted, and
the data are shown in table 4-III and figure 4-37.
The data show a considerable increase in the
penetration resistance of the compacted lunar
soil. In addition, the failure mode was one of
classical, incompressible shear with well-defined
radial and circumferential cracks and heaving
of the surrounding soil (fig. 4-39).
The soil was compacted again in an attempt to
achieve a denser state. The resulting bulk density
of the soil was determined to be 1.80±0.01 g/cc;
corresponding to a void ratio of 0.72 and a poros-
porosity of 41.8 percent. A two-stage penetration test
was performed which indicated a further increase
in the penetration resistance due to compaction.
Figure 4-39 shows the results of this test.
Preliminary analysis of the penetration data
has revealed the following;
A) The resistance to penetration of the dense
soil is more than 20 times greater than the re-
resistance to penetration of the loose soil.
.5
D
A
D ?
a
i
20
Pressure,
Symbol
o
a
A
30
psi
Bulk density.
1.36
1.77
1.80
i n
40 °^
g/cc
_J
50
10
Figure 4-37, — Penetration versus resistance to penetra-
penetration of loose and compacted lunar soil sample.
Figure 4-38. — Penetration of loose lunar soil sample.
(LRL photograph S-69-47484)
Figure 4-39. — Penetration of compacted lunar
sample. (LRL photograph S-69-47489)
soil
B) The cohesion for the dense soil ranges
from 0.05 to 0.20 psi.
C) The cohesion does not appear to be
affected by short-term exposure to nitrogen and
trace amounts of oxygen, water, and organic
materials at atmospheric pressure.
D) If the lunar surface soil in the LRL nitro-
nitrogen cabinet is compacted to a density close to
the maximum bulk density of the returned sample,
the soil offers sufficient resistance to penetration
to account for the behavior observed by the
astronauts when they pushed various tools into
the lunar surface material.
Summary and Conclusions
The upper centimeters of the surface material
in the vicinity of Tranquility Base are character-
characterized by a brownish, medium-gray, slightly co-
cohesive granular soil, which is largely composed
of bulky grains in the silt to fine-sand size range.
120
APOLLO 11 PRELIMINARY SCIENCE REPORT
Table 4-III. Lunar soil bulk sample. Penetration test results
Test
number
1
2
3
4
5
6
7
8
9
10
11
12(a)
12(b)
Densi/y,
g/cc
1.36
1.36
1.36
1.36
1.36
1.77
1.77
1.77
1.77
1.77
1.77
1.80
1.80
Force,
1b
<0.41
<.41
<.41
<-41
.69
<.4l
1.22
.41
2.20
1.30
8.70
6.50
17.95
Area,
in.z
0.049
.049
.049
.049
.416
.049
.049
.049
.049
.049
.416
.416
.416
Pressure,
psi
<8.3
<8.3
<8.3
<8.3
1.65
<8.29
24.8
8.29
44.7
26.5
20.7
15.6
43.1
Penetration,
in.
0.25
.77
.77
.77
.79
.32
.67
.25
1.00
.83
.67
8.26
\77
Pressure-penetration
ratio, psi/in.
—
—
—
.—
2.1
26.3
37.0
—
44.7
31.9
30.9
60.9
55.9
* The penetrometer was pushed into the soil
again at the same place until a total penetration
to a maximum penetration of 0.26 in.; then it was removed and applied
of 0.77 in. was recorded from the original surface of the sample.
Angular to subrounded rock fragments are dis-
distributed throughout the area. Some of these
fragments are lying on the surface; some are
partly buried, and some are barely exposed.
The lunar surface is relatively soft to depths
ranging from 5 to 20 cm. The soil can be easily
scooped, offers low resistance to penetration,
and provides low lateral support for staffs, poles,
or core tubes. Beneath this relatively soft sur-
surface, the resistance of the material to penetration
increases considerably.
The mechanical behavior of the lunar soil
can be summarized as follows:
Confinement of the loose material leads to a
significant increase in resistance to deformation,
which is a characteristic of soils deriving a large
portion of their strength from interparticle fric-
friction.
The soil has a small amount of cohesion. This
was evidenced by the following observations:
A) The soil has the ability to stand on vertical
slopes and to retain the detail of a deformed
shape. The sidewalls of trenches dug with the
scoop were smooth with sharp edges.
B) The fine grains stick together and, in some
locations, the astronauts found it difficult to dis-
distinguish soil clumps from rock fragments.
C) The holes made by the core tubes were
left intact upon removal of the tubes.
D) The material collected at the bottom of
the core tubes did not pour out when the core
bit was unscrewed.
Natural clods of fine-grained material crum-
crumbled under the astronauts3 boots. This may be
indicative of some cementation between the
grains, although LRL tests indicated that the
soil grains tended to cohere again after being
separated.
Most of the footprints indicate that the low
unit loads of approximately 0.7 N/cm2 A psi)
imposed by the astronauts caused compression of
the lunar surface soil, although bulging and
cracking of the soil adjacent to a footprint oc-
occurred in a few instances. The latter observation
indicates shearing rather than compressional de-
deformation of the soil,
The lunar surface soil was eroded by the LM
DPS engine; some of the particles removed dur-
during this erosion were observed to travel a con-
considerable distance.
Available information indicates that the LM
landing was achieved under essentially static-
loading conditions as far as the landing gear was
concerned. The relatively small LM footpad
SOIL MECHANICS INVESTIGATION
121
penetrations of 2.5 to 7.5 cm {1 to 3 in.) corre-
correspond to average static-bearing pressures of 0.6
to 1.5 N/cm2 @.8 to 2.1 psi).
Granular material from the surface adhered
to various objects such as the astronauts' boots
and clothing, the TV cable, and the LEC. It was
possible, however, to jar the sand-sized particles
loose from the boots.
Astronaut mobility was not significantly ham-
hampered by the soil conditions encountered; how-
however, irregular topography may pose control
problems in the operation of a roving vehicle
during subsequent lunar missions,
Preliminary visual and microscopic examina-
examination at the LRL of the silt-sized particulate
material adhering to and detached from a lunar
rock in the vacuum chamber showed that:
A) The majority of the individual particles
were dark, opaque, blocky, angular, and fresh in
appearance.
B) A small proportion of the grains, generally
those grains larger in size (up to fine-sand size),
were clear, translucent, blocky, and angular.
C) Groups or clumps of particles were
present.
D) Shards, needles, or filaments were not
observed among the particle shapes.
Visual examination of the material in the core
tubes at the LRL indicated the following:
A) The sample was remarkably uniform in its
charcoal-brown color.
B) The soil had the appearance of being
homogeneous and uniform in grain size.
C) Small reflecting surfaces gave the sample
a sparkly appearance.
D) Cohesion was evident in that both core-
tube samples retained their cylindrical shape.
E) One sample was much more disturbed in
appearance than the other, and the sample with
the disturbed appearance exhibited fissures and
cracks.
Sieve analyses were performed at the LRL on
the fine-grained material collected with the docu-
documented sample, the core tubes, and the bulk
sample. In all three situations, the grain-size dis-
distribution was found to be that of a silty-fine sand.
However, the aggregation of individual particles
biased the analysis toward the larger size range.
At the LRL the specific gravity of lunar soil
was measured to be 3.1, which is considerably
higher than the average value of approximately
2.7 for terrestrial soils. Based on the specific
gravity obtained for the lunar soil and on the
measured bulk densities, the void ratio of the
material in core tube 1 is 0.87 and in core
tube 2 is 1.01. The porosities in core tubes 1 and
2 are 46.5 and 50.1 percent, respectively. Because
of the disturbance involved in sampling, these
values may not be representative of the inplace
properties of the material.
At the LRL material finer than the 1-mm size
obtained from the lunar bulk sample was placed
loosely in a container, and the bulk density of
the material was found to be 1.36 g/cc. When
compacted, the bulk density of the lunar soil
was found to be 1.80 g/cc. In the compact state,
the bearing capacity of the material was deter-
determined by a small penetrometer. From these tests,
the cohesion of the material was estimated to be
in the range between 0.04 and 0.14 N/cm2 @.05
and 0.20 psi). These experiments were performed
in the nitrogen atmosphere of the cabinets in the
Biological Preparation Laboratory.
References
4-1, Kopal, Z.: Physics and Astronomy of the Moon.
Academic Press, 1962.
4-2. Jaffe, L, D.: Lunar Dust Depth in Mare Cogni-
tum. J. Geophys. Res., vol. 71, no. 4, Feb. 1966,
pp. 1095-1103.
4-3. Jaffe, L. D.; and Scott, R. F.: Lunar Surface
Strength: Implications of Luna 9 Landing. Sci-
Science, vol. 153, July 22, 1966, pp. 407-408.
4-4. Cbristensjsn, Elmer M.; Batterson, S. A.; et
al.: Lunar Surface Mechanical Properties —
Surveyor I. J. Geophys. Res., vol. 72, no. 2,
June 15, 1967, pp. 801-813.
4-5. Cherkasov, I. I.; et al.: Determination of the
Physical and Mechanical Properties of the Lunar
Surface Layer by Means of Luna 13 Automatic
Station. Moon and Planets II. North-Holland
Publishing Company, 1968, pp. 70-76.
4-6. Scott, Ronald F.: The Density of the Lunar
Surface Soil. J. Geophys. Res., vol. 73, no. 16,
Aug. 15, 1968, pp. 5469-5471.
4-7, Quaioe, William L.; and Oberbeck, Verne R.:
Thickness Determinations of the Lunar Surface
Layer from Lunar Impact Craters, J. Geophys,
Res., vol. 73, no. 16, Aug. 15, 1968, pp. 5247-
5270,
4-8. Scott, R. F.; and Roberson, F. I.: Soil Mechan-
Mechanics Surface Sampler: Lunar Surface Tests and
Analyses. Chap. IV of Surveyor III Mission
122
APOLLO 11 PRELIMINARY SCIENCE REPORT
Report, Part II: Science Results, TR32-1177,
Jet Propulsion Laboratory, Calif. Inst. Tech.,
June 1, 1967, pp. 69-110.
4-9. Christensen, E. M.; et al.: Lunar Surface Me-
Mechanical Properties. Chap. IV of Surveyor V
Mission Report, Part II: Science Results, TR32-
1246, Jet Propulsion Laboratory, Calif. Inst.
Tech., Nov. 1, 1967, pp. 43-88.
4-10. Chmstensen, E. M.; et a!.: Lunar Surface Me-
Mechanical Properties. Surveyor VI Mission Report,
Part II: Science Results, TR32-1262, Jet Propul-
Propulsion Laboratory, Calif. Inst. Tech., Jan, 10,
1968, pp. 47-107.
4-11. Scott, R. F.; and Roberson, F. I.: Soil Mechan-
Mechanics Surface Sampler. Chap. V of Surveyor VII
Mission Report, Part II; Science Results, TR32-
1264, Jet Propulsion Laboratory, Calif. Inst.
Tech., Mar. 15, 1968, pp. 135-185.
4-12. Hutton, R. E.: LM Soil Erosion and Visibility
Investigations, Part I: Summary Report and
Part II: Appendix (References). TRW Tech.
Rept. 11176-6060-RO-OO, Aug. 13, 1969.
4-13. Scott, Ronald F,; and Ko, Hon Yim: Transient
Rocket-Engine Gas Flow in Soil. AIAA, vol. 6,
no. 2, Feb. 1968.
4-14. Land, Norman S.; and Clark, Leonard V.: Ex-
Experimental Investigation of Jet Impingement on
Surfaces of Fine Particles in a Vacuum Envi-
Environment. NASA TN D-2633, Apr. 1965.
4-15. Meyerhof, G. G.: The Ultimate Bearing Capac-
Capacity of Foundations. Geotechnique, vol. II, no. 2,
Dec. 1951, pp. 301-330.
4-16. Halajian, J. D.: The Case for a Cohesive Lunar
Surface Model. Rept. no. ADR-04-04-64.2,
Grumman Aircraft Engineering Corp., 1964.
4-17. Bromwell, Leslie G.: The Friction of Quartz in
High Vacuum. Research Rept. R66-18, Depart-
Department of Civil Engineering, Soil Mechanics Divi-
Division, MIT, May 1966.
4-18. Ryan, J, A.: Adhesion of Silicates in Ultrahigh
Vacuum. J. Geophys. Res., vol. 71, no. 18, Sept.
15, 1966, pp. 4413-4425.
4-19. Nelson, John D.; and Vey, E.: Relative Cleanli-
Cleanliness as a Measure of Lunar Soil Strength. J.
Geophys. Res., vol. 73, no. 12, June 15, 1968,
pp. 3747-3764.
5. Preliminary Examination of Lunar Samples
This report describes the results of prelim-
preliminary physical, chemical, and biological analyses
of the lunar material returned from the July 20,
1969, Apollo 11 lunar landing at Mare Tran-
quillitatis. The analyses were performed at the
Lunar Receiving Laboratory (LRL) by the Pre-
Preliminary Examination Team (PET) consisting
of resident NASA staff members and visiting
scientists. The results of these analyses were
used to plan the allocation and distribution of
the lunar materials to the 142 scientists through-
throughout the world who will conduct detailed studies
of the samples,
The Apollo 11 astronauts collected three
separate samples: a contingency sample, a bulk
sample, and a documented sample. The con-
contingency sample, weighing approximately 1 kg,
was collected within 1.5 m of the lunar module
(LM) and consisted of a few rock fragments and
fine materials. The bulk-sample box contained
approximately 14 kg of rocks and fine materials
and was collected within 10 m of the LM. The
documented-sample box contained approximately
6 kg of rocks selected late in the extravehicular
activity (EVA) and two core tubes.
Both the bulk-sample and the documented-
sample containers were sealed on the lunar
surface, transferred into the LM, bagged, and
(after rendezvous) transferred into the command
and service module (CSM). The sample con-
containers were removed from the command mod-
module (CM) on the carrier Hornet, transferred into
the Mobile Quarantine Facility (MQF) and
placed in a second bag, and (after decontamina-
decontamination) transferred from the MQF into two air-
aircraft that returned the containers to the LRL on
July 25, 1969. The lunar samples in the sample
boxes were brought into the Sample Laboratory
(SL) of the LRL and put into decontamination
chambers, where terrestrial contamination was
removed by a peracetic acid spray.
The biological barrier in the SL is actually a
double barrier. The primary barrier consists of
vacuum chambers and special class III biological
cabinets, inside which the samples are handled.
The sealed walls of the building constitute a
secondary barrier. The inside of the Crew Recep-
Reception Area (CRA) and the SL are operated at a
small negative pressure so that any leakage will
be inward. Similarly, SL primary barrier cabinets
are operated at negative pressure with respect
to the rooms in which they are located. The
biological barriers are two-way barriers that pre-
prevent unsterilized lunar material from contam-
contaminating the atmosphere of the Earth and pre-
prevent terrestrial contaminants from reaching the
samples.
All samples were opened and processed in a
vacuum of 5X10~e T (or less) or in a dry nitro-
nitrogen atmosphere. All handling was done in gloved
cabinets. The documented-sample box was
opened in the vacuum chamber, and the rocks
were examined, described, photographed,
weighed, and chipped for physical and chemical
analysis and biological testing. The bulk-sample
box, the contingency-sample container, and the
core tubes were opened in a dry nitrogen atmos-
atmosphere inside one of the special cabinets after
proper determination that no short-term degra-
degradation of the sample occurred upon exposure to
oxygen, moist air, and carbon dioxide. Approxi-
Approximately 50 g of the core-tube material and 500 g
of the fines from the bulk box were removed
for biological testing. Most of the remaining
material was stored in a nitrogen atmosphere
inside the biological cabinets; the rest was stored
under vacuum conditions.
Portions of the sample were used for deter-
determination of density, of reaction to gas, of miner-
alogical properties, chemical analysis by optical
emission spectroscopy, total organic carbon anal-
analysis, and X-ray diffraction properties in the Physi-
Physical-Chemical Test Laboratory of the LRL. Rare
gases and volatile organic species were analyzed
123
124
APOLLO 11 PRELIMINARY SCIENCE REPORT
in the Gas Analysis Laboratory. Counting of
short-lived isotopes was performed in the LRL
Radiation Counting Laboratory, a specially
shielded underground laboratory. Magnetic prop-
properties and properties of the soil were also meas-
measured. The results of these studies are the subject
of this report.
Mineralogy and Petrology
The total weight of the lunar material returned
by Apollo 11 was 22 kg, of which 11 kg were
rock fragments more than 1 cm in diameter and
11 kg were smaller particulate material. Because
the documented sample container was filled by
picking up selected rocks with tongs, the con-
container held a variety of large rocks (total weight
6.0 kg). The total weight of the bulk sample was
14.6 kg.
The following discussion is based on stereo-
microscopic examination of the samples, aided by
random grain counts under the polarizing micro-
microscope. Some of the provisional identifications
were reinforced by limited further investigation
with the aid of spindle-stage and X-ray powder
diffraction methods, together with study of thin
sections of two of the crystalline rocks which
became available near the close of the prelim-
preliminary examination. In spite of the handicap of
an adherent layer of dust, all the rocks were
examined. Only the contingency samples and
small chips taken from the samples in the rock
boxes were free of dust when examined.
The returned lunar material may be divided
into the following four groups:
A) Type A — fine-grained vesicular crystalline
igneous rock
B) Type B — medium-grained vuggy crystal-
crystalline igneous rock
C) Type C — breccia consisting of small frag-
fragments of gray rocks and fine material
D) Type D — fines
The term "rocks" is applied to fragments larger
than 1 cm in diameter; the term "fines" is applied
to fragments smaller than 1 cm in diameter. All
the rocks and many smaller rock fragments show
unearthly surface features (fig. 5-1) that are dis-
discussed in the following paragraphs.
The crystalline rocks are volcanic in origin.
Figure 5-1. — Surface pits in breccia.
The term "volcanic," as used in this report
implies surface lavas or near-surface igneous
rocks and carries no connotations regarding im-
impact-generated or impact-triggered volcanism
versus volcanism in the common terrestrial sense.
The rocks contain pyrogenic mineral assem-
assemblages and gas cavities indicating crystallization
from melts. The major minerals can be assigned
to known rock-forming mineral groups. The
unique chemistry of the magmas has resulted in
mineral ratios unlike those of known terrestrial
volcanic liquids, yet not greatly different from
some terrestrial cumulates, at least in the major
elements.
Twenty crystalline rocks, most of which weigh
more than 50 g, were returned. The largest crys-
crystalline rock weighed 919 g. These rocks have
been divided into a fine-grained vesicular type
(type A, fig. 5-2) and a coarser grained vuggy
microgabbroic type (type B, fig. 5-3), but the
rocks may be members of a textural and com-
compositional series. Figures 5-2 and 5-3 illustrate
the two most common types.
A chip from a dark-gray vesicular rock with
subophitic texture (type A) has a bulk density of
approximately 3,4 g/cc. The vesicles range be-
between 1 and 3 mm in diameter, and most of the
vesicles are spherical; however, some are ovate.
Coalescence has modified other vesicles to create
irregularly shaped cavities that are larger than
single vesicles. The vesicles are faced with bril-
brilliant reflecting crystals composed of the ground-
PRELIMINARY EXAMINATION OF LUNAR SAMPLES
125
Figure 5-2, — Typical type A crystalline rock, (a) Sam-
Sample 10022. (b) Photomicrograph of sample 10022.
mass minerals. Such vesicles contain no tran-
transecting crystals or sublimate minerals. In addi-
addition to the spherical vesicles, minor irregularly
shaped cavities (or vugs) exist into which ground-
mass and accessory minerals project locally. Vugs
tend to take the place of spherical vesicles in the
more coarse-grained rocks; euhedral crystals
projecting into vugs are common.
Preliminary modal analysis of this type A
specimen, recalculated for 15 percent of void
space, yields clinopyroxene, 53 percent; plagio-
clase, 27 percent; opaques (abundant ilmenite,
perhaps minor troilite, and perhaps native iron),
18 percent; other translucent phases (at least
two), 2 percent; and minor olivine. Notable are
rare grains of olivine showing marginal trans-
transformation to clinopyroxene. The olivine grains
are as much as 0.5 mm long, whereas most other
mineral grains range between 0.05 and 0.2 mm
in diameter. In vuggy regions, there is a slight
increase in grain size. Except for the high con-
Figure 5-3, —Typical type B crystalline rocks, (a) Sam-
Sample 10047. (b) Sample 10050.
tent of opaque minerals, the lunar rock re-
resembles some terrestrial olivine-bearing basalts.
Mineral grain and vesicle sizes, shapes, and dis-
distribution suggest that the rocks originated near
the top or bottom of a lava flow or lava lake.
Although most of the type A rocks have
smaller vesicles, nine other type A rocks are
similar to the rocks previously described. The
most notable variation among type A rocks is in
olivine content, which ranges from zero in some
rocks to approximately 10 percent in other rocks.
The dark-brownish-gray, speckled type B
126
APOLLO 11 PRELIMINARY SCIENCE REPORT
rock (fig. 5-3) has irregular cavities and a bulk
density of approximately 3,2 g/cc. The texture is
granular and in general appearance resembles
the microgabbroic textures of segregation veins
and pods in some terrestrial basalts.
The grain size in type B rocks varies from 0.2
to 3.0 mm. The largest crystals, many of which
are euhedral, project into cavities. Preliminary
modal analysis indicates clinopyroxene, 46 per-
percent; plagioclase, 31 percent; opaques (mainly
ilmenite), 11 percent; low cristobalite, 5 percent;
and others, 7 percent. The others include an
unidentified yellow mineral that seems to be
concentrated in vuggy areas of the rock and a
high-index colorless mineral. Olivine is not pres-
present in this rock or in similar rocks.
The crystalline rocks present a series based
on groundmass grain size ranging from approxi-
approximately 0.1 to 1 mm, with larger crystals (up to
3.0 mm) in vuggy zones of the coarser grained
rocks. Ilmenite seems less abundant, and low
cristobalite seems more abundant in the coarser
grained rocks. In general, the abundance of vugs
increases and the abundance of vesicles decreases
as grain size increases. Olivine is found only in
the finer grained rocks, and the unidentified
yellow phase is found only in the coarser grained
rocks. The three major minerals (clinopyroxene,
calcic plagioclase, and ilmenite) are present in
all the rocks.
The apparently complete absence of hydrous
mineral phases is notable, as is the extremely
fresh appearance of all the crystalline rock in-
interiors, in spite of the microfractures and high
potassium-argon, which suggests that the rocks
are old.
All the breccias examined (type C, fig. 5-4)
are mixtures of fragments of different rock types
and are gray to dark gray, with specks of white,
light-gray, and brownish-gray rock fragments.
Most breccias are fine grained, with fragments
smaller than 1 cm in diameter; fragments smaller
than 0.5 cm predominate. Only a few fragments
in the breccias are rounded. The fragments con-
consist of either rocks or minerals similar to those
described previously, but have the distinction
that many fragments show a greater population
of closely spaced microfractures and various
degrees of vitrification. In addition, angular
fragments and spherules of glass (which also
(b)
(c)
Figure 5-4, -Type C breccia, (a) Sample 10019 illus-
illustrating rounding and glass-lined pits, (b) A chip of
sample 10019 illustrating rounding, glass-lined pits,
and lithic fragments, (c) A chip of sample 10019
illustrating rounding and lithic fragments.
are characteristic components of the lunar fines)
are present in a wide range of color and refrac-
refractive indices. In several specimens, vesicular fine-
finegrained crystalline rock constitutes a major frac-
PRELIMINARY EXAMINATION OF LUNAR SAMPLES
127
tion of the larger fragments. In other specimens,
mineral fragments and small fragments of the
coarser microgabbroic type predominate. Al-
Although the rock fragments are small, there seems
to be a wider range of variation in modal min-
mineral composition and in shock metamorphism of
the crystalline rock types than is shown by the
large crystalline rock samples returned. Several
minor rock types, one predominantly light gray
and one predominantly pale yellow, occur in
breccia but are not represented among the larger
individual rocks. Some breccias contain crystal
fragments larger than 3 mm across, indicating
the existence of coarser crystalline rocks than
those returned.
The finer fraction of the breccias is gray and
granular in appearance and consists largely of
glass particles (both angular and rounded) and
fragments of birefringent minerals, which are
coated in part with glass or with opaque or fine-
finegrained dusty material. The glass particles,
which form most of the matrix, are similar to the
glass of the finer material. Many single glass par-
particles are composed of more than one glass type
and are therefore unlike glass shards of common
terrestrial volcanic processes. Some of the brec-
breccias are transected by vesicular glass veins or
contain pods of glass, either formed in place or
injected along fractures.
The degrees of induration and the histories
of subsequent deformation of the breccias are
varied. While some breccias are poorly con-
consolidated and are soft and friable, others have
coarse layering. Still other breccias have closely
spaced fracture systems and are as hard as (if
not harder than) the hardest of the crystalline
rocks. The breccias and many of the broken
fragments of crystalline rocks in the breccias are
composed of impact ejecta.
Two types of unique surface features occur
on all rocks of the lunar samples: small pits lined
with glass, and glass spatters not necessarily
associated with pits. In addition, the crystalline
rocks show a generally lighter colored surface,
compared to the interior, which appears to be
related to microfracturing of surface crystals.
The diameters of pits average somewhat less
than 1 mm. Diameter-to-depth ratios of the pits
have a range of values, but the ratio is appar-
apparently smaller for pits in the breccias than for pits
in the crystalline rocks. A few of the rocks exam-
examined show pitting on rounded sides but no evi-
evident pitting on one (generally flat or irregularly
rough) surface. The glass surfaces in the pits are
bright reflecting and are commonly uneven and
botryoidal. Botryoidal surfaces are more com-
common in pits within breccias than in pits within
crystalline rocks. Raised, glassy rims occur in
greater abundance in surrounding pits within
the breccias. The glass extends beyond some pit
rims. Fractures and rare glass veinlets radiate
from some pits. The pits are presumably caused
by the impact of small particles on the surfaces
of the rocks.
In addition to glassy pits, thin glass crusts
occur that appear to be the result of spattering.
Spatter crusts more than 1 cm in diameter occur
on both breccia and crystalline rock surfaces.
These crusts may be related to nearby impact
events.
The surfaces of the crystalline rocks show
whitish blotches and halos around the glassy
pits. This whitish color is at least partially at-
attributable to intense microfracturing of minerals,
particularly feldspar and pyroxene, and does
not penetrate more than 0.5 to 1.0 mm below the
surface in most of the cross sections examined.
In some crystalline rocks, surface whitening is
so widespread that the whole surface is lighter
in color than the interior. This feature is par-
particularly noticeable in fine-grained rocks, which
are dark gray on freshly broken surfaces.
The most noticeable surface feature of the
rocks is the rounding of one or more edges and
corners. The most striking example of rounding,
and perhaps the most common, is that in which
one side of a rock is nearly flat and the re-
remainder of the surface is rounded. Rounding
appears to be more pronounced in the softer,
more friable breccias than in the crystalline
rocks. The breccias commonly have coarser
grains projecting above the original surface,
which suggests that the finer grains that once
surrounded them have been eroded away. Thus,
the appearance is similar to that of friable sedi-
sedimentary rocks of a wide range in grain size that
have been sandblasted. Both the rounding and
the detailed surface appearance indicate that an
erosional process has acted on the rocks. The
surface features of several rocks allow conclu-
128
APOLLO 11 PRELIMINARY SCIENCE REPORT
Figure 5-5. — Sample 10046 illustrating a type B rock
that displays evidence of its original position. The
upper right portion of the sample displays rounding,
glass-lined pits, and a light color. The lower left
portion of the sample displays a sharp angular outline,
few pits, and a dark color. This sample appears to
have been partially buried on the lunar surface with
only the upper right portion exposed.
sions to be made regarding the orientation of
the rock on the lunar surface (fig. 5-5).
Two core samples of material 2 cm in diam-
diameter were returned: core tube 1 contained 10 cm
and core tube 2 contained 13.5 cm of material.
The core samples were composed predominantly
of particles in the range of 1 mm to 30 jum, with
admixed angular rock fragments, crystal frag-
fragments, glass spherules, and aggregates of glass
and lithic fragments in the coarser sized fraction.
When the upper half of the split-tube core liner
was removed, the cylindrical shape of the mate-
material was retained perfectly. Both the material in
the tubes and the fines are generally medium
dark gray with a tinge of brown. When prodded
with a small spatula, the material disintegrates
particle by particle or forms extremely fragile
ephemeral units of subangular blocky shapes.
Neither core sample showed obvious grain-
size stratification. The core sample taken from
core tube 2 displayed a slightly lighter zone
approximately 6 cm from the top surface. This
zone is 2 to 5 mm thick with a sharp upper
boundary and a gradational lower boundary. In
grain size or texture, the lighter zone is not
megascopically different from the dark material.
Sieve analyses of material from the two core
tubes, a sample from the documented Apollo
lunar surface return container (ALSRC), and a
sample from the bulk ALSRC, are shown in
figure 5-6, These distributions are replicable by
simple dry sieving, but may be biased by an
aggregation of fines. Core tube 1 has a bulk
density of 1.66±0.03 g/cc, and core tube 2 has
a density of 1.54±0.03 g/cc.
The fines consist chiefly of a variety of glasses,
plagioclase, clinopyroxene, ilmenite, and olivine.
Rare spherules and rounded fragments of nickel-
iron up to 1 mm in size were observed. The
glass, which constitutes approximately one-half
the material, is of three types: A) botryoidal,
vesicular, and globular dark-gray fragments;
B) angular pale or colorless (or more rarely,
brown, yellow, or orange) fragments with a
refraction index ranging from approximately 1.5
to approximately 1.6; and C) spheroidal (fig.
5-7), ellipsoidal, dumbbell-shaped, and tear-
teardrop-shaped bodies, most of which are smaller
than 0.2 mm and range in color from red to
brown and from green to yellow. Refraction in-
indices range from less than 1.6 to more than 1.8
and are generally higher for the more intensely
colored glass. Material with a refraction index
greater than 1.7 is less common than material
with a lower index. The angular colorless and
pale glass, by far the more abundant type, is in
part turbid or weakly birefringent. Unlike nor-
2000 1000 500 250 125 62.5 31.2 15.6 7.8 3.9
Grain size, /»m
Figure 5-6. — Grain-size distribution in the lunar fines.
PRELIMINARY EXAMINATION OF LUNAR SAMPLES
129
Figure 5-7. — Glass spherules of various colors found
in fine-grained material.
mal quenched magma droplets and glasses from
terrestrial volcanic sources, many single glass
particles found in the core samples are inhomo-
geneous,
Evidence of impact metamorphism exists in
the lunar samples, particularly in the loose, fine-
finegrained materials and in the breccias. In con-
contrast, most of the crystalline rocks, although
commonly fractured or crumbly on the surface,
show negligible or weak shock effects in their
interiors. Only a small number show evidence
of strong shock. Crystalline rocks underlying
glass-lined pits are crushed or powdered, but are
not strongly shocked. Such regions range from
limited to wide distribution on the surfaces of
the crystalline rocks.
Many phenomena were observed in the loose
material and in the breccias that indicated that
melting was induced by strong and intense shock.
These phenomena included A) glass dumbbells,
teardrops, and other forms of evolution; B)
vesicular and flowed glass containing at least
two types of glass; and C) nickel-iron spherules.
The abundance of vitrified mineral fragments is
also evidence of moderate to strong shock. Un-
shocked minerals or lithic fragments are found
in the loose materials and in breccia, but these
fragments are not abundant. Most birefringent
crystal fragments found in the fines display pro-
pronounced straight to mosaic undulatory extinc-
extinction, and several display lamellar microstruc-
tures, indicating that these fragments have
encountered weak to strong shock.
Evidence of a multiple shock history is pro-
provided by fragments of breccia within breccia
and by breccias that contain spherules of glass
from prior impact events and that are splashed
with glass from subsequent impact events. Each
breccia sample contains a wide variety of min-
mineral and lithic fragments of various degrees of
shock, and each sample appears to have a com-
complex history.
Clinopyroxene is present in all of the rock
samples examined. The most abundant variety
is cinnamon brown to resin brown in reflected
light, and pale reddish brown to pinkish brown
in transmitted light, with little or no pleochro-
ism. The appearance of clinopyroxene in the
crystalline rocks is generally stubby prismatic
or anhedral, but sheaflike intergrowths contain-
containing feldspar are also present. Several crystals
are strongly zoned from the center outward, as
indicated by an increasing positive optic angle
from near 0° to 50°, together with an increas-
increasing refraction index and color intensity. The
determined optical properties of the crystals ap-
appear to fit into the pigeonite-augite series and
do not exclude titaniferous varieties. Cinnamon-
brown pigeonite in samples of fines was identi-
identified by X-ray diffraction.
Olivine from Foas to F075 is a subordinate
phenocrystic constituent of several of the finer
crystalline rocks and occurs sporadically as
crystal fragments in the breccias and dust. Oli-
Olivine is a clear, pale greenish-yellow color in the
crystalline rocks but may range from greenish
yellow to honey yellow and orange yellow in
the breccias and dust. The presence of olivine
in the crystalline rocks was confirmed by X-ray
diffraction methods.
Plagioclase is also abundant, but is generally
found in a smaller amount than are the ferro-
magnesian minerals. Plagioclase is indicated by
optical properties to be calcic, between An7o
and Ansio, with compositional zoning in several
rocks. The appearance of plagioclase is com-
commonly lath and plate shaped, with lamellar
twinning parallel and transverse to the plates.
The presence of calcic plagioclase in the crystal-
crystalline rocks was confirmed by X-ray diffraction
methods.
Ilmenite, as identified optically and by X-ray
diffraction, is present in relatively large amounts
130
APOLLO 11 PRELIMINARY SCIENCE REPORT
in the crystalline rocks, where ilmenite occurs
as plates and well-formed skeletal crystals. Il-
Ilmenite is also common in the breccias and dust
as a constituent of the lithic fragments and as
isolated crystal fragments.
Low cristobalite is present as thin, clear coat-
coatings and anhedral crystals. The cristobalite oc-
occurs in cavities and fills interstices between
plagioclase plates in several of the coarser crys-
crystalline rocks. It is characterized by a crackly sur-
surface and complex twinning. Unidentified yellow
transparent crystals occur in cavities interstitial
to the plagioclase crystals. The mineral is a char-
characteristic accessory in several of the more coarsely
crystalline rocks.
Troilite (tentative identification) occurs in
small amounts in several of the coarser crystalline
rocks as rounded masses in interstices between
plagioclase, clinopyroxene, or ilmenite. Native
iron (tentative identification) occurs as scat-
scattered blebs up to 10 /mi in diameter within the
troilite masses. Several other accessory minerals
are present in crystalline rocks but have not yet
been identified.
Chemistry
Chemical analyses of the rock samples were
made primarily by optical spectrographic meth-
methods operated inside the biological barrier. An
instrument with a dispersion of 5.2 A/mm was
used. Three separate techniques were used to
determine the chemical composition of the
rocks:
A) Determination of silicon, aluminum, iron,
magnesium, sodium, potassium, calcium, titani-
titanium, manganese, and chromium, using strontium
as the internal standard
B) Determination of iron, magnesium, tita-
titanium, manganese, chromium, zirconium, nickel,
cobalt, scandium, vanadium, barium, and stron-
strontium, using palladium as the internal standard
C) Determination of lithium, rubidium, ce-
cesium, lead, copper, and other volatile elements,
using sodium as the internal standard
The precision of the determinations was ±10
percent of the amount of an element present in
a rock. Accuracy of the results was controlled by
use of the international rock standard samples
(G-l, W-l, Sy-1, BCR-1, DTS-1, PCC-1, G-2,
AGV-1, and GSP-1) for calibration. Analyzed
terrestrial basaltic rocks (Hawaii and Galap-
Galapagos), chondritic meteorites (Forest City and
Leedey), and achondrites (Sioux County and
Johnstown) provided additional calibration
points. All spectrographic line identifications
were checked against individual-element spectra,
in addition to the Massachusetts Institute of
Technology wavelength tables and the U. S.
Bureau of Standards tables.
The spectrographic plates were examined to
establish the presence or absence of all ele-
elements that contained spectral lines in the wave-
wavelength regions covered. A list of elements that
were not detected in the rock samples is given
in table 5-1.
Table 5-1.
Element
Cesium
Beryllium
Lanthanum
Neodymium
Hafnium
Niobium
Tantalum
Molybdenum
Tungsten
Rhenium
Rubidium
Rhodium
Palladium
Iridium
Platinum
Elements undetected in rock samples
Detection limits,
ppm
1
3
30
30
50
50
100
5
20
100
10
10
10
50
50
Element
Gold
Zinc
Cadmium
Mercury
Boron
Gadolinium
Indium
Thallium
Germanium
Tin
Lead
Arsenic
Antimony
Bismuth
Tellurium
Detection limits,
ppm
10
30
10
100
5
10
1
1
5
10
2
100
20
20
100
Line interferences caused by titanium, chro-
chromium, and zirconium lines were checked for all
analytical lines. Wavelengths of the several prin-
principal lines were checked for those elements that
were not detected in the rock samples, because
line interferences caused by other elements were
visible on some lines.
Following sterilization procedures, three rock
samples were taken from behind the biological
barrier and analyzed by atomic absorption pro-
procedures for the presence of iron, magnesium,
calcium, titanium, sodium, and potassium. The
rocks were also analyzed by a colorimetric pro-
procedure for the presence of silicon.
Sample weights were small, typically from 10
to 50 mg. Larger weights A50 mg) were avail-
available from those samples taken from behind the
PRELIMINARY EXAMINATION OF LUNAR SAMPLES
131
biological barrier, notably the biopool sample
(LRL specimen 10054), which represented a
500-g sample. A total of 23 analyses were made
on the rock samples. Analytical data resulting
from these analyses and for 12 typical lunar
samples are given in tables 5—II and 5—III.
The rock samples were apparently kept free
from inorganic contamination from either the
rock box or the LM. Niobium, present in the
skirt of the descent engine exhaust (88 per-
percent), was not detected (detection limit 50
ppm) and indium, which forms the seal of the
rock box, was not present (detection limit 1
ppm).
Differences among the various rock samples
were less apparent than the overall similarity in
chemical composition (e.g., no samples con-
contained less than 5 percent titanium dioxide). In
detail, significant variations were shown in many
of the trace elements, nickel, zirconium, rubid-
rubidium, and potassium.
The major constituents of the rock samples are
silicon, aluminum, titanium, iron, calcium, and
magnesium. Sodium, chromium, manganese, po-
potassium, and zirconium are minor constituents
ranging from a few hundred parts per million to
half a percent by weight.
The most striking features of the rock-sample
chemical compositions in comparison with terres-
terrestrial rocks, meteorites, or cosmic abundance esti-
estimates are the high concentrations of titanium,
zirconium, and yttrium. In comparison with
chondritic meteorites, the rock samples contain
lower concentrations of iron and magnesium
and higher concentrations of calcium and alumi-
aluminum.
Among the trace and minor constituents, zir-
zirconium, strontium, barium, yttrium, and ytter-
Table 5—II. Elements detected in rock samples
[Elemental abundances]
Element
Rubidium*
Barium"
Potassium0
Strontium**
Calcium0
Sodium0
Ytterbium8
Yttrium*
Zirconium"
Chromium"
Vanadium"
Scandium*
Titanium'
Nickel"
Cobalt"
Copper8
Iron0
Manganese*
Magnesium0
Lithium1
Gallium"
Aluminum"
Silicon0
Type A rocks (vesicular)
10022
(b)
100
.17
110
6.4
.30
7
230
1000
2800
36
110
6.6
320
15
(b)
16
2000
3.9
11.5
(b)
4.1
20
10072
6.5
130
.17
55
6.8
•44
2
210
850
4700
30
45
6.0
(d)
12
5
13
2800
4.8
14
(b)
4.8
21
10057
6.0
180
.15
230
7.1
.40
6
310
>2000
6500
40
110
7.5
25
22
(b)
15,5
3800
5.7
22
(b)
5.8
16.8
10020
1.5
50
.053
85
7.1
.44
2.5
185
980
2100
20
110
7.2
(d)
3
4.5
14
2460
4.8
15
5
5.8
17.8
Type B rocks
10017
6.0
120
.18
55
7.1
.48
(b)
310
1250
4600
30
55
6.6
(d)
10
3
14.7
2700
5.1
25
(b)
5.3
18.7
10058
i.e
85
.09
190
7.5
.41
5
230
250
3700
32
130
5.4
(d)
7
(b)
13
4300
3.9
19
(b)
6.9
20
(crystalllr
10045
1.9
115
.084
60
7.1
.38
1.3
100
700
3500
40
90
4.8
(d)
7
6
14
2100
4.2
15
4
6.9
19.6
e)
10050
0.8
60
.053
140
7.1
.38
2.7
130
700
4800
80
170
5.4
55
10
10
15.5
3900
6.0
10.5
8
5.8
17.8
Type C rocks
(breccias)
10021
(b)
105
.12
150
7.9
.15
4.5
300
1500
2500
22
68
5.2
215
13
(b)
14.8
1700
4.5
(b)
(b)
5.8
20
10061
3.1
90
.15
60
7.9
.37
1.8
115
400
3000
32
55
5.4
235
12
8
12.4
2400
5.4
12.5
(b)
5.8
18.7
Type D fine
material
10037
2.2
68
.10
90
8.6
.40
2.5
130
400
2500
42
55
4.2
250
18
(b)
12.4
1750
4.8
15
(b)
6.9
20
Bulk
biopool
sample
10054
2
65
.11
140
8.3
.38
2.5
200
500
2800
30
60
4.2
120
11
(b)
12.1
2600
4.6
15
(b)
6.9
19.6
"In parts per million.
"No data.
eIn percent.
dNot detected.
132
APOLLO 11 PRELIMINARY SCIENCE REPORT
Table 5—III. Elements detected in rock samples
[Abundances expressed as weight, in percent oxides]
Oxide
SiO2
A12O3
TiO2
FeO
MgO
CaO
Na*O
K2O
MnO
Gr2O3
ZrO*
NiO
Total
Type A rocks (vesicular)
10022
43
7.7
11
21
6.5
9.0
.40
.21
.26
.41
.14
.04
99.0
10072
45
9
10
17
8
9.5
.60
.20
.36
.69
.11
(a)
100.5
10057
36
11
12.5
20
9.5
10
.54
.18
.49
.95
>.27
(a)
101.4
10020
38
11
12
18
8
10
.59
.064
.32
.31
.13
(a)
97.8
Type B rocks
10017
40
10
11
19
8.5
10
.65
.22
.35
.67
.19
(a)
100.5
10058
43
13
9
17
6.5
10.5
.56
.11
.55
.54
.03
(a)
100.8
(crystalline)
10045
42
13
8
18
7
10
.51
.10
.27
.51
.095
(a)
99.5
10050
38
11
9
20
10
10
.51
.064
.50
.70
.095
.007
99.9
TypeCrocks
(breccias)
10021
43
11
8.6
19
7.4
11
.20
.15
.22
.37
.20
.03
99.8
10061
40
12
10
16
9
11
.48
.17
.41
.69
.04
.04
99.8
Type D fine
material
10037
43
13
7
16
8
12
.54
.12
.23
.37
.05
.03
100.3
Bulk
biopool
sample
10054
42
13
7.0
15.6
7.6
11.6
.50
.14
,34
.41
.07
.015
98.2
•No data.
bium are enriched by one to two orders of
magnitude compared to chondritic abundances.
Potassium and rubidium are present in similar
amounts, and niclcel and cobalt are depleted by
large factors compared to chondrites. Nickel was
not detected (less than 1 ppm) in several rock
samples. However, the iron content remains high
in these samples, and the iron-nickel ratios are
high. The concentration of zirconium is equaled
only by alkali-rich rocks in the crust of the
Earth, such as nepheline syenites.
Rubidium-strontium ratios are low, approach-
approaching those of oceanic basaltic rocks on the Earth,
Barium is relatively abundant and, like lithium,
resembles the concentration levels of continental
basaltic rocks (approximately 10 ppm). Chro-
Chromium is notably abundant as a minor constituent,
and scandium is also present in larger amounts
than are generally found in terrestrial basalts.
Conversely, vanadium is less abundant than
either chromium or scandium.
The volatile elements (lead, bismuth, thallium,
etc.) are generally below the detection limits o?
the spectrographic techniques employed, The
platinum-group elements, silver and gold, were
not detected. Thus, numerous differences in de-
detail exist from terrestrial or meteoritic samples
previously available for analysis.
Rare-Gas Analytic Results
The gas analyses were obtained by using a
6-in., 60° magnetic deflection mass spectrometer.
The spectrometer is operated with a sensitivity
of approximately 2 X 100 cc/mV for helium,
neon, and argon and approximately 3 X 10~3
cc/mV for krypton and xenon. Rock samples
were prepared under liquid nitrogen and air con-
conditions. Chips of rock were taken, weighed,
wrapped in aluminum foil, and sterilized by
heating from 125° to 150° C for a 5- to 24-hr
period. The effect of the sterilization heatings
caused a release of less than 1 percent of the
gases present.
The rock samples were melted by radiofre-
quency induction heating in a molybdenum cru-
crucible. Vacuum conditions were maintained by a
water-cooled glass furnace with low helium-
diffusion characteristics. The gases released were
chemically purified with a hot titanium getter.
The heavier noble gases were condensed and in-
introduced into the mass spectrometer for measure-
measurement under static vacuum conditions in three
fractions: A) helium and neon, B) argon and
krypton, and C) xenon.
In general, after each rock sample was run, a
second heating was performed to insure that all
PRELIMINARY EXAMINATION OF LUNAR SAMPLES
133
the gas had been released from the rock and to
serve as a blank correction. The entire procedure
was standardized by introducing a calibrated
amount of the different rare gases into the mass
spectrometer.
The rare gases in the lunar samples show three
general patterns, which correspond to the three
rock types (breccias, igneous rocks, and fines).
Generally, the breccias and fines show extremely
large concentrations of rare gases. Large
amounts of noble gases are found in both surface
and subsurface breccia material. From the large
amounts of noble gases present and the isotopic
ratios, it is almost certain that the predominant
source for these gases is the solar wind. The only
other possible major source would be rare gases
condensed in lunar materials early in the history
of the solar system. The igneous rocks contain
less of the rare gases than do the other rocks.
This phenomenon can be interpreted either as
the result of a loss of rare gases during forma-
formation, or as a feature of igneous material repre-
representing subsurface lunar material that has not
been exposed to the solar wind except as a solid.
Temperature-release studies on both the fines
and the breccia reveal that the noble gases are
tightly bound and thus do not occur as simple
surface-absorbed gases.
The breccias appear to have been formed from
the fines near the surface of the Moon as a result
of some compacting process, possibly shock. This
conclusion is supported by petrological evidence.
The solar-wind noble gases may have been
driven into the separate grains as a result of
these shock events.
The results shown in table 5-IV indicate large
amounts of rare gases of solar composition. No
isotopic ratios have been measured previously
from the Sun; however, from theoretical con-
considerations, it is generally accepted that nuclear
processes occur that cause the solar neon 20/22
ratio to be larger than that of the atmosphere
of the Earth. This enrichment is clearly present
in all the samples measured. In addition, the
helium on the surface of the Sun should be close
to the original helium content of the solar sys-
system. The 4He/3He ratio of approximately 2600
agrees well with previous theoretical estimates.
The low value of the 40Ar/3eAr ratio is exactly
what would be expected for solar isotopic com-
composition. The relative elemental ratios for the
noble gases are those that would be expected in
the Sun if considerable helium and some neon
are assumed to be lost from the lunar surface
during the hot lunar day.
The isotopic ratios for xenon, presumed to be
of solar origin, in the fines and in a breccia are
presented in table 5-V. Isotopically, the xenon
in the two samples is identical. The isotopic pat-
pattern closely resembles that of trapped xenon
found in carbonaceous chondrites, except for a
slightly larger amount of the lighter xenon iso-
isotopes (presumably from spallation reactions)
and except for a deficiency of 134Xe or 138Xe. The
129Xe/132Xe ratio in the measured material is es-
essentially identical to that in carbonaceous chon-
chondrites. Krypton isotope data for the fine lunar
material are less precise, but resemble krypton
content found in carbonaceous chondrites.
Several of the crystalline rocks measured con-
Table 5-IV. Rare-gas analysis
Sample description
Lunar soil:
Sample A
Sample B
Typical agglomerate
rock:
Sample A
Sample B
Typical crystalline
rock:
Sample A
Sample B
Helium
10 -s cc/g^He
10 900 000
19 000 000
15 100 000
16 000 000
63 000
28 000
4/3
2500
2500
2900
2700
180
270
Neon
\0-Scc/g"«Nc
200 000
310 000
320 000
230 000
210
200
20/22
13
13
13
13
3.1
7.0
22/21
31
30
29
29
1.3
2.3
Argon
10-s cc/g «A
39 000
42 000
150 000
110 000
5 700
1600
40/36
1.1
1.2
2.3
2.2
96
42
36/38
5.3
5.4
5.2
5.2
1.2
2.4
Krypton
10-8 Cc/g
38
36
73
49
.34
.19
Xenon
10~8 cc/g
38
16
46
42
.65
.16
134
APOLLO 11 PRELIMINARY SCIENCE REPORT
Table 5-V. 'Xe/^Xe ratios
Sample
Fines
Breccia
mXe
0.0062
.0052
12S.Y,.
0.0071
.0057
0.086
.084
ni>xe
1.07
1.07
>30Xe
0.165
.164
i3\Xe
0.829
.820
iziXe
0.373
.37
^6Xe
0.306
.304
tain radiogenic 40Ar and spallation-produced
noble gases which, when coupled with potassium
contents, enable potassium argon ages and
cosmic-ray radiation ages to be estimated. Seven
rocks have yielded potassium argon ages, all of
which are consistent with a value of 3,0±0.7X 10⁹
yr. Radiation ages show a wider variance among
different rocks, ranging from approximately 107
yr to approximately 16X107 yr. The relative
amounts of spallation-produced helium, neon,
and argon differ from those in most stone
meteorites and probably reflect the unique
chemistry of the lunar material.
Gamma-Ray Spectromeiry
The Radiation Counting Laboratory (RCL)
received eight lunar samples for preliminary
study by nondestructive gamma-ray analysis.
These samples included one rock from the con-
contingency sample, five rocks from the documented-
sample box, and a sample of fines and one rock
from the bulk-sample box.
Because of the complex operations involved
in handling lunar material, preparation of
samples for analysis in the RCL was slow, and
analysis of the first RCL sample could not begin
until July 29, 1969. As a result, radioactive spe-
species with half lives of less than a few days were
not detectable. In addition, the intense inter-
interferences from the gamma-ray spectra of the
thorium and uranium decay series in the
samples made detection of weak gamma-ray
components very difficult.
The low-background gamma-ray spectrom-
spectrometers used in these studies were located 15 m
below the ground in a room supplied with
radon-free air and shielded by 0.9 m of com-
compacted dunite inside a welded steel liner of low
radioactivity. The principal detector system
consisted of two 23-cm-diameter, 13-cm-long
Nal (Tl) detectors at 180° with the sample be-
between them. Data were recorded in the singles
and coincidence modes. Response of the de-
detectors was enhanced by use of a surrounding
anticoincidence mantle. Background was re-
reduced further by surrounding the detectors and
the inner mantle with a thick lead shield, the
exterior of which was covered by a thin meson-
sensitive anticoincidence mantle. Spectra were
also recorded with a large-volume Ge(Li) de-
detector, which was located inside a lead shield
10 cm thick. However, all data in this report
were obtained from the Nal(Tl) scintillation
spectrometer. With the exception of the pream-
preamplifiers, all ancillary electronic instrumentation
was located in an adjacent control room.
For the preliminary investigation, the equip-
equipment was calibrated with the aid of a series
of standards prepared by dispersing known
amounts of radioactivity into quantities of elec-
trolytically reduced iron powder. The weights
of the cylindrical dispersed samples, which had
a density of 3.4 g/cc, overlapped the range of
anticipated lunar-sample weights. Lunar samples
were transferred to the RCL for analysis in a
variety of nonstandard containers. The material
of the container affects the gamma-ray response
through gamma-ray scattering and absorption.
Where feasible, a library of standard spectra
was recorded with dispersed sources inside the
type of container used for the actual lunar
sample. However, this procedure could not be
followed in every instance. The activity of each
radionuclide was determined by using the
method of least squares to resolve the gamma-
ray spectra.
Until it is possible to standardize the equip-
equipment with phantoms that have the same shape
and density and that contain known amounts of
the radionuclides of interest, the results of the
preliminary studies have been assigned large
errors. Some samples were processed for analy-
analysis without being weighed. In such cases, the
sample weight was estimated by correcting the
weight of the sample package for the weight of
the container, packing material, and biological
containment bags.
The results of the preliminary studies are
PRELIMINARY EXAMINATION OF LUNAR SAMPLES
135
summarized in table 5-VI. Twelve radioactive
species were identified; some identifications
were only tentative. The nuclides of shortest
half life that were characterized were 52Mn (half
life, 5.7 days) and 48V (half life, 16.1 days). It
is important to note that the concentrations
listed in table 5-VI represent averages for the
entire sample (usually a rock) and, therefore, are
not subject to sampling errors if the rock is
inhomogeneous.
The amount of potassium present is variable
and ranges over the average potassium concen-
concentration @.085 weight percent) for chondrites.
Conversely, the uranium and thorium concentra-
concentrations are near the values for terrestrial basalts,
and the thorium-to-uranium ratio is approxi-
approximately 4.1, with little variation. Despite vari-
variation of a factor of 5.6 in the potassium concen-
concentration, the potassium-to-uranium ratio deter-
determined for lunar surface material B400 to 3100)
is remarkably constant and much lower than
similar ratios for terrestrial rocks or meteorites.
Yields of cosmogenic 26A1 are generally high,
and the 22Na/2SAl ratio is considerably below
unity in both the lunar rocks and the soil. The
high yields of 26AI may be understood in terms
of the chemical composition of the lunar surface
material, if the samples in question have been
exposed to cosmic-ray bombardment for several
half lives @.74 X 106 years) of 26A1 so that the
production of 23A1 could reach saturation. Such
reasoning suggests that the material analyzed
in these studies has been "exposed to cosmic
radiation for at least several million years, which
is in agreement with the rare-gas analyses.
Magnetic Measurements
Preliminary magnetic measurements have
been completed on 31 samples of crystalline rock
and breccia, using a triaxial fluxgate gradiom-
eter in the vacuum chamber and class III cabi-
cabinets. The level of significance of the results from
various samples ranged from 1 X 10~5 to
1 X 10~2 emu/g. The significance level is a
function of sample weight, sample shape, inten-
intensity of magnetization, and the highly variable
magnetic interference generated by the cabinets
around the sample.
Of the 13 samples of crystalline rock meas-
measured, seven gave no measurable magnetic re-
.3
5
w
co rj oo co co cd oo
p ° f, o -h i1
S « +1 So "*
r~*! "^ r^
0 t- CO
01 il H
+1 w +1
CD >H 0O
co n
o
g-i d So +1 +1
+1 « +1 » fc
41
+1 +1
t- 1O
<M CO
=! hh d +| +|
¦"*
+1
CO
¦fl +1
i-H Pfl ^t T}( ^> rt t^*
fe S d -- - +1
CO « I CO CD
i-i +1 co
p<
¦* co
-t ©
5 d d +| +|
? +1 +1 g ^*
. +1 +1
ioo
vi +i +i
Tl CD 00
O) O] CO
co
8
d
o
in ^ i-H in
8 ?, ^ 71
+1
CO
+1 7J|
cq o
CO
to
a
< CD
?r
CD CD 05 I
d+ii]!
CO
+1
o
I ¦* j,1 s
<M « t2
+i +l
o o
•<}< co
I
"§ X *
1P:§
> ^ dc H
136
APOLLO 11 PRELIMINARY SCIENCE REPORT
sponse. In six samples, induced magnetization
of approximately 1 X 10~4 emu/g in fields
ranging from 0.3 to 1.9 Oe and with uncertain-
uncertainties from 25 to 50 percent was detected. One of
these six samples also had a barely detectable
remnant magnetization, approximately 3 X 10~4
emu/g with an uncertainty of approximately 50
percent.
The breccias are approximately 10 times as
magnetic as the crystalline rocks. Eighteen brec-
breccias were measured, five of which gave no meas-
measurable magnetic response. Seven of the breccia
samples showed only induced magnetization,
whereas both induced and remnant magnetiza-
magnetization was detected in five samples. Intensities of
induced magnetization in various breccia sam-
samples ranged from 1 X 10¹² to 1 X 10 emu/g
in fields ranging from 0,3 to 0.9 Oe and with un-
uncertainties from 10 to 50 percent. The intensity
of remnant magnetization in the five samples
was approximately 1 X 10~3 emu/g with uncer-
uncertainties from 20 to 50 percent. The ratio of rem-
remnant to induced magnetization for these five
samples varied between 0.4 and 0.9 Oe. Several
portions of fines from the contingency and bulk
samples were also measured; the specific suscep-
susceptibilities of these fines ranged from 1 X 10~2 to
4 X 10~2 emu/g, which is roughly 10 times
greater than the specific susceptibilities of the
breccias.
Organic Chemical Investigations
A simple survey method and a more elaborate
and specific technique have been used to esti-
estimate the abundance levels of organic matter in
the lunar samples. The survey method and the
specific technique are A) a pyrolysis-flame ion-
ization detector capable of yielding an estimate
of the total organic matter in the sample, regard-
regardless of type and origin, and B) a computer-
coupled high-sensitivity mass spectrometer ca-
capable of yielding detailed mass-spectrometric
data on the volatile and/or pyrolyzable organic
matter as a function of sample temperature.
From the mass-spectrometric data (combined
with the vaporization characteristics), an assess-
assessment may be made of the relative contributions
of terrestrial contaminants versus the possible
indigenous lunar organic matter.
Pyrolysis-Flame lonizafion Detector Determination of
Total Organic Carbon
Fourteen samples of lunar material were ana-
analyzed for total organic carbon content as part
of the preliminary examination at the LRL.
These samples included both fines and different
types of rocks from the contingency pouch and
the bulk and documented boxes.
The technique used in this determination is
based on the pyrolysis of small portions A0 to
40 mg) at 800° C in a Nichrome tube under a
flowing stream of hydrogen and helium, with
subsequent detection of the volatile products by
a hydrogen flame ionization detector. The com-
combustion of the organic volatiles produces meta-
stable oxygenated species in the flame zone which
undergo chemi-ionization to yield an ion current
proportional to the number of carbon atoms
entering the flame. After amplification and digi-
digital integration, the resultant single peak area is
compared with known standards on a log-log
least-squares calibration plot to yield the organic
carbon content in parts per million.
The detector response is highly specific to
organic compounds and does not result from
such inorganic gases as carbon dioxide, carbon
monoxide, water, nitrogen, oxygen, sulfur oxides,
nitrogen oxides, hydrogen halides, etc. Graphite
and diamond are not detected by this technique.
Terrestrial soils give values of 30 to 500 ppm
from dry desert areas and values of 500 to 20 000
ppm from agricultural areas. Ancient sediment
rocks can yield values as low as 50 ppm when
most of the organic matter has been converted
into kerogenic material. By this method, a por-
portion of the recently fallen Puebito de Allende
meteorite was found to contain 37 ppm of
organic carbon, and a sample of volcanic bomb
was found to have less than 1 ppm.
The apparatus for the determination is shown
in schematic form in figures 5-8 and 5-9 and is
shown in figure 5-10 as installed in the Class III
cabinetry in the Physical Chemistry Test Lab-
Laboratory of the LRL.
The fines from the contingency sample were
sampled 1 day after the plastic pouch had been
opened and the rocks removed with metallic
implements. This sample (sample 10010,5),
which indicated 16 :± 7 ppm of organic matter,
PRELIMINARY EXAMINATION OF LUNAR SAMPLES
137
^Electrometer
amplifier /Pyrolyzer
Digital
integrator
Pyrolyzer voltage
Pyrolyzer voltage ..
' 1 to2.5 V ac j
' " 15 to 30 A "j
300 V
Variac
high setting —
Variac f
low setting —-'
---Recorder
(log output)
W
Torroidal
transformer
1 1
0- to 5-sec
adjustable
time delay
relay switch
(ol-
Figure 5-8. — Organic carbon electronics schematic.
I
Figure 5-10. — Biological enclosure, organic carbon de-
determination.
Helium and hydrogen
in
Stainless steel cone-, t
Copper sea! -,_ S|
Nichrome tube--—___
25-mg sample
Quartz wool „__
Electrometer
input ---__
Air
Igniter-,,.
-300 V
Figure 5-9. — Organic carbon pyrolyzer-flame ionization
detector.
was exposed to the spacecraft and terrestrial
atmosphere during the return trip but was
handled carefully with respect to organic con-
contamination. Therefore, it was concluded that
this sample was not heavily contaminated.
Eleven days later, after many intrusions into the
sample for other experiments, another portion
of these fines was analyzed, showing 48 ± 18
ppm of organic matter. Microscopic examination
of these fines showed white fibers, which were
judged to be cellulose contamination.
Three rocks were analyzed from the contin-
contingency sample. An aggregate (sample 10021,21)
was chipped after extensive geologic examina-
examination {frequent rubber-glove contact) to give 44
ppm of organic matter. The crystalline rock
(sample 10024,4) was analyzed after only brief
geologic examination to give 17 ppm of organic
matter. Both these rocks had been stored in
plastic boxes. A third contingency rock (sample
10032,1), previously unexamined, was carefully
chipped under clean conditions and showed 10
ppm. These results from the contingency
samples show that even moderate handling
can easily introduce low amounts of organic-
matter contamination. The primary contamina-
contamination sources appear to be contact with rubber
gloves, plastic materials, fiber brushes and tis-
tissues, and air-Freon spray for dust removal.
However, because of the relatively simple proc-
processing procedure used with the contingency
sample, fairly clean samples can be obtained
with adequate precaution.
The documented box was opened in the F-201
vacuum chamber, which was known to contain
significant amounts of pump oil. In addition, the
relatively cumbersome hardsuit gloves made
sample processing more complex and subject to
contamination.
The fines (sample 10015,10) from the gas
reaction cell were analyzed after exposure to
nitrogen, carbon dioxide, and oxygen and were
found to give 126 ppm. White filaments were
observed in this sample.
Three aggregate rock samples were taken
from chipping operations in the vacuum cham-
138
APOLLO 11 PRELIMINARY SCIENCE REPORT
1
i
!
li
Si
.51
9
bo W>
1111
1
,2
i%
T3 T3 rO ,
afta
^ w ^
¦s-s-s
so w q « «
t~- 00 i-H CD O5
¦-« co
N O
i-H i-H
i
nil
in eg tM ¦* i-i
o" o" i-T m<" of
i-l i-H <N <N CO
O O O Q O
o o o o o
o
s
to
I
^3 i O f^ C
tu w ca p
r^ ^^ fj? &
o o o o
Cjl Cjl Cjl C-l
fc< t, fa [1.:
qin
o
tq 1O o
(O a) n
<u o o>
ta Is "S
6C too 60
< <
O
i-l T)l -^f CO
g is
a* S
& CL Ol P< Cl Q;
a; S? u v <i> Sy
M ? ? ^ ^ M
Ph Pli Pu Pm Pk ?
.9 .2 .2 .2 -2 .2
ajcoiniot-
I I
co o n« a^f
to 003 ¦* 03 o
HtOJJlCMrt
! 8 I*
1 — S P
t-^ C0^ CO^ t^_ CCn rH
of o" co" en c> cd"
83
p ij
Id
° - s
^ 5 Pi
^^ > o
S 0) '&
1
ber after the glove implosion and subsequent
heat sterilization. These chips were processed
outside the F—201 vacuum chamber in a sealed
can, and portions were taken on a clean bench
with organic cleanliness. Two chips were desig-
designated for physical-chemical examination and
were handled an unknown amount by the glove
operator. These samples A0061 and 10064) indi-
indicated 62 and 96 ppm. The third chip (sample
10068) was an interior-surface fragment sampled
in the F-201 vacuum chamber with metal tongs,
resulting in 39 ppm, which was distinctly lower
than results from the other two fragments from
the vacuum chamber. This result shows the
amount of contamination from F-201 handling
to be from 30 to 40 ppm from the gaseous com-
components and an additional 20 to 60 ppm from
other handling.
The bulk box was processed in the biological
preparation cabinetry under dry nitrogen, but
the samples in this box were inadvertently ex-
exposed to Freon and ethylene oxide during the
initial sterilization of the exterior of the box. The
rock chips from this box gave results between
28 and 88 ppm when handled routinely. Special
samples (processed for organic analysis) showed
marked improvement. A chip from sample 10056
gave 10 ppm, and the bulk fines (after sieving)
indicated 18 ppm. The major sources of contami-
contamination probably result from handling and the
rigorous sterilization procedures necessary for
introduction or removal of any materials from
the biological preparation cabinets.
The results of these tests are summarized in
table 5-VII. The data indicate that the indige-
indigenous organic content of the lunar samples is be-
below 10 ppm. Contamination from handling,
although low, can easily mask the native organic
matter. The samples returned from future Apollo
missions should give a better estimate of the
organic levels if adequate precautions are taken
to avoid organic contamination.
Mass Spectrometry
The mass-spectrometric investigation involved
examination of the lunar sample by repetitive
mass-spectrometric monitoring of the vapor
phase evolved by heating the lunar sample from
ambient temperature to approximately 500° C.
A mass spectrometer was operated on line with
PRELIMINARY EXAMINATION OF LUNAR SAMPLES
139
a Scientific Data Systems Sigma 2 computer.
The mass spectrometer was designed to meet
the LRL biological-containment requirements,
which necessitate a sterilizable inlet system, and
the mass spectrometer was equipped with a
high-efBciency ion source and a high-gain elec-
electron multiplier. The online computer permitted
continuous control of the scanning circuit, re-
recording of the mass spectra, and calibration of
the mass scale, spectrum normalization, and
visual (cathode-ray tube) display of the spec-
spectrum during each scan cycle.
The lunar material (approximately 50 mg)
was placed in a nickel capsule, sealed by a cold
weld, and transferred to the instrument inlet
system. The inlet system allowed insertion of
these capsules into an oven (at approximately
500° C) connected to the ionization chamber by
a heated 8-cm quartz tube.
To calibrate the system, three samples of
n-tetracosane on clean quartz (at concentrations
of 1, 2, and 3 ppm) were analyzed with the
mass spectrometer/computer system to deter-
determine the total ionization recorded versus the
amount of organic material present. (Concen-
(Concentration levels reported refer to an equivalent
signal of n-tetracosane.) Such concentrations are
relatively large in terms of instrument sensi-
sensitivity.
The lunar material studied came from three
distinct sample types: A) the core tubes; B)
fines (type D) from the bulk box; and C) in-
interior and exterior chips, fine- and medium-
grained (types A and B) and breccia (type C)
rocks that were returned in both boxes. Control
samples of outgassed clean sand (Ottawa sand),
which were exposed to the sample cabinet at-
atmosphere for a length of time similar to the
lunar samples' exposure, were analyzed to esti-
estimate the amount of organic contamination intro-
introduced by exposure to the atmosphere.
The levels of organic matter observed from
this experiment, whether indigenous or of ter-
terrestrial origin (contamination), were extremely
low @.2 to 5.0 ppm). Because of this low level,
the quantity of organic matter determined can
vary widely with the slightest amount of organic
contaminant from anywhere in the entire sample-
handling and storage procedure between the
Moon and the mass spectrometer. The analyses
of blanks and controls from all phases of lunar-
sample-handling and storage procedures, usually
using clean quartz, indicate that most of the
organic material observed in the lunar samples
is caused by organic matter contamination.
Data on a sample obtained from the core tube
and on a sample of fines from the bulk box may
indicate the presence of an extremely small
amount of pyrolyzable organic matter. This
assumption is based on the observation that the
abundance of ions at m/e 78 and 91 increased
in the spectra obtained later in the heating cycle
of these samples. These may be interpreted as
aromatic hydrocarbon ions that are indicative
of the products of the pyrolysis of indigenous
organic matter.
In conclusion, the maximum levels of indige-
indigenous organic matter indicated by the observa-
observations described in this report appear to be con-
considerably less than 1 ppm.
Biology
The preliminary examination of samples has
included microscopic studies to find any living,
previously living, or fossil material, if possible.
No evidence of any such material has been
found.
Approximately 700 g of fines and rock chips
have been subjected to an extensive biological
protocol. A large variety of biological systems
was challenged with lunar material. The biologi-
biological systems included the following:
A) Germ-free mice
B) Fish
C) Quail
D) Shrimp, oysters, and other invertebrates
E) Several lines of tissue cultures
F) Several varieties of insects
G) A considerable number of plants
(8) Lower animals, including paramecia
No evidence of pathogenicity had been ob-
observed when this report was written (August
23, 1969).
Conclusions
The major findings of this preliminary exami-
examination of the lunar samples are as follows:
A) The fabric and mineralogy of the rocks
allow the rocks to be divided into two genetic
140
APOLLO 11 PRELIMINARY SCIENCE REPORT
groups: (a) fine- and medium-grained crystal-
crystalline rocks of igneous origin, probably originally
deposited as lava flows, dismembered, and re-
deposited as impact debris and (b) breccias of
complex history.
B) The crystalline rocks are different from
any terrestrial rock and from meteorites, as
shown by the modal mineralogy and bulk chem-
chemistry.
C) Erosion has occurred on the lunar sur-
surface, as indicated by the rounding on most
roclcs and by the evidence of exposure to a proc-
process that gives the rocks a surface appearance
similar to sandblasted rocks. No evidence exists
of erosion by surface water.
D) The probable presence of the assemblage
iron-troilite-ilmenite and the absence of any hy-
drated phase suggest that the crystalline rocks
were formed under extremely low partial pres-
pressures of oxygen, water, and sulfur (in the range
of those in equilibrium with most meteorites).
E) The absence of secondary hydrated min-
minerals suggests that there has been no surface
water at Tranquility Base at any time since the
rocks were exposed.
F) Evidence of shock or impact metamor-
phism is common in the rocks and fines.
G) All the rocks display glass-lined surface
pits that may have been caused by the impact
of small particles.
(8) The fine material and the breccia contain
large amounts of all noble gases with elemental
and isotopic abundances that almost certainly
were derived from the solar wind. The fact that
interior samples of the breccias contain these
gases implies that the breccias were formed at
the lunar surface from material previously ex-
exposed to the solar wind.
(9) The 40K/40Ar measurements on igneous
rock indicate that those rocks crystallized
3 X 10⁹ to 4 X 10⁹ yr ago, Cosmic-ray-produced
nuclides indicate the rocks have been within 1 m
of the surface for periods of 20 X 106 to 160 X
106 yr.
A0) The level of indigenous volatilizable
and/or pyrolyzable organic material appears to
be extremely low (i.e., much less than 1 ppm).
A1) The chemical analyses of 23 lunar
samples show that all rocks and fines are gen-
generally similar chemically.
A2) The elemental constituents of lunar
samples are the same as those found in terres-
terrestrial igneous rocks and meteorites. However,
several significant differences in composition
occur: some refractory elements (e.g., titanium
and zirconium) are notably enriched and the
alkalis and some volatile elements are depleted.
A3) Elements that are enriched in iron me-
meteorites (i.e., nickel, cobalt, and the platinum
group) were not observed, or such elements
were low in abundance.
A4) Of 12 radioactive species identified, two
were cosmogenic radionuclides of short half life,
namely 52Mn (half life 5.7 days) and 48V (half
life 16.1 days).
A5) Uranium and thorium concentrations lie
near the typical values for terrestrial basalts;
however, the potassium-to-uranium ratio deter-
determined for lunar surface material is much lower
than such values determined for either terrestrial
rocks or meteorites.
A6) The high observed 2eAl concentration is
consistent with a long cosmic-ray exposure age
inferred from the rare-gas analysis.
A7) No evidence of biological material has
been found in the samples to date.
A8) The lunar soil at the LM landing site
is predominantly fine grained, granular, slightly
cohesive, and incompressible. The hardness in-
increases considerably at a depth of 6 in, The soil
is similar in appearance and behavior to the soil
at the Surveyor landing sites.
Discussion
The data and descriptive information in this
report were obtained to characterize the mate-
materials about to be distributed to principal investi-
investigators and their associates for specialized and
detailed study. The usefulness of this informa-
information in the selection of material for particular
experiments is well illustrated by the rare-gas
data. It would have been impossible to select
material suitable for a careful study of the
cosmic-ray-produced isotopes of neon, argon,
krypton, and xenon, or even for a straightfor-
straightforward potassium-argon age without the knowl-
knowledge of the variations in rare-gas content shown
PRELIMINARY EXAMINATION OF LUNAR SAMPLES
141
in table 5-IV. Similarly, the organic matter anal-
analyses provide guidance in selecting material for
further experiments and study of organic matter
in lunar materials.
In spite of the limited and specific objectives,
the preliminary examination has provided sig-
significant, and a few unexpected, results on long-
recognized questions.
The existence of an unexplained erosion proc-
process on the lunar surface was clearly indicated
by both the Ranger and the Lunar Orbiter
photographs. These photographs frequently show
very fresh block craters interspersed among
smoothed craters. Photographs of individual
rocks on Surveyor photographs give further evi-
evidence of rounding and abrasion of hard rocks
on the lunar surface. The surface morphology,
glass pits, and splashes seen on both hard and
fragmental rocks suggest that samples are now
available for detailed laboratory examination
that may elucidate a widespread and important
mechanism on the lunar surface. The evidence
provided by the first examination of these rocks
indicates that this process is unlike any process
so far observed on Earth.
The chemical composition of the Tranquility
Base fines and igneous rocks is unlike those of
any known terrestrial rock or meteorite. The
unique characteristic is the unusually high tita-
titanium, zirconium, yttrium, and chromium content
in the lunar rocks, compared to other rocks with
this approximate bulk composition. Also of great
interest is the low sodium, potassium, and rubid-
rubidium content. It is particularly significant that
the unique composition is that of a silicate
liquid, If this liquid has a volcanic origin, the
unique composition implies either that the com-
composition of the rock from which the liquid was
derived differs significantly from the composi-
composition of the mantle of the Earth, or that the
mechanism by which the liquid was formed
and/or the fractional crystallization of this liquid
on the Moon may also differ from terrestrial
analogs, The nearly identical composition found
for the fines, fragmental rocks, and igneous
rocks suggests that the unique composition
observed for the Tranquility Base materials is
characteristic of that part of the Moon and not
the result of a local isolated flow or intrusion.
Several specific geochemical observations on
the igneous rocks can be made from the present
data. The potassium-to-uranium ratios B400 to
3200) of the lunar materials are unusually low,
both when compared to chondritic meteorites
D5 000) and when compared to most common
Earth rocks A0 000). This ratio is not readily
changed by terrestrial igneous processes (refs.
5-1 and 5-2). If this generalization is extended
to lunar igneous processes, observed ratios can
be inferred to be characteristic of the entire
Moon. Similarly, the rubidium-to-strontium ratio
is more like that of the Earth and achondritic
meteorites than that of chondritic meteorites and
the Sun. Both these chemical characteristics sug-
suggest that, relative to chondrites, the Moon, like
the Earth, is depleted in alkali metals greater
than sodium in atomic number (ref. 5-3).
Variations in other elemental ratios that are
easily fractionated during igneous differentiation
processes (e.g., nickel/magnesium and barium/
strontium) suggest that chemical differentiation
has occurred in the formation of the igneous
rocks. The abundance of radioactive elements
(potassium, uranium, and thorium) in the sur-
surface materials is much greater than that inferred
(from thermal models of the Moon) for the
mean radioactive element content of the Moon
(ref. 5-4). This finding leads to the inference
that the surface materials are chemically differen-
differentiated with respect to the entire Moon.
The unusually high abundance of high-atomic-
number elements (iron and titanium) is clearly
consistent with the unusually high densities C.1
to 3,5 g/cc) reported previously. Both the Sur-
Surveyor alpha back-scattering analyses (ref. 5-5)
and optical studies (ref. 5-6) indicate that mare
materials may have significantly higher iron con-
contents than highland materials. Assuming the
rather plausible generalization that the densities
of Tranquility Base rocks are characteristic of
other mare regions, one can infer that large areas
of the lunar surface, particularly the mare re-
regions, may be made of materials with densities
in excess of the mean density of the Moon.
Perhaps the most exciting and profound obser-
observation made in the preliminary examination is
the great age of the igneous rocks from this lunar
region. The potassium argon age is both intrinsi-
142
APOLLO 11 PRELIMINARY SCIENCE REPORT
cally and experimentally uncertain; nevertheless,
it is clear that the crystallization of some Apollo
11 rocks may date back to times earlier than the
oldest rocks found on Earth. It seems likely that
if the age of the Apollo 11 rocks does not date
back to the time of formation of the Moon, rocks
from other regions of the Moon will.
References
5-1. Birch, A. F.: Differentiation of the Mantle. Geol.
Soc. Am. Bull., vol. 69, no. 4, Apr. 1958, pp.
483-486.
5-2. Wasserburc, G. J.; MacDonald, G. J. F.; Hoyle,
F.; and Fowler, W. A.: Relative Contributions
of Uranium, Thorium, and Potassium to Heat
Production in the Earth. Science, vol. 143, no.
3605, 1964, pp. 465-467.
5-3. Gast, P. W.; History of the Earth's Crust, R. A.
Phinney, ed., Princeton University Press, 1968,
pp. 15-27.
5-4. Anderson, D. L.; and Phinney, R. A.: Early Ther-
Thermal History of the Terrestrial Planets. In Mantles
of the Earth and Terrestrial Planets, S. K. Run-
corn, ed., Intersoience Publishers (London), 1967,
pp. 113-126.
5-5. Turkevich, A. L.; Anderson, W. A.; et al, ; Sur-
Surveyor Project Final Report, Part II. Science
Results. NASA TR 32-1265, 1968.
5-6. Adams, J. B.: Lunar and Martian Surfaces: Petro-
logic Significance of Absorption Bands in the
Near-Infrared. Science, vol. 159, no. 3822, 1968,
pp. 1453-1455.
Bibliography
Space Science Board, National Academy of Sciences: Con-
Conference on Potential Hazards of Back Contamination
from the Planets, July 29-30, 1964.
National Aeronautics and Space Administration; the De-
Department of Agriculture; the Department of Health,
Education, and Welfare; the Department of the Inte-
Interior; and the National Academy of Sciences: Inter-
agency Agreement on the Protection of the Earth's
Biosphere from Lunar Sources of Contamination, Au-
August 24, 1967.
McLane, J. C, Jr.; King, E. A., Jr.; Flory, D. A.; Rich-
Richardson, K. A.; Dawson, J. P.; Kemmereh, W, W.; and
Wooley, B. C: The Lunar Receiving Laboratory. Sci-
Science, vol. 155, 1967, pp. 525-529.
Shoemaker, E. M.; Morris, E. C; Batson, R. M.; Holt,
H. E.; Larson, K. B.; Montgomery, D, R.: Rennil-
son, J. J.; and Whitaker, E. A.;.Jet Propulsion Labo-
Laboratory Tech. Rept. 32-1265, 1969, p. 21.
ACKNOWLEDGMENTS
The following people contributed directly in obtaining
the data and in the preparation of this report: D. H.
Anderson, Manned Spacecraft Center (MSC); E. E.
Anderson, Brown and Root-Northrop (BRN); Klaus Bie-
man, Massachusetts Institute of Technology (MIT); P, R.
Bell, MSC; D. D. Bogard, MSC; Robin Brett, MSC; A. L.
Burlingame, University of California at Berkeley; W. D.
Carrier, MSC; E. C. T. Chao, United States Geological
Survey (USGS); N. C. Costes, Marshall Space Flight
Center; D. H. Dahlem, USGS; G. B. Dalrymple, USGS;
R. Doell, USGS; C. C. Davis, Ames Research Center;
J. S. Eldridge, Oak Ridge National Laboratory (ORNL);
M. S. Favaro, United States Department of Agriculture
(USDA); D. A. Flory, MSC; Clifford Frondel, Harvard
University; R. Fryxell, Washington State University; John
Funkhouser, State University of New York, Stony Brook;
P. W. Gast, Columbia University; W, R. Greenwood,
MSC; Maurice Grolier, USGS; C. S. Gromme, USGS;
G. H. Heiken, MSC; W. N. Hess, MSC; P. H. Johnson,
BRN; Richard D. Johnson, Ames Research Center; Elbert
A. King, Jr., MSC; N. Mancuso, MIT; J. D. Menzies,
USDA; J. K. Mitchell, University of California at Berke-
Berkeley; D. A. Morrison, MSC; R. Murphy, MIT; G. D. O'Kel-
ley, ORNL; G. G. Schaber, USGS; O. A. Schaeffer, State
University of New York, Stony Brook; D. Schleicher,
USGS; A. H. Schmitt, MSC; Ernest Schonfeld, MSC;
J. W. Schopf, University of California at Los Angeles;
R. F. Scott, California Institute of Technology; E. M,
Shoemaker, California Institute of Technology; B. R.
Simoneit, University of California at Berkeley; D. H.
Smith, University of California at Berkeley; R. L. Smith,
USGS; R. L. Sutton, USGS; S. R. Taylor, Australian
National University; F, C. Walls, University of California
at Berkeley; Jeff Warner, MSC; Ray E, Wilcox, USGS;
J. Zahringer, Max-Planck-Institute, Heidelberg, Germany.
The members of the Lunar Sample Analysis Planning
Team are W. N. Hess (Chairman), Physicist, MSC; J. R.
Arnold, Geochemist, University of California, San Diego;
G, Eglinton, Geochemist, University of Bristol, England;
C. Frondel, Mineralogist, Harvard University; P. W. Gast,
Geochemist, Columbia University; E. M. Shoemaker,
Geologist, California Institute of Technology; M. G. Sim-
Simmons, Geophysicist, MIT; R. M. Walker, Geophysicist,
Washington University; G. J. Wasserburg, Geochemist,
California Institute of Technology; L. P. Zill, Biologist,
Ames Research Center,
6. Passive Seismic Experiment
Gary V. Latham, Maurice Ewing, Frank Press,
George Sutton, James Dorman, Nafi Toksoz,
Ralph Wiggins, Yosio Nakamura, John Derr, and Frederick Duennebier
Purpose of the Passive Seismic Experiment
The Passive Seismic Experiment Package
(PSEP), which was deployed on the lunar sur-
surface by the Apollo 11 astronauts, was the princi-
principal tool for determining the internal structure,
physical state, tectonic activity, and composition
of the Moon. Detailed investigation of the lunar
structure must await the establishment and oper-
operation of a network of seismic stations; however, a
single suitable well-recorded seismic event can
provide information that is of fundamental im-
importance and that could not be gained in any
other way.
The PSEP flown on the Apollo 11 mission
offered the first opportunity for demonstrating
the feasibility of lunar seismic exploration. Seis-
Seismometers are among the most delicate of scien-
scientific instruments. They are normally operated on
piers in underground vaults at sites especially
selected for environmental stability and a low
level of background noise, The impossibility of
attaining such favorable operating conditions on
the lunar surface posed many design problems.
A principal goal of this experiment was to dem-
demonstrate the feasibility of obtaining seismic rec-
records of motions of the lunar surface and to in-
interpret them in terms of lunar structure. The
problem to be resolved was to produce seis-
seismometers that could be installed with a mini-
minimum demand on an astronaut's time and energy,
be adjusted and calibrated by remote control,
be operated on a foundation with uncertain me-
mechanical properties and with sensitivity charac-
characteristics that could be adjusted to conform with
the background noise characteristics of the
Moon, and that could remain operable through
the large changes in temperature on the lunar
surface.
The PSEP was successfully installed at Tran-
quility Base as part of the Apollo 11 mission
and was operated for 21 days. It demonstrated
that the goals of lunar seismic exploration could
indeed be achieved.
Instrument Performance
The PSEP is shown schematically in figure
6-1, The system weighs 48 kg and uses solar cells
to supply power. Thus, operation of the PSEP
is confined to lunar day. The PSEP sensor unit
contains three long-period (LP) seismometers
with resonant periods of 15 sec, alined orthogon-
orthogonally to measure surface motion in both horizontal
and vertical directions, and a single-axis, short-
period (SP) seismometer sensitive to vertical
motion at higher frequencies (resonant period
of 1 sec).
Low-frequency, horizontal-component seis-
seismometers are extremely sensitive to tilt and must
be leveled to high accuracy. In the Apollo seis-
seismic system, the two low-frequency, horizontal-
component seismometers are leveled to within 2
seconds of arc from the local vertical direction
by means of a two-axis, motor-driven gimbal
(one motor for each seismometer). A third motor
adjusts the low-frequency, vertical-component
seismometer in the vertical direction. Motor
operation is controlled from the Earth. These
elements are shown schematically in figure 6-2.
The low-frequency seismometers are mounted in
crisscross fashion to achieve a minimum volume
configuration. The instrument is controlled from
the Earth by a set of 15 commands that control
such functions as speed and direction of the lev-
leveling motors, instrument gain, and calibration.
Seismic data were obtained from the Apollo
11 seismometer system for 21 days. Initial activa-
143
144
APOLLO 11 PRELIMINARY SCIENCE REPORT
Passive seismic
unit
Antenna /Handlefbr
/ astronaut
/Solar panel
/ deployment
/ linkage
j?) "Antenna -
'^-^ positioning
\ mechanism
East
'Antenna \
mast
Carry
handle
Figure 6-1. - Diagram of the fully erected PSEP.
+X-axis
-Y-axis
Top view
+Y-axis
-X-axis
LP vertical
(Z) sensor
Capacitor plate ---
nertial mass "
Damping magnet--''
Capacitor
plate -N
1 nertial
mass
Bellows (retract
for uncage) -•"'
Zero length
spring *v
Motion A
^ Sensor
'Caging bellows
(retract for uncage)
Sensor
boorn^
__ Motion '
iR
^Damping
\
/Wormdriver \
spring \
adjustment \
motor 1
boom
LP horizontal /
(X.Y) sensors '
magnet
Figure 6-2, — Schematic diagrams of the elements of
the low-frequency (LP) seismometers.
tion was on July 21, 1969, and final turnoff was
on August 27, 1969. The instrument was em-
placed south of the lunar module (LM), 16.8 m
from the nearest point of the LM, as shown in
figure 3-16. The PSEP is shown erected on the
lunar surface in figure 6-3.
Termination of the experiment on August 27
resulted from failure of the system to receive and
execute commands from Earth. Analysis of cali-
calibration pulses and signals received from various
astronaut activities indicates that all four seis-
seismometers operated properly until the final 2
days of operation when the LP seismometers
drifted out of their operating ranges and could
not be recentered because of the absence of com-
command capability. Instrument response curves, as
derived from calibration pulses, are shown in
figure 6-4.
Aside from the eventual failure of the system
to respond to commands, the most significant
deviation from nominal operating characteristics
was that the actual maximum instrument tem-
temperature A90° F) exceeded the planned maxi-
maximum A40° F) by 50° F. This resulted in occa-
occasional transient signals on the LP seismometer
channels and several other minor effects, but did
not significantly degrade instrument perform-
performance. The PSEP performance fully demonstrated
the feasibility of operating seismic instruments
in the lunar environment.
One problem that became evident in the early
stages of the experiment was that the LM is a
source of seismic signals of unexpectedly large
amplitudes. Such seismic signals are assumed to
be generated primarily by venting gases or cir-
circulating fluids, or both, within the LM. Inelastic
deformation of the LM structure in response to
thermoelastic stress may also be a significant
source of seismic noise. Such noise signals make
interpretation of the data obtained from the ex-
experiment more difficult because they must be
recognized and separated from the signals of
events of natural origin that are sought.
The problem of seismic noise from the LM
will be reduced in later missions when the seis-
seismometers can be deployed at greater distances
from the LM. Because of this problem, every
effort must be made to achieve the greatest pos-
possible separation between the LM and the seis-
seismometers.
PASSIVE SEISMIC EXPERIMENT
145
Figure 6-3. — Photograph of the PSEP immediately after its deployment on the lunar surface.
Description of Recorded Seismic Signals
LP Seismometers
Aside from occasional transient signals of in-
instrument origin, the most conspicuous signals
observed on the seismograms from the LP seis-
seismometers are a series of wave trains having the
appearance of surface waves, that is, waves that
would propagate along the surface of the Moon
in contrast to body waves, which travel through
the lunar interior. A total of 30 such signals can
be clearly identified. No signals that might be
classified as body waves are observed in relation
to these wave trains. Most of the trains begin
with SP B to 4 sec) oscillations that gradually
increase to periods of 16 to 18 sec; that is, the
146
APOLLO 11 PRELIMINARY SCIENCE REPORT
109E
r-io8
gio'
? 5
s
a
¦5 10-
10
_ I
I
I
- I
~ I
SP
LP
V <
i
i
i
i
j
i
i
t
¦
i
i
i
¦
I I I I Mill I I J
lii i i I ii nil
10'
10°
101
102
Period, sec
Figuhe 6-4. - Response curves for the SP and LP seis-
seismometers (for the highest gain setting). Response
curves for the three LP seismometers are matched to
within 5 percent. One digital unit is equal to 5 mV.
trains are dispersed. The first of these recorded
wave trains is shown in figure 6-5. This wave
train is primarily on the x-component. For sev-
several wave trains, the period range is between
20 and 50 sec. No corresponding signals are
found on the LP vertical-component seismo-
grams. Dispersion curves (wave period versus
arrival time) for the first three wave trains are
shown in figure 6-6.
During the second lunar day that the experi-
experiment was operational, several of these wave
trains were observed to occur simultaneously
with a series of pulses on the SP vertical seis-
seismometer. The pulses on the SP vertical seis-
seismometer are of uniform amplitude, and the time
interval between pulses gradually increases. In
the situations where wave trains and pulses on
the SP vertical seismometer occur simultane-
simultaneously, it is evident that the LP wave trains are
simply the summation of the transient signals
that correspond to the pulses. Amplitudes are of
the order of 10 m^tm peak-to-peak, so these are
extremely small signals. While a natural origin
for these signals cannot presently be excluded,
the evidence strongly suggests that this entire
set of signals is produced by instrumental effects
that are*, as yet, unexplained.
SP seismometer, type B events
LM venting (?l
1 min
Figure 6-5. — Sample of a high-frequency seismic signal, perhaps generated by the LM,
recorded by the SP seismometer and a sample o? the background noise on the
LP seismometer channels. This section of the seismic record includes one of the
dispersed wave trains.
PASSIVE SEISMIC EXPERIMENT
147
800
700
600
i 500
400
¦? 300
it
200
100
cP
o ?
n
D
o
,o o
o
o
o
o
o
o
o
O Event on July 22, 1969
a Event on July 23, 1969
O Event on July 24, 1969
10
Wave period, sec
12
14
16
18
20
Figure 6-6. — Dispersion curves (wave train period versus arrival time) for three of the
dispersed wave trains recorded by the SP seismometer.
The SP Seismometer
A great variety of high-frequency B to 18 Hz)
signals is present on the seismograms from the
SP seismometer. As a part of the preliminary
investigations, an attempt has been made to sort
these signals into descriptive categories based
primarily upon the shapes of the signal enve-
envelopes and the spectral characteristics of each
type. Only a few spectra are available at the
present time. The signals are divided into the
following categories:
A) Signals produced by astronaut activities
while the astronauts were on the lunar surface
(type A)
B) Signals with impulsive onset and rela-
relatively short duration (types I and X)
C) Signals with emergent onset and rela-
relatively long duration (types B, M, T, and L)
Refinement in this categorization process can
be expected as the investigation proceeds. Such
refinement will be conducted with a view toward
a better understanding of the source mechanisms
involved.
Type A. Signals produced by astronaut activi-
activities were prominent on the SP seismometer from
initial operation until LM ascent. Such signals
were particularly strong when the astronauts
were in physical contact with the LM. The signal
produced when Astronaut Neil A. Armstrong
ascended the ladder to reenter the LM is shown
148
APOLLO 11 PRELIMINARY SCIENCE REPORT
SP seismometer
Initial contact
with ladder
5 sec
Ficuke 6-7. — Signal recorded when Astronaut Armstrong ascended the ladder of the LM.
in figure 6-7. The spectra of signals from various
astronaut activities are shown in figure 6-8. The
predominant frequency of all of the type A sig-
signals is between 7.2 and 7.3 Hz. This predominant
frequency is assumed to correspond to a funda-
fundamental mode of vibration of the LM. Three items
that were ejected from the LM struck the sur-
surface, and the spectra received also contain the
7.2-Hz peak (fig. 6-9). (These items were two
portable life support systems, weighing 75 lb
each, and the LM armrests, weighing a total of
12 lb.) However, it is important to note that the
peaks near 11 and 13 Hz in figure 6-9 would be
dominant if the spectra were corrected for in-
instrument response. The spectral peak at 7.2 Hz,
perhaps caused by LM resonance, was generated
presumably because each ejected item struck the
LM porch and ladder while falling to the sur-
surface.
In the spectra of signals recorded after the
departure of the LM ascent stage, the spectral
peak near 7.2 is shifted to 8.0 Hz. Resonances
in the LM descent-stage structure, which was
left on the lunar surface, would be expected to
shift to higher frequencies when the mass of
the ascent stage was removed.
The spectrum of one sample of signals from
astronaut activity that was performed while the
astronaut was not in contact with the LM is
included in figure 6-8 for comparison with activ-
activities that were performed in physical contact
with the LM. In the spectrum of sample (h)
of figure 6-8j Astronaut Armstrong was collect-
collecting rock samples in the vicinity of the seismom-
seismometers. The relative spectral content at higher
frequencies A0 to 15 Hz) is greater for the
sample (h) spectrum than for the other samples.
Seismic signals in this frequency range can thus
be attributed to astronaut footfalls on the lunar
surface.
Type B. When the PSEP was turned on, type
B signals with very large amplitudes were pres-
present on the SP seismometer record. The signals
gradually decreased over a period of 8 days,
until they disappeared completely on July 29,
1969. Maximum signal levels of approximately
200 mjim were recorded during the initial stages
of activity. Type B signals are shown in figures
6-5 and 6-10. The sections of the record that
are shown in figure 6-10 were recorded during
the final stages of activity. After a puzzling
sequence of changes in pattern, the signals be-
became repetitive with nearly identical structure
from train to train. The interval between events
generally decreased to approximately 30 sec near
their termination. Type B signals reappeared for
a period of 13 hr during the second lunar day
A3; 00 hr on August 21, 1969, to 02:00 hr on
Figure 6-8. — Spectra of signals recorded by the SP seismometer during various astronaut
activities: (a) Astronaut Aldrin ascending LM ladder, (b) Astronaut Armstrong
ascending LM ladder, (c) reaction-control-thruster test firing (first quad),
(d) reaction-control-thruster test firing (second quad), (e) impact of the
second portable life support system, (f) impact of the first portable life support
system, (g) impact of the LM armrests, and (h) Astronaut Armstrong collect-
collecting samples in the vicinity of PSEP. Spectra are not corrected for instrument
response.
PASSIVE SEISMIC EXPERIMENT
149
(a)
.30
.25
.20
.15
.10
.05
0
.20
.18
.16
.14
.12
.10
.08
.06
.04
¦8 .02
= 0
1.105
§.095
.085
.075
.065
.055
.045
.035
.025
.015
.005
.12
6 8 10 12 14 16 18 20
Frequency, Hz
2 4
6 8 10 12 14 16 18 20
Frequency, Hz
150
APOLLO 11 PRELIMINARY SCIENCE REPORT
I mpact of LM armrests A2 ib)
i i i i i i i i i i i i i i i i i i i i i i i i i i i i i i i i
I i I I i I - I
^
I mpact of first portable life support system G5 Ib)
i i i i i i i i i i i i i i i i i i i
i i i i i i i i i i i i i i i i
i i i i i i i i
I mpact of second portable life support system G5 Ib)
i i i i 1 i i i i i i i i i i i i i
i i i i i i i i I i i i 1 1 I I i i i i i
Time, sec
Figure 6-9. — Seismic signals recorded by the SP seismometer when various objects ejected
from the LM struck the lunar surface.
lmJn
July 26, 1969
Figure 6-10. — Real-time record section from the SP seismometer showing type B and type
M signals.
August 22, 1969) that the experiment was oper-
operational.
Spectra of three type B signals (and three
type M signals) are shown in figure 6-11. The
dominant spectral peak is 8.0 Hz. A subordinate
peak at 6.5 Hz is also suggested. These type B
events occurred after LM ascent. Before ascent,
the predominant frequency was approximately
7.2 Hz. As mentioned previously, this shift in
resonant frequency can be explained as the re-
result of removing the mass of the ascent stage
from the LM. The repetitive character of type B
events, the apparent correlation of type B signals
with LM resonant frequencies, and the eventual
disappearance of type B signals have led to the
tentative conclusion that the signals were pro-
produced within the LM structure, presumably by
venting or circulating gases or liquids, or both.
Type M. In the 34-hr interval between 23:00
hr on July 25, 1969, and 09:00 hr on July 27,
1969, 14 seismic signals with unusually large
amplitudes and long duration were recorded.
These signals began impulsively and lasted up
to 7 min for the largest trains. Low frequencies
(one-tenth to one-fifteenth Hz) associated with
the largest of these wave trains were also
observed on the LP vertical-component seismom-
seismometer (LPZ) records. No related signal was
PASSIVE SEISMIC EXPERIMENT
151
Type B signals
.3Or
Type M signals
Id)
4 S
16 12 14 M
, Hz
II 26 8
¦i W 12
Frequtrtcy, Hz
Figure 6-11. - Spectra of type B signals (swmpies (a), (b), smd (c)) *nd type M sisals
(samples (d), (e), *n& (f)). Spectra •« not cerrected for instrument
response.
152
APOLLO 11 PRELIMINARY SCIENCE REPORT
1 min
Aug 25, 1969
Ficuke 6-12. — Real-time record section of type T, I, and X signals from the SP seismometer.
Aug 20, 1969
Figure 6-13. — Real-time record section of type T, L, and X signals from the SP seismometer.
observed on the horizontal components. The
type M signals are believed to represent a sepa-
separate class of events. A type M signal is shown
in figure 6-10. Spectra for three type M events
are shown in figure 6-11. These spectra are re-
remarkably similar to the spectra of the type B
events; hence, type M events may also have
been generated within the LM.
Type T. Type T signals have emergent begin-
beginnings and reach maximum amplitudes within 10
sec after initial motion. The train gradually de-
decreases in amplitude and has a total duration
(above the 1-mm trace amplitude) of 1 to 4 min,
Several samples of type T signals are shown in
figures 6-12 and 6-13. The interval between sig-
signals is quite regular for long periods of time
with very repetitive waveforms. In detail, the
waveform changes with time in a complicated
fashion. Type T events ceased completely on
August 25, 1969.
Spectra for five type T signals are shown in
figure 6-15. All type T event spectra show a
broad peak near 8 Hz and a sharp peak between
•n*ui*,<<mm*un
¦:¦'. : ' lmln
Aug 3, 1969
Figure 6-14. — Real-time record section of a type X
signal from the SP seismometer.
12.8 and 14.7 Hz. A prominent peak near 5.7 Hz
is contained in four of the spectra, When cor-
corrected for instrument response, the peak between
12.8 and 14.7 Hz would dominate all spectra.
Type I. Type I signals have impulsive begin-
beginnings and relatively short durations (less than
1 min). An example of a type I signal is shown
in figure 6—12. No systematic pattern in the time
of occurrence has been found for this type of
signal, Spectra of seven type I signals are shown
in figure 6-16. Samples (a), (b), and (c) in
PASSIVE SEISMIC EXPERIMENT
153
.0110
.0095
.0080
.0065
.0050
.0035
.0ll5r
.0105
.0095
|.0085
?".0075
TO
^ .0065
.0055
.0045
.0035
.017
.016
.015
.014
.013
.012
.011
.010
.009
.008
.007
.006
.005
.004
.0040
10 12 14 16 18 20
Frequency, Hz
0
8 10 12 14
Frequency, Hz
16 18 20
Figure 6-15. — Spectra of five type T signals. Spectra are not corrected for instrument
response.
figure 6-16 are similar; all have a sharp peak
near 8 Hz and a subordinate peak near 15 Hz.
Samples (d), (e), and (f) in figure 6-16 are
distinctly different from one another and from
the first group. It is evident that several source
mechanisms are involved in type I signals, Pos-
154
APOLLO 11 PRELIMINARY SCIENCE REPORT
la)
14
12
10
08
06
04
02
0
f
J
i i i i i
2 4 6 8 10
Frequency,
k
<\^^y \ ~ (d)
i i i i i
12 14 16 18 20
Hz
2 4 6 8 10 12 14 16 18 20
Frequency, Hz
Figure 6-16. — Spectra of seven type I signals. Spectra are
not corrected for instrument response.
PASSIVE SEISMIC EXPERIMENT
155
sible sources for type I signals include A)
meteoroid impacts on the LM, on the lunar sur-
surface near the LM, and on the PSEP; B) thermo-
elastic energy release within the LM and the
PSEP; and C) LM (and possibly PLSS) venting.
Type L. Type L signals have emergent begin-
beginnings and relatively long durations A to 6 min).
The wave train builds up slowly and recedes
slowly into the background, with maximum trace
amplitude rarely exceeding 5 mm from peak to
peak (approximately 3.3 m^m at 8 Hz). A type L
signal spectrum is shown in figure 6-13. No regu-
regularity in the time of occurrence has been found
for this type of signal. Of the various types of
events, type L events contain the greatest vari-
variability in signal character and in time of occur-
occurrence. Spectra of three type L signals are shown
in figure 6-17. As was noted for type I signals,
type L signals show little similarity in spectral
character for the few samples that have been
computed. Thus, the presence of a variety of
sources for type L events is inferred.
Type X. Type X signals have impulsive begin-
Type L signals
Type L signals
Type L signals
10 12
Frequency, Hz
.225
.200
.175
.150
1.125
a.
".100
?
".075
.050
.025
0
Type X signals
4 6 8 10 12 14 16 18 20
Frequency, Hz
Figure 6-17. — Spectra of type L signals (samples (a), (b), (c)) and type X (sample (d))
signals. Spectra are not corrected for instrument response.
156
APOLLO 11 PRELIMINARY SCIENCE REPORT
nings and relatively short durations (normally
less than 10 sec). Maximum amplitudes occur
at the beginning of the wave train and decay
exponentially with a low-frequency B to 3 Hz)
component that is usually evident in the tail of
the train. Several examples of type X signals are
shown in figures 6-12, 6-13, and 6-14. No regu-
regularity in the time interval between type X events
has been found. The spectrum of a type X signal
is shown in figure 6-17. Prominent peats occur
at 2.8, 8.0, and 10.8 Hz. When corrected for in-
instrument response, the peats at 2.8 Hz and at
10.8 Hz are dominant. The signal for which the
spectrum (fig. 6-17) is shown occurred 38 hr
after initial turnon, at the time when background
signals of the B type were quite high; therefore,
the 8.0-Hz peak may be the result of contamina-
contamination associated with type B signals.
The spectral characteristic that clearly dis-
distinguishes type X signals from the other types of
signals is the low-frequency peak (at 2.8 Hz),
The most conspicuous structural resonance pres-
present within the PSEP in the 0- to 20-Hz band is
associated with vertical oscillation of the solar-
panel arrays, During development testing, the
resonant frequency for this mode of oscillation
was found to be 2.6 Hz. The coincidence of these
frequencies and the clearly resonant character
of the signal strongly support the hypothesis that
solar-panel oscillation is the main contributor to
type X signals. The most obvious sources for
excitation of the solar-panel resonances are im-
impacts of micrometeoroids on the PSEP and sud-
sudden dislocations produced within the PSEP
structure by thermoelastic stress,
A histogram of activity for type X, I, L, and T
signals is shown in figure 6-18. This figure repre-
represents the intensity of activity for each type of
signal as measured on the SP seismometer. Log-
Logging of these different types of events was begun
on the seismic records for July 28, 1969, when
the level of periodic repetitive noises (type B
signals) had subsided sufficiently so that type
X, I, L, and T signals could be identified and
compared with signals in later records. The
vertical axis of each bar graph is a measure of
the intensity of the activity. The width of each
bar of the graph spans the time interval on each
seismogram (usually 12 hr).
Instrument
temperature
;Night
Instrument
temperature
28 29 30 31 1 2 3
July, 1969
19 20 21 22 23 24 25 26 27
August, 1969
Figure 6-18. — A histogram of the intensity of activity
for type X, I, T, and L signals.
The intensity of activity plotted in figure 6-18
is the summation of all peak-to-peak trace ampli-
amplitudes greater than 1 mm on a particular seismo-
seismogram, divided by the time interval t of the seis-
seismogram, in hours. Thus, the area of each bar
of the graph is proportional to the total peak-to-
peak trace amplitude, in millimeters, for all
events of the particular type that occurred on
the seismogram corresponding to that bar. The
total area under a curve is, therefore, a measure
of the cumulative intensity for the particular
type of event. A curve showing central-station
internal temperature is also given in figure 6-18.
As shown in figure 6-18, type X and T activi-
activities were more intense during the second lunar
day of the experiment than during the first one,
and type L activity declined slightly from the
first lunar day to the second. Type I activity
does not clearly change in a systematic way with
time. There is a possibility that type X activity
varies periodically, with the maxima of intensity
that occurred at 2- to 3-day intervals during both
PASSIVE SEISMIC EXPERIMENT
157
the first and second lunar days the experiment
was operational. A tendency exists for successive
peaks of type X activity to decline during each
lunar day. In figure 6-18, the highest peak of
type X activity is reached soon after the begin-
beginning of the second lunar day. Type T activity
is especially prominent during this second lunar
day. It increased to a maximum and then disap-
disappeared in the interval between sunrise and local
noon at Tranquility Base. Type T activity
appears to have ended completely approximately
24 hr before the end of the recording period.
Type X and I activities also appear to have
ended at this time.
None of these types of activity (types T, X,
and I) seems to be related to instrument tem-
temperature. Neither the absolute temperature nor
the time derivative of the absolute temperature
appears to govern the seismic activity. Known
meteor streams do not appear to be related to
any of the most conspicuous peaks of intensity;
however, this possible relationship will be in-
investigated further.
The possibility that some of the transient sig-
signals observed on the SP seismometer output are
produced by meteoroids striking the PSEP can
be examined. By applying the principle of con-
conservation of momentum and using 10 kg as the
mass involved in the motion of the instrument
frame, 10 Hz as a representative signal fre-
frequency, 10 m/im as the maximum frame dis-
displacement (which is 20 percent of full scale
for maximum gain at 10 Hz), and 30 km/sec
as the velocity of the incoming meteoroid, a
value of 2 X 10~7 is obtained for the meteoroid
mass required to produce a transient signal of
the average observed amplitude A0 m/un, peak-
to-peak). The meteoroid mass required to pro-
produce the minimum detectable signal on the
seismometer at 10 Hz is approximately 10~9 g.
Using the meteoroid flux estimates of Hawkins
(ref. 6-1), approximately five meteoroid impacts
per day on the PSEP would produce seismic
motions of approximately 10 m/irn. This value
is consistent with the hypothesis that type X
events may be produced by direct meteoroid
impacts on the PSEP.
At this point in the investigation, the following
possible source mechanisms for the observed
seismic signals are suggested:
A) Venting gases from the LM and PLSS's
and circulating fluids within the LM
B) Thermoelastic stress relief within the LM
and PSEP structures
C) Meteoroid impacts on the LM, the PSEP,
and the lunar surface
D) Displacement of rock material along steep
lunar slopes
E) Moonquakes
F) Instrumental effects
Feedback (Tidal) Outputs and Instrument
Temperature
Signals corresponding to the slowly varying
motion of each of the LP seismometers are
transmitted on separate data channels. The data
from these channels are referred to as feedback
or tidal outputs. Instrument sensitivity at these
outputs is sufficient to detect changes in gravity
(on the vertical component) and the associated
tilts of the lunar surface (on the horizontal com-
components). In the PSEP, however, direct thermal
effects on the instrument platform and on the
spring of the LPZ seismometer were expected to
greatly exceed changes associated with lunar
tides. Internal instrument temperature was also
transmitted as a separate data channel.
Variations in the feedback signals and instru-
instrument temperature are plotted in figure 6-19 for
the total 21-day recording period. Step-function
discontinuities in these signals are produced
when the leveling and centering motors are in
operation. These discontinuities have been re-
removed from the output signal; hence, the total
dynamic range of the seismometers is exceeded
in the plot. Total excursion of the vertical com-
component was equivalent to approximately 142
mgal. The total range in tilt of the horizontal-
component seismometers was 370 /*rad for the
y-axis seismometer and 825 /trad for the x-axis
seismometer. The expected peak-to-peak tidal
variations are approximately 1 arcsec D.9 /*rad)
of tilt and 1 mgal of gravity. As had been ex-
expected, these signals are much too small, rela-
relative to thermally induced signals, to be observed.
As mentioned previously, the tilt variations are
produced by a combination of actual tilting of
the instrument platform in the lunar surface
material, tilting associated with thermal distor-
158
APOLLO 11 PRELIMINARY SCIENCE REPORT
200
180
160
"-140
1 120
1100
S 80
| 60
40
20
0
, Instrument temperature (AT - 04)
21 22 23 24 25 26 27 28 29 30 31 1 2 3 19 20 21 22 23 24
July, 1969 H— August, 1969
I i i I i I i i
30 60
90 120 150 180
Sun angle, deg
30
60
Figure 6-19. — Variations in feedback signals and instrument temperature over the 21-day
recording period.
tions of the instrument platform, and direct
thermal effects on the elements of the seismom-
seismometers and on the seismometer leveling systems.
Long-term variations in the LPZ seismometer
feedback signal are produced primarily by direct
thermal effects on the suspension spring.
Scientific Results
Perhaps the most important result of the PSEP
is the demonstration that it is possible to explore
another planet with the powerful tools of seis-
seismology. Despite the difficulty of interpreting
the data in the presence of the background
noises that resulted from the proximity of the
experiment to the LM, sufficient information has
been accumulated to show that greatly improved
data can be obtained from the first Apollo Lunar
Surface Experiments Package (ALSEP) by
making simple changes in the operating proce-
procedure. Specific improvements in operating pro-
procedure that should be made include the follow-
following:
A) The seismometer package must be moved
farther from the LM to reduce interfering noise
level caused by the LM.
B) The sensor must be removed from the
central station.
C) Better thermal control must be achieved.
D) Higher sensitivity must be sought.
All these improvements, except item D), were
planned for the Apollo 12 mission. Higher sensi-
sensitivity of the seismic instruments must await the
design changes that the advanced ALSEP will
make possible.
Another important result of the PSEP is the
discovery that the background noise level on the
Moon is extremely low. Before these data were
obtained, the level of lunar background noise
was uncertain by several orders of magnitude.
According to one popular hypothesis, the large
diurnal thermal variations within the lunar sur-
surface material produced stresses that would lead
to spallation and fracture and, consequently, to
a high level of background noise. Another hy-
hypothesis proposed that meteoroid impacts were
sufficiently numerous to create a significant con-
continuous noise level. Still another hypothesis cited
the absence of an atmosphere, oceans, and cul-
cultural activities to support the contention that
the background noise level on the Moon should
be much lower than the level on the Earth. The
PSEP indicated that the background seismic-
noise levels on the Moon are extremely low, as
described in the following sections,
PASSIVE SEISMIC EXPERIMENT
159
SP Background Seismic-Signal Level
A histogram of background seismic-signal
level which was recorded by the SP seismometer
for the first 9 lunar days of the experiment is
shown in figure 6-20. The high-amplitude signal
that occurs immediately after turnon is produced
partly by astronaut activities and partly by sig-
signals that are tentatively attributed to the LM.
These levels decreased steadily over a period of
8 days. After 8 days, occasional activity, as dis-
discussed in the section entitled "Description of
Recorded Seismic Signal," was observed. Thus,
the continuous background seismic signal near
1 Hz is less than 0.3 m^m, which corresponds to
system noise. Maximum signal levels of 1.2 /xtn
at frequencies of 7 to 8 Hz were observed during
the period when the astronauts were on the
surface.
LP Vertical-Component Seismometer
Except for the occasional occurrence of tran-
transient signals of instrumental origin, the back-
background seismic-signal level on the LPZ seismom-
seismometer is below system noise, that is, below 0.3
m/xm over the period range from 1 to 10 sec.
This level is between 100 and 10 000 times less
than average background levels observed on
Earth in the normal period range for microseisms
F to 8 sec).
LP Horizontal-Component Seismometers
Continuous seismic background signals of ex-
extremely small amplitudes A0 to 30 mum, peak-
to-peak) were observed on the records from the
two LP horizontal-component seismometers. The
amplitude of these signals decreased consider-
considerably for a 2- to 3-day interval near lunar noon,
when the rate of change of external temperature
with time is at a minimum. The signals are very
low frequency with periods of from 20 sec to
2 min. It is assumed that these signals corre-
correspond to the tilting of the instruments caused
by a combination of thermal distortions of the
metal pallet, which serves as the base of the
seismometer, and a rocking motion of the pallet
in the lunar surface material. The rocking motion
could also be produced by thermal effects. How-
However, the horizontal component of true lunar
seismic-signal background level at shorter peri-
periods (less than 10 sec) also appears to be less
than 0.3 m^m. The character of the background
signals on the LP seismometers is shown in
figure 6-5.
Of the many signals that have been recorded,
at least some were produced by the LM. Many
signals may be of natural origin; that is, they
may have been generated by moonquakes, im-
impacts, or movement of surface rocks. However,
none of the observed signals has the pattern
normally observed in recordings of seismic
activity on Earth (with the possible exception
of signals produced by local volcanic events and
by landslides). Distinct phases corresponding
to the various types of waves are not apparent
in any o? the recorded seismic signals, and most
wave trains are of long duration. The high sensi-
sensitivity at which the PSEP instruments were oper-
operated would have resulted in detection of many
distinctive seismic events if the Moon were as
seismically active as the Earth and if lunar rocks
transmitted seismic waves as effectively as do
Earth rocks. The fact that a large number of
unmistakable seismic events were not observed
during 21 days of operation is a major scientific
result. To describe this observation, it is con-
convenient to introduce the term "seismic recep-
receptivity."
Seismic receptivity is a measure of the over-
overall effectiveness with which seismic waves are
generated, transmitted, and detected at any
given point for any given body. The seismic
receptivity is the product of involving A) the
seismicity of the body, that is, the rate of seismic
energy release, B) the transmissibility of the
medium through which the waves propagate,
and C) the level of background seismic noise
at the sensor location.
The background seismic noise of the Moon
(for the sensor at Tranquility Base) is low. This
low background level results in high seismic
receptivity for the sensor. The problem to be
attacked by analysis of the data already obtained
and data expected from future missions is to
determine the extent to which each of two fac-
factors, seismicity and transmissibility, is respon-
responsible for the small number of distinctive seismic
events that have been recorded.
Among the possible explanations of low seis-
160
400 r
APOLLO 11 PRELIMINARY SCIENCE REPORT
H—Turn on
300
200
100
0
10
July 21, 1969
July 22, 1969
LM ascent
/ Loss of data
/'[—Return of data
[V
r 5 pii!
0*
Scale change -''
1
t 10
TO
2 5
July 23, 1969
July 24, 1969
July 25, 1969
10
5
0
10
5
' 26. 1969
July 27, 1969
July 28, 1969
10
July 29, 1969
3
12
Time, hr
15
18
21
Figure 6-20. — Histogram of signal level from the SP seismometer. A 1-mm trace amplitude
equals 1.9 m^m for the predominant signal component (8 Hz).
24
PASSIVE SEISMIC EXPERIMENT
161
mic receptivity are the heterogeneity of lunar
material, which would scatter the seismic waves;
a \ow-Q (where Q is the transmissibility quality
factor) interior, which would absorb seismic
waves; and an inability of the lunar material to
store high stress. Low seismicity, if confirmed by
future missions, would imply the absence of tec-
tectonic processes within the Moon such as those
associated with major crustal movements on
Earth.
One hypothesis that could explain the obser-
observations is that the body of the Moon is very
heterogeneous, at least in its outer regions. The
near-surface material is certainly heterogeneous
in character, as evidenced by the great numbers
of visible craters and surface fractures. This
heterogeneity may extend deep into the body of
the Moon. The scattering of seismic waves that
would occur in propagation through a highly
heterogeneous material would tend to increase
the duration of the observed seismic wave and
to suppress the appearance of distinct phases
within the wave train. The PSEP station was in
one of the mare regions, which are thought to
be great lakes of solidified lava. If this hypothe-
hypothesis is true, the maria would be expected to be
among the most homogeneous regions of the
Moon. However, since the original formation of
the maria, meteoroid impacts may have converted
these structures to rubble, If the age of Mare
Tranquillitatis is as great as first results indicate
(discussed in chapter 5), the process of fractur-
fracturing by impact may have proceeded to a very
great extent. Much of the visible evidence for
such fracturing may be hidden by the overlying
blanket of fragmental material. However, it
should be noted that nothing in the present
observations precludes the possibility of a high-
temperature (low-Q) lunar interior. This would
also contribute to low seismic receptivity.
With one lunar seismic station, one should not
expect to do effective seismology on the Moon,
unless the Moon were similar to the Earth, with
an abundance of natural seismic sources, and
unless the signals were similar in character to
those observed on Earth, so that one could draw
by analogy on Earth experience. Neither of these
two criteria appears to have been met. Seismic
experiments, nevertheless, will lead eventually
to answers to questions concerning the structure
and dynamics of the Moon. Results will come
more slowly than had been hoped, and there
will be greater dependence upon the establish-
establishment of a network of stations and use of artificial
sources.
Meteoroid impacts are a major factor in shap-
shaping the lunar surface. Determination of the size
and frequency distribution of meteoroid impacts
is necessary to estimate quantitatively the rates
of crater formation and erosion, A store of infor-
information, begun with the PSEP data, will be
uniquely suited to the study of this problem.
Two important implications that will affect
future seismic experiments emerge from the pre-
preliminary analysis of the PSEP data. The effec-
effectiveness of the use of moonquakes for investiga-
investigation of deep lunar structure is low, despite the
high sensitivity of the seismometers used. How-
However, the low background noise observed dem-
demonstrates that greater sensitivity can be used.
The effectiveness of the present instrumentation
will be greatly enhanced when a planned net-
network of three ALSEP stations is operable. Even
if the seismicity of the Moon is considerably less
than that of the Earth, this network can reason-
reasonably be expected to record several significant
lunar seismic events. Data from even a single
well-recorded lunar seismic event could be suffi-
sufficient to determine major structural features of
the Moon. Also, even if the Moon has an ex-
extremely low seismicity, probing of the deep lunar
interior by use of artificial sources, such as the
impacts of a Saturn IVB stage and the LM ascent
stage, is a strong possibility.
The low seismic-noise level measured by the
PSEP indicates that the major modification
needed in the advanced ALSEP is increased
sensitivity of the seismometer system. Increased
sensitivity may compensate for the apparent low
seismicity of the Moon to the extent that moon-
quakes can be as effective for investigation of
deep lunar structure as earthquakes are for study
of the interior of the Earth.
Reference
6-1. Hawkins, Gerald S.; The Meteor Population, Re-
Research Report No, 3. NASA CR-51365, August
1963.
7. Laser Ranging Retroreflector
C. O. Alley, P: L. Bender, R. F. Chang, D. G. Currie, R. H. Dicke, J, E, Faller,
W. M. Kaula, G. J. F. MacDonald, J. D. Mulholland, H. H, Plotkin, S. K. Poultney,
D, T. Wilkinson, Irvin Winer, Walter Carrion, Tom Johnson, Paul Spadin, Lloyd
Robinson, E. Joseph Wampler, Donald Wieber, E. Silverberg, C. Steggerda, J. Mid-
lendore, J. Rayner, W. Williams, Brian Warner, Harvey Richardson, and B, Bopp
Concept of the Experiment
The compact array of high-precision optical
retroreflectors (cube corners) deployed on the
Moon is intended to serve as a reference point in
measuring precise ranges betwen the array and
points on the Earth by using the technique of
short-pulse laser ranging. The atmospheric fluc-
fluctuations in the index of refraction prevent a laser
beam from being smaller than approximately 1
mile in diameter at the Moon. The curvature of
the lunar surface results in one side of the short
pulse being reflected before the other side, pro-
producing a reflected pulse measured in micro-
microseconds, even if the incident pulse is measured in
nanoseconds. The retroreflector array eliminates
this spreading because of the small size of the
array. (The maximum spreading of a pulse be-
because of optical libration tipping of the array will
be approximately ±0.125 nsec.) In addition, the
retroreflective property causes a much larger
amount of light to be directed back to the tele-
telescope from the array than is reflected from the
entire surface area illuminated by the laser
beam.
The basic uncertainty in measuring the ap-
approximately 2.5-sec round-trip travel time is as-
associated with the performance of photomulti-
pliers at the single photoelectron level. This
uncertainty is estimated to be approximately
1 nsec. When the entire system is calibrated and
the effects of the atmospheric delay are calcu-
calculated from local temperature, pressure, and
humidity measurements and subtracted from the
travel time, where the uncertainty in this cor-
correction is estimated to be less than 0.5 nsec, an
overall uncertainty of ±15 cm in one-way range
seems achievable.
With the =fcl5-cm uncertainty, monitoring the
changes in point-to-point distances from Earth
to the lunar reflector (by daily observations for
many years) will produce new information on
the dynamics of the Earth-Moon system. The
present uncertainty of three parts in 107 in the
knowledge of the velocity of light will not affect
the scientific aims of the experiment, since it
is the practice to measure astronomical distances
in light travel time, Primary scientific objec-
objectives include the study of gravitation and rela-
relativity (secular variation in the gravitational con-
constant), the physics of the Earth (fluctuation in
rotation rate, motion of the pole, large-scale
crustal motions), and the physics of the Moon
(physical librations, center-of-mass motion, size
and shape). Some of these objectives are dis-
discussed in references 7-1 to 7—4. Estimates made
by P. L. Bender of improvements expected in
some of these categories are shown in tables 7-1
to 7-III.
Properties of the Laser Ranging Retroreflector
Although the Laser Ranging Retroreflector
(LRRR) is simple in concept, the detailed de-
design of a device that would satisfy the stated
scientific aims has received much attention. The
primary design problem has been to avoid sys-
systematic gaps in ranging data expected to result
from the extreme variation in thermal condi-
conditions on the Moon (from full Sun illumination
to lunar night). A preliminary design based on
discussions among various members of the in-
investigator group and optical engineers was put
163
164
APOLLO 11 PRELIMINARY SCIENCE REPORT
Table 7-1. Lunar orbital data parameters
Quantity
Mean distance
Eccentricity
Angular position of Moon with respect to perigee
Angular position of Moon with respect to Sun
Time necessary to check predictions of Brans-Dicke
scalar-tensor gravitational theory, yr
Present accuracy
500 m
ixlO
2x10-"
5xlO
—
1,5-m range
uncertainty
Accuracy
250 m
4xlO-»
4xlO
4xlO
25
Time, yr
i
i
i
i
25
0.15-m range
uncertainty*
Accuracy
75 m
?5m
1.5xl0"s
4xlO-s
1.5xlO
l.SxlO
4xlO"8
8
Time, yr
0.5
1
.5
1
.5
.5
1
8
a Three observing stations are assumed for periods longer than 0.5 yr,
Table 7—II. Lunar libration and relation <
Quantity
Libration parameters:
,3= (C-A)/B
y= (B-A)/C
Coordinates of LRRR with respect to
center of mass:
Xx
X*
X3
if Laser Ranging Retrorefiector (LRRR) to center of mass
Present accuracy
(approximate)
ixlO
5xlO
500 m
200 m
200 m
1.5-m range
uncertainty
Accuracy
3xlO~7
2xlO~8
250 m
70 m
50 m
Time, yr
4
1.5
1
1
3
0J5-m range
uncertainty^
Accuracy
3xlO"?
3xlO-8
l.SxlO
2xl0"r
75 m
25 m
40 m
7m
50 m
5m
Time, yr
0.5
4
.5
1.5
.5
1
.5
1
.5
3
"Three observing stations are assumed for periods longer than 0.5 yr.
Table 7—III. Geophysical data determinable from LRRR
Quantity
Rotation period of Earth, sec
Distance of station from axis of rotation, m
Distance of station from equatorial plane," m
Motion of the pole," m
East-west continental drift rate observable in 5 yr,a em/yr
Time for observing predicted 10-cm/yr drift of Hawaii
toward Japan," yr
Present accuracy
(estimated)
5X10
10
20
Ito2
30 to 60
15 to 30
1.5-m range
uncertainty
lOxlO
3
6 to 20b
1.5
30
15
0.15-m range
uncertainty
lxHT3
0.3
0.6 to 2"
0.15
3
1.5
" Three or more observing stations are required.
b Depending upon the latitude of the station.
forth by J. E. Faller in a proposal to NASA (ref.
7-5).
The first financial support provided by NASA
was used to test the proposed design, which con-
consisted of small solid-corner reflectors made of
homogeneous fused silica. The test and evaluation
facilities at the NASA Goddard Space Flight Cen-
Center were used to simulate the lunar environment.
These tests verified that a metal coating could not
be used on the reflectors and showed that the
LASER RANGING RETROREFLECTOR
165
failure of total internal reflection at off-axis
angles posed serious problems in mounting the
reflectors to maintain small temperature gradi-
gradients during larger off-axis Sun angles (ref. 7-6).
.Aluminum retainer ring
. Upper Teflon
mounting ring
Fused silica
retroreflector
" Lower Teflon
mounting ring
Inside surface of cavity >
Figure 7-1. — Corner reflector mounting.
The tests verified the predicted performance dur-
during lunar night and during direct Sun illumina-
illumination within the total internal reflection region of
angles.
The efforts of thermal and mechanical design
engineers in close association with members of
the investigator group solved the problems and
led to the design shown in figure 7—1. The corner
reflectors are lightly mounted on tapered tabs
between Teflon rings, and are recessed by one-
half their diameter into cylindrical cavities in a
solid aluminum block. The predicted optical per-
performance, based on thermal analyses under chang-
changing lunar conditions, is shown in figure 7-2.
The need for careful pointing of the LRRR
toward the center of the Earth Iteration pattern
is shown by figure 7-3, which displays the off-
axis response of the recessed corner reflectors.
(The curve is the result of averaging over azi-
muthal orientation and polarization dependence.)
The motion of the Earth in the lunar sky because
of the optical librations of the Moon is shown in
figure 7-4 for the period July to October 1969.
The alinement in the east-west direction
100
60
40
2 10 1
Before < I - After
Time from local noon, Earth days
20
0
20
40
60
100
Sun angle from zenith, deg
Figure 7-2. — Predicted optical performance as a function of Sun angle, from thermal
analysis.
166
APOLLO 11 PRELIMINARY SCIENCE REPORT
„.--Average response employed in calculation
Figube 7-3. — Average off-axis performance of recessed
circular corner reflectors.
,2-
+ 0-
¦2 ¦
4 -
10
\ \AoctlO, 1969
Jul 1, 1969
Aug 28, 1969\ \ \l
Aug 30, 1969 \\Jj
sep 3, \m\Jy
II'
2 0 2
E ¦ I • W
Longitude, deg
10
Figure 7-4, — Optical librations for the period July to
October 1969.
achieved by Astronaut Neil A. Armstrong was
within the width of a division on the compass
mark. The leveling was within 0.5°, with the
bubble oriented toward the southwest. When
combined with the worst possible mechanical
tolerances of construction, the east-west aline-
ment is ±0.7°, and the overall pointing is
within 1° of the center of the libration pattern.
This excellent pointing means that the return
will not fall to extremely low values during the
extremes of the libration cycle. With the previous
information included, the relative expected re-
response from July 20 to September 9, 1969, is
shown in figure 7-5. Figure 7-5 is an upper
bound for the performance expected.
The flight hardware is shown in figure 7-6.
The gnomon, the alinement marks, and the bub-
bubble level are clearly shown. In figure 7-7, the
LRRR is shown deployed on the Moon.
In tests, each corner reflector which was se-
selected for the flight array exhibited an on-axis
diffraction performance greater than 90 percent
of that possible for a corner reflector having no
geometrical or homogeneity defects. The on-axis,
nondistorted performance is conveniently char-
characterized by a differential scattering cross section.
dil
= 5X10¹¹ cmVsteradian
180°
which yields the number by which the photon
flux density (photons per square centimeter)
incident on the reflector array must be multi-
multiplied to give the number of photons per steradian
intercepted by the telescope receiver. The cross
section includes the effect of velocity aberration
and is evaluated for a wavelength of 6943 A.
Observations of returns on August 1 and 3,
1969 (immediately before lunar sunset), and on
Jul 22 Jul 29 Aug 5 Aug 12 Aug 19 Aug 26 Sep 2 Sep 9
1969
Figure 7-5. — Upper bound of LRRR efficiency as a func-
function of time.
LASER RANGING RETROREFLECTOR
167
> : -,
August 20, 1969 (immediately after lunar sun-
sunrise), show that the mounting (designed to mini-
minimize temperature gradients at these large Sun
angles) has been successful. Observations of re-
returns on September 3 and 4, 1969 (during lunar
night), confirm the expectation that the reflector
would perform at very low temperatures and
that the differential thermal contractions of the
mount and corners do not produce large strains.
The survival of the reflectors throughout a lunar
night has been demonstrated. Performance deg-
degradation, if any, caused by the presence of debris
during lunar module (LM) ascent does not ap-
appear to be severe.
Ground Station Design
A single telescope can be used both as a trans-
transmitter and a receiver because the large diffrac-
diffraction pattern resulting from the 3.8-cm-diameter
t
Figube 7-6. - The LRRR before stowage in the scien-
scientific equipment bay.
corner reflectors (the central spot has a diameter
on the Earth of approximately 10 miles) allows
for a velocity aberration displacement of approx-
approximately 1 mile without significant loss of signal.
This was one of the major considerations in the
design of the LRRR array discussed previously.
The 2.5-sec light travel time between transmit-
transmitting and receiving readily allows the mechanical
insertion of a mirror that directs the returning
photons collected by the telescope into a photo-
multiplier detector.
The present beam divergence of short-pulse,
high-energy ruby lasers requires the use of a
large aperture to recollimate the beam so that
the beam is narrowed to match the divergence
allowed by the atmospheric fluctuations of the
168
APOLLO 11 PRELIMINARY SCIENCE REPORT
Figure 7-7. - The LRRR deployed on the Moon.
index of refraction — typically several seconds of
arc. Astronomers refer to this effect as "see-
"seeing." The degree of atmospheric turbulence at
an observatory at a given time thus determines
the size of the laser beam on the lunar surface,
producing a spread of approximately 2 km per
sec of arc divergence.
Techniques for pointing such narrow beams to
a specific location on the Moon were developed
during the successful Surveyor 7 laser-beam-
pointing tests (ref. 7-7). An argon-ion laser beam
was brought to a focus in the telescope focal
plane at the Moon-image spot that was chosen
for illumination. When the laser beam filled the
exit pupil of the telescope and matched the
/-number, the collimated beam was projected
to the selected location on the Moon and de-
detected by the television camera on the Surveyor
LASER RANGING RETROREFLECTOR
169
7. For the Apollo laser ranging experiment, the
beam is matched into the telescope by using a
diverging lens, because it is not possible to focus
high-power ruby laser beams in air without
causing electrical breakdown. The direction of
the projected beam is monitored by intercepting
a small portion of the beam with corner reflectors
mounted on the secondary mirror-support struc-
structure. These reflectors return the intercepted light
in such a manner that the light is brought to
focus, superimposed on the image of the Moon,
at the spot to which the beam is being sent. A
beam splitter coated with a highly damage-
resistant, multilayer dielectric coating reflects the
laser beam into the telescope and transmits the
image of the Moon and the laser light inter-
intercepted by the telescope corner reflectors into
the guiding system (ref. 7-8).
A view of the region of the Moon around
Tranquility Base is shown in figure 7-8, which
was taken through the guiding eyepiece of the
McDonald Observatory 107-in. telescope. The
reticle marks used to guide from craters are
clearly shown, along with the intercepted laser
light. In final alinement, the small circle is made
to coincide with both Tranquility Base and the
Figure 7-9. — Lick Observatory, University of California,
at Mount Hamilton, California.
Figure 7-8. — View through guiding eyepiece of the
McDonald Observatory 107-in. telescope during proc-
process of alinement.
Figure 7-10. — Lick Observatory 120-in. telescope dome.
center of the laser spot. The large size of the
laser spot is caused by imperfections in the
telescope corner reflectors, not by beam diver-
divergence. The diameter of the reticle circle is ap-
approximately 3.6 seconds of arc. Many craters are
not resolved because of poor seeing conditions
at the time the photograph was made.
Figures 7-9 to 7-14 are views of the Lick Ob-
Observatory, University of California, at Mount
Hamilton, California; the Lick Observatory 120-
in. telescope, the second largest in the world;
the McDonald Observatory, University of Texas,
at Mount Locke, Tex.; and the McDonald Ob-
Observatory 107-in. telescope, the third largest in
the world. Lasers were mounted in a stationary
position at a coude focus of each instrument.
The Lick Observatory participated in the ac-
acquisition phase of the experiment to increase
170
APOLLO 11 PRELIMINARY SCIENCE REPORT
Figure 7-11, — Lick Observatory 120-in. telescope.
Figure 7-13. — McDonald Observatory 107-in. telescope.
Figure 7-12. — McDonald Observatory, University of
Texas, at Mount Locke, Tex.
the probability of getting early returns because
the weather and seeing there are generally excel-
excellent in the summer. Returns at the Lick Observa-
Observatory, which is no longer in operation, were ob-
observed on August 1 and 3, 1969. The McDonald
Observatory is equipped to make daily range
measurements, weather permitting, for years. Re-
Returns were observed on August 20, September 3,
September 4, and September 22, 1969, at the Mc-
McDonald Observatory.
Observations at the Lick Observatory
System A
The ranging system at the Lick Observatory
consisted of a giant-pulse, high-powered ruby
laser (operated at the coude focus) which was
optically coupled through the 120-in. telescope
and could be fired at 30-sec intervals. The angu-
angular diameter of the outgoing beam was approxi-
approximately 2 seconds of arc and made a spot of light
on the Moon approximately 2 miles in diameter.
The return signal was detected by a photomulti-
plier that was mounted at the coude focus be-
behind a 10-second-of-arc field stop and a narrow
@.7 A) filter, which were used to reduce the
background illumination from the sunlit Moon.
A time-delay generator (TDG), initiated by the
firing of the laser, was used to activate the
acquiring electronics approximately 2.5 sec (the
Earth-Moon round-trip time for light) later, The
LASER RANGING RETROREFLECTOR
171
Figure 7-14. - Optical path in the McDonald Observatory 107-in. telescope.
delay generator was set for each shot by using
the LE 16 ephemeris. (See the section of this
report entitled "The Lunar Ephemeris: Predic-
Predictions and Preliminary Results.")
Following the pulse produced by the TDG,
the output pulses from the photomultiplier were
channeled sequentially into 12 binary sealers.
Each sealer channel had a dwell time that was
adjustable from 0.25 to 4 ^sec (ref. 7-8). The
routing of the pulses to the sealers was such that
a pulse arriving within 0.1 ,usec of the end of a
channel would also add a count to the following
channel, The sealers then contained a quantized
summary of the detector output for a short time
interval centered on the expected arrival time
of the reflected signal. After each sealer cycling
following a laser firing, a small online computer
read the contents and reset the sealers. The com-
computer stored the accumulated count for each of
the sealers and provided a printed output and
a cathode-ray-tube display of the data.
Scattered sunlight from the lunar surface pro-
produced a random background that slowly filled
the 12 time channels. Because the return from
172
APOLLO 11 PRELIMINARY SCIENCE REPORT
the retroreftector occurred with a predetermined
delay, the channel that corresponded in time to
the arrival of the signal accumulated data at a
faster rate than the other 12 channels, Figure
7-15 illustrates this point by showing the way in
which the data actually accumulated during run
18. Following acquisition on the night of August
1, 1969, 169 shots were fired, Range gate errors
occurred on 27 shots, and 22 shots were fired
with the telescope pointed away from the re-
reflector. For the remaining 120 shots, approxi-
approximately 100 above-background counts were re-
received. These results represent a return expecta-
expectation in excess of 80 percent and show that all
parts of the experiment operated satisfactorily.
Assuming a Poisson distribution of the recorded
photoelectrons, the returns correspond to an
5 shots
10 shots
15 shots
20 shots
1 2 3
¦ Behind
Time relative to predicted time, usec
i
i
i
i
i
i
j
5 6 7 8
Channel number
10 11 12
Figure 7-15. — Histogram showing the growth of the
retroreflected signal in channel 6,
average of 1.6 detectable photoelectrons per
shot. This number is a lower limit to the true
average because interference effects and guiding
errors probably reduced the number of returns
that were recorded. The strength of this signal
and the lack of "spill" into adjacent channels
clearly show that the signal did not come from
the "natural" lunar surface, from which the
return would be distributed over approximately
8 jusec. The timing of the trigger from the TDG
relative to Mulholland's ephemeris was changed
three times, and the channel widths were de-
decreased from 2 to 1 ^sec and then to 0.5 jusec.
After each change, the signal appeared in the
appropriate channel. The data from runs 10 to
21, the interval from the first acquisition to the
close of operation, are shown in table 7-IV.
Nine runs containing 162 shots were made before
acquisition.
Figure 7-16 shows a plot of the data taken
from table 7-IV. Runs 12 and 14 have not been
plotted in figure 7-16 because errors in setting
the TDG invalidated the timing. During run 19,
the telescope was not pointed at the reflector,
and no returns were seen. Because of a fortuitous
splitting of the return between two channels on
two runs, an effective timing precision of 0.1
jusec was achieved. This precision is equivalent
to a range error of approximately 15 m. In figure
7-16 an apparent drift in the time the returns
were detected, relative to Mulholland's predic-
predictions, is shown. The drift was caused by the 120-
in. telescope being located approximately 524 m
east of the locations given for the Lick Observa-
Observatory in the American Ephemeris and Nautical
Almanac. A curve showing this correction to the
original ephemeris is given in figure 7-16. Trans-
Translation of this curve along the ordinate is allow-
allowable, and the amount of time gives the difference
between the observed range and the predicted
range. When the correct coordinates are used,
the observations agree with the predicted curve.
System B
The primary function of acquisition system B
at the Lick Observatory was to locate the de-
deployed LRRR in range and position. System B
was not intended to satisfy the long-term objec-
objectives of the lunar ranging experiment; however,
LASER RANGING RETROREFLECTOR
173
Run
10
11
12
13
14
d15
16
17
18
19
f20
21
Table 7-IV.
Log of observation data
mowing acquisition
Total counts
Channel
1
12
12
(c)
13
(c)
4
1
6
3
3
2
5
2
8
12
(c)
8
(c)
3
1
3
1
3
1
2
3
16
12
(c)
8
(c)
3
2
4
3
3
1
2
4
18
11
(c)
12
(c)
5
2
2
5
10
0
3
5
12
11
(c)
7
(c)
4
1
3
4
3
2
6
14
6
(c)
b18
(c)
7
3
"9
9
3
4
1
7
10
13
(c)
11
(c)
6
3
2
3
5
l6
2
8
17
11
(c)
5
(c)
8
1
7
3
2
2
1
9
13
14
(c)
6
(c)
10
2
2
4
5
4
3
10
7
6
(c)
7
(c)
5
1
4
1
5
2
4
Ji
12
10
(c)
8
(c)
6
3
2
0
8
2
5
12
12
14
(c)
12
(c)
8
2
5
4
5
4
2
No.
of
shots
20
14
16
13
6
18
10
16
22
22
10
22
u.t.
for middle
of run,
hr:min
10:21
10:32
—
11:04
—
11:23
11:36
11:45
12:03
12:19
12:23
12:45
Channel
width,
2.0
2.0
2.0
2.0
1.0
1.0
.5
.5
.5
.5
.5
.5
Time
of first
channel1*
tisec
-20
-20
-10
-10
-10
-5
— 1
-1
-1
j
-1
-1
a With respect to ephemeris predictions.
6 Channel in which return was expected.
c Range-gate errors invalidated data.
d Data from three shots with erroneous range gates deleted from tabulation.
° Telescope pointed 16 km south of reflector.
'Thin clouds noted near Moon.
System B was designed to be a sensitive, mod-
moderately precise, semiautomatic, high-repetition
rate system using existing off-the-shelf equipment
wherever possible.
System B was composed of several essentially
independent subsystems. These subsystems were
the laser-transmitter/power-supply assembly, the
receiver-detector ranging system, the range gate
generator and data control and recorder system,
and the time standard system.
The laser transmitter uses oscillator and ampli-
amplifier heads employing a conventional rotating-
prism, bleachable-absorber, "(^-switch" mecha-
mechanism. The oscillator and amplifier heads are iden-
identical and use 110-mm-long, lS-mm-diameter
Brewster-Brewster rubies. An existing laser sys-
system that was modified for this program was
capable of operation at 10 J at 3-sec intervals
with a pulse width of 60 to 80 nsec.
For operation at the Lick Observatory, modi-
modification of the laser system required the incor-
incorporation of all normal transmit-receive ranging
functions and of a boresight capability onto the
laser case. An optical-mechanical assembly (fig.
7-17) was designed to be attached to the laser
case. The exiting laser beam passed through a
beam splitter, which was oriented at Brewster's
angle for minimum reflection of horizontally
polarized light. The small fraction of light scat-
scattered or reflected from the beam splitter was
detected by an FW 114A biplanar photodiode.
The output of the photodiode was used for the
range measurement initiation pulse and for
monitoring the operation of the laser. The beam
splitter was also used to couple a vertically
polarized helium-neon laser beam along the same
axis as the ruby beam. A helium-neon laser was
mounted parallel to the ruby laser, and the re-
resultant beam was expanded by a small autocolli-
mator and then reflected by a mirror mounted
parallel to the beam splitter. The reflected beam
was then rereflected by the beam splitter along
the laser axis. The laser produced an elliptical
cross-section beam that was corrected and ex-
expanded to 50 mm in diameter by the Brewster
entrance prism telescope. The 50-mm exit beam
was reflected at right angles onto a 50-mm-aper-
ture F39 lens that was positioned at the appro-
appropriate place with respect to the coude focus of
the 120-in. telescope optical system.
The returning energy follows essentially the
same path as the transmitted energy. A flip mir-
mirror, actuated by a small solenoid, reflects the
returning signal after the signal is passed through
the correcting telescope to a field-limiting lens
and aperture, The aperture in the field-limiting
174
APOLLO 11 PRELIMINARY SCIENCE REPORT
20
10
u
CD 1_
tive to predicted time, (.
Before ¦> | - Ai
rela
O3
E
^-
20
30
-
— —-
=3
I
1
i
¦
" t P
i i I i
10:00
11:00 12:00
u.t.. hnmln
13,00
Figure 7-16. — Three-dimensional figure showing the
time of the run (abscissa), the range window during
which the equipment was open for receiving data
(ordinate), and the number of counts in each channel
(width of the bar). It is clear that to each run in
which returns were expected they were seen in the
correct channel. During run 19 (third from right-hand
end), the telescope was pointed away from the re-
reflector, and no returns were seen.
system is sized for a 10-second-of-arc field of
view in space. Light passing through the aper-
aperture is collimated and passed through a 2.7-A
bandpass filter. The light is divided into two
equal beams by a dividing prism; then, the
beams of light enter the enhancement prism on
each of the two photomultipliers.
Two detectors (operating in coincidence) and
a range gate were used to eliminate as much
extraneous background noise as possible. Type
56 TVP photomultipliers used enhancement
prisms to allow multiple reflection of the en-
entrance light from the photocathode. The output
of each photomultiplier tube was discriminated
and shaped with an EGG T105/N dual discrimi-
discriminator. Because theoretical considerations indicate
that only a few photoelectrons occur for each
transmitted pulse, the discriminator was used to
stretch each detected pulse by the length of the
transmitted pulse. A coincidence overlap equal
to the transmitted pulse duration was necessary
because, lacking discrimination, a photoelectron
from each photomultiplier tube could be related
to any time within the transmitted pulse dura-
duration. The outputs of the discriminators were
AND'ed in the EGG C102B/N coincidence
module.
The actual range measurement (fig. 7-18) was
made with a 1-nsec time-interval counter. The
time-interval counter was started by the photo-
diode output each time the laser transmitter
operated. The discriminators and the stop chan-
channel of the time-interval unit were disabled by the
range gate until the expected time of arrival of
the reflected laser pulse. If both photomultiplier
tubes detected a photoelectron within the coin-
coincidence resolving time of the EGG C102B/N, the
output would stop the time-interval unit.
The photodiode signal was used in two other
measurements. First, the signal was used to stop
a lOO-jusec-resolution time-interval unit that was
started by the "ontime" timing signal from the
real-time clock. This measurement determined
the time, to the nearest 100 jusec, of the range
measurement. The pulse was also converted,
monitoring the overall performance of the laser
during the operation.
System B was controlled and operated by a
special digital logic assembly. This device (fig.
7-19) generated laser fire signals and the range
gate window, sampled all measurement devices
for information, and recorded the information.
One of the most important aspects of the oper-
operation is the generation of the range gate window,
based on knowledge of where the retroreflectors
should be. Furthermore, because this information
may not be as accurate as required, it is neces-
necessary to change the information essentially in
real time. The range gate window was generated
with an externally, as well as manually, pro-
programed delay pulse generator. The programed
input for the delay pulse generator was obtained
from a lunar prediction drive tape containing
the expected round-trip time interval to the lunar
surface for every 3 sec of time, A digital com-
comparison between the command time on the tape
and real time was made to maintain the tape in
LASER RANGING RETROREFLECTOR
175
Detector 1
Detector 2
Beam-correcting prism and
expanding telescope
To 120-in. telescope
50-mm diameter
Photodiode
Figure 7-17. — Optical schematic of system B at Lick Observatory.
synchronization with real time. The range infor-
information on the tape was then stored and trans-
transferred to the delay pulse generator prior to each
laser firing. The laser firing started the delay
pulse generator; and after the predicted delay,
a pulse initiated the range-gate-window pulse
generator. The range-gate-window length was
variable and was used to enable the detector dis-
discriminators and the range time-interval unit at
the time a return signal was expected.
The measured data were recorded with a
multiplexing data gate and standard line printer.
The control section generated print commands
for each series of measurements at the correct
time during the 3-sec cycle period. The control
section obtained timing signals from the time
standard rack (fig, 7-20), Real time was main-
maintained to an accuracy of ±10 /*sec during the
operation, by comparing signals from the Loran
C chain with the real-time clock using the Loran
C synchronization generator.
The system was operated for a period of 1 hr
and 45 min on the morning of August 3, 1969,
during which the laser was fired 1230 times.
The total number of apparent measured ranges
during this period was 98. The low number of
returns relative to the number of transmitted
pulses is related to a slight B sec of arc) mis-
alinement in the detector optical system and
to the failure of the delay pulse generator to
operate in the externally programed mode. Fur-
Furthermore, because returns were not immediately
recognized, an angle search was made over a
longer time period.
The measured range time could have three
possible sources: a return from the retroreflector,
a return from the lunar surface, or random noise
coincidence from reflected sunlight and back-
background. Statistically, 35 to 50 noise coincidences
and approximately 30 lunar surface ranges would
be expected in 1200 firings. Because the numbers
agree, within acceptable limits, with the total
number measured, it is not obvious that returns
from the retroreflectors were measured. How-
However, any returns from the retroreflectors should
fall within the precision of the system or within
100 nsec with respect to the true range to the
package.
176
APOLLO 11 PRELIMINARY SCIENCE REPORT
1 percent
transmitted
energy
One-half
received
energy
One-half
received
energy
Transmitter
beam
sampler
"On time"
pulse
Start
Stop
7 I
Detector 1
enhanced
Detector 2
enhanced
100 - iisec
delay - time
interval unit
Printer
gates
Transmitter
power
measurement
Printer
gates
Coincidence
Range gate
window
Start
Stop
Coincidence
module
Range - time
interval unit
Printer
gates
Range gate window
I Dual channel discriminator i i
Figure 7-18. — Receiver and ranging section.
The observed range time measurements were
compared arithmetically with the predicted range
time and then linearly corrected because of a
known parallax error. The parallax error oc-
occurred because a different site was used for the
range predictions, The linear correction was
performed by taking the initial range residuals
and fitting (in a least squares sense) a first-order
polynomial to the residuals. Then, only those
residuals occurring within a certain range of the
polynomial were used to redefine the polynomial.
This technique was used successively three times
to generate a polynomial about which 11 of the
measured ranges had a root mean square of 45
nsec. Furthermore, because of the parallax error,
the coefficients of the polynomial agree with the
expected deviations from the predicted range.
The range residuals corrected to this linear
equation were used to construct a histogram (fig.
7-21) with 100-nsec intervals from —5 to +5
/isec. The data lying outside of the ±5 jusec
were not displayed because no interval contained
more than one point and because no significant
bunching was observed. The histogram clearly
shows a central peak that cannot be supported
by any statistical interpretation other than one
assuming returns from the retroreflector.
Observations at the McDonald Observatory
The laser in use presently is a custom-built
two-stage pockels-cell switched ruby system.
Typical operating conditions were as follows;
A) Energy: 7 J
B) Pulse width: 20 nsec
C) Beam divergence: 2.4 mrad (measured at
full energy points)
D) Repetition rate: once every 6 sec
E) Wavelength: 6943.0 ± 0.2 A at 70° F
F) Amplifier rod diameter: 0.75 in.
LASER RANGING RETROREFLECTOR
177
Fire laser
Operate transmit-
receii/e switch
Predicted range
time interval
vs
time of day
Range gate
window to
power
measurement
and time
interval unit
Control section
Tape reader
Range gate
window
and bias
Range
Time
Transmitter
power
Print commands
Data print gates
Line printer
Timing-control signals
Digital time
comparator
and
storage
register
Time-code
generator
(real time>
Predicted
range
time
Delay pulse
generator
Laser transmitter pulse
Manual range in
1MHz
1-MHz
from
timing rack
Figure 7-19. — Range gate generator and data control.
The detector package contained a photomulti-
plier that had a measured quantum efficiency of
5 percent at 6943 angstroms and a dark current
of 80 000 counts per second. When cooled by
dry ice (as during ranging operations), the dark
current was 10 000 counts per second. Spectral
filters with widths of 3 and 0.7 A were available.
Both filters were temperature controlled. Pin-
holes restricting the field of view of the telescope
to 6" or 9" were commonly used. An air-driven
protective shutter was closed during the time of
laser firing, opening for approximately 1 sec
around the time for receiving returns. The net
efficiency of the whole receiver, ratio of photo-
electrons produced to photons entering the tele-
telescope aperture (with a 3-A filter), including
telescope optics, was measured to be 0.5 percent,
using starlight from Vega.
The block diagram of the timing electronics
used during the acquisition period is shown in
figure 7-22. The electronics consist of a multistop
time-to-pulse-height converter (MSTPHC) for
coarse range search covering an interval of 30
/isec with 0.5-^sec bins (ref. 7-8) in addition to
the core circuits forming part of the intended
subnanosecond timing system. The initial and
final vernier circuits of this system were not in
use. The range prediction provided by J. D. Mul-
holland was recorded on magnetic tape at 6-sec
intervals. The online computer read the range
prediction, set the range gate TDG, and fired the
laser within 1 jusec of the integral 6-sec epoch. The
TDG activated the MSTPHC, triggered a slow-
sweep oscilloscope (the display being recorded
on photographic film) and a fast-sweep oscillo-
oscilloscope (recorded on Polaroid), and activated a
10-^sec gate into the time-interval meter (TIM).
The computer read the number of counts in the
TIM and calculated the difference between this
reading and the range prediction, printing out