/


Tags: military affairs military training
Year: 1979


Text
DNA 1251-2-EX
COMPILATION OF LOCAL FALLOUT DATA
FROM TEST DETONATIONS 1945-1962
EXTRACTED FROM DASA 1251
Volume П -Oceanic U.S. Tests
General Electric Company—TEMPO
DASIAC
816 State Street
Santa Barbara, California 93102
1 May 1979
Extract
CONTRACT No. DNA 001-79-C-0081
APPROVED FOR PUBLIC RELEASE;
DISTRIBUTION UNLIMITED.
THIS WORK SPONSORED BY THE DEFENSE NUCLEAR AGENCY
UNDER RDT&E RMSS CODE B337079464 P99QAXDC00809 H2590D.
Prepared for ’
Director
DEFENSE NUCLEAR AGENCY
Washington, D. C. 20305
Destroy this report when it is no longer
needed. Do not return to sender.
PLEASE NOTIFY THE DEFENSE NUCLEAR AGENCY,
ATTN: STTI, WASHINGTON, D.C. 20305, IF
YOUR ADDRESS IS INCORRECT, IF YOU WISH TO
BE DELETED FROM THE DISTRIBUTION LIST, OR
IF THE ADDRESSEE IS NO LONGER EMPLOYED BY
YOUR ORGANIZATION.
___________UNCLASSIFIED_________________
SECURITY CLASSIFICATION OF THIS PAGE (When Data Entered)
REPORT DOCUMENTATION PAGE READ INSTRUCTIONS BEFORE COMPLETING FORM
1. REPORT NUMBER DNA 1251-2-EX 2. GOVT ACCESSION NO. 3. RECIPIENT’S CATALOG NUMBER
4. TITLE (and Subtitle) COMPILATION OF LOCAL FALLOUT DATA FROM TEST DETONATIONS 1945-1962 EXTRACTED FROM DASA 1251 Volume II—Oceanic U.S. Tests 5. TYPE OF REPORT a PERIOD COVERED Extract
6 PERFORMING ORG. REPORT NUMBER DASIAC SR 179 VOL. II
7. AUTHORS Howard A. Hawthorne, Editor 8. CONTRACT OR GRANT NUMBERfs} DNA 001-79-C-0081
a. performing organization name ano address General Electric Company—TEMPO DASIAC, 816 State Street Santa Barbara, California 93102 10. PROGRAM ELEMENT. PROJECT TASK AREA & WORK UNIT NUMBERS Subtask P99QAXDC008-09
II. CONTROLLING OFFICE NAME ANO ADDRESS .Di rector Defense Nuclear Agency Washington, D.C. 20305 12. REPORT DATE 1 May 1979
13. number of pages 351
14. MONITORING AGENCY NAME & ADORESSfi/ different from Controlling Office) 15. SECU RIT Y CL ASS (ot this report) UNCLASSIFIED
15a. DECLASSIFICATION 'DOWNGRADING SCHEDULE
16. Distribution statement (of this Report) Approved for public release; distribution unlimited.
17. DISTRIBUTION STATEMENT (of the abstract entered tn Block 20, if different from Report)
18. SUPPLEMENTARY NOTES This work sponsored by the Defense Nuclear Agency under RDT&E RMSS Code B337079464 P99QAXDC00809 H2590D.
19. KEY WORDS (Continue on reverse side if necessary and identify by block number) Nuclear Weapons Testing Pacific Proving Ground Fallout Enewetak Radiological Contamination Bikini Nuclear Radiation Johnston Island Christmas Island
20 ABSTRACT (Continue on reverse side If necessary and identify by block number) Fallout patterns from U.S. oceanic nuclear weapons tests. Also given are time and place of test and ambient winds.
DD , JAN M73 1 473 EDITION OF I NOV 65 IS OBSOLETE UNCLASSIFIED
SECURITY CLASSIFICATION OF THIS PAGE ("Hben Data Entered)
_____________UNCLASSIFIED_________________
SECURITY CLASSIFICATION OF THIS PAGEfHTien Data Entered)
UNCLASSIFIED
SECURITY CLASSIFICATION OF THIS PAGEfW'hen Data Entered)
TABLE OF CONTENTS
OPERATION PAGE NO,
Crossroads 4
Sandstone 13
Greenhouse 26
Ivy 50
Castle 61
Wigwam 97
Redwing 100
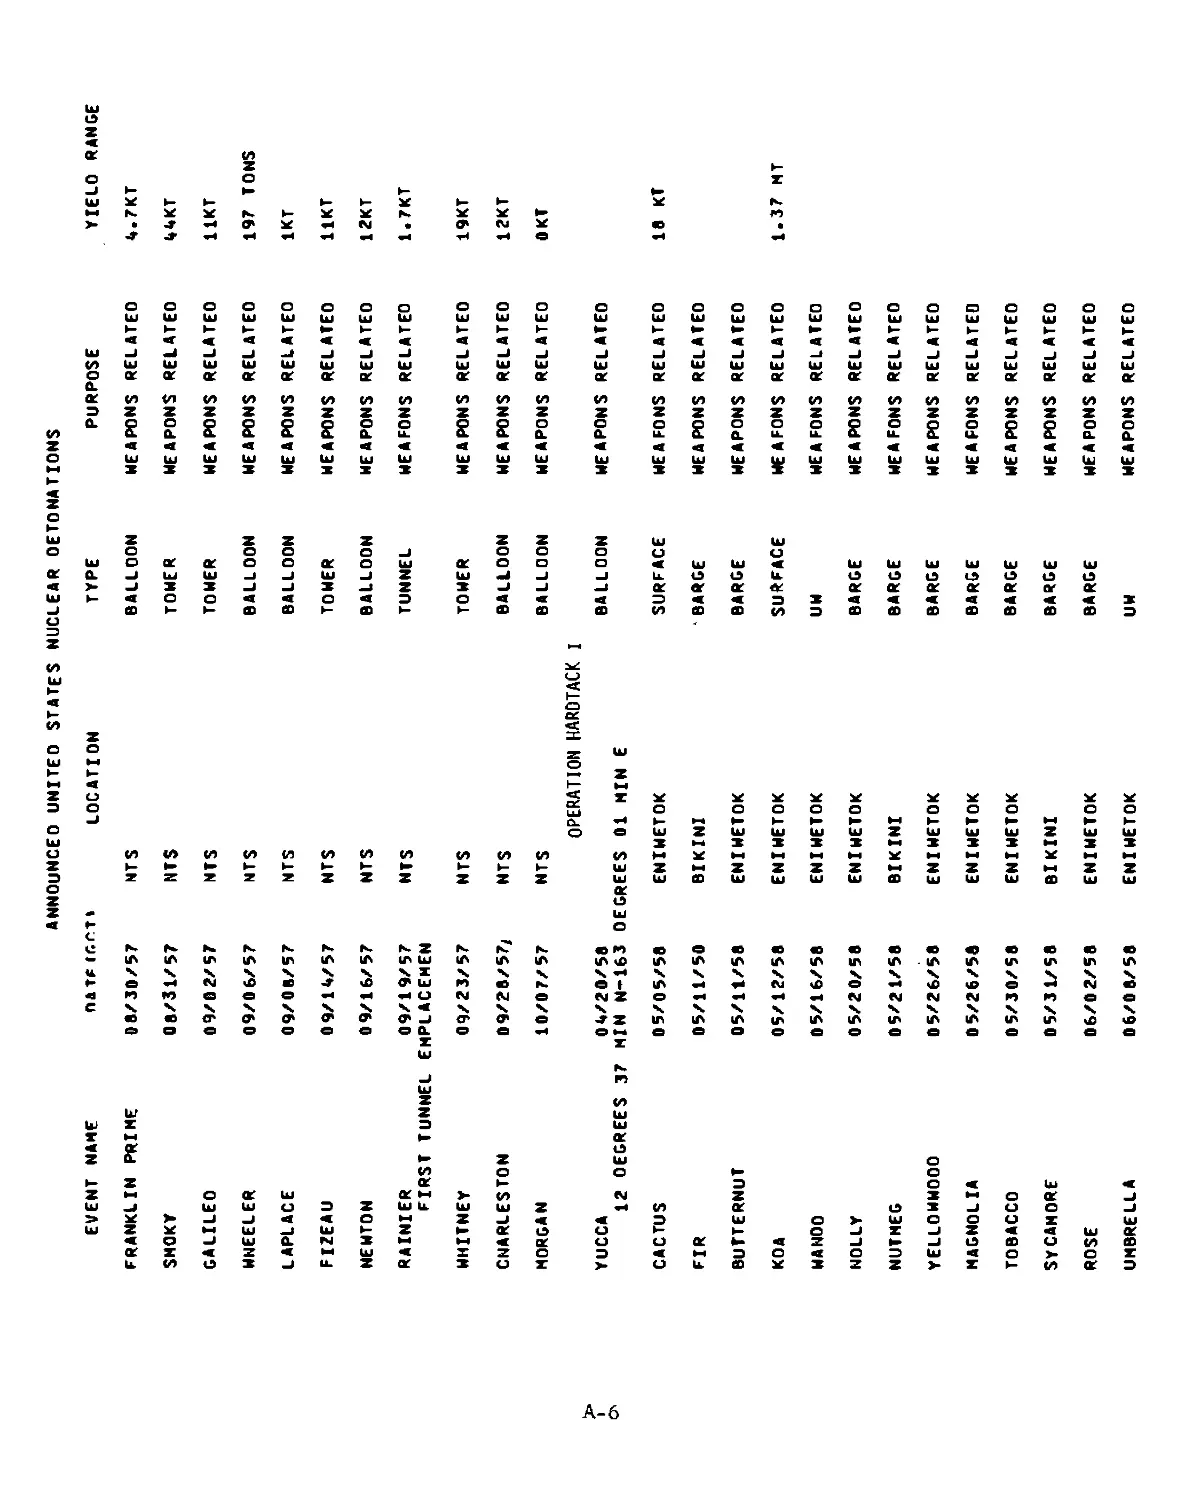
Hardtack I 185
Argus 316
Dominic 319
Appendix A-l
1
INTRODUCTION
The objective of this report is to provide a ready reference of
fallout patterns and related test data for those engaged in the anal-
ysis of fallout effects.
This compilation was extracted from DASA 1251 "Local Fallout from
Nuclear Test Detonations " (U) Vol. 2 "Compilation of Fallout Patterns
and Related Test Data" (U) Parts 1 through 3. DASA 1251 Vol. 2 was the
work of Manfred Morgenthau, Harvy Meieran, Richard Showers, Jeffrey
Morse, Norman Dombeck, and Arnoldo Garcia of the U.S. Army Nuclear
Defense Laboratory under Defense Atomic Support Agency (now Defense
Nuclear Agency) sponsorship.
Although local (early) fallout is emphasized, the data presented
will be useful to those studying world-wide (delayed) fallout as well.
In this report local fallout is defined as all fallout which consists
principally of the larger particles that are deposited within 24 hours
after the detonation. World-wide or delayed fallout is defined as
fallout which consists of very small particles which descend very
slowly over large areas of the earth's surface.
Data resulting from each U.S. detonation are presented chronolog-
ically. For each detonation, the basic information useful for an
interpretation of the fallout data is tabulated first. This is followed
by both on-site and off-site fallout patterns where available. A graph
of the growth-rate of the cloud and stem is presented next. Wind speed
and direction are than tabulated as a function of altitude, and hodo-
graphs are drawn from these data.
EXPLANATION COMMENTS ON DATA PRESENTED
Fallout Patterns
\
One or more fallout patterns are given for each event, except for
those shots for which no sigificant residual radiation was observed
downwind of GZ or for which no patterns were found in the literature.
In the remarks included on the basic data sheet for each shot, the
individual fallout patterns are discussed briefly; some comments are
made for those shots for which no patterns were available. The dose-
rate contours for the fallout patterns have been drawn to show the
gamma dose rate in roentgens per hour, three feet above the ground, in
terms of the one hour after burst reference time. The t-1,2 approximation
was used when no actual decay data was available to adjust radiation
measurements to the one hour reference time. It is important to recog-
nize the H+l hour is used as a reference time, and that only the con-
tours from low yield weapons are complete at one hour after burst.
For high yield weapons, fallout over some parts of the vast areas
2
shown does not commence until many hours after the burst. The time
of arrival of fallout is indicated on some of the fallout patterns by
"dot-dash" lines. The time lines are intended to give only a rough
average arrival time in hours as estimated from the wind reports and
the available monitoring information.
Induced Activity Patterns
The contamination resulting from low air bursts is due primarily
to the activity induced by neutrons which are captured by certain ele-
ments in the soil, notably sodium, manganese and aluminum. The re-
sulting radiation field is circular and covers a limited area about
ground zero. Weather conditions have very little influence on the
location or shape of the induced radiation pattern. However, increas-
ing the moisture content in soils can increase the induced activity
levels. The rate of decay of the induced radiation field is different
from the decay of fission products and depends on the composition of
the soil over which the weapon was detonated. For Nevada soil, the
sodium and manganese composition generally varies by a factor of 1.4
to 2 and the aluminum composition varies by a factor of 3 to 7 within
and between test areas. For most induced activity patterns in this
report, a general neutron-induced decay curve for Nevada soil was used
to extrapolate the observed dose rates back to H+l hour. For a few in-
duced activity patterns, Na24 decay is used to extrapolate the observed
dose rates to H+l hour. This decay rate is not strictly applicable but
it closely approximates the observed decay.
Wind Data
The tables of wind data give surface and upper air winds for
heights up to at least the top of the nuclear cloud. These data are
presented for times as close to shot time as possible and for several
times after shot. Directions are in degrees from which the wind is
blowing, and are measured clockwise from North. Velocities are in
statute miles per hour. The height of the tropopause at shot time is
given when available. Although the meteorological data were taken in
close proximity to ground zero, they do not necessarily represent the
wind field downwind from ground zero in space and time.
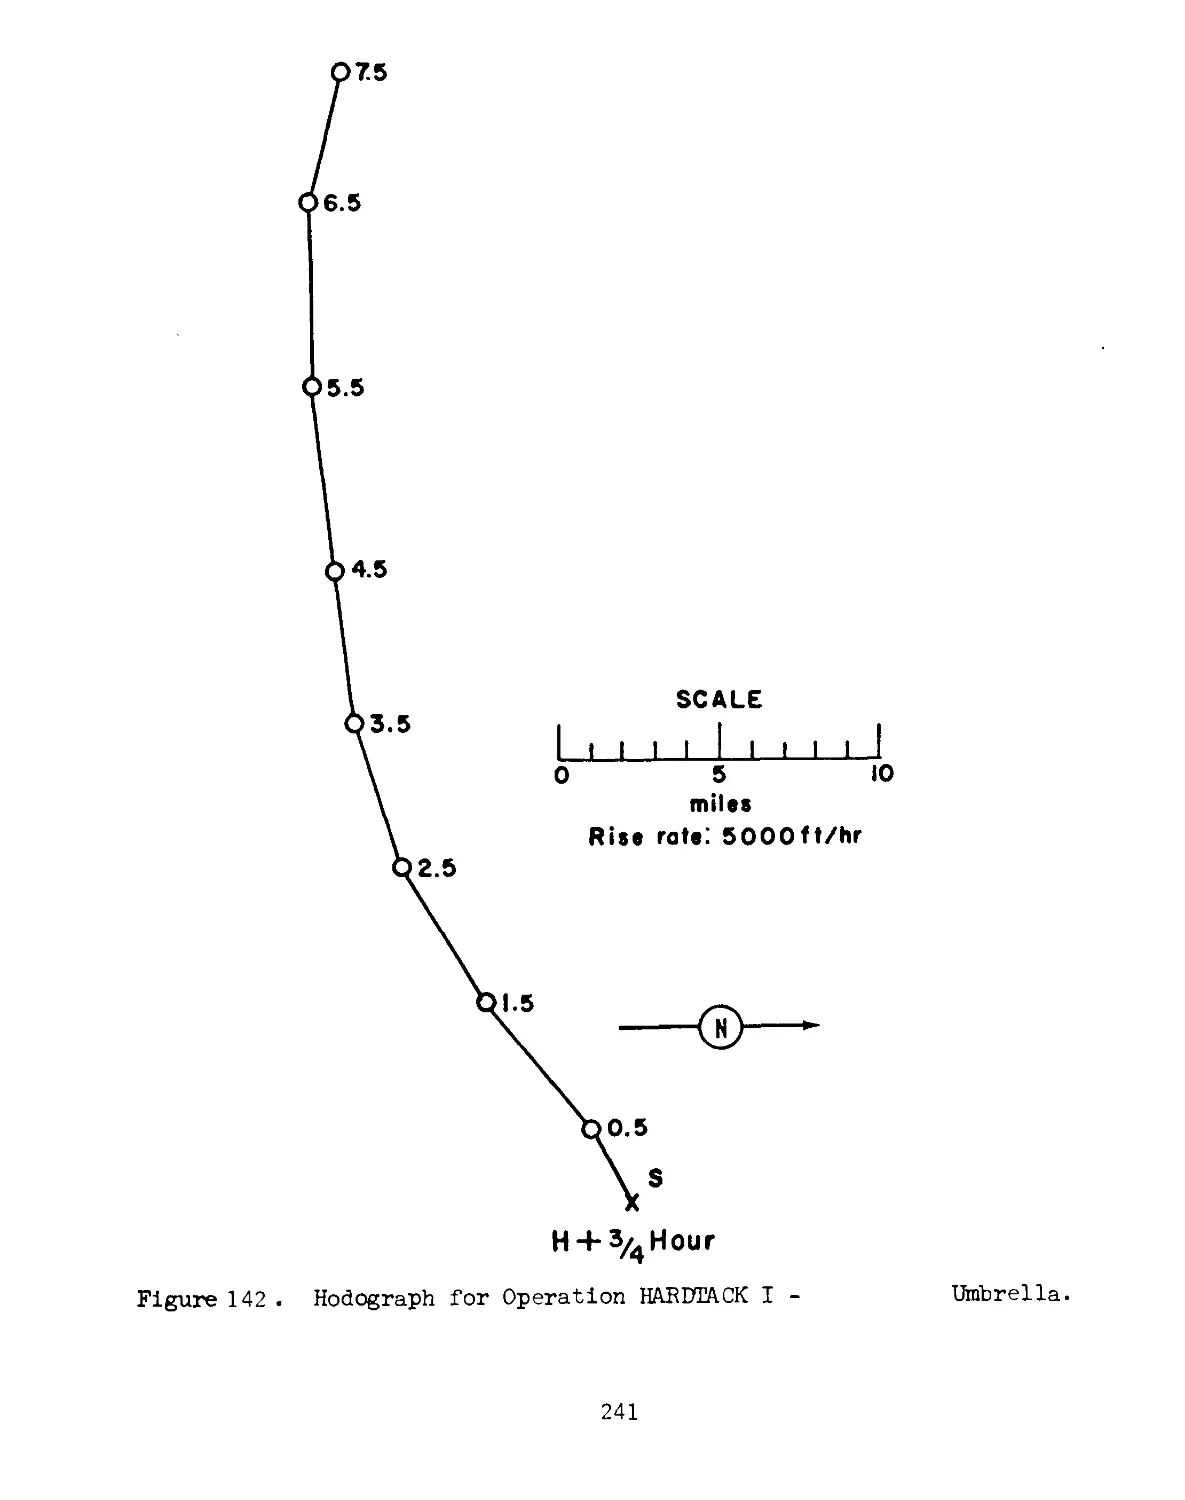
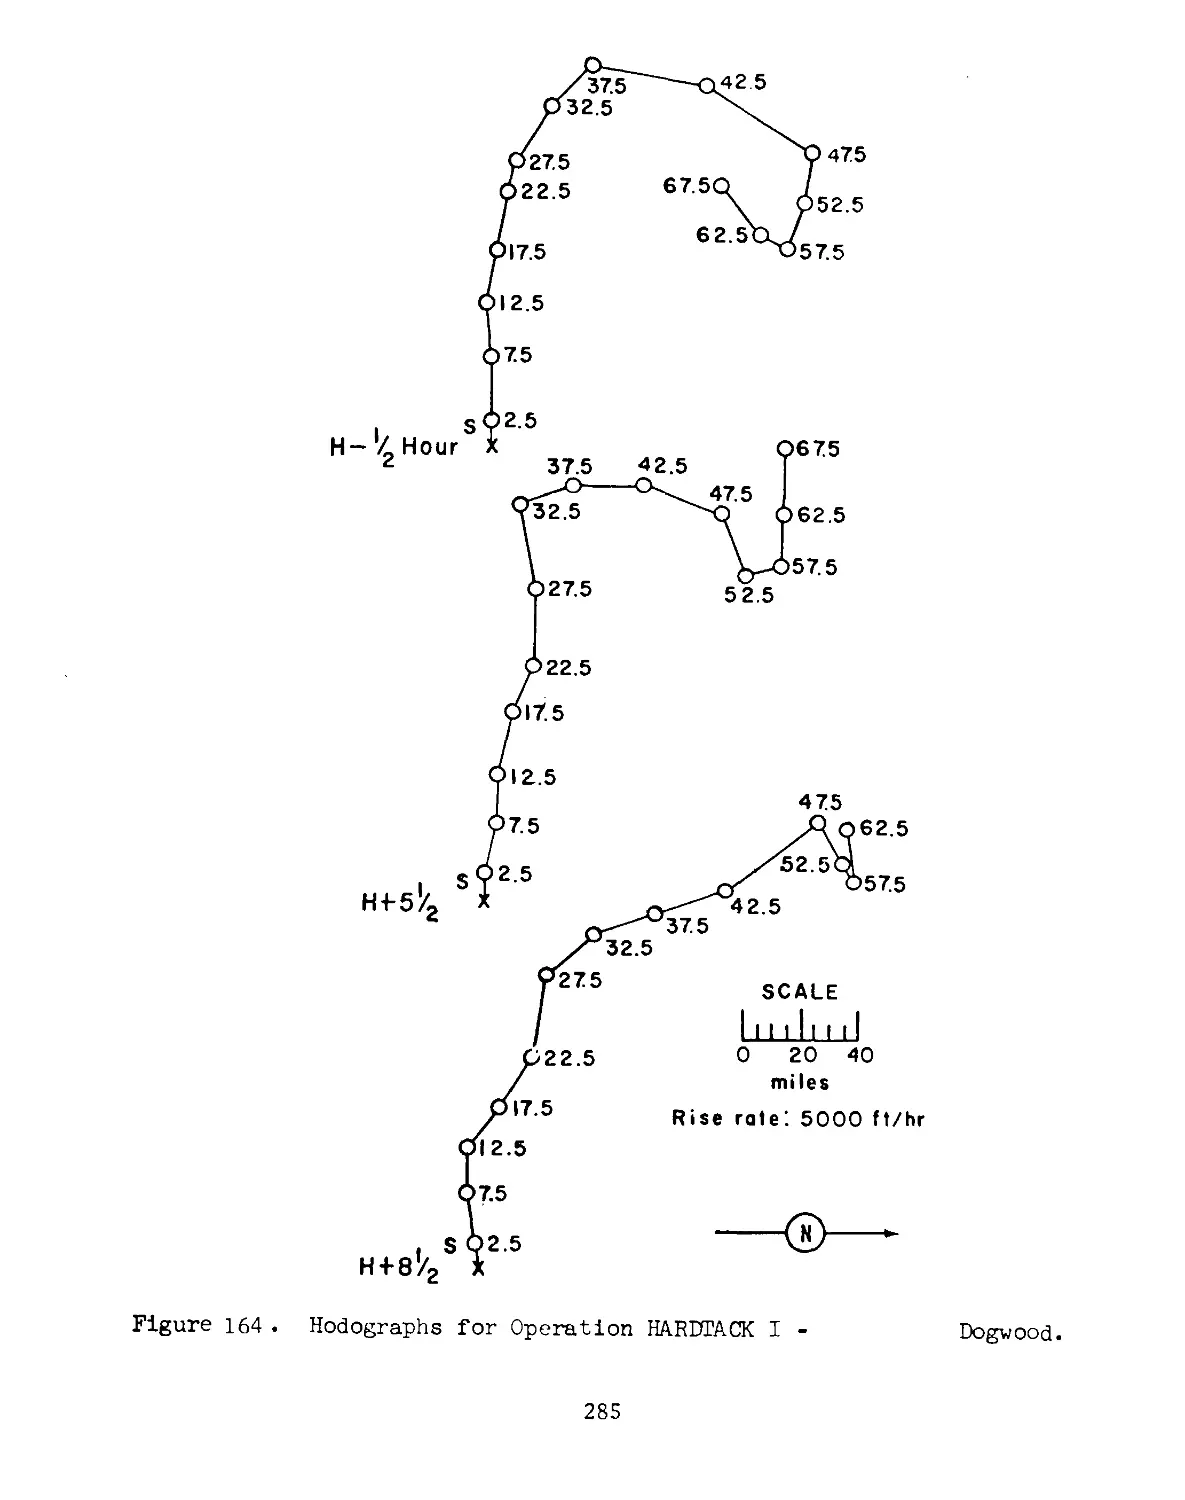
The hodographs are drawn for a constant balloon rise rate of
5,000 ft/hr and are presented for illustrative purposes only. The
fall rates of particles vary considerably with altitude; therefore,
errors will result from the use of a constant fall-rate hodograph for
fallout prediction. In general, particles in higher altitude levels
fall faster and the percentage change in the falling rate is greater
for larger particles. The numbers on the hodographs represent alti-
tudes in thousands of feet. The associated points represent the loca-
tions on the surface where particles having a constant fall-rate of
5,000 ft/hr would land if they originated over GZ at the altitudes
shown. The letter S on the hodographs stands for "Surface" and the
number next to it in parenthesis (for the Nevada shots) is the site
elevation of ground zero in feet above MSL.
3
STATUTE MILES
Figure 1 Operations CROSSROADS, Shot Locations
OPERATION CROSSROADS -
Able
PPG t ime GMT
DATE: 1 Jul I9U6 30 June 1946
TIME: 0900 2200
TOTAL YIELD: 23 kt
FIREBALL DATA:
Time to 1st minimum: NM
Time to 2nd maximum: NM
Radius at 2nd maximum: ~ 5?6 ft
Sponsor: LASL and DOD
SITE: PPG - Bikini
11° 37' 10" N
165° 29' 28" E
Site elevation: Sea level
HEIGHT OF BURST: 520 ft
TYPE OF BURST AND PLACEMENT:
Air burst over water
CLOUD TOP HEIGHT: 40,000 ft MSL
CLOUD BOTTOM HEIGHT: Not available
CRATER DATA: No crater
REMARKS:
The residual radioactivity on target vessels was low. On D+l day,
radioactivities greater than O.lr per 24 hours were found on only 13
vessels. The residual radioactivity in the water after H-hour was
negligible.
5
Figure 2. Cloud Dimensions: Operation CROSSROADS - Able.
6
ABLE
TABLE 1 BIKINI WIND DATA FOR OPERATION CROSSROADS,
Altitude (msl) H-hour H+5 hours H+8 hours
Dir Speed Dir Speed Dir Speed
feet degrees mph degrees mph degrees mph
Surface (070) (09) 045 09 070 08
2,000 130 15 — — — — — —
4,000 130 16 130 16 120 14
5,000 (130) (16) (130) (15) (120) (14)
6,000 140 17 130 14 120 15
8,000 120 13 120 14 020 16
10,000 (120) (19) 130 17 120 16
12,000 120 08 110 16 130 17
14,000 100 10 110 10 070 53
15,000 100 08 020 06 040 06
20,000 330 05 150 17 170 09
25,000 180 09 280 02 230 07
30,000 340 07 330 05 ЗЮ 05
35,000 340 02 080 06 Calm Calm
40,000 070 09 ЗбО 25 350 28
45,000 030 30 330 31 320 32
NOTES:
1. Numbers in parentheses are estimated values.
2. Surface wind data was obtained on Bikini; upper wind data was
obtained on board the Mt. McKinley.
3- Tropopause height was 5^,000 to 60,000 feet (exact height is
uncertain).
4. At H-hour the surface air pressure was 14.68 psi, the temperature
27-2°C and the dew point 23-4°C.
7
H-Hour
H + 5
SCALE
I L-l ±.
О IO 20 30
-J
40
Figure 3
8
OPERATION CROSSROADS
Baker
PPG time GMT
DATE: 25 Jul I9I+6 24 Jul 19^6
TIME: 0835 2135
TOTAL YIELD: 23 kt
Sponsor: LASL and DOD
SITE: PPG - Bikini - Near How
11° 37' 10" N
165 0 29' 28" E
Site elevation: Sea level
HEIGHT OF BURST: -90 ft
FIREBALL DATA:
Time to 1st minimum: NN
Time to 2nd maximum: NM
Radius at 2nd maximum: NM
TYPE OF BURST AND PLACEMENT:
Underwater - cable-supported
90 ft above lagoon floor.
Lagoon was 180 ft deep.
CLOUD TOP HEIGHT: 7,600 ft MSL
CRATER DATA:
Diameter: 3,300 ft maximum
1,800 ft minimum
Depth: 25 ft
REMARKS:
The contamination pattern is unreliable. The dose-rate readings
used for the pattern were obtained from the total dose measured by
film badges collected between D+10 days and D+15 days. The radioactivity
on the target vessels diminished At its greatest
extent the base surge extended about 2,000 yd upwind, 3,000 yd crosswind
and b,COO yd downwind. "The contamination resulted from fallout or
radioactive rain from the mushroom head reinforced somewhat by condensation
of the base surge. Ideally there should have been an annular infinitive-
dose pattern as a result of fallout from the outer edges of the mushroom
head. This ideal pattern was changed because of the intermittent be-
havior of the rain-out and because of the varying ability of the different
target ships to retain the fallout activity."
9
Distance From GZ, yards
Distance From GZ, yards
Figure 4. Operation CROSSROADS -
Baker. On-site
dose rate contours in r/hr at H+l hour.
10
11
TABLE 2 BIKINI WIND DATA FOR OPERATION CROSSROADS ~
BAKER
Altitude (msl) H-hour Altitude (msl) H-hour
Direction Speed Direct ion Speed
feet degrees mph feet degrees mph
Surface 200 03 11,000 080 09
2,000 160 12 15,000 080 09
U,000 160 12 16,000 080 13
6,000 150 09 20,000 110 09
8,000 150 08 25,000 050 12
10,000 120 09 30,000 010 20
12,000 110 1U 35,000 Обо 32
NOTES:
1. Surface wind data was obtained at H+l hour on Bikini;
upper wind data was obtained on board the "Fall River."
2. Tropopause height was 5^,000 to 60,000 feet (exact height
is uncertain).
3. At H-hour the surface air pressure was 1U.68 psi, the
temperature 28.9°C and the dew point 25-O°C.
Figure 6. Hodographs for Operation CROSSROADS -
Baker
12
GENE
HELEN
OCEAN
MACK
L A G О О N
ENIWETOK ATOLL
OPERATION SANDSTONE
SHOT LOCATIONS
Figure 7 . Operation SANDSTONE, Shot Locations.
13
OPERATION SANDSTONE
X-Ray
PPG Time GMT
DATE: 15 Apr 1948 14 Apr 19JI&
TIM!1,: 0617 1817
Sponsor: LASL
SITE: PPG - Eniwetok - Janet
11° 40' N
162° 14' 37" E
Site elevation.: Sea level
TOTAL YIELD: 37 kt
HEIGHT OF BURST: 200 ft
TYPE OF BURST AND PLACEMENT:
Tower burst over coral soil
FIREBILL IATA:
Time to 1st minimum: NM
Time to 2nd maximum: NM
Radius at 2nd maximum: NM
CLOUD TOP HEIGHT: 56,000 ft MSL
CLOUD BOTTOM HEIGHT: 25,000 ft MSL
CRATER IATA:. Not available
REMARKS:
No fallout pattern available. Radioactive samples were taken from
Ground Zero and showed a decay Also much
activity due to Na24 was observed. Cloud reached the tropopause
in 12 minutes.
14
Time, Minute*
Figure 8• Cloud Dimensions: Operation SANDSTONE -
X-Ray
15
TABLE 3 ENIWETOK WIND DATA FOR OPERATION SANDSTONE -
X-RAY
Altitude (MSL) H-hour H+2 hours H+3 hours
Dir Speed Dir Speed Dir Speed
feet degrees mph degrees mph degrees mph
Surface 090 10 090 12 070 16
2,000 — — 100 15 070 23
U,000 ... - 100 12 090 23
5,000 100 1U (100) (12) (095) (2U)
6,000 — — 090 12 100 25
8,000 — - 110 21 090 23
10,000 130 1U 130 15 080 16
12,000 — — 120 13 080 12
1U,OOO - 1U0 09 070 09
15,000 150 09 (1U0) (09) (075) (08)
16,000 - - - - 1U0 10 080 07
18,000 — - 1U0 09 360 07
20,000 160 09 1U0 02 210 02
25,000 230 12 220 12 120 09
30,000 2U0 1U 210 15 — —
35,000 220 23 210 21 — --
U0,000 220 15 220 21 — --
U5,000 220 3U 220 37 — --
50,000 230 23 230 21 — - -
55,000 220 1U - - - — - - - - -
NOTES:
1. Numbers in parentheses are estimated values.
2. Tropopause height was 55,000 ft MSL at H-hour.
3. The H-hour wind data was estimated by the USAF weather station
on Eniwetok Island. The H+2 and H+3 hour winds were measured.
U. At H-hour the sea level pressure was 1190 mb, temperature 75°F
and the dew point 71°F.
16
57.5
2.5
52.5
Figure 9.
Hodographs for Operation SANDSTONE -
X-Ray.
17
OPERATION SANDSTONE -
Yoke
PPG time GMT
DATE: 1 May I9U6 30 Apr 1948
TIME: ObO9 1809
TOTAL YIELD: 49 kt
FIREBALL DATA:
Time to 1st minimum: NM
Time to 2nd maximum: NM
Radius to 2nd maximum: NM
Sponsor: LASL
SITE: PPG - Eniwetok - Sally
11° 37' 40" N
162° 19' 27" E
Site elevation: Sea level
HEIGHT OF BURST: 200 ft
TYPE OF BURST AND PLACEMENT:
Tower burst over coral soil
CLOUD TOP HEIGHT: 56,000 ft MSL
CLOUD BOTTOM HEIGHT: 35,000 ft MSL
CRATER DATA: Not available
REMARKS:
No fallout pattern available. Cloud reached tropopause in 12
minutes. Yoke rain-out was observed on Kwajalein at H+36 hours;
rain fell for 10 hours and the maximum activity observed was 6 to
10 mr/hr.
18
Figure 10. Cloud Dimensions: Operation SANDSTONE - Yoke.
19
TABLE 4 ENIWETOK WIND DATA FOR OPERATION SANDSTONE -
YOKE
Altitude (MSL) H-hour H+3 hours
Dir Speed Dir Speed
feet degrees mph degrees mph
Surface 080 16 070 15
2,000 «• “ «• — 070 21
l+,000 — - - 090 12
5,000 090 11+ 170 07
6,000 - 180 08
10,000 160 12 150 39
H+,000 — - - 080 1+1
15,000 090 07 090 29
16,000 — 100 28
20,000 220 12 170 1+2
25,000 210 16 250 70
30,000 210 2U 270 1+7
35,000 220 1+8 — - -
1+0,000 210 57 — — — - -
U5,000 210 5U — --
50,000 200 1+9 — --
55,000 200 1+0 — - -
NOTES:
1. Tropopause height was estimated to be 56,000 ft MSL at H-hour.
2. The H-hour wind data was estimated by the USAF weather station
on Eniwetok Island. The H+3 hour winds were measured.
3. At H-hour the sea level pressure was IO5O mb, the temperature
79°F, and the dewpoint 72°F.
20
57.5
17.5
52.5
47.50
4 2.5CJ
37.5 г/
032.5
027.5
022.5
0^12.5 s
7.50—0* H-Hour
2.5
Figure 11. Hodographs for Operation SANDSTONE -
Yoke
21
OPERATION SANDSTONE
Zebra
PPG time GMT
DATE: 15 May 1^6 May 19^8
TIME: ObOU 18OU
TOTAL YIELD: 18 kt
Sponsor: LASL
SITE: PPG - Eniwetok - Yvonne
11° 33' 15" N
162° 21' 2U" E
Site elevation: Sea level
HEIGHT OF BURST: 200 ft
FIREBALL DATA:
Time to 1st minimum: NM
Time to 2nd maximum: NM
Radius at 2nd maximum: NM.
TYPE OF BURST AND PLACEMENT:
Tower burst over coral soil
CLOUD TOP HEIGHT: 28,1+00 ft MSL
CLOUD BOTTOM HEIGHT: 20,000 ft MSL
CRATER DATA: Not available
REMARKS:
No fallout pattern available.
22
Cloud Height (MSL) and Diameter, IO Feet
Figure 12. Cloud Dimensions: Operation SANDSTONE - Zebra.
23
TABLE 5 ENIWETOK WIND DATA FOR OPERATION SANDSTONE -
ZEBRA
Altitude (MSL) H-hour H+2 hours H+3 hours
Dir Speed Dir Speed Dir Speed
feet degrees mph degrees mph degrees mph
Surface 080 10 100 09 090 09
2,000 100 17 110 16 100 17
5,000 130 13 110 15 110 1U
10,000 220 13 190 12 220 1U
15,000 270 1U 2U0 07 2U0 08
20,000 2U0 21 250 20 2б0 2U
25,000 250 31 2б0 29 250 36
30,000 270 50 260 U5 270 UU
35,000 280 50 260 U6 290 UH
HO,000 270 83 290 U8 290 56
U5,000 270 HO 280 U8 270 55
NOTES:
1. Tropopause height was 5^,000 feet MSL at H-hour.
2. The H-wind data was estimated by the USAF weather station
on Eniwetok Island. The H+2 and H+3 hour winds were measured.
3. At Н-h'our the sea level pressure was 810 mb, the temperature
81°F, and the dew point T^°F.
24
47.5 0
SCALE
I 1111__1 I .1—
0 20 40 60 80 100
47.5Q
miles
Rise rate: 5000 ft/hr
H-Hour H + 2 H + 3
Figure 13. Hodographs for Operation SANDSTONE - Zebra
25
GENE
HELEN
N
MACK
L A G О 0 N
ENIWETOK ATOLL
OPERATION GREENHOUSE
SHOT LOCATIONS
Event
Dag
Figure 14 • Operation GREENHOUSE, Shot Locations
26
OPERATION GREENHOUSE -
Dog
DATE:
TIME:
PPG time
8 Apr 1951
063 u
GMT
7 Apr 1951
I83 if-
Sponsor: LASL
SITE: PPG - Eniwetok - Yvonne
11° 33' 21" N
162° 21’ 16" E
Site elevation: Sea level
HEIGHT OF BURST: 300 ft
TYPE OF BURST AND PLACEMENT:
Tower burst over coral soil
CLOUD TOP HEIGHT: 56,000 ft MSL
CLOUD BOTTOM HEIGHT: 33,000 ft MSL
REMARKS:
The dose-rate readings were corrected to H+l hour by applying the
t-1’2 law to measurements made by the Radiological Safety organi-
zation. Measurements on Yvonne were made at H+8j- hours. Many of
the measurements were obtained from a helicopter flying at an altitude
of 10 to 20 feet above the ground. These readings may therefore be
low by as much as 20 to 50 percent. The wind shear at about 20,000
feet accounts for the higher dose rates on the southeastern part of
the atoll, as compared to the southern end of the shot island.
27
Distance From GZ, Yards
Distance From GZ, Yards
Figure 15 • Operation GREENHOUSE - Dog.
Shot - Island dose rate contours in r/hr at H+l hour.
28
GENE
N
L A G О 0 N
MACK
ENIWETOK ATOLL
0 1 2 3 4 5
Figure 16. Operation GREENHOUSE -
rates in r/hr at H+l hour.
Dog. Atoll dose
29
30
TABLE 6 ENIWETOK WIND DATA FOR OPERATION GREENHOUSE - DOG
Altitude (MSL) H-hour H+2> hours
Dir Speed Dir Speed
feet degrees mph degrees mph
Surface 070 22 01+0 21
li,000 080 33 — -
5,000 (080) (30) 090 21+
6,000 080 26 w- - —
10,000 080 22 100 25
H+,000 070 21 070 25
15,000 (070) (2U) (070) (25)
16,000 070 29 070 21+
20,000 030 22 050 22
25,000 300 12 31+0 17
30,000 280 31 290 29
35,000 230 29 230 29
Ho,000 220 33 230 37
1+5,000 280 26 250 31
50,000 310 22 330 29
55,000 3U0 31 360 36
60,000 030 33 — —
NOTES:
1. Numbers in parentheses are estimated values.
2. Tropopause height was 55,000 ft MSL at H-hour.
3- At H-hour at a pressure of 1000 mb the temperature
was 25° C and the dew point 22°C.
31
32.5
057.5
Figure 18 . Hodographs for Operation GREENHOUSE -
Dog.
32
OPERATION GREENHOUSE -
Easy
PPG time GMT Sponsor: LASL
DATE: 21 Apr 1951 20 Apr 1951
TIME: Об27 1827 SITE: PPG - Eniwetok - Janet
11° 10’ 08" N
162° 11' 25” E
Site elevation: Sea level
TOTAL YIELD: 47 kt
HEIGHT OF BURST: 300 ft
TYPE OF BURST AND PLACEMENT:
Tower burst over coral soil
FIREBALL DATA:
Time to 1st minimum: 19 to 29-5 msec
Time to 2nd maximum: 200 to 230 msec
Radius at 2nd maximum: NM
CLOUD TOP HEIGHT: 11,000 ft MSL
CLOUD BOTTOM HEIGHT: 30,000 ft MSL
CRATER DATA: Diameter: 836 ft
Depth: 2.1 ft
REMARKS:
The fallout readings on the shot island were obtained by the
Radiological Safety organization at H+;?8 hours and corrected to
H+l hours, using the t-1’2 decay approximation. Dose rates
shown for other islands are based upon daily surveys made to
determine field decay rates. Readings were made 1 meter above
the ground with gamma ionization chambers. The values shown
were corrected to H+l hour by extrapolating from the experimental
decay curves. There was a wind shear at about 15,000 feet.
33
Figure 19. Operation GREENHOUSE - Easy. Shot Island
dose rate contours in r/hr at H+l hour.
34
GENE
N
L A G О 0 N
ENIWETOK ATOLL
Figure 20 . Operation GREENHOUSE -
rates in r/hr at H+l hour.
Easy. Atoll dose
35
Figure 21 . Cloud Dimensions: Operation GREENHOUSE -
Easy.
36
EASY
TABLE 7 ENIWETOK WIND DATA FOR OPERATION GREENHOUSE —
Altitude (MSL) H-3? hours H-hour Н+2-у hours H+8y hours
Dir Speed Dir Speed Dir Speed Dir Speed
feet degrees mph degrees mph degrees mph degrees mph
Surface 050 16 060 16 070 17 070 20
5,000 100 09 080 13 070 16 090 Об
10,000 070 08 090 06 100 05 200 Hi
Hl, 000 210 03 - 220 07 210 07
15,000 «• “ «• 2U0 06 (230) (07) (230) (08)
16,000 280 07 — -- 250 07 2б0 10
20,000 310 03 330 OU 36О 05 Calm Calm
25,000 320 13 350 13 300 08 310 22
30,000 260 20 270 28 270 15 270 1+0
35,000 270 28 280 31 280 35 270 1|6
l|0,000 280 32 280 37 280 L-0 270 1+0
1i5,000 260 35 270 38 2б0 37 2UO 28
50,000 270 28 260 32 2б0 30 250 30
55,000 350 35 21|0 23 3L-0 12 230 06
6си,ооо 330 15 330 15 - - - — — — - —
NOTES:
1. Numbers in parentheses are estimated values.
2. H-hour values were determined by interpolating between the H-3y
and H+2-| hour values.
3- Tropopause height was 53,000 ft MSL at H-hour.
'I. At H-hour at a pressure of 1,000 mb the temperature was 25°C and
the dew point 21°C.
37
SCALE
I 1 I I I I 1-1 L1 -LI.J
0 20 40 60
miles
Rise rate5000 ft/hr
Figure 22. Hodographs for Operation GREENHOUSE - Easy
38
OPERATION GREENHOUSE -
George
PPG time GMT
DATE: 9 May 1951 8 May 1951
TIME: 0930 2130
Sponsor: LASL
SITE: PPG - Eniwetok - Ruby
11° 37' 37" N
162° 18' 53" E
Site elevation: Sea level.
HEIGHT OF BURST: 200 ft
TYPE OF BURST AND PLACEMENT:
Tower burst over coral soil
CLOUD TOP HEIGHT: 56,000 ft MSL
CLOUD BOTTOM HEIGHT: Hl,000 ft MSL
REMARKS:
The survey readings on the shot island were obtained at H+2U hours
and extrapolated to H+l hour using the t-1'2 decay approximation. Since
the winds were from the west-southwest throughout their entire struc-
ture, no radiation reading higher than twice background was observed on
islands beyond 2,000 yards from ground zero.
39
Figure 23. Operation GREENHOUSE - George. On-site dose
rate contours in r/hr at H+l hour.
40
Figure 24 . Cloud Dimensions:
Operation GREENHOUSE -
George.
41
TABLE 8 ENIWETOK WIND DATA FOR OPERATION GREENHOUSE -
GEORGE
Altitude (MSL) H-hour H+6 hours H+12 hours
Dir Speed Dir Speed Dir Speed
feet degrees mph degrees mph degrees mph
Surface 2U0 1U 260 16 130 12
U,000 260 35 — - — —
5,000 (250) (32) 260 25 220 15
6,000 250 31 — — — — «• “ “ - -
10,000 250 U8 270 31 260 26
1U,OOO “ — 260 30 270 U1
15,000 260 26 (260) (31) (260) (HO)
16,000 — «• 260 32 260 39
20,000 230 23 220 32 260 23
25,000 190 25 200 23 2U0 37
30,000 230 2U 180 20 180 33
35,000 270 20 160 18 160 31
Uo,ooo 290 18 200 13 160 26
U5,000 170 03 010 07 170 16
50,000 310 15 — 030 U1
55,000 020 12 - - - - - - - - - -
NOTES:
1. Numbers in parentheses are estimated values.
2. Tropopause height was 55,000 ft MSL at H-hour.
3. At H-hour at a pressure of 1,000 mb the temperature was
27°C and the dew point ‘23° C.
42
47.5
>42.5
42.5
О 20 40 60
miles
Rise rote: 5000 ft / hr
Figure 25 . Hodographs for Operation GREENHOUSE -
George
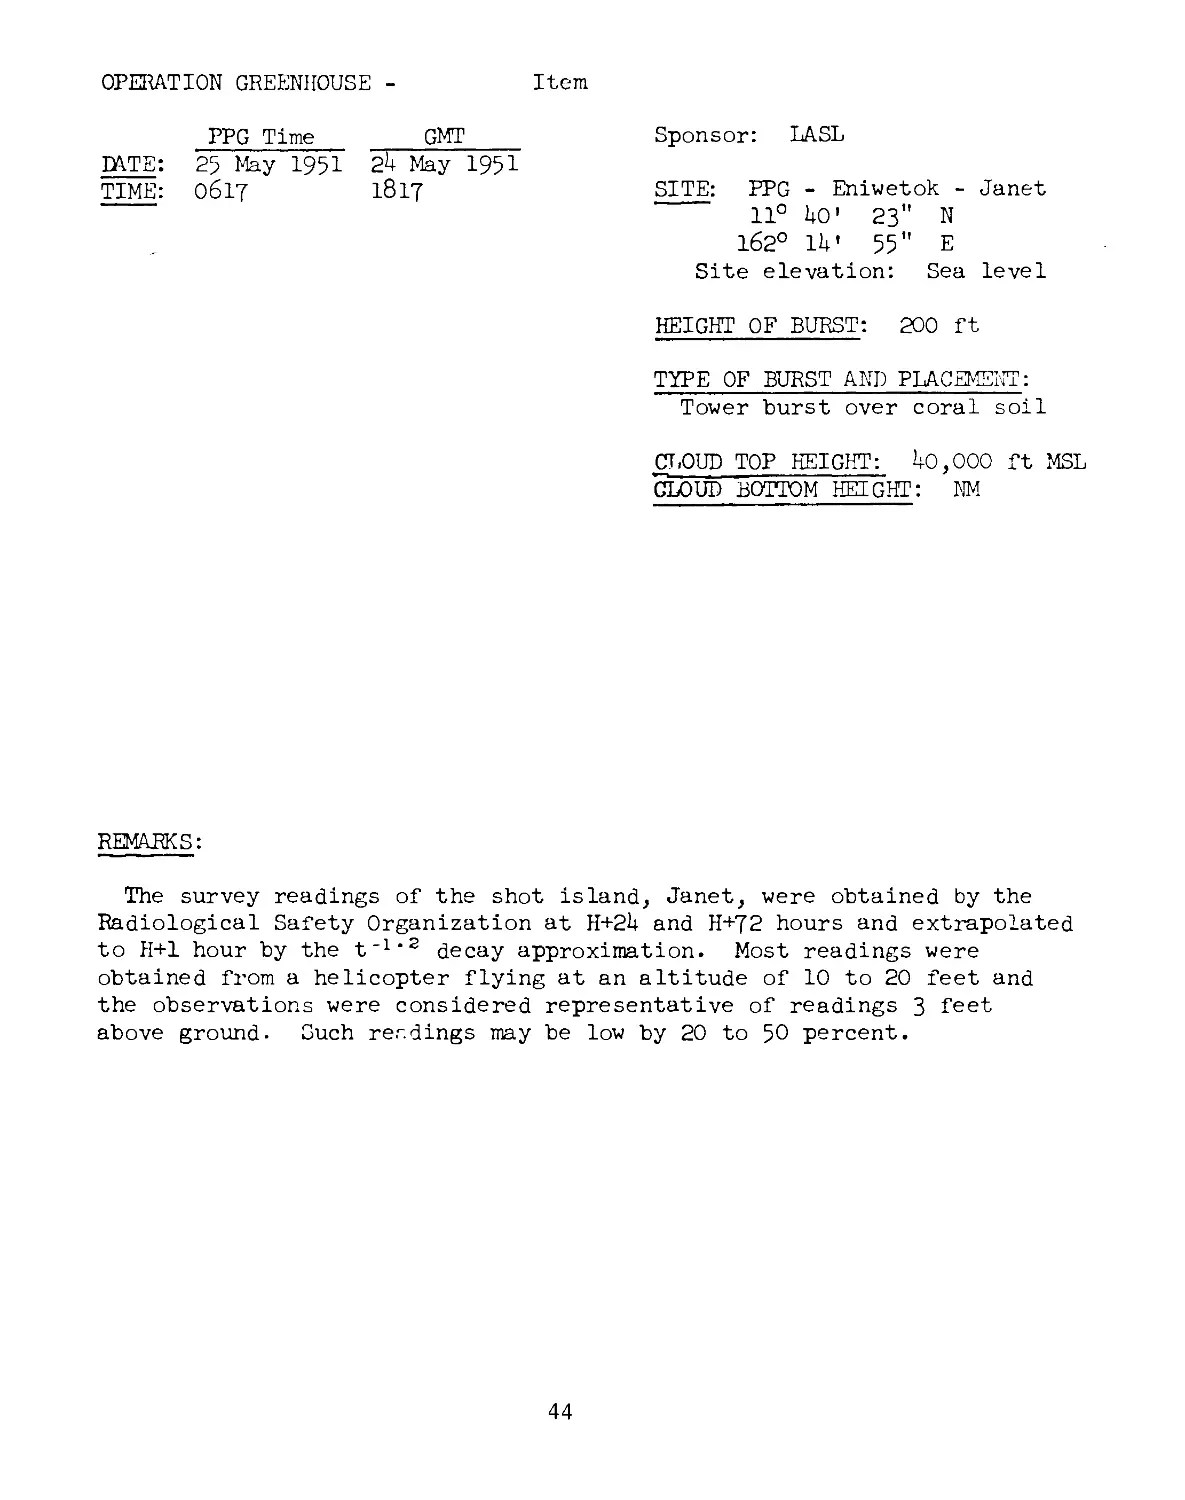
OPERATION GREENHOUSE -
Item
PPG Time GMT
DATE: 25 May 1951 2U May 1951
TIME: 0617 1817
Sponsor: LASL
SITE: PPG - Eniwetok - Janet
11° HO' 23" N
162° 1U' 55" E
Site elevation: Sea level
HEIGHT OF BURST: 200 ft
TYPE OF BURST AND PLACEMENT:
Tower burst over coral soil
CLOUD TOP HEIGHT: ^0,000 ft MSL
CLOUD BOTTOM HEIGHT: NM
REMARKS:
The survey readings of the shot island, Janet, were obtained by the
Radiological Safety Organization at H+2U and H+72 hours and extrapolated
to H+l hour by the t'1’2 decay approximation. Most readings were
obtained from a helicopter flying at an altitude of 10 to 20 feet and
the observations were considered representative of readings 3 feet
above ground. Such readings may be low by 20 to 50 percent.
44
Figure 26 . Operation GREENHOUSE - Item. Shot Island
dose rates in r/hr at H+l hour.
45
GENE
Figure 27 .
Item. Atoll dose
Operation GREENHOUSE -
rates in r/hr at H+l hour.
46
11111111
Figure 28. Cloud Dimensions: Operation GREENHOUSE -
Item
47
TABLE 9 ENIWETOK WIND DATA FOB OPERATION GREENHOUSE -
ITEM
Altitude (msl) H-hour H+2£ hours H+8j- hours
Dir Speed Dir Speed Dir Speed
feet degrees mph degrees mph degrees mph
Surface 070 15 070 22 070 15
5,000 090 16 080 17 090 15
10,000 090 05 060 02 Calm Calm
14,000 250 10 250 10 250 09
15,000 (260) (09) (260) (09) (270) (10)
16,000 280 (08) 270 09 290 13
20,000 290 09 300 10 310 16
25,000 250 12 ЗбО 09 350 13
30,000 ЗбО 10 — — 350 12
35,000 250 09 — — 250 06
40,000 280 08 -
45,000 150 08 «• «• “ — «• “ “ —
50,000 330 10 - - - — — —
NOTES:
1. Numbers in parentheses are estimated values.
2. Tropopause height was 55,000 ft MSL at H-hour.
3. At H-hour at a pressure of 1,000 mb the temperature was
31°C and the dew point 23°C.
48
SCALE
0 10 20 30
mile s
Rise rote; 5000 ft/hr
u
«3
Figure 29 . Hodographs for Operation GREENHOUSE
Item.
GENE
Figure 30. Operation IVY, Shot Locations.
50
OPERATION IVY -
Mike
PPG time GMT
DATE: 1 Nov 1952 31 Oct 1952
TIME: 0715 1915
TOTAL YIELD: 10.4 mt
Sponsor: LASL
SITE: PPG - Eniwetok - Flora
11° 1U' 1U" N
162° 11' Ul" E
Site elevation: Sea level
HEIGHT OF BURST: Surface
FIREBALL DATA:
Time to 1st minimum: 270 to ЗЮ msec
Time to 2nd maximum: 3 to 3-5 sec
Radius at 2nd maximum: NM
CLOUD TOP HEIGHT: 98,000 ft MSL
CLOUD BOTTOM HEIGHT: 59,000 ft MSL
CRATER LATA: Diameter: 6,2k0 ft
Depth: 16U ft
TYPE OF BURST AND PLACEMENT:
Surface burst on coral soil
and water
REMARKS:
Most of the fallout occurred over the open sea. Documentation of
the fallout was thus limited to the islands and the lagoon of
Eniwetok atoll. The lagoon dose rates were determined by multiplying
the readings obtained on rafts by the factor 7. This factor is
based upon the ratio of Operation Jangle field dose rates and readings
taken over flat plates after their removal from the contaminated area.
The data presented for the lagoon stations can thus be considered as
approximations only. The island dose rates are based upon ground-
and aerial-survey readings and were adjusted to H+l hour by using
the t"1*2 law to approximate >.he decay.
51
Distance From GZ, Statute Miles
Figure 31
Operation IVY - Mike. Atoll dose rate
contours in r/hr at H+l hour.
52
Figure 32 . Cloud Dimensions: Operation IVY -
Cloud Diameter 10 Feet
Mike.
53
TABLE 10 ENIWETOK WIND DATA FOR OPERATION IVY -
MIKE
Altitude (MSL) H-hour
Dir Speed
feet degrees mph
Surface 090 05
5,000 090 16
10,000 095 17
15,000 115 17
20,000 125 1U
25,000 170 15
30,000 220 20
U0,000 230 17
50,000 220 1U
60,000 OUO 09
70,000 100 23
80,000 085 09
90,000 280 12
100,000 250 23
110,000 300 23
120,000 0U0 Об
130,000 Calm Calm
135,000 Calm Calm
NOTES:
1. Tropopause height was 56,000 ft MSL at H-hour.
2. The surface air pressure was 1U.66 psi, the temperature
29. U°C and the dew point 23-8°C.
54
102.5
Figure 33 • Hodograph for Operation IVY - Mike.
55
OPERATION IVY -
King
PPG time GMT
DATE: 16 Nov 1952 15 Nov 1952
TIME: II30 2330
TOTAL YIELD: 500 kt
Sponsor: LASL
SITE: PPG - Reef northeast of
north end of Yvonne
11° 33' W N
162° 21' 09" E
Site elevation: Sea level
FIREBALL DATA:
Time to 1st minimum: 62 to TO msec
Time to 2nd maximum: TOO to 850 msec
Radius at 2nd maximum: 1,968 ft
CLOUD TOP HEIGHT: 6t,000 ft MSL
CLOUD BOTTOM HEIGHT: 51,800 ft MSL
HEIGHT OF BURST: l,U8o ft
CRATER DATA: No crater
TYPE OF BURST AND PLACEMENT:
Air burst over coral soil and
sea water
REMARKS:
Contamination of the islands of Eniwetok atoll was generally masked
by the contamination resulting from the earlier Mike shot. The dose
rates indicated in figure 102 are estimates based upon readings taken
from helicopters flying 25 feet above the ground. The estimates are
corrected for dose-rate levels existing on D-l.
56
GENE
Figure 34
Operation IVY - King.
Atoll dose rates in r/hr at H+l hour.
57
Figure 35. Cloud Dimensions: Operation IVY - King.
58
KING
TABLE 11 ENIWETOK WIND DATA FOR OPERATION IVY-
Altitude (MSL) H-hour H+3t- hours H+9> hours
Dir Speed Dir Speed Dir Speed
feet degrees mph degrees mph degrees mph
Surface 070 20 080 22 070 21
5,000 105 23 080 26 090 26
10,000 085 23 070 20 090 20
11,000 — — “ 070 12 080 13
15,000 069 19 «• “ -- - - “• “• — - -
16,000 060 16 olo 12 070 17
20,000 059 20 050 23 010 25
25,000 056 21 050 33 050 05
30,000 018 13 310 13 300 06
35,000 (351) (21) 330 26 260 18
Ho,000 325 28 290 11 070 33
1+5,000 (322) (29) 320 36 280 15
50,000 320 30 230 08 050 17
55,000 (021) (22) 080 20 080 26
60,000 083 11 090 33 070 ^3
65,000 (079) (17) 090 21 090 32
70,000 076 21 070 . 05 130 23
75,000 288 07 330 18 300 05
80,000 — -- 320 18 3H0 23
85,000 — “• — “• — 310 09 020 08
90,000 — — — — _ 320 06 — —
95,000 - - - - - 260 32 - - - - -
NOTES:
1. Numbers in parentheses are estimated values.
2. Tropopause height was 56,000 ft MSL at H-hour.
3- The surface air pressure was 11.66 psi, the temperature
28.0°C and the dew point 23.5°C.
59
о
SCALE
1111 111 I 11 1 11
0 20 40 60
miles
Rise rate; 5000 ft/hr
Figure 36 . Hodographs for Operation IVY - King.
Shot
BIKINI ATOLL
OPERATION CASTLE
SHOT LOCATIONS
Figure 37 . Operation CASTLE, Shot Locations.
61
GENE
Figure 38 . Operation 'CASTLE, Shot Locations.
62
Bravo
OPERATION CASTLE -
PPG Time СМГ
DATE: 1 Mar 195 28 Feb 195^
TIME: O6I5 1815
TOTAL YIELD: 15 Mt
Sponsor: LASL
SITE: PPG - Bikini - on reef between
Baker and Charlie
11° 1;Г 27” N
165° IL’ 25" E
Site elevation: Sea level
FIREBALL DATA:
Time to 1st minimum: 313 to 350 msec
Time to 2nd maximum: 3»5^ to 3*95 sec
Radius at 2nd maximum: 9,512 ft
TYPE OF BURST AND PTACEMENT:
Surface burst from platform on
Coral soil
HEIGHT OF BURST:
7 ft
CLOUD TOP HEIGHT: 111,000 ft
CLOUD BOTTOM jIEIGHT: 55,300 ft
CRATER DITA: Diameter: 6,000 ft
Depth: 210 ft.
Lip: Apparently
washed away
REMARKS:
The on-site fallout pattern was constructed from survey measurements on
Bikini Atoll, and from samples obtained with the total collectors and
gummed paper collectors. The free-floating sea stations were not in the
correct location to receive primary fallout. The data were extrapolated
to H+l hour by the composite gamma-ionization-decay curve obtained from
samples measured in the laboratory.
This is the only megaton shot where some downwind land areas were un-
expectedly contaminated; thus, partial documentation of fallout effects
was possible. However, the major portion of the fallout occurred over
the open ocean and was not documented. Because this shot is one of those
used as the basis of fallout predictlor for megaton yield weapons, three
off-site fallout patterns arc presented. The mosu widely known pattern
is shown in Figure 40. It was constructed immediately after the event
from the preliminary data available at Has, i.FSWP. 'The second pattern
was constructed by NRDL by establishing an experimental model; the field
data plus a thorough analysis of the wind structure existing at and after
shot time was used. The third pattern was consi.ructed by RAND Corp., by
supplementing field observations with model calculations.
63
Distonce From GZ, Statute Miles
Figure 39 . Operation CAS1LS - Bravo.
On-Eite dose rate contours in r/hr at H+l hour.
64
Distance
Г; cm GZ, Statute Miles
Figure 40
Operation CASTLE -
Off-site dose rate
Bravo»
contours in r/hr at H+l hour (AFSWP).
65
Distance From GZ,Statute Miles
Figure 41 Operation CASTLE - Bravo.
Off-site dose rate contours in r/hr at H+l hour (NRDL)
66
DISTANCE FROM GZ , STATUTE MILES
DISTANCE FR(iU 1Z, STATUTE MILES
Figure 42.
Operation CASTLE - Bravo.
Off-site dose rate contours in r/hr at H+l hour (HAND).
67
Cloud Height (MSL) and Stem Diameter, IO Feet
Figure 43. Cloud Dimensions: Operation CASTLE
Bravo.
68
BEA VO
TABLE 12 WIND DATA FOB OPHF.TION CASTLE -
Altitude (MSL) H-hour H-13 hours }?4<> hours
Di r I jpCPQ Dir Speed Dir Speed
feet degrees mph degrees mph degrees mph
Surface обо 14 070 17 обо 20
1,000 070 20 — —
2,000 090 21 070 23 090 16
3,000 090 20 — —
11,000 090 16 090 12 100 16
5,000 (100) (10) (090) (10) (090) (13)
6,000 120 05 080 13 080 09
7,000 310 05 — — —
8,000 310 05 300 07 350 03
9,000 320 08 — — --
10,000 310 06 150 13 300 17
12,000 14,000 3‘io 12 320 21 330 17
290 16 330 12 300 12
15,000 (290) (15) (330) (1M (300) (12)
1.6,000 290 15 320 17 300 12
18,000 290 15 300 26 310 16
20,000 280 15 290 26 290 20
25,000 260 22 210 25 250 28
30,000 250 30 230 36 250 33
35,000 240 40 - — — 260 55
4-0,000 230 4o — «• “ 250 51
45,000 250 52 “ “ — — 260 51
50,000 250 36 — - - 270 92
55,000 200 18 — “ — 350 13
57,000 3)40 31 — —
NOTED:
1. Numbers in parentheuee are estimated values.
2. H-ho;ir wind data was. obtained on board the U.S.S. Curtiss.
3- Tropopause height was 55,000 fl MOL.
h. At H-hour the sea level pressure was 1006.1 mb, the temperature
80°F, the dew point ?2OF and Die relative humidity 77$,
69
52.5 О-О57-5
Figure 44 . Hodographs for Operation CASTLE -
Bravo.
70
OPERATION CASTLE
- Romeo
РГТ time GMT______________
DATE: 27 Mor 195 2o Mar 195T
тшё: 0630 1830
Sponsor: LASL
SITE: PPG - Bikini - Shot 1 Crater
11° 141’ 27" N
1650 16’ 23" E
Site elevation: Sea Level
TOTAL YIELD: 11 Mt
HEIGHT OF BURST: 7 ft
CLOUD TOP HEIGHT: 110,000 ft MSL
CLOUD BOTTOM HEIGHT: W,500 ft MSL
TYPE OF BURST AND PLACEMENT:
Surface ours I from Large on "water
Water depth: 240 ft
REMARKS:
The ind1vidua1 island dose rates were taken from aerial surveys Ly
the Radiological Safety organization and corrected to H+l hour "with
the t*1’2 decay approximation. The contamination due to previous
shots was subtracted.
71
BIKINI ATOLL
Figure 45 •
Operation CASTLE - Romeo.
Island dose rates in r/hr at H+l hour.
Cloud Diameter, 10 feet
Figure 46 r Cloud Dimensions: Operation CASTLE - Romeo.
73
ROMEO
TABLE 13 BECINl WIND DATA FOR OPERATION CASTLE-
Altitude (MSL) H-hour H+3 hours H+9 hours
Dir Speed Dir Speed Dir Speed
feet degree s mph degrees : mph degrees mph
Surface o4o 12 070 12 070 Обо 20
1,000 060 15 070 17 21
2,000 070 16 070 17 070 18
3,000 060 15 070 14 090 21
4,000 060 13 090 10 110 21
5,000 060 08 120 12 120 17
6,000 080 06 100 13 (140) (15)
7,000 160 07 160 14 150 15
8,000 170 09 140 об 170 12
9,000 — — 120 06 190 09
10,000 180 09 180 06 200 Об
12,000 150 12 140 12 150 08
14,000 100 12 100 13 110 17
15,000 (100) (15) (100) (17) (100) (18)
16,000 090 17 090 22 (090) (20)
18,000 100 20 100 22 100 30
20,000 100 23 120 29 (080) (17)
25,000 170 16 180 07 200 02
30,000 220 09 130 05 170 32
35,000 180 21 180 20 220 15
4o,ooo 200 41 190 15 290 08
1+5,000 300 06 250 10 200 17
50,000 140 17 150 10 150 20
55,000 270 17 200 12 170 05
56,000 — — «• - - IbO 07 — —
60,000 270 15 — - - 240 15
62,000 — — — - - 2б0 12
65,000 320 12 - - — —
67,0-00 080 25 — - - “ — “ —
NOTES:
1. Numbers in parentheses are estimated values.
2. Wind data was obtained on board the U. S. S. Curtins.
3- Tropopause height wan 55;000 ft MSL.
4. At H-hour the nea level pressure was 1012.4 mb, the temperature
80°F, the dew point 72°F and the relative humidity 77$>.
74
SCALE
75
OPERATION CASTLE
- Koon
PPG tine _______Gltf
DATE: 7 Apr 195T 6 Apr I90T
TIME: 0620 1820
Sponsor: UCRL
TOTAL YIELD: 110 kt
FIREBALL DATA:
Time to 1st minimum: 52.9 ± 2 msec
Time to 2nd maximum: DM
Radius at 2nd maximum: IM
SITS: PPG - Bikini - Tare
11° 29' ^8" N
165° 221 0.7" E
Site elevation: Sea level
1 Ml GUT OF BURST: 13.6 ft
CLOUD TOP HE1GUT: 53,000 ft MSL
CLOUD BOTTOM HEIGJIT: NM
CRATER DATA: Diameter: 800 ft
Depth: 75 ft
TYPE OF BURST AND PLACEMENT:
Surface burst from platform on
coral soil
REMARKS:
The on-site fallout pattern was constructed from survey readings made
by technical, project personnel and by the Radiological Safety organization,
plus conversion of activity measurements of fallout samples collected on
rafts and five-floating buoys anchored in the lagoon. The fallout
occurred ideally with respect to the measurement stations so that more
readings than usual were available. The dose-rate readings were
extrapolated to IH1 hour by using actual field decay rates.
76
Distance From GZ, Statute Mies
Figure 48 • Operation CASTLE - Koon.
On-site dose rate contours in r/hr at H+l hour.
77
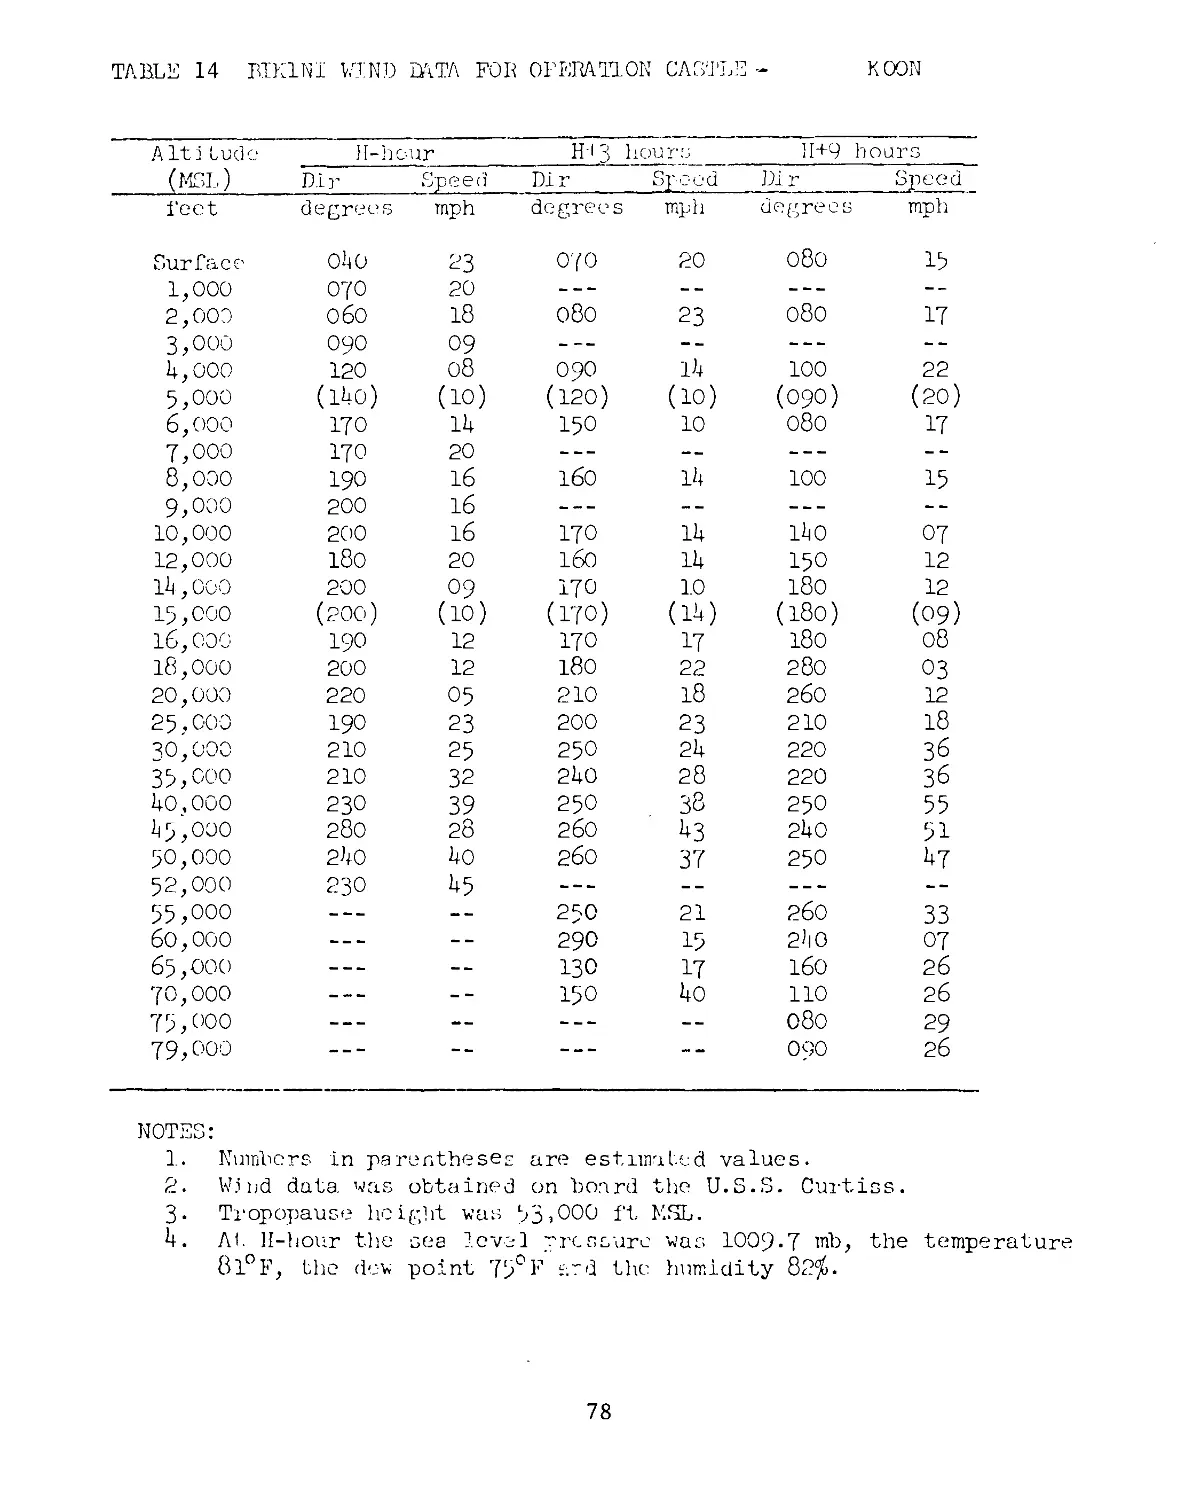
TABLE 14 BIKINI WIND DITA FOR OPERATION CASTLE - KOON
Alti Cudo H-hc sir H-I 3 hours 11+9 hours
(MSL) Dir Speed Dir •I"-- Dlr Speed
feet degrees mph degrees mph degrees mph
Surface 040 23 070 20 080 15
1,000 070 20 — “ “ — — —
2,000 060 18 080 23 080 17
3,000 090 09 — — — “• — —
4,000 120 08 090 14 100 22
5,000 (140) (10) (120) (10) (090) (20)
6,000 170 14 150 10 080 17
7,000 170 20 — — — — — — — — —
8,000 190 16 160 14 100 15
9,000 200 16 — “ — “
10,000 200 16 170 14 140 07
12,000 180 20 160 14 150 12
14,000 200 09 170 10 180 12
15,000 (200) (10) (170) (14) (180) (09)
16,000 190 12 170 17 180 08
18,000 200 12 180 22 280 03
20,000 220 05 210 18 260 12
25.000 190 23 200 23 210 18
30,000 210 25 250 24 220 36
35,coo 210 32 240 28 220 36
Ho,000 230 39 250 38 250 55
*15,000 280 28 2б0 43 240 51
50,000 240 40 2б0 37 250 47
52,000 230 45 — — — -- — — — — —
55,000 — — — - - 250 21 260 33
60,000 “ — “ 290 15 240 07
65,000 “ — — “ — 130 17 160 26
70,000 — — — 150 4o 110 26
75,000 — — “ — — — 080 29
79,000 — — — — — — — — 090 26
NOTES:
1. Numbers in parentheses are estimated values.
2. W.i ud data, was obtained on board the U.S.S. Curtiss.
3- Tropopause height was 53,000 ft MSL.
4. At. H-hour the sea level pressure was 1009-7 mb, the temperature
81°F, the dew point 75° F t.rd the humidity 82^.
78
81.5 7 7.5
72.5
67.5
Figure 49 . Hodographs for Operation CASTLE - Koon.
OPERATION CASTLE
Union
PPG time GMT
DATE: A’o Apr I9/1- i?5 Apr 19L>,l
TIM!:,': 0605 1809
TOTAL YIELD: 6.9 Mt
Sponsor: LASL
SITE: PPG - Bikini - near Dog &
Fox
11° 39’ 59" N
1650 23 ’ 1'i" E
Site elevation: Sea level
HEIGHT OF BURST: 7 ft
Water depth: 160 ft
CLOUD TOP HEIGHT: 9^,000 ft MSL
CLOUD BOTTOM HEIGHT: 51 />00 ft MSL
REMARKS:
The on-site fallout pattern was drawn from land survey readings made
by technical project personnel and by the Radiological Safety organization,
plus conversion of the activity to dose-rate readings of samples from
fallout collectors. The shot location and the winds localized the
radiation levels of military significance to the northeastern portion
of the atoll. Tne dose-rate readings were extrapolated to H+l hour
by using actual field-decay rates.
80
Distance FromGZ, Statute Miles
Figure 50 .
Operation CASTLE -
dose rate contour
Union. On-si be
in r/hr at H+l hour.
Cloud Height (MSL) And Stem Diemeter, IO Feet
Time , Minutes
Figure 51 • Cloud Dimensions: Operation CASTLE - Union.
Cloud Diameter, IO Feet
82
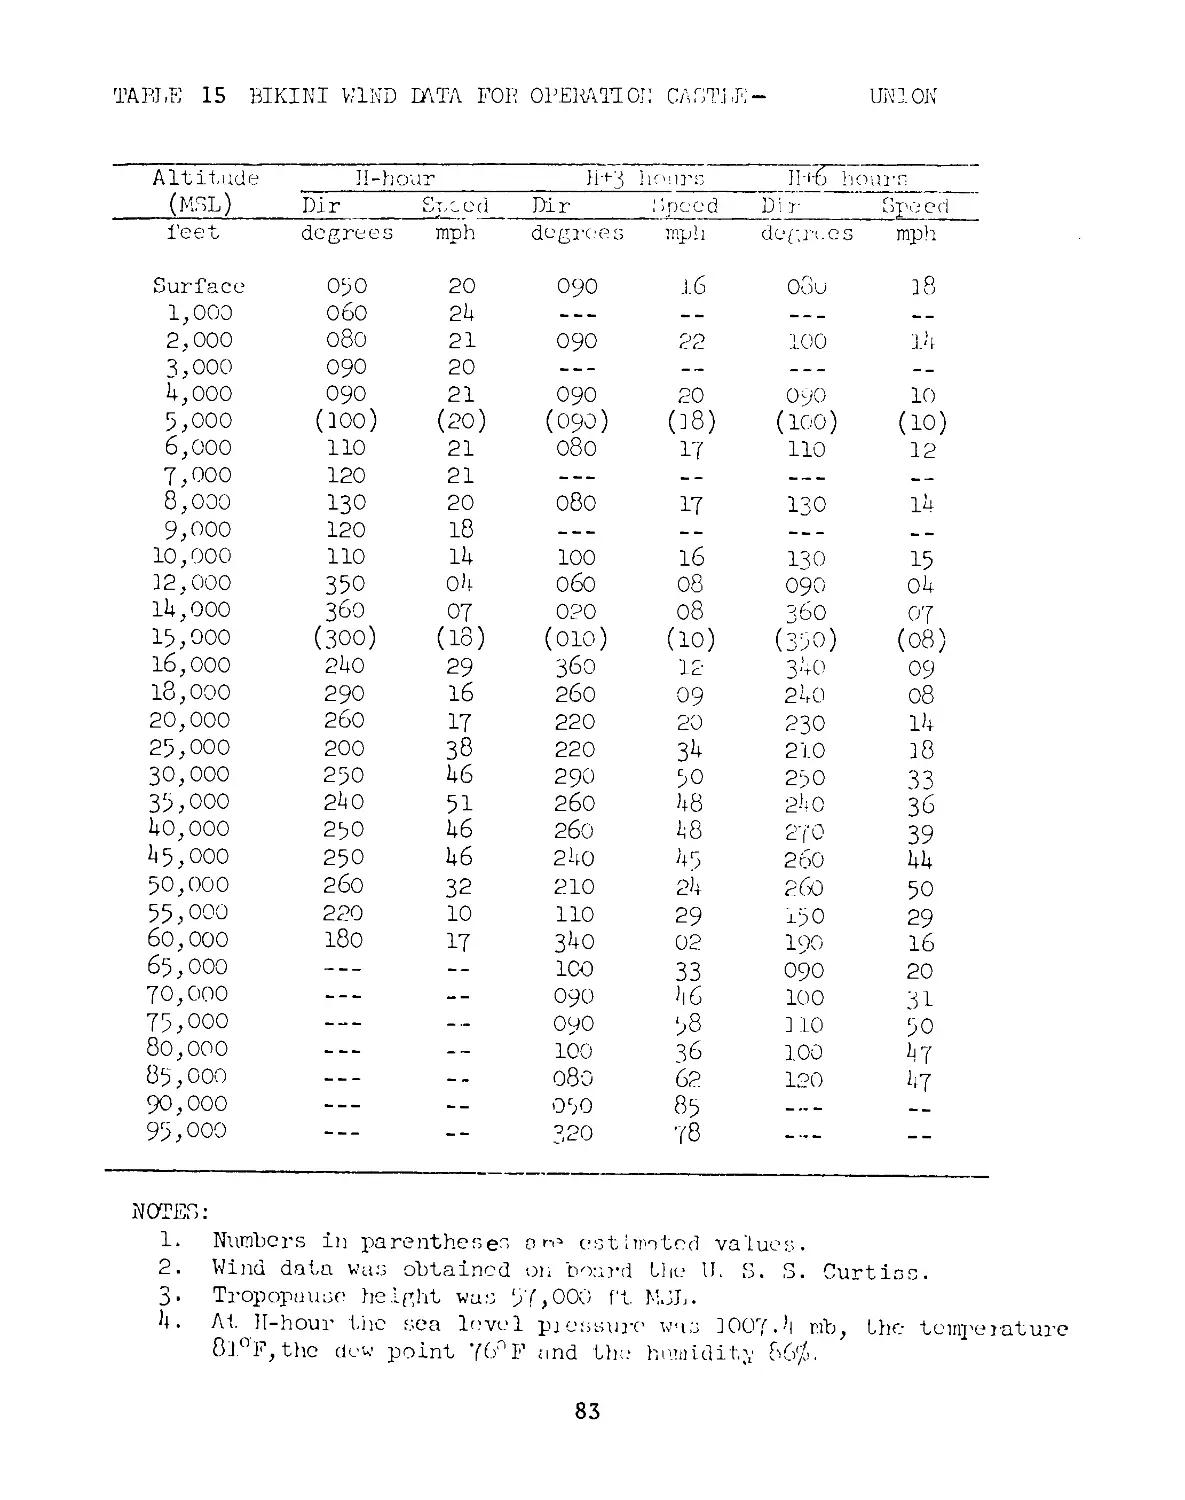
TABLE 15 BIKINI WIND DATA FOR OPERATION CASTLE —
UNION
Altitude H- hour H+3 hours n-i-6 hours
(MSL) Dir Speed Dir : ipecd Dir Speed
i'eet degree s mph degrees mph degree s mph
Surface 050 20 090 16 Oou 18
1,000 060 21 — — —
2,000 080 21 090 22 100 11
3,000 090 20 — — — — --
1,000 090 21 090 20 090 10
5,ooo (100) (20) (090) (38) (100) (10)
6,000 110 21 080 17 110 12
7,000 120 21 — — — —
8,000 130 20 080 17 130 11
9,000 120 18 — — “ — — — “
10,000 110 11 100 16 130 15
12,000 350 01 060 08 090 01
11,000 360 07 020 08 360 07
15,000 (300) (18) (010) (10) (350) (08)
16,000 210 29 360 12 310 09
18,000 290 16 260 09 210 08
20,000 260 17 220 20 230 11
25,000 200 38 220 31 210 18
30,000 250 16 290 50 250 33
35,000 210 51 2б0 18 210 36
Ho,000 250 16 2б0 18 270 39
15,000 250 16 210 A 5 260 11
50,000 260 32 210 21 2бО 50
55,000 220 10 110 29 ±50 29
60,000 180 17 3;+o 02 190 16
65,000 — -- ICO 33 090 20
70,000 — — — — — 090 16 100 31
75,000 — “ — ООО 58 ] 10 50
80,000 — — — — 100 36 100 17
85,000 — — — 080 62 120 17
90,000 — -- 050 85 — •- — “ —
95,000 — — 320 78 — —
NOTES:
1. Numbers in parentheses arp estimated values.
2. Wind data was obtained on board the U. S. S. Curtiss.
3. Tropopause height was 57,000 ft MSL.
1. At H-hour the sea level pxessure was J007-1 mb, the temperature
81°F, the dew point 76° F and the humidity 86'/>.
83
62.5
Rise rate; 5000 ft/hr
Figure 52. Hodographs for Operation CASTLE -
Uni on.
OPERATION CASTLE -
Yankee
PPG time GMT__________
BATE: 5 Мчу 19bJ+ W 19!A
TIME: 0610 1810
Sponsor:
TOTAL YIELD: 13.5 Mt
LASL
UTE: PPG - Bikini - near Dog
Fox 11° 391 76” N
167° 23’ 13” E
Site elevation: Sea level
HEIGHT OF BURST: 7 ft
TYPE OF BURST AND PLACEMENT:
CIjOUD TOP HEIGHT: 110,000 ft MSI.
CLOUD BOTTOM HEIGHT: 61,300 ft MSL
Surface burst from barge on water
REMARKS:
The individual island dose rates were computed from the D+l day
aerial-survey readings of the Radiological Safety organization. The
various readings were corrected to H+l hour,using the t“1,? re-
lationship, and extrapolated to 3 ft above the surface, using the air-to-
ground conversion factors determined later for the REDWING Flathead shot
102. The Fox, George, Nan, Oboe, Uncle and William readings were taken
at ground level. All other readings were obtained by aerial survey.
The off-site fallout pattern was documented for the first time by a
combined water-surface reading, aerial survey, and water-sampling operation.
The dose-rate readings were extrapolated to H+l hour by using actual
decay rates.
85
BIKINI ATOLL
00
cr
N
20
70 HOW-
UNCLE 0.2
1Э01ТЕМ
290Jie
SUGAR
240 KING
VICTOR 0.9
LCVE
190 MIKE
PETER
oboe 0.5
9 5 NAN
GEORGE
WILLIAM 0.5
TARE
ROGER
I ,, jajp».wa „,,, цАпьил ,~i
___________кЗЕ-Li'ji_
0 1 2 5 4 5
STATUTE MiLES
Figure 53 . Operation CASTLE - Yankee.
Island dose rates in r/hr at H+l hour
Distonce From GZ, Statute Miles
Figure 54. Operation CAiTI-F - Yankee.
Off-site dose rate contours in r/hr at H+l hour.
87
Cloud Height (M SL) And Stem Diameter, IO Feet
Figure 55. Cloud Dimensions: Operation CASTLE - Yankee.
Cloud Diameter, IO Feet
88
TAPLE 16 HEILT WIND DATA FOR OPERATION CASTLE ~
TALKEK
Altitude (MSL) JI-lion j’ Нн-ч hours H-i-6 hours II-I-9 hours
Dir 1 hued Dir Spew'd 1 и у Spar’d Dir £ Ipec.’d
feet degrees щрл degree: S Pip)) degrees mph degrees mph .
Surface 080 28 050 18 060 20 020 15
1,000 070 26 — — — —
2,000 080 29 070 29 090 26 080 22
3,000 080 28 — — — —
A, 000 080 26 07с p^j 110 30 090 23
5,000 (080) (25) (080) (2A) (110) (29) (090) (20)
6,000 070 23 090 23 110 29 090 18
7,000 070 21 — — —
8,000 070 13 ОАО 13 090 2A 110 12
9,000 ОАО 07 — __ — —
10,000 020 Об 320 02 080 17 1A0 10
12,000 010 Об 290 02 060 08 180 07
1А,000 з^о Об 350 09 110 03 210 05
15,000 (330) (10) (290) (08) (200) (06) (220) (об)
16,000 320 15 РАО 07 290 08 230 06
18,000 280 10 330 13 290 1A 2A0 12
20,000 290 16 2бо 10 280 12 260 10
25,000 230 2б 250 Ao 280 36 250 32
30,000 220 39 270 18 280 33 260 A 2
35,000 — — 2б0 16 280 31 270 66
0,000 — - — 2б0 29 2&0 29 260 57
A5,000 280 6А 280 A6 280 25 280 1A
50,000 250 51 — 270 62 170 30
55,000 200 53 — 260 33 1A0 37
60,000 — — -- - - - 1A0 A6
NOTES:
1. Numbers in parentheses are estimated values.
2. Wind d:O.a vac obtained on board the U. S. S. Curtiss.
3- Tropopause height was 55,000 ft MOL.
A. At П-hour the sea level pressure was 1018.8 mb, the temperature
8O.8°F, the dew point 75.0°F and the relative humidity 8A$>.
89
57.5
52.5
47.5
42.5
SCALE
О 20 40 60 80
miles
Rise rote: 5000ft/hr
47.5
32.5
27.5
42.5
37.5
2-5
(£>
12.5
22.5
17.5
12.5
7.5
H —Hour
H + 3
Орете
OPERATION castle
Nectar
PPG time GMT
DATE
TIME
.Vi May 195'5' 15 May 199)4
0620 1820
Sponsor: LASL
SITE: ITG - Eniwetok -
Ivy Mike Crater
11° йО1 ]2t" N
162° 11’ )+7" E
TOTAL YIELD:
1.69 Mt
Site elevation: Sea level
HEIGHT OF BURST: 7 ft
CLOUD TOP HEIGHT: 71,000 ft MSI,
CLOUD BOTTOM HEIGHT: 0,500 ft MSL
TYPE OF BURST AND PLACEMENT:
Surface burst from barge on water
REMARKS:
The on-site fallout pattern was_drawn from Radiological Safety
organization data and by converting the readings obtained from fall-
out samples to equivalent dose-rate i-eadings over land. Since the
fallout went in a northerly direction from ground zero very few of the?
collecting stations received significant fallout. The fallout col-
lected was primarily upwind fallout. Aerial survey was used for meas-
urements north of the atoll, and two tugs gathered water samples through-
out the fallout area. Analyses of the water samples, combined with an
estimate of the depth of mixing, served to determine the land-equivalent
exposure rate at a number of points. The aerial survey served to fill
in the contours.
91
Figure 57 .
Operation CASTLE - Nectar.
On-site dose rate contours in r/hr at H+l hour.
92
Distance From GZ, Statute Miles
93
Figure 59 . Cloud Dimensions: Operation CASTLE - Nectar.
94
NECTAR
TABLE 17 ENIWETOK WEND DATA FOR OPERATION CASTLE -
Altitude (№L) H-houi' H+3 hours H1-9 hours
Dir Speed Dir Speed Dir Speed
feet degrees mph degrees mph degrees ; mph
Surface 090 22 070 23 090 23
1,000 090 27 — —
2,000 100 20 110 27 100 20
3,000 110 22 — —
14,000 110 22 110 20 170 16
5,000 (no) (18) (100) (16) (150) (16)
6,000 110 16 100 17 160 17
7,000 100 17 — — —
8,000 100 12 120 13 160 16
9,000 110 13 — —
10,000 110 16 130 16 170 16
12,000 120 20 17 0 12 190 20
17,000 110 21 120 16 200 21
15,000 (120) (17) (120) (18) (200) (18)
16,000 130 17 120 28 200 11
18,000 170 17 200 08 190 17
20,000 130 09 150 21 190 15
25,000 190 07 210 06 Calm Calm
30,000 230 19 200 17 Ca 1 m Calm
35,000 210 10 210 29 180 16
70,000 210 29 210 31 180 10
75,000 230 37 270 27 Calm Calm
50,000 280 70 280 27 Calm Calm
55,000 290 77 ЗЮ 30 230 17
60,000 — -- — 270 18
NOTES:
1. Numbers in parentheses are estimated values.
2. Wind data was obtained by the weather station on
Eniwetok Island.
3- Tropopause height was 56,000 ft MSL.
7. At H-hour the sea level pressure was 1006.7 mb, the temperature
80°F, the dew point 75°F and the relative humidity 8^5%.
95
SCALE
I 1 I ill 1 1 I ! 1 L.l
0 20 40 60
miles
Rise ra te '• 5000 ft/hr
96
OPERATION WIGWAM
PDT GMT
DATE: TIME: 1A May 1955 1300 1Л May 1955 2000
TOTAL YIELD: 30 kt
Sponsor: DOD
SITE: Pacific Ocean HOO miles
Southwest of San Diego
28° M' N
126° 16' W
Site elevation: Sea level
HEIGHT OF BURST: 2000 ft under-
FIREBALL DATA:
Time to 1st minimum: NM
Time to 2nd maximum: NM
Radius at 2nd maximum: NM
water depth 16,000 ft
TYPE OF BURST AND PLACEMENT:
Subsurface burst - Device
suspended by cable from barge
SPRAY DOME HEIGHT:
FIRST PLUME HEIGHT:
880 ft MSL
1,1-150 ft MSL
EEMARKS:
"Trie contours given (for Н+1Л hour) were computed on the basis of
surface and subsurface water sampl.es and are reproduced here uncorrected.
They do not represent fallout activity deposited on the surface. The
activity was mixed throughout a surface zone whose depth remained roughly
constant for the first two days. This contaminated zone resulted from
debris thrown out locally during the surface events or from upwelling
of contaminated water from below. The downwind airborne radioactivity
varied with the base surge and yielded very little if any residual
fallout." At H+19 minutes the contaminated water area
was about 5-3 mi2. The area was contaminated in an irregular manner,
the peak intensities being approximately three times the average intensity
of 25 to 30 r/hr, 3 ft above the surface. The area circumscribed by a
50 mr/hr isointensity contour increased to 7.5 mi2 at НИЛ hr. At H+U.2
hr it had decreased to 3-5 mi2. Measurements of water samples indicated
a radioactive decay exponent
97
Distance From GZ, Statute Miles
Distance From GZ, Statute Miles
Figure 61. Operation WIGWAM. Off-site dose rate contours
in r/hr at hours.
98
Plume Height, Feet
Figure 62 . Plume Height Dimensions: Operation WIGWAM.
Plume Diameter, Feet
99
Figure 63 . Operation BEDWING
Shot Locations, Eniwetok Atoll
Figure 64. Operation BEDV1NG, Shot Locations, Bikini Atoll.
100
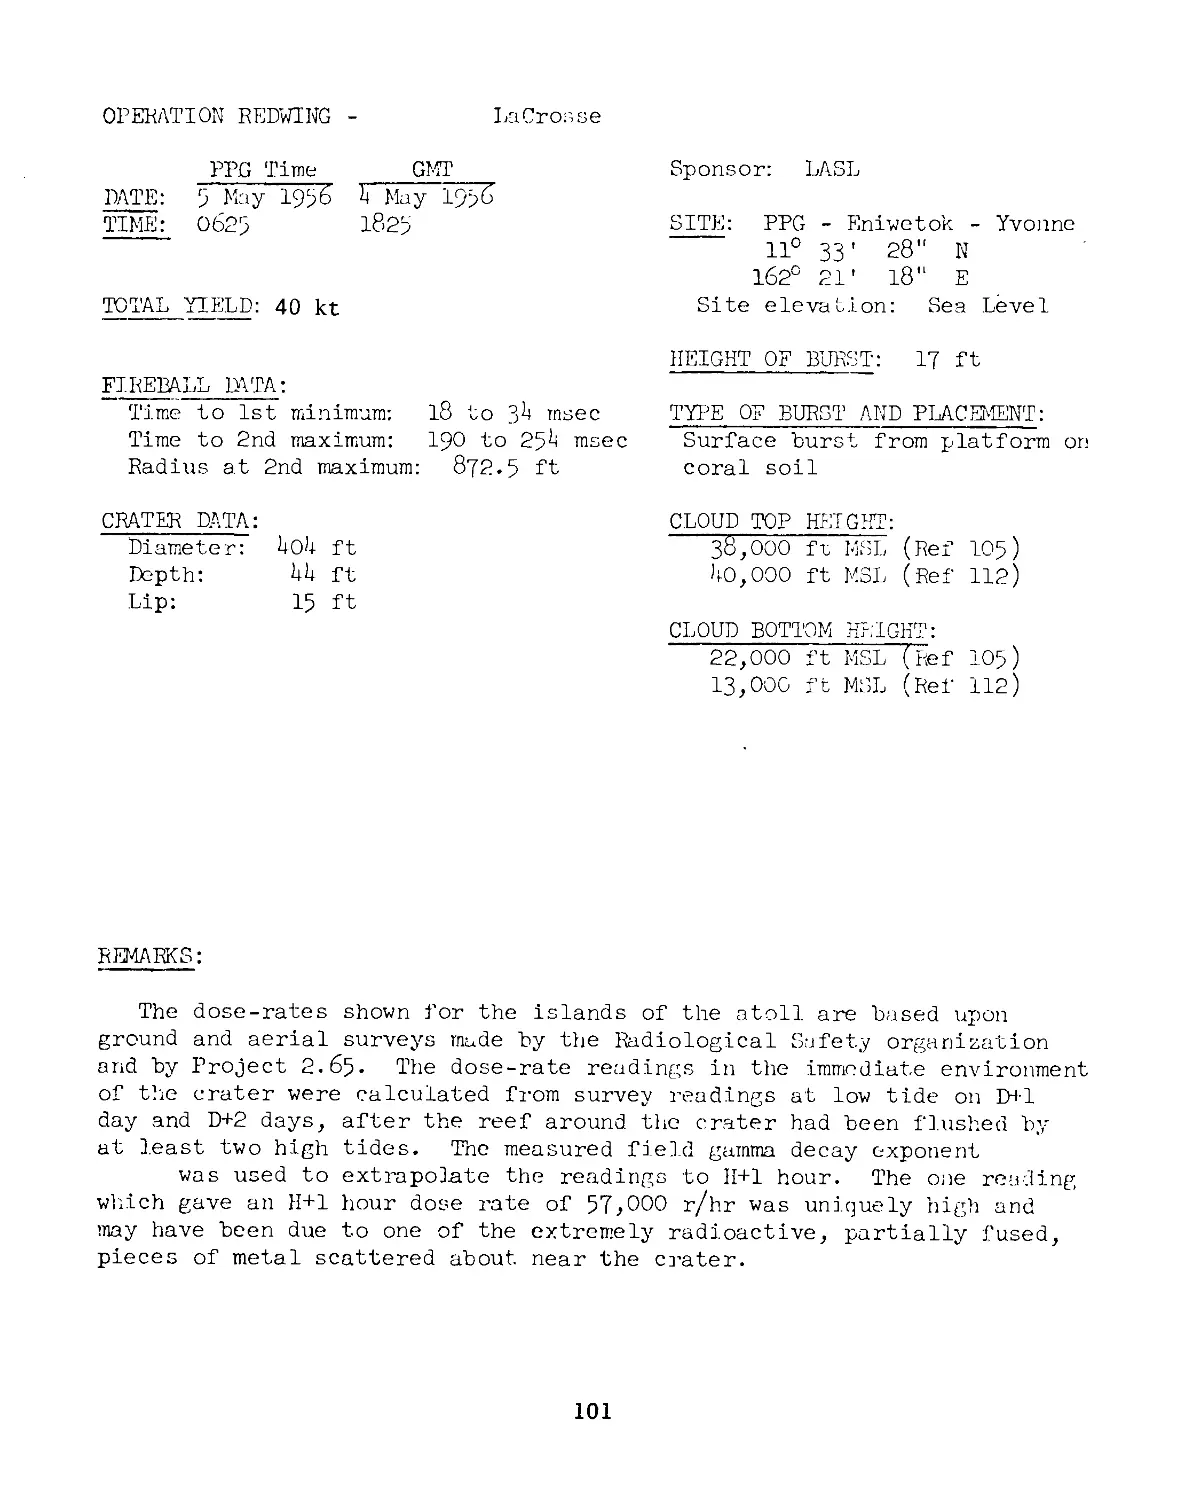
OPERATION REDWING
LaCrosse
PPG Time M
DATE: 5 May I956 8 May I956
TIME: 0625 182>
TOTAL YIELD: 40 kt
FIREBALL DATA:
Time to 1st minimum: 18 to 38 msec
Time to 2nd maximum: 19О to 25^ msec
Radius at 2nd maximum: 872.5 ft
Sponsor: LASL
SITE: PPG - Eniwetok - Yvonne
11° 33' 28" N
162° 21' 18" E
Site elevation: Sea Level
HEIGHT OF BURST: 17 ft
TYPE OF BURST AND PLACEMENT:
Surface burst from platform on
coral soil
CRATER DATA:
Diameter: U08 ft
Depth: 88 ft
Lip: 15 ft
CLOUD TOP HEIGHT:
38,000 fu MSL (Ref 105)
80,000 ft MSL (Ref 112)
CLOUD BOTTOM HEIGHT:
22,000 ft MSL (Ref 105)
13,000 ft MSL (Ref 112)
REMARKS:
The dose-rates shown for the islands of the atoll are based upon
ground and aerial surveys made by the Radiological Safety organization
and by Project 2.65. The dose-rate readings in the immediate environment
of the crater were calculated from survey readings at low tide on D+l
day and D+2 days, after the reef around the crater had been flushed by
at least two high tides. The measured field gamma decay exponent
was used to extrapolate the readings to H+l hour. The one reading
which gave an H+l hour dose rate of 57,000 r/hr was uniquely high and
may have been due to one of the extremely radioactive, partially fused,
pieces of metal scattered about near the crater.
101
GENE
HENRY GLENN
Figure 65 • Operation НЕСИ NG - Lacrosse.
Island dose rates in r/hr at H+l hour.
102
103
Figure 66 . Dose rate readings near the Lacrosse crater in r/hr at H+l hour.
Figure 67 . Cloud Dimensions: Operation BEDVCLNG - Lacrosse.
Diameter-curve 1 represents the diameter of the main
cloud; curve 2 refers to a portion of the cloud which
resulted from a shear at 8 minutes; curve 3 represents
the average diameter of two clouds which resulted from
a shear of the second cloud at 15 minutes.
104
LACHOOSE
TABLE 18 ENIWETOK WIND D\TA FOB OPERATION J-EDW1NG-
Altitude (MSL) li~l)Ol>r 1H2), hours h-h,; ]IOi Di r i- irs Т1+-ВЛ ho; .Л'Т,
Dlr 1 Speed Dir Speed lined Di r pood
feet degree s mph degrees mph degrees m.ph degrees mph
Surface 070 17 090 15 090 11 090 11
1,000 100 28 090 23 090 18 080 18
2,000 210 28 110 21 090 21 090 22
3,000 110 28 110 2b 110 29 100 29
1,000 110 29 110 26 110 31 100 31
5,000 110 33 110 29 110 29 100 32
6,000 100 3^ 110 28 110 33 110 30
7,000 100 32 110 28 110 33 110 26
8,000 090 26 110 31 110 31 110 23
9,000 090 23 100 33 110 31 120 23
10,000 100. 23 100 33 110 26 120 22
12,000 100 13 100 22 100 17 120 20
11,000 110 06 090 07 050 02 120 09
15,000 (180) (06) (020) (07) (020) (02) (olo) (08)
16,000 250 05 320 07 350 03 320 07
18,000 230 05 2б0 07 270 05 250 05
20,000 210 15 250 17 270 17 210 09
25,000 2б0 28 2б0 31 2б0 30 2б0 32
30,000 210 13 250 17 210 51 250 17
35,000 260 60 260 55 2б0 60 2б0 69
10,000 260 69 250 71 2б0 68 2б0 73
15,000 210 58 250 71 260 71 2б0 75
50,000 210 70 210 71 250 69 210 61
55,000 280 33 250 11 270 32 290 36
60,000 130 09 150 08 180 06 190 13
65,000 130 15 210 05 170 07 110 07
70,000 080 12 090 Об 090 13 080 12
75,000 110 32 090 25 110 38 090 37
80,000 090 18 110 17 110 51 100 19
85,000 100 61 090 61 090 62 090 56
90,000 100 72 110 69 100 71 100 61
91,000 100 65 - — --- -- *•••• --
95,000 --- -- 100 61 100 57 100 62
98,000 --- -- « ж « -- --- -- 100 63
100,000 --- -- 100 65 100 63 --- —
102,000 — — — -- --- — - 100 63 •— — --
105,000 — — — — — 100 67 --- -- — — —
106,000 — — — -- 100 67 --- -- — —— --
NOTES:
1. Numbers in parentheses are estimated values.
2. Tropopause height was 52,300 ft MSL. (Bei'erence 119).
3. Wind data was obtained by the weather station on Eniwetok Island.
1. At the surface the air pressure was 11.62 psi, the temperature 27-2°C,
the dew point 25.0°C, and the relative humidity 81/6.
105
52,5
P1Sure 68 .
MILE#
,000 FrZM,
~ Гаг й—«о„ вдвиго _
Hod
Lacrosse.
106
OPERATION REDWING
Cherokee
PPG time GMT_
IATE: El 1-lay 1936 20 May 19%
TIME: 0551 1751
Sponsor; LASL
SITE; PPG - Bikini - 16,000 ft NE
of Charlie
11° 10’ Об" N
161° 23' 39" E
Site elevation: Sea level
HEIGHT OF BURST: 1,350 ± 150 ft
TYPE OF BURST AND PLACEMENT:
Air burst over water
CLOUD TOP HEIGHT: 91,000 ft'MSL
CLOUD BOTTOM HEIGHT: 11,000 ft MSL
REMARKS:
No fallout was observed on the islands. Very light, fallout was
observed North of GZ. Gamma dose-rate readings on Charlie were at
background levels.
107
Figure 69 . Cloud Dimensions: Operation REDWING -
Cherokee.
108
TABLE 19 BIKINI WIND №TA FOR OPERATION REDWING -
CHEROKEE
Altitude (MSL) H-hour Ин-3 hours H+6 hours
Dir Speed Dir Speed Dir Speed
feet degree: s mph degrees mph degree; 3 mph
Surface 090 06 120 18 120 17
1,000 100 20 090 18 090 22
2,000 090 23 100 18 100 25
3,000 090 23 110 23 100 26
4,000 090 24 110 24 100 26
5,000 090 21 110 22 100 22
6,000 090 16 110 17 090 21
7,000 090 16 110 17 090 23
8,000 090 15 100 18 090 22
9,000 100 13 100 15 090 17
10,000 120 13 090 18 120 13
12,000 120 14 110 17 120 16
i4,ooo 140 16 130 18 110 15
15,000 (140) (16) (140) (17) (130) (15)
16,000 14o 17 150 17 150 15
18,000 130 17 160 16 170 23
20,000 14o 21 170 15 150 15
25,000 150 10 090 20 160 20
30,000 14o 07 150 14 150 10
35,000 260 07 220 12 220 09
4o,ooo 230 17 250 23 230 25
45,000 240 18 250 37 250 38
50,000 250 37 250 39 240 25
55,000 210 01 180 07 230 14
60,000 100 20 100 12 150 09
65,000 030 23 090 30 090 23
70,000 100 25 090 4o 090 31
75,000 090 55 090 ^5 080 53
78,000 — — — -- --- -- 080 60
80,000 090 58 090 53 --- --
85,000 080 63 090 35 --- --
87,000 --- -- 090 39 --
90,000 080 70 -- --
95,000 090 85 --- -- --- --
100,000 090 93 --- -- — — — --
NOTES;
1. Nmbers in parentheses are estimated values.
2. Tropopause height was 52,500 ft MSL.
3. Wind data was obtained on board the U. S. S. Curtiss.
4. At H-hour the sea level pressure was 1009.0 mb, the temperature
81°F, the dew point 73°F, and the relative humidity 76'/».
109
0102.5
097.5
H-Hour
H + 3
Figure 70 . Hodographs for Operation REDWING
Cherokee.
110
OPERATION REDWING
Zuni
RPG T1 mc__ __________GMT________
M’E: 28 May ‘19>6 2? May 19>6
TIME: 0956 1756
TOTAL YIELD: 3.5 mt
Sponsor:
UCRL
SITE: PPG - Bikini - Tare
11° 291 ¥3” N
163° 22' 09" E
Site elevation: Sea Level
FIREBALL DATA:
HEIGHT OF Bi ГРЕТ: Q It
Tims to 1st minimum:
16o ± 181; msec
Timo to 2nd maximum: 1-705 ± 2.15
Radius at 2nd maximum: 5,2U8 ft
CRATER DATA:
Diameter: 2,310 ft
Depth: 103 ft
Lip: No apparent lip
sec
TYPE OF BURST AND TLAGRIENT:
Surface burst from pls-.tform
on coral soil and over water
CLOUD TOP HEIGHT: 79,000 ft MSL
CLOUD BOTTOM flEIGJiJ1: 19,000 ft MSL
REMARKS:
The on-site fallout pattern was drawn from island readings taken by
scientific project 2.65 supplemented by fallout sample collection on
rafts and barges in the lagoon. The measured field decay exponent
was used to extrapolate the dose-rate readings to iHl hour. It
was observed that Line water adjacent to the benches of the northern
Islands of the atoJ.l was generally much more highly contaminated than
the islands.
The off-site fallout pattern was drawn from oceanographic surveys.
The oceanographic surveys used detector probes foi- measuring the dose-
rale at the surface, plus the allied equipment necessary for measuring
the dose-rate at depths to and below the thermocline (water-sampling
equipment for the taking of surface samples and for the collection of
samples from any desired depth). The dose-rale readings were extrapolated
to IH'l hour !;> using the decay measurements of the samples collected.
The portion of fallout that penetrated below the thermos line is unknown.
Rather than atteir.pt, to estimate the percentage, the results for the
dose rates assume no penetration beyond the depth O' mixing.
Ill
Distance frorn GZ, Statute Miles
Figure 71
Zuni.
On-site dose rate contours
Operation REDWING -
in r/hr at H-rl hour
Dislance from GZ, Statute Miles
Distance from GZ, Statute Miles
Figure 72 ♦ Operation REDWING - Zuni. Off-site
dose rate contours in r/hr at II+l hour.
113
Cloud Height(MSL) and Diameter,
Zuni.
Figure
73. Cloud Dimensions: Operation REDWING -
114
TAELE 20 BIKIHj WIND IATA FOR Ol-TL'ATiON REDWJ HG - ZUNI
H-l hour:
Ц1-3 hour
Altitude
(msl) Dir .Sp'.'ud Dir Spend Dll' Speed Dir Spnud
feet degrees mph degrees mph degrees mph degrees mph
Surface 070 22 050 22 Обо 30 090 21
1,000 090 26 080 26 060 26 070 28
2,000 090 21 070 25 060 2o 080 35
3,000 090 21 070 28 070 30 090 31
1,000 090 25 090 28 070 31 100 30
5,000 080 26 090 21 090 29 100 28
6,000 080 23 100 22 090 29 100 30
7,000 090 23 100 22 100 23 100 31
8,000 080 21 100 22 . 120 23 090 29
9,000 090 21 100 22 110 21 100 30
10,000 090 21 100 23 100 22 100 30
12,000 100 22 090 21 090 17 090 26
11,000 080 17 090 17 080 16 090 21
15,000 — — *— •— •— (100) (15) (080) (15) (090) (21)
16,000 110 15 110 12 070 11 090 25
18,000 110 17 100 12 090 13 090 17
20,000 110 11 110 12 110 10 090 17
25,ООО 170 18 160 18 170 20 260 02
30,000 210 26 170 11 160 18 180 13
35,000 250 36 220 29 200 35 230 35
10,000 260 31 220 16 210 50 2б0 50
15,000 230 51 210 10 220 13 230 61
50,000 210 37 210 29 250 31 210 32
51,000 — 250 29 — — — — — —
55,000 220 26 210 3 250 21 210 20
60,000 Обо 18 080 17 090 16 080 22
65?ООО 090 28 090 30 090 31 090 32
70,000 090 32 090 30 090 37 090 30
75,000 080 11 090 10 090 38 090 35
77,000 ~ ~ ~ ~ ~ ~ ~ ~ - - — — 100 1]
80,000 100 17 100 18 100 18 - — —
85,000 090 51 100 18 100 16 — —
86,000 — — — 100 13 — — — —
90,000 090 52 100 18 — -- — - -
NOTES:
1. Numbers in parenthes es are estimated values.
2. Tropopause height wa s 51,200 ft MSL.
3. Wind data was obtain ed on board the U. S. S. Curt is 5 •
1. H-hour data for alti tudes. over 51,000 ft were determined by inter-
polating from ra'asur •ements taken between H-l and IH •3 hours.
5. At II- hour the sea le vel press ;ure was 1010.5 mb, the tempo ratio 'C
81° F, the dew poi nt 76°!^ and the re la Live humidity 80$.
115
TABLE 2 0 WIND DATA DOR OPERATION REDWING -
ZUNI. (CONTD)
Altitude (MSL) PI к i ni Rougerik
И+9 hours 11+15 hours 11+21 hours
Di г Speed Dir Speed Dir ; Opeed
feet degrees mph degree: s mph degrees mph
.Surface 080 24 090 23 070 15
1,000 090 28 080 2)| 080 24
2,000 100 31 080 23 080 24
3 л ooo 100 31 090 20 080 21
4,000 100 28 090 18 080 16
5,000 100 29 090 18 080 13
6,000 100 25 090 20 090 12
7,000 100 26 100 21 090 12
8,000 100 31 100 21 090 14
9,000 090 30 090 21 090 14
10,000 090 26 100 21 090 12
12,000 100 25 100 22 090 14
14,000 080 31 090 21 100 12
15,000 (080) (26) (090) (18) (100) (14)
16,000 070 22 090 17 090 18
18,000 090 18 100 24 090 24
20,000 070 24 090 23 080 21
25,000 050 25 070 20 060 23
30,000 230 21 200 13 020 26
35л000 230 31 200 13 220 15
ко,000 210 46 210 26 230 2i
45 лООО 220 )<7 220 38 230 28
50,000 250 31 230 32 ЗЮ 25
53 лООО — — 2ij0 31 — * —
55лООО 290 16 — — — — 010 07
60,000 110 23 — — 150 14
б5лООО 090 26 — — — — 090 24
70,000 090 31 — - — 080 23
75лООО 090 37 — — 090 40
80,000 090 16 — — 080 47
85,000 090 44 — — 090 52
90,000 090 56 — — 080 56
95,000 100 65 — — 080 69
96,000 100 65 — — — —
99,000 — — — *. — 080 81
NOTES;
1. Numbers in parentheses are estimated values.
2. Wind data for H+9 hours and 11+15 hours were obtained on
board the U. S. S. Curtiss. Wind data for H-i-Pl hovjr, was
obtained by weather station uii Eniwetok Island (Roi.gcrik Atoll).
116
TABLE 20 RONGERIK WIND IATA FOR OPERATION REDWING -
ZUNI (Contd)
Altitude (MSL) IM-27 hours il+33 hours }H'39 hours
D.i r Speed Dir Speed Di?- Speed
feet degree s mph degree s mph degrees ; mp) 1
Surface 090 18 090 10 070 18
1,000 080 21 080 16 070 23
2,000 080 22 070 17 070 25
3,000 080 21 070 16 070 29
U,000 080 18 080 13 070 22
5,000 080 16 100 09 070 12
6,000 070 1U 090 06 080 07
7,000 080 13 080 06 080 07
8,000 090 13 090 08 070 07
9,000 090 13 090 10 080 07
10,000 090 13 080 13 080 10
12,000 080 12 060 13 090 12
1U,OOO 110 08 060 13 060 19
15,000 (090) (13) (080) (12) (обо) (15.)
16,000 070 17 090 10 обо 17
18,000 090 17 090 12 OUo 16
20,000 070 15 080 07 030 12
25,000 060 22 080 22 090 17
30,000 050 29 070 22 050 13
35,000 330 08 330 17 310 18
i+0,000 190 10 200 16 180 21
i+5,000 230 10 190 Об 290 09
50,000 230 1U 320 17 270 08
55,000 180 1U 200 09 220 17
60,000 110 16 ЗбО 05 080 17
65,000 090 22 100 15 090 23
70,000 080 29 0)10 08 080 26
75,000 100 38 100 32 080 38
80,000 090 36 090 hl 080 J47
85,000 090 55 090 56 100 57
90,000 090 60 090 61 090 67
92,000 — — — — — — 080 75
95,000 0'90 7^ 090 69 — —
100,000 090 81 090 81 — —
105,000 090 09 080 89 — —
110,000 090 69 080 102 — - ~
11Л,000 090 69 080 102 — --
NOTES:
1. Numbers in parentheses are estimated values.
2. Wind data was obtained by the weather station on Eniwetok
Island (Rongerik Atoll).
117
92.5
Figure 74
S
Hodograp'iis for Operation REDWING -
Zuni
118
SCALE
Lli-lLlllLi i 1111111 i.i I
0 20 40 60 80 100
MILES
RISE RATE 5000 FT/HR
Figure 75. Hodographs for Operation REDWING - Zuni.
119
OPERATION EEDM NG:
Yuma
PPG lime GMT
DATE: 28 May 19% 27 May 1986
TIME: G756 1956
Sponsor: UGRL
SITE: PPG - Eniwetok - Sally
11° 30' 33" N
162° 18' 55" E
Site elevation: Sea Level
HEIGHT OF BURST: - 205 ft
CLOUD TOP HEIGHT: 8,000 ft MSL
CLOUD BOTTOM HEIGHT: 1,000 ft MSL
TYPE OF BURST AND PLACEMENT:
Tower burst over coral soil
REMARKS:
Only island dose rate readings are available. These were taken
from the aerial and ground surveys made by the Radiological Safety
organization. The t-1,2 decay approximation was used to extrapolate
the dose rate readings to H+l hour. Significant amounts of alpha
(plutonium) contamination were found on the shot island.
120
GENE
HELEN
Figure 76 .
Operation REDWING - Yuma.
Island dose rates in r/hr at H+l hour.
121
TABLE 21 ENIWETOK WIND DATA FOR OPERA ITON REDWING -
YDMA
Altitude II-2 hour:; II hi our Ii+4 hours ’И-7 hours
(MSL) Dir Breed Dir Sneed Dlr Spc -d Dir Speed
feet degree ;s mph de.-rec:-. mph degrees mph degree :s mph
Surface 080 21 080 21 090 17 090 14
1,000 080 24 090 33 090 26 090 26
2,000 080 31 090 33 100 33 090 30
3,000 080 35 090 35 100 38 100 33
4,000 080 35 090 36 1.00 45 100 36
5,000 080 32 090 33 100 36 110 30
6,000 090 28 080 33 100 35 120 28
7,000 090 28 080 36 090 30 110 30
8,000 090 29 080 38 090 37 110 35
9,000 090 30 080 37 090 39 110 36
10,000 090 30 080 31 090 43 120 35
12,000 090 25 080 24 090 40 1.00 32
14,000 110 23 090 15 090 14 090 28
16,000 140 22 140 16 110 16 100 14
18,000 140 17 15О 14 120 18 120 15
20,000 180 05 100 12 100 14 100 12
25,000 170 26 160 21 180 12 270 08
30,000 2бО 21 190 22 160 21 220 23
35,000 230 35 220 35 190 41 220 47
40,000 220 5 5 210 44 200 55 200 52
45,000 — — — 230 51 240 35 230 40
50,000 — — — — 270 45 250 32 230 24
55,000 — ~ •— — 210 29 240 38 240 28
60,000 — — ~ — 060 14 ООО 10 100 15
65,000 — — c8o 37 100 39 100 32
70,000 — -- 110 38 100 38 100 31
75,000 — — 090 37 100 4o 090 37
80,000 — — 100 47 100 39 100 45
85,000 — — — -- 090 47 090 53 100 54
90,000 _ _ _ — 110 60 100 55 100 60
95,000 _ — _ — 100 68 090 67 100 71
98,000 — — — — — - - 100 85 — - -
100,000 — 100 89 — - ~ 100 68
102,000 — — 100 92 — — — “ --
1. Tropopause heicht was. 55,500 ft MSL.
2. Wind data was obtained by the weather station on Eniwetok Island.
3- H hour values were interpolated from data taken at H-2 hours and
JI+1 hour.
4. At the surface the air pressure was 14.64 psi, the temperature
27.5°0, the dew point 23.9°^ and the relative humidity 80$.
122
21
H-Hour Н4-4 Н+7
Figure 77. Hodographs for Operation REDWING -
Yuma.
123
OPERATION REDWING - . Erie
PPG Time GWP
RATE: 31 May 19% 30 М^У 19%
TIME: 0619 1819
Sponsor: LASL
SITE: PPG - Eniwetok - Yvonne
11° 32' 80" N
162° 21’ 52” E
Site elevation; Sea level
HEIGHT OF BURST: 300 ft
TOWER OF BURST AND PLACEMENT:
Tower burst over coral soil
CLOUD TOP HEIGHT: 32,000 ft MSL
CLOUD BOTTOM HEIGHT: 10,000 ft MSL
REMARKS:
Only island dose-rate readings are available. These were obtained
from aerial and ground surveys made by the Radiological Safety
organization at H+A hours. The t-1’s decay approximation was used
to extrapolate the dose-rate readings to H+l hour. Islands north of
Yvonne in the atoll were only slightly contaminated.
124
GENE
STATUTE MILES
Figure 78 .
Operation REDWING - Erie.
Island dose rates in r/hr at H+l hour.
125
TAELE 22 ENIWETOK WIL’D DATA FOR OPERATION RED',11 NG -
ERIE
Altitude (MSL) H-hour JJ-1-9 Jicurs 11+0 hours
Dir Speed Dir Speed Dir i 'Peecl
feet decree s mph decrees mph decrees mpi 1
Surface 100 16 1ЗО 16 090 12
1,000 100 28 100 20 090 23
2,000 100 28 100 21 090 23
3, ooo 100 23 100 22 090 2P
l+,000 100 21 100 22 090 20
5,000 090 20 100 18 090 16
6,000 090 16 100 12 100 17
7,000 080 10 110 07 100 16
8,000 100 08 110 06 100 16
9,000 100 17 090 07 110 16
10,000 080 05 090 08 120 11+
12,000 100 06 100 06 120 05
1^,000 090 09 090 07 120 09
15,000 (080) (10) (090) (09) (100) (07)
16,000 080 10 090 13 080 06
18,000 070 11+ 090 13 080 12
20,000 360 07 110 07 080 07
25,000 260 15 200 20 280 09
30,000 250 22 250 2h 230 17
35,ooo 2h0 270 28 21+0 30
ho,000 280 37 270 -'+1 280 38
)+5,ooo 280 36 270 70 2б0 38
50,000 2б0 38 250 1+1 $1+0 39
55,000 320 18 300 12 270 21+
60,000 080 12 090 13 11+0 07
65,000 090 26 080 27 080 21+
70,000 100 33 110 32 110 32
75,000 100 1+0 100 1+1+ 100 1+1+
80,000 100 72 090 68 120 62
85,000 090 79 090 98 120 72
90,000 090 71+ 110 83- 100 78
9h,000 090 77 — — — — —
95,000 — — — — 100 77 100 80
96,000 ------ _ — 1.00 78 — — — ~ —
100,000 — T — — — — — — 120 88
102,000 — ” — — -- 120 93
NOTES:
1. Numbers in parentheses are estimated values.
2. Tropopause height was >'+,100 ft MSL. (Reference 1J+9) •
3. Wind data was obtained by the weather station on Eniwetok Island.
1|. At H-hour the sea level pressure was 1009.1 mb, the temperature
80.3°F, the dew point 73-5°F, and the relative humidity 80.2$.
126
SCALE
L J.J-l 1 1 ! I 1.1 I 1
0 20 40 60
miles
Rise rate’- 5000 ft/hr
H-Hour H4-3 H+6
Figure 79 . Hodographs for Operation REDWING - Erie.
127
OPERATION REDWIN:
Seminole
ITG time GW Sponsor: LASL
D1TE: 6 June 1956 6 June 19>6 TIME: 1255 0055 SITE: PPG - Eniwetok - Irene 11° h0' 35" N 162° 13’ 02" E HEIGHT OF BURS?1: U-5 ft TYPE OF BURST AND PLACEMENT: Surface burst in water tank over coral soil CLOUD TOP HEIGHT: 16,000 ft MSL CLOUD BOTTOM HEIGHT: 9,000 ft MSL
REMARKS:
Only island dose-rate readings are available. These were obtained
from aerial and ground surveys made by the Radiological Safety
organization. The t"1'2 decay approximation was used to extrapolate
the dose-rate readings to H+l hour.
128
GENE
STATUTE MILES
Figure 80 .
Operation BEDWITTG - Seminole.
Island dose rates in r/hr at H+.1 hour.
129
TABLE 23 ENIWETOK WIND ШТЛ FOR OPERATION REDWING -
SEMINOLE
Altitude H-L hour 11-hou: г ILL hours ii-f-5 hour
(MSL) Dir Speed Dir Speed Dir Speed Dir Speed
feet degrees mph degrees mph degree s mph degrees mph
Surface 100 13 100 12 090 09 080 12
1,000 090 16 090 15 080 14 070 20
2,000 090 16 090 17 090 20 070 20
3,000 090 18 090 18 090 17 100 20
4,000 090 18 090 17 080 ]4 100 20
5,000 090 18 090 17 080 in 090 17
6,000 100 15 090 15 080 14 080 16
7,000 100 10 100 12 100 14 080 09
8,000 100 10 110 12 120 14 100 08
9,000 090 13 090 13 100 14 110 08
10,000 090 14 090 14 080 14 090 08
12,000 090 12 080 10 070 08 100 07
14,000 090 05 090 06 100 09 II4O 02
15,000 — — (100) (06) (100) (09) (Calm) (Calm
16,000 100 05 100 06 100 09 Calm Calm
18,000 110 02 110 03 110 05 Calm Calm
20,000 040 08 060 09 090 10 160 07
25,000 030 09 110 13 260 21 . 240 05
30,000 250 14 250 17 240 23 240 14
35,000 250 23 240 23 230 23 220 3-7
40,000 240 20 240 20 230 21 230 16
45,000 250 27 250 30 260 23 250 25
50,000 2б0 18 2б0 20 270 21 270 13
55,000 ЗбО 05 340 05 300 05 290 09
60,000 090 13 080 12 Обо 10 120 05
65,000 090 26 100 26 110 28 110 23
70,000 070 45 080 47 090 49 090 52
75,000 090 60 090 60 100 61 100 56
80,000 090 63 090 63 090 76 100 64
85,000 100 75 100 76 090 79 100 74
90,000 100 77 100 79 090 84 090 71
93,000 — — — — — — 090 84 090 71
95,000 100 81 100 80 . - - ~ — — — —
166,000 100 68 100 68 — — — — — —
1. Numbers in parentheses are estimated values.
2. Tropopause height was 52,200 ft MSL. (Reference 149).
3« Wind data was obtained by the weather station on Eniv/etok Island.
4. H-hour values were interpolated from data taken at H-l hour and
Hi-2 hours.
5- At the surface the air pressure was 14.64 psi, the temperature
30.5°0, the dew point 24.7°C and the relative humidity 7’1$.
130
47.5 52.5
miles
Rlep ris te : 5000 ft/hr
7.5 2.5
H+5
Figure 81 . Hodographs for Operation BEDWIKG -
Seminole.
131
OPERATION REDWING
Flathead
ITG Tj me
DATE: - 12 Jun 191 о
TIME: Об2б
_____GMT
11. Jun 1916
1.826
Sponsor; LASL
SITE: PPG - Bikini - 5^00° fl south
of Dog
1.1° 36’ 00" N
16;>° 2T' 05" E
Site elevation: Sea Level
HEIGHT OF BURST: 15 IT.
TYPE OF BURST AND PLACEMENT:
Surface Durst from barge on
water; center of gravity
approx. 15 ft above surface
of water; water depth 11U ft
CLOUD TOP HEIGHT-: 65,700 ft MSL
CLOUD BOTTOM HEIGHT: 38,600 it MSI
REMARKS:
The on-site fallout pattern was drawn from island readings taken
by scientific projects supplemented by fallout sample collection on
rafts and barges in the lagoon. Actual field decay measurements, which
indicated a decay exponent were used to extrapolate the
dose-rate readings to H+l hour.
The off-site fallout pattern was drawn from oceanographic surveys.
The oceanographic surveys used detector probes for measuring the dose-
rate at depths to and below the thermocline. Water-sampling equipment
was used for the taking of surface samples and for the collection of
samples from any desired depth. The dose-rate readings were extrapolated
to H+l hour by using the decay measurements of the samples collected.
Very little of the fallout should have been associated with solid
particles large enough to penetrate below the thermocline.
132
Distance From GZ, Statute Miles
Figure 82•
Operation REDWING - Flathead,
rate contours in r/hr at H+l hour.
On-site dose
133
Distance fromGZ, Statute Miles
Distance fromGZ, Stc lute Miles
Figure 83 . Operation REDWING - Flathead.
Off-site dose rate contours in r/hr at H+3. hour.
134
135
TABLE 24 BIKIWI VHND IATA FOR OPERATION RSDWIRG -
FLATHEAD
Altitude (MSL) H-2A Dir hours 11-how )'i-l;> hours Н-Зб hours Il+ri hours
Speed bir Speed Dr- Speed Dlr Spaed 1И r Sneed
ibet degrees ; mph degrees mph degrees mph degrees mph degrees mph
Surface 080 18 080 22 080 21 060 21 050 15 .
1,000 060 17 070 21 070 23 060 20 050 22
2,000 070 11 080 17 080 20 070 20 050 21
3,000 080 11 090 15 090 15 070 18 OoO 21
1,000 080 16 090 11 100 13 070 18 070 15
5,000 090 17 100 15 100 13 070 18 080 16
6,000 090 15 100 11 100 11 070 16 080 15
7,000 090 11 090 11 090 11 обо C'9 090 11
8,000 080 12 090 10 090 10 обо 08 090 09
9,000 080 10 090 09 100 08 090 07 060 06
10,000 090 09 100 08 100 07 050 06 050 05
12,000 090 08 090 07 090 05 090 08 100 Об
11,000 110 03 120 05 130 06 Calm Calm. Calm Calm
16,000 020 02 110 06 160 08 080 03 170 05
18,000 110 06 130 10 150 11 100 06 070 01
20,000 160 09 160 12 160 13 150 07 180 07
25,000 050 11 120 17 170 20 170 11 180 12
30,000 210 12 200 17 200 21 200 15 200 16
35,000 210 11 250 11 250 11 250 15 260 21
10,000 260 22 210 21 230 21 210 22 270 21
15,000 220 22 230 21 210 20 270 18 ЗЮ 18
50,000 300 15 310 15 ЗбО 15 330 11 030 15
55,000 070 11 090 17 100 20 070 21 100 20
60,000 090 28 090 28 —— 2.00 23 090 16
65,000 100 28 100 28 ...... —— 080 21 080 25
76,000 100 33 100 33 ...... — — 090 10 080 37
75,000 090 16 090 16 « ™ 080 16 080 57
80,000 ...... .... ...... «... ...... .... 080 63 090 61
85,000 e. — —— —— .... 090 61 080 68
90,000 ——— —— ...... —— 090 51 080 59
91,000 --- --- — — ——— -- — — 080 69
93,000 --- --- -- --- -- 090 56 » --
NOTES:
1. Tropopause height was 1(8,900 ft MSL at H-hour.
2. V/ind data was obtained on board the U. S. S. Curtiss.
3. H-hour values were interpolated from data taken at II-2p hours and
H+lp hours.
1. At H-hour the sea level pressure was 1012.9 mb, the temperature 82.0°F,
the dew point 76.0°F and the relative humidity 82.0^.
136
SCALE
Ll_l I 11 । : I । । IJ
0 20 40 60
mi!cs
Rise rate; 5000 ft/hr
47.5
H-Hour H4-l'/2
Figure 85 • Hodographs for Operation FEDWTiTG - Flathead.
137
OPERATION REEFING -
В l.ackf oot
РГС Time GMT
DATE: 12 June 19>U 11 June 19>6
TIME: Об2б 1826
Sponsor: LASL
SITE: PPG - Eniwetok - Yvonne
11° 33' 0)1" N
162° 21' 31" U
Site elevation: Sea level
HEIGHT OF BUR.; ::
200 ft
TYPE OF BURST AND PLACEMENT:
Tower burst over coral soil
CLOUD TOP HEIGHT: 25,000 ft MSL
CLOUD BOTTOM HEIGHT: 1L,OOO ft MSL
REMARKS;
Only island dose-rate readings are available. These were obtained
from aerial and ground surveys made by the Radiological Safety organi-
zation. The t-1*2 decay approximation was used to extrapolate the
dose-rate readings to H+l hour. Heavy contamination from this shot,
fired on central Yvonne, was limited primarily to the shot island.
However, the photo tower on Mack was highly contaminated from the
fa 11out.
138
CENE
HELEN
Figure 86 .
Operation REDWING
Blackfoot.
Island dose rates
in r/hr at Ii+1 hour.
139
TABLE 25 L’NIWE''C)K WZJ’TJU DATA FOR OPERATJ OR REDWING
BLACKFOOT
Alt!Lude (MSI.) JI-J hour J1-1 2 4 how:: JI-1-5.' 2m' >urs 11-1-8.4 hours
Dir Speed Dii‘ Speed Dir Speed Dir Speed
feet degrees mph degree s mpli degrees mph degree s mph
Surface 090 14 130 14 110 15 050 14
1,000 090 3 4 070 08 08C 2.8 080 18
2,000 090 15 080 16 080 16 070 17
3,000 100 24 090 15 090 16 080 14
4,000 100 18 100 15 090 16 080 12
5,000 100 15 2.00 14 090 13 080 13
6,000 100 13 090 15 100 12 080 12
7,000 100 12 090 14 100 12 080 12
8,000 100 12 090 13 100 13 100 13
9,000 090 09 090 12 100 13 100 13
10,000 070 09 090 07 090 10 100 14
12,000 080 09 090 07 100 09 100 08
14,000 090 08 110 10 100 09 100 09
15,000 (090) (09) (100) (10) (100) (08) (120) (06)
16,000 090 09 090 12 110 07 110 07
18,000 070 16 080 09 090 12 120 06
20,000 070 09 070 09 090 12 100 13
25,000 090 10 120 21 180 12 150 09
30,000 050 08 080 07 14 0 12 170 10
35,000 280 14 240 32 230 26 220 28
4o,ooo 240 35 240 28 240 23 230 23
45,000 240 23 250 17 030 09 290 23
50,000 310 22 010 13 090 16 020 12
52,000 — — — — — — — —
53,000 — — 030 20 — — 020 23
55,000 090 20 — - ~ 100 18 — — — —
60,000 120 26 — - - 100 20 — — — —
65,000 060 17 — - - 080 17 —
70,000 090 36 — — — - - 090 50 —
71,000 090 36 — — — — —
^5,000 — — — — — — — — 090 59 — — •• —
80,000 — — — — — — — — 090 59 •- — — —
82,000 — — — -- 090 61 — —
NOTES:
1. Numbers in parentheses are estimated values.
2. Tropopause height was ^2,^0G ft MSL.
3- Wind data was obtained by the weather station on Eniwetok Island.
4. At H-hour the sea level, pressure was 2.012.5 Bib, Rhe temperature
81.1°F, the dew point 75-8°F and the relative humidity 84.0$.
140
141
OPERATION REDWING
Kickapoo
PPG Time GMT
DATE: 14 June 19^6 13 June 1936
TIME: 1126 2326
Sponsor: UCRL
TIME
SITE: PPG - Eniwetok - Sally
11° 30' 38" N
162° 19' 11" E
Site elevation: Sea Level
HEIGHT 01' BURST: 300 ft
TYPE OF BURST AND PLACEMENT:
Tower burst over coral soil
CLOUD TOP HEIGHT: 16,ООО ft MSL
CLOUD BOTTOM HEIGHT: 11,000 ft MSL
REMARKS : Only island, dose-rate readings are available. These were
obtained from aerial and ground surveys made by the Radiological Safety
Organization. The t-1*3 decay approximation was used to extrapolate the
dose-rate readings to H+l hour. Heavy contamination was encountered only
on Sally, the shot island. Significant alpha (plutonium) contamination
was also found on the shot island.
142
GENE
'helen
Figure 88- Operation FEDWING -
Island dooe rates in r/hr at H+l hour.
Kickapoo.
143
TABLE 26 ENIWETOK WIND DATA FOR OPERATION REDWING
KICKAPOO
Altitude (MSL) ? 11-hour и+зЯ Dlr hours Speed Ji-i'9.,- Dir hours Speed
D.i r Speed
feet degrees 3 mph degree: s mph degree; 3 mph
Surface 080 12 050 12 080 12
1,000 090 12 090 12 090 14
2,000 090 14 090 14 090 14
3,000 090 17 090 17 100 14
4,000 090 16 100 15 090 13
5,000 100 14 100 13 090 10
6,000 120 12 120 12 070 08
7,000 100 07 120 12 080 07
8,000 080 Об 100 12 080 07
9,000 060 09 100 12 070 08
10,000 030 10 070 03 060 09
12,000 030 13 040 05 060 05
14,000 ОЗО 10 020 07 050 05
15,000 (030) (08) (020) (09) (050) (06)
16,000 020 06 020 13 o4o 07
18,000 020 12 020 09 o4o 12
20,000 070 12 050 07 020 14
25,000 030 10 o4o 15 030 23
30,000 ЗбО 09 350 17 010 15
35;000 350 12 350 18 o4o 15
4o,ooo 360 20 020 18 030 15
45,000 350 22 020 24 34c 23
50,000 340 24 250 26 350 29
55;000 060 26 050 32 060 30
60,000 080 24 090 16 070 25
65,000 100 31 110 37 100 39
70,000 090 46 090 51 090 51
75;000 090 77 100 61 100 56
80,000 100 74 100 69 090 65
81,000 — — — — — — -- 090 65
85,000 100 71 090 79 — — — --
90,000 090 83 090 80 — —
95;000 100 90 090 86 — — —
98,000 100 90 — -- — —
100,000 — ~ — -> _ 090 68 — — — —
102,000 — — 090 68 — — —
NOTES :
1. Numbers in parentheses are estimated, values.
2. Tropopause height was 53;100 ft MSL.
3. Wind data was obtained by weather station on Eniwetok Island.
4. At the surface the air pressure was 14.65 pci, the temperature
29.88c, the relative? humidity 71$>*
144
SCALE
0 10 20 30
H-Hcur H4-3’/2 H4-9’/2
Figure 89. Hodographs for Operation REDWING - Klckapoo
145
OPERATION REDWING
Ос age
PPG Tin.c GMT
DATE : 16 Jun 195 6 16 Jun 19%
TIME: 13% 01%
Sponsor: LASL
SITE: PPG - Eniwetok - Yvonne
11° 32' %" N
162° 21' 39" E
Site elevation: Sea Level
HEIGHT OF BURST: 6?0 ± 35 Ft
TYPE OF BURST AND PLACEMENT:
Air burst over coral soil
CLOUD TOP HEIGHT: 21,000 ft
CLOUD BOTTOM HEIGHT: 17,000 ft
MSL
MSL
REMARKS: No significant contamination was observed..
146
TABLE 27 ENIWETOK WIND DATA FOR OPERATION REDWING -
O3Ar4fI
Altitude (MSL) H-w h;rjr-3 H-hou. r Н+7т' i'juu; in 10h: uin;
])j V Speed Dir Speed. Dir Sneed Dir S peed
feet degrees nij-’ll degrees mph aegrc.es mph degrees 1 mph
Surface 150 14 150 14 160 16 180 15
1,000 130 16 130 16 — — — -- 160 12
2,000 130 18 110 17 — — 190 12
3,000 130 18 140 17 — — - -- I90 12
^,000 110 18 150 17 — — — 190 09
5,000 150 17 150 16 — — 190 10
6,000 160 16 160 16 — 19’0 13
7,000 170 14 170 14 — - — -- 1.90 13
8,000 180 09 180 09 — — 190 10
9,000 180 09 180 09 — — — -- 190 05
10,000 170 12 170 10 — 170 07
12,000 220 13 220 12 — 180 07
14,000 2 80 14 230 14 — *— — — 210 09
15,000 — *- - (220) (14) — —
16,000 210 15 210 13 — — — — 200 07
18,000 200 12 200 12 — -- 200 07
20,000 200 07 200 07 — — — 180 05
25,000 230 05 230 05 — — — -- 180 02
30,000 020 05 030 05 080 06 180 02
35,000 030 15 010 15 090 14 ЗбО 05
10,000 050 26 050 25 c4o 18 010 12
45,000 160 07 150 O9 050 30 - — —
50,000 110 14 120 14 230 12 —
55,000 110 07 140 07 120 07 —
60,000 110 07 130 12 090 1-0 —
NOTES:
1. Numbers in parentheses are estimated values.
Tropopause height was 51,500 ft MSL.
3. Wind data was obtained by the weather station on Eniwetok Island.
A. H-hour values above 30,000 ft were interpolated from data taken
at H-2p hours and H+l-y hours.
5. At the surface the air pressure was 14.63 psi, the temperature 29-9°C,
and the relative humidity 74$'
147
SCALE
H — Hour
Figure 90. Hodograph for Operation REDWING -
Osage
148
OPERATION REDWING
Inca
DATE :
TIME :
PPG Tj me
22 June 1990
09> 6
GMT
21 June 19%
2156
Sponsor: UCRL
SITE: PPG - Eniwetok - Pearl
11° 37' 93" N
162° 1?' 50" E
Site elevation: Sea Level
HEIGHT OP BURST: 200 ft
TYPE OP BURST AND PLACEMENT:
Tower burst over coral soil
CLOUD TOP HEIGHT: U2,000 ft MSL
CLOUD BOTTOM HEIGHT: 30,000 ft MSL
REMARKS : Only island, dose-rate readings are available. These -were
obtained from aerial and ground surveys made by the Radiological Safety
Organization. The t 1' “ decay approximation was used to extrapolate
the dose rate readings to H+l hour. Heavy contamination resulted only
on the shot island.
149
Figure 91. Operation REDWING -
Island, dose rates in r/hr at H+l hour.
Inca.
150
TABLE 28 ENIWETOK WIND DATA. FOR OPERATION REDWING-—
INCA
Altitude (MSL) H-l hour H-hour in 2 hours JU 5 hours И+8 hour s
Dir Speed Dir Speed Di r Speed D ir Speed Dir Speed
feet degree : s mph degrees mph degree ? s mph degree г; mph degree s mph
Surface 150 12 140 14 110 18 090 12 090 18
1,000 100 20 100 20 090 21 080 21 080 16
2,000 100 22 100 23 090 2 if- 090 23 080 20
3, ooo 110 26 100 26 O9O 28 100 29 080 26
4,000 110 29 100 29 090 28 100 29 080 26
5,000 110 29 100 29 090 29 100 29 080 23
6,000 110 29 110 29 100 30 100 28 090 20
7,000 100 29 100 29 100 30 100 24 090 17
8,000 100 29 100 30 100 31 100 24 110 23
9,000 090 29 090 29 100 29 100 24 110 24
10,000 090 29 090 28 100 2 if- 100 24 100 24
12,000 090 29 090 28 100 2 if- 090 20 090 21
14,000 100 29 100 26 100 23 090 22 100 23
15,000 (100) (28) (100) (26) (100) (23) (100) (21) (100) (22)
16,000 100 28 100 26 100 23 100 21 100 22
18,000 080 24 080 2 if- 090 23 110 20 O9O 22
20,000 080 22 080 23 090 26 100 22 090 20
25,000 010 25 020 22 C'ifO 16 010 13 o4o 09
30,000 240 18 220 16 170 12 180 14 150 13
35,000 210 25 200 23 170 17 170 14 210 10
40,000 210 30 210 29 200 26 270 17 260 30
45,000 230 36 240 36 260 35 270 31 300 26
50,000 — — — 300 23 320 2 if- 020 17 100 13
55,000 — — — -- 350 22 330 21 110 21 no 14
60,000 — — ~ ~ — - - — - - 100 25 090 24
65,000 — — — — — — 100 29 080 24
70,000 — — — — — — — — 090 49 100 54“
75,000 — — — — — — 100 53 100 42
80,000 — — — — — — — — 110 49 100 ^3
85,000 — — — — — 100 5^ 090 56
90,000 — — — — — — — -- — 09c 83 090 74
95,000 - - — — — — 090 97 090 44
97,000 ~ ~ — — — — — — — — — ~ — — 100 ^3
100,000 — -- — -- — -- 100 85 — —
NOTES:
1. Numbers in parentheses are estimated, values.
2. Tropopause height was 5^,^00 ft MSL at H+5 hours.
3. Wind data was obtained by the weather station on Eniwetok Island.
if-. H-hour values were interpolated from data taken at II-1 hour and H+2 hours.
5- At the surface the air pressure was 14.63 psi, the temperature 28.6° C and
the relative humidity 81$.
151
SCALE
11 I i 1 LLiJ
0 20 40
miles
Rise rate : 5000 ft/hr
152
Figure 92. Hodographs for Operation REDWING -
Inca
OPERATION REDVi'l NO -
PPG Timo
DATE: kG June’] 95G
tip ip 0606
GMT_____
25 Jn.no IQLG
18o6
Sponsor: IASI.
SITE: PPC - Bikini - 5,000 ft
Site south of Dey- 11е 38' 10" N 165° 27’ 05” E elevation: Sou level
HEIGiH.1
OF F’.IPST:
Surface
HET GIFT 0Г' B’.ffiST AND PJ A CEMENT:
Surface Durst from Large on water
CLOUD TOP HEIGHT:
75,000 8t M3.L
CLOUD BOTTOM IGjLGlFf: 75,000 ft MSL
REMARKS:
Only island dose-rate readings are available. They were obtained from
aerial and ground surveys made by the Radiological Safety Organization.
The t -1'2 decay approximation was used to extrapolate the dose rate
readings to H+l hour. This shot produced less contamination on the
islands than expected. However, the water adjacent to the northern
islands was heavily contaminated.
153
154
Figure 93. Operation. REDWING -
BIKINI ATOLL
Figui-e 94. Cloud. Dimensions: Operation REDWING -
Dakota
155
TABLE 29 BIKINI WIND DATA FOR OPERATION REDWING-
DAKOTA
Altitude (MSL) feet H-4 hrs H-l hr В hr 1H-3 hrs 11-16 hrs
Dir deg Speed mph Dir deg Speed mph Dir deg Speed Dir Speed Dir i Speed
mph deg mph deg mp>h
Surface 070 17 080 21 090 17 080 15 090 18
1,000 070 17 080 21 _ _ _ — 070 18 090 17
2,000 060 13 080 18 — — 080 21 100 21
3,000 080 17 030 17 no 21 090 23 100 25
4,000 080 16 070 17 no 17 100 22 090 26
5,000 120 15 070 17 100 15 100 17 090 22
6,000 120 18 090 15 100 16 no 13 080 17
7,000 110 18 080 13 100 14 no 15 100 16
8,000 120 15 100 17 120 16 no 17 ; no 18
9,000 130 13 110 18 120 16 100 18 ' 100 20
10,000 130 14 100 14 120 16 100 17 100 16
12,000 14,000 120 12 no 15 no 15 120 10 090 16
обо 06 100 13 130 15 080 12 080 10
16,000 ЗЮ 05 080 07 160 09 090 07 100 07
18,000 190 06 210 10 190 09 240 07 210 05
20,000 250 08 210 07 210 14 200 09 210 09
25,000 270 08 240 25 230 18 250 17 250 23
30,000 230 14 240 33 240 25 260 27 2бО 26
35,000 250 25 250 32 240 51 240 45 230 48
4o,ooo 250 41 24O 45 250 51 240 54 230 54
45,000 250 58 250 35 250 57 260 60 260 1<8
50,000 270 35 250 54 280 35 270 53 250 22
55,000 080 09 — — 090 08 — — — —, 130 10
60,000 100 22 — 100 16 —• —• —• - - 080 28
65,000 080 33 — — — — 080 39 _ _ _ — 090 28
70,000 100 45 — — 080 39 _ _ _ — 090 40
75,000 080 58 — — 080 62 _ _ _ — 100 58
80,000 090 63 — — 100 74 — — — 090 71
85,ooo 090 81 — -- 090 85 — — — — 090 87
90,000 100 89 — -- — — — -- — — — — — 090 77
NOTES:
1. Tropopause height was 54,200 ft MSL at H+9 hours.
2. Wind data was obtained on board the U.S.S. Curtiss.
3- At H-hour the sea level pressure was 1009-1 mb, the temperature
82.0°F, the dew point 75-O°F and the relative humidity 80.0$>.
156
092.5
157
Q86.5
SCALE
IЧ1 I I I I I i 11 I I I i I i I 11
0 20 40 eo 80 100
miles
Rise rate • 5000 ft/hr
0 87.5
082.5
Figure 95. Hodographs for Operation REDW1NG -
Dakota
OPERATION REDWING -
Mohawk
PPG T:i me G№
DATE: 3 Jul 2 Jul 1956
TIME: 0606 18o6
Sponsor: UCRL
SITE; PPG - Eniwetok - Ruby
11° 30' 38" N
162° 18' 39” E
Site elevation: Sea level
HEIGHT OF BURST: 300 ft
TYPE OF BURST AND PLACEMENT :
Tower burst over coral soil
CLOUD TOP HEIGHT:
CLOUD BOTTOM HEIGHT:
65,000 ft MSL
42,000 ft MSL
REMARKS: The dose-rate readings on the islands of the a.toll were
taken by aerial and ground surveys of scientific projects between H+9
hours and H+56 hours. The experimentally determined gamma field decay
exponent '.as used to extrapolate the dose rate readings to
H+l hour. Extremely heavy local contamination resulted on Ruby. In
addition, significant amounts of contamination were deposited on the
northern islands of the atoll. The readings taken between sites, Janet
and Olive, were corrected for the small dose rates observed there before
the shot- No such corrections were applied to sites, Pearl and Sally,
because the contamination from shot Mohawk was so heavy that the pre-
shot dose rates could be neglected. The readings in the vicinity of
the crater were taken between H+32 hours and H+56 hours. The average
field decay exponent was used to extrapolate the readings
to H+l hour. Approximately 2 hours after- detonation, light fallout
started on Elmer and continued for one hour. Peak intensity was 22 mr/hr.
158
STATUTE MILES
Figure 96. Operation REDWING -
Island dose rates in r/hr at H+l hour.
Mohawk.
159
160
Figure 97. Dose rate readings near the Mohawk crater in r/hr at H+l hour
161
TABLE 30 ENIWETOK WIND TATA FOR OPERATION REDWING -
MOJMT
Alt j. lude (MSL) H-3 hours H-hour H+3 hour H+6 hours
Hi r Speed Dir Speed Dir Speed Dir Speed
feet degrees mph degree s mpli degree: s mph degrees mph
Surface 130 28 130 21 140 18 130 18
1,000 110 24 110 18 090 18 090 20
2,0'00 110 24 120 100 23 OSO 21
3,000 100 26 110 26 120 25 090 23
4,000 100 22 110 30 120 25 090 23
5,000 110 20 110 37 120 26 100 23
6,000 110 23 120 35 120 21 110 23
7,000 090 22 120 29 110 16 130 24
8,000 090 20 120 op 100 18 120 26
9,000 090 16 100 16 100 18 120 26
10,000 080 15 Обо 15 090 16 100 25
12,000 070 12 070 18 060 18 070 16
14,000 o4o 07 050 18 030 17 050 14
15,000 — — (020) (16) (010) (17) (020) (13)
16,000 090 09 350 14 350 17 ЗбО 13
18,000 120 10 280 09 070 08 020 09
20,000 140 20 210 03 090 1.2 070 10
25,000 270 10 160 06 130 07 220 14
30,000 260 29 150 14 190 20 210 22
35,000 240 36 180 24 200 32 220 32
40,000 240 54 230 32 220 44 220 38
45,000 250 51 250 45 240 40 230 35
50,000 270 32 270 32 2б0 32 250 25
55,000 170 09 160 08 150 07 150 18
60,000 100 10 100 20 110 29 090 24
65,000 — — — — — — — 090 35 100 38
70,000 — — — — — 100 48 100 45
75,000 — — — — 100 54 100 52
80,000 — — — — — — 100 65 100 56
82,000 ~ ~ ~ — — — — — ~ ~ ~ — 100 56
85,000 — — — — 100 61 — —
90,000 — — — — — — 090 74 — — —
95,000 — — — — — — 090 79 — —
100,000 — — — — 090 88 — —
102,000 — — — •*— — — 090 88 — —
NOTES:
1. Numbers in parentheses are estimated values.
2. Tropopause height was 56,800 ft MSL.
3. Wind data was obtained by the weather station on Eniwetok Island.
4. H-hour values interpolated for 45,000 ft and above from JI-3 hours
and H-<3 hours data.
'J. At the surface the air pressure was 14.64 psi, the temperature 26.5°O, the
dew point ?2.8°C and the relative humidity 81.7^.
162
875
163
OPERATION REDW1HG
Apache
PPG Time GMT
DATE: 9 Jul 19G^ 8 Jul VjJS
TIME: O6O6 18O6
Sponsor: UCRL
PPG - Eniwetok - Flora
11° 70' 17" N
J6P° 12' 03" E
Site elevation:
Sea level.
HEIGHT OF BSRS1: Surface
TYPE OF PltRST AND PLACEMENT:
Surface burst from barge on
water over the Mike crater
CLOUD TOP HEIGHT: 66,700 ft MSL
CLOUD BOTTOM HEIGHT: 36,COO ft M
REMARKS:
Only island dose rate readings are available. These were taken by
aerial and ground surveys made by the Radiological Safety organization.
The t'1,3 decay approximation was used to extrapolate Lne dose rate
readings to H+l hour. This shot produced exceptionally heavy contamination
throughout the upper islands of the atoll. Water in the north end of
the lagoon was highly contaminated for a considerable distance from the
shot island, and as the silt and debris were moved out by lagoon current.:;,
the contamination spread widely.
164
GENE
HELEN
Figure 100 .
Operation REDWING - Apache.
Island dose rates in r/hr at H+l hour.
165
Cloud Height (MSL) and Diameter, IO reet
166
TABLE 31 31NIWETOK WIND DATA FOR OPERATION REDWING -
APACHE
AItitude H-l hour H-hcui H+l hour H+n- hours H+9 hoi
(MSL) Dll' Speed Dir Speed Dir Speed Dir Speed Dir f ''peed
feet degree; s mph degrees mph degree s mph degree ;s mph degrees mpn
Surface 070 12 070 12 070 12 070 15 090 14
1,000 070 14 070 16 060 20 080 21 080 16
2,000 070 14 070 18 070 23 080 23 090 17
3, ooo 080 12 080 17 070 24 090 27 090 24
4,000 IOC 15 0-90 20 OSO 26 090 23 100 28
5,000 100 15 100 23 100 31 090 23 100
6,000 110 15 no 18 no 22 090 21 100 24
7,000 110 17 no 18 120 21 ООО 21 100 21
8,000 130 16 120 22 100 21 100 21 100 21
9,000 130 18 130 21 130 23 no 21 110 20
10,000 14 0 18 140 21 140 23 no 21 no 20
12,000 150 09 150 10 14o 13 110 15 no 18
14,000 120 02 120 03 no 06 160 02 100 12
16,000 060 07 Обо 06 060 05 230 07 13Э 12
18,000 040 05 020 05 350 05 ЗЮ 02 300 09
20,000 050 02 030 05 020 07 020 05 ЗбО 09
25,000 230 07 190 08 160 09 230 07 320 12
30,000 300 1.0 270 10 250 09 180 09 210 13
35,000 no 24 200 111 210 i; 210 14- 210 20
4o,ooo 310 10 290 09 280 07 220 07 210 15
45,000 280 16 270 16 2б0 17 250 28 230 28
50,000 220 17 220 26 230 37 220 35 230 31
55,000 180 28 160 23 — — — — — 090 01 160 36
60,000 100 30 100 30 •— — 090 32 080 41
65,000 080 39 080 39 •— •— » — 090 41 100 45
70,000 “ “ — •».... — — — 100 44 100 55
75,000 — -- — — — — 100 54 090 54
80,000 — — --- -- — — 090 72 090 71
89,000 — — — — •- •" •- -- — — 090 108 --- — —
90,000 — — “ •" — — — — — — — — no 106
93,000 — — — -- — -- — — — — no 96
NOTES:
1. Numbers in parentheses are estimated values.
2. Tropopause height was 52,320 ft MSL at H-3 hours.
3- Wind data vzas obtained by the weather station on Eniwetok Island.
4. H-hour values interpolated; H-l hour and H+l hour data was used for
surface through 50,000 ft; H-l hour and Н+Ц- hours data was used for
55>000 ft and above.
5. At the surface the air pressure was 14.63 psi, the temperature 26.8°C,
the dew point 23.9°C, and the relative humidity 84$>.
167
57.5
62.5
RISE RATE GOOOFT/HR
Figure 102. Hodographs for Operation REDWING -
Apache
168
OPERATION REDWING -
Navajo
PPG Time GMT
IATE: 11 Jul 1956 10 Jul 195(j
TIME: 0556 1756
Sponsor: LASL
SITE: PPG - Bikini - South of Dog
11° 39' W N
165° 23' 1V' E
Site elevation: Sea level
HEIGHT OF BURST: 15 ft
TYPE OF BURST AND PLACEMENT:
Surface Burst from barge on
water; center of gravity
approx. 15 ft above surface
of water; depth to bottom-215 ft
CLOUD TOP HEIGHT: 85,000 ft MSL
CLOUD BOTTOM HEIGHT: 51,200 ft MSL
REMARKS:
The on-site fallout pattern was drawn from island readings taken by
scientific projects supplemented by fallout sample collections on rafts
and barges in the lagoon. The survey readings were obtained on D-day.
A gamma decay exponent determined from laboratory gamma
decay measurements, was used to convert the D-day readings to H+l
hour values. Light fallout occurred on Nan approximately 18 hours
after detonation, with peak gamma intensities of 22 mr/hr.
The off-site fallout pattern was drawn from aerial and oceanographic
surveys! The oceanographic surveys used detector probes for measuring
the dose rate at depths to and below the thermocline. Water sampling
equipment was used for taking of surface samples and for the collection
of samples from any desired depth. The dose rate readings were extrapo-
lated to H+l hour by using the decay measurements of the samples
collected.
169
170
Figure 103• Operation REDWING
45
Navajo. Atoll rate contours in r/hr at H+l hour.
Distonce from GZ, Stotute Miles
Figure 104. Operation REDWING - Navajo. Off-site dose
rate contours in r/hr at H+l hour.
171
Figure 105. Cloud Dimensions: Operation REDWING -
Navajo.
Cloud Diameter, Ю <t.
172
TABLIC 32 BIKINI WIND DXTA FOR OPERATION HEWING —
KVA JO
AItit ude (MSL) feet H-hour H-i-3 hours h-i-0 : hours H-i'9 hour;
Dlr speed ])ir degree 2p<-eci s mph fir degree: S] >0 c d s mph B:i r degrees Spoeci mph
degrees mph
Surface 090 12 090 20 090 21 080 14 .
1,000 080 24 080 2)1 100 20 080 14
2,000 080 26 080 25 100 24 090 15
3,000 080 25 080 29 090 26 100 20
J|,000 030 25 080 26 090 26 110 21
5,000 080 23 080 24 090 22 110 21
6,000 080 21 080 24 100 21 too 21
7,000 080 22 080 24 100 21 100 21
8,000 080 23 090 23 100 21 100 23
9,000 080 22 080 24 090 24 100 23
10,000 080 21 080 22 080 24 090 23
12,000 070 15 080 22 070 23 070 21
14,000 060 14 070 13 050 17 обо 15
15,000 (080) (12) (070) (13) (050) (15) (обо) (15)
16,000 100 10 070 2 3 обо 14 050 16
18,000 100 10 080 10 обо 13 070 13
20,000 i4o 09 090 08 100 07 090 08
25,000 180 08 170 09 270 03 070 05
30,000 210 17 240 13 2бо 14 290 15
35,000 220 24 270 17 240 16 270 22
4o,ooo 270 18 260 29 24o 32 240 34
45,000 240 35 250 37 230 42 220 38
50,000 240 33 240 21 240 30 250 34
52,000 230 37 — — — -> _ — ~ — — —
55,000 — — 120 14 300 06 050 18
60,000 — — 080 25 110 30 110
65,000 — — — -- 090 4o 090 35 080 35
70,000 — -- 080 52 090 47 090 44
72,000 — — — — ~ — — 090 48 — — —
74,000 — — — -- — -- — — — — 090 59
NOTES:
1. NurOors in parentheses are estimated values.
2. Wind data was obtained on board the U. S. S. Curtiss.
3- Tropopause height was y,Q,000 ft MSL.
4. At H-hour the sea level pressure was 1010.2 rnb, the temperature
81.2°F, the dew point 7U.0°F and the relative humidity 80.0$.
173
47.5
42.5
32.5
64.5
52.5
H-HOUR
27.50
22.50.
I7.51
12.5
75 ,^оХ
2.5
SCALE
UijlI 1 11 I 1 111
0 20 40 60
MILES
RISE RATE 1 5000 FT/HR
Figure 106 - Hodographs for Operation REDWING -
Navajo.
174
OPERATION REDWING -
Tcwa
DATE: .2.1 Jul 19>6 20 Jul 3 996
TIME: 09-96 1?96
TOTAL YIELD: 5 Mt
FIREBALL LATA:
Tine to ] st minimum: 189 to 290 msec
Time to 2nd maximum: 2.08 sec
Radius at 2nd maximum: 5,9^9 ft
CRATER LA TA:
Diameter: 9,000 ft
Depth: 129 ft
Sponsor: UCRTj
SITE: 1TG - Bikini - Charlie -
Dog Reci'
11° IO1 26" N
169° 20' 22” E
Site elevation: Sea level
HEIGHT OF BURST: 19 ft
TYPE OF BURST AND PLACEMEUT:
Surface burst from barge on
water; center of gravity 19
ft above surface of water;
depth to bottom 29 ft.
CLOUD TOP HEIGHT: 99,000 ft MSL
CLOUD ВОГТОМ HEIGHT: NM
REMARKS:
The on-site fallout pattern was drawn from island readings taken by
scientific projects, supplemented by fallout sample collection on rafts
and barges in the lagoon. Actual field decay measurements indicated a
decay exponent This decay exponent was used to extrapolate the
dose rate readings to H+l hour. The extremely heavy rains which followed
this shot had no observable effect on the decay rates. On all islands the
contamination remaining from previous shots was negligible in comparison
with the high radiation levels produced by this shot. Very slight
fallout occurring approximately 18 hours after firing increased the back-
ground on Nan by approximately 9 mr/hr. In contrast to the other barge
shots, contamination was also experienced on the atoll's southwestern
islands.
The off-site fallo-at pattern was drawn from oceanographic surveys. The
oceanographic surveys used detector probes for measuring the dose rate
at depths to and below the thermocline. Water-sampling equipment was
used for the taking of surface samples and for the collection of sam /J.es
from any desired depth. The dose rate readings were extrapolated to 11+1
hour by using the decay measurements of the samples collected. Fallout
from the firing of this device contaminated Eniwetok atoll. The fallout
on Eniwetok commenced approximately 9 hours after the device was fired
with a peak of 100 to 120 mr/hr.
175
176
580
470
Figure 107 . Operation REDWING - Tewa. Atoll dose rate contours in r/hr at H+l hour.
Distonce from GZ, Slotute Miles
Distance from GZ , Statute Mile.s
Figure 108 . Operation REDWING - Tewa.
Off-site dose rate contours in r/hr at H+l hour.
177
178
ТАШ!',' 33 LININ'! WIND П1ТА КОЖ 01W.TI0N Tb'JJJlIic; - THWA
AJ titude H-ho чу Н-1 з hours H'<*7 hour:; И+9 hours
(MSI,) fir Speed Dir Speed Dlr I ipoed Dlr Speed
feel deprees depree s Dlpn uegrees mph depree s mpl 1
Surface 090 15 090 16 100 Ъ 080 op
1,000 080 17 090 16 100 16 080 13
2,000 090 17 100 17 090 17 090 16
Зл ooo 110 18 3 00 20 100 21 090 3.6
6,000 110 18 100 21 100 090 18
5,000 110 18 100 20 090 £1/ 100 23
6,000 100 20 110 20 090 22 100 23
7,000 100 22 110 23 090 20 100 22
8,000 090 23 100 21 100 18 090 21
9,000 090 21 110 22 090 21 090 15
10,ООО 070 20 100 17 090 18 090 15
12,000 080 17 100 15 090 16 080 13
16-,ооо 080 16 100 10 o&o 10 060 09
1,5 ООО (100) (32) (100) (13) (090) (n) (080) (12)
16,000 120 07 100 15 090 13 090 16-
18,000 090 13 110 15 320 13 ЗбО 03
20,000 130 13 120 13 110 32 180 07
25,000 290 09 130 07 180 06 220 15
30,000 320 Об 210 13 170 05 260 07-
35 л 000 190 09 260 13 150 05 270 16
60,000 2б0 23 270 28 270 20 320 18
15,000 250 37 290 21 360 13 ОбО 31
50,000 270 25 2б0 21 080 20 310 12
55 л ООО 110 об 070 05 080 16 100 17
бо,ООО 070 33 080 37 080 23. 090 28
65,000 090 52 1.00 50 100 51 100 61
70,ООО 090 18 110 60 090 55 090 60
72,000 — — 110 37 — — — —
75 л ООО 080 61 — ~ — 090 60 090 63
80,000 100 Г) — -- 090 61 090 69
85,ООО 100 56 — — — -- 090 78 — —
90,000 — - - — -- 090 108 --- --
NOTES:
1. Numbers in parentheses are estimated values.
2. Wind data was obtained on board the U. S. S. Curtiss.
3- Tropopause height was 52,000 i't MSL.
6. At H-hour the sea love] pressure was 1009-3 mb, the- temperature
82°I1’, the dew point 77° 1' and the relative humidity 85/» •
179
92.5
О—
87.5
-о—
180
SCALE
11 11 I 111111 111 l 111 n 11 п I
0 20 40 60 80 100 120
MILES
RISE RATE 5000FT/HR
Figure 110. Hodographs for Operation REDWING -
Te-wa.
operation redwing
Huron
PPG Time
ffiTR: 22 July J 9'>6
TIME: 0616
Sponsor: LASL
21 July J9>0
1816
SIT Pl- PPG - EiMwotok - OPP Flora
11° l|0’ 19" N
162° 22' 09" E
Site elevation: Sea level
HEIGHT OF BURST: Surface
TYPE OF BURST AND PLACEMENT:
Surface burst from barge on
water
CLOUD TOP HEIGHT: 5’4,000 ft MSL
CLOUD BOTTOM HEIGHT: 27,000 ft MSI.
REMARKS:
Only island dose-rate readings are available. These were obtained
from aerial and ground surveys made by the Radiological Safety organi-
zation. The t-1"2 decay approximation was used to extrapolate the dose
rate readings to H+l hour.
181
GENE
STATUTE MILES
Figure 111.
Operation REDWING - Huron.
Island dose rates in r/hr at H-i-1 hour.
182
TABLE 34 ENIWETOK WIND IATA FOR OPERATION REDWING -
HURON
Altit.udu (mse) Il-hour H-1'3 1 uurs II-I-6 hows R+9 hows
Dir Speed Dir Speed Dir Speer] Dir f ’/peed
feet decrees mph decrees ; mph decree s mp! 1 degrees uiph
Surface 120 14 090 18 130 16 140 23
1,000 100 3.8 110 20 110 14 120 29
2,000 100 18 110 24 090 14 110 28
3,000 100 18 110 29 100 16 110 32
)|,000 100 18 100 30 обо 15 13.0 35
5,000 110 22 100 29 120 14 110 37
6,000 110 22 100 28 120 16 110 38
7,000 120 18 100 25 110 16 110 38
8,000 120 22 090 23 110 14 110 35
9,000 110 23 090 25 110 14 100 35
10,000 110 18 100 28 110 14 100 35
12,000 110 12 110 21 110 14 090 28
14,000 120 14 100 23 080 18 080 23
15,000 (140) (13) (090) (23) (HO) (13) (080) (16)
16,000 160 12 080 23 130 07 080 09
18,000 160 12 070 10 090 15 090 12
20,000 150 12 060 09 Обо 18 080 07
25,000 I7O 09 030 05 ЗбО 07 010 07
30,000 080 16 040 10 110 06 120 09
35,ooo Обо 32 050 37 060 14 090 24
4o,ooo 060 4o 050 39 100 09 060 25
44,ooo — — 050 39 — _ _ _ —
45,000 070 52 — 070 08 050 09
50,000 070 08 — — — — 080 15 260 10
55,000 070 23 — — — — 120 13 080 14
60,000 100 38 — — 120 20 090 4o
65,000 110 51 — — 100 22 090 52
70,000 090 56 — — 110 35 100 53
75,ooo 100 71 — — 090 37 100 63
80,000 100 79 — — — -- 070 23 Ю0 75
85,000 100 87 — — — - - 090 23 090 82
90,000 3 00 107 — — — — — — — — — — — —
99,000 — -- — -- — — 090 117
NOTES:
1. Numbers in parentheses are estimated valuqs.
2. Tropopause height was ^0,000 ft MSL at H-hour.
3. Wind data was obtained by the weather station on Eniwetok
Island.
4. At the surface the air pressure was 14.62 psi, the temperature
27.4°C, the dew point 24.5°C and the relative humidity
183
W+3
H +6
H-HOUR
ТТЛ
Н+Э
SCALE
LlliIu-lI.u Jail!
0 20 W ®0 £0
WILTS
RISE RATE 5000 FT/bH
Figure 112. Hodographs for Operation FLOWING
Huron.
Figure 113. Operation HARDTACK I, Shot Locations, Eniwetok Atoll
YuCCotHlfh Alllluda) Oalonolad 60 Mliaa Waal of Bikini
Figure 114. Operation HARDTACK I, Shot Locations, Bikini Atoll
185
OPERATION HARDTACK I - Yucca
PPG Time GMT____
DATE: 28 Apr 19>8 28 Apr 1958
TIME: 1UUO 02^0
Sponsor: DOD
SITE: PPG - USS Boxer 60 mi
west of Bikini
12° 37' 00" N
1630 01' 30" E
Site elevation: Sea level
HEIGHT OF BURST: 86,000 ft
TYPE OF BURST AND PLACEMENT:
Air burst from free balloon
over water
CLOUD TOP HEIGHT: NM
CLOUD BOTTOM HEIGHT: NM
REMARKS: No fallout
186
TABLE 35 BIKINI WIND DATA FOR OPERATION HARDTACK I -
YUCCA
Altitude H-hour
(MSL) Dir Speed
feet degrees mph
Surface 040 16
1,000 050 29
2,000 050 35
3,000 070 36
4,000 130 09
5,000 350 12
6,000 ЗбО 14
7,000 150 15
8,000 190 12
9,000 210 09
10,000 230 06
12,000 350 12
14,000 320 15
15,000 (320) (15)
16,000 330 16
18,000 300 15
20,000 260 07
23,000 210 15
25,000 240 18
30,000 200 13
35,000 210 32
40,000 270 44
45,000 270 51
50,000 270 40
55,000 270 38
60,000 280 33
65,000 250 18
70,000 070 15
75,000 180 09
1. Numbers in parentheses are estimated values.
2. Wind data was taken on board ship located within 3°
nautical miles of the Tower at Nan Island, Bikini Atoll.
3- Tropopause height was 53>000 ft MSL.
4. At H-hour the surface air pressure was 14.67 psi, the
temperature 25-7°C, the dew point 69.6°F, and the relative
humidity 75$.
187
Figure 11
H — Hour
5. Hodograph for Operation HARDTACK I -
Yucca.
188
OPERATION HARDTACK I -
Cactus
PPG Time
DATE: 6 May 1958
TIME: 0615
GMT
5 May
Sponsor: LASL
TOTAL YIELD: 18 kt
SITE: PPG - Eniwetok - Yvonne
11° 33' 23" N
162° 21' 15" E
Site elevation: Sea level
FIREBALL DATA:
Time to 1st minimum: 12 msec
Time to 2nd maximum: 130 msec
Radius at 2nd maximum: 656 ft
HEIGHT OF BURST: 3 ft
TYPE OF BURST AND PLACEMENT:
Surface burst - Platform on
coral soil
CRATER DATA:
Diameter: 3^+0 fl
Depth: 3^-5 ft
Lip Height: 8 to it ft
Lip Width: 115 to l?0 ft
CLOUD TOP HEIGHT: 19,000 ft MSL
CLOUD BOTTOM HEIGHT: NM
REMARKS:
Only individual island dose rates are available. These were obtained
from helicopter surveys at H+l hours made by the Radiological Safety
organization. The helicopter survey technique called for the pilot
either to land the aircraft at the desired spot, so that a ground
reading could be obtained, or to make a slow pass over the desired
spot at an elevation of 25 feet. Readings taken at 25 feet were
multiplied by a factor of 2 in order to obtain a reasonable approxi-
mation of the true ground reading. The basic instrument used in
the aerial surveys was the AN/PDR-39 survey meter modified to read
up to 500 r/hr. The t-1*2 decay approximation was used to extrapolate
the H+l Hour dose-rate readings to H+l hour.
189
GENE
Figure 116 • Operation НАВЕТАСК I - Cactus.
Island dose rates in r/hr at H+l hour.
190
TABLE 36 ENIWETOK WIND IATA FOR OPERATION HARDTACK I -
CACTUS
Altitude H+x hour Н+5р hours
(MSL) Dir Speed Dir Speed
feet degrees mph degrees mph
Surface 060 16 обо 16
1,000 070 21* обо 29
2,000 070 25 обо 21
3,000 Обо 26 обо 26
U,000 обо 21* обо 28
5,000 6,000 обо 23 050 25
обо 23 010 21
7,000 080 15 030 17
8,000 090 10 010 08
9,000 110 05 01+0 05
10,000 обо 03 160 08
12,000 200 02 220 10
1U,OOO 150 12 180 13
15,000 16,000 (130) (15) (160) (13)
100 18 130 11+
18,000 100 18 11+0 15
20,000 23,000 120 18 11*0 15
090 13 150 18
25,000 050 09 230 15
30,000 270 17 2б0 26
35,000 — — — -- 230 32
10,000 1*5,000 220 37 230 39
290 35 270 33
50,000 310 39 2"0 23
55,000 60,000 230 07 250 18
2бО 17 210 17
65,000 — — . 250 12
67,000 210 07 ...
70,000 120 08 090 05
75,000 80,000 О7О 13 080 12
080 31 090 23
85,000 080 52 100 33
90,000 090 60 100 10
95,000 — — . 100 62
96,000 100 57 ...
100,000 — — _ — 090 1*9
105,000 ... — — 090 51
110,000 ... - . 090 59
112,000 ... -- 090 61
NOTES;
1. Number in parentheses are estimated values.
2. Wind data was taken by the Eniwetok weather station.
3» Tropopause height was 51,000 ft MSL.
U. The surface air pressure was 1U.66 psi, the temperature 26.7°C,
the dew point 72°F and the relative humidity 76$.
191
SCALE
О IO 20 30
miles
Rise rate: 5000 ft/hr
Figure 117 . Hodographs for Operation HARETACK I -
Cactus.
192
OPERATION HARDTACK I - Fir
PPG Time GMT
DATE: 12 May 1958 11 May 1958
TIME: 0550 1750
CLOUD TOP HEIGHT: 90,000 ft MSL
CLOUD BOTTOM HEIGHT: NM
Sponsor: UCRL
SITE: PPG - Bikini - SW of
Charlie U,000 ft from
nearest edge of the island
11° H1‘ 27" N
165° 161 25" E
Site elevation: Sea level
HEIGHT OF BURST: 9.88 ft
TYPE OF BURST AND PLACEMENT:
Surface burst from barge on
water
REMARKS:
Only individual island dose rates are available. These were obtained
from Radiological Safety organization helicopter surveys at H+U hours.
The helicopter survey technique called for the pilot either to land the
aircraft at the desired spot, so that a ground reading could be ob-
tained, or to make a slow pass over the desired spot at an elevation
of 25 feet. Readings taken at 25 feet were multiplied by a factor
of 2 in order to obtain a reasonable approximation of the true ground
reading. The basic instrument used in the aerial surveys was the
AN/PDR-39 survey meter modified to read up to 500 r/hr. The t•2
decay approximation was used to extrapolate the H+U hour dose rate
readings to H+l hour.
193
194
Figure 118. Operation HARDTACK I - Fir.
Island dose rates in r/hr at H+l hour.
TABLE 37 BIKINI WIND DATA FOR OPERATION HARDTACK I - FIR
Altitude (MSL) hour h'+7) hours !!+12i hours
Dir .upeed Dir .'.pe-d Di r I ipeed
feet degrees mph degrees mpn degrees mph
Surface 070 25 070 25 060 28
1,000 070 26 обо 26 060 26
2,000 080 26 070 26 070 29
3,000 080 22 080 26 080 29
1,000 090 26 090 29 090 25
5,000 090 3<5 100 30 110 22
6,000 110 26 100 29 110 23
7,000 130 23 110 21 110 31
8,000 130 17 110 18 120 29
9,000 150 17 130 18 130 18
10,000 170 15 150 16 150 13
12,000 120 08 190 07 200 13
11,000 110 08 220 11 250 10
15,000 (090) (12) (170) (10) (210) (08)
16,000 070 11 120 07 180 Об
18,000 обо 07 110 Об 190 02
20,000 050 07 160 03 280 01
23,000 090 05 200 03 210 Об
25,000 130 Об 220 Об 250 10
30, ООО 280 20 280 17 270 17
35,000 (255) (34 (250) (28) (235) (32)
10,ООО 230 18 220 10 200 18
45,000 210 56 (250) (39) 220 55
50,000 2бО 15 280 39 260 33
51,000 280 26 — . - -
55,000 (270) (23) (200) (25) (£50) (21)
56,000 — 180 12 250 18
60,000 210 05 290 08 360 05
61,000 — — 080 09 * — . —
65,000 (120) (12) (190) (13) (110) (12)
67,000 360 06 — -. ... --
70,000 010 20 090 17 090 13
75,000 080 26 (090) (22) (090.) (16)
80,000 120 26 090 26 090 20
85,ООО 110 10 — . . — ... ..
88,000. -- -- 100 53
1. Numbers in parentheses are estimated values.
2. Wind data was taken On board ship located within 30 nautical
miles of the Tower at Nan Island, Bikini Atoll.
3» Tropopause height was 51,000 ft MSL.
1. The surface air pressure was 11.61 psi, the temperature 26.7°C,
the dew point 73-O°F, and the relative humidity 80^.
195
102.5
102.5
Figure 119 . Hodographs for Operation HARDTACK
SCALE
111 I 11 i 111 11 In t 1
0 20 40 60 80
miles
Rise rate : 5000ft/hr
196
OPERATION HARDTACK I - Butternut
PPG Time GMT Sponsor: LASL
1У\ТЕ: 12 May 1958 11 May 1958
TIME: O615 1815 SITE: PPG - Eniwetok - SW of
Yvonne
4,000 ft from the nearest
edge of the island
11° 20' 41" N
162° 21' 02" E
Site elevation: Sea level
HEIGHT OF BURST: 10.13 ft
TYPE OF BURST AND PLACEMENT;
Surface burst from barge on
water
Water depth: 65 ft
CLOUD TOP HEIGHT: 35,000 ft MSL
CLOUD BOTTOM HEIGHT: Mi
REMARKS:
Only individual island dose rates are available. These were obtained
from helicopter surveys at H+4 hours made by the Radiological Safety
Organization. The helicopter survey technique called for the pilot
either to land the aircraft at the desired spot, so that a ground reading
coula be obtained, or to make a slow pass over the desired spot at an
elevation of 25 feet. Readings taken at 25 feet were multiplied by
a factor of 2 in order to obtain a reasonable approximation of the true
ground reading. The basic instrument used in the aerial surveys was the
AN/PDR-39 survey meter modified to read up to 500 r/hr. Thet-1-2 decay
approximation was used to extrapolate the H+4 hour dose-rate readings
to H+l hour.
197
Figure 120 . Operation HARDTACK I - Butternut.
Island dose rates in r/hr at H+l hour.
198
TABLE 38 ENIWETOK WIND IATA FOR OPERATION HARDTACK I -
BUTTERNUT
Altitude (MSL) hour H+5\ hours '* -* l-l4 hours
Dir Speed Dir Speed Dir Speed
feet degrees mph degrees mph degrees mph
Surface 080 12 080 17 070 16
1,000 090 2U 080 2U 080 28
2,000 090 25 080 2U 080 29
3,000 090 25 090 29 090 29
U,000 100 21 090 28 100 26
5,000 120 18 100 2U 110 2U
6,000 120 18 120 2U 130 21
7,000 150 16 150 21 130 17
8,000 150 13 170 16 150 13
9,000 130 09 170 15 170 .15
10,000 100 10 120 08 160 10
12,000 090 09 190 07 230 09
1U,OOO 080 09 150 09 200 09
15,000 (080) (IM (120) (09) (1U0) (09)
16,000 070 18 090 09 080 08
18,000 100 12 110 09 070 07
20,000 100 09 090 07 070 05
23,000 110 07 160 02 3U0 05
25,000 Calm Calm 200 03 300 08
30,000 280 22 270 17 270 2U
35,000 (230) (Ul) 2U0 36 220 33
37,000 210 U9 — --
U0,000 230 ^3 220 39 210 37
U5,000 2бО U7 2U0 28 250 35
50,000 250 UO 2бО 33 260 UO
5^,000 280 21 — .- — —
55,000 — -- 250 16 260 17
60,000 200 05 250 09 300 12
65,000 ... .- 080 12 250 15
66,000 070 12 — . . . . — —
70,000 080 16 070 18 050 10
72,000 100 25 --- — .— .-
75j000 - -- . - 110 16 100 17
80,000 090 37 110 20 080 20
8U,000 100 36 ..- - . — -.
85,000 — -- 110 29 100 38
NOTES:
1. Numbers in parentheses are estimated values.
2. Wind data was taken by the Eniwetok weather station.
3- Tropopause height was 53,000 ft MSL.
The surface air pressure was 1U.63 psi, the temperature 27°C,.
the dew point 7U°F, and the relative humidity 80$.
199
200
SCALE
I i «I I i | । I । 11
0 20 40 60
mile*
Rise rate’ 5000ft/hr
Figure 121 . Hodographs for Operation HARDTACK I -
Butternut.
OPERATION HARDTACK I- Koa
PPG Time GMT
DATE: 13 May I956 12 May 1958
TIME: O63O 1830
TOTAL YIELD: 1.37 Mt
FIREBALL DATA:
Time to 1st minimum: 100 msec
Time to 2nd maximum: O.9L to 1-35
Radius at 2nd maximum: 3>6L1 ft
CRATER DATA:
Diameter: '+,000 ft
Depth: 171 ft
Lip: Apparently washed away
Sponsor: LASL
SITE: PPG - Eniwetok - West
end of Gene
11° 1+0’ 30" N
162° 12' 20" E
Site elevation: Sea level
HEIGHT OF BURST: 3 ft
sec
TYPE OF BURST AND PLACEMENT:
Surface burst from 10 ft deep
tank of water sitting on coral
soil
CLOUD TOP HEIGHT: 72,200 ft MSL
CLOUD BOTTOM HEIGHT: Dll
REMARKS:
Only individual island dose rates are available. These were obtained
from Radiological Safety organization helicopter surveys at H+L hours.
The helicopter survey technique called for the pilot either to land
inc aircraft at the desired spot, so that a ground reading could be
obtained, or to make a slow pass over the desired spot at an elevation
of 25 feet. Readings taken at 25 feet were multiplied by a factor of
2 in order to obtain a reasonable approximation of the true ground
reading. The basic instrument used in the aerial surveys was the
AN/PDR-39 survey meter modified to read up to 500 r/hr. The t-1’2
decay approximation was used to extrapolate the H+4 hour dose rate
readings to H+l hour.
201
GENE
Figure 122.
Operation HARDTACK I - Koa.
Island dose rates in r/hr at H+l hour.
202
Figure 123. Cloud Dimensions: Operation HABDTACK I - Koa.
203
TABLE 39 ENIWETOK WIND ОЛТА FOR OPERATION HARDTACK I - KOA.
Altitude (MSL) li-у hour H+5hours Н+1Г. hours
Dlr Speed Dir Speed Dir Speed
feet degrees mph degrees mph degrees mph
Surface 050 18 060 18 060 18
1,000 070 29 080 32 080 26
2,000 070 31 070 38 080 29
3,000 080 32 070 37 080 29
k,000 080 36 080 29 090 31
5,000 090 33 080 29 100 26
6,000 100 29 090 23 110 26
7,000 100 31 100 18 100 26
8,000 100 31 100 20 080 23
9,000 090 25 100 20 070 20
10,000 090 25 120 18 090 lk
12,000 100 29 130 20 120 13
lit, ООО 110 25 150 lk 120 03
15,000 (no) (20) (150) (lk) (160) (07)
16,000 120 lk IkO lk 190 12
18,000 110 12 IkO lk 180 05
20,000 070 08 130 05 220 09
23,000 200 09 180 18 180 16
25,000 270 lk 160 18 170 lk
30,000 250 2k 2k0 21 250 21
35,000 190 31 170 31 180 21
kO,ООО 220 29 190 29 230 31
U5,000 2k0 kO 260 52 (255) (32)
50,000 290 36 280 35 280 33
55,000 280 13 230 lk 200 33
60,000 IkO 17 210 07 270 12
65,000 090 07 обо 08 (210) (09)
70,000 100 16 130 09 150 07
7k,000 ... .. ... -- 670 16
75,000 100 23 070 20 080 18
80,000 100 31 090 36 100 30
85,000 090 kl 100 53 ... --
90,000 090 59 110 71 100 61
92,000 090 66 — -- ... --
95,000 ... . . 100 77 ... —
100,000 ... .. 100 83 100 68
105,000 ... .. 100 85 ... — “
110,000 ... . . 100 126 100 75
118,000 ... — ... - - 100 101
NOTES:
1. Numbers in parentheses are estimated values.
2. Wind data was taken by the Eniwetok weather station.
3. Tropopause height was 57,000 ft MSL.
k. The surface air pressure was lk.66 psi, the temperature 27-2°C,
the dew point 7k°F, and the relative humidity 79$.
204
SCALE
I I I I I I I 11 I I I I
0 20 40 60
miles
205
22.5 Rise rate: 5000ft/hr
67.5
Figure 124 . Hodographs for Operation HARDTACK I -
Koa.
OPERATION HARDTACK I
Wahoo
PPG Time GMT DATE: 16 May 1958 16 May 1958 Sponsor: LASL/DOD
TIME: 1330 0130 SITE: PPG - Eniwetok -south by SSW of Irwin about 6,000 ft from the island 11° 201 Ul" N 162° IO1 W E Site elevation: Sea level HEIGHT OF BURST: -500 ft under water TYPE OF BURST AND PLACEMENT: Underwater - Device suspended by a cable. Water depth 3,200 ft PLUME TOP HEIGHT: l,?60 ft MSL clt, 3-5 2" SeC PLUME DIAMETER: ЗЛ00 ft MSL
REMARKS: at 15y sec
"Nearly all of the total gamma dose occurred within 25 minutes after
zero time and was due to the passage of airborne radioactive material.
Gamma doses in excess of 100г occurred within the first 15 minutes at
downwind distances less than 16,000 feet. In both i'nstances the
residual field due to deposited radioactive materiel was relatively
insignificant, although radioactive foam may represent a radiologies 1
hazard."
206
Distance FromGZ, statute miles
Distance F * о m GZ, statute miles
Figure 125 . Operation HARDTACK I - Wahoo.
On-site cumulative dose to 6 hours in roentgens.
207
TABLE 40 ENIWETOK WIND DATA FOB OPERATION HARDTACK I -
WAHOO
Altitude (msl) H-l> hours H+ll hours
Dir Speed Dir Speed
feet degrees mph degrees mph
Surface 090 17 080 16
1,000 090 22 080 18
2,000 090 22 080 20
3,000 090 20 080 21
U,000 090- 17 080 20
5,000 070 13 060 11
6,000 010 08 050 12
7,000 330 07 350 07
8,000 280 12 300 11
9,000 290 17 300 20
10,000 280 21 300 22
12,000 310 16 290 1U
1U,OOO 290 09 310 12
16,000 020 07 310 09
18,000 210 11 020 09
20,000 010 08 010 13
23,000 060 05 010 07
25,000 210 02 ЗбО 07
30,000 300 15 260 10
35,000 2б0 35 ... — .
uo,ooo 270 25 270 30
U5,000 280 29 ... ..
50,000 310 15 310 21
52,000 “ “ . -- 270 09
55,000 070 06 ... --
60,000 обо 15 020 20
65,000 090 17 ... --
69,000 — — — -- 120 10
70,000 090 12 100 07
73,000 090 57 060 13
75,000 — — — -- ... ..
80,000 100 60 090 10
85,000 090 57 ... — .
90,000 090 57 090 72
95,000 . “ . — — ... ..
100,000 — “ - — — 090 79
110,000 . “ . -- 100 93
11U,OOO --- -- 100 100
NOTES:
1. Wind data was taken hy the Eniwetok weather station.
2. Tropopause height was 59,000 ft MSL.
3» The surface air pressure was 1U.69 psi, the temperature
3O.8°C, the dew point 73° F, and the relative humidity 63$.
208
SCALE
Li.il.lL» 1 I_1 J
0 5 10
miles
Rise rate: 5000 ft/hr
H -1 ’/2
Figure 126. Hodographs for Operation HABDTACK I - Wahoo
209
OPERATION HARDTACK I
Holly
PPG Time GMT
DATE; 21 May 1958 20 May 1958
TIME: 0630 1830
Sponsor; LASL
SITE; t PPG - Eniwetok - West
of Yvonne, U,000 fo
from the nearest edge
of the island
11° 32' 38" N
162° 21’ 22" E
Site elevation: Sea level
HEIGHT OF BURST: 13•06 ft
TYPE OF BURST AND PLACEMENT;
Surface hurst from barge on
water
Water depth: UO ft
CLOUD TOP HEIGHT: 15,000 ft MSL
CLOUD BOTTOM HEIGHT: 7,000 ft MSL
REMARKS:
Only individual island dose rates are available. These were obtained
from helicopter surveys made by the Radiological Safety organization
at H+U hours. The helicopter survey technique called for the pilot
either to land the aircraft at the desired spot, so that a ground
reading could be obtained, or to make a slow pass over the desired spot
at an elevation of 25 feet. Readings taken at 25 feet were multiplied
by a factor of 2 in order to obtain a reasonable approximation of the
true ground reading. The basic instrument used in the aerial surveys
was the AN/PDR-39 survey meter modified to read up to 5СЮ r/hr. The
t-i*2 decay approximation was used to extrapolate the H+U hour dose
rate readings to H+l hour.
210
GENE
Figure 127 •
Operation HARDTACK I - Holly.
Island dose rates in r/hr at H+l hour.
211
TABLE 41 ENIWETOK WIND DATA FOR OPERATION HARDTACK I -
HOLLY
Altitude (MSL) H-4 hour II+5-р- hours H+lOA hours
Dir Speed Dir Speed Dir Speed
feet degrees mph degrees mph degrees mph
Surface 080 16 090 23 080 23
1,000 080 24 080 26 070 26
2,000 080 26 080 26 070 24
3,000 080 26 080 24 080 24
4,000 080 24 070 22 080 26
5,000 080 23 070 17 080 24
6,000 090 14 080 17 070 20
7,000 100 10 100 17 080 16
8,000 120 12 120 14 110 17
9,000 150 12 140 14 120 14
10,000 180 12 150 10 150 09
12,000 210 05 210 10 210 05
14,000 280 10 240 05 270 02
15,000 (270) (07) (200) (05) (300) (05)
16,000 250 05 150 05 320 07
18,000 220 05 120 02 280 09
20,000 220 09 220 10 240 12
23,000 250 12 260 09 210 10
25,000 270 13 290 05 240 10
30,000 280 24 280 09 240 21
35,000 “ — “ — — 280 22 270 20
36,000 270 24 — — — — — — — - -
40,000 220 22 200 30 190 39
45,000 210 38 210 ^3 210 32
50,000 230 20 270 17 270 18
NOTES:
1. Numbers in parentheses are estimated values.
2. Wind data was taken by the Eniwetok weather station.
3- Tropopause height was 52,000 ft MSL.
4. The surface air pressure was 14.65 psi, the temperature 27 C,
the dew point 75° F, and the relative humidity 75^’
212
SCALE
I I I I I I I
0 10 20 30
miles
Rise rate : 5000 ft/hr
Figure 128. Hodographs for Operation HARDTACK I -
Holly.
213
OPERATION HARDTACK I
Nutmeg
PPG Time GMT
TATE: 22 May 1958 21 May 1958
TIME: 0920 2120
Sponsor: UCRL
SITE: PPG - Bikini - West end Tare
11° 29' E6" N
165° 22' 15" E
Site elevation: Sea level
HEIGHT OF BURST: 12.11 ft
TYPE OF BURST AND PLACEMENT:
Surface burst from barge on
water
CLOUD TOP HEIGHT: 20,000 ft MSL
CLOUD BOTTOM HEIGHT: 104
REMARKS:
Only individual island dose rates are available. These were obtained
from helicopter surveys made by the Radiological Safety organization at
H+U hours. The helicopter survey technique called for the pilot either
to land the aircraft at the desired spot, so that a ground reading
could be obtained, or to make a slow pass over the desired spot at an
elevation of 25 feet. Readings taken at 25 feet were multiplied by
a factor of 2 in order to obtain a reasonable approximation of the
true ground reading. The basic instrument used in the aerial surveys
was the AN/PDR-39 survey meter modified to read up to 500 r/hr.
The t-1,3 decay approximation was used to correct the H+E hour dose-
rate readings to H+l hour.
214
215
BIKINI ATOLL
Figure 129 . Operation HARDTACK I - Nutmeg.
Island dose rates in r/hr at H+l hour.
TABLE 42 BIKINI WIND DATA FOR OPERATION HARDTACK I-
NUTMEG
Altitude (MSL) H-hour H+25 hours H+8j hours
Dir Speed Dir Speed Dir Speed
feet degrees mph degrees mph decrees mph
Surface 090 16 080 16 080 14
1,000 090 16 070 18 070 14
2,000 090 15 070 16 080 15
3,000 090 18 080 18 080 14
4,000 090 18 090 15 090 09
5,000 090 16 120 14 090 12
6,000 100 17 no 17 110 09
7,000 090 18 100 20 110 14
8,000 070 18 080 20 080 14
9,000 090 18 090 23 090 14
10,000 100 17 100 20 110 14
12,000 080 10 130 16 120 14
14,000 120 10 150 12 140 14
15,000 (no) (12) (140) (12) (130) (09)
16,000 110 12 120 10 120 Об
18,000 220 12 340 10 070 07
20,000 240 08 280 08 310 05
23,000 210 09 190 07 320 07
25,000 230 06 200 15 270 12
30,000 310 24 ЗЮ 14 260 09
33,000 — V» v. ~ — — -V. 220 16
34,000 300 21 W — — — — — —
35,000 * * * — 260 16 — — — _ —
40,000 200 35 200 24 240 14
45,000 250 23 W — — -V. 290 14
50,000 320 10 310 07 200 02
55,000 — — 080 07 040 02
57,000 080 07 * V» V» v» V» — — v. V» —
60,000 200 06 160 06 250 07
64,000 * V» * V» * V» V» * — * 080 07
65,000 090 09 120 08 — — — —
70,000 no 12 no 08 080 08
72,000 — -- — — — — — 050 08
75,000 080 25 — — — — -- - —
80,000 090 36 090 35 090 З'7
82,000 — * V» 090 38 --- —
83,000 — — — -- 090 22
85,000 090 52 - -- -- - -- - “
NOTES:
1. Numbers in parentheses are estimated values.
2. Wind data was taken on board ship located within 30
nautical miles of the Tower at Nan Island, Bikini Atoll.
3. Tropopause height was 54,000 ft MSL.
4. The surface air pressure was 14.68 psi, the temperature 27.4°C,
the dew point 72-. 5° F, and the relative humidity 76$.
216
Figure 130 . Hodographs for Operation HARDTACK I -
SCALE
О IO 20 30
mi les
Rise rate •• 5000 ft/hr
Nutmeg.
217
OPERATION HARDTACK I
Yellowwood
DATE: 26 May 1958 26 May 1958
TIME: 1400 0200
Sponsor: LASL
SITE: PPG - Eniwetok - SW of
Janet 5,000 ft
11° .39' 37" N
162° 13' 31" E
Site elevation: Sea level
Water depth: 75 ft
HEIGHT OF BURST: 10.52 ft
TYPE OF BURST AND PLACEMENT:
Surface burst from barge on water
CLOUD TOP HEIGHT: 50,000 ft MSL
CLOUD BOTTOM EEIGHT: 30,000 ft MSL
REMARKS:
Only individual island dose rates are available. These were obtained
from Radiological Safety organization helicopter surveys at H+4 hours.
The helicopter survey technique called for the pilot either to land
the aircraft at the desired spot, so that a ground reading could be
obtained, or to make a slow pass over the desired spot at an elevation
of 25 feet. Readings taken at 25 feet were multiplied by a factor of
2 in order to obtain a reasonable approximation of the true ground
reading. The basic instrument used in the aerial surveys was the AN/PDR-39
survey meter modified to read up to 500 r/hr. The t-1*2 decay approxi-
mation was used to extrapolate the H+4 hour dose-rate readings to H+l
hour.
218
Figure 131. Operation HARDTACK I -
• Yellowwood.
Island dose rates in r/hr at H+1 hour.
219
TABLE 43 ENIWETOK WIND DATA FOR OPERATION HARDTACK I —
YELLOWWOOD
Altitude H-hour ________ H+U hours______________H+1O hours
(MSL) feet Dir degrees Speed mph Dir degrees Speed mph Dir degrees Speed mph
Surface 090 m O7O 18 080 15
1,000 090 16 080 20 080 18
2,000 090 16 080 17 080 18
3,000 090 18 080 17 090 18
U,000 080 17 090 15 100 16
5,000 080 16 090 12 100 12
6,000 070 13 080 09 100 12
7,000 060 13 070 09 090 12
8,000 050 09 070 12 090 15
9,000 050 10 070 12 090 15
10,000 050 08 060 13 090 09
12,000 ouo 12 050 12+ 030 12
H+,000 050 07 020 09 360 12
15,000 (обо) (07) (030) (08) (36O) (08)
16,000 070 07 0U0 07 350 06
18,000 обо 20 060 12 100 Об
20,000 070 30 060 12+ 090 09
23,000 090 18 080 18 080 20
25,000 100 22 090 18 090 16
30,000 080 29 070 23 070 29
35,000 110 30 090 23 050 23
uo,ooo 070 31 080 36 090 30
U5,000 080 32 090 29 080 32
50,000 090 2U 090 17 090 23
55,000 050 2U 050 32 050 2U
60,000 070 23 обо 20 030 . 2U
65,000 обо 09 050 16 080 21
70,000 090 07 100 23 080 21
75,000 080 U3 100 38 110 35
80,000 100 U9 100 U8 090 55
85,000 100 51 080 59 090 60
90,000 100 57 090 5U 090 61
95,000 100 63 090 53 — —
100,000 090 76 090 79 — —
1.5,000 080 86 090 9U — — — —
110,000 080 79 090 109 — —
115,000 100 105 090 105 — --
120,000 110 112 100 92 — — — —
122,000 — -- 100 90 — — — —
123,000 110 1Ш - -- -- — —
NOTES:
1. Numbers in parentheses are estimated values.
2. Wind data was taken by the Eniwetok weather station.
3- Tropopause height was 55,000 ft MSL.
П. The surface air pressure was 1U.66 psi, the temperature ЗО-б^С,
the dew point 73°F, and the relative humidity 63$.
220
77.5
H —Hour Н + 4 Н + 10
Figure 132- Hodographs for Operation HARDTACK I - Yellowwood.
221
OPERATION HARDTACK I
Magnolia
PPG Time GMT
DATE: 27 May 1958 26 May 1956
TIME: ОбОО 1800
Sponsor: LASL
SITE: PPG - Eniwetok - SW of
Yvonne, 3,000 ft from
the nearest edge of the
island
11° 32' 34" N
162° 21’ 14" E
Site elevation: Sea level
HEIGHT OF BURST: 13.88 ft
TYPE OF BURST AND PLACEMENT:
Surface burst from barge on
water
CLOUD TOP HEIGHT: 44,000 ft MSL
CLOUD BOTTOM HEIGHT: 15,000 ft :
REMARKS:
Only individual island dose rates are available. These were obtained
from helicopter surveys made by the Radiological Safety organization at
H+4 hours. The helicopter survey technique called for the pilot either
to land the aircraft at the desired spot, so that a ground reading
could be obtained, or to make a slow pass over the desired spot at an
elevation of 25 feet. Readings taken at 25 feet were multiplied by
a factor of 2 in order to obtain a reasonable approximation of the true
ground reading. The basic instrument used in the aerial surveys was
the AN/PDR-39 survey meter modified to read up to 500 r/hr. The t*1,2
decay approximation was used to extrapolate the H+4 hour dose-rate
readings to H+l hour.
222
Figure 133.
Operation HARDTACK I - Magnolia.
Island dose rates in r/hr at H+l hour.
223
TABLE 44 ENIWETOK WIND DATA FOR OPERATION HARDTACK I ~
MAGNOLIA
Altitude (MSL) H-hour H+6 hours II+ll hours
Dir Speed Dir ;'P'-ed Dir : peed
feet degrees mph degrees mph degrees mph
Surface 090 16 110 16 090 12
1,000 080 lh 100 16 080 lh
2,000 080 Ih 100 lh 100 09
3,000 090 lh 100 10 080 09
h,000 100 15 100 09 090 07
5,000 120 10 090 09 090 08
6,000 120 07 070 07 090 06
7,000 080 05 070 07 обо 03
8,000 070 08 070 09 020 Об
9,000 070 09 060 09 OhO Об
10,000 070 09 обо 09 O3O 03
12,000 060 09 ihO 03 260 03
ih,ooo OhO 12 110 Об 150 05
15,000 (OhO) (lh) (no) (07) (110) (05)
16,000 050 05 100 09 обо 05
18,000 100 09 190 09 080 09
20,000 130 09 090 12 070 12
23,000 090 16 070 lh 050 15
25,000 080 12 обо lh 020 13
30,000 060 31 обо 31 030 21
35,000 обо 25 OhO 20 030 23
ho,000 080 2h обо 30 050 25
U5,ooo 090 39 обо 22 020 18
50,000 OhO 2h 020 30 350 16
55,000 050 23 050 35 050 28
60,000 050 31 050 25 080 20
65,000 100 15 070 23 100 16
70,000 080 18 110 22 090 21
75,000 090 37 110 32 090 2h
80,000 090 h9 100 52 100 h8
85,000 090 71 100 6h 090 61
90,000 090 78 100 6h 090 69
91,000 090 78 ... . — ... —
95,000 ... .. 100 68 080 71
100,000 ... .. 100 69 080 6h
105,000 ... — . 100 80 ... —
110,000 ... — 100 99 ... --
113,000 — -- 100 101 —
NOTES:
1. Numbers in parentheses are estimated values.
2. Wind data was taken by the Eniwetok weather station.
3» Tropopause height was 5h,000 ft MSL.
h. The surface air pressure was lh-.бб psi, the temperature 26.8°C,
the dew point 72°F, and the relative humidity 76$.
224
SCALE
Figure 134. Hodographs for Operation HAFDTA.CK I
Magnolia.
225
OPERATION HARDTACK I
Tobacco
PPG Time GMT
DATE: 30 May 1956 30 May 1958
TIME: 1415 0215
Sponsor: LASL
SITE: PPG - Eniwetok - 3,000 ft
NW of Janet
11° 39' 48" N
162° 13' 48" E
Site elevation: Sea level
TYPE OF BURST AND PLACEMENT:
Surface burst from barge on
water
CLOUD TOP HEIGHT: 18,000 ft MSL
CLOUD BOTTOM HEIGHT: NM
REMARKS:
Only individual island dose rates are available. These were obtained
from helicopter surveys made by the Radiological Safety organization at
H+4 hours. The helicopter survey technique called for the pilot
either to land the aircraft at the desired spot, so that a ground
reading could be obtained, or to make a slow pass over the desired spot
at an elevation of 25 feet. Readings taken at 25 feet were multiplied
by a factor of 2 in order to obtain a reasonable approximation of the
true ground reading. The basic instrument used in the aerial surveys
was the AN/PDR-39 survey meter modified to read up to 500 r/hr. The
t-1 • 2 decay approximation was used to extrapolate the H+4 hour dose
rate readings to H+l hour.
226
GENE
STATUTE MILES
Figure 135.
Operation HARDTACK I - Tobacco.
Island dose rates in r/hr at H+l hour.
227
TAELE 45 ENIWETOK WIND DATA FOR OPERATION HARDTACK I -
TOBACCO
Altitude (MSL) H-l hour H+3:; hours H+9 \ hours
Dir Speed Dir Speed Dir Speed
feet degrees mph degrees mph degrees mph
Surface 080 14 080 23 120 28
1,000 080 24 080 26 090 24
2,000 080 36 080 29 100 28
3,000 090 21 090 29 no 30
4,000 090 16 090 26 120 25
5,000 090 14 100 22 130 22
6,000 090 17 100 22 140 22
7,000 090 22 110 21 140 26
8,000 100 21 no 16 130 29
9,000 110 18 110 16 120 32
10,000 130 20 110 20 no 33
12,000 140 14 120 09 100 29
14,000 130 10 130 07 120 19
15,000 (130) (11) (130) (06) (120) (13)
16,000 140 13 130 05 120 09
18,000 120 12 140 02 no 10
20,000 120 12 110 02 no 17
23,000 130 14 140 05 120 18
25,000 120 12 130 07 150 16
30,000 190 07 200 08 210 07
35,000 240 15 230 12 210 09
40,000 200 17 220 14 210 26
45,000 200 17 220 25 230 26
50,000 230 17 230 18 270 12
55,000 290 07 220 05 240 08
60,000 070 08 070 13 100 18
65,000 130 24 140 18 160 12
70,000 110 17 070 23 070 24
75,000 090 35 090 37 090 38
80,000 090 48 100 55 090 57
85,000 100 68 100 68 090 69
90,000 100 69 100 69 090 71
94,000 - -- — . ... -- 090 71
95,000 100 71 090 69 ... ..
100,000 100 77 090 69 ... —
105,000 100 72 100 76 ... --
110,000 090 77 ... —. .. . — “
118,000 090 95 ... — ... --
NOTES:
1. Numbers in parentheses are estimated values.
2. Wind data was taken by the Eniwetok weather station.
3. Tropopause height was 55,000 ft MSL.
4. The surface air pressure was 14.65 psi, the temperature 28.9°C,
the dew point 75°F, and the relative humidity 74^.
228
SCALE
Figure 136.
Hodographs for Operation HARDTACK I -
Tobacco.
229
OPERATION HARDTACK I
Sycamore
PPG Time СДОТ
EATE: 31 May 1958 31 May 195b
TIME: 1500 0300
Sponsor: UCRL
SITE: PPG - Bikini - SW of
Charlie 4,000 ft from
the nearest edge of the
island
11° 41’ 27" N
165° 16' 25" E
Site elevation: Sea level
HEIGHT OF BURST: 11.64 ft
TYPE OF BURST AND PLACEMENT:
Surface burst from barge on
water
CLOUD TOP HEIGHT: 46,000 ft MSL
CLOUD BOTTOM HEIGHT: NM
REMARKS:
Only individual island dose rates are available. These were obtained
from helicopter surveys made by the Radiological Safety organization
at H+4 hours. The helicopter survey technique called for the pilot
either to land the aircraft at the desired spot, so that a ground
reading could be obtained, or to make a slow pass over the desired
spot at an elevation of 25 feet. Readings taken at 25 feet were
multiplied by a factor of 2 in order to obtain a reasonable approximation
of the true ground reading. The basic instrument used in the aerial
surveys was the AN/PDR-39 survey meter modified to read up to 5^0 r/hr.
The t-1'2 decay approximation was used to extrapolate the H+4 hour
dose rate readings to H+l hour.
230
REEF--
25 TO 80
M BOAT
X 20
Figure 137. Operation HARDTACK I - Sycamore.
Island dose rates in r/hr at H+l hour.
TABLE 46 BIKINI WIND IATA FOR OPERATION HARDTACK I ~
SYCAMORE
Altitude (MSL) H-hour H+3 hours H+9 hours
Dlr Speed Dir Speed Dir Speed
feet degrees mph degrees mph degrees mph
Surface 090 12 100 17 070 21
1,000 110 22 090 21 080 22
2,000 100 23 090 22 080 24
3,000 110 28 090 24 080 25
4,000 110 24 100 23 090 23
5,000 110 18 110 22 080 18
6,000 110 14 110 18 090 15
7,000 100 17 110 18 100 15
8,000 100 07 100 18 100 15
9,000 110 14 100 17 090 20
10,000 120 14 110 16 110 14
12,000 120 16 110 16 130 16
14,000 080 15 090 13 100 17
15,000 (080) (13) (070) (13) (090) (15)
16,000 090 12 050 12 080 14
18,000 120 13 100 09 120 07
20,000 130 18 140 12 100 02
23,000 160 10 130 17 090 08
25,000 140 23 100 14 010 16
30,000 010 09 040 13 060 13
33,000 270 06 — . — -- —
34,000 — — - - - 120 10
35,000 (260). (12) 280 17 (140) (13)
40,000 220 26 230 23 230 23
45,000 230 24 (256) (17) 300 25
50,000 280 18 280 12 270 08
53,000 080 06 — - -
55,000 (150) (30) (080) (10) 060 16
57,000 100 35 — -- --- - -
60,000 120 26 120 22 100 20
65,000 080 16 — -- --
66,000 — — — 060 .30 • — — --
70,000 100 24 090 31 090 29
75,000 090 38 — - - - - - --
80,000 100 55 100 53 090 53
81,000 100 58 — — --- --
85,000 — -- — — — - - 090 41
90,000 — -- 090 59 080 75
91,000 ... — 090 59 ... ..
94,000 — -- — -- 080 68
NOTES:
1. Numbers in parentheses are estimated values.
2» Wind data was taken on board ship located within 30 nautical
miles of the Tower on Nan Island, Bikini Atoll.
3. Tropopause height was 55,000 ft MSL.
4. The surface air pregsure was 14.62 psi, the temperature 28.6°C,
the dew point 74l’F and the relative humidity 73$«
232
17.5
12.5
7.5'
2 5
32.5'
22.5
37 5
42 5
52 5
47.5
62.5'
575
H-Hour g
Figure 138. Hodographs for Operation HARDTACK I -
Sycamore.
233
OPERATION HARETACK I
Rose
PPG Time
DATE: 3 June 1958
TIME: 0645
GMT
2 June 1958
1845
Sponsor: LASL
SITE: PPG - Eniwetok - SW of
Yvonne 4,000 ft from the
nearest edge of the island
Site elevation:- Sea level
HEIGHT OF BURST: 15.43 ft
TYPE OF BURST AND PLACEMENT:
Surface burst from barge on
water
CLOUD TOP HEIGHT: 17,000 ft MSL
CLOUD BOTTOM HEIGHT: 5,000 ft MSL
REMARKS:
Only individual island dose rates are available. These were obtained
from helicopter surveys made by the Radiological Safety organization
at H+4 hours. The helicopter survey technique called for the pilot
either to land the aircraft at the desired spot, so that a ground
reading could be obtained, or to make a slow pass over the desired
spot at an elevation of 25 feet. Readings taken at 25 feet were
multiplied by a factor of 2.in order to obtain a reasonable approxi-
mation of the true ground reading. The basic instrument used in the
aerial surveys was the AN/PDR-39 survey meter modified to read up
to 500 r/hr. The t’1'2 decay approximation was used to extrapolate
the H+4 hour dose-rate readings to H+l hour.
234
Figure 139. Operation HARDTACK I -
Rose.
Island dose rates in r/hr at H+l hour.
235
TABLE 47 ENIWETOK WIND DATA FOR OPERATION HARDTACK I -
ROSE
Altitude (MSL) hour H +5 iiours
Dir Speed Dlr freed
feet degrees mph degrees mph
Surface 080 25 070 23
1,000 070 26 060 22
2,000 080 26 070 24
3,000 060 24 070 25
4,000 080 21 080 20
5,000 080 20 090 17
6,000 090 22 080 21
7,000 080 28 070 24
8,000 070 29 060 22
9,000 070 25 060 18
10,000 070 23 080 14
12,000 070 10 130 12
14,000 060 02 110 09
15,000 (070) (05) (no) (08)
16,000 080 07 120 07
18,000 110 12 120 13
20,000 130 09 130 17
23,000 100 22 100 15
25,000 100 24 100 23
30,000 090 15 090 21
35,000 140 09 090 15
40,000 180 29 130 24
45,000 160 21 160 34
50,000 240 07 090 09
55,000 обо 24 090 21
60,000 100 28 120 20
65,000 050 22 Обо 23
70,000 090 33 100 38
75,000 — — — -- 110 35
77,000 110 45 ... --
80,000 ... .. 110 43
85,000 ... " — 090 42
90,000 ... — 090 54
95,000 ... — 100 65
100,000 ... -- 100 76
105,000 ... — 100 84
110,000 ... .. 080 70
114,000 ... -- 110 76
NOTES:
1, Numbers in parentheses are estimated values.
2. Wind data was taken by the Eniwetok weather
station.
3. Tropopause height was 57,000 ft MSL.
4. The surface air pressure was 14.62 psi, the
temperature 27•2°C, the dew point 74° F, and
the relative humidity 79$<
236
27.5
27.5
022.5
175
12.5
7.5
022.5
0|7.5
12.5
SCALE
L75 1., I-J Ш
С 0 10 20 30
02.5
\ S
Н- ^Ноиг
miles
RiM rate! 5000ft/hr
Figure 140 .
Hodographs for Operation HARDTACK I -
Rose.
237
OPERATION HARDTACK I
Umbrella
PPG Time GMT
DATE: 9 June 195« 8 June 1958
TIME: 1115 2315
Sponsor: DOD
SITE: PPG - Eniwetok - NNE of
Henry
11° 22' 51" N
162° 13' 09" E
Site elevation: Sea level
Water depth: 150 ft
HEIGHT OF BURST: 150 ft underwater
TYPE OF BURST AND PLACEMENT:
Sub-surface burst on lagoon
bottom
REMARKS:
The pattern was obtained from a total of about 80 points which is
really too few to place much reliance on the rather pronounced lobing
of the downwind contours. “Nearly all of the total gamma dose occurred
within 25 minutes after zero time and was due to the passage of air-
borne radioactive material. Gamma doses in excess of 100г occurred
within the first 15 minutes at downwind distances less than 14,000 feet.
The residual field due to deposited radioactive material was relatively
insignificant, although radioactive foam may represent a radiological
hazard.11
238
Distance From GZ, Statute Miles
Figure 141 . Operation HARDTACK I - Umbrella. Idealized,
rate contours in r. (Contours represent cumulative
dose to 6 hours.)
239
TAELE 48 ENIWETOK WIND DATA FOR OPERATION HARDTACK I -
UMBRELLA
Altitude (MSL) hour h+8:,' hours
Dir Speed Dir Speed
feet degrees mph degrees mph
Surface обо 23 070 23
1,000 050 26 ... —
2,000 обо 24 ... --
3,000 070 24 ... — —
4,ooo 080 25 ... --
5,000 080 28 ... --
6,000 090 28 ... — —
7,000 100 21 ... --
8,000 100 17 ... — —
9,000 100 20 ... —
10,000 100 24 ... —
12,000 110 18 ... —
14,000 120 15 070 09
16,000 100 09 060 15
18,000 160 05 cBo 07
20,000 070 07 190 05
23,000 090 02 030 09
25,000 080 06 360 05
30,000 050 06 350 17
35,000 330 14 250 15
40,000 2б0 14 270 15
45,000 270 15 200 29
50,000 280 10 200 20
55,000 160 08 150 06
60,000 140 07 040 08
65,000 090 24 120 22
70,000 100 20 080 16
75,000 100 45 ... --
80,000 100 57 090 57
85,000 090 57 ... --
90,000 090 62 090 63
95,000 090 63 ... --
99,000 ... — — 090 56
100,000 090 60 ... — —
105,000 090 58 ... --
NOTES:
1. Wind data was taken hy the Eniwetok weather station.
2. Tropopause height was 5^,000 ft MSL.
3» The surface air pressure was 14.66 psi, the temperature
30°C, the dew point 72°F, and the relative humidity
63^.
240
7.5
Figure 142 . Hodograph for Operation HARDTACK I
Umbrella.
241
OPERATION HARDTACK I
Map Le
PPG Time GMT
EATE: 11 June 1958 10 June 1958
TIME: 0530 1730
Sponsor: UCRL
SITE: PPG - Bikini - South of
Fox
11° 41' 14" N
165° 241 54" E
Site elevation: Sea level
HEIGHT OF BURST: 11.58 ft
TYPE OF BURST AND PLACEMENT:
Surface burst from barge on
water
CLOUD TOP HEIGHT: 40,000 ft MSL
CLOUD BOTTOM HEIGHT: NM
REMARKS:
Only individual island dose rates are available. These were obtained
from Radiological Safety organization helicopter surveys at H+4 hours.
The helicopter survey technique called for the pilot either to land
the aircraft at the desired spot, so that a ground reading could be
obtained, or to make a slow pass over the desired spot at an elevation
of 25 feet. Readings taken at 25 feet were multiplied by a factor
of 2 in order to obtain a reasonable approximation of the true ground
reading. The basic instrument used in the aerial surveys was the
AN/PDR-39 survey meter modified to read up to 500 r/hr. The t-1,2
decay approximation was used to extrapolate the H+4 hour dose-rate
readings to H+l hour.
242
BIKINI ATOLL
TABLE 49 BIKINI WIND EATA FOR OPERATION HARDTACK I -
MAPLE
Altitude (MSL) II+4 hour H+6,-7 hours H+12I hours
Dir Speed Dir 3Peed Dir Speed
feet degrees mph degrees mph degrees mph
Surface 080 25 040 25 050 21
1,000 080 23 070 22 070 23
2,000 080 24 070 20 070 23
3,000 080 23 080 17 080 21
4,000 100 22 090 14 090 20
5,000 110 22 120 17 100 20
6,000 120 22 140 20 110 16
7,000 130 18 150 18 100 13
8,000 140 20 150 18 110 09
9,000 130 20 140 16 110 12
10,000 130 18 130 20 110 14
12,000 100 24 120 20 120 13
14,000 080 21 140 24 120 18
15,000 (080) (22) (140) (21) (130) (20)
16,000 080 24 140 18 130 20
18,000 140 29 120 24 150 13
20,000 140 28 130 26 130 15
23,000 130 21 140 15 120 20
25,000 190 10 190 08 330 18
30,000 270 20 280 09 280 18
35,000 250 38 (285) (17) (285) (17)
40,000 270 33 290 25 290 17
45,000 310 24 (315) (24) 350 26
50,000 330 20 340 23 350 24
54,000 070 03 ... — ... --
55,000 (080) (06) (350) (06) (250) (07)
56,000 _ — — . — 350 02 230 07
60,000 100 14 130 13 360 08
63,000 — — — ... -- 100 22
65,000 070 33 ... -- ... --
70,000 090 21 090 25 080 24
75,000 090 32 ... — ... — —
80,000 090 58 090 56 090 60
83,000 ... .. ... — 100 61
84,000 ... .. 090 56 ... — —
85,000 090 69 ... -- ... — —
90,000 090 79 — -- ... --
1. Numbers in parentheses are estimated values.
2. Wind data was taken on board ship located within 30 nautical
miles of the Tower at Nan, Bikini Atoll.
3« Tropopause height was 53,000 ft MSL.
4. The surface air pressure was 14.66 psi, the temperature
27.0°C, the dew point 7U°F, and the relative humidity 81^.
244
22 5
275
Figure 144
Hodographs for Operation HARDTACK I -
Maple
245
OPERATION HARDTACK I
Aspen
PPG Time GMT
DATE: 15 June 1958 14 June 1958
TIME: O53O 1730
Sponsor: UCRL
SITE; PPG - Bikini - SW of
Charlie 4,000 ft from
the island
11° 41' 27" N
1650 16' 24" E
Site elevation.: Sea level
HEIGHT OF BURST: 10.82 ft
CLOUD TOP HEIGHT: 48,600 ft
CLOUD BOTTOM HEIGHT: NM
TYPE OF BURST AND PLACEMENT:
Surface burst from barge on
water
REMARKS:
Only individual island dose rates are available. These were obtained
from Radiological Safety organization helicopter surveys at H+4 hours.
The helicopter survey technique called for the pilot either to land
the aircraft at the desired spot, so that a ground reading could be
obtained, or to make a slow pass over the desired spot at an elevation
of 25 feet. Readings taken at 25 feet were multiplied by a factor
of 2 in order to obtain a reasonable approximation of the true ground
reading. The basic instrument used in the aerial surveys was the
AN/PDR-39 survey meter modified to read up to 500 r/hr. The t -1’2
decay approximation was used to extrapolate the H+4 hour dose rate
readings to H+l hour.
246
247
0 1 2 3 4 5
STATUTE MILES
Figure 145. Operation HARDTACK - Aspen.
Island dose rates in r/hr at H+l hour.
TABLE 50 BIKINI WIND IATA FOR OPERATION HARDTACK I -
ASPEN
Altitude (MSL) H+A hour H+9u hours Н+12/ hours
'Dir f Speed Dir Speed Dir Speed
feet degrees raph degrees mph degrees mpn
Surface 050 21 Обо 21 Обо 23
1,000 070 22 060 22 070 2U
2,000 080 21 Обо 22 070 2U
3,000 090 21 070 22 070 22
U,000 090 21 090 2U 070 2U
5,000 090 20 090 25 070 2U
6,000 100 22 ... . . 090 22
7,000 110 22 ... -- 090 12
8,000 110 22 ... • — 080 23
9,000 120 23 100 22 080 21
10,000 110 1U 100 22 080 17
12,000 110 16 100 13 090 17
11,000 120 10 110 15 090 15
15,000 (no) (12) (110) (16) (090) (16)
16,000 110 13 no 17 090 18
18,000 120 13 no 15 090 17
20,000 120 13 120 18 090 17
23,000 1U0 21 120 17 100 15
25,000 150 23 130 21 120 18
30,000 160 26 1U0 23 130 23
35,000 170 29 (ПО) (26) (150) (2U)
37,000 — — — . . 1U0 28 ...
10,000 150 26 200 33 170 25
HU,000 . . ... 180 U6
U5,000 160 23 ... .. ... --
50,000 190 30 190 28 200 20
5^,000 100 1U ... .. ... — .
55,000 (110) (13) (110) (18) (150) (12)
56,000 — — — -- ... — . no 10
57,000 ... - . 070 15 ... --
60,000 150 08 060 17 100 20
62,000 060 20 ... . . ... . “
6h,000 ... . . ... .. no 08
66,000 ... — . 120 38 ... --
70,000 090 29 090 23 060 23
73,000 ... . . Обо U5 ... --
78,000 ... “ . ... — . 080 U8
89,000 ... -- . .. -- no 57
1. Numbers in parentheses are estimated values.
2. Wind data was taken on board ship located within 30 nautical
miles of the Tower at Nan, Bikini Atoll.
3. Tropopause height was 52,000 ft MSL.
Й. The surface air pressure was 1U.66 psi, the temperature 27.U°C,
the dew point 7U°F, and the relative humidity 78$.
248
Figure 146 . Hodographs for Operation HARDTACK I -
Aspen.
249
OPERATION HARDTACK I
Walnut
PPG Time GMT
EATE: 15 Jun 1958 1^ Jun 1958
TIME: 0630 1830
CLOUD TOP HEIGHT: 61,000 ft MSL
CLOUD BOTTOM HEIGHT: NM
Sponsor: LASL
SITE: PPG - Eniwetok - 5,000 ft
SW of Janet
11° 39' 37" N
162° 13' 31" E
Site elevation: Sea level
HEIGHT OF BURST: 7.21 ft
TYPE OF BURST AND PLACEMENT:
Surface burst from barge
on water
REMARKS:
Only individual island dose rates are available. These were obtained
from Radiological Safety organization helicopter surveys at H+I hours.
The helicopter survey technique called for the pilot either to land
the aircraft at the desired spot, so that a ground reading could be
obtained, or to make a slow pass over the desired spot at an elevation
of 25 feet. Readings taken at 25 feet were multiplied by a factor of
2 in order to obtain a reasonable approximation of the true ground
reading. The basic instrument used in the aerial surveys was the
AN/PDR-39 survey meter modified to read up to 5СЮ r/hr. The f1’2,
decay approximation was used to extrapolate the H+I hour dose-rate
readings to H+l hour.
250
Figure 147.
Operation HARDTACK I - Walnut.
Island dose rates in r/hr at H+l hour.
251
TABLE 51 ENIWETOK WIND DATA FOR HARDTACK I-
WALNUT
Altitude (MSL) hour !I+52 hours H+10;7 hours
Dir Speed Dir . .Sj^ed Dir Speed
feet degrees mph degrees mph degrees mph
Surface 070 16 100 17 080 17
1,000 070 22 070 25 060 17
2,000 080 22 080 20 070 21
3,000 090 22 100 20 080 21
U,000 090 22 100 20 090 21
5,000 090 20 100 18 090 2U
6,000 090 17 110 21 090 26
7,000 090 15 110 21 090 2U
8,000 090 15 110 17 100 20
9,000 100 15 110 1U 100 16
10,000 100 15 100 15 120 17
12,000 090 15 120 10 090 12
1U,OOO 110 17 110 08 110 07
15,000 (no) (20) (120) (09) (no) (08)
16,000 110 23 130 12 no 09
18,000 110 23 120 22 120 15
20,000 110 21 130 20 120 1U
23,000 150 1U 110 07 130 1U
25,000 200 13 130 07 1U0 18
30,000 180 29 160 1U 170 2U
35,000 190 2U 160 29 (170) (26)
U0,000 210 26 160 28 170 28
45,000 150 16 160 26 170 ^5
50,000 1U0 16 180 30 210 28
55,000 110 09 170 06 - - - - -
57,000 — — — .. ... -- 050 15
60,000 080 20 080 17 090 20
65,000 100 26 no 30 (090) (23)
70,000 090 29 090 28 080 28
75,000 090 U8 090 39 (080) (38)
80,000 090 57 090 53 090 59
85,000 090 69 090 69 ... --
90,000 090 73 100 76 080 51*
9U,000 090 73 ... — . ... --
95,000 ... -- 100 77 . — . --
100,000 ... -- 100 90 090 83
105,000 ... -- 090 9U 090 78
NOTES:
1. Numbers in parentheses are estimated values.
2. Wind data was taken by the Eniwetok weather station.
3. Tropepause height was 5^,000 ft MSL.
4. The surface air pressure was 1^.66 psi, the temperature 27.1°C
the dew point 76°F, and the relative humidity 8U$.
252
253
H-J^Hour H+5kz Н + 10к2
(n)
SCALE
11И I I 11 I t tiJ
0 20 40 60
MILES
Rise rote 5000ft/hr
Figure 148. Hodographs for Operation HARDTACK I - Walnut.
OPERATION HARDTACK I
Linden
PPG Time GMT
DATE: 18 Jun 1958 18 Jun 1958
TIME: 1500 0300
Sponsor: LASL
SITE: PPG - Eniwetok - West of
Yvonne, 4,000 ft from
the island
11° 321 39" N
162° 211 23" E
Site elevation: Sea level
Water depth; 33 ft
HEIGHT OF BURST: 8.25 ft
TYPE OF BURST AND PLACEMENT:
Surface burst from barge on
water
CLOUD TOP HEIGHT: 20,000 ft MSL
CLOUD BOTTOM HEIGHT: NM
REMARKS:
Only individual island dose rates are available. These were obtained
from helicopter surveys made by the Radiological Safety organization
at H+4 hours. The helicopter survey technique called for the pilot
either to land the aircraft at the desired spot, so that a ground
reading could be obtained, or to make a slow pass over the desired
spot at an elevation of 25 feet. Readings taken at 25 feet were
multiplied by a factor of 2 in order to obtain a reasonable approxi-
mation of the true ground reading. The basic instrument used in
the aerial surveys was the AN/PDR-39 survey meter modified to read up
to 500 r/hr. The t*1'2 decay approximation was used to extrapolate
the H+4 hour dose-rate readings to H+l hour.
254
GENE
STATUTE MILES
Figure 149 .
Operation HARDTACK I - Linden.
Island dose rates in r/hr at H+L hour.
255
TABLE 52 ENIWETOK WIND DATA FOR OPERATION HARDTACK I
LINDEN
Altitude (MSI,) H-hour H+3 hours H+9 hours
Dir Speed Dir Speed Dir Speed
feet degrees mph degrees mph degrees mph
Surface 110 18 110 18 070 16
1,000 090 17 080 14 — - .
2,000 100 14 080 15 — - .
3,000 120 12 090 12 — _
4,000 120 12 110 09 . “ .
5,000 120 09 110 10 . -
6,000 120 09 110 08 “ “ — --
7,000 120 05 100 07 --- — .
8,000 120 05 100 05 — — — — .
9,000 110 07 080 07 — — —
10,000 100 15 090 09 -- - . —
12,000 110 14 110 12 . “ — . —
14,000 140 12 120 09 ..
15,000 (130) (14) (120) (12) (120) (14)
16,000 130 17 130 14 120 14
18,000 110 24 110 25 130 18
20,000 100 20 110 23 120 16
23,000 100 16 100 12 130 10
25,000 140 13 140 13 140 07
30,000 Обо 15 070 13 080 07
35,000 070 25 . — — “ — 040 12
40,000 320 07 010 14 320 13
41,000 — •- — -- 290 17 — •“ .
45,000 340 13 “ . . -- 340 22
50,000 030 07 010 07 060 07
55,000 120 15 140 13 200 14
60,000 100 16 090 09 090 23
65,000 090 37 — — — — — 090 26
70,000 100 38 100 33 “ . — . —
75,000 120 40 •- . — .. — .
80,000 100 48 100 52 . — . . .
85,000 090 63 ... — — — “ “ . —
90,000 090 69 090 74 — .. — .
95,000 090 85 — __ ---
100,000 . 100 110 100 95 ...
NOTES;
1. Numbers in parentheses are estimated values.
2. Wind data was taken by the Eniwetok weather station.
3- Tropopause height was 54,000 ft MSL.
4. The surface air pressure was 14.65 psi, the temperature 31*2°C,
the dew point 77«5O°F, and the relative humidity 71$.
256
SCALE
L, I , I , I
0 10 20 30
257
OPERATION HARDTACK I
Redwood
PPG Time
DATE: 28 Jun 1958
TIME: 0530
GMT
27 Jun 1958
1730
Sponsor: UCRL
SITE: PPG - Bikini South of Fox
11° 41' 14" N
165° 241 54" E
Site elevation: Sea level
HEIGHT OF BURST: 10.79 ft
TYPE OF BURST AND PLACEMENT:
Surface burst from barge on
water
CLOUD TOP HEIGHT: 51,000 ft MSL
CLOUD BOTTOM HEIGHT: 28,000 ft MSL
REMARKS:
Only individual island dose rates are available. These were obtained
from Radiological Safety organization helicopter surveys at H+4 hours.
The helicopter survey technique called for the pilot either to land
the aircraft at the desired spot, so that a ground reading could be
obtained, or to make a slow pass over the desired spot at an elevation
of 25 feet. Readings taken at 25 feet were multiplied by a factor of 2
in order to obtain a reasonable approximation of the true ground reading.
The basic instrument used in the aerial surveys was the AN/PDR-39 survey
meter modified to read up to 500 r/hr. The t-1•2 decay approximation
was used to extrapolate the H+4 hour dose-rate readings to H+l hour.
25 8
259
TABLE 53 BIKINI WIND IATA FOR OPERATION HARDTACK I -
REDWOOD
Altitude (MSL) II+u hour H+9?- hours H+124 hours
Dir Speed Dir Speed Dir Speed
feet degrees mph degrees mph degrees mph
Surface 070 23 080 23 090 25
1,000 070 23 090 29 090 33
2,000 070 25 080 29 100 29
3,000 070 23 090 28 100 24
4,000 070 20 090 26 100 12
5,000 080 18 100 23 110 17
6,000 100 21 100 22 110 16
7,000 100 22 110 22 110 23
8,000 110 22 120 20 110 25
9,000 110 23 110 18 110 28
10,000 110 23 120 20 110 24
12,000 110 21 110 20 120 25
14,000 110 20 120 21 100 24
15,000 (110) (18) (HO) (21) (100) (25)
16,000 100 18 110 21 100 26
18,000 090 16 120 25 120 29
20,000 100 18 110 21 110 23
23,000 080 12 100 22 130 20
25,000 140 12 100 28 140 23
30,000 070 06 _ _ — — — 120 23
35,000 180 08 _ _ — — 140 07
40,000 170 16 — — — 190 07
45,000 210 26 — — — 220 09
50,000 230 24 — •- — — o4o 16
55,000 310 07 - — 140 18
60,000 130 08 — •- — — 080 28
65,000 — — •- — — •“ - - 090 41
70,000 _ _ — — — — _ — 100 54
72,000 — -- - - — - — 110 46
NOTES:
1. Numbers in parentheses are estimated values.
2. Wind data was taken on board ship within 30 nautical miles
of the tower at Nan Island, Bikini Atoll.
3. Tropopause height was 52,000 ft MSL.
4. The surface air pressure was 14.65 psi, the temperature 27.3°C,
the dew point t8.5°F, and the relative humidity 92^.
260
67.50
Figure 152 . Hodographs for Operation HARDTACK I - Redvood.
261
OPERATION HARDTACK I
Elder
DATE:
TIME:
PPG Time
28 June 1958
O63O
GMT
27 June 1958
I83O
Sponsor: LASL
SITE: PPG - Eniwetok - SW of
Janet 4,000 ft to
nearest edge of island
11° 39' 48" N
162° 13' 48" E
Site elevation: Sea level
HEIGHT OF BURST: 9-17 ft
CLOUD TOP HEIGHT: 50,000 ft MSL
CLOUD BOTTOM HEIGHT: NM
TYPE OF BURST AND PLACEMENT:
Surface burst from barge on
water-
REMARKS:
Only individual island dose rates are available. These were obtained
from Radiological Safety organization helicopter surveys at H+4 hours.
The helicopter survey technique called for the pilot either to land
the aircraft at the desired spot, so that a ground reading could be
obtained, or to make a slow pass over the desired spot at an elevation
of 25 feet. Readings taken at 25 feet were multiplied by a factor of 2
in order to obtain a reasonable approximation of the true ground
reading. The basic instrument used in the aerial surveys was the AN/PDR-39
survey meter modified to read up to 500 r/hr. The t'2 decay approxi-
mation was used to extrapolate the H+4 hour dose-rate readings to H+l.
hour.
262
GENE
Figure 153 .
Operation HARDTACK I - Elder.
Island dose rates in r/hr at H+l hour.
263
TABLE 54 ENIWETOK WIND DATA FOR OPERATION HARDTACK I -
ELDER
Altitude (MSL) H->- hour H+5'2 hours H+l11 hours
Dir Speed Dir Speed Dir Speed
feet degrees mph degrees mph degrees mph
Surface 080 21+ 090 17 100 16
1,000 070 26 070 23 100 26
2,000 070 26 090 21+ 100 26
3,000 080 21+ 100 21+ 100 26
4,000 090 22 100 22 100 26
5,000 090 22 100 21+ 100 26
6,000 100 22 110 28 100 26
7,000 120 23 110 23 100 26
8,000 130 21 110 22 100 26
9,000 130 22 100 21+ 100 30
10,000 120 20 110 26 100 31
12,000 090 20 100 22 100 26
U+,000 090 18 100 22 100 26
15,000 (100) (17) (100) (22) (100) (16)
16,000 110 16 100 22 100 06
18,000 120 13 120 22 080 33
20,000 110 16 120 22 (060) (20)
23,000 110 16 120 17 100 18
25,000 090 15 100 11+ 110 23
30,000 230 16 180 21 ll+o 28
34,000 — _ — — 160 38 — — —
35,000 190 33 (160) (37) ll+o 31
1+0,000 180 47 160 29 190 26
1+5,000 180 23 (220) (21) 21+0 07
50,000 180 23 280 13 150 13
53,000 — — — 180 13 — — — — —
55,000 120 13 (160) (14) 270 30
60,000 100 26 100 18 110 23
65,ooo 100 28 _ — — — 090 47
70,000 060 1+6 100 1+8 090 56
75,000 100 1+7 _ — — — 090 56
80,000 090 61 090 62 090 61
85,ooo 090 67 — — 090 74
90,000 090 93 100 87 090 87
95,000 090 90 — _ _ — — 090 90
100,000 — — “ 100 105 — _ _ — —
105,ooo — — — 100 117 — — — — —
110,000 _ _ — -- 100 107 — — —
116,000 — -- 100 90 - — — —
NOTES: 1. Numbers in parentheses 2. Wind data was taken by are estimated values, the Eniwetok weather station.
3. Trop opai1 s e hie 1 g 4. The curthee n i.r ;ht was 52,000 ft MSL. pressure was lU.63 psi, the temperature 27.4°C, the
doi point 74°F, and the relative humidity 78$.
264
77.5
72.5
67.5
Figure 154 .
Hodographs for Operation HARDTACK I -
Elder.
265
OPERATION HARDTACK I -
Oak
PPG Time GMT
DATE: 29 June 1958 28 June 1958
TIME: 0730 1930
TOTAL YIELD: 8.9 Mt
Sponsor: LASL
FIREBALL DATA:
Time to 1st minimum: NM
Time to 2nd maximum: 2.98 sec
Radius at 2nd maximum: NM
SITE: PPG - Eniwetok - 3 mi
SW of Alice
11° 36' 28" N
162° 06' 28" E
Site elevation: Sea level
Water depth: 13 ft
HEIGHT OF BURST: 6.5 ft
CRATER DATA:
Diameter: E,EOO ft
Depth: 183 ft
TYPE OF BURST AND PLACEMENT:
Surface burst from oarge on
water
CLOUD TOP HEIGHT: 78,000 ft MSL
CLOUD BOTTOM HEIGHT: NM
REMARKS:
Only individual island dose rates are available. These were obtained
from Radiological Safety organization helicopter surveys at H+U hours.
The helicopter survey technique called for the pilot either to land the
aircraft at. a desired spot, so that a ground reading could be obtained
or to make a slow pass over the desired spot at an elevation of 25 feet.
Readings taken at 25 feet were multiplied by a factor of 2 in order to
obtain a reasonable approximation of the true ground reading. The basic
instrument used in the aerial surveys was the AN/PDR-39 survey meter
modified to read up to 500 r/hr. The t'2 decay approximation was
used to extrapolate the Н+Ц hour dose-rate readings to H+l hour.
266
Figure 155.
Operation HARDTACK I - Oak.
Island dose rates in r/hr at H+l hour.
267
TABLE 55 ENIWETOK WIND DATA FOR OPERATION HARDTACK I -
OAK
Altitude (MSL) II+>- hour H+4> hours H+94 hours
Dir Speed Dir .. Speed . Dir Speed
feet degrees mph degrees mph degrees mph
Surface 120 16 090 12 100 22
1,000 090 22 080 17 100 30
2,000 100 24 080 22 100 30
3,000 100 24 080 22 100 28
4,000 100 24 090 20 100 60
5,000 110 22 100 20 100 23
6,000 110 20 110 17 100 16
7,000 120 20 120 17 100 18
8,000 120 20 130 17 100 18
9,000 130 18 130 17 100 17
10,000 140 17 130 17 100 13
12,000 150 16 130 18 120 13
14,000 130 18 150 22 130 12
15,000 (130) (17) (150) (21) (130) (09)
16,000 130 17 150 20 130 07
18,000 130 17 150 20 130 07
20,000 130 18 160 20 200 05
23,000 140 17 160 26 170 12
25,000 140 22 150 23 170 12
30,000 140 16 140 20 190 09
35,000 e “ — ж 140 16 160 10
40,000 120 20 110 16 100 16
44,000 обо 14 » — M -- e “ •* - -
45,000 (070) (14) 090 18 080 17
50,000 090 13 160 21 140 08
55,000 (100) (12) 070 08 040 12
57,000 110 12 e “ “ -- --- —
60,000 e — -- 080 31 080 30
65,000 — — •- — 090 33 100 35
70,000 e — •“ — — 090 ^3 090 41
75,000 M “ •- — — 090 56 090 54
80,000 M •- — — 100 67 100 67
85,000 e “ — — 100 97 090 78
90,000 — — — — — 090 72 090 84
91,000 — — “ — — 090 73 --- --
95,000 — — “ -- •- — •- -- 090 82
100,000 — — — -- “ — •- — “ 090 95
105,000 — _ — -- -- 100 106
110,000 м a> •- — ж -- 100 115
114,000 - -- --- 090 121
NOTES;
1. Numbers in parentheses are estimated values.
2. Wind data vias taken by the Enivietok weather station.
3» Tropopause height was 50,000 ft MSL.
4. The surface air pressure was 14.64 psi, the temperature 27«3°C
the dew point 76.5° F, and the relative humidity 8?$.
268
0 92.5
Q92.5
Figure 156.
Hodographs for Operation HARDTACK I -
Oak
269
OPERATION HARDTACK I
Hickory
PPG Time GMT Sponsor: UCRL
DATE: TIME: 29 June 1958 1200 29 June 1958 2400 SITE: PPG end 11° 165° - Bikini - Off west of Tare 291 46" N 221 15" E
Site elevation: Sea level
HEIGHT OF BURST: 12.11 ft
TYPE OF BURST AND PLACEMENT:
Surface burst from. barge on
CLOUD TOP HEIGHT: 2b,000 ft MSL water
CLOUD BOTTOM EIGHT: 12,000 ft MSL
CRATER DATA: Not available
REMARKS:
Only individual island dose rates are available. These were obtained
from helicopter surveys made by the Radiological Safety organization at
H+4 hours. The helicopter survey technique called for the pilot either
to land the aircraft at the desired spot, so that a ground reading could
be obtained, or to make a slow pass over the desired spot at an elevation
of 25 feet. Readings taken at 25 feet were multiplied by a factor of 2
in order to obtain a reasonaole approximation of the true ground reading.
The basic instrument used in the aerial surveys was the AN/PDR-39 survey
meter modified to read up to 500 r/hr. The t'1’2 decay approximation
was used to extrapolate the H+4 hour dose-rate readings to H+l hour.
270
271
Figure 157. Operation HARDTACK I - Hickory.
Island dose rates in r/hr at H+l hour.
TABLE 56 BIKINI WIND DATA FOR OPERATION HARDTACK I -
HICKORY
Altitude (MSL) H-hour H+6 hours H+12 hours
Dir Speed Dir £ Speed Dir Speed
feet degrees mph degrees mph degrees mph
Surface 090 09 050 23 080 17
1,000 080 23 080 28 080 22
2,000 080 23 080 36 080 24
3,000 080 24 080 36 080 23
4,000 090 fe4 090 16 080 21
5,000 090 24 090 31 070 20
6,000 090 21 080 29 060 21
7,000 090 22 090 24 060 21
8,000 090 20 090 22 070 18
9,000 090 17 080 15 090 21
10,000 100 18 070 12 090 20
12,000 100 14 050 13 070 21
14,000 110 15 070 14 070 21
15,000 (100) (17) (070) (10) (070) (21)
16,000 100 20 060 08 070 21
18,000 110 21 o4o 15 060 23
20,000 110 12 o4o 16 030 15
23,000 100 09 030 06 o4o 09
25,000 060 Об — -- 010 16
30,000 Calm Calm 010 07 050 03
35,000 160 08 100 08 110 12
40,000 - — — 110 09 070 08
45,000 - — - - o4o 20 020 14
50,000 — •- — i4o 10 060 03
55,000 --- - - 350 12 350 28
60,000 - - - 070 4o 080 35
65,000 - - - - - 120 25 090 18
70,000 •- •- •- - - 070 41 080 62
72,000 - - - -- 060 41 — — — --
1. Numbers in parentheses are estimated values.
2. Wind data was taken on board ship within 30 nautical miles of
the tower at Nan Island, Bikini Atoll.
3. Tropopause height was 51,000 ft MSL.
4. The surface air pressure was 14.65 psi, the temperature 27«8°C,
the .dew point 81.3°F, and the relative humidity 84$.
272
SCALE
h I ! I I I
C 10 20 30
miles
Rise rate: 5000ft/hr
Figure 158. Hodographs for Operation HARDTACK I - Hickory.
273
OPERATION HARDTACK I
Sequoia
PPG Time GMT
DATE: 2 July 195& 1 July 1958
TIME: ОбЗО 1830
CLOUD TOP HEIGHT: 17,000 ft MSL
CLOUD BOTTOM HEIGHT: NM
Sponsor: LASL
SITE: PPG - Eniwetok - j mi
west of Yvonne
11° 321 39" N
162° 211 23" E'
Site elevation: Sea level
HEIGHT OF BURST: 6.5 ft
TYPE OF BURST AND PLACEMENT:
Surface burst from barge
on water
REMARKS:
Only individual island dose rates are available. These were obtained
from Radiological Safety organization helicopter surveys at H+L hours.
The helicopter survey technique called for the pilot either to land
the aircraft at the desired spot, so that a ground reading could be
obtained, or to make a slow pass over the desired spot at an elevation
of 25 feet. Readings taken at 25 feet were multiplied by a factor
of 2 in order to obtain a reasonable approximation of the true ground
reading. The basic instrument used in the aerial surveys was the
AN/PDR-39 survey meter modified to read up to 500 r/hr. The t-1,2
decay approximation was used to extrapolate the H+4 hour dose-rate
readings to H+l hour.
274
GENE
Figure 159. Operation HARDTACK I - Sequoia.
Island dose rates in r/hr at H+l hour.
275
TABLE 57 ENIWETOK WIND DATA FOR OPERATION HARDTACK 1 -
SEQUOIA
Altitude (MSL) M hour H+5,1 hours H+lO-i hours
Dir Speed Dir Speed Dir Speed
feet degrees mph degrees mph degrees mph
Surface 100 14 080 18 090 18
1,000 090 20 090 18 090 23
2,000 090 22 090 22 090 24
3,000 100 22 100 22 090 24
4,000 100 26 100 22 090 23
5,000 100 23 100 24 090 22
6,000 100 22 100 20 100 20
7,000 100 22 090 17 100 17
8,000 100 25 100 15 100 15
9,000 100 21 110 14 100 14
10,000 100 18 110 16 100 16
12,000 110 20 110 16 090 15
14,000 130 15 130 14 130 08
15,000 (120) (13) (130) (13) (130) (09)
16,000 120 10 130 13 130 12
18,000 050 07 100 13 120 10
20,000 040 13 080 09 130 05
23,000 010 23 010 18 040 16
25,000 3U0 18 340 22 020 07
30,000 010 15 030 10 320 09
35,000 020 18 020 18 020 07
йо,ооо 010 28 ЗбО 21 010 17
1+5,000 020 36 010 29 010 21
50,000 270 26 340 22 300 17
55,000 010 18 310 12 050 08
60,000 080 14 100 22 110 18
65,000 100 28 100 30 080 29
70,000 090 39 090 45 090 48
75,000 100 55 100 47 100 57
80,000 090 56 090 54 090 67
85,000 100 72 100 70 090 75
90,000 090 68 100 80 090 76
95,000 090 90 090 90 090 83
100,000 090 98 ... -- 090 100
105,000 100 98 ... -- 090 109
110,000 ... .. ... -- 090 79
112,000 ... -- ... -- 100 82
NOTES:
1. Numbers in parentheses are estimated values.
2. Wind data vas taken by the Eniwetok veather station.
3. Tropopause height was 52,000 ft MSL.
5. The surface air pressure was 1^.61 psi, the temperature 27.2°C,
the dev point 83.5° F, and the relative humidity 76$.
276
SCALE
О |O 20 30
miles
Rise rote: 5000 ft/hr
Figure 160 . Hodographs for Operation HARDTACK I
Sequoia.
277
OPERATION HARDTACK I
Cedar
PPG Time
DATE: 3 July 1958
TIME: 0530
GMT
2 July 199B
1730
Sponsor: UCRL
SITE: PPG - Bikini - SW of
Charlie, 4,000 ft from
the island
Site elevation: Sea level
HEIGHT OF BURST: 10..84 ft
TYPE OF BURST AND PLACEMENT:
Surface burst from barge
on- water
CLOUD TOP HEIGHT: 50,000 ft MSL
CLOUD BOTTOM HEIGHT: 35,000 ft MSL
REMARKS:
Only individual island dose rates are available. These were obtained
from Radiological Safety organization helicopter surveys at H+4 hours.
The helicopter survey technique called for the pilot either to land the
aircraft at the desired spot, so that a ground reading could be obtained,
or to make a slow pass over the desired spot at an elevation of 25
feet. Readings taken at 25 feet were multiplied by a factor of 2 in
order to obtain a reasonable approximation of the true ground reading.
The basic instrument used in the aerial surveys was the AN/PDR-39
survey meter modified to read up to 5СЮ r/hr. The t'1"2 decay
approximation was used to extrapolate the H+4 hour dose-rate readings
to H+l hour.
278
279
BIKINI ATOLL
STATUTE MILES
Figure 161 . Operation HARDTACK I - Cedar.
Island dose rates in r/hr at H+l hour.
TABLE 5 8 BIKINI WIND DATA FOR OPERATION HARDTACK I ~
CEDAR
Altitude H+>- hour H+6 r - - -c— hours H+97 hours
(MSL) Dir : Speed Dir Speed Dir Sneed - ±
feet degrees mph degrees , mph degrees mph
Surface 080 18 090 16 090 18
1,000 090 26 110 17 080 22
2,000 100 29 100 23 090 25
3,000 110 30 080 28 090 26
4,000 110 29 100 25 100 28
5,000 110 28 090 25 100 26
6,000 110 24 080 24 100 25
7,000 100 24 080 23 070 24
8,000 100 25 080 28 100 22
9,000 100 21 090 30 110 26
10,000 090 20 090 30 100 28
12,000 080 16 090 21 120 21
14,000 обо 13 070 21 080 21
15,000 (040) (13) (070) (20) (090) (20)
16,000 030 13 070 20 100 20
18,000 350 03 050 17 060 13
20,000 270 12 Calm Ca Im 340 05
23,000 270 15 Calm Calm 340 08
25,000 (250) (16) 280 10 300 07
30,000 230 21 240 17 220 16
35,000 200 33 210 25 210 47
40,000 210 40 210 47 220 53
45,000 250 47 240 39 220 38
50,000 250 28 220 46 230 41
53,000 — -- 240 38 — --
55,000 260 20 — 290 09
60,000 090 22 — 100 26
65,ooo 080 28 — -- 100 31
1. Numbers in parentheses are estimated values.
2. Wind data was taken on board ship within 30 nautical miles
of the Tower at Nan island, Bikini Atoll.
3. Tropopause height was 51,000 ft MSL.
4. The surface air pressure was 14.65 psi, the temperature 28.4°C,
the dew point 76.3°?, and the relative humidity
280
281
OPERATION HARDTACK I
Dogwood
PPG Time
DATE: 6 July 1958
TIME: ОбЗО
GMT
5 July 1958
183O
CLOUD TOP HEIGHT: 58,000 ft MSL
CLOUD BOTTOM IEIGHT: 35,000 ft MSL
Sponsor: UCRL
SITE: PPG - Eniwetok - SW of
Janet 4,000 ft to nearest
edge of island (Sta. 1312)
11° 391 48" n
162° 13' 48" E
HEIGHT OF BURST: 12.25 ft
TYPE OF BURST AND PLACEMENT:
Surface burst from barge
on water
REMARKS:
Only individual island dose rates are available. These were obtained
from Radiological Safety organization helicopter surveys at H+4 hours.
The helicopter survey technique called for the pilot either to land
the aircraft at the desired spot, so that a ground reading could be
obtained, or to make a slow pass over the desired spot at an elevation
of 25 feet. Readings taken at 25 feet were multiplied by a factor
of 2 in order to obtain a reasonable approximation of the true
ground reading. The basic instrument used in the aerial surveys
was the AN/PDR-39 survey meter modified to read up to 50D r/hr. The
t-1 • 2 decay approximation was used to extrapolate the H+4 hour dose-
rate readings to H+l hour.
282
GENE
Figure 163. Operation HABDPACK I -
Dogwood.
Island dose rates in r/hr at H+l hour.
283
TABLE 59 ENIWETOK WIND DATA FOR OPERATION HARDTACK I-
DOGWOOD
Altitude (MSL) h-> hour H+57 hours h+BV hours
Dir Speed Dir Speed Dir Speed
feet degrees mph degrees mph degrees mph
Surface 090 18 090 18 080 16
1,000 080 20 080 17 080 16
2,000 080 24 090 20 070 18
3,000 090 25 100 17 070 21
4,000 090 24 100 15 080 21
5,000 090 20 100 15 080 16
6,000 090 17 100 15 090 14
7,000 080 20 100 14 090 15
8,000 080 17 080 14 090 15
9,000 070 18 080 17 080 14
10,000 080 20 090 17 090 14
12,000 100 16 090 18 100 14
14,000 100 14 100 20 120 17
15,000 (100) (17) (100) (20) (130) (16)
16,000 100 21 110 22 150 15
18,000 100 22 110 21 120 22
20,000 100 18 110 17 120 20
23,000 100 12 100 23 110 26
25,000 100 12 090 24 100 29
30,000 120 21 080 30 140 20
35,000 130 18 160 18 160 21
40,000 190 38 180 22 160 25
45,000 210 40 200 29 140 38
50,000 280 15 250 21 240 15
55,000 290 17 160 09 240 05
60,000 030 10 090 18 080 20
65,000 050 22 090 24 ... — —
70,000 050 44 090 38 ... --
75,000 050 40 100 40 ... --
80,000 . . “ -- 100 54 ... --
85,000 — — . -- 100 59 ... --
90,000 — — — -- 090 76 ... — .
95,000 ... -- 100 92 ... — .
100,000 .. . .. 100 101 ... --
105,000 ... -- 090 234 ... --
NOTES;
1. Numbers in parentheses are estimated values.
2. Wind data was taken by the Eniwetok weather station.
3. Tropopause height was 52,000 ft MSL.
4. The surface air pressure was 14.63 psi, the temperature 27.4°C,
the dew point 77°F, and the relative humidity 85$.
284
Figure 164 . Hodographs for Operation HARDTACK I -
Dogwood.
285
OPERATION HARDTACK I
Poplar
PPG Time GMT
DATE: 12 July 1958 12 July 1958
TIME: 1530 0330
CLOUD TOP HEIGHT: >61,000 ft MSL
CLOUD BOTTOM HEIGHT: 92,000 ft MSL
Sponsor: UCRL
SITE: PPG - Bikini - SW of
Charlie, 7,500 ft from
the nearest edge of island
11° 91' I?" N
165° 15' 52" E
Site elevation: Sea level
HEIGHT OF BURST: 11.66 ft
TYPE OF BURST AND PLACEMENT:
Surface burst from Large on
water over reef
REMARKS:
Only individual island dose rates are available. These were obtained
from the Radiological Safety organization helicopter surveys at
H+9 hours. The helicopter survey technique called for the pilot
either to land the aircraft at the desired spot, so that a ground
reading could be obtained, o^ to make a slow pass over the desired
spot at an elevation of 25 feet. Readings taken at 25 feet were
multiplied by a factor of 2 in order to obtain a reasonable approxi-
mation of the true ground reading. The basic instrument used in
the aerial surveys was the AN/PDR-39 survey meter modified to read
up to 500 r/hr. The t'1’2 decay approximation was used to extrapolate
the H+4 hour dose rate readings to H+l hour.
286
287
BIKINI ATOLL
Figure 165 •
Operation IIARDl'ACK I - Poplar.
Island dose rates in r/hr at H+l hour.
TABLE 60 BIKINI WIND IATA FOR OPERATION HARDTACK I ~
POLAR
Altitude (MSL) H+I hour H+8.i hours
Dir Speed Dir Speed
feet degrees mph degrees mph
Surface 060 14 070 18
1,000 070 22 070 21
2,000 060 24 080 24
3,000 060 22 080 22
4,000 060 22 080 20
5,000 050 22 090 15
6,000 060 21 090 14
7,000 070 18 080 17
8,000 070 14 080 20
9,000 070 07 070 21
10,000 060 13 070 24
12,000 080 22 070 26
14,000 100 18 090 21
15,000 (100) (15) (100) (21)
16,000 110 13 100 21
18,000 120 16 120 16
20,000 150 12 110 16
23,000 220 07 100 16
25,000 2б0 08 110 14
30,000 — - - 210 09
35,000 — 210 16
40,000 — — — - - 210 17
45,000 — 130 21
50,000 — — — - - 210 31
55,000 — — — 180 12
60,000 — — — - - 090 25
65,000 — — — - - 090 24
70,000 — — — - - 090 36
72,000 - - - - - 080 4?
NOTES:
1. Numbers in parentheses are estimated values.
2.. Weather observations were made using the standard rawinsonde
system on Nan Island (Bikini Atoll) adjacent to the Nan Tower.
Additional data was taken on board destroyers.
3> Tropopause height was 55;000 ft MSL.
4. The surface air pressure was 14.62 psi, the temperature 27.9°C
the dew point 81.9°F, and the relative humidity 99$*
288
SCALE
I i i I Ii । 1111 iJ
0 20 40 60
miles
Rise rate’. 5 00 0 ft/hr
for Operation HARDTACK I -
Figure 166- Hodographs
Poplar.
289
OPERATION HARDTACK I
Scaevola
DATE;
TIME:
PPG Time
14 July 1958
1600
GMT
14 July 1998
0400
Sponsor: LASL
SITE: PPG - Eniwetok - Off
Yvonne
11° 331 15" N
162° 21' 24" E
Site elevation: Sea level
CLOUD TOP HEIGHT: NM
CLOUD BOTTOM HEIGHT; NM
HEIGHT OF BURST: 20 ft
TYPE OF BURST AND PLACEMENT:
Surface burst from barge
on water
REMARKS:
No fallout.
290
OPERATION HARDTACK I-
Pisonia
PPG Time GMT
DATE: 18 July 1958 1? July 1958
TIME: 1100 2300
CLOUD TOP HEIGHT: 55,000 ft MSL
Sponsor: IASL
SITE: PPG - Eniwetok - 11,000 ft
W of Yvonne
11° 33' N
162° 191 4з" E
Site elevation: Sea level
HEIGHT OF BURST: 6.5 ft
TYPE OF BURST AND PLACEMENT:
Surface burst from barge on
water
CLOUD BOTTOM HEIGHT: IM
REMARKS;
Only individual island dose rates are available. These were
obtained from Radiological Safety organization helicopter surveys
at H+4 hours. The helicopter survey technique called for the
pilot either to land the aircraft at the desired spot, so that a
ground reading could be obtained, or to make a slow pass over the
desired spot at an elevation of 25 feet. Readings taken at 25
feet were multiplied by a factor of 2 in order to obtain a
reasonable approximation of the true ground reading. The basic
instrument used in the aerial surveys was the AN/PDR-39 survey
meter modified to read up to 500 r/hr. The t •2 decay approxi-
mation was used to extrapolate the H+4 hour dose-rate readings to H+l
hour.
291
Figure 167.
Operation HARDTACK I - Pisonia.
Island dose rates in r/hr at H+l hour.
292
TABLE 61 ENIWETOK WIND DATA FOR HARDTACK I -
PISONIA
Altitude (MSL) H+l hour H+6 hours H+I3 hours
Dir Speed Dir GPeed Dir Speed
feet degrees mph degrees mph degrees mph
Surface Calm Calm 330 09 070 m
1,000 180 09 030 05 070 22
2,000 170 10 090 09 070 20
3,000 160 m 090 12 080 17
Д,000 mo 17 100 13 090 15
5,000 130 m 120 m 110 15
6,000 130 12 mo 16 120 m
7,000 130 m 150 17 130 10
8,000 120 10 150 18 120 10
9,000 120 08 150 20 110 m
10,000 120 13 150 17 120 18
12,000 110 12 130 13 110 m
1Д,000 100 09 100 12 090 iu
15,000 (100) (08) (080) (13) (080) (14
16,000 090 07 070 15 070 m
18,000 120 17 no 05 090 09
20,000 120 m 120 02 100 05
23,000 080 18 090 m mo 09
25,000 060 15 090 17 120 12
30,000 060 22 Обо 15 090 07
35,000 050 21 0Д0 17 обо 07
ДО,000 070 09 050 12 090 09
U5,ooo 0Д0 20 одо 06 оДо 06
50,000 050 12 050 15 130 10
55,000 Ю0 12 210 05 130 12
60,000 110 22 120 30 110 20
65,000 090 31 090 39 090 дд
70,000 090 52 090 38 090 Д5
75,000 090 55 100 51 090 5Д
80,000 090 67 100 61 090 76
85,000 100 68 090 78 090 80
90,000 090 82 090 87 — — — --
95,000 090 75 090 98 — — — --
100,000 090 97 090 83 — — — --
101,000 — — — <“ — 090 76 — — о --
105,000 090 101 — — — -- --
NOTES;
1. Numbers in parentheses are estimated values.
2. Wind data was taken by the Eniwetok weather station.
3« The surface air pressure was 1U.67 psi, the temperature 26.8°C
the dew point 7U.9°F, and the relative humidity 83$.
293
SCALE
1 | | | I I | । I i i I I
0 20 40 60
miles
Rise rate' 5000 ft/hr
67.5 0
0 67.5
Q67.5
H + IHour H + 6 H + ’3
—
Figure 168. Hodographs for Operation HARDTACK I - Pisonia.
294
Juniper
OPERATION HARDTACK I
PPG Time GMT
DATE: 22 July 1958 22 July 1958
TIME: 1620 0420
CLOUD TOP HEIGHT: 40,000 ft MSL
CLOUD BOTTOM HEIGHT: 24,000 ft MSL
Sponsor: UCRL
SITE: PPG - Bikini - 4,000 ft
from west end of Tare
11° 291 46" N
165° 221 15" E
Site elevation: Sea level
HEIGHT OF BURST: 12.11 ft
TYPE OF BURST AND PLACEMENT:
Surface burst from barge
on water
REMARKS:
Only individual island dose rates are available. These were obtained
from Radiological Safety organization helicopter surveys at H+4 hours.
The helicopter survey technique called for rhe pilot either to land
the aircraft at the desired spot, so that a ground reading could be
obtained, or to make a slow pass over the desired spot at an elevation
of 25 feet. Readings taken at 25 feet were multiplied by a factor of 2
in order to obtain a reasonable approximation oi' the true ground
reading. The basic instrument used in the aerial surveys was the AN/PDR-39
survey meter modified to read up to 500 r/hr. The t"1'2 decay approxi-
mation was used to extrapolate the H+4 hour dose-rate readings to H+l
hour.
295
296
BIKINI ATOLL
TABLE 62 BIKINI WIND DATA FOR OPERATION HARDTACK I “ JUNIPER
Altitude (msl) H+i hour H+7i hours L uh h^urs
Dir ; Steed Dir S Dlr Lh eed
feet degrees mph degrees mph degrees mph
Surface 080 16 100 09 110 07
1,000 080 18 100 16 110 13
2,000 090 20 100 16 120 m
3,000 100 21 110 17 120 11+
l+,000 100 21 110 17 120 11+
5,000 100 20 110 17 110 15
6,000 110 18 110 18 110 17
7,000 110 16 100 20 110 20
8,000 110 13 090 18 100 18
9,000 110 09 090 17 100 15
10,000 110 10 080 16 100 15
12,000 120 13 090 16 100 16
H+,000 120 16 090 16 100 16
15,000 (120) (15) (090) (17) (100) (16)
16,000 130 11+ 100 18 100 16
18,000 130 15 100 15 100 13
20,000 130 18 110 18 090 12
23,000 130 21 120 20 10c 10
25,000 U+0 22 ll+o 09 100 09
30,000 ll+o 16 150 07 080 Об
35,000 150 12 300 02 260 12
Цо,ООО 310 12 310 11+ 330 10
1+5,000 090 10 070 1-3 300 13
50,000 120 12 120 09 050 09
55,000 230 07 320 03 060 07
60,000 080 31 090 38 090 36
65,000 090 36 080 32 — —
70,000 100 1+8 080 38 — - -
75,000 090 51 090 1+1 — - -
80,000 080 63 080 63 — «- —
85,000 090 67 090 79 — —
90,000 080 67 090 98 — - -
95,000 080 76 090 121 — - -
100,000 090 78 — - - — - -
105,000 090 80 --- — —
NOTES:
1. Numbers in parentheses are estimated values.
2. Weather observations were made using the standard rawinsonde
system on Nan Island (Bikini Atoll) adjacent to the Nan Tower.
Additional data was taken on board destroyers.
3- Tropopause height was 51,000 ft MSL.
Ц. The surface air pressure was 1U.6U psi, the temperature 3O.8°C,
the dew point 78-9°F, and the relative humidity 76^.
297
—(й>
Figure 170. Hodographs for Operation HARDTACK I - Juniper.
298
OPERATION HARDTACK I
Olive
PPG Time GMT
DATE: 23 July 1958 22 July 1958
TIME: 0830 2030
CLOUD TOP {EIGHT: 50,000 ft MSL
CLOUD BOTTOM HEIGHT: 15,000 ft MSL
Sponsor: UCRL
SITE: PPG - Eniwetok - SW of
Janet, U,000 ft from
the nearest edge of
island (Sta. 1312)
11° 39' U8" N
162° 13’ U8"' E
Site elevation: Sea level
HEIGHT OF BURST: 8.0 ft
TYPE OF BURST AND PLACEMENT:
Surface burse from barge
on water
REMARKS:
Only individual dose rates are available. These were obtained
from Radiological Safety orgnization helicopter surveys at H+U
hours. The helicopter survey technique called for the pilot
either to land the aircraft at the desired spot, so that a ground
reading could be obtained, or to make a slow pass over the desired
spot at an elevation of 25 feet. Readings taken at 25 feet were
multiplied by a factor of 2 in order to obtain a reasonable ap-
proximation of the true ground reading. The basic instrument used
in the aerial surveys was the AN/PDR-39 survey meter modified to
read up to 500 r/hr. The t*1,2 decay approximation was used to
extrapolate the H+9 hour dose-rate readings to 1H1 hour.
299
NORTH
IRENE.
JANET
WILMA
ZONA
CENE
HELEN
KATE
LUCY
PACIFIC OCEAN
BELLE
ALICE
0.8
N
MACK
'SCAR
0 0
A G
N
ALVIN
ENIWETOK
ATOLL
CLYDE
AVID
ELMER
0 12 3 4 5
STATUTE MILES
EDNA
DAISY
CLARA
!>**•
MARY
NANCY
OLIVE
PEARL
RUBY
SALLY
TILDA
URSULA
VERA
Figure 171. Operation HARDTACK I
Island dose rates in r/hr at H+l hour.
300
TABLE 63 ENIWETOK VTND DATA FOR OPERATION HARDTACK I -
OLIVE
Altitude (MSL) H-21 hours H-hour H+3 hours H+9‘. hours
Dir Speed Dir Creed Di r Speed Dlr Speed
feet degrees mph degree s mpn degrees mpn degrees mph
Surface 310 18 230 18 130 18 160 21
1,000 130 25 130 23 120 20 1U0 15
2,000 130 32 130 29 130 2U 150 17
3,000 130 29 130 26 1U0 22 150 21
U,000 130 26 1U0 2U 150 20 150 21
5,000 130 26 1U0 2U 150 20 160 21
6,000 130 26 1U0 2U 150 22 160 20
7,000 120 29 130 28 1U0 26 160 17
8,000 120 29 130 29 1U0 28 1U0 17
9,000 120 26 130 25 1U0 2U 1U0 16
10,000 120 23 130 23 1U0 22 1U0 16
12,000 110 23 120 23 130 22 1U0 20
1'4,000 120 2U 120 2U 130 2U 130 20
15,000 — -- (120) (23) (130) (22) (1U0) (18)
16,000 120 23 120 22 130 20 1U0 18
18,000 — — — -- 150 23 1U0 20
20,000 120 21 130 23 1U0 26 130 20
23,000 1U0 17 1U0 17 130 17 130 20
25,000 1U0 2U 1U0 18 1U0 12 130 18
30,000 150 15 150 1U 150 12 110 15
35,000 190 17 180 17 160 17 150 10
Uo,ooo 180 13 180 15 180 17 200 09
U5,ooo 1U0 10 1U0 1U 130 18 100 10
50,000 050 07 090 07 150 07 320 12
55,000 ouo 15 070 15 100 1U 090 26
60,000 100 33 100 32 100 31 120 25
65,000 070 33 080 37 100 U1 090 38
70,000 — * — — — - - 110 38 090 38
75,000 *- «- «- «- — — * — - - 090 52 090 59
80,000 — • «- — 100 70 100 67
85,000 — — « — -- 100 7^ 090 67
90,000 — • — — - - 090 82 090 89
91,000 — - - • * — • — — -- 090 92
9U,ooo — -- --- -- 090 90 — —
NOTES:
1. Numbers in parentheses are estimated values.
2. Wind data was taken by the Eniwetok weather station.
3. Tropopause height was U8,000 ft MSL.
U. H-hour values were interpolated from H-2^ hours and H+3p hours
data.
5> The surface air pressure was 1U.6U psi, the temperature 26.U°C,
the dew point 76°F, and the relative humidity 89^.
301
67.5
302
OPERATION HARDTACK I
Pine
PPG Timo
DATE: 2? July 1958
TIME: 0830
_____GMT
2b July 19>8
2030
Sponsor: UCRL
SITE: PPG - Eniwetok - SW of
Janet, 8,000 ft nearest edge of 11° 39' 22" N 162° 13' 11" E to island
Site elevation: Sea leve 1
HEIGHT OF BURST: 8.0 ft
CLOUD HEIGHT: Not available
TYPE OF BURST AND PLACEMENT:
Surface burst from barge
on water
REMARKS:
Only individual island dose rates are available. These were obtained
from the Radiological Safety organization helicopter surveys at
H+U hours. The helicopter survey technique called for the pilot
either to land the aircraft at the desired spot, so that a ground
reading could be obtained, or to make a slow pass over the desired
spot at an elevation of 25 f'et. Readings taken at 25 feet were
multiplied by a factor of 2 in order to obtain a reasonable
approximation 01' the true ground reading. The basic instrument
used in the aerial surveys was the AN/PDR-39 survey meter modified
to read up to 500 r/hr. The t-1’2 decay approximation was used
to extrapolate the H+9 hour dose-rate readings to ID1 hour.
303
9ENE
Figure 173.
Operation HARDTACK I - Pine.
Island dose rates in r/hr at H+l hour.
304
TABLE 64 ENIWETOK tTND DATA FOR OPERATION HARDTACK I -
PINE
Altitude (MSL) Dir hour Speed !i+3 hours hours
Dir Dir Speed
feet degrees mph degrees mph degrees mpn
Surface 200 18 230 12 200 05
1,000 • 210 17 — 190 08
2,000 200 17 — — 240 07
3,000 200 17 — 240 12
4,000 200 17 — 220 13
5,000 6,000 200 12 220 07 210 13
190 12 180 09 220 13
7,000 170 05 170 10 220 13
8,000 200 05 170 09 210 12
9,000 200 05 180 09 200 12
10,000 200 05 180 10 200 12
12,000 170 05 180 08 170 10
14,000 150 Об 170 09 210 10
15,000 (140) (05) (140) (05) (210) (06)
16,000 130 05 160 06 220 02
18,000 080 05 190 05 Calm Calm
20,000 100 08 190 03 120 05
23,000 140 13 180 09 120 07
25,000 160 17 160 14 150 08
30,000 160 26 150 18 140 10
35,000 150 24 140 26 120 20
40,000 190 16 140 21 140 26
45,000 200 16 150 20 120 33
50,000 190 14 170 13 180 05
55,000 130 14 130 14 120 15
60,000 080 23 090 23 130 23
65,000 090 41 — —
70,000 100 48 — -- —
75,000 100 59 — — — — — .. -
80,000 100 69 • — — w --
85,000 100 81 -- — — — --
90,000 100 91 100 68 — — — --
92,000 -- - 100 70 - -- --
95,000 100 90 --- -- --- --
100,000 100 99 - -- -- w- — --
105,000 100 240 - - - - -- --
110,000 100 126 — -- --- --
115,000 100 232 --- -- --- --
NOTES:
1. Numbers in parentheses are estimated values.
2. Wind data was taken by the Eniwetok weather station.
3. Tropopause height was 52,000 ft MSL.
4. The surface air pressure was 14.64 psi, the temperature 26.7°C
the dew point 75-5°F, and the relative humidity 85$.
305
Figure 174 . Hodographs for Operation HARDTACK I -
Pine.
306
OPERATION HARDTACK I
Teak
DATE:
TIME:
PPG Time
31 July iy>8
2350
31 July 1958
1050
Sponsor: DOD
SITE: PPG - Johnston Island
16° U' 38" N
169° 32' 00" W
HEIGHT OF BURST: 250,000 ft
ТУРЕ OF BURST AND PLACEMENT:
High altitude burst from
Redstone missile over
vicinity of Johnston Island.
REMARKS:
No local fallout.
CLOUD TOP HEIGHT: >1
CLOUD BOTTOM HEIGHT: NM
307
OPERATION HARDTACK I -
Qui:
PPG Time GMT
DATE: "6 Aug 1958 6 Aug 1958
TIME: 1A15’ 0215
Sponsor: UCRL - DOD
SITE: PPG - Rniwetok - Yvonne
11° 33' 15" N
162° 21' 2B" E
Site elevation: Sea level
HEIGHT OF BURST: 3 ft
TYPE OF BURST AND PLACEMENT:
CLOUD TOP HEIGHT: 1,500 ft MSL
Surface burst from platform
on coral soil
CLOUD BOTTOM HEIGHT: NM
REMARKS:
Only alpha contamination resulted from this detonation. Surface
alpha monitoring was conducted throughout the area on D and D+l day
with PAC-3G gas-flow proportional alpha counters. The readings
were taken in counts per minute, corrected for the probe area,
and multiplied by the appropriate shielding factors to compensate
for the roughness of the surface monitored. The two isoconcentration
lines shown are the most significant ones, since 3>5OO Hg/m2 is
the chronic hazard limit and any concentration in excess of 1,000 Нб.Лп
requires decontamination. It is interesting to note that in the great
majority of cases the alpha concentrations in the downwind area were
higher on D+l than on D day.
308
640
Figure 175. Operation HARDTACK I - Quince.
Alpha contamination in micrograms per square meter.
309
TAELE 65 ENIV.ETOK WIND DITA FOR CEPERATION HARDTACK I -
QUINCE
Altitude (MSL) H-hour
Dir ! Speed
feet degrees mph
Surface обо 13
241 OQO 14
482 070 14
723 070 16
964 o8o 16
NOTE: Wind data was taken by the Eniwetok weather station.
Figure 176. Hodograph for Operation HARDTACK I -
Quince.
310
OPERATION HARDTACK I
Orange
PPG Time GMT
DATE: 11 Aug IO38 11 Aug 1958
TIME: 2330 1030
Sponsor: DOD
SITE: PPG - Johnston
16° 21' 30" N
169° 32' 08" E
HEIGHT OF BURST: 111,1000
TYPE OF BURST AND PLACEMENT:
High altitude hurst from
Redstone missile over the
vicinity of Johnston Island.
CLOUD TOP IEIGHT: NM
CLOUD BOTTOM IEIGIE: NM
REMARKS: No local fallout.
311
OPERATION HARDTACK I
Fig
DATE:
TIME:
PPG Time
18 Aug 195'8
1600
GMT
18 Aug 195-8
Oil 00
Sponsor: UCRL - DOD
SITE: PPG - Eniwetok -
Yvonne
11° 33' 15" N
162° 21' 2U" E
Site elevation: Sea level
HEIGHT OF BURST: 1.5 ft
TYPE OF BURST AND PLACEMENT:
Surface burst from platform
over jT=i^cia soil
CLOUD TOP HEIGHT: 5,u00 ft MSL
CLOUD BOTTOM HEIGHT: O.3CO ft MSL
REMARKS:
The dose-rate contours were obtained by ground survey readings made by
scientific projects. Actual decay measurements were used to correct
the dose-rate readings to H+l hour. The portion of the pattern on the
island is reliable. That portion which is over water is less reliable
because it was not based upon free-field dose-rate readings but upon
calculations made from readings taken on five barges and from samples
collected in sticky pans mounted on 87 buoys.
312
Figure 177 . Operation НАВГТАСК I - Fig.
On-site dose rate contours in r/hr at H+l hour.
313
Time. Minutes
Figure 178 . Cloud Dimensions: Operation HARDTACK I - Fig.
314
TABLE 66 ENIWETOK WIND TATA FOR OPERATION HARDTACK I - FIG
Altitude Range (MSL) H-hour
Dir Speed
feet degrees mph
0 - 1,000 080 17
1,000 - 2,000 090 19
2,000 - 3,000 100 18
3,000 - 1,000 110 19
1,000 - 5,000 100 18
5,000 - 6,000 100 18
6,000 - 7,000 090 18
7,000 - 8,000 090 21
8,000 - 9,000 090 21
9,000 -10,000 080 21
NOTES: 1. Wind data was obtained by the weather stations on
Yvonne Island (Eniwetok Atoll); which were located
1,000 yds and 1,500 yds from GZ.
2. The surface air pressure was 11.62 psi, the temperature
30° C, the dew point 78qF, and the relative humidity 77^-
0
H-Hour
SCALE
Ю
Mil»»
Rite Rot» 5000 ft/hr
Figure
179 .
Hodograph for
Operation HARDTACK I -
Fig.
315
OPERATION ARGUS -
ARGUS I
Local Time ______GMT_____
DATE: 27 Aug 1958 27 Aug 1958
TIME: 0128 0228
TOTAL YIELD: 1-2 kt estimated
FIREBALL DATA:
Time to 1st minimum: NM
Time to 2nd maximum: NM
Radius at 2nd maximum: NM
Sponsor: DOD
SITE: South Atlantic
38° 88' S
11° 55' W
HEIGHT OF BURST: ~ 300 miles
TYPE OF BURST AND PLACEMENT:
High altitude burst
CLOUD TOP HEIGHT: NM
CLOUD BOTTOM HEIGHT: NM
REMARKS:
No fallout.
316
OPERATION ARGUS
ARGUS II
Local Time
DATE: 30 Aug 19>8
TIME: 0218
GMT
30 Auf; 1958
0318
TOTAL YIELD: j_2 kt estimated
FIREBALL DATA:
Time to 1st minimum: NM
Time to 2nd maximum: NM
Radius at 2nd maximum: NM
Sponsor: DOD
SITE: South Atlantic
49° 23' S
08° U3' W
HEIGHT OF BURST: ~ 300 miles
TYPE OF BURST AND PLACEMENT:
High al tituue burst
CLOUD TOP HEIGHT: NM
CLOUD BOTTOM HEIGHT1: NM
REMARKS: No fallout
317
OPERATION ARGUS
ARGUS III
Local time GMT
LATE: 6 Sep 1958 6 Sep 19t6
TIME: 2113 2213
TOTAL YIELD: 1-2 kt estimated
FIREBALL DATA:
Time to 1st minimum: NM
Time to 2nd maximum: NM
Radius at 2nd maximum: NM
REMARKS: No fallout
Sponsor: DOD
SITE: South Atlantic
U90 30' S
10° 2 b-' W
HEIGHT OF BURST: ~ 300 miles
TYPE OF BURST AND PLACEMENT:
High altitude burst
CLOUD TOP HEIGHT: NM
CLOUD BOTTOM HEIGHT: NM
318
OPERATION DOMINIC
Adobe
___ГОСТ_____ GMT___________
DATE: 25 Apr 1962 25 Apr 1962
TIME: 0545 1545
SPONSOR: LASL
SIГЕ : Chris tinas Island, GZ—10
SITE ELEVATION: Sea Level
HEIGHT OF BURST:
TYPE OF BURST AND' PLACEMENT :
Air (free fall), over
Pacific Ocean
OPERATION DOMINIC - GMT Aztec SPONSOR: LASL
LOOT
DATE: 27 Apr 1962 2 7 Apr 1962
TIME: 0601 1601 SITE: Christmas Island, G.Z-10 SITE ELEVATION: Sea Level HEIGHT OF BURST: TYPE OF BURST AND PLACEMENT: Air (free fall), over Pacific Ocean
OPERATION DOMINIC - Arkansas
LOCT GMT SPONSOR: LRL
DA ГЕ: 2 May 1962 2 May 1962
TIME: 0801 1801 SITE: Christmas Island, GZ-15
SITE ELEVATION: Sea Level
HEIGHT OF BURST:
TYPE OF BURST AND PLACEMENT:
Air (parachute drop), over
Pacific Ocean
319
operation Dominic -
Questa
LOCT GMT_ SPONSOR: LASL
DATE: TIME: 4 May 1962 0904 4 May 1904 1962 SITE: Christmas Island, GZ-15 SITE ELEVATION: Sea Level HEIGHT OF BURST:
TYPE OF BURS Г AND PLACEMENT:
Air (free fall)^ over Pacific Ocean
OPERATION DOMINIC “ LOCT GMT Frigate Bird SPONSOR: LRL
DATE: TIME: 6 May 1962 1330 6 May 2330 1962 SITE: Johnston Island danger area 4° 50' N 149° 49' W
SITE ELEVATION: Sea Level
HEIGHT OF BURST:
TYPE OF BURST AND PLACEMENT:
Air, from Polaris missile
OPERATION DOMINIC - LOCT GMT Yukon SPONSOR: LRL
DATE : TIME: 8 May 1962 0801 8 May 1801 1962 SITE: Christmas Island, GZ-10
SITE ELEVATION: Sea Level
HEIGHT OF BURST:
TYPE OF BURST AND PLACEMENT:
Air (parachute drop), over
Pacific Ocean
320
OPERATION DOMINIC -
Mesilla
LOCT GMT SPONSOR: LASL
DATE: 9 May 1962 TIME: 0701 OPERATION DOMINIC - LOCT DATE: 11 May 1962 9 May 1962 1701 Muskegon GMT 11 May 1962 SITE: Christmas Island, GZ-10 SITE ELEVATION: Sea Level HEIGHT OF BURST: TYPE OF BURST AND_PLACEMENT: Air (free fall), over Pacific Ocean SPONSOR: LRL
TIME: 0537 OPERATION DOMINIC - PST DATE: 11 May 1962 TIME: 1202 REMARKS: 1537 Sword Fish GMT 11 May 1962 2002 SITE: Christmas Island, GZ-10 SITE ELEVATION: Sea Level HEIGHT OF BURST: TYPE OF BURST AND PLACEMENT: Air (parachute drop), over Pacific Ocean SPONSOR: DOD SITE: ~400 miles west of San Diego 31° 14.7' ± 0.3' N 124° 13.3 ’ i 0.3' W SITE ELEVATION: Sea Level DEPTH OF BURST: WATER DEPTH: 17,100 ft TYPE OF BURST AND PLACEMENT: Underwater, from anti- submarine rocket
Figure 180 illustrates the growth and movement of the pool of radio-
activity resulting from the Sword Fish test. The contours from D-day
to DT6 days represent readings in inR/hr at 500 feet above the water surface.
321
Figure 180 OPERATION DOMINIC - Sword Fish contours
showing growth and movement of the pool of radio-
activity from D-day to D-i 6 days. Contours values in
mR/hi’ at the survey aircraft height of 500 feet.
322
Encino
OPERATION DOMINIC -
LOOT
DATE: 12 May 1962
TIME~: 0702
OPERATION DOMINIC -
LOCT
DATE: 14 May 1962
TIME: 0521
OPERATION DOMINIC -
LOCT
DATE: 19 May 1962
TIME: 0536
GMT Sponsor : LASL
12 May 1962
1702 SITE: Christmas Island, GZ-12
SITE ELEVATION: Sea Level
HEIGHT OF BURST:
TYPE OF BURST AND PLACEMENT:
Air (free fall), over
Pacific Ocean
Swanее
GMT SPONSOR: LRL
14 May 1962
1521 SITE: Christmas Island, GZ-10
SITE ELEVATION: Sea Level
HEIGHT OF BURST:
TYI*E OF BURST AND PLACEMENT:
Air (parachute drop),
over Pacific Ocean
Chetco
GMT SPONSOR: LRL
19 May 1962
1536 SITE: Christmas Island, GZ-10
SITE ELEVATION: Sea Level
HEIGHT OF BURST:
TYPE OF BURST AND PLACEMENT:
Air (parachute drop),over
Pacific Ocean
323
OPERATION DOMINIC
Tan anti
LOCT_____
DATE: 25 May 1962
TIME: 0608
OPERATION DOMINIC -
LOCT
DATE: 27 May 1962
TIME: 0702
OPERATION DOMINIC -
LOCT
DATE; 8 Jun 1962
TIME: 0702
GMT SPONSOR: LRL
25 May 1962
1608 SITE: Christmas Island, GZ-10
SITE ELEVATION: Sea Level
HEIGHT OF BURST:
TYPE OF BURST AND PLACEMENT:
Air (parachute drop), over
Pacific Ocean
Nambe
GMT SPONSOR: LASL
27 May 1962
1702 SITE: Christmas Island, GZ-10
SITE ELEVATION: Sea Level
HEIGHT OF BURST:
TYPE OF BURST AND PLACEMENT:
Air (free fall), over
Pacific Ocean
Alma
GMT SPONSOR: LASL
8 Jun 1962
1702 SITE: Christmas Island, GZ-15
SITE ELEVATION: Sea Leve1
HEIGHT OF JBURST:
TYPE OF BURST AND PLACEMENT:
Air (free fal l), over
Pacific Ocean
324
OPERATION DOMINIC
LOCT
DATE: 9 Jun 1962
TIME: 0537
Tru ck.ce
GMT
9 Jun 1962
1537
SPONSOR: LRL
SITE : Christmas Island, GZ-10
SITE ELEVATION: Sea. Level
HEIGHT OP BURST:
'TYPE OF BURST AND PLACEMENT:
Air (parachute drop), over
Pacific Ocean
OPERATION DOMINIC - Ycso
LOCT GMT
DATE: 10 Jun 1962 10 Jun 1962
TIME: 0601 1601
SPONSOR: LASL
SITE: Christmas Island, GZ-20
SITE ELEVATION: Sea Level
HEIGHT OF BURST:
TYPE OF BURST AND PLACEMENT:
Air (free fall), over
Pacific Ocean
OPERATION DOMINIC -
Harlem
LOCT GMT
DATE: 12 Jun 1962 12 Jun 1962
TIME: 0537 1537
SPONSOR: LRL
SITE: Christmas Island, GZ-17
SITE ELEVATION: Sea Level
HEIGHT OF BURST:
TYPE OF BURST AND PLACEMENT:
Air (parachute drop), over
Pacific Ocean
325
OPERATION DOMINIC
Rinconada
LOCT GMT SPONSOR: LASL
DATE: 15 Jun 1962 15 Jun 1962
TIME: 0600 1600 SITE: Christmas Island, GZ-17 SITE ELEVATION: Sea-Level HEIGHT OF BURST: TYPE OF BURST AND PLACEMENT: Air (free fall), over Pacific Ocean
OPERATION DOMINIC - GMT Dulce SPONSOR: LASL
LOCT
DATE: 17 Jun 1962 17 Jun 1962
TIME: 0600 1600 SITE: Christmas Island, Gz-iO SITE ELEVATION: Sea Level HEIGHT OF BURST: TYPE OF BURST AND PLACEMENT:
Air (free fall), over
Pacific Ocean
OPERATION DOMINIC - Petit
LOCT GMT SPONSOR: LRL
DATE: 19 Jun 1962 19 Jun 1962
TIME: 0501 1501 SITE: Christmas Island, GZ
SITE ELEVATION: Sea Level
HEIGHT OF BURST:
TYRE OF BURST AND PLACEMENT:
Ai r (parachute drop), over
Pacific Oceap
326
OPERATION DOMINIC - GMT Ototfi SPONSOR: LASL
LOCT
DATE: 22 Jun 1962 22 Jun 1962
TIME: 0600 OPERATION DOMINIC - LOST DATE: 27 Jun 1962 1600 GMT 27 Jun Bighorn 1962 SITE: Christmas Island, GZ-10 SITE ELEVATION: Sea Level HEIGHT OF BURST: TYPE OF BURST AND PLACEMENT; Air (free fall), over Pacific Ocean SPONSOR: LRL
TIME: 0519 OPERATION DOMINIC - LOCT DATE: 30 Jur? 1962 1519 GMT 30 Jun Bluestone 19o2 SITE: Christmas Island, GZ-30 SITE ELEVATION: Sea Level HEIGHT OF BURST: TYPE OF BURST AND PLACEMENT: Air (parachute drop), over Pacific Ocean SPONSOR: LRL
ri'lT: 0921 1521 SITS: Chirstmas Island, GZ-25 SITE ELEVATION: Sea Level
HEIGHT OF BURST;
TYPE OF BURST AND PLACEMENT:
Air (parachute drop), over
Pacific Ocean
327
OPERATION DOMINIC - Star Fish Prime
LOCT GMT
DATE: 8 Jul 1962 9 Jul 1962
TIME: 2200 0900
TOTAL YIELD: 1.4 Mt
SPONSOR: DOD
SIТЕ: Johnston Island
16° 28' 06.32" N
169° 37' 48.27" W
SITE ELEVATION: Sea Level
HEIGHT OF BIkST: 249 miles
TYPE OF BURST AND PLACEMENT:
High altitude, from Thor
missile
REMARKS;
This event was conducted as a part of the Fish Bowl Series.
OPERATION DOMINIC - Sunset
LOCT GMT SPONSOR: LASL
DATE: 10 Jul 1962 10 Jul 1962
TIME: 0633 1633 SITE: Christmas Island, GZ-17
SITE ELEVATION: Sea Level
HEIGHT OF BURST:
TYPE OF BURST AND PLACEMENT:
Air (free fall), over
Pacific Ocean
328
OPERATION DOMINIC - Pamlico
DATE: 11 LOCT Jul 1962 GMT SPONSOR: LRL 11 Jul 1962
T1ME: 05 37 1537 SITE: Christmas Island, GZ-2 SITE ELEVATION: Sea Level HEIGHT OF BURST: TYPE OF BURST AND PLACEMENT: Air (parachute drop), over Pacific Ocean
OPERATION DOMINIC - Androscoggin
LOCT GMT SPONSOR: LRL
DATE: 2 Oct 1962 2 Oct 1962
TIME: 0517 1617 SITE: Johnston Island 13° 38.5' N 172° 11.Г W
SITE ELEVATION: Sea Level
HEIGHT OF BURST:
TYPE OF BURST AND PLACEMENT:
Air (parachute drop), ewer
Pacific Ocean
OPERATION DOMINIC - Bumping
LOCT_____ GMT
DATE: 6 Oct 1962 6 Oct 1962
TIME: 0502 ‘ 1602
SPONSOR: LRL
SJLTEj Johnston Island
14° 30' N
168° 15' W
SITE ELEVATION: Sea Level
HEIGHT OF BURST:
TYPE OF BURST AND PLACEMENT:
Air (parachute drop),over
Pacific Ocean
329
OPERATION DOMINIC -
Cb r-:na
LOCT GMT SPONSOR: LASL
DATE: 18 Oct 1962 18 Oct 1962
TIME: 0501 1601 SITE: Johnston Island 14° 32' N 108° 44.7' W SITE ELEVATION; Sea Leve1 HEIGHT OF BURST: TYPE OF BURST AND PLACEMENT: Air (free fall), over Pacific Ocean
OPERATION DOMINIC - Check Mate
LOCT _________GMT______ SPONSOR: DOD
DATE: 19 Oct 1962 20 Oct' 1962
TIME: 2130 0830 SITE: Johnston Island
16° 04' 20.57" N
169° 36' 35.95" W
SITE ELEVATION: Sea Level
HEIGHT OF BURST:
TYPE OF BURST AND PLACEMENT:
High altitude, from XM-23
Strypi (Sergeant) missile
REMARKS:
This event was conducted as a part of the Fish Bowl Series.
330
OPERATION DOMINIC - Blue Gill Triple Prime
DATE:
TIME:
_____ГОСТ___
25 Oct 1962
2259
___GMT
26 Oct 1962
0959
SPONSOR: DOD
SITE: Johnston Island
16° 24' 57.03" N
169° 36' 11.15" W
SITE ELEVATION: Sea Level
HEIGHT OF BURST:
TYPE OF BURST AND PLACEMENT:
High altitude, from Thor missile
REMARKS:
This event was conducted as part of the Fish Bowl Series.
OPERATION DOMINIC - Calamity
LOCT
DATE: 27 Oct 1962
TIME: 0446
____GMT______
2 7 Oct 1962
1546
SPONSOR: LRL
SITE: Johnston Island
14° 31.Г N
168° 15.6' W
SITE ELEVATION: Sea Level
HEIGHT OF BURST:
TYPE OF BURST AND PLACEMENT:
Air (parachute drop), over
Pacific Ocean
331
OPERATION DOMINIC - Housatonic
___I,OCT_____
DATE: 30 Oct 1562
TIME; 0501
___GMT______
30 Oct 1962
1601
SPONSOR: LRL
SITE: Johnston Island
13° 36.8' N
172° 13' W
SITE ELEVATION: Sea Level
HEIGHT OF BURST:
TYPE OF BURST AND PLACEMENT:
Air (parachute drop), over
Pacific Ocean
OPERATION DOMINIC - King Fish
DATE: LOCT 1 Nov 1962 GMT 1 Nov 1962 SPONSOR: DOD
TIME: 0110 1210 SITE: Johnston Island 16° 06' 48.61" N 169* 40' 56.02" W SITE ELEVATION: Sea Level HEIGHT OF BURST: TYPE OF BURST AND PLACEMENT: High altitude, from Thor miss ile
REMARKS:
This event was conducted as a part of the Fish Bowl Series •
332
OPERATION DOMINIC
LOCT
DATE; 3 Nov 1962
TIME: 2030
Tight Rope
GMT________
4 Nov 1962
0730
SPONSOR: DOD
SIT.E: Johns ton Island
16c 42' 26.71" N
169° 32' 32.66" W
SITE ELEVATION : Sc.a Le ve 1
HEIGHT OF HURST:
TYPE OF BURST AND PLACEMENT:
High altitude, from Nike-
Hercules missile
REMARKS
This event was conducted as a part. o£ the Fish Bowl Series .
333
334
I
Announced United States Nuclear Detonations
APPENDIX A
Yields are listed as: Low (less than 20 kt)
Intermediate (20 to 999 kt inclusive)
Low Megaton (one to several megatons).
Prior to October 1958, testing was conducted on an intermittent
basis and each series of tests was designated by a series name, such
as OPERATION CROSSROADS. The United States conducted no tests from
October 30, 1958 to September 1961. After resumption of testing, tests
were conducted year around and were listed by fiscal year. For example,
all NTS tests during FY-1962, which ended June 30, 1962, were in the
OPERATION NOUGAT series except for four surface tests (Little Feller I
and II, Small Boy and Johnny Boy) designated DOMINIC II, which were a
continuation of the DOMINIC I series conducted in the Pacific.
A-l
announced united states nuclear detonations
EVENT NAME OATEIGCT) LOCATION TYPE PURPOSE YIELD RANGE
TRINITY 07/16/95 ALAMOGORDO TOWER WEAPONS RELATED 19KT
FIRST TEST OF AN A-BOMB
WORLD WAR II 08/05/95 JAPAN AIRDROP COMBAT 13 KT
FIRST COMBAT USE-HIROSHIMA
WORLD WAR II 08/09/95 JAPAN AIRDROP COMBAT 23 KT
second COMBAT USE-NAGASAKI
operation CROSSROADS
ABLE 06/30/96 BIKINI AIRDROP WEAPONS RELATED 23 KT
BAKER 07/29/96 BIKINI UW WEAPONS RELATED 23 KT
OPERATION SANDSTONE
X-RAY 09/19/98 ENIWETOK TOWER WEAPONS RELATED 37KT
YOKE 09/30/98 ENINETOK TOWER WEAPONS RELATED 99KT
ZEBRA 05/19/98 ENIWETOK TOWER WEAPONS RELATED 18KT
OPERATION RANGER
ABLE 01/27/51 NTS AIRDROP WEAPONS RELATED 1KT
> BAKER 01/28/51 NTS AIRDROP WEAPONS RELATED акт
h_> EASY 02/01/51 NTS AIRDROP WEAPONS RELATED 1KT
BAKER-2 02/02/51 NTS AIRDROP WEAPONS RELATED акт
FOX 02/06/51 NTS AIRDROP WEAPONS RELATED 22KT
OPERATION GREENHOUSE
DOC 09/07/51 ENIWETOK TOWER WEAPONS RELATED
EASY 09/20/51 ENIWETOK TOWER WEAPONS RELATED 97KT
GEORGE 05/00/51 ENINETOK TOWER WEAPONS RELATED
ITEM 05/29/51 ENIWETOK TOWER WEAPONS RELATED
OPERATION BUSTER-JANGLE
ABLE 10/22/51 NTS TOWER WEAPONS RELATED LESS THAN 0.1KT
BAKER 10/28/51 NTS AIRDROP WEAPONS RELATED 3.5KT
CHARLIE 10/30/51 NTS AIRDROP WEAPONS RELATED 19KT
OOG 11/01/51 NTS AIRDROP WEAPONS RELATED 21KT
EASY 11/05/51 NTS AIRDROP WEAPONS RELATED 31KT
SUGAR 11/19/51 NTS SURFACE WEAPONS RELATED 1.2KT
ANNOUNCED UNITED STATES NUCLEAR DETONATIONS
А-3
EVENT NAME OATE(GCT) LOCATION TYPE PURPOSE YIELD RANGE
UNCLE 11/29/51 NTS OPERATION TUMBLER-SNAPPER CRATER WEAPONS RELATED 1.2KT
ABLE 04/01/52 NTS AIRDROP WEAPONS RELATED 1KT
BAKER 04/15/52 NTS AIRDROP WEAPONS RELATED 1KT
CNARLIE 04/22/52 NTS AIRDROP WEAPONS RELATED 31KT
DOG 05/01/52 NTS AIRDROP WEAPONS RELATED 19KT
EASY 05/07/52 NTS TOWER WEAPONS RELATED 12KT
FOX 05/25/52 NTS TOWER WEAPONS RELATED 11KT
GEORGE 06/01/52 NTS TOWER WEAPONS RELATED 15KT
NOW 06/05/52 NTS OPERATION IVY TOWER WEAPONS RELATED 14KT
MIKE EXPERIMENTAL 10/31/52 THERMONUCLEAR ENIWETOK DEVICE SURFACE WEAPONS RELATED 10.4MT
KING 11/15/52 ENIWETOK airdrop WE APONS RELATED 500 KT
ANNIE 03/17/53 OPERATION UPSHOT-KNOTHOLE NTS TOWER weapons related 16KT
NANCY 03/24/53 NTS TOWER WEAPONS RELATED 24KT
RUTN 03/31/53 NTS TOWER WEAPONS RELATED 0.2KT
DIXIE 04/06/53 NTS AIRDROP WEAPONS RELATED 11KT
RAY 04/11/53 NTS TOWER WEAPONS RELATED 0.2KT
BADGER 04/10/53 NTS TOWER WEAPONS RELATED 23KT
SIMON 04/25/53 NTS tower WEAPONS RELATED 43KT
ENCORE 05/00/53 NTS AIRDROP WEAPONS RELATED 27KT
NARRY 05/19/53 NTS TOWER WEAPONS RELATED 3 2KT
GRABLE 05/25/53 FIREO FROM 200MM GUN NTS GUN WEAPONS RELATED 15KT
CLIMAX 06/04/53 NTS AIRDROP WEAPONS RELATED 61KT
BRAVO EXPERIMENTAL 02/20/54 thermonuclear OPERATION CASTLE BIKINI DEVICE SURFACE WEAPONS RELATED 15MT
ANNOUNCED UNITED STATES NUCLEAR DETONATIONS
А-4
EVENT NAME OATECGCT) LOCATION TYPE PURPOSE YIELD RANGE
ROMEO 03/26/54 BIKINI BARGE HEAPONS RELATED 11 MT
KOON 04/06/54 BIKINI SURFACE HE APONS RELATED 110 KT
UNION 04/25/54 BIKINI BARGE HEAFONS RELATED 6.9 MT
YANKEE 05/04/54 BIKINI BARGE HEAPONS RELATED 13.5 MT
NECTAR 05/13/54 ENIWETOK BARGE HEAPONS RELATED 1.69 MT
OPERATION TEAPOT
HASP 02/18/55 NTS AIRDROP HEAPONS RELATED 1KT
MO TN 02/22/55 NTS TOHER HEAPONS RELATED 2KT
TESLA 03/01/55 NTS TOHER HEAPONS RELATED 7KT
TURK 03/07/55 NTS TOHER HEAFONS RELATED 43KT
NORNET 03/12/55 NTS TOHER HEAFONS RELATED 4KT
BEE 03/22/55 NTS TOHER HEAFONS RELATED 8KT
ESS 03/23/55 NTS CRATER HEAPONS RELATED 1KT
APPLE-1 03/29/55 NTS TOHER HEAPONS RELATED 14KT
HASP PRIME 03/29/55 NTS AIRDROP HEAPONS RELATED 3KT
NA 04/06/55 NTS AIRDROP HEAPONS RELATED 3KT
POST 04/09/55 NTS TOHER HEAPONS RELATED 2KT
MET 04/15/55 NTS TOHER HEAPONS RELATED 22KT
APPLE-2 05/05/55 NTS TOHER HEAPONS RELATED 29KT
zuccnini 05/15/55 NTS TOHER HEAPONS RELATED 28KT
OPERATION WIGWAM
WIGWAM 05/14/55 UH HEAPONS RELATED 30 KT
29 OEGREESN-126 DEGREES H
OPERATION REDWING
LACROSSE 05/04/56 ENIHETOK SURFACE HEAPONS RELATED 40 KT
CNEROKEE 05/20/56 BIKINI AIRDROP HEAPONS RELATED SEVERAL MT
FIRST AIR DROP BY U.S. OF A thermonuclear heapon
ZUNI 05/27/56 BIKINI SURFACE HEAPONS RELATEO 3.5 MT
YUMA 05/27/56 ENIHETOK HEAPONS RELATEO
ANNOUNCED UNITED STATES NUCLEAR DETONATIONS
EVENT NAME OATECGCT» LOCATION TYPE PURPOSE YIELD RANGE
ERIE 0 5/30/56 ENIWETOK TOWER WEAPONS RELATEO
SEMINOLE 06/06/56 ENIWETOK SURFACE WEAPONS RELATEO
FLATHEAD 06/11/56 BIKINI BARGE WEAPONS RELATEO
BLACKFOOT 06/11/56 ENIWETOK TOWER WEAPONS RELATEO
KICKAPOO 06/13/56 ENIWETOK WEAPONS RELATEO
OSAGE 06/16/56 ENIWETOK AIRDROP WEAPONS RELATEO
INCA 06/21/56 ENIWETOK WEAPONS RELATEO
DAKOTA 06/25/56 BIKINI BARGE WEAPONS RELATEO
monawk 0 7/02/56 ENIWETOK WEAPONS RELATEO
APACHE 07/00/56 ENIWETOK BARGE WEAPONS RELATEO
NAVAJO 07/10/56 BIKINI BARGE WEAPONS RELATEO
TEWA 07/20/56 BIKINI BARGE WEAPONS RELATEO 5 MT
> I NURON 07/21/56 ENIWETOK BARGE WEAPONS RELATEO
СЛ OPERATION PLUMBBOB
BOLTZMAM 05/20/5? NTS TOWER WEAPONS RELATEO 12KT
FRANKLIN 06/02/57 NTS TOWER WEAPONS RELATEO 190TONS
LASSEN 06/05/57 NTS BALLOON WEAPONS RELATEO 0.5 TONS
WILSON 06/10/57 NTS BALLOON WEAPONS RELATEO 10KT
PRISCILLA 06/29/57 NTS BALLOON WEAPONS RELATEO 37KT
NOOO 07/0 5/5! NTS BALLOON WEAPONS RELATEO 79KT
OIABLO 07/15/5 NTS TOWER WEAPONS RELATEO 17KT
JOHN 0 7/19/5; NTS ROCKET WEAPONS RELATEO ABOUT 2KT
KEPLER 07/29/5'. NTS TOWER WEAPONS RELATEO 10KT
OWENS 07/25/5'. NTS BALLOON WEAPONS RELATEO 9.7KT
STOKES 08/0 7/51 NTS BALLOON WEAPONS RELATEO 19KT
SNASTA 0 8/18/57 NTS TOWER WEAPONS RELATEO 17KT
OOPPLER 08/23/57 NTS BALLOON WEAPONS RELATEO 11KT
ANNOUNCED UNITED STATES NUCLEAR DETONATIONS
EVENT NAME ПЛТ₽ 1Г.ПТ» LOCATION TYPE PURPOSE YIELD RANGE
franklin prime 08/30/57 MTS BALLOON WEAPONS RELATED 9.7KT
SMOKY 08/31/57 NTS TOWER WEAPONS RELATED 99KT
GALILEO 09/02/57 MTS TOWER WEAPONS RELATED 11KT
WNEELER 09/06/57 MTS BALLOON WEAPONS RELATED 197 TONS
LAPLACE 09/08/57 MTS BALLOON WEAPONS RELATED 1KT
FIZEAU 09/19/57 NTS TOWER WEAPONS RELATED 11KT
NEWTON 09/16/57 NTS BALLOON WEAPONS RELATED 12KT
RAINIER FIRST TUNNEL 09/19/57 EMPLACEMEN NTS TUNNEL WEAPONS RELATED 1.7KT
WHITNEY 09/23/57 NTS TOWER WEAPONS RELATED 19KT
CHARLESTON 09/28/57j NTS BALLOON WEAPONS RELATED 12KT
> I O' MORGAN YUCCA 12 DEGREES 37 10/07/57 NTS OPERATION HARDTACK I 09/20/58 MIN N-163 DEGREES 01 MIN E BALLOON BALLOON WEAPONS RELATED weapons related OKT
CACTUS 05/05/58 ENIWETOK SURFACE WEAPONS RELATED 18 KT
FIR 05/11/50 BIKINI * BARGE WEAPONS RELATED
BUTTERNUT 05/11/58 ENIWETOK BARGE WEAPONS RELATED
КОД 05/12/58 ENIWETOK SURFACE WEAPONS RELATED 1.37 MT
WANOO 05/16/58 ENIWETOK UW WEAPONS RELATED
NOLLY 05/20/58 ENIWETOK BARGE WEAPONS RELATED
NUTMEG 05/21/58 BIKINI barge WEAPONS RELATED
YELLOWWOOO 05/26/58 ENIWETOK BARGE WEAPONS RELATED
MAGNOLIA 05/26/58 ENIWETOK BARGE WEAPONS RELATED
TOBACCO 05/30/58 ENIWETOK BARGE WEAPONS RELATED
SYCAMORE 05/31/58 BIKINI BARGE WEAPONS RELATED
ROSE 06/02/58 ENIWETOK BARGE WEAPONS RELATED
UMBRELLA 06/08/58 ENIWETOK UW WEAPONS RELATED
ANNOUNCED UNITED STATES NUCLEAR DETONATIONS
EVENT NAME OATEIGCT) LOCATION TYPE PURPOSE YIELD RANGE
MAPLE 06/10/50 BIKINI BARGE WEAPONS RELATED
ASPEN 06/1G/58 BIKINI BARGE WEAPONS RELATED
WALNUT 06/1G/58 ENIWETOK BARGE WEAPONS RELATED
LINDEN 06/10/50 ENIWETOK BARGE WEAPONS RELATED
REDWOOD 06/27/50 BIKINI BARGE WEAPONS RELATED
ELDER 06/27/50 ENIWETOK BARGE WEAPONS RELATED
OAK 06/20/50 ENIWETOK BARGE WEAPONS RELATED 8.9 HT
HICKORY 06/29/50 BIKINI BARGE WEAPONS RELATED
SEQUOIA 07/01/50 ENIWETOK BARGE WEAPONS RELATED
CEDAR 07/0 2/50 BIKINI BARGE WEAPONS RELATED
DOGWOOD 0 7/05/50 ENIWETOK BARGE WEAPONS RELATED
POPLAR 07/12/50 BIKINI BARGE WEAPONS RELATED
> 1 PISONIA 07/17/50 ENIWETOK WEAPONS RELATED
JUNIPER 07/22/50 BIKINI BARGE WEAPONS RELATED
OLIVE 07/22/50 ENIWETOK BARGE WEAPONS RELATED
PINE 07/26/50 ENIWETOK BARGE WEAPONS RELATED
TEAK 00/01/50 JONNSTON ISL AREA ROCKET WEAPONS RELATED MEGATON RANGE
QUINCE 00/06/50 ENIWETOK WEAPONS RELATED
ORANGE 00/12/50 JONNSTON ISL AREA ROCKET WEAPONS RELATED MEGATON RANGE
FIG 00/10/50 ENIWETOK WEAPONS RELATED
OPERATION ARGUS
ARGUS I 00/27/50 SOUTH ATLANTIC ROCKET WEAPONS RELATED 1-2KT
ABOUT 300 MILES ALTITUDE
ARGUS II 00/30/50 SOUTN ATLANTIC ROCKET WEAPONS RELATED 1-2KT
ABOUT 300 MILES ALTITUDE
ARGUS III 09/06/50 SOUTN ATLANTIC ROCKET WEAPONS RELATED 1-2 KT
ABOUT 300 MILES ALTITUDE
OPERATION HARDTACK II
EOOY 09/19/50 NTS BALLOON WEAPONS RELATED 83 TONS
ANNOUNCED UNITED STATES NUCLEAR DETONATIONS
A-8
EVENT NAME OATE(GCT> LOCATION TYPE PURPOSE YIELD RANGE
MORA 09/29/58 NTS BALLOON WEAPONS RELATEO 2KT
TAMALPAIS 10/08/58 NTS TUNNEL WEAPONS RELATEO 72 TONS
SLIGNT VENTING
QUAY 10/10/58 NTS TOWER WEAPONS RELATEO 79 TONS
LEA 10/13/58 NTS BALLOON WEAPONS RELATEO l.GKT
HAMILTON 10/15/58 NTS TOWER WEAPONS RELATEO 1.2 TONS
LOGAN 10/16/58 NTS TUNNEL WEAPONS RELATEO 5KT
OONA ANA 10/16/58 NTS BALLOON WEAPONS RELATEO 37 TONS
RIO ARRIBA 10/18/50 NTS TOWER WEAPONS RELATEO 90 TONS
SOCORRO 10/22/58 NTS BALLOON WEAPONS RELATEO 6KT
WRANGELL 10/22/58 NTS BALLOON WEAPONS RELATEO 115 TONS
RUSHMORE 10/22/58 NTS BALLOON WEAPONS RELATEO 188 TONS
SANFORO 10/26/58 NTS BALLOON WEAPONS RELATEO G.9KT
OE BACA 10/26/58 NTS BALLOON WEAPONS RELATEO 2.2KT
EVANS 10/29/58 NTS tunnel WEAPONS RELATEO 55 TONS
VENTING
NUMBOLOT 10/29/50 NTS TOWER WEAPONS RELATEO 7.8 TONS
SANTA FE 10/30/58 NTS BALLOON WEAPONS RELATED 1.3KT
BLANCA 10/30/58 NTS TUNNEL WEAPONS RELATEO 19KT
SLIGNT VENTING
OPERATION NOUGAT
ANTLER 09/15/61 NTS TUNNEL WEAPONS RELATEO 2.9 KT
SHREW 09/16/61 NTS SHAFT WEAPONS RELATED LOW
LOW YIELD MEANS : LESS TNAN 20KT
CNENA 10/10/61 NTS TUNNEL WEAPONS RELATEO LOW
MINK 10/29/61 NTS SNAFT WEAPONS RELATEO LOW
FISNER 12/03/61 NTS SNAFT WEAPONS RELATEO 13.5KT
GNOME 12/10/61 CARLSBAD SNAFT PLOWSNARE 3.1KT
MULTIPLE-PURPOSE EXPERIMENT IN SALT.FORMED CAVITY 160-170 FT.DIAMETER
60-80 FT.HIGH
ANNOUNCED UNITED STATES NUCLEAR DETONATIONS
А-9
EVENT NAME OATEIGCT) LOCATION TYPE PURPOSE YIELD
MAO 12/13/61 NTS snaft HEAPONS RELATED 0.<»3KT
RINGTAIL 12/17/61 NTS SN*FT WEAPONS RELATED LOH
FEATNER 12/22/61 NTS TUNNEL HEAPONS RELATED LOH
STOAT 01/09/62 NTS SHAFT HEAPONS RELATED <».5KT
AGOUTI 01/18/62 NTS shaft HEAPONS RELATED 5.9KT
DORMOUSE 01/30/62 NTS SHAFT NEAFONS RELATED LOH
STILLHATER 02/0Q/62 NTS SHAFT HEAPONS RELATED 2.7KT
ARMADILLO 02/09/62 NTS SHAFT NEAFONS RELATED 6.6KT
narohat GRANITE 02/15/62 NTS SHAFT HEAFONS RELATED 5.9KT
CHINCHILLA 02/19/62 NTS SHAFT HEAPONS RELATED 1.8KT
COOSAH 02/19/62 NTS SHAFT HEAFONS RELATED LOH
CIMARRON 02/23/62 NTS SHAFT HEAPONS RELATED 11.2KT
PLATYPUS 02/21»/ 62 NTS SHAFT HEAPONS RELATED LOH
PAMPAS 03/01/62 NTS SHAFT JOINT US-UK LOH
OANNY BOY 03/05/62 NTS crater HEAPONS RELATED 0.Ч2КТ
RANGE
CRATER DIAMETER 265 FT. DEPTH 8<t FT. IN BASALT
ERMINE 03/06/62 NTS SNAFT HEAPONS RELATED LOH
BRAZOS 03/0 8/62 NTS snaft HEAFONS related 7.6KT
NOGNOSE 03/15/62 NTS shaft HEAPONS RELATED LOH
HOOSIC 03/28/62 NTS SNAFT HEAPONS RELATED 3KT
CNINCNILLA II 03/31/62 NTS snaft HEAPONS RELATED LOH
DORMOUSE II 0t/05/62 NTS snaft HEAPONS RELATED 10KT
PASSAIC OL/06/62 NTS snaft HEAPONS RELATED LOH
NUOSON OL/12/62 NTS snaft HEAPONS RELATED LOH
PLATTE 0L/1L/62 NTS tunnel HEAPONS RELATED 1.7KT
dead 0<»/21/62 NTS SNAFT HEAPONS RELATED LOH
ANNOUNCED UNITED STATES NUCLEAR DETONATIONS
A-10
EVENT NAME 1962 DATE (GCT » PACIFIC TESTS WERE LOCATION DESIGNATED OPERATION DOMINIC TYPE I PURPOSE YIELD RANGE
ADOBE 09/25/62 CHRISTMAS ISL AREA AIRDROP WEAPONS RELATED INTERMEDIATE
INTERMEDIATE MEANS 20 TO 1000 KT
AZTEC 09/27/62 CHRISTMAS ISL AREA AIRDROP WEAPONS RELATED INTERMEDIATE
BLACK 09/27/62 NTS SHAFT WEAPONS RELATED LOW
ARKANSAS 05/02/62 CHRISTMAS ISL AREA AIRDROP WEAPONS RELATED LOW MEGATON
QUESTA 05/09/62 CHRISTMAS ISL AREA AIRDROP WEAPONS RELATED INTERMEDIATE
FRIGATE BIRO 05/06/62 CHRISTMAS ISL AREA MISSILE WEAPONS RELATED
WARHEAD IN MISSILE LAUNCHED FROM POLARIS SUBMARINE
PACA 05/07/62 NTS SHAFT WEAPONS RELATED LOW
YUKON 05/00/62 CHRISTMAS ISL AREA AIRDROP WEAPONS RELATED INTERMEDIATE
MESILLA 05/09/62 CHRISTMAS ISL AREA AIRDROP WEAPONS RELATED INTERMEDIATE
MUSKEGON 05/11/62 CHRISTMAS ISL AREA AIRDROP WEAPONS RELATED INTERMEDIATE
SWORDFISH 05/11/62 EASTERN PACIFIC UW WEAPONS RELATED LOW
ANTISUBMARINE ROCKET /ASROC/ SYSTEM PROOF TEST
ENCINO 05/12/62 CHRISTMAS ISL AREA airdrop WEAPONS RELATED INTERMEDIATE
AARDVARK 05/12/62 NTS SHAFT WEAPONS RELATED 38KT
SWANEE 05/19/62 CHRISTMAS ISL AREA AIRDROP WEAPONS RELATED INTERMEDIATE
EEL 05/19/62 NTs SHAFT WEAPONS RELATED LOW
CNETCO 05/19/62 CHRISTMAS ISL AREA AIRDROP WEAPONS RELATED INTERMEDIATE
WHITE 05/25/62 NTS shaft WEAPONS RELATED LOW
TANANA 05/25/62 Christmas isl area AIRDROP WEAPONS RELATED LOW
NAMBE 05/2T/62 CHRISTMAS ISL area AIRDROP WEAPONS RELATED INTERMEDIATE
RACCOON 06/01/62 NTS SHAFT WEAPONS RELATED LOW
PACKRAT 06/06/62 NTS SHAFT WEAPONS RELATED LOW
ALMA 06/0 8/62 CHRISTMAS ISL AREA AIRDROP WEAPONS RELATED INTERMEDIATE
TRUCKEE 06/09/62 CHRISTMAS ISL AREA AIRDROP WEAPONS RELATED INTERMEDIATE
YESO 06/10/62 CHRISTMAS ISL AREA AIRDROP WEAPONS RELATED LOW MEGATON
NARLEM 06/12/62 CHRISTMAS ISL AREA AIRDROP WEAPONS RELATED INTERMEDIATE
ANNOUNCED UNITEO STATES NUCLEAR DETONATIONS
EVENT NAME OATEIGCTI LOCATION TYPE PURPOSE YIELD RANGE
DES MOINES 06/13/62 NTS TUNNEL WEAPONS RELATEO LOW
RINCONAOA 06/15/62 CNRISTMAS isl area AIRDROP WEAPONS RELATEO INTERMEDIATE
DULCE 06/17/62 CHRISTMAS ISL AREA AIRDROP WEAPONS RELATEO INTERMEDIATE
PETIT 06/19/62 CNRISTMAS ISL AREA airdrop WEAPONS RELATEO LOW
DAMAN I 06/21/62 NTS SNAFT WEAPONS RELATEO LOW
OTOWI 06/22/62 CNRISTMAS ISL AREA AIRDROP WEAPONS RELATEO INTERMEDIATE
BIGHORN 06/27/62 CNRISTMAS ISL AREA AIRDROP WEAPONS RELATEO MEGATON RANGE
HAYMAKER 06/27/62 NTS SHAFT WEAPONS RELATEO 56 KT
MARSHMALL ON ODO EVENT 06/28/62 NTS TUNNEL WEAPONS RELATEO LOW
BLUESTONE 06/30/E2 CHRISTMAS ISL AREA AIRDROP WEAPONS RELATEO LOW MEGATON
SACRAMENTO 06/30/62 NTS OPERATION STORAX SHAFT WEAPONS RELATEO LOW
SEDAN 07/06/62 NTS CRATER PLOWSHARE 100KT
EXCAVATION EXPERTMENT-CRATER 1280 FT.OIAM 320 FT .DEEP-THERMONUCLEAR oev.
LITTLE FELLERII 07/07/62 NTS SLIGHTLY ABOVE GROUND. DOMINIC II SERIES. SURFACE WEAPONS RELATEO LOW
STARFISN PRIME 07/09/62 JONNSTON ISL AREA ROCKET WEAPONS RELATEO 1.6 MEGATONS
HIGH ALTITU0F-650 KN
SUNSET 07/10/62 CNRISTMAS ISL AREA AIRDROP WEAPONS RELATEO INTERNEOIATE
PAMLICO 07/11/62 CHRISTMAS ISL AREA AIRDROP WEAPONS RELATEO LOW MEGATON
jonnny boy 07/11/62 NTS SURFACE WEAPONS RELATEO 0.5
SLIGHTLY ABOVE GROUND. DOMINIC II SERIES.
MERRIMAC 07/13/62 NTS SNAFT WEAPONS RELATEO LOW
SHALL BOY 07/16/62 NTS SURFACE WEAPONS RELATEO LOW
SLIGNTLY ABOVE GROUND. DOMINIC II SERIES.
LITTLE FELLER I 07/17/62 NTS SURFACE WEAPONS RELATEO LOW
TROOP PARTICIPATION. SLIGNTLY ABOVE GROUND. OOMINIC II SERIES.
WICHITA 07/27/62 NTS SNAFT weapons RELATEO LOW
YORK 08/26/62 NTS SNAFT WEAPONS RELATEO LOW
BOBAC 08/26/62 NTS SNAFT WEAPONS RELATEO LOW
announced united STATES NUCLEAR DETONATIONS
EVENT NAME OATECGCT > LOCATION TYPE PURPOSE YIELD RANGE
HYRAX РЕВА ALLEGHENY ANDROSCOGGIN 09/19/62 09/20/62 09/29/62 10/02/62 NTS NTS NTS JOHNSTON ISL AREA SHAFT SHAFT SHAFT AIRDROP HEAFONS RELATED neafons RELATED HEAFONS RELATED HEAPONS RELATED LOH LOH LOH INTERMEDIATE
MISSISSIPPI BUNPING 10/05/62 10/06/62 NTS JOHNSTON ISL AREA SHAFT airdrop HEAFONS RELATED HEAPONS RELATED 110 KT LOH
ROANOKE CH AHA 10/12/62 10/10/62 NTS JOHNSTON ISL AREA SHAFT AIRDROP HEAPONS RELATED HEAPONS RELATED LOH LOH HEGATON
BANDICOOT CHECKHATE 10/19/62 10/20/62 NTS JOHNSTON ISL AREA SHAFT ROCKET neapons RELATED HEAPONS RELATED LON LOH
HIGH ALTITUDE BLUEGILL 3PRIHE - TENS OF KHS 10/26/62 JOHNSTON ISL AREA ROCKET NEAPONS RELATED SUBMEGATON
HIGH ALTITUDE SANTEE CALAMITY - TENS OF KHS 10/27/62 10/27/62 NTS JOHNSTON ISL AREA shaft AIRDROP neapons related HEAPONS RELATED LOH INTERMEDIATE
HOUSATONIC 10/30/62 JOHNSTON ISL AREA AIRDROP HEAPONS RELATED HEGATON RANGE
KINGFISH 11/01/62 JOHNSTON ISL AREA ROCKET HEAPONS RELATED SUBHEGATON
HIGH ALTITUDE TIGHTROPE - TENS OF KHS 11/0 >1/62 JOHNSTON ISL AREA ROCKET HEAPONS RELATED LOH
HIGH ALTITUDE - TENS CF KHS ANACOSTIA 11/27/62 DEVICE DEVELOPMENT TENORAC 12/07/62 HAOISON 12/12/62 NUHBAT 12/12/62 NTS NTS NTS NTS SHAFT SHAFT TUNNEL SHAFT PLOHSHARE JOINT US-UK HEAPONS RELATED HEAPONS RELATED LOH LOH LOH LOH
DEPARTMENT OF THE AIR FORCE (Continued)
DEPARTMENT OF ENERGY CONTRACTORS (Continued)
Air Force Weapons Laboratory Lawrence Livermore Laboratory
Air Force Systems Comnand ATTN: Document Control for L-262, J. Knox
ATTN: NT ATTN: Document Control for Technical
ATTN: DYT Information Dept.
ATTN: SUL ATTN: Document Control for L-96, T. Harvey
ATTN: Document Control for F. Serduke
U.S. Air Force Occupational & Env. Health Lab.
Oak Ridge National Laboratory, Nuclear Division
OTHER GOVERNMENT AGENCIES ATTN: Document Control for Central Research
Library
Center for Disease Control ATTN: Document Control for F. Mynatt
U.S. Public Health Service ATTN: Document Control for C. Clifford
2 cy ATTN: G. Caldwell
Sandia Laboratories
Central Intelligence Agency ATTN: Document Control for J. Kaizur
ATTN: QMS, P. Zranka
DEPARTMENT OF DEFENSE CONTRACTORS
Department of Commerce
National Bureau of Standards BDM Corp.
Center for Radiation Research ATTN: C. Somers
2 cy ATTN: J. Hubei 1
Brookhaven National Laboratory
Department of Health, Education & Welfare ATTN: Nat. Neu. Cross. Sec., S. Pearl stein
Food & Drug Administration
Bureau of Radiobiological Health Energy Systems, Inc.
ATTN: J. Villforth ATTN: B. Ogle
Department of Justice General Electric Company-TEMPO
12 cy ATTN: B. Titus ATTN: DASIAC
Office of the Governor of the State of Utah General electric Company-TEMPO
2 cy ATTN: C. Peterson 2 cy ATTN: DASIAC
U.S. House of Representatives IIT RESEARCH Institute
Subcommittee on Health & the Environment ATTN: J. Bridges
Committee on Interstate & Foreign Comnerce U.S. Nuclear Regulatory Commission Institute for Defense Analyses ATTN: L. Schmidt
ATTN: R. Whipp JAYCOR
U.S. Senate ATTN: P. Harris
Committee on Armed Service ATTN: E. Weary
U.S. Senate
Committee on Veterans Affairs
ATTN: M. Milligan
National Academy of Sciences
National Materials Adivsory Board
ATTN: S. Jablon
U.S. Senate
Subcommittee on Energy, Nuclear Proliferation
& Federal Services Committee on Govt. Affairs
ATTN: T. Nelapoldi
R&D Associates
ATTN: H. Brode
ATTN: J. Marcum
ATTN: C. Macdonald
U.S. Senate Subcommi ttee on Health & Scientific Research Reynolds El ATTN: ectrical and Engr. Document Control Co., Inc. Facility for W. Brady
Utah Cancer Registry University Medical Center 2 cy ATTN: B. Lyon Veterans Administration ATTN: L. Hobson 2 cy ATTN: D. Starbuck 2 cy ATTN: F. Kuta Science Applications, Inc. ATTN: J. Klemm ATTN: J. McGahan ATTN: J. Goetz ATTN: W. Layson Tech Reps, Inc. ATTN: B. Collins
DEPARTMENT OF ENERGY CONTRACTORS
Los Alamos Scientific Laboratory
ATTN: Document Control for D. Harris & E. Young
ATTN: Document Control for T. Dowler
Di St-2
DISTRIBUTION LIST
DEPARTMENT OF DEFENSE
Armed Forces Radiobio'logy Research Institute
Defense Nuclear Agency
National Naval Medical Center
4 cy ATTN: Director
Assistant Secretary of Defense
Public Affairs
Assistant Secretary of Defense
Manpower Reserve Affairs & Logistics
Assistant Secretary of Defense
Health Affairs
Assistant Secretary of Defense
Legislative Affairs
Assistant to the Secretary of Defense
Atomic Energy
Defense Advanced Rsch. Proj. Agency
ATTN: Director
Defense Documentation Center
12 cy ATTN: DD
Defense Nuclear Agency
ATTN: DOST
ATTN: STSP
ATTN: VLWS
2 cy ATTN: Director
2 СУ ATTN: BA
2 СУ ATTN: РАО
4 СУ ATTN: GC
51 СУ ATTN: TITL
Deputy Asst. Secretary of Defense
Energy, Environment & Safety
ATTN: G. Marienthal
Commander
Field Command
Defense Nuclear Agency
ATTN: FCTMOT
ATTN: FCPR
ATTN: FCPRA
Chief
Field Command
Defense Nuclear Agency
Livermore Division
ATTN: FCPRL, L-395
Chief Field Command
Defense Nuclear Agency
Los Alamos Branch
Undersecretary of Def. for Rsch. & Engrg.
Department of Defense
ATTN: P. Winter
Director
Interservice Nuclear Weapons School
DEPARTMENT OF THE ARMY
Deputy Chief of Staff for Rsch., Dev. & Acq.
Department of the Army
ATTN: DAMA-CSS-N
Commander
Harry Diamond Laboratories
Department of the Army
3 cy ATTN: DELHD-N-CC
Office of the Chief of Staff
Department of the Army
ATTN: DACS-DMA, D. Way
Director
U.S. Army Ballistic Research Labs.
2 cy ATTN: DRDAR-BLB, J. Maloney
Commander
U.S. Army Nuclear & Chemical Agency
Commandant
U.S. Army Ordnance & Chemical Center and School
ATTN: H. Whitten
DEPARTMENT OF THE NAVY
Commandant
Marine Corps
Department of the Navy
2 cy ATTN: J. McNabb
Commander
Naval Ocean Systems Center
Commander
Naval Sea Systems Command
ATTN: SEA-08, M. Miles
Officer-in-Charge
Naval Surface Weapons Center
White Oak Laboratory
Commanding Officer
Naval Weapons Evaluation Facility
Navy Nuclear Test Personnel Review
5 cy ATTN: J. Buckley
Commander-in-Chief
U.S. Atlantic Fleet
DEPARTMENT OF THE AIR FORCE
Air Force Institute of Technology
Air University
ATTN: ENP, C. Bridgeman
Air Force Nuclear Test Personnel Review
4 cy ATTN: Commander
Dist-1