/


Text
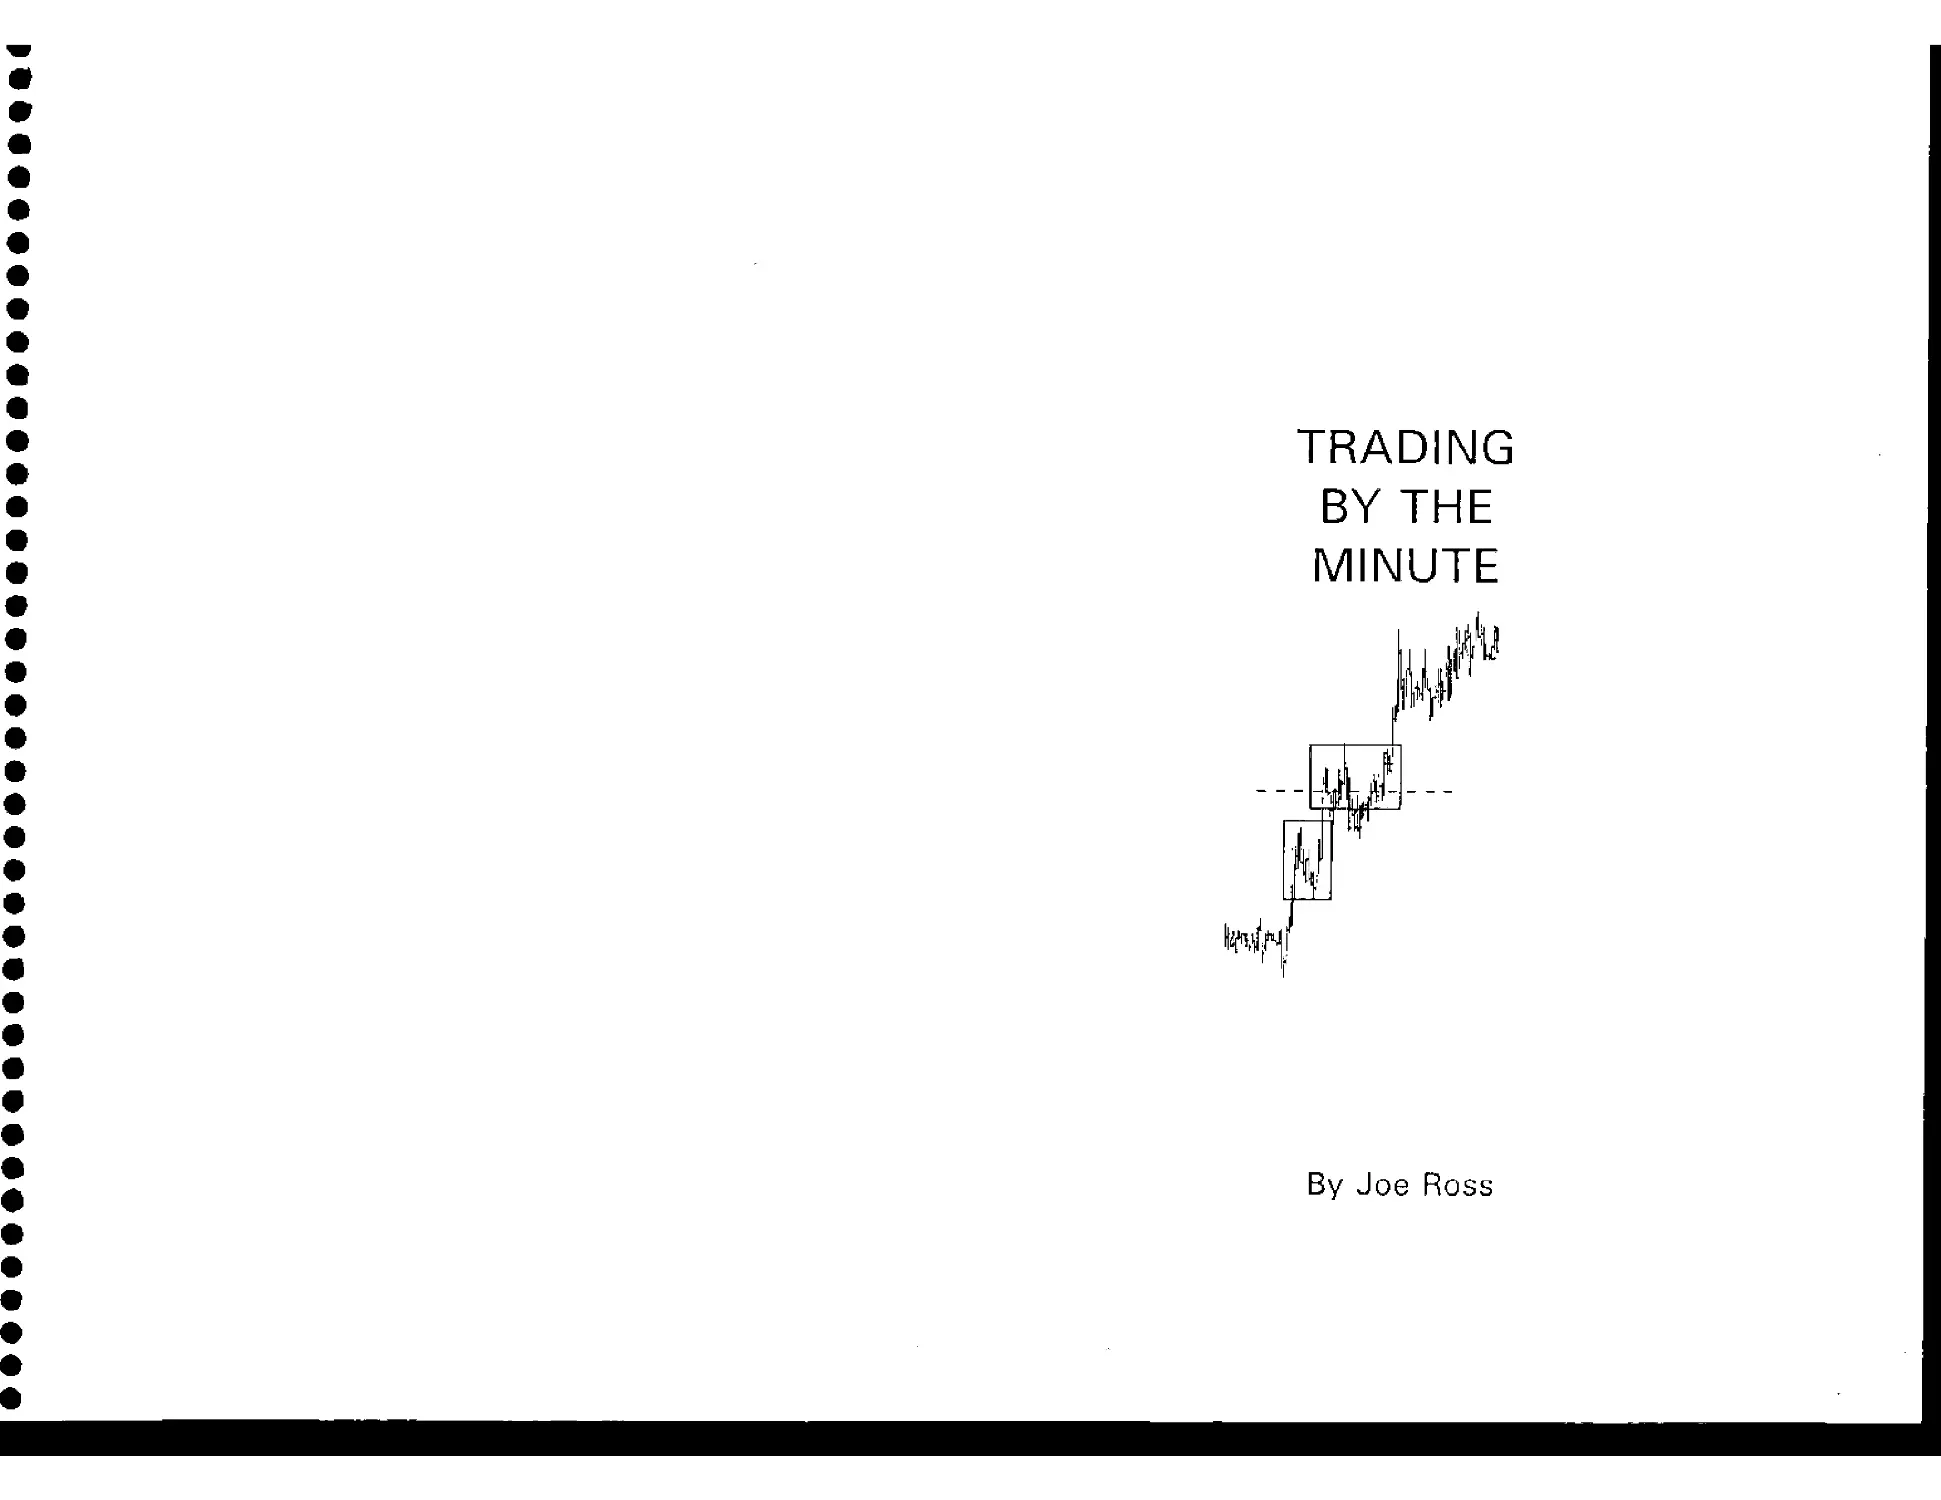
TRADING
BY THE
MINUTE
By Joe Ross
Other Books by Joe Ross:
Trading by the Book
Trading Is a Business
Trading the Ross Hook
Trading Optures and Futions
DISCLAIMER
NO CLAIM IS MADE BY JOE ROSS OR BY ROSS TRADING INTERNATIONAL
INCORPORATED THAT THE TRADING METHODS SHOWN HERE WILL
RESULT IN PROFITS AND WILL NOT RESULT IN LOSSES. COMMODITY
TRADING MAY NOT BE SUITABLE FOR ALL RECIPIENTS OF
THIS PUBLICATION. ALL COMMENTS, TECHNIQUES.
METHODS. AND CONCEPTS SHOWN WITHIN THIS MANUAL
ARE NOT AND SHOULD NOT BE CONSTRUED AS AN
OFFER TO BUY OR SELL ANY OF THE COMMODITIES
NAMED HEREIN. THE THOUGHTS EXPRESSED ARE NOT
GUARANTEED TO PRODUCE PROFITS. ALL OPINIONS ARE
SUBJECT TO CHANGE WITHOUT NOTICE. EACH TRADER IS
RESPONSIBLE FOR HIS/HER OWN ACTIONS. IF ANY.
PURCHASE OF THIS MANUAL CONSTITUTES YOUR
AGREEMENT TO THIS DISCLAIMER AND EXEMPTS THE
CREATORS AND DISTRIBUTORS FROM ANY LIABILITY OR
LITIGATION.
Trading By The Minute
to
Copyright 1990 by Joe Ross
Revised 1 991
Third Revision and Third Printing 1994
ALL RIGHTS RESERVED
No part of this publication may be reproduced, stored In a retrieval system,
or transmitted in any form or by any means, electronic, mechanical,
photocopying, recording or otherwise, without prior written permission
of the publisher and the copyright holder except in the case of brief
quotations embodied in critical articles and reviews.
Published by Trading Educators Ltd., RO. Box F 43527, Freeport, G.B., Bahamas.
Information on how to order - Telephone: {512} 259-0727 FAX: |512) 259-0747
Office hours: 7:00 A.M. - 6:00 P.M. CST Monday through Thursday
Orders by mail: P.O, Box F-43427, Freeport, G.B. Bahamas
To My Sori Scott В. Ross who contributed more to this book than he may ever kfiow.
L
Table of Contents
Table of Contents**.►**.***
Foreword
. . 6
In trocluct ion........
About This Hovis ion..
About Contract Sets..
.........................9
4 Its  * *    .     . x -  9
Chapter 1 . . . *..................♦,,*.***.............11
The Truth Is the Truth............**....................11
Definition of Daytrading,*.  * , - * * . * *...........11
A Br i ef canpar i son...................*******.......12
The Similarities.........................* , . , ......12
The Dif ferencG'J.....,...................*.«***>«*.*.* 13
Other Differences* ..,*.***.**.,*...................  .13
Chapter 2 . . * .................*,..**,.**...*..........]	3
Trade Select ion........................-*,**..........13
Trade selection, **..*,.**.**.**...................... .20
Selecting a Time-Franc...........................*....20
Selecting n Market.**.,*,.**.**..**.......... 20
Selecting an Entry Point. ,*,.**................***,** *21
Chapter 3,..**............................*........
Major Entry Signals* ....................*	* , . , ♦ * * .
The Breakout of a Trading Range............. .	* * . .
The Breakout of a 1-2-3 High or Low..............
The Breakout of a Ledge..........*,.,*,.,........
The Breakout of a Ross Hook.........**.*.*♦♦,.*,
Summary : Major Entry signa is.............  .	, , *
Chapter 4........................................      ,J6
Intermediate Entry S ignaIs.........,*,*,,**..........	. . 36
Chapter 5 *.........*..............*	* *..............  '1
Minor Entry Signals...........*****........  .	* * *...41
Priori! les ...*,. * *..........**..,... . ....**..*, r . . 4 2
Chapter Я.
*51
Housekcepi ng
51
Chapter 9.....* * , *.....................
Brokers and Commissions............*	* , * *
3
Chapter 10,....	.........................  ,	, . .
A Trading Plan.............	. . ........  .	. ♦ *
Approach. . . . ............. .	............
Staying Alive, ...................  .........
Staying in the Water........*.........
Plan the Work — Work the Plan............,	. . .
The Plan........
I Want It My Way..........., , . , . .	57
Chapter 11	GO
Filtering the Trade................................    £o
A Trading Filter.................................  ...60
Chapter 12	....... ...........................      72
Risk and Money Management.................... . .......73
Risk Management.................  ,	...................74
Money Management....................................  75
Chapter 13	      so
Congestions	Are	Important..........................  80
Chapter 14	35
hind-Set. .... .... . . .. ..... ...... . , .... , . , ..... . ....  . .8о
Chapter 15	......................................... 9 2
Search Out the Best................................  .	,92
Staying in rhe water. ............................    94
Preferred Patterns, .............................     100
Chapter 16	.....................,	...............  .	, ,ioi
The 'Phird Contract Sat.......................  .	...... .101
Chapter 17.	...................................... 107
Strategy and Tactics. ............................    107
Continuation Trading. ...............................107
Reversal reading. ...................................107
Gaps.............................................    109
First Break Versus Second Break......................110
Chapter 18	113
Trading the Minor Entry Signal......................... . 113
Minor Entry Signals.................................  113
Chapter 19................ ...........................  120
Trading Logic. ......................................  12D
Pivots..................... . .......................  120
Chapter 20,...........................................  123
Concrete Examples....................................  123
Base on Base........................................ 1 30
Chapter 21............................................  131
Finding the Trend.................................     131
Chapter 22* . . . *....................-...........1 J9
] i f teen M a nuit: Trad 1 ng...........................13	9
$g Per Round Turn. . ......*............................141
Average Voljti1ity. ,..,,*......*...................,...141
$ 15 Per Rounc! Turn.  -..................*...*,.***..,14 2
525 Per Round Turn. . ..................................* 14 2
Chapter 2 J ...... ......................................1 50
The Reversal Ear and others.......'..................*.150
Using Average Volatility tor й Stop Loss.152
Sagging Tops and Rising [bottoms............*...*,.,*..	153
Segment Counting....................................  155
Chapter 24 ,,.*.,*..**., *..............................* 167
Turn i ng Day Trades into Position Trades................16	7
Chapter 2 5 *................................................1 7ti
Sixty Minute Day trading..................................170
Chapter 2 6 * . * * . * * * . * *..........******* 226
Sip Trading...........................................    226
Chapter 27. . ..............*	. . * *........................3 10
Someth i ng О 1 d- Someth i ng Nev;.......................310
Identifying Congestion...................................lit
[dent i fying Trends* *,**,,*«,.,**..*,,*..................3 1G
Success i vc И ew [Extremes... . ..............  ......	110
Sagging Tops and Rising Bottoms...........................Ill
Segment Me thod................................    ....	j 11
True Trend Method*.....................................*311
Some Very Bas i c Tradng
True Correct ion Method .............................**.3 20
Summa ry **.**.**........ *.......................*,.,**321
Chapter 213......................* , ,**.*,.*, * . * * . ...	. 3x6
I'll] 1 Circle. ... 1( ........ ............  *	*.........*	* 326
The Floor. .**.**. . *....................* . * . * .***.**, 3 32
Cup with Handle*..*...................*	. , * *............3 34
I (edging.....* * . , *....................................3 36
Protective Stops.. ...............,..................... 337
Fibonnaci F;i 1 lacy . *..................**,,*,.*,,.*,.	3 39
Capital Preservation.............  ,	, * . ... . * * . ..340
Heads and Shou Idcro............*.***.*,	. ,.............342
I Trade What ]. Sec* .............*	, . *.............. 34	3
I ndex
5
Foreword
There are few authors in technical analyses who write with Joe Ross'
clarity, The interesting thing is that when you read lais manuals you feel tfie
sense of cfe/a vu. Those market features that you have seen in a vague
pattern are now brought into focus as if a fug Mels been lifted. You can now
define and hope fully an Lie ip ate market action.
Tins manual fuiluws in [ho stylo of Trading By The Rook, Indeed, there
are many siruiinrihen in form and content, Yet Trading By lire Minute lias its
own messages. Clearly a separate message to the day trader. but also there
are many areas in which a position trader will recognize value.
Joe and I have been friends for some time. We have collaborated on
trading techniques so I know of his dedication to the market. But in this hook
we see the other side of Joe — the instructor of the grand style. He is
teaching us "How to Fish".
W. E. Dalton, MD
Introduction
Please Read This
I have always boon a rather private trader. Over the years that I've
traded the commodity futures markets. I've used family techniques and
methods available only to myself, and to those taught by my family,
In my family, trading in the commodity markets goes (jack over 100
years.
The things I have discovered about futures trading, coupled with
wisdom of old, make up my style of trading.
Several years ago, I was suddenly stricken with a lengthy and
devastating illness that literally changed my lite.
All my hading knowledge Heady died with me. When it looked as if I
might have a little more limo loft, I set out to write down the way I trade. My
instructional manual, Trading By The Book, was first written for my wife and
children so they could, after learning the basics of trading, carry on the family
tradition should they choose.
When I wrote Trading By Tire Book, it was the first lime I had ever
revealed my trading methods to anyone. I did so because, at that time, I
fsrmly believed I find only a few months left to live.
It is now some time since rny release from the hospital. To everyone's
«imazemRfit, I am still ahve — aavti and back to being involved in die markets
on a daily basis. Nut only that, but I've found that I like to write and, even
more important, I enjoy leaching about the way I trade.
Trading By The Mmuhjr although a complete manurd in its own right, is
a natural sequel to my instructional manual. Trading By The Book, They are
really part and parcel with each other.
The success of Track g By The .Book has encouraged me to write this
sequel. In it, I will try to show many of the things I've learned about
successfully day trading in the futures markets.
My trading is sucn that it has evolved over the years. I have always
tried, and will cuminue to try, new things. I am not against any method,
system, or concept that car. be proven to work successfully over a period of
lime, I am never against anything that works for you in your trading.
With the onset of "daytradieg", I have fiad Io add many new wrinkles
to my tried and true techniques of the past. Yet the good old ways, the
methods that have been winners for over 100 years, arc still the mainstay of
my trading — even Trading By The Minute.
As I did in Trading By The Book, I will write this manual mostly in the
firsl person. I can tell you what I do, I cannot fell YOU what (o do. You're
going to do what you ware to do no matter what I say.
1
Hope lies in The extent to which you may want to emulate the success
of my own trading. The wise trader will seek to incorporate my knowledge
into his own method(s) and personal style of trading.
Most of the trades I show were engaged tn specifically for the purposes
of writing lliis book. Although I trade larger size and at lower commissions
than most, in the trades for tins book I used the number of contracts and
computed commissions and costs as shown throughout. In lhe final series of
trades in the S&P, I show actual lot size and costs.
When trading for purposes of writing the hook, 1 stay and even enter
trades late in the day This is not my usual way. I rarely trade as late in the
day as I do when writing lor a book. However, I find it necessary when
writing because of the time invested. When lfve spent an entire day watching
a screen, I push harder to come out of that day with something io show for it,
I warn to earn my keep for the day and 1 want to have something to show
my readers.
When 1 trade for purposes of writing a book, I try hard to be as
mechanical as f can be so that rny own instincts and intuitive feelings are
removed from the trade. I want the method to be in the forefront of each
trade. Yctr I find it is not always possible to separate my feelings from what I
am doing. Wherever such is the case, I have endeavored to explain my
thought process. There is a reason for doing what I do. I have toed to put
my reasoning into the book whenever I have deviated from the purest form of
the method.
There will be instances when I stray from the method and there is no
explanation. These are not intentional. I am not a perfect trader. I miss
moves, miscount bars and segments, miscount points and money, fail to see
various formations, etc.
In writing this book, the emphasis is on technique, not on the overall
way I trade. In order to teach a lesson, I am forced to have tunnel vision.
In actual practice. I filter every dayirade through the daily chart. I
attempt to trade only in markets that are trending on the daily chart. I take
only trades that are in the direction of the trend, especially when a market is
correcting.
When writing, I cannot lake such a broad view. In that sense, the
trades shown are out of context with the reality of the broader market. In
some instances, I purposefully took trades that were not in trending markets,
in order to illustrate a point.
In my own trading I am very selective. 1 choose only trades that 1 feel
are very strong — in my mind, virtually sure things.
In addition to my technical signals, I look for unusual things in the
market that might lip rtin off as to the very best selection. Such extraneous
matters go far beyond the scope of this book. Much as l‘d like to include
them here, the impracticality of doing so has to be a factor. I have neither the
time nor the willingness to sit down tn write a ten-thousand page tome
expounding every lost derail of the way I trade. Perhaps some day I'll do a
video of my trading so that much of what I do can he scon as well as hoard.
a
Those readers who are familiar with rny tutoring arid seminars know
shat I'm terrible with arithmetic. When I’m trading I make* turribie and careless
um>rs. I seem to have a very bad lime with fractions. My arillimctic
shortcomings have been there since ту earliest cfiikihuud memories. 1 am
tlyslexic. I make a lot of mistakes — I Пт’ггьк I have made a pro fit when I
haven't, I think I have taken a kiss when. I. I luvijri.'t. Of mo I use ton many or
tog few contracts tci cover costs because of arithmetic errors. Arnazimjfy, n
has never really affectcd my trading, [ just plow along doing my thing, and
somehow at the end of the week, nay wife, who keeps my books far таге
accurately than I ever coukl, tells me l‘ve dune okay. “Whatever it js you’re
doing/' she says, "keep up the good work/1
In llie par Is of the book involving bar and segment co on 11 r icj f I allude to
spreading my position overnight in a back mcmtlL "I tics particular subject goes
beyond the scope of tins book. Suffice <1 to say that 1 often hedge rny
positions tn markets that trade overnight by spreading or by emering stops in
the cash and/or loreign futures markets. This is a concept that mtally
contuses many of my readers and certainly many of my seminar students. As
stated, it goes far beyond the scope of this book, but for the reader who is
familiar with such tactics, please understand that J do this to protect my
position. For the reader who does not know what I'm talking about, this
should be an encouragement to attend a seminar io learn about such things
before, not after, suffering large losses of capital.
About This 1991 Revision
When I first wrote this book, I wanted to demonstrate a very specific
way of daytrading centered around the concept of matching congestions. In
practice, this has proved difficult for most of my students. They simply tin
nor have the experience needed to perceive and trade these matching
formations profitably. Yet, there are some who have done well with [his way
of trading. In pan, matching congestions are perceived Ihroirgh the eye of the
beholder, trading [I'njrn is somewhat intuitive, Describing how to recognize
them is definitely subjective.
In lliis revision they arc presented again tor those who have [lie depth
of experience in the markets to trade them well.
In addition, 5 have included methods for day trading that leave little or
no room at all for interpretation. I lead the reader step by step into the
segment counting method. This method is so precise that it could be
automated under some form of artdicial intelligence. It has definite and
consistent rules. In my opinion, it is best done in light of human reason and
judgment. This method takes up the greater part of the manual, and follows
lhe concepts presented feu matching congestions. If ma'ching congestions
seems loo difficult, then trade with the segment count method. It has proved
successful for over 100' years of position trading, and is still successful
regardless of time frame as long as a definitive chart is available.
About Contract Sets
In the first presentation of contract sets, I suggested using multiples of
three contracts. In tins. revision, 1 suggest using at leasi a two contract set,
then three, four, or live, Beyond five contracts, I recommend using
increments of live. I his would give ten, filiecti, twenty, twent y-five, etc.
What must be considered is which gives the best results over ell —
entering the market with an oddJol, or exiting the market with an odd-lot.
Rased on my own records, the better result co rues by exiting rhe
market with an odd-lot.
This will make more sense as the rest of (he material in the book is
absorbed. As the trades unfold, ask '’Is it better to enter (he market with a
nine lulr and liquidate a four Im io cover costs, leaving an exit for profit with
a five (round) lot, or is it better to enter with a ten (round! lot, liquidate a four
Im to cover costs, arid exit w4h a six (odd) lot?"
The odd lot is going to result in mere slippage for the fill. Il has proved
better to exit on the odd-let, and give up slippage on the profit end of a trade,
than to enter on rhe odd-lot, and give up slippage on the cost end of the
trade. In the lung run, the reader will have to decide this for himself within
the context of hrs own trading style.
About This 1992 Second Printing
I have adrlnd a morp mmiptmo description of (In: varirnis ways in spot a
trend Hi its uu;cp'ion.
Chuptcr 1
The Truth Is the Truth
Although 1 have whiten this book (гот the orientation of the intraday
chart, the things I do and show here can easily be extrapolated to the daily
chart. Where I show the relationship between a daily chart and an intraday
chart, those who arc not daytraders can do the same thing in the context of
the relationship between a weekly chart and a daily chart.
In essence, with a few exceptions, a chart is a chart is a chart.
What I show in (he early pans of this book centers almost entirely
around congestion areas which may be seen on any chari in any time frame.
In the later pai ls of the book, the things 1 will show center around trending
formations. It is important to be able to spot the very beginning of a trend,
and also be able to enter existing and established trends with great success.
The major differences between trading the intraday chart versus trading
the daily chart have to do with lime and volatility.
A more definitive comparison between the five minute chart and the
daily chart is given just ahead.
Decisions must Ire made more quickly using the intraday charts, and (he
tradable patterns form more quickly on the intraday charts.
Other than that, trading is essccitally the same. Later in the book, iri a
chapter entitled "Full Circle," I will demonstrate the truth of what I have just
said.
It is important to realize that the use of a live data feed, in most
instances, gives cur hi in advantages io i he day trader over the daily trader,
when it comes to lhe matter of optimizing entry and exit. When used
properly, daytrading can result in not leaving nearly so much money on the
table as can daily trading without intraday entry. However, proper use of
intraday data is very difficult to achieve. It takes great discipline to utilize it
properly so as not io end up overtrading.
Definition of Daylrading
At this point, I want to define daytrading as it will be used throughout
this hook. My definition may be different from that of others, so I want to
clarify exactly what I mean. Typically, daytrading is defined as entering a
market at or alter the open, and exiting at or before lhe close. In addition, my
definition of da у trading is any method or system thai uses a live, maf-ume
data source to determine entry and exit signals to and from any market. This
would include hand held quote devices, watching an electronic quote board,
or even one of the о id electrical cl ack er boards.
I know it is possible to ''daytmdc" without a live data feed. I have met
some who cEo that. I know of two men who literally drive lheir brokers crazy
by calling in every few minutes to find out the prices of Hie contracts they
trade intraday, By rny definition, fids is not daytrading, Nor is trading from a
delayed data feed daytrading, by my definition,
11
The most fundamental concept this book teaches ts that it is essential
to learn to recognize what any chart looks like just before an important
breakout. Equally important is to recognize congestion at the earliest possible
lime. This necessitates that a chart look a certain way. Throughout this
manual, I show charts that have that look. They must be of sufficient length
of time to be well formed, A five minute bond chan is the exact opposite of
the type of chan formations I look for. Later I will show a five minute bond
chart and other charts that are untradablc by my methods.
A Brief Comparison
When I first started daytrading in the commodity futures markets, I
was unable to find books of any kind covering the subject. Everything I did
was done without prior knowledge as to how to go about day trading,' I had
no idea of what to expect. I did not know if the things that had always
worked for me would continue to work successfully. Therefore, learning to
daytrade was a new adventure and a great challenge for mo.
In some respects, daytrading is not all that different from trading daily
charts. Yet. in other respects, it is as different as night and day.
The Similarities
The similarities between intraday trading and trading from the daily
chan ere numerous.
Intraday charts look pretty much like daily charts, but with some
notable exceptions. In part, how the charts look is a function of the data feed
service I use. I’ve tried different ones side by side, and there are differences
in the appearance of individual price bars. They often disagree about where a
price bar opens and closes, and where the high emd the low occurred. There
are also differences due to the particular software I use. The appearance of
the charts vary from one software package to another. I have tried several.
With some programs, the clock setting on the computer 1 use also
makes a difference in how the software sees the individual price bars. There
are differences in the way the data is handled from one computer program io
another, and even running tho same program on two computers with different
clock settings will make a difference in how the individual price bars appear
on the charts. When I talk about clock settings, 1 am referring to the time
clock on the computer that shows hours, minutes, and seconds, as opposed
to the internal clock that controls the hardware cycles.
Intraday charts make essentially thc^ same formations as do daily charts.
There are trading congestions connected by trends. There are retracements,
sideways movements, pauses, gaps, and waves.
1 suppose that if traders had the tune to study intraday chans in the
manner in wlircn they have studied monthly, weekly, and daily charts, that
cycles could be observed to occur as much on a one minute chart as they do
on a daily chart. I know of traders who trade intraday based upon astral
phenomena and ocean tides.
12
Intraday ci'-aris can be traded utilizing Fi b ui। и с c ।, Garm. and Elliot
techniques, fun lines, speedlines, pitchforks, oscillauns, nmving avcmge.s,
RSI, Stuchasi ics, DEMA, MACD, Commodity Chenin el Index, Volatility Slop,
Parabolic Slop, Cycle Projection, and any other of trie host Ы technical
analysis tools available for use in the market today.
The Differences
Some differences arc io be found in the way certain of the charts
appear to ilie eye. The long bond futures contract, Eurodollars, in fact all of
the interest rate contracts, appear flat on a five minute chan, силе different
from the way they appear on daily charts. On most days, the chart
forrnaiions on these do not begin to look like the daily charts urn it she price
bars are captured cin a sixty minute interval. Rotter yet is a 1minute chart
for seeing the interest rate contracts in the way I like to see a chart.
Differences in volatility show up in that a move on a one minute chart
that covers the entire height of the screen, may appear as a normal size bar
on a daily chan.
Charts for the more thinly traded contracts, and some, of the more
volatile contracts, appear as virtually unrecognizable and untradable, losing
any symmetry and formation I might waul to use in trading them.
Other Differences
Slippage is a greater problem in day trading than ir is in p о s । Ti о n trading.
The same amount of slippage on a day trade is proportionately greater in
relation to an intraday chan than it is to a daily chan. A daytradi? yields less
lime to absorb slippage. Therefore, holding slippage to з minimum becomes
criiicah
Keeping slippage* at о minimum necessitates my using more restrictive
types of orders on an intraday chart than I would on a daily chan. I must
know within a point or two where I ant going to be filled.
Trying ю have minimal slippage also affects size. I have to he careful
tn ruainiaifi lui sizes that arc normally traded on the floor. I want to avoid
odd-lots, such as twenty three orange juice1 compacts, or rime ciudc oil
contracts.
Very often, I will liquidate a lot size io cover costs that ts дгегнег than
needed just so I will he left with an easily liqiudaied mi size should I need to
get out in a hurry, or to help insure the least slippage lor a profit taking fill,
Fundamentals play little part in trading the intraday chans. News
affects the opening ccdls, and, of course, it can have impact nn the action
during the day, but a lung term position trade on a one minute chain can
consist of about twenty price bars. Often a trade consists of five to ten price
liars, and occasion ally only one price bar is sufliciont for a trading decision.
Seasonality, in lie conventional sense, lias virtually no manageable
effect on intraday trading, other than as a possible entry technique,
13
Nows stories and rumors greatly a (feci the intraday charts, causing
huge runs during the day and yawning yaps at lhe open.
Оbtaining good fills becomes absolutely critical in intraday trading, and
die problem of entry and exit on a same short term price bar can be
enormous, because one doesn't yet know if the entry fill was completed prior
to having to enter the exit order. In some of the mere thinly traded markets,
and at intervals when a market is fast, even a ten minute chart docs not give
sufficient time for knowing whettier or not an entry order was filled prior to
having to enter the exit order fur a particular trade. Execution is a major
consideration in daytrtiding, and I will delve into it in greater detail in the
appropriate places.
The amount of commissions to be paid becomes critical in daytroding.
Having toss limn and range ol movement with which to absorb overhead
means that it is vital to secure and maintain the lowest possible commissiuris
per round turn.
The area of trade management becomes totally different in intraday
trading, and the strategy and tactics involved are much different for mo when
I trade intraday than when I trade the daily charts. Please notice thru I said
trade гпапапетегл, and not risk management or money management. The
main difference in trade management lias to do with the hurried way in which
I have to Hade intraday.
By vzirlt? гияиоgement, I mean the mechanics of entering or exiling a
trade.
Those who have read my manual Trading By The Book know that I
pretty much reject the practicality of fundamental trading because, as an
individual, I have neither the time nor money to pursue the acquisition of
sufficient furidarriental knowledge from whrch to make trading decisions.
Also, with the exception of mentally rioting where Fibonacci ratios arc
located, along with the occasional use of □ simple offset moving average, I
reject the use of the dozens о I technical trading tools in my trading of the
intraday charts. As regards Fibonacci ratios, I use visual retracement ratios
only as a filter io tell me if a market is behaving normally. I do not use
Fibonacci expansion ratios to help me set objectives for my trades. They are
too time consuming arid toially unnecessary in the way I dayirade.
I would strongly urge anyone wanting a more complete understanding
of my basic trading philosophy to purchase Tmdiog By The Book. Much ol
what will ire found' in Trading By The Minute derives from the age old truths
found in Trading By The Book. The concepts shown in Trading By The Book,
along with many of the ups and techniques shown, are for the most part
applicable to trading in virtually any lime frame.
V/ncn irad-ng intraday charts, I use no "technical" tools at all, other
than occasiona’ly using ше moving average mentioned above. This is, more
specifically, a three bar simple moving average of the close sei forward three
bars in time. When E do use it, it's usually to provide variety in my trading so
that Гт iioi always doing exactly lhe same [fling.
1Л
Although I do have a sense of where the Fibonacci retracement ratios
are located, in my use of these I differ greatly from the "norm", in that I do
not trade from the retracement ratio points as do most who use Fibonacci, I
use my pcrceptiлп of where they are 10 tell me if a market is acting as I might
expect И to. In that sense, it is ’'nice io know” information.
My approach to intraday trading is based entirely upon what I see
before me in the form of a bar chart showing Open, High, Low, and Close,
As previously stated. I use virtually no technical fools in my trading. Why?
Because I ford they operate only to confuse lhe picture, AND BECAUSE THEY
ARE WHAT THE MAJORITY OF THE OTHER TRADERS ARE USING — AND iF
YOU BELIEVE THE STATISTICS, YOU KNOW THAT THE MAJORITY ARE
CONSISTENTLY LOSING IN THE MARKETS!
The closest I can get to the truth of what is happening in the markets is
what 1 am able to see on my bar chart as prices lick up and down on the
computer screen. Notice I sard "closest''. The bar chart is the best I can do,
but even it doesn't toll me the whole truth,
I know of a number of traders who thought that because they had a
live data feed, they could trade the markets just as a floor trader would, That
is emphatically nor true, although the data feed suppliers would like to
convince you that having a five data food is as though you are "right there in
the pit with the floor traders.”
On my live data feed, 1 can't see how many traders are in the pus. The
volume I see on my chart is only a best guess of tfie actual volume on the
trading floor. I can't immediately see if a market is thin, I can only guess, or
ask my broker. I cannot sense the emotions or moods on rhe trading floor. I
cannot tell'd there arc more buy orders than sell orders, or vice-versa.
I can only belatedly realize that a market has started to become “fast”.
Another handicap is that I cannot see who is doing the trading. I am unaware
when a "coinnierchlT or □ large trader comes onio the floor and begins to
suddenly or incrementally buy or sell. Probably my biggest disadvantage is
that I cannot see the "bid", "ask" or "size11 figures. Although they are
available through my daytrading software, [hey are posted too late to do me
any good. They are always behind-times.
Another important item thai's missing is that I can't hear the action as
the floor traders can, They react to the noise levels — I cannot.
These limitations, of necessity, have an effect on my trading style and
results. The way I trade has to compensate for the lack of "truth" I have to
deal with when trading from a computer screen.
Another major limitation I have is that of lime. I dare not use the
"natural'' pivot points that are in effect down on the floor. I dare not use the
same support and resistance points that are being used by the floor traders.
The difference is that they are THERE, in the pit, and can react immediately to
the price action. As stated, the floor traders have the advantage of ’’hearing"
ihe action on the floor.
15
Even though rny data feed is "real time", there is as much as a ten
second transmission delay between when I sec a price lick and when it
actually ticks on the floor. Added to that is the incremental delay within the
computer program that takes place between the time the data is received by
the program, and the time slice given to the particular markctlsl in winch I’m
trying to trade. The refresh tale io the screen for each tick causes a tiny
delay. The delays are something I have to live with that the floor trader
doesn't have co live with.
Another problem I have with time, which changes the 'whole hail game
as to the way I can trade versus the way someone on the tlour can trade, is
that 1 have to deal with the inevitable delay of the telephone call fur placing
my order, and the ensuing clerical procedure necessary to get my order into
the pit. Even if аси! when I call directly to the boor, there is a delay as the
order ticket is wnn.cn and then taken to or signaled to the trading pit.
The time intervals I lose, compared with the actuality Thai is faking
ptace on the trading floor, amount lo a tremendous handicap that has to be
dealt with and overcome by the methods I use in my trading.
I also have to five with higher commissions than do floor traders. Even
a low round-turn commission off the floor results in paying several limes the
commission that some floor traders pay.
Finally, I have to put up with the inevitable missed ticks (hat fail io
come across rr:y data feed and bad ticks that come all too frequently across
any data feed. They love to come at critical decision times. They are a major
annoyance in daytrading, especially those you cannot see because they fall
within the "norm" of the current price action,
I stated previously that technical indicators only tend to confuse the
picture. Anyone who uses them knows that a three bar version of a moving
average, a momentum oscillator, a channel index, DEMA, RSI, Stochastic,
etc,, look and behave differently than an eighteen bar version of the same
technical indicator. Which me is lo be believed? All technical indicators are
figments of the imagination. They are created by the trader and rrmder
different trading decisions from the same trader depending upon the length of
their base.
Technical indicators (end to smooth things, when the underlying reality
upon which they arc based is anything but smooth. Prices tend to chop up
and down, making rather large moves in spurts from time to time.
My way of trading is to trade from dw reality of what is happening to
the price as reflected on the computer screen in front of me. Since what 1 see
there is the closest I can come to the truth, for me ii 7s the truth.
Another thing to realise when trading intraday charts is that by the end
of the day there will, on the shorter term charts, be a great many Lars. For
instance, on a one minute chart, there may be as many as 2G0 price bars
showing. That is the equivalent of many months of trading on the daily
charts. In addition to those 260 bars, there arc those that have already slid
off the beginning ot the chart. This is especially uue of the currencies, the
interest rates, and the stock index charts.
16
г
Thai's a lot of росе bars, and it represents a lot of trading decisions. If
I were to add to my position each lime there was a hading op nor: emit у on a
one mi no a? chart I could go riots., .a nd so could my hr икот.
Therefore, 1 do not trade in and out ail day long. I simply cannot take
tlie wear and tear. If I did trade in and out (hku the lltior traders), I would
simply burn oui before the end of the day. И fact, I know sumuuJie who had
a nervous breakdown doing that very thing.
I'm nut saying that others can't do it. I'rn saying I can’t do ir. H's too
iiiicnsu tor inn, and it's loo much like hart! work.
I'rn olteri asked by at her s, ,hDo you dayiradc?"
By now the answer should be obvious. Yes, 1 do daytiai.iu. Bui I
cannot du si all the lune. It lakes great energy to daynadu. Il involves a
great intensity of cmiccmratiom
I have, a- hmes, day trad cd intensively for a few days, but then I had to
rest and get away from the markets. The odd thing abm.it that kind of intense
trading is that ! don't always know when I've had enough. 1 usually find out
or realize I've been at it too long when I wake up to the fact that I'm losing
too much money.
The intensity of dayirading has a way of hypnotizing me so that after
awhile I really am net seeing much of anything. I become d'.ill. My perception
of the market action is no longer sharp, 1 have become saiumied and my
mind lias become numb.
It takes great energy to dayimde and the cost in mental and physical
wear and tear makes it problematic I rum a practical standpoint.
I inn not alone 111 Uns perception of dayiradmtj. One h lend of mine,
who has houri a professions; irader for 24 years, says that ail he can stand of
it is two oi three days out ol each month,
Another friend, who has a seat at the CBOT, has told me it is easier to
trade down on the hour than tn daytrade from a screen off die fluor. He has
been trading foi 36 years, and is one of the all-time greats of trading.
Because ci a у tr ad irig is sn intense, because I pe r so j * a 11 у can't handle tun
much of n, and most of all because the greater pro hrs are made long :erm, I
also position trade rhe intraday charts. I attempt whenever pussT'e to turn a
daytrade into a position trade. ГН be showing how I do that in a later chapter.
Posit ion trading is a lot more relaxed. The trades more or less take care
of themselves. I don't have to pay much attention to them, Once I have
turned a dayirade into a position trade, ad I have to do is monimr li'.o trade
closely enough to move my profit protecting stops and gel our at any
objectives I have set tor the trade. Typically, my profit protuctu?.| stop is one
and the same with my objective. I want to be stopped out ’with a profit.
Lung ago J quit trying to pick market lops and bottoms,
17
Trade Select юн
Throughout the book, I will utilise many illustrations to demonstrate
what I'm talking about.
With what 1 have discussed so far as a background, let’s get down to
some trading concepts.
Market Anatomy
This is a market:
Looking at it carefully, what can be said about this market? What can
be seen in Iriis market? What truth can be found in ihis single pictograph of ;
market?
Il can be said that it opened at its high and closed near its low. Dues it
have a high? Does it also have a tow? Is this market in a trading range?
Truly it js in a trading range. It's in a trading range between the high and the
low.
Isn't that true of all markets? Every market in existence is in a trading
range between the hignest high and the lowest low that it has ever
experienced.
I noted some other vulhs about this market. It had an opening price
and it had a closing price. However, the open and the close were not
necessarily precise, instead, they represent a consensus of what Оле open
was and what the close was. By the time trading closes at the end of a day,
[he reported open may reflect a far different price from that which was
originally shown at the start of trading, The reported close also may change
drastically from where it was seen to exist at the end of trading and from
where the "officials" call it after the close of trading.
Although I can sec where the high and low were purported to be, I
have no idea about how many trades were made at each of them, or for
certain that the market ever actually traded at those price levels.
1 also don't know what the volume was for this market, and I don't
know what the open interest was, cilher, I will know both when it is too late
to do very much about it.
Vet, these truths, along with the trend if there is one, are all 1 have
upon which to base a tradmg decision should I choose to place a trade in this
market.
1 a
If I look ai a market and realize that it is in a trading range between the
all-time high anti the all-time lew, then 1 can also realize that within this
overall trading range there exist many lesser trading ranges. These lesser
trading ranges occur over time al virtually every level of price activity that a
market has.
But these trading ranges don't usually exist in a vacuum, formally they
are connected. The formations that connect them are calltMi trend lines. A
market, over time, has an anatomical structure. What I see arc trading
ranges, connected by trending fonualtons. Trending formations, in turn, are
made up of shorter trading ranges, gaps, large magnitude moves, and
progressively ascending or descending price bars.
Excuse me if all this seems overly simple, but I have to start
somewhere, What I'm attempting to do is to lay out a basic foundation for
what is io follow.
What I'm showing here is that a market can be dissected — divided up
into its component anatomical parts. There are ways to trade each of these
component parts. There are ways io Iradc from trading ranges. There arc
ways to trade progressively ascending or descending trend formations. There
are ways to trade from small congestion areas. There are ways to trade trend
reversals, breakouts, retracements, and corrections. And there are ways to
day trade markets, arid they are, in some respects, unique to daylrading.
This book is about how to trade the various situations that occur in die
market place. The methods I show in this book are valid in any intraday lime
frame in which they can be seen lo form. Many of the concepts I show are
valid m daily or weekly lime frames, tint the emphasis will be towards the
intraday charts.
Trading these intraday charts requires somewhat different strategies
and tactics from those that might be involved in trading daily, weekly, or
monthly charts, I make a good part of my living based upon using intraday
charts. This book and course will be based entirely upon intraday charts, and
other chans will be used only as they relate to the intraday chart.
Although these various formations are able to be traded as individual
entities, and can be successfully traded in ihat mariner, before inis book ends,
I hope to show how I trade in such a way as to automniically include the
individual component pans of what make up a marker. That technique will be
what 1 call "segment counting,"
Some of die things I say in tins hook will pertain only so die concepts
of intraday chart trading, bud in no way con Hint or contradict the things 1 said
in Trading By The Book.
There arc many 'ways in which to start a book of if us type. In Trading
By The Book, I started gut with trading the breakout of a trading range, in
this book, I will start out with the concept of trade selection.
19
Trade Selection
For me, trade selection consists of two things: selecting a market, and
selecting an entry point.
The first is easy; the second will take a bn more explanation.
Selecting a Time Frame
I tio not recommend trading on anything less than a five minute chart
for most dayiradurs. To trade anything less than a five minute chart is jo
invite disaster when it comes to execution. Most traders, although they have
a live data feed, are trading in such a way that they cannot possibly compete
in the five minute market. Why is this so?
The five minute market is to a great extent made up of ’'large" traders,
and ex-floor traders now trading from a screen. This group is steadily
growing in size, as floor traders are "encouraged" to leave the pits. Many of
them have seats on the exchange. Virtually all of them call sir eight to the
floor. How can the average trader, with low volume and a relatively small
account, compete in either time or costs? Another large group trading within
the five minute chart frame are CTA's.
Large traders, ex-floor traders, and CTA's are tracing at anywhere from
Six to fifteen dollars per round-turn. They do not have the time delay that
most traders have to live with. They don't have to call a broken who in turn
has to make out a ticket and then call lhe floor. For many who do not fall
into one of the above groups, there are even more intermediate stops than
that.
Even I, a: the low rates I pay and with the fast execution 1 get, can
barely get proper execution based on five minute chart formations,
Selecting a Market
The only markets in which I will daytrade based upon five minute cherts
are:
The currencies — Yun, Franc. D-Mark, and Pound.
The metals — Gold.
The stock indices — S&P and NYFE.
The oils — Crude Oil.
I do not trade the bonds or the Eurodollars on a five minuie chart
because they do not "form up" in the shorter time frames. Toe markets I do
trade all have sullicient 1кцmdily, and MOST IMPORTANT, all шоке excellent
trading patterns on a five minute chart. I never daytrade foodstuffs, gsains, or
meats on five minute charts other than to optimize an entry or exit from a
longer term trade.
Quite often 1 l.ave made my money in а currency tir gold before trie
Stock Market even opens. Thai way I cart watch the S&P without Iciv.ng lu
cortueri[ran? on anything else I also like tn trade the S&P atrm 2. PM, when
tficj bond market has closed. It riuthnig is happening in any of the other
markets, I wilt start watching the crude oil in hopes of some actiori there,
Crude oil is great to day trade w fieri it is vrj fa t i le.
И I had to select four markets in which to day trade, they would be S&P
500 [or NYFE1, gold, oilr and a currency, The currency selected would be the
one with the g re a ‘ e s I onea iiimmst and the greatest volume.
If I had to select ’wo markets in which to daytradc, they would be S&P
and gokl, or S&P and a currency. The choice would be for the two with tlie
greatest volatility.
If I I tad to daytradc in only one market, ft would be a toss up between
rite S&P and a currency as being the very best for my style of daytrnding.
If the stock market is thin, as it was after die '87 crash, I would trade a
currency, gold, and oil.
Selecting an Entry Point
My methods for selecting entry points are cither simple and
straightforward.
My entry techniques ere based upon three levels of entry into a market.
I will group those cis Major, Intermediate, and Minor. AR of litem have
one thing in common — THRUST!
I do nut believe in buying or selling retracements. I do not believe in
buying or selling within a channel or trading range unless a single leg up or
down has sufiicic-nt length to enable exccuiion ol a vvirining trade. !: a series
of trades turns out to be within a trading range or within a channel, it is
purely coincidental and definitely not because I have drawn channel lines, or
in soino way have defined a iradmg range. The same thing rs true of uptrend
and downtrend lines. I do not rise them other than for visual perception, and
do not trade rotracemunis to therm
I can end du success fully enter markets withoi it any signal from the
daily chart. EjljI I niucli prefei to enter an intraday tmde based i.ipoii a
significant event taken from tfic longer term momci’iiur;i of 1 he marked. Thu
daisy chart gives me those significant events.
Remember die market pictograph?
This is a market;
21
What would constitute a significant event in this market? What is the
most major thing that can happen? I contend that die single most significant
tiling that can happen is a breakout of the high or low,
Why? Because, as 1 previously pointed out, this market is in a trading
range between its high and low. To that extent, this market is stagnant.
Unless d makes a new high or a new low, it is rot really going
anywhere.
But whai if this market were to take out the Iligin like so:
Could I have made money trading the breakout of that high? The
answer to that is yes! Ard it is one basis for trading the five minute bar
charts.
WIiek I am talking about here is THRUST. For the time being, lot's
forget about where rhe market closed. That is of no significance whatsoever,
I will have made my money and been out of the trade long before the close.
The important thing is that the market opened at a certain level, and at
some time during the day it took out what had been the high at the opening
level, which was its previous high for the day. When that high was taken
out, it was a sigriificant event. Profits could have been made.
IMPORTANT! When I am dayirading a five minute chart, I am
interested only m what is happening today. I am not 'worried about I he close.
That is GO to 75 price bars away. I am not worried about tomorrow —
tomorrow is a whole new sot of events. I am not worried about what
happened yesterday — yesterday is history, except in that what happened
yesterday, or the day before, or the day before that, may be related to what
my actions will be today. More of that relationship ahead.
Although I will consider turning a daytracie into a position trade
according to certain rules lo be explained later, I must have a rule for my
daytradc in and of itself, and this rule is absolute: unless 1 am considering
conversion to a position trade, 1 will NEVER carry a daytrade overnight! I will
ALWAYS be out by the close of trading. That is what makes the trade a
daytrade. It is nol to be held overnight. If I do consider it for holding, it will
have lost its status as a daytrade. I will have converted it to a position trade
and will tiien begin to observe a dTferem set ol rules.
22
The truth about making [notiuy in the markets is shat rnosi of the
money to bn niadc is made when a market ''pops11 and then begins to trend.
П is the connector trends between congestions that offer the mast profit
monev 1 r, nndo
With that in mind. I wilt take in their order Major Entry Signals,
Intermediate Entry Signals, and Minor Entry Signals.
2 3
Chapter 3
Major Entry Signals
My major entry signals are as follows, and I give them niy hightisi
priority. They are all derived from the daily bar chart:
°	The breakout of a trading range. (For readers of Trading By The
Book, I do not use a Fibonacci envelope here,}
Q	The breakout of a 1-2-3 high or low.
0	The breakout of a ledge.
°	The breakout of a Ross hook,
in ail of these (echrnques based on the daily chart, I will ignore any gap
breakouts. Gaps nullify rny entry into the market. I want to enter only those
trades that trade "through41 rny breakout point.
For any who have read Trading By The Book, they will immediately
recognize rny major entry points. For those who haven't road Trading By The
Book. I suggest paying particularly close attention to whar I have io'say about
major entry po’-nts. Each wilt be illustrated for purposes of refreshing the
memory of previous readers and for introducing these concepts to new
readers.
Let's take these in the order listed above.
The Breakout of з Trading Range
Most of the time a trading range will be preceded on the daily chart by
either a gap or a day which is relatively large in size from high to low.
The figure on the next page illustrates this point.
2-1
2 5
My first step after noting a gap or a series of gaps, or a large size
trading day, is to begin io watch lor a trading range to evolve. Mere is how it
will usually happen:
D There wdl be a gap or large one day move up into or down into what
will eventually be seen as a trading range.
° There will be a ley (this is a leg Л or this \) counter Io I he thrust of
the gap or large day move.
° Then there wifi bo a second leg back in the direction of the gap or
large single day move. At that point we hove a market that, in its most
recent action, looks like this A, or this V. from о bird's eye view. It is then I
draw' a horizontal line across the highest high, and a parallel horizontal line
across the lowest low. it will usually take about 10 days or sn for all of this
to happen. The iormations Л or V constitute "market swines."
L, J
° In the next few days or so, a third leg will form giving us Л/, or V\.
I his is the beginning of what may turn out to be a trading range. Again I
draw horizontal lines across the highest high and the lowest low, unless the
old ones are still intact. I have now established a rudimentary envelope that is
delineated by drawing a simple horizontal line across the top of (he trading
range, and a parallel line across the bottom of the trading range.
c My next stop is to count Ilia number of bars on the daily chert.
Sometime between 21 and 29 days, a fourth leg will usually bt? complied.
1 he trading range now looks like ЛЛ., or Ш/, If there had ber.ni a new high or
low. or bom, during that last leg, I would have redrawn the envelope. Usually
this is not necessary,
I can now set a menial alen or a computer alert, or both, to tell me
when I pm approaching of these numbers which represent the outer limits of
the envelope. Any поп-gap breakout of these numbers will constitute an
entry point for me to daytrade.
This will be the least frequently occurring entry techntque in my
arsenal, but it wi'1 be one of the best. The thrust out of an envelope will yield
many a worthwhile trade.
The next figure wdl serve to illustrate this point.
DP
15396
J a 	I-
I
; is%z
18520
18094
' p I • I
17668
i 17226
•	 		  Ц
16792
I Pa	.La
16357
15923
--------I go long
У r’ at the
' J . lr breakout
t i’r of the high
t of the
trad inj
range.
19830
15490
My entry point is a trade-through by prices of the breakout point. The
breakout point is the highest high or (tie lowest Jow of (he trading range. I
will enter a trade at or before [lie breakout, I will not enter if prices gap past
my entry pui.ni.
The Breakout of a 1’2-3 High Or Low
Let's illustrate what a 1-2-3 is:
Note; The #3 point does not corrie down os low as the //1 point in a
uptrend, or as high as the point in a down trend.
I set a mental or computer alert, or both, to warn me of an impending
breakout of these key points. I wili not enter a trade if prices gap over my
entry point- I wilt cider it only if the market trades Lhnruigh my entry point.
1-2-3 Highs and Lows come only at market turning points that are in
effect major or intermediate high or lows. I look for 1-2’3 lows when a
market seems to be making a boitorn, or has reached a 50% or greater
retracement. I look for 1-2-3 hrghs when a market appears lo be making a
top, or has reached a 50% m greater retracement.
Exact entry will always be at or prior to the actual breakout taking
place.
The next figure illustrates this entry technique in action.
GC
The 1-2-3 low is characterized by the fact that the #3 point does not
come back (rcticice) as low as the it 1 point. A 1>2-3 In-jH is characterized by
the fact the #3 point does not come back (retrace) as high as (lie point.
2 9
The* Breakout of a Ledge
This is what a ledge might look like:
This is how I dcteimine what constitutes a lodge:
I look Ior a correction or congestion that is at least three bars in
length, but no more than ten bars in length.
The ledge is characterized by a "squaring oh" of highs and/or lows
rhe flatter ihc'bcttec Perfect squares arc best.
I trade the potential breakout in either direction. Opinion CANNOT be
a, I do NOT know which way the breakout will
For every alert on one side of the ledge, there is an opposite alert
ledge.
allowed to enter the picture
occur! For every u. _
entered at lhe other side of the
I can go back only as far
to find a matching high or low.
first leg of the previous market swing
These are the legs of the swing -> \
/\
Г елп go back on J у ss /	\	/
far as these legs -->/	\	/
Ilo matter how short /	\/
the log io. (It r.ay be only one
here is to allow
this technique Is a
the marker
"straddle
to lull rue whnt it is
Il's not a s1 raddle as
What I have done
going to do. In a scuse, — ..
the word is used in the stock market or in option trading.
The straddle 1 use becomes possible because the marked decides to
move sideways for a number of bars on (he chart, thereby making it possible
fur mu to siraddlu the prices with my buy and soil orders al nalural support
I mark these off as soon as i can draw a line with a ruler across two
highs, two lows, a high and a low, or a low and a high, josi so long as they
match. 1 will enter a trade only if prices break out of the ledge by trading
through the high or the low for both). I will not enter a trade if prices nap
past my entry points.
Once there arc more than fen bars on the chart, I stop trying to trade
the ledges, f wait for the market to start trending again or for a full blown
trading range to complete ilself-
Why docs this entry techrsigue work so well? Because it takes
advantage of natural support arid resistance points. Л breakout of a natural
support or resistance point will usually carry good momentum. There should
be enough explosive force to give a profitable short term trade.
In order to show more clearly what I'm doing with this technique, 1
have shown a Swiss Franc chart on the next several pages:
3 1
SWISS FRANC
SUISS FRANC
7462
I I I II I
7365
   ь . d b
7269
7172
I -  "I • W ' IP
7075
•
6976
6081
6784
IM ч
6687
d a a c
14 *Find two Matching highs.
-------- <- Find tuu natch ing lous- Then buy Lht± breakout of the
r I T г t hiyhs । or
-----
It doesn't natter [ . ypj
which cones first, as 14*
long as the two Matches are
separated by at least 1 price
sell the breakout of the lows.
1 can natch a high with a low, or a low with
a high, as long as the first natch is separated
from the second by at least one price bar.	t__„....
fnjt i <
The Matches do not haue to be exact* They can be —-
off By 1-2 ticks, but no mere than that. Exact Matches are
best* If I Laue any doubt, I leaue it alone.
6590
32

SWISS FBHNC
7560
7462
t т * 3 Ji I would trade th is uue
7365
7269
7172
j ' • i	I
7075
6978
6(HH
678-1
6687
I	I -
' 6590
p
and this
one.
but nut this one: t
Not a 11 ledges are
tradeable. I take
only these in which
there is no gap opening
past the entry point.
or thia one because of the
gap openings.
Here was a nice
Ik b* one.
1 T-- L
I trade only on actual non gap breakout of the sedge. Tru: entry may be
prior to or at [he breakout point. The breakout point is whore I have drawn
rhe line connecting two matching highs or two matching lows. Nohb this
may nut be the л bs Ы и t e high or Jew of the congestion chi ihe doily cfier!.
J 3
The Breakout of □ Hook
A Ross hook looks like this;
The top is the pojnt of the
hook. Л 1“2“3 low formation is
not necessary. If priccs go
b^. ck up a nd take out the point
of the hook, I buy.
The bottom is the point of
the hook. A 1-2-3 high
formation is not
necessary. If prices cone
back down and take out the
point of the hookt I sell.
In a sense, a hook is a part of a 1-2-3, but it doesn't have to have a
definitive high or low. It may pop out of a congestion area, or otherwise be
inti is t i r lyu ishej b -c as to any exact formation. Ross hooks occur at any level
only in trending markets, whereas 1-2-3 lows occur at inter med late and major
market lows, and 1-23 highs occur al intermediate and major market highs.
A Ross hock does not need more than one correction bar on the elwt
In a down market, as soon as you have a higher low, you have a hook. In
an up market, as soon as you have a lower high, you have a hook.
The next figure shows what I mean by Ross hooks.
DM
6719 [A
M		J
6629
J
p
6539
6450
6360
I bl I I • j ►
4
6269
GIBB
6B90
I I I a I Ь . I
60G8
ч г- e т i • e* .
5916
Б82В
Sone Hass Hacks (h)
and their accompanying
entry points.
!' 'i‘
J1
;1
The difference between a 1-2-3
low and a hack
can he seen here.
Г
J
L

L
4
b
The above Ross Hooks "h" were tradable because they had con-gap
breakouts. There are other hooks shown, but, because of gap openings, they
were rot tradable?. The -> shows where the entry would have hcen.
I've also shown a 1-2-3 low to demonstraie the difference between
1-2-3 tows and Ross Hooks,
An automatic ateri should be placed the minute a market makes a hook
on the dairy chan. I place die alert at a point prior to the taking out of the
hook.
Summary: Major Entry Signals
° The breakout of a trading range.
° The breakout of a '-2 3 high or low.
° The breakout of a ledge.
° The breakout of a Ross hook.
Note, some of these may he concurrent with one another as well as
with some of trie? intermediate and minor trsdmg signals which folJow.
Chapter 4
Iniennedhte Entry Signals
My intermediate entry signals are as tollows, and I usually take them:
°	Л breakout of the lowest low of the last three days taken as a group.
°	A breakout of the highest high of the last three days taken as a
group.
*	A breakout of any individual low of the last three days. This includes
a breakout of yesterday's tow.
°	A breakout of any individual high of the last three days. This includes
a breakout of yesterday's high.
The breakout must be by virtue of prices trading through my entry
points. A gap opening past my entry point nullifies the trade initially.
This is a very simple technique and docs not need much explanation, I
will enter a trade at a breakout as described above. The stronger trade may
come as a result of a breakout of the highest high or lowest low of the last
three days. At times it takes much pent up momentum to overcome the
extremes of the past three days of trading. But, this is not always the case.
Sometimes the move is nearly spent by the time the breakout occurs. One
has to experiment, with these to come to see them more clearly. The three
day breakout can act as a filter for lesser trades.
The following four pages contain examples of my Intermediate Entry
Signals-.
26
BP
19756
19554
• J s i • L I
19358
19162
18%6
• и
W77a
. i .
18574
18378
19102
Breakout of
the highest
high of the last
three days.
No cpp openings
a re a I louod .
. 17986
I   •
I
I
\ 17798
Arrows point to the breakout, point on the actual breakout day.
37
Arrows ponii to the breakout point on lhe actual breakout day.
DM
Arrows point to [lit? breakout point on the actual breakout day.
GC
42B0
9 • Ч • • • • * •
0	i N
421В
4140	“i>
<5070
а га а . • ч ?	• “
4000
I - I * а |
3930
3859
I II IV
3789
3720
— . а * - -г
3650
No gap openings
are a 1 lowed .
A breakout of
any individual
hicfli
| 3580
Arrows point to the breakout point on the actual breakout day.
q 0
Minor Entry Siv:iiniч
My minor entry signal is as follows, arid is optional.
A second breakout of the first trading congestion to form cm the chart after
the opening. This may include a congestion carryover from [Не ।eeveinis day.
By iliis time there should be little left io explain about how these must take
place. I enter only by virtue of prices trading through the breakout point. To
prevent being filled on a gap, t use stop orders after the open, Mure about this in
the chapter about ordering.
I Eero's an example of what 1 mean.
Breakout of the first congest kn
mi the chart ^ftsr the apeniny.
It flatcliES г congest ion Г ran the
pre»bus day.
<•> Ih'Sl^h
Enter here ----
on second tine thrcughJ 1
Ct40
6636
6632
6628
6624
6620
6616
6612
6603
6Ш
6E.W
65%
65%
6533
6534
6530
65 ?6
6572
6553
656-1
6560
6556
6552
6513
6511
6540
4 1
Priorities
Now it is time to show my priorities. I want to trade the major and
intermediate term breakouts first and foremost. This emails writing down
some sort of schedule as to where these breakouts will occur.
I have presented these in the order of their occurrences. There is no
specific priority to the major signal trades over the intermediate signal trades.
The breakout from a major entry point is not better than a breakout from an
intermediate entry point, nor is the breakout of the extremes of the last three
days taken as a group necessarily a better signal than the breakout of the
individual high or low of a-w of the last three days. Intermediate entry signals
do not take a lower priority than do major entry signals. The difference
between major entry signals and intermediate entry signals as it affects my
other trading will bo discussed in a later chapter.
However, the minor entry signal does defer to the others. The major
and the intermediate signals are more important than the minor. Any time I
can trade a major or intermediate signal rather titan a minor signal, I do.
Minor entry signats are optional, and I don't need to take thorn al all.
When I am trading, unless I am starving for action, I trade most major
and intermediate term signals, and let the minor entry signals pass me by.
The next three pages show additional examples of minor entry signals.
4 2
BP
5 NIMUTE
Trade a breakout
□f the Гirst
congestion after
the rppi’i.
S 10 11 1г 1 7M 111 12 1 В 5 10 11 1Z 1 1
15600
15600
13592
15504
19576
19560
13560
13552
19544
13536
13520
19520
19512
19504
194%
194%
194%
19472
19464
19456
19448
19440
13432
13424
13416
19400
CL 5 MINUTE
Trade a breakout пГ tbe
first cciiicjestion to form
11 10 11 12 1	9 10 1 12 1	9 10 11 12 1	9 10 11 12 1 1
3300
3360
3310
3320
3300
3200
3Z60
3Z4C
3ZZ0
3Z00
3180
3160
3140
3120
3100
3080
3060
3010
3O20
300G
Z9B0
2860
2940
29Z0
2900
2BG0
4-1
J? 5 tllNUTE
Trad и a breakout
иГ Hie first
congestion to Turn
after tlie орет .
, i
77?6
7772
77L0
7764
77Б0
77S6
7/S2
7740
7744
7740
7746
7732
7720
7724
7720
7716
7712
7708
7704
7700
70%
7692
7608
7684
7080
7676
1 12 1	8 9 10 11 12 1	8 9 IQ 11 12 1 0 9 10 1 12 1 1
Chapter 6
Stops
My slops are of two kinds — protective stops, and objective stops.
Protective Stops
It is very dilficull to loll someone just where to place stops. This is
because stop placement is a function of a number of variables. The size of
the account must certainly dictate stop placement. The ability to withstand
Dain {comfort level} is a major factor. I cannot tell another to place stops at a
certain percentage away from the entry. That doesn't make sense. If the
slops are too close, there will be losses on what might have been winning
trades. If tl*c stops are too far away, there will be larger losses on losing
trades than were necessary.
I cannot toll anyone to place his stops at a certain number of points
away from entry. I don't know the size of someone elses account and I
don't know that person's comfort level.
I would be Iligh-y suspicious of someone who presumed to hill me
where to place my stops, unless I were following that person’s trades on an
advisory basis. Then, of course, I must use that person's stops or I wouldn't
truly he following what I've paid to find out.
Since I w II not presume to tell anyone where to place his stops,, let me
tell -where I have a tendency to place mine.
Because the size of my margin account is not a worry for me, when I
enter a trade I piece a mental stop 10 licks away from my entry point. I
maintain this as a mental stop for as long as it is expedient to do so. If I’m in
only one hade, then I wait until the last possible second to phone in my stop.
I don’t want the pelicans in the pit io know where it is any sooner tfian is
absolutely necessary. They love to go fishing for stops and run them
whenever they cam Obviously, if I am engaged in a number of trades
simultaneously, it may be expeditious tc enter my stop earlier in the course of
the trade. If a market is fast when I enter, or It becomes fast, I will enter my
protective stop in the market.
I move my protective stop as soon as possible. For gold, crude oil,
and the currencies, I think about moving it up as soon as I have eight to ten
licks in the market. For the S&P, I look to move my stop as soon as I have
four ticks in pie market. When I say tick, keep in mind I am not talking about
points. A tick is one point in all of these markets except the British Pound
and thf] S&P. The Found moves two points per lick, and (he S&P moves five
points per lick.
Objective Stops
I use two types of obioctive stops: one for covering costs, and the
other fur iakirig profits.
For most riay :ra<lesF I'm i rd и a I Sy looking to cover costs and make a
small profit on a priri of my position.
4 6
I'm not going to tell anyone to trade a certain number of contracts at
one lime. Rut ГИ give an example of the tactics I ijsp.
My cost covering slop is just what it says. I liquidate a pan of my
position in order to cover costs. If I make a small profit along with it that's
fine but only coincidental. Later, when I talk about average volatility. I will be
more precise? about using a pari of my position to cover costs.
My best minimum configuration is a three contract-set. If 1 had to trade
fewer than three, I would consider using the Mid Am. I enter the trade with
my minimum configuration. Once I’ve covered costs, if 1 see $100 in gains
on my screen, I take profits on part of my positions at. the market. I don't
worry about slippage, I take what I can get. By the time my order hits the
floor, I may get only $60, $70t or $80. 1 don't worry about h4 I just take it. I
get that order io the floor N0W1 I ask lor a flash fill — I hold and wait. If the
market is fast, I may not be able to bold, but at least my order will have gone
to the floor.
Contract sets should be made up of 3, 4, 5, 10, 15, 20, 25, 30, or
etc., contracts.
As soon as possible after covering costs, or taking a profit, I quickly
move my stops up io bare breakeven. By that, I mean I move my stops up io
my entry point. If I get nailed, I haven't lost anything. I am alive to try again
another limo. There will he plenty of oilier limes.
И I am not stopped out, then I wad for the market to retrace. The next
lime it takes out the old high in an up market or the old low in a down market,
I move my slops forward another five ticks.
I continue moving my stops every time the market breaks the old Highs
and heads higher. At the very least, I try to protect one-half of the unrealized
paper profits in she trade. Paper profits are defined as the amount of money
or points I could have made had I gotten out at the greatest extreme prices
reached since my entry point.
If I were unable to trade al least a three lot, then I would trade two
contracts until I had both my account to where I could trade at least a three
lot.
Just as with three lots, if I were trading two lots Id dose out one
contract and bring it home if 1 saw $100 in profits on my screen. As with a
three lot trade, I wouldn't worry about slippage, I'd take what I could get. By
the time my order would hit the floor I may have gotten only $60, $70, or
$80. I wouldn’t worry about it, I'd just lake it. I'd get that order to the floor
NOW! I'd ask for a flash fill — hold and wail. If the market is fast I may not
be able to hold, but at least my order would have gone to lhe floor.
As before, I'd quickly move the stop on my second contract up io bare
breakeven. By that 1 mean I'd move my stop up to my entry point. If I'm
nailed, 1 haven't lost anything о I her than costs. I’d be alive to try again
another time. There will always be plenty of oihcr limes.
1
If I were nor stopped out, then I'd wait for the market to retrace. The
next rime it takes out the last high in an up market, or the last low in a down
market. I’d move my slops forward another live ticks. As soon as my second
contract would approach $100 more in profcis, I’d call in a market order to
exit. Again, I wouldn't worry about slippage. My goal here would be to build
my account so dial when a market docs run, I'd be able to go with it for the
big bucks,
II I were able to handle only one contract at a time, then I'd have to
take profits at or about $100. Period, the end! I'd lake my money and run,
I'd build my account, rd nibble away al llне market until I had enough money
in my account to trade a two lot. I’d be patient. Growth may come slowly,
but it would come. I'd be PATIENT!
Another point I need to reveal about my trading is that when I lose, I
have a tendency to double up on my next attempt at a marker 1 don't always
do it, but I often do it when I go right back into a market. My win percentage
is high enough that it pays me to go back, in with double the contracts.
I'll be showing that later in the book
Chapter 7
Orderi ин
Entry Orders
From ihis point on, whenever I write about a com r act-set, unless noted
otherwise, I am talking ahoul entering a market with three contracts. When I
trade more th,an three or four contracts, I trade five or multiples of five.
Whatever 1 do, I. don't want io trade in odd lots. It's hard enough to
get good fills trading in numbers that other traders utiuze. Recently I spoke
with a trader who had gotten a terrible fill in Orange Juice. The slippage on
his exit order was fifty points. When I asked him how many contracts were
involved, tlie answer was twenty-throe. I had to shake my head in disbelief.
Here he was in a thin market, trading at a time of the year {Spring) when the
Orange Juice market was paper thin, and trading a twenty-three lot. Is it any
wonder he had slippage of fifty points?
It's also important to enter price orders at numbers that pre likely to be
filled without slippage.
For instance, Orange Juice is worth $1.50 a point and usually licks
about five points at a time. This makes it extremely difficult to place orders
that will not have slippage. If I were to use five dollar intervals, I will be
trading at numbers that end in zero or five. Yet $1.50 will not divide into
$5.00 in any way other than fractronally. A similar thing is hue for Unleaded
Gasoline, Heating Oil ($4.2O/point each), [he meats, and Lumber. All of these
are thin markets to begin with. Unless a trader is aware of the digital endings
that will get good fills, he is asking for trouble when he trades them.
Order placement is critical in daytrading. The number one thing I try to
remember in ordering is to be patient and avoid greed. 1 place all my entry
orders as STOPS at my entry price. That means I use STOP LIMIT orders.
Where possible, I place my entry orders as STOP WITH LIMIT. WITH LIMIT"
means give a price range in which Гт willing to be filled. If the market
rushes past me and I am filled a little higher, I don't worry about it. Slippage
is figured into what Гт doing. By giving a price range for rny fill I'm able to
control the amount of slippage Гт willing to take. However, in some markets
Гт forced to use regular STOP orders,
Using STOP LIMIT and STOP WITH LIMIT means I miss many trades. I
don't care if I do. If I can't have it my way, I don+t want the trade. Stop
Limit orders have low priority on the floor. They will not always get me a fill.
I generally do not place orders in the market before the open. Except at
major entry points, I have no resting orders in the market until the market is
approaching my entry point going in my direction on an intraday basis. Then,
and only then, do I place a resting "today only" order in the market.
The market will often gap open past my entry point, So whatl I miss
that trade. I have tried to learn to think in this manner; "If it doesn't happen
my way» then let rt go," I don't sit and drool thinking, "Oh, if only I had put
that in as a market order, I could have made a fortune."
4 9
The trade must trade through my price and be filled in the manrier I
requested, or I forget it. I go look elsewhere.
Throughout this manual I will repeatedly stress that 1 must have this
kind of discipline. I take only those trades that happen my way, and are filled
according to my instructions. 1 let everything else go by.
Exit Orders
Just as 1 want to he careful about my entry order, I also want to
explicitly stare my final exit order, I get out AT THE MARKET I do not issue
"or better" orders. Just as soon as my objective is reached, I exit AT THE
MARKET. If I want lu be anticipatory, it is OK. That way I will be more
assured of getting something for the risk l‘ve taken if prices trade near my
exit point. I do not use '‘Market If Touched orders" for my final exit order. It
takes too long to cancel-replace a MIT order wilh an At The Market order.
Not only that, but I could end up going the wrong way if the order is not in
rhe pit fast enough. The only preferable way for final exit is AT THE
MARKET. As soon as I see prices approach or surpass my goal. I get out AT
THE MARKET. I cannot stress this enough. Yes, there will be slippage. Yes,
I wilt not always get rny price. Yes, I will find plenty of reasons to curse the
market, my biokpr, and the	floor traders in the pit. But at least I
will usually get out with something,
Of course, all of the above presumes that I am actively watching the
trade via a live data feed. Allow me to point out that if my objective is
reached, and I am not able to watch the price action, I can place a MIT or a
buy or sell stop in rhe market. In (he case of the MIT. as soon as prices trade
ai my objective, the MIT wilt become a market order. In the case of a stop
order, as soon as prices trade through my objective price, the slop will
become a market order and I wilt have my fill.
U must be extremely quick al canceling out any protective stop orders
when the market has moved ahead sufficiently to warrant doing so. I don't
want the market to come back and hit them.
If the trade goes against me, I get out. I get out at my stop, or, if I am
uEifiure because the trade doesn't seem to be going according to plan, I get
out r<0W1
Yes, I may mumble and grumble, Yes, I may feci exasperation and
frijstmtiori, bul I must lake the hit and get out. This was not my trade.
Maybe I got a really bad fit!, r nay tie some news Mt the market and it began to
move rapidly away from my trade, Whatever the reason, there is only one
thing to du — GET OUT!
Will I do it? Not always. Do 1 have the discipline to enter my orders
the way I've stated here? Yes, usually I Do I want to stay among the majority
who lose in the markets? No! So 1 must do what I've written here.
I remember; where possible stop limit, or stop with limit orders on
entries. At The Market orders on exits. With the exception of when 1 have to
use plain stop orders, no other way — EVER—in those situations!
5 0
Chapter 8
f luusckeeping
Because dayirading is ar times both fast and furious, 1 must keep
accurate records of my trades, I must know the Hrne I entered the trade, I
must get a ticket number for the trade. I must keep ccum of the contracts 1
have on m each nndc, Iley, nobody said that day trading is easy.
As soon as I see prices lick at and then through my entry point, I
assume I have been filled. 1 call my broker. 1 nag that broker until he gets my
order out. I cannot wait half an hour to find out if I've been filled. I have to
know NOW! This takes a lol of effort on my part, I may be trying to watch
several markets. I am trying to write down where I am in each market. I am
wailing for the fill, and al the same time I need to call my broker and bug that
broker without mercy until I know if and where my stop order was filled.
To do all that, I had better be one terrific housekeeper, if I am not
totally organized, I will eat my shirt. I write down ail my potential entry
points, I must keep track, of those prices. When I call in an order, I keep
track of those ticket numbers. Ticket 1 23 bought three gold at 401,90. I
write it down. Ticket 345 sold one gold at 402.80. I wnm it down.
"Wom how many gold coniracis am f stiff in?" Whoa! Wait a minute,
ticket 678 to sell three S&P at 309,10 just got missed, the market opened
below me at 309.00. Quick, get that order canceled. "Straight cancel ticket
678 selling three S&P's al what????" What was that figure? "Oh, there it is,
309J0, Thank goodness I wrote it down/' “Now, where was Л... Oh yeah...
how many gold contracts am / shit holding? Two!" I write it down.
I'm not exaggerating. No wayl Daytrading a five or even a fifteen
minute chart is some kind of a busy job. I can do it only in short bursts.
Anyone who is a nervous type will be eaten alive, I must keep accurate
records. 1 must know, and know that I know, when I am flat, or when I still
have one or more positions on. I've had my broker call to fell me I wasn’t flat
— that I still had trades on. He was wrong. My record keeping was more
accurate than his, I've had my broker call to tell me he thought I was flat. I
couldn't be sure, because I gut things messed up and didn't write something
down. The next day I had a $2900 loss in the D-Mark staring me in the face
ar the open. I was wrong. His record keeping was no more accurate than
mine. That’s when I started tape recording my orders.
I've had trie broker call to (ell me 1 was still long a Yen and did I want
to sell it befoic lhe close? My records, and my tape recording, showed I was
flat. He couldri'i be sure because die market was fast and ho didn't know if
all the tickets were in and accounted for. What would have happened had I
sold a Yen contract at the market? 1 would havo been short one Yen contract
at the close. The next morning saw a gap opening to the upside of $3700.
Thankfully, I hadn’t inadvertently gone short.
Do 1 need to keep accurate records? Absolutely, for sum, YES! So, I
write it down, write ii down, WHITE IT DOWN.
r
If I miss a ticket number, 1 call back and dig it oui. I write it dawn.
Whenever possible, I write out all orders in advance. Then I read them to the
broker so I make fewer mistakes. I use them as a script, so I won't say "buy
when I mean "sell." I tape record every order. Sooner or later the day will
corrie when 1 desperately want out of a market and will "sell" it instead oF
"buying” it to get out. I need to know what I said, and I need to hear what
the broker said. I replay the tape just to be sure.
I time stamp every order by say;ng, "This is account 12345 al 8;22
a.m. on 1 2 July ___'*
When I'm in the heat of battle, 1 have to be extra careful of what I say.
In the rush to exit a trade, I may say the wrong thing. If I have had time lo
do so, I will have written out my exit order.
I hate to say how many times I've been short three contracts, and
wanted io add five or ten contracts, in a hurry, watching two or three other
trades, and blurted "buy five D-Marks al the market” when I realty wanted to
say "sell.”
I hate to tell how many times I've been long three contracts, added to
my position with five contracts, made a bundle on the trade, and [hen at exit
time forgot I had eight still on and said, "sell live." Thai's why I write it
down, write it down, WHITE IT D0WN1 I keep my house clean.
52
Chapter 9
Brokers and Commissions
Thein is nothing more important to my day I rading Than to have a very
responsive and accurate broker handling my account. Г11 discuss some of the
problems I encoirnier in day Trading that make this so.
At times my trading will be fast and furious, I may he long a five lot
and need to load up with a fifteen lot. If this is happening in mum than cue
maikct (which it often is}, I need a broker who is adept ai keeping track of my
trades. No one broker, unless that broker is totally dedicated io my trading,
can possibly keep crack of all my trades. I need an aten broker with a very
competent staff, all of whom are familiar with my trading.
I need a broker who can gut the orders back from the trading hour
quickly. Hers got to gut diem out with all speed.
There will be times in fast markets when I need io get out before I
know exactly where I got in.
I cannot afford to use a novice broker. On the other hand, an
es l a b list it’d broker will have other clients who are important to him/her who
also need attention,
I QBnnn! afford to use any broker who well rior deal with me cm a
discount basis. 7 he absolute tops 1 cam afford to pay for cornmrssion is a Jot
less than many pay will; a discount broker.
What I pay depends on my trading volume, the size of my account,
and, to a certain extent, upon how much my broker needs the business.
I try wherever possible to be able to call directly to the floor,
I need a broker who has good desk posiiion on rhe floor arid good
representation m the pit.
Such brokers arc? hard to сото by. I know. I've looked lung and limd.
When I lirid one, I will stay with Jum as long as possible.
In the heat of -riding, there are limes when I have ’rcudr» remembering
exactly where and what my various positions are. Hopefully, my broker will
provide a goad backup.
I also need a broker who will allow me to day trade with 25% (no more)
of minimum margin. By mirrmurn margin 1 mean the minimum margin fur a
commodity as set out by the exchange, rather than the broker's minimum
margin.
Some brokers will clear me to trade at 25% minimum margin on the
S&P. 1 tint's riot good enough. 1 want a broker who will allow inc to
daytrade with 25% of exchange minimum margins across the board.
In that way I can add to positions with sufficient contracts when
needed. It is also the reason I must be out of the market before the close.
There absolutely cannot be any overnight positions, unless I have decided to
change my trade into a position trade.
This puls the burden of time on me. There is a definite time constraint.
I have from the opening of trading until the close to make my money, if I
have failed by them I close rny position — win or lose — and get out.
I make absolutely sure that my relationship with my broker is solid. The
broker works for me. I will be delegating a certain amount of authority
each and every time I issue buy/sell orders.
I prefer a broker who doesn't trade a personal account. I don't want
my broker lading my bets. I also don’t want a broker who gives advice. И it
is offered, I politely Inform my broker that I don’t want to hear it. If it is
offered again, I move my account. Broker advice can cause me to lose the
courage of my convictions.
Also, I want a broker who can keep my activities confidential. I donTt
want the broker iu give my trades to any other clients.
I have had brokers who were piggy-backing my trades for their own
accouni(s). With one broker, when [he fills came back, he was grabbing the
best ones for his account, and giving me the lesser fills. You can tell this is
happening when you start getting consistently lousy fills, or when a broker
doesn't issue ticket numbers.
5 4
Chapter 10
A Trading Plan
WARNING1 No one should attempt daytrading from five minute charts
unless fie is a decisive, quick thinker. If a person tends to panic when things
go wrong, then that person should not trade five minute charts. Na one
should trade? a five minute chan who is paying more than $25 total in
commissions and costs. No one should trade a five minute chart who is not
able to call directly to the floor.
I've taken care of all the loose ends. I've talked about trade selection,
entry points, stops, ordering, brokers, commissions, and housekeeping. Now,
I'll talk about daytrading, and specifically daytrading intraday bar charts.
Approach
My approach to trading is simple: MAKE MONEY! In order Io do that, I
must STAY ALIVE. The other side of that statement is: DON'T LOSE
MONEY! Refuse to lose.
In Trading By The Book. I offered a set of character traits that would
make anyone a better trader. Those traits are worth repeating here. I quote:
"Self-discipline
Knowledge
Patience
Self-control
Resourcefulness
Diligence
Flexibility
Concentration
Dec; siveness
Persistence
Discretion
Perseverance
Consistency"
55
"In addition to (he above attributes, there must be total honcsiy and
truthfulness. I must know myself and my weaknesses, be emotionally,
mentally and physically hr, and ready to take action when needed — without
procrastination. I must overcome greed and have an intensity about me that
enables me to control not only my emotions, but my thoughts as well. That is
a tall order, but it is slid not enough, I must also become a top notch
manager — planning, directing, organizing, controlling and dele gating/'
None of the above has changed. If anything, it is more true of
daytrading than it is of daily position trading.
Staying Alive
Preservation, of capital and self, retaining both my money and my
dignity, are prime elements of successful daytrading.
I cannot afford to take a financial or emotional beating in the markets.
It undermines my self-confidence, and I will not have the courage of rny
convictions, Without faith, without the courage of conviction, Гт better off
not trading at all. I'd be belter off putting my money into utility stocks.
It's better to take a series of small losses (S 150-5250) than to take a
single big hit. h is far less demoralizing. I realize I won't win every day.
The losses will always be there. I have to get used (o them. Out they
won't matter if I can stay alive in the markets until a big win comes along.
If taking losses can't be a pan of my makeup, then I don't belong in
this business.
Staying in the Waler
Trading is a business of slaying in die water. I trade, taking small
losses and small wins, until I hit the big one, the one I can take to the bonk.
I can't win unless I do stay in the waler. I can't stay in the waler if I'm
demoralized. Continually losing more than I gain will undermine rny faith. E'EI
begin to experiment. I'll change my game plan and I'll become a statistic.
Plan the Work - Work the Plan
One of the oldest cliches in the world is plan your work — work your
plan. Daytrading is a business, therefore I must have a business plan.
Why not just trade the breakout of the open and be done with it? That
takes very little planning. Why not just trade the S&P after 2 PM when the
bond market quits messing things up? Often there is lots of good action then.
My business plan should include those trades that have a high
probability of being winners.
56
The Plan
Why go Through the exercise of selecting trades the way I do? Here's
wl'.y’ My selection methods force me to take in the big picture. The big
picture is always a part of good planning. By looking at the daily chan, I am
able Ц) gel perspective. 1 want to point out that the daily chan is 60-75 times
(lie magnitude of the five minute chart. Between 7:20 AM and 2;00 PM there
will be 74 ± five minute bars err the chart. It's easy to lost.! the fores’ among
the trees.
Breakouts nt daily highs and lows usually carry enough thrust to see me
through lu a profit. It might seem that the more major a breakout is, the more
chance that the thrust will be sufficient to transport me to a profit. However,
(fiat is not necessarily true.
1 Want It My Way
I want it my way, or I don’t want it at all, f don't care if the trade I
missed goes on to make a millron dollars, if it didn't happen the way I wanted
it to happen, then I'll just miss that one. I miss plenty of super-good Trades,
bin at least I'm stilt here to tell about them, I want and will take only those
trades that are filled my way, according to my specifications. If I give market
orders on entry, I will have too much slippage on both ends of the trade.
That's not good. It doesn't fit in with the plan.
The plan must allow for slippage, and tosses, and the plan must allow
for missed trades. I don't worry about missing a trade. There are plenty of
trades, more than I could ever handle. Wishful thinking about missed trades is
no more than a manifestation of greed. If I'm greedy, I wifi lose.
The plan calls for getting out of at least one corn reel, and preferably
two, as soon as I see $70 to $100 in profits. Yes, the trade might have gone
on to make $1,000 dollars. However, it may also go on to lose $1,000. If I
don't get out at the $70 to $100 that the plan calls fur, then greed lias gotten
the bet lor of me and overall I'll lose.
The plan allows for slippage of lime. When 1 call in my order, the
phone isn't always answered on the first ring — or even by the eighth ring.
I’m long three December gold. I've just seen my trade hit the $ 1 00
level. I lift the phone and punch the memory button that has my broker's
number on it. lhe phone rings once. I see my $100 profit shrink to $60 on
one quick tick of the arrow on the chart. The phone rings a second time. The
arrow ticks back up to -r $1 10.
The broker picks up the phone, I yell, "Account 1 234, 9:75, 1 5,
November, selling one Christmas gold AT THE MARKET, I'll hold." The
market arrow licks up to $120 profit. I hear the broker say, "Ticket 128 sells
one Deece gold market." The arrow ticks down to + $90. I hear the floor
say. "Fred, sell one Deece gold, market." The arrow ticks down u> -r $80. I
hear my broker say, "Account 1234 gets it." Then I hear, "OK" My broker
says, "Thanks." Then he says "Hey Joe, you gut it, your price." I say to
film, "Thanks." I say to myself, "Son a gun, what a lousy fill. I saw it go
up to $120 and all I made was a lousy $80 less commission."
57
1 hen 1 jcnicinibcr, lhe plan calls for this tn happen. I'm within The
parameters of the plan. At least I didn't lose. I've covered costs. In a
business, I always cover cosis before I think about profits. "OK, lot's see
what I can pet out of that second contract."
I'm alive, I have expectations. That small win starts me out on tlie
right foot, and 1 have the courage of my convictions. I now have some
staying power. The plan is working, and Гт working the plan. I have
persevered in staying on track so far.
Why is it so important to get that small win? Because not only docs it
give me a morale lift, but as stated, it covers expenses. I always have to
think about covering costs before 1 can think about taking profits. It never
fails to amaze me how many Traders fail to realize this basic concept and put
it into practice. Even traders who are eminently successful businessmen
seem to completely ignore this when they are trading the futures markets.
Since the plan calls for having it my way, then of necessity there may
be days when I don't trade at all. Will this cause me to change the plan? If it
does, then 1 am not only greedy, but I would have no consistency.
Although h is rare, there are days when 1 don't trade at all because
nothing falls wiihiri the parameters of the plan. Of course, if I am willing io
trade a breakout of the first congestion after the opening, this will rarely
happen.
The larger the Time frame from which I'm willing to take my entry
signals, the mure potential there is for days in which I don't trade at all. This
is a great time tn take in an Eirt museum, or the zoo, or an extra round of golf.
I could even go fishing. Why? Because the plan calls for a little H & R now
and then. I go ahead, take my wife out shopping. Why else am I trying to
make a buck? I enjoy the profits I make in the markets. I don't let them build
up any higher Than I absolutely need for trading. I take the rest and pul it into
equities and interest bearing paper.
! dordt have to trade every day, do I? If I do, then I’ve missed the
whole point of trading. Trading is for making money — not zombies. If I
trade all day every day, or even pari of the day every day, I will have lost my
flexibility. I will be using poor discretion. My concentration wdl wane. My
decisiveness will lose its edge. In a word, I will have become a gambler —
totally out of controb I will have turned into a trading zombie. A pair of red,
greedy eyes, star.ng at a boob tube. Boredom will set m, I will have depleted
my source of adrenalin. I will gel numb. 1 will not act arid react the way 1
should, and I will lose.
My desire ш make money will have become my god. I will have
become a stave to trading.
My solution is to take regular breaks from daytrading. I schedule them
and am sure to take them. I take at least one week a month away from the
screen. I also schedule and take 2-3 vacations a year totally away from all
markets. All (his in addition to taking lime away from my trading in order io
tutor and answer questions from those wanting more help. Can I earn a living
daytrading so few days out of the month, fewer than 12 months out of a
year ? Yes I
58
Let hip repeat (he plan to this point:
** I take entries from major, intermediate, arid then minor signals. I
prioritize thorn in Him order.
° I write down all potential orders. I write them out exactly the way I
will give them. Some may be repeals of the previous day.
° I sot alerts in any way I cam Since my software allows it, I sei visual
and audible alerts. If I were unable to set ihcm on the computer, I would
watch prices on as many markets as I could comfortably watch and stilt
function as a trader At first this might be only one or two. I set niy alerts at
5 or 10 ticks prior to the entry point so I will have time to react.
0 I make sure that all entry orders are slop limit or stop with limit. If a
market gaps open beyond my entry point, I wait until tomorrow to try again in
that market, or until developments today dictate (hat I should keep trying.
0 In the event I am not able to use a stop limit or stop with limit order,
if the market rushes through my stop order and Гт filled past rny entry point,
I live with it. И the market hits my entry point arid then retraces without
giving me my fill, I don't sweat И. Гт thankful.
* If I think I might hove been filled, {the market has licked at or beyond
my price), then I bug the day Ugh is out of my broker until I know for sure if
and where I was filled.
° if Гт filled and the market goes my way, Then I exit from the market
on a single contract trade as soon as I see $70 to G100 on (lie chart, but not
until I know fur sure I'm in this trade.
g If I’rn trading two contracts, I exit the second one when I see the
next $70 to $100 on [he chart.
° If Гт trading any amount more than two contracts-sets, I let all or
sortie of them ride, moving my stops up regularly to protect profits.
° I take regular rest periods away from the screen and away from
trading.
The knowledge I've given so far is far from complete. There is more to
come. There is a specific way I trade Hie breakouts already muniioncd.
In the next chapter, I will begin m explain the technique in detail.
Chapter I I
Filtering the Trade
I've slated that I want to trade the thrust of the breakout of a particular
point: the breakout of a trading range, a 1-2-3 high or low, a ledge, or a Ross
hook. All these events are based on the daily chart.
I m also willing to trade the breakout of the local high or low of the last
three days taken as a group, or a breakout of an individual high or lew of the
last three days. These, too. are based upon what is happening on the daily
chart.
In all oases, I do not want to trade a gap opening that takes out the
high or low.
Finally, Ггп willing to trade a breakout of the first congestion after the
open, even if that congestion, is a pan of yesterday's ending congestion. The
breakout based upon the intraday congestion on the five minute chart is a
clue to what follows.
A Trading Filter
A trading filter serves several purposes. It allows me to use a small
stop, h helps me avoid false breakouts. It anticipates the breakout and helps
me to get into the trade earlier than I might normally have done.
I‘II state what it is, and then give an example.
As a market approaches one of my major or intermediate entry points. I
will take a breakout of the congestion that normally occurs jusr prior to such a
breakout. I will trade only in the direct ion of (fie anticipated breakout. There
are more refinements to this filter, and they will all be covered in detail as we
progress through [lie manual. But first, let's visit a new market.
When I sec a bar on the daily chan that is similar to ttie one above,
representing a single day's price action, I'm seeing something that lias
squeezed an entire day's price action into a single picture. This picture is very
deceiving as to what actually happened in the market.
I see an open depicted here, but which direction did the trading take
after the open? Did the market trade lower before it traded higher? Did the
market initially break to the upside, make its high, and then trade lower all day
only to rally to the close at the end of the day?
Did the market perhaps open low, trade to its highs, reverse itself on
sonrts piece of news, then trade to its lows and finally rally again to where I
see the close?
The answers to those questions arc part of (he reason why snnulaied
systems based upon daisy charts hardly over work when one tries to trade
them. In fact, I've never yet seen one that did work.
The riot figure shows a
picture of (he daily crude oil chair.
CL DAILV
4200
4100
4000
3900
3000
3700
3000
3500
3400
3300
3200
3100
3000
2300
2 GOO
2700
2600
2500
2400
2300
2200
Z100
ZOOO
1500
WOO
1700
10
The price bar in crude nil for that day is similar to the picture on the
preceding page, That picture is telling the truth insofar as possible H tine’s
universe has a time frame of one day.
But J one's universe has a time frame of five minutes, then that same
price bar is seen io consist of many price bars, and those price bars looked
like the boxed off section of the figure bo'ow,
CL 5 rtlHUTE
jiii'iiii
Seen here a gap
open ing to the down-
side, Го I lowed by a
brief 5 fi inute rally,
fol lowed by a rather
erratic day of trading,
capped off by a strong
rally in the final hour
of trading.
3570
3560
3550
3540
3530
35Z0
3510
3500
3490
3480
3470
3460
3450
3440
3430
3420
3410
3406
3390
33B0
3370
3360
3350
3310
3330
3320
There are a couple of congestions during the dny I will be looking at.
Based upon what I've covered so far, is il possible to guess which ones they
are and why I will be interested in them?
CL 5 MINUTE
I
L
I j
Гп interested in
the tua areas narked
an the chart. Uiiy?
Because the first one
represents a breakout
of the h iy]i of three
days ago.
The second one is л
breakout of the luiyla
two days ago, Both are
congestions just prior
to an intermediate ewi
3570
3S60
3550
3546
3530
3520
3510
3500
3190
34 B0
3470
3466
3450
3440
3430
3420
3410
3400
3390
33B0
3370
3360
3350
3340
3330
3320
What is important about the earlier congestion shown is that it
represents a breakout of the high of three; days ago. The second congestion
shown represents a breakout ot the high of two days ago. Both are
significant events.
CL DAILY
8
Г31 show that again on the daily crude oil chart.
4200
4100
4000
3900
3GG0
3700
3500
3500
3400
3300
3200
3100
3000
2900
ZCOO
2700
2000
Z50G
2100
2300
zzoe
2100
2000
1900
1B00
1700
9
10
As can be seen, today’s price bar took out the high of three days ago
and the high of two days ago.
That meets with the plan and fits within the parameters cif my trading
signals.
The high four days ago was 34 50. The high two days ago wus 3485,
After the first bsg swing in prices prices settled into a tight trading range
just under 3400 — ranging between 3375 and 34OO.
A buy order was definitely in order at 3401-3403.
64
I could have said "Buy three Christmas crude oil at 340'1 slop, 3403
limit," or "Buy three Christmas crude oil at 3401 stop limit/ or "Buy
Christmas crude oil at 3401 stop/’ figuring that if prices ran into resistance at
3420 I would still he OK. I would place a protective stop fifteen points below
niy fill by giving a contingency order: "If filledr sell three Christmas emefe oil
at fifteen points below tin? fill/1
As it turned out, I placed the order at 3401 stop, 3403 hmil anil was
filled at 3403 on three contract-sets.
When prices reached 3410, I picked up the phone and celled in a sell
order for one coritract-set At Tito Market. It was filled at 3415 as the market
was ticking feverishly up and down. When the market readied 3420, I sold
one contract-set at die market and got filled al 3416, I left one contract-set
to run, bid moved my stop up to 3405 and straight canceled my other two
protective stops. I exited the final contract dining the ensuing congestion at a
price of 3458. My total profit at that point was a nice reward for my efforts.
Whai did I do rigtit in this trade? i covered my costs with the first
contract. I made sure I had a profit with rhe second contract. I protected Hie
profits I had ori the third contract by moving up my slop, and finally, I lei it
run until the next congestion and then got out. I have succeeded in geiung
whai I could out of the connector between two congestions. (Note: I ofmn
unload two contract-sets til the firsi opportunity for liquidation.)
Laier, ГII show the concept of average? vol al Hit у and how to use it io
know liow many contracts and at what price to liquidate to cover costs.
Now, let's lock at what happened in that last hour of trading.
After my exit from the congestion of the 3460 area, the market
plunged back down.
h then began a somewhat orderly recovery, moving up lor most of the
last hour of trading,
CL 5 HINUTE
;Г I ufls interested in
the tun areas narked
on the chart. Uhy?	J
Пес?» 11 sc the first one
represented a breakout
□Г the hiefh of three
days aym
t
F
The second one was a
breakout of the high
two days ago. Both were
congestions just prior
to an intermediate event.
3570
3560
3550
3540
3530
3520
3510
3500
3130
34 BO
3470
3450
3450
3140
3430
3420
3410
3400
3390
33B0
3370
3360
3350
3340
3330
3320
65
I did not participate in the? trading during that last hour, being otherwise
engaged. Even without trading that last breakout, I stiil did very well.
Sor I asked rnysel(r "Why do I need to trade more than a couple of
weeks out of entth inonili?”
ГН show another example. It's happening right now on. my computer
screen as I write this. It's a perfect example of what I mean.
Ш 5 HIMJTE
4
fl
<- High of Iucj days ago
Long on a
breakout of
the high of
two days ago,->
Long <*г л
breakouI dC ‘
(-'Yesterday's. high. high.
	W I» III
I.
4 !\ ri “Ongoing price range
inc hides
today's open.
Now, I'll show how this trade developed.
664G
6636
6632
6628
66Z4
66ZG
6616
6612
6608
6604
6600
6596
6592
6500
6504
6500
6576
6572
6568
6564
6560
6556
6552
6548
6544
6540
t
h
1

I
1
67
DM 5 MINUTE
This is where I left _>i
6615
6612
6635
6636
6633
6630
662?
6621
6621
6610
6615
6612
6605
6606
6603
6600
6597
6594
6591
65B0
6585
6582
6579
6576
6573
6570
I got long rny first set ol contracts when (he high of the congestion
marked £1 was (akeri out, NOT because it was the high of (lie previous day
(that was only coincidcrrtal], but because it was a breakout of the congestion
just prior to a breakout of yesterday's high.
I got long my second set of contracts when the high of the congestion
marked #2 was taken out. This was a few ticks prior to the high of two days
ago being taken cui.
I want to siress thi-it. I GO WITH THE BREAKOUT OF THE
CONGESTION PRIOR TO THE BREAKOUT OF THE HIGH OR LOW OF THE
ENTRY-SIGNAL DAY!
SQ
St), what were the results nt my trading had I traded io only three lots?
Long (3) at 6GOH (one tick over yesterday's high). Protective slugs (3)
at 6589. Out of 1 contract at 6612 at the market (tried for 6614).
Cancel reglace (3) stops at 6589 with (21 stops at 6594.
Long (3) at 6G16 (1 tick over high of two days ago. Total long |5).
Cancel replace (2) stops at 6594 with (5) stops at 6601 (15 points
below East entry).
Out f2) at 6624. Taking profits on (he second contract from f.rst set
and covering costs on the first contract of second set.
Caned replace (5) stops at 6601 with [3} stops at 6611. Now long (3)
contracts to let run.
Out (3) at 6650 (not shown)
Straight cancel remaining stops.
Mow I can count rny money, the dealin's done.
69
Does it always go this smoothly? Lot's take a look.
BP 5 НГМПЕ
l|(i.
10
10
12
19130
19420
19110
19100
19390
19380
19370
19360
19350
19340
15330
15320
15310
19300
19290
192U0
19270
19260
19250
19240
19230
15ZZ0
19Z10
19200
19190
191G0
1
0
5
1 got long [3] British Pound contracts at 19338, shown as #1 long. My
first abjective was lo cover costs at about 19358, I placed 3 protective stops
al 19318 (risk $125 per contract 4 costs = ±$150 each.)
I got out of 1 contract at exactly 19358 and bagged about $100 after
costs on that contract. So far so good. I replace canceled my 3 protective
stops at 19318 with 2 protective stops at 19328.
Then the market worn against me and I was stopped out at two at
193 28 for я total loss of about $165 including costs.
The market dropped further arid then climbed back into the same
congesbon area that it had the day before, and that it had earlier on this day.
70
If the breakout of yesterday's high was a significant event for my
earlier three contracts, then it surely is a significant event now - maybe even
more sq.
DF 5 MINUTE
Yesterday's h igli
Yesterday’s close
I
19130
19120
19110
19100
19390
19380
19370
19360
19350
19310
19330
19320
19310
19300
19290
19200
19270
19260
19250
19210
19Z30
19ZZ0
19ZW
19200
19150
19100
I
i
b
J again went long (3) British Pound contract-sets at 19338, shown as
#2 long. My f«rst objective was to cover costs at about 19358- I again
placed 3 protective stops at 19318 {risk around $150 per contract including
costsh
The market marched upward, and I exited one contract at, of all places,
19358. 1 replace canceled my 3 protective stops at 19318, with 2 protective
stops al 19328. I now was down only $65 per contract sei.
I exited a second contraci al 19376, trying for 19378, and picked up
another i $90 per contract-set, so ) was now in the black. I moved my last
protective stop to 19338.
When the market shot up to ns high for the day of 19420, and then did
more than a 100% retracement on the very next price bar, I figured it was
time to get out. I exiled at 19390 for an additional profit of ± $300 per
contract-set including costs. Not a great trading day in the Pound, but by
following rny plan. I netted over $350 per contract-set in. that one commodity.
7 1
Chapter 12
Risk and Мопсу M пинцете nt
V
There, I’ve shown it, the basic concept of one way I trade. There are
loss days, too, and HI try to show some before we’re done. However, there
aren't many of them in comparison with the winning days.
Now I ward to show one of the liner points of my trading. It will serve
to bringjhis discussion into the area ol risk and money management. The
crude oil chart below will serve as the vehicle.
CL 5 ttlNUTE
I'm looking at four day's worth of five minute charts here. I've blocked
off what has turned out to be a very significant area. It should be noticed
that prices entered this area at some point on every single one of those days.
But even before I saw all four days, when day two dropped into that
area, I was looking to sell any breakout of the congestion low of day one. I
never got my chance, as the market closed inside the congestion area. On
day three I did short the minor congestion at the open of day two, which then
went on to take out the low of day one.
3850
3BZ5
ЗВЭД
3775
3756
37Z5
3700
3675
3650
36Z5
3600
3575
3550
3525
3500
3475
3450
34Z5
3400
3375
3350
3325
3300
3275
3250
3225
As can be seen, diiy three was not the bust of days tor me in the crude
oil( but it was more or less typical of the kind of trade I end up in. I'll show it
more closely on the following page.
72
CL 5 MINUTE
Opened ->
<------— - - - - “j
The above lines slicw
where the congest ion
was 3 dajs agio.
I у fit short at 3300.
The Market get to
33-1И.
3500
3530
3580
3570
3550
3550
3510
3530
3520
3510
3500
3430
3150
3170
3150
3150
3410
3430
34Z0
3110
3100
3330
3380
3370
3350
3350
The market opened al 3-100, moved up sljgtiLly, (lien took oljt the low
of day 1 (3390). I was waiting for it at 3389, and got filled at 3388. I took
my first piofii at 3377r and my second profit at 3365. I then field on with
one contract to run. The oil never really ran. It worn down to 3340.
Now I have developed a very firm philosophy for my "let it run"
contracts}. I try to never give back more than 50% of the potential profit on
my "let it run" coniract(s). So when prices had reached 3340, I moved my
stop to protect one half my profits. At 3340, I had 48 points per contract in
the erode. I moved my protective stop to 3364, and bought it back there.
Let's review my money and risk management philosophy, They are
different and need To bit cxpLimod. They arc Ihj!h a part of die finer points of
Hading.
7 3
Risk Management
Ггп usually not willing to risk more than $150 per contract on anything
but the stock index contracts and the bonds. There I will usually risk $250
and $315 or less per contract respectively.
Assuming the ideal of 3  5 or a multiple of 5 contracts upon initial
entry, I want to set my innial protective stop $150 away from my cniiy fill.
Let шс repeat that., $ 1 50 away from my entry fill, NOT my entry point.
Why? If my entry point in gold is 360.00 and Гт filled a( 360.20, the
stop goes at 358.70 — $150 lower than my fill.
If I place it at 358.50 ($150 lower than my entry point}, I'm not risking
$150, I’m then risking $170.
Now I ask myself a question. If I get filled at 360.00 and prices move
up to 361.00, what is my risk?
If anyone said $150, I can tell right now that person cannot be winning
in the markets on a regular basis. Let's see why,
If Гт filled m 360,00 on a gold contract with rny stop at 358.70, and
prices move up to 361.20, Ггп now risking 25 points, or $250.
But. that's not all. I’ve been leaving something out. What about
overhead? I also have at stake the cost of commission and fees. They are
not part of my rLsk in an accounting sense, yel I have to take them into
account when 1 compute losses, and subtract them from my profits.
So let me restate my risk management criteria: I will usually not risk
more than $150 on anything except the stock indexes and the bonds.
That means for gold and crude oil, my initial protective stop is going to
be set at a distance that is $150 away from where I get filled including
commissions and fees.
Assuming Гт paying $18 per round turn in commissions, and that fees
amount to $2, then a stop in gold must be placed 13 points away from my
fill. If Гт stopped out, then t will lose $130 + $20 in commissions and fees.
That means in the currencies my initial protective stop goes 10 11
points away from my entry (20-22 for the Expound).
Гт not saying that anyone elsc’s stop lias lo go there. Гт saying my
stop goes there. If someone else is willing to risk more, then hr should place
his stop further away. The most important thing about risk is mat Гт
comiortablu with it. That way I can do "my thing'1 without worrying about
being annihilated. I use comfortable stops at all times. I will modify this
concept to a certain extent later on when I talk about average volatility.
И Гт fat from a bunch of big wins, I may be able io or even want to
increase my risk. Thai's my choice. I can’t tell anyone to do it or not to do
it. I can only say this: when i’rn feeling comfy and sleek based on some good
wins, and 1 increase my risk, that is usually when I take a bath and am
brought home to reality and my originaE lower risk. Greed will get me every
time. That’s when 1 will vow to never do it again. Those vows never seem to
last very long fur some reason.
Risk management is a subject that is so broad that the only thing I can
do is to encourage others to read widely on the subject The best places to
look for information on risk management are the books written by successful
gamblers.
One of the best books I have found on this subject is The Track Attack,
written by Clark Gary, and available through Trading Educators for $89.95.
Clark Gary is my nephew, a professional horseman, and a steady winner at
the tracks since he was 15 years old. Why? He is a master al understanding
risk. I can honestly say that he has never had to have a job. At age 30, he
continues to make his living at the track. Now how about that for a nepotls-
tiCj patronizing plug? In his book you will see some small sections I let him
borrow from Trading by the Book. Other than that, the material is all his own.
Traders should strive to become masters at risk management.
Money Management
Money management and risk management are part and parcel of each
other. They overlap, and yet they are different. Defining that difference is
rather difficult. Perhaps they are two sides of the same coin. Risk
management says, "I can afford to risk only so much/’ Money management
asks 1lWhat can I expect to make lor the risk i have taken?"
I’m willing to risk $150 in gold. Now, what can I expect to make for
that risk? I have to have my priorities straight here. To the best of my ability,
I have limited my risk. Now I can look forward with greedy, beady eyes to
how much I might make. But first things first. Before I can make anything, 1
have to cover costs. Costs in this business are made up of several items.
There is slippage, there is comEiiission, there are fees These are
obvious, direct costs. But what about indirect costs? I've got to cover the
cost of my data feed, exchange fees, software, hardware, and my time.
Surely my tune is worth something.
The broker's lime is worth something. I know that every time I see
how much ho butchers my earnings. How about my time as a trader? Is my
lime wor th something? It had bet ter be. and I had better realize that. What
about the costs of all I he oilier books, systems, paraphernalia, subscriptions,
etc., that one buys to suppiemem his education in trading?
Others have made a fortune off of my trading — I had better do so.
too. И I don’t, it would be because I never learned how to really count the
cost. The real cost of trading is staggering!
Yet so many I talk to, even professionals, call н a "game/' Hey, if this
is a game, then it is one of the most dangerous games in the world. My
financial life is at stake here. Not only that, my self-respect, my self image,
my whole outlook on life can be destroyed in this so-called "game/’
Trading is a business. The sooner one treats it as such, the sooner one
will become a winner. If Гт not a good businessman, I wifi riot bo a good
trader. I have to understand risk, and I have to understand how to turn a
profit.
Here is how I typically manage my money, with slight variations as to
the number of contract sets I liquidate to cover costs:
0 As soon as I sec sufficient gain on one or two contract-sets, I
liquidate those contract-sets. That covers my direct costs lor the remaining
contract-sets. Depending upon how last the market is moving and the angle
of ascent, I then move my stop up io one of two places - either to
breakeven {my fill price — I’ve already covered direct costs with the first
contract-set), or to a place where Гт not risking any more than $150 ($250
fur the stock indexes and $315 for (he bonds! from the place where I exited
the first contract-set.
Here's an exampie: Гт long gold at 360.00. My initial
protective stop is ar 358.50. The market moves up to 361.00. I liquidate
one contract-set at 360 90. I have now earned $90 per contract in the
contract-sei to cover my costs. If I liquidate two contract-seis. I will have
also earned a small profit.
Now itTs lime to move my stopls). I can move my stpp(s) on the
remaining contract-set(s) to 360.00. Thai is breakeven. I already covered my
direct costs when I liquidated the first contract-set.
1 can move my stops to $150 away from 360.90, placing them
at 359.40. Thai way I’rn still risking $ 1 50. Let me repeat that. I'm still
risking $150, not the $60 that exists between 359.40 ’and 360.00.
1 can do a combination of the above. Place a stop at 360.00
breakeven for one contract-sei, and a stop at 359.40 for the remaining
contract-set.
Al $90 for the first coni ract-set, have I made a profit? No? How
about at $100, $120? No and No! All I've done is covered direct costs. If
my cosis in commissions and fees were $60, I now have $30 left over — so
I'vs made a profit right? Wrong! What about that data feed, software,
books, systems, and subscriptions? What about my time? I haven't made a
thing yeti
I
° So where does the profit come in? If gold moves up ;u so the г $130
$100, I will issue о market order to liquidate the second or third contract-set.
I was long this contract-set at 360.00. Gold is now at 362.00. With a
market order filled at 362.CO, I well make about $200 per contract in die
contract-set. Now am I making a profit? Well, maybe. Maybe, jus! maybe,
I've covered my indirect costs. A big pari of that depends upon how much in
the hole I rim from prior losing trades. Alia! I've finally gotum arourid io 'hat!
The truth is, I haven'! made <i thing until I cover past losses. Past losses are a
*	part of my overhead. Even the IRS will agree with that. They let me take
those past losses off against current income. For some, past losses are a
mighty big hole to have to climb out of.
"Yup!", someone will say. Td have to live to be a hundred and win
every day to make up for all my past losses." Sorry, But it's never too late
io swp playing the futures game, and start running one's trading as a
i	business. I sincerely hope and pray this book will help my readers so do that.
-	° So, what about that last cciniract-sei? At 362.00, I have $200 of
unrealized profit. Where do I pul the stop? 7 waul this baby to being home
the bacon, Boy / have a tot о/ high hopes for this last contract seb ЛЪу/л? /
should pot the slop far away so this one can ready run, right?" Wrong!
'	That's dreaming, that's playing the game. I want to do this in a bu-siricss-like
manner. I don't want to gamble. I’ll put the stop in a place where, if I have
to be stopped out, I will have al least something for the risk I’ve taken, ['ll
(	put the stop at 361.00 and lock in a guaranteed profit cd at least $100 per
contract on this last contracbseL I'll never risk more than 50% nf my
(	unrealized profits.
0 Okay. Now, what if my last stop doesn't get taken o-ui the next time
I	the market reiraces? Then I can keep moving my slop up. There arc several
ways to do it. I can maintain a stop that is always $150 away from the most
recent high that this market has made. I can move my stop up $50 every
lime the market moves up $100. I car keep moving my stop to just below
the low of die Iasi market retracement prior to its contiriuing to move in a
	profitable direction. I can trail my stop at one or two ticks on the other side
of a moving average thtsf is showing containment of prices. Where I do this is
b	a ma I ter of choice.
77
With my risk arid money management philosophy in mind, let me
review my short trade in inc crude oil.
CL 5 MINUTE
Opened ->]
The aboue lines show
uhcre the Longest ion
uas 3 days ago.
 1 ;
i Nl
I got short at 33B0.
 The market got to
3340.
11
3600
3590
351.Ю
3570
3560
3550
35 IO
3530
□5Z0
3510
3500
3430
3480
3 470
34t0
3450
3440
3430
3420
3410
3400
3390
3380
3370
3380
3350
The market opened at 3400, moved up slightly., arid then took out the
low of day 1 13390), I was waiting for it at 3389 and got fillrHl ar 3388. I
took my first profit at 3377, and my second profit at 3365- I then field on
Willi one contract to run. The oil never really ran, It went down to 3340,
and then began a major upward intraday recovery.
When prices had reached 3340, I moved my stop io protect 1/2 of my
unrealized paper profits. At 3340, I had 48 points per contract in the crude. I
moved my p f о I ec I ivtt slap to 33G4, and bought it back ilium, netting 24
points.
I want to share an amazing statistic. I have this on good authority: In
any given fraclo 4i any market, 80% of the traders enter on the right side of
the trade. Vet, the vast majority of those traders will end up losing money on
the trade. Why? Because they will sit there stewing in their gieed, and
watch their profits fritter away. They will not take profits! They will try to
milk just a bit more oul of the market. When the market moves away from
the most profit they have seen, (hey wi.l hold on in the Topes that the market
will move in their direction just one more time.
Instead, the market will move against them, perhaps gradually or
perhaps suddenly. In any event, the traders who didn't take profits will now
be on the defensive. They will be facing a breakeven or a loss. They may
even commit suicide by moving their stop ahead to meet the onslaught of the
price action. Before they know it. that fatal tick will have arrived, and they
arc out with a loss. If I have just described my reader, then now be aware
that there is a way to circumvent these losses — they don't have to happen
to anyone.
Do I do as I have said? Do I fake the profits while they are there? Do I
take them systematically, and on schedufe? You'd better believe it. I've just
shown how io do it. Need I say more?
I have a little friend. That's
my friend over there on the right.
I protect him as best J can. When
I go *o market with him, he has
a tendency to wander away and get
lost.
There have been times wh.cn I lost him, and rt caused me great pain
and grief. I don't ever want to lose him again. Most people have one just like
him. Have they been losing theirs? If they have, [fieri they'd better protect
theirs as I do mine.
7 9
Chapter 13
Congesiions Are Important
Let me review some material I've covered, arid then move on to another
refinement.
Upon entry into a market, I warn ro trade a breakout brought about by
any one of my major or intermediate signals.
For actual entry irnо such a trade, 1 want to trade the breakout of any
congestion that existed just prior to my entry point. That way I can get into
the trade very early or somewhat early.
THIS BREAKOUT OF THE CONGESTION PRIOR TO THE TAKING OUT
OF THE ENTRY SIGNAL IS MY TRADING FILTER. IT IS IMPORTANT
BECAUSE IT GIVES ME A JUMP ON THE MARKET
If I have gotten into the trade very early (the nearest congesimn area
was distant from the breakout point on the daily chart), prices wifi almost
surely test the area of the high or low that was the basis for my entry signal.
The thrust that carries prices from the breakout of the intraday congestion to
the area of the high or low is where we will make our money EVEN IF
prices only rest the high or low and NEVER actually break out,
If I have даней into the trade somewhat early [the nearest congestion
is quite close 10 the breakout pomt on the daily ciiart), prices will almost
surely make a new high or low. The thrust that carries prices from the
intraday congestion to the new daily high or low is where I wdl make my
money.
SO
I
!	Let mo illustrate inis.
।
।
।	The {jaily bar for vostcrday might look like this:
luaul to bin; a breakout of this high on the; daily о Lar I,
<-	1 want to sell a breakout oT this leu on the daily chart.
The five minute chart for yesterday might look like this;
Congest ion closest to the
high. As prices take out
the high of th is congest inn
I will be long.
closest to the
tou. As prices take
oct the lou of this
congestion, I ui 11
be cl।art .
j
*<- Yesterday's lou.
I want, to enter on a breakout of the congestion area, rather than on a
breakout of yesterday's actual high or low.
But what if there is not congestion area ujjon which to base a
breakout? Just such a situation occurred in the currencies as illustrated
below, and gives an at Id it ion a I refinement .in my trading.
Here is a rule. If prices are making new highs or new lows relative to
the last three days or more, I may enter based upon a non gap breakout of
yesterday’s high or low. Let mo show what I meam
81
SF 5 MINUTE
(- H igh 7936
f 7928
It <"cia"e?9ZO
7Э12
7901
7056
?U0fl
7080
7072
7BM
7056
2018
704G
7032
If today’s open were to be 7024
right around yesterday’s 7B16
close, but not a gap open 7ГЮЯ
that tabes out the higlu ?B0O
J would go long a breakout
of the high. If prices wcre7?nd
to congest in Ike area of
the close,that would make 77/6
it easier. But they Might 7760
open and go right up and 7760
never give ne a chance to 7752
get in at this level. 7744
11-02 13:45 0- 7925 11- 7931 L- 7925 C- 7928 U- 2? T- ОТ- ОТ- 0
As 1 look back at prices, I can see that there are no prior congestions on
the high side from which to base an entry. If prices open today somewhere
below the high, or even al the high, I can take a breakout of this high as rny
entry. However, if I do, I run the risk of a quick pop followed by a
retracement io test support at the high. So if I take this trade on a quick
breakout of die high, I must be prepared to risk mure than I normally would in
order to be sure I'm on board.
A much more conservative approach would be to wait and see. If
prices open below tire fngh and continue lo trade in the area of lhe close, then
I have the congestion I am looking for as my crihy signal.
If prices npen and quickly take out lhe high, then I can wail for a
possible re I race mo nt iriar will last support at what was the high.
By following the more conservative strategy, I can maintain my risk al
$150 per contract, Here's what actually happened
SF S hlKUТЕ
IIS
This is
i'
1st Ъгегкои I
2nd
breakout
If I take the first breakout of the high
1 an in effect taking the wore risky
trade. There Jias been nu cuh<ie$ t io?i uei
If 1 wait until there is congestion» ny
chances for success are greater and I
danJt have to increase ny risk.
at a time. The market opened lower, tested
I'll trike this trade one slop
uptrend line, and then moved up to take out yesterday's high at 7935, by
8024
8016
B003
8000
7992
7904
7976
7960
7960
7952
7944
7936
7920
7920
791Z
7904
7096
7BBB
7000
7072
7064
7066
7U4G
7040
7032
7024
r
h
I
Since I da not trade bounces from uptrend lines, I waned for some kind
Of congestion to form. If the market were to keep on going and not congest
in the area of yesterday's close, 1 would let that go by. 1 want it my way or
not at all. I don't mind missing a big move if it's nut my move.
The market then retraced from the new high at 7936 to form
somewhat of an ЛЛ formation. I figured this might be as close as I was going
to get to my desired congestion, and so I entered an order to buy a breakout
of yesterday's high, I was filled at 7936.
When the niarket started trading at 7944, I pul in в market order arid
got filled at 7946 — winch was the next high. I now had ten points in the
Swiss, and so I moved my remaining two contract sets to breakeven at 7936
□ nd was slopped out [here.
Subsequently., prices made a true congestion by moving down into the
area of yesterday's close. I’ve marked that boxed off area for easier viewing,
on the chart on the next page.
в 3
SF 5 MINUTE
n г
Дг
lUlilllhliHI
3	10
Long
,, .	, here
This is the
b геа к on t	.... _,
This is	__
yesterday's high -> “j}' i
p ijlTrue congest ion
1 i ь .
8024
8016
8008
8000
7992
7984
797b
7968
7950
7952
7344
7936
79Z8
7920
7912
7904
И ! take the first breakout of the high,
I an in effect taking' the tnore risky
trade. There has been no congestion yet, 7396
If I uait until there is congest ion> ny
chances far success are greater and I
don't ha ив to increase ny risk,
7608
7080
7072
7064
7B56
78*0
7640
7B32
7BZ4
12
10
12
3
Since the breakout of the high was good for entry earlier, I worn long
when И broke out again. This time I had no trouble cix all in making all my
objectives.
Simultaneous to the trade in the Swiss, I did one in the D-mark. The
only difference was that the D-mark never gave the false breakout that the
Swiss gave shortly after the opening.
Cliupier 14
Milki-Set
Pvt; been revealing niy trailing secrets. Many will be skeptics! of what
I'm saying. After all, what kind of a nut would go around telling everyone
how to make money in the markets?
Many have become somewhat jaded by the plethora of garbage that
has been sold over the years claiming to show the "magic" way io trade.
I'd like to answer some of the many questions people ask me, and then
make a number of comments that will show my approach and mind-set for
iradimj lite markets.
In the fall ol 1987, following a couple of days of sevcm abdominal
pain, i boctm’H? very ill. I didn’t know what was wrong, so I more or less took
to my bed, aliho'jgh I tried to continue functioning as a trader.
After about eight days, I developed a severe case of hiccoughs and
visited my doctor Io see if he emdd do anylhing about it. While I was t’mrc,
he did a rominc hlood test and look a urine specimen. The1 results of the tests
were alarming enough that lie suggested I immediately report to the
emergency mom at the hospital.
My wife drove me there, and after a series of brief eon versa! ions with
various doctors in the emergency room, I was admitted for exploratory
surgery. I have absolutely no recollection of ever leaving the emergency
room. My next memory of anything other than nightmarish dreams about
suffocating io death, was 2 1/2 months later someone telling me that my
broker was liquidating a December corn trade 1 had been in because the
contract was about to expire and the broker didn’t think I wanted to take
delivery on a load of corn.
From that point, I drifted in and out of sleep for another couple of
weeks before I was made aware that no one had ever thought I would Irve. I
was supposed so have been dead on several occasions due to complications
of surgery, severe respiratory distress, Staph pneumonia, Spinal Meningitis,
and Mononucleosis, following what had been a burst appendix with severe
peritonitis,
I then became aware that the doctors thought that even though I had
somehow survived, I would probably never walk again. They also thought
that there was a distinct possibiFity I might never talk again.
I was starving to death, and could nor retain food. I was pretty sure in
my own mind I was about ready to go where my ancestors before me had
go ne.
1f anyone thinks that an experience such as I had is anything that can
he easily sloughed olf, then think again. What happened to me changed my
hie., and it changed the way I trade. It gave me a whole new mind-set. That
change in my thinking is why I was willing to publish this book,
3 5
Up until the lime of my "significant emotional experience," I was totally
a private trader. I was essentially unaware of other traders, their activities,
the publications they read, the concepts with which they traded, or that most
traders were losing most of the lime.
My education in trading was derived from sources far removed from
those that most traders have ever encountered. It would take far too much
space in this hock tn go into all of that. (I do tell more about this in my book,
Trading Is a Business.)
My experience was first in the long term aspects of trading from daily
chans. Later, I applied the techniques and methods I had acquired to the
intraday chans, modifying the tactics used in order to accommodate the
differential in time.
As I began my long recovery (it’s still going on), I had ample time to
think about a great many things.
My children were not yet ready to trade, they simply were not mature
enough. My wife didn’t have the foggiest notion of what trading is. I decided
tn write dnwri what I knew. That way, in case they ever wanted to use die
market to earn their living, they would at leas! have some input from me,
Before I even had the book finished, I mentioned what I was doing to
another trader. He had called me for support on trading software I was using
at the time. The programmer was going out of town, and referred the trader
to me. I agreed to answer his questions as best I could, because I had been
given simi’ar support from the programmer in the past.
When the other trader heard I was writing a book, he asked me for a
copy of it. I was reluctant at first, but in jest I said I would sell it to him for
$750 doNars. I was sure this would blow him away, Instead, he sent me a
check for the book — to be sent tO; him upon completion. Then I received
another nail from someone 1 had never met. He, loo, wanted the book, again
at a price of $750. He asked me what the book was called. I didn't have a
title for it, but blurted out "Well, how about "Trading by (he Book?" He said.
"Send it just as soon as you finish it.”
I sold a number of books this way. I didn't mind sharing what I knew.
As I got to know some of these individuals by their calling to ask questions
and the subsequent conversations, eventually tutoring some of them, I
became aware of the vast wasteland of commodity trading. It hurt me deeply
lo find out huw many traders were being taken advantage of in the markets.
I had been given a new life. 1 found out I didn't have to live as
intensely as I hard The condition of my devastated body wouldn't allow it.
For quite some time t couldn't even watch a live data feed, (he excitement of
daytradrng was more than I could bear. The pain in my stomach when the
adrenalin flowed would cause me to double over in agony. I was reduced to
only casual trading uf the daily charts.
Sli'l, people were catling or writing and sending for my book. My
conversations with them were demoralizing to say (he least. Here are some
Typical quotes.
96
"Trading 27 years arid only have had 1 winning year — and
thni by accident."
"Trading for 15 years, and lost 2 1/2 million dollars."
"Trading for 12 years, and have lost my entire inheritance/'
"I've? put my family into poverty with my trading over the
lost 30 years — our whole nest egg is gone. Now I'll have
to work in tiie days when I expected to be retired/’
I have talked to eminently successful businessmen -- men with giant
incomes. Men who have succeeded in everything else they ever tried — but
they have failed miserably when It corncs to trading in the futures markets.
One foreign ambassador I know of had lost $700,000 in 1939 alone,
I am a compassionate man. Much of my compassion was born of
excruciating physical pain and misery. Not just from my recent illness, but
from past problems with my health.
The few quotes above, coupled with dozens of other similar and even
worse disaster stories about the markets, made me want to reach out and
help.
Yes, I hove a sincere desire to help others to succeed in the markets.
So I have made Trading by the Book, Trading by the Minute, Trading Is a
Business and Trading the Ross Hook available. Anyone who can't understand
that will have to live with his skepticism. He won't get much out of this
book.
The greatest single problem I encounter when I am tutoring others is
unbridled greed. People cannot bring themselves to take a small profit when
it is there to take. They hesitate because they want more. What's wrong
with making $100 in the S&P? What’s wrong with covering costs first, then
seeking profits? I get out when there are profits. I can always get back in.
Part and parcel of this terrible greed is being in a hurry. The traders I
tutor are in such a hurry to get into the market. It's as if ihis were the last
spaceship leaving from a dying Earth. It should be just the oiher way around.
My advice is, be stow gelling info tlie market and in a hurry to gci out!
The next biggest problem I come across as regards other traders is that
they don't know how to use something {hat works without trying to fix it.
They say they want to know how to hade, but what they really want to do is
to re-invent die wheel. This lack of discipline is the ruination of many a
would-be trader. If something works, leave it alone. I am sure that amidst all
the rubble out there, there must be some mediods and systems that work.
But there are few indeed who can follow* another's system.
Thai is why I did not even attempt to present this book as a system. I
know that only a few will follow it. Instead, I've tried to present the
fundamental tools and understanding that are needed lo win in die markets.
8'?
Another problem [bar crops up when cfeaNng with other traders is their
incredible selfishness. They tliink that it something works, it should be kept
secret. Why? Because they fear that if everyone starts doing it. it will no
longer work.
That kind of thinking flies in the face of fact and I ruth, I seriously
doubt that of all the people who purchased my first book, that even 5% have
consistently utilized the methods, tricks, and techniques I presented there, in
fact, 1 doubt if 5% of them still trade the markets at all!
The same will be true of this book. Of the thousands of traders who
might buy this book, only a few hundred will actually purchase it. Of those, a
tiny percent will actually do what it says. Within a year or two, most of the
others will no longer be trading.
i am appalled at the lack of a business-like approach I find to be
overwhelmingly prevalent among traders. I meet and speak with men who are
fantastically astute businessmen» But when it comes to trading in the futures
markets, they completely abandon a business approach, becoming instead
reckless gamblers.
Men who are masters of good management seem to fall apart at the
seams when it comes to managing risk and money. Men who are cool, calm,
and collected under everyday job and business stresses, seem to turn into
hysterical, raving fools when it comes to trading in the markets.
The markets are such that every weakness and flaw of character is
revealed when trading. A man who is a liar, no matter how clever, will lie to
himself. He will tell himself that a market is going up when any нюгсп can
see that it is going down.
A man who is greedy will be destroyed because he will stay too long.
A man who is dishonest will end up being dishonest with himself and
wilt be annihilated by the market,
A man who is skeptical will never have the faith and confidence to
trade successfully.
A man who is distrustful will never have the courage of his convictions
and will soon lose his margin money, To make matters worse, most of the
"professionals" he will encounter in the markets will give him little to
encourage such nuse In general, traders are prey to a whole host of vultures
whose only goal is to part the trader from his money as quickly as possible.
Such a situation hardly encourages trust and confidence.
If I were to try to devise the most fantastic character building device
ever created. I could do no better than the markets. The markets represent
the ultimate challenge to self’mastery, self-discipline, and self-coniroi.
The markets attack the greatest human failing of alt — vanity. There is
nothing I can think of that can quickly make a man as humble as the markets
can.
8S
The only way I know to consistently win is to humbly approach the
markets with great awe and respect. Then, in the full realization of how
awesome the markets truly can Be, determine to master every human, flaw
one can find in oneself.
Sincere, deep, arid thorough self examination must come before the
markets, or oneself, can bo mastered,
The search must be for the simplest tilings, not the most complicated.
It is absolutely incredible to see how complex people try to make their
trading, It seems that the more complicated □ formula is presented to be, the
more people think diet somehow ”Illis’* is the holy grail of trading. What
nonsense! The truth of the markets is in the simplicity of their movement. A
market is going up, down, or sideways.
If it is going up, and if Гт honest, 1 can see that it is going up. 1 don't
need a logarithmic, parabolic, standard deviation band to TcH me that, A child
could tell me that. "Oh look, Daddy, that market is gomg up,"
II a market is coming down, I don't cart’ how many trend linns or
moving averages I draw on my chart, they will not contain it. Dues drawing a
trend line underneath a trend somehow magically stop prices from coming
down? When prices reach the bottom of your computer screen, dues that
mean they can go no further?
I've had traders Toll me that d prices break through a trend hue, we are
witnessing a significant event. Is that true? Would wo buih draw the trend
line in the same place? Would one of us draw it exactly the same twice?
And if prices make 3 new low and then rally back, do we now draw a new
trend line at a lesser angle? Is that now somehow the magic line drawn in the
sand that says "Prices, you can't cross this line’"?
Give me a break! That's as bad as saying that the divergence of an
oscillator from prices means something. Look, I'm no great mathematician,
but I know that when you detrend an oscillator, it is going to drift, There will
be plenty of times when a market continues io trend seemingly forever, when
the oscillator (any oscillator) will trend in exactly die opposite direction. If a
market is (rending up and (he oscillator is trending down, does that prove
divergence? Someday, of course, that market will start to move down. But
that could be months from now. When it docs, al! the great prognosticators
will say, "See, you could have known the market was going to come down,
just look at that divergence!"
Pardon me, but I think, just about any four year old child could have told
you that what goes up will eventually come down. Who needs an oscillator
to tel! you that?
If traders spent the time mastering themselves that they spend on
mastering the markets with techideal analysis, there would be tar fewer
dropouts and many more successful traders in the markets today.
If traders spent as much energy in seeking simplicity arid truth as they
spend making things complicated and false, there would be mure traders still
with us today.
If traders spent as much time examining themselves as they spend on
examining the crossover of two or three moving averages, they would make a
great deal more in the markets than they now do.
To mo, ihe height of folly is taking a moving average, detrending it to
create an oscillator, and then trading a combination of the oscillator and lhe
moving average that was just detrended»
Except fur very luuited and appropriate use. the 1। ?c Г и ii c; tl tools I find
being vised in the markets are for the most part worthless.
In Trading by the Book, I said something to this effect:
Would you carve a doll out of wood and then bow down before it in
worship? What is the difference between doing that, and taking an oscillator
of your own or someone else's manufacture, and then entering a trade
because the oscillator says to do so? Who is to say that lhe oscillator should
be set at live bars, or ten bars, or twenty bars? If we each set it differently,
we will get different results and therefore different trading decisions.
Let’s face it, there is no such thing as oversold, and there is no such
thing as overbought. As I write this book, the Canadian dollar has been
overbought for cluse io three years and it is still going up. Silver has been
going down for about the same length of time. Who’s to say when and
where it will stop3
I have a friend, a very well capitalized, big-time trader. When silver
was at around $6.40 in November of 1988, he said, "Man, silver is making a
bottom here. I'm looking fur $12 silver inside of a year. All lhe fundamentals
say that it lias to go up. All my technicals say that it's oversold. Гт going to
scale it in by buying every time n makes a new low." That was back in 1988.
Me has steadily bought silver because it is so "absolutely oversold." He has
rolled over mujiple contracts repeatedly, and is now $900.000 in the hole.
When I talked to him recently he said, "Man, if you've got enough money,
you can always be right,"
I guess that maybe he does have enough money. Rallies in silver don’t
do firm much good because he’s in too deep. Sure, one of these days silver
will quit being oversold and chmb to $12. Maybe by then ho will be able to
break even — that is if silver doesn’t break him first. Hmm — I wonder how
well he'd sleep tonight. Silver just made another new low. It's now well
under $4.
it puts me in mind of a?l trie people who sold the British Pound this year
at lhe $1.80 level because it was overbought. Now it's flirting with $2,00,
A lot of people got "British Pounded.”
Hey, I'm no exception. I was crazy enough to buy $18 crude oil puts
when crude went to $28 because it was way overbought. Al $35 it was
surely overbought. Didn’t ail the oscillators say so? Now >t's at $40 arid rny
Puts wifi probably expire worthless. I wonder if ips overbought yet?
The closest thing any one can hope to get thar is nearest lhe l ruth is
what is seen on a simple price chart, unless, of course, we are like the old-
timers who could sec in their mind's eye what was going on in the markets
just by rcadmg the tape or watching the ciacker board.
There are still some of those blessed souls around, still riiaking their
money in the markets, still ergoying what they do. We could all learn a
pro Found Ins sun or two from thorn.
Tape reading seems io bo going ihn way of all the good things. It's
becoming a lost art. These old pros can successfully daytradc from a clacker
board. It makes me ashamed to have to sit in front of an expensive
computer, with an outrageously priced data feed, paying even more
outrageously priced exchange fees, and not be ab c to do an ounce better
than those who httve gone before me did and still do just by reading the
numbers. No fundamentals here, no technicals, no cycles, no seasonals, no
astral phenomena, no oscillators, no moving averages, no parabolics, no
channels, no speed lines, no heads and shoulders, no pitchforks, no Fibonacci,
no Elliot Waves, no fractals, no chaos theory, no any of these things. Just
profits, based on truth — the truth (hat is revealed in the movement of prices.
My best advice to anyone who wants to trade is to work on and learn
fiow to uncierslarrd simple price movement. Learn to read it and learn to
interpret what it is saying.
The probiem with most technical studies is that lhey smooth away the
minute details that are exactly what I am looking for in my trading, I know, I
know, someone will tell me that I don't want to have to react to every little
fluctuation of lire market.
But what are those guys down on lhe floor doing? They react to all the
detail. They don’t have any fancy studies in front of thorn, they just know
where prices ;ue — arid they win — and must others don’t!
The floor traders have to pay attention to detail. They have to watch
lhe prices on the screen. They have to decide and react to what is
happening, and most of them arc taking home the bread. И they don’t, they
will soon not be floor traders, lhe floor traders make money watching prices.
The old geezers who watch die decker boards (there still are a few around —
cl acker boards I moan - no, I mean both! make money watching prices, and
Joe Fancypants, wdh all his sophisticated electronic equipment, is losing his
best friend.
With that in mind, lei's look at some additional refinements.
91
Chapter 15
Search Out [he Best
One of the most important things that anyone who trades can learn to
do is to identify the best trades.
These can differ from one person to another because we each tend to
see trades differently. What looks like congestion io one looks more like
volatility to another, and so forth.
But all can learn to recognize what happens in the market that results tn
successful trades
Having identified the one or two methods and techniques that
consistently work, it is imperative to refine them so they result in the highest
probability of winning possible within the individual's own frame of reference,
ais/her own mind-set, and his/her own comfort level.
Not everyone trades the same. That it why it is patently ridiculous to
worry about how many people will buy and/or use this book. Stops will not
be bunched because each has a dilferent level of risk tolerance, different size
margin accounts, and feels comfortable with differing numbers of contracts.
Each will likely trade in different markets to a certain extent because individual
perceptions of what is tradable will differ.
The best I can do for anyone is to show exactly what I am comfortable
with, then let them adapt that to their own comfort level.
The trick here is to identify success and then slick to it like glue. When
it works, don't fix it. I don't experiment with something (hat js making
money. I stay with the very best trades I can find. There is no need to chase
a market. I am slow to get in and quick to get out.
If I'm not absolutely sure of a trade, 1 stay out, If it doesn't develop
exactly to my liking, I stay out. I wait fur those trades to come I hat exactly
match my specifications. I let all others go by. I may not Irada today, so
what? The market may go on to make somebody a fortune — no big deal. I
discipline myself to know my trade, and then take only those trades. I do not
let greed get the best ol me.
What does a good trade look like? Let me show what it looks like lo
me. It won't be exactly what someone else might like, but it will be similar.
9 2
CL 5 MINUTE
This Jas the high
of the previous
I
t!
J
J
.. [ an i liters sled in the boxyj squared uff area.
the level of the flat area of the prior day. A couple
of identical clones and a high for one bar conplcled
the squared off boxy area.
This area of
flat tops teok place just before the
high of the day near the close.
H^tice that it also raade a snail flat hottcn.
3BZ0
ЗБ00
35B0
35Б0
3540
3520
3500
3100
3150
3110
3420
3100
ЗЗШ)
3350
3310
3320
3300
3200
3250
3240
3220
3200
3W0
3150
3140
3120
On the crude oil chart shown above, 1 am interested in taking a trade
based upon a breakout of trie congestion that occurred closest to the high of
the day. Prices had congested there brudly prior w the high, and had then
fallen back to the congestion area just before the close.
The next morning, prices opened lower, and by a cluster of closes at
the same level as the group of flat highs from the day before, plus the high of
one bar at that level, there is a definite squared off boxy shape lo die prices
as they congested in the same area.
According to my plan set forth in the earlier chapters. I want to trade a
breakout of the congestion that took place closest to yesterday's high. t
don't want eo wait tor the high itself to be taken out, if at all possible.
9 3
Why? J want to already he in The market when and if yesterday's high
is taken out. Why da I want to already be in [lie market then? There are two
reasons:
1. If the congestion is taken out to the upside, there is a high
probability that prices will go up and test yesterday's high. I can make a
small profit if that happens. It also will have given me a head start in case
prices go on and take out yesterday's high and move oven higher.
2. If prices do rake out yesterday's high, that is precisely where
a whole bunch of buy orders will come into the market. There will be a Eot of
buy stops sitting in the market at that point. The momentum behind that
buying will drive prices up even more, and so 1 have an excellent chance of
cashing in on such an event.
A close look at the chart will show exactly what happened.
Staying in the Water
The whole idea behind my trading is that I don't mind taking a smalt
loss, or even just making expenses, if I can be in the market when it runs.
Usually, I will not he stopped out for a loss equal to my entire risk..
When markets take out congestion areas, they usually have enough
momentum to insure I will at least make expenses. At that point, I will have
pulled my stops to breakeven and will not be hurt if prices come back down.
If the buying or selling that comes into the market at the actual breakout is
sufficient to carry prices a Ы higher, I will cash my second contract-set.
If prices have sufficient momentum for the market to run, my third
contract-set will sec me catching my portion of the run.
Do I expect to make it all, right to the most profitable point of the day?
No. All I want is a piece of the action. Sometimes I will get more, sometimes
less, but at least I'll get something. A whole bunch of those pieces earn me
my livelihood.
There are many times I will be stopped out with little or nothing for the
risk I have taken, only to sec the market then run the way I had hoped for.
Will I chase ihat market? No! If it doesn't happen my way, I forget that
trade. The trade must he my trade. It must happen my way, according to my
plan, or I don't want any part of it regardless of what subsequently happens.
No "hut if’s", no Tl only's". My way or no way!
I'll show micphc-r trade now.
94
DM 5 MINUTE
Ь768
Гн looking at the iuo boxy areas that are at
4
I
hatching levels* The first is characterized
by rnjslhj ГЫ tups, uil.li a little squaring
off of the bottoms. The second, at approx-
imately the same price level, is characterized
by a flat bottom If prices uere to take out
that area tomorrow, they would a Joust surely
test the high.
6764
6760
6756
6752
6748
6741
6740
6736
6732
67Z8
67Z4
6720
6716
6712
6708
6704
6700
6536
663Z
6680
66B4
6680
6676
6672
6668
12 1 7 В 9 10 11 1Z 1 7 8 9
10 11
12 1 7 В 9 10 11 12 1 6
И prices rake out the congestions to the upside in the area 1 Have boxed
off, there is a high probability that prices will test the high.
What I would like to see on the next trading day would be an open that
is a bit lower, followed by sonic more r rading at the boxed level.
A breakout would have me in the market, with enough room between
the breakout and the high to at least cover costs. If prices continue upward, I
might make a pro lit r and if the market runs, I will make my lake-home pay,
11 it doesn't happen the way S anticipate, I will lot the trade go by^
GC 5 MINUTE
These boxes sliou a critical area of trading
over a span of 3 days. Prices congested and
squared off 5 t ines at that sane approximate
ieuc ].
3325
3320
3915
3910
3305
3900
3695
3830
3885
3880
3875
3870
3885
3880
3855
3850
3815
3810
3835
3830
3825
3820
3815
3310
3805
3300
от- 0
The boxes I’ve marked off demonstrate a critical area of conoestinn,
•J
The first box shows that 3 great deal of trading took place at that price
level actually causing a pennant shaped correction prior to the close.
The second box shows that on the following day, prices rcsuriiE?d st
that congestion level right at the open. The trade was la enter long on a
breakout of the congestion shown in the second box. I ignore the spike highs
and/or lows. What I'm interested in is the fact that prices traded at ihc same
level so often.
The third box shows that later that same day, prices traded there again,
only this time after making the low of that day.
_j 6
The lows of that fourth box are at just about Hie middle of the
congestion shown in the third box. A short position was put on at she
takeout of the congestion shown in the fourth box. As can bo seen, prices
made a nice move, and although gold didn’t run, I was able to cash all three
contract-sets.
The fifth box shows the congestion level at the end of the day that
approximately matches the congestion area made earlier at box four. I 'would
nor trade lung the fol Io wing day based solely upon a breakout of the
congestion in box five, because it is not the congestion closest to the high.
GO 5 MINUTE
3525
3320
box
iiu nber
|W
if
11-09 3:20 0- 3375 II- 307? L- 3875 C- 3077 U- 10 T- 0 I-
3815
3810
3505
3500
3035
3080
3885
3000
3075
3870
3865
3350
3B5S
3U5C
3345
3Q40
3B35
3830
3025
3BZ0
3B15
3B10
3B0S
3D00
0
Г iuu <
Instead, I would await further developments. ldd like to see it trade
again at (hat level, and then take the mast logica! breakout of that area.
97
SP 5 MINUTE

3165G
31600
31550
31500
31450
31400
31350
31306
31250
31200
31150
31160
31050
31000
30950
30900
30D50
30000
30750
30700
30650
30660
30550
i
11-06 13:00 0-31460 H-31160 L-31330 031415 U-
30500
30450
0 7-	6
This chart shows an almost perfect trade in the S&P. Prices congested
right after making the* high and just prior to the close. The next morning saw
a gap up open, and then prices trading right back into the congestion area.
Then prices played dippydoo for awhile arid finally broke out. The S&P ran all
the way to the end.
эн
US S П1ГШТЕ
11-03 10-50 0- 3201 H- 3Z01 L- 3200 С- 9201 0-	5 Т- 0 Т-
9300
8Z3G
9228
9226
9Z24
9Z22
9220
9219
9216
9214
9Z12
9210
9208
9206
9204
9202
9ZOO
3130
9120
9126
9124
9122
9120
9118
9116
9114
О I- О
Although I do not trade bonds on (he five minute chart, I just had to
show this classic example of what I'm talking about. It just happens to be a
day when there was enough activity in bonds far them to "form up1’ on the
five minute chart.
Preferred Patterns
I preh^r boxy, flat, squared off congestions over any other kind.
Next; I prefer repetitive congestions in the same area, such as on the
S&P chart and the gold chart in the previous, figures.
I prefer that the boxed off section not be too high from top io bottom.
I ignore spike highs or lows, and prefer dusters of opens and closes, highs
and lows all within a very narrow range on the individual five minute bars.
I feel it is essentia! to have software that will enable viewing of ar least
three day's worth of trading at one time. This means being able to see 240
five minute росс bars on rhe screen al one time. That way it's possible to
see where the daily highs and lows were over the last three days. Alerts can
then be sot accordingly.
IOC
Chapter 16
The Third Contract Set
When I've i:()vered costs on the first contract set. and ninde a modest
profit on th г j second contract set. what do I do with the third contract set?
Нол do t trade ii?
I want ю be in the market when it runs. For the most part, the major
profits l‘m going lo make occur when the market does run.
Heie's how it works. Гш quick to take profits to cover my costs.
picking up die phone as soon as I approach $100± on a trade. At (fiat time I
liquidate contract-set #1. 3 move at least one of my contract sets to biemk-
everi. Actually, I prefer moving both the remaining contract sets to break-
even. h's a matter of comfort level. Often, I will liquidate coritract-set
number two at the same time as I liquidate contract-set number one.
If I haven't already liquidated it. as soon as I see another $1001 on the
trade, I liquidate contract-set #2. If the market goes nowhere, I will probably
be stopped out at break-even. This will happen fairly often. The marker may
then go on to make fat probes without me, I don't sweat it.
I may take $ 1 00 ± on contract-set #2, and then get stopped out on
contract-set #3. If I do, I have lost nothing. Paper profits are just that, paper.
I can’t take them to the bank.
However, two or three times a month in each market, sometimes more,
a market wii: have a good run. That’s what I've been wraiitng for. I’ve been
staying patiently in the water. I've been dipping my toe in each time I trade,
looking to see tf this is my day. It may have cost me a few bucks, or I may
have made a few bucks while I wait for my day in the sum
On the days the market runs and I'm able to stay with и, mi у break-
even stop wdl liavii held. Now the market starts to move jn a direction to
make me profits.
Will 1 gut all ol the move? Probably not. Wi.l I tie able to call the top or
bottom? Definitely not, I won't even try, I will be satiskcd to make a profit.
Making profits is the goal of my overall plan. Why am I here? To make a
buck — but not to suffer while doing so. Hove,1 I made it clear? ALL HIGHT,
heie goes. Let me put everything in the context of another real life example.
101
SF 5 HINIJTE
N Close
7536
79Z8
7920
Stopped out at
th is level on 3rd set.
К 2nd profit here ->p
J Costs covered here ->
an 2nd trade *
G 1st profit
L C_ Placed a stop here dti Bed
contract set.
W- Long a breakout of this
и I congestion* Stop 12 points back,
fins Lias > F Costs covered
yesterday's
high----
Stopped out at this
price leuel on 3rd contract sct♦
- Retracement did not take out stop.
Large congestion near the high in price,
1' <- This is the opening bar*
E Initial Stop
12 points below
7512
?ЭМ
7836
78B8
7880
7072
7861
7BS6
7818
7840
7ВЭ2
7821
7B1G
7060
7800
out-7?92
7734
7776
7768
7760
7752
7744
7736


I le,e й is, a stop at a time.
A - shows yesteiday’s high. В - shows today's open. C - shows the
ronin congestion that is nearest to the price level of yesterday's high, D -
shows the price level а г which I got long, just above (ho congestion high fil
should have been a Ict'c lower but I chickened out end look the high). E
shows 1 put my stop 12 points per contract below my entry. F - shows the
puce level at which I covered costs on the first contract-soi. G shows the
price level at which I took profits on my second set. H  shows the price level
at which i was forced to take profits on the 3rd contract set.
102
I-K is
liappe ned.
hate rne for
virtually a repeat of AH .mid it should be
l-K will introduce the next thing I want to
this.
fairly evident
write abmJt,
as to what
Some will
5 HINUTE
1
К Close
1J,
i'
ri#!,
j г
Stopped out at
th is leuel on 3rd set.
This was
yesterday *s
high-------
F Costs cowered
lie re
F

J Costs cowered
□я 2nd trade.
G 1st profit
here-----\

L <- Placed a stop here on 3rd
Lang a breakout of this
congestion. Stop 1Z points back.
’<4-|-Slopped out at this
H	price level on 3rd contract-set,
H"~ Retracement did not take out stop.
4<- , <- Long here when congestion high uos taken
J. |Л
<- Large congestion near the high in price.
B V Ihi
is the open ing bar .
E Iii it ia 1 Stop
12 points beloui
I don't always take thiit add-on set of contracts that are represented by
A-l. Yes, 1 know that's where 1 made a good piece of profit right? Righif But
that's also where I incurred additional risk. When I entered that second set of
contracts at point L I stood to lose everything 1 made on
taken into account. It's a pan of risk management.
7936
7928
79ZG
7912
7904
7896
7808
7880
7872
7864
7856
7840
7846
783Z
78Z4
7816
7868
7800
OLjt-?792
7784
7776
7768
7760
7752
7744
7736
That has to bo
So how do I know whether to hike it or not? Roy, I almost hate to say
it, but it has something to do wish waves. However, if it turns out that this
has anything to do with Elliot waves, believe rne it is purely coincidental. To
me, Elliot waves arc what my wife cooks in — a crock.
103
4
I usually trade on add-on set of contracts, (i.e. a continuation set} at
the breakout of the first congestion after the first fog up. But not always. I-K
is a continuation set of the second leg up and ГН come back to it soon.
Here's what I mean:
I trade a breakout
of the second congestion -> /
/\/\/\/\/\/congest ion
/ leg up
congestion/\/\/\/\/\/
However, there are exceptions to this find they arc why I said
"usually/1 I have to keep my eye on the clock. I have to make sure this is
happening when there is still at least one hour of trading loft in the market I
want to trade. These are best when they occur early in the trading.
All right! So why didn't I take the secund breakout on the trade I've
been showing? Here's why! I do it only if the second congestion is relatively
flat, or corled. I don t do it if there is a hag. [ hate to say how many bucks I
lost til I figured that one out, I won’t tell. Just take my word for it that it
was plenty. On the other hand, I should tell "why/1
When a flag formation is made it looks like this:
Ц
J
In a down market, it looks the same. Just turn the page upside down
and hold it up to a mirror.
The problem is that, because it represents a serious retracement, prices
are apt to spend a good part of their momentum just reaching back to the lop
of the flag pole. There will usually not be enough momentum to carry very far
before prices congest again.
Now if prices had made a W formation or on ДЛ formation, it would
have been a different story. Then prices would have been able io move a lot
higher.
Гт saying that I want to see more congestion before Гт willing to put
myself at risk once again. ! especially like tight congestions. By tight, I mean
lots of individual price bars with just about equal tops, bottoms, opens, and
closes.
A close look will show that I took the very next breakout, the one
above the flag, for exactly that reason.
104
Let's talk about add-on Seis on a third breakcnn. Thu rule is the same,
they must come with at least art hour of Trailing left in the market. The
breakouts must come from prior congestion.
1 never, ever, take a fourth breakout no matter what. Remember that 1
have lo be out by the close. Few are the days when a market will even offer
a fourth breakout, Ely then, it will be too late in the day to risk it. Fourth
breakouts usually don't go all that far. Elliot enthusiasts probably have some
kind of explanation for all of this. Whoa! Don't tell me, I don't want to
know* Looking at that again...
Tliis did congest.
* “ “ right through this area
]1 ue shoun with the dashed line.
Й This neier congested.
But if I had this as a first breakout fron
a prior day's congestion, it uould be OK.
Bui it is OK to
the first entry.
take a flag breakout fur
Let me show what I mean.
it's best to wan
patiently for tlic tightest
>1
Sometimes
congestions to occur. Tight and flat are the best.
They save a lot of care and worry.
1Г tins, or another congestion area.
Most have seen therm
or herej fren prior days
had been
□ver herej
theei it uould
have been OK to
take the break-
4
л
tian despite the flag.

<— They look like this,
4

к rl-1^	/	л-
l d ^’ф> r	(— or this,
<— or even this.
1 loue these.
I have learned to spot these.
they are worth a lot of money.
Now then, everything I'vo been showing for the most part has been in
uptrending markets. Can I help it if everything was going up when I wrote
this?
The exact opposite is true for ciowntrending markets. To see how they
look, more or less, just turn the pages upside down. The flags may be
pointing to the left instead of the right, but they still convey the idea. Up
market, down market, it's all the same. That's one of the reasons tor trading
futures, right? Up, down, it doesn't manor. I can earn my living in either
one.
Now that I’ve shown how to trade continuation sets, I can go on to the
next subject, which is really an old subject revisited — trading strategy and
tactics.
10 6
Chapter 17
Slnilcgy and Tactics
I've shown my plan. The plan represents my strategy in the markets.
Strategy is Hie way I've planned and directed my trading operation. I've
planned to take profits at certain levels. I’ve planned to cover my costs, Tve
planned to lot my third contract-set run. l‘vc planned how and where I will
take continuation trades. I've directed my broker through the orders I've
placed.
Tactics, on the other hand, is the way I have marshaled arid
maneuvered my trades in and around congestion areas. Tactics is placing
myself in the best position in the markets to take advantage of price
movement as seen through momentum.
Tactics are seen in the methods I used to enter my orders, place my
stops, lake rny profits, etc.
The dictionary says that Strategy is the science of planning and
directing, whereas Tactics is lhe science of arranging and maneuvering.
Continuation Trading
I've shown how and when I wilt take a continuation trade on a five
minute chart. I will take a breakout of the next congestion after the first
breakout which constituted my initial entry, There must be at least ал hour of
trading left in order tor me to do this. I will take a breakout of a subsequent
congestion if there is sufficient time to do so. The sum of the matter is that 1
will enter a market no more than three limes in a single day — in a single
direction.
There are a couple of additional criteria I use for coniinuabon trades:
Normally I will take a continuation trade only when my third
contract’Set is in the black and has not been taken out by a fifty percent
retracement.
The best continuation trades come from pointy Ross hooks. If a
hook is made which lends to have a flat top, then du not expect the
continuation to go as far as it will if lhe Ross hook has a sharp point to it as it
forms.
Reversal Trading
Is there a time to reverse direction? Yes, there is.. Sometimes a market
will make an outside day tt might take out yesterday's high, and then turn
right around and take out yesterday's low. The outside day may he so large
from top to bonom as to take out the highs and lows of several days. I
watch for this when [here is feverish activity m Hie markets.
The rules for changing direction arc identical with the rules for trading
one way: I lake a breakout of the longest, tightest, and/or best ctmgestion
that occurred prior to lhe extreme.
107
I might be Fong early in the day, and then sometime later I might find
myself short. I may even have time to enter the market three additional times
in the opposite direction from my original trade.
I'm notjalking about reversing a bad trade here, that v/ill come later.
What I m talking about is flexibility in my planning. What I'm getting at is
having a mind-set that realizes that such (lungs can occur, and a plan that
allows for such evciiluafuics. When there is an outside day, I will nut change
my tactics. 1 still enter and exit as before, but my strategy has laid out for rne
what to do rn such a situation.
103
Gaps
How do I handle gc±ps? If prices gap past my entry congestion, I let my
trade go by. QUT IF prices trade back into my congestion, then I take a
breakout the same as I originally planned. Here’s what I look for:
A gap opening fat hued
by a retraceneni to
yesterday's trading range
before yesterday's high,
followed Ьу поге congestion
today, and then д breakout.
1 take this kind of trade.
Note that prices must again congest at or about the same level as they
did on a previous day. The previous matching congestion could have taken
place up io three days ago-
There is cnc other way I will trade after a gap open. Ii is if prices gap
open, then retrace through a prior trading range, and then breakout in die
direction of the open.
ft gap opening, a rally back through prior congestion,
then a breakout of that congestion hi the direction of
the open.
Now, what do I tie about false breakouts? I'll show that last chan
again.
1 no
1Г Гп stopped
<- cul here,
ftssuno >-
that I
had taken
a breakout
of the Iou
shown at
the dotted
Hue.
<  I qo back
hi when
pr ices
break
through
аул in -
First Break Versus Second Break
The second attempt at entry shown above brings up another point I
need Jo bring (jut about rriy trading. What I'm about to show is a matter of
CliOlCC.
There is a mure conservative way io trade these breakouts of
congestion that, take place prior to the actual breakout which is based upon
the entry signa!. I’d better make dial more clear.
I may be about to take з trade that is based upon a breakout of the
congestion l anticipate wid be a breakout that will fulfill the requirements of
one of my entry signals. For instance, a market may be just about ready to
take out the high of a trading range. I am looking for a congestion just prior
to such a breakout. Up until now I've shown my technique as being that I
take the Г1П5Т breakout of the congestion prior to the actual breakout of an
intermediate or major entry signal.
However, a more conservative approach is to take a second breakout of
the congestion. By doing so, a lol of good trades will be missed. But also, a
lot of shorter term knl-backs will be missed. I’ll illustrate what 11rn talking
about on trie next page. In part it is a matter of perception.
no
CL
5 MINUTE
3510
3495
3400
3465
3450
3435
34Z0
3405
3300
3375
3360
3345
3330
3315
3300
3Z05
3270
3255
3Z40
Sell 2nd 3225
breakout.3210
3105
ij	3180
j	3165
3150
3135
Notice, the second time through has to take out the low of the first
time through.
0л the foreshortened il removed some of Hie price bars in the middle)
crude oil chart I’ve shown, prices congested around the low of the previous
dsy at point Л, and then congested there again after the open on the day
shown at point B. When prices broke through the congestion lows at 3260, a
short position would have made costs on the first contract-set, and another
ten points or so for the second conuacbseh Then a rally back would have
taken out the break-even stop at 3260 and the trade would have been oven
That is what actually happened the way I traded it.
However, had I waited for the second breakout shown at point C, the
results would have been more spectacular for die third contract-set, even
though the entry would have been at a lower point, around 3240. Sometimes
tiiere is no rally back and the trade is entirely missed. Bui when (here is a
rafly back, and then a second penetration of the congestion area, die chances
are higher for making profits.
Trading lhe second breakout is pan and parcel of rny minor entry
signal, and so the last example was a perfect lead in for the next topic.
But before we get fully into if. I've just got to show this absolutely
picture perfect trade .1 made in gold the day Ггп writing this.
GC 5 Н1ШТЕ
Congest ion at
yesterday's low.
gap open.
Here's the
brcakuti t.
<-
This is the kind
1 live for?
3800
3B75
3B70
3065
3B60
3B55
3050
3045
3040
3035
3030
3825
3820
3B15
3810
3805
ЭВО0
37%
3750
3785
3780
3775
3770
3765
3760
3755
Ildllltii !,I|J-| ,1.1 r.
Il
112
Chapter 18
[radin« the Minor Entry Signal
-r	b—•
The last time I really mentioned the minor entry signal was clear 1к-к:к in
Chapter 5. Let пи; repeat the signal, and then I can go on to show how to
trade it. It is not my favorite trade. I would rather take any major or
intermediate signal ahead of it.
Minor Entry Signals
My ruirior entry signal is as follows and is optional:
A breakout of the first trading congestion to form on the chart after pic
opening, This may include a congestion carryover from the previous day.
There is a matter of choice here — I can take either the first or the
second breakout of this congestion. The second breakout is trie more
conservative of the two methods, but as with a higher priority signal, die
second breakout, while safer, often results in missing the entire move.
I have a tendency to take the first breakout if the congestmfi proves to
be very long and meandering in length. Otherwise, I prefur a secund
breakout.
The first breakout often cfoes not have much thrust behind it, unless it
is a continuation carryover from the previous day.
When the first congestion is coincident with a more major signal, then
It is traded as such. Otherwise, it is traded on its own merit. Just such a
congestion occurred in gold the very next morning subsequent to the beautiful
gold trade shown in the chart above, Hcrcrs the way it looked.
113
GC S MINUTE
3BB0
3B?5
GiId gapped up at the open and
then uent into 1 trading range *
I'm uniting for a definite trend
to form. Either prices иi11 drift
down and then breakthrough to the
upside or they will drift up and
tlwn breakthrough to the downside J840
3835
3830
3BZ5
3GZ0
3815
3010
3B0S
3BOO
3795
3790
3785
3780
3775
3770
37G5
3760
3755
3B70
38&5
3B60
3855
385G
3845
I have mo opinion here, I
will let the market shau
ne uhat it's going to do.
Open ->
f
+

я
As is plainly evident, nothing has happened yet. There is merely a
congestion taking place. It Is not the congestion nearest to the low, because
that one is below the present one. At this point, I don't have a clue as to
which way, if any, it will break out. It may just meander along sideways fur
the rest ol the day. Г11 show it later on so that what actually happened will
bo evident. But, looking at it right now, it is not very tradable, What I would
hope for is a gradual climb upward, followed by a reversal breakthrough ol the
lows. Whether it will happen that way remains to be seen. As a prophet I
have tended to be a false one. As far as my actual trading goes, I would
probably pass tins one up and go looking for better situations.
1Ы
GC 5 MINUTE
As the dfty progresses, yr ices
are drifting up - beginnng to
trend. The drift is gradual
and indecisive.
If prices would thrust down
through this norningJs
congestion, I would be
tenytcd to enter a trade.
3BM
3860
ЭВ56
3B52
3848
3814
3840
3836
3832
3BZ8
3824
3826
3016
3812
ЗВОЭ
3804
3800
37%
3792
3700
3784
3780
3776
3772
3768
3764
As can be seen, nothing much has happened. I’m looking for thrust
and haven't scan it yet.
GO 5 HIHUTE
Гп still looking Гог a sharp thrust.
1Г the Market would plunge through
3792, the place where iiJs really tight
at the beginning nF trading, I
m ight go for it.	(Ь
i
] uouM have ta be cautious
because J’d be t nidi ng right
support. For that reason, Td
leave this trade alone unless
I
into
best
it criss-crosses the congest ion and
then breaks out to the upside .
3064
3060
3056
3B52
3040
3044
3040
3036
3032
3028
3B24
30Z0
3016
3012
3008
3004
3000
3706
3792
3708
3704
3700
3776
3772
3768
3764
I 1 I I I I i I I 1 1 ।., I I I M ... I HI
10	11	12
10
This trade might have had possibilities had it drifted down first and
then taken out the congestion to the upside. A breakout to the downside
would cause me to trade or.lv 0 it wok out the extreme lows of the
congestion that is the one closest to yesterday’s lows.
116
GC 5 MINUTE
A1ir there's the anticipated
downside breakout.
The breakout comes late in the day too late to expect much out of the
trade. I did гни take this breakout because it was too close to support.
ЗВЫ
ЗВ6Ф
3B%
3BS2
3818
3B41
3810
383b
3B3Z
3GZG
3824
3820
3816
3812
3800
3004
3800
37%
3792
3708.
3704
3700
3776
3772
3700
3764
117
5 MINUTE

fa
J
J?
L4
Here's where prices
brake out.
J
3037
3034
Tlie breakout
to the upside
сале too late
in the day to
be of any
va lue *
r
I

%.
>
No gold trade today. But let's look al what happened the next day.
3B31
3BZO
3BZ5
3BZZ
3B19
3B16
3B13
3B10
ЭВО7
3BD4
3B01
3730
3795
379Z
3789
3786
3783
3780
3777
3774
3771
3760
3765
3762
118
GC 5 fl [HUTE
It took another dau, but it Finally
happened.
3825
38ZZ
3813
3816
3813
3810
3807
3804
3801
3738
3795
3792
3789
3786
3783
3780
3777
3771
3771
3760
3765
376Z
3759
3756
3753
3750
Let me explain what happened.
Early in the morning, I noticed that rny data feed was not working. The
signal indicator was showing that any signal received was kind and clear. But
there was sonic kind of transmission problem and so there was no signal.
The market opened at 7:20 up a few points. Lower than what is
shown on the chart. The data Iced started coming in at 7:56, so I was
missing 7 bars on the chart. I checked with my broker and he said that the
market had traded up slightly since the open.
Soon after, the market started its plunge, I placed a sol! stop order
exactly whore I would have the previous day, just under that little tight area
shown in pie hox. The rest is seif explanatory. The market didn't run, but I
made prof its on all three contract sets.
119
Chapter 19
Trading Logic
I
There is a definite logic and reasoning behind the way I trade. I'll	*
explain it in this chapter. Perhaps by knowing why I do what I do, it will be	;
possible to emulate what it is I'm doing,	!
At the very outset of this book, I mentioned that the most fundamental	;
concept that would be shown is how to recognize what a chart looks like just	j
prior to an important breakout. In the next chapter, lfm going to show	j
numerous examples of that as a sort of review of the trading method I've	'
been reaching so far. But first let rne explain what I think is happening in the
market, and my rationale for doing what I do.
Pivots
Because I do not have the advantages of trading on the floor, I am
forced to compensate for the disadvantages of trading from a live data feed. I
mentioned this in an early chapter of this book.
I noted I could not utilize the same pivot points that were used on the
floor because of the time delay my trading must incur as opposed to the true
real-time trading that takes place in the pit.
Now here is my version of what is happening — this is whai I visualize
is taking place on lhe fluor.
When 1 see groupings of opens, closes, highs, and lows, all in the same
place, at the same price level give or lake a rick or two, I feel lhat these are
the natural support/resislanco points down on the floor. I call them pivots.
However, as stated earlier, I cannot trade these because prices can move
significantly away from these levels from the time 1 react to what I see, to the
time my order is able to reach the floor.
Here is what those congestions look like.
L
Just look at all tlie Opens, closes, hicfhs and lous clustered
at the leucls shqun by Lbe arrows.
120
When these events lake place near one of my entry signal points, I feel
that one of two things is about to happen:
1	. The floor will drive prices to lhe extreme, and then slop
there, hi oilier words, prices will test a high or low signa! point,
2	. The floor will drive prices to the extreme and them the public
will drive them past lhe extreme. In other words, there will be a breakout of a
signal point,
My technique is io straddle these congestions. When puces scan to
move, I wifi lose the points the floor traders can make between the center of
the congestion and the outer limits ch the congestion. I have to give these to
lhe flour due to (lie rime delay I am faced with.
If rhe floor drives prices up to the extreme and no further, I can expect
io make a small prolit on distance between the outer liruils of the congesiion
arid lhe extreme that constitutes lhe entry signal.
What happens at the extreme determines any additional p r ut itab i I it у in
the trade. It's important to follow closely what I’m about to say,
There must be at least seven to ten licks between the breakout of the
congestion and lhe extreme for this concept to work.
At (he breakout of lhe congestion, I wilt typically enter with three
cm H ram -sets. As soon as I sec $70 to $100 gain cm the trade, I call in rny
order to liquidate one or two contract-sets. Al times, I have a resting Ml I
order at the $70 to $ 100 level.
In the situation where 1 liquidate two contract-seis, I have covered my
costs and have earned a small profit. I immediately move rny stop to pull lhe
third contract-set to breakeven.
At lhe breakout of what constituted the entry signed, I will make money
as lhe public comes into the trade.
Recalling that what constitutes an entry signal is a significant event on
the daily chart, there is a reasonable expectation that al the breakout of a
trading range, a 1-2 3 high or low, a Ross hook, a ledge, the highest high or
lowest low of lhe last three days, yesterday’s high or low. etc., there will be
ал entry inio die market by the public — daily traders, and dnytraders. Their
entry into the market will drive prices further in the direct on of [he trade in
which I am already positioned. Their entry will give me profits on some of rny
contracts, provided I’m still in the trade and have not been slopped out of my
third contract-set when I protect it at breakeven.
There will be □ significant number of times I will be stopped out at
breakeven on the third contract set. That is not a problem, f don't have to
hit a home run every lime I step up to the plate. I will st least have covered
my costs and made a small profit. I will be alive, and ready io try again at a
later time.
121
When I see another $70 to $100 of profits on my third contract-set, I
will move my protective slop to lock in fifty percent of my unrealized paper
profits. Most times, this stop will be taken out soon after placement. I am
happy with this situation. I do not fret over what I could've made had I
stayed in, or kept my stop further back.
Several times a month, prices will take off and never look back. That is
when the market will hand me a fat profit. When that happens, I trail my
stop, either according to an offset moving average that shows containment,
or by placing it just outside of natural support or resistance points.
I consider continuation trades at well defined Ross hooks or ledges, but
I always bear in mind that additional contracts entail additional risk.
Continuation contracts always carry the risk of my losing everything I've
already worked so hard 10 earn.
When the public enters the trade, I have achieved the same advantage
over the daily trader as the floor trader has over me. By trading the breakout
of the trading range that occurs just prior 10 the breakout of the extreme (my
entry signal), I have in effect faded the daily trader. I end up selling when ho
is buying, or buying when he is selling. If the entry of daily traders is of
sufficient magnitude to drive prices strongly in the direction of the trade, 1 hen
my third contract-sei will reap large profits.
122
Chapter 20
I am trading the breakout of congestion prior to one of my entry
signals. What spectlically am I looking for? What do those congestions look
like? The answer wilt result in many successful trading opportunities, Watch
carefully.
A market gaps and looks like This:
Open
<
>
I*
s'
1
Ll
<- Okay tu buy here.
Vesierday's high
This is the intraday signal
Breakout — )
Open
Optional high risk
continuation add-on.
f------Buy
I

1 2 3
This is the intraday signal
Open
This type of entry is valid on any najor or internediate signal-
Today's open ->
<“ buy a Lreakcjiil of
yesterday's high.
Note retracenerrt to yesterday's
congestion. There were not
enough ticks available between
the congestion and the high
to warrant an entry prior to a
breakout of the high.
124
High risk add-ons are first tine
breakouts of the IllLjl!
of tuo days ago,
or yesterday's high..
High
tuo
days ago . ->
Ves(erday's
h i<jh.
Znd tine
through is
<- Buy a breakout
of this congest ion ,
These types of entries
are valid on any major
or intermediate signals.
II igli
tuD
days ago.
Buy a breakout L
of yesterday’s n
h igh
,C- Yesterday's
! high.
1st ->
tine.
d
i;;
-2nd time
,is bettor.
lI
'This loner set of price bars yields a mtch better trading situation
for add on contracts.
12 5
This is one of the best trades I can make: A wide congestion followed bya
pop, followed by a narrow congestion. This type of signal is valid on any major
or intermediate entry signal.
U ide
congest ion ->
Yesterday's low ->
РОГ ->
Vil
Marгои
congest ion
L Sell
Optional sell _>
at the breakout
□Г yesterday's
low.
It wouldn't have nade any difference as to the direction of the POP. It could
have looked like th is -
U ide -> / \ / \
/

I*
J
/

L
X
ГОР
/
।
/
Sell the breakout of
the narrower congestion
virea, with an optional sell
\ at a breakout of the low
X
4
126
Ноге fs л summary of pattorns:
A yep above yesterday's high, but below one or more of [fie past three
days' htglis:
/\ЛЛ/\/*ЛЛ
Day 1
/NO TRADE! Because,
Today's . / retracement
nvpn ->/v into prior congestion.
Yesterday’s high ->/vVV*/VV
Dag 3
A gap, retглсспепt through congestion, and then a breakout of the highs.
AAA/V\A
л	/	TRADE a BREAKOUT
/VVSAAAZ	0F THE HIGH
Day 3
‘ V\A“ БцУ
Day 4
This Market traced
back to the niddie
ar through the
prior congestion.
127
A gapj a retraccnent through the congestion nearest yesterday's lou, and
a breakout of the Gungestion. An entry could also be nade ал a take-out
of yesterday's low following the breakout of the congestion nearest the Idw.
Yesterday's low
Sell breakout
nearest
yesterday's low.
A gap, a retracement to the highs of the congestion nearest yesterday's high.
Then 3 congestion today, and a breakout of today's congestion which is closer to
yesterday's high than whs yesterday's congestion. Trade the breakout of the
higher congestion if the two congestions are equal in size from top to bottom.
Otherwise trade the breakout of the tighter congestion.
Breakout □£
congestion
nearest
yesterday's
hijfk.
Day 1
Uhem prices open at a hew high aboue the last three days'.
Gap open to a neu high far the last three days,
No retracement to any prior congest ion of the
last three dags> HD TRADE!
Gap open to a new hiyh for the last three days.
RctractTient to middle or botton if any prior
congestion of the last three days, OK TO TRADE?
/Gap open to a new high for the last three days.
/ Retracement through any congestion qf the last
\	/ three days with subsequent breakout back in the
/\АЛ^\ \ / direction of the gap opening, OK TO TRADE *
V
ta
Gap tipcTi to now high far the last three days,
Retracement to niddlc, hot ton, or through any
congestion of the past three days. This fol lowed
by a congestion of equal height today. TRADE A
BREAKOUT OF THE HIGHER OF THE TWO CONGESTIONS’
On the reverse tif all these uhen going short,
129
1Г a congestion is right at a pre и ions h igrh or low, there must be л retracement
to at least the middle of the congestion before trading the breakout.
<- Hug
Breakout of yesterday's congestion at the high.
Sometimes the congestion nearest yesterdays high
comes today.
Often, there
is no gap.
I uant a trade through the congestion area
no matter which side it is on relatiue to today's open.
-Sell the breakout of the congestion and
4 optionally sell a breakout of the leu .
If the congestions are equal from top to
bottom, trade a breakout cf the one nearest
I
the extreme.
1? the congestions are unequal from
top to bottom, trade a breakout of
the t ightest one.
Base on Ease
I
When there are two congestions of approximately equal size from top
to bottom, we want lo trade a breakout oi the higher one when going lang,
and a breakout of the lower one when going short. This will allow us to avoid	!
trading into an overhead resistance or underlying support area. However, if	1
(here are sufficient ticks separating the two congestion areas, it is OK to enter
buy or sefl orders with the anticipation of exiting when prices reach the
second congestion area.
13 0
Chapter 21
Finding (he [’rend
hi finding the trend, I will begin with a theme. This chapter shows one
way to find a trend in its infancy — just as it's being born. As the book
progresses, Г11 show variations of this theme, and build upon it. The
variations exist in how I count the bars. The variations are either more or less
conservative. I have started with what is the most conservative method here
in this chapter using the S&P. I will end, several chapters from now, with
what is the least conservative method, again, using a five miriuie SStP. The
difference yields fewer (most conservative) or more (least conservative)
trades. What I show will lead step by step into segment counting.
Take a good look al the chart on this page.
SF 5 MINUTE
Wouldn't it have been fabulous to have caught such a nice trend in the
S&P? It’s really easy to look back at [hat trend and say, "I could
have made lots of money on that move.” Rends arc the easiest >
thing in the world to spot when yot/rc looking back at. them. But
is there a way to spot them sooner? How could],	?|
anyone have gotten into such a move early, M	F u
maybe even ahead of everyone else?	j IL	I JI it
There is a way, and I will show it on the
following pages,	4
b
h

г
I can show what I mean.
First, let me turn away all but (he
parts that we need to look at.
33100
33050
33000
38950
38900
Э8В50
38800
38750
38700
38650
Э8600
38550
Э8500
38456
38406
38350
38300
38250
38ZG0
38150
38100
30050
38006
37950
1 2 389 10 11 12 1 2 389 10 11 12 1 2 389 10 11
I
iz""l "’"z.3
37906
37056
1 31
SP 5 MINUTE
I'll begin with some very Simple rules: I must see throe bars in a row
of higher highs. When I see that, I will attempt to buy a breakout >
of the third high. If I cannot gut in and the market corrects alter 1
the three! bar, that third bar will constitute the point of a
Ross hook, and I will go long if and when it is taken out.
My initial stop will be placed below the low of the last
correction, and then will be brought up to just below the
latest correction. I will cover rny costs as soon as I have
four ticks in the trade.
: 1

J
As you can see, I was long as prices took
the high of the third successive bar of
higher highs. I was long as shown at
the
out
! Г
buy" arrow.
1
-J
i
I

Buy
<— Slap here
1
388Z5
38800
38275
38750
- 38725
38700
38575
38650
30625
38600
38575
30550
38525
38500
30475
38450
38425
30400
38375
38350
38325
30300
38Z75
38250
38225
38200
13 2
SP 5 MINUTE
Notice that almost as soon as 1 got in, I was able to cover costs with. four
licks us the S&P. Al that point, I was trading "free" of costs, Thu j‘
very next bar saw the start cl a two bar correction that did not take if
out rny stop. If the correction would have been as many as Sour
bars. I would have, if uijt already stopped out, exited rny	d ।
long position arid entered the market on the short side. I	i]
consider Hie louri.lt bar of new extremes in any direction L I y1
to by the start of a new trend.	г к’Д-
Day

3E3B2S
3EB00
38775
38750
38725
38700
30875
38850
386Z5
38600
38575
38550
3B5Z5
38500
38475
38450
38425
38400
38375
38350
3B3Z5
38300
38275
38250
38225
38200
3 8 9
10
SP 5 ШЛИТЕ
Once I have established э four bar upward trend, I now consider any
move to the downside as being a correction. When I am experiencing
a correction, I attempt to enter at the breakout of lhe extreme of
the correcting bar. In this case, I would be trying to buy a	if ‘
breakout of the high of the first correction bar to the downside. -H
Fading an entry at a breakout of the high of the first
correction bar, I would try to buy a breakout ol lhe high
of lhe next correction bar. In this case I was filled at
a breakout of the high of lhe second bar ol correction.
I've shown this buy point with th<* arrow It came on
the bar following lhe second bar of correction. When
filled
I moved all stops
as indicated on the chart.

1	1	!	I	I
I । I : I I I । I I I !	,	I .	. i . |	|	.	!	i [
11	12	1	2	3 8 0	10	11	12
30825
38m
38775
38750
38725
38700
38675
38650
386Z5
30600
30575
30550
38525
38500
38475
38450
38425
38400
38375
30350
38325
38300
38275
38250
38225
38200
134
SP 5 MINUTE
I did not buy thn next correction. In all honesty I foil that the trade was -----
gelling too risky. The market looked mighty toppy. At the lime the next к1п/л
correction was made (a one bar correction] what 1 was looking at was as 38800
shown on this chart. As can be seen, prices were still in a trading range, 38775
and although I was riot risking a great deal of money, this was not the mcst^?c-^
awe inspiring chart I have ever seen. I fell it was better to wait for further
developments. What I was hoping for was a good breakout ot the trading 387Z5
range I was in. However,
as the uptrend was intact.
was determined to stay with rny trades as long 38700
38G75
Buy
Buy
<— All
stofls
i	l; \ I I .
3	I I I
10	11	12
38650
38&Z5
386G0
38575
38550
38525
38500
38175
38450
38425
38400
38375
38350
38325
38300
38275
30250
38225
38200
135
SP 5 MINUTE
Suddenly, S&P began to move. It made Hires nice size bars up
resulting in a breakout of the trading range as it closed out the
third bar up. I was now looking for a retracement. Most of the
time, when prices take out 3 trading range, there will be some
son of retracement, I was determined to not miss rny chance to
add to my position, I began trying to buy breakouts ot the
htghs of the correcting bars. I was filled as shown. As
soon as I covered costs, I moved all stops as shown. I. J.

1
—fillej
4
3

L
L
Г
i
г
Г‘ J
38825
38800
38775
30750
38725
3B7S0
3B675
38650
38625
3B600
38575
3055a
30525
38500
38475
38450
38425
30400
38375
30350
30325
3B3G0
38275
38250
38225
38200
11
12
a
io
11
12
136
SP 5 MIKUTE
until
I've shown where I added to my position and where 1 trailed rny stop
my
final exit laic
in
the day.
Guy
Buy
i
11
1Z
Buy
38825
IrK-Buy 38B00
:	38775
, 17[l'ere38750
<- here
38725
38700
38675
38650
38625
38600
<—then here
(^7 and here
tu here
here
Stops
weiit
i-
30550
33525
3EJ500
33175
38450
38425
38400
38375
38350
38325
33300
38275
38250
38Z25
38ZOO
id
J
12
Here arc same clarifications. If a bar makes a new high and also a new
low (an outsule bar}, I do not consider il to be a correction bar unless the
close is below the previous bar's low (the opposite would be true in an upside
correction io a down market!. If a bar is an inside bar, 1 du not consider it to
be a correction bar. Later, I'll point it out, when doing the segment count an
inside bar will be considered a correction. For now, it is not.
137
There ere several points la be made about the series at trades I've just
shown, The first is that I "slaved in the water" until the trend developed to
the point where money could be mode. I also lost money on my last entry
This is part of trading. I have no way of knowing when the trade is over until
1 get stopped out. Ths very same principles would have applied had this been
a daily chart, or a sixty minute chart, or a fifteen minute chart. I intentionally
did not trade any Ross hooks an the series of trades for the purposes of
simplicity. I intentionally did not use an offset moving average to define the
trend. I inteniionaJly ignored all reversal bars (open high—close low in ari up
market and open low close high in a down marked in this series of trades.
The concepts left out here are adequately covered in Trading by the Book and
in my teaching letter Traders Notebook.
Any or ail of the things I left out could have made this series of trades
even more profitable. In the chapters that follow, I wall move out to charts of
a larger time-frame. I will also show different combinations of techniques in
the way I traded them at the times shown in the illustrations.
I have no way of knowing how others feel about trading in various
markets. I know that some prefer to trade in only one or two markets, while
others follow as many as thirty or forty markets. I am one of those who
follow about twenty markets, watch twelve, and actively trade in about eight
to twelve depending on where the action is.
My personal preference is for variety I like to browse through the
various markets daily and intraday and choose those I feel show the most
promise. Sometimes I gel "hung-up" on trading a particular market and will
stay with it until it becomes dul and uninteresting, or I just tire of trading it.
I also like to trade in differing time frames for the sake of variety. I
have been very fortunate in being successful in developing a number of ways
of trading, so I don't have to do the same things ail the time. I don’t believe I
could have lassed as long as I have as a trader without having had the variety
of trading that has been able io hold my interest.
I am aware that some systems traders trade as many as a half dozen
mechanical systems. Perhaps it is done to achieve variety. Trading can be
pretty hum-drum if you trade the same markets in the same ways all the time.
I am also an advocate of periodically trading a "mono-technique." This
is pretty much what I have done in the S&B illustration in this chapter. By
trading only one basic method, I am able to prove to myself that the method
still works, and am able to compare the results with how wrell the method
worked in the past. This enables me to fine tune my meihods, and to discard
or temporarily lay aside those that are not working as well as I might like. I
have gone so far as to trade one method for one entire year just so I could
fine tune it to current market action.
By having variety, I'm able to enjoy trading. If something doesn't seem
to be working as well as I might like. I'm able to switch. 8y combining mono-
techniques, I have been aide to come up with enough excitement lo hold my
interest over the years.
138
Chapter 22
Fifteen Минне Trading
In this chapter I will introduce what has become known as a doji. Also
I will also be showing a way to find the trend using a simple count, and
showing how I compute average volatility. The emphasis in this chapter is on
the simple count to identify the trend, and on how to use average volatility.
One of my favorite, easy-to-trade commodities is bean oil. I call it the
"little S&P/' because on the daily charts, it trends very much like the five
minute S&P chart. Often, when I have had a rough time in the markets, I will
turn to my old friend bean oik Somehow it helps me lo regain my
perspective, It's the commodity I cut my teeth on. When I trade bean oik I
always, go back io the most basic fundamentals of trading.
I diligently follow the trend. I carefully count the bars going in one
direction. I am very mindful of rising bottoms and falling tops even when the
market seems to be going nowhere.
Bean oil is a market in which I can be braver than I am in most other
markets. It is an old ally, and somehow trading it puts everything back the
way it's supposed io be. Too often, I neglect it to go alter bigger game.
Sooner or later I return for comfort and confidence. If the day ever comes
where I fail in the bean oil, that is the day I will quit trading forever,
Bean oil is a low risk trade in most instances. If you are just starting to
daytrade, and don't want to risk a lot of money, it is an excellent vehicle for
initiation into daytrading. Even with the worst execution/turnaround, almost
anyone can trade a fifteen minute bean oil chart. Another point of interest
about the bean oil is that, except under the most volatile circumstances such
as a drought, I can stay in overnight without great fear of a horrible opening
gap. If I am at all concerned about volatility, I can spread the risk off against
Soy Meal overnight, and then drop the weak end of the spread when I see the
market commit itself one way or the other.
na 15 MINUTE
2055
2052
2045
Z04h
Z043
2040
203?
ZD34
Z031
ZOZO
20Z5
ZOZZ
2015
Z016
2013
Z010
2007
2004
2001
15 JU
1555
1 J'JZ
IJU'J
1 39
What I want to show here is a typical series of trades in bean oil.
Nothing spectacular just the normal way I make money by trading.
Sometimes I win, sometimes I lose. Sometimes I don't make all that much.
Perhaps if I show the "reality" of trading as I actually do it, my readers will
gain the correct perspective on their own trading.
This scries of trades began at a time when I needed my old friend. The
first fifteen minute bur is shown by the arrow. From that po ut unlif the bar at
which I've shown the next arrow, I never was able to count three consecutive
new highs, or three consecutive new lows. I've boxed off that entire area as
shown on the chart above.
At next day, J got short a ten tot after three consecutive new tows. At
the fourth bar, I sold the breakout of the low of lhe third bar. My slop was
ten ticks away, the typical amount Tm wili ng to risk on a Hade. My entry
price was 2C23.
As can be seen, the bar at which I went short was a reversal bar [lower
open, higher close). The market went almost immediately against me closing
one tick above the high of the previous bar. I can now begin to count a
correction. Irve numbered that as bar 1 of the correction. Then follow two
additional correcting bars,
1
1
4
2055
2052
2045
2046
Z043
2040
2037
Z034
2031
2028
2025
2022
2015
2016
2013
2010
2007
2004
2001
1990
1935
1592
1505
1586
1583
140
When it became apparent that the third bar of correction was going to
rnaierialize, J called in a order to exit my short position and enter a long
position at a breakout of the high of the third bar. I covered my short at 2033
and simultaneously went long a twenty lot [Point B). As prices climbed to a
high of 2055, I was able to cover all costs and move rny stop to a position of
protecting prolits. It’s important at this point to have a brief discussion about
costs. They can make a huge difference in the ouitmmu of trading
Let's look at three different situations. Those arc extremely important,
because anyone who wants to be a day t rad с r must realize (he ctn (sequences
ol what they are about to do.
$6 Per Pound Turn
Paying $G a round turn per contract as I do at the СЕЮТ, on that last
series of trades, trading first a ten lot and then a twenty lot in the hean cel,
my costs were $180. Add to that the ten points per contract I lost on the
trade before reversing, and I would have had a total loss plus costs of $780
going into my reversing long position. In order to cover all direct costs of the
two trades, I would need io earn $180. In other words, J need thirty points
on one of my contracts to cover costs. Looking at the bean oil I can sec that
that's more points than average volatility has been yrelding in the bean oil.
TO COMPUTE AVERAGE CURRENT VOLATILITY I TAKE THE SUM OF
THE DIFFERENCES BETWEEN THE HIGH AND THE LOW OF THE LATEST
FIVE PRICE BARS AND DIVIDE BY FIVE. In this case, including the bar on
which I went long, average volatility is a fraction over five. In other words,
on an average, bean oil price bars are moving five points from top io bottom.
At times, I use average volatility to sot both my stop loss and my cost
covering liquidation paint. If average volatility is greater than the amount I’m
willing to risk, I either don't trade at all, or 1 drop it in favor of a ten point stop
loss, and perhaps an even smaller cost liquidation stop. Conversely, if
average volatility is so low that it would require more than half my position
just to cover costs, I do not enter a trade. In these cases. I’ve used it as a
tiltcr.
That means that if 1 want a reasonable chance to cover cosis on this
trade, I will have to cash six of my twenty contracis when I see five points of
gain in lhe bean od (6x5x6). I must place that order in the market MIT and
risk a little slippage, or I can cash seven of my twenty contracts al five points
MIT to make up for the slippage I rnighi get.
I chose to cash seven contracts, in the hopes I would al least cover
costs on this trade and the previous trade. As it turned out, by the time
prices reached their high at 2055, I had 22 points in lhe trade. I was able to
cash seven contracts at 2039. Instead of slippage, I picked up one point of
windfall profits. As soon as prices had moved safely ahead, I pulled my stops
to breakeven, and when prices topped out at 2055, I moved my stops up to
protect eleven points (50%) of profit in the trade. I was stopped out there at
2044 on the price bar following the one that reached 2055.
That gave rue thirteen contracts at eleven paints of profit per contract
for a total of 143 points of profit. Thai translates to $858 in profits. 1 had to
subtract $600 from that which left me $258 for the entire series. I can add
to [hat my windfall profit of $4 2 (or a grand total of $300 in profits.
$15 Per Round Turn
Now. let’s look at what would have happened on Riis scries of trades if
I had to pay costs of $ 1 5 per round turn.
Instead of having costs of $180 at the time? of reversing my position, 1
would have had to adsorb $450 in costs for the trade. In order to do that, I
would need a total of severrty-five points in order io break even. That means
1 would have hail to liquidate fifteen contracts at five points (average
volatility) each in order to cover my costs.
Thai would leave me only five contracts with which to cover the $600
in losses I had incurred, I would have to get twenty points apiece on (hose
five contracts to break even on the trade.
That was okay this time because the trade made twenty-two points
beyond my entry point. Allowing for possible slippage, I would have had tn
place my order to liquidate those five contracts at 2054 MIT. I probably
would have been able to get 2053, 2054, or even 2055. But I would have
been very lucky to hove broken even or even luckier to make a couple of
bucks on the trade.
$25 Per Round Turn
At $25 per round turn, there was no way to have made a profit on this
series of trades utilizing the money management scheme I've been showing.
The best I could do would be to mitigate my losses. At $25, I would have
been facing a staggering $750 in costs, plus the $600 in losses from my
failed short position.
That doesn't mean ail would have been lost. It only means that rny
money management scheme would have to be a lot different.
Please recall there were twenty-two points of profit available in the
trade. With a twenty contract position, that means that at its best point,
there was $2640 profit available in the trade. With total costs and losses of
$1350, I still could have almost doubled my money by staying long the entire
twenty contracts and exiting at the point where 1 had twenty-two points.
Obviously, that is not very likely, nor is it commensurate with human
nature. 1 had no way of knowing where the top would be. Once I had
twenty-two points, why wouldn't I be looking for twenty-five, or thirty
points?
If I were an absolutely brilliant trader I would possibly have exited on
the close of tine price bar that made the high. But I'm nut that good. The
best I can see I would have clone were ! holding all twenty contracts, would
be to have gotten out at the close of the bar following that. Until I saw that
the bar was not going to make a new high, I would have stayed in the trade
continuing to live in hope. That next price bar closed at 2041. Realistically,
 tie very best I could have gotten from ifie trade would have been $960 in the
plus column against a total of $1350 in the minus column.
142
Another possibility would have been to use a different fiber for entering
lids trade. Certainly, I would have needed to see a great deal more volatility
before being able to enter □ trade Perhaps I would have needed to use an
entirely different method such as taking a major entry signal from the daily
chart.
What's the point of ah this? Am I trying to keep people from
daytrading? The answer is no! It's simply that so many daytraders and
would-be dayiraders call me up and tell rue they arc paying anywhere from
$25 - $G5 per round turn. Then they tell me they are losing in the markets.
Is it any wonder? How can anyone trade a five minute or even a fifteen
minute chart and hope to make money paying that kind of overhead? It
simply doesn't compute. Yet, invariably, I am told by these callers that they
are trading on crie minute charts, three minute charts, five minute charts, six
minute charts, ten minute charts, twelve minute charts, etc.,, etc., ad
ridiculum,..
When I ask them if they are calling straight to the floor, the answer is
"no" or ”1 don't know."
It is simply impossible to compete in the very short time frames with
that kind of overhead, and with the kind of execution that even [he host
broker in the world can give when there arc so many desks that have to be
gone through for Hie trade to reach the fluor.
Traders who subject themselves to such turnaround and overhead are
doomed to frustration and failure.
If a person insists an trading the short lime frames, then a way must be
found to call directly to the floor, and a way must be found to trade at a low
price per round turn. For now. let's got on with the bean oil trading.
143
My next entry opportunity came when I was able to enter a ten lot
short on breakout of a third successive new low. I've shown [he count on
the chart. I was filled at the open of the fourth 15 minute bar at a price of
2041. My initial protective stop was al 2051. Prices dropped sharply and
fast.
I covered costs based on an average volatility of three. To do that, I
liquidated four of my ten contracts. As prices moved further ahead quickly. I
moved my stops to breakeven. When prices continued downward. I began to
protect one-half of my unrealized paper profits in the trade.
BO 15 MINUTE
I 1111 d I I I 1 Ы 111J I JI h IJ11 !
2 05!)
2055
2052
2049
204b
2043
2040
2037
2034
Z031
2028
2025
2022
2019
201&
2013
2010
2007
Z004
2001
1998
1995
1992
l‘JU9
1900
1983
14 4
As expected after such a sharp move, prices corrected. I began io try
selling a breakout of the low of each correction bar. I was filled on a ten lot
at 2004 as shown by the arrow as prices took out (he low of the second bar
at the correction. I placed ail stops at 2014.
BO 15 HlHUTE
205П
2055
Z05Z
Z015
2045
Z043
2040
2037
zo:m
2031
ZOZB
Z0Z5
ZOZZ
2О1Э
Z0I5
2013
Z010
Z007
2004
2001
1590
1595
I'J'JZ
1LJB9
19U0
rJUJ
My average volaiitipy figure was now eleven. That meant liquidating
one contract to cover costs at a price of 1994. That price was hit, but not
before the next correction.
14 5
As prices corrected again, I began to try selling a breakout of lhe
correction bar lows. I was filled short on a ten lot at 1993. I placed
protective stops for this lot at 2008, and moved all other stops to 2004, My
average volatility for this entry was six. Thai meant I would need to liquidate
2 contracts at 1993 in order to cover costs for this latest ten lot.
uu is HJMUTE
Z0SI.1
2055
zo^z
ZO19
Z04G
2043
Z04G
203?
2034
2031
2020
2025
2022
Z015
Z0J6
2013
Z010
2007
2004
2001
1Э0П
1555
155Z
19B5
1506
1503
The very next price bar enabled me to caver costs on all outstanding
contracts as prices ticked down to a local low of 1988. I pulled all stops to
1998, thereby protecting profits and ensuring I would do no worse than break
even on rny latest trade. I was now carrying six contracts from my original
trade, nine contracts from lhe second trade, and eight contracts from my last
trade.
It's at this point I need to introduce a formation that has always been
very important to rue. Although I never before had a name for it, since the
introduction of Candlestick. trading I have come (o call it a doji,
A doji occurs whenever the open and close of a price bar are equal, or
very close to being equal. It doesn't matter where on the price bar die
equality occurs, Il can happen at or close tn the high,, at or close to the low,
or anywhere in between. The main thing is that a doji has meaning. It is part
of the way a market talks. My job is to listen. A doji strongly indicates a
change at direction may be imminent, A doji interrupts a trend by showing
hesitation. The market is not sure which way to go.
I've marked die doji on the next chart with the letter ’’d" beneath it.
My usual reaction to a doji is to move my slops just beyond the extreme.
14 6
That meant I moved ail stops to 1995 as soon as the doji was
completed. Also, because the doji failed to make a new low, I attempted to
sell a breakout of the low in case the trend continued.
i subsequently tried to sell a breakout of each successive low for the
next two price bars. Моле of these resulted in a fill.
BO 15 tllHLJIE
ZQ50
ZD55
Z05Z
2049
2016
20-13
Z04O
2037
2034
2031
2020
2025
2022
2010
2016
2013
2010
2007
2004
Z001
1398
1995
1992
1909
1906
19B3
147
I was then stopped out at 1995. I had made three points on eight
contracts, nine points on nine contracts, and forty-six points on six contracts,
for a total of 381 points. Having already covered all my costs, my net profit ‘
was $2,296.	¥
The chart below shows where I got out at 1995, I then attempted to
reenter the market at various times, but was never able to trade a breakout
after three successive new highs or lows.
no 15 MINUTE
205П
2055
2052
2049
2046
2043
2040
2037
2034
2031
20ZB
2C3Z5
2022
Z019
2016
2013
2010
2007
2004
2001
1990
1995
19lJZ
191FJ
19ПЬ
19R3
I've just shown a very simple and basic way to trade. The main feature
of this method is the counting of three successive new highs or tows so I can
trade a breakout of the extreme of the third in the succession. I’ve shown
how a money management plan is absolutely critical to my trading. 1 must
have the correct money management scheme to go with the time frame in
which I am trading, the amount of commission l‘m paying, and the market
volatility in which I'm trading. This is just one of many successful ways to
trade. It’s simply a matter of realizing how to fit the various parts together.
From here on, dojis will become important in all the trading I show. I
will also show what I call a reversal bar. Reversal bars are nor the same as
what others call a "key11 reversal. While all key reversals may be reversal
bars, all reversal bars are not "key" reversals. The reversal bars I will show
are different. They are a somewhat stronger in meaning than a doji, but they
cause me to do essentially the some things
Before leaving this page, notice the 1-2-3 markings, In the next
chapter, I will show how to count segments in order to'obtain additional
Opportunities.
ГII be showing (hem in conjunction with trading a thirty mirnrie chart.
However, they work just as well on a one minute chart. or a one month chart
The truth is always (he truth. The only difference is in the adaptation of
money, risk, and hade management.
When this next series of trades is complete, along with the dojis and
reversal bars, it might be profitable to go back over Ehu trades on the S&P
500 arid the bean oil trades Eu sec how differently they might came out.
1 would also suggest going back over all trades shown so fag based
upon other commission rates. It is vital.у important to work out □ viable plan
for taking profits and setting stops based upon the reality of the overheat/
coses that each individual might he facing. Although I will show some
combinations as the book goes along, it is impossible to cover every
commission and cost structure that readers may be Jiving with. Obviously the
more a person has to pay in overhead, the greater the time frame that will
have to be traded, and the further away [he stops will have to be in order for
line trade to develop profitably.
149
Chapter 23
The Reversal Bar and Others
It's time now to look at some thirty minute intraday trading. I really
want to tear into this chart, because it is vital to show how to dissect market
anatomy. There will be some valuable lessons discussed as I go through the
next series of trades.
This chapter will dEilve into a thirty minute corn chart. The lessons can
be applied to virtually any time frame. I traded this series in corn especially
for (his book. I usually do not trade corn day in and day out. I chose corn
because if it can be traded profitably at $25 per round turn, anything can.
C 30 tllNUTE
I'll start with a down move of two successive days into what
subsequently becomes a congestion area. How сап 1 know that this is a
congestion area?
There am a number of ways, and this is a goad time to point out. at least two
qf thrm
2540
2534
2530
2524
2520
2514
2510
2504
250G
2494
2490
2484
2480
2474
2470
2464
2460
2454
2450
2444
2440
2434
2430
2424
2420
2414
First, I’ll count the swings. Two swings, consisting of four fogs, always
constitute congestion. They look like this: ДЛ or W. I marked them on the
chan. In this cast?, there were three swings during the congestion.
Here's another wonderful way to know when a market is in congestion. It
utilizes the concept of a senes of reversal bars, a series of dojis or a combination
of both.
What I waich for looks like this:
b
5-
I
150
Now, ГН show that corn chart again. "Take a close look at Lhe
congestion area on this page.
C JQ ill HIKE
ZS4G
Z534
Notice the alternation of “open high-close low", "open low-close high” bars ,
during the congestion period. Intermixed, bui more often near cither extreme of O,?
the congestion area, are dojis. [
Z5Z0
Z514
Z510
Z504
Z500
Е4Э4
2490
2101
Z4B0
Z474
Z470
2464
2 4 GO
2454
2450
Z444
Z140
Z434
Z43O
Z424
2420
Z414
i f -i i i i < ь i з i i i a i i i i f г i i i i i . г i i j i । i i । । j । i -i г i i i i g । и I -i I I i к I I -J ( । 4 |	|| | J | p । | | ! | I I t I I 9 I nil
3	10	16	17	?.O Z1 ZZ Z.) Z4 ZL 23	30	31	10
Equally as important as knowing when a market is in congestion, is
knowing when it is about to break cut of congestion and begin trending.
Anyone can look back and see that a market has trended, or is now in □
trend. But it's a lot harder to spot when a market is going to start trending.
I’ve already shown how the beginning of a trend can be surmised by
respectively buying or selling the breakout of the extreme of a third
successive higher high, or a third successive lower low.
However, a close look at the earn chart on this page will quickly reveal
that no such oppurlunity occurred in corn.
How then can it be known thai corn was about to break out? How
could a person have entered this corn market before everyone else by spotting
the very beginning of the trend that took out the congestion to (lie upside?
Markets speak. To those who chart, they speak a graphic language, I
have made it my life’s work to be able to understand what the markets are
telling me. By learning to understand the way a market speaks, I can belter
communicate and get in step with (he market. 1 have learned to patiently and
carefully listen to the markets. Lei me show how to read lhe graphic
language that corn was speaking at a couple of very important junctures in
lhe market. The next topic leads into it.
Using Average Volatility for a Stop Loss
The reader should notice that in the corn trades that follow 1 have
switched from using an absolute stop loss to using average volatility as a stop
loss. The question is, when do you do this?
The only way in which I can answer this question is contained in the
following discussion.
The placement of slops is a most difficult matter. There are many
things to consider when placing them. The size of the trading account must
certainly be involved. So, too, must be the number of positions already in
effect, and their currant status; are those positions ahead or behind?
Also needing to be addressed are, how fast is the market, and what is
the current tick size? Both should properly be taken into account in setting a
stop.
How fast is the trader, and what kind of turnaround can he expect from
his broker? Although the trader may be lightening fast in his reactions ю the
market, the broker may not be, and vice-versa. Certainty turn-around time
must be taken into account when setting intraday stops. The market
continues to move regardless of how fast the trader and his broker may be.
Another major factor in setting stops is comfort level. If the trader is
uncomfortable with the stop, either because it is too close to, or too far from
the price action, then the stop will probably not be effective.
What I've dune here with average volatility used to set stops is to show
a way that the market can dictate the scop placement. This is simply another
concept apart from the way most traders set stops based on sortie
percentage, fixed number of points, or a set amount of money away from
entry.
The concept is not new. There are programs that calculate what is
known as the "volatility stop11 study. Typically this is used as a reversal
system, but I suspect i(*s similar enough in nature to what I've done that it
could be used for setting the stops using my trading methods. One
discussion lrve seen states that the volatility figure is added to the lowest
close while short, and subtracted from the highest close while long. This
would differ from my own work mainly in that I add or subtract the volatility
from the entry point as opposed to the close. One other difference is that the
"volatility stop'1 uses a multiplier constant to heighten the effect of volatility.
I believe that the "volatility stop" would be perfectly adequate for
trading the methods I've shown and will show in this book. If used, I would
set its parameters at 5,1, The number 5 would be the number of bars for
which to compute volatility, and the number 1 would replace the multiplier
constant usually used with the volatility stop study which is typically 2.8 or
3,1.
Ar times “volatility stop" may place the stop further away than average
volatility measured from the entry. At other times, it may place the stop
closer since It is computed from a previous bar's close.
152
Sagging Tops and Rising Bottoms
c :io MINUTE
The upper arrow shows three successive sagging tops. The lower arrow
shows the bar on which I went s icrt a ten lot, at 246.50. My protective slop
was at 247.50
Illi I н 1111 [llIEI II
Il I H > I И , U 11 11 I:. i I I I I И I
/ио
Zli.’M
Z530
2‘TM
2520
ZS14
2510
2504
2500
24*J4
24*J0
Z4IJ4
24 BO
2474
Z470
Z4M
Z4f*0
Z-154
Z450
2444
2440
2434
24 30
2424
Z4Z0
2414
g to 16	1?	20	21	22	23	24	28	28	30	31	10
The overage volatility for the last five price bars is 1/10. I must choose
either 1.25 or 1.00 as my factor for covering costs. Since 1.10 is closer io
1.00. I chose 1.00.
I know that most of the people reading this book are paying more in
commissions and costs than I dor so I chose a figure of $25 for commissions
and costs in order to demonstrate the way I handled the trade. 1 entered this
trade with diat in mind. No one calling his own shuts in the market should
ever pay more than that. Anyone paying more than that should not be
daytradtng at all.
If I’m looking at $25 a round turn. I must cover costs of $250 for this
trade.
To be absolutely safe in covering costs. I must liquidate six of my
contracts at 245.50. Al that point, I will place my stop at breakeven. I
placed an order in the market to buy six contracts at 245.50 MIT. About
seventy minutes of trading later, I was stopped out on my MIT. Il was the
last trading bar of the day.
Notice that with sagging lops, it is not necessary for new lows to occur
as it was wher^ 1 showed the S&P in chapter 21. Each tower high counts one.
Three successive lower highs yields an entry signal when the low of the bar
that made (tic third lower high is taken out. The reverse of all this is true for
counting rising bottoms.
153
The following day, the market opened higher. Tested the lows, and then
began to move up. I moved my stop to the previous bar’s high and was
slopped out of all contracts at 245,25. My score was $50 earned from the
six contracts I had liquidated earlier, plus another $50 I earned on the quarter
point I made on the remaining four contracts. Whenever I don't lose on a
trade, i feel that I've had a victory in the market. I hate to lose, and so I use
tight stops, and take profits when the market is willing to give them to me.
Later that dayr 1 tried again to enter the market. The next chart shows
an attempt that failed. The important thing is to realize how it is that I try to
pick up the trend while still risking relative у UtHe on the trade.
c 30 hINUTE
I tried to sell a
breakout of this low
2540
2534
2530
2524
2520
2514
2510
2504
2500
2104
2450
2404
240G
2474
2470
Z464
2460
2454
2450
2444
Z440
2431
2130
2421
Z4Z0
Z111
t
With sagging lops, I'm looking for three successive lower highs. If I find
them, I will sell a breakout of the low of the bar that made the third successive
lower high.
The opposite of sagging tops are rising bottoms. И I were to go long, I would
buy the high of the bar that made the third successive higher low. That situation
might look like this.
it could also look like this.
Even though a lower low was
made, the buy would take
place.
<- Buy
However, none ol the techniques I've previously shown would have solved
the next problem I faced with corn.
Segment Counting
С1И.ЗО niriUTE
Years ago. when I first started trading, I discovered a technique that has
stood me well throughout my trading career. It involves connecting corrections
and double bars.
Take a close look at how I've connected the lows on the chart.
11 I 1111111' I [ 11111 1111.. 111111  1111111 h 11 'hid hul 1111111
5	10	16	17	20	71	7.7. Z3 24
i siliil lи.Jiili।и11 ilLdi
ZfJ Z‘J 30	31	10
Z54Q
zsai
Z530
zszi
2520
2514
2510
2504
Z5O0
2494
2490
2404
Z400
2474
2470
2464
2460
2454
2450
2444
2440
2434
2430
2424
2420
2414
I’ve connected a low to a second low.
to a correction low, and the correction low to
I've connected the second low
a double low.
15 5
I will buy a breakout of (he high of the bar whose Sow made the third
segment.
This technique will work in any market, in any time frame, so long as
you are seeing something that has well formed patterns. IN interrupt the corn
trading for now to give an idea of (he type of chart that docs not make well
formed tradable [mt terns for the met hods I use. All of the following charts
have formations that arc too FLAT, too BOXY, or too SKETCHY
US 5 niHUTE
96Z0
9G1U
9G1G
9(iH
9b 12
jbl (J
9600
У GOG
9GCM
Эбог
5 GOO
9530
95ZB
95Z6
9524
9SZZ
5520
Э51Й
9Ы6
5514
55 12
-J510
У5ОИ
JUOG
9504
9502
C 5 HINUTE
Z4I3Z
Z-lltO
247G
2474
247Z
2470
24 Gb
24G4
Z4GZ
24G0
Z45G
Z-154
2452
2450
Z44G
2444
244Z
24 40
Z4JG
24 34
2432
Z430
Z42G
2424
15 6
JU Ъ HIMUTE
LZ'HO
1ZSZO
12 SOO
ШНО
12460
121 10
12 120
12400
123110
12360
1Z3H0
12320
12300
12ZD0
1 2260
122-10
12220
12200
1Z1U0
12100
12140
12 120
12100
120U0
12060
12040
li?ZS
U7Z0
U715
U710
(1705
H70O
0695
OG‘JO
U6US
fjfrfiO
HG7S
8070
BfiGS
8000
П055
H8S0
ПОЛ 5
0640
Ut/JS
£1630
UbZJj
8620
U01S
Ш110
0605
(1600
157
ilG 5 MINUTE
J'J 15
9ГИ15
9070
9055
9U4Q
9CJZ5
9010
9795
Ч7ПО
9765
9750
9735
97ZCJ
9705
9690
9675
9660
9G45
9G30
9615
5600
9505
9570
9555
954 0
П 5 M1HUTE
* JL
1 >. .1 1
NO
,l[
9
I i 11i 11 11  11 II r11111 I If। 11
lOIlll'J 11ГЛ0
I,,III,
11
Ю 13. iz
1390
13Z4
1JZO
1314
1310
130-1
1300
1Z34
1290
1Ш
1200
1274
1270
1264
1260
1254
1250
1244
1210
1234
1230
1224
1ZZO
1214
1210
1204
Now 1 can continue with the corn trading. Most of the grains need
thirty minute or greater charts to see tradable formations. The same is true of
the foodstuffs. The mierest rate contracts need 60-120 minutes to give
decent formations.
158
The time frame to choose is the one in which you car; see well formed
tradable patterns. When a market becomes fast or volatile, a shorter time
frame can generally be used. When a market is slow and non-volatile, a
longer time frame should be used.
I wanted to get long я ten lot in corn based upon a breakout of the high
of the price bar whose low completed the third segment I had drawn on the
chart. I computed the average volatility while I waited for my opportunity.
The figure came out to .61, which is closer to ,50 than it is to 75. That
meant in order Io cover costs, I v/ould have to liquidate all of my contracts as
soon as I saw SO of movement in my direction. I had a real dilemma on my
hands. I would need twice the average volatility in order to cover costs with
five contracts.
This was a problem I usually don't have to face. But with commissions
and costs of $25, it was very real. The only thing I could see that might
convince me to go ahead and try was that prices had made a breakout of an
intraday trading range. They had taken out a minor triple top, and if they
would take out the high it would constitute a take out of the double high of
the last two bars. II they did that, the move might be explosive and give me
the amount needed to make my goal. Here’s what I was looking at when I
had to make my decision.
C JO rtlHUTE
2510
2534
2530
2524
2520
Z5L4
Z510
2504
2500
2494
2490
2484
Z480
Z1T1
2470
2464
2460
2454
2450
2441
2440
2434
Z430
2421
2420
2411
l| I Ini ill 11 Illi lull. I Ihull И I I I I I I I I I I I I I III! Illll l-M.! 4 1J
9	10	1 fl 17	20	21	22	23	24	28	29
I bull I ,.||
30	31	10
I decided to go ahead and give it □ try. Be aware that Гт doing here
what I said might have io be done when reviewing the various cost structures
I showed in relation to bean oil. Гт entering a trade, not based upon the
segment count alone, but because of lhe other things that corn prices are
doing in conjunction with the count. This is where judgment enters into
trading. Otherwise, 1 would bo a robot trading a mechanical system.
159
As prices broke out, I went long 0 теп lot. My entry price was 248.50,
I placed my slop at 247.50. Average volatility was .61, so I could count only 2510
on .50 to cover costs. That meant liquidating one-half my position at 249.50
in order to cover costs.
C 30 HtNUTE
2524
2520
2514
2510
Z504
2500
P.494
24У0
24П4
Z4U0
2474
2470
2464
2460
2454
2450
2444
Z440
2434
2430
2424
2420
2414
И II III 111 I II Jill liIJ|, rill.J 171 Ilf l.r I 11 r 111
**	10	17	20 Z1 22 Z3 24 ZB 23	30	31	10
Once in the trade, I began to be sorry I had taken the chance. The
close of my entry bar turned out to be a reversal bar. It was 1 P.M., there
would be only one more bar. ! was visualizing a losing day In corn. Boy, was
I ever wrong. The last fifteen minutes were the most exciting of the entire
day. I don’t know what happened, but someone put a rockef under corn and
it look off. Since prices coincidentally had taken out the highest high of the	!
last three days, I decided io hold overnight,
I covered costs with a five lot at 249,50. By the dose, I was
protecting 50% of my profits in the trade.
The next day, when prices mode a reversal bar, ! moved my siojj to just
below the low of that bar. The next bar was encouraging, and the following
bar prices went even higher. That turned out to be the high. The next bar
was a reversal bar and I pulled all stops to 251.00. I was stopped out there	;
two bars later.	;
The results of the trade looked like this: Five contracts had been used
to cover costs. Five contracts were liquidated at a profit ar 251,00 for a gain
of 5125 each. Total profits were $625.00.
Two other points concerning this chart need explanation: Why didn't I
start my count at point tta,4 and why did I not enter the market at a breakout
of the doji bar that formed point "b?"
i
Actually, I did start counting at point '’a," but the market went into	I
congestion by definition of reversing bars that made the double low at "a."
followed by a doji, a reversing bar, and then two dojis.
160
I
A trade was not entered at point ”b," because J fell it was more
important to enter when I saw prices clear the congestion area than to simply
trade the count by rote.
Now, it was lime to go to work again.
As prices retreated from the high of the day, I began to count and
connect the diminishing highs. I also tried to buy breakouts of the highs as
prices were correcting, but no new highs were made.
C 'JO MINUTE
Z'HO
Z5.34
2530
2524
zbzo
Z514
Z510
2504
2560
2494
Z4'J0
г-ии
Z4fl0
2474
2470
Z464
2460
Z454
Z450
Z444
zd-io
Z434
2430
2424
Z4Z0
24 14
I was tilted (S} on a ten lot as shown at 250, on the Iasi bar of the day.
Average vulaulity was 3/4 of a poini. I was willing to turn this (mile into an
overnight position if necessary. My goal for every daytradc is to turn it into a
position trade when I can. I'll go into more of that later in this chapter.
However, since the trade did not meet my criteria for conversion to a position
trade, I decided to gel out on a MIT if prices reached my cost covering
liquidation point. I placed an order ю liquidate the emiie position at 249 1/4
MIT. I watched the trade closely because if prices ware to fail to reach 249
1/4, 1 would make sure to be out by the close. I got out of five contracts at
249. and the remainder at 249 1/4.
The dealin1 was done, now it was lime to count my money for tin?
trades entered this day,
I cashed five contracts at 249 for a gain of $500, and ton contracts at
249 1/4 for a gain of $375 dollars. Total gross gain was $375. I had costs
of $250, leaving me with a net profit of $625. Now, it was time for me to
plan my trades for the following day.
1.61
С 30 ГПШТЕ
2540
2534
2530
2524
2520
2514
2510
Z5O4
Z500
24Э4
Z4*5O
24(14
гл во
2474
2470
2464
2460
Z454
2450
2444
2440
2434
2430
2424
2420
2414
Corn opened, traded down continuing the momentum of the previous
day. and then closed on the high of the opening bar. That action created a
reversal bar. Prices were correcting against lhe previous down move, so I
tried to sell a breakout of the low of Hie reversal bar. I couldn't get in, but
when the next bar was in place, I entered an order to sell corn on a breakout
of lhe low created by that bar. It was the second bar of the day. I was filled
with a ten lor on the next bar at a price of 249, exactly where I had
liquidated 1/2 my position the day before. Average volatility was 1 1/4
points. I placed a MIT order to liquidate four contracts at 247 3/4 and placed
my stop al 250. The market moved down, but not to where I could liquidate
to cover costs. The lowest it went to was 248 1/4. The price bar that made
the low was a doji, so I moved my stop loss to just above its high at 249 1/4.
I was stopped out there with a loss of $375 including costs. However, the
day was not yet over.
162
с 30 MINUTE
2540
ZS34
2530
Z5Z4
25Z0
2514
Z510
Z504
2500
Z494
24Э0
2404
Z48G
2474
247G
2464
2460
2454
2450
2444
2440
Z434
2430
2424
Z4ZO
2414
As prices corrected from she low, I tried lo sell breakouts of the low of
each succeeding bar. I wanted to place an order to buy a twenty lot at a
breakout of the Ross hook. I began counting die higher lows and then
realized that average volatility was only 3/4 of a point. Thai meant 1 would
have to liquidate fourteen contracts in order to cover costs. Since that was
more than one-half my contemplated entry size, 1 had to forego entry at that
point.
I had no other entry opportunities prior to the close so, once again it
was lime lo tote up the dollars for the day. Sad to say, but 1 was down
$375.
These results were typical of the way I trade with one exception:
When I’m not trading fur my writing, I trade with more contracts. However, it
shows the way Hading is for me. I usually stay with a market until it gives
me a win. I don't expect to win every scrips of trades. I simply try to stay in
the water until a big move comes along. I never know when a big move is
right around lhe corner.
зо тнитт
2540
2534
2530
2524
2520
Z514
2510
2504
2500
2494
2490
Z4B4
Z4B0
2474
2470
2454
2450
2451
2450
2444
2440
2434
2430
2424
2420
2414
As shown above, I was able to get a count of three to go short a
breakout of the low that made the third sagging high. Expectations for profit
were too low — average volatility was between 1/2-3/4 of a point.
That meant I would have to liquidate more than half my position just to
cover costs. I have a rule that if I have to liquidate more than half of my
position to cover costs, I will not take the trade.
The next day afforded an opportunity to explain a concept I adhere to
religiously. I never trade a gap opening on a daily chan where the gap is
outside of the previous day’s trading range. However, I will trade a gap on an
intraday chart after the open, as long as it is inside the daily range of the last
three days.
с за niniJTE
ч So 1 d
<-vul
2520
2Ы4
2510
2504
Z50Q
Z494
Z490
Z4fM
2480
2474
2470
Z-1M
Z4G0
2454
2450
2444
2440
2434
2430
2424
Z420
2414
С [i I? й —
I ! i . n I I 11 I i. * I I ь I 11L
2540
2534
2533
Prices gapped down on the open, but still inside (be trading range of
the Iasi three days. However, prices were threatening to take nut the entry
signal of a breakout of lhe lowest low of the last three days.
I got short a ten lot at 248, which represented a breakout of the lowest
low of the last throe days {LL3D}. Average volatility was 1 point. That meant
I had to liquidate five contracts to cover costs. My stop was 1 point hack al
249. I never had a chance to cover costs as prices traded first down and
then up taking out my stop at 249, I was down $750,
Prices opened the second bar of the day the same as the f'rst bat. If
248 was good lor me to enter the first time, then it was good for me to enter
a second time. I got short a twenty lot ar 248, only this time, (second lime
through), the trade was good.
I covered costs with a new average volatility of 1 1/4. That took eight
contracts. Two bars later, corn made its low for lhe day. When the next bar
turned out lo be a doji, 1 moved my stop to protect 1/2 of the unrealized
paper profits in the trade. I protected 2 1/2 of the 4 3/4 ihat had been made.
I tried to sell the a breakout of the low of the doji bar as well as the low of
lhe day, which was now a Ross hook.
When the next bar took out the high of lhe doji bar, I exited on lhe
close. It was a reversal bar. I got rid of sixteen contracts at 245 lor a gruss
profit of $1,800. From that I. had to subtract the $750 i lost cadier that day.
My not was $1,050.
3 had now traded corn loriy enough to prove a point, Corn can
successfully be traded on a Tbarty minute chan using $25 commissions and
tecs'. Imagine how much belter I can do with much lower direct costs
It is important for every daytrader to attempt to obtain the lowest
possible costs. They turn out to be an enormous factor on a percentage basis
in every claytrade taken.
Similarly, it is vita! that a daytmder solicit and secure the best possible
pxpfuticin times. Io do this, one must know how io place orders properly,
No'brokerace house is go«nq to Im a trader call the floor if that trader has not
mastered ordering. For a discussion of the kinds of orders I typma ly utilize in
my own trading, I suggest reading Trading.J5_а_Визте_зз, available from Tiad-
inq Educators Ltd For a very complete treatment on ordering, I suggest
obtaining Howjo Plr]CE_h3.ding..QHieis, This audio cassette course arid
manual am also available through Trading Educators Ltd, You can call (512?
259-0727 or lax 1512) 259 0747 (or information on how to order or write,
Trading Educators Lid., P.O. Box F-435 27, Freeport,. G.B., Bahamas
16 6
Chapter 24
Turning Day Trades into Position Trades
A very important consideration in my daytrading is the ability to torn a
daytrade into a position trade.
Perhaps I've traded position trades for too lory. 1 simply cannot resist
the temptation to make the conversion.
For years the only way I traded was to position trade. It seems to me
that strictly day trading leaves too much money on the table.
И I have a winning position in a futures contract, why shouldn’t I hold
onto it overnight? Isn't one of the oldest rules of trading to '’hold onto your
winners?"
Over time I have come to have an appreciation for which daytrados turn
into the best position trades.
I attempt to hold onto any daytiade entered as a result of one of my
major entry signals. If I am in a daytradc when a major entry signal occurs, or
enter one because of a major entry signal, I make every attempt to hold that
trade overnight. My major entry signals arc the breakout of a 1-2-3 high or
low, the breakout of a Poss honk, the breakout of a lodge, or the breakout of
a trading range.
There is one intermediate term signal that will cause me to try to hang
onto a trade and convert it into a position trade. That signal is the breakout
of the lowest low or the highest high of the last three days. For purposes of
conversion, that intermediate signal is the same as a major entry signal.
Once the* trade is converted, I maintain it as a position trade. As much
as possible, I monitor and keep an eye on the trade intraday but I do not
trade in and out of it on a daytrading basis, I try to stay in. Therefore, the
only time I will try to hang onto a trade and convert it is if it meets one of the
signals mentioned, and is also in a profitable position at the time I decide to
hold.
167
Although it's not necessary. I also like to see the trade as being tn an
established trend,
That means that ir has had a leg up (or down|, a correction, and then
has taken out a Ross hook,
I like it even better when 1 am in a profitable position that has not been
taken out by the correction as shown below.
Rh

. Profit Slop
not taken nut.
Г like it best when l‘m nursing a profitable position on the first leg and
am aide to add to my position during the correction prior :o the hook's being
taken out. Here's a RULE: A correction can last for only three bars. Beyond
that, 1 consider it the start of a new trend'
Uli
, buy here b/4 the hook.
.,,, Prof it Stop
not taken out.
If I’m holding overnight in a currency, I place a stop in the Forex. If it is
a meiaf, sugar, or cocoa, I place a slop in London. The stops arc placed to
protect profits. If I'm not in a profitable position by the close, I do not hold
overnight even if the contract made an entry signal than would cause rnc to
want this to be a position trade.
It Гт holding overnight in a gram, cr crude <л:г bid also widi metals and
softs, I consider spreading off against a back month to prevent being
surprised by a gap open against me. Of course, I then lose die benefit of any
overnight gap tfiat would have been in rny favor. What I g.vtr up is lhe price
of being able to sleep well.
1 do not hold overnight for bonds or lhe S&P. If I'm trading Eurodollars,
I spread against a back month when Гт staying overnight.
Once conversion has been made to a position trade, 1 hang unto it as
long as I possibly can by placing stops jusl below a curve fitted moving
average, or at nat-ural support points. The longer Гт able to stay in die trade,
die less I look at a irilraday. It the trade lasts past die first coircction on die
daily chait, 1 quit monitoring it intraday. My techniques lor dial are best
explained in Trading by the Book, available from Trading Educators Ltd.
10У
Chapter 25
Sixty Minute Daylrading
I’ve shown how I trade five, fifteen, and thirty minute charts. Next, I'll
show how the same techniques can be used profitably on sixty minute charts.
There is probably nothing more difficult to trade than sugar when it's in
a trading range. It has to be one of the more treacherous contracts around.
What makes it especially difficult to trade is the annoying problem of the bad
ticks that come from the New York exchanges. You’re never quite sure of
where price really is. I did this scries of trades for the purposes of writing this
book, The New York exchanges should be ashamed of the garbage data they
put out. That, coupled with the rotten tilts obtained when trading there, make
trading there all the more difficult, I can only hope some of the powers that
be in New York wfU read this book. In my opinion, one of the best things that
could happen would be for all traders to boycott the New York exchanges
until they gel their act together, To add insult to injury, the fees in New York
are higher than in Chicago both for trading and for live data.
SB 60 MINUTE
Here's how sugar looked when I strirted this series of trades
036
B32
B28
BZ4
020
816
812
808
B04
BOO
786
732
788
781
7B0
776
772
768
761
760
756
752
748
744
SB 60 MINUTE
B36
B32
BZ8
824
BZO
B16
812
808
804
800
7%
792
788
784
7 BO
776
772
768
764
760
756
752
748
744
740
736
IL lil 11 и I 11 11 I  L н i III III : И H II
20 21 22 23 ?A 20 29 30 31 3 4 5 6 7 10 11 12 13
I started out. by connecting the segments going in each direction and
marking the Roms hooks on my chart. Connecting segments is a very
important part of my trading. As I go along, I will be more detailed in my
explanation. Hopefully, by the lime this manual is done, I will have explained
it completely. The first thing to notice is that there is an intervening lower
high between the lirst two highs that I connected. In the case shown above,
I had to connect throe highs to achieve two segments.. There may be more
than one intervening bar between the highs [lows for an uptrend) connected.
An important difference to notice is that I did not have to start out with
three successive lower highs and lower lows. All I need to initiate a trade is
three successively lower lows. For an uptrend, I need three successively
higher highs, each segment created by connecting two not necessarily
successive lows.
171
SB 60 MINUTE
B36
832
L I । I H I I I I I ! I I । I I I II I । 1 I I I I I I I , : I : | | |||	[	|
ZO 21 Z2 Z3 Z4 28 ZD 30 31 3 4 5 6 7 10 11 12 13
821
820
816
BIZ
800
BO4
800
796
792
788
784
780
776
772
768
764
766
756
752
740
744
740
736

Before a definitive trend could be established through either a bar count
or a segment count, prices look out a local high hook and I got tong a ten lot
at 823. Average volatilHy rounded off was 6 ticks. That meant I would have
to cash four contracts to cover costs. I placed a MIT order at B29, and a
protective stop at 817.
The reason I got long where I did was that I wanted to get a jump on
the breakout of the Ross hook located at the highest high on the chart, I
hoped that the public’s entry into the market al that breakout would drive
prices even higher. An entry at 823 offered me seven points to the point of
the Ross hook, sufficient for me to cover costs in case prices topped out
there.
SB 60 MINUTE
i
i i I i । i i i i i i i । । । । i i । i । । । । । । и Li
2021 ZZ 23 24 20 29 30 31 3
illlli ! Hl IHIH
4 5 6 7 10 11 12 13
000
855
850
845
840
835
830
825
820
815
810
805
800
795
790
785
780
775
770
765
760
755
750
745
740
735
I easily made costs and liquidated four contracts with a windfall profit
ol one tick at 830.
Prices moved up to a high of 851. so I moved my stop to protect at
least hall my profits. My profit protection was al 837. Because the breakout
took out the highest high of the last three days, I began to consider holding
the trade overnight as a position trade. By the time the market was ready to
close, I had made up my mind to stay in the trade.
173
SB 60 MIHUTE
I .Illi
И i J И I I I i r I Г I I I Г I I H r J i ! f I Lil I I	I | h | II	I |	| t || ||
Z21 ZZ 23 24 2C 23 30 31 3	4 5	6 7 10	11	1Z 13	14
065
ч B60
BBS
B56
845
BIO
835
B30
8ZS
BZO
815
BIO
80S
800
755
790
TBS
780
775
770
765
750
755
750
745
740
The first bar on the next day brought even greater profits, I moved my
stop to take advantage of that, My stop was now at 844, protecting at least
haJf the unrealized paper profits in the trade.
174
SB 60 MINUTE
Bh
I
10
11
865
ВО
B55
850
845
B40
E35
830
BZ5
829
815
810
805
BOO
795
790
785
780
775
770
765
769
755
750
745
749
13
I
11
The next bar look ou! my stop at 844. I had costs of $250 in the
trade, but had covered those with $63.60 to spare. Add to that the 1276.80
I made on six contracts, and I had a total of $1340.40.
I placed an order to buy a breakout of tire high of the correcting bar.
I considered this bar a correcting bar, because the trend is still in effect
due to fact that there was a breakout of the high of the bar that made the
third segment of the segment count.
Notice that as soon as I get a correction, I begin numbering the
segments of the correction, I also identify the hook.
175
SB 60 MIMUTE
Buy
B65
86G
BSG
845
В4Э
B35
830
B25
62 G
815
BIG
BOS
80G
795
790
785
780
775
77G
765
760
755
75G
745
740
i i 11111 f 11 । j 1111 111111 [ i I
Z122 23 24 ZB 23 30 31 3
II lib I II. Illi Illi
4	5 6 ? 10 11 12 13 И
The next bar didn’t amount to
because it made lhe picture change.
a hilt of beans, yet it was important
When the market talks, I listen,
I now had two segments going down. The market was still correcting.
The new inside bar established a Ross hook ar a breakout of the previous low.
I placed an order to buy a breakout of the high of the inside bar. J also
placed art order to sell a breakout of the Ross hook created by this inside bar.
Some who have seen my style of trading would say I'm an aggressive
trader. They arc correct. When the market is speaking, 1 get very close so I
can hear what it is saying. I want to trap every word. By doing I hat 1 also
trap its moves. As lhe chart shows, I was willing to go with the market in
whichever way it wanted to go. I want to dance with it, I go where ii goes.
SB 60 MINUTE
I was short a ten lot at 839. Average volatility
was 15 points. Thai meant liquidating to cover costs
with two contracts al 824, However, I did not want to
risk 15 points per contract, i feel that 10 points is
enough to risk on a sugar trade. Therefore, J had to
adjust my liquidation price to 10 points as well. At
10 points I would have to liquidate three contracts to
cover costs,
<Sold
I I П I I I f I i ' I I I J I I , I 1 I I I r I I I
Z12.Z 23 24 28 29 90 31	3
4	5 6	7 10 11
865
86G
В5Э
845
840
835
830
825
820
815
BIO
805
800
795
790
785
?B0
775
779
785
760
755
750
745
740
13 И
I placed an order to liquidate three contracts at 829 MIT Prices hit
829 exactly at the low of the price bar on which I got short. I was filled at
830 which covered costs with 52.40 to spare. As the bar closed, I liquidated
lhe remainder of rny position at 834, I had made 5 points per contract on
seven contracts for additional profits of $392. My net profit for the day was
$444.40
I assessed the situation as I planned for tomorrow's trade.
Since this was only the third bar of correction to an uptrend, I would
place an order to buy a breakout of the high if the opportunity presented
itself. I didn't really expect to be filled. Discipline also dictated I try io buy a
breakout of the Floss hook.
177
SD 60 MINUTE
Rh
070
065
860
855
850
845
840
035
B30
025
820
015
010
005
000
735
730
785
780
775
770
765
760
755
750
745
I I I I I I । । t11 I I I i I I I i h 11 I I
ггг гз 24 го гз зо 3i з
4 5	6 7 10 И 12 13 14 17
Г got long a ten lot at 853 as prices took out yesterday's high. I got
iong an additional five lot al 865 as prices also look out the Ross hook. Since
the Ross hook was a breakout of the highest high of the last three days, this
trade was a candidate for holding overnight. Average volatility was far too
great for rnc to use it for either my stop loss or my cost liquidation objective.
Therefore, I used a 10 tick stop for each. Staying overnight meant placing a
stop loss overnight in the London market. It would either be that, or exit the
trade. Time would tell.
Once I was long the ten lot al 853, I covered costs al 863r cashing
three of rny contracts. I moved my stop loss to breakeven at 853.
Next I was filled at 865 on a five lot. I placed my cost liquidation
objective at S75 and my stop loss at 855. I wailed for the next tick.
Perhaps [Ins entry will strongly point out the need for discipline and
poise while trading. I go with the market, wherever il takes me. I refuse lo
prejudge a market or what it will do.
178
SB1U.60 MINUTE
i 	' ;
I 111111 i I I I 11 ill 11 [ I!
1	5 b 7 1G 11 12 13 14 17
B?0
В 65
B6G
055
856
845
846
835
836
825
BZG
015
BIG
805
800
795
79G
785
780
775
77G
765
766
755
756
745
When the price bar closed, and the above price bar opened, I moved my
853 stop to 860 to protect profits on my ten lot. 1 was stopped out there
with a 7 tick profit. My ten lot trade had made $86.00 when I cashed the
first three contracts. The other seven b.ad made $548,40, for a total of
$634.40.
I hi-icf been unable to liquidate arid cover costs on my five lol, and
because this bar closed with a tower high, I decided to move my stop up to
one tick below the low at 856.
179
I was stopped out at 856 on rny five lot. I had lost a little more than
half of my costs, or $629.00, The bar that took me out of the trade was a
reversal bar,
SB 6G HIMUTE
.....Buy 878
r 	865
J j 4	866
ll	850
I	845
840
J	BBS
830
л	r	825
j ' r-Tm ’	BZ0
L-- I’U 1	810
BOS
800
795
790
785
780
775
770
765
760
755
750
ill	745
10 11 12 J 14 17
The close being lower than the open represented a correction, and so I
placed a buy stop above the high of the bar.
18 D
SB 60 MINUTE
I I I I ; I 1 I I 1 [ I : I 1 11 1 J I I I Hl I l I I I ,	.	! . I ;
ZZZ3 24 28 2'J 30 313-1567 10 И 12 13 И 17
I was filiecJ on a ten lot at 869. Average volatihty was still too great,
so I placed my protective stop at 859 and my cost liquidation stop at 879.
As the close neared, I decided to hold overnight with a stop in the London
market. Prices had been making new highs, and I fell it was worthwhile to
stay with the trade.
SB 60 ЛIMUTE
28
29 30 31
10
11 12 13 К 17
18
888
882
876
8?0
064
858
852
846
840
834
828
816
810
804
790
792
786
780
774
760
76Z
756
750
744
738
1
Г
I
h
When the market opened, I canceled my stop in the London market and
later was able lo cover costs with a three lot. I pulled my slop to 877 to
protect approximately half lhe unrealized profit in the trade.
18 2
SB ЬО MINUTE
I
IJ 11 11 ] I 11 11J I 1 I I 1111 I
23 Z4 20 23 30 31 3
II' llhil I I llllllJi I hl
4 5 6 7 10 11 12 13 14 17 IB
When the next bar closed. 1
natch to 878.
inched my profit protecting stop up another
894
888
882
D76
B7G
B64
В 58
852
846
849
834
В 28
816
SIG
804
798
782
7B6
7BO
774
768
762
756
750
744
18 3
SB 66 И INUTE
B94
/’ Fuy BBS
8B2
B76
B70
864
850
B52
046
810
834
Bza
в 16
810
804
788
792
7B6
780
774
768
762
756
750
744
11 г 111 I i fi I I 11 i i (11 I 1 ' ! I I II	JI
23 24 28 29 30 31 3 4 5 6 7 10 11 12
I || 1 Ml
13 14 1? 18
I was stopped out at 878. Since This was a correction bar, I placed a
buy Stop just above the high and got ready for the last bar of the day.
184
SB 60 MINUTE
2324 28 29 30 31
? 10
894
BBQ
BOZ
876
870
B64
850
852
846
B40
834
820
822
016
810
804
798
792
7B6
780
774
768
762
756
750
744
1?
I
I.
10
The Iasi bar of the day was also a correction. I marked my chart as
you sec above. I would wait for lhe open rnmorrow and buy a breakout of
the high of the last bar, and also a breakout of the high of the bar that was
the point of the Flcss hook.
185
S3 60 F1INUTE
RJi
094
888
002
876
870
864
85B
852
846
84G
B34
GZO
616
BIO
004
798
792
786
780
774
760
762
756
750
744
ZZ4
ZB 23 30 31
11
18 19


7 W
h
r
12 13 14
When prices opened above my buy point but were stiff within
Yesterday's price range, 1 decided to enter the market at 875 if given the
chance. That meant I would try to enter if prices traded back up through the
previous bar's high.
I have to admit I was pushing this trade, but I didn’t want to miss
getting in early on a breakout of the Ross hook in the event it rook place.
Average volatility was siiM greater than I was walling to risk on the
trade, so I placed my cost liquidation objective at 875, and my stop loss at
865. Prices went on to a lev; of 868, so I had tu hold my breath for awhile.
186
SD 60 ttlMUTE
B34
BOB
002
B76
B7G
B84
859
852
848
849
834
820
822
816
810
804
790
79Z
706
700
774
760
762
756
750
744
24 ZB Z9 30 31
10
11
12 13 14 1?
IB
19

*
E
к
The next price bar brought vindication as prices moved up and closed at
the high, 1 was able to liquidate three contracts and made $86.00 over costs.
I moved my stop to 881 to protect six points of profit.
1 R7
SB 60 tllhUTE
B94
008
BOZ
876
87G
864
B46
B4G
B34
В 28

816
BIG
730
792
706
200
774
760
762
756
750
744
2428 23 30 31
7 10
11 12 13 14
17 18 19
I was soon filled a
five lot on my Ross
When the next price bar opened,
proved to be (he high of that price bar. I hate
and then prices go immediately against me.
Hook breakout at 890.
when I get filled by one
This
1 ink
Average volatility
along with my other stop.
was
above 10 points, so 1 placed my step al 881,
I was stopped out of both trades at 881. I had lost $250 in costs, and
$504 in points. Offsetting that was S86 from rny first contract set and
$470.40 in profits. My net loss this day was $ 1 77,60. I don't always win.
188
SB СО HINUTE
B94
BBB
BBZ
876
370
664
ВБВ
652
646
B4G
B34
В2Й
BZZ
BIG
GIO
0Q4
780
782
786
780
774
768
762
756
750
744
Z7J1 Z9 30 31	3	4
5 6 7 10 11 1Z 13 14 17 W ’ 18
When the last bar of the day made a corrective doji, I decided to place
a buy stop at the new Ross hook, as wcSI as at the high of the doji bar as
sown as I saw the open.
18.9
SB GO hlNUTE
fill
891
BB8
8BZ
876
870
864
ВБ8
852
BIG
BIO
834
828
822
816
810
804
798
792
786
780
774
760
762
756
750
744
28
29 3G 31
7 10
11 12 13 И 1? IB 19 20
buy - - Л
r
Г

The following day, prices opened lower. I've shown above what my
chart looked like. This was the second bar of correction, I would try to buy
its high and a breakout of the Ross hook.
190
SB 66 MINUTE
28 29 30 31
10 11 12 13
14
17 18 19 20
B94
BBQ
BB2
B76
8?G
864
858
852
846
B4G
B34
B28
B16
BIG
804
790
792
7B6
780
774
768
762
756
756
744
I was filled a ten loi at 879. Average volatility was running
consistently around 12 points. Il was still outside the amount I'm willing to
risk on a sugar trade on the sixty minute chart.
I placed my liquidation objective at 889 and my stop loss at 869.
When this price bar closed lower than it had opened. I placed an order
to exit the trade at the market. Why did I do that? Because I was looking at
{from left I.o right), a reversal bar, a doji, and two consecutive bars that
opened higher than they closed.
mi
SB 60 MINUTE
I I I i I 1 l I. I
2829 30 31
III Illi I I I II
11 1Z 13 11 17 18 IS 20
B94
BBG
B8Z
876
B70
864
858
B5Z
846
840
834
820
B16
810
804
7Э6
732
786
7 BO
774
768
76Z
756
750
744
I was able to liquidate my ten lot al 877 for a loss of two licks per
contract. Add to that toy costs of $250 and I was down on ihis trade by
$474.
As soon as I was out of the trade, I marked my chart as shown above.
Prices were now at a critical juncture. If the high was taken out, I would
assume that the three segments of correction were over. If the low was
taken out, I would assume that a new trend was in effect.
192
SB Б0 MINUTE
I I I 11 I H I
229 30 31 3
B94
BBS
002
876
870
864
B58
652
B46
010
834
828
8ZZ
816
BIO
B04
798
792
786
780
774
760
762
756
750
744
i » i i. i j	i i и i	и :
1 5 Б ? 10 11 12 13 И 1? 10 13 20
The following price han the East of the day, was an inside bar. When it
completed, I marked my chart as shown above. For the reader who is familiar
with my work, and as shown earlier in this book, the above formation also
was a ledge.
In all honesty, I was again pushing for a trade, 1 lend to do that when I
trade for rny writing. This is overtrading, and very aggressive. I'm virtually
forcing myself into the trade by (rapping the market. I want lo emphasize
that such tactics are not necessarily good. Normally I would be looking
elsewhere for much better trading situations. But when I trade for my writing,
and make a commitment to pursue a scries of trades to the bi tier end, I trade
as if this market wore the only market in town. I apologize for mat, and hope
rny readers will realize that such trading is unbalanced and nut surI'icittritty
selective.
193
SB 60 MINUIE
094
000
802
876
G7G
064
050
852
046
040
034
028
022
016
010
004
750
792
706
700
774
768
762
756
750
714
l J in I I11 J I	। I , II.
5 6 7 10 11 12 13 14 17 10 1Э 20 21
I was short a twenty lot on a breakout of the Ross hook. I used a
twenty lot here because I rarely take more than two hits in a row. I play the
probabilities on trades like these. 1 know a lot of statistics experts who would
say that my chances of losing on this trade were the same as for any other
trade. I emphatically do not agree with that kind of thinking. They may be
able to prove it mathematically, but arithmetic doesn't always accurately
describe real life. In this case, I'm dealing with sequential rather than random
probability.
I was filled al 864. I liquidated six contracts at 854 and moved my
stop to protect 7 [joints of profit. I was stopped out of fifteen contracts at
857 and four contracts at 856.
J macle $172 profit when I covered costs, $784 profit on ton contracts,
and $224 on four contracts for a total profit of $1314.-10. I had redeemed
rny previous losses.
Since prices closed back into the congestion area, I decided to place a
sell stop where I had previously placed it. I would short another ten contracts
at 864. This represented a second time through entry al the edge of
congestion.
SB 60 HINUTE
I
2930 31 3 d S 6 7 10 IL 12 13 14 17 18 13 20 21
B94
B80
882
876
870
В 64
B58
B52
B46
big
834
828
8ZZ
816
810
804
738
792
786
780
774
760
762
756
750
744
The following bar saw prices open at 8 65, trade up for awhile, and
then take out the Ross hook. I was tilled with a ten lot at 864. I placed a
buy slop to protect against loss al 874. I covered costs with three contracts
at 854. When the bar closed lower, I moved rny stop loss to protect profits
at 853. That was опекай of the twenty-two points of unrealized profits
showing tn the trade.
1 35
SB 60 М1МВГЕ
111 ii 11 I
Z3G 31 3
4	5 6 7 19
I III lllfl
11 1Z 13 14
1
1? 10 19 Z0 21
894
B88
882
B76
070
864
B50
852
846
840
834
BZB
816
BIO
804
798
792
786
7B0
774
768
76Z
756
750
744
With lhe next bar being a reversal ban I moved my stop to just above
the high, I also placed a sell order just below the low in case the trend
continued.
196
SB Б0 NIHUTE
hull! I il ill I
30 31	3	4 5
di. I , ii hili ih J Hi
6 7 10 11 12 13 14 1? 18
19
20 21
894
888
882
876
870
864
B58
852
846
840
834
828
822
816
810
804
798
792
786
780
774
768
762
756
750
744

I shorted a fave lot at 842 with a step at 849 whsrc the stop was for my ten
lai. Prices dropped down at first, but t was unable to cover costs, When prices
carne back through where the price bar had opened, I cashed all twelve contracts at
lhe market. Amazingly all were fillr?d at the same price — 846.
The results wore a win arid a loss. The seven contracts from earlier made
Eighteen points, or $141 1.20. Add to that the $86.00 1 had made when I covered
coats, and I had at total of $149 7,20
The five lot had costs of $125, Added to that was a four point loss which
resulted in a toss of $224. My lotat loss was $349. Taking that against rny win ot
$1497.20 (eft me with $1148.20.
1 wres now anticipating placing a sell stop below' the low of this outside bar.
Tomorrow would see whether or not il could be dune.
197
SD 60 MIMUTE
Hll' 11 I 111 I i 11 i i I || I
6 7 10 11 12 13 11 17 18 19 Z0 Z1 25
091
888
B82
076
870
061
858
D5Z
816
B1G
831
028
022
816
filO
801
798
792
786
780
771
768
762
756
750
711
The opening bar the next day brought another day ol correction, I
connected the two lows. I also placed an order to soil both a breakout of the
low of the correcting bar and the Ross hook.
198
SB 60 MINUTE
11 II
3031	3
/•
№
sell
B34
BBS
BB2
B?6
B7G
B64
B58
052
846
846
B34
BZ8
BZZ
016
810
804
758
782
706
780
774
768
762
756
75G
744
Sh ,
. * -1 buy
2
I I 1 I	U	I I	И	! I	11 H
4	5	6	7	10	11	12	13	14 17 18	13 Z0	21 25
An inside doji bar was not much help, other than allowing me to
identity a Ross hook and connect a line across the lows of the correction. I
now had two corrective bars, I moved my sell order up to below the little doji
bar and waited for further developments.
193
SB 60 MINUTE
894
BUG
ВБ2
876
В 70
В 64
858
В 52
846
B40
834
BZO
B16
810
B04
790
792
786
788
774
768
762
756
750
744
331	3 1 5 6 7 19 11 12 13 14 17 IB 13 20 21 25
I was long a ten lot at 861 when prices took out the Ross hook.
Average volatility was high enough that 1 used a 10 point stop and a 10 point,
liquidation objective.
2 00
SB 50 hINUTE
4|
J
834
8B0
8B2
B76
B?G
ВБ4
850
B5Z
B46
B40
B34
828
016
□10
B04
798
792
786
7 BO
774
7Б8
762
756
750
744
[ 11 I 11 I hi 111	1111 I I i
31	3	4	5	6	7 10 11 12 13 14 17 18 TJ ZO Z1 25
Neither slop was filled going into the doji closing bar. Just prior to the
close, I decided to spread die trade off against the March contract if only to
give the trade more time. I was down 3 points at the close. It cost me
another $250 to find о id what would happen tomorrow.
The inside doji had made another Floss hook, so I would place a buy
order there, too, if the market didn't go against me overnight.
2 01
ЗВ 60 K1MUTE
894
800
B82
876
87G
864
850
852
846
646
834
828
822
816
810
804
730
792
786
780
774
768
762
756
750
744
। I i н rlllil । .I I r111111[ I II i I
31 3 4 5 6 ? 10 11 12 13 И 1? 18 19 20 21 25 26
Next day, ihe market opened higher moving up to 373 on the opening
bar. f waited on pins and needles while prices traded down and away from
the open. 1 dropped the short side of my spread when prices traded back
through (he open. 1 was able to cover costs tor my ten lot with three
contracts. 1 had a surplus of $86. J moved rny protective stop to breakeven
at 367.
On lhe way to 8 73r the market filled my buy order for a five lot on з
breakout of the Ross hook. I was long at 868. I placed a stop loss at 861
with the stops for the seven contracts I had left from my ten lot. Because
average volatility was up. my cost covering objective was twelve points, or
one contract at 880.
2 02
SB 60 MINUTE
31
19
11 1Z 13 14 17 13 19 20 Z1 25 Z6
B94
BBS
682
В7Й
B?G
864
B52
B46
646
634
816
BIO
604
738
792
786
780
774
768
762
756
750
744
к
1
г
I
Prices pushed higher, I was able to cover costs on my five let, and I
pulled all stops lo 872. Now everything was in a profitable position,
203
SB 60 HIHUTE

I
h ill llliliililll Ii II ililli.iil I III Li I ill! I L i
313 4 5 6 ? 10 11 12 13 14 1? IB 19 20 Z1 25 26
993
896
В 89
BBZ
875
B8S
ВЫ
854
84?
BIO
833
826
819
812
805
758
791
784
777
77G
783
756
719
742
735
?ZB
Prices rose even higher on the next price bar. 1 moved all stops to 878
to protect protits.
20‘1
SB 60 MINUTE
10 11 1Z
11 17 10
I
I
; ' 1 I
19 20 21 25 Z6
900
891
888
882
876
870
861
850
852
816
810
831
820
8Z2
816
010
801
798
792
786
786
771
768
76Z
756
756
With prices making a double юр and a reversal on the Iasi bar of the
day, I exited my entire position one minute before the close at 891.
I feared a gap down opening for the following day, and did not like the
alternatives that were available. A slop in the London market didn’t make
much sense because I wouldn't know exactly where to put it unless I
watched the London opening. That meant getting up in the middle of the
night.
1 didn't ward to spend another $375 for insurr-nice by using a spread
against March. The easiest thing to do was to get out, so I did.
Profits were $3,852.80 based upon one contract making 12 points,
three contracts making 10 points, seven contracts making 30 points, and four
contracts making 23 points. Costs of $625 gave net profit of $3,227.80.
205
SB 60 HlhUTE
3-1 5 6 7 10 11 12 13 14
I	1 I
1? 18 19 20 21 25 26 2?
906
900
894
B8IJ
082
876
870
BG4
850
852
046
840
834
820
822
816
810
804
798
79Z
786
780
774
760
762
756
Although I lost some points on the open, I was glad I had gotten out of
the trade the day before.. Prices plunged all through the day.
I placed a buy stop above the triple top and waited for further
developments.
206
SB 60 MINUTE
900
895
8%
885
880
875
B7G
B65
В 60
850
BIS
840
835
830
BZ5
BZO
B15
BIO
805
BOO
735
790
7B5
7 BO
775
li Hlill.h I I i Hl Hili li1 I ! Il II I
3 1 5 5 7 10 H 12 13 И 17 13 19 20 21 25 Zb Z7
At (he next bar, I placed a sell stop below the Ross hook and a buy
stop above (lie high of the inside bar
207
SB Б0 MINUTE
Il I
6 7 10
,'i I Hi i h Hill i III I li I
11 12 13 14 17 13 13 20 21 25 26 27
900
895
090
885
080
875
B7G
865
866
B55
В 50
815
B40
835
830
820
815
816
805
800
795
790
7B5
780
775
I was short a ten lot ar 876 on a breakout of the Ross hook. My stop
loss was at 886, and my liquidation objective was 866. Prices did not reach
866 on this bar,
208
SB 60 MINUTE
Illi III. | ].
! 5 6 7 10
i ih iiiiJ; ll 11 I! и’ Ll.i 111
11 12 13 В 1? 10 19 20 21 25 2b 27
900
В 35
890
BBS
BBO
B75
870
865
860
855
850
845
BiO
B35
830
825
BZO
815
810
805
800
795
790
785
780
775
Prices did reach my liquidation objective, and I cashed three contracts
io cover costs, I then moved my stop io breakeven. Prices went down pretty
hard, but then began to work their way back up. Shortly after prices reached
their low for the day, I computed what one*haff of the unrealized paper profits
in the trade would be. I moved to save 11 points of the 22 I had made. I
was stopped out just before the close at 865.
2 □ 9
Next morning, sugar opened higher. Prices were now above lhe Ross
hook of the previous day. The open had created another Ross hook as well
By opening above the low made by yesterday's last price bar, I now had two
hooks staring at me. Here’s how things looked shortly after the open:
SB 60 MINUTE


10
12
13
14
17
18
19
27 28
900
895
890
885
880
875
879
865
860
855
850
845
840
835
830
825
02G
815
DIG
805
809
795
790
785
780
775
j
Over the years, I've learned an important lesson, [f an entry signal was
good for profits once, it is good for profits twice.. I have to admit I was a bit
nervous about taking the old Ross hook. I was afraid prices might retrace
after the open just enough to give me a fill and then take olf the wrong way.
But I've learned to trade what I see. not what I think. If that older Ross hook
was good once, then ii ought to be good again. I placed an order to sell a ten
lol if prices broke below.
210
SB ЕЮ HIHUTE

10 11 12 13 И 17 10 19
20 21
28
900
895
890
BB5
880
875
870
ВБ5
ВЕЮ
B55
B50
B45
В 40
В 35
B3G
825
В 20
В15
В16
005
BOO
795
730
785
780
775

Prices broke below the old Ross hook and 1 was filled on a ten lot at
874. И wasn't loo long before rny cost liquidation objective was reached at
864. I cashed three contracts there on a MIT. I ended up being filled at 863,
so 1 got a bonus of one point. Prices kept working thciir way down, so I
moved the stop on seven contracts to breakeven.
211
SB 60 И!MUТЕ
906
095
896
865
886
875
876
В 65
866
850
845
840
В 35
B36
B25
820
815
816
805
BOO
795
790
7B5
7ЕЮ
775
I : Ml i !U Illi	I I H I
4 5 6 7 10 11 12 13 14 17 18 19 20 21 25 26 27 2ft
I was filled on a five lot at 853. As soon as I was filled, prices began
to move up. I quickly moved lhe stop on seven contracts to protect half the
profits I had made. 1 proiecied 11 ticks at a price of 863. The trade called
for me to place the slop on my five lot at 863 as well. I had a cost covering
objective at 843. The hour closed at 862,
212
The next bar opened ar 861, and I had hopes of prices moving even
lower. My expectations were dashed when prices ticked to 3G3. It was iirne
to place an order below the new Ross hook. While I waded tor things to
develop, I toted up the score. I had made eleven points on my entire ten lot
at 863 — first when I covered costs on three contracts at that price, and then
again when I took profits on seven contracts. I had total costs of $250, so
my net profit was $1,232 - $250 = $982,
I had lost $560 on five contracts plus $1 25 in costs, for a to:ai of
$685.
SB
When prices opened and then traded up sharply, I placed a mental sell
stop below the open, li prices were to take out lhe open, they might test the
area of lhe Ross hook which would give me a chance to scalp out a piece of
the market.
GO h INUTE
4
5 6 ? 10 11 12 13 14
900
1	695
।	L	890
/ i	885
.li t ( hl I '	880
LI Ll 	875
I I p	L1	870
,	r i	^Nental 665
о	!	, j	’A, «sell Ю
>	,P	855
T	...sell	B50
P<	Rh	845
;	840
035
830
B25
BZO
В15
810
805
BOO
795
790
785
780
775
i . ’I
II Г1 a I
17 18 19 20 Z1 Z5 Z6 27 ZB
sb 6o mihute
N
 i )	I t ►
111 III1	I I 11	I i I 11 II i I I	i , Il 11 I I 11 I
45 6	7 10	11 12 13	14 17 18	19 Z9 21 25 26	27 ZB
900
ВЭ5
В 9G
8B5
880
B75
870
865
BGO
850
845
B40
835
B30
B25
820
815
BIO
895
BOO
795
790
785
780
775
I was filled on a ten lot at 860 with a liquidation objective of 850 tc
cover costs. The hour closed below my entry, but failed to reach 850. My
stop loss was at 860.
214
The next hour, the last of the day, opened where the previous bar
closed. It stayed in a very tight trading range between 853 and 855 for thirty
minutes, and then proceeded downward, reaching a low of 840 during the
next ten minutes.
On the way, it gave me my cost liquidation objective at 850, and filled
a five tot on a breakout of the Ross hook at 851. By reaching 840, I was also
able to cover costs on the five lot at 84 L I cashed two contracts. At 840
the market looked like this:
SB 60 rilHUTl
I
J

1
10
11
1Z
13
14
1?
18
13
20
27 28
900
095
896
BBS
8B6
B75
B?0
BBS
860
850
B45
840
835
830
825
BZO
815
BIG
895
BOO
795
790
785
780
775
Too laic to do me any good, I realized I could have simply liquidated
fewer contracts, and avoided paying extra commissions.
215
Then, just before the final five minutes of the day, sugar started flying
up, and in a fast market. I barely had time to save my neck. 1 moved all stops
to 851. I was filled on all contracts at 852 as the market roared past my
position and moved all the way up to 872, closing at 868. I could hardly
believe my eyes. ’’What in the world happened?” I wondered.
S3 60 MINUTE
7 10
11
12 13 14 17 18
19
20
900
895
890
BBS
889
BPS
B70
В 65
860
B50
B45
B40
835
830
825
BZO
В15
810
805
800
795
790
705
780
775


2? 28
The day was over, so I started doing my score keeping arithmetic. I
was short a ten lot at 860, had covered costs at 850, and was stopped out at
852. That gave me $710.40 for my ten lot.
On my five lot, I was short at 851, I had covered costs with two
contracts at 841 netting $9£) for the two, and was slopped out at 852 on
three contracts, losing 1 tick apiece. My loss was $33.60, My five lot had
made $65.40 to add to rhe $710,40 I had made on my ten lot.
216
The next day. prices opened lower. 1 placed an order to short a
breakout of rhe Boss hook. When the opening price bar closed, I placed an
order to short a breakout of the correction low.
SB 60 MINUTE
I t i I J i I
5 6 7 10 11
nilllllhllil il illJil'lllihll I
13 14 17 18 13 20 Z1 25 26 27
Z8
9G0
835
890
805
880
875
870
865
860
855
650
845
B40
B35
В 30
825
820
BIS
010
005
800
795
790
785
780
775
Al the close of the second hour of the day. I canceled replaced my
order, and moved it up to short a breakout of that low.
В 60 MIHUTE
5 6
19 11 1Z 13 14 17
I I I II l 1
18 15 20 21 25 26 27 28
DOS
855
830
805
BBO
875
870
865
B60
B55
B50
845
B40
835
030
BZ5
B20
815
B10
BC5
BOO
735
730
785
780
775
218	!
I
The third bar of the day made a higher high and a higher low, closing
on a doji.
SB 60 MINUTE
900
B95
B90
B85
BBG
875
870
865
860
855
850
845
840
835
830
825
820
815
810
805
DOO
795
790
785
780
775
219
is.
The last bar of The day was a small reversal, so I let everything stand as
SB 6S H1NUTE
56 7 10 11 1Z 13 14 17 18 19 ZO 21 25 Z6 27 28 1
990
095
890
BBS
880
075
8?0
865
860
850
B45
B40
835
83Й
BZ5
828
815
BIO
805
BOO
795
790
7B5
780
775
220
The first bar of the day opened just above where the previous day had
closed. It traded up s few (icks in the next ten minutes, and then began to
move down.
I had placed a buy order above the high of yesterday’s closing bar, and
a sell order just underneath the low. The Ross hook was still in effect, so I
had a sell order there, too.
SB 60 MINUTE
'	I 	1
[ j.1 I IJ 111 1111 I Ii .	. i ; I il 11 I I г И
6 7 10 11 12 13 14 17 10 IS 20 Z1 Z5 26 27 28	1	2
300
035
090
885
880
875
870
885
BGO
855
850
845
B-10
835
B30
BZ5
820
815
010
805
800
735
730
785
780
775
Prices took out my sell stop at 851, and I was short a ten lot. My cost
covering objective was 841 MIT I was filled at 842 on a bounce off ttie low
at 841. I pulled my stop to breakeven.
The market then began to move up, but closed below my breakeven
stop.
221
The next hour didn't bring much action, so I left everything in place.
SB BO MINUTE
900
B95
ВЭД
BBS
B80
В 75
B70
BB5
BBO
B50
В15
B40
835
830
825
B20
815
BIO
B05
BOO
755
790
785
780
775
1
The third bar of the
just above its high.
SB BO MINUTE
day was a doji, so 3 brought
protective stop to
t I I I 111 I i 111 I i
6 ? 10 11 12 13 14
I I I I'll
IB 15 ZO 21 25 26
90S
9QG
895
890
BBS
880
B?5
\	879
1 1	BB5
B60
ль' st°P B56
845
B49
1	B35
830
8Z5
8Z0
015
810
895
800
795
790
765
780
11	i I
za i 2
223
The last bar of the day didn't do much, either
close at 843.
got out just before the
SB 60 MINUIT
One hour
rising
connector ->
67 10
ill Ini 11 II h
и iz 13 14 17 ia
19 20 21 25 26 27 28
965
90G
B90
8B5
086
B70
865
860
855
050
045
84G
835
030
8Z5
829
B15
BIO
005
800
795
796
7B5
700
That completed my series of sugar trades on the sixty minute chart.
I hope that, in looking back, my readers will see that this market was
not particularly splendid in its actions. Taken as a whole, other than a one
hour rising connector from one trading range to another, the sugar market
was moving sideways in a trading rangel
lTve marked it off the congestion areas and shown them on the next
page,
224
sn 60 ПINUTE
67 10 11 1Z 13 14 1? IB 19 20 21 Z5 Z6 27 2S 12
I suppose no book on dayUadiriy would be complete unless it included a
full day's trading in the S&P.
I'll show how I do that in the next chapter.
995
900
BOS
B90
BB5
880
875
870
865
860
855
850
845
840
835
B30
825
8Z0
815
810
805
800
795
790
785
780
i
I
225
Chapter 26
SAP Trading
When I trade The S&P. I do it on a five minute chart, There is virtually
no difference in the way I trade lhe S&P on a five птinute chart and the way I
trade, say. bean oil on a daily chart. The only exception is that I will trade a
gap open from one intraday liar to the next on the S&P. and will usually not
do so on a daily ciiari.
But there is an enormous difference in execution. I warn to caution my
readers on a number of things, because I have seen otherwise good traders
destroyed by trading the five minute S&P.
Getting into the S&P is like stepping into the ring with a rattlesnake.
You can be bitten quickly and when you least expect it. The S&P is fast,
volatile, and often does the unexpected.
If I were not trading al very low commissions and receiving excellent
turnaround calling direct to the floor, I would not dare to trade the S&P on a
five minute chart. It is for too dangerous. Besides, I would be competing
directly with CTA's and off the floor professionals who are trading under
those conditions. Il’s belter to trade the S&P on a ten or fifteen minute chart
if it’s not possible to obtain low commissions and speedy turnaround.
Anol tier criteria is being fast on your feet. I must be a nimble and agile
trader to Trade the S&P on a five minute basts. Fortunately, my trading habits
are so well ingrained that 1 trade correctly almost by instinct. My habit
patterns are well formed. I know, and know that I know,. I will follow my
method and my plan. If tlieil were not the case. I would be better off trading
the S&P in a larger time frame.
There is little time to think. Reactions have to he virtually automatic.
I have no way of knowing how mentally spry any reader of this book
might be. But again I warn you, trading the S&P is no place for the trader
who is faint of heart, or one who does not have the capital to be in this
business. Certainly, it is no place for the trader with a small account, one
who can trade only one contract at a lime, or who is trading with money
needed for living.
With these warnings in mind, I present a typical day of S&P trading on
a five minute chart. I intentionally chose a day when the market was not
trending because I want to show that what I do will work intraday in lhe S&P
whether It's trending or not. On the daily chart, 1 was trading an outside day
following an inside day. The outside day took place well within the bounds of
an even larger day that took place before the inside day. These days look
place at almost deed center of what had been a trading range that lasted for
five months. I also chose a day when I was not holding a seminar, and one
on which I accepted no outside phone calls.
When I trade the S&P, I do not even entertain thoughts of holding
overnight. For me, it is strictly a daytrade.
I tracked this trade paying my normal commission of $6 a round turn.
The day started down at the open, but within the trading range of (he
previous day. The previous day had boon spent mostly in a long trading
range, and had opened gap down from the close of the prior day.
In this chapter, 1 will take the concept I've been showing a little bit
further in that every time I connect two points, I will refer io it as a segment.
There's more than one way to use the concept of segments These
charts should show enough for anyone to get the hang of it, and at The end
Til show how to drop an old segment and pick up a new one. In segment
counting, an inside bar is counted as part of a correction. This differs from
the concept shown in chapter 21, where I had to have three higher highs or
three lower lows before I could enter the market.
SP 5 КI HUTE
open
37740
377Z5
37710
37695
376B0
37665
37650
37635
37620
37605
37590
37575
37566
37515
37530
37515
37500
374B5
37476
37155
37440
37425
37410
37395
Э73В0
37365
i
227
The second bar had a higher low and a higher high. I started my count.
When the next bar made a higher low and closed on its highs, I upped
my count-
SP 5 HlHUTE
uih
и
12
37749
37725
377 ie
37БЭ5
37680
37665
3765G
37635
37620
37605
37590
37575
37560
37545
37530
37515
3750G
374B5
37470
37455
37440
37425
37410
37395
37380
37365
H
223
count l
The next bar made a higher low and
closed on ns Inglis.
I upped my
SP 5 MINUTE
37740
37725
37710
376%
37660
37665
37650
37635
37620
37605
37590
37575
37560
37545
37530
37515
37500
37105
37470
37455
37440
374Z5
37410
37395
37300
37365
Hi IJ Hi I t 11 I : I III! I I b I! . i
8	9 IB 11 1Z 1	2
2 29
All of a sudden, prices really started climbing. The next bar gapped
open, and took out a good part of the previous day's trading range. 1 placed
an order to buy just above the high.
SF 5 MINUTE

j
"I
buy
37710
37725
37710
37635
37600
37665
37650
37635
376Z0
37605
37530
37575
37560
37545
37530
37515
37500
374B5
37470
37455
37440
37425
37410
37305
373B0
37365
4

r

Z
8
10
11
12
В
2 30
I was filled at the open with a twenty-five lol- The price was 37575.
Since I can cover costs with $150. and the S&P almost always gives me a
two tick move. I cashed five contracts at 37585 to cover costs and put me
ahead in the trade. I had $250 less the $150, which gave me the mental
satisfaction that helps me Io trade the S&P. My stop loss, which had been
$250 per contract away, was pulled up to break even as the bar closed.
I like to sian my trading on a positive note,
happy with two ticks HO points! in the S&P.
SP 5 hlMUTE
One way io do it is io be
37740
37725
37719
37695
3?6BG
37665
37650
37635
37620
37605
37599
37575
37560
37545
37530
37515
37500
374 B5
37479
37455
37440
37425
37410
37395
37380
37365
231
Prices continued to climb, but began to slow down as they reached the
highs of yesterday's trading range. I moved my stop up to protect half the
unrealized profits in the trade. My stop was at 37645 to protect 70 points.
SP 5 MINUTE
10
11
12
2
37740
37725
37710
37695
37680
37665
37650
37635
37620
37605
37590
37575
37560
37545
37530
37515
37500
374B5
37470
37455
37440
37425
37410
37395
373B0
37365
232
The next price bar was an inside reversal bar creating a Ross hcuk.
Since I had enough room to cover costs on a breakout of this ban J placed a
buy stop for a fifteen lot above die correcting bar at 37505 and a ten lot
above the hook at 3771 5r and pulled my stop up to just under the low at
37650. The point of the hook was 37710.
SP
5 HIKUTE
37740
Rh
..,, buy
buy
.*
I
37725
37710
37555
37БВ0
37565
37550
37535
375Z0
37505
9	10	11
(
1
fl
37590
37575
37560
37545
37530
37515
37500
37485
37470
37455
37440
37425
37410
37395
37380
37365

2 33
When prices corrected again, I was stopped out with my profit of 70
points each for 20 contracts; I placed a buy stop to purchase a twenty-five
lot just above the high, and left the buy stop above the Ross hunk in place.
SP 5 MINUTE
37740
JUi T
, ...bitj
37725
37710
 tl!lJ 37695
37680
37665
37650
37635
37620
37685
37550
37575
37560
37545
37530
37515
37500
371B5
37170
37455
37140
37425
37410
37395
37380
37365
Й
I was filled a twenty-five lot on my buy stop above lhe previous high at
37700. Prices closed a lick below me. My stop loss was $250 per contract
back, and my cost covering stop was two ticks above at 37710.
SP 5 MINUTE
37755
37740
37725
37710
37695
376B0
37665
37650
37635
37620
37605
37596
37575
37560
37545
37530
37515
37500
37485
37470
37455
37440
374Z5
37410
37395
37380
235
Prices gapped open on the next bar and raced higher. J covered costs
on my twenty-five lot by selling a five lot, and pulled my stop to breakeven. I
also got filled on my Ross hook fifteen lot, and covered costs for it by selling
another five lot. When 1 covered costs on my fifteen lotr prices were still
moving up. I moved my protective slop up to cover half the profits on my
twenty lot. While J was at it prices moved up a tad more, and I protected my
ten lot. Within seconds, prices started to race back down,
SP
5 MINUTE
Kh
37755
37746
37725
37710
376%
37686
37665
37650
37635
37626
37605
37590
37575
37566
37545
37530
37515
375ЕЮ
37485
37470
37455
37440
37425
37410
37395
373B0
This market was now, by my definition, in congestion, I had four
closes within the price range of the bar I've marked with an "x." The lower
limit of the congestion is bar number 2, which is also a Ross hook. The upper
limit of congestion is bar x, also a Ross hook
236
I was slopped out and had io wait during almost lhe entire next bar to
find out where my fills were. I had dumped twenty contracts at a 20 point
profit, and ten coniracis at a 15 point profit. I also find to take a restroom
break while I waited for the phone to ring. Once (he broker called with my
price, I was able to place my order above lhe new Ross hook.
S? 5 MINUTE

Old Rh ->
10
11
1Z
Neu
Rh
-I
<
37755
37740
3772S
37710
37Б95
37БВ0
37665
37650
37635
37620
37605
37590
37575
37560
37545
37530
37515
3750C
374B5
37470
37455
37440
37425
37410
37395
37306
r
I
I
Since prices were correcting, I placed a buy stop above the correcting
bar’s high, as well as above the Ross hook.
SP 5 NINUTE
buy R? 37755
„..buy 37710
37725
Ц	37710
ЫН	37695
(	376D0
37665
37650
37635
37620
37605
375%
J	37575
37560
37545
37530
37515
!	37500
и	37465
37470
37455
37440
37425
i i	I
I ii Ш1111 i I1! J dhiili I iiHlII udlDlii Hill
8	10	11	12	1	2
37410
37395
373B0
230
Once again I was long a twenty-five lot with a stop $250 away. I was
able to cover with five contracts at 2 ticks. That put me $100 to the good. I
was in the market at 37735; I covered at 37745. The market moved to
37755, so I moved my stop up to 37740 so as not to lose on rhe twenty
contracts I had left.
I was also long a fifteen lot at 37750, with my stop loss for those
contracts $250 away at 37700. I had covered costs early with two ticks,
just in case prices didn't clear the Ross hook of three bars earlier. I also
wanted to be in the clear on costs for this set in case the breakout of the
Ross hook was filled.
SP 5 HIHUTE
37755
37749
37725
37710
37695
Э76В0
37665
37650
37635
37620
37695
37599
37575
37569
37545
37530
37515
37500
374 B5
37470
37455
37440
37425
37410
37395
37380
2 39
The next bar opened at 37740, taking out lhe twenty contracts I had
left from the first trade of this set. That gave me $500 tn additional profits.
Prices clipped down to 37730 before they took off for new highs I was able
to cover costs on rny fifteen lot by cashing five contracts for a net $100
profit. That left me with ten contracts as prrces closed at new highs for the
day.
5 HIHUTE
I
t

f
r
37660
37B4G
37820
37800
37700
37760
37740
37720
37760
37680
37660
37640
37620
37606
37580
37560
37540
37520
37500
37480
37460
37440
37420
37400
373B0
37369
10
12
1 4
24 0
As prices moved up, I moved my stop to protect half of the unrealized
paper profits in the trade.
SB 5 HINUTE
Э7ВБ0
ч Э7В1О
37BZ0
37890
37780
377Б0
’]	37740
377Z0
f।Ш ’	37700
I I i	H	37Б80
I И ‘Mi	H	37660
J i'l J MI ] rT	37640
1 MlJ 1 'nJ'	rj	37620
I 11) .	T'!	И I.	1	37600
Ч’|Г	|frU^[k	*	375C0
’Ц	l' w	г	37580
) Uh	37510
M.	L .	37520
Ь »	4	’
’  JH	37500
iffP t	37Ш
37460
37440
L	37420
37400
2 11
Prices made a double top and a doji,
below the low of the bar.
pulled my profit stop to just
5 HIHUTE
L
I
T
N
Г

10
11
12
ti
к
И
I
37B60
37040
37820
 St°P37800
37700
37760
37740
37720
37709
376B0
37Б60
37640
37620
376&G
375B0
37560
37540
37520
37500
37480
37460
37440
37420
37400
37380
37360
z
24 2
When I saw that prices were going 1o close lower than they had
opened, I called in a sell order to liquidate all contracts.
SP 5 MINUTE
32ВБ6
37D40
370
37800
37780
37780
377-10
37720
37706
376BG
37666
37616
37626
37606
37588
37566
37540
37520
37500
37480
37460
37440
37426
37400
37380
37360
10 11 12 1 Z 3 8 8
243
I was filled st the open of the next bar. Sc far I was doing well this
day. I had made 60 points on a ten lot for $3,000 to go with my earlier
profits.
I placed a buy stop above the triple top and the high of the correction
bar, and began to count the correction.
SP 5 MINUTE
Buy
37860
37810
buy a?826
37800
37780
37760
37740
37720
37700
37680
37660
37640
37620
37600
37580
37560
37540
37520
37500
374B0
37460
37446
37420
37400
37306
37366
244
г
The next bar corrected some more.
My chart looked like this:
I moved my buy stop to just above
SP 5 HIMUTE
37860
1	37840
buy 37820
В	37BO0
37789
3778G
37740
37720
10
37700
37680
37660
37640
37620
37600
37580
37560
37540
37520
37500
37480
37460
37440
37429
32400
373B0
37360
III dll hi
10	11
В
24 5
When the next bar made a double tap, I kepi my buy stop in the same
place, but I moved my segment count over to the second bar.
SP 5 MINUTE
i
4
L'
3?BS0
37310
buy 37820
37800
37780
37750
37740
Э7720
37700
376B0
37660
37610
37620
37600
37580
3756G
3751G
37520
37500
37430
37460
37440
37420
37400
37300
37360
IEI
10
11
12
10
2 46
I now had three segments down, so 1 placed an order co buy a breakout
of the high of the current ban and also a sell order to sell a breakout of the
low of the current bar. A new low would constitute a potential trend change
from up to down.
SP 5 HIHUTE
Э70Б0
3784G
10
,	37В20
huy 37800
se 11377BO
37760
37740
37720
37700
376B0
37БЫЭ
37640
37620
37600
37580
37560
37540
37520
37500
374B0
37460
37440
37420
37400
37380
37360
24 7
I was filled short on a iwcniy-five lot al 37775. Prices then formed a doji. I
didn't tike that, so I moved my stop to just above the high of the doji bar.
SP 5 MINUTE
37860
37B4G
37820
37B0G
37780
37760
37740
37720
37700
376BG
37660
37640
3762G
37600
37580
3756G
3754O
37520
37500
37400
37460
37440
37420
3740O
373B0
37360
Once the third segment has broken out, I consider truth to be that Гт
in a new trend. As far as I was concerned, I was now in a downtrend,
despite the doji finish of the last price bar. This concept is vital to my trading.
248
I was slopped out of all twenty five contracts at 37790. My loss was
$2025 including cos's. Prices had now formed a Ross hook. I pfaccd a sell
stop below the hook.
I did not place a sell stop below the correcting bar because I needed 2
ticks lion points) io cower costs between the point of the hook and one tick
below the correcting bar.
SP 5 MINUTE
When there is not enough room
to cover costs. I iclrain from
laking lhe trade.
. f I I L . I
11 1111 iiI iн I
10
И 12
11
1
37BL0
II	37840
r]|l	370
1 4|1 ч	37B00
T.. seii 377BG
H)i	37760
t	]	37740
i	37720
। Jj'J	37700
3	376B0
3766Q
37640
• |	37620
37600
37580
37560
lb	37540
l|	37520
i r	H	37500
Jnr И	37480
1	।	37460
37440
1	J	37420
37400
37380
hl	37360
’ J I	.If,
> I1 hill); i illlh
Z 3 8 3	10
24 9
Prices macle a doji on the next bar, so I placed a sell stop under it just
as it was closing. This was the second bar of correction.
I placed a sell slop the re because if I were to be Til I Rd 1 tick below the
low, there would be enough room for ma to cover costs by the time 1 reached
the point of the Ross hook.
SP 5 MINUTE
37B60
Э7В10
3?BZ0
Rh 3??60
37740
37720
37700
376B0
37660
37640
37620
37600
375B0
37560
37540
375Z0
37500
371 GO
374Б0
37440
37420
37100
373CO
37360
250
I
When prices made another doji, I could clearly count four out of the last
five bars in congestion, with lhe Iasi four closes within the price range of the
fourth bar back. I canceled the sell order under the previous bar's low, but I
kept a sell order under the Ross hook. I also placed a buy order above die
small double top made earlier. My chari looked like this:
SF 5 tllMUTE
.... buy
.... se 11
Rh
37060
378-50
37339
37800
37780
37760
37740
37720
37700
37680
37660
37640
37620
37600
37500
37560
37540
37520
3750G
Э74В0
37460
37440
374Z0
37400
373B0
37360
The downtrend was no longer intact. I was looking at congestion. The
Hoss hook formed the lower limit of the congestion, arid the small double top
formed the upper limit. A breakout of either would give me a trading entry.
25 1
I was filled short on a twenty five lot at 37770. My slop loss was
$250 per contract away, and my cost covering objective was 37760. Prices
went as low as 37765.
SP 5 MINUTE
37B6G
Э7В46
37BZG
37BCG
377BG
377БС
3774G
377ZG
377013
37680
3766G
37640
3762G
3760G
375BG
3756G
37540
3752G
3750G
374B6
3746G
37440
374Z0
37406
3738G
3736G
252
The next bar went □ bit lower, enabling me to cover costs with five
contracts at 37760. I netted $100 for my trouble, and pulled my protective
stop to breakeven (b/el as the bar closed.
SP 5 MINUTE
37860
37340
37320
37800
37780
37760
37710
37720
37700
37880
37860
37640
376Z0
37800
37580
37560
[ III11 Lili
10	11
37540
37520
37500
37400
37460
37440
374Z0
37400
37380
I
37360
10
25 3
Prices dropped even further, making it possible for me to begin to
protect haff of the unrealized profits. I placed my stop at 37750
SP 5 MINUIE
37860
37810
з?вго
□7BDG
37780
37760
37740
37720
37700
37680
37660
37640
37620
376ЕЮ
37580
37560
37510
37520
37500
371BG
37160
37110
37120
37100
37380
37360
HlhiiHi
Prices dropped some more after the next bar opened Then they
started to rally back. I made a quick calculation of the unrealized profits, and
moved my stop to 37730. I was stopped out there as prices closed at
37745, I had made 40 points on twenty contracts.
SP 5 MINUTE
37860
37940
37929
37B00
37780
37760
Э7740
37720
37700
37699
37669
37649
37620
376M
Э7580
37560
37540
37520
37500
37480
3746G
3744G
37420
37400
373B0
37360
2 55
The next bar saw prices go lower, I was hoping I would soon get a
chance to get back in.
SP 5 MINUTE
ill il il iihiiininli
з в з io ii
Э7В60
37B10
37820
37800
37780
37768
37740
37720
37700
37680
37660
37640
37620
3760G
37580
37560
37540
37520
37500
37480
37460
37440
37420
37400
37380
37360
Then came an inside doji. It gave me a Ross hook to trade, so 1 placed
sell stop beneath the hook, but not beneath the dojn The doji represented
2 first bar of correction, but there was not room to cover costs prior to
taking out the Ross hook in the
SP 5 HIMUTE
event of a fill.
37069 •
3?B40 д
37820
]jJi ИГ'	37000 •
T	;i	37730	•
41	37760	ж
Ii	37740	T
j	377Z0	•
L sell 37700	•
Rh	37680	ф
37660 a
37640 W
37620 •
37600 ф
37580
37560
37510•
375Z0 •
37500 *
37400
37460•
37440 •
37420ф
37400
37300 •
37360•
Liliiillilll •
io и	A
257
] was filled short a twenty-five lot al 37695. My slop was $250 away,
and my cost liquidation objective was 37685. I was able to cover costs with
a five lot and netted $100. I then moved my protective stop to breakeven.
5 MINUTE

37860
37810
37BZG
37000
37780
37760
37740
З77го
37700
37680
37660
37640
37620
37600
37580
37560
37540
37520
37500
37480
37460
37440
37426
37406
37380
37360
The market became very fast, and all of a sudden prices broke loose.
The next bar gapped down, and by the close, I was protecting 35 points of
profit on twenty contracts. My stop was at 37G60.
SP 5 IHNUTE
37ВЫЭ
37B40
37BZ0
37B0G
3778G
3776G
37740
37720
377O0
37680
37660
37640
37620
37600
375B0
37560
37540
3752G
37500
37480
3746G
3744G
37420
37400
37380
37360
llh Hill
259
Prices went on to make a new low. When they began to rally back, 1
calculated the amount of unrealized profit in the trade, and moved my stop to
protect an additional 15 points. I moved my stop to 37645.
SP 5 MINUTE
37060
37B40
32820
37800
37780
37766
37746
37726
37700
37680
37666
37646
37620
37600
37580
37566
37540
37526
37500
37480
37460
37440
37426
37400
37380
37360
260
I was slopped out at 37645 with profits of 50 points on twenty
contracts.
The correction left behind a Ross hook and sufficient room for cost
covering to suit the low of lhe corrective bar. I placed orders to sell them
bo tii.
5 MINUTE
*
T]
J
I
f

I
Rh
4
t
1
378Б0
37840
37820
37000
37780
37760
37740
37720
37700
37680
4	37660
37640
... sell3?g20
-sell 37600
37580
37560
37540
37520
37500
37480
37160
37440
37120
37409
37380
37360
261
Prices corrected sharply. I began my count,
io below the correction low.
I also moved my sell order
SP 5 HIMUTE
37860
37810
37820
37G0G
3771Ю
Rh
.sell
3776G
37710
37720
37700
37880
sell37660
37610
32620
37600
37580
37560
37540
37520
37500
37180
37460
37410
37420
37400
37380
37360
11 hl)'I
11
262
Prices made an inside reversal bar. I moved rny sell stop up to the low
of that bar, and also placed a buy slop above the high of that bar as well as
the new Ross hook.
S? 5 HIHUTE
37 В 69
37B4G
320Z0
370OG
37789
37769
37749
377Z9
37709
37689
37669
37640
37620
37609
., sell
Hh	37589
37560
37540
37529
37500
37480
37460
37440
37429
37409
37380
37369
2 63
I was filled short on a twenty-five lot at 37685. My slop loss was
$250 away, antj my cost covering stop was at 37675.
SP 5 ИIKUТЕ
нН I I I iilH
Hill II1H
378643
37840
37B20
37800
37786
37760
37740
37720
37700
37680
37660
37640
37620
37600
37580
37560
37540
37520
37506
37480
37460
37440
374Z6
37400
37380
37360
264
Prices ticked at 37685
Prices dropped lower enabling me lo cover costs and make $100 al
37675. I attempted to move my stop to breakeven at 3768b, bul was unable
lo gel ths order in as scon as I would have liked. Prices ticked at 37685
before closing on a doji.
SP
5 til MUTE
1
n
a
i 4
j-

37860
37ЁИ0
37B20
37BOO
377B0
37760
37740
37720
37700
378B0
37660
37540
37620
37500
37550
37560
37540
3757G
37500
374B0
37460
37410
37420
37400
373(30
37360
265
It turned out to be а [иску break for me that I wasn't stopped out at
breakeven, but dojis don't always mean reversal. The next bar opened lower
and didn't look back until it hit 37600* It bounced there and recovered
somewhat, I moved my stop to 37645, and lhe bar closed at 37630.
SP 5 MINUTE
37060
37D40
3702G
37BD0
37780
37760
3774G
37720
37700
376B0
37660
37640
3762G
37600
375BG
37560
37540
37520
37500
3748G
3746G
37440
37420
37400
37380
37360
2 66
The next bar opened, and prices nipped up to 37640, I thought for
sure they would come and get my stop, but they never did. Puces plunged
again. I moved to cover more profits. As I did, I realized Td missed a Ross
hook from earlier in the day. My stop was now at 37630.
SP 5 HIMUTE
37B6G
37B4G
37BZG
37B0G
327BG
3776G
37748
377ZG
37700
376B6
37666
37646
37626
37606
37586
3756G
37540
37520
37500
37488
37468
37440
37426
37400
1Z
hihiill
i
37380
37360
I
2 67
Prices went a bit lower and closed on a doji bar. I placed my stop just
above the high. Whenever I see a doji or reversal, I know there is indecision
tn the market. When the market can’t make up its mind which way to go, 1
start getting ready to get cur
SP 5 MINUTE
1 li I llllinlll II llhil
3 8 5	10	11	12
37860
37840
37820
3780G
37730
377ЫЭ
37740
37729
3770G
376B0
3766G
37640
376Z0
3760G
Э75В0
3756G
37540
Э7520
37500
3748G
37460
37440
37420
37400
3738G
37360
263
The market made up its mind on the next bar, as prices moved right on
up in a strong correction. My stop was taken out and I ended up with 75
point on twenty contracts. 1 then did what I have trained myself to do, I
placed a sell order under the Ross hook.
SP 5 MINUTE
37860
37840
37BZ0
37BOO
37780
37760
37740
377Z0
37760
37680
-<	37660
37640
37620
37600
.]	37580
 seH 32560
Rh	37540
37520
lillhiir.lilll Mhi I
10	11	12
37500
374B0
37460
37410
37420
37400
37360
37360
2 69
Prices made a reversal Ьзг. I placed my count on lhe char:, called in a
sell order under the tow, and waited. I am very consistent when I trade, bur
do on occasion miss a hook or fail to seize a trading opportunity.
SP 5 MINUTE
l
41
Li
Bh
37860
37B40
37820
37800
37780
37760
37740
37720
37700
37680
37660
E 37640
t 37620
 SEll37GeO
37580
37560
37540
37520
37500
374B0
37460
37440
374Z0
37400
373B0
37360
sell
10	11
12
270
Гус shown this so many times now, I hope the reader will know exactly
what ii is I did. Gut just in case. I now had a count of 3 segments going up.
I placed a buy order above the high, and moved my sell order below the low.
SF 5 MINUTE
37860
37846
37826
37800
3778G
37766
37746
37726
37706
37686
37666
37640
37620
37606
37580
37560
37540
37520
37500
37480
37466
37440
37426
3740G
37380
Э7360
I was short a twenty-five lot at 37615 on what turned out to be a tiny
doji bar. My stop was $250 above my entry and my liquidation goal for
covering costs was at 37605. With about one minute to go on the bar, I
catled in and moved my protective stop to one tick above the previous bar's
close. I didn't tike the hesitation I was seeing in the market.
SP 5 MIHUTE
j.
37B60
37840
37820
37800
37780
37760
37740
37720
37700
37680
37660
37640
37620
3760O
37580
37560
37540
37520
37500
37480
37460
37440
374Z0
37400
37300
37360
i

12
10
11
8
272
I didn’t have to worry for too long. The next bar opened a tad lower
and then dropped enough for me to cover costs. After covering, I moved my
stop first to breakeven and then, as the bar closed, to protect half my profits.
My stop was at 37600.
SP 5 MINUTE
37B60 •
3784G •
378Z0 *
37800
37780 •
37760 •
37740 ф
37720
37700 •
37680 •
37660
37640 A
37620 •
37600 •
37580 ф
37560 e
37540 W
375Z0 •
37500 >
37480 a
37460
37440 •
37420 >
37400 ф
37380 Z
37360 •
I
1
273
I was stopped cut at 37600 as prices corrected, I made 1 5 points on
twenty contracts. Being a disciplined trader I did my usual thing. I placed a
sell stop below the Ross hook. When there is enough room to cover costs, I
also place a sell stop below the low of the bar that is making a correction, tn
this case there was not enough room for the second sell order.
5 HIMUTE


Rh
.sell
4
I
*
I
37066
37040
37070
37D00
37780
37760
37740
37726
37706
376B6
37660
37640
37620
37600
37580
Э7560
37540
375ZG
37500
37480
37466
37446
37426
37406
37386
37360
12
10
11
12
I came within one tick of being filled on [he next price bar as prices
closed on a double bottom. Looking back, I determined that this lime I
wouldn't miss the old Ross hook made earlier in the day.
SP 5 HINUTE
-i
io
sell ,.. r
ЯИ
.... sell
Hh
37860
37840
37820
37B0G
Э77В0
3776G
37740
377ZG
37700
376B0
3766G
37640
37620
37600
375B0
37560
37540
37520
3750G
37480
37469
37440
37420
37400
37380
3736G

IlHhlH

27 5
I was filled with a twenty-five lot at 37580. This was a break because
the prices opened at 37575. They immediately ticked up and I was filled. I
placed my protect ve stop $250 per contract above my entry I should
explain here that my stop goes into effect contingent upon my being filled.. I
dorft call it in separately. As prices went down, 1 was able to cover costs
with five contracts and pulled my stop to breakeven.
Also on the way down, I was filled with a fifteen lot at 37560 based on
a breakout of the older Ross hook. My protective stop was placed $250
above my entry, and I was able to cover costs on this contract set. I cashed
five contracts here as well. I pulled all stops — from both contract sets — to
37560. I was stopped out there as prices rose io lhe close. I had made 20
points on twenty contracts.
Cost covering had added a couple of hundred bucks
to the kilty.
SP 5 MINUTE
3786G
37840
37B20
37890
377B0
37766
37740
37720
37700
37600
37660
37Б40
37620
37600
375B0
37560
37540
37520
37500
37480
37460
37440
37420
37400
37380
37360
276
As prices corrected. I did my usual thintj. I placed a sell stop
underneath the Ross hook. I placed a sell stop beneath the corrective bar's
low because this time there was room to cover costs. I waited patiently for
developments.
SP 5 HINUTE
37860
37B40
37B2G
37800
37780
37760
37720 л
37700 ’
37680 •
37660 I
 I
1
37Б28
37600
' ee113?540
Jill
37480
37460
37440
37420
111 Hill. Hill
37380
37360
iz
1 z
в
12
and moved
count
my
5 MINUTE
4
The next
my sell stop up
bar brought more correction. I started
to the low of the now corrective bar.
Hh
Л. sei I
37860
37010
378Z0
37800
37780
37260
37710
377Z0
37700
37680
37660
37610
37670
sBii3?beo
375D0
37560
37510
37529
37500
371 BO
37460
Э7440
37420
37400
37380
37360
27Й
10
11
The next bar brought a reversal, but □ higher low. I connected my third
segment arid moved my sell stop to below the low. Since I would consider a
a breakout to the upside of the double highs the beginning of a new trend, I
placed a buy order to get long if a breakout should happen that way.
SP 5 HIHUTE
bay
37860
3781G
3780©
37700
37760
37740
37720
37706
376B0
37666
37649
37676
37600
37589
37569
.. sell
flh
37540
37526
37500
37480
37460
37440
374 Z0
37400
37386
37360
32Б2в
. t
I
279
The mark of a good method is that it keeps a trader out of the market
when it's going sideways, I know of no mechanical method that can do that.
When the next bar developed as an inside bar, the market was, by my
definition, not going anywhere.
SP 5 MINUTE
<
Tiie trend was broken I
idhlHiJlilllll II llllllillli1
389	10	11	12
37860
3784G
378ZG
37B0G
37780
37760
37740
37720
37700
37680
37660
37640
37620
37600
37580
37560
37540
37520
37500
Э74В0
37460
37440
37420
37400
37380
37360
T
I
r
4
Notice; There had now been four higher lows, thereby breaking the
downtrend. The developing uptrend had failed to mature. The previous bar
did not make a new high and was a reversal bar. The current bar not only
failed to make a new high, it too was a reversal bar. Based on the fact that
there was no longer an identifiable trend, I did something I was hoping I
would get to show on this series of trades. I rephrased the segment count.
1‘vo shown how I do it on the next chart.
230
I move the segments up one notch so they are then numbered as I've
shown on the chan. With the new segment count in place, I then called in an
order to buy a
breakout of the high of tho bar completing the third
segment.
5 MINUTE
1

J f


Rib trend was broken!
10
11
37B6
37B4
3762
3??B
3776
3?72<
Э768С
3?6L(F
3?EH>
37E0(U
3756(F
375&Л
3?5‘ll£
3752(U
3750СГ
3748Л
3746ф
37420
3?38t3>

2
231
The next bar gave more evidence of a non-trending market by dipping
lowed and then reversing the direction of the previous bar.
As stated earlier, it is essential to know and recognize when a market is
in congestion. When it is, I don't want to be in it. Such a market belongs to
the floor traders, not to me. They love when a market goes sideways They
can safely scalp to their hearts' content. I cannot compete with them,
because I can never match the speed with which they can react lo the action
□n the floor and place their orders. The markets they hale — trending
markets — are where I make my money. There's a piece of the market for
everyone, according to their trading style. When a lion kills a zebra, he eats
the organs. Then the vultures come, and they tear at the flesh. When the
hyenas come, they cat the bones. The ants and beetles get what's left.
There’s something for each of them. So it is with the markets.
SF 5 HIHUTE
t


37B60
37B40
37B20
37890
37780
37760
37740
37720
37700
Э76В0
37GG0
37640
37620
37600
37500
3756G
Э7540
37520
37500
374ВФ
37460
37440
37420
37400
373B0
37360
10
11
12
282
Further confirmation of a non-trending market camn with the doji bar
that materialized next. The market was now in congestion by every definition
I could think of.
When a market goes into a congestion,
define and count a new trend.
will not trade it until I can
SP 5 HIHUTE
idi!
3786$
3784$
37BZG
3780$
37780
3776$
3774$
3772$
3778$
3766$
3766$
3764G
37620
3760$
3758$
37560
37540
3752$
37500
374B0
3746$
3744$
37420
3749$
3738$
37360
2S J
i went ahead and did my thing. I started a count. If the market was
going to go anywhere, sooner or later I would catch up with it.
SP 5 M1MUTE
.U
37860
37B40
370
37800
377BG
37760
3774G
37720
3770G
37880
37660
37640
37620
37600
37580
37560
37540
375Z0
37500
374B0
37460
37440
37420
37400
37380
37360
234
three
waited to
Prices moved a bit higher, but ended up making a reversal bar. This is
not unusual for a market in congestion. Since I could now count
segments up, I placed a buy order above the high of the bar, arid
see if there would be a breakout,
5 MINUTE
1
<
I

4
I
j
37840
37820
37B0G
377BG
3776Q
37740
37720
37700
376BG
37660
37640
37620
37600
37560
37560
37540
37520
37500
37480
37460
37440
37420
37400
37380
37360
10
11
1Z
28 5
The next bar completely demolished the emerging uptrend. I marked
the double high as a place lo buy, and went back to waiting.
SP 5 MINUTE
f

i
Г
3786G
з?аю
37B2G
37BOO
Э77В0
37760
37740
. buy 37720
37700
37680
37660
37610
37620
37600
375B0
37560
3754®
37520
37500
374B0
37460
37440
37420
37400
373B0
37360

9
10
11
12
286
Next there w^s an inside bar at about the same price level as the
previous ccmtjestion area, I was still waiting. Notice that the correction to
lhe down bar did not constitute a Ross hook. ROSS HOOKS COME ONLY IN
TRENDING MARKETS. This market, by rriy definition, of a trend, is still in
congestion,
SP 5 tllMUTE
b- 1
I *
.... buy
is
not
floss
37B60
37B40
37BZ0
370O0
37700
37760
37710
37720
37700
37680
37660
37610
37623
37608
37500
37560
37540
375Z0
37500
37400
37450
37440
374ZG
37400
37380
373G0
I
Ы I
237
The following price bar headed south, so I placed a count on rny chart.
SP 5 HINUTE
37050
37040
37820
37800
37780
37760
37740
37720
3770G
37680
376Б0
37640
37620
37600
375BG
37560
37540
3752G
3750G
3748G
37460
37440
37420
374GG
Э73В0
37360
288
No downtrend materialized. The next bar failed to make a new low and
closed higher than it opened, creating a reversal bar and a double bottom.
SP 5 MIMUIE
37B60
37B10
37820
37000
37780
37760
37740
37720
L
37700
3?6D0
37ББ0
J
37640
1
37620
к
4
37600
375C0
a
se
37540
37520
10	11
12
37500
37480
37460
37440
37420
37400
37380
37360
289
The tollowing bar reversed again. What had happened was that lhe
trading range was still there, only it was getting wider. To тс, that means a
weakening'market. If it were getting tighter, I would expect an explosive
move. However, when a congestion widens, I expect short untradable trend
legs until the market widens out enough to make the legs worth trading.
SP 5 HIHUTE
37060
37040
37B2G
37BG0
37780
37760
37740
377Z0
37700
376G0
37660
37640
376Z0
37600
37580
37560
37540
375Z0
37500
37480
37460
37440
37420
37400
37380
37360

Prices broke a bit. but I wasn't expecting them to really break out of
the trading range. It usually takes from 21-25± bars before a breakout can
be expected. I could now count two segments up, so I marked them on the
chart.
SP 5 KINUTE
37B68
37B40
37B20
37898
37788
377ЫЭ
3774(3
37728
37798
376BO
37660
37840
37820
37600
37588
37566
37546
37520
37500
37480
37460
37440
37426
37490
373B0
37360
25 1
As might be expected in a Trading range, the next bar reversed, closing
near its lows. Although it doesn't work perfectly, this method of counting
segments to identify a trend, and understanding when a market is in
congestion, has wonderfully kept me out of untradable trading ranges and
congestion areas for many years.
So, although this part of the book may be not as exciting, the wise
trader wilt pay great heed to what I’m showing here. Knowing when io trade
and when to siL and wait is worth a fortune —- it has boon for me,
Still, because I will not prejudge a market — I let it tell me what it
wants to do — I dutifully drew my trend line and numbered my segments. I
cailed in a buy order above rhe high and wailed.
SP 5 MINUTE
37B60
Э7В40
37820
37800
37780
377Б0
37740
37720
buy ™
376BO
37660
37640
37620
37600
37580
37560
37540
37520
37500
37460
37460
3744C
37420
37400
373ЕЮ
37360
The next bar again confirmed the trading range, and killed the uptrend.
Just for grins, I counted the bars in the range so far. There wen? fifteen. I’ve
drawn a box around the bars.
I like to test my methods to see if they still work. To make tr a bit
easier for me to finish This series, J'm going to change the chart scaling a bit.
You rnay not even notice.
SP 5 HINUIE
37860
37B40
37B20
378M
377B0
37760
37740
377Z0
37700
376BG
3766G
37640
376Z0
37600
37500
37560
37540
37520
37500
374B0
37460
37440
37420
37400
373B0
37360
293
I
I
The following bar confirmed the congestion once and for all. I most
certainly was looking at ап ДД. Il was lhe sixteenth bar of the range. 1
moved the segment on the "up" count as shown.
Just in
case I was wrong, 1 numbered the segments going down.
MINJTE
В
I
J
37860
Э7840
37820
37800
377ЕЮ
37766
37740
37720
37700
37600
37660
37610
37620
37600
37500
37560
37540
37526
37500
37400
37460
37440
37420
37400
37306
37360
i
3
10
12
294
The next bar stayed in the trading range making a double high. I
changed lhe segments identifying the trend by swinging the trend lines over
to the latest high. At this point the up count was dead.
SP 5 MINUTE
37860
37040
a?Bze
37890
377B9
37760
3774G
37720
37709
37689
37660
37640
37620
37600
37580
37560
3754G
37526
3750G
37489
3746G
3744G
37420
37400
37380
37360
295
Alternating reversal bars continued io identify congestion. This was the
eighteenth ban It was also 2:15 in the afternoon. Quite often the S&P will
make a significant move between 2:00 and 2:50 p.m. I wondered if this was
a day in which it wouldn't. t redrew the segment of the trend.
SP 5 HIMJTE
37060
37B40
37820
37800
37780
37766
37740
37726
37766
37680
37660
37640
37620
37600
37580
37560
37546
37520
37500
374B0
37460
37440
37420
37400
373B0
37366
2 У 6
By now watching the S&P was getting boring, h seemed os if the
excitement was over for the (Jay. However. I was determined to grind this
out for purposes of writing this book. I didn't know but that there was a
great tesson just ahead.
SF 5 rtINUTE
3
llrll
1
37B6G
3734G
Э7В20
37B0O
37780
37780
37740
37720
37700
37880
37660
37640
37620
37600
37500
37560
37540
37520
37500
37480
37460
37440
37420
37400
37360
37360
297
As the bar closed, I began drawing my segment lines, I quickly
idemilied them, This was lhe twentieth bar of congestion. The next bar
might get something started.
5 HIMUTE
37П60
37840
37BZG
37000
3??B0
37760
37740
37720
37700
37680
37660
37540
37620
37600
37580
37560
37540
375ZG
37500
37480
37450
37440
37420
37400
373B0
37360
2 90
The twenty-first bar of congestion didn't exactly shake the earth, but it
had good niomonium. Maybe this was lhe beginning of an uptrend?
SP 5 HlhUTE
В
Э7В60
37010
37820
37ВСЮ
37780
37760
3771G
377Z0
37700
37680
37660
3764G
376EG
37600
37SB0
37560
37540
37520
37500
37480
37460
37440
37426
37400
37380
37360
2 9 9
The twenty-second bar of congestion moved up nicely. It had good
momentum, and i thought to myself, "maybe this is Ц!" One more bar and I
could place niy buy order in the market.
5 ШЛИТЕ
37ВБ0
37840
37B20
37B0G
377BG
a??6G
37740
3772G
37700
37680
37660
37640
376Z0
37600
375BO
37560
37540
375ZG
37500
374B0
37450
37440
37420
37400
373B0
37360
3 о о
Well, it wasn't "it.“
r	1 Pfl
broken the uptrend. I had
I would have to be patient. The reversal bar had
to rephrase my segment count.
SP 5 HIHUTE
370 •
37840 *
37820
37800 •
37780 •
37760 A
3774G ж
377ZG •
37700 •
37680 £
37660 *
37640 W
37620 •
37600
37580
37550
37540
37520
37500
37480
37460
37440
37420
37400
37380
37360
301
I was a bit disappointed, but my training and discipline caused me to draw the
igments and number them on the chart. If I got a breakout of the highest high, I
ould buy it. Otherwise 1 would still, by definition, be in congestion. However, it
as getting late in the day I decided to irade only a five lot.
SP 5 FIIHLJTE
37060
37840
37820
37800
37780
37760
37740
37720
37700
376B0
37660
37640
37620
37600
37580
37560
37540
375Z0
37506
37480
37460
37440
37420
37400
373BC
37360
I In IHH Hui'hlin Hu
3 8 9	10 Ц 12
2
302
Once again prices proved la bo in congestion. To show that the market
had no idea of which way to go, prices formed a doji. Despite the fact I now
had a shifted throe count to the upside, 1 wouldn't dare enter a trade that
failed to take out the highest high.
SP 5 rtlHUTE
3766G
3781G
378ZG
37B0G
37786
37760
37740
377Z0
3770©
37680
37660
37640
376Z0
37600
37580
37560
37540
375Z0
37500
374B0
37460
37440
37420
37400
37386
37360
3C3
The S&P was slill tn a trading range. I would wait to see if prices took
our that highest high. My only other choice was if I could get a breakout of a
three count to the short side before the market closed.
SP 5 MINUTE
I I III I llllllniNl IH lllhi I Lilli I liri [ lilhll
3 8 9	10	11 1Z 1	2
37860
37B4G
37820
37B00
Э77В0
37760
37740
37720
37709
37680
3766O
37640
37620
37600
375B0
37560
37540
375Z0
37500
374B0
37460
37440
37420
37400
373BO
37360
3 04
The next bar killed the uptrend once again. I coukl now number only
three segments going down. Sometimes the S&P makes a big move right at
the end of the day. Il was too late in [he day to catch it. There would not be
enough bars to suit me.
SP 5 tfINUTE
37EJ6O *
3?S4G •
378Z0 •
37800 A
37780
37760 •
37740 •
37720 л
37700
37680 •
37G60 •
37610 ф
37620 A
37600 •
37580 •
37560 >
37540 ж
37520 W
37500 •
37480 •
37466 *
37440 *
37420 •
37400 •
37380 л
37360 _
я
305
I had a three count going two bars before lhe last bar of lhe day. Even
if I were to get a breakout going into the last bar, I would not chance in
SP S tIINLITE
37660
Э7В10
37826
3780G
37706
37760
37749
37729
37700
37680
37669
37640
376Z0
37600
37500
37560
37540
37520
37500
374B0
37460
37440
37420
37400
37380
37360
306
SP
I didn't fee] too bad about not taking
up looking like
this:
that last
trade.
The market ended
5 MINUTE
Е»
it
37866
37810
37820
37860
37780
37760
37710
37720
37760
37680
37660
37610
37620
37600
37580
37560
37510
37520
37500
37480
37466
37410
37420
37400
37380
37360
10
11
1Z

Я

।
L
a
L

I was glad it was over, I had enough risk for one day, I thought to
myself, "Next time, ГП trade the NYFE. An Important advantage to trading
the NYFE is not having to put up with the program traders.
This was a good day for me in the S&P. I did not go through dozens of
charts looking for a day in which I would be a winner.
What I’ve shown here is a day of trading almost exactly the way it
happened- In actuality, there were a couple of trades on which I came out
ahead, that I shouldn't have taken. I felt that to show them would be a
disservice to my readers. You have plenty of bad habits without acquiring
some of mine.
307
I pushed too hard on those trades, and although I made a small profit
on them, I was overtrading when I took them. They were inconsistent with
what Pve been trying to teach. One of these days, I will videotape a day of
trading. Then you will see and hear some of the stupid things I do. There are
plenty of days when I lose amounts greater than I made this day. Overall, I
come out ahead.
I do not trade the S&P every day. In fact, most of those who read this
book who are familiar with my trading know I don't trade nearly as often as
others. I'm quite content to take a living out of the markets. I collect data on
most markets, keep an eye on some of them, and do most of my trading in
about eight,
I make most of my money in the currencies and the S&P or the NYFE.
Given the choice. I actually like the NYFE better than the S&P. There is less
competition and less of a frantic feeling trading the NYFE. It is only about
sixty percent as volatile. The fills are a tick or two worse.
When I do trade, I am extremely finicky about trade selection. I like to
win. I hate losing. I will not trade just to trade. I refuse to trade every day
as though I were under some obligation to do so — except when I'm writing a
book.
Most traders I have met feel they have to trade every day. Each day
they pick out something and put on a trade. How their brokers must love
them!
I trade for me, riot to make my broker happy, The next chart I show Is
how the S&P looked overall. Perhaps the reader can come to see why I
selected to enter a stock index trade.
SPILL 5 MINUTE
38030
38040
38000
37960
37920
37000
37840
37800
37760
37720
37680
37640
37600
37S6G
37S20
37480
37440
37400
308
I reasoned that the stock index futures could not go on and on doing
nutfirng for very long. I fell that an explosive day or pan of a day was due.
Although prices wore antsy for only part of the day. it was enough to make
some bucks in (he S&P. After the initial trading frenzy, the S&P simply
chopped around in the same trading range ir had the previous day.
It's interesting to note that money can be made in a trading range if (he
market is volatile enough and the trading range from top to bottom has
sufficient distance to allow it.
Looking at the previous chart, it should be obvious that overall the
market was going sideways, When a five minute chart is going sideways,
lu>w much trend can there possibly be on the daily chart?
I look for potentially explosive situations to trade.
I’ve shown them in this book, A breakout from matching congestions,
my four major entry signals, my intermediate and minor signals — all are
explosive situations.
My own preference is major entry signals. They don't happen every
day, and that is one of the main reasons I will not trade every day. I warn the
greatest chances for success when I trade. Explosive situations give me that
chance.
Whim 1 began trading this flay. I' had no idea how well it would turn
out. Not all my trading days do as well. Yet Г find I have trading days like
this quite often. / HONESTLY BEL/EVE /7 fS MY TRADE SELECTION THAT IS
/N LARGE PART RESPONSIBLE!/ Ninety to ninety-five percent of traders
overtrade. They trade too of tert and too much.
I have seen many futures contracts make beautiful one day moves on
the daily chart, yet had I traded them intraday, I would have been chopped to
pieces. Conversely, I have seen ’'nothing days" like the one I just completed
in the S&P, where on the daily chart the whole thing amounted to not much
of anything, yet intraday I've made a lol of money.
This is not an uncommon occurrence when daytrading, If a nice move
on lhe daily chan occurs gradually intraday, I often lose because I get
whipsawed by the shallowness of the ascent or descent. On the other hand,
if the market moves steeply while still giving me a chance to get in, I may
have a great day intraday, while the daily chart shows a "nothing day". Such
was lhe case with this last S&P trade,
A significant lesson I hope I have taught here is the importance of size,
and correspondingly taking just a few ticks out of the market on a portion of
the position, If the market runs, the remainder of the position will take care
of the big profits.
309
Chapter 27
Something Old — Something New
Before moving into the final chapter, ГП give a recap of the techniques
I've shown for identifying congestion,
Identifying Congestion
Congestions are spotted when /V\ or W is on the chart.
The smallest possible ЛЛ сг W is found when there is a series of
reversing open-high—close-low or open-low—close-high bars, Such a series
would involve at least four bars.
1
Any series of four or more price bars involving reversing opens and
Closes, dojis, or both, constitute congestion.
Congestion exists when there are any four price bars with closes inside
the trading range of a single preceding price bar even if one or more of those
bars have highs or lows outside the range of lhe bar containing the closes.
Identifying Trends
I've shown several ways to identify a trend. I'll recap those and add
more.
Successive New Extremes
The first way is, I wait until I see a breakout of a high of a third
successive higher-high series of price bars.
Buy breakout of the high
Or, I wait until I see a breakout of a low of a third successive lower-low
scries of price bars.
Sell breakout of the low
Sagging Tops and Rising Bottoms
A second way to find the trend is by watching for sagging tops and
j rising bottoms.
< ‘Soil a breakout of the third low even though not all three bars
made new lows. The tops are sagging.
- Buy a breakout of the third high even
though not all three made
new highs. The bottoms
are rising.
Segment Method
The third way is to connect segments until there are three segments
defining the trend. Here is the segment method:
sir/ hrr^kiNil d hfh
<-----Sell br&ikail uF hijli
The next way is the one 1 have traded the longest, h's the one I was
originally taught. I traded with this method for three years al the beginning of
my career, and have never abandoned it. I'll show it here just as it was
shown in the sixth issue of my newsletter Traders Notebook, If you've read
Trading Is A Business., it s in there too. I apologize for repeating it, but it is
important.
True Trend Method
Some Very Basic Trading
"Over the years, my trading has become somewhat intricate, and very
intuitive. This is due to viewing thousands upon thousands of charts, and
trading In every time frame from one minute charts to weekly charts.
3 1 1
"But trading doesn't have to be intuitive and intricate at all. In fact,
some of the best trading I've ever done has been some of the most
straightforward and simple trading of my entire career.
"In this issue, I'm going to start showing you some very basic trading
techniques. They have served me well for many years. I will start out with
the very first method I ever learned. I traded successfully with it from the
very outset of my trading, and in fact, I ran a $5,000 account up to $28,000
in the first five months I used it.
"This method worked for me immediately and still works today. I have
no doubt it will always work, because it is based on truth. Truth is constant,
it never changes.
"You have heard time and time again that the trend is your friend. In
this method, I will teach you how to use the trend. You have heard that you
need to keep your losses small and stay with your winners. This technique
will enable you to do that. It is so simple that many of you will not believe it.
You have heard that you should let the market tell you what to do. This
concept is the very embodiment of that wisdom.
"It will be your loss if you don't accept the sheer simplicity of the plain
truth I’m about to show you, I can tell you this, I made my living for lhe first
three years I traded with this one simple way to trade. I did nothing else
except wait until the right event took place.
"Are you ready for this? OK, here we gol
Bdirt DAILY	13CJ1 1У71 1TJ1 1Э91	5113
01-23 06:11 2312	*0	Пт
35372
2560
2510
Z5Z0
2500
Z4D0
2160
2140
2420
2400
23B0
2360
Z340
Z3Z0
2300
22B0
2260
224(1
2Z20
2200
Z1B0
2160
2140
Z1Z0
2100
zone
2060
312
"The situation I was looking for was lhe ability lo draw a trend line in a
trending market. When I first started trading, t had no computer. I traded
from a set of purchased chans that carne out once a week. I Had w keep
them up io date by hand. I drew in tbe bars each day showing the open,
high, low, arid close. I can't draw a straight line with a ruler, so I hared every
minute of it,
"Once the daily bars were drawn, 1 drew in the trend lines. I connected
highs lo highs in a down trending market, and lows to lows in an uptrending
market.
"On a trade such as the one shown above, my job was to trade only
when I could draw a clear trend line. This forced me to wait tor my first trade
until a markei corrected so I could connect the previous high to the current
correction high. When I could do that, I had an established trend.
"My first duty was to connect the highest high of the latest lug (o lhe
first, correction high. After that, I was allowed to connect lhe last correction
high to the current correction high only if the angle of the trend line remained
in the same overall direction or steepened its angle of descent.
"Once I had established a trend line, I was to try to sell a single
contract upon a breakout of the low of each day in which the market moved
upward towards the trend line. I was not to trade if prices gapped below my
self point. I was to trade only if prices traded through my sell point. My sell
point was always one tick below the low of the previous day, which
represented a breakout of yesterday's low.
"When I was in a trade, 1 was to stay in it as lang as prices moved
away from the trend line by making a lower high, and/or a close lower than
the open. My initial slop was lo be 10 ticks away from the pnee action,
"I was to add to my position as prices moved away from the trend line
by selling trade-through breakouts of the low.
"I was to have a resting sell stop one rick below every Ross hook. A
Ross hook is a pivot point, created when a market changes direction for even
one day. In the case of a down trending market, this would be created just as
soon as prices had a day upon which lhey failed lo make a new low. In an up
trending market, a Ross hook is established on any day in which prices fail to
make a new high.
"At no time was I to allow a correction to go beyond ihc previous day's
high, nor was I to allow a correction to go beyond reducing rny profits for the
latest leg to an amount greater chan 50% of my unrealized paper profits once
I had $100 of profits in the trade. Furthermore, once I had $50 of profit in a
trade, I was lo pul my stops to breakeven by the lime of the close.
"I was to be on my guard and to tighten stops on any day in which lhe
market closed higher than ii had opened.
313
’ Of course, just the opposite of my criteria for handling opens, closes,
and lows was true in an uptrending market. In a market that was moving up,
I would be on guard if the close was lower than the open. I would start trying
to buy when prices were moving downward against the grain of the upward
trend. I would buy trade through breakouts of the high of the previous day,
My trend lines would be drawn from low to low.
"With these simple rules in mind, let’s look again at the bean oil chart.
1991 1991 1991 1991 5ИВ 35372
Mn
DC1H DAILY
01-23 05:3") 2312
+ 0
2560
2510
Z520
2500
2480
2160
2440
2420
2400
Z360
2360
2310
2320
Z3G0
22ЕЮ
2260
2240
2220
2200
Z10O
2160
2140
2120
2100
ZOBO
Z060
"Point A on the chart is placed just below a horizontal line showing a
congestion area. Prices were supporting at or near that line.
"Point В on lhe chart shows a gap down out of the congestion area.
Prices moved down to point C and then corrected on the following day,
marked E. The failure to make a new low on day E, created a Poss hook at
point C.
Since point D was the high of lhe previous correction, 1 would have
chosen that as the highest high for my trend line.
r,C-D would have been the first time 1 could have drawn a trend line. E
represents a one day correction. I would have tried io sell a breakout of the
low of that correction day. I wou:d have been filled twice on the next day —
once when prices took out the low of day Eh and once when prices took out
my resting sell stop at day C, the location of the Ross hook At the close» I
would have been showing a small profit on two contracts, a total of five ticks
on the first and a total of four ticks on the second. Since nine ticks
represented $54, I would have placed my protective stops to breakeven.
"The following day I would have been stopped out at the open. 1 would
have lost one tick on my first contract and two ticks on my second. I would
have been down $68.
315
"The subsequent correction broke through where lhe I rend fine would
have been, thereby ending the series, but leaving behind э Ross hook at point
F.
"I would now have been without a trend line, but day G would have
taken nut the Ross hook at point F, and $o I would have been short one
contract. At lhe close I was showing profits of $120. I then would move my
stop to a point at which I would be able to salvage at least 50% of my
unrealized paper profits.
"I would have been stopped out (he following day at the open with a
five tick profit, or $30. Subtracting costs would have lek rnc with a $20
loss. I would have then been down $88.
"Day H would have seen me short again as prices lock out the Ross
hook created by the failure of lhe previous day io make a new low,
"By lhe time of the close, I would have had $103 in profits, so I would
have moved my protective stop to protect 50% of ihose profits.
"I would have been stopped out the next day (I), having salvaged nine
ticks. Subtracting costs, I would have made $4 on the trade, and so would
then have been down a total of $84.
"I-K was a correction. I would have tried each day to sell a breakout of
the low.
"When the market finished correcting at К, I would then have been able
to establish a trend line from point J to point K.
"I would not have been able to enter a trade lhe day fallowing day K,
nor the next day, because of gap openings below the low of the previous day
"I would have gone short on day L as it took out the low of the
previous day I would have been stopped out for a loss of $85, That, added
to my existing loss of $84, would have pul me in ihe hole by an amount of
$169.
"Day M would have seen the high of the correction, and so f would
have connected day К to day M. My trend line would have been intact, and
so I would have kept trying,
”1 would not have been able to sell short on any of lhe five days
following day M.
"Day N created a Ross hook by failing to make a new low. The
following day, m, prices made a higher low by one tick, and reached the
height of the correction. I would have drawn my trend line to connect M to
m.
316
"On day О. f would have sold one contract as prices rook out the low
of the previous day, and another contract as prices took our the Ross hook.
At ihe close of day О, I would have had no profits to show fur the trade. The
following day, prices moved lower, and by die close 1 find 18 ticks of profit
between the iwo contracts. I would have moved my protective stop to
salvage at Eeast one-half of those ticks.
"From that point on, until my exit al day Z, my two contracts were
never In trouble. My 50% trailing stop would never have been hit.
"Let's continue, because there’s more.
"Day P opened one tick above where 1 would have had a resting sell
stop to short a breakout of the previous day's low. I would have been sh.orr a
third contract on day P, and been showing a profit of 22 ticks at the close. I
would have protected 11 of those ticks with a buy stop.
“On day 0, prices moved down even more, and by the close I would
have been showing an unrealized paper profit of 29 ticks. I would have
protected 15 of those ticks and been stopped out the following day. R, with a
profit of $90 less costs of $25, for a net profit on that contract of $65. Thai
would have reduced my losses to $104, with two contracis still open end
making money.
"Prices corrected to point R, and so day R would have become the next
point for connecting my trend line.
*On day S, prices traded through the Ross hook of day Q, I would
hove added contract number 3 at that point. At the close, the position would
have been showing a 16 tick profit. I would have protected one-hall of that.
"The protective slop would have held, and on day Tr I would have
added a fourth contract as prices took out the low of day S.
"At the close of day T, I would have moved my stop on contract
number three to protect 14 ticks of profit {1/2 ol 27 ticks made}, and would
have pulled my stop on contract number four to breakeven, as I had nine ticks
of profit in it.
"On day U, I would have been stopped out of contract number 4 at
breakeven. All my other positions were sale. I would have been down $154
less the value of my open positions,
"Day (J also would have seen me short a breakout of the low of the
previous day, By the close I was protecting 50% of 37 licks. This was now
contract number four
"Day V would have seen me protecting 50% of an additional 16 licks
for a total of 27 ticks of profit.
"The foilowing day would have seen me cashing that profit for $162
From that, I would have had to subtract $25, leaving me with $137 to apply
to rny debit of $154. That would have loft my actual cash at a loss of $17,
Place against that the value of my three open positions and 1 would have been
doing well.
3 17
"Prices corrected to day W, and the following day I would have beer)
short as prices took out the low of day W. By the close of lhe day I would
have moved my slop to breakeven with $78 of profit showing, This was now
□ pen position number 4.
"Day X would have seen me move rny protective stop to protect 22
ticks of profit, or $132 The following day I would been stopped out, netting
$107 on the trade. My cash position would have been plus $90.
“Prices corrected to day Y. I would have shorted a breakout of the low
□ f day Y, and boon stopped out the following day with a kiss of $85. My
cash position would have been up $5.
"At the time of day Z, I was protecting 50% of 108 ticks made from
the breakout of day Q down to the close of day X. I would have been
stopped out of trade number three with a profit of $324 less $25. or a net
profit of $299. My cash position would have been plus $304.
"At the close of day Z, a blow off day, 1 would have moved my stop to
just one tick above the high. I would have been stopped out there the
following day on my remaining two contracts. I would have made 105 and
106 ticks respectively on each of those positions. The total dollars would
have been $1266, less $50 costs, for a not of $1216. Add to that my
previous winnings of $304, and I would have had $1520 dollars to spend,
"So, whafs the point of all this? I want you io see what trading is
really like. I want you to see why you must keep your losses smell.
"Look at how many times I had to attempt this market and take small
losses before I was able to really score,
"That's what trading is all about. Keep in mind that the losses were all
calculated losses. There were plenty of them, but they were all within the
parameters of my trading plan. Would such a method work in today's
markets? You bet I The series of trades I just shewed you could have been
made starting with a chart of July 1991 Bean Oil, and going hack to July of
1990. The first trades shown were the short positrons on day F, which was
October 4, 1 99C.
"Did I actually make these trades? No! Why? Because I was trading
elsewhere at the time. But the truth is the truth. I’ve shown you how I
learned to trade. I traded that way exclusively for three years. I supported
myself and my family with my trading. I learned to be pattern and to wait for
trending markets.
"The method I was using forced me to wait, I was never allowed to
trade what I was thinking, I had to trade only what I sow. The truth I had to
trade with was aiways on the chart in front of me. There was no other truth.
I had no oscillator, and no moving averages. Just a trend line, and a straight
edge with which to draw it.
"When I looked bock at the chart, I sow I had missed a connecting
point. Since 1 had already used all lhe letters of lhe alphabet, day M connects
4s this Uif* only way to hove traded Bean Oil? Ггп sure it isn't, but
trading this way forced me to learn many valuable lessons,
“I learned that the trend was my friend as long as I honored it. As long
as prices were below the trend line, I traded only to the short side. If prices
were above a trend line, I took only long positions.
"I learned I had to take a lot of small hits. I learned noi to fear (hem. I
learned to cherish the profits I had, and to protect them. I learned to be
unwilling to give them all back.
"The losses had to come when I had little or no profit in a trade. The
losses had to be kept minuscule in size, My first account was $5,000, not
my own money. I had to borrow it, and I had to protect it. I had to put up
my home as collateral. I dared not lose that money.
"My arrangement with my lenders {rny uncles) was strictly business. It
had to be, and now I appreciate the reason why. If I had been given that
money, I would have soon lost it. It would not have been the same if it were
money I could just Ihrow away.
"I had to manage that money. I had to pinch every penny. I had to run
my trading as a business. This was no game. This was real. The roof over
my head was at stake,
"I was forced to learn to enter a market more than once, to make
numerous attempts. To do this, I had to conserve capital. И I were to take a
big loss the first time in, J would in no way have the courage or the capital to
try again.
"Can you see that? If you allow yourself to take a beating on a trade, it
not only greatly diminishes your capital, but it deprives you of the will to
continue trying,
"Although we can be somewhat sure of the trend {it's true while it
lastsb we can never be sure of the timing. No one knows exactly when a
market will break and run, or when it will continue to run. Consequently, you
have to be prepared to make several attempts.
"It's the sort of thing where you stick your toe in the water to see if
it's too hot. If you get burned, you are quick to pull that toe out of {he water.
So you wait. When you see that it's time to try again, you slick that toe back
into the water. Perhaps this time you can go swimming. If not, try again.
But you don't just jump in and get scalded with third degree burns all over
your body.
"If you sit there and take a big loss, you will have been badly burned.
You'll be like a whipped dog. You’ll have to slink away to a corner and tick
your wounds. You'll no longer have the courage of your convictions. Do you
know what you will do then? You’ll probably go out and buy another system.
"I don't know where I read this, but it says it all. "When a woman has
a bad day, she goes out and buys a new hat. When a trader has a bad day,
he goes out and buys a new system," If you know who first said or wrote
that, let me know.
"When I do a mailing for my books, do you know who sends for them?
That's right, the person who just took a big hit in the market.
"If 1 mail the same list again, I’ll get the same number of sales. Why?
Because next time Г11 get others who have lost.
"The winners almost always throw my letter in the trash. Who wants
to read a book about trading when he is winning? How many of you are
willing to shell out $2500 to $3000 for a new system when you are ahead in
your trading?”
True Correction Method
A method I often use is one 1 call the "True Correction" method. It's
similar to lhe segment method but it differs in that a line connecting two
segments cannot be drawn until a true correction lias taken place.
I'll show the difference between the two methods side by side.
TCM SM
t; The difference is that under the True Correction method
"1 I cannot count a segment until there has been a takeout
of the low. A segment cannot be counted until a new low
is made.
No difference here because the correction has taken out
the intervening lows.
n But look at the difference in the count when there are
В progressively higher lows. Obviously, the True Correction
' method is more conservative.
Ranked in order from most conservative to most liberal they arm
True Trend method
Successive New Extremes
Sagging Taps and Rising Bottoms
True Correction method
Segment method
If s best to pick out one that fits your temperament and style of trading
and stick with it. When you become proficient in using one, begin to master
another. Eventually you will become extremely good at detecting a trend just
as it is being born. Don't become entirely mechanical in using these methods,
Mix and blend them with good judgment. Always look at the big picture, Got
perspective, Move to a greater time frame. Step back and view the entire
chart. Squeeze the price bars closer together and take a broader outlook on
the entire situation.
320
Summary
Here is a verbal recap of the various methods for identifying die very
beginnings of a trend:
True Trend Method (TTM): Downward
The True Trend Method does not require counting or shifting. It only requires
the ability to draw a trend line in an already trending market. The method
involves connecting highs to highs in a downtrondiog market, and lows to
lows in an up trending market. When analyzing downward, you connect the
highest high of the last up leg to the current correction high. After that you
repeat the process by connecting the current correction high to the next
correction high.
When applying downward, you are allowed to connect correction bar tops
only to correction bar tops. The method needs only a single higher high
(correction bar) in a downtrend in order to create a connection. That is to say
you need only ONE connection {one correcting bar) to draw a trend line. Once
you have an established trend line you try to sell a breakout of the low of
each day in which the market moves towards the trend line. The sell point is
1 tick below the low of the previous day, which once trading begins,
represents a breakout of yesterday’s low. You stay in the trade as long as
prices move away from the trend line by making a lower high, and/or a close
lower than lhe open. You add to your position as price moves away from the
trend line by selling trade-through breakouts of the low of each correction bar.
You also are to place a resting sell stop below every Ross Hock. The True
Trend method is not considered a counting metItod. You aren't counting
anything; youTe simply connecting comedian extremes to correction
extremes.
True Trend Method ITTMк Upward
The True Trend Method docs not require counting or shifting. It requires only
lhe ability to draw a trend line in an already trending market. The method
involves connecting lows to lows in an up trending market, and highs to highs
in a down trending market. When analyzing upward, you connect the lowest
low of the last down leg to the current correction low. After that you repeat
the process by connecting the current correction low to die next correction
low. When applying upward , you are allowed to connect correction bar
tied toms only to correction bar bottoms. The method needs only a single
lower low (correction bar) in an uptrend in order to create a connection, That
is to say you need only ONE connectron lone correcting bar) to draw a trend
line. Once you have an established trend line you try to buy a breakout of
lhe high of each day in which the market moves towards the trend line.
The buy point is 1 tick above the high of the previous day, which once trading
begins, represents a breakout of yesterday's high. You stay in the trade as
long as prices move away from the trend line by making a higher low, and/or
a close higher than the open. You add to your position as price moves away
from the trend line by buying trade-through breakouts of lhe high of each
correction bar. You also are to place a resting buy stop above every Ross
Hook. The True Trend method is not considered a counting method. You
aren't counting anything; you're simply connecting correction extremes to
correction extremes.
321
Successive New Extremes Method (SNEM]: Downward
The Successive New Extremes Method requires counting but does not require
shifting. The method needs 3 consecutive bars of Lower Lows when
considering a downtrend; you must see 3 bars of Lower Lows in a row. You
need focus on only one side of the bar; lows when you're counting
downward, and highs when you're counting upward. The method does not
require that you wait for a correction bar. You simply sell one tick below the
low of the bar representing the 03 segment.
The Successive New Extremes Method is considered a counting method. I:
requires a three count before entry. There is no shifting of the count involved
with this method. You sell a breakout of a low of the bar that makes a third
successive lower low.
Successive New Extremes Method (SNEMk Upward
The Successive New Extremes Method requfres counting but does not require
shifting. The method needs 3 consecutive bars of Higher Highs when
considering an uptrend; you must see 3 bars of Higher Highs in a row. You
need focus on only one side of the bar; highs when youTe counting upward,
and lows when you’re counting downward. The method does not require that
you wail for a correction bar. You simply buy one tick above the high of the
bar representing the 03 segment.
The Successive New Extremes Method is considered a counting method. It
requires a three count before entry. There is no shifting of the count involved
with this method. You buy a breakout of a high of the bar that makes a third
successive higher high.
Sagging Tops and Rising Bottoms Method (STM & RBM)
Sagging Tops (STM); Downward;
The Sagging Tops Method requires counting but does not require shifting.
Sagging Tops require 3 consecutive bars of Lower Highs. Three consecutive
bars means exactly that, three consecutive bars; no intervening bars are
allowed. You need focus on only one side of the bar; Lower Highs when
you're counting downward and Higher Lows when you're counting upward.
With Sagging Tops, it is not necessary for new lows to occur: you need only
for Lower Highs to occur. Each lower high counts one. Three successive
lower highs yield an entry signal at the point where the low of the bar that
made the third lower high is taken out. With Sagging Tops, look for three
successive lower highs Sell a breakout of (he low of the bar dial made the
third successive lower high.
The Sagging Tops Method is considered a counting method. It requires a
three count before entry. There is no shifting of the count involve.
3 22
Sagging Tops an Rising Bottoms Method (STM & RBM)
Rising Bottoms (RBM): Upward
The Rising Bottoms Method requires counting but does not require shifting.
Rising Bottoms require 3 consecutive bars of Higher Lows. Throe consecutive
bars means exactly that, three consecubvc bars; no intervening bars are
allowed.
You need focus on only one side of lhe bar; Higher Lows when you’re
counting upward and Lower Highs when you’re counting downward. With
Rising Bottoms, it is not necessary for new highs to occur; you need only for
Higher Lows to occur. Each higher low counts one. Three successive higher
lows yield an entry signal at the point where the high of the bar that made the
third higher low is taken out. With Rising Bottoms, look for three successive
lower highs. Buy a breakout of the high of the bar that made the third
successive higher low.
The Rising Bottoms Method is considered a counting method. It requires a
three count before entry. There is no shilling of the count involved.
True Correction Method (ТСГИ); Downward
The True Correction Method requires both counting and shifting. When
analyzing downward, the True Correction Method must have a Lower High
AND a Lower Low on the same bar before beginning the count. Thus
beginning from the last high in price, any bar having both a Lower High AND a
Lower Low, on the same bar, becomes the bar representing segment number
one.
After the first segment has been labeled this method is similar in every respect
to the Segment Counting Method; meaning you need only Lower Highs for
segments 2 and 3. If the bar representing segment 3 isn't taken out by the
very next bar, you shift the count 1 segment to the right and begin the count
again.
The True Correction Method is a counting method. It requires a three count
before entry. In a downtrend you try to sell 1 tick below the low of the bar
representing the #3 segment.
Il is important to note that there may be several intervening bars between the
segments.
To repeat, the True Correction Method docs require both counting and
shifting
True Correction Method (TCM)i Upward
The True Correction Method requires both counting and shifting. When
analyzing upward, the True Correction Method must have a Higher Low AND
a Higher High on the same bar before beginning the count. Thus beginning
from the last low in price, any bar having both з Higher Low AND a Higher
High, on the same bar. becomes the bar representing segment number one.
323
After the first segment has been labeled this method is similar in every respect
to the Segment Counting Method; meaning you need only Higher Lows for
segments 2 and 3. If the bar representing segment 3 isn't taken out by the
very next bar, you shift the count 1 segment to the right and begin the count
again.
The True Correction Method is a counting method. Il requires a three count
before entry. In an uptrend you try to buy 1 tick above the high of the bar
representing (lie #3 segment. Il is important to note that there may be
several intervening bars between the segments.
To repeat the True Correction Method does require both counting and
shifting.
Segment Counting Method (SCM): Downward
The Segment Counting Method (SCM), like the True Correction Method,
requires botti counting and shifting. When analyzing downward, lhe Segment
Counting Method needs only 3 Lower Highs. You attempt to sell die breakout
of the low of the bar representing the #3 segment.
The segment highs do nut need to be successively lower highs. There may be
several intervening bars between the connected highs. The method does
require 3 segments AND a breakout by the very next bar or you must rephrase
the count by shifting 1 segment to lhe right and begin a recount.
When applying downward, breakout means a takeout of the low of the bar
representing the #3 segment. You do not need to wail for a correction, you
simply sell the low of the bar representing the #3 segment.
This method works well on the S&P intraday. You use the SCM to count your
way out of congestion; once you have a breakout you trade lhe trend and
stop counting.
Segment Counting Method (SCM): Upward
Segment Counting Method (SCM), tike the True Correction Method, requires
both counting and shifting. When applying upward, the Segment Counting
Method needs only 3 Higher Lows. You attempt io buy the breakout of the
high of the bar representing the #3 segment.
The segment lows do not need to be successively higher lows. There may be
several intervening bars between lhe connected lows. The method does
require 3 segments AND a breakout by lhe very nexi bar or you must rephrase
die count by shifting 1 segment to the right and begin a recount.
When analyzing upward, breakout means a takeout of the high of the bar
representing the #3 segment. You do not need to wait for a correction, you
simply buy the high of the bar representing the $3 segment.
This method works well on the S&P intraday. You use the SCM to count your
way out of congestion; once you have a breakout you trade the trend and
stop counting.
324
Gt?neral Comments
The True Correction Method (TCM1 and the Segment Counting Method ISCM)
are both counting methods that require shifting. The only difference is when
you begin to apply the count.
In the True Correction Method, when counting up, you must have both a
Higher Low AND □ Higher High on the same bar before you can begin the
count, after that you need only Higher Lows; while in the Segment count,
you need only Higher Lows for all three segments.
When counting down, you must have both a Lower High ANO a Lower Low
on the same bar before you can begin the count, after that you need only
Lower Highs; while in the Segment Counting Method you need only Lower
Highs for all three segments.
When applying either method, True Correction or Segment Counting,
whenever you fail to take out the extreme of the bar representing the third
segment, you have to shift the count and begin recounting from one segment
to the right.
Note; The terms segment counting and segment method are one and the
same, and are used interchangeably throughout this book.
325
Chapter 28
Full Circle
I’ve been showing how I trade Intraday charts.
However, despite my daytrading escapades, I have never left off
position trading of the daily charts. This is something I mix. in with my daily
trading. Here’s how I do it, and it takes me right back to the earlier parts of
this book.
Whenever a trade derives from one of my major entry signals, I then
have a perfect candidate for a position trade.
For instance, when prices break out of an envelope or from a ledge,
when prices lake out a 1-2-3 high or low, or a hook, I have an opportunity io
add contracts to the trade. These additional contracts will be held overnight
along with any others that are still open.
I'm not going to go into how I trade them here, because how I do it
is/was the subject of Trading by the Book. But clearly, my positioning in the
trade based upon lhe optimization I can get from the intraday entry make
these position trades better and more profitable than they arc just trading
them from a daily chart.
By optimization I mean that, because Гт able to enter from a breakout
of the intraday congestion that comes before the actual breakout point on the
daily chart, I am usually in the trade earlier than I would have been using just
a daily chan. That means that when the other traders enter on the breakout
of these significant major entry points, they often give a boost to my already
positioned contracts, driving them further ahead in the direction in which Гт
trading.
By optimization, I mean not leaving ariy more money on the table than I
have to.
It’s rather like what some of the pros and floor traders I know do with
moving averages. Some of them are mindful of where nine and eighteen day
moving averages will cross, and position themselves in the market ahead of
time in order to be there when the sheep who take these signals as gospel
truth all dive into the market driving it to profits for lhe pros. Believe me, the
pros will soon bail out, undermining the market and leaving lire sheep to
wonder what happened to the trade.
Other professionals watch other tilings they know will bring the
"suckers1' (their word — not mine) into the markets.
I'd like to take what’s left of this book to talk about some of these
things in general — things I hope arc of interest.
When I’m trading, if I don't know what is going on, I don't trade. This
is a rule of trading I'm sure you have heard before.
Yet I know that many ignore this rule. I Can tell by what is said to me
on the phone and in letters.
336
The reason for not knowing whai is going on is an unwillingness to
make the effort necessary To become a goad Trader,
Trading is hard work. It's not easy. I spend 85% of my time getting
ready to trade and only 15% of my time trading.
That means doing my analysis work before I trade. How else сап I
know what's going on? I can't judge from the news. I can’t listen to the
opinion of others. I have to analyze the market and then trade from what I
see.
I try to never trade what I think, only what I sec. My opinion is
worthless, and what I think is my opinion and nothing more.
Here's how I was taught to do my analytical work.
First, I went through all my chans to get an overview of the markets.
During that time, I looked for trending markets. Trend linns were placed on
the charts as long as they had a 30° or greater angle. Until I became used to
what that looked like, I used a protractor to determine the angle. This action
got me used to identifying the trend.
Next, 1 went through all my charts again looking for against the grain
moves — the intermediate trend that went against the longer term trend. This
alerted me to markets that might soon resume trending.
Then I went through all my charts looking for Ross hooks. I marked
each hook with a bright red 1hh". Then, in light of lhe size of my margin
account, I tried to select those markets that appeared to have the greatest
potential, and I placed order entry stops just above or below the hooks.
These were resting orders in the market, i tried to never miss a hook. I
phoned my orders in daily.
How did I know which markets had the greatest potential? The answer
is simple. I selected those markets which had the strongest trend lines.
Now there was a trick to this. I didn't want too steep an angle,
because in an up market that often signals (hat the end of a move is near.
Markets that break out too fast and go straight up rarely give an opportunity
for entry before they start to chop around in congestion, Markets that have
been going up at a steady angle, and suddenly that angle steepens, are giving
□ warning that the move may soon be over.
In down markets I was willing ю allow a sleeper angle, because often a
market will move down three times faster than it moved up.
What I most wanted was trending markets that were making a
retracement. Them I could attempt an entry as the market retraced» when it
reached the proximity of the trend line, and then seemed to resume its trend,
and when it look out the Ross hook created by the retracement.
Sometimes I had to wait for weeks before the markets started trending.
Tho same is true today, nothing has changed» There will usually be al least э
couple of markets in that condition, but there are times when there are none.
327
Yet I did rny homework every day. There was no way to know when
an important breakout, the beginning of a trend, would occur, unless I
performed my daily analytical work.
Finally I would set my work aside and take a break for dinner. After
dinner, when my head had cleared a bit, I would look at them again. I would
then do my best to come up with a trading plan. I would try ю think through
what I was going to do. I would ask myself a million “what if’s," I tried to
anticipate what might happen in the market.
Often, that kind of thinking would cause me to eliminate some of my
potential trades. Also, a second look at times resulted tn "Why didn’t I see
this before?"
For instance, what if 1 was looking at a market and il was approaching
its trend tine. Wouldn't it have been reasonable to ask myself, "II this market
breaks the trend line, what should I do?" I asked myself how such an event
would change the picture. If! had a position, I asked myself il I still wanted
to hold it. If I had no position, I asked myself, "Is this an event that will
cause me to take a position opposite what was the trend?" If it was such an
event, then should I place an order entry stop with limit, just outside of that
trend line? Very often, when prices approach a trend line from what has been
a trending channel, they are already in a counter trend within the channel.
That means a breakout of the trend line would be a continuation of this newly
formed trend.
Finally, I would put my work aside and go to bod. In die morning I
would look at my charts once again. Then I would write out scripts for the
orders I wanted to place.
I would rehearse how authoritatively I was going to give these orders,
Al) this and more I did before I entered a trade. But most traders do
their analysis after rhe trade is made. Too often, they do it when the trade is
already going against them.
Many times traders go into a trade, and then when they are in it, they
say to themselves, "Oh no, why didn't I see that before?" How could it have
been seen before if they hadn't looked, and looked again, and ihought about
it, and then perhaps looked one more time?
Also, many traders do their analysis after entering the trade in search of
a justification for having entered. "Now I'm in the trade, let's see if I can find
a couple of good reasons as to why!"
If I want to continue as a successful trader, I have to be fiard. Hard on
myself and hard on my broker. I don't mean I have to be a rat, or be impolite,
or be contemptuous. I just have to be firm in all I do. 1 can't afford to be
"Mickey Mouse" about the way I do things. This is a business, i must be
businesslike in conducting my affairs.
32 8
As a business person, I must manage my business. One of (he main
functions of management is planning. I have to plan my trades. Other things
I look for as I go through my charts are: One-two-three formations, cups with
handle, matching congestions, reversal bars and dojis + These arc all part of
my plan.
I have to have good reasons) for getting into a trade. But, too often
others get into a trade, and then look around to see if there was a good
reason for having done so. That way they justify to themselves that (hey did
the right thing, when in fact they did the wrong thing.
The horrible thing about not doing analysis work and researching a
trade is that they give more thought to choosing which flavor ice cream they
will eat than they give to which market to enter and how and when to do it.
By not taking the time for preparation, they end up not having enough
time to weigh the pros and cons or really familiarize themselves with what
they are getting into.
They don't have time to realize that prices have supported two ticks
away from their entry about forty times in the past. They don't have time to
see that they are trading right into overhead selling, They don't have time to
notice that if prices break out of yesterday's high, they will also probably take
out a Ross hook. They don't have time to see where prices are In relation to
the trend line. They don’t have time to really grasp the overall trend, or the
wave that is going counter trend. They don't have time to really consider
where they will place their stop. They don't have time to read the market and
to see what it might be telling them.
All these things could be anticipated ahead of time, but if they have not
done their homework, they will end up chasing markets in a desperate
attempt to get into "the big move."
Here's one item 1 look for when I am in a trade. It's a piece of
information I was taught a long time ago. Amazingly, it is now coming into
vogue via the Japanese candlestick charts. It has to do with what I have
always called a ' reversal bar."
I'll show an example of what I look for.
Essentially, there are (wo forms of reversal bars. Singly, one is more
important than the other; in combination, they are just about equally
important.
329
The least important is what the Japanese call a "doji.11
and have adopted it into my trading lingo, it looks like this:
I love that term
The main thing to notice about a
doji is tho fact that tho open
and the close are about the same.
The open and close do not have
to be exactly the same, just very
near to each other.
330
I
A high percentage of the lime, when 3 see a doji and a market is
trending, I'm alcrlcid that the market is going to go the opposite way on the
following price bar.
A more important reversal bar is seen when in a down market I get a
close that is higher than the open, and m an up market I get a close that is
lower than the open.
An even stronger indication of an
imminent major trend change comes
when there is a combination of a
doji and a reversal bar.
Reversa l bar “> ’
1<- Doji
The very best indicator of a trend change
comes when there is a combination of two
or even three successive reversal bars, or
a combination of dojis and reversal bars
mixed in with one or two bars that fit the
pattern of the trend.
Note: I do not confuse the mix of bars in a
trending market with those in a congestion.
A look at congestion areas on most any
chart will show that there arc usually
reversal bars almost every other day.
When I see a series о I reversing bars,
(open higher than dose on one day, and
close higher than open; the next day, I
get out of the market. И I were not in
I'd stay out until J see a breakout or
come to the realization that the market is
trending.
These reversal bar, doji combinations occur in a downtrend while I'm
still seeing lower highs and lower lows. Conversely, they occur in an uptrend
while I'm stilt seeing higher highs and higher lows. In other words, to the
casual viewer, it still looks as though the trend is intact. Blh if a trader knows
how to read a market, as I was taught, these reversal bars and dojis are
powerful signals.
If E have a position when these combinations occur, it is time to really
lighten up my stops. I get ready to bail out.
I would say that dojis work singly about 55% of the time: in
combination with a reversal bar, about 70% of the time. A single reversal bar
will indicate a trend change of at least one bar about 65% of the time. A pair
of reversal bars will indicate a counter trend move from 70-75% of the time.
These figures are just estimates based on experience. I've never actually
counted to see the exact percentages. All I know is that they work. They are
an example of letting the market tell you what it is going to do.
When a trader knows how to read a market, and has a pretty good idea
of what it is going to do, then he is able to get in step with that market and
go along tor a ride.
331
The Floor
Many "at home" traders wonder, "What in the world is going on down
on the floor? How is it that floor traders always manage to fade those trading
off the floor? Does it have to be that way? Why is it that floor traders can
trade against the trend and get away with it?
Floor traders certainly appear to have the advantage over the rest of us.
But do they really?
It's important to know the truth. It's vital to daytrading to know where
and when the floor traders have the advantage and where and when they do
not.
Let's get a few tilings straight.
Floor traders as a rule don't do any better than anyone else as far as
succeeding in this business. The mortality rate is very high. They come in
with their money and go out broke just as daytraders and positron traders do.
They constitute trading casualties in the markets (he same as others.
They have some advantages. Here are a few of them. 1. They can
trade at a much lower round turn cost than I can. They pay somewhere
around $1.50 for a round turn. 2. They can see (he bid/ask prices and the
size. Because they can sell at the ask price and buy at the bid price, floor
traders may seem to be able to trade against the trend, 3. They can see who
is coming onto the floor. 4. They can ‘ hear" the market. They can react tn
the noise of a busy market. They can move with the marker as soon as they
sense the excitement. 5. They do not suffer the terrible time delays we have
in getting our orders to lhe floor; They are there and can react as fast as is
humanly possible.
I can sell only at the bid price and buy only at the ask price. I also pay
much higher commissions. I've always wondered just how unfair are Lhe
commissions that are charged? Dees it cost the broker any more to buy or
sell a fifty lot than it does a one lot? Why do I have to pay the same price per
car when I order ten, as I do when I order one? Wouldn't it be more fair if I
paid a single commission regardless of how many contracts are in a lot? In
addition, I would pay lhe exchange fees per contract, same as the floor,
1 have the inevitable time delay ol dialing lhe telephone, wailing for
someone to pick it up at the other end. recording my order, calling the trading
desk, waiting while they record the ticket, and wailing for the order to be
arbed over to the pit via hand signal or runner. To make matters worse, I
have to pay atrocious commissions, several times as much as do the floor
traders. Even though I call straight to the floor at each exchange where 1
trade, it takes time to do the paper work.
Because of these disadvantages, I must trade with as much in my favor
as possible.
How do I do this? Noiice carefully what Гт going to show.
332
Because I cannot see the bid/ask, I must trade only with the trend. 1
must be a buyer in up markets and a seller in dawn markets, Once a bull
trend is definable, then I must buy every lime I can. Thai means buying
retracements by trying to buy breakouts of the highs as prices move away
from the trend and buying breakouts of highs when prices are moving towards
the trend. Once a bear trend is definable, 1 must sell at every opportunity.
That means trying to sell breakouts of lows on the retracement days, and on
the days where prices move in the direction of the trend.
As crazy as it may seem, statistics show that as prices approach a
trend line due to a correction, the odds become two to one in favor of a
successful trade if I enter in the direction of the trend. The best place to do
so is when prices have changed direction back towards the trend direction.
I must not attempt to trade in sideways markets. It is in lhe sideways
markets, called trading ranges, that I get myself killed.
Trading ranges are just what the term says. They are an area that is
strictly for floor traders. They arc a "trader's range." They are strictly for
those traders who have the shortest term view of (he market. This is (rue
whether I am trading a daily chart or a five minute chan. Trading ranges are
for traders - floor traders, those down in the trading pits. I stay out of them.
How can I neutralize the time advantage the floor trader has? I can do
this only by having resting stop orders for entry into or exit from a market.
That way my order is down in the trading pit when prices reach my target
and can be executed as quickly as is humanly possible.
The only way I can ever pay lower commissions is to call my own
shots, and patronize the discount brokers. I pressure them constantly to give
me lower rates. I bug the blazes out of (hem tor lower commissions. Of
course, traders could bombard the exchanges with letters telling them how
they feel about being raped on every trade.
There is not much I can do about seeing who comes in to trade, and I
cannot hear the trade as they do on the floor. Hopefully, that disadvantage
will disappear if and when they place the floor traders in front of a screen and
out of lhe pits.
I've often wondered what would happen if traders with live data feeds
demanded to see the bid/ask on their screens. Surely if they can provide the
floor traders with such information when they remove them from the pits,
then such information could be provided to those with live data feeds.
The next question arises. Do I have any advantages at all over the floor
traders? You bet I do. I can go for the long pull, I can trade the trend!
A floor trader who is a scalper (most are) is looking for a few ticks and
then out. Quite often, after the scalpers get out, lhe market goes on to make
a bundle of additional ticks. The scalper leaves those lying on the table for
me to take.
333
How can J take advantage of that situation? When the scalpers start
cashing their profits, lhe market wilt retrace somewhat. Il is the liquidation by
scalpers and short term floor traders that create minor retracements in
markets. Great! I wart for the retracementr As soon as prices move back in
the direction of the trend, I jump in.
The floor trader can actually lose his shirt when a market makes a big,
sudden move as did the stock market in 1987, and again in 1989. In those
instances, lhe public took hold of the market.
There are some real horror stories that came out of the markets during
those times.
Let me quote from some material written by William F. Eng, a
professional trader. I made a copy of this for my files. It’s quite interesting.
"The quandary posed to the professional when the public takes hold of
the market applies not only to bull markets, but also to downside markets,
Horror stories abounded after the October 19, 1987, worldwide market crash.
Friday, October 16, was die first day of the massive downdraft. Many
professionals who were still in business on that day told me that they had
substantial profits on Friday's close. They came into the markets Monday
opening short and made embarrassingly huge amounts of money immediately
at lhe opening bell. As one professional told me: 'I couldn't help myself. The
market just handed me fistful's of money.' ft was what happened during the
rest of that Monday, October 19, that did these professionals in. The market
opened much lower, rallied, and then sold off dramatically. On the opening,
some pros covered shorts. As the market went lower, they started to go long
at 150 point lower, then 200 points lower, then 300 points lower, then 400
points lower. It looked as if the lows of the century were going to be tested.
Al the bottom they sold all their positions."
Such was also the fate of the Fibonacci traders. Fibonacci traders buy
at the .382. .50, and .618 retracement levels. They expect the market to
reverse there. Imagine how badly they ale their shoes during ths crashes of
1987 and 1969? When the market started down, they would have boughr at
those levels, expecting a reversal to be imminent. When they finally decided
to sell their long positions, who would have been there to buy them? They
would have eaten those positions big-time. Most of the ones I know received
margin calls and went bankrupt. They simply couldn’t sustain a loss like that.
Cup with Handle
Several years ago, when I first subscribed to Investor’s Daily, my
subscription came with a free book written by the publisher of that
newspaper.
In the book was described a formation termed a "cup with handle.'* I
picked up on that formation, and it has stood me well ever since. I’ll share
that with you.
On the next page is a chart of crude oil. It shows the cup with handle
formation, Ц also turned out to be □ matching congestion formation, just as
can be seen on an intraday chart.

As I've noted before, matching congestions occur on intraday charts,
daily charts, and on weekly charts as well.
CL DALLY
!
DEC
JAM	FEB
iiiiHiiiillihiillniiH [
MAR
APR
2B50
2B00
2750
2700
2650
2600
2550
2500
2450
Z400
2350
2300
2250
2200
2150
2100
2050
2000
1950
1900
1850
WOO
1750
1700
1650
1600
d hkiiipBtpBifi'iii
The cup with handle formation is created by a dip in prices followed by
a congestion that towards its end begins to have rising bottoms.
When trading the cup with handle in the stock market the anticipation
is for the market to go up. When trading futures, the anticipation is for a
breakout in either direction. That is a significant difference.
Notice carefully that whenever there is a light congestion with rising
bottoms, it will usually break and will have a strong move to the upside.
The reverse is also true, A tight congestion with falling tops will
usually go down sharply, very soon.
33 5
CL DAILV
4
DEC
JAN
2856
2806
2756
2700
2650
Z606
2556
2500
2450
2496
2350
2300
2Z50
2260
2156
2100
2050
2060
1550
1900
1850
1800
1750
1706
1656
1600
FEB
ПАИ
APJ1
r
r
The matching congestion areas are also ал excellent way to enter a
market. The upward bias of the rising bottoms gives a pretty good clue as to
which way prices are going to break out. The chart above gives me an
opportunity to offer another concept — hedging a position.
Hedging
On the day shown by lhe arrow, the close was sharply lower than the
open.
I was long June crude oil and hedged my position by selling an equal
number of July crude oil corHracts at the close.
33 6
If prices were to gap down on the next day's open, I would have a
chance io make back on the July whai I would lose on the June. That would
preserve the profits 1 had made to (hat date.
The hedge works like this: Long June crude at 1951 per contract. The
close was 2048. I had 97 points per contract of profit in the June.
If prices were to gap down on the open, because crude oil trades in
London overnight, I would be able to preserve most of my profits.
As of the close, May crude had the strongest contract, June was next
strongest, and July was the weakest.
My reasoning was if prices moved down. I would make more on the
weak July than I lost on the stronger June. If prices should turn and move
up, I would make more on the stronger June than I lost on the weaker July.
All in all, it beat placing a stop in a market that was hovering above a gap.
If I were to place the stop just below the low, and it got taken out
there, 1 would have been Okay and would have salvaged 95 or 96 points.
Then I would have been out of the market and have had ю reorder at a higher
level. But if prices would have gapped past my stop, I stood to lose a healthy
portion of what I'd already made. So what 1 did was to hedge my own
position in the market. This enabled me to give crude oil every chance to
resume its upward trend
Protective Slops
Stop placement is where we separate the kids from the adults. Stop
placement is the sole responsibility of you as the manager of your trading
business. It is one buck you cannot pass. You are the end of the line when it
comes to placing stops.
Let me show you why you, and only you, can decide where to place
the stop. There are several considerations:
The size of your margin account has the greatest effect on stop
placement. When you look at a trade and see where the stop should go, or
where you would like it to go, you then have to look at the size of your
margin account and determine whether or not you can even consider the
trade.
Your comfort level. Although you may have sufficient margin to
place the stop where you would like to, and although (he stop is logical for
lhe trade, you may not feel comfortable with the stop being so far away for
even so close), and so you will decide not to take the trade with the stop far
away, or move (he stop back if it appears too close.
Volatility. You must take into account marker volatility when
placing your protective stop. If a market that normally licks five points at a
time suddenly begins to tick twenty points a( a time, you must certainly take
that into consideration. You may find out 1h<ii you have to place your stop
too far away for the size of your bank or your comfort level.
3 37
When you use rnental slops, there are two other considerations which
you must ponder when placing your protective stop. They are; Your speed in
placing the order, and the speed at which your broker can place the order.
Let's look at each.
The speed at which you can place lhe order. This depends upon
how fast you think on your feet. There are three factors here: Perception,
decision, and action. How long does it take you to perceive that NOW is the
lime to pick up the phono and place your stop in the market?
Then, once you make the perception, how long does it take you
to decide to do something about what you have perceived? Are yon quick to
decide upon your perceptions? Finally, arg you quick to act once you have
made a decision?
Some of us arc very quick in ail three areas. Some of us are too
slow to utilize mental stops. Only you can tell from the experiences you are
having in the market whether or not you are quick enough to use mental
slops.
Other factors that can enter in arc based upon your trading
environment. Whether you trade at home or at the office, if you are subject
to interruptions, you dare not use mental stops.
The speed at which your broker can place the order depends
upon his organizational setup.
1Г you have a broker who is a "chatty Charlie", watch out. Even
though he may not be chatty with you, he may fool
order in while he chats with one of his other clients.
If your broker is one who trades a lot,
he may be taking care of his own before he gets
around to taking care of yours.
around with getting your
Other considerations are: Whether or not you are able to call
directly to the trade desk on the floor, and better yet, whether you can call
directly to someone stationed next to the pit,
If you are using mental stops, you should time your orders. Find
out hew long it takes from the time you roach for the phono until you hear
that you are filled. Test this procedure in several markets On several
occasions.
Then you may want to use my "tick-in-half" rule. For every 1/2
minute your order cakes — from the time you reach for the phone until you
get your fill — add one lick to your mental slop. If this is satisfactory
slippage, then its okay for you to use mental stops. Time these as flash fills
since your menial stops should be market orders.
338
The number of trades you already have an in other markets can have an
effect upon where you place your stop, If you arc already pretty well
margined-up. you may not be able to financially, or comfortably afford to put
on another trade with the protective stop in the place you feel right in having
it. In that event, it's best to pass this trade, or liquidate another trade so that
you can comfortably enter the one you are contemplating. Remember, if you
overtrade, put on too many trades, you will get into trouble and have to ptace
your stops too close.
There are other considerations that may be involved in special
situations which affect where you will place your protective stop, and
whether or not you want to take the trade when you see where that stop will
be.
The main point is. if you can’t place the protective stop where it should
be, don't enter the trade.
I think that from the previous discussion, you should be able to see
that protective stop placement takes a good deal of planning and thought.
It’s part of what you do 85% of the time you arc a trader.
Why? The markets trend only 15% of the time, You should be trading
only 15% of the time in any of the markets that you trade. The other 85% of
the time you should be planning, organizing, delegating, directing, and
controlling. That is what a good manager does. Inherent in owning and
operating your trading business is proper management. When I spend the
proper amount of time preparing to trade, administering and managing the
trade, 1 don’t have time to sit and watch a screen all day. I don't have time
to overtrade Гт busy keeping track of what is going on. Гт filling out order
sheets. I’m almost constantly on the phone directing my broker, Гт listening
to the playback of my tape recorded orders. I'm one lively dude, and I look as
if someone speeded up the film, Гт busy, busy, busy. Гт thinking ahead —
what if, what if, what if? "What if prices take out that low? What will I do
then?” "What if this is a reverse hook, what then?" "This looks like
congestion, what do f do next?" I plan, I anticipate, I call in orders, I cancel
orders. I move stops. I bug my broker for fills. I check to see if I'm making
enough points. I manage my trading business,
Fibonacci Fallacy
In my leaching, I have often mentioned the use of Fibonacci techniques
and concepts. You should know by now I utilize them in only two ways: I
use them to make projections of where the market might go so 1 can set profit
objectives, I restrict this to one situation only: The breakout of a Fibonacci
envelope placed around a trading range (Part I, Trading by the Book) — which
is an expansion concept; and to determine where I might expect support or
resistance in a market — which is a retracement concept.
I place absolutely no credence in any sort of "magic" involving
Fibonacci numbers and ratios. I would NEVER, EVER, consider trading
retracements to them with one exception — trapping prices between a
Fibonacci ratio and a 4/1 offset moving average when I want to enter an
established trend (Part II, Trading by the Book).
339
I might lack for a bounce at a Fibonacci retracement, but I would never
trade it solely because il was a bounce from such a retracement. El has to be
coopted with something else, in this case the 4/1 moving average. I would
never, under any circumstances, set an entry order at a Fibonacci ratio level
other than by mere coincidence.
To me, with the exceptions mentioned above, the use of Fibonacci
ratios is restricted to the level of telling me whether or not a market is acting
normally.
Now I want to explain exactly why Fibonacci trading is wrong — a false
god — a deceiver that will allow a trader to win sometimes, only to suck that
same trader in and strip him of his wealth at other times. When a trader
trades the "golden ratios'*, he is doomed to continually give back what he has
worked so hard to gain. Гт going to call this section:
Capital Preservation
In Trading Is a Business, I taught a number of the things Ггп going to
say next.
To operate one's trading as a business, sufficient capital with which to
trade must be available. This capital will give control over the trading
opportunities that present themselves. The more capital available for trading,
the more opportunities there will be to make that capital go to work, tn that
way the trader can guide his career as a business-like trader.
When trading, there are a number of ways to control risk. Stop
placement is one of them. There is, however, only one way to preserve
capital — trades must be planned. A trader must learn to think them through,
so that he can ascertain where in the trade the risk exists. The risk to capital
lies somewhere within the life of the contemplated trade.
In my book Trading Is a Business, I talked extensively about how so
many traders have a wrong perception of the market. I also lit into traders for
having a wrong anticipation of what a trade will bring, Typically, traders are
always stepping up to the plate to try to hit a home run, instead of being
satisfied with gening on base, which is the equivalent of taking home steady
profits, The market, and only the market, can hand a trader home runs,
I also tried to show in Trading is a Business, that most traders are
intelligent, well-educated professionals or retirees with years of life
experiences from which to draw, and yet they go on losing money in lhe
markets.
It is the very high level of intelligence traders possess that attracts
them to highly mathematical concepts for trading markets, There is nothing
mathematical about markets, and therefore trading them that way dooms one
to failure. Ves, / know that so many of the ads say that markets are cyclical,
astrological, mathematical, symmetrical, geometrical, and all kinds of other
"leaf's", but don't you believe them!
340
Fibonacci trading is mathematical, and therefore appeals to the highly
intellectual trader. In reality, as can be seen, it turns out to be another false
god.
Suppose the Crude Oil market is seen by a trader to trend upward,
begin to falter, and then head down toward a Fibonacci support level. The
first commonly accepted support level is composed of a .382 retracement of
the previous move. A resting order to buy is placed at that retracement level.
Let’s imagine that thereTs a $15,000 margin account involved, and that
the margin for Crude Oil is $1500 per contract. Now the trader, enters a
trade long for one contract. The trader anticipates a "magic” Fibonacci
bounce. Nothing happens. The trader decides to hold overnight.
Now imagine lhe trader also has placed a resting order to buy one more
contract al the .500 retracement level. Fifty percent is the so called "golden
ratio." The trader and most of the other worshipers of this idol witl have
resting orders at the "golden ratio/' and so there should be adequate support,
sufficient to cause a bounce.
Of course, lhe floor traders, who also know about the "golden ratio/'
are there to help them till their golden orders.
As stated, with the trader's and others1 entry inlo the market at that
point, there may even be somewhat of a bounce, and the market may rally for
a few ticks. However, if the fundamentals that are driving the market down
remain tn place, the rally will not last long, and so the market will rccross lhe
"golden ratio", and head south toward the next magic number. At that point,
traders will be waiting with eager anticipation for the expected bounce at
the .618 retracement. It they don’t get it, may their "god" help thoml
Now let's look at what would have happened to the trader's account.
With the first contract, he had to put up $1,500 io control the trade. At lhe
"golden ratio", he had lo cough up another $1,500 in margin. But he also
had to risk the amount of money that he is losing by the mark-to-market
distance between lhe .382 retracement and the .500 retracement. Let's
assume such distance was worth an additional $2,000. When he enters the
trade at the "golden ratio", il requires $5,000 co control the trade.
At the .618 retracement, lhe market has moved down another $2,000
He has an order to buy another contract, thereby adding another $1,500
needed to control the trade. In addition, he has $4,000 of baggage to carry
from the first contract, and an additional $2,000 to carry from the second
contract. This mark-io-markei baggage consists of lhe losses he now has in
the trade.
It is now taking $10r500 to control this trade. He is rapidly running out
of margin. He has no more room left to buy. The next retracement is
at .750. To carry the trade there, he will need a bigger margin account, ff
lhe market goes against him, down to the .750 Fibonacci number and he has
to liquidate there, he will end up with a margin call. *Nuff said? The whole
thing is shown on the next page:
341
TRADE			MARKET				LOSS		COMTRACT COST	TOTAL CONTRACT	HAUG 114 Cflkt.	COST TO : CONTROL	HET MA11GIH
			И1		HZ	 3		Total Loss					15000
N 1	о	.3F1Z							15H0	15B0		1500	1АГ.АА
ttz	0	.SOO	z	.000				2 ,C0O	1500	3000	1500	5000	10000
S3	P	GIO	4	.BOO	Z ,000			Ь ,W»H	15 00	4500	3000	10500	4500
	P	.750	6	.BOB	4,000		2 ,0013	12 ,000	—	45B0	4500	1G5Q0
Heads and Shoulders
Another piece of mythology is the so called heads and shoulders
formation, The formation itself is real at least in the eye of the beholder.
What is wrong is the expectation, Anyone who thinks he knows which way a
heads and shoulders formation is going to break needs to have his own head
(and maybe even his own shoulders) examined. To prove my point, I submit
the following very common example.
BP
19B30
M
0
193%
.  -4	I
1896Z
18SZ8
18B94
*1 IP ►	1 ’ I
17660
172Z6
• * 1		  I I
16792
a	• л •
163S7
15923
a
15490
above Гл mat inn is a typical
The
heads and shoulders pattern.
There's only one thing wrong,
with th is picture, Bid you get
it? This market is supposed to
cone down - not go up*
Guess what? This happens 40-45У
□f the tine. It goes the wrong
way.
r
BP
Please pardon the pun, but sometimes this is the way I feel about some
of these figments of lhe imagination that some people claim lo trade from.
Some of these formations are strictly in the eye of the beholder. Now. don't
blame me for what I see. Not only canT I do math, but Гт also dyslexic.
Dyslexia may be the secret of my trading success. Perhaps I can write a book
about how to become dyslexic.
If I can trade from a chart seeing things all wrong, then the reader
should surely be able to do it seeing things straight side up,
I Trade What I See
Here is something that comes up time and time again. Г11 mention
what il is. h*s something I had to learn to think about with all my might, and
as often as I could. I used to write this one down. I placed it where I would
have to read il every dayr and made sure I read il and thought about il every
day. The majority of traders will understand it academically, but not from the
depth of soul I eventually came to. I had to come to the point where I really
understood what Гт about to say; the understanding came to be deep.
Here's the poster I made for myself.
JOE, NEVER TRADE WHAT YOU THINK, TRADE ONLY WHAT YOU SEE!
Whai I think is merely another opinion — mine, Most have learned that
their own opinion is as good as anyone else's opinion. That is right, but it is
also wrong. I came to see it as being that my opinion is as bad as anyone
else's opinion.
3 4 3
Il’s the old viewpoint of the cup being half full or half empty. In the
case of trading, the cup is half empty. My opinion is bad. ii stinks.
As long as I try to trade based on what I think, I will be trading on
opinion.
When prices broke out on a gap up and Td missed a trade. I'd think
that it was too laie to get in now. That is what I thought. The fact was that
prices were going up. Then, when prices started coming back down, I’d think
that prices are not really going to go up. Again that was my opinion. The
truth is I didn't and couldn't really know which way prices would go.
Therefore, when I saw prices begin to go up again, I learned I had io try to
buy. In a bull market, I learned to buy every chance I got. 1 look for reasons
to buy, I buy the minute a retracement starts to go back up again. I buy
when today's prices take out yesterday's high. I buy at the breakout of lhe
Ross hook that was created when the retracement began. I buy buy, buy
That is the only way I've learned to make money in this business when prices
are going up.
When I see prices going down, I selll When prices break out of
congestion and move down, I watt for a correction. As soon as prices are
moving down again, I sell a breakout of the low. In fact. I try to be selling
breakouts of the lows the entire time prices are correcting. Once prices start
moving down and the trend is established, I sell every chance I get. I sell a
breakout of yesterday’s low, every day. I have resting sell orders below every
Ross hook, i sell and sell some more. That's how I make money in bear
markets.
I trade what ! sec. I trade with the trend. 1 buy bull markets. I sell
bear markets. I can see when a trend is in force. A little child can see that. I
don't need an oscillator to tell me which way the trend is going. I draw a
trend line on the chart. If the trend is up, I buy. If the trend is down, I sell. I
trade what 1 see.
If I think the market can't go any higher, and the trend is up, 1 buy. I
trade what I see, not what I think. If I think that surely this is the bottom,
and the trend is down, I sell, What I think doesn't matter. It's what I see
that counts.
In growing up, I had become so used to doing what I thought that it
was hard to divorce myself from my own opinion. After all. I'd lived by my
wits most of my life. In lhe markets, that will kill a trader. Trading is simple,
but it is harder than all get-out to separate what is seen from what is thought.
I work at doing that. 1 let this concept sink deeply into my thoughts, it has
become a part of every fiber of my being. It took a lot of effort on my part.
Strange Data
A piece of data I've come across Is that upon initial entry into a market,
80% of traders are on the right side of the trade. Yet they end up as net
losers. Why? When I first learned of this, it boggled my mind. How could
such a thing be?
344
Here is lhe answer: Apart from rhe flat-out gamblers who are in lhe
markets, many, many traders have read and studied intently everything they
could afford to buy or send off and receive for free. They have been diligent
about getting their education in every aspect of trading but one — they
haven*t learned how to make money.
That’s rightl They have learned how to trade. Indeed, they know how
to trade! What they don't know is how to make money. Believe me, there is
a world of difference between the two.
I've shown some of how to do it in this book. The rest you will find
in Trading Is a Business,
Knowing flow to trade is a different animal from knowing how to make
money from trading, Apart from Trading Is a.Business, l‘ve never seen or
heard of such a book. If there is one, I’d like to hear about it.
Many of my readers know how to trade. They are actually pretty good
at it. But when it comes time to reel in a profit, they don't seem to know
how or when.
1 would venture to say that many of the traders and would-be traders I
teach are better and more astute at trading than I am. But they are consistent
and/or overall net losers in the markets. Trading Is a Business addresses in
detail the reasons for this and explicitly shows how to turn a profit in lhe
markets.
I (irmly believe that we are soon coming to the point when almost
everyone who trades will have to lake up some form of dayirading to survive.
Willi the advent of computerized trading, the markets will be traded
continuously, twenty four hours a day round the clock. Traders may be
forced to enter and exit a trade on the same day, or be faced with yawning
gaps the following day as world and market events continue to flow while
they sleep. Already, the more knowledgeable traders are placing stops in the
Forex markets to avoid multi-thousand dollar overnight kisses in the
currencies. Such stops will become commonplace for anyone who wants to
hold a position overnight.
There will be some advantages, too many to go into here, but for
instance, a trade could be put on early in the morning upon awakening and
taken off later that night upon retiring.
The floor trader, as he exists today, will disappear. He will be relegated
to a screen and have to trade much as the rest of us do.
Already a move is on that is thinning (he trading pits. The costs io
trade on the floor and the requirements to trade on the floor are rising,
causing a gradual flow of traders out of the pits and upsiairs lo a trading
screen. These traders are having to relearn how to trade. I know, because
I’ve been teaching many of them.
345
Their exodus, э trickle now, but eventually a flood, is already causing
increased volatility down on the floor. Not that the open interest is affected
by their leaving the floor, but that as the floor thins out it is much more apt to
be driven by emotion and hysteria. This is already happening, and will
increase.
The competition from foreign commodity markers, coupled with the age
of the computer, may sound the death knell for what is probably the Iasi
bastion of free capitalism in the world — open outcry trading.
Whether this will be good or bad is purely philosophical. I suspect it
wifi be a mixture of both. The important thing is that a lol of adjustments will
have to be made. Many of the things that worked in the past will no longer
work in the future.
I'm not miking about entry or exit signals. I'm not talking about
technical analysis or chart patterns. Those will remain the same. A chart is a
chart is a chart. The charts will look the same. They will give the same
signals as before. It is rhe trading taciicsF the expectations at each level, and
the risk and money management that may be different.
The "locals" will be impacted more than anyone else with having to
learn a now way to trade. They will have to learn to trade from a chart, or a
tote board, or whatever way they want to see prices. Some of them have
never done it that way.
They may be subject to (he same delay I have to live with vis-a-vis the
telephone. That's unclear to me at the moment. Again, they may be able to
enter (heir trades direcily into the system. It is also possible they may be able
to see as much or more of what is going on than they did before.
Al! of us may find ourselves placing our orders with a computer, or
calling a broker who will place our order on the computer. A computer will
match up the buy/sell pairs.
i can surmise that those having seats, and perhaps the locals, may be
able to call the computer directly, The rest of us will still have to go through
a broker, who will in turn call the computer. To a certain extent, that will
maintain the same relative degree of unfairness in the market that exists
today. It will also keep the brokers rich as they will be allowed to continue to
suck our blood in much the same way they do now.
I'm not talking about the broker who does research and gives trading
advice or manages accounts  - that broker is entitled to a commission. Who!
I'm talking about are the discounters and even full service brokers who leech
off traders who are calling all their own shots.
It would be nice, but not likely, for traders who don't need or want a
broker to be extended lhe same trading privileges. It would be nice if any
trader who was computerized and had telecommunications equipment were
able to directly piace an order without the need for a broker. Perhaps a write-
in campaign is needed here.
Systems and methods that do not take into account the changes that
are now in the making will fall apart at the seams. No one now knows the
full extent of the changes that are coming or the impact they will have. But
when they happen, I intend to take whatever ume is necessary to adjust my
personal trading to the new order. 1 especially feel that timing and fills will be
lhe critical areas. I intend to trade very gingerly until I know what kind of fills
will come out of the new order, and how to time my market entries and exits.
I would suggest to sny full time trader that he begin to bank a greater
portion of his earnings against that time when we may all have to trade quite
lightly. with reduced incomes, while we all learn how to trade in a new world.
Unanswered at this time are questions like, will there be sessions that
open and close, or will trading be continuous, and around lhe clock? If there
are no sessions, what will happen as concerns the close? Will there be a
close? If not, what will happen to all of the technical indicators that depend
upon the close? What about all of the mechanical systems that focus on the
close for their trading parameters? Ditto for those that rely on the open?
There are gobs of traders who look to the breakout of the open to tell
them what (o do. If there is no close, will there be an open?
I don't really think there will be no open or close. There will almost
surely be trading sessions or segments. Certainly there must be a cut off
point at which there will be accountability.
Whai will happen to such staple commodities as corn, beans, and
wheat? Are there suddenly going to be more traders of those commodities?
That's hardly likely. But, whereas now all of the corn trading is done in one
approximately five hour session, all those who trade it will be strung out over
a twenty-four hour period.
There probably won't be any more corn, and there won't be any more
corn traders, but The volume of corn trading traffic will be spread out by a
factor of almost five. That may make it very difficult to get good fills, as (he
volume will be thin.
Markets that are already thin will become paper thin if and when the
trading is spread out over a twenty’four hour period. What sort of hysteria
will rule the trading in these markets? What will the slippage be like? Will
those off-lhc-floor ex-floor traders be able to run the markets — first one way
and then the other?
What will happen to the volume from all lhe traders who now figure out
their trades, call in their orders, and then go off to work? Will they still
behave that way, or will they wait until they come home from work, have
dinner, and then sit down in front of their screen (o trade — what? a night
session, or a continuous session? Any one who has traded the night session
in the bonds knows how awful it can be. Currently, it is characterized as a
thin market that rarely goes anywhere.
347
Beyond the scope of rny current thought is what will happen lo such
things as commercial TV while those who used to watch it sit down to trade
instead of watching Monday night football. Will we turn into a nation of
gamblers? Who needs the lotteries when he can throw his money away on a
chance to get rich in the markets?
Will the average age of traders become lower as our youth, watching
their parents trade all evening, become addicted to the markets?
The Impact of twenty-four hour trading has yet to be realized or
measured.
When the bar chart, as we know it today first came into existence, it
revolutionized trading. Who would have thought ahead of time it would have
so great an impact?
It brought many into the market who would never have been there at
all. Il made possible all of the charting services. It was indirectly responsible
for all of the technical analysis that we see today as chart watching went
from merely pattern recognition to the charting of technical indicators as.used
today Even candlestick charting derives from the concept of the bar chart.
Think of all the books, newsletters, advisories, and magazines that have
derived from the concept of the bar chart and how to analyze it. What would
followers of Andrews, Gann, and Elliott do without the bar chart?
Are we about to see a similar revolution in trading?
Because of the constant shifting and changing that concerns the trading
world, and because it’s impossible to place everything into a book, or even a
series of books, I have started a newsletter.
It is not an advisory. One of its purposes is to keep my readers
informed of what is happening in the markets and how it affects their trading.
In the newsletter I show more trading techniques than I'm able to show in my
books. I get into the nitty-gritty of trading, it is a leaching newsletter, and it
is called Traders Notebook.
If you want to see concepts that go above and beyond my books, you
should become a subscriber. You have made an investment in the books I
write. The newsletter keeps that investment current and up-to-date.
Subscriptions are sold on a calendar year basis only, so that whenever
you order you will receive that year’s issues to date, and subsequent issues
through December. Previous year's issusc are also available, starting with
1991.
34 3
In this hook, as in my previous book, I continue to offer my services at
seminars as a tutor and educator. In a typical seminar session I teach you
how to trade and how to make money from your trades You can shortcut
the slow and painful method of learning to trade by losing your ''friend.11 You
will learn to trade correctly from the beginning. You'll have fewer bad habits
to break. Of course, some of you can write a sequel to this book. You can
call it "Trading by the Seat of your Pants.”
If you already have them (bad habits}, I will show you how to break
them and get your trading onto the right track. In most cases, it takes me
less than an hour to figure out what you are doing wrong.
For those of you who would like to trade using a computer, I offer to
obtain г) high quality one for you at a very modest price. Computers have
been my hobby for thirty-one years. It comes loaded with a lot of freebies,
and is ready to run.
If you purchase Market Detective or Investograph Plus Special
Edition/RT software to do your charting, we load it onto the computer far you,
so you're ready tn trade right away.
If you are interested in becoming a professional in the business and
want to become licensed (you should), 1 offer the Series Three examination
course at a substantial discount to what many other are charging. Ditto, if
you would like the course on computer disks.
I will end this hook with a piece of advice. In a sense, it will serve as a
lead in for Trading Is a Business; Don't overtrade!
Don't think you have to take every trade that comes along. Wait for
the very best. Wait for the pre-breakout trading congestions that are small
and tight, or long and skinny. Be selective in trading. Be patient. Be very
cautious in getting into a market and very easily convinced to get out. Just
because you've learned a new trick or two doesn't mean that you have to
trade it every time you think you see it.
When trading congestions, keep in mind that the ties! of the best trades
come when there is a wide congestion, followed by a POP or spike, followed
by a fighter congestion. Trading only those would give a winning record in
the high 90's percentile.
When trading other man congestions, above all, find and slay with the
trend.
Resolve to do it that way. Resolve to establish! sound trading habits.
If you have any questions or comments, call (512} 259-0727 tor infor-
mation on how to resell me. If I'm in the middle of a trade, I'll tell you and
may have to put you on hold for a minute or two. If you can’t hold, fust hang
up I'll understand. You may lax me messages or requst information by fax
by calling {512} 259-0747.
349
[f you w;mt to write, my address is:
Joe Ross
P.O.Box F 42527
Freeport, G.B. Bahamas
I welcome any arid all comments and criticisms of my work. I want to
learn and tn grow as much as anyone else. When you write nice things, it
encourages me to do more for you. When you point out my mistakes, I rush
to correct them and it makes it better for the next person who buys lhe book.
if you want to further your education under my tutelage, 1 give three
day private sern;nars in Austin, Texas. I give these once a month.
Attendance is limited. A prerequisite for taking the seminar is that you must
have read Trading Is a Business and either Trading by the Book, Trading by
the Minute, or Trading the Ross Hook.
The first day of the seminar, I present my entire methodology. I put
together as a continuous whoic all the bits and pieces I reveal in my books. I
offer a money back guarantee: If you are dissatisfied with what I am teaching
or what you feci you can learn from me at die end of the first day of
attendance, you will receive a full refund of any money you have paid for the
seminar. We will part friends.
You will receive personal attention, and I will make time for a free one-
on-one consultation with you while you arc here — remember to ask for it.
Once you have taken the seminar, you may take it again as often as I
hold them for up to two years. There will be no additional charge.
At the seminar, you will be shown a great many things that are
impossible to get into a book. Here are some of the novel concepts you will
be taught: How io neutralize the advantages the floor has over you; Several
techniques for getting into a market ahead of everyone else so that their entry
pushes along your position; Several techniques for taking the risk out of a
trade; Techniques for buying more time for a trade without getting hurt, How
to safely hold overnight positions in volatile markets; How to figure the true
risk in a trade: How to engage in "Tick Banking"; how to find the trend before
everyone else; and, much, much more in lhe way of tips and tricks to help
your trading, Call rny office at (512) 259-0727 to sign up.
Joe Ross
3 50
Index
Add-on Contracts, 103, 104, 105
Alert
setting, 30, 59
Average Volatility
how to compute, 141
used as a filter, 141
used as a stop loss, 152, 153
used to cover costs, 141
Brokers and Commissions, 53, 54
Capital Preservation, 340
Congestion is my filter, 80
Congestions are Important, 80
Continuation Trading, 107
Contract Sets, Э, 101
Contracts Sets, 104
Crude oil trade, 61 *6G
Daytrading
definition of, 11
Doji*s, 146, 329-331
Entry orders, 49
Entry Signals
intermediate entry signal, 3 6
major entry signal, 24
minor entry signal, 41, 113
priorities of, 42
Fibonacci
a fallacy?. 339
Filtering
a trading filter, 60
average volatility used as, 141
using congestion to filter a crude oil. 63
Hedging, 336, 337
Housekeeping
record keeping, 51
tape recording orders, 51
ticket numbers, 51
time stamping orders, 52
Intermediate Entry Signals, 36
Ledge - what it looks like, 30
351
Major Entry Signals
a summary of, 35
the breakout of a 1-2-3 high, 28
the breakout of a ledge, 30
the breakout of a Ross hock, 34
the breakout of a trading range, 24
Market
anatomy of, 18
Mind-Set, 85
Minor Entry Signal, 41, 113
Objective stops, 46
Odd Lots, 10
Ordering
contract sets, 49
entry orders, 49
exit orders, 50
giving correct prices, 49
Pivots, 1 20
Protective stops, 46
Reversal Bars, 150. 329-331
Risk and Money Management
money management, 75
risk management, 74
Ross Hook what it looks like, 34
Round Lots, 10
Segment Counting, 155
Slippage, 10
Stops, 46
Stops
objective, 46
protective, 46, 337
Strategy and Tactics
continuation trading, 107
false breakouts, 109, 110
first break versus second break, 110
gaps, 109
reversal trading, 107
Summary of trend identification methods, 321-325
Swings and legs of swings, 30
Tape recording, 51
Ticket numbers, 51
Trade Selection
preferred patterns, 100
search out the best, 92
selecting a market, 20
selecting a time frame, 20
selecting an entry point, 21
staying in the waler, 94
what a good trade looks like, 92, 98, 99
Trading
a few words about the floor, 332
a summary of intraday patterns, 127
a WARNING about dayrrading, 55
comparison between daytrading and position trading, 12
cup with handle, 334
differences between daytrading and position trading, 13
Fibonacci fallacy, 339
Fifteen minute Bean Oil, 139
Five minute S&P, 226
hedging, 336
identifying congestion recap. 310
identifying trends recap, 310
intraday patterns, 123, 124, 125, 126
preserving capital, 340
priorities, 42
similarities between daytrading and position trading, 12
Sixty minute Sugar, 1 70 225
slippage and lot size, 13
Thirty minute corn, 150
trade what you see, 338
Trading a fifteen minute chart, 1 39
trading a five minute chart, 226
trading a sixty minute chart, 170
Trading a thirty minute chart, 150-151
turning daytrades into position trades, 167
Trading Logic, 1 20
Trading Logic
points about the S&P trade, 138
Trading Plan
approach, 55
stay alive, 56
slay in lhe water, 56
The plan, 57
your way or no way, 57
Trend
finding the trend
finding the trend
finding the trend
finding the trend
finding the trend
finding the trend
finding the trend
in Bean Oil, segment count, 155
in Bean Oil, successive new extremes method, 139
in Corn, Sagging Tops and, 153
in Corn, successive new extremes method, 150
in Sugar, segment counting, 170
in the S&P, segment count, 226
in the S&P, successive new extremes method, 131
finding three successive new extremes, 132
fourth bar a new trend, 133
successive new extremes, clarifications, 137
Trend Identification
finding the trend, 131
Sagging Tops and Rising Bottoms, 311
Segment Method, 311
Successive New Extremes Method, 310
True Correction Method, 320
True Trend Method. 311
353