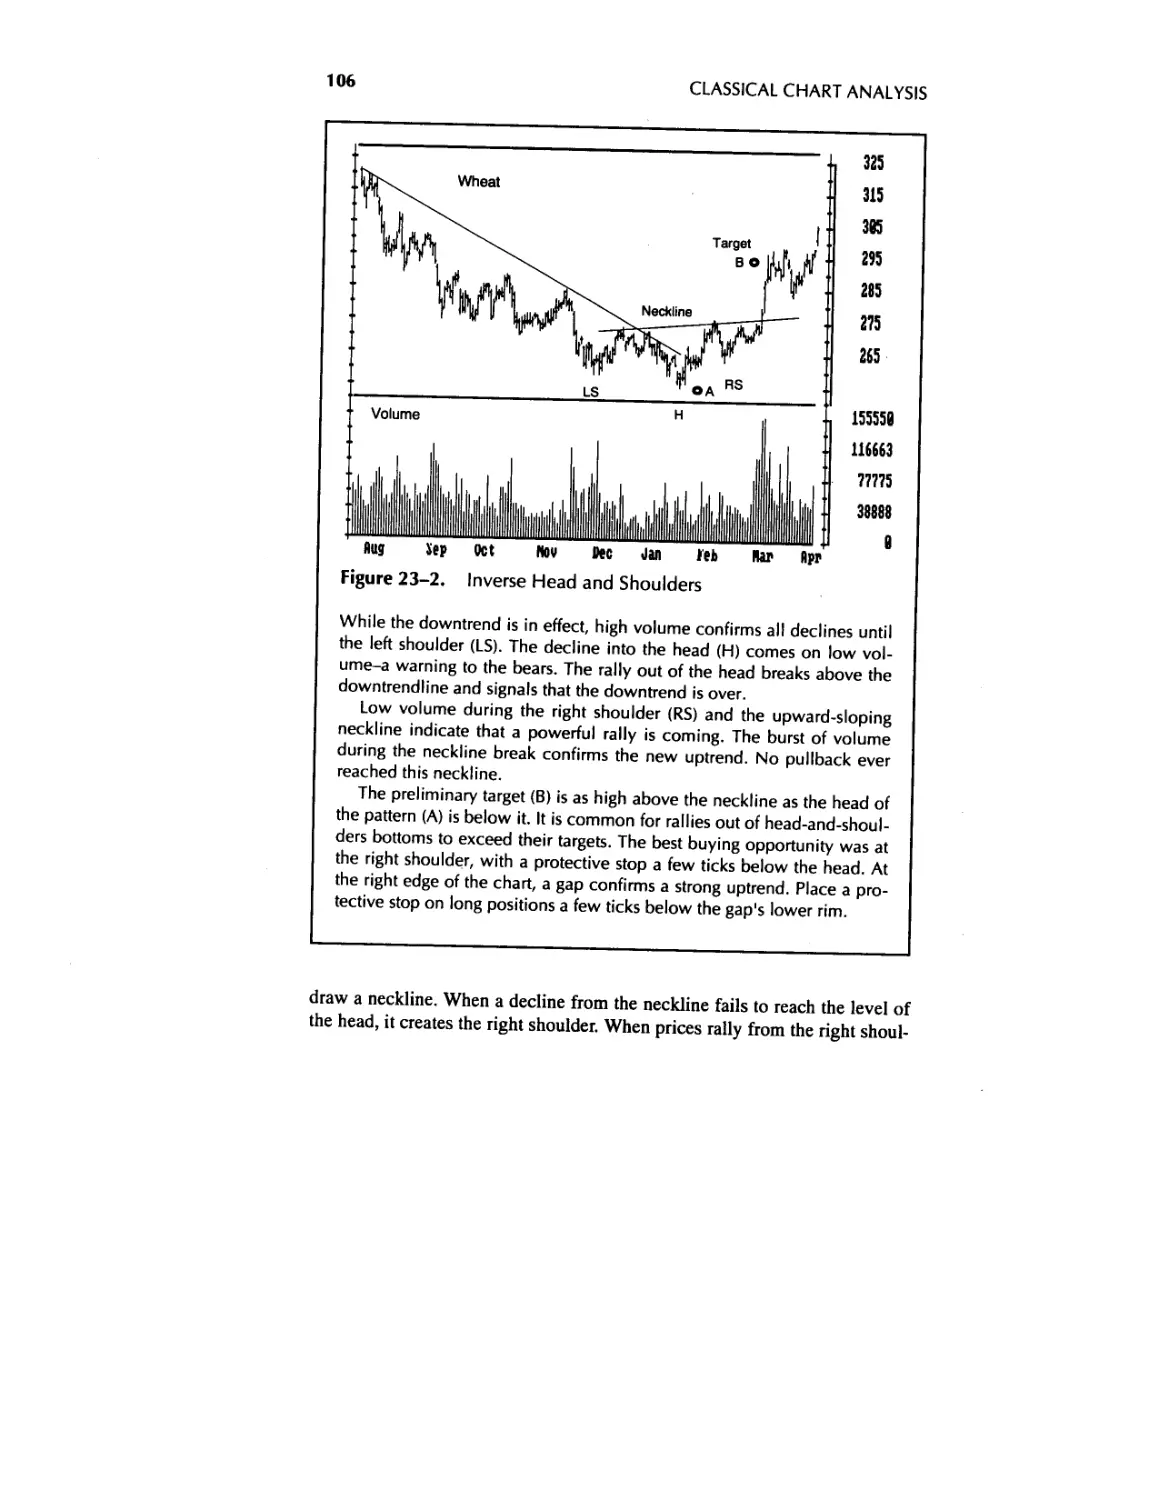
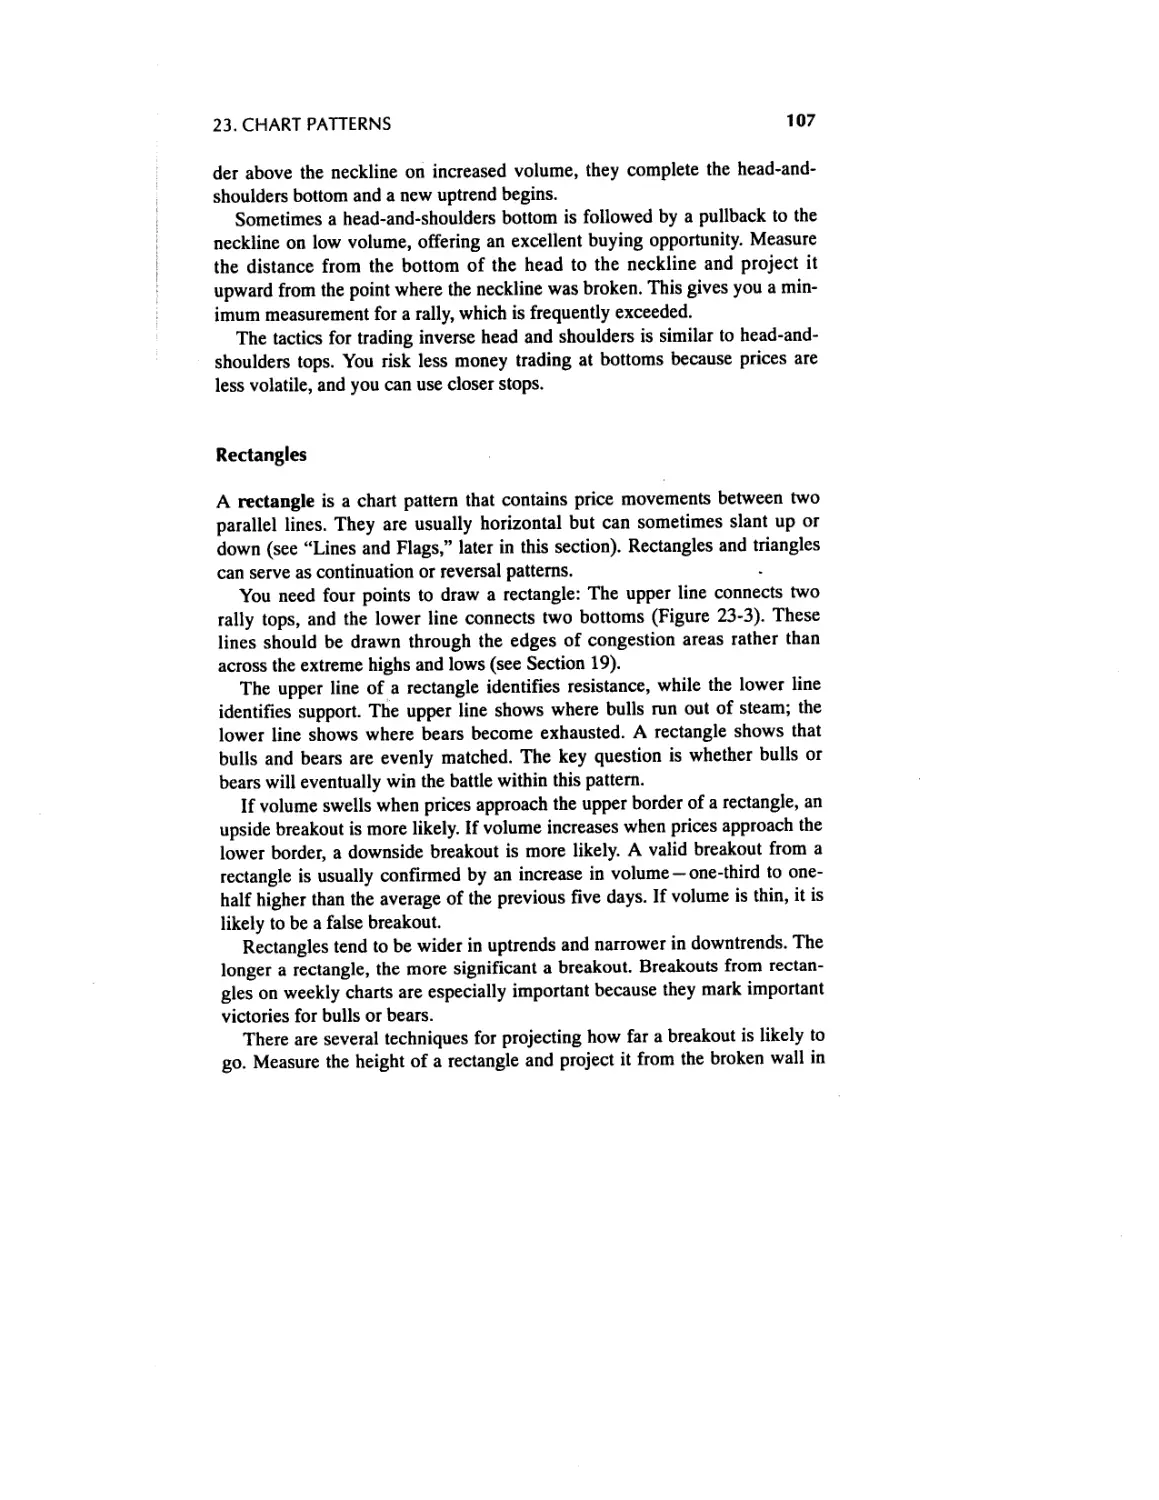
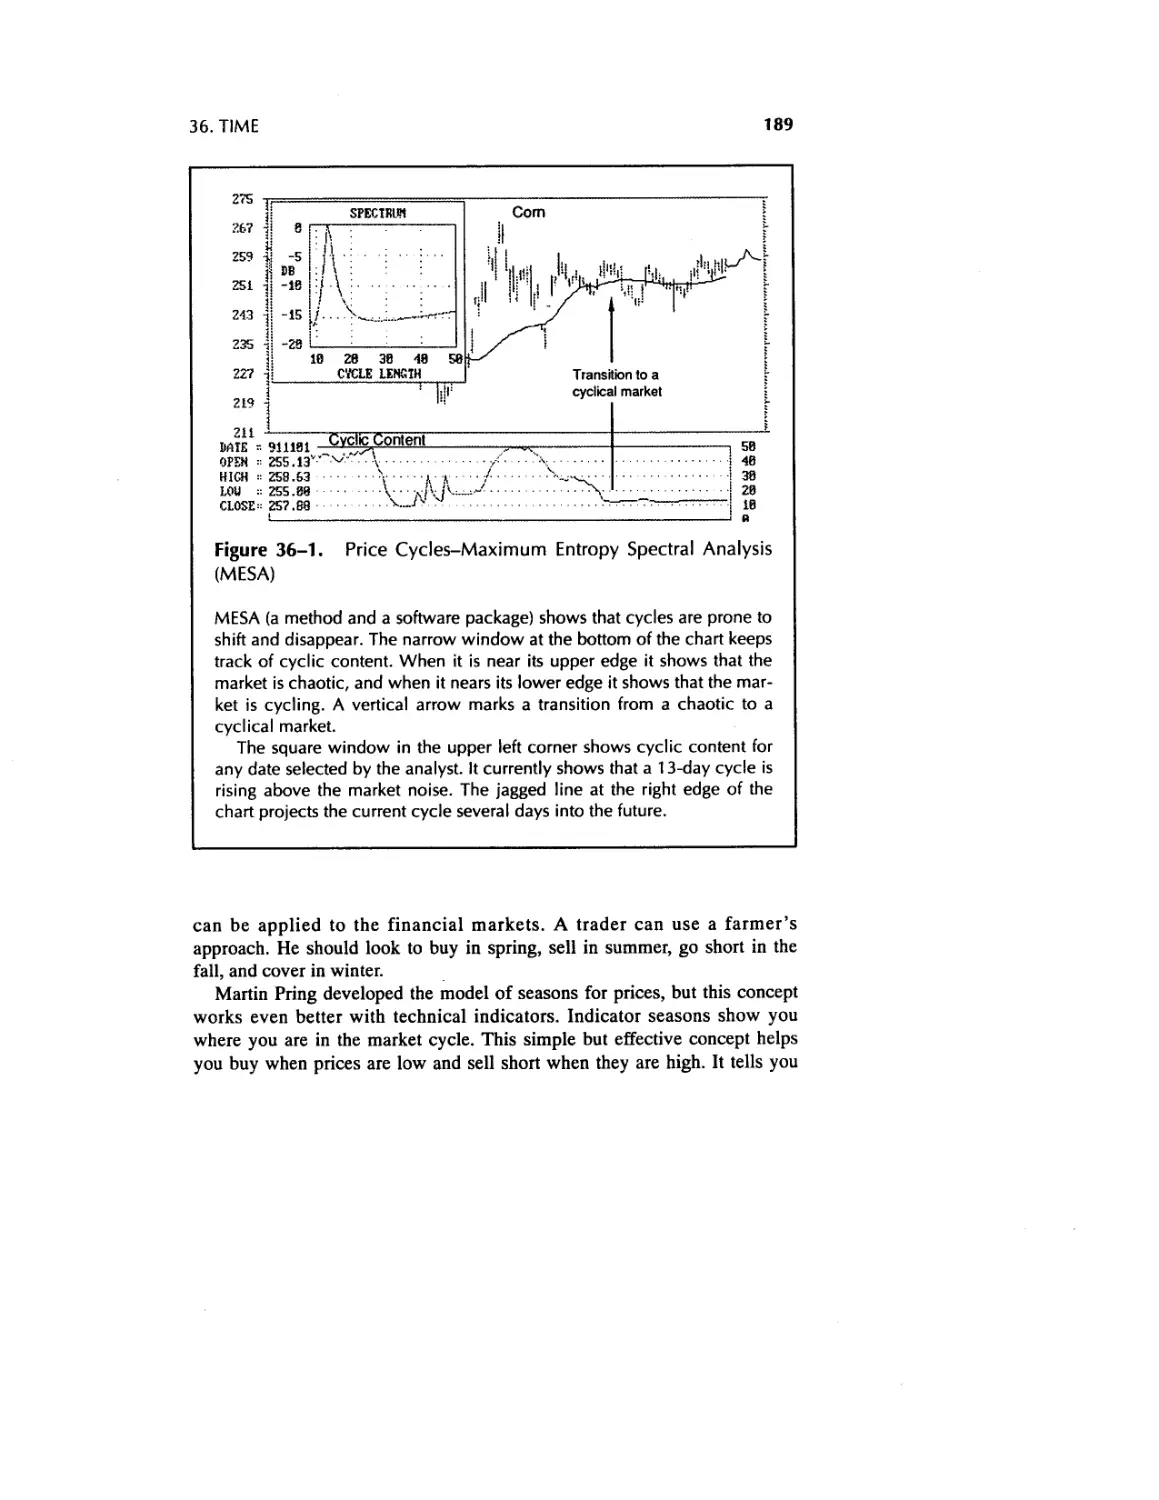
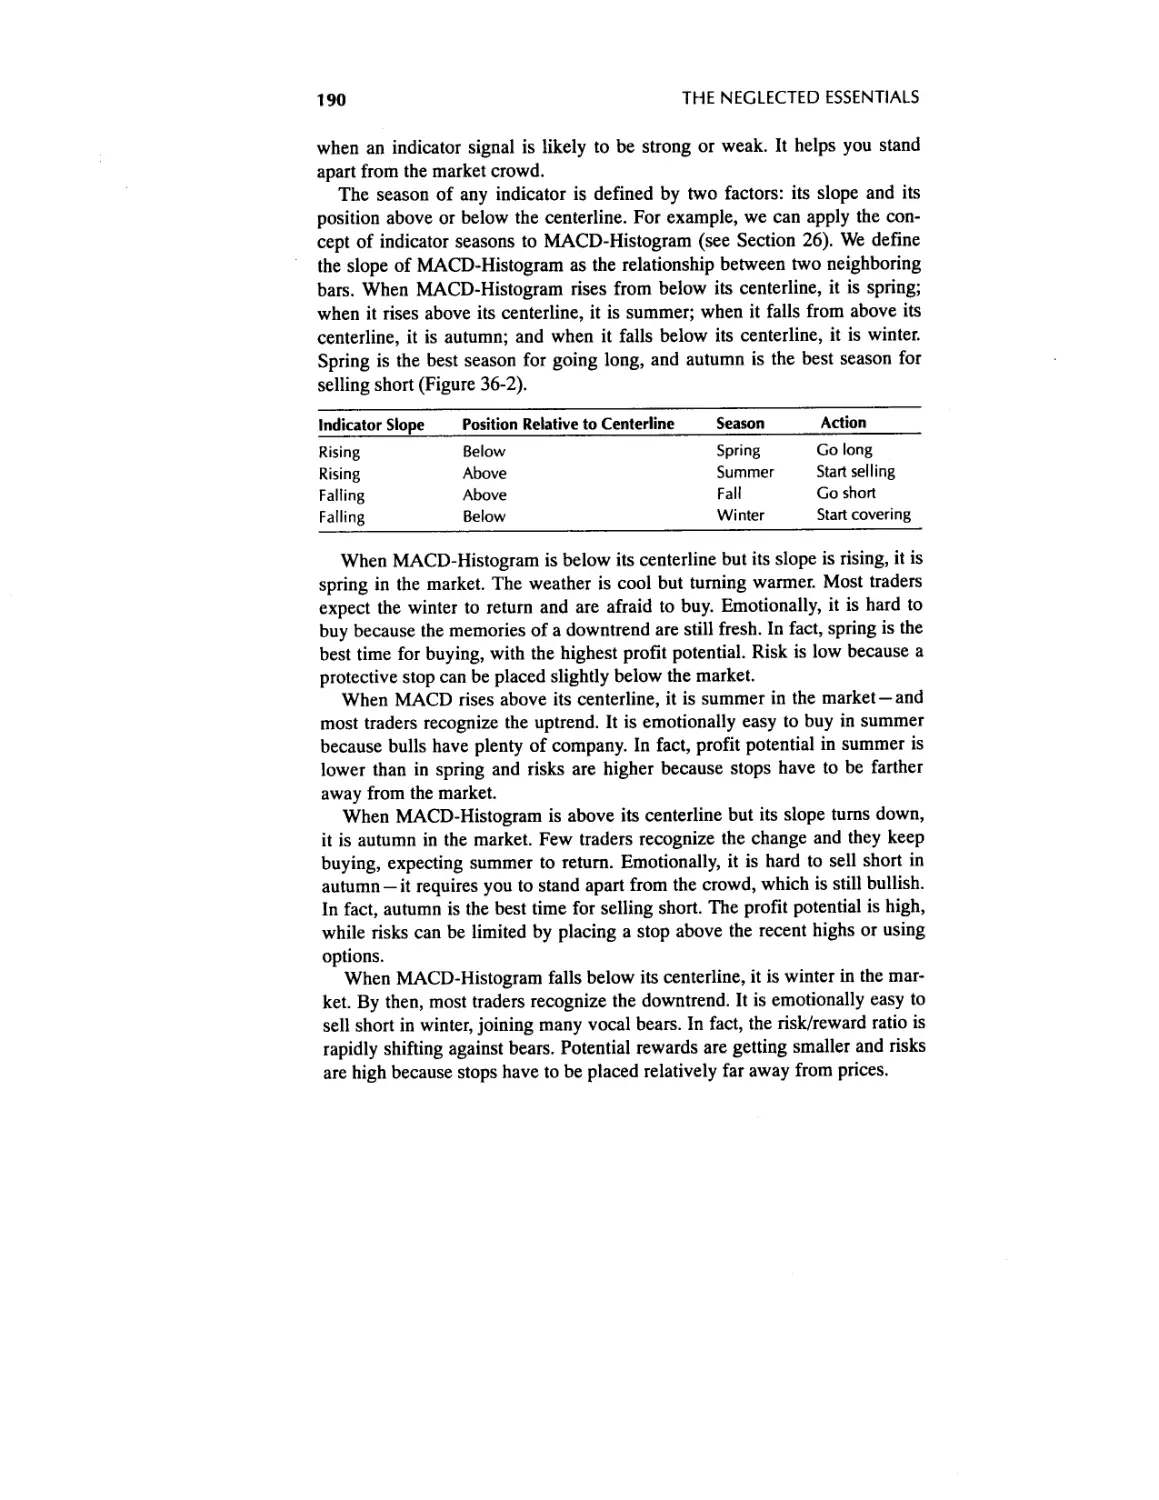
/


Text
2 3 ?ooj
TRADING FOR
A LIVING
WILEY FINANCE EDITIONS
FINANCIAL STATEMENT ANALYSIS
Martin S. Fridson
DYNAMIC ASSET ALLOCATION
David A. Hammer
INTERMARKET TECHNICAL ANALYSIS
John J. Murphy
INVESTING IN INTANGIBLE ASSETS
Russell L. Parr
FORECASTING FINANCIAL MARKETS
Tony Plummer
PORTFOLIO MANAGEMENT FORMULAS
Ralph Vince
TRADING AND INVESTING IN BOND OPTIONS
M. Anthony Wong
THE COMPLETE GUIDE TO CONVERTIBLE SECURITIES WORLDWIDE
Laura A. Zubulake
MANAGED FUTURES IN THE INSTITUTIONAL PORTFOLIO
Charles B. Epstein, Editor
ANALYZING AND FORECASTING FUTURES PRICES
Anthony F. Herbst
CHAOS AND ORDER IN THE CAPITAL MARKETS
Edgar E. Peters
INSIDE THE FINANCIAL FUTURES MARKETS, 3RD EDITION
Mark J. Powers and Mark G. Castelino
RELATIVE DIVIDEND YIELD
Anthony E. Spare
SELLING SHORT
Joseph A. Walker
TREASURY OPERATIONS AND THE FOREIGN EXCHANGE CHALLENGE
Dimitris N. Chorafas
THE FOREIGN EXCHANGE AND MONEY MARKETS GUIDE
Julian Walmsley
CORPORATE FINANCIAL RISK MANAGEMENT
Diane B. Wunnicke, David R. Wilson, Brooke Wunnicke
MONEY MANAGEMENT STRATEGIES FOR FUTURES TRADERS
Nauzer J. Balsara
THE MATHEMATICS OF MONEY MANAGEMENT
Ralph Vince
THE NEW TECHNOLOGY OF FINANCIAL MANAGEMENT
Dimitris N. Chorafas
THE DAY TRADER’S MANUAL
William F. Eng
OPTION MARKET MAKING
Allen J. Baird
TRADER VIC II: PRINCIPLES OF MARKET ANALYSIS AND FORECASTING
Victor Sperandeo with T. Sullivan Brown
TRADING FOR A LIVING
Dr. Alexander Elder
STUDY GUIDE FOR TRADING FOR A LIVING
Dr. Alexander Elder
TRADING FOR
A LIVING
Psychology
TradingTactics
Money Management
Dr. Alexander Elder
Director
Financial Trading Seminars, Inc.
John Wiley & Sons, Inc.
New York • Chichester • Brisbane • Toronto • Singapore
CompuTrac™ is a trademark of CompuTrac Software Inc.
PageMaker® is a registered trademark of Aldus Corporation.
In recognition of the importance of preserving what has been written, it is a policy
of John Wiley & Sons, Inc., to have books of enduring value printed on acid-free
paper, and we exert our best efforts to that end.
Copyright © 1993 by Dr. Alexander Elder
Published by John Wiley & Sons, Inc.
All rights reserved. Published simultaneously in Canada.
Reproduction or translation of any part of this work beyond that permitted by
Section 107 or 108 of the 1976 United States Copyright Act without the permission
of the copyright owner is unlawful. Requests for permission or further information
should be addressed to the Permissions Department, John Wiley & Sons, Inc.
This publication is designed to provide accurate and authoritative information in
regard to the subject matter covered. It is sold with the understanding that the pub-
lisher is not engaged in rendering legal, accounting, or other professional service. If
legal advice or other expert assistance is required, the services of a competent pro-
fessional person should be sought. From a Declaration of Principles jointly
adopted by a Committee of the American Bar Association and a Committee of
Publishers.
Library of Congress Cataloging-in-Publication Data
Elder, Alexander
Trading for a living : psychology, trading tactics, money
management / Alexander Elder.
p. cm.
Includes bibliographical references and index.
ISBN 0-471-59224-2
1. Stocks. 2. Futures. 3. Options (Futures) I. Title.
HG4661.E43 1992
32.64’5 — dc20 92-35165
Printed in the United States of America
10 9
To Lou Taylor—
a trader, a wise man, a true friend
Contents
Introduction 1
1. Trading—The Last Frontier 1
2. Psychology Is the Key 3
3. The Odds Against You 6
I Individual Psychology 11
4. Why Trade? 11
5. Fantasy versus Reality 12
6. Market Gurus 17
7. Self-Destructiveness 24
8. Trading Psychology 27
9. Trading Lessons from AA 29
10. Losers Anonymous 33
11. Winners and Losers 38
II Mass Psychology 43
12. What Is Price? 43
13. What Is the Market? 47
14. The Trading Scene 51
15. The Market Crowd and You 56
16. Psychology of Trends 61
17. Managing versus Forecasting 65
vii
viii CONTENTS
III Classical Chart Analysis 69
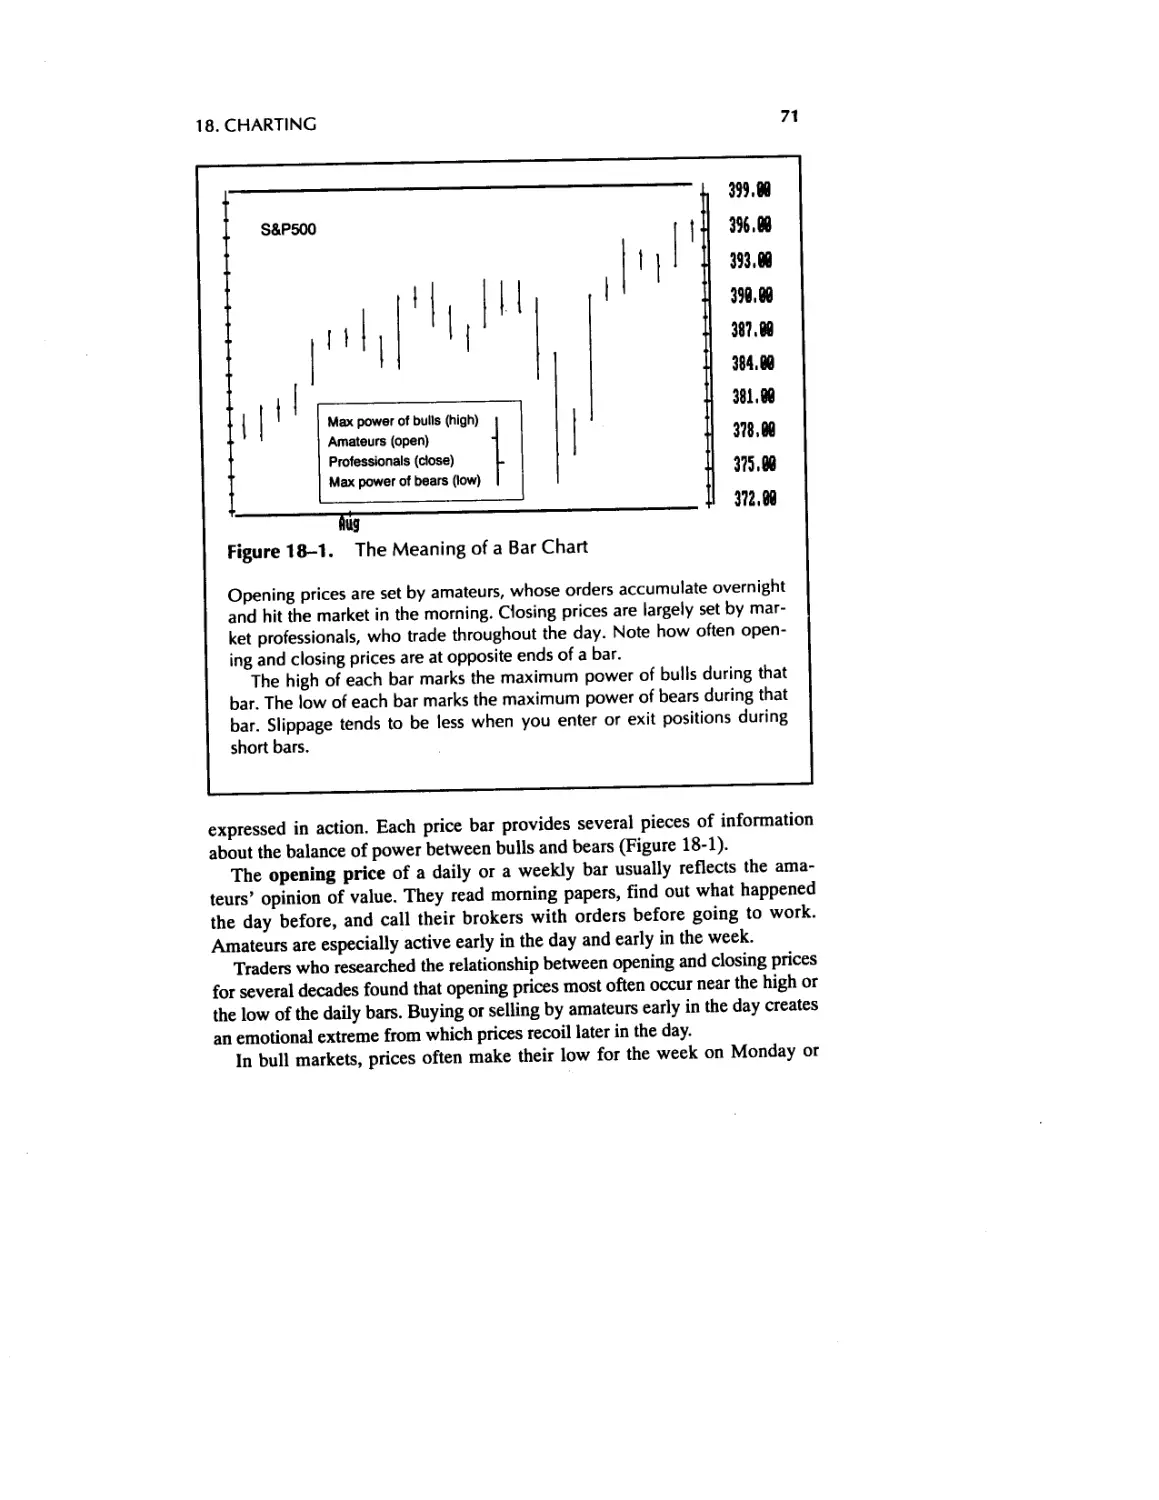
18. Charting 69
19. Support and Resistance 75
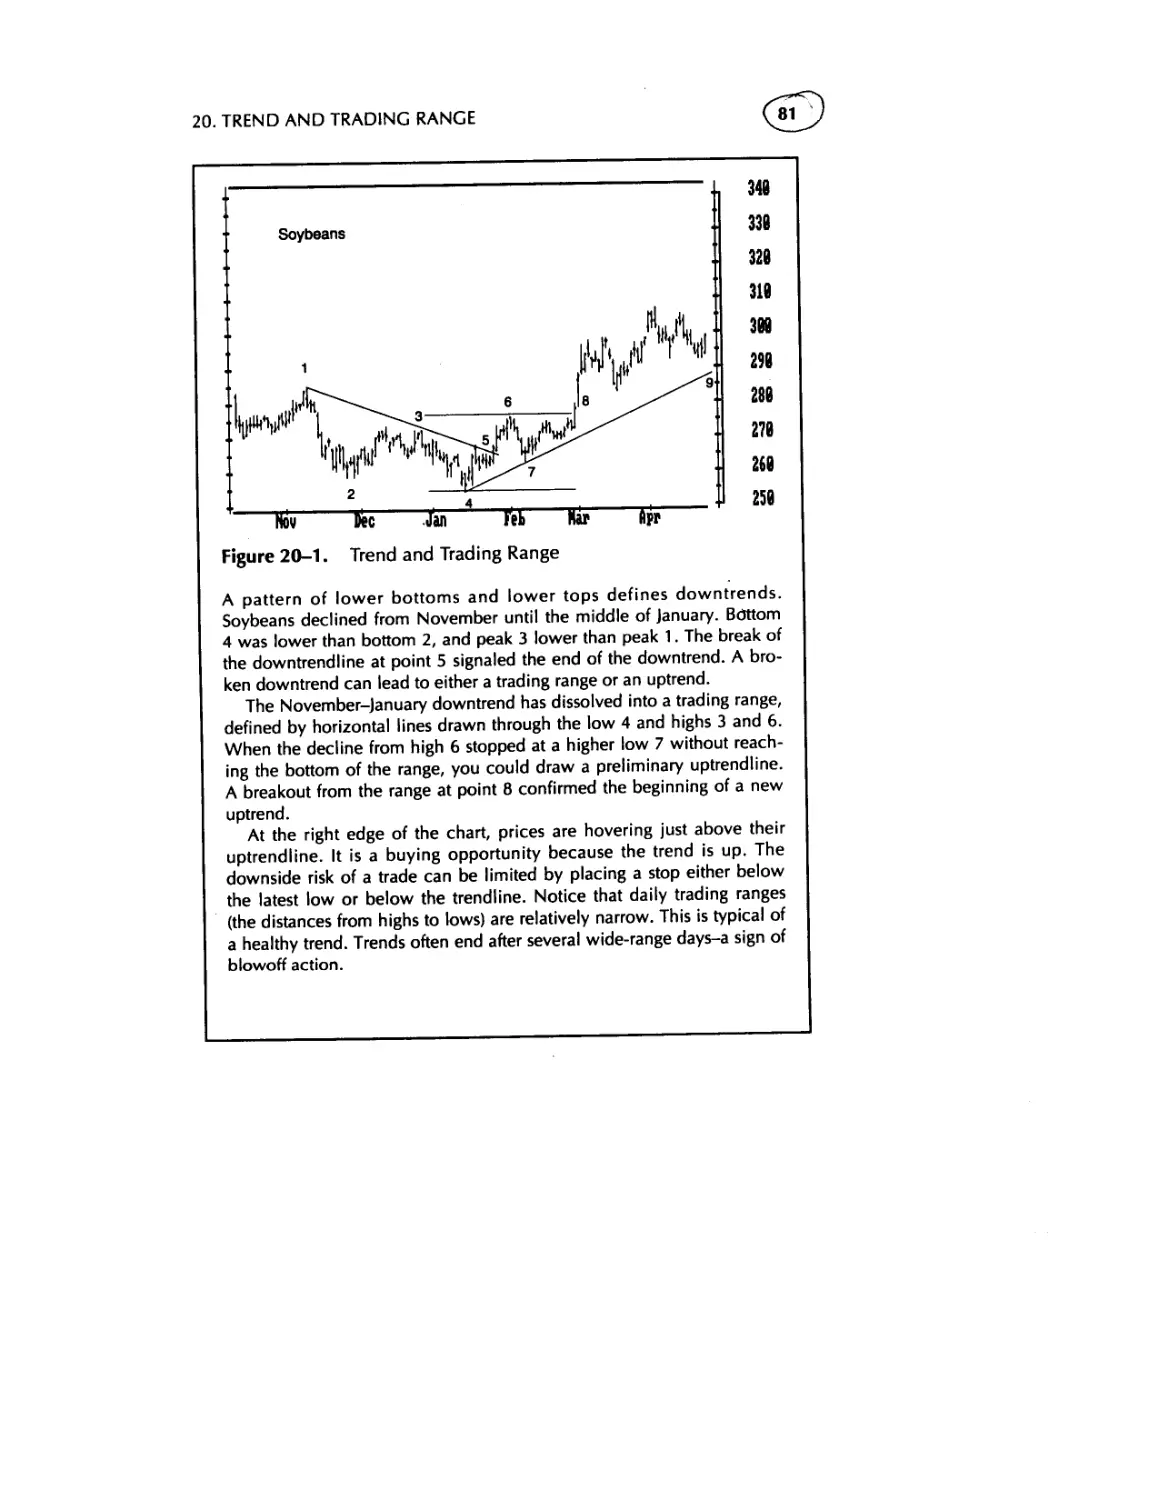
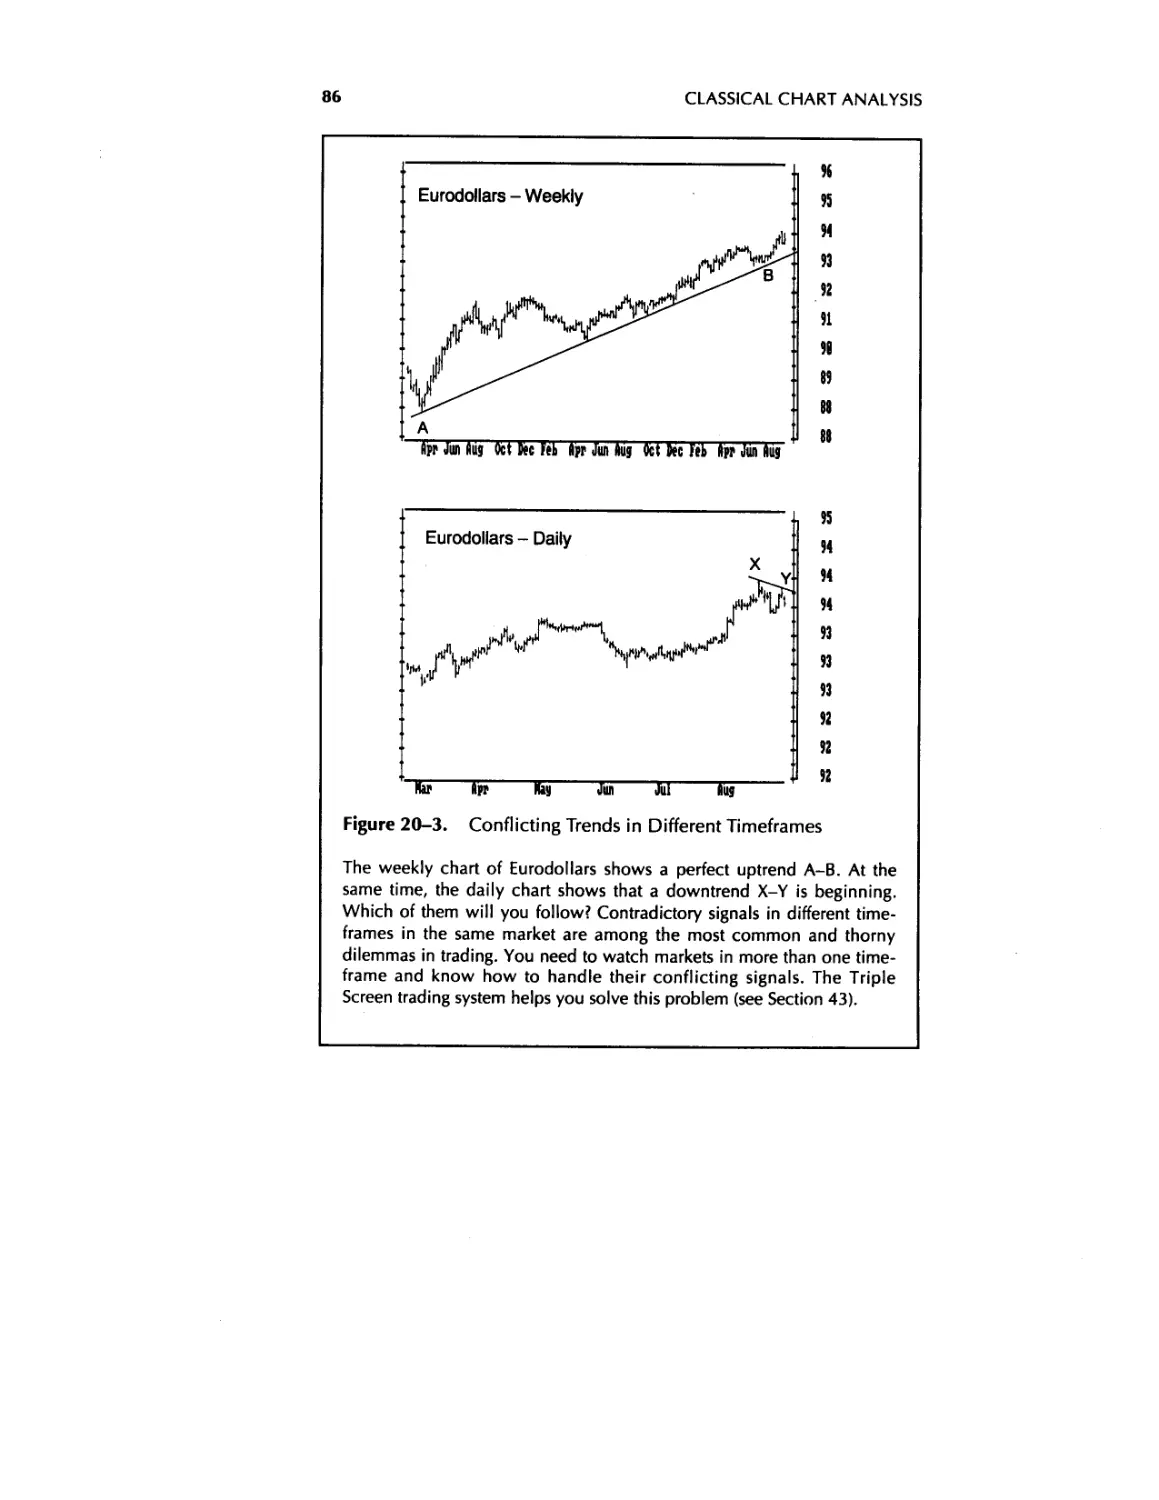
20. Trend and Trading Range 80
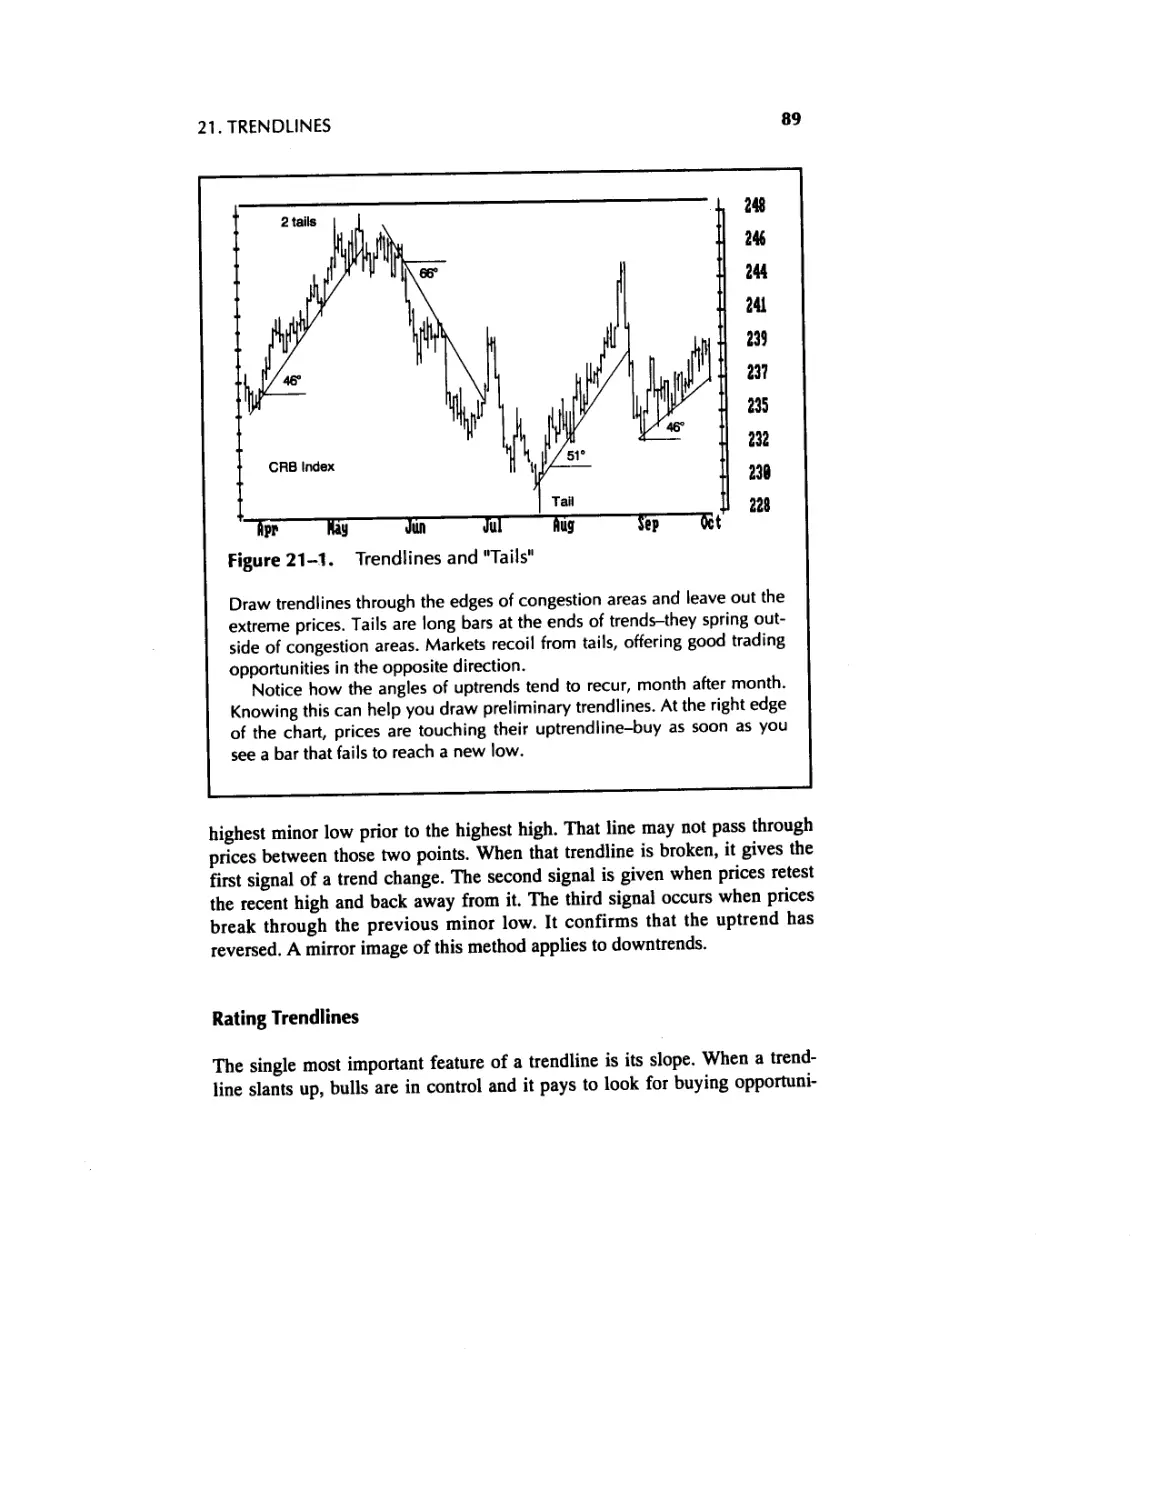
21. Trendlines 87
22. Gaps 95
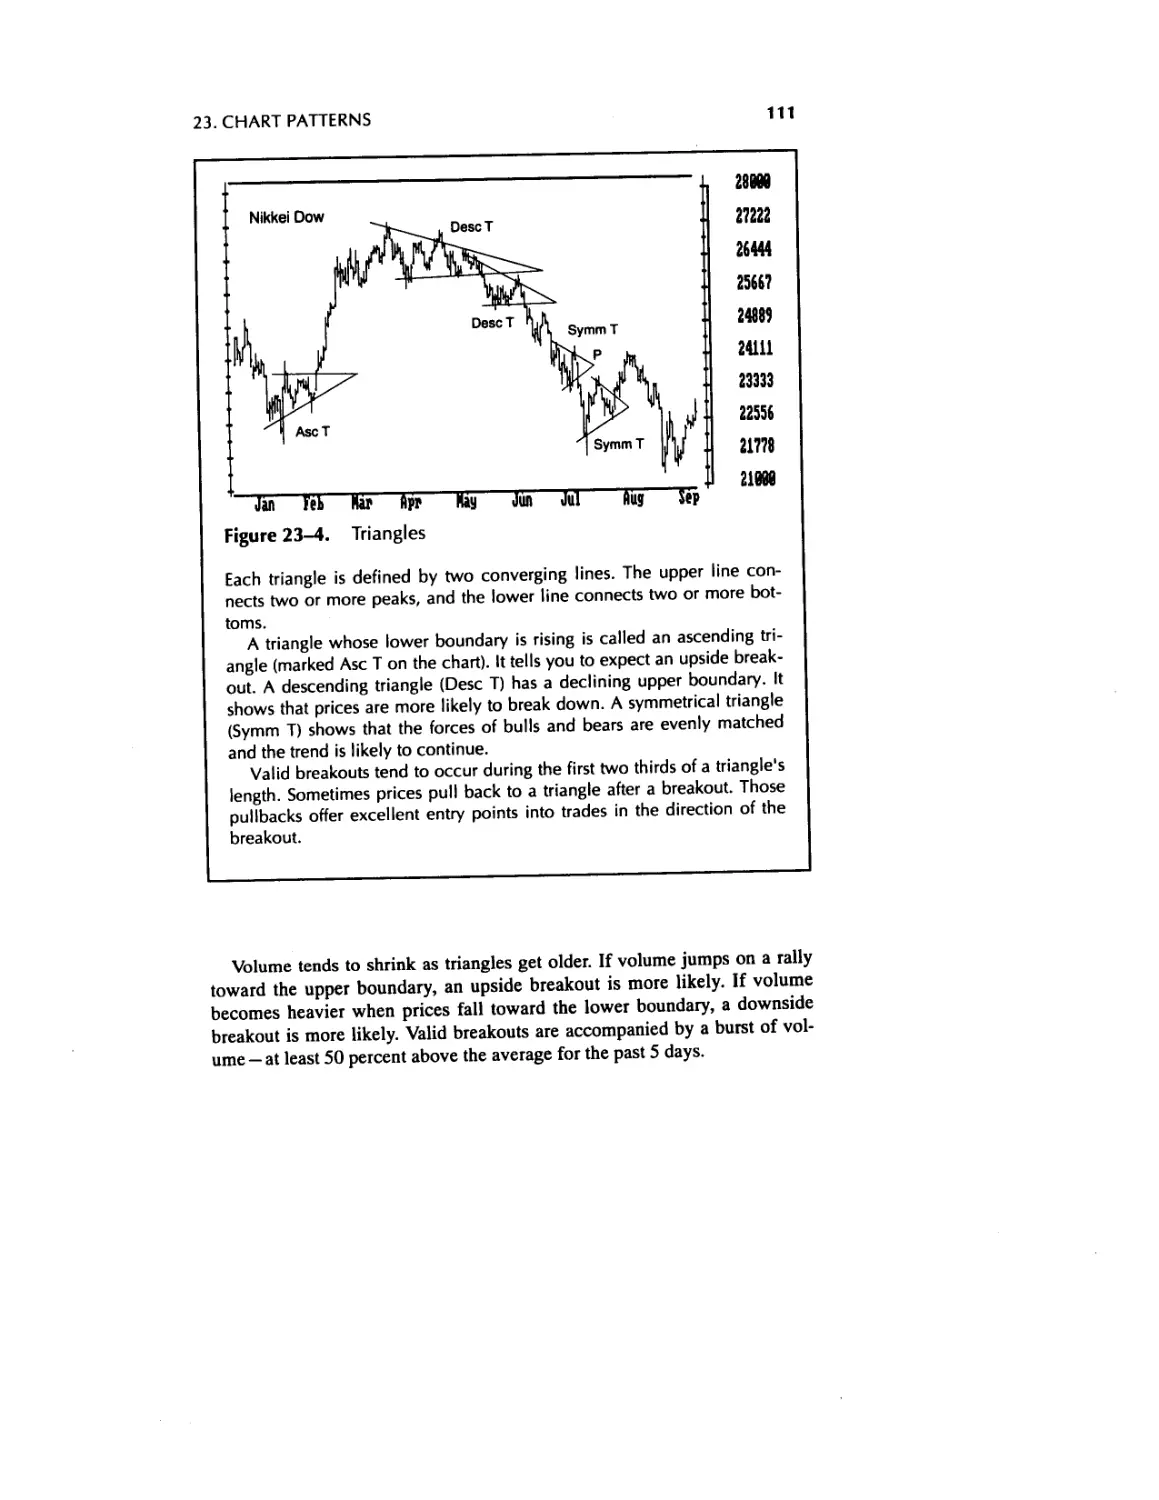
23. Chart Patterns 101
IV Computerized Technical Analysis 115
24. Computers in Trading 115
25. Moving Averages 120
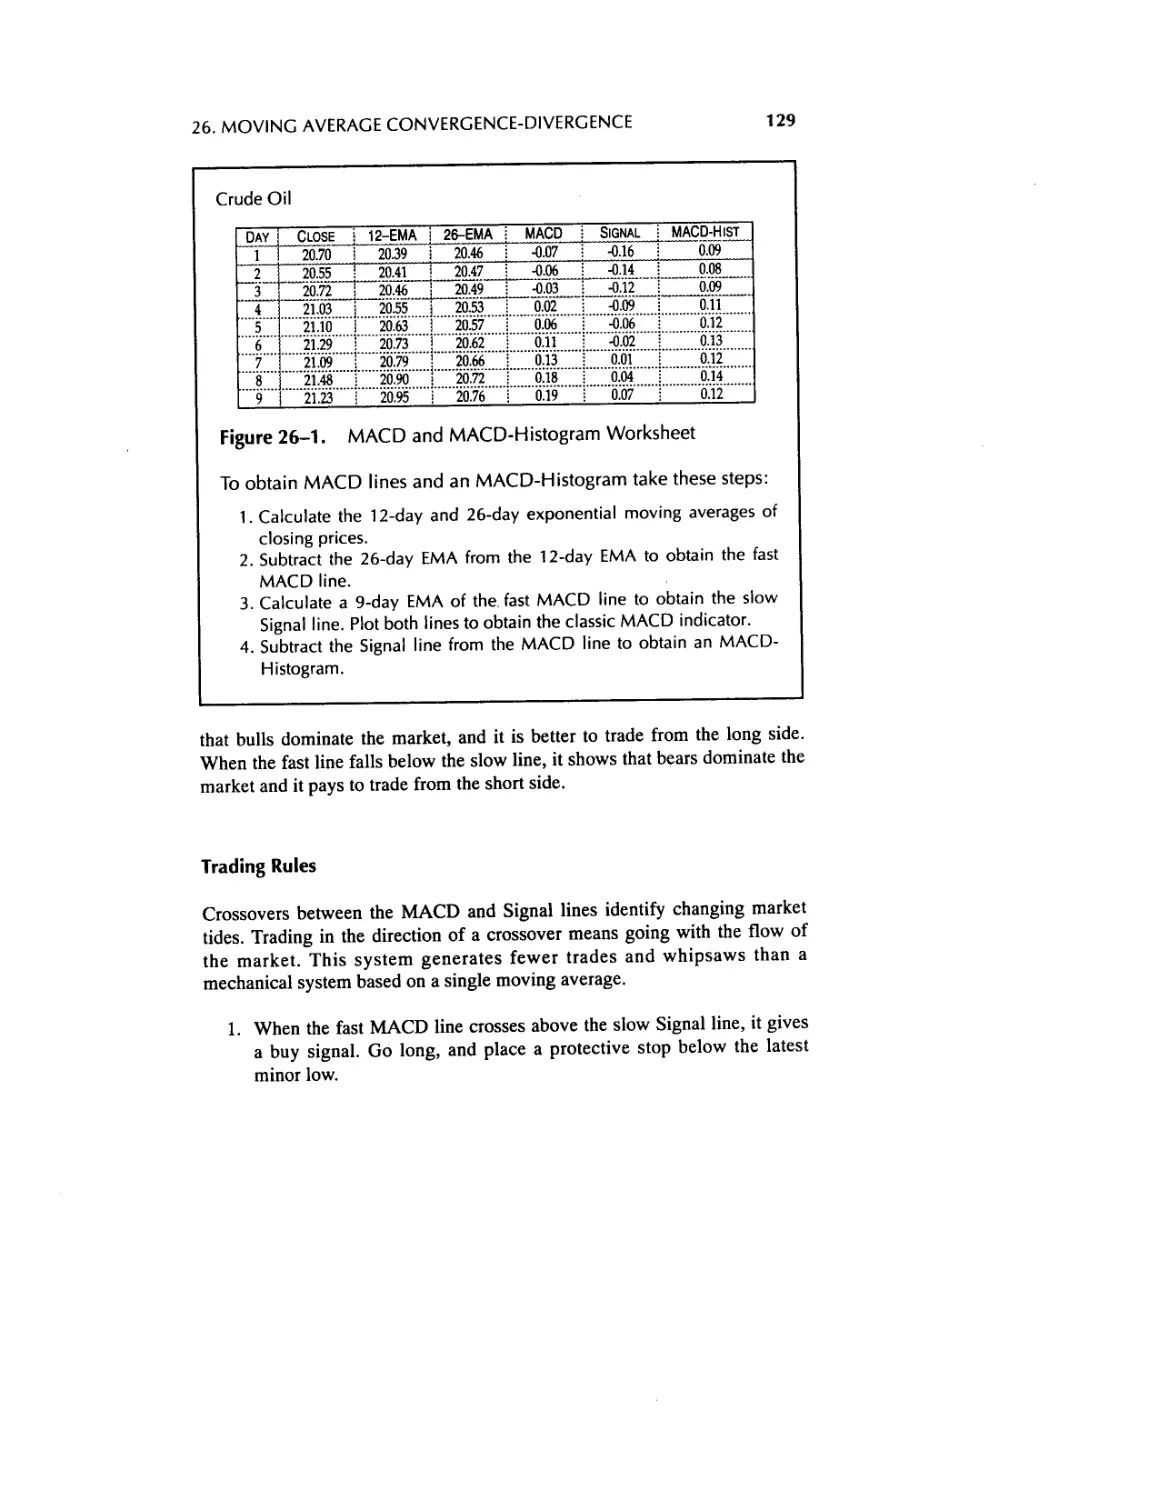
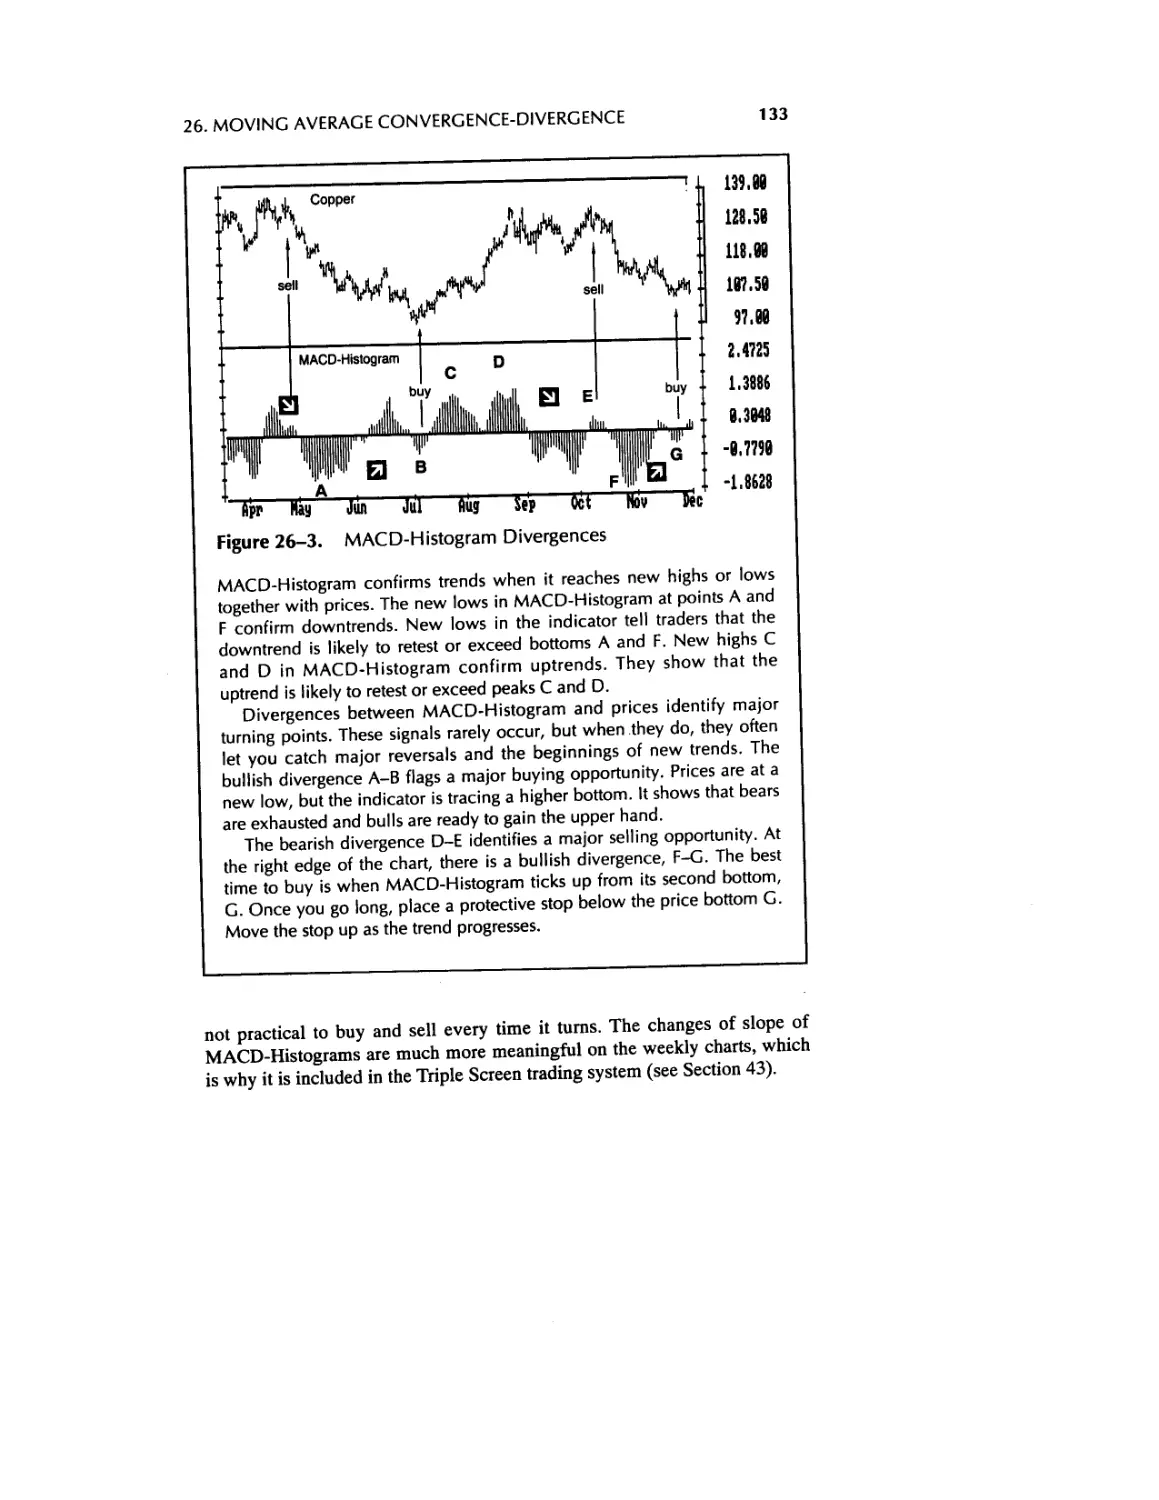
26. Moving Average Convergence-Divergence (MACD) and MACD-
Histogram 127
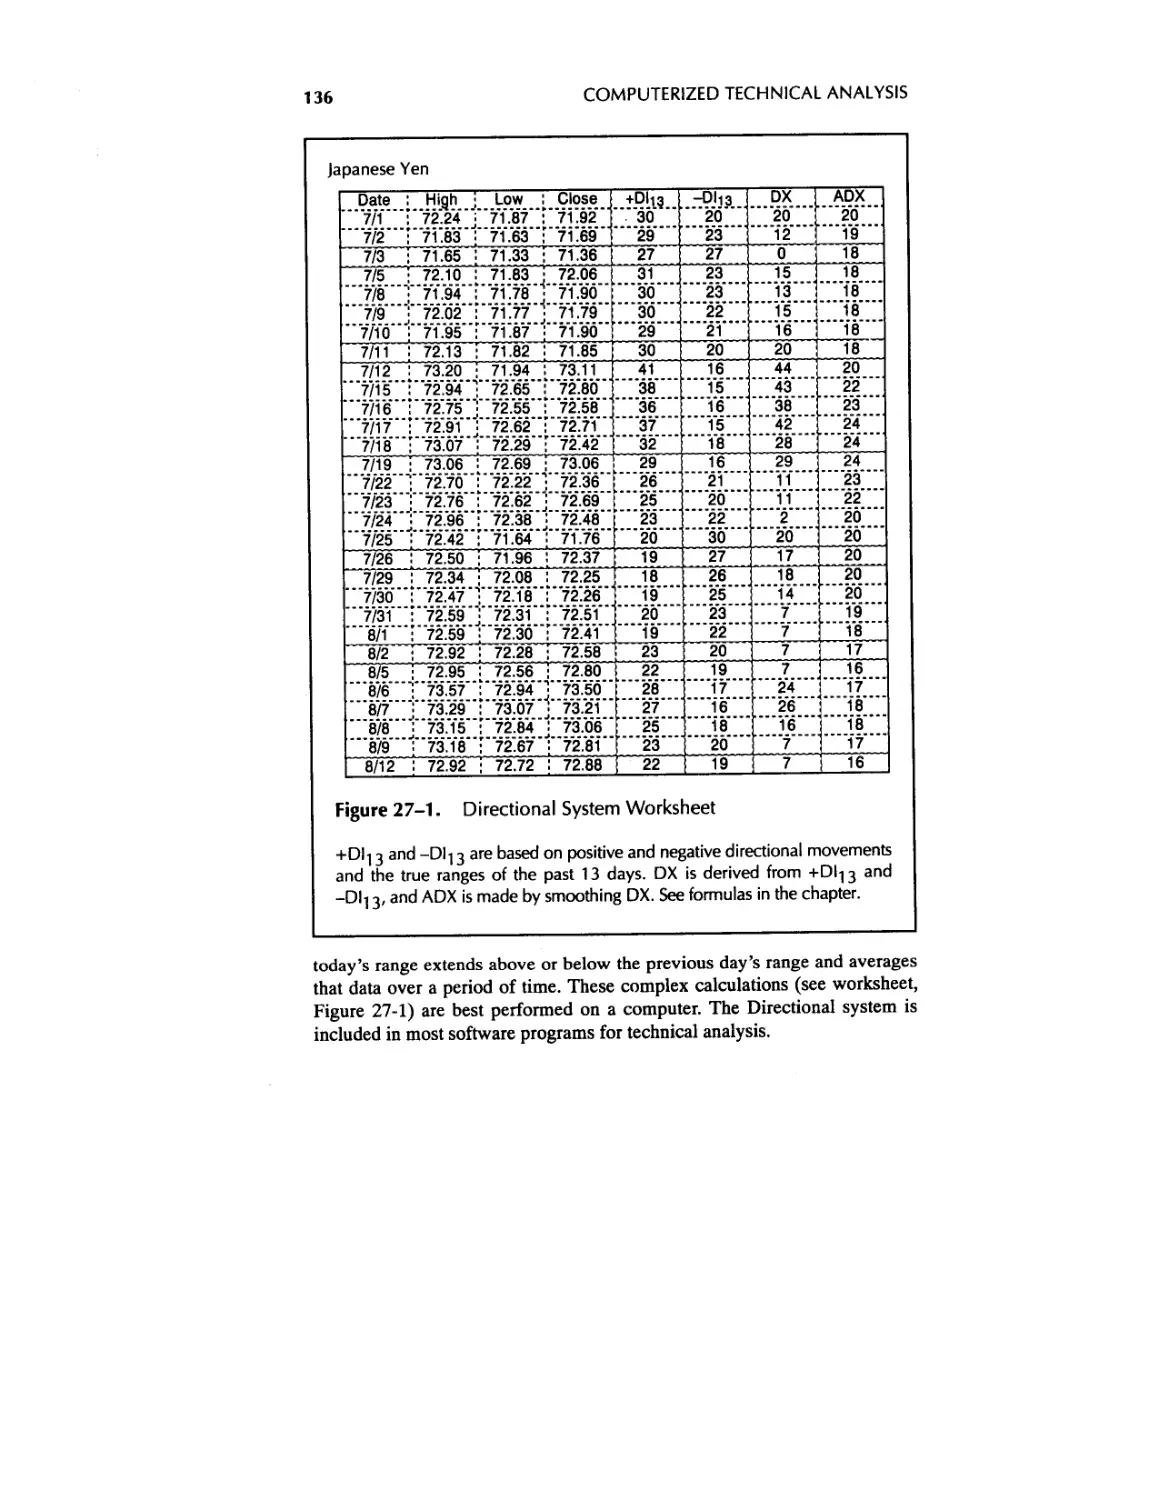
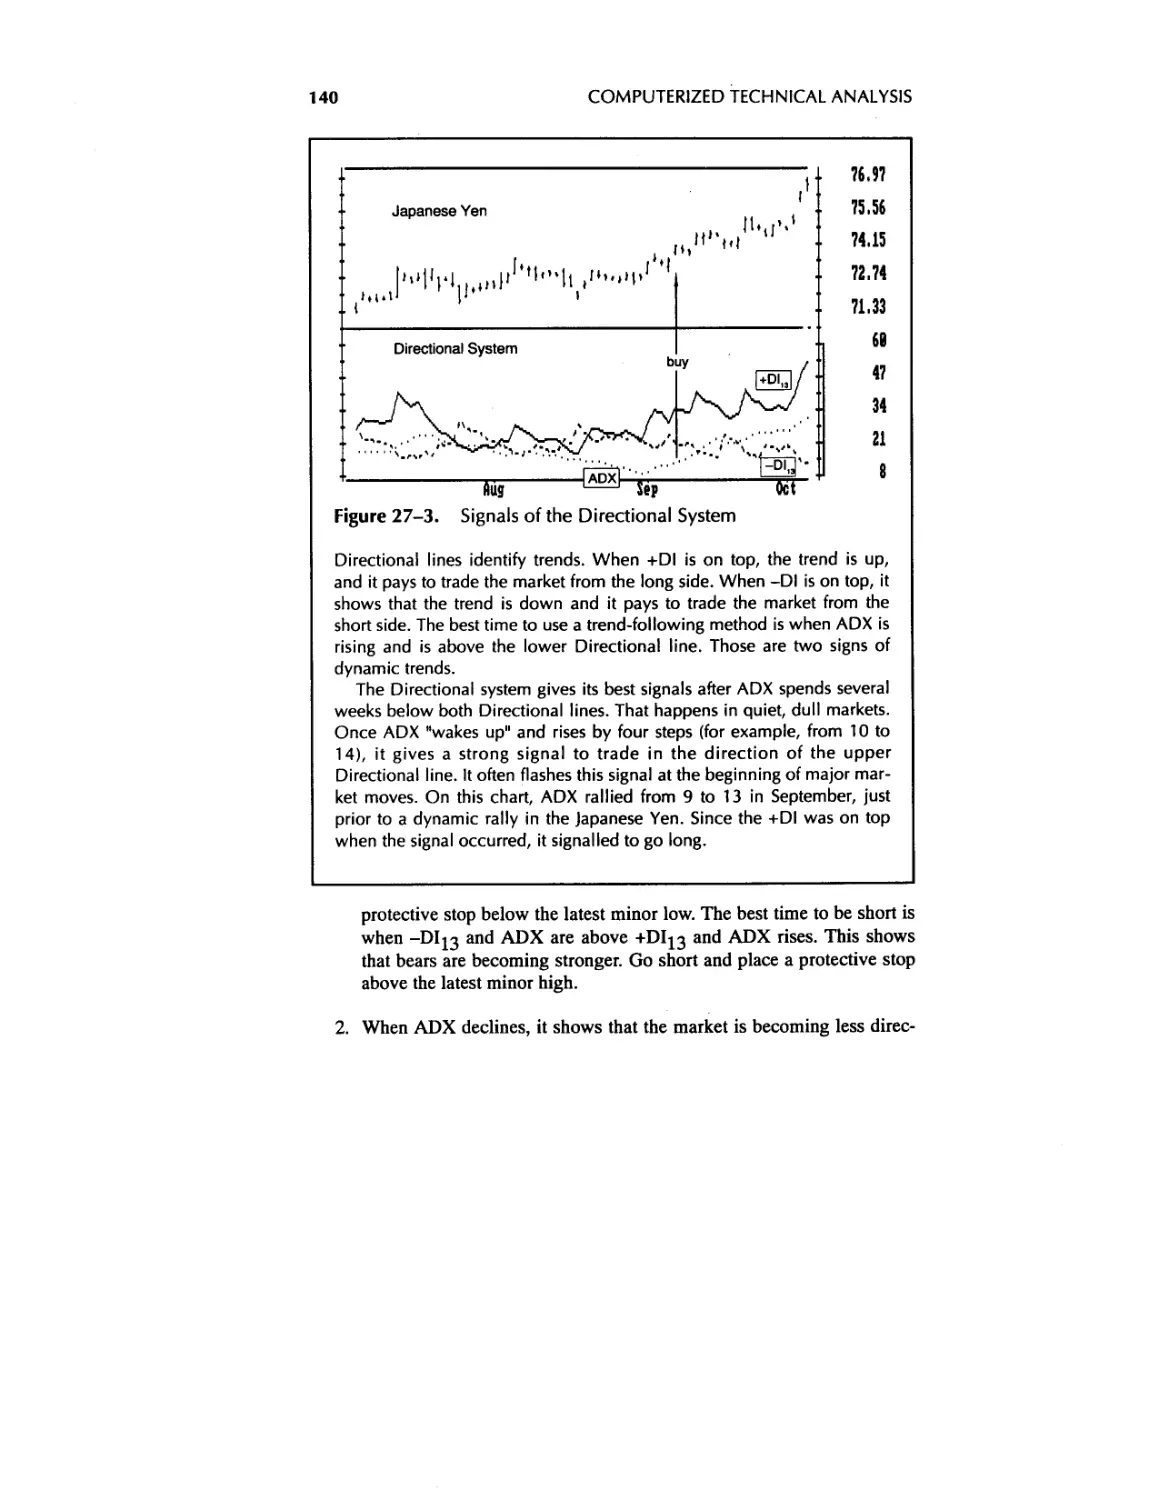
27. The Directional System 135
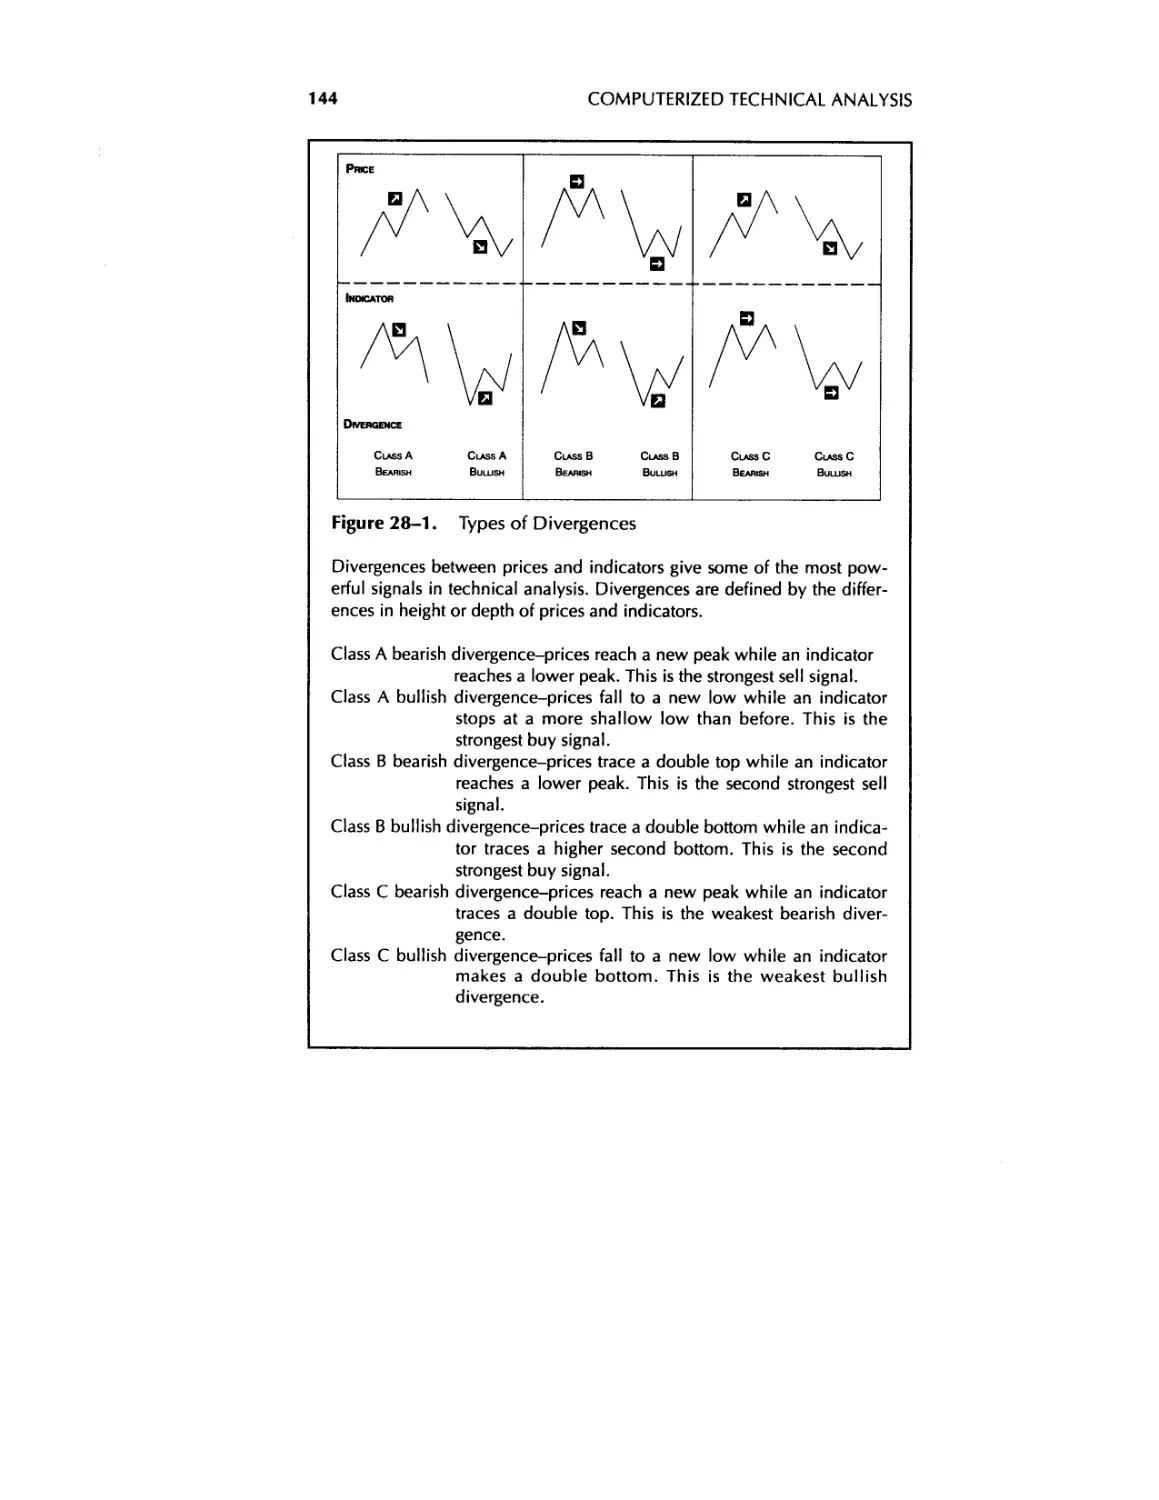
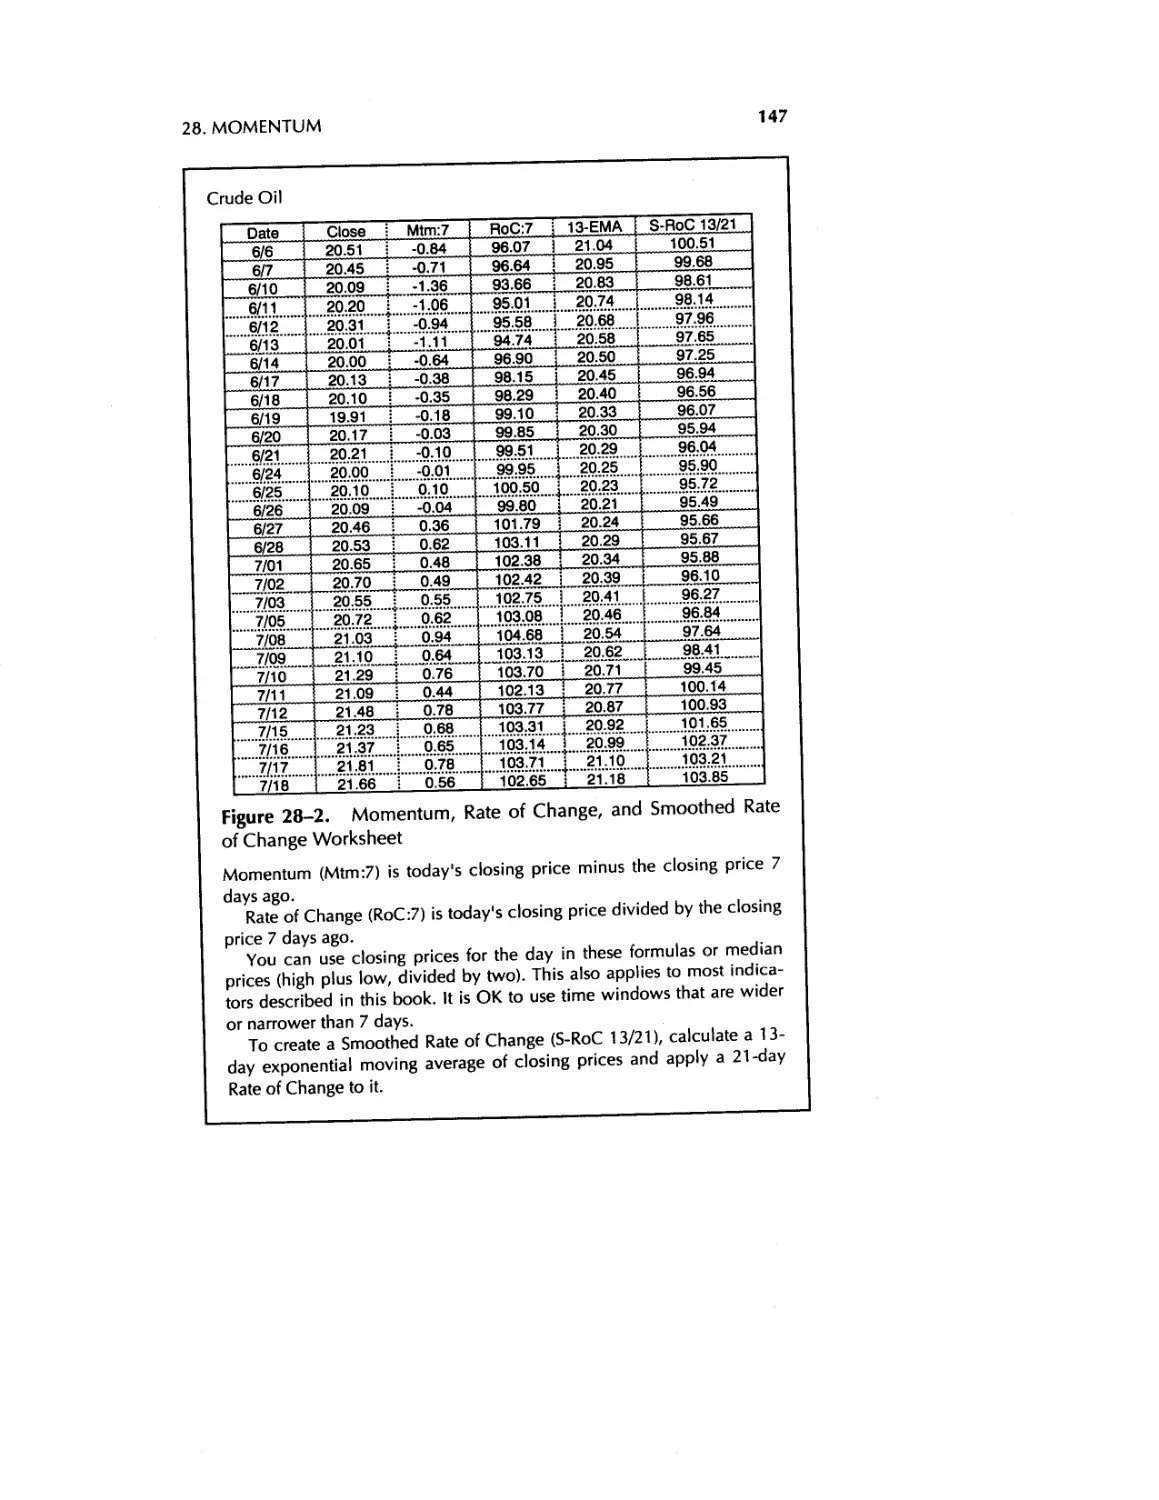
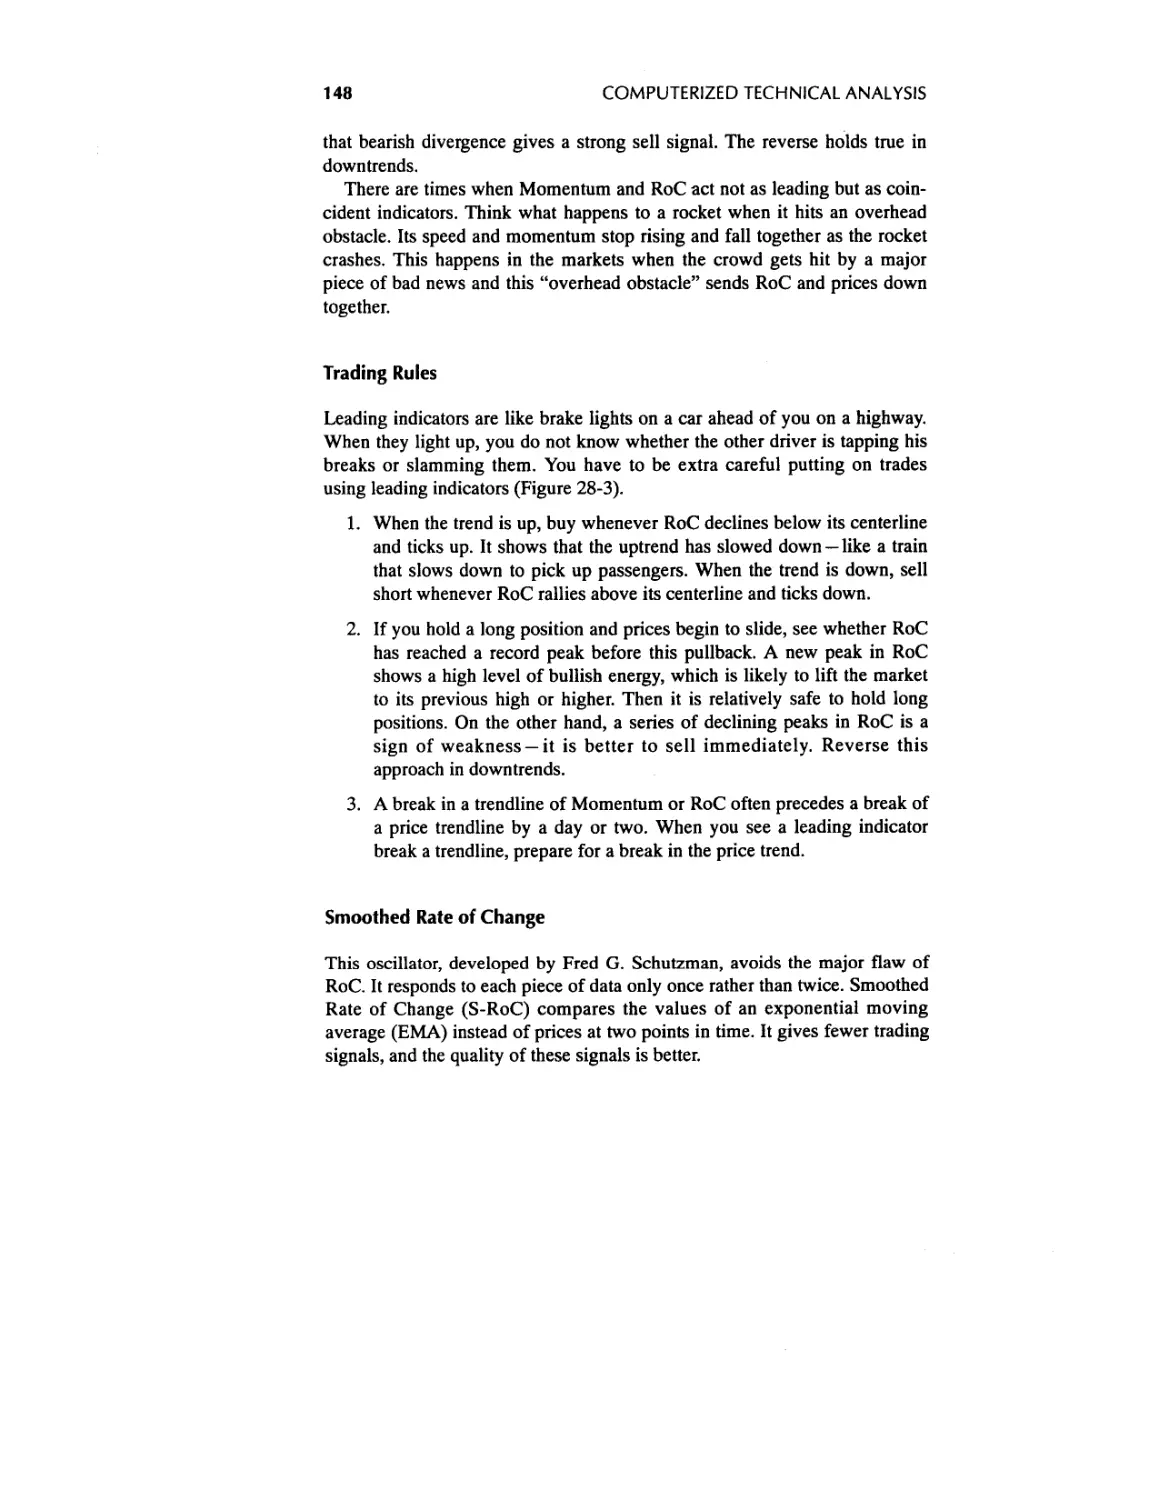
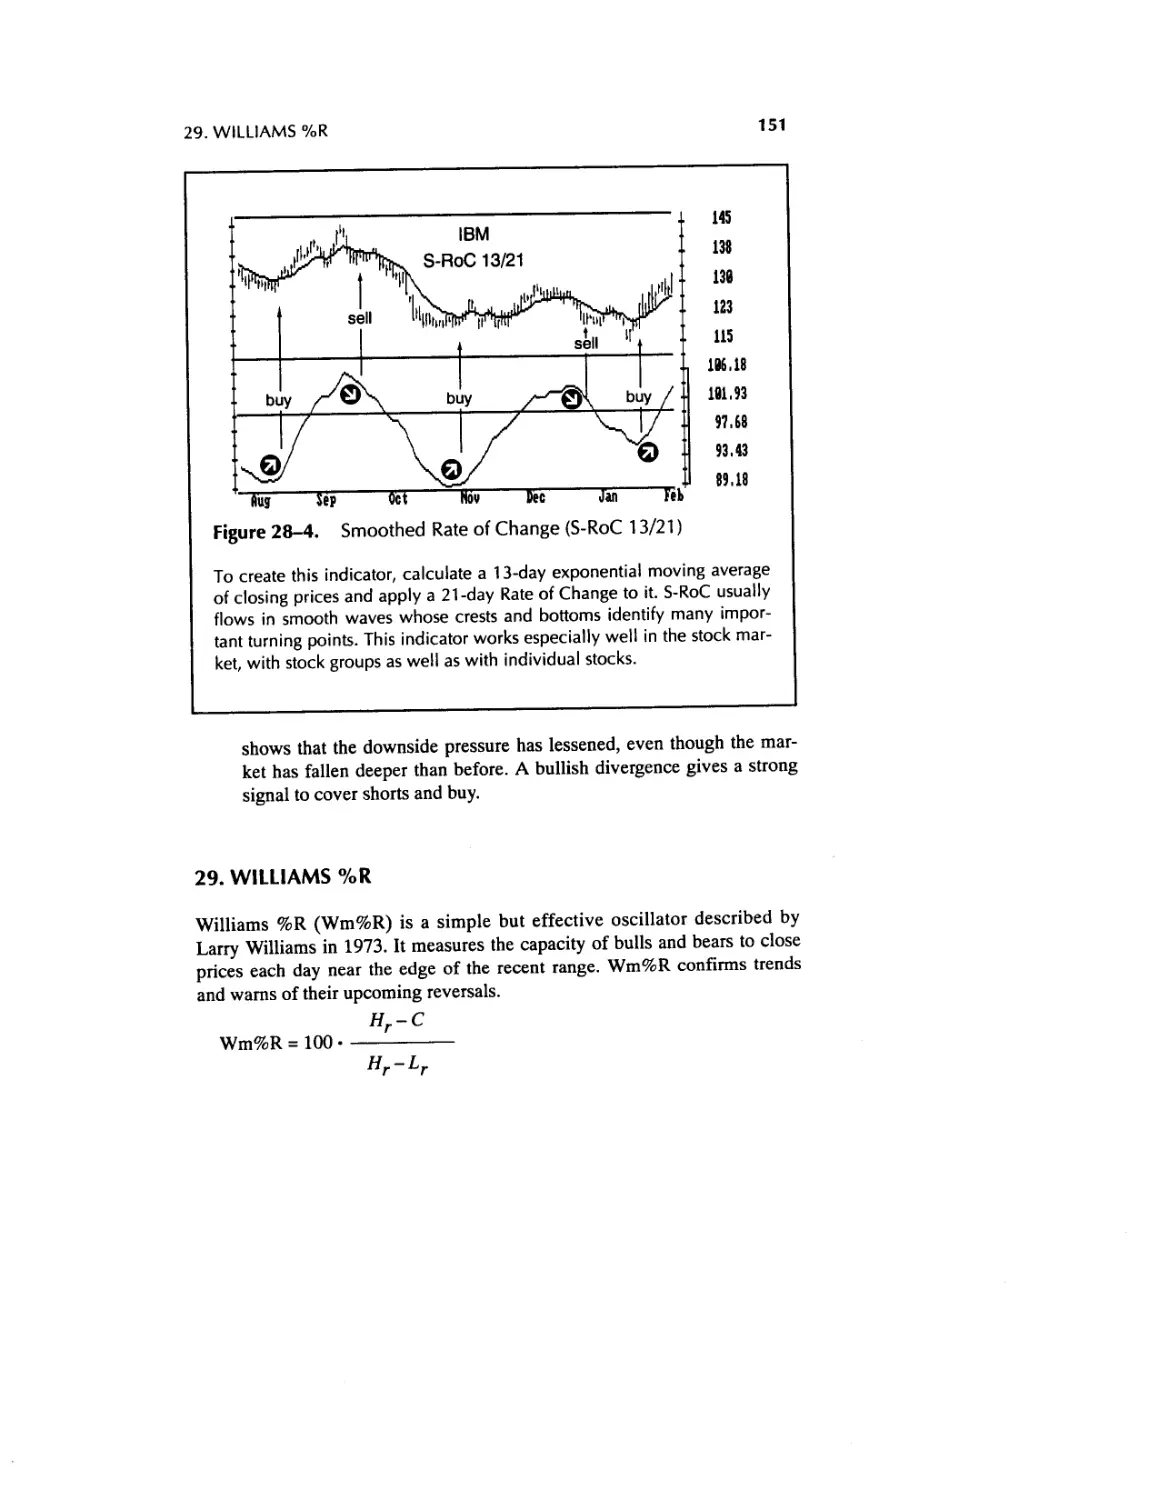
28. Momentum, Rate of Change, and Smoothed Rate of Change 142
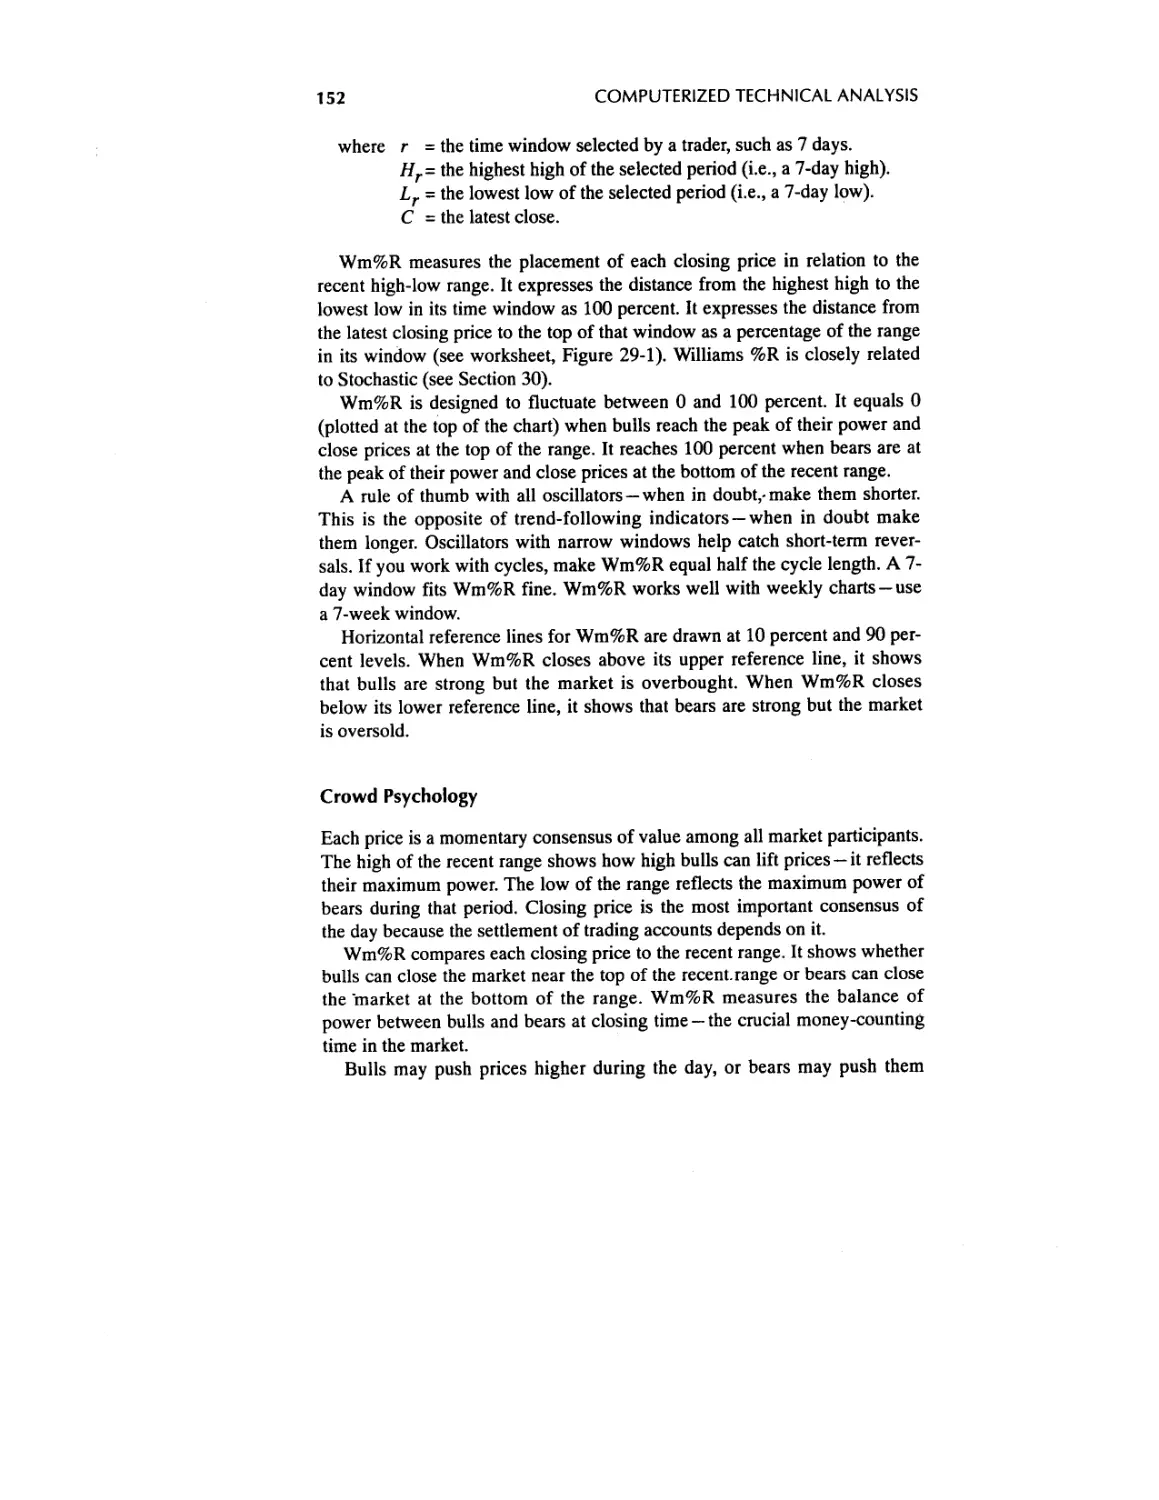
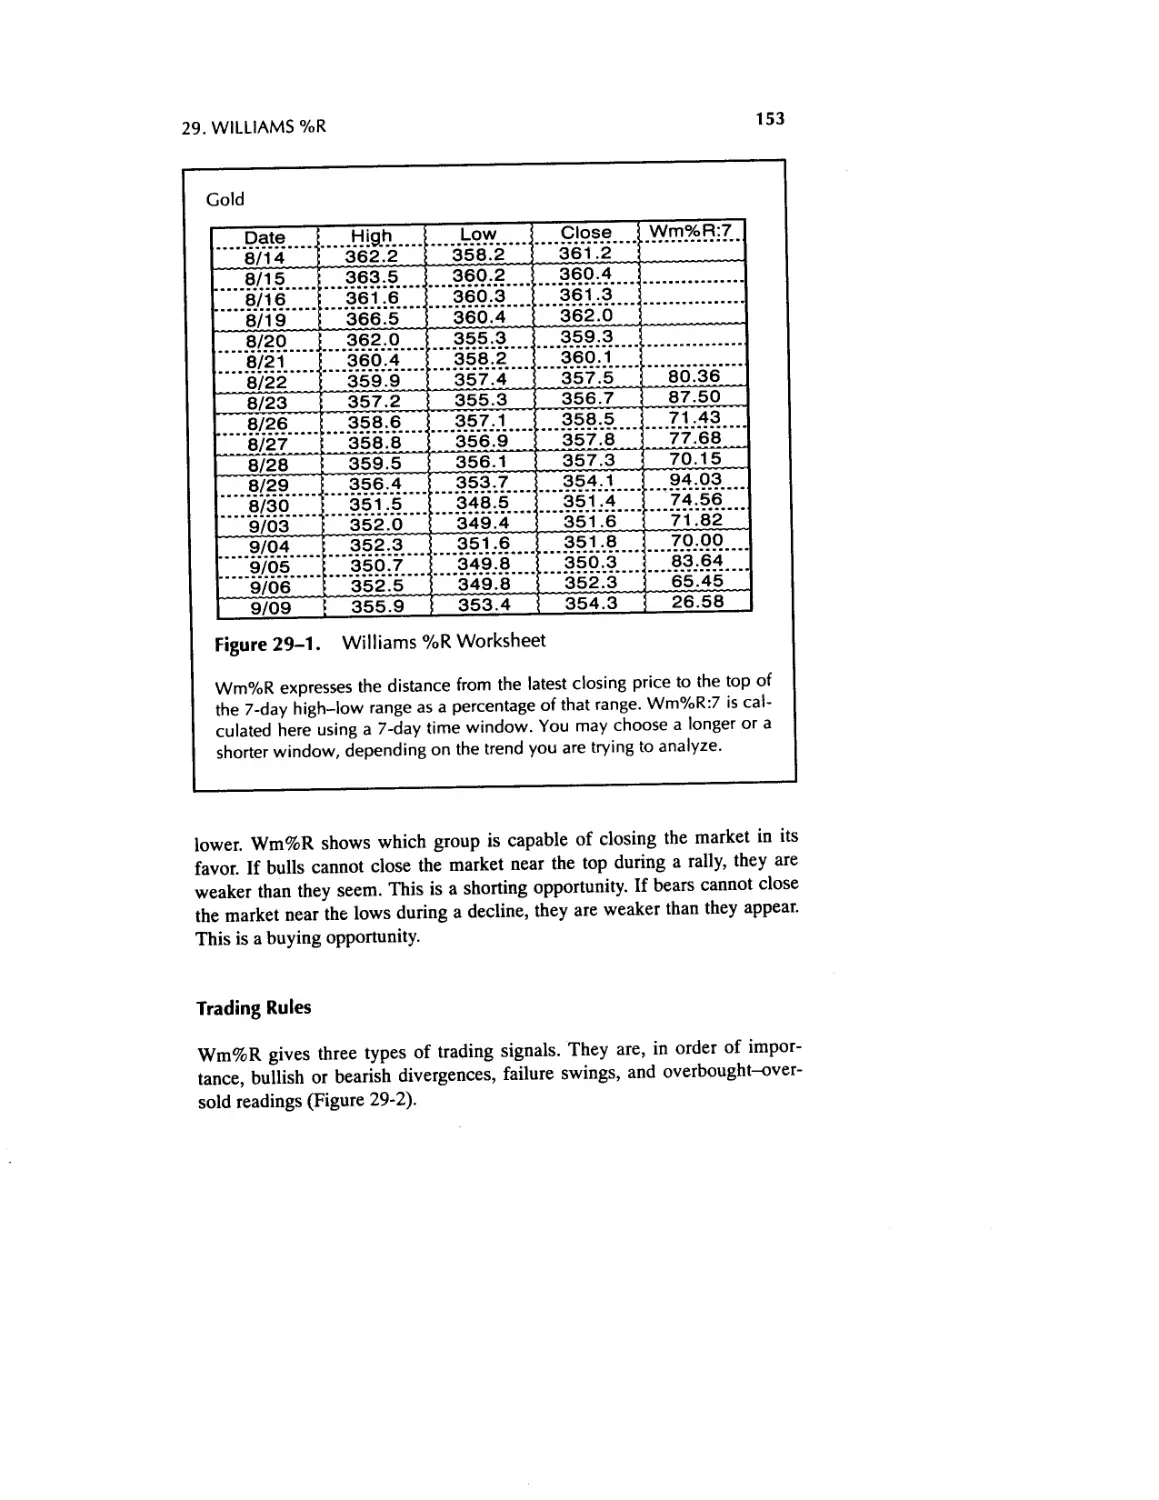
29. Williams %R 151
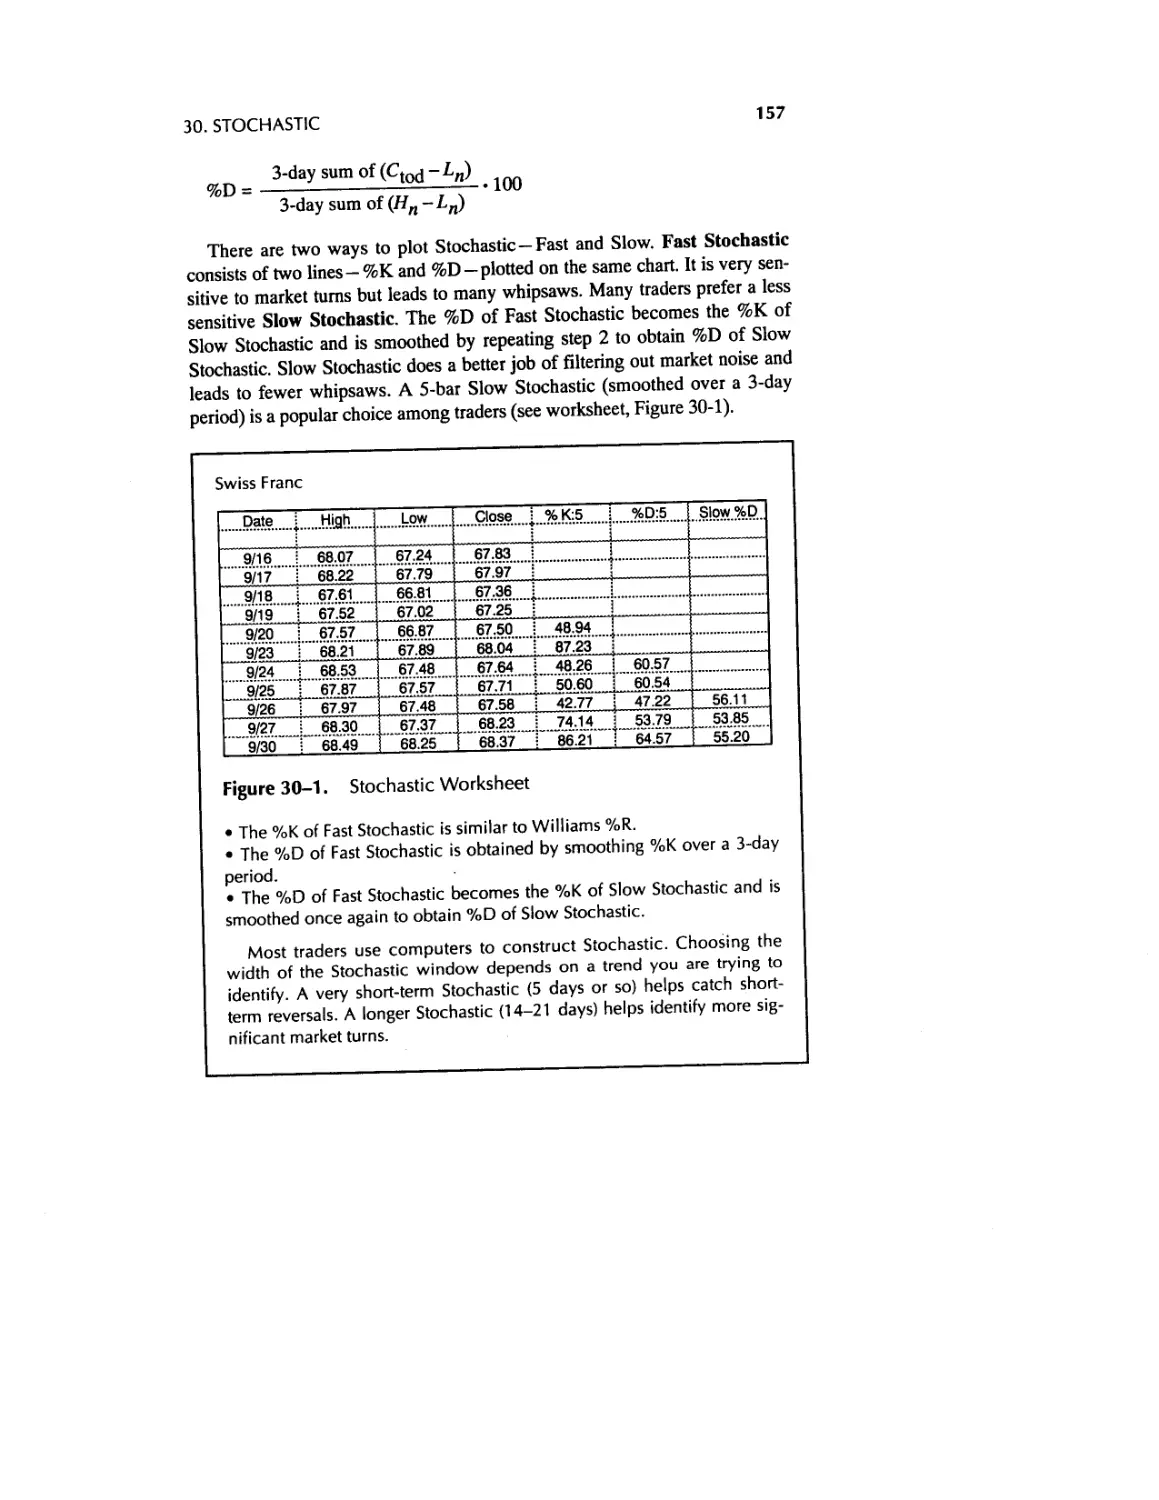
30. Stochastic 156
31. Relative Strength Index 162
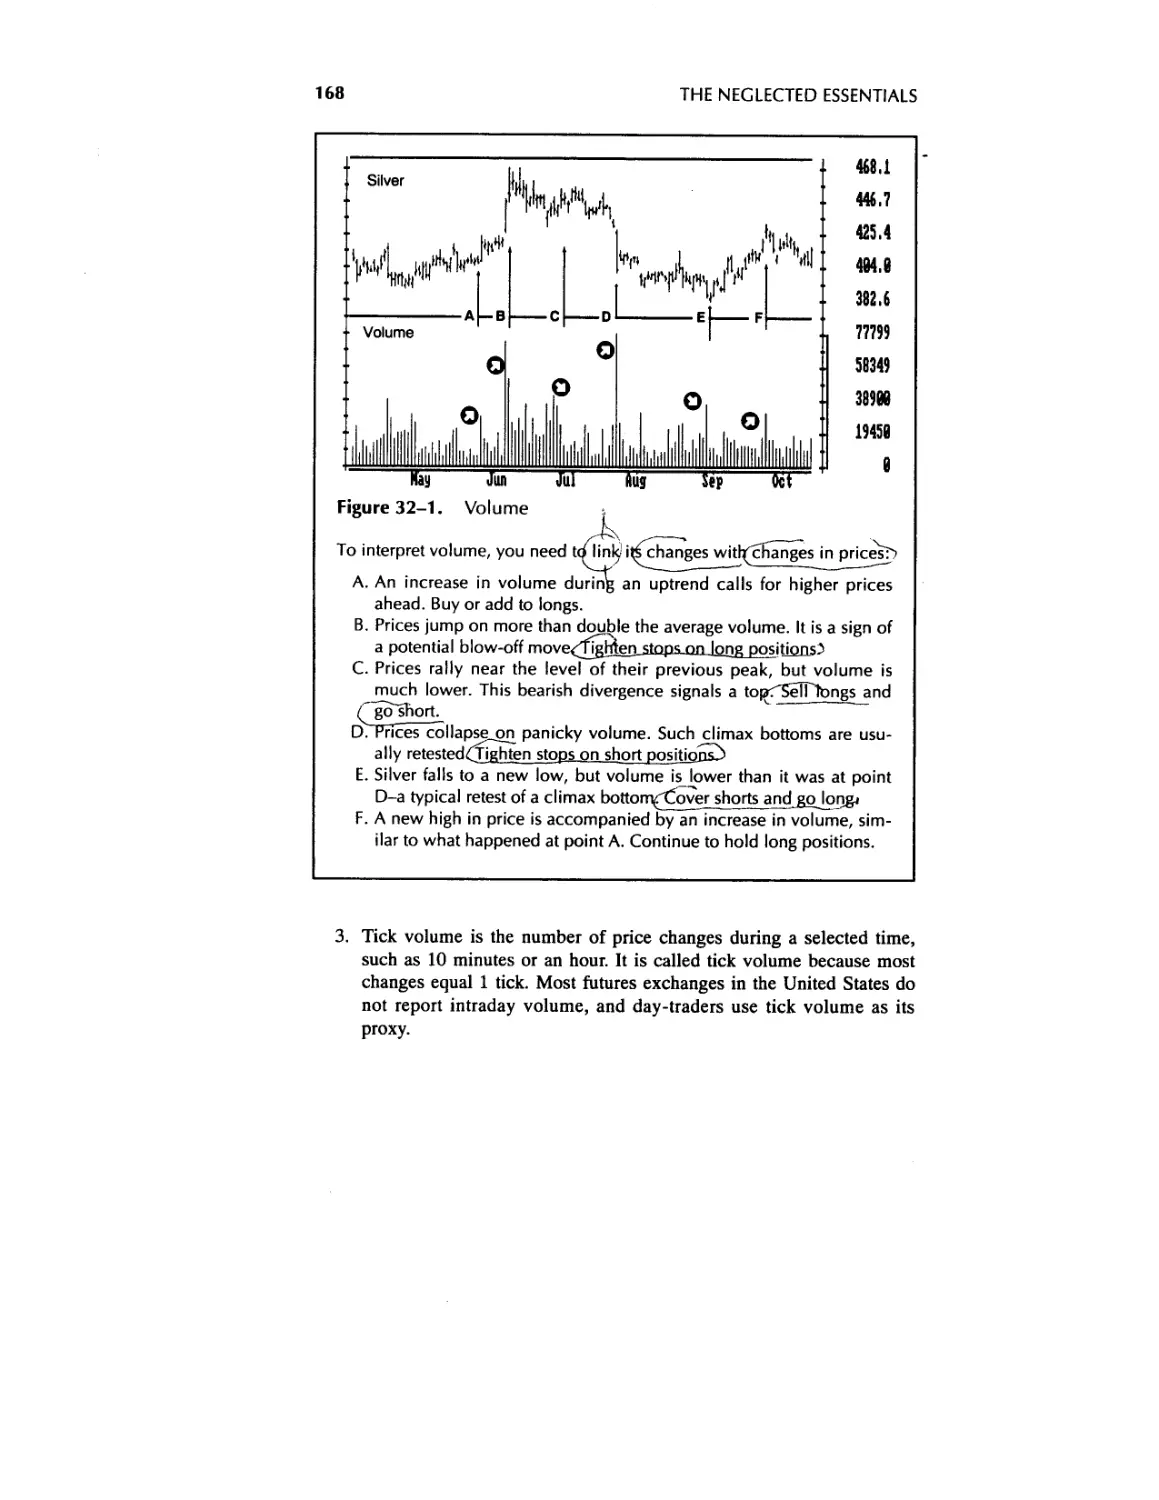
The Neglected Essentials 167
32. Volume 167
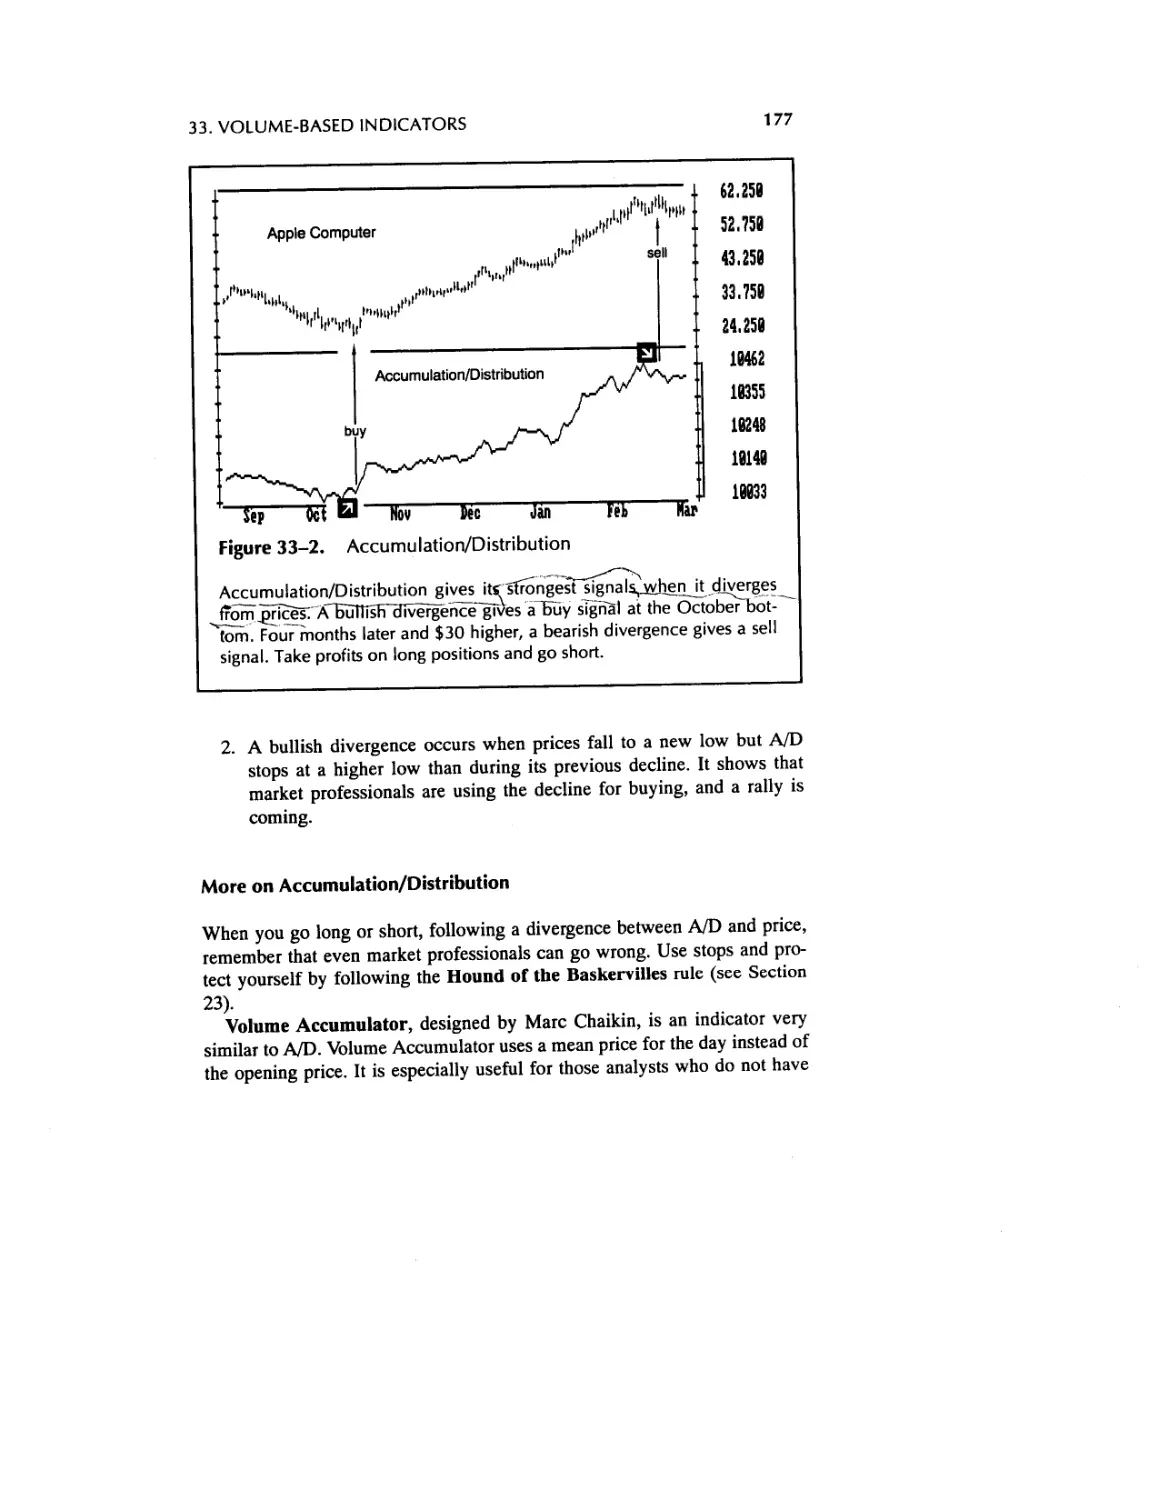
33. Volume-Based Indicators 172
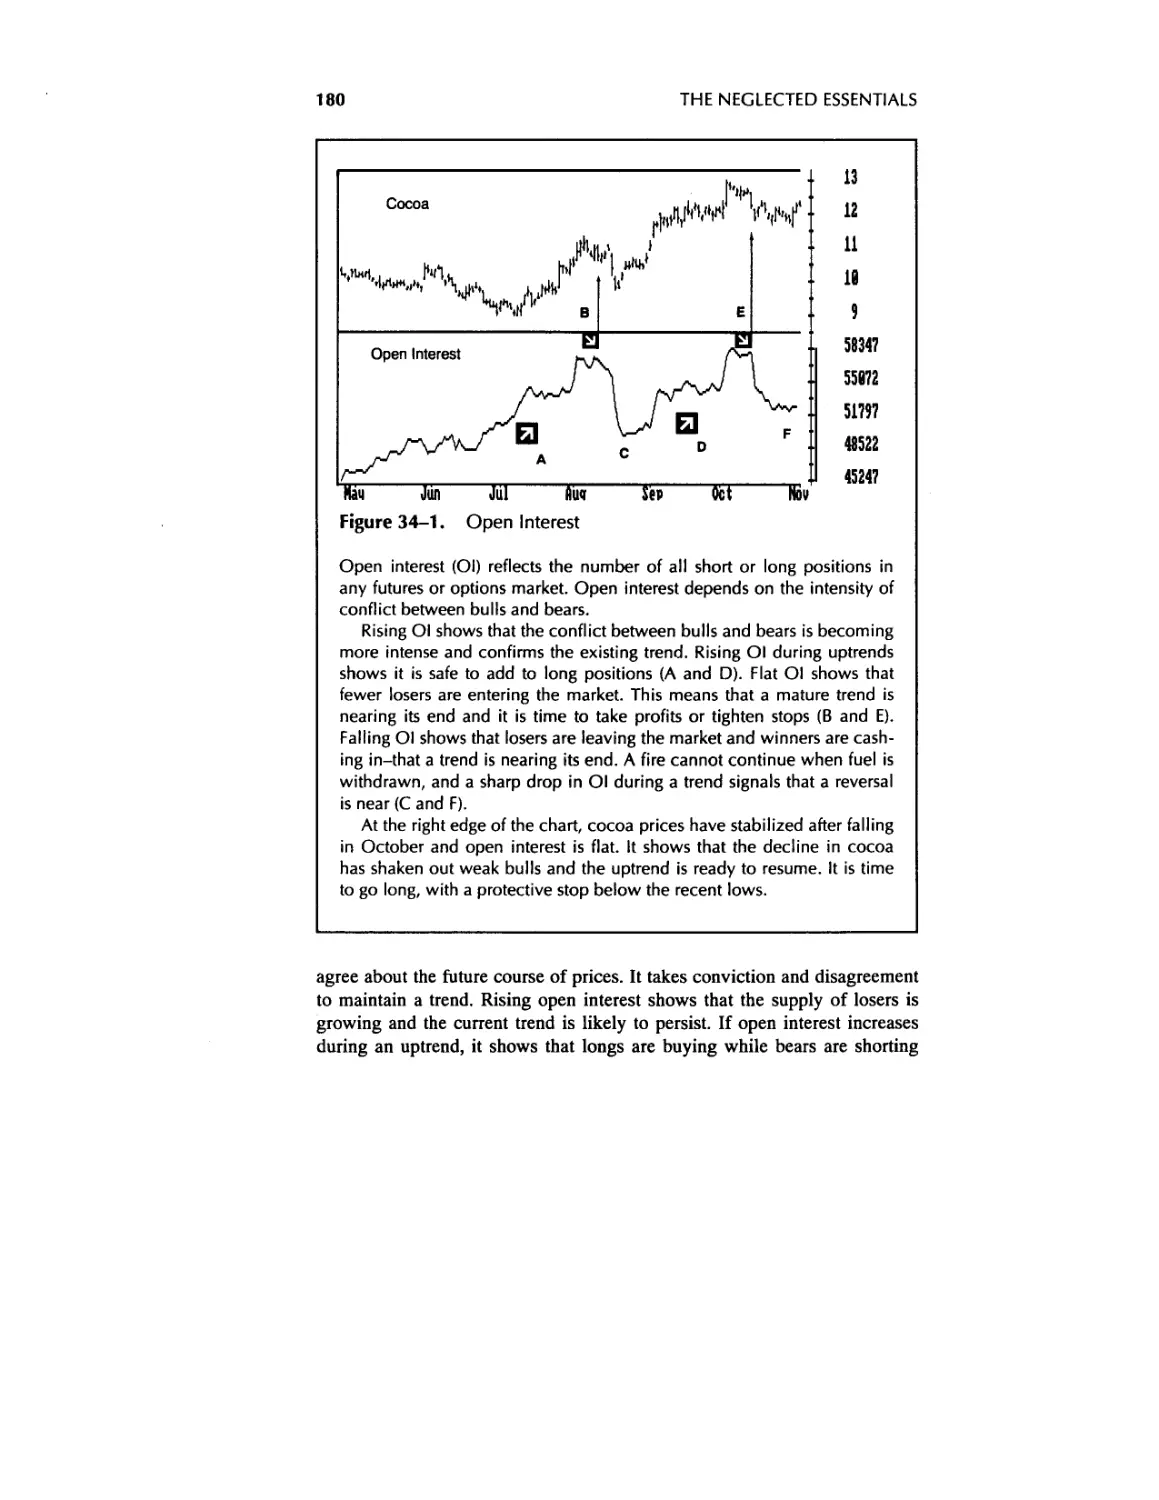
34. Open Interest 178
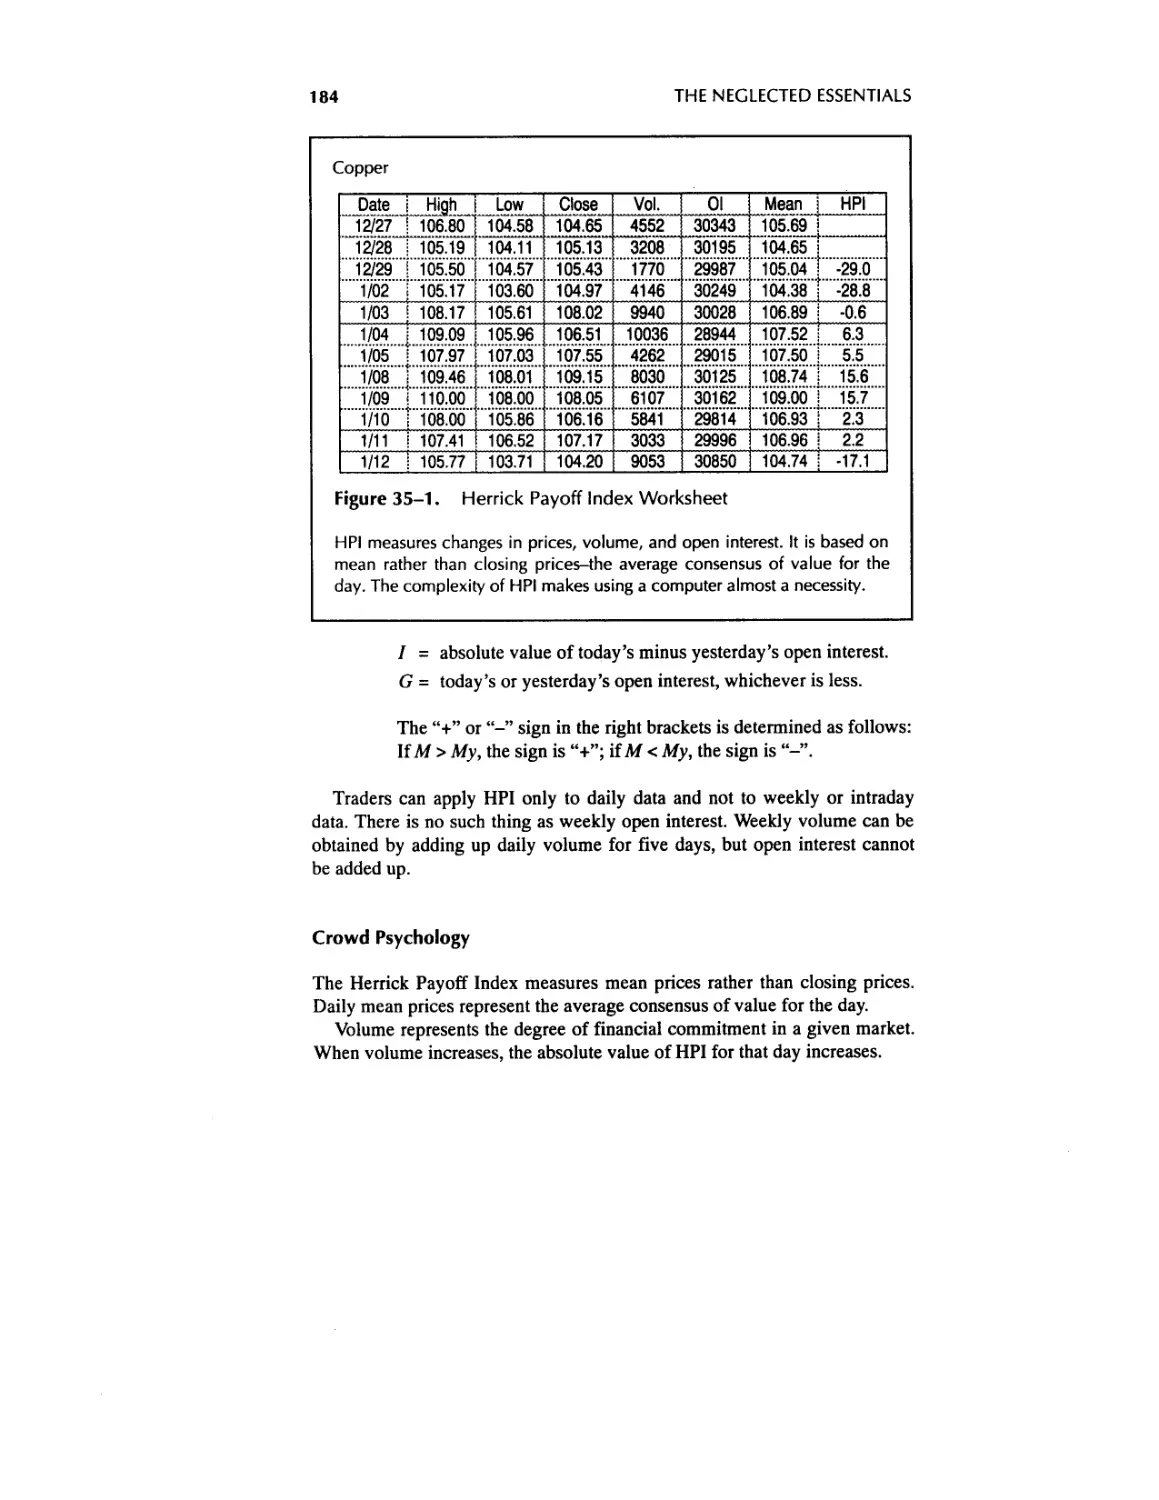
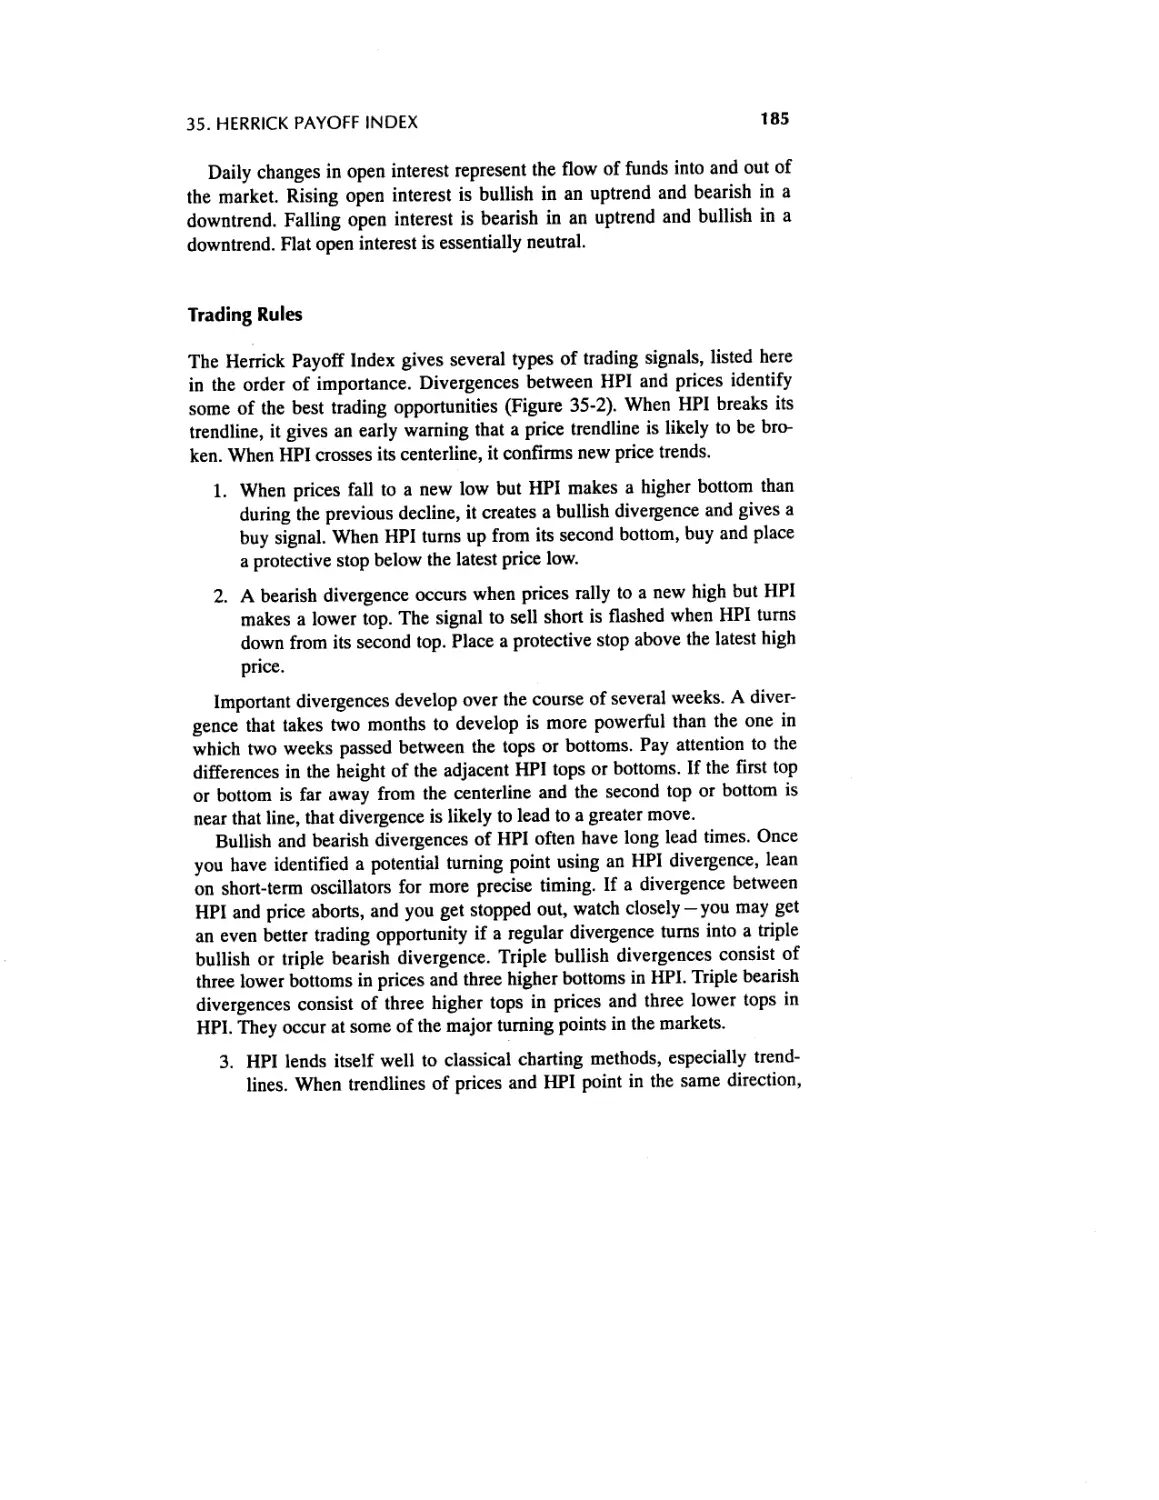
35. Herrick Payoff Index 183
36. Time 187
VI Stock Market Indicators 194
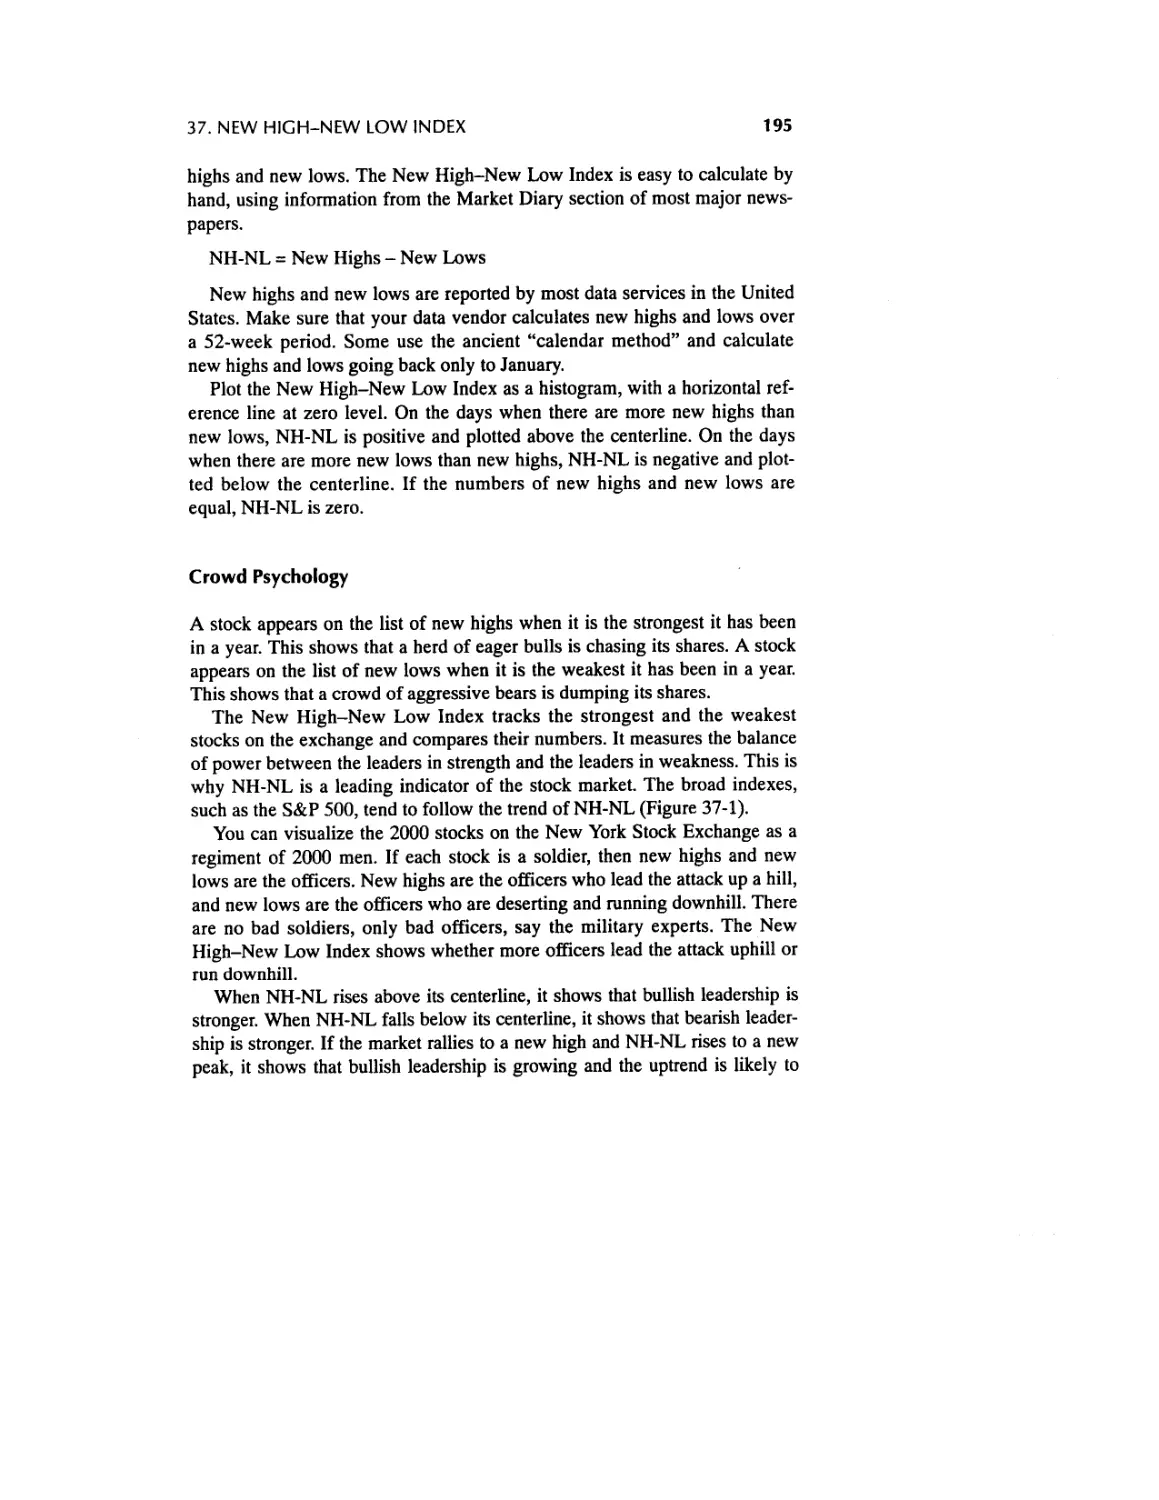
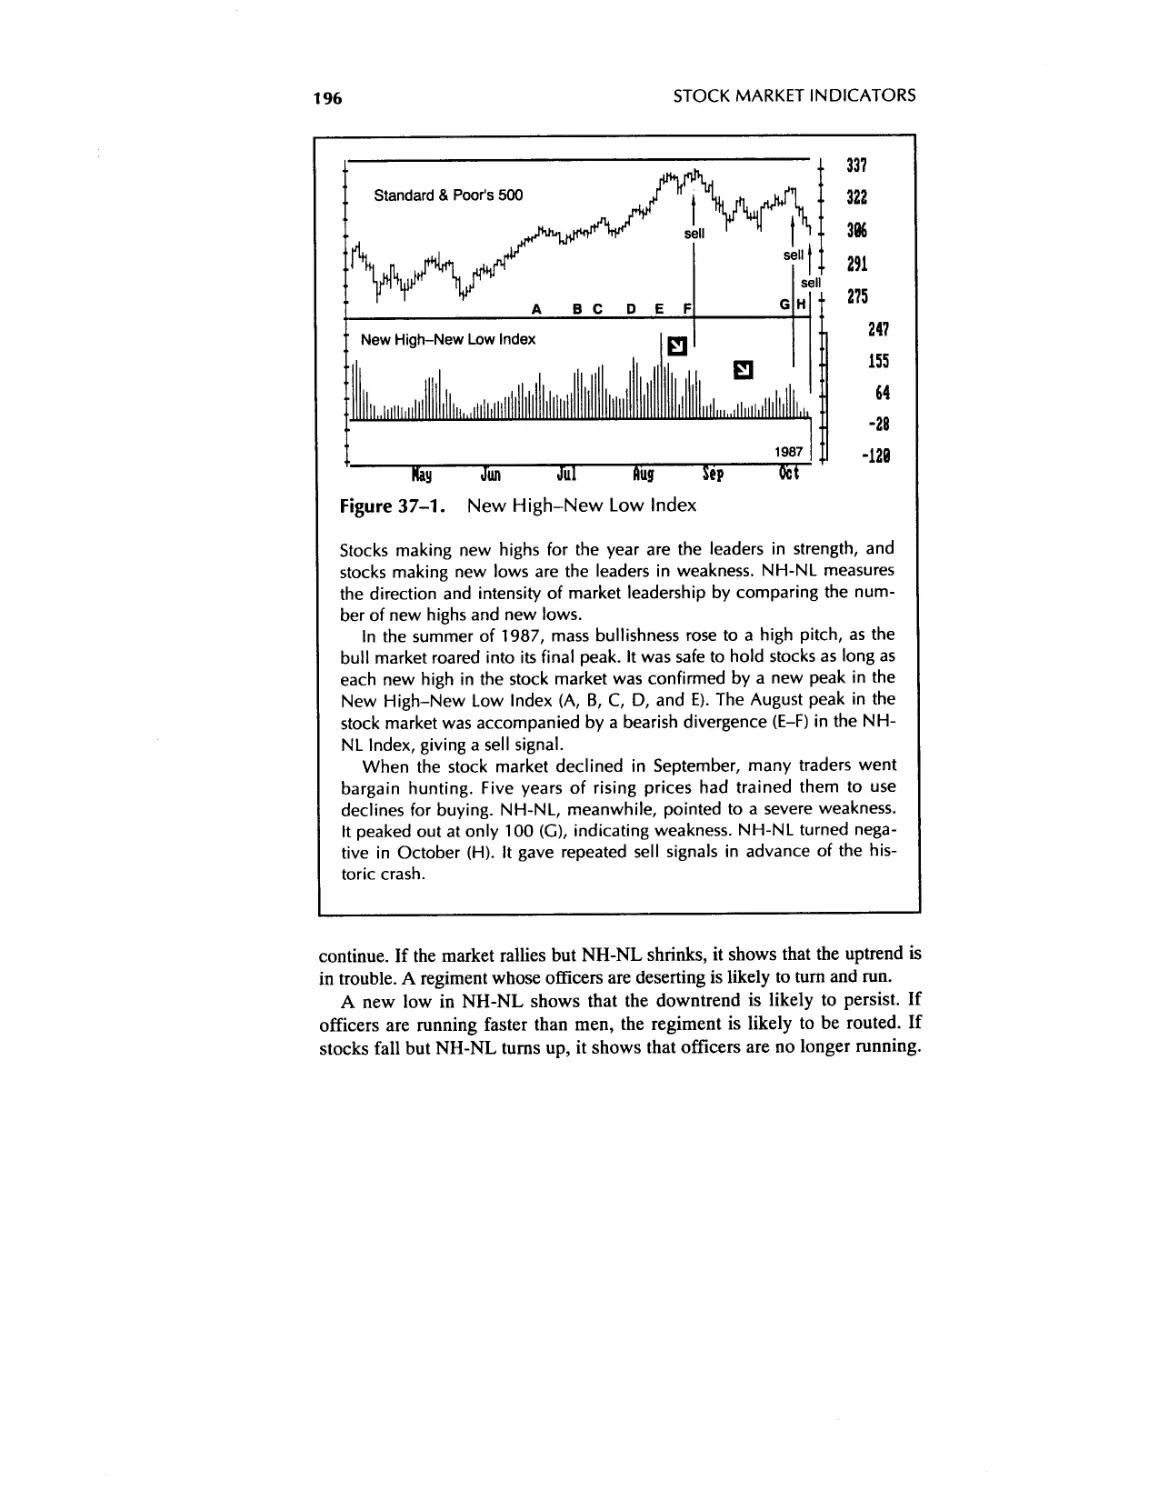
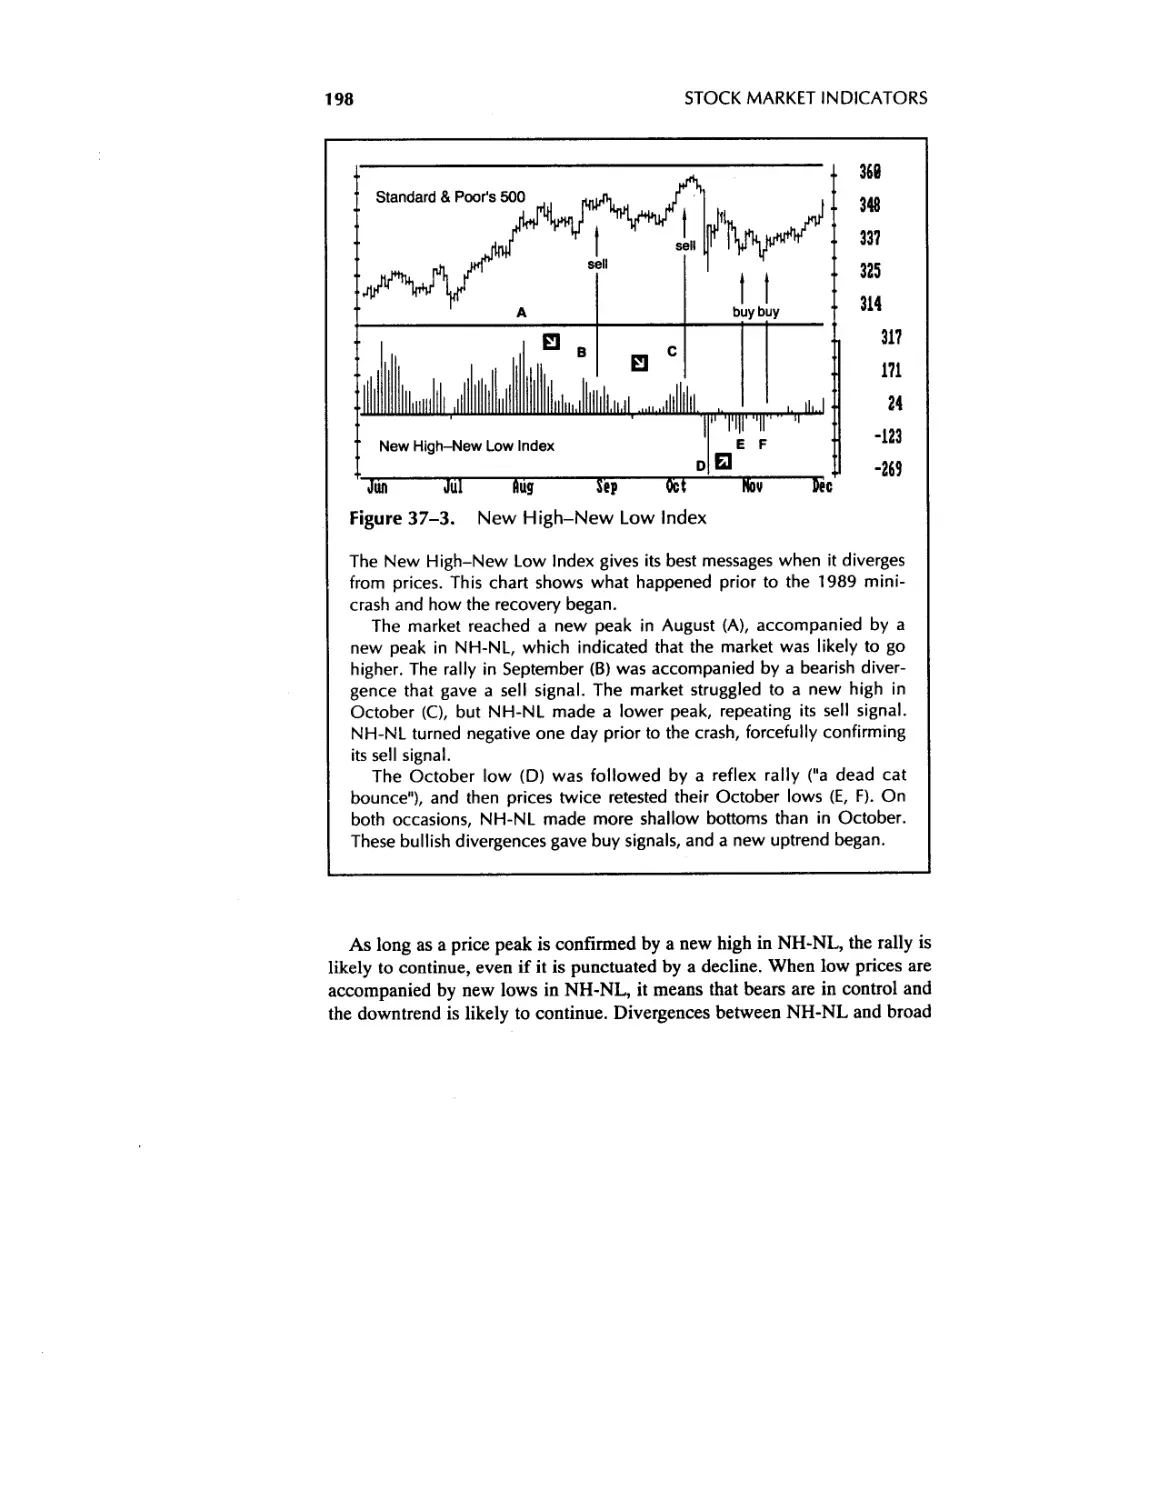
37. New High-New Low Index 194
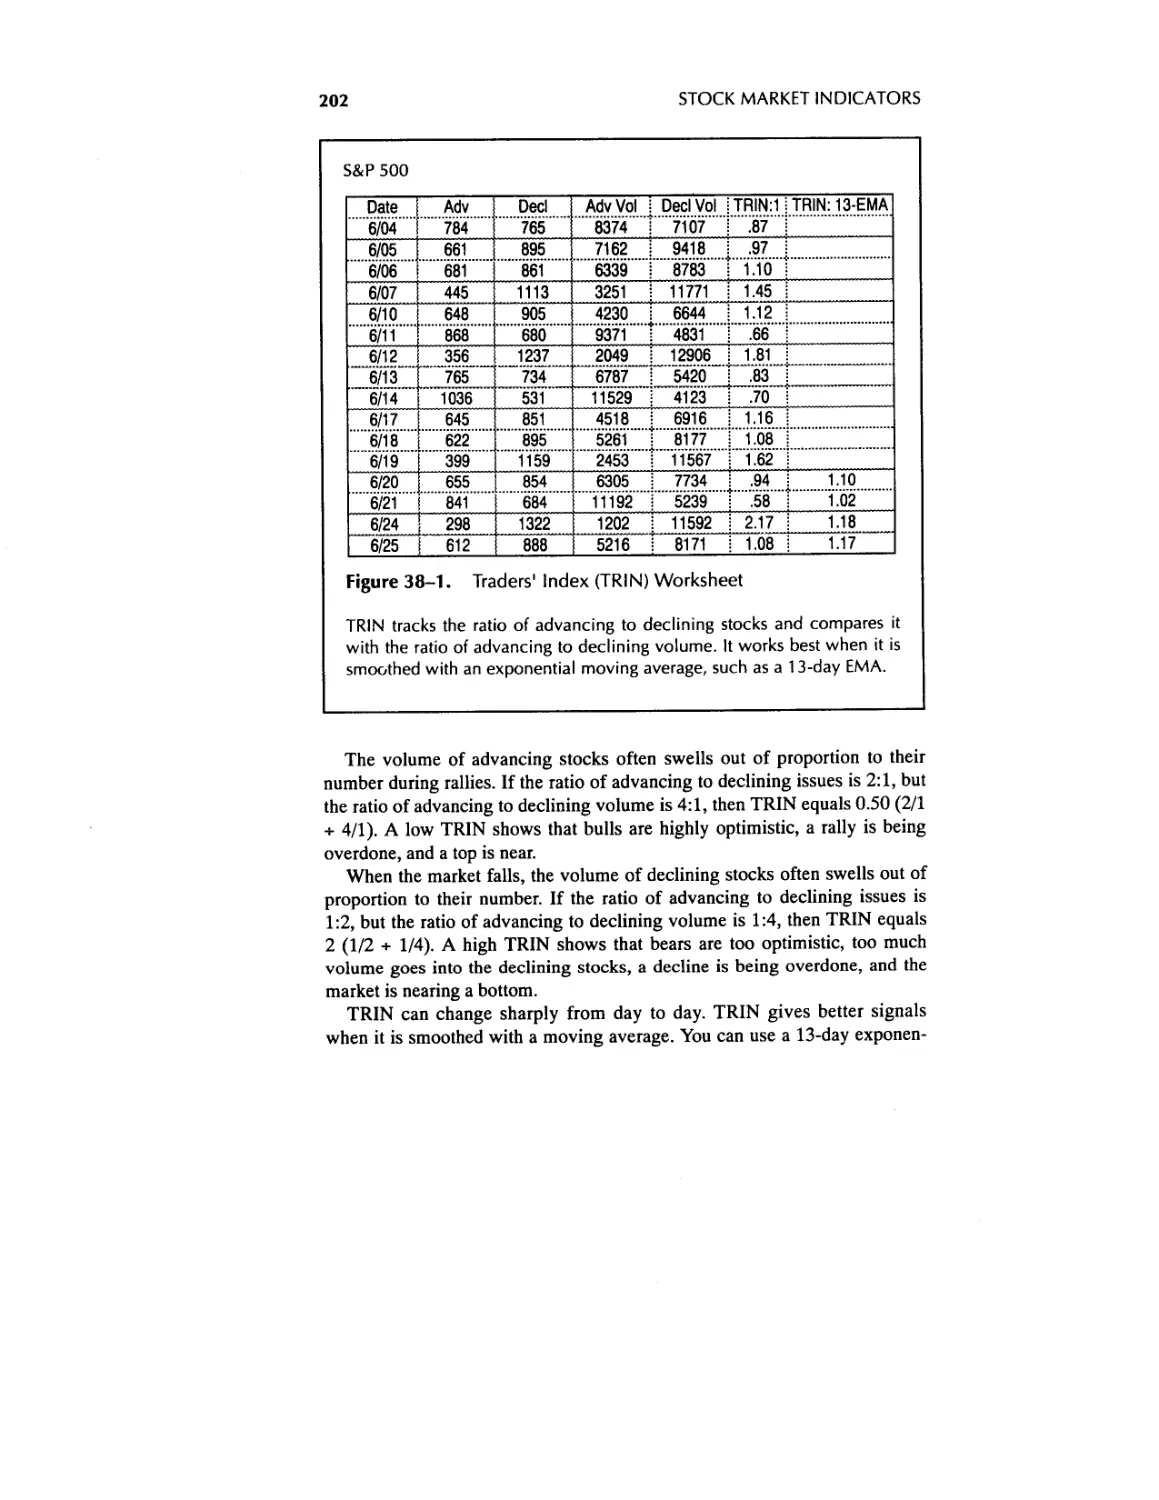
38. Traders’ Index and Other Stock Market Indicators 201
VII Psychological Indicators 209
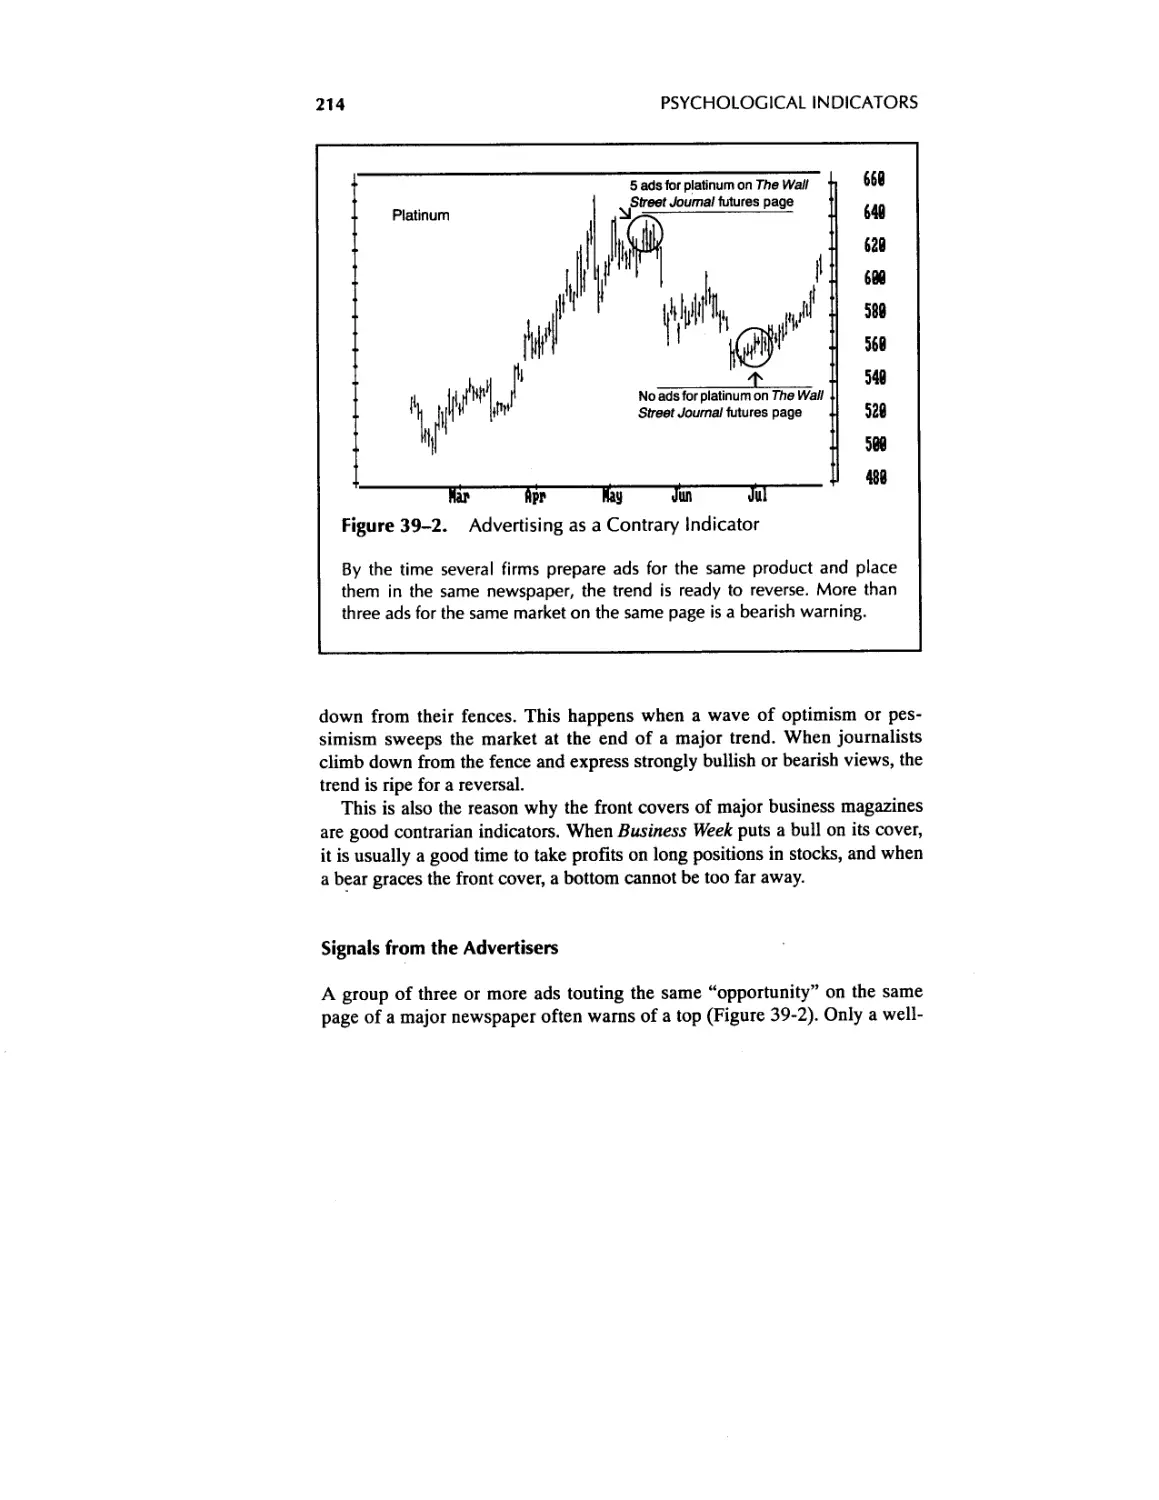
39. Consensus Indicators 209
40. Commitment Indicators 215
CONTENTS ix
VIII New Indicators 220
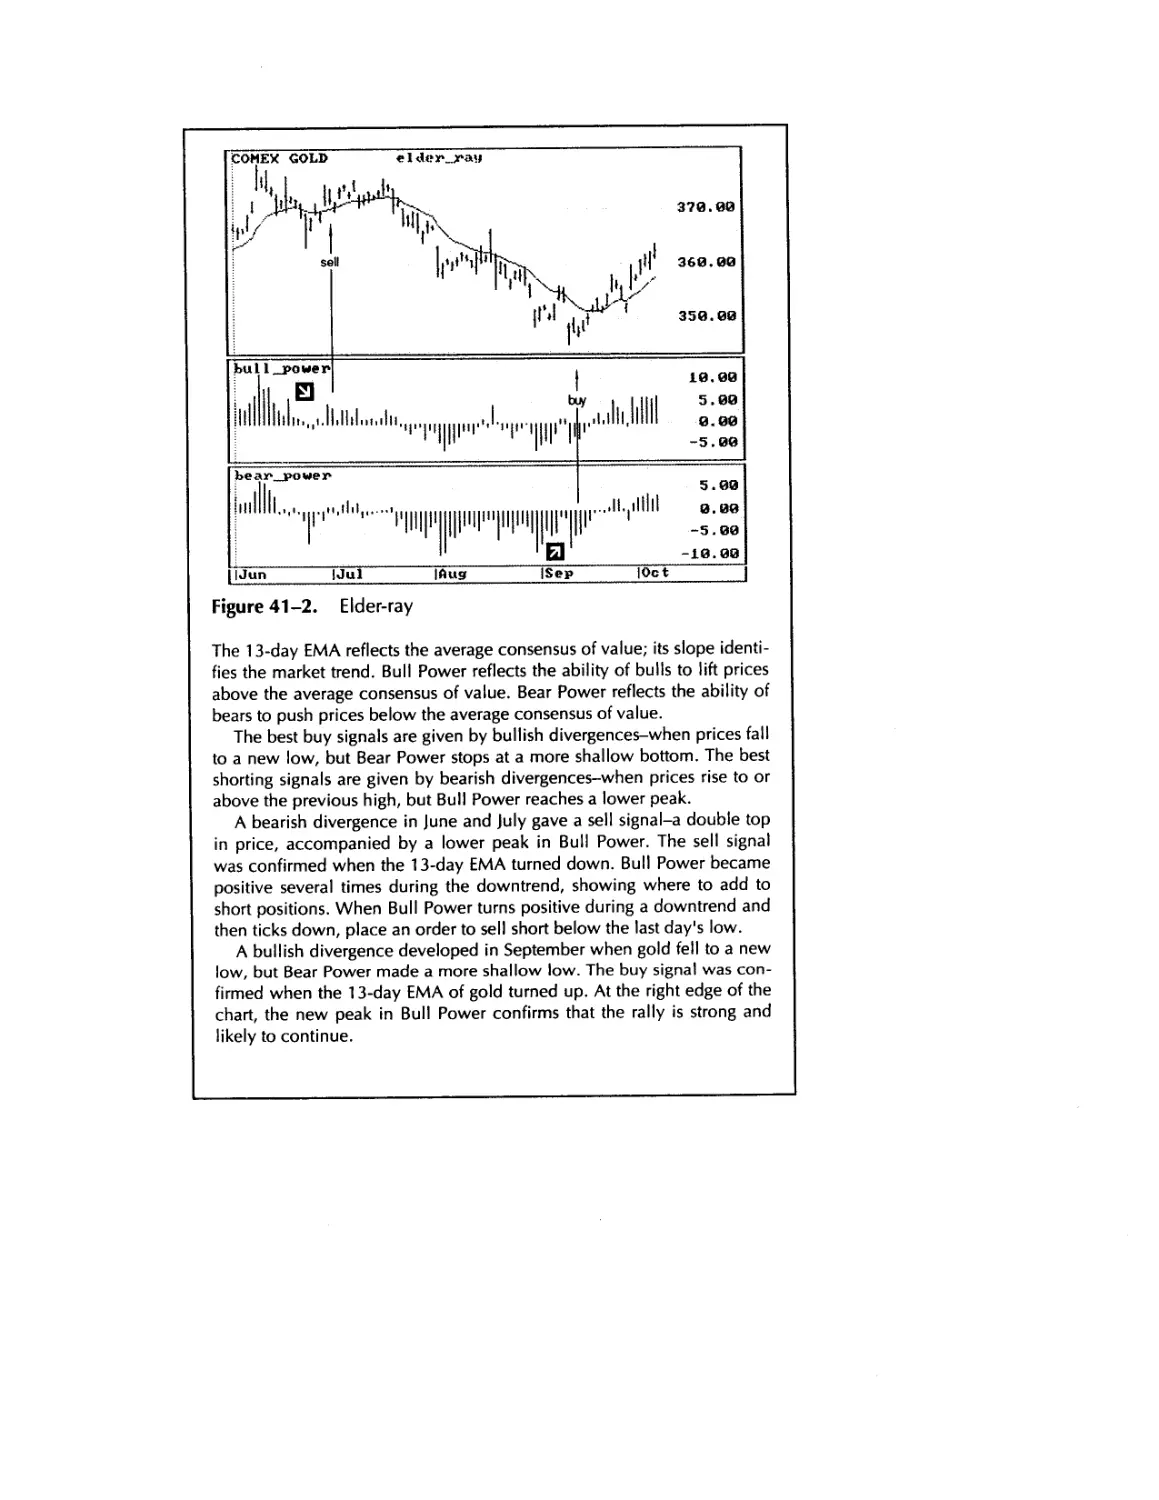
41. Elder-ray 220
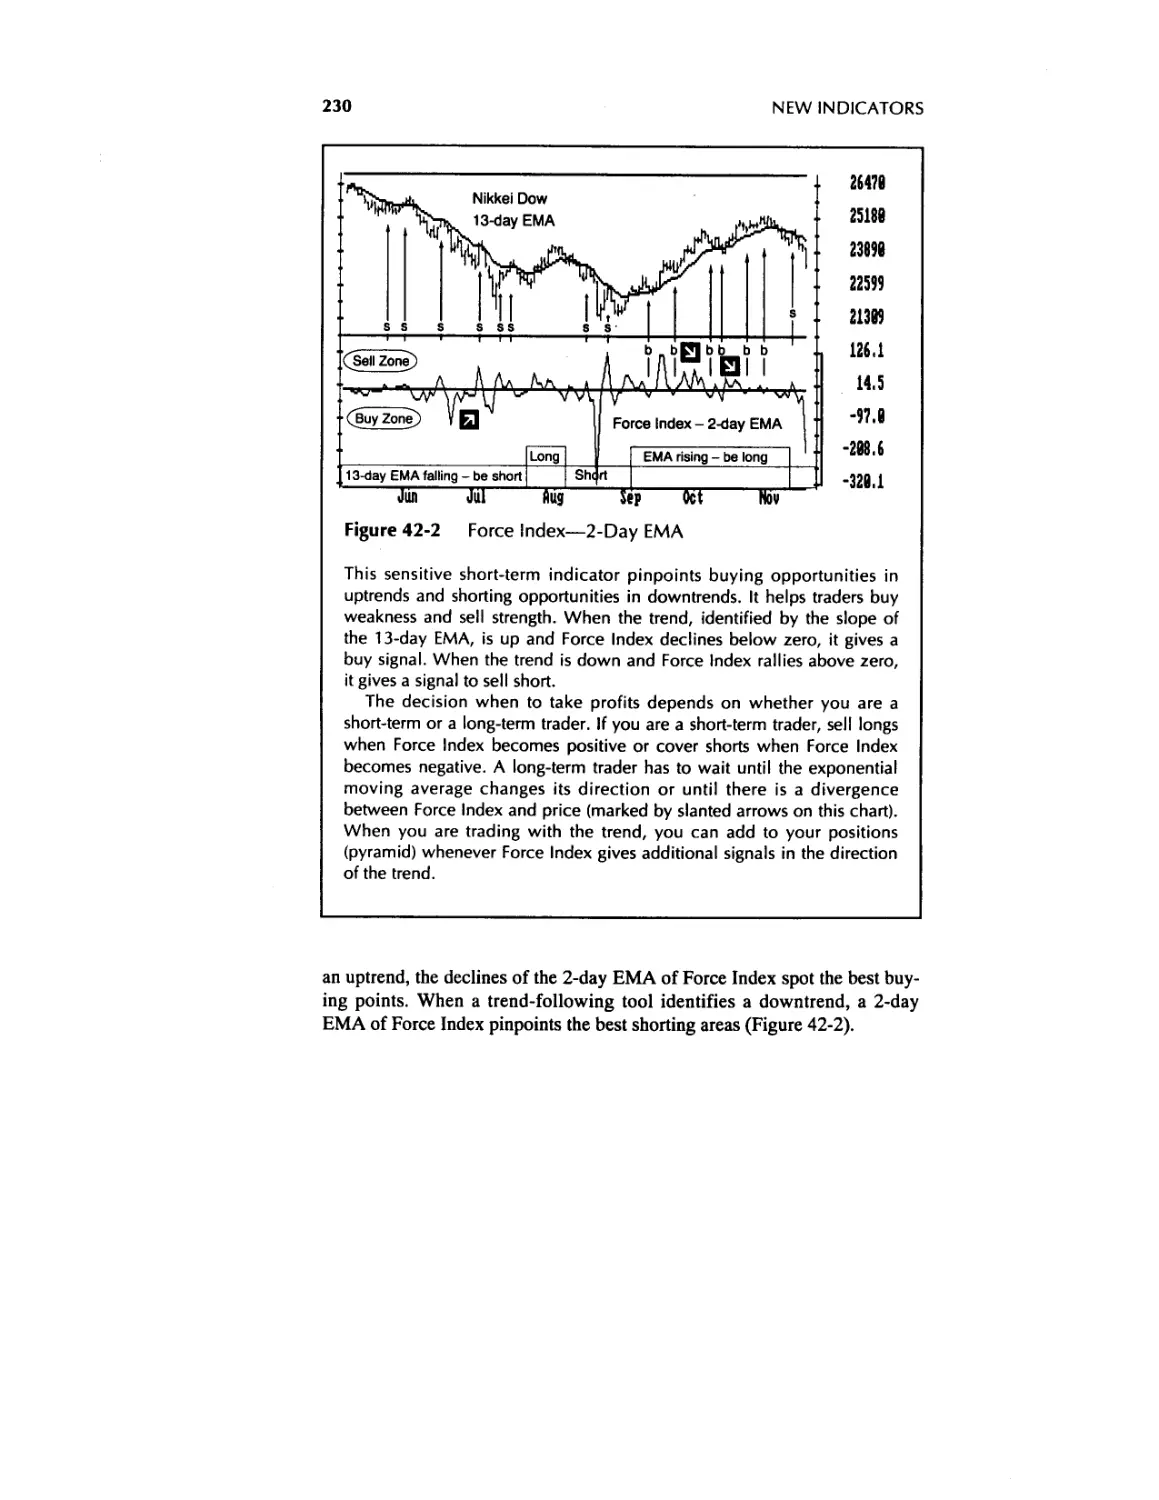
42. Force Index 227
IX Trading Systems 235
43. Triple Screen Trading System^- 235
44. Parabolic Trading System 244
45. Channel Trading Systems 247
X Risk Management 254
46. Emotions and Probabilities 254
47. Money Management 257
48. Exiting Trades 263
Afterword 269
Acknowledgments 271
Sources 275
Index 279
TRADING FOR
A LIVING
Introduction
1. TRADING—THE LAST FRONTIER
You can be free. You can live and work anywhere in the world. You can be
independent from routine and not answer to anybody.
This is the life of a successful trader.
Many aspire to this but few succeed. An amateur looks at a quote screen
and sees millions of dollars sparkle in front of his face. He reaches for the
money — and loses. He reaches again — and loses more. Traders lose because
the game is hard, or out of ignorance, or lack of discipline. If any of these ail
you, I wrote this book for you.
How I Began to Trade
In the summer of 1976,1 drove from New York to California. I threw a few
books on psychiatry (I was a first-year psychiatric resident), several histo-
ries, and a paperback copy of Engel’s How to Buy Stocks into the trunk of
my old Dodge. Little did I know that a dog-eared paperback, borrowed from
a lawyer friend, would in due time change the course of my life. That friend,
incidentally, had a perfect reverse golden touch—any investment he touched
went under water. But that’s another story.
I gulped down the Engel book in campgrounds across America, finishing
it on a Pacific beach in La Jolla. I had known nothing about the stock mar-
ket, and the idea of making money by thinking gripped me.
I had grown up in the Soviet Union in the days when it was, in the words
of a former U.S. president, “an evil empire.” I hated the Soviet system and
wanted to get out, but emigration was forbidden. I entered college at 16,
graduated medical school at 22, completed my residency, and then took a job
1
2
INTRODUCTION
as a ship’s doctor. Now I could break free! I jumped the Soviet ship in
Abidjan, Ivory Coast.
I ran to the U.S. Embassy through the clogged dusty streets of an African
port city, chased by my ex-crewmates. The bureaucrats at the embassy fum-
bled and almost handed me back to the Soviets. I resisted, and they put me in
a “safe house” and then on a plane to New York. I landed at Kennedy
Airport in February 1974, arriving from Africa with summer clothes on my
back and $25 in my pocket. I spoke some English, but did not know a soul in
this country.
I had no idea what stocks, bonds, futures, or options were and sometimes
got a queasy feeling just from looking at the American dollar bills in my
wallet. In the old country, a handful of them could buy you three years in
Siberia.
Reading How to Buy Stocks opened a whole new world for me. Returning
to New York, I bought my first stock—it was KinderCare. Ever since then, I
have avidly studied the markets and invested and traded stocks, options, and
now mostly futures.
My professional career proceeded on a separate track. I completed a resi-
dency in psychiatry at a major university hospital, studied at the New York
Psychoanalytic Institute, and served as book editor for the largest psychiatric
newspaper in the United States. These days, I am busy trading and go to my
psychiatric office, across the street from Carnegie Hall, only a few after-
noons a week, after the markets close. I love practicing psychiatry, but I
spend most of my time in the markets.
Learning to trade has been a long journey—with soaring highs and aching
lows. In moving forward —or in circles —I repeatedly knocked my face
against the wall and ran my trading account into the ground. Each time I
returned to a hospital job, put a stake together, read, thought, did more test-
ing, and then started trading again.
My trading slowly improved, but the breakthrough came when I realized
that the key to winning was inside my head and not inside a computer.
Psychiatry gave me the insight into trading that I will share with you.
Do You Really Want to Succeed?
For the past 17 years I’ve had a friend whose wife is fat. She is an elegant
dresser, and she has been on a diet for as long as I have known her. She says
she wants to lose weight and she does not eat cake or potatoes in front of
2. PSYCHOLOGY IS THE KEY
3
people — but when I come into her kitchen, I often see her go at it with a big
fork. She says she wants to be slim, but remains as fat today as the day we
met. Why?
The short-term pleasure of eating is stronger for her than the delayed plea-
sure and health benefits of weight loss. My friend’s wife reminds me of a
great many traders who say they want to be successful but keep making
impulsive trades—going for the short-term thrills of gambling in the markets.
People deceive themselves and play games with themselves. Lying to oth-
ers is bad enough, but lying to yourself is hopeless. Bookstores are full of
good books on dieting, but the world is full of overweight people.
This book will teach you how to analyze and trade the markets and how to
deal with your own mind. I can give you the knowledge. Only you can sup-
ply the motivation.
2. PSYCHOLOGY IS THE KEY
You may base your trades on fundamental or technical analysis. You may
trade because of hunches about economic and political trends, use “inside
information,” or simply hope.
Remember how you felt the last time you placed an order? Were you anx-
ious to jump in or afraid of losing? Did you procrastinate before picking up
the phone? When you closed out a trade, did you feel elated or humiliated?
The feelings of thousands of traders merge into huge psychological tides that
move the markets.
Getting Off the Roller Coaster
The majority of traders spend most of their time looking for good trades.
Once they enter a trade, they lose control and either squirm from pain or grin
from pleasure. They ride an emotional roller coaster and miss the essential
element of winning—the management of their emotions. Their inability to
manage themselves leads to poor money management of their accounts.
If your mind is not in gear with the markets, or if you ignore changes in
mass psychology of crowds, then you have no chance of making money
trading. All winning professionals know the enormous importance of psy-
chology in trading. All losing amateurs ignore it.
Friends and clients who know that I am a psychiatrist often ask me
4
INTRODUCTION
whether this helps me as a trader. Good psychiatry and good trading have
one important principle in common. Both focus on reality, on seeing the
world the way it is. To live a healthy life, you have to live with your eyes
open. To be a good trader, you need to trade with your eyes open, recognize
real trends and turns, and not waste time or energy on regrets and wishful
thinking.
A Man's Game?
Brokerage house records show that most traders are male. The files of my
educational firm, Financial Trading Seminars, Inc., confirm that approxi-
mately 95 percent of traders are men. For this reason, you’ll find that I com-
monly use the masculine pronoun (he) in the anecdotes and cases throughout
this book. Of course, no disrespect is intended to the many successful
women traders.
The percentage of women is higher among institutional traders—employ-
ees of banks, trading firms, and the like. In my experience, however, the few
women who get involved in trading succeed more often than men. A woman
needs exceptional drive to plunge into this male preserve.
Trading is similar to such thrilling and dangerous sports as sky-diving,
rock-climbing, and scuba-diving. They also attract mostly men—fewer than
1 percent of hang gliders are female.
Men are drawn to risky sports in our increasingly regulated society. Dr.
David Klein, a sociologist at the University of Michigan, was quoted in the
New York Times as saying, “as work becomes more and more routinized . . .
we turn to recreation for a sense of accomplishment. The safer and more rou-
tine we make work, the more we will push people into recreations where
individual distinction and discretion, adventure and excitement play a part.”
These sports provide intense pleasure but have a stigma of danger because
many participants ignore the risks and take thoughtless chances. Dr. John
Tongue, an orthopedic surgeon in Oregon who studied accidents among hang
gliders, found that the chance of death rises among more experienced pilots
because they take greater risks. An athlete who wants to enjoy risky sports
has to follow safety rules. When you reduce risks, you gain an added sense
of accomplishment and control. The same goes for trading.
You can succeed in trading only if you handle it as a serious intellectual
pursuit. Emotional trading is lethal. To help ensure success, practice defen-
sive money management. A good trader watches his capital as carefully as a
professional scuba diver watches his air supply.
2. PSYCHOLOGY IS THE KEY
5
How This Book Is Organized
\
Successful trading stands on three pillars: psychology, market analysis and\
trading systems, and money management. This book will help you explore
all three.
The first chapter of this book shows you a new approach to managing
your emotions as a trader. I discovered this method while practicing psychia-
try. It has greatly improved my trading, and it can help you, too.
The second chapter describes the crowd psychology of markets. Mass
behavior is more primitive than individual behavior. If you understand how
crowds behave, then you can profit from their mood swings and avoid being
swept up in their emotions.
The third chapter of the book shows how chart patterns reveal crowd
behavior. Classical technical analysis is applied social psychology, like poll-
taking. Trendlines, gaps, and other chart patterns actually reflect crowd
behavior.
The fourth chapter teaches modern methods of computerized technical
analysis. Indicators provide a deeper insight into mass psychology than clas-
sical technical analysis. Trend-following indicators help identify market
trends, while oscillators show when trends are ready to reverse.
Volume and open interest also reflect crowd behavior. The fifth chapter
focuses on them as well as on the passage of time in the markets. Crowds
have a very short attention span, and a trader who relates price changes to
time gains a competitive advantage.
The sixth chapter focuses on the best techniques of stock market analysts.
They can be especially helpful for stock index futures and options traders.
Sentiment indicators measuring the opinions of investors and traders are
profiled in the seventh chapter. Crowds follow trends, and it often pays to
join them when prices are moving. Sentiment indicators show when it is time
to abandon the crowd—before it misses an important reversal.
The eighth chapter reveals two proprietary indicators. Elder-ray is a price-
based indicator that measures the power of bulls and bears below the surface
of the markets. Force Index measures prices and volume. It shows whether
the dominant market group is becoming stronger or weaker.
The ninth chapter presents several trading systems. The Triple Screen
trading system is my own method. I have used it for years. This and other
systems show you how to select trades and find entry and exit points.
The tenth chapter focuses on money management. This essential aspect of
successful trading is neglected by most amateurs. You can have a brilliant
trading system, but if your money management is bad, then a short string of
6
INTRODUCTION
losses will destroy your account. Trading without proper money manage-
ment is like trying to cross a desert barefoot.
You are about to spend many hours with this book. When you find ideas
that seem valuable to you, test them in the one crucible that matters—your
own experience. You can make this knowledge your own only by question-
ing it.
3. THE ODDS AGAINST YOU
Why do most traders lose and wash out of the markets? Emotional and
thoughtless trading are two reasons, but there is another. Markets are actually
set up so that most traders must lose money.
The trading industry kills traders with commissions and slippage. Most
amateurs cannot believe this, just as medieval peasants could not believe that
tiny invisible germs could kill them. If you ignore slippage and deal with a
broker who charges high commissions, you are acting like a peasant who
drinks from a communal pool during a cholera epidemic.
You pay commissions for entering and exiting trades. Slippage is the dif-
ference between the price at which you place your order and the price at
which it gets filled. When you place a limit order, it is filled at your price or
not at all. When you feel eager to enter or exit the market and give a market
order, it is often filled at a worse price than prevailed when you placed it.
The trading industry keeps draining huge amounts of money from the
markets. Exchanges, regulators, brokers, and advisors live off the markets
while generations of traders keep washing out. Markets need a fresh supply
of losers just as builders of the ancient pyramids of Egypt needed a fresh
supply of slaves. Losers bring money into the markets, which is necessary
for the prosperity of the trading industry.
A Minus-Sum Game
Brokers, exchanges, and advisors run marketing campaigns to attract more
losers to the markets. Some mention that futures trading is a zero-sum game.
They count on the fact that most people feel smarter than average and expect
to win in a zero-sum game.
Winners in a zero-sum game make as much as losers lose. If you and I bet
3. THE ODDS AGAINST YOU
7
$10 on the direction of the next 100-point move in the Dow, one of us will
collect $10 and the other will lose $10. The person who is smarter should
win this game over a period of time.
People buy the trading industry’s propaganda about the zero-sum game,
take the bait and open trading accounts. They do not realize that trading is a
minus-sum game. Winners receive less than what losers lose because the
industry drains money from the market.
For example, roulette in a casino is a minus-sum game because the casino
sweeps away 3 percent to 6 percent of all bets. This makes roulette
unwinnable in the long run. You and I can get into in a minus-sum game if
we make the same $10 bet on the next 100-point move in the Dow but deal
through brokers. When we settle, the loser is out $13 and the winner collects
only $7, while two brokers smile all the way to the bank.
Commissions and slippage are to traders what death and taxes are to all of
us. They take some fun out of life and ultimately bring it to an end. A trader
must support his broker and the machinery of exchanges before he collects a
dime. Being simply “better than average” is not good enough. You have to
be head and shoulders above the crowd to win a minus-sum game.
Commissions
You can expect to pay a round-trip commission of anywhere from $12 to
$100 for every futures contract you trade. Big traders who deal with discount
houses pay less; small traders who deal with full-service brokers pay more.
Amateurs ignore commissions while dreaming of fat profits. Brokers argue
that commissions are tiny relative to the value of underlying contracts.
To understand the role of commissions, you need to compare them to your
margin, not to the value of the contract. For example, you may pay $30 to
trade a single contract of corn (5,000 bushels, worth approximately
$10,000). A broker will say that the $30 commission is less than 1 percent of
contract value. In reality, you have to deposit about $600 to trade a contract
of com. A $30 commission represents 5 percent of margin. This means you
have to make 5 percent on the capital committed to the trade, simply to break
even. If you trade com four times a year, you will have to make a 20 percent
annual profit to avoid losing money! Very few people can do this. Many
money managers would give their eyeteeth for 20 percent annual returns. A
“small commission” is not a nuisance-it is a major barrier to success!
8
INTRODUCTION
Many amateurs generate 50 percent and more of their account size in com-
missions per year—if they last that long. Even discounted commissions raise
a tall barrier to successful trading. I have heard brokers chuckle as they gos-
siped about clients who beat their brains out just to stay even with the game.
Shop for the lowest possible commissions. Do not be shy about bargaining
for lower rates. I have heard many brokers complain about a shortage of
customers—but not many customers complain about the shortage of brokers.
Tell your broker it is in his best interest to charge you low commissions
because you will survive and remain a client for a long time. Design a trad-
ing system that will trade less often.
Slippage
Slippage takes either piranha-sized or shark-sized bites out of your account
whenever you enter and exit the markets. Slippage means having your orders
filled at a different price than that which existed when you placed an order. It
is like paying 30 cents for an apple in a grocery store even though the posted
price is 29 cents.
There are three kinds of slippage: common, volatility-based, and criminal.
Common slippage is due to a spread between buying and selling prices.
Floor traders maintain two prices in the market—the bid and the ask.
For example, your broker may quote you 390.45 for June S&P 500. If you
want to buy a contract at the market, you’ll have to pay at least 390.50. If
you want to sell at the market, you will receive 390.40 or less. Since each
point is worth $5, the 10-point spread between bid and ask transfers $50
from your pocket to floor traders. They charge you for the privilege of enter-
ing or exiting a trade.
The spread between bid and ask is legal. It tends to be narrow in big, liq-
uid markets such as the S&P 500 and bonds, and much wider in thinly traded
markets such as orange juice and cocoa. The exchanges claim that the spread
is the price you pay for liquidity—being able to trade whenever you wish.
Electronic trading promises to cut slippage.
Slippage rises with market volatility. Floor traders can get away with
more in fast-moving markets. When the market begins to run, slippage goes
through the roof. When the S&P 500 rallies or drops, you can get hit with a
20 to 30 point slippage, and sometimes 100 points or more.
The third kind of slippage is caused by criminal activities of floor traders.
3. THE ODDS AGAINST YOU
9
They have many ways of stealing money from customers. Some put their
bad trades into your account and keep good trades for themselves. This kind
of activity and other criminal games were recently described in a book,
Brokers, Bagmen and Moles, by David Greising and Laurie Morse.
When a hundred men spend day after day standing shoulder to shoulder in
a small pit, they develop a camaraderie — an “us against them” mentality.
Floor traders have a nickname for outsiders which shows that they consider
us less than human. They call us “paper” (as in “Is paper coming in today?”).
That is why you have to take steps to protect yourself.
To reduce slippage, trade liquid markets and avoid thin and fast-moving
markets. Go long or short when the market is quiet. Use limit orders. Buy or
sell at a specified price. Keep a record of prices at the time when you
placed your order and have your broker fight the floor on your behalf when
necessary.
Total Damage
Slippage and commissions make trading similar to swimming in a shark-
infested lagoon. Let us compare an example from a broker’s sales pitch to
what happens in the real world.
The “party line” goes like this: A contract of gold futures covers 100
ounces of gold. Five individuals buy a contract each from someone who sells
five contracts short. Gold falls $4 and the buyers bail out, losing $4 per
ounce or $400 per contract. The intelligent trader, who sold five contracts
short, covers his position and makes $400 per contract, for a total of $2000.
In the real world, however, each loser has lost more than $400. He paid at
least a $25 round-trip commission and was probably hit with $20 slippage
coming and going. As a result, each loser lost $465 per contract and, as a
group, they lost $2325. The winner, who sold 5 contracts short, probably
paid a $15 round-trip commission and was hit with $10 slippage coming and
going, reducing his gain by $35 per contract, or $175 for 5 contracts. He
pocketed only $1825.
The winner thought he made $2000, but he received only $1825. The
losers thought they lost $2000, but in fact they lost $2325. In total, fully
$500 ($2325 - $1825) was siphoned from the table. The lion’s share was
pocketed by floor traders and brokers who took a much bigger cut than any
casino or a racetrack would dare!
10
INTRODUCTION
Other expenses also drain traders’ money. The cost of computers and data,
fees for advisory services and books—including the one you are reading
now—all come out of your trading funds.
Look for a broker with the cheapest commissions and watch him like a
hawk. Design a trading system that gives signals relatively infrequently and
allows you to enter markets during quiet times.
Individual Psychology
4. WHY TRADE?
Trading appears deceptively easy. When a beginner wins, he feels brilliant
and invincible. Then he takes wild risks and loses everything.
People trade for many reasons —some rational and many irrational.
Trading offers an opportunity to make a lot of money in a hurry. Money
symbolizes freedom to many people, even though they often do not know
what to do with their freedom.
If you know how to trade, you can make your own hours, live and work
wherever you please, and never answer to a boss. Trading is a fascinating
intellectual pursuit: chess, poker, and a crossword rolled in one. Trading
attracts people who love puzzles and brainteasers.
Trading attracts risk-takers and repels those who avoid risk. An average
person gets up in the morning, goes to work, has a lunch break, returns
home, has a beer and dinner, watches TV, and goes to sleep. If he makes a
few extra dollars, he puts them into a savings account. A trader keeps odd
hours and puts his capital at risk. Many traders are loners who abandon the
certainty of the present and take a leap into the unknown.
Self-Fulfillment
Most people have an innate drive to achieve their personal best, to develop
their abilities to the fullest. This drive, along with the pleasure of the game
and the lure of money, propels traders to challenge the markets.
11
12
INDIVIDUAL PSYCHOLOGY
Good traders tend to be hardworking and shrewd men. They are open to
new ideas. The goal of a good trader, paradoxically, is not to make money.
His goal is to trade well. If he trades right, money follows almost as an
afterthought. Successful traders keep honing their skills. Trying to reach
their personal best is more important to them than making money.
A successful New York trader said to me: “If I become half a percent
smarter each year, I’ll be a genius by the time I die.” His drive to improve
himself is the hallmark of a successful trader.
A professional trader from Texas invited me to his office and said: “If you
sit across the table from me while I day-trade, you won’t be able to tell
whether I am $2000 ahead or $2000 behind on that day.” He has risen to a
level where winning does not elate him and losing does not deflate him. He
is so focused on trading right and improving his skills that money no longer
influences his emotions.
The trouble with self-fulfillment is that many people have a self-destruc-
tive streak. Accident-prone drivers keep destroying their cars, and self-
destructive traders keep destroying their accounts (see Section 7). Markets
offer unlimited opportunities for self-sabotage, as well as for self-fulfillment.
Acting out your internal conflicts in the marketplace is a very expensive
proposition.
Traders who are not at peace with themselves often try to fulfill their con-
tradictory wishes in the market. If you do not know where you are going,
you will wind up somewhere you never wanted to be.
5. FANTASY VERSUS REALITY
If you hear from a friend with little farming experience that he plans to feed
himself with food grown on a quarter-acre plot, you will expect him to go
hungry. We all know that one can squeeze only so much blood from a turnip.
The one field in which grown-ups let their fantasies soar is trading.
Just the other day, a friend told me that he expected to support himself
trading his $6000 account. When I tried to show him the futility of his plan,
he quickly changed our topic of conversation. He is a bright analyst, but he
refuses to see that his “intensive farming” plan is suicidal. In his desperate
effort to succeed, he must take on large positions — and the slightest wiggle
of the market is sure to put him out of business.
A successful trader is a realist. He knows his abilities and limitations. He
sees what is happening in the markets and knows how to react to them. He
5. FANTASY VERSUS REALITY
13
analyzes the markets without cutting comers, observes his own reactions,
and makes realistic plans. A professional trader cannot afford illusions.
Once an amateur takes a few hits and gets a few margin calls, he becomes
fearful instead of cocky and starts developing strange ideas about the mar-
kets. Losers buy, sell, or miss trades thanks to their fantastic ideas. They act
like children who are afraid to pass a cemetery or look under their bed at
night because they are afraid of ghosts. The unstructured environment of the
market makes it is easy to develop fantasies.
Most people who have grown up in Western civilization have several sim-
ilar fantasies. They are so widespread that when I studied at the New York
Psychoanalytic Institute, there was a course called “Universal Fantasies.”
For example, most people have a fantasy in childhood that they were
adopted rather than born to their parents. A fantasy seems to explain the
unfriendly and impersonal world. It consoles a child but prevents him from
seeing reality. Our fantasies influence our behavior, even if we are not con-
sciously aware of them.
In talking to hundreds of traders, I keep hearing them express several uni-
versal fantasies. They distort reality and stand in the way of trading success.
A successful trader must identify his fantasies and get rid of them.
The Brain Myth
Losers who suffer from the “brain myth” will tell you, “I lost because I
didn’t know trading secrets.” Many losers have a fantasy that successful
traders have some secret knowledge. This fantasy helps support a lively mar-
ket in advisory services and ready-made trading systems.
A demoralized trader often whips out his checkbook and goes shopping
for “trading secrets.” He may send money to a charlatan for a $3000 “can’t
miss,” backtested, computerized trading system. When that self-destructs, he
sends another check for a “scientific manual” that explains how he can stop
being a loser and become a true insider and a winner by contemplating the
Moon, Saturn, or even Uranus.
The losers do not know that trading is intellectually fairly simple. It is less
demanding than taking out an appendix, building a bridge, or trying a case in
court. Good traders are often shrewd, but few of them are intellectuals. Many
have not been to college, and some have even dropped out of high school.
Intelligent and hardworking people who have succeeded in their careers
often feel drawn to trading. The average client of a brokerage firm is 50
14
INDIVIDUAL PSYCHOLOGY
years old, is married, and has a college education. Many have postgraduate
degrees or own their businesses. The two largest professional groups among
traders are engineers and farmers.
Why do these intelligent and hardworking people fail in trading? What
separates winners from losers is neither intelligence nor secrets, and cer-
tainly not education.
The Undercapitalization Myth
Many losers think that they would be successful if they could trade a bigger
account. All losers get knocked out of the game by a string of losses or a sin-
gle abysmally bad trade. Often, after the amateur is sold out, the market
reverses and moves in the direction he expected. The loser is ready to kick
either himself or his broker: Had he survived another week, he might have
made a small fortune!
Losers take this reversal as a confirmation of their methods. They earn,
save, or borrow enough money to open another small account. The story
repeats: The loser gets wiped out, the market reverses and “proves” the loser
right, but only too late — he has been sold out again. That’s when the fantasy
is bom: “If only I had a bigger account, I could have stayed in the market a
little longer and won.”
Some losers raise money from relatives and friends by showing them a
paper track record. It seems to prove that they would have won big, if only
they had had more money to work with. But if they raise more money, they
lose that, too —it is as if the market were laughing at them!
A loser is not undercapitalized — his mind is underdeveloped. A loser can
destroy a big account almost as quickly as a small one. He overtrades, and
his money management is sloppy. He takes risks that are too big, whatever
the size of his account. No matter how good his system is, a streak of bad
trades is sure to put him out of business.
Traders often ask me how much money they need to begin trading. They
want to be able to withstand a drawdown, a temporary drop in the account
equity. They expect to lose a large amount of money before making any!
They sound like an engineer who plans to build several bridges that collapse
before erecting his masterpiece. Would a surgeon plan on killing several
patients while becoming an expert at taking out an appendix?
A trader who wants to survive and prosper must control his losses. You do
5. FANTASY VERSUS REALITY
15
that by risking only a tiny fraction of your equity on any single trade (see
Chapter 10, “Risk Management”). Give yourself several years to learn how
to trade. Do not start with an account bigger than $20,000, and do not lose
more than 2 percent of your equity on any single trade. Learn from cheap
mistakes in a small account.
Amateurs neither expect to lose nor are in any way prepared for it. The
notion of being undercapitalized is a cop-out that helps them avoid two
painful truths: their lack of trading discipline, and their lack of a realistic
money management plan.
The one advantage of a large trading account is that the price of equip-
ment and services represents a smaller percentage of your money. A man-
ager of a million-dollar fund who spends $10,000 on computers and semi-
nars is only 1 percent behind the game. The same expenditure would
represent 50 percent of the equity of a trader with a $20,000 account.
The Autopilot Myth
Imagine that a stranger walks into your driveway and tries to sell you an
automatic system for driving your car. Just pay a few hundred dollars for a
computer chip, install it in your car, and stop wasting energy on driving, he
says. You can take a nap in the driver’s seat while the “Easy Swing System”
whisks you to work. You would probably laugh the salesman out of your
driveway. But would you laugh if he tried to sell you an automatic trading
system?
Traders who believe in the autopilot myth think that the pursuit of wealth
can be automated. Some try to develop an automatic trading system, while
others buy one from the experts. Men who have spent years honing their
skills as lawyers, doctors, or businessmen plunk down thousands of dollars
for canned competence. They are driven by greed, laziness, and mathemati-
cal illiteracy.
Systems used to be written on sheets of paper, but now they usually come
on copy-protected diskettes. Some are primitive; others are elaborate, with
built-in optimization and money management rules. Many traders spend
thousands of dollars searching for magic that will turn a few pages of com-
puter code into an endless stream of money. People who pay for automatic
trading systems are like medieval knights who paid alchemists for the secret
of turning base metals into gold.
16
INDIVIDUAL PSYCHOLOGY
Complex human activities do not lend themselves to automation.
Computerized learning systems have not replaced teachers, and programs for
doing taxes have not created unemployment among accountants. Most
human activities call for an exercise of judgment; machines and systems can
help but not replace humans. So many system buyers have been burned that
they have formed an organization, Club 3000, named after the price of many
systems.
If you could buy a successful automatic trading system, you could move
to Tahiti and spend the rest of your life in leisure, supported by a stream of
checks from your broker. So far, the only people who have made money
from trading systems are the system sellers. They form a small but colorful
cottage industry. If their systems worked, why would they sell them? They
could move to Tahiti themselves and cash checks from their brokers!
Meanwhile, every system seller has a line. Some say they like programming
better than trading. Others claim that they sell their systems only to raise
trading capital.
Markets always change and defeat automatic trading systems. Yesterday’s
rigid rules work poorly today and will probably stop working tomorrow. A
competent trader can adjust his methods when he detects trouble. An auto-
matic system is less adaptable and self-destructs.
Airlines pay high salaries to pilots despite having autopilots. They do it
because humans can handle unforeseen events. When a roof blows off an air-
liner over the Pacific or when a plane runs out of gas over the Canadian
wilderness, only a human can handle such a crisis. These emergencies have
been reported in the press, and in each of them experienced pilots managed
to land their airliners by improvising. No autopilot can do that. Betting your
money on an automatic system is like betting your life on an autopilot. The
first unexpected event will destroy your account.
There are good trading systems out there, but they have to be monitored
and adjusted using individual judgment. You have to stay on the ball—you
cannot abdicate your responsibility for your success to a trading system.
Traders who have the autopilot fantasy try to repeat what they felt as
infants. Their mothers used to fulfill their needs for food, warmth, and com-
fort. Now they try to re-create the experience of passively lying on their
backs and having profits flow to them like an endless stream of free, warm
milk.
The market is not your mother. It consists of tough men and women who
look for ways to take money away from you instead of pouring milk into
your mouth.
6. MARKET GURUS
17
The Personality Cult
Most people give lip service to their wish for freedom and independence.
When they come under pressure, they change their tune and start looking for
“strong leadership.” Traders in distress often seek directions from assorted
gurus.
When I was growing up in the former Soviet Union, children were taught
that Stalin was our great leader. Later we found out what a monster he had
been, but while he was alive, most people enjoyed following the leader. He
freed them from the need to think for themselves.
“Little Stalins” were installed in every area of society —in economics,
biology, architecture, and so on. When I came to the United States and began
to trade, I was amazed to see how many traders were looking for a guru —
their “little Stalin” in the market. The fantasy that someone else can make
you rich deserves its own discussion later in this chapter.
Trade with Your Eyes Open
Every winner needs to master three essential components of trading: a sound
individual psychology, a logical trading system, and a good money manage-
ment plan. These essentials are like three legs of a stool —remove one and
the stool will fall, together with the person who sits on it. Losers try to build
a stool with only one leg, or two at the most. They usually focus exclusively
on trading systems.
Your trades must be based on clearly defined rules. You have to analyze
your feelings as you trade, to make sure that your decisions are intellectually
sound. You have to structure your money management so that no string of
losses can kick you out of the game.
6. MARKET GURUS*
Gurus have been with us ever since the public entered markets. In 1841, the
classic book on market manias, Extraordinary Popular Delusions and the
Madness of Crowds, was published in England. It is still in print today. Its
author, Charles Mackay, described the Dutch Tulip Mania, the South Seas
Bubble in England, and other mass manias. Human nature changes slowly,
*This section originally appeared as an article, “Market Gurus,” in the September 1990 issue of Futures
and Options World. London, U.K. ©1990 by Alexander Elder.
18
INDIVIDUAL PSYCHOLOGY
and today new mass manias, including guru manias, continue to sweep the
markets.
Guru manias spring up faster now than they did centuries ago, thanks to
modern telecommunications. Even educated and intelligent investors and
traders follow market gurus, like the devotees of the false Messiahs in the
Middle Ages.
There are three types of gurus in the financial markets: market cycle
gurus, magic method gurus, and dead gurus. Some gurus call important mar-
ket turns. Others promote “unique methods”—new highways to riches. Still
others have escaped criticism and invited cult following through the simple
mechanism of departing this world.
Market Cycle Gurus
For many decades, the U.S. stock market has generally followed a four-year
cycle. Significant bear market lows occurred in 1962, 1966, 1970, 1974,
1978, and 1982. The broad stock market has normally spent 2.5 or 3 years
going up and 1 or 1.5 years going down.
A new market cycle guru emerges in almost every major stock market
cycle, once every 4 years. A guru’s fame tends to last for 2 to 3 years. The
reigning period of each guru coincides with a major bull market in the
United States.
A market cycle guru forecasts all major rallies and declines. Each correct
forecast increases his fame and prompts even more people to buy or sell
when he issues his next forecast. As more and more people take notice of the
guru, his advice becomes a self-fulfilling prophecy. When you recognize a
hot new guru, it pays to follow his advice.
There are thousands of analysts, some of whom are certain to be on a hot
streak at any given time. Most analysts become hot at some point in their
careers for the same reason a broken clock shows the right time twice a day.
Those who have tasted the joy of being on a hot streak sometimes feel
crushed when it ends and they wash out of the market. But there are enough
old foxes who enjoy their occasional hot streaks, yet continue working as
usual after their hot streak ends.
The success of a market cycle guru depends on more than short-term luck.
He has a pet theory about the market. That theory—cycles, volume, Elliott
Wave, whatever—is usually developed several years prior to reaching star-
dom. At first, the market refuses to follow an aspiring guru’s pet theory. Then
6. MARKET GURUS
19
the market changes and for several years comes in gear with theory. That is
when the star of the market guru rises high and bright above the marketplace.
Compare this to what happens to fashion models as public tastes change.
One year, blondes are popular, another year, redheads. Suddenly, last year’s
blonde star is no longer wanted for the front cover of a major women’s mag-
azine. Everybody wants a dark model, or a woman with a birthmark on her
face. A model does not change—public tastes do.
Gurus always come from the fringes of market analysis. They are never
establishment analysts. Institutional employees play it safe and never
achieve spectacular results because each uses similar methods. A market
cycle guru is an outsider with a unique theory.
A guru usually earns a living publishing a newsletter and can grow rich
selling his advice. Subscriptions can soar from a few hundred annually to
tens of thousands. A recent market cycle guru was reported to have hired
three people just to open the envelopes with money pouring into his firm.
At investment conferences, a guru is surrounded by a mob of admirers. If
you ever find yourself in such a crowd, notice that a guru is seldom asked
questions about his theory. His admirers are content to drink in the sound of
his voice. They brag to their friends about having met him.
A guru remains famous for as long as the market behaves according to his
theory—usually for less than the duration of one 4-year market cycle. At
some point the market changes and starts marching to a different tune. A
guru continues to use old methods that worked spectacularly well in the past
and rapidly loses his following. When the guru’s forecasts stop working,
public admiration turns to hatred. It is impossible for a discredited market
cycle guru to return to stardom.
The reigning guru in the early 1970s was Edson Gould. He based his fore-
casts on policy changes of the Federal Reserve, as reflected in the discount
rate. His famous rule of “three steps and a stumble” stated that if the Federal
Reserve raised the discount rate three times, that showed tightening and led
to a bear market. Lowering the discount rate in three steps revealed a loosen-
ing of the monetary policy and led to a bull market. Gould also developed an
original charting technique called speedlines —shallow trendlines whose
angles depended on the velocity of a trend and the depth of market reactions.
Gould became very hot during the bear market of 1973-1974. He vaulted
to prominence after correctly calling the December 1974 bottom, when the
Dow Jones Industrials fell to near 500. The market rocketed higher, Gould
presciently identified its important turning points using speedlines, and his
fame grew. But soon the United States was flooded with liquidity, inflation
20
INDIVIDUAL PSYCHOLOGY
intensified, and Gould’s methods, developed in a different monetary environ-
ment, stopped working. By 1976, he had lost most of his following, and few
people today even remember his name.
The new market cycle guru emerged in 1978. Joseph Granville stated that
changes in stock market volume preceded changes in prices. He expressed it
colorfully: “Volume is the steam that makes the choo-choo go.” Granville
developed his theory while working for a major Wall Street brokerage firm.
He wrote in his autobiography that the idea came to him while sitting on a
toilet contemplating the design of floor tiles. Granville took his idea from the
bathroom to the chartroom, but the market refused to follow his forecasts.
He went broke, got divorced, and slept on the floor of his friend’s office. By
the late 1970s, the market started to follow Granville’s scripts as never
before or since, and people began to take notice.
Granville toured the United States speaking to overflow crowds. He
arrived on stage in a carriage, issued forecasts, and chided “bagholders” who
would not recognize his theory. He played piano, sang, and, on occasion,
even dropped his pants to make a point. His forecasts were spectacularly cor-
rect; he drew attention to himself and became widely quoted in the mass
media. Granville became big enough to move the stock market. When he
announced that he was bearish, the Dow dropped over 40 points in a day — a
huge decline by the standards of that time. Granville became intoxicated
with his success. The market surged higher in 1982, but he remained very
bearish and kept advising his dwindling band of followers to continue to sell
short. The market rocketed higher into 1983. Granville finally gave up and
recommended buying when the Dow doubled in value. He continued to pub-
lish a market newsletter, a shadow of his former successful self.
A new guru entered the spotlight in 1984. Robert Prechter has made a
name for himself as an Elliott Wave theorist. Elliott was an impecunious
accountant who developed his market theory in the 1930s. He believed that
the stock market rallied in 5 waves and fell in 3 waves, which in turn could
be subdivided into lesser waves.
Like other market cycle gurus before him, Prechter had been writing an
advisory letter for many years with modest success. When the bull market
penetrated the 1000 level on the Dow, people began to pay attention to the
young analyst who kept calling for the Dow to reach 3000. The bull market
went from strength to strength, and Prechter’s fame grew by leaps and
bounds.
In the roaring bull market of the 1980s, Prechter’s fame swept outside the
narrow world of investment newsletters and conferences. Prechter appeared
on national television and was interviewed by popular magazines. In October
6. MARKET GURUS
21
1987, he appeared to vacillate, first issuing a sell signal, then telling his fol-
lowers to get ready to buy. As the Dow crashed 500 points, mass adulation
of Prechter gave way to scorn and hatred. Some blamed him for the decline,
others were angry that the market never reached his stated target of 3000.
Prechter’s advisory business shrank, and he largely retired from it.
All market cycle gurus have several traits in common. They become
active in the forecasting business several years prior to reaching stardom.
Each has a unique theory, a few followers, and some credibility, conferred by
sheer survival in the advisory business. The fact that each guru’s theory did
not work for a number of years is ignored by his followers. When the theory
becomes correct, the mass media take notice. When a theory stops working,
mass adulation of a guru turns to hatred.
When you recognize that a successful new guru is emerging, it is prof-
itable to jump on his bandwagon. It is even more important to recognize
when a guru has reached his peak. All gurus crash—and by definition, they
crash from the height of their fame. When a guru becomes accepted by the
mass media, it is a sign that he has reached his crest. The mainstream media
is wary of outsiders. When several mass magazines devote space to a hot
market guru, you know that his end is near.
Another warning sign that a market guru has reached his peak occurs
when he is interviewed by Barron’s—America’s largest business weekly.
Every January, Barron’s invites a panel of prominent analysts to dispense
wisdom and issue forecasts for the year ahead. The panel is usually made up
of “safe” analysts who focus on price/earnings ratios, emerging growth
industries, and so on. It is highly atypical of Barron’s to invite a hot guru
with an offbeat theory to its January panel. A guru gets invited only when
the public clamors for him, and to exclude him would diminish the prestige
of the magazine. Both Granville and Prechter were invited to the January
panel when each man was at the crest of his fame. Each guru fell within a
few months of appearing on that panel. The next time a market guru is on
Barron’s January panel, do not renew your subscription to his newsletter.
Mass psychology being what it is, new gurus will certainly emerge. An
old cycle guru never fully comes back. Once he stumbles, the adulation turns
to derision and hatred. An expensive vase, once shattered, can never be fully
restored.
Magic Method Gurus
Market cycle gurus are creatures of the stock market, but “method gurus” are
more prominent in the derivative markets, especially in the futures markets.
22
INDIVIDUAL PSYCHOLOGY
A “method guru” erupts on the financial scene after discovering a new ana-
lytic or trading method.
Traders always look for an edge, an advantage over fellow traders. Like
knights shopping for swords, they are willing to pay handsomely for their
trading tools. No price is too high if it lets them tap into a money pipeline.
A magic method guru sells a new set of keys to market profits. As soon as
enough people become familiar with a new method and test it in the markets,
it inevitably deteriorates and starts losing popularity. Markets are forever
changing, and the methods that worked yesterday are not likely to work
today and even less likely to work a year from now.
In the early 1970s, Chicago market letter writer Jake Bernstein became
hot by using market cycles to call tops and bottoms. His methods worked
well and his fame spread. Bernstein charged high fees for his newsletters, ran
conferences, managed funds, and produced an endless flow of books. As
usual, the markets changed, becoming less and less cyclical in the 1980s.
Peter Steidlmayer was another method guru whose star rose high above
Chicago. He urged his followers to discard old trading methods in favor of
his Market Profile. That method promised to reveal the secrets of supply and
demand and give true believers an ability to buy at the bottoms and sell at
the tops. Steidlmayer teamed up with entrepreneur Kevin Koy, and their fre-
quent seminars attracted upward of 50 people who paid $1600 for a 4-day
class. There appeared to be no conspicuous examples of success among
Market Profile devotees, and the founders had a nasty falling out.
Steidlmayer got a job with a brokerage firm, and both he and Koy continued
to give occasional seminars.
Oddly enough, even in this era of fast global links, reputations change
slowly. A guru whose image has been destroyed in his own country can
make money peddling his theory overseas. That point has been made to me
by a guru who compared his continued popularity in Asia to what happens
to faded American singers and movie stars. They are unable to attract an
audience in the United States, but they can still make a living singing
abroad.
Dead Gurus
The third type of a market guru is a dead guru. His books are reissued, his
market courses are scrutinized by new generations of eager traders, and the
6. MARKET GURUS
23
legend of the dear-departed analyst’s prowess and personal wealth grows
posthumously. The dead guru is no longer among us and cannot capitalize on
his fame. Other promoters profit from his reputation and from expired copy-
rights. One dear-departed guru is R. N. Elliott, but the best example of such a
legend is W. D. Gann.
Various opportunists sell “Gann courses” and “Gann software.” They
claim that Gann was one of the best traders who ever lived, that he left a $50
million estate, and so on. I interviewed W. D. Gann’s son, an analyst for a
Boston bank. He told me that his famous father could not support his family
by trading but earned his living by writing and selling instructional courses.
When W. D. Gann died in the 1950s, his estate, including his house, was val-
ued at slightly over $100,000. The legend of W. D. Gann, the giant of trad-
ing, is perpetuated by those who sell courses and other paraphernalia to
gullible customers.
The Followers of Gurus
The personalities of market gurus differ. Some are dead, but those who are
alive range from serious academic types to great showmen. A guru has to
produce original research for several years, then get lucky when the market
turns his way.
To read about the scandals that surrounded many gurus, try Winner Takes
All by William Gallacher and The Dow Jones Guide to Trading Systems by
Bruce Babcock. The purpose of this section is simply analysis of the guru
phenomenon.
When we pay a guru, we expect to get back more than we spend. We act
like a man who bets a few dollars against a three-card monte dealer on a
street comer. He hopes to win more than he put down on an overturned crate.
Only the ignorant or greedy take the bait.
Some people turn to gurus in search of a strong leader. They look for a
parent-like omniscient provider. As a friend once said, “They walk with their
umbilical cords in hand, looking for a place to plug them in.” A smart pro-
moter provides such a receptacle, for a fee.
The public wants gurus, and new gurus will come. As an intelligent trader,
you must realize that in the long run, no guru is going to make you rich. You
have to work on that yourself.
24
INDIVIDUAL PSYCHOLOGY
7. SELF-DESTRUCTIVENESS
Trading is a very hard game. A trader who wants to be successful in the long
run has to be very serious about what he does. He cannot afford to be naive
or to trade because of some hidden psychological agenda.
Unfortunately, trading often appeals to impulsive people, to gamblers, and
to those who feel that the world owes them a living. If you trade for the
excitement, you are liable to take trades with bad odds and accept unneces-
sary risks. The markets are unforgiving, and emotional trading always results
in losses.
Gambling
Gambling means betting on games of chance or skill. It exists in all societies,
and most people have gambled at some point in their lives.
Freud believed that gambling was universally attractive because it was a
substitute for masturbation. The repetitive and exciting activity of the hands,
the irresistible urge, the resolutions to stop, the intoxicating quality of plea-
sure, and the feelings of guilt link gambling and masturbation.
Dr. Ralph Greenson, a prominent California psychoanalyst, has divided
gamblers into three groups: the normal person who gambles for diversion
and who can stop when he wishes; the professional gambler, who selects
gambling as his means of earning a livelihood; and the neurotic gambler,
who gambles because he is driven by unconscious needs and is unable to
stop.
A neurotic gambler either feels lucky or wants to test his luck. Winning
gives him a sense of power. He feels pleased, like a baby feeding at a breast. A
neurotic gambler always loses because he tries to re-create that omnipotent
feeling of bliss instead of concentrating on a realistic long-term game plan.
Dr. Sheila Blume, director of the compulsive gambling program at South
Oaks Hospital in New York, calls gambling “an addiction without a drug.”
Most gamblers are men who gamble for the action. Women tend to gamble
as a means of escape. Losers usually hide their losses and try to look and act
like winners, but they are plagued by self-doubt.
Trading stocks, futures, and options gives a gambler a high but it does
appear more respectable than betting on the ponies. Moreover, gambling in
the financial markets has an aura of sophistication and offers a better intel-
lectual diversion than playing numbers with a bookie.
7. SELF-DESTRUCTIVENESS
25
Gamblers feel happy when trades go in their favor. They feel terribly low
when they lose. They differ from successful professionals who focus on long-
term plans and do not get particularly upset or excited in the process of trading.
Brokers are well aware that many of their clients are gamblers. They often
try to avoid leaving messages for traders with their wives, even when they
call to confirm a trade. Amateurs are not the only ones involved in gam-
bling—quite a bit of it goes on among professionals. Sonny Kleinfield
describes in his book, The Traders, the endemic betting on sports events on
the floors of financial exchanges.
The key sign of gambling is the inability to resist the urge to bet. If you
feel that you are trading too much and the results are poor, stop trading for a
month. This will give you a chance to re-evaluate your trading. If the urge to
trade is so strong that you cannot stay away from the action for a month,
then it is time to visit your local chapter of Gamblers Anonymous or start
using the principles of Alcoholics Anonymous, outlined later in this chapter.
Self-Sabotage
After practicing psychiatry for many years, I became convinced that most
failures in life are due to self-sabotage. We fail in our professional, personal,
and business affairs not because of stupidity or incompetence, but to fulfill
an unconscious wish to fail.
A brilliant and witty friend of mine has a lifelong history of demolishing
his success. As a young man, he was a successful industrial salesman and
was sacked; he entered training as a broker and rose near the top of his firm
but was sued; he became a well-known trader but busted out while disentan-
gling himself from previous disasters. He blamed all his failures on envious
bosses, incompetent regulators, and an unsupportive wife.
Finally, he hit bottom. He had no job and no money. He borrowed a quote
terminal from another busted-out trader and raised capital from a few people
who had heard that he had traded well in the past. He knew how to trade and
made money for his pool. As the word spread, more people brought in
money. My friend was on a roll. At that point, he went on a speaking tour of
Asia but continued to trade from the road. He took a side trip into a country
famous for its prostitutes, leaving a very large open position with no protec-
tive stop. By the time he returned to civilization, the markets had staged a
major move and his pool was wiped out. Did he try to figure out his prob-
lem? Did he try to change? No—he blamed his broker!
26
INDIVIDUAL PSYCHOLOGY
It hurts to look within yourself for the cause of your failure. When traders
get in trouble, they tend to blame others, bad luck, or anything else.
A prominent trader came to me for a consultation. His equity was being
demolished by a rally in the U.S. dollar, in which he was heavily short. He
had grown up fighting a nasty and arrogant father. He had made a name for
himself by betting large positions on reversals of established trends. This
trader kept adding to his short position because he could not admit that the
market, which represented his father, was bigger and stronger than he was.
These are just two examples of how people act out self-destructive ten-
dencies. We sabotage ourselves by acting like impulsive children rather than
intelligent adults. We cling to our self-defeating patterns even though they
can be treated — failure is a curable disease.
The mental baggage from childhood can prevent you from succeeding in
the markets. You have to find your weaknesses in order to change. Keep a
trading diary — write down your reasons for entering and exiting every trade.
Look for repetitive patterns of success and failure.
The Demolition Derby
Almost every profession and business provides a safety net for its members.
Your bosses, colleagues, and clients can warn you when you behave danger-
ously or self-destructively. There is no such support in trading, which makes
it more dangerous than most human endeavors. The markets offer many
opportunities to self-destruct without a safety net.
All members of society make small allowances to protect one another
from the consequences of our mistakes. When you drive, you try to avoid
hitting other cars and they try to avoid hitting you. If someone swings open
the door of a parked car, you swerve. If someone cuts in front of you on a
highway, you may curse, but you will slow down. You avoid collisions
because they are too costly for both parties.
Markets operate without normal human helpfulness. Every trader tries to
hit others. Every trader gets hit by others. The trading highway is littered
with wrecks. Trading is the most dangerous human endeavor, short of war.
Buying at the high point of the day is like swinging your car door open
into the traffic. When your buy order reaches the floor, traders rush to sell to
you — to rip your door off along with your arm. Other traders want you to fail
because they get the money you lose.
8. TRADING PSYCHOLOGY
27
Controlling Self-Destructiveness
Most people go through life making the same mistakes at sixty that they
made at twenty. Others structure their lives to succeed in one area while act-
ing out internal conflicts in another. Very few people grow out of their prob-
lems.
You need to be aware of your tendency to sabotage yourself. Stop blaming
your losses on bad luck or on others and take responsibility for the results.
Start keeping a diary—a record of all your trades, with reasons for entering
and exiting them. Look for repetitive patterns of success and failure. Those
who do not learn from the past are condemned to repeat it.
You need a psychological safety net the way mountain climbers need their
survival gear. I found the principles of Alcoholics Anonymous, outlined later
in this chapter, to be of great help. Strict money management rules also pro-
vide a safety net.
If you seek therapy for your trading problems, choose a competent thera-
pist who knows what trading is about. You are ultimately responsible for
your own therapy and must monitor its progress. I usually tell my patients
that if a month goes by without clear signs of improvement, then therapy is
in trouble. When therapy shows no progress for two months, it is time to
seek a consultation with another therapist.
8. TRADING PSYCHOLOGY
Your feelings have an immediate impact on your account equity. Ybu may
have a brilliant trading system, but if you feel frightened, arrogant, or upset,
your account is sure to suffer. When you recognize that a gambler’s high or
fear is clouding your mind, stop trading. Your success or failure as a trader
depends on controlling your emotions.
When you trade, you compete against the sharpest minds in the world.
The field on which you compete has been slanted to ensure your failure. If
you allow your emotions to interfere with your trading, the battle is over.
You are responsible for every trade that you make. A trade begins when
you decide to enter the market and ends only when you decide to take your-
self out. Having a good trading system is not enough. Most traders with good
systems wash out of the markets because psychologically they are not pre-
pared to win.
28
INDIVIDUAL PSYCHOLOGY
Bending the Rules
Markets offer enormous temptations, like walking through a gold vault or
through a harem. Markets evoke powerful greed for more gains and a great
fear of losing what we’ve got. Those feelings cloud our perceptions of
opportunities and dangers.
Most amateurs feel like geniuses after a winning streak. It is exciting to
believe that you are so good you can bend your own rules and succeed.
That’s when traders deviate from their rules and go into a self-destruct mode.
Traders gain some knowledge, they win, their emotions kick in, and they
self-destruct. Most traders promptly give their “killings” back to the markets.
The markets are full of rags to riches to rags stories. The hallmark of a suc-
cessful trader is his ability to accumulate equity.
You need to make trading as objective as possible. Keep a diary of all
your trades with “before and after” charts, keep a spreadsheet listing all your
trades, including commissions and slippage, and maintain very strict money
management rules. You may have to devote as much energy to analyzing
yourself as you do to analyzing the markets.
When I was learning how to trade, I read every book on trading psychol-
ogy I could find. Many writers offered sensible advice. Some stressed disci-
pline: “You cannot let the markets sway you. Do not make decisions during
trading hours. Plan a trade, and trade a plan.” Others stressed flexibility: “Do
not enter the market with any preconceived notions. Change your plans
when markets change.” Some experts suggested isolation —no business
news, no Wall Street Journal, no listening to other traders, just you and the
markets. Others advised being open-minded, keeping in touch with other
traders and soaking up fresh ideas. Each piece of advice seemed to make
sense but contradicted other equally sensible advice.
I kept reading, trading, and focusing on system development. I also con-
tinued to practice psychiatry. I never thought the two fields were con-
nected—until I had a sudden insight. The idea that changed how I trade
came from psychiatry.
The Insight That Changed My Trading
Like most psychiatrists, I always had some patients with alcohol problems. I
also served as a consultant to a major drug rehabilitation program. It did not
9. TRADING LESSONS FROM AA
29
take me long to realize that alcoholics and addicts were more likely to
recover in self-help groups than in classical psychiatric settings.
Psychotherapy, medications, and expensive hospitals and clinics can sober
up a drunk but seldom succeed in keeping him sober. Most addicts quickly
relapse. They have a much better chance to recover if they become active in
Alcoholics Anonymous (AA) or other self-help groups.
Once I realized that AA members were likely to stay sober and rebuild
their lives, I became a big fan of Alcoholics Anonymous. I began sending
patients with drinking problems to AA and related groups, such as ACOA
(Adult Children of Alcoholics). Now, if an alcoholic comes to me for treat-
ment, I insist that he also go to AA. I tell him that to do otherwise would
mean wasting our time and his money.
One night, many years ago, I stopped by a friend’s office on the way to a
party at our department of psychiatry. We had two hours before the party,
and my friend, who was a recovering alcoholic, said: “Do you want to take
in a movie or go to an AA meeting?” I had sent many patients to AA but had
never been to a meeting, since I have never had a drinking problem. I
jumped at a chance to attend an AA meeting—it was a new experience.
The meeting was held at a local YMCA. A dozen men and a few women
sat on folding chairs in a plain room. The meeting lasted an hour. I was
amazed by what I heard —these people seemed to talk about my trading!
They talked about alcohol, but as long as I substituted the word “loss” for
“alcohol,” most of what they said applied to me! My account equity was still
swinging up and down in those days. I left that YMCA room knowing that I
had to handle my losses the way AA handles alcoholism.
9. TRADING LESSONS FROM AA
Almost any drunk can stay sober for a few days. Soon, the urge to drink
overwhelms him again and he returns to the bottle. He cannot resist his urge
because he continues to feel and think like an alcoholic. Sobriety begins and
ends inside a person’s mind.
Alcoholics Anonymous (AA) has a system for changing the way people
think and feel about drinking. AA members use a 12-step program for
changing their minds. These 12 steps, described in the book Twelve Steps
and Twelve Traditions, refer to 12 stages of personal growth. Recovering
alcoholics attend meetings where they share their experiences with other
30
INDIVIDUAL PSYCHOLOGY
recovering alcoholics, supporting each other in their sobriety. Any member
can get a sponsor—another AA member whom he can call for support when
he feels the urge to drink.
AA was founded in the 1930s by two alcoholics—a doctor and a traveling
salesman. They began meeting and helping each other stay sober. They
developed a system that worked so well, others began to join them. AA has
only one goal — to help its members stay sober. It does no fund-raising, takes
no political positions, and runs no promotional campaigns. AA keeps grow-
ing thanks only to word of mouth. It owes its success only to its effective-
ness.
The 12-step program of AA is so effective that people with other prob-
lems now use it. There are 12-step groups for children of alcoholics, smok-
ers, gamblers, and others. I have become convinced that traders can stop los-
ing money in the markets if they apply the key principles of Alcoholics
Anonymous to their trading.
Denial
A social drinker enjoys a cocktail or a glass of wine or beer but stops when
he feels he’s had enough. An alcoholic’s chemistry is different. Once an
alcoholic takes a drink, he feels an urge to drink more, until he gets drunk.
A drunk often says that he needs to cut down on alcohol, but he cannot
admit that his drinking is out of control. Most drunks deny that they are alco-
holics. Try telling an alcoholic relative, friend, or employee that his drinking
is out of control and damaging his life and you will run into a wall of denial.
An alcoholic often says: “My boss fired me ’cause I was hung over and
came in late. My wife took the kids and left ’cause she had no sense to begin
with. My landlord is trying to kick me out of the apartment ’cause I’m a little
behind on the rent. I’m gonna have to cut down on my drinking, and every-
thing will be all right.”
This man has lost his family and his job. He is about to lose the roof over
his head. His life is spinning out of control—but he keeps saying that he can
cut down on his drinking. This is denial!
Alcoholics deny their problems while their lives are falling apart. Most of
them nurse the fantasy of being able to control their drinking. As long as an
alcoholic believes that he can “control his drinking,” he is headed downhill.
Nothing will ever change, even if he gets a new job, a new wife, and a new
landlord.
9. TRADING LESSONS FROM AA
31
Alcoholics deny that alcohol controls their lives. When they talk of reduc-
ing drinking, they talk about managing the unmanageable. They are like a
driver whose car spins out of control on a mountain road. When the car
careens down a cliff, it is too late to promise to drive carefully. An alco-
holic’s life careens out of control while he denies he’s an alcoholic.
There is a stark parallel between an alcoholic and a trader whose account
is being demolished by losses. He keeps changing trading tactics, acting like
an alcoholic who tries to solve his problem by switching from hard liquor to
beer. A loser denies that he has lost control over his course in the market.
Rock Bottom
A drunk can begin his journey to recovery only after he admits that he is an
alcoholic. He must see that alcohol controls his life and not the other way
around. Most drunks cannot accept this painful truth. They can face it only
after they hit rock bottom.
Some alcoholics hit rock bottom when they develop a life-threatening ill-
ness. Others hit rock bottom after being rejected by their family or losing a
job. An alcoholic needs to sink to a point so low, so deep down in the gutter,
so unbearably painful that it finally penetrates his denial.
The pain of hitting rock bottom feels intolerable. It makes an alcoholic see
how deeply he has sunk. This pain penetrates his denial. He sees a stark and
simple choice — either turn his life around or die. Only then is an alcoholic
ready to begin his journey to recovery.
Profits make traders feel powerful and give them an emotional high. They
try to get high again, put on reckless trades, and give back their profits. Most
traders cannot stand the pain of a string of severe losses. They die as traders
after hitting rock bottom and wash out of the markets. The few survivors
realize that the main trouble is not with their methods, the trouble is with
their thinking. They can change and become successful traders.
The First Step
An alcoholic who wants to recover has to go through twelve steps — twelve
stages of personal growth. He needs to change how he thinks and feels, how
he relates to himself and others. The first step of AA is the hardest.
The first step an alcoholic has to take is to admit that he is powerless over
32
INDIVIDUAL PSYCHOLOGY
alcohol. He must admit that his life has become unmanageable, that alcohol
is stronger than he is. Most alcoholics cannot take that step, drop out, and go
on to destroy their lives.
If alcohol is stronger than you, then you can never touch it again, not a sip
for as long as you live. You have to give up drinking forever. Most drunks do
not want to give up that pleasure. They destroy their lives rather than take
the first step of AA. Only the pain of hitting rock bottom can supply the
motivation to take that first step.
One Day at a Time
You have probably seen bumper stickers on cars that say “One day at a time”
or “Easy does it.” Those are AA slogans, and people who drive those cars
are probably recovering alcoholics.
Planning for life without alcohol can seem overwhelming. That’s why AA
encourages its members to live sober one day at a time.
The goal of every AA member is to stay sober today and go to bed sober
tonight. Gradually, days become weeks, then months, then years. AA meet-
ings and other activities help each recovering alcoholic stay sober, one day at
a time.
Recovering alcoholics receive — and give others — invaluable support and
fellowship at these meetings. They are held at all hours, all over the world.
Traders have much to learn from those meetings.
An AA Meeting
One of the best things that a trader can do is go to an AA meeting. I espe-
cially recommend it to a trader on a losing streak. Call Alcoholics
Anonymous and ask about the next “open meeting” or “beginners’ meeting”
in your area.
A meeting lasts about an hour. You can sit in the back of the room and lis-
ten carefully. There is no pressure to speak, and nobody asks for your last
name.
Each meeting begins with a long-term member getting up and speaking
about his or her personal struggle for recovery from alcoholism. Several
other members share their experiences. There is a collection to cover
expenses—most people give a dollar. All you have to do is listen carefully,
10. LOSERS ANONYMOUS
33
and every time you hear the word “alcohol,” substitute the word “loss” for it.
You will feel as if the people in the meeting are talking about your trading!
10. LOSERS ANONYMOUS
A social drinker enjoys an occasional drink, but an alcoholic craves alcohol.
He denies that alcohol controls and destroys his life — until he reaches a per-
sonal crisis. It may be a life-threatening illness, unemployment, desertion by
a family member, or another unbearably painful event. AA calls it “hitting
rock bottom.”
The pain of hitting rock bottom punctures an alcoholic’s denial. He sees a
stark choice—to drown or to turn and swim up for air. His first step to recov-
ery is to admit that he is powerless over alcohol. A recovering alcoholic can
never drink again.
Loss is to a loser what alcohol is to an alcoholic. A small loss is like a sin-
gle drink. A big loss is like a bender. A series of losses is like an alcoholic
binge. A loser keeps switching between different markets, gurus, and trading
systems. His equity shrinks while he is trying to re-create the pleasurable
sensation of winning.
Losing traders think and act like alcoholics, except that their speech is not
slurred. The two groups are so much alike that you can predict what a loser
will do by using alcoholics as a model.
Alcoholism is a curable disease —and so is losing. Losers can change if
they start using the principles of Alcoholics Anonymous.
The Urge to Trade
Successful traders treat drawdowns the way social drinkers treat alcohol.
They have a little and stop. If they take several losses in a row, they take that
as a signal that something is wrong: It is time to stop and rethink their analy-
sis or methods. Losers cannot stop —they keep trading because they are
addicted to the excitement of the game and keep hoping for a big win.
One prominent trading advisor wrote that the pleasure of trading was
higher than that of sex or flying jet aircraft. Just as an alcoholic proceeds
from social drinking to drunkenness, losers take bigger and bigger risks.
They cross the line between taking a business risk and gambling. Many
losers do not even know that line exists.
34
INDIVIDUAL PSYCHOLOGY
Losers feel the urge to trade, just as alcoholics feel the urge to drink. They
make impulsive trades, go on trading binges, and try to trade their way out of
a hole.
Losers bleed money from their accounts. Most of them bust out, but some
turn to managing other people’s money after they lose their own; still others
sell advisory services, like burned-out drunks who wash glasses in a bar.
Most losers hide their losses from themselves and from everyone else.
They keep shuffling money, keep poor records, and throw away brokerage
slips. A loser is like an alcoholic who does not want to know how many
ounces of liquor he drank.
Into the Hole
A loser never knows why he loses. If he knew, he would have done some-
thing about it and become a winner. He keeps trading in a fog. A loser tries
to manage his trading the way an alcoholic tries to manage his drinking.
Losers try to trade their way out of a hole. They switch trading systems,
buy new software, or take tips from a new guru. They act out a rescue fan-
tasy—a charming belief in Santa Claus. Their desperate belief in magic solu-
tions helps many advisors sell their services to the public.
When losses mount and equity shrinks, a loser acts like an alcoholic
threatened with an eviction or a firing. A loser grows desperate and converts
outright positions into spreads, doubles up on losing positions, reverses and
trades in the opposite direction, and so on. Losers get as much good from
these maneuvers as an alcoholic who switches from hard liquor to wine.
A losing trader careens out of control, trying to manage the unmanage-
able. Alcoholics die prematurely, and most traders bust out of the markets
and never come back. New trading methods, hot tips, and improved software
cannot help you until you learn to handle yourself. You have to change how
you think in order to stop losing and begin your recovery as a trader.
Losers get drunk on losses; they’re addicted to losses. Traders prefer prof-
its, but even losses provide plenty of excitement. The pleasure of trading is
very high. Few losers are actively trying to lose—but then few alcoholics are
consciously trying to end up in the gutter.
A loser keeps getting high from trading while his equity shrinks. Trying to
tell him that he is a loser is like trying to take a bottle away from a drunk. A
loser has to hit rock bottom before he can begin to recover.
10. LOSERS ANONYMOUS
35
Rock Bottom
Hitting rock bottom feels horrible. It is painful and humiliating. You hit it
when you lose money you cannot afford to lose. You hit it when you gamble
away your savings. You hit it after you tell your friends how smart you are
and later have to ask them for a loan. You hit rock bottom when the market
comes roaring at you and yells: “You fool!”
Some people hit rock bottom after only a few weeks of trading. Others
keep adding money to their account to postpone the day of reckoning. It
hurts to see a loser in the mirror.
We spend our lifetimes building up self-esteem. Most of us have a high
opinion of ourselves. It hurts a smart and successful person to hit rock bot-
tom. Your first impulse may be to hide, but remember you are not alone.
Almost every trader has been there.
Most people who hit rock bottom die as traders. They slink away from the
market and never look back. Brokerage records indicate that 90 out of 100
people trading today will probably be gone from the markets a year from
now. They will hit rock bottom, crumble, and leave. They will try to forget
trading as they would a bad dream.
Some losers will lick their wounds and wait until the pain fades away.
Then they will return to trading, having learned little. They will be fearful,
and their fear will further impair their trading.
Very few traders will begin the process of change and growth. For these
rare individuals, the pain of hitting rock bottom will interrupt the vicious
cycle of getting high from winning and then losing everything and crashing.
When you admit that you have a personal problem that causes you to lose,
you can begin building a new trading life. You can start developing the disci-
pline of a winner.
The First Step
An alcoholic needs to admit that he cannot control his drinking. A trader
needs to admit that he cannot control his losses. He needs to admit that he
has a psychological problem with the losses and that he is destroying his
trading account. The first step of an AA member is to say: “I am an alco-
holic, I am powerless over alcohol.” As a trader, you have to take your first
step and say: “I am a loser, I am powerless over losses.”
36
INDIVIDUAL PSYCHOLOGY
A trader can recover using the principles of Alcoholics Anonymous.
Recovering alcoholics struggle to stay sober, one day at a time. Now you
have to struggle to trade without losses, one day at a time.
You may say this is impossible. What if you buy, and the market immedi-
ately ticks down? What if you sell short at the bottom tick, and the market
rallies? Even the best traders lose money on some trades.
The answer is to draw a line between a businessman’s risk and a loss. A
trader must take a businessman’s risk, but he may never take a loss greater
than his predetermined risk.
A storekeeper takes a risk every time he stocks new merchandise. If it
does not sell, he will lose money. An intelligent businessman takes only risks
that will not put him out of business even if he makes several mistakes in a
row. Stocking two crates of merchandise may be a sensible business risk, but
stocking a full trailer is probably a gamble.
As a trader, you are in the business of trading. You need to define your
businessman’s risk—the maximum amount of money you will risk on any
single trade. There is no standard dollar amount, just as there is no standard
business. An acceptable businessman’s risk depends, first of all, on the size
of your trading account. It also depends on your trading method and pain tol-
erance.
The concept of a businessman’s risk will change the way you manage
your money (see Chapter 10, “Risk Management”). A sensible trader never
risks more than 2 percent of account equity on any trade. For example, if you
have $30,000 in your account, you may not risk more than $600 per trade,
and if you have $10,000, you may not risk more than $200. If your account
is small, limit yourself to trading less expensive markets, or mini-contracts.
If you see an attractive trade but your stop would have to be placed where
more than 2 percent of equity would be at risk—pass that trade. Avoid risk-
ing more than 2 percent on a trade the way a recovering alcoholic avoids
bars. If you are not sure how much to risk, err on the side of caution.
If you blame excess commissions on a broker and slippage on a floor
trader, you give up control of your trading life. Try to reduce both, but take
responsibility for them. If you lose even a dollar more than your business-
man’s risk, including commissions and slippage, you are a loser.
Do you keep good trading records? Poor record-keeping is a sure sign of a
gambler and a loser. Good businessmen keep good records. Your trading
records must show the date and price of every entry and exit, slippage, com-
missions, stops, all adjustments of stops, reasons for entering, objectives for
10. LOSERS ANONYMOUS
37
exiting, maximum paper profit, maximum paper loss after a stop was hit, and
any other necessary data.
If you bail out of a trade within your businessman’s risk, it is normal busi-
ness. There is no bargaining, no waiting for another tick, no hoping for a
change. Losing a dollar more than your established businessman’s risk is like
getting drunk, getting into a brawl, getting sick to your stomach on your way
home, and waking up in the gutter with a headache. You would never want
that to happen.
A Meeting for One
When you go to an AA meeting, you will see people who have not had a
drink in years stand up and say: “Hello, my name is so-and-so, and I am an
alcoholic.” Why do they call themselves alcoholics after years of sobriety?
Because if they think they have beaten alcoholism, they will start drinking
again. If a person stops thinking he is an alcoholic, he is free to take a drink,
then another, and will probably end up in the gutter again. A person who
wants to stay sober must remember that he is an alcoholic for the rest of his
life.
Traders would benefit from our own self-help organization — I’d call it
Losers Anonymous. Why not Traders Anonymous? Because a harsh name
helps to focus attention on our self-destructive tendencies. After all,
Alcoholics Anonymous do not call themselves Drinkers Anonymous. As
long as you call yourself a loser, you focus on avoiding losses.
Several traders have argued against what they thought was the “negative
thinking” of Losers Anonymous. A retired woman from Texas, a highly suc-
cessful trader, described her approach to me. She is very religious and thinks
it would not please the Lord for her to lose money. She cuts her losses very
fast because of that. I thought that our methods were similar. The goal is to
cut losses due to some objective, external rule.
Trading within a businessman’s risk is like living without alcohol. A
trader has to admit that he is a loser, just as a drunk has to admit that he is an
alcoholic. Then he can begin his journey to recovery.
This is why every morning before trading I sit in front of the quote screen
in my office and say: “Good morning, my name is Alex, and I am a loser. I
have it in me to do serious financial damage to my account.” This is like an
AA meeting—it keeps my mind focused on the first principles. Even if I take
38
INDIVIDUAL PSYCHOLOGY
thousands of dollars out of the market today, tomorrow I will say: “Good
morning, my name is Alex and 1 am a loser.”
A friend of mine joked: “When I sit in front of my quote machine in the
morning, I say, ‘My name is John, and I’m gonna rip your throat out.’” His
thinking generates tension. “Losers Anonymous” thinking generates serenity.
A trader who feels serene and relaxed can focus on looking for the best and
safest trades. A trader who is tense is like a driver who freezes at the wheel.
When a sober man and a drunk enter a race, you know who is more likely to
win. A drunk may win once in a while thanks to luck, but the sober man is
the one to bet on. You want to be the sober man in the race.
11. WINNERS AND LOSERS
We come to the market from different walks of life and bring with us the
mental baggage of our upbringing and prior experiences. Most of us find that
when we act in the market the way we do in our everyday life, we lose
money.
Your success or failure in the market depends on your thoughts and feel-
ings. It depends on your attitudes toward gain and risk, fear and greed, and
on how you handle the excitement of trading and risk.
Most of all, your success or failure depends on your ability to use your
intellect rather than act out your emotions. A trader who feels overjoyed
when he wins and depressed when he loses cannot accumulate equity
because he is controlled by his emotions. If you let the market make you feel
high or low, you will lose money.
To be a winner in the market you must know yourself and act coolly and
responsibly. The pain of losing scares people into looking for magic meth-
ods. At the same time, they discard much of what is useful in their profes-
sional or business backgrounds.
Like an Ocean
The market is like an ocean—it moves up and down regardless of what you
want. You may feel joy when you buy a stock and it explodes in a rally. You
may feel drenched with fear when you go short but the market rises and your
equity melts with every uptick. These feelings have nothing to do with the
market—they exist only inside you.
11. WINNERS AND LOSERS
39
The market does not know you exist. You can do nothing to influence it.
You can only control your behavior.
The ocean does not care about your welfare, but it has no wish to hurt you
either. You may feel joy on a sunny day, when a gentle wind pushes your
sailboat where you want it to go. You may feel panic on a stormy day when
the ocean pushes your boat toward the rocks. Your feelings about the ocean
exist only in your mind. They threaten your survival when you let your feel-
ings rather than intellect control your behavior.
A sailor cannot control the ocean, but he can control himself. He studies
currents and weather patterns. He learns safe sailing techniques and gains
experience. He knows when to sail and when to stay in the harbor. A suc-
cessful sailor uses his intelligence.
An ocean can be useful —you can fish in it and use its surface to get to
other islands. An ocean can be dangerous — you can drown in it. The more
rational your approach, the more likely you are to get what you want. When
you act out your emotions, you cannot focus on the reality of the ocean.
A trader has to study trends and reversals in the market the way a sailor
studies the ocean. He must trade on a small scale while learning to handle
himself in the market. You can never control the market but you can learn to
control yourself.
A beginner who has a string of profitable trades often feels he can walk on
water. He starts taking wild risks and blows up his account. On the other hand,
an amateur who takes several losses in a row often feels so demoralized that he
cannot place an order even when his system gives him a strong signal to buy or
sell. If trading makes you feel elated or frightened, you cannot fully use your
intellect. When joy sweeps you off your feet, you will make inational trades
and lose. When fear grips you, you’ll miss profitable trades.
A professional trader uses his head and stays calm. Only amateurs
become excited or depressed because of their trades. Emotional reactions are
a luxury that you cannot afford in the markets.
Emotional Trading
Most people crave excitement and entertainment. Singers, actors, and profes-
sional athletes command much higher incomes in our society than do such
mundane workmen as physicians, pilots, or college professors. People love
to have their nerves tickled — they buy lottery tickets, fly to Las Vegas, and
slow down to gawk at road accidents.
40
INDIVIDUAL PSYCHOLOGY
Trading is a heady experience and can be very addictive. Losers who drop
money in the markets receive a tremendous entertainment value.
The market is among the most entertaining places on the face of the Earth.
It is a spectator sport and a participant sport rolled into one. Imagine going to
a major-league ball game in which you are not confined to the bleachers. For
a few hundred dollars you can run onto the field and join the game. If you hit
the ball right, you will get paid like a professional.
You would probably think twice before running onto the field the first few
times. This cautious attitude is responsible for the well-known “beginner’s
luck.” Once a beginner hits the ball well a few times and collects his pay, he
is likely to get the idea that he is better than the pros and could make a good
living at it. Greedy amateurs start running out onto the field too often, even
when there are no good playing opportunities. Before they know what hit
them, a short string of losses destroys their careers.
Emotional decisions are lethal in the markets. You can see a good model
of emotional trading by going to a racetrack, turning around, and watching
the humans instead of the horses. Gamblers stomp their feet, jump up and
down, and yell at horses and jockeys. Thousands of people act out their emo-
tions. Winners embrace and losers tear up their tickets in disgust. The joy,
the pain, and the intensity of wishful thinking are caricatures of what hap-
pens in the markets. A cool handicapper who tries to make a living at the
track does not get excited, yell, or bet the bulk of his roll on any race.
Casinos love drunk patrons. They pour gamblers free drinks because
drunks are more emotional and gamble more. Casinos try to throw out intel-
ligent card-counters. There is less free liquor on Wall Street than in a casino,
but at least here they do not throw you out of the game for being a good
trader.
In Charge of Your Life
When a monkey hurts its foot on a tree stump, he flies into a rage and
kicks the piepe of wood. You laugh at a monkey, but do you laugh at your-
self when you act like him? If the market drops while you are long, you
may double up on your losing trade or else go short, trying to get even.
You act emotionally instead of using your intellect. What is the difference
between a trader trying to get back at the market and a monkey kicking a
tree stump? Acting out of anger, fear, or elation destroys your chance of
11. WINNERS AND LOSERS
41
success. You have to analyze your behavior in the market instead of acting
out your feelings.
We get angry at the market, we become afraid of it, we develop silly
superstitions. All the while, the market keeps cycling through its rallies and
declines like an ocean going through its storms and calm periods. Mark
Douglas writes in The Disciplined Trader that in the market, “There is no
beginning, middle, or end — only what you create in your own mind. Rarely
do any of us grow up learning to operate in an arena that allows for complete
freedom of creative expression, with no external structure to restrict it in any
way.”
We try to cajole or manipulate the market, acting like the ancient emperor
Xerxes, who ordered his soldiers to horsewhip the sea for sinking his fleet.
Most of us are not aware how manipulative we are, how we baigain, how we
act out our feelings in the market. Most of us consider ourselves the center of
the universe and expect every person or group to be either good or bad to us.
This does not work in the market which is completely impersonal.
Leston Havens, a Harvard University psychiatrist, writes: “Cannibalism
and slavery are probably the oldest manifestations of human predation and
submission. Although both are now discouraged, their continued existence in
psychological forms demonstrates that civilization has achieved great suc-
cess in moving from the concrete and physical to the abstract and psycholog-
ical, while persisting in the same purposes.” Parents threaten their children,
bullies hit them, teachers try to bend their will in school. Little wonder that
most of us grow up either hiding in a shell or learning how to manipulate
others in self-defense. Acting independently does not feel natural to us—but
that is the only way to succeed in the market.
Douglas warns, “If the market’s behavior seems mysterious to you, it’s
because your own behavior is mysterious and unmanageable. You can’t
really determine what the market is likely to do next when you don’t even
know what you’ll do next.” Ultimately, “the one thing you can control is
yourself. As a trader, you have the power either to give yourself money or to
give your money to other traders.” He adds, “The traders who can make
money consistently . . . approach trading from the perspective of a mental
discipline.”
Each trader has his own demons to exorcise on the journey to becoming a
successful professional. Here are several rules that worked for me as I grew
from a wild amateur into an erratic semiprofessional and finally into a pro-
fessional trader. You may change this list to suit your personality.
42
INDIVIDUAL PSYCHOLOGY
1. Decide that you are in the market for the long haul —that is, you want
to be a trader even 20 years from now.
2. Learn as much as you can. Read and listen to experts, but keep a
degree of healthy skepticism about everything. Ask questions, and do
not accept experts at their word.
3. Do not get greedy and rush to trade — take your time to learn. The mar-
kets will be there with more good opportunities in the months and
years ahead.
4. Develop a method for analyzing the market—that is, “If A happens,
then В is likely to happen.” Markets have many dimensions—use sev-
eral analytic methods to confirm trades. Test everything on historical
data and then in the markets, using real money. Markets keep chang-
ing—you need different tools for trading bull and bear markets and
transitional periods as well as a method for telling the difference (see
the sections on technical analysis).
5. Develop a money management plan. Your first goal must be long-term
survival; your second goal, a steady growth of capital; and your third
goal, making high profits. Most traders put the third goal first and are
unaware that goals 1 and 2 exist (see Chapter 10, “Risk Management”).
6. Be aware that a trader is the weakest link in any trading system. Go to
a meeting of Alcoholics Anonymous to learn how to avoid losses or
develop your own method for cutting out impulsive trades.
7. Winners think, feel, and act differently than losers. You must look
within yourself, strip away your illusions, and change your old ways
of being, thinking, and acting. Change is hard, but if you want to be a
professional trader, you have to work on changing your personality.
II
Mass Psychology
12. WHAT IS PRICE?
Wall Street is named after a wall that kept farm animals from wandering
away from the settlement at the tip of Manhattan. The farming legacy lives
on in the language of traders. Four animals are mentioned especially often on
Wall Street: bulls and bears, hogs and sheep. Traders say: “Bulls make
money, bears make money, but hogs get slaughtered.”
A bull fights by striking up with his horns. A bull is a buyer—a person
who bets on a rally and profits from a rise in prices. A bear fights by striking
down with his paws. A bear is a seller—a person who bets on a decline and
profits from a fall in prices.
Hogs are greedy. They get slaughtered when they trade to satisfy their
greed. Some hogs buy or sell positions that are too large for them and get
destroyed by a small adverse move. Other hogs overstay their positions —
they keep waiting for profits to get bigger even after the trend reverses.
Sheep are passive and fearful followers of trends, tips, and gurus. They
sometimes put on a bull’s horns or a bearskin and try to swagger. You recog-
nize them by their pitiful bleating when the market becomes volatile.
Whenever the market is open, bulls are buying, bears are selling, hogs and
sheep get trampled underfoot, and the undecided traders wait on the side-
lines. Quote machines all over the world show a steady stream of quotes —
the latest prices for any trading vehicle. Thousands of eyes are focused on
each price quote as people make trading decisions.
43
44
MASS PSYCHOLOGY
Arguing About Price
When I ask traders at a seminar, “What is price?” some answer, “Price is a
perceived value.” Others say, “Price is what a person at one particular point
in time is willing to pay another person for a commodity.” Someone says,
“Price is what the last person paid for it. That’s the price right now.” Another
suggests, “No, it’s what the next person will pay.”
Traders who cannot give a clear definition of price do not know what they
are analyzing. Your success or failure as a trader depends on handling
prices—and you had better know what they mean! Some attendees at the
seminars I give become agitated as they search for an answer to a seemingly
obvious question. Arguments fly back and forth, as in this discussion:
I’ll give you the worst-case example. In the 1929 crash, Singer stock was
selling for $100 and all of sudden there’s no bid, no bid, no bid, and
somebody comes forth—“I gotta sell, what am I bid?” and one of the
floor clerks said “one dollar” and he got it. He got the stock.
Price is what the greater fool is ready to pay.
Take the ’87 market. All of that 500-point decline — stocks weren’t worth
any less after the decline than before. So it was the difference in the
perception and the willingness of the next person to pay for it.
You might carry that one step further. What you’re paying for is abso-
lutely worthless. It is just a piece of paper. The only value that it does
have is the intrinsic dividend value, compared to government paper at
that time.
It still has the value of whatever anybody will pay you. If no one wants to
pay you for it, it has no value.
It’ll pay you for a yield.
What if you trade soybeans? You can eat them.
How about a stock that has no yield?
But doesn’t it have assets?
The company that issued the stock has value, cash flow.
I give you one share of IBM; if no one wants to buy it, you can light a
cigarette with it.
12. WHAT IS PRICE?
45
There is no such thing that no one wants to buy IBM. There is always a
bid and an ask.
Take a look at United Airlines. One day the paper says it’s $300 and the
next day it’s $150.
There’s no change in the airline, they’re still making the same cash flow,
they’ve still got the same book value, and the same assets—what’s the
difference?
The price of stock has very little to do with the company it represents. The
price of IBM stock has very little to do with IBM. As I visualize it, the
price of stock is connected by a mile-long rubber band to IBM and it
can be wildly higher and wildly lower — IBM just keeps chugging
along and it’s a very, very remote connection.
Price is the intersection of supply and demand curves.
Each serious trader must know the meaning of price. You need to know what
you analyze before you go out and start buying and selling stocks, futures, or
options.
Resolving Conflict
There are three groups of traders in the market: buyers, sellers, and unde-
cided traders. “Ask” is what a seller asks for his merchandise. “Bid” is what
a buyer offers for that merchandise. Buyers and sellers are always in conflict.
Buyers want to pay as little as possible, and sellers want to charge as
much as possible. If members of both groups insist on having their way, no
trade can take place. No trade means no price — only wishful quotes of buy-
ers and sellers.
A seller has a choice: to wait until prices rise, or to accept a lower offer
for his merchandise. A buyer also has a choice: to wait until prices come
down, or to offer to pay more to the sellers.
A trade occurs when there is a momentary meeting of two minds: An
eager bull agrees to a seller’s terms and pays up, or an eager bear agrees to a
buyer’s terms and sells a little cheaper. The presence of undecided traders
puts pressure on both bulls and bears.
When a buyer and a seller bargain in private, they may haggle at a
46
MASS PSYCHOLOGY
leisurely pace. The two must move much faster when they bargain at the
exchange. They know that they are surrounded by a crowd of other traders
who may butt in on their deal at any moment.
The buyer knows that if he thinks for too long, another trader can step in
and snap away his bargain. A seller knows that if he tries to hold out for a
higher price, another trader may step in and sell at a lower price. The crowd
of undecided traders makes buyers and sellers more anxious to accommodate
their opponents. A trade occurs when there is a meeting of two minds.
A Consensus of Value
Each tick on your quote screen represents a deal between a buyer and a
seller. Buyers are buying because they expect prices to rise. Sellers are sell-
ing because they expect prices to fall. Buyers and sellers trade while sur-
rounded by crowds of undecided traders. They may become buyers or sellers
as prices change or as time passes.
Buying by bulls pushes markets up, selling by bears pushes markets
down, and undecided traders make everything happen faster by creating a
sense of urgency in buyers and sellers.
Traders come to the markets from all over the world: in person, via com-
puters, or through their brokers. Everybody has a chance to buy and to sell.
Each price is a momentary consensus of value of all market participants,
expressed in action. Price is a psychological event—a momentary balance of
opinion between bulls and bears. Prices are created by masses of traders—
buyers, sellers, and undecided people. The patterns of prices and volume
reflect the mass psychology of the markets.
Behavior Patterns
Huge crowds converge on stock, commodity, and option exchanges — either
in person or represented by their brokers. Big money and little money, smart
money and dumb money, institutional money and private money, all meet on
the exchange floor. Each price represents a momentary consensus of value
between buyers, sellers, and undecided traders at the moment of transaction.
There is a crowd of traders behind every pattern in the chartbook.
Crowd consensus changes from moment to moment. Sometimes it gets
established in a very low-key environment, and at other times the environ-
13. WHAT IS THE MARKET?
47
ment turns wild. Prices move in small increments during quiet times.
When a crowd becomes either spooked or elated, prices begin to jump.
Imagine bidding for a life preserver aboard a sinking ship —that’s how
prices leap when masses of traders become emotional about a trend. An
astute trader tries to enter the market during quiet times and take profits
during wild times.
Technical analysts study swings of mass psychology in the financial mar-
kets. Each trading session is a battle between bulls, who make money when
prices rise, and bears, who profit when prices fall. The goal of technical ana-
lysts is to discover the balance of power between bulls and bears and bet on
the winning group. If bulls are much stronger, you should buy and hold. If
bears are much stronger, you should sell and sell short. If both camps are
about equal in strength, a wise trader stands aside. He lets bullies fight with
each other and puts on a trade only when he is reasonably sure who is likely
to win.
Prices, volume, and open interest reflect crowd behavior. So do the indica-
tors that are based on them. This makes technical analysis similar to poll-tak-
ing. Both combine science and art: They are scientific to the extent that we
use statistical methods and computers; they are artistic to the extent that we
use personal judgment to interpret our findings.
13. WHAT IS THE MARKET?
What is the reality behind market symbols, prices, numbers, and graphs?
When you check prices in your newspaper, watch quotes on your screen, or
plot an indicator on your chart, what exactly are you looking at? What is the
market that you want to analyze and trade?
Amateurs act as if the market is a giant happening, a ball game in which
they can join the professionals and make money. Traders from a scientific or
engineering background often treat the market as a physical event. They
apply to it the principles of signal processing, noise reduction, and similar
ideas. By contrast, all professional traders know full well what the market
is—it is a huge mass of people.
Every trader tries to take money away from other traders by outguessing
them on the probable direction of the market. The members of the market
crowd live on different continents. They are united by modem telecommuni-
cations in the pursuit of profit at each other’s expense. The market is a huge
crowd of people. Each member of the crowd tries to take money away from
48
MASS PSYCHOLOGY
other members by outsmarting them. The market is a uniquely harsh envi-
ronment because everyone is against you, and you are against everyone.
Not only is the market harsh, you have to pay high prices for entering and
exiting it. You have to jump over two high barriers—commissions and slip-
page — before you can collect a dime. The moment you place an order you
owe your broker a commission—you are behind the game before you begin.
Then floor traders try to hit you with slippage when your order arrives on the
floor. They try to take another bite out of your account when you exit your
trade. In trading, you compete against some of the brightest minds in the
world while fending off the piranhas of commissions and slippage.
Worldwide Crowds
In the old days, markets were small and many traders knew one another. The
New York Stock Exchange was formed in 1792 as a club of two dozen bro-
kers. On sunny days they used to trade under a cottonwood tree and on rainy
days in Fraunces Tavern. The first thing brokers did after they organized the
New York Stock Exchange was to stick the public with fixed commissions
that lasted for the next 180 years.
Today, only floor traders meet face-to-face. Most of us are linked to the
market electronically. Members of the financial crowd watch the same
quotes on their terminals, read the same articles in the financial media, and
get similar sales pitches from brokers. These links unite us as members of
the market crowd even if we are thousands of miles away from the
exchange.
Thanks to modem telecommunications, the world is becoming smaller
and the markets are growing. The euphoria of London flows to New York,
and the gloom of Tokyo infects Hong Kong.
When you analyze the market, you are analyzing crowd behavior. Crowds
behave alike in different cultures on all continents. Social psychologists have
uncovered several laws that govern crowd behavior. A trader needs to under-
stand how market crowds influence his mind.
Groups, Not Individuals
Most people feel a strong urge to join the crowd and to “act like everybody
else.” This primitive urge clouds your judgment when you put on a trade. A
13. WHAT IS THE MARKET?
49
successful trader must think independently. He needs to be strong enough to
analyze the market alone and to carry out his trading decisions.
If eight or ten people place their hands on your head and push you down,
your knees will buckle, no matter how strong you are. The crowd may be
stupid, but it is stronger than you. Crowds have the power to create trends.
Never buck a trend. If a trend is up, you should only buy or stand aside.
Never sell short because “the prices are too high” —never argue with the
crowd. You do not have to run with the crowd—but you should never run
against it.
Respect the strength of the crowd — but do not fear it. Crowds are power-
ful, but primitive, their behavior simple and repetitive. A trader who thinks
for himself can take money from crowd members.
The Source of Money
When you try to make money trading, do you ever stop to wonder where
your expected profits will come from? Is there money in the markets because
of higher company earnings, or lower interest rates, or a good soybean crop?
The only reason there is money in the markets is that other traders put it
there. The money you want to make belongs to other people who have no
intention of giving it to you.
Trading means trying to rob other people while they are trying to rob you.
It is a hard business. Winning is especially difficult because brokers and
floor traders skim money from losers and winners alike.
Tim Slater compared trading to a medieval battle. A man used to go on a
battlefield with his sword and try to kill his opponent, who was trying to kill
him at the same time. The winner took the loser’s weapons, his chattels, and
his wife, and sold his children into slavery. Now we trade on the exchanges
instead of doing battle in an open field. When you take money away from a
man, it is not that different from drawing his blood. He may lose his house,
his chattels, and his wife, and his children may suffer.
An optimistic friend of mine once snickered that there are plenty of poorly
prepared people on the battlefield: “Ninety to ninety-five percent of the bro-
kers don’t know the first thing about research. They don’t know what they’re
doing. We have the knowledge, and some poor people who do not have it are
just giving the money away to charity.” This theory sounds good, but it is
wrong—there is no easy money in the market.
There are plenty of dumb sheep waiting to be fleeced or slaughtered. The
50
MASS PSYCHOLOGY
sheep are easy—but if you want a piece of their meat, you’ve got to fight
some very dangerous competitors. There are mean professionals: American
gunslingers, English knights, German landsknechts, Japanese samurai, and
other warriors, all going after the same hapless sheep. Trading means bat-
tling crowds of hostile people while paying for the privilege of entering the
battle and leaving it, whether dead, wounded, or alive.
Inside Information
There is at least one group of people who consistently get information before
other traders. Records show that corporate insiders consistently make profits
in the stock market. Those records reflect legitimate trades that have been
reported by insiders to the Securities and Exchange Commission. They rep-
resent the tip of the iceberg — but there is a great deal of illegitimate insider
trading in the stock market.
People who trade on inside information are stealing money from the rest
of us. The insider trials of the 1980s have landed some of the more notorious
insiders in jail — Dennis Levine, Ivan Boesky, and others. For a while, hardly
a week went by without an arrest, indictment, conviction or a consent
decree: The Yuppy Five, Michael Milken, even a psychiatrist in Connecticut
who traded after learning about a pending takeover from a patient.
The defendants of the 1980s insider trials were caught because they
became greedy and careless — and ran into a federal prosecutor in New York
with major political ambitions. The tip of the iceberg has been shaved down,
but its bulk continues to float. Do not ask whose ship it will hit—it is your
trading account.
Trying to reduce insider trading is like trying to get rid of rats on a farm.
Pesticides keep them under control but do not root them out. A retired chief
executive of a publicly traded firm explained to me that a smart man does
not trade on inside information but gives it to his golfing buddies at a coun-
try club. Later they give him inside information on their companies, and both
profit without being detected. The insider network is safe as long as its mem-
bers follow the same code of conduct and do not become too greedy.
Insider trading is legal in the futures markets. Technical analysis helps
you detect insider buying and selling. Charts reflect all trades by all market
participants—even by the insiders. They leave their tracks on the charts just
like everyone else—and it is your job as a technical analyst to follow them to
the bank.
14. THE TRADING SCENE
51
14. THE TRADING SCENE
Humans have traded since the dawn of history — it was safer to trade with
your neighbors than to raid them. As society developed, money became the
medium of exchange. Stock and commodity markets are among the hall-
marks of an advanced society. One of the first economic developments in
Eastern Europe following the collapse of communism was the establishment
of stock and commodity exchanges.
It took Marco Polo, a medieval Italian traveler, 15 years to get from Italy
to China. Now when a European trader wants to buy gold in Hong Kong, he
can get his order filled in a minute.
Today, stock, futures, and options markets span the globe. In India alone,
there are 14 stock exchanges. There are over 65 futures and options
exchanges in the world. As Barbara Diamond and Mark Kollar write in their
book, 24-Hour Trading, they make markets in nearly 400 contracts — from
gold to greasy wool, from Australian All-Ordinaries Index to dried silk
cocoons. All exchanges must meet three criteria, first developed in the ago-
ras of ancient Greece and the medieval fairs of Western Europe: an estab-
lished location, rules for grading merchandise, and defined contract terms.
Individual Traders
Private traders usually come to the market after a successful career in busi-
ness or in the professions. An average private futures trader in the United
States is a 50-year-old, married, college-educated man. Many futures traders
own their own businesses, and many have postgraduate degrees. The two
largest occupational groups among futures traders are farmers and engineers.
Most people trade for partly rational, partly irrational reasons. Rational
reasons include the desire to earn a large return on capital. Irrational reasons
include gambling and a search for excitement. Most traders are not aware of
their irrational motives.
Learning to trade takes hard work, time, energy, and money. Few individ-
uals rise to the level of professionals who can support themselves by trading.
Professionals are extremely serious about what they do. They satisfy their
irrational goals outside the markets, while amateurs act them out in the mar-
ketplace.
The major economic role of a trader is to support his broker — to help him
pay his mortgage and keep his children in private schools. In addition, the
52
MASS PSYCHOLOGY
role of a speculator is to help companies raise capital in the stock market and
to assume a price risk in the commodities markets, allowing producers to
focus on production. These lofty economic goals are far from a speculator’s
mind when he gives an order to his broker.
Institutional Traders
Institutions are responsible for a huge volume of trading. Their deep pockets
give them several advantages. They pay low institutional commissions. They
can afford to hire the best researchers, brokers, and traders. Some even strike
back at floor traders who steal too much in slippage. The spate of arrests and
trials of Chicago floor traders in 1990 and 1991 began when Archer Daniels
Midland, a food processing firm, brought in the FBI.
A friend of mine who heads a trading desk at a bank bases some of his
decisions on a service provided by a group of former CIA officers. They
scan the media to detect early trends in society and send their reports to him.
My trader friend culls some of his best ideas from these reports. The sub-
stantial annual fee for those experts is small potatoes for his firm compared
with the millions of dollars it trades. Most private traders do not have such
opportunities. It is easier for institutions to buy the best research.
An acquaintance who used to trade successfully for a Wall Street invest-
ment bank found himself in trouble when he quit to trade for himself. He dis-
covered that a real-time quote system in his Park Avenue apartment in
Manhattan did not give him news as fast as the squawk box on the trading
floor of his old firm. Brokers from around the country used to call him with
the latest ideas because they wanted his orders. “When you trade from your
house, you are never the first to hear the news,” he says.
Some large firms have intelligence networks that enable them to act
before the public. One day, when oil futures rallied in response to a fire on a
platform in the North Sea, I called a friend at an oil firm. The market was
frantic, but he was relaxed—he had bought oil futures half an hour before
they exploded. He had gotten a telex from an agent in the area of the fire
well before the reports appeared on the newswire. Timely information is
priceless, but only a large company can afford an intelligence network.
The firms that deal in both futures and cash markets have two advantages.
They have true inside information, and they are exempt from speculative
position limits (see Section 40). Recently, I visited an acquaintance at a
multinational oil company. After passing through security that was tighter
14. THE TRADING SCENE
53
than at Kennedy International Airport, I walked through glass-enclosed cor-
ridors. Clusters of men huddled around monitors trading oil products. When
I asked my host whether his traders were hedging or speculating, he looked
me straight in the eye and said, “Yes.” I asked again and received the same
answer. Companies crisscross the thin line between hedging and speculating
based on inside information.
Employees of trading firms have a psychological advantage — they can be
more relaxed because their own money is not at risk. Most individuals do not
have the discipline to stop trading when they get on a losing streak, but insti-
tutions impose discipline on traders. A trader is given two limits — how much
he may risk on a single trade and the maximum amount he may lose in a
month. These limits work as stop-loss orders on a trader.
With all these advantages, how can an individual trader compete against
institutions and win? First, many institutional trading departments are poorly
run. Second, the Achilles heel of most institutions is that they often have to
trade, while an individual trader is free to trade or stay out of the market.
Banks have to be active in the bond market and food processing companies
have to be active in the grain market at almost any price. An individual
trader is free to wait for the best trading opportunities.
Most private traders fritter away this advantage by overtrading. An indi-
vidual who wants to succeed against the giants must develop patience and
eliminate greed. Remember, your goal is to trade well, not to trade often.
Successful institutional traders receive raises and bonuses. Even a high
bonus can feel puny to someone who earns many millions of dollars for his
firm. Successful institutional traders often talk of quitting and going to trade
for themselves.
Only a handful of them manage to make the transition. Most traders who
leave institutions get caught up in the emotions of fear, greed, elation, and
panic when they start risking their own money. They seldom do well trading
for their own account—another sign that psychology is at the root of trading
success or failure.
The Swordmakers
Medieval knights shopped for the sharpest swords, and modern traders
shop for the best trading tools. The growing access to data, computers, and
software creates a more level playing field for traders. Prices of hardware
fall almost monthly and software keeps getting better. It is easy for even a
54
MASS PSYCHOLOGY
computer-illiterate trader to hire a consultant and set up a system (see
Section 24).
A computer allows you to speed up your research and follow up on more
leads. It is not a substitute for making trading decisions. A computer helps
you analyze more markets in greater depth, but the ultimate responsibility
for every trade rests with you.
There are three types of trading software: toolboxes, black boxes, and
gray boxes. A toolbox allows you to display data, draw charts, plot indica-
tors, and even test your trading system. Toolboxes for options traders include
option valuation models. It is as easy to adapt a good toolbox to your needs
as it is to adjust your car seat.
What goes inside a black box is secret. You feed it data, and it tells you
when to buy and sell. It is like magic—a way to make money without think-
ing. Black boxes usually come with excellent historical track records. This is
only natural because they were created to fit old data! Markets keep chang-
ing, and black boxes keep blowing up, but new generations of losers keep
buying new black boxes.
Gray boxes straddle the fence between toolboxes and black boxes. These
packages are usually put out by prominent market personalities. They dis-
close the general logic of their system and allow you to adjust some of their
parameters.
Advisors
Advisory newsletters are colorful splashes on the trading scene. Freedom of
the press allows anyone to put a typewriter on his kitchen table, buy a few
stamps, and start sending out a financial advisory letter. Their “track
records” are largely an exercise in futility because hardly anybody ever takes
every bit of advice in any newsletter.
Some newsletters provide useful ideas and point readers in the direction
of trading opportunities. A few offer educational value. Mostly, they sell out-
siders an illusion of being an insider, of knowing what happens or is about to
happen in the markets.
Newsletters are good entertainment. Your subscription rents you a penpal
who sends amusing and interesting letters and never asks you to write back,
except for a check at renewal time.
Services that rate newsletters are for-profit affairs run by small business-
men whose well-being depends on the well-being of the advisory industry.
14. THE TRADING SCENE
55
Rating services may occasionally tut-tut an advisor, but they dedicate most
of their energy to loud cheerleading.
I used to write an advisory newsletter: worked hard, did not fudge results,
and received good ratings. I saw from the inside a tremendous potential for
fudging results. This is a well-kept secret of the advisory industry.
When I was getting into letter writing, one of the most prominent advisors
told me that I should spend less time on research and more on marketing.
The first principle of letter writing is: “If you have to make forecasts, make a
lot of them.” Whenever a forecast turns out right, double the volume of pro-
motional mail.
Trading Contests
Trading contests are run by small firms or individuals. Contestants pay orga-
nizers to monitor their results and publicize the names of winners. Trading
contests have two flaws—one mild, and another possibly criminal. This is a
scandal waiting to be explored by investigative journalists.
All contests hide information about losers and tell you only about win-
ners. Each dog has its day in the sun, and most losers have at least one good
quarter. If you keep entering contests and taking wild chances, eventually
you will have a winning quarter, reap the publicity, and attract money man-
agement clients.
Many advisors enter trading contests with a small stake, which they chalk
off to marketing expense. If they get lucky they receive valuable publicity,
while their losses are hidden. Nobody hears about a contestant who destroys
his account. I know several traders who are so bad they could not trade
candy with a child. They are chronic losers—but all of them appeared on the
list of winners of a major contest, with great percentage gains. That publicity
allowed them to raise money from the public—which they proceeded to lose.
If trading contests disclosed the names and results of all participants, that
would promptly kill the enterprise.
A more malignant flaw of trading contests is the financial collusion
between some organizers and contestants. Many organizers have a direct
financial incentive to rig the results and help their co-conspirators obtain
publicity as winners. They use it to raise money from the public.
The proprietor of one of the contests told me that he was raising money
for his star winner. How objective can a judge be if he has a business rela-
tionship with one of his contestants? It appeared that the amount he could
56
MASS PSYCHOLOGY
raise depended on how well his “star” performed in his contest. That highly
touted star promptly lost money put under his management.
The worst abuses can occur in contests run by brokerage firms. A firm
can set up contest rules, attract participants, have them trade through the
firm, judge them, publicize their results, and then go for the jugular—raising
money from the public for winners to manage, thereby generating fees and
commissions. It would be easy for such a firm to create a star. All it would
have to do is open several accounts for the designated “winner.” At the end
of each day it could put the best trades into a contest account and the rest of
the trades into other accounts, creating a great “track record.” Trading con-
tests can be an attractive tool for fleecing the public.
15. THE MARKET CROWD AND YOU
The market is a loosely organized crowd whose members bet that prices will
rise or fall. Since each price represents the consensus of the crowd at the
moment of transaction, all traders are in effect betting on the future mood of
the crowd. That crowd keeps swinging from indifference to optimism or pes-
simism and from hope to fear. Most people do not follow their own trading
plans because they let the crowd influence their feelings, thoughts, and
actions.
Bulls and bears battle in the market, and the value of your investment sinks
or soars, depending on the actions of total strangers. You cannot control the
markets. You can only decide whether and when to enter or exit trades.
Most traders feel jittery when we enter a trade. Their judgment becomes
clouded by emotions after they join the market crowd. These crowd-induced
emotions make traders deviate from their trading plans and lose money.
Experts on Crowds
Charles Mackay, a Scottish barrister, wrote his classic book, Extraordinary
Popular Delusions and the Madness of Crowds, in 1841. He described sev-
eral mass manias, including the Tulip Mania in Holland in 1634 and the
South Seas investment bubble in England in 1720.
The tulip craze began as a bull market in tulip bulbs. The long bull market
convinced the prosperous Dutch that tulips would continue to appreciate.
Many of them abandoned their businesses to grow tulips, trade them, or
15. THE MARKET CROWD AND YOU
57
become tulip brokers. Banks accepted tulips as collateral and speculators
profited. Finally, that mania collapsed in waves of panic selling, leaving
many people destitute and the nation shocked. Mackay sighed, “Men go mad
in crowds, and they come back to their senses slowly and one by one.”
In 1897, Gustave LeBon, a French philosopher and politician, wrote The
Crowd, one of the best books on mass psychology. A trader who reads it
today can see his reflection in a century-old minor.
LeBon wrote that when people gather in a crowd, “Whoever be the indi-
viduals that compose it, however like or unlike be their mode of life, their
occupations, their character, or their intelligence, the fact that they have been
transformed into a crowd puts them in possession of a sort of collective mind
which makes them feel, think, and act in a manner quite different from that
in which each individual of them would feel, think, and act were he in a state
of isolation.”
People change when they join crowds. They become more credulous and
impulsive, anxiously search for a leader, and react to emotions instead of
using their intellect. An individual who becomes involved in a group
becomes less capable of thinking for himself.
The experiments of American social psychologists in the 1950s have
proven that people think differently in groups than they do alone. For exam-
ple, an individual can easily tell which of the two lines on a piece of paper is
longer. He loses that ability when he is put into a group whose other mem-
bers deliberately give wrong answers. Intelligent, college-educated people
believe a group of strangers more than they believe their own eyes!
Group members believe others, and particularly group leaders, more than
they believe themselves. Theodore Adorno and other sociologists showed in
their two-volume study, The American Soldier, that the single best predictor
of an individual’s effectiveness in combat was his relationship with his
sergeant. A soldier who trusts his leader will literally follow him to his death.
A trader who believes he is following a trend may hold a losing position
until his equity is wiped out.
Sigmund Freud explained that groups are held together by the loyalty of
members to the leader. Our feelings toward group leaders stem from our
childhood feelings toward our fathers —a mixture of trust, awe, fear, the
desire for approval, and potential rebellion. When we join groups, our think-
ing on issues involving that group regresses to the level of a child. A leader-
less group cannot hold itself together and falls apart. This explains buying
and selling panics. When traders suddenly feel that the trend they have been
following has abandoned them, they dump their positions in a panic.
58
MASS PSYCHOLOGY
Group members may catch a few trends, but they get killed when trends
reverse. When you join a group, you act like a child following a parent.
Markets do not care about your well-being. Successful traders are indepen-
dent thinkers.
Why Join?
People have been joining crowds for safety since the beginning of time. If a
group of hunters took on a saber-toothed tiger, most of them were likely to
survive. A lone hunter had a slim chance of coming out alive from such an
encounter. Loners got killed more often and left fewer offspring. Group
members were more likely to survive, and the tendency to join groups
appears to have been bred into humans.
Our society glorifies freedom and free will, but we carry many primitive
impulses beneath the thin veneer of civilization. We want to join groups for
safety and be led by strong leaders. The greater the uncertainty, the stronger
our wish to join and to follow.
No saber-toothed tigers roam the canyons of Wall Street, but you probably
fear for your financial survival. Your fear swells up because you cannot con-
trol changes in prices. The value of your position rises and falls because of
buying and selling by total strangers. This uncertainty makes most traders
look for a leader who will tell them what to do.
You may have rationally decided to go long or short, but the moment you
put on a trade, the crowd starts sucking you in. You need to pay attention to
several signs that indicate when you start turning into a sweaty crowd mem-
ber instead of an intelligent trader.
You start losing your independence when you watch prices like a hawk
and feel elated if they go your way or depressed if they go against you. You
are in trouble when you start trusting gurus more than yourself and impul-
sively add to losing positions or reverse them. You lose your independence
when you do not follow your own trading plan. When you notice what is
happening, try to come back to your senses; if you cannot regain your com-
posure, exit your trade.
Crowd Mentality
People become primitive and action-oriented when they join crowds.
Crowds feel simple but strong emotions such as tenor, elation, alarm, and
joy. Crowds swing from fear to glee, from panic to mirth. A scientist can be
15. THE MARKET CROWD AND YOU
59
cool and rational in his lab but make harebrained trades after being swept
up in the mass hysteria of the market. A group can suck you in, whether you
trade from a crowded brokerage office or from a remote mountaintop.
When you let others influence your trading decisions, you lose your chance
of success.
Group loyalty is essential for the survival of a military unit. Joining a
union can help you keep a job even if your performance is not very good.
But no group can protect you in the market.
The crowd is bigger and stronger than you. No matter how smart you are,
you cannot argue with the crowd. You have only one choice — to join the
crowd or to act independently.
Many traders are puzzled why markets always seem to reverse immedi-
ately after they dump their losing position. This happens because crowd
members are gripped by the same fear—and everybody dumps at the same
time. Once the fit of selling has ended, the market has nowhere to go but up.
Optimism returns to the marketplace, and the crowd feels greedy and goes
on a new buying binge.
Crowds are primitive, and your trading strategies should be simple. You
do not have to be a rocket scientist to design a winning trading method. If the
trade goes against you — cut your losses and run. It never pays to aigue with
the crowd—simply use your judgment to decide when to join and when to
leave.
Your human nature prepares you to give up your independence under
stress. When you put on a trade, you feel the desire to imitate others and
overlook objective trading signals. This is why you need to develop and fol-
low trading systems and money management rules. They represent your
rational individual decisions, made before you enter a trade and become a
crowd member.
Who Leads?
You may feel intense joy when prices move in your favor. You may feel
angry, depressed, and fearful when prices go against you, and you may anx-
iously wait to see what the market will do to you next. Traders join crowds
when they feel stressed or threatened. Battered by emotions, they lose their
independence and begin imitating other group members, especially the group
leader.
When children feel frightened, they want to be told what to do and look
up to their parents. They transfer that attitude to teachers, doctors, ministers,
60
MASS PSYCHOLOGY
bosses, and assorted experts. Traders turn to gurus, trading system vendors,
newspaper columnists, and other market leaders. But, as Tony Plummer bril-
liantly pointed out in his book, Forecasting Financial Markets, the main
leader of the market is price.
Price is the leader of the market crowd. Traders all over the world follow
the market’s upticks and downticks. Price seems to say to traders, “Follow
me, and I will show you the way to riches.” Most traders consider them-
selves independent. Few of us realize how strongly we focus on the behavior
of our group leader.
A trend that goes in your favor symbolizes a strong, bountiful parent call-
ing you to share a meal or risk being left out. A trend that goes against you
symbolizes an angry, punishing parent. When you are gripped by these feel-
ings, it is easy to overlook objective signals that tell you to exit. You may
feel defiant, or bargain, or beg forgiveness—while avoiding the rational act
of accepting your loss and getting out of a losing position.
Independence
You need to base your trades on a carefully prepared trading plan and not
jump in response to price changes. It pays to write down your plan. You need
to know exactly under what conditions you will enter and exit a trade. Do
not make decisions on the spur of the moment, when you are vulnerable to
being sucked into the crowd.
You can succeed in trading only when you think and act as an individual.
The weakest part of any trading system is the trader himself. Traders fail when
they trade without a plan or deviate from their plans. Plans are created by rea-
soning individuals. Impulsive trades are made by sweaty group members.
You have to observe yourself and notice changes in your mental state as
you trade. Write down your reasons for entering a trade and the rules for
getting out of it, including money management rules. You must not change
your plan while you have an open position.
Sirens were sea creatures of Greek myths who sang so beautifully that
sailors jumped overboard and drowned. When Odysseus wanted to hear the
Sirens’ songs, he ordered his men to tie him to the mast and to put wax in
their own ears. Odysseus heard the Sirens’ song but survived because he
could not jump. You ensure your survival as a trader when on a clear day
you tie yourself to the mast of a trading plan and money management rules.
16. PSYCHOLOGY OF TRENDS
61
16. PSYCHOLOGY OF TRENDS
Each price is the momentary consensus of value of all market participants. It
shows their latest vote on the value of a trading vehicle. Any trader can “put
in his two cents’ worth” by giving an order to buy or to sell, or by refusing to
trade at the cunent level.
Each bar on a chart reflects the battle between bulls and bears. When bulls
feel strongly bullish, they buy more eagerly and push markets up. When
bears feel strongly bearish, they sell more actively and push markets down.
Each price reflects action or lack of action by all traders in the market.
Charts are a window into mass psychology. When you analyze charts, you
analyze the behavior of traders. Technical indicators help make this analysis
more objective.
Technical analysis is applied social psychology. It aims to recognize
trends and changes in crowd behavior in order to make intelligent trading
decisions.
Strong Feelings
Ask most traders why prices went up, and you are likely to get a stock
answer—more buyers than sellers. This is not true. The number of trading
instruments, such as stocks or futures, bought and sold in any market is
always equal.
If you want to buy a contract of Swiss Francs, someone has to sell it to
you. If you want to sell short a contract of the S&P 500, someone has to buy
it from you. The number of stocks bought and sold is equal in the stock mar-
ket. Furthermore, the number of long and short positions in the futures mar-
kets is always equal. Prices move up or down because of changes in the
intensity of greed and fear among buyers or sellers.
When the trend is up, bulls feel optimistic and do not mind paying a little
extra. They buy high because they expect prices to rise even higher. Bears
feel tense in an uptrend, and they agree to sell only at a higher price. When
greedy and optimistic bulls meet fearful and defensive bears, the market ral-
lies. The stronger their feelings, the sharper the rally. The rally ends only
when many bulls lose their enthusiasm.
When prices slide, bears feel optimistic and do not quibble about selling
short at lower prices. Bulls are fearful and agree to buy only at a discount.
62
MASS PSYCHOLOGY
As long as bears feel like winners, they continue to sell at lower prices, and
the downtrend continues. It ends when bears start feeling cautious and refuse
to sell at lower prices.
Rallies and Declines
Few traders act as purely rational human beings. There is a great deal of
emotional activity in the markets. Most market participants act on the princi-
ple of “monkey see, monkey do.” The waves of fear and greed sweep up
bulls and bears.
Markets rise because of greed among buyers and fear among short sellers.
Bulls normally like to buy on the cheap. When they turn very bullish, they
become more concerned with not missing the rally than with getting a cheap
price. A rally continues as long as bulls are greedy enough to meet sellers’
demands.
The sharpness of a rally depends on how traders feel. If buyers feel just a
little stronger than sellers, the market rises slowly. When they feel much
stronger than sellers, the market rises fast. It is the job of a technical analyst
to find when buyers are strong and when they start running out of steam.
Short sellers feel trapped by rising markets, as their profits melt and turn
into losses. When short sellers rush to cover, a rally becomes nearly vertical.
Fear is a stronger emotion than greed, and rallies driven by short covering
are especially sharp.
Markets fall because of greed among bears and fear among bulls.
Normally bears prefer to sell short on rallies, but if they expect to make a lot
of money on a decline, they don’t mind shorting on the way down. Fearful
buyers agree to buy only below the market. As long as short sellers are will-
ing to meet those demands and sell at a bid, the decline continues.
As bulls’ profits melt and turn into losses, they panic and sell at almost
any price. They are so eager to get out that they hit the bids under the mar-
ket. Markets can fall very fast when hit by panic selling.
Trend Leaders
Loyalty is the glue that holds groups together. Freud showed that group
members relate to their leader the way children relate to a father. Group
16. PSYCHOLOGY OF TRENDS
63
members expect leaders to inspire and reward them when they are good but
to punish them when they are bad.
Who leads market trends? When individuals try to control a market, they
usually end up badly. For example, the bull market in silver in the 1980s was
led by the Hunt brothers of Texas and their Arab associates. The Hunts
ended up in a bankruptcy court. They had no money left even for a limousine
and had to ride the subway to the courthouse. Market gurus sometimes lead
trends, but they never last beyond one market cycle (see Section 6).
Tony Plummer, a British trader, has presented a revolutionary idea in his
book, Forecasting Financial Markets—The Truth Behind Technical Analysis.
He showed that price itself functions as the leader of the market crowd! Most
traders focus their attention on price.
Winners feel rewarded when price moves in their favor, and losers feel
punished when price moves against them. Crowd members remain blissfully
unaware that when they focus on price they create their own leader. Traders
who feel mesmerized by price swings create their own idols.
When the trend is up, bulls feel rewarded by a bountiful parent. The longer
an uptrend lasts, the more confident they feel. When a child’s behavior is
rewarded, he continues to do what he did. When bulls make money, they add to
long positions and new bulls enter the market. Bears feel they are being pun-
ished for selling short. Many of them cover shorts, go long, and join the bulls.
Buying by happy bulls and covering by fearful bears pushes uptrends
higher. Buyers feel rewarded while sellers feel punished. Both feel emotion-
ally involved, but few traders realize that they are creating the uptrend, creat-
ing their own leader.
Eventually a price shock occurs — a major sale hits the market, and there
are not enough buyers to absorb it. The uptrend takes a dive. Bulls feel mis-
treated, like children whose father hit them with a strap during a meal, but
bears feel encouraged.
A price shock plants the seeds of an uptrend’s reversal. Even if the market
recovers and reaches a new high, bulls feel more skittish and bears become
bolder. This lack of cohesion in the dominant group and optimism among its
opponents makes the uptrend ready to reverse. Several technical indicators
identify tops by tracing a pattern called bearish divergence (see Section 28). It
occurs when prices reach a new high but the indicator reaches a lower high
than it did on a previous rally. Bearish divergences mark the best shorting
opportunities.
When the trend is down, bears feel like good children, praised and
62
MASS PSYCHOLOGY
As long as bears feel like winners, they continue to sell at lower prices, and
the downtrend continues. It ends when bears start feeling cautious and refuse
to sell at lower prices.
Rallies and Declines
Few traders act as purely rational human beings. There is a great deal of
emotional activity in the markets. Most market participants act on the princi-
ple of “monkey see, monkey do.” The waves of fear and greed sweep up
bulls and bears.
Markets rise because of greed among buyers and fear among short sellers.
Bulls normally like to buy on the cheap. When they turn very bullish, they
become more concerned with not missing the rally than with getting a cheap
price. A rally continues as long as bulls are greedy enough to meet sellers’
demands.
The sharpness of a rally depends on how traders feel. If buyers feel just a
little stronger than sellers, the market rises slowly. When they feel much
stronger than sellers, the market rises fast. It is the job of a technical analyst
to find when buyers are strong and when they start running out of steam.
Short sellers feel trapped by rising markets, as their profits melt and turn
into losses. When short sellers rush to cover, a rally becomes nearly vertical.
Fear is a stronger emotion than greed, and rallies driven by short covering
are especially sharp.
Markets fall because of greed among bears and fear among bulls.
Normally bears prefer to sell short on rallies, but if they expect to make a lot
of money on a decline, they don’t mind shorting on the way down. Fearful
buyers agree to buy only below the market. As long as short sellers are will-
ing to meet those demands and sell at a bid, the decline continues.
As bulls’ profits melt and turn into losses, they panic and sell at almost
any price. They are so eager to get out that they hit the bids under the mar-
ket. Markets can fall very fast when hit by panic selling.
Trend Leaders
Loyalty is the glue that holds groups together. Freud showed that group
members relate to their leader the way children relate to a father. Group
16. PSYCHOLOGY OF TRENDS
63
members expect leaders to inspire and reward them when they are good but
to punish them when they are bad.
Who leads market trends? When individuals try to control a market, they
usually end up badly. For example, the bull market in silver in the 1980s was
led by the Hunt brothers of Texas and their Arab associates. The Hunts
ended up in a bankruptcy court. They had no money left even for a limousine
and had to ride the subway to the courthouse. Market gurus sometimes lead
trends, but they never last beyond one market cycle (see Section 6).
Tony Plummer, a British trader, has presented a revolutionary idea in his
book, Forecasting Financial Markets—The Truth Behind Technical Analysis.
He showed that price itself functions as the leader of the market crowd! Most
traders focus their attention on price.
Winners feel rewarded when price moves in their favor, and losers feel
punished when price moves against them. Crowd members remain blissfully
unaware that when they focus on price they create their own leader. Traders
who feel mesmerized by price swings create their own idols.
When the trend is up, bulls feel rewarded by a bountiful parent. The longer
an uptrend lasts, the more confident they feel. When a child’s behavior is
rewarded, he continues to do what he did. When bulls make money, they add to
long positions and new bulls enter the market. Bears feel they are being pun-
ished for selling short. Many of them cover shorts, go long, and join the bulls.
Buying by happy bulls and covering by fearful bears pushes uptrends
higher. Buyers feel rewarded while sellers feel punished. Both feel emotion-
ally involved, but few traders realize that they are creating the uptrend, creat-
ing their own leader.
Eventually a price shock occurs—a major sale hits the market, and there
are not enough buyers to absorb it. The uptrend takes a dive. Bulls feel mis-
treated, like children whose father hit them with a strap during a meal, but
bears feel encouraged.
A price shock plants the seeds of an uptrend’s reversal. Even if the market
recovers and reaches a new high, bulls feel more skittish and bears become
bolder. This lack of cohesion in the dominant group and optimism among its
opponents makes the uptrend ready to reverse. Several technical indicators
identify tops by tracing a pattern called bearish divergence (see Section 28). It
occurs when prices reach a new high but the indicator reaches a lower high
than it did on a previous rally. Bearish divergences mark the best shorting
opportunities.
When the trend is down, bears feel like good children, praised and
64
MASS PSYCHOLOGY
rewarded for being smart. They feel increasingly confident, add to their posi-
tions, and the downtrend continues. New bears come into the market. Most
people admire winners, and the financial media keep interviewing bears in
bear markets.
Bulls lose money in downtrends, and that makes them feel bad. Bulls
dump their positions, and many switch sides to join bears. Their selling
pushes markets lower.
After a while, bears grow confident and bulls feel demoralized. Suddenly,
a price shock occurs. A cluster of buy orders soaks up all available sell
orders and lifts the market. Now bears feel like children whose father has
lashed out at them in the midst of a happy meal.
A price shock plants the seeds of a downtrend’s eventual reversal because
bears become more fearful and bulls grow bolder. When a child begins to
doubt that Santa Claus exists, he seldom believes in Santa again. Even if
bears recover and prices fall to a new low, several technical indicators iden-
tify their weakness by tracing a pattern called a bullish divergence. It occurs
when prices fall to a new low but an indicator traces a more shallow bottom
than during the previous decline. Bullish divergences identify the best buy-
ing opportunities.
Social Psychology
An individual has a free will and his behavior is hard to predict. Group
behavior is more primitive and easier to follow. When you analyze markets,
you analyze group behavior. You need to identify the direction in which
groups run and their changes.
Groups suck us in and cloud our judgment. The problem for most analysts
is that they get caught in the mentality of the groups they analyze.
The longer a rally continues, the more technicians get caught up in bullish
sentiment, ignore the danger signs, and miss the reversal. The longer a
decline goes on, the more technicians get caught up in bearish gloom and
ignore bullish signs. This is why it helps to have a written plan for analyzing
the markets. We have to decide in advance what indicators we will watch
and how we will interpret them.
Floor traders use several tools for tracking the quality and intensity of a
crowd’s feelings. They watch the crowd’s ability to break through recent
support and resistance levels. They keep an eye on the flow of “paper” — cus-
tomer orders that come to the floor in response to price changes. Floor
17. MANAGING VERSUS FORECASTING
65
traders listen to the changes in pitch and volume of the roar on the exchange
floor.
If you trade away from the floor, you need other tools for analyzing
crowd behavior. Your charts and indicators reflect mass psychology in
action. A technical analyst is an applied social psychologist, often armed
with a computer.
17. MANAGING VERSUS FORECASTING
I once ran into a very fat surgeon at a seminar. He told me that he had lost a
quarter of a million dollars in three years trading stocks and options. When I
asked him how he made his trading decisions, he sheepishly pointed to his
ample gut. He gambled on hunches and used his professional income to sup-
port his habit. There are two alternatives to “gut feel”: One is fundamental
analysis; the other is technical analysis.
Major bull and bear markets result from fundamental changes in supply
and demand. Fundamental analysts follow crop reports, study the actions
of the Federal Reserve, track industry utilization rates, and so on. Even if
you know those factors, you can lose money trading if you are out of touch
with intermediate- and short-term trends. They depend on the crowd’s
emotions.
Technical analysts believe that prices reflect everything known about the
market, including all fundamental factors. Each price represents the consen-
sus of value of all market participants — large commercial interests and small
speculators, fundamental researchers, technicians, and gamblers.
Technical analysis is a study of mass psychology. It is partly a science and
partly an art. Technicians use many scientific methods, including mathemati-
cal concepts of game theory, probabilities, and so on. Many technicians use
computers to track sophisticated indicators.
Technical analysis is also an art. The bars on a chart coalesce into patterns
and formations. When prices and indicators move, they produce a sense of
flow and rhythm, a feeling of tension and beauty that helps you sense what is
happening and how to trade.
Individual behavior is complex, diverse, and difficult to predict. Group
behavior is primitive. Technicians study the behavior patterns of market
crowds. They trade when they recognize a pattern that preceded past market
moves.
66
MASS PSYCHOLOGY
Poll-Taking
Political poll-taking is a good model of technical analysis. Technicians and
polltakers try to read the mass mind. Polltakers do it for political gain, tech-
nicians for financial gain. Politicians want to know their chances of being
elected or re-elected. They make promises to constituents and then ask poll-
takers about their odds of winning.
Polltakers use scientific methods: statistics, sampling procedures, and so
on. They also need a flair for interviewing and phrasing questions; they
have to be plugged into the emotional undercurrents of their party. Poll-tak-
ing is a combination of science and art. If a polltaker says he is a scientist,
ask him why every major political polltaker in the United States is affiliated
with either the Democratic or Republican party. True science knows no
party.
A market technician must rise above party affiliation. Be neither a bull
nor a bear, but only seek the truth. A biased bull looks at a chart and says,
“Where can I buy?” A biased bear looks at the same chart and tries to find
where he can go short. A top-flight analyst is free of bullish or bearish bias.
There is a trick to help you detect your bias. If you want to buy, turn your
chart upside down and see whether it looks like a sell. If it still looks like a
buy after you flip it, then you have to work on getting a bullish bias out of
your system. If both charts look like a sell, then you have to work on puiging
a bearish bias.
A Crystal Ball
Most traders take price swings personally. They feel very proud when they
make money and love to talk about their profits. When a trade goes against
them they feel like punished children and try to keep their losses secret. You
can read traders’ emotions on their faces.
Many traders believe that the aim of a market analyst is to forecast future
prices. The amateurs in most Helds ask for forecasts, while professionals
simply manage information and make decisions based on probabilities. Take
medicine, for example. A patient is brought to an emergency room with a
knife sticking out of his chest—and the anxious family members have only
two questions: “Will he survive?” and “when can he go home?” They ask the
doctor for a forecast.
17. MANAGING VERSUS FORECASTING
67
But the doctor is not forecasting — he is taking care of problems as they
emerge. His first job is to prevent the patient from dying from shock, and so
he gives him pain-killers and starts an intravenous drip to replace lost
blood. Then he removes the knife and sutures damaged organs. After that,
he has to watch against infection. He monitors the trend of a patient’s health
and takes measures to prevent complications. He is managing —not fore-
casting. When a family begs for a forecast, he may give it to them, but its
practical value is low.
To make money trading, you do not need to forecast the future. You have
to extract information from the market and find out whether bulls or bears
are in control. You need to measure the strength of the dominant market
group and decide how likely the current trend is to continue. You need to
practice conservative money management aimed at long-term survival and
profit accumulation. You must observe how your mind works and avoid slip-
ping into greed or fear. A trader who does all of this will succeed more than
any forecaster.
Read the Market, Manage Yourself
A tremendous volume of information pours out of the markets during trading
hours. Changes in prices tell us about the battles of bulls and bears. Your job
is to analyze this information and bet on the dominant market group.
Dramatic forecasts are a marketing gimmick. People who sell advisory
services or raise money know that good calls attract paying customers, while
bad calls are quickly forgotten. My phone rang while I was writing this chap-
ter. One of the famous gurus, cunently down on his luck, told me that he
identified a “once-in-a-lifetime buying opportunity” in a certain agricultural
market. He asked me to raise money for him and promised to multiply it a
hundredfold in six months! I do not know how many fools he hooked, but
dramatic forecasts have always been good for fleecing the public.
Use your common sense when you analyze markets. When some new
development puzzles you, compare it to life outside the markets. For exam-
ple, indicators may give you buy signals in two markets. Should you buy
the market that declined a lot before the buy signal or the one that declined
a little? Compare this to what happens to a man after a fall. If he falls down
a flight of stairs, he may dust himself off and run up again. But if he falls
out of a third story window, he’s not going to run anytime soon; he needs
68
MASS PSYCHOLOGY
time to recover. Prices seldom rally very hard immediately after a bad
decline.
Successful trading stands on three pillars. You need to analyze the bal-
ance of power between bulls and bears. You need to practice good money
management. You need personal discipline to follow your trading plan and
avoid getting high in the markets.
Ill
Classical Chart Analysis
18. CHARTING
Chartists study market action, trying to identify recurrent price patterns.
Their goal is to profit from trading when patterns recur. Most chartists work
with bar graphs showing high, low, and closing prices and volume. Some
also watch opening prices and open interest. Point-and-figure chartists track
only price changes and ignore time, volume, and open interest.
Classical charting requires only a pencil and paper. It appeals to visually
oriented people. Those who plot data by hand often develop a physical feel
for prices. Computers speed charting at a cost of losing some of that feel.
The biggest problem in charting is wishful thinking. Traders often con-
vince themselves that a pattern is bullish or bearish depending on whether
they want to buy or to sell.
Early in this century Herman Rorschach, a Swiss psychiatrist, designed a
test for exploring a person’s mind. He dropped ink on 10 sheets of paper and
folded each in half, creating a symmetrical inkblot. Most people who peer at
these sheets describe what they see: parts of the anatomy, animals, buildings,
and so on. In reality, there are only inkblots! Each person sees what’s on his
mind. Most traders use charts as a giant Rorschach test. They project their
hopes, fears, and fantasies onto the charts.
Brief History
The first chartists in the United States appeared at the turn of the century.
They included Charles Dow, the author of a famous stock market theory, and
69
70
CLASSICAL CHART ANALYSIS
William Hamilton, who succeeded Dow as the editor of the Wall Street
Journal. Dow’s famous maxim was “The averages discount everything.” He
meant that changes in the Dow Jones Industrial and Rail Averages reflected
all knowledge and hopes about the economy and the stock market.
Dow never wrote a book, only the Wall Street Journal editorials.
Hamilton took over the job after Dow died and struck a blow for charting
when he wrote “The Turn of the Tide,” an editorial following the 1929 crash.
Hamilton laid out the principles of Dow theory in his book, The Stock
Market Barometer. Robert Rhea, a newsletter publisher, brought the theory
to its pinnacle in his 1932 book, The Dow Theory.
The decade of the 1930s was the Golden Age of charting. Many innovators
found themselves with time on their hands after the crash of 1929. Schabaker,
Rhea, Elliott, Wyckoff, Gann, and others published their research during that
decade. Their work went in two distinct directions. Some, such as Wyckoff
and Schabaker, saw charts as a graphic record of supply and demand in the
markets. Others, such as Elliott and Gann, searched for a perfect order in the
markets—a fascinating but futile undertaking (see Section 6).
In 1948, Edwards (who was a son-in-law of Schabaker) and Magee pub-
lished Technical Analysis of Stock Trends. They popularized such concepts
as triangles, rectangles, head-and-shoulders, and other chart formations, as
well as support and resistance and trendlines. Other chartists have applied
these concepts to commodities.
Markets have changed a great deal since the days of Edwards and Magee.
In the 1940s, daily volume of an active stock on the New York Stock
Exchange was only several hundred shares, while in the 1990s it often
exceeds a million. The balance of power in the stock market has shifted in
favor of bulls. Early chartists wrote that stock market tops were sharp and
fast, while bottoms took a long time to develop. That was true in their defla-
tionary era, but the opposite has been true since the 1950s. Now bottoms
tend to form quickly while tops tend to take longer.
The Meaning of a Bar Chart
Chart patterns reflect the tides of greed and fear among traders. This book
focuses on daily charts, but you can apply many of its principles to other
data. The rules for reading weekly, daily, hourly, or intraday charts are very
similar.
Each price is a momentary consensus of value of all market participants
18. CHARTING
71
S&P500
Max power of bulls (high)
Amateurs (open)
Professionals (dose)
Max power of bears (low)
W
399.ee
396.ee
393.00
зэе.ее
387.00
384.60
381.00
378.ee
375.00
372.00
Figure 18-1. The Meaning of a Bar Chart
Opening prices are set by amateurs, whose orders accumulate overnight
and hit the market in the morning. Closing prices are largely set by mar-
ket professionals, who trade throughout the day. Note how often open-
ing and closing prices are at opposite ends of a bar.
The high of each bar marks the maximum power of bulls during that
bar. The low of each bar marks the maximum power of bears during that
bar. Slippage tends to be less when you enter or exit positions during
short bars.
expressed in action. Each price bar provides several pieces of information
about the balance of power between bulls and bears (Figure 18-1).
The opening price of a daily or a weekly bar usually reflects the ama-
teurs’ opinion of value. They read morning papers, find out what happened
the day before, and call their brokers with orders before going to work.
Amateurs are especially active early in the day and early in the week.
Traders who researched the relationship between opening and closing prices
for several decades found that opening prices most often occur near the high or
the low of the daily bars. Buying or selling by amateurs early in the day creates
an emotional extreme from which prices recoil later in the day.
In bull markets, prices often make their low for the week on Monday or
72
CLASSICAL CHART ANALYSIS
Tuesday on profit taking by amateurs, then rally to a new high on Thursday
or Friday. In bear markets, the high for the week is often set on Monday or
Tuesday, with a new low toward the end of the week, on Thursday or Friday.
The closing prices of daily and weekly bars tend to reflect the actions of
professional traders. They watch the markets throughout the day, respond to
changes, and become especially active near the close. Many of them take
profits at that time to avoid carrying trades overnight.
Professionals as a group usually trade against the amateurs. They tend to
buy lower openings, sell short higher openings, and unwind their positions as
the day goes on. Traders need to pay attention to the relationship between
opening and closing prices. If prices closed higher than they opened, then
market professionals were probably more bullish than amateurs. If prices
closed lower than they opened, then market professionals were probably
more bearish than amateurs. It pays to trade with the professionals and
against the amateurs.
The high of each bar represents the maximum power of bulls during that
bar. Bulls make money when prices go up. Their buying pushes prices
higher, and every uptick adds to their profits. Finally, bulls reach a point
where they cannot lift prices — not even by one more tick. The high of a daily
bar represents the maximum power of bulls during the day, and the high of a
weekly bar marks the maximum power of bulls during the week; the high of
a 5-minute bar reflects the maximum power of bulls during that 5-minute
period. The highest point of a bar represents the maximum power of bulls
during that bar.
The low of each bar represents the maximum power of bears during that
bar. Bears make money when prices go down. They keep selling short, their
selling pushes prices lower, and every downtick adds to their profits. At
some point they run out of either capital or enthusiasm, and prices stop
falling. The low of each bar shows the maximum power of bears during that
bar. The low of a daily bar marks the maximum power of bears during that
day, and the low of a weekly bar identifies the maximum power of bears dur-
ing that week.
The closing tick of each bar reveals the outcome of a battle between
bulls and bears during that bar. If prices close near the high of the daily bar,
it shows that bulls won the day’s battle. If prices close near the low of the
day, it shows that bears won the day. Closing prices on daily charts of the
futures markets are especially important. The amount of money in your
account depends on them because your account equity is “marked to market”
each night.
The distance between the high and the low of any bar reveals the inten-
18. CHARTING
73
sity of conflict between bulls and bears. An average bar marks a relatively
cool market. A bar that is only half as long as average reveals a sleepy, disin-
terested market. A bar that is two times taller than average shows a boiling
market where bulls and bears battle all over the field.
Slippage (see Section 3) is usually lower in quiet markets. It pays to enter
your trades during short or normal bars. Tall bars are good for taking profits.
Trying to put on a position when the market is running is like jumping on a
moving train. It is better to wait for the next one.
Japanese Candlesticks
Japanese rice traders began using candlestick charts some two centuries
before the first chartists appeared in America. Instead of bars, these charts
have rows of candles with wicks at both ends. The body of each candle rep-
resents the distance between the opening and closing prices. If the closing
price is higher than the opening, the body is white. If the closing price is
lower, the body is black.
The tip of the upper wick represents the high of the day, and the bottom of
the lower wick represents the low of the day. The Japanese consider highs and
lows relatively unimportant, according to Steve Nison, author of Japanese
Candlestick Charting Techniques. They focus on the relationship between
opening and closing prices and on patterns that include several candles.
The main advantage of a candlestick chart is its focus on the struggle
between amateurs who control openings and professionals who control clos-
ings. Unfortunately, most candlestick chartists fail to use many tools of
Western analysts. They ignore volume and have no trendlines or technical
indicators. These gaps are being filled by modem American analysts such as
Greg Morris, whose Candlepower software combines Western technical
indicators with classical candlestick patterns.
Market Profile
This charting technique for tracking accumulation and distribution during
each trading session was developed by J. Peter Steidlmayer. Market Profile
requires access to real-time data—a constant flow of quotes throughout the
day. It assigns one letter of the alphabet to each half-hour of trading. Each
price level reached during that half-hour is marked with its own letter.
As prices change, more and more letters fill the screen, creating a bell-
74
CLASSICAL CHART ANALYSIS
shaped curve. When prices erupt in a trend, Market Profile reflects that by
becoming elongated. Market Profile is sometimes combined with Liquidity
Data Bank. It tracks intraday volume of trading by several groups—floor
traders, hedgers, and off-the-floor traders.
Efficient Markets, Random Walk, and Nature's Law
Efficient Market theory is an academic notion that nobody can outperform
the market because any price at any given moment incorporates all available
information. Warren Buffet, one of the most successful investors of our cen-
tury, commented: “I think it’s fascinating how the ruling orthodoxy can
cause a lot of people to think the earth is flat. Investing in a market where
people believe in efficiency is like playing bridge with someone who’s been
told it doesn’t do any good to look at the cards.”
The logical flaw of Efficient Market theory is that it equates knowledge
with action. People may have knowledge, but the emotional pull of the
crowd often leads them to trade irrationally. A good analyst can detect repet-
itive patterns of crowd behavior on his charts and exploit them.
Random Walk theorists claim that market prices change at random. Of
course, there is a fair amount of randomness or “noise” in the markets, just
as there is randomness in any other crowd milling around. An intelligent
observer can identify repetitive behavior patterns of a crowd and make sensi-
ble bets on their continuation or reversal.
People have memories, they remember past prices, and their memories
influence their buying and selling decisions. Memories help create support
under the market and resistance above it. Random Walkers deny that memo-
ries of the past influence our behavior in the present.
As Milton Friedman has pointed out, prices carry information about the
availability of supply and the intensity of demand. Market participants use
that information to make their buying and selling decisions. For example,
consumers buy more merchandise when it is on sale and less when prices are
high. Financial traders are just as capable of logical behavior as homemakers
in a supermarket. When prices are low, bargain hunters step in. A shortage
can lead to a buying panic, but high prices choke off demand.
Nature’s Law is the rallying cry of a clutch of mystics who oppose
Random Walkers in the financial markets. Mystics claim that there is a per-
fect order in the markets, which they say move like clockwork in response to
immutable natural laws. R. N. Elliott even titled his last book Nature’s Law.
19. SUPPORT AND RESISTANCE
75
The “perfect order” crowd gravitates to astrology and looks for links
between prices and the movements of the planets. Most mystics try to hide
their astrological bent, but it is easy to draw them out of a shell. Next time
someone talks to you about natural order in the markets, ask him about
astrology. He will probably jump at the chance to come out of the closet and
talk about the stars.
Those who believe in perfect order in the markets accept that tops and
bottoms can be predicted far into the future. Amateurs love forecasts, and
mysticism provides a great marketing gimmick. It helps sell courses, trading
systems, and newsletters.
Mystics, Random Walk academics, and Efficient Market theorists have
one trait in common. They are equally divorced from the reality of the mar-
kets. Extremists argue with one another but they think alike.
19. SUPPORT AND RESISTANCE
A ball hits the floor and bounces. It drops after it hits the ceiling. Support
and resistance are like a floor and a ceiling, with prices sandwiched between
them. Understanding support and resistance is essential for understanding
price trends and chart patterns. Rating their strength helps you decide
whether the trend is likely to continue or to reverse.
Support is a price level where buying is strong enough to interrupt or
reverse a downtrend. When a downtrend hits support, it bounces like a
diver who hits the bottom and pushes away from it. Support is represented
on a chart by a horizontal or near-horizontal line connecting several bot-
toms (Figure 19-1).
Resistance is a price level where selling is strong enough to interrupt or
reverse an uptrend. When an uptrend hits resistance, it stops or tumbles
down like a man who hits his head on a branch while climbing a tree.
Resistance is represented on a chart by a horizontal or near-horizontal line
connecting several tops.
It is better to draw support and resistance lines across the edges of conges-
tion areas instead of extreme prices. The edges show where masses of traders
have changed their minds, while the extreme points reflect only panic among
the weakest traders.
Minor support or resistance causes trends to pause, while major support or
resistance causes them to reverse. Traders buy at support and sell at resis-
tance, making their effectiveness a self-fulfilling prophecy.
76
CLASSICAL CHART ANALYSIS
Figure 19-1. Support and Resistance
196
192
18?
183
1?8
174
169
165
168
156
Draw horizontal lines through the upper and lower edges of congestion
areas. The bottom line marks the support-the level at which buyers over-
power sellers. The upper line identifies resistance, where sellers over-
power buyers. Areas of support and resistance often switch their roles.
Note how the level of support in March became the line of resistance in
May. The strength of these barriers increases each time prices touch
them and bounce away.
Beware of false breakouts from support and resistance. The letter F
marks false breakouts on this chart. Amateurs tend to follow breakouts,
while professionals tend to fade (trade against) them. At the right edge of
the chart, prices are hitting strong resistance. This is the time to look for
a shorting opportunity, with a protective stop slightly above the line of
resistance.
Memories, Pain, and Regret
Support and resistance exist because people have memories. Our memories
prompt us to buy and sell at certain levels. Buying and selling by crowds of
traders creates support and resistance.
If traders remember that prices have recently stopped falling and turned
up from a certain level, they are likely to buy when prices approach that
19. SUPPORT AND RESISTANCE
77
level again. If traders remember that an uptrend has recently reversed after
rising to a certain peak, they tend to sell and go short when prices approach
that level again.
For example, all major rallies in the stock market from 1966 until 1982
ended whenever the Dow Jones Industrial Average rallied to 950 or 1050.
The resistance was so strong that traders named it “A Graveyard in the Sky.”
Once the bulls rammed the market through that level, it became a major sup-
port area.
Support and resistance exist because masses of traders feel pain and
regret. Traders who hold losing positions feel intense pain. Losers are deter-
mined to get out as soon as the market gives them another chance. Traders
who missed an opportunity feel regret and also wait for the market to give
them a second chance. Feelings of pain and regret are mild in trading ranges
where swings are small and losers do not get hurt too badly. Breakouts from
trading ranges create intense pain and regret.
When the market stays flat for a while, traders get used to buying at the
lower edge of the range and shorting at the upper edge. In uptrends, bears
who sold short feel pain and bulls feel regret that they did not buy more.
Both feel determined to buy if the market gives them a second chance. The
pain of bears and regret of bulls make them ready to buy, creating support
during reactions in an uptrend.
Resistance is an area where bulls feel pain, bears feel regret, and both are
ready to sell. When prices break down from a trading range, bulls who
bought feel pain, feel trapped, and wait for a rally to let them get out even.
Bears regret that they have not shorted more and wait for a rally to give them
a second chance to sell short. Bulls’ pain and bears’ regret create resis-
tance — a ceiling above the market in downtrends. The strength of support
and resistance depends on the strength of feelings among masses of traders.
Strength of Support and Resistance
A congestion area that has been hit by several trends is like a cratered battle-
field. Its defenders have plenty of cover, and an attacking force is likely to
slow down. The longer prices stay in a congestion zone, the stronger the
emotional commitment of bulls and bears to that area. When prices approach
that zone from above, it serves as support. When prices rally into it from
below, it acts as resistance. A congestion area can reverse its role and serve
as either support or resistance.
78 1 CLASSICAL CHART ANALYSIS
The strength of every support or resistance zone depends on three factors:
its length, its height, and the volume of trading that has taken place in it. You
can visualize these factors as the length, the width, and the depth of a con-
gestion zone.
The longer a support or resistance area —its length of time or the number
of hits it took—the stronger it is. Support and resistance, like good wine,
become better with age. A 2-week trading range provides only minimal sup-
port or resistance, a 2-month range gives people time to become used to it
and creates intermediate support or resistance, while a 2-year range becomes
accepted as a standard of value and offers major support or resistance.
As support and resistance levels grow old, they gradually become weaker.
Losers keep washing out of the markets, replaced by newcomers who do not
have the same emotional commitment to old price levels. People who lost
money only recently remember full well what happened to them. They are
probably still in the market, feeling pain and regret, trying to get even.
People who made bad decisions several years ago are probably out of the
markets and their memories matter less.
The strength of support and resistance increases each time that area is hit.
When traders see that prices have reversed at a certain level, they tend to bet
on a reversal the next time prices reach that level.
The taller the support and resistance zone, the stronger it is. A tall con-
gestion zone is like a tall fence around a property. A congestion zone whose
height equals 1 percent of current market value (four points in the case of the
S&P 500 at 400) provides only minor support or resistance. A congestion
zone that is 3 percent tall provides intermediate support or resistance, and a
congestion zone that is 7 percent tall or higher can grind down a major trend.
The greater the volume of trading in a support and resistance zone, the
stronger it is. High volume in a congestion area shows active involvement
by traders — a sign of strong emotional commitment. Low volume shows that
traders have little interest in transacting at that level — a sign of weak support
or resistance.
Trading Rule;
1. Whenever the trend you are riding approaches support or resistance,
tighten your protective stop. A protective stop is an order to sell below
the market when you are long or to cover shorts above the market
when you are short. This stop protects you from getting badly hurt by
19. SUPPORT AND RESISTANCE
79
an adverse market move. A trend reveals its health by how it acts
when it hits support or resistance. If it is strong enough to penetrate
that zone, it accelerates, and your tight stop is not touched. If a trend
bounces away from support or resistance, it reveals its weakness. In
that case, your tight stop salvages a good chunk of profits.
2. Support and resistance are more important on long-term charts than on
short-term charts. Weekly charts are more important than dailies. A
good trader keeps an eye on several timeframes and defers to the
longer one. If the weekly trend is sailing through a clear zone, the fact
that the daily trend is hitting resistance is less important. When a
weekly trend approaches support or resistance, you should be more
inclined to act.
3. Support and resistance levels are useful for placing stop-loss and pro-
tect-profit orders. The bottom of a congestion area is the bottom line
of support. If you buy and place your stop below that level, you give
the uptrend plenty of room. More cautious traders buy after an upside
breakout and place a stop in the middle of a congestion area. A true
upside breakout should not be followed by a pullback into the range,
just as a rocket is not supposed to sink back to its launching pad.
Reverse this procedure in downtrends.
Many traders avoid placing stops at round numbers. This superstition
began with off-the-cuff advice by Edwards and Magee to avoid placing stops
at round numbers because “everybody” was placing them there. Now, if
traders buy copper at 92, they place a stop at 89.75 rather than 90. When
they sell a stock short at 76, they place a protective stop at 80.25 rather than
80. These days there are fewer stops at round numbers than at fractional
numbers. It is better to place your stops at logical levels, round or not.
True and False Breakouts
Markets spend more time in trading ranges than they do in trends. Most
breakouts from trading ranges are false breakouts. They suck in trend-fol-
lowers just before prices return into the trading range. A false breakout is the
bane of amateurs, but professional traders love them.
Professionals expect prices to fluctuate without going very far most of the
time. They wait until an upside breakout stops reaching new highs or a
80
CLASSICAL CHART ANALYSIS
downside breakout stops making new lows. Then they pounce —they fade
the breakout (trade against it) and place a protective stop at the latest
extreme point. It is a very tight stop, and their risk is low, while there is a big
profit potential from a pullback into the congestion zone. The risk/reward
ratio is so good that professionals can afford to be wrong half the time and
still come out ahead of the game.
The best time to buy an upside breakout on a daily chart is when your
analysis of the weekly chart suggests that a new uptrend is developing. True
breakouts are confirmed by heavy volume, while false breakouts tend to
have light volume. True breakouts are confirmed when technical indicators
reach new extreme highs or lows in the direction of the trend, while false
breakouts are often marked by divergences between prices and indicators.
20. TREND AND TRADING RANGE
Traders try to profit from changes in prices: Buy low and sell high, or sell
short high and cover low. Even a quick look at a chart reveals that markets
spend most of their time in trading ranges. They spend less time in trends.
A trend exists when prices keep rising or falling over time. In an
uptrend, each rally reaches a higher high than the preceding rally and each
decline stops at a higher level than the preceding decline. In a downtrend,
each decline falls to a lower low than the preceding decline and each rally
stops at a lower level than the preceding rally. In a trading range, most ral-
lies stop at about the same high and declines peter out at about the same low.
A trader needs to identify trends and trading ranges. It is easier to trade
during trends (Figure 20-1). It is harder to make money when prices are flat
unless you write options, which requires a special skill.
Trading in trends and in trading ranges calls for different tactics. When
you go long in an uptrend or sell short in a downtrend, you have to give that
trend the benefit of the doubt and not be shaken out easily. It pays to buckle
your seat belt and hang on for as long as the trend continues. When you trade
in a trading range, you have to be nimble andtlose out your position at the .
slightest sign of a reversal.
Another difference in trading tactics between trends and trading ranges is
the handling of strength and weakness. You have to follow strength during
trends—buy in uptrends and sell short in downtrends. When prices are in a
trading range, you have to do the opposite — buy weakness and sell strength.
20. TREND AND TRADING RANGE
340
330
320
319
300
299
289
270
269
259
Figure 20-1. Trend and Trading Range
A pattern of lower bottoms and lower tops defines downtrends.
Soybeans declined from November until the middle of January. Bottom
4 was lower than bottom 2, and peak 3 lower than peak 1. The break of
the downtrendline at point 5 signaled the end of the downtrend. A bro-
ken downtrend can lead to either a trading range or an uptrend.
The November-January downtrend has dissolved into a trading range,
defined by horizontal lines drawn through the low 4 and highs 3 and 6.
When the decline from high 6 stopped at a higher low 7 without reach-
ing the bottom of the range, you could draw a preliminary uptrendline.
A breakout from the range at point 8 confirmed the beginning of a new
uptrend.
At the right edge of the chart, prices are hovering just above their
uptrendline. It is a buying opportunity because the trend is up. The
downside risk of a trade can be limited by placing a stop either below
the latest low or below the trendline. Notice that daily trading ranges
(the distances from highs to lows) are relatively narrow. This is typical of
a healthy trend. Trends often end after several wide-range days-a sign of
blowoff action.
82
CLASSICAL CHART ANALYSIS
Mass Psychology
An uptrend emerges when bulls are stronger than bears and their buying forces
prices up. If bears manage to push prices down, bulls return in force, break the
decline, and force prices to a new high. Downtrends occur when bears are
stronger and their selling pushes markets down. When a flurry of buying lifts
prices, bears sell short into that rally, stop it, and send prices to new lows.
When bulls and bears are equally strong or weak, prices stay in a trading
range. When bulls manage to push prices up, bears sell short into that rally
and prices fall. Bargain hunters step in and break the decline; bears cover
shorts, their buying fuels a minor rally, and the cycle repeats.
A trading range is like a fight between two equally strong gangs. They
push one another back and forth on a street comer but neither can control the
turf. A trend is like a fight where a stronger gang chases the weaker gang
down the street. Every once in a while the weaker gang stops and puts up a
fight but then is forced to turn and run again.
Prices in trading ranges go nowhere, just as crowds spend most of their
time in aimless milling. Markets spend more time in trading ranges than in
trends because aimlessness is more common among people than purposeful
action. When a crowd becomes agitated, it surges and creates a trend.
Crowds do not stay excited for long —they go back to meandering.
Professionals tend to give the benefit of the doubt to trading ranges.
The Hard Right Edge
Identifying trends and trading ranges is one of the hardest tasks in technical
analysis. It is easy to find them in the middle of a chart, but the closer you
get to the right edge, the harder it gets.
Trends and trading ranges clearly stand out on old charts. Experts show
those charts at seminars and make it seem easy to catch trends. Trouble is,
your broker does not allow you to trade in the middle of the chart. He says
you must make your trading decisions at the hard right edge of the chart!
The past is fixed and easy to analyze. The future is fluid and uncertain. By
the time you identify a trend, a good chunk of it is gone. Nobody rings a bell
when a trend dissolves into a trading range. By the time you recognize that
change, you will lose some money trying to trade as if the market was still
trending.
20. TREND AND TRADING RANGE
83
Many chart patterns and indicator signals contradict one another at the
right edge of the chart. You have to base your decisions on probabilities in an
atmosphere of uncertainty.
Most people cannot accept uncertainty. They have a strong emotional
need to be right. They hang onto losing positions, waiting for the market to
turn and make them whole. Trying to be right in the market is very expen-
sive. Professional traders get out of losing trades fast. When the market devi-
ates from your analysis, you have to cut losses without fuss or emotions.
Methods and Techniques
There is no single magic method for identifying trends and trading ranges.
There are several methods, and it pays to combine them. When they confirm
one another, their message is reinforced. When they contradict one another,
it is better to pass up a trade.
1. Analyze the pattern of highs and lows. When rallies keep reaching
higher levels and declines keep stopping at higher levels, they identify
an uptrend. The pattern of lower lows and lower highs identifies a
downtrend, and the pattern of irregular highs and lows points to a trad-
ing range (Figure 20-1).
2. Draw an uptrendline connecting significant recent lows and a down-
trendline connecting significant recent highs (see Section 21). The
slope of the latest trendline identifies the current trend (Figures 20-1,
20-2,21-1).
A significant high or low on a daily chart is the highest high or the lowest
low for at least a week. As you study charts, you become better at identify-
ing those points. Technical analysis is partly a science and partly an art.
3. Plot a 13-day or longer exponential moving average (see Section 25).
The direction of its slope identifies the trend. If a moving average has
not reached a new high or low in a month, then the market is in a trad-
ing range.
4. Several market indicators, such as MACD (see Section 26) and the
Directional system (Section 27), help identify trends. The Directional
system is especially good at catching early stages of new trends.
84
CLASSICAL CHART ANALYSIS
Figure 20-2. Trendlines Identify Trends
56
54
52
58
48
46
44
42
40
38
The most important message of a trendline is the direction of its slope.
When the slope is up, trade that market from the long side. When the
slope is down, trade that market from the short side.
The uptrendline connecting bottoms 1 and 2 identifies an uptrend. It
tells you to trade heating oil only from the long side. Notice that some-
times prices break their uptrendline but later pull back to it from below
(3). This is a superb shorting opportunity. This happens again at point 7,
where prices rise to their old uptrendline after breaking it.
When you trade in the direction of the trendline, you are usually trad-
ing in the direction of the market tide. At the right edge of the chart, you
need to look for a shorting opportunity because the trend is down. Do
not sell short immediately, because prices are too far below their down-
trendline and your stop would have to be too wide. It is essential to wait
for trades with a good risk/reward ratio. Patience is a virtue for a trader.
Trade or Wait
When you identify an uptrend and decide to buy, you have to decide whether
to buy immediately or wait for a dip. If you buy fast, you get in gear with the
trend, but your stops are likely to be farther away and you risk more.
If you wait for a dip, you will risk less but will have four groups of com-
20. TREND AND TRADING RANGE
85
petitors: longs who want to add to their positions, shorts who want to get out
even, traders who never bought, and traders who sold too early but are eager
to buy. The waiting area for a pullback is very crowded! Markets are not
known for their charity, and a deep pullback may well signal the beginning
of a reversal. This reasoning also applies to downtrends. Waiting for pull-
backs while a trend is gathering steam is an amateur’s game.
If the market is in a trading range and you are waiting for a breakout, you
have to decide whether to buy in anticipation of a breakout, during a break-
out, or on a pullback after a valid breakout. If you trade multiple positions,
you can buy a third in anticipation, a third on a breakout, and a third on a
pullback.
Whatever method you use, there is one money management rule that will
keep you out of the riskiest trades. The distance from the entry point to the
level of a protective stop should never be more than 2 percent of your
account equity (see Chapter 10). No matter how attractive a trade is, pass it
up if it requires a wider stop.
Money management tactics are different in trends and trading ranges. It
pays to put on a smaller position in a trend but use a wider stop. Then you will
be less likely to get shaken out by reactions while you keep risk under control.
You may put on a bigger position in a trading range but use a tighter stop.
Finding good entry points is extremely important in trading ranges. You
have to be very precise because the profit potential is so limited. A trend is
more forgiving of a sloppy entry, as long as you trade in the direction of the
trend. Old traders chuckle: “Do not confuse brains with a bull market.”
When you cannot tell whether the market is in a trend or in a trading range,
remember that professionals give the benefit of the doubt to trading ranges.
If you are not sure, stand aside.
Professionals love trading ranges because they can slide in and out of
positions with little risk of being impaled on a trend. Since they pay low or
no commissions and suffer little slippage, it is profitable for them to trade in
gently fluctuating markets. Those of us who trade away from the floor are
better off trying to catch trends. You can trade less frequently during trends,
and your account suffers less from commissions and slippage.
Conflicting Timeframes
Most traders ignore the fact that markets usually are both in a trend and in a
trading range at the same time! They pick one timeframe such as daily or
86
CLASSICAL CHART ANALYSIS
Eurodollars - Daily
X
К 1*4
A4'*’''
lar Ij5 Ray Jwi Jul Ей
95
94
94
94
93
93
93
92
92
92
Figure 20-3. Conflicting Trends in Different Timeframes
The weekly chart of Eurodollars shows a perfect uptrend A-В. At the
same time, the daily chart shows that a downtrend X-Y is beginning.
Which of them will you follow? Contradictory signals in different time-
frames in the same market are among the most common and thorny
dilemmas in trading. You need to watch markets in more than one time-
frame and know how to handle their conflicting signals. The Triple
Screen trading system helps you solve this problem (see Section 43).
21. TRENDLINES
87
hourly and look for trades on daily charts. With their attention fixed on daily
or hourly charts, trends from other timeframes, such as weekly or 10-minute
trends, keep sneaking up on them and wreaking havoc with their plans.
Markets exist in several timeframes simultaneously (see Section 36).
They exist on a 10-minute chart, an hourly chart, a daily chart, a weekly
chart, and any other chart. The market may look like a buy on a daily chart
but a sell on a weekly chart, and vice versa (Figure 20-3). The signals in dif-
ferent timeframes of the same market often contradict one another. Which of
them will you follow?
When you are in doubt about a trend, step back and examine the charts in
a timeframe that is larger than the one you are trying to trade. This search for
a greater perspective is one of the key principles of the Triple Screen trading
system (see Section 43).
A losing trader often thinks he would be better off if he had a real-time
quote machine on his desk. One of the universal fantasies of losers is that
they would be winners if they could get their data faster and focused on a
shorter timeframe. But they lose money even faster with a quote system!
When that happens, some losers say they would be better off trading right on
the exchange floor, without any delay for data transmission. But more than
half of floor traders wash out in their first year; being in the middle of the
action does not do losers any good.
The conflicting signals in different timeframes of the same market are one
of the great puzzles in market analysis. What looks like a trend on a daily
chart may show up as a blip on a flat weekly chart. What looks like a flat
trading range on a daily chart shows rich uptrends and downtrends on an
hourly chart, and so on. When professionals are in doubt, they look at the big
picture, but amateurs focus on the short-term charts.
21. TRENDLINES
Charts reveal the actions of bulls and bears. Bottoms of declines show where
bears stopped and bulls regained control of the market. Peaks of rallies show
where bulls ran out of steam and bears gained control. A line connecting two
nearby bottoms shows the lowest common denominator of bullish power. A
line that connects two nearby tops shows the lowest common denominator of
the power of bears. Those lines are called trendlines. Traders use them to
identify trends.
88
CLASSICAL CHART ANALYSIS
When prices rally, draw an uptrendline across the bottoms. When prices
decline, draw a downtrendline across the tops. Projecting those lines into the
future helps anticipate buying and selling points.
The most important feature of a trendline is its angle — it identifies the
dominant market force. When a trendline points up, it shows that bulls are in
control. Then it pays to buy with a protective stop below the trendline. When
a trendline points down, it shows that bears are in control. Then it pays to
sell short and protect your position with a stop above the trendline.
Trendlines are among the oldest tools of traders. Modem computerized
tools for identifying trends include moving averages, the Directional system,
and MACD (Chapter 4).
How to Draw a Trendline
Most chartists draw a trendline through extreme high and low points, but it is
better to draw it through the edges of congestion areas (Figure 21-1). Those
edges show where the majority of traders have reversed direction. Technical
analysis is poll-taking — and polltakers want to track opinions of masses, not
of a few extremists. Drawing trendlines through the edges of congestion
areas is somewhat subjective. You have to watch out for the temptation to
slant your ruler.
Panic dumping by bulls at the bottoms and panic covering by bears at the
tops create extremes, which appear as long “tails” on the charts. You want to
base your trendlines on the edges of congestion areas and not on tails
because tails show little about the crowd other than its tendency to panic.
The extreme points are very important—but not for drawing trendlines.
Markets usually recoil from those tails, offering opportunities to short-term
traders (Figure 21-1). As Steidlmayer pointed out, a bar that looks like a fin-
ger sticking out of a tight chart pattern provides a valuable reference point
for short-term traders.
Markets constantly fluctuate, seeking an area that generates the highest
volume of trading. A tail shows that a certain price has been rejected by the
market. It usually leads to a swing in the opposite direction. As soon as you
recognize a tail, trade against it. Place your protective stop halfway through
the tail. If the market starts “chewing its tail,” it is time to get out.
Victor Sperandeo described another method for drawing trendlines in his
book, Trader Vic. His technique helps identify reversals of well-established
trends (Figure 21-2).
Sperandeo draws an uptrendline from the lowest low of the move to the
21. TRENDLINES
89
248
246
244
241
239
23?
235
232
230
228
Figure 21-1. Trendlines and "Tails"
Draw trendlines through the edges of congestion areas and leave out the
extreme prices. Tails are long bars at the ends of trends-they spring out-
side of congestion areas. Markets recoil from tails, offering good trading
opportunities in the opposite direction.
Notice how the angles of uptrends tend to recur, month after month.
Knowing this can help you draw preliminary trendlines. At the right edge
of the chart, prices are touching their uptrendline-buy as soon as you
see a bar that fails to reach a new low.
highest minor low prior to the highest high. That line may not pass through
prices between those two points. When that trendline is broken, it gives the
first signal of a trend change. The second signal is given when prices retest
the recent high and back away from it. The third signal occurs when prices
break through the previous minor low. It confirms that the uptrend has
reversed. A mirror image of this method applies to downtrends.
Rating Trendlines
The single most important feature of a trendline is its slope. When a trend-
line slants up, bulls are in control and it pays to look for buying opportuni-
90
CLASSICAL CHART ANALYSIS
15.95
15.25
14.55
13.86
13.16
12.46
11.76
11.87
18.37
9.67
Figure 21-2. 1-2-3 Reversal Method
Draw a trendline from the highest high (A) to the highest minor high (B)
preceding the lowest low (C) so that it does not pass through prices
between A and B. The break of this trendline (1) is the first signal of a
trend change. A test of the recent low (2) gives the second signal of a
trend change. This is a good time to start buying. When prices break
through their minor high (3), they will confirm that the trend has
reversed. This method, described by Victor Sperandeo, helps catch
major reversals rather than shorter-term swings.
ties. When a trendline slants down, bears are in control and it pays to look
for shorting opportunities. You can rate the importance of any trendline by
examining five factors: the timeframe of the trendline, its length, the number
of times prices touch it, its angle, and volume.
The longer the timeframe, the more important the trendline. A trendline
on a weekly chart identifies a more important trend than a daily trendline. A
trendline on a daily chart identifies a more important trend than an hourly
trendline, and so on.
The longer the trendline, the more valid it is. A short trendline reflects
mass behavior over a short period. A longer trendline reflects mass behavior
over a longer time. The longer a trend continues, the greater its inertia. A
major bull market may follow its trendline for several years.
The more contacts between prices and trendline, the more valid that line.
21. TRENDLINES
91
When the trend is up, a return to the trendline shows a rebellion among
bears. When the trend is down, a rally to the trendline shows a rebellion by
the bulls. When prices pull back to a trendline and then bounce away from it,
you know that the dominant market group has beaten the rebels.
A preliminary trendline is drawn across only two points. Three points of
contact make that line more valid. Four or five points of contact show that
the dominant market crowd is firmly in control.
The angle between a trendline and the horizontal axis reflects the emo-
tional intensity of the dominant market crowd. A steep trendline shows that
the dominant crowd is moving rapidly. A relatively flat trendline shows that
the dominant crowd is moving slowly. A shallow trendline is likely to last
longer, like a turtle racing against a hare.
It pays to measure the angle of every trendline and write it down on your
chart (Figure 21-1). This can be done using a computer, a protractor, or a
Chinese Charting Tool. Comparing angles of trendlines shows whether the
dominant market crowd is becoming more bullish or bearish. It is uncanny
how often trendlines trace the same angle time and again in a given market.
It may be because the key players seldom change.
Sometimes prices accelerate away from their trendline. Then you can draw a
new, steeper trendline. It shows that a trend is speeding up, becoming unsustain-
able (Figure 21-3). When you draw a new, steeper trendline, tighten your stop,
place it immediately below the latest trendline, and adjust that stop at every new
bar. The breaking of a steep trendline is usually followed by a sharp reversal.
When the trend is up, volume normally expands when prices rally and
shrinks when they decline. This shows that rallies attract traders while
declines leave them cold. The opposite occurs in downtrends —volume
expands on declines and shrinks on rallies. A pullback on heavy volume
threatens a trendline because it shows that the rebellious crowd is growing.
If volume expands when prices move in the direction of a trendline, it con-
firms that trendline; if volume shrinks when prices pull back to a trendline, it
also confirms the trendline. If volume expands when prices return to a trend-
line, it warns of a potential break; if volume shrinks when prices pull away
from a trendline, it warns that the trendline is in danger.
Trendline Breaks
The breaking of a well-established trendline shows that the dominant market
crowd has lost its power. You have to be careful not to anticipate trading sig-
nals—most traders lose money when they jump the gun.
92
CLASSICAL CHART ANALYSIS
Figure 21-3. When Trendlines Accelerate
369
356
342
329
315
302
288
274
261
247
The stock market rose slowly but steadily from its 1987 bottom. You
could buy each time prices touched their shallow uptrendline (1). The
uptrend accelerated in 1988, and at point A, a new uptrendline (2) had
to be drawn. When the new, steeper trendline was broken, it indicated
that the bull move was over. The market offered, as it sometimes does,
an excellent shorting opportunity at point B, when it pulled back to its
old uptrendline before crashing.
A trendline is not a glass floor under the market —one crack and it is
gone. It is more like a fence that bulls or bears can lean on. They can even
violate it a bit without toppling it, the way animals shake a fence. A trendline
break is valid only if prices close on the other side of a trendline. Some
traders insist that a trendline has to be penetrated by two or three percentage
points of price ($8-$12 in the case of $400/oz. gold).
After a very steep uptrend is broken, prices often rally again, retest their
old high, and touch their old uptrendline from below (Figures 20-2, 21-3).
When that happens, you have a near-perfect shorting opportunity: a combi-
nation of a double top, a pullback to an old trendline, and perhaps a bearish
divergence from technical indicators. The reverse also applies to down-
trends.
21. TRENDLINES
93
Trading Rules
1. Trade in the direction of the slope of a trendline. If it points up, look
for buying opportunities and avoid shorting. When the slope is down,
trade from the short side and avoid buying.
2. A trendline provides support or resistance. When prices rise, place buy
orders at the uptrendline and protective orders below. Reverse the pro-
cedure in downtrends.
3. Steep trendlines precede sharp breaks. If a trendline is steeper than
45°, place your stop right at the trendline and adjust it daily.
4. Prices often retest their latest extreme after breaking a steep trendline.
A pullback rally to an old high on falling volume and with indicator
divergences provides an excellent shorting opportunity. A decline to
an old low after a downtrendline is broken provides a low-risk buying
opportunity.
5. Draw a channel line parallel to a trendline and use it as a target for
profit taking.
Trendline Channels
A channel consists of two parallel lines that contain prices (Figure 21-4). If
you draw an uptrendline across the bottoms of reactions, you can draw a
channel line parallel to it across the tops of rallies. When you draw a down-
trendline across the tops of rallies, you can also draw a channel line parallel
to it across the bottoms of declines.
Channel lines, like trendlines, should be drawn across the edges of con-
gestion areas, leaving out the extreme highs and lows. The presence of a
channel line reinforces the validity of the trendline itself. The validity of
channel lines depends on how many times they were touched by prices.
A channel line marks the area of bulls’ maximum power in an uptrend and
bears’ maximum power in a downtrend. The wider the channel, the stronger
the trend. It pays to trade in the direction of the channel’s slope, going long
in the lower quarter or half of a rising channel and selling short in the upper
quarter or half of a falling channel. Profits should be taken at the opposite
channel wall (see also Section 45).
94
CLASSICAL CHART ANALYSIS
Figure 21-4. Trendline Channels and Preliminary Trendlines
The downtrendline 1, drawn across rally peaks, identifies a bear market
in corn. A channel line 2 is drawn across the lows, parallel to the trend-
line. The channel line helps track the maximum power of bears in a
downtrend. The best shorting opportunities are in the upper half of a
falling channel, while the best buying opportunities are in the lower half
of a rising channel.
When prices break out above their downtrendline, channels can help
you draw a preliminary uptrendline. First, draw a new channel line 3 to
connect the last two rally tops. Then draw line 4 parallel to it, touching
the latest bottom. This is the new preliminary uptrendline.
At the right edge of the chart, corn is trending higher. It is expen-
sive-near its upper channel line. If you want to go long, place an order
to buy in the vicinity of the new uptrendline 4.
A Preliminary Trendline
Normally, a trendline touches at least two points on a chart. There is a little-
known technique for drawing a preliminary trendline through only one point
(Figure 21-4).
When prices break their downtrend and rally above it, you can assume
that the downtrend has ended and a new uptrend may begin. Connect the two
latest peaks — this is the channel line of the new uptrend. Draw a line parallel
22. GAPS
95
to it through the latest low. This preliminary uptrendline, drawn parallel to a
channel line, tells you where to expect the next bottom. It often points to
excellent buying opportunities. This procedure tends to work better at bot-
toms than at the tops.
More on Trendlines
When prices break their uptrend, measure the vertical distance from the
trendline to the latest top and project it down from the breaking point. If the
crowd can become optimistic enough to swing prices so many dollars above
the trendline, then it is likely to become equally pessimistic and swing prices
the same distance down from the trendline. Reverse this procedure in down-
trends. This method gives you the minimum target for a new move, which is
often exceeded.
Trendlines can also be applied to volume and to indicators. The slope of
a trendline of volume shows whether more or fewer people are becoming
involved in the market. A rising trendline of volume confirms the current
price trend. A falling trendline of volume shows that the market crowd is
refusing to follow the current price trend. Among technical indicators, the
Relative Strength Index (see Section 31) is especially well suited for trend-
line analysis. It often breaks its trendlines in advance of prices, providing an
early warning of a trend change.
22. GAPS
A gap is a chart pattern that consists of two adjacent bars, where the low of
one bar is higher than the high of the other bar (Figure 22-1). It shows that
no trades took place at a certain price, only at higher and lower levels.
Webster’s Dictionary defines: “Gap: 1. a hole or opening, as in a wall or
fence, made by breaking or parting; breach. 2. an interruption of continuity
in space or time; hiatus; lacuna.”
Gaps occur when prices jump in response to a sudden imbalance of buy or
sell orders. A scary piece of news often triggers gaps. Gaps on daily charts
show reactions to events that took place while the market was closed. Had
the news come out during trading hours, a gap might have occurred only on
intraday charts and perhaps have led to a wider daily range.
For example, a strike at a major copper mine is bullish for copper. If the
news comes out in the evening, the shorts become frightened and want to
96
CLASSICAL CHART ANALYSIS
397.2
393.1
388.9
384.8
380.7
376.5
372.4
368.3
364.1
360.0
89183
66887
№92
22296
8
cover. They flood the pit with buy orders before the opening bell. Floor
traders respond by opening copper above the previous day’s high. The smart
money, incidentally, has probably bought copper before the strike was
announced. Smart money tends to put on trades when markets are quiet, but
amateurs tend to jump on the news.
Gaps show that the trading crowd is spooked, that losers are getting hurt
and dumping their positions. When you know that bulls or bears are hurting,
you can figure out what they are likely to do next and trade accordingly.
Some gaps are valid; others are phony. Valid gaps occur when the market
skips a price level. Phony gaps occur when a financial instrument trades in
another market while the market you analyze is closed. For example, daily
charts of Chicago currency futures are full of phony gaps. Currencies trade
in Tokyo, London, and elsewhere while the Chicago Mercantile Exchange is
22. GAPS
97
Figure 22-1. Gaps
Cover this chart with a sheet of paper and slide it slowly from left to right.
A. A breakaway gap. Sell short and place a stop a few ticks above the
gap's upper rim.
B. An exhaustion gap-prices pull back into it the next day. The down-
trend is over. Cover shorts immediately.
C. Another exhaustion gap, marked by a lack of new highs after the gap.
Several days of churning offer good shorting opportunities with a stop
above the high.
D. A continuation gap in a downtrend. Go short, with a stop a few ticks
above the gap's upper rim. Prices hit that stop a few days later-no
method is fail-safe.
E. An exhaustion gap, closed two days after it opened. Cover shorts
immediately.
F. A common gap in the midst of a congestion area, closed the next day.
No action recommended.
G. A breakaway gap. Go long and place a protective stop a few ticks
below the gap's lower rim.
H. A continuation gap. Add to longs and place a protective stop a few
ticks below the gap's lower rim. The gap at the right edge of this chart
could be either a continuation or an exhaustion gap. Relatively quiet
volume suggests continuation. If you buy, place a protective stop a
few ticks below the lower rim of this gap.
closed. When the exchange reopens, its prices gap simply to reflect price
changes overseas.
All gaps can be divided into four major groups: common, breakaway, con-
tinuation, and exhaustion. You need to identify them because each tells a dif-
ferent story and calls for different trading tactics.
Common Gaps
Common gaps are rapidly closed—prices return into the gap within a few
days. Common gaps usually occur in quiet trendless markets. They are seen
in futures contracts for late delivery, in thinly traded stocks, and at sold-out,
low-volume market bottoms.
98
CLASSICAL CHART ANALYSIS
Common gaps show no follow-through — no new highs after an upside
gap or new lows after a downside gap. Volume may slightly increase on the
day of a common gap, but the following days show a return to average vol-
ume. The lack of new highs or lows and indifferent volume show that neither
bulls nor bears have strong feelings about the market. Common gaps are the
least useful of all gaps for trading.
Common gaps occur more often than other gaps. It takes very little to cre-
ate them in a dull market. A Comex floor trader at one of our seminars spoke
of how he could push gold up or down $2 an ounce on a quiet day. He was
known as a big trader and if he suddenly began bidding for 20 contracts at a
time, other floor traders stepped back, figuring he knew something. Gold
would gap up, and the trick for him was to sell before that gap was closed.
An ex-dividend gap is a common gap that occurs in the stock market on the
day a dividend becomes payable. For example, if the dividend is 50 cents, then
each share is worth 50 cents less after that dividend is paid. This is similar to a
drop in the price of a cow after it delivers a calf. Once the calf is bom, the price
of the cow falls by the amount of the calf’s price because it is no longer
included with the cow. Ex-dividend gaps were common in the old days. Today,
the average daily range of a dividend-paying stock is greater than the amount of
its dividend, and the ex-dividend drop seldom results in a gap.
Breakaway Gaps
A breakaway gap occurs when prices leap out of a congestion zone on heavy
volume and begin a new trend. A breakaway gap can remain open for weeks
or months, and sometimes years. The longer the range that preceded the gap,
the longer the subsequent trend.
An upside breakaway gap is usually followed by new highs for several
days in a row, and a downside breakaway gap is followed by a series of new
lows. There is a sharp increase in volume on the day of the breakaway gap
and for several days after that. Volume on the day of the gap may be twice as
high as the average volume for the previous few days.
A breakaway gap marks a major change in mass mentality — it reveals a
great pressure behind the new trend. The sooner you jump aboard the new
trend, the better.
Most gaps are common gaps that are quickly closed. Professional traders
like to fade them—trade against gaps. You have to be careful because if you
do it mechanically, sooner or later a breakaway gap will clobber you. It takes
deep pockets to hold a losing position for months, waiting for a gap to close.
22. GAPS
99
Continuation Gaps
A continuation gap occurs in the midst of a powerful trend, which continues
to reach new highs or new lows without filling the gap. It is similar to a
breakaway gap but occurs in the middle of a trend rather than in the begin-
ning. Continuation gaps show a new surge of power among the dominant
market crowd. The inflationary bull markets in commodities in the 1970s
had many of them.
A continuation gap can help you estimate how far a trend is likely to
carry. Measure the vertical distance from the beginning of a trend to the gap,
and then project it from the gap in the direction of the trend. When the mar-
ket approaches that target, it is time to begin taking profits.
Volume confirms continuation gaps when it jumps at least 50 percent
above the average for the previous few days. If prices do not reach new
highs or new lows for several days after a gap, you are probably dealing with
a treacherous exhaustion gap.
Exhaustion Gaps
An exhaustion gap is not followed by new highs during uptrends or new lows
during downtrends—prices churn and then return into the gap and close it.
Exhaustion gaps appear at the ends of trends. Prices rise or fall for several
weeks or months, and then gap in the direction of the trend. At first, an
exhaustion gap looks like a continuation gap — a leap in the direction of the
trend on heavy volume. If prices fail to reach new highs or new lows for sev-
eral days after the gap, it is probably an exhaustion gap.
An exhaustion gap is confirmed only when prices reverse and close it.
This gap is like the last spurt of a tired athlete. He springs away from the
pack but cannot sustain the pace; as soon as others close in on him, you
know that he will lose the race.
Trading Rules
1. Common gaps do not offer good trading opportunities, but if you must
trade, fade them. If prices gap up, sell short as soon as the market
stops reaching new highs and place a protective stop above the high of
the past few days; cover shorts and take profits at the lower rim of the
100
CLASSICAL CHART ANALYSIS
gap. If prices gap down, go long as soon as the market stops reaching
new lows and place a protective stop below the low of the past few
days; place an order to sell and take profits at the upper rim of the gap.
2. If a market gaps out of a long trading range on a burst of volume and
continues to make new highs or lows, you are probably dealing with a
breakaway gap. If prices have gapped to the upside, buy and place a
protective stop at the lower rim of the gap. A valid breakaway gap
almost never gets closed. Reverse the procedure in downtrends.
Waiting for a pullback when a new trend has just begun may leave you
on the sidelines.
3. Trading a continuation gap is similar to trading a breakaway gap—buy
early and place a protective stop at the lower rim of the gap. Reverse
the procedure in downtrends. Tighten your stops when a trend
approaches its target as projected by the continuation gap.
4. A valid breakaway or continuation gap must be confirmed by a series
of several new highs or lows. Otherwise, you may be dealing with an
exhaustion gap. If the market refuses to reach new highs or lows in the
direction of the gap, exit your trade and re-evaluate the market from
the sidelines.
5. Exhaustion gaps offer attractive trading opportunities because they are
often followed by violent reversals. When you identify an upside
exhaustion gap, sell short and place a protective stop above the latest
high. Once prices begin to slide, weak bulls will start bailing out. Stay
short as long as prices continue to reach new lows and cover the day
after prices fail to make a new low. Reverse the procedure in down-
trends. Because of high volatility, exhaustion gaps are easier to trade
using options, especially buying puts at the tops.
More on Gaps
An island reversal is a combination of a continuation gap and a breakaway
gap in the opposite direction. An island reversal looks like an island, sepa-
rated from the rest of price action by a gulf in which no trading took place. It
begins as a continuation gap, followed by a compact trading range with high
trading volume. Then prices gap in the opposite direction and leave behind
an island of prices. This pattern occurs very seldom, but it marks major
reversal areas. Trade against the trend that preceded an island.
23. CHART PATTERNS
101
It pays to watch for gaps in related markets. If gold shows a breakaway
gap but silver and platinum do not, then you may get a chance to position for
a “catch-up move” in a market that has not yet become frenzied.
Gaps can serve as support and resistance levels. If greater volume
occuned after an upside gap, it indicates very strong support. If greater vol-
ume occurred before the gap, then support is less strong.
Technical indicators help identify types of gaps. The Force Index (see
Section 42) is based on price and volume. If Force Index shows only a minor
change on the day of a gap, it is probably a common gap. When Force Index
reaches a record high or a low level for several weeks, it confirms break-
away and continuation gaps.
Intraday charts show many opening gaps, when prices open outside the
previous day’s range. When there is an imbalance of public buy and sell
orders before the opening, floor traders open markets higher or lower. If out-
siders want to buy, floor traders sell to them at such a high price that the
slightest dip will make them money. If customers want to sell, floor traders
will take merchandise off their hands—at a price that is low enough to profit
from the slightest bounce. Professionals play it cool — they know that crowds
seldom stay excited for long and prices tend to pull back into yesterday’s
range. They sell above that range or buy below, waiting to unwind their posi-
tions and take profits when the opening gap is closed.
If you trade the S&P 500 futures, remember that their opening gaps are
almost always closed. If the S&P 500 futures open higher, they almost
always sink during the day and touch their previous day’s high. If they open
lower, they almost always rally during the day and touch their previous day’s
low. Savvy day-traders tend to sell short higher openings and buy lower
openings. This is not a mechanical method —you have to buy or sell only
after indicators tell you that the force behind the opening gap has been spent
and the market is ready to close the gap.
23. CHART PATTERNS
The patterns you see on your chart or computer screen are the trails left by
bulls and bears. A chartist is a hunter who follows subtle signs, visible only
to those who know what to look for. Chart patterns can help you decide
when a trend is likely to continue or to reverse.
There are two main groups of patterns: continuation and reversal.
Continuation patterns include flags and pennants. They suggest trading in
102
CLASSICAL CHART ANALYSIS
the direction of the current trend. Reversal patterns include head and shoul-
ders, inverse head and shoulders, and double tops and bottoms. They indi-
cate it is time to take profits on existing positions. Some patterns can serve
as either continuation or reversal formations. Triangles and rectangles are
notorious for doing that double duty.
When several chart patterns point in the same direction, their signals are
reinforced. For example, if an uptrendline gets broken when a head-and-
shoulders top is being completed, they both confirm that the uptrend is end-
ing. When different patterns give conflicting messages, their signals cancel
one another, and it is better not to trade.
Head-and-Shoulders Tops
A healthy uptrend moves up in steps. Most rallies reach higher peaks than
the preceding rally and declines stop at a higher level than the previous
decline. When an uptrend fails to reach a higher high or a decline falls below
the previous low, it shows that bulls are losing their grip.
Head-and-shoulders tops mark the ends of uptrends (Figure 23-1). The
“head” is a price peak surrounded by two lower peaks, or “shoulders.” A
neckline connects the lows of declines from the left shoulder and the head.
The neckline does not have to be horizontal — it may be flat, rising, or
falling. A downsloping neckline is especially bearish —it shows that bears
are becoming stronger.
When prices fail to rally above the head, they confirm that a head-and-
shoulders top is developing. The right shoulder may be higher or lower than
the left and may be shorter or longer. The decline from the right shoulder
breaks the neckline. When that happens, the uptrend is dead.
After breaking the neckline, prices sometimes pull back to it on low vol-
ume. This feeble rally offers an excellent shorting opportunity, with a logical
stop just above the neckline.
Head-and-shoulders tops often have typical volume patterns. Volume is
often lower on the head than on the left shoulder. It is even lower on the right
shoulder. Volume tends to increase when prices break the neckline. When
prices pull back to it, volume is very thin.
A head-and-shoulders pattern provides an approximate target for the new
downtrend. You can obtain it by measuring the distance from the top of the
head to the neckline and projecting this down from the neckline.
An uptrend remains healthy as long as each new rally reaches a aew
high. Rising volume confirms7aHies?^6fumelanrwhen prices7each the
bead (H) and flashes a warning to tighten stops on long positions. The
decline from the head breaks the uptrendline and signals that the
uptrend is over.
The head, in this case, is an "island reversal" (see "Gaps," Section
22)-a very bearish pattern. Volume shoots up ominously during the
decline from the head. The right shoulder (RS) is much smaller than the
left-another sign of weakness. Low volume on the right shoulder also
points to a good shorting opportunity.
The decline from the right shoulder breaks the neckline. This com-
pletes the head-and-shoulders pattern. There is an excellent shorting
opportunity when prices pull back to the neckline from below on low
volume. The distance from the top of the head to the neckline (A) pro-
vides a target for the decline (B). At the right edge of the chart, hold shorts
because prices continue to fall on rising volume and have not reached
their target; place a protective stop at the top of the past 5 days' range.
104
CLASSICAL CHART ANALYSIS
Trading Rules
Once you identify a head-and-shoulders top, you need to make two trading
decisions: what to do about your long position and how to go about shorting.
You have three choices for managing your longs: sell them outright, tighten
your stops, or sell some and hold the rest.
Many traders take the fourth choice — they simply freeze and do nothing.
Trading is a complex, nontrivial game that demands making decisions in an
atmosphere of uncertainty.
Your decision depends on how certain you feel about the pattern. It also
depends on the size of your account. A laige account allows you to buy and
sell gradually. Having to trade a single contract in a small account demands
precise timing—it is a good school for a beginning trader.
You must analyze your charts in more than one timeframe (see Section
36). If weekly charts are toppy, a head-and-shoulders pattern on the dailies
should prompt you to run for the exit. If weeklies are strong, then it is often
better to simply tighten the stops. Technical indicators can also help you
decide how urgent it is to sell.
Markets often are more volatile at tops, with wide swings between short-
term highs and lows. Selling short and placing a stop above the latest high
may expose you to more risk than the maximum amount allowed per con-
tract in your account (see Chapter 10). You may have to pass up the trade or
buy puts to keep your monetary risk within allowed limits.
1. Sell when you recognize the head or the right shoulder of a head-and-
shoulders pattern, based on low volume, a break of an uptrend, and a
divergence between indicators and prices.
2. The decline from the head establishes a neckline. If you still hold a
long position, place a stop below the neckline.
3. The rally to the right shoulder is usually marked by low volume and
glaring weakness in technical indicators; it offers the last good oppor-
tunity to cash out of the uptrend. Technical indicators often reach
higher levels on the right shoulder than on the head but they never
exceed the levels reached during the left shoulder. When you sell short
into the right shoulder, place your stop at the top of the head. Make
that order “stop-and-reverse” — if stopped out of the short position,
reverse and go long (see “The Hound of the Baskervilles” signal).
23. CHART PATTERNS
105
4. Once the neckline is broken, a pullback on low volume offers an
excellent shorting opportunity, with a protective stop slightly above
the neckline.
The Hound of the Baskervilles
This signal occurs when a reliable chart or indicator pattern does not lead to
the action you expect and prices move in the opposite direction. A head-and-
shoulders pattern indicates that the uptrend is over. If prices continue to rise,
they give the Hound of the Baskervilles signal.
This signal is named after the story by Sir Arthur Conan Doyle in which
Sherlock Holmes was called to solve a murder at a country estate. He found
the essential clue when he realized that the family dog did not bark while the
murder was being committed. That meant the dog knew the criminal and the
murder was an inside job. The signal was given by the lack of expected
action — by the lack of barking!
When the market refuses to bark in response to a perfectly good signal, it
gives you the Hound of the Baskervilles signal. This shows that something is
fundamentally changing below the surface. Then it is time to get in gear with
the new powerful trend.
A head-and-shoulders pattern gives a strong sell signal. If the market
refuses to collapse but rallies from the right shoulder, it gives you its Hound
of the Baskervilles signal. When prices rise above the head, it is time to
cover shorts, reverse, and go long. An aborted head-and-shoulders top often
leads to a very strong rally. Buy the upside breakout, and place a protective
stop slightly below the top of the head.
Inverse Head and Shoulders
Some traders call this pattern a head-and-shoulders bottom—a mirror image
of a head-and-shoulders top. It looks like a silhouette of a person upside
down: the head at the lowest point, surrounded by two shoulders. This pat-
tern develops when a downtrend loses its force and gets ready to reverse
(Figure 23-2).
In a valid downtrend, each new low falls lower than the previous low, and
each rally stops at a lower level. A strong rally from the head allows you to
106
CLASSICAL CHART ANALYSIS
325
315
385
295
285
275
285
155550
116663
77775
38888
While the downtrend is in effect, high volume confirms all declines until
the left shoulder (LS). The decline into the head (H) comes on low vol-
ume-a warning to the bears. The rally out of the head breaks above the
downtrendline and signals that the downtrend is over.
Low volume during the right shoulder (RS) and the upward-sloping
neckline indicate that a powerful rally is coming. The burst of volume
during the neckline break confirms the new uptrend. No pullback ever
reached this neckline.
The preliminary target (B) is as high above the neckline as the head of
the pattern (A) is below it. It is common for rallies out of head-and-shoul-
ders bottoms to exceed their targets. The best buying opportunity was at
the right shoulder, with a protective stop a few ticks below the head. At
the right edge of the chart, a gap confirms a strong uptrend. Place a pro-
tective stop on long positions a few ticks below the gap's lower rim.
draw a neckline. When a decline from the neckline fails to reach the level of
the head, it creates the right shoulder. When prices rally from the right shoul-
23. CHART PATTERNS
107
der above the neckline on increased volume, they complete the head-and-
shoulders bottom and a new uptrend begins.
Sometimes a head-and-shoulders bottom is followed by a pullback to the
neckline on low volume, offering an excellent buying opportunity. Measure
the distance from the bottom of the head to the neckline and project it
upward from the point where the neckline was broken. This gives you a min-
imum measurement for a rally, which is frequently exceeded.
The tactics for trading inverse head and shoulders is similar to head-and-
shoulders tops. You risk less money trading at bottoms because prices are
less volatile, and you can use closer stops.
Rectangles
A rectangle is a chart pattern that contains price movements between two
parallel lines. They are usually horizontal but can sometimes slant up or
down (see “Lines and Flags,” later in this section). Rectangles and triangles
can serve as continuation or reversal patterns.
You need four points to draw a rectangle: The upper line connects two
rally tops, and the lower line connects two bottoms (Figure 23-3). These
lines should be drawn through the edges of congestion areas rather than
across the extreme highs and lows (see Section 19).
The upper line of a rectangle identifies resistance, while the lower line
identifies support. The upper line shows where bulls run out of steam; the
lower line shows where bears become exhausted. A rectangle shows that
bulls and bears are evenly matched. The key question is whether bulls or
bears will eventually win the battle within this pattern.
If volume swells when prices approach the upper border of a rectangle, an
upside breakout is more likely. If volume increases when prices approach the
lower border, a downside breakout is more likely. A valid breakout from a
rectangle is usually confirmed by an increase in volume — one-third to one-
half higher than the average of the previous five days. If volume is thin, it is
likely to be a false breakout.
Rectangles tend to be wider in uptrends and narrower in downtrends. The
longer a rectangle, the more significant a breakout. Breakouts from rectan-
gles on weekly charts are especially important because they mark important
victories for bulls or bears.
There are several techniques for projecting how far a breakout is likely to
go. Measure the height of a rectangle and project it from the broken wall in
108
CLASSICAL CHART ANALYSIS
92.60
92.40
92.20
92.00
91.80
91.60
91.40
91.20
91.00
90.80
Figure 23-3. Rectangles
The upper border of each rectangle is drawn across two or more highs.
The lower border is drawn across two or more lows. A rectangle may
serve either as a continuation or a reversal pattern. As long as a major
trendline is intact, a rectangle is more likely to serve as a continuation
pattern.
After prices break out of a rectangle, they often return and touch its
wall from the outside (B, D, and E). These pullbacks offer excellent
entries into low-risk trades in the direction of the breakout, with a pro-
tective stop inside the rectangle.
The same price levels tend to serve as both support and resistance.
Notice how line D turned from support into resistance and back into
support. At the right edge of the chart, prices are well above their
uptrendline, and it is better to wait for a pullback before buying.
the direction of the breakout. This is the minimum target. The maximum tar-
get is obtained by taking the length of the rectangle and projecting it verti-
cally from the broken wall in the direction of a breakout. Tony Plummer
writes that a rectangle is a part of a spiral-like development of a trend. He
recommends measuring the height of a rectangle, multiplying it by three
23. CHART PATTERNS
109
Fibonacci ratios (1.618, 2.618, and 4.236), and projecting those measure-
ments in the direction of the breakout to obtain a price target.
Trading Rules
Floor traders can profit from trading short-term swings between a rectangle’s
walls, but the big money is made by trading in the direction of a breakout.
1. When trading within a rectangle, buy at the lower boundary and sell
short at the upper boundary. Oscillators can help you decide when
prices are ready to reverse within a rectangle. Stochastic, the Relative
Strength Index, and Williams %R (see Chapter 4) mark price rever-
sals within rectangles when they hit their reference lines and change
direction.
If you buy at the lower border of a rectangle, place your protective
stop slightly below that rectangle. If you sell short near the upper wall
of a rectangle, place a protective stop slightly above that border. You
have to be very nimble and take profits at the first sign of a reversal. It
is dangerous to hold on for a few extra ticks within a rectangle.
2. To find out whether an upside or a downside breakout is more likely,
analyze the market in a longer timeframe than the one you are trading.
If you want to catch a breakout on a daily chart, identify the weekly
trend because a breakout is more likely to go in its direction (see
Section 43).
3. Once you buy an upside breakout or sell short a downside breakout,
place your protective stop slightly inside the rectangle. There may be a
pullback to the rectangle wall on light volume, but prices should not
return into a rectangle after a valid breakout.
Lines and Flags
A line is a kind of a rectangle — a lengthy congestion area. In Dow theory, a
line is a correction against the primary trend. It is a congestion zone whose
height is approximately 3 percent of current stock market value. When the
stock market “draws a line” instead of reacting more deeply against its major
trend, it shows a particularly strong primary trend.
A flag is a rectangle whose boundaries are parallel but slant up or down.
110
CLASSICAL CHART ANALYSIS
Breakouts tend to go against the slope of the flag. If a flag slants upward, a
downside breakout is more likely. If the flag slants down, an upside breakout
is more likely.
If you see a downsloping flag in an uptrend, place a buy order above the
latest peak of the flag to catch an upside breakout. A rising flag in an uptrend
marks distribution, and a downside breakout is more likely. Place an order to
sell short below the latest low of that flag. Reverse the procedure in down-
trends.
Triangles
A triangle is a congestion area whose upper and lower boundaries conveige
on the right (Figure 23-4). It can serve either as a reversal or, more often, as
a continuation pattern. Some technicians call triangles coils. The market
winds up and the energy of traders becomes compressed, ready to spring
from a triangle.
A small triangle whose height is 10 to 15 percent of the preceding trend is
more likely to serve as a continuation pattern. Many uptrends and down-
trends are punctuated by these triangles, as sentences are punctuated by com-
mas. Large triangles whose height equals a third or more of the preceding
trend are more likely to serve as reversal patterns. Finally, some triangles
simply fizzle out into listless trading ranges.
Triangles can be divided into three major groups, depending on their
angles. The upper and lower lines of symmetrical triangles converge at the
same angles. If the upper line is inclined 30 degrees to the horizontal, then
the lower line is also inclined 30 degrees. Symmetrical triangles reflect a fair
balance of power between bulls and bears and are more likely to serve as
continuation patterns.
An ascending triangle has a relatively flat upper boundary and a rising
lower boundary. Its flat upper boundary shows that bulls are maintaining
their strength and can lift prices to the same level, while bears are losing
their ability to drive prices lower. An ascending triangle is more likely to
result in an upside breakout.
A descending triangle has a relatively flat lower boundary, while its upper
boundary slants down. Its flat lower boundary shows that bears are maintain-
ing their strength and continue to drive prices down, while bulls are losing
their capacity to lift prices. A descending triangle is more likely to lead to a
downside breakout.
23. CHART PATTERNS
111
28888
27222
26444
25667
24889
24111
23333
22556
21778
21888
Each triangle is defined by two converging lines. The upper line con-
nects two or more peaks, and the lower line connects two or more bot-
toms.
A triangle whose lower boundary is rising is called an ascending tri-
angle (marked Asc T on the chart). It tells you to expect an upside break-
out. A descending triangle (Desc T) has a declining upper boundary. It
shows that prices are more likely to break down. A symmetrical triangle
(Symm T) shows that the forces of bulls and bears are evenly matched
and the trend is likely to continue.
Valid breakouts tend to occur during the first two thirds of a triangle's
length. Sometimes prices pull back to a triangle after a breakout. Those
pullbacks offer excellent entry points into trades in the direction of the
breakout.
Volume tends to shrink as triangles get older. If volume jumps on a rally
toward the upper boundary, an upside breakout is more likely. If volume
becomes heavier when prices fall toward the lower boundary, a downside
breakout is more likely. Valid breakouts are accompanied by a burst of vol-
ume — at least 50 percent above the average for the past 5 days.
112
CLASSICAL CHART ANALYSIS
Valid breakouts occur during the first two thirds of a triangle. It is better
not to trade breakouts from the last third of a triangle. If prices stagnate all
the way into the apex, they are likely to remain flat. A triangle is like a fight
between two tired boxers who keep leaning on each other. An early breakout
shows that one of the fighters is stronger. If prices stay within a triangle all
the way into the apex, that shows that both boxers are exhausted and no
trend is likely to emerge.
Charts of related markets often show triangles at the same time. If gold,
silver, and platinum all trace triangles and gold breaks out to the upside, then
platinum and silver are likely to follow. This approach works well with cur-
rencies, especially with closely related ones, such as the German Mark and
Swiss Franc. It also works with stocks in the same group—compare General
Motors to Ford but not to IBM.
Triangles provide a minimum target for a move following a breakout.
Measure the height of a triangle at its base and project vertically from the
point where the triangle was broken. If you are dealing with a small triangle
in the midst of a dynamic trend, that minimum measurement is likely to be
exceeded. You can also use the Fibonacci projections mentioned earlier.
Trading Rules
It’s better not to trade minor swings within a triangle unless that triangle is
very large. As a triangle grows older, the swings become narrower. Profit
potential shrinks, while slippage and commissions continue to take just as
bad a bite from your account as before.
1. If you trade inside a triangle, use oscillators such as Stochastic (see
Section 30) and Elder-ray (see Section 41). They can help you catch
minor swings.
2. In trying to decide whether a triangle on a daily chart is likely to lead
to an upside or a downside breakout, look at the weekly chart (see
Section 43). If the weekly trend is up, then a triangle on the daily
charts is more likely to break out to the upside, and vice versa.
3. When you want to buy an upside breakout, place a buy order slightly
above the upper boundary of a triangle. Keep lowering your order as
the triangle becomes narrower. If you want to short a downside break-
23. CHART PATTERNS
113
out, place a sell order slightly below the lower boundary. Keep raising
it as the triangle becomes narrower. Once you are in a trade, place a
protective stop slightly inside the triangle. Prices may pull back to the
wall, but they should not return deep inside a triangle following a
valid breakout.
4. When a breakout from a triangle is followed by a pullback, pay atten-
tion to volume. A pullback on heavy volume threatens to abort the
breakout, but a pullback on light volume offers a good opportunity to
add to your position.
5. When prices approach the last third of a triangle, cancel your buy or
sell orders. Breakouts from the last third of a triangle are very unreli-
able.
Atypical Triangles
A pennant is a small triangle whose lines are slanted in the same direction.
Pennants that slant against the trend serve as continuation patterns. There is
an old saying “The pennant flies at half-mast” — a rally is likely to travel as
far after the pennant as it did before. A pennant that slants in the direction of
the trend indicates exhaustion — a trend is nearing a reversal.
A widening triangle occurs when prices set a series of higher highs and
lower lows. This pattern shows that the market is becoming hysterically
volatile, with bulls and bears pouring in. The fight between bulls and bears
becomes too hot for the uptrend to continue — a widening triangle kills an
uptrend.
A diamond starts out as a widening triangle and ends as a symmetrical
triangle. You have to squint very hard to recognize it. Diamonds are prime
examples of Rorschach-type patterns for chartists. If you look long enough,
you will find them, but their trading usefulness is minimal. I used to look for
diamonds ... and most of them were fake zirconium.
Double Tops and Bottoms
Double tops occur when prices rally to the area of the previous high. Double
bottoms occur when prices fall near the previous low. The second top or bot-
114
CLASSICAL CHART ANALYSIS
tom can be slightly above or below the first. This often confuses beginning
analysts.
Savvy traders use technical indicators to identify double tops and bottoms.
They are often marked by bullish and bearish divergences. Buying at double
bottoms and selling short at double tops offer some of the best trading oppor-
tunities.
IV
Computerized Technical
Analysis
24. COMPUTERS IN TRADING
To be a successful trader, you must understand markets better than your
competitors do. You can analyze them more thoroughly using a computer.
Many traders who compete with you in the markets already have these
machines.
Manual charting can help you develop an intuitive, physical feel for
prices. You can buy some graph paper and plot several stocks or commodi-
ties each day. Once you post your charts, write down at what level you will
be a buyer or a seller and where you will place your stops.
After you do that for a while, you will probably want to analyze more
markets using technical indicators. Then it is time to look for a computer and
technical analysis software.
Driving or Walking
A trader without a computer is like a man traveling on a bicycle. His legs
grow strong and he sees a lot of scenery, but his progress is slow. When you
travel on business and want to get to the point fast, you get a car.
A computer can help you track and analyze more markets in depth. It can
take over routine tasks and free up your mind for thinking. A computer
115
116
COMPUTERIZED TECHNICAL ANALYSIS
allows you to use more indicators and spot more opportunities in the mar-
kets. Trading is an information game. A computer helps you process more
information.
Computerized technical analysis is more objective than classical charting.
You can argue about whether a head-and-shoulders pattern is present —but
there is never an argument about an indicator’s direction. When an indicator
points up, it is clearly up, and when it is down, it is clearly down.
Switching from manual charting to computerized analysis is like giving
up an abacus for a calculator. It may slow you down for a while, as you learn
to push the keys, but the eventual increase in speed is worth the effort.
Three Steps to Computerized Analysis
There are three steps to becoming a computerized trader. First you must
choose software, then a computer, and finally data for analysis. Different
programs require different computers, which is why it pays to choose soft-
ware first. Software tells a computer how to process data and how to display
the results. Each program has a unique list of features and its own look and
feel.
Draw a list of tasks you want your computer to perform for you and show
it to computerized traders. Contact a traders’ group such as Club 3000 to see
what its members like. Many traders call Financial Trading Seminars, Inc.
for our opinion on the best packages. Magazines for traders, such as Futures
and Technical Analysis of Stocks and Commodities carry many ads for tech-
nical analysis software. Read those ads and software reviews, and send away
for demo diskettes.
Once you narrow down your choices to two or three programs, call the
companies whose software you like and ask for names of users in your area.
Insist on names of real users —your best source of practical and unbiased
advice. Many traders feel isolated and enjoy contact with other traders. They
like to show their equipment and tell you about the quality of technical sup-
port.
Most programs for technical analysis fall into one of three groups: tool-
boxes, black boxes, and gray boxes. Toolboxes are for serious traders, black
boxes are for people who believe in Santa Claus, and gray boxes are in
between. When considering a new package, ask yourself which group it
belongs to.
24. COMPUTERS IN TRADING
117
Toolboxes
If you want to work with wood or metal, you can go to a hardware store and
buy a toolbox with a set of tools. You must learn how to use those tools to
work smarter and more efficiently. A technical analysis toolbox provides a
set of electronic tools for processing market data.
A toolbox draws daily and weekly charts, splits the screen into several
windows, and plots prices and indicators. A good toolbox includes many
popular indicators, such as moving averages, channels, MACD, MACD-
Histogram, Stochastic, the Relative Strength Index, and a dozen others. It
allows you to fine-tune all indicators. For example, it lets you switch from a
5-day to a 9-day Stochastic at the push of a button.
A quality package allows you to write your own indicators into the sys-
tem. You may have a favorite formula that you want to follow, along with
ready-made indicators. Avoid programs that limit you to canned indicators.
A good toolbox allows you to compare any two markets and analyze
their spreads. If you trade options, your toolbox must include an options
valuation model. Advanced packages allow you to test the profitability of
trading systems.
There are good toolboxes at all price levels. At the high end, CompuTrac’s™
list of indicators runs to two pages, it allows you to test profitability, and it is
highly automated. Most of the charts in this book were drawn using CompuTrac.
Financial Trading Seminars, Inc. maintains a list of recommended resources for
computerized traders—software packages at all price levels, data services, com-
puter configurations, and so on. This list is updated every few months and
offered to traders as a public service. You can receive this timely information by
contacting our company at the address that appears in the back of this book.
Black Boxes
Black box software tells you what to buy and sell and when to buy or sell it
without telling you why. You put data into a black box, lights blink, gears
click, and out comes a piece of paper telling you what to do. Thousands of
traders pay good money for this.
Most black boxes are sold by hustlers to gullible or insecure traders.
Black boxes always come with impressive track records showing profitable
past performance. Every black box self-destructs because markets keep
changing. Even systems with built-in optimization do not work because we
118
COMPUTERIZED TECHNICAL ANALYSIS
do not know what kind of optimization will be needed in the future. There is
no substitute for mature judgment in trading. The only way to make money
from a black box is to sell one.
Each black box is guaranteed to fail, even if sold by an honest developer.
Complex human activities such as trading cannot be automated. Machines
can help but not replace humans.
Trading with a black box means using a slice of someone else’s intelligence,
as it existed at some point in the past. Markets change, and experts change
their minds, but a black box keeps churning out its buy and sell signals.
Trading with a black box is like having sex using a penile implant — you may
deceive your partner for a while, but you will never deceive yourself.
Gray Boxes
Like a black box, a gray box generates trading signals based on a proprietary
formula. Unlike a black box, it gives you a general understanding of its for-
mula and allows you to fine-tune its operations to some degree. The closer a
gray box is to a toolbox, the better it is.
Well-known gray boxes include such programs as MESA. It is considered
the best program for identifying market cycles.
Computers
Different software programs run on different machines. This is why it is bet-
ter to choose your software before you buy a computer. Get the most modem
machine, so that it will remain useful for years. Traders keep demanding
more memory and speed — I never heard anyone complain about having too
much of either. Buy a fast modem for collecting data from a database. Get a
laser printer if you need to print high-quality charts.
Most programs allow you to automate studies and print them out. You
push a button and leave the computer alone. When you return, there is a
ream of charts with indicators piled in front of the printer. The tedious work
is done, and you can go to work making trading decisions.
It pays to hire a person who already uses the package to set up your sys-
tem. I often do that when I start using a new piece of software — it saves a lot
of time and energy. Once you know which buttons to push, you can run most
programs without knowing much about computers.
24. COMPUTERS IN TRADING
119
Market Data
Each trader needs to start with a historical database and update it daily. In the
old days, both had to be created manually. Now historical data for any given
market costs less than a dollar per month, and updates are cheap. It takes less
than a minute to update a dozen markets by modem, using your regular
phone line. There are many reliable databases offering a variety of stock,
currency, futures, and options data.
Some traders collect their data around the clock. They use satellite dishes,
FM receivers, and dedicated phone lines. Real-time data is necessary for
day-trading, but not for position trading.
Position traders enter and exit positions within days or weeks. Day-traders
enter and exit trades within a few hours if not minutes. You need to become a
competent position trader before you can day-trade. You can compare position
trading and day-trading to playing a video game at level one or level nine. You
run the same mazes and dodge the same monsters, but the pace of the game is
so fast that at level nine your reactions must be almost automatic. If you stop
to think, you are dead. Learn to analyze the markets and trade at level one—
leam to be a position trader before attempting to day-trade.
When you buy historical data, it pays to cover two bull markets and two
bear markets. Starting to analyze a new market, I usually review a monthly
chartbook covering 20 years of trading to see whether the market is histori-
cally high or low. I buy three to five years’ worth of weekly data and one
year of daily data.
When you begin using a computer, focus on six or fewer markets and add
more later. For example, you may follow Treasury Bonds, Standard & Poor’s
500, gold, and Japanese Yen or the German Mark. Change this list if you
want to follow agricultural or industrial markets. Choose a few technical
indicators, and run them daily on each market. After you leam them well,
add new ones. I use a battery of 10 or 12 indicators at any given time, plus
one new indicator. I watch it for several months and compare its signals to
others. If it proves useful, I add it to the standard package.
Three Major Groups of Indicators
Indicators can help you identify trends and their turning points. They can
provide a deeper insight into the balance of power between bulls and bears.
Indicators are more objective than chart patterns.
120
COMPUTERIZED TECHNICAL ANALYSIS
The trouble with indicators is that they often contradict one another. Some
of them work best in trending markets, others in flat markets. Some are good
at catching turning points, while others are better at following trends.
Most beginners look for a single indicator—a silver bullet to kill the con-
fusion in the markets. Others lump together many indicators and try to aver-
age their signals. Either way, a careless beginner with a computer is like a
teenager with a sports car—an accident waiting to happen. A serious trader
needs to know which indicators work best under different conditions. Before
you use any indicator, you must understand what it measures and how it
works. Only then can you have confidence in its signals.
Professionals divide indicators into three groups: trend-following indicators,
oscillators, and miscellaneous. Trend-following indicators work best when
markets are moving but give bad and dangerous signals when the markets are
flat. Oscillators catch turning points in flat markets but give premature and
dangerous signals when the markets begin to trend. Miscellaneous indicators
provide special insights into mass psychology. The secret of successful trading
is to combine several indicators from different groups so that their negative
features cancel each other out while their positive features remain undisturbed.
This is the aim of the Triple Screen trading system (see Section 43).
Trend-following indicators include moving averages, MACD (moving
average convergence-divergence), MACD-Histogram, the Directional
System, On-Balance Volume, Accumulation/Distribution, and others. Trend-
following indicators are coincident or lagging indicators — they turn after
trends reverse.
Oscillators help identify turning points. They include Stochastic, Rate of
Change, Smoothed Rate of Change, Momentum, the Relative Strength
Index, Elder-ray, the Force Index, Williams %R, the Commodity Channel
Index, and others. Oscillators are leading or coincident indicators and often
turn ahead of prices.
Miscellaneous indicators provide insights into the intensity of bullish or
bearish market opinion. They include the New High-New Low Index, the
Put-Call Ratio, Bullish Consensus, Commitments of Traders, the
Advance/Decline Index, the Traders’ Index, and so on. They can be leading
or coincident indicators.
25. MOVING AVERAGES
Wall Street old-timers claim that moving averages were brought to the finan-
cial markets by antiaircraft gunners. They used moving averages to site guns
25. MOVING AVERAGES
121
on enemy planes during World War 11 and applied this method to prices. The
two early experts on moving averages were Richard Donchian and J. M.
Hurst —neither apparently a gunner. Donchian was a Merrill Lynch
employee who developed trading methods based on moving average
crossovers. Hurst was an engineer who applied moving averages to stocks in
his now-classic book, The Profit Magic of Stock Transaction Timing.
A moving average (MA) shows the average value of data in its time win-
dow. A 5-day MA shows the average price for the past 5 days, a 20-day MA
shows the average price for the past 20 days, and so on. When you connect
each day’s MA values, you create a moving average line.
c- i Pl+P2 + ... + PN
Simple MA =-------------—-----------
where P is the price being averaged
N is the number of days in the moving average (selected by trader)
The value of MA depends on two factors: values that are being averaged and
the width of the MA time window. Suppose you want to calculate a 3-day sim-
ple moving average of a stock. If it closes at 19,21, and 20 on three consecutive
days, then a 3-day simple MA of closing prices is 20 (19 + 21 + 20, divided by
3). Suppose that on the fourth day the stock closes at 22. It makes its 3-day MA
rise to 21 — the average of the last three days (21 + 20 + 22), divided by 3.
There are three main types of moving averages: simple, exponential, and
weighted. Most traders use simple MAs because they are easy to calculate,
and Donchian and Hurst used them in precomputer days. Simple MAs, how-
ever, have a fatal flaw —they change twice in response to each price.
Twice as Much Bark
A simple MA changes twice in response to each piece of data. First, it
changes when a new piece of data is added to the moving average. That is
good—we want our MA to reflect changes in prices. The bad thing is that
MA changes again when an old price is dropped off at the end of the moving
average window. When a high price is dropped, a simple MA ticks down.
When a low price is dropped, a simple MA rises. Those changes have noth-
ing to do with the cunent reality of the market.
Imagine that a stock hovers between 80 and 90, and its 10-day simple MA
stands at 85 but includes one day when the stock reached 105. When that
high number is dropped at the end of the 10-day window, the MA dives, as if
122
COMPUTERIZED TECHNICAL ANALYSIS
in a downtrend. That meaningless dive has nothing to do with the current
reality of the market.
When an old piece of data gets dropped off, a simple moving average
jumps. A simple MA is like a guard dog that barks twice — once when some-
one approaches the house, and once again when someone walks away from
it. You do not know when to believe that dog. Traders use simple MAs out of
inertia. A modem computerized trader is better off using exponential moving
averages.
Market Psychology
Each price is a snapshot of the current mass consensus of value (see Section
12). A single price does not tell you whether the crowd is bullish or bear-
ish—just as a single photo does not tell you whether a person is an optimist
or a pessimist. If, on the other hand, someone brings ten photos of a person
to a lab and gets a composite picture, it will reveal that person’s typical fea-
tures. If you update a composite photo each day, you can monitor trends in
that person’s mood.
A moving average is a composite photograph of the market—it combines
prices for several days. The market consists of huge crowds, and a moving
average identifies the direction of mass movement.
The most important message of a moving average is the direction of its
slope. When it rises, it shows that the crowd is becoming more optimistic—
bullish. When it falls, it shows that the crowd is becoming more pes-
simistic-bearish. When the crowd is more bullish than before, prices rise
above a moving average. When the crowd is more bearish than before, prices
fall below a moving average.
Exponential Moving Averages
An exponential moving average (EMA) is a better trend-following tool than
a simple MA. It gives greater weight to the latest data and responds to
changes faster than a simple MA. At the same time, an EMA does not jump
in response to old data. This guard dog has better ears, and it barks only
when someone approaches the house.
25. MOVING AVERAGES
123
EMA = Ptod • К + EMAyest • (1 - K)
2
where К - ------------
N + 1
N = the number of days in the EMA (chosen by the trader).
Ptod = today’s price.
EMAyest = the EMA of yesterday.
Technical analysis software allows you to select the EMA length and cal-
culate it at a push of a key. To do it by hand, follow these steps:
1. Choose the EMA length (see below). Let us say, we want a 10-day
EMA.
2. Calculate the coefficient К for that length (see above). For example, if
you want a 10-day EMA, К equals 2 divided by 10 + 1, or 0.18.
3. Calculate a simple MA for the first 10 days—add closing prices and
divide the sum by 10.
4. On the 11th day, multiply the closing price by K, multiply the previous
day’s MA by (1 - K), and add the two. The result is the 10-day EMA.
5. Keep repeating step 4 on each subsequent day to obtain the latest
EMA (see worksheet, Figure 25-1).
An EMA has two major advantages over a simple MA. First, it assigns
greater weight to the last trading day. The latest mood of the crowd is more
important. In a 10-day EMA, the last closing price is responsible for 18 per-
cent of EMA value, while in a simple MA all days are equal. Second, EMA
does not drop old data the way a simple MA does. Old data slowly fades
away, like a mood of the past lingering in a composite photo.
Choosing the Length of a Moving Average
A relatively short EMA is more sensitive to price changes —it allows you to
catch new trends sooner. It also changes its direction more often and produces
more whipsaws. A whipsaw is a rapid reversal of a trading signal. A relatively
long EMA leads to fewer whipsaws but misses turning points by a wider margin.
124
COMPUTERIZED TECHNICAL ANALYSIS
Gold
Day Close 10-EMA
1 447.3
2 456.8
3 451.0
4 452.5
5 453.4
6 455.5
7 456.0
8 454.7
9 453.5
1 0 456.5 453.7
1 1 459.5 454.8
1 2 465.2 456.6
1 3 460.8 457.4
1 4 460.8 458.0
Figure 25-1. Ten-Day EMA Worksheet
Begin by calculating a simple moving average. The first value in column
3 is a simple MA. Then calculate an exponential moving average on
each subsequent day, according to the formula provided in the chapter.
When computers first became available, traders crunched numbers to find
the “best” moving averages for different markets. They found which MAs
worked in the past —but it did not help them trade because markets kept
changing. Our brokers do not let us trade the past.
It pays to tie EMA length to a cycle if you can find it. A moving average
should be half the length of the dominant market cycle (see Section 36). If
you find a 22-day cycle, use an 11-day moving average. If the cycle is 34
days long, then use a 17-day moving average. Trouble is, cycles keep chang-
ing their length and disappearing. Some traders use software such as MESA
to look for valid cycles, but MESA shows that noise is greater than cycle
amplitude most of the time.
Finally, traders can fall back on a simple rule of thumb: The longer the
25. MOVING AVERAGES
125
trend you are trying to catch, the longer the moving average you need. You
need a bigger fishing rod to catch a bigger fish. A 200-day moving average
works for long-term stock investors who want to ride major trends. Most
traders can use an EMA between 10 and 20 days. A moving average should
not be shorter than 8 days to avoid defeating its purpose as a trend-following
tool. I have been using a 13-day exponential moving average for most of my
trading in the past several years.
Trading Rules
A successful trader does not forecast the future — he monitors the market and
manages his trading position (see Section 17). Moving averages help us to
trade in the direction of the trend. The single most important message of a
moving average is the direction of its slope. It shows the direction of the
market’s inertia. When an EMA rises, it is best to trade the market from the
long side, and when it falls, it pays to trade from the short side (Figure 25-2).
1. When an EMA rises, trade that market from the long side. Buy when
prices dip near or slightly below the moving average. Once you are
long, place a protective stop below the latest minor low and move the
stop to the break-even point as soon as prices close above their EMA.
2. When the EMA falls, trade that market from the short side. Sell short
when prices rally toward or slightly above the EMA, and place a pro-
tective stop above the latest minor high. Lower that stop to the break-
even point as soon as prices close below their EMA.
3. When the EMA goes flat and only wiggles a little, it identifies an aim-
less, trendless market. Do not trade using a trend-following method.
Mechanical Systems
The old mechanical trading methods using moving averages usually had four
steps: (1) Buy when the MA rises and prices close above it; (2) sell when
prices close below the MA; (3) sell short when the MA declines and prices
close below it; (4) cover shorts when prices close above the MA. This
mechanical method works in trending markets but leads to whipsaws when
markets go flat.
Trying to filter out whipsaws with mechanical rules is self-defeating — fil-
126
COMPUTERIZED TECHNICAL ANALYSIS
When the EMA rises, it shows that the trend is up and the market should
be traded from the long side. The best time to buy is when prices return
to their EMA-not when they are high above it. Those trades offer a better
risk/reward ratio.
When the EMA declines, it shows that the trend is down and the mar-
ket should be traded from the short side. It is best to sell when prices
rally back to their EMA. When the EMA goes flat, as it did in December,
it tells you that the market has stopped trending. Stop using a trend-fol-
lowing method but continue to track this indicator, waiting for it to enter
a trend.
ters reduce profits as much as losses. An example of a filter is a rule that
requires that prices close on the other side of MA not once, but twice, or that
they penetrate MA by a certain margin. Mechanical filters reduce losses, but
they also diminish the best feature of a moving average — its ability to lock
onto a trend early.
The favorite approach of Donchian, one of the originators of trading with
moving averages, was to use crossovers of 4-, 9-, and 18-day MAs. Trading
signals were given when all three MAs turned in the same direction. His
26. MOVING AVERAGE CONVERGENCE-DIVERGENCE
127
method, like other mechanical trading methods, only worked in strongly
trending markets.
A trader must accept that an EMA, like any other trading tool, has good
and bad sides. Moving averages help you identify and follow trends, but they
lead to whipsaws in trading ranges. We will look for an answer to this
dilemma in Chapter 9 on the Triple Screen trading system.
More on Moving Averages
Moving averages serve as support and resistance zones. A rising MA tends
to serve as a floor below prices, and a falling MA serves as a ceiling above
them. That’s why it pays to buy near a rising MA, and sell short near a
falling MA.
Moving averages can be applied to indicators as well as prices. Some
traders use a 5-day moving average of volume. When volume falls below
its 5-day MA, it shows reduced public interest in the minor trend, which is
likely to reverse. When volume overshoots its MA, it shows strong public
interest and confirms the price trend.
The proper way to plot a simple moving average is to lag it behind prices
by half its length. For example, a 10-day simple MA properly belongs in the
middle of a 10-day period, and it should be plotted underneath the 5th or 6th
day. An exponential moving average is more heavily weighted toward the
latest data, and a 10-day EMA should be plotted underneath the 7th or 8th
day. Most software packages allow you to lag a moving average.
Moving averages can be based not only on closing prices but also on the
mean between the high and the low. MAs of closing prices are used for
daily analysis, but day-traders prefer to apply MAs to median prices.
An exponential moving average assigns greater weight to the latest day of
trading, but a weighted moving average (WMA) allows you to assign any
weight to any day, depending on what you deem important. WMAs are so
complicated that traders are better off using EMAs.
26. MOVING AVERAGE CONVERGENCE-
DIVERGENCE (MACD) AND MACD-HISTOGRAM
Moving averages identify trends by filtering out daily price ripples. A more
advanced indicator was constructed by Gerald Appel, an analyst and money
128
COMPUTERIZED TECHNICAL ANALYSIS
manager in New York. Moving Average Convergence-Divergence, or
MACD for short, consists not of one, but three exponential moving averages.
It appears on the charts as two lines whose crossovers give trading signals.
How to Create MACD
The original MACD indicator consists of two lines: a solid line (called the
MACD line) and a dashed line (called the Signal line). The MACD line is
made up of two exponential moving averages (EMAs). It responds to
changes in prices relatively quickly. The Signal line is made up of the
MACD line smoothed with another EMA. It responds to changes in prices
more slowly.
Buy and sell signals are given when the fast MACD line crosses above or
below the slow Signal line. The MACD indicator is included in most pro-
grams for technical analysis. Few traders calculate it by hand — a computer
does the job faster and more accurately.
To create MACD:
1. Calculate a 12-day EMA of closing prices.
2. Calculate a 26-day EMA of closing prices.
3. Subtract the 26-day EMA from the 12-day EMA, and plot their differ-
ence as a solid line. This is the fast MACD line.
4. Calculate a 9-day EMA of the fast line, and plot the result as a dashed
line. This is the slow Signal line (see the worksheet, Figure 26-1).
Market Psychology
Each price reflects the consensus of value among the mass of market partici-
pants at the moment of the trade. A moving average represents an average
consensus of value in a selected period — a composite photo of mass consen-
sus. A long moving average tracks long-term consensus, and a short moving
average tracks short-term consensus.
Crossovers of the MACD and Signal lines identify shifts in the balance of
power of bulls and bears. The fast MACD line reflects mass consensus over
a shorter period. The slow Signal line reflects mass consensus over a longer
period. When the fast MACD line rises above the slow Signal line, it shows
26. MOVING AVERAGE CONVERGENCE-DIVERGENCE
129
Crude Oil
DAY Close ! 12-EMA 26-EMA MACD Signal MACD-HIST
1 20.70 i 20.39 20.46 -0.07 -0.16 0.09
2 20.55 I 20.41 20.47 0.06 -0.14 0.08
3 20.72 1 20.46 20.49 -0.03 -0.12 0.09
4 21.03 j 20.55 20.53 0.02 -0.09 0.11
5 21.10 1 20.63 20.57 0.06 -0.06 0.12
6 21.29 I 20.73 20.62 0.11 -0.02 0.13
7 21.09 i 20.79 20.66 0.13 0.01 0.12
8 21.48 j 20.90 20.72 0.18 0.04 0.14
9 21.23 I 20.95 20.76 0.19 0.07 0.12
Figure 26-1. MACD and MACD-Histogram Worksheet
To obtain MACD lines and an MACD-Histogram take these steps:
1. Calculate the 12-day and 26-day exponential moving averages of
closing prices.
2. Subtract the 26-day EMA from the 12-day EMA to obtain the fast
MACD line.
3. Calculate a 9-day EMA of the. fast MACD line to obtain the slow
Signal line. Plot both lines to obtain the classic MACD indicator.
4. Subtract the Signal line from the MACD line to obtain an MACD-
Histogram.
that bulls dominate the market, and it is better to trade from the long side.
When the fast line falls below the slow line, it shows that bears dominate the
market and it pays to trade from the short side.
Trading Rules
Crossovers between the MACD and Signal lines identify changing market
tides. Trading in the direction of a crossover means going with the flow of
the market. This system generates fewer trades and whipsaws than a
mechanical system based on a single moving average.
1. When the fast MACD line crosses above the slow Signal line, it gives
a buy signal. Go long, and place a protective stop below the latest
minor low.
130
COMPUTERIZED TECHNICAL ANALYSIS
22.01
20.80
19.60
18.39
17.18
0.3836
-0.1193
-0.6221
-1.1250
-1.6279
Figure 26-2. MACD Lines
When the fast MACD line crosses above the slow Signal line, it
gives a buy signal. Sell signals are given when the fast line crosses
below the slow line. These rules help catch all the major trends
and generate fewer whipsaws than crossovers of prices and a sin-
gle moving average.
2. When the fast line crosses below the slow line, it gives a sell signal.
Go short, and place a protective stop above the latest minor high
(Figure 26-2).
More on MACD
Many traders try to optimize MACD by using other moving averages than
the standard 12-, 26-, and 9-bar EMAs; 5-34-7 is another popular choice.
Some traders try to link MACD to market cycles. The trouble is cycles are
not present in the markets most of the time (see Section 36). If you use
cycles, the first EMA should be one quarter the length of the dominant cycle
and the second EMA half the cycle length. The third EMA is a smoothing
device whose length does not have to be tied to a cycle. Beware of optimiz-
26. MOVING AVERAGE CONVERGENCE-DIVERGENCE
131
ing MACD too often. If you fiddle with MACD long enough, you can make
it give you any signal you want using the same data.
A “quick-and-dirty” way to plot MACD is used by traders whose soft-
ware does not include this indicator. Some packages allow you to draw only
two EMAs. In that case, you can use crossovers between two EMAs, such as
11-day and 26-day EMAs as a proxy for MACD and Signal lines.
MACD-Histogram
MACD-Histogram offers a deeper insight into the balance of power between
bulls and bears than the original MACD. It shows not only whether bulls or
bears are in control but also whether they are growing stronger or weaker. It
is one of the best tools available to a market technician.
MACD-Histogram = MACD line - Signal line
MACD-Histogram measures the difference between the MACD line and
the Signal line (see worksheet, Figure 26-1). It plots that difference as a his-
togram — a series of vertical bars. That distance may appear puny, but a com-
puter rescales it to fill the screen.
If the fast line is above the slow line, MACD-Histogram is positive and
plotted above the zero line. If the fast line is below the slow line, MACD-
Histogram is negative and plotted below the zero line. When the two lines
touch, MACD-Histogram equals zero.
When the spread between the MACD and Signal lines increases, MACD-
Histogram becomes taller or deeper, depending on its direction. When the
two lines draw closer, MACD-Histogram becomes shorter.
The slope of MACD-Histogram is defined by the relationship between
any two neighboring bars. If the last bar is higher (like the height of letters
m-M), the slope of MACD-Histogram is up. If the last bar is lower (like the
depth of letters P-p), then the slope of MACD-Histogram is down.
Market Psychology
MACD-Histogram shows the difference between long-term and short-term
consensus of value. The fast MACD line reflects market consensus over a
shorter period. The slow Signal line reflects market consensus over a longer
period. MACD-Histogram tracks the difference between these two lines.
132
COMPUTERIZED TECHNICAL ANALYSIS
The slope of MACD-Histogram identifies the dominant market group. A
rising MACD-Histogram shows that bulls are becoming stronger. A falling
MACD-Histogram shows that bears are becoming stronger.
When the fast MACD line rallies faster than the slow Signal line, MACD-
Histogram rises. It shows that bulls are becoming stronger than they have
been — it is a good time to trade from the long side. When the fast MACD
line drops faster than the slow line, MACD-Histogram falls. It shows that
bears are becoming stronger—it is a good time to trade from the short side.
When the slope of MACD-Histogram moves in the same direction as
prices, the trend is safe. When the slope of MACD-Histogram moves in a
direction opposite to that of prices, the health of the trend is questioned. It is
best to trade in the direction of the slope of MACD-Histogram because it
shows whether bulls or bears dominate the market.
The slope of MACD-Histogram is more important than its position above
or below the centerline. The best sell signals are given when MACD-
Histogram is above its centerline but its slope turns down, showing that bulls
have become exhausted. The best buy signals occur when MACD-Histogram
is below its centerline but its slope turns up, showing that bears have become
exhausted.
Trading Rules
MACD-Histogram gives two types of trading signals. One is common and
occurs at every price bar. The other is rare and occurs only a few times a
year in any market—but it is extremely strong.
The common signal is given by the slope of MACD-Histogram (Figure
26-3). When the current bar is higher than the preceding bar, the slope is up.
It shows that bulls are in control and it is time to buy. When the current bar is
lower than the preceding bar, the slope is down. It shows that bears are in
control and it is time to be short. When prices go one way but MACD-
Histogram moves the other way, it shows that the dominant crowd is losing
its enthusiasm and the trend is weaker than it appears.
1. Buy when MACD-Histogram stops falling and ticks up. Place a pro-
tective stop below the latest minor low.
2. Sell short when MACD-Histogram stops rising and ticks down. Place
a protective stop above the latest minor high.
MACD-Histogram ticks up and down on the daily charts so often that is
26. MOVING AVERAGE CONVERGENCE-DIVERGENCE
133
MACD-Histogram
Tip? Hay Tun Jul Bug Nov 5ec
139,08
128.58
118.00
107.50
97.08
2.4725
1.3886
8.3048
-8.7798
-1.8628
Figure 26-3. MACD-Histogram Divergences
MACD-Histogram confirms trends when it reaches new highs or lows
together with prices. The new lows in MACD-Histogram at points A and
F confirm downtrends. New lows in the indicator tell traders that the
downtrend is likely to retest or exceed bottoms A and F. New highs C
and D in MACD-Histogram confirm uptrends. They show that the
uptrend is likely to retest or exceed peaks C and D.
Divergences between MACD-Histogram and prices identify major
turning points. These signals rarely occur, but when they do, they often
let you catch major reversals and the beginnings of new trends. The
bullish divergence A-В flags a major buying opportunity. Prices are at a
new low, but the indicator is tracing a higher bottom. It shows that bears
are exhausted and bulls are ready to gain the upper hand.
The bearish divergence D-E identifies a major selling opportunity. At
the right edge of the chart, there is a bullish divergence, F-G. The best
time to buy is when MACD-Histogram ticks up from its second bottom,
G. Once you go long, place a protective stop below the price bottom G.
Move the stop up as the trend progresses.
not practical to buy and sell every time it turns. The changes of slope of
MACD-Histograms are much more meaningful on the weekly charts, which
is why it is included in the Triple Screen trading system (see Section 43).
134
COMPUTERIZED TECHNICAL ANALYSIS
When to Expect a New Peak or Valley
MACD-Histogram works like headlights on a car—it gives traders a glimpse
of the road ahead. New highs and lows in this indicator are usually followed
by new high or low prices.
A record peak for the past three months in daily MACD-Histogram shows
that bulls are very strong and prices are likely to rise even higher. A record
new low for MACD-Histogram for the past three months shows that lower
prices are likely ahead.
When MACD-Histogram reaches a new high during a rally, the uptrend is
healthy and you can expect the next rally to retest or exceed its previous
peak. If MACD-Histogram falls to a new low during a downtrend, it shows
that bears are strong and prices are likely to retest or exceed their latest low.
The Strongest Signal in Technical Analysis
Divergences between MACD-Histogram and prices occur only a few times a
year in any given market, but they give some of the most powerful messages
in technical analysis. These divergences identify major turning points and
give “extra-strength” buy or sell signals. They do not occur at every impor-
tant top and bottom, but when you see one, you know that a major reversal is
probably at hand.
When prices rally to a new high, but MACD-Histogram traces a lower
top, it creates a bearish divergence (Figure 26-3). A lower top in MACD-
Histogram shows that bulls are internally weak even though prices are
higher. When bulls are running out of steam, bears are ready to grab control.
Bearish divergences between MACD-Histogram and prices identify weak-
ness at market tops. They give sell signals when most traders feel excited
about a breakout to a new high!
3. Sell short when MACD-Histogram ticks down from its second, lower
top, while prices are at a new high. Place a protective stop above the
latest high.
As long as prices keep falling to new lows and MACD-Histogram keeps
going lower, it confirms the downtrend. If prices fall to a new low but
MACD-Histogram traces a more shallow low, it creates a bullish divergence.
It shows that prices are falling out of inertia, bears are weaker than they
seem, and bulls are ready to gain control. Bullish divergences between
27. THE DIRECTIONAL SYSTEM
135
MACD-Histogram and prices identify strength at market bottoms. They give
buy signals when most traders feel fearful about a breakdown to a new low!
4. Buy when MACD-Histogram ticks up from its second, more shallow
bottom while prices are at a new low. Place a protective stop below the
latest low.
If a bullish divergence between MACD-Histogram and price is aborted
and prices fall to a new low, you will be stopped out. Continue to watch
MACD-Histogram. If it traces a more shallow third bottom while prices
decline to a new low, you are dealing with a “triple bullish divergence” — an
especially strong buy signal. Buy again as soon as MACD-Histogram ticks
up from its shallow third bottom. The reverse applies to shorting triple bear-
ish divergences.
More on MACD-Histogram
MACD-Histogram works in any timeframe: weekly, daily, and intraday. The
signals of weekly MACD-Histogram lead to greater price moves than the
daily or intraday indicators. This principle applies to all indicators — signals
in longer timeframes lead to greater price moves.
When you use MACD and MACD-Histogram on the weekly charts, you
do not have to wait until Friday to get your signals. A major trend can
change in the middle of the week — the market does not watch the calendar.
Because of this, weekly studies have to be performed each day.
27. THE DIRECTIONAL SYSTEM
The Directional system is a trend-following method. It was developed by J.
Welles Wilder, Jr., in the mid-1970s and modified by several analysts. The
Directional system identifies trends and shows when a trend is moving fast
enough to make it worth following. It helps traders take chunks of profit out
of the middle of important trends.
How to Construct the Directional System
Directional Movement is defined as the portion of today’s range that is out-
side of the previous day’s range. The Directional system checks whether
136
COMPUTERIZED TECHNICAL ANALYSIS
Japanese Yen
Date : High Low : Close +Dhg -DI13 DX ADX
7/1 : 72.24 • 71.87 : 71.92 ...30... 20 20 20
7/2 : 71.83 : 71.63 71.69 29 23 12 19
7/3 71.65 : 71.33 : 71.36 27 27 0 18
7/5 • 72.10 : 71.83 72.06 31 23 15 18
7/8 1 71.94 ; 71.78 ; 71.90 30 23 13 18
7/9 j 72.02 : 71.77 : 71.79 30 22 15 18
7/Ю : 71.95 : 71.87 : 71.90 29 21 16 18
7/11 : 72.13 : 71.82 : 71.85 30 20 20 18
7/12 : 73.20 • 71.94 ; 73.11 41 16 44 20
7/15 : 72.94 1 72.65 : 72.80 38 15' 43 22
7/16 ; 72.75 72.55 i 72.58 36 16 38 23
7/17 • 72.91 • 72.62 : 72.71 37 15 42 24
7/18 • 73.07 : 72.29 ; 72.42 32 18 28 24
7/19 • 73.06 ! 72.69 73.06 29 16 29 24
7/22 72.70 ! 72.22 ; 72.36 26 21 ii 23
7/23 ; 72.76 ! 72.62 ; 72.69 25 20 и 22
7/24 : 72.96 : 72.38 ; 72.48 23 22 2 20
7/25 : 72.42 : 71.64 : 71.76 20 30 20 20
7/26 : 72.50 71.96 : 72.37 19 27 17 20
7/29 : 72.34 72.08 : 72.25 18 26 18 20
7/30 : 72.47 ; 72.18 : 72.26 19 25 14 20
7/31 : 72.59 • 72.3’i : 72.51 20 23 7 19
8/1 : 72.59 : 72.30 : 72.41 19 22 7 18
8/2 ; 72.92 ! 72.28 ; 72.58 23 20 7 17
8/5 : 72.95 : 72.56 72.80 22 19 7 16
8/6 1 73.57 : 72.94 ; 73.50 28 17 24 17
8/7 j 73.29 : 73.07 : 73.21 27 16 26 18
8/8 J 73.15 : 72.84 : 73.06 25 18 16 18
8/9 : 73.18 • 72.67 : 72.81 23 20 7 17
8/12 : 72.92 : 72.72 : 72.88 22 19 7 16
Figure 27-1. Directional System Worksheet
+ОЦ 3 and -DI] з are based on positive and negative directional movements
and the true ranges of the past 13 days. DX is derived from +DI^3 and
-Dl^ 3, and ADX is made by smoothing DX. See formulas in the chapter.
today’s range extends above or below the previous day’s range and averages
that data over a period of time. These complex calculations (see worksheet,
Figure 27-1) are best performed on a computer. The Directional system is
included in most software programs for technical analysis.
27. THE DIRECTIONAL SYSTEM
137
1. Identify “Directional Movement” (DM) by comparing today’s high-
to-low range with yesterday’s high-to-low range. Directional
Movement is the largest part of today’s range outside of yesterday’s
range. There are four types of DM (Figure 27-2). DM is always a posi-
tive number (+DM and -DM refer simply to movement above or
below yesterday’s range).
2. Identify the “True Range” (TR) of the market you analyze. It is
always a positive number, the largest of three:
A. The distance from today’s high to today’s low
B. The distance from today’s high to yesterday’s close
C. The distance from today’s low to yesterday’s close
3. Calculate daily Directional Indicators (+DI and -DI). They allow
you to compare different markets by expressing their directional
movement as a percentage of each market’s true range. Each DI is a
positive number: +DI equals zero on a day that has no directional
movement up; -DI equals zero on a day that has no directional move-
ment down.
+DM -DM
+DI =------------- -DI =--------------
TR TR
4. Calculate smoothed Directional Lines (+DIjj and -DI|j). Smooth
+DI and -DI are created with moving averages. Most software pack-
ages allow you to pick any period for smoothing, such as a 13-day
moving average. You get two indicator lines: smoothed Positive and
Negative Directional lines, +DIar*d -DI13. Both numbers are posi-
tive. They are usually plotted in different colors, or as a solid and a
dashed line.
The relationship between Positive and Negative lines identifies trends.
When +DI}3 is on top, it shows that the trend is up, and when -Dfyj
is on top, it shows that the trend is down. The crossovers of +DI13 and
-DI 13 give buy and sell signals.
5. Calculate the Average Directional Indicator (ADX). This unique
component of Directional system shows when a trend is worth follow-
ing. ADX measures the spread between Directional Lines +DIj3 and
-DI13. It is calculated in two steps:
138
COMPUTERIZED TECHNICAL ANALYSIS
Directional Movement
+ DM
-DM
DM = 0
DM = 0
+ DM
+ DM
-DM
Figure 27-2. Directional Movement
Directional Movement is the largest part of today's range that is outside of
yesterday's range.
A. If today's range extends above yesterday's range, Directional
Movement is positive (+DM).
B. If today's range extends below yesterday's range, Directional
Movement is negative (-DM).
C. If today's range is inside of yesterday's range or extends above and
below it by equal amounts, there is no Directional Movement (DM =
0). If today's range extends both above and below yesterday's range,
DM is positive or negative, depending on which part of the "outside
range" is larger.
D. On a limit up day, +DM equals the distance from today's close to yes-
terday's high. On a limit down day, -DM equals the distance from
today's close to yesterday's low.
A. Calculate the daily Directional Indicator DX:
+DIi3 + -DI13
27. THE DIRECTIONAL SYSTEM
139
For example, +DI13 = 34; _^13 = 18. Then,
34-18 16
DX =---------------- • 100 =--------- • 100 = 30.77, rounded off = 31
34 + 18 52
B. Calculate the Average Directional Indicator ADX by smoothing
DX with a moving average, such as a 13-day EMA.
When a trend proceeds in a healthy manner, the spread between two
smoothed Directional lines increases and ADX rises. ADX declines when a
trend reverses or when a market enters a trading range. It pays to use a trend-
following method when ADX rises and not when ADX declines.
Crowd Behavior
The Directional system tracks changes in mass bullishness and bearishness
by measuring the capacity of bulls and bears to move prices outside of the
previous day’s range. If today’s high is above yesterday’s high, it shows that
the market crowd is becoming more bullish. If today’s low is below yester-
day’s low, it shows that the market crowd is becoming more bearish.
The relative position of Directional lines identifies trends. When the
Positive Directional line is above the Negative Directional line, it shows that
bullish traders dominate the market. When the Negative Directional line
rises above the Positive Directional line, it shows that bearish traders are
stronger. It pays to trade in the direction of the upper Directional line.
The Average Directional Indicator ADX rises when the spread between
Directional lines increases. This shows that market leaders are becoming
stronger, losers are getting weaker, and the trend is likely to continue. When
the ADX rises, it pays to trade in the direction of the upper Directional line,
using a trend-following method.
ADX declines when the spread between +DI13 and -DIj3 narrows down.
This shows that the dominant market group is losing its strength, while the
underdogs are gaining. Then the market is in turmoil, and it is better not to
use trend-following methods.
Trading Rules
1. Trade only from the long side when +DIj3 is above -DI^. Trade only
from the short side when -DIj3 is above +DI13. The best time to be
long is when both +DI13 and ADX are above -DI13 and ADX rises.
This shows that the uptrend is getting stronger. Go long and place a
140
COMPUTERIZED TECHNICAL ANALYSIS
76.97
75.56
74.15
72.74
71.33
68
47
34
21
8
Figure 27-3. Signals of the Directional System
Directional lines identify trends. When +DI is on top, the trend is up,
and it pays to trade the market from the long side. When -DI is on top, it
shows that the trend is down and it pays to trade the market from the
short side. The best time to use a trend-following method is when ADX is
rising and is above the lower Directional line. Those are two signs of
dynamic trends.
The Directional system gives its best signals after ADX spends several
weeks below both Directional lines. That happens in quiet, dull markets.
Once ADX “wakes up" and rises by four steps (for example, from 10 to
14), it gives a strong signal to trade in the direction of the upper
Directional line. It often flashes this signal at the beginning of major mar-
ket moves. On this chart, ADX rallied from 9 to 13 in September, just
prior to a dynamic rally in the Japanese Yen. Since the +DI was on top
when the signal occurred, it signalled to go long.
protective stop below the latest minor low. The best time to be short is
when -DIj3 and ADX are above +DI13 and ADX rises. This shows
that bears are becoming stronger. Go short and place a protective stop
above the latest minor high.
2. When ADX declines, it shows that the market is becoming less direc-
27. THE DIRECTIONAL SYSTEM
141
tional. There are usually many whipsaws, just as there are turbulences
in the water during the change of tide. When ADX points down, it is
better not to use a trend-following method.
3. When ADX falls below both Directional lines, it identifies a flat,
sleepy market. Do not use a trend-following system but start getting
ready, because major trends emerge from such lulls.
4. The single best signal of the Directional system comes after ADX falls
below both Directional lines. The longer it stays there, the stronger the
base for the next move. When ADX rallies from below both Directional
lines, it shows that the market is waking up from a lull. When ADX
rises by four steps (i.e., from 9 to 13) from its lowest point below both
Directional lines, it “rings a bell” on a new trend. It shows that a new
bull market or bear market is being bom (Figure 27-3). Buy if +DI13 is
on top and place a stop below the latest minor low. Sell short if -DI13 is
on top and place a stop above the latest minor high.
For example, if ADX rises from 8 to 12 while both lines are above 12
and +DIj3 is on top, it indicates that a new uptrend is beginning. If
ADX rises from 9 to 13 while both lines are above 13 and -DIj3 is on
top, it shows that a new downtrend is starting.
The Directional System is unique in telling you when a major new trend is
likely to begin. It rings a bell once or twice a year in any given market. It
signals when a new baby bull or baby bear is being bom. Monetary risk is
usually low at that time, due to low volatility while the trend is still young.
5. When ADX rallies above both Directional lines, it identifies an over-
heated market. When ADX turns down from above both Directional
lines, it shows that the major trend has stumbled. It is a good time to
take profits. If you trade multiple contracts, you definitely want to take
partial profits.
Market indicators give hard signals and soft signals. For example, a viola-
tion of a price low or a change in direction of a moving average are hard sig-
nals. A downturn of ADX is a soft signal. Once you see ADX turn down,
you ought to be very, very careful about adding to positions. You should start
taking profits, reducing positions, and looking to get out of your position
rather than adding to it.
142
COMPUTERIZED TECHNICAL ANALYSIS
28. MOMENTUM, RATE OF CHANGE, AND
SMOOTHED RATE OF CHANGE
When greed or fear grips a mass of traders, the crowd surges. Oscillators
measure the speed of that surge and track its momentum.
Technical indicators are divided into three main groups. Trend-following
indicators help identify trends. Oscillators help find turning points.
Miscellaneous indicators, such as the New High-New Low Index, track gen-
eral changes in mass psychology.
Oscillators identify the emotional extremes of market crowds. They allow
you to find unsustainable levels of optimism and pessimism. Professionals
tend to fade those extremes. They bet against them, for a return to normalcy.
When the market rises and the crowd gets up on its hind legs and roars from
greed, professionals sell short. They buy when the market falls and the
crowd howls in fear. Oscillators help them to time those trades.
Overbought and Oversold
Martin Pring compares trend-following indicators and oscillators to the foot-
prints of a man walking his dog on a leash. The man leaves a fairly straight
trail —like a trend-following indicator. The dog’s trail swings right and left as
far as the leash allows — like an oscillator. When the dog reaches the end of
its leash, it is likely to turn and run the other way.
You can follow the trail of a man to find the trend of the pair. When the
dog deviates from that trail by the length of its leash, it usually turns around.
Usually, but not always. If a dog sees a cat or a rabbit, it may become excited
enough to pull its owner off his trail. Traders need to use judgment when
using oscillator signals.
An oscillator becomes overbought when it reaches a high level associated
with tops in the past. Overbought means too high, ready to turn down. An
oscillator becomes oversold when it reaches a low level associated with bot-
toms in the past. Oversold means too low, ready to tum up.
Overbought and oversold levels are marked by horizontal reference lines
on the charts. The proper way to draw those lines is to place them so that an
oscillator spends only about 5 percent of its time beyond each line. Place
overbought and oversold lines so that they cut across only the highest peaks
and the lowest valleys of an oscillator for the past six months. Readjust these
lines once every three months.
28. MOMENTUM
143
When an oscillator rises or falls beyond its reference line, it helps a trader
to pick a top or a bottom. Oscillators work spectacularly well in trading
ranges, but they give premature and dangerous trading signals when a new
trend erupts from a range. When a strong trend begins, oscillators start acting
like a dog that pulls its owner off his path.
An oscillator can stay overbought for weeks at a time when a new, strong
uptrend begins, giving premature sell signals. It can stay oversold for weeks
in a steep downtrend, giving premature buy signals. Knowing when to use
oscillators and when to rely on trend-following indicators is a hallmark of a
mature analyst (see Section 43).
Types of Divergences
Oscillators, as well as other indicators, give their best trading signals when
they diverge from prices. Bullish divergences occur when prices fall to a new
low while an oscillator refuses to decline to a new low. They show that bears
are losing power, prices are falling out of inertia, and bulls are ready to seize
control. Bullish divergences often mark the ends of downtrends.
Bearish divergences occur in uptrends — they identify market tops. They
emerge when prices rally to a new high while an oscillator refuses to rise to a
new peak. A bearish divergence shows that bulls are running out of steam,
prices are rising out of inertia, and bears are ready to take control.
There are three classes of bullish and bearish divergences (Figure 28-1).
Class A divergences identify important turning points —the best trading
opportunities. Class В divergences are less strong, and class C divergences
are least important. Valid divergences are clearly visible — they seem to jump
from the charts. If you need a ruler to tell whether there is a divergence,
assume there is none.
Class A bearish divergences occur when prices reach a new high but an
oscillator reaches a lower high than it did on a previous rally. Class A bear-
ish divergences usually lead to sharp breaks. Class A bullish divergences
occur when prices reach a new low but an oscillator traces a higher bottom
than during its previous decline. They often precede sharp rallies.
Class В bearish divergences occur when prices make a double top but an
oscillator traces a lower second top. Class В bullish divergences occur when
prices make a double bottom but an oscillator traces a higher second bottom.
Class C bearish divergences occur when prices rise to a new high but an
indicator stops at the same level it reached during the previous rally. It shows
144
COMPUTERIZED TECHNICAL ANALYSIS
Price
Indicator
Divergence
Class A Class A Class В Class В Class C Class C
Bearish Bullish Bearish Bullish Bearish Bullish
Figure 28-1. Types of Divergences
Divergences between prices and indicators give some of the most pow-
erful signals in technical analysis. Divergences are defined by the differ-
ences in height or depth of prices and indicators.
Class A bearish divergence-prices reach a new peak while an indicator
reaches a lower peak. This is the strongest sell signal.
Class A bullish divergence-prices fall to a new low while an indicator
stops at a more shallow low than before. This is the
strongest buy signal.
Class В bearish divergence-prices trace a double top while an indicator
reaches a lower peak. This is the second strongest sell
signal.
Class В bullish divergence-prices trace a double bottom while an indica-
tor traces a higher second bottom. This is the second
strongest buy signal.
Class C bearish divergence-prices reach a new peak while an indicator
traces a double top. This is the weakest bearish diver-
gence.
Class C bullish divergence-prices fall to a new low while an indicator
makes a double bottom. This is the weakest bullish
divergence.
28. MOMENTUM
145
that bulls are becoming neither stronger nor weaker. Class C bullish diver-
gences occur when prices fall to a new low but the indicator traces a double
bottom.
Class A divergences almost always identify good trades. Class В and C
divergences more often lead to whipsaws. It is best to ignore them, unless
they are strongly confirmed by other indicators.
Triple Bullish or Bearish Divergences consist of three price bottoms and
three oscillator bottoms or three price tops and three oscillator tops. They are
even stronger than regular divergences. In order for a triple divergence to
occur, a regular bullish or bearish divergence first has to abort. That’s
another good reason to practice tight money management! If you lose only a
little on a whipsaw, you will not suffer—and you will have both the money
and psychological strength to re-enter a trade.
Momentum and Rate of Change
Momentum and Rate of Change measure trend acceleration—its gain or loss
of speed. These leading indicators show when a trend speeds up, slows
down, or maintains its rate of progress. They usually reach a peak before the
trend reaches its high and reach a bottom before prices hit their low.
As long as oscillators keep reaching new highs, it is safe to hold long
positions. As long as they keep reaching new lows, it is safe to hold short
positions. When an oscillator reaches a new high, it shows that an uptrend
is gaining speed and is likely to continue. When an oscillator traces a lower
peak, it shows that an uptrend has stopped accelerating, like a rocket that
has run out of fuel. When it flies only because of inertia, you have to get
ready for a reversal. The same reasoning applies to oscillator lows in
downtrends.
Momentum and Rate of Change compare today’s closing price to a price a
selected period of time ago. Momentum subtracts a past price from today’s
price; Rate of Change divides today’s price by a past price.
^*tod
M = ^tod _ Aod - n R°C =
“tod — n
where M = Momentum.
RoC = Rate of Change.
Ptod ~ Today’s closing price.
Ptod - n = Closing price n days ago (chosen by trader).
146
COMPUTERIZED TECHNICAL ANALYSIS
For example, a 7-day Momentum of closing prices equals today’s closing
price minus the closing price 7 days ago. Momentum is positive if today’s
price is higher, negative if today’s price is lower, and at zero if today’s price
equals the price of 7 days ago. The slope of the line connecting momentum
values for each day shows whether momentum is rising or falling.
A 7-day Rate of Change (RoC) divides the latest price by the closing
price 7 days ago. If they are equal, RoC equals 1. If today’s price is higher,
then RoC is greater than 1, and if today’s price is lower, then RoC is less
than 1. The slope of the line that connects values for each day shows whether
Rate of Change is rising or falling (see worksheet, Figure 28-2).
A trader must choose the width of the time window for Momentum or
RoC. As a rule of thumb, it pays to keep oscillator windows fairly narrow.
Use wide windows for trend-following indicators whose goal it is to catch
trends. Use narrow windows for oscillators to detect short-term changes in
the markets.
Momentum and RoC share a flaw with simple moving averages — they
jump twice in response to each piece of data. They react to each new price,
and they jump again when that piece of data leaves the oscillator’s window.
Smoothed Rate of Change takes care of this problem.
Crowd Psychology
Each price reflects the consensus of value of all market participants at the
moment of transaction. Momentum and RoC compare today’s price (today’s
consensus of value) to a previous price (an earlier consensus of value). They
measure changes in mass optimism or pessimism.
To find out whether a child is growing fast enough, you can measure his
height each month and compare it with his height six months ago. Then you
find out whether your child is growing normally, growing so slowly that you
should take him to a doctor, or growing fast enough to think about applying
for a basketball scholarship. Momentum and RoC tell you whether a trend is
accelerating, slowing down, or moving at the same speed.
When Momentum or RoC rises to a new peak, it shows that the optimism
of the market crowd is growing, and prices are likely to rally higher. When
Momentum or RoC falls to a new low, it shows that the pessimism of the
market crowd is increasing, and lower prices are likely ahead.
When prices rise but Momentum or RoC falls, it warns you that a top is
near —it is time to think of taking profits on long positions or tightening
stops. If prices reach a new high but Momentum or RoC reaches a lower top,
28. MOMENTUM
147
Crude Oil
Date Close i Mtm:7 RoC:7 i 13-EMA S-RoC 13/21
6/6 20.51 -0.84 96.07 I 21.04 100.51
6/7 20.45 i -0.71 96.64 I 20.95 99.68
6/10 20.09 -1.36 93.66 I 20.83 98.61
6/11 20.20 1 -1.06 95.01 T~2O74 98.14
6/12 20.31 ; -0.94 95.58 I 20.68 97.96
6/13 20.01 1 -111 94.74 ! 20.58 97.65
6/14 20.00 -0.64 96.90 I 20.50 97.25
6/17 20.13 -0.38 98.15 1 20.45 96.94
6/18 20.10 : -0.35 98.29 i 20.40 96.56
6/19 19.91 -0.18 99.10 | 20.33 96.07
6/20 20.17 -0.03 99.85 i 20.30 95.94
6/21 20.21 -0.10 99.51 1 20.29 96.04
6/24 20.00 : -o.bi 99.95 1 20.25 '95.96
6/25 20.10 0.10 166.50 ; 20.23 95.72
6/26 20.09 -0.04 99.80 "t 2b:21 95.49
6/27 20.46 0.36 101.79 1 20.24 95.66
6/28 20.53 0.62 103.11 | 20.29 95.67
7/01 20.65 0.48 102.38 1 20.34 95.88
7/02 20.70 i 0.49 102.42 j 20.39 96.10
7/03 20.55 : 0.55 102.75 1 20.41 96.27
7/05 20.72 : 0.62 103.08 > 20.46 96.84
7/08 , 21.03 : 0.94 104.68 I 20.54 97.64
7/09 ' 21.10 0.64 103.13 20.62~ 98.41
7/10 21.29 0.76 103.70 i 20.71 99.45
7/11 21.09 0.44 102.13 ! 20.77 100.14
7/12 21.48 0.78 103.77 j 20.87 100.93
7/15 21.23 0.68 103.31 > 20.92 101.65
7/16 21.37 = 0.65 103.14 1 20.99 102.37
7/17 21.81 6.78 103.71 : '21.10 103.21
7/18 21.66 i 0.56 102.65 ' 21.18 103.85
Figure 28-2. Momentum, Rate of Change, and Smoothed Rate
of Change Worksheet
Momentum (Mtm:7) is today's closing price minus the closing price 7
days ago.
Rate of Change (RoC:7) is today's closing price divided by the closing
price 7 days ago.
You can use closing prices for the day in these formulas or median
prices (high plus low, divided by two). This also applies to most indica-
tors described in this book. It is OK to use time windows that are wider
or narrower than 7 days.
To create a Smoothed Rate of Change (S-RoC 13/21), calculate a 13-
day exponential moving average of closing prices and apply a 21-day
Rate of Change to it.
148
COMPUTERIZED TECHNICAL ANALYSIS
that bearish divergence gives a strong sell signal. The reverse holds true in
downtrends.
There are times when Momentum and RoC act not as leading but as coin-
cident indicators. Think what happens to a rocket when it hits an overhead
obstacle. Its speed and momentum stop rising and fall together as the rocket
crashes. This happens in the markets when the crowd gets hit by a major
piece of bad news and this “overhead obstacle” sends RoC and prices down
together.
Trading Rules
Leading indicators are like brake lights on a car ahead of you on a highway.
When they light up, you do not know whether the other driver is tapping his
breaks or slamming them. You have to be extra careful putting on trades
using leading indicators (Figure 28-3).
1. When the trend is up, buy whenever RoC declines below its centerline
and ticks up. It shows that the uptrend has slowed down — like a train
that slows down to pick up passengers. When the trend is down, sell
short whenever RoC rallies above its centerline and ticks down.
2. If you hold a long position and prices begin to slide, see whether RoC
has reached a record peak before this pullback. A new peak in RoC
shows a high level of bullish energy, which is likely to lift the market
to its previous high or higher. Then it is relatively safe to hold long
positions. On the other hand, a series of declining peaks in RoC is a
sign of weakness —it is better to sell immediately. Reverse this
approach in downtrends.
3. A break in a trendline of Momentum or RoC often precedes a break of
a price trendline by a day or two. When you see a leading indicator
break a trendline, prepare for a break in the price trend.
Smoothed Rate of Change
This oscillator, developed by Fred G. Schutzman, avoids the major flaw of
RoC. It responds to each piece of data only once rather than twice. Smoothed
Rate of Change (S-RoC) compares the values of an exponential moving
average (EMA) instead of prices at two points in time. It gives fewer trading
signals, and the quality of these signals is better.
28. MOMENTUM
149
Figure 28-3. Seven-day Momentum (Mtm:7) and Rate of
Change (RoC:7)
When Momentum or RoC rises, it shows that a rally is accelerating.
When it falls, it shows that a decline is accelerating. Peaks and bottoms
of these indicators show when a trend has reached its maximum speed.
Once Momentum or RoC turns, it is time to begin a countdown to a
reversal. These indicators give their best signals when they diverge from
prices (as marked by arrows on the chart).
Momentum and RoC can be analyzed using classical charting meth-
ods, which often give leading trading signals. Notice how RoC and
Momentum have sliced through their resistance in August, several days
prior to a price breakout. At the right edge of the chart, a bearish diver-
gence shows that the uptrend has run out of steam. It is time to take prof-
its on long positions and go short, with a protective stop a few ticks
above the September top.
150
COMPUTERIZED TECHNICAL ANALYSIS
To create S-RoC you must first calculate an exponential moving average
of closing prices (see Section 25). The next step is to apply Rate of Change
to the EMA. S-RoC is not very sensitive to the length of its EMA or RoC
parts. You can calculate a 13-day EMA of closing prices and then apply a
21-day Rate of Change to it (see worksheet, Figure 28-2).
Some traders calculate the Rate of Change of prices first and then smooth
it with a moving average. Their method produces a much jumpier indicator,
which is less useful than S-RoC.
Crowd Behavior
An exponential moving average reflects the average consensus of value of
all market participants during the period of its window. It is like a composite
photograph that reflects major features of the market crowd rather than its
fleeting moods.
S-RoC compares each reading of an EMA to a past reading from your
selected period of time. It compares the average mass consensus today to the
average consensus in the past. S-RoC tracks major shifts in the bullishness
and bearishness of the market crowd.
Trading Rules
Changes in the direction of S-RoC often identify important market turns.
Upturns of S-RoC mark significant bottoms, and its downturns mark impor-
tant tops (Figure 28-4). Divergences between S-RoC and prices give espe-
cially strong buy and sell signals.
1. Buy when S-RoC turns up from below its centerline.
2. Sell when S-RoC stops rising and turns down. Sell short when S-RoC
turns down from above its centerline.
3. If prices reach a new high but S-RoC traces a lower peak, it shows that
the market crowd is less enthusiastic even though prices are higher. A
bearish divergence between S-RoC and price gives a strong signal to
sell short.
4. If prices fall to a new low but S-RoC traces a higher bottom, it shows
that the market crowd is less fearful, even though prices are lower. It
29. WILLIAMS %R
151
Figure 28-4. Smoothed Rate of Change (S-RoC 13/21)
To create this indicator, calculate a 13-day exponential moving average
of closing prices and apply a 21-day Rate of Change to it. S-RoC usually
flows in smooth waves whose crests and bottoms identify many impor-
tant turning points. This indicator works especially well in the stock mar-
ket, with stock groups as well as with individual stocks.
shows that the downside pressure has lessened, even though the mar-
ket has fallen deeper than before. A bullish divergence gives a strong
signal to cover shorts and buy.
29. WILLIAMS %R
Williams %R (Wm%R) is a simple but effective oscillator described by
Larry Williams in 1973. It measures the capacity of bulls and bears to close
prices each day near the edge of the recent range. Wm%R confirms trends
and warns of their upcoming reversals.
Hr-C
Wm%R = 100----------
Hr-Lr
152
COMPUTERIZED TECHNICAL ANALYSIS
where r = the time window selected by a trader, such as 7 days.
Hr= the highest high of the selected period (i.e., a 7-day high).
Lr = the lowest low of the selected period (i.e., a 7-day low).
C = the latest close.
Wm%R measures the placement of each closing price in relation to the
recent high-low range. It expresses the distance from the highest high to the
lowest low in its time window as 100 percent. It expresses the distance from
the latest closing price to the top of that window as a percentage of the range
in its window (see worksheet, Figure 29-1). Williams %R is closely related
to Stochastic (see Section 30).
Wm%R is designed to fluctuate between 0 and 100 percent. It equals 0
(plotted at the top of the chart) when bulls reach the peak of their power and
close prices at the top of the range. It reaches 100 percent when bears are at
the peak of their power and close prices at the bottom of the recent range.
A rule of thumb with all oscillators—when in doubt,-make them shorter.
This is the opposite of trend-following indicators — when in doubt make
them longer. Oscillators with narrow windows help catch short-term rever-
sals. If you work with cycles, make Wm%R equal half the cycle length. A 7-
day window fits Wm%R fine. Wm%R works well with weekly charts —use
a 7-week window.
Horizontal reference lines for Wm%R are drawn at 10 percent and 90 per-
cent levels. When Wm%R closes above its upper reference line, it shows
that bulls are strong but the market is overbought. When Wm%R closes
below its lower reference line, it shows that bears are strong but the market
is oversold.
Crowd Psychology
Each price is a momentary consensus of value among all market participants.
The high of the recent range shows how high bulls can lift prices — it reflects
their maximum power. The low of the range reflects the maximum power of
bears during that period. Closing price is the most important consensus of
the day because the settlement of trading accounts depends on it.
Wm%R compares each closing price to the recent range. It shows whether
bulls can close the market near the top of the recent, range or bears can close
the market at the bottom of the range. Wm%R measures the balance of
power between bulls and bears at closing time — the crucial money-counting
time in the market.
Bulls may push prices higher during the day, or bears may push them
29. WILLIAMS %R
153
Gold
Date High Low Close Wm%R:7
8/14 362.2 358.2 361.2
8/15 363.5 360.2 360.4
8/16 361.6 360.3 361.3
8/19 366.5 360.4 362.0
8/20 362.0 355.3 359.3
8/21 360.4 358.2 360.1
8/22 359.9 357.4 357.5 80.36
8/23 357.2 355.3 356.7 87.50
8/26 358.6 357.1 358.5 71.43
8/27 358.8 356.9 357.8 77.68
8/28 359.5 356.1 357.3 70.15
8/29 356.4 353.7 354.1 94.03
8/30 351.5 348.5 351.4 74.56
9/03 352.0 349.4 351.6 71.82
9/04 352.3 351.6 351.8 70.00
9/05 350.7 349.8 350.3 83.64
9/06 352.5 349.8 352.3 65.45
9/09 355.9 353.4 354.3 26.58
Figure 29-1. Williams %R Worksheet
Wm%R expresses the distance from the latest closing price to the top of
the 7-day high-low range as a percentage of that range. Wm%R:7 is cal-
culated here using a 7-day time window. You may choose a longer or a
shorter window, depending on the trend you are trying to analyze.
lower. Wm%R shows which group is capable of closing the market in its
favor. If bulls cannot close the market near the top during a rally, they are
weaker than they seem. This is a shorting opportunity. If bears cannot close
the market near the lows during a decline, they are weaker than they appear.
This is a buying opportunity.
Trading Rules
Wm%R gives three types of trading signals. They are, in order of impor-
tance, bullish or bearish divergences, failure swings, and overbought-over-
sold readings (Figure 29-2).
154
COMPUTERIZED TECHNICAL ANALYSIS
Figure 29-2. Seven-Day Williams %R (Wm%R:7)
When Wm%R rises above its upper reference line, it shows that the mar-
ket is overbought. When it falls below its lower reference line, it shows
that the market is oversold. The best buy and sell signals are given by
divergences (marked by arrows). A Class В bearish divergence in July
gave a sell signal. A Class A bullish divergence in September gave a
strong buy signal.
Failure swings (marked by the letter F) occur when Wm%R reverses
without reaching its reference line. This happens during reactions against
very strong trends-failure swings confirm those trends. A failure swing
during a downtrend in August gave a strong sell signal. A failure swing
during an uptrend in September gave a strong buy signal.
At the right edge of the chart, prices are surging. If Wm%R dips below
its lower reference line, use that as a buying opportunity. Do not sell
short unless a bearish divergence emerges.
Divergences
Divergences between prices and Wm%R rarely occur. They identify the best
trading opportunities. When Wm%R rises above its upper reference line,
falls, and then cannot rise above that line during the next rally, it creates a
bearish divergence. It shows that bulls are losing their power and the market
29.WILLIAMS %R
155
is likely to fall. A bullish divergence occurs when Wm%R falls below its
lower reference line, rallies, and then cannot decline below that line when
prices slide again. It shows that bears are losing power and a rally is in the
offing.
1. When you identify a bullish divergence, go long and place a protective
stop below the recent price low.
2. When you identify a bearish divergence, go short and place a protec-
tive stop above the recent price high.
Failure Swings
Crowds tend to swing from one extreme to the other. Wm%R seldom
reverses in the middle of its range. Failure swings occur when Wm%R fails
to rise above its upper reference line during a rally or fall below its lower
reference line during a decline.
3. When Wm%R stops rising in the middle of a rally and turns down
without reaching its upper reference line, it produces a failure swing.
This shows that bulls are especially weak and gives a sell signal.
4. When Wm%R stops falling in the middle of a decline and turns up
without reaching its lower reference line, that is a failure swing. It
shows that bears are very weak and gives a buy signal.
Overbought and Oversold
When prices close near the upper edge of their range, Wm%R reaches its top
and becomes overbought. When prices close near the bottom of their recent
range, Wm%R falls and becomes oversold. Neither bulls nor bears are all-
powerful. They seldom can close prices near the extreme of the recent range
for too many days in a row.
5. When Wm%R rises above its upper reference line, it marks a potential
market top and gives a sell signal.
6. When Wm%R falls below its lower reference line, it marks a potential
market bottom and gives a buy signal.
These overbought and oversold signals tend to work well during flat trad-
ing ranges. They become premature and dangerous when the market enters a
156
COMPUTERIZED TECHNICAL ANALYSIS
trend. Wm%R can stay near the top for a week or longer during a strong
rally: Its overbought readings can identify strength rather than a shorting
opportunity. Similarly, in a strong downtrend, Wm%R can stay oversold for
weeks, indicating weakness rather than a buying opportunity.
Overbought and oversold readings of Wm%R should be used for trading
only after you identify the major trend. Use long-term trend-following indi-
cators for that purpose (see Section 43). If a weekly chart shows a bull mar-
ket, take only buy signals from daily Wm%R, and do not go short when it
gives a sell signal. If a weekly chart indicates a bear market, sell short when-
ever daily Wm%R gives you a sell signal, but do not go long when it
becomes oversold.
30. STOCHASTIC
Stochastic is an oscillator popularized by George Lane. It is now included in
many software programs and widely used by computerized traders.
Stochastic tracks the relationship of each closing price to the recent high-low
range.
Stochastic is more complex than Williams %R. It includes several steps
for filtering out market noise and weeding out bad signals. Stochastic con-
sists of two lines: a fast line called %K and a slow line called %D.
1. The first step in calculating Stochastic is to obtain “raw Stochastic” or
%K:
Qod ~^n
%K=------------ • 100
^n~^n
where Ctotj = today’s close.
= the lowest point for the selected number of days.
= the highest point for the selected number of days.
= the number of days for Stochastic, selected by the trader.
Ln
n
The standard width of Stochastic’s time window is 5 days, although some
traders use much higher values. A narrow window helps catch more turning
points, but a wider window helps identify major turning points.
2. The second step is to obtain %D. It is done by smoothing %K—usu-
ally over a three-day period. It can be done in several ways, such as:
30. STOCHASTIC
157
3-day sum of (Ctnfi -Z„)
%D =----------------—-------— • 100
3-day sum of (Hn-L^)
There are two ways to plot Stochastic—Fast and Slow. Fast Stochastic
consists of two lines—%K and %D—plotted on the same chart. It is very sen-
sitive to market turns but leads to many whipsaws. Many traders prefer a less
sensitive Slow Stochastic. The %D of Fast Stochastic becomes the %K of
Slow Stochastic and is smoothed by repeating step 2 to obtain %D of Slow
Stochastic. Slow Stochastic does a better job of filtering out market noise and
leads to fewer whipsaws. A 5-bar Slow Stochastic (smoothed over a 3-day
period) is a popular choice among traders (see worksheet, Figure 30-1).
Swiss Franc
Date i High Low Close 1 %K:5 %D:5 Slow %D
9/16 ; 68.07 67.24 67.83 ;
9/17 • 68.22 67.79 67.97 i
9/18 j 67.61 66.81 67.36 i
9/19 I 67.52 67.02 67.25 :
9/20 i 67.57 66.87 67.50 i 48.94
9/23 I 68.21 67.89 68.04 = 87.23
9/24 i 68.53 67.48 67.64 i 48.26 60.57
9/25 i 67.87 67.57 67.71 i 50.60 60.54
9/26 i 67.97 67.48 67.58 ; 42.77 i 47.22 56.11
9/27 ; 68.30 67.37 68.23 i 74.14 I 53.79 53.85
9/30 i 68.49 68.25 68.37 = 86.21 64.57 55.20
Figure 30-1. Stochastic Worksheet
• The %K of Fast Stochastic is similar to Williams %R.
• The %D of Fast Stochastic is obtained by smoothing %K over a 3-day
period.
• The %D of Fast Stochastic becomes the %K of Slow Stochastic and is
smoothed once again to obtain %D of Slow Stochastic.
Most traders use computers to construct Stochastic. Choosing the
width of the Stochastic window depends on a trend you are trying to
identify. A very short-term Stochastic (5 days or so) helps catch short-
term reversals. A longer Stochastic (14-21 days) helps identify more sig-
nificant market turns.
158
COMPUTERIZED TECHNICAL ANALYSIS
Stochastic is designed to fluctuate between 0 and 100. Reference lines are
drawn at 20 percent and 80 percent levels to mark overbought and oversold
areas. Slow Stochastic seldom reaches the same extremes as raw Williams
%R.
Crowd Psychology
Each price is the consensus of value of all market participants at the moment
of transaction. Daily closing prices are important because the settlement of
trading accounts depends on them. The high of any period marks the maxi-
mum power of bulls during that time. The low of that period shows the max-
imum power of bears during that time.
Stochastic measures the capacity of bulls or bears to close the market near
the upper or lower edge of the recent range. When prices rally, markets tend
to close near the high. If bulls can lift prices up during the day but cannot
close them near the top, Stochastic turns down. It shows that bulls are
weaker than they seem and gives a sell signal.
Daily closes tend to occur near the lows during downtrends. When a bar
closes near its high, it shows that bears can only push prices down during the
day but cannot hold them down. An upturn of Stochastic shows that bears
are weaker than they appear and flashes a buy signal.
Trading Rules
Stochastic shows when bulls or bears become stronger or weaker. This
information helps you decide whether bulls or bears are likely to win the
current fight in the market. It pays to trade with the winners and against
the losers.
Stochastic gives three types of trading signals, listed here in the order of
importance: divergences, the level of Stochastic lines, and their direction
(Figure 30-2).
Divergences
The most powerful buy and sell signals of Stochastic are given by diver-
gences between this indicator and prices.
30. STOCHASTIC
159
Figure 30-2. Five-Day Slow Stochastic
68.53
67,08
65.48
63.96
62.43
120.88
98.88
68. N
38.88
8,88
Stochastic lines help identify top and bottom areas when they move
above or below their reference lines. These signals work well during
trading ranges but are premature when a new trend begins (see early
September). Stochastic gives its best signals when it diverges from prices.
There is a Class A bearish divergence in early October, prior to a sharp
price break.
Once you go long or short using Stochastic, place a protective stop
immediately below the latest minor low or above the latest minor high.
There is a buy signal at the right edge of the chart-it is time to cover
shorts and buy.
1. A bullish divergence occurs when prices fall to a new low but
Stochastic traces a higher bottom than during the previous decline. It
shows that bears are losing strength and prices are falling out of iner-
tia. As soon as Stochastic turns up from its second bottom, it gives a
strong buy signal: Go long and place a protective stop below the latest
low in the market. The best buy signals occur when the first bottom is
below the lower reference line and the second is above it.
2. A bearish divergence occurs when prices rally to a new high but
Stochastic traces a lower top than during its previous rally. It shows
160
COMPUTERIZED TECHNICAL ANALYSIS
that bulls are becoming weaker and prices are rising out of inertia. As
soon as Stochastic turns down from its second top, it gives a sell sig-
nal: Go short and place a protective stop above the latest price peak.
The best sell signals occur when the first top is above the upper refer-
ence line and the second is below.
Overbought and Oversold
When Stochastic rallies above its upper reference line, it shows that the mar-
ket is overbought. Overbought means too high, ready to turn down. When
Stochastic falls below its lower reference line, it shows that the market is
oversold. Oversold means too low, ready to turn up.
These signals work fine during trading ranges but not when a market
develops a trend. In uptrends, Stochastic quickly becomes overbought and
keeps giving sell signals while the market rallies. In downtrends, Stochastic
quickly becomes oversold and keeps giving premature buy signals. It pays to
combine Stochastic with a long-term trend-following indicator (see Section
43). The Triple Screen trading system allows traders to take buy signals from
daily Stochastic only when the weekly trend is up. When the weekly trend is
down, it allows traders to take only sell signals from daily Stochastic.
3. When you identify an uptrend on a weekly chart, wait for daily
Stochastic lines to decline below their lower reference line. Then,
without waiting for their crossover or an upturn, place a buy order
above the high of the latest price bar. Once you are long, place a pro-
tective stop below the low of the trade day or the previous day,
whichever is lower.
The shape of Stochastic’s bottom often indicates whether a rally is likely
to be strong or weak. If the bottom is narrow and shallow, it shows that bears
are weak and the rally is likely to be strong. If it is deep and wide, it shows
that bears are strong and the rally is likely to be weak. It is better to take only
strong buy signals.
4. When you identify a downtrend on a weekly chart, wait for daily
Stochastic lines to rally above their upper reference line. Then, with-
out waiting for their crossover or a downturn, place an order to sell
short below the low of the latest price bar. By the time Stochastic lines
cross over, the market is often in a free fall. Once you are short, place
30. STOCHASTIC
161
a protective stop above the high of the trade day or the previous day,
whichever is higher.
The shape of Stochastic’s top often indicates whether a decline is likely to
be steep or sluggish. A narrow top in Stochastic shows that bulls are weak
and a severe decline is likely. A Stochastic top that is high and wide shows
that bulls are strong—it is safer to pass up that sell signal.
5. Do not buy when Stochastic is overbought and do not sell short when
it is oversold. This rule filters out most bad trades.
Line Direction
When both Stochastic lines are headed in the same direction, they confirm
the short-term trend. When prices rise and both Stochastic lines rise, the
uptrend is likely to continue. When prices slide and both Stochastic lines fall,
the short-term downtrend is likely to continue.
More on Stochastic
Stochastic can be used in any timeframe, including weekly, daily, or intra-
day. Weekly Stochastic usually changes its direction one week prior to
weekly MACD-Histogram. If weekly Stochastic turns, it warns you that
trend-following MACD-Histogram is likely to turn the next week. It is a sig-
nal to tighten stops on existing positions or start taking profits.
Choosing the width of the Stochastic window is important. Short-term
oscillators are more sensitive. Long-term oscillators turn only at important
tops and bottoms. If you use Stochastic as a stand-alone oscillator, a longer
Stochastic is preferable. If you use Stochastic as part of a trading system,
combined with trend-following indicators, then a shorter Stochastic is
preferable.
An ingenious way to use Stochastic, popularized by Jacob Bernstein, is
called a Stochastic pop. When Stochastic crosses above its upper reference
line, it indicates strength. You can buy for a quick rally and sell as soon as
Stochastic turns down. This signal can help you catch the last splash of the
bullish wave.
Stochastic is one of the favorite tools of automatic trading systems devel-
opers. These modern-day alchemists try to use Stochastic in a pu.ely
162
COMPUTERIZED TECHNICAL ANALYSIS
mechanical manner, buying and selling when the two Stochastic lines cross.
They discard Stochastic when it fails to deliver magic results. Trading the
crossovers of Stochastic lines is not profitable, no matter how much you
optimize them, because Stochastic works differently, depending on whether
the market is in a trend or in a trading range.
31. RELATIVE STRENGTH INDEX
Relative Strength Index (RSI) is an oscillator developed by J. Welles Wilder,
Jr. It is now included in most software packages. RSI measures the strength
of any trading vehicle by monitoring changes in its closing prices. It is a
leading or a coincident indicator—it is never a laggard.
RSI = 100 -
100
1 + RS
average of net UP closing changes for a selected number of days
RS =--------------------------------------------------------------
average of net DOWN closing changes for the same
number of days
The pattern of RSI peaks and valleys does not change in response to the
width of its time window. Trading signals become more visible with shorter
RSI, such as 7 or 9 days. Most traders use computers to calculate and plot
RSI. Take these steps to calculate a 7-day RSI for any market:
1. Obtain closing prices for the past 7 days.
2. Find all days where the market closed higher than the day before and
add up the amounts of increases. Divide the sum by 7 to obtain the
average UP closing change.
3. Find all days when the market closed lower than the day before and
add up the amounts of declines. Divide the sum by 7 to obtain the
average DOWN closing change.
4. Divide the average UP closing change by the average DOWN closing
change to obtain Relative Strength (RS). Insert RS in the formula
above to arrive at RSI — Relative Strength Index.
5. Repeat the process daily (see worksheet, Figure 31-1).
31. RELATIVE STRENGTH INDEX
163
Swiss Franc
Date Close UpAvg:7 > DownAvg:7 ; RSI:7
iO/29 77.34 .1 i
10/30 78.02 г i
10/31 77.71
11/1 __ "1 г
11/2 79.15 1 t
11/5 79.91 i t
11/6 79.63 I !
11/7 79.99 0.4629 I 0.0843 I 84.60
11/8 79.96 0.3967 | 0.0765 i 83.83
11/9 79.94 0.3401 1 0.0685 i 83.24
11/12 79.96 0.2943 I 0.0587 * 83.38
11/13 79.76 0.2523 1 0.0789 i 76.18
11/14 80.09 0.2634 0.0676 79.58
11/15 79.72 0.2258 I 0.1108 I 67.08
11/16 80.10 0.2478 I 0.0950 • 72.29
Figure 31-1. Seven-Day Relative Strength Index Worksheet
Begin by calculating average UP closing and average DOWN closing for
the past 7 days. Insert the results in the RSI formula and then start using
the calculation shortcut, as outlined in the text.
If you calculate RSI by hand, you can use a shortcut. Once you have 7
days’ worth of data, replace steps 2 and 3 on all following days:
2. Multiply yesterday’s average UP closing change by 6, add today’s UP
closing change, if any, and divide the total by 7. That is your new
average UP closing change.
3. Multiply yesterday’s average DOWN closing change by 6, add today’s
DOWN close if any, and divide the total by 7. That is your new aver-
age DOWN closing change. Then proceed to step 4 (opposite page).
RSI fluctuates between 0 and 100. When RSI reaches a peak and turns
down, it identifies a top. When RSI falls and then turns up, it identifies a bot-
tom. These turns come at different levels in different markets or even in the
same market, during bull and bear periods.
164
COMPUTERIZED TECHNICAL ANALYSIS
Overbought and oversold levels vary from market to market and from
year to year. There are no magical levels marking all tops and bottoms.
Oversold and overbought signals are like hot and cold readings on a ther-
mometer. The same temperature has a different meaning in summer or in
winter.
Horizontal reference lines must cut across the highest peaks and the low-
est valleys of RSI. They are often drawn at 30 and 70. Some traders use 40
and 80 levels in bull markets or 20 and 60 in bear markets. Use the 5 percent
rule: Draw each line at a level beyond which RSI has spent less than 5 per-
cent of its time in the past 4 to 6 months. Adjust reference lines once every
three months.
Mass Psychology
Each price represents the consensus of value of all market participants at the
moment of transaction. Closing price reflects the most important consensus
of the day because the settlement of traders’ accounts depends on it. When
the market closes higher, bulls make money and bears lose. When the market
closes lower, bears make money and bulls lose.
Most traders in all markets pay more attention to closing prices than to
any other prices. In the futures markets, money is transferred from losers’ to
winners’ accounts at the end of each trading day. RSI shows whether bulls or
bears are stronger at closing time —the crucial money-counting time in the
market.
Trading Rules
RSI gives three types of trading signals. They are, in order of importance,
divergences, charting patterns, and the level of RSI.
Bullish and Bearish Divergences
Divergences between RSI and prices give the strongest buy and sell signals.
They tend to occur at major tops and bottoms. They show when the trend is
weak and ready to reverse (Figure 31-2).
1. Bullish divergences give buy signals. They occur when prices fall to a
31. RELATIVE STRENGTH INDEX
165
69.72
67.90
66.07
64.25
62.43
iee.ee
75.00
50.60
25.06
e.ee
Figure 31-2. Seven-Day Relative Strength Index
RSI gives its best trading signals when it diverges from prices. Its
strongest divergences are those in which prices rise to a new high or fall
to a new low, while RSI fails to cross its reference line.
RSI tends to break its trendlines ahead of prices. In addition to the
ones marked, you can find several other examples on this chart where
the breaking of RSI trendlines identifies turning points in the Swiss Franc.
At the right edge of the chart, as soon as RSI breaks above its trendline, it
will confirm a bullish divergence and give a strong buy signal.
new low but RSI makes a more shallow bottom than during its previ-
ous decline. Buy as soon as RSI turns up from its second bottom, and
place a protective stop below the latest minor price low. Buy signals
are especially strong if the first RSI bottom is below its lower refer-
ence line and the second bottom is above that line.
2. Bearish divergences give sell signals. They occur when prices rally to
a new peak but RSI makes a lower top than during the previous rally.
Sell short as soon as RSI turns down from its second top, and place a
protective stop above the latest minor high. Sell signals are especially
strong if the first RSI top is above its upper reference line and the sec-
ond top is below it.
166
COMPUTERIZED TECHNICAL ANALYSIS
Charting Patterns
Classical charting methods work better with Relative Strength Index than
with other indicators. Trendlines, support and resistance, and head-and-
shoulders patterns work well with RSI. RSI often completes these patterns a
few days in advance of prices, providing hints of likely trend changes. For
example, RSI trendlines are usually broken one or two days before price
trendlines.
3. When RSI breaks its downtrendline, place an order to buy above the
price trendline in order to catch an upside breakout.
4. When RSI breaks its uptrendline, place an order to sell short below the
price trendline to catch a downside breakout.
RSI Levels
When RSI rises above its upper reference line, it shows that bulls are strong
but the market is overbought and entering its sell zone. When RSI declines
below its lower reference line, it shows that bears are strong but the market
is oversold and entering its buy zone.
It pays to buy using overbought signals of daily RSI only when the
weekly trend is up. It pays to sell short using sell signals of daily RSI only
when the weekly trend is down (see Section 43).
5. Buy when RSI declines below its lower reference line and then rallies
above it.
6. Sell short when RSI rises above its upper reference line and then
crosses below it.
More on RSI
Some traders try to find deeper meaning in RSI patterns. Some analysts have
described formations called positive and negative reversals, which they
said forecasted the extent of any price move using RSI patterns. So far, there
have been no reports of conspicuous success using these patterns from any-
one but their promoters.
V
The Neglected Essentials
32. VOLUME
Volume represents the activity of traders and investors. Each unit of volume
in the market reflects the action of two persons: One trader sells a share and
another buys a share, or one buys a contract and another sells a contract.
Daily volume is the number of contracts or shares traded in one day.
Traders usually plot volume as a histogram—vertical bars whose height
reflects each day’s volume (Figure 32-1). They usually draw it underneath
prices. Changes in volume show how bulls and bears react to price swings.
Changes in volume provide clues as to whether trends are likely to continue
or to reverse.
Some traders ignore volume. They think that prices already reflect all
information known to the market. They say, “You get paid on price and not
on volume.” Professionals, on the other hand, know that analyzing volume
can help them understand markets deeper and trade better.
There are three ways to measure volume:
1. The actual number of shares or contracts traded. For example, the
New York Stock Exchange reports volume this way. This is the most
objective way of measuring volume.
2. The number of trades that took place. For example, the London Stock
Exchange reports volume this way. This method is less objective
because it does not distinguish between a 100-share trade and a 5000-
share trade.
167
168
THE NEGLECTED ESSENTIALS
Volume
Nay
468.1
446.7
425.4
484.8
382.6
77799
58349
38988
19458
8
Figure 32-1.
To interpret volume, you need to link! i (changes in
A. An increase in volume during an uptrend calls for higher prices
prices:
ahead. Buy or add to longs.
B. Prices jump on more than double the average volume. It is a sign of
a potential blow-off move/fjghten stops on long positions^
C. Prices rally near the level of their previous peak, but volume is
much lower. This bearish divergence signals a topCSeTTTbngs and
(^go~short.
□.Prices collapse_on panicky volume. Such climax bottoms are usu-
ally retestedp ighten stops on short positions^»
E. Silver falls to a new low, but volume is lower than it was at point
D-а typical retest of a climax bottom^Cover shorts and go longt
F. A new high in price is accompanied by an increase in volume, sim-
ilar to what happened at point A. Continue to hold long positions.
3. Tick volume is the number of price changes during a selected time,
such as 10 minutes or an hour. It is called tick volume because most
changes equal 1 tick. Most futures exchanges in the United States do
not report intraday volume, and day-traders use tick volume as its
proxy.
32. VOLUME
169
Volume reflects the activity of buyers and sellers. If you compare volume
between two markets, it will show which one is more active or liquid. You
are likely to suffer less slippage in liquid markets than in thin, low-volume
markets.
Crowd Psychology
Volume reflects the degree of financial and emotional involvement, as well
as pain, of market participants. A trade begins with a financial commitment
by two persons. The decision to buy or sell may be rational, but the act of
buying or selling creates an emotional commitment in most people. Buyers
and sellers crave to be right. They scream at the market, pray, or use lucky
talismans. Volume reflects the degree of emotional involvement among
traders.
Each tick takes money away from losers and gives it to winners. When
prices rise, longs make money and shorts lose. When prices fall, shorts gain
and longs lose. Winners feel happy and elated, while losers feel depressed
and angry. Whenever prices move, about half the traders are hurting. When
prices rise, bears are in pain, and when prices fall, bulls suffer. The greater
the increase in volume, the more pain in the market.
Traders react to losses like frogs to hot water. If you throw a frog into a
boiling kettle, it will jump in response to sudden pain, but if you put a frog
into cool water and heat it slowly, you can boil it alive. If a sudden price
change hits traders, they jump from pain and liquidate losing positions. The
same losers can be very patient if their losses increase gradually.
You can lose a great deal of money in a sleepy market, such as com,
where a one-cent move costs only $50. If com goes against you just a few
cents a day, the pain is easy to tolerate. If you hang on, those pennies can add
up to thousands of dollars in losses. Sharp moves, on the other hand, make
losers cut their losses in a panic. Once weak hands get shaken out, the mar-
ket is ready to reverse. Trends can last for a long time on moderate volume
but can expire after a burst of volume.
Who buys from a trader who sells his losing long position? It may be a
short seller taking profits and covering shorts. It may be a bargain hunter
who steps in because prices are “too low.” That bottom-picker assumes the
position of a loser who washed out—and he either catches the bottom or
becomes the new loser.
Who sells to a trader who buys to cover his losing short position? It may
170
THE NEGLECTED ESSENTIALS
be a savvy investor who takes profits on his long position. It also may be a
top-picker who sells short because he thinks that prices are “too high.” He
assumes the position of a loser who covered his shorts, and only the future
will tell whether he is right or wrong.
When shorts give up during a rally, they buy to cover and push the market
higher. Prices rise, flush out even more shorts, and the rally feeds on itself.
When longs give up during a decline, they sell and push the market lower.
Falling prices flush out even more longs, and the decline feeds on itself.
Losers who give up propel trends. A trend that moves on steady volume is
likely to continue. Steady volume shows that new losers replace those who
wash out. Trends need a fresh supply of losers the way builders of the
ancient pyramids needed a fresh supply of slaves.
Falling volume shows that the supply of losers is running low and a trend
is ready to reverse. It happens after enough losers catch on to how wrong
they are. Old losers keep bailing out, but fewer new losers come in. Falling
volume gives a sign that the trend is about to reverse.
A burst of extremely high volume also gives a signal that a trend is nearing
its end. It shows that masses of losers are bailing out. You can probably recall
holding a losing trade longer than you should have. Once the pain becomes
intolerable and you get out, the trend reverses and the market goes the way you
expected, but without you! This happens time and again because most ama-
teurs react to stress similarly and bail out at about the same time. Professionals
do not hang in while the market beats them up. They close out losing trades
fast and reverse or wait on the sidelines, ready to re-enter.
Volume usually stays low in trading ranges because there is relatively lit-
tle pain. People feel comfortable with small price changes, and trendless
markets seem to drag on forever. A breakout is often marked by a dramatic
increase in volume because losers run for the exits. A breakout on low vol-
ume shows little emotional commitment to a new trend. It indicates that
prices are likely to return into their trading range.
Rising volume during a rally shows that more buyers and short sellers are
pouring in. Buyers are eager to buy even if they have to pay up, and shorts
are eager to sell to them. Rising volume shows that losers who leave are
being replaced by a new crop of losers.
When volume shrinks during a rally, it shows that bulls are becoming less
eager, while bears are no longer running for cover. The intelligent bears have
left long ago, followed by weak bears who could not take the pain. Falling
volume shows that fuel is being removed from the uptrend and it is ready to
reverse.
32. VOLUME
171
When volume dries up during a decline, it shows that bears are less eager
to sell short, while bulls are no longer running for the exits. The intelligent
bulls have sold long ago, and the weak bulls have been shaken out. Falling
volume shows that the remaining bulls have a higher level of pain tolerance.
Perhaps they have deeper pockets or bought later in the decline, or both.
Falling volume identifies an area in which a downtrend is likely to reverse.
This reasoning applies to long and short timeframes. As a rule of thumb,
if today’s volume is higher than yesterday’s volume, then today’s trend is
likely to continue.
Trading Rules
The terms “high volume” and “low volume” are relative. What is low for
IBM is high for Apple Computer, while what is low for gold is high for plat-
inum, and so on. As a rule of thumb, “high volume” for any given market is
at least 25 percent above average for the past two weeks, and “low volume”
is at least 25 percent below average.
1. High volume confirms trends. If prices rise to a new peak and volume
reaches a new high, then prices are likely to retest or exceed that peak.
2. If the market falls to a new low and the volume reaches a new high,
that bottom is likely to be retested or exceeded. A “climax bottom” is
almost always retested on low volume, offering an excellent buying
opportunity.
3. If volume shrinks while a trend continues, that trend is ripe for a rever-
sal. When a market rises to a new peak on lower volume than its pre-
vious peak, look for a shorting opportunity. This technique does not
work as well at market bottoms because a decline can persist on low
volume. There is a saying on Wall Street: “It takes buying to put
stocks up, but they can fall of their own weight.”
4. Watch volume during reactions against the trend. When an uptrend is
punctuated by a decline, volume often picks up in a flurry of profit
taking. When the dip continues but volume shrinks, it shows that bulls
are no longer running or that selling pressure is spent. When volume
dries up, it shows that the reaction is nearing an end and the uptrend is
ready to resume. This identifies a good buying opportunity. Major
downtrends are often punctuated by rallies which begin on heavy vol-
172
THE NEGLECTED ESSENTIALS
ume. Once weak bears have been flushed out, volume shrinks and
gives a signal to sell short.
More on Volume
You can use a moving average to define the trend of volume. The slope of a
5-day exponential moving average of volume can define volume’s trend.
You can also draw trendlines of volume and watch for their breakouts (see
Section 21). Volume breakouts confirm price breakouts.
Volume-based indicators provide more precise timing signals than volume
alone. Traders’ Index, Herrick Payoff Index, Force Index, and others include
volume data (see Chapters 6 and 8).
33. VOLUME-BASED INDICATORS
Traders can use several technical indicators to help them analyze volume.
Some traders track a 5-day exponential moving average of volume. Its slope
identifies the trend of volume (see Sections 25 and 32). Others use On-
Balance Volume and Accumulation/Distribution.
On-Balance Volume
On-Balance Volume (OBV) is an indicator designed by Joseph Granville and
described in his book, New Strategy of Daily Stock Market Timing. Granville
used OBV as a leading indicator of the stock market, but other analysts have
applied it to the futures markets.
OBV is a running total of volume. It rises or falls each day, depending on
whether prices close higher or lower than on the previous day. When a stock
closes higher, it shows that bulls won the day’s battle; its volume on that day
is added to OBV. When a stock closes lower, it shows that bears won the
day, and that day’s volume is subtracted from OBV. If prices close
unchanged, OBV stays unchanged.
On-Balance Volume often rises or falls before prices — it acts as a leading
indicator. As Granville put it, “Volume is the steam that makes the choo-
choo go.”
33. VOLUME-BASED INDICATORS
173
Crowd Psychology
Prices represent the consensus of value, while volume represents the emo-
tions of market participants. It reflects the intensity of traders’ financial and
emotional commitments, as well as pain among losers (see Section 32).
OBV is a running total of volume. It tracks changes in traders’ involvement
in the market and the intensity of their pain.
A new high in OBV shows that bulls are powerful, bears are hurting, and
prices are likely to rise. A new low in OBV shows that bears are powerful,
bulls are hurting, and prices are likely to fall. When the pattern of OBV devi-
ates from the pattern of prices, it shows that mass emotions are not in gear
with mass consensus. A crowd is more likely to follow its heart than its
mind. This is why changes in volume often precede changes in prices.
Trading Signals
The patterns of OBV tops and bottoms are more important than the absolute
levels of this indicator. Those levels depend on when you start to calculate
On-Balance Volume. When OBV rises or falls together with prices, the trend
is confirmed. If prices reach a new high and OBV reaches a new high, the
uptrend is likely to continue. If prices reach a new low and OBV falls to a
new low, the downtrend is likely to continue. It is safer to trade in the direc-
tion of a trend that is confirmed by OBV (Figure 33-1).
1. When OBV reaches a new high, it confirms the power of bulls, indi-
cates that prices are likely to rise even higher, and gives a buy signal.
When OBV reaches a new low, it confirms the power of bears, calls
for lower prices ahead, and gives a signal to sell short.
2. OBV gives its strongest buy and sell signals when it diverges from
prices- If prices rally, sell off, and then riseTo аГ hew high, but OBV
rallies to a lower high, it creates a bearish divergence and gives a
strong sell signal. If prices decline, rebound, and then fall to a new
low, but OBV falls to a more shallow bottom, it traces a bullish diver-
gence and gives a strong buy signal. Long-term divergences are more
important than short-term divergences. Divergences that develop over
the course of several weeks give stronger signals than those that last
only a few days.
174
THE NEGLECTED ESSENTIALS
73
65
56
48
48
65858?
534736
418964
287193
163421
When OBV moves in gear with a trading vehicle, it confirms its trend.
The uptrend A of OBV confirms the stock rally. Its break in March gives
a sell signal. There are two shorting signals at the top. The first, in early
April, is given by a bearish divergence between OBV and price. Two
weeks later, OBV breaks its support B, giving another signal to sell short.
The downtrendline C of OBV confirms the slide of Apple
Computer-hold shorts. An upside breakout in July gives a signal to cover
shorts.
3. When prices are in a trading range and OBV breaks out to a new high,
it gives a buy signal. When prices are in a trading range and OBV
breaks down and falls to a new low, it gives a signal to sell short.
More on OBV
One of the reasons for Granville’s success in his heyday (see Section 6) was
that he combined OBV with two other indicators — the Net Field Trend
indicator and the Climax indicator. Granville calculated OBV for each
stock in the Dow Jones Industrial Average and rated its OBV pattern as ris-
ing, falling, or neutral. He called that a Net Field Trend of a stock: It could
33. VOLUME-BASED INDICATORS
175
be +1, -1, or 0. Climax indicator was a sum of the Net Field Trends of all 30
Dow stocks.
When the stock market rallied and the Climax indicator reached a new
high, it confirmed strength and gave a buy signal. If the stock market rallied
but the Climax indicator made a lower top, it gave a sell signal.
You can view the Dow Jones Industrial Average as a team of 30 horses
pulling the market wagon. The Climax indicator shows how many horses are
pulling uphill, downhill, or standing still. If 24 out of 30 horses pull up, 1
down and 5 are resting, then the market wagon is likely to move up. If 9
horses pull up, 7 pull down, and 14 are resting, then the wagon is ready to
roll downhill.
OBV, the Net Field Trend indicator, and the Climax indicator can be eas-
ily programmed on a computer. It would be worthwhile to apply them to a
database which includes all stocks of the S&P 500 index. That may produce
good signals for trading S&P 500 futures or options.
Accumulation/Distribution
This indicator was developed by Larry Williams and described in his 1972
book, How I Made a Million Dollars. It was designed as a leading indicator
for stocks, but several analysts have applied it to futures. The unique feature
of Accumulation/Distribution (A/D) is that it tracks the relationship between
opening and closing prices, along with volume.
If prices close higher than they opened, then bulls won the day and A/D is
positiveTlf prices close lower than they opened, then the bears won and A/D
is negative. If prices close where they opened, then nobody won and A/D is
zero. A running total of each day’s A/D creates a cumulative
Accumulation/Distribution indicator.
A/D credits bulls or bears with only a fraction of each day’s volume. That
fraction depends on the day’s range and the distance from opening to closing
price. The greater the spread ^between opening and closing pricerelativeto
daily range/tKFgreaterThe^hang^iiTAccumulation/Distnbution.
Close - Open
A/D =------------------- Volume
High - Low
For example, if the distance from today’s high to low is 5 points but the dis-
tance from the open to the close is 2 points, then only 2/5 of today’s volume
176
THE NEGLECTED ESSENTIALS
is credited to the winning camp. The pattern of A/D highs and lows is more
important than its absolute level, which depends on the starting date.
When the market rises, most people focus on new highs. But if prices
open higher and close lower, then A/D, which tracks their relationship, turns
down. It warns that the uptrend is weaker than it appears. If A/D ticks up
while prices are down, it shows that bulls are gaining strength.
Crowd Behavior
Opening and closing prices are among the most important prices of the day.
The opening price reflects all the pressures that have gathered while the mar-
ket was closed. Openings are often dominated by amateurs who read their
newspapers in the evening and trade in the morning.
Professional traders are active throughout the day. They often trade
against the amateurs. As the day goes on, waves of buying and selling by
amateurs and slow-moving institutions gradually subside. Professionals usu-
ally dominate the markets at closing time. Closing prices are especially
important because the settlement of trading accounts depends on them.
A/D tracks the outcomes of daily battles between amateurs and profes-
sionals. It ticks up when prices close higher than they opened—when profes-
sionals are more bullish than amateurs. It ticks down when prices close
lower than they opened—when professionals are more bearish than ama-
teurs. It pays to bet with the professionals and against the amateurs.
Trading Rules
When the market opens low and closes high, it moves from weakness to
strength. A/D then rises and shows that market professionals are more
bullish than amateurs. This means that the market is likely to move higher
the following day. When A/D falls, it shows that market professionals are
more bearish than amateurs. When the market moves from strength to weak-
ness, it is likely to reach a lower low the following day.
The best trading signals are given by divergences between A/D and
prices.
1. If prices rally to a new high but A/D reaches a lower peak, it gives a
signal to sell short. This bearish divergence shows that market profes-
sionals are selling into the rally (Figure 33-2).
33. VOLUME-BASED INDICATORS
177
62.258
52.758
43.258
33.750
24.258
10462
10355
10248
10140
10033
Figure 33-2. Accumulation/Distribution
Accumulation/Distribution gives its sTrongestTignais^yyhenjtdiyerges
ffom^pnc^ ATtHlislTdivergiehce^ives abuy signal at the Octoberbot-
tom. FouTmonths later and $30 higher, a bearish divergence gives a sell
signal. Take profits on long positions and go short.
2. A bullish divergence occurs when prices fall to a new low but A/D
stops at a higher low than during its previous decline. It shows that
market professionals are using the decline for buying, and a rally is
coming.
More on Accumulation/Distribution
When you go long or short, following a divergence between A/D and price,
remember that even market professionals can go wrong. Use stops and pro-
tect yourself by following the Hound of the Baskervilles rule (see Section
23).
Volume Accumulator, designed by Marc Chaikin, is an indicator very
similar to A/D. Volume Accumulator uses a mean price for the day instead of
the opening price. It is especially useful for those analysts who do not have
178
THE NEGLECTED ESSENTIALS
access to opening prices. Its trading signals and rules are similar to
Accumulation/Distribution.
There are important parallels between A/D and Japanese Candlestick
charts. Both focus on the differences between opening and closing prices.
A/D goes further than candlesticks by taking volume into account.
34. OPEN INTEREST
Open interest is the number of contracts held by buyers or owed by short
sellers in a given market on a given day. It shows the number of existing
contracts. Open interest equals either a total long or a total short position.
Stock market shares are traded for as long as a company stays in business
as a separate unit. Futures and options traders, on the other hand, deal in con-
tracts for a future delivery that expire at a set time.
A futures or options buyer who wants to accept delivery and a seller who
wants to deliver have to wait until the first notice day. This waiting period
ensures that the numbers of contracts that are long and short are always equal.
In any case, very few futures and options traders plan to deliver or to accept
delivery. Most traders close out their positions before the first notice day.
Open interest rises or falls depending on whether new traders enter the
market or old traders exit it. Open interest rises only when a new buyer and a
new seller enter the market. Their trade creates a new contract. For example,
if open interest in April COMEX gold is 8500 contracts, then 8500 contracts
are held by bulls and 8500 contracts are owed by short sellers at the close of
that day. If open interest rises to 8600, it means that the net of 100 new con-
tracts have been bought and sold short.
Open interest falls when a trader who is long trades with someone who is
short. When both of them close out their positions, open interest falls by one
contract because one contract disappears. If a new bull buys from an old bull
who is getting out of his long position, open interest remains unchanged:
Open interest also does not change when a new bear sells to an old bear who
needs to buy because he is closing out his short position.
Buyer Seller Open Interest
New buyer New seller Increases
New buyer Former buyer sells Unchanged
Former seller buys to cover New seller Unchanged
Former seller buys to cover Former buyer sells Decreases
34. OPEN INTEREST
179
Most futures and options exchanges release open interest data one day
later than prices. Some exchanges provide phone numbers to call for prelimi-
nary figures on open interest.
Technicians usually plot open interest as a line below price bars (Figure
34-1). Some chart services also plot average open interest for the past several
years. Open interest gives important messages when it deviates from its sea-
sonal norm. Open interest varies from season to season in many markets
because of massive hedging by commercial interests at different stages in
production cycles.
Open interest in currency futures tends to drop four times a year, at the
time of a contract rollover. If open interest does not drop during a rollover, it
shows a strong commitment among traders to the existing trend, which is
likely to accelerate.
Crowd Psychology
It takes one bull and one bear to create a futures or options contract. A bull
buys a contract if he is convinced that prices are going higher. A bear sells
short a contract if he is convinced that prices are going lower. When the two
trade, open interest rises by one contract. A single trade between one bull
and one bear is unlikely to move the markets. But when thousands of traders
make their trades, they propel or reverse market trends.
Open interest reflects the intensity of conflict between bulls and bears. It
reflects the willingness of longs to maintain long positions and the willing-
ness of shorts to maintain short positions. When bulls and bears do not
expect the market to move in their favor, they close out their positions and
open interest shrinks.
There are two people on opposite sides of every trade. One of them gets
hurt when prices change. If prices rally, bears get hurt. If prices fall, bulls get
hurt. As long as the losers hope, they hang on, and open interest does not
change.
A rise in open interest shows that a crowd of confident bulls is facing
down a crowd of equally confident bears. It points to a growing disagree-
ment between the two camps. One group is sure to lose, but as long as poten-
tial losers keep pouring in, the trend will continue. These ideas have been
clearly put forth in L. Dee Belveal’s classic book, Charting Commodity
Market Price Behavior.
Bulls and bears keep adding to their positions as long as they strongly dis-
180
THE NEGLECTED ESSENTIALS
Figure 34-1. Open Interest
13
12
11
10
9
58347
55072
51797
48522
45247
Open interest (Ol) reflects the number of all short or long positions in
any futures or options market. Open interest depends on the intensity of
conflict between bulls and bears.
Rising Ol shows that the conflict between bulls and bears is becoming
more intense and confirms the existing trend. Rising Ol during uptrends
shows it is safe to add to long positions (A and D). Flat Ol shows that
fewer losers are entering the market. This means that a mature trend is
nearing its end and it is time to take profits or tighten stops (B and E).
Falling Ol shows that losers are leaving the market and winners are cash-
ing in-that a trend is nearing its end. A fire cannot continue when fuel is
withdrawn, and a sharp drop in Ol during a trend signals that a reversal
is near (C and F).
At the right edge of the chart, cocoa prices have stabilized after falling
in October and open interest is flat. It shows that the decline in cocoa
has shaken out weak bulls and the uptrend is ready to resume. It is time
to go long, with a protective stop below the recent lows.
agree about the future course of prices. It takes conviction and disagreement
to maintain a trend. Rising open interest shows that the supply of losers is
growing and the cunent trend is likely to persist. If open interest increases
during an uptrend, it shows that longs are buying while bears are shorting
34. OPEN INTEREST
181
because they believe that the market is too high. They are likely to run for
cover when the uptrend puts a squeeze on them — and their buying will pro-
pel prices higher.
If open interest rises during a downtrend, it shows that shorts are aggres-
sively selling while bottom-pickers are buying. Those bargain hunters are
likely to bail out when falling prices hurt them, and their selling will push
prices even lower. An increase in open interest gives a green light to the
existing trend.
When a bull is convinced that prices are going higher and decides to buy,
but a bear is afraid to sell short, that bull can buy only from another bull who
bought earlier and now wants to get out. Their trade creates no new contract,
and open interest stays unchanged. When open interest stays flat during a
rally, it shows that the supply of losers has stopped growing.
When a bear is convinced that prices are going lower, he wants to sell
short. If a bull is afraid to buy from him, that bear can only sell to another
bear who shorted earlier and now wants to cover and leave. Their trade cre-
ates no new contract, and open interest does not change. When open interest
stays flat during a decline, it shows that the supply of bottom-pickers is not
growing. Whenever open interest flattens out, it flashes a yellow light—a
warning that the trend is aging and the best gains are probably behind.
Falling open interest shows that losers are bailing out while winners are
taking profits. When their disagreement decreases, the trend is ripe for a
reversal. Open interest falls when losers abandon hope and get out of the
market without being replaced by new losers. When a bull decides to get out
of his long position and a bear decides to cover his short position, the two
may trade with one another. When they do, a contract disappears, and open
interest shrinks by one contract. Falling open interest shows that winners are
cashing in and losers are giving up hope. It flashes a red light—it signals the
end of a trend.
Trading Rules
A 10 percent change in open interest deserves serious attention, while a 25
percent change often gives major trading messages. The meaning of rising,
falling, or flat open interest depends on whether prices are rallying, falling,
or flat at the time of change in open interest.
1. When open interest rises during a rally, it confirms the uptrend and
gives a signal that it is safe to add to long positions. It shows that more
182
THE NEGLECTED ESSENTIALS
short sellers are coming into the market. When they bail out, their
short covering is likely to push the rally higher.
2. When open interest rises while prices fall, it shows that bottom-pick-
ers are active in the market. It is safe to sell short because these bar-
gain hunters are likely to push prices lower when they throw in the
towel.
3. When open interest rises while prices are in a trading range, it is a
bearish sign. Commercial hedgers are more likely to sell short than
speculators. A sharp increase in open interest while prices are flat
shows that savvy hedgers are probably shorting the market.
4. When open interest falls sharply while prices are in a trading range, it
identifies short covering by major commercial interests and gives a
buy signal. When commercials start covering shorts, they show that
they expect the market to rise.
5. When open interest falls during a rally, it shows that both winners and
losers are getting “cold feet.” Longs are taking their profits, and shorts
are covering. Markets discount the future, and a trend that is accepted
by the majority is ready to reverse. If open interest falls during a rally,
sell and get ready to sell short.
6. When open interest falls during a decline, it shows that shorts are cov-
ering and buyers are taking their losses and bailing out. If open interest
falls during a slide, cover shorts and get ready to buy.
7. When open interest goes flat during a rally, it warns that the uptrend is
getting old and the best gains have already been made. This gives you
a signal to tighten stops on long positions and avoid new buying.
When open interest goes flat during a decline, it warns you that the
downtrend is mature and it is best to tighten stops on short positions.
Flat open interest in a trading range does not contribute any new infor-
mation.
More on Open Interest
The higher the open interest, the more active the market, and the less slip-
page you risk while getting in and out of positions. Short-term traders should
focus on the markets with the highest open interest. In the futures markets, it
pays to trade the delivery months with the highest open interest.
35. HERRICK PAYOFF INDEX
183
Tracking Commitments of Traders reports can help you find out
whether new buying or selling is primarily done by small or large specula-
tors or by hedgers (see Chapter 7).
Very few technical indicators use open interest. The Herrick Payoff
Index is the best-known indicator that utilizes it.
35. HERRICK PAYOFF INDEX
The Herrick Payoff Index (HPI) is an indicator developed by John Herrick, a
technical market analyst from California. He taught it privately, but the indi-
cator became more popular after it was included in CompuTrac software in
the early 1980s.
The Herrick Payoff Index helps detect accumulation and distribution.
Most indicators measure only prices, some measure volume, but HPI tracks
open interest as well as prices and volume. HPI confirms valid trends and
helps catch their reversals.
How to Construct HPI
The Herrick Payoff Index may be calculated using several types of daily
data. You may use a single contract with its own price, volume, and open
interest. It is more practical to combine volume and open interest from all
contracts and apply them to the prices of the most active delivery month.
HPI uses daily high and low prices, volume, and open interest. It requires
data for at least three weeks before it begins producing meaningful numbers.
Its complex formula makes using a computer almost a necessity (see work-
sheet, Figure 35-1).
HPI = Xy + (K-Ky)
where Ky = yesterday’s HPI.
К = • C • V] • [1 ± {(/• 2)/G}]
and M = mean price — i.e., (High + Low)/2.
My = yesterday’s mean price.
C = the value of a 1-cent move (or use the same constant for
all contracts).
V = volume.
184
THE NEGLECTED ESSENTIALS
Copper
Date i High Low Close Vol. Ol Mean i HPI
12/27 ; 106.80 104.58 104.65 4552 30343 105.69 i
.... ...... в a. в .. ......... — — ........— ..................
12/28 i 105.19 104.11 105.13 3208 30195 104.65 i
12/29 I i 05.50 104.57 i 05.43 1770 29987 105.04 I -29.0
1/02 i 105.17 103.60 i 04.97 4146 30249 104.38 i -28.8
1/03 I 108.17 105.61 108.02 9940 30028 106.89 i -0.6
1/04 j 109.09 105.96 106.51 10036 28944 107.52 i 6.3
1/05 I 107.97 107.03 107.‘55 4262 29015 107.50 I 5.5
1/08 i 109.46 ide.'di 109.15 8030 30125 108.74 i 15.6
1/09 i iio.oo 108.00 108.05 6107 30162 109.00 I 15.7
1/10 I ide.oo 105.86 106.16 5841 29814 106.93 I 2.3
1/11 s 107.41 106.52 107.17 3033 29996 106.96 I 2.2
1/12 i 105.77 103.71 104.20 9053 30850 104.74 ; -17.1
Figure 35-1. Herrick Payoff Index Worksheet
HPI measures changes in prices, volume, and open interest. It is based on
mean rather than closing prices-the average consensus of value for the
day. The complexity of HPI makes using a computer almost a necessity.
I = absolute value of today’s minus yesterday’s open interest.
G = today’s or yesterday’s open interest, whichever is less.
The “+” or sign in the right brackets is determined as follows:
If M > My, the sign is if M < My, the sign is
Traders can apply HPI only to daily data and not to weekly or intraday
data. There is no such thing as weekly open interest. Weekly volume can be
obtained by adding up daily volume for five days, but open interest cannot
be added up.
Crowd Psychology
The Herrick Payoff Index measures mean prices rather than closing prices.
Daily mean prices represent the average consensus of value for the day.
Volume represents the degree of financial commitment in a given market.
When volume increases, the absolute value of HPI for that day increases.
35. HERRICK PAYOFF INDEX
185
Daily changes in open interest represent the flow of funds into and out of
the market. Rising open interest is bullish in an uptrend and bearish in a
downtrend. Falling open interest is bearish in an uptrend and bullish in a
downtrend. Flat open interest is essentially neutral.
Trading Rules
The Herrick Payoff Index gives several types of trading signals, listed here
in the order of importance. Divergences between HPI and prices identify
some of the best trading opportunities (Figure 35-2). When HPI breaks its
trendline, it gives an early warning that a price trendline is likely to be bro-
ken. When HPI crosses its centerline, it confirms new price trends.
1. When prices fall to a new low but HPI makes a higher bottom than
during the previous decline, it creates a bullish divergence and gives a
buy signal. When HPI turns up from its second bottom, buy and place
a protective stop below the latest price low.
2. A bearish divergence occurs when prices rally to a new high but HPI
makes a lower top. The signal to sell short is flashed when HPI turns
down from its second top. Place a protective stop above the latest high
price.
Important divergences develop over the course of several weeks. A diver-
gence that takes two months to develop is more powerful than the one in
which two weeks passed between the tops or bottoms. Pay attention to the
differences in the height of the adjacent HPI tops or bottoms. If the first top
or bottom is far away from the centerline and the second top or bottom is
near that line, that divergence is likely to lead to a greater move.
Bullish and bearish divergences of HPI often have long lead times. Once
you have identified a potential turning point using an HPI divergence, lean
on short-term oscillators for more precise timing. If a divergence between
HPI and price aborts, and you get stopped out, watch closely — you may get
an even better trading opportunity if a regular divergence turns into a triple
bullish or triple bearish divergence. Triple bullish divergences consist of
three lower bottoms in prices and three higher bottoms in HPI. Triple bearish
divergences consist of three higher tops in prices and three lower tops in
HPI. They occur at some of the major turning points in the markets.
3. HPI lends itself well to classical charting methods, especially trend-
lines. When trendlines of prices and HPI point in the same direction,
186
THE NEGLECTED ESSENTIALS
128
122
115
109
103
89.2
51.?
14.1
-23.4
-61.8
Figure 35-2. Herrick Payoff Index
HPI tracks the flow of funds into or out of the market by measuring
changes in prices, volume, and open interest. HPI gives its best signals
when its patterns diverge from price patterns. HPI identified market tops
in August and September by tracing lower peaks while prices rose to
new highs. HPI called market bottoms in October and November when
it stopped declining and bottomed out at more shallow levels while cop-
per slid to new lows.
The bullish divergence in November was followed by a breaking of a
downtrendline of HPI and a rally above HPI's centerline. This combina-
tion gave an especially strong signal to buy copper. The best signals
develop slowly and give traders plenty of time to get aboard a new
trend.
they confirm trends. HPI often breaks its trendline before prices break
theirs. When HPI breaks below its uptrend, it gives a sell signal. When
it breaks above a downtrend, it gives a buy signal. Then it pays to
either take profits or to tighten stops.
4. The position of HPI above or below its centerline shows whether bulls
or bears dominate the market. When HPI is above its centerline, it
shows that bulls are in control —it is better to be long. When HPI is
below its centerline, it is better to be short. Bulls may buy or add to
36. TIME
187
their long positions when HPI rises above its centerline. When HPI
declines below its centerline, it confirms downtrends.
36. TIME
Most people conduct their lives as if they intend to live forever—with no
review of the past, no real planning for the future, and minimal learning from
past mistakes. Freud showed that the unconscious mind does not have a
notion of time. Our deep-seated wishes remain laigely unchanged through-
out life.
When people join crowds, their behavior becomes even more primitive
and impulsive than when they are alone. Crowds pay no attention to time
even though they are affected by its passage. Individuals are ruled by the cal-
endar and the clock, but crowds have no notion of time. Crowds act out their
emotions as if they had all the time in the world.
Most traders focus only on changes in prices and pay little attention to
time. This is just another sign of being caught up in mass mentality.
The awareness of time is a sign of civilization. A thinking person is aware
of time, while someone who is acting impulsively is not. A market analyst
who pays attention to time is aware of a dimension hidden from the market
crowd.
Cycles
Long-term price cycles are a fact of economic life. For example, the U.S.
stock market tends to run in four-year cycles. They exist because the ruling
party inflates the economy going into the presidential election once every
four years. The party that wins the election deflates the economy when vot-
ers cannot take revenge at the polls. Flooding the economy with liquidity
lifts the stock market, and draining liquidity pushes it down. This is why the
2 years before a presidential election tend to be bullish, and the first 12 to 18
months following an election tend to be bearish.
Major cycles in agricultural commodities are due to fundamental produc-
tion factors, coupled with the mass psychology of producers. For example,
when livestock prices rise, farmers breed more animals. When those animals
reach the market, prices fall and producers cut back. When the supply is
absorbed, scarcity pushes prices up, breeders go to work again, and the
188
THE NEGLECTED ESSENTIALS
bull/bear cycle repeats. This cycle is shorter in hogs than in cattle because
pigs breed faster than cows.
Long-term cycles can help traders identify market tides. Instead, most
traders get themselves in trouble by trying to use short-term cycles for preci-
sion timing and predicting minor turning points.
Price peaks and valleys on the charts often seem to follow in an orderly
manner. Traders reach for a pencil and a ruler, measure distances between
neighboring peaks, and project them into the future to forecast the next top.
Then they measure distances between recent bottoms and extend them into
the future to forecast the next low.
Cycles put bread and butter on the tables of several experts who sell ser-
vices forecasting highs and lows. Few of them realize that what appears like
a cycle on the charts is often a figment of the imagination. If you analyze
price data using a mathematically rigorous program such as John Ehlers’
MESA (Maximum Entropy Spectral Analysis), you will see that approxi-
mately 80 percent of what appears like cycles is simply market noise. A
human mind needs to find order in chaos—and an illusion of order is better
than no order for most people.
If you look at any river from the air, it appears to have cycles, swinging
right and left. Every river meanders in its valley because water flows faster in
its middle than near the shores, creating turbulences that force the river to turn.
Looking for market cycles with a ruler and a pencil is like searching for
water with a divining rod. Profits from an occasional success are erased by
many losses due to unsound methods. If you are serious about trading with
cycles, you need a mathematical method for finding them, such as MESA or
Fourier analysis.
Fourier analysis searches for cycles in very large data samples, but MESA
takes a different tack. It searches for evidence of orderly cyclical movement
in a relatively short data window (Figure 36-1). Unlike other packages,
which give nonstop trading signals, MESA tells traders that no valid cycles
are present about 80 percent of the time. It aims to recognize cycles as they
emerge from market noise and tells you when a cycle begins to fade.
Indicator Seasons
A farmer sows in spring, harvests in late summer, and uses the fall to get
ready for winter. There is a time to sow and a time to reap, a time to bet on a
warm trend and a time to get ready for a cold spell. The concept of seasons
36. TIME
189
i
DATE1 = 911181 -Gyplj^pgnlent.........
OPEN ~ 255.13v'~X/‘ \................
HIGH ° 258.63 .........\......fl......:
LOU :: 255.08 ..........X- J''. /
CLOSE- 257.08
50
40
30
20
10
й
Figure 36-1. Price Cycles-Maximum Entropy Spectral Analysis
(MESA)
MESA (a method and a software package) shows that cycles are prone to
shift and disappear. The narrow window at the bottom of the chart keeps
track of cyclic content. When it is near its upper edge it shows that the
market is chaotic, and when it nears its lower edge it shows that the mar-
ket is cycling. A vertical arrow marks a transition from a chaotic to a
cyclical market.
The square window in the upper left corner shows cyclic content for
any date selected by the analyst. It currently shows that a 13-day cycle is
rising above the market noise. The jagged line at the right edge of the
chart projects the current cycle several days into the future.
can be applied to the financial markets. A trader can use a farmer’s
approach. He should look to buy in spring, sell in summer, go short in the
fall, and cover in winter.
Martin Pring developed the model of seasons for prices, but this concept
works even better with technical indicators. Indicator seasons show you
where you are in the market cycle. This simple but effective concept helps
you buy when prices are low and sell short when they are high. It tells you
190
THE NEGLECTED ESSENTIALS
when an indicator signal is likely to be strong or weak. It helps you stand
apart from the market crowd.
The season of any indicator is defined by two factors: its slope and its
position above or below the centerline. For example, we can apply the con-
cept of indicator seasons to MACD-Histogram (see Section 26). We define
the slope of MACD-Histogram as the relationship between two neighboring
bars. When MACD-Histogram rises from below its centerline, it is spring;
when it rises above its centerline, it is summer; when it falls from above its
centerline, it is autumn; and when it falls below its centerline, it is winter.
Spring is the best season for going long, and autumn is the best season for
selling short (Figure 36-2).
Indicator Slope Position Relative to Centerline Season Action
Rising Below Spring Go long
Rising Above Summer Start selling
Falling Above Fall Go short
Falling Below Winter Start covering
When MACD-Histogram is below its centerline but its slope is rising, it is
spring in the market. The weather is cool but turning warmer. Most traders
expect the winter to return and are afraid to buy. Emotionally, it is hard to
buy because the memories of a downtrend are still fresh. In fact, spring is the
best time for buying, with the highest profit potential. Risk is low because a
protective stop can be placed slightly below the market.
When MACD rises above its centerline, it is summer in the market—and
most traders recognize the uptrend. It is emotionally easy to buy in summer
because bulls have plenty of company. In fact, profit potential in summer is
lower than in spring and risks are higher because stops have to be farther
away from the market.
When MACD-Histogram is above its centerline but its slope turns down,
it is autumn in the market. Few traders recognize the change and they keep
buying, expecting summer to return. Emotionally, it is hard to sell short in
autumn — it requires you to stand apart from the crowd, which is still bullish.
In fact, autumn is the best time for selling short. The profit potential is high,
while risks can be limited by placing a stop above the recent highs or using
options.
When MACD-Histogram falls below its centerline, it is winter in the mar-
ket. By then, most traders recognize the downtrend. It is emotionally easy to
sell short in winter, joining many vocal bears. In fact, the risk/reward ratio is
rapidly shifting against bears. Potential rewards are getting smaller and risks
are high because stops have to be placed relatively far away from prices.
36. TIME
191
11 Nikkei Dow Weekly
sell
MACD-Histogram
Autumn
buy
Summer
Winter s₽nmG
Aug Sep Oct Nov Jan Feb Mar Apr May Jun Jul Aug Sep Oct Nov
32421
29261
26102
22942
19782
607.10
276.45
4.1923
384.83
715.48
Figure 36-2. Indicator Seasons
The concept of seasons can be applied to almost any indicator, even
though this example focuses on the weekly MACD-Histogram. It helps
you trade in gear with the markets.
Autumn-the indicator is above its centerline but falling. This is the
best season for establishing short positions.
Winter-the indicator drops below its centerline. Use weakness to take
profits on short positions.
Spring-the indicator turns up from below its centerline. It is the best
time to establish long positions. Notice “a cold spell11 in spring
when prices fell to a new low and MACD-Histogram ticked down
temporarily. Do not sell short when MACD-Histogram turns down
from below its centerline. Do not buy when it turns up from above
its centerline. A bullish divergence when prices fall to a new low
while the indicator makes a more shallow bottom gives a powerful
buy signal.
Summer-the indicator rises above its centerline. When the weather
gets hot, use strength to take profits on long positions.
Just as a fanner pays attention to the vagaries of weather, a trader needs to
pay attention to the vagaries of the markets. An autumn on the farm can be
interrupted by an Indian summer, and a market can stage a strong rally in
192
THE NEGLECTED ESSENTIALS
autumn. A sudden freeze can hit the fields in spring, and the market can drop
early in a bull move. A trader needs to use his judgment and apply several
indicators and techniques to avoid getting whipsawed (see Section 43).
The concept of indicator seasons focuses a trader’s attention on the pas-
sage of time in the market. It helps you plan for the season ahead instead of
jumping in response to other people’s actions.
Retracements
Many traders watch price retracements. For example, if a market rallies 120
points, traders try to add to long positions when the market retraces 50 per-
cent of the preceding move and declines 60 points from the top.
Many floor traders look for a trend to reverse after it retraces 61.8 percent
of the previous move. This number is based on the Fibonacci number series.
This idea of measuring retracements can also be applied to time. It pays to
measure how long each rally and decline have lasted. For example, rallies in
a bull market are often interrupted by declines that last approximately half as
long as the preceding rallies. If you discover that rallies tend to last 8 days
and declines 5 days, that knowledge encourages you to look for a buying
opportunity 4 days into a decline.
The Factor of Five
Analysts often feel confused when they look at charts in different timeframes
and see that the market is going in several directions at once. The trend may
be up on the daily charts but down on the weeklies, and vice versa. Which of
these trends will you follow? This becomes even more complex if you look
at intraday charts. Most traders pick one timeframe and close their eyes to
others — until a sudden move outside of “their” timeframe hits them.
The factor of 5 links all timeframes. If you start with monthly charts and
proceed to the weeklies, you will notice that there are 4.5 weeks to a month.
As you switch to daily charts, you will see 5 trading days to a week. As your
timeframe narrows, you will look at hourly charts —and there are approxi-
mately 5—6 hours to a trading day. Day-traders can proceed even further and
look at 10-minute charts, followed by 2-minute charts. All are related by the
factor of 5.
36. TIME
193
The proper way to analyze any market is to analyze it in at least two time-
frames. They should be related by the factor of 5. When you analyze the
market in two timeframes, the shorter of them has to be five times shorter
than the longer one. If you want to analyze daily charts, you must first exam-
ine weekly charts, and if you want to day-trade using 10-minute charts, you
first need to analyze hourly charts. This is one of the key principles of the
Triple Screen trading system (see Section 43).
VI
Stock Market Indicators
37. NEW HIGH-NEW LOW INDEX
Stock and futures traders used to live like two separate tribes. They traded
different markets and used different analytic tools. The wall between them
began to crumble after stock index futures were created in 1982. Both tribes
rushed to trade them. An astute trader owes it to himself to master the tools
of both tribes.
Shrewd stock traders use Stochastic, moving averages, and other tools of
futures analysts. Futures and options traders can time their stock index trades
better by using stock market indicators. They include the New High-New
Low Index (probably the best leading indicator of the stock market), the
Traders’ Index (TRIN), and several others.
How to Construct NH-NL
The New High-New Low Index (NH-NL) tracks the numbers of market
leaders. It measures the number of stocks that have reached new highs or
lows for the year on any given day. The stocks on the list of new highs are
the leaders in strength, and the stocks on the list of new lows are the leaders
in weakness. NH-NL confirms trends when it rallies or falls in gear with
prices. It identifies tops and bottoms in the stock market when it diverges
from prices.
The New High-New Low Index measures daily differences between new
194
37. NEW HIGH-NEW LOW INDEX
195
highs and new lows. The New High-New Low Index is easy to calculate by
hand, using information from the Market Diary section of most major news-
papers.
NH-NL = New Highs - New Lows
New highs and new lows are reported by most data services in the United
States. Make sure that your data vendor calculates new highs and lows over
a 52-week period. Some use the ancient “calendar method” and calculate
new highs and lows going back only to January.
Plot the New High-New Low Index as a histogram, with a horizontal ref-
erence line at zero level. On the days when there are more new highs than
new lows, NH-NL is positive and plotted above the centerline. On the days
when there are more new lows than new highs, NH-NL is negative and plot-
ted below the centerline. If the numbers of new highs and new lows are
equal, NH-NL is zero.
Crowd Psychology
A stock appears on the list of new highs when it is the strongest it has been
in a year. This shows that a herd of eager bulls is chasing its shares. A stock
appears on the list of new lows when it is the weakest it has been in a year.
This shows that a crowd of aggressive bears is dumping its shares.
The New High-New Low Index tracks the strongest and the weakest
stocks on the exchange and compares their numbers. It measures the balance
of power between the leaders in strength and the leaders in weakness. This is
why NH-NL is a leading indicator of the stock market. The broad indexes,
such as the S&P 500, tend to follow the trend of NH-NL (Figure 37-1).
You can visualize the 2000 stocks on the New York Stock Exchange as a
regiment of 2000 men. If each stock is a soldier, then new highs and new
lows are the officers. New highs are the officers who lead the attack up a hill,
and new lows are the officers who are deserting and running downhill. There
are no bad soldiers, only bad officers, say the military experts. The New
High-New Low Index shows whether more officers lead the attack uphill or
run downhill.
When NH-NL rises above its centerline, it shows that bullish leadership is
stronger. When NH-NL falls below its centerline, it shows that bearish leader-
ship is stronger. If the market rallies to a new high and NH-NL rises to a new
peak, it shows that bullish leadership is growing and the uptrend is likely to
196
STOCK MARKET INDICATORS
Figure 37-1. New High-New Low Index
337
322
306
291
275
247
155
64
-28
-120
Stocks making new highs for the year are the leaders in strength, and
stocks making new lows are the leaders in weakness. NH-NL measures
the direction and intensity of market leadership by comparing the num-
ber of new highs and new lows.
In the summer of 1987, mass bullishness rose to a high pitch, as the
bull market roared into its final peak. It was safe to hold stocks as long as
each new high in the stock market was confirmed by a new peak in the
New High-New Low Index (А, В, C, D, and E). The August peak in the
stock market was accompanied by a bearish divergence (E-F) in the NH-
NL Index, giving a sell signal.
When the stock market declined in September, many traders went
bargain hunting. Five years of rising prices had trained them to use
declines for buying. NH-NL, meanwhile, pointed to a severe weakness.
It peaked out at only 100 (C), indicating weakness. NH-NL turned nega-
tive in October (H). It gave repeated sell signals in advance of the his-
toric crash.
continue. If the market rallies but NH-NL shrinks, it shows that the uptrend is
in trouble. A regiment whose officers are deserting is likely to turn and run.
A new low in NH-NL shows that the downtrend is likely to persist. If
officers are running faster than men, the regiment is likely to be routed. If
stocks fall but NH-NL turns up, it shows that officers are no longer running.
37. NEW HIGH-NEW LOW INDEX
197
When officers regain their morale, the whole regiment is likely to rally
(Figures 37-2 and 37-3).
Trading Rules
Traders need to pay attention to three aspects of NH-NL, listed here in the
order of their importance: divergences between the peaks and bottoms of
NH-NL and prices, the trend of NH-NL, and the level of NH-NL above or
below its centerline.
Standard & Poor's 500
New High-New Low Index
1987
1988
328
308
272
244
216
96
-246
-588
-929
-1271
□
Figure 37-2. New High-New Low Index
The stock market crashed in October 1987, and the number of new lows
exploded, reaching nearly 1300 (A). The stock market bounced ("a dead
cat bounce") and fell back to its lows (B). The newspapers were filled
with alarmist articles, wondering whether this was the end of the
Western financial system as we knew it. NH-NL flashed a much more
optimistic message. It showed that new lows were shrinking-the officers
were refusing to run. The market retested its lows in December (C), and
NH-NL traced an even stronger bullish divergence, giving a buy signal. It
was confirmed when NH-NL crossed into positive territory (D). This was
the beginning of a 2-year bull market.
198
STOCK MARKET INDICATORS
New High-New Low Index E F
D El
Tun Jul Rug Sei 5ct Row Dec
360
348
337
325
314
317
171
24
-123
-269
Figure 37-3. New High-New Low Index
The New High-New Low Index gives its best messages when it diverges
from prices. This chart shows what happened prior to the 1989 mini-
crash and how the recovery began.
The market reached a new peak in August (A), accompanied by a
new peak in NH-NL, which indicated that the market was likely to go
higher. The rally in September (B) was accompanied by a bearish diver-
gence that gave a sell signal. The market struggled to a new high in
October (C), but NH-NL made a lower peak, repeating its sell signal.
NH-NL turned negative one day prior to the crash, forcefully confirming
its sell signal.
The October low (D) was followed by a reflex rally ("a dead cat
bounce"), and then prices twice retested their October lows (E, F). On
both occasions, NH-NL made more shallow bottoms than in October.
These bullish divergences gave buy signals, and a new uptrend began.
As long as a price peak is confirmed by a new high in NH-NL, the rally is
likely to continue, even if it is punctuated by a decline. When low prices are
accompanied by new lows in NH-NL, it means that bears are in control and
the downtrend is likely to continue. Divergences between NH-NL and broad
37. NEW HIGH-NEW LOW INDEX
199
market averages provide the best trading signals. A trend that loses its lead-
ers is likely to reverse.
1. If NH-NL traces a lower peak while the market rallies to a new high, it
creates a bearish divergence. This shows that bullish leadership is
weakening even though the broad market is higher. Bearish diver-
gences mark the ends of uptrends. If the last peak in NH-NL is about
+100 or less, then a major reversal is probably at hand and it is time to
get short. If the latest peak is much higher than +100, then the upside
leadership is strong enough to prevent the market from collapsing.
2. If NH-NL traces a more shallow bottom while the market declines to a
new low, it creates a bullish divergence. This shows that bearish lead-
ership is shrinking, even though the market is lower. If the latest low
in NH-NL is near -100, it shows that the bearish leadership is
exhausted and a major upside reversal is near. If the latest low is much
lower than -100, then bears still have some strength, and the down-
trend may pause but not reverse. Keep in mind that bullish diver-
gences at stock market bottoms tend to develop faster than bearish
divergences at market tops: Buy fast and sell slowly.
The slope of NH-NL on any given day is defined by the trend of its bars
for the last few days. When the market rallies and NH-NL rises, it confirms
uptrends. When NH-NL declines together with the market, it confirms
downtrends.
3. A rise in NH-NL shows that it is safe to hold long positions and add to
them. If NH-NL declines while the broad market stays flat or rallies, it
is time to take profits on short-term long positions. When NH-NL
falls, it shows that the bearish leadership is strong and it is safe to hold
short positions and even add to them. If the market continues to fall
but NH-NL rises, the downtrend is in question —it is time to cover
shorts.
4. If NH-NL rises on a flat day, it flashes a bullish message and gives a
buy signal. It shows that officers are going over the top while the sol-
diers are still crouching in their foxholes. When NH-NL falls on a flat
day, it gives a signal to sell short. It shows that officers are deserting
while the troops are still holding their positions. Soldiers are not
stupid — if the officers run, they will not stay and fight.
200
STOCK MARKET INDICATORS
The position of NH-NL in relation to its centerline shows whether bulls or
bears are in control. When NH-NL is above its centerline, it shows that more
market leaders are bullish than bearish. Then it is better to trade the stock
market from the long side. When NH-NL is below its centerline, it shows
that bearish leadership is stronger, and it is better to trade from the short side.
NH-NL can stay above its centerline for months at a time in bull markets and
below its centerline for months at a time in bear markets.
5. If NH-NL stays negative for several months but then rallies above its
centerline, it signals that a bull move is likely to begin. Then it is time
to look for buying opportunities, using oscillators for precise timing. If
NH-NL stays positive for several months but then falls below its cen-
terline, it shows that a bear move is likely to begin. Then it is time to
look for shorting opportunities using oscillators for precise timing.
More on NH-NL
Old analysts used to smooth NH-NL using 10-day and 30-day simple mov-
ing averages. When a 10-day MA of NH-NL crossed above a 30-day MA, it
gave a buy signal. When a 10-day MA crossed below a 30-day MA, it gave a
sell signal. Raw NH-NL gives clearer signals, but if you still want to smooth
NH-NL, it is better to use exponential moving averages.
The number of new highs and new lows is reported daily by the New
York Stock Exchange, the American Stock Exchange, the Over-the-Counter
Exchange, and the London Stock Exchange. Most overseas stock
exchanges do not report these numbers, but a computer-equipped analyst
should have no difficulty creating NH-NL for any market. Traders who use
NH-NL outside of the United States get an edge over competitors who lack
this indicator. You need to obtain one year’s worth of daily data for every
stock on the exchange you follow and update that file daily. Program your
computer to examine your database each day and flag those stocks that have
reached a new high or a new low for the past 52 weeks.
NH-NL does not work in the stock markets dominated by a handful of
stocks. For example, hundreds of stocks are listed on the Milan Stock
Exchange in Italy, but only 2 of them —FIAT and Generale — represent
nearly 70 percent of total market capitalization. These two giants can over-
ride the rest of the market.
38. TRADERS' INDEX AND OTHER STOCK MARKET INDICATORS
201
38. TRADERS' INDEX AND OTHER STOCK
MARKET INDICATORS
The Traders’ Index (TRIN) is a leading stock market indicator. It shows
when major rallies and declines get ready to reverse by measuring the inten-
sity of optimism of the dominant market group. Excessive optimism is asso-
ciated with market tops and excessive pessimism with bottoms.
TRIN measures the ratio of advancing to declining stocks and compares it
to the ratio of advancing to declining volume. This indicator was popularized
by Richard Arms and is included in most quote systems. Any broker with a
terminal on his desk can punch a few keys and see the latest TRIN. It is easy
to calculate TRIN by hand or by using a computer at the end of each trading
day.
New market developments have changed TRIN over the years: listed
stock options, index arbitrage, dividend recapture plays, and so on. The orig-
inal interpretation of TRIN had to be adjusted, but TRIN continues to stand
out as one of the best stock market indicators. It helps in timing stock trades
as well as trades in stock index futures and options.
How to Construct TRIN
You need four pieces of data to calculate the Traders’ Index: the number and
volume of advancing and declining stocks as well as the volume of both
groups. These figures are released by the New York Stock Exchange and
several other exchanges throughout each trading session.
Adv Issues Adv Volume
TRIN =---------------1----------------
Decl Issues Decl Volume
TRIN compares the relationship between the ratio of advancing and
declining stocks and the ratio of advancing and declining volume (see work-
sheet, Figure 38-1). If 1000 stocks rally on a volume of 100 million shares,
and 1000 stocks decline on a volume of 100 million shares, then TRIN
equals 1. If 1500 stocks go up on a volume of 150 million shares and 500
stocks go down on a volume of 50 million shares, TRIN remains 1.
TRIN falls when the volume of advancing stocks is disproportionately
high, compared to their number. TRIN rises when the volume of declining
stocks is disproportionately high, compared to their number.
202
STOCK MARKET INDICATORS
S&P 500
Date Adv Decl Adv Vol i Decl Vol TRIN:1 TRIN:13-EMA
6/04 784 765 8374 i 7107 .87
6/05 661 895 7162 1 9418 .97
6/06 681 861 6339 i 8783 1.10
6/07 445 1113 3251 i 11771 1.45
6/10 648 905 4230 i 6644 1.12
6/ii 868 '680 9371 I 4831 .66
6/12 6/13“ 6/14 356 ' 765 ' 1036 1237 2.734' 531" 2049 6787 11529 L 1??06_ 1 ’"5420^ j 4123 1.81 .70
6/17 645 851 4518 : 6916 1.16
6/18 622 895 5261 I 8177 1.08
6/19 399 1159 2453 i 11567 1.62
6/20 655 854 6305 i 7734 .94 1.10
6/21 841 684 11192 1 5239 .58 1.02
6/24 298 1322 1202 1 11592 2.17 1.18
6/25 612 888 5216 i 8171 1.08 1.17
Figure 38-1. Traders' Index (TRIN) Worksheet
TRIN tracks the ratio of advancing to declining stocks and compares it
with the ratio of advancing to declining volume. It works best when it is
smoothed with an exponential moving average, such as a 13-day EMA.
The volume of advancing stocks often swells out of proportion to their
number during rallies. If the ratio of advancing to declining issues is 2:1, but
the ratio of advancing to declining volume is 4:1, then TRIN equals 0.50 (2/1
+ 4/1). A low TRIN shows that bulls are highly optimistic, a rally is being
overdone, and a top is near.
When the market falls, the volume of declining stocks often swells out of
proportion to their number. If the ratio of advancing to declining issues is
1:2, but the ratio of advancing to declining volume is 1:4, then TRIN equals
2 (1/2 + 1/4). A high TRIN shows that bears are too optimistic, too much
volume goes into the declining stocks, a decline is being overdone, and the
market is nearing a bottom.
TRIN can change sharply from day to day. TRIN gives better signals
when it is smoothed with a moving average. You can use a 13-day exponen-
38. TRADERS' INDEX AND OTHER STOCK MARKET INDICATORS
203
tial moving average of daily TRIN (see Section 25). It filters out the noise of
daily swings and shows the true trend of this indicator. For the rest of this
chapter, the term TRIN is used as shorthand for 13-day EMA of daily TRIN.
Plot TRIN on an inverted vertical scale. Low numbers on the top identify
market peaks, and high numbers at the bottom identify market lows. Two
horizontal reference lines mark overbought and oversold levels. When TRIN
rises above its upper reference line, it shows that the stock market is over-
bought and nearing a top. When TRIN falls below its lower reference line, it
shows that the market is oversold and nearing a bottom.
The level of reference lines depends on whether the stocks are in a bull or
bear market or a neutral trading range. The overbought line is usually placed
at 0.65 or 0.70 in bull markets, 0.70 or 0.75 in bear markets. The oversold
line is placed at 0.90 or 0.95 in bull markets, 1.00 or 1.10 in bear markets.
These levels may shift by the time you read this book—use them as a start-
ing point for your own research.
The best way to draw reference lines is to examine a chart of an index
such as the S&P 500 for the past six months, along with TRIN. Mark all
important tops and bottoms of the S&P 500 and draw two reference lines
that cut across the corresponding tops and bottoms of TRIN. When TRIN
enters those extreme areas again, you will know that the market has entered
a reversal zone. Adjust oversold and overbought lines every three months.
Crowd Psychology
The stock market is a manic-depressive beast —it swings from expansive
mania to fearful depression. The mood of a manic-depressive patient goes
through cycles. When he reaches the bottom of depression, his mood starts
to improve. When he rises to the height of mania, he starts to slow down.
Traders can use TRIN to diagnose manic and depressive episodes in the
stock market and bet on their reversals (see Figure 38-2).
Crowds are emotional and short-term oriented. Trends often go farther
than you expect because crowds act out their feelings and run instead of act-
ing rationally. Trends reverse when masses of traders get tired of running.
TRIN shows when they become exhausted.
If bulls become greedy during a rally, they buy so many shares that
advancing volume swells out of proportion with the number of advancing
stocks. When TRIN rises above its upper reference line it shows that mass
optimism has risen to a level associated with tops.
204
STOCK MARKET INDICATORS
360
348
337
325
314
-8.68
-0.78
-8.89
-0.99
-1.09
Figure 38-2. Traders' Index (TRIN)
When the volume of rising stocks rises out of proportion to their number,
it reflects bullish enthusiasm, and TRIN becomes overbought. It rises and
then flashes a sell signal when it leaves its overbought zone. When the
volume of declining stocks becomes too large relative to their number,
TRIN becomes oversold. It gives a buy signal when it leaves its oversold
zone.
TRIN gives its best buy and sell signals when it diverges from the pat-
tern of the S&P 500 index. The market rose higher in October than in
September, but TRIN reached a lower top, giving a strong sell signal.
After the October fall, the market retested its bottom in November, but a
much higher bottom in TRIN showed that bears were out of breath. This
bullish divergence gave a strong buy signal. At the right edge of the
chart, the market is strong but TRIN is nowhere near overbought-hold
longs.
If bears dump shares during a decline, then downside volume swells out
of proportion with the number of declining stocks. When TRIN falls below
its lower reference line, it shows that bearishness is being overdone and an
upside reversal is near.
38. TRADERS' INDEX AND OTHER STOCK MARKET INDICATORS
205
Changes of TRIN are similar to what happens during rush hours at a sub-
urban commuter train station. In the morning, the departure platform gets
overcrowded, while at night there is a crowd at the arriving platform. The
biggest crowd identifies the peak of the trend — either into the city or back
home. You can identify traffic reversals by measuring the number of com-
muters crowding a platform. That is what TRIN does in the stock market.
TRIN identifies rush hours in uptrends and downtrends. It flags bullish
extremes at stock market tops and bearish extremes at market bottoms. TRIN
identifies mood swings of the stock market crowd. Professionals use this
information because they tend to trade against deviations and for a return to
normalcy.
Trading Rules
TRIN is plotted on an inverted scale. High numbers mark the bottoms and
low numbers signal market tops. TRIN hovers between 0.75 to 0.85 in neu-
tral markets. It is less than 1.0 because the volume of advancing stocks nor-
mally exceeds the volume of declining stocks. People are normally more
bullish than bearish.
TRIN cannot be used mechanically — the same readings mean different
things under different market conditions. Overbought and oversold readings
are lower during bear markets and higher during bull markets. For example,
TRIN of 0.60 marks great bullish strength at an early stage of a bull market. It
tells you to look for every opportunity to add to long positions. The same read-
ing of 0.60 during a rally in a bear market marks a major shorting opportunity.
This is why it pays to adjust overbought and oversold lines every three months.
1. Buy when TRIN leaves its oversold zone. When it crosses above its
lower reference line, it shows that bears have run out of steam. Buying
at this time is like betting on a traffic reversal after the rush hour.
2. Sell when TRIN leaves its overbought zone. When TRIN sinks below
its upper reference line, it shows that bulls are running out of breath.
Selling short at this time is safer than trying to pick the exact top.
3. TRIN works best when combined with the New High-New Low
Index (see Section 37). If TRIN becomes oversold while NH-NL
reaches a new low, it shows that bearish leadership is strong and the
downtrend is likely to continue. If TRIN becomes oversold but NH-
206
STOCK MARKET INDICATORS
NL traces a bullish divergence, it marks an important low. The com-
bined signals of TRIN and NH-NL give traders confidence to buy a
larger position.
4. If TRIN becomes overbought but NH-NL rises to a new high, it shows
that the upside leadership is strong and the uptrend is likely to con-
tinue. If TRIN becomes overbought while NH-NL traces a bearish
divergence, it often marks an important stock market top. Then you
can short a larger position.
TRIN gives its strongest buy and sell signals when it diverges from prices.
5. When the stock market rises to a new high but TRIN traces a lower
peak than it did during its previous rally, it shows that bulls are losing
power. When bulls cannot purchase as many shares as before, the
uptrend is in trouble. A bearish divergence between TRIN and the
stock market gives a strong sell signal.
6. When the stock market falls to a new low but TRIN flattens out at a
more shallow level than during its previous decline, it shows that bears
have fewer stocks to sell. When bears start losing power, the market is
ready to rally. A bullish divergence between TRIN and the stock mar-
ket gives a strong buy signal.
More on TRIN
The New York Stock Exchange releases information on advancing and
declining stocks and their volume throughout each trading session. Intraday
TRIN can be used by day-traders.
TRIN can be applied to any stock exchange that reports the numbers of
advancing and declining stocks and their volume. When that data becomes
available for overseas exchanges, the first traders to use it will have a com-
petitive advantage.
Advance/Dedine
The Advance/Decline line (A/D line) measures mass participation in rallies
and declines. If New Highs and New Lows are the officers, and the Dow
38. TRADERS' INDEX AND OTHER STOCK MARKET INDICATORS
207
Jones Industrials are the generals, then the A/D line shows whether or not
the soldiers are following their leaders. A rally or decline is more likely to
persist when the A/D line rises to a new high or falls to a new low in gear
with the Dow.
To calculate A/D for each day, subtract the number of declining stocks
from the number of advancing stocks and ignore unchanged stocks. The
result is positive or negative, depending on whether more stocks advanced or
declined. For example, if 1900 stocks were traded, 900 advanced, 700
declined, and 300 were unchanged, then Advance/Decline equals +200 (900
- 700). Each day’s Advance/Decline figures are added to the previous day’s
total, creating a cumulative A/D line.
Traders should keep an eye on new peaks and valleys in the A/D line
because its absolute level depends mostly on its starting date. Broadly based
rallies and declines have greater staying power. If a new high in the stock
market is accompanied by a new high in the A/D line, it shows that the rally
has broad support and is likely to continue. If the stock market reaches a new
peak but the A/D line reaches a lower peak than during the previous rally, it
shows that fewer stocks are participating, and the rally may be near its end.
When the market falls to a new low but the A/D line traces a more shallow
bottom than during the previous decline, it shows that the decline is narrow-
ing down and the bear move is nearing an end. These signals tend to precede
reversals by weeks if not months.
Most Active Stocks
The Most Active Stocks indicator (MAS) is an advance/decline line of the
15 most active stocks on the New York Stock Exchange. They are listed
daily in many newspapers. Several large capitalization stocks, such as IBM,
frequently appear on this list. Other stocks make the list only when they
catch the public’s eye due to an extremely positive or negative piece of
news. MAS is a big money indicator — it shows whether big money is bullish
or bearish.
MAS for each day equals the number of the most active stocks that
advanced minus the number of the most active stocks that declined. For
example, if 9 of the most active stocks went up, 4 fell, and 2 were
unchanged, then MAS for that day is 5 (9 - 4). Each day’s MAS is added to
the previous day’s total, creating a cumulative MAS line.
When MAS moves in the same direction as the broad stock market, it
208
STOCK MARKET INDICATORS
shows that big money supports the trend and it is likely to continue. When
the market goes one way and MAS goes the other way, it shows that big
money is betting on a reversal. When the trend of MAS diverges from the
price trend, the market is especially likely to reverse.
Other Stock Market Indicators
Only a few stock market indicators have withstood the test of time. The New
High-New Low Index and TRIN are probably the best stock market indica-
tors, followed by Advance/Decline and Most Active Stocks.
Old stock market books are full of fascinating indicators, but you have to
be very careful using them today. Changes in the market over the years have
killed many indicators.
Indicators based on volume of low-priced stocks lost their usefulness
when the average volume of the U.S. stock market soared tenfold and the
Dow rose sixfold. The Member Short Sale Ratio and the Specialist Short
Sale Ratio stopped working after options became popular. Member and spe-
cialist short sales are now tied up in the intermarket arbitrage. Odd-lot
statistics lost value when conservative odd-lotters bought mutual funds. The
Odd-lot Short Sale Ratio stopped working when gamblers discovered puts.
VII
Psychological Indicators
39. CONSENSUS INDICATORS
Many private traders keep their market opinions to themselves, but financial
journalists and market letter writers spew them forth like open fire hydrants.
Some writers are very bright, but both groups as a whole have poor trading
records.
Financial journalists and letter writers overstay important trends and miss
major turning points. When these groups become bullish or bearish, it pays
to trade against them. The behavior of groups is more primitive than individ-
ual behavior.
Consensus indicators, also known as contrary opinion indicators, are not
as exact as trend-following indicators or oscillators. They simply draw your
attention to the fact that a trend is ready to reverse. When you get that mes-
sage, use technical indicators for more precise timing.
As long as the market crowd remains in conflict, the trend can continue.
When the crowd reaches a strong consensus, the trend is ready to reverse.
When the crowd becomes highly bullish, it pays to get ready to sell. When
the crowd becomes strongly bearish, it pays to get ready to buy.
The foundations of the contrary opinion theory were laid by Charles
Mackay, a Scottish barrister. He described in his book, Extraordinary
Popular Delusions and the Madness of Crowds, crowd behavior during the
Dutch Tulip Mania and the South Seas Bubble in England. Humphrey B.
Neill applied the theory of contrary opinion to stocks and other financial
ОЛЛ
210
PSYCHOLOGICAL INDICATORS
markets. He explained in his book, The Art of Contrary Thinking, why the
majority must be wrong at the market’s major turning points. Prices are
established by crowds, and by the time the majority turns bullish, there are
not enough new buyers left to support a bull market.
Abraham W. Cohen, a New York lawyer, came up with the idea of polling
market advisors and using their responses as a proxy for the entire body of
traders. Cohen was a skeptical man who spent many years on Wall Street and
saw that the advisors as a group performed no better than the market crowd.
In 1963, he established a service called Investors Intelligence for tracking
market letter writers. When the majority of them became bearish, Cohen
identified a buying opportunity. Selling opportunities were marked by strong
bullishness among letter writers. James H. Sibbet applied this theory to com-
modities. In 1964, he set up an advisory service called Market Vane. He
studied the opinions of advisors and also weighed them in proportion to the
numbers of their subscribers.
Tracking Advisory Opinion
Some letter writers are very smart, but taken as a group they are no better
than average traders. They become very bullish at major tops and very bear-
ish at major bottoms. Their consensus is similar to that of the trading crowd.
Most letter writers follow trends because they are afraid to appear foolish
and lose subscribers by missing a major move. The longer a trend continues,
the louder letter writers bay at it. The advisors are most bullish at market
tops and most bearish at market bottoms. When most letter writers become
strongly bullish or bearish, it is a good idea to trade against them.
Several rating services track the percentage of bulls and bears among
advisors. The main rating services are Investors Intelligence in the stock
market and Market Vane in the futures markets. Some advisors are very
skilled at doubletalk. The man who speaks from both sides of his mouth can
later claim that he was right regardless of the market’s direction. Editors of
Investors Intelligence and Market Vane have plenty of experience pinning
down such lizards. As long as the same editor does the ratings, they remain
internally consistent.
Investors Intelligence
Investors Intelligence was founded by Abe Cohen in 1963. He died in 1983,
and his work is being continued by Michael Burke, the new editor and pub-
39. CONSENSUS INDICATORS
211
lisher. Investors Intelligence monitors about 130 stock market letters. It tabu-
lates the percentage of bulls, bears, and fence-sitters among letter writers.
The percentage of bears is especially important because it is emotionally
hard for stock market writers to be bearish.
When the percentage of bears among stock market letter writers rises
above 55, the market is near an important bottom. When the percentage of
bears falls below 15 and the percentage of bulls rises above 65, the stock
market is near an important top.
Market Vane
Market Vane rates about 70 newsletters covering 32 markets. It rates each
writer’s degree of bullishness in each market on a 9-point scale. It multiplies
these ratings by an estimated number of subscribers to each service (most
advisors wildly inflate those numbers to appear more popular). A consensus
report on a scale from 0 (most bearish) to 100 (most bullish) is created by
adding the ratings of all advisors. When bullish consensus approaches 70
percent to 80 percent, it is time to look for a downside reversal, and when it
nears 20 percent to 30 percent, it is time to look to buy.
The reason for trading against the extremes in consensus is rooted in the
structure of the futures markets. The number of contracts bought long and
sold short is always equal. For example, if open interest in gold is 12,000
contracts, then 12,000 contracts are long and 12,000 contracts are short.
While the number of long and short contracts is always equal, the number
of individuals who hold them keeps changing. If the majority is bullish, then
the minority, those who are short, has more contracts per person than the
longs. If the majority is bearish, then the bullish minority has bigger posi-
tions per person. The following example illustrates what happens when the
consensus changes among 1000 traders who hold 12,000 contracts in one
market.
Open Interest Bullish Consensus Number of Bulls Number of Bears Contracts per Bull Contracts per Bear
12,000 50 500 500 24 24
12,000 80 800 200 15 60
12,000 20 200 800 60 15
1. If bullish consensus equals 50 percent, then 50 percent of traders are
long and 50 percent are short. An average trader who is long holds as
many contracts as an average trader who is short.
212
PSYCHOLOGICAL INDICATORS
D. Mark Weekly
Bullish Consensus
41
О *
38 41
Jun Aug Oct Dec Feb Nay Aug Oct Dec Nar Nay Jul Sep Nov Jan
?0
65
60
55
50
45
40
35
30
25
' О
' 31
Figure 39-1. Bullish Consensus
The opinions of market advisors serve as a proxy for the opinions of the
entire market crowd. The best time to buy is when the crowd is bearish,
and the best time to go short is when the crowd is bullish. The levels of
bullishness at which to buy or sell short vary from market to market.
They need to be adjusted every few months.
This weekly chart shows a bull market in the D. Mark, steadily mov-
ing up between a trendline and a parallel channel line. Whenever
bullish consensus fell below 45 percent during this bull market, it gave a
buy signal. The lower the bullish consensus, the more explosive the sub-
sequent rally!
2. When bullish consensus reaches 80 percent, it shows that 80 percent
of traders are long and 20 percent are short. Since the sizes of total
long and total short positions are always equal, an average bear is
short four times as many contracts as are held long by an average bull.
This means that an average bear has four times more money than an
average bull. The big money is on the short side of the market.
3. When bullish consensus falls to 20 percent, it means that 20 percent of
39. CONSENSUS INDICATORS
213
traders are long and 80 percent are short. Since the numbers of long
and short contracts are always equal, an average bull holds four times
more contracts than are held by an average bear. It shows that big
money is on the long side of the market.
Big money did not grow big by being stupid. Big traders tend to be more
knowledgeable and successful than average — otherwise they stop being big
traders. When big money gravitates to one side of the market, think of trad-
ing in that direction.
To interpret bullish consensus in any market, obtain at least twelve
months of historical data on consensus and note the levels at which the mar-
ket has turned in the past (Figure 39-1). Update these levels once every three
months. The next time the market consensus becomes highly bullish, look
for an opportunity to sell short using technical indicators. When the consen-
sus becomes very bearish, look for a buying opportunity.
Advisory opinion sometimes begins to change a week or two in advance
of major trend reversals. If bullish consensus ticks down from 78 to 76, or if
it rises from 25 to 27, it shows that the savviest advisors are abandoning
what looks like a winning trend. This means that the trend is ready to
reverse.
Signals from the Press
To understand any group of people, you must know what its members want
and what they fear. Financial journalists want to appear serious, intelligent,
and informed; they are afraid of appearing ignorant or flaky. It is normal for
financial journalists to straddle the fence and present several sides of every
issue. A journalist is safe as long as he writes something like “monetary pol-
icy is about to push the market up, unless unforeseen factors push it down.”
Internal contradiction is the normal state of affairs in financial journalism.
Many financial editors are even bigger cowards than their writers. They print
contradictory articles and call this “presenting a balanced picture.”
For example, a recent issue of Business Week had an article headlined
“The Winds of Inflation Are Blowing a Little Harder” on page 19. The arti-
cle stated that the end of a war was likely to push oil prices up. Another arti-
cle on page 32 of the same issue was headlined “Why the Inflation Scare Is
Just That.” It stated that the end of a war was going to push oil prices down.
Only a powerful and long-lasting trend can lure journalists and editors
214
PSYCHOLOGICAL INDICATORS
5 ads for platinum on The Wall
Street Journal futures oaoe
la? ЙР? Hay Jun JuT
660
640
620
600
580
560
540
528
500
480
Figure 39-2. Advertising as a Contrary Indicator
By the time several firms prepare ads for the same product and place
them in the same newspaper, the trend is ready to reverse. More than
three ads for the same market on the same page is a bearish warning.
down from their fences. This happens when a wave of optimism or pes-
simism sweeps the market at the end of a major trend. When journalists
climb down from the fence and express strongly bullish or bearish views, the
trend is ripe for a reversal.
This is also the reason why the front covers of major business magazines
are good contrarian indicators. When Business Week puts a bull on its cover,
it is usually a good time to take profits on long positions in stocks, and when
a bear graces the front cover, a bottom cannot be too far away.
Signals from the Advertisers
A group of three or more ads touting the same “opportunity” on the same
page of a major newspaper often warns of a top (Figure 39-2). Only a well-
40. COMMITMENT INDICATORS
215
established uptrend can break through the inertia of several brokerage
firms. By the time all of them recognize a trend, come up with trading rec-
ommendations, produce ads, and place them in a newspaper, that trend is
very old.
The ads on the commodities page of the Wall Street Journal appeal to the
bullish appetites of the least-informed traders. Those ads almost never rec-
ommend selling; it is hard to get amateurs excited about going short. When
three or more ads on the same day day tout opportunities in the same market,
it is time to look at technical indicators for shorting signals.
40. COMMITMENT INDICATORS
Several government agencies and exchanges collect data on buying and sell-
ing by several groups of investors and traders. They publish summary
reports of actual trades—commitments of money as well as ego. It pays to
trade with those groups that have a track record of success and bet against
those with poor track records.
For example, the Commodity Futures Trading Commission (CFTC)
reports long and short positions of hedgers and big speculators. Hedgers —
the commercial producers and consumers of commodities — are the most
successful participants in the futures markets. The Securities and Exchange
Commission (SEC) reports purchases and sales by corporate insiders.
Officers of publicly traded companies know when to buy or sell their com-
pany shares. The New York Stock Exchange reports the number of shares
bought, sold, and shorted by its members and by odd-lot traders. Members
are more successful than small-time speculators.
Commitments of Traders
Traders must report their positions to the CFTC after they reach certain lev-
els, called reporting levels. At the time of this writing, if you are long or
short 100 contracts of corn or 300 contracts of the S&P 500 futures, the
CFTC classifies you as a big speculator. Brokers send reports on positions
that reach reporting levels to the CFTC. It compiles them and releases sum-
maries once every two weeks.
The CFTC also sets up the maximum number of contracts, called position
216
PSYCHOLOGICAL INDICATORS
limits, that a speculator is allowed to hold in any given market. At this time,
a speculator may not be net long or short more than 2400 contracts of com or
500 contracts of the S&P 500 futures. These limits are set to prevent very
large speculators from accumulating positions that are big enough to bully
the markets.
The CFTC divides all market participants into three groups: commercials,
small speculators, and large speculators. Commercials, also known as
hedgers, are firms or individuals who deal in actual commodities in the nor-
mal course of business. In theory, they trade futures to hedge business risks.
For example, a bank trades interest rate futures to hedge its loan portfolio, or
a food processing company trades wheat futures to offset the risks of buying
grain. Hedgers post smaller margins and are exempt from speculative posi-
tion limits.
Large speculators are those traders whose positions reach reporting lev-
els. The CFTC reports buying and selling by commercials and large specula-
tors. To find the positions of small traders, you need to subtract the hold-
ings of the first two groups from the open interest.
The divisions between hedgers, big speculators, and small speculators are
somewhat artificial. Smart small traders grow into big traders, dumb big
traders become small traders, and many hedgers speculate. Some market par-
ticipants play games that distort the CFTC reports. For example, an acquain-
tance who owns a brokerage firm sometimes registers his wealthy speculator
clients as hedgers, claiming they trade stock index and bond futures to hedge
their stock and bond positions.
The commercials can legally speculate in the futures markets using inside
information. Some of them are big enough to play futures markets against
cash markets. For example, an oil firm may buy crude oil futures, divert sev-
eral tankers, and hold them offshore in order to tighten supplies and push
futures prices up. They can take profits on long positions, go short, and
deliver several tankers at once to refiners in order to push crude futures
down and cover shorts. This manipulation is illegal, and most firms hotly
deny that it takes place.
As a group, the commercials have the best track record in the futures mar-
kets. They have inside information and are well-capitalized. It pays to follow
them because they are successful in the long run. The few exceptions, such
as orange juice hedgers, only confirm this rule.
Big speculators used to be highly successful as a group until a decade or
so ago. They used to be wealthy individuals who took careful risks with their
own money. Today’s big traders are commodity funds. These trend-follow-
40. COMMITMENT INDICATORS
217
ing behemoths do poorly as a group. The masses of small traders are the
proverbial “wrong-way Corrigans” of the markets.
It is not enough to know whether a certain group is short or long.
Commercials are often short futures because many of them own physical
commodities. Small traders are usually long, reflecting their perennial opti-
mism. To draw valid conclusions from the CFTC reports, you need to com-
pare current positions to their historical norms.
The modem approach to analyzing commitments of traders has been devel-
oped by Curtis Arnold and popularized by Stephen Briese, publisher of the
Bullish Review newsletter. These analysts measure deviations of current commit-
ments from their historical norms. Bullish Review uses the following formula:
Cunent Net - Minimum Net
COT Index =--------------------------------
Maximum Net - Minimum Net
where COT Index = commitments of Traders Index.
Current Net = the difference between commercial and
speculative net positions.
Minimum Net = the smallest difference between commer-
cial and speculative net positions.
Maximum Net= the largest difference between commercial
and speculative net positions.
Net Position = long contracts minus short contracts of any
given group.
When the COT Index rises above 90 percent, it shows that commercials
are uncommonly bullish and gives a buy signal. When the COT Index falls
below 10 percent, it shows that commercials are uncommonly bearish and
gives a sell signal.
Insider Trading
Officers and investors who hold more than 5 percent of the shares in publicly
traded companies must report their buying and selling to the Securities and
Exchange Commission. The SEC tabulates insider buying and selling and
releases this data to the public once a month.
Corporate insiders have a record of buying stocks cheap and selling dear.
Insider buying emerges after severe market drops, and insider selling accel-
erates when the market rallies and becomes overpriced.
218
PSYCHOLOGICAL INDICATORS
Buying or selling by a single insider matters little. For example, an execu-
tive may sell shares in his firm to meet major personal expenses or may buy
shares to exercise stock options. Analysts who researched legal insider trad-
ing found that insider buying or selling was meaningful only if more than
three executives or large stockholders bought or sold within a month. These
actions reveal that something very positive or negative is about to happen to
the firm. A stock is likely to rise if three insiders buy in one month and to
fall if three insiders sell within a month.
Stock Exchange Members
Membership in a stock exchange — particularly as a specialist — is a license
to mint money. An element of risk does not deter generations of traders from
paying hundreds of thousands of dollars for the privilege of planting their
feet on a few square inches of a crowded floor.
The Member Short Sale Ratio (MSSR) is the ratio of shorting by mem-
bers to total shorting. The Specialist Short Sale Ratio (SSSR) is the ratio of
shorting by specialists to shorting by members. These indicators used to
serve as the best tools of stock market technicians. High readings of MSSR
(over 85 percent) and SSSR (over 60 percent) showed that savvy traders
were selling short to the public and identified stock market tops. Low read-
ings of MSSR (below 75 percent) and SSSR (below 40 percent) showed that
members were buying from the bearish public and identified stock market
bottoms. These indicators became erratic in the 1980s. They were done in by
the options markets, which gave exchange members more opportunities for
arbitrage. Now it is impossible to tell when their shorting is due to bearish-
ness or to arbitrage plays.
Odd-Lot Activity
Odd-lotters are people who trade less than 100 shares of stock at a time — the
small fry of the stock exchange. They remind us of a more bucolic time on
Wall Street. Odd-lotters transacted one quarter of the exchange volume a
century ago, and 1 percent as recently as two decades ago. Odd-lotters as a
group are value investors. They buy when stocks are cheap and sell when
prices rise.
The indicators for tracking the behavior of odd-lotters were developed in
40. COMMITMENT INDICATORS
219
the 1930s. The Odd-Lot Sales Ratio measured the ratio of odd-lot sales to
purchases. When it fell, it showed that odd-lotters were buying and the stock
market was near the bottom. When it rose, it indicated that odd-lotters were
selling and the stock market was near the top.
The Odd-Lot Short Sale Ratio was a very different indicator. It tracked
the behavior of short-sellers among odd-lotters, many of whom were gam-
blers. Very low levels of odd-lot short sales indicated that the market was
near the top, and high levels of odd-lot short sales showed that the stock
market was at a bottom.
These indicators lost value as the financial scene changed in the 1970s
and 1980s. The intelligent small investors moved their money into well-run
mutual funds, and gamblers discovered that they could get more bang for
their money in options. Now the New York Stock Exchange has a preferen-
tial mechanism for filling odd-lot orders, and many professionals trade in 99-
share lots.
VIII
New Indicators
41. ELDER-RAY
Elder-ray is a new technical indicator. It was developed in 1989 by this
author and named for its similarity to X-rays. Doctors use X-rays to see bone
structure below the surface of the skin. Traders can use Elder-ray to see the
power of bulls and bears below the surface of the markets.
To be a successful trader, you do not have to forecast the future. You need
to find when bulls or bears are in control and trade with the dominant group.
Elder-ray helps you see when bulls and bears become stronger or weaker.
How to Construct Elder-ray
Elder-ray combines the best features of trend-following indicators and oscil-
lators (see Section 24). It includes an exponential moving average, which is
a trend-following indicator. Its Bull Power and Bear Power components are
oscillators.
To create Elder-ray, divide your computer screen or chart paper into three
horizontal windows. Plot a bar chart and an exponential moving average
(EMA) in the upper window. Plot Bull Power in the middle window and
Bear Power in the bottom window.
It takes four steps to construct Elder-ray (see worksheet, Figure 41-1).
220
41. ELDER-RAY
221
Gold
Date High ; Low Close 13-EMA Bull Power Bear Power
09/19 353.5 351.4 351.6 351.34 2.16 f 0.06
09/20 352.1 : 350.9 351.7 351.39 0.71 : -0.49
09/23 354.2 : 352.2 354.1 351.78 2.42 : 0.42
09/24 357.9 ; 354.9 357.1 352.54 5.36 2.36
09/25 356.8 : 355.3 356.2 353.06 3.74 f 2.24
09/26 355.9 : 355.3 354.1 353.21 2.69 : 0.09
09/27 352.6 : 350.9 352.5 353.i 1 -0.51 : -2.21
09/30 359.6 • 355.2 357.4 353.72 5.88 1.48
10/01 357.8 : 356.8 357.4 345.25 3.55 2.55
10/02 360.8 : 357.9 358.8 354.90 5.90 : 3.00
Figure 41-1. Elder-ray Worksheet
Bull Power = High of the bar - 13-day EMA.
Bear Power = Low of the bar - 13-day EMA
It is normal for Bull Power to be positive and for Bear Power to be
negative. The higher the Bull Power, the stronger the bulls, and the
deeper the Bear Power, the stronger the bears. When Bull Power turns
negative, it shows that the bears are so strong they completely over-
power the bulls. If Bear Power turns positive, it shows that bulls are
uncommonly strong, completely overpowering the bears.
1. Draw a bar chart of any trading vehicle in the top window of your
screen.
2. Plot an EMA of closing prices in the same window. A 13-day EMA is
a good choice.
Bull Power = High - EMA
Bear Power = Low - EMA
3. Calculate Bull Power according to the above formula. Plot it as a his-
togram in the middle window. Bull Power of any day equals the high
of that day minus the EMA of that day. Normally, the high of a bar is
above the EMA, Bull Power is positive, and the histogram is above
222
NEW INDICATORS
the centerline. The entire bar may sink below the EMA during a sharp
break. When the high is below the EMA, Bull Power turns negative
and its histogram falls below the centerline.
4. Calculate Bear Power and plot it as a histogram in the bottom window.
Bear Power of any bar equals the low of that bar minus the EMA.
Normally, the low of a bar is below the EMA, Bear Power is negative,
and the histogram is below the centerline. If the entire bar rises above
the EMA during a sharp rally, then Bear Power turns positive and its
histogram rises above the centerline (Figure 41-2).
Trading Psychology
Elder-ray combines several pieces of information: price, a moving average,
the high of each bar, and the low of each bar. We need to understand their
meaning in order to understand Elder-ray.
Each price is a momentary consensus of value (see Section 12). Buyers
are buying because they expect prices to rise. Sellers are selling because
they expect them to fall. The undecided traders are standing aside, but their
presence puts pressure on bulls and bears. A trade takes place when a
buyer is willing to buy and a seller is willing to sell, both prompted by fear
that an undecided trader may step in and snap away an opportunity. The
price of every trade reflects the latest consensus of value of any trading
vehicle.
A moving average shows the average consensus of value during its time
window. A 10-day MA represents the average consensus of value for the
past 10 days, a 20-day MA for the past 20 days, and so on. An exponential
moving average is more reliable than a simple MA (see Section 25). The
most important message of a moving average is its slope. When it rises, it
shows that the crowd is becoming more bullish. When it declines, it shows
that the crowd is becoming more bearish. Trade in the direction of the slope
of a moving average.
The high of any bar reflects the maximum power of bulls during that bar.
Bulls make money when prices rise. They keep buying until they cannot lift
prices any higher. Bulls would love to raise prices one more tick —but they
are out of breath. The high point of a daily bar represents the maximum
power of bulls during the day, the high point of a weekly bar represents the
maximum power of bulls during the week, and so on.
The low of any bar represents the maximum power of bears during that
The 13-day EMA reflects the average consensus of value; its slope identi-
fies the market trend. Bull Power reflects the ability of bulls to lift prices
above the average consensus of value. Bear Power reflects the ability of
bears to push prices below the average consensus of value.
The best buy signals are given by bullish divergences-when prices fall
to a new low, but Bear Power stops at a more shallow bottom. The best
shorting signals are given by bearish divergences-when prices rise to or
above the previous high, but Bull Power reaches a lower peak.
A bearish divergence in June and July gave a sell signal-a double top
in price, accompanied by a lower peak in Bull Power. The sell signal
was confirmed when the 13-day EMA turned down. Bull Power became
positive several times during the downtrend, showing where to add to
short positions. When Bull Power turns positive during a downtrend and
then ticks down, place an order to sell short below the last day's low.
A bullish divergence developed in September when gold fell to a new
low, but Bear Power made a more shallow low. The buy signal was con-
firmed when the 13-day EMA of gold turned up. At the right edge of the
chart, the new peak in Bull Power confirms that the rally is strong and
likely to continue.
224
NEW INDICATORS
bar. Bears make money when prices fall. They keep selling and shorting
until they cannot push prices down another tick. The lowest point of a daily
bar reflects the maximum power of bears during the day, the low of a weekly
bar shows the maximum power of bears during the week, and so on.
Elder-ray compares the maximum power of bulls and bears to the average
consensus of value. It does this by measuring the spread between the high
and the low of every bar and an exponential moving average.
Bull Power reflects the bulls’ ability to push prices above the average
consensus of value. It measures the distance from the bar’s high to the EMA.
Bull Power is normally positive. It rises when bulls become stronger and
falls when they stumble. Bear Power turns negative when bulls’ heads are
under water.
Bear Power reflects the bears’ ability to push prices below the average
consensus of value. It measures the distance from the bar’s low to the EMA.
Bear Power is normally negative. It deepens when bears grow stronger and
rises when they become weaker. If Bear Power turns positive, it shows that
very strong bulls are holding bears up in the air by the scruff of their necks.
To summarize the key points of Elder-ray:
1. Price is a consensus of value, expressed in action.
2. A moving average is an average consensus of value.
3. The highest point of each bar represents the maximum power of bulls
during that bar.
4. The lowest point of each bar represents the maximum power of bears
during that bar.
5. Bull Power is the difference between the raw power of bulls and the
average consensus of value.
6. Bear Power is the difference between the raw power of bears and the
average consensus of value.
Trading Rules
Elder-ray can work as a stand-alone trading method, but it pays to combine it
with another method, such as the Triple Screen trading system (see Section
43). If you use Elder-ray alone, remember that the slope of its EMA identifies
41. ELDER-RAY
225
the trend, and trade only in that direction. Use Bull Power and Bear Power to
find entry and exit points for your trades in the direction of that trend.
Triple Screen, on the other hand, identifies the trend using weekly charts.
It then uses Bull Power and Bear Power on the daily charts to find trades in
the direction of the weekly trend. If the weekly trend is up, Triple Screen
takes only buy signals from daily Elder-ray. If the weekly trend is down, it
takes only shorting signals from daily Elder-ray.
Buying and Selling
There are two essential conditions for buying:
1. The trend is up (identified by EMA or a weekly trend-following indi-
cator).
2. Bear Power is negative but rising.
The third and fourth conditions are desirable but not essential:
3. The latest peak in Bull Power is higher than the previous peak.
4. Bear Power is rising from a bullish divergence.
Do not buy when Bear Power is positive. This occurs in runaway
uptrends, when the entire bar rises above the EMA. If you buy when bears
are being held up in the air, you are betting on the greater fool theory — pay-
ing a high price and hoping to meet a greater fool down the road willing to
buy from you at an even higher price.
The best time to buy is when Bear Power is negative but rising—when
bears regain their footing but are starting to slip again. When Bear Power
ticks up, place a buy order above the high of the last two days. If the rally
continues, your stop will be touched and you will go long. Once long, place
a protective stop below the latest minor low.
The strongest buy signals are given by bullish divergences between Bear
Power and price. If prices fall to a new low but Bear Power traces a higher
bottom, it shows that prices are falling out of inertia and bears are becoming
weaker. When Bear Power ticks up from the second bottom, buy a larger
than usual position.
Bear Power is useful for deciding when to pyramid. As the uptrend con-
tinues, you can add to your long position whenever Bear Power dips below
its centerline and then ticks up again.
226
NEW INDICATORS
If you buy using indicators, use them to decide when to sell. Do not be
distracted by every uptick and downtick of Bull Power—its normal breath-
ing process. You can monitor the power of bulls by tracking the pattern of
peaks and valleys in Bull Power. As long as every new peak in price is
accompanied by a new peak in Bull Power, the uptrend is safe. Sell when
bulls start losing power. A sell signal is given when prices reach a new high
but Bull Power reaches a lower peak than it reached during its previous rally.
Shorting and Covering
There are two essential conditions for shorting:
1. The trend is down (identified by EMA or weekly trend-following indi-
cator).
2. Bull Power is positive but falling.
The third and fourth conditions are desirable but not essential:
3. The latest bottom in Bear Power is deeper than its previous bottom.
4. Bull Power is falling from a bearish divergence.
Do not sell short if Bull Power is already negative. This happens when the
whole price bar is below the EMA —during a waterfall decline. If you sell
short when bears already have bulls’ heads under water, you are betting that
bears can push bulls’ heads even deeper. This is another version of the
greater fool theory.
The best time to sell short is when Bull Power is positive but falling. It
shows that bulls have come up for air but are starting to sink again. Place an
order to sell short below the low of the last two days. If the decline contin-
ues, you will be stopped in automatically. Once short, place a protective stop
above the latest minor high.
The strongest shorting signals are given by bearish divetgences between
Bull Power and prices. If prices rally to a new high but Bull Power reaches a
lower top, it shows that bulls are weaker than before and prices are rising out
of inertia. When Bull Power ticks down from a lower top, sell short a bigger
position.
Bull Power shows when to pyramid short positions. As a downtrend con-
tinues, you can add to your shorts whenever Bull Power rallies above its cen-
terline and then ticks down again.
If you sell short using indicators, use them also for deciding when to
42. FORCE INDEX
227
cover. When the trend is down, monitor Bear Power to see whether bears are
becoming stronger or weaker. The pattern of peaks and valleys in Bear
Power is much more important than its single upticks and downticks. If a
new low in price is accompanied by a new low in Bear Power, the down-
trend is safe.
A bullish divergence occurs when prices fall to a new low but Bear Power
traces a more shallow bottom. It shows that bears are running out of steam
and prices are falling out of inertia. This is a signal to cover shorts and get
ready to go long.
Divergences between Bull and Bear Power and prices mark the best trad-
ing opportunities. X-rays show broken bones under healthy skin—and Elder-
ray shows when the dominant group is broken below the surface of a trend.
42. FORCE INDEX
Force Index is an oscillator developed by this author. It measures the force of
bulls behind every rally and of bears behind every decline.
Force Index combines three essential pieces of market information — the
direction of price change, its extent, and trading volume. It provides a new,
practical way of using volume to make trading decisions.
Force Index can be used raw, but it works better if you smooth it with a
moving average. Force Index smoothed with a short MA helps pinpoint
entry and exit points. Force Index smoothed with a long MA reveals major
changes in the force of bulls and bears.
How to Construct Force Index
The force of every move is defined by its direction, distance, and volume. If
prices close higher than the previous bar, the force is positive. If prices close
lower than the previous bar, the force is negative. The greater the change in
prices, the greater the force. The bigger the volume, the greater the force of
the move (see worksheet, Figure 42-1).
Force Index = Volumetoday • (Closetoday - Closeyesterday)
Raw Force Index is plotted as a histogram, with a horizontal centerline at
228
NEW INDICATORS
Nikkei Dow
Date Close I Volume : Force Index i Fl: 2-ema i Fl: 13-ema
10/29 25329 ] 3834
10/30 25242 4495 -391065 ;
T'6/31 ’25194 j 1372 -65856 i -130807 ;
11/01 24295 1 2547 i -2289753 : -1570105 I
11/02 11/05 24195 1 24385 F 2891 1448 “ • -2891001 T 275120*’ -716102 1 -55287 |
11/06 23966 ; 2796 -1171524; -799445 i
_J1/07__ Ti/oe 23500 j "22970 1 3675 3167 ; -1712550^ T -1678510 ; ^1408182: -1588400'I' —
ii/09 22932 t 2880 t -109440* 4502426 *
11/13 23974 j 2484 2588328 ; 1524743 ;
11/14 23937 ; 1827 -67599 ; 463181 ;
11/15 23487 > 2212 -995400 ; -509206 i
ii/16 23172 1 2741 -863415 -745345 : -338231
ii/i9 23519 1 1931 T 676057; 198256; -261590
11/20 23205 1 1405 -441170; -228027 ; -256796
11/21 22816 i 2259 -878751 ; -661843 i -314660
11/22 23400 j 2163 1263192; 621514 : -180921
Figure 42-1. Force Index Worksheet
Force Index = Volumetoday • (Closetoday-Closeyesterday)
Short-term Force Index is smoothed with a 2-day exponential moving
average. Intermediate-term Force Index is smoothed with a 13-day expo-
nential moving average. You can use a programming trick to reduce very
large Force Index numbers-simply divide Force Index by the latest clos-
ing price.
a zero level. If the market closes higher, Force Index is positive and is plot-
ted above the centerline. If the market closes lower, Force Index is negative
and plotted below the centerline. If the market closes unchanged, Force
Index equals zero.
The histogram of raw Force Index appears very jagged. This indicator
gives better trading signals after being smoothed with a moving average (see
Section 25). A 2-day EMA of Force Index provides a minimal degree of
smoothing. It is useful for finding entry points into the markets. It pays to
buy when the 2-day EMA is negative and sell when it is positive, as long as
you trade in the direction of the 13-day EMA of prices.
A 13-day EMA of Force Index tracks longer-term changes in the force of
bulls and bears. When it crosses above its centerline, it shows that bulls are
42. FORCE INDEX
229
in control. When it turns negative, it shows that bears are in control.
Divergences between a 13-day EMA of Force Index and prices identify
important turning points.
Trading Psychology
When the market closes higher, it shows that bulls won the day’s battle, and
when it closes lower, it shows that bears carried the day. The distance
between today’s and yesterday’s closing prices reflects the margin of victory
by bulls or bears. The greater this distance, the more important the victory.
Volume reflects the degree of commitment by the mass of market partic-
ipants (see Section 32). Prices moving at high volume are like an
avalanche that gathers mass as it rolls. High-volume rallies and declines
have more inertia and are more likely to continue. Low volume, on the
other hand, shows that the supply of losers is running low and a trend is
nearing an end.
Prices reflect what market participants think, while volume reflects their
feelings. Force Index combines price and volume —it shows whether the
head and the heart of the market are in gear with each other.
When Force Index rallies to a new high, it shows that the force of bulls is
high and the uptrend is likely to continue. When Force Index falls to a new
low, it shows that the force of bears is big and the downtrend is likely to per-
sist. If the change in prices is not confirmed by volume, Force Index flattens
out and warns that a trend is about to reverse. It also flattens out and warns
that a trend reversal is near if high volume generates only a small price
move.
Trading Rules
Short-Term Force Index
A 2-day EMA of Force Index is a highly sensitive indicator of the short-term
force of bulls and bears. When it swings above its centerline, it shows that
bulls are stronger, and when it falls below its centerline, it shows that bears
are stronger.
A 2-day EMA of Force Index is so sensitive that it is best used to fine-
tune signals of other indicators. When a trend-following indicator identifies
230
NEW INDICATORS
b bgjbb ь b
CjSell Zone)
(Buy Zone)
Force Index - 2-day EMA
13-day EMA falling - be short
Long
Sh< rt
MP
EMA rising - be long
Jun Jul Aug
Figure 42-2 Force Index—2-Day EMA
26470
25188
23890
22599
21309
126.1
14.5
-97.0
-208.6
-320.1
75cT Nov
This sensitive short-term indicator pinpoints buying opportunities in
uptrends and shorting opportunities in downtrends. It helps traders buy
weakness and sell strength. When the trend, identified by the slope of
the 13-day EMA, is up and Force Index declines below zero, it gives a
buy signal. When the trend is down and Force Index rallies above zero,
it gives a signal to sell short.
The decision when to take profits depends on whether you are a
short-term or a long-term trader. If you are a short-term trader, sell longs
when Force Index becomes positive or cover shorts when Force Index
becomes negative. A long-term trader has to wait until the exponential
moving average changes its direction or until there is a divergence
between Force Index and price (marked by slanted arrows on this chart).
When you are trading with the trend, you can add to your positions
(pyramid) whenever Force Index gives additional signals in the direction
of the trend.
an uptrend, the declines of the 2-day EMA of Force Index spot the best buy-
ing points. When a trend-following tool identifies a downtrend, a 2-day
EMA of Force Index pinpoints the best shorting areas (Figure 42-2).
42. FORCE INDEX
231
1. Buy when a 2-day EMA of Force Index turns negative during
uptrends.
No matter how fast and furious an uptrend, there are always pullbacks. If
you delay buying until the 2-day EMA of Force Index turns negative, you
will buy closer to a short-term bottom.
When a 2-day EMA of Force Index turns negative during an uptrend,
place a buy order above the high price of that day. If the uptrend resumes and
prices rally, you will be stopped in on the long side. If prices continue to
decline, your order will not be executed. Then lower your buy order to
within one tick of the high of the latest bar. Once your buy stop is triggered,
place a protective stop below the low of the trade day or the previous day,
whichever is lower. This tight stop is seldom touched in a strong uptrend, but
it gets you out early if the trend is weak.
2. Sell short when a 2-day EMA of Force Index turns positive in down-
trends.
When trend-following indicators identify a downtrend, wait until the 2-day
EMA of Force Index turns positive. It indicates a quick splash of bullish-
ness—a shorting opportunity. Place an order to sell short below the low of
the latest price bar.
If the 2-day EMA of Force Index continues to rally after you place your
sell order, raise it daily to within a tick of the latest bar’s low. Once prices
slide and you go short, place a protective stop above the high of the latest
price bar or the previous bar, whichever is higher. Move your stop down to a
break-even level as early as possible.
A 2-day EMA of Force Index helps you decide when to pyramid your
positions. You can add to longs in uptrends each time Force Index turns neg-
ative and add to shorts in downtrends whenever Force Index turns positive.
Force Index even provides a glimpse into the future. When a 2-day EMA
of Force Index falls to its lowest low in a month, it shows that bears are
strong and prices are likely to fall even lower. When a 2-day EMA of Force
Index rallies to its highest level in a month, it shows that bulls are strong and
prices are likely to rise even higher.
A 2-day EMA of Force Index helps decide when to close out a position. A
short-term trader who buys when this indicator is negative should sell when
it turns positive. A short-term trader who goes short when this indicator is
positive should cover when it turns negative. A longer-term trader should get
232
NEW INDICATORS
out of his position only if a trend changes (as identified by the slope of a 13-
day EMA of price) or if there is a divergence between 2-day EMA of Force
Index and the trend.
3. Bullish divergences between 2-day EMA of Force Index and price
give strong buy signals. A bullish divergence occurs when prices fall
to a new low while Force Index makes a more shallow bottom.
4. Bearish divergences between 2-day EMA of Force Index and price
give strong sell signals. A bearish divergence occurs when prices rally
to a new high while Force Index traces a lower second top.
A 2-day EMA of Force Index fits well into the Triple Screen trading sys-
tem (see Section 43). Its ability to find short-term buying and selling points
is especially useful when it is combined with a longer-term trend-following
indicator.
Intermediate-Term Force Index
A 13-day EMA of Force Index identifies longer-term changes in the strength of
bulls and bears. Its position relative to its centerline shows which group is in
control. Its divergences from prices identify major turning points (Figure 42-3).
5. When a 13-day EMA of Force Index is above the centerline, bulls are in
control of the market, and when it is below the centerline, bears are in
control. When this indicator flutters near its centerline, it identifies a
trendless market—a warning not to use trend-following trading methods.
When a rally begins, prices often jump on heavy volume. When a 13-day
EMA of Force Index reaches a new high, it confirms the uptrend. When the
uptrend ages, prices rise more slowly or volume becomes thinner. Then a 13-
day EMA of Force Index starts tracing lower tops and eventually drops
below its centerline. It signals that the back of the bull has been broken.
6. A new peak in the 13-day EMA of Force Index shows that a rally is
likely to continue. A bearish divergence between a 13-day EMA of
Force Index and price gives a strong signal to sell short. If prices reach
a new high but this indicator traces a lower peak, it warns that bulls
are losing power and bears are ready to take control.
42. FORCE INDEX
233
26470
25180
23890
22599
21309
40.9
11.8
-17.3
-48.5
-75.6
Figure 42-3 Force Index—13-Day EMA
Divergences between a 13-day EMA of Force Index and prices identify
important turning points in the markets. A bullish divergence between a
13-day EMA of Force Index and the Nikkei Dow in August pointed to a
buying opportunity. The Nikkei Dow retested its lows, but Force Index
traced a much more shallow second bottom, giving a buy signal.
A spike low in Force Index, like the one seen in August, gives two
trading messages. In the long run, it usually marks the end of an impor-
tant decline. In the short run, it tells traders that the latest price bottom is
likely to be retested or exceeded.
The Nikkei Dow surged higher in October, but Force Index kept trac-
ing lower tops. Its bearish divergence showed that bulls were growing
weak and prices neared a top. There was plenty of time to position short.
The spike low at the right edge of the chart indicates that the latest price
low is likely to be retested or exceeded.
7. A new low in 13-day EMA of Force Index shows that a downtrend is
likely to continue. If prices fall to a new low but this indicator traces a
more shallow low, it warns that bears are losing power. This bullish
divergence gives a strong buy signal.
234
NEW INDICATORS
When a downtrend begins, prices usually drop on heavy volume. When a
13-day EMA of Force Index falls to new lows, it confirms the decline. As
the downtrend grows old, prices fall more slowly or volume dries up. Then
the 13-day EMA of Force Index starts tracing more shallow bottoms and
finally rallies above its centerline. It shows that the back of the bear has been
broken.
IX
Trading Systems
43. TRIPLE SCREEN TRADING SYSTEM
The Triple Screen trading system was developed by this author and has been
used for trading since 1985. It was first presented to the public in April 1986,
in an article in Futures Magazine.
Triple Screen applies three tests or screens to every trade. Many trades
that seem attractive at first are rejected by one or another screen. Those
trades that pass the Triple Screen test have a higher degree of profitability.
Triple Screen combines trend-following methods and counter-trend tech-
niques. It analyzes all potential trades in several timeframes. Triple Screen is
more than a trading system, it is a method, a style of trading.
Trend-Following Indicators and Oscillators
Beginners often look for a magic bullet—a single indicator for making
money. If they get lucky for a while, they feel as if they discovered the royal
road to profits. When the magic dies, amateurs give back their profits with
interest and go looking for another magic tool. The markets are too complex
to be analyzed with a single indicator.
Different indicators give contradictory signals in the same market. Trend-
following indicators rise during uptrends and give buy signals, while oscilla-
tors become overbought and give sell signals. Trend-following indicators
235
236
TRADING SYSTEMS
turn down in downtrends and give signals to sell short but oscillators become
oversold and give buy signals.
Trend-following indicators are profitable when markets are moving but
lead to whipsaws in trading ranges. Oscillators are profitable in trading
ranges, but give premature and dangerous signals when the markets begin to
trend. Traders say: “The trend is your friend,” and “Let your profits run.”
They also say: “Buy low, sell high.” But why sell if the trend is up? And
how high is high?
Some traders try to average out the votes of trend-following indicators
and oscillators. It is easy to rig this vote. If you use more trend-following
tools, the vote will go one way, and if you use more oscillators, it will go the
other way. A trader can always find a group of indicators telling him what he
wants to hear.
The Triple Screen trading system combines trend-following indicators
with oscillators. It is designed to filter out their disadvantages while preserv-
ing their strengths.
Choosing Timeframes—The Factor of Five
Another major dilemma is that the trend can be up and down at the same
time, depending on what charts you use. A daily chart may show an uptrend
while a weekly chart shows a downtrend, and vice versa (see Section 36). A
trader needs to handle conflicting signals in different timeframes.
Charles Dow, the author of the venerable Dow theory, stated at the turn of
the century that the stock market had three trends. The long-term trend lasted
several years, the intermediate trend several months, and anything shorter
than that was a minor trend. Robert Rhea, the great market technician of the
1930s, compared the three market trends to a tide, a wave, and a ripple. He
believed that traders should trade in the direction of the market tide and take
advantage of the waves but ignore the ripples.
Times have changed, and the markets have become more volatile. Traders
need a more flexible definition of timeframes. The Triple Screen trading sys-
tem is based on the observation that every timeframe relates to the larger and
shorter ones by approximately a factor of five (see Section 36).
Each trader needs to decide which timeframe he wants to trade. Triple
Screen calls that the intermediate timeframe. The long-term timeframe is
one order of magnitude longer. The short-term timeframe is one order of
magnitude shorter.
43. TRIPLE SCREEN TRADING SYSTEM
237
For example, if you want to carry a trade for several days or weeks, then
your intermediate timeframe will be defined by the daily charts. Weekly
charts are one order of magnitude longer, and they determine the long-term
timeframe. Hourly charts are one order of magnitude shorter, and they deter-
mine the short-term timeframe.
Day-traders who hold their positions for less than an hour can use the
same principle. For them, a 10-minute chart may define the intermediate
timeframe, an hourly chart the long-term timeframe, and a 2-minute chart the
short-term timeframe.
Triple Screen demands that you examine the long-term chart first. It
allows you to trade only in the direction of the tide—the trend on the long-
term chart. It uses the waves that go against the tide for entering positions.
For example, daily declines create buying opportunities when the weekly
trend is up. Daily rallies provide shorting opportunities when the weekly
trend is down.
First Screen—Market Tide
Triple Screen begins by analyzing the long-term chart, one order of magni-
tude greater than the one you plan to trade. Most traders pay attention only to
the daily charts, with everybody watching the same few months of data. If
you begin by analyzing weekly charts, your perspective will be five times
greater than that of your competitors.
The first screen of Triple Screen uses trend-following indicators to iden-
tify long-term trends. The original system uses the slope of weekly MACD-
Histogram (see Section 26) to identify the market tide. The slope is defined
as the relationship between the two latest bars. When the slope is up, it
shows that bulls are in control—it is time to trade from the long side. When
the slope is down, it shows that bears are in control and tells you to trade
only from the short side (Figure 43-1).
A single uptick or a downtick of weekly MACD-Histogram indicates a
change of a trend. The upturns that occur below the centerline give better
buy signals than those above the centerline (See “Indicator Seasons” in
Section 36). The downturns that occur above the centerline give better sell
signals than the downturns below the centerline.
Some traders use other indicators to identify major trends. Steve Notis
wrote an article in Futures magazine showing how he used the Directional
System as the first screen of Triple Screen. Even a simpler tool, such as the
238
TRADING SYSTEMS
409.6
393.5
377.5
361.4
345.3
2.8826
03004
-0.2817
-1.4639
-2.6460
Figure 43-1. Weekly MACD-Histogram—The First Screen of
Triple Screen
The slope of MACD-Histogram is defined by the relationship between its
two latest bars (see inset). Triple Screen tells traders to examine weekly
charts before looking at the dailies. When the weekly trend is up, it
allows us to trade only from the long side or stand aside. When the
weekly trend is falling, it allows us only to trade from the short side or
stand aside.
Weekly MACD-Histogram gives a buy signal when its slope turns up.
The best buy signals are given when this indicator turns up below its
centerline. When MACD-Histogram turns down, it gives a sell signal.
The best sell signals are given when it turns down from above its center-
line (see "Indicator Seasons," Section 36). Once you find the trend of the
weekly MACD-Histogram, turn to daily charts and look for trades in the
same direction.
slope of a 13-week exponential moving average, can serve as the first screen
of the Triple Screen trading system. The principle is the same. You can use
most trend-following indicators, as long as you analyze the trend on the
weekly charts first and then look for trades on the daily charts only in that
direction.
43. TRIPLE SCREEN TRADING SYSTEM
239
Screen One: Identify the weekly trend using a trend-following indica-
tor and trade only in its direction.
A trader has three choices: buy, sell, or stand aside. The first screen of the
Triple Screen trading system takes away one of those choices. It acts as a
censor who permits you only to buy or stand aside during major uptrends. It
allows you only to sell short or stand aside during major downtrends. You
have to swim with the tide or stay out of the water.
Second Screen—Market Wave
The second screen identifies the wave that goes against the tide. When the
weekly trend is up, daily declines point to buying opportunities. When the
weekly trend is down, daily rallies point to shorting opportunities.
The second screen applies oscillators to the daily charts in order to iden-
tify deviations from the weekly trend. Oscillators give buy signals when
markets decline and sell signals when markets rise. The second screen of the
Triple Screen trading system allows you to take only those daily signals that
point in the direction of the weekly trend.
Screen Two: Apply an oscillator to a daily chart. Use daily declines
during weekly uptrends to find buying opportunities and daily rallies
during weekly downtrends to find shorting opportunities.
When the weekly trend is up, Triple Screen takes only buy signals from
daily oscillators and ignores their sell signals. When the weekly trend is
down, Triple Screen takes only shorting signals from oscillators and ignores
their buy signals. Force Index and Elder-ray are good oscillators to use with
Triple Screen, but Stochastic and Williams %R also perform well.
When the weekly MACD-Histogram rises, the 2-day EMA of Force Index
(see Chapter 8) gives buy signals when it falls below its centerline, as long as it
does not fall to a new multiweek low. When the weekly MACD-Histogram
declines, Force Index gives shorting signals when it rallies above its centerline,
as long as it does not rise to a new multiweek high (Figure 43-2).
When the weekly trend is up, daily Elder-ray (see Section 41) gives a buy
signal when Bear Power declines below zero and then ticks back up toward
240
TRADING SYSTEMS
378.6
378.3
362.8
353.6
345.3
967.1
516.9
66.6
-383.6
-833.8
Figure 43-2. Daily Force Index—The Second Screen of Triple
Screen
The 2-day EMA of Force Index is one of several oscillators that can work
as the second screen of the Triple Screen trading system. Force Index
marks buying opportunities when it falls below its centerline. It marks
selling opportunities when it rallies above its centerline.
When the weekly trend is up, take only buy signals from the daily
oscillator for entering long positions. When the weekly trend is down,
take only sell signals for entering short positions. At the right edge of the
chart, the weekly trend has turned down. Wait for a rise in Force Index
in order to sell short.
the centerline. When the weekly trend is down, daily Elder-ray signals to go
short when Bull Power rallies above zero and then ticks back down.
Stochastic (see Section 30) gives trading signals when its lines enter a buy
or a sell zone. When weekly MACD-Histogram rises but daily Stochastic
falls below 30, it identifies an oversold area, a buying opportunity. When the
weekly MACD-Histogram declines but daily Stochastic rises above 70, it
identifies an overbought area, a shorting opportunity.
Williams %R (see Section 29) needs a 4- or 5-day window to work with
Triple Screen. It is interpreted similarly to Stochastic. The Relative Strength
43. TRIPLE SCREEN TRADING SYSTEM
241
Index does not react to price changes as fast as other oscillators. It helps with
overall market analysis, but is too slow for Triple Screen.
Third Screen—Intraday Breakout
The first screen of the Triple Screen trading system identifies market tide on
a weekly chart. The second screen identifies a wave that goes against that
tide on a daily chart. The third screen identifies the ripples in the direction of
the tide. It uses intraday price action to pinpoint entry points.
The third screen does not require a chart or an indicator. It is a technique
for entering the market after the first and second screens gave a signal to buy
or sell short. The third screen is called a trailing buy-stop technique in
uptrends and a trailing sell-stop technique in downtrends (Figure 43-3).
When the weekly trend is up and the daily trend is down, trailing buy-
stops catch upside breakouts. When the weekly trend is down and the daily
trend is up, trailing sell-stops catch downside breakouts.
Triple Screen Summary
Weekly Trend Daily Trend Action Order
Up Up Stand aside None
Up Down Go long Trailing buy-stop
Down Down Stand aside None
Down Up Go short Trailing sell-stop
When the weekly trend is up and a daily oscillator declines, it activates a
trailing buy-stop technique. Place a buy order one tick above the high of the
previous day. If prices rally, you will be stopped in long automatically when
the rally takes out the previous day’s high. If prices continue to decline, your
buy-stop will not be touched. Lower your buy order the next day to the level
one tick above the latest price bar. Keep lowering your buy-stop each day until
stopped in or until the weekly indicator reverses and cancels its buy signal.
When the weekly trend is down, wait for a rally in a daily oscillator to
activate a trailing sell-stop technique. Place an order to sell short one tick
below the latest bar’s low. As soon as the market turns down, you will be
stopped in on the short side. If the rally continues, keep raising your sell
order daily. The aim of a trailing sell-stop technique is to catch an intraday
downside breakout from a daily uptrend in the direction of a weekly down-
trend.
370.0
366.1
362.2
358.3
354.4
350.6
346.7
342.8
338.9
335.0
Figure 43-3. Trailing Buy-Stop—The Third Screen of Triple
Screen
Weekly MACD-Histogram has turned up in mid-September. When the
first screen points up, every decline of the second screen-the 2-day EMA
of Force Index-marks a buying opportunity.
a. Force Index falls below its centerline. Place a buy order for tomor-
row 1 tick above the high of day a.
b. The decline continues. Lower the buy order to 1 tick above the
high of bar b.
c. Bought at the opening. Place a stop at the low of bar b. The new
high in Force Index shows that the rally is strong, likely to continue.
d. Force Index falls below its centerline. Place a buy order at the bar's
high.
e. Bought when prices rallied above the high of d. Place a stop at the
low of bar d.
f. Force Index falls below its centerline. Place a buy order at the bar's
high.
g. Decline continues. Lower the buy-stop to within 1 tick of the high
of bar g.
h. Bought when prices rallied above the high of g. Place a stop at the
low of bar g.
i. Force Index falls below its centerline. Place a buy order at the bar's
high.
j. Decline continues. Lower the buy-stop to within 1 tick of the high
of bar j.
k. Bought at the opening. Place a stop at the low of bar j.
I. Cold opens lower and hits the protective stop. It is important to use
stops because no indicator is perfect.
43. TRIPLE SCREEN TRADING SYSTEM
243
Screen Three: Use the trailing buy-stop technique when the weekly
trend is up and the daily oscillator is down. Use the trailing sell-stop
technique when the weekly trend is down and the daily oscillator is up.
Stop-Loss
Proper money management is essential for successful trading. A disciplined
trader cuts his losses short and outperforms a loser who keeps hanging on
and hoping. The Triple Screen trading system calls for placing very tight
stops.
, As soon as you buy, place a stop-loss order one tick below the low of the
trade day or the previous day, whichever is lower. Once you sell short, place
a protective stop-loss one tick above the high of the trade day or the previous
day, whichever is higher. Move your stop to a break-even level as soon as the
market moves in your favor. Afterwards, the rule of thumb is to move your
stop to protect approximately 50 percent of paper profits (see Section 48).
The reason for using such tight stops is that Triple Screen trades only in
the direction of the tide. If a trade does not work out fast, it is a sign that
something is fundamentally changing below the surface of the market. Then
it is better to run fast. The first loss is the best loss —it allows you to re-
examine the market from the safety of the sidelines.
Conservative traders should go long or short on the first signal of the
Triple Screen trading system and stay with that position until the major trend
reverses or until stopped out. Active traders can use each new signal from
the daily oscillator for pyramiding the original position.
A position trader should try and stay with a trade until the weekly trend
reverses. A short-term trader may take profits using signals from the second
screen. For example, if a trader is long and Force Index becomes positive or
Stochastic rises to 70 percent, he may sell and take profits, then look for
another buying opportunity.
The Triple Screen trading system combines different timeframes and sev-
eral types of indicators. It uses a trend-following indicator with the long-term
charts and a short-term oscillator with the intermediate charts. It uses special
entry techniques for buying or selling short. It also uses tight money man-
agement rules.
244
TRADING SYSTEMS
44. PARABOLIC TRADING SYSTEM
The Parabolic trading system was described in 1976 by J. Welles Wilder, Jr.
It was named after the pattern of its stops during runaway moves, which
resembled a parabola. The Parabolic system is now included in many soft-
ware packages.
Parabolic aims to catch trends and to reverse positions when trends
reverse. Its unique feature is that it responds to the passage of time as well
as to changing prices. Most traders focus on prices but ignore time (see
Section 36).
How to Construct Parabolic
Parabolic is a reversal system, designed to keep a trader in the market all the
time. When Parabolic stops you out of a long position, it tells you to go short
at the same price. If it stops you out of a short position, it tells you to go long
at the same price and time. This method worked well during the inflationary
markets of the 1970s, but has led to many whipsaws in later years. Now
Parabolic should be used selectively, only when markets are trending.
Parabolic is based on a good old rule — move your stops only in the direc-
tion of the trade and never against it. If you are long, you may raise your
stops but never lower them. If you are short, you may only lower your stops.
Parabolic stops are set daily, using a formula:
StOPtomorrow ~ ^Орц^ау + AF * (EPtra(]e — StOploday)
where Stoptoday = the current stop.
Stoptomorrow = the stop for the next trading day.
ЕР(га(1е = the extreme point reached by the market in the
current trade. If a trader is long, EP is the highest
high reached since the day he bought. If a trader is
short, EP is the lowest low reached since the
day he went short.
AF = the acceleration factor. This unique tool deter-
mines how fast to move a stop in the direction of a
trend. AF depends on the number of new highs
since the entry into a long trade or the number of
new lows since the entry into a short trade.
On the Erst day in a trade, Acceleration Factor equals 0.02. This means
that the stop is moved by 2 percent of the distance between the extreme point
44. PARABOLIC TRADING SYSTEM
245
and the original stop. AF increases by 0.02 each day the rally reaches a new
high or a decline reaches a new low, up to the maximum of 0.20.
If the market reaches 3 higher highs during a long trade, AF equals 0.08
[0.02 + (0.02 • 3)], and if the market reaches 9 new highs, AF rises to its
maximum of 0.20, or 0.02 + (0.02 • 9). In the latter case, the daily stop gets
moved by 20 percent of the distance between the extreme point of the trade
and the latest stop.
In the beginning of a trade, Acceleration Factor is small and stops move
slowly. As the market reaches new highs or new lows, AF increases and
stops move fast. If the market does not reach new highs or lows, AF keeps
moving stops in the direction of the trade. By doing so, Parabolic forces
traders to get out of trades that go nowhere.
Many traders change the Acceleration Factor. They adjust the size of the
basic 0.02 step and the 0.20 maximum size of AF. Some increase them to
make the system more sensitive, others decrease them to make the system
react slower. The size of a step often varies from 0.015 to 0.025 and the
maximum size of AF from 0.18 to 0.23.
Trading Psychology
Losers go broke by hanging onto losing positions and hoping for a reversal.
The Parabolic system protects traders from indecision and imposes an iron
discipline on them. It sets a stop the moment you enter a trade and tells you
to move it in the direction of the trade.
If you go long or short but prices remain flat, it gives you a message that
your timing was wrong. You would not have bought or shorted unless you
expected prices to move right after you put on a trade! Parabolic does not let
you hang onto a trade that goes nowhere. It moves stops in the direction of
the trade, saying in effect “Put up or shut up.”
The Parabolic system is extremely useful during runaway trends. When
prices soar or crash without a pullback, it is hard to place stops using normal
chart patterns or indicators. Parabolic is the best tool for placing stops under
those conditions.
Trading Rules
When you begin using Parabolic in any given market, go back several weeks
to calculate its stops. Adjust Parabolic stops daily, with one exception: If it
tells you to move the stop into the previous day’s range, don’t do it. Stops
should be kept outside of the previous day’s range.
246
TRADING SYSTEMS
Tec Jan Feb Rar Sw йач Jun
140
135
131
126
122
117
113
108
104
100
Figure 44-1. Parabolic System
Parabolic works well when the markets are moving, but not when the
markets are flat. If you get whipsawed twice in a row, it signals a flat
market. Stop using Parabolic, but continue to track it on paper until you
get two good signals.
Parabolic shines in fast-moving markets. Here it took most of the
profit out of a 30+ point run in IBM and its subsequent decline, with a
single whipsaw in April. Two whipsaws in a row in May gave a signal to
stop using Parabolic.
The Parabolic system works well in trending markets but leads to whip-
saws in trendless markets. It can generate spectacular profits during price
trends but chop up an account in a trading range. Do not use it as an auto-
matic trading method.
The original Parabolic was a true reversal system. When a trader was long
one contract, it told him to place an order to sell two contracts if his stop was
hit. Then he sold his long position and automatically went short. When a
trader was short one contract, Parabolic told him to place an order to buy two
if his stop was hit. Then he covered his short position and went long.
A trader is better off entering the market using some other trading
method, such as the Triple Screen trading system, and then switching to
45. CHANNEL TRADING SYSTEMS
247
Parabolic only if he finds himself riding a dynamic uptrend or a downtrend
(Figure 44-1).
1. When you find yourself in a strong uptrend, go over the past several
weeks of data and apply the Parabolic system. Having updated
Parabolic to the current day, begin calculating stops daily and use
them to protect profits on your long position.
2. When you find yourself short in a fast downtrend, apply Parabolic to
the past several weeks of data and update it to the present day. From
that day on, calculate its stops daily to protect profits on your short
position.
The Parabolic system ties together price and time and moves stops in the
direction of the trade. The faster the trend, the faster Parabolic moves its
stops. Parabolic is an excellent tool for getting the most out of a strong trend
that was entered using any method.
45. CHANNEL TRADING SYSTEMS
Prices often flow in channels, the way rivers flow in valleys. When a river
touches the right edge of its valley, it turns left. When a river touches the left
rim of its valley, it turns right. When prices rally, they often seem to stop at
an invisible ceiling. When they fall, they often seem to hit an invisible floor.
Channels help traders identify buying and selling opportunities and avoid
bad trades. The original research into trading channels was conducted by J.
M. Hurst and described in his 1970 book, The Profit Magic of Stock
Transaction Timing.
Four Ways to Construct a Channel
Channels help traders because their boundaries show where to expect sup-
port or resistance to come into the market. There are four main ways to con-
struct a channel:
1. By drawing a channel line parallel to a trendline (see Section 21).
2. By plotting two lines parallel to a moving average: one above it and
another below.
248
TRADING SYSTEMS
3. Same as above, only the distance between each line and the moving
average changes depending on the market’s volatility (Bollinger
bands).
4. By drawing a moving average of the highs and another of the lows.
Channels parallel to trendlines are useful for long-term analysis, especially
on the weekly charts. Channels around moving averages are useful for short-
term analysis, especially on daily and intraday charts. Channels whose width
depends on volatility are good for catching early stages of major new trends.
Support is where buyers buy with greater intensity than sellers sell.
Resistance is where sellers sell with greater intensity than buyers buy (see
Section 19). Channels show where to expect support and resistance in the
future.
A channel’s slope identifies a market’s trend. When a channel lies flat,
you may trade all swings within its walls. When a channel rises, it pays to
trade only from the long side, buying at the lower wall and selling at the
upper wall. When a channel declines, it pays to trade only from the short
side, shorting at the upper channel wall and covering at the lower wall.
Moving Average Channels
A 13-day exponential moving average can serve as the backbone of a chan-
nel (see Section 25). Draw upper and lower channel lines parallel to it. The
width of a channel depends on the coefficient selected by the trader.
Upper Channel Line = EMA + Channel Coefficient • EMA
Lower Channel Line = EMA - Channel Coefficient • EMA
You need to adjust channel coefficients until a channel contains 90 per-
cent to 95 percent of the price action. A channel shows the boundaries
between normal and abnormal price action. It is normal for prices to be
inside a channel, and only unusual events push them outside. The market is
undervalued below its lower channel line and overvalued above its upper
channel line.
For example, in 1992, the channel coefficient on the daily chart of the
S&P 500 futures was 1.5 percent. If the 13-day EMA stood at 400, then the
upper channel line was 406 [400 + (400 • 1.5/100)] and the lower channel
line was 394 [400 - (400 • 1.5/100)].
45. CHANNEL TRADING SYSTEMS
249
Adjust channel coefficients at least once every three months to make a
channel contain 90 percent to 95 percent of prices. If prices keep blowing
out of a channel and staying outside for more than a few days, that channel
should be widened. Too many reversals within the channel without reaching
its walls indicate falling volatility, and that channel should be tightened.
Volatile markets require wider channels, and quieter markets require nar-
row channels. Long-term charts require wider channels. As a rule of thumb,
weekly channel coefficients are twice as wide as daily ones.
Mass Psychology
An exponential moving average reflects the average consensus of value
during the time covered by that average (see Section 25). When prices rise
above the average consensus of value, sellers see an opportunity to take
profits on long positions or go short. When they overpower the bulls,
prices decline. When prices fall below the moving average, bargain hunters
step in. Their buying and short covering by bears lift prices, and the cycle
repeats.
When prices are near their moving average, the market is fairly valued.
When prices are at or below the lower channel line, the market is underval-
ued. When prices are at or above the upper channel line, the market is over-
valued. Channels help traders find buying opportunities when the market is
cheap and shorting opportunities when the market is dear.
The market is like a manic-depressive person. When he reaches the height
of mania, he is ready to calm down, and when he reaches the bottom of his
depression, his mood is ready to improve. A channel marks the limits of
mass optimism and pessimism. Its upper line shows where bulls run out of
steam, and its lower line shows where bears become exhausted.
Every animal fights harder closer to home. The upper channel line shows
where bears have their backs against the wall and fight off the bulls. The
lower channel line shows where bulls have their backs against the wall and
fight off the bears.
When a rally fails to reach the upper channel line, it is a bearish sign. It
shows that bulls are becoming weaker. If a rally shoots out of a channel and
prices close above it, it shows that the uptrend is strong. The reverse rules
apply in downtrends.
Channels help traders who use them remain objective when others get
swept up in bullish or bearish hysteria. If prices touch the upper channel line,
250
TRADING SYSTEMS
you see that mass bullishness is being overdone and it is time to think about
selling. When everyone turns bearish but prices touch the lower channel line,
you know that it is time to think about buying instead of selling.
Trading Rules
Amateurs and market professionals handle channels differently. Amateurs
bet on long shots —they tend to buy upside breakouts and sell short down-
side breakouts. When an amateur sees a breakout from a channel, he hopes
that a major new trend is about to begin and make him rich quick.
Professionals trade against deviations and for a return to normalcy. It is
normal for prices to remain within channels. Most breakouts are exhaustion
moves that are quickly aborted. Professionals like to fade them —trade
against them. They sell short as soon as an upside breakout stalls and buy
when a downside breakout stops reaching new lows.
Breakouts can produce spectacular gains for amateurs when a major new
trend blows out of a channel. Amateurs occasionally win, but it pays to trade
with the professionals. Most breakouts are false and are followed by reversals.
Moving average channels can be used as a stand-alone trading method or
combined with other techniques. Gerald Appel has recommended the follow-
ing rules for trading with channels:
1. Draw a moving average and build a channel around it. When a chan-
nel is relatively flat, the market is almost always a good buy near the
bottom of its trading channel and a good sell near the top.
2. When the trend turns up and a channel rises sharply, an upside pene-
tration of the upper channel line shows very strong bullish momentum.
It indicates that you will probably have one more chance to sell in the
area of the highs that are being made. It is normal for the market to
return to its moving average after an upside penetration, offering an
excellent buying opportunity. Sell your long position when the market
returns to the top of the channel.
3. The above rule works in reverse during sharp downtrends. A breakout
below the lower channel boundary indicates that a pullback to the
moving average is likely to occur, offering another opportunity to sell
short. When prices return to the lower channel line, it is time to cover
shorts.
45. CHANNEL TRADING SYSTEMS
251
The best trading signals are given by a combination of channels and
technical indicators. Indicators give their strongest signals when they
diverge from prices (see Figure 45-1). A method for combining channels
and divergences has been described by Manning Stoller in an interview
with this author.
4. A sell signal is given when prices reach the upper channel line while
an indicator, such as Stochastic or MACD-Histogram, traces a lower
top and creates a bearish divergence. It shows that bulls are becoming
weak when prices are overextended.
5. A buy signal is given when prices reach the lower channel line while
an indicator traces a higher bottom and creates a bullish divergence. It
shows that bears are becoming weak when prices are already low.
We must analyze markets in more than one timeframe. Go long when
prices are rising from the bottom to the top of the channel on both weekly
and daily charts. Sell short when prices are sinking from the top to the bot-
tom of the channel on both weekly and daily charts.
6. Go long below the moving average when the channel is rising, and
take profits at the upper channel line. Go short when the channel is
falling, and take profits at the lower channel line.
Standard Deviation Channels (Bollinger Bands)
Standard Deviation Channels have been proposed by Perry Kaufman in his
book, The New Commodity Trading Systems and Methods, and popularized
by analyst John Bollinger. The unique feature of Bollinger bands is that their
width changes in response to market volatility. Trading rules for them differ
from those for other channels.
1. Calculate a 21-day EMA.
2. Subtract the 21-day EMA from each closing price to obtain all the
deviations from the average.
3. Square each of the deviations and get their sum to obtain the total
squared deviation.
4. Divide the total squared deviation by the EMA length to obtain the
average squared deviation.
252
TRADING SYSTEMS
Figure 45-1. Trading with Channels and Indicators
78
68
66
64
62
0.3655
0.2132
0.0609
-8.0914
-0.2438
A moving average reflects the average consensus of value. A channel or
an envelope must be adjusted until it contains 90 percent-95 percent of
all data. The upper channel line shows where the market is overvalued.
The lower channel line shows where it is undervalued. It pays to buy in
the lower half of a rising channel and to sell short in the upper half of a
falling channel. Channels work best when their signals are combined
with indicator divergences.
Bullish divergences in July and October occurred when the Swiss
Franc was undervalued, near its lower channel line. These buy signals
led to strong rallies. Bearish divergences occurred in August and
November, when the Swiss Franc was overvalued, near its upper chan-
nel line. These sell signals were followed by sharp breaks. Combining
channels with divergences allows you to trade against the market crowd
at key turning points.
5. Take the square root of the average squared deviation to obtain the
standard deviation.
These steps, outlined by John Bollinger, can be performed by many soft-
ware packages for technical analysis. A Bollinger band becomes wider when
volatility increases and narrows down when it decreases. A narrow Bollinger
45. CHANNEL TRADING SYSTEMS
253
band identifies a sleepy, quiet market. Major market moves ted to erupt from
flat bases. Bollinger bands help find transitions from quiet to active markets.
When prices rally outside a very narrow Bollinger band, they give a buy
signal. When they drop out of a very narrow Bollinger band, they give a sig-
nal to go short. When prices pull back to their channel from the outside, it is
time to close out positions.
Bollinger bands are especially useful for options traders. Options prices
depend heavily on the swings in volatility. Bollinger bands help you buy
when volatility is low and options are relatively cheap. They help you sell
options when volatility is high and options are expensive.
More on Channels
Some traders use channels whose upper line is a moving average of the
highs and whose lower line is a moving average of the lows. They appear
more ragged than other channels. A trader has to choose a smoothing period
for these channels. Here, as elsewhere, a 13-day EMA is a safe bet. A 13-day
EMA of the highs creates the upper channel line, and a 13-day EMA of the
lows creates the lower channel line.
One of the popular technical indicators is the Commodity Channel
Index (CCI). It is based on the same principles as channels —it measures
deviations from the moving average. If you use channels in trading, you may
dispense with the CCI. Channels are better because they keep you visually
closer to prices.
X
Risk Management
46. EMOTIONS AND PROBABILITIES
Trading is so exciting that it often makes amateurs feel high. A trade for
them is like a ticket to a movie or a professional bailgame. Trading is a much
more expensive entertainment than the cinema.
Nobody can get high and make money at the same time. Emotional trad-
ing is the enemy of success. Greed and fear are bound to destroy a trader.
You need to use your intellect instead of trading on gut feeling.
A trader who gets giddy from profits is like a lawyer who starts counting
cash in the middle of a trial. A trader who gets upset at losses is like a sur-
geon who faints at the sight of blood. A real professional does not get too
excited about wins or losses.
The goal of a successful professional in any field is to reach his personal
best — to become the best doctor, the best lawyer, or the best trader. Money
flows to them almost as an afterthought. You need to concentrate on trading
right—and not on the money. Each trade has to be handled like a surgical
procedure — seriously, soberly, without sloppiness or shortcuts.
Why Johnny Can't Sell
A loser cannot cut his losses quickly. When a trade starts going sour, he
hopes and hangs on. He feels that he cannot afford to get out, meets his mar-
254
46. EMOTIONS AND PROBABILITIES
255
gin calls, and keeps hoping for a reversal. His paper loss grows until what
seemed like a bad loss starts looking like a bargain. Finally, his broker forces
him to bite the bullet and take his punishment. As soon as he gets out of a
trade, the market comes roaring back.
The loser is ready to smash his head against the wall — had he hung on, he
would have made a small fortune on the reversal. Trends reverse when they
do because most losers are alike. They act on their gut feelings instead of
using their heads. The emotions of people are similar, regardless of their cul-
tural backgrounds or educational levels. A frightened trader with sweaty
palms and a pounding heart feels the same whether he grew up in New York
or Hong Kong and whether he had 2 years or 20 years of schooling.
Roy Shapiro, a New York psychologist from whose article this subtitle is
borrowed, writes:
With great hope, in the private place where we make our trading decisions, our
current idea is made ready.... one difficulty in selling is the attachment expe-
rienced toward the position. After all, once something is ours, we naturally
tend to become attached to it. . . . This attachment to the things we buy has
been called the “endowment effect” by psychologists and economists and we
all recognize it in our financial transactions as well as in our inability to part
with that old sports jacket hanging in the closet.
The speculator is the parent of the idea. ... the position takes on meaning
as a personal extension of self, almost as one’s child might. . . . Another rea-
son that Johnny does not sell, even when the position may be losing ground, is
because he wants to dream. . . . For many, at the moment of purchase critical
judgment weakens and hope ascends to govern the decision process.
Dreaming in the markets is a luxury that nobody can afford. If your
trades are based on dreams, you are better off putting your money into
psychotherapy.
Dr. Shapiro describes a test that shows how people conduct business
involving a chance. First, a group of people are given a choice: a 75 percent
chance to win $1000 with a 25 percent chance of getting nothing —or a sure
$700. Four out of five subjects take the second choice, even after it is
explained to them that the first choice leads to a $750 gain over time. The
majority makes the emotional decision and settles for a smaller gain.
Another test is given: People have to choose between a sure loss of $700
or a 75 percent chance of losing $1000 and a 25 percent chance of losing
nothing. Three out of four take the second choice, condemning themselves to
lose $50 more than they have to. In trying to avoid risk, they maximize
losses!
Risk Management
46. EMOTIONS AND PROBABILITIES
Trading is so exciting that it often makes amateurs feel high. A trade for
them is like a ticket to a movie or a professional ballgame. Trading is a much
more expensive entertainment than the cinema.
Nobody can get high and make money at the same time. Emotional trad-
ing is the enemy of success. Greed and fear are bound to destroy a trader.
You need to use your intellect instead of trading on gut feeling.
A trader who gets giddy from profits is like a lawyer who starts counting
cash in the middle of a trial. A trader who gets upset at losses is like a sur-
geon who faints at the sight of blood. A real professional does not get too
excited about wins or losses.
The goal of a successful professional in any field is to reach his personal
best—to become the best doctor, the best lawyer, or the best trader. Money
flows to them almost as an afterthought. You need to concentrate on trading
right —and not on the money. Each trade has to be handled like a surgical
procedure — seriously, soberly, without sloppiness or shortcuts.
Why Johnny Can't Sell
A loser cannot cut his losses quickly. When a trade starts going sour, he
hopes and hangs on. He feels that he cannot afford to get out, meets his mar-
254
46. EMOTIONS AND PROBABILITIES
255
gin calls, and keeps hoping for a reversal. His paper loss grows until what
seemed like a bad loss starts looking like a bargain. Finally, his broker forces
him to bite the bullet and take his punishment. As soon as he gets out of a
trade, the market comes roaring back.
The loser is ready to smash his head against the wall — had he hung on, he
would have made a small fortune on the reversal. Trends reverse when they
do because most losers are alike. They act on their gut feelings instead of
using their heads. The emotions of people are similar, regardless of their cul-
tural backgrounds or educational levels. A frightened trader with sweaty
palms and a pounding heart feels the same whether he grew up in New York
or Hong Kong and whether he had 2 years or 20 years of schooling.
Roy Shapiro, a New York psychologist from whose article this subtitle is
borrowed, writes:
With great hope, in the private place where we make our trading decisions, our
current idea is made ready.... one difficulty in selling is the attachment expe-
rienced toward the position. After all, once something is ours, we naturally
tend to become attached to it. . . . This attachment to the things we buy has
been called the “endowment effect” by psychologists and economists and we
all recognize it in our financial transactions as well as in our inability to part
with that old sports jacket hanging in the closet.
The speculator is the parent of the idea. ... the position takes on meaning
as a personal extension of self, almost as one’s child might. . . . Another rea-
son that Johnny does not sell, even when the position may be losing ground, is
because he wants to dream. . . . For many, at the moment of purchase critical
judgment weakens and hope ascends to govern the decision process.
Dreaming in the markets is a luxury that nobody can afford. If your
trades are based on dreams, you are better off putting your money into
psychotherapy.
Dr. Shapiro describes a test that shows how people conduct business
involving a chance. First, a group of people are given a choice: a 75 percent
chance to win $1000 with a 25 percent chance of getting nothing —or a sure
$700. Four out of five subjects take the second choice, even after it is
explained to them that the first choice leads to a $750 gain over time. The
majority makes the emotional decision and settles for a smaller gain.
Another test is given: People have to choose between a sure loss of $700
or a 75 percent chance of losing $1000 and a 25 percent chance of losing
nothing. Three out of four take the second choice, condemning themselves to
lose $50 more than they have to. In trying to avoid risk, they maximize
losses!
256
RISK MANAGEMENT
Emotional traders want certain gains and turn down profitable wagers that
involve uncertainty. They go into risky gambles to avoid taking certain
losses. It is human nature to take profits quickly and postpone taking losses.
Irrational behavior increases when people feel under pressure. According to
Dr. Shapiro, “bets on long shots increase in the last two races of the day.”
Emotional trading destroys losers. If you review your trading records, you
will see that the real damage to your account was done by a few large losses
or by long strings of losses while trying to trade your way out of a hole.
Good money management would have kept you out of the hole in the first
place.
Probability and Innumeracy
Losing traders look for “a sure thing,” hang on to hope, and irrationally
avoid accepting small losses. Their trading is based on emotions. Losers do
not understand the key concepts of probability. They have no grasp of odds
or random processes and have many superstitions about them.
Innumeracy — not knowing the basic notions of probability, chance, and
randomness — is a fatal intellectual weakness in traders. Those simple ideas
can be learned from many basic books.
The lively book Innumeracy by John Allen Paulos is an excellent primer
on the concepts of probability. Paulos describes being told by a seemingly
intelligent person at a cocktail party: “If the chance of rain is 50 percent on
Saturday and 50 percent on Sunday, then it is 100 percent certain it will be a
rainy weekend.” Someone who understands so little about probability is sure
to lose money trading. You owe it to yourself to develop a basic grasp of
mathematical concepts involved in trading.
Ralph Vince begins his important book Portfolio Management Formulas
with a delightful paragraph: “Toss a coin in the air. For an instant you experi-
ence one of the most fascinating paradoxes of nature — the random process.
While the coin is in the air there is no way to tell for certain whether it will
land heads or tails. Yet over many tosses the outcome can be reasonably pre-
dicted.”
Mathematical expectation is an important concept for traders. It is called
the player’s edge (a positive expectation) or the house advantage (a negative
expectation), depending on who the odds in a game favor. If you and I flip a
coin, neither of us has an edge — each has a 50 percent chance of winning.
But if you flip a coin in a casino that skims 10 percent from every pot, you
will win only 90 cents for every dollar you lose. This “house advantage” ere-
47. MONEY MANAGEMENT
257
ates a negative mathematical expectation for you. No system for money
management can beat a negative expectation game over a period of time.
A Positive Expectation
If you know how to count cards in blackjack, you can have an edge against a
casino (unless they detect you and throw you out. Casinos love drunk gam-
blers but hate card counters). An edge lets you win more often than you lose
over a period of time. Good money management can help you make more
money from your edge and minimize losses. Without an edge, you might as
well give money to charity. In trading, the edge comes from a system that
delivers greater profits than losses, slippage, and commissions. No money
management method can rescue a bad trading system.
You can win only if you trade with a positive mathematical expectation—
a sensible trading system. Trading on hunches leads to disasters. Many
traders act like drunks wandering through a casino, going from game to
game. Slippage and commissions destroy those who overtrade.
The best trading systems are crude and robust. They are made of a few
elements. The more complex the systems, the more elements that can break.
Traders love to optimize their systems using past data. The trouble is, your
broker won’t let you trade the past. Markets change, and the ideal parameters
from the past may be no good today. Try to de-optimize your system
instead — check how it would have performed under bad conditions. A robust
system holds up well when markets change. It is likely to beat a heavily opti-
mized system in real world trading.
Finally, when you develop a good system, don’t mess with it. Design
another one if you like to tinker. As Robert Prechter put it: “Most traders
take a good system and destroy it by trying to make it into a perfect system.”
Once you have your trading system, it is time to set the rules for money
management.
47. MONEY MANAGEMENT
Suppose you and I bet a penny on a coin flip: Tails, you win, heads, you lose.
Suppose you have $10 of risk capital and I have $1. Even though I have less
money, I have little to fear—it would take a string of 100 losses to wipe me
out. We can play for a long time, unless two brokers get between us and
drain our capital by commissions and slippage.
258
RISK MANAGEMENT
The odds will dramatically change if you and I raise our bet to a quarter. If
I have only $1, then a string of only four losses will destroy me. If you have
$10, you can afford to lose a quarter 40 times in a row. A series of four
losses is likely to come much sooner than forty. All other factors being
equal, the poorer of two traders is the first to go broke.
Most amateurs think that “other factors” are far from equal. They consider
themselves brighter than the rest of us. The trading industry works hard to
reinforce that delusion, telling traders that winners get the money lost by
losers. They try to hide the fact that trading is a minus-sum game (see
Section 3). Cocky amateurs take wild risks, producing commissions for bro-
kers and profits for floor traders. When they blow themselves out of the mar-
ket, new suckers come in because hope springs eternal.
Survival First
The first goal of money management is to ensure survival. You need to avoid
risks that can put you out of business. The second goal is to earn a steady
rate of return, and the third goal is to earn high returns — but survival comes
first.
“Do not risk thy whole wad” is the first rule of trading. Losers violate it
by betting too much on a single trade. They continue to trade the same or
even a bigger size during a losing streak. Most losers go bust trying to trade
their way out of a hole. Good money management can keep you out of the
hole in the first place.
The deeper you fall, the more slippery your hole. If you lose 10 percent,
you need to gain 11 percent to recoup that loss, but if you lose 20 percent,
you need to gain 25 percent to come back. If you lose 40 percent, you need
to make a whopping 67 percent, and if you lose 50 percent, you need to
make 100 percent simply to recover. While losses grow arithmetically, the
profits that are required to recoup them increase geometrically.
You have to know in advance how much you can lose — when and at what
level you will cut your loss. Professionals tend to run as soon as they smell
trouble and re-enter the market when they see fit. Amateurs hang on and
hope.
Get Rich Slowly
An amateur trying to get rich quick is like a monkey out on a thin branch. He
reaches for a ripe fruit but crashes when the branch breaks under his weight.
47. MONEY MANAGEMENT
259
Institutional traders as a group tend to be more successful than private
traders. They owe it to their bosses, who enforce discipline (See Section 14).
If a trader loses more than his limit on a single trade, he is fired for insubor-
dination. If he loses his monthly limit, his trading privileges are suspended
for the rest of the month and he becomes a gofer, fetching other traders cof-
fee. If he loses his monthly limit several times in a row, the company either
fires or transfers him. This system makes institutional traders avoid losses.
Private traders have to be their own enforcers.
An amateur who opens a $20,000 trading account and expects to run it
into a million in two years is like a teenager who runs away to Hollywood to
become a pop singer. He may succeed, but the exceptions only confirm the
rule. Amateurs try to get rich quick but destroy themselves by taking wild
risks. They may succeed for a while but hang themselves, given enough
rope.
Amateurs often ask me what percentage profit they can make annually
from trading. The answer depends on their skills or lack of such and market
conditions. Amateurs never ask a more important question: “How much will
I lose before I stop trading and re-evaluate myself, my system, and the mar-
kets?” If you focus on handling losses, profits will take care of themselves.
A person who makes 25 percent profit annually is a king of Wall Street.
Many top-flight money managers would give away their firstborn child to be
able to top this. A trader who can double his money in a year is a star—as
rare as a pop musician or a top athlete.
If you set modest goals for yourself and achieve them, you can go very
far. If you can make 30 percent annually, people will beg you to manage
their money. If you manage $10 million —not an outlandish amount in
today’s markets —your management fee alone can run 6 percent of that, or
$600,000 a year. If you make a 30 percent profit, you will keep 15 percent of
it as an incentive fee — another $450,000. You will earn over a million dol-
lars a year trading, without taking big risks. Keep these numbers in mind
when you plan your next trade. Trade to establish the best track record, with
steady gains and small drawdowns.
How Much to Risk
Most traders get killed by one of two bullets: ignorance or emotion.
Amateurs act on hunches and stumble into trades that they should never take
due to negative mathematical expectations. Those who survive the stage of
virginal ignorance go on to design better systems. When they become more
260
RISK MANAGEMENT
confident, they lift their heads out of the foxholes —and the second bullet
hits them! Confidence makes them greedy, they risk too much money on a
trade, and a short string of losses blows them out of the market.
If you bet a quarter of your account on each trade, your ruin is guaranteed.
You will be wiped out by a very short losing streak, which happens even
with excellent trading systems. Even if you bet a tenth of your account on a
trade, you will not survive much longer.
A professional cannot afford to lose more than a tiny percentage of his
equity on a single trade. An amateur has the same attitude toward trading as
an alcoholic has toward drinking. He sets out to have a good time, but winds
up destroying himself.
Extensive testing has shown that the maximum amount a trader may lose on
a single trade without damaging his long-term prospects is 2 percent of his
equity. This limit includes slippage and commissions. If you have a $20,000
account, you may not risk more than $400 on any trade. If you have a
$100,000 account, you may not risk more $2000 on a trade, but if you have
only $10,000 in your account, then you can risk no more than $200 on a trade.
Most amateurs shake their heads when they hear this. Many have small
accounts and the 2 percent rule throws a monkey wrench into the dreams of
quick profits. Most successful professionals, on the other hand, consider the
2 percent limit too high. They do not allow themselves to risk more than 1
percent or 1.5 percent of their equity on any single trade.
The 2 percent rule puts a solid floor under the amount of damage the market
can do to your account. Even a string of five or six losing trades will not crip-
ple your prospects. In any case, if you are trading to create the best track
record, you will not want to show more than a 6 percent or 8 percent monthly
loss. When you hit that limit, stop trading for the rest of the month. Use this
cooling-off period to reexamine yourself, your methods, and the markets.
The 2 percent rule keeps you out of riskier trades. When your system
gives an entry signal, check to see where to place a logical stop. If that
would expose more than 2 percent of your account equity — pass up that
trade. It pays to wait for trades that allow very close stops (see Chapter 9).
Waiting for them reduces the excitement of trading but enhances profit
potential. You choose which of the two you really want.
The 2 percent rule helps you decide how many contracts to trade. For
example, if you have $20,000 in your account, you may risk up to $400 per
trade. If your system flags an attractive trade with a $275 risk, then you may
trade only one contract. If the risk is only $175, then you can afford to trade
two contracts.
47. MONEY MANAGEMENT
261
What about pyramiding — increasing the size of your trading positions as
a trade moves in your favor? The 2 percent rule helps here too. If you show
profit on a trend-following position, you may add to it, as long as your
existing position is at a break-even level or better and the risk on the addi-
tional position does not exceed 2 percent of your equity.
Martingale Systems
Once you set your maximum risk per trade, you have to decide whether to
risk the same amount on every trade. Most systems vary the amount of
money at risk from trade to trade. One of the oldest money management sys-
tems is the martingale, originally developed for gambling. It has you bet a
greater amount after a loss, in order to “come back.” Needless to say, this
approach has a great emotional appeal to losers.
A martingale player in a casino keeps betting $1 as long as he wins, but if
he loses, he doubles up and bets $2. If he wins, he ends up with a $1 profit
(-$1 + $2) and goes back to betting $1. If he loses, he doubles up again and
bets $4. If he wins, he gets a $1 profit (-$1, -$2, +$4), but if he loses, he
doubles up and bets $8. As long as he keeps doubling up, his very first win
will cover all his losses and return a profit equal to his original bet.
A martingale system sounds like a no-lose proposition, until you realize
that a long run of bad trades will wipe out every gambler, no matter how
rich. At the extreme, a gambler who starts betting $1 and has 46 losses in a
row, has to bet $70 trillion on his 47th bet—more than the net worth of the
entire world (about $50 trillion). He is sure to run out of money or hit the
house limit much sooner than that. A martingale system is futile if you have
a negative or even-money expectation. It is self-defeating if you have a win-
ning system and a positive expectation.
Amateurs love martingale systems because of their emotional appeal.
There is a common superstition that you can get unlucky only up to a point
and that bad luck is bound to change. Losers often trade more heavily after a
drawdown. A loser fighting to come back often doubles his trading size after
a loss. This is a very poor method of money management.
If you want to vary your trading size, logic requires you to trade more
when your system is in gear with the market and making money. As your
account grows, the 2 percent rule allows you to trade larger amounts. You
should trade less when your system is out of sync with the market and losing
money.
262
RISK MANAGEMENT
Optimal f
Some traders who develop computerized trading systems believe in trading
what they call the optimal /—an “optimal fixed fraction” of the account. The
fraction of capital they risk on any trade depends on a formula that is based
on the performance of their trading system and their account size. It is a
complex method, but whether you use it or not, you can borrow several
sound ideas from it.
Ralph Vince has shown in his book, Portfolio Management Formulas,
that: (1) optimal /keeps changing; (2) if you trade more than optimal /, you
gain no benefit and are virtually certain to go broke; (3) if you trade less than
optimal /, your risk decreases arithmetically but your profits decrease geo-
metrically.
Trading at the optimal /is emotionally hard because it can lead to 85 per-
cent drawdowns. It should be attempted only with true risk capital. The key
point here is that if you trade more than the optimal fraction, you are certain
to destroy your account. The lesson is: When in doubt, risk less.
Computerized testing of money management rules has confirmed several
old-timers’ rules and observations. The true measure of any system’s finan-
cial risk is its biggest losing trade. A drawdown depends on the length of an
adverse run, which can never be predicted. Diversification can buffer the
drawdowns. You can diversify by trading different markets and using differ-
ent systems. Closely related markets such as currencies offer no diversifica-
tion. A small trader is forced to follow a simple rule: Put all your eggs into
one basket and watch it like a hawk.
According to Vince, computer testing has proven several common
money management rules: Never average down; never meet a margin call;
if you must lighten up, liquidate your worst position; the first mistake is
the cheapest.
Reinvesting Profits
Pay attention to what you feel when you handle profits. Many traders feel
tom between a craving for a bigger and faster buck and a fear of losing. A
professional trader calmly removes some money from his account, just as
any other professional draws an income from his work. An amateur who
fearfully grabs a profit and buys something with it before he can lose it
shows little confidence in his ability to make money.
Reinvesting can turn a winning system into a losing one, but no method of
48. EXITING TRADES
263
reinvesting profits can turn a losing system into a winning one. Leaving
profits in your account allows you to make money faster by trading more
contracts or being able to establish long-term positions using wider stops.
Removing some of your profits provides a cash flow. The government also
wants its share in taxes.
There is no hard and fast rule for splitting your profits between reinvest-
ment and personal use. It depends on your personality and the size of your
trading account. If you start with a small account, such as $50,000, you will
not want to drain profits from it. When your account is well into six figures,
you may begin treating it as an income-producing business.
You will need to make important personal decisions. Do you need
$30,000 or $300,000 a year to live on? Are you willing to cut spending in
order to leave more in your account? The answers to these questions depend
on your personality. Make sure to use your intellect and not your emotions
when you make these decisions.
48. EXITING TRADES
Taking a loss can be emotionally hard, but taking a profit can be even harder.
You can take a small loss automatically if you have the discipline to set a
stop the moment you enter a trade. Taking a profit requires more thought.
When the market moves in your favor, you need to decide whether to stay
put, get out, or add to your position.
An amateur can tie his mind into a knot trying to decide what to do about
a profit. He multiplies the number of ticks by their dollar value and feels a
surge of greed: Let the trade run, make even more money. Then the market
ticks against him, and he is hit with a jolt of fear: Grab that profit now,
before it melts. A trader who acts on his emotions cannot make rational deci-
sions.
One of the worst mistakes of traders is counting money while they have
an open position. Counting money ties your mind into a knot. It interferes
with your ability to trade rationally. If you catch yourself counting paper
profits and thinking what you can buy with them—get rid of those thoughts!
If you cannot get rid of them, get rid of your position.
If a beginner cashes out too early, he kicks himself for leaving money on
the table. He decides to hang on the next time, overstays a trade, and loses
money. If a beginner misses a profit because of a reversal, he grabs the first
profit on the next trade and may well miss a major move. The market tugs on
the amateur’s emotions and he jerks in response.
264
RISK MANAGEMENT
A trader who responds to his feelings instead of external reality is certain to
lose. He may grab a profit here and there but will eventually bust out, even if
his system gives him good trades. Greed and fear destroy traders by clouding
their minds. The only way to succeed in trading is to use your intellect.
Quality Before Money
The goal of a successful trader is to make the best trades. Money is secondary.
If this surprises you, think how good professionals in any field operate. Good
teachers, doctors, lawyers, farmers, and others make money—but they do not
count it while they work. If they do, the quality of their work suffers.
If you ask your doctor how much money he earned today, he won’t be able
to answer (and if he can, you do not want him for a doctor). Ask your lawyer
how much money he made today. He may have a general idea that he put in
some billable hours, but not exactly how many dollars he made. If he counts
money while he works, you do not want him for a lawyer. A real pro devotes
all his energy to practicing his craft the best he can — not to counting money.
Counting money in a trade flashes a red light—a warning that you are
about to lose because your emotions are kicking in and they will override
your intellect. That is why it is a good idea to get out of a trade if you cannot
get money off your mind.
Concentrate on quality —on finding trades that make sense and having a
money management plan that puts you in control. Focus on finding good
entry points and avoid gambles. Then the money will follow almost as an
afterthought. You may count it later, well after a trade is over.
A good trader must focus on finding and completing good trades. A pro-
fessional always studies the markets, looks for opportunities, hones his
money management skills, and so on. If you ask him how much money he
made on the current trade, he will have only a general idea of being a little or
a lot ahead of the game, or a little behind (he can never be a lot behind
because of tight stops). Like other professionals, he focuses on practicing his
craft and polishing his skills. He does not count money in a trade. He knows
that he will make money, as long as he does what is right in the markets.
Indicator Signals
If you use indicators for finding trades, use them also to get you out of
trades. If your indicators are in gear with the market when it is time to buy or
go short, use them to decide when it is time to sell or to cover.
48. EXITING TRADES
265
A trader often becomes emotionally attached to a trade. Profits give peo-
ple a high, but even a loss can tingle the nerves, like a scary but exciting ride
on a roller coaster. When those indicator signals that flagged a trade disap-
pear, get out of the market fast, regardless of your feelings.
For example, you may go long because a 13-week EMA has ticked up on
the weekly charts while daily Stochastic fell into its buy zone. If you go
long, decide in advance whether you will sell when daily Stochastic rallies
and becomes overbought or when the 13-week EMA turns down. Write
down your plan and keep it where you can always see it.
You may go short because weekly MACD-Histogram ticked down and
daily Elder-ray gave a sell signal. Decide in advance whether you will cover
when daily Elder-ray gives a buy signal or when weekly MACD-Histogram
turns up. You need to decide in advance which signals you will take. There
will be many signals—and the best time to decide is before you enter a trade.
Profit Targets, Elliott, and Fibonacci
Some traders try to establish profit targets. They want to sell strength when
prices hit resistance or buy weakness when prices reach support. Elliott
Wave theory is the main method for trying to forecast reversal points.
R. N. Elliott wrote several articles about the stock market and a book,
Nature’s Law. He believed that every movement in the stock market could
be broken into waves, smaller waves, and subwaves. Those waves
explained every turning point and occasionally allowed him to make correct
predictions.
Those analysts who sell advisory services based on Elliott’s methods
always come up with so-called “alternate counts.” They explain everything
in hindsight but are not reliable in dealing with the future.
Fibonacci numbers and their ratios, especially 1.618, 2.618, and 4.236
express many relationships in nature. As Trudi Garland writes in her lucid
book Fascinating Fibonaccis, these numbers express the ratios between the
diameters of neighboring spirals in a seashell and in a galaxy, the number of
seeds in the adjacent rows of a sunflower, and so on. Elliott was the first to
point out that these relationships also apply to the financial markets.
Tony Plummer describes in his book Forecasting Financial Markets how
he uses Fibonacci ratios to decide how far a breakout from a trading range is
likely to carry. He measures the height of a trading range, trades in the direc-
tion of a breakout, and then looks for reversal targets by multiplying the
height of the range by Fibonacci numbers. Experienced traders combine
266
RISK MANAGEMENT
profit targets with other technical studies. They look for indicator signals at
the projected turning points. If indicators diverge from a trend that is
approaching a target, it reinforces the signal to get out. Trading on targets
alone can be a tremendous ego boost, but the markets are too complex to be
handled with a few simple numbers.
Setting Stops
Serious traders place stops the moment they enter a trade. As time passes,
stops need to be adjusted to reduce the amount of money at risk and to pro-
tect a bigger chunk of profit. Stops should be moved only one way — in the
direction of the trade. We all like to hope that a trade will succeed —and a
stop is a piece of reality that prevents traders from hanging on to empty
hope.
When you are long, you may keep your stops in place or raise them but
never lower them. When you are short, you may keep your stops in place or
lower them but never raise them. Cutting extra slack to a losing trade is a
loser’s game. If a trade is not working out, it shows that your analysis was
flawed or the market has changed. Then it is time to run fast.
Serious traders use stops the way sailors use ratchets —to take out the
slack in their sails. Losers who move stops away from the market vote in
favor of fantasy and against reality.
Learning to place stops is like learning to drive defensively. Most of us
learn the same techniques and we adjust them to fit our personal styles. The
following are the basic rules for placing stops.
1. Stop-Loss Order
Place your stop the moment you enter a trade. Trading without a stop is
like walking down Fifth Avenue in Manhattan without pants on. It can be
done, I have seen people do it, but it is not worth the trouble. A stop will
not protect you from a bad trading system; the best it can do is slow down
the damage.
A stop-loss order limits your risk even though it does not always work.
Sometimes prices gap through a stop. A stop is not a perfect tool but it is the
best defensive tool we have.
48. EXITING TRADES
267
When you go long, place your stop below the latest minor support level.
When you go short, place a stop above the latest minor resistance (see
Section 20). The Parabolic system (see Section 44) moves the stops in the
direction of the trade, depending on the passage of time and changes in
prices. If you use the Triple Screen trading system (see Section 43), place
your stop after entering a trade at the extreme of the past two days’ range.
Avoid all trades where a logical stop would expose more than 2 percent of
your equity. This limit includes slippage and commissions.
2. Break-Even Order
The first few days in a trade are the hardest. You have done your home-
work, found a trade, and placed an order. It has been filled, and you placed a
stop-loss order. There is not much else you can do —you are like a pilot
strapped into his seat for takeoff. The engines are blasting at full power, but
the speed is low, and there is no room to maneuver—just sit back and trust
your system.
As soon as prices start to move in your favor, move your stop to a break-
even level. When the takeoff is completed, your flight is at a safer stage.
Now you get to choose between keeping your money or gaining more,
instead of choosing between a loss and a gain.
As a rule, prices have to move away from your entry point by more than
the average daily range before you move your stop to a break-even level. It
takes judgment and experience to know when to do it.
When you move a stop to a break-even level, you increase the risk of a
whipsaw. Amateurs often kick themselves for “leaving money on the
table.” Many amateurs allow themselves only one entry into a trade. There
is nothing wrong with re-entering a trade after getting stopped out.
Professionals keep trying to get in until they get a good entry, using tight
money management.
3. Protect—Profit Order
As prices continue to move in your favor, you have to protect your paper
profits. Paper profit is real money — treat it with the same respect as money
in your wallet. Risk only a portion of it, as the price of staying in the trade.
If you are a conservative trader, apply the 2 percent rule to your paper
profits. This protect-profit order is a “money stop,” protecting your equity.
268
RISK MANAGEMENT
Keep moving it in the direction of the trade so that no more than 2 percent of
your growing equity is ever exposed.
More aggressive traders use the 50 percent rule. If you follow it, half the
paper profit is yours and half belongs to the market. You can mark the high-
est high reached in a long trade or the lowest low reached in a short trade,
and place your stop halfway between that point and your entry point. For
example, if prices move 10 points in your favor, place a stop to protect 5
points of profit.
If in doubt, use the Parabolic system (see Section 44) to help you adjust
your stops. When you are not sure whether to stay in a trade or not, take
profits and re-evaluate the situation from the sidelines. There is nothing
wrong with exiting and re-entering a trade. People think much more clearly
when they have no money at risk.
After the Trade
A trade does not end when you close out your position. You must analyze it
and learn from it. Many traders throw their confirmation slips into a folder
and go looking for the next trade. They miss an essential part of growing to
become a professional trader—review and self-analysis.
Have you identified a good trade? Which indicators were useful and
which did not work? How good was your entry? Was the initial stop too far
or too close? Why and by how much? Did you move your stop to a break-
even level too early or too late? Were your protect-profit stops too loose or
too tight? Did you recognize the signals to exit a trade? What should you
have done differently? What did you feel at the various stages of the trade?
This analysis is an antidote against emotional trading.
Ask yourself these and other questions and learn from your experiences.
A cool, intelligent analysis does you more good than gloating about profits
or wallowing in regrets.
Start keeping a “before and after” notebook. Whenever you enter a posi-
tion, print out the current charts. Paste them on the left page of your note-
book and jot down your main reasons for buying or shorting. Write down
your plan for managing the trade.
When you exit, print the charts again and paste them on the right page of
your notebook. Write down your reasons for exiting and list what you did
right or wrong. You will have a pictorial record of your trades and thoughts.
This notebook will help you learn from the past and discover blind spots in
yyour thinking. Learn from history and profit from your experiences.
Afterword
One hot summer, in the mountains of northern Italy, I sat down to draft the
first outline of this book. Two and a half years later, on a frigid January in
New York City, I printed out its last chart. I wrote and rewrote this book
three times, to make it clearer and to reflect my growing experience.
I have changed as a person, and my methods continue to evolve. If I could
work on this manuscript for another two and a half years, it would become a
different book, but it is time to let go.
Pulling the Trigger
Traders sometimes confide in me that they have trouble “pulling the trig-
ger” — buying or selling when their methods tell them to go long or short. I
had this problem once, for a very short time. My friend Lou, to whom this
book is dedicated, helped me get rid of it.
One Sunday afternoon I mentioned to Lou that I saw several attractive
trades but doubted I’d take any of them the following week because I had
recently gotten beat up in the markets. Lou, who is usually cool and mild-
mannered, suddenly began yelling. “I want you to trade at the opening on
Monday!” I did not feel like trading—I was afraid of losing. “I don’t give a
shit whether you win or lose — trade tomorrow at the open!” I seldom trade at
the open, but I could trade 10 minutes later, looking for an opening range
breakout. “10 minutes is OK, but trade tomorrow!”
I thought about what had happened and realized what my problem was. I
was like a skier at the top of the hill who had taken a bad spill and was afraid
to go down again. Whatever my technique, if I was afraid to go downhill, I
could not be a skier.
Fear of placing an order is the biggest problem that a serious trader can
269
270
AFTERWORD
have. There is no way to handle this problem with ease and comfort. It has to
be handled hard, by a sheer effort of will, which is why Lou yelled at me —
as a friend.
You need to design a system or borrow one from this book and adapt it to
your needs. Skiers do a little practice on a bunny slope, and you can paper-
trade. Design a sensible money management plan, using the 2 percent rule.
Limit your monthly losses to the maximum of 6 percent or 8 percent of your
risk capital. At this point you are like a skier, ready at the top of the hill.
Push off when your system flags you to go! Push off now!
If you do not go downhill when the flag comes down, you might as well
sell your skis and take up golf or raise goldfish. In other words, forget about
trading.
Now you have a system, you’ve learned money management rules, you
know the psychological rules for cutting losses. Now you must trade. Can
you? Traders try to weasel out of making this decision. They papertrade for
years, buy automatic trading systems, and so on. Several traders have even
asked me to hypnotize them. These games must end. It is time to make an
effort of will!
Consider this book my friendly yell at you.
The Endless Trail
Markets change, new opportunities emerge, and old ones melt away. Good
traders are successful but humble people — they always learn. Being a trader
is a lifelong challenge.
I hope this book helps you to grow as a trader. If you have read this far,
you must be serious about your work. Take this book for what it is — a
description of what’s on one trader’s mind and how he goes about solving
problems that all of us face. Take the ideas that appeal to you, and shape
them to fit your style.
If you believe that being a trader is worth the effort—as I decided years
ago —my best wishes to you. I continue to learn, and like any trader, I
reserve the right to be smarter tomorrow than I am today.
Acknowledgments
After finishing a project of several years, I owe a sweet debt of gratitude to
hundreds of persons — teachers, friends, and clients. If you do not see your
name here, please forgive me, and I’ll thank you in person the next time we
meet.
Thanks, first of all, to all the clients of Financial Trading Seminars, Inc.
Often a phone would ring and a trader would ask for “Dr. Elder’s book.” The
book was not written yet, not advertised anywhere—but clients expected a
book from me. That was terrific encouragement.
Writing a book was a hard job, but it helped me organize my thoughts and
become a better trader. Two friends provided a soft push at the birth of this
project. First, Tim Slater invited me to seminars in Asia, and then Martin
Pring introduced me to people at WEFA, which led to a conference in Italy.
Walking with Tim through Snake Alley to a smoky restaurant in Taipei and,
a few months later, sitting in a cafe in Milan with Martin, I felt friendly but
unmistakable pressure to organize my thoughts and start writing.
The blank screen of a word processor seemed huge and forbidding. To get
the job rolling, I offered a number of seminars and taped some of them.
Those transcripts helped me flesh out the ideas for this book. Thanks to all
the analysts and traders in New York and Toronto, London and Singapore
who came to my seminars, listened, and asked hundreds of questions. Some
were experts whose comments forced me to stretch my mind farther than I
expected; others were beginners whose questions served as a reminder to
keep my feet on the ground. I hope you are all making money trading.
Three persons, a colleague and two patients, have opened my mind to the
idea of 12 Steps —a major factor in my improvement as a trader. Thank you,
Dagmar O’Connor, Jim S., and Kathy H. (Kathy died last year, after a long
battle with cancer, and visiting her for months in a hospice reinforced my
belief that there are values more important than money.) Thanks to the pro-
271
272
ACKNOWLEDGMENTS
fessional traders who came to consult with me as a psychiatrist and entrusted
me with their confidence. You reinforced my conviction that if you get your
head in order, money tends to flow in.
Great thanks to everybody who works for my company, Financial Trading
Seminars, Inc. It is a unique group of people — intelligent, dynamic, and fun
to be with. Each has been selected from dozens if not hundreds of appli-
cants — you are the best. Thanks especially to our managers — Carol Keegan
Kayne and Inga Boguslavsky. Carol helped me edit every chapter. We had
many passionate arguments about the language, most of which Carol won,
and if you have any complaints about the clarity of this book, I’ll give you
her number.
Once the manuscript was ready, I divided it into a dozen sections and
mailed each to a top expert in the field. These busy and successful people
found time to review several chapters each and suggested many improve-
ments. In addition to the friends already mentioned, they included Gerald
Appel, Stephen Briese, Ralph Cato, Mark Douglas, John Ehlers, Perry
Kaufman, Tony Plummer, Fred Schutzman, Bo Thunman, Ralph Vince, and
David Weis. Thank you for being so generous with your time and advice. If
the market is a minus-sum game, then having friends like you is an espe-
cially big plus!
Thanks to the analysts who wrote before me. It was often hard to find who
was first —there is a thicket of conflicting claims in our field. As Henry
Kissinger once said, “Academic fights are so bitter because the stakes are so
small.” Most charts in this book were drawn using CompuTrac software on
an IBM-compatible and imported into PageMaker® for the Macintosh.
Thanks to Norbert Rudek for helping to set up the system and for unstinting
phone support. Thanks to the editors at Barron’s, Futures, Technical Analysis
of Stocks and Commodities, Futures and Options World, and other maga-
zines for encouraging me to write articles and book and software reviews—it
was a good training for the book.
Many thanks to Stephen Reibel, M.D., a fellow psychiatrist and a former
boss at St. Luke’s-Roosevelt Hospital Center for covering my practice. I can
go and teach all over the world knowing that my patients in New York are in
good hands.
Lou Taylor, to whom this book is dedicated, has offered a treasury of
superb ideas. I wish he would write a book. His wise advice made a huge
difference at several important turning points. My family, especially Miriam,
Nicole, and Danny, provided cheerful support and a happy diversion from
business.
ACKNOWLEDGMENTS
273
Finally, I want to thank my friend from way back when, Nicolai
Gorbunoff. A scientist, he was destroyed by the Soviet system when I was
but a teenager. In the closed, Communist party-dominated world that we
lived in, he planted a simple but revolutionary idea in my mind: that the only
standard for research and work was the “world class.” You had to strive to be
among the best in the world, or else it did not pay to try. Thank you Nicolai,
and thank you, all my friends.
New York
November 1992
Dr. Alexander Elder
Sources
Angell, George. Winning in the Futures Market (1979) (Chicago: Probus Publishing,
1990).
Appel, Gerald. Day-Trading with Gerald Appel (video) (New York: Financial
Trading Seminars, Inc., 1989).
Arms, Richard W., Jr. The Arms Index (Homewood, IL: Business One Irwin, 1988).
Babcock, Bruce, Jr. The Dow Jones Irwin Guide to Commodity Trading Systems
(Homewood, IL: Dow Jones Irwin, 1989).
Balsara, Nauzer J. Money Management Stategies for Future Traders (New York:
John Wiley & Sons, 1992).
Belveal, L. Dee. Charting Commodity Market Price Behavior (1969) (Homewood,
IL: Dow Jones Irwin, 1989).
Bullish Review Newsletter, Rosemount, MN.
Club 3000 Newsletter, Augusta, MI.
CompuTrac Software Manual (1982) (New Orleans, LA: CompuTrac, 1991).
Davis, L. J. “Buffet Takes Stock,” The New York Times, April 1,1990.
Diamond, Barbara, and Mark Kollar. 24-Hour Trading (New York: John Wiley &
Sons, 1989).
Douglas, Mark. The Disciplined Trader (New York: New York Institute of Finance,
1990).
Edwards, Robert D., and John Magee. Technical Analysis of Stock Trends (1948)
(New York: New York Institute of Finance, 1992).
Ehlers, John. MESA and Trading Market Cycles (New York: John Wiley & Sons,
1992).
Elder, Alexander. Directional System (video) (New York: Financial Trading
Seminars, Inc., 1988).
Elder-ray (video) (New York: Financial Trading Seminars, Inc., 1990).
_______ MACD & MACD-Histogram (video) (New York: Financial Trading Seminars,
Inc., 1988).
“Market Gurus,” Futures and Options World, London, September 1990.
_______ Relative Strength Index (video) (New York: Financial Trading Seminars, Inc.,
1988).
Stochastic (video) (New York: Financial Trading Seminars, Inc., 1988).
275
276
SOURCES
Technical Analysis in Just 52 Minutes (video) (New York: Financial
Trading Seminars, Inc., 1992).
“Triple Screen Trading System,” Futures Magazine, April 1986.
Triple Screen Trading System (video) (New York: Financial Trading Seminars,
Inc., 1989).
Williams %R (video) (New York: Financial Trading Seminars, Inc., 1988).
Elliott, Ralph Nelson. Nature’s Law (1946) (Gainesville, GA: New Classics Library,
1980).
Engel, Louis. How to Buy Stocks (1953) (New York: Bantam Books, 1977).
Freud, Sigmund. Group Psychology and the Analysis of the Ego (1921) (London:
Hogarth Press, 1974).
Friedman, Milton. Essays in Positive Economics (Chicago: The University of
Chicago Press, 1453).
Frost, A. J., and R. R. Prechter, Jr. Elliott Wave Principle (Gainesville, GA: New
Classics Library, 1978).
Gallacher, William. Winner Takes All—A Privateer's Guide to Commodity Trading
(Toronto: Midway Publications, 1983).
Gann, W. D. How to Make Profits in Commodities (Chicago: W. D. Gann Holdings,
1951).
Garland, Trudi Hammel. Fascinating Fibonaccis (Palo Alto, CA: Dale Seymour
Publications, 1987).
Granville, Joseph. New Strategy of Daily Stock Market Timing for Maximum Profit
(Englewood Cliffs, NJ: Prentice Hall, 1976).
The Book of Granville; Reflections of a Stock Market Prophet (New York:
St. Martin’s Press, 1984).
Greenson, Ralph R. “On Gambling” (1947), in Explorations in Psychoanalysis
(New York: International Universities Press, 1978).
Greising, David, and Laurie Morse. Brokers, Bagmen & Moles (New York: John
Wiley & Sons, 1991).
Havens, Leston. Making Contact (Cambridge, MA: Harvard University Press,
1986).
Hurst, J. M. The Profit Magic of Stock Transaction Timing (Englewood Cliffs, NJ:
Prentice-Hall, 1970).
Kannerman, Daniel, and Amos Tversky. “Choices, Values, and Frames,” American
Psychologist, 39(4) (April 1984), 341-350.
Kaufman, Perry. The New Commodity Trading Systems and Methods (New York:
John Wiley & Sons, 1987).
Kleinfield, Sonny. The Traders (New York: Holt, Rinehart and Winston, 1983).
Lefevre, Edwin. Reminiscences of a Stock Operator (1923) (Greenville, SC: Traders
Press, 1985).
LeBon, Gustave. The Crowd (1897) (Atlanta, GA: Cherokee Publishing, 1982).
SOURCES
277
Mackay, Charles. Extraordinary Popular Delusions and the Madness of Crowds
(1841) (New York: Crown Publishers, 1980).
Murphy, John J. Technical Analysis of the Futures Markets (New York: New York
Institute of Finance, 1986).
Neill, Humphrey B. The Art of Contrary Thinking (1954) (Caldwell, ID: Caxton
Printers, 1985).
Tape Reading and Market Tactics (1931) (New York: Forbes Publishing,
1931).
Nison, Steve. Japanese Candlestick Charting Techniques (New York: New York
Institute of Finance, 1991).
Notis, Steve. “How to Gain an Edge with a Filtered Approach,” Futures Magazine,
September 1989.
Pacelli, Albert Peter. The Speculator’s Edge (New York: John Wiley & Sons, 1989).
Paulos, John Allen. Innumeracy. Mathematical Illiteracy and Its Consequences
(New York, Vintage Press, 1988).
Plummer, Tony. Forecasting Financial Markets (London: Kogan Page, 1989).
Pring, Martin J. Technical Analysis Explained, 3rd ed. (New York: McGraw-Hill,
1991).
Rhea, Robert. The Dow Theory (New York: Barron’s, 1932).
Rorschach, Herman. Psychodiagnostics (1921) (New York: Grune & Stratton, 1942).
Schutzman, Fred G. “Smoothing Rate of Change: New Twist to Old Study,” Futures
Magazine, April 1991.
Shapiro, Roy. Why Johnny Can’t Sell Losers: Psychological Roots, unpublished arti-
cle, 1991.
Sperandeo, Victor. Trader Vic—Methods of a Wall Street Master (New York: John
Wiley & Sons, 1991).
Steidlmayer, J. Peter, and Kevin Koy. Markets & Market Logic (Chicago: Porcupine
Press, 1986).
Teweles, Richard J., and Frank J. Jones. The Futures Game, 2nd ed. (New York:
McGraw-Hill, 1987).
Twelve Steps and Twelve Traditions (New York: Alcoholics Anonymous World
Services, 1952).
Vince, Ralph. Portfolio Management Formulas (New York: John Wiley & Sons,
1990).
Wilder, J. Welles, Jr. New Concepts in Technical Trading Systems (Greensboro, SC:
Trend Research, 1976).
Williams, Larry. How I Made One Million Dollars (Carmel Valley, CA: Conceptual
Management, 1973).
The Secret of Selecting Stocks (Carmel Valley, CA: Conceptual
Management, 1972).
Index
Accumulation/Distribution, 175-178
crowd behavior, 176
how to construct, 175-176
trading rules, 176-177
Volume Accumulator, 177-178
Advance/Decline line, 206-207. See
also Stock market indicators.
Alcoholics Anonymous (AA) and trad-
ing, 29-33, 39—40. See also
Psychology of trading.
denial, 30-31
rock bottom, 31,34-35
Losers Anonymous, 37-38
recovery, 29,31, 34, 36-38
the first step, 31-32, 35-37
12 steps, 29-32, 42, 271
Breakouts, 79-80,105,107-112,170,
250, 265
false, 76,79-80,107,250
pullbacks, 84-85, 91-93,103,108,
111, 113
Channels, 93-94, 247-253
Bollinger bands, 248, 251-253
how to construct, 251-252
trading rules, 253
channel trading systems, 250-252.
See also Trading systems.
Commodity Channel Index, 253
four types of channels, 247-248
moving average channels, 248-251
how to construct, 248-249
mass psychology, 249-250
trading rules, 250-251
parallel to trendlines, 93-94
Chaos and noise, 47, 74,124,157,188,
203
Charts, 69-74,115-116. See also
Prices.
bar, 69
intraday, 70,135, 206, 248. See
also Day-trading.
meaning, 70-73
tails, 88-89
weekly, 70, 80, 90,104,109, 112,
133,135,152,156,160, 225,
237-239, 248, 249
candlestick, 73,178
chart patterns, 46, 61, 65, 70, 91, 99,
101-114,166,185. See also
Head and shoulders; Rectangles;
Support and resistance; Trends
and trading ranges; Triangles.
congestion areas, 75-76, 88-89, 93,
107,109-110
continuation and reversal, 101-102,
107-108,110-113, 208, 244
279
280
INDEX
crowd psychology, 76-77, 82,
91-92, 95-96, 98-99
extreme points, 75,88-89,93.
See also Charts, bar, tails.
tops and bottoms, 70, 202,210
double tops and bottoms, 113-114
hand-drawn vs. computerized,
115-116,118
Market Profile, 22,73-74
point-and-figure, 69
Commitment indicators, 215-219. See
also Indicators, psychological.
Commitments of Traders index, 217
insider trading, legal, 217-218
odd-lot activity, 218-219. See also
Stock Market indicators.
stock exchange members, 218. See
also Stock Market indicators.
Computers, 9,15, 69,116-119
data, 116-119
hardware, 116-118
quote machine, 43, 46, 48, 52, 87,
201
software, 34, 53-54,116-118, 251
black boxes, 117-118
gray boxes, 118, 124, 188
MESA, 117,124,188-189
toolboxes, 54,117
CompuTrac, 117,183, 272
three steps to computerized analysis,
116
fact sheet offer, 117
Consensus indicators, 209-215. See
also Indicators, psychological.
bullish consensus, 210-214
how it works, 211-212
Contrary Opinion theory, 209-210
advisory opinion, 210-213
financial advertisers, 214—215
media headlines, 213-214
Cycles, 18-19, 41, 82,124,130,151,
187-189. See also Time.
Fourier analysis, 188
Maximum Entropy Spectral Analysis
(MESA), 117,124,188-189
Day-trading, 12,101,119,135,193,
237. See also Charts, intraday.
vs. position trading, 119,243
The Directional system, 83,135-141,
237. See also Indicators, trend-
following.
crowd behavior, 139
how to construct, 135-139
trading rules, 139-141
identifying “baby bulls,” 140-141
Edwards, R. D., and J. Magee, 70, 79
Elder-ray, 112, 220-227, 239-240,
265. See also Indicators, oscil-
lators.
how to construct, 220-222
Bull Power and Bear Power,
221-227
trading psychology, 222-224
trading rules, 224—227
Elliott Wave theory, 18-21, 70, 265
Elliott, R. N„ 20, 23, 70, 265
Financial Trading Seminars, Inc., 4,
44-45,116, 271-272
fact sheet offer, 117
Force Index, 100, 227-234, 239-240.
See also Indicators, oscillators,
how to construct, 227-229
trading psychology, 229
trading rules
intermediate-term, 232-234
short-term, 229-232, 239-240
Freud, Sigmund, 24, 57, 62,187
Gann, W. D., 23,70
interview with son, 23
Gaps, 95-101
causes, 95-97
valid and phony gaps, 96-97
trading rules, 99-100
INDEX
281
types of gaps
breakaway, 96-99,100
common, 96-100
continuation, 96-97,99-100
ex-dividend, 98
exhaustion, 96-97,99-100
island reversal, 100
opening, 101
Government and trading. See also
Inside information.
Commodity Futures Trading
Commission (CFTC ), 215-217
position limits, 52, 215-216
reporting levels, 215-216
Securities and Exchange Commission
(SEC), 50,215,217
Granville, Joseph, 20-21,172. See also
On-Balance Volume.
Gurus, 17-23, 34, 43, 58, 63. See also
Elliott, Gann, Granville; Trading
industry, advisors.
dead gurus, 22-23
magic method gurus, 21-22
market cycle gurus, 18-21,63
Head and shoulders, 102-105,166. See
also Chart patterns.
inverse head and shoulders, 105-107
trading rules, 104-105
Herrick Payoff Index, 183-187
crowd psychology, 184-185
how to construct, 183-184
trading rules, 184—187
chart patterns, 185-186
divergences, 185-186
The Hound of the Baskervilles signal,
104-105, 177
Indicators, 65,114-166, 264-265. See
also Overbought and oversold.
and chart patterns, 80, 83,95,101,
104
choosing the length, 123-125,152
the 5 percent rule, 164, 248
rule of thumb, 124—125,152
crowd psychology, 122,128-129,
131-132,139,146,150,
152-153,158,164,169-171,
173,176,179-181,184-185,
195-197, 203-205, 211,
222-224, 229, 245, 249-250
developing your own, 117. See also
Elder-ray, Force Index.
divergences, 63,64, 80,92-93,114,
133-135,148-150,153-155,
158-160,173-174,176-177,
185-186,191,196-199, 204,
206, 223, 225-227, 230-234,
251, 252, 266. See also price
shocks.
classes A, B, and C, 143-145
triple bullish or bearish, 135,145,
185
indicator seasons, 188-192, 237
defined, 190
leading and coincident, 120,145,148,
162,172
oscillators, 120,142-166,199. See
also Elder-ray, Momentum,
Relative Strength Index,
Stochastic, Williams %R.
psychological, 120, 209-219. See
also Consensus indicators and
Commitment indicators.
three major groups, 119-120,142,
235-236, 243
trend-following, 120. See also the
Directional System; MACD;
Moving averages; On-Balance
Volume.
Inside information, 50, 52-54, 215-218.
See also Theft.
Leaders of market trends, 23, 57-60, 63,
195-200, 206. See also New
High-New Low Index.
282
INDEX
Managing others’ money, 25,34,55-56,
67,259
track record, 14,54,117
Market(s), 47-50
international, 48, 51, 96, 206
as an ocean, 38-39
related, 96,101,112,117
source of money in the markets,
49-50,164
uncertainty, 82-83
Market analysis, 18-21, 65-68, 88. See
also Trading.
astrology and mysticism, 74-75
common sense, 67-68
Dow Theory, 69,109, 236
Efficient Market theory, 74-75
forecasting, 18-21, 75, 91, 231. See
also Prices, price targets.
managing vs. forecasting, 66-67,
125, 220
fundamental analysis, 65,187-188
Random Walk theory, 74—75
seasonality, 179
technical analysis, 46-47, 50, 61,
64-68
art or science, 65-66
the 5 percent rule, 164, 248
and poll-taking, 47, 66, 236
Market crowds, 56-60. See also Chart
patterns, crowd psychology;
Indicators, crowd psychology;
Traders.
changes in individuals
childlike behavior, 13,57-58,60
crowd behavior vs. individual
behavior, 48-49,187
reasons for joining crowds, 58-60
mass manias
the Dutch tulip mania, 17, 56-57,
209
the South Seas bubble, 17, 56-57,
209
mass psychology, 43-68,187,203,
209
laws of social psychology, 57-58,
64-65
optimism and pessimism, 56,142,
146, 201-203, 217, 249
Mathematics for traders, 256-262. See
also Money Management;
Trading systems, optimization.
innumeracy, 15, 256
margin, 7
minus-sum game, 6-7,258
negative expectation, 256-257,259,
261
positive expectation, 256-257, 261
probabilities, 254-258
odds, 24, 256-258
risk of ruin, 260
zero-sum game, 6-7
Media, 20-21, 48, 60, 63,197, 209,
213-215
advertisers, 214-215
Barron’s, 21, 272
Business Week, 213-214
Futures, 117, 235, 237, 272
Futures and Options World, 17, 272
the impact of news, 95
Technical Analysis of Stocks and
Commodities, 117,272
The Wall Street Journal, 28, 70,
214-215
Momentum, 120,142-151,250. See
also Indicators, oscillators;
Overbought and oversold.
Momentum indicator, 145-149
crowd psychology, 146-148
how to construct, 145-147
trading rules, 148
Rate of Change, 145-149
crowd psychology, 146-148
how to construct, 145-147
trading rules, 148
INDEX
283
Smoothed Rate of Change, 147-151
crowd behavior, 150
how to construct, 148-150
trading rules, 150-151
Money management, 14-16, 27, 42,
59-60, 67,145, 257-268, 270.
See also Mathematics for
traders; Stop-Loss orders.
businessman’s risk, 36-37
drawdown, 14,33,261,262
Martingale systems, 261
optimal f, 262
pyramiding, 225-226, 230-231, 243,
261
risk/reward ratio, 84
the 2 percent rule, 36, 85, 260-261,
267, 270
the 6-8 percent rule, 260, 270
Moving averages, 120-127,137,146,
222, 227. See also Indicators,
trend-following.
simple
a fatal flaw, 121-122,146
how to construct, 121
market psychology, 122
a mechanical system, 125-126
exponential, 83,122-129,148,172,
200, 202-203, 220-226,
228-234, 238, 248-253, 265
how to construct, 123-124
choosing the length, 123-125
good and bad features, 127
lagging by half-cycle, 127
trading rules, 125
weighted, 121,127
Moving Average Convergence-
Divergence (MACD), 83. See
also Indicators, trend-following.
MACD-Histogram, 131-135,
190-191, 237-241, 251, 265
how to construct, 131
market psychology, 131-132
trading rules, 132-135
divergences, 133-135
when to expect new highs or lows,
134, 250
MACD Lines, 127-131
how to construct, 128-129
optimization and cycles, 130-131
“quick-and-dirty,” 131
market psychology, 128-129
trading rules, 129-130
New High-New Low Index, 194—200,
205-206. See also Stock market
indicators.
crowd psychology, 195-197
how to construct, 195
trading rules, 197-200
On-Balance Volume, 172-175. See also
Indicators, trend-following;
Volume.
additional indicators
Climax indicator, 174—175
Net Field Trend indicator, 174—175
crowd psychology, 173
how to construct, 172
trading rules, 173-174
Open Interest, 178-187. See also
Herrick Payoff Index,
crowd psychology, 179-181
measure of conflict, 179-181
in currencies, 179
trading rules, 181-182
Options, 80,100, 117, 201, 251
Overbought and oversold, 142-143,
153,155-156, 160-161,164,
166, 203-205. See also
Indicators.
Parabolic trading system, 244-247, 267,
268. See also Trading systems,
how to construct, 244-245
284
INDEX
trading psychology, 245
trading rules, 245—247
Plummer, Tony, 60, 63,108, 265, 272
Prices. See also Charts.
deviations and normalcy, 142, 250
strength and weakness, 80
directional movement, 135-136
meaning, 43-47,61,70-73,222-224
closing, 70-73,156-158,162-164
consensus of value, 44—46,131,
248,252
high and low, 70-73, 83,156-158,
222, 253
mean, 127,178,184-185
moved by mass emotions, 61-65
opening, 70-73
price shocks, 63-64
price targets, 93, 95, 99,103,
107-109,111-112, 265-266.
See also Channels.
Fibonacci ratios, 109,112,192,
265-266
retracements, 192
quote machine, 43,46,48, 52, 87, 201
rallies and declines, 60-64,170
trends, 60-64,167
Pring, Martin, 142,189, 271
Psychiatry, 1-2,3-4,13, 25, 27-29,
203, 249, 270, 272, 273
Psychological indicators. See Consensus
indicators and Commitment
indicators.
Psychology of trading. See also
Alcoholics Anonymous and
trading.
amateurs, 39, 47, 75, 85, 235,258
blaming others, 25-26
overtrading, 53
discipline, 1,14, 35, 41, 68, 243, 259
and dieting, 2-3
and trading limits, 53, 259. See also
Traders, institutional.
emotional trading, 17, 27, 38-41, 47,
53,56-62, 66, 75-76, 83,
169-171, 227, 254-256,
259-260, 262
elation, 24-25, 27-28, 33, 38-40,
53,58
fear, 35,38-39,53,56,58-59,
61-63,70,142,181,254-255,
263-264,269-270
selling climax, 59
greed, 15,40,50,53,59, 61-63,70,
142, 203, 254, 263-264
hope, 56,179-181, 255
self-destructiveness, 12, 24—27
fantasies of traders
the autopilot myth, 15-16, 246
the brain myth, 13-14
the greater fool theory, 44, 225-226
the rescue fantasy, 34
the Rorschach test, 69,113
Santa Claus, 64,116
the undercapitalization myth, 14—15
models of trading
as an addiction, 24, 33-34,40, 257
as a battle, 26, 47-50, 57, 72, 77, 82,
111, 199, 207, 229, 249
as entertainment, 3-4,10,11, 24, 28,
39-40,47,51,54, 254, 260, 261
as gambling, 24-25, 27, 33, 35, 40,
51, 65, 208, 257, 261
and masturbation, 24
pain, 35, 76
measured by volume, 169-171,173
reality and fantasy, 4,12-17, 30,47,
75,265. See also Market
crowds, mass manias, the Dutch
Tulip mania, the South Seas
bubble.
psychology of losers, 13-17, 24,
31-41, 53-54, 87,169,
179-181, 229, 245, 254-256,
261, 263
counting money, 263-264
laziness, 15
INDEX
285
psychology of winners, 6-7,16,27,
31-42, 49,58-60, 68
differences between winners and
losers, 17, 24,33-42, 55, 63-64,
169,182,258
goals, 12,53,254, 258,264
independence, 41,49,58-60
signs of losing, 58
intellect, 13-14, 23, 38, 40,57, 229,
254,263
Odysseus at the mast, 60
responsibility, 54
self-esteem, 35
self-fulfillment, 11-12
Rectangles, 107-110. See also Charts.
flag, 109-110
line (Dow theory), 109
trading rules, 109
Relative Strength Index, 162-166,
240-241. See also Indicators,
oscillators.
how to construct, 162-163
mass psychology, 164
trading rules, 164-166
charting patterns, 165-166
divergences, 164—166
Stochastic, 112,156-162,239-240,251,
265. See also Indicators, oscil-
lators.
crowd psychology, 158
how to construct, 156-157
Fast and Slow, 157
trading rules, 158-161
divergences, 158-160
overbought/oversold, 160-161
Stock market indicators, 18, 20. See
also Advance/Decline Line,
New High-New Low Index,
Traders’ Index.
the Member Short Sale Ratio, 208,
218
the Most Active Stocks, 207-208
the Odd-lot Sale Ratio, 219
the Odd-lot Short Sale Ratio, 208,
219
the Specialist Short Sale Ratio, 208,
218
the Volume of Low-Priced Stocks,
208
Stop-loss orders, 80,81,85,89,93,97,
102-107,113,133,159,180,
225-226, 230-231, 244-247,
266-267. See also Money man-
agement.
break-even orders, 243, 267
the 50 percent rule, 243, 267-268
losses, cutting, 254—255,260
protect-profit orders, 267-268
stop-and-reverse orders, 104—105. See
also Parabolic trading system.
Support and resistance, 75-80,100,
107-108,127,149, 247-248,
266-267. See also Charts.
crowd psychology, 76-77
edges of congestion areas, 75-76
and indicators, 127,149,166
measuring, 78
trading rules, 78-79
Theft, 8-9,50. See also Inside informa-
tion.
Time, 76, 78, 82, 90,152,156-157,161,
185,187-193, 203, 244-245,
267. See also Parabolic trading
system.
the factor of five, 192-193, 236-237,
266-267
indicator length-rule of thumb,
124—125, 152. See also
Indicators.
indicator seasons, 188-192, 237
timeframes, 85-87, 90, 104, 146,
235-237, 250
how to define, 236-237
286
INDEX
Traders. See also Psychology of trading,
amateurs and professionals, 3-5,
24-25,47, 72-73, 76, 79-80,
87,96,101,142,167,170,176,
243, 250, 254, 258, 262-264,
265, 267, 271
bulls and bears, hogs and sheep, 43
buyers, sellers, and undecided, 45-47,
179-181
commercials, 179,182-183
futures and cash markets, 52
engineers, 14, 47
floor traders, 8-9, 64—65, 96,100,
109, 258. See also Trading
Industry.
hedgers, large, and small speculators,
216-217. See also Commitment
indicators, Commitments of
Traders index.
institutional, 4,19, 46,52-53, 259
men and women, 4
private, 51, 53, 259
professional, 12-13, 24, 36, 37, 39,
41,47,51, 82-83, 85, 98,120,
167, 205, 254, 269-270, 272
Traders’ Index (TRIN), 201-206. See
also Stock market indicators.
crowd psychology, 203-205
how to construct, 201-203
trading rules, 205-206
Trading, 11,24
approaches, 34, 59, 68
buying opportunity, 81, 89-90, 93-95,
114,132-133,143-145,171,
247
decisions at the right edge of the chart,
76, 81, 82-83, 84, 89, 94, 97,
103,106,108,149,154,159,
165,180,189, 204, 223, 233,
240
entering trades, 27,56,58, 60,
111-113,126, 239, 241-243
exiting trades, 27, 56,58, 60,141,
226-227, 230-232, 263-268
learning to trade, 5-6,42,51,54. See
also Financial Trading
Seminars, Inc.
plan, 12,14-15, 24, 28, 42, 56, 58, 60,
64. See also Trading systems,
profitability, 112,117, 235, 259-260
record-keeping, 34,36-37
and a trading diary, 27-28, 60,
268
risk, 11, 24, 33, 36-37, 262
rules, 42, 78-79, 93, 99-100,
104-105,109,112-113,125,
129-130, 132-135,139-141,
148,150,153-155,158-161,
164-166,171-172, 173-174,
176-177,181-182,185-187,
190,197-200, 205-206,
224-226, 229-234, 241,
245-247, 250-251
strength and weakness, 80
shorting opportunity, 84, 90, 92-94,
97,102,103,114,132-133,
143-145,172, 247
uncertainty, 58, 86,103
whipsaws, 123,125,129-130,141,
192, 236, 244-247, 267
Trading industry, 6-7, 258
advisors, 6,10,13,16-23, 34,53-55,
67,161, 209-213. See also
Consensus indicators, Contrary
Opinion theory; Gurus,
newsletters, 54-55, 209-213
Bullish Review, 217
Club 3000,116,133,135
Investors’ Intelligence, 210-211
Market Vane, 210-213
software developers, 117-118,
161-162
brokers, 6-10, 48, 49, 51,56, 216
commissions and slippage, 6-10, 28,
INDEX
287
36,48, 52, 70-73, 85,112,169,
182,257-258,260,267
floor traders, 8-10, 48-49, 65, 87,
96,101
exchanges, 6-7, 25,51, 87,179, 200,
206, 218
American Stock Exchange, 200
Chicago Mercantile Exchange, 96
London Stock Exchange, 167,
200
Milan Stock Exchange, 200
New York Stock Exchange, 48,70,
167,195, 200, 201, 207, 208,
215
Over the Counter Exchange, 200
trading contests, 55-56
Wall Street, 20,43,58,171,218
Trading systems, 10,15-17, 27, 34,
59-60,117,125,257, 259-260,
266-267,270. See also
Channel, channel trading sys-
tems; Parabolic trading system;
Triple Screen trading system,
automatic, 15-16,101,125-126,
161-162, 270
optimization, 15,117,124,130, 257
and de-optimization, 257
Trends and trading ranges, 80-95,
98-100,102,105,109-113,
126,156,159-160,170,199,
203, 249, 265. See also Charts,
how to identify, 83
accelerating trends, 91-92,145
differences in trading tactics, 80
mass psychology, 81
trading rules, 84-85
Trendlines, 19, 83-84, 86-95,102,
165-166. See also Chart pat-
terns.
crowd psychology, 90-91
how to plot, 88-89
accelerating, 92
angles, 89-90
breaks, 91-93
preliminary, 94—95
rating the importance, 89-91
of volume and indicators, 95,148,
166,172. See also Herrick
Payoff Index; Relative Strength
Index.
trading rules, 93
Triangles, 110-113. See also Charts.
trading rules, 112-113
types
ascending, 110-111
descending, 110-111
diamonds, 113
pennants, 113
symmetrical, 110-111,113
widening, 113
Triple Screen trading system, 86-87,
120,133,160-161,193, 224,
232,235-243, 246, 267. See
also Trading systems.
first screen, 237-239
second screen, 239-241
third screen, 241-243
trailing buy-stop and sell-stop, 231,
241-243
Volatility, 100,113, 236, 248, 251-253.
See also Channels, Bollinger
bands.
Volume, 18, 20, 76, 95,127, 167-178,
201-203, 208, 227-229. See
also Volume-based indicators.
and chart patterns, 80, 88, 91, 98-100,
102-107,109, 111-113
crowd psychology, 167, 169-171
reflection of pain, 169-171,173
and a moving average, 172
three ways of measuring, 167-168
tick volume, 168
trading rules, 171-172
288
INDEX
Volume Accumulator. See
Accumulation/Distribution.
Volume-based indicators. See On-
Balance Volume,
Accumulation/Distribution. See
also Indictors, trend-following.
Williams %R, 151-156, 239-240. See
also Indicators, oscillators.
crowd psychology, 152-153
how to construct, 151-153
trading rules, 153-155
divergences, 153-155
failure swings, 155
overbought/oversold, 153,155-156
About the Author
Alexander Elder, M.D., was born in Leningrad and grew up in
Estonia where he entered medical school at the age of 16. At 23,
while working as a ship’s doctor, he jumped a Soviet ship in Africa
and received political asylum in the United States. He continued to
work as a psychiatrist in New York City, served as the book editor of
The Psychiatric Times, and taught at Columbia University. After
becoming involved in financial trading, Dr. Elder published dozens of
articles, software, and book reveiws and spoke at many conferences.
In 1988 he founded Financial Trading Seminars, Inc., an educational
firm for traders. Dr. Elder consults for individuals and financial insti-
tutions and conducts seminars for traders. His firm produces video-
tapes on trading and supplies trading books.
Readers of Trading for a Living are welcome to request a current
information kit by writing or calling:
Financial Trading Seminars, Inc.
PO Box 20555, Columbus Circle Station
New York, NY 10023, USA
800-458-0939 or 212-432-7630
Fax 718-639-8889
289