/


Text
Fertilizer
Manual
This manual is a successor to and in part a revision of the
IFDC/UNIDO Fertilizer Manual Published in December 1979
Editors: —_
United Nations Industrial Development Organization (UNIDO) and
International Fertilizer Development Center (IFDC).
Kluwer Academic Publishers in cooperation with:
11lUinA United Nations Industrial Development Organization, (UNIDO)
^IJgKJy Vienna, Austria
.p International Fertilizer Development Center (IFDC)
1***' Muscle Shoals, Alabama (U.S.A.)
iu
A C.I.P. Catalogue record for this book is available.from the Library of Congress.
ISBN 0-7923-5032-4(HB)
ISBN 0-7923-501 l-I(PB)
Published by Kluwer Academic Publishers,
P.O. Box 17, 3300 AA Dordrecht, The Netherlands.
Hardbound Edition:
Sold and distributed in the U.S.A. and Canada
by Kluwer Academic Publishers,
101 Philip Drive, Norwell, MA 02061, U.S.A.
In all other countries, sold and distributed
by Kluwer Academic Publishers,
P.O. Box 322, 3300 AH Dordrecht, The Netherlands.
Softbound Edition:
Sold and distributed
by IFDC,
P.O. Box 2040, Muscle Shoals, AL 35661, U.S.A.
Printed on acid-free paper
This manual has been prepared by the United Nations Industrial Development Organization (UNIDO)
and International Fertilizer Development Center (IFDC) within UNIDO project XP/GLO/93/094.
The views expressed in this pubKcation are those of the authors and do not necessarily reflect the views
of the Secretariat of UNIDO or of IFDC.
Mention of firm names and commercial products does not imply the endorsement of UNIDO or IFDC.
Copyright © 1998,(year of first publication), by United Nations Industrial Development Organization
(UNIDO) and International Fertilizer Development Center (IFDC). All Rights Reserved.
No pan of the material protected by this copyright notice may be reproduced or
utilized in any form or by any means, electronic or mechanical,
including photocopying, recording or by any information storage and
retrieval system, without written permission from the copyright owner.
Printed in the Netherlands
Preface
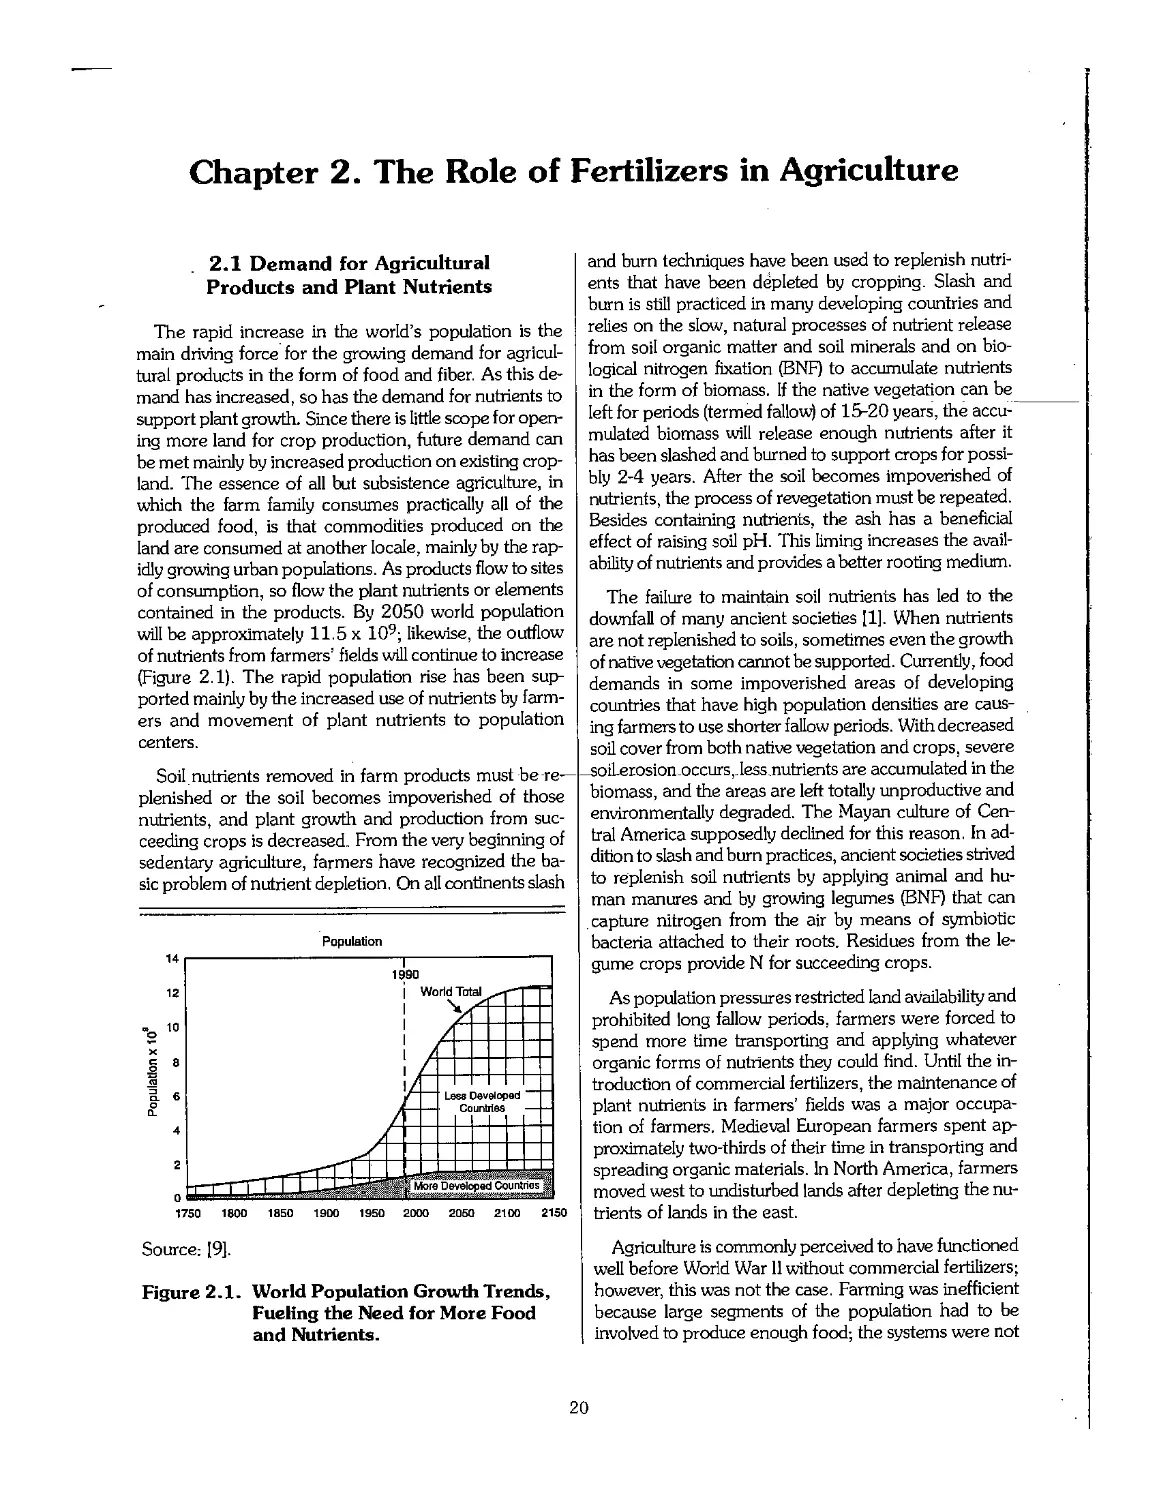
According to the United Nations, world population will reach 8.5 x 10⁹ in 2025. Over 93%
of the growth will occur in the developing countries. Such unprecedented growth in population
will create equally unprecedented pressures on the natural resource base-land, water, and air-to
produce adequate food, fiber, and raw materials to meet the growing demand.
The United Nations projects that the number of people living in absolute poverty will increase
from 1.2 x 10⁹ today to 1.5 x 109 by 2025. Today more than 700 million people in the
developing countries do not have access to sufficient food to lead healthy, productive lives. If
current trends in population growth and food production continue, by the year 2025, the World
Bank estimates that Africa alone will have an annual food shortage of 250 million tonnes.
To solve these seemingly.insurmountable problems, the United Nations forecasts that
agricultural output must be tripled and people must have the income to buy it. With increasingly limited
land under cultivation, sustainable food security cannot be achieved without the benefits of
intensified agriculture-the key to alleviating poverty- The adoption of improved technology and
the application of modern inputs of agriculture, including inorganic and organic fertilizers, can
significantly boost food supply and help to protect the environment. In fact, Dr. Norman Borlaug,
1970 Nobel Peace Prize recipient, has said that "the use of chemical fertilizers must be
expanded J^orJoJhreefolcLto_maintain-soil Jert^ developing countries
over the next 25 years if the world is to feed itself."
The publication of this edition of the Fertilizer Manual is timely in that the World Food
Summit was held in Rome in November 1996. At this Summit, policymakers from around the
world discussed the global challenges created by a burgeoning population, shrinking land area
available for food production, and mounting food insecurity.
The last revision of the Fertilizer Manual was published in 1979. Since that time major
advances in fertilizer technology have occurred whereby more energy-efficient processes and
reductions in the cost of production have resulted. This edition of the Fertilizer Manual
provides planners with information on these new advances.
m
Editorial Note
In the 3rd edition of the Fertilizer Manual, basic information from the 2nd edition has been
retained. The contents of the chapters were reviewed by consultants; professionals in the given
fields of agronomics, technology, and economics. The names of contributors are as follows:
Chapter 1 - D. W. Rutland (IFDC); Chapter 2 - B. H. Byrnes (IFDC); Chapter 3 - W. C.
Brummit (IFDC); Chapter 4 - B. L. Bumb (IFDQ; Chapter 5 - S. J. Van Kauwenbergh, T.A.B._
Lawendy, and J, W. Foster (IFDC); D. E. Garrett, P. Rozwadowski, and B. Groover (UN1DO);
Chapters 6 and 7 - B. Groover (UNIDO); Chapter 8 - D. P. Aleinov (UNIDO); Chapter 9 - J. R.
Lazo de la Vega and G. R. Coleman (IFDC); Chapter 10 - F. P. Achorn (UNIDO); Chapter 11 -
P. Rozwadowski (UNIDO); Chapters 12, 13, and 14-A. Davister(UNIDO); Chapter 15 -D. E.
Garrett (UNIDO); Chapter 16 - J. J. Schultz (IFDC); Chapter 17 - J. Mortvedt and R. G. Lee
(IFDC); Chapter 18 - D. W. Rutland (IFDC); Chapters 19, 20, and 22 - J. A. Kopytowski
(UNIDO) (S. A. Ahmed from East West Center, Honolulu, Hawaii, contributed with the EWC
methodology on projection of fertilizers consumption); Chapter 21 - D. E. Nichols, J. R. Polo,
and D. I. Gregory (IFDC). The technical editors of the Fertilizer Manual were R. G. Lee (IFDC)
and J. A. Kopytowski (UNIDO). Internationally acknowledged fertilizer manufacturers,
licensors, and engineering companies were asked to contribute nonconfidential information related
to their processes. The following companies responded and their special contribution is
appreciated and acknowledged in the Fertilizer Manual where needed: Babcock-King-Wilkinson,
Chiyoda Corp., Lurgi GmbH, Snamprogetti-SpArM,,-W.-Kellogg,-H.-Topsoe, Kemira
Engineering Oy, Uhde GmbH, Stamicarbon SA, and Raytheon Engineers. Other companies' processes
are described on the basis of publicly available information. Also information published by IFDC
in workshop proceedings from 1990 to 1995 was used in some chapters, and references to this
information are given. The information from these workshops has been especially useful in
preparation of Chapters 2, 16, 19, and 21.
IFDC and UNIDO have used their best efforts in development of the information contained in
the Fertilizer Manual. The use of the information contained herein shall be at the sole
discretion of the user. It is unavoidable in a work of this magnitude that some of the information will
require frequent updating. Readers should keep in mind that when authors refer to "current" or
"present" situations, they usually mean 1996 unless otherwise specified.
Special thanks are extended to the following collaborators in the preparation of this manual.
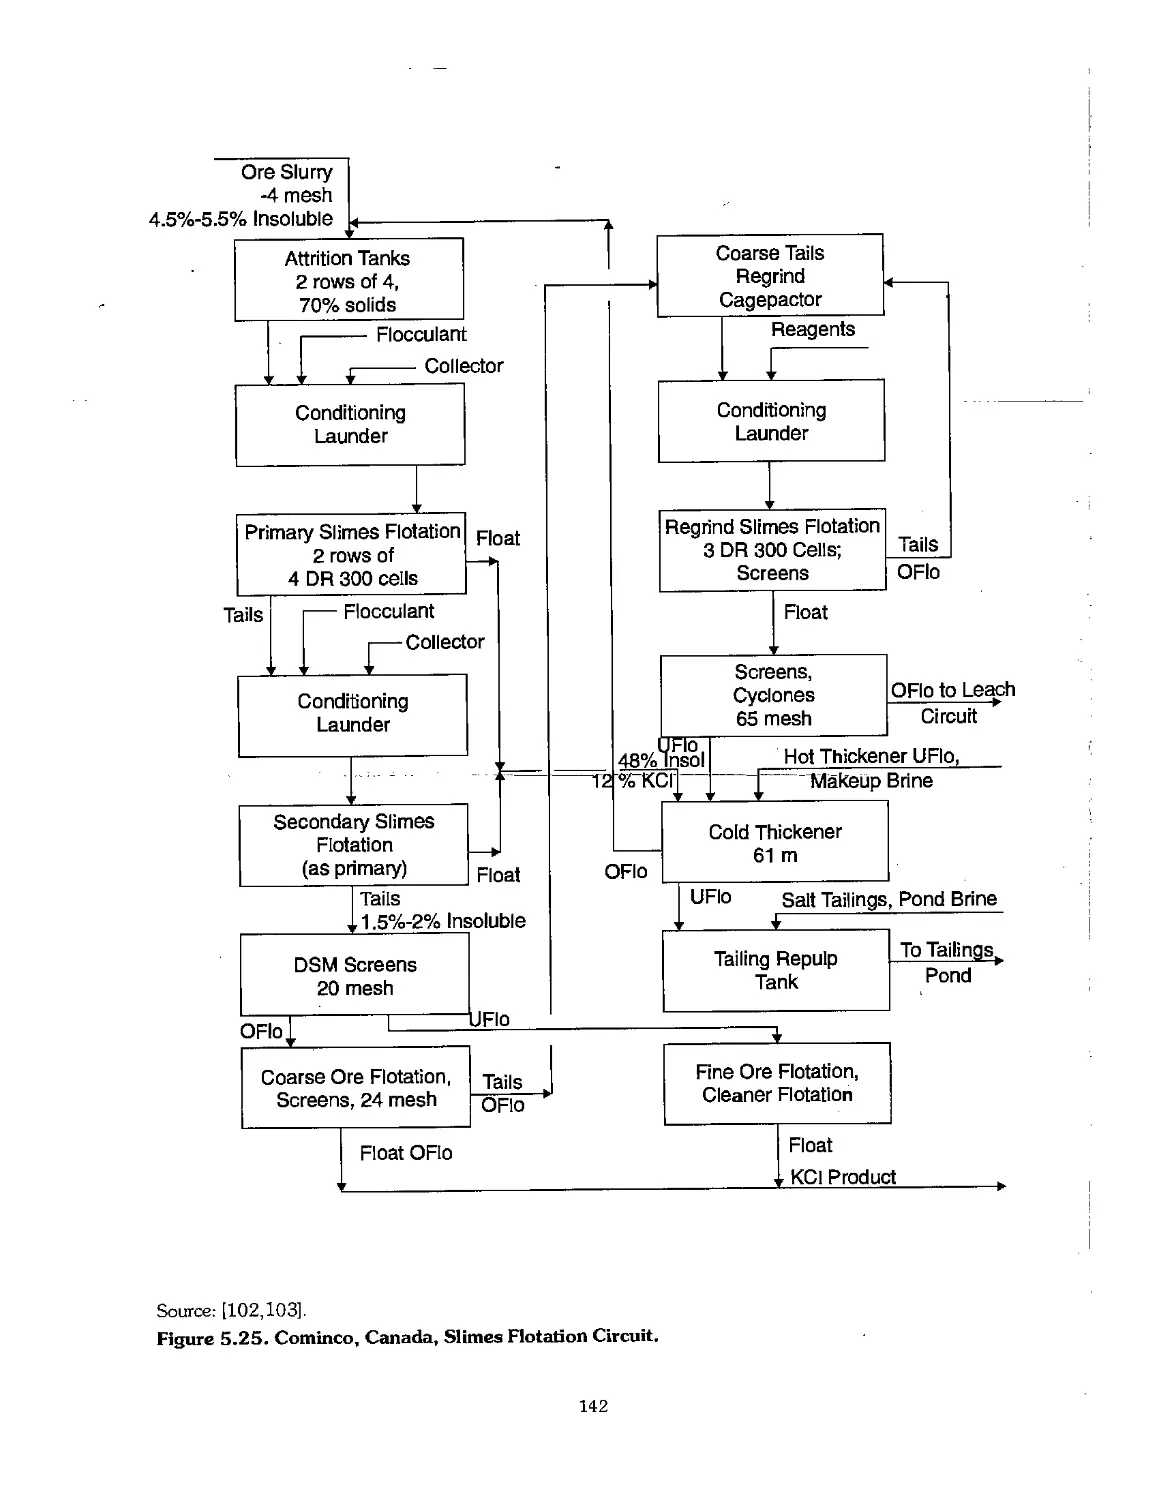
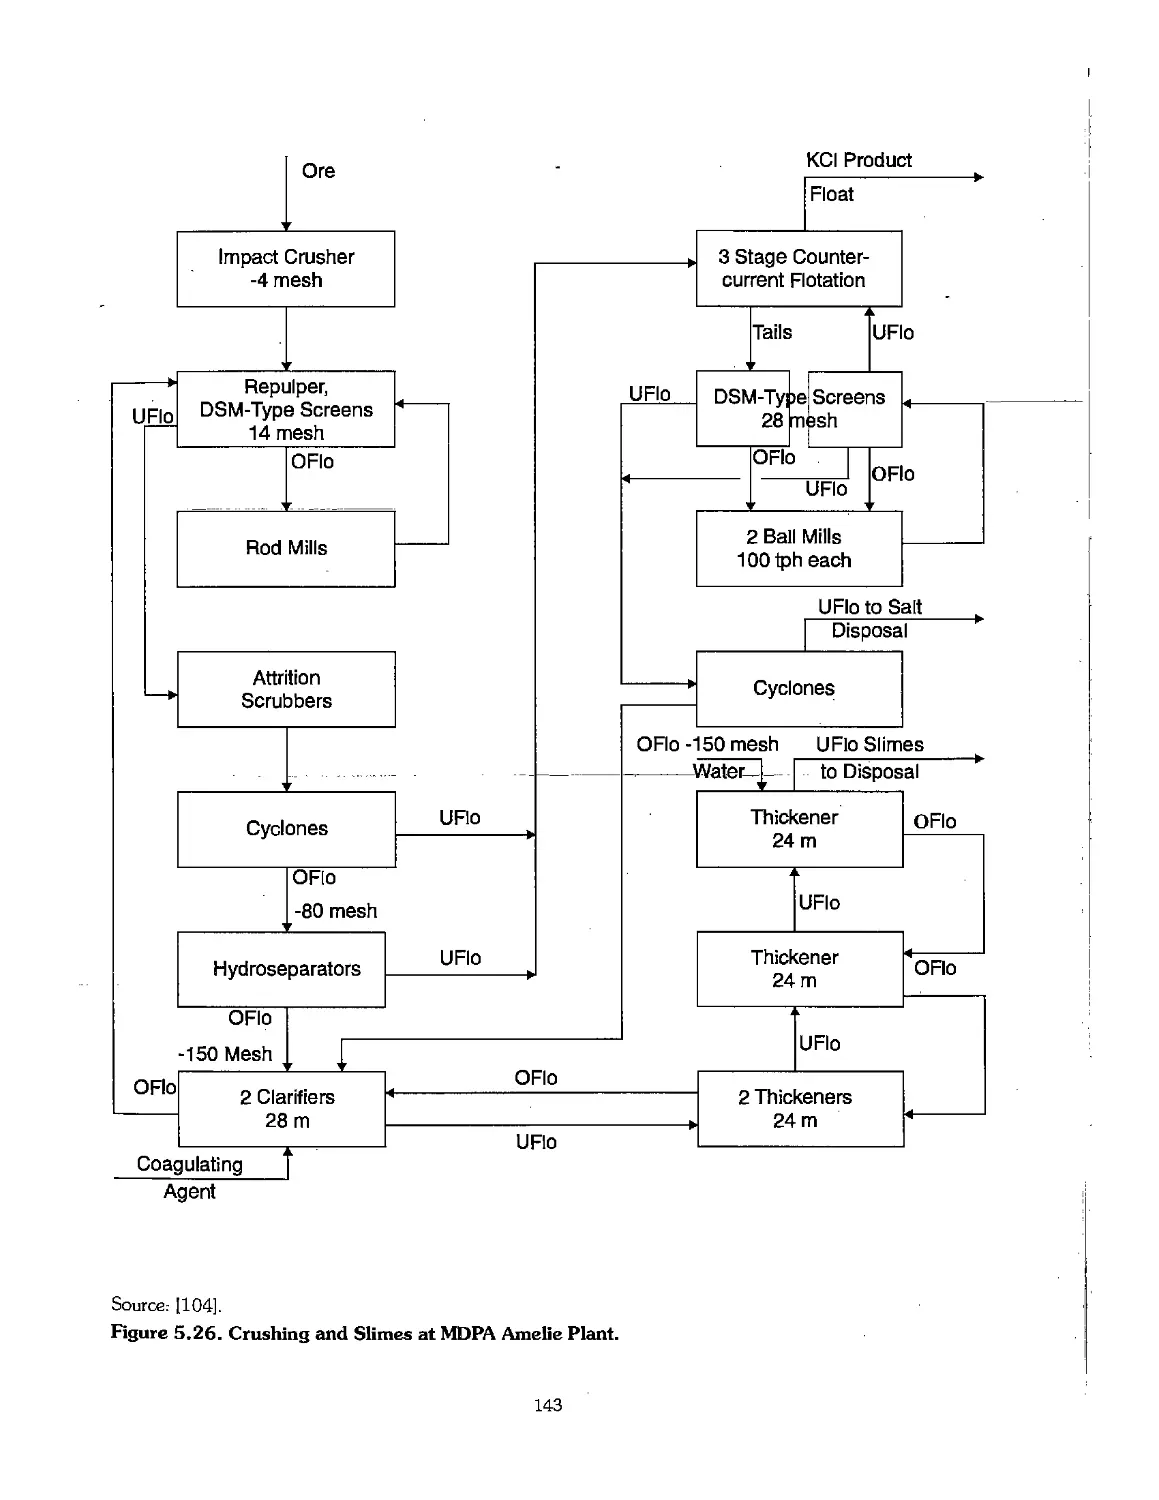
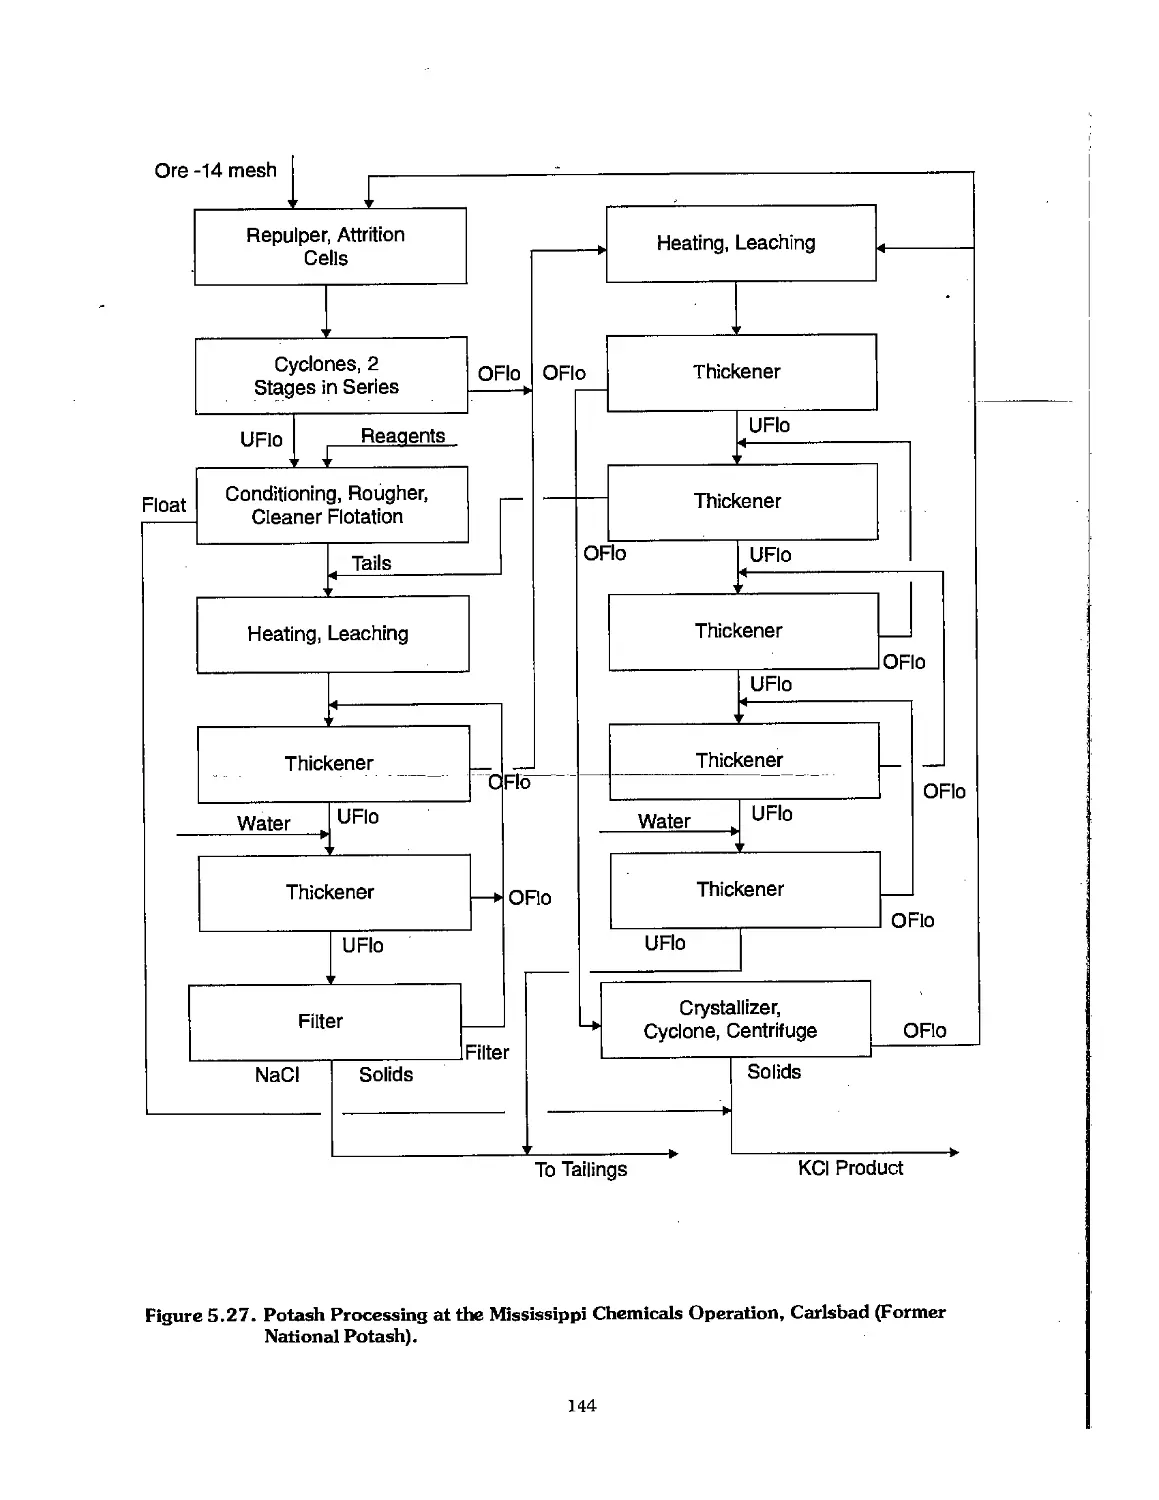
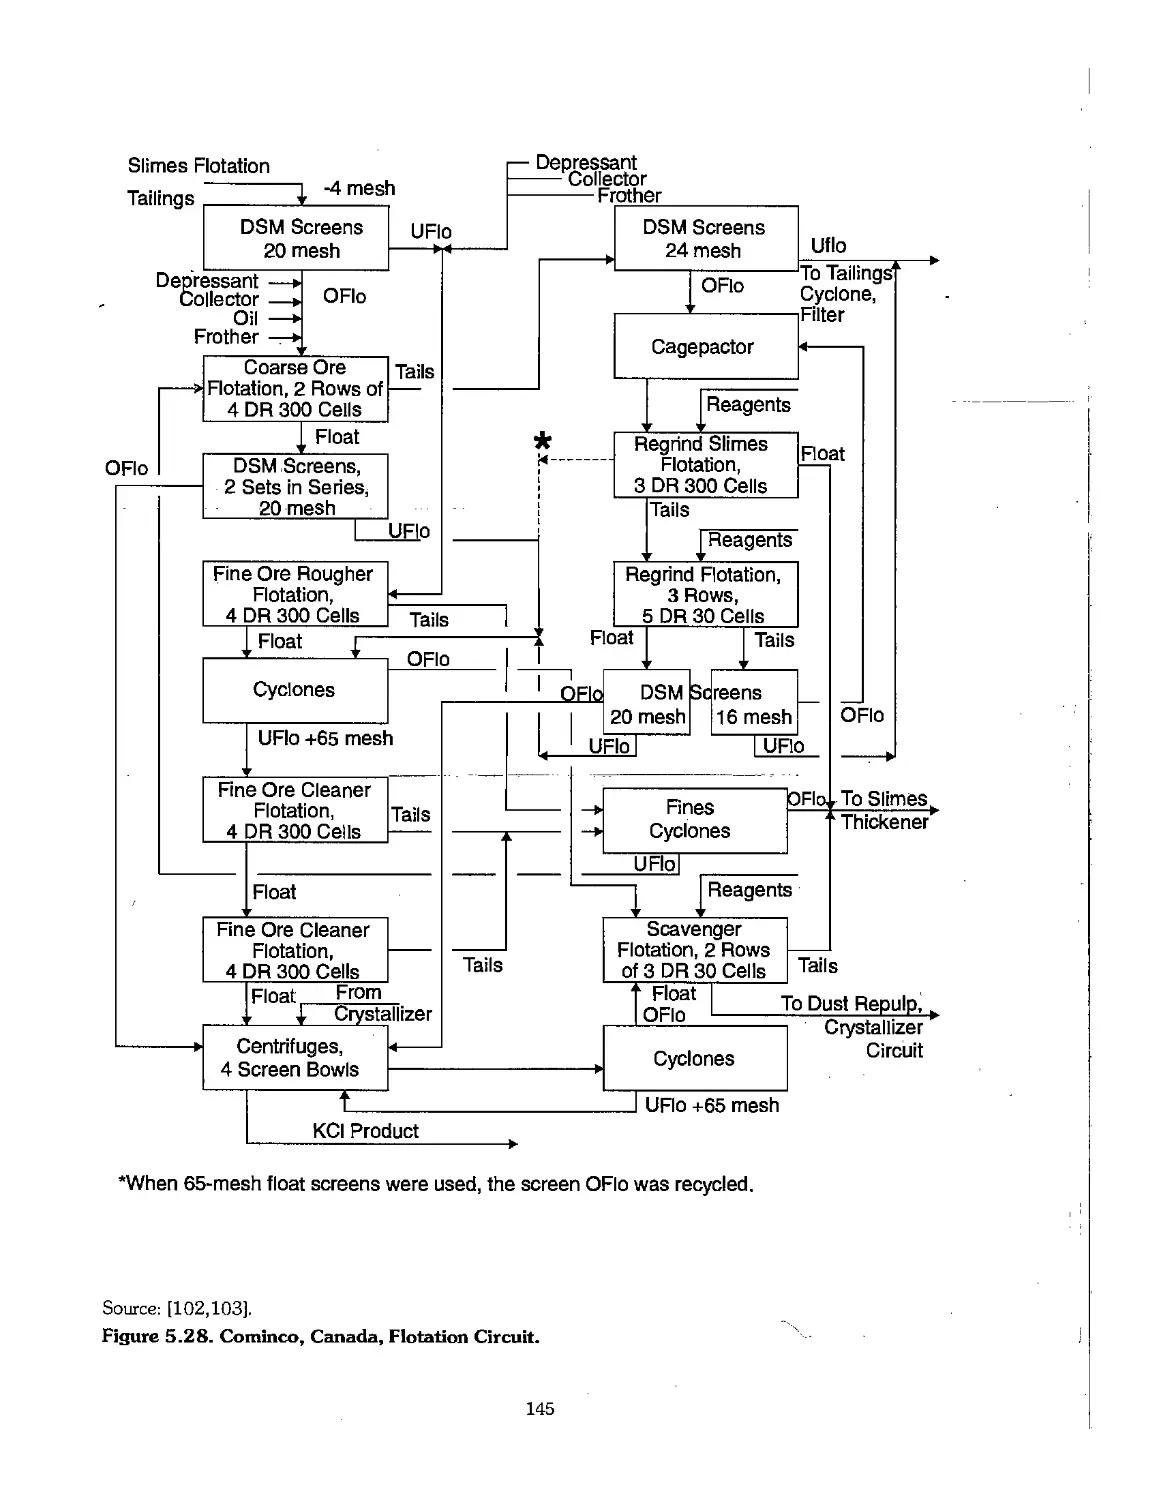
• R. Rejewski (UNIDO) - preparation of the flow diagrams.
• Marie R. Stribling, Elizabeth N. Roth, and Marie K. Thompson (IFDQ - proofing and
editing.
• Lynda F. Young (IFDC) - computer graphics.
• Jane L. Goss, Alicia K. Hall, Janice C. Gautney, and Donna W. Venable (IFDC) - word
processing and layout.
• The contribution by Donna W. Venable is especially recognized.
IV
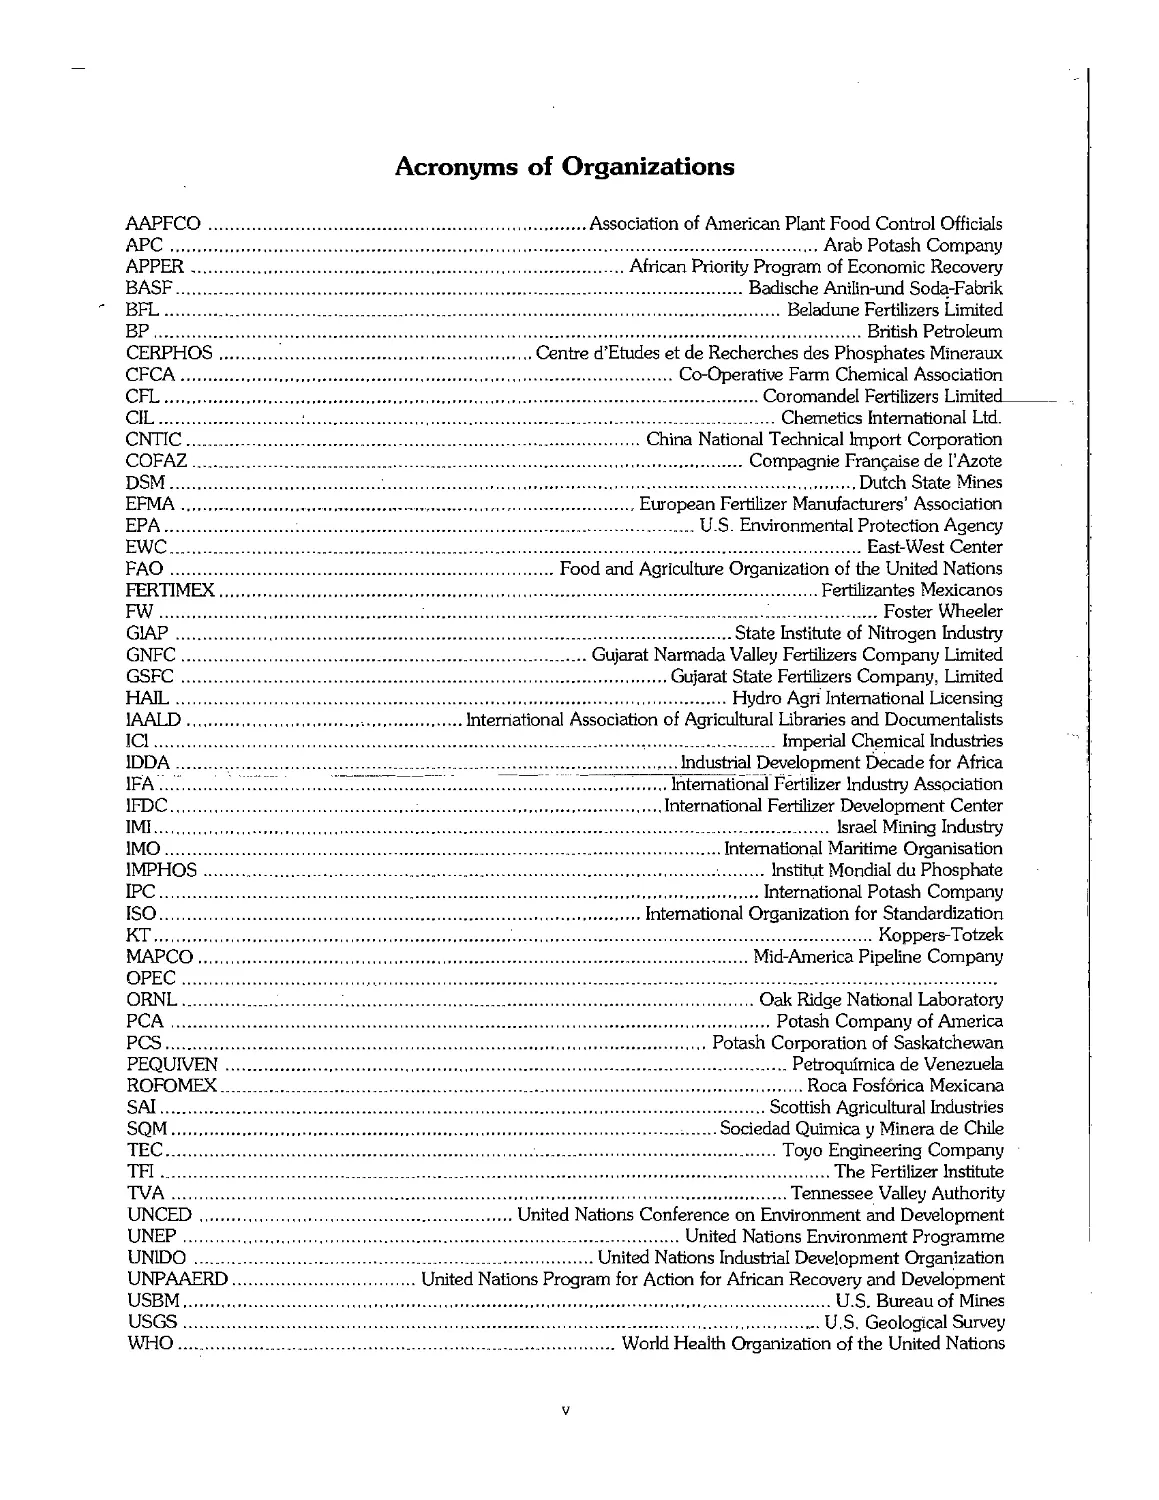
Acronyms of Organizations
AAPFCO Association of American Plant Food Control Officials
APC Arab Potash Company
APPER African Priority Program of Economic Recovery
BASF Badische Anilin-und Soda-Fabrik
BFL Beladune Fertilizers Limited
BP British Petroleum
CERPHOS Centre d'Etudes et de Recherches des Phosphates Mineraux
CFCA Co-Operative Farm Chemical Association
CFL Coromandel Fertilizers Limited-
C1L Chemetics International Ltd.
CNTIC China National Technical Import Corporation
COFAZ Compagnie Francaisede I1 Azote
DSM Dutch State Mines
EFMA , ,.., , European Fertilizer Manufacturers' Association
EPA : U.S. Environmental Protection Agency
EWC East-West Center
FAO Food and Agriculture Organization of the United Nations
FERTIMEX Ferullzantes Mexicanos
FW '. Foster Wheeler
G1AP State Institute of Nitrogen Industry
GNFC Gujarat Narmada Valley Fertilizers Company Limited
GSFC Gujarat State Fertilizers Company, Limited
HAIL Hydro Agri International Licensing
1AALD International Association of Agricultural Libraries and Documentalists
IC1 , Imperial Chemical Industries
1DDA , Industrial Development Decade for Africa
1FA International Fertilizer Industry Association
1FDC International Fertilizer Development Center
IMI Israel Mining Industry
1MO International Maritime Organisation
1MPHOS lnstitut Mondial du Phosphate
IPC International Potash Company
ISO International Organization for Standardization
KT Koppers-Totzek
MAPCO Mid-America Pipeline Company
OPEC
ORNL Oak Ridge National Laboratory
PCA Potash Company of America
PCS Potash Corporation of Saskatchewan
PEQUIVEN Petroquimica de Venezuela
ROFOMEX Roca Fosforica Mexicana
SAI Scottish Agricultural Industries
SQM i Sociedad Quimica y Minera de Chile
TEC Toyo Engineering Company
TFI The Fertilizer Institute
TVA Tennessee Valley Authority
UNCED United Nations Conference on Environment and Development
UNEP United Nations Environment Programme
UN1DO United Nations Industrial Development Organization
UNPAAERD United Nations Program for Action for African Recovery and Development
USBM , U.S. Bureau of Mines
USGS U,S, Geological Survey
WHO World Health Organization of the United Nations
v
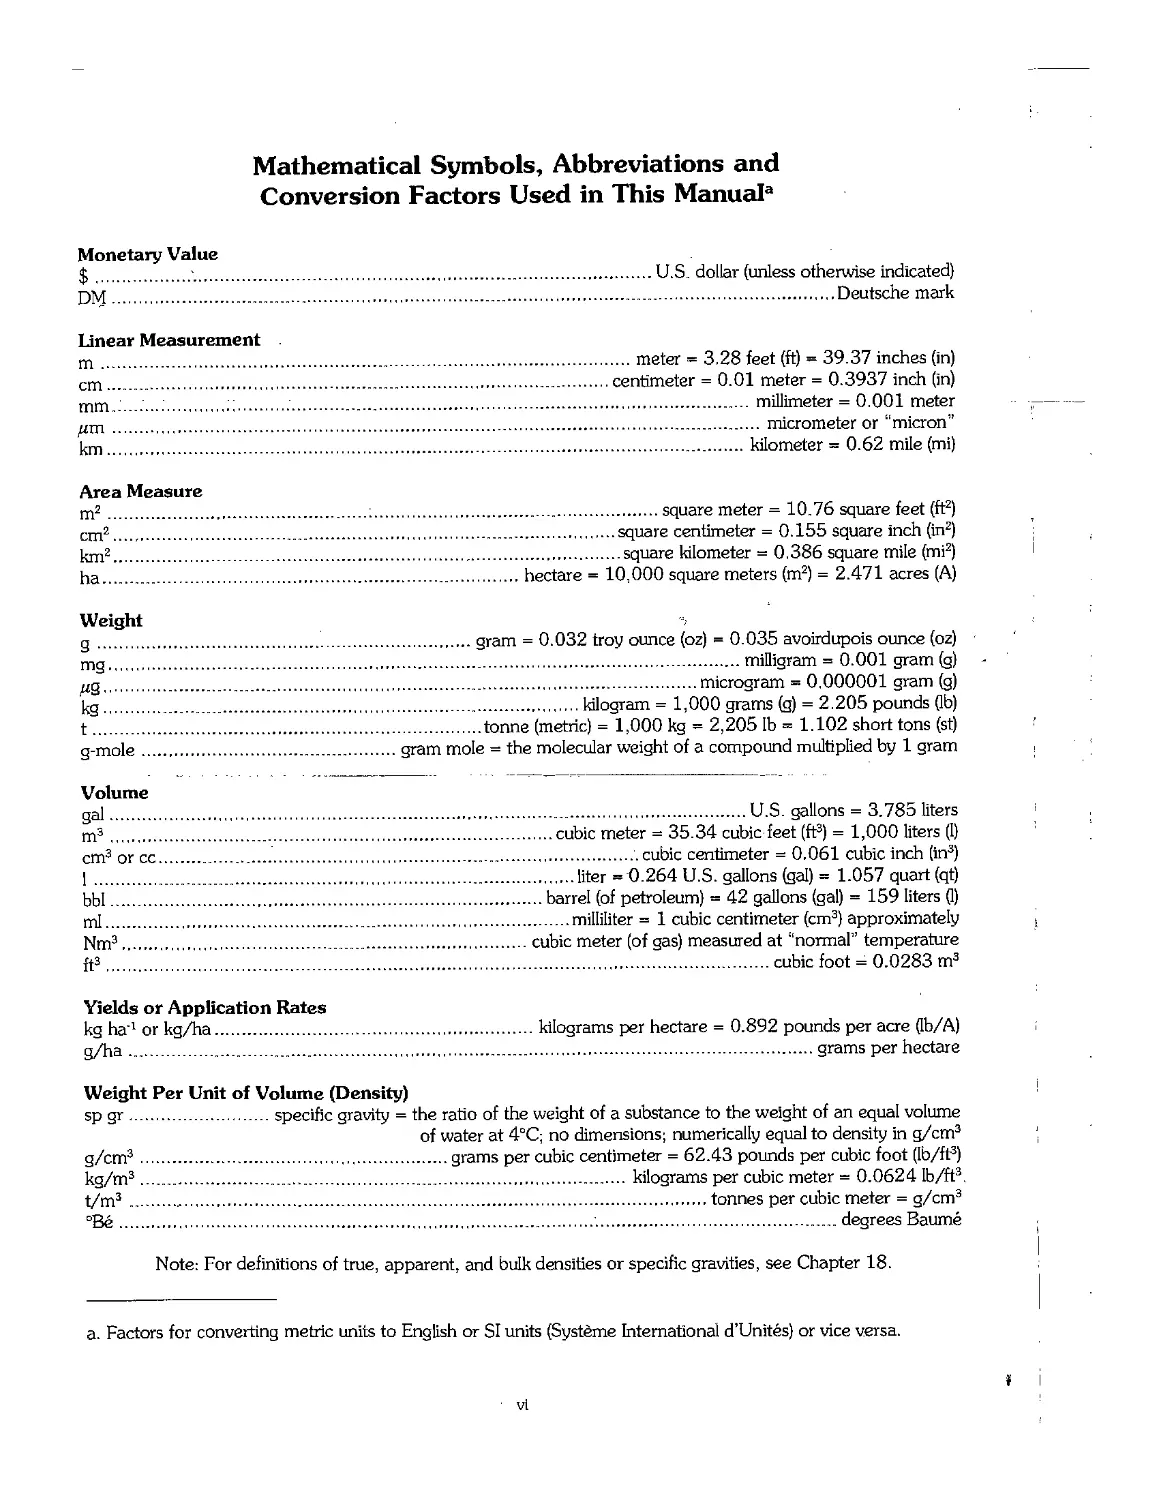
Mathematical Symbols, Abbreviations and
Conversion Factors Used in This Manual3
Monetary Value
$ '. U.S. dollar (unless otherwise indicated}
DM Deutsche mark
Linear Measurement
m meter - 3,28 feet (ft) = 39.37 inches (in)
cm centimeter = 0.01 meter = 0.3937 inch (in)
mm. J.-.'...: ;; millimeter = 0.001 meter
fim micrometer or "micron"
km kilometer = 0.62 mile (mi)
Area Measure
m2 square meter = 10.76 square feet (ft2)
cm2...., square centimeter = 0.155 square inch (in2)
km2 square kilometer = 0,386 square mile (mi2)
ha hectare = 10,000 square meters (m2) = 2.471 acres (A)
Weight
g gram = 0.032 troy ounce (oz) - 0.035 avoirdupois ounce (oz)
mg milligram = 0.001 gram (g)
fig microgram = 0,000001 gram (g)
kg kilogram = 1,000 grams (g) = 2.205 pounds (lb)
t tonne (metric) = 1,000 kg = 2,205 lb = 1.102 short tons (st)
g-mole gram mole = the molecular weight of a compound multiplied by 1 gram
Volume
gal U.S. gallons = 3.785 liters
m3 cubic meter = 35.34 cubic feet (ft3) = 1,000 liters (I)
cm3 or cc .cubic centimeter = 0.061 cubic inch (in3)
1 liter = 0.264 U.S. gallons (gal) = 1-057 quart (qt)
bbl barrel (of petroleum) = 42 gallons (gal) = 159 liters (1)
ml milliliter = 1 cubic centimeter (cm3) approximately
Nm3 cubic meter (of gas) measured at "normal" temperature
ft3 cubic foot = 0.0283 m3
Yields or Application Rates
kg ha"1 or kg/ha kilograms per hectare = 0.892 pounds per acre Ob/A)
g/ha grams per hectare
Weight Per Unit of Volume (Density)
sp gr specific gravity = the ratio of the weight of a substance to the weight of an equal volume
of water at 4°C; no dimensions; numerically equal to density in g/cm3
g/cm3 grams per cubic centimeter = 62.43 pounds per cubic foot (lb/ft3)
kg/m3 kilograms per cubic meter = 0.0624 lb/ft3,
t/m3 tonnes per cubic meter = g/cm3
°Be degrees Baume
Note: For definitions of true, apparent, and bulk densities or specific gravities, see Chapter 18.
a. Factors for converting metric units to English or SI units (Systeme International d'Unites) or vice versa.
vl
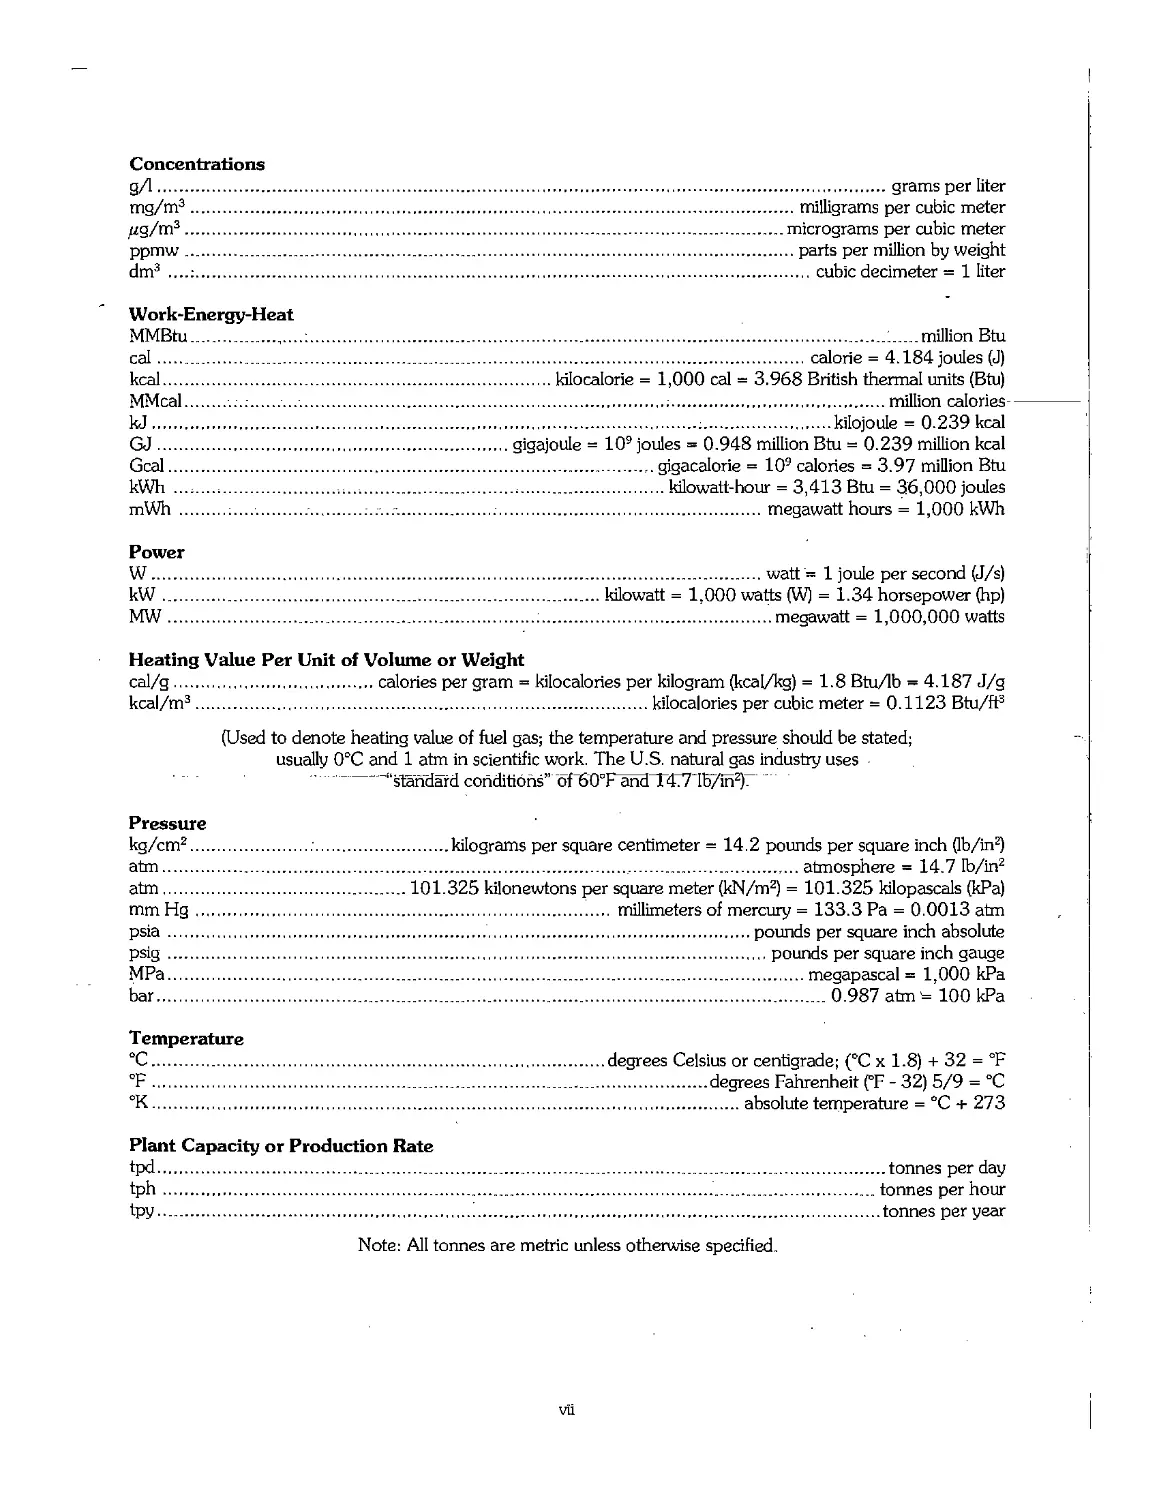
Concentrations
g/1 grams per liter
mg/m3 milligrams per cubic meter
fig/vn2 micrograms per cubic meter
ppmw parts per million by weight
dm3 ....: cubic decimeter = 1 liter
Work-Energy-Heat
MMBtu million Btu
cal calorie = 4.184 joules (J)
kcal kilocalorie = 1,000 cal = 3.968 British thermal units (Btu)
MMcal million calories -
kJ kilojoule = 0.239 kcal
GJ gigajouIe = 109 joules = 0.948 million Btu = 0.239 million kcal
Gcal ,. gigacalorie = 109 calories = 3.97 million Btu
kWh ; kilowatt-hour = 3,413 Btu = 36,000 joules
mWh megawatt hours = 1,000 kWh
Power
W watt = 1 joule per second (J/s)
kW kilowatt = 1,000 watts (W) = 1.34 horsepower (hp)
MW : megawatt = 1,000,000 watts
Heating Value Per Unit of Volume or Weight
cal/g calories per gram = kilocalories per kilogram (kcal/kg) = 1.8 Btu/lb = 4.187 J/g
kcal/m3 kilocalories per cubic meter = 0.1123 Btu/ft3
(Used to denote heating value of fuel gas; the temperature and pressure should be stated;
usually 0°C and 1 atm in scientific work. The U.S. natural gas industry uses ■
"standard conditions" "of"60DFaTid"T4T71B/iri2)~
Pressure
kg/cm2 kilograms per square centimeter = 14.2 pounds per square inch (lb/in2)
atm ,... atmosphere = 14-7 lb/in2
atm 101.325 kilonewtons per square meter (kN/m2) = 101.325 kilopascals (kPa)
mmHg millimeters of mercury = 133.3 Pa = 0.0013 atm
psia pounds per square inch absolute
psig pounds per square inch gauge
MPa megapascal= 1,000 kPa
bar 0.987 atm = 100 kPa
Temperature
°C degrees Celsius or centigrade; (°C x 1.8) + 32 = °F
°F degrees Fahrenheit (°F - 32) 5/9 = °C
°K absolute temperature = °C + 273
Plant Capacity or Production Rate
tpd tonnes per day
tph tonnes per hour
tpy '. tonnes per year
Note: All tonnes are metric unless otherwise specified.
vii
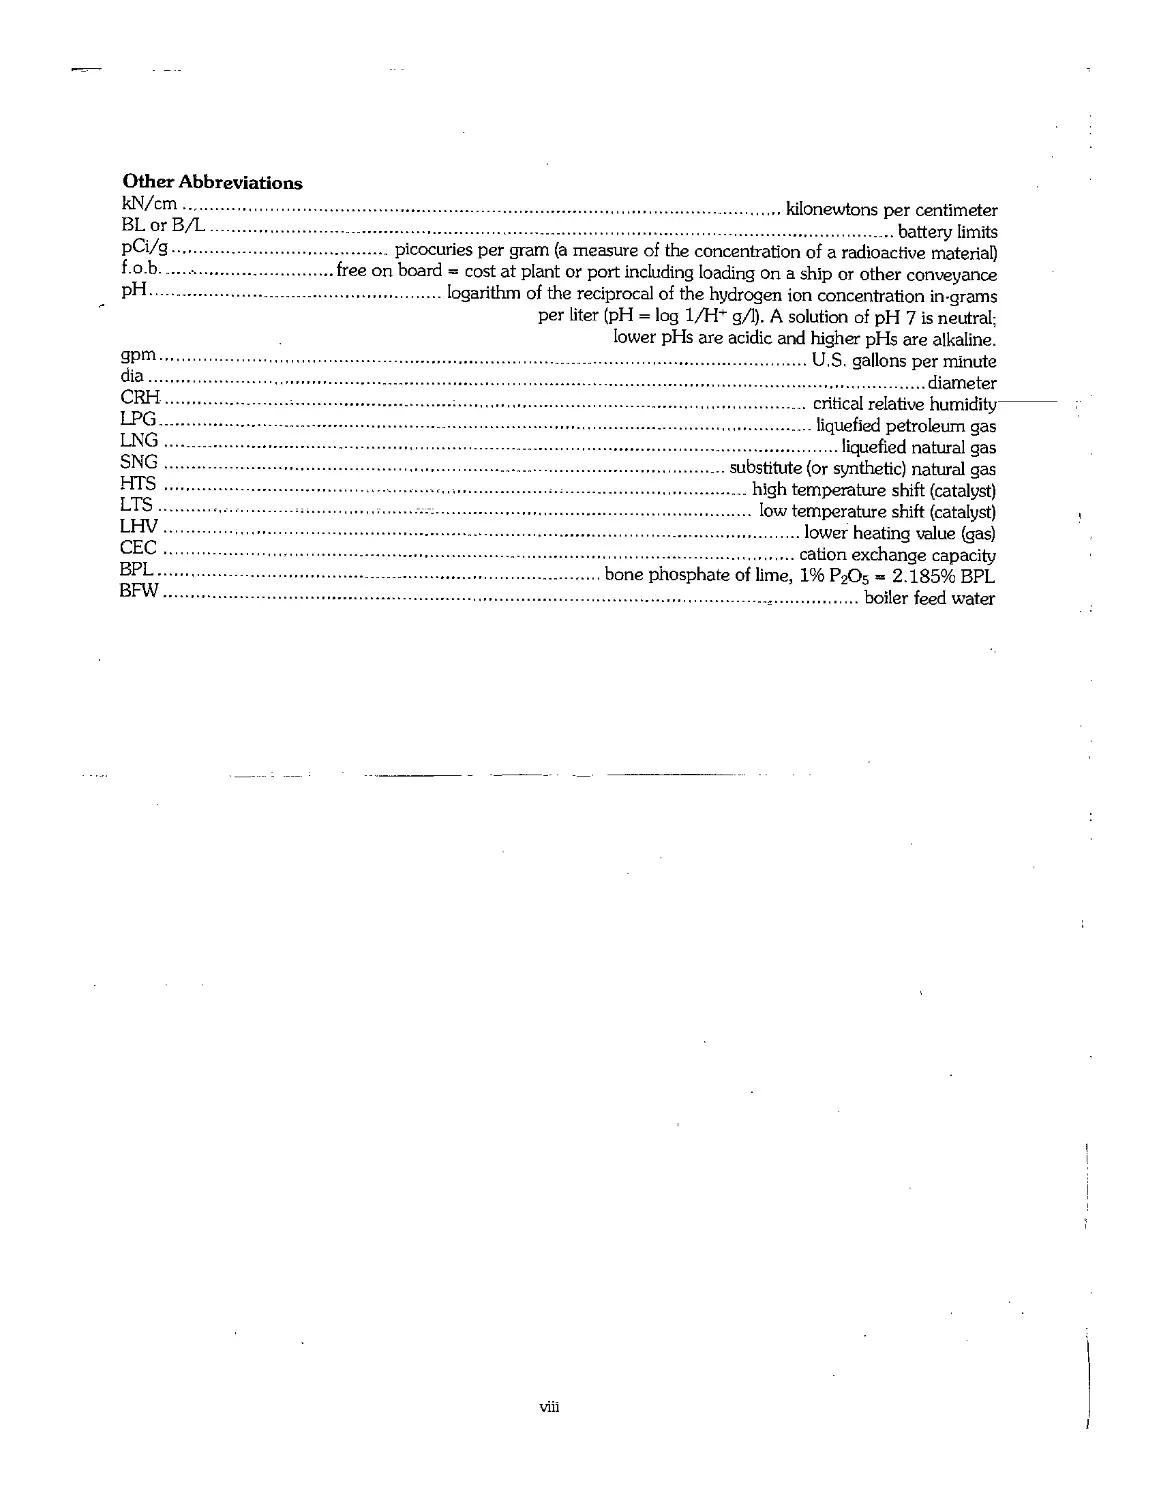
Other Abbreviations
kN/cm kilonewtons per centimeter
BLorB/L battery limits
pCi/g picocuries per gram (a measure of the concentration of a radioactive material)
f.o.b ■ free on board = cost at plant or port including loading on a ship or other conveyance
pH logarithm of the reciprocal of the hydrogen ion concentration in-grams
per liter (pH = log 1/H+ g/1). A solution of pH 7 is neutral;
lower pHs are acidic and higher pHs are alkaline.
gpm U.S. gallons per minute
dia diameter
CRH -. critical relative humidity
LPG liquefied petroleum gas
LNG liquefied natural gas
SNG substitute (or synthetic) natural gas
HTS high temperature shift (catalyst)
LTS -.-.-. -.- ...■ low temperature shift (catalyst)
LHV lower heating value (gas)
CEC , cation exchange capacity
BPL ,.... bone phosphate of lime, 1%P205= 2.185% BPL
BFW ^ boiler feed water
viii
Table of Contents
Page
Chapter 1. General Concepts, Classification, Terminology, and Definitions 1
1.1 Introduction 2
. 1.2 Plant Nutrients .-. 2
1.3 Fertilizer Grade , 2
1.4 Nutrient Availability 3
1.5 Fertilizer Regulations 4
1.6 Fertilizer Specifications 5
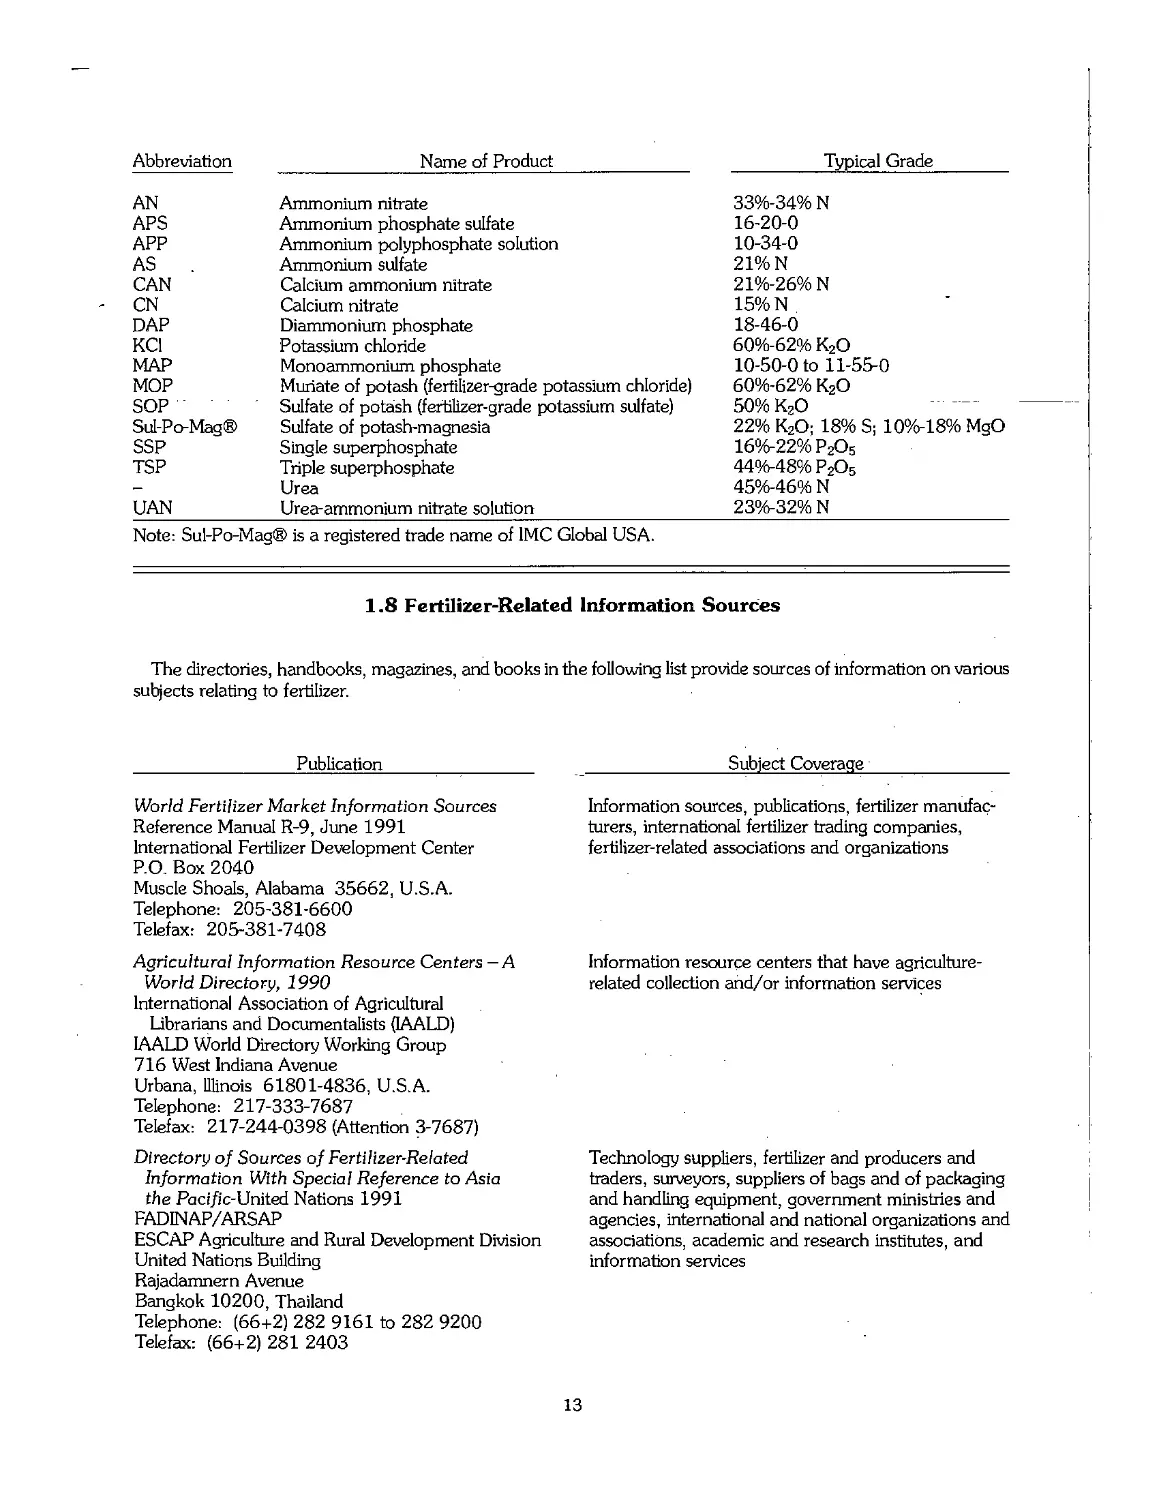
1.7 Terminology and Definitions 5
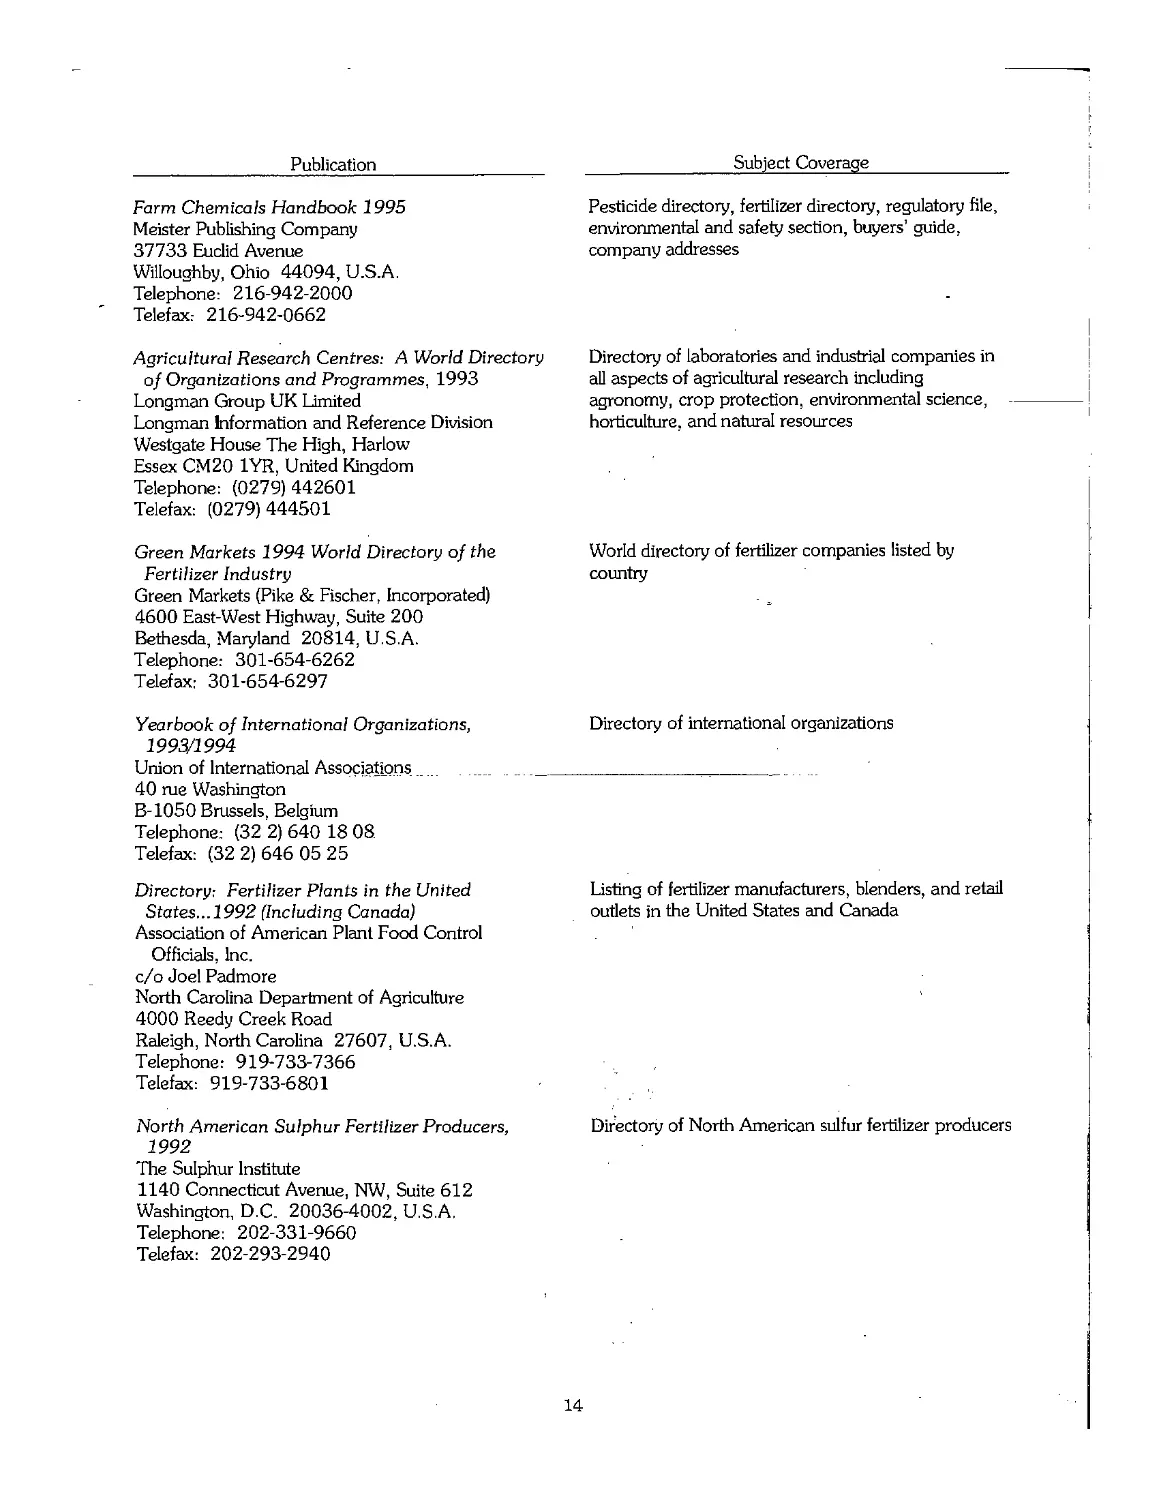
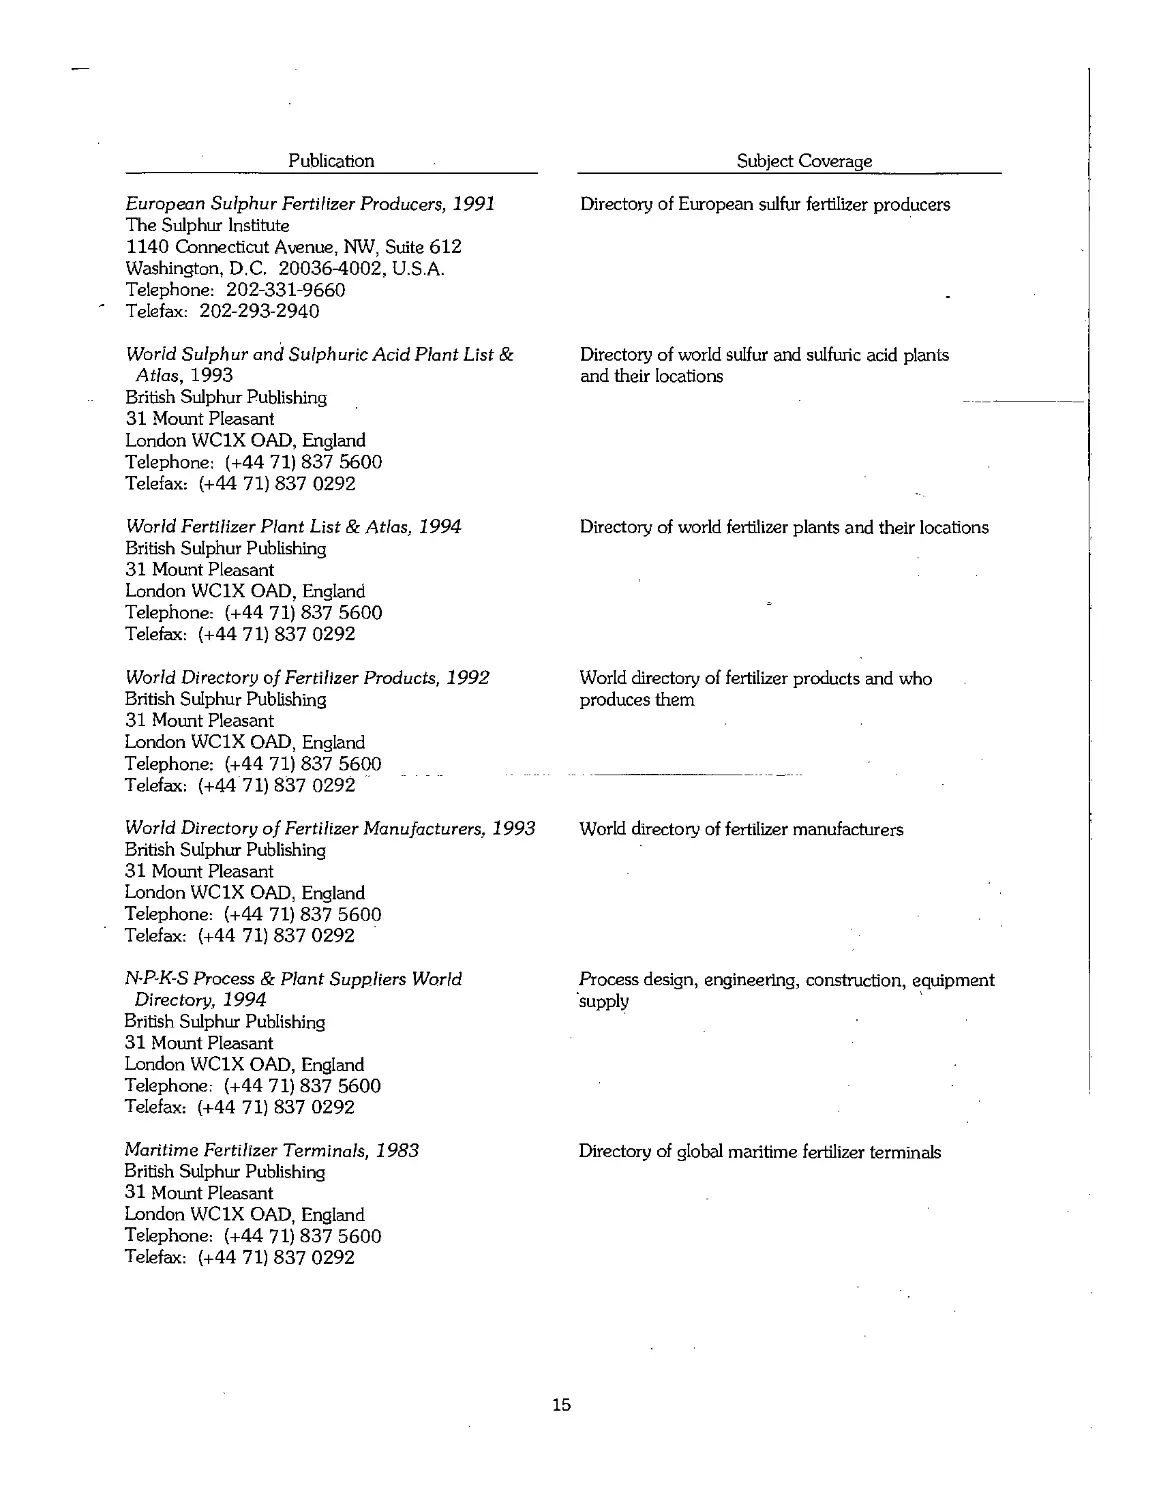
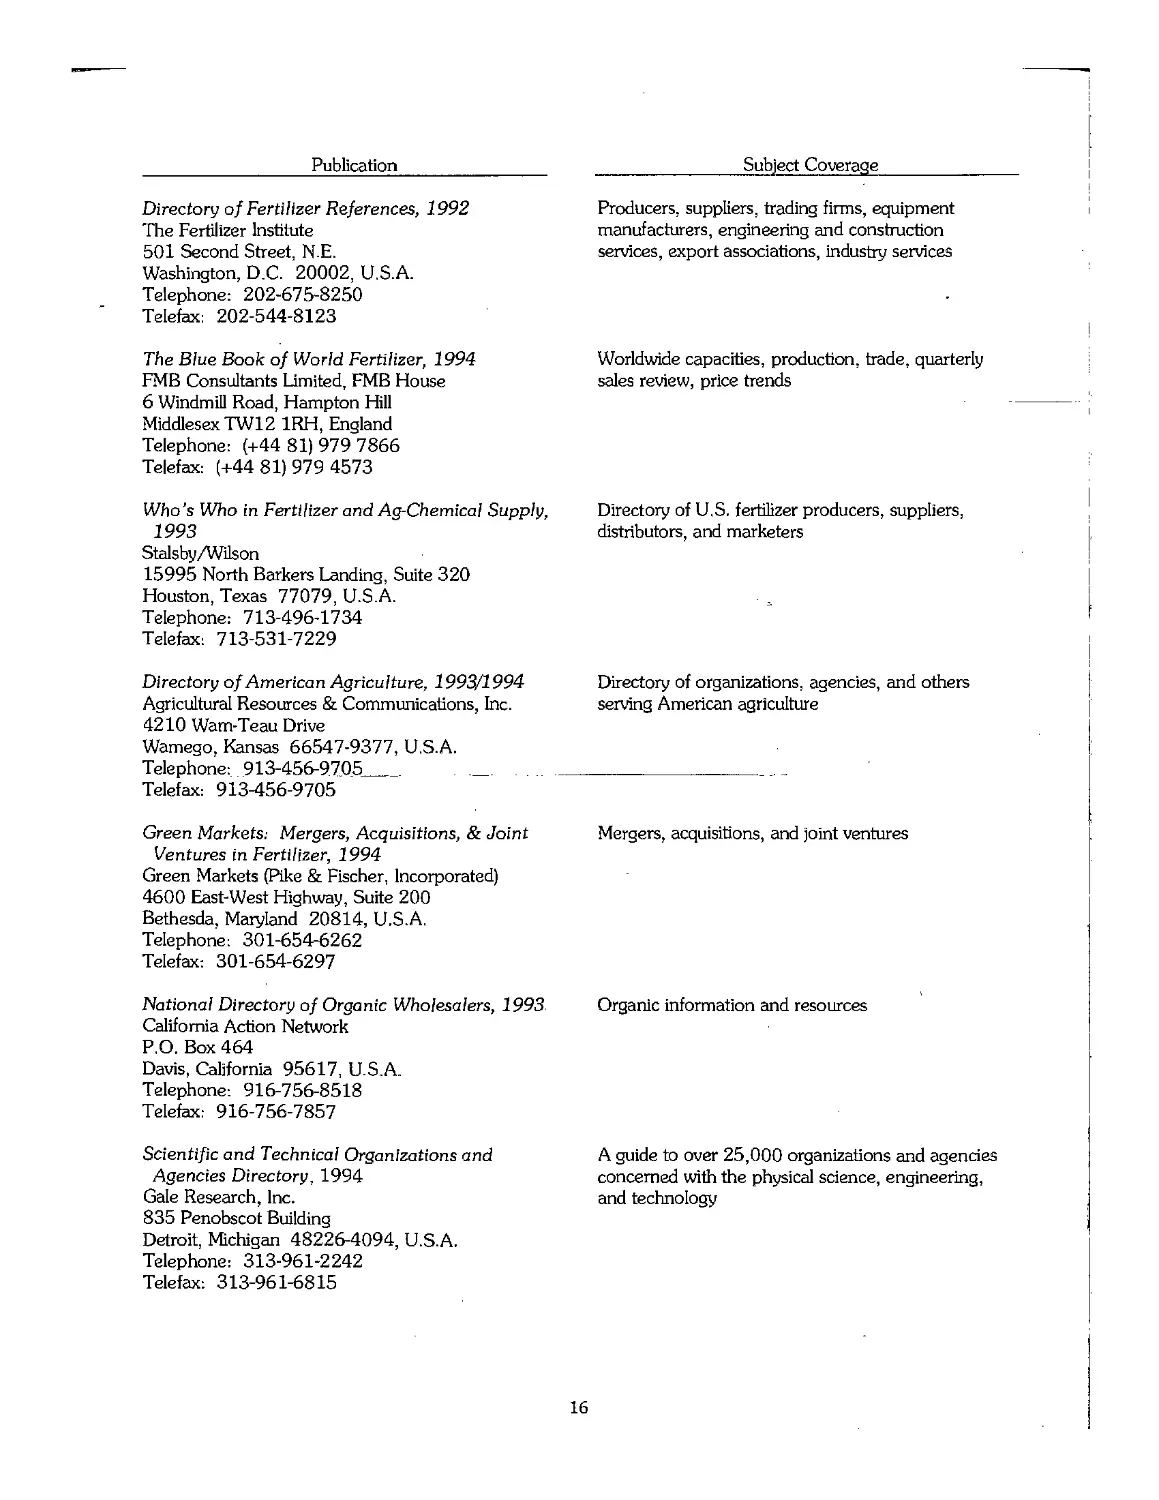
1.8 Fertilizer-Related Information Sources 13
1.9 Resource Publications 18
Chapter 2. The Role of Fertilizers in Agriculture 19
2.1 Demand for Agricultural Products and Plant Nutrients 20
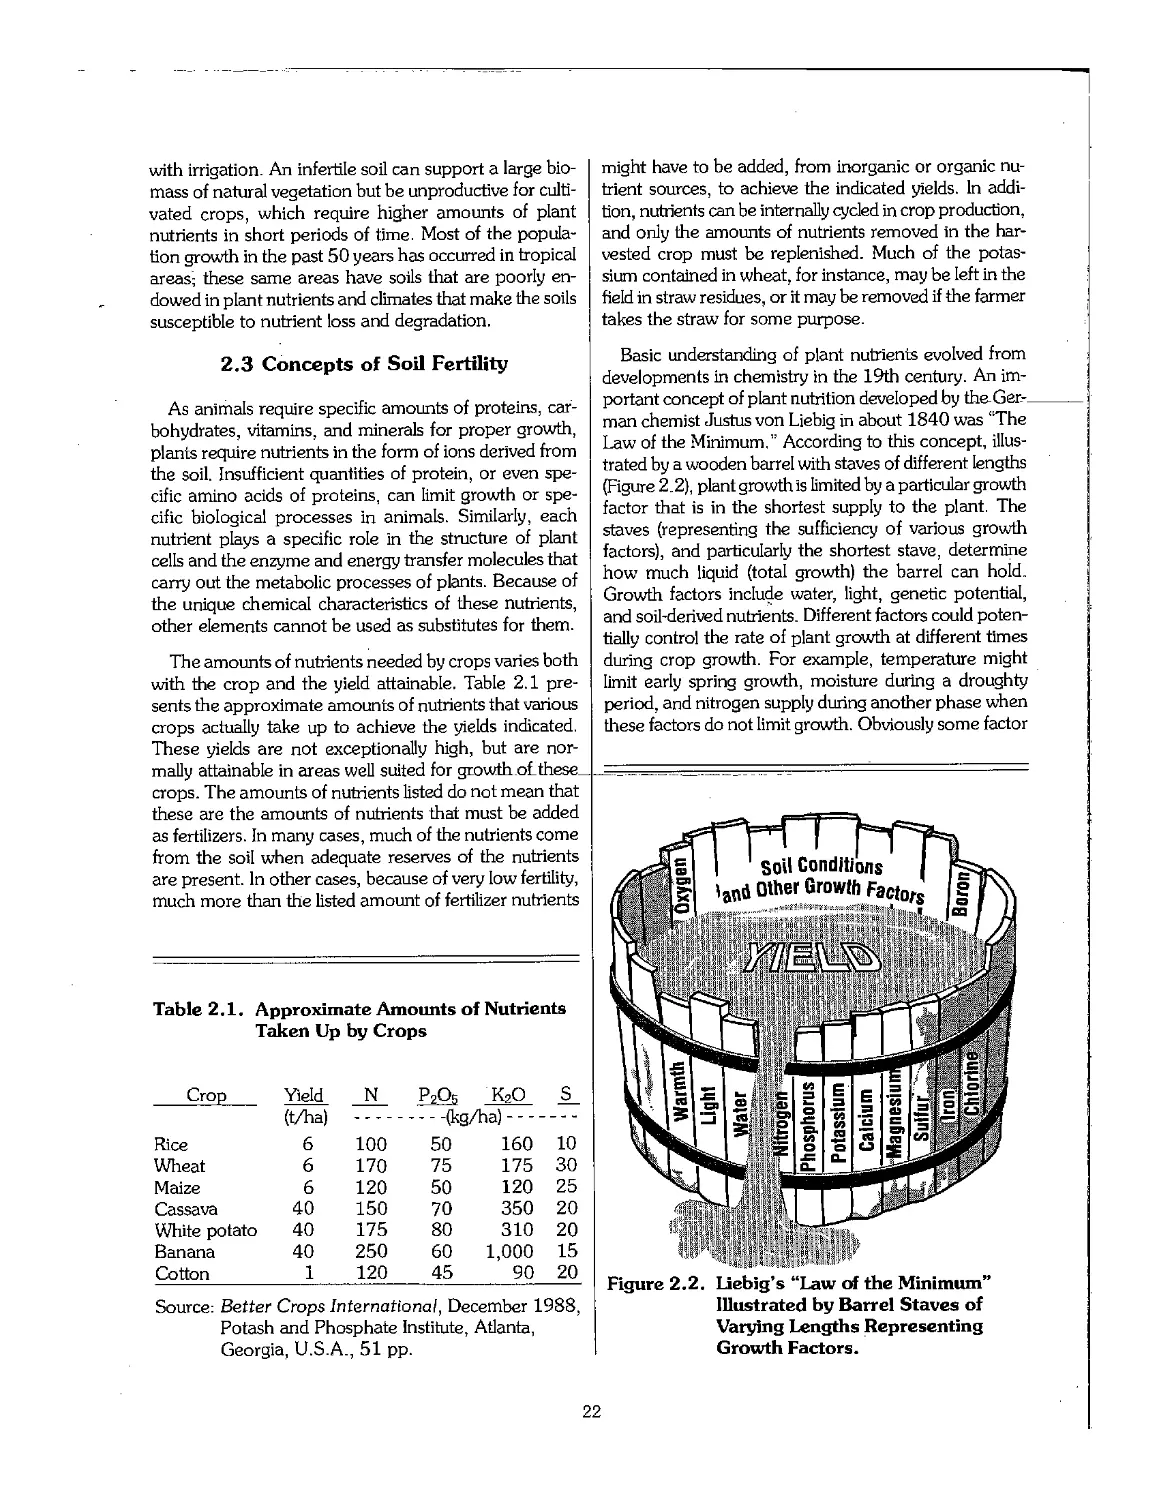
2.2 The Soil Resource 21
2.3 Concepts of Soil Fertility 22
2.4 Fundamentals of N, P, and K ! 28
2.5 Diagnosis of Nutrient Problems 37
2.6 Profitable Fertilizer Use 39
2.7 Soil Productivity and Sustainability 43
2.8 References 44
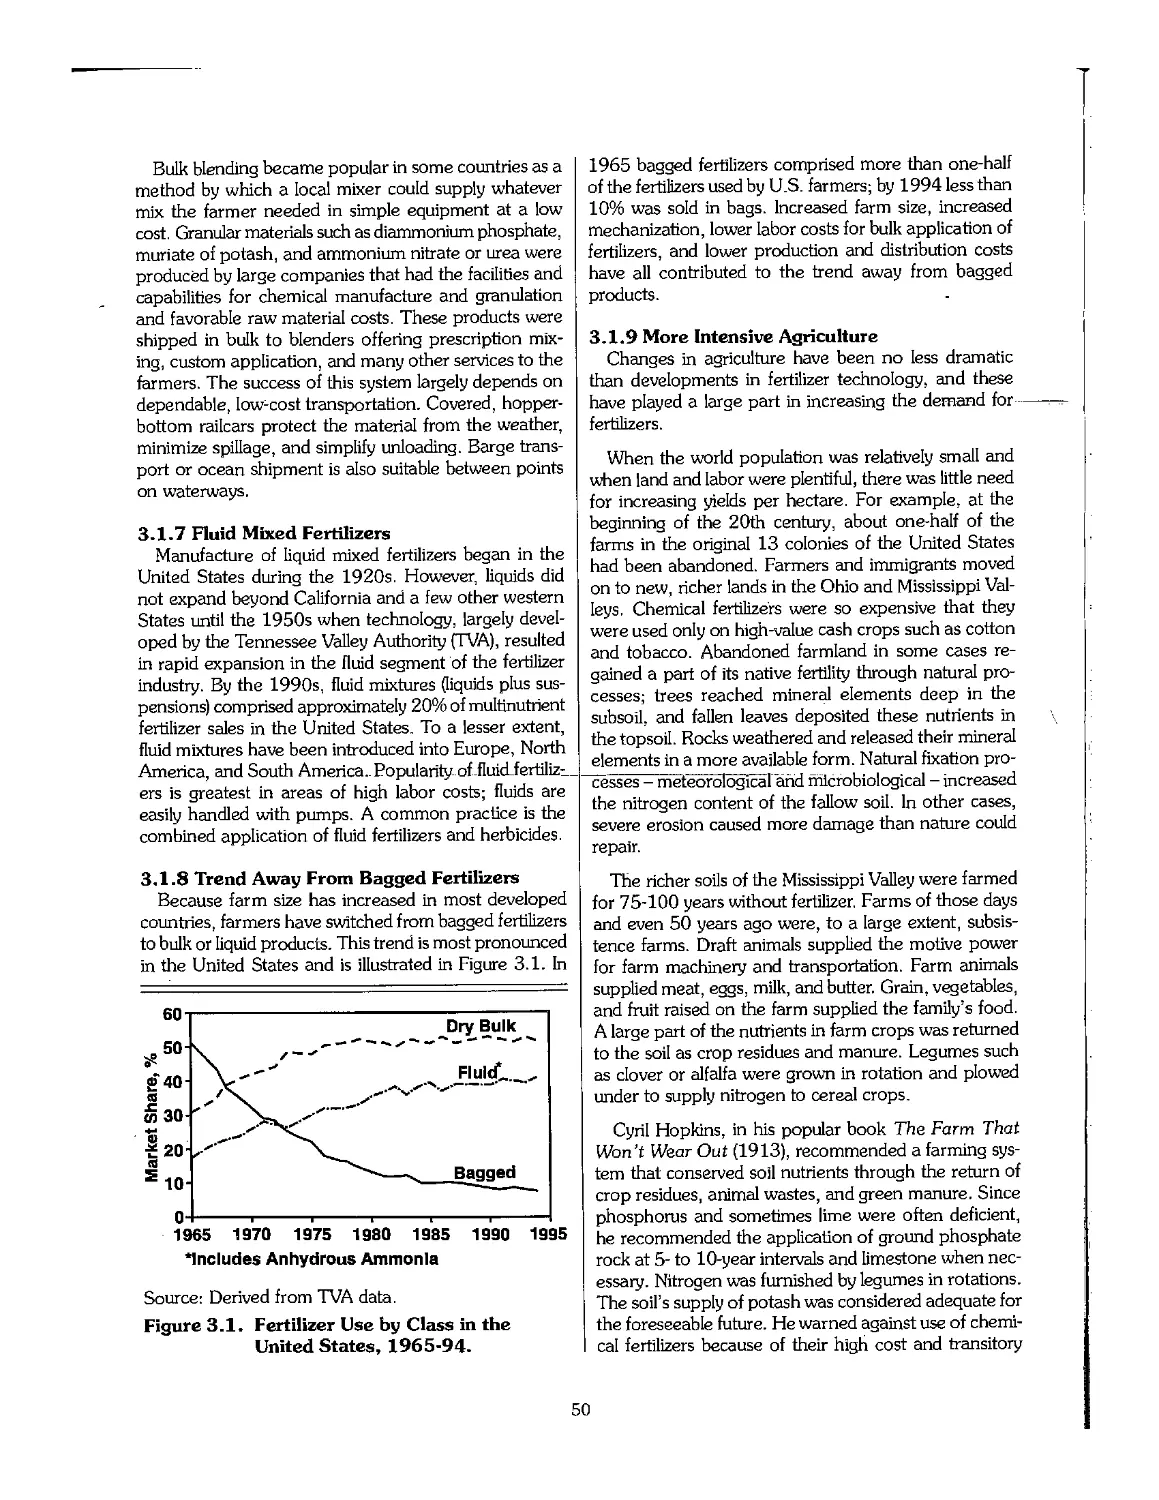
Chapter 3. Status of the Fertilizer Industry 45
3.1 Short History of Fertilizer Development 46
3.2 Statistical Overview of Fertilizer Production, 1960-95 51
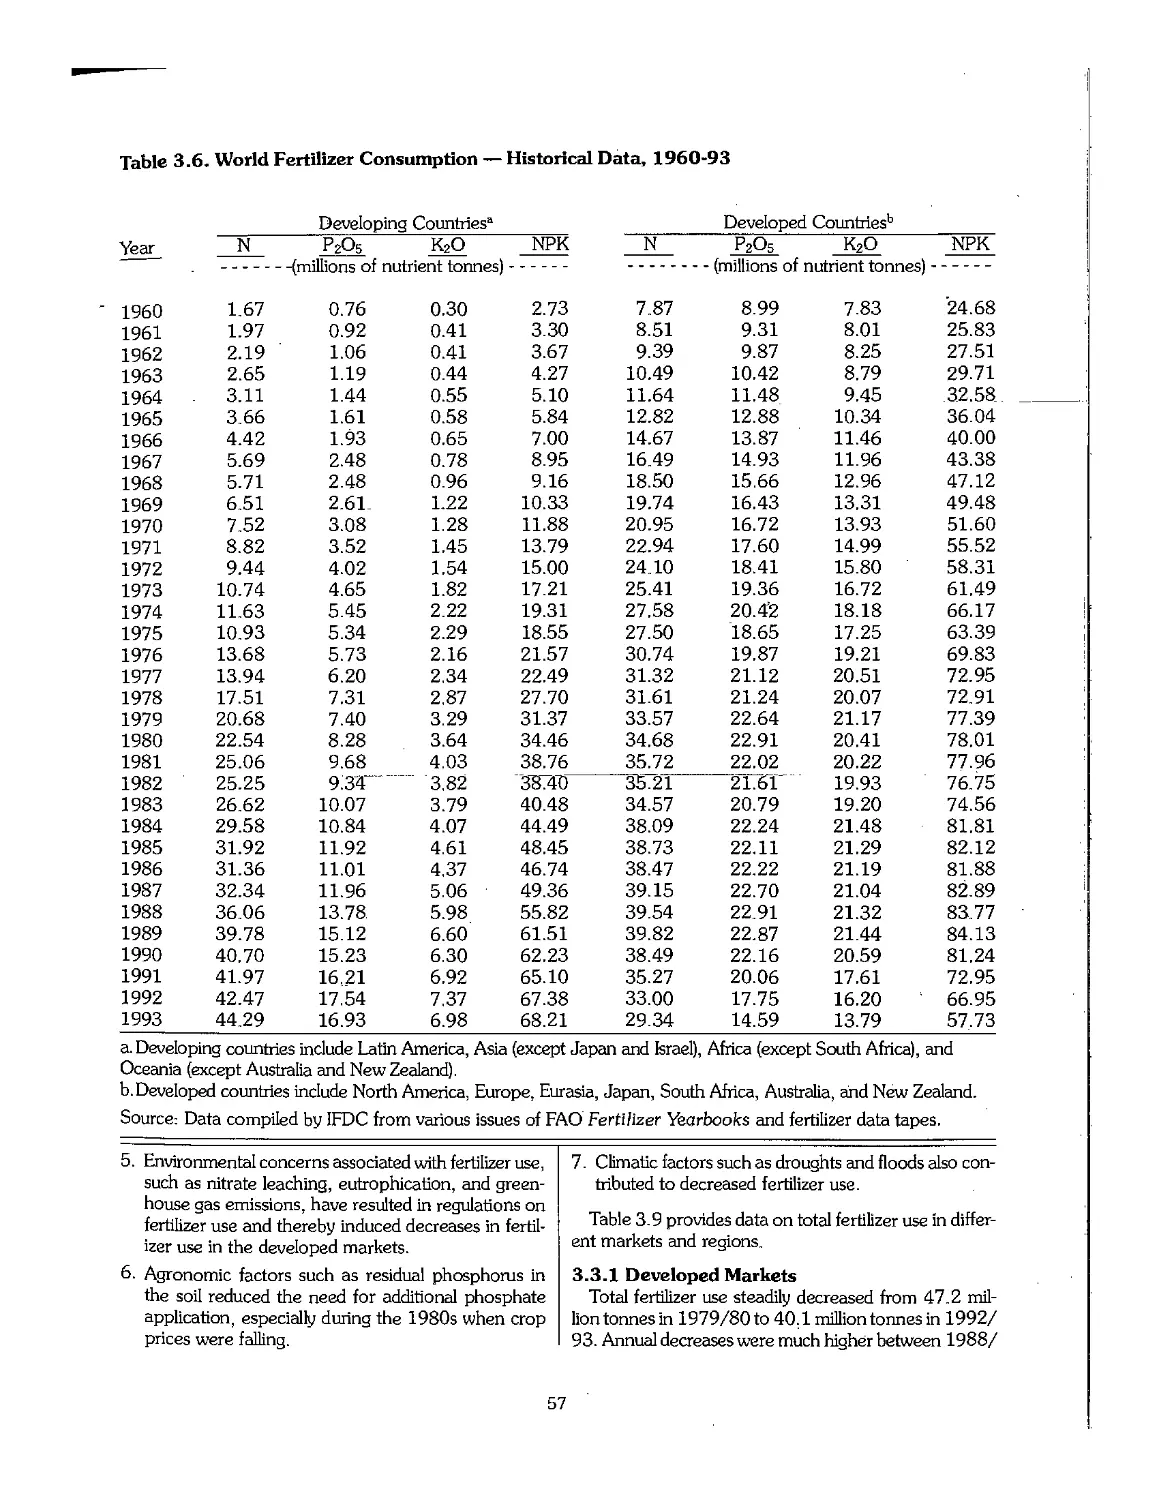
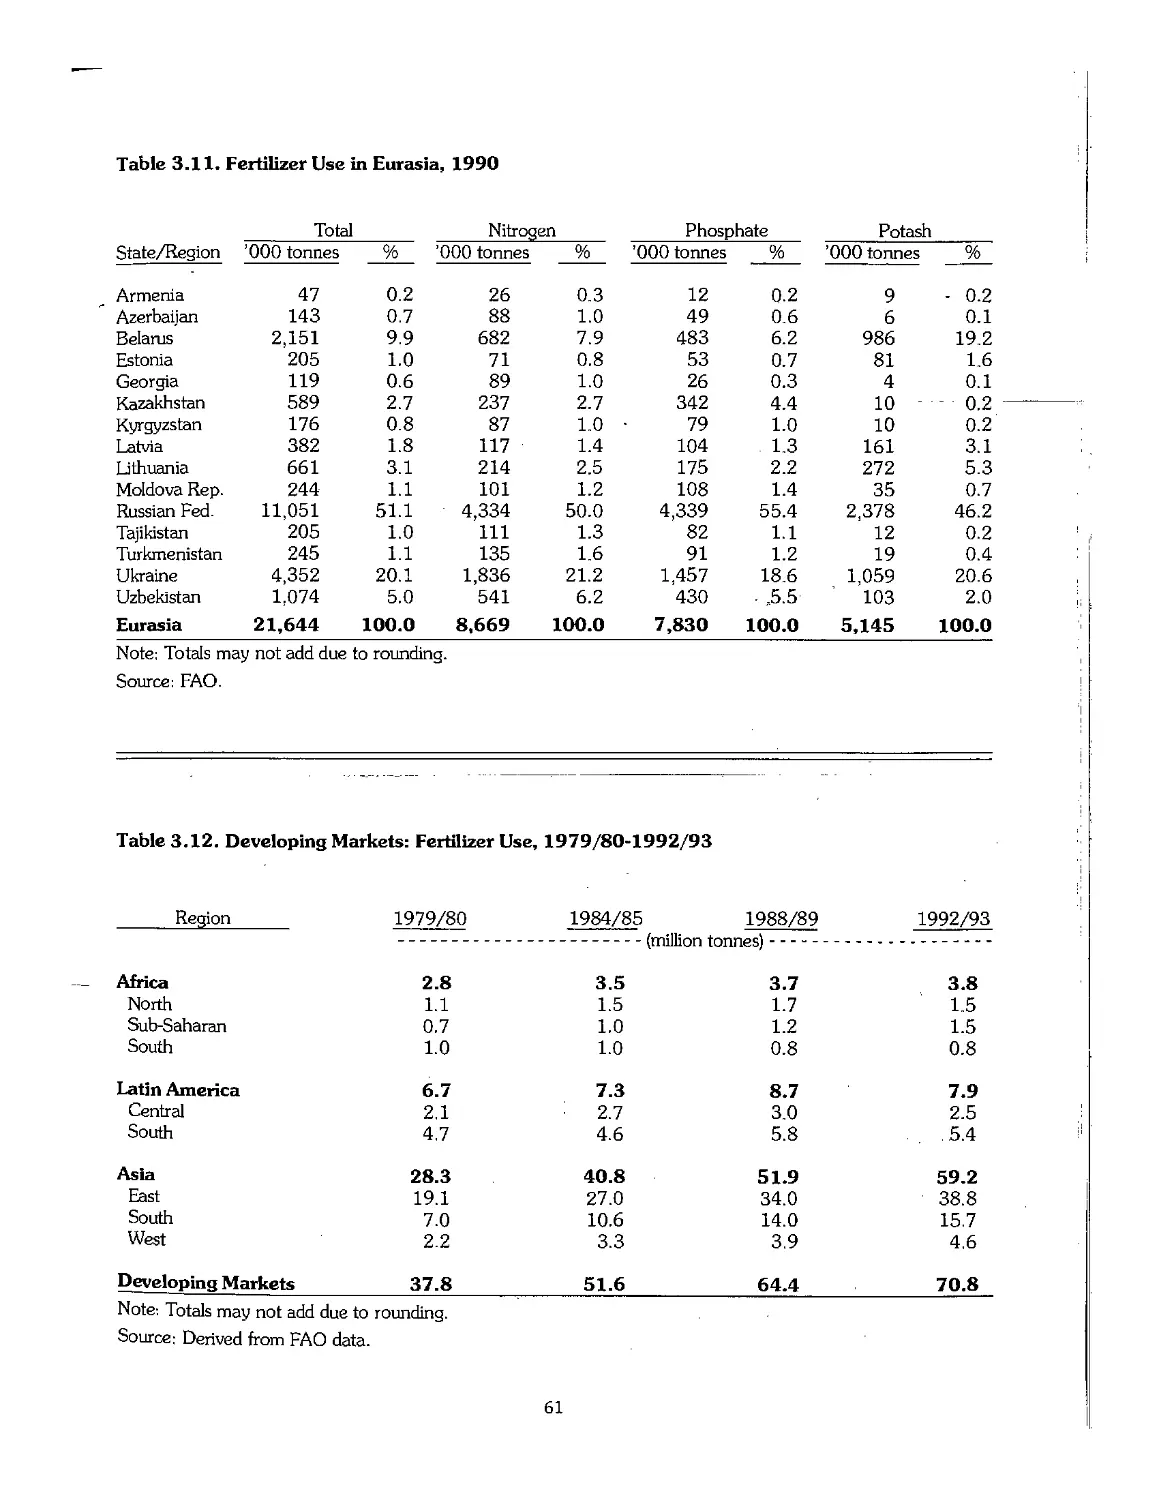
3.3 Statistical Overview of Fertilizer Consumption, 1960-95 55
3.4 Trends in Fertilizer Trade 63
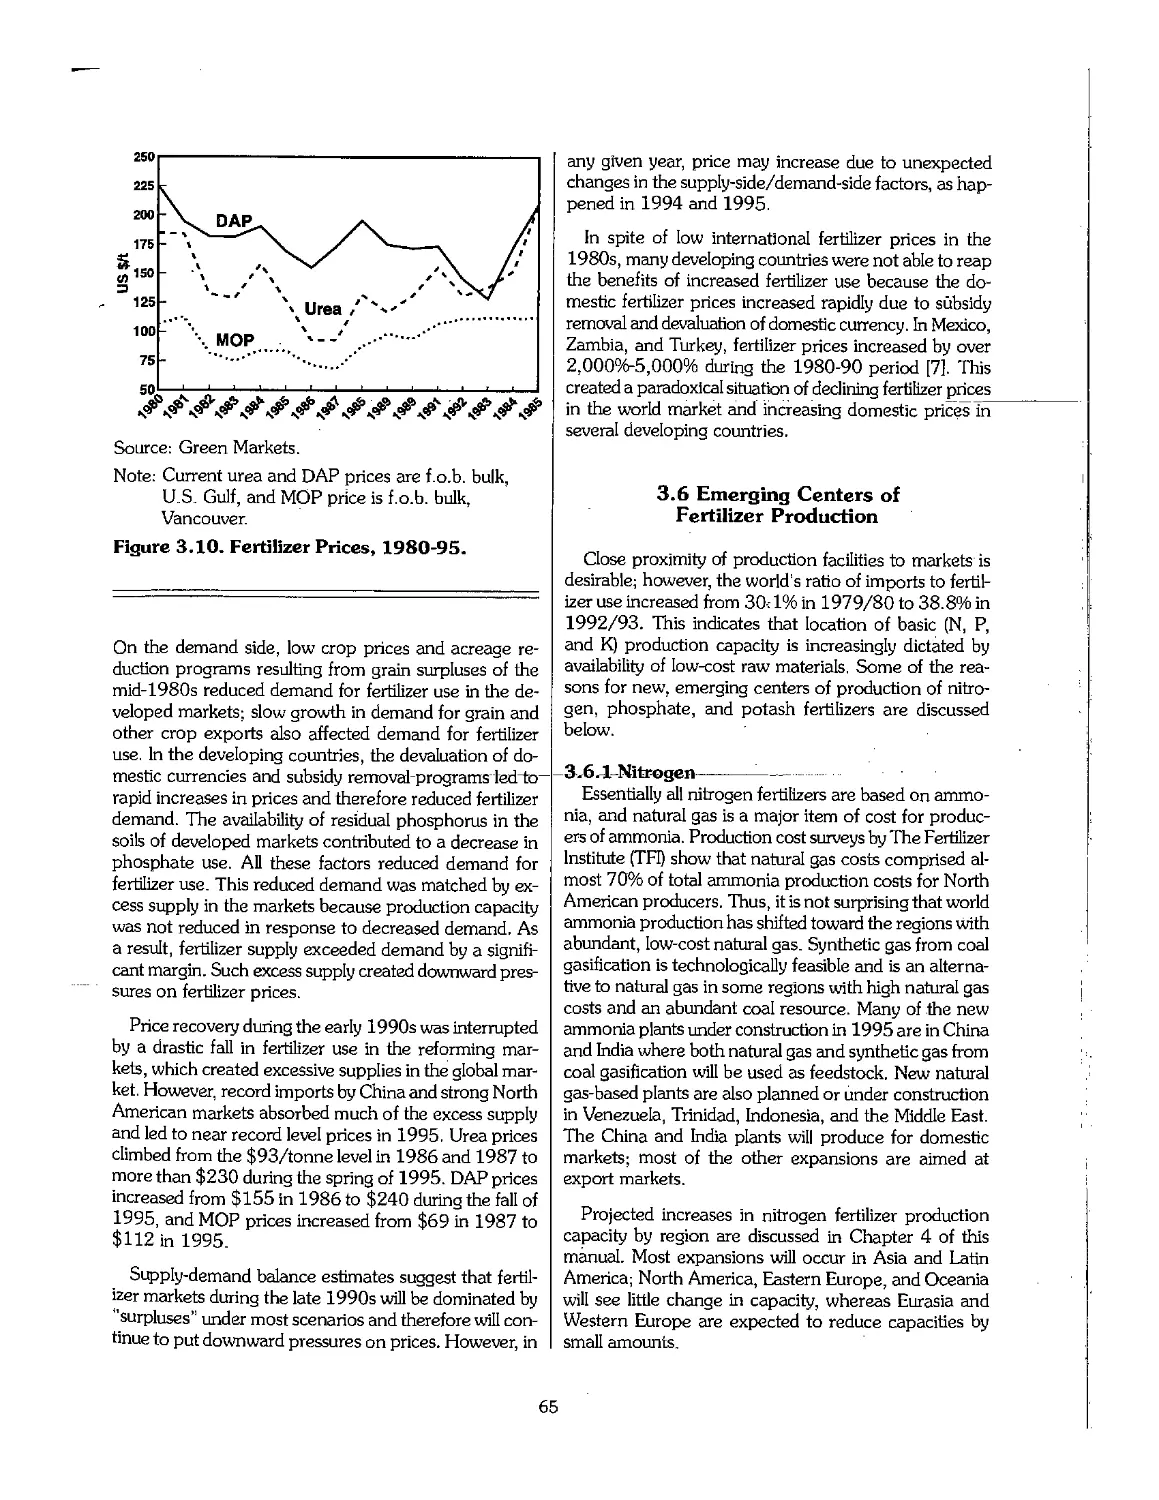
3.5 Trends in Fertilizer Prices 64
3.6 Emerging Centers of Fertilizer Production 65
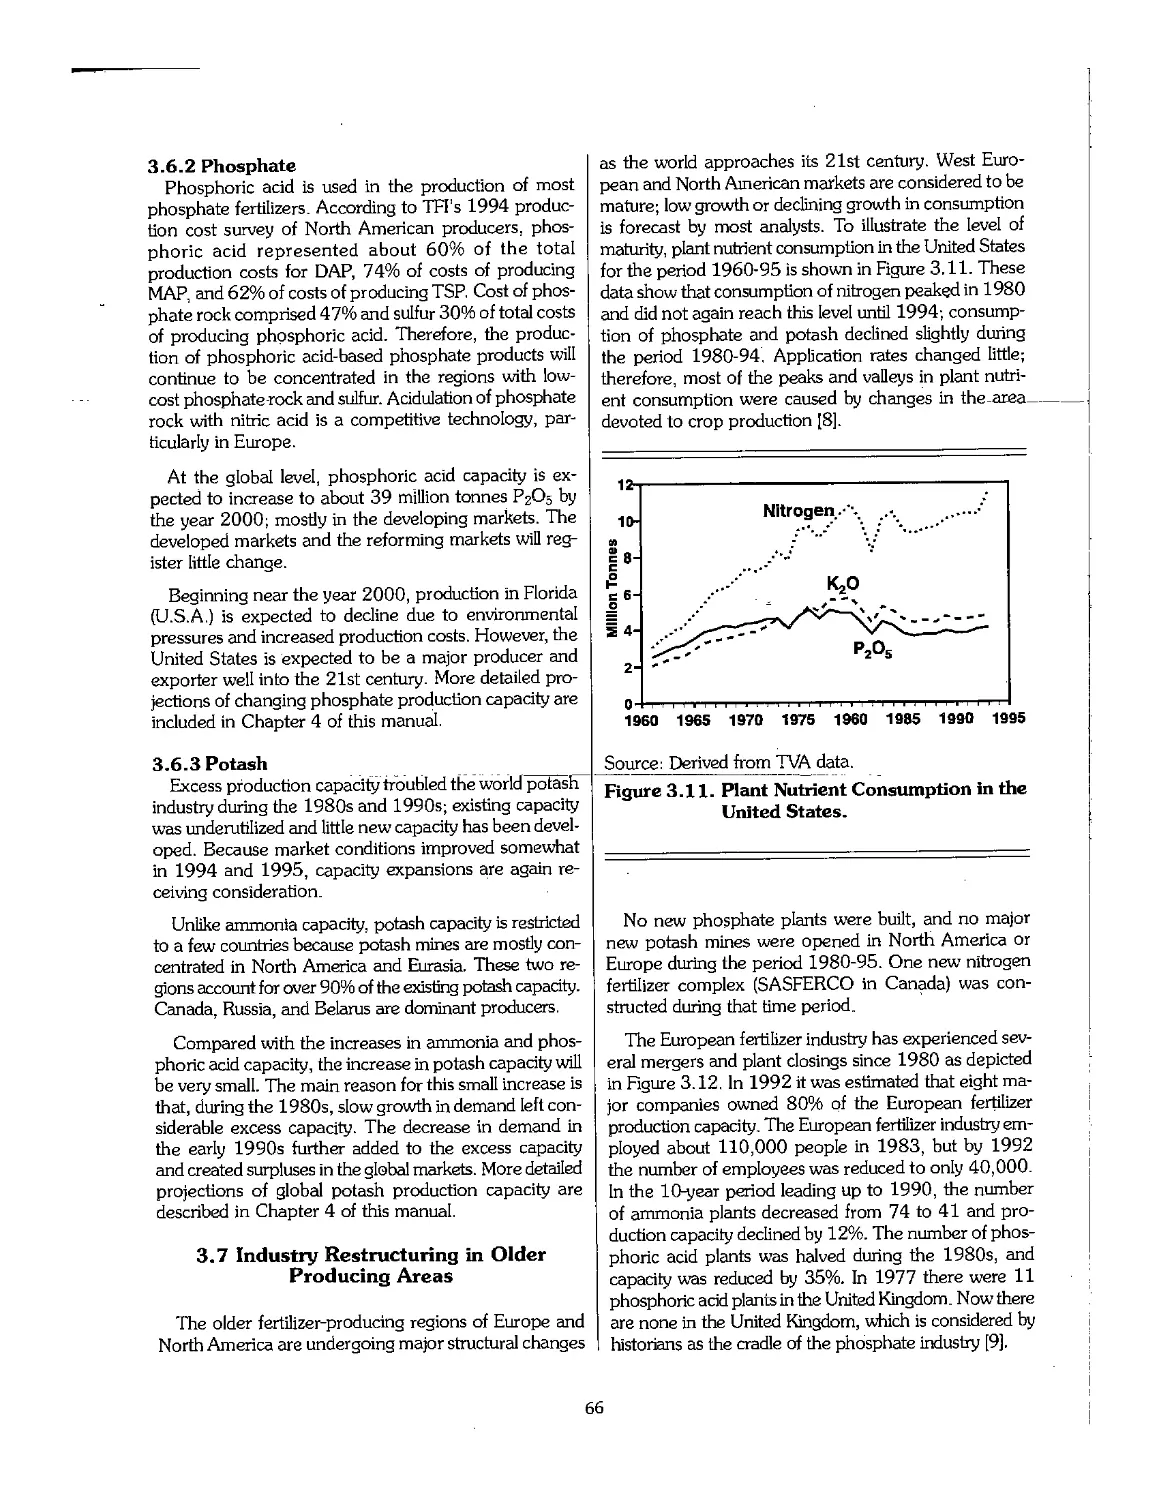
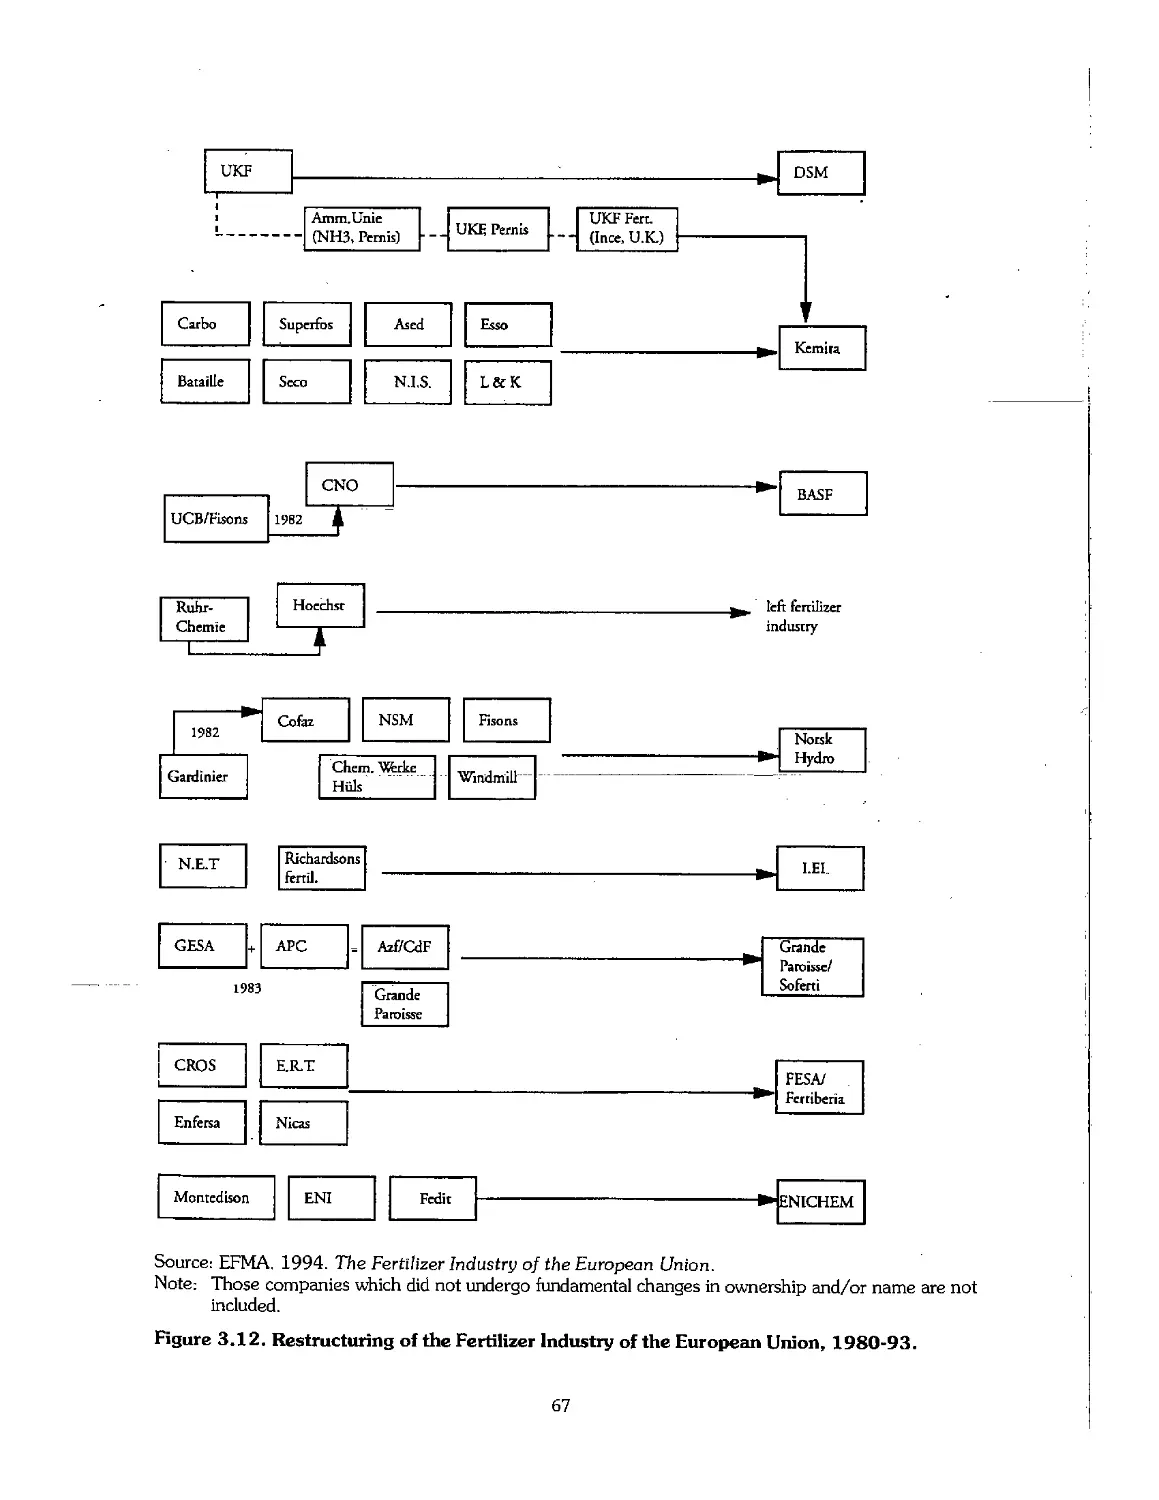
3.7 Industry Restructuring in Older Producing Areas 66
3.8 References .- 69
Chapter 4. Outlook for the Fertilizer Industry, 1995-2005 70
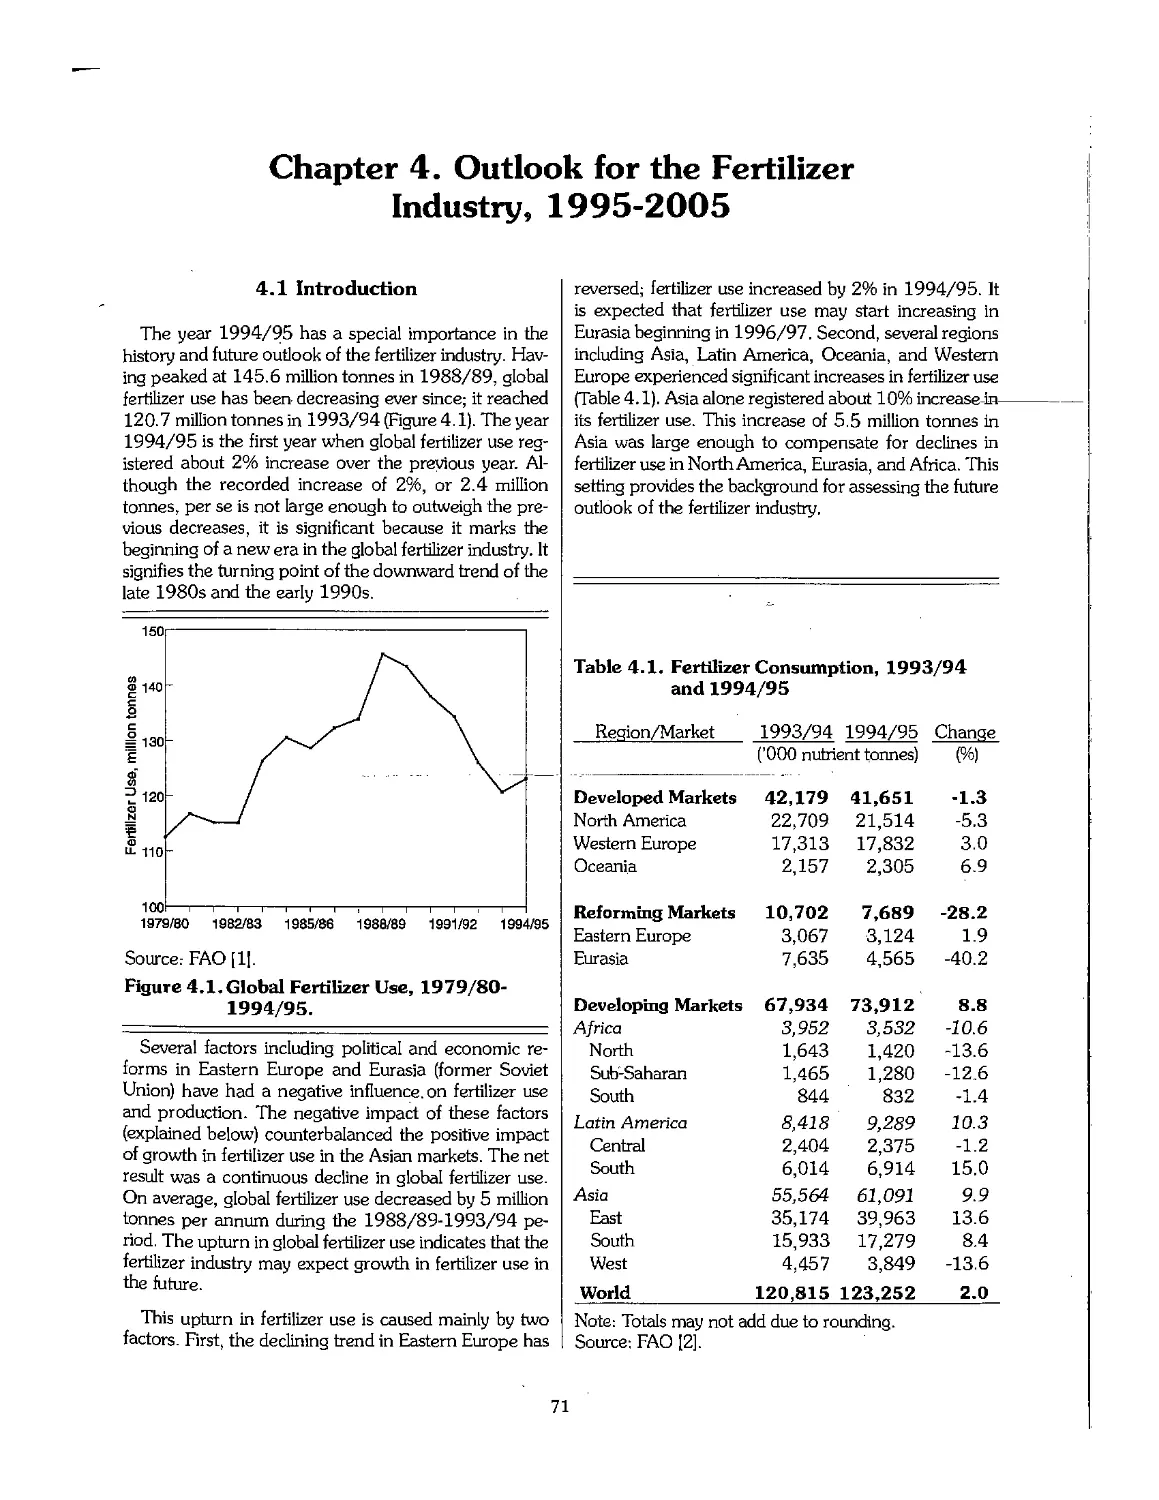
4.1 Introduction 71
4.2 Recent Economic and Political Developments and Their Impact on the Fertilizer Industry 72
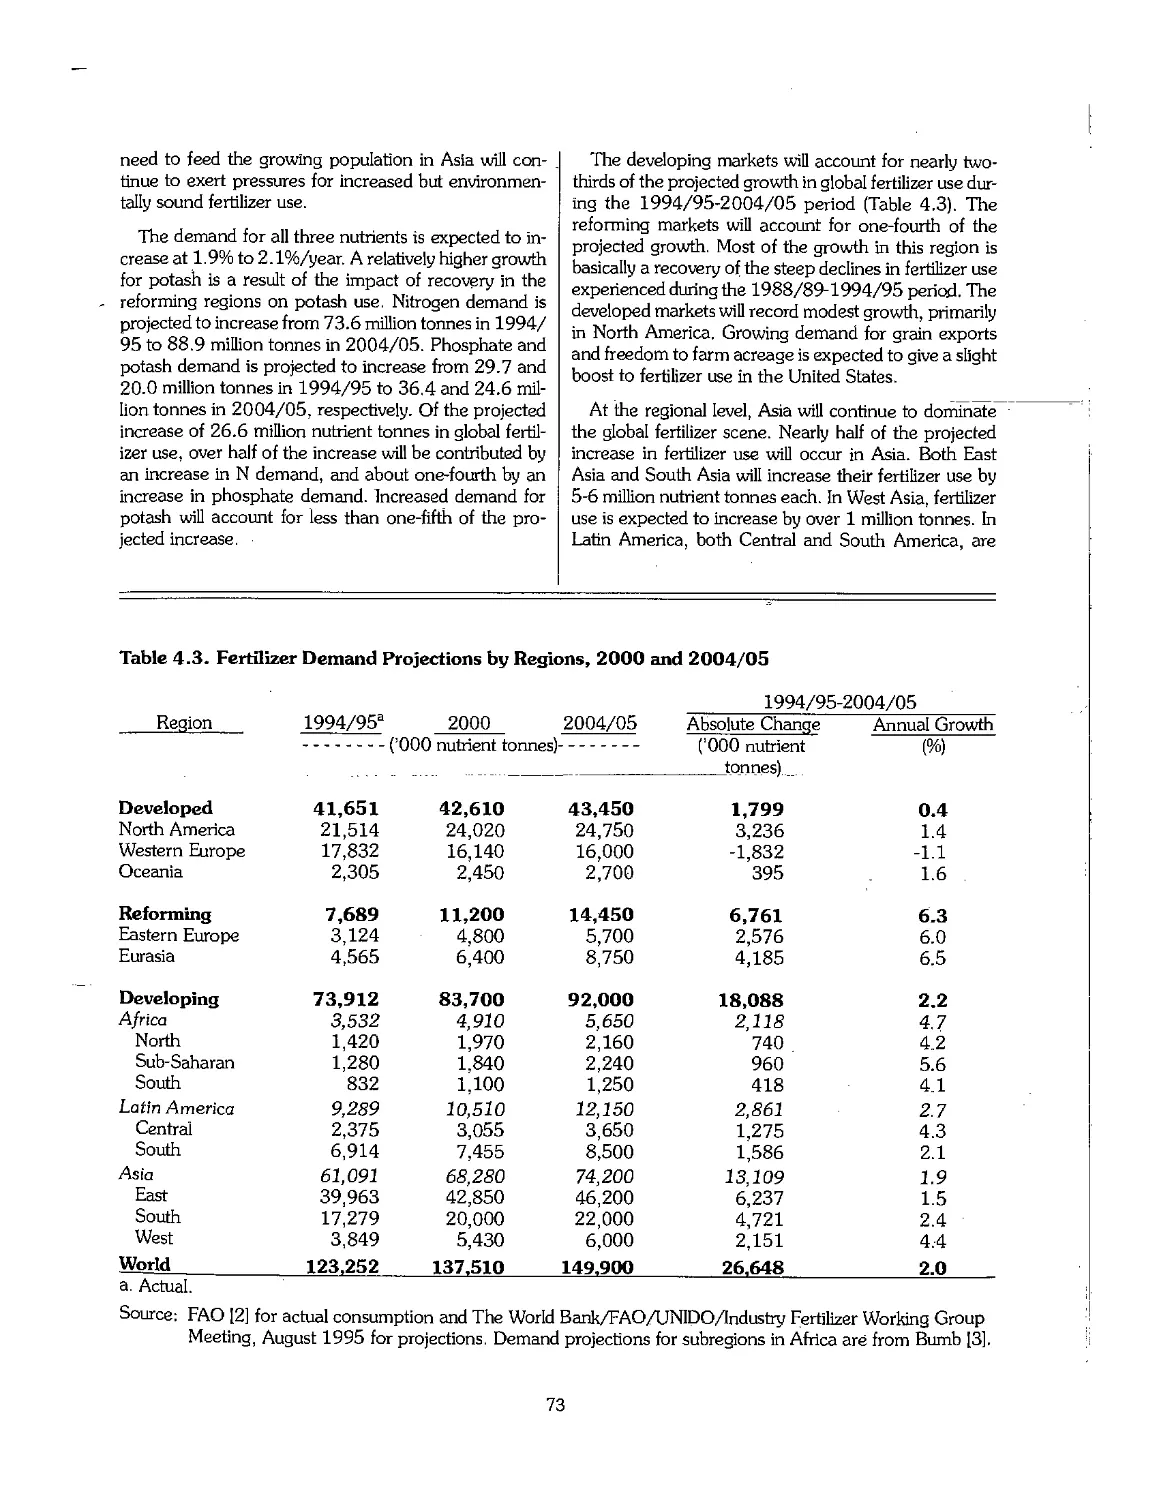
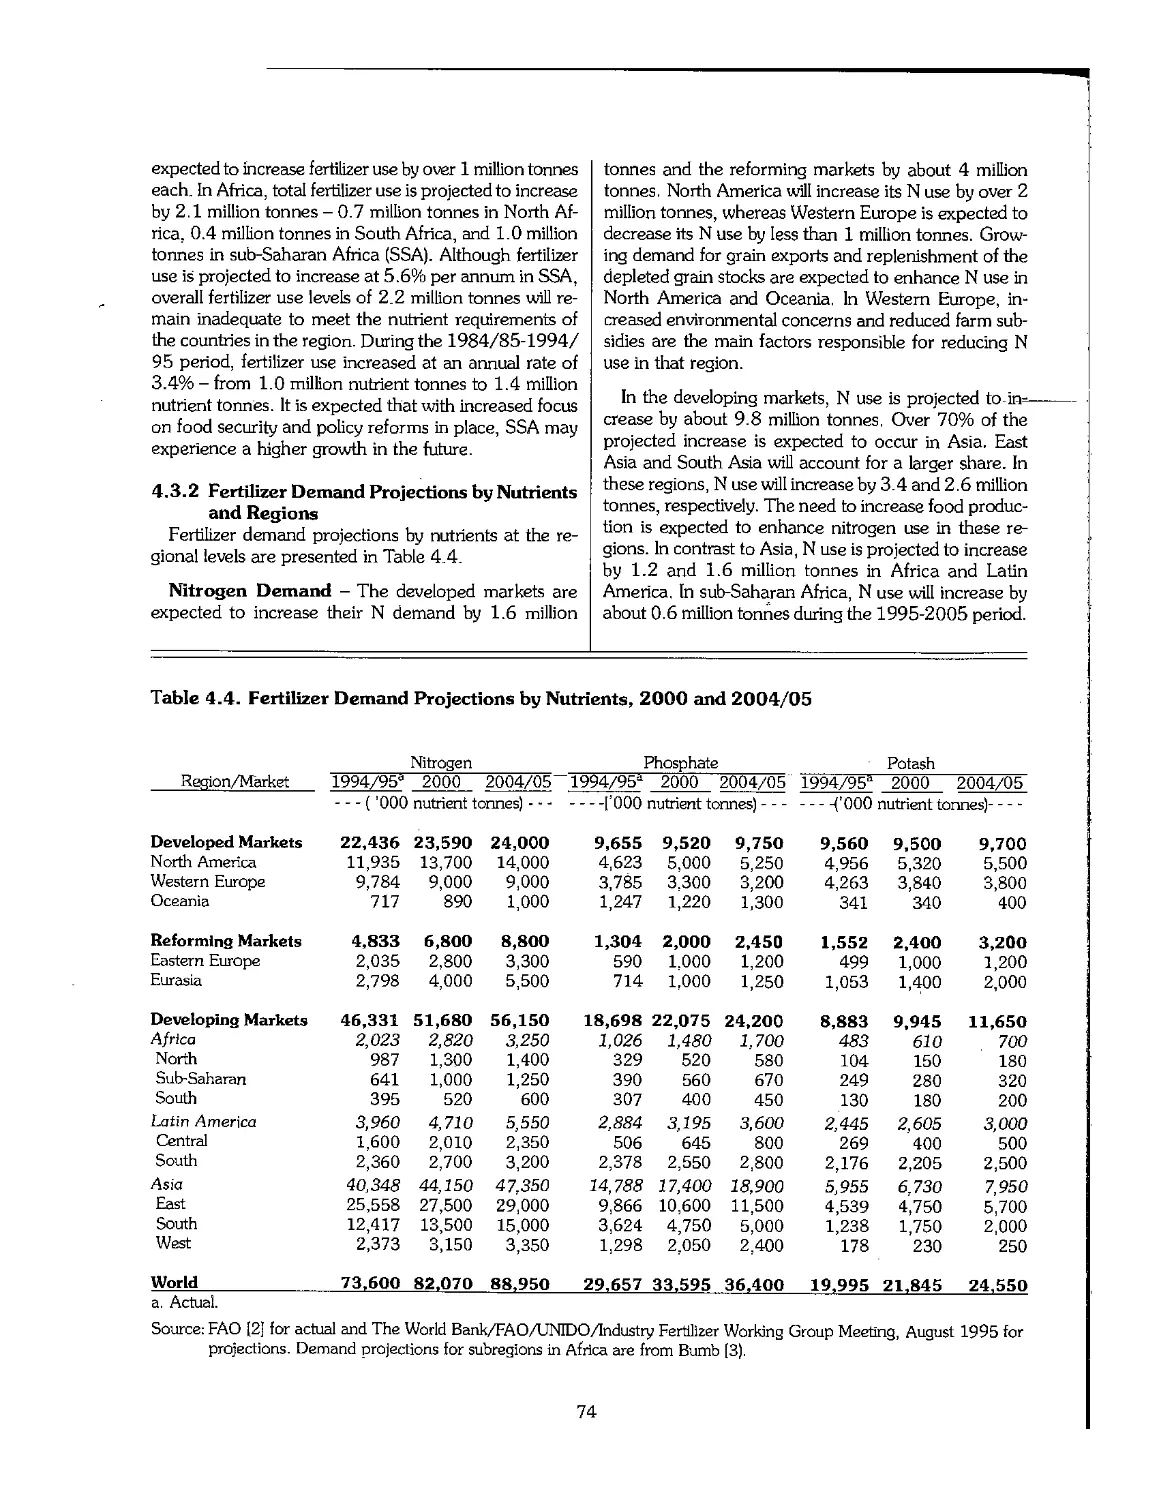
4.3 Future Outlook for Fertilizer Demand 72
4.4 Future Outlook for Fertilizer Supply > 75
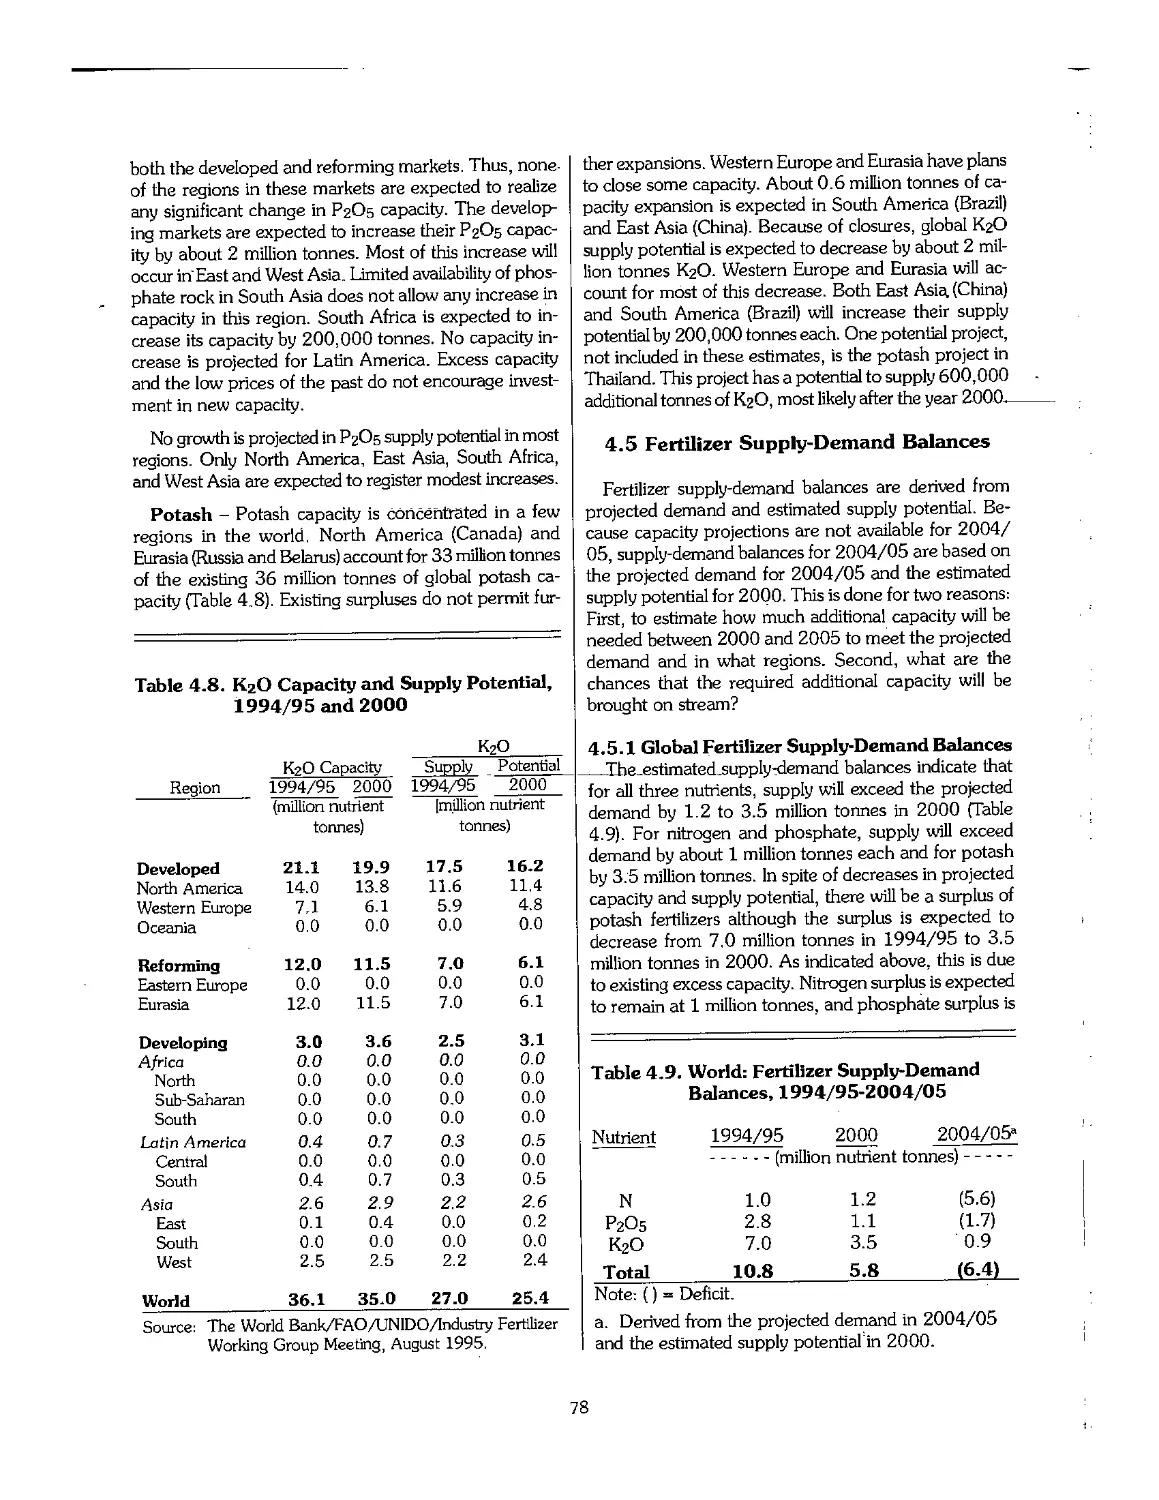
4.5 Fertilizer Supply-Demand Balances 78
4.6 Summary 80
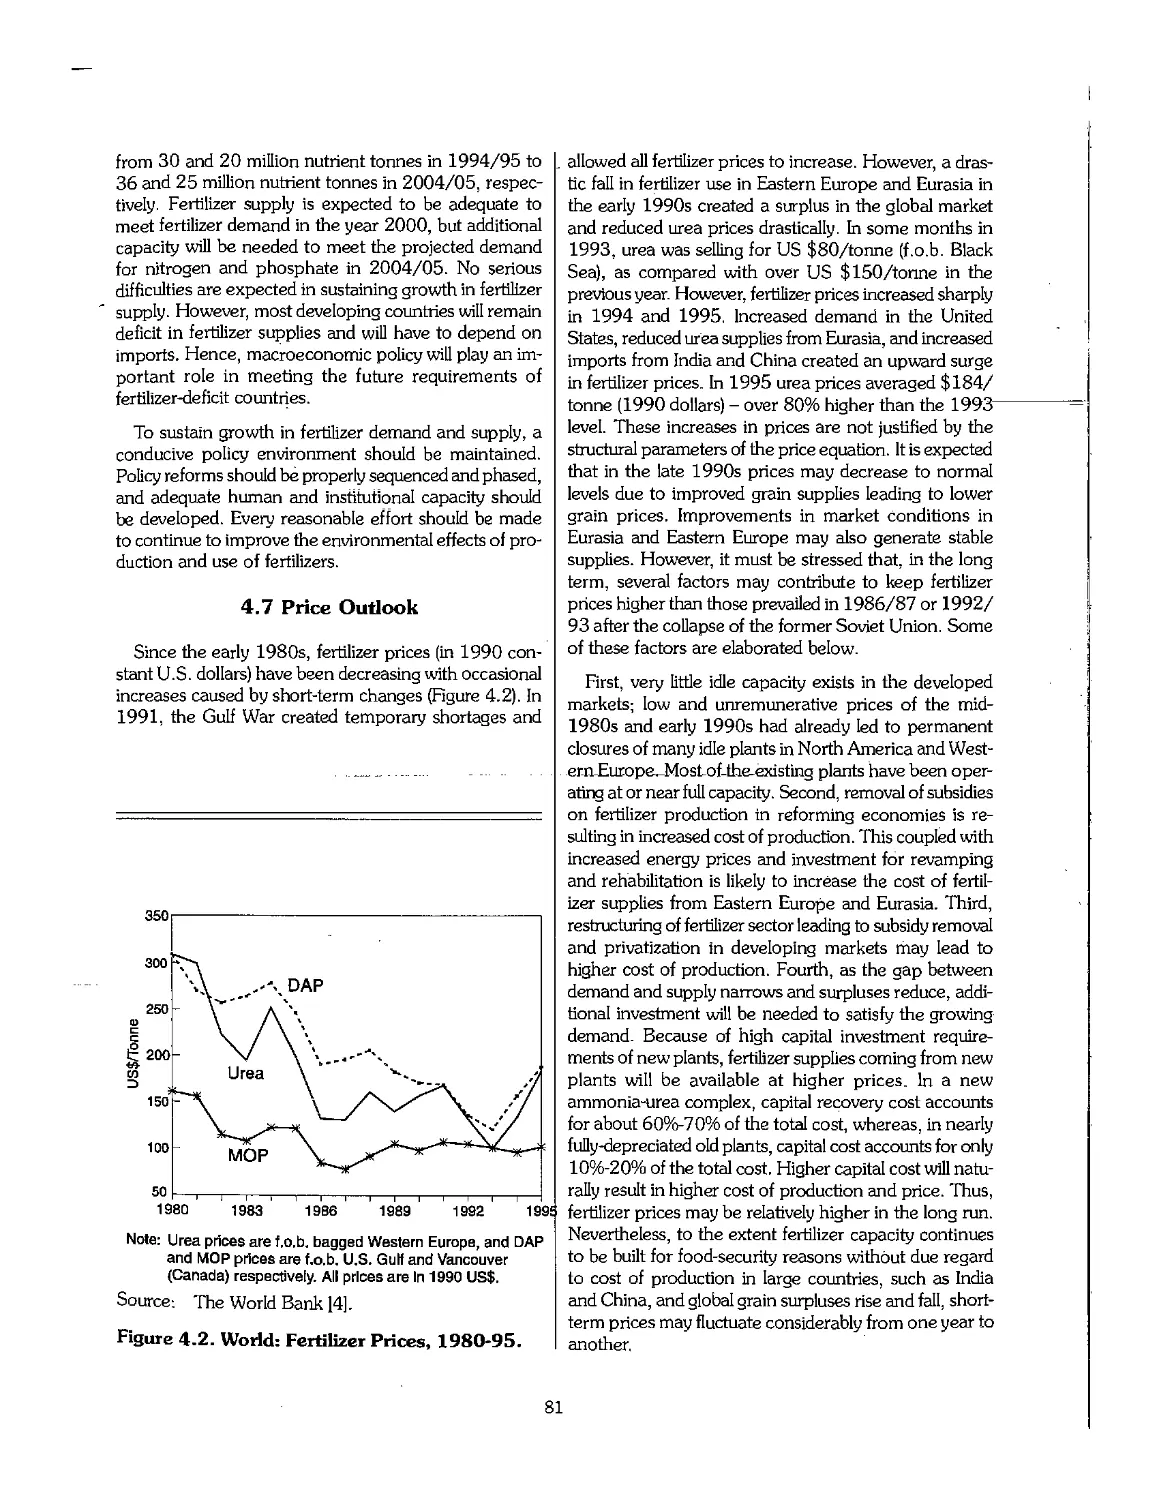
4.7 Price Outlook 81
4.8 References 82
Chapter 5. Fertilizer Raw Materials and Reserves ■ 83
5.1 Availability and Sources of Raw Materials 85
5.2 Nitrogen Feedstocks 85
5.3 Phosphate Rock 90
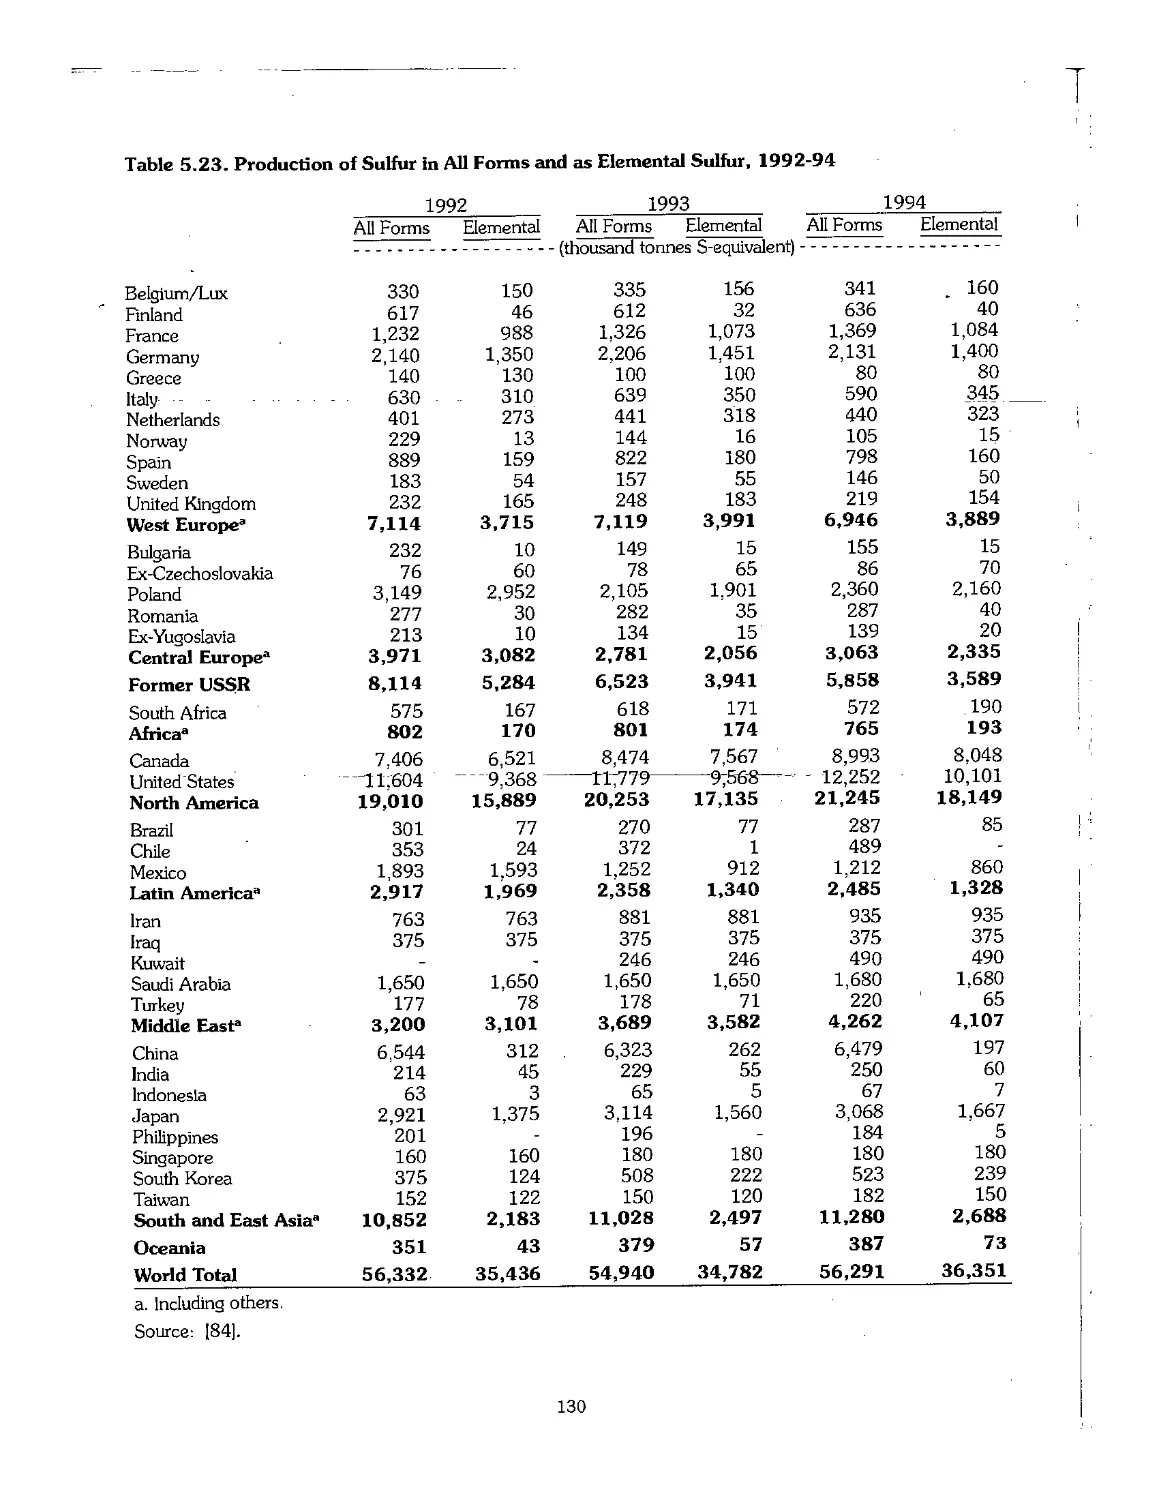
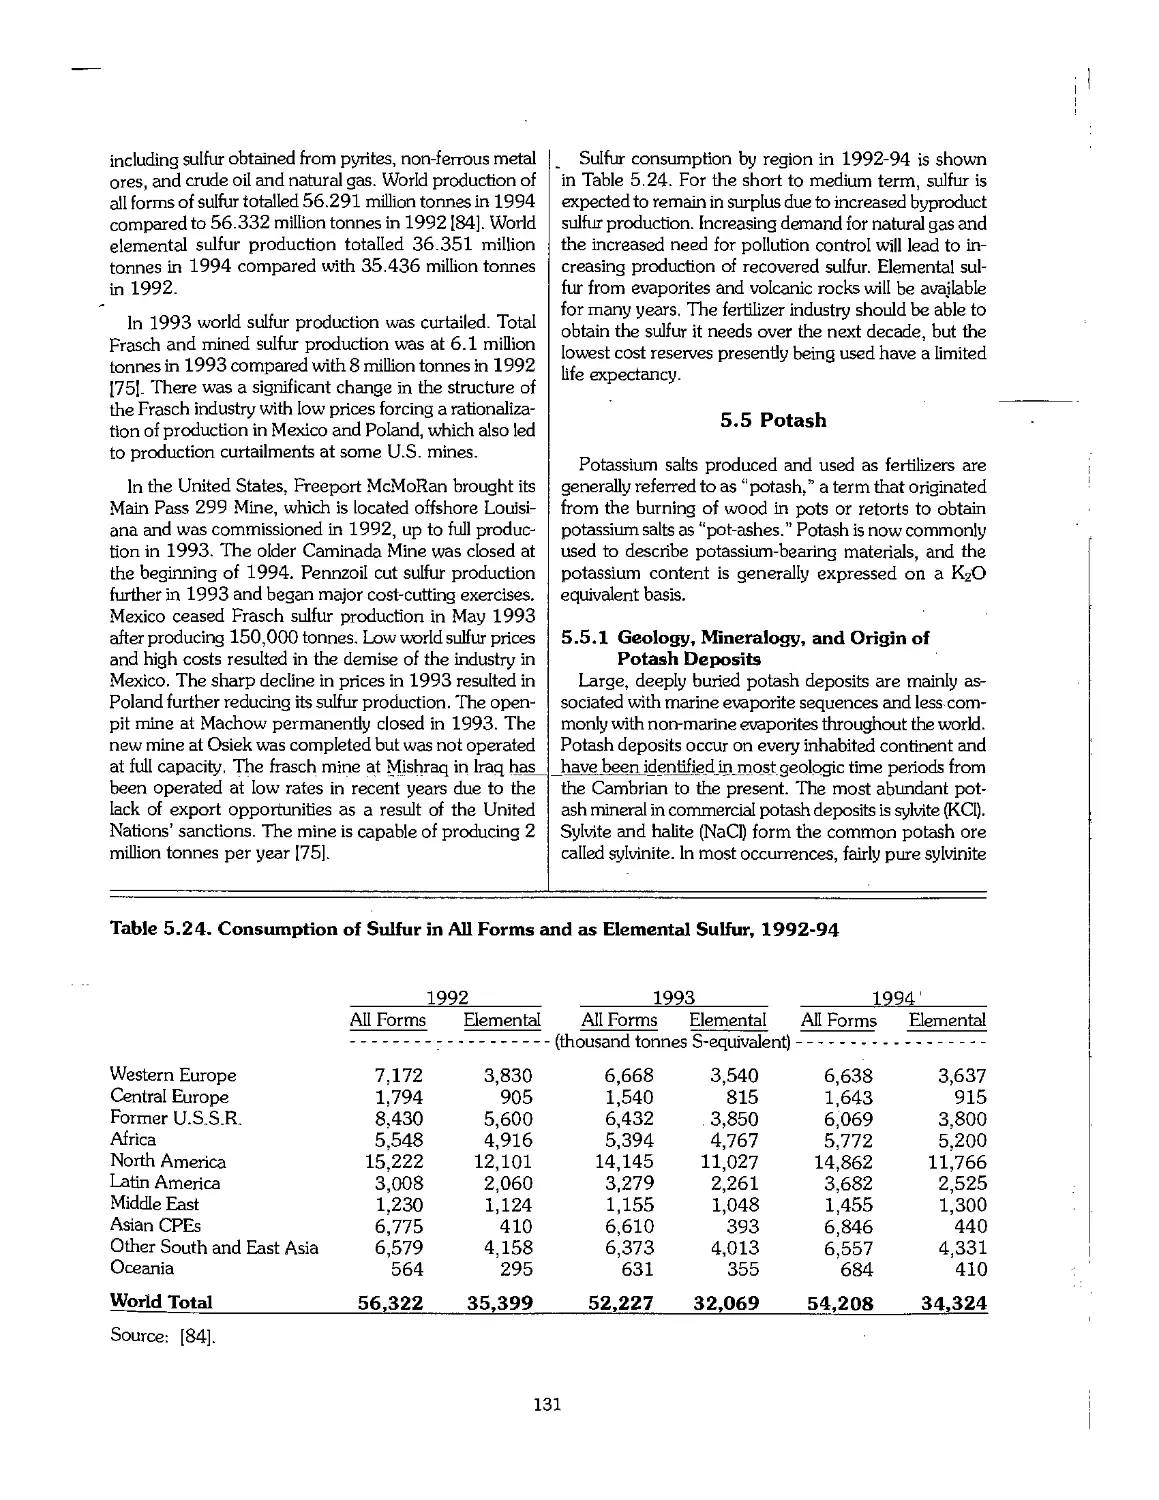
5.4 Sulfur 126
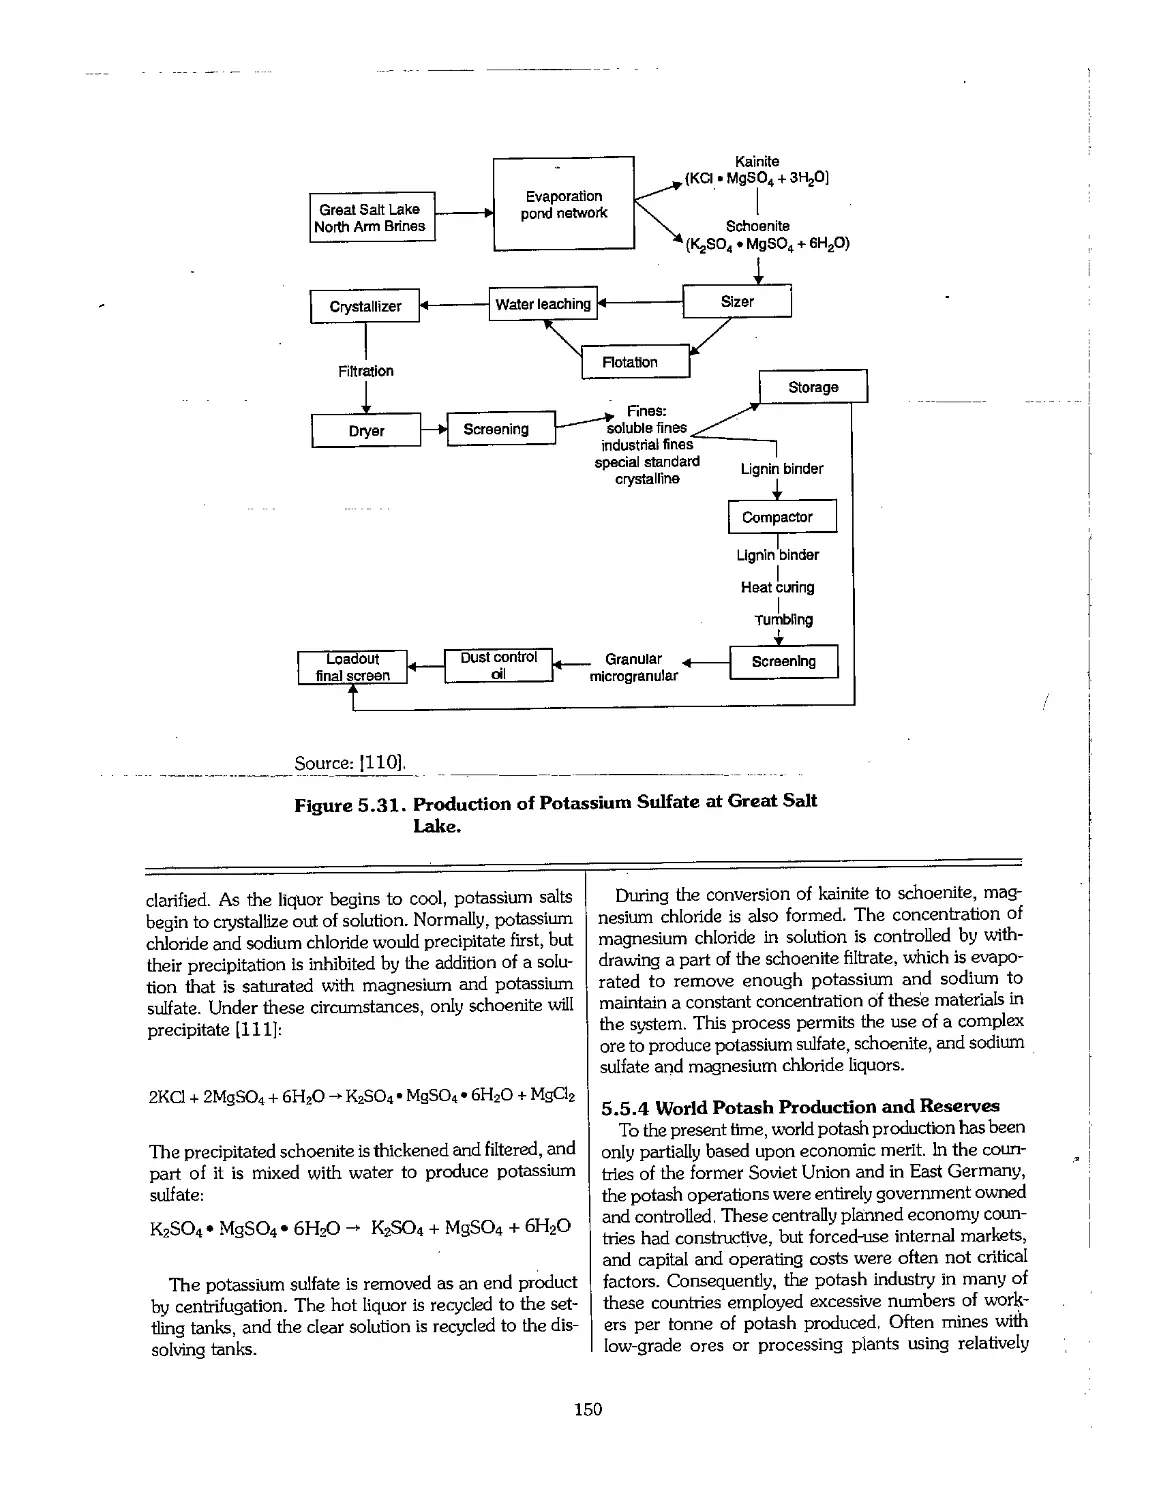
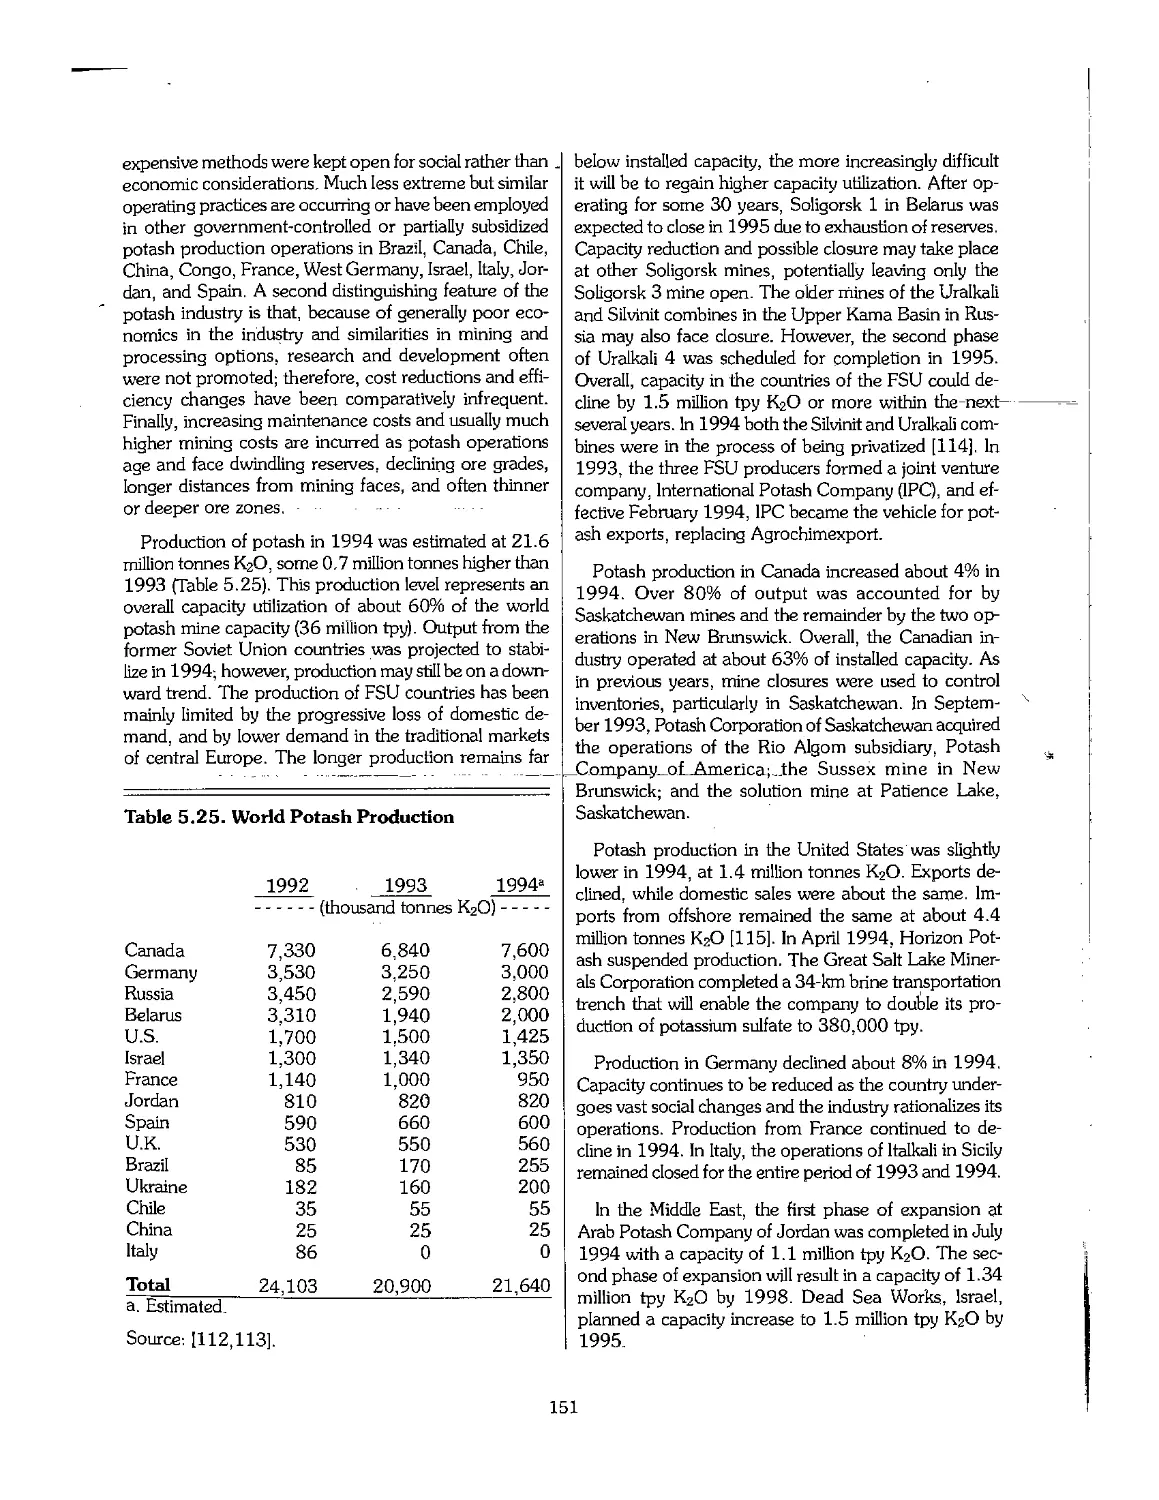
5.5 Potash 131
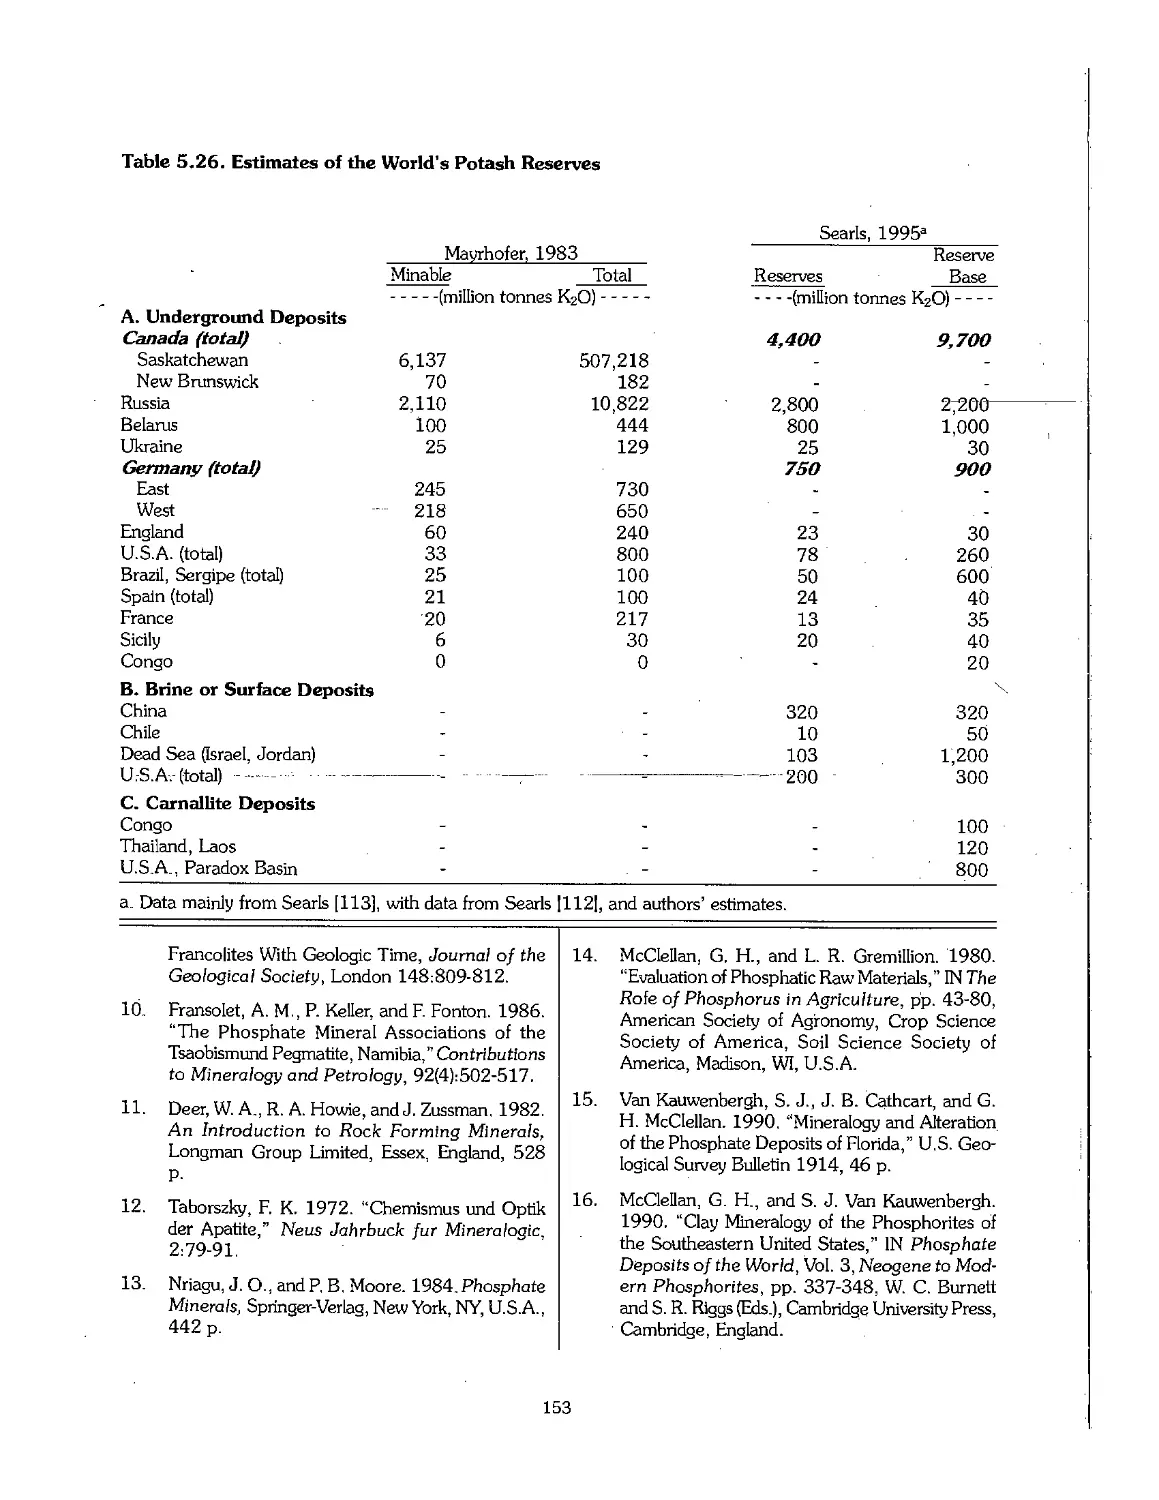
5.6 References 152
ix
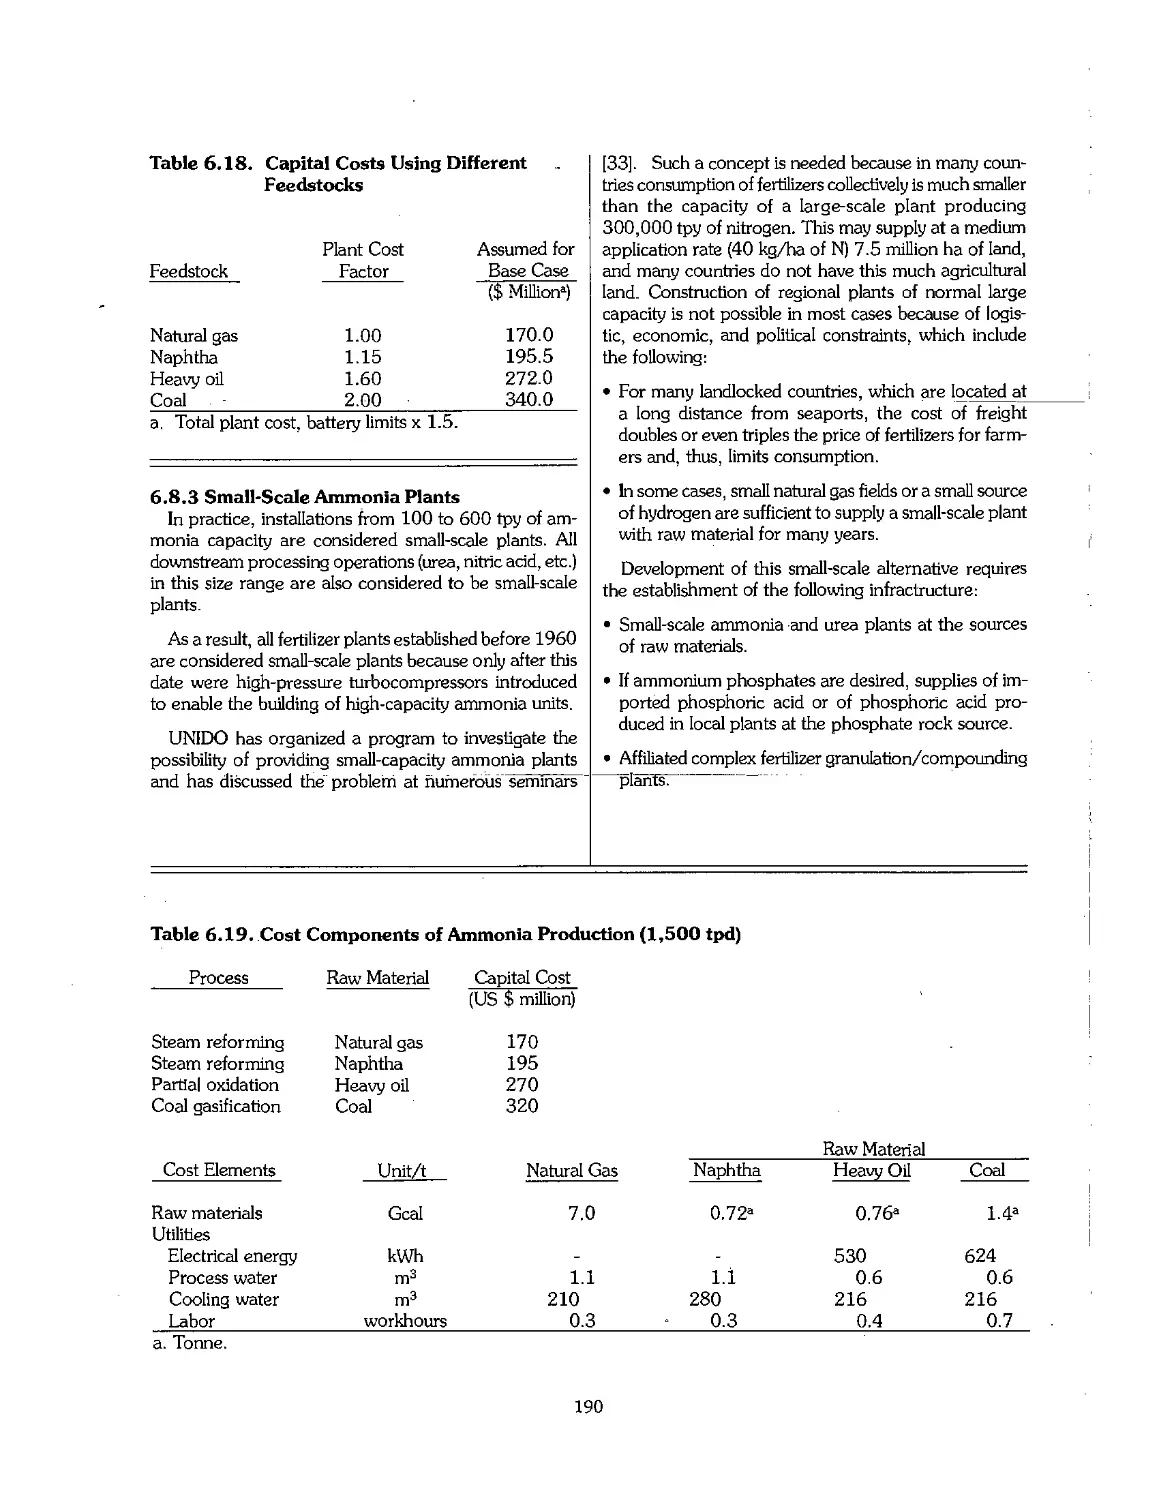
Chapter 6. Production of Ammonia 158
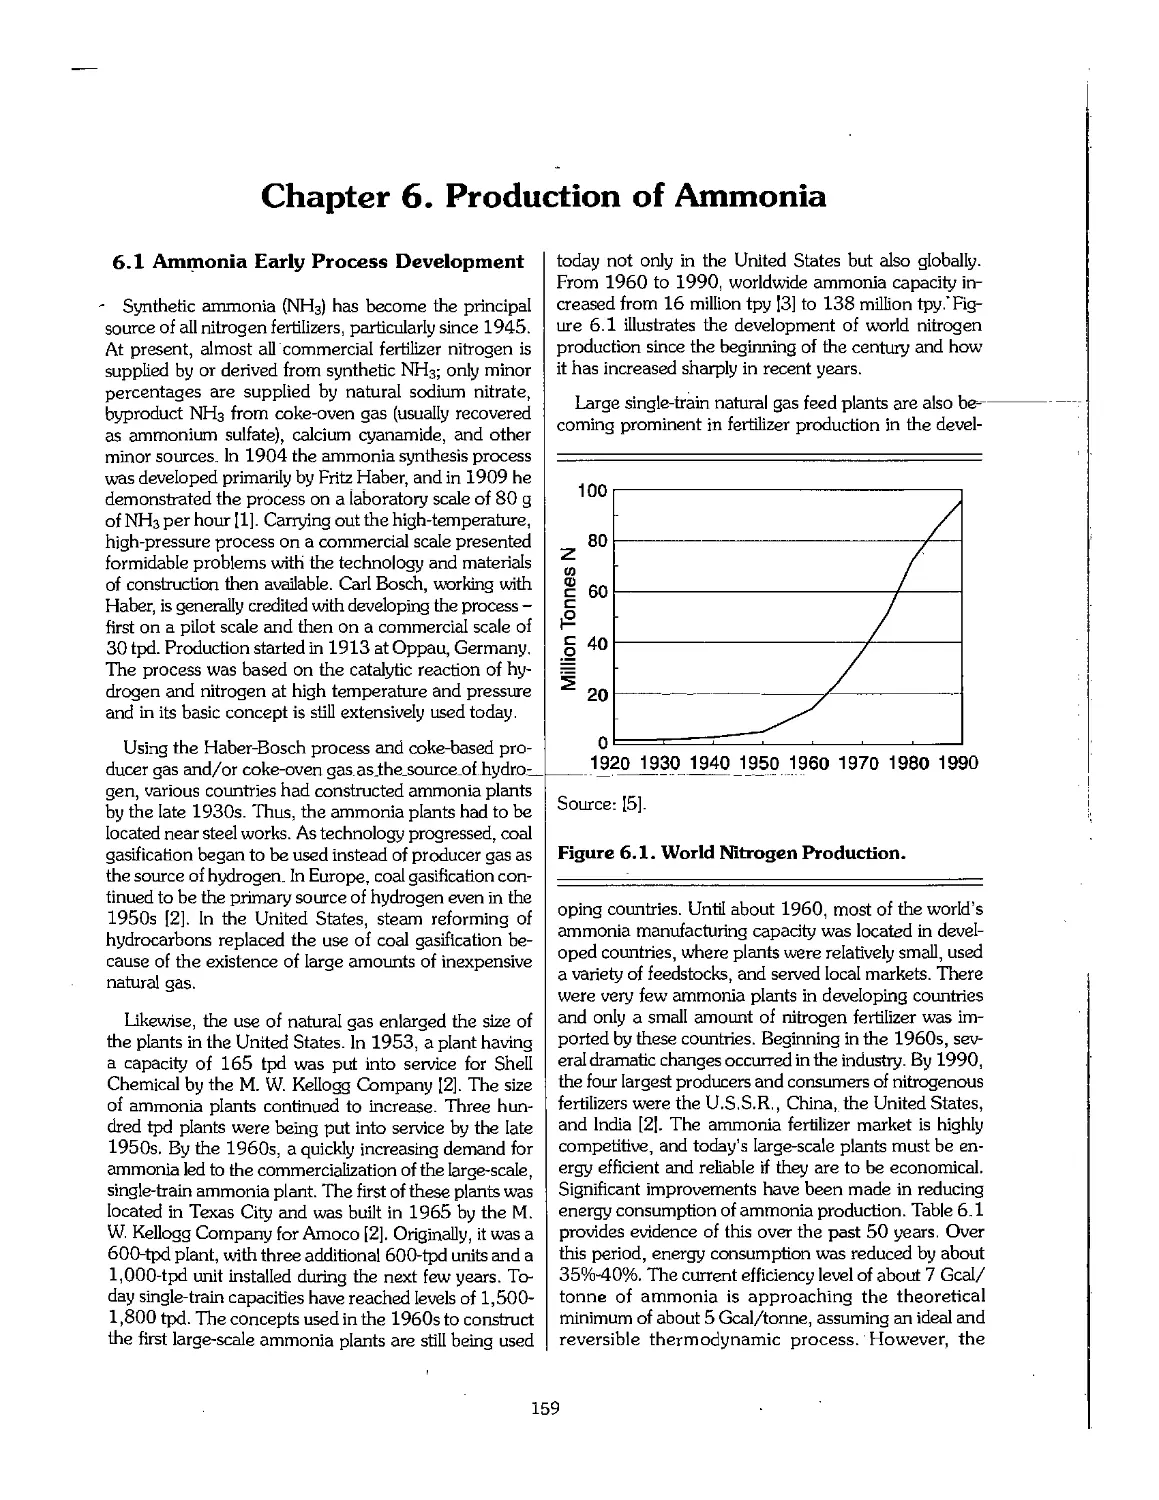
6.1 Ammonia Early Process Development 159
6.2 Physical Properties of Ammonia 160
6.3 Feedstock for Ammonia Production 160
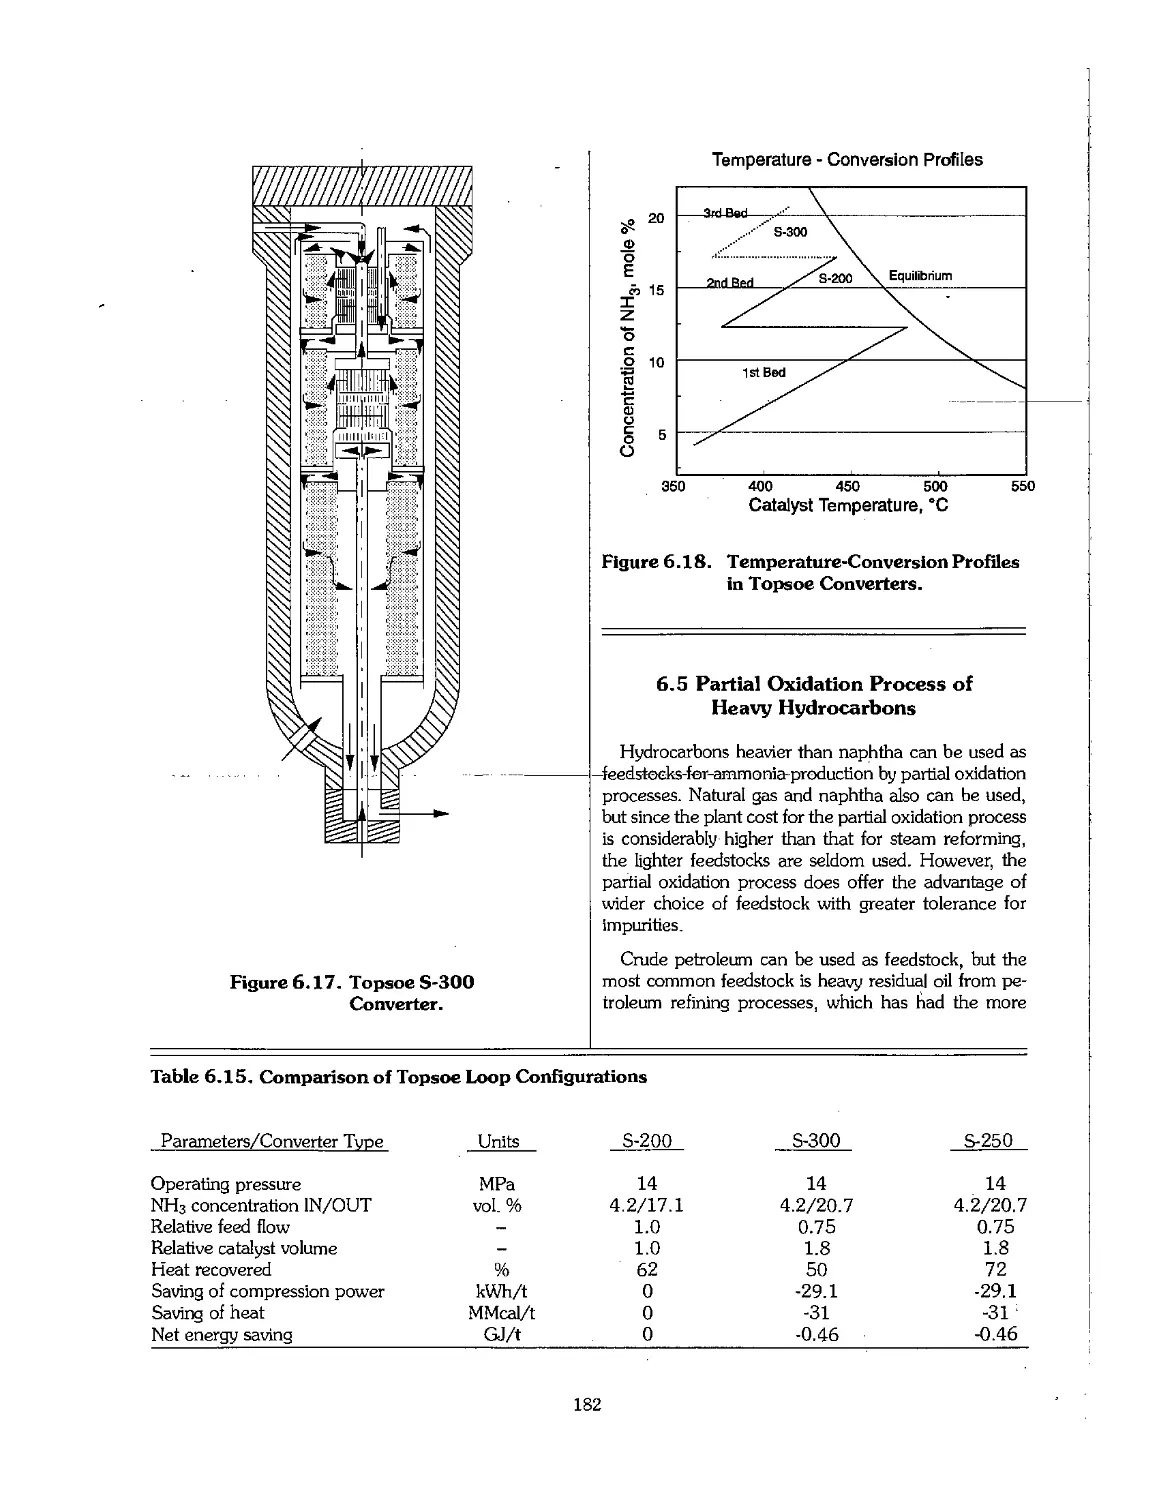
6.4 Production Technology of Ammonia 164
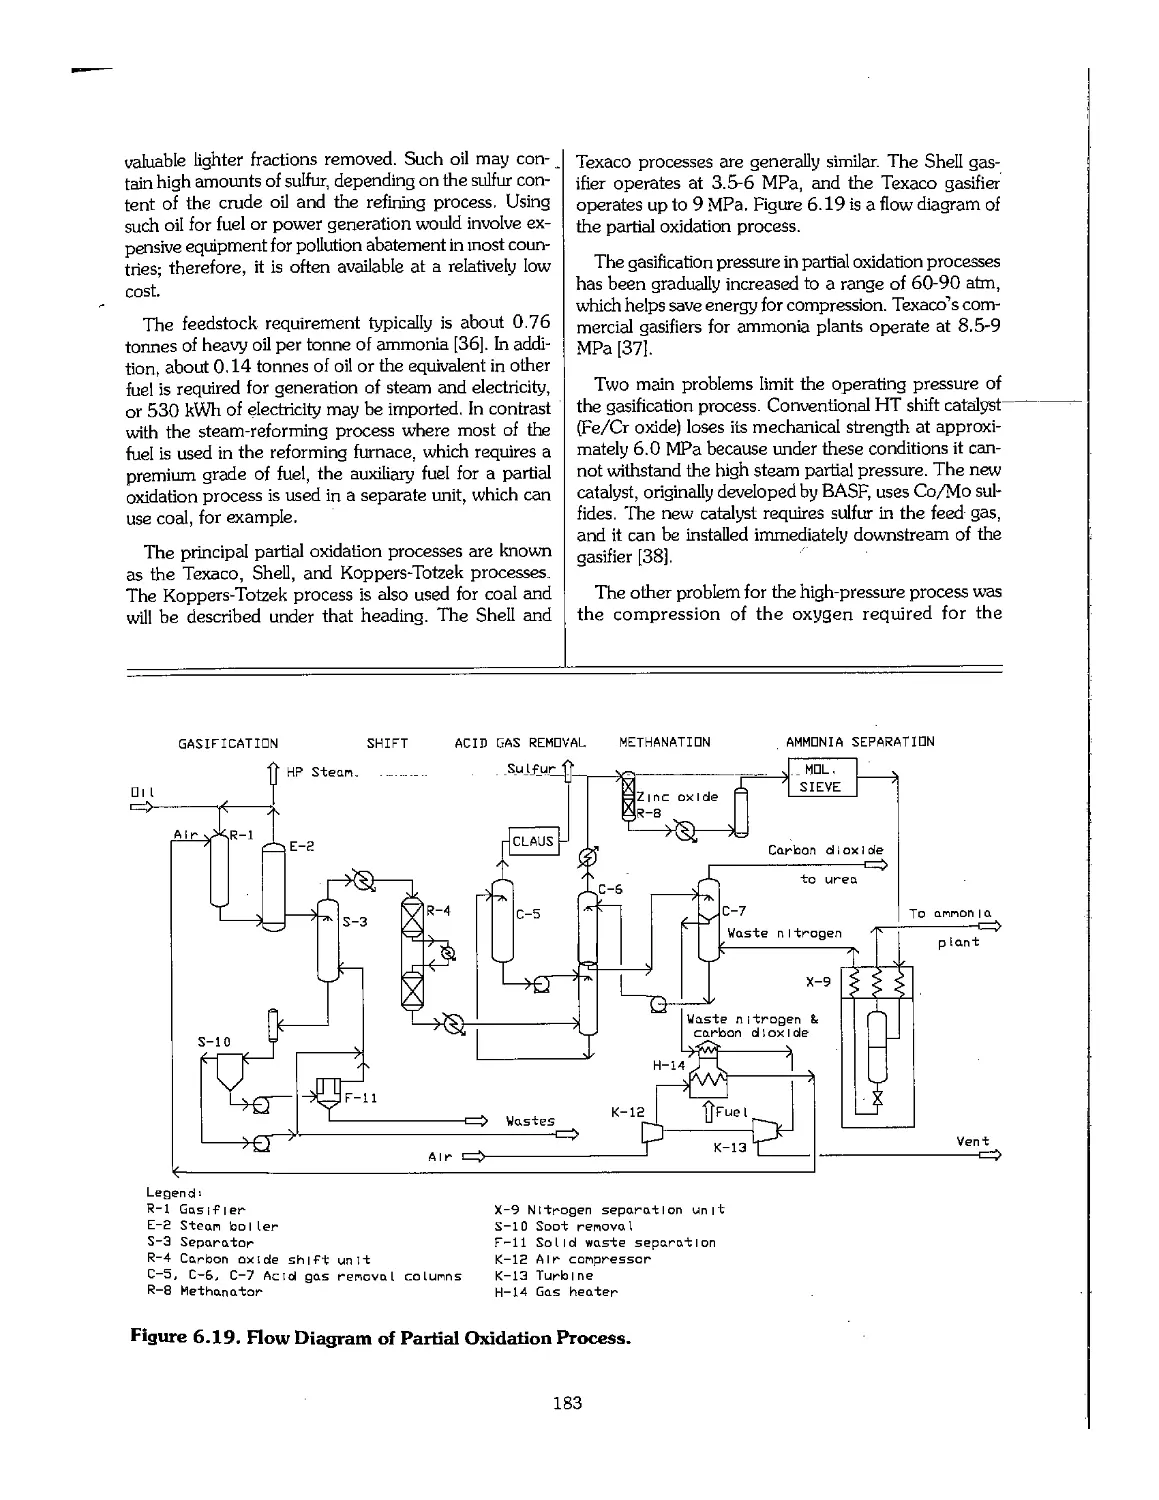
6.5 Partial Oxidation Process of Heavy Hydrocarbons 182
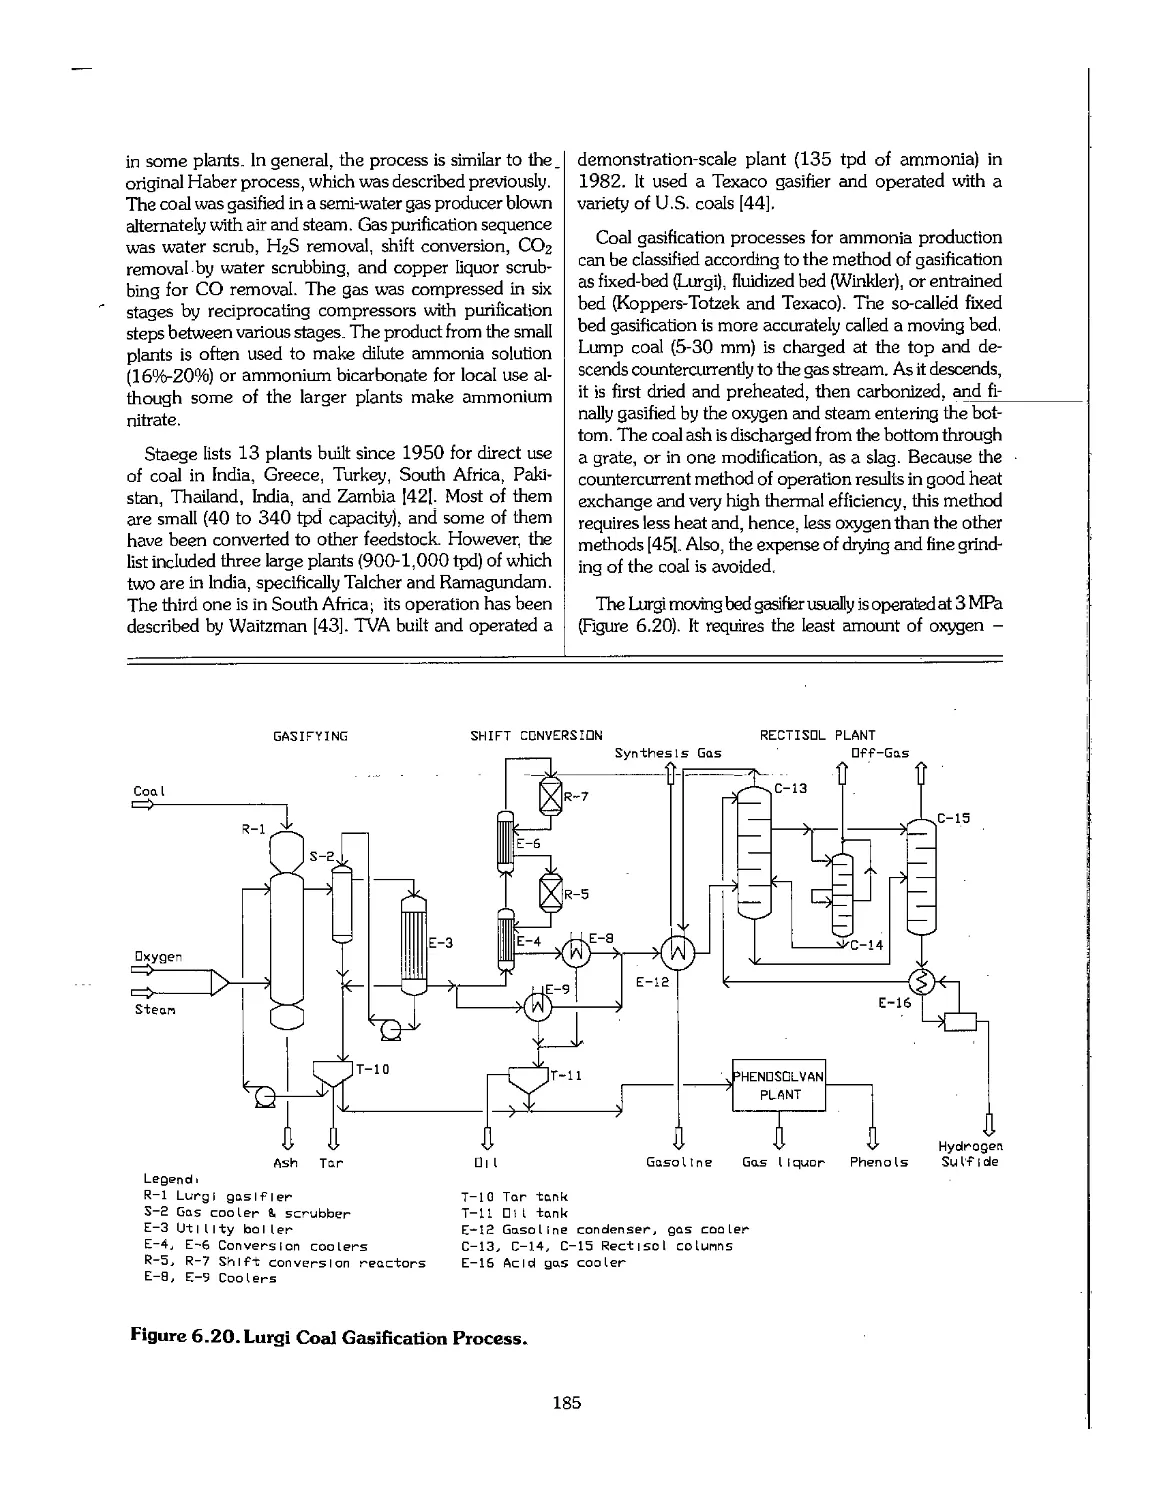
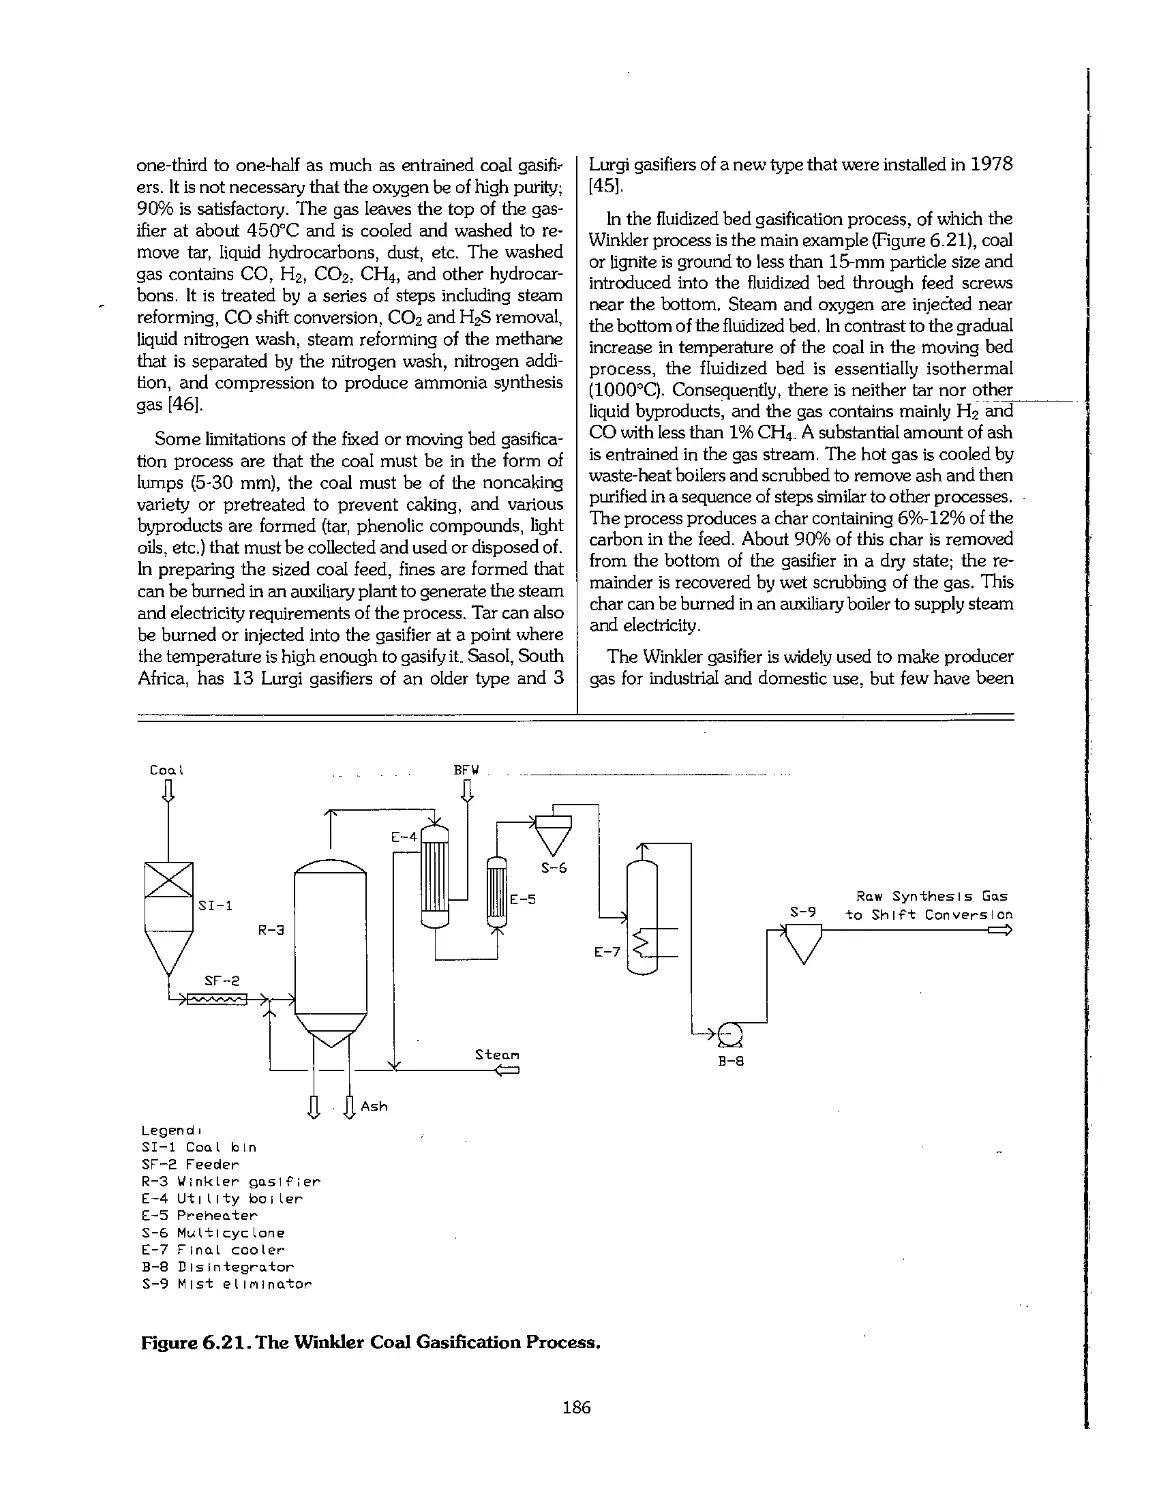
6.6 Ammonia From Coal : 184
6.7 Ammonia From Electrolytic Hydrogen 187
6.8 Economics of Ammonia Production 188
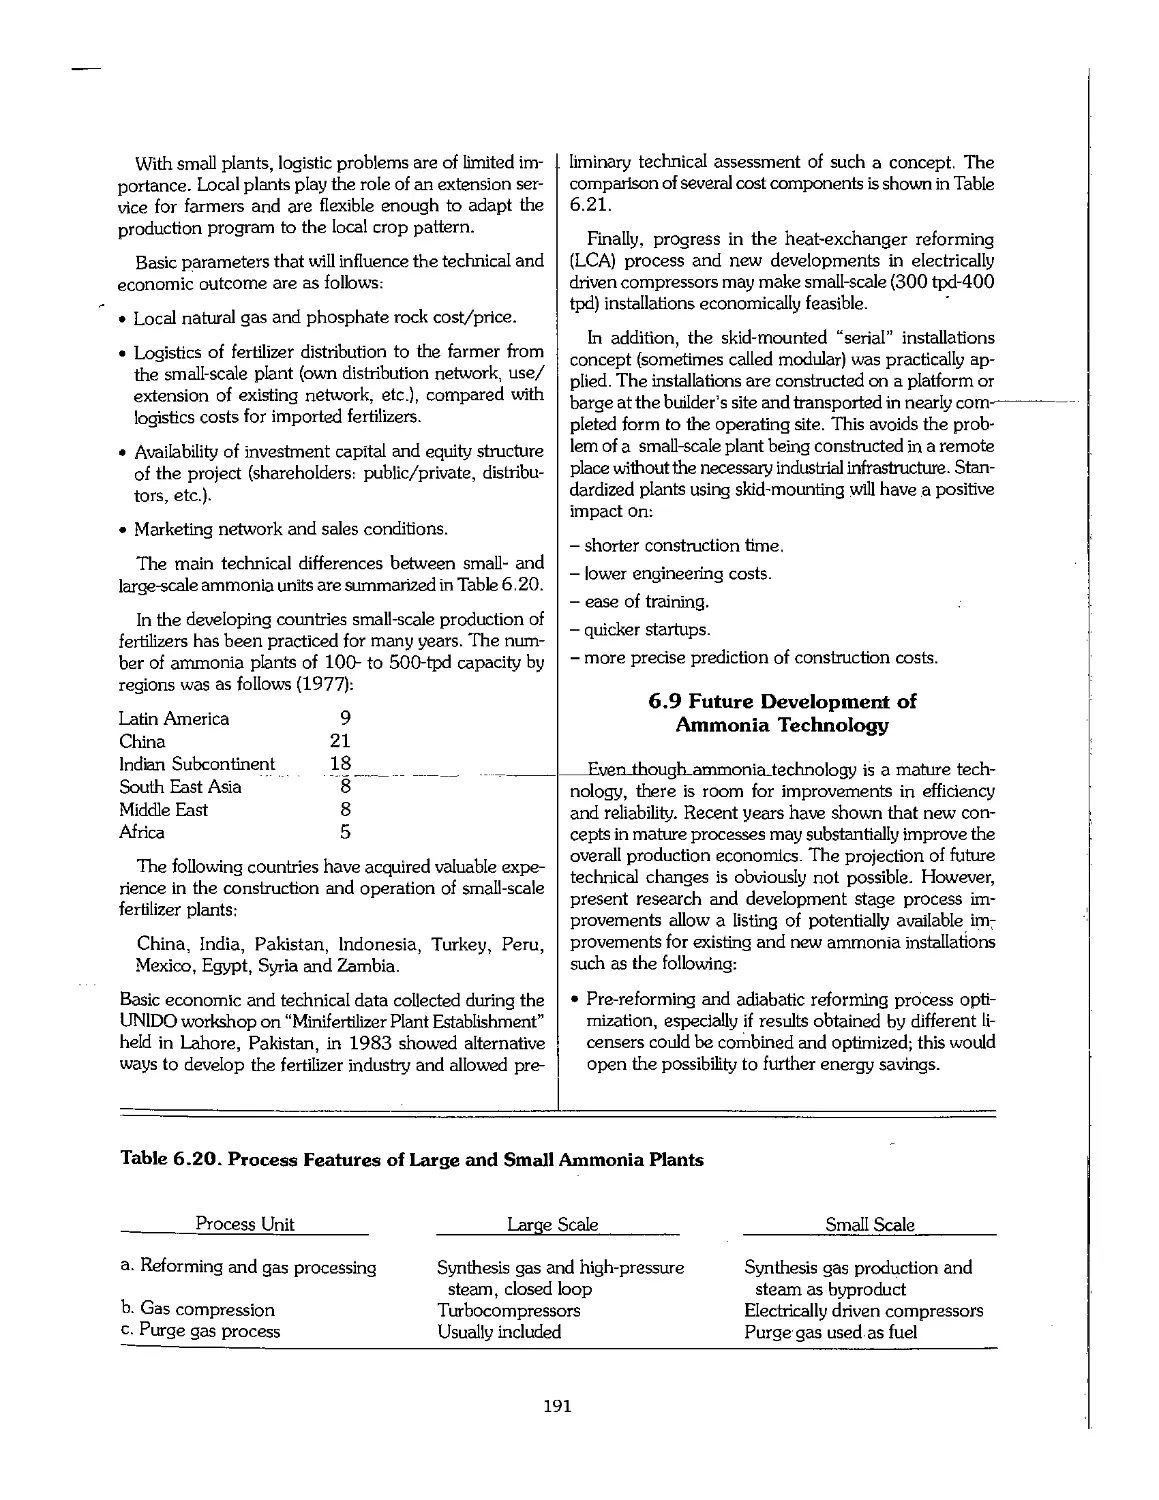
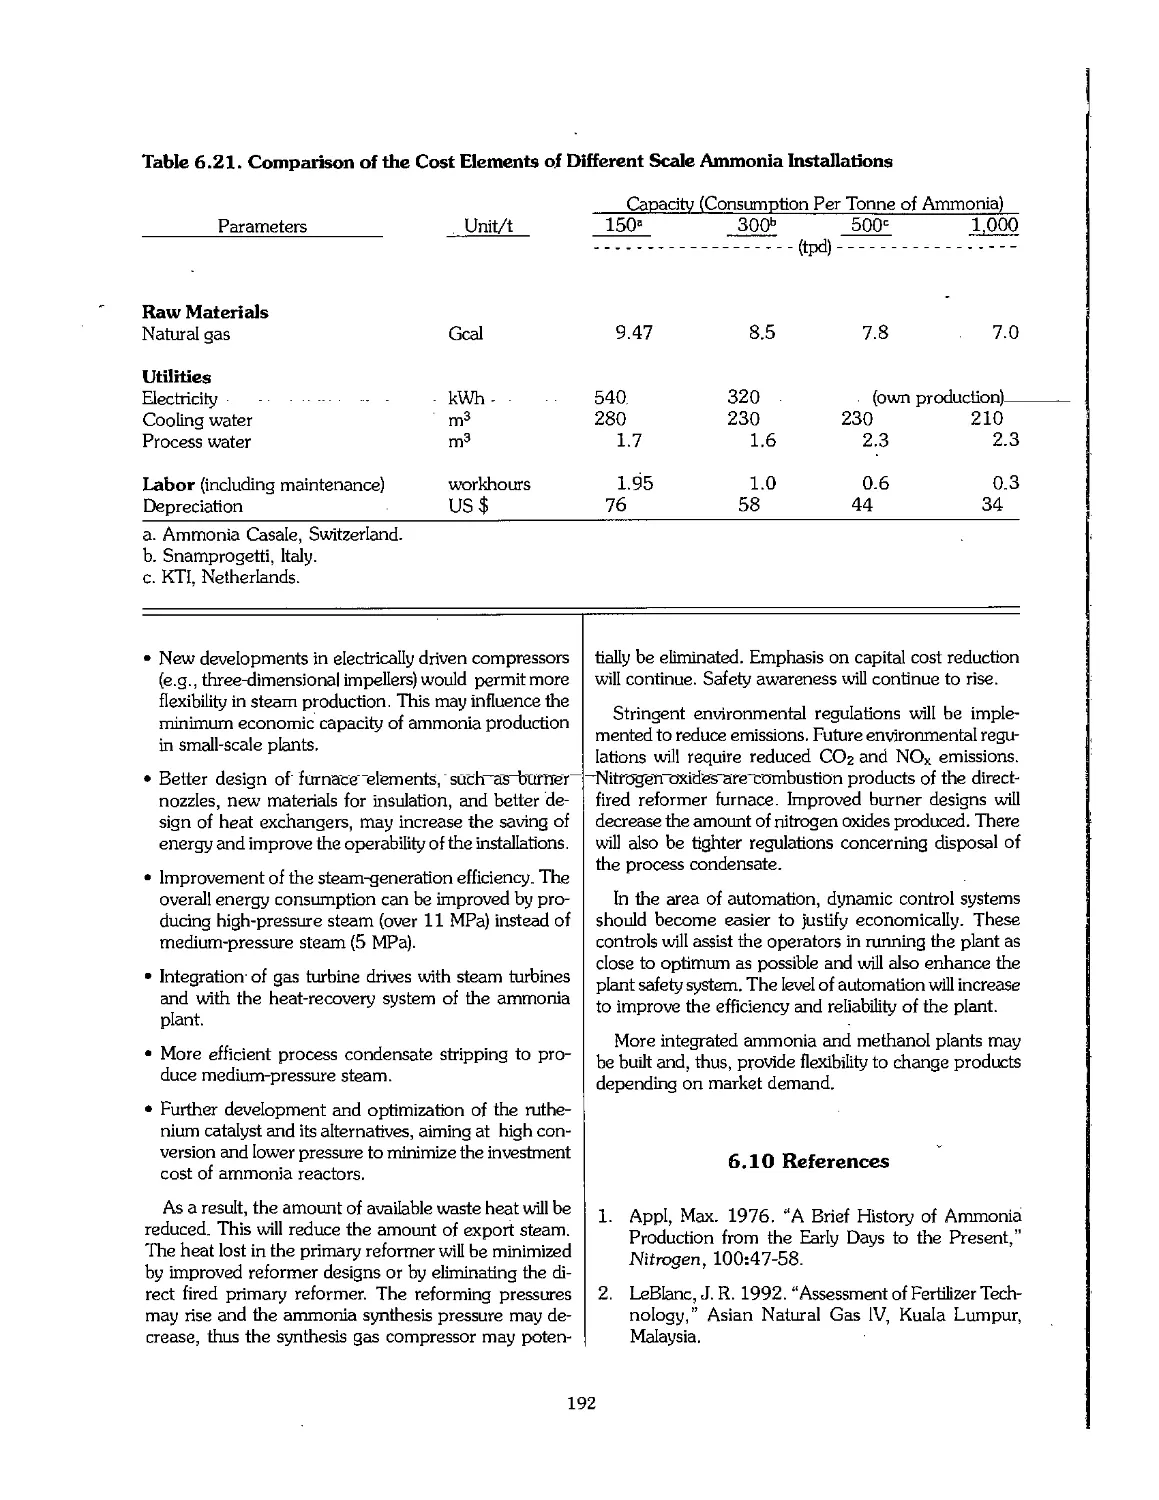
6.9 Future Development of Ammonia Technology 191
6.10 References 192
Chapter 7. Transportation and Storage of Ammonia 195
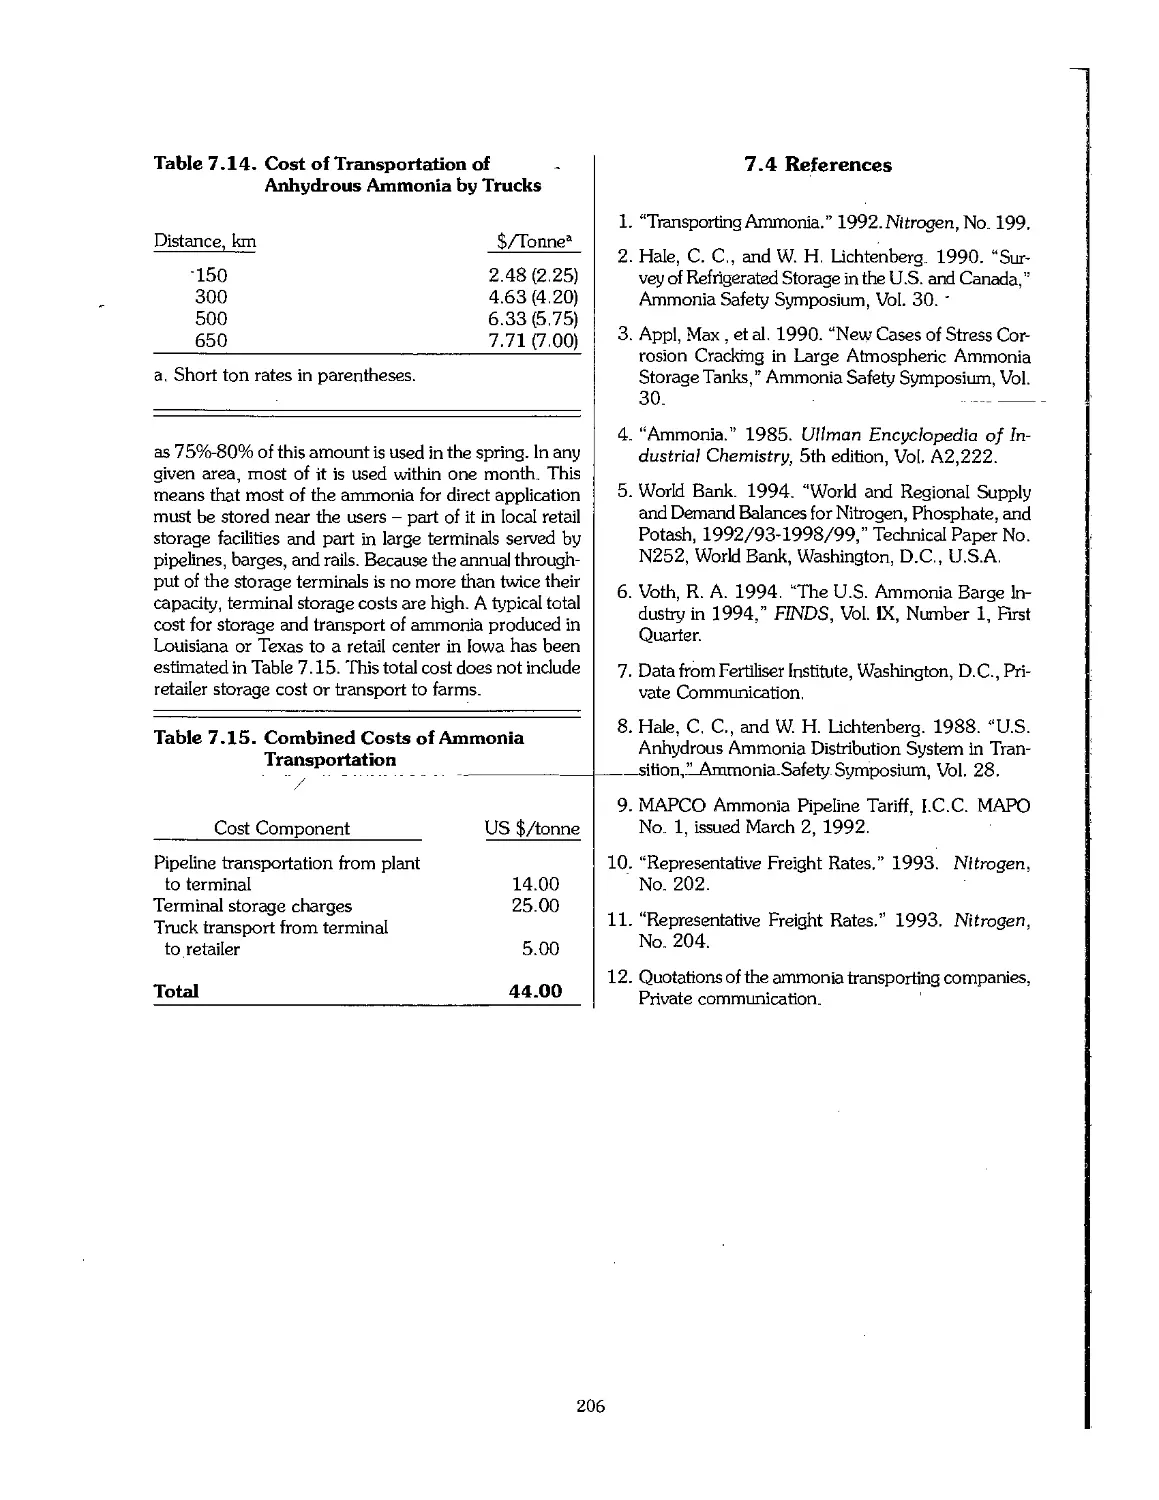
7.1 Introduction 196
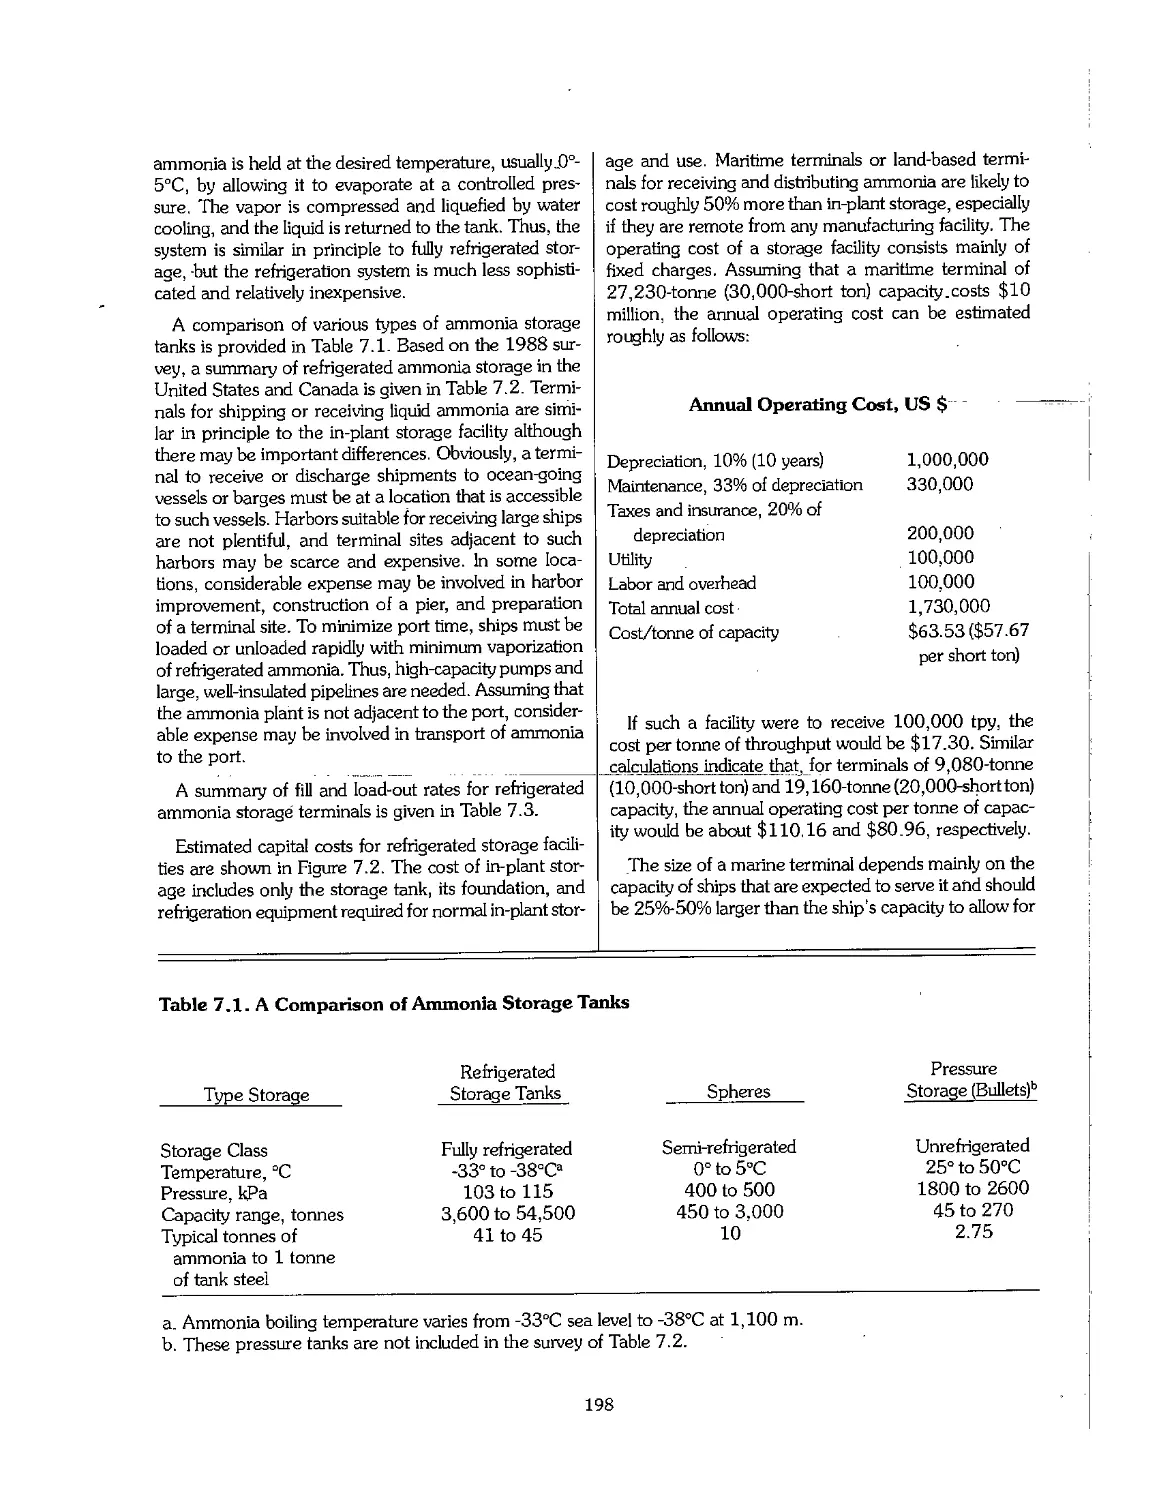
7.2 Ammonia Storage 197
7.3 Transportation of Ammonia ,, 199
7.4 References 206
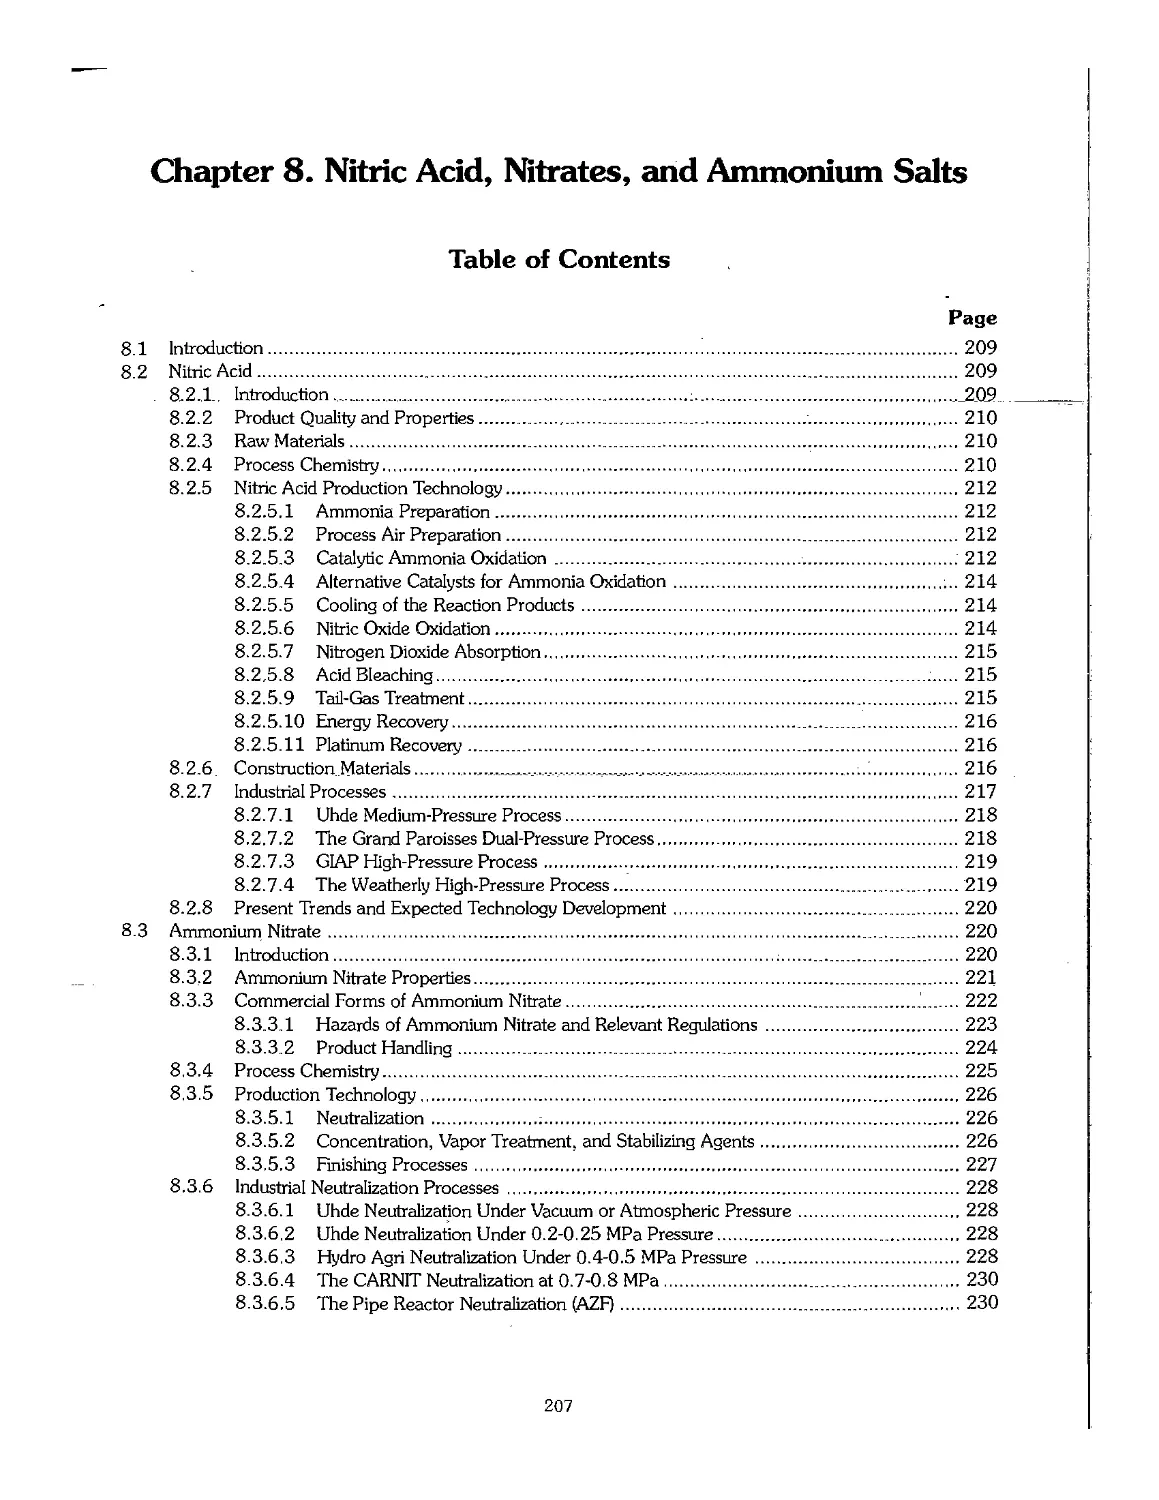
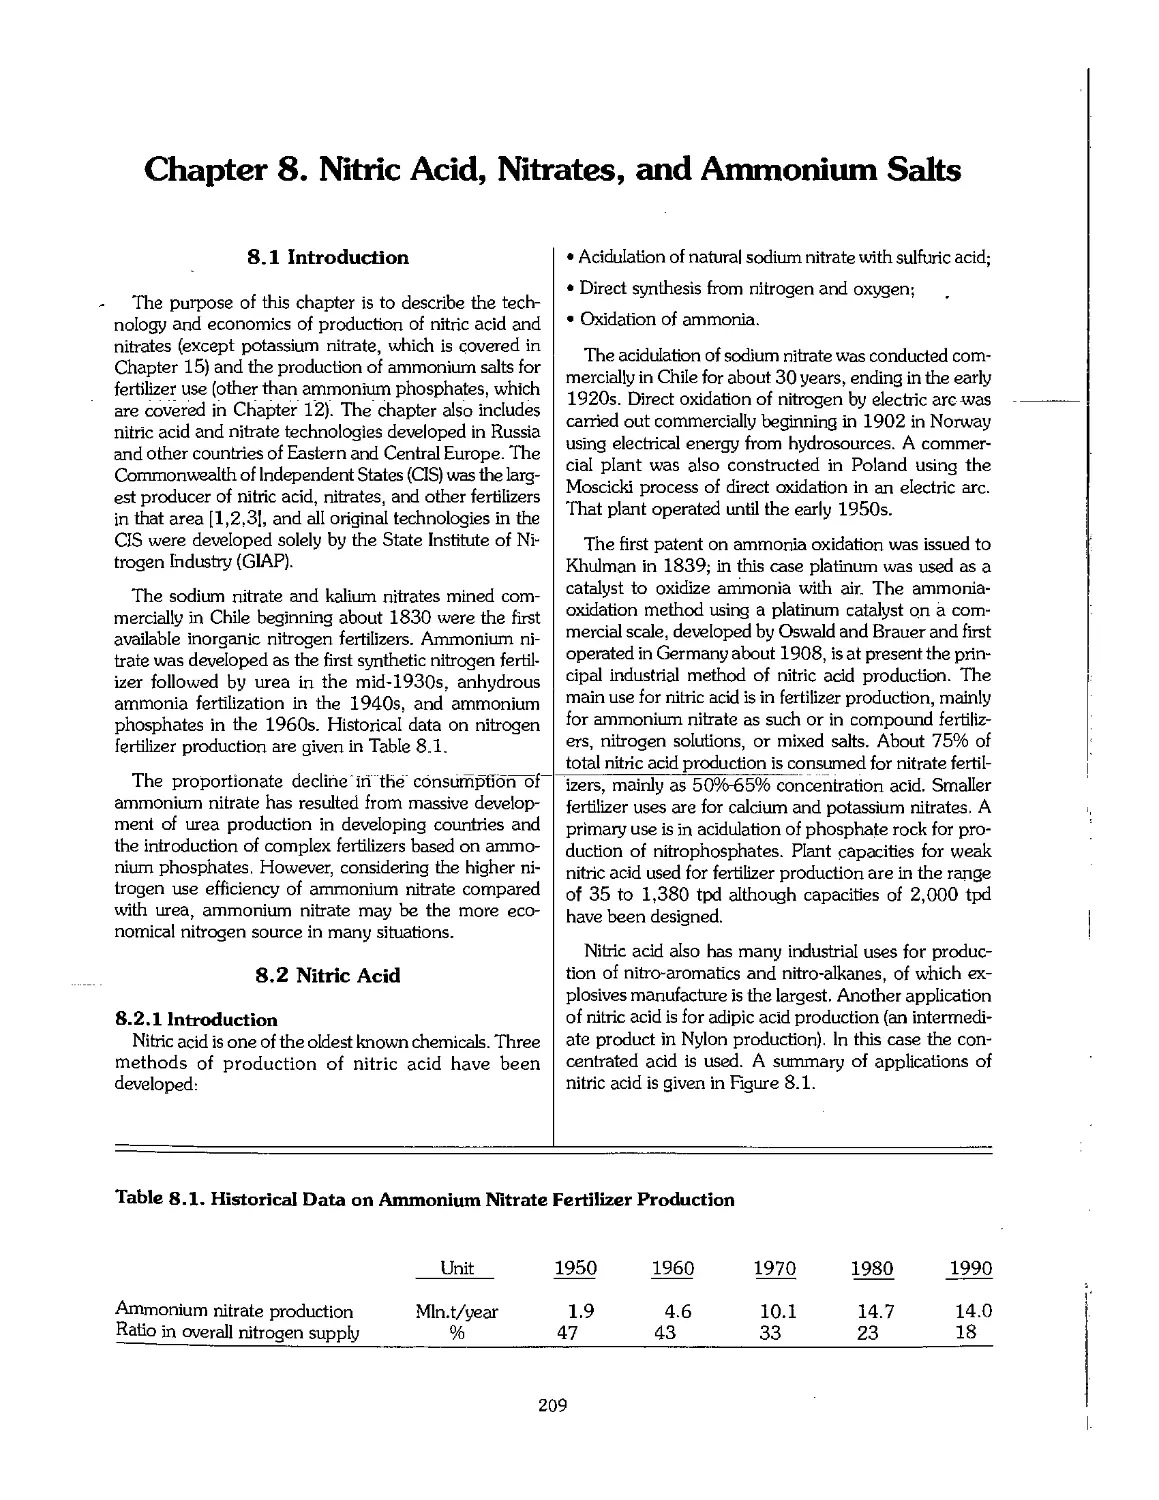
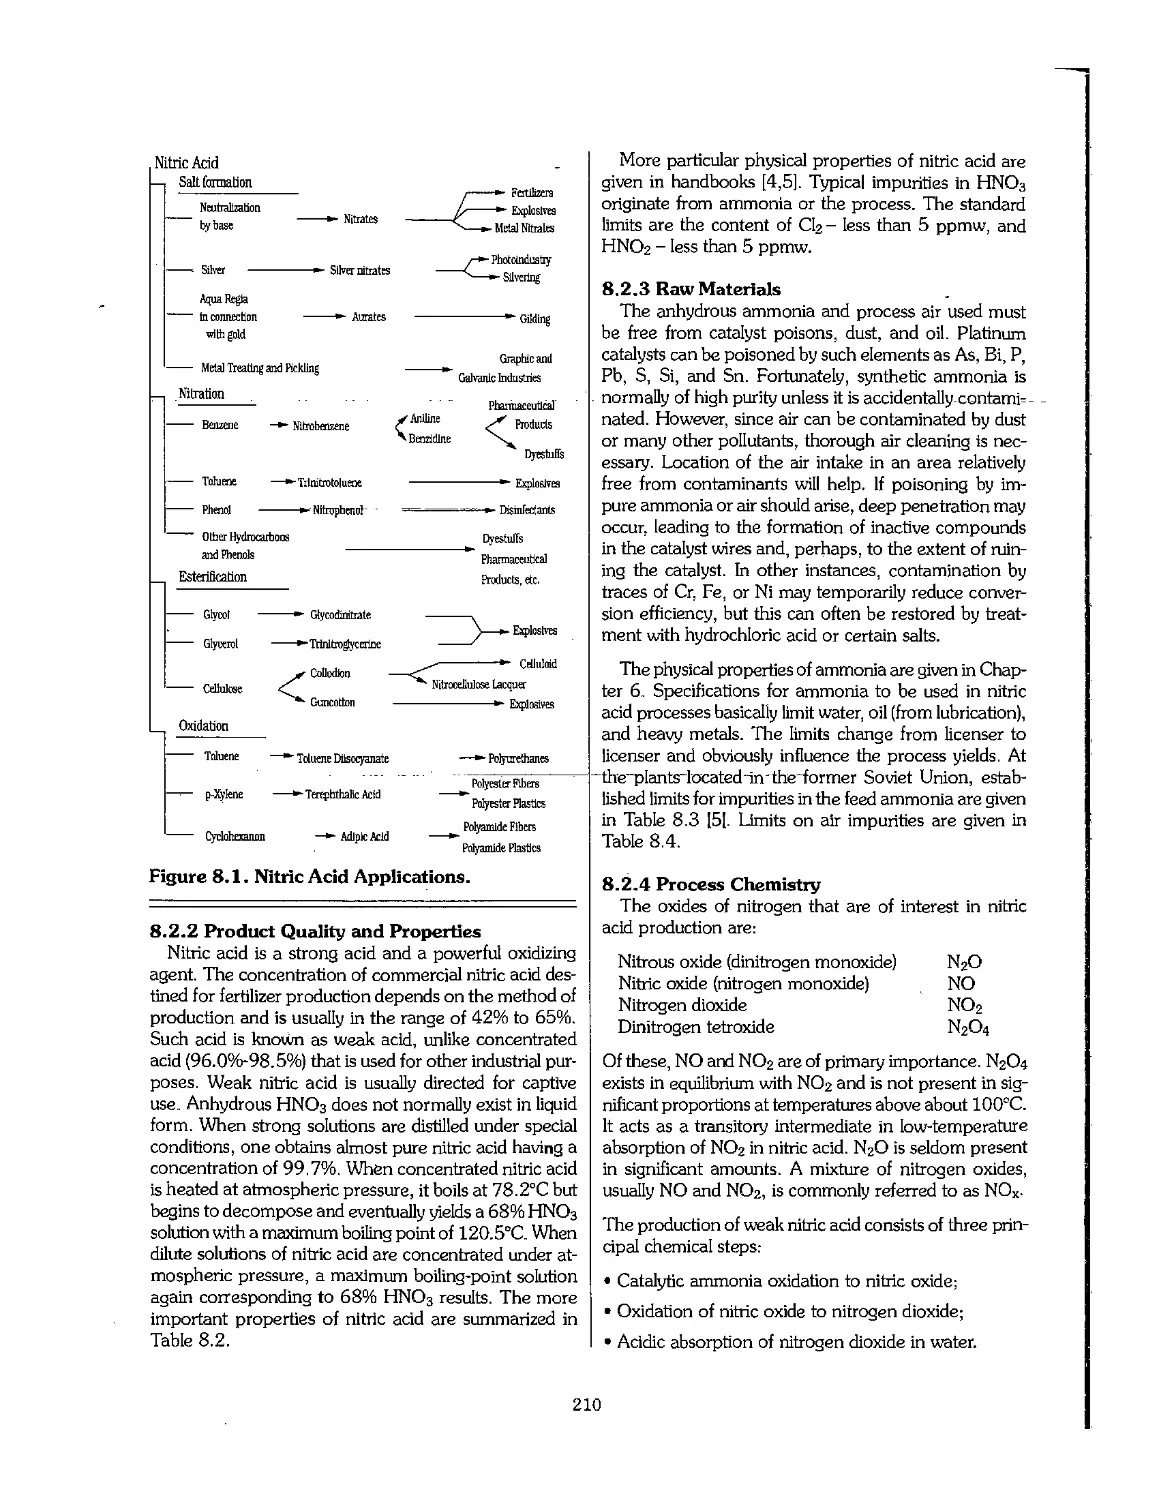
Chapter 8. Nitric Acid, Nitrates, and Ammonium Salts 207
8.1 Introduction 209
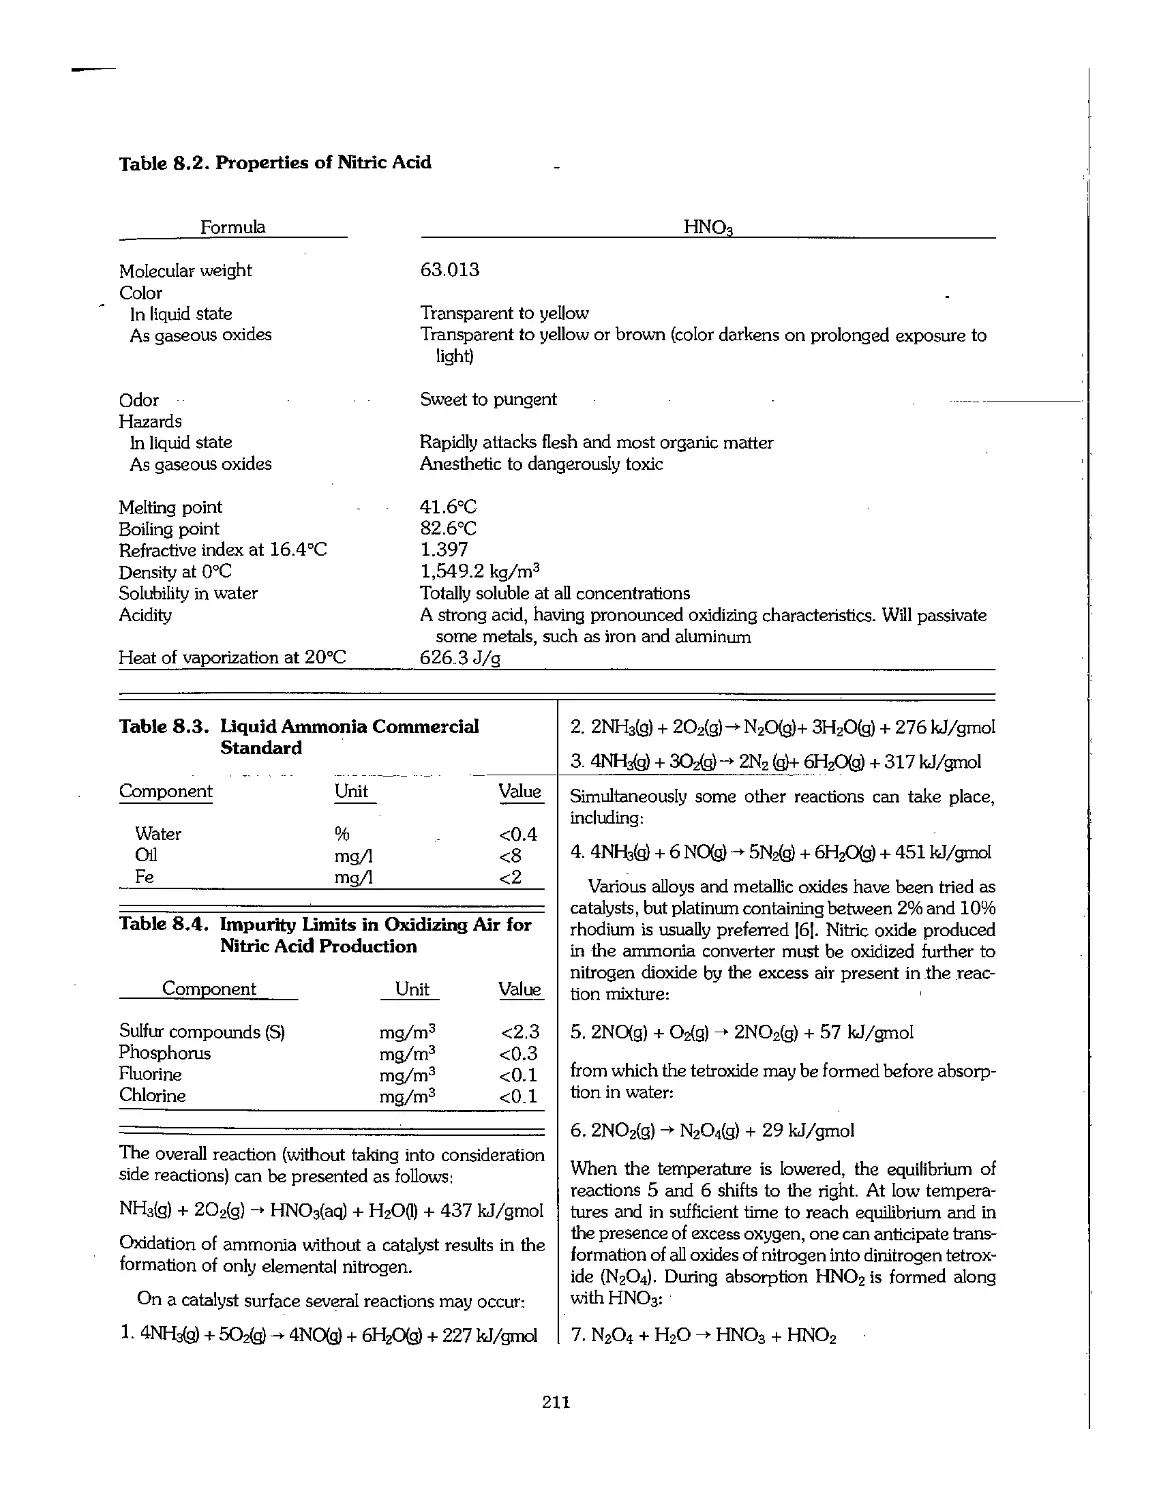
8.2 Nitric Acid 209
8.3 Ammonium Nitrate 220
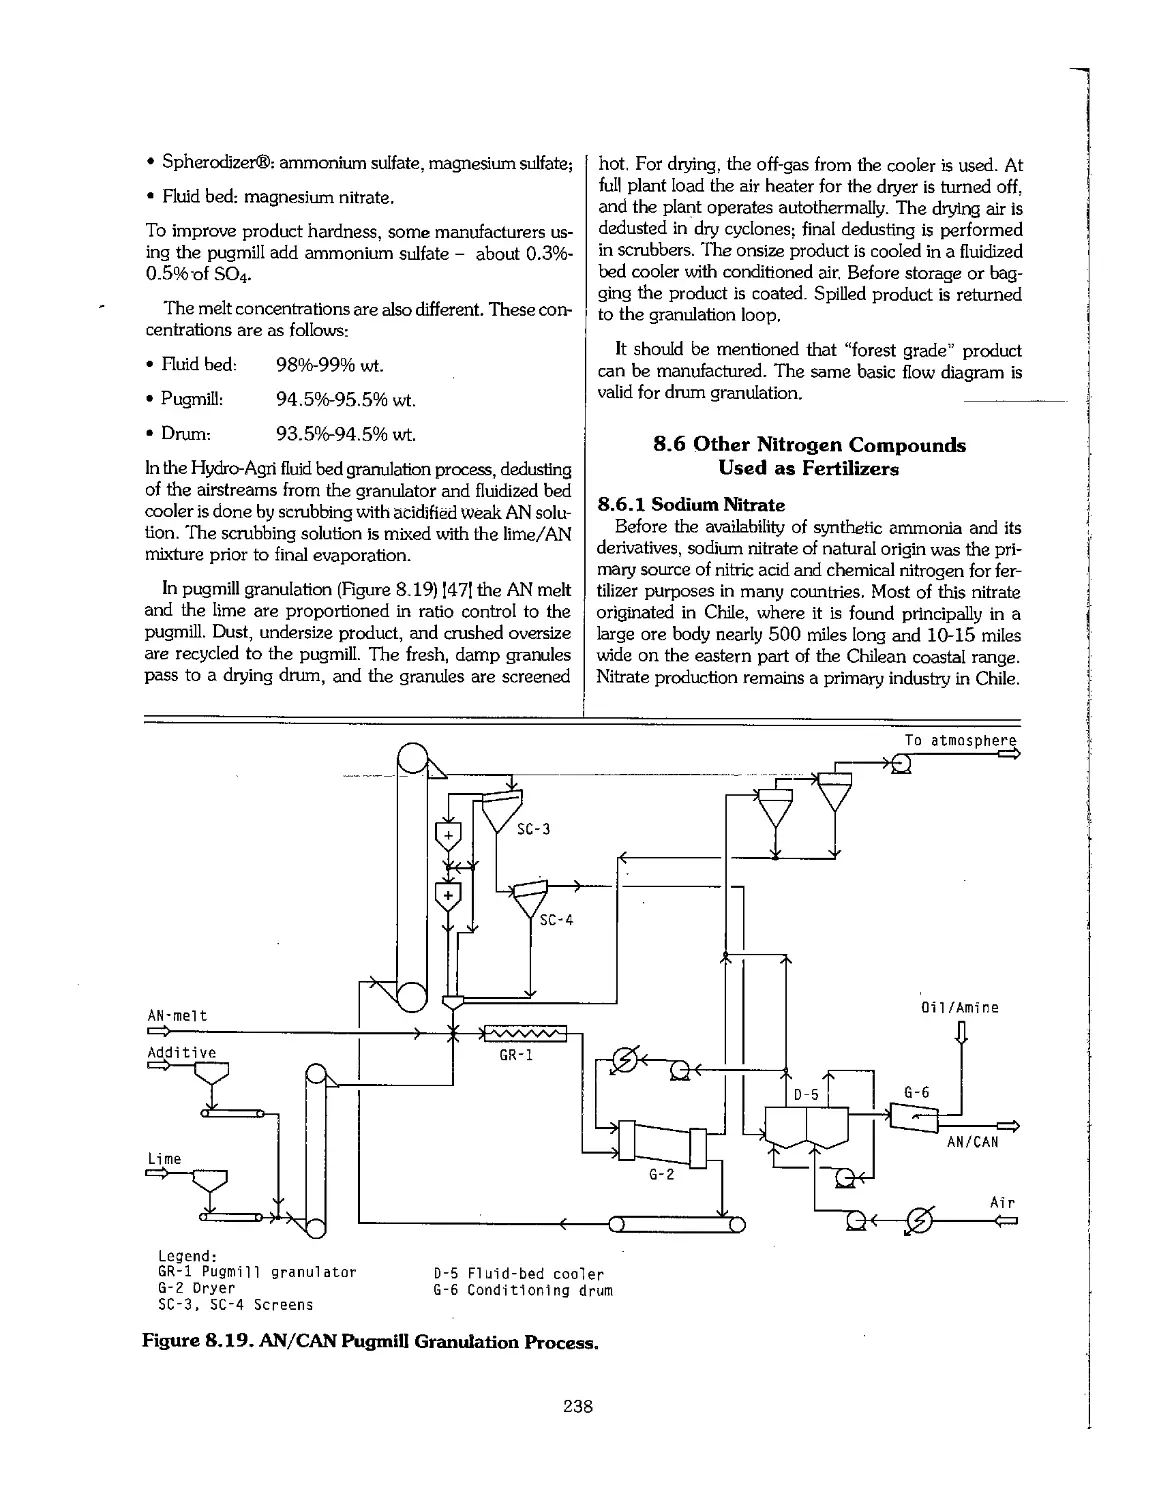
8.4 Pollution Control : 236
8.5 Production of Calcium Ammonium Nitrate 236
8.6 Other Nitrogen Compounds Used as Fertilizers 238
8.7 References 253
Chapter 9. Urea 256
9.1 Introduction 257
9.2 Properties of Urea 258
9.3 Process Operating Variables ,,; 258
9.4 Urea Processes ... ™~"~."."." 77.7.7 77.7.. 259
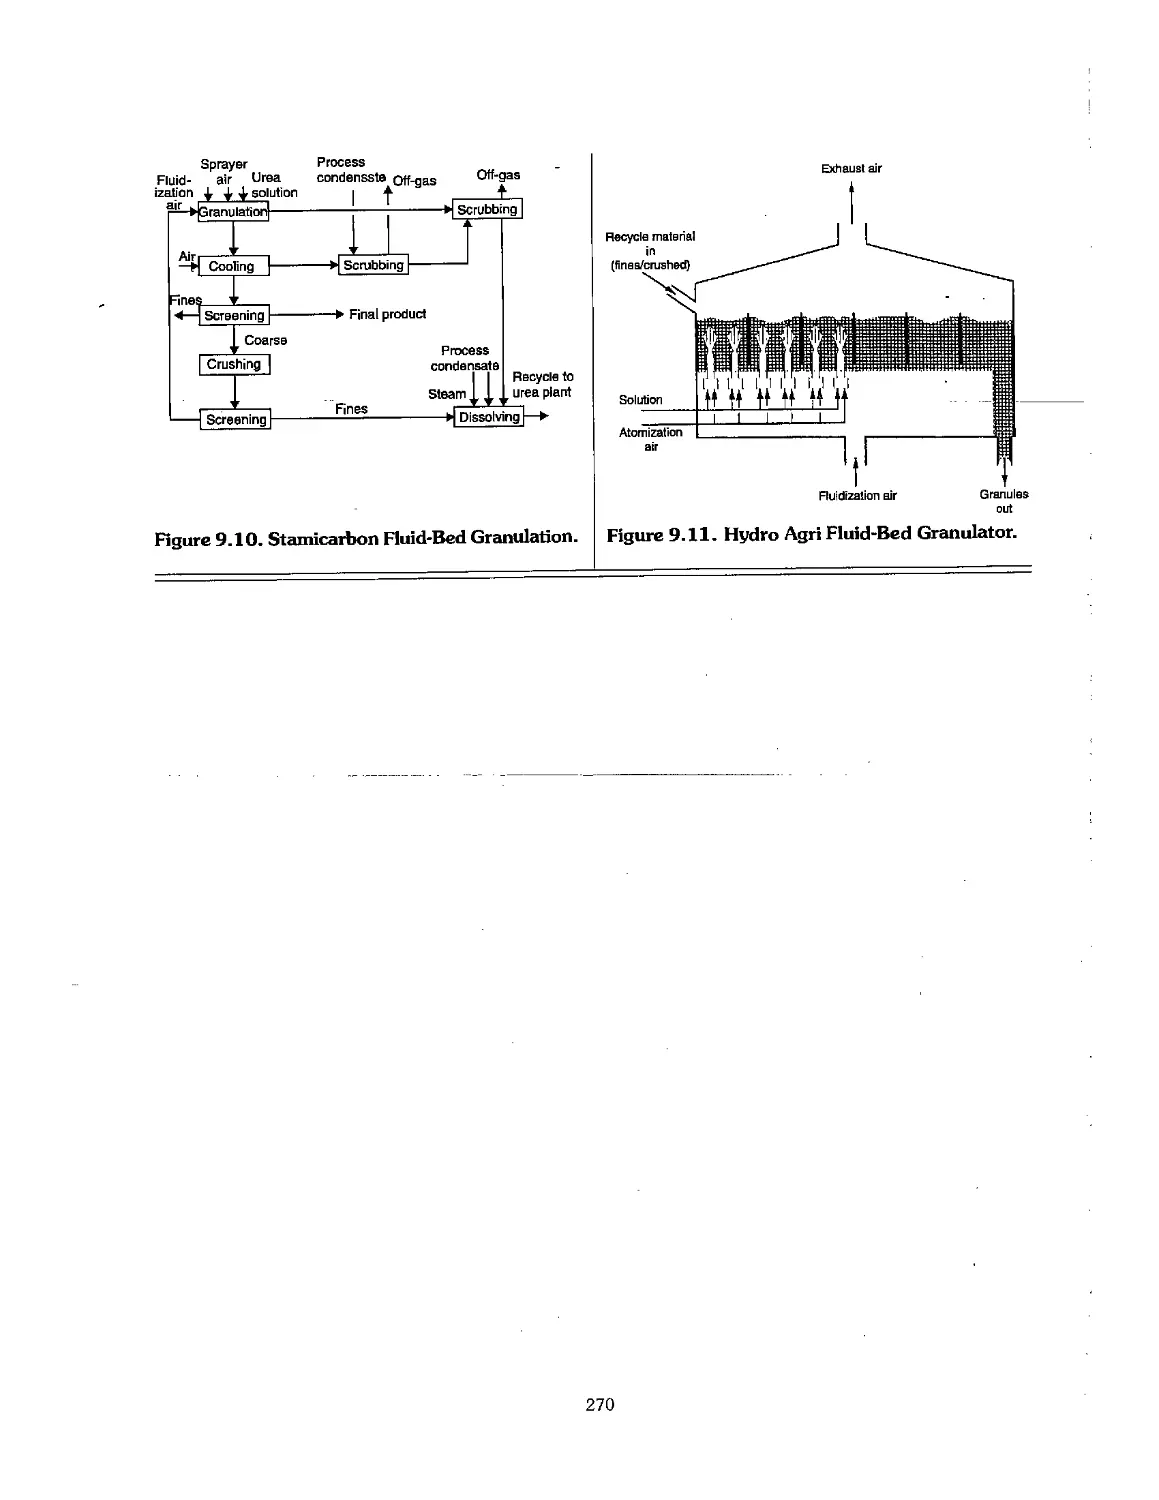
9.5 Urea Finishing Processes 266
9.6 Economics 268
9.7 References 268
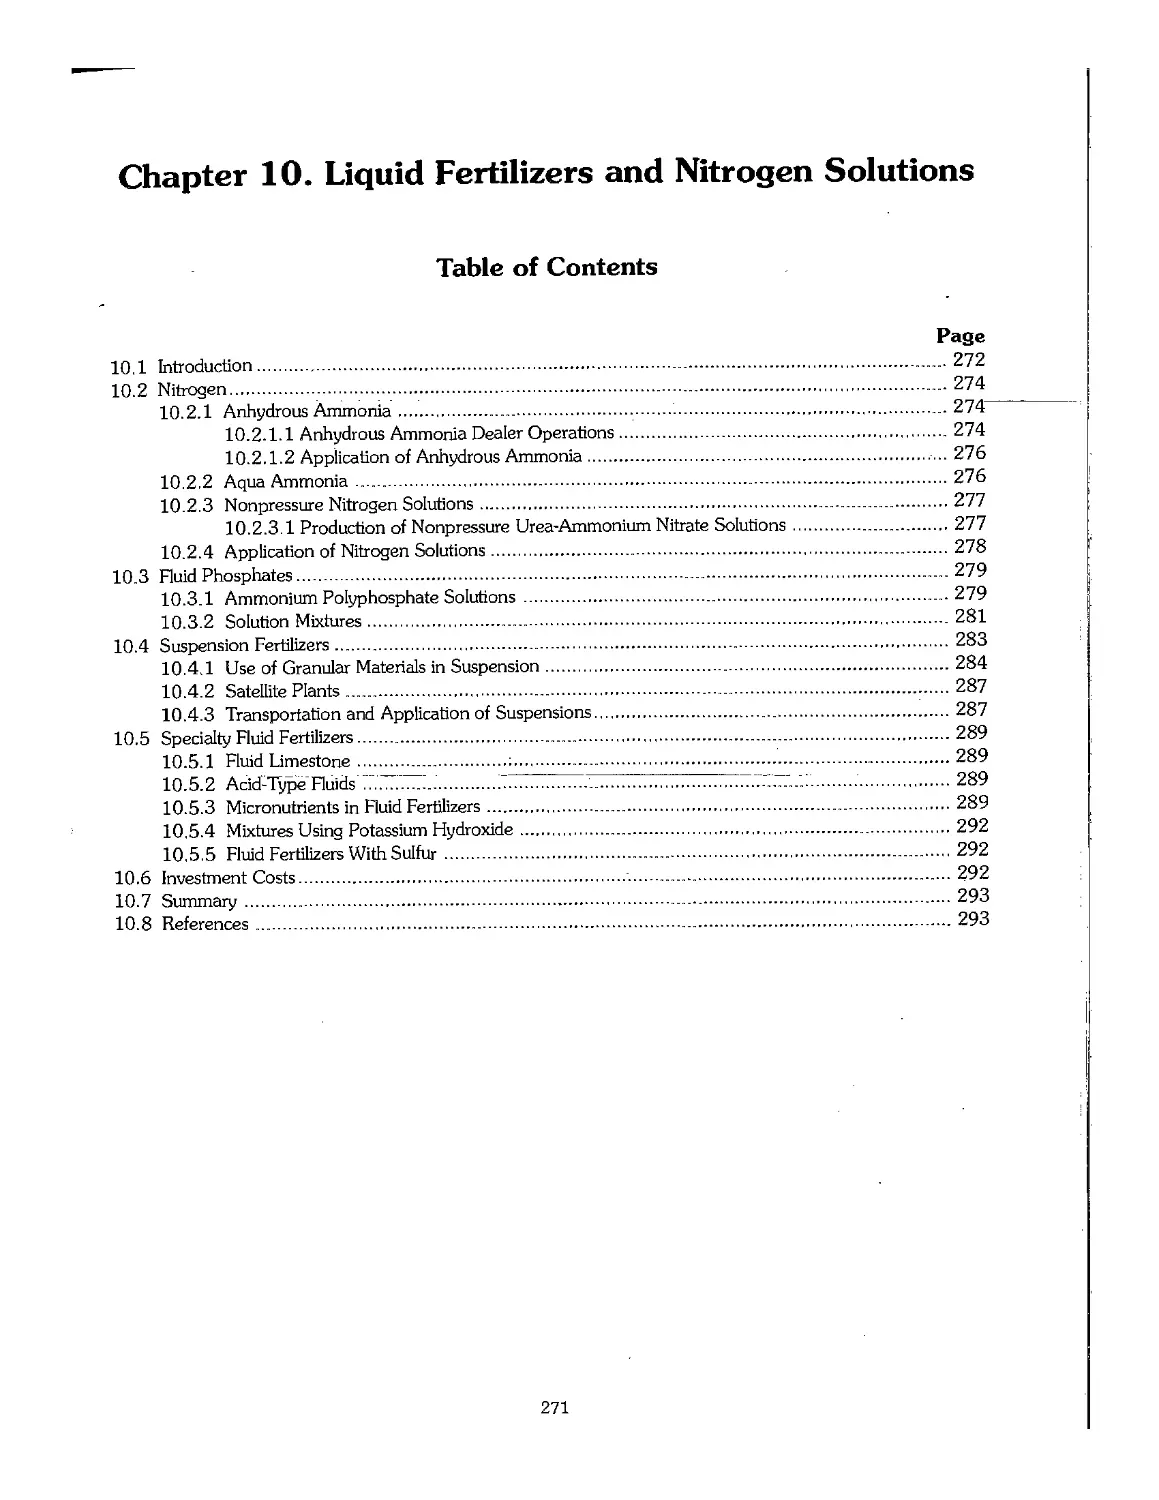
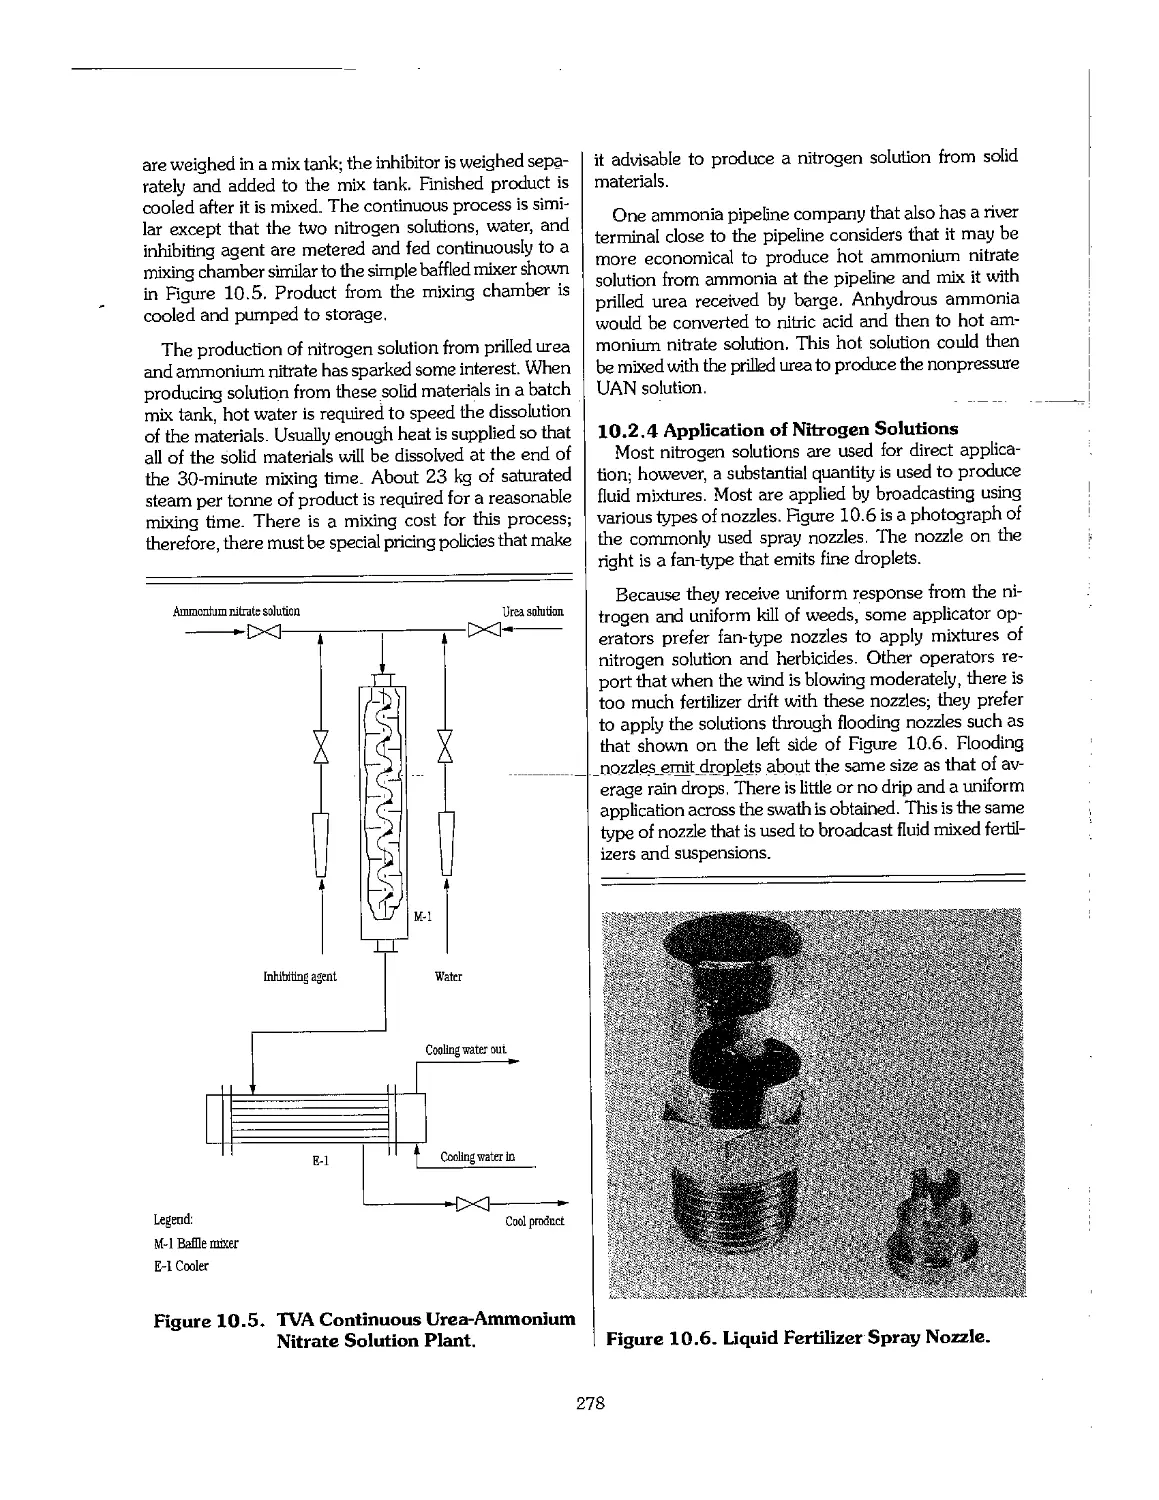
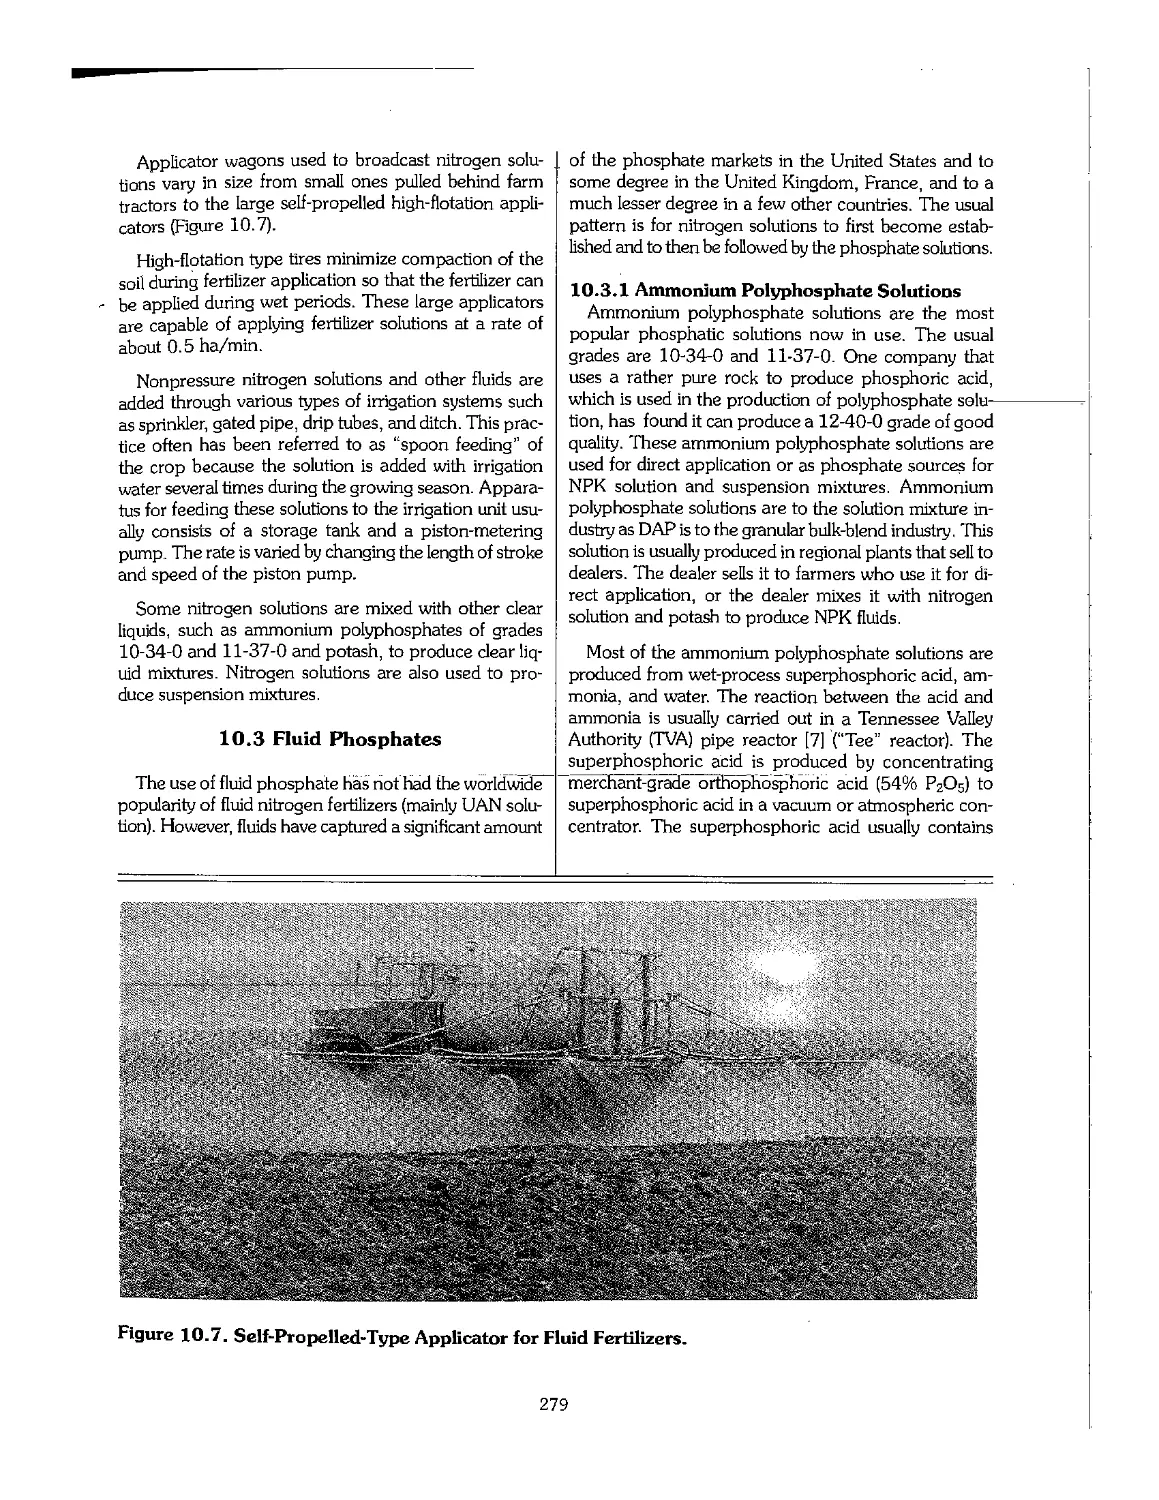
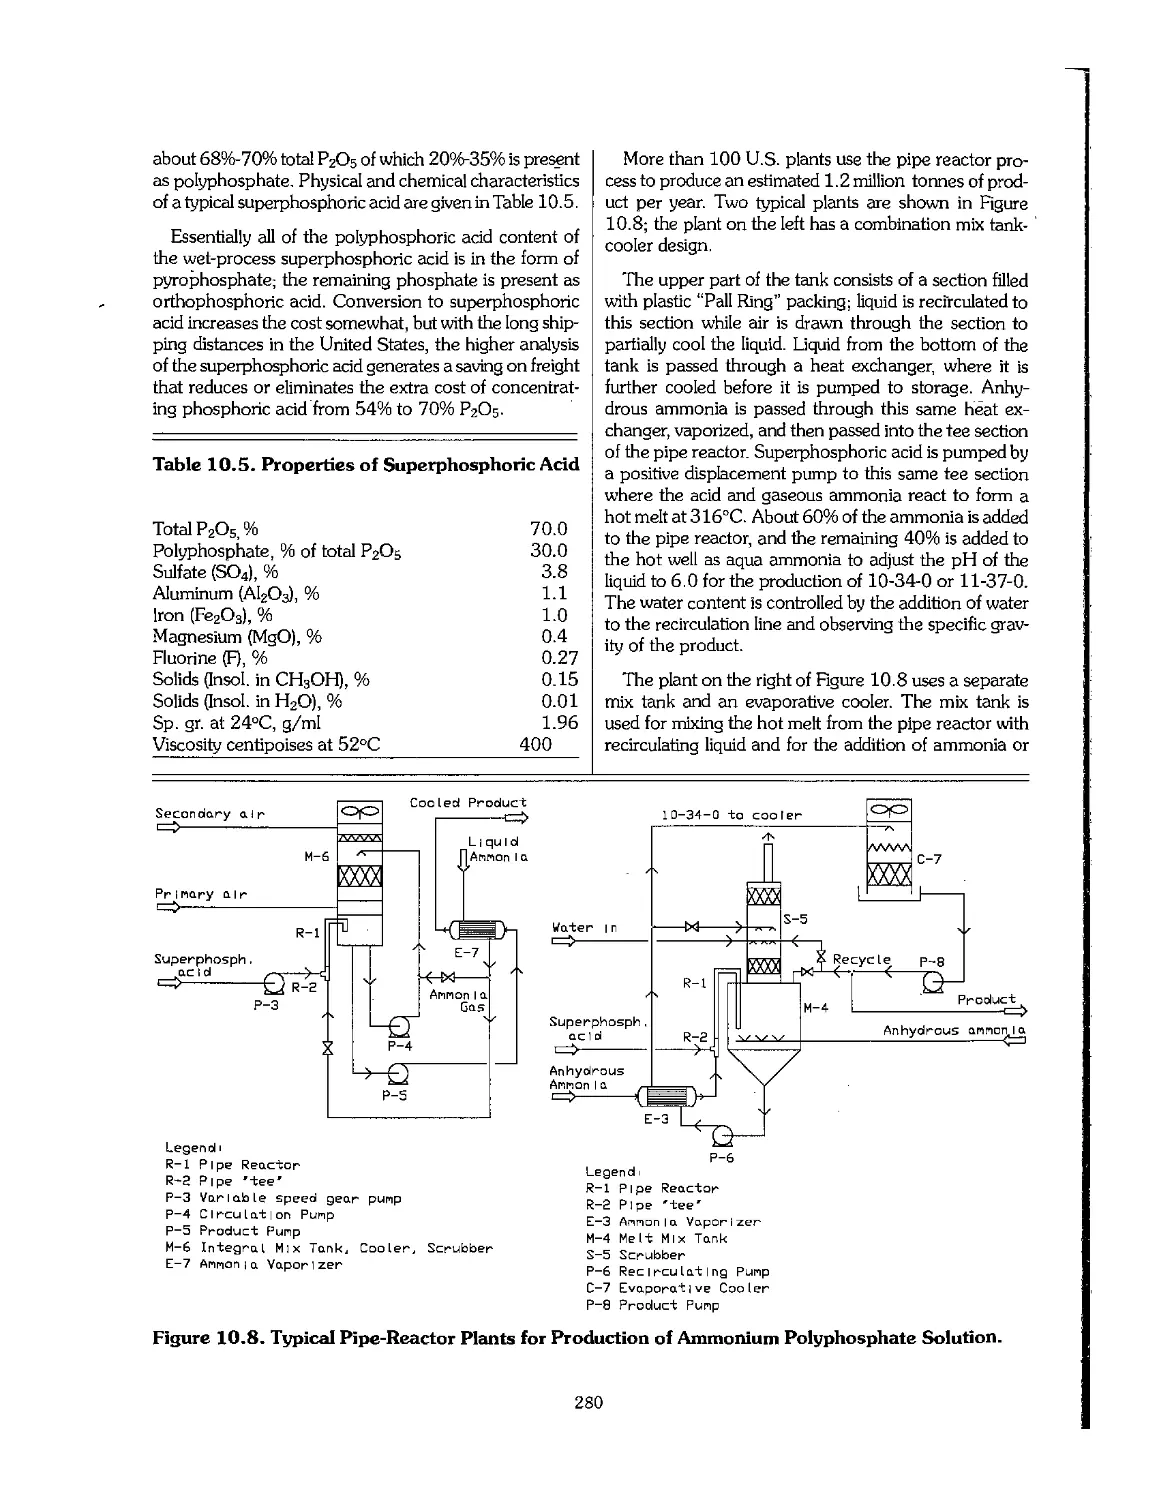
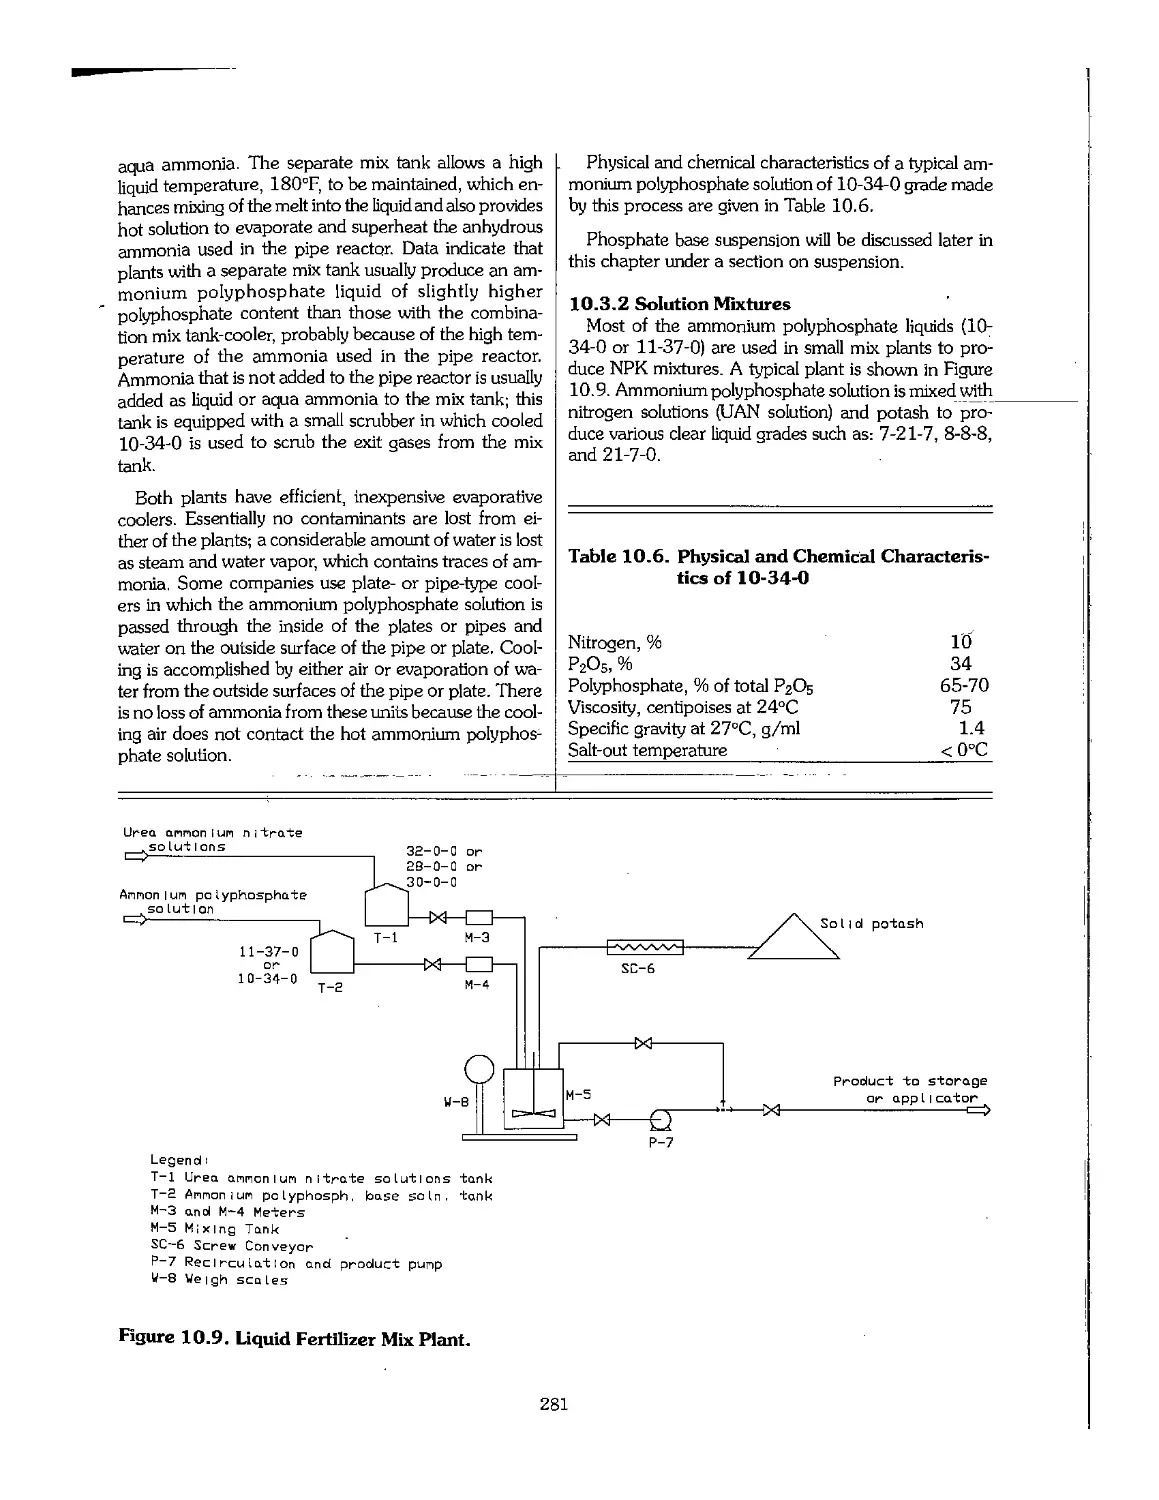
Chapter 10. Liquid Fertilizers and Nitrogen Solutions 271
10.1 Introduction , 272
10.2 Nitrogen 274
10.3 Fluid Phosphates 279
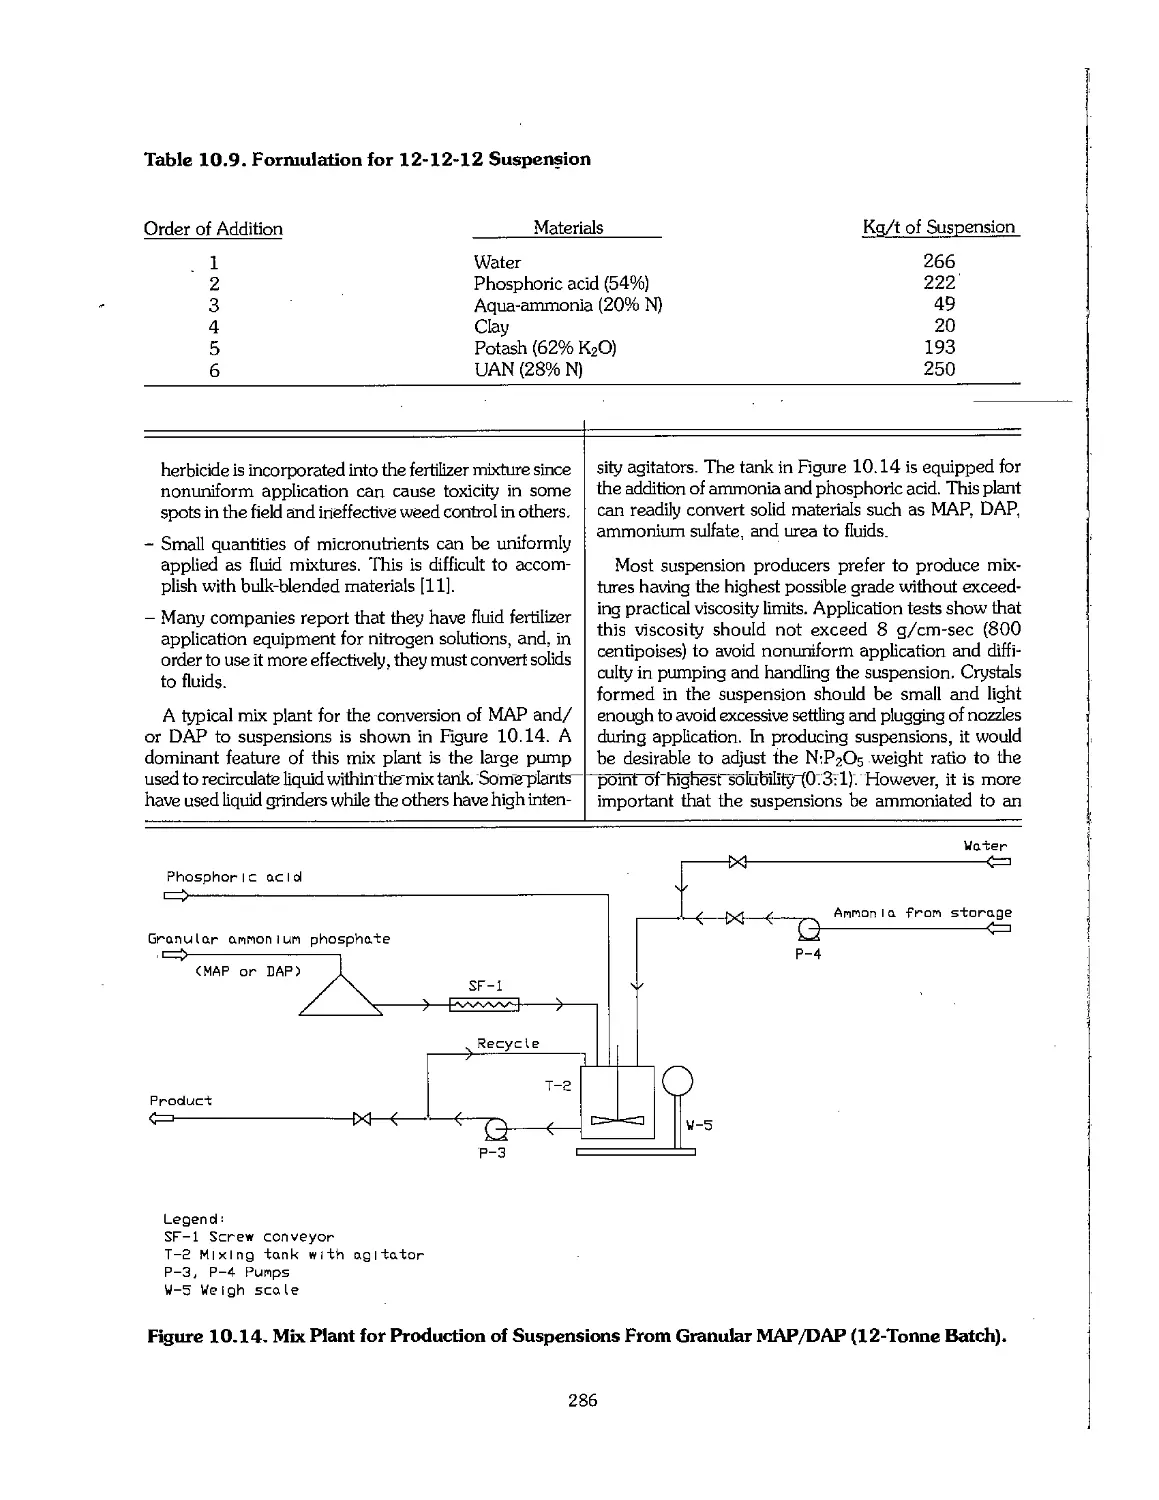
10.4 Suspension Fertilizers 283
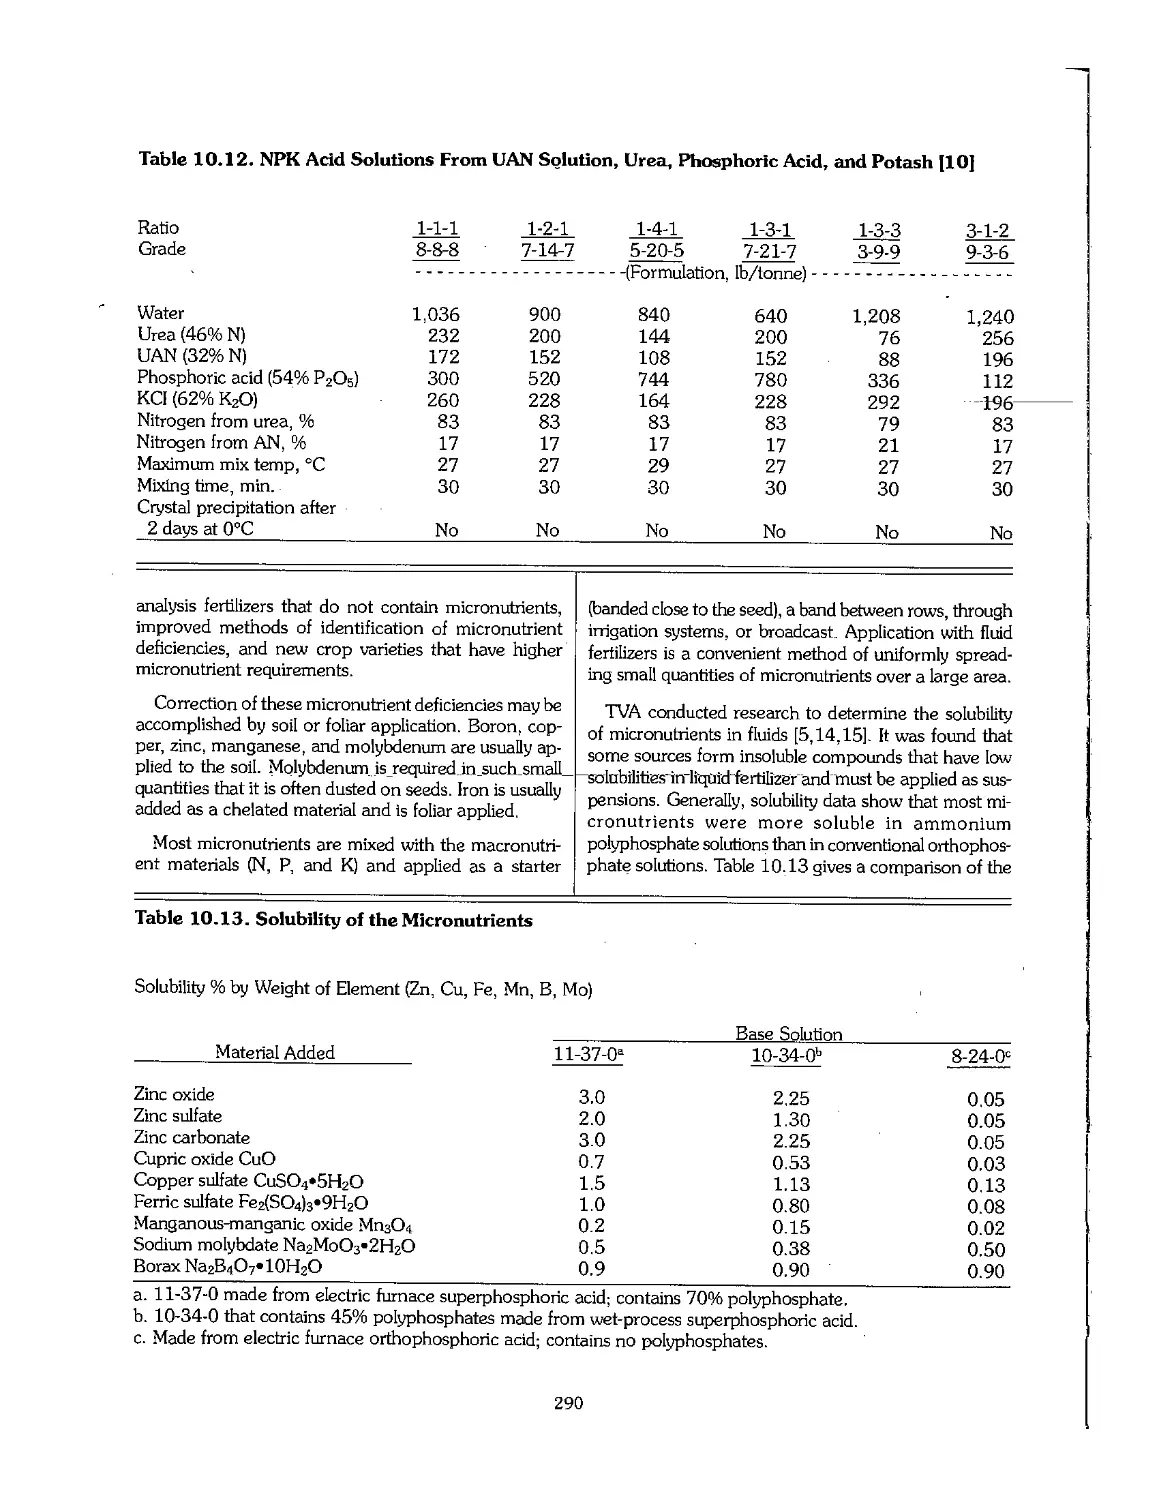
10.5 Specialty Huid Fertilizers t 289
10.6 Investment Costs 292
10.7 Summary 293
10.8 References 293
Chapter 11. Sulfuric and Phosphoric Acids 295
11.1 Sulfuric Acid 296
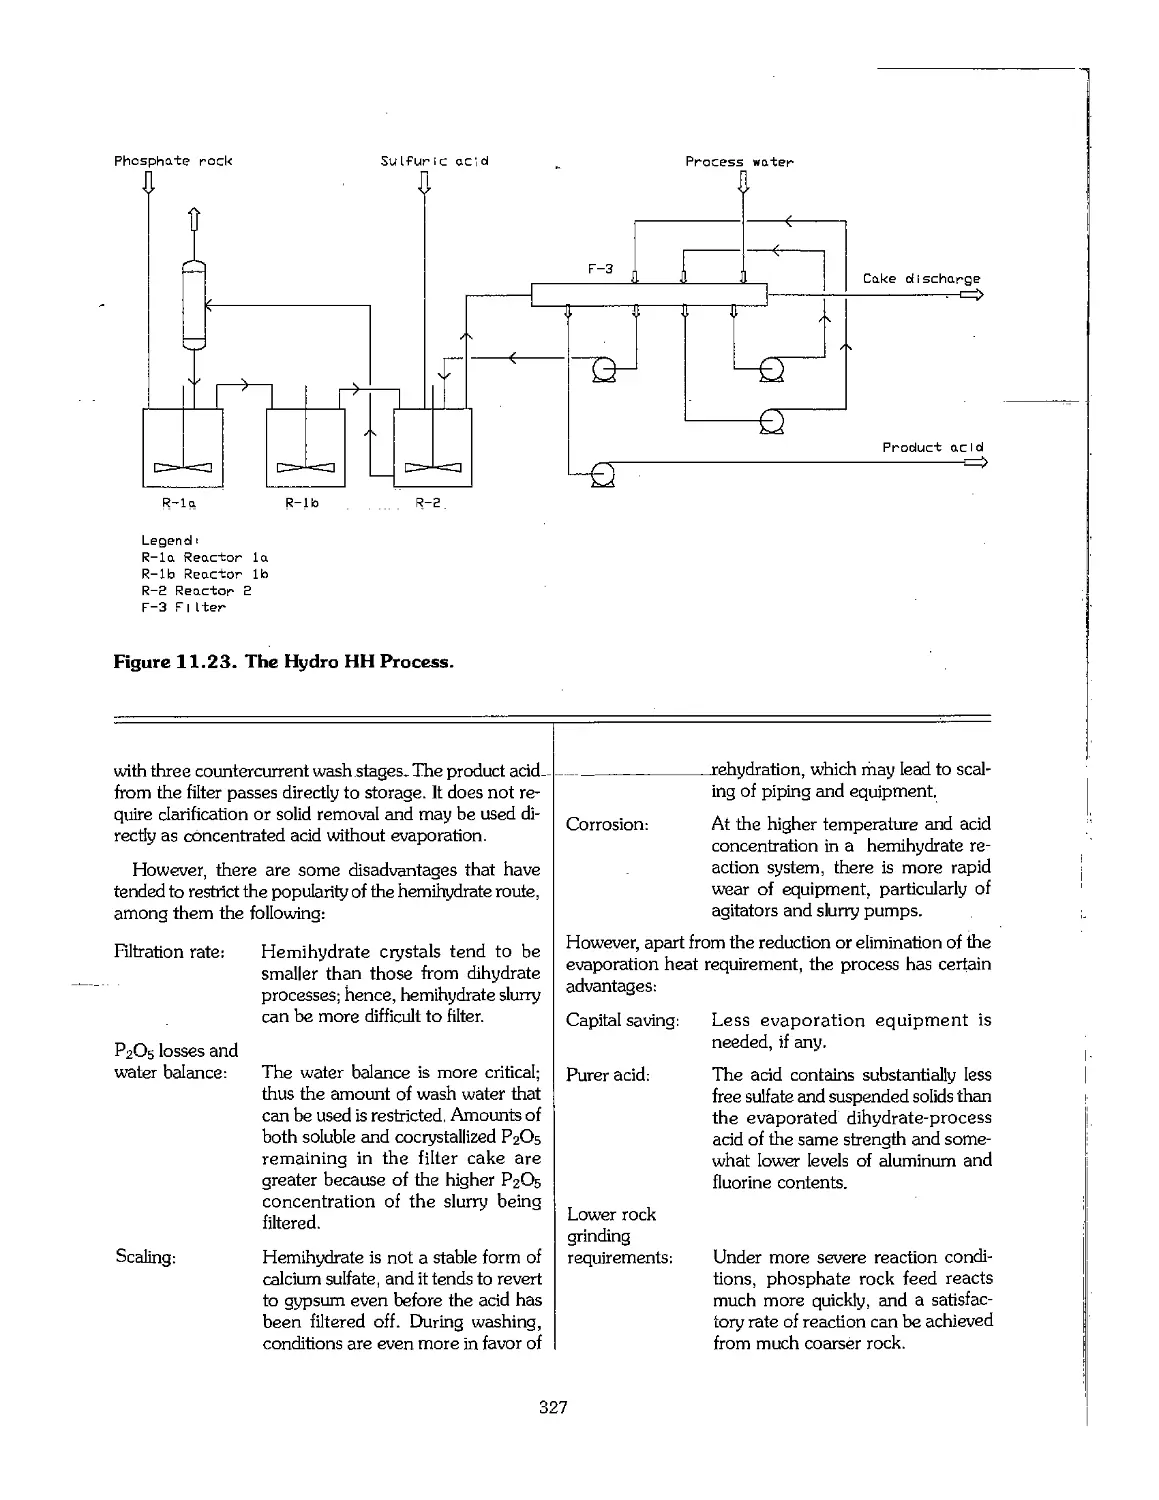
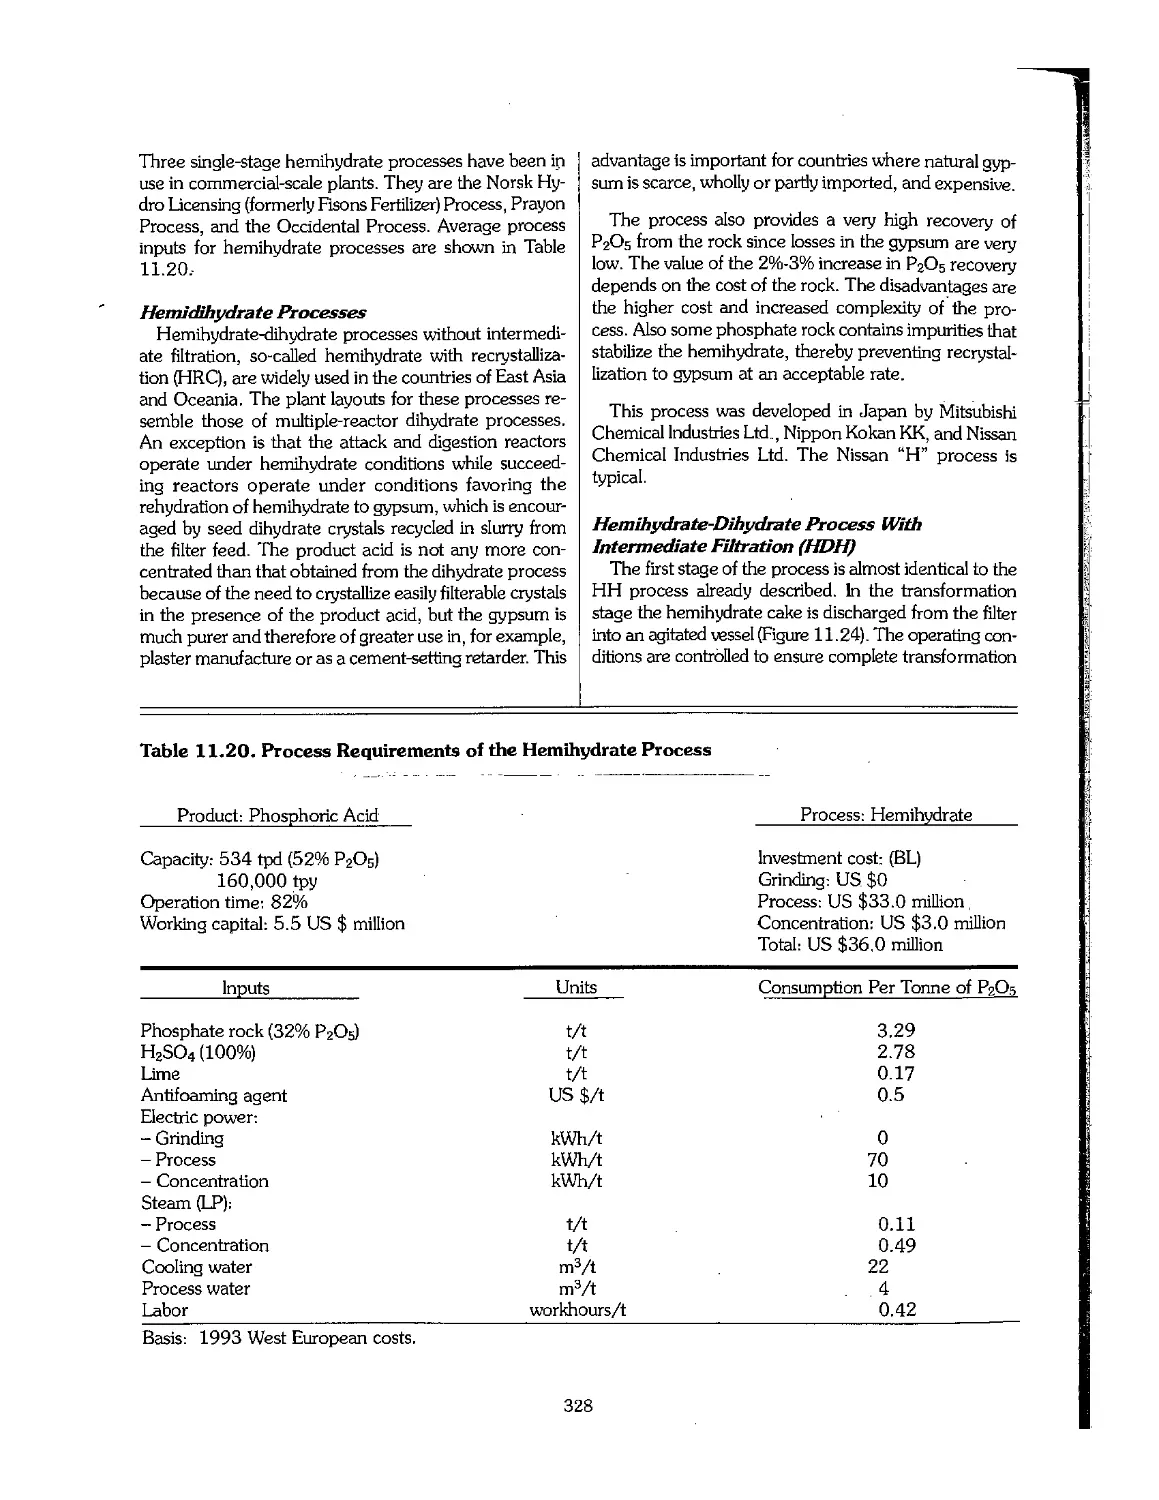
11.2 Wet-Process Phosphoric Acid 311
11.3 Superphosphoric Acid 332
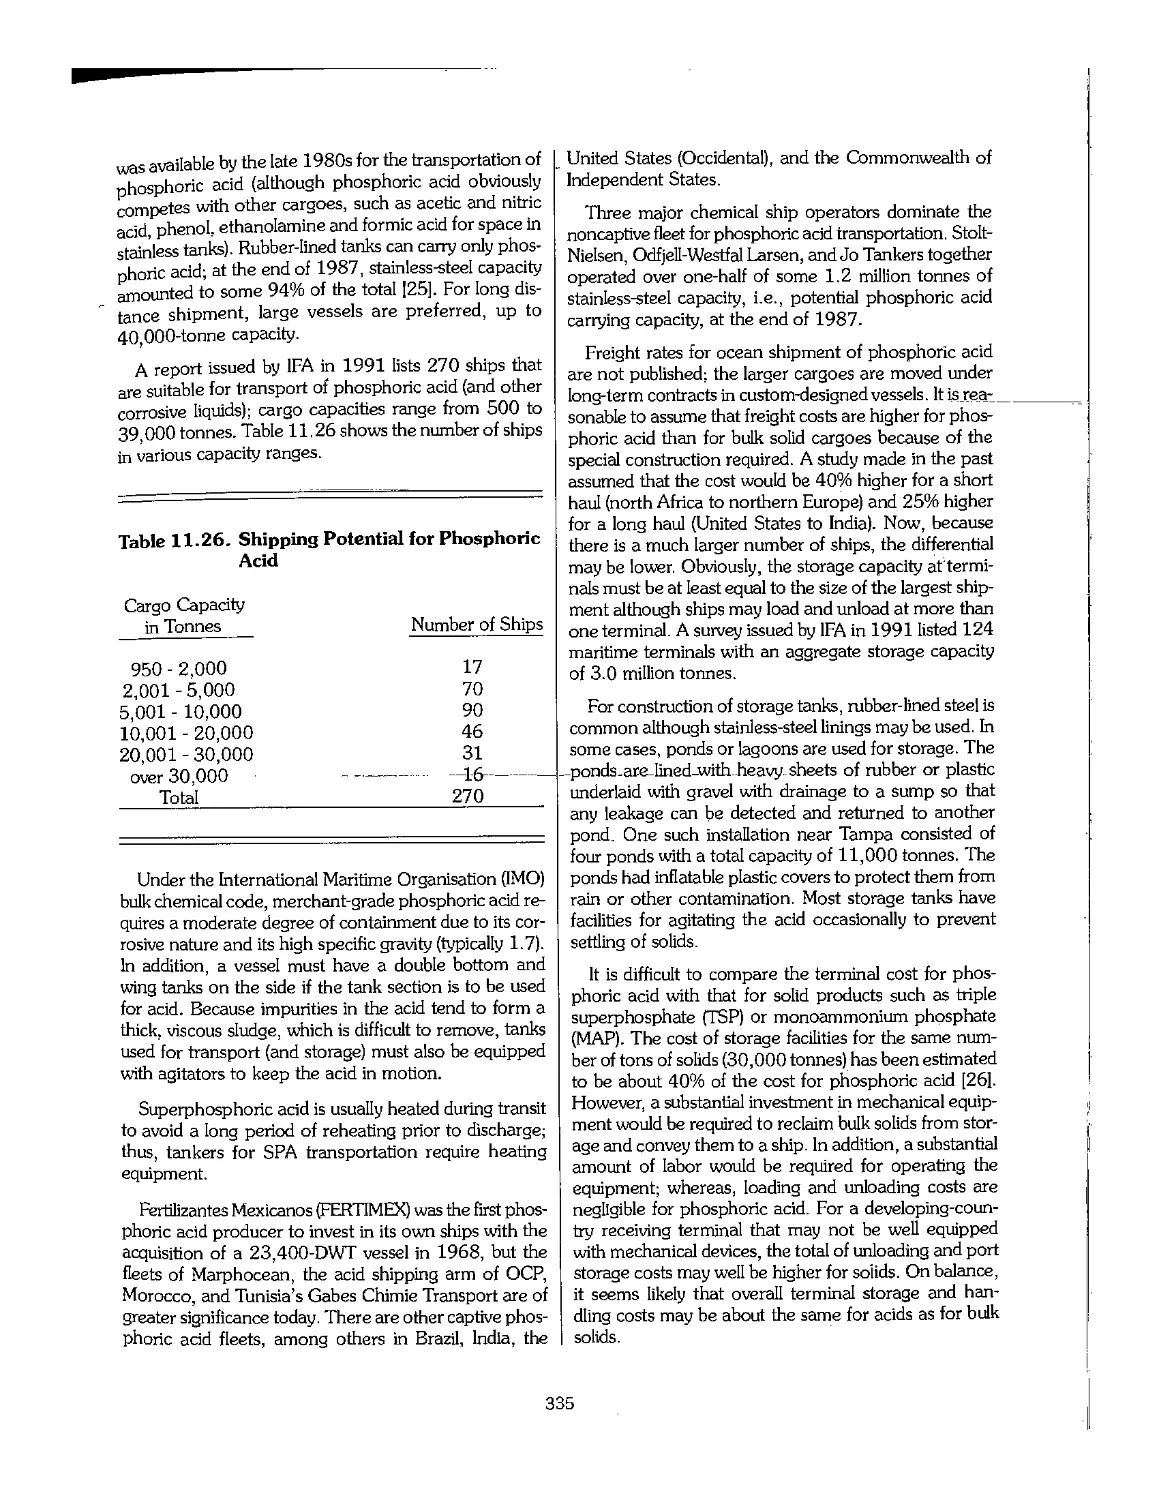
11.4 Shipment of Phosphoric Acid 333
11.5 Use of Byproduct Gypsum 336
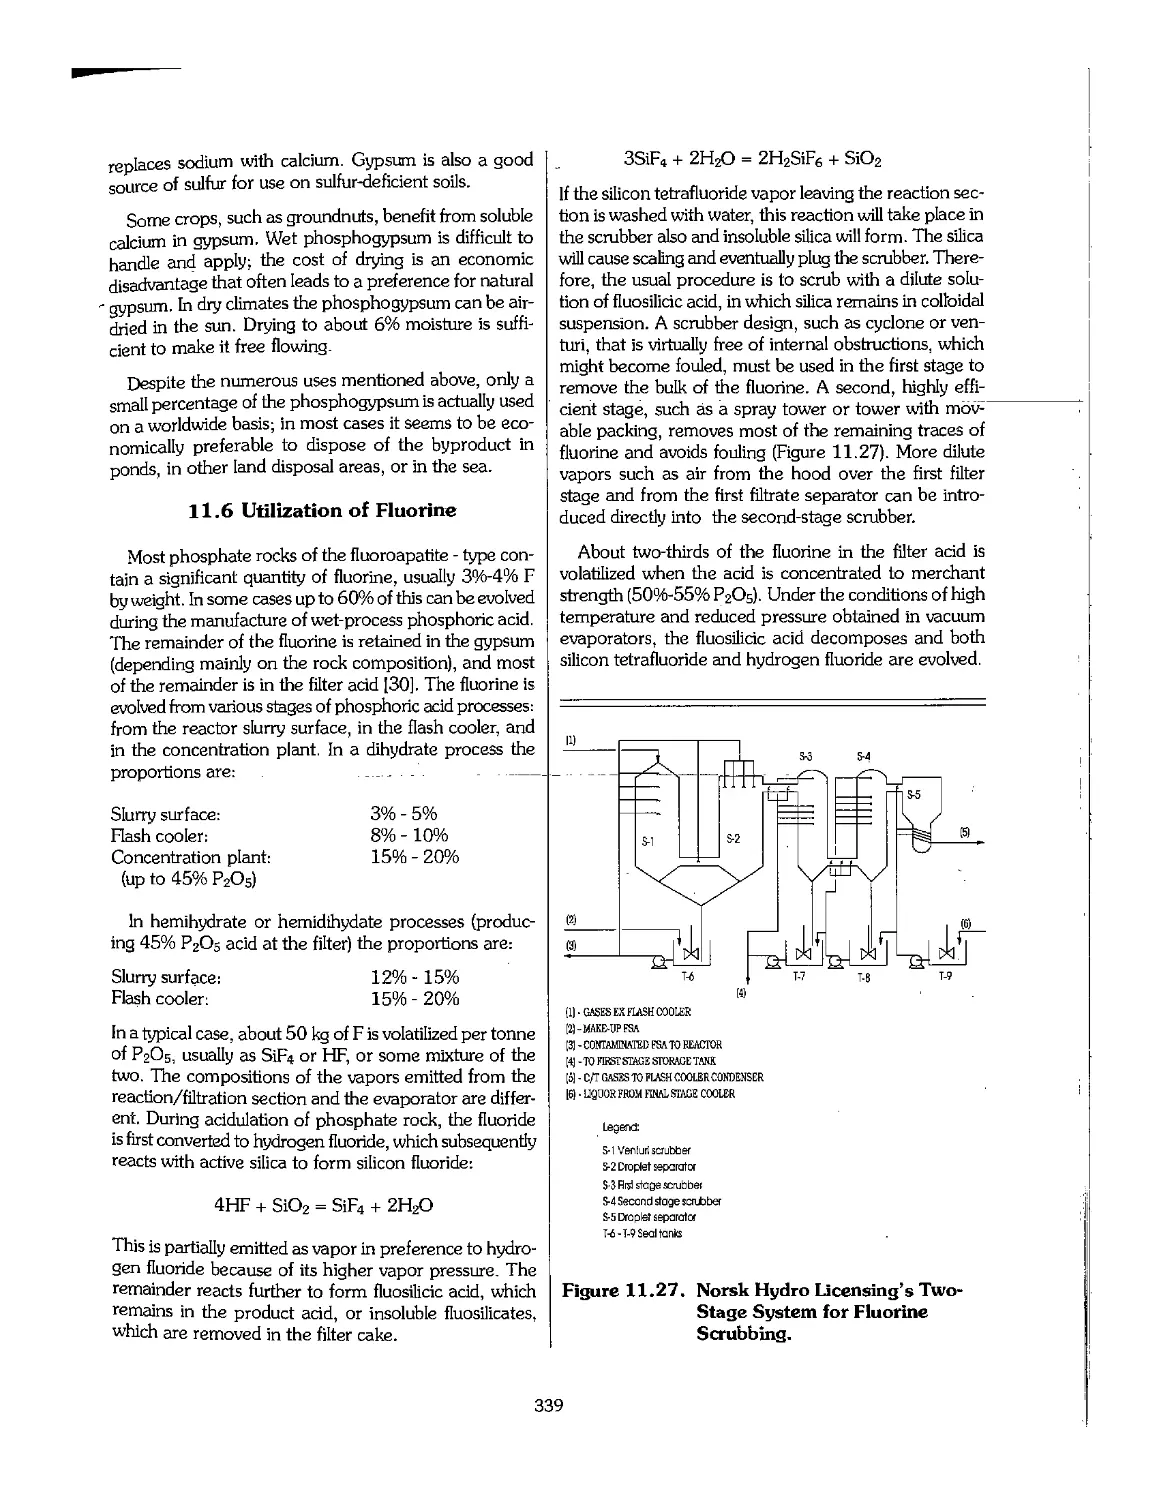
11.6 Utilization of Huorine 339
11.7 Uranium Extraction 340
11.8 Purification of Phosphoric Acid 341
11.9 Production of Phosphoric Acid Using Acids Other Than Sulfuric 345
11.10 Phosphoric Acid Production by the Electric Furnace Process : 348
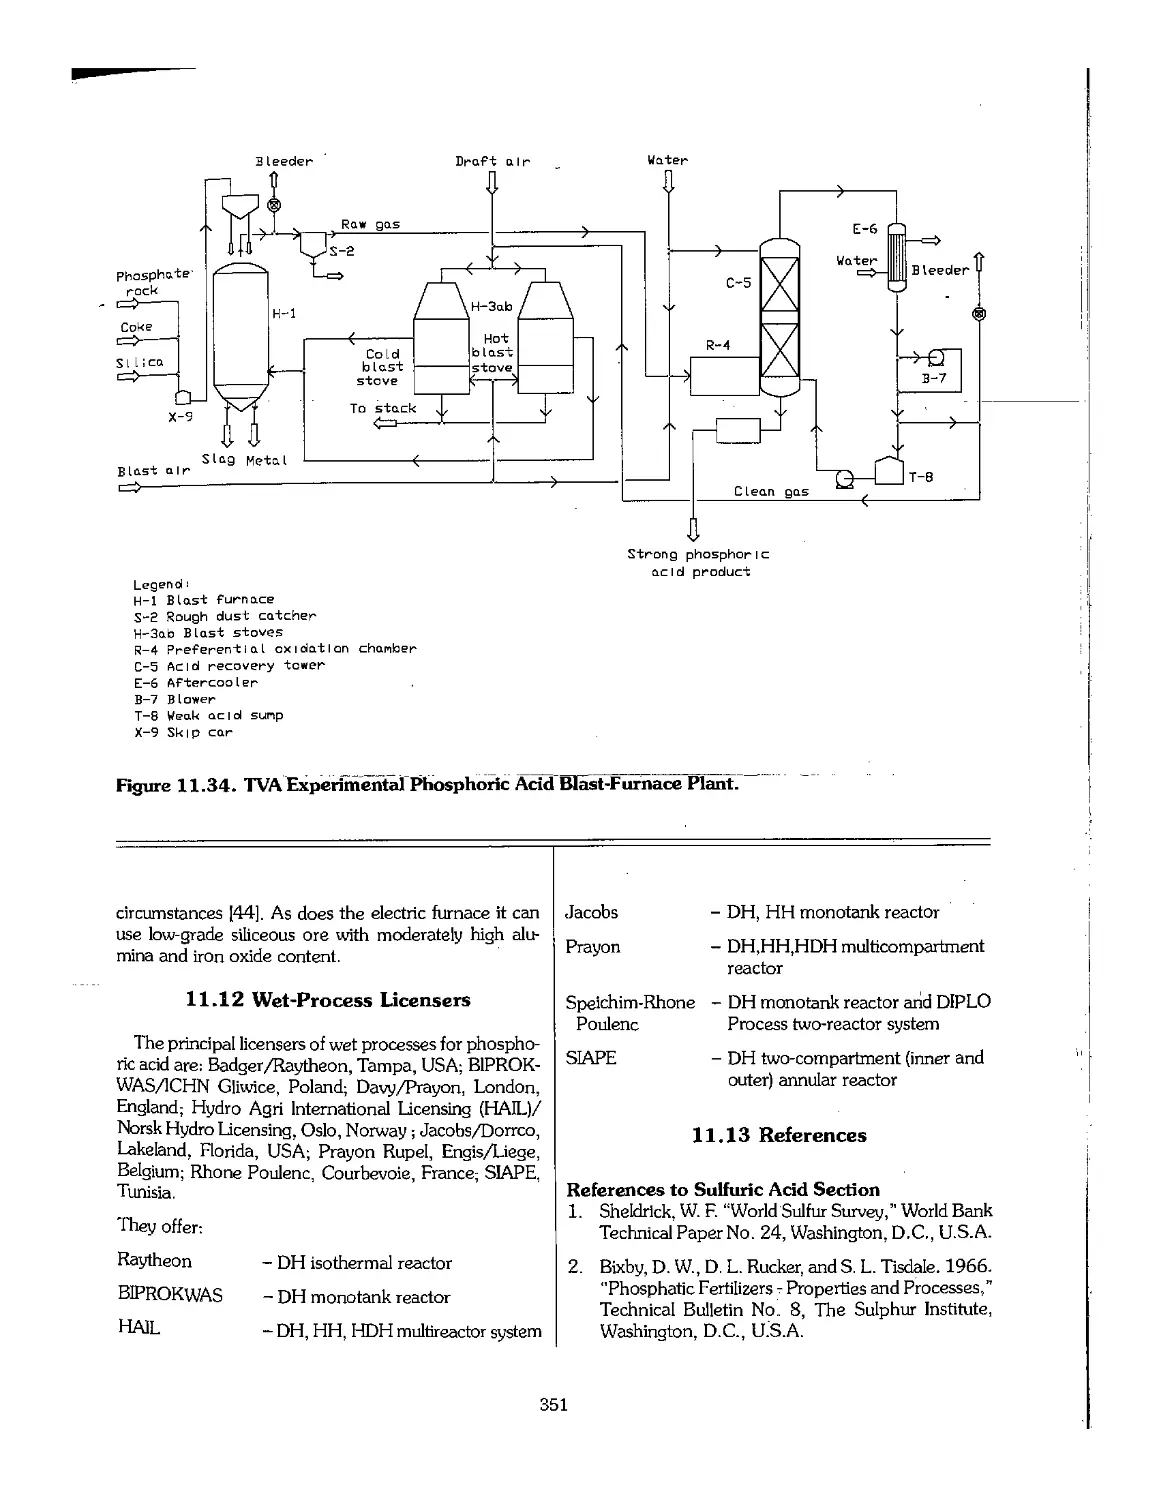
11.11 Phosphoric Acid Production by the Blast-Furnace Process 350
11.12 Wet-Process Licensers 351
11.13 References 351
x
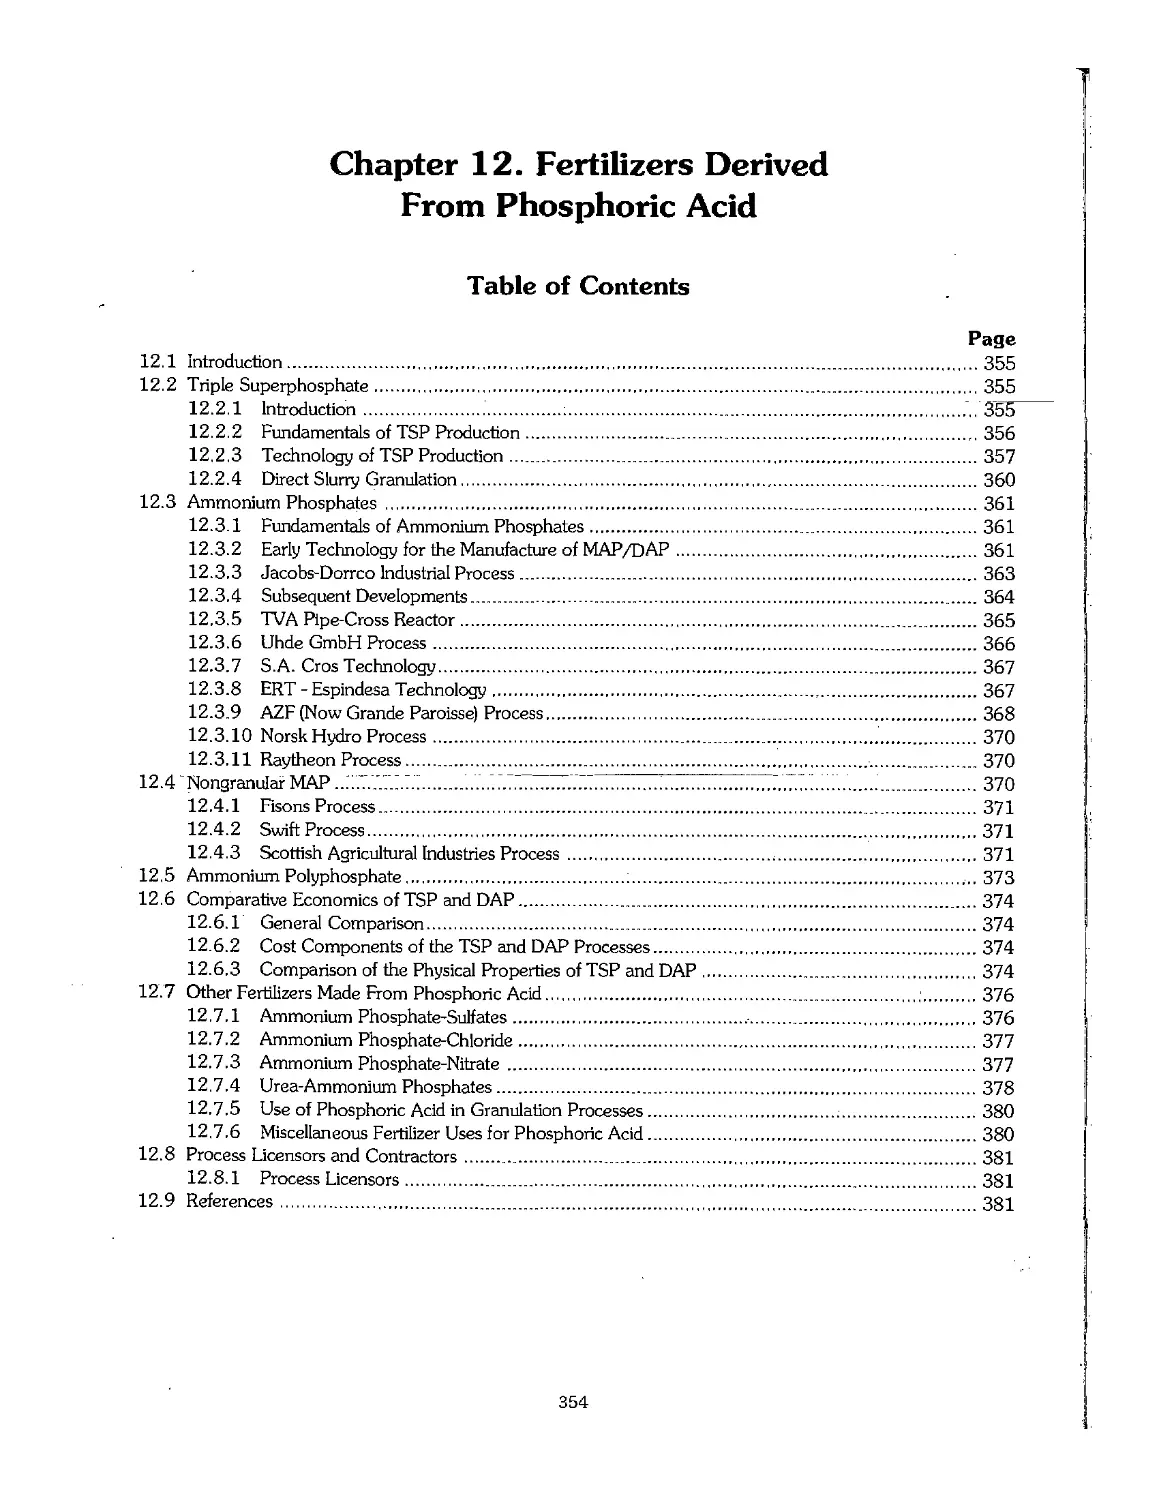
Chapter 12. Fertilizers Derived From Phosphoric Acid 354
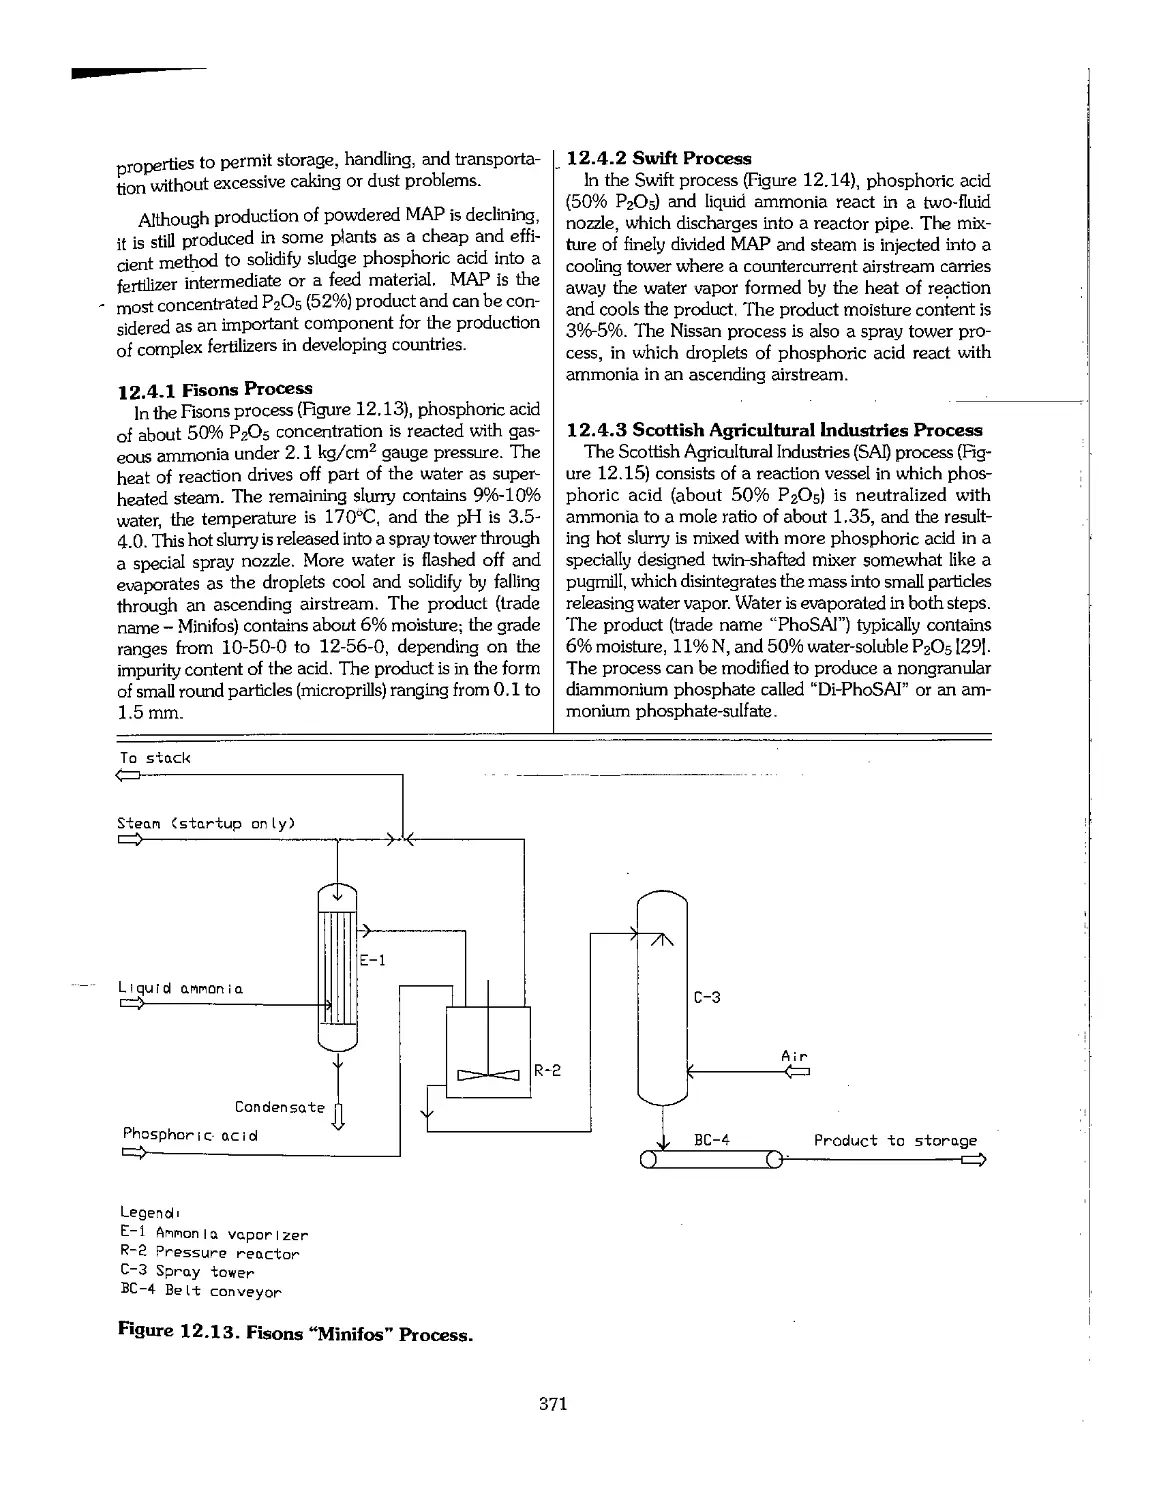
12.1 Introduction 355
12.2 Triple Superphosphate 355
12.3 Ammonium Phosphates 361
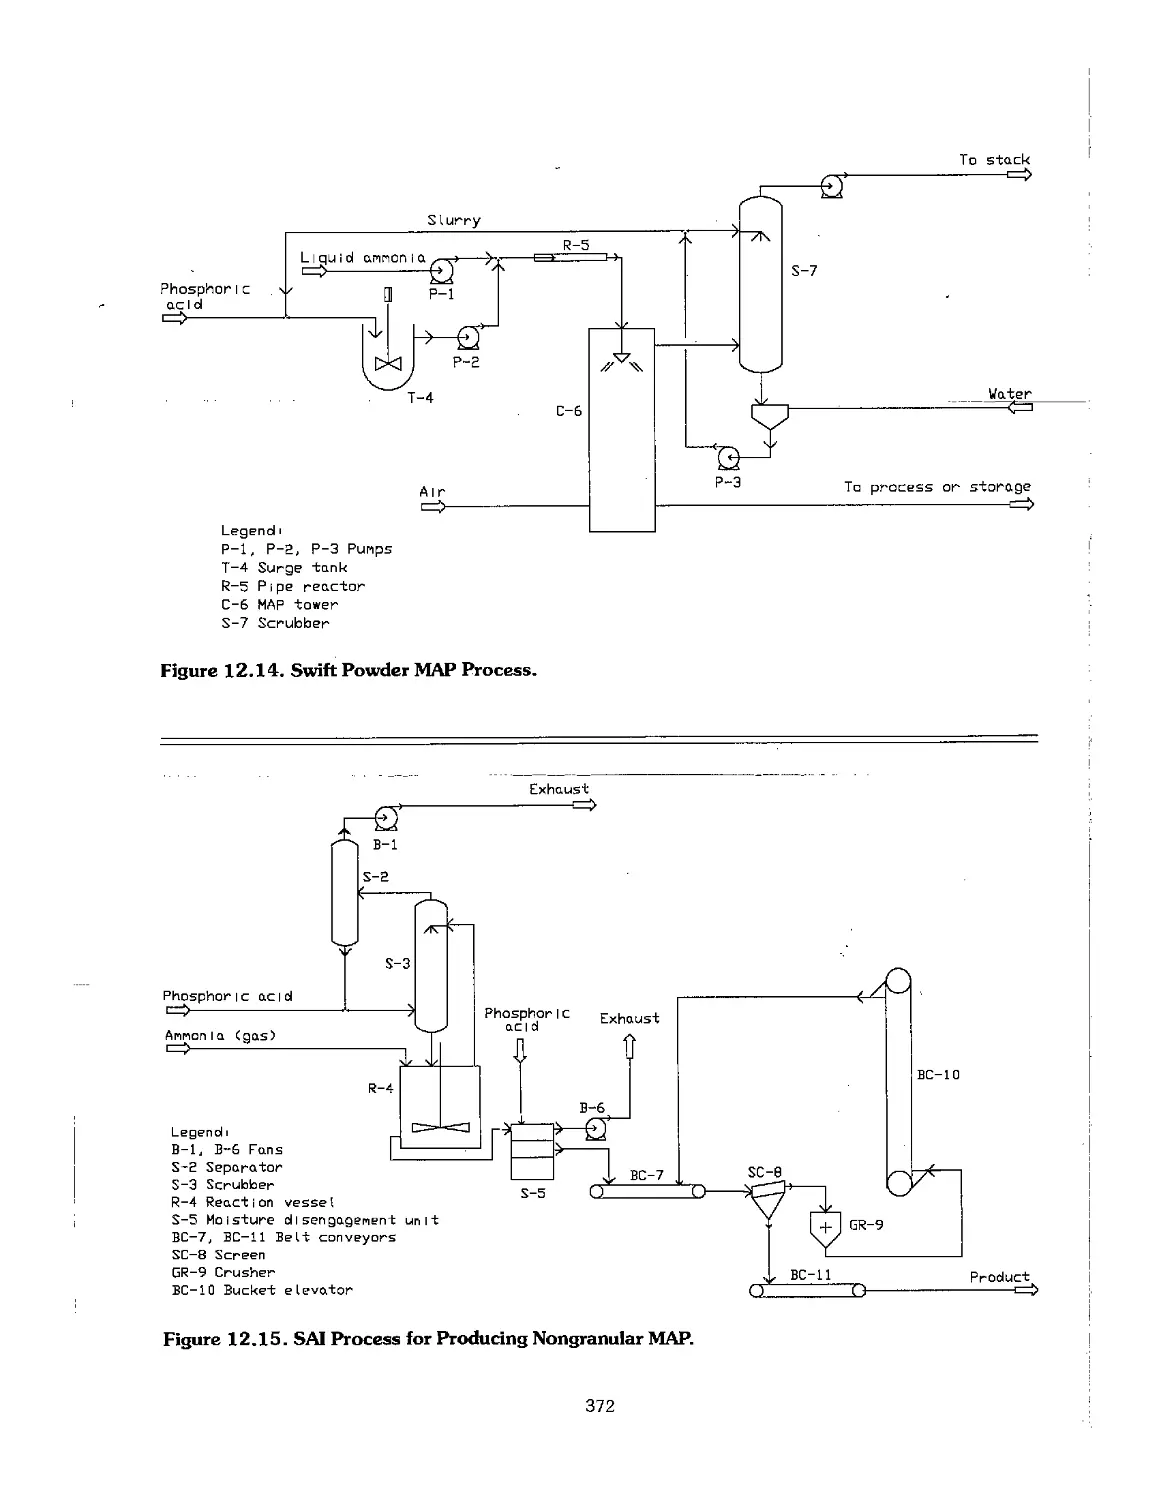
12.4 Nongranular MAP 370
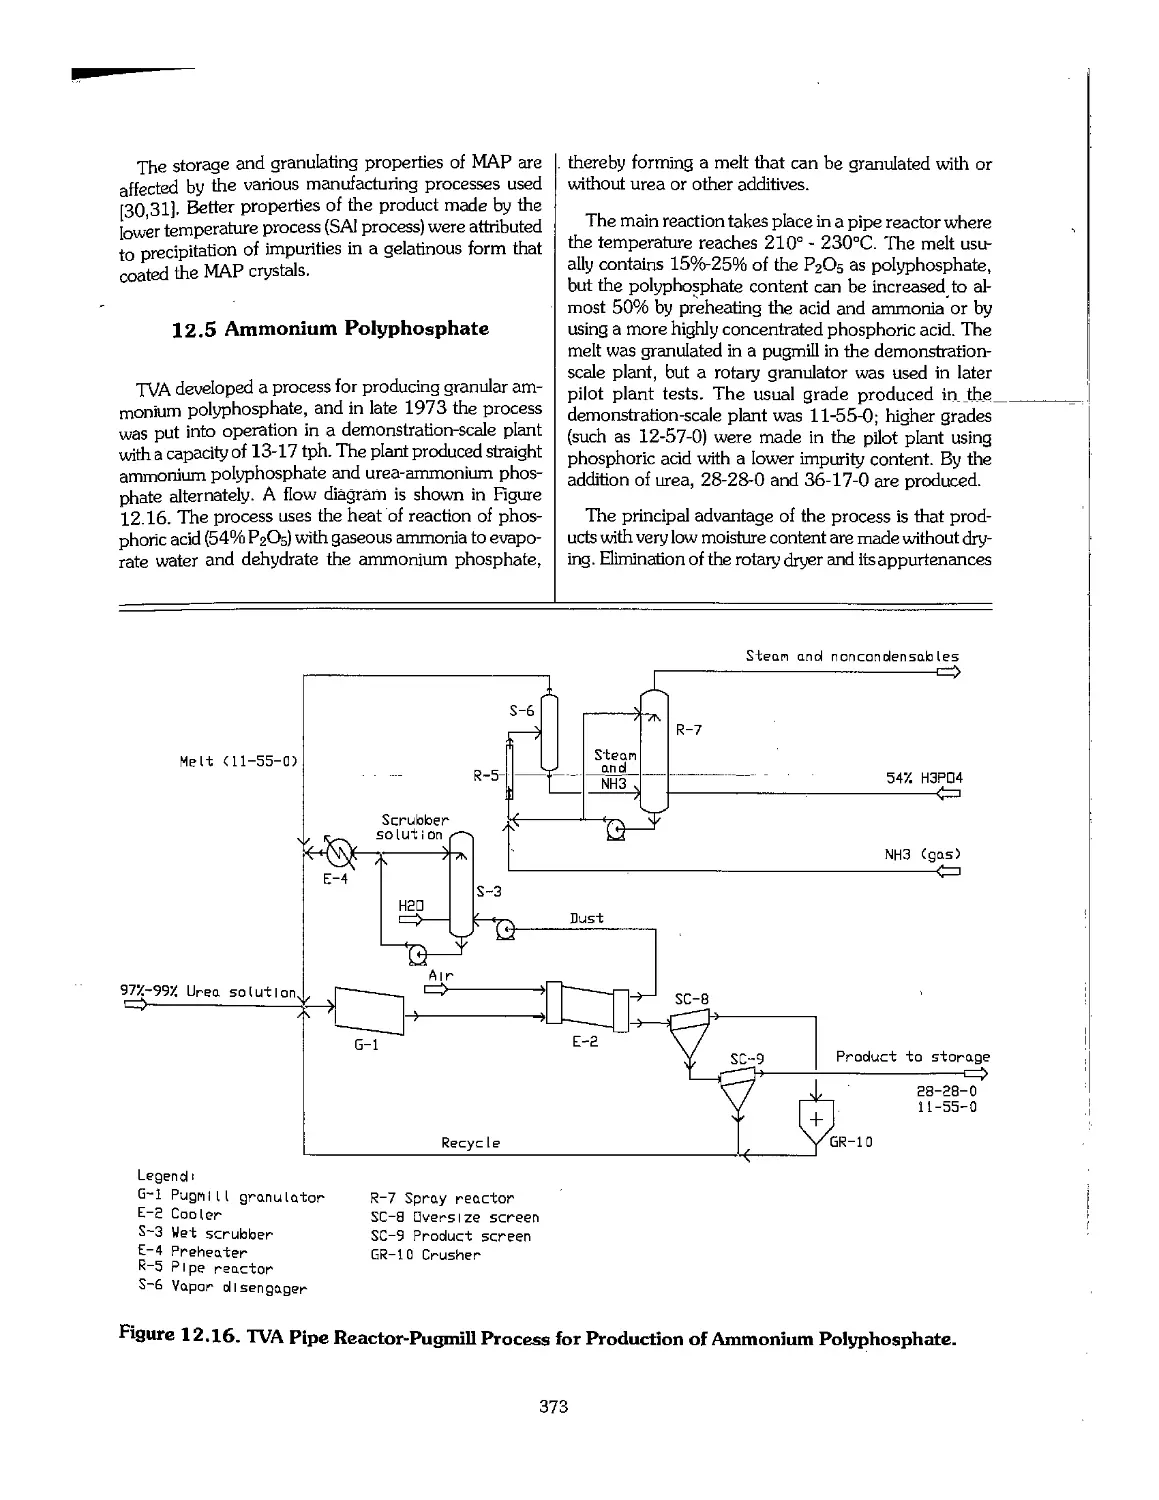
12.5 Ammonium Polyphosphate , 373
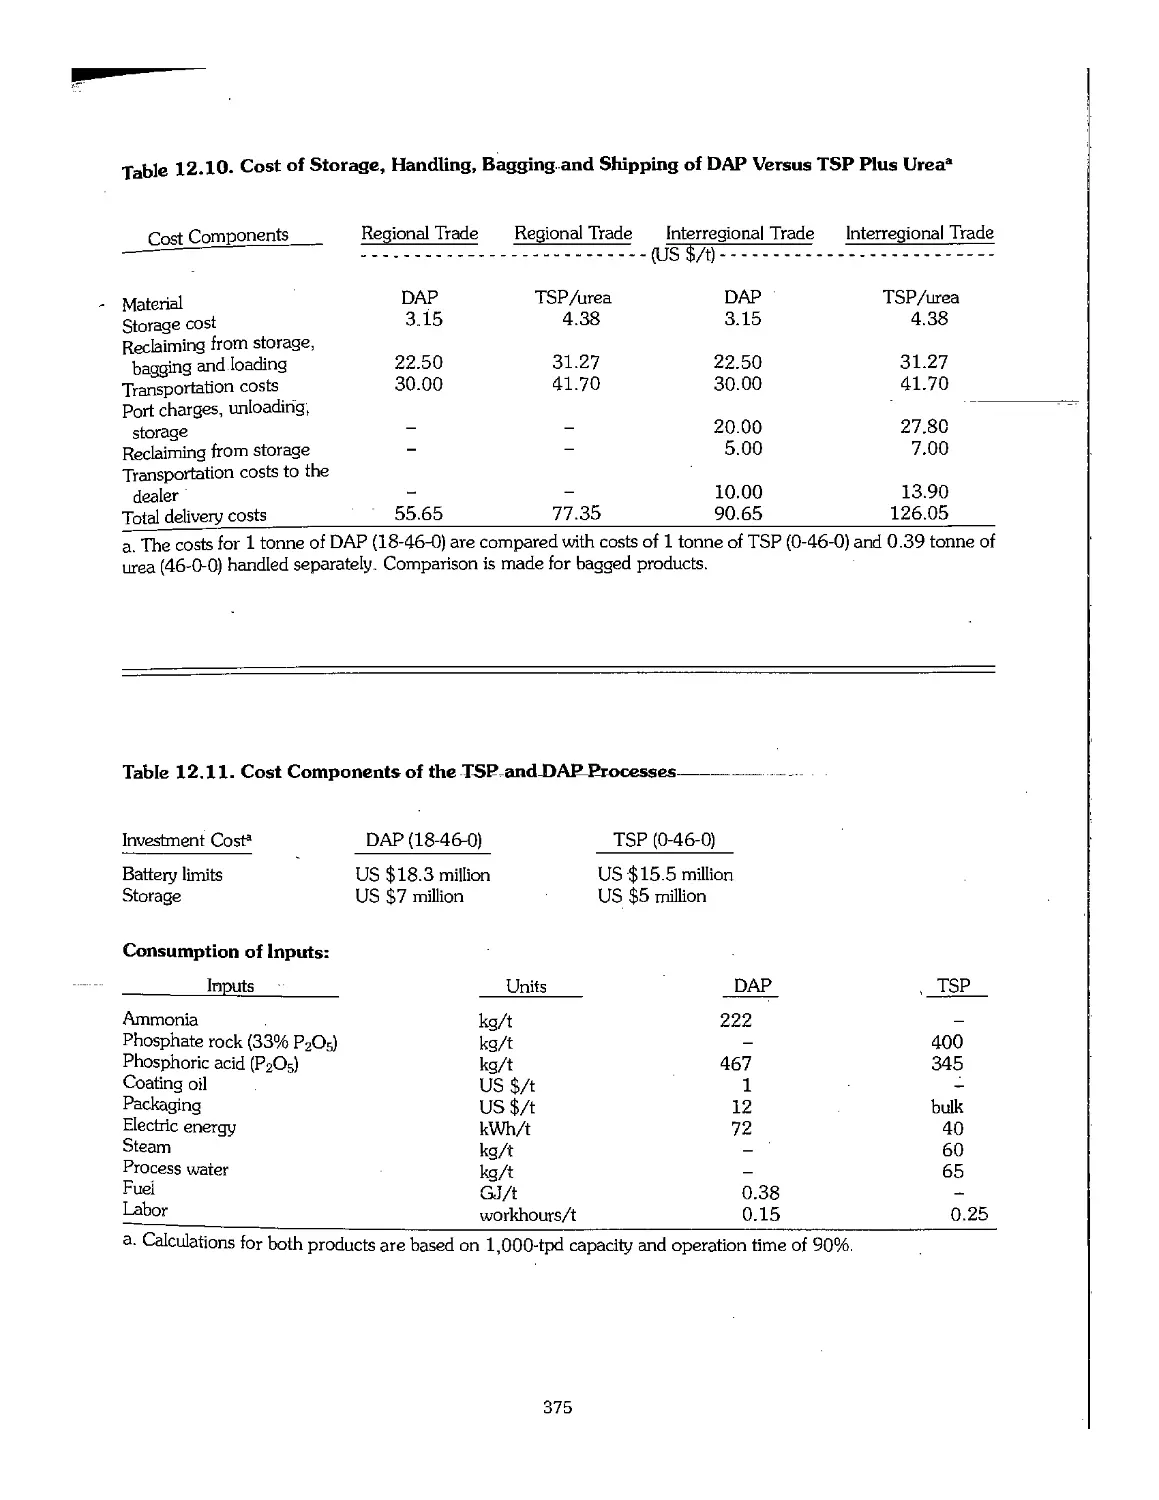
12.6 Comparative Economics of TSP and DAP .\.. 374
12.7 Other Fertilizers Made From Phosphoric Acid 376
12.8 Process Licensors and Contractors 381
12.9 References 381
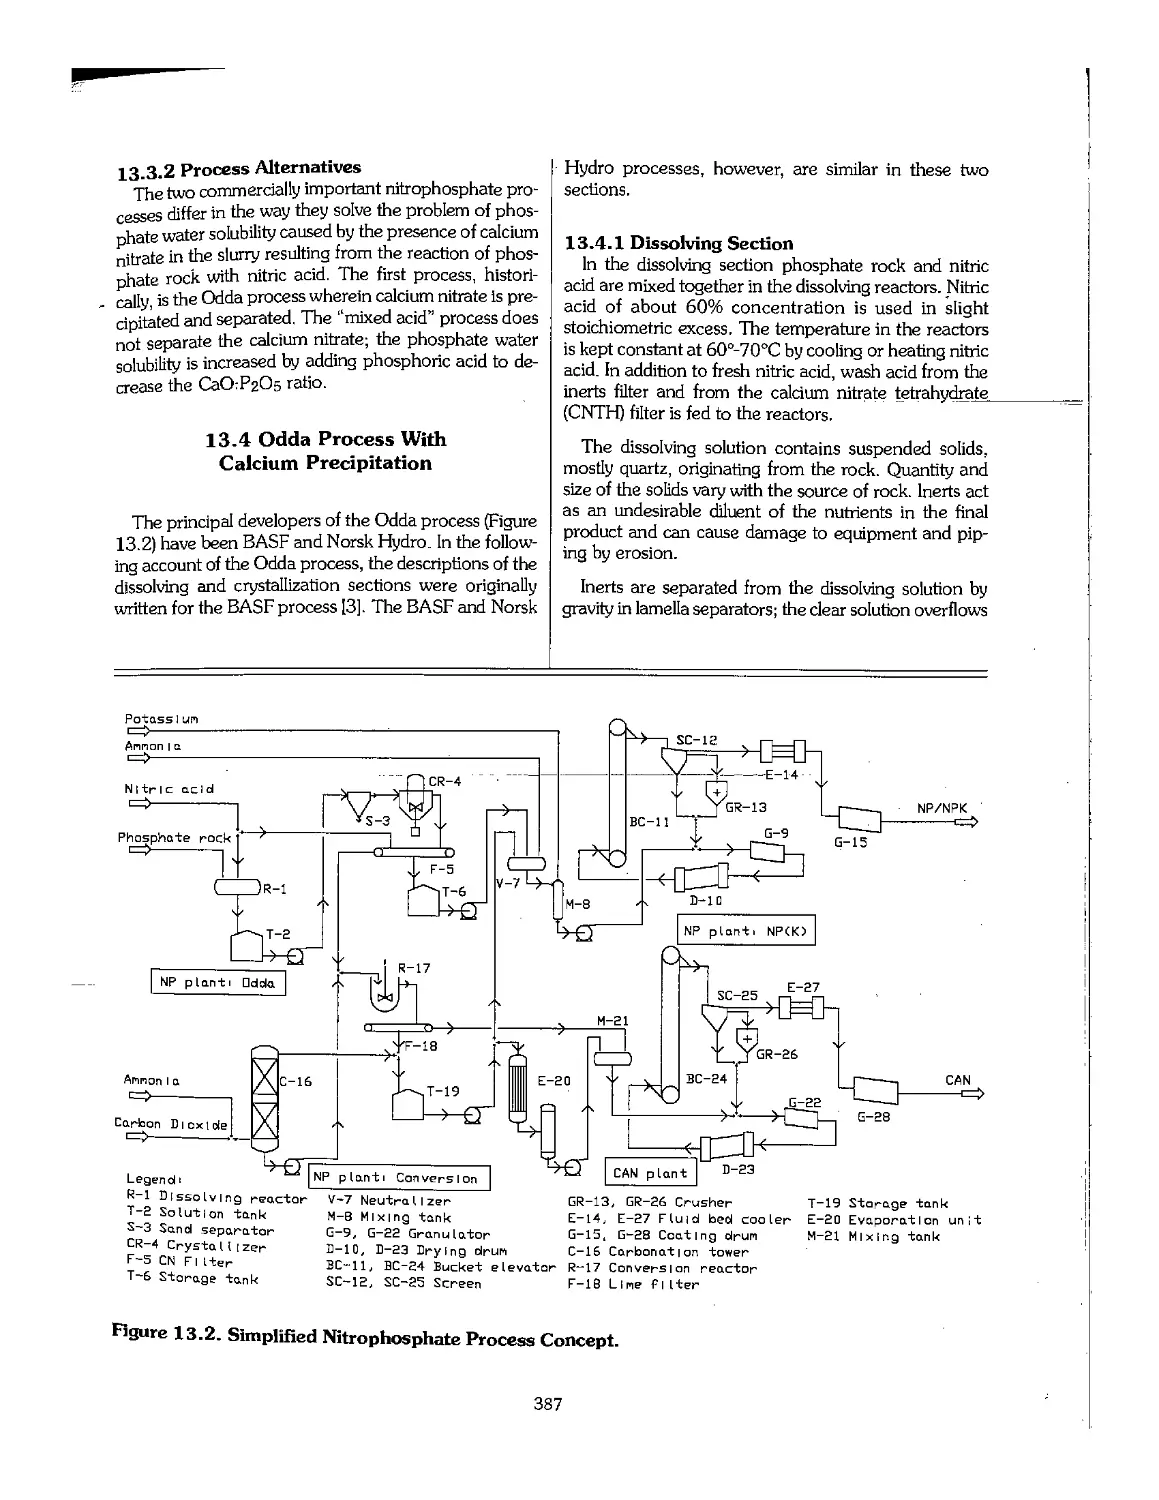
Chapter 13. Nitrophosphate Fertilizers 384
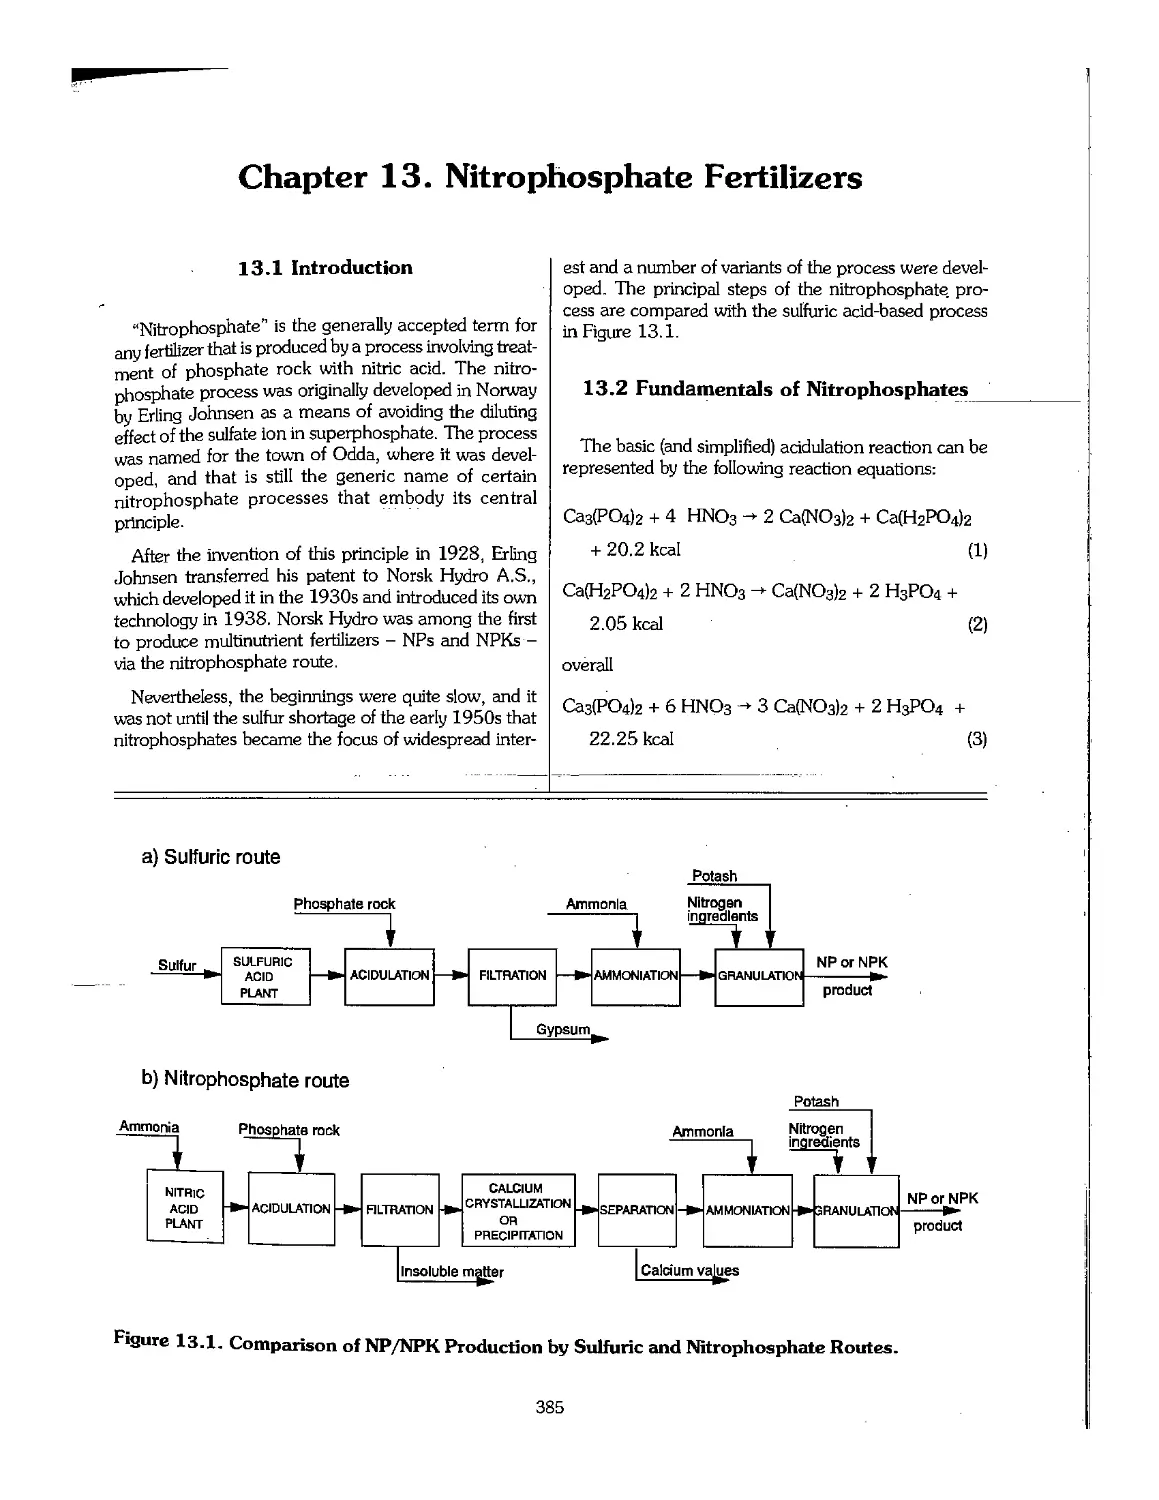
13.1 Introduction 385
13.2 Fundamentals of Nitrophosphates 385
13.3 Nitrophosphate Processes , 386
13.4 Odda Process With Calcium Precipitation , 387
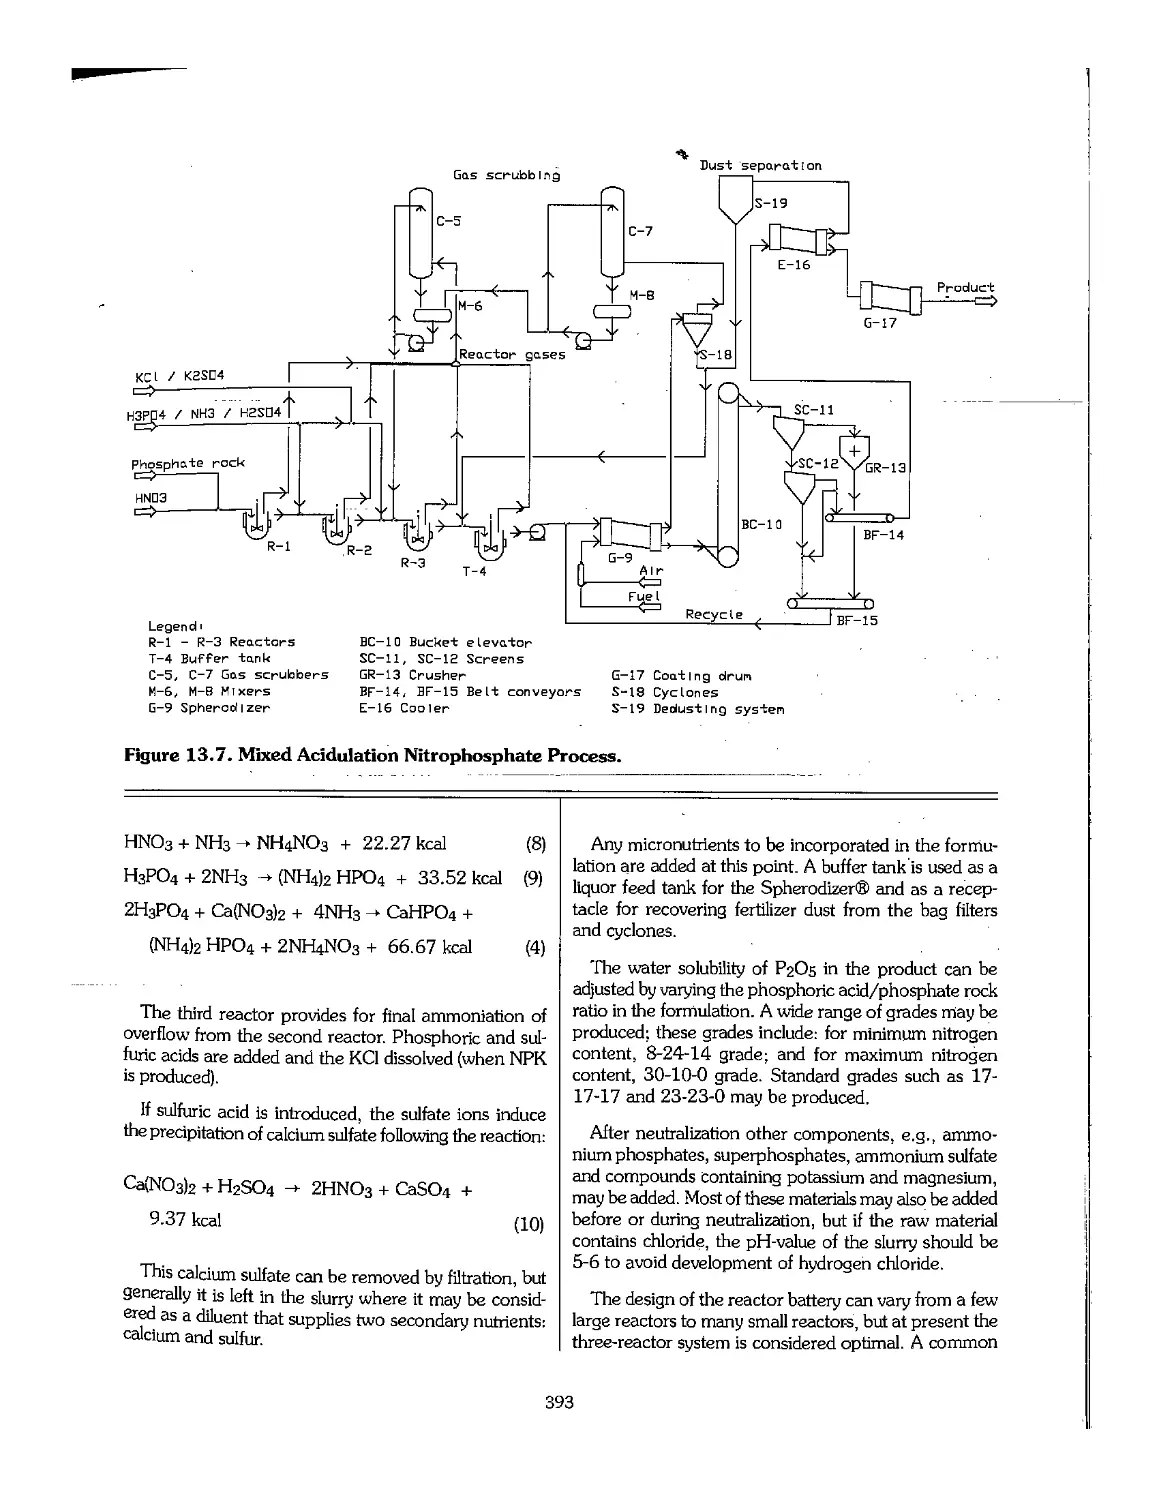
13.5 The Mixed-Acid Process 392
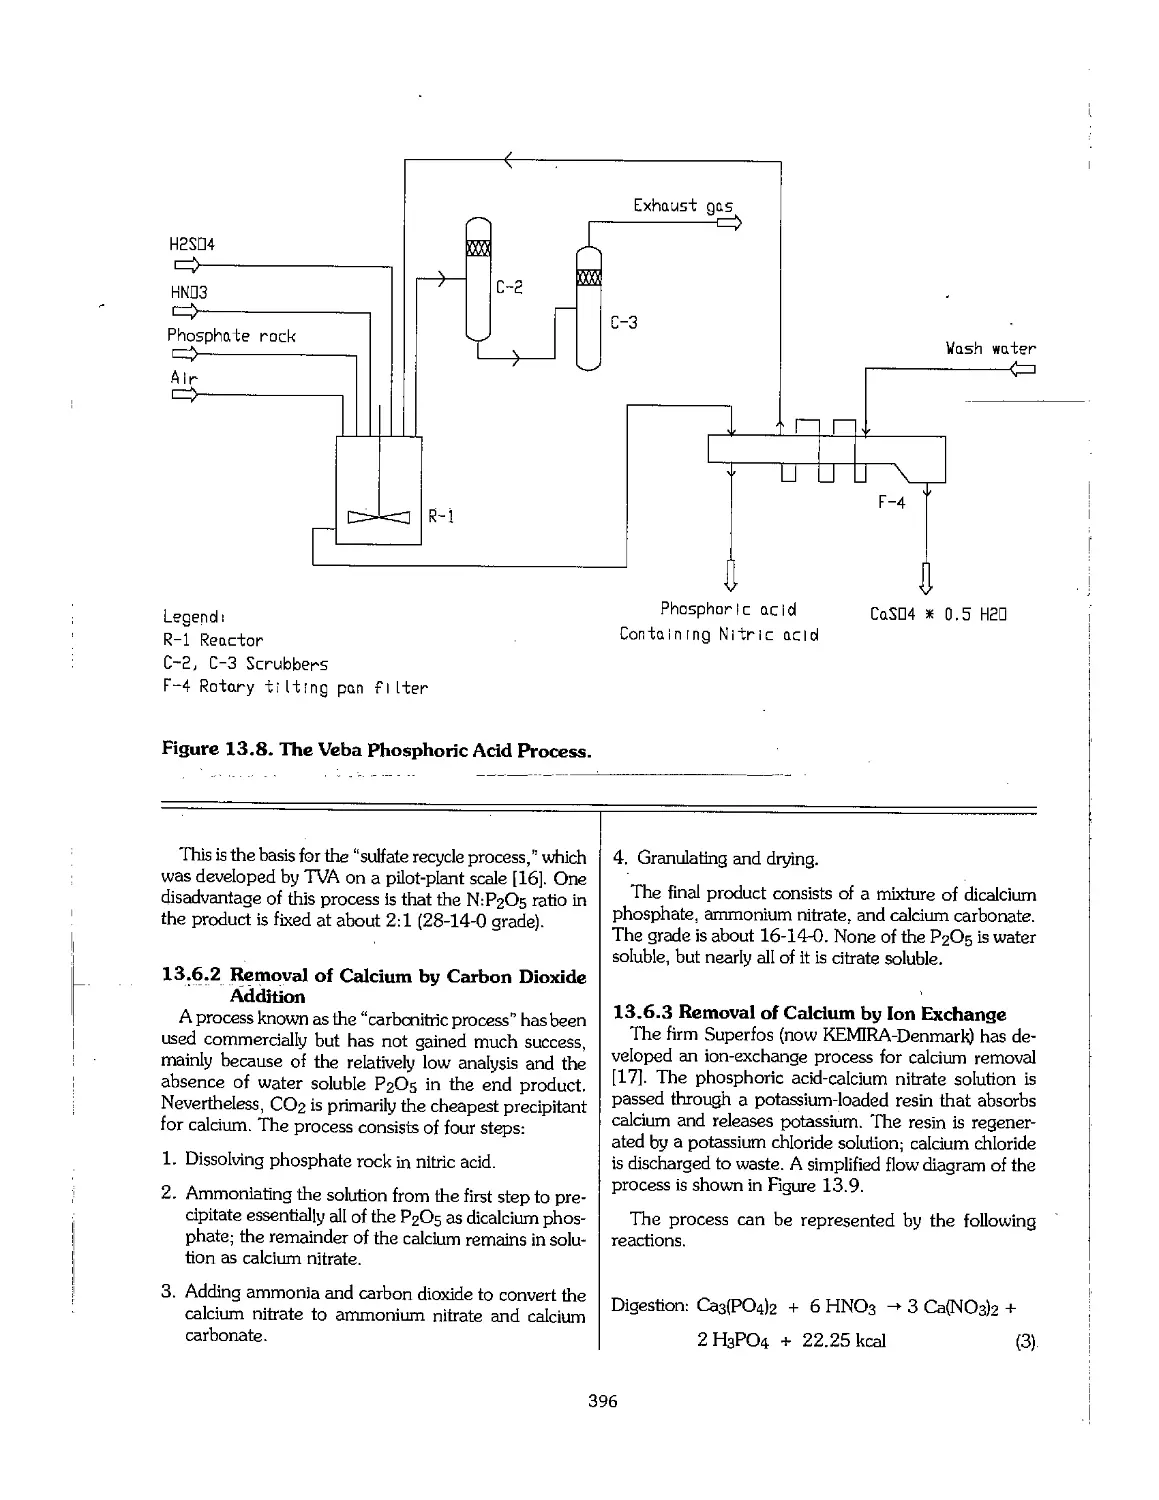
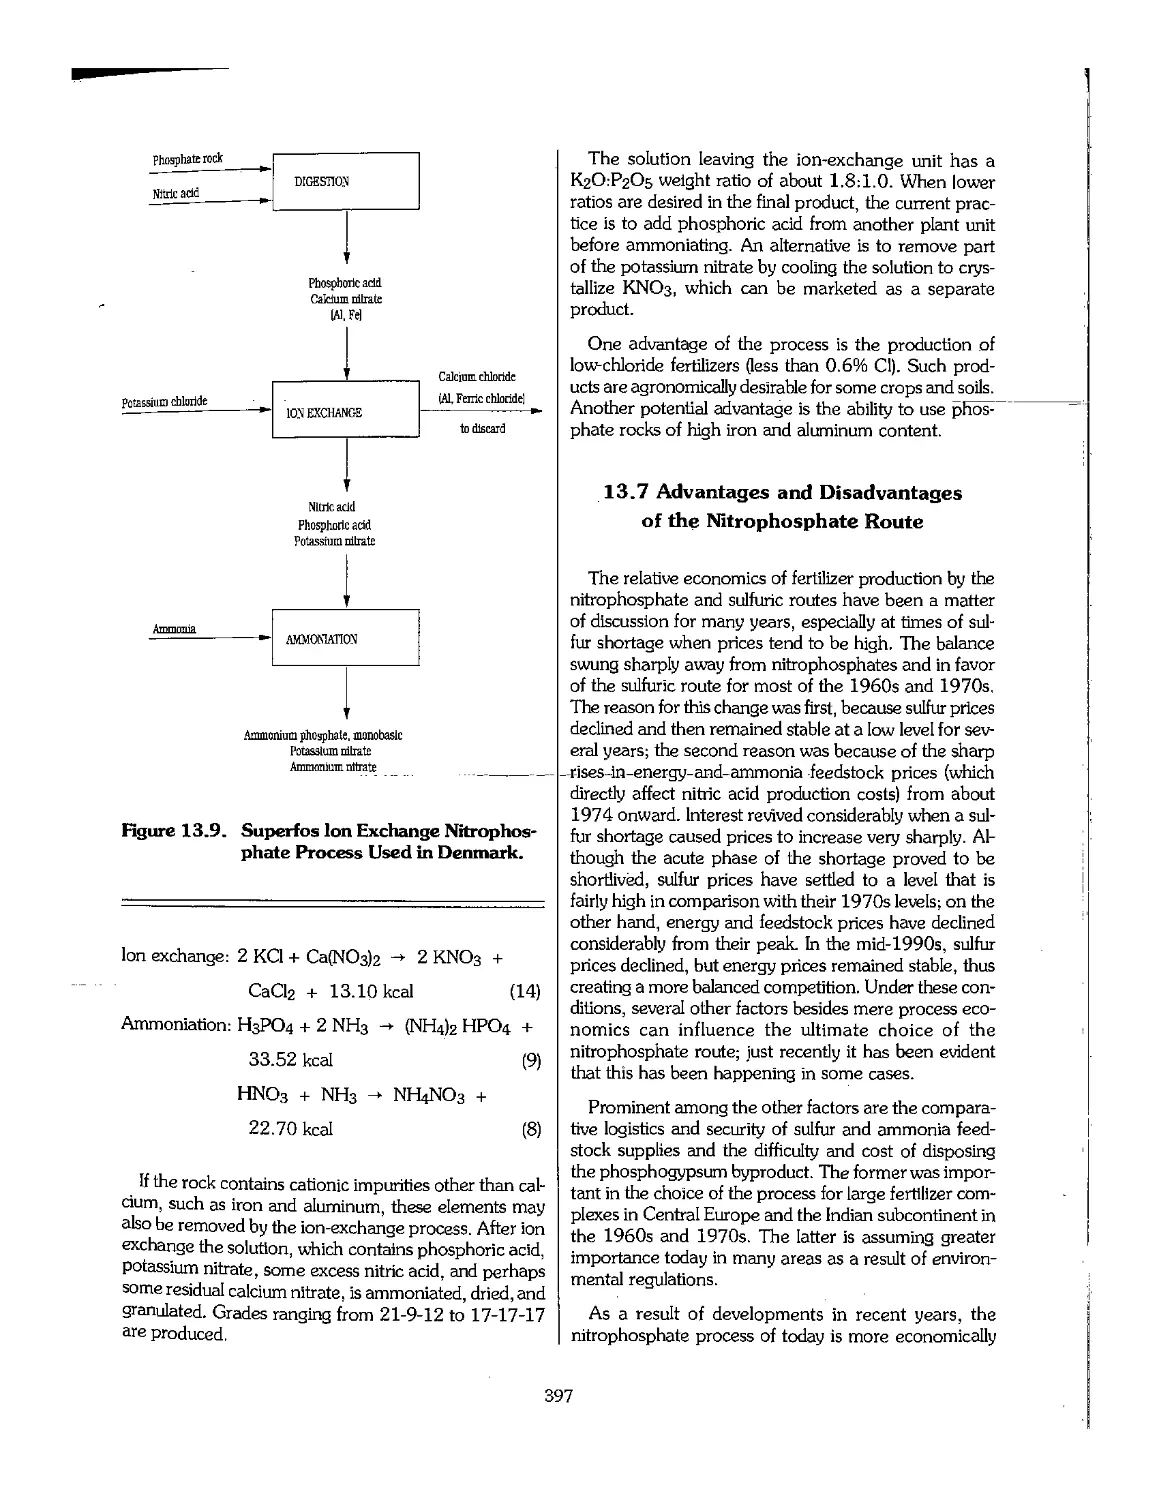
13.6 Other Processes 395
13.7 Advantages and Disadvantages of the Nitrophosphate Route 397
13.8 Development in Quantities and Market Share 398
13.9 References -, 398
Chapter 14. Other Phosphate Fertilizers 400
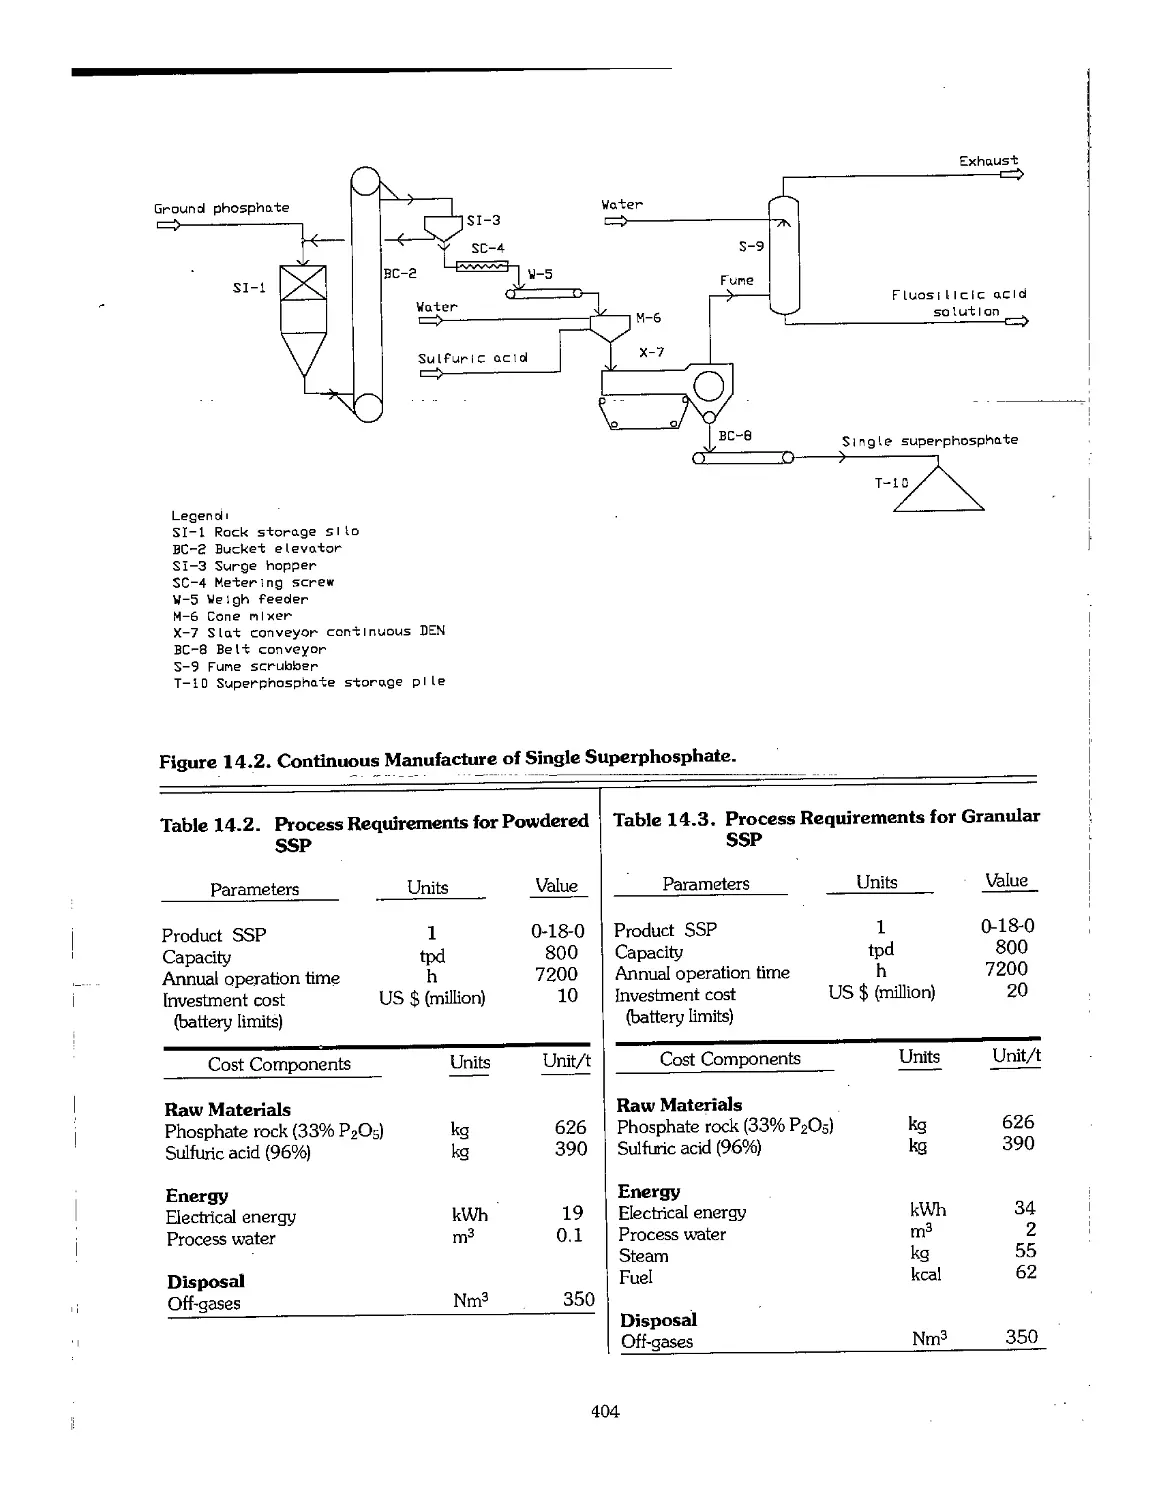
14.1 Single Superphosphate (SSP) 401
14.2 Phosphate Rock as a Fertilizer 405
14.3 Basic Slag 408
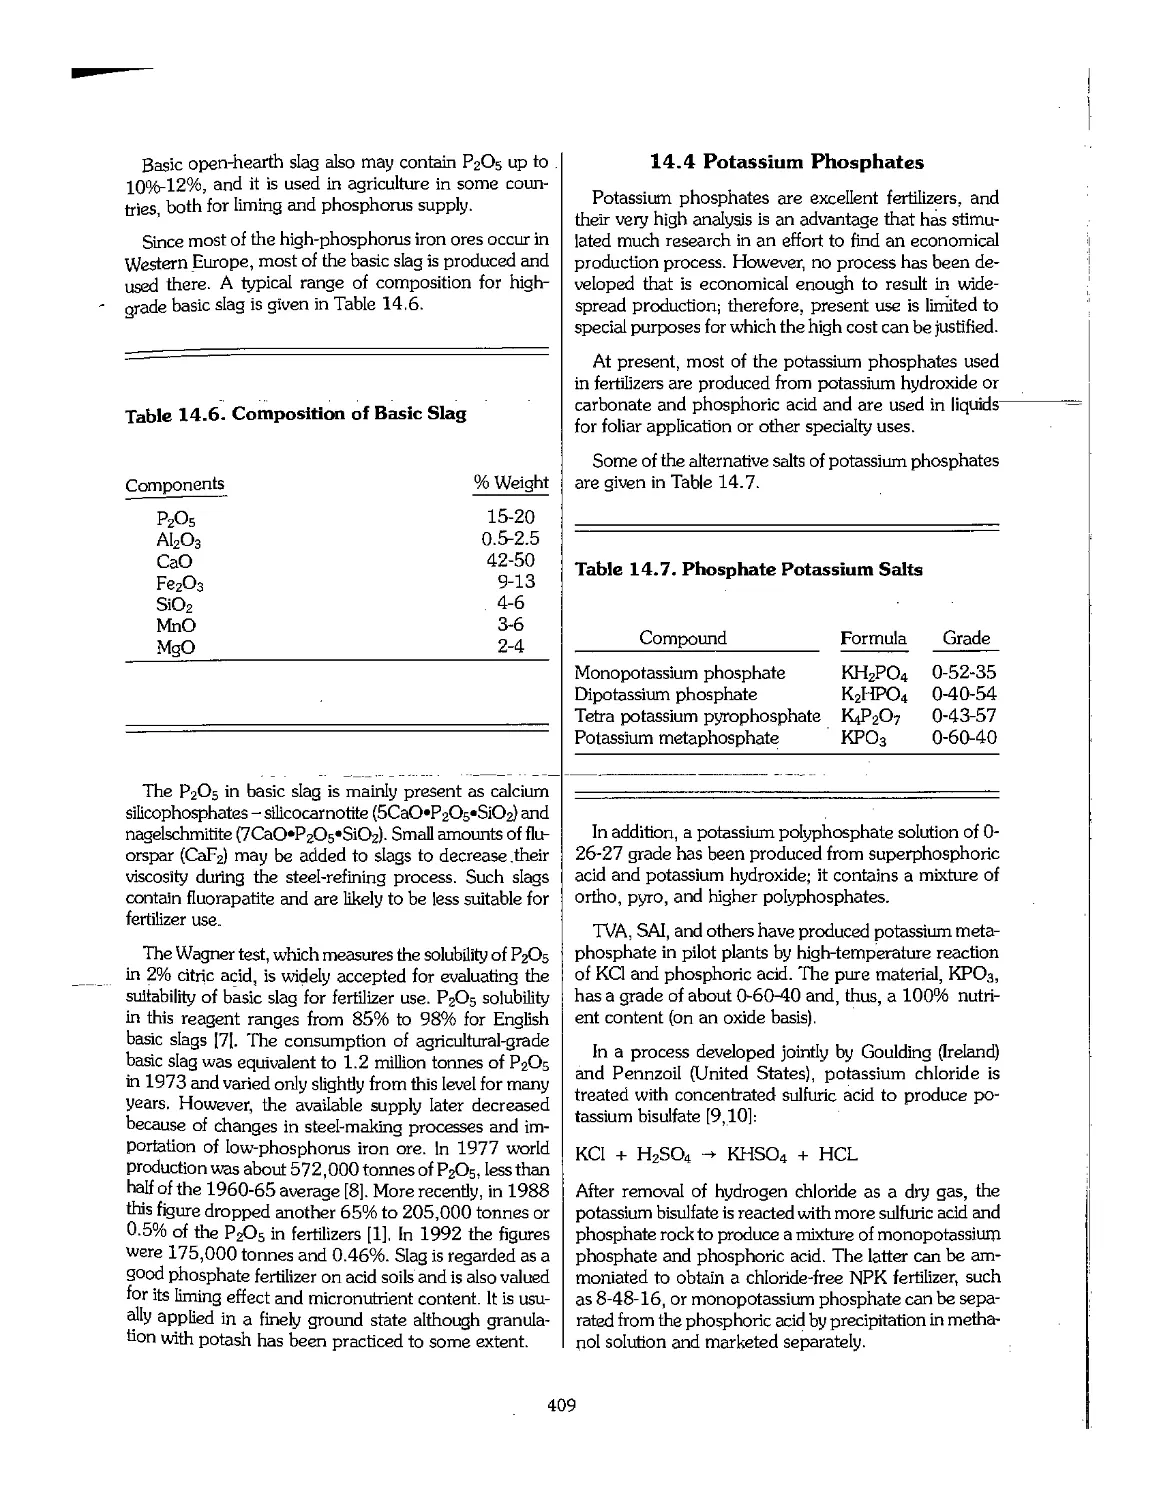
14.4 Potassium Phosphates 409
14.5 Bone Meal 410
14.6 Fused Calcium Magnesium Phosphate , 410
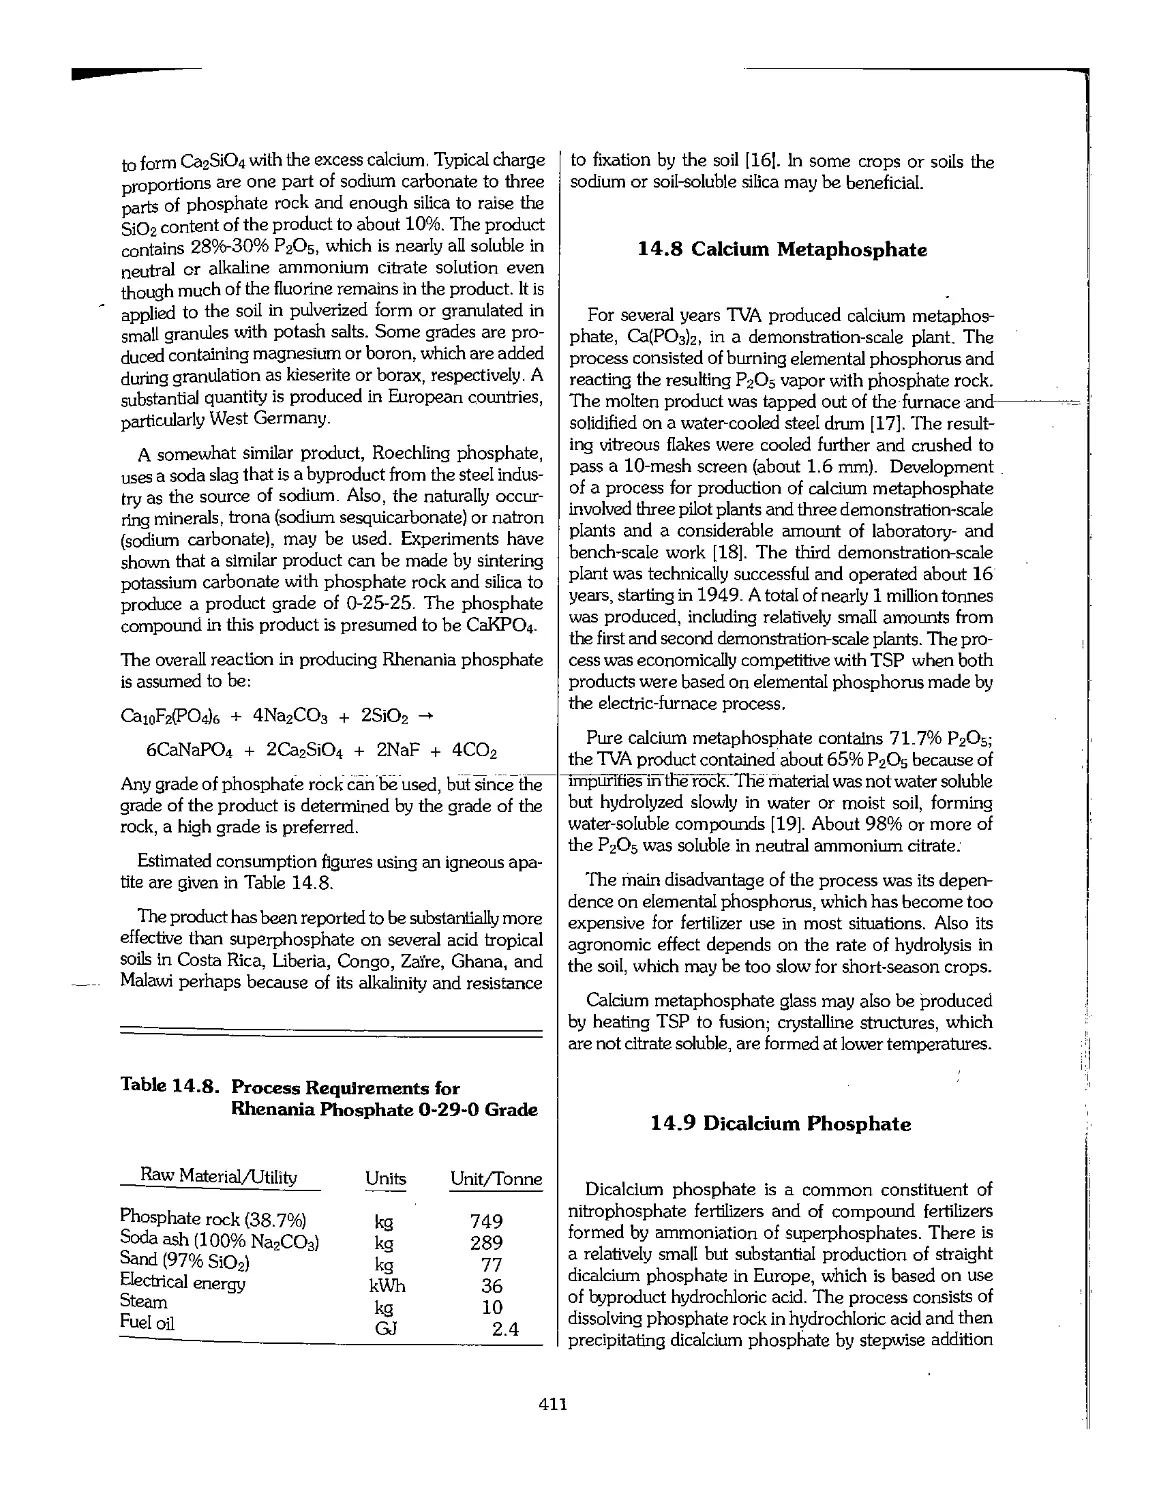
14,7 RhenaniaPhosphate.^^:;:;;::~: ::::::...:..:...:.:::: ■, "."..". : 410
14.8 Calcium Metaphosphate 411
14.9 Dicalcium Phosphate 411
14.10 Magnesium Phosphates 412
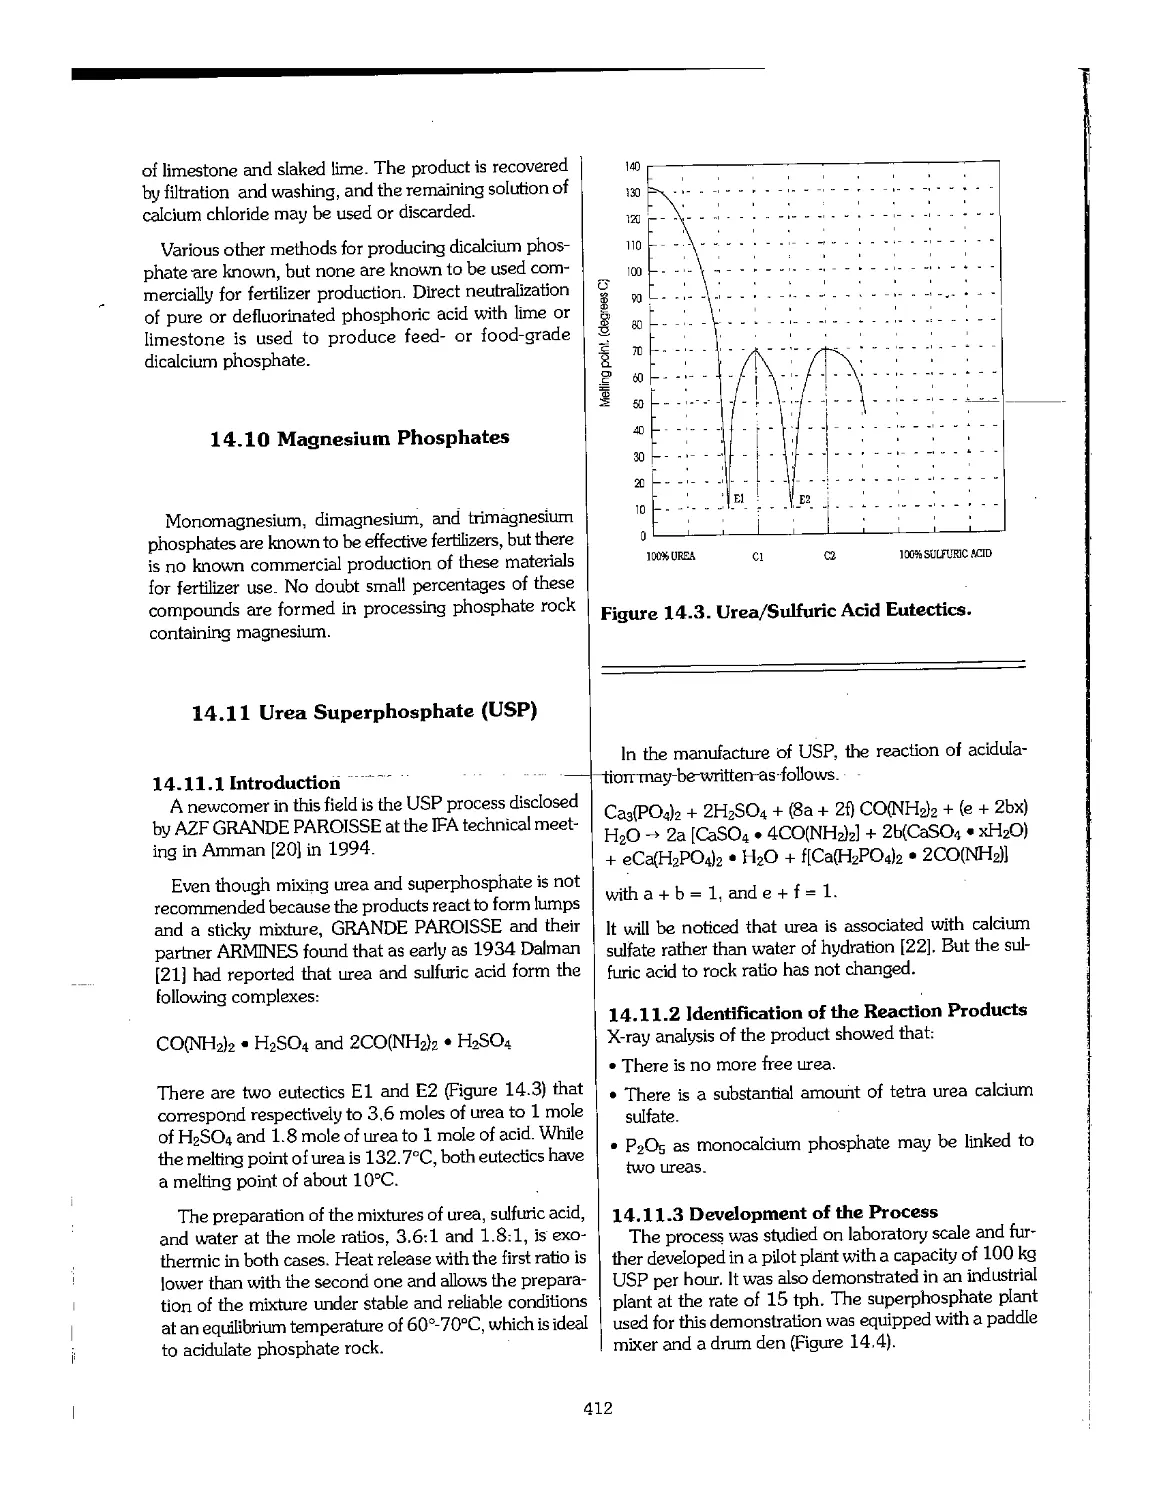
14.11 Urea Superphosphate (USP) 412
14.12 References 414
Chapter 15. Potash Fertilizers 416
15.1 Introduction 417
15.2 Potash in Agriculture 417
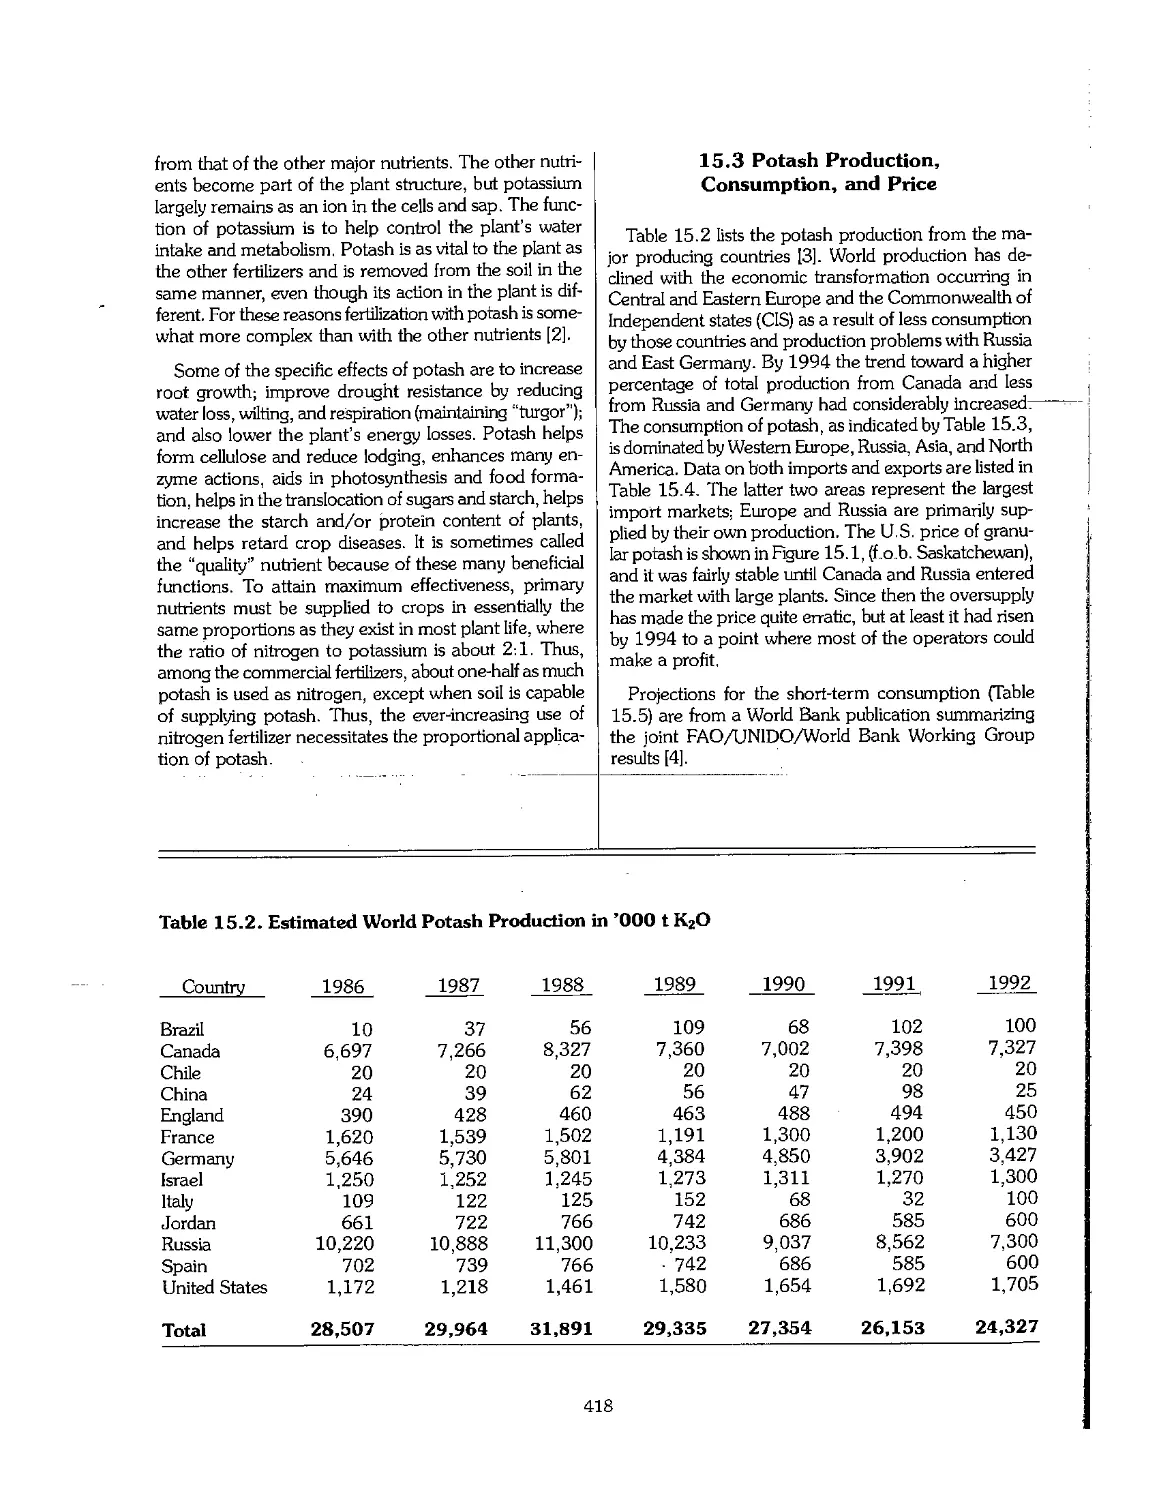
15.3 Potash Production, Consumption, and Price l 418
15.4 Product Quality 420
15.5 Other Potassium Fertilizers 424
15.6 Chemical-Grade Potash 430
15.7 References 431
Chapter 16. Compound Fertilizers 432
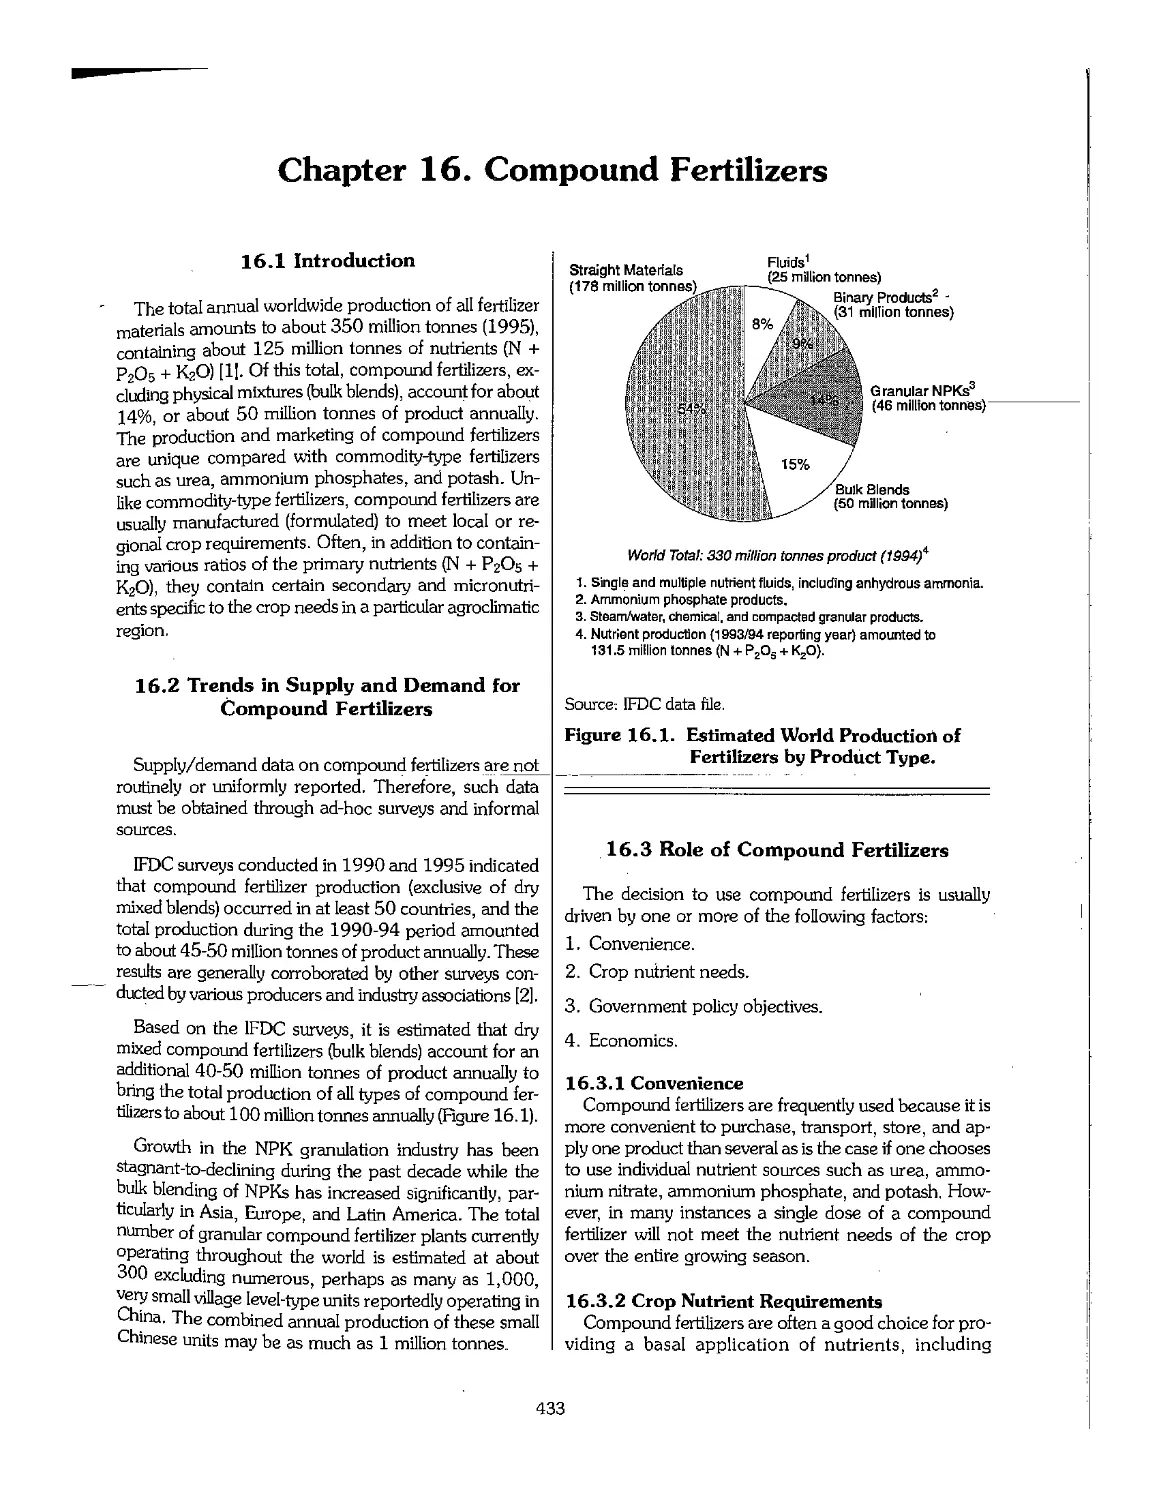
16.1 Introduction , 433
16.2 Trends in Supply and Demand for Compound Fertilizers 433
16.3 Role of Compound Fertilizers 433
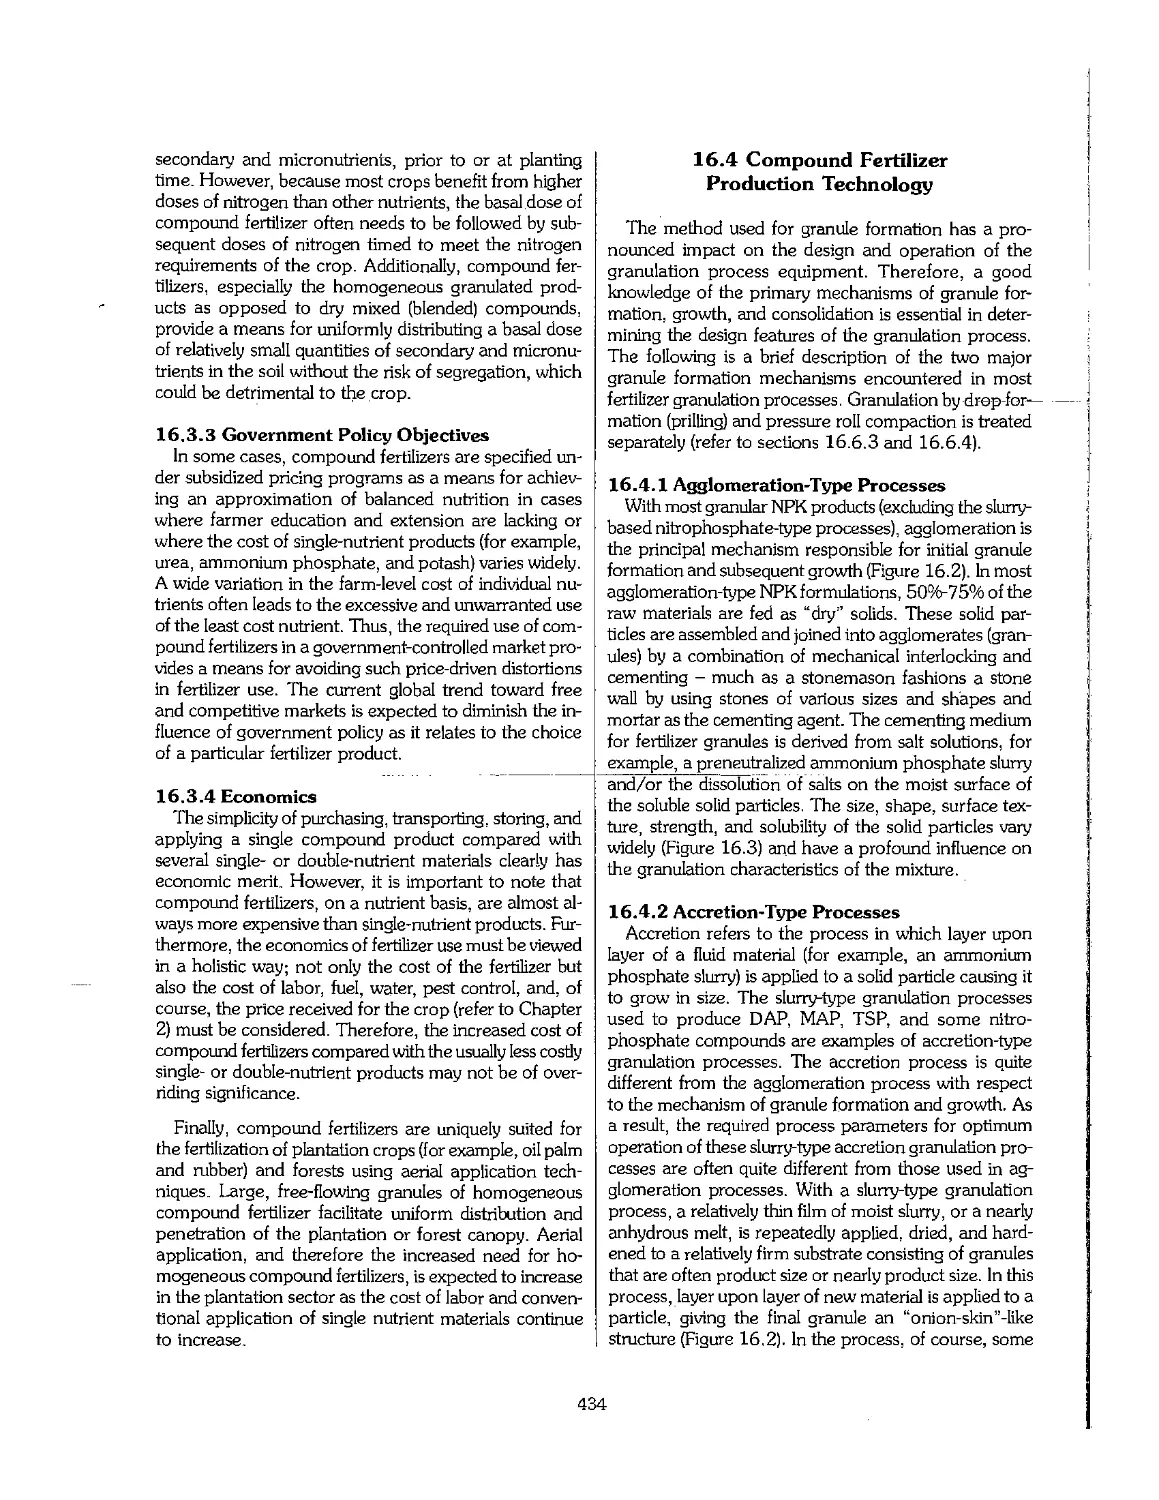
16.4 Compound Fertilizer Production Technology 434
16.5 Physical and Chemical Parameters for Producing Agglomerated NPKs 435
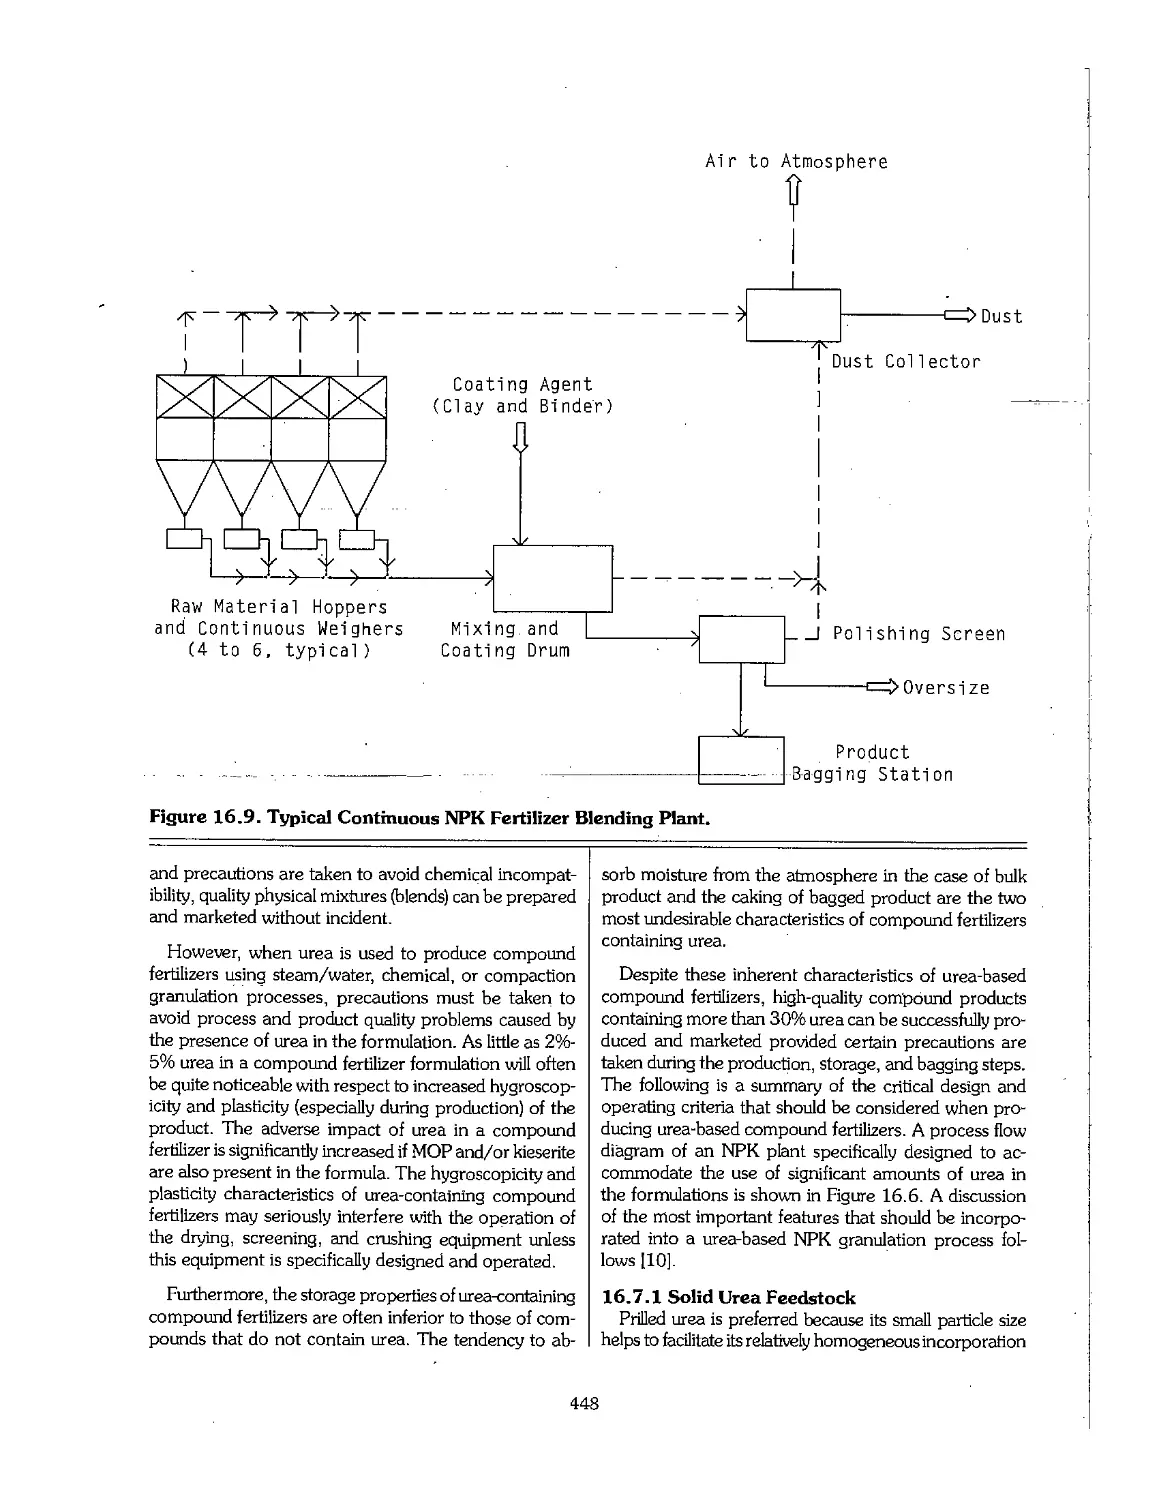
16.6 Processes for Manufacturing Compound Fertilizers 441
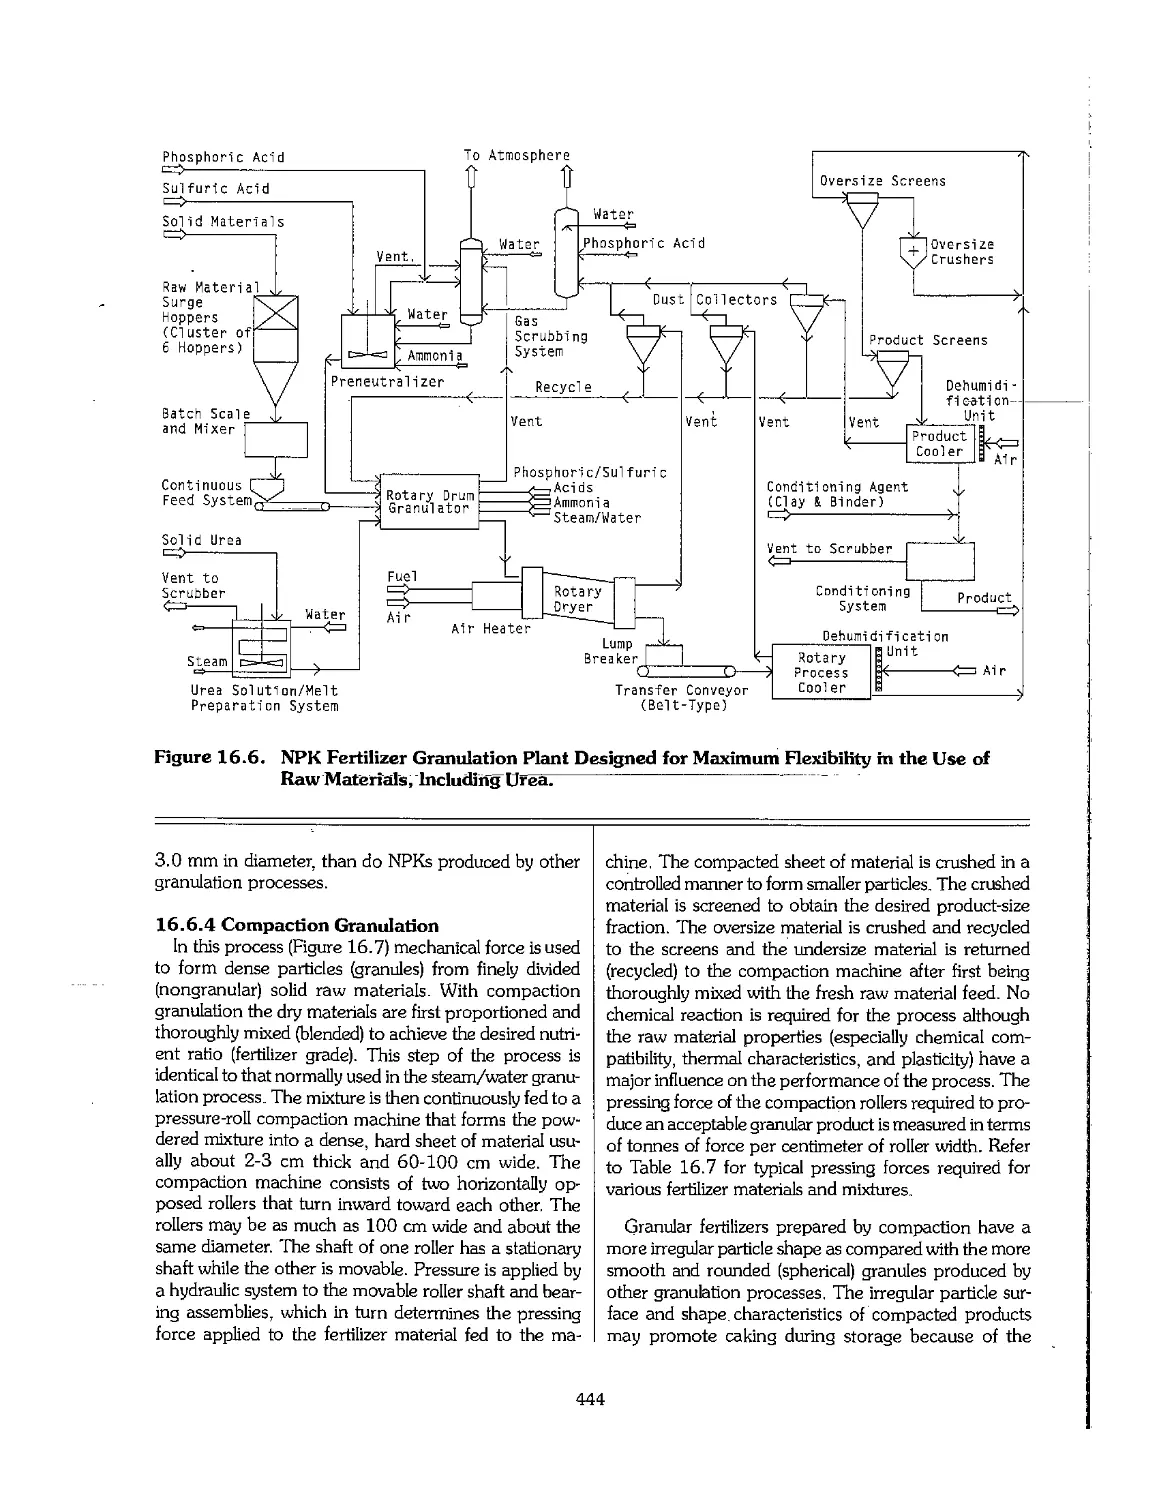
16.7 Unique Requirements for Manufacturing Urea-Based Granular Compound Fertilizers 447
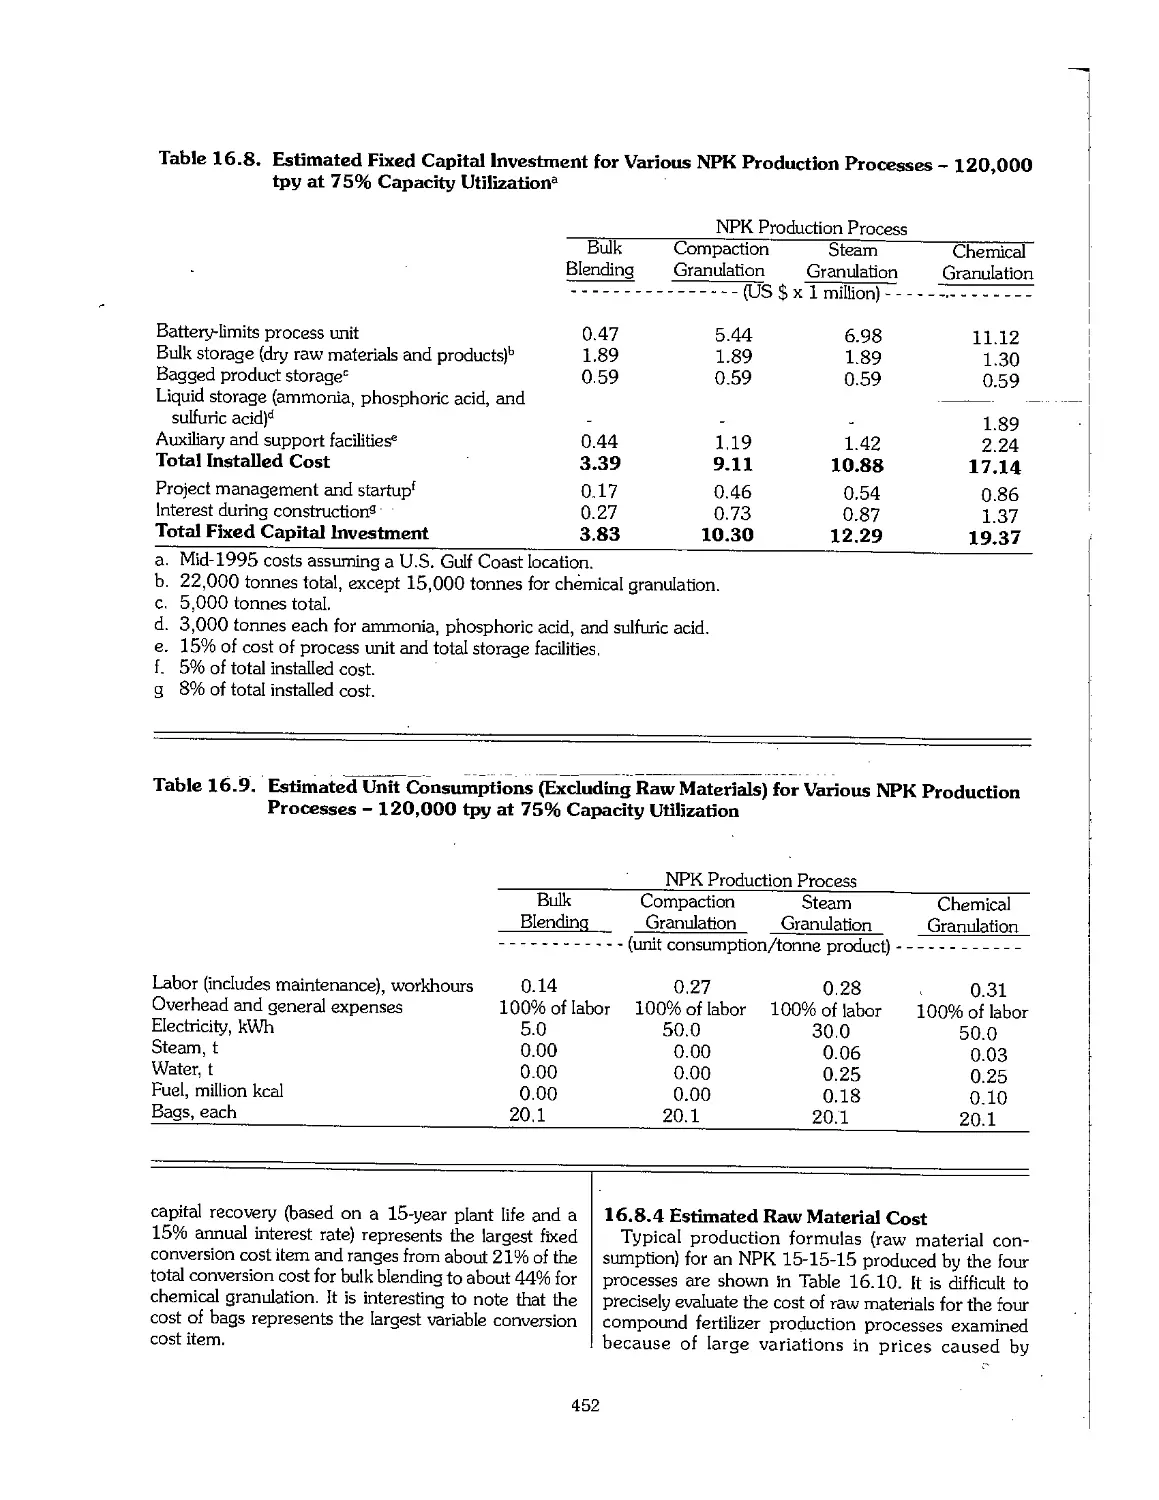
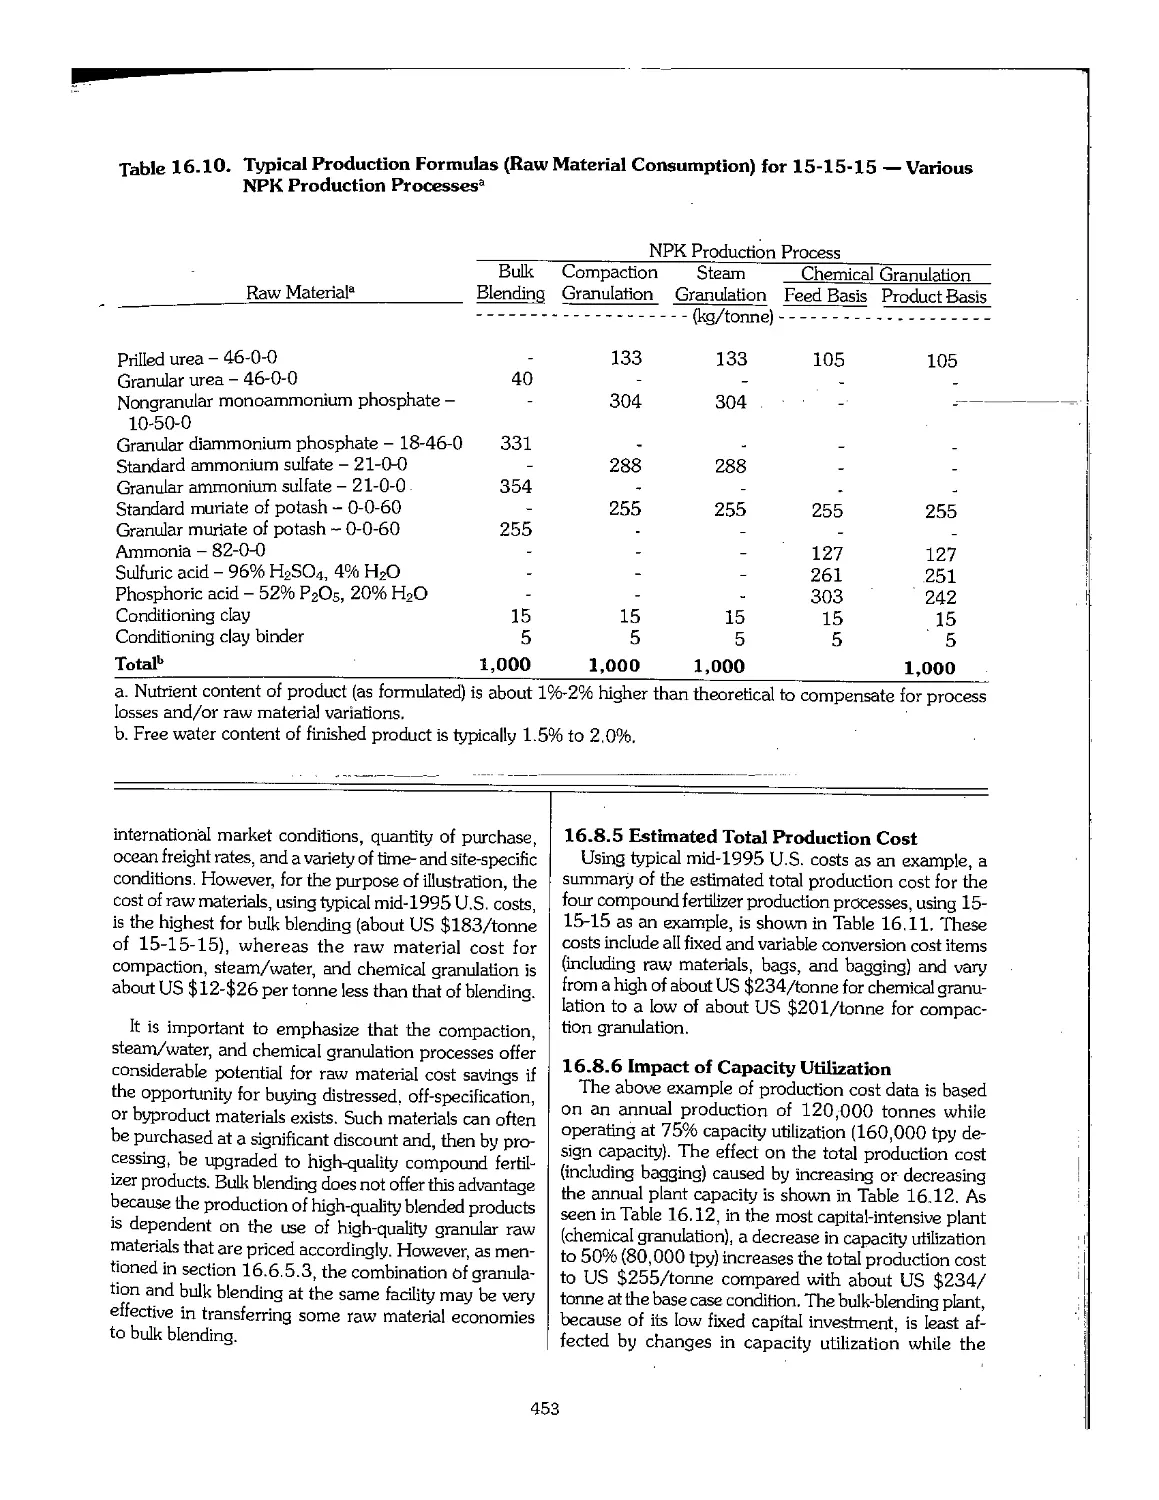
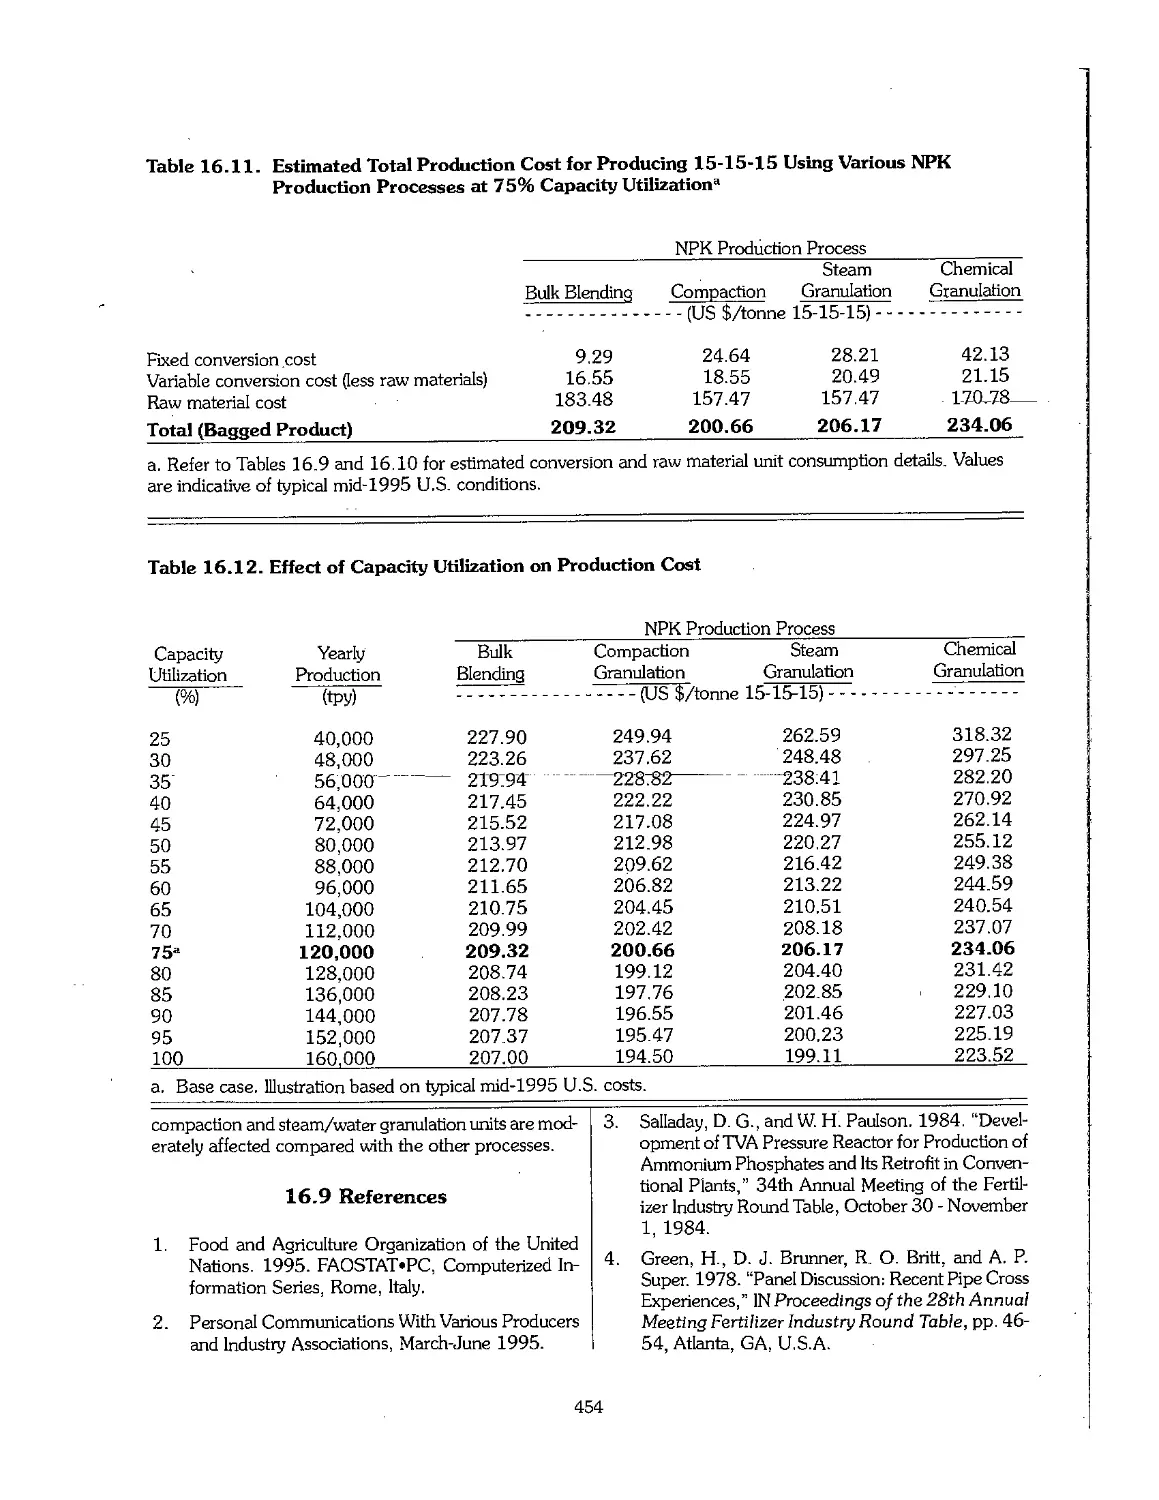
16.8 Investment and Operating Costs 451
16.9 References 454
xi
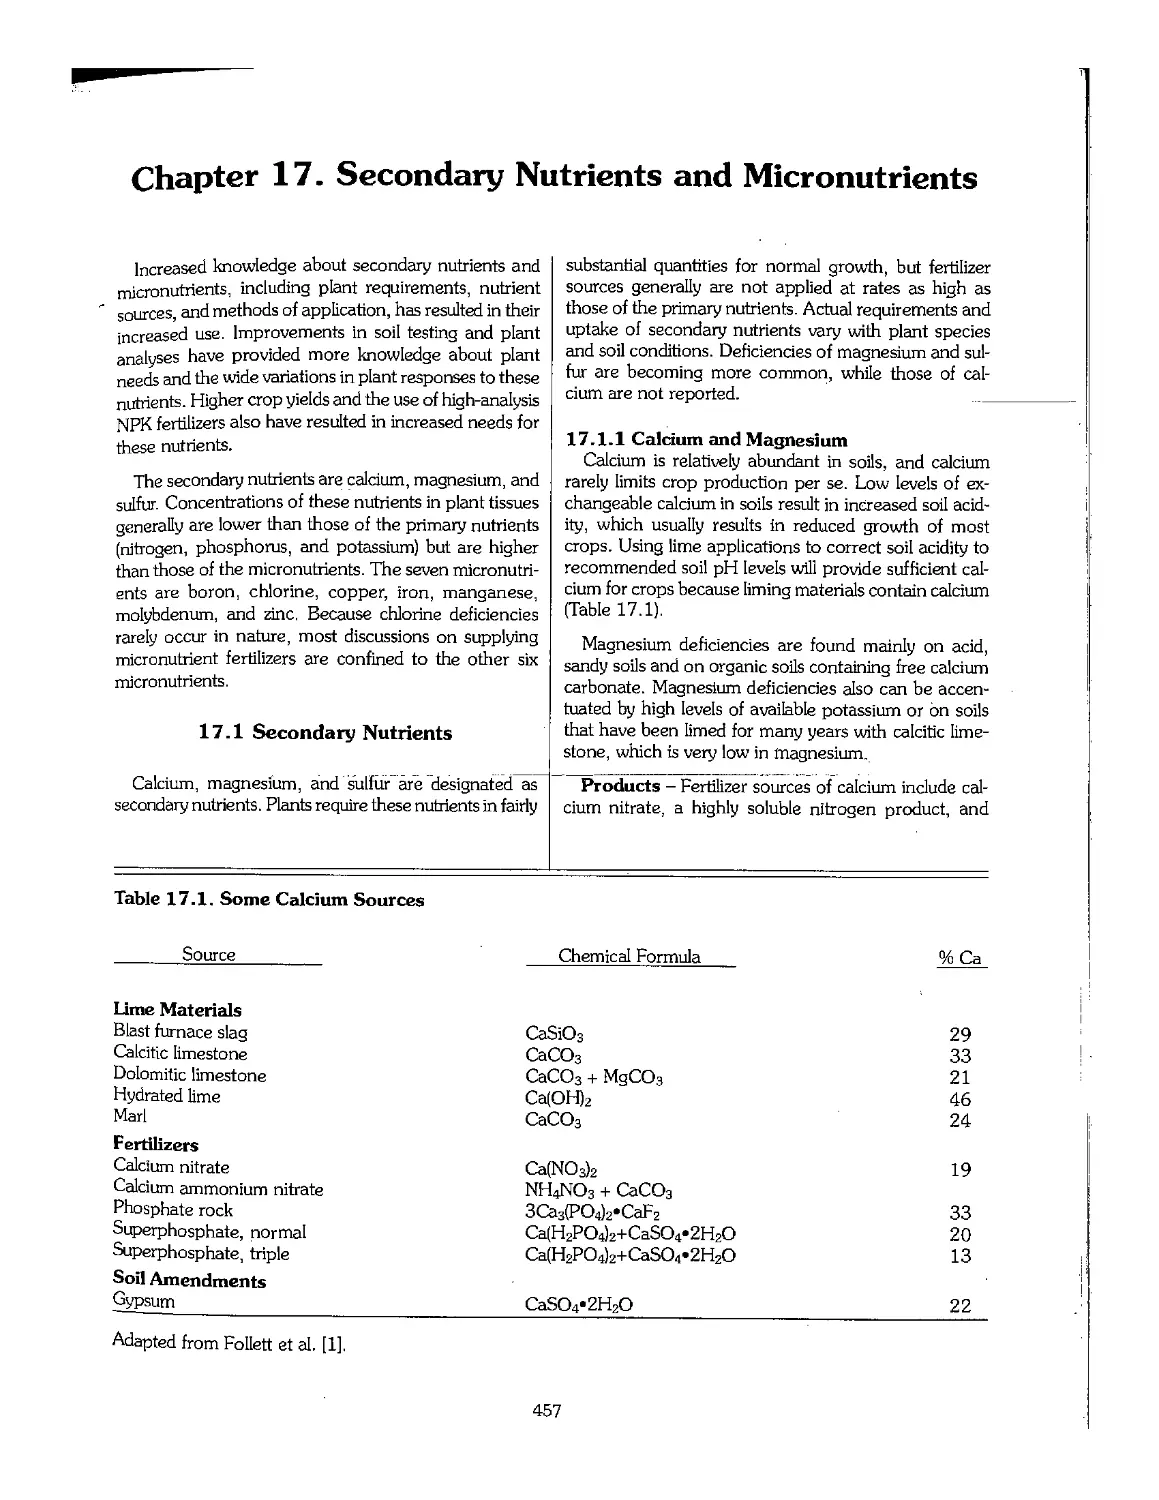
Chapter 17. Secondary Nutrients and Micronutrients 456
17.1 Secondary Nutrients 457
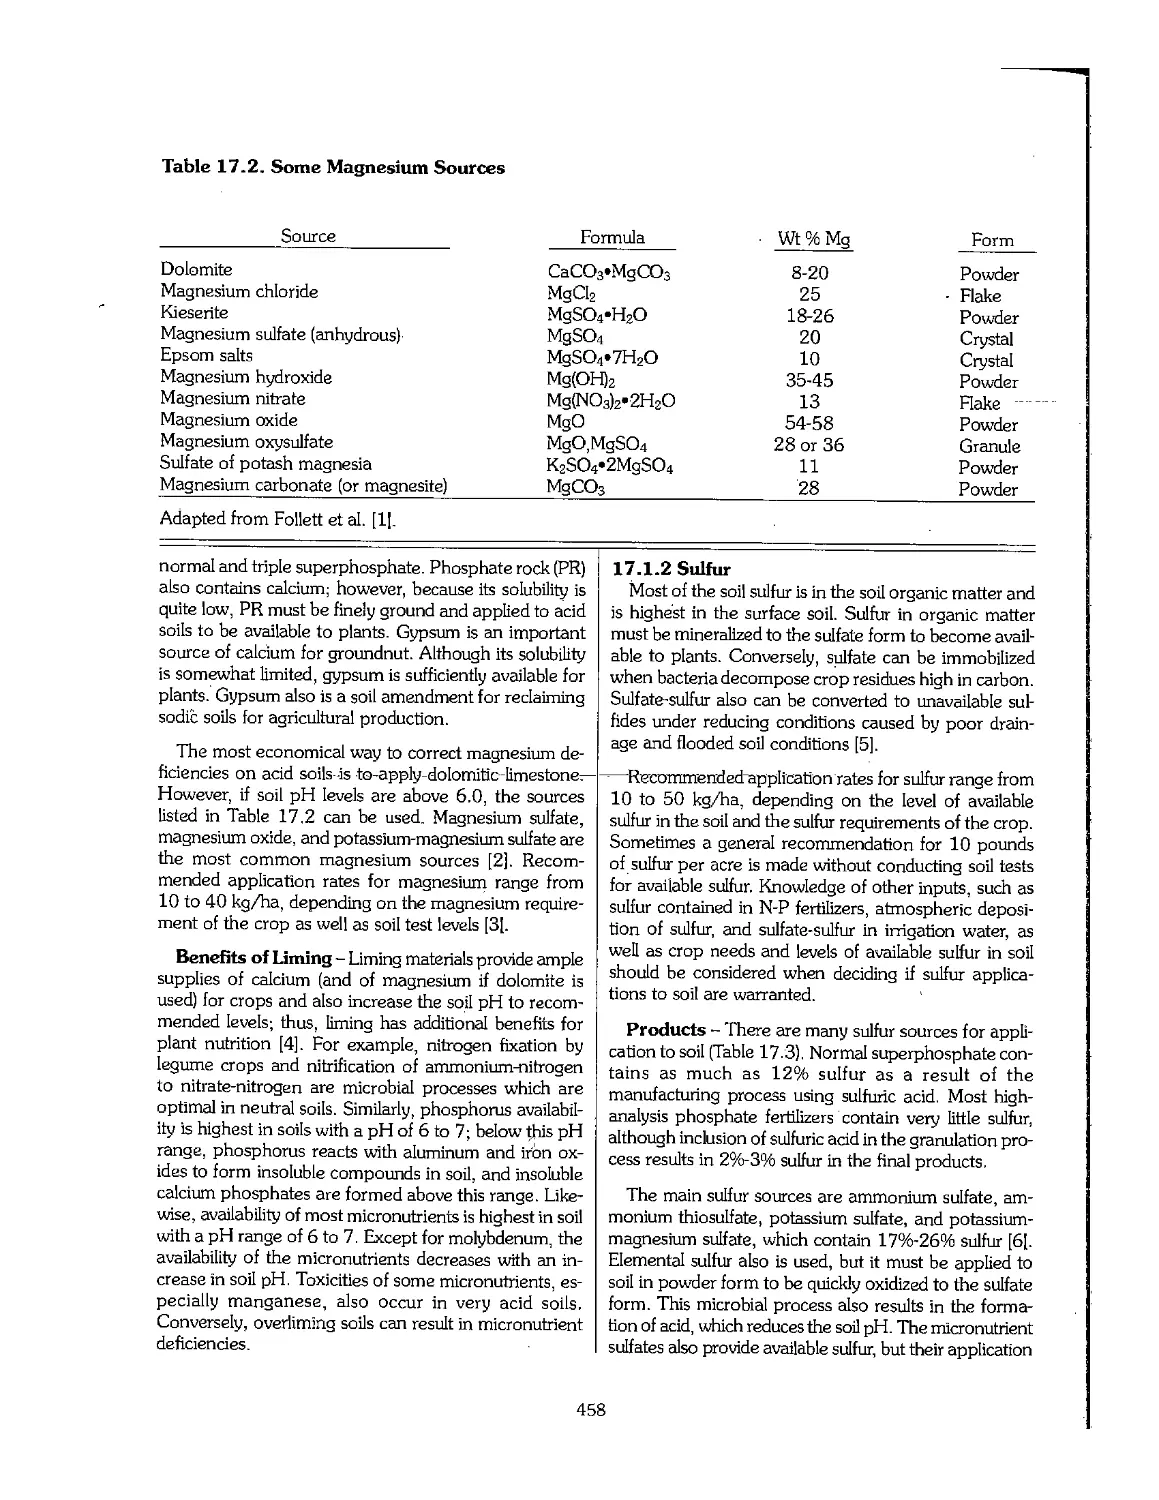
17.2 Micronutrients 460
17.3 Preparation of Fertilizers Containing Micronutrients 462
17.4 Other Useful Elements 467
17.5 Acknowledgment 468
17.6 References ' 468
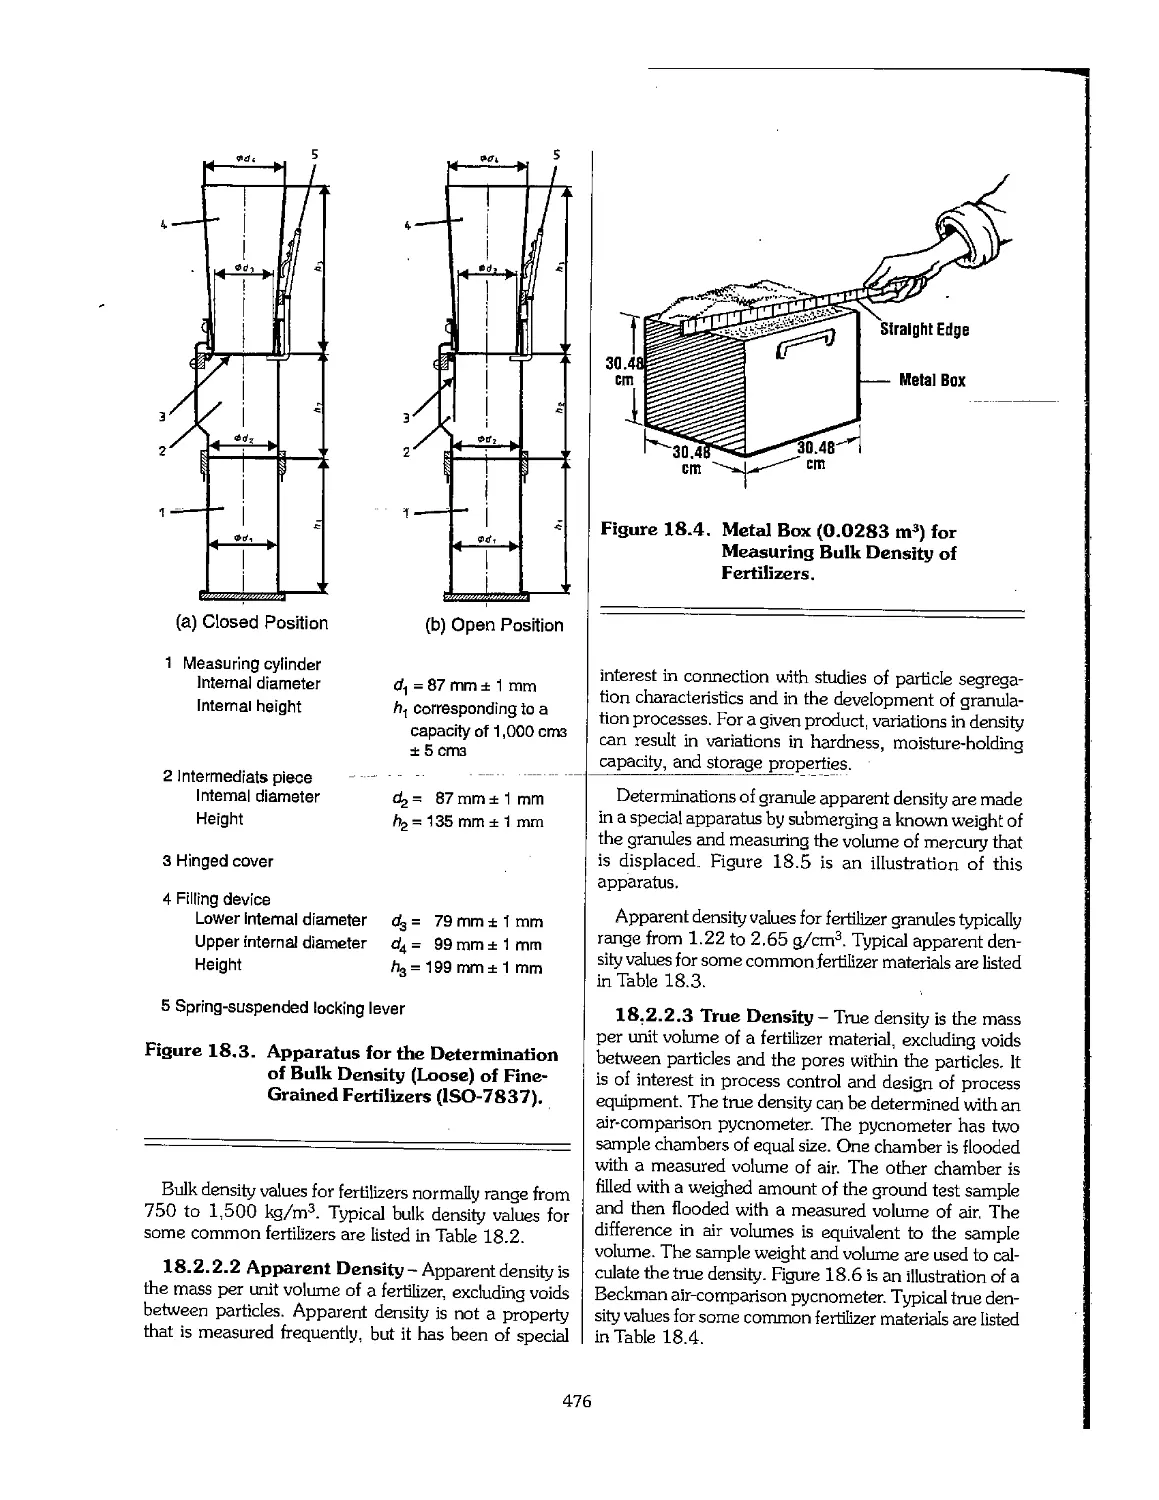
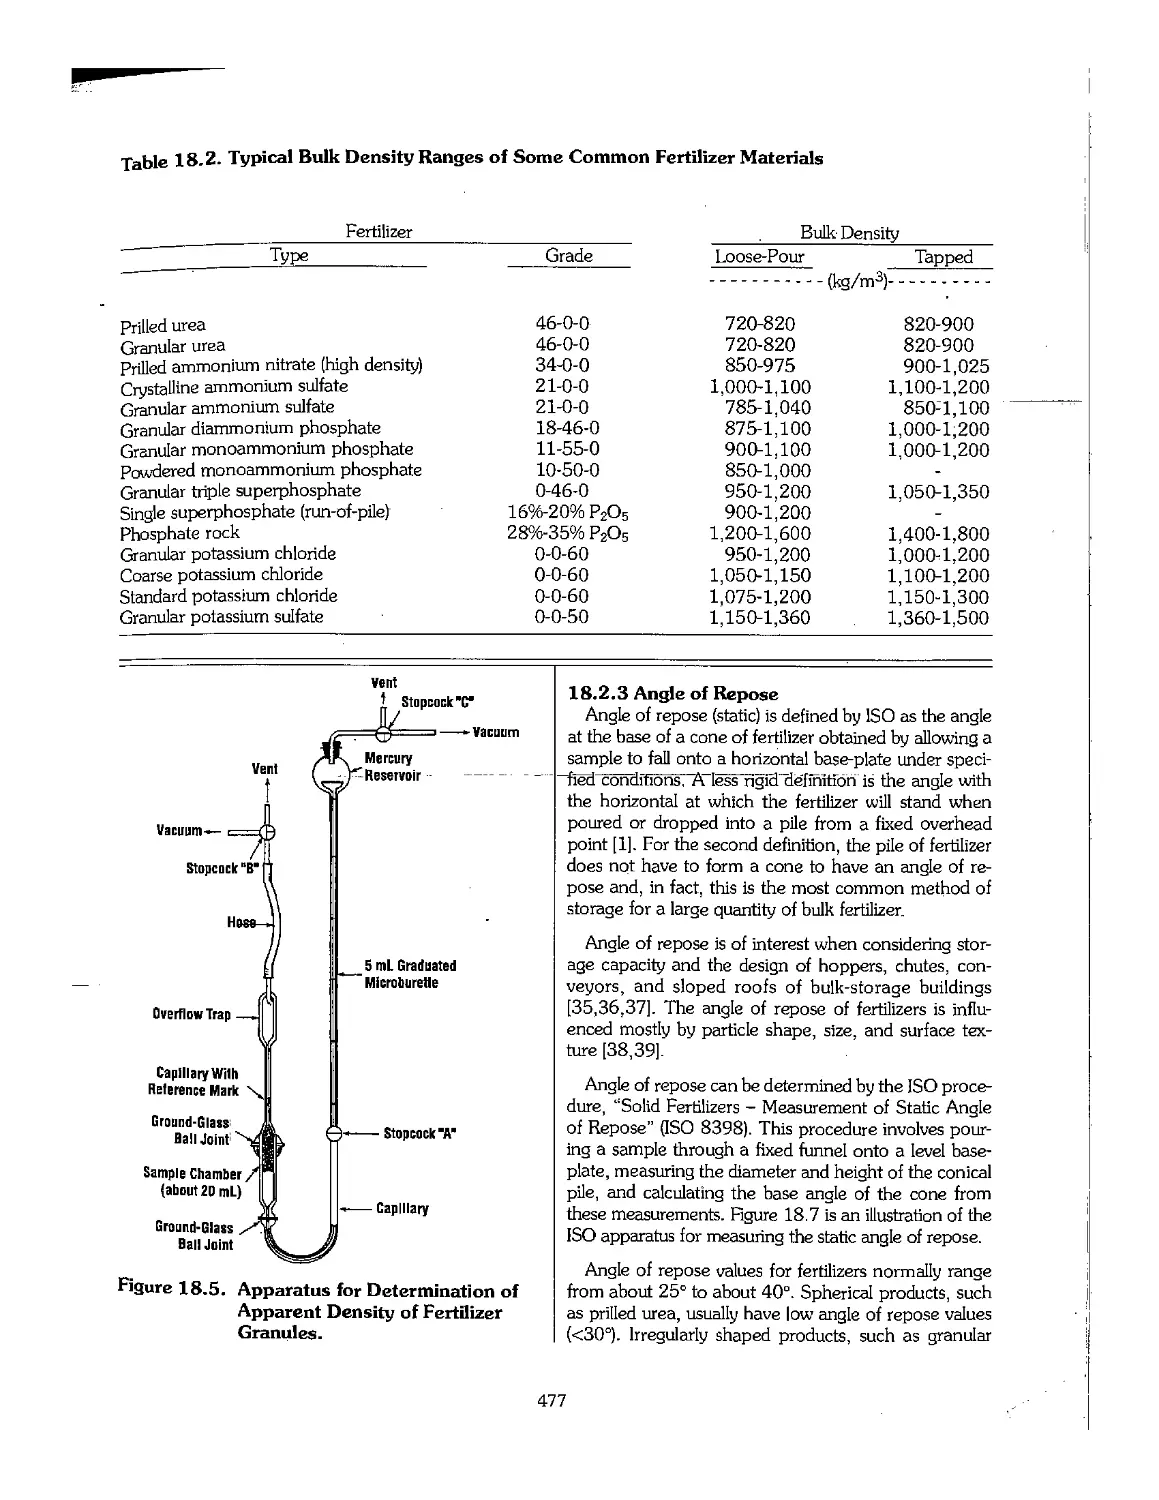
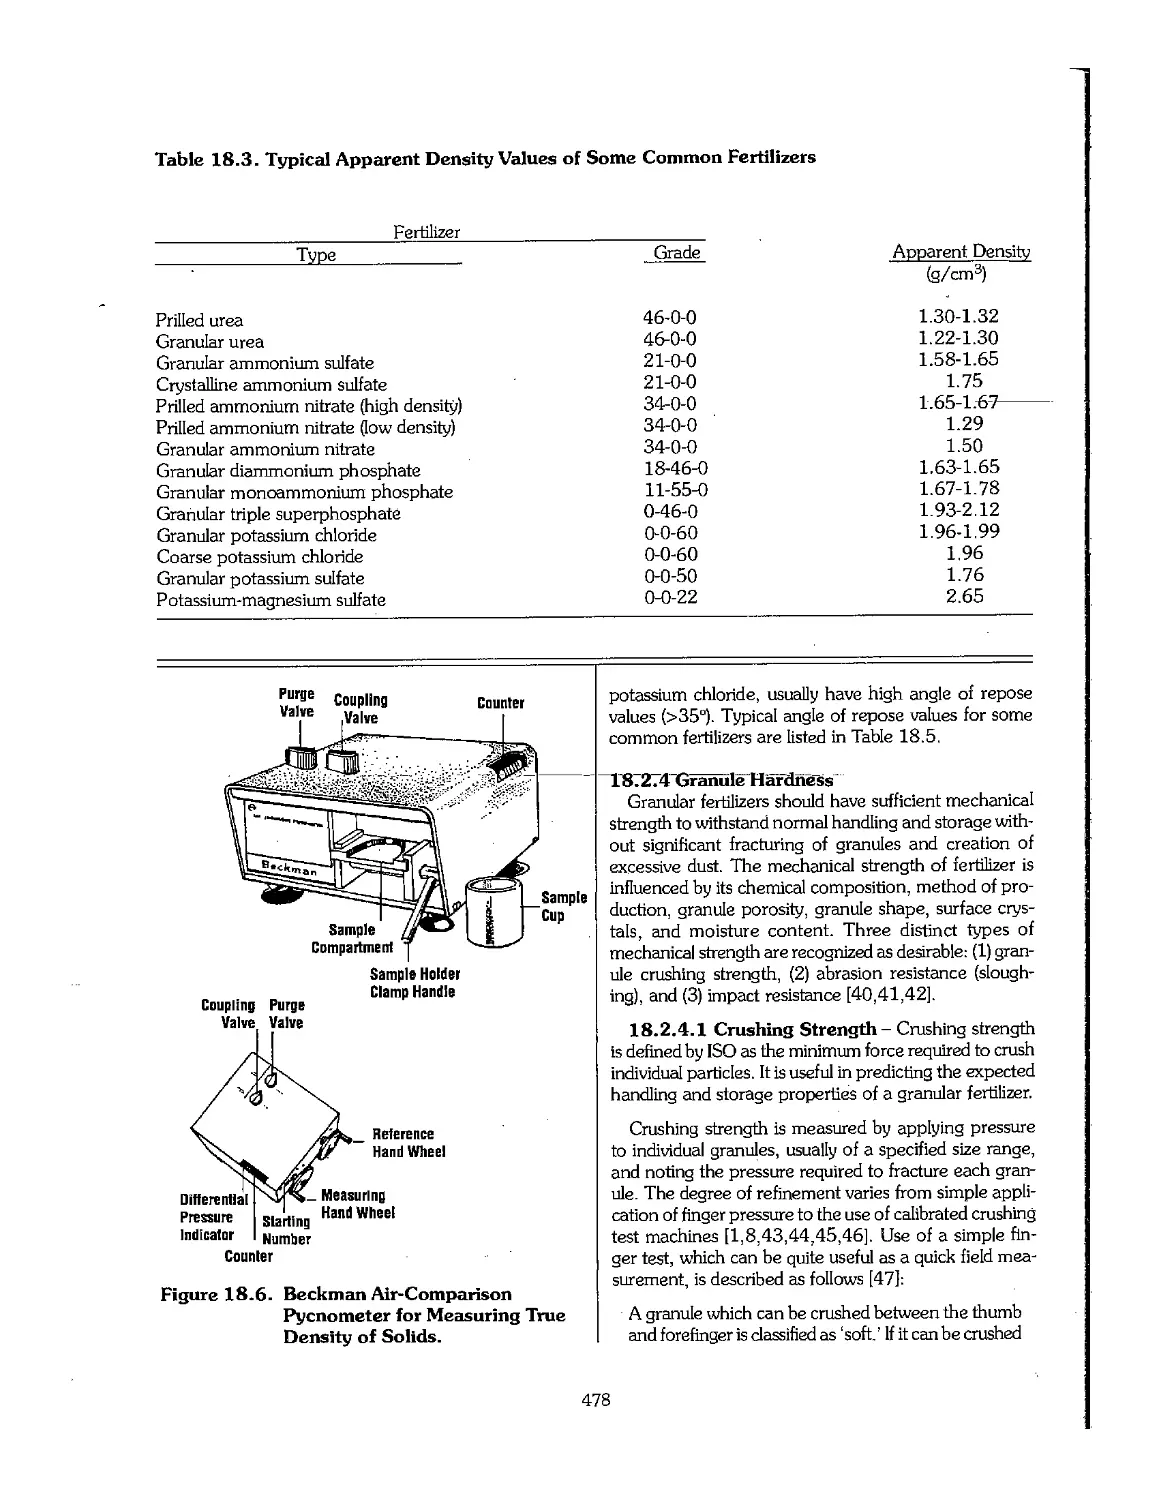
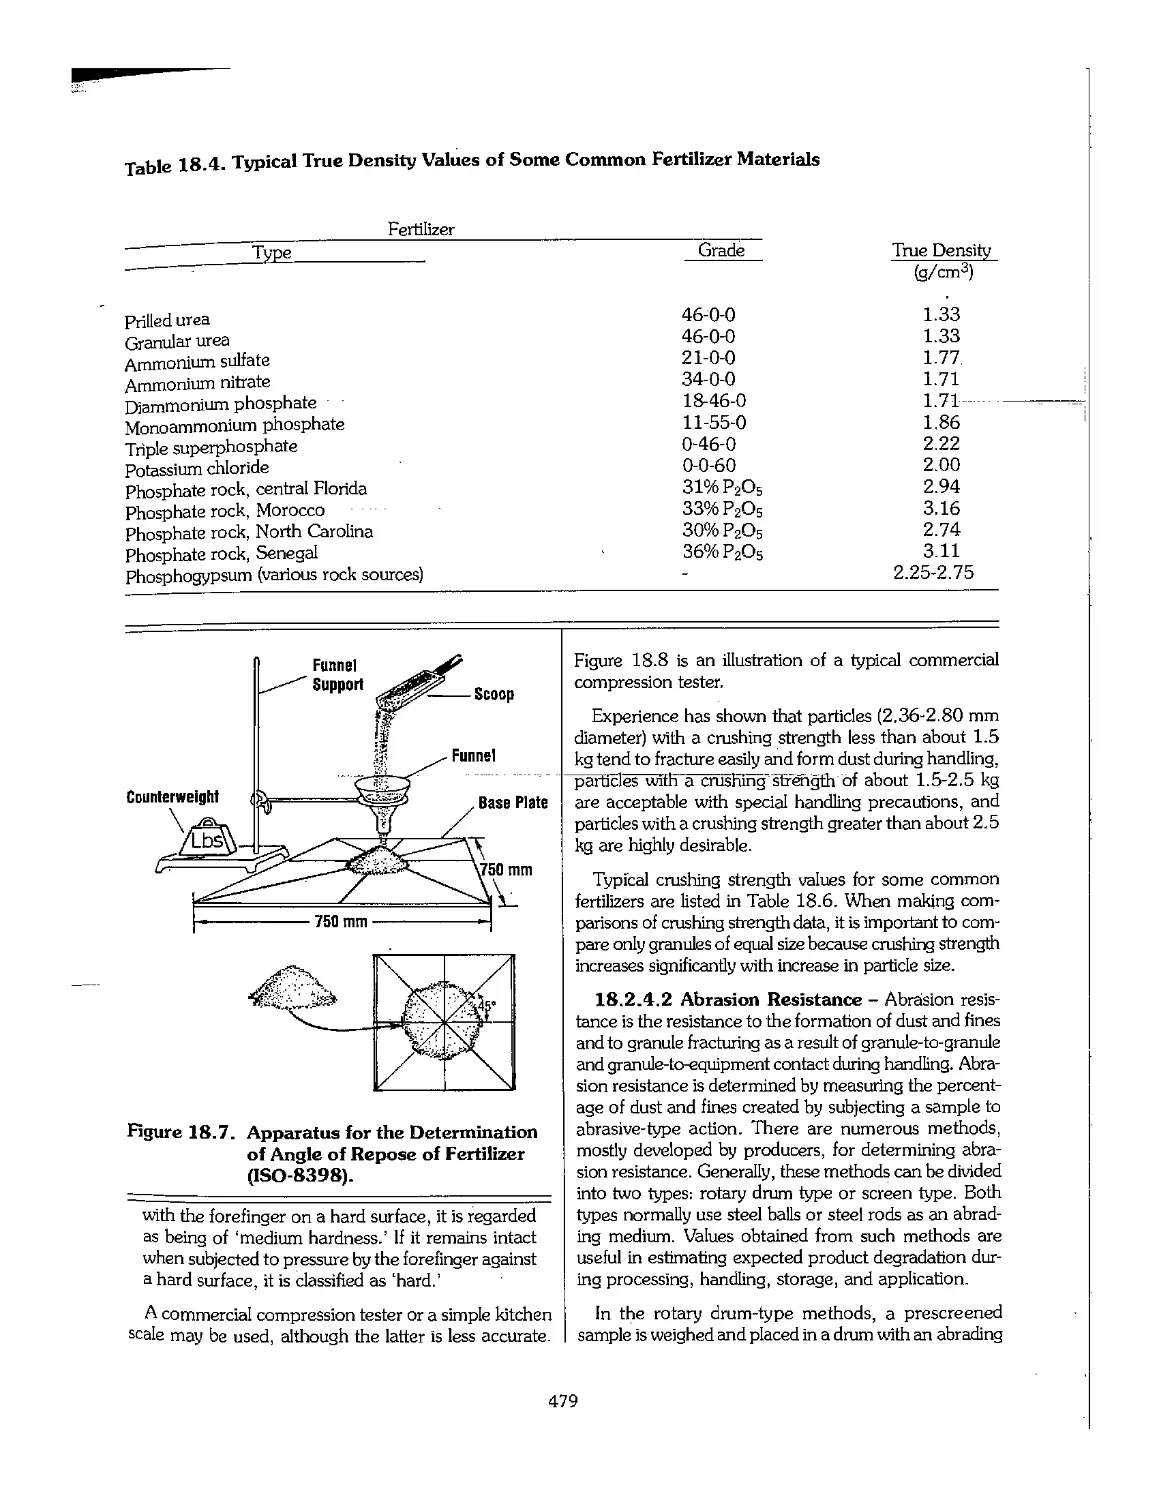
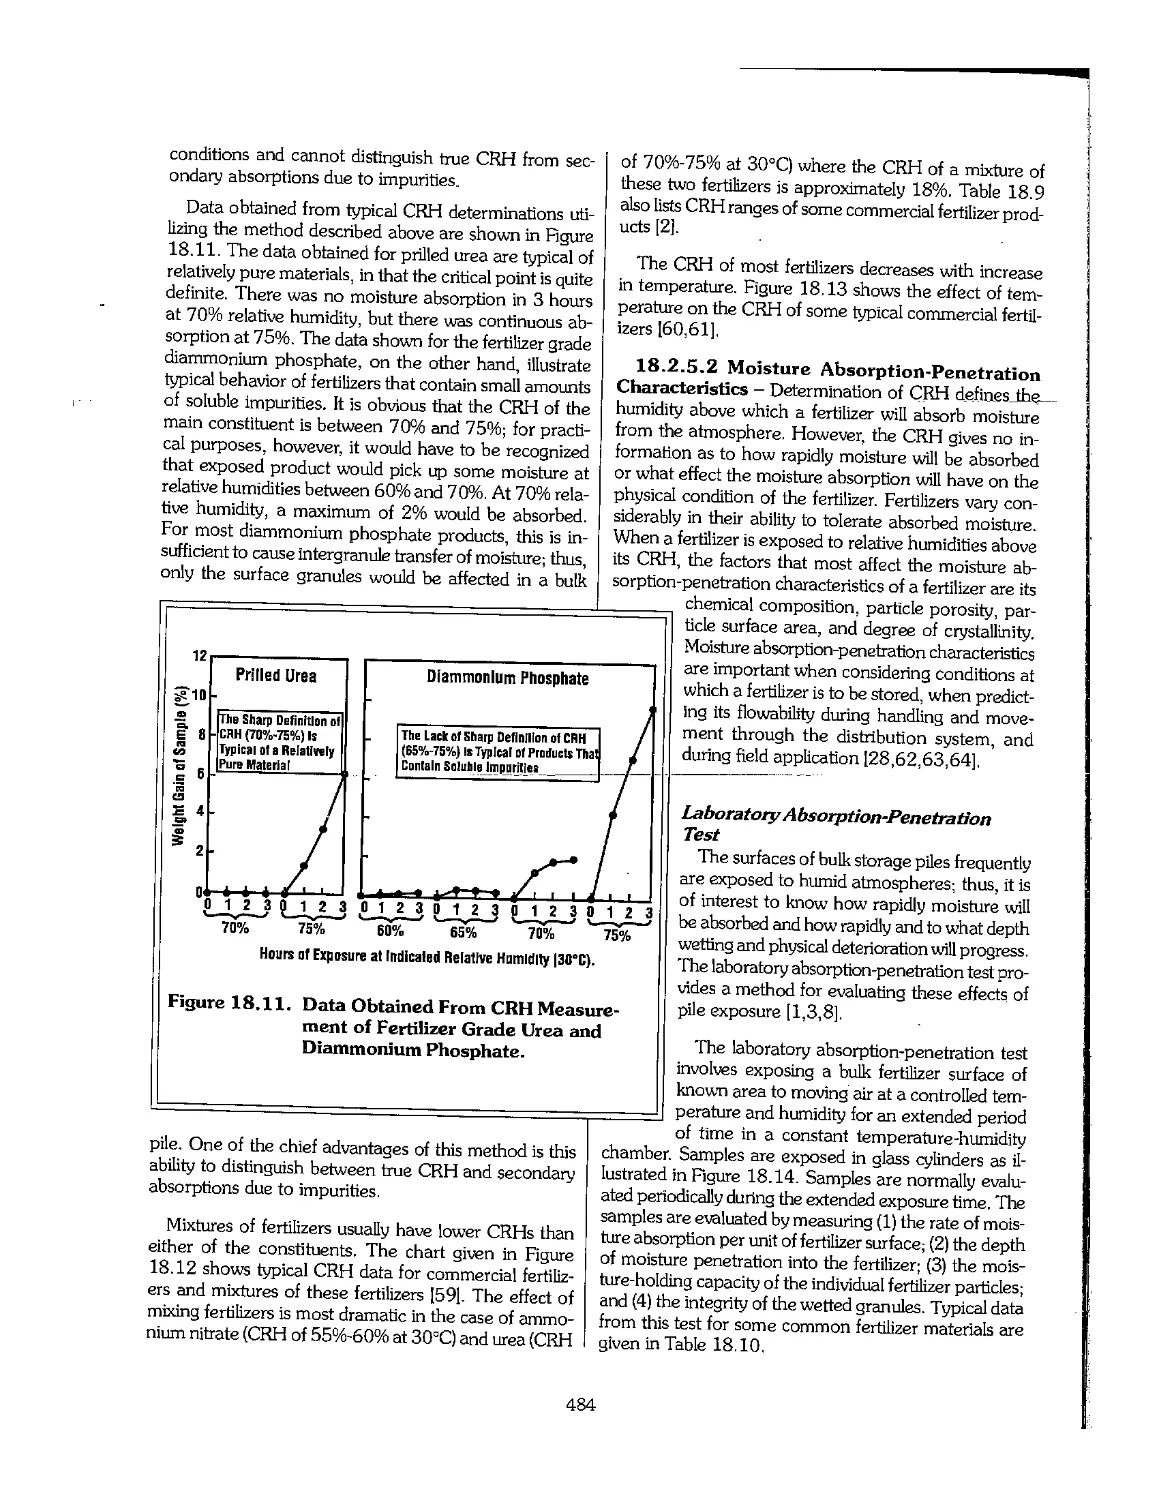
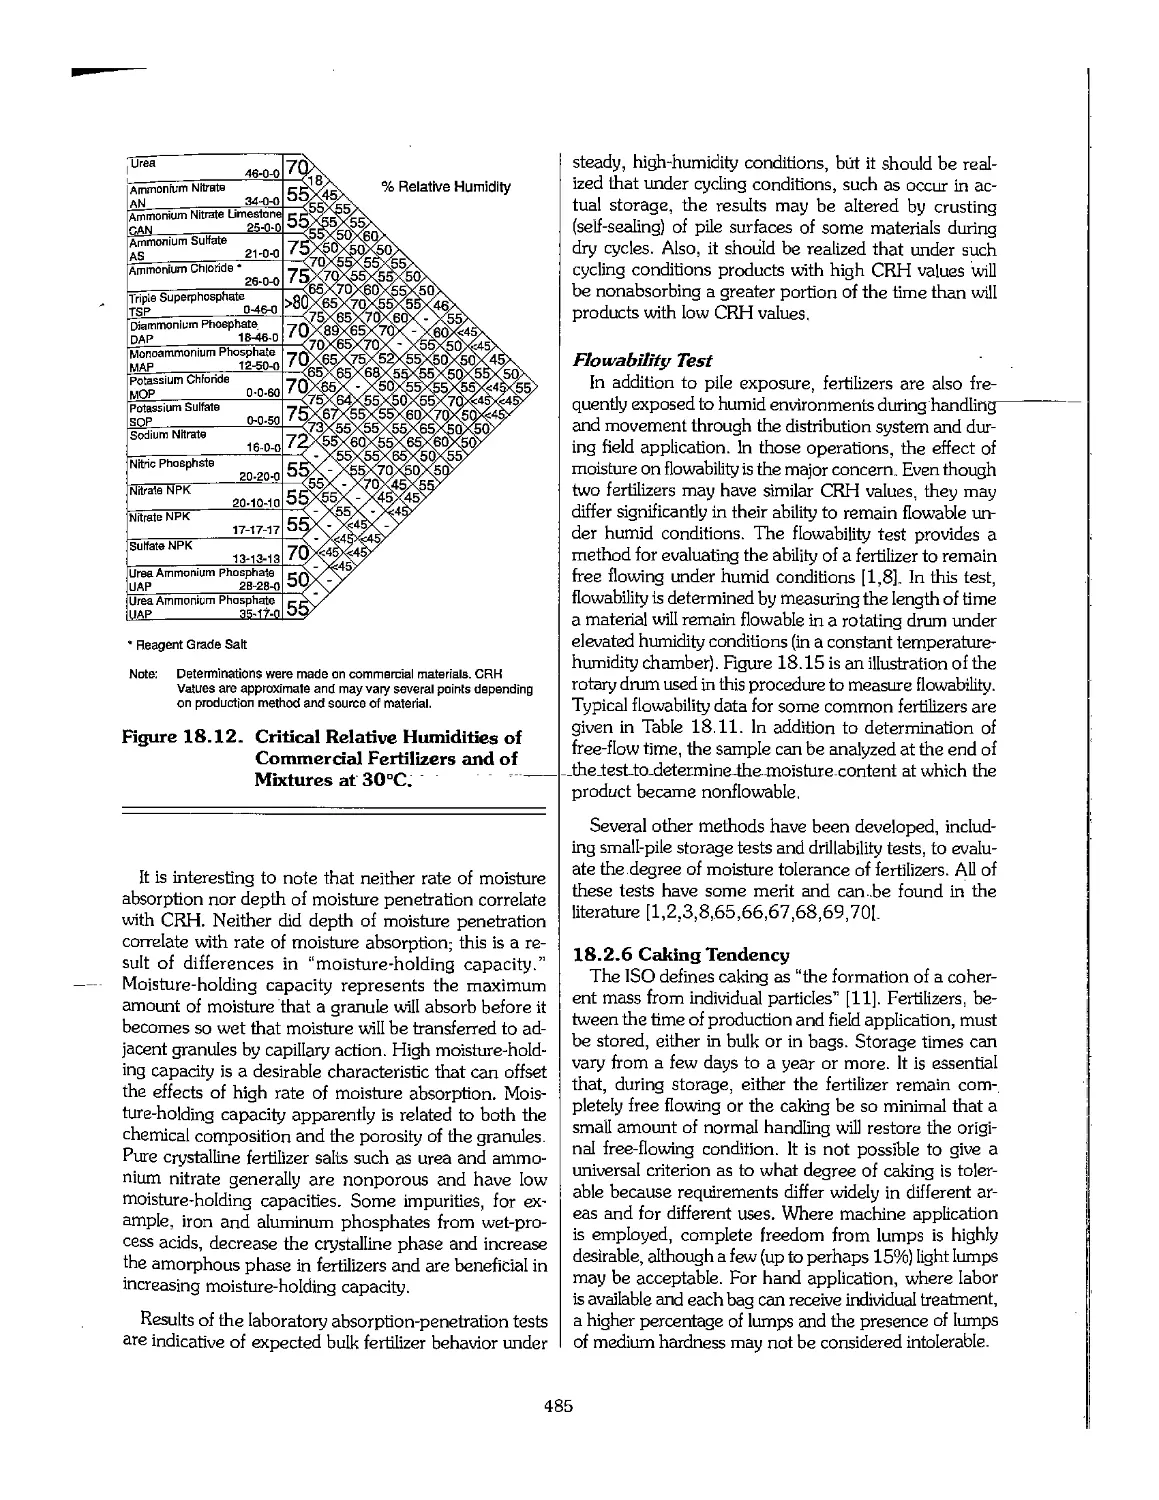
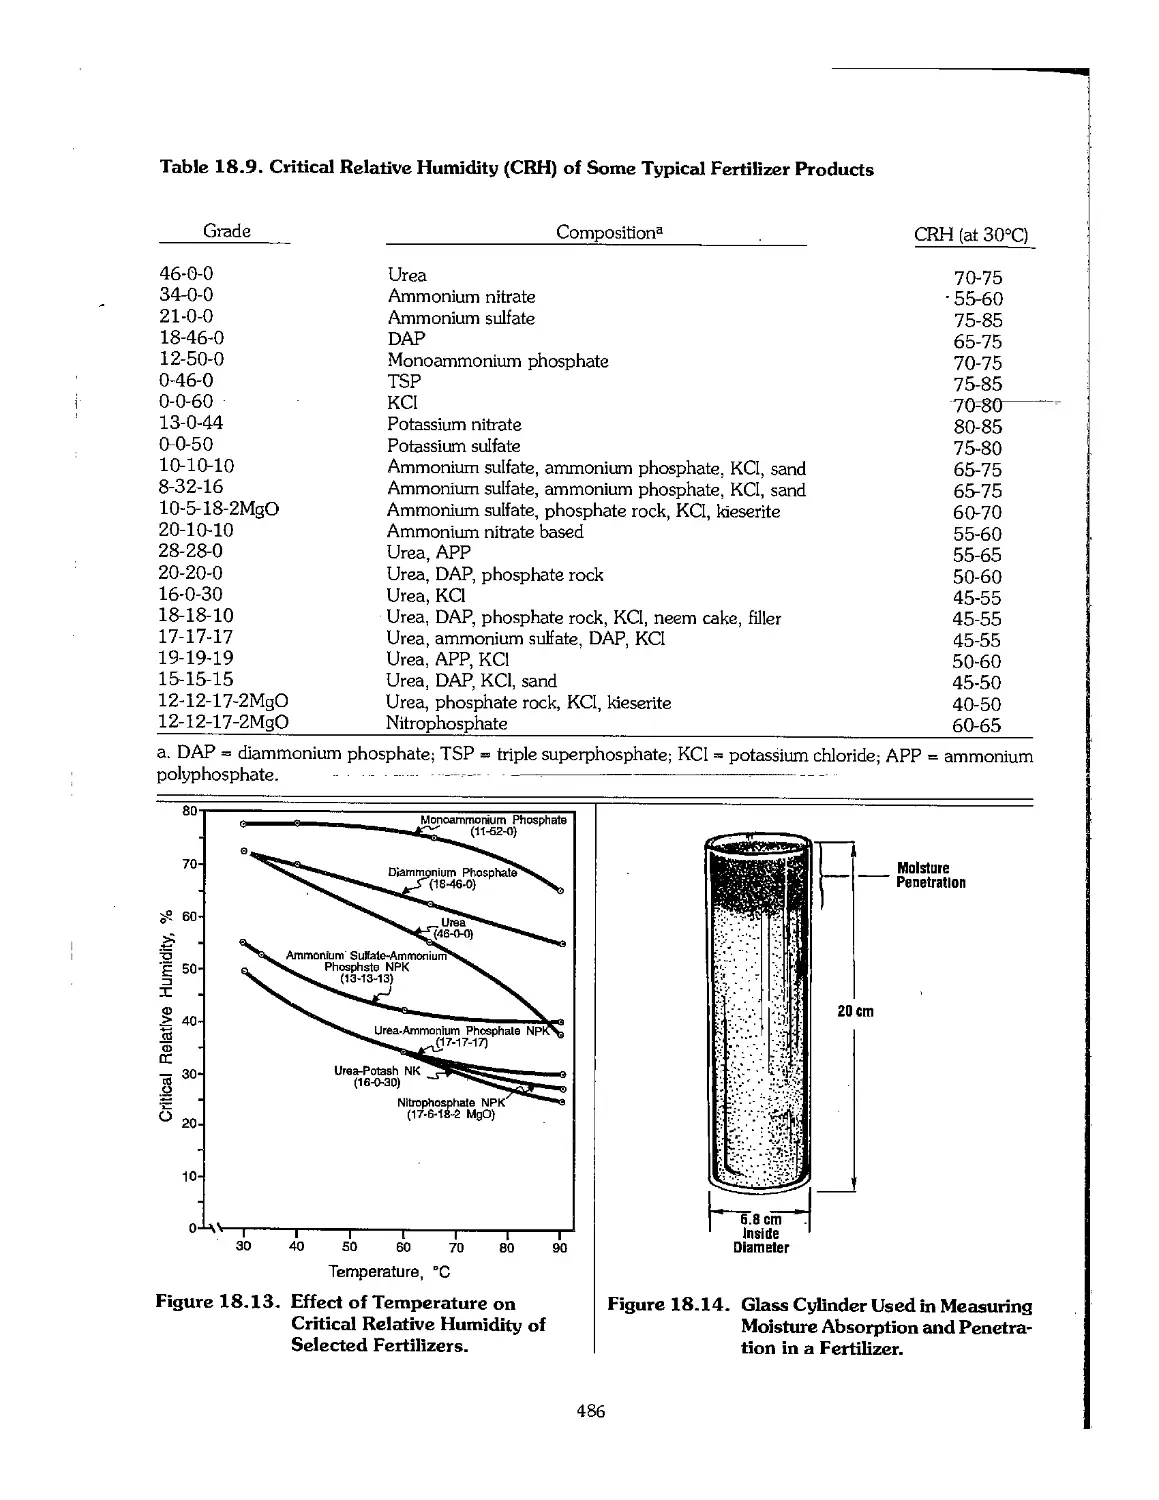
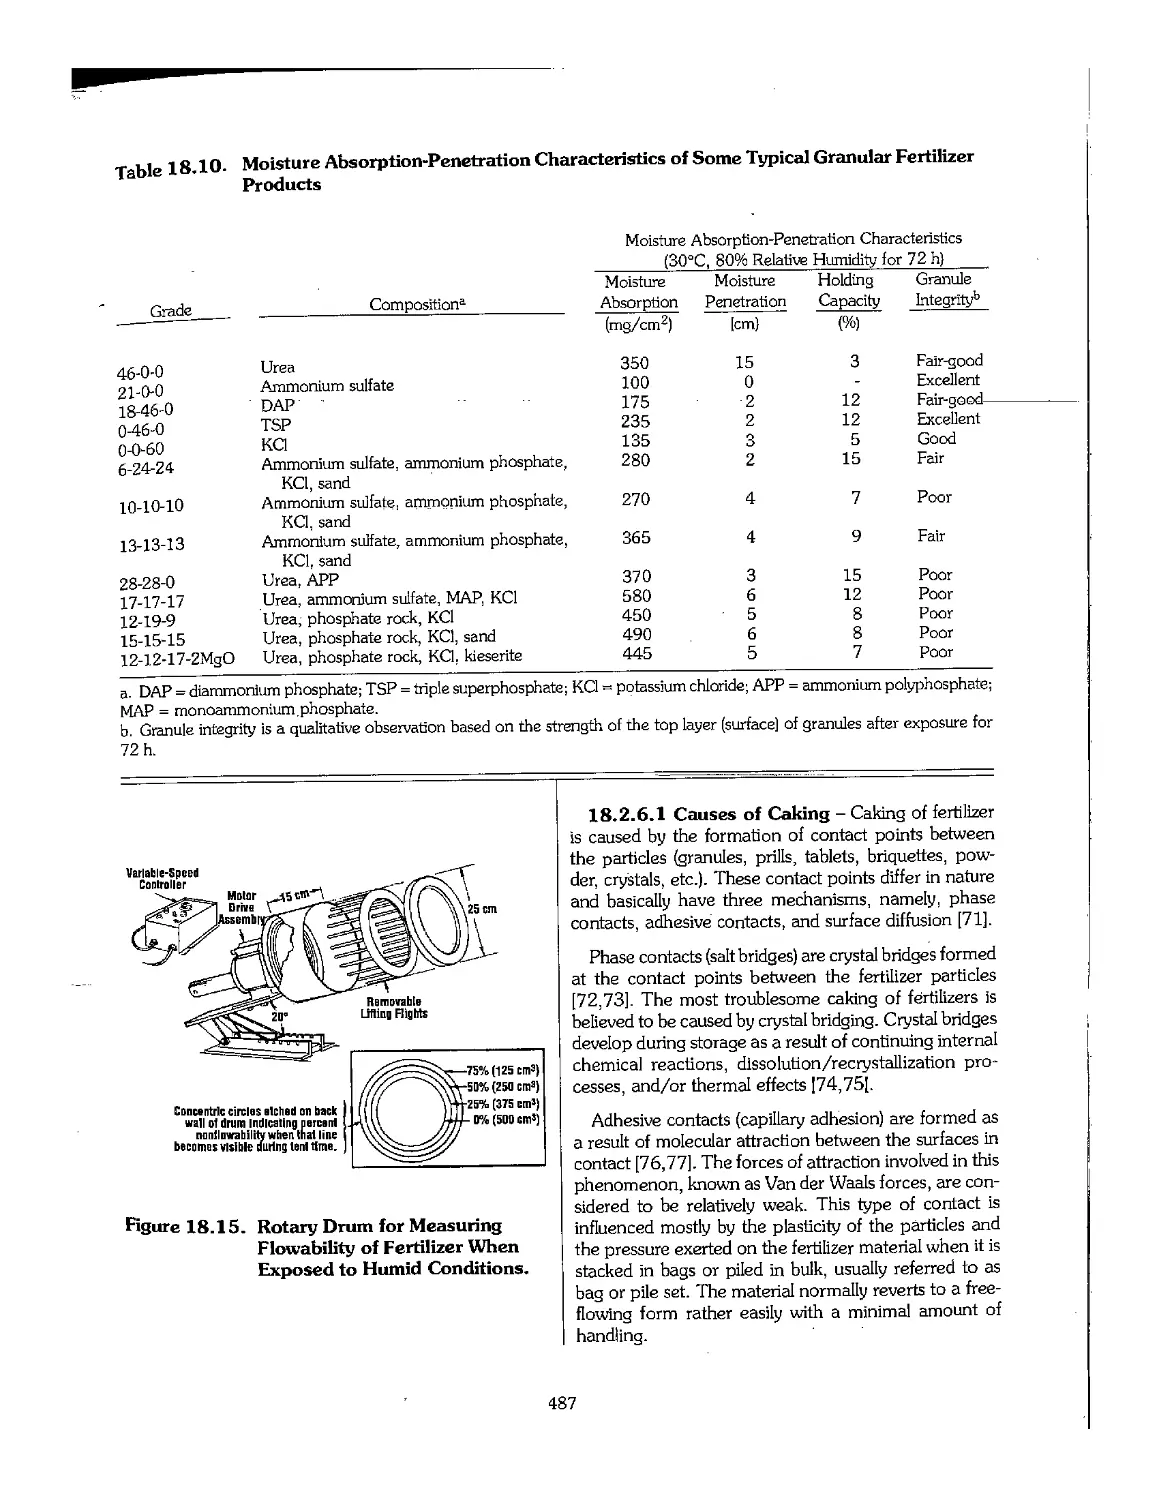
Chapter 18. Physical Properties of Fertilizers 470
18.1 Introduction 471
18.2 Physical Properties of Solid Fertilizers 471
18.3 Physical Properties of Fluid Fertilizers V :...:494
18.4 References 499
Chapter 19. Environmental Protection and Pollution Prevention 506
19.1 Introduction 507
19.2 Environmental Issues Related to the Use of Fertilizers ,. 508
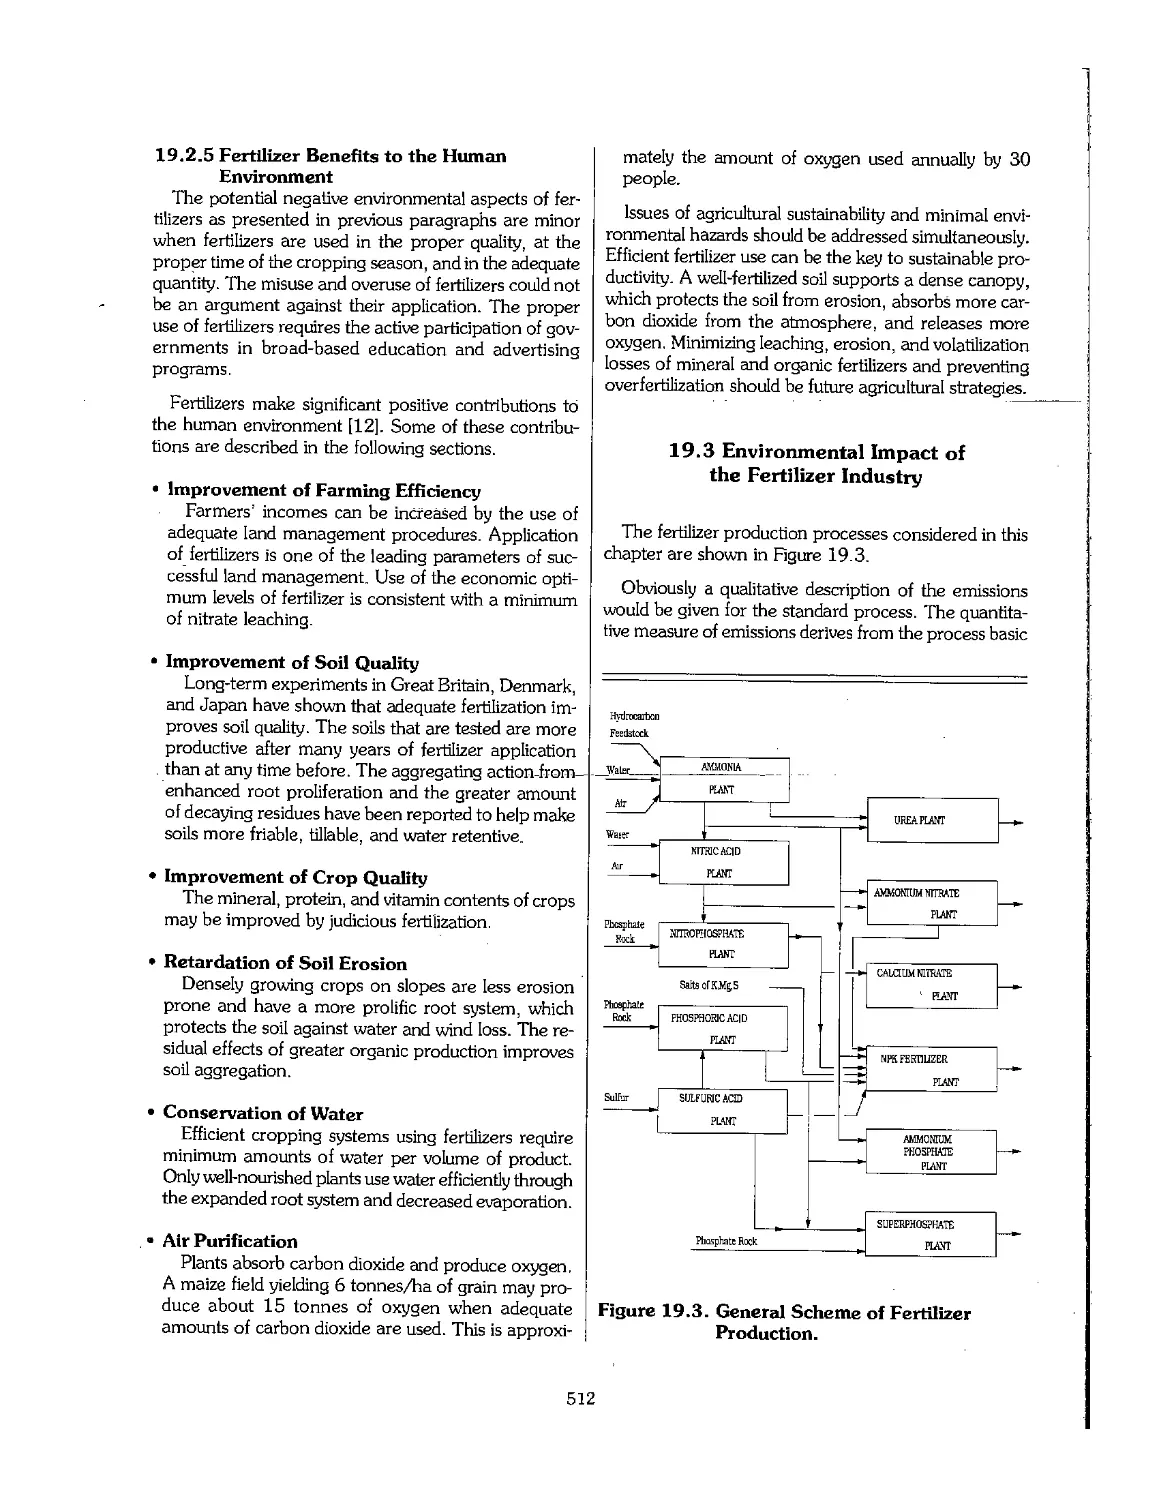
19.3 Environmental Impact of the Fertilizer Industry 512
19.4 Phosphogypsum 535
19.5 Environmental Impact Assessment 537
19.6 The Role of International Organizations 540
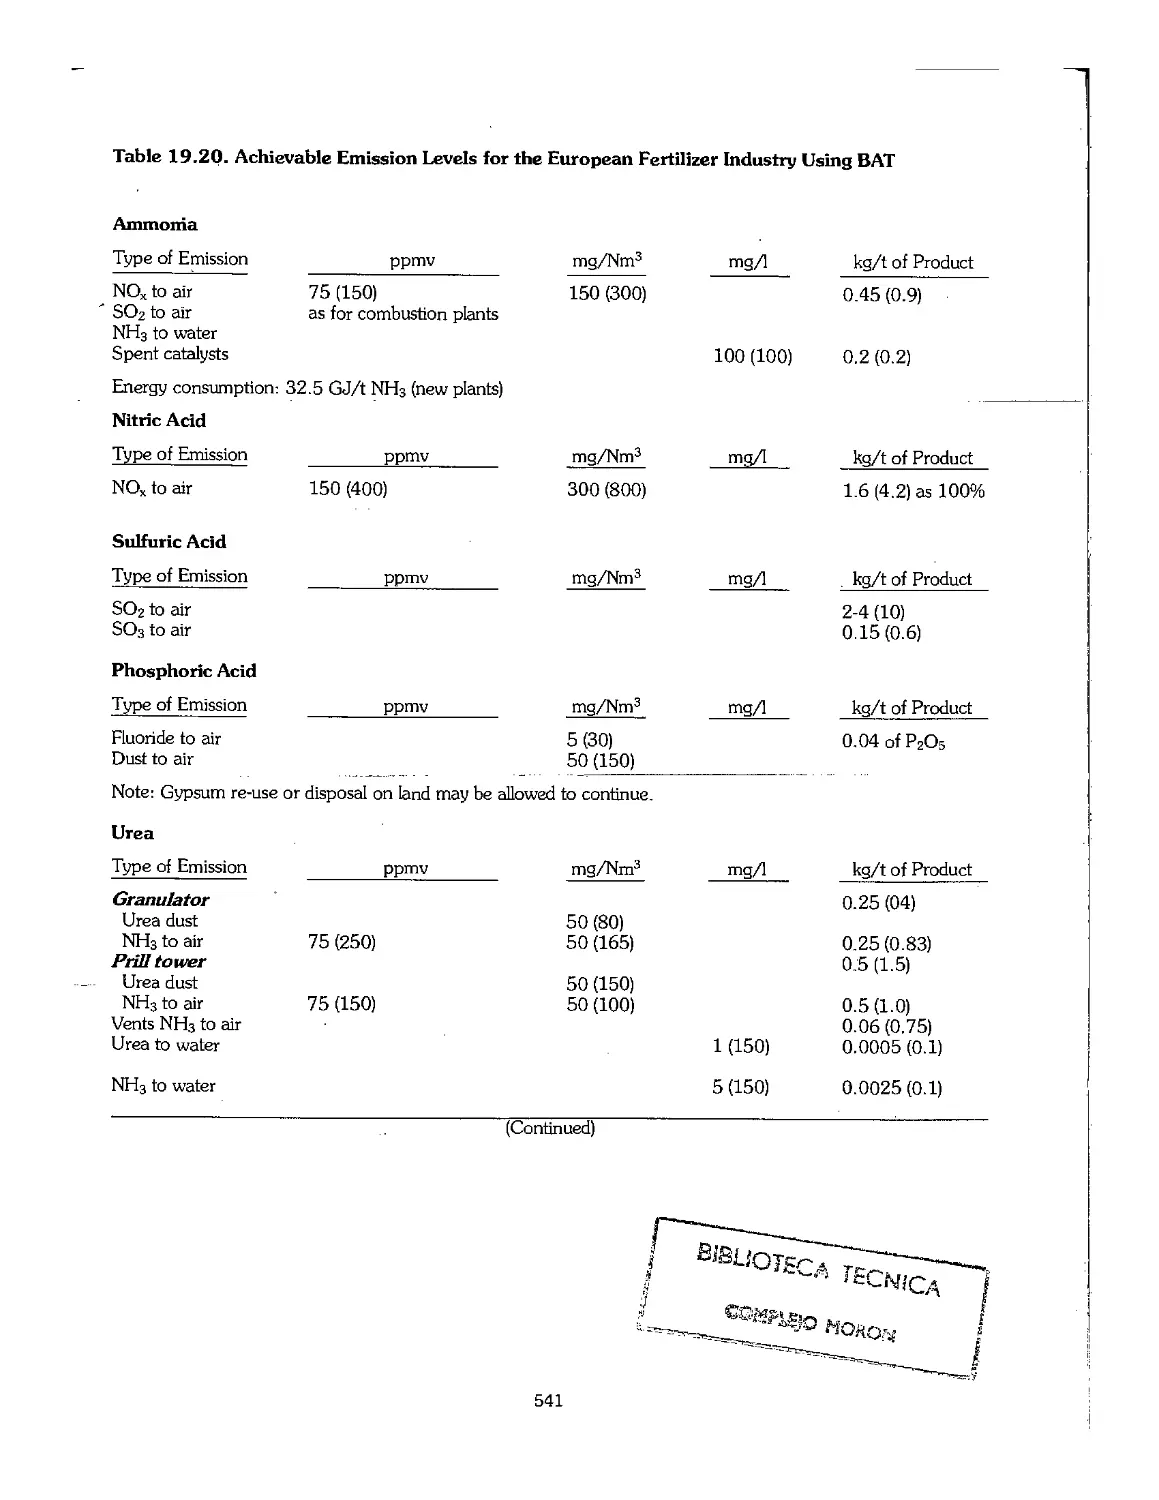
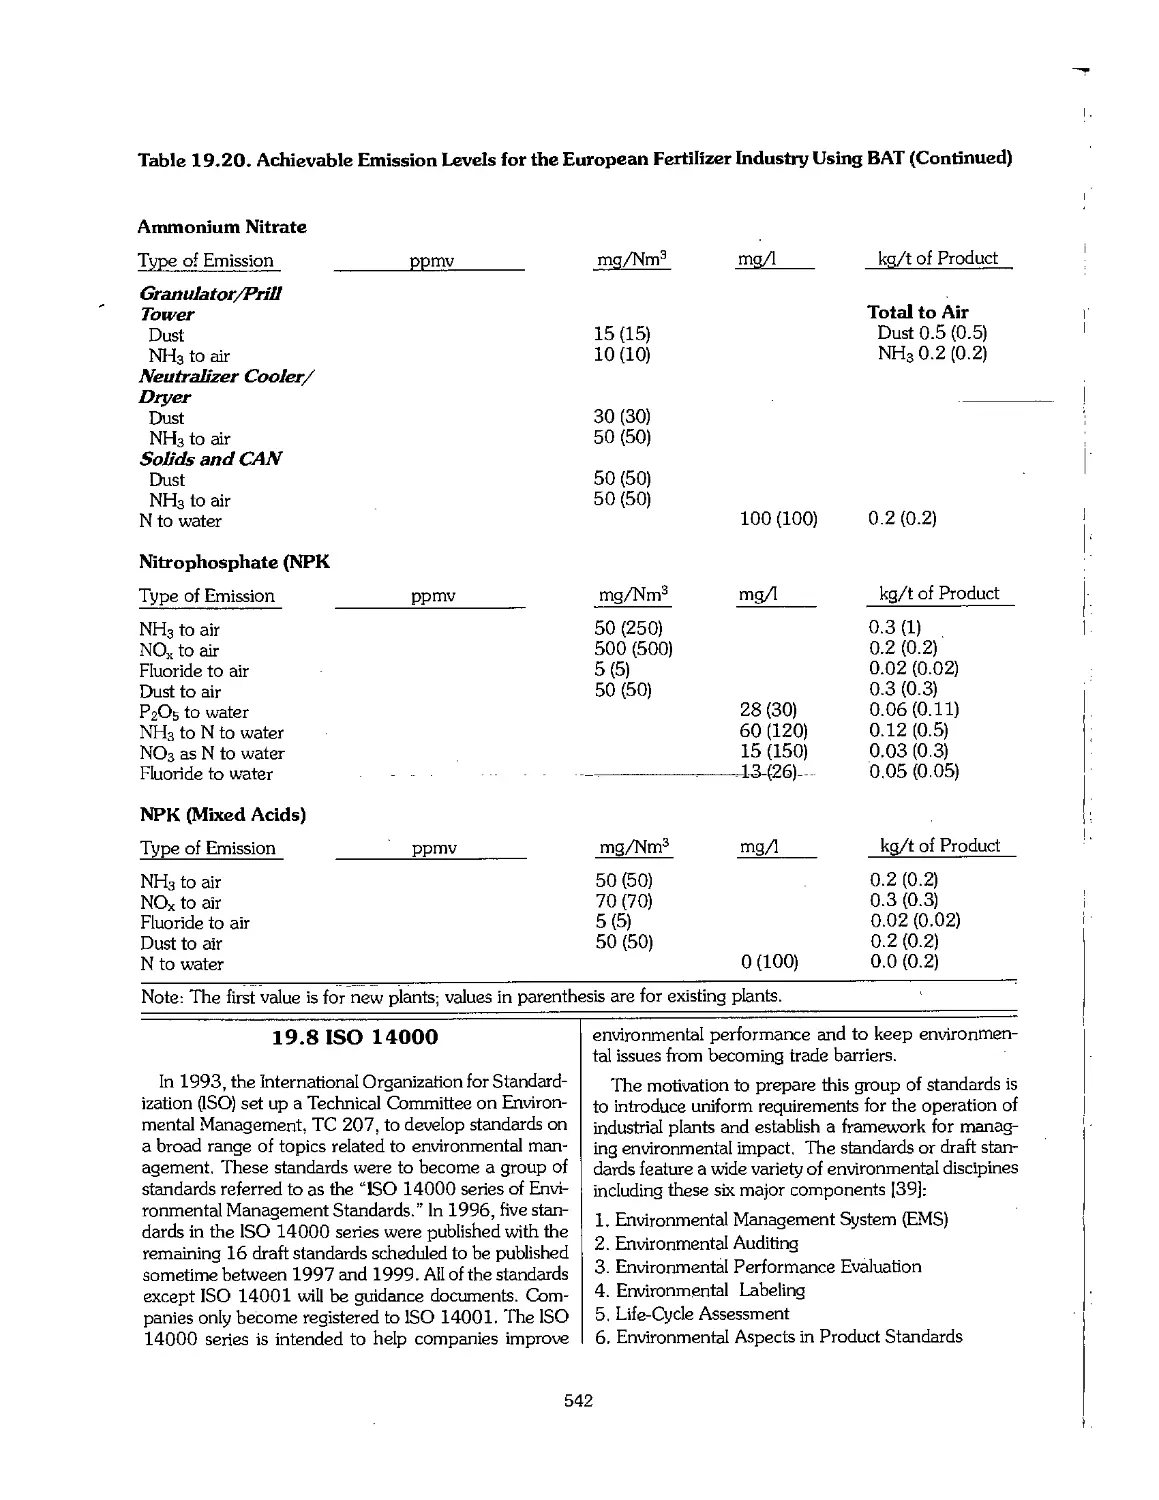
19.7 Best Available Technology (BAT) 540
19.8 ISO 14000 542
19.9 References ...f..... 543
Chapter 20. Planning for the Development of a Fertilizer Industry 545
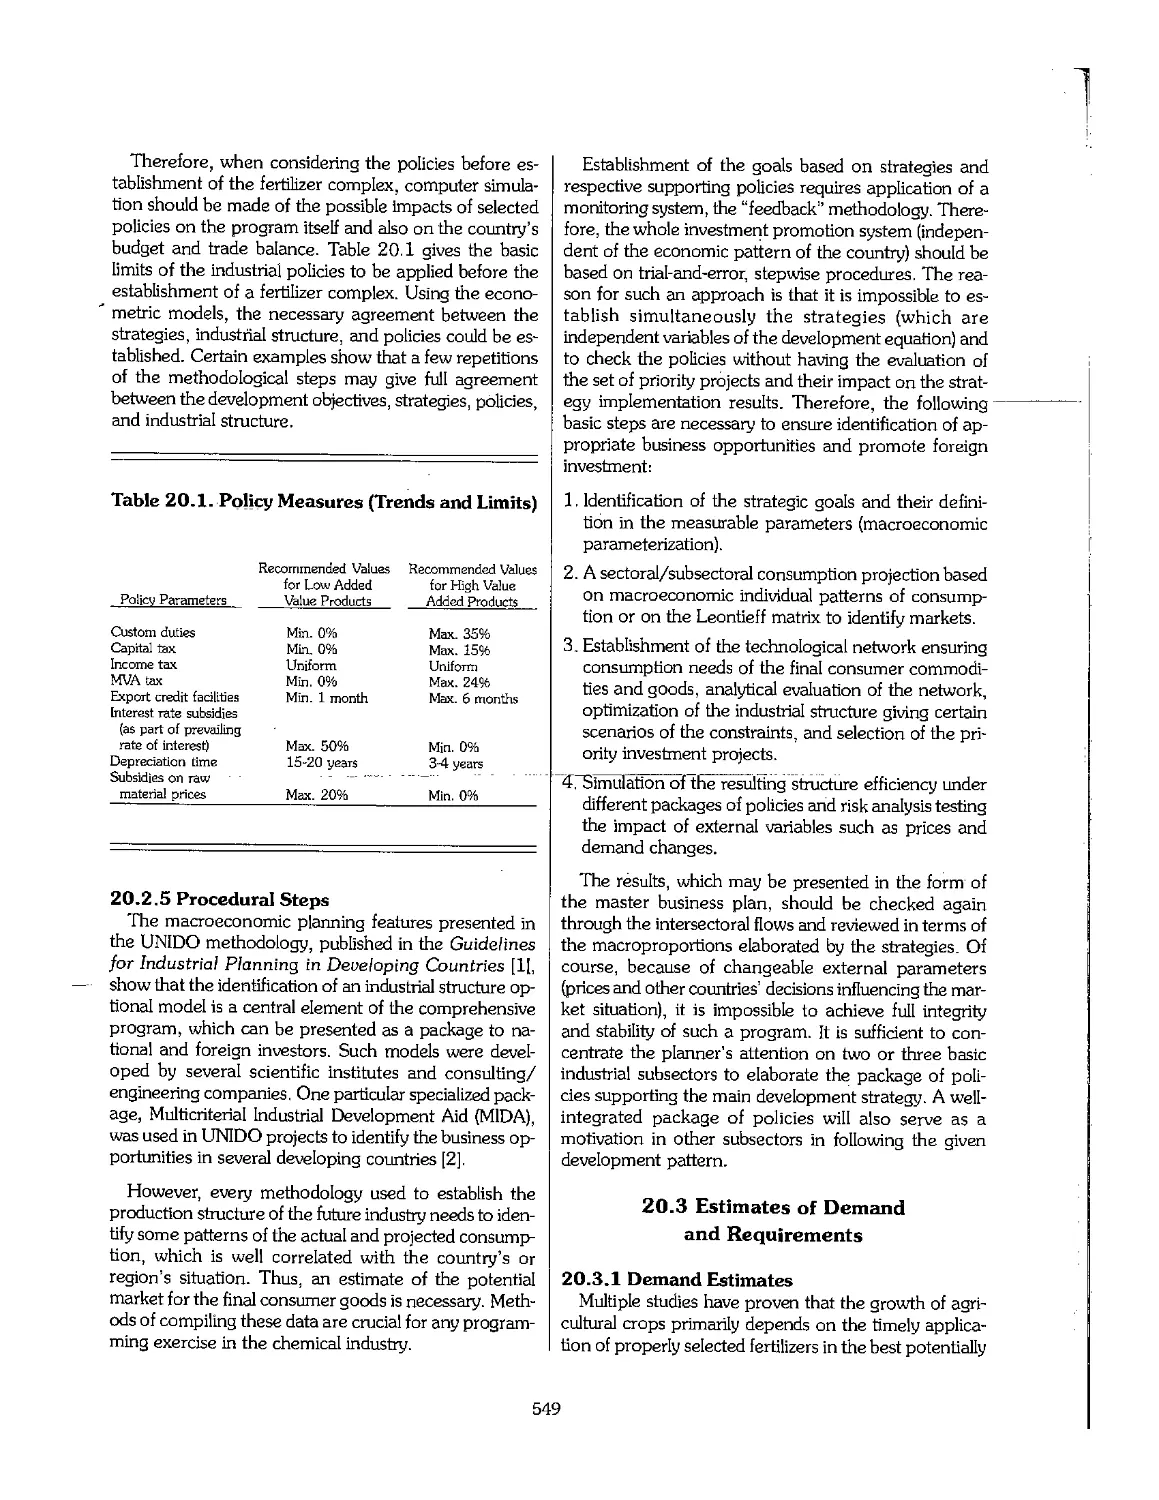
20.1 Introduction 546
20.2 Strategies and Policies of Fertilizer Industry Development 547
20.3 Estimates of Demand_and_Requirements_.,,,,,,,,,,,_._._._._._._..._._,^,...._,^._._._._._._._._._._._._._._._. 549
20.4 Establishment and Development of the Fertilizer Industry 558
20.5 Paving the Way to Plant Operation , 564
20.6 References ,.... 567
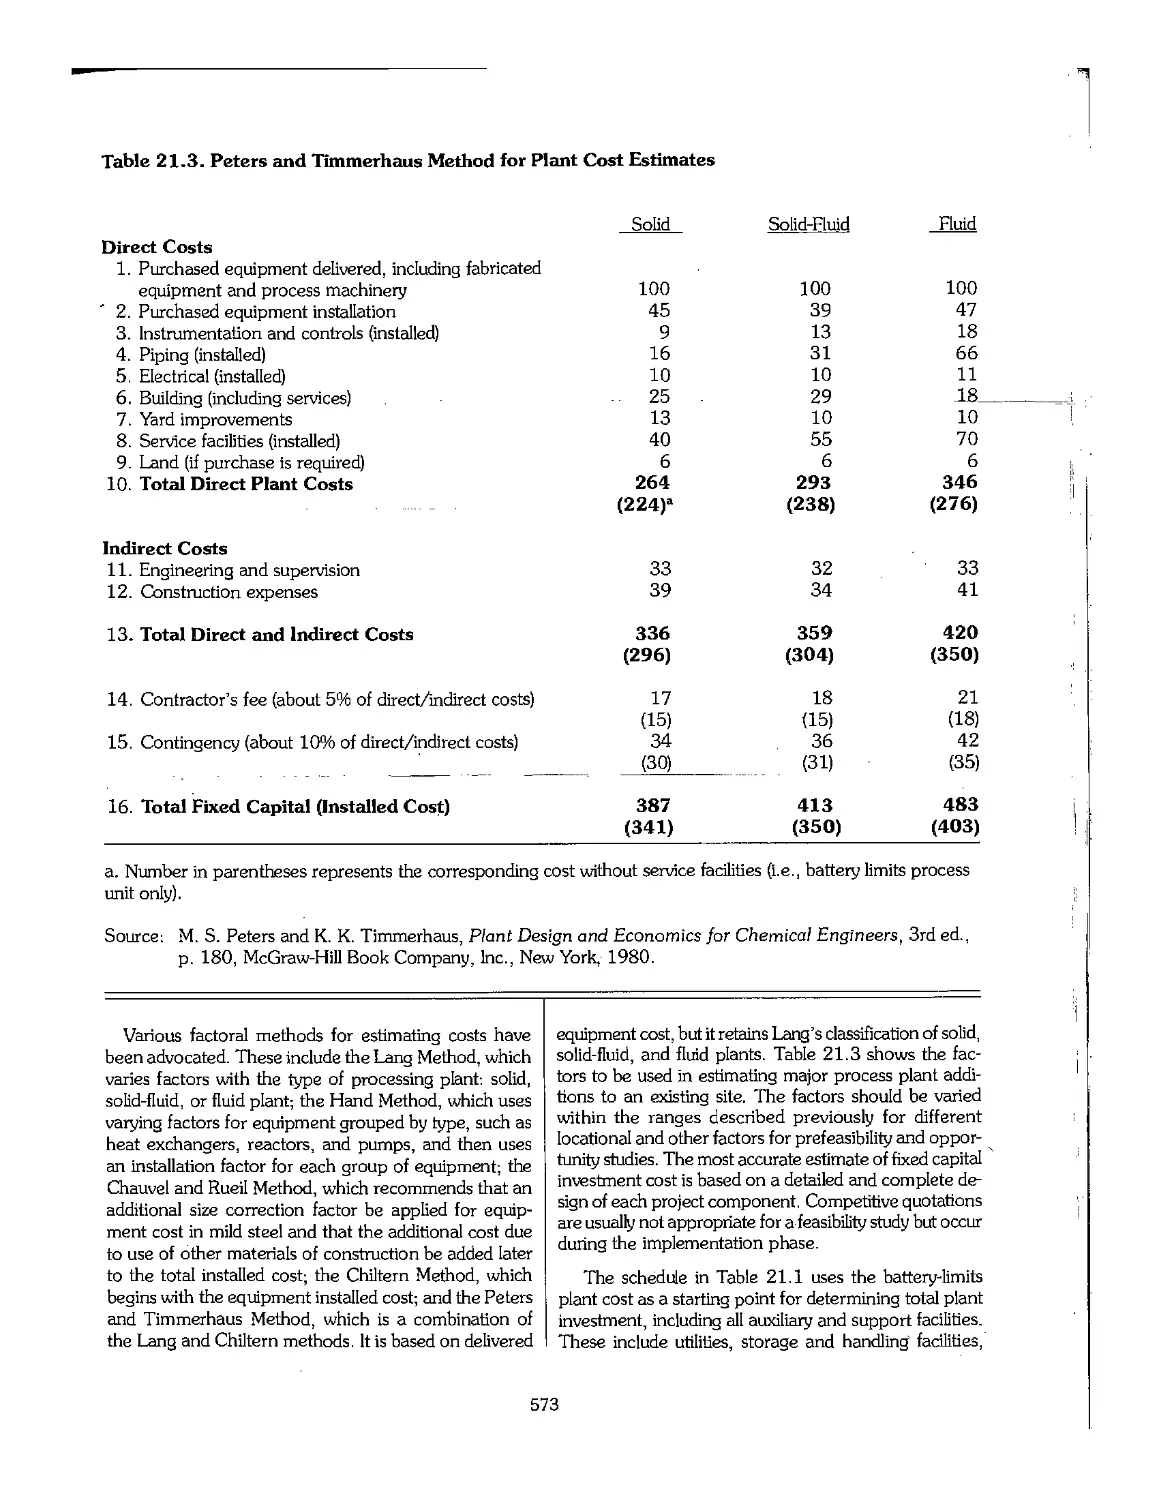
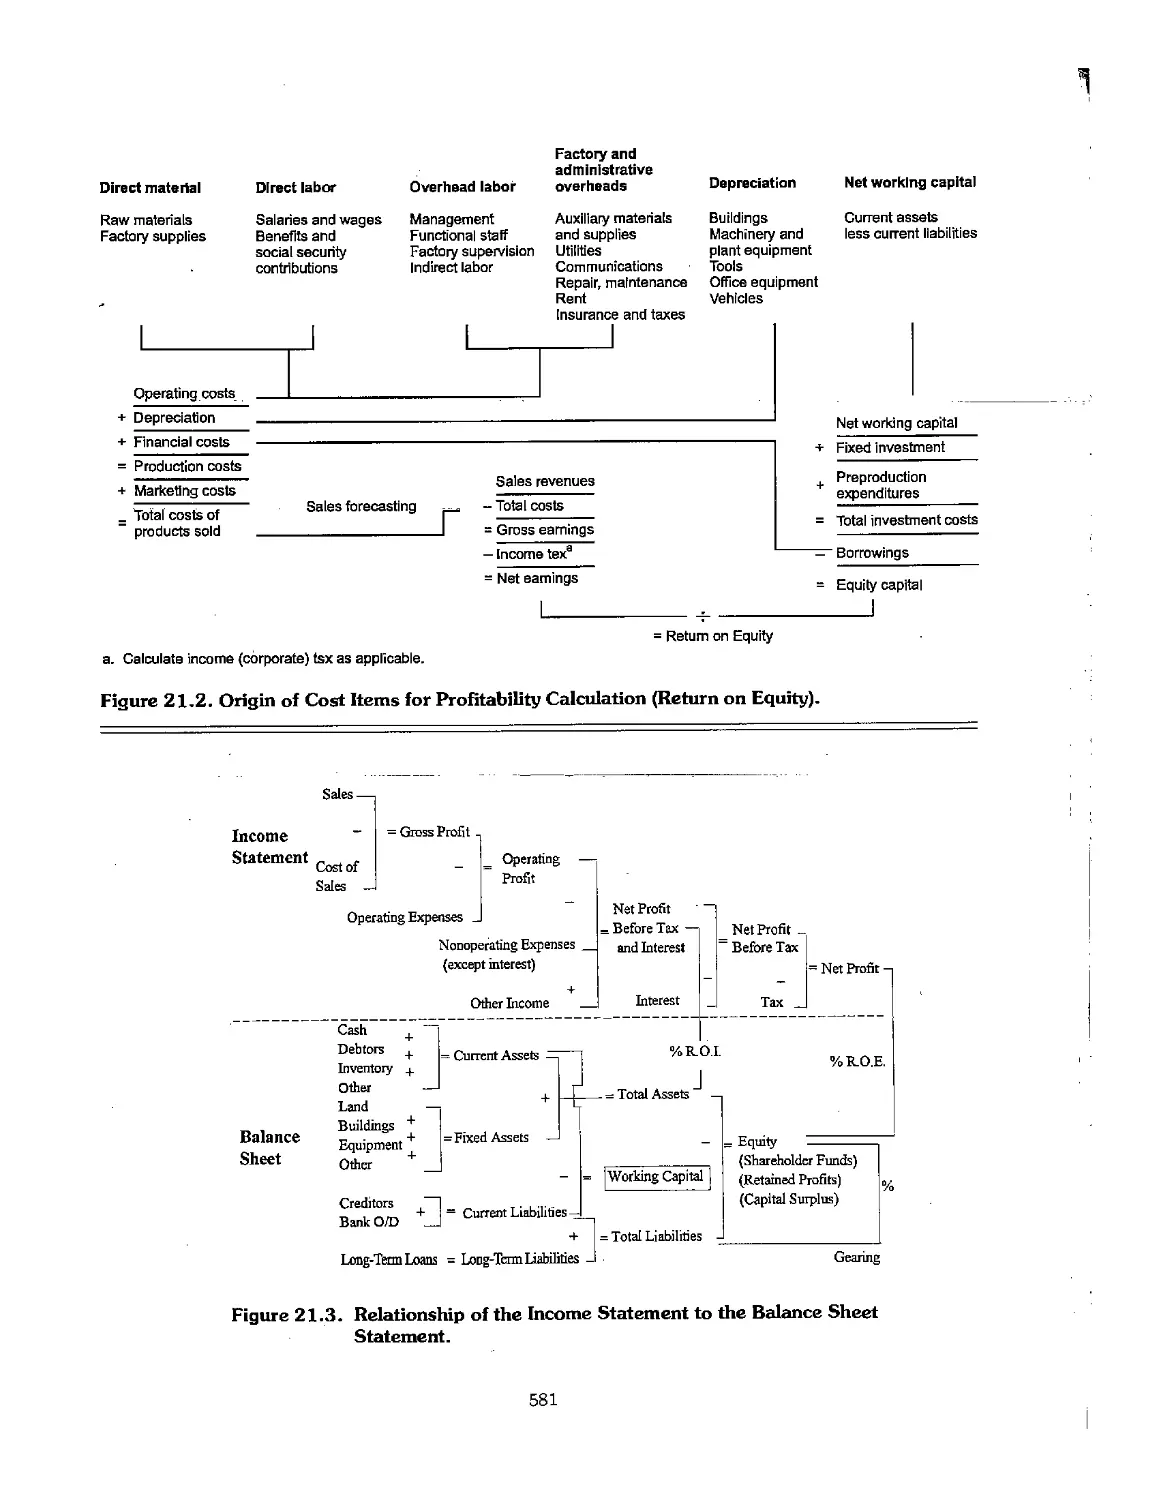
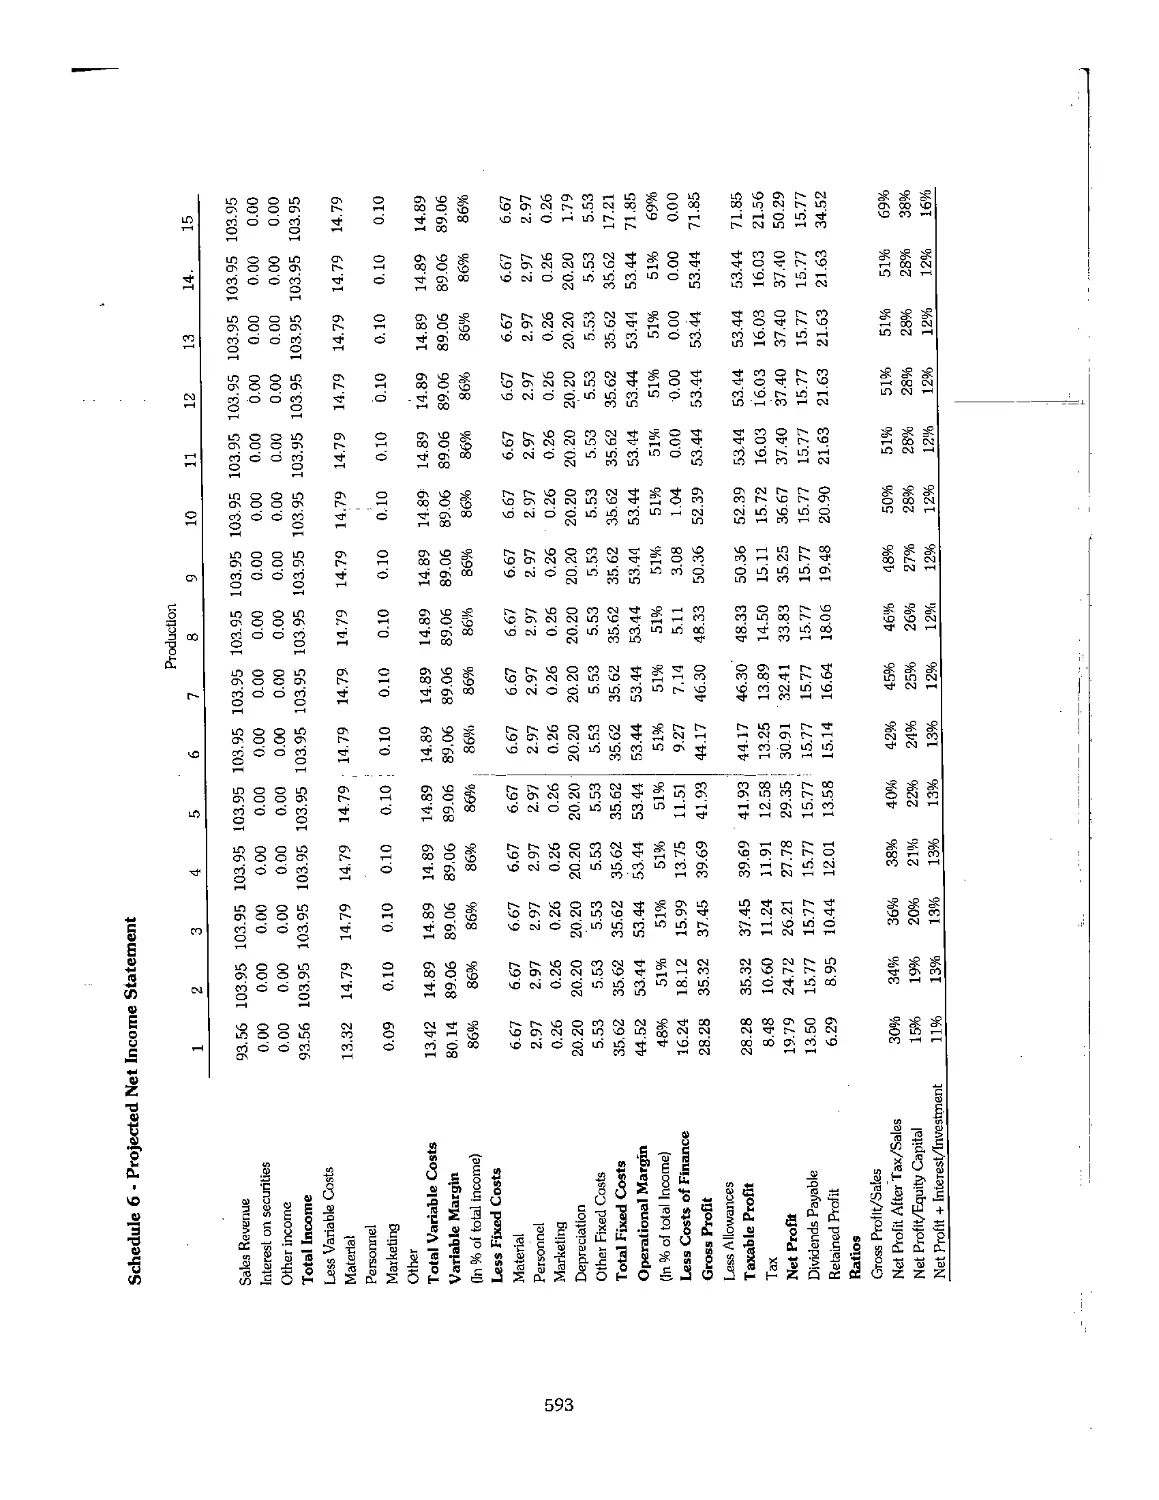
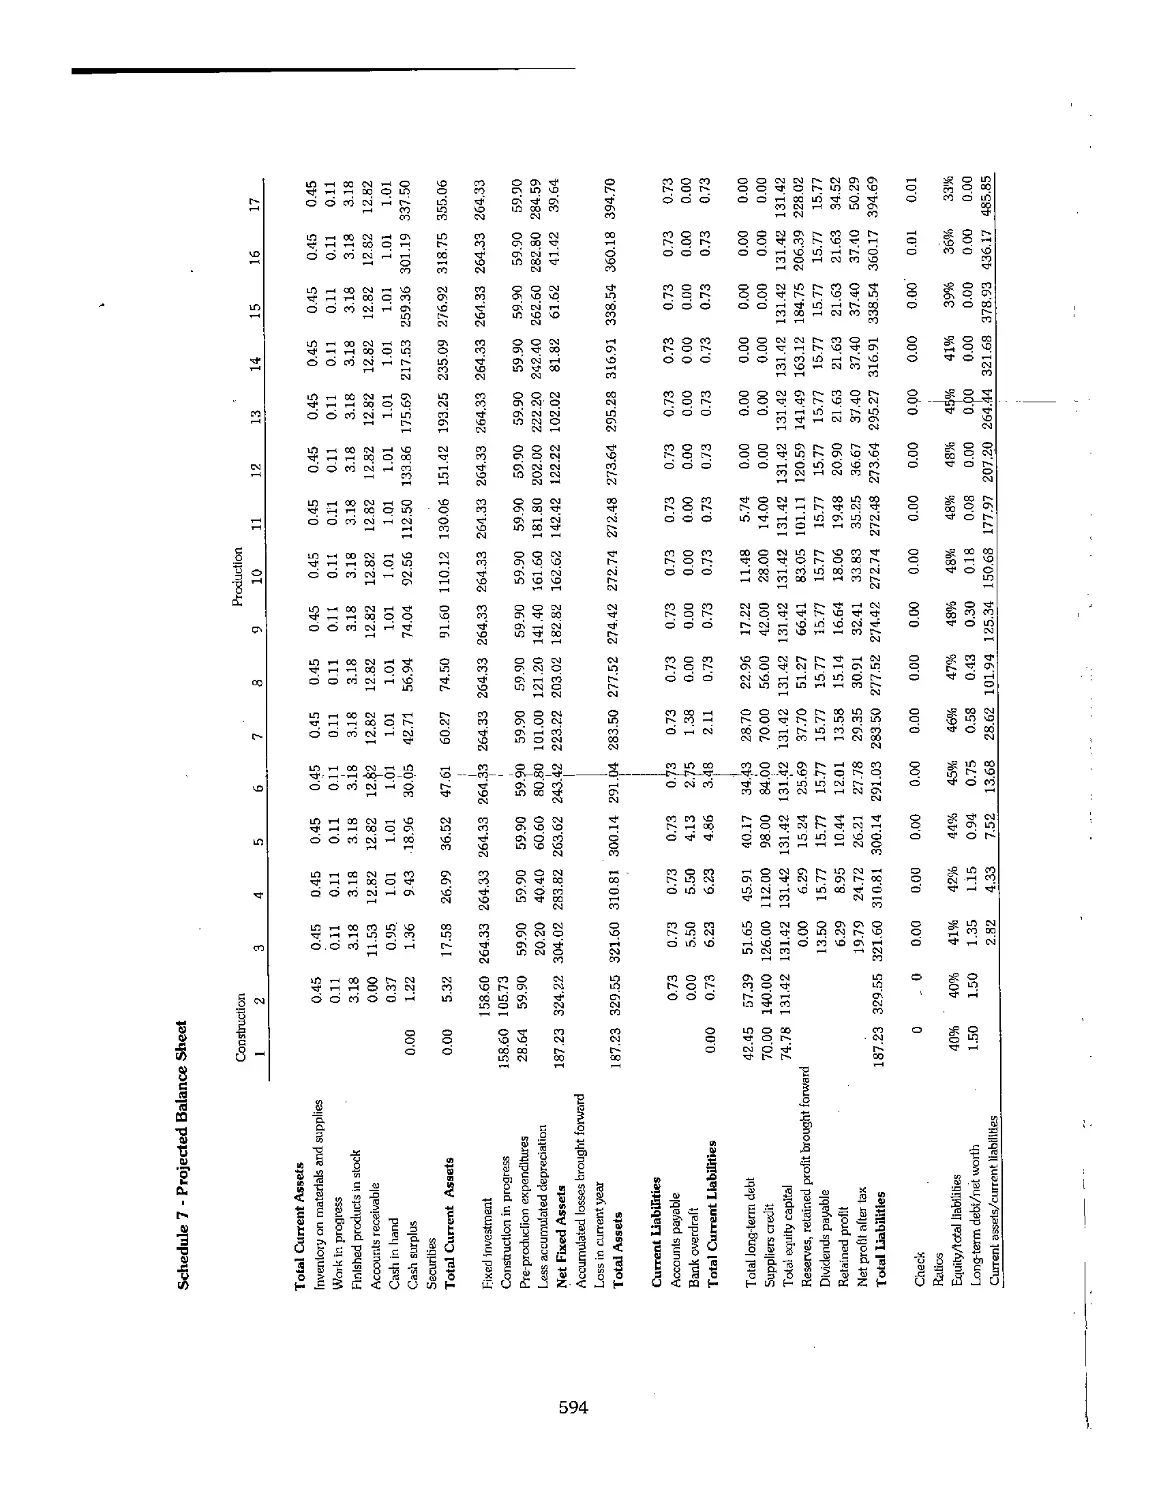
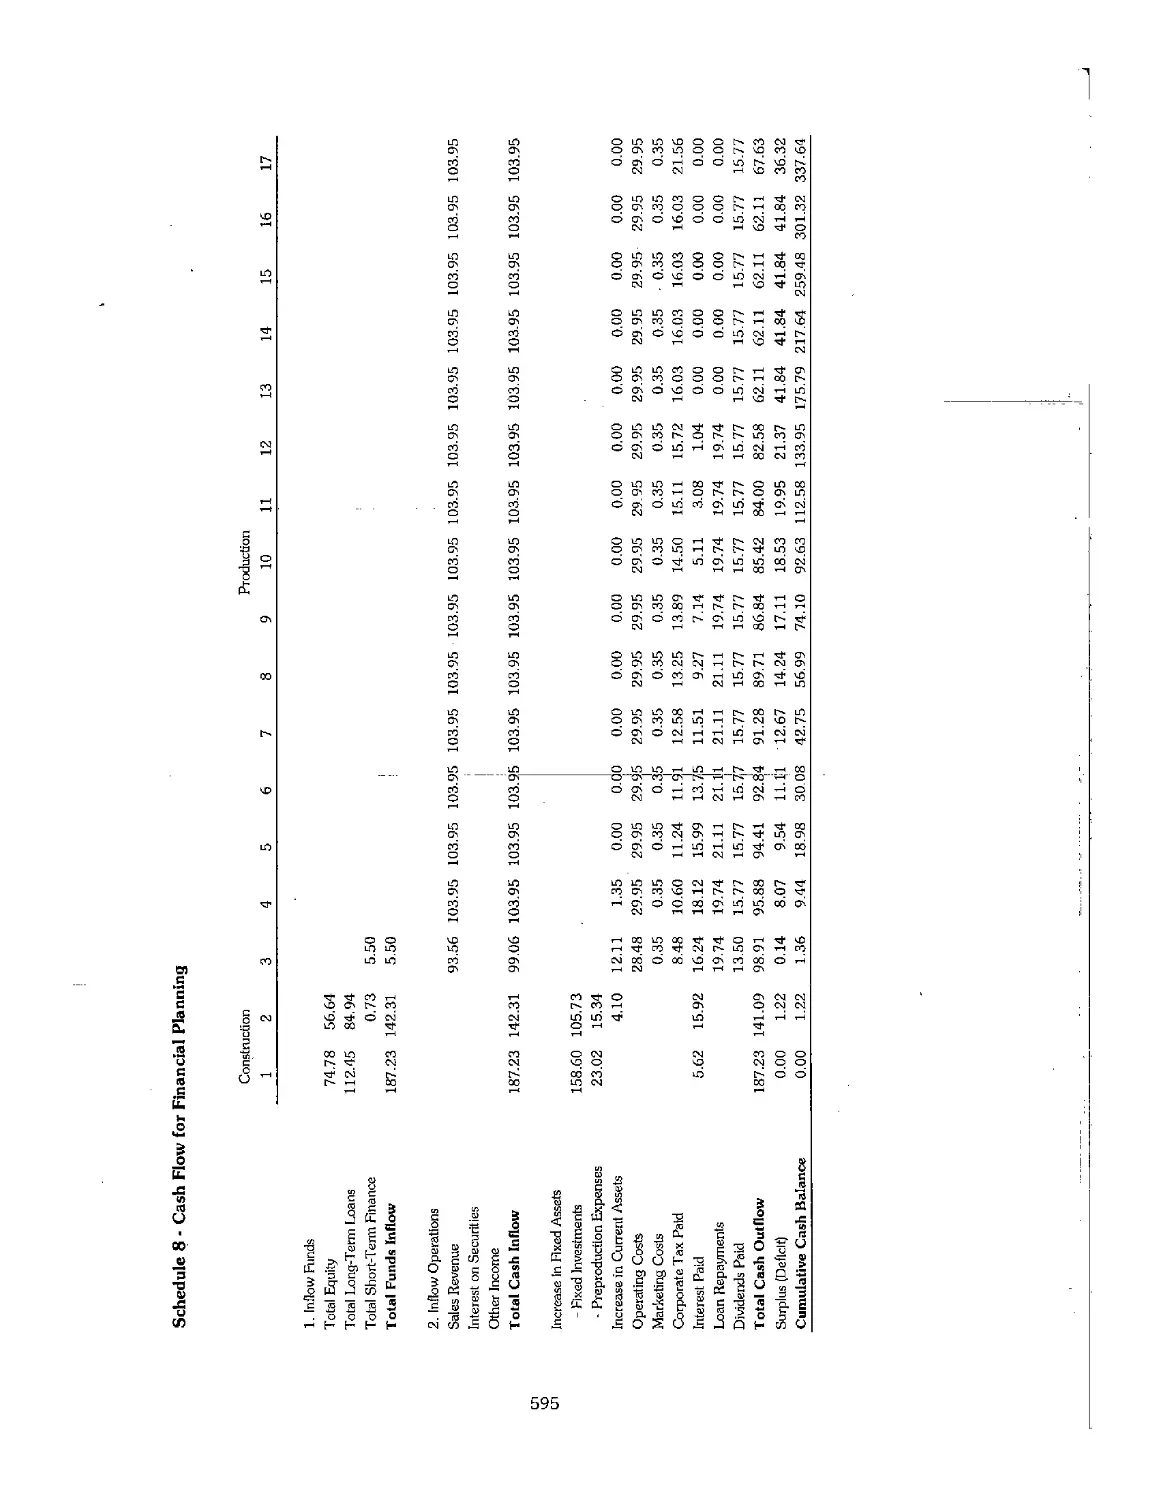
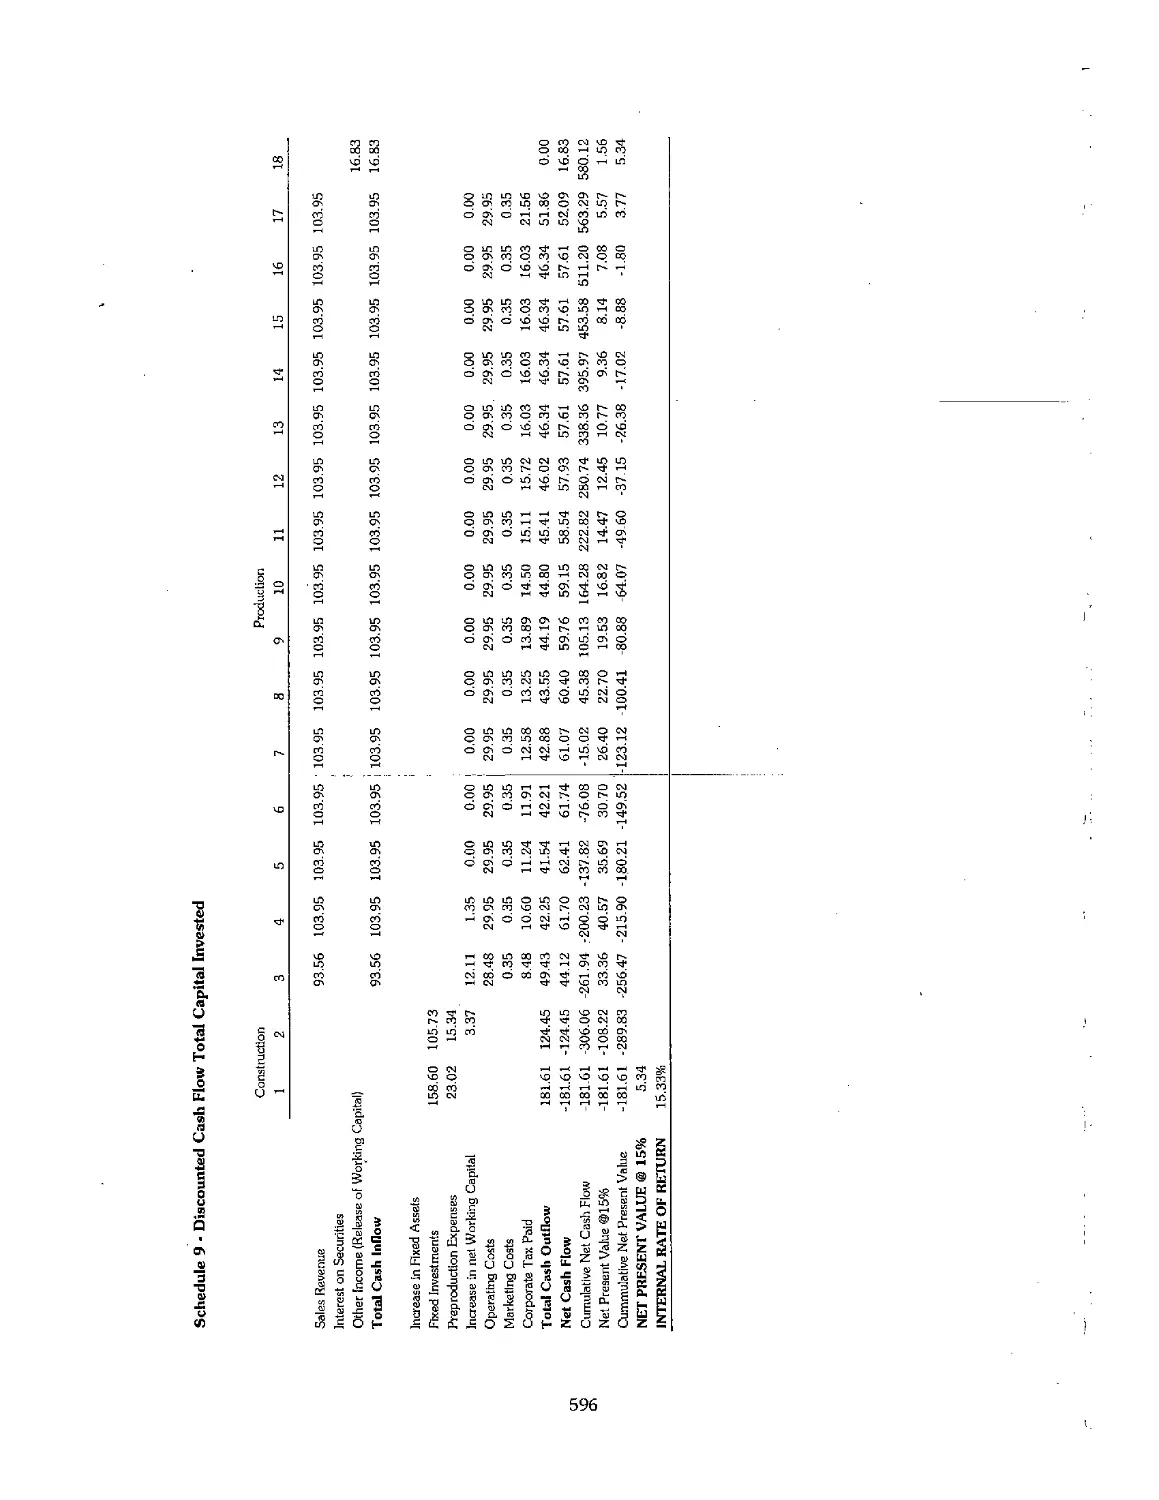
Chapter 21. Economics of Fertilizer Manufacture 568
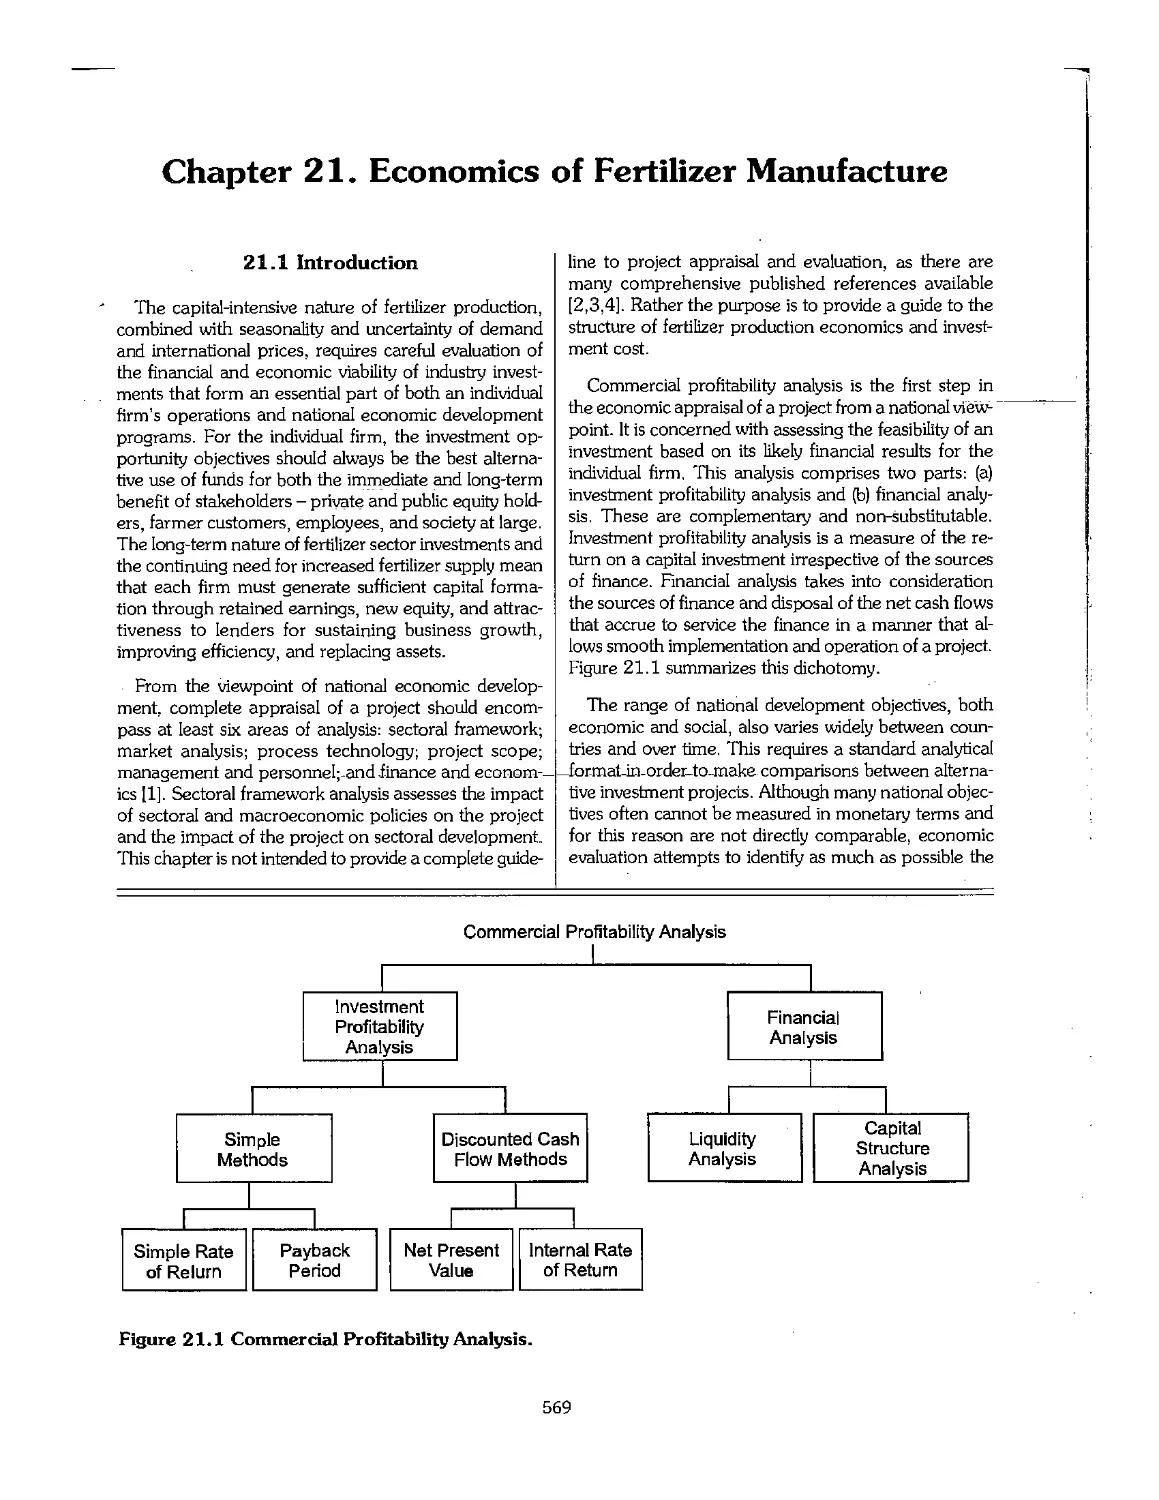
21.1 Introduction 569
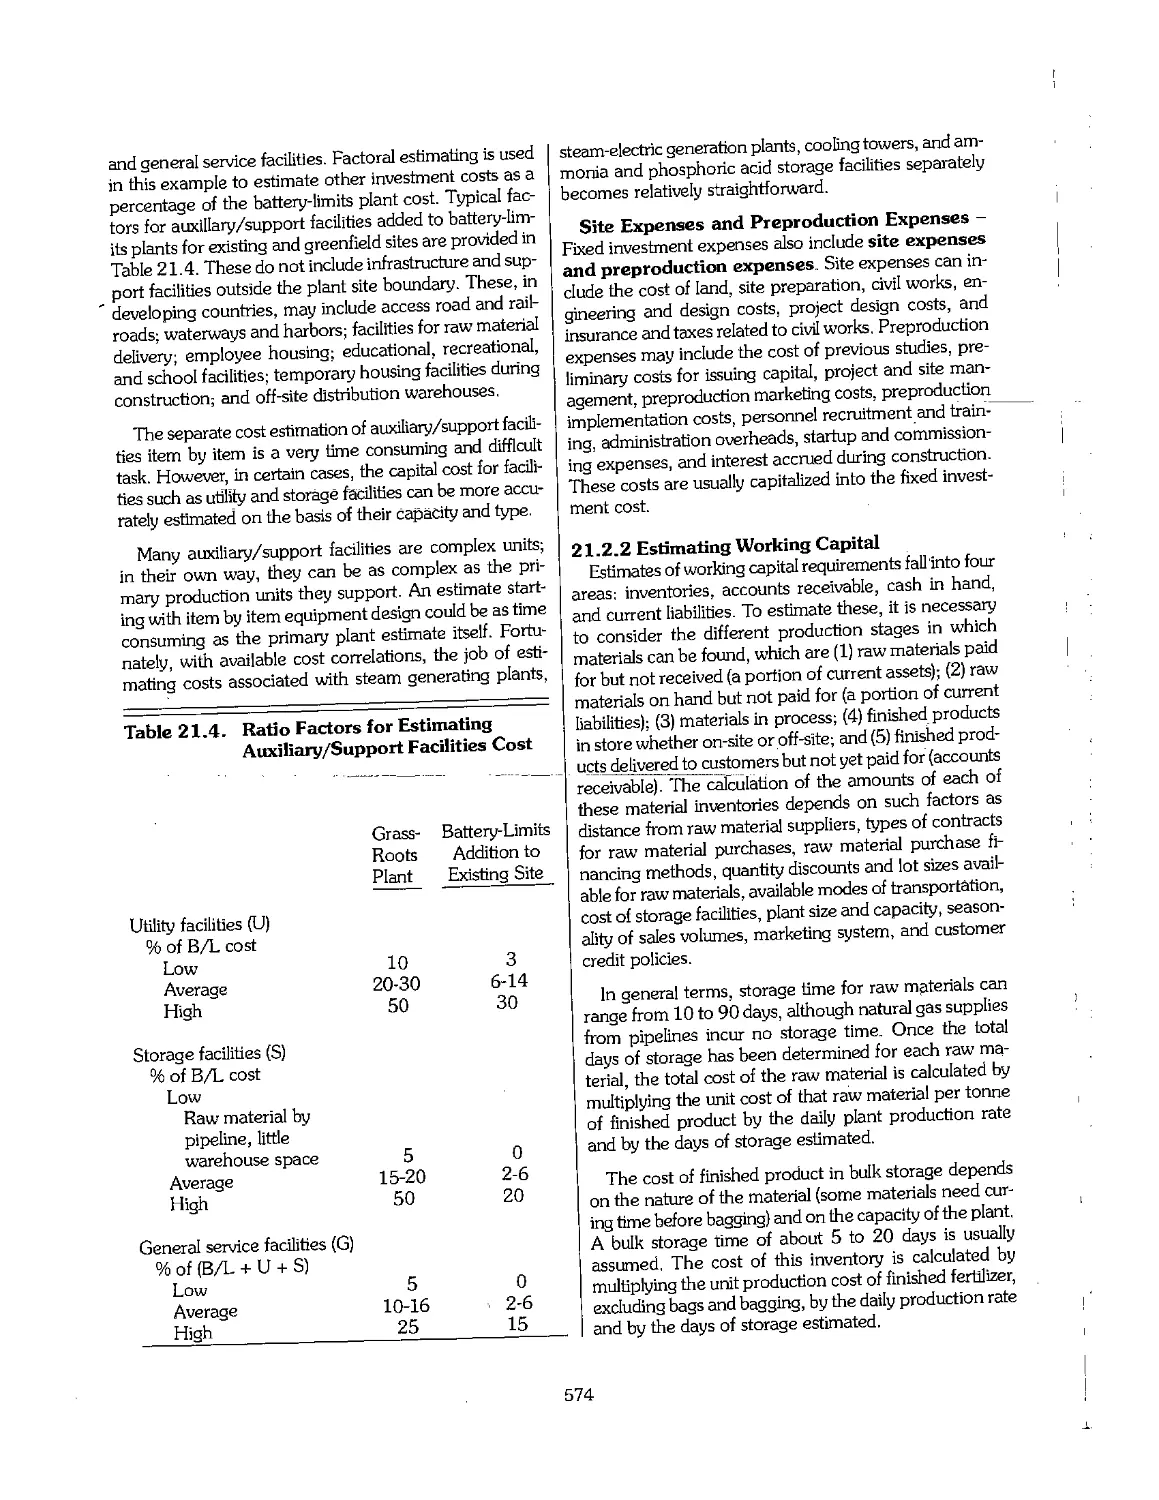
21.2 The Structure of Investment Costs 570
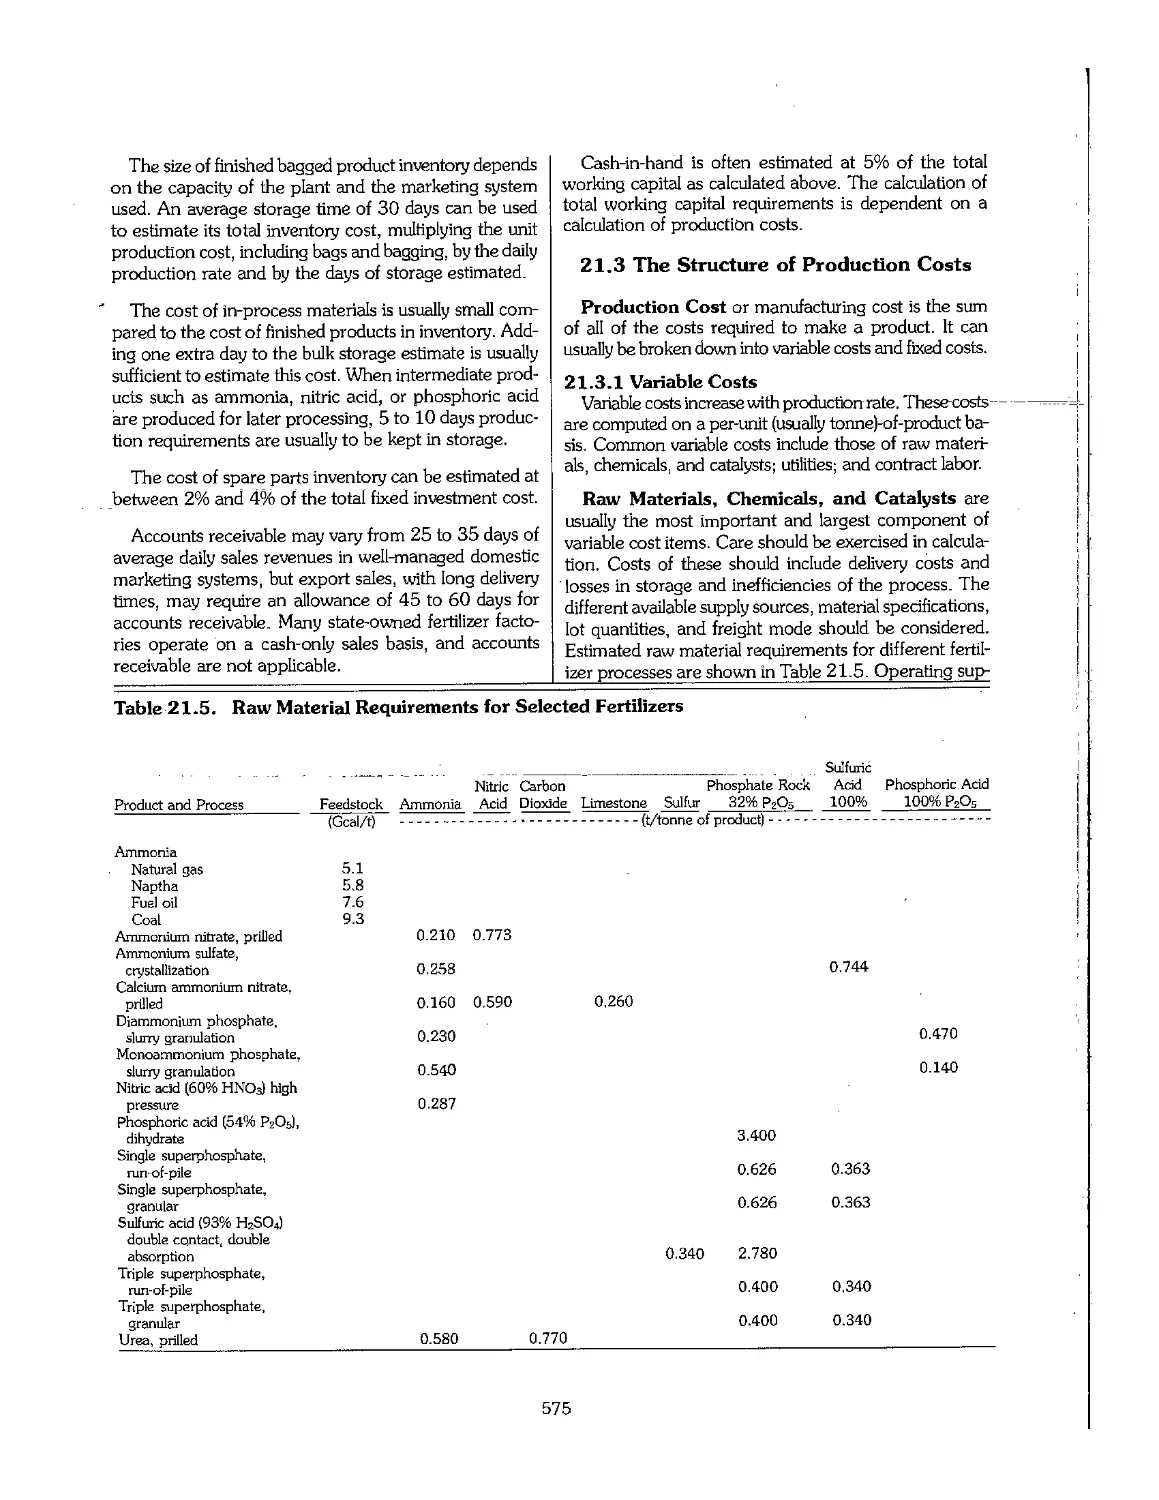
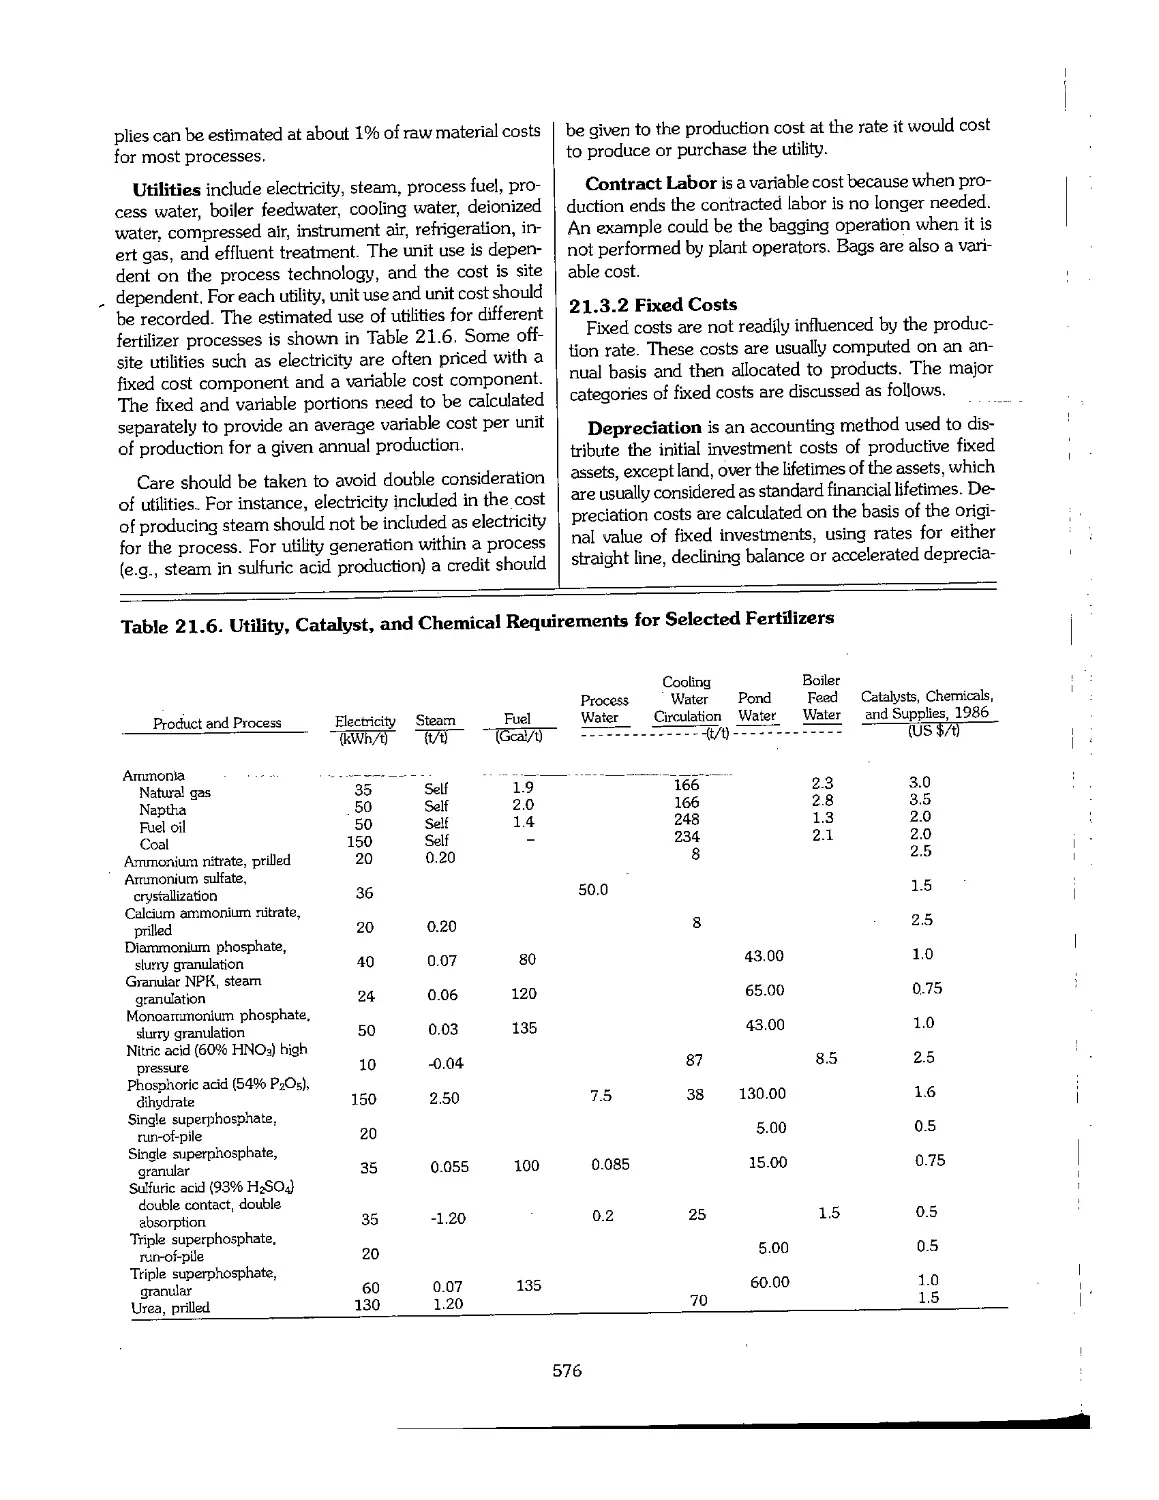
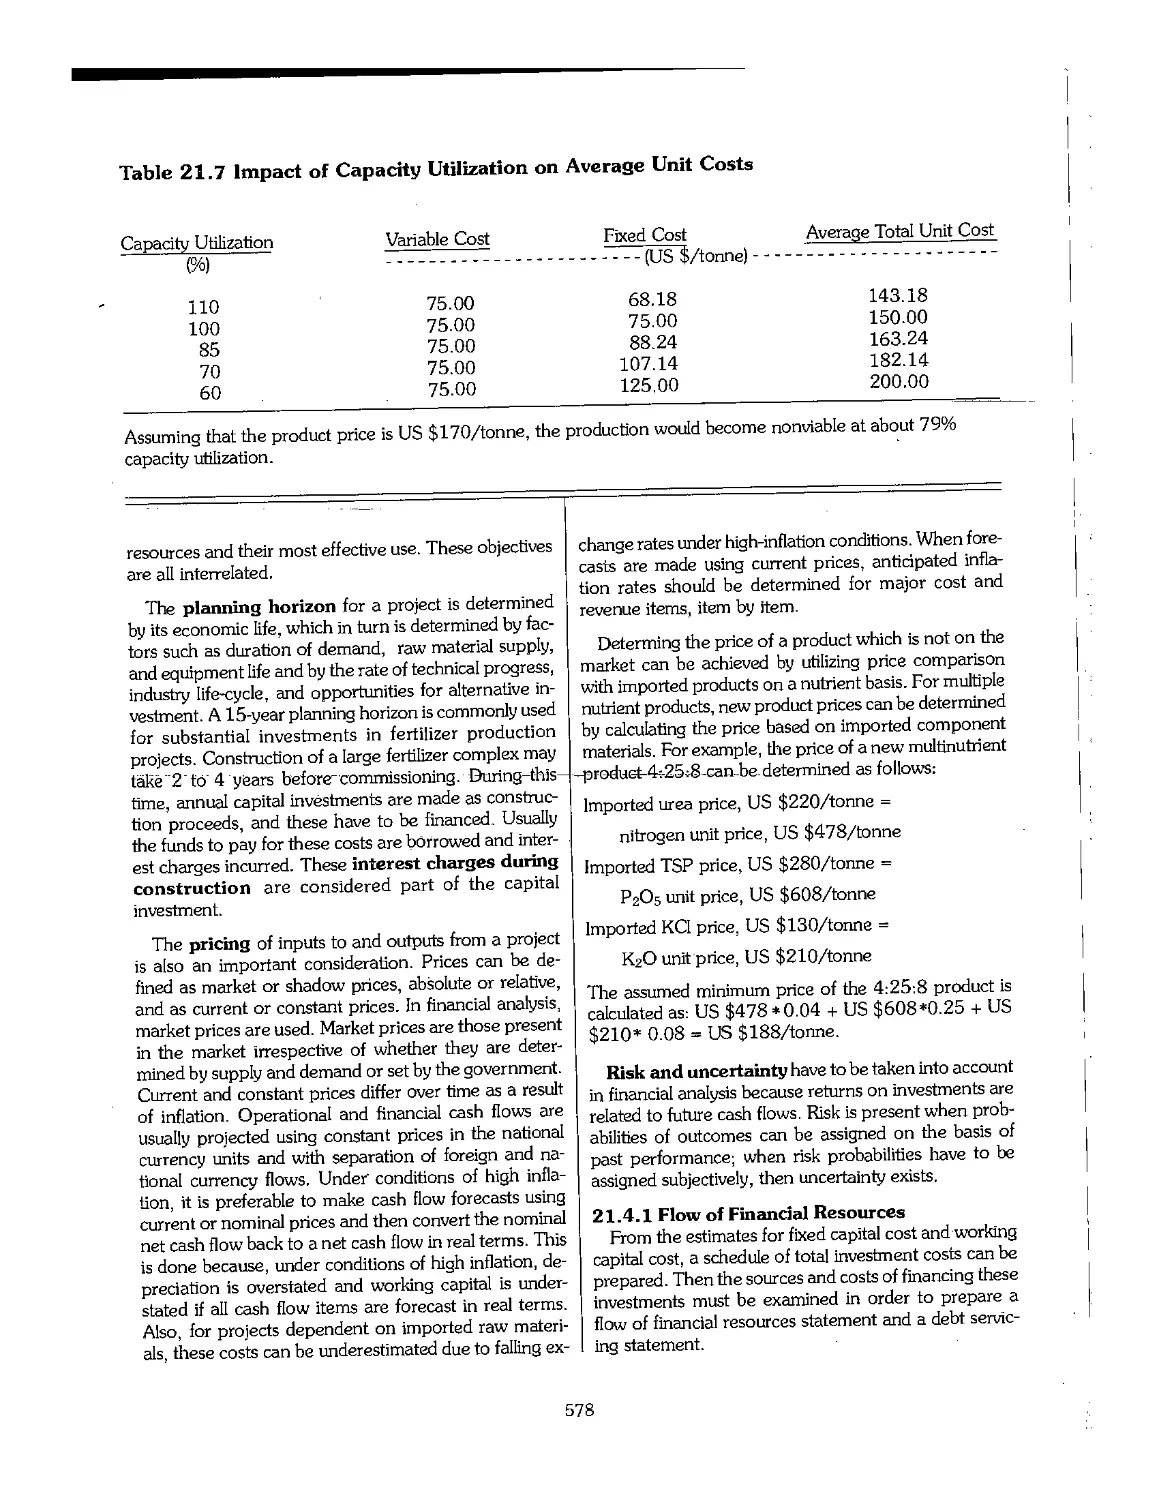
21.3 The Structure of Production Costs 575
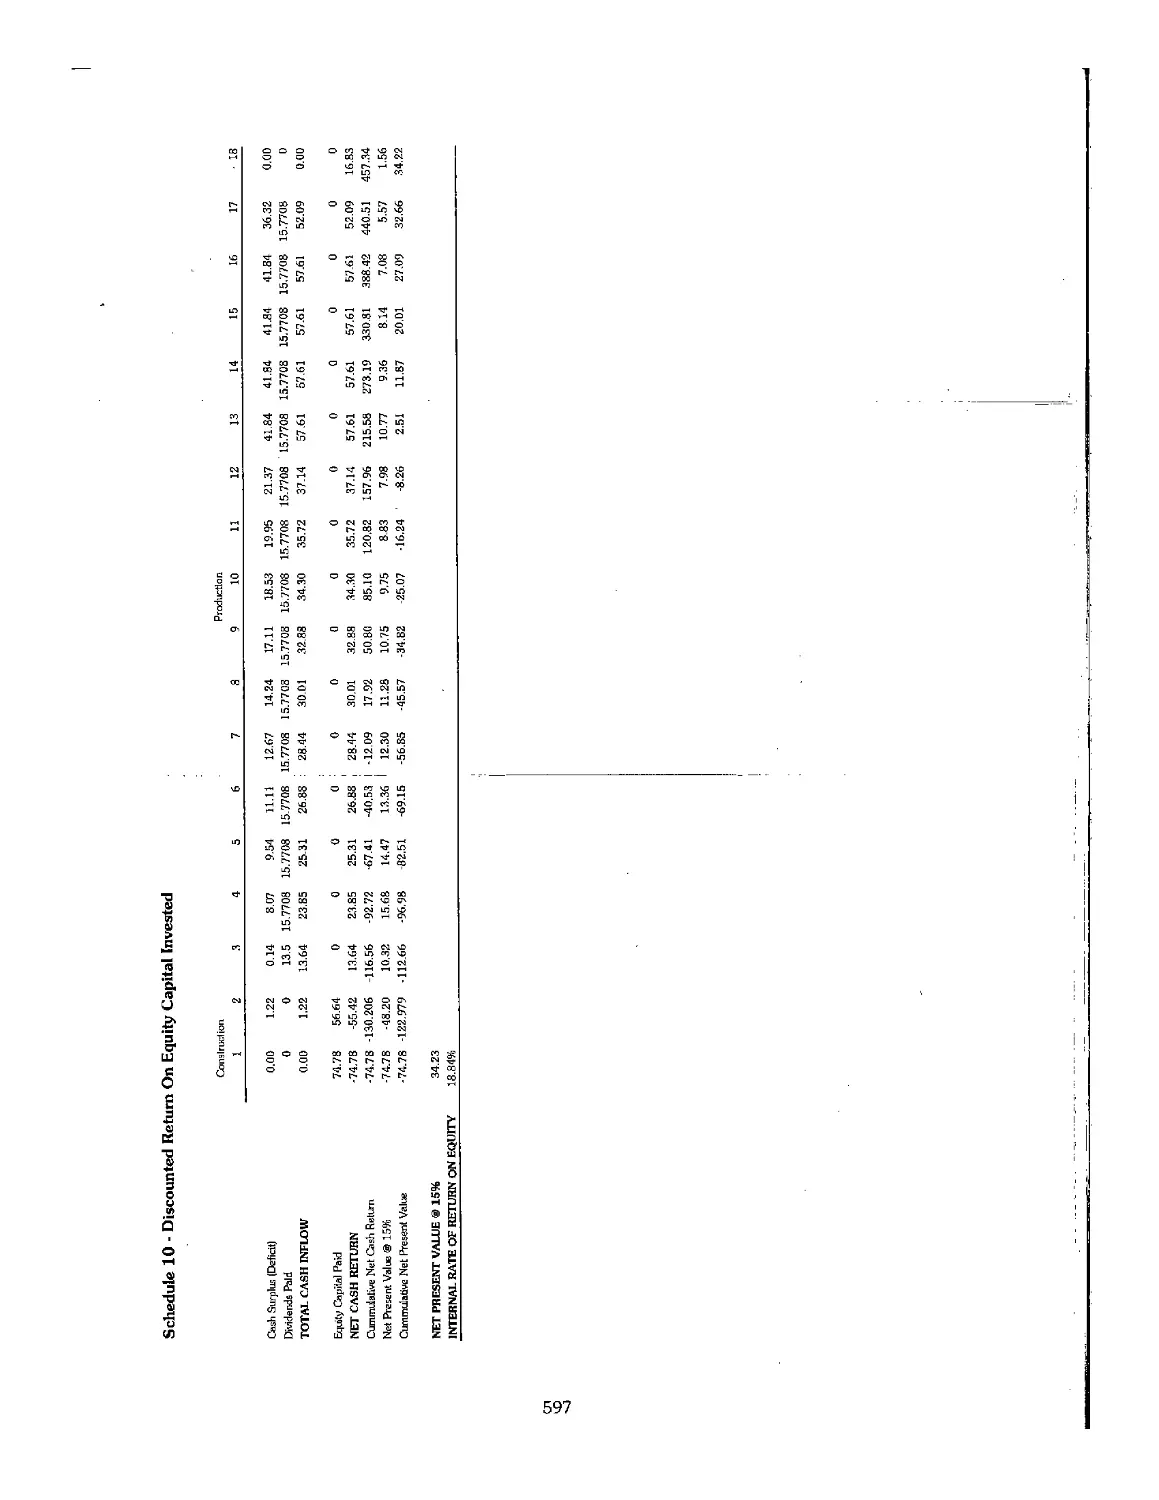
21.4 Financial Analysis 577
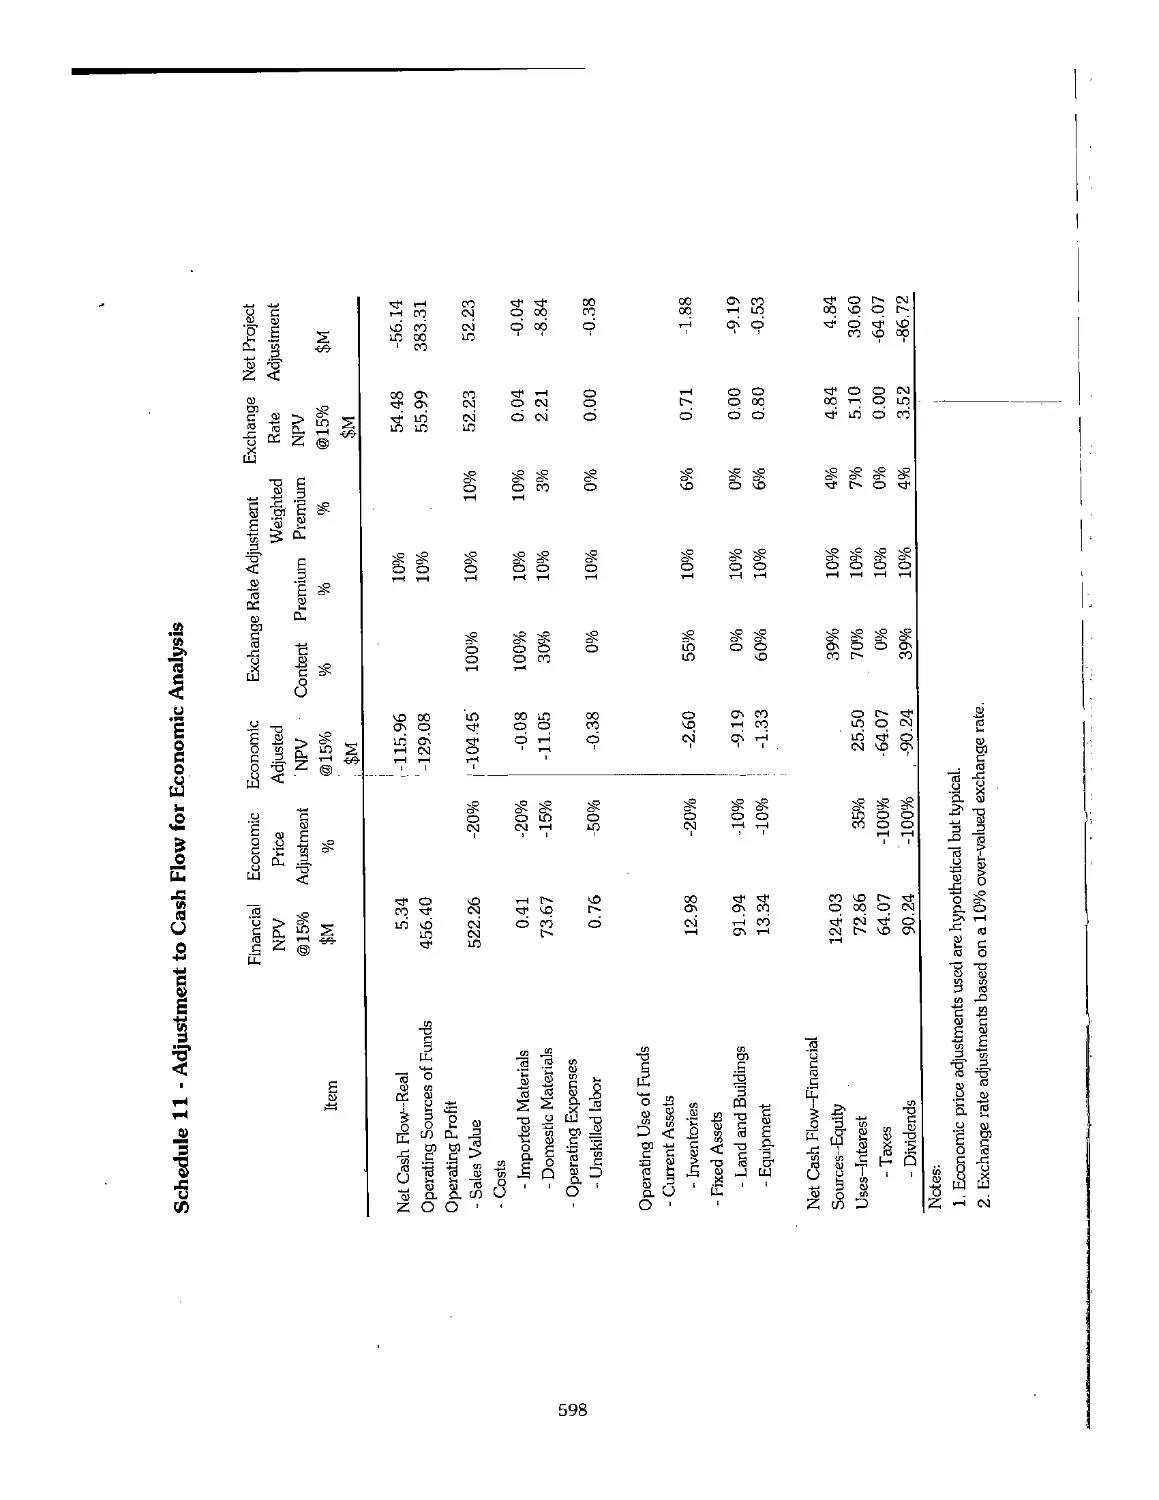
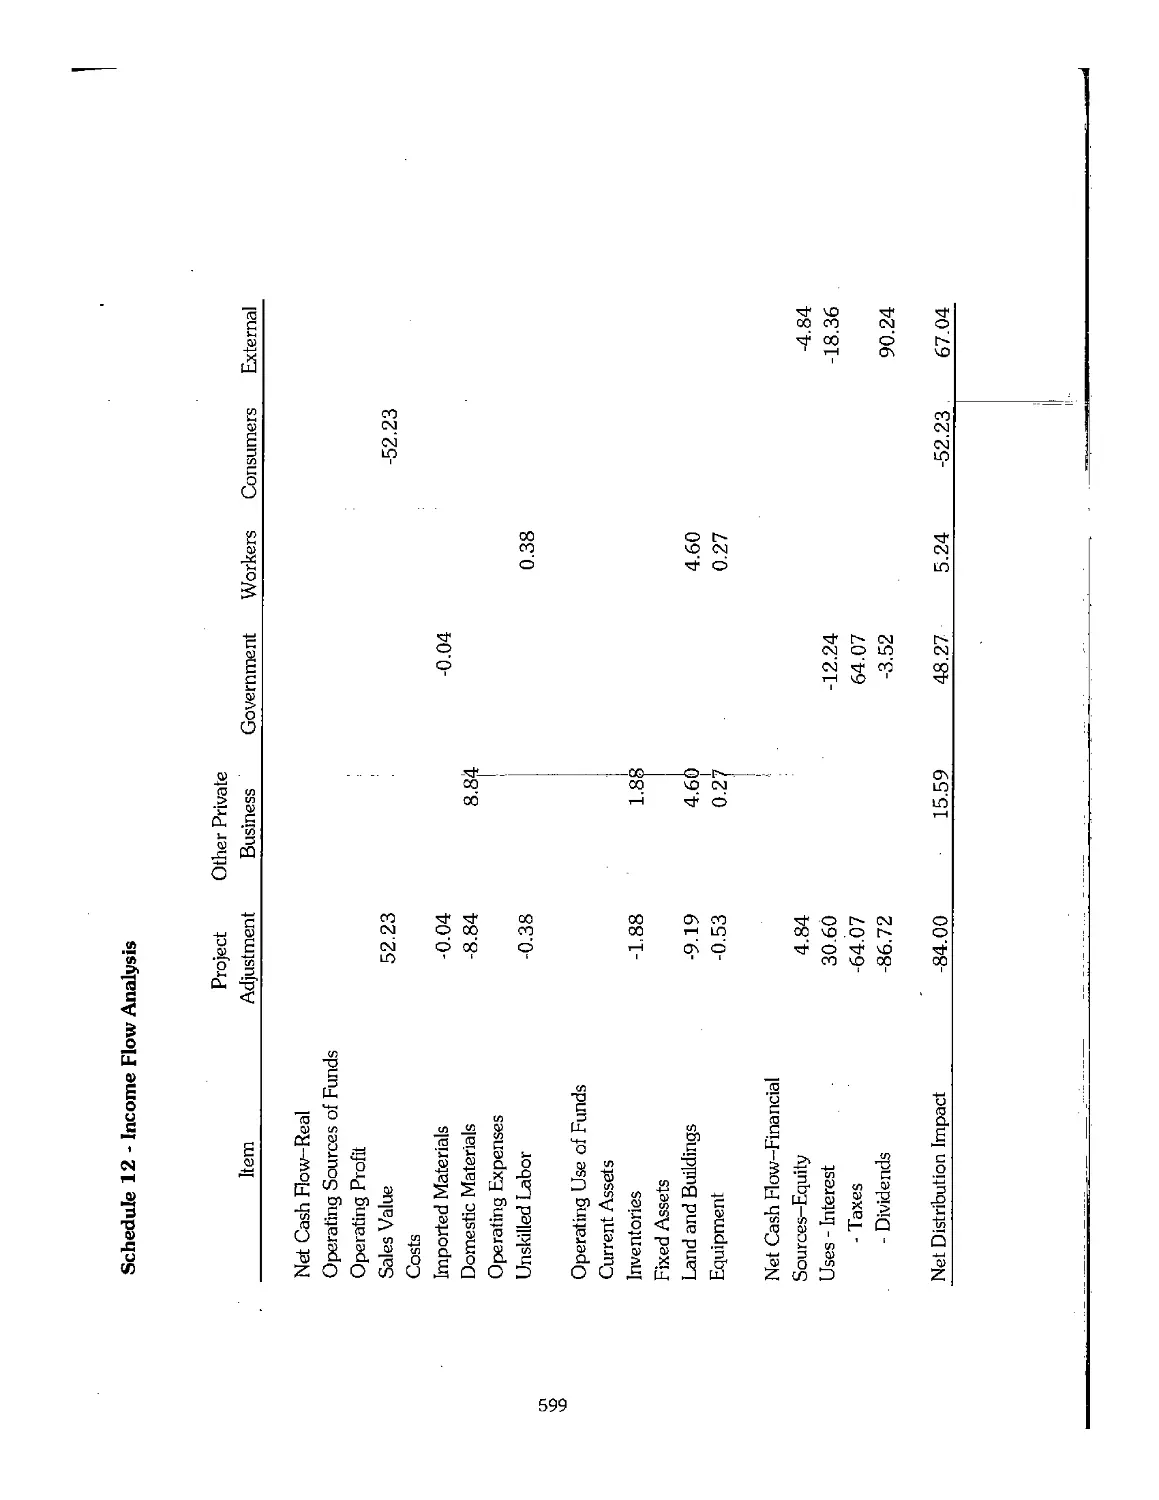
21.5 Economic Analysis Structure 584
21.6 Use of Computers for Financial Economic Analysis 586
21.7 Guidelines for Achieving Well-Established Projects 586
21.8 References 600
Chapter 22. Challenges Facing the Fertilizer Industry 601
22.1 Introduction 602
22.2 Resolution of Macroeconomic Contradictions 602
22.3 Fertilizer Production Capacity and Demand 603
22.4 Transformation From Public to Private 604
22.5 Establishment of New Facilities 605
22.6 Potential for Reducing Fertilizer Costs 607
22.7 General Conclusions , 608
22.8 References , 609
xu
Chapter 1. General Concepts, Classincation,
Terminology, and Definitions
Table of Contents
Page
1.1 Introduction ~.7.~T
1.2 Plant Nutrients 2
1.2.1 Classification 2
1.2.2 Expression 2
1.3 Fertilizer Grade 2
1.4 Nutrient Availability 3
1.5 Fertilizer Regulations 4
1.6 Fertilizer Specifications 5
1.7 Terminology and Definitions 5
1.8 Fertilizer-Related Information Sources 13
1.9 Resource Publications 18
1
Chapter 1. General Concepts, Classification,
Terminology, and Definitions
1.1 Introduction
A fertilizer is a material that furnishes one or more of
the chemical elements necessary for the proper
development and growth of plants. The most important
fertilizers are fertilizer products (also called chemical or
mineral fertilizers), manures, and plant residues, A
fertilizer product is a material produced by industrial
processes with the specific purpose of being used as a
fertilizer. Fertilizers are essential in today's agricultural
system to replace the elements extracted from the soil
in the form of food and other agricultural products.
1.2 Plant Nutrients
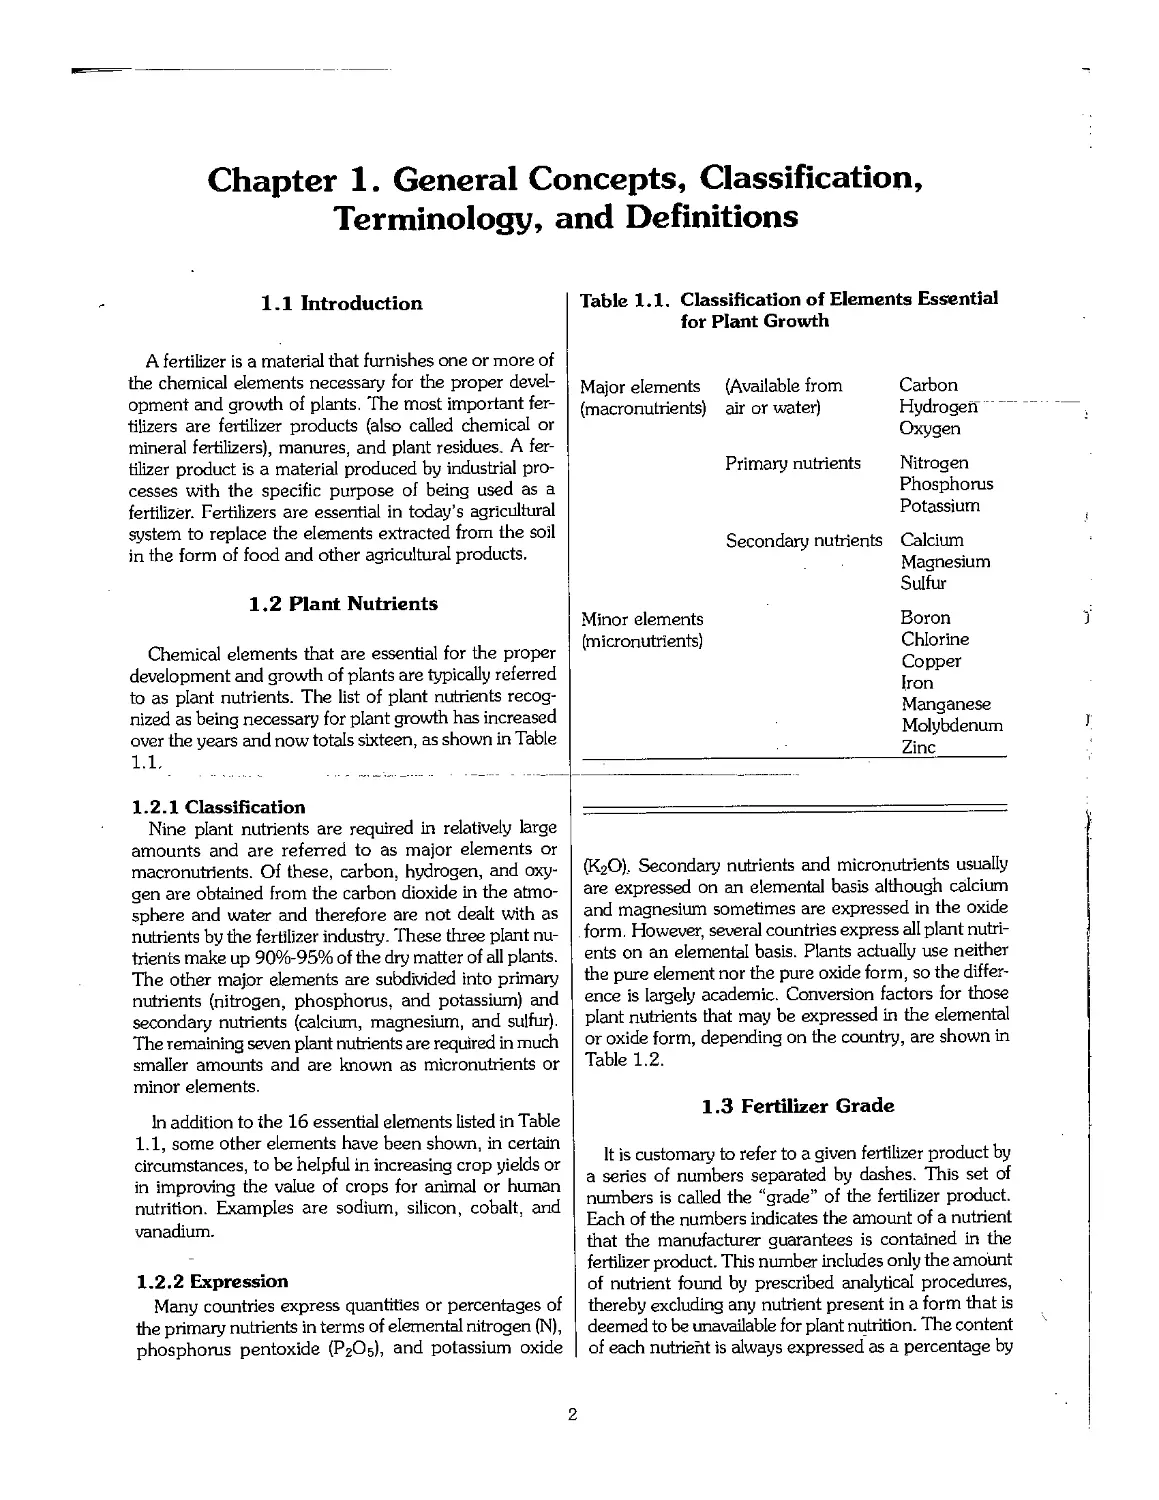
Chemical elements that are essential for the proper
development and growth of plants are typically referred
to as plant nutrients. The list of plant nutrients
recognized as being necessary for plant growth has increased
over the years and now totals sixteen, as shown in Table
1.1,
1.2.1 Classification
Nine plant nutrients are required in relatively large
amounts and are referred to as major elements or
macronutrients. Of these, carbon, hydrogen, and
oxygen are obtained from the carbon dioxide in the
atmosphere and water and therefore are not dealt with as
nutrients by the fertilizer industry. These three plant
nutrients make up 90%-95% of the dry matter of all plants.
The other major elements are subdivided into primary
nutrients (nitrogen, phosphorus, and potassium) and
secondary nutrients (calcium, magnesium, and sulfur).
The remaining seven plant nutrients are required in much
smaller amounts and are known as micronutrients or
minor elements.
In addition to the 16 essential elements listed in Table
1.1, some other elements have been shown, in certain
circumstances, to be helpful in increasing crop yields or
in improving the value of crops for animal or human
nutrition. Examples are sodium, silicon, cobalt, and
vanadium.
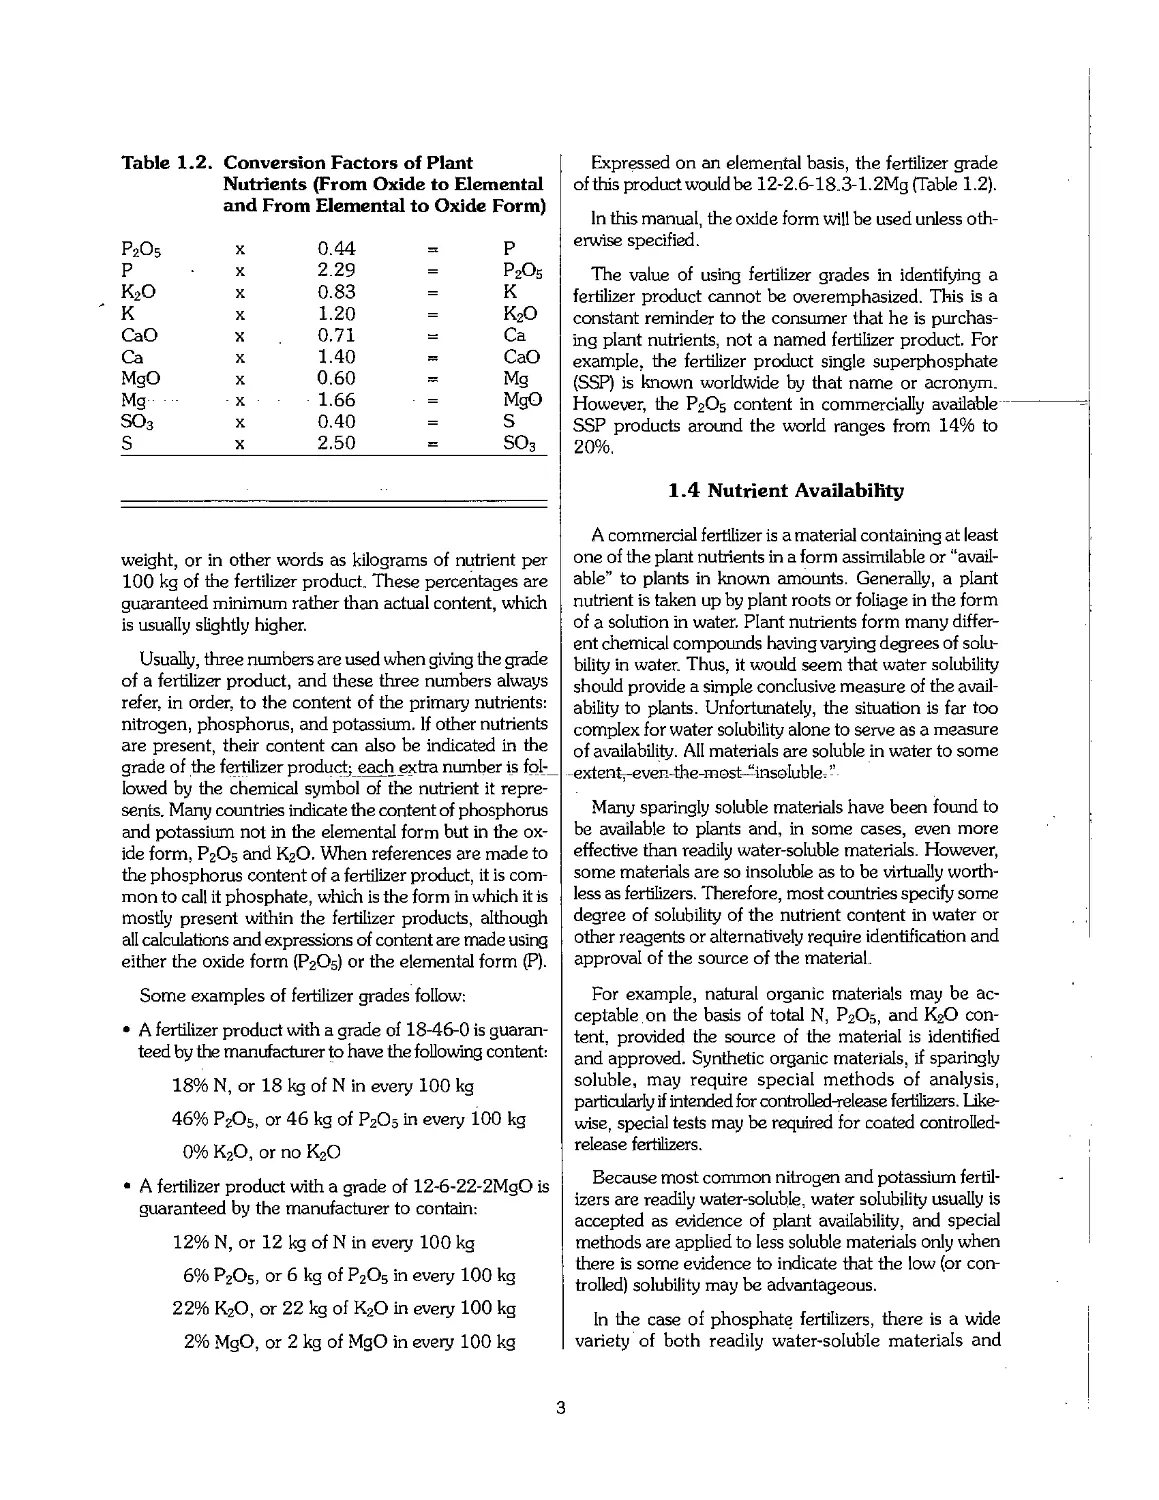
1.2.2 Expression
Many countries express quantities or percentages of
the primary nutrients in terms of elemental nitrogen (N),
phosphorus pentoxide (P2O5), and potassium oxide
Table 1.1. Classification of Elements Essential
for Plant Growth
Major elements (Available from Carbon
(macronutrients) air or water) Hydrogen
Oxygen
Primary nutrients Nitrogen
Phosphorus
Potassium
Secondary nutrients Calcium
Magnesium
Sulfur
Minor elements Boron
(micronutrients) Chlorine
Copper
Iron
Manganese
Molybdenum
Zinc
(K2O).. Secondary nutrients and micronutrients usually
are expressed on an elemental basis although calcium
and magnesium sometimes are expressed in the oxide
form. However, several countries express all plant
nutrients on an elemental basis. Plants actually use neither
the pure element nor the pure oxide form, so the
difference is largely academic. Conversion factors for those
plant nutrients that may be expressed in the elemental
or oxide form, depending on the country, are shown in
Table 1.2.
1.3 Fertilizer Grade
It is customary to refer to a given fertilizer product by
a series of numbers separated by dashes. This set of
numbers is called the "grade" of the fertilizer product.
Each of the numbers indicates the amount of a nutrient
that the manufacturer guarantees is contained in the
fertilizer product. This number includes only the amount
of nutrient found by prescribed analytical procedures,
thereby excluding any nutrient present in a form that is
deemed to be unavailable for plant nutrition. The content
of each nutrient is always expressed as a percentage by
2
Table 1.2. Conversion Factors of Plant
Nutrients (From Oxide to Elemental
and From Elemental to Oxide Form)
P205
p
K20
K
CaO
Ca
MgO
Mg
SO3
S
X
X
X
X
X
X
X
X
X
X
0.44
2.29
0.83
1.20
0.71
1.40
0.60
1.66
0.40
2.50
=
=
=
=
=
=
=
■ =
=
=
P
p2o5
K
K20
Ca
CaO
Mg
MgO
S
so3
weight, or in other words as kilograms of nutrient per
100 kg of the fertilizer product. These percentages are
guaranteed minimum rather than actual content, which
is usually slightly higher.
Usually, three numbers are used when giving the grade
of a fertilizer product, and these three numbers always
refer, in order, to the content of the primary nutrients:
nitrogen, phosphorus, and potassium. If other nutrients
are present, their content can also be indicated in the
grade of the fertilizer product; each extra number is
followed by the chemical symbol of the nutrient it
represents. Many countries indicate the content of phosphorus
and potassium not in the elemental form but in the
oxide form, P2O5 and K2O. When references are made to
the phosphorus content of a fertilizer product, it is
common to call it phosphate, which is the form in which it is
mostly present within the fertilizer products, although
all calculations and expressions of content are made using
either the oxide form (P2O5) or the elemental form (P).
Some examples of fertilizer grades follow:
• A fertilizer product with a grade of 18-46-0 is
guaranteed by the manufacturer to have the following content:
18% N, or 18 kg of N in every 100 kg
46% P205, or 46 kg of P205 in every 100 kg
0% K20, or no K20
• A fertilizer product with a grade of 12-6-22-2MgO is
guaranteed by the manufacturer to contain:
12% N, or 12 kg of N in every 100 kg
6% P205, or 6 kg of P205 in every 100 kg
22% KzO, or 22 kg of K20 in every 100 kg
2% MgO, or 2 kg of MgO in every 100 kg
Expressed on an elemental basis, the fertilizer grade
of this product would be 12-2.6-18.3-l.2Mg (Table 1.2).
In this manual, the oxide form will be used unless
otherwise specified.
The value of using fertilizer grades in identifying a
fertilizer product cannot be overemphasized. This is a
constant reminder to the consumer that he is
purchasing plant nutrients, not a named fertilizer product. For
example, the fertilizer product single superphosphate
(SSP) is known worldwide by that name or acronym.
However, the P2O5 content in commercially available ~
SSP products around the world ranges from 14% to
20%,
1.4 Nutrient Availability
A commercial fertilizer is a material containing at least
one of the plant nutrients in a form assimilable or
"available" to plants in known amounts. Generally, a plant
nutrient is taken up by plant roots or foliage in the form
of a solution in water. Plant nutrients form many
different chemical compounds having varying degrees of
solubility in water. Thus, it would seem that water solubility
should provide a simple conclusive measure of the
availability to plants. Unfortunately, the situation is far too
complex for water solubility alone to serve as a measure
of availability. All materials are soluble in water to some
-extent^-even-the-most—insoluble, '-'-
Many sparingly soluble materials have been found to
be available to plants and, in some cases, even more
effective than readily water-soluble materials. However,
some materials are so insoluble as to be virtually
worthless as fertilizers. Therefore, most countries specify some
degree of solubility of the nutrient content in water or
other reagents or alternatively require identification and
approval of the source of the material.
For example, natural organic materials may be
acceptable on the basis of total N, P2O5, and K2O
content, provided the source of the material is identified
and approved. Synthetic organic materials, if sparingly
soluble, may require special methods of analysis,
particularly if intended for controlled-release fertilizers,
likewise, special tests may be required for coated controlled-
release fertilizers.
Because most common nitrogen and potassium
fertilizers are readily water-soluble, water solubility usually is
accepted as evidence of plant availability, and special
methods are applied to less soluble materials only when
there is some evidence to indicate that the low (or
controlled) solubility may be advantageous.
In the case of phosphate fertilizers, there is a wide
variety of both readily water-soluble materials and
3
sparingly water-soluble materials, and several methods
are in use for evaluating their agronomic availability.
The most common methods other than water solubility
are based on solubility of P2O5 in neutral or alkaline
ammonium citrate solutions or in solutions of citric or
formic acid, In addition, the total P2O5 may be
acceptable for some materials. Examples of the solubility
criteria used for quality control of phosphate fertilizers follow.
Germany - Phosphate is expressed as the sum of
P2O5 soluble in water and (alkaline) ammonium citrate.
For superphosphate, at least 90% of the sum must be
soluble in water. For compound fertilizers, at least 30%
of the sum must be soluble in water.
Belgium - For TSP, 38% P2O5 soluble in neutral
ammonium citrate must be guaranteed; 93% of the
indicated content must be water soluble.
Soft rock phosphate must contain not less than 25%
P2O5 soluble in mineral acids, of which not less than
55% must be soluble in 2% formic acid. It must be ground
to a fineness so that at least 90% passes through a 63-
micron sieve; 99% must pass through a 125-micron
sieve.
For compound fertilizers, the P2O5 content may be
expressed as that which is soluble in neutral ammonium
citrate, soluble in water, or soluble in water and neutral
ammonium citrate. If the compound fertilizer contains
Thomas (basic) slag as the only source of phosphate,-
the P2O5 claimed is that which is soluble in 2% citric
acid.
United States - The guaranteed P2O5 content of all
fertilizers is based on the "available phosphate" content,
which is the P2O5 content soluble in neutral ammonium
citrate including that soluble in water. There is no
provision for determining or stating the water-soluble P2O5
content separately. The total P2O5 may be stated but is
not included in the guaranteed available phosphate
content.
European Union (EU) - Directives specify the
following permissible solvents as a basis for evaluating
phosphate fertilizers:
1. Water for those materials "where applicable."
2. Formic acid (2%) for soft natural phosphates.
3. Citric acid (2%) for basic slag.
4. Petermann's solution at 65°C for precipitated
dicalcium phosphate dihydrate,
5. Petermann's solution at ambient temperature for
"disintegrated phosphates."
6. Joulie's solution for all straight and compound
fertilizers in which phosphate occurs in alumino-calcic
form.
7, Neutral ammonium citrate solution for all fertilizer.
Joulie's and Petermann's solutions are alkaline
ammonium citrates containing free ammonia. Solvent
compositions, extraction methods, ratios of sample to solvent,
and methods for analysis are specified for each solvent.
It is beyond the scope of this manual to describe in
detail the analytical methods that are used for fertilizers.
The development of suitable methods for analyzing
fertilizers for availability has claimed the attention of
agricultural chemists since the beginning of the industry.
The methods are constantly being revised and improved
as new knowledge and new tools become available to
the chemist.
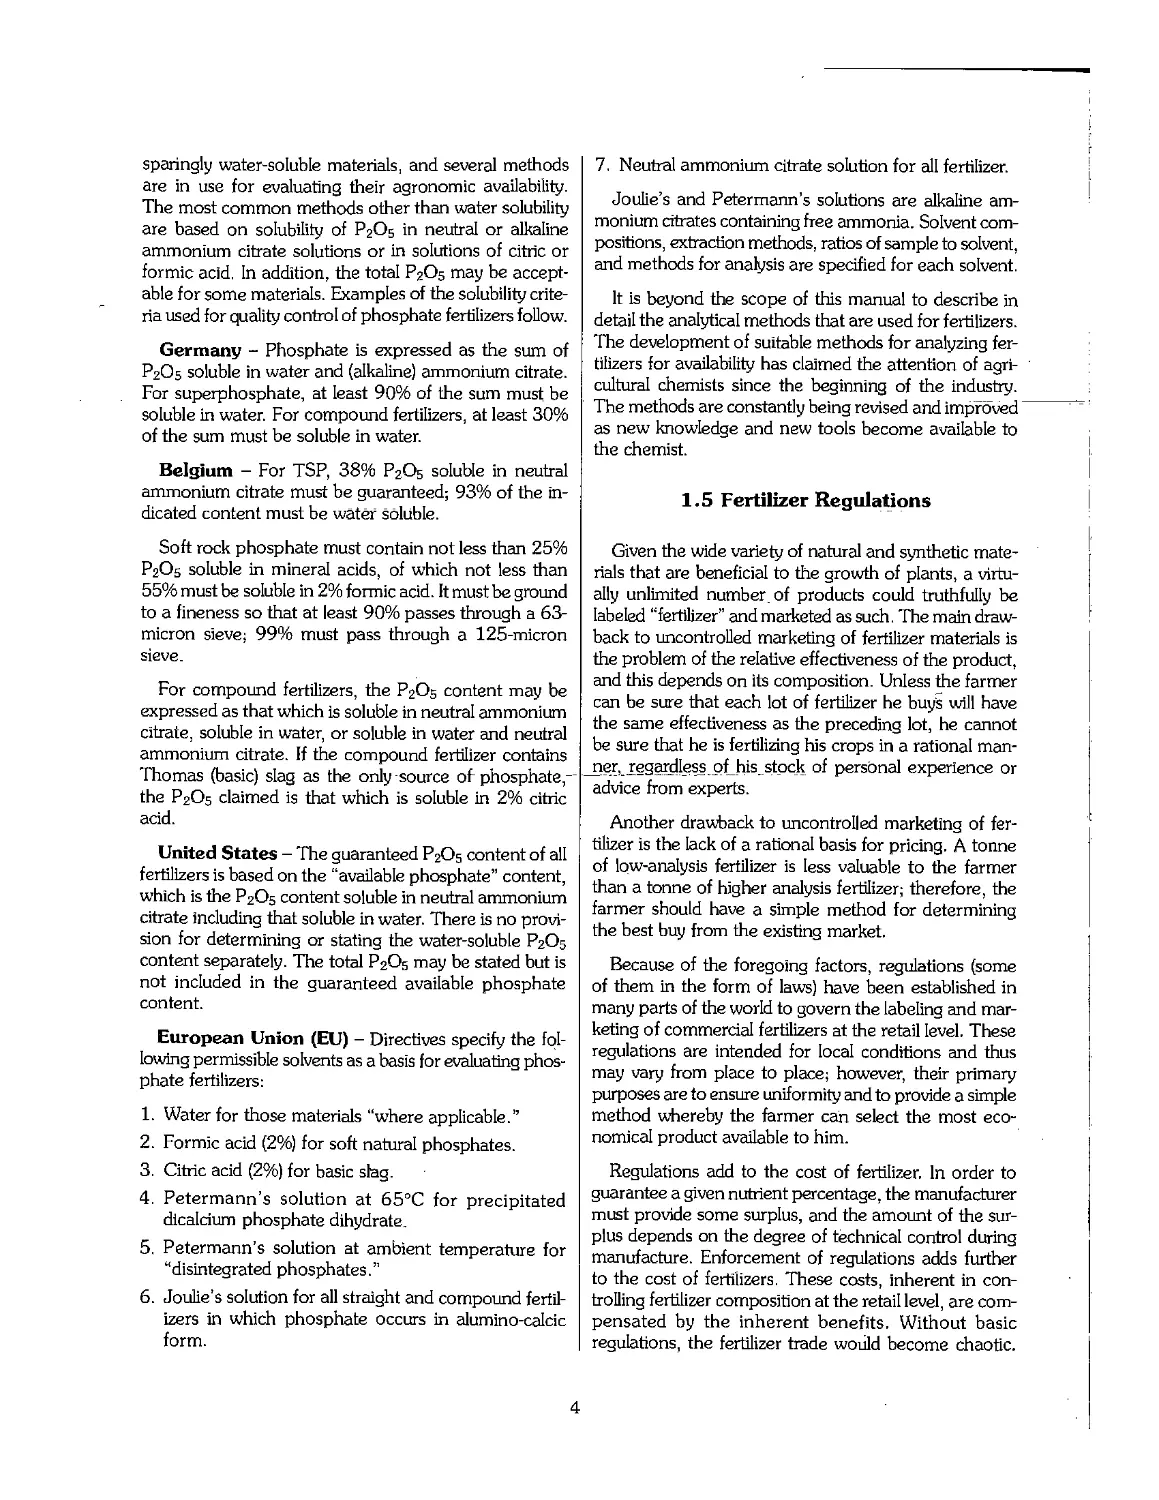
1.5 Fertilizer Regulations
Given the wide variety of natural and synthetic
materials that are beneficial to the growth of plants, a
virtually unlimited number, of products could truthfully be
labeled "fertilizer" and marketed as such. The main
drawback to uncontrolled marketing of fertilizer materials is
the problem of the relative effectiveness of the product,
and this depends on its composition. Unless the farmer
can be sure that each lot of fertilizer he buys will have
the same effectiveness as the preceding lot, he cannot
be sure that he is fertilizing his crops in a rational man-
i}eAI693rdtess.Pt_his..stpck of personal experience or
advice from experts.
Another drawback to uncontrolled marketing of
fertilizer is the lack of a rational basis for pricing. A tonne
of low-analysis fertilizer is less valuable to the farmer
than a tonne of higher analysis fertilizer; therefore, the
farmer should have a simple method for determining
the best buy from the existing market.
Because of the foregoing factors, regulations (some
of them in the form of laws) have been established in
many parts of the world to govern the labeling and
marketing of commercial fertilizers at the retail level. These
regulations are intended for local conditions and thus
may vary from place to place; however, their primary
purposes are to ensure uniformity and to provide a simple
method whereby the farmer can select the most
economical product available to him.
Regulations add to the cost of fertilizer. In order to
guarantee a given nutrient percentage, the manufacturer
must provide some surplus, and the amount of the
surplus depends on the degree of technical control during
manufacture. Enforcement of regulations adds further
to the cost of fertilizers. These costs, inherent in
controlling fertilizer composition at the retail level, are
compensated by the inherent benefits. Without basic
regulations, the fertilizer trade would become chaotic.
4
As with other regulations, care should be taken to limit
them to the essentials,
1.6 Fertilizer Specifications
Specifications are the requirements with which a
fertilizer should conform, as agreed upon between buyer
and seller. Fertilizer specifications meet differing
requirements depending on the use or intent of the
specification information.
Specifications are normally used in the contract
between the buyer and seller of a fertilizer to ensure
agreement on product characteristics or more often to define
the product in sufficient detail to effect the satisfaction
of both buyer and seller.
Normally a farmer (consumer) gets a specification on
the fertilizer bag or, for a bulk delivery, on the invoice.
This type of specification typically consists of the
fertilizer grade, a guaranteed analysis, the net weight, and
sometimes additional information about the product. This
information is typically that which is required by
government regulations, not necessarily by the customer.
More commonly, when one refers to specifications, it
is to specifications that have legal implications for
buyers and sellers of large quantities of materials. A well-
written fertilizer specification should include the following
elements in detail:
1. Nutrient contents and concentrations.
2. Nutrient chemical composition.
3. Moisture content.
4. Particle size distribution.
5. Physical condition.
6. Solubility and/or availability.
7. Conditioner.
8. Special limitations pertaining to phytotoxic
production byproducts or additives.
9. Packaging details (if any).
10. Methodology used in quantifying or qualifying items
1 through 9.
11. Penalties or discounts for deviation from the stated
values and conditions.
Fertilizer specifications that include all of the above
items may or may not meet the buyers' standards when
bids are received. Usually when the buyer issues
invitations to bid accompanied by the product's desired
specifications, the seller tries to meet all items in order to
have a chance for his bid to be accepted- If the seller
cannot meet all the terms and conditions of the
specification, he would expect that his bid would be rejected
by the buyer. However, there are instances where the
seller will include exceptions with his bid. This is the
seller's way of telling the buyer that he knows the
product is not to the specification, but that he (the seller) is
bidding a different (usually slightly different) material.
Once the buyer accepts a bid with exceptions, the
exceptions supplant the original specification and become
part of a new contractual agreement between buyer and
seller.
From a buyer's standpoint, one might consider that
the more detailed a specification, the more certain the
buyer becomes of the product quality. Usually, the more
detailed a specification, the more difficult it is for the
manufacturer to meet all the requirements, resulting in
a more expensive material or severely limiting the
number of sellers who are qualified to bid.
It is, therefore, to the purchaser's advantage to use
standard products with the "normally accepted"
specifications whenever possible. This approach allows more
suppliers the opportunity to bid, resulting in a
competitive market for the buyer.
Even when the material purchased meets all of the
buyer's bid specifications, the material or product may
not be well suited for its intended use. This is especially
~tn^^f^hl5sp]^^fcclC"Phosphate rock is quite variable
in phosphate content from deposit to deposit and in
quantities of impurities that drastically affect the rock's
performance in production of nitrophosphates,
phosphoric acid, superphosphates, and ammonium
phosphates. Thus, the material purchased may not be what
was initially wanted. Even though this material may meet
all the stated specifications, it is possible for unspecified
contaminants or impurities to affect the performance of
the materials in subsequent processing or the crop
response in finished fertilizers.
It is important then to state in the specifications not
only what is wanted in the product but also what is not
wanted in the product.
1.7 Terminology and Definitions
The following terminology and definitions commonly
used in the fertilizer industry are limited to those whose
meaning might not be obvious from usual dictionary
definitions.
Fertilizer - In the simplest terminology, a material,
the main function of which is to provide plant nutrients.
In Japan, fertilizer is defined as being any substance
that is applied to the soil for the purpose of supplying
nutrients to plants or producing a chemical change in
the soil that will contribute to the cultivation of plants or
that is applied to the plant to supply plant nutrients.
In the Republic of the Philippines, the term fertilizer
includes substances (either solid or liquid), nutrient
elements (either organic or inorganic, single or in
combination), and any materials applied directly to the soil for
the purpose of promoting plant growth, increasing crop
yields, or promoting their quality.
In Thailand, fertilizer means an organic or inorganic
substance, whether of natural formation or produced
through any method whatsoever, that is used as a
nutrient element for plants or for causing a chemical change
in the soil for the growth of plants.
In some countries, terms such as chemical fertilizer,
mineral fertilizer, or inorganic fertilizer are used to
distinguish the manufactured product from natural organic
materials of plant or animal origin. The latter materials
are called.organic fertilizers.
Chemical Fertilizer - In Thailand, a fertilizer
derived from inorganic substances or synthetic organic
substances, including single fertilizer, mixed fertilizer, and
compound fertilizer as well as organic fertilizer mixed
with chemical fertilizer but excluding white lime, marl,
plaster, or gypsum.
In Mauritius, chemical fertilizer means any substances_
containing one or more of the basic elements (nitrogen,
phosphorus, potassium, calcium, magnesium, and
silicon) used as a fertilizer.
Inorganic (Mineral) Fertilizer - A term used by
the International Organization for Standardization (ISO)
for fertilizer in which the declared nutrients are in the
form of inorganic salts obtained by extraction and/or
by physical and/or chemical industrial processes,
The Association of American Plant Food Control
Officials (AAPFCO) defines "synthetic" as any substance
generated from another material or materials by means
of a chemical reaction.
Organic Fertilizer - Carbonaceous materials mainly
of vegetable and/or animal origin added to the soil
specifically for the nutrition of plants (ISO).
In Australia, organic fertilizers are defined as those
manufactured from animal and vegetable byproducts. In
Thailand, organic fertilizer means a fertilizer derived from
organic material; it is produced through the process of
drying, chopping, grinding, fermenting, sifting, or other
methods but is not a chemical fertilizer. In Malaysia,
organic fertilizers are fertilizers that are derived mainly from
biological products (plant or animal) where most of the
nutrient elements are present as organic compounds. In
Japan and the Philippines, the term "special fertilizer"
is used to define organic-type fertilizer products.
AAPFCO, in the United States, uses the term
"natural organic fertilizers" and gives the following definition:
Materials derived from either plant or animal
products containing one or more elements (other than
carbon, hydrogen, and oxygen) which are essential
for plant growth. These materials may be subjected
to biological degradation processes under normal
conditions of aging, rainfall, sun-curing, air dryings-
composting, rotting, enzymatic, or anaerobic/
aerobic bacterial action, or any combination of
these. These materials shall not be mixed with
synthetic materials or changed in any physical or
chemical manner from their initial state except by
manipulations such as drying, cooking, chopping,
grinding, shredding, ashing, hydrolysis, or pelleting,
AAPFCO also defines organic fertilizer as a material
containing carbon and one or more elements, other than
hydrogen and oxygen, essential for plant growth,
The ISO and AAPFCO have defined several other
terms relating to organic-type products. Some of the
ISO terms are semi-organic fertilizer, organic nitrogenous
fertilizer, synthetic organic nitrogenous fertilizer, manure,
-erganiG-soil-eonditioner^ and semi-organic soil
conditioner. Some of the AAPFCO terms are compost,
natural inorganic fertilizer, natural fertilizer, natural base
fertilizer, organic base fertilizer, and animal manures,
Soil Conditioner - Material added to soils, the main
function of which is to improve their physical and/or
chemical properties and/or their biological activity (ISO).
In Malaysia, soil conditioner is defined as any
substance that is added to the soil for the purpose of
improving its physical or chemical character, enhancing
soil productivity, or promoting the growth of crops -
exclusive, however, of commercial fertilizers and
farmyard manure. In Malaysia, "soil amendment" has the
same definition as soil conditioner, except it includes the
statement that a soil amendment supplies some nutrients.
AAPFCO defines soil amendment as any substance
that is intended to improve the physical characteristics
of the soil, except commercial fertilizers, agricultural
liming materials, unmanipulated animal manures, unmani-
pulated vegetable manures, and pesticides.
Liming Material - An inorganic soil conditioner
containing one or both of the elements calcium and
magnesium, generally in the form of an oxide, hydroxide, or
carbonate, principally intended to maintain or raise the
pH of soil (ISO).
6
In Malaysia, a liming material is defined simply as a
material used to neutralize soil acidity. AAPFCO in the
United States defines "agricultural liming materials" as
products whose calcium and magnesium compounds are
capable of neutralizing soil acidity.
Fertilizer Material - A fertilizer that meets any of
the following conditions (AAPFCO):
1. Contains important quantities of no more than one
of the primary plant nutrients (nitrogen,
phosphorus, or potassium).
2. Has 85% or more of its plant nutrient content present
in the form of a single chemical compound.
3. Is derived from a plant or animal residue or byproduct
or natural material deposit which has been processed
in such a way that its content of plant nutrients has
not been materially changed except by purification
and concentration.
Straight Fertilizer - A qualification generally given
to a nitrogenous, phosphatic, or potassic fertilizer
having a declarable content of only one of the primary plant
nutrients, i.e., nitrogen, phosphorus, or potassium (ISO).
In Malaysia, straight fertilizer is a generally loose term
used in the fertilizer trade to signify a fertilizer that
usually contains one nutrient element. In Australia, straight
fertilizer is the term used to describe fertilizer containing
only one of the elements nitrogen, phosphorus, or
potassium. In Thailand, the term ""stegie "fertilizer""is equiva--
lent to straight fertilizer.
Compound Fertilizer - A fertilizer that has a
declarable content of at least two of the plant nutrients
nitrogen, phosphorus, and potassium, obtained
chemically or by blending, or both (ISO).
This term is defined and used around the world with
several different meanings, Additionally, terms.such as
complex fertilizer, composite fertilizer, mixed fertilizer,
mixture of fertilizers, fertilizer mixture, granulated
mixture, physical mixture, and NPK fertilizer are also used
in a similar vein and often have conflicting and/or
overlapping definitions. A few examples follow:
1. Compound Fertilizer (Malaysia) - Any
homogeneous product containing two or more of the
following plant nutrient elements for fertilizing crops:
nitrogen, phosphorus, potassium, and magnesium.
It may also contain trace elements. The material is
also known as composite fertilizer, complex
fertilizer, and multinutrient fertilizer. The material shall
be in the form of granules, pellets, prills, or crystals
and shall be free-flowing.
2. Compound Fertilizer (Thailand) - A chemical
fertilizer produced by chemical process and having
at least two primary nutrient elements. '
3. Compounds (Australia) - The term applied to
fertilizer manufactured by a chemical reaction and
containing two or more of the three main elements -
nitrogen, phosphorus, and potassium.
4. Compound or Complex Fertilizer (India) - A
fertilizer containing two or more essential plant
nutrients that have undergone chemical reaction
during the production process.
5. Complex Fertilizer (Malaysia) - A term used in
the fertilizer trade to denote a compound fertilizer,
all the nutrient contents of which have undergone- -
chemical interaction during the manufacturing
process.
6. Mixed Fertilizer (AAPFCO) - A fertilizer
containing any combination or mixture of fertilizer
materials (see AAPFCO definition for fertilizer materials).
7. Mixed Fertilizer (Australia) - The term applied
to a fertilizer that is a physical mixture of two or
more of the straight fertilizers. Mixed fertilizer may
be powdered or granulated.
8. Mixed Fertilizer (Philippines) - A fertilizer
containing any combination or mixture of commercial
fertilizers.
9. Mixed Fertilizer (Thailand) - A chemical
fertilizer derived from a mixture of various kinds or types
—of~chemrcal~fertilizers"to~obtain required nutrient
elements.
10. Fertilizer Mixture (Malaysia) - A product
obtained by mixing different fertilizer stock materials
arid containing more than one of the major plant
nutrients, namely, nitrogen, phosphorus, potassium,
and magnesium.
11. Granulated Mixture (India) -A mixture of
fertilizers containing any two or more essential plant
nutrients made by intimately mixing two or more
fertilizer materials with or without inert material, and
granulating them together, without involving any
chemical reaction.
12. Physical Mixture (India) - A mixture of fertilizers
containing any two or more essential plant
nutrients made by physically mixing fertilizers with or
without inert material necessary to make a required
grade, without involving any chemical reaction.
13. NPK/NP/PK Fertilizers - Terms similar to and
often used in conjunction with mixtures and
compounds. They signify that the fertilizer contains
nitrogen (N), phosphorus (P), and/or potassium (K).
Blended Fertilizer - A fertilizer, obtained by dry
mixing, that has a declarable content of at least two of
7
the plant nutrients nitrogen, phosphorus, and potassium
(ISO).
In the United States, bulk-blended fertilizer is
generally defined as a compound fertilizer produced by
mixing two or more fertilizers whose granules are similar in
size. These fertilizers are also called blended fertilizers
or bulk blends.
In Australia, bulk blends are considered to be
mixtures of two or more compounds or compounds and
straight fertilizers, preferably in a pelletized (granular)
form.
Granular Fertilizer - Solid material that is formed
into particles of a predetermined mean size (ISO).
In the United States, AAPFCO defines granular
fertilizer as a product, 95% or more of which can be
retained on a series of sieves within the range of U.S. No.
4 (4.75-mm opening) to and including U.S. No. 20 (850-
mm opening) and whose largest particle can pass through
a sieve having an opening not larger than four times
that of the sieve which retains 95% or more of the
product.
In the AAPFCO definition, granular fertilizer denotes
a particular size range for products. The definition for
"pelletized fertilizer" in the United States (AAPFCO) is
similar to that of the ISO definition for granular
fertilizer, although-more specific.-The-AAPFCO defines-a-
pelletized fertilizer as a product, uniform in size and
usually of globular shape, containing one or more
nutrients and produced by one of several methods including
(a) solidification of a melt as it falls through a counter-
current stream of air, (b) application of dried layers of
slurry to recycling particles, (c) compaction, (d)
extrusion, and (e) granulation.
In Australia, the comparable term is "granulated or
pelleted fertilizers" and refers to fertilizers that have been
treated in such a way that the granules are uniform in
size.
In Malaysia, the comparable term is "granulated
fertilizer" and is defined as a fertilizer that has been made
into particles of approximately uniform size, with 90%
of the material falling in the range of 1 mm to 4 mm
diameter.
Coated Fertilizer - Granular fertilizer that is
covered with a thin layer of a different material in order to
improve the behavior and/or modify the characteristics
of the fertilizer (ISO).
Other similar definitions or variations are as follows:
1. Coated Fertilizer - Granular fertilizer that has been
coated with a thin layer of some substance to
prevent caking or dust formation, or to control
dissolution rate.
2. Conditioned Fertilizer - Fertilizer treated with an
additive to improve physical condition or prevent
caking. The conditioning agent may be applied as a
coating or incorporated in the product.
3. Filler (AAPFCO) - A substance added to fertilizer
materials to provide bulk, prevent caking, or serve
some purpose other than providing essential plant
nutrients.
4. Filler (ISO) - Substance incorporated in a fertilizer
solely to reduce the nutrient content and without any
declarable fertilizer nutrients.
Slow-Release Fertilizer - A fertilizer whose
nutrients are present as a chemical compound or whose
physical state is such that the nutrient availability to plants
is spread over time (ISO).
In Malaysia, a slow-release fertilizer is defined as a
fertilizer whose rate of release is regulated by the use of
coatings of such materials as sulfur and polymeric
compounds.
The AAPFCO defines a slow- or controlled-release
fertilizer as a fertilizer containing a plant nutrient in a
form which delays its availability for plant uptake and
use after application, or which extends its availability to
Trie plant s^gBricaritIy~Ionger than a reference "rapidly
available nutrient fertilizer" such as ammonium nitrate
or urea, ammonium phosphate, or potassium chloride.
Such delay of initial availability or extended time of
continued availability may be achieved by a variety of
mechanisms. These include controlled water solubility
of the material (due to semipermeable coatings,
occlusion, or the inherent water insolubility of polymers,
natural nitrogenous organics, protein materials, or other
chemical forms), slow hydrolysis of water-soluble, low-
molecular-weight compounds, or other unknown means.
Other related terms are:
1. Coated Slow-Release Fertilizer (AAPFCO) - A
product containing sources of water-soluble nutrients,
release of which in the soil is controlled by a coating
applied to the fertilizer.
2. Polymer-Coated Fertilizer (AAPFCO) - A coated
slow-release fertilizer consisting of fertilizer particles
coated with a polymer (plastic) resin. It is a source of
slowly available plant nutrients.
3. Controlled-Release Fertilizers - Fertilizers in
which one or more of the nutrients have limited
solubility in the soil solution, so that they become
available to the growing plant over a controlled period.
The ideal in such a fertilizer would be the release of
nutrients at a rate exactly equal to the needs of the
plant. The limited solubility may be an inherent
characteristic of the fertilizer, or it may be imparted to a
soluble fertilizer by coating the particles.
4. \itrbgen Stabilizer (AAPFCO) - A substance
added to a fertilizer to extend the time that the
nitrogen component of the fertilizer remains in the soil in
the ammoniacal'form.
5. Nitrification Inhibitor (Australia) - Complex
chemical substance that has the effect of killing or
temporarily reducing the activity of the soil
bacterium Nitrosomonas, which is responsible for the
conversion of ammonium-nitrogen in the process of
nitrification. The effect is similar to that of slow-release
fertilizers. Nitrification inhibitors are added to
nitrogen products before application.
6. Urease Inhibitor (Australia) - Complex chemical
substance that has the effect of temporarily
preventing the activity of the soil enzyme urease,
liquid Fertilizer - A term used for fertilizers in
suspension or solution and for liquefied ammonia (ISO).
In Malaysia, this term includes anhydrous ammonia,
ammoniating solutions, liquid mixed fertilizer solutions,
suspensions, and slurries. The principal materials used
in making liquid fertilizer are ammonia, ammonium
nitrate, urea, phosphoric acid, and potassium chlorideT
In the United States, the term liquid or fluid fertilizer
is a general term usually including fertilizers wholly or
partially in solution that can be handled as a liquid. This
includes clear liquids, liquids containing solids in
suspension, and usually anhydrous ammonia; however,
anhydrous ammonia sometimes is referred to as a gaseous
fertilizer even though it is applied as a liquid. AAPFCO
defines liquid fertilizer as a fluid in which the plant
nutrients are in true solution.
Other related terms are:
1. Solution Fertilizers (ISO) - Liquid fertilizer free
of solid particles.
2. Suspension Fertilizer (ISO) - A two-phase
fertilizer in which solid particles are maintained in
suspension in the aqueous phase,
3. Suspension Fertilizer (AAPFCO) - A fluid
containing dissolved and undissolved plant nutrients, The
suspension of the undissolved plant nutrients may be
inherent with the materials or produced with the aid
of a suspending agent of nonfertilizer properties.
Mechanical agitation may be necessary in some cases
to facilitate uniform suspension of undissolved plant
nutrients.
4, Suspension Fertilizer - A liquid (fluid) fertilizer
containing solids held in suspension, for example, by the
addition of a small amount of clay. The solids may be
water-soluble in a saturated solution, or they may be
insoluble, or both.
5, Slurry Fertilizer (AAPFCO) - A fluid mixture that
contains dissolved and undissolved plant nutrient
materials and requires continuous mechanical
agitation to assure homogeneity.
Specialty Fertilizer - A fertilizer recommended or
used principally for golf courses, lawns, home gardens,
house plants, or for any purpose other than growing
farm crops. The AAPFCO defines specialty fertilizer as
a fertilizer distributed for nonfarm use.
Powder - A solid substance in the form of very fine
particles (ISO).
Powder is also referred to as "nongranular fertilizer'7
and is sometimes defined as a fertilizer containing fine
particles, usually with some upper limit such as 3 mm
but no lower limit.
Very few fertilizer materials are sold now in the
powder form. This was the standard form of fertilizer
materials many years ago, before granulation processes were
developed. Powders present problems in handling and
application because of their tendency to cake {becom-
■~ing-cemientedirrlarge"bIo"cks)7lheir usual'inability to flow
freely, and their dustiness during application. Powders
are not amenable to machine broadcasting because the
fine particles cannot be spread evenly by the machine.
Some fertilizer materials of low solubility are made into
very fine powders to enhance their availability to the
crops by increasing their surface area. Amendments such
as agricultural limestone are applied as finely divided
powders to speed reaction with the soil.
Run-of-Pile (ROP) - Products that are taken from
the production piles without undergoing careful control
of the particle size. This form of material consists of
particles of many different sizes, from very fine powders
to coarse, pebble-like particles. Usually the coarse
particles are very friable and can be crushed under finger
pressure. Typical examples of fertilizers sold as run-of-
pile materials are some forms of single superphosphate
and monoammonium phosphate.
Granulation - A general term for processes such as
agglomeration, accretion, or crushing used to make a
granular fertilizer (ISO).
Granulation has a number of advantages, particularly
in reducing the quantity of dust in a fertilizer, improving
uniformity of flow when it is being applied, and
minimizing segregation when these fertilizers are blended.
9
Prill - A granule obtained by solidification of droplets
of fertilizer or by crystallization under special conditions
(ISO).
Prills are smooth, spherical particles. In the fertilizer
industry, by far the most common method of producing
prills is by the solidification of molten drops of the
fertilizer product. The molten fertilizer is sprayed from a
height inside a closed tower while a stream of air is moved
upward inside the tower. As the drops fall, they cool
and solidify. Prills are usually smaller than particles
produced by other processes. This process is mostly used in
producing urea, ammonium nitrate, and some NPK
grades.
Granules - Relatively spherical particles produced
by enlarging small particles through successive
deposition of a liquid or slurry material, which solidifies on the
surface through crystallization and/or drying. Different
processes are used depending on the material being
granulated. The surface of granules is not as smooth as
that of prills, although some granulation processes will
produce surfaces that are much smoother than others.
These particles are usually stronger (have greater
resistance against crushing) than prills. Granular diammonium
phosphate (DAP) is a typical example of slurry
granulation.
Crystals - Particles that have flat sides and sharp
edges and corners, resembling the particle shape of sugar
and table salt. These particles are made by lettirigThe-
fertilizer crystallize from a strong solution by removal of
water through heat and, in some cases, vacuum. The
final processing steps for some crystalline materials some-
rimes include tumbling to break off some of the edges
and corners, which tends to give a more spherical
particle. Some forms of ammonium sulfate and muriate of
potash are produced by crystallization. The large
crystals are often separated from the smaller particles by
screening. The large crystals are often called granules.
Compacted Particles - Particles that have totally
irregular shapes. They resemble the shapes of crushed
rocks. These particles are made by crushing down to
size from thick and wide continuous sheets made by
pressing solid particles of the component materials
between cylindrical rolls under high pressure. Some
muriate of potash products are typical compacted materials.
Recycle - In a fertilizer process, a portion of the
finished or partially finished product that is returned to an
early stage of the process for an additional pass through
the subsequent processing steps. In fertilizer
granulation processes, it is common practice to return under-
size product and crushed oversize product as recycle to
the granulator. Such recycling not only reclaims these
off-size materials but also serves the important functions
of reducing moisture content and lowering temperature
in the granulator. The latter functions are of such
importance that frequently it is beneficial to also crush and
recycle some product-size material.
Formula - A term used in some countries to express,
by numbers, in the order N-P-K (nitrogen-phosphorus-
potassium), the respective content of these nutrients in
a compound fertilizer.
The AAPFCO defines "fertilizer formula" as the
quantity and grade of the crude stock material used in
making a fertilizer mixture. Malaysia uses the same definition.
Another common definition is a list of the kind, nutrient
content, and amount of stock materials required to
produce a given weight of mixed fertilizer of a given
nutrient content.
Bulk - Qualification given to a fertilizer or soil
conditioner not packed in a container (ISO).
The AAPFCO defines a "bulk fertilizer" as a fertilizer
delivered to a purchaser either in solid or liquid state in
a nonpackage form to which a label cannot be attached,
Malaysia uses the same" definition.
Guarantee (of Composition) - Quantitative and/
or qualitative characteristics with which a market
product must comply for contractual or legal requirements
(ISO).
Other similar or related terms are:
-1-,Declarable Content (ISO) - That content of an
element (or an oxide) which, according to national
legislation, may be given on a label or document
associated with a fertilizer or soil conditioner.
2. Guaranteed Analysis (Japan) - The minimum
amount of each of the main components, expressed
as percentages, which are guaranteed by the producer,
importer, or dealer to be contained in any fertilizer
he produces, imports, or sells.
3. Guaranteed Analysis (Philippines) - A statement
guaranteeing the contents in terms of the minimum
percentage of plant food claimed on the
manufacturer's label.
4. Guaranteed Analysis (AAPFCO) - The minimum
percentage of plant nutrients claimed in the
following order and form:
A. Total nitrogen (N) %
Available phosphate (P205) %
Soluble potash (K20) %
B. For unacidulated mineral phosphatic material and
basic slag, bone, tankage, and other organic
phosphatic materials, the total phosphate and/or
degree of fineness may also be guaranteed.
10
C. Guarantees for plant nutrients other than
nitrogen, phosphorus, and potassium may be
permitted or required by regulation. The guarantees for
such other nutrients shall be expressed in the form
of the element. The source (oxides, salts,
chelates, etc.) of such other nutrients may be required
to be stated on the application for registration
and may be included on the label, Other
beneficial substances or compounds, determinable by
laboratory methods, also may be guaranteed with
permission from the regulatory authority and with
the advice of the Director of the Agricultural
Experiment Station. When any plant nutrients or
other substances or compounds are guaranteed,
they shall be subject to inspection and analysis in
accord with the methods and regulations
prescribed by the regulatory authority.
Fertilizer Unit - The unit mass of a fertilizer
nutrient (in the form of the element or an oxide), generally 1
kg (ISO).
In the United States, fertilizer unit is defined as 10 kg
of plant nutrients or 1% of a 1,000-kg tonne of fertilizer.
Plant Food Ratio - The ratio of the numbers of
fertilizer units in a given mass of fertilizer expressed in
the order N-P-K (ISO). In other words, it is the ratio of
two or more nutrient percentages to another. A 5-10-
15 grade has a 1-2-3 ratio; 10-20-20 a 1-2-2 ratio; 0-
10-20 a 0-1-2 ratio.
Label - Piece of paper or plastic, or a printed area of
a package or container, marked with the necessary
information to identify the product and make known its
essential characteristics (ISO),
The AAPFCO defines label as the display of all
written, printed, or graphic matter, upon the immediate
container, or a statement accompanying a fertilizer.
The Philippines defines label as a display or written,
printed, or graphic matter designed in any manner or
by any means upon the immediate container of
commercial fertilizer.
Brand - Term, design, or trademark used in
connection with one or several grades of fertilizer (AAPFCO),
The Philippines uses the same definition.
Custom Mixture - A fertilizer formulated according
to specifications that are furnished by/for a consumer
prior to mixing, usually based on the results of soil tests.
Chloride-Free Fertilizers - Fertilizers containing less
than some specified amount of chlorine. Because the
usual source of chlorine in fertilizer is potassium
chloride, the term usually means a fertilizer containing
potassium from some other source such as potassium sulfate
or potassium nitrate. Low-chlorine fertilizers may be
preferred for agronomic reasons or, in the case of some
compound fertilizers containing ammonium nitrate, to
avoid hazardous thermal instability. The maximum
chloride content of chloride-free fertilizers may be in the
range of 1.0%-2.5% depending on the type of fertilizer
and country regulations.
Standard Chemical Fertilizer - A chemical
fertilizer for which the Minister has announced the formula
and minimum or maximum quantity of nutrient element
or poisonous substance and other necessary
characteristics for each kind of soil chemical fertilizer (Thailand).
Sampling Unit - A defined quantity of material
having a boundary which may be physical - for example, a
container - or hypothetical - for example, a particular
time or time interval in the case of a flow of material
(ISO). . .
A similar term, "lot," is defined by the AAPFCO as
any identifiable quantity of fertilizer that can be sampled
officially.
Investigational Allowance - An allowance for
variations inherent in the taking, preparation, and analysis
of an official sample of fertilizer (AAPFCO).
In the Philippines, a similar term, "tolerance," means
the variation from the guaranteed analysis authorized
by laws or rules and regulations.
Solubility of a Fertilizer Nutrient - The quantity
of a given nutrient that will be extracted by a specific
medium under specified conditions, expressed as a
percentage by mass of the fertilizer (ISO).
The AAPFCO defines available phosphate as the sum
of the water-soluble and the citrate-soluble phosphate.
Malaysia defines phosphate available as the sum of the
water-soluble and the citrate-soluble phosphoric acid (as
P2O5).
The term "available," as applied to each of the three
primary fertilizer constituents, nitrogen, phosphorus, and
potassium, has somewhat different meanings, For each
nutrient, all the content that is soluble in water is
available. In addition, however, some of the content that is
not soluble in water is available to plants,
It is preferable to use the terms "active" and
"inactive" as applied to insoluble nitrogen, unless the results
of actual field or growing tests can be used. Animal and
vegetable materials may decompose in damp, warm soils,
and part or all of the nitrogen thus becomes available to
growing plants, Some of the nitrogen may, however,
remain unavailable. In order to anticipate the relative
value of the nitrogen contained in organic (animal and
vegetable) materials, empirical laboratory methods have
been developed which give results in reasonable
agreement with field tests.
11
Available phosphate in ammonium phosphates,
superphosphates, or mixed fertilizers is the water-soluble
plus the ammonium citrate-soluble phosphate. For
basic slag, fused phosphates, and phosphate rocks, the
available phosphate is determined as the part soluble in
a 2% citric acid solution.
Available potash is considered to be that which is
soluble in water, aqueous ammonium oxalate, or
aqueous ammonium citrate.
"Available plant nutrient" is intended to mean that
which is in a form capable of being assimilated by
growing plants or of being converted into such a form in the
soil during the growing season.
Moisture - Free water held by solids as distinguished
from water of crystallization and water of constitution
which are in chemical combination and no longer have
the properties of water.
Heavy Metals - Metallic elements that are located
in the transitional series of the periodic chart of
elements, These metals are not required in plant nutrition
and usually are found in relatively small amounts in
nature. Toxicity to plants could result with high
concentrations of some heavy metals in soil, and problems in
animal and human health may result if heavy metal
concentrations in the diet are above certain critical levels.
Examples are cadmium (Cd), chromium (Cr)—lead-(Pb),-
nickel (Ni), and vanadium (V). Levels of heavy metals
may be a problem in some phosphate rock deposits,
sewage sludge, animal manures, and some industrial
byproducts used as a source of fertilizer.
Fines - Fertilizer particles that are smaller than the
size of particles intended to be manufactured for sale.
Deficiency - The amount of nutrient found by analysis
to be less than that guaranteed, which may result from a
lack of nutrient ingredients or from lack of uniformity
(AAPFCO).
In the Philippines, deficiency is defined as the amount
found by analysis to be less than that guaranteed.
Deteriorated Chemical Fertilizer - A chemical
fertilizer which has expired or, as a result of any factor,
has deteriorated in quality so that the quantity of
nutrient element is reduced or its condition changed
(Thailand).
Misbranding - A fertilizer shall be deemed to be
misbranded:
A. If its labeling is false or misleading in any particular.
B. If it is distributed under the name of another fertilizer
product.
C. If it is not labeled as required by regulation.
D. If it purports to be or is represented as a fertilizer, or
is represented as containing a plant nutrient or
fertilizer unless such plant nutrient or fertilizer conforms
to the definition of identity, if any, prescribed by
regulation (AAPFCO).
Adulteration - A fertilizer shall be deemed to be
adulterated:
A. If it contains any deleterious or harmful ingredient in
sufficient amount to render it injurious to beneficial
plant life when applied in accordance with directions
for use on the label, or if the label does not contain
adequate warning statements or directions for use
that may be necessary to protect plant life,
B. If its composition falls below or differs from that which
it is purported to possess by its labeling.
C. If it contains unwanted crop seed or weed seed.
Application - General term for all processes of
administering fertilizer and soil conditioners to a crop or
-soiI-or-both-(ISO).——- -
This term embraces broadcasting,
spreading/spraying, or dusting, as well as more specific placement
methods including injection into the soil and the drilling of
seed and fertilizer combined. It may be broadened to
cover nutrient film techniques and the addition of
fertilizers to irrigation water (fertigation).
Dose Rate; Dose - The mass or volume of a
fertilizer or soil conditioner or nutrient applied to unit area
of cultivated land or unit mass of growth medium (ISO).
Plant Food - Marketing term used to express plant
nutrients in a fertilizer.
Fertilizer Distribution - General term for
transportation, intermediate storage, and marketing of
fertilizer, including all operations after the fertilizer leaves
the factory and before it reaches the farm.
Abbreviations - Many of the more common
fertilizers are often identified or referred to by abbreviations.
The following list indicates those abbreviations most
commonly encountered:
12
Abbreviation
Name of Product
Typical Grade
AN
APS
APP
AS
CAN
CN
DAP
KC1
MAP
MOP
SOP
Sul-Po-Mag®
SSP
TSP
-
UAN
Ammonium nitrate
Ammonium phosphate sulfate
Ammonium polyphosphate solution
Ammonium sulfate
Calcium ammonium nitrate
Calcium nitrate
Diammonium phosphate
Potassium chloride
Monoammonium phosphate
Muriate of potash (fertilizer-grade potassium chloride)
Sulfate of potash (fertilizer-grade potassium
Sulfate of potash-magnesia
Single superphosphate
Triple superphosphate
Urea
Urea-ammonium nitrate solution
sulfate)
33%-34% N
16-20-0
10-34-0
21% N
21%-26%N
15% N
18-46-0
60%-62% K20
10-50-0 to 11-55-0
60%-62% K20
50%K2O
22% K20; 18% S; 10°/crl8% MgO
16°/^22% P2Os
44%-48% P205
45%-46% N
23%-32% N
Note: Sul-Po-Mag® is a registered trade name of IMC Global USA.
1.8 Fertilizer-Related Information Sources
The directories, handbooks, magazines, and books in the following list provide sources of information on various
subjects relating to fertilizer.
Publication
World Fertilizer Market Information Sources
Reference Manual R-9, June 1991
International Fertilizer Development Center
P.O. Box 2040
Muscle Shoals, Alabama 35662, U.S.A.
Telephone: 205-381-6600
Telefax: 205-381-7408
Agricultural Information Resource Centers — A
World Directory, 1990
International Association of Agricultural
Librarians and Documentalists {IAALD)
IAALD World Directory Working Group
716 West Indiana Avenue
Urbana, Illinois 61801-4836, U.S.A.
Telephone: 217-333-7687
Telefax: 217-244-0398 (Attention 3-7687)
Directory of Sources of Fertilizer-Related
Information With Special Reference to Asia
the Paci/ic-United Nations 1991
FAD1NAP/ARSAP
ESCAP Agriculture and Rural Development Division
United Nations Building
Rajadamnern Avenue
Bangkok 10200, Thailand
Telephone: (66+2) 282 9161 to 282 9200
Telefax: (66+2) 281 2403
Subject Coverage
Information sources, publications, fertilizer
manufacturers, international fertilizer trading companies,
fertilizer-related associations and organizations
Information resource centers that have agriculture-
related collection and/or information services
Technology suppliers, fertilizer and producers and
traders, surveyors, suppliers of bags and of packaging
and handling equipment, government ministries and
agencies, international and national organizations and
associations, academic and research institutes, and
information services
13
Publication
Subject Coverage
Farm Chemicals Handbook 1995
Msister Publishing Company
37733 Euclid Avenue
Willoughby, Ohio 44094, U.S.A.
Telephone: 216-942-2000
Telefax: 216-942-0662
Agricultural Research Centres: A World Directory
of Organizations and Programmes, 1993
Longman Group UK Limited
Longman Information and Reference Division
Westgate House The High, Harlow
Essex CM20 1YR, United Kingdom
Telephone: (0279) 442601
Telefax: (0279)444501
Green Markets 1994 World Directory of the
Fertilizer Industry
Green Markets (Pike & Fischer, Incorporated)
4600 East-West Highway, Suite 200
Bethesda, Maryland 20814, U.SA.
Telephone: 301-654-6262
Telefax: 301-654-6297
Yearbook of International Organizations,
1993/1994
Union of International Associations__... . ...... _.
40 rue Washington
B-1050 Brussels, Belgium
Telephone: (32 2) 640 18 08
Telefax: (32 2)646 05 25
Directory: Fertilizer Plants in the United
States...1992 (Including Canada)
Association of American Plant Food Control
Officials, Inc.
c/o Joel Padmore
North Carolina Department of Agriculture
4000 Reedy Creek Road
Raleigh, North Carolina 27607, U.SA.
Telephone: 919-733-7366
Telefax: 919-733-6801
Pesticide directory, fertilizer directory, regulatory file,
environmental and safety section, buyers' guide,
company addresses
Directory of laboratories and industrial companies in
all aspects of agricultural research including
agronomy, crop protection, environmental science,
horticulture, and natural resources
World directory of fertilizer companies listed by
country
Directory of international organizations
Listing of fertilizer manufacturers, blenders, and retail
outlets in the United States and Canada
North American Sulphur Fertilizer Producers,
1992
The Sulphur Institute
1140 Connecticut Avenue, NW, Suite 612
Washington, D.C. 20036-4002, U.SA,
Telephone; 202-331-9660
Telefax: 202-293-2940
Directory of North American sulfur fertilizer producers
14
Publication ^ Subject Coverage
European Sulphur Fertilizer Producers, 1991 Directory of European sulfur fertilizer producers
The Sulphur Institute
1140 Connecticut Avenue, NW, Suite 612
Washington, D,C. 20036-4002, U.S.A.
Telephone: 202-331-9660
Telefax: 202-293-2940
World Sulph ur and Suiph uric Acid Plant List & Directory of world sulfur and sulfuric acid plants
Atlas, 1993 and their locations
British Sulphur Publishing
31 Mount Pleasant
London WC1X OAD, England
Telephone: (+44 71)837 5600
Telefax: (+44 71)837 0292
World Fertilizer Plant List & Atlas, 1994 Directory of world fertilizer plants and their locations
British Sulphur Publishing
31 Mount Pleasant
London WC1X OAD, England
Telephone: (+44 71)837 5600
Telefax: (+44 71)837 0292
World Directory of Fertilizer Products, 1992 World directory of fertilizer products and who
British Sulphur Publishing produces them
31 Mount Pleasant
London WC1X OAD, England
Telephone: (+44 71)837 5600 _________
Telefax: (+44 71) 837 0292 "
World Directory of Fertilizer Manufacturers, 1993 World directory of fertilizer manufacturers
British Sulphur Publishing
31 Mount Pleasant
London WC1X OAD, England
Telephone: (+44 71) 837 5600
Telefax: (+44 71) 837 0292
N-P-K-S Process & Plant Suppliers World Process design, engineering, construction, equipment
Directory, 1994 supply
British Sulphur Publishing
31 Mount Pleasant
London WC1X OAD, England
Telephone: (+44 71)837 5600
Telefax: (+44 71)837 0292
Maritime Fertilizer Terminals, 1983 Directory of global maritime fertilizer terminals
British Sulphur Publishing
31 Mount Pleasant
London WC1X OAD, England
Telephone: (+44 71)837 5600
Telefax: (+44 71)837 0292
15
Directory of Fertilizer References, 1992
The Fertilizer Institute
501 Second Street, N.E.
Washington, D.C. 20002, U.S.A.
Telephone: 202-675-8250
Telefax; 202-544-8123
The Blue Book of World Fertilizer, 1994 Worldwide capacities, production, trade, quarterly
FMB Consultants Limited, FMB House sales review, price trends
6 Windmill Road, Hampton Hill
Middlesex TW12 1RH, England
Telephone: (+44 81) 979 7866
Telefax: (+44 81)979 4573
Who's Who in Fertilizer and Ag-Chemical Supply, Directory of U.S. fertilizer producers, suppliers,
1993 distributors, and marketers
Stalsby/Wilson
15995 North Barkers Landing, Suite 320
Houston, Texas 77079, U.S.A.
Telephone: 713-496-1734
Telefax: 713-531-7229
Directory of American Agriculture, 1993/1994
Agricultural Resources & Communications, Inc.
4210 Wam-Teau Drive
Wamego, Kansas 66547-9377, U.S.A.
Telephone: 913-456-9705__ _
Telefax: 913-456-9705
Green Markets: Mergers, Acquisitions, & Joint Mergers, acquisitions, and joint ventures
Ventures in Fertilizer, 1994
Green Markets (Pike & Fischer, Incorporated)
4600 East-West Highway, Suite 200
Bethesda, Maryland 20814, U.S.A.
Telephone: 301-654-6262
Telefax: 301-654-6297
National Directory of Organic Wholesalers, 1993 Organic information and resources
California Action Network
P.O. Box 464
Davis, California 95617, U.S.A.
Telephone: 916-756-8518
Telefax: 916-756-7857
Scientific and Technical Organizations and A guide to over 25,000 organizations and agencies
Agencies Directory, 1994 concerned with the physical science, engineering,
Gale Research, Inc. and technology
835 Penobscot Building
Detroit, Michigan 48226-4094, U.S.A.
Telephone: 313-961-2242
Telefax: 313-961-6815
Producers, suppliers, trading firms, equipment
manufacturers, engineering and construction
services, export associations, industry services
Directory of organizations, agencies, and others
serving American agriculture
16
Publication
Mineral Industry Surveys
United States Bureau of Mines
810 7th Street, NW
Washington, D.C. 20241, U.S.A.
Telephone: 202-501-9409
Telefax: 202-501-3751
Research Centers Directory, 1991
Gale Research Inc.
835 Penobscot Building
Detroit, Michigan 48226-4094, U.S.A.
Telephone: 313-961-2242
Telefax: 313-961-6815
International Research Center Directory, 1994-95
Gale Research Inc.
835 Penobscot Building
Detroit, Michigan 48226-4094, U.S.A.
Telephone: 313-961-2242
Telefax: 313-961-6815
Encyclopedia of Associations, 1995
Gale Research Inc.
835 Penobscot Building
Detroit, Michigan 48226-4094, U.S.A.
Telephone: 313-961-2242
Telefax: 313-961-6815
Ag Retailer Magazine
Agricultural Retailers Association
11701 Borman Drive, Suite 110
St. Louis, Missouri 63146, U.S.A.
Telephone: 314-567-6655
Telefax: 314-567-6808
Fertilizer Focus Magazine
FMB Publications Ltd., FMB House
6 Windmill Road, Hampton Hill
Middlesex TW12 1RH, England
Telephone: (+44 81) 979 7866
Telefax: (+44 81)979 4573
Subject Coverage
Directories for producers of limestone, phosphate,
nitrogen, sulfur, and potash
Guide to university-related and other nonprofit
research organizations
A world guide to government, university, independent
nonprofit, and commercial research and development
centers, institutes, laboratories, bureaus, test facilities,
experiment stations, research parks, data collection
and analysis centers, foundations, and councils
A guide to national and international organizations
including trade, agricultural, environmental,
engineering, technological, and governmental
Fertilizer plant equipment list (published yearly)
1. Directory of bulk materials handling directory
equipment suppliers (published yearly)
2. Directory of bag and bagging machinery suppliers
(published yearly)
3. Directory of shipbrokers (published yearly)
17
1.9 Resource Publications
1. International Fertilizer Development Center &
United Nations Industrial Development
Organization. December 1979. Fertilizer Manual, 1FDC
Reference Manual R-l, Edited by T. P Hignett.
2. UN1DO. 1967. Fertilizer Manual, Vienna, Austria.
3. Incitec Limited. 1990. Fertilizer Handbook,
Morningside, Queensland, Australia, Edited by J.
S„ Glendinning.
4. 1FDC, 1993. Farm Servicing Handbook, 1FDCA-
3, prepared by C. C. Yaptenco, Jr.
5. Association of American Plant Food Control
Officials, Inc. 1994. Official Publication No. 47, West
Lafayette, IN, U.S.A.
6. Meister Publishing Company. 1995. Farm
Chemicals Handbook, Willoughby, OH, U.S.A.
7. The Fertilizer Institute. 1976. The Fertilizer
Handbook, Washington, D.C., U.S.A^
8. International Organization for Standardization,
1983. Fertilizers and Soil Conditioners -
Classification; ISO 7851, Geneva, Switzerland.
9. International Organization__for. Standardization^
1984. Fertilizers and Soil Conditioners -
Vocabulary; ISO 8157, Geneva, Switzerland.
10. International Organization for Standardization.
1989. Fertilizers and Soil Conditioners -
Vocabulary, Addendum 1; draft addendum ISO 8157,
Geneva, Switzerland.
11. Standards and Industrial Research Institute of
Malaysia. 1980. Malaysian Standard - Glossary of
Terms Used in the Fertilizer Trade and Industry,
Selangor, Malaysia.
12. Chemical Fertilizer Control Act -Mauritius. 1981.
13. Fertilizer and Pesticide Authority of the Philippines.
1975. FIA Brand Resolution No. 2-75 (Philippine
Fertilizer Regulatory Law), Makati, Metro Manila,
Philippines.
14. Ministry of Agriculture, Agricultural Regulatory
Division. 1975. Fertilizer Act, Bangkok, Thailand.
15. Order Concerning the Admissibility of Fertilizer
Types (Fertilizer Order). 1963. Federal Republic of
Germany.
16. The National Institute of Agro-Environmental
Sciences, Ministry of Agriculture, Forestry, and
Fisheries. Fertilizer Control Law of Japan, Tsukuba-shi,
lbaraki-ken, Japan.
17. Fertiliser Association of India. 1993. The
Fertilizer Control Order, New Delhi, India.
18
Chapter 2. The Role of Fertilizers in Agriculture
Table of Contents
Page
2.1 Demand for Agricultural Products and Plant Nutrients 20
.2.2 The Soil Resource ............. 21.
2.3 Concepts of Soil Fertility 22
2.3.1 Classifications of Soil Nutrients 23
2.3.1.1 Macronutrients , 24
2.3.1.2 Micronutrients 24
2.3.2 Factors Affecting Nutrient Availability 24
2.3.2.1 SoilpH 24
2.3.2.2 Soil Cation Exchange 26
2.3.2.3 Soil Organic Matter - Soil Life 27
2.3.2.4 Cropping Interactions 27
2.4 Fundamentals of N, P, and K 28
2.4.1 Soil Nitrogen 28
2.4.1.1 Application of N Fertilizers 30
2.4.2 Soil Phosphorus 32
2.4.2.1 P Fixation 33
2.4.2.2 Dissolution and Water Solubility of P Fertilizers 34
2.4.2.3 Effects of Placement aiuiP_ar^de3i^J3D^E&is^c^^f.-.-J.-.--^.-.^r... ■-■ 34
2.4.3 Soil Potassium r 35
2.4.4 Soil Sulfur 36
2.4.5 Other Nutrient Deficiencies 36
2.4.6 Non-Nutrient Soil Problems , , 36
2.5 Diagnosis of Nutrient Problems 37
2.5.1 Plant Tissue Analysis -. 37
2.5.2 Soil Testing 38
2.6 Profitable Fertilizer Use 39
2.6.1 The Economics of Fertilizer Use 39
2.6.2 Site-Specific Management 1 42
2.7 Soil Productivity and Sustainability 43
2.8 References 44
19
Chapter 2. The Role of
2.1 Demand for Agricultural
Products and Plant Nutrients
The rapid increase in the world's population is the
main driving force for the growing demand for
agricultural products in the form of food and fiber. As this
demand has increased, so has the demand for nutrients to
support plant growth. Since there is little scope for
opening more land for crop production, future demand can
be met mainly by increased production on existing
cropland. The essence of all but subsistence agriculture, in
which the farm family consumes practically all of the
produced food, is that commodities produced on the
land are consumed at another locale, mainly by the
rapidly growing urban populations. As products flow to sites
of consumption, so flow the plant nutrients or elements
contained in the products. By 2050 world population
will be approximately 11.5 x 10⁹; likewise, the outflow
of nutrients from farmers' fields will continue to increase
(Figure 2.1). The rapid population rise has been
supported mainly by the increased use of nutrients by
farmers and movement of plant nutrients to population
centers.
Soil nutrients removed in farm products must be
replenished or the soil becomes impoverished of those
nutrients, and plant growth and production from
succeeding crops is decreased. From the very beginning of
sedentary agriculture, farmers have recognized the
basic problem of nutrient depletion, On all continents slash
Population
1—
1990
Source: [9].
Figure 2.1. World Population Growth Trends,
Fueling the Need for More Food
and Nutrients.
in Agriculture
and burn techniques have been used to replenish
nutrients that have been depleted by cropping. Slash and
burn is still practiced in many developing countries and
relies on the slow, natural processes of nutrient release
from soil organic matter and soil minerals and on
biological nitrogen fixation (BNF) to accumulate nutrients
in the form of biomass. If the native vegetation can be
left for periods (termed fallow) of 15-20 years, the
accumulated biomass will release enough nutrients after it
has been slashed and burned to support crops for
possibly 2-4 years. After the soil becomes impoverished of
nutrients, the process of revegetation must be repeated.
Besides containing nutrients, the ash has a beneficial
effect of raising soil pH. This liming increases the
availability of nutrients and provides a better rooting medium.
The failure to maintain soil nutrients has led to the
downfall of many ancient societies [1]. When nutrients
are not replenished to soils, sometimes even the growth
of native vegetation cannot be supported. Currently, food
demands in some impoverished areas of developing
countries that have high population densities are
causing farmers to use shorter fallow periods. With decreased
soil cover from both native vegetation and crops, severe
-SoiLerosion_occursr less .nutrients are accumulated in the
biomass, and the areas are left totally unproductive and
environmentally degraded. The Mayan culture of
Central America supposedly declined for this reason, In
addition to slash and burn practices, ancient societies strived
to replenish soil nutrients by applying animal and
human manures and by growing legumes (BNF) that can
capture nitrogen from the air by means of symbiotic
bacteria attached to their roots. Residues from the
legume crops provide N for succeeding crops.
As population pressures restricted land availability and
prohibited long fallow periods, farmers were forced to
spend more time transporting and applying whatever
organic forms of nutrients they could find. Until the
introduction of commercial fertilizers, the maintenance of
plant nutrients in farmers' fields was a major
occupation of farmers. Medieval European farmers spent
approximately two-thirds of their time in transporting and
spreading organic materials. In North America, farmers
moved west to undisturbed lands after depleting the
nutrients of lands in the east.
Agriculture is commonly perceived to have functioned
well before World War 11 without commercial fertilizers;
however, this was not the case. Farming was inefficient
because large segments of the population had to be
involved to produce enough food; the systems were not
20
sustainable in nutrients even with the use of fallows and
legumes in crop rotations. There were many periods of
mass starvation and deprivation [2], and the farming
systems, which consisted of poor soil conservation
practices and low nutrient inputs, caused great damage to
the environment. Because an extensive area of land was
required for such agriculture, marginal land was culti-
" vated and the soils ultimately were degraded. At the time
of the Dust Bowl years (1930-33), one-third more land
was being cultivated in the United States than currently.
The scars left on the land as a result of these practices
are still evident throughout the world.
2.2 The Soil Resource
In addition to water and sunlight, the soil covering the
earth's surface is a basic support system for all
terrestrial life. While human activities have impacted hydro-
logic cycles and, to some extent, sunlight, their primary
consequences, both to the detriment of the life support
system and to the enhancement of its ability to support
human populations, have been caused by manipulation
of soils. Soils are the loose, unconsolidated materials
covering the earth, which are derived from rock
materials, either in place or carried by wind or water from
another location, and they serve to physically support
plants and provide water and nutrients for growth.
However, soils are not simply the mineral materials derived
from rock; they also contain populations of
microorganisms and soil fauna that are integral to soil
development, nutrient and water dynamics, weathering of rock
materials, and the physical characteristics of soils. In
general, soils are about 48% by volume inorganic materials,
4% organic material, and 48% open space, about one-
half of which is occupied by water.
If soils are to be cultivated for crop production, other
conditions must be present that are conducive to plant
growth, i.e., a favorable climate, adequate water and
rooting depth, absence of excessive flooding or seawa-
ter intrusions, favorable terrain, and sufficient culrivat-
able area. Arable or cultivatable land, therefore, consists
of only about 24% of the earth's land surface. Another
27% is suitable only for grazing, and 47% of the earth's
land surface will not support any agricultural activity [3].
In a natural state, the availability of nutrients in soils
depends on the nutrient contents of the parent
materials (the rocks or naturally imported materials) and on
processes that degrade the minerals to make the
nutrients available to plants, recycle nutrients between the
soil and vegetation, and remove them from the soil-plant
system. The processes that form soils, particularly
weathering of rocks to smaller particles, break down the
mineral structures; thereby, their contained nutrients are
released to soil solution and made available for plant
uptake. As the mineral structures are broken down and
new ones are formed in response to a climatic regime,
particularly moisture and temperature, soils change in
character, generally at slower speeds during dry or cold
periods and at faster speeds under warmer or moister
conditions. Young soils contain a storehouse of
undegraded minerals that can release nutrients.
Therefore, a soil's age is a relative rather than a chronological
characteristic. In soils that have been subjected to warmer
temperatures and more moisture for longer periods, the
minerals are changed in form, the weatherable
minerals are degraded, and nutrients are lost to the sea. Gla--
cial deposition areas of temperate regions contain fertile
soils formed from ground rock materials, which are of
recent origin and located in temperate climates. Because
most tropical soils are exposed to longer periods of
weathering, higher temperatures, and more moisture,
they undergo more weathering. Recently formed
volcanic soils and soils in river valleys, which receive
sediment from flooding events, are essentially the only
tropical soils that have not been weathered enough to
have had much of their weatherable minerals degraded
and most of their nutrients removed. As with
organisms, soils go through transitions of aging, and the rate
of the process depends on the environment.
Younger soils still contain a storehouse of nutrients in
the mineral fraction; however, most of the nutrients of
warm and moist tropical soils are stored only in the ac-
'-cumu]ated-biomas5^growing-on"the soils. The recycling
of the nutrients under most native vegetation is very
efficient in maintaining the nutrients in the system, but
losses still occur as evidenced from the low nutrient
status of many tropical soils that have always been covered
by native vegetation. This efficient cycling is drastically
changed by removal of the native vegetation and
cultivation of the soil, which increase the rates of organic
material breakdown and expose the soil to water and
wind erosion, both of which increase the rates of
nutrient removal While many tropical soils can support large
amounts of biomass production, they are rapidly depleted
of nutrients under cultivation. European colonialists had
a difficult time recognizing the large differences between
temperate soils and tropical soils. Their practices caused
rapid removal of nutrients under cultivation. They also
failed to understand how much more important the
maintenance of soil organic matter was to store and
supply nutrients in tropical soils relative to the
temperate soils.
Productivity of soils is quite different from soil fertility.
If a soil is to be productive for crop production, it must
have a suitable climate, sufficient but not excessive water-
supplying ability, and available plant nutrients for crop
growth. A droughty soil may be fertile (contain nutrients)
but not productive; however, it could become productive
21
with irrigation. An infertile soil can support a large bio-
mass of natural vegetation but be unproductive for
cultivated crops, which require higher amounts of plant
nutrients in short periods of time. Most of the
population growth in the past 50 years has occurred in tropical
areas; these same areas have soils that are poorly
endowed in plant nutrients and climates that make the soils
susceptible to nutrient loss and degradation.
2.3 Concepts of Soil Fertility
As animals require specific amounts of proteins,
carbohydrates, vitamins, and minerals for proper growth,
plants require nutrients in the form of ions derived from
the soil. Insufficient quantities of protein, or even
specific amino acids of proteins, can limit growth or
specific biological processes in animals. Similarly, each
nutrient plays a specific role in the structure of plant
cells and the enzyme and energy transfer molecules that
carry out the metabolic processes of plants. Because of
the unique chemical characteristics of these nutrients,
other elements cannot be used as substitutes for them.
The amounts of nutrients needed by crops varies both
with the crop and the yield attainable. Table 2.1
presents the approximate amounts of nutrients that various
crops actually take up to achieve the yields indicated.
These yields are not exceptionally high, but are
normally attainable in areas well suited for growth.of_these_
crops. The amounts of nutrients listed do not mean that
these are the amounts of nutrients that must be added
as fertilizers. In many cases, much of the nutrients come
from the soil when adequate reserves of the nutrients
are present. In other cases, because of very low fertility,
much more than the listed amount of fertilizer nutrients
Table 2.1. Approximate Amounts of Nutrients
Taken Up by Crops
Crop
Yield
N
P2O5
K20
Rice
Wheat
Maize
Cassava
White potato
Banana
Cotton
(t/ha)
6
6
6
40
40
40
1
100
170
120
150
175
250
120
A-.^\
50
75
50
70
80
60
45
160
175
120
350
310
1,000
90
10
30
25
20
20
15
20
Source: Better Crops International, December 1988,
Potash and Phosphate Institute, Atlanta,
Georgia, U.S.A., 51 pp.
might have to be added, from inorganic or organic
nutrient sources, to achieve the indicated yields. In
addition, nutrients can be internally cycled in crop production,
and only the amounts of nutrients removed in the
harvested crop must be replenished. Much of the
potassium contained in wheat, for instance, may be left in the
field in straw residues, or it may be removed if the farmer
takes the straw for some purpose.
Basic understanding of plant nutrients evolved from
developments in chemistry in the 19th century. An
important concept of plant nutrition developed by theGer-_
man chemist Justus von Liebig in about 1840 was "The
Law of the Minimum," According to this concept,
illustrated by a wooden barrel with staves of different lengths
(Figure 2.2), plant growth is limited by a particular growth
factor that is in the shortest supply to the plant. The
staves (representing the sufficiency of various growth
factors), and particularly the shortest stave, determine
how much liquid (total growth) the barrel can hold.
Growth factors include water, light, genetic potential,
and soil-derived nutrients. Different factors could
potentially control the rate of plant growth at different times
during crop growth. For example, temperature might
limit early spring growth, moisture during a droughty
period, and nitrogen supply during another phase when
these factors do not limit growth. Obviously some factor
Figure 2.2. Liebig's "Law of the Minimum"
Illustrated by Barrel Staves of
Varying Lengths Representing
Growth Factors.
22
always limits plant growth, ultimately genetic capability.
By manipulating the soil-related factors over which he
has some control, the farmer tries to lengthen the
limiting stave or staves to increase crop yield and profit. He
lengthens the growth-limiting staves by using such
practices as irrigation, nutrient additions, weed control, and
suitable crop varieties.
The analogy of the barrel illustrates some useful
concepts:
1. If other factors, e.g., moisture or day length, limit
growth, there is no benefit to increasing plant
nutrient levels above those that can be used by the crop.
2. When a limiting factor is removed by irrigation or
nutrient addition, other nutrients or factors become
limiting.
3. It is not a useful practice to raise the available level of
one nutrient far above that of others. The nutrients
should be added to supply those crop needs that the
soil does not provide. Many people refer to this
practice as "balanced" fertilization; it does not mean that
fertilizers must be added in a specific nutrient ratio
but that the nutrient-supplying capacities are
maintained in relative balance to the crop needs.
2.3.1 Classifications of Soil Nutrients
Only a few forms of nutrients are taken up by plants
{Table 2.2). Concentrations of these forms of nutrients
are normally low in soils, but soils have the ability to
store nutrients in many organic and inorganic mofecules.
They are transformed to the soluble plant-available forms
at rates defined by the environmental conditions for the
biotic and abiotic reactions, amounts of the different
nonavailable forms, their rates of conversion, and
removal of various nutrient forms from soil solution. Thus,
all of the plant nutrients have ionic forms that are plant-
available, and soils contain an assortment of less-available
forms that became available to plants through chemical
and biological reactions.
The nutrients supplied from soils have been classified
in different ways: by their functions in plants, by whether
they generally need to be added to soils to optimize
growth, or by their mobility in the plant. For agricultural
production, nutrients are classified by the quantities of
the nutrients needed by plants and whether they are
Table 2.2. Classification, Available Forms, and Concentrations of Nutrients in Plants
Macronutricntsa
Primary (Major)
Nitrogen
Phosphorus
Potassium
Secondary (Minor)
Calcium
Magnesium
Sulfur
Micronutrientsc
(Trace Elements)
Boron
Copper
Chlorine
Iron
Manganese
Molybdenum
Zinc
Cobalt
References
Chemical Symbol
N
P
Kb
Ca
Mg
S
B
Cu
a
Fe
Mn
Mo
Zn
Co
Principal
Forms Taken Up by Plants
NH4+ and N03"
HP04= and H2PO4-
K+
Ca^
Mg++
HSO4" and S04=
H3BO3, H2BO3-
Cu++, Cu(OH)+
a-
Fe++, Fe(OH)2+,
Fe(OH)++, Fe+++
Mn+2
Mo04=, HM0O4-
Zn++
Co++
Brady, 1984 [3]
Approximate
Concentrations in Soils
0.3%-l%
0.02%-0.5%
- 0.05%-3.8%
0.7+%
0.6+%
30-500 ppmw
4-100 ppmw
1-100 ppmw
7-50 ppmw+
196-6%
120-6,000 ppmw
0.1-40 ppmw
10-130 ppmw
1-40 ppmw
Jackson, 19651101;
Mitchell, 1965 [11];
Brady, 1984 13]
Approximate Concentrations
of Element in Plants
(%)
1,5
0.2
1
0.5
0.2
0.1
(ppmw)
20
6
35-2,000
100
50
0.1, 1.6
20
0.1
Epstein, 1972 [12];
Brady, 1984 131
a. Carbon, hydrogen, and oxygen are~furnished from CO2 and water and are not considered "nutrients" in the normal agricultural
sense.
b. From the Latin "kalium."
c. Other elements, such as sodium, fluorine, iodine, barium, strontium, nickel, vanadium, and silicon may be essential to particular
plant species.
23
normally present in sufficient quantities in soils to
optimize the growth of a crop.
2.3.1.1 Macronutrients - The elements nitrogen
(N), phosphorus (P), and potassium (K) are the nutrients
that most often limit crop growth, and they are called
"macronutrients." The soil factors affecting the
availability of each of these nutrients are discussed separately
in this chapter. Since N, P, and K are the nutrients most
widely deficient in soils, they are also called the "major,"
"primary," or the "fertilizer" nutrients. Sometimes S is
also considered a major nutrient because deficiencies
are becoming more widespread. As discussed in
Chapter 1, both synthesized and organic fertilizers are
applied to cropland principally to supply N, P, and K. This
is not to say that they are deficient in all soils and for all
crops. For instance, many soils have sufficient
weathering clays so that K is not deficient, and K may become
deficient only after many years of cropping. Nitrogen
may not be limiting for a crop that is planted after a
good legume crop, or the soil may be able to release
sufficient P to maximize the growth of a grass crop but
not nearly enough to grow a good crop of white (Irish)
potatoes. As explained earlier, soils ultimately become
depleted of any plant nutrient unless the supply is
replenished either from the atmosphere, added soil
materials, or organic or synthesized fertilizers.
Calcium, Mg, and S are-called the "secondary"
nutrients of the macronutrients because they are not as widely_
deficient as N, P, and K. They may also have been
considered secondary in that they are often contained in
materials that are applied to supply another nutrient or
need. For instance, Ca and Mg are supplied in large
amounts in dolomitic limestones that are applied to raise
the pH of acidic soils- Similarly, S fertilizers are not
usually applied simply as S sources but are "secondary" to
another nutrient, e.g., in P fertilizers such as single
superphosphate, or in the N fertilizer ammonium
sulfate. One should not be misled by the term "secondary" -
deficiencies of Ca, Mg, or other nutrients can be as
serious as more common deficiencies of N, P, K, or S.
They can also very severely limit plant growth.
2.3.1.2 Micronutrients - Other elements that are
needed by plants in much lower amounts than the
macronutrients are called micronutrients or trace elements
(Table 2.2), They are as essential to plant growth as the
macronutrients because they perform very essential and
specific roles, particularly in molecules involved with
energy transfer processes, hormones, and enzymes.
When deficiencies of micronutrients are properly
diagnosed and corrected, spectacular growth increases can
occur by making small amounts of the limiting element
available to the crop.
Plant species vary in their susceptibility to micronutri-
ent deficiencies. For instance, zinc deficiencies normally
become evident in maize or sorghum crops before they
appear in other crops. Crucifers, leafy vegetables, and
forage legumes are susceptible to boron deficiencies.
Certain tree species and shrubs will first show iron
deficiencies. Legumes will respond to molybdenum before
most other crops; and manganese deficiencies
generally are observed on soybeans and small grain crops
before they are seen in other plants.
A characteristic of micronutrients is that they can
become toxic to plants more readily than the
macronutrients. Iron toxicities are fairly common in flooded rice,
and boron has a narrow range between deficiency and
toxicity. Therefore, the proper diagnosis of the cause of
toxicity or deficiency and application of the proper
element, form, and amount are needed to alleviate micro-
nutrient deficiencies. Molybdenum might be added at
35-70 g/ha to correct a deficiency, whereas 3 or 4 kg/
ha of this element may cause toxicity. Fortunately, soils
form many relatively insoluble compounds with most of
the micronutrients, which limit the amounts of the
elements in soil solution at any one time. In addition, plants
have considerable capacity to discriminate between
wanted and unwanted elements. In many cases, plants
are adversely affected by excess nutrients that interfere
with the uptake of some other nutrient, rather than from
toxicity of the nutrient per se.
Deficiencies and toxicities of micronutrients are usu-
-alIy_reIatedio...the_content of the soils' parent materials.
Oxides, hydroxides, and sometimes sulfides of
micronutrients precipitate in soils after they have been released
by weathering of silicate clays. The organic material in
soils is very important in supplying micronutrients not
only by releasing nutrients as the organic material is
degraded by microbial action but also by solubilizing
micronutrients by chelation, Soil pH and cation exchange
capacity of soils are important aspects that greatly
affect the availability of both macronutrients and
micronutrients.
2.3.2 Factors Affecting Nutrient Availability
As mentioned earlier, all species of plants need
practically the same nutrients, but they differ both in the
amounts of particular nutrients needed for growth and
their ability to use nutrients that are available in the soil.
Soil factors such as soil pH, cation exchange in soils,
organic matter in soils, and cropping interactions
influence nutrient availability and are important
considerations in fertilizer use.
2.3.2.1 Soil pH - Soil pH is conceptually the same
as solution pH, the negative logarithm of the H"1" ion
activity (understood to mean effective concentration).
Soils of humid regions tend to become more acidic with
time, whereas soils of arid regions remain more neutral
or alkaline. Soil pH can sometimes be changed
24
significantly in only a few years. The amounts of N
addition, soil weathering, and the types of vegetation can
affect the rate at which soil pH'decreases. Soil pH greatly
affects the solubility of nutrient compounds in soils,
biological reactions that release nutrients, and the
development of toxicities from particular elements.
Soil pH is measured by using a permeable glass
electrode or litmus paper after adding water or a dilute soluble
salt solution to a soil sample. Protons (H+ ions) in the
water phase are a measurement of acidity or basicity as
in solution pH, Soils are pH buffered by organic and
inorganic weak acids and clays that can adsorb and de-
sorb H+. Soils in their normal state have pHs from about
3.8 to 9 (Figure 2.3), depending on the parent material,
weathering, and vegetation. The main effect of soil pH
on plant growth is due to the effects of pH on the ionic
forms of compounds in the soil and on the solubilization
of minerals. Soil pH affects the availability of all the
nutrient elements but has the greatest effect on P and
several micronutrients. Most of the nutrients are more
available at pHs from 6 to 7.5 (Figure 2.4). The
mineralogy and total amounts of nutrients greatly affect the
nutrient availability; thus, Figure 2.4 serves illustrative
purposes only. For instance, it is certainly possible to
have P deficiencies on a soil with pH of 6.2 even though
P is normally most available at pH 6.2.
Besides the effects on nutrient availability, toxicities
of aluminum and manganese occur at low pHs, below^
about 4.6. The solubility of compounds of these
elements increases dramatically as the pH decreases below
r
Soil
9.0-
8.0-
pH
Range J
of <
Soil \ 6.0-
pHa
3.0-
(Mainly
Mineral Soils
of Arid
Regions)
Neutral
.■Ideal'
SoilpH
Ground Limestone Required to Raise pH to 6.2
Sandy Soil
— D.5
Acidic _2.0
(Commontp jj
Humid Regions)
VeiyAcidic" A-Z
Loam Soil
(Approximate t/ha)
2.5
3.7
5.5
7.0
CfavSoii
5.0
S.B
6.9
9.0
Figure 2.3. Soil pHs and Approximate Calcium
Carbonate Required to Increase pH
to 6.5.
pH 4.5 5.0 5.5 6.0 6.5 7.0 7.5 8.0 8.5 9.0 9.5 pH
^
1 T
urn
i r
Nitroger
Phosphorus
Potassium
Sulfur
Calcium
Magnesium
Manganese
Boron
Copper and Zinc
I I
Figure 2.4. Relative Availabilities of Nutrients
at Various Soil pHs.
4.6. Aluminum toxicity is particularly important on acidic
tropical soils that may have low pH in their subsoils,
which limits root development into these layers.
Aluminum toxicities decrease the permeability of root cells
and reduce root growth; thus, the plant's ability to take
_up_water_andLnutrJentsJs decreased. This effect can be
much more detrimental to the plant than P deficiencies
because of low pH and high AI concentrations per se
[4[. In addition to nutrient availability due to solubility
effects, mineralization of N from organic matter is
decreased, and BNF by the rhizobia of legumes is decreased
at low pHs,
Soils become more acidic with soil weathering, which
depends on the climatic regime. Wetter climates cause
soils to become acidic more rapidly than drier climates
because the base cations are leached from the soil and
clays are degraded. Nitrification, the microbial
conversion of ammonium to nitrate, also acidifies soils. The
ammonium may be of organic or synthetic (chemical
fertilizer) origin; the effect on soil pH is the same.
Cropping, which speeds organic matter decomposition,
nitrification, and the application of ammonium-N fertilizer
sources (including urea) are therefore inevitable and
important causes of soil acidification. Nitrate additions cause
no acidification, but the use of organic-N materials and
ammonium sources will ultimately necessitate the
addition of liming materials to readjust the soil pH. This will
be discussed more fully in the section on N.
Liming materials are either bases or conjugate salts of
weak acids. Wood ashes and basic slag are used as
liming materials as are other basic waste products. However,
25
the most common liming agents are carbonates such as
limestones, oyster shells, and marls. They neutralize soil
acidity by displacing protons from cation exchange sites
(discussed in the next section) with Ca or Mg. and
forming carbonate species that ultimately form water and
CO2 (Figure 2.5). The dissolution of carbonates is slow;
therefore, materials must be finely ground and well
incorporated into the soil to hasten the reactions. In
addition to reducing the acidity of soils, liming materials
contain the important macronutrient Ca, and dolomitic
limestones contain Mg as well.
Liming of acidic soils is normally done by applying
tonne-per-hectare quantities of liming materials to raise
the pH to about 6.0. However, very impressive results
have been achieved on tropical soils by adding smaller
quantities, 500-600 kg ha"1, which raise the pH only
0.3-0.5 pH units. This increase in pH is enough to greatly
reduce Al toxicities and/or furnish growth-limiting Ca
and Mg. The amount of liming material needed to raise
the soil pH to a particular level depends not only on the
initial pH but also upon the amount of protons held on
exchange sites, termed residual acidity (illustrated in
Figure 2.5).
Soil ' II Ca++
Colloid
(Clay)
NH4+
+ CaCQ3
H20 + CO2
Figure 2.5. Neutralization of Soil Acidity by
Carbonate Liming Materials.
As important as soil pH is to maintaining favorable
plant growth conditions, it is somewhat incongruous that
the subject receives so little attention in many farming
systems. Often agricultural lime is sold only through
assistance from governmental subsidy programs. The
benefits of liming are often difficult for farmers to observe
until very severe toxicities or deficiencies develop. Many
of the concepts of soil liming developed for temperate
climates, such as the desired pH, appropriate fineness
of grind, etc., may not have been properly applied to
wet tropical soils, and more liming materials will be
needed to keep these soils productive, Fertilizers alone
cannot maintain the soils of many regions in a
productive state. The practice of liming deserves much more
attention than it traditionally receives.
2.3.2.2 Soil Cation Exchange - Next to
photosynthesis, many plant scientists consider the ability of
soil materials to exchange cations to be the most
important phenomenon that enables soils to support plant
growth. Minerals and organic materials have permanent
negative charges that give them the ability to adsorb
and desorb cations by exchange. This phenomenon
reduces susceptibility of these ions to leaching and buffers
their concentrations in soil solution to provide ions for
growth and to reduce the possibility of toxic
concentrations. Cation exchange in the mineral clay or colloidal
fractions of soils is developed by the substitution of similar-
sized cations for silicon (Si) atoms in the silicate layers of
clay minerals. Aluminum, Mg, and other elements of
lesser valence than Si occupy positions in the silicate
lattices. This gives the clay a net negative charge that
must be satiated by cations on the edges or between the
layers of the clay particles. Most often K occupies
interlayer positions, while any cation, including H and
AI ions, can occupy the negatively charged sites at the
edges of the clays to maintain electroneutrality (as
illustrated for soil acidity, Figure 2.5). There are also
hydroxide clays of Fe and Al, which have no negative
charges and thus no cation exchange capacity.
'A'clarification "Of "terminology may prevent some
confusion. Clay can mean the smallest size of solid particles
of soils or less than 0.002-mm diameter. "Clays" can
also refer to the clay minerals, which are layered
silicates, such as vermiculite, montmorillonite, kaolinite,
illite, etc., that have the substitution in the silicate layers
that give them net negative charges, and layers of base
cations holding the silicate layers together.
After being degraded by biological activity, organic
materials form stable materials called humus. These
organic materials can be colloidal but are largely bound to
minerals in the soil. These organics have weak acid
groups that can absorb cations. These weak acids, such
as phenolic, carboxylic, and enolic groups, are very
affected by soil pH. At very low pHs, protons are held so
tightly on the groups that there is little potential for
exchange with other cations. As the soil pH is increased,
exchange can then occur, and at more neutral pHs,
organic materials have much higher exchange capacity
per unit weight than clay minerals. Sandy soils have little
clay to provide cation exchange capacity; therefore, the
organic matter is very important. If the soil pH is very
low, these soils have practically no exchange capacity
and no nutrient-holding ability.
Cation exchange can be thought of as the formation
of a complex salt, with the amount of a particular salt
26
formed being dependent on the dissociation constants
of the salts and concentrations of ions in solution.
Cations are interchanged on and off the negatively charged
sites, but the sites are always occupied by cations. The
retention and release of Ca++, Mg++, K+, NH4+, and
many of the micronutrients give soil with adequate
cation exchange capacity (CEC) the ability to maintain
nutrient ion concentrations in the soil solution at levels
conducive to plant growth. This ability obviously depends
on the amounts and types of clays, the amount of stable
organic matter in soils, and soil pH. Clays and organic
matter are the most important fractions of soils because
of their high specific area, their CEC, and their ability to
bind soil particles together to form larger, stable
aggregates. They affect the nutrient and water-holding
characteristics of soils and the physical handling characteristics
of a soil or tilth, It is more difficult to maintain nutrient
levels in soils with little clay or organic matter content;
sandy soils with low CEC have more tendency to leach
nutrients; their pH can be decreased quickly; they have
low water-holding capacity and develop wide ranges of
nutrient deficiencies.
2.3.2.3 Soil Organic Matter - Soil Life - As
mentioned earlier, soils are not simply inorganic
storehouses of chemicals in various forms; they are also very
active biological entities that have microbial and
macrofauna populations upon which plant growth, soil
fertility, and soil development all depend. Comprising
perhaps only 0.03% of the total-weight of soil,
the-living biomass decomposes organic materials for recycling
nutrients and CO2, transforms molecular forms of
nutrients, and affects many soil physical properties that
are important to plant growth. The amount of soil
biomass depends on the amounts and types of organic
materials added to soils and the conditions that affect
microbial growth. The organic matter content of soils,
fresh additions of organic material, and the climatic
regime determine how much soil life and activity can be
supported.
In addition to CEC and nutrient storage and release,
organic matter causes aggregation of soil particles, which
helps to develop large soil pores that facilitates water
infiltration, gas movement, root penetration, and
resistance to soil erosion. Soil tilth, or the characteristic of
soils to be physically manipulated, is improved with
organic matter, and the water-holding capacity of soils is
increased by organic materials. Organic materials make
heavy clay soils less sticky and much easier to till, while
increasing the CEC and water-holding ability of sandier
or light soils. Organic matter also reduces Al and Mn
toxicities in acidic soils.
In temperate climates, organic material degradation
slows during cold months, whereas in warm climates
the organic matter is degraded throughout the year The
amount of organic matter that accumulates in soil is not
simply a matter of temperature, however. Very dry soil
conditions can limit biological activity and organic
matter degradation, Saturated soil conditions also reduce
the activity by limiting the supply of oxygen that is needed
for the more rapid aerobic degradation. Organic soils
such as peats develop under conditions in which soils
are flooded during much of the year. The amount and
characteristics of organic matter returned to the soil
obviously also affect the organic matter content of soils.
Lighter (sandier) soils tend to have less organic matter
than soils with more clay content in a given context-of
temperature, cropping, etc., because of better aeration
and less ability to form organic-clay complexes that
protect the humus material from degradation.
Under natural conditions, essentially the only way to
remove organic material other than by microbial
degradation is by fire. However, when land is cleared and the
soil is rilled for planting crops, the mixing action
exposes the organic material to oxygen, and degradation
rates are greatly increased, regardless of the climatic
conditions- The organic matter content then declines
with cropping and reaches a new equilibrium
depending on the climate, crop rotations, biomass production,
and amount of crop residue returned to the soil (Figure
2.6). Note that as a generality temperate soils start with
more organic matter than tropical soils and tend to
maintain a higher level of organic matter than tropical soils.
As discussed previously, the weathering of clays is more
rapid under tropical conditions; therefore, organic
matter becomes an even more important component of
tropical soils than temperate soils in maintaining soil
physical properties and CEC.
2.3.2.4 Cropping Interactions - It should be self-
evident that crop response to nutrients is highly
interactive with other growth conditions. Nutrient problems can
be caused by adverse weather conditions, or the response
to nutrient additions can be nil or even negative,
Similarly, insect pests and weeds reduce the effect of
fertilizer additions. As conceptualized by the "Law of the
Minimum," growth is dependent on the most limiting
factor, but rarely does only one factor limit growth.
Several different factors may influence growth at various
times during the growing season. Because the strong
interactions between nutrient availability, weather, and
pests, confound the interpretation of the effect of a
particular nutrient, fertilizer experiments are normally
conducted under conditions in which the researcher tries to
eliminate all of the controllable limitations to yield. Thus,
N experiments would normally be conducted on soils
fertilized with P, K, and other nutrients at an optimum
level, and pests would also be controlled as much as
possible. This is quite different from the situation of
farmers who make highly complex decisions on the
27
Cropping
Begun
With
Crop
Rotations,
ous a, ■ Residue
mmmmm-^!PproPs Management:
Time, years
Figure 2.6. Illustration of the Decrease of Soil Organic Matter Following Land Cultivation.
investment of limited amounts of money, labor, time, or
land under multiple constraints.
One of the consequences of this approach is that the
actual benefits of fertilizers are over-estimated in fertility
trials relative to when they are used by farmers. In
addition, the results from adverse years when no or poor
response to fertilizer occurs are usually not reported
because weather caused no response to the nutrient.
Unfortunately, farmers cannot make decisions under a
similar lack of constraints; they must make investment
decisions regarding seed, pesticides, labor, and fertilizer
inputs in a total farm management context. To
maximize the benefits from management factors, the
limiting factors should be in balance with each other, e.g.,
the crop variety must be able to benefit from the
fertilizers used. Weed and insect control, plant density, water
availability, tillage, and other management practices
should be adequate for the farmer to realize a profit
from fertilizer use.
2.4 Fundamentals of N, P, and K
Soil factors that affect the plant availability of the
primary or fertilizer nutrients (N, P, and K) are quite
complex, and different from one another. The available
forms, mechanisms of becoming plant-available, forms
of stored nutrients in soils, and timing of plant uptake
are different not only between the nutrients but also for
individual fertilizer sources of each nutrient, A basic
understanding of the reaction of nutrients in soils and the
factors that affect the response of crops to fertilizers is
essential for people in the fertilizer industry so that they
can make informed production and marketing decisions
based on what can increase the profit from using
fertilizers.
2.4.1 Soil Nitrogen
Nitrogen is a component of amino acids, which make
up proteins, chlorophyll (the molecule that captures the
sun's energy), enzymes, and the genetic material, nucleic
acids. Therefore, this nutrient is needed in large amounts
by all plants. Plants that do not have adequate N are
yellowish, have yellowing and browning older leaves,
are stunted, and have poor root systems. Without
additions of N, the nutrient is practically uniformly deficient
for all grasses and cultivated crops. The only exceptions
are the leguminous crops that have symbiotic bacterial
colonies growing within the plant, which have the
ability to meet N needs through fixation of atmospheric N2.
Excess N can cause excessive vegetative growth, delayed
maturity, and stalk breakage in small grains. The other
28
macronutrients do not have direct detrimental effects
when applied to excess.
The availability of N to plants is largely controlled by
soil microbial processes. The N cycle in soils is complex,
and under certain conditions large amounts of plant-
available IN can be lost from the soil in drainage water or
to the atmosphere (Figure 2.7). In this way, N is
different from the other nutrients, which are not as readily
lost from soils. The rates of conversion between forms
of N and the direction (immobilization and
mineralization} depend principally on the growth conditions of the
microorganisms, i.e., temperature, moisture, oxygen
availability, and composition of organic substrates, etc.,
rather than simply abiotic reactions.
Nitrogen uptake depends on the relatively small
amount of available N forms in soil' solution, the soil's
ability to replenish the available forms, and the growth
conditions for the plant. Of course, any condition that
inhibits plant growth such as other nutrient deficiencies,
poor rooting conditions, poor weather, etc., will reduce
N uptake.
Nitrate (N03~) is the main form of N available to
upland crops, whereas ammonium (NH4+) is the main form
taken up by plants growing under flooded conditions,
notably rice. Nitrate moves through soils with the soil
water, since soils have little anion-absorbing capacity.
Therefore, NO3" can move with water to plant roots
for uptake. Nitrate is also eligible for leaching into
groundwater. To reduce NO3"" pollution, it is therefore
important that the amounts of NO3" stored in the soil be
minimized during periods in which water percolates
through the soil. Fertilizer-N applications can be made
more efficient by applying the N shortly before it is
needed by the crop.
Immobilization: NH4"1"
Figure 2.7. The Nitrogen Cycle in the Atmosphere-Biosphere.
29
Nitrate-N is also subject to loss from the soil through
microbial processes when soils become highly
anaerobic due to water saturation, which inhibits oxygen
movement. When soils become anaerobic, certain microbes
use NO3" as a terminal electron acceptor, and the NO3-
is converted to N2 and N20, forms of N that cannot be
used by plants. This loss of plant-available N, called deni-
trification, therefore precludes NO3" use in flooded rice
culture. When soils are flooded to grow rice, the NO3"
accumulated from organic matter transformations
during the period of dry season fallow is lost through deni-
trification. Upland soils, which become very wet for a
week or more because of poor internal drainage or
weather conditions, can lose NO3" through denitrifica-
tion, particularly if there is readily degradable organic
material in the soil. The organic material causes O2 to
be consumed more rapidly and provides growth
substances for the denitrifying organisms.
While the denitrification process is lamented by
agronomists as a loss of plant-available N from the soil
system, it is the only way that N is recycled back to the
atmosphere as N2. Without this process, lower soil
layers and groundwaters would become large reservoirs of
NC>3~, and the oxygen-enriched atmosphere would
support continual conflagrations and, thus, make life
difficult. Therefore, the N cycle is just as important as the
carbon and the hydrologic cycles to the life support
system of the earth,
Ammonium-N is a plant-available form in addition to
NO3", but in normal upland soils it is converted fairly
rapidly to NO3" by a series of microbial reactions
collectively called nitrification (Figure 2.7). Most NH4+
fertilizers are converted to NC>3~ within a few weeks, but this
period can vary with soil temperature, moisture, O2
availability, soil pH, and the manner in which NH4+ or NH3
was applied. Soils of pH of less than 5.0 nitrify more
slowly than more neutral soils. Concentrated zones of
NHi"1" can also reduce the rate of its conversion to NC>3~.
As a cation, NH4+ can be absorbed onto cation exchange
sites and is therefore normally not subject to leaching as
is NO3". In addition, NH4+ can move into the interior of
clay lattice structures and be protected from nitrification
or plant uptake; this is called ammonium fixation. While
not significant on most soils, fixation can be appreciable
on certain clayey soils. Since NH4+ is absorbed on
exchange sites, it also does not move with water to plant
roots like NO3"; therefore, it is normally not as
important a form of available N for upland crops as N03~.
As illustrated (Figure 2,7), N in organic forms is the
major storehouse of N in soils and since the biological
conversions occur fairly rapidly, plants rely mainly on N
derived from organic material to meet their N needs.
When NH4+ and NO3" are added to soils, the soil
microorganisms make the major decisions as to what
happens to the N, that is, whether the N is put into the
organic-N pool by their assimilation of the N or is
converted to other forms of N either usable or unusable by
plants. When a carbonaceous material, for instance
straw, is added to soils, N03~ or NH4+ (termed mineral
N) will be used by the microbes to utilize the carbon
energy source, and there will be net immobilization or
incorporation of the plant-available N into unavailable
organic forms. This organic N can then be converted
back to NH4+- and then to NC>3~ after only a few weeks
and become available to the crop. This organic pool of
N is therefore the most important aspect of N nutrition,-
and 70%-80% of the N taken up by crops is normally
from this pool rather than directly from mineral
fertilizer additions. Synthesized fertilizer-N sources not only
increase the available mineral N status of soil but also
temporarily increase the amount of N in soil organic
matter as well.
2.4.1.1 Application of N Fertilizers - Because
N applied to soils can enter the large organic pool or be
lost from the soil by the several mechanisms illustrated
in Figure 2.7, N efficiency, or how efficiently the
applied N is taken up by the crop, is normally only 40%-
50%. Efficiencies of 90% are also possible under
conditions when the crop is growing rapidly and takes
up more of the applied N before other processes occur.
Since the amounts of N fertilizers used are normally more
than other nutrients and losses are variable and high,
—m^thrrds^o"irnprove"Nefficiencies have been of
considerable interest. Judicious timing of applications,
coatings to control the release of N, improved application
methods, nitrification inhibitors, and urease inhibitors
have all been demonstrated to improve efficiencies, but
considerable scope still remains to increase N use
efficiencies.
There is considerable evidence that plants respond
better to having both NH4+ and N03~ present in soils.
For this reason and to reduce losses of fertilizer N through
leaching and denitrification, there has been
considerable work on developing organic compounds that
specifically block the nitrification processes. Currently the
compounds dicyandiamide (DCD), which is both an N
source and a nitrification inhibitor, and 2-chIoro-6-
(trichloromethyl) pyridine (trade named N-serve) are
marketed as nitrification inhibitors,
Efficiency can be affected by the form of N used,
either nitrate, ammonium, ammonia (either in solution or
anhydrous), or urea. There have been scores of
experiments to compare N sources, improve N efficiency, and
establish the reasons for poor efficiencies. This research
has shown that generally there is little difference in crop
response to different N sources provided the fertilizers
are applied appropriately. This means that anhydrous
ammonia is placed below the soil surface to avoid losses,
and urea is incorporated, etc. Under a specific
condition, one form may produce slightly better results than
another, but under another condition the results might
be reversed, depending on the susceptibility of the
particular N form to the major loss mechanisms under
particular weather and soil conditions. An exception to this
generality is the ill-advised use of nitrate sources on
flooded soils.
2.4.1.1.1 Urea Reactions in Soils- Urea requires
more specific discussion because it is neither an
ammonium nor nitrate form, but it can be considered an
ammonium source. Urea is the main form of N excreted by
animals. Because of the importance of available N
sources, microorganisms and higher plants have
developed an enzyme capable of hydrolyzing urea to be able
to utilize the N from urea. The enzyme, urease, was the
first enzyme to be crystallized in a pure state. All
enzymes are protein catalysts of biological origin, but
urease can exist extracellularly in organic matter-clay
complexes, This extracellular enzyme gives soils an
intrinsic lower-limit of urease activity, mainly related to
the amounts of clay in the soil. Since urease is of
biological origin and it is also contained in microbial cells,
urease activity is also related to the biological activity of
soils, which is a function of the organic matter content
and other microbial growth factors.
Urease catalyzes the following reaction:
CO(NH2)2 + 2 H20 + H+ > 2 NH4+ + HC03~.
urease
The reaction is written to illustrate the formation of the
ionic species most prevalent at soil pHs. While urea is
extremely stable at ambient conditions, soil urease
converts urea rapidly; often urea fertilizer additions are
completely hydrolyzed in 2 to 3 days, a very rapid
reaction in soil terms. The rate of hydrolysis depends on the
soil temperature, moisture, how dispersed the urea is,
and the amount of urease present, Very cold or dry soils
hydrolyze urea more slowly than warmer or moist soils.
The enzyme activity can be significantly different in
different zones of a particular soil. High enzyme activities
can develop on a moist soil surface because of algal and
other microbial growth on the soil surface.
For a given urea distribution, the faster the urea
hydrolysis, the higher the ammoniacal and carbonate
concentrations can become. The ammonia/ammonium
equilibrium (pKa = 9.3) at the soil surface determines
how much ammonia is lost to the atmosphere, but the
loss is also related to soil moisture, wind turbulence across
the soil, soil CEC, and possibly solar energy input, In
addition to producing high pH conditions conducive to
ammonia volatilization losses from surface-applied urea,
the pH is also buffered by the carbonate produced.
Therefore ammonium sulfate, diammonium phosphate, and
ammonium nitrate, which lack this buffer, are less
susceptible to NH3 volatilization losses than urea when
surface applied. After urea hydrolysis, the ammoniacal
forms are nitrified like any ammonium source.
The loss of NH3 to the atmosphere of surface-applied
urea can be extreme; loss of 50% within 7 days of
application has been measured for both flooded rice and moist
upland soils. Losses can be greatly decreased by
incorporation shortly after application, by banding, by point
placement of large granules of urea at a depth of 5 to
10 cm, or if water additions shortly after the urea
application wash the urea into the soil. Urea is very soluble
in water, and it is not absorbed by soil particles and
therefore moves freely with water in soils. The effect of urea
granule size on urea hydrolysis and subsequent N losses
can vary. Smaller urea particles facilitate more rapid urea
hydrolysis but also provides more access to cation
exchange sites for NH44" absorption. It is possible to leach
urea when large granules are applied to soils with high
percolation rates and low urease activities, i.e., sandy
soils. If urea is incorporated shortly after application, its
efficiency is the same as any other source. For topdress
applications to pastureland, efficiency would average
perhaps 70%-90% that of other N sources, with the
amounts of ammonia volatilization loss being very
dependent on weather conditions following application.
~2r4rlrlT2l^dvefve~Effects of Nitrogen
Transformations - Leaving out several intermediate
reactions, the microbiological process of nitrification can be
simplified to the following:
2 02
NH4+ > NO3- +2H+ + H20 + Energy.
This illustrates that the process is aerobic (requires O2)
and yields energy for the microbes. Most importantly to
soil productivity, it is acidifying. Ammonium,, whether
originating from organic matter mineralization, urea, or
ammonium salts, goes through the same process and,
as a result acidifies soils, while addition of nitrate does
not cause acidification. Therefore, it is an unfortunate
aspect of crop cultivation that large amounts of N are
needed to grow crops, and N additions, either as NH4+
or organic forms, acidify soils. The N compounds in
organic and legume residues also acidify soils since they
are ammonium sources following mineralization of the
N-containing compounds. The amount of acidification,
in equivalents of pure calcium carbonate needed for its
neutralization, varies with the carrier anion of the
material, ammonia volatilization losses, and secondary
reaction products {Table 2.3}. The choice of N products can
therefore be based not only on the price per unit of N
but also on the cost of counteracting the acidification
31
Table 2.3. Acidification Caused by Various N Products
kg Pure CaCQ3 to Neutralize5
Material
Ammonium sulfate
Ammonium nitrate
Urea
Anhydrous ammonia
Monoammonium phosphate
Potassium nitrate
Calcium ammonium nitrate
Dried blood
Sewage sludge productc
Peruvian guano
%N
20.5
33.5
46.6
82.2
11.0
13.0
20.5
13,0
7.0
13.8
Per kg of N
5,35
1,75
1.80
1.80
5.00
0*
0
1.75
1.70
0.95
Per kg of Material
1.10
0.59
0.84
1.48
0.55
nb
0
0.23
0.12
0.13
a. CaCC>3 needed to neutralize material after nitrification in soil, assuming no N losses.
b. Actually base forming.
c. Milorgantte, from Milwaukee, Wl (U.S.A.)
Source: Based on Tisdale et al. [5].
caused by the product. Additions of N fertilizers in
excess of plant needs will cause soils to acidify more quickly.
Additions of N fertilizers in excess of crop uptake or if
applied at inappropriate times can cause another
problem - contamination of groundwaters with nitrate. UuK"
ing different periods of a crop season, the amount of
nitrate in the soil varies with the rates of mineralization,
ammonification, and nitrification and the counteracting
processes of plant uptake, leaching, and denitrification
(Figure 2.7), Nitrate leaching is generally not a problem
during periods of active crop growth except on very sandy
soils that receive excess amounts of water. At the end of
cropping seasons there is normally very little N in
mineral (available) forms since healthy crops are effective at
taking up N in these forms.
2.4.2 Soil Phosphorus
Phosphorus compounds are important in energy
transfer and storage reactions since electrons are moved via
adenosine di- and triphosphate in most biochemical
reactions. Phosphorus is also a constituent of nucleic
acids, which make up genetic encoded strands of DNA
and RNA used for protein synthesis. Flowering, fruiting,
seed formation, and early plant development therefore
rely heavily on P supplies, as do root development and
several other processes. Even though the P content of
plant tissues is about 0.1%-0.4%, which is about one-
half of the amounts of N or K, P is a critical component
of particular compounds basic to life. Phosphorus is fairly
mobile in plants and is therefore moved to the youngest
tissues if plants are P deficient. Deficiencies of P are not
as readily observed as those of N, or even K, although
the effects on growth and yield are often dramatic. Some
plant species exhibit a purple or red coloration when
they are deficient in P; all will show overall stunting.
—Th"e-orthophasphate"form H2PO4"" predominates as
the form of P taken up by plants although there are also
a few organic compounds that have been shown to be
taken up directly by plants. The solubility of orthophos-
phate compounds in the soil largely controls the
availability of P to plants. At any time during a growing
season, the P concentrations in soil solution may vary
from 0.05 to 3 ppmw. Unlike N, which is supplied as
NO3" by mass flow of water to plant roots, only a
fraction of the P needed by plants is supplied by mass flow
with soil water. Diffusion is a much more important
mechanism by which plant roots are supplied with P,
and the amounts of P in solution and its replenishment
are determined by the dissolution of relatively insoluble
P compounds or minerals. However, plant roots are not
totally passive sinks for P; the exudation of organic
materials provides substrates for microbial populations,
which produce various acids that help to dissolve P
compounds in soils. Zones around plant roots, called the
rhizosphere, support colonies of microorganisms that
are essential to the growth of many species of plants.
Essentially all native soil P originates from apatitic
minerals, As apatites weather, new minerals are formed,
which are relatively soluble, and make up the labile P
pool, which replenishes P in soil solution. Many less
soluble forms are also formed that comprise a nonlabile
pool, which is a large but fairly inert storehouse for P.
32
The P moves between the various pools of varying
solubilities in response to changing phosphate and cation
concentrations. The distribution of these compounds
depends principally on the Ca, Fe, Mn, and Al
concentrations and the soil pH. Organic forms of P can also be
of importance in soils. Young soils, which contain
weatherable apatites, are better endowed with available-
P than older, more weathered and acidified soils.
2.4.2.1 P Fixation - When water-soluble sources
of P are added to soils, the orthophosphate forms are
converted to many different compounds, depending on
the above elements and soil pH. In soils of moderate
pH, Ca phosphates dominate, whereas Fe and Al
compounds become more important in more acidic soils.
An incomplete list of over 60 compounds or mineral
forms of phosphates has been identified as being formed
in a P fertilizer reaction zone [5]. These compounds then
revert to even more stable or insoluble compounds with
time. Various sorption reactions onto metal oxides,
hydroxides, and carbonate mineral surfaces also occur;
these reactions are either reversible or relatively
irreversible and affect phosphate solubilities and supply.
These relatively irreversible reactions of phosphate are
collectively called P fixation and are very dependent on
the chemical constituents of soils. Soils that are of near
neutral reaction and sandy texture have little fixation;
next would come other neutral soils with lower levels of
soluble Fe and Al. Soils with the highest fixation are
acidic, clayey soils high in Fe and Al. Younger sbilstencl
to have more available-P and lower fixation capacity
although some young volcanic soils have colloidal
amorphous materials that fix large amounts of P. The response
of crops to added water-soluble phosphate fertilizers is
very dependent on P fixation capacity since the amount
of P which is actually available depends on the P fixation
capacity (Figure 2.8).
100-
1
1
3 50-
i
1
0
4
V
1 Littioor
/ No Response
/ No Deficiency
Low. Moderate
Response
Moderately
Deficient
/ ^^r ^^^r Ugh P Response
v^"""*"^ "^ Severely Deficient
300 400 500 E00 700
SolublePAddsd. kg/ha
Figure 2.8. Illustration of Phosphorus
Availability in Soils of Different P
Fixation Capacity as Soluble P
Fertilizers Are Added.
Figure 2.8 attempts to illustrate several points: (1) crop
response to P fertilizer is very dependent on the fixation
capacity of the soil that is fertilized; (2) response to P
can change dramatically with P fertilization after the
fixation capacity is satisfied; (3) after P fixation is satisfied
and the available P level is raised to the no-response
zone, further P additions are only needed to replenish P
removed by the crop; and (4) the efficiency of P
applications will be different on the same soil, depending on
the amount of soluble P fertilizers that have been
previously applied.
A favorable aspect of the mechanisms by which P is
held and released in soils is that there is little P lost from
a soil except through harvested crop removal and soil
erosion. The P lost through erosion is contained in clay
particles and organic matter. There generally is little
movement of P through soils with percolating water since
soils contain Ca, Fe, and Al in sufficient quantity to
precipitate the forms of P. However, extremely P-fertile soils
can leach small amounts of orthophosphate. Organic-P
forms are more mobile in soils than mineral forms. Soils
that have had large amounts of animal manures added
can have organic-P compounds leached into relatively
shallow water tables. The P added in animal manures
can move perhaps twice as far as similar amounts of
inorganic P.
In fortunate contrast to N, the formation of P com-
pounds-oLlimited-soIubilitiesin-Soils allows P fertility to
increase through P additions, and P applied in one year
can furnish P to succeeding crops. This is called a
residual fertilizer effect. The P not used by the crop
remains mainly in the nonlabile or plant-unavailable pool,
but it still contributes to the P nutrition of crops for many
years. From solely an agronomic perspective, it is most
beneficial to build P fertility rapidly by fairly large
additions, then apply only the amounts needed to maintain
the P status, which can be done every other year or
every third year.
While fixation of P largely controls the efficiency of P
fertilizer use, even under the best of conditions the
uptake of added fertilizer P by the first year's crop is
normally only 10%-15%, even lower than for N which is
readily lost from soils. This low amount of uptake of
applied P fertilizer results from the formation of nonlabile
and fixed compounds, which contribute little to uptake
in a specific cropping season. An interesting example
of an extreme in P fixation occurs in the Cerrados area
of Brazil. In early fertilizer trials in the region, little
response to P was found even though the soils were
extremely P deficient. It was thought that crop production
on these soils would not be economic because of the
severe P fixation. Scientists showed that large amounts
of P (400-800 kg P205/ha) could be added to satisfy
the P fixation of the soils, and amounts added above
33
this amount produced a typical P response found for
less fixing soils. When the P needed to satisfy P fixation
of the soils was treated as a capital investment in the
land, important land areas in the Cerrados region
became major suppliers of soybeans to the world market.
Although liming can reduce P fixation considerably by
reducing the formation of insoluble Fe and AI
compounds, additions of other materials besides phosphate
do not reduce P fixation.
2.4.2.2 Dissolution and Water Solubility of P
Fertilizers - An important question regarding P
fertilizers is how much water solubility is desirable to furnish
P to crops. The main issues are (1) the expense of
making apatite more water soluble by treatment with strong
acids or by heating and (2) if much of the water-soluble
P is rapidly fixed or made insoluble, what is gained by
adding a soluble source? Answering these questions is
not easy because soil characteristics, P application
method, P fertilizer particle size, crop P demand, the
value of the residual P, and even the weather influence
the answers \6\. Obviously the addition of ground
apatite (phosphate rock or PR), with limited solubility, would
not meet the needs of crops with high and rapid
demand. They have the greatest benefit on highly acidic
soils and must be applied in larger amounts than more
concentrated and soluble P sources. Fertilizer particle
size and the proximity of particles to each other affect
dissolution of P fertilizers and the rate of fixation
(precipitation, occlusion, etc.) that occurs around the
materials, since P movement is controlled by solubilities and
diffusion mechanisms.
Phosphate fertilizers are analyzed by various methods
in different countries to establish their value as fertilizers.
Using the U.S. system, for example, P fertilizers are
analyzed for water-soluble P, citrate-soluble P (soluble in
IN ammonium citrate after water extraction), and total
P. Plant-available P is considered to be the sum of the
water- and citrate-soluble P. In actuality, of course, plant
availability is not only a function of forms of P in the
fertilizer but the soil environment into which the
fertilizer is placed. The uptake pattern of the plant,
particularly how rapid the P uptake is, determines to a large
extent how suitable different sources are for different
crops. Fertilizers of low solubility are more suitable for
long-term crops on low fixation soils, whereas higher
solubilities are required for short-season crops with high
P requirements. Thus, cassava or tree crops would
respond better to less-soluble P sources than would white
potatoes. Not only are their demand rates for P
different (slow versus fast, respectively) but also the soil
temperatures under which the crops are grown are much
different. Potatoes therefore require large amounts of
soluble P; cassava requires little,
In some cases crops may have similar P requirements
and uptake patterns, but the soil environment defines
the response. For example, flooded rice and wheat may
need similar amounts of P, but under flooded reduced
soil conditions, Fe phosphates and other minerals
become very soluble. Even small amounts of total P in the
soil can meet the rice requirements, while wheat grown
on the same field under upland conditions may be
severely P deficient. In another example, ground PR might
supply a wheat crop with adequate P on a soil with a pH
of 5,0, but on a soil of pH 6.0 the same amount of PR
would have little effect.
The diammonium and monoammonium phosphates
are completely water soluble, as are potassium
phosphates. Acidified PR products (nitric phosphates, single
superphosphate, and triple superphosphate) and heated
or calcined products can differ in their available P
content depending on the degree of acidification, the
extent of the reaction, or the degree of calcination,
Phosphate rocks can be applied directly to soils to
furnish P, and they have been used for the past century.
With their limited solubility, however, they are most
beneficial on very acidic soils (pH below about 5.2). Most
PR must be ground to a fairly fine state to improve its '
reactivity in soils, which make it less convenient to handle
than granulated fertilizers. There are large differences
in the reactivity of PRs, which increases with the amount
of substitution of carbonate for phosphate in the apatitic
mineral structure. Warm climates with adequate soil
moisture and acidic soils have the potential for PR to be
competitive with" other P sources under certain
conditions, particularly for slow growing crops, and if
transportation costs are low.
With the exception of PRs used for direct application,
there normally is a negligible difference in crop response
between sources of the common P fertilizers, which
indicates in itself that differences in water solubility is not
a major factor in determining P availability. A possible
exception to this generalization is that N-P sources are
sometimes more efficiently used in banded applications
because of N-P interaction created by increased root
proliferation in the fertilizer zone and anion/cation
effects. The effect of placing ammonium sources with
water-soluble P has been shown to be the most beneficial.
It is generally accepted that 80% water solubility is
sufficient for most crops, and 60% water solubility is
often sufficient for long season crops or extensively
rooted crops like forage legumes or grasses. Low water
solubility products are less effective on calcareous (free
calcium carbonate, pH above 7.5) soils. High water
solubility is also desirable on cooler soils and for crops with <
high P demand or with limited rooting zones. Partial
acidulation of PRs can supply some water soluble P and
is also an alternative.
2.4.2.3 Effects of Placement and Particle Size
on P Efficiency - The efficiency of P fertilizer use can
34
be affected more than other fertilizer nutrients by the
method of placement and the size of particles. On soils
with high P fixation, the placement of P fertilizers in
concentrated zones can greatly improve efficiencies of
uptake by reducing the exposure of the soluble
phosphate forms to precipitation as insoluble "fixed" forms
and by inducing plant root proliferation in the zone.
Banding of P fertilizers has become common practice
to improve efficiency, but it requires soil openers and
fertilizer hoppers oh the planter or drill equipment.
Manual band application is laborious, Bands often
increase P efficiency threefold over broadcast incorporated
applications, but the efficiency can actually be reduced
on dry soils because nutrient uptake ceases when the
soil in the fertilizer zone becomes dry. Bands are
therefore most efficient if they are at a depth where there is
good soil moisture and yet readily reached by plant roots.
Band applications can be done with the seed, called a
pop-up application in the United States; beneath and to
the side of the seed, called a starter application; or
between the crop rows. Starter or pop-up applications are
most beneficial on cold, wet soils.
Similarly to bands, the size of individual granules can
affect the amount of P fixation that occurs. Large
granules of P sources are therefore more efficiently used on
many soils than smaller particles. Obviously there are
limits to this generalization since the particles cannot be
so large that access by roots is limited. Surface
applications are generally not as efficiently used as applications-
within the plow layer since plant roots do not normally
grow near the soil surface. Surface banding before
plowing, however, can also improve P efficiency. An
exception to improving P efficiencies with concentrated
zones of fertilization is with insoluble sources such as
PR, which requires soil contact for dissolution.
2.4.3 Soil Potassium
Potassium is considerably different than the other
fertilizer nutrients, both in its function within plants and in
theway it becomes available to plants. Unlike most nu-.
trients, K in plants does not become part of structural
components of plants nor elements of proteins,
carbohydrates, etc., but it remains as an ion, mainly in
cellular liquids. It functions to control turgidity of cells, helps
in the transport mechanisms of starches and sugars, acts
in protein synthesis, and activates enzymes. It
encourages root growth, makes plant stalks healthy and strong,
and is very important in reducing the effects of drought.
Frequently, the most important benefits of good K
nutrition are not only in yield but also from the reduction
of fungal diseases, and improved quality of harvested
products. Since K is very mobile in plants, deficiency
symptoms are seen in older leaves first, usually as
yellowing or browning of the leaf margins, or in some crops
as brown spots on the older leaves. Deficiency
symptoms are not as readily observable as those of N, even
though K is needed in almost the same amounts as N-
Overall slow growth, lodging (the plant falls over from
stalk weakness), and poor grain or fruit quality are often
indicators of K deficiencies. Potassium is important to
crops in root and grain development, and many other
aspects of plant growth and development.
As a cation, K enters soil solution from cation
exchange sites of clays and organic materials, The
exchangeable K originates from the weathering of the
minerals contained in the rocks from which soils are
formed. Potassium feldspars are very large natural re-
serves of available K in young soils; however, they are
rapidly weathered and thus are essentially absent from
moist tropical soils. Various micas, orthoclase, and mi-
crocline are primary silicate minerals that contain K.
These primary minerals degrade to illite, clay chlorite,
and vermiculite with release of K+ contained as layers in
the clay lattices, Vermiculite and its degradation product
montmorillonite (smectite) are 2:1 layer clays, meaning
that two tetrahedral silica sheets around one octahedral
alumina sheet comprise the basic structure. These clays
have the ability to expand and contract with changes in
soil moisture, an important characteristic because they
can affect water movement and storage, K release and
absorption, and soil structure.
Young soils with appreciable clay content commonly
contain large amounts of K, and some of these soils can
be croppecTfor years without development of
substantial K deficiencies. Weathered, sandy, and organic soils
are primarily in need of K additions. Sandy and
weathered soils, particularly under warm, wet climatic
conditions under which organic matter degrades rapidly, have
low CEC, which means they can retain only small
quantities of K. They also lack clays that can fix K within the
clay lattices. Potassium added to such soils can be leached
as can other base cations, particularly when other
nutrients such as N and S are added, which add concomitant
anions to maintain electroneutrality in the leachate.
The leaching of K+ tends to be more dependent upon
the amount of percolate passing through the soil than
on soil texture. Sandy soils, however, can infiltrate more
water than heavier soils, so less runoff occurs than with
a heavier soil on a similar slope and rainfall intensity,
Leaching losses of K+ can vary from essentially nil to
somewhat more than 100 kg K ha"1 yr"1. Losses from
sandy irrigated soils can be particularly high. Soil liming
generally decreases the amount of K leached from soils;
in one case it reduced losses to about one-half [71, and
this is an important aspect of liming in maintaining soil
fertility,
Losses of K through erosion of clays from the soil
surface can be very substantial. Few measurements of
runoff loss have apparently been done, but these losses
35
are certainly important. Since K can be lost from soils
and fixed in clay minerals, yearly additions of K are more
efficient than larger, infrequent applications on some .
soils although few crops respond to split applications of
K in the same season as they do to N.
Plants need large amounts of K, which is removed in
harvested plant parts. Plant residues left in the field can
return some K back to the soil. Animal manures are
important sources of K because they often contain as
much K as N. Applied K salts, as KCI or K2SO4, give
the same K response, but in some cases the crops may
respond to either the CI or S carriers.
Because 100 kg K per hectare is often removed
annually through cropping, even soils that have adequate
amounts of K in their clay materials will ultimately
develop K deficiencies. The Hungarian Plain, for example,
became deficient in many nutrients through centuries of
cropping although the soils were relatively fertile in their
native state, Many countries have not conducted
adequate extension and demonstration work to convince
farmers to use adequate K, and more effort is needed in
this area.
2.4.4 Soil Sulfur
Sulfur is needed by plants in amounts similar to those
of P. It is an essential constituent of three amino acids,
the building blocks of proteins and enzymes. It cycles in
the soil-plant-atmospheric system similarly to N, with
reduced sulfide forms (H2S, pyrites), oxidized sulfate, and-
organic S forms existing in soils, while sulfur dioxide
and organic sulfur compounds exist in the atmosphere.
As with nitrogen, organic forms of S comprise the
major storehouse for soil S. A notable difference between
N and S is that gypsum (CaS04»2H20), a relatively
insoluble mineral, can form in soils to maintain S in more
arid soils. Insoluble sulfates also form in wetter soils and
accumulate S in subsoils. Obviously the atmosphere does
not contain elemental S as it does N2.
Sulfur deficiencies in plants look similar and are often
confused with those of N. Both deficiencies are
manifest as yellowing of the plant; yet, there are clear
distinctions. Deficiencies of S are seen in the younger leaves,
whereas those of N are seen mainly in the older leaves.
Sulfur deficiencies result in small, spindly plants and
severely reduced nodulation for BNF in legumes. Seed and
fruit maturation is also delayed.
Sulfur deficiencies can readily develop, particularly in
humid areas and areas that do not receive S from the
atmosphere or from S-containing fertilizers. Atmospheric
sources of S are organic S compounds emitted from
marine plankton and inorganic S from oil and coal
combustion. Because enforcement of environmental laws and
better technologies have reduced the amount of S that
soils receive through acid rain, this source has decreased.
In addition, since higher analysis fertilizers have largely
replaced S-containing single superphosphate and
ammonium sulfate, incidental contributions of S to soils are
reduced. Sulfur deficiencies are therefore expected to
increase, and sulfur-containing fertilizers will probably
be needed, particularly in moist tropical areas and
especially for legume and vegetable production..
2.4.5 Other Nutrient Deficiencies
As stated earlier, deficiencies of the micronutrients
(needed in small amounts by plants) and other nutrients
such as Ca and Mg (needed in large amounts)-Gan all
cause extreme reductions in plant growth and yield. In
some cases, additions of small amounts of
micronutrients can correct a deficiency and may be added to NPK
fertilizers to alleviate the problem. Larger amounts of
Ca and Mg are needed. Deficiencies of micronutrients
are often caused by unavailability of the nutrients even
though they may be present in large amounts in the
soil. This phenomenon occurs most notably on soils that
have a high pH, and the addition of the nutrient to the
soil only causes precipitation of the nutrient as insoluble
forms. The high pH could be lowered to alleviate the
deficiency, or the nutrient could be supplied efficiently
by foliar application of soluble nutrient forms to the
plants. Many nutrient problems can be alleviated or
avoided by application of organic materials and by
maintaining the organic matter content of soils.
""While'^nnn^iefJth""discussion of these deficiencies is
beyond the scope of this chapter, there are a few
generalizations. Problematic soils are normally the very acidic
and the very basic soils. Sandy soils, particularly those
that are deficient in organic material, are especially
problematic, particularly after fertilizers have been used and
new deficiencies are created because of the increased
removal of nutrients in harvested crops. Inefficient and
excessive use of fertilizers can also induce nutrient
deficiencies or soil problems; for example, Zn deficiencies
can be caused by excessive P use, and soil acidification
can be caused by ammonium fertilizers. New, and often
unexpected, nutrient problems can develop with
cropping, which can only be adequately diagnosed and
addressed by trained agronomists. There are numerous
interactions of factors that may be important besides
pH, organic matter, and fertilizer use. Crops vary
substantially in the amounts of micronutrients that they
require and how efficiently they use what is available. Many
problems with nutrients can be avoided by good land -
management, particularly controlling soil erosion,
maintaining the soil organic matter content and the soil pH.
2.4.6 Non-Nutrient Soil Problems
Productive soils can be rendered unproductive through
mismanagement. The most common mismanagement
is that the soil is not adequately protected from wind
36
and water erosion by plants or crop residues. Erosion
preferentially removes the organic matter and clays from
soils, the two most important constituents to soil
productivity. Materials eroded from soil have higher
nutrient concentrations than the original soils by factors of 3
to 12. Soils naturally concentrate nutrients in the
surface or topsoil layer, which also is a much better
physical growth medium than undeveloped subsoil layers. As
the topsoil is eroded, soils become less productive. Loss
of gross national product (GNP) because of soil erosion
has been estimated to be from 1.5% to 10% per year in
several tropical countries.
Soil productivity can also be lost through poor
irrigation management and poor water quality, which cause
the accumulation of soluble salts in the soil. Irrigation
waters contain soluble salts that remain in the soil after
the large amounts of water are transpired by crops,
particularly in hot, arid areas. The salts can be leached from
the rooting zone if adequate water is added and the soil
permits water movement. However, some soils do not
allow enough water movement through them to remove
the salts, and the salts reduce soil productivity.
Expansion of irrigated areas has been a major driving force of
increasing world crop production. Unfortunately, poor
irrigation techniques, poor water quality, and unsuitable
soils have caused many irrigated areas to become saline
and waterlogged. Current estimates are that the areal
extent of irrigated areas being created is about equal to
the areas being permanently destroyed by salinityand
high water tables.
Salinity raises the osmotic pressure of the soil water,
which inhibits water uptake by plants. In addition, if the
irrigation water contains high amounts of Na relative to
Ca and Mg, the soil clays can be deflocculated or
dispersed as Na comes to occupy a higher proportion of
cation exchange sites relative to Ca and Mg. As the clays
are dispersed, the aggregation of soil particles is
destroyed, and the soil becomes practically impermeable
to water. This makes the removal of salts very difficult if
not impossible. Although it is extremely difficult, sodium-
affected (sodic) soils can be ameliorated by the addition
of Ca (usually gypsum), by the selection of deep-rooted
plants, and by careful water management. The best
solution is to avoid the problem by monitoring the Na
content relative to the other cations, good water
management, use of crop rotations, and application of
Ca sources.
Because chemical fertilizers are salts, the over-
application of soluble fertilizers can cause the soil
solution to have high osmotic pressure and inhibit water
uptake by seeds or plants. For this reason, soluble
fertilizers (mainly the N and K forms) cannot be applied in
large amounts with seeds or close to plants. A "salt
index" was developed years ago to provide relative
guidance as to the effect of the fertilizers on the osmotic
pressure of soil solution, While the concept is
reasonable, the application of it has not been very useful since
the type of soil, rainfall, and moisture content largely
determine the salt effects on germinating seeds. The
salt index therefore has been of limited value in
developing application rates and techniques, and agronomists
have developed more specific recommendations as to
how much fertilizer can be placed with the seed or banded
next to the seed. Often ammonia toxicities to
germinating seeds from urea or an ammonium fertilizer cause
germination problems rather than a salt effect.
The salt effect of fertilizers and soil salinity developed
in irrigated systems have led to recommendations and
policies regarding fertilizer use in certain countries. This
has been largely an unfortunate outcome based on poor
understanding of the origin of salts and the possible
effect of fertilizers. The amount of salts contained in even
good quality irrigation water is much greater than the
amount of salts added at normal rates of fertilization.
The calculation of salt buildup with different quality waters
is fairly simple and readily shows that the salt addition
from fertilizers, such as potash (KCI), is inconsequential.
Texts on soil salinity do not even discuss the issue since
the salts from fertilizers are not significant in the
development of soil salinity,
2.5 Diagnosis of Nutrient Problems
Trained, experienced agronomists can often look at
the leaves of crops and diagnose deficiency symptoms
and other soil problems. Because of the large number
of interactions, such as crop, variety, growth stage,
weather conditions, tillage, land history, and other
factors, this is often successful only if the agronomist can
personally observe the crop. However, in some cases
deficiency symptoms are difficult to diagnose in the field.
The crop may not show sufficient symptoms to
diagnose the problem, called "hidden hunger" in fertilizer
promotions, or have multiple nutritional problems.
Herbicide damage and diseases may make it difficult to clearly
determine deficiencies and toxicities. Tissue sampling
and analysis can be used to establish the deficiency or
toxicity. The concentrations of nutrients in specific leaf
tissues, response to nutrient addition, and crop yields
have been shown to be highly related.
2.5.1 Plant Tissue Analysis
The analysis of tissues can be used to identify observed
nutrient deficiencies, to survey geographical areas for
possible problems, and to distinguish between nutrient
problems and herbicide damage or other problems. Since
plant symptoms are a manifestation of a lack or a buildup
of particular compounds in plants, which may result from
a variety of causes, the measurement of nutrient
concentrations is a much clearer indication than the
symptoms, and use of tissue analysis began as early as
1926 in the United States. Generally the youngest fully
developed leaf of plants gives the largest range between
sufficiency and deficiency. At early growth stages, whole
plants can be used. Nutrient deficiencies may occur and
then disappear at various stages of growth, but the most
critical period to developing yield is the time of
flowering and very early fruiting stage.
Scientists have developed indices of concentrations
of nutrients in specific plant parts at certain growth
stages. A system called the Critical Nutrient Range (CNR)
establishes ranges of concentrations of nutrients for many
crops, which delineate sufficiency, deficiency, and
toxicities. This approach works quite well when one
nutrient is mainly limiting. Occasionally, however, excesses
of one nutrient, or deficiencies of several nutrients, cause
the CNR to give misleading indications. This has
prompted scientists to use nutrient concentration ratios
to determine antagonisms between nutrients, such as
N/S, K/Mg, K/Ca, N/P, and others. Comprehensive
consideration of the many possible nutrient interactions
is needed. In addition, it should be noted that nutrient
concentrations may be high because nutrient
deficiencies cause metabolic processes and growth to decrease.
If one of the deficient nutrients is added, growth may
then increase and other nutrients are shown to be
deficient because their concentrations are essentially diluted
inthetissue. ~ ~ '"
A system called DR1S (Diagnosis and
Recommendation Integrated System) was developed by a South African
researcher to overcome these limitations. The system
compares ratios of the nutrient concentrations and can
help determine when nutrients are in balance relative to
each other, This gives a better indication of which
nutrients are deficient [8].
The analysis of plants gives a reliable indication of
what nutrients are actually available and recovered by
the crop, However, in many cases, that knowledge comes
too late to apply fertilizer to affect the growth of the
current crop; it is likely useful for succeeding crops or
for perennial crops. Tissue analyses also require fairly
sophisticated instrumentation and a knowledge base for
the interpretation. To maximize the benefits of money
spent on fertilizers and to avoid crop nutritional
problems and environmental problems, farmers need the
techniques of soil testing and tissue analysis to
determine which nutrients are needed and in what quantities.
2.5.2 Soil Testing
Adjacent fields having the same soil but different
fertilization and cropping histories develop different levels
of soil fertility over time. This fertility level greatly
affects the crop response to particular nutrients and
obviously the most profitable fertilizer rate, If the farmer has
a good estimate of the fertility status for each nutrient,
anticipated crop growth conditions, and the relation of
nutrient addition and crop yield, he could fertilize at a
rate that maximizes his profit given the prices for the
fertilizer and the crop. This is difficult for most farmers
to do, but soil testing can remove some of the guesswork.
Soil testing (often called somewhat inappropriately
"analysis") is a process of taking a representative soil
sample from a field and testing it for available nutrients.
From this test, expected yield, and prices, a
recommendation is made of how much fertilizer should be applied
to maximize the profit for the farmer. Although not an
exact science, the process has proved its worth in the
past 50 years. Soil testing becomes more important
after fertilizers are used for some years since large
differences in fertility between fields in an area will develop,
and P and K levels increase in the soil. It is therefore
very cost-effective to establish more accurately the
necessary rates and monitor the soils for other potential
problems.
Soil testing uses quite rudimentary analytical
procedures; the problem is to select the correct extractants
and measure parameters that are indices of the
availability of each nutrient. This requires a chemical
extraction or other method that gives numbers for the fertility
status of each nutrient or other characteristics that re-
--late-well-to-expected crop response. Normally
categories of (1) very deficient, (2) deficient, (3) sufficient, and
(4) high are satisfactory- The test is analogous to a blood
test. Knowing that your red blood cell count is 1,252/
cc is not particularly useful unless you know if that
number is considered normal, high, or low. Similarly, is an
extractable P level of 15 ppmw P high or low? Is 150 kg
K per hectare sufficient or deficient? Some agronomists
spend their careers conducting experiments that allow
them to relate the numbers of the tests to the most
profitable use of fertilizers, and a great amount of
information exists on soil tests and expected fertilizer response
for different crops.
Soil testing procedures are used to measure soil pH
and in places where they might be problematic, soil
salinity and alkalinity (in soil science terms this refers to
the Na content, not pH). This can be used to suggest
management procedures, selection of crop, and liming
recommendations and providing information on
irrigation and drainage problems, The soil test
recommendations give farmers guidelines for not only rates of each
nutrient but also advice on the most efficient methods
of application and timings of fertilizers. A major
problem that occurs when soil testing is not used with
fertilizer use is that soils become too fertile in certain nutrients.
This not only causes inefficiencies but also can cause
new nutrient problems to occur, excess acidity,
38
contamination of water resources by nutrients, and
excess leaching losses of other nutrients.
Testing for N is problematic because of the rapid
fluctuations in available N that can occur, However, if the
soils, climate, and crops are well known, agronomists
can make good recommendations based on past
cropping and yield potential. In some cases they may
additionally base it on a soil organic matter test. In recent
years, more accurate N recommendation procedures
have been developed by testing the soil for nitrate
before N fertilizer topdressings to small grains or
sidedressings on row crops. Chlorophyll meters, which
measure the intensity of the green color of leaves, have
also been used successfully.
The measurement of P availability in soils requires
very good application of the art of soil testing because
the soil extractant must remove P from many minerals
of different solubilities in amounts proportional to the
amount of P that will become available to the crop
during growth. The P extractants are therefore chosen
depending on prevalent soil characteristics of the area to
give the best possible relationship between extractable
P and crop response. The P test is one of the more
valuable tests since it is a relatively expensive nutrient
that can build to excess levels and cause deficiencies of
other nutrients, such as Zn. Information on the most
profitable application rate and the best method of
applying P at particular soil test levels arid with particular"
crops is valuable information for farmers.
The test for K is more straightforward and universal
than that for the other nutrients. This test measures the
amount of K+ on cation exchange sites by displacing
the K+ with an excess of another cation. However,
knowledge of K fixation and release of exchangeable K+ on
specific soils is very important to the interpretation. On
a sandy soil, 150 kg K ha"1 may be quite sufficient,
whereas on a clayey soil, profitable responses to
additional applied K up to tests of 350 kg K ha"1 may be
found. Similar tests for Ca and Mg may be conducted
on soils suspected of having these deficiencies,
The availability of other nutrients, such as S, Zn, B,
Cu, CI, Mo, Mn, and Fe, can be measured in soils, but
these tests are far more difficult to conduct. Plant tissue
testing is often used more successfully to diagnose these
deficiencies (or toxicities).
Despite its limitations, soil testing is a very valuable
tool to improve the efficiency of fertilizer use and to
avoid many soil management problems. In addition, it
gives a scientific basis for fertilizers to be sold to
farmers. Most agronomists believe fertilizers should not be
used over a long period without a small investment in
soil testing. The possibilities for creating new problems
and the inefficiency of use require that soil testing be used.
2.6 Profitable Fertilizer Use
From the previous discussions on the basics of plant
growth and soil nutrients, the following tenets should be.
clear: (1) response is not simply a function of fertilizer
additions but may be affected by many other growth
and management factors, (2) new deficiencies and/or
problems develop over time, (3) response can be changed
drastically by the timing and method of fertilizer
application, and (4) fertilizer response depends on the
fertility of the soil. Soils in a native state normally are
responsive to N and P, and many also respond to K arid"
other nutrients. As fertilizers are used, P and K status
increases, and yield response to those nutrients
decreases, whereas the response to N may increase
because of the soil's higher P and K fertility. For example,
100 kg P ha"1 may be the agronomically optimum
amount to fertilize a soil initially, but this would decrease
to rates required to simply replenish the removed P
after 20 years of fertilization (Figure 2.9).
2.6.1 The Economics of Fertilizer Use
An initial assumption is that the goal of fertilizer use is
to maximize the farmer's profit. For some farmers this
assumption may not be true or only partially true.
Although higher profit is usually the main motivation
for fertilizer use, farmers' decisions about fertilizer use
are affected by biophysical, economic, and social
constraints and~by ris!Tal^^tfie?"lrTotivations, which are
difficult to assess. Economic analysis is based on a per-
hectare or area basis because farmers normally have a
specific area of land to plant to crops. In a typical
response curve, because of diminishing returns, the
addition of the first few kilograms of fertilizer has the largest
effect on yield or largest incremental effect, but these
very low fertilizer rates will not maximize the benefits to
the farmer.
In Figure 2.10, familiar response curves of crop yield
to fertilizer are used in conjunction with prices to derive
revenue and cost curves and graphically illustrate the
changes in total revenue and costs associated with the
use of fertilizers. Curves are shown for fields With high
(Field A) and low fertility (Field B). Total revenue curves
TR A and TR B represent changes in values of crop
output as a result of additions of fertilizer, and fertilizer
use costs include the cost of fertilizer plus all other costs
that vary with the use of fertilizers, for example, labor
required for additional weeding and the harvesting of
additional output. These curves show that (1) without
fertilizer use, crop yields and total revenues are higher
in soils with high initial fertility levels; (2) fertilizer use
has a greater impact on crop yield, total revenues, and
profits in soils with low initial levels of soil fertility; and
(3) the fertile Field A requires less fertilizer to maximize
profit than Field B. In general, soils with high soil fertility
39
Initial most effective rate to maximize yield
when fertilizer is first used.
Most effective rate to maximize yield after 6 to
8 years of applying fertilizer at rate I.
Maintenance application needed to maximize
yield after i 0-15 years of applying fertilizer at
rate I.
40 60 80 100
Fertilizer Rate, kg nutrient/ha
Figure 2.9. Expected Changes in Fertilizer Response to P or K as Fertilizers Are Used.
Field B
TRB
100
Fertilizer Additions, kg/ha
Figure 2.10. Benefits and Costs to Fertilizer
Use at Different Initial Fertility
Levels.
levels are more productive and can provide higher crop
yields, revenues, and profits to farmers even if fertilizers
are not used. Only the additions to profit derived from
fertilizer use are depicted in Figure 2.10. The two curves
(Figure 2.10) illustrate the reasons why farmers should
try to raise the soil fertility for nutrients such as P to a
state at which relatively small amounts can be added to
maintain soil fertility. A similar situation between fields
could occur for N if a legume crop were grown the
season before on field A. Generally, however, there is little
residual effect from N, thus these response differences
to N between fields would not occur except in the case
of the legume. Although this analysis appears
straightforward on the surface, how does the farmer know,
before fertilizing the field, if the response will be like
that of field A or field B? He cannot conduct response
trials in each of his fields. Soil testing is needed to
maximize the benefits from fertilizer use.
Because of variability in climatic and other factors, a
single response curve for a field of a given fertility does
not exist. Rather, there is essentially a continuum of
response curves, bounded by the limits of the climate and
other growth factors (Figure 2.11). Similarly, with
variations in prices the revenues and profit can change
substantially. More variability and uncertainty in prices
and weather result in larger differences in revenues and
profits between good and poor years. Remote locations
may be less favored because of volatile prices and poor
marketing capabilities. Unfortunately, when the weather
is favorable, it is favorable to many farmers, then local
production increases, and prices drop unless there are
wide marketing capabilities for the produce. Under more
40
se£
Fertilizer Rate, kg/ha
Figure 2.11. Crop Response Curves Under
Favorable and Unfavorable
Conditions of Production and
Prices.
favorable and stable conditions for agricultural
production and marketing, farmers can more easily predict the
revenues and profits from fertilizers. Figure 2.11 could
also contrast developed versus less developed
agricultural production systems and marketing capabilities.
Various mathematical models or algebraic equations
can be used to estimate fertilizer response curves such
as those shown in Figures 2.10 and 2,11.
Mathematical models selected for this purpose are equations that
properly represent agricultural production-fertilizer
relationships that can be estimated using statistical
methods. A quadratic function model is commonly used to
estimate fertilizer response functions that properly
represent agricultural output increasing at a decreasing rate
as a result of increased fertilizer application rates, A
quadratic response function model may be written as:
Y = A + BF-hCF2; B>0, C<0;
where Y is crop yield, F is fertilizer rate, and A, B, and
C are coefficients of the response function, which are
usually estimated using ordinary least square procedures
and experimental data. The actual yield for a given year,
of course, is affected by many other factors besides
fertilizer rate, such as weather, diseases, and insect or weed
infestations.
The economic optimum rate of fertilizer is the rate
that provides maximum profit-maximum addition to
profit as a result of fertilizer use. This rate, say P, is
determined by imposing the condition for profit
maximization
3Y Pf
= — and solving for F;
8F P/
where Pf and Py are the prices of fertilizer and crop
output, respectively. Thus, for the case of the quadratic
response function model presented above
F-
Pf
B
2C.
The main indicators of profitability used in the
economic evaluation of fertilizer use are (Figure 2,12):
1. The magnitude of added profit due to fertilizer use
expressed in monetary value per unit of area, for
example, US $/ha.
2. The value:cost ratio (VCR), which is the value of the
increased crop output produced as a result of
fertilizer use divided by the cost of fertilizer. The VCR
changes with the rate of application and should be
evaluated at optimum rates of fertilizer use.
o
O
c
<u
>
<u
CC
$
Added Gross Value
Fertilizer Added Cost
Added Cost
Economic Optimum Rate
25 50 75^100 125 150 175
Fertilizer Additions, kg/ha
Figure 2.12. Benefits and Costs of Fertilizer Use.
41
In addition, the fertilizer:crop price ratio is often used
to measure the price of fertilizer in terms of units of
crop output, i.e., how many kilograms of crop output
will be needed to buy a kilogram of fertilizer.
For most farmers, the impact of fertilizer on profit is
the key determinant of their decision to use fertilizers.
The VCR measures the economic return of fertilizers to
expenditures. The VCR is an important indicator in the
context of risk and uncertainty associated with fertilizer
use in rainfed agriculture. Usually the risk of fertilizer
use is associated with the uncertainty of crop yield due
to weather variations and also uncertainty about prices
for the produce.
For a farmer who has the advantage of reliable weather
or irrigation, a VCR of 2 may be acceptable, whereas a
farmer with less reliable weather and less control over
prices often requires a VCR of more than 3 to justify
investment in fertilizer. Risk aversion by farmers in well-
developed agricultural systems is somewhat different
because they have price subsidy programs, less
variation in weather and prices, crop insurance, good access
to credit, and a low share of fertilizer cost relative to
total costs. The more resource-favored farmers of
developed countries view risk of fertilizer use in terms of
trying to ensure that they apply enough fertilizer,
particularly N, to maximize the benefit when favorable
growth conditions occur. Whereas poorer farmers tend
to apply smaller amounts, the more affluent farmerstend"
to apply more because they hope to maximize profit
and achieve high crop yields in the best years.
Farmers of the less-developed regions tend to be very
sensitive to fertilizer price increases, whereas farmers
who pay less for fertilizer relative to their total expenses
tend to be relatively insensitive. For these reasons
increasing fertilizer prices tend to decrease use
disproportionately for farmers who can least afford the reduced
production caused by lower fertilizer use.
Despite the inherent uncertainties of crop production,
risks can best be avoided by maintaining fertilizer use in
balance with the farmer management skills and soil
productivity, which involves average weather conditions, A
cartoon frequently used in fertilizer promotion shows
two farmers talking across the fence. The one with
obviously poor crops says to the other with good crops, "1
would fertilize too if I had good soil like you." Farmers
with good management skills risk less in using fertilizers
than farmers who are poor managers.
2.6.2 Site-Specific Management
In the late 1980s and early 1990s, land management
systems were developed in the United States which can
be used by farmers and fertilizer dealers to provide more
exact fertilizer application and management of other
inputs. Called "Precision Agriculture" or "Site-Specific
Management," it became possible when computer and
satellite technologies enabled accurate knowledge of
location in fields and the management of large amounts
of data. The two necessary tools are the Global
Positioning System (GPS) and a Geographical Information
System (G1S). The GPS is a small (7 x 10- x 20 cm)
locator device which communicates with a system of
satellites in orbit around the earth, originally established
for U.S. military purposes. The G1S is a computer-based
information management system that manages the data
from each of the unit mapping areas, called pixels, and"
allows the interfacing of the database with other
equipment. The pixels are delineated in a uniform grid, and
may be from 1 to 3 hectares in size, Individual
characteristics of each pixel for nutrient level, yield, or any
other parameter can be managed by the GIS.
Using the GPS locator, soil samples can be taken from
within the small areas on a grid system, and accurately
identified in the GIS..Similarly, harvesting equipment is
equipped with "on the go" yield monitoring devices which
are linked to the locator and the GIS of a computer
system. Fertilizer spreaders use the GPS in conjunction
with the soil fertility test data stored in the GIS to apply
needed nutrients to individual areas using variable rate
spreading equipment. Planting machinery can be
equipped to change seeding rates in response to soil
—par-ameters-in-the-GIS.- Herbicide applications can be
made in accord with soil organic matter content or weed
infestations. Irrigation equipment can be linked to the
GIS to apply water in response to soil infiltration rates
or water-holding capacity.
The systems are, of course, expensive, but provide a
much better recordkeeping system for farmers. It helps
them to identify yield differences in fields and the likely
reasons for those differences. Corrective actions can be
taken to improve production on lower yielding areas
with the variable rate systems, and farmers can
integrate and visualize soil, yield and other parameters with
the GIS. Pesticides, water, and fertilizers can be
managed to reduce costs and very importantly, reduce the
adverse environmental impacts of their use. The
systems provide an extremely valuable set of tools that give
farmers the ability to more carefully manage their land.
Site-specific management or precision agriculture is
an exciting and valuable tool that allows farmers to
manage land and crop production more efficiently and more
environmentally responsibly. The technology is
continuing to develop, and farmers and farmer advisers are
developing their capabilities to use the technology. Many
in the fertilizer industry believe the technology is as
revolutionary as the development of high-yielding varieties
or the mechanization of agriculture.
42
2.7 Soil Productivity and Sustainability
In the early 1980s, the concept of what agriculturists
called "sustainability" started to gain attention. In the
late 1970s the term was used by Lady Eve Balfour to
describe "regenerative" agriculture or agricultural
production systems that rely very little on external inputs to
a farm, but use internal and efficient organic matter
recycling and crop rotations for nutrient maintenance, use
less pesticides, less energy, and have other attributes
that are beneficial to society as a whole. Its original
connotations were of low-input organic agriculture.
The concept, however, was broadened and redefined
by more "conventional" or "production" agriculturists
who saw great merit in the underlying principles of what
is now considered sustainable agriculture. These
agriculturists came to believe that essentially all agriculture
could be greatly improved to better meet both short-
and long-term societal needs. Modern or conventional
high-external input agriculture did not adequately
address environmental concerns, rapid depletion of
resources, equity concerns of society, and the ability of
future generations to have reasonable standards of
living. The concept of sustainability has become an
overriding philosophical and ethical approach to address
problems in the agricultural sector and the problems
originating from agriculture. Agriculture cannot function
responsibly as a part of society with the sole purpose of
profit maximization for the current land-user because of-
environmental, resource depletion, and intergenerational
concerns.
Sustainability addresses farming holistically rather than
by each component (e.g., fertility, erosion, weed
control, etc.) and considers the entire enterprise, the
farming family, soils, plants, and animals, and agriculture's
role in meeting societal needs, Farming viewed from
narrow disciplines lacks ability to solve one problem
without causing another. Sustainability attempts to address
causes of problems, not treat the symptoms, and to be
more in accord with and use natural processes as much
as possible, rather than to dominate nature. For example,
natural systems recycle and retain nutrients well,
maintain soil cover, and are biologically diverse. The diversity
makes the system more resilient to weather and other
types of adversity, and reduces the buildup of pest
populations. The converse and what makes "modern"
agriculture less sustainable and in need of better approaches
are the monoculture crop systems and poor integration
of crop and livestock practices. This causes pollution
from manures, wastes valuable nutrients, the soils are
not protected from erosion, and there is excessive
reliance on pesticides and inorganic fertilizers. The
concepts were initially scoffed at by traditional agricultural
people until they realized that the extremely narrow,
single-discipline approach to meeting the needs of
agricultural production were indeed, in most cases,
wasteful, despoiling, and did not address farmer problems nor
develop solutions based on farmers' needs and
perspectives.
The concept became widely accepted as it was
realized that the conventional methods of production are
not meshed well and that sustainability does nofmean
going back to the horse-drawn days but taking the best
scientific knowledge to approach farming differently. The
economic viability of farmers must obviously be
maintained, but farming must meet the needs of future
generations and society as a whole, not just the profit
maximization for the current land user.
More sustainable practices always require a higher
level of management intensity, i.e., better, more
knowledgeable management. Most practices that are judged
more sustainable than an alternative have synergistic or
several benefits not only to farming but also to the
environment and resource conservation. Examples are
organic matter recycling (soil protection from erosion,
nutrient cycling, less water contamination, better soil
tilth and water-holding capacity, weed suppression) and
greater crop diversification (reduced weed and insect
infestations, less susceptibility to adversities of weather
and prices, better soil protection); systems that reduce
runoff from fields decrease erosion and furnish more
water to the crop and protect surface waters from
contamination. Whereas the more sustainable practices have
multiple"benefits7They require more knowledge, better
management, and possibly more time and different farm
equipment. Integrated pest management (IPM), which
relies on very specific targeting of insects and use of
pesticides in conjunction with other methods to control
harmful insects, is considered more sustainable than the
more conventional practices of relying only on
pesticides. It provides multiple benefits, such as better use of
natural predation, and it is less environmentally
objectionable because it requires less pesticides, but it requires
a higher level of management and understanding.
It should be obvious that more sustainable does not
mean low-external input. Low-input agricultural systems
are in many ways much less sustainable than higher
external input systems because they do not meet
current farmer and societal needs, degrade soils through
erosion and nutrient depletion, and have additional
adverse impacts, such as requiring more land to be
cultivated. There are numerous examples of how low-input
systems have become much more sustainable by use of
greater external inputs.
As far as fertilizers and nutrients are concerned, greater
sustainability means increasing fertilizer efficiency,
reducing excess applications, avoiding losses of nutrients
by runoff and leaching, using practices for organic
matter maintenance through careful management of crop
43
residues, animal manures and other available sources,
and decreasing energy use in manufacturing,
distribution, and application of fertilizers, Soil testing, band
applications of fertilizers, efficient use of on-farm
resources, use of legumes, and split applications and proper
timing of N are viewed as more sustainable than their
alternatives.
Each farm unit has unique problems, constraints, and
capabilities; therefore, sustainability requires a very site-
specific approach. Sustainability requires adaptability
because what is deemed to be :'more sustainable" today
may put the farmer out of business tomorrow, Some of
the largest problems of modern agriculture are the loss
of livestock and cropping integration, loss of
populations from rural areas, the large amount of
capitalization required in modern agriculture, and the extent to
which the farmer or the government controls the
management of land. These questions are arising more and
more in protection of water, biodiversity, and land
resources as societies develop consciousness of the
importance of the interrelationships of the natural world,
societal needs, and farming activities.
The term "sustainability" may lose favor, but the
underlying concepts of societal, environmental, and
intergenerational responsibility will be issues as long as
man continues to live on the planet. These issues will
become more complicated with time. Understanding of
the complexities of agricultural processes at both global
and micro scales continues to grow as~d6T:he human"
population and demands on resources.
2.8 References
1. Ponting, C. 1990. "Historical Perspectives on
Sustainable Development," Environment, 32(9}:4-9, 31-33.
2. Dando, W. A. 1980. The Geography of Famine,
John Wiley and Sons, Inc., New York, NY, U.S.A.
3. Brady, N, C. 1984. The Nature and Properties of
Soils, Ninth Edition, Macmillan Publishing, New
York, NY, U.S.A.
4. Black, C. A. 1968, Soil-Plant Relationships,
Second Edition, John Wiley and Sons, Inc., New York,
NY, U.S.A.
5. Tisdale, S. L., W L. Nelson, and J. D. Beaton, 1985.
Soil Fertility and Fertilizers, Fourth Edition,
Macmillan Publishing, New York, NY, U.S.A.
6. Kilmer, V. J., and J. Webb. 1968. "Agronomic
Effectiveness of Different Fertilizers," IN Changing
Patterns in Fertilizer Use, L. B. Nelson (Ed.), pp. 33-65,
Soil Science Society of America, Madison, Wl,
U.S.A.
7. Bertsch, P. M., and G. W. Thomas. 1985.
"Potassium Status of Temperate Region Soils" IN
Potassium in Agriculture, R. L. Munson (Ed.), pp.
131-162, American Society of Agronomy,
Madison, WI, U.S.A.
8. Munson, R. D., and W L. Nelson. 1990,
"Principles and Practices in Plant Analysis," IN Soil
Testing and Plant Analysis, Third Edition, R. L,
Westerman (Ed.), pp. 377-82, Soil Science Society
of America, Madison, WI, U.S.A.
9. Bongaarts, J. 1994. "Global and Regional
Population Projections to 2025," Paper presented at the
IFPRI Round Table on Population and Food in the
Early 21st Century, Washington, D.C., U.S.A.
10. Jackson, M. L. 1965. "Chemical Composition of
Soils," IN Chemistry of the Soil, Second Edition,
F E. Bear (Ed.), pp. 71-141, Reinhold Publishing,
New York, NY, U.S.A.
11. Mitchell, R. L. 1965. "Trace Hements in Soils," IN
Chemistry of the Soil, Second Edition, F_ E. Bear
(Ed.), pp. 320-368, Reinhold Publishing, New York,
NY, U.S.A.
12. Epstein, E. 1972. Mineral Nutrition of Plants:
Principles and Perspectives, John Wiley and Sons,
Inc., New York, NY, U.S.A.
44
Chapter 3. Status of the Fertilizer Industry
Table of Contents
Page
3.1 Short History of Fertilizer Development 46
3.1.1 Foundation for the Modern Fertilizer Industry 46
3.1.2 Phosphate Fertilizers 47
3.1.3 Nitrogen Fertilizers 48
3.1.4 Potash Fertilizers 48
3.1.5 Other Nutrients 49
3.1.6 Compound Fertilizers 49
3.1.7 Fluid Mixed Fertilizers 50
3.1.8 Trend Away From Bagged Fertilizers 50
3.1.9 More Intensive Agriculture 50
3.2 Statistical Overview of Fertilizer Production, 1960-95 .-.,-. 51
3.2.1 Developed Markets 52
3.2.2 Reforming Markets .. 53
3.2.3 Developing Markets 54
3.2.4 Regional Shares :..... 55
3.3 Statistical Overview of Fertilizer Consumption, 1960-95 55
3.3.1 Developed Markets 57
3.3.2 Reforming Markets.-1::^..... 1Lll_. ■ -■■■ 58
3.3.3 Developing Markets 59
3-3.4 Regional Shares 62
3.4 Trends in Fertilizer Trade 63
3.4.1 Global Trends 63
3.4.2 Regional Trends 63
3.5 Trends in Fertilizer Prices 64
3.6 Emerging Centers of Fertilizer Production , 65
3.6.1 Nitrogen 65
3.6.2 Phosphate 66
3.6.3 Potash '. 66
3.7 Industry Restructuring in Older Producing Areas 66
3.8 References 69
45
Chapter 3. Status of
3.1 Short History of
Fertilizer Development
The history of the world fertilizer industry can be traced
to the earliest agriculture when man began cultivation
of plants to produce food. Prior to cultivation of plants
and domestication of animals, man was a hunter and-
gatherer of whatever sources of food he could find in
his local environment. The early farmers soon learned
that some soils were more productive than others; they
also learned that continuous cultivation of the same land
resulted in reduced yields. Some learned that the
addition of manures, composts, fish, ashes, and other
substances would sometimes increase yields or apparently
restore productivity to fields that were considered to be
"worn out." Most of these soil amendments (the first
fertilizers) were discovered by trial and error, and results
were unpredictable.
Agriculture and the use of soil amendments appear to
have started through independent developments in
Mesopotamia (now Iraq) in the river basins of the Tigris
and Euphrates, in the Nile Valley, in the Orient, and
possibly other parts of the world. By Graeco-Roman
times, the art of farming and fertilizeruse-was-being-
documented by Plato (428-348 B.C.), Aristotle (384-
322 B.C.), and other scholars of the day. These Greek
and flater) Roman observations dominated agricultural
practices and philosophies well into the eighteenth
century,
Some of the early theories were later proven to be
wrong, primarily because the scientific method had hot
yet been developed; theories were based on speculation
and reasoning by the most learned philosophers of that
era. It must be remembered that soil science and
chemistry did not develop very far until late in the eighteenth
century. Aristotle, for example, believed that organic
matter was the source of all plant nutrition. Empedocles
(490-430 B.C.) thought that everything, organic or
inorganic, was composed of four elements - earth, air,
fire, and water. In spite of flaws in this scientific base,
some useful textbooks or agricultural practices were
developed during the middle ages (12th through 16th
century) by the Romans, Arab scholars, and others. But soil
fertility and soil amendment practices remained much
the same in the year 1800 as were described by the
Greek scholars in 300 B.C. The major "fertilizer
materials" were animal manures, composts, sewage, sea sand,
seaweed, fish, bones, and liming materials, particularly
marl. Crop yields remained low: wheat, for example,
sown at 2 to 2V2 bushels per acre returned seed-yield
the Fertilizer Industry
ratios of 1:3 or slightly higher, with 1:6 occurring only
under the most favorable conditions.
One of the first true experiments with a living plant
appears to have been conducted by Van Helmont (1577-
1644), a Flemish physician and chemist, in his classical
"willow experiment,"
I took an earthen vessel into which 1 put 200 pounds
of soil dried in an oven, then 1 moistened it with
rainwater and pressed into it a shoot of willow tree
weighing 5 pounds. After exactly 5 years the tree
had grown up and weighed 169 pounds and 3
ounces. But the vessel had never received anything
but rainwater or distilled water to moisten it when
necessary. At the end 1 dried the soil once more
and got the same 200 pounds 1 started with, less
about 2 ounces. Therefore, the 164 pounds of
increased weight of wood, bark, and root came from
the water alone.
Van Helmont considered the 2-ounce loss in the weight
of the soil to be within experimental error, and his
conclusion was erroneous. However, his simple, direct
approach and use of quantitative measurement paved the
-way-for-future-experimentation that led to an
understanding of plant nutrition, which led to a scientific
approach to fertilizer development [1].
3.1.1 Foundation for the Modern Fertilizer
Industry
Justus Von Liebig (1803-73) is generally considered
to be the father of the world fertilizer industry. Von Liebig
stressed the value of mineral elements derived from the
soil in plant nutrition and the necessity of replacing those
elements to maintain soil fertility. He recognized the value
of nitrogen but believed that plants could derive their
nitrogen from the air. He envisioned a fertilizer industry
with nutrients such as phosphate, lime, magnesia, and
potash prepared in chemical factories. He recommended
treatment of bones with sulfuric acid to render the
phosphate more readily available.
Von Liebig was a philosopher and a scientist. His
philosophy was as follows:
Perfect agriculture is the true foundation of all trade
and industry - it is the foundation of the riches of
nations. But a rational system of agriculture cannot
be formed without the application of scientific
principles for such a system must be based on an exact
acquaintance with the means of vegetable nutrition.
This knowledge we must seek through chemistry.
Liebig propounded the "Law of the Minimum," which
is still a useful concept despite its lack of quantitative
exactness. This law states that, if one of the nutrients
from the soil or air is deficient or lacking in availability,
growth will be poor even when all other elements are
abundant. "If the deficient element is supplied, growth
will be increased in proportion to the amount supplied
up to the point where the supply of that element is no
longer the limiting factor. Increasing the supply beyond
this point is not helpful since some other element is
now in minimum supply and becomes the limiting factor.
The concept of the law of the minimum has been
modified as additional elements have proved to be
essential in plant nutrition and has been extended to
include other factors such as moisture, temperature, insect
control, weed control, light, plant population, and
genetic capacities of plant varieties. In fact, modern
advances of crop production have consisted mainly of
identifying successive limiting factors and correcting
them.
3.1.2 Phosphate Fertilizers
The first phosphate fertilizer as such - ground bones -
was used widely in Europe during the early part of the
19th century. When the supply of animal bones was
short, human bones were gathered from battlefields or
burial places, Treatment of bones with sulfuric acid
began about 1830 and soon became a common practice.
Dilute acid was used, and the product was a slurry, which
was distributed in wooden casks. Potash salts and
sulfate of ammonia or nitrate of soda sometimes were
added; thus, the first liquid mixed chemical fertilizers were
produced.
In about 1840 treatment of phosphate rock with
sulfuric acid yielded an effective phosphate fertilizer, which
was called superphosphate. The first successful
commercial superphosphate production was started by Lawes in
England in 1842. Others followed, and by 1853 there
were 14 manufacturers in the United Kingdom and
several in other countries. By 1870, 80 factories were
operating in the United Kingdom.
Many of the early factories were primitive; ground
rock and sulfuric acid were mixed in kettles or vats by
manual labor with paddles or hoes. However, by 1862,
Lawes was using a continuous mixer with a 100-tpd
capacity. Some modern plants produce 1,000 or more
tonnes per day, but smaller plants serving local areas
generally are favored since it is seldom economical to
ship the low-analysis material long distances,
The history of production of concentrated or triple
superphosphate is associated with the production of
phosphoric acid. The first known commercial
production occurred in the 1870s in Germany where the
objective was to use a low-grade phosphate rock that
had a high content of iron and aluminum. A very dilute
phosphoric acid was produced by batch extraction and
filtration of the rock, and this was concentrated by
evaporation. The acid was used to acidulate more phosphate
rock. Other plants were soon built in Europe and
America. However, most of them were small, and much
of the product was used in sugar clarification rather than
for fertilizer.
Triple superphosphate did not become an important
fertilizer until the 1950s. In contrast with ordinary su^
perphosphate, triple superphosphate has a higher
content of phosphate than the phosphate rock from which
it is made; thus, it should be produced near the source
of the rock in large plants, with shipment of the product
to local mixing plants or to farmers.
Although ammonium phosphate had long been known
to be an effective fertilizer and small quantities had been
produced in several countries from time to time, it did
not become a popular fertilizer until the 1960s.
Ammonium phosphates (diammonium phosphate and
monoammonium phosphate) are now the leading form
of phosphate fertilizer in the world.
Development of nitrophosphate fertilizer was started
in Europe in the 1930s. Several processes were
developed, and subsequent improvements have added to their
efficiency and improved the quality of the products. The
popularity of nitropfiosphates^iri Europe has continued,
and several plants have been built in other continents.
Many of the plants are quite large and produce 1,500
or more tonnes of product per day.
Direct application of raw, finely ground phosphate
rock has been practiced to a substantial extent in the
United States, Russia, and China and to some extent in
other countries. The practice has almost disappeared in
the United States. However, recent information
indicates that the value of raw phosphate varies widely with
variations in the character of the ore and the crop and
soil on which it is used. There are indications that
reactive rocks may be useful sources for at least part of the
phosphorus requirement of many crops grown on acid
soils.
Early sources of phosphate rock were small deposits
in England, Ireland, Spain, France, Germany, and the
United States (South Carolina). Most of these deposits
are no longer mined because of their low grade or
because they have been virtually exhausted. Present
supplies are mainly from other areas of the United States,
Russia, and Morocco with smaller outputs from the Near
East, Egypt, Tunisia, Algeria, South Africa, Brazil, Togo,
Senegal, and the Pacific Islands. New discoveries have
been found, and several new deposits appear to be very
large and capable of producing a good grade of rock.
47
To name a few, deposits in Australia, Peru, Arabia,
Venezuela, Colombia, Iran, and India have interesting
possibilities, and some are being exploited at this time.
3.1.3 Nitrogen Fertilizers
For many years the need for supplying nitrogen in
fertilizers was considered to be of secondary importance
although the essential role of nitrogen in crop
production was recognized. Natural supplies and a system of
crop rotation were deemed adequate, Fixed nitrogen is
supplied in rainwater (about 5 kg/ha), and atmospheric
nitrogen is fixed by certain leguminous crops that were
included in the rotation. Return of crop residues and
waste materials helped to conserve the nitrogen supply.
These natural supplies were supplemented by small
amounts of fertilizer nitrogen from guano, Chilean
nitrate of soda, and various organic wastes.
Coal contains about 1% nitrogen, about half of which
is evolved as ammonia in byproduct coke ovens or some
types of gas producers. Starting in the latter part of the
19th century, this nitrogen became an increasing source
of fertilizer nitrogen. Most of it was in the form of
ammonium sulfate; smaller amounts were supplied as gas
liquor, a dilute solution of ammonia.
As a growing population made it evident that world
food needs could be met only by an increased supply of
fixed nitrogen, research in several countries was
concentrated on the fixation of atmospheric nitrogen^ Three-
commercially successful processes emerged. In 1903 the
arc process was introduced commercially in Norway.
Nitrogen and oxygen were combined to form nitric
oxide (NO) at a very high temperature (about 3250°C) in
an electric arc; at lower temperatures the nitric oxide
reacted with more oxygen to form nitrogen dioxide
(NO2), which was hydrated in the presence of excess air
to form nitric acid. The nitric acid was converted to the
end product, calcium nitrate, by reaction with limestone.
At about the same time the calcium cyanamide
process was perfected. Calcium carbide, produced by
reaction of lime with coke in an electric furnace, was
converted to calcium cyanamide (CaCN^) by reaction
with pure nitrogen extracted from the air. The product
could be used directly as a fertilizer, or it could be hydro-
lyzed to form ammonia.
The economics of the arc and cyanamide processes
depended on low-cost electricity; at best, both were
costly.
Direct synthesis of ammonia from nitrogen and
hydrogen was first carried out successfully on a
commercial scale in Germany in 1913, Plants were built in several
other countries after World War I. Most of these plants
derived their hydrogen-nitrogen synthesis mixtures from
the reactions of coke with steam and air
The first ammonia plants were quite small, 25-50 tpd,
and costs remained high. Much of the ammonia was
used to produce explosives or industrial chemicals.
Fertilizer use remained small because chemical nitrogen was
too expensive for liberal use on farm crops other than
those of high cash value. Even as late as 1950 many
agriculturists advocated that principal reliance for
nitrogen supplies be placed on legumes grown in rotation
with other crops.
During the latter half of the 20th century, successive
improvements in ammonia production have lowered-the
cost to the point that its liberal use in crop production is
economically attractive. Notable among these
improvements was perfection of processes for reforming
natural gas or naphtha to supply the hydrogen-nitrogen
synthesis gas and to increase the scale of operation.
The use of centrifugal compressors, starting in the
1960s, made possible large, single-train ammonia plants
of 1,000- or even 1,500-tpd capacity. These large
ammonia plants are capable of producing ammonia much
more economically than the older, smaller plants that
used reciprocating compressors.
At first the final products - ammonium sulfate,
calcium nitrate, sodium nitrate, and calcium cyanamide -
.were all low-analysis materials (15%-21% N).
Ammonium nitrate (34% N) began to be an important fertilizer
_materiaI_in_the_13A0s and. became the leading form in
the 1960s. More recently, urea production (46% N) has
grown rapidly and is now the world's leading form.
Direct application of ammonia (82% N) to the soil, either
in anhydrous form or in aqueous solution, is popular in
the-United States, Canada, and Australia and has been
introduced into other countries.
The popularity of urea-ammonium nitrate solutions
(28%-32% N) has increased in North America and parts
of Europe during the 1980s and 1990s. Much of the
popularity is due to ease of handling plus the ease of
mixing herbicides with nitrogen solution for simultaneous
on-farm application,
3.1.4 Potash Fertilizers
Early sources of potash were wood ashes, sugar beet
wastes, and saltpeter. The salt deposits in Germany were
opened in 1860 and dominated the world market for
75 years. Low-grade, unrefined ores such as manure
salts (20%-25% K20) and kainite (19% KzO) were the
first products. The development of refining methods
gradually increased the grade of commercial products.
High-grade potassium chloride (60%-62% K2O) is now
the main product. Potassium sulfate, sulfate of potash-
magnesia, and potassium nitrate are the principal
nonchloride potash fertilizers. They are more
expensive and hence are used primarily on crops or soils for
48
which the chloride is unsuited. Important potash
deposits were found in other countries, and production was
started in France (1910), Spain (1925), Russia (1930),
United States (1931), and Canada (1960). Large
deposits occur elsewhere and may be used in the future.
3.1.5 Other Nutrients
One of the important early fertilizers was gypsum,
which supplied sulfur and calcium. Its use evidently
originated when a German plasterer observed that small
amounts of plaster, which spilled from his wheelbarrow,
made the grass along the pathway lush and green. In
any event, gypsum for agricultural use became known
as "land plaster."
Later, superphosphate and ammonium sulfate
supplied adequate amounts of sulfur even though their
primary purpose was to supply phosphorus and nitrogen.
Likewise, basic slag has been widely used in Europe and
the United States for its phosphorus, calcium, and mi-
cronutrient content. In most industrial countries, millions
of tonnes of sulfur from fuel combustion escape to the
atmosphere and subsequently return to Earth in rainfall.
In most such areas the deliberate addition of sulfur to
fertilizer has not proved necessary, but there are
important exceptions. As the removal of sulfur from stack gas
becomes widespread for the prevention of atmospheric
pollution, more sulfur may need to be added to
fertilizers. In many less industrial areas the need for sulfur is
already well known, ~" "" "~~
Limestone and dolomite are widely used to supply
calcium and magnesium when these nutrients are
needed. Other magnesium materials include magnesium
silicate, calcined brucite (MgO), magnesium sulfate, and
Iangbeinite (K2S04 • 2MgS04).
The importance of most micronutrients in crop
production was not recognized until the 20th century. Iron
is an exception: Gris (France) discovered in 1844 that
chlorosis of some plants can be corrected by spraying
them with iron salts. Liebig noted the presence of
manganese in plant ash but doubted that it was a nutritive
element. It was not until 1905 that manganese was
recognized as essential to plant growth; then copper and
boron followed in the 1920s before zinc (about 1930),
molybdenum (1939), and chlorine (1954). Still other
elements that are not strictly essential may, in some cases,
be economically important in increasing crop yields or
improving quality. Silicon, sodium, and cobalt are
examples.
3.1.6 Compound Fertilizers
Most of the early experimenters in chemical
fertilizers, such as Murray and Liebig, worked with mixtures
that contained several nutrients. However, as the
European fertilizer industry developed, the usual practice was
the separate production of straight fertilizers - each
containing only one primary nutrient.
In contrast, the early development of the US.
fertilizer industry was primarily devoted to providing
compound fertilizer, Starting from these extremes, the
practices of the two areas converged and compound
fertilizers are now relatively more important in Europe
than in the rest of the world. The trend is toward
supplying most of the phosphate and potash and smaller
proportions of the nitrogen in compound fertilizer, which
also may contain secondary or micronutrients. Much of
the nitrogen is supplied as a straight material.
The reason for the popularity of compound fertilizer
is that farmers in industrialized nations no longer have
the time or inclination to apply several fertilizers
separately, nor do they have facilities to mix them. In
addition, formulations are becoming more and more complex
as farmers strive for higher yields and greater
productivity, However, nitrogen is often applied separately
because timing is important, and supplemental applications
of nitrogen during the growing season are often needed
for best results. Some straight nitrogen materials, such ;
as anhydrous ammonia, are much cheaper than the same
amount of nitrogen in compound fertilizers.
At first, compound fertilizers were made by simple
mixing of low-grade materials - guano, superphosphate,
ammonium sulfate, potassium chloride, and waste or-
^aTuc"lfIafe^alsT"nmestone often was added as a filler
and to neutralize the acidity of superphosphate. Am-
moniation of superphosphate became popular in the
1930s because it supplied nitrogen economically and
improved the physical properties of the superphosphate.
Light ammoniation in batch mixers characterized the
early practice. Gradually, the various waste organic
materials were eliminated, often because a better use
was found for them. For example, cottonseed meal
became more valuable for animal feed. Analyses of
products rose as fillers were eliminated.
With the higher analyses came increased caking
problems. Increased use of mechanical application equipment
by farmers called for dependably free-flowing material;
thus, granulation became popular starting in the 1950s.
Analyses of compound fertilizer rose further as triple
superphosphate replaced ordinary superphosphate, and
ammonium nitrate or urea replaced ammonium sulfate
or sodium nitrate. Later, still higher analyses were
attained by the liberal use of phosphoric acid and
ammonia in the formulations. Compound fertilizer preparation
was no longer a simple mechanical task but a complex
chemical engineering operation. As such, its economics
depended on large-scale operation. Some small local
mixers expanded to large regional manufacturers;
others became bulk blenders or went out of business.
49
Bulk blending became popular in some countries as a
method by which a local mixer could supply whatever
mix the farmer needed in simple equipment at a low
cost. Granular materials such as diammonium phosphate,
muriate of potash, and ammonium nitrate or urea were
produced by large companies that had the facilities and
capabilities for chemical manufacture and granulation
and favorable raw material costs. These products were
shipped in bulk to blenders offering prescription
mixing, custom application, and many other services to the
farmers. The success of this system largely depends on
dependable, low-cost transportation. Covered, hopper-
bottom railcars protect the material from the weather,
minimize spillage, and simplify unloading. Barge
transport or ocean shipment is also suitable between points
on waterways.
3.1.7 Fluid Mixed Fertilizers
Manufacture of liquid mixed fertilizers began in the
United States during the 1920s. However, liquids did
not expand beyond California and a few other western
States until the 1950s when technology, largely
developed by the Tennessee Valley Authority (TVA), resulted
in rapid expansion in the fluid segment of the fertilizer
industry. By the 1990s, fluid mixtures fliquids plus
suspensions) comprised approximately 20% of multinutrient
fertilizer sales in the United States, To a lesser extent,
fluid mixtures have been introduced into Europe, North
America, and South America.. Popularity. otfluidJertiliz^
ers is greatest in areas of high labor costs; fluids are
easily handled with pumps. A common practice is the
combined application of fluid fertilizers and herbicides.
3.1.8 Trend Away From Bagged Fertilizers
Because farm size has increased in most developed
countries, farmers have switched from bagged fertilizers
to bulk or liquid products. This trend is most pronounced
in the United States and is illustrated in Figure 3.1. In
1965 1970 1975 1980 1985 1990 1995
'Includes Anhydrous Ammonia
Source: Derived from TVA data.
Figure 3.1. Fertilizer Use by Class in the
United States, 1965-94.
1965 bagged fertilizers comprised more than one-half
of the fertilizers used by U.S. farmers; by 1994 less than
10% was sold in bags. Increased farm size, increased
mechanization, lower labor costs for bulk application of
fertilizers, and lower production and distribution costs
have all contributed to the trend away from bagged
products.
3.1.9 More Intensive Agriculture
Changes in agriculture have been no less dramatic
than developments in fertilizer technology, and these
have played a large part in increasing the demand for
fertilizers.
When the world population was relatively small and
when land and labor were plentiful, there was little need
for increasing yields per hectare. For example, at the
beginning of the 20th century, about one-half of the
farms in the original 13 colonies of the United States
had been abandoned. Farmers and immigrants moved
on to new, richer lands in the Ohio and Mississippi
Valleys, Chemical fertilizers were so expensive that they
were used only on high-value cash crops such as cotton
and tobacco. Abandoned farmland in some cases
regained a part of its native fertility through natural
processes; trees reached mineral elements deep in the
subsoil, and fallen leaves deposited these nutrients in
the topsoil. Rocks weathered and released their mineral
elements in a more available form. Natural fixation pro-
cesses - meteorological'ahd microbiological - increased
the nitrogen content of the fallow soil. In other cases,
severe erosion caused more damage than nature could
repair.
The richer soils of the Mississippi Valley were farmed
for 75-100 years without fertilizer, Farms of those days
and even 50 years ago were, to a large extent,
subsistence farms. Draft animals supplied the motive power
for farm machinery and transportation. Farm animals
supplied meat, eggs, milk, and butter. Grain, vegetables,
and fruit raised on the farm supplied the family's food.
A large part of the nutrients in farm crops was returned
to the soil as crop residues and manure. Legumes such
as clover or alfalfa were grown in rotation and plowed
under to supply nitrogen to cereal crops,
Cyril Hopkins, in his popular book The Farm That
Won't Wear Out (1913), recommended a farming
system that conserved soil nutrients through the return of
crop residues, animal wastes, and green manure. Since
phosphorus and sometimes lime were often deficient,
he recommended the application of ground phosphate
rock at 5- to 10-year intervals and limestone when
necessary. Nitrogen was furnished by legumes in rotations.
The soil's supply of potash was considered adequate for
the foreseeable future. He warned against use of
chemical fertilizers because of their high cost and transitory
50
effect. For example, at that time the delivered cost of
superphosphate was four times that of ground
phosphate rock.
Hopkins gave examples of how his system increased
the profits of a farm's operation. The system was
indeed profitable under the conditions existing 80 years
-ago, and yields were much better than the national
average but still low by present-day standards.
Many countries have passed through this stage when
low yields, utilization and conservation of native soil
fertility, and bringing new land under cultivation were
adequate and economical methods for supplying food
needs. Today the rapidly growing population leaves few
countries that choice. Yields per hectare must be greatly
increased in many developing countries as they have
been in developed (and some developing) countries.
Increased fertilizer use is a necessary requirement for
intensive agriculture. More of the farm produce now leaves
the farm to feed workers in the cities. Decreased use of
draft animals releases more food for people, but less
manure is available. These factors mean that less of the
nutrient content of crops is returned to the soil. On the other
hand, higher yields mean more crop residues and increased
importance of returning crop residues to the soil.
An important landmark in the intensification of
agriculture is the development of high-yielding varieties of
cereal crops. Starting in the 1930s, the development of
hybrid corn played a primary role-in- increasing yields-
and fertilizer use, In addition, the varieties adapted to
climatic conditions (drought-resistant or early-maturing,
for example) extend the area in which this crop can be
grown. Improved varieties of wheat and rice followed,
and improvement is continuing with these and other
crops. These improved varieties are much more
responsive to fertilizer and have been a large factor in increased
fertilizer use.
Dr. B. L. Bumb of the International Fertilizer
Development Center analyzed FAO's fertilizer production and
consumption yearbooks and data tapes in 1994 and
developed Tables 3.1-3.16 and Figures 3.2 - 3.9 which
appear in this chapter. Data are presented to show
global production and consumption trends; trends by
geographic region; and trends by developed and developing
countries. Data are also presented to describe fertilizer
production and consumption in the reforming markets
of Eastern Europe and Eurasia. Chapter 4 includes data
for 1994 and 1995, and fertilizer production and
consumption projections are extended through the year 2005.
3.2 Statistical Overview of Fertilizer
Production, 1960-95
World fertilizer production increased steadily from 28
million nutrient tonnes in 1960 to a peak of 158 mil-
160
s14U
5 1ZQ
£ 100
1 so
£ 60
MA
40
0
,
Total NPK
f "•' *N
,--'
/■
lf-
„ ■ -" Nitrogen
-' -*■•" -*— i—
.** *f
^^^■^ Phosphate
1960 1965
1970
1975
1980
1985 1980 1965
Figure 3.2. World Nitrogen, Phosphate,
Potash, and Total NPK Production,
1960-94.
lion tonnes in 1989 as shown in Figure 3,2,
(Throughout this chapter, statistical data are reported for the split
year ending June 30 of the year stated; for example,
1985 refers to the period July 1, 1984, through June
30, 1985.) Production increases averaged almost 4.5
million tonnes per year during this 29-year period.
However, world production totals declined by an average of
about 5 million tonnes per year during the next 5 years
to a low of 132 million tonnes in 1994. A steep decline
in production in the reforming economies of Eastern
Europe and Eurasia was primarily responsible for this
-decrease-in-global-fertilizer-produetion. Production trends
were similar for all three primary plant nutrients.
Between 1980 and 1990 nitrogen production increased
by 26 million tonnes and phosphate and
potash'production by 8 and 5 million tonnes, respectively.
Statistics showing annual fertilizer production by
economic class of countries (developed and developing) for
the years 1960 through 1995 are shown in Table 3.1.
Other data, presented in Table 3.2, show recent
production trends within developed markets, developing
markets, and the reforming markets of Eastern Europe
and Eurasia.
At the regional level, all regions except Western
Europe and Oceania registered an increase in fertilizer
production during the 1980s, In contrast, only North
America, Africa, and Asia registered increases during
the early 1990s (Table 3.2),
Several factors affected fertilizer production during the
1979/80 to 1994/95 period. Depressed fertilizer prices,
economic and political reforms, structural adjustment
programs, raw material shortages, and depressed
demand were some of the important contributory factors.
Table 3.3 provides data on fertilizer production in
different markets and regions, The growth experiences of
the three market groups are not uniform". The developed
51
Tabic 3.1. World Fertilizer Production — Historical Data, 1960-95
Developing Countries
Developed Countries'3
Year
1960c
1965
1970
1975
1980
1981
1982
1983
1984
1985
1986
1987
1988
1989
1990
1991
1992
1993
1994
1995
N
0,74
2.07
3.87
7,82
17.72
19.69
20.61
22.16
23.65
26,77
26.92
29,16
31,94
34.06
35.46
35.90
36.49
37.73
38.02
40.30
P2O5
K2O
- (millions of nutrient tonnes]
0.44
1.10
2.17
4.24
6.20
7.69
7.46
7.81
8.59
9.02
8.90
10.34
11.48
13.01
12.17
12,87
13.67
13.26
12.42
14.01
0,18
0.60
0.87
3.01
0.40
0,43
0.48
0.56
2.20
3.47
5.70
6,97
7.97
8.90
9.76
9.57
10.54
10.60
11.53
13.28
a. Developing countries include Latin America, As
NPK
1.19
3.22
6.13
12.36
23.96
27.42
28.12
30.03
32.46
36.13
36.39
40.20
44.21
47.96
48.60
49.72
51.22
52.04
51.60
55.64
1a (except Jap
N
8.49
15.58
26.36
34.62
41.90
43.09
41.68
41.26
44.17
47.74
46.18
48.26
50.34
51.66
49.19
46.00
44.13
42.21
41.35
40.10
P2O5
K20
- (millions of nutrient tonnes) -
9.34
13,97
18.19
22.94
27.06
26.83
24.23
24,30
26.51
27.47
25.74
27.03
27,66
. 28,37
27.56
26.11
24.94
21.56
19,34
18.77
8.69
12.13
16.57
23.10
25.81
27.41
25.61
24.36
27.68
28.33
27.72
28.06
30.02
30.27
27.35
25.75
23.93
22.45
19.34
21,92
NPK
26.52
41.68
61.12
80.66
94.78
97.33
91.51
89.93
98.36
103.55
99.63
103.36
108.03
110,29
104.11
97.87
93.00
86.22
80.04
80.79
an and Israel), Africa (except South Africa), and
b. Developed countries include North America, Europe, Eurasia, Japan, South Africa, Australia, and New
Zealand.
c. Yearly data represent production for the period July 1 through June 30, i.e., 1960 data are for the period
July 1, 1959, through June 30, 1960.
Source: Data compiled by IFDC from various issues of FAO Fertihzer Yearbooks and fertilizer data tapes.
markets experienced a steady decline and the
developing markets a steady increase in fertilizer production
between 1979/80 and 1992/93. The reforming
markets had a contrasting experience. Fertilizer production
increased in these markets in the 1980s and decreased
in the early 1990s.
3.2.1 Developed Markets
Fertilizer production decreased from 60.9 million
tonnes in 1979/80 to 54.9 million tonnes in 1992/93.
Decreases in fertilizer production in Western Europe and
Oceania contributed mostly to this trend. Depressed
demand and low prices caused many fertilizer plants to
be unprofitable and unsustainable in these regions.
In contrast to Western Europe and Oceania, North
America registered an increase in production. Most of
the increase in production occurred after 1984/85 partly
in response to increased domestic prices after the drought
of 1988 and partly in response to increased demand for
phosphate fertilizers, especially diammonium phosphate
(DAP), from the developing markets in Asia. Domestic
availability of fertilizer raw materials such as phosphate
rock, sulfur, natural gas, and potash ore helped North
America to sustain its production. Unlike North America,
Western Europe and Oceania depended on imported
raw materials and therefore were unable to compete
with cheap fertilizers imported from the regions endowed
with raw materials. Environmental regulations, especially
those dealing with the disposal of phosphogypsum, also
affected fertilizer production in Western Europe.
Most of the decrease in total fertilizer production
resulted from the decrease in phosphate and potash
production. Nitrogen production decreased in the early
1980s but recovered and increased after the mid-1980s;
after 1988/89, however, it again decreased.
52
Table 3.2. Annual Growth in Regional Fertilizer
Production, 1979/80-1992/93
Region
Developed Regions
North America
Western Europe
Oceania
Reforming Regions
Eastern Europe
Eurasia
Developing Regions
Africa
Asia
Latin America
World
1979/80-
1988/89
0.3
1.1
(P.l)
(2.6)
4.6
1.3
5,6
6.6
8.0
6.5
5.9
3.2
1988-89-
1992/93
(%)
(2-4)
1.4
(8.4)
(10.5)
(12.4)
(20.6)
(10.6)
2.0
1.4
2.5
(2-0)
(3.3)
( ) = decrease.
Source: Derived from FAO data.
3.2.2 Reforming Markets
Fertilizer production increased from 30,0 million
tonnes in 1979/80 to 45.2 million tonnes in 1988/89
and decreased rapidly thereafter to reach 27.7 million
tonnes in 1992/93. Production of all three nutrients,
namely, nitrogen, phosphate, and potash, followed a
similar trend. However, potash production decreased by
a lower amount than nitrogen production partly because
increased costs of energy (natural gas) had a smaller
impact on potash production than on nitrogen
production in Eurasia.
Most of the increase in production occurred during-
the 1979/80-1984/85 period and was contributed by
growth in fertilizer production in Eurasia. Economic and
political reforms are responsible for the recent decline
in production, Specifically, depressed demand, removal
of subsidies, the high cost of energy and raw materials,
and low capacity utilization resulting from outdated
technology and poor maintenance have contributed to
decreased production. Sudden withdrawal of governmental
support without the provision of an alternative and
adequate financial and institutional support also
contributed to this process.
Nevertheless, devaluation of domestic currencies has
created some incentives for the enterprises to continue
Table 3.3. World: Fertilizer Production by Regions, 1979/80-1992/93
Region/Market
Developed Markets
North America
Western Europe
Oceania
Reforming Markets
Eastern Europe
Eurasia
Developing Markets
Africa
Asia
Latin America
World
1979/80
60.9
32.0
27.3
1.6
30.0
8.4
21.6
27.9
2.0
22.8
3.1
118.7
1984/85
60.3
32.8
26.3
1.2
39.2
9.2
30.0
40.2
3.4
32.4
4.4
139.7
1988/89
(million tonnes)
61.3
35.0
25.1
1.3
45.2
9.4
35.9
51.7
4.7
41,9
5,1
158.3
1992/93
54.9
36.0
18.0
0.9
27.7
4,7
23.0
55.7
4.9
46.2
4.6
138.3
Note: Totals may not add due to rounding.
Source: Derived from FAO data.
53
production and export fertilizer products to earn hard
currency. Consequently, many countries in Eurasia and
Eastern Europe have sold products in the international
markets at low prices. This practice, however, will not
be sustainable in the long term.
In Eurasia, fertilizer production, like fertilizer use, is
heavily concentrated in Russia. In 1990, Russia
accounted for over one-half of the total fertilizer
production - ranging from 43% of K20 to 56% of P205.
Ukraine and Belarus are other dominant producers. Over
one-half of the potash production occurred in Belarus,
and about one-fifth to one-fourth of phosphate and
nitrogen production took place in Ukraine (Table 3.4).
Although fertilizer production has decreased
drastically in recent years, these markets, especially Eurasia,
are rich in raw materials such as natural gas, potash
ores, and phosphate rock. Therefore, they will continue
to play an important role in supplying nitrogen and
potash fertilizers in the global markets. Because Eastern
Europe is not as rich in energy resources and raw
materials, increased energy costs may reduce its
comparative advantage in world fertilizer markets.
3.2.3 Developing Markets
Fertilizer production nearly doubled in the developing
markets -from 27.9 million tonnes in 1979/80 to 55.7
million tonnes in 1992/93 (Table3.5). Although all three
regions experienced increases in fertilizer-production,-
Asia contributed over 80% to this increase. Likewise,
nitrogen production contributed the most to the increase
in total fertilizer production.
In Asia fertilizer production increased by 23.4 million
tonnes - from 22.8 million tonnes in 1979/80 to 46,2
million tonnes in 1992/93. All three subregions
registered growth in fertilizer production. Availability of raw
materials, growing fertilizer demand, conducive policy
environment, and governmental support contributed to
this rapid increase in production.
Compared with fertilizer production in Asia, Latin
America's fertilizer production increased by a small-
amount of 2 million tonnes between 1979/80 and
1988/89, Both South America and Central America
contributed to this increase. After 1988/89, fertilizer
production decreased in both subregions - relatively more
in South America. Macroeconomic instability, decrease
in demand, and changes introduced under structural
adjustment programs have contributed to the observed
decrease in fertilizer production in Latin America in the
early 1990s, It is likely that fertilizer production may
decrease further due to privatization and subsidy removal
programs in the 1990s, as inefficient units are closed
under competitive market pressures.
Africa registered an increase of 2.9 million tonnes in
its fertilizer production from 1980 to 1993. Most of this
increase occurred in phosphate production in North
-A£rica,_SubzSaharan.Africa.experienced a modest
increase and South Africa a small decline, Sub-Saharan
Table 3.4. Fertilizer Production in Eurasia, 1990
Total
Nitrogen
Phosphate
Potash
State/Region
Azerbaijan
Belarus
Estonia
Georgia
Kazakhstan
Latvia
Lithuania
Russian Fed.
Tajikistan
Turkmenistan
Ukraine
Uzbekistan
Eurasia
'000 tonnes
205
5,996
216
130
1,181
180
480
15,845
73
192
4,726
1,762
30,987
%
0.7
19.4
0.7
0.4
3.8
0.6
1.6
51.1
0.2
0.6
15,3
5.7
100.0
'000 tonnes
747
106
130
431
41
312
7,054
73
55
3,022
1,113
13,084
%
5.7
0.8
1,0
3.3
0.3
2,4
53.9
0.6
0.4
23.1
8.5
1C0.0
'000 tonnes
166
257
110
0
737
139
168
4,943
0
137
1,561
649
8,867
%
1.9
2.9
1.2
0.0
8.3
1.6
1.9
55.8
0.0
1.5
17.6
7,3
100.0
'000 tonnes
39
4,992
0
0
13
0
0
3,848
0
0
143
0
9,035
%
0.4
55.3
0.0
0.0
0.1
0.0
0.0
42.6
0.0
0.0
1.6
0.0
100.0
Note: Totals may not add due to rounding.
Source: FAO.
54
Table 3.5. Developing Markets: Fertilizer Production, 1979/80-1992/93
Region/Market
Africa
North
Sub-Saharan
South
Latin America
Central
South
Asia
East
South
West
1979/80
2.0
0.9
0.2
0.9
3.1
1.1
2.0
22.8
. . 16,2
3.8
2.8
1984/85
3.4
2.2
0.2
1.0
4.4
1.7
2.7
32.4
20.6
7,0
4.8
1988/89
4.7
3.3
0.5
0.8
5.1
2.2
2.9
41.9
24.4
11.1
6.4
1992/93
4.9
3.6
0.5
0.8
4.6
2.1
2.5
46.2
27.3
12.2
6.7
Developing Markets 27.9
ueveioping Manteis z/.a
Note: Totals may not add due to rounding.
Source: Derived from FAO data.
40.2
51.7
55.7
Africa's increase was created by the commissioning of a
large ammonia-urea plant in Nigeria in 1988.
3.2.4 Regional Shares
Asia increased its share from 19% in 1979/80 to
33% in 1992/93 (Figure 3.3). In contrast to its decreased-
share in fertilizer use, North America maintained its share
in fertilizer production at about one-fourth of the world
production. The major loser was Western Europe; its
share in global fertilizer production dropped from 23%
to 13%. Africa and Latin America made small gains,
and Eastern Europe and Eurasia lost their shares by small
percentage points.
3.3 Statistical Overview of Fertilizer
~—~~Consumptionr 1960-95
World fertilizer consumption increased from
approximately 28 million nutrient tonnes in 1960 to a peak of
146 million tonnes in 1989 as shown in Figure 3.4.
Weatem
Europe
23.0% .
Oceania
1.3%
North
America
26.9%
Eastern
Europe
7.0%
Western Oceania
Europe 0.6%
13.0%
Eastern
Europe
3.4%
North
America
26.0%
Latin Eurasia
America 16>7%
2.6%
Eurasia
18.2%
Asia
19.2%
Africa
3.5%
Africa
1.7%
1979/80
Asia
33.4%
1992/93
Source: Derived from FAO data.
Figure 3.3. Global Fertilizer Production: Regional Shares, 1979/80 and 1992/93.
55
Annual consumption increases averaged about 3.9
million nutrient tonnes during this 30-year period. During
the next 4 years, consumption declined by an average
of 4.9 million tonnes per year and reached a level of
126 million tonnes in 1993, Most of this recent decline
occurred in the reforming markets of Eastern Europe
and Eurasia.
Annual fertilizer consumption by economic class of
countries (developed and developing) for the years 1960
through 1995 is shown in Table 3.6.
Different markets had different experiences. Fertilizer
use decreased steadily in the developed markets and in-
140
M
£120
c
tioo
c
|j 80
z
% 60
1 40
20
0
-
-
M w **
^
.'■'
TTTTTT
Total NF>K
/■■*.
.».■""■ v
----.'
f -
j.. / Nitrogen
s-*r Phosphate
^j**""^ ^ _ * m "* - - - ™ mWrm *w
"-7.r.Tl7~r-""-""" * Potash""'™"-
I960
1965
1970
1975
1980
1985
1990
1995
Figure 3.4. World Nitrogen, Phosphate,
Potash, and Total NPK
Consumption, 1960-94.
creased significantly in the developing markets during
the. 1980s and the early 1990s. However, in the
reforming markets, it increased until 1988/89 and
decreased rapidly thereafter. A steep decrease in fertilizer
use in these markets resulted from the economic
reforms introduced after the demise of communism.
Western Europe contributed the most to the trends in the
developed markets, whereas Asia dominated those in
the developing markets.
Nitrogen (N), phosphate (P2O5), and potash (K20) use
also increased during the 1980s and decreased during
the early 1990s (Table 3.7). N use increased by higher
amounts than did K20 and P205 use in the 1980s.
Higher growth in N use resulted from two factors: First,
the developing markets of Asia, Africa, and Latin
America continued to experience higher growth in N
use, and second, because of residual phosphorus and
potassium in the soils and unfavorable crop prices, the
developed markets experienced declines in P2O5 and
K20 use. Between 1988/89 and 1992/93, potash use
decreased by a much higher amount than did phosphate
and nitrogen use.
The annual growth in fertilizer use slowed
considerably during the 1980s. Total fertilizer use grew at 2.8%
per annum during the 1980s. This growth was about
one-half of the annual growth in the 1970s and one-
third of the growth in the 1960s [21; it was also about
two-thirds of the projected growth for the 1980s
(projections made by the FAO/UNIDO/World Bank
Fertilizer Working Group, June 1980). Because investments
for production capacity were made on the basis of the
projected growth in demand, slower growth in fertilizer
use led to excess production capacity and lower
fertilizer prices in the 1980s. The slow growth in fertilizer^
use produced near stagnation in per capita fertilizer use.
The slow growth of the 1980s converted into a rapid
decline in the early 1990s, Between 1988/89 and
1992/93, global fertilizer use decreased at an annual
rate of 3.6%. This led to an increased surplus in the
market, depressed fertilizer prices, and forced closure
of some fertilizer plants.
In the 1980s, Asia and Eurasia registered over 5%
annual growth in their fertilizer use. However, during
the early 1990s, Eurasia's fertilizer use decreased at an
annual rate of over 18%, whereas Asia's use increased
by 3.6% per annum, Few other regions experienced
significant growth in their fertilizer use during the early
1990s (Table 3,8). After 1988/89, fertilizer use in
Western and Eastern Europe decreased at an annual rate of
-7% -and-35%rrespectively.
Several factors have contributed to the slow growth
of the 1980s and steep fall of the 1990s. These factors,
which are discussed in more detail while analyzing the
trends in developed and developing markets, are briefly
summarized below.
1. Economic reforms in Eastern Europe and Eurasia
had a tremendous effect on fertilizer use in these
regions. During a short period of time, fertilizer use
decreased by 30%-70% in many countries.
2. Debt crises, foreign exchange shortages, and balance-
of-payment difficulties led to restricted fertilizer
supplies and therefore decreased fertilizer use in many
developing countries, especially in Africa and Latin
America.
3. Policy reforms introduced under structural adjustment
programs such as the devaluation of domestic
currency, subsidy removal, and privatization (sudden
withdrawal of governmental organizations) have had
a negative impact on fertilizer use in several
developing countries,
4. Depressed crop prices resulting from grain surpluses
and acreage reduction programs in the developed
markets have contributed to a decline or stagnation
in fertilizer use.
56
Tabic 3.6. World Fertilizer Consumption — Historical Data, 1960-93
Developing Countries3
Developed Countries'3
Year
1960
1961
1962
1963
1964
1965
1966
1967
1968
1969
1970
1971
1972
1973
1974
1975
1976
1977
1978
1979
1980
1981
1982
1983
1984
1985
1986
1987
1988
1989
1990
1991
1992
1993
N
1,67
1.97
2.19
2.65
3.11
3,66
4.42
5.69
5.71
6,51
7,52
8.82
9.44
10.74
11,63
10,93
13.68
13.94
17.51
20.68
22.54
25.06
25.25
26,62
29.58
31.92
31.36
32.34
36,06
39.78
40.70
41.97
42.47
44,29
p2o5
K20
- -(millions of nutrient tonnes)
0.76
0.92
1.06
1.19
1.44
1.61
1.93
2.48
2.48
2.61.
3.08
3.52
4.02
4.65
5.45
5.34
5.73
6.20
7.31
7.40
8.28
9.68
10.07
10.84
11.92
11.01
11.96
13.78
15.12
15.23
16,21
17,54
16.93
0.30
0.41
0.41
0.44
0.55
0.58
0.65
0.78
0.96
1.22
1.28
1.45
1.54
1.82
2.22
2.29
2.16
2,34
2,87
3.29
3.64
4.03
" 3,82
3.79
4.07
4.61
4,37
5.06
5.98
6.60
6.30
6.92
7,37
6.98
NPK
2.73
3.30
3.67
4.27
5.10
5.84
7.00
8.95
9.16
10.33
11.88
13.79
15.00
17.21
19.31
18.55
21.57
22.49
27.70
31.37
34.46
38.76
"38740
40.48
44.49
48.45
46.74
49.36
55.82
61.51
62.23
65.10
67.38
68.21
N
7,87
8.51
9.39
10.49
11.64
12.82
14.67
16,49
18.50
19.74
20.95
22.94
24,10
25.41
27.58
27.50
30.74
31.32
31.61
33.57
34.68
35.72
35.21
34.57
38.09
38.73
38.47
39.15
39.54
39.82
38.49
35.27
33.00
29.34
P2O5
K20
- (millions of nutrient tonnes)
8.99
9.31
9.87
10.42
11.48
12.88
13.87
14.93
15,66
16.43
16.72
17.60
18.41
19.36
20.42
18.65
19.87
21.12
21.24
22.64
22.91
22.02
21.61
20.79
22.24
22.11
22.22
22.70
22,91
22.87
22.16
20.06
17.75
14.59
7.83
8.01
8.25
8.79
9.45
10.34
11.46
11.96
12.96
13.31
13.93
14.99
15.80
16.72
18.18
17.25
19.21
20.51
20.07
21.17
20.41
20.22
19.93
19.20
21.48
21.29
21.19
21.04
21.32
21.44
20.59
17.61
16.20
13.79
NPK
24.68
25.83
27.51
29.71
32.58
36.04
40.00
43.38
47.12
49.48
51.60
55.52
58.31
61.49
66.17
63.39
69.83
72.95
72,91
77.39
78.01
77.96
76,75
74.56
81.81
82.12
81.88
82.89
83,77
84.13
81.24
72.95
66.95
57.73
a. Developing countries include Latin America, Asia (except Japan and Israel), Africa (except South Africa), and
Oceania (except Australia and New Zealand).
b. Developed countries include North America, Europe, Eurasia, Japan, South Africa, Australia, and New Zealand.
Source: Data compiled by IFDC from various issues of FAO Fertilizer Yearbooks and fertilizer data tapes.
Environmental concerns associated with fertilizer use,
such as nitrate leaching, eutrophication, and
greenhouse gas emissions, have resulted in regulations on
fertilizer use and thereby induced decreases in
fertilizer use in the developed markets.
Agronomic factors such as residual phosphorus in
the soil reduced the need for additional phosphate
application, especially during the 1980s when crop
prices were falling.
7. Climatic factors such as droughts and floods also
contributed to decreased fertilizer use.
Table 3.9 provides data on total fertilizer use in
different markets and regions,
3.3.1 Developed Markets
Total fertilizer use steadily decreased from 47,2
million tonnes in 1979/80 to 40.1 million tonnes in 1992/
93. Annual decreases were much higher between 1988/
57
Table 3.7. World: Fertilizer Use by Nutrients,
1979/80-1992/93
Year/Period
N
P2O5
K9O
Total
Fertilizer
1979/80
1984/85
1988/89
1992/93
Use (million tonnes)
57.2 31.2
70.1 34.0
79.6 38.0
73.6 31.5
Annual Growth (%)
1980-89
1989-93
3,5 2.2
(2.0) (4.3)
24.1
25,9
28,4
20.8
1.8
(7.3)
112.8
130.6
145.6
125,9
2.8
(3.6)
( } = decrease.
Source: Derived from FAO data.
Table 3.8. Annual Growth in Regional
Fertilizer Use, 1979/80-1992/93
Reqion
Developed Markets
North America
Western Europe
Oceania
Reforming Markets
Eastern Europe
Eurasia
Developing Markets
Africa
Asia
Latin America
World
( } = decrease.
1979/80-
1988/89
(%)
(0.6)
(1.5)
0,3 ~—
0,1
3.7
(0.2)
5.5
5.3
2,1
6.0
3.4
2.8
Source: Derived from FAO data.
1988/89-
1992/93
(%)
(2-6)
1.3
' 1770)
(1.1)
(22.1)
(35.4)
(18.4}
2.7
0,3
3.6
(2.9)
(3.6)
89 and 1992/93 than those between 1979/80 and
1988/89, During the 1980s, fertilizer use in Western
Europe and Oceania decreased by modest amounts,
whereas in North America, it decreased by 2.8 million
tonnes. During the early 1990s, however, the situation
reversed. North America and Oceania increased their
fertilizer use by small amounts, whereas Western
Europe experienced a 24% decline. Decreased prices,
acreage reduction programs and production quotas under
the Common Agricultural Policy of the European Union,
and drought contributed to this decline in fertilizer use.
Economic reforms and restructuring in the former East
Germany (now the eastern part of the unified Germany)
also contributed,
Depressed crop prices and acreage reduction
programs seem to have contributed to an annual decline of
2.8% in fertilizer use in North America during the 1980s.
Residual phosphorus in the soils may have also allowed
farmers to reduce phosphate consumption without
adversely affecting crop yields. Phosphate use decreased
in all three regions of the developed markets (Table 3.10).
3.3.2 Reforming Markets
The reforming markets of the 1990s are basically the
centrally planned economies of the 1980s. In these
markets, total fertilizer use increased in the 1980s and
decreased rapidly in the 1990s (Figure 3,5).
During the 1980s, total fertilizer use in these markets
increased from 27.5 million tonnes in 1979/80 to 37.3
million tonnes in 1988/89. Most of this increase was
contributed by an increase in fertilizer use in Eurasia.
Eastern Europe experienced little increase in its
fertilizer use. The 5.5% annual growth in fertilizer use in
Eurasia resulted from government commitment to
increasing fertilizer use to achieve food security in the
former Soviet Union [3],
After 1988, many of the countries of Eastern Europe
and Eurasia initiated political and economic reforms,
which led to the demise of communism and movement
toward the establishment of democratic polities and
market-based economies. A series of economic reforms
were introduced, under which domestic currencies were
allowed to float in the open markets. Consequently, the
currencies of these countries depreciated rapidly. Such
devaluations followed by deregulation and liberalization
resulted in rapid increases in the prices of many
commodities, Sudden withdrawal of the government from
agriculture, industry, and trade also resulted in the
disruption of marketing and distribution channels. Hence,
fertilizer prices increased, and fertilizers were not
available to the farmers on time. Further, farmers were
unable to sell their agricultural produce and have adequate
financial resources to purchase fertilizers. Inflationary
pressures, inadequate credit arrangements, and poor
technical support to new private farmers also adversely
affected fertilizer use.
Rapid devaluation of domestic currency increased the
cost of imported fertilizers. Foreign exchange shortages
and the dissolution of barter trade among the former
communist countries affected fertilizer supplies and use
in these countries. Between 1988/89 and 1992/93,
fertilizer use decreased by 55% in" Eurasia and 71% in
58
Table 3.9. World: Fertilizer Use by Markets and Regions, 1979/80-1992/93
Market/Region
Developed Markets
North America
Western Europe
Oceania
Reforming Markets
Eastern Europe
Eurasia
Developing Markets
Africa
Asia
Latin America
1979/80
47.2
22.7
22.7
1.8
27.5
10.1
17.4
37.8
2.8
28.3
6.7
1984/85 1988/89
45.8
22.1
22.0
1.8
33.1
10.1
23.1
51.6
3.5
40.8
7.3
44.0
19.9
22.4
1.7
37.3
10.1
27.2
64.4
3.7
51.9
8.7
1992/93
40.1
21.2
17.0
1.9
15.0
2.9
12.2
70.8
3.8
59.2
7.9
World
112.5
130.6
145.6
125.9
Note: Totals may not add due to rounding.
Source: Derived from FAO data.
Table 3.10. Developed Markets: Annua!
Decline in Phosphate Use, 1979/
80-1992/93
Region
North America
Western Europe
Oceania
Developed Markets
Annual Decline
1979/80-
1988/89
-(%)-
2.8
1.7
1.7
2.2
1988/89-
1992/93
(1.0)
8.9
2.0
3.7
( ) = growth,
Source: Derived from FAO data.
Eastern Europe (Figure 3.6). In 1993/94, Russia, a major
user in Eurasia, reported another 40% decrease in its
fertilizer use [4].
About one-half of the fertilizer use in Eurasia is
concentrated in Russia (officially known as Russian
Federation), In 1990, Russia used 11.1 million tonnes of
fertilizer nutrients. Ukraine and Belarus were two other
states accounting for a relatively large share. These three
states accounted for about 81% of total fertilizer use in
Eurasia (Table 3.11).
The developments in Eurasia during the 1980-93
period can be divided into three phases [3]. Phase I
consists of the period, 1980-88, when the old communist
government ruled and the rules of the centrally planned
economy applied. During this period, fertilizer use in-
creased rapidly. Phase II consists of the period, 1988-
91, when reforms under perestroika were introduced
by the Gorbachev government. During this period,
controls on prices remained effective, but allocation rules of
the planned economy were relaxed. Enterprises were
given freedom to sell their products as they wished.
Consequently, "disorganization" rather than
privatization of distribution channels occurred during this period.
This resulted in decreased fertilizer use. The last phase
started when the former Soviet Union ceased to exist
and its republics became independent states. The
disintegration also resulted in further disorganization and
disruption of supply and distribution channels. Economic
reforms led to devaluation, deregulation, and
liberalization of prices and supply arrangements. Because these
changes were not accompanied by well-developed
institutional infrastructures and management skills, they
contributed to a rapid collapse of agricultural and fertilizer
markets,
3.3.3 Developing Markets
Unlike the developed and reforming markets, the
developing markets registered significant increases in their
fertilizer use. Total fertilizer use increased by 87% - from
37,8 million tonnes in 1979/80 to 70.8 million tonnes
in 1992/93 (Table 3.12). Asia contributed about 94%
to this growth.
59
100
1979/80
1984/85 1989/90 1962/93 1979/BO
80
1984/85
1989/90 1992/93
1979/80
1984/85
1989/90 1992/93 1979/80
1984/85
19B9/90 1992/93
Source: Derived from FAO data.
Figure 3.5. Global Fertilizer Use by Markets, 1979/80-1992/93.
1988/89
1990/91
1992/93
1988/89
1990/91
1992/93
Source: Derived from FAO data.
Figure 3.6. Fertilizer Use in Eastern Europe
and Eurasia, 1988/89-1992-93.
Asia's total fertilizer use increased from 28.3 million
tonnes in 1979/80 to 40.8 million tonnes in 1984/85
^n^59^"rntlioinmnerifrl992/93, All three subre-
gions, namely East Asia, South Asia, and West Asia,
registered growth in fertilizer use. A conducive and stable
policy environment was the most important factor in
maintaining growth in fertilizer use. Whether Asia will
be able to keep this tempo of growth in the future is not
clear. In 1992/93, India introduced several ad hoc policy
changes that affected fertilizer use and production
adversely. For example, the removal of subsidy on P2O5
and K2O led to 14% and 31% decreases in their use,
respectively 15].
Compared with Asia, Africa experienced a small
increase in its fertilizer use between 1979/80 and 1992/
93. North Africa and sub-Saharan Africa registered
increases, whereas South Africa experienced continuous
decline in the 1980s. In sub-Saharan Africa, fertilizer
use increased from 0.7 million tonnes in 1979/80 to 1.2
million tonnes in 1988/89 and 1.5 million tonnes in
1992/93. In spite of this 50% increase, per hectare
fertilizer use in sub-Saharan Africa is still very low at 11 kg/ha.
Foreign exchange shortages, structural adjustment
programs, and drought have induced slow growth in
many African countries. Debt crisis and balance-of-pay-
ment difficulties have made many nations in sub-Saharan
Africa dependent on foreign aid for fertilizer supplies.
About two-thirds of the countries in sub-Saharan Africa
60
Table 3.11. Fertilizer Use in Eurasia, 1990
Total
Nitrogen
Phosphate
Potash
State/Region
Armenia
Azerbaijan
Belarus
Estonia
Georgia
Kazakhstan
Kyrgyzstan
Latvia
Lithuania
Moldova Rep.
Russian Fed.
Tajikistan
Turkmenistan
Ukraine
Uzbekistan
Eurasia
'000 tonnes
47
143
2,151
205
119
589
176
382
661
244
11,051
205
245
4,352
1,074
21,644
% '000 tonnes
0.2
0.7
9.9
1.0
0.6
2.7
0.8
1.8
3.1
1.1
51.1
1.0
1.1
20.1
5.0
100.0
Note; Totals may not add due to rounding.
Source: FAO.
26
88
682
71
89
237
87
117
214
101
4,334
111
135
1,836
541
8,669
%
0,3
1.0
7.9
0.8
1.0
2.7
1,0
1.4
2.5
1.2
50.0
1.3
1,6
21.2
6.2
100.0
'000 tonnes
12
49
483
53
26
342
79
104
175
108
4,339
82
91
1,457
430
7,830
%
0.2
0,6
6.2
0.7
0.3
4.4
1.0
1,3
2.2
1.4
55.4
1.1
1.2
18,6
- ,5.5
100.0
'000 tonnes
9
6
986
81
4
10 -
10
161
272
35
2,378
12
19
1,059
103
5,145
%
- 0.2
0.1
19,2
1,6
0.1
0.2
0.2
3.1
5.3
0.7
46.2
0.2
0.4
20.6
2.0
100.0
Table 3.12. Developing Markets: Fertilizer Use, 1979/80-1992/93
Region
1979/80
1984/85
Note: Totals may not add due to rounding.
Source; Derived from FAO data.
1988/89
1992/93
Africa
North
Sub-Saharan
South
Latin America
Central
South
Asia
East
South
West
Developing Markets
2.8
1.1
0.7
1.0
6.7
2,1
4,7
28.3
19.1
7.0
2.2
37.8
3.5
1.5
1.0
1.0
7.3
■ 2.7
4.6
40.8
27.0
10.6
3.3
51.6
3.7
1.7
1.2
0.8
8.7
3,0
5.8
51.9
34.0
14.0
3,9
64.4
3.8
1,5
1.5
0.8
7.9
2.5
5.4
59.2
38.8
15.7
4,6
70.8
61
depended on donor support to meet over 50% of their
fertilizer requirements {Table 3.13). Devaluation of
currency, removal of subsidies, and sudden withdrawal of
government from fertilizer markets also adversely
affected fertilizer use in many African countries including
Ghana, Senegal, and Zambia. Figure 3.7 vividly
indicates that the structural adjustment program introduced
in 1984 had a negative impact on fertilizer use in Ghana.
Latin America's fertilizer use increased from 6.7
million tonnes in 1979/80 to 8.7 million tonnes in 1988/
.89. Thereafter, it decreased by 9% to 7.9 million tonnes.
Both Central and South America contributed to these
trends.
Table 3.13. Sub-Saharan Africa: Distribution
of Countries by the Ratio of
Fertilizer Aid to Fertilizer Imports,
1985-90
Ratio
(%)
0
1-20
20-50
50-80
80-99
100
1985
7
3
2
3
2
23
1987
8
4
"" 1
5
2
20
1990
6
3
"2
1
0
22
Total
40
40
40
Source: FERTECON, Unpublished data.
1984 1986
Source: [10].
Figure 3.7. Ghana: Fertilizer Consumption and
Price, 1980-90.
Although Latin America recorded a 3.4% average
annual growth in its fertilizer use during the 1980s, its
fertilizer use fluctuated widely from one year to another
(Figure 3.8). Having reached 7.5 million tonnes in 1981,
it decreased to 5.7 million tonnes in 1984, recovered to
8.8 million tonnes in 1988, and decreased again
thereafter. The 1992/93 level was marginally higher than
that in 1981. Partly, these fluctuations were caused by
the removal (1981), reintroduction (1984), and removal
again (1988) of fertilizer subsidy in Venezuela and the
removal of credit subsidies in Brazil.
Unlike Asia, Latin America experienced consideraBe
policy instability and an unfavorable policy environment.
Ad hoc policy changes were introduced in several
countries. Debt crisis, currency depreciation, and declining
crop prices also contributed to fluctuations in fertilizer
use. Mexico, Brazil, and Venezuela have removed
fertilizer subsidies. Because these changes were not met by
the availability of increased credit funds for farmers and
dealers, they had an adverse impact on fertilizer use.
However, it is expected that improved incentives and
better financial arrangements may accelerate growth in
fertilizer use in the 1990s [6].
1978/80
1997/88
1961/92
Source: FAO.
Figure 3.8. Latin America: Fertilizer Use*
1979-80-1992/93.
3.3.4 Regional Shares
Due to relatively higher growth in fertilizer use, Asia
increased its share in global fertilizer use from 25% in
1979/80 to 47% in 1992/93 (Figure 3.9). Latin
America maintained its share, and Africa increased its
share by one percentage point - from 2% in 1979/80
to 3% in 1992/93. Asia's gains were at the cost of
Western Europe, Eastern Europe, and Eurasia who lost
their shares by 5-7 percentage points each. North
America also decreased its share by 3 percentage points.
Thus Asia has become the dominant region in the
global fertilizer market.
62
Western
Europe
20%
Oceania
2%
Eastern
Europe
9%
Eurasia
15%
North
America
20%
Western
Eastern Europe
Europe 13% Oceania
2% I 2%
Eurasia ^^^^^^_
10% A^^HI^ North
America
„ w __ „ 17%
Africa
3%
Latin
America
6%
1979/80
1992/93
Source: Derived from FAO data.
Figure 3.9. Global Fertilizer Use: Regional Shares, 1979/80 and 1992/93.
3.4 Trends in Fertilizer Trade
3.4.1 Global Trends
Global fertilizer imports increased-at 3.9% per annum-—
from 34.0 million tonnes in 1979/80 to 48.5 million
tonnes in 1988/89 - and stagnated after 1988/89
(Table 3.14). The share of imports in consumption also
increased from 30.1% in 1979/80 to 33.3% in 1988/
89 and 38,8% in 1992/93. Likewise the ratio of
exports to production also increased from 29% in 1979/
80 to 34.4% in 1992/93. These trends suggest that
fertilizer trade has become an important source of
fertilizer supply in several countries. Because of low global
fertilizer prices, many developing countries including
India and China have relied more on imports to meet
their domestic fertilizer requirements and less on
investments in capacity building for achieving fertilizer self-
sufficiency. Increased exports from the reforming
markets have also contributed to this process.
Imports of N increased by a higher amount than did
K20 imports. Foreign exchange shortages and
perceptions about K2O requirements for crop production in many
developing countries kept K20 imports to a minimum.
3.4.2 Regional Trends
Table 3.15 provides data on net imports at the
regional level. Net imports are defined as the difference
between imports and exports. Because net imports data
exclude intraregional trade among countries within a
region, they indicate whether a particular region is deficit
Table 3.14. World: Import and Export of
Fertilizers, 1979/80-1992/93*
1979/80 1988/89 1992/93
Imports
N
P2O5
K20
Total
Ratio of Imports
to Fertilizer Use (%)
Exports
N
P205
K20
Total
Ratio of Exports
to Production (%)
12,6
5,8
15,5
34.0
30.1
11.9
6.8
15,6
34.4
29.0
(million tonnes)-
19.8
9.6
19.1
48.5
33.3
19.5
10.3
18.5
4S.3
30.5
21.2
10.5
17:1
48.8
3S.S
20.8
10.5
16.3
47.6
34.4
a. In theory, at the global level, fertilizer imports should
be equal to fertilizer exports. In reality, they differ slightly
due to in-transit shipments, losses, and recording errors.
Note: Totals may not add due to rounding.
Source: Derived from FAO data.
63
Table 3.15. World: Net Fertilizer Imports,3
1979/80-1992/93
Region/Market 1979/80 1988/89 1992/93
Developed Markets (9.4)
North America (6.7]
Western Europe- (3.0]
Oceania 0.3
Reforming Markets (1-5)
Eastern Europe 1.5
Eurasia (3.0)
Developing Markets 10.5
Africa 0,9
Asia 6.0
Latin America 4.6
World (0.4)
(million tonnes)
(86)
(8.1)
(1.2)
0.7
(5.0)
(7.6)
1.4
1.2
(4.8)
1.2
(6.0]
13.6
(0.8]
10.6
3.8
(10.8)
[1-4)
(9.3]
17.0
(1.0)
14,6
3.4
0.1
1.2
(1 = net exports,
a. Imports minus exports.
Note: Totals may not add due to rounding.
Source: Derived from FAO data.
or surplus in fertilizer nutrients. On this basis, the
developed and reforming markets had a surplus, and the
developing markets had a deficit in their fertilizer trade
balance sheets; that is, the developed and-refor-ming-
markets were net exporters and the developing markets
net importers. However, net exports decreased in the
developed markets by about 50% and increased over
sevenfold in the reforming markets, In the developed
markets, North America improved its position, but
Western Europe reversed its position from being a net
exporter in 1979/80 to being a net importer in 1992/
93. Oceania remained a net importer, and its net
imports increased from 0.3 million tonnes in 1979/80 to
1.2 million tonnes in 1992/93. Reduced domestic
production induced increased imports in Oceania.
Eurasia also improved its position as a net exporter
by increasing net exports from 3.0 million tonnes in
1979/80 to 9.3 million tonnes in 1992/93. A drastic
fall in domestic use has further strengthened its
position. Eastern Europe's net imports decreased over time,
and as a result of a drastic reduction in domestic use, it
has become a net exporter in the world fertilizer market.
Among the developing markets, both Asia and Latin
America remained net importers, whereas Africa
changed its position from that of a net importer to that
of a net exporter. In 1979/80 Africa was a net importer
of about 0.9 million tonnes of fertilizer nutrients, but in
1992/93 it became a net exporter of 1 million tonnes
of fertilizer nutrients. North Africa alone contributed to
this switchover in Africa's trading position (Table 3,16);
Table 3.16. Developing Markets: Net Fertilizer
Imports,3 1979/80-1992/93
Region/Market
Africa
North
Sub-Saharan
South
Latin America
Central
South
Asia
East
South
West
Developing Markets
1979/80 1988/89 1992/93
(million tonnes)
0.9
0,2
0.6
0.1
3.6
1.0
2,7
6.0
3.2
3.1
(0-4)
10.5
(0.8)
(1.5)
0,8
[0.0)
3.8
0.8
2.9
10.6
10.5
2.5
(2.4)
13.6
(1.0)
(2.1)
1.0
0,1
3.4
"074~
3,0
14.6
12.1
4.1
(1.6)
17.0
() = net exports.
a. Imports minus exports.
Note: Totals may not add due to rounding.
Source: Derived from FAO data,
exports of phosphate fertilizer from Morocco, Jordan,
and Tunisia dominated the African exports. Sub-Saharan
Africa remained a net importer, Both South America
-and-Cent-ral-Amer-ica-remained-net importers although
Central America's dependence on fertilizer imports was
modest.
Similarly, East and South Asia remained net
importers, and net fertilizer imports increased nearly fourfold
in East Asia. Achieving food security through increased
fertilizer use was the main force behind such a
spectacular increase in net imports of fertilizer nutrients in East
Asia. On the other hand, West Asia increased its net
exports from 0.4 million tonnes in 1979/80 to 2.4
million tonnes in 1988/89. The availability of cheap
natural gas encouraged investments in production
capacity for exports in West Asia. After 1988/89, its
exports decreased because relatively cheaper exports were
available from the reforming markets.
3.5 Trends in Fertilizer Prices
Fertilizers prices tend to be cyclical and are often quite
volatile; recent history is no exception. Prices (in US $)
of urea, diammonium phosphate (DAP), and muriate of
potash (MOP) for the period 1980-95 are shown in
Figure 3.10. Prices of all three products declined during
the period 1980-87 but have recovered since that time.
The 1980-87 declining trend in prices was induced
by both the demand-side and the supply-side factors.
64
so
1 ■ ■ ■
Source: Green Markets.
Note: Current urea and DAP prices are f.o.b. bulk,
U.S. Gulf, and MOP price is f.o.b. bulk,
Vancouver.
Figure 3.10. Fertilizer Prices, 1980-95.
On the demand side, low crop prices and acreage
reduction programs resulting from grain surpluses of the
mid-1980s reduced demand for fertilizer use in the
developed markets; slow growth in demand for grain and
other crop exports also affected demand for fertilizer
use. In the developing countries, the devaluation of
domestic currencies and subsidy removal-programs ledio-
rapid increases in prices and therefore reduced fertilizer
demand. The availability of residual phosphorus in the
soils of developed markets contributed to a decrease in
phosphate use. All these factors reduced demand for
fertilizer use. This reduced demand was matched by
excess supply in the markets because production capacity
was not reduced in response to decreased demand. As
a result, fertilizer supply exceeded demand by a
significant margin. Such excess supply created downward
pressures on fertilizer prices.
Price recovery during the early 1990s was interrupted
by a drastic fall in fertilizer use in the reforming
markets, which created excessive supplies in the global
market. However, record imports by China and strong North
American markets absorbed much of the excess supply
and led to near record level prices in 1995, Urea prices
climbed from the $93/tonne level in 1986 and 1987 to
more than $230 during the spring of 1995. DAP prices
increased from $155 in 1986 to $240 during the fall of
1995, and MOP prices increased from $69 in 1987 to
$112 in 1995.
Supply-demand balance estimates suggest that
fertilizer markets during the late 1990s will be dominated by
"surpluses" under most scenarios and therefore will
continue to put downward pressures on prices. However, in
any given year, price may increase due to unexpected
changes in the supply-side/demand-side factors, as
happened in 1994 and 1995.
In spite of low international fertilizer prices in the
1980s, many developing countries were not able to reap
the benefits of increased fertilizer use because the
domestic fertilizer prices increased rapidly due to subsidy
removal and devaluation of domestic currency. In Mexico,
Zambia, and Turkey, fertilizer prices increased by over
2,0000/^5,000% during the 1980-90 period [7]. This
created a paradoxical situation of declining fertilizer prices
jn the world market and increasing domestic prices in
several developing countries.
3.6 Emerging Centers of
Fertilizer Production
Close proximity of production facilities to markets is
desirable; however, the world's ratio of imports to
fertilizer use increased from 30:1% in 1979/80 to 38.8% in
1992/93. This indicates that location of basic (N, P,
and K) production capacity is increasingly dictated by
availability of low-cost raw materials, Some of the
reasons for new, emerging centers of production of
nitrogen, phosphate, and potash fertilizers are discussed
below.
-3-~6J.-Nitrogen ——-—
Essentially all nitrogen fertilizers are based on
ammonia, and natural gas is a major item of cost for
producers of ammonia. Production cost surveys by The Fertilizer
Institute (TFI) show that natural gas costs comprised
almost 70% of total ammonia production costs for North
American producers. Thus, it is not surprising that world
ammonia production has shifted toward the regions with
abundant, low-cost natural gas. Synthetic gas from coal
gasification is technologically feasible and is an
alternative to natural gas in some regions with high natural gas
costs and an abundant coal resource. Many of the new
ammonia plants under construction in 1995 are in China
and India where both natural gas and synthetic gas from
coal gasification will be used as feedstock. New natural
gas-based plants are also planned or under construction
in Venezuela, Trinidad, Indonesia, and the Middle East.
The China and India plants will produce for domestic
markets; most of the other expansions are aimed at
export markets.
Projected increases in nitrogen fertilizer production
capacity by region are discussed in Chapter 4 of this
manual. Most expansions will occur in Asia and Latin
America; North America, Eastern Europe, and Oceania
will see little change in capacity, whereas Eurasia and
Western Europe are expected to reduce capacities by
small amounts.
65
3.6.2 Phosphate
Phosphoric acid is used in the production of most
phosphate fertilizers. According to TFI's 1994
production cost survey of North American producers,
phosphoric acid represented about 60% of the total
production costs for DAP, 74% of costs of producing
MAP, and 62% of costs of producing TSP, Cost of
phosphate rock comprised 47% and sulfur 30% of total costs
of producing phosphoric acid. Therefore, the
production of phosphoric acid-based phosphate products will
continue to be concentrated in the regions with low-
cost phosphate rock and sulfur. Acidulation of phosphate
rock with nitric acid is a competitive technology,
particularly in Europe.
At the global level, phosphoric acid capacity is
expected to increase to about 39 million tonnes P2O5 by
the year 2000; mostly in the developing markets. The
developed markets and the reforming markets will
register little change.
Beginning near the year 2000, production in Florida
(U.S.A.) is expected to decline due to environmental
pressures and increased production costs. However, the
United States is expected to be a major producer and
exporter well into the 21st century. More detailed
projections of changing phosphate production capacity are
included in Chapter 4 of this manual.
3.6.3 Potash
Excess production capacity troubled the world potash-
industry during the 1980s and 1990s; existing capacity
was underutilized and little new capacity has been
developed. Because market conditions improved somewhat
in 1994 and 1995, capacity expansions are again
receiving consideration.
Unlike ammonia capacity, potash capacity is restricted
to a few countries because potash mines are mostly
concentrated in North America and Eurasia. These two
regions account for over 90% of the existing potash capacity.
Canada, Russia, and Belarus are dominant producers.
Compared with the increases in ammonia and
phosphoric acid capacity, the increase in potash capacity will
be very small. The main reason for this small increase is
that, during the 1980s, slow growth in demand left
considerable excess capacity. The decrease in demand in
the early 1990s further added to the excess capacity
and created surpluses in the global markets. More detailed
projections of global potash production capacity are
described in Chapter 4 of this manual.
3.7 Industry Restructuring in Older
Producing Areas
The older fertilizer-producing regions of Europe and
North America are undergoing major structural changes
as the world approaches its 21st century. West
European and North American markets are considered to be
mature; low growth or declining growth in consumption
is forecast by most analysts. To illustrate the level of
maturity, plant nutrient consumption in the United States
for the period 1960-95 is shown in Figure 3.11. These
data show that consumption of nitrogen peaked in 1980
and did not again reach this level until 1994;
consumption of phosphate and potash declined slightly during
the period 1980-94, Application rates changed little;
therefore, most of the peaks and valleys in plant
nutrient consumption were caused by changes in the-area-
devoted to crop production [8].
12-
10-
«
e 6-
.0
14-
2-
0-
Nitrogen.\ ...
.»*■-'
KaO
>^^ P2O5
1960 1965 1970 1975 1960 1985 1990 1995
Source: Derived from TVA data.
Figure 3.11. Plant Nutrient Consumption in the
United States.
No new phosphate plants were built, and no major
new potash mines were opened in North America or
Europe during the period 1980-95. One new nitrogen
fertilizer complex (SASFERCO in Canada) was
constructed during that time period.
The European fertilizer industry has experienced
several mergers and plant closings since 1980 as depicted
in Figure 3.12, In 1992 it was estimated that eight
major companies owned 80% of the European fertilizer
production capacity. The European fertilizer industry
employed about 110,000 people in 1983, but by 1992
the number of employees was reduced to only 40,000.
In the 10-year period leading up to 1990, the number
of ammonia plants decreased from 74 to 41 and
production capacity declined by 12%. The number of
phosphoric acid plants was halved during the 1980s, and
capacity was reduced by 35%. In 1977 there were 11
phosphoric acid plants in the United Kingdom, Now there
are none in the United Kingdom, which is considered by
historians as the cradle of the phosphate industry [9].
66
UKF
DSM
Amm.Unie
(NH3, Pemis)
Carbo
Superfos
Ased
Bataille
Scco
N.I.S.
UKF, Pernis .„
UKF Pert.
(Ince, U.K.)
Esso
L&K
Kemira
UCB/Fisons
CNO
1982
J
BASF
Ruhx-
Chemte
Hocchst
J
left fertilizer
industry
1982
Gaidinier
Coins.
NSM
Ckem. \fcrke
Hiils
Fisons
■Windmill—
-
Norsk
Hydro
N.E.T
Richardsons
fertil.
I.EI.
GESA
APC
1983
CROS
E.R.T
Enfersa
Nicas
Azf/CdF
Grande
Paroisse
Grande
Paroisse/
Sofeni
FESA/
Fertiberia
Montedison
ENI
Fedit
ENICHEM
Source: EFMA, 1994. The Fertilizer Industry of the European Union.
Note: Those companies which did not undergo fundamental changes in ownership and/or name are not
included.
Figure 3.12. Restructuring of the Fertilizer Industry of the European Union, 1980-93.
67
The U.S. fertilizer industry has also experienced
rationalization. In 1975, 61 different companies operated
93 ammonia plants with a combined capacity of about
16.8 million tonnes per year. In 1995, 26 companies
operated 39 ammonia plants with a combined capacity
of 15.7 million tonnes per year (Figure 3.13). The
average age of U.S. ammonia plants was 22 years in 1995;
however, these old plants have generally been well
maintained and were operated at more than 100% of design
capacity in recent years.
-e 20,000
9>.
£-15,000
5
03
Cl
03
o
c 12,500
o
£ 10,000
Producing \
Companies \
*+.
70
40 §
-30*
I E
z
1975
1980
1985.
Year
1990
20
1995
Source: Data for 1975 through 1990 derived from
various reports by TVA's National Fertilizer
Environmental Research Center; 1995 data
derived from International Fertilizer
Development Center report: North American
Fertilizer Capacity, June 1996.
Figure 3.13. Ammonia Production Capacity in
the United States, Number of
Producing Companies, 1975-95.
The United States continues as the world's largest
producer of phosphate fertilizers and expanded
ammonium phosphate production capacity by 87% between
1975 and 1995 (Figure 3.14). However, maturity of
the domestic market has forced U.S. phosphate
producers to become more dependent on exports. In 1995,
the United States exported more than 10.5 million
tonnes of ammonium phosphate; these exports
accounted for about 63% of the U.S. production of
ammonium phosphate.
^IO.OOOt
°- 4,000L
1975
1985
Year
Source: Data for 1975 through 1990 derived from
various reports by TVA's National Fertilizer
and Environmental Research Center; 1995
data derived from International Fertilizer
Development Center report: North American
Fertilizer Capacity, June 1996.
Figure 3.14. Ammonium Phosphate Capacity in
the United States, Number of
Producing Companies, 1975-95.
Canada has become the world's largest producer of
potash and is the largest exporting country in the world.
In 1995, 6 companies operated Canada's 12 potash
mines with a combined production capacity of about
12.3 million tonnes of K2O per year.
Globalization is the term that most aptly describes the
current restructuring of the world fertilizer industry.
Mature domestic markets and relatively high gas costs
have forced nitrogen producers in older producing
areas to seek joint venture partners or form strategic
alliances with firms in the regions of the world that have
low-cost natural gas. U.S. and European companies now
own ammonia plants in Trinidad and have plans for
nitrogen plants in Venezuela, Argentina, Chile, and other
countries. Japan is investing in nitrogen production
facilities in Jordan and Canada; whereas, India is
investing in nitrogen production in Jordan, United Arab
Emirates, and Oman. Major phosphate-importing
countries are seeking joint ventures in countries that have
high-quality phosphate rock reserves and/or phosphate
plants. China has invested in phosphate production
facilities in the United States; India is considering similar
investments in the United States and Morocco.
68
3.8 References
1. Nelson, L. B, 1990. History of the U.S. Fertilizer
Industry, Tennessee Valley Authority, Muscle
Shoals, AL, U.S.A.
2. Bumb, B. L. 1989. Global Fertilizer Perspective,
1960-95: The Dynamics of Growth and Structural
Change, T-34 and T-35, International Fertilizer
Development Center, Muscle Shoals, AL, U.S.A,
3. Aleinov, D. P. 1993. "The Russian Nitrogen
industry," Paper presented at the 1993 1FA Regional
Conference for Europe, Vienna, Austria,
4. FERTECON, Ltd., London, U.K.
5. Narayan, P. 1993. "Recent Developments in Indian
Fertilizer Sector," Paper presented at World Bank/
FA Roundtable Meeting, Washington, D.C., U.S.A.
6. Puggina, W A. 1993. "Fertilizer Demand in Brazil:
Evolution, Present Situation and Perspectives," Pa-
per presented at the Sixty-First IFA Annual
Conference, New Orleans, LA, U.S.A.
7. Bumb, B. L. 1995. Global Fertilizer Perspective,
1980-2000: The Challenges in Structural
Transformation, T-42, International Fertilizer
Development Center, Muscle Shoals, AL, U.S.A.
8. Brummitt, W C. 1995, "Structure and Trends Within
the United States Fertilizer Industry," Paper
presented at Management Staff Training for Hubei
(China) Phosphate Project, International Fertilizer
Development Center, Muscle Shoals, AL, U.S.A.
9. Maene, L. M. 1992. "Fertilizer Industry
Restructuring: West and East Europe," Paper presented at the
Fertilizer Industry Round Table Meeting, Baltimore,
MD, U.S.A.
10. Bumb, B. L., J. F. Teboh, J. K. Atta, and W K.
Asenso-Okyere. 1994. Ghana: Policy Environment
and Fertilizer Sector Development, T-41,
International Fertilizer Development Center, Muscle
Shoals, AL, U.S.A.
69
Chapter 4. Outlook for the Fertilizer
Industry, 1995-2005
Table of Contents
Page
4.1 Introduction 71
4.2 Recent Economic and Political Developments and Their Impact on the Fertilizer Industry 72
4.3 Future Outlook for Fertilizer Demand 72
4.3.1 Global Fertilizer Demand Projections 72
4.3.2 Fertilizer Demand Projections by Nutrients and Regions 74
4.4 Future Outlook for Fertilizer Supply , 75
4.4.1 Global Fertilizer Supply Projections , 76
4.4.2 Fertilizer Supply Potential by Nutrients and Regions , 76
4.5 Fertilizer Supply-Demand Balances , 78
4.5.1 Global Fertilizer Supply-Demand Balances 78
4.5.2 Supply-Demand Balances by Nutrients and Regions 79
4.6 Summary 80
4.7 Price Outlook 81
4.8 References , 82
70
Chapter 4. Outlook for the Fertilizer
Industry, 1995-2005
4.1 Introduction
The year 1994/95 has a special importance in the
history and future outlook of the fertilizer industry.
Having peaked at 145.6 million tonnes in 1988/89, global
fertilizer use has been decreasing ever since; it reached
120.7 million tonnes in 1993/94 (Figure 4.1). The year
1994/95 is the first year when global fertilizer use
registered about 2% increase over the previous year.
Although the recorded increase of 2%, or 2.4 million
tonnes, per se is not large enough to outweigh the
previous decreases, it is significant because it marks the
beginning of a new era in the global fertilizer industry. It
signifies the turning point of the downward trend of the
late 1980s and the early 1990s.
150
o 140
1979/80 1982/83 1985/86 1988/89 1991/92 1994/95
Source: FAO [1\.
Figure 4.1. Global Fertilizer Use, 1979/80-
1994/95.
Several factors including political and economic
reforms in Eastern Europe and Eurasia (former Soviet
Union) have had a negative influence, on fertilizer use
and production. The negative impact of these factors
(explained below) counterbalanced the positive impact
of growth in fertilizer use in the Asian markets. The net
result was a continuous decline in global fertilizer use.
On average, global fertilizer use decreased by 5 million
tonnes per annum during the 1988/89-1993/94
period. The upturn in global fertilizer use indicates that the
fertilizer industry may expect growth in fertilizer use in
the future.
This upturn in fertilizer use is caused mainly by two
factors. First, the declining trend in Eastern Europe has
reversed; fertilizer use increased by 2% in 1994/95. It
is expected that fertilizer use may start increasing in
Eurasia beginning in 1996/97. Second, several regions
including Asia, Latin America, Oceania, and Western
Europe experienced significant increases in fertilizer use
{Table 4.1). Asia alone registered about 10% increase-in-
its fertilizer use. This increase of 5.5 million tonnes in
Asia was large enough to compensate for declines in
fertilizer use in North America, Eurasia, and Africa. This
setting provides the background for assessing the future
outlook of the fertilizer industry.
Table 4.1. Fertilizer Consumption, 1993/94
and 1994/95
Region/Market
Developed Markets
North America
Western Europe
Oceania
Reforming Markets
Eastern Europe
Eurasia
Developing Markets
Africa
North
Sub-Saharan
South
Latin America
Central
South
Asia
East
South
West
World
1993/94
1994/95
('000 nutrient tonnes)
42,179 41,651
22,709
17,313
2,157
10,702
3,067
7,635
67,934
3,952
1,643
1,465
844
5,42 5
2,404
6,014
55,564
35,174
15,933
4,457
120,815
21,514
17,832
2,305
7,689
3,124
4,565
73,912
3,532
1,420
1,280
832
9,289
2,375
6,914
61,091
39,963
17,279
3,849
123,252
Chanqe
(%)
-1.3
-5.3
3.0
6.9
-28.2
1.9
-40.2
8.8
-10.6
-13.6
-12,6
-1.4
10.3
-1.2
15.0
9.9
13.6
8.4
-13.6
2.0
Note: Totals may not add due to rounding.
Source; FAO [2].
71
4.2 Recent Economic and Political
Developments and Their Impact
on the Fertilizer Industry
In the late 1980s and the early 1990s, many
countries experienced profound political and economic
changes. The most notable among these changes are
the collapse of communism and centrally planned
economies in Eastern Europe and Eurasia and the
implementation of structural adjustment programs in developing
countries, especially Africa and Latin America. As a
result of the political and economic changes in the former
centrally planned economies, many policy changes, such
as devaluation of domestic currency, subsidy removal,
and privatization of production, marketing, and
distribution facilities, were introduced. Most importantly, the
governmental interference in economic activities was
drastically reduced. These changes had an adverse
effect on both fertilizer use and production in these
regions. Both devaluation and liberalization of prices
including subsidy removal resulted in high prices for
fertilizers, Nominal and real prices increased severalfold.
Increased prices reduced fertilizer demand drastically.
Between 1988/89 and 1993/94, fertilizer use decreased
by 69%-72%. Reduced demand also had an adverse
impact on fertilizer production, albeit with a lag. Fertilizer
production decreased in these regions by over 50%.
Initially, decreased domestic demand in these_coun^_
tries created production surpluses, which were diverted
to international markets and depressed fertilizer prices.
Between 1991 and 1993, urea prices decreased by about
40%. Prices of other products also decreased
significantly. Such depressed prices made fertilizer production
unprofitable in Western Europe and North America and
forced plant closures.
These catastrophic effects were further compounded
by the adverse impact of policy changes in the
developing countries. Devaluation and subsidy removal in many
developing countries resulted in increased fertilizer prices
and reduced demand. Ad hoc privatization of marketing
and distribution facilities also affected fertilizer use
adversely. As a result, there was little growth in fertilizer
use in Africa and Latin America in the early 1990s. All
these factors produced a declining trend in global
fertilizer use in the late 1980s and the early 1990s.
4.3 Future Outlook for
Fertilizer Demand
The experience of the late 1980s and the early 1990s
indicates that it is difficult to assess the future outlook of-
the fertilizer industry. Many uncertainties surround the
industry. Uncertainty introduced by the weather leads
to wide fluctuations in crop prices, In addition,
uncertainty introduced by policy reforms leads to changes in
fertilizer subsidies and organizational arrangements and
makes it difficult to forecast fertilizer demand and
supply more accurately. Recent changes in .the U.S. Farm
Bill, which give freedom of farming to farmers, and
environmental regulation and common agricultural policy
reforms in Europe add further uncertainty to
forecasting demand and supply. However, by considering
various factors, the World Bank/FAO/TJNIDO/Fertilizer
Industry Working Group (referred to as the Working
Group hereafter) has developed supply and demand
projections. The Working Group's projections are used to
provide an assessment of the future outlook for the
fertilizer industry.
4.3.1 Global Fertilizer Demand Projections
The demand projections developed by the Working
Group are presented in Table 4.2. Global fertilizer
demand is projected to increase at 2% per annum - from
123.3 million tonnes in 1994/95 to 137.5 million
tonnes in 1999/2000 (referred to as 2000 hereafter)
and 149.9 million tonnes in 2004/05. The demand is
projected to grow at a higher rate during the first half
than the second half of the projection period. This
results from two factors, namely higher growth in North
America and recovery in the reforming regions. The
Table 4.2. Global Fertilizer Demand Projections, 1994/95-2004/05
1994/95
1994/95 - 2004/05
Nutrient
N
P2O5
K20
Total
(Actual)
73.6
29.7
20.0
123.3
1999/2000a
82.1
33.6
21.8
137.5
2004/05
88.9
36.4
24.6
149.9
Absolute Change
(million nutrient
tonnes)
15.3
6.7
4.6
26.6
Annual Change
(%)
1.9
2.0
2.1
2.0
a. Referred to as 2000 hereafter.
Source: FAO [2] for actual consumption and World Bank/FAO/UNIDO/Industry Fertilizer Working Group
Meeting, August 1995 for projections.
72
need to feed the growing population in Asia will
continue to exert pressures for increased but
environmentally sound fertilizer use.
The demand for all three nutrients is expected to
increase at 1.9% to 2.1%/year. A relatively higher growth
for potash is a result of the impact of recovery in the
reforming regions on potash use. Nitrogen demand is
projected to increase from 73.6 million tonnes in 1994/
95 to 88.9 million tonnes in 2004/05. Phosphate and
potash demand is projected to increase from 29.7 and
20.0 million tonnes in 1994/95 to 36,4 and 24.6
million tonnes in 2004/05, respectively. Of the projected
increase of 26.6 million nutrient tonnes in global
fertilizer use, over half of the increase will be contributed by
an increase in N demand, and about one-fourth by an
increase in phosphate demand. Increased demand for
potash will account for less than one-fifth of the
projected increase.
The developing markets will account for nearly two-
thirds of the projected growth in global fertilizer use
during the 1994/95-2004/05 period (Table 4.3). The
reforming markets will account for one-fourth of the
projected growth. Most of the growth in this region is
basically a recovery of the steep declines in fertilizer use
experienced during the 1988/89-1994/95 period. The
developed markets will record modest growth, primarily
in North America. Growing demand for grain exports
and freedom to farm acreage is expected to give a slight
boost to fertilizer use in the United States.
At the regional level, Asia will continue to dominate
the global fertilizer scene. Nearly half of the projected
increase in fertilizer use will occur in Asia. Both East
Asia and South Asia will increase their fertilizer use by
5-6 million nutrient tonnes each. In West Asia, fertilizer
use is expected to increase by over 1 million tonnes. In
Latin America, both Central and South America, are
Table 4.3. Fertilizer Demand Projections by Regions, 2000 and 2004/05
1994/95-2004/05
a. Actual.
Region
Developed
North America
Western Europe
Oceania
Reforming
Eastern Europe
Eurasia
Developing
Africa
North
Sub-Saharan
South
Latin America
Central
South
Asia
East
South
West
World
1994/95a
41,651
21,514
17,832
2,305
7,689
3,124
4,565
73,912
3,532
1,420
1,280
832
9,289
2,375
6,914
61,091
39,963
17,279
3,849
123,252
2000
'000 nutrient tonnes
42,610
24,020
16,140
2,450
11,200
4,800
6,400
83,700
4,910
1,970
1,840
1,100
10,510
3,055
7,455
68,280
42,850
20,000
5,430
137,510
2004/05
43,450
24,750
16,000
2,700
14,450
5,700
8,750
92,000
5,650
2,160
2,240
1,250
12,150
3,650
8,500
74,200
46,200
22,000
6,000
149,900
Absolute Change
('000 nutrient
tonnes)
1,799
3,236
-1,832
395
6,761
2,576
4,185
18,088
2,118
740
960
418
2,861
1,275
1,586
13,109
6,237
4,721
2,151
26,648
Annual Growth
(%)
0.4
1.4
-1.1
1.6
6.3
6.0
6.5
2.2
4,7
4,2
5.6
4,1
2.7
4.3
2.1
1.9
1.5
2.4
4.4
2.0
Source: FAO [2] for actual consumption and The World Barik/FAO/UNIDO/Industry Fertilizer Working Group
Meeting, August 1995 for projections. Demand projections for subregions in Africa are from Bumb [3].
73
expected to increase fertilizer use by over 1 million tonnes
each. In Africa, total fertilizer use is projected to increase
by 2.1 million tonnes - 0.7 million tonnes in North
Africa, 0.4 million tonnes in South Africa, and 1.0 million
tonnes in sub-Saharan Africa (SSA). Although fertilizer
use is projected to increase at 5.6% per annum in SSA,
overall fertilizer use levels of 2,2 million tonnes will
remain inadequate to meet the nutrient requirements of
the countries in the region. During the 1984/85-1994/
95 period, fertilizer use increased at an annual rate of
3.4% - from 1.0 million nutrient tonnes to 1.4 million
nutrient tonnes. It is expected that with increased focus
on food security and policy reforms in place, SSA may
experience a higher growth in the future.
4.3.2 Fertilizer Demand Projections by Nutrients
and Regions
Fertilizer demand projections by nutrients at the
regional levels are presented in Table 4,4,
Nitrogen Demand - The developed markets are
expected to increase their N demand by 1.6 million
tonnes and the reforming markets by about 4 million
tonnes. North America will increase its N use by over 2
million tonnes, whereas Western Europe is expected to
decrease its N use by less than 1 million tonnes.
Growing demand for grain exports and replenishment of the
depleted grain stocks are expected to enhance N use in
North America and Oceania, In Western Europe,
increased environmental concerns and reduced farm
subsidies are the main factors responsible for reducing N
use in that region.
In the developing markets, N use is projected to in=-
crease by about 9.8 million tonnes, Over 70% of the
projected increase is expected to occur in Asia. East
Asia and South Asia will account for a larger share. In
these regions, N use will increase by 3.4 and 2.6 million
tonnes, respectively. The need to increase food
production is expected to enhance nitrogen use in these
regions. In contrast to Asia, N use is projected to increase
by 1.2 and 1.6 million tonnes in Africa and Latin
America, In sub-Saharan Africa, N use will increase by
about 0.6 million tonnes during the 1995-2005 period.
Table 4.4. Fertilizer Demand Projections by Nutrients, 2000 and 2004/05
Nitrogen
Phosphate
Potash
Reqion/Market
Developed Markets
North America
Western Europe
Oceania
Reforming Markets
Eastern Europe
Eurasia
Developing Markets
Africa
North
Sub-Saharan
South
Latin America
Central
South
Asia
East
South
West
World
a. Actual.
1994/95"
2000
2004/05
( '000 nutrient tonnes) —
22,436
11,935
9,784
717
4,833
2,035
2,798
46,331
2,023
987
641
395
3,960
1,600
2,360
40,348
25,558
12,417
2,373
73.600
23,590
13,700
9,000
890
6,800
2,800
4,000
51,680
2,820
1,300
1,000
520
4,710
2,010
2,700
44,150
27,500
13,500
3,150
82.070
24,000
14,000
9,000
1,000
8,800
3,300
5,500
56,150
3,250
1,400
1,250
600
5,550
2,350
3,200
47,350
29,000
15,000
3,350
88,950
"1994/95*
2000
2004/05
['000 nutrient tonnes) —
9,655
4,623
3,785
1,247
1,304
590
714
18,698
1,026
329
390
307
2,884
506
2,378
14,788
9,866
3,624
1,298
29,657
9,520
5,000
3.300
1,220
2,000
1.000
1,000
22,075
1,480
520
560
400
3,195
645
2,550
17,400
10,600
4,750
2,050
33.595
9,750
5,250
3,200
1,300
2,450
1,200
1,250
24,200
1,700
580
670
450
3,600
800
2,800
18,900
11,500
5,000
2,400
36,400
1994/95°
2000
2004/05
('000 nutrient tonnes)
9,560
4,956
4,263
341
1,552
499
1,053
8,883
483
104
249
130
2,445
269
2,176
5,955
4,539
1,238
178
19,995
9,500
5,320
3,840
340
2,400
1,000
1,400
9,945
610
150
280
180
2,605
400
2,205
6,730
4,750
1,750
230
21,845
9,700
5,500
3,800
400
3,200
1,200
2,000
11,650
700
180
320
200
3,000
500
2,500
7,950
5,700
2,000
250
24,550
Source: FAO [2] for actual and The World Bank/FAO/UNIDO/Industry Fertilizer Working Group Meeting, August 1995 for
projections. Demand projections for subregions in Africa are from Bumb [3).
74
subjective judgments about both quantifiable and.
nonquantifiable parameters. The wave of privatization
and deregulation that followed the collapse of the
Soviet Union is having, and will continue to have,
profound effects on the global supply of fertilizers and their
raw materials. The obligation to survive within the
framework of private solvency, or at least with a sharply
increased regard for normal entrepreneurial behavior, is
governing an increasing proportion of the industry. This
phenomenon is occurring not only in Eurasia and
Eastern Europe but also in the large developing markets of
Asia and Latin America. At the same time, these areas
are becoming subject to the same environmental
pressures, which involve the same additional investment
expenses, constraints, and obligations as in the Western
market economies even though these vary in ways and
degrees. Moreover, the trend toward the reduction or
elimination of subsidies on fertilizer use has already had
dramatic effects in numerous countries; thus, it is
especially difficult to forecast future consumption,
particularly in those countries such as India, where existing large
subsidies are in extreme dispute. This situation makes it
more difficult than ever to forecast the future
development of fertilizer supply; however, on the basis of the
available information and informed judgments, the
Working Group has developed estimates of fertilizer
capacities and supply potential for the 1994/95-2000 period.
These estimates are derived from announcements about
closures, expansions, and new projects. Because it re-
quires only 2-3 years to bring new ammonia or
phosphoric acid capacity on stream, plans about future
capacity beyond a 3-year period are mostly uncertain;
changes in conditions can delay or postpone the
implementation of the planned projects. Nevertheless, these
are the most reliable estimates and therefore are used in
developing supply forecasts and supply-demand balances
in the future.
4.4.1 Global Fertilizer Supply Projections
The estimates of capacity and supply potential
prepared by the Working Group are presented in Table 4.5,
Nitrogen capacity is based on ammonia capacity because
ammonia is the main source of nitrogen fertilizers.
Phosphoric acid capacity is used for estimating capacity for
producing phosphate fertilizers; phosphoric acid
generally accounts for over two-thirds of the phosphate
fertilizers. Since potassium fertilizers are mainly derived from
potash ores or sea brines, potash capacity is the main
source of potassium fertilizers. Supply potential is
derived from capacity by considering operating rates,
nonfertilizer uses, conversion and distribution losses, and
fertilizers available from nonammonia and nonacid
sources. Although nonammonia sources are
insignificant, nonphosphoric acid sources, such as SSP, and
phosphate rock used in the production of TSP and NPKs
and for direct application, account for about one-third
Table 4.5. World: Fertilizer Capacity and
Supply Potential, 1994/95-2000
Capacity Supply Potential
Nutrient 1994/95 2000 1994/95 2000
(million nutrient (million nutrient
tonnes) tonnes)
N 114.4 123,5 74.6 83.3
P205 34.1 36.6 32.5 347
K20 36.1 35.0 27.0 .25 A.
Total 184.6 195.1 134.1 143.4
Source; TheWorUBank/FAO/UNlX)/Indist]^Fertaizer
Working Group Meeting, August 1995.
of phosphate fertilizers and therefore add significantly
to the supply of phosphate fertilizers available from
phosphoric acid sources.
Global nitrogen capacity is projected to increase from
114.4 million tonnes in 1994/95 to 123.5 million
tonnes in 2000 - at a rate of 2 million tpy. In contrast,
P2O5 capacity is projected to increase by only 2.5
million tonnes. The existing excess capacity does not make
investment in new capacity profitable. Despite this small
increase, no shortages of phosphate fertilizers are
expected in the 1990s. Likewise, the existing excess pot-
-ash-capacity-may_lead. to closure of some of the potash
capacity-from 36.1 million tonnes in 1994/95 to 35.0
million tonnes in 2000,
Overall, fertilizer supply potential is projected to
increase from 134.1 million tonnes in 1994/95 to 143.4
million tonnes in 2000. Most of this increase will be
contributed by an increase in nitrogen supply potential,
which is projected to increase from 74.6 million tonnes
in 1994/95 to 83,3 million tonnes in 2000. Because
demand is projected to increase from 73,6 million tonnes
to 82.1 million tonnes during the same period, nitrogen
supply will be adequate to meet the projected demand
and will leave about a 1 million tonne surplus over
demand. Phosphate supply potential is projected to
increase by over 2 million tonnes, whereas potash supply
potential is projected to decrease by a little less than 2
million tonnes. However, because the projected demand
for these two nutrients is less than the projected supply,
no shortages are expected in the year 2000. On the
contrary, the industry will have a surplus of 1.1 million
tonnes of P2O5 and 3.6 million tonnes of K2O (see
section 4.5 for details).
4.4.2 Fertilizer Supply Potential by Nutrients and
Regions
Nitrogen - The projected N capacity and supply
potential by markets and regions are presented in Table
4.6. Modest growth in N capacity and supply potential
is expected in the developed markets. The reforming
markets are expected to register a slight decline due to
closure of old plants in Russia and other countries. Of all
the regions in these market groups, only North America
is expected to increase its capacity by a modest amount.
Table 4.6. N Capacity and Supply Potential,
1994/95 and 2000
N
N Capacity
Supply Potential
Region
Developed
North America
Western Europe
Oceania
Reforming
Eastern Europe
Eurasia
Developing
Africa
North
Sub-Saharan
South
Latin America
Central
South
Asia
East
South
West
World
1994/95 2Q00 1994/95 2000
(million nutrient (million nutrient
tonnes) tonnes)
28.2
16.5
11.1
0.6
29.5
8.3
21.2
56.7
3.8
2.6
0.4
0.8
5.4
3.5
1.9
47.5
29.6
12.4
5.5
29.0
17.2
11.2
0.6
28.3
8.1
20.2
66.2
4.1
2.6
0.7
0.8
6.9
4,2
2.7
55,2
33.1
15,3
6.8
114.4 123.5
20.0
12.2
7.5
0.3
16.6
4.3
12.3
38.0
2.3
1.5
0.3
0.5
"4.4
3.1
1.3
31.3
18.7
8.9
3.7
74.6
20.5
12.6
7.6
0.3
15.2
4.4
10.8
47.6
2.5
1.5
0.5
0.5
"5:3"
3.7
1.6
39.8
23.1
li:5
5.2
83.3
Source: The World Bank/FAO/UNIDO/Industry Fertilizer
Working Group Meeting, August 1995. Data for
subregions in Africa are from Bumb [3),
The developing markets are expected to increase their
N capacity by 9.5 million tonnes. Most of this increase
is expected to occur in East and South Asia. Africa and
Latin America are expected to register modest increases
in capacity; thus, most of the projected increase in
global N capacity is expected to occur in Asia. Both the
need for satisfying the growing food demand in East
and South Asia and the availability of natural gas in West
Asia make Asia the dominant region in the global
market. In Asia, N capacity is expected to reach 55.2
million tonnes in 2000, With Asia contributing most of the
increase in global N capacity, its share in global N
capacity will increase from 41% in 1995 to 45% in 2000,
whereas Eurasia's share will decrease from 18% to 14%
during the same period. Other regions will register
modest changes in their shares.
What is true for capacity is also true for supply
potential, The developed markets are expected to register a
marginal increase and the reforming markets a modest
decrease. The developing markets will expand their N
supply potential by approximately 10 million tonnes.
Of this, 8.5 million tonnes will be in Asia and 1 million
tonnes in Latin America. Africa will increase its supply
potential by only 200,000 tonnes N in Nigeria. By 2000,
East Asia will be supplying twice as much nitrogen fertil--
izer as North America will, or as much as North America
and Eurasia combined. South Asia will be supplying 11.5
million tonnes of N - more than Eurasia's supply potential
but marginally less than North America's.
Phosphate -The projected P2O5 capacity and
supply potential are presented in Table 4.7, Modest increases
in P2O5 capacity and supply potential are projected for
Table 4.7. P2O5 Capacity and Supply Potential,
1994/95 and 2000
Region
Developed
North America
Western Europe
Oceania
Reforming
Eastern Europe
Eurasia
Developing
Africa
North
Sub-Saharan
South
Latin America
Central
South
Asia
East
South
West
World
P2O5 Capacity
JL994/95 2000
(million nutrient
tonnes)
P2O5
Supply Potential
1994/95 2000
(million nutrient
tonnes)
14.0
12.1
1.9
0.0
8.1
1.9
6,2
12.0
5.4
4.2
0.4
0.8
1,4
0.7
0,7
5.2
2,1
0.8
2,3
14.3
12.4
1.9
0.0
8.2
1.9
6.3
14.1
5.7
4.3
0.4
1.0
1.4
0.7
0.7
7.0
3.3
0.8
2.9
12.2
10.2
1.4
0.6
5.0
1.7
3.3
15.3
5.0
3.9
0.3
0.8
1.6
0.
1.
12.5
10.4
1.5
0.6
5.1
1,8
3.3
17.1
5,3
4,0
0.3
1,0
1.6
0.5
1.1
10,2
7.0
1.1
2.1
34.1 36.6 32.5 34.7
Source: The World Bank/FAO/UNIDO/Industry Fertilizer
Working Group Meeting, August 1995, Data for
subregions in Africa are from Bumb (3).
77
both the developed and reforming markets. Thus, none-
of the regions in these markets are expected to realize
any significant change in P2O5 capacity. The
developing markets are expected to increase their P2O5
capacity by about 2 million tonnes. Most of this increase will
occur in" East and West Asia, Limited availability of
phosphate rock in South Asia does not allow any increase in
capacity in this region. South Africa is expected to
increase its capacity by 200,000 tonnes. No capacity
increase is projected for Latin America. Excess capacity
and the low prices of the past do not encourage
investment in new capacity.
No growth is projected in P2O5 supply potential in most
regions. Only North America, East Asia, South Africa,
and West Asia are expected to register modest increases.
Potash - Potash capacity is concentrated in a few
regions in the world, North America (Canada) and
Eurasia (Russia and Belarus) account for 33 million tonnes
of the existing 36 million tonnes of global potash
capacity (Table 4,8). Existing surpluses do not permit fur-
Table 4.8. KzO Capacity and Supply Potential,
1994/95 and 2000
K20
Region
Developed
North America
Western Europe
Oceania
Reforming
Eastern Europe
Eurasia
Developing
Africa
North
Sub-Saharan
South
Latin America
Central
South
Asia
East
South
West
World
K2O Capacity
1994/95 2Q00
(million nutrient
tonnes)
Supply Potential
1994/95 2000
[million nutrient
tonnes)
21.1
14.0
7,1
0.0
12.0
0.0
12.0
3.0
0.0
0.0
0.0
0.0
0.4
0.0
0,4
2.6
0.1
0.0
2.5
19.9
13.8
6.1
0.0
11.5
0.0
11.5
3.6
0.0
0.0
0.0
0.0
0.7
0.0
0.7
2.9
0.4
0.0
2.5
17.5
11.6
5.9
0.0
7.0
0.0
7.0
2.5
0.0
0.0
0,0
0.0
0.3
0.0
0.3
2,2
0.0
0.0
2.2
36.1 35.0 27.0
16.2
11.4
4.8
0.0
6.1
0.0
6.1
3.1
0.0
0.0
0.0
0.0
0.5
0.0
0.5
2.6
0.2
0.0
2.4
25.4
Source: The World Bank/FAO/UNIDO/Industry Fertilizer
Working Group Meeting, August 1995.
ther expansions. Western Europe and Eurasia have plans
to close some capacity. About 0.6 million tonnes of
capacity expansion is expected in South America (Brazil)
and East Asia (China). Because of closures, global K2O
supply potential is expected to decrease by about 2
million tonnes K2O. Western Europe and Eurasia will
account for most of this decrease. Both East Asia. (China)
and South America (Brazil) will increase their supply
potential by 200,000 tonnes each. One potential project,
not included in these estimates, is the potash project in
Thailand. This project has a potential to supply 600,000
additional tonnes of K2O, most likely after the year 2-000—
4.5 Fertilizer Supply-Demand Balances
Fertilizer supply-demand balances are derived from
projected demand and estimated supply potential.
Because capacity projections are not available for 2004/
05, supply-demand balances for 2004/05 are based on
the projected demand for 2004/05 and the estimated
supply potential for 2000. This is done for two reasons:
First, to estimate how much additional capacity will be
needed between 2000 and 2005 to meet the projected
demand and in what regions. Second, what are the
chances that the required additional capacity will be
brought on stream?
4.5.1 Global Fertilizer Supply-Demand Balances
_The-estimated-SuppIy<lemand balances indicate that
for all three nutrients, supply will exceed the projected
demand by 1.2 to 3.5 million tonnes in 2000 (Table
4.9). For nitrogen and phosphate, supply will exceed
demand by about 1 million tonnes each and for potash
by 3.5 million tonnes. In spite of decreases in projected
capacity and supply potential, there will be a surplus of
potash fertilizers although the surplus is expected to
decrease from 7,0 million tonnes in 1994/95 to 3.5
million tonnes in 2000. As indicated above, this is due
to existing excess capacity. Nitrogen surplus is expected
to remain at 1 million tonnes, and phosphate surplus is
Table 4.9. World: Fertilizer Supply-Demand
Balances, 1994/95-2004/05
Nutrient
N
P2O5
K20
Total
1994/95
2000
2004/05"
(million nutrient tonnes)
1.0
2.8
7.0
10.8
1.2
1.1
3.5
5.8
(5.6)
(1-7)
0.9
(6.4)
Note: () = Deficit,
a. Derived from the projected demand in 2004/05
and the estimated supply potential in 2000.
78
expected to decrease from 2.8 million tonnes to 1.1
million tonnes. Overall, fertilizer surplus is expected to
decrease from 10.8 million tonnes in 1994/95 to 5.8
million tonnes in 2000.
Unless additional capacity is brought on stream, both
N and P2O5 will be in short supply in 2005. There will
be a deficit of 5.6 million tonnes of N and 1.7 million
tonnes of P2O5. For potash, there will be a surplus of 1
million tonnes of K2O. Because several companies are
planning to build ammonia/urea plants in Asia and Latin
America, it is unlikely that nitrogen fertilizers will
remain in short supply. Some of the planned plants
include India-Oman and India-Iran joint ventures, an
Arcadian plant in Trinidad, and plants in China,
Indonesia, Venezuela and Argentina. Some additional capacity
is also expected in North America (Table 4.10).
However, it must be stressed that the planned new capacity
estimates included in Table 4.10 are based on announced
intentions rather than firm commitments. If prices do
not remain attractive or finances are not available,
especially in developing and reforming markets, some of
this planned new capacity may not materialize.
Nevertheless, under normal circumstances, adequate additional
capacity may come onstream to bridge the gap between
demand and supply. Moreover, arrangements should also
be made for replacing old capacity. During the 1993-
95 period, about 4 million tonnes of N capacity was
closed annually. With growing demand, such
replacement may generally occur, but in Eurasia and other
reforming countries, such a scenario is not automatically
guaranteed. All national and international efforts should
be made to revitalize the fertilizer sector in the
reforming markets. Similarly, China, Morocco, Jordan, and
Egypt have plans to build additional phosphate
capacity. Although there is adequate potash capacity to meet
the demand in 2004/05, some planned projects, such
as one in Thailand and another in Argentina, may add
additional potash capacity. The fluctuations in prices may
affect the realization of these projects. However, as fer-
Table 4-10. Planned N Capacity Increases After
2000 (million tonnes)
Region
North America
Eastern Europe
Eurasia
Africa
Latin America
Asia
Planned N Capacity
3.3
0.5
0.5
0.8
1.6
5.2
Total
11.9
tilizer supply becomes limited, prices may increase to
justify additional investment. As the supply-demand
forecasts suggest, unless additional capacity is brought on
stream, nitrogen and phosphate shortages will develop
by 2004/05 and put pressure on prices. Additionally,
continued growth in population in Asia, especially in
countries like India and China, may create pressure to
invest in fertilizer production for food security reasons.
Further increased prices may improve capacity
utilization currently averaging at about 81% at the global level.
Every 1% point increase in capacity utilization can add
an additional 1 million tonnes of N. Thus, chances seem
reasonable that required additional supply will be
forthcoming to meet the projected demand in 2004/05.
4.5.2 Supply-Demand Balances by Nutrients and
Regions
Supply-demand balances by nutrients and regions are
presented in Table 4.11.
Nitrogen - Both developed and developing markets
will remain deficit in nitrogen, whereas reforming
markets will continue to have substantial surpluses (6-8
million tonnes). In the developed markets the nitrogen deficit
will increase from 2.4 million tonnes in 1994/95 to 3.5
million tonnes in 2004/05, All three regions - North
America, Western Europe, and Oceania - are expected
to remain deficit in nitrogen. The N deficit in Western
Europe is expected to decrease from 2,3 million tonnes
-in-1994/95-to-lT4-million-tonnes in 2004/05, whereas
in North America, it is expected to increase from a
surplus of 0.3 million tonnes in 1994/95 to a deficit of 1.4
million tonnes in 2005. In the reforming markets, as
demand recovers, N surplus is expected to decrease in
both regions - Eastern Europe and Eurasia.
In the developing markets, as new capacity comes on
stream after 1994/95, the nitrogen deficit will decrease
from 8.4 million tonnes in 1994/95 to 4.1 million
tonnes in 2000 but will increase again to 8.6 million
tonnes in 2005. All three regions, namely, Africa, Latin
America, and Asia, are expected to have a deficit in
nitrogen supply. However, West Asia, North Africa, and
Central America will have a surplus. East Asia, South
Asia, South America, and sub-Saharan Africa will have
a deficit. Because of a rapidly growing demand, in spite
of planned large increases in capacity, South and East
Asia will continue to depend on imports. Due to import
dependence, macroeconomic policy, especially exchange
rate stability and foreign exchange allocations, will play
a crucial role in meeting the future demand in these
subregions. In the past, fertilizer aid played an
important role in satisfying the fertilizer requirements of sub-
Saharan Africa. Increasingly, fertilizer aid is being
reduced by donors; therefore, countries in this region
may have to make additional efforts to ensure fertilizer
supplies,
79
Table 4.11. Regional Fertilizer Supply-Demand Balances, 1994/95-2004/05
Nitrogen
Phosphate
Potash
Region
Developed
North America
Western Europe
Oceania
Reforming
Eastern Europe
Eurasia
Developing
Africa
North
Sub-Saharan
South
Latin America
Central
South
Asia
East
South
West
1994/95
2000
2004/05
- - (million nutrient tonnes)- -
-2.4
0.3
-2.3
-0.4
11.8
2.3
9.5
-8.4
0.3
03
-0.3
0.1
0.4
1.5
-1.1
-9.1
-6.9
-3.5
1.3
-3.1
-1.1
-1.4
-0.6
8 4
1.6
6.8
-4.1
-0.3
0.2
-0.5
0.0
0.6
1.7
-1.1
-4.4
AA
-2.0
2.0
-3.5
-1.4
-1.4
-0.7
6 4
1.1
5.3
-8.6
-0.8
0.1
-0.8
-0.1
-0.3
1.4
-1.6
-7.6
-5.9
-3.5
1.9
Note: Totals may not add due to rounding.
Source: The World
1994/95
- - (million
2.6
5.6
-2.4
-0.6
3 7
1.1
2.6
-3.5
4.0
3.6
-0.1
0.5
-1.3
0.0
-1.3
-6.2
-3.8
-2.5
0.1
2000
nutrien
3.0
5.4
-1.8
-0.6
3 1
0.8
2.3
-5.0
3.8
3.5
-0.3
0.6
-1.6
-0.1
-1.5
-7.2
-3,6
-3.7
0.0
2004/05
tonnes) - -
2.8
5.2
-1.7
-0.7
2 7
0.6
2.1
-7.1
3.6
3,4
-0,4
0.6
-2.0
-0.3
-1.7
-8.7
-A.b
-3.9
-0.3
1994/95
- - (million
7.9
6.6
1.6
-0.3
5 4
-0.5
5.9
-6.3
-0.4
-0.1
-0.2
-0.1
-2.2
-0,3
-1.9
-3.7
-4.5
-1.2
2.0
2000
2004/05
nutrient tonnes) - -
6.7
6.1
1.0
-0.3
3 7
-1.0
4.7
-6.7
-0.7
-0.2
-0.3
-0.2
-2.1
-0.4
-1.7
-4.1
-4.6
-1.8
2.2
Bank/FAO/UNIDO/Industry Fertilizer Working Group Meeting, August 1995.
6.5
5.9
1.0
-0.4
2 9
-1.2
4.1
-8.4
-0.7
-0.2
-0.3
-0.2
-2.5
-0.5
-2.0
-5.3
-5.5
-2.0
2.2
Phosphate - Both developed and reforming
markets are expected to have phosphate surpluses - with a
heavy concentration in North America and Eurasia.
Although North America has traditionally been a major
producer and exporter of phosphate fertilizers, a
surplus in Eurasia results from a drastic reduction in
fertilizer use during the reform process. In both regions,
surpluses will range between 2 and 5 million tonnes and
will gradually decrease during the 1995-2005 period.
Western Europe will continue to have a deficit.
In developing markets, deficits are forecast to increase
from 3.5 million tonnes in 1994/95 to 7.1 million
tonnes in 2004/05. Except North Africa (Morocco), all
regions and subregions are expected to increase their
deficits. In Asia, deficits will reach 8.7 million tonnes in
2004/05. Obviously, fertilizer imports will remain
crucial for these regions to satisfy the domestic phosphate
fertilizer requirements. Additional capacity of about 2
million tonnes P2O5 will be needed by 2004/05. Projects
in Morocco, Senegal, and Egypt may come on stream
to balance the situation.
Potash - Like phosphate surpluses, potash surpluses
will be concentrated in the developed and reforming
markets. North America and Eurasia will account for
most of the surpluses in these markets. The developing
markets will remain in deficit (6-8 million tonnes).
Except West Asia, all regions in this group will be in deficit.
East Asia will have the highest deficit of 5.5 million tonnes
in 2004/05. Canada, Russia, and Belarus will remain
major exporters; Israel and Jordan will also export
potash fertilizers to Asian markets.
4.6 Summary
The year 1994/95 provides a turning point in the
history and future outlook of the fertilizer industry, Since
1988/89, global fertilizer use had been declining due to
the drastic reduction in fertilizer use in the former
centrally planned economies. The year 1994/95 is the first
year after the fall of the Berlin wall in 1988 when global
fertilizer use registered a 2% increase. During the 1994/
95-2004/05 period, fertilizer demand is projected to
increase by 2%/year - from 123 million nutrient tonnes
in 1994/95 to 150 million nutrient tonnes in 2004/
05. The demand for all three nutrients is projected to
increase at 1.9%-2.1% per annum. Nitrogen demand is
projected to increase from 74 million nutrient tonnes in
1994/95 to 89 million nutrient tonnes in 2004/05.
Phosphate and potash demand is projected to increase
80
from 30 and 20 million nutrient tonnes in 1994/95 to
36 and 25 million nutrient tonnes in 2004/05,
respectively. Fertilizer supply is expected to be adequate to
meet fertilizer demand in the year 2000, but additional
capacity will be needed to meet the projected demand
for nitrogen and phosphate in 2004/05. No serious
difficulties are expected in sustaining growth in fertilizer
supply. However, most developing countries will remain
deficit in fertilizer supplies and will have to depend on
imports. Hence, macroeconomic policy will play an
important role in meeting the future requirements of
fertilizer-deficit countries.
To sustain growth in fertilizer demand and supply, a
conducive policy environment should be maintained.
Policy reforms should be properly sequenced and phased,
and adequate human and institutional capacity should
be developed. Every reasonable effort should be made
to continue to improve the environmental effects of
production and use of fertilizers.
4.7 Price Outlook
Since the early 1980s, fertilizer prices (in 1990
constant U.S. dollars) have been decreasing with occasional
increases caused by short-term changes (figure 4.2). In
1991, the Gulf War created temporary shortages and
350
JU i—i—i—i—i—i—r—i—i—i—i—i—i—i—i—I
1980 1983 19S6 1989 1992 199E
Note: Urea prices are f.o.b. bagged Western Europe, and DAP
and MOP prices are f.o.b. U.S. Gulf and Vancouver
(Canada) respectively. All prices are In 1990 US$.
Source: The World Bank 14].
Figure 4.2. World: Fertilizer Prices, 1980-95.
allowed all fertilizer prices to increase. However, a
drastic fall in fertilizer use in Eastern Europe and Eurasia in
the early 1990s created a surplus in the global market
and reduced urea prices drastically. In some months in
1993, urea was selling for US $80/tonne (f.o.b. Black
Sea), as compared with over US $150/tonne in the
previous year. However, fertilizer prices increased sharply
in 1994 and 1995, Increased demand in the United
States, reduced urea supplies from Eurasia, and increased
imports from India and China created an upward surge
in fertilizer prices. In 1995 urea prices averaged $184/
tonne (1990 dollars) - over 80% higher than the 1993"
level. These increases in prices are not justified by the
structural parameters of the price equation. It is expected
that in the late 1990s prices may decrease to normal
levels due to improved grain supplies leading to lower
grain prices. Improvements in market conditions in
Eurasia and Eastern Europe may also generate stable
supplies. However, it must be stressed that, in the long
term, several factors may contribute to keep fertilizer
prices higher than those prevailed in 1986/87 or 1992/
93 after the collapse of the former Soviet Union. Some
of these factors are elaborated below.
First, very little idle capacity exists in the developed
markets; low and unremunerative prices of the mid-
1980s and early 1990s had already led to permanent
closures of many idle plants in North America and West-
ern-Europe^-MosLof-the-existing plants have been
operating at or near full capacity. Second, removal of subsidies
on fertilizer production in reforming economies is
resulting in increased cost of production. This coupled with
increased energy prices and investment for revamping
and rehabilitation is likely to increase the cost of
fertilizer supplies from Eastern Europe and Eurasia. Third,
restructuring of fertilizer sector leading to subsidy removal
and privatization in developing markets may lead to
higher cost of production. Fourth, as the gap between
demand and supply narrows and surpluses reduce,
additional investment will be needed to satisfy the growing
demand. Because of high capital investment
requirements of new plants, fertilizer supplies coming from new
plants will be available at higher prices. In a new
ammonia-urea complex, capital recovery cost accounts
for about 60%-70% of the total cost, whereas, in nearly
fully-depreciated old plants, capital cost accounts for only
10%-20% of the total cost. Higher capital cost will
naturally result in higher cost of production and price. Thus,
fertilizer prices may be relatively higher in the long run.
Nevertheless, to the extent fertilizer capacity continues
to be built for food-security reasons without due regard
to cost of production in large countries, such as India
and China, and global grain surpluses rise and fall, short-
term prices may fluctuate considerably from one year to
another,
81
4.8 References
1. FAO (1996a). Fertilizer Yearbook, Rome, Italy.
2. FAO (1996b). Fertilizer Data, Computer files.
3. Bumb, B. L. 1995. Global Fertilizer Perspective,
1980-2000: The Challenges in Structural
Transformation, T-42, International Fertilizer
Development Center (IFDQ, Muscle Shoals, AL, U.S.A.
4, The World Bank. 1996, Commodity Markets and
the Developing Countries: A World Bank
Quarterly, February, Washington, D.C., U.S.A.
Chapter 5. Fertilizer Raw Materials and Reserves
Table of Contents
Page
5.1 Availability and Sources of Raw Materials 85
5.2 Nitrogen Feedstocks 85
5:2.1 Origins of Hydrocarbons arid Coal 85
5.2.2 World Ammonia Production and Feedstock Reserves 87
5.2.3 Ammonia Feedstock Outlook 89
5.3 Phosphate Rock , 90
5.3.1 Geological Origin and Characteristics of Phosphate Rock 90
5.3.2 Phosphate Rock Mineralogy 91
5.3.2.1 Sedimentary Apatites 91
5.3.2.2 Igneous Apatites 96
5.3.2.3 Aluminum and Iron Phosphates s 96
5.3.2.4 Other Minerals in Phosphate Rocks 97
5.3.3 Apatite Reactivity 97
5.3.4 Effect of Mineralogy on Further Processing 99
5.3.5 Phosphate Rock Mining 100
5.3.5.1 Surface Methods 100
5.3.5.2 Underground Methods 102
5.3.6 Beneficiation of Phosphate Rock 102
5.3.6.1 Benefidatiori Techniques....77^7777777777 .77.7, 102
5.3.6.2 Examples of Beneficiation Processes 104
5.3.7 Factors Affecting Quality of Phosphate Rock 107
5.3.7.1 Physical Factors 108
5.3.7.2 Chemical Factors 109
5.3.7.3 Measuring and Estimating the Impact of Phosphate Rock Quality Factors Ill
5.3.8 World Phosphate Rock Production and Reserves Ill
5.3.8.1 World Phosphate Rock Production and Quality Ill
5.3.8.2 World Phosphate Rock Reserves and Resources 116
5.3.8.3 Future Trends in World Phosphate Rock Production > 120
5.3.9 Factors That Influence Economic and Commercial Viability of Producing Phosphate Deposits... 124
5.4 Sulfur 126
5.4.1 Sulfur Sources 126
5.4.2 Production Methods 127
5.4.2.1 Production From Native Sulfur Deposits 127
5.4.2.2 Sulfur Recovery From Gases , 128
5.4.2.3 Sulfur Production From Sulfide Ores and Sulfates 128
5.4.3 World Production, Sulfur Reserves and Resources 129
5.5 Potash 131
5.5.1 Geology, Mineralogy, and Origin of Potash Deposits 131
5.5.1.1 Buried Potash Deposits 132
5.5.1.2 Brine or Surface Potash Deposits 138
5.5-2 Potash Mining 139
5.5.2.1 Conventional Mining 139
5.5.2.2 Solution Mining 140
83
Table of Contents (Continued)
Page
5.5.3 Beneficiation and Processing of Potash Ores and Brines 140
5.5.3.1 Crushing and Grinding 140
5.5.3.2 Desliming : 141
5.5.3.3 Flotation 141
5.5.3.4 Heavy Media Separation , 146
5.5.3.5 Electrostatic Separation 146
5.5.3.6 Thermal Dissolution-Crystallization ^^JL^fi
5.5.3.7 Beneficiation of Carnallite Ores and Brines 147
5.5.3.8 Disposal of Brines and Tailings 148
5.5.3.9 Beneficiation of Sulfate Ores 148
5.5.4 World Potash Production and Reserves 150
5.6 References 152
84
Chapter 5. Fertilizer Raw Materials and Reserves
5.1 Availability and Sources
of Raw Materials
The primary raw materials for nitrogen fertilizers are
natural gas, naphtha, fuel oil, and coal. The manufacture
of phosphate fertilizers most often requires sulfur and
phosphate rock. Naturally occurring potassium salts form the
basis of the production of most potash fertilizers.
Natural gas, naphtha, fuel oil, and sulfur are substances
or mixtures to which clearly definable specifications can
be applied; compositions may vary little regardless of
where they are obtained or produced. Potash ores vary
greatly in composition from locality to locality; however,
the end products of mining, beneficiation, and
processing generally have relatively constant compositions.
Phosphate rock and coal are products that can vary
significantly in composition and other characteristics. These
variations can have significant effects on the processes
used to upgrade the as-mined ores or on the processes
in which they are used to manufacture fertilizers from
beneficiated products.
A fertilizer plant or power plant may be designed to
use a particular phosphate rock or coal. Changes in the
sources of raw materials may adversely affect process1"
ing and lead to lower efficiency, the loss of output, and/
or serious operational difficulties. Coal and phosphate
rock supplies are generally secured with medium- to long-
term contracts. Test programs and trials of alternative
supplies are in order if changes in supply sources are
necessary. Plant designs should allow for variations in
the quality of both phosphate rock and coal even when
the feedstocks are to be procured from single sources
over the projected life of a facility. It is desirable to
construct production facilities with sufficient flexibility to
accept feedstocks from several sources to benefit from
competitive situations and/or to account for the
possibility that the intended source of supply may be terminated.
Information is presented in this chapter concerning
the physical characteristics, geology, geographic
distribution, reserves and resources, processing, and
production of fertilizer raw materials. This chapter is based on
several chapters from the previous edition.
Considerable effort was expended in developing more
comprehensive overviews of the geologic, mineralogic, and
processing characteristics of fertilizer raw materials.
As in previous editions, the difficulties in establishing
the amount of resources/reserves for fertilizer raw
materials on a global basis are recognized. A review of
resource/reserve terminology is given in Section 5.3.8.2,
World Phosphate Rock Reserves and Resources.
Resource/reserve data for specific raw materials are
presented in each section.
It is impossible to present more than gross estimates
of world resources of fertilizer raw materials for several
reasons. Although man continues to explore his
environment and many areas of the globe have been
explored in detail, particularly in the last 30 years, there
are areas of the globe that have not been surveyed or
have been surveyed inadequately. When deposits are
known to exist, the extent and quality of information on
the quantity or quality of material in the deposit may
vary greatly, Reasonably good data may only exist when
considerable effort and funds have been spent to
develop deposits. Detailed exploration and evaluation of a
deposit is an expensive process only undertaken when
commercial exploitation is probable.
Estimators may also use different criteria for
categorizing reserves and resources. Some estimators may take
an optimistic approach, whereas others may be more
pragmatic. Data may be gathered from many sources
both public and private, Producers may not wish to
divulge reserves for competitive reasons, In general, pub-
"Iic"saurces~ofinformation"may"be'much more optimistic
than private sources.
5.2 Nitrogen Feedstocks
Ammonia is a basic building block for most nitrogen
fertilizers with the exception of some naturally
occurring nitrates. In ammonia manufacture, nitrogen is
actually fixed from the earth's atmosphere. At about 78%,
nitrogen is the most common gas in the earth's
atmosphere. The amount of nitrogen in the earth's
atmosphere is not considered a limiting factor in nitrogen
fertilizer production.
Hydrocarbon and coal feedstocks for ammonia
manufacture perform a dual role as sources of both
hydrogen and energy. The relative amounts of hydrogen and
energy that are actually supplied for the manufacture of
ammonia depend on the type of feedstock and type and
efficiency of a process. An average figure for the
contribution to each category may be 60% hydrogen and 40%
energy. Water also contributes a portion of the
hydrogen needed for ammonia manufacture.
5.2.1 Origins of Hydrocarbons and Coal
Natural gas, oil, and coal are associated with
sedimentary rocks. Natural gas and oil are produced from
sedimentary rocks ranging in age from Precambrian
85
(+600 million years) to Cenozoic (60 million years, to
the present).
It is widely accepted that plankton living in ocean
waters were the sources of nearly all petroleum.
Finegrained muds rich in planktonic remains are deposited
offshore in low-energy, oxygen-poor environments. Slow
decomposition by anaerobic bacteria turns the
planktonic remains into an amorphous material called
sapropel. As the muds are buried and form shales and
mudstones, the sapropel is converted to petroleum
compounds by biologic, chemical, and physical processes,
which are not fully understood. Young petroleum tends
to have compounds of higher molecular weight and
produces heavy crudes. With deeper burial, increased
temperature and pressure break down the organic structures
into lighter and simpler hydrocarbon compounds. At
great depth, methane may be the only remaining
hydrocarbon.
Several criteria must be met before petroleum
hydrocarbons can accumulate to form a field:
1. Sapropelic source beds must be formed.
2. With burial, heat and pressure conditions must exist
to bring the source beds to maturity and generate
petroleum compounds.
3. Migration from source beds to reservoir rocks must
be possible.
4. Suitable porous reservoir beds must exist.
5. Traps (stratigraphic and structural) must exist so that
accumulations can form.
6. A suitable seal or cap rock must exist to prevent the
oil and gas from escaping.
Perhaps 60% of the world's petroleum reserves are
associated with sandstones, whereas about 40% are
associated with limestones. Gas migrates undip of (above)
the liquid fraction, may form separate fields, or may cap
the oil zone.
Significant oil and gas fields are mainly associated with
large basins located on continental margins, on former
continental margins, or in intercontinental basins where
significant sediment accumulations have occurred. These
accumulations may be currently located onshore or
offshore. Areas devoid of petroleum accumulations include
areas of igneous rocks or sedimentary rocks that have
been subjected to very high levels of heat and pressure.
Crude oils are separated into components such as
gasoline, naphtha, and fuel oils by distillation, Higher
weight petroleum compounds may be broken down to
lighter fractions by heat in a process called thermal
cracking or under the influence of catalysts (catalytic
cracking). Lighter fractions may be processed to higher weight
hydrocarbons by a process called reforming. Sulfur is
generally removed from natural gas near the wellhead,
and sulfur is removed in the process of refining crude
oils.
Liquid petroleum fractions are more easily transported
and stored than gases, which require high-pressure
compression and transportation in special vessels. In areas
where there is no market for petroleum gas or
developed infrastructure to transport natural gas, the use of
natural gas to produce ammonia and solid nitrogen
fertilizers may be the only and/or most lucrative option tor
development.
Coals are formed in swamps under warm climatic
conditions that promote rapid vegetative growth. Coal
deposits are generally associated with mountain-building
events and deltaic environments. Coals can be traced to
the Devonian period, when woody plants first evolved,
about 370 million years before the present.
To be preserved, vegetative matter must accumulate
quickly in an anaerobic environment. After deposition,
anaerobic bacteria cause biochemical changes that slowly
transform the vegetative matter into peat. As the peat
deposits become buried beneath increasing thicknesses
of younger sediments, the peat is subjected to increases
in temperature and pressure. Water and volatile
compounds are expulsed, and crosslinking occurs between
"carbon atoms.
Under the effects of increasing temperature and
pressure, peat acquires the solidity, color, and chemical
composition of coal. These changes are the basis for a
progressive increase in the rank of coal. Coal is
characterized or ranked by four groups although the
boundaries between groups are arbitrary. Peat is more or less
spongy decomposed plant debris with a high water
content. Brown coals and lignite have high water contents
and 40%-55% volatile contents. Bituminous coals are
the best known coals; those with 30%-45% volatiles are
widely used for steam-raising and general combustion,
while those with 20%-30% volatiles may be suitable for
coking. Anthracites or hard coals contain up to 95%
carbon and less than 5% volatiles.
Coals contain impurities such as sulfur (mostly between
0.5% and 3.0%) and clays, which lead to varying amounts
of ash and clinker. As coals increase in rank, calorific
values increase to the anthracite level at which, due to
expulsion of most volatiles, calorific values may decrease
somewhat. The calorific content and impurity content
of coals dictate the design of coal-burning or gasifying
facilities and associated pollution control equipment.
Commercial coal beds are generally extensive arid
thick, have minimal partings, and have acceptable
calorific contents. Coal is mined by both opencast and
underground methods that are very similar to the
methods used to mine phosphate rock. If the coal is mined
underground, suitable roof rock conditions must exist.
The thickness and character of overburden and other
site-specific conditions determine the use of opencast
methods.
Power generation using coal requires significant
amounts of water and coal. Coal-fired power
generation units and/or fertilizer production units are often
located near the mine site.
5.2.2 World Ammonia Production and Feedstock
Reserves
Table 5,1 presents an estimate of energy requirements
and natural gas equivalents for ammonia manufacture
through the year 2000/01, This forecast indicates that
world ammonia production will be increasing at slightly
over 3% per year. These energy requirements may be
met by natural gas, oil, naphtha, or coal depending on
the regions of the world where the ammonia will be
produced. Liquefied natural gas (LNG) and liquefied
.petroleum gas (LPG) are used as feedstocks in some
regions that produce little oil or natural gas. Table 5.2
shows the production of natural gas and petroleum for
the year 1995 and the reserves at the end of 1995.
The cost of feedstocks will vary from region to region
depending on supply, reserves, etc. In the past, there
has been some credibility to pricing natural gas,
naphtha, oil, and coal on an energy content basis. However,
in recent times extensive pipeline construction in
developed countries has given the end user more options in
obtaining supplies of feedstock so that price is driven
more by competition than energy content. This prin-~
ciple also applies to refinery capacity, i.e., the region
that has the most excess capacity will normally have the
lowest cost oil and naphtha. Generally, coal has been
priced much lower than natural gas or liquid feedstocks
on an energy-content basis,
Since the energy crisis of 1977/78 in the United
States, there has been a movement for deregulation of
pipelines/transportation. The various components of
moving natural gas from the wellhead to the end user
have been priced separately, e.g., gathering, storage,
Table 5.1. Forecast of World Ammonia Production ('000 tonnes nitrogen)
1997/98
3,848
6,368
5,123
26,308
27,277
68,924
18,291
11,446
8,067
20,965
566
59,335
128,259
155,743
176.54
6,228
1,573
1998/99
3,848
7,483
5,489
27,035
28,221
72,076
18,425
11,537
8,067
21,372
566
59,967
132,043
160,338
181.75
6,413
1,619
1999/2000
4,445
8,969
5,489
29,487
28,465
76,855
18,
11,537
8,067
21,279
566
59,874
136,729
166,028
188.20
6,641
1,677
2000/01
4,445
9,462
5,489
30,513
28,465
78,374
11,537
8,067
21,279
566
59,874
138,248
167,873
190.29
6,715
1,696
Developing Regions
Africa
Latin America
West Asia
East Asia
China
Total
Developed Regions
North America
Western Europe
Eastern Europe
Former Soviet Union (FSU)
Oceania
Total
World Total
Ammonia Equivalent ('000 tonnes)
Natural Gas Required (109 m3)
Energy Required (MMBtu x 106)
Energy Required (Gcal x 106)
Source: International Fertilizer Development Center, unpublished data.
Notes: 1. Ammonia equivalent based on average of 1.0.1 Gcal/tonne (40 MMBtu/tonne).
2. Natural gas assumed to contain 0.14 Gcal/m3 (1,000 Btu/ft3).
87
Table 5.2. World Production and Reserves of Natural Gas and Petroleum
Natural Gas
Production
1995
Reserves
1995 End
(109 m3
Petroleum
Production
1995
(109bbl/d)
Reserves
1995 End
(.109bbl)
Developing Regions
Africa
Latin America
West Asia
East Asia
China
Total
Developed Regions
North America
Western Europe
Eastern Europe
Former Soviet Union (FSU)
Oceania
Total
World Total
Energy Equivalent (MMBtu x 109)
Energy Equivalent (Gcal x 109)
Source: 11].
84,40
78.00
179.70
114.40
17.60
474.10
713.30
208.20
34.70
659.70
29.60
1,645.50
2,11960
74.84
18.86
9,400
5,700
46,700
5,700
1,700
69,200
8,400
4,600
900
56,000
600
70,500
139,700
4,933
1,243
6.97
5.65
20.84
2,92
2.99
39.37
13.74
5.94
0.67
7.23
0.58
28.16
67.53
411.96
104
73,100
78,900
12,700
24,000
854,000
86,600
13,700
4,000
57,000
1,600
162,900
1,016,900
6,203,000
1,562,000
Notes: 1. Energy contentof 'natural gas assumed~at" 8.9 ^MMcal/frr^SS.SlO Btu/m3).
2. Energy content of petroleum assumed at 1.54 Gcal/bbl (6.1 MMBtu/bbI).
3. 3.9685 MMBtu equivalent to 1 Gcal.
and transportation. This has allowed the end user to
purchase those services needed, and the price of the
natural gas is adjusted accordingly, This also permits the
end user to purchase feedstock directly from the
producer and have it transported to the plant site. Other
countries are moving in this direction.
During the 1977/78 energy crisis, the natural gas
reserve/production ratio indicated a 12-year supply, and
forecasts indicated that natural gas would reach a price
of over $10.00 per million British thermal units (MMBtu).
This did not occur, and some 17 years later, the United
States still has a reserve/production ratio indicating a
8.5- to 9.0-year supply. The price of natural gas in the
1990-96 timeframe has ranged from as low as $0.25
per Gcal ($1,00 per MMBtu) to as high as $1.13 per
Gcal ($4,50 per MMBtu).
Feedstocks in developing countries will vary
depending on not only availability but also the ability to move
the feedstock to the plant site. Coal is used as a
feedstock where natural gas is not readily available. Table
5.3 shows world production and reserves of coal for
1995 and the end of 1995 111,
China is a large producer of nitrogen and probably is
the world's largest ammonia producer using coal as a
feedstock. Because of vast reserves of coal and the lack
of a pipeline infrastructure for transporting natural gas,
the feedstock used is generally coal, naphtha, or oil.
Accordingly, many of the nitrogen plants in China are
equipped to use dual feedstocks, and recent reports
indicate that retrofits are being installed to allow plants to
switch between feedstocks and use gasification more
efficiently. Chinese news releases indicate that additional
nitrogen plants are being planned using natural gas from
the Hainan Islands. It is expected that as pipeline
transportation infrastructure is developed, more of the
Chinese nitrogen plants will switch to natural gas as a
feedstock.
In south central Asia, primarily India, several new
nitrogen plants are in the planning stage, but the lack of
in-country natural gas reserves requires the use of oil or
naphtha as a feedstock. Feasibility studies on pipelines
from the Middle East to India are in progress, but when
this will result in natural gas sources for Indian nitrogen
plants is conjectural. LNG as a feedstock is another
consideration for India, but this is an expensive alternative.
Table 5.3. World Production and Reserves of Coal, 1995
Developing Regions
Africa
Latin America
West Asia
East Asia
China
Total
Developed Regions
North America
Western Europe
Eastern Europe
Former Soviet Union (FSU)
Oceania
Total
World Total
Energy Equivalent (MMBtu x 109)
Energy Equivalent (Gcal x 109)
Production
(million tonnes oil equivalent)
113.3
26.2
133.4
74.8
655.5
1,003.2
593.7
139.3
156.9
203.8
128,2
1,225.1
2,225.1
97.7
24,6
Reserves
(million tonnes coal)
61,672
10,196
72,360
33,766
11 a ^nn
292,494
250,392
104,419
52,248
241,000
91,057
739,116
1,031,610
30,659
7,723
Source: [1].
Notes: 1. Energy content of oil assumed at 6.1 MMBtu/bbI.
2. Energy content of coal assumed at 29.7 MMBtu/tojme^.
3. 3.9685 MMBtu equivalent to 1 Gcal.
4, 7.2 bbl of oil/tonne.
5, Includes anthracite, bituminous, and lignite coals.
Other east Asian countries, the Koreas, and Japan
have little natural gas and use naphtha or LNG for
ammonia production. Indications are that several
southeast Asian countries (Thailand, Malaysia, and Indonesia)
have large reserves of natural gas and oil, and
significant oil and gas exploration is underway in this region.
LNG is a large export from this area, much of which
goes to Japan.
The former Soviet Union (FSU) has large reserves of
oil and natural gas, but adequate pipeline capacity to
supply internal regions and eastern and western Europe
is lacking, Considering the pipeline construction that is
already underway and the planned pipeline
construction, assuming that capital is available, it is expected
that this problem will be solved in the next few years.
Additional pipelines from the North Sea are to bring
natural gas into western Europe, which will put
competitive pressure on prices in this region,
Proven oil and natural gas reserves in Latin America,
with natural gas prices well below average, make this a
logical location for additional nitrogen production for
export. Negotiations are in progress between
Venezuela and large nitrogen producers to construct new
nitrogen plants in Venezuela.
5.2.3 Ammonia Feedstock Outlook
While reliable data are not readily available on
feedstock use by type, e.g., natural gas, oil, naphtha, and
coal, a look at world reserves of natural gas, oil, and
coal by region indicates that natural gas will be the
dominant feedstock. Coal use will decline because of
environmental aspects and high plant costs. Oil and naphtha
will continue to be used as feedstocks primarily in those
regions or areas that do not have natural c^as reserves
and are unable to receive natural gas by pipeline.
Review of reserve data covering all feedstocks indicates no
shortage of feedstock material through the year 2000.
Barring any world conflicts and with some exceptions,
feedstock prices are not expected to dramatically increase
through the year 2000. Natural gas reserves appear to
be holding or gaining slightly on production, and oil
89
reserves in OPEC and non-OPEC countries are such
that production will control price. Oil prices have been
relatively stable since the energy shortage of the late
1970s and early 1980s. Coal prices have also been
relatively stable over this same period and are expected to
remain stable in the short-term future.
5.3 Phosphate Rock
"Phosphate rock" is an imprecise term that includes
both unprocessed rocks and beneficiated concentrates.
Practically all production of phosphate fertilizers is based
on phosphate rocks containing some form of the
mineral apatite.
5.3.1 Geological Origin and Characteristics of
Phosphate Rock
There are two main types of phosphate rock deposits -
sedimentary and igneous. Sedimentary phosphate
deposits are exploited to produce more than 80% of the
total world production of phosphate rock,
Igneous phosphate deposits are often associated with
carbonatites and/or alkalic (silica deficient) intrusions.
Igneous phosphate rock concentrates are produced from
deposits that are mainly exploited in Russia, the
Republic of South Africa, Brazil, Finland, and Zimbabwe.
Igneous phosphate ores are often low in grade (less than
5% P-2O5) but can be upgraded, toJbigh-grade_prqducte__
(from about 35% to over 40% P205).
Sedimentary phosphate rocks occur throughout the
geological time scale. Most sedimentary deposits were
apparently formed in offshore marine conditions on
continental shelves. They exhibit a wide range of
chemical compositions and great variations in physical form.
Economic deposits usually occur as one or more thick
high-grade beds that are unconsolidated and have a
uniform granular texture and composition, shallow
overburden, and a minimum of structural deformation.
Insular deposits are a type of sedimentary deposit
associated with oceanic islands. Insular deposits have been
an important source of phosphate rock for more than
100 years. However, intensive exploitation has caused
several deposits to be totally depleted or to have short
projected lifetimes (Ocean Island, Christmas Island, and
Nauru, to name a few).
Depending on their origin (igneous or sedimentary),
phosphate rocks have widely differing mineralogic,
textural, and chemical characteristics. Furthermore, entire
deposits or portions of deposits have been influenced
by near-surface conditions that alter their original
mineralogic, textural, and chemical characteristics. Indeed,
many igneous apatite deposits are composed of loose
residual materials. In these cases the apatite has
survived weathering and has become concentrated due to
the fact that it is more resistant to this process than are
associated minerals.
Many important sedimentary phosphate deposits owe
their present character to surface or near-surface
processes. For instance, the Florida deposits have peen
reworked in the past under surface conditions. Several
cycles of deposition and reworking have concentrated
the phosphate, and weathering has removed most of
the carbonates from the upper (near the surface)
portions of the deposits. —
While each general type of phosphate deposit
(sedimentary and igneous) would seem to have its own
general set of characteristics, widely differing characteristics
are found within sedimentary and igneous deposits as
groups. Some igneous phosphate deposits, such as the
Kola deposit in Russia, are hard-rock deposits. Apatite
crystals are found within a hard crystalline fabric of other
igneous minerals, With intense weathering, the fabric
of igneous phosphate rocks can be destroyed; soft
soillike residual deposits, such as those found at Sukulu Hills,
Uganda, are produced. The character of such soil-like
material is more like an unconsolidated sedimentary rock
than a hard-rock igneous deposit. Weathering of
igneous deposits may also be at an intermediate stage,
between an unaltered hard rock and soft soils.
_Sedimentary_.phosphate. rocks can range from loose
unconsolidated materials, to weakly cemented
materials, to highly indurated rocks. In general, younger
sedimentary phosphate rocks that have not been subjected
to deep burial and that contain significant amounts of
phosphate particles, sands, and clays tend to be in the
unconsolidated category. Phosphate rocks of varying
ages have been deposited simultaneously with
carbonates. Such carbonate-containing phosphate rocks can
range from weakly indurated to highly indurated,
depending on the postdepositional history and degree of
carbonate cementation. As previously mentioned,
exposure to near-surface conditions may result in the
leaching of carbonates from the rock.
When sedimentary phosphate rocks have been
subjected to varying levels of burial and heat, profound min-
eralogical and textural changes can occur. In general,
the rock becomes less porous, more compact, and more
highly indurated. Crystal growth occurs, and individual
phosphate particles can become highly interbcked.
Mineral compositions can change as strata come to
equilibrium under new temperature/pressure regimes.
Sedimentary phosphate rocks that have been subjected
to extremely deep burial (high pressure and perhaps
shearing forces and/or heat) may be further categorized
as a third type of phosphate rocks, metamorphic
phosphate rocks. Igneous rocks may also be subjected to heat
90
and pressure to form metamorphic phosphate rocks. In
extreme cases, metamorphosed sedimentary phosphates
may be very difficult to differentiate from igneous rocks.
Metamorphic phosphate rocks will not be dealt with
separately in this section except to say that
metamorphic examples of both sedimentary and igneous
phosphate deposits can be found.
5.3.2 Phosphate Rock Mineralogy
Phosphate rock mineralogy can be highly variable,
depending primarily on the origin of the rock (igneous
or sedimentary), its formational or postdepositional
history, and the type and degree of near-surface processes
that the rock has been subjected to. Sedimentary
apatites are formed near the surface of the earth under low
temperature and pressure in a variety of environments
that can range from freshwater to marine to hypersa-
line conditions. Igneous apatites, on the other hand, are
formed under very high temperature and pressure.
Although these apatites have similar formulas and crystal
structures, they are distinctly different when analyzed in
depth and may be separated into groups based on
common characteristics.
Minerals associated with the various types of
phosphate rocks are fairly distinctive. High-temperature
igneous minerals are associated with hard-rock and mildly
weathered igneous phosphate deposits. Clastic
sedimentary minerals such as quartz and clays or biological or
chemical precipitates such as carbonates are associated"
with sedimentary phosphate rocks.
Under conditions near the surface of the earth, a wide
spectrum of secondary minerals can form that may be
common to both igneous and sedimentary phosphate
rocks. These minerals include iron and aluminum
phosphates, clays, and iron oxides.
5.3.2.1 Sedimentary Apatites - Most
sedimentary deposits contain varieties of carbonate-fluorapatite
that are collectively called francolite.. Francolite is
defined as an apatite that contains significant CO2 with
>1% fluorine [2]. In establishing a series of systematic
relationships among francolites, McCIellan and Lehr [3]
and McCIellan [4] used x-ray diffraction (XRD), chemical
analysis, and statistical methods to show that the
contents of Ca, Na, Mg, P, CO2, and F can adequately
describe most francolites (Table 5.4). McCIellan and Van
Kauwenbergh [6[ used similar methods, reconfirmed
earlier findings, and included S04 as a minor component-in--
the francolite structure. Studies of francolite in
commercial phosphate rock concentrates show that the
replacement of Ca2+ by Na+ and Mg2+ is systematic although
limited. Thus, at least a part of the Na+ and Mg2+ in a
commercial concentrate can be substituted within the
francolite structure and cannot be removed by
benefication. Most importantly, carbonate substitutes for
phosphate in a 1:1 ratio. The maximum amount of
substitution is between 6% and 7% C02, Net charge
imbalances are compensated by both cation and anion
substitutions (primarily Na+1 and F"1). The incorporation
of C02 into the francolite structure is accompanied by
increased fluorine contents. In this section, these
carbonate apatites are referred to as excess-fluorine
francolites.
_ One of the most important results of these studies
was the recognition that francolite compositions and
properties can be estimated by x-ray and optical
measurements. In excess-fluorine francolites, the unit-cell a
dimension (a value) decreases from 9.369 ± 0.001A to
approximately 9.320 ± O.OOlA with maximum
carbonate substitution. The index of refraction also decreases
with increasing carbonate substitution (Table 5.4).
Table 5.4. Varieties of Apatite and Selected Crystallographic and Optical Properties
Variety
Francolite3
FrancoIiteb
Carbonate-hydroxylapatite
Fluorapatite
Hydroxylapatite
Chlorapatite
Formula
Cai0^Na<Mgy(P04)fr.2(C03)zF2Fo.42
Ca10^NabMgb(P04UC03)cF2Fo.is5c
Ca10(PO4,CO3)6OH2
Ca10(PO4)6F2
Ca10(PO4)6OH2
Ca10(PO4)GCI2
Unit-Cell
a-Value
(A)
9.320-9.369
9.318-9.369
9,420
9.370
9.420
9.640
Refractive
Index
(ND25)
1.595-1.633
1.597-1.633
1.630
1,629-1.633
1.651
1,667
a-13,4].
b- [5].
91
Sedimentary phosphate rocks that are obtained from.
insular and cave deposits often contain carbonate
apatites that have a lower F content than that of
stoichiometric fluorapatite and, according to calculations, contain
significant amounts of hydroxyl in their structures.
Although some of these carbonate apatites may meet the
francolite definition, they have crystallographic,
chemical, and other physical properties that differ
substantially from those of francolites that contain excess fluorine
[7]. These carbonate apatites form a series with end
members that contain almost no fluorine (carbonate-
hydroxylapatite) (Table 5.4) and end members that are
very close in composition to pure fluorapatite and
francolites that have almost no carbonate substitution.
Members of this series are referred to as hydroxyl-fluor-
carbonate apatites in this section. Table 5.5 shows the
a-values of some phosphate rocks containing hydroxyl-
fluor-carbonate apatites in this series.
Table 5.5. Unit-Cell a-Dimension of Some
Hydroxyl-Containing Carbonate
Apatites in Some Sedimentary PRs
PR Source
Naura Island3
Christmas Island3
Lumphun, Thailand3
Mejillones, Chileb
Sechura, Perub
Length of a-axis
(A)
9.375
9.389
9.434
9.332
9.337
a, Samples from insular or cave deposits. These
apatites are part of a hydroxyl-fluor-carbonate apatite
series,
b. Calculations indicate these samples are fluorine-
deficient and may contain significant hydroxyl, Unit-
cell a-dimensions are similar to those of excess-
fluorine francolites, but other properties vary.
Continuing studies of sedimentary apatite mineralogy
have indicated that some minor revisions of previous
francolite models are warranted [5]. In studies conducted
at IFDC, data from approximately 1,200 phosphate rock
samples were sorted into groups from predominantly
marine deposits, insular or guano-derived deposits, and
igneous deposits. The samples from sedimentary deposits
were further screened, and all samples with less than
28% P2O5 were removed from further consideration.
This P2O5 level is the approximate level to which most
phosphate ores are concentrated for further chemical
processing to fertilizers although the data base contains
many naturally occurring phosphate samples with high
P2O5 contents. These data were also carefully screened
to remove any samples that had to be subjected to heat
treatments, contained iron and/or aluminum
phosphates, or contained free carbonates. Many of the
samples were extracted with neutral ammonium citrate
(NAC) or other mild extraction media to remove all
detectable free carbonates. This resulted in a data base
that included samples from most of the major deposits
in the world.
Screening by this method resulted in a data base
containing approximately 260 samples from predominantly
marine deposits. The francolites in these samples^ were
mainly of the excess-fluorine type as described by
McCIellan and Van Kauwenbergh \6\. The number of
samples from insular or guano-derived deposits was much
more limited. Screening by this method resulted in a
data base containing approximately 30 samples.
It is practically impossible to find pure samples of
sedimentary apatites. This fact has plagued apatite
mineralogists since apatite studies were first performed. In
order to evaluate these sedimentary apatites, each
chemical analysis was recalculated to a 100% apatite basis.
Based on previous studies, it was assumed that the
excess-fluorine francolites contained CaO, Na20, MgO,
P2O5, C03;SO4, andF.
Some of the results of the analysis of the data from
excess-fluorine francolites are portrayed in Figures 5.1-
5.6. The results of this analysis reconfirm previous
1.6-1
1.2-
0.8-
0.4-
Q.0-1
y = 5.996 - 0.998 x
r3 = 0.938
4.4 4.6 4,8 5.0 5.2 5.4 5.6 5.3 6.0
Moles P04 / formula wt.
Source: [6].
Figure 5.1. Excess-Fluorine Francolites.
Correlation of Moles of CO3"2 Per
Formula Weight With PO4"3 Per
Formula Weight.
92
2
1
-
0.6-
.
0.4-
-
0.2-
0,0-
y = 1.253 x
r2 = 0.942
og$o
CO
o
0
0im
•
0°
CO
o3 r-
0
]
o
6>
■
o
o
o
1 1
0.0
071 0.2 O.J
Moles CO, / P0,
0.4
Source: [6].
Figure 5.2.
Excess-Fluorine Francolites,
Correlation of Moles of Na+1 With
Increasing C03"2 for P04-3
Substitution.
0.18-,
y = 4.019 x
r2 = 0.944
-r*^—;—«—i—■—;—'—i—■—i—>—i—'—i
0.00 0.02 0.04 0.06 O.OB 0.10 0,12 0.14 0,16
Moles SO,
Source: [6].
Figure 5.4. Excess-Fluorine Francolites,
Correlation of Moles of Na"1 With
S04_2for 120 Samples.
0.1 0.2 0.3
Moles CO^ / PO,
Source: 16].
Figure 5.3. Excess-Fluorine Francolites,
Correlation of Moles of Mg+2 With
Increasing C03 2 for PO4'3
Substitution.
3.0-,
2.5-
2,0-
o6>
ft °OQO
°° o
'"■*£j?jjk0_flb" 8t?3»c?
o ^
c*s
O O OC
,o°°
8P
Oo o
! 5 J — y = 52.444 - 5.383 x. r* = 0,770
i—■—i—'—i—■—i—■—i—■—i—'—r
9.31 9.32 9.34 9.34 9.35 9.36 9.3S
fl-VQlue
Figure 5.5. Correlation of Moles of P1 with
the Unit-Cell a Value, Excess-
Fluorine Francolites.
93
9.38-1
9.37- O
9.36-
. 9,35-
9,34-
9.33-
9.32-
9.31-J
y = 9.369 - 0.034 x
r2 = 0.925
I ■ | i | - | I | I | i J I | : |
O.C 0.2 0.4 0.5 0.8 1.0 1.2 1.4 1.6
Moles COj / formula weight
Source: 16].
Figure 5.6. Excess-Fluorine Francolites,
Correlation of Moles of Mg+2 With
Increasing COa 2 for PO4"3
Substitution.
findings and refine the previous francolite models.
According to this model, excess-fluorine francolites derived
from sedimentary phosphate rocks can range from a
minimum P2O5 content of about 33.3 wt % with a
maximum CO2 substitution of about 6.9 wt %, to a
maximum P2O5 content of 42,2 wt % P205 with no C02
substitution.
Perhaps the most significant deviation of this model
from previous models is an apparent reduction in the
amount of fluorine in the theoretical francolite formula,
According to previous francolite formulae, carbonate
substitution (z) is accompanied by 0.4 z increased
fluorine substitution. The regression line comparing
fluorine content to a-values (Figure 5.5) in the present model
is drawn through a veritable cloud of data although the
correlation coefficient (r2) is acceptable (0.77). Fluorine
values as high as 2.4 to 2.5 moles per unit cell, as
determined by previous models, are certainly possible based
on the data used to drive the present model. However,
statistical analysis indicates that the excess-fluorine
francolite model formula should be revised to
Caio-a*NaaMgb(P04)frc(C03)cF2+o.i85c.
Analysis of samples containing apatites in the hydroxyl-
fluor-carbonate apatite series indicates that the best
correlation that can be obtained between any chemical, crys-
tallographic, or physical properties is the F content
(moles) versus thea-^alue (Figure 5.7). Significantly, the
simultaneous plotting and analysis of data from the
excess-fluorine francolite data set and the hydroxyl-fluor-
carbonate apatite data set clearly separate these
carbonate apatites into two distinct groups or series
(Figure 5.8). Whereas carbonate substitution is the dominant
9.44-
9.43-
"
9,42-
■
9,41-
■
S 9.40-
>
rt 9.39-
9.38-
9.37-
9.35-
9.35-
O
V
--
1 '
0.0
O
O'
Y "
0 0
\o
■"v.
Qd9 X °
9.427 - 0.036 k.
1 ■ ■ • 1 •
0.4 O.S
^
s.
'Q, 0
0 \o
NO
0 fr
r> - 0.92)
1 1 1 ■ 1
1.2
<
°\
OO
1 1 I 1
1,6
1
2,0
Moles F
Source: [71.
Figure 5.7. Relationship of the Fluorine
Content of Hydroxyl-Fluor-
Carbonate Apatites to the Unit-Cell
a Value.
1
9.44-
9.42-
9.40-
9.3B-
9.36-
9.34-
9.32-
9.30-
0
0
+
0
3-5°
0 ~-o 0
y = 9.4270 - 0.0353 x. r1 = 93.93S *#f
HjtiroxyHIUQr-caAwietoApaBBS \. +
/ = 9.7425 - 0.18577 *. r' = 77.0K
Excess-Ruorina Francolites
?+2 +
1 2
F (moles)
Figure 5.8. Correlation of the Unit-Cell a Value
With the Moles of F'1 in Hydroxyl-
Fluor-Carbonate Apatites and
Excess-Fluorine Francolites.
94
factor influencing the chemical, crystallographic, and
physical characteristics of excess-fluorine francolites, the
carbonate contents of hydroxyl-fluor-carbonate apatites
clearly cannot be correlated to the a-value (Figure 5.9).
Apatites in the hydroxyl-fluor-carbonate apatite
series that are only slightly fluorine deficient have a-di-
mensions in the upper range of excess-fluorine francolites
(= 9.360-9.370A). The carbonate apatites in this series
that are assumed to be highly OH' substituted have a-
dimensions similar to those measured for pure igneous
hydroxylapatite (9.410-9.430A) or carbonate-hydroxyl-
apatites (9.430A). Perhaps due to a limited sample base,
9.44-t
9.42-J
9.40-
d°
a 0 ooo
jHj* **+++,
9.36
9.34-|
9.32H -- y - 9.3689 - 0.3370 x. r1 = 92.5SS + +
+ Excess Fluo.-rne FrcncalUes
a tq_ ° Hydroxymuor^arbonHteAoelites
i ■—1 ■—n ■ 1 1 1 ■ 1 > 1—
0.0 0.2 . . 0.4 0.6 _ 0.S 1,0 - 1.2
CO3 (moles)
--1,6—
Figure 5.9. Correlation of the Unit-Cell a Value
With the Moles of CO3 in Excess-
Fluorine Francolites and Hydroxy!-
Fluor-Carbonate Apatites.
other systematic chemical variations that are well
established in francolites (Na, Mg, and CO2 contents versus
unit-cell a-dimensions) cannot be definitively established
within the hydroxyl-fluor-carbonate apatite series at this
time. It is presently impossible, by current analytical
methods, to determine the hydroxyl content of these
apatites. All estimations of hydroxyl contents must be
based on the relative lack of fluorine or calculated based
on charge imbalances. Based on charge balance
calculations, it is assumed that hydroxyl-fluor-carbonate
apatites contain excess hydroxyl in their structures that is
associated with carbonate substitution similar to the
excess fluorine associated with carbonate in excess-fluorine
francolites.
Some carbonate apatites do not fit well within either
the excess-fluorine francolite series or the hydroxyl-fluor-
carbonate apatite series and perhaps belong in an
intermediate class {Table 5.5). Phosphate rocks from the
deposits in Sechura, Peru, and Mejillones, Chile, might
be placed in this category. The carbonate apatites in
these rocks have unit-cell a-dimensions that fall plainly
into the range of the francolite series (=9.320-9.370A).
However, samples from these deposits, which have been
extracted for free carbonates, exhibit higher carbonate
contents and chemical reactivities than calculations based
on excess-fluorine francolite models would indicate.
Calculations indicate that the carbonate apatites from these
deposits have lower fluorine contents than expected and
may contain significant hydroxyl substitution.
Phosphate rocks from the same sedimentary deposit
may contain apatites with widely differing properties due
to geologic conditions and postdepositional alterations
[8]. Francolites are metastable with respect to fluorapa-
tite and can be systematically altered through the
combined effects of weathering, metamorphism, and time
[4]. Older sedimentary rocks generally contain francolites
with a limited amount of carbonate substitution, whereas
younger sedimentary phosphate rocks may have
compositions that span the francolite model (Figure 5.10)
[9].
The determination of the type and amount of apatite,
in a phosphate rock is very important. Sedimentary
phosphate rocks containing the most highly carbonate-
substituted apatites can only be beneficiated to maxi-
"mtjnr-grades~of~33-34~wt % P2O5. Depending on the
amount of carbonate substitution, the grade can increase
to a maximum of about 42 wt % P2O5 for sedimentary
apatites with essentially no substitution, In order to reach
CO,, (weight pareatit)
Pliocene - MkKeoft
Eowm
Creuceoua
Fwmirn
□frbixiiiin
OfdOVldon
Combrfcfi
infracanbrian
PracambriBn
1 1 1 1 1 1 1—
▲
Figure 5.10. Variation in CO2 Contents in
"Excess-Fluorine" Francolites of
Varying Geologic Ages (472
Samples, 165 Deposits; Peak of
Triangle Represents Average CO2
Content).
95
comparable concentrate grades, increasing amounts of
gangue minerals must be removed from sedimentary
phosphate rocks containing highly carbonate-substituted
apatites (Table 5.6).
5.3.2.2 Igneous Apatites-The apatite associated
with igneous source rocks may be of a primary mag-
matic, hydrothermal, or secondary origin. Primary
igneous apatite crystals are generally well formed and found
in association with high-temperature minerals or the
weathering products of high-temperature minerals.
Apatite may also form in the last stages of hydrothermal
alteration of phosphate-bearing igneous bodies. Evidence
from phosphatic pegmatites 110] suggests that apatite
may form at temperatures as low as 50°-100°C.
Secondary apatite is common in the weathered and
supergene-enriched zones of igneous deposits. Such
apatites are generally microcrystalline and may have
some degree of carbonate substitution.
Table 5.6. Mineral Composition of Selected
Sedimentary Phosphate Rocks
Source
Western U.S.A.
Tennessee, U.S.A.
Sechura, Peru
Florida, U.S.A.
Morocco
North Carolina, U.S.A,
Tunisia
Apatite3 Gangue Minerals
(wt %)
79,8 20.2
82.7 17,3
86.4 13.6
86.3 13.7
88.2 11.8
90.7 9.3
92.2 7.8
a. Wt % apatite = actual P205/theoretical P205 (100%
apatite). Assumes all samples contain 32% P2O5.
Primary apatite from igneous sources may be of fluo-
rapatite, hydroxyIapatite, or chlorapatite varieties (Table
5.4). A continuous series exists between the fluorapa-
tite and hydroxylapatite end members, Examples of fluo-
rapatite and hydroxylapatite mixing with chlorapatite are
limited. Statistical models have been established to equate
the wide range of crystallographic, chemical, and
physical properties of sedimentary apatites; however, models
equating these properties in igneous apatites are
generally lacking although optical and crystallographic
properties do vary (Table 5.4} (Figure 5.11). Perhaps the most
clearly recognized effect of anion substitution in igneous
apatites is that of the variation of the average refractive
index (ND25) [11,12] (Figure 5.11). Pure apatites from
igneous deposits contain slightly over 42% P2O5.
Fluara polite
0JJO4
awe
■ Ca„(PO*),0Ht
SO0C7
Hydroxylapatite
Source: 111].
Figure 5.11. Optical Properties of Fluor-,
Chlor- and Hydroxylapatites.
5.3.2.3 Aluminum and Iron Phosphates - A
total P2O5 analysis of a potential ore is not a dependable
criterion for evaluation of a phosphate deposit. With
the weathering of apatitic phosphates and associated
minerals, a suite of other secondary phosphate
minerals may form (Table 5.7). These minerals are most com-
-monly-aluminumz,and_ironicontaining phosphates. These
minerals cannot be processed by the methods used to
beneficiate apatitic calcium phosphates. Aluminum and
iron phosphate minerals may form in both sedimentary
and igneous deposits.
Probably the most common secondary phosphate
minerals produced by weathering are members of the
crandallite series. Wavellite is also a common
aluminophosphate weathering mineral. Iron phosphates
Table 5.7. Common Secondary Phosphate
Minerals Formed During the
Weathering of Phosphate Deposits
Crandallite Series
Crandallite
Goyazite
Gorceixite
Wavellite
Varisite
Strengite
Dufrenite
Beraunite
CaAl3(P04)2(OH)5-H20
(Sr,Ca)AI3(P04)2(OH)5-H2O
(Ba,Ca)Al3(P04)z(OH)5-H20
AI3(P04)2(OH)3.5H20
AIP04-2H20
FePCV2H20
Fe+2Fe+3(P04)3(OH)5«2H20
Fe+2Fe5+3(P04)4(OH)5»4H20
96
such as dufrenite, strengite, or beraunite may also form.
Table 5.7 provides a list of only the most common
phosphates found in these deposits. There are over 300
currently valid names for species of phosphate minerals
|13I.
Aluminophosphate ores with high P2O5 contents can
- be calcined at low temperatures (550° to 600°C) to
remove waters of hydration and alter the crystallinity of
the aluminophosphate minerals. This treatment results
3n marked improvements in the availability of P2O5 as
measured by common extraction procedures.
In Senegal, approximately 300,000 tpy (1994/95)
of product called Phos-Pal is produced by calcination of
aluminophosphate ores. The Phos-Pal product contains
34% P205, and 26%-27% P205 is soluble in
ammonium citrate (Joulie test),
Two calcined aluminophosphate products, Calciphos
(coarse product) and Citraphos (fine product), were
produced by calcining Christmas Island C grade ore. The
products had a total minimum P2O5 content of 30%; a
minimum of 20% P2O5 was soluble in neutral
ammonium citrate, and approximately 10% P2O5 was soluble
in 2% citric acid or 2% formic acid. These products are
not currently being produced.
5.3.2.4 Other Minerals in Phosphate Rocks -
The most common nonphosphatic accessory minerals
associated with sedimentary phosphate rocks are quartz,—
clays, and two carbonates: dolomite (CaMg(CC>3)2) and
calcite (CaCC>3). Carbonate-cemented phosphate rocks
are particularly noteworthy because of their abundance.
McCIellan and Gremillion [141 estimated that there are
3 tonnes of carbonate-cemented phosphate rock for
every tonne of ore that could be handled by conventional
milling and flotation processes (quartz- and clay-
containing phosphate rocks).
Quartz can occur as detrital grains or as chalcedony
cement. Chalcedony cement or particles in samples can
be particularly difficult to detect using optical microscopy
because the material is anisotropic in nature and similar
in appearance to microcrystalline francolite. Quartz can
also occur as opaline varieties in sedimentary phosphate
rocks.
Other tectosilicates found in sedimentary phosphate
rocks include the various feldspars. Orthoclase is
probably the most common feldspar variety, although many
other types have been detected in samples from various
localities. The high-temperature potassium feldspar,
sanadine, has even been detected in sedimentary
phosphate rocks from geologic provinces where volcanic
activity was occurring during deposition. Micas (biotite
and muscovite) can also be found in sedimentary
phosphate rocks.
The clays found in sedimentary phosphate rocks
include illite, kaolinite, smectites, and magnesium-rich clays
such as palygorskite and sepiolite. Mite often appears to
be a detrital mineral. Kaolinite, smectites, and
magnesium-rich clays often appear to occur in zones within
phosphate deposits. This zonation may be related to
weathering and the general alteration of deposits under
surface or near-surface conditions [15,16]. Clay-like
minerals such as the zeolite clinoptilolite occasionally are
found in phosphate rock.
Apatite of igneous origin is preferentially associated
with alkaline intrusions and carbonatites. Common
minerals associated with apatite-bearing alkaline igneous
intrusions include nepheline, alkali feldspars, micas,
pyroxenes, and amphiboles. Commonly the pyroxenes and
amphiboles are Mg- or Fe-rich varieties, and the micas
are biotite or phlogopite.
Carbonatites may or may not be associated with
alkaline igneous complexes. Calcite and/or dolomite can be
present in these carbonatites. Magnetite is very
commonly associated with igneous apatite in carbonatite
deposits.
Weathering of carbonatites has played an important
part in producing some igneous apatite deposits.
Weathering leaches and removes the more soluble carbonates
and silicates, leaving resistant minerals such as apatite,
magnetite and other iron oxides, pyrochlore, and
zircon ifTthe residuum over ffieclepbsit.
During igneous phosphate rock weathering, a wide
variety of secondary phosphate minerals and clays may
form. These phosphate minerals and clays include all
the minerals previously mentioned in conjunction with
sedimentary deposits. The residuum over such deposits
is typically very rich in iron and contains significant
proportions of hematite and goethite.
5.3.3 Apatite Reactivity
Several methods can be used to measure apatite
reactivity. All these methods are empirical methods; that
is, they depend on standardized procedures and specific
extraction media. Common extraction media include
neutral ammonium citrate (NAC), 2% citric acid, and
formic acid. It is not the purpose of this section to
discuss the relative merits or disadvantages of different
methods. A discussion of these methods can be found
in McCIellan and Van Kauwenbergh [7]. All discussions
in this section are based on extraction with NAC (AOAC
method).
Lehr and McCIellan [17] studied a suite of
sedimentary phosphate rocks and an igneous phosphate rock
concentrate and concluded that carbonate substitution
in apatite was the dominant factor influencing reactivity
measurements. This study also concluded that reactivity
97
measurements with NAC resulted in the highest
correlations with various apatite physical and chemical
properties. McCIellan and Van Kauwenbergh [7] and Van
Kauwenbergh and McCIellan [18] have further
characterized sedimentary phosphate rock reactivity
according to the separation of excess-fluorine francolites and
insular or guano-derived apatites (hydroxyl-fluor-carbon-
ate apatites). Excess-fluorine francolites have NAC
solubilities ranging from about 1.3% P2O5 at 0% carbonate
substitution to about 7% P2O5 at 6-9 wt % C02
substitution (Figure 5.12).
Apatites from insular or guano-derived deposits
exhibit NAC solubilities which range from about 3.5% to
7% P205. While the C02 content of hydroxyl-fluor-car-'
bonate apatites cannot be correlated with unit cell a-
valueSj the unit cell a-values of these apatites do appear
to be related to the NAC solubility (Figure 5.13) and the
fluorine content can be clearly related to solubility
(Figure 5.14).
Igneous apatites have essentially no carbonate in their
structures although at times traces of CO2 are picked up
in chemical analyses of igneous apatite crystals. The
reactivities of igneous apatites as measured with NAC
are very low (Table 5.8), corresponding to values
obtained from excess-fluorine francolites with essentially
no carbonate substitution.
9-1
6-
So-*'
o
E
I 3
2-
— y - -20.065 + 16.379 *. r*=O.B19
oO°o°o °o&
I
1.3
-1—r—p-
1.4
I ^
1.5
1.6
1.7
CoO/P,03 (Weight %)
Figure 5.12. Relationship of CaO/P205 Weight
% Ratio to Neutral Ammonium
Citrate Soluble P205, "Excess-
Fluorine" Francolites.
Ed."
-is
o
E
E
9.00-,
s.oo-
7.00-
6.00-
5.00-
4.00-
3.00-J
— y = -582.373 + 62.640 x, r1 ■ 0.755
Oy O
9,34
9.36
9.36 9.40
Unjl-Cell a
9.42
9.44
Figure 5.13. Unit-Cell a Dimension Versus
Neutral Ammonium Citrate
Solubility (% P2Os) of Hydroxyl-
Fluor-Carbonate Apatites.
9.00-1
S.00-
w 7.00-
e2" 6.00-
.26?
o
< 5.00-
4.00-
3.00-1
O O
— y = B.692054 - 1.2B1754 x. r> = 0.773
0.0
■ r ■ -t-t-i -r-
0.5 1.0
Moles F
-i—[—
1.5
I
2.0
Figure 5.14. Relationship of the Fluorine
Content of Hydroxyl-Fluor-
Carbonate Apatites to Neutral
Ammonium Citrate Solubility.
98
Table 5.8. Neutral Ammonium Citrate
Solubility (AOAC Method) of Some
Igneous Apatite Concentrates
Deposit, Country
Phalaborwa, S. Africa
Dorowa, Zimbabwe
Tapira, Brazil
Matongo, Burundi
Araxa, Brazil
Martison, Canada
Sukulu Hills, Uganda
Total P205
(wt %)
36-41
33.1
35.4
39.6
36.1
37.8
41,0
NACP2O5
(%p2o5)
0.4-1.5
0.8
0.8
1.3
1.4
1.5
1.6
As previously mentioned in the discussion of excess-
fluorine francolites, samples from the same deposits can
have widely varying francolite a-values, C02 contents,
and compositions. Samples from all types of
sedimentary deposits, including those from the same deposits or
from deposits within the same country, exhibit widely
varying NAC solubilities due to compositional differences
(Figure 5.15).
The type of apatite and/or degree of carbonate
substitution largely determines the reactivity (as
independently measured by reactivity tests) and suitability for"
direct application. The mosfliighly carbohate-substitutecT'
sedimentary apatites have the highest reactivity and
highest potential. Reactivity of sedimentary apatites decreases
with decreasing carbonate substitution to a level where
reactivities are essentially the same as those of igneous
apatites. Igneous apatites have the lowest potential for
direct application of all the apatites.
While determination of the type of apatite and
reactivity of a phosphate rock may give an indication of the
potential for direct application, many other factors are
involved. These factors include type of crop Gong or
short term), soil pH and other soil characteristics, and
climatic factors, Agronomic testwork is needed to
determine the potential for direct application under specific
conditions or a range of conditions.
5.3.4 Effect of Mineralogy on Further Processing
The texture and mineralogic contents of phosphate
rocks can have a profound effect on the possibilities for
beneficiation. Phosphate rocks that contain large well-
defined apatite crystals or phosphate grains that break
cleanly from enclosing crystals or cements usually have
good liberation characteristics and typically can be
further processed. Phosphate rocks containing small
apatite crystals or grains that may be well-intergrown with
enclosing crystals or cements require finer grinding for
UNITED STATES
North Carolina
Florida
Western Field
AFRICA
Tunisia
Algeria
Morocco
Egypt
Senegal
Togo
MIDDLE EAST
Israel
Jordan
Syria
LATIN AMERICA
Colombia
Peru
Venezuela
Mexico
OCEAN ISLANDS
Nauru
Christmas Is.
Curacao
BB-©
O—CTTD) O
Q Q
<*~KT|7TnrTT> ifijQ
0-OCDO(ffiPO-Q
G-O-9 O
S-6HH5H90 SB
G 0 COTOCOOOIDQ O
G—©Q
GB-€EffiHS-G
rri ittot*— 17m
Q—ggMHIB—B-O QB—O
O OO CEE—O
O-ffi-
tfipmrrTiri
012345675
Neutral Ammonium Citrate Solubility
Figure 5.15. Neutral Ammonium Citrate
Solubilities of Sedimentary
——Phosphate-Rocks From Various
Countries.
liberation; further processing of such rocks usually
results in high phosphate losses and lower grade
concentrates, Sedimentary phosphate rocks containing
phosphate grains or a microcrystalline phosphate
matrix with significant amounts of occluded gangue are
typically very difficult to beneficiate to levels suitable for
fertilizer processing.
The type of rock, the grain or crystal size, and the
amount of gangue minerals determine possible
beneficiation routes. Fine clays or Fe and Al phosphates in
unconsolidated sedimentary phosphate rocks can often
be removed by simple water washing and size
classification methods (screening or hydrocyclones). Plate-like
micas can also be removed by hydraulic methods. For
weathered igneous phosphate rocks, attrition scrubbing
may be required to remove Fe and Al phosphates and
fine iron oxides from the surface of apatite grains.
Magnetic or paramagnetic minerals can be removed by
magnetic fields.
Chemical ratios and the level of certain chemical
constituents can be important considerations in deposit
assessment, beneficiation, and processing for use as
99
fertilizers. One of the most useful criteria in the mineral-.
ogical and metallurgical evaluation of phosphate
deposits is the CaO/P205 ratio. The CaO/P205 ratio of pure
igneous apatite is approximately 1.32. For excess-
fluorine francolite, CaO/P20s ratios can range from 1.66
to 1.32."In an unbeneficiated phosphate rock sample,
this ratio may be influenced by the presence of other
phosphate and nonphosphate minerals. The presence
of calcium-aluminum, aluminum, and iron phosphates
decreases the CaCyT^Os ratio below that of the apatite
that is present. Crandallite minerals have a CaO/T^Os
ratio of approximately 0.39, Wavellite and many iron
phosphates contain no calcium (CaO/T^Os = 0). If the
CaO/T^Os ratio of a phosphate rock is below the ratio
predicted for the variety of apatite present, significant
amounts of nonapatite phosphates may be present.
Based on CaO/T^Os ratios, mineralogic determinations,
and beneficiation testwork, portions of or entire
phosphate deposits may be deemed unsuitable for further
processing.
Carbonate substitution in the apatite lattice increases
the CaO/P205 ratio. The presence of other calcium-
bearing minerals will also raise the CaO/PzOs ratio above
1.32. In both sedimentary and igneous phosphate
deposits, these calcium-bearing minerals often are calcite
and dolomite. Calcium-bearing silicates such as augite,
feldspars, and clays also may raise the ratio.
Many fertilizer processing calculations are based on
CaO levels and/or CaO/PzOs ratios. Acid consumptions
in acid attack processing are primarily related to CaO
contents, and the relative yield of P2Q5 is closely related
to the CaCyT^Os ratio. The presence of carbonates
results in the increased consumption of costly acids. Ca-
bearing silicates may be highly resistant to acid attack
and are relatively inert.
The characteristics of potential ores from a deposit
are critical in the evaluation of the deposit. For instance,
low CaCyT^Os ratios and elevated Fe2C<3 and AI2O3
contents may be indicative of undesirable ore zones.
Knowledge of these factors can guide further planning
and exploration. Chemical analysis (and expenses for
analyses) can be limited to those analyses that are
actually needed to adequately define potential ore zones.
Portions of deposits with unsuitable ore types may be
eliminated from resource/reserve calculations. Portions
of deposits may be determined to have slightly different
characteristics and may require different processing
methods. The first evaluation of a phosphate deposit
should probably include some type or level of
characterization studies. Many aspects of phosphate
characterization that initially may seem minor to nonspecialists
may be critical at some point in later studies.
5.3.5 Phosphate Rock Mining
The most successful phosphate mining operations in
the world generally involve high-volume removal of waste
and ore, low or reasonable costs for upgrading, ore
suitable for upgrading to prevailing market-grade
specifications, and large annual concentrate output. Successful
export-oriented mining operations are also generally
located within 200 km of the coast and a port, or there
is a well-developed transportation network to a port or
markets,
A wide variety of techniques and many types of
equipment are used to mine and process phosphate -rockr—
Phosphate rock is mined by both surface (open cast or
strip mining) and underground methods, In the
following sections, several examples of mining operations
illustrate the diversity of mining methods and equipment
that may be employed.
5.3.5.1 Surface Methods - Surface mining can
take many forms, from manual methods employing picks
and shovels to highly mechanized operations. Surface
mining is by far the most popular method for phosphate
deposits.
In Burkina Faso at the Kodjari Mine, perhaps a
maximum of a few thousand tonnes of phosphate rock is
produced per year. After less than 1 m of overburden
waste is removed, jackhammers are used to excavate
the relatively hard but thin-bedded sedimentary phos-
prTate"rock"frorn"the-surface; front-end loaders are used
to load the rock into trucks. The Kodjari phosphate rock
is transported about 40 km to the site of the crushing,
grinding, and bagging facility at Diapaga. The ground
Kodjari rock is distributed throughout Burkina Faso as a
direct-application phosphate source (=25% P2O5).
In Tanzania at the Minjingu Mine, power shovels,
bulldozers, front-end loaders, and dump trucks are used
to strip overburden and produce up to 22,000 tpy from
flat-lying soft phosphate beds about 1 m thick that
gently dip off Minjingu Hill. The phosphate beds may range
in P205 content from less than 20% P2Q5 to about 25%
P2O5. A dry beneficiation process results in a
concentrate containing about 30% P2O5. Minjingu phosphate
rock has been trucked to Kenya where it is used as a
direct-application phosphate source; it is also used to
make single superphosphate (SSP) in Kenya, Up to about
20,000 tpy of Minjingu concentrate was trucked to
Arusha (about 90 km) and then railed to a phosphoric
acid/triple superphosphate (TSP) plant at Tanga on the
coast until the plant was closed in the late 1980s.
At the Riecito Mine in Venezuela, dozer/rippers (Cat
D8), large front-end loaders (5 m3), and large mine trucks
(35 t) are used to strip overburden and mine over
100,000 tpy of phosphate rock from beds up to about
20 m thick. Crushed and screened Riecito phosphate
100
rock (27°/cr28% P205) is transported by truck (351) about
90 km to the PEQUIVEN fertilizer complex at Moron
where it is used to produce phosphoric acid, A rail line
to the mine has been under construction for several years,
Small diesel draglines and power shovels were used
to mine soft phosphate deposits at the surface in the
- Tennessee phosphate district of the United States, In
this area, mining sites could be as small as 5 acres and
located at considerable distances (up to about 150 km)
from processing plants. Small, over-the-road dump trucks
were used for transport. Mobility of equipment was
important in this case. The phosphate ore is a residual
deposit remaining from the dissolution of limestones.
The subsurface in these areas is composed of irregular
limestone pinnacles and solution features; small buckets
on the draglines (si m3) and power shovels were
essential in this situation to maximize recovery, Tennessee
ores were washed and screened and mainly used in the
production of elemental phosphorus in electric arc
furnaces,
Mining methods similar to those used in Tennessee
are employed on the island of Nauru. On Nauru, the
soft phosphate ore is developed over a highly irregular
limestone karst sub-surface where limestone pinnacles
may be over 12 m in height. Prior to World War 11, the
island was mined by labor-intensive methods. After World
War 11, laborers were still used in the pits where small
clamshell excavators could not extract the ore.and for_a_
final cleaning of the pinnacles. Due to safety
considerations, workmen were removed from the pits in 1978.
Phosphate is currently mined using a backshovel and
several small clamshell digger cranes, Ore is transported
to the primary crusher by 10- to 20-tonne trucks.
Crushed and sorted ore is transported to the drying plant
and storage facilities on the coast by a narrow-gauge
railway.
In Idaho, U.S.A., at the Henry Mine (Monsanto
Corporation), the producing beds of the Meade Peak
Member of the Phosphoria Formation are very soft and dip
at angles of 50°-60°. Bulldozers with vertical scraper
blades peel off layers of ore; then earthmovers scrape
up the ore and move it to storage piles according to
grade. The high wall is benched approximately every
50 ft with 10- to 15-ft benches. The ore is transported
by truck to the plant on a special road where it is used
for elemental phosphorus manufacture.
In Florida (U.S.A.), large electric walking draglines are
used to both strip soft overburden and mine the
essentially flat-lying soft phosphate beds. Typical bucket sizes
may range from 40 m3 to 70 m3. The draglines must
have a relatively flat and stable surface to work from
and walk on. Bulldozers, dump trucks, graders,
earthmovers, power shovels, and various other equip-
.ment are used for site preparation, This type of
equipment is also used for land reclamation once an area is
mined-out.
Each Florida mine uses a minimum of two draglines.
While one dragline is mining ore, the other dragline strips
overburden. In this way the beneficiation plant is
constantly fed without a stockpiling and reclaiming step in
the process. One of the advantages of using draglines is
that they can mine wet or moist ore from a bench above
the ore horizon. Indeed, although losses may be high
and the practice is not recommended, ore can be mined
from underwater. Ore is dumped from dragline buckets
into ore pits where water is sprayed at high velocity
from "pit guns" to break up the ore. A grizzly is used to
screen out large debris, and the ore is transported to the
beneficiation plant hydraulically via pipes. In Florida up
to 15 tonnes of water may be used to produce 1 tonne
of concentrate although most of this water is recycled.
One operation in Florida does not use draglines to
remove overburden or mine the ore. The Wingate Creek
Mine in Manatee County uses one dredge to mine
overburden and another to remove ore, which is pumped to
the beneficiation plant.
Most of the phosphate rock produced in Florida is
used in Florida to produce fertilizer, Phosphate rock
concentrate is moved mainly by railroads. Some rock is
exported through terminals in the Tampa area.
Large draglines are used to remove overburden at the
Kingisepp Mine in Russia. Up to 23 m of hard
limestone overburden is blasted and removed by the
draglines. Smaller scale equipment is used to selectively
remove the approximately 2.5-m-thick ore bed, which
is friable and does not require blasting. Large dump trucks
are used to transport the ore to the beneficiation plant,
which is located within an integrated fertilizer
production complex.
In the initial phase of mining at the Lee Creek Mine
(currently owned by PCS Phosphates) near Aurora, North
Carolina (U.S.A.), a dredge was used to remove a
portion of the overburden. The dredged section of the mine
development was pumped out, and conventional earth-
moving equipment was used to prepare the pad (a shell
bed) that the draglines walked on. Two draglines were
used to remove a final thickness of overburden and the
ore zone. The overburden and ore thicknesses in North
Carolina are much thicker than those in Florida. In the
Aurora Phosphate District, the overburden and ore zones
may be from 10 to 15m thick. Use of the dredge at Lee
Creek has been discontinued, and currently a portion of
the overburden is removed with large bucket wheel
excavators, The Lee Creek ore (@14% P2O5) is mined and
stockpiled next to the washer pit, fed into the washer
101
pit, disaggregated, and transported hydraulically to the
beneficiation plant. Much of the rock is used internally
at the site to produce a variety of products. Phosphate
rock is also transferred by barge to the ocean port
facility at Morehead City.
Large bucket wheel excavators are very suitable for
open pit operations when the overburden and ore are
soft and dry. In Togo the first several meters of
overburden, containing tree roots and other debris, are extracted
using bulldozers, front-end loaders, power shovels, and
large dump trucks. Large bucket wheel excavators
remove the remaining overburden (from 7 to 30 m) in
two benches. The overburden is transferred to mined-
out areas by conveyors and offloaded by transloaders.
In Togo bucket wheel excavators are also used to mine
the ore zones, which can be as much as 6 m thick.
Conveyors move the ore to a transfer point where it is loaded
into railcars for shipment to the beneficiation plant on
the coast. Beneficiated concentrate is conveyed to an
offshore loading platform,
5.3.5.2 Underground Methods - There are
several underground phosphate rock mining operations in
the world and, just as with surface mining, the methods
used range from labor intensive to highly mechanized.
In India, mining of the Mussoorie deposit was entirely
by hand in the initial stages of development (1960s and
1970s). The deposit lies within the Himalayas, and the
beds can be highly contorted' Over the years
underground mining has become mechanized and highly
sophisticated, employing methods such as block caving,
inclined room and pillar, shrinkage stoping, and sub-
level caving. Mussoorie rock is crushed, ground, and
bagged to produce a direct-application product.
In Baja California, Mexico, at the San Juan de la Costa
Mine of Roca Fosforica Mexicana (ROFOMEX),"a
moderately well cemented, relatively flat lying, sedimentary
bed is mined. A room and pillar method in a
herringbone configuration is used to extract about 65% of the
ore. Continuous miners mine a bed approximately 1 m
thick. The continuous miners feed ore to shuttle cars,
which in turn transfer the ore to feeder stations and
conveyor belts that transport the ore to one of several
mine entrances. Conveyors and/or trucks move the rock
to a beneficiation plant stockpile, Beneficiated rock
(about 30% P2O5) is stockpiled to air dry. The dock is
located adjacent to the beneficiation plant. Conveyors
load the air-dried rock onto ships.
Underground methods have been used in Morocco
for many years. Ore has been produced by a
combination of mechanized and classical methods. Conventional
room and pillar methods were used with the aid of short-
wall drum shearers. Underground methods are also used
in Tunisia and Egypt to mine gently sloping sedimentary
102
beds. Long-JwalI techniques similar to the techniques used
to mine coal have been used in Tunisia.
A combination of open pit and underground mines is
used in Russia to produce the phosphate ores of the
Khibiny Complex. As surface deposits have been
exhausted, underground mines have been developed at
several sites; there are plans to achieve depths of over
2,500 m.
5.3.6 Beneficiation of Phosphate Rock
Increasing world fertilizer demand in the 1960s and
1970s and the need for phosphate feedstocks
stimulated efforts to develop techniques to upgrade low-grade
ores and remove impurities. Among the common
impurities (gangue minerals) associated with phosphate ores
are clays (kaolinite, illite, smectites, and attapulgite),
quartz and other silicates (usually feldspars), carbonates
(mainly calcite and dolomite), secondary phosphates
(iron- and aluminum-bearing phosphates), and iron
oxides (goethite, hematite, and magnetite). It is highly
desirable, for both economic and technical reasons, to
remove as much of these impurities as possible and thus
to increase the apatite content and the grade of
phosphate feedstocks and improve the chemical quality.
Phosphate ores can be beneficiated by many methods, and
usually a combination of methods is used.
5.3.6.1 Beneficiation Techniques - In phosphate
r-ock-beneficiation,- the availability of water is of prime
importance and may dictate the process or processes
used. The total lack of water or lack of availability of
freshwater may exclude deposits from development or
restrict capacity. In areas where water availability is
severely restricted, such as at several locations in North
Africa and the Middle East, dry screening may be an
effective way to produce preconcentrates or concentrates
if ore characteristics are suitable. Seawater or brackish
water may be used for washing and size classification
such as in Togo, West Africa. Seawater may also be
used for flotation such as at the ROFOMEX mine in
Baja California, Mexico. Where seawater or brackish
water is used for beneficiation, a freshwater final rinse is
needed to remove as much chloride as possible from
the final concentrate. In other areas of the world,
freshwater availability is not such a problem. In Florida from
8 to 15 tonnes of freshwater is used to produce each
tonne of phosphate rock. Water is carefully managed in
Florida, and most of this water is recycled.
Clays, fine-grained iron-aluminum phosphates, and
fine-grained iron oxides can often be removed from
phosphate ores fairly simply by using combinations of
comminution, scrubbing, water washing, screening, and/
or hydrocyclones. The disposal of fine ore constituents
can be problematic. In some areas of the world, fines
may be disposed of at sea or in mined-out areas. In
other situations, environmentally suitable disposal of fine
waste is mandated. In Florida about 1 tonne of fines
(slimes) is generated for each tonne of concentrate
produced. The slimes leave the beneficiatton plants in Florida
as slurries at approximately 3% solids. These slimes
contain clays that do not readily flocculate and settle. Vast
aboveground areas are required for slimes settling ponds
' in Florida. The earth dams for slimes storage may range
from 20 to 60 ft tall, and up to 70% of the mined
acreage may be set aside for slimes storage. The Florida
slimes consolidate very slowly, preventing any type of
reclamation for long periods of time after mining. The
failure of earthen slimes dams in Florida is also a
problem. Significant efforts by private companies and
governmental organizations in Florida have been aimed at
developing reasonable economic methods of slimes
disposal while maintaining acceptable environmental
standards and producing multi-use land forms in reclaimed
areas. Disposal of fine waste produced by the beneficia-
tion of phosphate ores in other areas of the world may
not be so problematic. Slimes generated by the
operations of PCS Phosphates in North Carolina (formerly
Texasgulf) settle much more quickly than do Florida slimes
and are slurried with flotation tailings and gypsum to
mined-out areas.
The beneficiatton technique of froth flotation is widely
used within the world phosphate industry. Froth
flotation is generally employed with silicious ores when other
less expensive or less complicated-techniques fail-to pro----
duce phosphate concentrates suitable for chemical
processing, Of course, these other techniques are often
employed to prepare the feed for froth flotation. Prior
to conditioning for flotation, flotation feed is deslimed.
Fine particles have high surface to volume ratios and
cause excessive consumption of relatively expensive
reagents. Also, very fine particles are undesirable because
they may become entrained in the various streams of
the flotation process.
In the flotation of phosphate ores, apatite particles
are generally directly transferred to the froth fraction
(direct flotation) by using anionic collectors such as fatty
acids. The anionic collectors selectively attach to the
phosphate particles, rendering them hydrophobic, and
the particles attach and are lifted to the surface by air
bubbles and formation of the froth. The
mineral-bearing froth may simply overflow the cells or it may be
skimmed off by paddles. Quartz or other silicates are
typically removed from the bottom of the flotation cells
as tailings. A second stage of flotation may be added to
remove silica from the phosphate-rich float through the
use of cationic collectors (usually amines). In this case
the silica is floated, and the phosphate particles report
to the underflow. Tailings from the flotation process,
due to their size, dewater easily and are pumped to
storage areas or directly back to mined-out areas.
The removal of carbonates from phosphate rock has
been the focus of significant research efforts for several
reasons. Many countries have large deposits of
phosphate rock that contain significant amounts of calcite
(CaC03) and dolomite (CaMg[C03]2). Many of these
deposits are not exploitable using existing beneficiation
technology. Carbonates in phosphate concentrates,
consume valuable acid in any acid-attack processing scheme
and lower the grade of resulting products. High
magnesium contents, from the dissolution of dolomite and other
impurities, can contribute to poor chemical and
physical characteristics in fertilizer products.
Although-carbonate, to varying degrees, is part of the crystal structure
of the apatite typically found in sedimentary phosphate
ores, it is desirable to reduce the free carbonate
contents of phosphate ores and concentrates as much as
possible.
Several treatments have been proposed for the
removal of free carbonates from phosphate ores
including flotation [19,20], acid washing [21], calcination [22],
magnetic separation [23], and heavy media separation
[19], Heavy media separation can be utilized when the
phosphate grains are liberated from the associated
gangue minerals at relatively coarse sizes. Magnetic
separation may be possible when the carbonates are
contaminated with iron oxides.
Calcination of phosphate ores to remove carbonates
_is_exp_ensivej3ecausejDi_the_high costs of energy used to
attain the.temperatures necessary to thermally
disassociate carbonates (approximately 780° to 835°C),
Calcination is a very satisfactory method for removing organic
matter. Calcination is practiced commercially at several
phosphate mines around the world, mainly to improve
final product quality by removing minor amounts of
carbonates and organic matter. Calcination is also used
where the cost of natural gas is very low. The oxides
(CaO and MgO) produced by calcination of significant
amounts of carbonates can be removed by slaking with
water. The slaking process adds a size classification step
and a drying step to the beneficiation process, further
increasing costs.
Flotation of calcareous and dolomitic phosphate ores
seems to be the most economically viable technical
alternative. However, selective flotation of carbonates from
phosphate is rather difficult due to the similarity in the
physico-chemical properties of carbonate and phosphate
minerals. Carbonate/phosphate separation by flotation
is commercially used in Finland and Brazil to treat
igneous phosphate ores.
Despite the fact that significant research has been
conducted on the selective flotation of
carbonate-containing phosphate ores, carbonate flotation has not been
commercially adopted for the treatment of sedimentary
103
phosphate ores. Both direct and reverse phosphate and
carbonate flotation techniques have been tested for
effectiveness in upgrading sedimentary phosphate ores
with high carbonate contents. In carbonate flotation
processes, the phosphate minerals may be depressed
by using an aluminum sulfate/sodium potassium tartrate
mixture 124], sodium tripolyphosphate [25], diphos-
phonic acid [26], hydrofluosilicic acid [27], sodium
silicate, or sulfuric or phosphoric acid in slightly acidic pulps
(pH 5,-6,0) and simultaneously floating the carbonate
by using fatty acids or their sulfonated salts [28]. Related
methods have been developed for anionic flotation of
both carbonate and phosphate followed by selective
deoiling of the phosphate surface using sulfuric acid at
pH 5.3 and then floating the carbonate fraction 129].
Direct cationic phosphate flotation uses a tallow amine
acetate/fuel oil mixture while depressing carbonate
using acetic or hydrofluoric acids [30]. Some of these
methods show promise and may be utilized in the future.
Many phosphate ores have high iron contents that
render them undesirable for chemical processing into
fertilizers. Iron minerals are often present as iron oxides
coating the surface or interlocking with the phosphate
grains. Complex iron-containing silicates (such as am-
phiboles, micas, and clays) are another major source of
iron in most phosphate ores. Iron may also be present
as iron phosphates.
Various methods have been developed for the removal-
of iron gangue minerals from phosphate rocks,
including scrubbing and size classification [31], magnetic
separation [32], and flotation [33], Quite often combinations
of two of these methods are used to reduce the iron
content of concentrates to acceptable levels. Attrition
scrubbing to remove iron minerals coating the surface
of phosphate particles is generally recommended for
igneous ores with well-formed competent apatite crystals.
Attrition scrubbing of sedimentary phosphate rocks
containing soft phosphate grains usually results in high
phosphate losses as fines. Gravity separation of iron-bearing
minerals from phosphate ores can sometimes be
achieved by using heavy media. Good separation
efficiencies can usually be obtained with coarsely liberated
particles or closely sized feeds. Low-intensity magnetic
separation can be used to separate iron minerals with
high magnetic susceptibilities such as magnetite, and wet
high-intensity magnetic separation can be used to
separate feebly magnetic minerals such as hematite and go-
ethite. Flotation of iron oxides from phosphate ores by
using anionic and cationic collectors has been studied
by many investigators. The effects of organic and
inorganic electrolytes on the activation and depression of
iron oxides in flotation systems have been reported.
Starches and sodium silicate have been proven to be
effective depressants for iron minerals [34].
5.3.6.2 Examples of Beneficiation Processes-
The design of the beneficiation processes can vary widely
depending on the characteristics of the ores being
processed. For sedimentary phosphate ores, beneficiation
flowsheets can be as simple as washing and size
classification. Beneficiation flowsheets can also be very
complicated when several size classification steps,, several
stages of flotation, or other processing steps are used.
The following examples illustrate beneficiation schemes
for two sedimentary phosphate ores (Togo and Florida)
and two igneous phosphate ores (Sukulu and Siilinjarvi),
The Hahotoe and Kpogame phosphate mines lie"to~
the north of Lake Togo in the coastal area of southern
Togo. Ore is transported to the beneficiation plant on
the coast by a narrow- gauge railway. The beneficiation
plant common to both mines comprises five processing
trains resulting in an overall design capacity of 3,5
million tpy (Figure 5.16). The raw ore feed is scrubbed with
seawater and wet screened at between 0.8 and 3 mm
depending on the characteristics of the ore. The next
processing stage involves slurrying with seawater and
using a series of primary and secondary hydrocyclones.
Fines (approximately minus 44 (im), which include clays,
constitute approximately 40% of the composition of the
feed and are removed by hydrocycloning. The wet ore
concentrate is dewatered using 430-mm hydrocyclones
and then passes through centrifuges where it is given a
freshwater rinse to reduce the chloride content. A Iarge-
-diameter-rotary- dryer-with low airflow is used to reduce
moisture from 17% to less than 2%. The dry product
can be passed through a vibrating screen to remove
particles over 400 mm, and ferrous material can be
removed by an optional electromagnetic separation step.
The Togo phosphate rock concentrate is marketed at a
P2O5 content of over 36%,
The ores from the land pebble phosphate deposits of
central Florida typically consist of about equal portions
of phosphatic grains, quartz sands, and clays. Florida
beneficiation plants usually include a washer section
(Figure 5.17a) and a flotation section (Figure 5.17b). In the
following descriptions and figures, the size classifications
are approximate and depend on the equipment used at
specific installations. In the washer section, the ore slurry
(matrix) is processed using log washers, trommel screens
and inclined screens to remove large-scale
contamination (tree roots, large particles, etc.), break up clay balls,
free and clean the phosphate particles, and classify the
material. The minus 50 mm to plus 9.5 mm and minus
9.5 mm to plus 1.0 mm fractions may be separated as
phosphate pebble products if they are of suitable grade
and quality. The minus 1.0 mm fraction is deslimed in
hydroseparators or hydrocyclones. The minus 0.1 mm
fraction (slimes) is pumped to clay storage ponds. The
minus 1.0 mm plus 0.1 mm fraction (flotation feed) is
pumped to the flotation section.
104
Phosphate Ore
(~10%-25%P2O5)
Seawater
Washing
Trommel
Seawater_
Screens
(1-3 mm)
Seawater
Hydrocyclones
(Primary and
Secondary)
Fresh
Water
Centrifuge
Dryer
Magnetic
Separator
(Optional)
Oversize > Waste
Overflow
-44 micron
Slimes
> Waste
T
Product
(~35%-36% P205)
Figure 5.16. Simplified Togo Phosphate Ore
Processing Scheme.
In the flotation section, classification units may be used
to split the minus 1,0 mm plus 0.1 mm feed into two
size fractions for separate treatment. The coarser
fraction (minus 1.0 mm to approximately plus 0.4 mm) can
be concentrated by gravity (spirals) and froth flotation
methods. The finer, minus 0.4 mm plus 0.10 mm,
fraction is dewatered to 60%-75% solids. After being
conditioned with a pH regulator and a phosphate collector
(fatty acids with fuel oil or kerosene as an extender), the
pulp goes to the rougher cells. The underflow (silica
tailings) is pumped to reclamation areas. The concentrate
(froth product) is scrubbed with sulfuric acid to deoil the
particle surfaces, washed with water, and then
conditioned with an amine for silica flotation. The quartz froth
product from the amine flotation is pumped to waste
storage areas, and the underflow is the final (double-
float) phosphate concentrate, typically assaying 2%-3%
silica and 31°/^34% P205 (68%-75% BPL).
The techniques used to beneficiate igneous phosphate
ores can be very diverse depending on ore
characteristics; two examples illustrate the diversity of igneous ores.
Soft and unconsolidated Sukulu phosphate rock ore from
Uganda resembles an iron-rich soil. The Sukulu ore is a
residual deposit of phosphate and iron minerals that are
resistant to weathering or are weathering products. The
deposit is developed on an igneous structure called a
carbonatite, which was formed deep below the surface
of the earth. The precursor carbonatite contains
carbonates, magnetite, iron-rich silicates, and apatite. Deep
weathering has removed carbonates and increased the
relative abundance of iron oxides and apatite in the
soillike residuum formed over the carbonatite. Sukulu ore
can be beneficiated by using many of the techniques
employed to treat sedimentary ores. Hard igneous
phosphate rock from Siilinjarvi in Finland in some ways re-
-sembles-the-unweathered precursor materials from which
the soft Sukulu deposit was formed, and it requires
different beneficiation techniques.
Prior to the cessation of activities in 1977, the
concentrates produced by the Sukulu mine were used to
produce SSP. At the Sukulu beneficiation plant, a front
end loader fed the loose unconsolidated ore into a
hopper with a feeding mechanism, which in turn fed the
ore onto a belt conveyor leading to the washer, The ore
was slurried, screened, and deslimed with hydrocyclones.
The deslimed ore slurry was then pumped to the
primary magnetic separators. The partially magnetically
separated ore was ground in ball mills and sized down to
minus 0,1 mm to liberate apatite and magnetite. This
was followed by another step of magnetic separation
and slimes removal. The deslimed pulp was then
conditioned with a pH regulator and sodium oleate as a
flotation agent. Flotation was carried out in stages (one
rougher and three cleaner steps) with a scavenger
flotation circuit for the tailings of the rougher cell. The
phosphate concentrate would typically assay 41.0%-42%
P205 (90% BPL) and less than 1.2% Fe203.
The low-grade (mill feed is approximately 3.5% to
5,5% P2O5) igneous apatite deposit at Siilinjarvi,
Finland, on average is composed of about 65% phlogopite
mica [K(Mg,Fe)3AlSi03Oio(6H,F)2], 19% caicite, 4%
105
Water
Clayballs +50 mm
1
Water
Hammer mill
Disintegrated material
I
-50 +9.5 mm material
| j Water sprays
Backwash
Log washer
r
Water
Vibrating screen
Backwash
Coarse pebble
Pebble storage bin
-50 +9.5 mm
Phosphate matrix
(40% solids)
L_l
Launder or tub
1 mm screen
+1 mm material
Trommel
50 mm opening
Undersize -50 mm
Inclined screen
1 mm mesh
Oversize+1 mm
Double-deck
vibrating screen
-9,5 +1 mm
Log washer
Vibrating screen
Fine pebble
Pebble storage bin
-9.5 +1 mm
-1 mm material
Underflow
Undersize -1 mm
Undersize -1 mm
Water
Undersize-1 mm
Hydro separator
I
Overflow
To waste
Flotation feed bin
Source: Adapted from Bureau of Mines Information Circular 7814, United States Department of the Interior,
1958.
Figure 5.17a. Florida: Generalized Scheme of Phosphate Rock Beneficiation—Washing.
dolomite, 10% apatite, and 5% other silicates. Mining
at Siilinjarvi is controlled by a computer-based open-pit
surveying and planning system to reduce the effects of
mineralogical variations on further processing. The ore
is very hard and must be blasted. The use of blending
stockpiles after primary crushing and screening further
helps to reduce variations in the ore feed to the
beneficiation plant. A flowsheet of the Siilinjarvi plant is shown
in Figure 5.18,
Crushing, screening, blending, grinding, and
conditioning prepare the Siilinjarvi ore for flotation. All the
ore must be treated in this manner. With a hard igneous
phosphate ore such as this, there is no option to
remove impurities and upgrade the flotation feed by other
methods. The ore slurry is fed to the flotation section at
35% by weight minus 74 u.m. The slurry is conditioned
with an N-substituted sarcosine as a selective phosphate
collector, The conditioned pulp is pumped to a
distributing box that feeds the rougher flotation cells. Outokumpu
double-cell flotation units of 38 m3 capacity are used.
The apatite rougher concentrate advances through a
four-stage cleaning process. The final cleaner flotation
concentrate flows to a 20-m-diameter center-drive
thickener to raise its solid content from 36%-40% to 65% by
weight solids in the thickener underflow. The moisture
content of the concentrate is then reduced to 6%-8% by
using pressure filters. The apatite concentrate averages
85% by weight minus 150 mm and typically assays
35.5% P205 (77.5% BPL), 6.5% C02, 1,95% MgO,
0.03% K20, 0.09% Na20, 0.5% Si02, 0.4% Fe, and
8% moisture, The concentrate is fed directly into a
phosphoric acid plant. The beneficiation plant also produces
a calcite concentrate, and phlogopite mica is produced
as a byproduct.
106
+1
'
n mm ^
'
Storage
+1.0 mm
r
l
Flotation feed bin
1
Underflow
i
Pump
1
Hydro-sizers
+0.4 mm
Table feed bin
I
Rotary conditioner
i
Distributor
4
Vibrating tables
1
■
f
1
r~
Conditioner
i
Vibrating tables
1
4— Concentrate +■
Middling
'
Storage
+0.4 mm
r*
-+- Overflow
r
^ -0.4 mm
1
Hydro-separators
1
Underflow
4
Feed bin
4
Vertical conditioner
I
Flotation cells
1
tion
w Tailing
to waste
HaSO, -
+
Dswatering cone
i ,.
Vertical conditioner
Water —i
'
'
Tailing
to waste
Wash box
1
Underflow
1 «-
Conditioner
1
Flotation cells
Concentrate ►
Overflow
slime
I
To waste
—► Tailing to waste
i
i
Cationic
flotation
reagents
-Froth—|
To waste
Storage
-0.4 mm
Source: Adapted from Bureau of Mines Information Circular 7814, United States Department of the Interior,
1958.
Figure 5.17b. Florida: Generalized Scheme of Phosphate Rock Beneficiation—Flotation.
Sedimentary phosphate ores, particularly those that
have been subjected to the effects of heat and/or
pressure (perhaps deep burial) may become highly
consolidated, well cemented, and very indurated. Such
phosphate ores are typically of Paleozoic or Precam-
brian age. The production of well-consolidated, and highly
indurated sedimentary ores may require mining and
beneficiation techniques resembling those typically used for
hard igneous phosphate ores. Such phosphate ores are
mined and beneficiated in India and China.
5.3.7 Factors Affecting Quality of Phosphate Rock
The wide variety of geologic settings in which
phosphate rocks occur results in textures, accessory mineral
assemblages, and chemical compositions that range from
simple to very complex. Variations in quality from a single
phosphate rock source can arise due to the fact that
continuous mining removes beds or ore zones that have
internal variations, and beneficiation processes may
deviate from normal practices for various technical or
economic reasons. Impurity contents and compositional
differences not only contribute to processing difficulties
that have an indirect effect on product quality but also
can directly contribute to fertilizer product compositions.
The principal market specification relating to the P2O5
content (grade) of phosphate rock is not a reliable
indicator of the potential quality of phosphate fertilizer
107
Crushing and
screen Ing
Blending stockpiles
Class If I cat ion
s/1 Rod N_, y] BaI I N*
^\Jm_LLK Xinl III/*
"Apo,-t|-te
flotation
Tall Ing Tailing
classification thickenIng
Conditioning
Apatite concentrates Calclte concentrates
Figure 5. IS. Generalized Scheme for Processing Siilinjarvi Phosphate Ore.
produced by a particular process, nor is it an indicator
of the similarity of equivalent grade phosphate rocks
from different sources. In general, lower P2O5 means
higher impurity contents. Lower P2O5 content results in
lower yields, and high impurity contents result in more
processing problems and higher costs. Variability in phos-
"phate rock compositions contributes to the physical and
chemical quality factors summarized in Table 5.9 135].
The effects of impurities are not all negative. The
presence of some impurities has a positive effect during
processing and/or on the physical properties of products
[36,37].
5.3.7.1 Physical Factors - Processing of
commercial phosphate rock concentrates depends to a large
extent upon their texture. In general, a phosphate rock
concentrate has the ideal texture for processing when it
is disaggregated and contains relatively soft but
competent porous sand-sized sedimentary phosphate particles
that are easily handled and metered mechanically.
Grinding of these phosphates to a particle size range required
for phosphate fertilizer manufacture presents no major
problems. Concentrates with porous phosphate particles
may be suitable for phosphoric acid manufacture with-
Table.5.9. Quality Factors for Commercial
Phosphate Rocks
Physical Factors
Texture: hardness, porosity, cementing, or coating phases
Phosphate particle size: coarse to cryptocrystalline
Degree of crystallinity of the apatite
Effect of physical treatments: natural or calcined state
Chemical Factors
P content of phosphate rock (BPL grade]
F content of the apatite
Carbonate content of the apatite
Free carbonate content
CaO/P205 weight ratio (phosphate and accessory mineral
sources}
Fe and Al content (combined R2O3)
Mg content (phosphate and accessory mineral sources]
Content of inert mineral gangue (insoluble oxides and silicates)
Na and K (phosphate and accessory mineral sources)
Organic matter (native types ■*■ beneficiation reagents)
Chlorides (from evaporite salts, phosphate substitution, process
water}
Heavy metals (Cd, Pb, Zn, Hg]
Potentially toxic elements (Se, As, Cr, V)
Radionucleides (U, Th, Ra, Rn) from phosphate minerals
Source: Adapted from Lehr [35].
108
out grinding. Many of these desired textural properties
are common to many sedimentary phosphate
concentrates, but not to concentrates produced from igneous
or metamorphic phosphate deposits [38].
Sedimentary phosphate rocks with compact,
indurated, coarse particles, or concentrates containing coarse
, apatite crystals such as those of igneous or
metamorphic origin are often slowly reactive in acidulatJon
processes. Reaction/retention times may become long, and
phosphate losses may become unacceptable due to
blinding of phosphate particle surfaces. These types of
concentrates may require fine grinding to an acceptable
particle size, thereby increasing surface area, to be
suitable for acidulation, A common grind for relatively un-
reactive phosphate rocks is 70% minus 200-mesh (Tyler).
Calcined phosphate rocks may have low reactivity
because of agglomeration, loss of porosity, and thermally
induced crystal growth of the apatite. When francolites
are treated with heat, carbonate is expulsed and the
apatite recrystallizes, producing apatites similar in
composition and reactivity to igneous apatites.
5.3.7.2 Chemical Factors - In spite of the known
physical, miner alogical, and chemical differences that
exist among various types of phosphate rocks, grade is
typically the primary criterion used to differentiate
phosphate rocks and is often expressed in terms of tricalcium
phosphate [CasfPO^]. The trade name for tricalcium
phosphate is "bone phosphate of lime" or BPL. Early_
workers believed that tricalcium phosphate was the chief
constituent of commercial phosphate rock. Later
studies have shown that bones and phosphate rock consist
of varieties of apatite. Because these commercial terms
are widely used, the following conversion factors are
included for reference purposes:
P2Q5 = 0.4576 x BPL
BPL = 2.1852 xP2Os
P = 0.1997 x BPL
Commercial phosphate rocks vary in grade from about
80 BPL to about 60 BPL. Most international trade
involves the higher grade phosphate rock, and lower grade
rock is often used at local processing facilities. The
economics of shipping and processing low-grade phosphate
rocks are not favorable.
Phosphorus Content - A somewhat loose
terminology may be used to indicate processing quality
according to grade although no absolute marketing
specifications presently exist. Each producer will have
its own specifications. Trade organizations have
established grade categories for record-keeping purposes. For
example, the International Fertilizer Industry
Association (IFA), Paris, France, uses five grade categories (65
. BPL and under, 66-68 BPL, 69-72 BPL, 73-77 BPL,
and 78 BPL and over) at the present time,
Premium-grade phosphate rock concentrates were
considered by Lehr [351 to contain at least 31% P2O5
(over 68% BPL). Lehr [35[ considered phosphate
concentrates to be nonpremium grades when the P2O5
content was below 31% and the concentrations of accessory
mineral impurities were correspondingly higher.
Regardless of grade, marginal phosphate rocks were
considered by Lehr to be raw materials with high contents of
accessory mineral impurities that render them marginal
or unsuitable for chemical processing.
Robinson [39] indicated that in Europe phosphate
rocks were generally considered high grade if they had
P2O5 contents in the 33%r39% range (over 72 BPL).
Phosphate rocks were considered low grade if their P2O5
content was in the 28%-33% range.
Phosphate rocks from both igneous and sedimentary
sources are generally lumped together in statistical
tabulations by grade. There are very few sedimentary
phosphate deposits from which most of the concentrate
production is entirely over 33% P2O5. There are several
major sedimentary deposits where a proportion of the
production is over 33% P2O5 but most is below 33%
P2O5. lrr contrast, concentrates produced from igneous
phosphate rocks are almost invariably over 33% P2O5
"and are usually over 35%-36% P205 (-78 BPL).
It is not important that phosphate rocks be placed in
categories according to grade. It is important to realize
that higher P2O5 contents translate to lower impurity
contents. Increased P2O5 contents in concentrates
result in increased yields per tonne of material shipped,
handled, and processed. Lower impurity contents
generally result in increased reaction efficiencies, fewer
processing problems, and less waste. In general, higher P2O5
concentrates command higher prices. Processing of
phosphate rocks containing less P2O5 and more
impurities results in less product, higher processing costs, and
less potential profit. Correspondingly, phosphate rocks
with lower P2O5 content are priced lower.
Carbonates- Carbonate, to varying degrees, is part
of the crystal structure of sedimentary apatite (francolite).
It is desirable that the free carbonate contents of
phosphate ores and concentrate be as low as possible. The
carbonate content of internationally traded phosphate
rock is usually minimal and generally confined to the
carbonate component. Carbonates cause foaming in the
production of phosphoric acid and consume valuable
acid in any acid-attack processing scheme. If
carbonates are disassociated by calcination, the CaO (and
perhaps MgO) remaining must be removed by slaking, or
acid consumption will still be high, The dissolution of
dolomite (calcium magnesium carbonate) releases
109
magnesium impurities in processing systems. A benefit.,
of the carbonate content of the francolite in phosphate
rock is seen in SSP and TSP manufacture by the den
process. Phosphate rocks that contain carbonate
produce a porous friable den product that is more easily cut
and handled.
Iron and Aluminum — High iron and aluminum
contents are not desirable in commercial phosphate
concentrates. High R2O3 (AI2O3 + FegOs) contents can
lead to poor physical properties in superphosphates,
fertilizer intermediates that are difficult to handle, and
phosphoric acid-based products that are difficult to dry
and that may cake in storage. When concentrations of
R2O3 exceed about 3%, problems resulting from
precipitation of iron and aluminum phosphate compounds
can be expected during concentration, cooling, and
storage of phosphoric acid. Fertilizers produced from
phosphate rocks and phosphoric acid containing high
amounts of R2O3 also contain less water-soluble P2O5
as a percentage of total P2O5 due to the formation of
water-insoluble iron and aluminum compounds.
Furthermore, the presence of high iron and alumina contents
can lead to reversion of water-soluble P2O5 compounds
to insoluble compounds over the passage of time in
storage. An acceptable level of the R2O3/P2O5 weight ratio
in phosphate rock feedstocks for processing to
fertilizers is about 0.1 or less [361.
Low aluminum contents (<0.1%-.0.2%) in phosphate.
rock concentrates can lead to needle-like gypsum
crystal formation in phosphoric acid manufacture, low
filtration rates, low wash efficiency, and unacceptable P2O5
recovery. Low AI2O3 and perhaps low Fe2Ga content in
phosphoric acid used to produce ammonium phosphates
results in products that tend to cake easily. Iron-rich high-
aluminum clays (kaolinites) have been added during the
granulation of SSP and TSP produced from high-purity
phosphate rock and phosphoric acid to promote
granulation and assist in the formation of strong granules.
Magnesium - High magnesium contents in concert
with high R2O3 contents result in similar processing and
product problems, High magnesium contents can result
in the formation of compounds that increase the
viscosity of phosphoric acid upon concentration, even when
the R2O3 contents are low. The presence of magnesium
leads to the precipitation of insoluble phosphate
compounds in the manufacture of liquid ammonium
phosphate fertilizers.
Fluorine Content - Phosphate concentrates with
high fluorine contents and low silica contents yield
phosphoric acid that is high in fluorine. In the production of
phosphoric acid, excess free fluorine ions result in long,
thin, needle-like phosphogypsum crystals, which are
difficult to filter and have a low washing efficiency and a
high final cake moisture. When a phosphate rock has
excess fluorine, the addition of active silica is beneficial
to improve the crystal shape [371. Free aluminum and
magnesium may react with fluorine to lower the free
fluorine content. High fluorine contents in phosphoric
acid have a marked influence on the kinds and amounts
of insoluble precipitates that form in the ammoniation
products, and the concentration of the residual fluorine
in liquid fertilizers is especially critical [40].
Silica and Silicate - Silica present as crystalline
quartz is generally unreactive in any acid attack scheme
' and mainly acts as a diluent. Crystalline quartz increases
the erosion rate for beneficiation and fertilizer
processing equipment. Fine crystalline quartz can hamper
filtration by filling the pores of the cake and plugging the
filter cloth. Active silica has a positive effect on the
reduction of corrosion, as it complexes with the free
fluorine ions and influences the crystallization of
phosphogypsum [37]. During phosphoric acid
manufacture, blinding of the filter cloth can occur when
colloidal silica is formed in the reaction medium.
Sodium and Potassium - The quantity of sodium
or potassium in the phosphate rock has an impact on
the scaling tendency during phosphoric acid production,
If sufficient fluorine and dissolved silica are present in
the acid, the formation of Na2SiFe and K2Sip6 is
expected to increase scaling in the filter circuit. These
compounds are water insoluble and act as diluents in
monoammonium phosphate (MAP), diammonium
phosphate (DAP), and nitrophosphates.
Strontium - Strontium sulfate (SrSC>4) has a
minimum solubility in 40% phosphoric acid. SrS04 forms a
scale in the heat exchangers of phosphoric acid
concentrators. An extremely thin film of this precipitate
causes pronounced reductions in the capacities of such
units [371,
Organic Matter - Some forms of organic
compounds give rise to persistent foams that require the use
of antifoaming agents. The presence of organic matter
may result in NOK release in nitrophosphate
manufacture. During processing, the presence of organic matter
may result in odors that may persist and be
objectionable to the population near a fertilizer plant. Organic
matter may be a benefit if the phosphate rock is
processed by the electric furnace method where the organic
matter burns and reduces fuel and energy requirements.
Sulfides- Sulfides can release H2S, which is a toxic
gas, during acidulation. Sulfides produce reducing
conditions, increase corrosion rates in phosphoric acid
manufacture, and give NOK release in nitrophosphate
manufacture.
110
Chlorides - The usual sources of chloride ions in
phosphate concentrates are the evaporite salts found in
some sedimentary ores or from seawater or brackish
water that might have been used in beneficiation.
Chlorides sharply increase the corrosion rates of steel
equipment during acidulation. In general, chloride contents
.higher than 200-300 ppmw cannot be tolerated because
corrosion rates for common stainless steels then become
excessive [36[. With special steels, use of plastics, and
special concrete construction, higher CI contents can
be tolerated.
Heavy Metals-Heavy metals do not appear to have
any adverse effect on fertilizer manufacture but may be
potentially hazardous. Some countries have imposed a
limit on the Cd^Os weight ratio.
There is no known process that is capable of
removing Cd from phosphate ores at no cost. Limits in
fertilizers can only be reached economically by using
phosphate rocks with low Cd content or by blending
the above-average Cd content phosphate rocks with
other ores that contain a minimum amount of Cd. Some
phosphate rocks with higher than average Cd content
have been excluded from the European market. The
bioresponsibility of Cd has not yet been established
clearly, and the European Community has committed
to studies to clarify this matter. The EC is also giving
financial support for studies of processes to remove Cd
from phosphoric acid.
Radionucleides - The radioactivity of the
commercial phosphate rocks does not interfere with fertilizer
manufacture but must be considered because of
potential health hazards. Recent interest has been focused on
U and Ra, regarding both recovery and potential health
hazards in manufacturing and in handling byproducts
and final products.
During the digestion of phosphate rock by the dihy-
drate process, most of the uranium reports to the
phosphoric acid solution. Becker [41] estimates that 85%-95%
of the uranium in the phosphate rock feed goes into
solution. Several processes have been developed for the
extraction of uranium from phosphoric acid.
Whereas uranium mainly reports to the phosphoric
acid stream during processing, radium-226 preferentially
reports to the phosphogypsum byproduct. Radium-226
is a long-lived alpha emitter with a half life of 1,622
years and is a gamma radiation source when
accompanied by radon-222 and its progeny. The U.S.
Environmental Protection Agency (EPA) has imposed a limit of
10 pCi/g radiation for phosphogypsum, and
phosphogypsum produced from Florida phosphate rock
must be contained in piles near the processing plant.
Phosphogypsum produced from central Florida
phosphate rock cannot be sold for any purpose, and its
movement is strictly controlled.
5.3.7.3 Measuring and Estimating the Impact
of Phosphate Rock Quality Factors - The quality of
phosphate rock influences the design, capital costs, and
operating costs of processing facilities. If a phosphate
rock source has been used for many years, a wealth of
engineering data and expertise has probably been
developed concerning its use. However, when new or
different sources of phosphate feedstock are to be used,
the effects of physical and chemical factors can often^
be determined only by laboratory and pilot plant-scale
testwork. In comparative studies, unknowns are
compared with phosphate rocks or intermediates with known
processing characteristics and specified processing
conditions. The data from such tests can be used in
designing or modifying processing plants. It should be stressed
that such tests should simulate industrial processes as
closely as possible, and be of sufficient scale and
duration to provide reliable data for design purposes.
Becker [41] presents a step-by-step approach to make
economic comparisons of the use of different phosphate
rocks in phosphoric acid production. A case study is
presented calculating the equivalent prices for two
phosphate rocks differing in grade and impurity contents. In
the calculations, consideration is given to processing
losses, sulfuric acid consumption, grinding costs, filtra-
-tion-ratesy-and-acid-GonGentration-costs. Although some
of the losses and sulfuric acid consumption can be based
on chemical analyses and realistic assumptions, some
of the critical data needed must be obtained by actual
testwork. Becker [41] also presents phosphate rock data
sheets and guidelines for use which may be helpful in
establishing preliminary investment cost estimates for a
chosen phosphate rock quality, optimizing plant
economics by comparing the economics of a particular rock
with other phosphate rocks that might be purchased,
and competitive phosphate rock valuation.
5.3.8 World Phosphate Rock Production and
Reserves
5.3.8.1 World Phosphate Rock Production and
Quality - Commercial production of phosphate rock
for the production of fertilizers began in the mid-19th
century. In 1847, about 500 tonnes of phosphate rock
was mined in Suffolk, England [42]. World production
increased to 5,000 tonnes in 1850, 10,000 tonnes in
1853, over 100,000 tonnes in 1865, over 1 million tonnes
in 1885, over 10 million tonnes in 1928, and over 100
million tonnes in 1974. In the mid-1970s, one estimate
indicated that world phosphate rock production would be
about 300 million tonnes by the year 2000 [43],
Such estimates proved to be overly optimistic. Figure
5.19 shows world growth in phosphate rock production
111
150
1945 1950 1955 1960 1965 1970 1975 1980
Year
Source: [44].
Figure 5.19. World Mine Production of
Phosphate Concentrate,
1945-81.
between 1945 and 1981 [44]. In 1945 total world
concentrate tonnage was just over 10 million tonnes. Growth
in phosphate concentrate production seems to have
increased linearly to about the mid-1960s, reaching a level
of about 50 million tonnes; an abrupt increase in the"
growth rate then occurred. In the 1980s and into the
early 1990s, phosphate rock production growth
stagnated (Figure 5.20) and seemed to have leveled off at a
world production rate of around 150 million tonnes prior
to the breakup of the Soviet Union (1990/91).
World phosphate rock production figures for 1988
are given in Table 5.10. The figures for 1988 were
chosen for illustrative purposes because the world phosphate
market was relatively stable at this time. Based on 1988
data, four countries - the United States, FSU, Morocco
(including Western Sahara), and China - collectively
produced about 75% of the world's phosphate rock. The
top 12 countries produced about 95% of the world's
total phosphate rock.
Trade conflicts in the world phosphate market in 1989
did not prove to deter phosphate rock production, and
world production increased slightly to approximately 163
million tonnes, according to the United States Bureau
of Mines (USBM) [45]. In 1990 world production fell to
about 154 million tonnes. U.S. production decreased
about 4 million tonnes, With the advent of significant
social changes in the FSU and associated economic
disruption, FSU production declined from about 35
million tonnes of phosphate rock in 1990 to about 29
million tonnes in 1991. Overall world production
200
150
1BB1 19S2 1983 1994 1965 1986 1987 1968 1989 1990 1991 1992 1993*
a. Estimated.
Source: Data for 1981-89 compiled from U.S. Bureau
of Mines Mineral Commodity Reports, 1983-
92, and data for 1990-93 compiled from Mew
[46],
Figure 5.20. World Phosphate Rock
Production, 1981-93.
dropped further to approximately 145 million tonnes in
1991 [46[. Due mainly to further decreases in
production from the FSU and slightly reduced production in
the United States, world phosphate rock production fell
to 135 million tonnes in 1992.
Estimates of 1993 world phosphate rock production
ranged from 117 million to 131 million tonnes [46, 47,
48]. Although production in the FSU was thought to
have stabilized near 19 million tonnes (about half of the
pre-1990 levels), production in the United States was
down about 9 million tonnes and Morocco decreased
production about 1 million tonnes. Final USBM figures
for 1993 indicate a total world mine production of 120
million tonnes [47].
Estimates of 1994 world production indicate an
approximate increase of 10 million tonnes over 1993
production to 130 million tonnes. For comparison with
1988 data (Table 5.10), one set of world phosphate
rock production estimates for 1994 is given in Table
5.11. In this compilation, FSU data have been
separated into Russia, Kazakhstan, and other countries, and
therefore several producers have changed positions in
ranking. While overall world production decreased
approximately 32 million tonnes from 1988 to 1994 (about
20%), the top 4 producing countries still produce about
112
Table 5.10. World Phosphate Rock Production, 1988
United States
Former Sdviet Union
Morocco atjid Western Sahara
China
Subtotal Top Four
Jordan
Tunisia
Brazil
Israel
Togo
Republic of South Africa
Syria
Senegal
Subtotal Top Twelve
Nauru
Algeria
Iraq
Egypt
Mexico
India
Finland
North Korea
Vietnam
Sweden
Zimbabwe
Turkey
Colombia
Pakistan
Sri Lanka
Tanzania
Australia
Peru
Mali
Chile
Thailand
Philippines
Indonesia
Venezuela3
World Total
Product
(thousand tonnes)
45,389
34,400
25,015
16,600
121,404
6,611
6,103
4,672
3,479
3,464
2,850
2,342
2,326
153,251
1,540
1,332
1,273
1,146
835
739
584
500
330
142
125
74
35
35
23
15
13
13
10
9
8
8
1
World Total
(%
28:0
21.2
15.4
10.2
74.8
4.1
3.7
2.9
2.1
2.1
1.7
1.4
1.4
94.6
0.8
0.8
0.8
0.7
0.7
0.4
0.3
0.3
0.2
0.1
0.1
<0.1
<0.1
<0.1
<0.1
<0.1
<0.1
<0.1
<0.1
<0.1
<0.1
<0.1
<0.1
162,041
100.0b
a. No Venezuela production reported for 1988; 99,000 tonnes reported for 1987; and 237,000 tonnes
reported for 1989.
b. Totals may not add to 100% due to rounding.
Source: [49],
113
Table 5.11. World Phosphate Rock Production, 1994a
Product
(thousand tonnes)
United States
China
Morocco and Western Sahara
Russia
Subtotal Top Four
Tunisia
Jordan
Kazakhstan
Israel
Brazil1*
Republic of South Africa
Senegal
Togo
Subtotal Top Twelve
All Othersc
World Total
41,000
24,000
19,500
8,500
93,000
6,200
4,500
4,000
3,600
3,500
3,000
2,000
2,000
121,800
7,500
129,300
World Total
(%)
31.7
1S.5
15.1
6.6
71.9
4.8
3.5
3.1
2.8
2,7
2.3
1.5
1.5
94.2
5.8
100
a. Estimated data mainly from USBM [47].
b. Data from Barboza, et al. [50J.
c. USBM data corrected using Brazil data.
72% of the world's phosphate rock and the top 12
producing countries account' f6T94%"of total productionr-
Phosphate rock is a relatively low-cost bulk
commodity. The average cost of phosphate rock in the United
States was $22.00/tonne in 1994. For comparative
purposes, the average cost of rock salt in the United
States in the same year was $20/tonne and the
average cost of raw peat was $26/tonne [47], Over the past
15-20 years since the phosphate rock shortage of 1975,
the price of U.S. phosphate rock in constant dollars has
steadily declined, with only minor recovery in 1980 and
1981 and in the early 1990s (Figure 5.21). In general,
world phosphate rock prices have behaved similarly to
U.S. phosphate rock prices. In 1993 world phosphate
rock prices dropped to 20-year lows 146,52].
World phosphate rock production capacity has been
estimated as 195.5 million tpy [49]. At 150 million tpy,
world capacity utilization is about 77%. At 130 million
tpy, world capacity utilization is about 66%. Perhaps
most significant in this scenario are the production
capacities of the two primary players in the export
market: the United States (55 million tpy) and Morocco and
Western Sahara (32 million tpy). Competition, together
with the overcapacity of the major players and of the
world as a whole, is one of the prime reasons that world
phosphate rock prices have not increased over the past
15-20 years.
60
Constant 1990 U.S. Dollars
i i i ; i i i i i r
1970 1975 1980
Year
t^ i i r^
1985 1990
(Average annual U.S. producer domestic
and export price, f.o.b. mine.)
Source: [51).
Figure 5.21. Time-Price Relationships for
Phosphate Rock.
114
It has been widely suggested for many years that, in
general, there has been a continuous decrease in world
phosphate rock quality as reserves of high-quality rock
are being depleted [14,531. Perhaps it would be more
appropriate to say that high-grade concentrates from
some sources are becoming depleted (principally Florida)
and, in general, the quality of phosphate rock that was
'utilized on a worldwide basis was lower as demand for
phosphate rock grew.
Table 5.12 shows a breakdown of world phosphate
rock production by grade as percentages of total
production from 1971 to 1993. This is a partial
breakdown of world production in that this table and the
following tables (Tables 5.13 and 5.14) do not include
data from the FSU or other countries with centrally
planned economies. During this time period, a vast
amount of growth occurred in the world phosphate rock
Table 5.12. World Production of Phosphate
Rock by Grade, 1971 to 1993a
Grade (BPL)
Time Period -68 69-72 73-77 78+
(% 0f total production) — -
1991-93
1986-90
1981-85
1976-80
1971-75
48.5
43.7
45.4
38.1
28.8
29.9
33.4
31.5
36.7
24.0
10.3
11.4
12.8
12.6
31.9
11,2
11.5
10.2
12.6
15.2
a. Does not include data from former Soviet Union or
other centrally planned economy countries.
Source: 1FDC unpublished data.
Table 5.13. U.S. Production of Phosphate
Rock by Grade, 1971 to 1993a
Grade (BPL)
Time Period -68 69-72 73-77 78+
(% of total production)
1991-93
1986-90
1981-85
1976-80
1971-75
71.4
62.4
59.5
56,6
55.7
22.1
28.1
28,4
32.8
23.7
6.4
9.4
12.1
10.6
20.5
a, Does not include data from Former Soviet Union or
other centrally planned economy countries.
Source: 1FDC unpublished data.
Table 5.14. World Production of Phosphate
Rock by Grade, Non-U.S.
Producers, 1976 to I993a
Grade (BPL)
Time Period -68 69-72 73-77 78+
- (% of total production)
1991-93 28,5 36.6 13.7 21.0
1986-90 29.4 37.6 13.0 '20.0
1981-85 33.2 34.2 13,4 19.2
1976-80 18.6 40.8 14.7 25.8
a. Does not include data from former Soviet Union or
other centrally planned economy countries.
Source: IFDC unpublished data.
and fertilizer industry, and most of the increased
demand was satisfied by increased production of lower
grade (-68 BPL) phosphate rock.
These world production data are highly influenced by
the data from U.S. producers. Table 5.13 shows U.S.
production of phosphate rock by grade as percentages
of total production for the period from 1971 to 1993,
Increased demand was largely met by increased produc-
"tiarroi1o"weTgrade"rc5clr(-68"BPL) which could be mined
and processed profitably. As a percentage of total
production, the production of the highest grade phosphate
rock typically produced in Florida (73-77 BPL) steadily
decreased.
When U,S, production is subtracted from world
production figures (Table 5.14), a different picture of world
production is obtained. Table 5.14 shows that, between
the periods of 1976-80 and 1981-85, production of -
68 BPL phosphate rock by non-U.S. producers
significantly increased (about 78%); however, since 1985, the
percentage of -68 BPL phosphate rock has steadily
decreased. The relative amount of 69-72 BPL phosphate
rock produced dropped significantly between the
periods of 1976-80 and 1981-85 and then has increased
and perhaps has stabilized at about 37%-38% of total
production. Although a drop in percentage of total
production for the higher grades (73-77 BPL and 78+BPL)
occurred between the time periods of 1976-80 and
1981-85, the production of these grades has slightly
increased or is stable.
High-grade phosphate rock is available from many
sedimentary and igneous sources (Togo, Senegal,
Morocco, and South Africa, to name a few). However,
premium rocks from these sources are available at
premium prices. Because of the increase in demand and
115
availability of lower cost, lower quality phosphate rock,
phosphate fertilizer process engineers have modified
their technology and are exploring new technologies to
cope with lower grade rocks containing higher levels of
impurities.
5.3.8.2 World Phosphate Rock Reserves and
Resources - There is no system accepted worldwide
for classifying phosphate rock reserves and resources.
In the best cases, facts and figures used to compile world
phosphate rock reserve and resource estimates are
derived from deposit-specific reports and generally
available scientific papers. The phosphate industry is a highly
competitive industry, and many producers consider the
status of their production and phosphate rock reserves
a trade secret. Thus, documentation concerning many
deposits is simply not available. In many cases, reserve
estimates are obtained by word of mouth and only in
general terms. The reliability of information obtained in
this manner is highly variable. For most phosphate
deposits, there is generally a lack of information
concerning the extent of exploration and various criteria used to
determine the economics of production or the potential
for economic development. As a result of these factors,
world phosphate reserve and resource estimates
developed by various authors are highly variable. Most
authors do attempt to distinguish between phosphate
reserves and resources.
Reserves are defined as "identified resources"of"mirifr
eral or fuel-bearing rock from which the mineral or fuel
can be extracted profitably with existing technology and
under present economic conditions" [541. The use of
the term "reserves" usually indicates that enough
exploration or development work has been done to define
the extent and grade of a deposit with a reasonable
degree of accuracy. It also indicates that the deposit could
be mined and processed to recover a marketable
product at the time of the study or under a specified
economic scenario. Reserves may be further classified as
proven, probable, or possible and as indicated or
inferred, depending upon the degree of exploration
activities. Reserves may also be classified as economic,
marginal, or subeconomic, depending on the estimated
cost of exploitation and current and projected market
values. This terminology and this type of highly detailed
reserve/resource classification system have been
developed by the USBM and the U.S. Geological Survey
(USGS) [55,561. Many international authors may use
this terminology; however, adherence to the definitions
for certain terms can be highly variable.
Reserve estimates may be stated in terms of the total
amount of ore and percentage of P2O5, or the estimates
may be stated as the amount and grade of recoverable
product. Estimates of the amount of product potentially
available from a deposit require extensive detailed
information. When this detailed information is not
available, assumptions must be made concerning the amount
of the original P2O5 that can be recovered in the
product and the eventual grade of the product.
Resources are defined as "reserves plus all other
mineral deposits that may eventually become available -
either known deposits that are not economically or
technologically recoverable at present, or unknown
deposits, rich or lean, that may be inferred to exist but
have not yet been discovered" [541. Use of the term
"resources" implies that the extent and quality of a
phosphate deposit cannot be definitively estimated because
of insufficient information, The term "resources" also
implies that the deposit cannot be economically exploited
under current conditions.
Most reserve/resource estimates are subjective; they
depend on the standards assumed by the author or his
organization in determining the circumstances that may
render a deposit economically useful. For example, one
estimate [56] indicates there are several hundred million
tonnes of phosphatic limestone (16%-20% P2O5) in the
United States. The authors do not include these figures
in their estimates for the total "identified recoverable
resources" of the United States, apparently because these
phosphatic limestones cannot be processed using
current technology and the United States presently has vast
-amounts-of-reGoverable-rock. Similar deposits in
phosphate resource-poor countries might be listed as
resources and possibly even as "reserves," depending on
the author's perception of the term "reserves."
This section relies heavily on several data sources,
Substantial differences in reserve and/or resource
estimates and other data may exist between various sources.
It is not the purpose of this paper to critique these
sources; however, it is prudent to point out that these
discrepancies exist and that all such quoted figures should
be considered as order of magnitude estimates.
Phosphate deposits are widespread throughout the
world, occurring on all continents with the possible
exception of Antarctica. Figure 5.22 includes only those
deposits that are currently worked, have been worked
in the past, or have been shown in detailed studies to be
potentially economically viable under certain conditions.
The figure includes several very small deposits that are
worked for direct-application phosphate rock. The
figure does not include every occurrence that might be
termed a deposit. By definition, a deposit is "earth
material of any type either consolidated or unconsolidated
that has accumulated by some natural process or agent"
[57]. The term "deposit" does not imply that phosphate
exists in a form, quantity, or quality that is technically or
economically feasible to produce. The average
116
■ Igneous Deposits
® Sedimentary Deposits
X Island Deposits
Figure 5.22. Economic and Potentially Economic Phosphate Deposits of the World.
abundance of P2O5 in the earth's crust is 0,22 weight %
[58]; a concentration of 1.0 weight % P2O5 is certainly
anomalous and therefore can be termed a deposit.
Tables 5.15, 5.16, and 5.17 illustrate three sources
of world phosphate reserve and resource data. Estimates
are provided by country in Tables 5.15 and 5.16 and by
continent and country in Table 5.17. Table 5.18
provides estimates for sites in the United States by cost per
tonne.
The source of the data for Table 5.15 is the USBM
[47]; the table lists the top 10 producing countries, their
reserves, and their reserve base. In this context, reserve
base can be considered synonymous with the term
resources. No reserve data are listed for Russia, Senegal,
Togo, or Tunisia in this compilation. These countries
are mining, processing, and/or exporting phosphate
concentrates and will do so for many years. Even
without the reserve data for these countries, it is evident that
6 of the top 10 producing countries possess about 88%
of the world's phosphate reserves. The reserve base data,
which include data from all top 10 producing countries,
indicate that about 91% of all the phosphate resources
of the world are found within these countries.
A slightly different set of figures is given in Table 5.16.
Williams and Griffin [59] used the USBM data for 1989
with some revisions. In this compilation, no data on
reserves were available for Israel. Under this compilation,
approximately 95% of the world's economic reserves
were held by the world's present top nine producers in
1990. Williams and Griffin [59] also computed the
present life of reserves based on current production rates
for these countries, Based on the present extraction rates
and economic conditions in 1990, over half of the top
10 phosphate-producing countries will have exceeded
the life of their reserves in less than 50 years. Under
this scenario, the reserves of both the United States and
the former Soviet Union will be depleted in about 30
years (assuming late 1980s' production rates).
Herring and Fantel [61] modeled depletion of world
phosphate rock reserves based on demand created by
population growth. Using USBM world reserve data and
a base year of 1990, they considered various scenarios
of unconstrained growth with no future additions to
reserves. The results of this study generally indicate that
world reserves will be depleted in about 50 years from
1990, the base year, and additional resources (termed a
117
Table 5.15. World Phosphate Rock Reserves and Reserve Base
Country
United States
China
Israel
Jordan
Morocco and Western Sahara
Senegal
South Africa
Togo
Tunisia
Russia
Other countries
World Total
Reserves3
Reserve Baseb
1,200,000
210,000
180,000
90,000
5,900,000
-
2,500,000
-
-
-
1,300,000
11,380,000
4,440,000
210,000
180,000
570,000
21,440,000
160,000
2,500,000
60,000
270,000
1,000,000
3,000,000
33,830,000
a. Cost less than $40/tonne. Cost includes capital, operating expenses, taxes, royalties, and a 15% return
on investment f.o.b, mine.
b. Criteria for reserve base established by a joint U.S. Bureau of Mines and U.S. Geological Survey working
group.
Source: [47].
Table 5.16. World Phosphate Rock Reserves and Resources (thousand tonnes)
Country
United States
Former Soviet Union
Morocco and Western Sahara
China
Jordan
Tunisia
Israel
Togo
South Africa
Senegal
Othersb
Total
Economic
Reserves3
1,300,000
1,300,000
7,000,000
210,000
600,000
267,000
-
40,000
2,500,000
160,000
725,000
14,102,000
Ufe
(years)
27
33
318
12
100
41
-
12
960
73
-
Resources
5,200,000
1,300,000
22,000,000
210,000
700,000
533,000
190,000
70,000
2,500,000
160,000
3,725,000
36,588,000
a. Producible at <$35/tonne, including 15% rate of return on investment.
b. Revised to include centrally planned economies and market economy countries.
Source: I59J.
118
Table 5.17. World Economic Identified Phosphate Concentrate Resources
Continent and Country
North America
United States
Canada
Mexico
South America
Brazil
Peru
Other
Africa
Algeria
Morocco and Western Sahara
Senegal
South Africa
Tunisia
Other
Asia
China
Iraq
Israel
Jordan
Other
Oceania
Australia
Other
Europe
Former Soviet Union
Finland
World Total
Reserves
Inferred Reserve Base and
Reserve Base
(million tonnes)
1,260
37
208
551
428
120
250
2,100
155
1,800
70
82
170
296
70
530
241
340
51
6,500
-
(million tonnes)
22,587
37
2,416
558
1,353
211
435
62,575
200
6,781
1,021
1,216
1,000
296
449
1,542
807
850
51
8,000 .
46
15,259
112,431
Source: [60[.
Table 5.18. U.S. Phosphate Rock Reserve Base in Terms of Costa
Cost (1989, $/tonne)
Florida
North Carolina
Western United States
Tennessee
Total
<20
224
2
226
20-30
263
392
73
3
731
30-40
258
14
272
40-60
-(million tonnes
1,101
339
70
8
1,518
60-80
520
762
1,282
80-100
173
177
350
Total
2,539
731
1,096
13
4,379
a. Tonnes available at indicated cost.
Source: [51],
119
modified reserve base), which may or may not be
economically minable, would be depleted in perhaps
another 50 years.
The United States and other countries will not,
however, simply run out of phosphate rock at some
predetermined date in the future. Table 5.18 indicates the
amount of phosphate reserves available from various
mining areas in the United States in terms of cost per
tonne. Most of the current reserve figures assume a
maximum cost of $40/tonne for estimates. If the cost
of phosphate rock reaches $60/tonne, the U.S. reserve
base more than doubles to 2.8 x 10⁹ tonnes. These
types of detailed data are not available for most other
world producers although Fantel, Peterson, and
Stowasser [62] have estimated the amounts of
potentially recoverable phosphate rock at various production
costs from all deposits in market economy countries,
the United States, North Africa, and the Middle East. It
is reasonable to assume that a similar situation governs
the reserve/resource situation in other countries around
the world. If phosphate rock prices eventually rise
worldwide, a portion of the phosphate rock now classified as
resources in many countries will be reclassified as
reserves.
Sheldon [60] categorized phosphate concentrate
reserves and resources by continents and regions {Table
5.17). According to this scheme, it may appear at first
glance that each major continent/region-hasamplere^
serves of phosphate rock concentrates with the possible
exception of Oceania (391 million tonnes); each of the
other categories has over 1 x 10⁹ tonnes. However,
within a region, the total reserves may be dominated by
the reserves of a few countries, or even one country.
According to Sheldon [60], the United States holds
approximately 84% of the reserves of North America. The
former Soviet Union holds all of the reserves of Europe,
In this scenario, the phosphate reserves of Finland are
probably considered uneconomic by world standards.
The phosphate rock mine in Finland is integrated with
downstream processing facilities for the production of
several marketable products with added value; it would
probably not be economically viable to produce
phosphate rock concentrates as the only product.
According to Sheldon's figures, Morocco and South
Africa possess about 87% of African phosphate reserves.
It should be noted that these countries plus Algeria,
Senegal, and Tunisia possess over 98% of the African
total of concentrate resources. Togo, currently the world's
ninth or tenth leading producer, is among the
remaining countries holding 2% of the reserves in Africa. Other
countries in Africa hold 1,2 x 10⁹ tonnes of inferred
reserves (resources) or less than 2% of the total African
resources. Significantly, with the exception of phosphate
producers in West Africa as well as in South Africa and
120
perhaps Zimbabwe, most of the deposits of sub-Saharan
Africa are termed resources and are not commercially
viable or are considered uneconomic to exploit at the
present time.
The reserves of South America are dominated by Brazil
and Peru. Although total South American resources may
seem substantial (1.1 x 10⁹ tonnes), other countries hold
only about 12.0% of this total. The Peru deposit
(Sechura) has not yet been developed commercially.
Production costs for the mines in Brazil appear to be very
high (Figure 5.23), and production costs from any other
new mines in South America are likely to be high.
In Sheldon's scenario, the Asian reserves are distorted
by countries that might be more properly termed Middle
Eastern countries and that are aligned for all practical
purposes with North African producers. Of Asia's total
reserves (1.3 x 10⁹ tonnes), 68% may be ascribed to
Iraq, Israel, and Jordan. The "other" reserves category
for Asia may also include other Middle Eastern
countries. China is the one distinctly Asian country in this
category, and its reserves are rather limited (170 million
tonnes).
The Oceania reserve figures are dominated by
Australia with approximately 87% of the total reserves (340
million tonnes). The Australian deposits have not been
developed commercially. Among the other deposits are
Nauru and Christmas Island. These insular deposits have
contributed significantly toTegibhal trade in the past and,
although both are presently being worked, their
economic reserves are very small (perhaps 10-20 million
tonnes total).
5.3.8.3 Future Trends m World Phosphate Rock
Production - One phosphate rock production forecast
for the present top four world producers, formulated
prior to the political events in the former Soviet Union
and world downturn in phosphate production in 1991,
is given in Table 5.19. Under this scenario, the United
States, former Soviet Union, and China basically would
maintain their production in a market that is assumed to
grow at an annual average of 1.8% to the year 2000
[59]. Morocco would increase production and its
market share during this period. During this time period,
Morocco would become the dominant world exporter
in terms of both rock and chemical products (Table 5.20).
Jordan would also increase its production during this
period. China and the former Soviet Union do not
appear in Table 5.20 because they were not foreseen to
become significant phosphate exporters.
Prior to the situation of the late 1980s and early
1990s, World Bank estimates indicated that the
stagnant phosphate rock market of the 1980s would
continue until the end of the century [63]. By the year 2000',
European imports may decline by 3-4 million tonnes,
Producing Mine
Potential Mines
and Deposits
Source: [62].
Figure 5.23. Estimated Production Costs for Selected World Phosphate Surface Mines and
Deposits.
Table 5.19. Phosphate Rock Production
Forecast for Current Top Four
Producing Countries
United States
Former Soviet Union
Morocco
China
1990
48
39
23
17
1995
2000
(million tonnes)
50
39
34.5
18
48
41
40
19
Source: [59].
whereas Asian imports may increase by 2-3 million
tonnes; overall there may be a decrease in total
production. One source [64] indicated that the need for capital
investment in new mines is expected to keep phosphate
rock prices slowly increasing in the early 1990s. If
investments in new mines are not forthcoming, depletion
of reserves will cause a tight market in the mid-1990s
and prices may rise sharply.
Beyond the year 2000, production from the
southeastern United States was predicted by Stowasser [51,
65] to fall sharply to about 31.2 million tonnes between
the years 2000 and 2005 and to about 24.5 million
tonnes by the year 2015 {Table 5,21), A projection to
121
Table 5.20. Major Phosphate Exporters
Country
Morocco
United States6
Jordan
Tunisia
Togo
Israel
South Africa
Senegal
Rock
199Q
Products3
Total
(million tonnes equivalent
phosphate rock)
14.8
8.0
5.0
1.0
3.4
2.4
1.0
1.5
8.2
17.7
0.9
3.5
0
1.2
1.3
0.5
23.0
25.7
5.9
4.5
3.4
3.6
2.3
2.0
Rock
- 1995
Products3
Total
(million tonnes equivalent
phosphate rock}
14.8
7,5
5.0
1.0
3.4
1.0
1.0
1.5
16.2
19.5
2.0
3.4
0
1.1
1.3
0.6
31.0
27.0
7.0
4.4
3.4
3.5
2.3
2.1
2000
Rock Products8 Total
(million tonnes equivalent
phosphate rock)
15.8
7.0
5.0
1.0
3.0
2.4
1.4
1.5
22.2
18.0
3.9
3.4
0
1.1
1.3
1.5
38.0
25.0
10.0
6.0
3,0-
3.5
3.0
3.5
a. Values refer to amount of rock used for chemically processed products.
b. Domestic use in the United States will be about 22-23 million tonnes in the 1990s.
Source: [59].
the year 2040 indicated that total U.S. phosphate rock
production may be as low as 17.4 million tonnes [511,
Several factors probably contributed to these analyses.
Only two new phosphate rock mines were in the
planning stage at the time of these projections. The Florida
rock reserves of higher grade and quality are becoming
depleted. Mining in Florida is competing with other land
use options; minable. landsj-nay be worth more as
residential or commercial property. Environmental concerns
may also exclude tracts and/or entire mining areas from
future consideration. Although additional rock is
available from lands peripheral to the traditional central
Florida phosphate district (mainly to the south),
overburden may be thicker and the ore grades are lower.
Phosphate concentrates produced from these lands will
generally be of lower grade with higher impurity
contents. Because of these factors and ever-increasing and
more stringent environmental regulations, the costs of
mining and processing in Florida and the rest of the
United States will continue to increase, especially if new
mines are developed, Based on Stowasser's analyses [51,
65], U.S. production eventually may not be able to meet
U.S. agrochemical industry demands.
Not all U.S. producers will be affected similarly by the
depleting reserve situation and declines in rock quality,
and the effect may not be as dramatic as predicted by
Stowasser [51,65]. lMC-Agrico is the largest U.S. pro-
"dacerrlMC^Agriccroperates10 mines in Florida and five
phosphate fertilizer facilities in the United States. The
total capacity of lMC-Agrico mines is 28.2 million tpy
[48] or approximately half of total U.S. production
capacity. Prior to and during the last 10 years, as the Florida
phosphate rock industry has undergone considerable
rationalization, lMC-Agrico (or precursor companies) has
acquired mining lands, often through the acquisition of
preexisting mining operations. lMC-Agrico has quoted
its estimated recoverable reserves as 336 million tonnes
of concentrate or about 17 years of production at the
1992 production rate (about 20 million tpy) [48]. The
Table 5.21. Projected U.S. Phosphate Rock Concentrate Production
Florida and North Carolina
Western United States
Total United States
Source: [65].
1995
39,2
6.8
46.0
2000
48.1
5.8
53.9
2005
(million tonnes)-
31.2
5.8
37.0
2010
24.5
5.8
30.3
2015
24.5
5.8
30.3
122
company has proven probable reserves of 484 million .
tonnes, of which 262 million tonnes is available under
option arrangements. Although lMC-Agrico has
substantial reserves for the future, the reserves of most Florida
producers are much more severely limited. However,
several new mines are currently being opened or are in
the permitting process (Cargill - formerly Mobil Mining
and Minerals Company, South Fort Mead, 3.2 million
tpy; C. F. Industries, South Pasture, 2,7 million tpy),
and the lives of these operations are projected to be
between 30-40 years.
Potash Corporation of Saskatchewan Phosphates or
PCS Phosphates (formerly Texasgulf Inc.) operates the
Lee Creek Mine at Aurora, North Carolina. The present
capacity of the mine is 5.4 million tpy. The company
has plans to double its capacity if and when the market
for phosphate rock and phosphate products improves.
The company has indicated that it has reserves for the
next 200 years at current production rates [481.
Several mines are operating in the western United
States with an approximate combined capacity of about
7 million tpy [48], Several new mines have recently been
opened in this area including the Rasmussen Ridge Mine
(1993, Rh6ne Poulenc, capacity 2.3 million tpy), Smoky
Canyon Mine (1992, J. R. Simplot 1.4 million tpy),
and the FMC Mine at Dry Valley (1993, 1.36 million
tpy). SF Phosphates, a joint venture between J. R.
Simplot and Farmland Industries,-operates -a- -mine at—-
Vernal, Utah. This mine has a capacity of 1.81 million
tpy and an estimated life of 50 years at current
production rates (about half capacity). Although these western
producers will not affect the world market, they will
supply a portion of the U.S. and Canadian phosphate
requirement for many years.
The data from individual producers indicate that the
analyses of Stowasser [51,65] were perhaps too
pessimistic. On the basis of data from IMC-Agrico, the
development of new mines by Cargill and C. F. Industries,
the capacity of the PCS Phosphates operation, and the
contributions of western producers, and assuming these
estimates are correct, the United States should be able
to maintain a production capacity of 45-50 million tpy
for the next 10-15 years or until the time period of 2005
to 2010. If demand is sufficient and/or the price of
phosphate rock increases, it is also possible that additional
new mines could be developed in Florida and the
western United States and/or that PCS Phosphates could
increase production, It is also possible that new mining
techniques such as borehole mining might be used to
produce deposits that presently are not economically
recoverable.
Although the grade and quality of Florida concentrates
are declining and are foreseen to continue to decline in
the future, the Florida phosphate industry has learned
to cope with lower grade ores and concentrates. The
Florida phosphate rock industry has significant vertical
integration, and fertilizer producers are taking
advantage of highly developed infrastructure and favorable raw
materials and energy costs. At present only about 3
million tpy of total U.S. production (mostly from Florida)
is exported as phosphate rock. Fertilizer producers in
the United States have learned to use concentrates with
grades as low as 60-65 BPL.
China is not foreseen to become a significant factor
with respect to phosphate exports in the future. China
is presently a net importer of phosphate products.
Reserves of phosphate rock in China, although widespread,
are very limited according to USBM sources [47]. The
quality of the phosphate rock from these deposits is low
by world standards. Chinese phosphate rocks may
contain high levels of MgO, CQ2, and/or silicate impurities,
and the concentrates produced from these deposits are
not generally suitable for export. China's status as a net
importer is not expected to change.
The future production status of the countries
constituting the former Soviet Union is speculative. The grade
of ores from the Kola deposits has progressively declined.
As near-surface reserves have been depleted, the cost
of production has increased [64]. Extensive exploration
in the former Soviet Union has resulted in few signifi-
-cant-diseoveries-to-support-declining output from the
Kola deposits. The sedimentary deposits of the former
Soviet Union are generally of low grade and quality when
compared with concentrates available on the world
market.
The Kola deposits, operated by P.O. Apatit, formed
the core of FSU phosphate rock and fertilizer
production capabilities. In 1989, P.O. Apatit produced about
20 million tonnes of phosphate rock [66J. The P.O.
Apatit production estimate for 1993 was about 8.5
million tonnes. Due to the drop in demand and to
rationalization and privatization, mines and several processing
plants have been closed. The downturn of the Kola
industry (and Russian economy) is also intimately
intertwined with FSU sedimentary phosphate rock production
and the fertilizer industry based on this rock. The
production of many fertilizer plants in the FSU used high-
quality phosphoric acid feedstock produced from Kola
apatite and locally obtained lower grade sedimentary
phosphate rock to produce off-grade TSP products.
Prior to the breakup of the Soviet Union, about 3
million tpy of Kola rock was exported, mostly to eastern
Europe. Export sales had fallen to about 800,000 tonnes
in 1992 and were estimated to be even less in 1993
[66]. Possibly the Kola deposits could be further
developed for the world export market. Rationalization of
123
the Russian industry will occur, and it is uncertain at
what costs Kola rock can be produced and if it will be
competitive on the world market.
Among the current top four phosphate rock
producing countries, Morocco is certainly in the most
advantageous position. Depending exactly on which reserve/
resource classification is used, Morocco may possess over
one-half of the world's phosphate rock reserves.
Morocco has invested heavily in the mining and downstream
phosphate processing industry and has tremendous
potential to expand both mining and processing activities.
As in Florida, lower grade phosphate rock concentrates
are used for production of added-value products and
higher grade phosphate rock is generally destined for
the export market. Moroccan processing costs will increase
in the future. However, production costs for new mines
should eventually be less than production costs of new
mines in the southeastern United States (Figure 5.23).
In the future, potential increased production of
phosphate rock may also come from Jordan, Iraq, or South
Africa, Production from Jordan is expected to reach
about 9 million tonnes by the year 2000. Production at
current or declining levels is expected from Tunisia, Togo,
Algeria, Israel, Senegal, Syria, Brazil, and Nauru. Mine-
out on Nauru is expected in the next 5-10 years,
depending on the production rate. The Togo deposit will
probably be mined out in less than 20 years, depending
on the production rate and whether- a new miningarea-
(Dagbati) is opened.
Potentially increased phosphate rock production could
come from several new mines, including Sechura, Peru;
Al-Jalamid, Saudi Arabia; Bofal-Loubboira, Mauritania;
Farim, Guinea-Bissau; Sra Ouertane, Tunisia; and
Duchess, Australia, to name several. Studies performed on
these deposits indicate they are marginally economic or
may be economic under certain conditions,
There is also the potential to discover new deposits.
Phosphate deposits have been discovered within the past
100 years at a rate far greater than the rate of
consumption (Figure 5.24) [60]. It is expected that new
deposits will be discovered in the future. However, oil
exploration programs have probed most of the coastal
sedimentary basins of the world during the past 20-30
years, and any large-scale discoveries of phosphate rock
probably would have occurred in conjunction with these
activities.
Another source of future phosphate production is
offshore deposits, Deposits of this type occur along the
southeastern coast of the United States, on the Peru-
Chile shelf, offshore Namibia, on the Chatham Rise off
New Zealand, offshore Baja California, Mexico, and off
the Congo River delta. At the present time, none of
these offshore deposits are mined, and they probably
<
zi
to"
<
CO
zS
1
2
1= —.
CD W
U CD
C C
° £
o 2
<D O
to *o
o. ^<
8
_J0
E
O
12
10
8
6
4
2
CO
u
uth Afrii
o
c0
0
c0
10
Q_
I f
O
o
2
f£
3
O
■o
s
.Oulad
g
CO
O
sz
■c
o
shore N
c
O -
03
3 b
O -E
** CO
c 5=
§ O
C5_^
World phosphate reserves
1985 \
i i
*
<
1860 1880 1900 1920 1940 1960 1980
Year of Discovery
Source: [60J,
Figure 5.24. History of the Discovery of World
Phosphate Resources.
will not be mined as long as ample reserves exist
onshore.
Phosphate rock prices will increase when demand
approaches the limits of supply. When phosphate rock
prices increase, some resources become reserves,
marginal mining projects become viable, and production is
stimulated. In the future, fuel and fuel-related
transportation costs may become even more important
components in the world phosphate rock production scenario.
Political disruptions, always an unknown factor, can
profoundly influence the supply and demand for fertilizer
raw materials on a worldwide basis.
5.3.9 Factors That Influence Economic and
Commercial Viability of Producing
Phosphate Deposits
For every phosphate deposit there is a combination
of factors that define whether production is both
technically and economically feasible, No one factor is
absolute, and phosphate deposits differ so much in their
geologic character and processing characteristics that
124
largely parallel conditions rarely, if ever, exist. Mining
cannot be considered as a single factor in itself because
it is technically and economically linked to beneficiation
and transportation. Ultimately the costs of
transportation to a site from where the phosphate concentrate
can be distributed, or to where fertilizers are produced,
may be the most significant factor in determining if
mining and producing a phosphate deposit are
economically feasible,
Some of the major factors that affect the viability of
producing phosphate deposits include the size of the
market for product and production level, location,
availability of water, costs of transporting both products to
market and needed inputs to the mine site, geologic
character, ore to waste ratios, mining method or
methods, ore grade arid quality, ratio of concentration,
potential seasonality of operations due to climatic
conditions, cost of infrastructure Giving facilities,
transportation, power), costs of raw materials (fuel, reagents,
etc.), availability and cost of labor, stability and
effectiveness of raw material supply systems, stability of
governments and political issues, environmental issues, and the
availability and cost of capital. This list is presented in
no particular order and is not intended to be
all-inclusive. However, any of these factors, and other factors,
can change a phosphate deposit from an economic
reserve to an uneconomic resource. Each of these factors
can substantially influence the cost of production.
The difference between production costs over the life
of the project and the price of phosphate rock
determines what profit may be realized by developing a
deposit. The selling price of phosphate rock is determined
by the characteristics of the product, the price that
customers will pay, the profit margin a producer is willing
to accept, and other factors associated with a
competitive free market. On a worldwide basis, this situation is
confused by the fact that many phosphate producers
are government owned and/or governments may
subsidize and promote the use of phosphate fertilizers.
Producers with the lowest costs should be able to offer
products at the lowest selling price. Of course, grade
and quality factors must be considered in the selling price.
It is very difficult to determine current production costs
for phosphate rock mining. Production costs are
generally withheld by producers due to the competitive nature
of the global phosphate rock industry. There are few'
data in the generally available literature concerning
direct mining costs for specific operations. It is also often
very difficult to differentiate the costs associated with
the operating costs of the mine and mill, debt servicing,
various taxes and royalties, and profits.
In general, surface mining costs are much lower than
the costs of mining underground. Limited data in
McCIellan and Hignett [67] indicate that the cost of un-
„ derground mining may be about 2-3 times the cost of
surface operations.
Figure 5.23 gives an indication of the relative overall
costs of production and a comparative ranking among
the producers listed. Figure 5.23 was based on data and
cost estimates developed prior to 1985. These data and
indicated cost levels may still be appropriate in 1996 as
most of the same producers are operating under similar
conditions. In 1985 phosphate mine operating costs
were about $10/tonne for the lowest cost producers to
nearly $20/tonne for the highest cost producers. Mine
plus mill operating costs ranged from about $15/tonne
to over $30/tonne for the highest cost producers. Taxes
and royalties, transportation costs, and a significant
return on investment over the life of a property further
increase production costs.
Limited data indicate that the total production costs
for all Florida mines in 1995 was about $17/short ton
($18.74/tonne) of concentrate. During 1995, average
prices for all grades of phosphate rock f.o.b. central
Florida were $22-$24/short ton ($24.25-$26.45/
tonne). In 1995 Florida phosphate rock shipped f.o.b.
from Tampa cost $32-$34/shortton ($35.27-$40.78/
tonne) for 68-BPL rock and $36-$38/short ton ($39.68-
$41.89/tonne) for 72-BPL rock.
In mid-1995 various grades of phosphate rocks were
available from North Africa producers at prices from
$30 to $37/tonne. Prices of Moroccan phosphate rock
are usually quoted FAS (free-along-side), which means
customers must pay for loading. Phosphate rock from
Jordan sold in the range of $38-$46/tonne, depending
on the grade. It can be assumed that, similar to Florida
prices, these prices reflect production costs plus a profit,
Quite often it is perceived that small phosphate de- -
posits in developing countries can be mined by small-
scale, low-cost, labor-intensive methods to produce
low-cost raw material for local fertilizer plants or for use
as direct-application phosphate rock products. This may
or may not be the case, depending on the situation.
Over the course of history, mining and transportation
of products have progressively become more
mechanized to increase productivity and overcome the
limitations imposed by simple manpower. Indeed before the
development of steam engines and subsequent advances,
draft animals were employed to overcome the strength
and endurance limitations imposed by manpower.
Phosphate rock is a bulk commodity that is used by the tonne.
The mining of a few hundred or thousands of tonnes is
a significant undertaking, Phosphate rocks used for
direct application typically must be ground in order to
enhance their dissolution rates in soils. The grinding of
phosphate rock, while one of the most simple
processing options available, is the first step in subsequent
125
processing; it requires fabricated equipment, a source'
of power, and significant amounts of energy. The
movement of tonnes of phosphate rock or fertilizer over
hundreds or thousands of kilometers and possibly through
several handling steps is expensive and energy-intensive.
Many factors may limit the feasibility of developing
small phosphate deposits in developing countries. If the
apatite of the rock is not a highly reactive variety, it
simply may not be agronomically suitable for direct
application- A small market for phosphate rock in a
country or area limits the potential size of operations and
leads to potentially high per unit costs. Often it seems
that phosphate deposits are remotely located far from
agricultural or industrial areas in developing countries.
The costs of transportation to market may be
prohibitive, Almost invariably, mining or processing equipment
must be imported, and this is costly. In a developing
country, a substantial inventory of spare parts and fuel
must be maintained. Lack of critical parts can shut down
an operation for indefinite periods (sometimes months)
until parts are obtained.
If infrastructure (transportation, power, housing, etc.)
is lacking, development can be very costly, and it
becomes more costly the more remote a location is. Poor
roads lead to high maintenance costs for vehicles. If
railroads do exist, service may be less than optimal under
developing country conditions, and poor service can
cripple an operation. Fuel and electrical poweT~costs~~
can be very high in energy-poor countries.
Phosphate rock is only one of the materials needed
in the production of phosphate fertilizers. Although the
availability of low-cost phosphate rock is certainly
advantageous in any phosphate fertilizer production
situation, the total costs of providing other needed chemicals
(sulfur, sulfuric acid, etc) and power (electrical, fuels) may
more than overshadow the advantage of a low-cost
phosphate rock source in a developing country. When all the
development costs and production costs are tabulated,
the low cost of labor in a developing country may be a
minor factor
Case studies by IFDC of small-scale phosphate rock
mining and production in many developing countries
have indicated production costs from about US $25/
tonne to several hundred dollars per tonne. At the lower
costs, almost invariably the mining and production
equipment and initial technical expertise were donated.
At the higher costs, typically the operations were
established and/or subsidized by a host government or
aid organization; however, capacity was severely
underutilized.
Phosphate rock can often be purchased on the world
market from high-volume, low-cost producers and
transported to sites in developing countries at lower costs
than those incurred for developing a small indigenous
deposit. Further, phosphate fertilizers can often be
purchased on the world market from high-volume, low-cost
producers and transported to developing countries at
lower costs per unit of nutrient than can be provided by
indigenously produced phosphate rock.
5.4 Sulfur
Sulfur is one of the more common constituents of the
earth's crust and can be ranked as the 16th or 17th
most abundant element [68]. The mean sulfur contents
of the rocks forming the crust of the earth is estimated
to be about 400 pprnw. Sulfur naturally occurs as
elemental sulfur, metal sulfides in coal and mineral ores,
sulfates, hydrogen sulfide in natural gas, and complex
organic sulfur compounds in crude oil and coal. All of
these various forms of sulfur are used as sulfur sources,
but the most important sources are elemental sulfur,
hydrogen sulfide in natural gas, and iron pyrites.
The uses of sulfur are as varied as its sources, but
approximately 80%-85% of the sulfur that is produced
is used to manufacture sulfuric acid. Approximately half
of this acid is used in fertilizer production, mainly to
convert phosphates to water-soluble forms. Sulfur is an
important plant nutrient, and elemental or other forms
of sulfur are sometimes added or mixed with other fertil-
_izersJo_cpjT^_julfui^eJiciencies, Elemental sulfur can
also be used in agriculture as a pesticide or fungicide.
5.4.1 Sulfur Sources
Native sulfur or brimstone, sulfur naturally occurring
in the elemental form, is found in several geologic
environments. During volcanic activity- sulfur may be
sublimated directly around volcanic vents. Although sulfur
production from volcanic deposits is generally limited,
considerable tonnages have been produced in Japan
from such deposits.
Native sulfur may be formed from gypsum and
anhydrite in evaporite deposits through the movement of
saline waters and hydrocarbons and the influence of
anaerobic sulfate-reducing bacteria. Major sulfur
deposits associated with salt domes such as in the U.S. Gulf
Coast and stratified sulfur deposits such as found in
Sicily, Poland, and Iraq are thought to have been formed
by this process.
Deposits of pyrite (FeSz) or other iron sulfides are found
in many countries. Sulfides are found in a broad
spectrum of geologic environments from igneous rocks (both
volcanic and intrusive) to sedimentary rocks. Iron sulfide
deposits can be extremely important for those countries
that do not possess other sulfur sources. The
importance of iron sulfides has been diminishing to a certain
extent due to high production costs and the move to a
126
global economy. Iron sulfides are mainly used for the
direct production of sulfur dioxide and sulfuric acid. The
cinder obtained by roasting iron sulfides has been
utilized in some cases for iron and steel making [69],
Many of the non-ferrous metals such as copper, lead,
zinc, and nickel are obtained from sulfide ores. One of
- the final stages of the extraction processes for these
metals is the separation or removal of sulfur by roasting;
sulfur is recovered in the off-gases.
Fossil fuels such as coal, crude oil, and natural gas
contain sulfur in low but variable quantities; the amount
mainly depends upon the geologic origins of the fuels.
In the United States, coals from portions of the eastern,
midwestern, and southern states are relatively high in
sulfur (2%-4% S), while coals from portions of the
eastern states and from the western states may contain less
than 1% S. The sulfur content of German lignite is
usually l%-2%. South African coals range in sulfur content
from 0.3%-2.8% S [70]. Occasionally, some of the py-
rite that occurs in coals can be mechanically separated.
However, fine pyrite and the sulfur that is organically
bound in the coal are very difficult to remove or cannot
be removed. When coal is burned to generate heat,
sulfur will escape to the atmosphere as sulfur dioxide if the
off-gases are not treated. During the coking of coal, most
of the sulfur will be converted to hydrogen sulfide, which
has to be removed from the gases. This potential
pollutant/byproduct is converted to sulfur dioxide, sulfuric acid,—
and ammonium sulfate.
Crude oil usually contains between 0.1% and 2.8%
sulfur. A few individual crudes contain over 3% S 171].
Sulfur is largely removed during oil processing, resulting
in substantial quantities of byproduct hydrogen sulfide
and mercaptans.
The composition of natural gas varies widely. Some
natural gases may contain almost no sulfur; in others,
the hydrogen sulfide content may be extremely high.
Gas originating from southwestern France, for instance,
contains 15% H2S, and some of the natural gases from
Canada (Alberta and northeast British Colombia)
contain about 30% H2S. Natural gas and crude oils
containing substantial amounts of H2S are termed "sour." In
general, sour crude oil and sour natural gas are
associated with production from carbonate formations.
Among the naturally occurring sulfate ores, only
gypsum has ever been of any importance as a raw material
for sulfur production, and only in the direct production
of sulfur dioxide for sulfuric acid manufacture. Byproduct
calcium sulfate from phosphoric acid production
(phosphogypsum) has been used to produce sulfuric acid.
Elemental sulfur has never been extracted from sulfates
on any significant scale because of high energy costs.
Experimental work has been done on both chemical [72[
..and microbiological [73] methods of reducing gypsum
to hydrogen sulfide.
5.4.2 Production Methods
5.4.2.1 Production From Native Sulfur
Deposits - Sulfur-containing ores are usually excavated by
conventional open-pit or underground mining methods. In
the deposits around the Gulf of Mexico that are
associated with salt domes, and in one or two other places in
the world, elemental sulfur is produced directly from
deposits by melting with hot water and pumping the
molten sulfur to the surface (Frasch process) [74]. Many- -
processes have been used or proposed for extracting
sulfur from sulfur ores [75]. However, only a few
processes have gained commercial importance, including
flotation, melting out, distillation, and the Frasch process.
Flotation can be used to upgrade sulfur ores [76].
After grinding the ore to the liberation size (the size at
which the sulfur particles are free from the associated
gangue minerals), sulfur is floated with foaming agents
such as pine oil, cresylic acid, or amyl alcohol. When
the gangue minerals contain carbonates, certain
depressants such as water glass (sodium silicate) are
recommended. Flotation results in concentrates containing
70%-90% S. The disadvantages of flotation are that it
does not produce pure sulfur, as do most other
processes, and that the sulfur concentrate has to be dried.
ProducersJn_Sicily_used.the.meIting-out process and
had a virtual world monopoly in sulfur production until
1904 [691. Sulfur melts at 112°-114°C, but becomes
highly viscous at temperatures above 158°C. Originally,
sulfur was melted out in moundlike ore piles known as
"calcarilli." Calcarilli were built up on small hearths
equipped with drain holes and simply ignited.
Approximately one-third of the sulfur was recovered by this
method; the other two-thirds was burned and lost to the
atmosphere as sulfur dioxide. A substantial improvement
in yield was achieved by covering the ore pile with soil,
as practiced in charcoal making; sulfur yields increased
from 30% to approximately 60%. The melting process
was substantially changed by the introduction of
chamber furnaces, which improved the yield of sulfur up to
78%. The Sicilian sulfur monopoly effectively ended with
the introduction of the Frasch production method and
development of deposits in the Gulf Coast region of the
United States.
Distillation of sulfur has been practiced in Japan by
the "Yakutori Process" [77]. Sulfur-bearing ore is heated
by external firing with coal to above 440°C (the boiling
point of sulfur). The process uses small retorts (0.4 m3)
which are made of 13% chromium steel and hold
approximately 0.24 tonne of ore. Up to 100 retorts can
be coupled to form one furnace. To produce one tonne
of recovered sulfur, 0.41 tonne of coal is consumed.
127
The most effective and economic method of
extracting sulfur from native deposits in situ under suitable
conditions is the Frasch process [74]. The process
involves injecting hot water directly into the sulfur deposit
and then pumping the molten sulfur to the surface. The
sulfur is then pumped to storage areas where it
solidifies. In this way, blocks of pure sulfur are obtained.
Frasch-produced sulfur can be quite pure (99.7%-99.8%)'
and light yellow in color. If the sulfur is associated with
small amounts of bituminous residues, it is brown or
blackish. This so-called dark sulfur may contain up to
1% carbon, mainly present as complex organic sulfur.
The United States, Poland, and Iraq practice Frasch
sulfur production on a commercial scale, as did Mexico
until 1993.
5.4.2.2 Sulfur Recovery From Gases -
Recovered sulfur accounts for over 60% of the total world
production of elemental sulfur. Most of the recovered
sulfur originates from the processing of fossil
hydrocarbons, especially natural gas, oil, and coal. In natural gas,
sulfur is mainly in the form of hydrogen sulfide, but in
oil and coal it is also present as organic compounds such
as mercaptans and as sulfides, disulfides, and
heterocyclic compounds.
Hydrogen sulfide cannot be tolerated in natural gas,
even in low concentrations, because of its great toxicity.
Hydrogen sulfide is also corrosive. Therefore, "sour"
natural gas containing hydrogen sulfide is__usually des^_
ulfurized near the wellhead to very high standards of
purity.
In the refining of crude oil, sulfur partly comes off as
hydrogen sulfide, but mostly tends to accumulate in the
heavy fractions. The practice of using high-sulfur heavy
oils containing 3%-4% sulfur as industrial fuels is no
longer permissible under the pollution control
regulations in force in many parts of the world. Therefore,
heavy oils are often treated with hydrogen to reduce the
organic sulfur to hydrogen sulfide [78].
There are essentially three types of practical processes
for removing hydrogen sulfide from gas streams:
sorption on a solid; reversible chemical or physical
absorption in a liquid medium; and absorption and oxidation in
an oxidizing liquid medium (direct conversion). In the
direct conversion processes, not only is hydrogen
sulfide removed from the sour gas stream, but it is also
converted into elemental sulfur in the same liquid
medium. There are two methods by which this conversion
can be achieved. One is the so-called "Wet Claus"
process, in which sulfur dioxide is introduced and reacts
with the hydrogen sulfide according to the following
equation:
2 H2S + S02 -> 3S + 2H20
Processes of this type are most frequently used for
processing tail gases from Claus sulfur recovery plants, which
are operated to contain the correct stoichiometric
proportions of hydrogen sulfide and sulfur dioxide [79[. The
other type of direct conversion process uses an alkaline
solution (often sodium carbonate) containing one or more
mild oxidizing agents that oxidize hydrogen sulfide to
sulfur and are then themselves regenerated by oxidation
with air [80],
Where coal is used as a fuel for industrial and power
station boilers, coal processing for the purpose of
removing sulfur is too costly, and very large quantities or
coal, including the high- sulfur varieties, are still burned
directly. Often high- and low-sulfur coals are blended to
stay within specified sulfur-emission limits. In the best of
cases, both pyritic and organic sulfur in the coal is burned
to sulfur dioxide and discharged with the combustion
gases. Where emission standards must be met, some
method of removing at least a portion of the sulfur
dioxide from the off-gases must be used [69]. However,
although the technology exists, it is seldom economically
justifiable to recover sulfur or any other useful sulfur
product under these conditions.
5.4.2.3 Sulfur Production From Sulfide Ores
and Sulfates - Non-ferrous metal ores such as copper,
zinc, lead, and cobalt are found mainly in the sulfide
form. A typical copper ore concentrate composition is
_270ACu,_28°/o_Fe,_and.32% S. in the roasting stage the
sulfide components are broken down under the
influence of heat to cuprous sulfide and elemental sulfur [81].
Various methods have been used or have been
proposed for the production of elemental sulfur from
sulfide ores. Methods of treating sulfide ores fall generally
into several groups. Thermal decomposition of pyrites
occurs at about 600°C; in the absence of air, pyrite
decomposes and sulfur gases can be recovered from the
off-gases by condensation [82]. Roasting and/or
smelting sulfides under reducing conditions with coal, coke,
or a reducing gas produces a gas mixture containing
hydrogen sulfide and sulfur dioxide. These compounds
can be converted to sulfur in a Claus plant [80].
Reacting pyrite with sulfur dioxide can produce elemental
sulfur and magnetite:
3FeS2 + 2S02 -> Fe304 + 8S
Sulfide ores can be treated with chlorine or hydrogen
chloride. Wet chemical or biological/chemical
extraction methods can also be used to produce sulfur from
sulfide ores.
Although off-gases from smelting operations are
somewhat more concentrated than gases from the burning
of coal, the economics are generally not in favor of
recovering sulfur from smelting off-gases. Sulfur recovery
128
may help offset costs associated with pollution controls
to conform to emission standards.
Sulfates are not currently a significant commercial
source of sulfur because of economic factors. Large
inputs of energy are required to reduce sulfur from
sulfates. Most of the chemical methods proposed involve
■ reduction of a sulfate to a sulfide followed by acidulation
of the sulfide to produce hydrogen sulfide, which is then
processed to sulfur by the Claus process. Suitable
reducing agents include coke, hydrogen, or reducing gases
(hydrogen + carbon monoxide produced by partial
combustion of a fuel).
5.4.3 World Production, Sulfur Reserves and
Resources
Sulfur ore bodies that are worth exploiting on a large
scale are restricted to a few regions in the world.
However, there are many deposits of local importance. Table
5.22 lists world sulfur reserves and the world sulfur
reserve base. Significant sedimentary sulfur deposits are
Table 5.22. World Sulfur Reserves and
Reserve Base
Reserves3
Reserve Baseac
(tonnes x 103)
United States
Canada
China
France
Iraq
Italy
Japan
Mexico
Poland
Russia
Saudi Arabia
Spain
Ukraine
Other Countries
World Total
140,000
158,000
100,000
10,000
130,000
10,000
5,000
75,000
130,000
NA
100,000
50,000
NA
470,000
1.400.000
230,000
330.000
250,000
20,000
500,000
15,000
15,000
120,000
300,000
NA
130,000
300,000
NA
1,300,000
3.500.000
a. All forms as elemental S.
b. Defined as economically producible under current
conditions.
c. Resource base from which reserves are estimated.
Reserve base may encompass those parts of the
resources that have a reasonable potential for
becoming economically available within planning
horizons beyond those that assume proven technology
and current economics.
Source: [83].
Jocated in several regions. Deposits are found in the Gulf
of Mexico Basin in the states of Louisiana and Texas in
the United States and also in Mexico. In the
Mediterranean Basin, the main deposits are in Sicily, but there
are other deposits on the Italian mainland and on the
French and Spanish coasts of the Mediterranean. In the
Eastern European Basin, sulfur deposits are found along
the Volga River and the coast of the Caspian Sea along
the Caucasus Mountains. North of the Carpathians in
Poland, sulfur deposits are found in the Central
European Basin. Sulfur deposits are located in Turkmenistan
and Uzbekistan of the former Soviet Union and-in-
Afghanistan.
Volcanic-related sulfur deposits are found in several
areas of the world. In the East Pacific Basin, volcanic
sulfur deposits extend along the Philippines, Japan, the
Kuril Islands, and the Kamchatka Peninsula. In the West
Pacific or Cordillera Basin, deposits extend along the
western side of North and South America through
Mexico, Peru, Bolivia, and Chile [69].
Large deposits of pyrite are present in several areas
of the world including India, Poland, Albania, China,
and the former Soviet Union. However, the use of
pyrites is not as technically or economically favorable as
the use of other sources of sulfur. Pure pyrite contains
about 53.5 wt % S, and high-grade ores may contain
46% sulfur. Freight charges for shipping pyrite are high
_comparedio.shipping_pure_sulfur. At approximately 35%
S, pyrite combustion in pyrite-buming furnaces may not
be self-sustaining, and auxiliary fuel sources may be
required, Capital costs are higher for sulfuric acid plants
using pyrites than for those plants using elemental
sulfur, and operating costs are also higher. Pyrite-burning
sulfuric acid plants have more troublesome pollution
problems than do sulfur-burning plants due to materials-
handling problems and particulate emissions. The
disposal of the iron oxide sinter may also present problems
in that pyrites may contain several potentially, harmful
heavy metals, which may be concentrated in the sinter.
It is difficult to make a significant estimate of the total
world reserves of sulfur because of the wide variety of
forms in which it occurs. Reserves may total 1.4 x 10⁹
tonnes 183], Total resources are probably about 5.0 x
1011 tonnes, to 7.5 x 10¹¹ tonnes, of which more than
99% is present in coal, oil shales, and gypsum; these
are materials that do not make a significant contribution
to present world production. World resources of
elemental sulfur in evaporite, volcanic deposits, and sulfur
associated with natural gas, petroleum, tar sands, and metal
sulfides may amount to about 5. x 109 tonnes {Table
5.22).
Table 5.23 shows the world production of sulfur from
1992 to 1994 as elemental sulfur and sulfur in all forms,
129
Tabic 5.23. Production of Sulfur in All Forms and as Elemental Sulfur, 1992-94
1992 1993 1994
Belgium/Lux
Finland
France
Germany
Greece
Italy
Netherlands
Norway
Spain
Sweden
United Kingdom
West Europe3
Bulgaria
Ex-Czechoslovakia
Poland
Romania
Ex-Yugoslavia
Central Europe*
Former USSR
South Africa
Africa3
Canada
United "States
North America
Brazil
Chile
Mexico
Latin America3
Iran
Iraq
Kuwait
Saudi Arabia
Turkey
Middle East*
China
India
Indonesia
Japan
Philippines
Singapore
South Korea
Taiwan
South and East Asia-
Oceania
World Total
a. Including others.
Source: [84].
All Forms
330
617
1,232
2,140
140
630
401
229
889
183
232
7,114
232
76
3,149
277
213
3,971
8,114
575
802
7,406
—11,604
19,010
301
353
1,893
2,917
763
375
-
1,650
177
3,200
6,544
214
63
2,921
201
160
375
152
10,852
351
56,332
Elemental
150
46
988
1,350
130
310
273
13
159
54
165
3,715
10
60
2,952
30
10
3,082
5,284
167
170
6,521
—-9,368"
15,889
77
24
1,593
1,969
763
375
-
1,650
78
3,101
312
45
3
1,375
-
160
124
122
2,183
43
35,436
All Forms
Elemental
- (thousand tonnes S-equivalent)
335
612
1,326
2,206
100
639
441
144
822
157
248
7,119
149
78
2,105
282
134
2,781
6,523
618
801
8,474
11,779—
20,253
270
372
1,252
2,358
881
375
246
1,650
178
3,689
6,323
229
65
3,114
196
180
508
150
11,028
379
54,940
156
32
1,073
1,451
100
350
318
16
180
55
183
3,991
15
65
1,901
35
15
2,056
3,941
171
174
7,567
9;56S-
17,135
77
1
912
1,340
881
375
246
1,650
71
3,582
262
55
5
1,560
-
180
222
120
2,497
57
34,782
All Forms
341
636
1,369
2,131
80
590
440
105
798
146
219
6,946
155
86
2,360
287
139
3,063
5,858
572
765
8,993
- 12,252
21,245
287
489
1,212
2,485
935
375
490
1,680
220
4,262
6,479
250
67
3,068
184
180
523
182
11,280
387
56,291
Elemental
160
40
1,084
1,400
80
345
323
15
160
50
154
3,889
15
70
2,160
40
20
2,335
3,589
190
193
8,048
10,101
18,149
85
-
860
1,328
935
375
490
1,680
65
4,107
197
60
7
1,667
5
180
239
150
2,688
73
36,351
130
including sulfur obtained from pyrites, non-ferrous metal
ores, and crude oil and natural gas. World production of
all forms of sulfur totalled 56.291 million tonnes in 1994
compared to 56.332 million tonnes in 1992 [84]. World
elemental sulfur production totalled 36.351 million
tonnes in 1994 compared with 35.436 million tonnes
in 1992.
In 1993 world sulfur production was curtailed. Total
Frasch and mined sulfur production was at 6.1 million
tonnes in 1993 compared with 8 million tonnes in 1992
[751- There was a significant change in the structure of
the Frasch industry with low prices forcing a
rationalization of production in Mexico and Poland, which also led
to production curtailments at some U.S. mines.
In the United States, Freeport McMoRan brought its
Main Pass 299 Mine, which is located offshore
Louisiana and was commissioned in 1992, up to full
production in 1993. The older Caminada Mine was closed at
the beginning of 1994. Pennzoil cut sulfur production
further in 1993 and began major cost-cutting exercises.
Mexico ceased Frasch sulfur production in May 1993
after producing 150,000 tonnes. Low world sulfur prices
and high costs resulted in the demise of the industry in
Mexico. The sharp decline in prices in 1993 resulted in
Poland further reducing its sulfur production. The open-
pit mine at Machow permanently closed in 1993. The
new mine at Osiek was completed but was not operated
at full capacity, The frasch mine at Mishraq in Iraq has_
been operated at low rates in recent years due to the
lack of export opportunities as a result of the United
Nations' sanctions. The mine is capable of producing 2
million tonnes per year [75].
Sulfur consumption by region in 1992-94 is shown
in Table 5.24. For the short to medium term, sulfur is
expected to remain in surplus due to increased byproduct
sulfur production. Increasing demand for natural gas and
the increased need for pollution control will lead to
increasing production of recovered sulfur. Elemental
sulfur from evaporites and volcanic rocks will be available
for many years, The fertilizer industry should be able to
obtain the sulfur it needs over the next decade, but the
lowest cost reserves presently being used have a limited
life expectancy.
5.5 Potash
Potassium salts produced and used as fertilizers are
generally referred to as "potash," a term that originated
from the burning of wood in pots or retorts to obtain
potassium salts as "pot-ashes." Potash is now commonly
used to describe potassium-bearing materials, and the
potassium content is generally expressed on a K2O
equivalent basis.
5.5.1 Geology, Mineralogy, and Origin of
Potash Deposits
Large, deeply buried potash deposits are mainly
associated with marine evaporite sequences and less
commonly with non-marine evaporites throughout the world.
Potash deposits occur on every inhabited continent and
have been identified in most geologic time periods from
the Cambrian to the present. The most abundant
potash mineral in commercial potash deposits is sylvite (KCI).
Sylvite and halite (NaCl) form the common potash ore
called sylvinite. In most occurrences, fairly pure sylvinite
Table 5.24. Consumption of Sulfur in All Forms and as Elemental Sulfur, 1992-94
1992
1993
Western Europe
Central Europe
Former U.S.S.R
Africa
North America
Latin America
Middle East
Asian CPEs
Other South and East Asia
Oceania
World Total
Source: [84].
1994
All Forms
7,172
1,794
8,430
5,548
15,222
3,008
1,230
6,775
6,579
564
Elemental
3,830
905
5,600
4,916
12,101
2,060
1,124
410
4,158
295
All Forms
Elemental
(thousand tonnes S-equivalent)
6,668
1,540
6,432
5,394
14,145
3,279
1,155
6,610
6,373
631
3,540
815
3,850
4,767
11,027
2,261
1,048
393
4,013
355
All Forms
6,638
1,643
6,069
5,772
14,862
3,682
1,455
6,846
6,557
684
Elemental
3,637
915
3,800
5,200
11,766
2,525
1,300
440
4,331
410
56,322 35,399
52,227 32,069
54,208
34,324
131
exists with essentially no soluble sulfate or other salts. In.
other deposits, fairly pure carnallite (KCI MgCl • 6H20)
is also found with halite. In only a limited number of
deposits do soluble sulfate salts occur, such as zones of
the Zechstein Basin where the occurrence of "hartsalz"
Isylvite plus halite with kieserite (MgSC>4 • H2O) and/or
anhydrite (CaSO^] is common. Double salts occur in
deposits in Sicily and Ethiopia where kainite (KCI •
MgSOq • 3H20) is predominant. Double salts also occur
in the deposits of the Carlsbad, New Mexico area, and
the Carpathian region (Ukraine) where langbeinite
(K2SO4 • 2MgSC>4) occurs extensively. In many
deposits, there are also some occurrences, or occasionally large
amounts, of the insoluble mineral polyhalite (K2SO4
MgS04 2CaS04 • 2H20). In three locations around the
world, sylvinite occurs with carnallite and tachyhydrite
(CaCI2 2MgCI2 • 12HzO).
On a worldwide basis, there appear to be as many as
100 large buried potash deposits that could produce
products of commercial quality and about the same
number of significant potash brine deposits. The buried
deposits are primarily of marine origin, Surprisingly, the
exact mode of the formation of these deposits, as well
as a smaller number of deposits that are associated with
hot springs, is not known and is the subject of
considerable speculation.
Sodium and potassium are major components of sea-
water. With sufficient evaporation, halite, epsomite, and—
potash double salts will crystallize. At some point in the
geologic history of a potash deposit, this mixture of salts
is transformed to either kainite-epsomite-halite or more
often to carnallite-kieserite-halite, depending upon the
extent of evaporation. There are no circumstances that
will cause sylvite to be formed directly from seawater. It
is generally recognized that, after evaporite formations
are flooded with weaker brines, carnallite is converted
to sylvinite, and kieserite is dissolved [85], However, the
kieserite dissolution part of this theory is controversial,
and there is speculation that all or most of the sulfate
content of the seawater may be removed before final
evaporation, either by sulfate-reducing bacteria or by
the intrusion of calcium chloride-bearing waters. Either
reaction mechanism is fairly easy to discredit, and there
is no positive proof of any one mechanism. It is also
quite certain that extensive diagenetic changes can and
often did occur long after burial of potash deposits, which
further complicates the subject.
5-5.1.1 Buried Potash Deposits - The potash
deposits of the world vary widely in their size (ore
resources and reserves}, grade (minable % K20), and
factors that impact economics, such as their location and
the cost of mining and processing. Mining costs depend
upon capacity, depth to the ore, thickness and
uniformity of the potash bed, dip of the beds, strength and
. integrity of the overlying strata (to form a strong roof),
danger of water intrusion (flooding) and the attendant
cost of penetrating the aquifer zones with shafts and
pumping the water, problems with toxic combustible
gasses or "rock bursts," amount of insolubles in the ore,
ease of "desliming," the KCl-NaCI liberation size, and
amount of impurities present. Location is very
important with respect to the deposit's distance from
markets, transportation, infrastructure, and the cost of
transportation. Government royalties, taxes or fees, and
possible special circumstances in selling the product (i,e.,
protective tariffs, local or controlled markets, reciprocal
trade agreements, etc.) have a great impact on
economics. Due to the complexity of these factors, those
deposits that are the largest and that have the highest grade
and potentially lowest production costs in the world may
not be fully exploited, nor do they totally dominate the
potash market. A condensed review of the currently
produced and better known buried potash deposits will
be briefly presented in the following section.
Brazil (Sergipe); Congo; Thailand - Although
these deposits are widely separated geographically, they
are similar in that they contain medium to small sylvite-
bearing sylvinite formations with similar unusual
mineral assemblages. There are commercial quantities of
sylvinite, considerably more carnallite, significant
amounts of tachyhydrite, and smaller quantities of
bischofite (MgCI2 • 6H20). All three deposits and their
salt beds contain essentially no carbonates (calcite or
dolomite) or gypsum (or anhydrite), except at the top of
the Sergipe and Congo formations. The lower sections
of the basins are filled with land-derived sediments, and
the halite rests directly on these sediments. Potash
occurs at the very edges of the basins, instead of in the
more common structure of halite and/or anhydrite and
dolomite surrounding the potash and covering a much
wider area.
It appears that these deposits are of continental and
not marine origin. The potash source could have been a
high-Ca geothermal brine similar to the brines emitted
from the rift zones of the Red Sea or Salton Sea. The
coast lines near the Congo and Brazil deposits would
have been closely dovetailed before continental drift, and
they are of identical age (Lower Cretaceous, Aptian).
Wardlaw and Nicholls [86] have shown that the Congo
and Brazil deposits contain very similar concentrations
of 10 trace elements, and a number of the
concentrations of these elements are quite different from those
found in other potash deposits. Only very hot high-Ca
brines (such as now occur at Lake Magadi, Kenya,
depositing soda ash) could crystallize such massive
deposits of extremely hygroscopic tachyhydrite and bischofite.
Potash occurs primarily around the edges of carnallite
zones in these deposits, having been formed by water
intruding into the carnallite, which was then converted
to sylvinite.
132
The depth of the Sergipe deposit in Brazil varies from
500 to 850 m, and the potash beds are uneven and
highly variable in thickness [87]. The thickness of the
potash zones at Sergipe varies from 2 to 31.3 m and
averages about 20.5 m. The sylvinite zones contain some
carnallite, have an average grade of 25% K2O, and are
mined in two layers. Each of those layers is up to 11 m
thick and separated by 3-6 m of halite. The tachyhydrite
in the floor has low mechanical strength and high creep
tendencies, and it is very hygroscopic.
The Congo deposit (Holle) contains less sylvinite, about
the same amount of carnallite (estimated at 15% of the
total salts), and more bischofite than the Sergipe
deposit. A "normal" depositional sequence of thin black
shales is followed by halite and then carnallite, with some
zones converted to sylvinite, In most areas, the
uppermost mineralized zones contain tachyhydrite or
bischofite. A commercial potash operation was initiated
in 1969, but developed many mining problems leading
to poor productivity, The sylvinite beds were often thin
and not very continuous, irregular in dip and variable in
composition, and they occurred within an oddly shaped
area (a large U). At Holle, sylvinite was found primarily
in the second highest salt (9th evaporite) cycle in four
separate beds. Two layers, beds 3 and 7/8, were mined.
In the mining area, the upper bed (7/8) occurred at a
depth of 288-380 m over an area of 28 km2 and
averaged 18% K20. Bed 3, which was 10-20 m below bed
7/8, had an average thickness of "3 m with an ore grade-'
up to 38% K20 and only 0.1% insolubles. On June 20,
1977, water from an overlying aquifer began to enter
the mine. Water flow rapidly increased, and within 36
hours the entire mine was flooded. Most of the
equipment was lost, and the mine was abandoned [88]. In
recent years, there have been several proposals to
reopen the mine as a carnallite mine because of the
thickness and uniformity of the carnallite beds.
A much larger basin of this type, also of Cretaceous
age, occurs in Thailand and extends into neighboring
Laos. The basin is divided by the Phu Phan mountain
range into the Khorat Basin to the south and the Sakhon
Nakhon Basin in the north. The potential ores of this
deposit contain up to 3.7% boracite (MgClB7Oi3). The
deposit is composed largely of carnallite. Sylvinite beds
appear to occur primarily on the flanks of salt domes or
anticlines [891. ASEAN Potash Mining Company Ltd.,
a consortium funded by several countries in the region,
has been studying the feasibility of producing and
processing carnallite based on a traditional room and pillar
mining system in a portion of the deposit at Bamnet
Narong in the Khorat Basin. An incline is currently being
driven to the potash zone, Total ore resources are
approximately 366 million tonnes K2O. Total minable
reserves are approximately 83,4 million tonnes K2O.
A private company, Asia Pacific Resources Ltd., is
developing sylvinite resources in the Sakhon Nakhon
Basin near Udon Thani. Thus far, drilling has indicated
a reserve base of 250 million tonnes of sylvinite ore, of
which 160 million tonnes is deemed minable reserves
at 25% K20, This ore can be treated using traditional
flotation processes.
Canada: New Brunswick - The New Brunswick
potash deposits associated with the Windsor Group
evaporites are found in three structures at the southern
end of the Moncton Basin: Penobsquis (mined by
Potash Corporation of Saskatchewan [PCS[, formerly"
operated by Potash Company of America [PCAI); Clover
Hill (mined by Potacan); and Millstream (development
rights acquired by IMC, Canada). Each deposit lies within
gradual-to-steep flanks of synclines formed by salt
doming. Even though each deposit is located in a separate
structure, the potash beds have the same cycles and
general thickness of layers within beds. Some carnallite
occurs at Penobsquis, but there is little carnallite at Clover
Hill. The sylvinite layer is divided into units called A, B,
C, and D. The lower unit, or A zone, is 1-10 m thick,
fine grained, and varies from high-grade sylvinite to
barren halite. The B (1-15 m thick) and C (0.5-10 m thick)
zones comprise the main mining levels. The D zone is
more variable and occasionally is extensively folded. The
crystal size of the sylvinite ores ranges between 2 and 5
mm. The ores contain 0.5%-5.0% insolubles, and grade
averages_28.%_K20_atXIover_Hill (Potacan) and 26%
K20 at Penobsquis. Ore depth varies from 460 to 1,035
m, and the deposits vary from 10 to 35 km2 in area
[90],
Canada: Saskatchewan - The largest and most
minable potash reserves in the world occur in
Saskatchewan, Canada, extend slightly into Manitoba,
and extend substantially but at considerable depth (1,000
m to over 3,500 m) into Montana and North Dakota in
the United States. Sylvinite ore occurs in three
members of the Prairie Evaporite Formation (Upper Middle
Devonian), The lowest potash member is called the
Esterhazy. Above the Esterhazy there is a comparatively
minor bed, the White Bear (these two beds do not occur
in the northwest area of the Evaporite Basin), followed
by the Belle Plaine Member. The Patience Lake
Member occurs at the top of the sequence. The Patience
Lake Member is divided into two main ore zones (upper
and lower). The potash beds dip slightly to the west and
more strongly to the south at a rate of 3-9 m/km.
Potash is difficult and expensive to mine at depths below
about 1.100 m, and the conventional shaft mines lie in
the shallowest northwest edge of the Patience Lake
Member near Saskatoon, or the northeast edge of the
Esterhazy Member near the town of Esterhazy.
Solution mines are not so depth-limited, and one mine is
located west-northwest of Regina where an appreciable
thickening of the Belle Plaine Potash Member occurs.
Another solution mine is developed on the flooded PCS
Patience Lake Division mine near Saskatoon [91].
The minable zone of the Esterhazy Member is
reasonably thick and high in grade, has a low insolubles
content, and is overlain by a comparatively strong strata
("roof" rock). An approximately 2,4-m-thick zone of the
Esterhazy Member is mined at three locations {IMC Kl,
IMC K2, and PCS Rocanville). The ore from the
Esterhazy Member averages 25% K20 and 1% insolubles.
Some carnallite is present in the ore, varying from less
than 1% (normal) to as much as 10%. The sylvite
liberation size is unusually large (much of the ore is liberated
at plus 3-mesh [Tyler] or plus 6,7 mm).
Other shaft mines in Canada mainly produce from
the Patience Lake Member. Most operations mine the
top 2.74-3.35 m of the 3.66- to 4.57-m-thick Upper
Patience Lake Member One mine operates on the lower
ore zone and recovers nearly all of the 4,57- to 5.79-m-
thick potash bed. The ore grade (20%-26% K20)
recovered in these mines is generally inversely proportional
to the thickness mined, The insolubles content typically
is 4%-7%, primarily resulting from several thin clay
partings located within the potash zone.
Europe: The Zechstein Basin - During the
Permian period, the Zechstein Basin was a large gulf that
covered much of present-day Germany, parts of the
North Sea, the Netherlands, an edge of England, Vo-
land, and the Baltic region. Marine shale, limestone (or
dolomite), and gypsum (or anhydrite) were deposited over
all of the basin, and halite was deposited over large
areas. Potash deposits were formed in more limited
areas. All of these potash deposits exhibit some
minor-to-major plastic flow, fracturing, and possibly
basalt intrusion, and they have been altered by geother-
mal or other water, These postdepositional alterations
have resulted in quite variable strata and mineralization.
The four Zechstein evaporate cycles or series are
described by Z numbers. The oldest formation, the Zl
Werra Series, contains two potash beds, the Hessen and
Thuringen, and is found only in southern Germany. The
Zl beds vary considerably, but in general, the lower
Thuringen bed contains sylvite (15%), kieserite (10%),
and carnallite (10%), and is capped by a carnallite
breccia. The upper, or Hessen, bed contains much less
carnallite and averages 15%-20% in both sylvite and
kieserite content. The second evaporite cycle, or Z2
Stassfurt Series, is found predominately in central
Germany. The Stassfurt Series contains carnallite or car-
nallite-kieserite, grading laterally into sylvite-kieserite
(hartsalz). The Stassfurt Series is often capped by
gypsum and kainite, apparently formed by a conversion of
the carnallite-kieserite mixture. In the third evaporite
cycle, or Z3 Leine Series, there are two potash beds,
the Ronnenberg and Riedel, which are found
predominantly in northern Germany. Both the Ronnenberg and
Riedel beds are usually found only in small lenses (with a
few exceptions, such as at Zielitz), and contain fairly
pure sylvinite. The fourth evaporite cycle is the Z4 Aller
Series. In England, the Z3 Leine Series and.Z4 Aller
Series contain only sylvinite or carnallite. Potash from
the Zechstein Basin is commercially produced in
England and Germany.
England (North Yorkshire Deposit) - A
comparatively small but very interesting potash occurrence is
commercially mined in England. The Boulby potash bed is
assumed to be Z3 (with the Z4 missing in that area) and
extends just under the English east coast at a depth of
1,100-1,200 m in the mining area. To the south of the
mining area, where the Z4 also occurs, both potash beds
occur about 200 m or more deeper. The average
potash grade as mined in 1992 was about 40% KCI (24%
K20), and the ore contained 10%-15% (usually near the
higher number) insolubles. It is also one of the world's
most unusual sylvinite formations. Talbot et al. (1982)
have proposed that the sylvinite reached the present
position by flowing into the overlying grey anhydrite shale
and salt clay. The sylvinite resembles a metamorphic
gneiss, both in terms of crystal fabric and because it
contains many rounded fragments of rocks from
adjacent beds, According to theory, the fluid mass of sylvinite
presXimatiIy*circulated"to form extensive pillow-shaped
structures that follow the underlying fault system in the
area. The NaCI and KCI crystals of the sylvinite contain
significant amounts of gases under high pressure.
Germany - In southern Germany, both Zl beds
(Hessen and Thuringen) are mined and processed at four
plants. The ore consists of various types of hartsalz,
perhaps formed as a result of the low permeability of
the underlying Kupferschiefer shale (copper shale), which
prevented the leaching of magnesium sulfate. The beds
in the area are comparatively flat-lying and continuous,
but within the deposit there are various fold structures,
barren zones, faults, basalt intrusions, and sudden
thickening and thinning of the ore. The Thuringen bed
consists of halite, sylvite, kieserite, and carnallite and
averages 3 m in thickness. A carriallite-shale breccia often
overlies this potash zone and at places is the dominant
formation. There is about 20 m of halite separating the
two potash beds, with the upper or Hessen bed ranging
from 2.0 to 2.5 m thick and containing 9°/crl0% K20
and 5%-10% MgS04. At the top of the Hessen bed is a
mixed carnallite zone up to 3 m thick, and peripheral
carnallite zones can be up to 15 m thick. Mining in the
Werra-Fulda District can be difficult. Basaltic intrusions
and block faulting have greatly altered the potash beds
in some locations, and high-pressure carbon dioxide is
134
trapped in halite or sylvite crystals [93]. Pressure release
often results in rock bursts in these areas. Several major
earthquakes have apparently resulted from injecting plant
waste liquors into an overlying fissured dolomite
formation.
The Z2 Stassfurt Series forms the most extensive min-
able potash deposits in central Germany. The Z2 Series
is always found on the flanks of diapirs (salt domes) in
the former West Germany, and thus occurs as highly
contorted and predominately steeply dipping deposits.
The Z3 Ronnenberg or Riedel beds are also associated
with some of these deposits, The Stassfurt bed exists
predominately as a carnallite-kieserite mixture, often with
a low potassium content, and the bed may not be
economical to produce alone. The Stassfurt bed is
underlain by a bituminous, high-organic shale or dolomite,
which along with a thick anhydrite layer may have
reduced the permeability sufficiently to prevent
magnesium sulfate from leaching from the bed. Some of the
carnallite has been converted to sylvite in the outer edges
of the deposit, and the potash bed is often capped with
a kainite mixture, presumably formed by a carnallite-
kieserite reaction. In some zones, a schoenite mixture is
found on top of this kainite; this is also most likely a
reaction product. These minerals appear to have been
formed by the intrusion of brines at a much later date.
The Z3 Ronnenberg and Riedel beds consist mainly
of sylvinite with sporatic occurrences-of carnallite and—
with no magnesium sulfates. Both beds exist as isolated
discontinuous units, and occasionally each is minable
alone, for example, the Ronnenberg bed at the Zielitz
deposit. Here the Ronnenberg bed slopes steadily from
18° to 25° and is found at depths of 400-1,000 m. The
bed is 6-9 m thick and contains about 25% KCI (15%
K2O), with no sulfates and only minor amounts of
insolubles. The halite that overlies the Ronnenberg bed
at the Zielitz deposit contains some carnallite,
Europe: Tertiary Deposits - Exploitable potash
areas of Tertiary age are found in France, Italy, and
Spain. These occurrences vary considerably in size,
potash content, and potential for future production.
France - The Tertiary Period (Oligocene Epoch)
Alsace-Wittelsheim potash deposit in France contains
two potash beds separated by about 20 m of halite. The
lower bed is found in an area of about 300 km2 and is
1-5 m thick; the ore contains 12%-20% K2Q. The
upper bed covers an area of 115 km2; it averages 1.5 m in
thickness, and the ore contains 20%-27% K2Q. The
potash content of the beds diminishes to less than 11%
at their edges, where they thin to 1 m or less. The beds
are found at depths of 420-1,800 m, and they dip slowly
and variably to the north-northeast at 0°-25°. To the
east of the Wittelsheim deposit, and separated by the
. Mulhouse uplift, is the Munchhouse deposit. A small high-
grade companion potash deposit (the Biiggingen deposit)
occurs in Germany a few miles to the east. The
Btiggingen deposit is found in an area of 1.6 km2, has a
potash bed thickness of 0.5-4.0 m, and occurs at depths
of over 800 m. The last mine to operate on the
Btiggingen deposit closed in the early 1970s. There have
been many mines on the Wittelsheim deposit, but only
two remained in operation in 1994, with less than 10
years of minable reserves. Both mines are operated by
Mines de Potasse d'Alsace. Conditions are adverse in
the area, The Iong^wall mining technique used in_the-
area liberates variable quantities of methane as the shale
in the roof falls. There is a high geothermal gradient in
the area, and the rock temperature is 47°C at 800 m
and 54°C at 1,000 m.
Italy - The potash deposits of Italy are located on the
island of Sicily and were formed during the late Miocene
when the Mediterranean Sea was a partially or totally
isolated gulf. The deposits are composed of isolated ore
bodies in two generally parallel troughs 115 km long, 5-
10 km wide, and separated by 11-25 km. Kainite is the
dominant potash mineral in the deposits. The ore in
most of the individual ore bodies occurs as six layers of
variable thickness and has a grade of 10%-16% K2O
(pure kainite contains 18.9% K2O), with very little
insoluble content (0,4%-2.0%). There has been
considerable tectonic activity in the area, and the deposits are
-stradn3rally"disturtfedrtittle-ifany of the limestone
associated with the deposits has been converted to
dolomite, nor has the gypsum associated with the deposits
been converted to anhydrite. This evidence, along with
isotopic data, indicates that when the deposits were
formed the evaporation of the parent seawater did not
usually proceed past the kainite crystallization point. The
largest ore body is at Pasquasia, covering a 24-km2 area
at depths of 300-800 m. There are five beds at Pasquasia
in highly undulating synclinal and anticlinal forms. The
No. 2 bed is the thickest, averaging perhaps a 30-m
thickness of 10.5% to 13.5% K20 ore [94].
Spain - Spain has two exploitable potash areas,
occurring at opposite ends of a long (300 km), narrow
depositional basin of Upper Eocene age, formed
between the Pyrenes, the Iberian ranges, and the
Catalonian coastal range. The saline mineral sequences
in both deposits are quite similar, with an "old halite" at
the base, a sylvinite-producing horizon, and carnallite
and halite above the main producing horizon.
The western or Navarra basin covers a 400-km2 area
and contains a sylvinite bed averaging 2 m in thickness.
The sylvinite bed is made up of 18 thin layers 4-14 cm
thick alternating with layers of halite 2-12 cm thick. On
top of the sylvinite bed is a massive halite bed, generally
0.7-1 m thick, but sometimes absent altogether, and
135
above the halite is a 10- to 12-m bed of carnallite. The -
deposit has a synclinal structure with two major fracture
systems dividing it into three blocks. Two of the blocks
are uplifted, and the central block is downfaulted as much
as 300-600 m.
The second exploitable area, the Castean or Catalonia
" potash basin, is located 75 km northwest of Barcelona
and covers an area of about 2,600 km2.. The Catalonia
deposit contains 2 to 4 layers of potash ore. The lower
sylvinite bed or A bed is typically 3.0-3-2 m thick and
averages 18% K2O. Above the A bed is a 2.5-m halite
layer, followed by 0.7-0.9 m of sylvinite called the B
bed, which analyzes about 35% K2O. Above the B bed
are two thin marl layers followed by 6-8 m of
alternating carnallite-halite beds.
At the Llobregat mine, the potash beds are nearly
horizontal (5° dip), with some folding, and are generally
in the form of a large syncline. At Llobregat the beds
are found over a 10-km2 area, and the depth to the
beds varies from 300 to 400 m.
At the Cardona mine, the deposit is formed around a
diapiric anticline. The potash beds form a horseshoe-
shaped deposit 1 km wide and 5 km long around the
northern flank of the salt dome. Beds with 20°-80° dips
are mined in stopes at depths up to 1,025 m. The
potash zone mined varies from 8 to 20 m in thickness and
averages 11%-12%K20.
At Suria, potash is mined on the southern flank of
the Suria anticline. One or two of the four potash beds
are recovered (in two mines) from depths between 550
and 880 m. The potash beds dip at angles up to 20°
and have generally been thickened; there are a number
of barren and folded zones. The lower (A) bed may
average 6.5 m thick with ore averaging 20.6% K2Q. The
upper bed (B) averages 5.5 m at 27% K2Q. A portion of
the overlying carnallite bed has been converted to
sylvinite, which is also mined [95].
Former Soviet Union: Belarus (Soligorsk or
Starobin) - The second largest potash deposit in the
former Soviet Union (FSU), and one of the world's larger
potash deposits, is of Upper Devonian age and is found
in the Pripyat Depression. The deposit has as many as
30 individual potash beds and four main potash-bearing
layers, numbered from the upper bed down. Four mines,
Soligorsk 1, 2, 3, and 4, usually mine Bed 2 and the
lower section of Bed 3. In the mining area, Bed 2 is at a
depth of 350-620 m and is 1.8-4.4 m thick. The sylvinite
ore contains an average of 11% K2Q with 5% insolubles
over an area of 250 km2. Bed 2 is nearly horizontal,
sloping gently to the east. Bed 3 lies about 160 m below
Bed 2. The lower sylvinite zone of Bed 3 (1.5-2.8 m
thick) averages 13.4%-16.4% K2Q with 9% insolubles
and extends over a 350-km2 area.
Former Soviet Union: Ukraine (Carpathian
Deposit) - High-sulfate potash deposits occur in the
Carpathian area of western Ukraine. Up to 15
discontinuous ore bodies contain predominately langbeinite and
kainite, with varying but substantial quantities of
carnallite, sylvite, and polyhalite. Lesser quantities of kieserite,
schoenite, Ieonite, and glaserite are also found.in the
ore, as well as large amounts of insolubles. The deposits
occur in a 170 km by 15 km area in two zones, which
range from lower to middle Miocene in age. The main
deposits are centered near Kalush and Stebnik, about
70 km apart. There are often two to five potash-beds,..
typically occurring as 1- to 5-m-thick lenses 0,5-1.0 km
long and 200-300 m wide. Most of the ore bodies are
moderately to steeply inclined at depths of 0-800 m (an
open-pit mine is developed on one ore body). The ores
average about 10% K2Q with 10%-18% insolubles and
are very difficult to process.
Former Soviet Union: Russia (Upper Kama
Basin) ~ The largest potash occurrence mined in
Russia, and second in size only to the Saskatchewan
deposits in Canada (although perhaps smaller than the less
extensively explored Russian Siberian deposits), is of
Permian age and is located in the Pre-Ural Trough adjacent
to the Kama River and the Ural Mountains. Six mines
and plants (one mine flooded and was abandoned) are
centered about the towns of Solikamsk, Berezniki, and
Romanovo, The potash deposit underlies about a 3,000-
km2~area-and-con$ists"of 43 potentially minable beds.
The lower sylvinite horizon is 26-30 m thick and
contains the major sylvinite beds. The upper sylvinite-car-
nallite zone is 70-80 m thick. Several of the major beds
were mined in 1991: the Red II (also called the Krll or
Kp), Red I (or Krl or R), A, B, and V. The Red 11 is the
principal bed worked across the region. The beds that
are mined are 1,2-6.1 m thick, and the average interbed
thickness of halite is 1.5-2.0 m. The ore averages about
15% K20 with 3%-5% insolubles. The potash beds
generally have very gentle dips of 0°-4°, but there are some
gradual uplifts and folds as well as occasional cavities
and numerous barren zones. Halite beds with clay
partings lie on top of the mined potash, with thicknesses of
0,8-1.2 m, limiting roof spans to 3-16 m. The depth of
the deposit varies from 75 to 450 m, and there is a
high-pressure aquifer above the deposit.
United States: Carlsbad, New Mexico - The
Carlsbad deposit is stratigraphically and mineralogically
complex and contains 11 potash beds separated by thick
halite and sporatic thin anhydrite or polyhalite layers.
The potash ore bodies vary considerably in terms of
their area, shape, and location, but they are fairly flat
with only moderate undulations, faulting, and folding.
The main ore minerals are sylvite and langbeinite. To
the east of the commercial potash deposits, there is a
massive polyhalite formation. The lowest potash merri-
ber is known as the first ore zone and consists
principally of sylvinite. It has been commercially mined by all
Carlsbad operators and has been largely depleted. This
ore zone, 3.0 to 4.6 m thick, contains three generally
dark red potash beds, each about 0.6-0,9 m thick and
containing >20% KC1. The potash beds are separated
by 0.1-0.5 m of orange halite. The upper 0,6-0,9 m
' and bottom 0.3-0.6 m of the first ore zone are low in
potash and often contain 5%-10% brown clay. The
potash beds that have been commercially exploited are the
1st, 4th, 5th, 7th, and 10th beds. Langbeinite has been
principally produced from the 1st, 4th, and 5th potash
beds [961.
United States: Paradox Basin, Utah and
Colorado (Cane Creek) - The Paradox Basin covers an
area of 16,000 km2. Potash has been found in 18 of
the basin's 29 evaporite cycles, and 11 of the cycles
contain potash beds that may be considered of economic
importance, The cycles are numbered from the top
down, and cycles five and nine appear to be the most
promising. Carnallite and sylvite occur in large
quantities, and in some beds the K2O content exceeds 30%.
Some of the beds of individual cycles are quite
extensive; the potash beds of cycle 19 can be observed over a
distance of 180 km. Within the basin there is a series of
parallel northwest-trending anticlines composed of
individual diapiric salt structures that have often penetrated
the overlying beds. In the anticlines, the thickness of the
salt beds may have as much as doubled:-The only struc- -
ture that has been commercially exploited to date is the
Cane Creek anticline near Moab, Utah. The fifth
potash cycle is produced at a depth of about 1,200 m. The
ore zone averaged 3.4 m in thickness over an area of
31 km2 with 25%-30% K20. The mine originally was a
shaft mine and room and pillar operation. However, the
mine was gassy (contained methane) and hot (up to
35°C), the sylvinite bed was highly irregular in thickness
and dip, and there were many faults. All these factors
made mining very difficult and costly. In 1970 the mine
was intentionally flooded, and the mine now operates
as a solution mine.
Undeveloped Major Deposits - There are several
potash deposits around the world that may be worthy of
commercialization. Several of these deposits will be
discussed in the following section.
In southwest Argentina, a deposit containing 300
million tonnes of deep resources has been reported in
an area of 300 km2. The Argentina deposit is located
260 km from an existing railroad and 650-850 km from
a port. There are two potash zones: One zone is 2.2-
2.5 m thick and analyzes 28%-32% K30; the second
zone is 10-20 m thick with 20°Xr27% K20 ore. A $10
million solution mining pilot plant and a 250,000-tpy
KC1 production plant were announced in 1992.
In the Amazon Basin of Brazil, sylvinite has been
discovered in two evaporite cycles at depths of
approximately 1,000 m. Reserves may be substantial. Each
potash zone is 2.5-2.7 m thick and contains 28%-33%
K2O as sylvinite.
Perhaps the world's youngest large buried potash
deposit is located in Ethiopia. The potash deposits of the
Danakil Depression are Pleistocene in age and contain
separate beds of both kainite and sylvinite. The lowest
potash bed consists of fine-grained kainite (to 74%) with
halite and varies from 4 to 14 m in thickness. Above the
lower kainite bed are 3-24 m of mixed carnallite salts
trending toward more kainite on the bottom, with more
sylvite near the top. The upper zone or sylvinite bed is a
0- tol2-m interval, with an abundance of sylvite near
the top and increasing amounts of carnallite, polyhalite,
and kainite near the base, The upper sylvinite bed also
contains considerable anhydrite, indicating that a high-
Ca spring (which still exists) did influence the waters of
the basin in their final evaporative stages to precipitate
sulfates.
Sylvinite and carnallite deposits have been discovered
in Morocco in at least four locations, in three separate
basins. The depth to potash zones varies from 500 to
1,000 m, and the potash bed thickness ranges from
2.5 to 9 m. Following a United Nations-sponsored
drilling program, reserves of sylvinite in Morocco were esti-
-jT^ted-as-40-nuUion-tonnes-averaging. 13% K2O, and
carnallite reserves were estimated as 200 million tonnes
averaging 10% K2O.
In Poland, potash occurs in the Zechstein Z3 and Z4
beds but in generally limited quantity and at low grades
(8%-9% K2O). In one area, carnallite beds up to 25 m
thick occur. However, the greatest attention has been
given to the Puck Bay area's extensive polyhalite
formations.
In addition to the two major and one minor potash-
producing areas in the countries of the former Soviet
Union, there are at least six occurrences that appear to
be major deposits (Gaurdak-Kugitang Basin, Pre-Caspian
Depression, Dnieper-Don Basin, Pripyat Basin,
Siberian Platform, and the Pre-Ural Trough). The Siberian
Platform may contain one of the world's largest potash
deposits, with comparatively easily mined, high-grade
sylvinite beds. Plans had been formulated to
commercially develop several of these deposits, but with the
political and economic changes in central and eastern
Europe, these plans have been postponed or canceled.
Most of the deposits are of medium- to high-grade
sylvinite, but in parts of the Carpathian Foredeep,
considerable deposits of langbeinite have been discovered.
One of the announced mines (Karlyuk in Asia) was
planned as a solution mine. Another project (Petrikov,
137
Pripyat Basin) was planned as a joint magnesium metal-
potash operation based on carnallite production.
In the Silurian Michigan Basin of the United States,
potash-bearing salts may occur over an area of 33,800
km2, Sylvinite zones with thicknesses up to 27 m and
beds containing up to 25% K20 (but averaging much
less over the potash-bearing interval) have been
discovered. A 40,000-tpy KC1 solution mining pilot plant has
operated on a potash zone at a depth of 1,540-2,560
m for several years.
5.5.1.2 Brine or Surface Potash Deposits - In
addition to the buried potash deposits, there are brine
or surface potash deposits in North America, South
America, and Asia/Middle East. This section gives a brief
review of these deposits.
Chile: Chilean Nitrate Deposits - The Chilean
nitrate deposits are unique, and the formation of these
soluble salt mineral deposits is one of the great
mysteries of the world. It is beyond the scope of this chapter to
discuss the various theories concerning the origin of these
deposits. The deposits occur in the Atacama Desert
region of northern Chile over a north-south range of
approximately 700 km and an east-west distance of 10-150
km as an almost continuous deposit of
sodium-potassium nitrate and other soluble salts. The Atacama Desert
is one of the. driest regions in the world with as much as
20 years between rainshowers. These deposits are the
only substantial concentration of potassium andsoxliurrr
nitrate, iodate, perchlorate, and chromate salts found
anywhere in the world. This deposit contains an
estimated 109 tonnes of sodium nitrate, slightly less sodium
chloride, and perhaps twice that amount of sodium
sulfate. Potassium nitrate, magnesium sulfate, and boric
acid may total about 100 million tonnes each, while the
iodine and sodium perchlorate contents are about 5
million tonnes each. Almost no bromine is present. The
ore occurs as a "caliche" and is generally most
concentrated from 1 to 5 m below the surface, High-grade zones
have been commercially extracted since the 1800s.
Chile: Salar de Atacama - The Salar de Atacama
in northern Chile is a large (approximately 50 km x
100 km), high-altitude dry lake. It is bounded by the
Andes Mountains on the north and east and a fuming
volcanic cone to the south. The average surface
elevation is 2,300 m. The San Pedro River flows into the
northern edge of the basin forming a partially flooded
shallow delta. The El Tatio geyser, producing high-lithium
geothermal brines, also flows into the basin. The lake
floor covers about 3,000 km2, and over 40% of this
area is covered with salt crusts. A complex, saturated
brine is found within 0.6 m of the surface over most of
the lake's area, and extends to depths of at least 40 m
in the areas tested. The potassium concentration in the
brine varies from 15 to 44 g/1, indicating the presence
of at least 120 million tonnes of KCI and 80 million
tonnes of K2SO4. The brine also contains considerable
lithium and boron, and both lithium and potash are
presently commercially recovered.
China: Qarhan Lake, Qaidam Basin - There are
a number of saline lakes in China that can be
considered potential potash deposits. The largest of these lakes
occur in the Qaidam Basin, a 120,000-km2 area that
contains both wet and dry (playa) lakes with a wide
variety of mineralization, The Qaidam Basin is located in
the north of the Qinghai-Xizang (Tibet) Plateau about_
2,800 km west of Peking at an elevation of 2,600-3,200
m. The climate is arid, windy, and very cold in the
winters. The largest of the potash-bearing sub-basins are
the Qarhan and Dalongtan playas, which contain beds
of carnallite as well as potassium-bearing brines. The
estimated reserves of Qarhan Lake are 360 million
tonnes K2O Q97I- In 1989 commercial exploitation
began, and the Qinghai Potash Fertilizer Factory had an
announced initial capacity of 200,000 tpy of KCI. Plans
were being formulated in 1994 for developing additional
capacity of 800,000 tpy. Solar evaporation of lake brine
produces carnallite (as at the Dead Sea operations), and
the carnallite is harvested and converted into KCI.
Israel and Jordan: The Dead Sea - The Dead
Sea, which lies in both Israel and Jordan, is the lowest
point in the long (600 km), narrow (10-20 km) rift val-
-Iey-that-extends-nor-thward-from-the Red Sea between
Aqaba and beyond the Sea of Galilee. It is the lowest
natural lake on earth; the surface is about 396 m below
sea level. The Dead Sea is 76 km long and 16 km wide;
it has an area of 930 km2 and a mean depth of 329 m.
It contains an estimated 47 x 109 tonnes of salts, of
which perhaps 1 x 10⁹ tonnes is KCI. The brine in the
Dead Sea has a high MgCl2 and CaGa content, and this
composition is quite unusual. The brine is processed by
first crystallizing out halite in large solar ponds, and then
continuing the evaporation of the brine in a second set
of ponds to deposit carnallite and halite. The impure
carnallite is harvested and fed to the processing plants
to produce KCI and other products. Residual brine is
returned to the Dead Sea. All phases of both the Israeli
and Jordanian operations are very large, and Israel is
probably the world's lowest cost potash producer.
Mexico: Cerro Prieto (Salton Sea Geothermal
Brine) - The highest temperature brines of the Salton
Sea geothermal system are centered in pools just
southeast of the Salton Sea in California, and much further
south in the Cerro Prieto area of Mexico. The Salton
Sea Basin is an inland trough that is an extension of the
Gulf of California rift-fault system. The northern
geothermal area in the United States covers an area of about
50 km2, and the southern area in Mexico is somewhat
smaller. In the north, brine temperatures have measured
138
300°C at a depth of 900 m and 360°C at 2,100 m. At
Cerro Prieto, geothermal power-production wells draw
brines from depths of 780-1,450 m with temperatures
of 250° to 344°C. The northern reservoir contains a
concentrated brine with a very complex chemical
composition, and is estimated to contain a total of 165
million tonnes of KG. Plans have been made for further
solar evaporation of the Cerro Prieto geothermal power
plant exhaust brine to recover the potash. However, the
project has not yet become operational.
United States: Great Salt Lake, Utah - The Great
Salt Lake is a large, nearly saturated inland saline lake
with a brine much like seawater bitterns. The Great Salt
Lake is a remnant of a much larger pre-existing lake,
Lake Bonneville. The lake extends for 110 km in
maximum length and 50 km in width; it had an area of
about 2,600 km3 in 1965. The Great Salt Lake is quite
shallow. The deepest part has varied from 8.1 to 14.2
m during recorded history, and volume has changed more
than threefold. The Southern Pacific Railroad built a
large semiporous rock-filled causeway (with two large
culverts) across the lake in 1955, which resulted in the
northern one-third of the lake (about 1,000 km2)
receiving less annual water input and becoming more
concentrated. Brine is withdrawn from the northern third
of the lake and sent to solar ponds to crystallize mixed
potash salts (primarily kainite and NaCI), which are
harvested and converted to potassium sulfate. The estimated
reserves are about 200 million tonnes of potassium-
sulfate,
United States: Bonneville Salt Flats, Wendover,
Utah - The potash operation near Wendover, Utah,
processes subsurface brines that are remnants of the
waters of ancient Lake Bonneville, just as the brines are
in the Great Salt Lake, 200 km to the east. These brines
are associated with the salt crust and shallow sediments
of the Bonneville Salt Flats, which cover an area of
approximately 400 km2. The brine is gathered from
extensive trenches in the surface of the flats and directed
to solar evaporation ponds, The brine contains
considerably less sulfate than does the brine in the Great Salt
Lake, and upon solar evaporation most of the
potassium salts crystallize as sylvite with halite. The sylvinite
is harvested, and KC1 is recovered by flotation,
United States: Searles Lake, California- Searles
Valley lies near the eastern slope of the Sierra Nevada
Mountains in south-central California; the city of Los
Angeles is located approximately 200 km to the south-
southwest. Searles Lake is a nearly elliptical desert playa
about 16 km long and 10 km wide. Approximately two-
thirds of its surface (100 km2) consists of mud, and one-
third (37 km2) is composed of halite. The water-soluble
minerals in the lake sediments are a mixture of many
salts with hanksite (9Na2S04' 2Na2C03 • KCI) being
.one of the major components. The upper and lower
salt (younger) beds are porous and contain the brine
that has been used for commercial potash production
by evaporation and crystallization since early in the
twentieth century. The total reserves of potassium chloride
equivalent appear to be in excess of 90 million tonnes.
5.5.2 Potash Mining
There are two basic types of potash mining:
conventional mining, which encompasses several standard
methods, modified as necessary for specific situations,
and solution mining.
5.5.2.1 Conventional Mining - Each potash
deposit has its own characteristics and mining problems
that must be handled on an individual basis. However,
many standard methods have become widely accepted
within the potash mining industry. For potash beds that
are relatively flat and uniform in thickness, or for cutting
entries, boring machines with two or four cutting, arms
have proven to be the most effective and economical.
mining method. For moderately inclined, undulating aiid/,
or thickening-thinning potash seams, continuous
miners with cutting "drums" mounted on one or two
moveable arms are the most effective. For highly variable ore
bodies, or ore with potential rock-bursts or other special
needs, drilling and blasting are still required.
Most mine configurations are the conventional room
and pillar design, except that "stress relief mining"
(multiple entries with outer yield pillars) has proven highly
effective for the deeper mines with plastic flow (of the
ore) or unstable roof conditions, For thicker or highly
inclined potash seams, the open stope (successive
horizontal cuts for thick beds) or cut and fill methods allow
both a high ore recovery and an easy means of
disposing of both waste produced underground and plant
tailings.
For those mines without high-pressure aquifers above
the potash and with somewhat plastic overlying strata,
the long-wall mining method, which allows the roof to
descend soon after the ore is cut, can provide very high
ore recovery rates and result in high productivity. In the
case of long-wall mining, the beds must be fairly
uniform and continuous (very minor faulting, etc.) over the
width and length of individual mining panels. Although
long-wall mining can produce ores at relatively low costs
per tonne, equipment and development costs can be
high and the method is not as flexible as other methods.
Underground ore transport is now accomplished
almost entirely by conveyor belts. Conveyor belts may be
suspended from the roof or set on the floor. For the
highest capacity mines with continuous {borer or drum)
mining machines, flexible belt conveyors attached to or
directly fed from the miner and directly feeding a panel
belt have produced considerable savings. Some mines
139
employ either shuttle cars to take the ore from the mirt
ing machines to the feeder-breaker at the panel belt, or
load-haul-dump (LHD) machines that pick up ore from
the floor and then haul it to a feed station. Most mines
have considerable underground ore storage capacity to
even out the flow, as well as feed bins where the ore is
loaded into high-speed "skips" (elevator bins) that take
the ore to the surface and dump it, with all aspects of
the loading-lifting-dumping cycle being done
automatically. A few shallower mines bring the ore to the surface
with conveyor belts in long inclined tunnels.
The costs of potash mining by conventional methods
can vary tremendously. Mining is the major expense of
potash production in operations that require more
manpower because of low-grade ore or difficult mining
conditions. For ore bodies and situations that allow
high-capacity operations, mining can be somewhat less
expensive than the processing of potash ores at the
surface.
5.5.2.2 Solution Mining - In 1994 three potash
plants in Canada and the United States utilized solution
mining as their method of operation. The mine of Ka-
Iium Chemicals, near Moose Jaw, Saskatchewan
(Canada), was designed as a conventional 3-pipe (pipes
to inject water near the top, withdraw brine from the
bottom, and pad the upper surface all in one well)
solution mining operation to take.advantage of a majorJhick^
ening of the Belle Plaine Member at about 1,650-m
depth. Brine from the well field is evaporated in triple-
effect evaporators to crystallize dissolved halite, and the
brine is then cooled to crystallize the potash salts. The
residual brine is recirculated to the evaporators, although
in the winter it is first sent to ponds to be further cooled
and to precipitate additional potash salts.
The PCS Patience Lake Division uses solution mining
for a former conventional mine that had been
extensively operated for 22 years and then was accidentally
flooded. Due to the tremendous surface area of the
previous workings, the operation selectively dissolves only
the KCI. Brine is withdrawn from the mine in the winter
and sent to a pond, which was formerly used for tailings
before being rebuilt as a holding and cooling reservoir.
Potash is crystallized, and then the residual brine is
returned to the mine. The potash is harvested by floating
dredges and sent to the plant for further processing and
drying, screening, and compaction,
A similar intentionally flooded mine is operated at the
Moab Cane Creek, Utah (U.S.A.) plant. The potash brine
is solar evaporated to crystallize sylvinite. The sylvinite
is dry harvested and sent to a processing plant for
conventional flotation.
5.5.3 Beneficiation and Processing of Potash
Ores and Brines
The beneficiation of raw potash ore into marketable
products, similar to potash mining operations, requires
a somewhat different scheme and equipment for each
processing plant. The ore composition (mineralogy), ore
grade (K2O content), liberation size (amount of
maximum particle size required to allow separation of the
different minerals), and type and amount of slimes
(insolubles such as clay, anhydrite, dolomite, silica, etc.)
are different for every deposit, and perhaps may be highly
variable within a single deposit.-Accordingly, the.mod.-.
em potash processing plant must have an efficient, highly
versatile process to accommodate variations in the feed
yet still maintain product quality at as low a production
cost as possible,
Four basic beneficiation techniques have been applied
in the potash industry: flotation, heavy media
separation, electrostatic separation, and thermal dissolution-
crystallization. Other techniques have also been
experimented with. These include ammoniacal
leaching and gravity separation using shaking tables.
Ammoniacal leaching has proven too costly, and gravity
separation can only produce impure concentrates (about
80% KCI). Most potash processing plants practice a
combination of beneficiation techniques. Each method
will be reviewed separately in the following sections.
5.5.3.1 Crushing and Grinding - The first step in
the beneficiation of a solid potash ore is to reduce the
ore to a size where the potash is liberated from the other
ore constituents and can be separated from them. A
prime consideration in crushing and grinding is that a
minimum amount of fines be produced. Any fines
produced by grinding must be processed by more costly
methods, Larger and closely sized product is more
valuable, and less energy is spent on grinding. Another prime
consideration is that both the capital costs involved in
establishing the operation and the production costs be
minimized. To accomplish these goals, processing
usually begins with various size reduction equipment and
coarse (0.6-1,2 cm) screens working in closed circuit
(recycling the oversize) because coarse ore crushing and
screening are relatively simple and less expensive than
other steps. There are a large number of equipment
choices, but most modern plants start out with dry
screening. The oversize is recycled to an impactor, and the
undersize is sent to other types of size classification
equipment.
The second and third stages of grinding and
classification involve even greater choices of equipment, but
are relatively more expensive. For small liberation sizes
(usually between 100- and 150-mesh, Tyler), wet ball or
rod mills are required. For larger liberation stees (plus
100-mesh, Tyler), wet or dry impactors or cagemills are
140
used. The oversize closed circuit separators are either
screens or, if wet processing is utilized, screens and rake
or screw classifiers. Undersize separators (usually to split
at 100- to 200-mesh, Tyler) are typically wet cyclones
and/or hydroclassifiers.
5.5.3.2 Desliming- Fine particles, both ore
minerals and insolubles, are always removed to the greatest
extent possible before the potash separation step. In
flotation, fine particles with high surface areas tend to
adsorb excessive quantities of flotation reagents.
Excessive amounts of fines can significantly raise reagent costs
and cause contamination of the product. Fine gangue
particles may float or become mechanically entrapped
in the product. The ore slurry is first "attrition scrubbed"
to liberate and disperse the fines, The equipment used
varies widely, in that any form of intense agitation is
effective in slimes removal. In a few plants, some or all
of the slimes are separated by selectively floating the
slimes from the sylvinite (Figure 5,25). However, most
plants deslime by using one or more stages of cyclones
and hydroseparators (Figure 5.26). A liberation size of
about 150-mesh has been determined to provide the
best cut-off range for flotation of most potash ores. Many
plants (especially those employing fine grinding) make a
second size classification at 200- to 400-mesh to
reduce potash losses. These fine solids are then floated in
a fines flotation circuit, and the impure float is usually
sent to a hot leach-crystallization plant for further
processing. In several plants, the slimes slurry is hot leached—
to further recover potash (Figure 5.27). Whatever
treatment is used, the residual slimes are finally thickened
and sent to tailings areas for disposal. If regrinding of
coarse flotation tails is practiced, these solids are also
deslimed again before being refloated.
5.5.3.3 Rotation - Flotation is a selective benefi-
ciation process that utilizes the differences in surface
properties of various minerals. By conditioning ores with
specific reagents, selected minerals can be induced to
become either hydrophobic (water repellent) or hydro-
philic (water attracting) in solutions. If a solution is then
agitated and aerated by introducing air bubbles, mineral
particles that are hydrophobic will preferentially attach
themselves to the air bubbles and float to the surface
where they can be removed. The waste (gangue)
materials in the pulp at the bottom of the cells are disposed
of as tailings. This type of flotation, where the valuable
minerals are removed in the froth, is termed direct
flotation and is the most common flotation technique
employed in the potash industry.
The most important reagents used in flotation are
collectors. In the case of flotation to treat sylvinite ores,
a cationic collector is added to the closely sized and
deslimed ore slurry. These collectors are mostly straight-
chain aliphatic primary amines derived from natural fats
and oils that are neutralized by acetic or hydrochloric
acid before use. The polar end group of the reagent is
selectively adsorbed on potash, rendering its surface
hydrophobic. The salt (NaCl) and other gangue minerals
sink in the pulp and are removed from the bottom of
the flotation cell.
Another category of reagents that is commonly used
is known as frothers. Frothers are used to aid the
formation of, and stabilize, the flotation froth. Generally,
these reagents are organic heteropolar compounds. Pine
oil, a widely used frother, contains aromatic alcohols, A
wide range of synthetic frothers is also available. A
conventional frother, MIBC (methylisobutyl carbinol), is used
in potash flotation as a modifier to inhibit the formation
of excessive amine froth [98],
Modifiers or regulators constitute another class of
flotation reagents that are used to control the process. In
potash flotation, slimes depressants such as starch, guar
gum, dextrine, and synthetic compounds are typically
used [991.
In potash flotation the objective is usually to separate
sylvite from halite by using cationic collectors. When
the potash ores contain sulfate minerals like kieserite,
sulfate salts can be floated by using fatty acids or
sulfated fatty acids as collectors. Combined salts such as
kainite (KC1 • MgS04 • 3H20) can be floated by using
coconut amine, as performed in Sicily, Italy. Schoenite
"(K2SO4 • MgSQ4 • 6H20)7 processed from Great Salt
Lake, U.S.A., brines, can be floated by using coconut
fatty acid [1001. Ores containing carnallite may be pre-
treated to remove magnesium chloride and give simple
potassium chloride and halite, which then can be floated
with tallow amine 198].
Potash flotation circuits always have both rougher and
cleaner cells. In the rougher cells, an attempt is made to
float as much potash as possible, while in the cleaner
cells the purity of the floated product is the prime
consideration. The coarse particles of the rougher tailings
and the tailings from the cleaner cells are usually reground
to a smaller size range and refloated. In situations where
the potash ore is liberated at fairly coarse sizes, the coarse
size fraction is conditioned with reagents and floated
separately from the fines, thus decreasing reagent
consumption and generally improving recovery (Figure 5.28).
With very fine ores, some companies (such as MDPA,
France) use countercurrent flotation because the use of
traditional flotation cells leads to excessive mechanical
entrainment of the salt (Figure 5.26). In this case, the
tailings from each stage are returned to the previous
stage and the float advances to the next stage, both to
be repeatedly refloated [101]. If the fine-floated potash
product is not quite up to grade, it may be hot or cold
leached to dissolve halite and to increase the purity.
141
Ore Slurry
-4 mesh
4.5%-5.5% Insoluble
Attrition Tanks
2 rows of 4,
70% solids
Flocculant
Collector
Conditioning
Launder
Primary Slimes Flotation
2 rows of
4 DR 300 cells
Tails
Float
—h
Flocculant
— Collector
Conditioning
Launder
Secondary Slimes
Flotation
(as primary)
Float
Tails
,,1.5%-2% Insoluble
DSM Screens
20 mesh
OFlo,r
UFlo
Coarse Tails
Reg rind
Cagepactor
Reagents
Conditioning
Launder
Regrind Slimes Flotation
3 DR 300 Cells;
Screens
48%
Tails
OFlo
Float
Screens,
Cyclones
65 mesh
9,
nsol
T2%"KCI
OFlo
OFlo to Leach
Circuit
Hot Thickener UFlo,
"Makeup Brine
Cold Thickener
61 m
UFlo salt Tailings, Pond Brine
Tailing Repulp
Tank
ToTailings>
Pond
Coarse Ore Flotation,
Screens, 24 mesh
Tails
OFlo
Fine Ore Flotation,
Cleaner Flotation
Float OFlo
Float
1 KC1 Product
Source: [102,103].
Figure 5.25. Cominco, Canada, Slimes Flotation Circuit.
142
(J
Flo
—►
Ore
i'
Impact Crusher
-4 mesh
i
r
Repulper,
DSM-Type Screens
14 mesh
'
OFlo
r
Rod Mills
Attrition
Scrubbers
OFlo
C
}oa<
i
r
Cyclones
1
ORo
-80 mesh
Hydroseparators
OFlo
-150 Mesh
-
'
2 Clarifiers
28 m
gulating
L
URo
UFlo
UFlo
OFlo -"
\
OFlo
UFlo
KCI Product
Float
3 Stage Counter-
current Flotation
. i
.
Tails UFlo
DSM-Type Screens
28 nosh
i
OFlo
UFlo
OFlo
2 Ball Mills
100tpheach
UFlo to Salt p
Disposal
Cyclones
50 mesh
Ateiter-
1 '
UFlo Slimes
Thickener
24 m
j
UFlo
Thickener
24 m
UFlo
2 Thickeners
24 m
OFlo
OFlo
Agent
Source: [104].
Figure 5.26. Crushing and Slimes at MDPA Amelie Plant.
143
Ore -14 mesh
Float
■
■
"
Repulper, Attrition
Cells
■
r
Cyclones, 2
Stages in Series
UFin Reaqents
■4-
Conditioning, Rougher,
Cleaner Flotation
1
Tails
'
Heating, Leaching
■
-
Thickener
Water .
'
UFlo
Thickener
1
UFlo
Filter
F
NaCI
Solids
_
OFlo
"C
—*
OFlo
Flo
OFlo
-ilter
■'
Heating, Leaching
■
Thickener
UFlo
'
Thickener
OFlo
UFlo
-
Thickener
UFlo
■
Thickener
Water
UFlo
Thickener
UFlo
Crystallizer,
Cyclone, Centrifuge
►
Solids
OFlo
OF
OFlo
=10
OFlo
>
To Tailings
KCI Product
Figure 5.27. Potash Processing at the Mississippi Chemicals Operation, Carlsbad (Former
National Potash).
144
Slimes Flotation
- ... I -4 mesh
Tailings
DSM Screens
20 mesh
Depressant —►
Collector —»
Oil —►
Froth er —-►
OFlo
OFlo
UFlo
ir
Coarse Ore
Flotation, 2 Rows of
4 DR 300 Cells
■
Float
DSM Screens,
2 Sets in Series,
20 mesh
Tails
unu
Fine Ore Rougher
Flotation,
4 DR 300 Cells
I Float
r~
Cyclones
%
|—
Depressant
DSM Screens
24 mesh
1'
ORo
Cagepactor
i
k
t*
Reagents
"
Regrind Slimes
Flotation,
3 DR 300 Cells
Tails
■
,
UFlo +65 mesh
Fine Ore Cleaner
Flotation,
*
Tails
Float
Fine Ore Cleaner
4
■
nuLcuiun,
DR 300 Cells
Float From
| CrystE
Centrifuges,
4 Screen Bowls
t
tllizer
' CI
Tails
Regrind Flotation,
3 Rows,
5 DR 30 Cells
1
1 OFlo
j
Tails
< UF
'
Uflo
To Tailings
Cyclone,
i~ nier
Flop*
Tails
'
DSM Screens
20 mesh 16 mesh
=lo
L
-*
—
UFlo
Fines -
Cyclones
UFlo
■'
Reagents
Scavenger
0
KCI Product
>
3 DR 30 Cells
Float I T
ORo I
Cyclones
UFlo +65 mesh
)Fla
,
OFlo
r To Slimes
' Thickener
Tails
o Dust Repulp,
Crystallizer
Circuit
*When 65-mesh float screens were used, the screen OFlo was recycled.
Source: [102,103].
Figure 5.28. Cominco, Canada, Flotation Circuit.
145
5.5.3.4 Heavy Media Separation - Heavy media
separation is a useful beneficiation process as a
preliminary scalping operation or in combination with other
techniques. The process utilizes the difference in
specific gravity of sylvite (KCI) and halite (NaCl). Halite is
the more dense mineral (specific gravity 2.13 versus 1.9
for sylvite). In a liquid of intermediate specific gravity,
halite will sink and sylvite will float. Commercial heavy
media operations use a very finely divided weighting
agent, typically ferrosilicon or magnetite of minus 200-
mesh, which is slurried to create an artificial heavy
medium at the specific gravity required for separation. After
separation, the magnetite or ferrosilicon is recovered by
magnetic separation and recirculated to the system [105].
5.5.3.5 Electrostatic Separation - Electrostatic
separation is a dry technique in which a mixture of
minerals may be differentiated according to their electrical
conductivity. For potash minerals, which are not
naturally conductive, the separation must be preceded by a
conditioning step that induces the minerals to carry
electrostatic charges of different magnitudes and, if possible,
different polarities. For potash, fractional or triboelec-
tric charging is used; the charges are induced through
repeated physical contact between the different minerals.
In Germany, the potash ore is ground to between
minus 1 and 2 mm. The ground ore is conditioned with
one or more reagents, preferably aromatic and aliphatic
monocarboxylic acids, The-mixture-is then heated-in-a-
fluidized bed, and the relative humidity is adjusted to
enhance charging of the particles. The ore is then fed
into the electrostatic separator, to yield three fractions,
i.e., product, residue, and middlings. The middlings,
after further grinding, are recycled to the conditioning
stage.
Using this process provides two main advantages in
terms of costs and environmental impact. By using a
dry pre-enrichment step in the mine (underground),
hoisting costs are reduced because only valuable
preconcentrated ore is moved to the surface. Thus, the
process decreases the environmental impact of
disposing of salt tailings on the surface or the costs of
returning salt tailings to the mine. Using a dry process to
improve product grade also eliminates drying costs [106].
5.5.3.6 Thermal Dissolution-Crystallization -
Thermal dissolution-crystallization is possible because
potassium chloride is much more soluble in hot water
than in cold and sodium chloride is only slightly more
soluble at 100°C than at 20°C. In saturated solutions
containing both salts, sodium chloride is actually less
soluble at higher temperatures. When a brine that is
saturated with both salts at 20°C is heated to 100°C, it
is capable of dissolving substantial amounts of KCI but
not NaCl.
A typical dissolution-crystallization flow diagram is il-
-lustrated-in-Eigure-5.29 [107]. Sylvinite ore is crushed
Ore
Crusher
Slurry:
saturated brine,
NaCl, clay
3_
Centrifuge
Vacuum
cooler-crystallizer
KCI
Brine & KCI crystals
Brine & KCI crystals
Brine & KCI crystals
Source: [105]. - —^
Figure 5.29. Beneficiation of Potash Based on Thermal Dissolution-Crystallization.
146
to minus 3-mesh and washed with cold, saturated NaCI-
KC1 solution. Clays are removed from the solution by
desliming, and the clarified solution is then heated and
used to dissolve the potash in the washed ore.
Undissolved NaCl is discarded as tailings, The brine solution is
then cooled under vacuum, and the KCI crystallizes out
and is separated, washed, and dried. The remaining brine
■ is recycled. When a high-purity KCI for chemical use is
required, the crystalline KCI is redissolved and recrystal-
lized to produce a double-refined product containing
more than 99.9% KCI.
Commercially, the thermal dissolution-crystallization
process is used in France by MDPA at the Marie-Louise
and Amelie refineries and in Germany by Kali und Saltz
at the Sigmundshall, Neuhof-EImers, and Friedrichshall
refineries. In eastern Europe and the former Soviet
Union, this process is used to treat potash ores that
contain high levels of clays and magnesium chloride
levels that exceed 30% MgCI2. The main disadvantage of
this process is the high energy consumption required to
heat all the mother liquor. Corrosive hot brines must be
handled, which results in higher plant maintenance costs
and requires the process equipment to be manufactured
of special high-cost materials. Although thermal
dissolution-crystallization is used only in solution mining, a
wider application would be the extraction of potash from
brines.
5.5.3.7 Beneficiation of Carnallite Ores and
Brines'- Carnalliteores are "thesourceof" only a'small-
percentage of the world's potash supply even though
there are large deposits of carnal lite-containing ores in
many regions. One disadvantage of carnallite ores is
their low grade. Pure carnallite (KCI • MgCl • 6H20)
contains only 17% K2Q. Carnallite cannot be used as a
direct-application potash fertilizer because it is
deliquescent. Dissolution and recrystallization methods must be
used to process carnallite ores, and these methods are
energy intensive and expensive. A large volume of
byproduct magnesium chloride solution is produced in
carnallite processing, which is likely to pose a disposal
problem. In spite of many disadvantages, ores or brines
containing carnallite are processed to produce KCI in
several countries including Germany, Israel, Jordan, and
Spain, and may be utilized in the future in Thailand,
Pakistan, and the Congo.
Carnallite has been mined, beneficiated, and processed
in Germany for approximately 130 years. These
operations were economically sustainable only as long as the
German mines supplied a very significant portion of the
world potash market. As a result of international
competition based on the production of sylvinite ores,
carnallite processing plants in Germany that only produced
KCI were forced to close and potash production in
Germany was concentrated at mines with significant amounts
of sylvinite ores.
. The conventional mining and beneficiation sequence
for potash recovery from carnallite encompasses the
operations of mechanically mining the ore, hoisting ore
to the surface, beneficiating the ore to a carnallite
concentrate, dissolving the carnallite, recrystallizing
potassium chloride, disposing of saline solid wastes, and
disposing of saline liquid effluents. Carnallite ore.
processing methods vary widely and depend upon
accessory minerals that are associated with the ore.
There are two general methods of carnallite
processing: cold leaching and hot leaching. Cold leaching
processes are carried out at 20°-25°C. Carnallite ore from
Klodawa, Poland, is processed to recover a liquor
saturated in magnesium chloride, a coarse sodium chloride
solid product, and a fine residue of sylvite and kieserite.
Initial grinding of the ore determines the eventual purity
of the coarse and fine decomposition products. The
temperature used to decompose the carnallite is not critical,
but must be below 25DC to prevent sulfate from
remaining in the magnesium chloride liquor. Decomposition of
the ore is carried out using unsaturated brine
recirculated from a later filtration stage. In order to prevent
reprecipitation of carnallite, the decomposition liquor is
allowed to reach only 90% saturation in magnesium
chloride. The fine decomposition product contains sylvite
and kieserite and meets the specification for some
potash-magnesium fertilizers (46% potassium chloride and
45% magnesium sulfate). However, flotation can be used
to~ separate~kleserite fromi sylvite [98[.
Carnallite ores may also be treated by a hot leach at
about 100°C to dissolve MgCl2, KCI, and any NaCl that
may be present. The hot solution is then clarified to
remove solid impurities and then evaporated and cooled.
After the KCI and NaCl crystals are recovered, they are
separated by one of several beneficiation techniques.
In Germany, at the Hattorf and Wintershall mines,
carnallite ore is first ground to minus 4 mm. The ore is
then leached at approximately 90°C, and the carnallite
decomposes. Saturation in potassium chloride is not
reached, and only sodium chloride and kieserite remain
as solids. The solids and brine are separated by
filtration; the brine is cooled to a temperature of
approximately 30DC in vacuum crystallizers, and KCI is
precipitated, The 40% K2O product is upgraded by the
addition of a liquor from the potassium sulfate section
of the refinery.. On centrifuging, a 60% KCI product is
recovered [108].
Processing of the Dead Sea brine by the Arab Potash
Company (APC) in Jordan traditionally utilizes solar
evaporation and the hot leach process to produce
potash. However, APC's current expansion involves
processing by flotation followed by cold crystallization [109].
The Dead Sea brine typically contains 11.5 g/1 KCI.
147
The concentration of other salts is: MgCfe 130 g/l, NaCI
87 g/l, CaCI2 37 g/l, and MgBr 5 g/l. Brine is pumped
from the Dead Sea into a 10-km-long gravity canal
feeding a series of solar ponds. The solar ponds are divided
into three basic sections: the salt ponds, the pre-carnallite
ponds; and the carnallite ponds. Sodium chloride is
precipitated in the salt ponds. The pre-carnallite ponds are
used to regulate the concentration of the brine that is
fed to the carnallite ponds as close as possible to the
point at which carnallite precipitation begins. Carnallite
is recovered with a specially designed floating-track
harvesting machine. A screw-type cutterhead harvests the
30- to 50-cm-thick carnallite layer. The carnallite slurry
(20%-25% solids) is cycloned to reduce the water
content and pumped at 40% solids to the processing plant.
The slurry is first wet screened to separate the large
high-grade carnallite crystals, which are fed to cold
crystallizers. Undersize slurry from the screens is mixed
with brine discharged from the cold crystallizers.
Additional carnallite is then crystallized, and the slurry is
thickened. The thickener overflow is returned to the
evaporation ponds. The underflow is subjected to salt
flotation. Floated NaCI slurry is pumped to the tailings
area. The carnallite sink fraction is settled in a
thickener. Thickener underflow is dewatered in centrifuges.
The cake from the thickener underflow is conveyed to
the cold crystallizers where carnallite is decomposed by
the addition of water and recycle brine. Crystallizer
discharge slurry is wet screened to remove large partieles^-
Crystallizer screen undersize slurry is subjected to
leaching in agitated pans to dissolve any remaining sodium
chloride, The leach tank discharge slurry is transported
to a thickener, then to two stages of dewatering
centrifuges, and finally to a rotary dryer. The dried potassium
chloride product passes through screens to be separated
into two fractions, standard and fines, according to the
required size specifications. The products are collected
and stored. A typical block diagram for the cold
crystallization process is shown in Figure 5.30.
5.5.3.8 Disposal of Brines and Tailmgs - A major
problem in all plants that process potash ores is the
disposal of excess brine and tailings. Until recently, plants
merely stacked their waste salt and slimes and injected
the excess brine underground, or dumped both into the
nearest river. New plants have been required to
eliminate these practices, Cleveland Potash, England, repulps
the tailings in seawater and discharges them one mile
offshore at the bottom of the turbulent North Sea.
Frequent inspections have shown that there is no sediment
buildup or impact on marine life in the area. The two
potash operations in New Brunswick, Canada, run a
much tighter water balance in their plants and
evaporate excess brine. This results in a 5%-15% higher yield
than in other potash plants. Tailings, containing small
amounts of residual MgC^ brine, are mechanically or
hydraulically backfilled into the areas previously mined.
The tailings are compacted as equipment is driven over
them to make the next cut in inclined potash ore
bodies. This process of dewatering and backfilling costs more
than surface impoundment or river disposal, but greater
potash recovery and other savings help to defray
additional costs.
5.5.3.9 Beneficiation of Sulfate Ores - The
processes for beneficiating langbeinite, alunite, and
complex sulfate ores into marketable products are discussed
in this section. __
Langbeinite- Langbeinite (K2SO4 • 2MgSC>4) is
separated from sylvite and halite by selective washing, froth
flotation, or heavy media separation. Langbeinite may
be marketed as fertilizer or animal feed as a source of K,
Mg, and S, or it may be converted to other products.
Potassium sulfate is produced by reacting one molecule
of langbeinite with four molecules of KG. Potassium
magnesium sulfate is produced by refining langbeinite.
The reactions to produce potassium sulfate and
potassium magnesium sulfate are as follows:
K2S04 • 2MgS04 + 4KC1 -> 3K2S04 + 2MgCla
Langbeinite muriate potassium
of potash sulfate
2tK2S04 • 2MgS04) + 2KCL -»■ 3[K2S04 • MgS04) + MgCI2
—Langbeinite——-—-muriate of potassium
potash magnesium sulfate
A flowchart of the production of potassium sulfate
from the Great Salt Lake, U.S.A., is shown in Figure
5.31. Water from the lake is pumped and distributed to
shallow ponds covering an area of 19,200 acres. Solar
evaporation causes the brine to reach saturation with
sodium chloride, and the salt settles on the pond floor.
Further evaporation of the brine in subsequent ponds
results in the precipitation of kainite, sylvite, and
carnallite, which are harvested from the ponds for further
processing. Fractional crystallization is used to separate the
final potassium sulfate product from the other minerals
[110].
Alunite- Alunite [K2 • Al6(OH)l2 • (S04)4I is a
potential source of potassium sulfate, alumina, and sulfur
dioxide byproduct. The economics of production hinge
on the value of the alumina. Processing involves ore
comminution, roasting, and leaching to recover
potassium sulfate solution. Filtered solids can be processed in
a Bayer-type process plant for alumina recovery [111].
Production of 1 million tpy of alumina (AI2O3) would
require about 10 million tonnes of alunite ore and would
yield about 500,000 tonnes of potassium sulfate and
nearly 800,000 tonnes of sulfuric acid. Energy costs
148
Crude
carnallite S~
slurry
Water
Coarse
carnallite
Carnallite
benaficiatlon
Overflow
2--j£
Thickeners
U/f
Centrifuges
Cold
crystallizers
KCl slurry
Brine
Brine
'Nad
Fuel
oil
Fine
carnallite
*
Brine to
evaporation
pans
Product
leaching
NaCI
Washwater
Centrifuges
Effluent
Dryer and
cooler
Dust
cyclones
.To air
Screening
Storage
and
loading
NaCI slurry
to tailings
To Aqaba
Source: [109].
Figure 5.30. Cold Crystallization of Carnallite at the Arab Potash Company, Jordan.
and the utilization of the coproducts limit the potential
for the production of alumina or potassium sulfate from
alunite.
Complex Sulfate Ores- Complex mixtures of
potash ores may contain any or all of the following
minerals: anhydrite, epsomite, halite, kainite, kieserite,
langbeinite, polyhalite, and sylvite along with clays. Bc-
traction of potassium salts from such ores becomes quite
complicated because the mineralogical forms of the
various components can be unstable. Whenever potassium
sulfate is the desired product, free sylvite and kainite
must be present in the same molecular proportions.
Ideally the reaction is as follows:
KCl + KCl • MgS04 • 3H20 -* K2S04 + MgCl2 + 3H20
kainite
When the ore is deficient in sylvite, schoenite is
produced:
2KCI • MgS04* 3H20 -+ K2S04* MgS04« 6H20 + MgCl2
kainite schoenite
Potash ores from the Carpathian deposits in the
Ukraine contain several minerals, and processing involves
grinding and hot leaching with a "synthetic kainite"
solution. The leaching process dissolves epsomite,
kainite, and sylvite. Langbeinite, halite, and polyhalite are
insoluble in this liquor. Clay remains suspended until it is
149
Great Salt Lake
North Arm Brines
Evaporation
pond network
Crystallizer 4
Water leaching 4
Kainite
{KCI«MgS04 + 3H20]
Schoenite
(KgSO,, ♦ MgS04 + 6H20)
L
Sizer
Filtration
Dryer
> Screening
Loadout
final screen
Dust control
oil
Rotation
fr Fines:
soluble fines
industrial fines
special standard
crystalline
_ Granular 4-
microgranular
Storage
Lignin binder
i
Compactor
Lignin binder
Heat curing
Tumbling
*__
Screening
Source: 1110],
Figure 5.31. Production of Potassium Sulfate at Great Salt
Lake.
clarified. As the liquor begins to cool, potassium salts
begin to crystallize out of solution. Normally, potassium
chloride and sodium chloride would precipitate first, but
their precipitation is inhibited by the addition of a
solution that is saturated with magnesium and potassium
sulfate. Under these circumstances, only schoenite will
precipitate [111]:
2KC1 + 2MgS04 + 6H20 -* K2SO4 • MgS04 • 6H20 + MgCl2
The precipitated schoenite is thickened and filtered, and
part of it is mixed with water to produce potassium
sulfate:
K2S04» MgSQ4» 6H2O -> K2SO4 + MgS04 + 6H20
The potassium sulfate is removed as an end product
by centrifugation. The hot liquor is recycled to the
settling tanks, and the clear solution is recycled to the
dissolving tanks.
During the conversion of kainite to schoenite,
magnesium chloride is also formed. The concentration of
magnesium chloride in solution is controlled by
withdrawing a part of the schoenite filtrate, which is
evaporated to remove enough potassium and sodium to
maintain a constant concentration of these materials in
the system. This process permits the use of a complex
ore to produce potassium sulfate, schoenite, and sodium
sulfate and magnesium chloride liquors.
5.5.4 World Potash Production and Reserves
To the present time, world potash production has been
only partially based upon economic merit. In the
countries of the former Soviet Union and in East Germany,
the potash operations were entirely government owned
and controlled, These centrally planned economy
countries had constructive, but forced-use internal markets,
and capital and operating costs were often not critical
factors. Consequently, the potash industry in many of
these countries employed excessive numbers of
workers per tonne of potash produced, Often mines with
low-grade ores or processing plants using relatively
150
expensive methods were kept open for social rather than
economic considerations. Much less extreme but similar
operating practices are occurring or have been employed
in other government-controlled or partially subsidized
potash production operations in Brazil, Canada, Chile,
China, Congo, France, West Germany, Israel, Italy,
Jordan, and Spain. A second distinguishing feature of the
potash industry is that, because of generally poor
economics in the industry and similarities in mining and
processing options, research and development often
were not promoted; therefore, cost reductions and
efficiency changes have been comparatively infrequent.
Finally, increasing maintenance costs and usually much
higher mining costs are incurred as potash operations
age and face dwindling reserves, declining ore grades,
longer distances from mining faces, and often thinner
or deeper ore zones,
Production of potash in 1994 was estimated at 21.6
million tonnes K2O, some 0,7 million tonnes higher than
1993 {Table 5.25). This production level represents an
overall capacity utilization of about 60% of the world
potash mine capacity (36 million tpy). Output from the
former Soviet Union countries was projected to
stabilize in 1994; however, production may still be on a
downward trend. The production of FSU countries has been
mainly limited by the progressive loss of domestic
demand, and by lower demand in the traditional markets
of central Europe. The longer production remains far
Tabic 5.25. World Potash Production
1992
1993
19943
Canada
Germany
Russia
Belarus
U.S.
Israel
France
Jordan
Spain
U.K.
Brazil
Ukraine
Chile
China
Italy
Total
a. Estimated,
(thousand tonnes K20)
7,330
3,530
3,450
3,310
1,700
1,300
1,140
810
590
530
85
182
35
25
86
24,103
6,840
3,250
2,590
1,940
1.500
1,340
1,000
820
660
550
170
160
55
25
0
20,900
7,600
3,000
2,800
2,000
1,425
1,350
950
820
600
560
255
200
55
25
0
21,640
Source: [112,113].
below installed capacity, the more increasingly difficult
it will be to regain higher capacity utilization. After
operating for some 30 years, Soligorsk 1 in Belarus was
expected to close in 1995 due to exhaustion of reserves.
Capacity reduction and possible closure may take place
at other Soligorsk mines, potentially leaving only the
Soligorsk 3 mine open. The older mines of the Uralkali
and Silvinit combines in the Upper Kama Basin in
Russia may also face closure. However, the second phase
of Uralkali 4 was scheduled for completion in 1995.
Overall, capacity in the countries of the FSU could
decline by 1.5 million tpy K2O or more within the-next-
several years. In 1994 both the Silvinit and Uralkali
combines were in the process of being privatized [114], In
1993, the three FSU producers formed a joint venture
company, International Potash Company (IPC), and
effective February 1994, IPC became the vehicle for
potash exports, replacing Agrochimexport.
Potash production in Canada increased about 4% in
1994. Over 80% of output was accounted for by
Saskatchewan mines and the remainder by the two
operations in New Brunswick. Overall, the Canadian
industry operated at about 63% of installed capacity. As
in previous years, mine closures were used to control
inventories, particularly in Saskatchewan. In
September 1993, Potash Corporation of Saskatchewan acquired
the operations of the Rio Algom subsidiary, Potash
_Company_oiAmerica;.Jhe Sussex mine in New
Brunswick; and the solution mine at Patience Lake,
Saskatchewan.
Potash production in the United States was slightly
lower in 1994, at 1.4 million tonnes K20. Exports
declined, while domestic sales were about the same.
Imports from offshore remained the same at about 4.4
million tonnes K2O [115]. In April 1994, Horizon
Potash suspended production. The Great Salt Lake
Minerals Corporation completed a 34-km brine transportation
trench that will enable the company to double its
production of potassium sulfate to 380,000 tpy.
Production in Germany declined about 8% in 1994,
Capacity continues to be reduced as the country
undergoes vast social changes and the industry rationalizes its
operations. Production from France continued to
decline in 1994. In Italy, the operations of ltalkali in Sicily
remained closed for the entire period of 1993 and 1994.
In the Middle East, the first phase of expansion at
Arab Potash Company of Jordan was completed in July
1994 with a capacity of 1.1 million tpy K20. The
second phase of expansion will result in a capacity of 1.34
million tpy K20 by 1998. Dead Sea Works, Israel,
planned a capacity increase to 1.5 million tpy K20 by
1995,
151
In Asia, ASEAN Potash Mining engaged Jacobs
Engineering to review and update its feasibility study for an
underground mine, based on carnallite production, at
Bamnet Narong in Thailand. Asia Pacific Resources
continued development activities on its lease area near
Udon Tharn and was listed on the Toronto Stock
exchange in 1996. The mine near Udon Thani would be
based on sylvinite reserves and traditional processing
methods.
Unidade OperacionalTaquari-Vassouras, a subsidiary
of CRUD, Brazil, invested in equipment that would
allow the Sergipe mine to attain the design capacity of
300,000 tpy K2Q by 1995. Sociedad Quimicay Minera
de Chile (SQM) began construction of the first phase of
the Minsal project, and production of 80,000 tpy KCI
was scheduled for 1996. Full production capacity would
be 300,000 tpy. Construction work at the joint venture
project between China and the Dead Sea Works of
Israel is proceeding, which will increase the annual
capacity at the Golmud plant in Qinghai Province to 1
million tonnes KCI.
The potash industry will continue to face challenges
in the coming years. A recent survey predicted that the
potash industry will inevitably face significant
overcapacity even beyond the turn of this century. The surplus
of potential supply over demand currently amounts to
about 4 million tonnes K20, and excess capacity is
predicted to be 2.5 million tonnes K20 in 1999 [l-16J^A*a-
result of overcapacity, large producers will have to
continue to operate at reduced capacities, primarily in
Canada and the countries of the FSU. In the 1970s,
Canada and the FSU dramatically expanded potash
production capacities on demand projections that proved
eventually to be largely incorrect, With tough market
conditions, producers are bound to enhance their
positions in home markets through cost or logistic
advantages, customer service, and quality of product.
It is difficult to estimate the amount of minable potash
reserves for the major deposits of the world for a
number of reasons. First, most of the deposits have been
incompletely explored, and exploration data are not
made public. Second, the definition of economically
minable ore changes with time, technological development,
the price of potash, and the owner's interests. Also few
details are published on the fraction of barren zones,
areas in mines that must be left because of faults,
intrusions, fear of water breakthrough or rock bursts, or very
sudden ore body changes. Finally, it is unknown whether
solution mining will be considered at the end of
conventional mining. Perhaps the most authoritative estimate
on world potash reserves has been made by Mayrhofer
[117], but his figures are now somewhat old, optimistic
for the German deposits, and conservative for the
others. Table 5,26 lists these values, along with those from
Searls [112,113], which are partly the reported reserves
of various governments and, in some cases, estimates
by the authors.
5.6 References
Anonymous. 1996. BP Statistical Review of
World Energy 1996, The British Petroleum
Company, London, England, 41 p.
McConnell, D, 1938. "A Structural Investigation
of the Isomorphism of the Apatite Group,"
American Mineral, 54:1379-1391.
McCIellan, G. H,( and J. R. Lehr. 1969. "Crystal
Chemical Investigation of Natural Apatites,"
American Mineralogist, 54:1374-1391,
McCIellan, G, H. 1980. "Mineralogy of
Carbonate Fluorapatites^Jouma/ of the Geological
Society of London, 137:675-681.
Van Kauwenbergh, S. J- 1995. "Mineralogy and
Characterization of Phosphate Rock," IN Direct
Application of Phosphate Rock and
Appropriate Technology Fertilizers in Asia — What
Hinders Acceptance and Growth, pp. 29-47, K.
Dahanayake, S. J, Van Kauwenbergh, and D. T
~HelIums-(FMs7)7lnstitute of Fundamental Studies,
Kandy, Sri Lanka.
6. McCIellan, G. H., and S. J. Van Kauwenbergh.
1990. "Mineralogy of Sedimentary Apatites," IN
Phosphorite Research and Development, pp.
23-31, A.J.G. Notholt and 1. Jarvis (Eds.),
Geological Society Special Publication, No. 52,
London, England.
7. McCIellan, G. H., and S. J. Van Kauwenbergh.
1990. "Relationship of Mineralogy to
Sedimentary Phosphate Rock Reactivity," IN Proceedings
of the Workshop on Phosphate Sources for Acid
Soils in the Humid Tropics of Asia, pp. 1-17,
Malaysian Rubber Research Institute and
Malaysian Society of Soil Science, Kuala Lumpur,
Malaysia.
8. Van Kauwenbergh, S. J,, and G. H. McCIellan.
1990. "Comparative Geology and Mineralogy of
the Southeastern United States and Togo
Phosphorites," IN Phosphorite Research and
Development, pp. 139-155, A.J.G. Notholt and I. Javis
(Eds.), Geological Society Special Publication, No.
52, London, England,
9. McCIellan, G. H., and S. J. Van Kauwenbergh".
1991. Mineralogic and Chemical Variation of
152
Table 5.26. Estimates of the World's Potash Reserves
A. Underground Deposits
Canada (total)
Saskatchewan
New Brunswick
Russia
Belarus
Ukraine
Germany (total)
East
West
England
U.S.A. (total)
Brazil, Sergipe (total)
Spain (total)
France
Sicily
Congo
B. Brine or Surface Deposits
China
Chile
Dead Sea (Israel, Jordan)
U.o.A.-(total) -—-
C. Carnallite Deposits
Congo
Thailand, Laos
U.S.A., Paradox Basin
Mayrhofer, 1983
Minable
Total
(million tonnes K20)
6,137
70
2,110
100
25
245
218
60
33
25
21
20
6
0
-
-
-
•
-
-
-
507,218
182
10,822
444
129
730
650
240
800
100
100
217
30
0
-
-
-
_
-
-
. -
Searls,
Reserves
1995a
Reserve
Base
(million tonnes K2O)
4,400
-
-
2,800
800
25
750
-
-
23
78
50
24
13
20
-
320
10
103
__ .__ onn
iUU
-
-
-
9,700
-
-
2;200
1,000
30
900
-
30
260
600
40
35
40
20
\
320
50
1,200
300
100
120
800
a. Data mainly from Searls [113], with data from Searls I112J, and authors' estimates.
Francolites With Geologic Time, Journal of the
Geological Society, London 148:809-812.
10. Fransolet, A. M., P. Keller, and F. Fonton. 1986.
"The Phosphate Mineral Associations of the
Tsaobismund Pegmatite, Namibia," Contributions
to Mineralogy and Petrology, 92(4):502-517.
11. Deer, W. A., R. A. Howie, and J. Zussman, 1982.
An Introduction to Rock Forming Minerals,
Longman Group Limited, Essex, England, 528
P.
12. Taborszky, F. K. 1972. "Chemismus und Optik
der Apatite," Neus Jahrbuck fur Mineralogic,
2:79-91.
13. Nriagu, J. O., and P, B, Moore. 1984.Phosphate
Minerals, Springer-Verlag, New York, NY, U.S.A.,
442 p.
14. McCIeBan, G. R, and L. R. Gremillion. 1980.
"Evaluation of Phosphatic Raw Materials," IN The
Rote of Phosphorus in Agriculture, pp. 43-80,
American Society of Agronomy, Crop Science
Society of America, Soil Science Society of
America, Madison, WI, U.S.A.
15. Van Kauwenbergh, S. J., J. B. Cathcart, and G.
H. McCIellan. 1990, "Mineralogy and Alteration
of the Phosphate Deposits of Florida," U,S.
Geological Survey Bulletin 1914, 46 p.
16. McCIellan, G. H., and S. J. Van Kauwenbergh.
1990. "Clay Mineralogy of the Phosphorites of
the Southeastern United States," IN Phosphate
Deposits of the World, Vol. 3, Neogene to
Modern Phosphorites, pp. 337-348, W. C. Burnett
and S. R. Riggs (Eds.), Cambridge. University Press,
Cambridge, England.
153
17. Lehr, J. R., and G. H. McClellan. 1972. A
Revised Reactivity Scale for Evaluating Phosphate
Rocks for Direct Application, Bulletin Y-43,
National Fertilizer Development Center,
Tennessee Valley Authority, Muscle Shoals, AL, U.S.A.
18. Van Kauwenbergh, S. J., and G. H. McClellan.
1990. "Mineralogy of Sedimentary Apatites and
the Relationship to Phosphate Rock Reactivity,"
Paper presented at the National Workshop on
Fertilizer Efficiency. Cisarua, Indonesia,
November 12-13, 1990.
19. Lawendy, T.A.B., and G. H. McClellan. 1993,
"Rotation of Dolomitic and Calcareous Phosphate
Ores," IN Beneficiation of Phosphate: Theory
and Practice, pp. 231-243, H, El-Shall, B. M.
Moudgil, and R, Wiegel (Eds.), Society for
Mining, Metallurgy, and Exploration, Inc., Littleton,
CO, U.S.A.
20. Lawendy, T.A.B., W. R. Clayton, and G. H.
McClellan. 1987, "Beneficiation of Some
Indigenous Phosphate Ores," Paper presented at 194th
American Chemical Society National Meeting,
New Orleans, LA, U.S.A.
21. Abu-Eishah, S. 1., et al. 1991. "Beneficiation of
Calcareous Phosphate Rocks Using Dilute Acetic
Acid Solutions," International Journal of Min-
^era/sPr6cessing,"31:ll"5-l"26". ~ ~ ~
22. Doheim, M. A., M. M. Tarshan, and M. M. EI-
Gendy. 1978. "Calcination of Phosphate Rock
in a Fluidized Bed Furnace," Journal of Applied
Chemistry and Biotechnology, 28(8):531-538.
23. Unkelbach, K. H., and H. D. Wasmuth. 1991,
"A High Intensity Drum-Equipped Magnetic
Separator With Superconducting Magnet," Industrial
Minerals Supplement, pp, 48-54.
24. Smani, S. M,, P. Blazy, and J. M. Cases. 1975.
"Beneficiation of Sedimentary Moroccan
Phosphate Ores," Trans. SME-A1ME, 298(2):176-
182.
25. Lowver, J. E., W O, McGintock, andR. E. Snow.
1983. "Method of Beneficiating Phosphate Ores
Containing Dolomite," U.S. Patent 4,372,843.
26. Lehr, J, R., and S. S. Hsieh, 1981.
"Beneficiation of High Carbonate Phosphate Ores," U.S.
Patent 4,287,053.
27. Rule, A. R., D. E, Larson, and C. B, Dallenbach.
1982. "Application of Carbonate — Silica
Flotation Techniques to Western Phosphate Minerals,"
U,S, Bureau of Mines, Report of Investigations
No. 8728.
28. Houot, R., and J, L. Polgaire. 1980. "Inverse
Flotation Beneficiation of Phosphate Ores," IN
Proceedings of the 2nd International Congress on
Phosphorus Compounds, pp. 231-246, Institut
Mondial du Phosphate (1MPHOS), Paris, France,
29. Hedi, E. 1979, "Flotation of Phosphate Minerals,
Part I. Elimination of Siliceous and Calcareous
Exogangue," Industrie Minerale Mineralurgie,
22:147-149.
30. Snow. R. E. 1979. "Beneficiation of Phosphate
Ores," U.S. Patent 4,144,969.
31. International Fertilizer Development Center
(1FDQ. 1990. "Technical Evaluation of
Producing Phosphate Concentrates From Matongo
Deposit, Burundi," IFDC Technical Report, pp.
34-41, Muscle Shoals, AL, U.S.A.
32. Russel, A. 1992. "Magnetic Separation: An Ever
More Exacting Science," Industrial Minerals,
294:39-57.
33. Lawendy, T.A.B., and S. J. Van Kauwenbergh.
1993. "Flotation of High-Iron Phosphate Ores
and Phosphatic Iron Ores," IN Beneficiation of
Phosphate; Theory and Practice, pp. 29-43, H.
El-Shall, B. M. Moudgil, andR. Wiegel (Eds.),
Society for Mining, Metallurgy, and Exploration, Inc.,
__LittletonjCQ,..U.S.A._
34. Qi, G. W, A, Parentich, L. H. Little, and L. J,
Waren. 1992. "Selective Flotation of Apatite From
Iron Oxides," International Journal of Minerals
. Processing, 134:83-102.
35. Lehr, J. R. 1980, "Phosphate Raw Materials and
Fertilizers: Part 1 - A Look Ahead," Publication
No. X491, Tennessee Valley Authority, Muscle
Shoals, AL, U.S.A.
36. McClellan, G. H., and J. R, Lehr. 1982.
"Impurities of Phosphate Rock - Good or Bad," IN
Proceedings of 32nd Annua/ Meeting of Fertilizer
Industry Roundtable, pp. 238-252, Atlanta, GA,
U.S.A.
37. Smith, P. A. 1991. "High Grade Phosphate: Are
Impurities a Bonus or a Penalty?" Fertilizer News,
36(12): 35-41.
38. McClellan, G. H., and L. R. Gremillion. 1980,
"Evaluation of Phosphatic Raw Materials,"
Publication No. X498, Tennessee Valley Authority,
Muscle Shoals, AL, U.S.A.
39. Robinson, N, 1978, "Fisons Experience on the
• Effect of Phosphate Rock Impurities on
Phosphoric Acid Plant Performance," IN Proceedings of
154
thelSMA Technical/Economic Conference, Or-.
Iando, FL, U.S.A., October 23-27, pp. 97-112.
40. Lehr, J. R. 1968. "Purification of Wet-Process
Acid in Phosphoric Acid," IN Phosphoric Acid,
Vol. 1, Part 2, A. V. Slack (Ed.), Marcel Dekker,
Inc., New York, NY, U.S.A.
41. Becker, P. 1989. Phosphate and Phosphoric
Acid -Raw Materials, Technology, and the
Economics of the Wet Process, Fertilizer Science and
Technobgy Series, Vol, 6, Marcel Dekker, New
York, NY, U.S.A., 740 pp.
42. Gray, A. N. 1930. Phosphates and
Superphosphates, International Superphosphate
Manufacturers Association, Paris, France.
43. Anonymous. 1976. "World Wide Study of the
Fertilizer industry 1975-2000," Draft report prepared
by the United Nations Industrial Development
Organization (UNIDO) and presented on November
16-18 at a meeting in Vienna, Austria.
44. Krauss, U. H, H. G. Saam, and H. W Schmidt,
1984, Internationa! Strategic Minerals
Inventory Summary Report -Phosphate, U.S.
Geological Survey Circular 930-C, 41 p.
45. U.S. Bureau of Mines. 1991. Mineral
Commodity; Summaries, Phosphate Rocks, pp. 118-119,
U.S. Department of thejntenpr, Washington^
D.C., U.S.A.
46. Mew, M. C. 1994. "Phosphate Rock - First Green
Shoots of Recovery," Engineering and Mining
Journal, 195(3):50-53.
47. U.S. Bureau of Mines. 1995. Mineral
Commodity Summaries, Phosphate Rocks, pp. 124-125,
U.S. Department of the Interior, Washington,
D.C., U.S.A.
48. Anonymous, 1994. "Rocky Prospects for U.S.
Producers," Phosphorus and Potassium,
190(March-ApriI): 11-15.
49. Stowasser, W. F 1990. Phosphate Rock, Annual
Report, Bureau of Mines, U.S. Department of the
Interior, Washington, D.C., U.S.A., 18 p.
50. Barboza, F.LM., W Chamber, P. Santa, and M. L.
Maron. 1995, "Brazil," IN Mining Annual Review,
pp. 78-82, The Mining Journal Ltd,, London, England.
51. Stowasser, W. F 1991. "Phosphate Rock -
Analysis of the Phosphate Rock Situation in the United
States: 1990-2040," Engineering and Mining
Journal, 192(9): 16CC-161I.
52. Anonymous. 1994. "Phosphate Rock: No
Respite," Mining Journal, 322(8272):293-295.
53. Anonymous, 1992. "Phosphate Rock Grade and
Quality," Phosphorus and Potassium,
178(March-April):28-36.
54. Brobst, D. A., and W. P. Pratt. 1973. United
States Mineral Resources, U.S, Geological
Survey Professional Paper 820, 722 p.
55. U.S. Bureau of Mines and U.S. Geological
Survey. 1981. Principles of a Resource/Reserve
Classification for Minerals, U.S. Geological
Survey Circular 831, 5 p.
56. U.S. Geological Survey. 1982. Sedimentary
Phosphate Resource Classification System of
the U.S. Bureau of Mines and the U.S.
Geological Survey, U.S. Geological Survey Circular 882,
9 P.
57. Bates, R. L., and J. A. Jackson, 1980. Glossary
of Geology, 2nd Edition, American Geological
Institute, Alexandria, VA, U.S.A., 749 p.
58. Carmichael, R. S. 1982. Handbook of Physical
Properties of Rocks, Vol. 1, CRC Press Inc., Boca
Raton, FL, U.S.A., 404 p.
59. Williams, J. M., and A. W. Griffin. 1990.
"Overview of Major World Phosphate Mining
Operations in the 1990s," Paper presented at the Fifth
Annual Regional Phosphate Conference, Lake-
-land,JEL,-U.S.A^September 29, 1960.
60. Sheldon, R. P. 1987. "Industrial Minerals - With
Emphasis on Phosphate Rock," IN Resources and
World Development, pp, 347-361, D, J.
McLaren and B. J. Skinner (Eds.), John Wiley &
Son Limited, New York, NY^ U.S.A.
61. Herring, J. R., and R, J. Fantel, 1993.
"Phosphate Rock Demand Into the Next Century:
Impact on World Food Supply," Nonrenewable
Resources, 2(3):226-246.
62. Fantel, R. J,, G. R. Peterson, and W. F Stowasser.
1985. "The Worldwide Availability of Phosphate
Rock," Natural Resources Forum, 9(l):5-24.
63. Constant, K. M., and W. F. Sheldrick. 1990,
"Outlook for Fertilizer Demand, Supply and Trade,"
Asia Technical Department, The World Bank,
Washington, D.C., U.S.A.
64. Mew, M, 1990. "Phosphate Rock," IN Metals
and Mineral Annual Review, pp. 110-112, The
Mining Journal, Ltd., London, England,
65. Stowasser, W F. 1992, Personal Communications.
66. Anonymous. 1993. "Coming to Terms With the
New Order," Phosphorus and Potassium,
188(Nov.-Dec.):12-14.
155
67. McClellan, G. H., and T. P. Hignett. 1978. .
,:Some Economic and Technical Factors
Affecting Use of Phosphate Raw Materials," IN
Phosphorus in the Environment: Its Chemistry; and
Biochemistry, pp. 49-73, Ciba Foundation
Symposium 57, EIsevier/Excerpta Medica/North
Holland Inc., New York, NY, U.S.A.
68. Carmichael, R. S. 1982. Handbook of Physical
Properties of Rocks, Volume 1, CRC Press Inc.,
Boca Raton, FL, U.S.A., 407 p.
69. Fischer, H. 1984. "Sulfur, Sulfur Dioxide, and
Sulfuric Acid," The British Sulphur Corporation, Ltd.,
London, England.
70. Hoddinott, P. J, 1994. "Energy Minerals," lNMet-
als and Minerals Annual Review, pp. 105-115,
Mining Journal Ltd., London, England.
71. Hagar, R., G. E. Smith, and R. Vielvoye. 1983.
The Oil and Gas Journal, 81(ll):23-26.
72. Anonymous. 1980. "Elemental Sulphur
Production: Recovery From Low-Grade Pyrites and
Phosphogypsum," Sulphur, No. 147(March-
ApriI):36-38.
73. Conghill, D. 1971. "Sulfates Processing," British
Patent (number unknown).
74. Anonymous. 1994, "Frasch.Mines Restru_ctureJo_ _
Live Another Day "Sulphur, No. 230(Jan.-Feb.):3.
75. Bain, B. 1994. "Sulphur," IN Metals and Miner
als Annual Review, pp, 97-98, Mining Journal
Ltd.. London, England.
76. Forbath, T. P. 1953. "Sulphur Recovery From
Low-Grade Surface Deposits," Mining Engineer-
ins, 5:881-885.
77. Griffith, S. V, 1941. "Extraction of Sulfur,"
Mining Magazine, 64:123-130.
78. Anonymous, 1994, "State of the Art Refinery
Symbolises New Germany," Sulphur, No.
235(Nov.-Dec.):71-73,
79. Lagas, J. A., and J. Borshoom. 1994. "The
Super Claus Process in the Light of Future
Development,1' IN Proceedings of "Sulfur 94"
Conference, pp. 41-46, Tampa, FL, U.S.A.
80. Goar, B. G. 1994. "Improving the Claus Plant
Performance by Oxygen Enrichment," IN
Proceedings of "Sulfur 94" Conference, pp, 127-
132, Tampa, FL, U.S.A.
81. Habashi, F. 1978. Chaicopyrite, Its Chemistry
and Metallurgy, McGraw-Hill, New York, NY,
U.S.A.
. 82. Anonymous, 1956. "Smelting of Sulfide Minerals,"
Quarterly Bulletin No. 13, pp. 10-12, The British
Sulphur Corporation, Ltd., London, England.
83. U.S. Bureau of Mines. 1995. Mineral
Commodity Summaries, Sulfur, pp. 166-167, U.S.
Department of the Interior, Washington, D.C., U.S.A.
84. Anonymous. 1995. "Statistical Supplement,"
Sulphur, No, 241(Nov.-Dec.):32-35.
85. Garrett, D. E. 1996. Potash: Deposits,
Processing, Properties and Uses, Chapman & Hall, New
York, NY, U.S.A.
86. Wardlaw, N. C, and G. D. Nicholls. 1972.
"Cretaceous Evaporites of Brazil and West Africa and
Their Bearing on the Theory of Continent
Separation," IN Proceedings ofthe24th International
Geological Congress, pp. 43-55, Montreal,
Canada, Sect. 6.
87. DeEston, S.M.,andW.J,Hennies. 1991.
"Considerations of Environmental Engineering and
Mine Safety at the Sergipe Potash Mine," Paper
presented at "Kali 91," Second International
Potash Technology Conference, Hamburg, Germany,
May 26-29, 1991.
88. DeRuiter, P. A. 1979. "The Gabon and Congo
Basins' Salt Deposits," Economic Geology,
-——74y4-l-9=*3ir™ -
89. Hite, R. J. 1986, "Potash Deposits of the Khorat
Plateau, Thailand," IN Fertilizer Minerals in Asia
and the Pacific, Vol. 1, pp. 51-73, United
Nations Economic and Social Commission for Asia
and the Pacific.
90. Roulston, B. V., and D. C. Waugh. 1983, "Strati-
graphic Comparison of the Mississippian Potash
Deposits of New Brunswick, Canada," IN Sixth
International Symposium on Salt, Vol. 1, pp, 115-
129, The Salt Institute, Alexandria, VA, U.S.A.
91. Fuzesy, A, 1982. Potash in Saskatchewan,
Saskatchewan Geological Survey Report 181, 44 p,
92. Talbot, C. J., C. P. Tully, and P. J, Woods. 1982.
"The Structural Geology of the Boulby Potash
Mine," Tectonophysics, 85(3-4):167-204.
93. Messer, E., and H. Roth. 1983, "Geology of the
Werra-Fulda Potash Deposit," Monograph Series
on Mineral Deposits, Vol. 22, pp. 79-107,
Gebruder Boontrager, Stuttgart, Germany.
94. Ramberti, L. 1980. "Potash Salt Deposits of
Sicily; Genetic, Stratigraphic and Paleogeographic
Characteristics," Bo//er£ino Delia Associazione
Mineria Subalpina 17, (2):327-353.
156
95. Salas,R. G.,etal. 1991. "Geological-MiningSur- .
vey of Suria K S.A. in the Catalonian Potash
Basin," Paper presented at "Kali 91," Second
International Potash Technology Conference,
Hamburg, Germany, May 26-29, 1991,
96. Griswold, G. B. 1982. "Geologic Overview of the
Carlsbad Mining District," New Mexico Bureau
Mines and Mineral Resources, Circular 182, pp.
17-22.
97. Sun, Dapeng, and D. E. Lock. 1990. "Origins of
Potash Deposits in the Qaidam Basin, China,"
Science in China, Series B., Vol. 33, No. 2, pp.
198-210.
98. Anonymous. 1986. "Beneficiating Potash to
Commercial Product," Phosphorus and
Potassium, No. 145(Nov.-Dec,}:30-36,
99. Foot, D. G., C. E. Jordan, and J. L. Huiatt. 1980.
"Direct Flotation of Potash From Carnallite," U.S.
Bureau of Mines Report of Investigations 8678,
100. Anonymous. 1992. "Potash Extraction by
Flotation," Phosphorus and Potassium, No. 182(Nov.-
Dec): 20-26.
101. Medemblik, L. 1991, "Treatment of Clay
Suspensions in MDPS's Potassium Chloride Flotation
Plant," IN Preprints oj[the\XW International
Mineral Processing Congress, pp. 104-120,
Dresden, Germany.
102. Cormode, G. A. 1992. "Personal
Communication," Cominco Fertilizers,
103. Mireau, R. M. 1992. "PersonalCommunication,"
Cominco Fertilizers,
104. Medemblik, L. 1992. "Personal Communication,"
Mines de Potasse d'Alsace.
105. Anonymous. 1983. "Mining and Beneficiating
Potash," Phosphorus and Potassium, No.
128(Nov.-Dec.):26-31.
106. Larmour, D. 1983. "Electrostatic Separation of
Potash-PCS Mining Experience," Paper presented
at the First International Potash Technology
Conference, Saskatoon, Canada.
107. Breniaux, J., and J. P. Marx. 1991. "Equipment
of a Long-Life Panel at MDPA," Paper presented
at "Kail 91," Second International Potash
Technology Conference, Hamburg, Germany, May 26-
29, 1991.
108. Duchrow, G., I. Fitz, and N. Griishow. 1990.
"Solution Mining Provides the Solution to an
Economic Problem, Possibilities for Profitable
Carnallite Extraction in East Germany,"
Phosphorus and Potassium, No. 167(Sept.-Oct.):20-25.
109. Amira, J., W. Stanley, H. Armstrong, and M.
Frimodig. 1992. "From Hot to Cold
Crystallization, "Phosphorus and Potassium, No. 182(Nov.-
Dec.):28-32.
110. Anonymous. 1992. "Optimization of Solar
Evaporation Systems,"Pfiosphorus andPotassium, No.
179(May-June): 17-25.
111. Anonymous. 1972. "Technical Advances by the
U.S.S.R. Potash Industry," Phosphorus and
Potassium, No. 53(May-June):52-55.
112. Searls, J. P. 1991. Potash Annual Report,
Bureau of Mines, U.S. Department of the Interior,
Washington, D.C., U.S.A., 15 p.
113. Searls, J. P. 1995. "Potash," IN Mineral
Commodity Summaries 1994, pp. 128-129, Bureau
*of"Mmes7"UTS~Departmentof the Interior,
Washington, D.C., U.S.A.
114. Spooner, J. 1994. "Potash," INMetals and
Minerals Annual Review, pp. 98-99, Mining
Journal Ltd., London, England.
115. Warner, P. 1993. "Potash Overview," Paper
presented at the International Training Workshop —
Indigenous Resource Development for the
Fertilizer Sector, 1FDC, Muscle Shoals, AL, U.S.A.
116. Anonymous. 1992. "An Outfook for Potash,"
Phosphorus and Potassium, 180(July, Aug.):20-27.
117. Mayrhofer, H. 1983. "World Reserves of
Mineable Potash Salts Based on Structural Analysis,"
INSixih International Symposium on Salt, Vol.
1, pp. 141-160, The Salt Institute, Alexandria,
VA, U.S.A.
157
Chapter 6. Production of Ammonia
Table of Contents
Page
6.1 Ammonia Early Process Development 159
6.2 Physical Properties of Ammonia ..., . -1-60-
6.3 Feedstock for Ammonia Production 160
6.3.1 Feedstock Requirements 162
6.4 Production Technology of Ammonia 164
6.4.1 Synthesis Gas Preparation Processes , 165
6.4.1.1 Steam Reforming 166
6.4.1.2 Gas Processing Into Pure Hydrogen 168
6.4.2 Ammonia Synthesis , 172
6.4.2.1 Thermodynamics and Kinetics 172
6.4.2.2 Technology of Ammonia Synthesis 173
6.4.3 Advances in Ammonia Technology 175
6.4.3.1 Advances in Gas Preparation Technology 175
6.4.3.2 Advances in Ammonia Synthesis 179
6.5 Partial Oxidation Process of Heavy Hydrocarbons 182
6.6 Ammonia From Coal 184
6.7 Ammonia From Electrolytic Hydrogen 187
6.8 Economics of Ammonia~Production"7r^77T^T- ......tttttt^tt:- --.--.-.-.-:..-. 188
6.8.1 Investment Costs 188
6.8.2 Elements of Production Costs 189
6.8.3 Small-Scale Ammonia Plants 190
6.9 Future Development of Ammonia Technology 191
6.10 References 192
158
Chapter 6. Production of Ammonia
6.1 Ammonia Early Process Development
- Synthetic ammonia (NH3) has become the principal
source of all nitrogen fertilizers, particularly since 1945.
At present, almost all commercial fertilizer nitrogen is
supplied by or derived from synthetic NH3; only minor
percentages are supplied by natural sodium nitrate,
byproduct NH3 from coke-oven gas (usually recovered
as ammonium sulfate), calcium cyanamide, and other
minor sources. In 1904 the ammonia synthesis process
was developed primarily by Fritz Haber, and in 1909 he
demonstrated the process on a laboratory scale of 80 g
of NH3 per hour [1]. Carrying out the high-temperature,
high-pressure process on a commercial scale presented
formidable problems with the technology and materials
of construction then available. Carl Bosch, working with
Haber, is generally credited with developing the process -
first on a pilot scale and then on a commercial scale of
30 tpd. Production started in 1913 at Oppau, Germany,
The process was based on the catalytic reaction of
hydrogen and nitrogen at high temperature and pressure
and in its basic concept is still extensively used today.
Using the Haber-Bosch process and coke-based
producer gas and/or coke-oven gas as..the_source_of hydros
gen, various countries had constructed ammonia plants
by the late 1930s. Thus, the ammonia plants had to be
located near steel works. As technology progressed, coal
gasification began to be used instead of producer gas as
the source of hydrogen. In Europe, coal gasification
continued to be the primary source of hydrogen even in the
1950s [2]. In the United States, steam reforming of
hydrocarbons replaced the use of coal gasification
because of the existence of large amounts of inexpensive
natural gas.
Likewise, the use of natural gas enlarged the size of
the plants in the United States. In 1953, a plant having
a capacity of 165 tpd was put into service for Shell
Chemical by the M. W. Kellogg Company [2]. The size
of ammonia plants continued to increase. Three
hundred tpd plants were being put into service by the late
1950s. By the 1960s, a quickly increasing demand for
ammonia led to the commercialization of the large-scale,
single-train ammonia plant. The first of these plants was
located in Texas City and was built in 1965 by the M.
W. Kellogg Company for Amoco [2], Originally, it was a
600-tpd plant, with three additional 600-tpd units and a
1,000-tpd unit installed during the next few years.
Today single-train capacities have reached levels of 1,500-
1,800 tpd. The concepts used in the 1960s to construct
the first large-scale ammonia plants are still being used
today not only in the United States but also globally.
From 1960 to 1990, worldwide ammonia capacity
increased from 16 million tpy 13] to 138 million tpy."
Figure 6.1 illustrates the development of world nitrogen
production since the beginning of the century and how
it has increased sharply in recent years.
Large single-train natural gas feed plants are also
becoming prominent in fertilizer production in the devel-
100
80
z
W
S 60
c
.2 40
S20
0
1920 1930 1940 1950 1960 1970 1980 1990
Source: [5].
Figure 6.1. World Nitrogen Production.
oping countries. Until about 1960, most of the world's
ammonia manufacturing capacity was located in
developed countries, where plants were relatively small, used
a variety of feedstocks, and served local markets. There
were very few ammonia plants in developing countries
and only a small amount of nitrogen fertilizer was
imported by these countries. Beginning in the 1960s,
several dramatic changes occurred in the industry. By 1990,
the four largest producers and consumers of nitrogenous
fertilizers were the U.S.S.R,, China, the United States,
and India [2\. The ammonia fertilizer market is highly
competitive, and today's large-scale plants must be
energy efficient and reliable if they are to be economical.
Significant improvements have been made in reducing
energy consumption of ammonia production. Table 6,1
provides evidence of this over the past 50 years. Over
this period, energy consumption was reduced by about
35%-40%. The current efficiency level of about 7 Gcal/
tonne of ammonia is approaching the theoretical
minimum of about 5 Gcal/tonne, assuming an ideal and
reversible thermodynamic process. However, the
159
Table 6.1. Ammonia Plant Energy
Consumption [2]
Years
1943-65
1965-72
1972-83
1983-94
Typical Natural Gas
Consumption, LHV, Gcal/t
10.5-11.1
8.9- 9.4
8.6- 8.9
6.9- 7.2
efficiency of energy consumption can be further
improved [2].
6.2 Physical Properties of Ammonia
The following table, Table 6.2, lists many of the
important properties of ammonia. Table 6.3 contains the
densities of aqueous ammonia at 15° Celsius. Ammonia
has flammable limits of 16%-25% by volume in the air
and 15%-79% in oxygen [4]. Ammonia-air mixtures are
not easily ignited since the ignition temperature is 650°
Celsius. The mixture can explode if ignited. Ammonia
Table 6.2. Physicar Properties of Anhydrous
Ammonia [4]
Property
Unit
Value
Molecular weight
Boiling point
Freezing point
Critical temperature
Critical pressure
Specific heat (gas)
- at 0°C
- at 100°C
- at 200°C
Heat of formation (gas)
- at 0°K
- at 298°K
Solubility in water
- at 0°C
- at 20°C
- at 40°C
- at 60°C
Specific gravity
- at -40°C
- at 0°C
- at 40°C
1
°C
°c
°c
MPa
J/kg°K
kJ/mol
%, weight
g/ml
17.03
-33,35
-77.7
133.0
11,425
2,097.2
2,226.2
2,105.6
-39.2
-46.2
42.8
33.1
23.4
4.1
0.690
0.639
0.580
Table 6.3. Density of Aqueous Ammonia at 15°C
[4]
Ammonia
(wt%)
16
32
50
75
100
Density
(g/cm3)
0.970
0,947
0.889
0.832
0.733
0.618
is readily soluble in water. A large amount of heat, about
2180 kJ (520 kcal), is produced when the dissolution of
1 kg of ammonia gas occurs,
6.3 Feedstock for Ammonia Production
Before World War II (1939), three million tpy of
nitrogen was produced as ammonia; 90% was derived from
coal and coke. By I960, about 16 million tpy of
ammonia was produced using cheaply available natural gas in
the United States [5]. Naphtha became the most
common feedstock in other developed countries because of
jts low price, and some fuel oil was also used. Naphtha
became more popular with the development of the
Imperial Chemical Industries (IC1) steam-reforming process
for naphtha and led to many new plants around the
world. Soon, many of these plants closed as a result of
the increase in the price of naphtha because of its
increased demand and the 1973 oil crisis. Since 1975,
the primary feedstock of most new plants is natural gas,
with about 78% of the world ammonia capacity as shown
in Figure 6.2.
78.7%
World Capacity
1990: 114 Million
Tonnes N
□ Gas
j^j Coal & Coke
■ Naphtha
Soil
P Other
Figure 6.2. Major Feedstock for Ammonia
Production.
160
This percentage is so large because of the low energy
needs and investment costs of natural gas. Future
predictions show natural gas to remain as the main
feedstock due to its reserves and opportunity costs, especially
in developing countries [5]. The only exception is China,
where coal-is the primary feedstock.
- Natural Gas - As mentioned previously, natural gas
is the principal feedstock for ammonia production.
Natural gas is classified as "associated" or "nonassociated."
Associated gas occurs with crude oil; it is liberated from
the oil when the pressure is released in the oil-gas
separator plant. Its composition varies with the pressure at
which the separator is operated. Since methane is the
most volatile, it can be released at a relatively high
pressure. By releasing gas at successively lower pressures, a
separation can be made in which methane is released
first, and the less volatile gases, ethane, butane, and
propane, are collected separately.
The higher hydrocarbons usually have a higher value
for petrochemical production or for sale as liquefied
petroleum gas (LPG) than methane. Therefore, in most
cases, these products are sold separately, and the term
"natural gas" usually refers to the fraction that contains
mostly methane with only small percentages, of ethane
and higher hydrocarbons. For use as ammonia
feedstock, methane is preferable to the higher hydrocarbons
because all carbon in the feedstock is converted to
carbon dioxide or monoxide, which must beremovedfrom—
the ammonia synthesis gas. Therefore, the lower the
carbon:hydrogen ratio in the feedstock, the smaller and
less expensive the purification units in the synthesis gas
preparation section will be.
In ammonia-urea complexes where all of the
ammonia is used to make urea, the amount of CO2 derived
from methane feedstock may not be sufficient for the
urea plant needs. Urea requires a CC>2:NH3 ratio of 1:2;
whereas, the production of ammonia by reforming pure
methane results in a CC>2:NH3 ratio of 7:16. In this case
it would be advantageous if the natural gas contained
enough higher hydrocarbons to supply enough CO2 for
urea production. This is often the case as shown by the
example of natural gas composition given in Table 6.4.
Both associated and nonassociated natural gases vary
widely in composition; the example in Table 6.4 is only
an illustration. Gas from some nonassociated deposits
may be nearly pure methane. In other deposits gas may
contain higher percentages of H2S, CO2, or both. Other,
usually minor, constituents are N2 and sometimes He
(helium). The CQ2 and H2S are usually removed by
scrubbing before delivery by pipeline to avoid corrosion of
the pipeline; the H2S may be converted to elemental
sulfur, which may be a profitable byproduct in some
cases.
-Table 6.4. Composition of Representative
Sample of Natural Gas
% by Volume
Constituent At Well Head As Delivered by Pipeline
CH4
N2
Argon
C02
H2S
Hydrocarbons
C2H6
C3H8
C4H10
C5H12
C6H14+
75.9
7.3
8.9
3,3
1.2
0,8
0.5
2.3
Liquefied Petroleum Gas - LPG, which primarily
contains butane and propane, has been used as
ammonia feedstock in Japan. Liquefied natural gas (LNG) is
also used in Japan. These materials are relatively
expensive but are often less expensive than naphtha,
Naphtha - In those areas of the world where natural
-gas^s-unavailable^-naphtha-became a favored feedstock
for ammonia production by steam reforming,
particularly in the period of 1950-74 when naphtha was
relatively cheap. In many countries the amount of naphtha
produced in oil refining exceeded the demand. Naphtha
is the lighter fraction of hydrocarbons; it boils from about
40° to 130°C with an average molecular weight of about
88 and an H.C atomic ratio of about 2,23. Straight-run
naphtha is preferred to naphtha produced from higher
hydrocarbons by cracking or "hydrocracking" because
the latter usually contains sulfur compounds that are
difficult to remove. The composition and properties of
typical naphtha are given in Table 6.5.
Since 1974 the price of naphtha on the world
market has risen more rapidly than that of other feedstocks
because of the demand for naphtha for use in the
manufacture of motor fuel and petrochemicals (ethylene,
propylene, etc.). Therefore, several plants originally designed
to use naphtha have switched to other feedstocks such
as natural gas. As a result, few new plants are being
built to use this feedstock.
The process for steam reforming of naphtha was
developed mainly by 1C1 in England and has been widely
used in Europe, Japan, and many developing countries.
The main technical problem was to avoid carbon
formation on the reforming catalyst without excessive steam
161
Table 6.5. Composition and Properties of
Representative Sample of Naphtha
Constituent or Property
Average Value
Specific gravity at 15„5DC
Initial boiling point, DC
Final boiling point, °C
Unsaturates, % (volume)
Aromatics, % (volume)
Saturates,""% (volume)
Total sulfur (ppmw)
Sulfur as (ppmw):
H2S
RSH
R2S2
R2S
S
Unreactive S
C,%
H, %
Mol. wt.
Heating value, kcal/kg
0.686
41
131
1
4
95
368
2
146
119
80
1
20
84.4
15.7
88
10,500
consumption. This problem was solved by modifications
of the catalyst composition. ~ ~
Refinery Gases - Petroleum refineries and
petrochemical operations produce a variety of byproduct gases
that can be used as fuel or feedstock or both. The
composition of refinery tail gas varies widely; it usually
contains H2, CH4, and higher hydrocarbons and can be
used as ammonia feedstock by steam reforming. The
amount of available tail gas is likely to be insufficient for
an economical scale of ammonia production unless the
refinery is a very large one. Another drawback is that
the volume and composition of the tail gas may vary
according to the demand for the various refinery
products, and these variations can cause difficulties in the
ammonia plant operation. Also, refineries often have a
use for the components of the tail gas. For instance, the
hydrogen can be separated and used in "hydrocrack-
ing" (production of light hydrocarbons by hydrogenat-
ing and cracking heavier fractions). Only a few ammonia
plants in Europe and Japan use refinery tail gas.
Coke-Oven Gas - Before the 1940s, coke-oven gas
was used for a large portion of ammonia production.
Coke-oven gas contains about 55% H2, 25% CH4, 8%
CO, 6% N2, minor amounts of higher hydrocarbons,
CO2, and various impurities. Presumably, it could be used
for ammonia production by steam reforming after
purification, but the usual practice is to separate the
hydrogen by a cryogenic process involving a liquid nitrogen
wash. Many steel-producing plants have an air
separation unit to supply oxygen for use in steel production;
thus, the liquid nitrogen is available from this source.
The cryogenic process produces a nitrogen-hydrogen
gas mixture suitable for ammonia synthesis, and the
remaining gas mixture of CO, CH4, and heavier
hydrocarbons is used as a fuel. The main drawback is similar
to that of refinery tail gas; the amount of coke-oven gas
depends on coke production which, in turn, depends
on steel production. Only a few plants use coke-oven
gas for feedstock.
Heavy Oil - Liquid hydrocarbons heavier than
naphtha are used for ammonia feedstock by partial oxidation .
processes, which will be discussed in a later section of ■
this chapter.
Hydrogen-Rich Off-Gases - Byproduct hydrogen
sources have been used for ammonia production in the
past. Table 6.6 lists sources of hydrogen-rich gases. In
the 1970s, the price of light hydrocarbons began to
rise, which led to other feedstocks such as hydrogen-
rich off-gases being reconsidered. Some large plants
using methanol or other plant purge gases were built [6].
Table 6.7 shows the commercial operations data for
three such projects.
Other Feedstocks - Methanol or ethanol can be
used as feedstock in steam-reforming processes, but no
commercial use has been reported. Other feedstocks
such as electrolytic hydrogen, coal, and fuel oil will be
discussed separately under applicable process headings.
6.3.1 Feedstock Requirements
In nearly all ammonia plants the same material is used
as both feedstock and fuel. The fuel requirements may
be 40% of the total or more, depending on the extent
to which heat recovery equipment is used. In previous
years when fuel was inexpensive, many ammonia plants
were built with minimum heat recovery facilities. Buividas
et al. give an example of how the fuel requirement
(natural gas) was decreased by 34% through more efficient
energy use, which primarily included high-pressure steam
generation and preheating combustion air to the
reformers [7[. The decrease in total fuel plus feedstock
requirement was about 15%. The increase in fuel efficiency
was obtained at the expense of about 6% increase in
plant investment costs. Table 6.8 shows the requirements
for fuel plus feedstock that assume efficient heat recovery.
In a natural gas-based plant 20%-30% of the gas is
used for fuel and the balance for feedstock. The lower
fuel values are for plants equipped with good energy-
recovery systems. Fuel requirements do not include
electric power generation or steam generation other than
that connected with heat recovery. Modern ammonia
162
Table 6.6. Sources of H2-Rich Gases [6]
H2-Rich Gas Stream in %
Methanol purge gas
Ethylene plant H2 gasa
CO plant H2 gasb
Caustic soda plant H2
Cyclar and BTX plants
Coke-oven gas
H2
80.0
84.4
97.0
99.86
96.6
60.0
CO
2.00
0.20
1.95
-
-
6.5
co2
2.60
-
-
0.02
-
2.5
CH4
14,0
15,4
0,04
-
4.0
22.5
N2
1.0
-
0.09
0.24
-
6.5
MeOH
0.4
-
-
-
_
c
o2
-
-
0.06
-
0.5
Cfe
0.06 15 ppmv
a. Based on ethane feed.
b. CO plant based on cold box for CO separation.
c. Hydrocarbons about 1.5%, after pretreatment.
Table 6.7. Commercial Operations With H2~Rich Gas [6]
Owner (Location)
Georgia Pacific (U.S.A.)
Ocelot [Canada)
Kemira Ltd. (U.K.)
Capacity
(million tpd)
520
545
750
Feed
MeOH purge & H3
caustic plant
MeOH purge
H2 from CO plants
rom
Process Schemes
LT shift, CO2 removal, N2 wash,
conventional syn loop
CO2 removal, N2 wash, modem
syn loop
N2 wash, modern syn loop
On-Stream Date
1977
1986
1988
Table 6.8. Energy Requirements Per Tonne of Ammonia [36]
Feedstock and Fuel
Natural gas
Naphtha
Fuel oil
Coal
Assumed Heating Value3
8,015 kcal/m3
10,556 kcal/kg
9,722 kcal/kg
6,333 kcal/kg
Quantity
873 m3
0.72 t
0.87 t
1.541
Gcal
7.0
7.6
8.5
9.8
a. All values are lower heating values (LHV).
163
plants are self-sufficient in steam supply, and much of-
the mechanical power is supplied by steam rather than
electricity. However, in developing countries, a captive
electric generating plant usually is considered essential
for a dependable supply of electricity. Also, if a urea
plant is associated with the ammonia plant, additional
fuel will be required to supply the steam needed for urea
production. Therefore, total fuel requirements may be
larger than those mentioned above.
When a high-cost feedstock is used for ammonia
production, it may be advantageous to use a lower cost fuel
for heating and for producing steam and electricity.
Likewise, when the supply of feedstock (such as natural gas)
is inadequate for both fuel and feedstock, a different
material may be used as fuel. Several plants in the United
States that use natural gas feedstock are equipped to
use a light fuel oil for heating the reformer In cases
where the fuel oil is more expensive than natural gas,
the fuel oil system may be used only when the natural
gas supply is limited.
Use of heavy oil or coal for fuel could be considered
for plants using expensive or scarce feedstocks.
However, these fuels cannot be used to heat reformer
furnaces unless some extensive modifications are made.
Impurities in heavy oil or coal would adversely affect the
reformer tubes by causing corrosion or erosion unless
design modifications were made. Deane and Brown have
described a naphtha-based flowsheet in which -a--non—
premium fuel" is used for preheating the feedstock and
the air to the secondary reformer [8]. Obviously, there
would be no technical problem in using coal for steam
and electric power in units designed for that purpose.
Direct use of coal for heating the reformer furnace would
present serious difficulties, but indirect use such as
byproduct gas derived from coal may be technically and
economically feasible in some cases.
Energy consumption in the ammonia process depends
on the design of the different process units. In practice
at least a dozen different combinations of process units
are used depending on site-specific, conditions. There is
no single ammonia process model suitable for all
situations. The energy-saving processes usually have higher
investment costs, and a detailed study on combinations
of the available process units should be carried out.
Production costs, for obvious reasons, are not published;
therefore, a comprehensive evaluation requires a
detailed engineering study. The results of this type of study
have been provided by Topsoe [9]. In all cases Topsoe
technology has been used, the plants have been
considered "stand alone" ammonia plants with no-export/-
import of steam or power with a cooling water
temperature of 30°C. Three cases were considered:
Case 1 - minimum energy consumption
Case II - realistic concept of low-energy plant
Case III - low investment cost
The results are given in Table 6.9.
Obviously the site conditions will influence strongly
the thermal efficiency. This is especially valid for the
subtropical and high-temperature regions. The case study
[9] showed that an increase in the cooling water
temperature from 20°C to 35°C would raise the energy
consumption by 0.23 Gcal/tonne of ammonia. Supply of
the cooling water from open reservoirs instead of a pres-
surizelTsystem would~iricrease the energy consumption
by another 0.1 Gcal/tonne of ammonia.
These examples indicate why only detailed case
studies may show the real energy consumption of an
ammonia plant.
6.4 Production Technology of Ammonia
Production of ammonia may be considered as being
composed of two major steps:
Table 6.9. Energy Consumption in
Parameters/Case
S/C ratio
Pre-reformer
Shift configuration9
CO2 removal
Final purification
Synthesis
Steam from condensate
stripping
Energy consumption
Gcal/t
Different Proc
Casel
2.5
Yes
MT + LT
Physical
Methanation
S-250
MP
6.60
ess Configurations
Case II
2.8
No
HT + LT
MDEA
Methanation
S-200
MP
6.85
Case m
3.3
No
HT + LT
HPC
Methanation
S-200
HP
7.00
a. HT = high temperature, LT = low temperature, MT = medium temperature.
164
- Preparation of the ammonia synthesis gas composed
from nitrogen and hydrogen in a molar proportion
of 1:3.
- Synthesis and separation of the ammonia.
A simplified flow diagram for the production of
ammonia by steam reforming of natural gas or naphtha is
shown in Figure 6.3. In the following discussion, each
of the steps will be discussed in the sequence in which
they occur.
6.4.1 Synthesis Gas Preparation Processes
Synthesis gas for ammonia production consists of
hydrogen and nitrogen in about a 3:1 mole ratio,
residual methane, argon introduced with the process air,
and traces of carbon oxides. There are several processes
available for synthesis gas generation, and each is
characterized by the specific feedstock used- A typical
synthesis gas composition by volume is: hydrogen, 74%;
nitrogen, 24%; methane, 0.8%; argon, 0.3%; carbon
oxides, 2-10 ppmv; and water vapor, 0,1 ppmv [4].
The source of nitrogen is always air; however,
hydrogen can be derived from a variety of raw materials
including water, light and heavy hydrocarbons resulting
from crude oil refining, coal, natural gas, and sometimes
a combination of these raw materials. In all cases, part
of the hydrogen produced is derived from water.
Synthesis gas preparation consists of three'steps:
(1) feedstock conversion, (2) carbon monoxide
conversion, and (3) gas purification. Table 6,10 gives the main
processes for each of the feedstocks used. In each case,
except for water electrolysis, simultaneous to the
reactions shown, the water-gas shift reaction occurs.
CO + H20 +* C02 + H2
AH= -41 kJ/mol (-9.8 kcal/mol)
Equilibrium is achieved in steam reforming; equilibrium
is approached for partial oxidation processes [4]. The
reactions are given in Table 6.10. .
Purge gas
Legend.
S-l Sulfur removal
R-2 Primary reformer
K-3 Air conpressor
R-4 Secondary reformer
E-5, E-7. E-8 Heat recovery C-12 CD2 absorber
D-18 Dryer
R-6 HT shift converter R-13 Methanator C-19 CDS stripper
R-7 LT shift converter E-14, E-21 Heat recovery R-2Q Ammonla converter
E-1D Cooler E-15, E-22 Cooler X-33 NH3 refrigeration
C-ll Condensate stripper E-16 Syn-gas cooler E-24 Chiller
K-17 Syn-gas compressor S-£5 HP separator
Figure 6.3. Simplified Flowsheet of Ammonia Production.
165
Table 6.10. Hydrogen Generation Raw Materials and Processes [4]
l
Raw Material
Natural- gas
Naphtha
Fuel oil
Coal
Water
Process Description
Steam reforming3
Steam reforming15
Partial oxidation
Coal gasification
Electrolysis
Feedstock Conversion Reaction
CnH(2n+2> + nHsO -+ nCO + (2n+l)H:
CnFW) + nH20 -» nCO + (2n+l)H:
nCO + (2n+l)H;
CnHfzn+2l + n/202 -► nCO + (n+l)H2
C+l/202 ^C0
H20 -+ l/202 + H2
a. Nickel is used as catalyst.
b. Promoted nickel is used as catalyst,
The most economic hydrocarbon feedstock is likely
to be the one having the highest hydrogen:carbon
ratio. From Table 6.10 it can be seen that, for a given
amount of carbon (feed), proportionally more hydrogen
is generated by steam reforming than by partial
oxidation. Thus, in the manufacture of hydrogen for
ammonia synthesis, partial oxidation processes require more
feed, which ultimately leads to larger carbon dioxide
removal facilities. In addition, the raw synthesis gas
generated by partial oxidation is much higher in carbon
monoxide content than that coming from a steam-
reforming operation. This high CO content requires
larger facilities, both in terms of equipment and catalyst,
for shift conversion.- Because-more C02 removaLand-
higher shift conversion lead to higher investment and
operating costs, partial oxidation processes are normally used
only for materials that cannot be handled by steam
reforming such as coal or heavy hydrocarbon feeds [4].
6.4.1.1 Steam Reforming
Feedstock Preparation - As mentioned previously,
most natural gas requires some purification, particularly
the removal of C02 and H2S, which may be done by
the natural gas producer if the gas is transmitted by
pipeline. If the gas is taken directly from wellheads, the user
(ammonia producer) may have to purify the gas.
Depending on the source, natural gas may contain entrained
dust or droplets of liquid (oil or water), which should be
removed by separators, filters, etc.
After the initial purification, natural gas is compressed
to reformer pressure, if not already at that pressure,
and preheated. Then, any remaining sulfur is removed
to avoid poisoning of catalysts. The sulfur may be
removed by adsorption on activated carbon at ambient
temperature or by absorption by hot zinc oxide (290°-
400DC) after the gas has been preheated.
ZnO + H2S +* ZnS + H20
In some cases both treatments may be used. Some
natural gas may contain significant amounts of chlorides,
which can poison catalysts, particularly the low-
temperature shift catalyst. Catalysts or absorbents are
available to remove chlorides. If the feedstock contains
nonreactive sulfur, hydrotreating is required. The
preheated gas or vaporized naphtha is mixed with a small
amount of hydrogen (recycled synthesis gas) and passed
through a "hydrotreater" containing a cobalt-molybdenum
catalyst, which converts sulfur compounds to H2S; the gas
then goes to a sulfur-removal catalyst (zinc oxide).
RSH + 1/2H2 +* H2S + RH
Since naphtha usually contains unreactive sulfur,
hydrotreating or hydrodesulfurization is commonly used
-in-naphtlia-based-pIants.-The catalysts (absorbents) used
in the guard beds are expensive and cannot be
regenerated, Therefore, if the feedstock contains much sulfur
or chloride, some means for removing most of these
impurities as a pretreatment should be considered. In
the case of natural gas, absorption in an alkaline solvent
such as monoethanolamine or potassium carbonate,
which can be regenerated, is commonly used for
removing most of the sulfur.
Sulfur and chlorides (and other catalyst poisons) can
enter the ammonia plant in the steam or in the air to
the secondary reformer; thus, precautions should be
taken to eliminate such impurities insofar as is practical,
In addition, a layer of guard absorbent may be placed
on top of the catalyst, particularly in the case of the low-
temperature shift catalyst.
Primary Reforming - The purpose of the primary
reforming step is to convert the bulk of the
hydrocarbon feed to H2 and CO by reaction with steam.
CH4 + H20 *- CO + 3H2
AH = 206 kJ/moI(49.2 kcal/mole) [10]
Nickel catalyst is used for this reaction. The shift
conversion reaction also occurs to some extent:
CO + H20++ CQ2 + H2
166
AH =-41 kJ/mole [11]
The overall reaction is endothermic and requires a large
amount of heat to be applied to the reactants.
The primary reformer is a furnace with a large
number of catalyst-packed vertical tubes. The fuel is burned
in the furnace, whereby the required heat is provided
for the reaction occurring inside the tubes at 750°-850°C.
The preheated feedstock and high-pressure steam at 3-
4 MPa pressure are mixed and enter at the top of the
furnace.
Centrifugally cast reformer tubes made of alloy A 698
HK 40 have been widely used for steam reforming. In
the last decade, newer alloys such as A 297 HP and
Manaurite 36X were developed. See Table 6.11 for the
composition of these alloys.
Manaurite 36X has a much higher nickel content than
HK 40 and a little more chromium, and it is stabilized
with niobium [12,13]. Its creep rupture behavior is
superior to HK 40 and A 297 HP, which never found
broad acceptance [14]. By using superior alloy, the
reformer can be designed for higher pressure, up to 4,3
MPa at the reformer outlet. The higher pressure is
compensated by higher temperature for achieving the same
methane conversion in the primary reformer. The
reformer tubes range from 7.5 cm to 20 cm in diameter
with a wall thickness of 0.6 cm to 2,5 cm and a length
ranging from 3 m to 14 m- [15[.-The -tubes are-packed-
with catalyst containing nickel on a calcium aluminate
base, usually in the shape of a ring about 16 mm in
diameter by 16 mm long. The nickel content typically is
14%-16%. Promoters such as potassium may be added,
and the composition of the base may be varied to
increase its strength, durability, and porosity. The
temperature of the gas leaving the reformer tubes may be
750°-850°C, and the temperature of the tube wall may
be 900°-950°C or more. This high temperature and
the high pressure constitute severe conditions that
require expensive materials of construction at the reformer
outlet and careful design and operation. The heat in the
combustion gas leaving the reformer is used successively
to produce steam, to preheat the incoming feedstock-
steam mixture, and, where fuel economy is important,
to preheat combustion air.
There are many designs of reformer furnaces; all of
these designs aim at efficient heat transfer by radiation,
convection, and even heat distribution to prevent
overheating or underheating any of the tubes or portions of
the tube. The fuel burners may be placed at the top,
sides, or bottom of the furnace. Various means are used
to cope with the difficult problem of connecting the tubes
to the inlet and outlet gas connections so that thermal
stress will not cause failure of the tubes or their
connections. Some designs permit the isolation of a tube or
tubes that have failed. This arrangement permits the
plant to continue operation even after some of the tubes
have failed. During scheduled shutdowns, tubes that have
failed or that are in poor condition can be replaced.
Secondary Reforming - The gas leaving the
primary reformer usually contains 5%-15% methane (dry
basis). The object of the secondary reforming step is to
complete the conversion of methane to H2, CO, and
-CO-2-and-to-SuppIy-the-required proportion of N2 for
NH3 synthesis. This is done by adding air in the amount
required to give an N:H atomic ratio of 1:3 in the
synthesis gas after the shift conversion step. This means
that the mole ratio of N2:(H2 + CO) should be 1:3 in the
gas leaving the reformer unless more N2 or H2 can be
added in some subsequent step of the process. The
oxygen accompanying the nitrogen in the air burns part of
Table 6.11. Chemical Composition of Reformer Tube Alloys (wt %) [14]
Grade
A 698 HK 40
(min)
(max)
A 297 HP
(min)
(max)
Manaurite 36X
(min)
(max)
Ni
19
22
33
37
32
35
Cr
23
27
24
28
23
27
Mn
1.5
2.0
1.5
Si
0.5
2.0
2.5
1.5
Nb
-
1,5
Mo
0.5
0.5
C
0.35
0,45
0.35
0.75
0.35
0.45
P
0.04
0.04
0.03
S
0.04
0.04
0.03
167
the combustibles (H2, CO, and CH4) in the partially
reformed gas, thereby raising the temperature high enough
for rapid completion of the reforming.
Although most processes involve the use of air alone,
in some cases oxygen-enriched air is used to supply more
heat and, thereby, take some of the load from the
primary reforming step. In fact, it is possible to add enough
oxygen so that the reforming process becomes
"autothermal" and the primary reforming step can be
omitted entirely. On the other hand, less air can be used
than required for nitrogen supply, and part of the
nitrogen can be added separately, preferably at a later step
in the process. This arrangement places more load on
the primary reformer but decreases the amount of
feedstock required. This can be an advantage when the
feedstock is expensive (or in short supply) and a less expensive
fuel is used in the primary reformer.
In the usual case when air to the secondary reformer
is the sole source of nitrogen, the heat input is limited to
that generated by combustion reactions plus the
sensible heat in the preheated air and in the gas from the
primary reformer.
A typical secondary reformer is a cylindrical, refractory-
lined, insulated vessel. The upper part is empty and serves
as a combustion chamber in which the gas from the
primary reformer is partially oxidized by preheated air.
The lower part is filled with a catalyst similar to that in
the primary reformer. The air should be free frofrTdusT
that might clog the catalyst bed and from catalyst
poisons (S, CI, and As). The air is filtered, compressed to
reformer pressure, and mixed with the gas in a burner
at the top of the vessel. The combustion causes the
temperature to rise to about 1200°C in the combustion
chamber. As the hot gas descends through the catalyst
bed, it is cooled by the endothermic reforming
reactions and leaves the reformer at a temperature of about
950°-1000°C, The gas at this point contains, on a dry
basis, about 56% H2, 12% CO, 8% C02, 23% N2, plus
argon, and usually less than 0.5% CH4. It also contains
excess steam ranging from one-third to one-half of the
total gas volume,
6.4.1.2 Gas Processing Into Pure Hydrogen
Carbon Monoxide Conversion - Gas from the
secondary reformer is cooled {generating steam) to about
375DC, which is the usual temperature for the shift
conversion reaction:
CO + H20 -»■ H2 + C02
AH = -41 kJ/mole
The reaction is exothermic; therefore, it is usually
carried out in two steps with heat removal between steps.
The rate of reaction is more rapid at high temperatures,
but equilibrium is more favorable at low temperatures.
Thus, it is common practice to operate the first step at a
higher temperature than the second so that most of the
CO is converted in the first step (from 12% to 3%
content in the gas), and in the second step the CO is
reduced to less than 1% (often as low as 0.2%).
Prior to 1960, the same type of catalyst was used in
both steps. This catalyst is mainly iron and chromium
oxides, about 55% Fe, and 6% Cr. It is active only at
relatively high temperatures (350°-430°C) and is known
as a high-temperature shift (HTS) catalyst. About 1960
a new copper-based catalyst came into use, "which is
active at lower temperatures (200°-260°C) and is known
as low-temperature shift (LTS) catalyst. Most LTS
catalysts contain zinc and alumina in addition to copper and
are poisoned by sulfur and chlorine compounds.
It is possible to use a guard bed ahead of the LTS
catalyst bed. Formally, it used to be a ZnO bed.
Nowadays a sacrificial LTS catalyst volume is provided on top
of the LTS bed.
Carbon Dioxide Removal - After leaving the shift
conversion step, the gas may contain 18% C02 or more
depending on the feedstock composition. It is then
cooled, if necessary, to a temperature range that depends
on the requirements of the absorbent used in the CO2
removal step. Absorption in water was commonly used
in pre-1940 plants, Its disadvantages were high energy
—consumption-and-[oss~of H2 and N2, which are
appreciably soluble in water at the high pressure used.
Recovering CO2 that had adequate purity for urea production
was difficult, Between 1940 and I960, a 20% solution
of monoethanolamine (MEA) was favored. After I960,
most new plants used potassium carbonate solution with
various additives to promote absorption and inhibit
corrosion. The main advantage of potassium carbonate
solution is lower heat requirements for stripping the C02
from the solvent. However, there are several other
solvents in use, mainly organic liquids, some of which have
a proprietary composition.
The potassium carbonate system operates mainly
isothermal-C02 absorption at high pressure and CO2
release at low pressure. In the absorption step the
pressure is typically about 3.0 MPa (reformer pressure
minus pressure losses), and the temperature may be 100°C.
The C02 is absorbed chemically by the conversion of
potassium carbonate to bicarbonate. When the solution
pressure is reduced to about atmospheric pressure, part
of the C02 and water vapor escape, CO2 release is
assisted by steam stripping. The steam is raised in the
regenerator reboiler heated by the gas from the LTS
shift converter; thus, some or most of the heat required
by the C02 removal process is derived from the heat in
the incoming gas. The regenerated solution is returned
to the absorber.
168
In contrast MEA absorption-regeneration operates „
on a temperature differential with absorption at a
relatively low temperature, 27°-60°C, and regeneration at
100°-140°C. Thus, it is necessary to cool the incoming
gas to the absorber and to heat the MEA solution in the
regenerator with steam. The MEA process has been
improved by the addition of promoters and corrosion
inhibitors, thereby lowering heat requirements.
Much attention has been given in recent years to
methods for removal of acid gases (mainly CO2 and H2S),
not only from ammonia synthesis gas but also from
natural gas, synthesis gas for products other than ammonia,
and fuel gas produced by coal gasification. Numerous
processes have been developed, and the choice of
process for an ammonia plant may depend on a balance
between energy cost, capital costs, and other factors.
Since partial oxidation of heavy oil or coal yields gases
containing H2S and CO2, the acid gas removal process
for this use must be capable of removing and separating
these impurities. Some partial oxidation processes
produce gas containing small percentages of hydrogen
cyanide, which must be removed and converted to nontoxic
compounds.
A complete discussion of CO2 removal processes is
beyond the possibility of this manual; however, Table
6,12 briefly summarizes the characteristics of the main
processes. The energy consumption is related to the
existing installations, This is.an-update of a summary--
provided by Quartulli [16].
Methanation - The gas leaving the CO2 absorption
step still contains about 0.3% CO and 0.1% or less C02.
These oxides must be removed prior to the ammonia
synthesis step because they would decrease the activity
of the ammonia synthesis catalyst and cause deposition
of ammonium carbamate in the synthesis loop. The
methanation reactions are [4]:
CO+3H2 -* CH4+H2Q, AH25C = -206.1kJ/moI
C02+4H2-> CH4+2H20, AH25C = -164.9 kJ/mol
These reactions are the reverse of the reformer
reactions, and a similar nickel-based catalyst is used. It will
be noted that each molecule of CO and C02 consumes
three or four molecules of H2, respectively, Therefore,
it is necessary to efficiently remove CO and CO2 to the
minimum practical level
The methanation step is usually carried out with a gas
inlet temperature of 300°-350°C; therefore, the gas must
be preheated to that temperature. Since the reactions
are exothermic, the temperature may rise to 320°-400°C
at the gas outlet, depending on the CO + C02 content
of the gas. A heat exchanger is commonly used to
preheat the incoming gas and cool the exit gas.
Compression - The synthesis gas leaving the
methanation step typically contains about 74% H2, 24% N2,
0.8% CH4, and 0.3% Ar, dry basis. The gas must be
compressed to the pressure required by the synthesis
step. Before centrifugal compressors came into general
use, reciprocating compressors were used. These
reciprocating compressors often involved as many as five
stages of compression with the various gas purification
steps at intermediate pressures. Synthesis pressures
varied widely from 10 to 80 MPa depending on the
process, Reciprocating compressors are still used for small
plants (less than 500 tpd), but centrifugal compressors—
are now used in most new plants that have capacities of
600-1,800 tpd. Synthesis pressures in these new plants
usually are in the range of 15-25 MPa although some of
the larger plants may operate at 30-35 MPa.
Centrifugal compressors are driven by steam turbines using high-
pressure steam generated mainly from hot process gas
leaving the secondary reformer. The steam is exhausted
at a lower pressure and used in the reforming process
and other process steps.
Because reciprocating compressors are driven by
electric motors, they are more efficient than centrifugal
compressors. Typical efficiencies are reported to be 87%
for reciprocating compressors as compared with 70%
for the centrifugal type. However, reciprocating
compressors are more expensive, especially for large plants.
Their maintenance costs are also higher.
Centrifugal compressors are usually built with two or
three casings and often with interstage cooling.
Compressor design is highly specialized, and the details of
design, arrangement, and operation are complex.
Cooling and compressing the gas condenses nearly all of the
water vapor remaining in it. The compressed gas enters
the synthesis loop at various points depending on the
process design.
Drying of Synthesis Gas - No water is allowed to
enter the synthesis converter because of its adverse
effect on the catalyst. The older plants used to remove the
residual water by mixing the makeup synthesis gas with
the converted gas ahead of the ammonia condensation
and separation. However, it required more compression
power since converter effluent undergoes recycle
compression before product condensation. It also diluted the
ammonia concentration of the converted gas and
resulted in a lesser amount of ammonia condensed and
higher recycle flow rates. Most modern plants use
molecular sieve dryers to remove water in the synthesis gas
to less than 1 ppmv. The sieves are usually located at
the interstage of the synthesis gas compressor [4[. The
dried makeup gas can then be combined with the
recycle and sent directly to the ammonia converter.
Excess Nitrogen Rejection - Some processes use
excess air in the secondary reformer to reduce the
169
Table 6.12. Processes for Removal of C02
System
Solvent
Corrosion
Inhibitor
Acid Gas Content
in Treated Gas
Heat Required
Chemical Type Systems
Amine-Based
MEA 15%-20% monoethanol
amine
Inhibited MEA 25%-35% MEA plus
UCAR amine guard
TEA/MEA Triethanol amine and
monoethanol amine
AMDEA 40%-50% MDEA plus
additive
Potassium-Carbonate Based
Benfield 25%-30% K2C03
plus additives
Catacarb
Carsol
25-30% K2CO3 plus
additives
r^COa plus additives
Flexsorb HP K2C03 plus sterlcally
hindered amine
Lurgi
Vetrocoke
Vetrocoke
25%-30% K2CO3
plus additives
K2CO3 plus As203
K2C03 plus glycine
and secondary amine
None Less than 50 ppmv High
Yes
Less than 50 ppmv Medium
None Less than 50 ppmv Low
None 100-1,000 ppmv Low
Yes
Yes
Yes
Yes
500-1,000 ppmv Low
500-1,000 ppmv Low
500-1,000 ppmv Low
500-1,000 ppmv Low
Yes
500-1,000 ppmv Low
Arsenic 500-1,000 ppmv Low
inhibits
Yes
250-1,000 ppmv Low
General Comments
High utility consumption.
Requires extensive use of
alloy materials to combat
corrosion.
Inhibitor allows higher
CO2 loading, reducing
solution circulation and
utilities consumption [151.
Used in several NH3
installations. Separate
absorption and stripping
system is required for
each solvent.
Two-stage configuration
normally used in
ammonia plants [53,541.
Used extensively for
ammonia. Low operating
costs. Used both as single-
stage and two-stage
systems [55,56),
Has been used in
ammonia plants up to
1,540 tpd capacity
[16),
Used as a single-stage or
two-stage system. Used in
NH3 plants up to 1,360
tpd capacity.
Commercialized recently
in a 1,640-tpd and a
472-tpd ammonia plant
previously using
conventional K2CO3
processes [57).
Used in several
installations in Germany
and other areas [16].
Use of arsenic presents
disposal and pollution
problems. Considerable
experience.
Low-energy flowsheet
uses two-pressure-level
regeneration, reducing
regeneration heat by 50%
compared to traditional
process [58].
(Continued)
170
Table 6.12. Processes for Removal of C02 (Continued)
System
Solvent
Corrosion Acid Gas Content
Inhibitor in Treated Gas
Heat Required General Comments
Sulfinol Sulfolane, di-
isopropanol-amine
solution
Physical Absorption Systems
Purisol (NMP) N-methyl-2-pyrrolidone
None Less than 100 ppmv
None Less than 50 ppmv
Rectisol
Methanol
None Less than 10 ppmv
Fluor solvent Propylene carbonate
None Dependent on
pressure
Selexol
Propylene glycol
dimethyl ether
None Dependent on
pressure
Low Process can be used for
CO2 and H2S removal
applications in synthesis
gas and natural gas
services. Chemicals cost
relatively high.
Low Used in high-pressure
processes such as partial
oxidation-based plants,
Excellent acid gas
cleanup. Solvent is non-
corrosive.
Low System circulates
refrigerated methanol.
Several columns required.
Can be used for CO2,
H2S, and COS removal in
partial oxidation and coal
gasification processes.
High investment.
Low Has high degree of
solubility for C02. Acid
— gas desorbed by release of
pressure without
application of heat.
Requires intermediate
flash operation. Process
works to best advantage
at high pressure [59]-
Low Suitable for high pressure
absorption services.Can
operate at low pressure
but increased residual gas
content. Can also be
employed for natural gas
treatment. Part of C02 is
lost during flash [60).
primary reformer duty and make its operating
conditions less severe. The excess nitrogen in the synthesis
gas must be removed before it is sent for ammonia
synthesis. The Braun Purifier process is a well-known
process using the concept of excess air in the secondary
reformer. In this process excess nitrogen is removed
cryogenically as shown in Figure 6.4.
The dry synthesis gas is cooled and expanded in a
turbine to liquefy a portion of the gas. After further
cooling, the vapor from the partially liquefied stream is
scrubbed in the purifier column to remove all but about
0.2% argon and almost all the methane [4J. The vapor
from the top of the column contains the desired H2=N2
ratio. The excess nitrogen stream; containing methane
and other impurities such as argon and a small amount
of carbon monoxide from the purifier column, is used
as a regeneration gas for molecular sieve beds and
eventually as fuel after recovering refrigeration in the heat
exchangers. There are other processes that use Pressure
171
Fuel
Syngas with
cz>
Synthesis gas to compression -
<=>
excess Nitrogen
K-l
E-2
E-4
C-3
V
Legendi
K-l Expansion turbine
E-2 Heat exchanger
C-3 Purifier column
E-4 Heat exchanger
Figure 6.4. Braun Purifier.
Swing Adsorption (PSA) for excess nitrogen rejection.
These processes are discussed later in this chapter.
6.4.2 Ammonia Synthesis"
6.4.2.1 Thermodynamics and Kinetics [4]
The synthesis of ammonia is composed of the
following reversible reaction of hydrogen and nitrogen.
N2+3H,
2NH,
This reaction is exothermic; the net heat of reaction is
about 11,000 cal/g mole at 18° Celsius (647 kcalAg of
NH3), assuming NH3 is in the gaseous state. The net
heat released by the reaction increases with rising
temperature and may be 15% - 20% higher at the usual
operating conditions of 400° - 500°C. The following is
a mathematical equation of this:
AH = [2.2523 x 10"2 + 34.7236/T + 1.89905 x 10⁷/
T3]p -22.3792T -1.057 x lO-^T2 + 7.08048 x 10 6T3 -
38327.0 [17]
The amount of ammonia present in an equilibrium
mixture at different temperatures and pressures was
experimentally developed for pressures ranging from 1,000
to 101,000 kPa (10-1,000 arm) [18,19,20]. This led to
the calculation of the reaction equilibrium constant [211,
which is dependent on temperature, pressure, and the
ratio of hydrogen and nitrogen present. Table 6,13 lists
Table 6.13. Equilibrium Content of Ammonia
for a Gas Containing a Hydrogen:
Nitrogen Ratio of 3:1 [22]
Equilibrium in % of Ammonia
Pressure, kPa
Temperature in °K 10,133 20,265 30,398 40,350
65.72
45.26
28.14
16.72
Using 0% Inerts
633 35.10 49.62 58.91
713 17.92 29.46 38.18
793 8.32 16.13 22.48
873 4.53 8,80 12,84
Using 10% Inerts
633 28.63 40.53 48.14 5370
713 14.60 24.06 31.21 37.02
793 7.18 13.16 18.38 23.04
873 3.69 7.17 10.49 13.68
ammonia equilibrium concentrations for a feed using a
3:1 hydrogen to nitrogen ratio and either 0% or 10%
inerts [22].
A catalytic surface, often based on metallic iron, is
always used to form ammonia from an industrial-scale
reaction of hydrogen and nitrogen. The metallic iron
catalyst is primarily made from magnetite, Fe3C>4, that
has been promoted using alkali in the form of potash
and metals, such as aluminum, calcium, or magnesium.
Caution must be taken because the catalyst could
undergo thermal degradation. It could also be permanently
poisoned by sulfur, arsenic, phosphorus, chlorine, and
heavy hydrocarbons; oxygen-bearing compounds will
cause temporary poisoning, which may be reversed if
the exposure was only for a short while [4].
Synthesis pressure, synthesis temperature, space
velocity, inlet gas composition, and catalyst particle size
all affect ammonia synthesis, LeChatelier's principle
helps explain how synthesis pressure affects the
synthesis of ammonia. As the ammonia reaction takes place,
there is a decrease in volume. Thus, raising the pressure
increases the equilibrium percentage of ammonia and
accelerates the reaction rate. The ammonia synthesis
reaction is exothermic, therefore, higher temperatures
increase reaction rates and thermal degradation of the
catalyst. But the equilibrium amount of ammonia
decreases with an increase in temperature. Space
velocity, the ratio of the volumetric rate of gas at standard
conditions to the volume of the catalyst, decreases the
172
percentage of ammonia in the gas as it increases. Yet, if _
the space velocity is increased while the volume of the
catalyst remains constant, more ammonia may be
produced [4[. This can be seen in Figure 6.5 [22],
Commercial operations usually have space velocities between
8,000 and 60,000 Ir1.
The inerts level as seen in Table 6.13, ammonia
concentration, and hydrogen-to-nitrogen ratio all determine
the effect of inlet gas composition on ammonia
synthesis. The reaction rate changes with ammonia in the
incoming gas. Though the optimum hydrogen-to-nitrogen
ratio may be a little less than 3:1 [221, most commercial
facilities operate at a hydrogen-to-nitrogen ratio of 3:1.
To increase catalyst activity, the catalyst particle must
be made smaller, thus the ratio of the catalyst surface
area to its volume is increased. Small catalyst particles
also have a lower resistance to mass transfer within the
catalyst pore structure. Radial and horizontal ammonia
converter designs use the smaller catalysts, ranging from
1.5 to 3.0 mm, for higher activity. Axial flow converters,
on the other hand, primarily use 6-10 mm catalysts [4].
Ammonia in exit gas as a function
of space velocity [22]
■ , ■- - ■ ■ -—-
""*-..
""-
32,120kPa~
15,300 kPa
"""--■...
—"-—1
0 20 40 60 80 100 120
Space velocity x 10^, h'1
Figure 6.5. Ammonia Content in Exit Gas.
6.4.2.2 Technology of Ammonia Synthesis
As mentioned previously, ammonia synthesis is
commonly carried out at 400o-450°C, using an iron catalyst
promoted with potassium and alumina. The gas
entering the converter consists mainly of gas circulated in the
loop with a relatively small amount of fresh synthesis
gas called "makeup" gas. The gas entering the converter
contains N2 and H2 in a 1:3 ratio plus 10%-14% "inerts"
and about 2% NH3. The "inerts" consist mainly of
methane, argon, and sometimes helium if the natural gas
feedstock contains the element. (Methane is not, strictly
speaking, an inert gas, but the term is used in ammonia
synthesis context since it does not participate in the
reaction.) Since the inert gas concentration tends to
increase as the N2 and H2 are removed, it is necessary to
vent a side stream of "purge gas" to keep the inert gas
concentration at a tolerable level.
Ammonia synthesis converters differ in the type of
flow: axial, radial, or crossflow, The reactor is designed
for good gas distribution throughout the catalytic bed at
minimum pressure drop. The converters also differ in
the way temperature control of the reactants is achieved
(quench or indirect cooling) and how reaction heat
recovery is done. The quench converter was popular for
some time because of its simple design. In the quench
converter, only a part of the recycle enters the first
catalyst bed at about 400°C and leaves the bed at about
500°C. The gas temperature is quenched by mixing with
cooler (150°-200°Q recycle gas before entering the next
catalyst bed.
In an indirect-cooled converter, heat exchangers are
used to cool the gas out of each bed. The heat is used to
preheat the inlet gas to the converter or to raise steam.
The catalyst efficiency improves by increasing the
catalyst surface area per unit volume with a small particle
size of 1.5-3 mm instead of 6-10 mm. The small par-
"ticles increase tfie~reacfi6rY rate but increase the
pressure drop unless the gas velocity through the catalyst
bed is reduced. Radial flow converters provide larger
gas flow area compared with an axial flow converter. All
modern, low-energy designs use radial or crossflow
designs with indirect temperature control [4].
The gas leaving the converter will contain 12%-18%
NH3, depending mainly on the pressure; conversion per
pass increases with pressure. The gas is cooled first by
heat exchange with the incoming gas, then by air or
water, and finally by refrigeration to condense most of
the ammonia as a liquid. The degree of cooling required
depends on the pressure. At high pressures much of the
ammonia can be condensed at temperatures obtainable
by water cooling. At lower pressures (15-20 MPa)
increased reliance must be placed on refrigeration. If the
ammonia is to be delivered to atmospheric pressure
storage, it must be further cooled to -33°C (Chapter 7). The
gas remaining after ammonia condensation is recycled
to the converter by means of a compressor.
Ammonia Converter Design - Today all low-
energy designs use indirectly cooled converters. The
design and layout offered by various ammonia plant
designers differ considerably. Kellogg's Horizontal
Converter and Topsoe's Series 200 Converter use two
catalyst layers with an intermediate heat exchanger for
173
the feed, all in one vessel for a plant size of at least
1,800 tpd.
The Topsoe Series 200 Converter is a radial flow
converter as shown in Figure 6,6, It has two catalyst
beds having annular cross sections. The gas flows
radially inwards. A single heat exchanger is installed at the
outlet of the first bed. The converter inlet gas enters at
the bottom and flows through an annular space between
the shell and catalyst bed. The annular flow of gas keeps
the converter shell at a low temperature and protects it
from hydrogen attack [15[. The gas is heated in the
interchanger before it enters the first bed. The effluent
from the first bed is cooled in the interchanger and flows
through the second bed. A large number of old
converters have a dead zone of catalyst at the top of each bed.
The Ammonia Casale axial-radial converter design is
Pressure
shell
2nd catalyst bed §•
I
I Main gas inlet
Inter-bed heat
exchanger
1
\v> Lower heat
I.
exchanger
Gas outlet
Cold bypass
Figure 6-6.Topsoe Series 200 Converter.
shown in Figure 6.7. The annular top bed is left open at
the top to permit a part of the gas to flow axially through
the catalyst. The remainder of the gas flows radially
through the catalyst bed [151. Its design is flexible and
can be fitted well into existing converter shells. A large
number of old converters have been retrofitted to Casale
axial-radial flow design; thus, synthesis loop efficiency
has been improved.
Uhde uses three catalyst beds. The first two beds and
an interchanger are in one vessel. A waste heat boiler
generating HP steam cools the gas before it enters _a_
second vessel containing the third catalyst bed. The
effluent of the third bed goes through a second HP steam
boiler.
Figure 6.7. Ammonia Casale Converter.
Kellogg uses a horizontal cylindrical converter in which
catalyst beds are arranged side by side, as shown in
Figure 6.8.
The gas flows vertically through rectangular beds with
minimum depth. The catalyst beds and an interchanger
are installed on a cartridge that can be inserted into the
vessel by a trolley system, rolling on tracks [15[.
The Brown & Root Eraun Adiabatic Converter is a
variation of the concept in which the effluent from the
first bed is cooled in a heat exchanger directly coupled
to the converter. There are two adiabatic converters in
174
Manhole
Thermowell
ffffi
Bed2B
Thermowell
Manhole
Quench
Figure 6.8. Kellogg Horizontal Converter.
series; each contains a single catalyst bed held in a simple
cylindrical vessel. The reactor wall comes in direct
contact with 400°C gas [15].
Purge Gas Recovery - To control the
concentration of inerts in the recycle gas, it is necessary to draw a
purge stream from the synthesis loop. In the older plant,
this gas was used as fuel in the reformer. The purge gas
has a typical composition"of~61%iiydrdgen, 20%"riitro~
gen, 13% methane, 4% argon, and 2% ammonia [231-
Recovering and recycling hydrogen from the purge gas
can reduce the quantity of hydrogen to be produced by
steam reforming. Cryogenics, membrane, and PSA
processes have all been commercially applied in ammonia
plants for the recovery of hydrogen and nitrogen from
the purge gas.
The cryogenic process for purge gas recovery
operates at a high pressure, typically 7 MPa. Currently,
the process is limited to operation below 9 MPa due to
the pressure limitation on the brazed aluminum fin heat
exchangers [23]. A hydrogen recovery of 90%-98% can
be achieved; in addition, about 30% of the nitrogen can
be recovered. The hydrogen-rich stream is returned to
the second stage of the ammonia synthesis gas
compressor. The cryogenic process requires pretreatment
of the purge gas to remove ammonia and water.
Ammonia in the purge stream is removed by water wash,
and the moisture is removed in a molecular sieve dryer.
Membrane separators are widely accepted for
recovering hydrogen from the ammonia plant purge gas
[24], In a two-stage membrane, the first stage accepts
feed at 13 MPa and delivers the hydrogen-rich
permeate stream at about 7 MPa for recycle to the second
stage of the synthesis gas compressor. The non-permeate
from the first-stage membrane is fed to the second-stage
membrane and delivers permeate at 2.5 MPa to the
suction of the synthesis gas compressor. About 65% of
the hydrogen is recovered in the first stage, and 35% is
recovered in the second stage. Typically, total hydrogen
recovery of 85%-90% is achieved at a hydrogen purity
of 87% to 90% [23]. The membrane units are modular
in nature.; and the number of modules is directly
proportional t& the throughput of the unit.
Pressure Suing Adsorption (PSA) has been used
to produce ultra-high-purity hydrogen from ammonia
plant purge gas. There are some PSA applications for
the production of an H2 and N2 mixture from the purge
gas. The PSA experience is limited to less than 5 MPa
feed pressure. The recovered hydrogen stream is
available at a pressure slightly lower than the feed pressure.
The argon-rich stream is available at a low pressure of
0.3 to 4 kPa. Hydrogen recovery of 70%-85% in PSA
is somewhat lower than the membrane and cryogenic
processes. The PSA requires no pretreatment of the
purge stream; ammonia and water in the purge stream
are removed by PSA in addition to argon and methane.
6.4.3 Advances in Ammonia Technology
6.4.3.1 Advances in Gas Preparation Technology
Steam reforming has remained the prevalent (or
prevailing) process for ammonia production. However, the
primary reformer, the heart of the steam-reforming
process, is the single most expensive piece of equipment in
an ammonia plant, is somewhat complicated, and
requires close attention to operate. The regular primary
reformer operates at less than 50% efficiency; the
remainder is recovered as steam produced from waste heat.
175
The excess steam is normally exported for off-site
utilities or for an adjoining urea plant.
Some new concepts have been developed to improve
the reforming section heat efficiency.
Introduction of the Pre-Reforming Process
Adiabatic pre-reforming may be used for steam
reforming of hydrocarbon feedstock ranging from natural
gas to heavy naphtha with a final boiling point above
200°C and an aromatics content up to 30%. The
process is carried out in a fixed-bed adiabatic reactor loaded
with a highly active reforming catalyst located upstream
from the primary reformer (Figure 6.9).
In the pre-reformer, hydrocarbons are converted into
a mixture of carbon oxides, hydrogen, and methane.
This endothermic reaction is followed by exothermic
methanation and shift reaction, which adjusts the
equilibrium between the carbon oxides, methane, hydrogen
and water. This concept has been proposed by Topsoe
[25].
Substitution of the Primary Reformer by Heat
Exchanger Reformer
The reforming exchanger offers an alternative to the
conventional fired primary reformer. The reforming is
done in a tubular exchanger with catalyst-filled tubes.
The reforming exchanger concept totally eliminates the
furnace and uses a hot secondary reformer outlet as its
heat source. Surplus air over the stoichiometric demand
or oxygen-enriched air in the secondary reformer is
required to balance the heat demand for the primary
reforming reaction. Chiyoda proposed this concept in
1984 [26,27]; however, 1C1 was the first one.to
commercialize a reformer exchanger called the Gas Heat
Reformer (GHR) as part of their Leading Concept
Ammonia (LCA) process. The GHR is discussed further
under the LCA process section.
Uhde has developed its Combined Autothermic
Reformer (CAR) and has successfully operated a
demonstration unit, which produces 13,000 m3/h of process
gas at 1.7 MPa [28]. CAR is a combination of
reforming exchanger and air partial oxidation in a single
vessel. The mixture of natural gas and steam is passed
through the tubes filled with catalyst. These tubes are
heated externally by hot reformed gas from the partial
oxidation section. No commercial CAR unit has been
installed as of late 1994.
Similarly, Topsoe has developed a reforming
exchanger, which is in commercial operation for
hydrogen production. The heat source is external to the process;
as of 1994, Topsoe has not implemented the reformer
exchanger unit in commercial ammonia production.
fc-i
Process air
Process steam
Natural gas feed
■=> >
R-2
R-3
^
Recycle gas
To stack
<=^
B*
Combustion a1r
M
-*£!
x
x
z:
~K.
A M
Fuel gas
u=$
R-4
R-5
\
To waste heat
recovery and shift
cz>
Legend:
K-l A1r compressor
R-2 Hydrodesulfurizatlon
R-3 Prereformer
R-4 Primary reformer
R-5 Secondary reformer
Source: 19].
Figure 6.9. The Concept of the Pre-Reforming Unh.
176
M. W. Kellogg developed and commercialized their
first Kellogg Reforming Exchanger System (KRES) in
1994. Figure 6.10 illustrates Kellogg's concept [29].
Desulfurized natural gas feedstock is mixed with
process steam, preheated, and divided into two streams that
pass in parallel to the reforming exchanger and the adia-
batic reformer (or secondary reformer). Air or oxygen-
enriched air is added to the part entering the adiabatic
reformer The effluent from the adiabatic reformer passes
directly to the shell side of the reforming exchanger.
The mixed feed to the reforming exchanger flows
downward through the catalyst-filled tubes, and reformed gas
leaving the tubes is mixed with adiabatic reformer
effluent. The combined gas then flows upward on the shell
side of the reforming exchanger and provides the
necessary heat to the catalyst tubes. The reformed gas
leaving the shell of the reforming exchanger is sent for further
heat recovery and other traditional processing steps such
as shift converter, CO2 removal, etc.
The M. W. Kellogg Co. commissioned its first
commercial reforming exchanger in 1994 at Ocelot
Ammonia Company plant in British Columbia, Canada, The
reforming exchanger supplements the existing feed from
the methanol plant purge gas and expands the existing
plant capacity from 544 tpd by 40%. Kellogg claims
lower capital cost due to reduced equipment and con-
AtmosphEMc air
Legend:
K-l A1r compressor
K-2 Natural gas compressor
E-3 Feed preheater
E-4 Heat recovery
E-S Reforming exchanger
R-6 Autothermal reformer
Source: [29].
Figure 6.10. Kellogg Reforming Exchanger
System (KRES).
struction costs and a smaller plot; potential of reduced
energy consumption; and reduced emission of NOx and
CO2 by as much as 75% [29[. The capital cost savings
or energy savings estimates are not yet available.
ICI Leading Concept Ammonia (LCA) Process
IC1 brought on stream in 1988 two identical 450-tpd
ammonia plants based on the LCA process at lCTs own
plant at Severnside, U.K. The LCA concept is radically
different from the traditional, highly integrated steam-
reforming process. The need to raise high-pressure
steam, a common feature in a conventional ammonia
plant, is eliminated [30]. The LCA concept has a "core"
unit consisting of key process operations and a separate
utility area containing the power and steam system,
refrigeration, CO2 recovery, and other utilities. Figures
6.11 and 6,12 show a flow diagram for a core unit and
how the core unit connects with the common utility
section,
The core plant uses a gas heat reactor (GHR) in which
the primary reformer is heated directly by the process
gas exiting the secondary reformer. The CO shift is
performed in a single-stage isothermal shift reactor at
250°C, using a special copper-based catalyst. With this
shift catalyst and the low temperature level, there is no
danger of a Fischer-Tropsch reaction, allowing the lower
steam:carbon ratio of only 2.5 at the reformer [31]. A
PSA system removes CQ2 and excess nitrogen in the
synthesis gas.
Natural gas is desulfurized and passed through a feed
gas saturator where it is contacted with circulating hot
process condensate. The saturator provides in excess of
90% of the requirement of steam for reforming, It is
mixed with a further quantity of steam to give a
steamrcarbon ratio of about 2.5, and it is preheated by
the reformed gas stream. The reactants enter the GHR,
which operates with an exit temperature of 700°-750°C
and at a pressure of 3.0-4.5 MPa. The gas mixture is
then fed to a secondary reformer for further reforming
with an excess of process air. The reformed gas is cooled
by providing heat for the GHR and preheating the
reactants. The cooled, reformed gas is shifted in an
isothermal water-cooled shift converter at 250°C. After shift
conversion, the gas is cooled by direct contact with
circulating process condensate and then fed to a PSA unit
to remove excess nitrogen, CO2, and part of the inerts.
Part of the CO2 is recovered from the PSA tail gas using
an aqueous tertiary amine. The gas leaving the PSA
unit is methanated, cooled, and dried [30].
The ammonia synthesis reactor operates at a
pressure of 8.0 MPa using lCl's cobalt-promoted catalyst.
The gas enters at 225°C and leaves at 380°C [31]. The
low-pressure synthesis loop ensures that high machine
efficiency is sustained for the two-stage centrifugal
compressor, despite the small size of the plant. Electric drives
177
Legend:
K-l Ai" r compressor
E-2 Preheater
E-3 GHR
R-4 Secondary reformer
E-5 Heat recovery
E-6 Heater
R-7 Hydrodesulfurizer
C-8 5aturator
R-9 Isothermal shift
C-10 Desaturator
R-11 Hethanator
E-12 Heat recovery
E-13 Heat recovery
X-14 Syngas dryer
K-15 Make-gas compressor
K-l6 Circulator
E-17 Heat recovery
E-18 Utility boiler
R-19 Converter
E-ZO Cooler
S-21 2-stage ammonia separator
Figure 6.11. LCA Process (Core Unit).
CORE UNIT (*2)
UTILITIES (common)
DESULFUREATION
SATURATION
SHIFT CONVERSION
DESATURAT10N
PROCESS
AIH HEATEH
PROCESS AIR
COMPRESSOR
Air
Condensate
METHANATION
AND DRYING
COMPRESSION
CIRCULATOR
SYNTHESIS LOOP
Purge gas
Saturated steam
Ammonia vapor ■■
Legend:
1 - IP steam export
2 - Electricity
3-LP steam
4-COa
5 - Makeup water
6 - Liquid ammonia
7-Ammonia vapor
UTILITIES
BOILER
TURBOALTERNATOR
COjRECOVERY
COOLING WATER
SYSTEM
DEMJN. PLANT BFW
REFRIGERATION
Figure 6.12. Arrangement of LCA Core Units
and Utilities Section.
are used for the synthesis gas compressor and air
compressor. Table 6.14 gives typical data for the LCA
process.
There are no data available to compare the cost of
LCA process with other conventional processes. To date
there are only the two above-mentioned plants based
on this technology.
Lmde Ammonia Concept (LAC) - LAC is a
combination of a hydrogen plant, a nitrogen plant, and an
ammonia synthesis loop, The hydrogen plant uses a
primary reformer, shift converters, and a PSA unit to
get ultra-pure hydrogen. The pure hydrogen is mixed
with pure nitrogen from an air separation unit to give
inerts-free ammonia synthesis gas. This concept is
expected to be implemented in a 1,350-tpd ammonia plant
at GSFC, Baroda, India (Figure 6.13),
The following features differentiate this process from
the conventional steam-reforming process:
1. It eliminates secondary reforming. The reforming
section produces hydrogen, which is later mixed with
nitrogen from an air separation plant to make
ammonia synthesis gas.
178
Table 6.14. Representative Data of the LCA
Process [31]
Natural gas (feed + fuel) 6.5
Import power (5.4 MW at
2,640 kcal/kWh) 0,74
Total energy consumption 7.22
Liquid ammonia product
(14 bar, 30°Q 457
C02 (purity > 99%) 617
Gcal/t NH3
Gcal/t NH3
Gcal/t NH3
tpd
tpd
Feed
NH3
Conventional Ammonia Plant
Desulfur-
ization
Ammonia
Synthesis
Purge
Rect
svery
Primary
Reform
Compressor
Comp
Sec'n
Rsform
Methanation
Ai
HT/LT
Shift
Wash
LINDE Ammonia Concept
Feed
Air
Desultur-
ization
Air
Compressor
Primary
Reform
Nitrogen
Unit
Isotherm
Shift
PSA
Ammonia
Ammonia
Synthesis
Compressor
Source: [321.
Figure 6.13.Linde Ammonia Concept.
2, It uses an isothermal shift reactor for CO shift
conversion as shown in Figure 6.13 I32J.
3. It uses a PSA unit to remove C02, CH4, and a small
residual amount of CO from the hydrogen stream,
producing 99.999 mole % pure hydrogen,
The following advantages are claimed by the process
developer for the LAC process:
- The isothermal shift reactor allows conversion to 0.7%
CO (dry basis) in a single step;
- The catalyst bed is kept at a constant temperature of
about 250°C by a spiral wound cooling coil;
- Inside the coil tube, process condensate is evaporated
and the steam raised is used in the primary reformer.
This isothermal reactor technology has been in
commercial use in 10 plants worldwide [32].
The PSA unit is able to supply pure hydrogen even in
case of a disturbance upstream in the reformer. This is~
in sharp contrast to the conventional plant where
disturbances in the CO shift or CO2 removal areas cause a
shutdown due to high temperature in the methanator.
PARC Ammonia Process of Kinetics
Technology India, Ltd. (KTI) - The PARC process combines
air separation (to produce nitrogen) with steam
reforming, HT shift, and PSA to make synthesis gas. In the
proprietary PSA unit, nitrogen purge is used to enhance
hydrogen recovery and introduce the stoichiometric
nitrogen requirement, A Rankin cycle is used to generate
electric power from the heat of the HT shift converter,
This process eliminates the need for secondary
reforming, LT shift, C02 scrubbing, and methanation. If C02
is required for urea manufacture, a CO2 scrubbing unit
is added in front of the PSA, Overall energy efficiency
ranges from 7.0 to 7.6 Gcal/tonne NH3, depending on
plant specifics; The C02 recovery unit adds another 0.2
Gcal/tonne of ammonia 131],
Topsoe Economic Process - Topsoe continuously
improves the energy efficiency of its design by
optimizing all units of the ammonia process rather than using
radically new schemes. The newly started installations
in Indonesia and Bangladesh confirmed energy
consumption during the test run at about 7 Gcal/tonne of
ammonia [33],
Further improvement is expected from a pre-reformer
positioned upstream of the primary reformer to allow
reformer feed to be heated to a higher temperature at a
low steamicarbon ratio without deposition of carbon. In
addition, Topsoe has developed a shift conversion
catalyst based entirely on copper, which does not promote a
Bsher-Tropsch reaction at a low steam:dry gas ratio.
6.4.3.2 Advances in Ammonia Synthesis
New developments are related to two elements of
ammonia synthesis:
- Construction of the reactor.
- Development of a new catalyst.
Regarding the latter, iron catalyst for ammonia
synthesis normally has a process life of 10 years or more.
179
The favorable properties of ruthenium as an ammonia
synthesis catalyst have been known for many years.
Previously its high price prevented its use; however,
ruthenium is now much less expensive, and economics of
operation using ruthenium catalyst must be
reconsidered : The major differences between the catalysts are
much lower volume of the ruthenium catalyst, lower
pressure of operation, higher temperature, lower mole
% of hydrogen and nitrogen, and high partial pressure
of ammonia allowed in the process. The expected
immediate energy savings are about 0.2-0,3 Gcal/tonne
of ammonia. The stability of ruthenium catalyst must be -
proven before it will begin to replace iron catalyst. Tests
have shown that ruthenium is stable as a catalyst: it does
not sinter, and its poisoning susceptibility is similar to
the classic catalyst. However, longevity of the catalyst
depends also on the carrier. Until now two carriers have
been disclosed: special graphite by Kellogg and ceramic
support by Topsoe.
Kellogg Advanced Ammonia Process (KAAP)
[34] - KAAP is based on a precious-metal-based
ammonia synthesis catalyst. This is the first commercially
proven process that does not use the traditional iron
catalyst. The new catalyst was jointly developed by M.
W. Kellogg and British Petroleum (BP). Kellogg and BP
demonstrated in a process demonstration unit that the
new catalyst using ruthenium supported on a
proprietary graphite structure with various co-promoters
provided 10-20 times the activity of an iron-based catalyst-
currently available, while operating at a low synthesis
loop pressure of 7-9 MPa, at high ammonia conversion
(18%-22%), and over a wide range of hydrogen-to-
nitrogen ratios. KAAP technology was commercialized
in 1992 at Ocelot Ammonia Co., Kitimat, Canada. The
basic sequence of process operations is similar to low-
energy ammonia plants based on natural gas steam
reforming. The synthesis loop for the KAAP is shown in
Figure 6.14.
The KAAP ammonia plant design has the following
technical features:
• Single-Case Synthesis Gas Compressor
• Radial Flow, lntercooled Converter Design
• Low-Pressure Synthesis Loop
• High-Activity Ammonia Synthesis Catalyst
The KAAP reactor is a four-bed intercooled radial flow,
hot wall vessel, The first bed uses a charge of
conventional magnetite catalyst to take full advantage of high
ammonia reaction rate at low ammonia concentration.
The other three beds are charged with KAAP catalyst.
A series of intercoolers and external steam generators
are provided for heat integration as shown in Figure
6.15.
SYNTHESIS
GAS w
MAKEUP
7-9.3 MPa
SINGLE-
STAGE
COMPRESSION
.
TO FUEL
i
PURGE-GAS
RECOVERY UNIT
i,
PURGE
,
''
4-BED
INTERCOOLED RADIAL
FLOW AMMONIA
REACTOR
BFW
22%
,,NH3
HEAT
RECOVERY
1
,
FEED/EFFLUENT
EXCHANGER
11
AMMONIA
PRODUCT
CONDENSATION
& SEPARATION
NH3
"
STEAM
- ■ —
Figure 6.14. The Kellogg Advanced Ammonia
Process (KAAP) Synthesis Loop.
BFW-+STEAM
BFW+STEAM
BFW+STEAM
BFW
1 - 1st Interchanger
2-2nd Interchanger
3 - 3rd Interchanger
4 - 4th Interchanger
Figure 6.15. KAAP Reactor.
EXCHANGER
ISO
The KAAP reactor at Ocelot is a full flow converter
installed in such a manner that it operates in series with
the existing magnetite converter. The reactor is a two-
bed radial flow, hot wall design with external insulation.
An interchanger is provided to exchange the heat
between the feed and effluent of the first bed. The feed to
the KAAP reactor contains 15% ammonia. The
ammonia concentration is increased to more than 21% at the
exit of the KAAP reactor. The addition of a KAAP
reactor and a new waste heat boiler to produce MP steam
by KAAP reactor effluent has the potential of
increasing the capacity of the synloop by 40%.
The KAAP technology for a grass root installation
relative to current low-energy technology can provide
the following benefits: the synloop energy consumption
is reduced by 40%; that translates to overall plant
energy reduction by about 1.0 GJ/tonne. The overall plant
capital cost is reduced by about 5%.
Topsoe Ammonia Reactor Development
The Topsoe S-250 converter system also uses two
radial flow converters in series with waste-heat boilers
between the converters and after the last converter. The
principle of operation of the S-250 system is shown in
Figure 6.16.
This system provides an energy saving of 0,11 Gcal/
tonne of ammonia compared to the S-200 loop [35].
Topsoe has developed a new S-300 converter, which is
a three-bed radial flow converter with two internal heat
exchangers. The Topsoe S-300 converter is shown in
Figure 6.17. The S-300 is cheaper than the S-250
configuration, and the energy saving can be up to that of
the S-250 system level.
The temperature versus conversion profiles in all three
Topsoe reactors are given in Figure 6,18, The S-300
converter retains all features of the S-200 radial
converter:
- Low pressure due to the radial flow.
- Use of small catalyst particle size.
- High conversion per pass due to indirect cooling.
- Good operability and easy temperature control.
It is claimed that S-300 compared with S-200 offers
either the same performance with smaller catalyst
volume or higher conversion by full use of the third bed.
The comparison of loop configurations is given in Table
6.15.
tr
R-l
Purge gas
cz^>
Make-up gas
c=>
S-12
E-ll
NH3 < L>
' S-13
Product
^=>
amnionla
Legend'
R-l S-200 or S-300 converter
R-2 S-50 converter
E-3 - E-ll Heat recovery
S-12 Purge gas separator
S-13 Anmonla separator
K-14 Compressor unit
Source: [9].
Figure 6.16. Topsoe Layout of Synthesis Loop Using S-250 System.
181
Figure 6.17. Topsoe S-300
Converter.
Temperature - Conversion Profiles
^ 20
<D
O
E
m 15
X
O 10
"c
ai
o
% 5
O
..,.■■"''" S-300 \
?nH R*H /s-200
\ Equilibrium
\^
^ \
1st Bed .x"''
■-——-
^
350 400 450 500
Catalyst Temperature, °C
550
Figure 6.18. Temperature-Conversion Profiles
in Topsoe Converters.
6.5 Partial Oxidation Process of
Heavy Hydrocarbons
Hydrocarbons heavier than naphtha can be used as
-feedstoeks-for-ammonia-produclion by partial oxidation
processes. Natural gas and naphtha also can be used,
but since the plant cost for the partial oxidation process
is considerably higher than that for steam reforming,
the lighter feedstocks are seldom used. However, the
partial oxidation process does offer the advantage of
wider choice of feedstock with greater tolerance for
impurities.
Crude petroleum can be used as feedstock, but the
most common feedstock is heavy residual oil from
petroleum refining processes, which has had the more
Table 6.15, Comparison of Topsoe Loop Configurations
Parameters/Converter Type
Operating pressure
NH3 concentration IN/OUT
Relative feed flow
Relative catalyst volume
Heat recovered
Saving of compression power
Saving of heat
Net energy saving
Units
S-200
S-300
S-250
MPa
vol. %
_
-
%
kWh/t
MMcal/t
GJ/t
14
4.2/17.1
1.0
1.0
62
0
0
0
14
4.2/20.7
0.75
1.8
50
-29.1
-31
-0.46
14
4.2/20.7
0.75
1.8
72
-29.1
-31L
-0.46
182
valuable lighter fractions removed. Such oil may
contain high amounts of sulfur, depending on the sulfur
content of the crude oil and the refining process, Using
such oil for fuel or power generation would involve
expensive equipment for pollution abatement in most
countries; therefore, it is often available at a relatively low
cost.
The feedstock requirement typically is about 0.76
tonnes of heavy oil per tonne of ammonia [36]. In
addition, about 0.14 tonnes of oil or the equivalent in other
fuel is required for generation of steam and electricity,
or 530 kWh of electricity may be imported, In contrast
with the steam-reforming process where most of the
fuel is used in the reforming furnace, which requires a
premium grade of fuel, the auxiliary fuel for a partial
oxidation process is used in a separate unit, which can
use coal, for example.
The principal partial oxidation processes are known
as the Texaco, Shell, and Koppers-Totzek processes.
The Koppers-Totzek process is also used for coal and
will be described under that heading. The Shell and
Texaco processes are generally similar. The Shell gas-
ifier operates at 3.5-6 MPa, and the Texaco gasifier
operates up to 9 MPa. Figure 6.19 is a flow diagram of
the partial oxidation process.
The gasification pressure in partial oxidation processes
has been gradually increased to a range of 60-90 atm,
which helps save energy for compression. TexacxTs
commercial gasifiers for ammonia plants operate at 8.5-9
MPa [371.
Two main problems limit the operating pressure of
the gasification process. Conventional HT shift catalyst"
(Fe/Cr oxide) loses its mechanical strength at
approximately 6.0 MPa because under these conditions it
cannot withstand the high steam partial pressure. The new
catalyst, originally developed by BASF, uses Co/Mo
sulfides. The new catalyst requires sulfur in the feed gas,
and it can be installed immediately downstream of the
gasifier [38].
The other problem for the high-pressure process was
the compression of the oxygen required for the
GASIFICATION SHIFT ACID GAS REMOVAL METHANATIDN
■> HP Stean . .-SuJJlurjft
rCLAUS J
AMMONIA SEPARATION
-5l
_ MDL.
SIEVE
I-)-*
.C-6
X
Carbon diox Ide
r^>
C-5
X
->£T
J
Q-
^
to urea
C-7
Waste nItrogen
X-9
Waste nI trogen &
carbon dioxide
H-14
1
c=> Wastes
K-12
Air !=>-
iTFuel
To onnonI a
c=>
p I ant
\J
Vent
1=>
Legend'
R-l Gasifier
E-2 Stean tool ler
S-3 Separator
R-4 Carbon oxide shift unit
C-5j C-6, C-7 Acid gas removal coLunns
R-8 Methanator
X-9 Nitrogen separation unit
S-10 Soot removal
F-ll Solid waste separation
K-12 Air conpressor
K-13 Turbine
H-14 Gas heater
Figure 6.19. Flow Diagram of Partial Oxidation Process.
183
gasification. Safety is a great concern when
compressing oxygen because oxygen readability increases with
pressure. The maximum pressure attained by turbo-
compressors is about 7.5 MPa. Reciprocating
compressors are not acceptable for modern plants [38]. Linde
A.G. developed a liquid oxygen pump to pump the
liquid up to 10 MPa. The high-pressure liquid oxygen is
vaporized in the cold box to get high-pressure oxygen
gas,
Heavy fuel oil is preheated and pumped into the gas-
ifier along with high-pressure steam and preheated
oxygen from an air separation unit. The reaction occurs at
a high temperature (1200°-1500°Q, and no catalyst is
required. The chemical reactions involved are complex
but can be described by reactions shown in Table 6.16.
Table 6.16. Principal Gasification Reactions [37]
Partial combustion CmHnSr+,5m02 -*• mCO+(.5n-r)H2 +rH2S
Side Reactions
Hydrocracking CmHnS,+{r-.5n+2)H2 - CHi+{m-l]C+rH25
Steam gasification HaO+C -» H2+CO
Reforming H2O+CH4 - 3H2+CO
Water gas shift H20+CO — H2+C02
A typical composition of the resulting gas is_46%_H2,_
47% CO, and 4% CO2 dry basis with small percentages
of H2S and N2. A considerable amount of soot (carbon)
remains suspended in the gas.
The hot gas is quenched with process water to the
inlet temperature of the shift conversion step (about
300°C), and most of the soot is removed in the water,
which goes to a soot recovery unit. The soot is
eventually recycled in the oil feedstock or used as fuel for steam
generation, and the water from which the soot was
recovered is recycled to the quench step. The quenching
step also vaporizes some of the water into the gas stream,
which supplies water vapor needed for the shift reaction.
The shift reaction is carried out by commercially
available sulfur-tolerant catalyst; thus, the CO content of the
gas is reduced to about 1%. The next step is removal of
CO2 and H2S by a scrubbing process such as Rectisol or
Selexol. The H2S is recovered separately and sent to a
Claus process unit for conversion to elemental sulfur.
The CO2 is of adequate purity for urea production.
The final purification step is a liquid nitrogen wash
process, which uses liquid nitrogen from the air
separation plant. This process removes CO and also lowers
the CH4 and argon content to a very low level. These
impurities leave the process in a gas stream that is
useful as fuel in steam generation.
Prior to the nitrogen wash, residual CO2 and water
are removed by molecular sieve to prevent freezing of
these gases in the nitrogen wash column.
After purification, nitrogen is added to adjust the N2:H2
ratio to the stoichiometric 1:3 ratio, and the gas is
compressed for ammonia synthesis. This step is similar to
that described under steam-reforming processes.
However, it is claimed that because of the efficiency of the
nitrogen wash step in removing impurities and inerts,
the synthesis step can be operated without gas purge
and, consequently, with higher efficiency. AIso_the gas
purity contributes to the long life of the synthesis catalyst.
There are 48 ammonia plants based on Texaco
partial oxidation technology. The most recent ones are a
1,350-tpd plant for GNFC, India, which was started in
1981; three 1,000-tpd plants of CNTIC, China, which
were started in 1983, 84, and 85; three 1,000-tpd units
for CNTIC, China, scheduled for startup in 1995/96;
and also a 1,350-tpd plant for GSFC, India, scheduled
for startup in 1996. The GSFC plant will use natural
gas and naphtha as feedstock, while the other plants
are based on residual oil.
Ammonia production using air for partial oxidation
or gasification instead of oxygen has been
commercialized by Texaco. The air gasification concept can be
applied to the complete range of feed materials extending
from natural gas and refinery gas, through liquid
hydrocarbons, to coaTand coke [371. No oxygen plant is
needed in this case. The product from the air gasifier
contains about 50% nitrogen. The excess nitrogen is
removed from the ammonia synthesis gas by a
cryogenic condenser. This cryogenic unit can be designed to
remove the inerts (CH4 + Ar) from the synthesis gas.
The synthesis gas out of the cryogenic unit is dry and
can be introduced into the ammonia loop at a point
downstream of the product ammonia condenser. The
waste nitrogen leaves the cryogenic unit at 0,5-1.0 MPa
and is heated and expanded to atmospheric pressure;
thus, part of the power needed for the air compressor is
provided [37].
6.6 Ammonia From Coal
About 10% of the world's ammonia production is
based on coal, coke, or lignite. About half of the coal-
based capacity is in the People's Republic of China where
there are over 1,000 small plants with capacities
ranging from 3,000 to 10,000 tpy [39]. It was reported that
1,100 small coal-based ammonia plants were built
between 1966 and 1974 and 100 more per year were
being added in 1975 [40]. The technology of one of
these plants has been described [41]. The feedstock was
lump anthracite or semi-anthracite although it was
reported that briquetted coal or lower grade coal was used
184
in some plants. In general, the process is similar to the.
original Haber process, which was described previously.
The coal was gasified in a semi-water gas producer blown
alternately with air and steam. Gas purification sequence
was water scrub, H2S removal, shift conversion, CO2
removal by water scrubbing, and copper liquor
scrubbing for CO removal. The gas was compressed in six
stages by reciprocating compressors with purification
steps between various stages. The product from the small
plants is often used to make dilute ammonia solution
(16%-20%) or ammonium bicarbonate for local use
although some of the larger plants make ammonium
nitrate.
Staege lists 13 plants built since 1950 for direct use
of coal in India, Greece, Turkey, South Africa,
Pakistan, Thailand, India, and Zambia [42[. Most of them
are small (40 to 340 tpd capacity), and some of them
have been converted to other feedstock. However, the
list included three large plants (900-1,000 tpd) of which
two are in India, specifically Talcher and Ramagundam.
The third one is in South Africa; its operation has been
described by Waitzman [43]. TVA built and operated a
demonstration-scale plant (135 tpd of ammonia) in
1982. It used a Texaco gasifier and operated with a
variety of U.S. coals [44].
Coal gasification processes for ammonia production
can be classified according to the method of gasification
as fixed-bed (Lurgi), fluidized bed (Winkler), or entrained
bed (Koppers-Totzek and Texaco). The so-called fixed
bed gasification is more accurately called a moving bed,
Lump coal (5-30 mm) is charged at the top and
descends countercurrently to the gas stream. As it descends,
it is first dried and preheated, then carbonized, and fi-
nally gasified by the oxygen and steam entering the
bottom. The coal ash is discharged from the bottom through
a grate, or in one modification, as a slag. Because the
countercurrent method of operation results in good heat
exchange and very high thermal efficiency, this method
requires less heat and, hence, less oxygen than the other
methods [451. Also, the expense of drying and fine
grinding of the coal is avoided.
The Lurgi moving bed gasiffer usually is operated at 3 MPa
(Figure 6.20). It requires the least amount of oxygen -
GASIFYING
SHIFT CONVERSION
Synthesis Gas
RECTISDL PLANT
Off-Gas
C-15
a
Ash Tar
Legend 1
R-l Lurgi gasifier
S-2 Gas cooler 4 scrubber
E-3 Uti U-ty bo I ler
E-4, E-6 Conversion coolers
R-5., R-7 Shift conversion reactors
E-8, E-9 Coolers
Ui I
Gasoline Gas liquor Phenol;
Hydrogen
SuIf Ide
T-10 Tar tank
T-U Dl L tank
E-12 Gasoline condenser, gas cooler
C-13, C-14, C-15 Rectisol columns
E-1S Acid gas cooler
Figure 6.20. Lurgi Coal Gasification Process.
185
one-third to one-half as much as entrained coal gasifi-
ers. It is not necessary that the oxygen be of high purity;
90% is satisfactory. The gas leaves the top of the gas-
ifier at about 450°C and is cooled and washed to
remove tar, liquid hydrocarbons, dust, etc. The washed
gas contains CO, H2, C02, CH4, and other
hydrocarbons. It is treated by a series of steps including steam
reforming, CO shift conversion, CO2 and H2S removal,
liquid nitrogen wash, steam reforming of the methane
that is separated by the nitrogen wash, nitrogen
addition, and compression to produce ammonia synthesis
gas [46].
Some limitations of the fixed or moving bed
gasification process are that the coal must be in the form of
lumps (5-30 mm), the coal must be of the noncaking
variety or pretreated to prevent caking, and various
byproducts are formed (tar, phenolic compounds, light
oils, etc.) that must be collected and used or disposed of.
In preparing the sized coal feed, fines are formed that
can be burned in an auxiliary plant to generate the steam
and electricity requirements of the process. Tar can also
be burned or injected into the gasifier at a point where
the temperature is high enough to gasify it, Sasol, South
Africa, has 13 Lurgi gasifiers of an older type and 3
Lurgi gasifiers of a new type that were installed in 1978
[45].
In the fluidized bed gasification process, of which the
Winkler process is the main example (Figure 6.21), coal
or lignite is ground to less than 15-mm particle size and
introduced into the fluidized bed through feed screws
near the bottom. Steam and oxygen are injected near
the bottom of the fluidized bed, In contrast to the gradual
increase in temperature of the coal in the moving bed
process, the fluidized bed is essentially isothermal
(1000°C). Consequently, there is neither tar nor other_
liquid byproducts, and the gas contains mainly H2 and
CO with less than 1% CH4, A substantial amount of ash
is entrained in the gas stream. The hot gas is cooled by
waste-heat boilers and scrubbed to remove ash and then
purified in a sequence of steps similar to other processes.
The process produces a char containing 6%-12% of the
carbon in the feed. About 90% of this char is removed
from the bottom of the gasifier in a dry state; the
remainder is recovered by wet scrubbing of the gas. This
char can be burned in an auxiliary boiler to supply steam
and electricity.
The Winkler gasifier is widely used to make producer
gas for industrial and domestic use, but few have been
Raw Synthesis Gas
to Shift Conversion
>=>
a 4Ash
Legend 1
SI-1 Coal bin
SF-E Feeder
R-3 Uinkler gasifier
E-4 U-t 1 Uty loo 1 Ler
E-5 Preheater
S-6 Mul-ticyc Lone
E-7 Final cooler
B-8 DIslntegrator
S-9 M 1st el inmator
Figure 6.21. The Winkler Coal Gasification Process.
186
used for ammonia production, A 300-tpd ammonia plant _
at Neyveli, India, is based on a low-pressure (114 kPa)
gasifier. It was put into operation in 1964 [47]. Two
smaller plants are in Turkey and Yugoslavia. The
advantages of the Winkler gasifer are that it will work with
almost any grade of coal or lignite and that it is
adaptable to high-capacity units. Disadvantages for ammonia
production are low pressure (1-3 atm), which increases
compression costs, and the ash content of the gas, which
requires an electrostatic precipitator for final cleanup.
Entrained coal gasifiers are typified by the Koppers-
Totzek (KT) and Texaco processes. Most of the present
coal-based ammonia plants (except in China) use the
KT process, The process is essentially a partial
oxidation process as are most coal gasification processes. At
least two KT ammonia plants have been built to use
either coal or heavy oil although only one (in Finland) is
known to have used both feedstocks [48]. However, any
entrained gasification units presumably could be readily
adapted to heavy oil or lighter hydrocarbons including
natural gas.
In the KT process coal is dried and finely ground to
about 75% through 200-mesh (Tyler). The powdered
coal is picked up by streams of oxygen and blown into
the gasification chamber through two burners facing each
other. More recently, four-burner units have been used.
Steam enters through annular openings around the
burners. The gasification is complete in about one-tenth of a
second at temperatures in the range of 1000°-1260°C.
Part of the ash is fused and removed from the bottom of
the gasifier, and part is entrained in the gas. The gas
typically contains 56% CO, 31% H2, 11% C02, and
less than 0,1% CH4. After being cooled in waste-heat
boilers, the ash is removed by wet scrubbing and
electrostatic precipitation. The remainder of the ammonia
synthesis gas preparation is similar to that described
under partial oxidation of fuel oil.
Disadvantages of the process are the need for fine
grinding of coal, operation at low pressures (1-3 atm),
and higher oxygen consumption than other coal
gasification processes.
The Texaco process differs from the KT process in
that the finely ground coal is mixed with water to form a
thick slurry containing about 35%-40% water. The slurry
is preheated and fed, together with oxygen, into a
gasifier that can operate at pressures as high as 80 atm
(Figure 6.22). The process as applied to ammonia
production has been described by Netzer and Moe 149]. In
this case the gasifier is operated at 58 atm and about
1300°C. Fused ash is quenched with water in a
chamber at the bottom of the gasifier and removed as a slurry.
The hot gas is quenched to 1000°C by water, passes
through a waste-heat boiler, and is cleaned to remove
soot and fly ash in a venturi scrubber In another
configuration of the Texaco process, the gas is further
quenched to 215°C before exiting the gasifier; this
provides the higher steam:gas ratio that is needed for shift
conversion. A utility boiler is not used, and the gas goes
directly from the gasifier to a venturi scrubber
The sequence of the remaining steps of synthesis gas
preparation is CO shift conversion, removal of H2S and
CO2 by Rectisol wash (cold methanol), and liquid
nitrogen wash. As in other partial oxidation processes, the
H2S is converted to elemental sulfur. Ube Industries,
Japan, commissioned a 1,500-tpd ammonia plant in 1984
using the Texaco coal gasification process. An energy
consumption of 10.9 Gcal/tonne of ammonia is stated;
this is lower than the normal quoted figure of 11,6 Gcal/
tonne of NH3 for coal-based processes 131]. Another
1,000 tpd coal-based ammonia plant is scheduled for
startup at Wehei, China, in 1996.
6.7 Ammonia From Electrolytic Hydrogen
Several ammonia plants have been built to produce
ammonia from hydrogen that results from the
electrolysis of water. These plants have been located where low-
cost hydroelectric power is available in Norway, India
(Nangal), Egypt (Aswan), Zimbabwe (Kwa-Kwe), Peru
(Cuzco), Iceland, and Canada (Trail, British Columbia).
The India (Nangal) plant has already been converted to
hydrocarbon feedstock due to the shortage of power in
-the-regionr-The-technoIogy of the electrolytic process
has been described by Mrochek and Grundt [50,51].
Purified water is the feedstock; potassium hydroxide is
added to increase the conductivity, but it does not
participate in the reaction. Commercial cells vary
somewhat in efficiency, but a typical power consumption is
4.3 kWh/m3 of H2, which corresponds to about 8,600
kWh/tonne of ammonia [51J. Additional energy is
required for an air separation plant to produce the
nitrogen required for ammonia production. Energy also is
required for compression of the hydrogen and nitrogen
and recirculation of the gas mixture through the
synthesis loop. The total energy requirement is about 10,200
kWh/tonne of ammonia. This energy is equivalent to
about 8.8 million kcal/tonne of ammonia, which is
higher than that for natural gas-based ammonia plants.
Also, if fuel were used to generate electricity, nearly three
times as much thermal energy would be required since
the efficiency of conversion of thermal energy to
electrical energy is seldom more than 38%.
The process generates one volume of oxygen per two
volumes of hydrogen or about 0,7 tonne of 02/tonne
of NH3; thus, a credit for byproduct oxygen can be taken
if there is a use for it, For example, the oxygen can be
used in an iron and steel industry. A small additional
amount of oxygen would be available from the air
separation unit, Another potential byproduct is heavy water
187
BFW
Oxygen
■=>
K-
\J/
X
p-i
j£
Steam
c=3
Raw Synthesis Gas to Shift Conversion
R-2
*
Coal +
Water
-^>
E-3
m
S-4
E-5
^s
^s
T-6
^
Legend:
P-l SIurry pump
R-2 Texaco gasifier
E-3 Utility boiler
S-4 Scrubber
E-5 Heater
T-6 Ash lockhopper
E-7 Cooler
S-8 Carbon separator
P-9 Pump „ _ . ,L.
Wastewater
E-7
A
S-8
*q
->=>
P-9
Granulated ash
Figure 6.22. Texaco Coal Gasification Process.
-c=£>
(deuterium oxide, D20). Pure water contains about
0,0135% D2O. The hydrogen is electrolyzed more
rapidly than its isotope, deuterium; thus, the concentration
of D2O in the electrolyte builds up and can be recovered
at a.rate of 70 g/tonne of NH3 [51]. Heavy water is
used in some types of nuclear reactors.
Since the electrolytic process does not produce CO2,
ammonia cannot be used to make urea unless CO2 is
available from another source. It can be used to make
ammonium salts (sulfates, phosphates, or nitrates), or
ammonia can be applied to the soil directly either in the
anhydrous form or in aqueous solution.
The cost of ammonia production by the electrolytic
process is not greatly dependent on plant size, but, of
course, it is strongly dependent on the cost of
electricity, Thus, if low-cost electricity is available, the
electrolytic plant would be competitive with plants using other
processes, particularly for small plants.
A particular advantage in developing countries would
be the fact that ammonia production from electrolytic
hydrogen is a much simpler process than those using
other feedstocks.
Hydrogen is also a byproduct of electrolytic
production of chlorine from caustic soda, and several small
ammonia plants have used this hydrogen to make
ammonia either as the only feedstock or as a
supplementary source. The amount of hydrogen available from
chlorine-caustic plants is too small to supply a
significant portion of the ammonia needs in most situations.
6.8 Economics of Ammonia Production
6.8.1 Investment Costs
Since ammonia production is highly capital intensive,
it is especially important that the estimated or assumed
capital costs be as accurate and realistic as possible. When
the process, feedstock, and location have been selected,
an accurate estimate of the capital requirements can be
made. The World Bank has considered the following
four different scenarios for investment costs.
188
1, Existing Site - Developed Location
A plant on an existing site in a developed
location, where all infrastructure exists. When an
additional plant is built on an existing site, a significant
saving may be realized not only in infrastructure but
also in offsites. It is assumed that the cost of a plant
on an existing site would be about 20% lower than
a plant on a new site in a developed location.
2. New Site - Developed Location
It is assumed that supporting facilities such as
roads, a port, railroad, etc., and social structure
exist. People will be available to work in the plant.
Equipment can often be provided from local sources
and maintained using local facilities.
3. New Site - Developing Location
Some infrastructure is established but not as much
as for the scenario described in item number 2. It is
necessary to expand port or rail facilities to meet
the needs of the project. Local specialized
engineering facilities will not be available.
4, Developing Site - Remote Location
There is no supporting infrastructure available.
All roads, ports, railroads, etc., and social amenities
must be provided as part of the project cost. All
equipment has to be imported. Most of the labor to
build and operate the plant will have to be brought
in from outside. There is no supporting technical
infrastructure available before the project. Costs for
establishing the required infrastructure will be very
high.
Investment costs vary greatly depending on the basis
for estimation, often on the bidding location, and on
the relative strengths of international currencies. It will
also depend on the market situation for the
construction of chemical plants 15].
In the past 25 years, process designs have been
developed and gradually improved for ammonia
production by steam reforming of natural gas, naphtha, and
other light hydrocarbons in plants using centrifugal
compressors. Standard designs have evolved for four
capacities: 900 tpd, 1,040 tpd, 1,360 tpd, and 1,500
tpd. The great majority of new plants built in the past
decade have been designed for one of these capacities
even though the capability exists for design of larger
plants.
The majority of new plants built or ordered" in the
past decade have been in the 1,000- to 1,500-tpd
capacity range. The larger size is sometimes used in
locations where site development costs are high; the total
project cost may be lower per annual tonne of capacity.
However, in some cases where site development costs
are high, it may be preferable to locate two or more
plants at the same site as has been done in Indonesia
and South Korea, for example.
The investment cost data of the World Bank
summarized in Table 6.17 represent typical figures based on
the investment costs of numerous ammonia projects
surveyed.
Relatively fewer plants have been built to produce
ammonia by partial oxidation of heavy oil or coal. Most
of the plants built in China have capacities of 1,000
tpd, and those in India, 1,000-1,350 tpd. For feedstocks
other than natural gas, the capital costs will be estimated
by applying the factors listed in Table 6.18.
These factors are a compromise between estimated
_costs_fxom_se.ver.al_sources„and are similar to relative
costs given by Nichols and Blouin [52]. The factor for
naphtha-based plants presumably can be applied with
some degree of confidence to standardized plant sizes
that are lower and higher than the base case. For other
feedstocks there is insufficient data to indicate how the
plant cost would vary with capacity. Comparisons of
the estimated production costs as affected by factors
other than the scale of operation will be based on 1,500-
tpd capacity.
6.8.2 Elements of Production Costs
The cost estimates and economic evaluation of
ammonia installations are given in Chapter 21. Table 6.19
gives the basic elements of the costs of production of
ammonia using four different raw materials.
Table 6.17. Investment Costs for a 1,500-tpd Ammonia Plant [5] (US $ millions)
Ammonia Project @ 1,500 tpd NH3
Battery limits including offsites
Infrastructure
Existing Site
Developed Location
170
New Site New Site New Site
Developed Location Developing Location Remote Location
210
230
50
250
100
Total Project Cost
170
210
280
350
189
Table 6.18. Capital Costs Using Different
Feedstocks
Plant Cost
Feedstock Factor
Natural gas 1.00
Naphtha 1.15
Heavy oil 1.60
Coal 2.00
Assumed for
Base Case
($ Million*)
170.0
195.5
272.0
340.0
a, Total plant cost, battery limits x 1.5.
6.8.3 Small-Scale Ammonia Plants
In practice, installations from 100 to 600 tpy of
ammonia capacity are considered small-scale plants. All
downstream processing operations (urea, nitric acid, etc.)
in this size range are also considered to be small-scale
plants.
As a result, all fertilizer plants established before 1960
are considered small-scale plants because only after this
date were high-pressure turbocompressors introduced
to enable the building of high-capacity ammonia units.
UN1DO has organized a program to investigate the
possibility of providing small-capacity ammonia plants
and has discussed the problem at numerous seminars
[33]. Such a concept is needed because in many
countries consumption of fertilizers collectively is much smaller
than the capacity of a large-scale plant producing
300,000 tpy of nitrogen. This may supply at a medium
application rate (40 kg/ha of N) 7.5 million ha of land,
and many countries do not have this much agricultural
land. Construction of regional plants of normal large
capacity is not possible in most cases because of
logistic, economic, and political constraints, which include
the following:
• For many landlocked countries, which are located at
a long distance from seaports, the cost of freight
doubles or even triples the price of fertilizers for
farmers and, thus, limits consumption.
• In some cases, small natural gas fields or a small source
of hydrogen are sufficient to supply a small-scale plant
with raw material for many years.
Development of this small-scale alternative requires
the establishment of the following infractructure:
• Small-scale ammonia and urea plants at the sources
of raw materials.
• If ammonium phosphates are desired, supplies of
imported phosphoric acid or of phosphoric acid
produced in local plants at the phosphate rock source.
• Affiliated complex fertilizer granulation/compounding
plantsT
Table 6.19. Cost Components of Ammonia Production (1,500 tpd)
Process
Steam reforming
Steam reforming
Partial oxidation
Coal gasification
Cost Elements
Raw materials
Utilities
Electrical energy
Process water
Cooling water
Labor
a. Tonne.
Raw Material
Natural gas
Naphtha
Heavy oil
Coal
Unit/t
Gcal
kWh
m3
m3
workhours
Capital Cost
(US $ million)
170
195
270
320
Natural Gas
7.0
-
1.1
210
0.3
Naphtha
0.72a
-
1.1
280
0.3
-
Raw Material
Heavy Oil
0.76a
530
0.6
216
0.4
Coal
1.4a
624
0.6
216
0.7
190
With small plants, logistic problems are of limited
importance. Local plants play the role of an extension
service for farmers and are flexible enough to adapt the
production program to the local crop pattern.
Basic parameters that will influence the technical and
economic outcome are as follows:
• Local natural gas and phosphate rock cost/price.
• Logistics of fertilizer distribution to the farmer from
the small-scale plant (own distribution network, use/
extension of existing network, etc.), compared with
logistics costs for imported fertilizers.
• Availability of investment capital and equity structure
of the project (shareholders: public/private,
distributors, etc.).
• Marketing network and sales conditions.
The main technical differences between small- and
large-scale ammonia units are summarized in Table 6.20.
In the developing countries small-scale production of
fertilizers has been practiced for many years. The
number of ammonia plants of 100- to 500-tpd capacity by
regions was as follows (1977):
Latin America
China
Indian Subcontinent
South East Asia
Middle East
Africa
9
21
18
8
8
5
The following countries have acquired valuable
experience in the construction and operation of small-scale
fertilizer plants;
China, India, Pakistan, Indonesia, Turkey, Peru,
Mexico, Egypt, Syria and Zambia.
Basic economic and technical data collected during the
UN1DO workshop on "Minifertilizer Plant Establishment"
held in Lahore, Pakistan, in 1983 showed alternative
ways to develop the fertilizer industry and allowed
preliminary technical assessment of such a concept. The
comparison of several cost components is shown in Table
6.21.
Finally, progress in the heat-exchanger reforming
(LCA) process and new developments in electrically
driven compressors may make small-scale (300 tpd-400
tpd) installations economically feasible.
In addition, the skid-mounted "serial" installations
concept (sometimes called modular) was practically
applied. The installations are constructed on a platform or
barge at the builder's site and transported in nearly com--
pleted form to the operating site. This avoids the
problem of a small-scale plant being constructed in a remote
place without the necessary industrial infrastructure.
Standardized plants using skid-mounting will have a positive
impact on:
- shorter construction time,
- lower engineering costs.
- ease of training.
- quicker startups.
- more precise prediction of construction costs.
6.9 Future Development of
Ammonia Technology
Even_though_ammonia_technology is a mature
technology, there is room for improvements in efficiency
and reliability. Recent years have shown that new
concepts in mature processes may substantially improve the
overall production economics. The projection of future
technical changes is obviously not possible. However,
present research and development stage process
improvements allow a listing of potentially available inri7
provements for existing and new ammonia installations
such as the following:
• Pre-reforming and adiabatic reforming process
optimization, especially if results obtained by different
licensers could be combined and optimized; this would
open the possibility to further energy savings.
Table 6.20. Process Features of Large and Small Ammonia Plants
Process Unit
a. Reforming and gas processing
b. Gas compression
c. Purge gas process
Large Scale
Synthesis gas and high-pressure
steam, closed loop
Turbocompressors
Usually included
Small Scale
Synthesis gas production and
steam as byproduct
Electrically driven compressors
Purge gas used as fuel
191
Table 6.21. Comparison of the Cost Elements of Different Scale Ammonia Installations
Parameters
Unit/t
Raw Materials
Natural gas
Utilities
Electricity -
Cooling water
Process water
Labor (including maintenance)
Depreciation
Gcal
- kWh-
m3
m3
workhours
US$
9.47
540.
280
1.7
1.95
76
Capacity (Consumption Per Tonne of Ammonia)
150a 300b 500'
(tpd)
1,000
8.5
320
230
1.6
1.0
58
7.8
7.0
(own production)—
230 210
2.3 2.3
0.6
44
0.3
34
a. Ammonia Casale, Switzerland.
b. Snamprogetti, Italy.
c. KTI, Netherlands.
• New developments in electrically driven compressors
(e.g., three-dimensional impellers) would permit more
flexibility in steam production. This may influence the
minimum economic capacity of ammonia production
in small-scale plants.
• Better design of furnace "elements, su"ch"*as~barrrer
nozzles, new materials for insulation, and better
design of heat exchangers, may increase the saving of
energy and improve the operability of the installations.
• Improvement of the steam-generation efficiency. The
overall energy consumption can be improved by
producing high-pressure steam (over 11 MPa) instead of
medium-pressure steam (5 MPa).
• Integration of gas turbine drives with steam turbines
and with the heat-recovery system of the ammonia
plant.
• More efficient process condensate stripping to
produce medium-pressure steam.
• Further development and optimization of the
ruthenium catalyst and its alternatives, aiming at high
conversion and lower pressure to minimize the investment
cost of ammonia reactors.
As a result, the amount of available waste heat will be
reduced. This will reduce the amount of export steam.
The heat lost in the primary reformer will be minimized
by improved reformer designs or by eliminating the
direct fired primary reformer. The reforming pressures
may rise and the ammonia synthesis pressure may
decrease, thus the synthesis gas compressor may
potentially be eliminated. Emphasis on capital cost reduction
will continue. Safety awareness will continue to rise.
Stringent environmental regulations will be
implemented to reduce emissions. Future environmental
regulations will require reduced CO2 and NO* emissions.
"Nitro"geir'o'xid"e's"afe~cambustion products of the direct-
fired reformer furnace. Improved burner designs will
decrease the amount of nitrogen oxides produced. There
will also be tighter regulations concerning disposal of
the process condensate.
In the area of automation, dynamic control systems
should become easier to justify economically. These
controls will assist the operators in running the plant as
close to optimum as possible and will also enhance the
plant safety system. The level of automation will increase
to improve the efficiency and reliability of the plant.
More integrated ammonia and methanol plants may
be built and, thus, provide flexibility to change products
depending on market demand.
6.10 References
1. AppI, Max. 1976. "A Brief History of Ammonia
Production from the Early Days to the Present,"
Nitrogen, 100:47-58.
2. LeBIanc, J. R. 1992. "Assessment of Fertilizer
Technology," Asian Natural Gas IV, Kuala Lumpur,
Malaysia.
192
3. Bumb, Balu L. 1989. Global Fertilizer Perspec- .
tive, 1960-95, International Fertilizer Development
Center, Muscle Shoals, AL, U.S.A.
4. Kirk-Othmer. 1992. Encyclopedia of Chemical
Technology, 4th ed., Vol. 2, pp, 638-691.
5. Constant, Kurt Michael, and William F Sheldrick.
1992, World Nitrogen Survey, pp. 68-69, 80-88,
The World Bank, Washington, D.C., U.S.A.
6. Czuppon, T, A., and J. M. Lee. 1987. "Hydrogen-
Rich Offgases Can Reduce Ammonia Production
Costs," Oil and Gas Journal, 87(36):42-46.
7. Buividas, L. J., J. A, Finneran, and O. J. Quartulli.
1974. "Alternate Ammonia Feedstocks,"
Chemical Engineering Progress, 70(10):21-35.
8. Brown, F. C, and A, A. Deane. 1977. "Ammonia
Plants - Efficiency, Reliability or Both," FA1/IFDC
1977 Seminar, New Delhi, India.
9. "New Developments of the Topsoe Ammonia
Process." 1994. Haldor Topsoe A/S, Private
Communication.
10. Benner, G. S., and co-workers. 1986. U.S. Pat.
4,568,530, M. W Kellogg Corporation, Houston,
TX, U.S.A.
11. Imperial Chemical Industries, Ltd. 1989, Catalyst
Handbook, M. V. Twigg (Ed;), Wolfe Publishing"
Frome, England.
12. Pons, F, and A. Spolidor. 1990, "Latest
Developments of High-Grade Alloys," AIChE Ammonia
Safety Symposium, San Diego, CA, U.S.A.
13. Mohri, T., T. Shibasaki, and K. Takamura. 1992.
"Application of Advanced Material for Catalyst Tubes
for Steam Reformers," AIChE Safety in Ammonia
Plants Symposium, San Antonio, TX, U.S.A.
14. AppI, Max. 1992. "Modern Ammonia Technology,
Where Have We Got to, Where Are We Going?"
Nitrogen, 199:46-75.
15. "Ammonia." 1985. Ullmann Encyclopedia of
Industrial Chemistry, 5th ed., Vol. A2.
16. Quartulli, O. J. "Developments in Ammonia
Production Technology," Undated publication of the M.
W Kellogg Co., Houston, TX, U.S.A.
17. Kazarnovskii, Ya. S. 1945. Zh. Fiz. Khim., 19:392.
18. Haber, F., S. Tamaru, and C. Ponnaz. 1915, Z.
Elektrochem., 21:89.
19. Larson, A. T. 1924. J. Am. Chem. Soc, 46:367-
372,
20. Dodge, R. L., and A. T Larson, 1923. J. Am.
Chem. Soc, 45:2918-2930,
21. Beattie, J. A., and L. J, Gillespie. 1930. Phys. Rev.,
36:743-753..
22. Nielsen, A. 1968. "An Investigation on Promoted
Iron Catalyst for the Synthesis of Ammonia;" Jul.
GjellerupsForlag., 3rded., 16-17, 56-57, 64.
23. Krishnamurthy, Krish R, 1993. "Evaluation of
Competing Technologies for Hydrogen and Argon
Recovery from Ammonia Plant Purge Gas," IN
Cryogenic Processes and Machinery, Leonard A.
Wenzel (Ed.), AIChE Symposium Series, Vol. 89,
No. 294, pp. 109-114.
24. Ashton, G. J., and W H. lsalski. 1985. "Rare Gases
and the Ammonia Producers," Fourth Fertiliser
Nitrogen Proc., British Sulphur Corp., International
Conference of Fertiliser Tech., p. 126.
25. Aziz, Zahid. 1994. Fertilizer Technology Series Nl
Ammonia Synthesis, UNIDO Communication, p, 2.
26. Miyasugi, T, et al. 1984. "A Heat Exchanger Type
Steam Reformer for Ammonia Production," Chem i-
cal Engineering Progress, 80:64.
■ 27. Miyasugi, T., et al. 1984. "Energy-Saving
Ammonia Process with Heat Exchanger Reformer," Am-
monia-Safety-Symposium.-
28. Marsh, H. D., et al. 1992. "CAR-Demonstration
Unit on Stream," Ammonia Safety Symposium,
29. KRES-Kellogg Reforming Exchanger System.
Undated brochure, M. W Kellogg Co., Houston,
TX, U.S.A.
30. Halstead, J, M., A. M. Haslett, and A. Pinto. 1988.
"Design and Experience of 1CILCA Ammonia
Process," FAI Seminar, New Delhi, India.
31. AppI, Max. 1993. "Modern Ammonia Technology:
Where Have We Got to, Where are We Going?"
Nitrogen, 202:44-53.
32. Stead, Phillips. 1993. "The Linde Ammonia
Concept (LAC)," Fertiliser News, 38(12):15-20.
33. "Minifertilizer Plant Concept." 1983. Proceedings
of the Lahore UNIDO Seminar, Lahore, Pakistan.
34. Czuppon, T A., et. al. 1993. "The Kellogg Advanced
Ammonia Process First Commerlcal Application at
Ocelot Ammonia Company," Ammonia Safety
Symposium.
35. "Energy Consumption in Ammonia
Production-Influence of External Conditions and Key Parameter,"
Undated Haldor Topsoe brochure.
193
36. Linde AG - Process Engineering and Contracting
Division brochure. 1992.
37. Quintana, Manuel E., and G. F. Skinner. 1990.
"Development in Partial Oxidation - Ammonia from
Low-Grade Oil Residue," FAI Seminar, New Delhi,
India.
38. HoIIriegelskrueth, H. J. 1985, "Synthesis Gas from
Refinery Residues," Linde Reports on Science and
Technology, No, 40,
39. Wang, K. P. 1975. The People's Repubiicof China,
U.S. Bureau of Mines, Washington, D.C., U.S.A.
40. "American Rural Small-Scale Industry Delegation."
1977. Rural Small-Scale Industry in the People's
Republic of China, Chapter VI, University of
California Press, Berkeley and Los Angeles, CA, U.S.A.
41. AppI, Max, 1992, "Modern Ammonia Technology,
Where Have We Got to, Where are We Going?"
Nitrogen, 200:27-38.
42. Staege, H. 1977. "Gasification of Coal by the
Koppers-Totzek Process for the Production of
Ammonia," Chemical Age of India, 28(11A):903-910.
43. Waitzman, D. A. 1977. "Recent Technological
Developments in Nitrogenous Fertiliser
Production-Ammonia From Coal Projects," FA1/1FDC Fertilizer
Seminar, New Delhi, India. - - -- — ———-
44. Waitzman, D, A. 1985. "TVA Ammonia from Coal
Projects," Ammonia Production via Coal
Gasification, Muscle Shoals, AL, U.S.A.
45. Becker, P. D. 1979. "Lurgi Pressure Gasification
and its Application for Ammonia Manufacture," TVA
Symposium Ammonia from Coal, Muscle Shoals,
AL, U.S.A.
46. Sharma, N. C. 1977. "The Modern Route for
Ammonia Plants Based on Coal," Chemical Age
of India, 28(llA):918-923.
47. Bailey, E. E., and T. K. Subramanium. 1979.
"Winkler Coal Gasification Process and its
Application in Ammonia Synthesis Plants," TVA
Symposium Ammonia from Coal, Muscle Shoals, AL,
U.S.A.
48. Beck, Bruno. 1979. "The Koppers-Totzek Coal
Gasification Process and its Role in Today's Coal-
Based Nitrogenous Fertilizer Production," TVA
Symposium Ammonia from Coal, Muscle Shoals, AL,
U.S.A.
49. Netzer, D., and J. Moe. 1977. "Ammonia from
Coal," Chemical Engineering, 84(23); 129-132.
50. James, G. R., and A, V. Slack (Eds,). 1973,
Ammonia, Part 1, pp. 369-401, Marcel Dekker, New York,
NY, U.S.A.
51. Grundt, T. 1977. "Water Electrolysis and Its
Possibilities as Basis for Fertilizer,P.r.oduction," Seminar
on Development of Small Scale Hydroelectric Power
and Fertilizer, Pokhara, Nepal.
52. Blouin, G. M., and D. E, Nichols. 1977. "Economic
Considerations of Chemical Nitrogen Fixation,"
American Chemical Society Meeting, Chicago, 1L,
U.S.A.
53. Nobles, J. E,, L. N. Shay, and J. C. Stover. 1988.
"BASF's Activated MDEA Process for C02 Removal
in Ammonia Plants," Nitrogen, 88:243-252.
54. Hefner, W, Y Ide, and D, W, Stanbridge. 1984.
"Recent Developments in the BASF Activated
MDEA Process," American Institute of Chemical
Engineers National Meeting,
55. Graver, B, S. 1987. "Process for the Removal of
—Acid-GasesiromJVIixtures," (to Union Carbide), U.S.
Patent 4,702,898.
56. Bartoo, R. K., T. M. Gemborys, and C. W. Wolf.
1991. "Recent Improvements to the Benfield
Process Extend its Use," Nitrogen '91, pp. 127-139,
British Sulphur Corporation Ltd., London, England,
57. Song, Cook C, et al. 1992. "Conversion of C02 .
Removal Process for Flexsorb HP Solvent,"
Ammonia Safety Symposium.
58. Tomasi, L. 1992. "Energy-Efficient C02 Removal
Process, GV Low-Energy Process," Fertiliser News.
59. Lewis, J. L., M, B, Pascoo, and H. D, Truby. 1979,
"Fluor Solvent," Hydrocarbon Processing,
58(4):112.
60. Huurdeman, T L., and Vinod A. Shah. 1989.
"Synthesis Gas Treating with Physical Solvent Process
using Selexol Process Technology," Ammonia Plant
Safety AIChE Symposium,
194
Chapter 7. Transportation and Storage of Ammonia
Tabic of Contents
Page
7.1 Introduction 196
7.2 Ammonia Storage , _1_97_.
7.3 Transportation of Ammonia 199
7.3.1 Ocean Transportation of Ammonia 199
7.3.2 Shipment of Ammonia by Barge 200
7.3.3 Transportation of Ammonia by Pipeline 202
7.3.4 Transportation of Ammonia by Rail 205
7.3.5 Transportation of Anhydrous Ammonia by Truck 205
7.4 References 206
I BIBUOTECA TECNICA
I CGMpypjo MOAO&
195
Chapter 7. Transportation
7.1 Introduction
Much of the world's ammonia production is shipped
from the plants where it is produced to other locations
for further processing into finished fertilizers, for direct
use as fertilizer, or for use as a raw material for
nonfertilizer products. The total world ammonia trade
in 1991 was about 11,5 million tonnes of nitrogen,
which was approximately 12.4% of the total world
ammonia production. Of this total, about 9,4 million tonnes
was transported by sea [1]. About 1.2 million tonnes of
nitrogen was exported from Canada to the United States
[II. Over 5.4 million tonnes of ammonia is transported
within the United States annually. Ammonia is
transported by ships, barges, rail, trucks, and pipeline.
The ships carrying anhydrous ammonia also carry
other liquefied gases, especially liquefied petroleum gases
(LPG). In general, equipment that is suitable for
transporting LPG is also suitable for transporting anhydrous
ammonia. Such facilities (trucks, rail tankers, barges, and
ships) often are used interchangeably for transport of
the two materials. The ammonia shipping and LPG
shipping compete for the "available "shipping capacity.
Ammonia is almost invariably transported in the
liquid state; therefore, it must either be compressed or
refrigerated or some combination of the two. Ammonia
storage tanks may be classified as fully refrigerated, semi-
refrigerated, or pressurized, and a similar classification
can be applied to transport equipment. Fully
refrigerated storage tanks are equipped to maintain a
temperature of about -33°C, at which the vapor pressure of
ammonia is atmospheric (see Chapter 6). In semi-
refrigerated storage tanks, the ammonia is kept at a
moderately low temperature, such as 0° to 5°C, at which the
gauge pressure is only 400-500 kPa. This permits the
use of tanks made of much lighter steel than would be
required if the temperature were uncontrolled.
Unrefrigerated pressure storage tanks usually are
designed for pressures up to about 1.8 MPa, which should
be adequate for any ambient temperature normally
encountered in most climates.
The metallurgy of the steel used for storage tanks,
transport vessels, and pipelines is important but rather
too complex for detailed explanation here. However,
two points should be noted. Each type of steel has a
transition temperature below which it is subject to brittle
fracture. The brittle fracture is initiated at a notch or
crack, usually near a weld where a stress occurs. Once
and Storage of Ammonia
initiated, a fracture may spread rapidly. Therefore, it is
important that a vessel or pipeline not be operated at a
temperature below its transition temperature unless it
has been thermally stress relieved. Stress relieving is
expensive and sometimes impractical. For this reason,
pressure vessels and pipelines should not receive
refrigerated ammonia; the ammonia should be warmed to a
temperature above the transition temperature of the steeT
used in the vessel.
Another problem is stress corrosion cracking (SCC)
of pressure vessels, which may occur over a wide range
of temperatures and pressures. SCC in ammonia
storage tanks has been reported in various papers over the
years. This subject has been frequently discussed in
Ammonia Safety Symposiums. The Ammonia Safety
Committee of the A.l.Ch.E. conducted a survey of ammonia
storage tanks in 1988. With only one exception,
previous reports had indicated that SCC was not unusual in
pressure storage bullets and semi-refrigerated storage
tank spheres, but there were no reports of SCC in the
fully refrigerated tanks at temperatures of -33°C or
below [2]. The 1988 survey, however, found that, of 37
refrigerated storage tanks inspected, 4 showed surface
-Gr-acks-but-S-were-shallow enough to be ground out [2].
Cracks are mainly formed in welds and the heat-
affected zones (HAZ) around the welds. In a series of
experimental investigations, it has been shown that the
susceptibility for SCC can be reduced by complete post-
weld heat treatment, by excluding oxygen, and by
adding at least 0.2 wt % water. Most of the experiments
were done with pressurized ammonia at ambient
temperature 131. Complete exclusion of oxygen when
handling ammonia is difficult. Although adding water to
ammonia is possible, it is known to cause SCC in the
vapor phase of the tank in the presence of oxygen
because, in the vapor phase, equilibrium concentration of
oxygen is 650 times higher and water concentration
500 times lower than in the liquid phase [3\. Thus the
vapor phase will be rich in oxygen with practically no
water present. The stress relieving by post-weld heat
treatment of the HAZ seems to be the only reliable
method to avoid SCC in ammonia tanks. BASF found
no sign of SCC in their new stress-relieved 200-m3
sphere in Ludwigshaften, when it was inspected after 2
years of operation, whereas they found SCC in an older
tank that was not stress relieved [3[.
Storage and transport of ammonia at the retail level
will be described in Chapter 6. The present chapter is
concerned mainly with large-scale transport and storage.
7.2 Ammonia Storage
Even when all of the ammonia is used at the plant site
where it is produced, it is common practice to have
facilities for storage of 3 to 15 days' production so that
interruptions in operation of downstream facilities will
not require interruption of the ammonia plant
operation. In an ammonia-urea complex, for example, when
the urea plant must be shut down for repairs, the
ammonia plant can continue to operate with the ammonia
going to storage.
Following are two preferred methods for storing
liquid ammonia, One is the pressure storage at ambient
temperature in spherical or cylindrical vessels up to a
capacity of about 1,500 tonnes. The other method is
atmospheric pressure storage at -33°C in insulated
cylindrical tanks up to about 50,000-tonne capacity.
Additionally, reduced pressure storage at about 0°C in an
insulated, usually spherical vessel for a capacity up to
about 2,500 tonnes per vessel is also used [4]. The
suitability of storage depends on the required temperature
and flow quantity of ammonia into and out of the storage.
The pressurized tanks are suitable- for storing small
quantities of ammonia from pipeline systems, tank cars,
and barges carrying pressurized ammonia. Usually,
cylindrical vessels are designed for 2-5 MPa. The larger
spherical vessels are designed only for 1.6 MPa to avoid
wall thickness above 30 mm [41, The cylindrical vessels
are used for a capacity up to 150 tonnes and the
spherical vessels for a capacity up to 1,500 tonnes. A
pressure control is required for the bleeding of inert gases
flashed off the liquid ammonia.
The low-temperature storage tanks are best suited for
the storage of ammonia from the synthesis loop at a
low temperature and for the shipping terminals
handling a large capacity. The tanks operate at atmospheric
pressure, and they are well insulated to minimize the
heat leak into the storage tank. The boil-off vapor from
the tank is re-liquified by compression and water
cooling, The inerts in the boil-off vapors are purged from
the compressor loop. Refrigerated ammonia storage
tanks are of two types. One type is of double^wall
construction; the annular space between the walls is filled
with loose perlite insulation and kept slightly above
atmospheric pressure with dry air, nitrogen, or inert gas
(Figure 7.1). The other type of tank is of single-wall
construction, insulated on the outside with foam glass,
styrofoam, polyisocyanate foam, or polyurethane foam.
Although the investment cost is greater for the double-
wall tank than for single-wall construction, maintenance
costs usually are lower. The double-wall tank provides a
secondary containment feature for added safety. Semi-
refrigerated storage tanks are also well insulated; the
To f'.are
<="
r
o
~i
RefrigeratI on
un i t
-> r~
5
v
L.
Legend ■■
T-l DoubLe integrity storage "tank
P-2, P-3 Load Ing pumps
E-4 NH3 preheoter
.J
T-l
Liquid NH3 fron B.L.
Ship (off-) Loading
^=>
P-2
NH3 "to consumer
c=>
Rai L tanker (un-) Loading
P-3
Figure 7.1. Ammonia Storage Installation.
197
ammonia is held at the desired temperature, usually_0°-
5°C, by allowing it to evaporate at a controlled
pressure, The vapor is compressed and liquefied by water
cooling, and the liquid is returned to the tank. Thus, the
system is similar in principle to fully refrigerated
storage, -but the refrigeration system is much less
sophisticated and relatively inexpensive.
A comparison of various types of ammonia storage
tanks is provided in Table 7.1. Based on the 1988
survey, a summary of refrigerated ammonia storage in the
United States and Canada is given in Table 7.2.
Terminals for shipping or receiving liquid ammonia are
similar in principle to the in-plant storage facility although
there may be important differences. Obviously, a
terminal to receive or discharge shipments to ocean-going
vessels or barges must be at a location that is accessible
to such vessels. Harbors suitable for receiving large ships
are not plentiful, and terminal sites adjacent to such
harbors may be scarce and expensive. In some
locations, considerable expense may be involved in harbor
improvement, construction of a pier, and preparation
of a terminal site. To minimize port time, ships must be
loaded or unloaded rapidly with minimum vaporization
of refrigerated ammonia. Thus, high-capacity pumps and
large, well-insulated pipelines are needed. Assuming that
the ammonia plant is not adjacent to the port,
considerable expense may be involved in transport of ammonia
to the port.
A summary of fill and load-out rates for refrigerated
ammonia storage terminals is given in Table 7.3.
Estimated capital costs for refrigerated storage
facilities are shown in Figure 7.2. The cost of in-plant
storage includes only the storage tank, its foundation, and
refrigeration equipment required for normal in-plant
storage and use. Maritime terminals or land-based
terminals for receiving and distributing ammonia are likely to
cost roughly 50% more than in-plant storage, especially
if they are remote from any manufacturing facility. The
operating cost of a storage facility consists mainly of
fixed charges. Assuming that a maritime terminal of
27,230-tonne (30,000-short ton) capacity.costs $10
million, the annual operating cost can be estimated
roughly as follows:
Annual Operating Cost, US $
Depreciation, 10% (10 years) 1,000,000
Maintenance, 33% of depreciation 330,000
Taxes and insurance, 20% of
depreciation 200,000
Utility 100,000
Labor and overhead 100,000
Total annual cost 1,730,000
Cost/tonne of capacity $63.53 ($57.67
per short ton)
If such a facility were to receive 100,000 tpy, the
cost per tonne of throughput would be $17.30. Similar
..calculations indicate that, for terminals of 9,080-tonne
(10,000-short ton) and 19,160-tonne (20,000-shortton)
capacity, the annual operating cost per tonne of
capacity would be about $110,16 and $80,96, respectively.
The size of a marine terminal depends mainly on the
capacity of ships that are expected to serve it and should
be 25%-50% larger than the ship's capacity to allow for
Table 7.1. A Comparison of Ammonia Storage Tanks
Type Storage
Refrigerated
Storage Tanks
Spheres
Pressure
Storage (Bullets)b
Storage Class
Temperature, DC
Pressure, kPa
Capacity range, tonnes
Typical tonnes of
ammonia to 1 tonne
of tank steel
Fully refrigerated
-33° to -38QCa
103 to 115
3,600 to 54,500
41 to 45
Semi-refrigerated
0° to 5°C
400 to 500
450 to 3,000
10
Unrefrigerated
25° to 50°C
1800 to 2600
45 to 270
2.75
a. Ammonia boiling temperature varies from -33DC sea level to -38°C at 1,100 m.
b. These pressure tanks are not included in the survey of Table 7.2.
198
Table 7.2. Overall Capacity for Ammonia
Storage (U.S.A. and Canada)3
Number of tanks
Number of owners
Number of locations
Total storage
capacity, tonnes'
Average capacity,
tonnes
Range in tank sizes
Spheres (tonnes)
Tanks (tonnes)
335
75
219
6,063,850(6,679,720)
18,156(20,000)
454 to 2,996 (500 to 3.300)
3,630 to 45,390 (4,000 to 50,000)
a. Short tons in parentheses.
Source: [2).
delays in scheduling shipments and delays due to storms,
strikes, etc.
The terminal cost for any given annual throughput
decreases as the size of the terminal decreases.
However, a smaller terminal capacity requires a larger
number of shipments in smaller ships, which may increase
freight costs. Therefore, determination of the minimum
cost of importing ammonia involves a balance between
freight costs and terminal costs.
7.3 Transportation of Ammonia
7.3.1 Ocean Transportation of Ammonia
For overseas or coastal shipment of ammonia, the
ships that are commonly used are equipped with well-
insulated tanks to contain liquid ammonia at slightly above
Table 7.3. Refrigerated Ammonia Storage Terminals: Fill and Load-Out Rates
Fill Rate in Tonnes Per Hour:
Storage at plants
Remote Terminals:3
Pipeline
Rail unloading
Truck unloading
Barge unloading
Ship unloading
Minimum
12
3
3
3
91
379
1983 Survey
Maximum
103
77
36
94
908
1,816
Average
40
23
15
19
322
826
Minimum
5
14
6
94
94
379
1988 Survey
Maximum
113
53
75
113
454
1,816
Average
44
28
31
101
263
890
Load-Out Rate m Tonnes Per Hour:
Fertilizer Plant
Remote Terminals:1*
Pipeline
Rail loading
Truck loading
Barge loading
Ship loading
Minimum
4
4
18
9
82
91
1983 Survey
Maximum
151
265
118
302
454
681
Average
44
66
55
104
245
387
Minimum
9
15
9
7.5
152
363
1988 Survey
Maximum
75
109
272
272
477
908
Average
31
46
61
115
284
529
a. Source of supply.
b. Destination from terminal.
Source: \2\.
199
j
o
CO
Li.
01
O)
CO
o
5
o
o
..>
r
i***
In-
flafitfme 6
^"""
slant ston
TarTd-lias
ge
3d teirrilfi! if
5 10 15 20 25 30
NH3 Storage Capacity, Thousand Short Tons
Figure 7.2. Refrigerated Ammonia Storage
Capital Cost.
atmospheric pressure and at a corresponding
temperature of about -33°C. The ships are equipped with
refrigeration facilities that, in principle, are similar to those of
a storage facility. The ships are also equipped with pumps
of sufficient capacity to discharge the cargo at a rapid
rate.
The cost of ocean transport depends on a large
number of factors: the cost of the-shipsor thecost-of-char--
tering the ship, distance, ship speed, fuel cost, crew cost,
port charges and time in port, number of destination
ports, and the supply and demand for shipping space.
The last factor is important in that it causes freight costs
to fluctuate widely..
Ammonia competes with LPG in the shipping sector.
However, there is a dedicated ammonia fleet of 40-65
vessels. Since the start of 1990, the shipment of
ammonia has consistently required a total of 65 vessels
with an aggregate capacity of 1.7 million m3 III. The
total available capacity to carry either LPG or ammonia
was estimated at about 8.6 million m3 in 1992.
Generally, the size of the vessel determines whether LPG or
ammonia is shipped. Table 7.4 provides the general
guidelines. Ships larger than 60,000 m3 are mostly used
for LPG, except for two Russian vessels used exclusively
for ammonia.
The C.l.S. countries dominate the anhydrous
ammonia export market, currently having 30% of the market
with a wide range of customers. Eastern Europe and
Western Europe, as well as the United States, import
large quantities of ammonia from the region. Other large
importers are Morocco, Tunisia, and Jordan. The Arab
Gulf states are also large exporters, mainly to India,
Turkey, and countries in the Far East [51.
The freight rates for ocean shipping depend not only
on the distance the cargo has to travel, but also on the
size of the cargo and the availability of the ships in that
size range. Some representative freight rates for shipping
ammonia for the period of September 1992 to August
1993 are shown in Table 7.5.
The seasonality of the LPG market has a direct
bearing on ammonia freight. Demand for both is quieter in
the summer months than in the winter, when the colder
weather causes demand for LPG to rise sharply. The
freight rates fluctuate for every shipment.
It should be emphasized that the total cost of
shipping and receiving ammonia includes not only the freight
but also the cost of operating loading, receiving, and
storage terminals, as discussed previously. Also the total
cost may include transport to the terminal. For example,
the C.I.S. terminals at Ventspils and Odessa are
supplied by pipeline from ammonia plants located several
hundred kilometers inland.
7.3.2 Shipment of Ammonia by Barge
Barge shipment of anhydrous ammonia is
economical for countries or regions that have inland or coastal
waterways and is extensively used in Europe and the
United States. Self-propelled barges are commonly used
in Europe where inland waterways are often narrow or
shallow. Their capacities may range from 500 to 3,000
tonnes, Most of the larger barges are fully refrigerated,
and smaller ones are semi-refrigerated. For most of the
inland rivers and canals, barges of about 1,000-tonne
capacity are suitable; larger self-propelled barges may
be useful for coastal shipping.
In the United States, barges play an important role in
ammonia transportation. Between 2 and 2.2 million
tonnes of anhydrous ammonia moves by barge each
year. About one million tonnes of the ammonia
transported is used for agricultural business; farmers apply
45% directly on the field, and 55% is converted to other
fertilizers such as UAN, DAP, and MAP. The balance of
anhydrous ammonia is used for industrial production of
chemicals such as nitric acid, adipic acid, acrylonitrile,
and aniline [6].
In the United States, towed barges are commonly used,
and several barges are lashed together and propelled by
a single tugboat. A tow may be formed by two barges or
more depending on the width of the waterway. Barges
for transport of anhydrous ammonia usually are fully
refrigerated, and their capacities may be in the range of
1,500 to 2,500 tonnes; smaller ones are used mainly
where the depth or width of the waterway is insufficient
for larger ones.
There are currently 39 barges in use for transporting
ammonia in the United States. They are typically 90 m
200
Table 7.4. Ships for Ammonia and LPG
Size of Vessel
30,000 to 59,999
20,000 to 29,999
10,00010 19,999
Under 10,000
Number of Ships Aggregate Capacity
(million "m3)
Use
42
26
48
400
1.8
0.7
0.6
1.0
Most important size in ammonia trade.
Higher LPG freight rates attract this size
into LPG trade.
More heavily involved in ammonia trade
than LPG trade. This size provides
greater flexibility at loading and ^~
unloading ports.
Mostly used for inter-regional and
coastal transportation of ammonia.
Used for short haul transportation of
both LPG and ammonia.
Note: 1 m3 = 0.68 tonne of ammonia at -33°C
Source: [1[.
Table 7.5. Representative Freight Rates (Sept. 1992 - August 1993)
Route
Cargo Size
(tonnes)
Typical Freight Rate
($/tonne)
Yuzhnny to US Gulf
Yuzhnny to Gabes, Tunisia
Arab Gulf to India
Arab Gulf to Taiwan
Arab Gulf to S. Korea
Yuzhnny to West Coast, India
Yuzhnny to North Africa
35,000
15-18,000
10-15,000
12-15,000
30-35,000
22-26,000
35,000
Mid-Upper 20s
13-Low 20s
23-24 (West Coast)
Mid 20s (East Coast)
Mid 20s-Mid 30s
Low 20s-32
Low 40s
20
Source: [1,10,111.
long and 15 m wide, and can carry up to 2,500 tonnes
of ammonia. A typical river tow consists of two barges
of 5,000 tonnes in total [1,6]. All the barges in use
today were built between 1964 and 1968, when new
ammonia plants were being established in Louisiana and
along the Gulf Coast. A 13,600-km network of
waterways, called The Western Inland River System, efficiently
connects the producing plants with many industries that
use ammonia and with the corn belt.
The Western Inland River System consists of the
Mississippi River, the Gulf lntercoastal Waterways (G1WW),
and their tributaries. About half of the U.S. population
and more than two-thirds of the, agricultural land are in
states served by these waterways. The principal rivers
include the upper Mississippi between Cairo, Illinois and
Minneapolis/St. Paul, Minnesota; the lower Mississippi
between Cairo, Illinois and New Orleans, Louisiana; the
Missouri to Sioux City, Iowa; the Ohio to Pittsburg,
201
Pennsylvania; the Arkansas to Tulsa, Oklahoma; the
Tennessee Tombigbee Waterway; and the GIWW between
Brownsville, Texas and St. Maries, Florida [6]. At least
35 ammonia terminals are located on rivers in the United
States. Several of these terminals can deliver ammonia
from-a barge to the Gulf Central Pipeline System.
The market for barging ammonia is experiencing slight
growth on the industrial side, but is declining on the
agricultural side. Nitrogen solutions are displacing direct-
application ammonia. The amount of nitrogen solution
used increased from 6.0 million tonnes in 1980 to 7.9
million tonnes in 1993. In the same period, the amount
of anhydrous ammonia used as fertilizer dropped from
5.0 million tonnes to 4,0 million tonnes [7]. A further
reduction in the barge market is likely as the ammonia-
producing industry consolidates, the pipeline network is
extended, and plants to produce ammonia derivatives
are built next to ammonia plants, Currently there is an
oversupply of barges, and barge freight rates are
depressed. In the late 1970s, the fair market charter rate
for a barge exceeded $1,200 per day. Today, the rate
would be less than one-half of that amount. Some
typical barge freight rates follow in Table 7,6.
The rates depend on both the difficulty of access and
the distance. Small barges must be used on shallow
rivers, and the rate is higher for such locations.
Table 7.6. Barge Freight Rates in the United
States
From
To
Distance
Rate
(km) ($/tonne)
New Orleans Texas City
New Orleans Cincinnati
640
2,080
10-11
25
7.3.3 Transportation of Ammonia by Pipeline
Transportation of anhydrous ammonia by pipeline is
economically attractive in some cases. Examples of long
distance ammonia transport by pipeline are found in
Mexico, the former Soviet Union, and the United States.
Pipelines may be used to transport ammonia from
manufacturing plants to maritime terminals for shipment to
factories that produce finished fertilizers or to market
areas for direct application. A pipeline may serve some
combination of these purposes.
Relatively short pipelines, up to 50 km, have been
used for 30 years or more for ammonia transportation.
For example, in Sterlington, Louisiana, a pipeline 6.4
km long and 7.6 cm in diameter was in use in the 1950s
to transport ammonia from an ammonia plant to an
ammonium nitrate plant. Likewise, in Portugal a
pipeline 10 cm in diameter and 17 km long was in
operation in 1960 to connect an ammonia plant with a
fertilizer plant. A 50-km pipeline is used to transport
ammonia from an ammonia plant in Carling, France to
a urea plant in Besch, Germany; a parallel pipeline
supplies carbon dioxide. In Mexico a pipeline which is about
240 km long crosses the country from the Gulf of Mexico
to the Pacific. One of the first European pipelines was
built in Czechoslovakia between Most and Lovesick
Pipeline transportation is well developed in the United
States. For the purpose of outlining the facilities
available in the United States, the four main systems have
been broken down as follows:
Gulf Central Pipeline System and Gulf Central
Storage and Terminal Company
Mid-America Pipeline Company
Tampa Bay Pipe Line Company
Table 7.7 indicates the length of the pipelines.
The following sections include key facts for each of
these four company facilities. Maps are included for the
Gulf Central Pipeline Company and the Mid-America
Pipeline Company.
Gulf Central Pipeline Company System (Santa
Fe Southern Pacific Corp.) - The longest pipeline
system now operating in the United States extends across
seven states with a length of 3,060 km [8]. The seven
states are Louisiana, Arkansas, Missouri, Iowa, Nebraska,
Illinois, and Indiana.
Ammonia plants primarily in Louisiana supply the
ammonia to the pipeline. Gulf Central Pipeline
Company has booster pumping stations along the route to
Table 7.7. Ammonia Pipelines (Overall Length)
Pipeline
Gulf Central Pipeline
(Santa Fe}
Mid-America Pipeline
(MAPCO)
Tampa Bay Pipe Line
Total
Source: [8].
Miles
1,900
1,090
83
3,073
Kilometers
3,057
1,754
134
4,945
202
offset pressure drop and changes in elevation as the
ammonia leaves the Gulf Coast and moves inland to
higher elevations [8].
The main line of the Gulf Central Pipeline originates
at anhydrous ammonia production plants near New
Orleans, Louisiana. This main line parallels the
Mississippi River north to Iowa. The main line then turns west
across the state of Iowa and terminates in Aurora,
Nebraska.
A major branch from the main Gulf Central Pipeline
extends east across the Mississippi River just north of
St. Louis, Missouri. This branch then crosses Illinois and
Indiana, terminating near Huntington, Indiana
(southeast of Chicago) [8]. Table 7.8 summarizes the design
basis for this installation.
Gulf Central Storage and Terminal Company- To
supplement the Gulf Central Pipeline, the Gulf Central
Storage and Terminal Company provides complete
operating ammonia terminals for public storage of
anhydrous ammonia. Eleven cryogenic storage terminals are
located along the pipeline in strategic locations. Each
terminal provides full storage and terminal delivery
service [8].
Mid-America Pipeline Company (MAPCO)- The
MAPCO ammonia pipeline (Figure 7.3) was the first
interstate system in operation. The initial charging of
the line with ammonia in 1968 came from an ammonia
manufacturing plant in Borger, Texas, The MAPCO line
now extends about 1,7 50 km northeast from north Texas
across Oklahoma, Kansas, Nebraska, and lowa7 ending
in Minnesota, The main line and branches provide
connections from three major ammonia plants to 13
distribution centers in four of these six states [S\. Table 7.9
summarizes the design basis for this ammonia pipeline.
Tampa Bay Pipe Line (Florida/ - The newest of
the U.S. anhydrous ammonia pipeline operations was
commissioned in 1978 at a length of 100 km. About 3
years ago, the length was extended to 132 km 18].
The ammonia liquid arrives at the Tampa Bay Port by
ship and is unloaded into either the Royster refrigerated
ammonia storage terminal or a newer
International-Mineral Company terminal on the Florida west shore. The
Tampa Bay office and pumping station is located about
5 km east of the two terminals.
Refrigerated ammonia from these terminals is first
reheated to about 10°C and then transferred to the
pipeline pumping station upon request. Table 7,10
summarizes the pipeline design basis.
These pipeline systems are common carriers and are
subject to regulation by the U.S. Government (Interstate
Commerce Commission), which requires (among other
things) that the rates be published.
The common contract rates used by the pipeline are
based on 12-month minimum tonnage. Table 7.11
shows rates published by MAPCO Ammonia Pipeline
_[-9-]-.-Note-that-the-.rates are not dependent on the
distance of the shipment.
The spot market rates depend on the place of origin
and the destination. However there is not a large
Table 7.8. Gulf Central Pipeline Design Basis
Control Center
Capacity
Main Pipe Line
Branch
Maximum Pressure
Minimum Pressure
Overall Length
Tulsa, OK
1,816,000 tpy (2,000,000 short tons per year). Approximately 5.7 m3/minute
(1,500 gal per minute).
25.4 cm (10") Alexandria, LA to Hermann, MO
20.3 cm (8") to Spencer, IA
15.2 cm (6") from Spencer, IA to Aurora, NE
20.3 cm (8") from Hermann, MO to Terre Haute, IN
15,2 cm (6") to Huntington, IN
9,917 kPa (1,424 psig)
2,169 kPa (300 psig)
3,057 km (1,900 miles)
Source: [81.
203
Figure 7.3. MAPCO Ammonia Pipeline.
Table 7.9. MAPCO Pipeline
Control Center: Tulsa, OK.
Capacity: 831,000 tpy (915,000 short tons
per year), Approximately 2.63 m3 per
minute; 2,270 tpd (700 gal per minute;
2,500 short tons per day).
Main Pipeline: A. 15.2 and 20.3 cm (6" and 8") from
Borger, TX to Hutchinson, KS.
B. 15.2 and 20.3 cm (6" and 8") from
Tulsa, OK (Vferdrigris) to Hutchinson,
KS.
C. 15.2 and 20.3 cm (6" and 8") from
Hutchinson, KS to Mankato, MN.
Overall Length: 1,754 km.
Source: [81.
Table 7.10. Tampa Bay Pipe Line
Control Center:
Capacity:
Pressure:
Discharge
Inlet
Main Line:
Branch Lines:
Overall Length:
Tampa, FL.
4.1 mVminute, 3,630 tpd
(1,075 gpm, 4,000 short tons
per day).
6,305 kPa (900 psig).
2,169 kPa (300 psig).
15.2 cm (6").
10.2 cm (4").
132 km.
Source: [81,
204
Tabic 7.11. MAPCO Ammonia Pipeline: Annual
Volume Rates3
Twelve Consecutive Month
Tonnage, Minimum
13,620(15,000)
90,780 (100,000)
181,560(200,000)
363,200 (400,000)
454,000 (500,000)
$ Per Tonne, Tariff Rate
14.65 (13.30)
14.30(12.98)
13,87 (12.59)
11.68(10.60)
10.46 (9.50)
a. Short ton values in parentheses.
Source; [9].
variation in the rates between any two locations.
MAPCO's published rates (issued March 2, 1992, but
still current in 1994) show a variation from $12.83 to
$15.25. Some examples of the rates are shown in Table
7.12.
The rates shown are for transportation only. If the
ammonia is loaded directly from the pipeline into trucks,
there is a truck loading charge of $1.43/tonne if the
loading is done by the pipeline company, except at
Mocane, Oklahoma where the charges will be-$2T45/—
tonne. When the ammonia is stored in the pipeline
company's storage terminal facilities, there is an
additional charge for storage space, which may vary from
$15 to $38 per tonne. But most of the storage facilities
are owned by the shipper or consignee.
7.3.4 Transportation of Ammonia by Rail
Ammonia is transported by rail in the United States
mainly in cars having capacities of about 70-78 tonnes.
Table 7.12. Spot Prices for MAPCO's Ammonia
Pipeline Transportation, US $/
tonne
From:
To:
Farmland, Farnsworth
Farmland, Mankato
Conway Terminal
Source: [9).
Cominco,
Berger
12,83
15,25
13.59
Farmland,
Enid
13.70
14.78
13,52
Terra,
Mocane
12.83
14.89
13.24
In general, rail transport is used for shorter distances
than pipeline or barge transportation, but not always,
because rail transport can be more economical for
supplying some points than a combination of barge or
pipeline and rail or truck. In some areas that are far from a
river or pipeline, shipping by rail may be the only
option. For instance, for shipping ammonia from Western
Canada to the Midwest United States, railroad and truck
are the main options, One use for rail transport is from
pipeline or large terminal to another storage terminal.
For transport by rail, the ammonia, if taken from re^
frigerated storage, must be warmed to at least 5DC
because the rail cars are not designed for handling -33°C
ammonia.
Though the railroads in the United States and Canada
are regulated and there is a ceiling on tariff that the
railroad can charge, most of the large transporters are
able to negotiate contracts to ship ammonia at a rate
lower than the regulated tariff rate. Representative freight
costs for transportation of ammonia by rail in cars of
78-tonne capacity are shown in Table 7.13. The rates
are based on the supposition that the cars are supplied
by the shipper. The railroads have few, if any, cars
suitable for ammonia transportation.
Table 7.13. Representative Rail Freight Rates
—for Anhydrous Ammonia
From:
Savannah, GA
Donaldsonville, LA
Donaldsonville, LA
British Columbia,
Canada
To:
Augusta, GA
Macon, GA
Enid, OK
Des Moines,
1A
Distance
(km)'
240
925
1,650
Single Car
Rate
($/tonne)
14.66
46.00
68.00
110.00
Source: [121.
7.3.5 Transportation of Anhydrous Ammonia
by Truck
Truck transportation is the most expensive method
of moving anhydrous ammonia and hence is used mainly
for short distance. The trucks used in the United States
consist of a tractor and a detachable trailer. Truck
capacity is in the range of 16-18 tonnes. The trailers are
also used to transport LPG. Some examples of truck
transport costs are shown in Table 7.14. In the United
States, about 4.0 million tonnes of anhydrous ammonia
is used for direct application each year, Probably as much
205
Tabic 7.14. Cost of Transportation of
Anhydrous Ammonia by Trucks
Distance, km
150
300
500
650
$/Tonnea
2.48 (2.25)
4.63(4.20)
6.33 (5,75)
7.71 (7,00)
a, Short ton rates in parentheses.
as 75%-80% of this amount is used in the spring. In any
given area, most of it is used within one month. This
means that most of the ammonia for direct application
must be stored near the users - part of it in local retail
storage facilities and part in large terminals served by
pipelines, barges, and rails. Because the annual
throughput of the storage terminals is no more than twice their
capacity, terminal storage costs are high. A typical total
cost for storage and transport of ammonia produced in
Louisiana or Texas to a retail center in Iowa has been
estimated in Table 7.15. This total cost does not include
retailer storage cost or transport to farms.
Table 7.15. Combined Costs of Ammonia
Transportation
Cost Component
US $/t
onne
Pipeline transportation from plant
to terminal
Terminal storage charges
Truck transport from terminal
to retailer
Total
14.00
25.00
5.00
44.00
7.4 References
1. "TransportingAmmonia." 1992.Nitrogen, No, 199.
2. Hale, C. C„ and W. H. Lichtenberg, 1990.
"Survey of Fief rigerated Storage in the U.S. and Canada,"
Ammonia Safety Symposium, Vol. 30. "
3. Appl, Max , et al. 1990. "New Cases of Stress
Corrosion Cracking in Large Atmospheric Ammonia
Storage Tanks," Ammonia Safety Symposium, Vol.
30, -..—
4. "Ammonia." 1985. UUman Encyclopedia of
Industrial Chemistry, 5th edition, Vol. A2,222.
5. World Bank. 1994, "World and Regional Supply
and Demand Balances for Nitrogen, Phosphate, and
Potash, 1992/93-1998/99," Technical Paper No.
N252, World Bank, Washington, D.C., U.S.A.
6. Voth, R. A. 1994. "The U.S. Ammonia Barge
Industry in 1994," FINDS, Vol. IX, Number 1, First
Quarter.
7. Data from Fertiliser Institute, Washington, D.C.,
Private Communication,
8. Hale, C, C, and W H. Lichtenberg. 1988. "U.S.
Anhydrous Ammonia Distribution System in Tran-
sition,ILAmmonia-Safety Symposium, Vol. 28.
9. MAPCO Ammonia Pipeline Tariff, l.C.C. MAPO
No, 1, issued March 2, 1992.
10. "Representative Freight Rates." 1993. Nitrogen,
No, 202.
11. "Representative Freight Rates." 1993. Nitrogen,
No, 204.
12. Quotations of the ammonia transporting companies,
Private communication.
206
Chapter 8. Nitric Acid, Nitrates, and Ammonium Salts
Table of Contents
Page
8.1 Introduction 209
8.2 Nitric Acid 209
8.2.1.. Introduction., : __2_09 .
8.2.2 Product Quality and Properties , 210
8.2.3 Raw Materials 210
8.2.4 Process Chemistry 210
8.2.5 Nitric Acid Production Technology 212
8.2.5.1 Ammonia Preparation 212
8.2.5.2 Process Air Preparation 212
8.2.5.3 Catalytic Ammonia Oxidation 212
8.2.5.4 Alternative Catalysts for Ammonia Oxidation 214
8.2.5.5 Cooling of the Reaction Products 214
8.2.5.6 Nitric Oxide Oxidation 214
8.2.5.7 Nitrogen Dioxide Absorption 215
8.2.5.8 Acid Bleaching 215
8.2.5.9 Tail-Gas Treatment 215
8.2.5.10 Energy Recovery 216
8.2.5.11 Platinum Recovery 216
8.2.6 Construction Materials , ,_.,,,,..,,,,,,.,. ,.,.,„.,..,..,,, :.'. 216
8.2.7 Industrial Processes 217
8.2.7.1 Uhde Medium-Pressure Process 218
8.2.7.2 The Grand Paroisses Dual-Pressure Process 218
8.2.7.3 GIAP High-Pressure Process 219
8.2.7.4 The Weatherly High-Pressure Process... 219
8.2.8 Present Trends and Expected Technology Development 220
8.3 Ammonium Nitrate 220
8.3.1 Introduction 220
8.3.2 Ammonium Nitrate Properties 221
8.3.3 Commercial Forms of Ammonium Nitrate 222
8.3.3.1 Hazards of Ammonium Nitrate and Relevant Regulations 223
8.3.3.2 Product Handling 224
8.3.4 Process Chemistry 225
8.3.5 Production Technology 226
8.3.5.1 Neutralization : 226
8.3.5.2 Concentration, Vapor Treatment, and Stabilizing Agents 226
8.3.5.3 Finishing Processes 227
8.3.6 Industrial Neutralization Processes 228
8.3.6.1 Uhde Neutralization Under Vacuum or Atmospheric Pressure 228
8.3.6.2 Uhde Neutralization Under 0.2-0.25 MPa Pressure 228
8.3.6.3 Hydro Agri Neutralization Under 0.4-0.5 MPa Pressure 228
8.3.6.4 The CARNIT Neutralization at 0.7-0.8 MPa 230
8.3.6.5 The Pipe Reactor Neutralization (AZF) 230
207
8.3.7 Industrial Finishing Processes _ 230
8.3.7.1 The AZF-Grand Paroisse Prilling Process 230
8.3.7.2 GIAP Neutralization/Prilling Technology 232
8.3.7.3 Granulation Processes 234
8.3.7.4 Production of Straight Granulated Ammonium Nitrate 234
8.4 ' Pollution Control 236
8.5 Production of Calcium Ammonium Nitrate '. 236
8.6 Other Nitrogen Compounds Used as Fertilizers ,.. 238
8.6.1 Sodium Nitrate 238
8.6.1.1 Properties of Sodium Nitrate 239
.. 8.6.1.2 Commercial Form 239
8.6.1.3 Storage and Transportation , 239
8.6.1.4 Raw Materials 239
8.6.1.5 Production From Natural Deposits 240
8.6.1.6 Synthetic Sodium Nitrate 240
8.6.2 Calcium Nitrate 241
8.6.2.1 Properties of Calcium Nitrate 242
8.6.2.2 Commercial Form, Storage, and Transportation , 242
8.6.2.3 Production Technology of Calcium Nitrate 242
8.6.3 Ammonium Sulfate 242
8.6.3.1 Properties of Ammonium Sulfate 242
8.6.3.2 Commercial Form, Storage, and Transportation 243
8.6.3.3 Production Technology '. 244
8.6.3.4 Combined Reaction-Evaporation Methods 245
8.6.3.5 Byproduct From Coke-Oven Gas or Town Gas Scrubbing 246
8.6.3.6 Ammonium Carbonate-Gypsum Process 246
8.6.3.7 Recovery FromJndustriaLByproductliquors .... 248
8.6.3.8 Spray-Tower Ammoniation 249
8.6.3.9 Double-and Mixed-Salt Production 249
8.6.3.10 Miscellaneous Processes 249
8.6.4 Ammonium Chloride 249
8.6.4.1 General Information 249
8.6.4.2 Properties of Ammonium Chloride , 250
8.6.4.3 Commercial Form, Storage, and Transportation 250
8.6.4.4 Raw Materials 250
8.6.4.5 Production Methods 250
8.6.4.6 The Dual-Salt Process ' 251
8.6.4.7 The Direct-Neutralization Method 252
8.6.4.8 Miscellaneous Processes 253
8.7 References 253
208
Chapter 8. Nitric Acid, Nitrates, and Ammonium Salts
8.1 Introduction
The purpose of this chapter is to describe the
technology and economics of production of nitric acid and
nitrates (except potassium nitrate, which is covered in
Chapter 15) and the production of ammonium salts for
fertilizer use (other than ammonium phosphates, which
are covered in Chapter 12). The chapter also includes
nitric acid and nitrate technologies developed in Russia
and other countries of Eastern and Central Europe. The
Commonwealth of Independent States (CIS) was the
largest producer of nitric acid, nitrates, and other fertilizers
in that area [1,2.31, and all original technologies in the
CIS were developed solely by the State Institute of
Nitrogen Industry (GIAP).
The sodium nitrate and kalium nitrates mined
commercially in Chile beginning about 1830 were the first
available inorganic nitrogen fertilizers. Ammonium
nitrate was developed as the first synthetic nitrogen
fertilizer followed by urea in the mid-1930s, anhydrous
ammonia fertilization in the 1940s, and ammonium
phosphates in the 1960s. Historical data on nitrogen
fertilizer production are given in Table 8.1.
The proportionate decline in the consumpfiofTof"
ammonium nitrate has resulted from massive
development of urea production in developing countries and
the introduction of complex fertilizers based on
ammonium phosphates, However, considering the higher
nitrogen use efficiency of ammonium nitrate compared
with urea, ammonium nitrate may be the more
economical nitrogen source in many situations.
8.2 Nitric Acid
8.2.1 Introduction
Nitric acid is one of the oldest known chemicals. Three
methods of production of nitric acid have been
developed:
• Acidulation of natural sodium nitrate with sulfuric acid;
• Direct synthesis from nitrogen and oxygen;
• Oxidation of ammonia.
The acidulation of sodium nitrate was conducted
commercially in Chile for about 30 years, ending in the early
1920s. Direct oxidation of nitrogen by electric arc was
carried out commercially beginning in 1902 in Norway
using electrical energy from hydrosources. A
commercial plant was also constructed in Poland using the
Moscicki process of direct oxidation in an electric arc.
That plant operated until the early 1950s.
The first patent on ammonia oxidation was issued to
Khulman in 1839; in this case platinum was used as a
catalyst to oxidize ammonia with air. The ammonia-
oxidation method using a platinum catalyst on a
commercial scale, developed by Oswald and Brauer and first
operated in Germany about 1908, is at present the
principal industrial method of nitric acid production. The
main use for nitric acid is in fertilizer production, mainly
for ammonium nitrate as such or in compound
fertilizers, nitrogen solutions, or mixed salts. About 75% of
total nitric acid production is consumed for nitrate
fertilizers, mainly as 50%-65% concentration acid. Smaller
fertilizer uses are for calcium and potassium nitrates, A
primary use is in acidulation of phosphate rock for
production of nitrophosphates. Plant capacities for weak
nitric acid used for fertilizer production are in the range
of 35 to 1,380 tpd although capacities of 2,000 tpd
have been designed.
Nitric acid also has many industrial uses for
production of nitro-aromatics and nitro-alkanes, of which
explosives manufacture is the largest. Another application
of nitric acid is for adipic acid production (an
intermediate product in Nylon production). In this case the
concentrated acid is used. A summary of applications of
nitric acid is given in Figure 8.1.
Table 8.1. Historical Data on Ammonium Nitrate Fertilizer Production
Unit
Ammonium nitrate production
Ratio in overall nitrogen supply
Mln.t/year
%
1950
1.9
47
1960
4.6
43
1970
10.1
33
1980
14.7
23
1990
14.0
18
209
Nitric Acid
—, Salt formation
Fertilizers
Neutralization
bvbase
Nitrates
—. Silver —
AquaRegia
— in coniiection
with gold
■- Silver mtiates
■ i
— Metal Treating and Pickling
Nitration
— Benzene
— Toluene
— Phenol
-*■ Nitrobenzene
—"-Trinitrotoluene
^ Nitropbenor -
Photolndustry
Silvering
(Aniline
Benzidine
""Gilding
Graphic and
Galvanic Industries
Pharmaceutical
Products
<:
Dyestufls
■Disinfectants
Other Hydrocarbons
and Phenols
Esterification
Glycol -
Glycerol
Cellulose
Oxidation
Toluene
-— p-Xylene
Cyclohexanan
•" Giycodimtrate
"-Tcinltrogryeerlne
-f Collodion
^*- Guncotton
*" Toluene Diisocyanate
•- Terephthalic Acid
—*- AdlpicMd
DyestuTfs
Pharmaceutical
Products, etc.
S—*-Explosives
Celluloid
Nitrocellulose Lacquer
*- Explosives
• Poryurethanes
Polyester Fibers
Polyester Plastics
Poryamide Fibers
Potyamide Plastics
Figure 8.1. Nitric Acid Applications.
8.2.2 Product Quality and Properties
Nitric acid is a strong acid and a powerful oxidizing
agent. The concentration of commercial nitric acid
destined for fertilizer production depends on the method of
production and is usually in the range of 42% to 65%.
Such acid is known as weak acid, unlike concentrated
acid (96.0%-98.5%) that is used for other industrial
purposes. Weak nitric acid is usually directed for captive
use. Anhydrous HNO3 does not normally exist in liquid
form. When strong solutions are distilled under special
conditions, one obtains almost pure nitric acid having a
concentration of 99,7%, When concentrated nitric acid
is heated at atmospheric pressure, it boils at 78.2°C but
begins to decompose and eventually yields a 68% HNO3
solution with a maximum boiling point of 120.5°C When
dilute solutions of nitric acid are concentrated under
atmospheric pressure, a maximum boiling-point solution
again corresponding to 68% HNO3 results. The more
important properties of nitric acid are summarized in
Table 8.2.
More particular physical properties of nitric acid are
given in handbooks [4,5]. Typical impurities in HNO3
originate from ammonia or the process. The standard
limits are the content of CI2 - less than 5 ppmw, and
HNO2 - less than 5 ppmw.
8.2.3 Raw Materials
The anhydrous ammonia and process air used must
be free from catalyst poisons, dust, and oil. Platinum
catalysts can be poisoned by such elements as As, Bi, P,
Pb, S, Si, and Sn. Fortunately, synthetic ammonia is
normally of high purity unless it is accidentally
contaminated. However, since air can be contaminated by dust
or many other pollutants, thorough air cleaning is
necessary. Location of the air intake in an area relatively
free from contaminants will help. If poisoning by
impure ammonia or air should arise, deep penetration may
occur, leading to the formation of inactive compounds
in the catalyst wires and, perhaps, to the extent of
ruining the catalyst. In other instances, contamination by
traces of Cr, Fe, or Ni may temporarily reduce
conversion efficiency, but this can often be restored by
treatment with hydrochloric acid or certain salts.
The physical properties of ammonia are given in
Chapter 6, Specifications for ammonia to be used in nitric
acid processes basically limit water, oil (from lubrication),
and heavy metals. The limits change from licenser to
licenser and obviously influence the process yields. At
-the~plants-located'in'the"former Soviet Union,
established limits for impurities in the feed ammonia are given
in Table 8.3 [5[. Limits on air impurities are given in
Table 8.4.
8.2.4 Process Chemistry
The oxides of nitrogen that are of interest in nitric
acid production are:
Nitrous oxide (dinitrogen monoxide) N2O
Nitric oxide (nitrogen monoxide) NO
Nitrogen dioxide NO2
Dinitrogen tetroxide N2O4
Of these, NO and NO2 are of primary importance. N2O4
exists in equilibrium with NO2 and is not present in
significant proportions at temperatures above about 100°C.
It acts as a transitory intermediate in low-temperature
absorption of NO2 in nitric acid. N20 is seldom present
in significant amounts. A mixture of nitrogen oxides,
usually NO and NO2, is commonly referred to as N0X.
The production of weak nitric acid consists of three
principal chemical steps:
• Catalytic ammonia oxidation to nitric oxide;
• Oxidation of nitric oxide to nitrogen dioxide;
• Acidic absorption of nitrogen dioxide in water.
210
Table 8.2. Properties of Nitric Acid
Formula
HNOi
Molecular weight
Color
In liquid state
As gaseous oxides
Odor
Hazards
In liquid state
As gaseous oxides
Melting point
Boiling point
Refractive index at 16.4°C
Density at 0°C
Solubility in water
Acidity
Heat of vaporization at 20°C
63.013
Transparent to yellow
Transparent to yellow or brown (color darkens on prolonged exposure to
light)
Sweet to pungent
Rapidly attacks flesh and most organic matter
Anesthetic to dangerously toxic
41.6°G
82.6°C
1.397
1,549.2 kg/m3
Totally soluble at all concentrations
A strong acid, having pronounced oxidizing characteristics. Will passivate
some metals, such as iron and aluminum
626,3 J/g
Table 8.3. Liquid Ammonia Commercial
Standard
Component
Water
Oil
Fe
Unit
%
mg/1
mg/1
Value
<0.4
<8
<2
Table 8.4. Impurity Limits in Oxidizing Air for
Nitric Acid Production
Component
Unit
Value
Sulfur compounds (S)
Phosphorus
Fluorine
Chlorine
mg/m3
mg/m3
mg/m3
mg/m3
<2,3
<0.3
<0.1
<0.1
The overall reaction (without taking into consideration
side reactions) can be presented as follows:
NH3(g) + 202(g) -» HN03(aq) + H20(1) + 437 kJ/gmol
Oxidation of ammonia without a catalyst results in the
formation of only elemental nitrogen.
On a catalyst surface several reactions may occur:
1. 4NH3<g) + 502<g) -> 4NO(g) + 6H20(g) + 227 kJ/gmol
2. 2NH3(g) + 202(g) -*■ N20(g)+ 3H20<g) + 276 kJ/gmol
3. 4NHa{g) + 302(3} -> 2N2 <g)+ oHzCKg) + 317 kJ/gmol
Simultaneously some other reactions can take place,
including:
4. 4NH3(g) + 6 NO(g) -> 5N2(g) + 6H20(g) + 451 kJ/gmol
Various alloys and metallic oxides have been tried as
catalysts, but platinum containing between 2% and 10%
rhodium is usually preferred \6\. Nitric oxide produced
in the ammonia converter must be oxidized further to
nitrogen dioxide by the excess air present in the
reaction mixture:
5. 2NO(g) + 02(g) -> 2N02(g) + 57 kJ/gmol
from which the tetroxide may be formed before
absorption in water:
6. 2N02(g) -> N204(g) + 29 kJ/gmol
When the temperature is lowered, the equilibrium of
reactions 5 and 6 shifts to the right. At low
temperatures and in sufficient time to reach equilibrium and in
the presence of excess oxygen, one can anticipate
transformation of all oxides of nitrogen into dinitrogen
tetroxide (N2O4). During absorption HNO2 is formed along
with HNO3:
7. N204 + H20 -> HNO3 + HN02
211
HNO2 decomposes and emits NO gas, which must again
be oxidized to NO2.
8. HN02 -* NO + H20
giving the summary reactions:
9. 3N204(g) + 2H2OQ) -> 4HN03(aq) + 2NO{g) + 16
kJ/gmol
10. 2N204(g) + 02(g) + 2H20(1) -* 4HN03 (aq) + 59
kJ/gmol
11. 3N02(g) + H2OQ) -* 2HN03(aq) + NO(g) + 59 kJ/
gmol
12. 4N02{g) + 02(g) + 2H20(I) -+ 4HN03(aq) + 87 W
gmol
Oxidation of NO (reaction 5) is the limiting stage of HNO3
formation. With decreasing concentrations of nitric oxide
and oxygen, the speed of oxidation decreases sharply.
Absorber performance, therefore, is improved by higher
pressure, lower temperature, and higher oxygen
content in the gas phase. In the ammonia converter,
however, oxidation of ammonia is favored by lower pressure.
The overall reaction of nitric acid production is strongly
exothermic. Of the total heat released, more than half
is released in the ammonia oxidation step at a high
temperature, and economical recovery as steam or for other
purposes is permitted. Also, part of the heat released by
the subsequent oxidatiorro"f~nitric 6xide~cah~be recov-
ered at a useful temperature level. The remainder of the
heat is released at a temperature too low for useful
recovery and requires a net consumption of energy for
circulation of cooling water, acid and process gas and,
in some processes, for refrigeration.
8.2.5 Nitric Acid Production Technology
Numerous proprietary processes for nitric acid
manufacture are now available. They differ primarily in
design details or selected operating conditions to suit the
plant sizes, cost of raw materials, energy cost, cost of
installation, and so forth, not in fundamental principles.
The production process usually is composed of the
following process units:
1. Vaporization, superheating, and filtration of
anhydrous ammonia;
2. Preheating, filtration, and compression of process
air;
3. Catalytic oxidation of ammonia;
4. Cooling of nitric oxide by heat exchange with
various media, e.g., process air, boiler water, tail gas,
etc.;
5. Oxidation of nitric oxide to higher oxides;
6. Absorption of nitrogen oxides in water to form
nitric acid;
7. Bleaching of acid by additional air or other means;
8. Treatment of tail gas to reduce air pollution (and to
improve total plant efficiency);
9. Recovery of energy in heated and compressed
process gases;
10, Recovery of catalysts for resale,
8.2.5.1 Ammonia Preparation -The anhydrous
ammonia used must be free from catalyst poisons, and
the oil content must be limited to a few parts per million
to avoid fouling the vaporizer and catalyst screens.
Liquid ammonia is vaporized, filtered, and superheated to
eliminate any possibility of liquid droplets entering the
catalyst chamber and burning holes in the screens.
Liquid ammonia filters remove solid contaminants. All
particles larger than 3 mm should be eliminated.
Vaporization of the ammonia is often used to provide
refrigeration for chilling the absorber. The superheated
vapor, after additional filtration, is thoroughly mixed with
process air in various ways according to the type of
process. Filtration of ammonia gas should remove 99.9%
of oil and all solid particles larger than 0.5 mm.
8.2.5.2 Process Air Preparation - Process air must
also be free from catalyst poisons, dust, and oil. It is
common to incorporate two-stage air filtration on the
compressor air intake using a high air filtration efficiency,
i.e., approximately 99.9% of all particles larger than
0,5 mm should be removed. For medium- and high-
pressure oxidation, rotary compressors of the lobe, vane,
centrifugal, or axial-flow design can be used, with an
increasing preference for the last two types since these
units can be combined with various turbine drives and
expanders in the form of one large single-shaft
installation.
8.2.5.3 Catalytic Ammonia Oxidation - The
ratio of ammonia to air and the flow rate of each
component must be carefully controlled to ensure maximum
conversion efficiency, prevention of explosion, and
maximum plant output. Use of static mixers is common. The
percentage of excess air usually results in 8.5%-12.5%
of NH3 by volume in the air-ammonia mixture. The lower
explosion limit is about 14,5% of ammonia in the
mixture.
The ammonia conversion efficiency, expressed as a
percentage of the ammonia that is converted to NO, is
mainly a function of the catalyst selectivity and activity,
temperature, pressure, thoroughness of mixing of the
incoming air and ammonia, and velocity of gas flow
through catalyst [7[.
212
• Catalyst
The customary choice of catalyst is a platinum-
rhodium gauze because this alloy promotes reaction
and also meets other operating criteria, such as
severe conditions of service. The usual rhodium content
is 4%-10%. Because higher percentages tend to give
slightly greater conversions and longer life, a 10%
rhodium content has become standard in many
processes [6J. In high-pressure plants (0.8-1,1 MPa) the
usual alloy is 90% platinum and 10% rhodium. In
medium-pressure plants platinum alloyed with 5%-7%
rhodium is often used.
The need to minimize and control contact time to
suppress unwanted reactions and to minimize catalyst
requirements led to the early adoption of fine woven
screens as a suitable catalyst form. These are usually
circular in shape and are stacked in multiple array,
because the use of several (5 to 45) screens permits
the residence time and contact time to be easily
varied to obtain the maximum yield of nitric oxide.
Usually a platinum-rhodium catalyst is used in the form of
a fine mesh (standardized at 1,024 mesh/cm2), either
of the fishbone or line cloth pattern. In an attempt to
achieve higher efficiencies and smaller platinum losses
[6], knitted gauzes were introduced not long ago.
Chrome^ickel alloy grids are used to support these
fine screens.
When first installed, a new gauze exhibits a
relatively low activity, but after several days of operation
under proper conditions, catalytic efficiency rises to a
satisfactory level and remains nearly constant during
the useful life of the screen, which should be several
weeks or even months for high- and low-pressure
burners, respectively. During operation, the crystalline
structure of the platinum alloy is modified by the severity
of service, and distortion takes place. Erosion also
occurs if vibration is present, especially at high
temperatures and pressures, which also results in
diminished activity. Eventually, the screen wears out and
must be replaced.
Most plants, particularly those with high-pressure
burners, have some kind of filter thattecovers part of
the platinum, which is lost from the catalyst. Reported
net consumption of platinum catalysts is in the range
of 100-200 mg/tonne of HNQ3 for medium- and high-
pressure units. In the republics of the CIS more
complicated platinum alloys are used (Table 8.5), For
instance, in the dual-pressure GIAP process the
medium-pressure burner (0.4 MPa) contains seven
screens of alloy No. 5 (alloy No. 1 is recommended
for startup). Contrary to Western practice, wires that
are 0.09 mm (instead of 0.076 mm) in diameter are
used. A reported screen-life prior to regeneration of
-Table 8.5. Alternative Catalyst Alloys Used in
the CIS
Pt Pd_ Rh_ Ru_
(wt%)--
Alloy No. 1 92.5 4.0 3.5
Alloy No. 5 81.0 15.0 3.5 0.5
about 90 days of continuous operation is obtained-
Total lifetime, prior to change, is 200 days. An
overview on the development of nitric acid catalysts in
Russia is presented in the article of Chernyshov and
Kisil [2].
Ammonia oxidation reactors (burners) for
atmospheric and Iow-to-medium pressures are often 3-4 m
in diameter and may incorporate up to seven or more
catalyst screens. High-pressure burners usually are
smaller in diameter, perhaps 1.2-1.8 m, and may
contain 12-45 gauzes. High-pressure units of this size can
produce 350 tonnes of HN03, or even more, per 24-
hour day. Larger size plants are now common; more
than 1,000 tpd can be produced with a single burner
with either high- or medium-pressure burners although
two burners may be preferable for the lower range of
medium-pressure processes, However; recent designs
of soTrre"high^pressure"burners in which diameters are
increased to reduce gas velocities are said to approach
efficiencies formerly attainable only in low-pressure
units. Most low-pressure burners operate at
approximately 800D-820°C and high-pressure units at about
900°-940°C, The higher temperatures, pressures, and
gas velocities associated with high-pressure burners
cause greater catalyst losses. Table 8.6 gives an
indication of the effect of operating pressure on ammonia
conversion efficiency, catalyst losses, and operating time.
Platinum catalysts can be poisoned by such elements
as As, Bi, P, Pb, S, Si, and Sn. Contact with these
elements leads to the formation of inactive compounds
in the wires and decreases catalyst activity, In other
Table 8.6. Ammonia Conversion Efficiency and
Catalyst Losses
NH3 Catalyst Operating
Pressure Efficiency Losses Time
(MPa) (%) (g/tHN03) (months)
0.1 97.5 0.06 6-8
0.5-0.6 95.5 0.14 5-6
0.9-LO 93.5 O30 1.5-2
213
instances contamination by traces of Cr, Ni, or Fe may
temporarily reduce conversion efficiency, but this can
often be restored by treatment with hydrochloric acid
or certain salts. In some factories the gauzes are
dismantled occasionally and accumulated solids are
removed by gently brushing the gauzes, However,
catalyst gauzes should receive minimal handling
because they become brittle during service.
Temperature and Pressure of Reaction
As the pressure increases, higher temperatures are
needed to preserve high conversion efficiency. The
temperature is controlled by preheating the air and
ammonia and by the amount of excess air. However,
the theoretical temperature limit is about 1000GC,
above which the decomposition of ammonia to
nitrogen starts to predominate. Ammonia conversion
efficiency as a function of temperature and pressure is
given in Table 8.7.
Table 8.7. Ammonia Conversion Efficiency
Pressure
(MPa)
0.1
0.35
0.8
1.05
Temperature
CO
790-850—
870
920
940
Conversion
Efficiency
(%)
-97=98-
96-97
95-96
94-95
• Contact Time
An important variable in ammonia conversion is
the rate of gas crossing the catalyst. Increased flow
rates lead to quicker oxygen transport rates on the
catalyst surface and the removal from the catalyst
surface of intermediate products. High gas velocities and
a short contact time, which is usually approximately
0.001 seconds, minimize undesirable side reactions.
Increased flow rates and provision of several layers of
catalyst help to minimize the undesirable reaction
products. The optimal velocity increases with reaction
temperature. The ammonia loading rate, which expresses
the flow rate, is considered optimal at the range of
3.6-4.3 kg of ammonia per gram of catalyst per day.
Gas velocities are much greater in high-pressure
burners, and efficiencies are usually lower, However, the
high flow rates increase catalyst losses.
8.2.5.4 Alternative Catalysts for Ammonia
Oxidation - The high cost of the metals of the platinum
group fosters the continual search for new nonplatinum
catalysts for ammonia oxidation, At optimal
temperatures (800°-900DC) and atmospheric pressure, catalytic
activity of individual oxides of metals to the reaction of
ammonia oxidation decreases in the line: C03O4 >
C02O4 > Cr203 > Fe203 > Mn203 > Bi2Os > CuO, Ag20
> CeOz > PbO > NiO > La203 > Si203 > V2Q3 > V205
> ZnO > AI2O3 > WO3 > Mo03 < Si02. In most cases
the same sequence is observed concerning selectivity
for NO formation. Thus, most of the prospective non-
platinum catalysts are based on oxides of the three
metals: Co, Fe, or Cr [5]. .. ._
Because oxidation of ammonia on a nonplatinum
catalyst differs substantially from the process on a
platinum catalyst, the use of nonplatinum catalysts is
restricted. In the republics of the CIS two-step catalysts
are widely used. One or several platinum gauzes are
used as the first step, and a bed of nonplatinum oxide
catalyst is used as the second step. The platinum step
offsets the drawbacks of the nonplatinum step. A
significant share of the ammonia burners in the CIS
operate with the two-step catalysts. Reportedly, this allows
the platinum input to be reduced by 40%-50% and
platinum losses to be reduced by 15%-30% under equal
conditions. The ammonia conversion efficiency is considered
to be approximately the same as with conventional
catalysts [8,9].
___8..2.5^.5_C_o_oling_of the Reaction Products - To
increase the formation of nitrogen dioxide and to
recover heat for use elsewhere in the plant, hot gases
leaving the burner are cooled, and the energy efficiency of
the process is increased. In most medium- and high-
pressure plants, different sequences are used; the gases
may pass subsequently through a wasteheat boiler, a tail-
gas heater, a cooler-condenser, a compressor (in dual-
pressure plants), and a second cooler-condenser. In some
cases the gases also may pass through a steam
superheater and a combustion air preheater. A platinum-
recovery filter usually precedes the cooler-condenser. In
one process all major heat exchangers are mounted end-
to-end to simplify plant design and to reduce capital costs,
In several European processes, some of the heat
exchangers are built as an integral part of other
equipment, for example, the burner or the wasteheat boilers.
Heat recovery of approximately 82%-85% is attained
in some plants; higher figures are limited by dew point
and corrosion considerations. In certain cases, about 1.1
tonnes of steam per tonne of 100% HNO3 can be
produced, Most of this is normally used for power purposes
within the nitric acid plant, but as much as 0.4 tonne
may be available for export.
8.2.5.6 Nitric Oxide Oxidation - Nitric oxide
produced in the ammonia burner is oxidized in two
reactions that occur sequentially:
214
* Reaction of nitric oxide with oxygen to form nitrogen
dioxide;
• A dimerization reaction to produce nitrogen tetroxide.
Both reactions are homogenous, moderately
exothermic and noncatalytic reactions. The oxidation reaction
is a very slow process with a negative temperature
coefficient. The oxidation rate varies rath the third power of
absolute pressure. The dimerization reaction is
instantaneous, is assumed to be always in equilibrium, and is a
direct function of pressure and inverse function of
temperature.
In atmospheric and some low- to medium-pressure
processes, one or more separate oxidation-cooling units
are often included prior to gas absorption. These units
are built in the form of vertical towers^ which are cooled
with external water curtains, shell-and-tube units, and
also drum and cascade coolers. Excess air in the gas
promotes initial oxidation, and some of the water vapor
also present condenses to form weak nitric acid, which
is later concentrated in the absorption section.
Additional air for oxidation usually is injected at some point
in the process, often in the absorption tower. In some
plants, the gas is rapidly cooled to condense the water
vapor without forming much weak acid, thereby
helping to increase final acid concentration. A special
condenser-cyclone separator unit designed for this
purpose is described by Graham_et_al._[10].
Some high-pressure processes seek to maximize the
extent of oxidation of NO to NO2 in the heat recovery
train so that heat generated by this reaction can be
recovered at a relatively high temperature level. This can
be accomplished by inserting extra chambers in the train
to increase retention time, for instance, between the
waste heat boiler and the tail-gas heater. Up to 80% of
the NO can be oxidized to NO2 before it enters the cooler-
condenser by this means. In some other high-pressure
processes, gas cooling and NO oxidation may be
undertaken in a combined oxidation absorption column.
However, the additional flexibility provided by a separate
oxidation-cooling unit and the ability to minimize the
amount of weak acid formed prior to absorption is
considered advantageous by many producers.
8.2.5.7 Nitrogen Dioxide Absorption - The
absorption of nitrogen dioxide comprises two processes:
* Cooling down the gaseous mixture below the dew point
to remove excess water and thus to increase the
partial pressure of nitrogen oxides.
• Absorption of nitrogen oxides in water,
As already shown, during the absorption reaction
additional NO is formed, further oxidized, and absorbed.
Absorber performance is controlled by temperature
and pressure. At reduced temperatures the gas-phase
equilibrium moves toward the formation of dinitrogen
tetroxide and an increased solubility in HNO3.
Therefore, lower temperatures improve the absorption rate
and increase the acid concentration. At higher pressures
the NO oxidation reaction is quicker, and equilibrium
moves toward nitrogen dioxide. In addition, with higher
pressure more concentrated nitric acid is produced.
At near atmospheric pressures, oxidation and
absorption rates are slow, and earlier atmospheric and low-
pressure plants used between five and ten very large
towers. Maximum strengths attainable were in the range
of 42% to 52% HNO3. To reduce capital investment
and to obtain increased operating efficiencies,
absorption under pressure was developed, using various types
of equipment, e.g., cascade coolers, packed columns,
spray towers, and columns incorporating bubble plates,
sieves, and such special devices as the Kuhlman tray.
Because acid concentrations are favored by low-
temperature absorption, several different cooling
methods have also been developed, e.g., by external units of
the plate, drum, or cascade type; by water curtains
outside the tower; and also by cooling coils strategically
located inside the absorption column. In some plants
using low-pressure ammonia oxidation, vaporization of
the ammonia is used to prechill the absorber feedwater
_and_co.oling_water. _.
Modern pressure-absorption systems permit
absorption efficiencies of more than 99% and acid
concentrations in the range of 55% to 65% to be obtained. In
some processes, concentrations of up to 70% HNO3
are achieved by using high pressures and cooled water
in conjunction with specially designed absorption
columns. In some plants, excess air may be injected into
either the cooler or absorption column to speed the
oxidation reaction. Process water for absorption systems
must be very pure to reduce corrosion effects in the
nitric acid plant and also in applications involving
subsequent use of the acid. In particular, the chloride content
must be very low. Hence, water from condensate sources
or ion-exchange purification units is often used.
8.2.5.8 Acid Bleaching - Acid produced in most
absorber units is invariably yellow or brown in color
because of dissolved nitrogen dioxide. This is not
acceptable for the handling of nitric acid and for most
applications. The nitrogen dioxide is removed either in
a separate small bleaching tower or in an additional,
lower section of the main absorber column by means of
compressed air injection. The gases are recycled to the
oxidation tower.
8.2.5.9 Tail-Gas Treatment - Except for
atmospheric units, exit gas from the absorber is normally
215
preheated and expanded in a turbine to recover an
appreciable amount of the energy used for compression
purposes. This gas contains primarily nitrogen, some
water vapor, oxygen, and mixed nitric oxides.
In the 1960s typical concentrations of NOx in the
tail-gas ranged from 1,500 to 3,000 ppmv. In recent
years concern about pollution control has led to laws
and regulations to reduce permissible levels of NOx in
tail-gas from nitric acid plants. For example, the
maximum concentration in the United States is equivalent to
200 ppmv of NO2 for new plants or 500 ppmv for
existing plants. (The level is stated in kg of NO2 equivalent per
tonne of HNO3.) In Russia the regulations are even stricter.
To meet the requirements that authorities in various
countries have established, a variety of methods have
been used. The principal methods employed to control
the level of NO* in tail-gas are:
• Extended absorption;
• Nonselective catalytic reduction (NSCR) with fuel such
as methane or ammonia plant purge gas;
• Selective catalytic reduction (SCR) with ammonia.
Other methods such as absorption by silica gel or
molecular sieves or scrubbing with alkalies or urea solutions
are also used by some companies but to a smaller
extent. Detailed descriptions of tail-gas treatment processes
are given in Chapter 19 [11,12].
8.2.5.10 Energy Recovery - Except in older plants
operating at atmospheric pressure throughout and in
very small medium- and high-pressure installations, most
or all of the energy needed to drive the air compressor,
or both air compressor and nitrous gas compressor, can
be recovered either in the form of mechanical energy
(by tail-gas expansion turbine) or in the form of steam.
In some instances, surplus steam for export or to
produce electricity is generated. The air compressor, steam
turbine, and tail-gas expander are usually built in the
form of a single, in-line unit. In dual-pressure plants this
system is also included. Tail-gas turbines usually supply
35%-85% of the compression energy. The tail-gas
turbine is a multistage design usually equipped with partial
load valves or adjustable guide vanes to control the plant
pressure. It should be mentioned that efficient
operation of the plants largely depends on efficient and
reliable operation of the machines. For medium- and
high-pressure oxidation, rotary compressors of the lobe,
vane, centrifugal or axial-flow design are used; the latter
two types are preferred because they can be combined
with turbine drives and expanders as a single-shaft
installation. The heat for air preheating can be provided
to some extent by the heat of compression.
8.2.5.11 Platinum Recovery - During operation
the surface of the catalyst is damaged by abrasion and
vaporization. Vaporization loss dominates at the
beginning of operation, but vaporization weakens the metal
structure and leads to abrasion and erosion.
The possible range of platinum losses is given in
Figure 8.2. Platinum from the catalyst passes into the gas
stream in the form of very fine particles, and its loss can
substantially increase the production cost. Therefore,
several methods of platinum recovery were developed
and installed in many plants. Two types of recovery
systems - catchment gauzes and mechanical filters - are
usually offered.
0.4
2 0.3 -
So.2 -
10.1
— : : . ; r ■ —■
* a
* . i
0 0.1 0.2 0.3 0.4 0.5 0.6 0.7 0.8 0.9 1
Operating pressure; |MPa]
Figure 8.2. Relationship Between Platinum
Losses and Operating Pressure.
The principle of catchment gauzes is to collect
platinum at a temperature as high as possible while the main
portion of the platinum loss is still in vapor form. At
these temperatures, platinum atoms strike the metal
surface and form an alloy with the catchment metal for
subsequent recovery. The system can recover up to 80%
of the primary platinum losses [6,13]. The catchment
gauzes, which are installed at the bottom of the burner,
are composed of a mesh screen and two or more metal
gauzes. Catchment gauzes are returned together with
the catalyst gauzes to the precious metal refining plant.
The mechanical filters, which are composed of glass
wool or silica fibers, are commonly installed downstream
of the catalyst where the gas temperature is below 300°C.
Recovery rates of 50% have been reported [141,
8.2.6 Construction Materials
The corrosive behavior of nitric acid toward metals
requires the proper selection of construction material.
216
The principal material wherever nitric acid or wet nitric
oxides are present is chromium-nickel austenitic steel.
The carbon content in this steel must be kept as low as
possible because chromium forms carbides that are not
acid resistant. The stainless steel used in nitric acid plants
to resist nitrous gases and nitric acid is standard
austenitic steel of type AISl 304L, 321, 347 (U.S.A.) or W n
1.4306, W n 1.4541, W n 1.4550 (Germany). For
equipment in contact with hot, higher concentration
nitric acid, special alternative alloys are used (AISl 304
L-nitric grade, AISl 310 L). Alloyed steels are also used
for welded.parts of pumps, impellers, and rotating
elements of compressors. For equipment that handles
ammonia, air, and hot, dry gases, normal carbon steel
can be used. However, for safety in operation,
especially during startup and shutdown operations, nitric acid
plants are often equipped with practically all stainless
steel equipment. Because they are resistant to nitric acid,
various fluorocarbon plastic materials are used for flanges,
gaskets, and seals.
8.2.7 Industrial Processes
Industrial plants are classified according to the
pressure used:
• Monopressure plants. These plants operate at the
same pressure in the ammonia oxidation and
absorption sections of the plant. Monopressure plants are
classified as low pressure (0.3-0.5 MPa) and high
pressure (0.8-1.3 MPa). --- ...
• Dual-pressure plants. These plants operate under lower
pressure in the ammonia oxidation section than in
the absorption section.
In general, high-pressure operation permits smaller
plant units to be used for a given output and helps to
reduce capital costs. High pressures also favor NO2
absorption; however, high-pressure ammonia oxidation
induces greater catalyst losses and also increases power
requirements unless additional equipment is installed for
power recovery. Because of recent emphasis on
pollution control, the ability of high-pressure processes to
attain acceptably low NOx levels in the tail-gas has
favored their adoption. Therefore, most new plants use
either mono-high-pressure or dual-pressure (medium-
pressure combustion, high-pressure absorption)
processes although some mono-medium-pressure processes
are used. -
According to Honti [151 the high-pressure processes
generally will have the lowest capital cost and highest
operating cost because of higher platinum losses, less
efficient NH3 conversion, and lower steam recovery.
Medium-pressure processes have the highest capital cost
and lowest operating cost (assuming the NOx content of
the tail-gas is acceptable), The dual-pressure process
represents a compromise, The choice may be influenced
by local conditions,
The first nitric acid plants used near-atmospheric
pressure throughout. However, practically all modern plants
use elevated pressures. A comparison of the different
pressure processes is given in Table 8.8. These values
are intended to be illustrative only. The choice of the
process always depends on local conditions; however, a
-general-prineiple-may-be-that lower capacity plants
favor the high monopressure alternative. The dual-pressure
choice seems to be a compromise between the higher
investment costs of mono-medium pressure and higher
operating costs of mono-high pressure alternative. Table
8,9 gives overall capital costs and typical process
requirements for a small dual-pressure plant.
Table 8.8. Typical Parameters of Nitric Acid Processes [17]
Parameter
Pressure
NH3 consumption
NOx abatement (NH3)
Ptlosses3
Energy consumption
Steam credit
Cooling water
NOx in tail-gasb
Relative capital cost
Units
MPa
kg/t
kg/t
mg/t
kWh
t/t
m3/t
ppmv
%
Mono-Medium
Pressure
0.5/0.5
283
0.5
60
8.5
0.6
120
400
120
Mono-High
Pressure
1.0/1.0
288
-
130
8.0
0.4
140
<200
100
Dual-Pressure
0.5/1.0
282
.
60
9.0
0.3
130
<200
110
a. With Pt recovery system.
b. With abatement system.
217
Table 8.9. Nitric Acid Plant (Dual-Pressure) Process Requirements
Product: Nitric acid (54%)
Capacity: 350 tpd
Capacity utilization: 90%
Annual production: 107,100 tpy
Process: Dual pressure
Investment cost:
- Battery limits US $15.2 million
- Working capital US$ 0.45 million
Cost Components
Raw materials
Ammonia
Catalyst
Utilities:
Electrical energy
Process water
Cooling water
Steam (credit)
Labor
Unit
US$
kWh
m3
m3
t
workhours
Unit/t
0.282-
0.93
9.0
1.5
130
(0.3)
0.22
Before particular industrial processes are described, it
should be noted that each process is based on
information supplied by a different engineering and
construction organization. Each of the organizations offers several
processes to meet various client needs. In addition,
several other companies offer nitric acid processes, and
there is no intention to imply that processes offered by
the four companies mentioned by name are necessarily
superior to those offered by other companies. This does
not imply any kind of endorsement by UNIDO or 1FDC.
Plant capacities in the following discussion are
expressed in terms of 100% HNO3 although the actual
acid concentration produced is usually 55%-68%.
8.2.7.1 Uhde Medium-Pressure Process - In the
Uhde medium-pressure process (Figure 8.3) the air
required to burn the ammonia is supplied by an uncooled
air compressor. The operating pressure is governed by
the maximum final pressure obtainable in an uncooled
compressor, i.e., 0.4-0.5 MPa in the case of radial
compressors (for a plant capacity of up to 200 tpd HNO3),
and 0.5-0.6 MPa with axial flow compressors (for a plant
capacity above 250 tpd HNO3). Hence, plant capacities
of 1,000 tpd HNO3 can be realized by employing only
one ammonia combustion element and two absorption
towers. The air compressor is normally driven by a steam
turbine and by a tail-gas expansion turbine; the steam is
generated within the plant. Alternatively, the
compressor may be driven electrically, in which case all the steam
generated is available for export.
The energy requirements of the plant can be adapted
to prevailing conditions. For instance, if the credit for
steam is high, the reaction heat may be used extensively
to generate steam. Conversely, it may be used to heat
the tail-gas for power recovery in the tail-gas turbine.
It is possible with this type of plant to produce acid
with a concentration of up to 68% HNO3, while the
-NGx-content-m-theHiail-gas leaving acid absorption will
be about 500 ppmv. Ammonia refrigeration cooling is
used, depending on final pressure, to the maximum
extent in connection with the cooling water temperature
to optimize absorption conditions according to acid
strength and/or tail-gas requirements. The NOx
concentration may be further lowered to less than 200 ppmv
by selective catalytic reduction (SCR) using a non-noble-
metal catalyst and ammonia as the reducing agent
according to the BASF NOx abatement process. Overall
nitrogen yield is 96.2% or 95.8% in conjunction with
the BASF process. Uhde also offers a high-pressure
process (0.8-1.0 MPa) and a dual-pressure process
(ammonia oxidation at 0.5 MPa and absorption at 1.0-1.4 MPa).
8.2.7.2 The Grand Paroisse Dual-Pressure
Process - The Grand Paroisse dual-pressure extended
absorption process (Figure 8.4) operates at a pressure
of 0.35-0,6 MPa for ammonia oxidation and 1.0-1.5
MPa for the absorption step. The absorption is carried
out in a single tower, but to improve the recovery in an
existing plant that has a shorter tower, a second tower
may be added. Chilled water from the ammonia
vaporizer is used to cool the upper part of the absorption
tower. The NOK content of the tail-gas is 200 ppmv or
less. The nitric acid concentration is up to 68%. At least
three plants employing this process were recently
constructed; two 902-tpd units for CNTIC in Lucheng,
218
Legend:
E-l Vaporizer
E-2 Superheater
F-3 Ammonia filter
M-4 Mixer
F-5 Air filter
K-6 Air compressor
R-7 Converter
E-9 Tail gas heater
E-9 Cooler condenser
C-10 Fi rst absorber
C-ll Second absorber
E-12 Tai1 gas preheater
X-13 Tail gas abatement unit
K-14 Tail gas expansion turbine
E-15 Wasteheat boiler
V-16 Steam drum
K-17 Condensing steam turbine
E-18 Steam turbine condenser
C-19 Bleacher
Figure 8.3. Uhde Medium-Pressure Process.
China (1987); 750 tpd for Enfersa in Sagunto, Spain
(1988); and 1,200 tpd for Tagas in Mersin, Turkey
(1990). The company also offers a monopressure
process (0.5-1.0 MPa).
8.2.7.3 GIAP High-Pressure Process -The GIAP
(Russia) high-pressure process (Figure 8.5) typically
operates at an approximate pressure of 0.7 MPa [5]. The
absorption is conducted in a single tall tower (44 m).
The main feature of this process is that the air
compressor is driven by a high-temperature gas turbine. The
process incorporates a nonselective catalytic reduction
(NSCR) unit for reduction of NOx. The tail-gas discharged
from the NSCR unit at a temperature about 700°C is
used to drive the gas turbine. The high efficiency of
energy recovery at such high temperature allows supply of
all process energy requirements and for supply of about
1.5 tonnes of export steam per tonne of acid.
Alternatively the steam may be converted to electricity. Such a
process is especially useful for sites with a large steam
consumption because it can decrease investments for
steam boilers. The nitric acid concentration is about 60%.
The NOx content in tail-gas may be 50 ppmv or less,
More than 100 plants that employ this process are
operative in the republics of the CIS and other countries.
The company also offers a dual-pressure process with
NSCR or SCR NO* abatement system.
8.2.7.4 The Weatherly High-Pressure Process -
The Weatherly high-pressure process (Figure 8,6)
typically operates at about 1.0 MPa pressure for both the
ammonia oxidation and absorption steps [16]. The
various heat exchangers located from the ammonia oxidizer
to the platinum filter are butted against each other to
form a compact train and minimize construction costs.
Spool pieces are inserted in the train to increase
retention time and thereby increase the percentage of NO
oxidized to NO2 at a temperature high enough for
economical recovery of the heat of reaction. In the extended
recovery option, the upper part of the absorption tower
is cooled to about 4°C by using refrigerated potassium
carbonate brine as the coolant. The brine may be
refrigerated in a low-pressure ammonia vaporizer with the
ammonia vapor going to ammonium nitrate production.
Alternatively, mechanical refrigeration can be used. With
the extended absorption system, the NOx
concentration can be lowered to less than 200 ppmv. The
company also offers the alternative of reduction of tail-gas
by combustion with fuel gas. The usual nitric acid
concentration is 58%-60%.
219
Cool ing HgD
<zzi_.
Legendi
E-l Vaporizer
E-2 Superheater
F-3 FI Iter
E-4 Preheater
F-5 FiIter
K-6 Conpressar
M-7 Mixer
R-8 Converter
E-9 Tall gas heater
Nitric acid
E-l0 EcononIzer
E~ll Cooler - condenser
S-12 Weak acid separator
K-13 Nitrous gas compressor
E-14 Tall gas preheater
E-15 Gaoler - condenser
C-16 Absorber
S-17 Separator
K-1B Tail gas expander
T-19 Start-up tank
K-20 Stean turbine
E-21 Condenser
E-22 Bleach air cooler
V-23 Bleacher
Figure 8.4. The Grand-Paroisse Dual-Pressure Process.
8.2.8 Present Trends and Expected Technology
Development
There is little opportunity to improve further the
Oswald nitric acid process. The overall efficiency of
ammonia conversion into acid is in the range of 94%-
96%, The process is self-sufficient in energy supply and
can even export steam. Up to 80% of platinum catalyst
losses can now be recovered. Capital investments were
significantly reduced by the development of high-pressure
absorption and with the design of efficient and reliable
compressors and expanders. Economies of scale improve
little for single-train units with capacities above 1,000
tpd.
The present trends in nitric acid production are as follows;
1, A tendency from low- to medium- or high-pressure
processes;
2, Capacities should continue to increase with single-
train plants; these plants should produce up to 2,000
tonne of nitric acid per day;
3, Advanced energy recovery and a more efficient use
of raw material by using improved methods of
calculation are likely to lead to reduced investment costs
and thus lower overall production costs [171.
A pattern of incremental improvements in the
technology may be expected to continue, but there is little
expectation of a significant breakthrough in capital
investment and production costs.
Recently, investigations on direct synthesis of nitric
oxide in low-temperature plasma were carried out [5].
Two methods were investigated:
• Under high temperatures (2000Q-2700°C) in
equilibrium plasma [18,19];
• In nonequilibrium plasma at relatively low temperatures.
It was proved that the new process can be realized on a
commercial scale. Unfortunately, the consumption of
electricity is quite high, and the new process cannot
compete with the Oswald process under present
prevailing prices of raw materials and utilities.
8.3 Ammonium Nitrate
8.3.1 Introduction
Ammonium nitrate is the most popular form of
nitrogen fertilizer in most European countries. In the United
States and Canada ammonium nitrate is being slowly
220
Tail gas
E-6
<-
E-5
I
fi-12
S-7
t
H20
C-10
E-
S-9
1C
Cooling water
c=>
C-ll
i
Nitric Add
Nitrous gas
Legend:
F-l Air filter
K-2a Axial compressor
K-2b Centrifugal compressor
K-2c Expander turbine
R-3 NSCR reactor
X-4 Preparatory chamber
E-5, E-6 Heaters
5-7, S-9 Separators
E-8 Cooler-condenser
C-10 Absorber
C-ll Bleach column
R-1Z Oxidizer
R-13 Converter
E-14, E-17 Uasteheat boilers
F-15 Filter
H-16 Mixer
E-18. E-19 Economizers
V-20 Deaerator
P-21 Feeding pump
Figure 8.5. GIAP High-Pressure Process.
replaced by anhydrous ammonia and liquid fertilizers. It
is rare in the developing countries, where urea
dominates the market. It is applied as a straight material or in
combination with calcium carbonate, limestone, or
dolomite. The combination is called calcium ammonium
nitrate (CAN) or ammonium nitrate-limestone (ANL) or
various trade names and in compound fertilizers
including nitrophosphates. It is also a principal ingredient of
most liquid nitrogen fertilizers. The nitrogen in
ammonium nitrate is more rapidly available to some crops than
urea or ammonium sulfate; most crops take up nitrogen
mainly in the nitrate form; thus, ammoniacal nitrogen
must be converted to nitrate in the soil before it
becomes effective. Many crops respond well to a mixture
of ammonium and nitrate nitrogen. Even though the
nitrification process is rapid in warm soil, it is slower in
cool soil (10°C and below). Urea may cause seedling
damage due to volatilization of ammonia, and
ammonium sulfate is strongly acid forming. For these and other
reasons ammonium nitrate and CAN are effective
fertilizers in zones with medium and low temperatures
during the cropping period, especially in those with a short
vegetation period.
The main disadvantages of ammonium nitrate are as
follows:
• It is quite hygroscopic;
• There is some risk of fire or even explosions unless
suitable precautions are taken;
• It is less effective for flooded rice than urea or
ammoniacal nitrogen fertilizers;
• It is more prone to leaching immediately after
application than ammoniacal products.
Although ammonium nitrate is principally used as
fertilizer, it also has some industrial uses, notably for
production of explosives. Plant capacities for ammonium nitrate
or CAN fertilizer production range from 400 to 3,000
tpd.
8.3.2 Ammonium Nitrate Properties
Ammonium nitrate is a white crystalline substance with
a nitrogen content of 35% and a density of about 1.725
kg/m3. The melting points depend on the content of
the water, and it is practically impossible to obtain dry
221
Process Water
Liquid
Ammonia ,„
=^—-§i-H
E-Zl F-EZ
Legend:
F-l Air filter
K-2 Expander turbine
K-3 Axial centrifugal compressor
K-4 Steam turbine
E-5 Tail gas preheater
5-6 Entrainment separator
E-7 Economizer
E-8 Air heater
C-9 Absorber
Cool i'ng Water
M-10 Mixer
X-ll Gauze
R-12 Converter
E-13 Expander gas heater
E-14 Wasteheat boiler
E-15 Gas heater
F-16 Pt/Rh filter
E-17 Wasteheat exchanger
E-18 Cooler-condenser
S-19 Acid separator
P-20 Interchanger pump
E-21 Vaporizer
F-22 Filter
E-23 Superheater
Figure 8.6. The Weatherly High-Pressure Process.
product in the industrial conditions {Table 8.10). The
solubility of ammonium nitrate and boiling points of
solutions [20] are given in Table 8.11.
In production and storage of ammonium nitrate,
transformations of the crystal states that may affect the
quality of the product occur. Crystalline states are given in
Table 8.12 121,22]. Critical relative humidities [23] at
increasing temperatures are given in Table 8.13.
Some additives such as Mg(NC"3) 2, (NH4) 2SO4, and
some others can slightly change the critical relative
humidities.
Table 8.10. Melting Points of Ammonium
Nitrate
Water Content, % Weight
0
0.1
0.2
0.5
Melting Point,
169.6
167.8
166.6
163.2
°C
8.3.3 Commercial Forms of Ammonium
\itrate
A large share of ammonium nitrate is supplied to the
domestic and international markets as prilled product
although granulated material is preferred in many
industrialized countries. The main difference is in the size
and strength of the particles. The granules are usually
coarser and harder than prills and are more suitable for
bulk blending. For industrial use some quantities of
crystalline product are produced.
Both primary materials (prilled and granulated)
usually incorporate additives (stabilizers) that improve the
quality of the product. Prills and granules may be coated
with anticaking products. In a number of countries prills
or granules are coated with surface-active materials such
as amines and others; this process is sometimes called
"wet coating." For severe climatic conditions and
longtime storage, a "dry coating" by inert material such as
kaolin or talcum, in addition to "wet coating," may be
used.
When ammonium nitrate is used as straight material,
the nitrogen content ranges from 30% to 34.5%. If it is
mixed with milled limestone of calcitic or dolomitic type
to make CAN, the nitrogen content is usually in the
222
Table 8.11. Solubility in Water and Boiling
Points [20] of Ammonium Nitrate
Solutions
Temperature
(°C)
Solubility
{g/100 g H20)
Of saturated solution:
0
20
40
60
80
100
150
169.6
At boiling point:
110
120
130
140
150
160
180
200
220a
230a
119
190
286
421
630
1,024
5,782
pure
Concentration
54.3
65.5
74.1
80.8
86.3
91.1
98.3
100.0
51,9
71.3
81.4
87.0
90.75
93.4
95.9
97,55
98.9a
100a
a. Extrapolated data.
Table 8.12. Crystalline States of Ammonium
Nitrate
System
—
1
11
111
IV
V
Temperature
(°Q
>169.6
169.6-125.2
125.2-84.2
84.2 - 32.3
32.3 - (-16.8)
<(-16.8)
State
liquid
cubic
tetragonal
a-rhombic
ft-rhombic
tetragonal
Vol. Change
(%)
-
+2.1
-1.3
+3.6
-2,9
-
range of 25%-28%. The most common grades for CAN
are 26% N (75% AN) or 27.5% (76.5% AN),
8.3.3.1 Hazards of Ammonium Nitrate and
Relevant Regulations - Ammonium nitrate is a strong
oxidizer. Under certain conditions (closed volume and
elevated pressure, contamination) it can explode.
Ammonium nitrate is generally regarded in most countries
as posing no unacceptable hazard when specification of
Table 8.13. Critical Relative Humidities (CRH)
of Ammonium Nitrate
Temperature
(°C)
0
20
30
40
50
60
Vapor Pressure
(mm Hg)
3.8
11.0
18.0
29.0
44.0
62.0
CRH
78,0
65.0
58.5
52.5
46.5
41,0
the material is fulfilled. Fertilizer-grade ammonium
nitrate cannot be exploded by impact, by heat, or by fire
alone.
However, explosivity of ammonium nitrate depends
on what the material is mixed with, how much
carbonaceous material is present, etc. Therefore, some
countries prohibit production and application of straight
ammonium nitrate. In a majority of countries the
detailed specification is regulated by law and the safe
handling, transportation, and application of ammonium
nitrate are ensured. In Europe the qualities of
ammonium nitrate are defined by the regulations of the Euro-
-pean-eommitree-No—1=250/7 (23:9.1980) and its
complements No. L-38/1 (2.7.1987) and No. L-63/
12 (9.3.1988), Table 8.14 gives the European Union's
regulations compared with the specifications of The
Fertilizer Institute (TFI) in the United States,
In Russia (and probably in other republics of the CIS)
the specifications of commercial ammonium nitrate are
standardized by the State All-Union Standard GOST 2-
85, which is still active. According to this standard two
grades of ammonium nitrate are produced: grade A is
destined for industrial use and grade B for use as
fertilizer. A high-density prilling process is used to produce
ammonium nitrate of both grades. The product
specifications are shown in Table 8.15.
Compound fertilizers containing ammonium nitrate
may be subject to propagated decomposition called
"cigar burning," when ignited. Once ignited the
decomposition propagates through the mass of material at the
rate of 5 cm-50 cm per hour with a temperature in the
decomposition zone of 300°-500DC, producing red-
brown hazardous fumes. Compound fertilizers with
ammonium nitrate, having a content of 4% or more of
KG, are susceptible to this phenomenon. The reaction
is inhibited by ammonium phosphate; therefore, NPK
grades containing ammonium nitrate and ammonium
phosphate are free from this hazard. In addition, hazards
223
Table 8.14. Specifications of Fertilizer-Grade Ammonium Nitrate
Parameter
European Union
USTFI
Oil retention (five thermocydes 25°-50°Q
Organic matter:
- product 28.0%-31.5% N
- product >31.5% N
pH value of 10% solution
Fines in product:
- passing 1-mm screen
- passing 0.5-mm screen
Chlorine
Heavy metals
Sulfur
<4 weight %
<0.4 weight %
<0.2 weight %
>4.5
<5.0 weight %
<3.0 weight %
<0.02 weight %
Cu <10 mg/kg
<0.2 weight %
>4.0
0.15 weight %
Maximum release of 4.6 ml
of H2 from 50-g sample
0.01 weight %
Table 8.15. Ammonium Nitrate Specification in Russia
Ammonium Nitrate
Parameters
Appearance
Nitrogen content
Calculated as NH4NO3, not less than
Calculated as N, not" less" than"
Water content (method of drying), not more than
Content of additives:
Calcium nitrate and magnesium
Nitrate calculated as CaO
Phosphates calculated as P2O5
Ammonium sulfate
Ammonium sulfate plus phosphate
Ability to spill (to disintegrate into prills), not less than
Content of prills 1-4 mm, not less than
2-3 mm, not less than
Grade A
Grade B
Prilled product without foreign admixtures
98%
no limits
0.2°/cr0.3% depending
on additives
0.2°/cr0.5%
0.2%-1.2%
0.3%-0.7%
QA%-0.6%
100%
no limits
no limits
no limits
34.4
0.2%-0.3% depending
on additives
0.296-0.5%
0.2%-1.2%
0.396-0.7%
0.496-0.6%
100%
95%
50%
of explosion of ammonium nitrate-containing fertilizers
have been acknowledged, and some governments have
issued specific regulations (e.g., in the Netherlands).
Limits on ammonium nitrate content are given in Table 8.16.
Special requirements may be established for the
strength of prills. The strength of ammonium nitrate
prills depends very much on the stabilizing additive that
is used. The results of tests with three kinds of additives
are given in Table 8.17.
8.3.3.2 Product Handling - Ammonium nitrate
may be stored in bulk although in most climates this
requires air-conditioned facilities. Storage facilities should
have adequate ventilation to allow quick dispersion of
heat and toxic gases in the event of fire [20,24,25,26,
27,281. The storage area must be equipped with a high-
efficiency sprinkler system. Ammonium nitrate has its
own oxygen for burning, and only large amounts of water
can extinguish a fire. In most countries the commercial
product is bagged in bags that should be "moisture
proof"; at least one ply should be impermeable to
moisture. If they are properly designed, plastic-film bags or
bags with plastic liners are suitable. Bulk shipment is
common in some countries using covered, hopper-
bottom cars. Before loading, the inside of the vehicle
224
Table 8.16. Limits of Ammonium Nitrate
Content in Compounds
Material Mixed
With AN
Chalk
Ammonium sulfate
DAP
Calcium phosphate
Potassium chloride
Potassium sulfate
Maximum Allowable Content
of AN in % Weight
80
40-45
65-70
70
70
70
Table 8.17. Static Strength of High-Density
Prills [33]
Additives
Sulfate
Magnesium
Boron/magnesium
Static Strength
N/Prill (kg/prill)
10(1.0)
8 (0.8)
12.5(1.25)
should be thoroughly cIeaned.-lHsimportanti:o"prevent^
contamination of ammonium nitrate with organic
materials such as grease or other hydrocarbons, chlorates,
nitrates, and metal salts (Zn, Cu), which when ignited
may support fire. In some countries, modes of
transportation are regulated by law; for example, in Russia
transportation is regulated by GOST 2-85, whereby only three
methods of transportation are allowed: in bags
(commonly 50 kg); in large soft containers; and in bulk, closed
carriers 15],
8.3.4 Process Chemistry
The process chemistry is simple, and the only
reaction observed is the reaction between anhydrous
ammonia and nitric acid:
NH3(g) + HNO3 (aq) -»■ NH4NO3 + 145 kJ/gmol
The production is highly exothermic and proceeds
with high speed. The concentration of the nitric acid
used in the process may vary from 45% to 60%,
depending on the process. The concentration of the
resulting solution depends on the concentration of the nitric
acid and temperature of the process. Except for the
United States, where a large amount of ammonium
nitrate is used in liquid form, most ammonium nitrate
solution is concentrated and processed into prills or
granules.
Prilling and granulation from melt must take into
consideration changes in the crystal phase and specific
volume. This is shown in Figure 8.7.
According to research results [291 harder prills or
granules can be produced when, during ammonium nitrate
cooling, the changes in crystal phase occur with
minimal volume and structural changes, e.g., when crystals
of system II are transformed directly into crystals of
system IV. This type of transformation is possible when the
moisture content of the melt is less than 0.1% or special
inorganic salts that prevent formation of phase HI are_
added.
0.72
0.7
0.66
O 0.66
X
E 0.64
ffl"
£
9
> 0.62
"u
ID
Cl
" 0.6" "
056
■
V
o.oi;
u>
IV
3
iii^^
......
H - ■
0.0215
6
B4.2
I j
'J*
-. ■
in
MELT
,
CM
d
'■
0.013
/
(50)
50 100 150
Temperature, °C
I-cubic
II - tetragonal
lll-alpha-rombie
IV-beta-rhombic
V-tetragonal
Figure 8.7. Specific Volume Changes of
Crystalline Ammonium Nitrate.
Changes in crystal specific volume may cause the
granules to degrade during storage or handling. This is
especially important in subtropical countries where the
phase-change temperature of 32.2°C can be passed
through often with a specific volume change of 0.0215 m3/
tonne, leading to disintegration of the prills or granules.
Ammonium nitrate is a strong oxidizer that can
support combustion. Dry ammonium nitrate should not be
heated; the following reactions occur when it is heated:
225
Between the melting point (170°C) and about 250°C,
the following exothermic reaction predominates 129].
NH4NO3 -> N02 + 2H20 + 37 kJ/gmol
Above 250°C, nitric acid and ammonia may be formed:
NH4NO3 -* NH3 + HNO3 -174 kJ/gmol
Since this reaction is endothermic, the
decomposition temperature can be self-limiting if the NO2 formed
in the previous reaction escapes freely. If not, another,
highly exothermic reaction can occur:
NH4NO3 + 2N02 -> N2 + 2HN03 + H20 + 232 kJ/gmol
Therefore, even at low temperature when small amounts
of nitric dioxide are present, the reaction can proceed.
The explosive decomposition of ammonium nitrate
can be described by the following reaction:
2NH4NO3 -*■ 2N2 + 02 +4H20 + 118 kJ/gmol
8.3.5 Production Technology
Solid ammonium nitrate is produced in the form of
prills, granules, or crystals. Large tonnages of
ammonium nitrate are made in the form of highly
concentrated (80%-90%) hot solutions that are used for the
production of urea-ammonium nitrate solutions
(Chapter 10) or are further concentrated for granulation or
prilling, __ __._._ .._ .
Ammonium nitrate production is composed of the
following process sections:
• Neutralization.
• Concentration.
• Finishing.
• Process condensate treatment.
• Vapor treatment with heat recovery.
8.3.5.1 Neutralization - When sufficient steam to
operate the plant is readily available from byproduct or
other low-cost sources, the use of an atmospheric type
of neutralizer may be preferable since such units are
relatively low in capital costs and simple to operate.
Alternatively, most or all of the steam needed to preheat
the feeds and to concentrate Lthe ammonium nitrate
solution can be generated by neutralizing acids containing
more than 50% HNO3 in a unit of the pressure type,
(By using a 64% acid, about 1 tonne of steam can be
produced for each tonne of ammonia neutralized.) In
some plants, especially those designed to make a
crystalline product, neutralizations are performed under
vacuum in equipment similar to that used for
ammonium sulfate manufacture.
In pressure-neutralized processes, the neutralizer
usually operates at 4-5 arm and 175°-180°C. Nitric acid is
fed to the neutralizer at a usual concentration range of
50%-60%. In some cases it may be preheated with
byproduct steam. Ammonia is fed to the neutralizer in
gaseous form. If it is available in liquid form, it is
vaporized in a heat exchanger by steam or air, If .air is used
the cooled air may be used to cool the prilled or
granulated ammonium nitrate product. The neutralizer may
be operated at a low pH (3-4) to avoid ammonia loss,
and more ammonia may be added later to adjust the pH
to 7. The concentration of the solution from the
neutralizer is usually in the range of 80%-87% ammonium
nitrate. It is evaporated further by using steam from the
neutralizer to a concentration of 94%-98%. In many
plants, a final evaporator-concentrator is used to increase
the solution concentration to 99.5%-99.8%.
In the case of atmospheric pressure neutralization,
the temperature in the neutralizer is lower (about 145°C),
and the steam generated is at a lower temperature and
pressure. The waste steam can be used to vaporize
ammonia or to evaporate the ammonium nitrate
solution in a vacuum evaporator. Depending on the
efficiency of utilization, the heat of reaction, the nitric acid
concentration, and other factors, the net steam
requirement may range from 0.0 to 0.5 tonne/tonne of AN;
in some cases a small surplus of steam may be available
for export [30,31],
8.3.5.2 Concentration, Vapor Treatment, and
Stabilizing Agents - Practically all types of
evaporators and separators are used. Examples are as follows:
• Natural circulation system.
• Falling film (under vacuum or air-swept),
• Forced circulation.
In vapor treatment the tendency is toward well-designed
scrubbing columns, either packed columns for the
recovery of ammonium nitrate and ammonia, or low
pressure-drop trays for the recovery of ammonium
nitrate and nitric acid [32,33,34,35]. For process
condensate treatment, the ion-exchange process 136] is also
considered to be an effective and economical method.
Most fertilizer-grade ammonium nitrate is treated with
inorganic stabilizers to retard the 32°C crystal transition
and improve storage properties. The most popular salt
used to prevent disintegration from the crystal phase
change is magnesium nitrate. It is added as a solution to
the hot ammonium nitrate solution prior to final
concentration or in the form of the dry oxide (MgO) to the
melt just before prilling. Final concentrations in the
ammonium nitrate product are up to about 1.5%
magnesium nitrate or 0.4% as MgO.
226
Stabilization against thermal disintegration does not
prevent caking but does reduce dust formation. The
product remains hygroscopic, and caking is best prevented
by protecting the product from direct contact with
ambient air. For this aim the prills and granules are also
coated with very small amounts of anticaking materials
such as oil/amine mixtures. Some other materials are
used as well.
Magnesium nitrate works only when "melt
granulation" or high-density prilling is done; i.e., the melt
concentration is about 99.5% weight or higher as for:
• High-density prilling.
• ICi-Nitram process [371.
• NH-pan granulation [381.
• Hydro Agri Fluid Bed granulation [39].
In fluid bed granulation the feed melt concentration is
97%, but the product leaving the granulator has only
0.25% moisture. The water content of the solidifying
melt must be significantly lower than the possible water
of hydration of the added magnesium nitrate (Mg (NC>3)2 •
6-7 H2O). The additive thus serves as an internal des-
iccant agent and shifts the 32°C crystal transition point
to about 45°C.
Salts used for other finishing processes including
"solution granulation," where the concentration ranges from
93% to 97%, are aluminum--arid~ifoTl^uJfales"I40^1^
The addition of ammonium sulfate alone increases the
hardness. In some countries mixtures of either calcium
nitrate and magnesium nitrate or ammonium sulfate and
ammonium phosphate are commonly used. An
effective but more expensive stabilizing agent is the mixture
of boric acid, diammonium phosphate, and ammonium
sulfate called "PermaIene-34." This additive eliminates
the transition point of 84°C and shifts the 32°C one to
43°C [42,43]. According to Olevsky [44,45] the. static
strength of high-density prills depends considerably on
the chemical composition of the stabilizing agents.
8.3.5.3 Finishing Processes - Several finishing
processes have been used including graining, flaking,
granulation, crystallization, and prilling. In low-density
prilling the ammonium nitrate solution is fed to the prill
tower at about 95% concentration, and the resulting
prills are dried and cooled. The prills are somewhat
porous and may have an apparent specific gravity as low
as 1.29 compared with 1,65 for high-density prills. Low-
density prilling is used to produce ammonium nitrate for
use as a blasting agent. A porous prill that will absorb oil
is preferred for this use. GIAP has improved this
process using special additives that promote the formation
of pores in the prills.
The high-density prilling process, using 99+%
solution concentration, is used in many plants making straight
ammonium nitrate for fertilizer use. High-density
prilling requires expensive fume abatement equipment and
has low flexibility for production of different N-content
products. In addition, the product size is limited and the
prdductTslessTiard. Capital costs and process
requirements for a high-density prilling plant are given in Table
8.18.
Table 8.18. Ammonium Nitrate Prilling Process Requirements
Product: Ammonium nitrate
Capacity: 1,400 tpd
Capacity utilization: 90%
Annual production: 415,800 tpy
Process: High-density prilling
Investment cost:
- battery limits, US $28 million
- storage, US $7 million
Working capital, US $3.6 million
Cost Components
Raw materials
Ammonia
Nitric acid (as 100%}
Stabilizer
Utilities:
Electrical energy
Process water
Cooling water
Steam
Labor
Unit
t
t
US$
kWh
m3
m3
t
workhours
Unit/t
0.208
0.774
1.2
26,2
0.1
1.1
0.35
0.15
227
Granulation processes have an advantage over
prilling regarding the choice of particle size range of the
product. The most widely used granulation methods
include rotary pan, rotary drum, and fluid-bed processes.
8.3.6 Industrial Neutralization Processes
8.3.6.1 Uhde Neutralization Under Vacuum or
Atmospheric Pressure - This system has the lowest
investment cost, The process is shown in Figure 8.8.
The reactor is slightly pressurized to prevent ammonium
nitrate solution from boiling since this impedes the
absorption of ammonia. After it is heated by the reaction,
the circulated ammonium nitrate solution is fed via a
restriction orifice to the flash evaporator where part of
the water is evaporated and the solution is cooled down.
By using feed acid at an adequate concentration and
preheating the feedstock, the ammonium nitrate
solution may reach a concentration of about 95%. The
neutralization pressure ranges between 0.03 MPa and 0.12
MPa and the reaction temperature, 130° to 145°C; thus,
all of the equipment will be of normal stainless steel
(304L). However, the concentration of the ammonium
nitrate is slightly low for going directly to the finishing
process, and a small final evaporator is needed. The
process parameters are given in Table 8.19,
8.3.6.2 Uhde Neutralization Under 0.2-0.25
MPa Pressure - This process was developed to
balance the heat requirements but still operate in normal
stainless steel equipment. The heat of neutralization is used
in a heat exchanger to concentrate ammonium nitrate
solution recycled from the flash evaporator. The heat
exchanger after flashing can act as a condenser- or reboiler.
In the latter case, a steam of pressure of 0.4 MPa is
produced. The steam from the flash evaporator is condensed,
and the AN solution is heated. The process is carried out
at 0.2-0,25 MPa pressure and is shown in Figure 8,9.
The process parameters are given in Table 8.20: —
8.3.6.3 Hydro Agri Neutralization Under 0.4-
0.5 MPa Pressure - Neutralization is carried out at
0.4-0.5 MPa, but the operating temperatures (175"-
185°C) require highly resistant materials (special low
carbon 304L and titanium). The process flowsheet is
shown in Figure 8.10. The heat of reaction is used for
concentrating the AN solution to 95% and production
of steam for export.
Vapor to scrubber
60* Nitric acid
i=>
Ammonia gas
E-9
97. b% AN-solutlon
toy
E-f
^d^^
a n
P-4
P-7
Legend:
R-l Reactor
E-2 Nitric acid Preheater
E-3 Ammonia Preheater
P-4 Circulating pump
E-5 Flash evaporator
R-6 Neutralizer
P-7 AN-pump
E-8 Reboiler
E-9 Flash evaporator
Figure 8.8. Uhde Neutralization Process Under Vacuum or Atmospheric Pressure.
228
Table 8.19. Uhde Neutralization Process Parameters
Flashing
Pressure
(MPa) [kg/tAN) (kg/tAN)
NH3 HN03100
Steam
Concentration After Final Consumption Cooling Water Electric Power
Neutralization Concentration 1 MPa Consumption Consumption
[%) (%) [kg/t AN) (m3/tAN) (kWh/t AN)
0.05
0.1
213
213
789
789
92.5
90.0
97
97
80
90
28,5
5a
3.5
3.5
a. Without scrubbing.
Vapor to scrubber
AN-solutlon 97,6 '/.
<^
60 V. Nl-tr Ic acid
c^>
AmmonI a gas
c=>
Legend 1
R-l Reactor
E-2 Annan I a preheater
P-3 Circulating punp
E-4 Heat exchanger
E-5, E-7, E-B Flash evaporators
E-6 RebolLer
Figure 8.9. Uhde LP Neutralization Process With 0.4 MPa Steam Production.
Table 8.20. Uhde Pressure Neutralization Process Parameters
Flashing
Pressure
[MPa)
0.2
0.35
NH3
[kg/t AN)
213
213
HN03 100%
(kg/t AN]
789
789
Final
Concentration
(%)
97
97
Steam
Generation
0.45 MPa
(kg/tAN)
240
173
Steam
Consumption
IMPa
kg/tAN
98
55
Cooling Water
Consumption
(mVtAN)
19.2
17.5
Electric Power
Consumption
(kWh/t AN)
3.5
3.5
229
Process s^ecm
Arimon la
Expor"t stean
<=B
Pure condensates
<=>
BFW
>=>
NItr1c ac I d
n^>
Process condensates
<=,
Legend'
E-l, E-3, E~4, E-9, E-15 Heat exchangers
S-2, S-6, 5-8, S-12 Separators
R-5 Converter
C-7 Condensing column
S-10 AN-solution separator
P-llj P-13 Pumps
E-14 U-tl U-ty boi ler
Figure 8.10. Hydro Agri Medium-Pressure Neutralization Process.
8.3.6.4 The GARNTT Neutralization at 0^-078
MPa - The CARN1T process (Kemira, SA, Belgium)
operates at 185°C at the reactor output pressure of 0.75
MPa.
The neutralization is carried out in two steps:
• Alkaline, where the low carbon stainless steel can be
applied.
• Acidic, where the titanium reactor is installed.
The alkaline hot solution passes through a steam boiler
and falling film evaporator made of low carbon stainless
steel. Concentrated solution is recycled to the second
reactor where additional nitric acid is added before
flashing and scrubbing (Figure 8.11). The parameters of the
process are given in Table 8.21,
8.3.6.5 The Pipe Reactor Neutralization (AZF) -
In the AZF-Grand Paroisse process (Figure 8.12) the
neutralization is carried out in a pipe reactor using
gaseous ammonia and preheated nitric acid to give an
ammonium nitrate melt of up to 97% concentration directly.
The evolved steam is used to evaporate and superheat
the feed ammonia and preheat the acid. The balance of
the steam is condensed. The ammonia and acid, at
pressure, are mixed at high velocity in the pipe reactor and
are neutralized at a generated temperature of up to
-2QQ°Gr-The-solution-flashes into the separator
operating near atmospheric pressure, and the resulting steam
passes overhead directly to the ammonia evaporator or
alternatively to be scrubbed with dilute AN solution to
reduce ammonia and AN in the downstream
condensates. Concentrated 95% - 97% AN solution overflows
from the tank to the pump tank. If the AN solution is less
than 96%, it is first concentrated in a falling film
evaporator. The process parameters are given in Table 8.22,
8.3.7 Industrial Finishing Processes
8.3.7.1 The AZF-Grand Paroisse Prilling
Process - The AZF-Grand Paroisse prilling process for
fertilizer or industrial grade is shown in Figure 8.13. The
ammonium nitrate solution from the pipe reactor
neutralization step is first concentrated to 99.8% in an air-
swept falling film evaporator, with steam condensing in
the shell. If porous AN prills suitable for industrial
explosives are to be made, then 95% solution is pumped
directly to the mixing tank for redissolving recycled
off-specification material. The solution concentration and
pH are controlled by adding scrubbing liquor and
gaseous ammonia respectively. The solution is pumped
through sprays arranged in the top of the prilling tower.
Fans located at the top ensure a countercurrent flow of
cooling air against the falling droplets. Various options
are available to clean the air before they are discharged
230
A
E-3
R-2
N I-trie Acid
c=r>
R-l
E-4
AnnonI a
r=>
60 '/. Nitric Acid
5,5 bar steam
Anmonla to R-l
<=>
Annonla llq,
c=>
E-7
E-6
Nitric Acid to R-l
cz^>
D
S-5
E-B
^Sr^I
Nitric Acid
<=:
vent
-c=>
■*' E-9
B-1E
condensates
P-14
S-13
P-15
E-ll
P-16
Legendi
R-l Primary reactor
R-2 Secondary reactor
E-3 Flash evaporator
E-4 Falling film exchanger
S-5 Vapor separator
E-6 NH3 llq, vaporizer
E-7j E-S Ammonia and acid preheaters
E-9 Off-gas final condenser
Figure 8.11. CARNIT Process Flowsheet.
E-10 UtlMty boiler
E-ll Falling film exchanger
E-ia Exhaust fan
S-13 Final scrubber
P-14 - P-16 Pumps
Table 8.21. CARNIT Process Parameters
AN 97.6 Y. wt,
1=>
Parameter
Feed
HN03 liquid
NH3gas
Reactor input,
HNO3 liquid
NH3gas
Recycle solution
Reactor output,
AN solution
Concentration section,
AN solution from E-4
Product,
AN solution from E-ll
Flashinq Pressure NH*
(MPa) (kg/t AN)
0.018 212.5
Concentration
(%)
HNO3 100%
(kg/t AN)
787.5
60
100
60
100
65,6
65,6
83-84
97.5
Final AN
Concentration
(%)
97:5
Steam
Generation
0,6 MPa
(kg/t AN)
128
Temperature Pressure
(°C) (MPa)
30 0.95
30 1.1
65 0.9
65 0.95
160 0,8
185 0,75
80-82 0.018
155 0.4
Cooling Water Electric Power
BFW Consumption Consumption
(kg/t AN) (m3/t AN) (kWh/t AN)
133 11 1.85
231
N l-trie Acid
■=>
Annon la
<=>
c=>
AnnonI urn
Ni trate
Solut Ion
-M
BE
Pipe Reactor
Separator
~n<—l^
Pump Tank
ft
Venturl
Scrubber
■Q-*
dl tute AnnonIun Nitrate
a*
M <R) >
ft
cw
Evaporator
Acid
Heater
Condenser
B*
->£!
-c^>
Condensate
Condensate
Tank
Figure 8.12. AZF Pipe Reactor Neutralization.
Table 8.22. Parameters of the AZF Pipe Reactor Process
Parameter
Reactor input,
HNQ3 liquid
NH3 gas
Separator,
AN solution
Concentrator,
AN solution
Product,
AN solution
Concentration
(%)
51
100
73
95
97.5
Temperature
80
160
170
132
155
Pressure
(MPa)
0.6
0.6
0.4
0.03
0.04
to the atmosphere. The prills are collected at the bottom
for discharge to the drying, cooling, and screening
section. Recently (1990) the process was installed by GP-
AZF in Mazingarbe, France, with a capacity of 500 tpd.
Some other companies, for instance, Imperial
Chemicals Industries (1CI), have also offered high-density
prilling processes. However, the main European producers
of high-density prills are Russia and other republics of
the CIS countries. In the CIS all ammonium nitrate
fertilizer plants use the high-density prilling process.
8.3.7.2 GIAP Neutralization/Prilling
Technology - Figure 8.14 presents a simplified flow diagram of
232
Hot air
AN soln.
c=> —>
H
Vent
flv
ent -
E-l
Steam
Ammonia
pH control
c^ _
V
^
Cond.
M-2
PT-3
-i
Scrubber liquor
<I
Vent
DEDUSTING
AND K
SCRUBBING
Condensate from
neutralzation section
<=,
DRYING
$ COOLING
SCREENING
Product to coating
-£ ,=>
Oversize
and undersize
D
Legend:
E-l Evaporator
M-2 Mixing tank
PT-3 Prilling tower
Figure 8.13. The AZF-Grand Paroisse Prilling Process.
To atmosphere
C=j
To atmosphere
H2 =*
Weak AN solution
Steam
T-U
^<Ji
Legend'
E-l, E-2 Preheaters of Amnonlo
and Nitric Acid
R-3a, R-3b Neutral Izers
X4, X5, X9 - pH Adjusters
E-6 Final evaporator
C-7 Washer of steari-alr mixture
S-8, S-lBab Scrubbers
F-1D Fi Iter
T-ll. T-15 Tanks for melt
X-9
Ammanla
P-12, P-13 Pumps
T-14 Tank for AN solution
X-16 Acoustic spray head
PT-I7 Prl11 tower
B-19q, B-19b, B-22abc Fans
BC-20 Belt conveyor
E-21 Fluldized bed cooler
E-23abc, E-24 Air heaters
Melt
E-23abc B-22abc
Figure 8.14. GIAP High-Density Prilling Process.
233
the GIAP high-density prilling process. A portion of the
waste steam from the neutralizer is used to preheat the
nitric acid to 70°-90°C; the remainder of the steam is
fed to the prill tower air scrubber. The gaseous
ammonia is preheated by a portion of the waste steam to
160°C. The concentration of the solution from the
atmospheric-pressure neutralizer is as high as 89%-92%,
The solution is further evaporated to a concentration of
99.7%-99.8% in the final evaporator and is fed to the
spray heads of special design to form "uniform"
("monodispersion") prills. On Figure 8.14, item X-16 is
a so-called "acoustic" spray head installed in the upper
part of prill towers of many CIS plants. Several other
designs of "monodispersion" spray heads were tried and
are used at some plants. Such spray heads in
conjunction with a fluidized cooling bed can provide up to 85%
prills of 2- to 3-mm diameter. There is a choice of
alternative stabilizers added to the AN solution before
prilling, The prills are conditioned prior to bagging.
A distinguishing feature of this process is its simple
operation and high reliability because most equipment,
except for pumps and fans, is static and lacks moving
parts. The high quality of the product (up to 85% of 2-
3 mm prills) allows it to be bagged without screening.
The product is screened only when it is sent to the
adjacent warehouse for lengthy bulk storage [44].
The process has been operated at many CIS sites, for
example, in Dorogobuj, Novgorod. Kirovo-Chepetsk,
and others at capacities of up to 1,500 tpd [3].
The company also offers a proprietary low-emission
prilling process with a closed circuit for prill tower
cooling air. An original method for flow of cooling air through
the system (without fans) is used in that process.
8.3.7.3 Granulation Processes - Prilling has the
disadvantages of difficult emission control, limited
product size, and lower product hardness. Granulation
processes are flexible and allow easier emission control.
Granulation plants can produce other products, for
example, calcium nitrate (CN), ammonium nitrate sulfate
(ANS), and NPKs. Granulation gives a coarser product
than prilling, thereby minimizing segregation of bulk-
blended fertilizers.
8.3.7.4 Production of Straight Granulated
Ammonium Nitrate - Products with nitrogen contents
in the range of 30%-34.5% are classified as straight
ammonium nitrate. The following granulation processes
are offered for straight ammonium nitrate production:
■ Cold spherodizers
• Drum granulation
• Pugmill
• Pan granulation
• Fluid bed granulation
• Fluidized drum granulation
These processes are used for products containing up to
34.5% N. For products that contain up to 33.5% N, the
pugmill, drum and cold spherodizers are used also
[30,31]. These processes operate the same way as for
CAN. However, the ammonium nitrate melt
concentrations (wt. %) are different: '
Drum
Pugmill
Pan granulation
Fluid bed granulation
Fluidized drum granulation
96-96.5
........._953-96
99.5
99
97.5
With all methods, additives are obligatory for
granulation and for improving storage properties. Process
requirements for a granulation plant are given in Table
8.23.
Figure 8.15 shows the process flowsheet of a pan
granulation plant [38]. Dry recycled material is fed at a
controlled rate to the inclined rotating pan granulator.
In the granulator a hot melt, which is virtually moisture
free, is sprayed onto the moving bed of solids and
solidifies on the cool particles. Round granules are formed by
agglomeration, and, as their size increases, they move
~upwardsirrtheTotating-pan- finally rolling over the rim.
The granulation temperature is controlled by the rate at
which solids are fed to the pan. An optimum
temperature range for agglomeration, within which a high growth
rate of the particles is obtained, is 5°-25°C below the
temperature at which the fertilizer melt solidifies. The
recycle ratio under these conditions is about 0.5/0.7:1
for ammonium nitrate. Granules leaving the pan are
plastic and have a somewhat irregular surface. They enter
a polishing drum where they are exposed to mild
mechanical forces and smoothed. A certain amount of
cooling also occurs. Cooling to the desired product
temperature is then performed in normal cooling
equipment, such as a fluidized bed or a rotary drum.
Depending on the climatic conditions at the plant site and the
desired product temperature, the cooling air may be
conditioned. Cooled granules are conveyed to a screen.
Oversize material from the screen is fed to a crusher
and the crushed material, undersize granules, and dust
from the cyclones, are recycled to the pan.
Because of the high melt concentration and
temperature, a "blue fume" of submicron ammonium nitrate -
similar to the fume during prilling of high-density
ammonium nitrate - has to be recovered for treatment.
However, the air flow from the pan and polishing drum
is relatively small. A wet scrubber may be used for
234
Table 8.23. Ammonium Nitrate Granulation Process Requirements
Product: Ammonium nitrate
Capacity: 1,400 tpd
Capacity utilization: 90%
Annual production: 415,800 tpy
Process: Pipe reactor/drum granulation
Investment cost:
- battery limits, US $31.6 million
- storage, US $7.0 million
Working capital, US $3.6 million
Cost Components
Unit
Unit/t
Raw materials
Ammonia
Nitric acid (as 100%)
Stabilizer
Utilities:
Electrical energy
Process water
Cooling water
Steam
Labor
t
t
US$
kWh
m3
m3
t
workhours
0.210
0,773
1.2
31.0
0.1
20.0
0.11
0.23
m
si -1
To evaporation
<=■
V
SF:2 G-3
Additional solid feed (limestone)
cr$
>
Melt feed
Legend:
SI-1 Recycle hopper
SF-2 Feeder
G-3 Pan granulator
D-4 Polishing drum
S-5 Wet scrubber
T-6 Water tank
E-7 Cooler
SC-8 Screen
S-9 Dry cyclone
GR-10 Crusher
D-ll Coating drum
BC-12 Recycle bucket elevator
11.
D-4
^
5-5 Water
Air
§74
CZDt-6
1>
E-7
To atmosphere
c=*>
/—\
.5C-8 GR-10
Vs.
■N
-^-
BC-12
D-ll
Product
■=>
Figure 8.15. The Norsk-Hydro Pan Granulation Plant.
235
recovery; this is not usually practical in a prilling proce_ss
with a high rate of air flow from the top of the prilling
tower. The air from the product cooler is treated in wet
or dry cyclones.
A rather new process is fluidized drum granulation
[46], developed by the French company Kaltenbach-
Thuring as shown in Figure 8.16 where the principle of
the fluidized drum granulator is illustrated, and in Figure
8.17 where the flowsheet is given. The special
granulator consists of a rotary drum fitted with lifters and a
fluidized bed installed inside the granulator. It is swept
with atmospheric or conditioned air according to the
desired applications. Seed material fed to the
granulator acts as recycle.
The seed material has to undergo a double operation
in the granulator:
• Size increase.
• Cooling and/or drying as the case may be.
This is obtained in a series of cycles. Seed material lifted
to the upper part of the drum falls to the surface of the
fluidized bed. The product is cooled and/or dried on the
perforated plate. The plate is inclined so that the
product flows down along the plate and falls into the lower
part of the drum. During this fall, the curtain is sprayed
with melt or slurry, The lifters then deliver the coated
granules to the fluid bed. The number of cycles needed
to obtain the desired particlgTsize- is determined by the
residence time in the drum and is controlled by an
adjustable overflow threshold.
Various additives such as filler, micronutrients, or other
specific additives can be added with the sprayed prod-
-Alroullet
2 - Fhifdlztng air
3-Solution
4 - Recycled product
Figure 8.16. The Kaltenbach-Thuring Fluidized
Drum Granulator.
uct. An external fan ensures the evacuation of the air
out of the granulator. The heat balance and granulation
behavior determine how much recycle material has to
be dissolved in the feed ammonium nitrate melt and how
much can be recycled as dry matter to the drum.
8.4 Pollution Control
As in all industrial operations, pollution control
requirements for AN and CAN plants have become more
stringent in recent years. This has posed a difficult
problem for high-density AN prilling because of Ir^arge—
volume of air exhausted from prill towers and because
of the very small particle size of the fume in the air.
Fuming is much more severe in high-density prilling
because the AN melt must be at higher temperature (about
180°C) to keep it from freezing. At this temperature
there is an appreciable vapor pressure of NH3 + HNO3
resulting from dissociation of AN, according to the
equation:
NH4NO3 -+ NH3 + HNO3
The dissociation products recombine in the cooler air to
form a blue haze consisting of AN particles of submi-
cron size. Particles of this size are difficult to collect, and
they present a highly visible and stable haze or "blue
fume." The problem is much less serious with low-density
prilling because of lower AN solution temperatures. It is
Jess-serious-in-granulation-processes because of much
smaller volumes of air in contact with hot solution.
A more detailed description of pollution abatement in
AN plants is given in Chapter 19.
8.5 Production of Calcium
Ammonium Nitrate
In countries where AN is not allowed for application,
CAN is a substitute. CAN is preferred over AN for use
on acid soils. In the early 1960s, the usual grade of
CAN was about 21% N; this grade corresponds to 60%
AN; the grade has been increased in most countries to
26% - 27.5% N (about 75% AN).
CAN is produced by mixing concentrated ammonium
nitrate solution with ground calcitic or dolomitic
limestone, chalk marl, or precipitated calcium carbonate from
nitrophosphate production. The mixing should be done
quickly to avoid decomposition of the ammonium nitrate:
2NH4NO3 + CaC03 -* Ca(N03)2 + 2NH3 + C02 + H20
Both technologies - prilling and granulation - can be
used for production of CAN, In prilling CAN the AN
solution is premixed with the ground limestone
immediately before prilling, A rotating perforated bucket is the
preferred type of drop-forming instrument. Prill towers
236
Ai r
c3
c^>
Steam
Product
to storage
[=>
Legend:
SC-1, SC-2 Product screens
S-3, S-4 Cyclones
SI - 5 Storage silo
G-6 Fluidized drum granulator
T-7 Feed tank
E-8 Product cooling
E-9 Ai r heater
Figure 8.17. The Kahenbach-Thuring Fluidized Drum Process.
are very high (30 m-50 m) depending on the AN
solution concentration and cooling equipment used. Prilled
CAN is conditioned with china clay, kieselguhr or
calcined Fuller's earth in amounts ranging from 1% to 3%.
In the prill tower mean particle size is 2 mm-2.5 mm.
To obtain larger product, Hoechst and CDF Chimie (now
AZF) have developed combined prilling-granulation
technologies. The AZF process is shown in Figure 8.18.
The prilling tower produces only seed prills from about
35% of the ammonium nitrate solution. The prills are
directed to the swelling drum where the rest of the AN
and calcium carbonate are added to the AN solution.
The fines are recycled.
The following granulation processes are available:
• Cold spherodizer.
• Fluid bed.
• Pugmill.
• Drum.
Pan granulation of CAN has proven difficult because
the pan is very sensitive to heat and material balance
factors. The product shape is irregular. The Spherodizer®
processes and all other processes need additives:
Solution
99, B 7.
Washing
solutions
V-l
Solution 95 V.
.*«.
Solution 97.5 7.
Slurry 76
FlI\er
C=
Fines
to renertJnc
P^a
Fines
recycled SI
Protection 100
<=■
Legendi
V-lj V-E Concentrators
T-3 Mixing t, .ashing tonk
PT-4 Prl lima tower
D-5 Swelling drum
SO 6 Screen
Figure 8.18. Combined Prilling/Granulation
Process.
237
• Spherodizer®: ammonium sulfate, magnesium sulfate;
• Fluid bed: magnesium nitrate.
To improve product hardness, some manufacturers
using the pugmill add ammonium sulfate - about 0.3%-
0.5%ofSO4.
The melt concentrations are also different. These
concentrations are as follows:
• Fluid bed: 98%-99% wt.
• Pugmill: 94.5%-95.5%wt.
• Drum: 93.5%-94.5%wt.
In the Hydro-Agri fluid bed granulation process, dedusting
of the airstreams from the granulator and fluidized bed
cooler is done by scrubbing with acidified weak AN
solution. The scrubbing solution is mixed with the lime/AN
mixture prior to final evaporation.
In pugmill granulation (Figure 8,19) [471 the AN melt
and the lime are proportioned in ratio control to the
pugmill. Dust, undersize product, and crushed oversize
are recycled to the pugmill. The fresh, damp granules
pass to a drying drum, and the granules are screened
hot, For drying, the off-gas from the cooler is used. At
full plant load the air heater for the dryer is turned off,
and the plant operates autothermally. The drying air is
dedusted in dry cyclones; final dedusting is performed
in scrubbers. The onsize product is cooled in a fluidized
bed cooler with conditioned air, Before storage or
bagging the product is coated. Spilled product is returned
to the granulation loop.
It should be mentioned that "forest grade" product
can be manufactured. The same basic flow diagram is
valid for drum granulation. _____
8.6 Other Nitrogen Compounds
Used as Fertilizers
8.6.1 Sodium Nitrate
Before the availability of synthetic ammonia and its
derivatives, sodium nitrate of natural origin was the
primary source of nitric acid and chemical nitrogen for
fertilizer purposes in many countries. Most of this nitrate
originated in Chile, where it is found principally in a
large ore body nearly 500 miles long and 10-15 miles
wide on the eastern part of the Chilean coastal range.
Nitrate production remains a primary industry in Chile.
To atmosphere
■^
Legend:
GR-1 Pugmill granulator
G-2 Dryer
SC-3, SC-4 Screens
D-5 Fluid-bed cooler
G-6 Conditioning drum
Figure 8.19. AN/CAN Pugmill Granulation Process.
238
Small deposits occur in other areas, e.g,, Africa,
Australia, Mexico. Substantial amounts of synthetic sodium
nitrate were formerly made in Europe and the United
States, but production declined after World War 11, and
now only insignificant amounts are produced from
byproduct sources.
As a fertilizer, sodium nitrate has long been applied
as a surface dressing for cotton, tobacco, and some
vegetable crops. However, its use as a "straight" nitrogen
fertilizer has declined considerably during the past
century. For example, in the United Kingdom, some 20,000
tonnes of N was used in the form of sodium nitrate in
1899, but relatively none is used today. As with other
nitrates, sodium nitrate is prone to leaching in the soil,
but it has the advantage of possessing a metallic cation.
Unlike ammonia and its derivatives, including urea,
sodium nitrate will not promote cation losses in the soil
and lead to unsuspected soil acidity.
Industrial applications include meat preservation, heat
treatment of metals, and use as a flux in the ceramic
and metallurgical industries,
8.6.1.1 Properties of Sodium Nitrate - Sodium
nitrate is a white crystalline substance with an N content
of about 16% and a sodium content of about 27%. Some
properties of sodium nitrate are given in Table 8.24.
8.6.1.2 Commercial Form - Sodium nitrate is
traded as crystalline, prilled or grained material: ~ -
Sodium nitrate produced by the Guggenheim method
from caliche is usually a crystalline product about 48
mesh in size; the product contains approximately 3.5%
of free moisture. Prilled product contains about 98%
sodium nitrate and 0.2%-0.3% free moisture, and the
size of the product is in the range of 10-20 mesh,
Table 8.24. Properties of Sodium Nitrate
Properties Value
Solubility g/100 g of water
- at 0°C
- at 10°C
- at 30°C
- at 100°C
Sulk density kg/m3
Pellets
Coarse material
Fine powder
>itical relative humidity, %
- at 20°C
- at 30°C
73
96
176
180
1,202
1,282
1,363
75
74
Synthetic sodium nitrate produced in the CIS is a
crystalline material. Two grades having standard properties
and analyses that are produced (GOST-828-77) in CIS
countries are listed in Table 8.25.
8.6.1.3 Storage and Transportation - Because
sodium nitrate is a toxic product, some precautions
(respirator, rubber gloves, and goggles) should be obs'erved
when handling it. Sodium nitrate can be stored and
shipped in bulk, under conditions of low humidity, but
should be packed in moisture-resistant bags when
intended for use in damp or tropical climates. In some
countries, it is regarded as a potential fire hazard and
may necessitate special labeling, insurance, and other
precautions as for ammonium nitrate and potassium
nitrate. Materials such as bags or timber, when allowed
to dry after impregnation with sodium nitrate, may
quickly ignite if they are exposed to elevated
temperatures and should be destroyed or thoroughly washed and
fireproofed.
Table 8.25. Standard Analyses of Sodium
Nitrate in the CIS
Content Top Grade 1st Grade
"NaNO?,T^Iesrtrian " " 99.8% 99.5%
H2Q, no more than 0.5% 1.0%
Insoluble in water materials,
no more than 0.03% 0.04%
Chlorides (as NaCl), no more
than 0.15% 0.5%
Oxidizable material
(as NaNQ2), no more than 0.01% 0.015%
8.6.1.4 Raw Materials - Only nitrate ore (caliche)
is needed to produce sodium nitrate of natural origin,
Caliche varies widely in composition and may range from
80% to virtually zero nitrate content although little high-
grade material is available today. A typical analysis of
run-of-mine ore might be the following (in percentages):
NaNQ3 7-10
NaCI 4-10
Na2S04 10-30
Mg, Ca, K, Br, 12 2-7
H2Q 1-2
Remainder (Gangue) 41-76
These components are present in the form of complex,
mixed sulfates, e.g., darapskite (NaNC*3 • Na2SC>4 • H2O).
239
Different chemicals may be used to produce synthetic
sodium nitrate: ammonia, soda ash, nitric acid, caustic
soda, sodium chloride, and some others. Most of them
are used to produce sodium nitrate in minor quantities
(sometimes as a byproduct) for industrial applications.
8.6.1.5 Production From Natural Deposits-In
Chile, production is based on the Guggenheim method,
which permits ores containing under 10% nitrate to be
profitably worked. Caliche is mined by open-pit
operations, using draglines and power shovels, and is crushed
to about 80% between 3/4 and 3/8 inches (1.9-0,95
cm). This product is leached at about 40°C with water in
a series of vats; each vat has a capacity of some 10,000
tonnes of crushed ore. The underflow from each vat is
heated before passing to the next since sodium nitrate
has a negative heat of solution. After extraction and
washing are complete, the residue is removed from the
vats and transported to a waste dump.
Fine material from the crushers is pulped in a
separate system, and the gangue is removed by means of
Moore filters. The filtrates are combined with liquor from
the leach tanks and are chilled in shell-and-tube units to
precipitate crystalline sodium nitrate. Initial cooling is
effected by heat-exchange with in-process leach liquor
and final chilling by ammonia. The sodium nitrate slurry
is dewatered and washed in batch centrifuges to yield a
crystalline product. When a grained or prill-type
product is required, the centrifuged.salt is melted_at_abo.ut_
325°C in reverberator furnaces, sprayed in large
towers, cooled and screened to yield pellets in the 10- to
20-mesh size range.
8.6.1.6 Synthetic Sodium Nitrate - During the
early part of the 20th century, several chemical
processes for manufacture of sodium nitrate were
developed. All these methods produce a sodium nitrate
solution that is concentrated, crystallized, and centrifuged.
In some cases, the dewatered and washed salt is dried in
a rotary drier prior to screening, storage, and bagging;
alternatively, it may be melted and grained or prilled.
Appreciable quantities of sodium nitrate have also been
made in the United States by the salt process developed
by the Allied Chemical Corporation. In this method
(which is believed not to be currently in operation),
nitric acid and sodium chloride are reacted to yield sodium
nitrate, chlorine, nitrosyl chloride, and water, e.g.:
4HN03 + 3NaCI -* 3NaNOs + CI2 + 2H20 + NOCI
The nitrosyl chloride can be used as an intermediate for
other derivatives, or it can be reacted with sodium
carbonate to yield additional sodium nitrate, sodium
chloride, nitric oxide, and carbon dioxide:
3NOC1 + 2 Na2C03 ->■ NaN03 + 3NaCl + 2NO + 2C02
The produced salts can be redigested and the nitric
oxide used to make additional sodium nitrate (or nitric acid).
Alternatively, the nitrosyl chloride can be oxidized to
yield dinitrogen tetroxide and chlorine for further use,
e.g.:
2NOC1 + 02 -► N204 + CI2
In 1934/35 Norsk Hydro developed a process to
produce sodium nitrate from calcium nitrate (byproduct of
nitrophosphate plants). It is based upon ion exchange,
using zeolite exchange resin. The ion exchange takes
place between calcium nitrate in water soIutioTraTrd~so=='
dium chloride contained in seawater, used as a
regeneration agent [20]. Other methods used to produce
sodium nitrate in minor quantities include reacting nitric
acid with soda ash or caustic soda, Several double-
decomposition reactions between various nitrates and
alkali salts, for example, ammonium nitrate and caustic
soda or common salt, have either been proposed or
tested on a small scale.
In the CIS a method of manufacture of sodium nitrate
and sodium nitrite from ammonia and sodium
carbonate, developed by GIAP, and currently in operation, has
been shown on Figure 8.20,
The method is based upon oxidation of ammonia in
the presence of platinum catalyst at atmospheric
pressure, absorption of the nitrogen oxides produced by water
-solution-of-sodium-earbonate, and separation of sodium
nitrate and sodium nitrite,
The nitrous gas after the burner is cooled in a
wasteheat boiler to 210°-270°C and fed to the first
absorber where nitrogen oxides are cooled further and
partially absorbed by a water solution of sodium
carbonate. Two reactions can take place:
Na2CQ3 + NO + N02 -* 2NaN02 + C02
Na2C03 + 2NOz -> NaN03 + NaN02 + C02
The solution leaving the absorber is fed to the
crystallization section. The gas from the absorber is washed,
compressed to about 0.4 MPa, and sent to the second
absorber where the remaining nitrogen oxides are
absorbed under pressure in a countercurrent stream of fresh
sodium carbonate solution. The tail-gas from the
second absorber is treated in an SCR NOx abatement unit
before it is vented. The solution from the second
absorber is added to the circulating solution of the first
absorber.
In the crystallization section the solution from the first
absorber is filtered and evaporated. Crystalline sodium
nitrite is separated from the solution in the primary
centrifuge, dried in a rotary drum, and sent to storage. The
mother liquor from the primary centrifuge is further
240
Condensate
To atmosphere
Steam
To condens.
Legend:
R-l Converter
E-2 Wasteheat boiler
C-3 Fi rst absorber
P-4, P-13, P-15, P-19
E-5. E-ll Coolers
V-6, V-10 Washers
K-7 Compressor
E-8 Heat exchanger
C-9 Second absorber
T-12. T-14, T-18, T-30 Tanl<s
E-16, E-20, E-32 Heaters
F-17 Filter
P-31 Pumps
L-Ufip-is
B-281
E-27
D-26
E-21 - E-23. E-33 - E-35 Evaporators
CR-24, CR-36 Vacuum crystal 1izers
S-25, S-37 Centrifuges
D-26 Drum dryer
E-27 Calorifer
B-28 Fan
BC-29 Bucket elevator
Figure 8.20. GIAP SodiumNitrate ProductionTechnoiogyr
evaporated and centrifuged. The mother liquor from the
secondary centrifuge is fed to a column reactor where
the liquor is treated with nitric acid to convert NaNC>2 to
NaN03:
3NaN02 + 2HN03 -* 3NaN03 + 2NO + H20.
Sodium nitrate is separated from the solution and dried
in a rotary dryer.
This method of sodium nitrate/nitrite production is
economically justifiable if there is an appropriate demand
for sodium nitrite. Sodium nitrite has a wide range of
applications: in the production of dyes and building
materials, in the food industry, iodine industry, the
machine-building industry and many others. The
process is operated at Berezniki Joint-Stock Company
"Azot," Russia.
8.6.2 Calcium Nitrate
Although simple methods are available for producing
calcium nitrate, its use as a fertilizer is offset by its
extreme hygroscopicity. As a fertilizer, calcium nitrate has
special advantages for use on saline soils because the
calcium displaces the sodium that is absorbed by clay in
soils, For this reason, it may be preferred for use in
areas with soil salinity problems. In addition, calcium
nitrate has the advantage of being non-acid forming; it
improves the physical properties of exhausted and
acidified soils; and can be used as a topdressing [48].
Calcium nitrate is produced in large quantities at plants
in:
• Norway by Norsk Hydro
• Egypt by Semadco
• Portugal by Quimigai
• Ukraine by Dnieprodzerzhinsk cokery
• Netherlands by Stamicarbon
Plant capacities of one single train range from 150 to
1,200 tpd. Its extreme hygroscopicity requires air-
conditioned plants and good-quality, sealed, moisture-
proof bags.
Other applications include explosives, pyrotechnics,
and inorganic chemical operations. In some countries it
is used in sizable tonnages as a de-icing agent (at airports).
241
8.6.2.1 Properties of Calcium Nitrate -- The
properties of pure calcium nitrate anhydride are given
in Table 8.26.
Calcium nitrate forms four modifications:
- -Ca(N03)2
- Ca(N03)2 • 2H20 (H20 = 18%)
- Ca(N03)2 • 3H20 (H20 = 24.8%)
- Ca(N03)2 • 4H20 (H20 = 30.5%)
Table 8.26. Properties of Calcium Nitrate
Formula
Appearance . ..
Molecular weight
Melting point
Density, 20°C
Solubility:
atO°C
at 100°C
at 150°C
Critical relative humidity [53]:
at 20DC
at 30°C
Ca(N03)2
White, crystalline
164.10
555.7°C
2.36 (anhydride)
50.5%
78.4%
79.0%
54.8%
46.7%
By the addition of ammonium nitrate, the double salt
5Ca(N03)2 • NH4N03 • 10H3O is formed. The melting
point of the double salt is 100°-105°C; pH-value, 6-6.5,
8.6.2.2 Commercial Form, Storage, and
Transportation - Calcium nitrate is traded as granulated,
prilled, or flaked products. The trend is toward
granulated products. Typical specification of fertilizer grade is
as follows:
Total nitrogen 15.5%
Ca(NQ3)2 - content 76,5-82%
NH4NO;) - content 4.5-7.2%
H20 - content 12-17%
Hardness is as follows:
Prills
Drum granules
Pugmill granules
Screen analysis is as follows:
Flakes 95%-99% between 2 and 5 mm
Granules 90%-92% between 2 and 4 mm
Prills 93%-95% between 1 and 3 mm
2.0+A 0.5 kg/grain
3.0 +/- 0.5 kg/grain
3.5 +/- 0.5 kg/grain
Coating (only fertilizer grade): by oil-dissolved
anticaking agents (water free)
Bulk density
Packing
1,050-1,100 kg/m3
50-kg bags
Bulk storage is to be avoided at all costs. Immediate
bagging in multilayered bituminoid paper bags, PE-lined
jute bags, or mono-layer PE bags is mandatory.
As with other oxidizing nitrate fertilizers, precautions
should be taken to avoid impregnation with organic
material and contact with a heat source. Special storage-
and shipping regulations must be observed.
8.6.2.3 Production Technology of Calcium
Nitrate - There are two principal methods of calcium
nitrate production; they are as follows:
A. Neutralization of 50%-56% nitric acid by ground
limestone; filtration of the 45%-52% solution,
addition of ammonia to reach the correct ammonium
nitrate level and to the correct pH value of about 4.
Three-stage evaporation is used to concentrate the
solution to about 79%-82%.
B. Use of calcium nitrate tetrahydrate byproduct
separated from nitrophosphate processes. The separated
tetrahydrate can be remelted in its own crystal
water by wasteheat, which gives a solution of about
70%.
""Finishing ofproducfis mainly performed by
granulation in a pugmill, drum granulator, or pan granulator.
Older plants using flaking technology were modified to
granulation. Because of effluent problems, most prilling
plants have been replaced by granulation plants. Oil
prilling was abandoned because of difficult-to-handle wastes.
The granulation technology for calcium nitrate is the
same as for CAN with one exception; cooling must be
done prior to screening and crushing.
Products intended for field application are coated with
an anticaking agent of stearylamine (15%) and parafinic
oil (85%). Products for greenhouse or drip irrigation and
for explosives are not coated.
Due to the high solubility of calcium nitrate in water,
wet scrubbing is used for the vapors from the
evaporation section and for the air from the finishing section.
Simple vertical or horizontal scrubbers are used to meet
the 10-30 mg/Nm3 requirement of dust in the exhaust.
Scrubbing liquor and uncoated spilled product are
reprocessed.
8.6.3 Ammonium Sulfate
8.6.3.1 Properties of Ammonium Sulfate -
Ammonium sulfate was once the leading form of
nitrogen fertilizer, but it now supplies a relatively small
percentage of the world total nitrogen fertilizer because
242
of the more rapid growth in use of urea, ammonium
nitrate and, in some countries, UAN solutions and
anhydrous ammonia. The main advantages of ammonium
sulfate are its low hygroscopicity, good physical
properties (when properly prepared), chemical stability, and
good agronomic effectiveness. It is a good source of
.- sulfur and nitrogen. Its reaction in the soil is strongly
acid-forming, which is an advantage on alkaline soils
and for some crops such as tea; in some other situations
its acid-forming character is a disadvantage. Its main
disadvantage is its lower analysis (21% N), which
increases packaging, storage, and transportation costs.
As a result, the delivered cost at the farm level is usually
higher per unit of nitrogen than that of urea or
ammonium nitrate. However, in some cases, ammonium
sulfate may be the most economic source of nitrogen when
the transportation distance is short, when it is available
as a byproduct at low cost, or when a credit can be
taken for its sulfur content.
Ammonium sulfate is available as a byproduct from
the steel industry (recovered from coke-oven gas) and
from some metallurgical and chemical processes. One
large source is byproduct from the production of capro-
lactam. The bulk of ammonium sulfate produced in
developed countries is a byproduct.
Table 8.27. Properties of Pure Ammonium
Formula
Molecular weight
Nitrogen content
Color
Density of solid, 20°
Specific gravity of saturated solutions
Specific heat of solid
Specific heat of saturated solutions
Heat of crystallization
Heat of dilution
Melting point
Thermal stability
PH
Loose-bulk density
Angle of repose
Critical relative humidity
at 20°C
at 30°C
Solubility, g/100 g of water
atO°C
at 100°C
Table 8.27 shows the more important properties of
crystalline ammonium sulfate.
8.6.3.2 Commercial Form, Storage, and
Transportation - Fertilizer-grade ammonium sulfate
specifications normally indicate a minimal nitrogen content,
which is usually not less than 20.5%. Limitations on
free acidity and free moisture are also generally
demanded; typical figures are 0.2% for free H2SO4 and
0.2% for free H20. Occasionally, maximal values for
certain organic or inorganic impurities may also be
specified for byproduct material.
Crystal size-range specifications depend on customer
requirements and the type of application. For direct
application or bulk blending, large crystals, mainly in the
range of 1-3 mm, are preferred although somewhat
smaller crystals may be acceptable in some countries for
direct application, such as 90% retention on an 0.8-
mm screen. To obtain crystals of this size, considerable
design and operating skill is usually needed, and in some
plants additives are used to promote crystal growth or
modify the crystal shape [49]. For use in the production
of fertilizers, small crystals are acceptable. There is a
trend toward the production of small crystals (mainly
0.2-0.8 mm), which are used by producers of granular
compound fertilizers or are granulated by roll
compaction for direct application or bulk blending.
(NH4)2S04
132.14
21.2%
white
1.769
1.2414 at 20°C
1.2502 at 93DC
0.345 caI/g-°C at 91°C
0.67 caI/g-°C at 20°C
0.63cal/g-°Cat 100°C
11.6 kcaVkg in 42% solution
6,35 kcalAg from 42% to 1.8% solutions
512.2°C
Decomposes above 280°C
5.0
962 kg/m3
28°
81%
81.1%
70.6
103.8
243
In the countries of the CIS, ammonium sulfate
properties should comply with the specifications given in Table
8.2S.
Several factors contribute to trouble-free storage of
ammonium sulfate and other fertilizers. First, the
product should be of uniform crystal size and should contain
a low percentage of fines. It should be dry and
preferably have below 0.1% free moisture. No free acidity
should be present on the crystal surfaces. The product
should be cooled with dry air under controlled
conditions after drying, particularly when the ambient
temperature and humidity are sufficiently high to cause
subsequent moisture condensation after cooling in a bulk
storage pile or in sealed bags. Ammonium sulfate is
commonly shipped in polyethylene or paper bags.
8.6.3.3 Production Technology- Several
different methods are used for ammonium sulfate
manufacture, in accordance with available raw materials and local
conditions.
The principal methods are as follows:
1. Reacting ammonia and sulfuric acid in a saturator-
evaporator under vacuum or at atmospheric
pressure and recovering the crystals via a centrifuge or
filter.
2. Scrubbing coke-oven gas or town gas with sulfuric
acid in saturator units of special design and
recovering the crystals by centrifugihg or filtration. "
3. Reacting ammonium carbonate with anhydrite or
gypsum derived from natural or byproduct sources,
removing the calcium carbonate by filtering,
evaporating, and crystallizing ammonium sulfate from the
mother liquor prior to centrifuging.
4. Evaporating byproduct liquors containing ammonium
sulfate produced from other processes and
separating the nearly pure salt by: (a) crystallization and
centrifuging or alternatively (b) recovering' by slurry
granulation in a moving bed and recycling in a drier-
screening system to produce granules of the required
size range.
5. Directly reacting gaseous ammonia with sulfuric acid
in a spray tower to form a dry, amorphous product.
6. Simultaneously producing ammonium sulfate and
other ammonium salts in granulated fertilizer
processes to produce phosphate, nitrate, and nitro-
phosphate multinutrient fertilizers containing
ammonium sulfate.
7. Using other miscellaneous processes, such as
recovering ammonium sulfate from S02 in flue gas or in
sulfuric acid tail-gas, which are in use or have been
proposed.
Except in special cases, such as those described in
subparagraphs 4, 5, and 6 above, crystallization is of
primary importance in ammonium sulfate production.
Fortunately, there are several publications reviewing the
JundamentaLpr.ocess.„andJdesign features that control
crystal formation and influence plant performance
[50,51,52,53[. Some processes used to produce
ammonium sulfate are described below.
Table 8.28. Standard Specifications of Ammonium Sulfate in CIS Countries
Appearance
Content in Product, %
Nitrogen, no less than
Water, no more than
granulated
crystalline
H2S04j no more than
granulated
crystalline
Size Range
granulated
1-4 mm, no less than
crystalline
+ 0.5 mm, no less than
retention on 6-mm screen
Top Grade
white granules or transparent crystals
21
0.6
0.2
0.5
0.03
1st Grade
not standardized
21
_
0,3
_
0.05
90
80
absent
not standardized
not standardized
244
8.6.3.4 Combined Reaction-Evaporation
Methods - Anhydrous ammonia and strong sulfuric acid are
reacted in continuous saturator-crystallizer units
operating either under vacuum or atmospheric pressure. In
installations of the vacuum type, the heat of reaction is
removed by evaporating water either present in the feed
acid or added to the system for temperature-control
purposes. This technique is also used for saturators of
the atmospheric type; alternative cooling can be achieved
in the latter by blowing large volumes of air through the
slurry. The reaction between gaseous, anhydrous
ammonia and sulfuric acid can be shown as follows:
2 NH3(g) + r^SO^ -* (NH4)2S04
The exothermic heat of the reaction given above is
approximately 2,350 kcalAg of N.
Units of the vacuum type are built in the form of a
suspension vessel surmounted by a flash chamber,
Ammonia and sulfuric acid are introduced via a slurry
recycle line, wherein they react and superheat the recycling
slurry, which is subsequently flashed in the upper
chamber at a reduced pressure generally between 55 and 58
cm of mercury. The loss of water in this zone
supersaturates the slurry, which recirculates to the lower
suspension vessel via an internal pipe and comes into contact
with small crystals and nuclei, thereby inducing further
crystal growth in terms of size rather than in number.
Slurry is recycled by a thermal syphon and/or--by-an-
external pump, and as it is brought into contact with
newly added reactants, the exothermic heat that is
produced destroys undesirable nuclei and fines. Skilled
design of the suspension vessel and the means of slurry
withdrawal permit considerable size classification to be
attained in the unit, and proper instrumentation ensures
long periods of uniform operation.
This type of crystallizer is generally known as the
"Krystal" or "Oslo" unit and was developed in Norway
by Isaacssen and Jeremiassen [54]. Figure 8.21
illustrates diagram matically the use of forced circulation in
conjunction with this design of crystallizer for
ammonium sulfate production.
During operation, it is important to- control the pH
within fairly close limits, e.g., 3.0-3.5, since a lower value
yields undesirable, thin crystals. Excessive acidity also
promotes an overgrowth of crystals, especially in
pipelines, and necessitates frequent redissolving or "killing"
with steam. Insufficient acidity, on the other hand, not
only produces inferior crystals, which are difficult to wash
and store, but may cause ammonia losses as well. For
these reasons, some producers maintain a free acidity
of 1.0-1.5 g of H2S04/liter of solution.
Another popular type of reduced-pressure crystallizer
is the draft-tube baffle unit, in which a vigorous upward
^ =^
If I E ° PRODUCT
\ L(T)D *"£fl CRYSTALS
Legend
A "Kryslai' type of vacuum evaporator-crystallizer
B Forced-circulation pump
C Slurry-recirculation pump
D Mother-liquor recycle pump
E Mother-liquor tank
F Continuous or batch centrifuge
G Slurry concentrator
H Drier conveyor
I Rotary drier
J Dried-product conveyor
K Vacuum condenser-ejector unit
Figure 8.21. Ammonium Sulfate Crystallization.
slurry recirculation is maintained by means of an inter-
nal impeller and draft [55]. Growing crystals are brought
to the surface of the flashing slurry, where supersatura-
tion induces maximum crystal growth, and sufficient
nuclei are present to minimize scale formation inside
the unit.
Atmospheric pressure units are of several types and
are preferred by some producers to the vacuum
crystallizer, especially for small and medium outputs, because
of their simplicity and somewhat lower investment costs.
Ammonia can be added via a sparger tube or a jet-type
mixer. In one proprietary process, a simple absorption
column incorporating a few large slotted bubble-hoods
is used. Another design employs a single vessel for both
reaction and crystallization, and reaction heat is removed
by evaporation of water, supplemented in many cases
by air blowing. In other designs, separate neutralizing
and crystallizing vessels are used to provide easier
operation and closer control. An optimum balance between
cooling-air energy and crystal yield is usually obtained
when the crystallization temperature is controlled in the
range of 63°-66DC.
In most cases, crystals are recovered from ammonium
sulfate slurry by recycling through the continuous or the
automatic batch-type centrifuge, wherein the product is
screened and spin-dried, washed with water and weak
ammonia, and again spin-dried before being conveyed
to the drier. In some plants, continuous top-feed filters -
245
not centrifugal - are used. For small output, top-feed
filters can sometimes be used with advantage since the
product can be separated, washed, and dried in a single
machine.
Ammonium sulfate liquors are quite corrosive, and
wetted parts of the equipment are usually made of
stainless steel or rubber-lined mild steel. Modifiers intended
to improve crystal size and shape include small amounts
of trivalent metallic salts. Corrosion inhibitors such as
traces of phosphoric acid or arsenic compounds are also
added in some cases.
8.6.3.5 Byproduct From Coke-Oven Gas or
Town Gas Scrubbing - Typical bituminous coals used
for gas and coke production contain about l%-2% of
nitrogen, and some 15%-20% of this can be recovered
as ammonia, amounting to approximately 2.5-3.0 kg
of NHa/tonne of coal used, Most byproduct ammonia is
usually associated with high-temperature carbonization
units, e.g., coking plants for iron and steel production,
where the amount of ammonium sulfate produced may
be equivalent to about 20 kg/tonne of steel. However,
in more recent years, world ammonium sulfate prices
have fluctuated widely, and, from time to time, byproduct
material from gasworks and coke ovens has been sold
at price levels not much greater than the cost of the
sulfuric acid needed as a raw material. As a result, some
producers have converted their units to ammonium
phosphate production, while spme_others intend to^readjusL
their plants for recovery of ammonia as such. Other
byproducts recovered from gas-washing units, because
of necessity or additional financial return, include
ammonium thiocyanate, ferrocyanides, pyridins, and tar.
Three principal methods are available for ammonia
and/or ammonium salt recovery; they are known as the
direct, indirect, and semidirect processes, respectively.
In the first method, the entire gas stream is cooled to
remove as much tar as possible and is then passed
through a saturator of the bubbler type (or, in more
recent plants, a scrubber of the spray type), wherein it is
washed with sulfuric acid. The ammonium sulfate slurry
produced is withdrawn, centrifuged, washed, dried, and
sent to storage. Advantages of this type of unit include
high recoveries, relatively low investment and operating
costs, low steam needs, and small effluent liquor
volumes. Nevertheless, in many instances, the product is
unavoidably contaminated with tar and pyridines and
may be unacceptable unless, perhaps, it is recrystallized
prior to sale. In addition, chlorides present in the fuel or
water may react to form ammonium chloride and
create additional corrosion problems unless linings of
rubber or plastic material are used. Furthermore, except in
cases where a separate crystallizer is employed,
flexibility regarding size, shape, and purity of the product is
likely to be very limited because it becomes difficult to
maintain an optimum balance between the free acidity
needed to suppress impurities and the optimum pH
needed to promote good crystal growth.
Earlier problems of direct operation led to the
development of the indirect method, whereby the gases are
first cooled by contact with recirculating wash liquor,
following in some cases by a further scrubbing with
water. Combined liquors are sent to the upper section of
an ammonia still of the bubble-cap type, in which
contact with steam releases the "free" ammonia present as.
ammonium carbonate, ammonium sulfide, and other
easily dissociated salts. The liquor then passes to an
adjoining lime leg, where treatment with lime [iquor
decomposes the "fixed" ammonium salts, e.g., ammonium
chloride. Steam passing upwards from the base of the
column strips virtually all of the ammonia gas produced,
which is recovered as a crude ammonia solution or is
sent to a sulfuric acid washer for ammonium sulfate
production. Advantages of this method include the
production of a salt substantially free from impurities and also
having considerable flexibility, plus an ability to make
aqua ammonia and derivatives. However, operating costs
are high, and effluent disposal problems may arise. In
addition, ammonia losses may be appreciable, because
of incomplete reaction and absorption.
The semidirect process offers a compromise between
-direct-and-indirect operation, whereby the gas is first
cooled and washed to deposit tar and an aqueous
condensate [56]. The latter is "sprung" in a relatively small
ammonia still, and the released NH3 is combined with
the main gas stream, which is reheated to about 70°C
and scrubbed with a solution containing nearly saturated
ammonium sulfate and 5%-6% of sulfuric acid,at about
50°-70°C in units either of the spray-absorber type or
of the older saturator type incorporating a cracker pipe
(or bubbling ring). Because this process gives ammonia
recoveries that are greater than those attainable by
direct operation and also produces a salt largely free from
tar, pyridine, and other impurities, it has become the
most popular for large installations. Figure 8.22 shows
the basic flow diagram of a semidirect gas scrubber/
ammonium sulfate unit.
Several varieties and modifications of these systems
are found throughout the world; they are principally
developed by the Koppers, Otto, and Wilputte
organizations 157].
8.6.3.6 Ammonium Carbonate-Gypsum Process-
This method, which is also known as the Merseburg
Process, was originally developed in Germany and has
long been used in Austria, India, Pakistan, and the United
Kingdom [58]. It is based on combining ammonia and
carbon dioxide to produce ammonium carbonate, which
246
^^> Gas to storage
BC-15
D-1S
Product
* I <=>
BC-17 -t0 storage
Waste liquor to sump
cr>
Legend t
£-1 Prlnary gas cooler E-10 Dephlegmator
S-2 Electrostatic tar precipitator CR-11 Sulfate saturatoi—crystalllzer
£-3 Gas reheater S-12 Slurry concentrator
B-4 Main gas blower P-13 Slurry feed purip
S-5 Tar separator S-14 Batch or continuous centrifuge
T-6 Crude ammonia liquor storage BC-15 Dryer conveyor
P-7 Still feed pump D-16 Ratary dryer
V-8 Line leg BC-17 Product conveyor
C-9 Ammonla st|I I
Figure 8.22. Semidirect Gas Scrubber/Ammonium Sulfate Production.
is then reacted with gypsum or anhydrite (of natural or
byproduct origin) to yield ammonium sulfate and
calcium carbonate, as follows:
NH3 + H20 -* NH4OH
2 NH4OH + C02 -> (NH4)2C03 + H20
CaS04 • 2H20 + (NH4)2C03 -»■ CaC03 +
(NH4)2S04 + 2 H20.
All of the reactions are exothermic. Under certain
circumstances, this process has several advantages, for
example, countries that do not have indigenous sulfur
supplies but do have natural or byproduct sources of
gypsum (or anhydrite) can produce ammonium sulfate
without purchasing sulfur from abroad [591. In addition,
the byproduct calcium carbonate can be used for
cement production or other purposes, such as for
agricultural lime or in calcium ammonium nitrate manufacture.
One disadvantage is the large amount of energy (steam)
required to recover solid ammonium sulfate from the
relatively dilute solution.
In one Indian plant (Sindri), ammonia gas is absorbed
in water and carbonated at a pressure of about 2.1 kg/
cm2 in two series-connected aluminum towers because
this pressure allows a higher cooling-^water temperature
to be used than if atmospheric pressure were used.
Carbon dioxide is introduced at the base of the primary
tower, which is packed with 5-cm (2-inch) stoneware
rings wetted with a solution of ammonium hydroxide
and recycling ammonium carbonate. Final absorption is
undertaken in the secondary tower, and reaction heat is
removed by recirculating liquor through water-cooled
heat exchangers in closed circuit with each tower. The
preferred liquor strength corresponds to approximately
170 g of ammonia and 225 g of carbon dioxide per
liter. Stainless steel is used for the wetted parts of pumps,
and liquor piping is made of aluminum.
In another Indian plant (Fertilizer and Chemicals, Ltd.,
Travancore), jet absorbers were used to prepare both
the ammonia solution and the ammonium carbonate
liquor in conjunction with a carbonating tower. Cooling
was undertaken by recycling liquor through water-cooled
heat exchangers, and the heat of reaction vaporized the
liquid anhydrous ammonia used in the process. When
the desired strength was reached, the solution was sent
to storage and subsequent reaction. The relation between
liquor strength, moisture in the gypsum, and the resulting
247
ammonium sulfate liquor concentration has been
reported by George and Gopinath [60]. This plant was
scrapped in April 1985.
When natural gypsum or anhydrite is used, it is crushed
and ground before reaction. In one case, the preferred
final size is about 90% through 120 mesh although,
under certain circumstances, there are indications that
a coarser size is permissible, When using byproduct
gypsum of phosphoric acid plant origin, it may be
preferable to remove impurities by repulping the filter cake in
an agitated vessel (or, alternatively, by scalping in liquid
cyclones) prior to washing and dewatering to the
maximum extent on a drum or disc filter before reacting with
ammonium carbonate.
Reaction can be undertaken either in a series of
wooden vessels or mild-steel tanks fitted with steam coils
and agitators, and the reaction train is usually designed
to give a total retention time of 4-6 hours. The slurry
produced is filtered and the calcium carbonate cake
washed and dewatered on continuous vacuum machines
of the traveling-belt type, or alternatively, on a two-stage
drum-filter installation provided with intermediate
repulping. (In some earlier plants, plate-frame filter
presses were installed for this purpose.) Final
clarification by pressure filtration or settling is sometimes
employed to ensure maximum purity of product, followed
by neutralization with sulfuric acid and heating to about
110°C to remove excess ammonia prior to
concentration and crystallization. The evaporator feed-liquor
usually contains about 500-520 g of ammonium sulfate and
less than 0,1 g of ammonia per liter. Evaporation is
undertaken in continuous multiple effect evaporator-
crystallizers, and production can be supplemented, if
desired, by adding ammonia and sulfuric acid to the crys-
tallizer recirculating line. Crystals of the required size
range are separated and washed in a centrifuge, jdried_
in a rotary drier at 120°C, and sent to storage.
Alternatively, a vertical tray type of dryer-cooler can be used
since this is said to give reduced crystal breakage and
dust formation, compared with the use of rotary dryer
and cooler. A diagram of a gypsum-process ammonium
sulfate plant is given in Figure 8.23,
8.6.3.7 Recovery From Industrial Byproduct
Liquors - Byproduct units have been installed in many
countries for producing ammonium sulfate from the
waste streams of caprolactam, acrylonitrile, and certain
other processes. In such cases, the waste liquor should
normally contain at least 35% of ammonium sulfate in
Gypsum
BC-1
Cooling water
i
^^
Sulfuric Acid
S-8
0^9^
F-6
Ammonia
c=£
Product
1 >-—T D-14 SC-15
Legend:
BC-1 Gypsum conveyor
T-2 Gypsum washing tank
F-3 Gypsum dewatering filter
R-4 Primary reactor
R-5 Secondary reactor
F-6 Calcium carbonate filter
T-7 Ammonium carbonate storage tank
S-B Sulfate-llquor clarifier
P-9a. P-Sb Evaporator feed pumps
CR-lOa, CR-lOb Vac. evaporator-crystall
S-ll 51urry concentrator
S-12 Batch or continuous centrifuge
SC-13 Dryer conveyor
D-14 Rotary dryer
SC-15 Product conveyor
C-16. C-17 Ammonium carbonate towers
E-18. E-19 Heat exchangers
P-21a, P-21b Pumps
Figure 8.23. Gypsum Process of Ammonium Sulfate Production.
248
solution. Otherwise, recovery may not be justified
except for the purpose of preventing stream pollution. The
usual content of ammonium sulfate in the waste stream
of the caprolactam process is in the range of 25%-42%.
Since recovery often is unprofitable, processes have been
developed recently for making caprolactam that
produce less byproduct ammonium sulfate or none [61[.
Most processes operating now produce 1.8-4.0 tonnes
of ammonium sulfate per tonne of caprolactam.
Occasionally, spent sulfuric acid from petroleum
refineries, petrochemical plants, and soap factories can
be used for ammonium sulfate production if impurities
do not cause insurmountable frothing or corrosion
problems or render the product unacceptable. If the acid is
too badly contaminated, it may be more expedient to
burn off the impurities in a specially designed furnace
and to produce fresh acid for ammoniation.
8.6.3.8 Spray-Tower Ammoniation - Substantial
tonnages of ammonium sulfate have been made for many
years in Japan in spray towers from the chamber or
contact type of sulfuric acid and anhydrous ammonia.
The acid is sprayed into ammonia vapor inside the tower,
and the heat of reaction produces a dry, amorphous
product primarily less than 300 mesh, which is
continuously removed from the base of the tower by a screw
conveyer. This form of ammonium sulfate is particularly
suitable for use in granular compound fertilizers.
8.6.3.9 Double- and Mixed-SaltProduction"^
By ammoniating mixtures of sulfuric and nitric acid or
by combining their ammonium salts in special ways, it is
possible to produce compounds containing both ammo-
niacal and nitrate nitrogen in the form of true double
salts. Three double salts have been identified;
(NH4)2SQ4 • NH4NO3-
(NH4)2S04 • 2NH4NO3
{NH4)2S04 ■ 3 NritNOa"
One German process produces an ammonium sulfate
nitrate corresponding to approximately (NH4)2S04 •
NH4N03 and containing 62% ammonium sulfate and
38% ammonium nitrate. Total nitrogen content is 26%;
about three-quarters of this is present in the ammonia-
cal form and one-quarter as nitrate nitrogen. It is made
by ammoniating the requisite mixture of sulfuric and
nitric acids, evaporating to a moisture content of 3%,
adding about 1% of ferrous sulfate (to reduce subsequent
caking), cooling to 100DC, chilling, and flaking. After
further conditioning by spraying with dilute ammonia
solution, the double salt is granulated (sometimes with
additional ammonium sulfate), dried, cooled, and bagged.
In a simpler process, also of German origin, ammonium
nitrate solution is evaporated under vacuum to 95%
concentration, cooled to about 130°C, and reacted with
solid ammonium sulfate in a pugmill granulator system
having a recycle ratio of 2 or 3:1 of product until a pH
of 4,0 is attained, after which the product is dried, cooled,
and bagged. Processes for prilling the product have also
been developed.
For several years, the Tennessee Valley Authority
(TVA) produced an ammonium nitrate-sulfate,
containing 30% N, mainly for use in sulfur-deficient areas. The
process involved ammoniation of a mixture of nitric acid
and sulfuric acid, followed by pan granulation of the
resulting slurry. The product consisted mainly of the double
salt (NH4)2S04 • 3NI-UNO3. Compared with ammonium
sulfate, ammonium nitrate-sulfate of the usual grade (26%
N) contains an additional 5% N, Its storage properties
are superior to ammonium nitrate or a mixture of solid
ammonium sulfate and ammonium nitrate since free
ammonium nitrate is absent. However, the large-scale
manufacture of urea and binary and ternary high-analysis
fertilizers has diminished the importance of ammonium
sulfate-nitrate in most countries.
When mixtures of sulfuric acid and phosphoric acid
are ammoniated, a variety of mixed and double-salt
products can be made. One of the most popular is "ammo-
phos," containing 16% N and 20% P205. After
ammoniation the slurry formed is granulated in a pugmill
or drum unit, then dried and screened (and sometimes
cooled) to give a water-soluble product containing about
two-thirds ammonium sulfate and one-third ammonium
phosphate by weight. This material has good storage
properties under normal conditions.
8.6.3.10 Miscellaneous Processes - Numerous
processes have been proposed or developed for
recovering sulfur from flue gas. These processes are based on
scrubbing with ammonia or injection of ammonia into
the flue gas; ammonium sulfite, bisulfite, sulfate, or
mixtures of these compounds result from the processes.
Ammonium sulfate can be produced as a final product,
and some commercial use has been reported in Japan.
However, the demand for ammonium sulfate is small in
comparison with the potential supply from flue-gas
sulfur; therefore, most processes involve disposal of the
sulfur as calcium sulfate or sulfite and recycling of ammonia.
8.6.4 Ammonium Chloride
8.6.4.1 General Information - Ammonium
chloride is used for fertilization either as such or in a variety
of compound fertilizers [62], Examples are:
18-22-0 (ammonium-phosphate chloride)
16-0-20 (ammonium-potassium chloride)
14-14-14
12-18-14
Ammonium chloride is used in other grades of
compound fertilizers in combination with urea or ammonium
249
sulfate. Advantages of ammonium chloride are that it
has a higher concentration than ammonium sulfate and
a somewhat lower cost per unit of N (in Japan). It has
some agronomic advantages for rice [63]; nitrification is
less rapid than with urea or ammonium sulfate and,
therefore, N losses are lower and yields are higher.
. Although ammonium chloride is best known as a rice
fertilizer, it has been successfully tested and used on other
crops such as wheat, barley, sugarcane, maize, fiber
crops, and sorghum in a variety of climatic conditions.
Of particular note, however, is the use of ammonium
chloride on palms; a linear response of coconut to
chlorine in terms of copra yield per tree was shown 164].
Ammonium chloride is as highly acid-forming as
ammonium sulfate per unit of N, which can be a
disadvantage. Other disadvantages are its low N content
compared with urea or ammonium nitrate and the high
chloride content, which can be harmful on some crops
or soils. Nevertheless, it is possible that ammonium
chloride fertilizer could become a useful outlet for surplus
chlorine or byproduct hydrochloric acid that arises from
time to time in various countries. Another useful feature
of ammonium chloride is that it can be applied to rice
with safety in the presence of certain fungi, which would
reduce ammonium sulfate to toxic sulfides. The
industrial uses of ammonium chloride are worldwide although
in relatively small tonnages. The main applications
include dry-battery manufacture and use as a.flux for sol-
dering and brazing. As a fertilizer, ammonium chloride
is notably popular in east and southeast Asia.
8.6.4.2 Properties of Ammonium Chloride- The
properties of ammonium chloride are given in Table
8,29.
8.6.4.3 Commercial Form, Storage, and
Transportation - The fertilizer-grade product contains 25%
N. The product can be in the form of either crystals or
granules. Coarse crystalline or granular forms are
preferred for direct application, whereas fine crystals can
be used in compound fertilizers.
A typical analysis of the material produced by the dual-
salt process is given in Table 8.30. The direct-neutralization
method, in principle, may yield a purer material,
The same requirements as to ammonium sulfate should
be observed. The product is to be packed in moisture-
proof bags prior to storing or transportation.
8.6.4.4 Raw Materials - Principal raw materials
are common salt (NaCI) and anhydrous ammonia in the
case of the dual-salt process or anhydrous ammonia and
hydrochloric acid (HCI) for the direct-neutralization
method. To take advantage of byproduct CO2, it is
advisable to install the dual-salt process at a site where
anhydrous ammonia is produced. For the direct-
Table 8.29. Properties of Ammonium Chloride
Formula
Molecular weight
Nitrogen content
Color
Density of solid, 20°C
Solubility, g/100 g of water at:
Temperature, °C
0
20
40
60
80
100
115.6 (boiling point)
Effect of heat:
Crystal relative humidity
at 20°C
at 30°C
NH4CI
53.5
26%
white
1.526
29.4
37.2
45.8
55.3
65.6
77.3
87.3
Ammonium chloride
begins to dissociate at
350°C and sublimes
at 520°C
79.2
77.5
Table 8.30. Dual-Salt Process Product
Specification
%
NH4CI (minimum)
NaCI
Carbonates as CO2
Sulfates as SO4
Insoluble material
95.0
1.5
0.5
0.3
0.1
neutralization method, byproduct HCI may be used, e.g.,
byproduct HCI from the production of potassium
sulfate by the Mannheim process. In addition, substantial
amounts of byproduct HCI are available from other
industries. HCI is a strong, highly corrosive acid; thus,
special precautions should be observed when handling
it.
8.6.4.5 Production Methods - Several methods
for producing ammonium chloride are used; the order
of importance is as follows:
1. The dual-salt process, whereby ammonium chloride
and sodium carbonate are produced simultaneously.
2. Direct neutralization of ammonia with hydrochloric
acid.
3. Miscellaneous methods,
250
8.6.4.6 The Dual-Salt Process - Most ammonium
chloride used in India, China, and Japan for fertilizer
purposes is produced by the dual-salt process as shown
in Figure 8.24 [62] or in suitably modified Solvay plants.
In this method, ammonium chloride is salted out by
the addition of solid, washed sodium chloride rather than
decomposition by lime liquor to recover ammonia as in
the Solvay ammonia-soda process.
In conventional Solvay plants, an ammoniated
solution of about 30% sodium chloride is treated with
carbon dioxide in large absorber towers to form ammonium
carbonate:
2NH3 + HaO + C02 -> (NH4)2C03
Additional carbonation produces ammonium bicarbonate:
(NH4)2C03 + C02 + H20 -> 2NH4HCO3
The addition of sodium chloride yields sodium
bicarbonate and ammonium chloride:
NH4HCO3 + NaCl -> NaHC03 + NH4C1
The sodium bicarbonate is separated by centrifuging or
filtration and calcined to produce sodium carbonate and
C02; the latter is recycled to the system. In the Solvay
process, reaction reaches equilibrium at about 75%
completion, and the mother liquor is reacted with lime
liquor to recover ammonia for reuse in the process, i.e.:
2NH4C1 + Ca(OH)2 -+ CaCI2 + 2NH3 + 2HzO
The calcium chloride liquor can sometimes be sold but
may have to be discarded in the absence of suitable
markets.
In the dual-salt process (or the modified Solvay
process), the mother liquor remaining after separation of^
sodium bicarbonate is ammoniated, cooled below 15°C,
and salted out by adding washed, solid sodium chloride.
The precipitated ammonium chloride is centrifuged,
washed, and dried, The fine crystals can be granulated
by roll compaction or used in compound fertilizers. In
Japan, a method of producing large ammonium
chloride crystals of rice grain shape, 2-3 mm in size, has
been developed by undertaking cooling, nucleation, and
crystallization of the ammonium chloride under closely
controlled conditions in separate vessels" of special design.
Slurry from the last crystallizer is centrifuged, washed,
and dried to about 0.25% free moisture in a rotary drier
Water
V_7 S-8
^i^
c-12
urn.
D-9
BC-10
Product
Amnonlun chloride
JS
T-li
Carbon dioxide gas
C=i
Product Soda Ash
c=>
Legend 1
S-l Salt washer
S-2 Salt centrifuge
T-3 Anmoniated-brine tank
R~4 Salt reactor
P-5 S lurry pump
T-S Annonlun chloride slurry tank
V-7 Ammonium chloride concentrator
S-8 Ammonium chloride centrifuge
D-9 Annon1um chloride dryer
BC-10 Ammonium chloride
product conveyor
T-ll Mother-liquor tank
C-12 Carbonating tower
T-13 Bicarbonate slurry tank
T-14 Bicarbonate nothei1—liquor tank
S-15 Bicarbonate centrifuge
V-16 Soda ash calcmer
BC-17 Soda ash product conveyor
E-18 Amnon1ated-brIne cooler
C-19 Ammonlatlon tower
Figure 8.24. Dual-Salt Ammonium Chloride Process.
251
at 105°C, After removal of ammonium chloride, the
liquor is reammoniated and returned to the carbonating
tower to produce further sodium bicarbonate and to
commence a new cycle of operations, The ammonium
chloride produced by this method, particularly when
granulated or produced in coarse crystal form, is reported
to have good physical properties.
The economics of the process must be evaluated in
comparison with alternative methods for producing soda
ash. This subject is discussed in a UNIDO publication
[62]. In most countries the demand for nitrogen
fertilizers greatly exceeds the demand for soda ash; therefore,
ammonium chloride from this source is not likely to
supply a large percentage of nitrogen fertilizer needs.
8.6.4.7 The Direct-Neutralization Method -
Ammonium chloride of high purity is made in several
countries by the direct reaction between anhydrous
ammonia vapor and hydrochloric acid gas, according to
the reaction:
NH3(g) + HCI(g) -* NH4CI
The reaction is exothermic (42,000 cal/g-mole). In most
cases, neutralization is undertaken at reduced pressures
of 250-300 mm of mercury in one or more rubber-lined
steel vacuum reaction vessels protected with an
additional inner lining of inert brick. Concentrated
hydrochloric acid gas is passed through an aspirator, wherein
it is diluted with air to about 20% concentration and
enters the reaction vessel" via~ a vertical spafgeT"tubeT
According to preference, ammonia gas is introduced
either by a second sparger or by tangential nozzles in
. the base of the reaction vessel. Agitation is provided by
the large volume of air entering the reactor with the
hydrochloric acid vapor; thus, the need for a
mechanical agitator with its additional power requirements and
maintenance problems is avoided.
Similarly, operation under vacuum not only provides
excellent cooling but simultaneously prevents escape of
noxious vapors and eliminates the need for
hydrochloric acid-vapor blowers, plus their attendant cost and
maintenance charges. A reduced pressure of 250-330 mm
of mercury and a corresponding slurry temperature of
75°-80cC represent typical operating conditions.
In most cases, it is normal to maintain a uniform acid
feed for the desired output level and to control the
ammonia addition to achieve a steady pH of 8.0. The
control system should include an audible alarm and provisions
for shutting off the acid if the pH falls below 7.0;
otherwise, those components in the system not protected by
rubber or plastic linings (e.g., the centrifuge) would be
quickly damaged by corrosion. Slurry is withdrawn from
the saturator at about 80% solids concentration, and
the ammonium chloride crystals are separated and rinsed
in stainless-steel centrifuges. In some cases, drying is
also undertaken in the separator by blowing hot air
through the crystal bed before discharge. Alternatively,
a top-feed filter-drier can be used rather than centrifuges.
Mother liquor from the centrifuges is pumped back to
the saturator(s) via a storage tank. Saturator offgases
must be well scrubbed before entering the vacuum pump
or ejector unit to prevent corrosion and to eliminate air
pollution, A two-stage scrubbing system is usually
employed and may consist of a direct, barometric scrubber-
condenser followed by a wetted, packed tower. Liquor
from the scrubber-condenser is returned to the mother-
liquor tank and is evaporated in the saturator, thus pro^
viding a means of temperature control and acid recovery.
Figure 8,25 shows the basic flow diagram for a typical
direct-neutralization unit.
As with other processes involving reactions between
hydrochloric acid (or chlorides) and ammonia, traces of
free chlorine in the acid feed can lead to disastrous
explosions caused by the formation of nitrogen trichloride
in the saturator. Hence, adequate safety precautions must
be installed whereby the HCI gas feed is monitored and
the flow discontinued when chlorine is detected. This
can be accomplished by such means as bypassing a small
stream of gas through a photocell-calorimeter unit
containing potassium iodide or using a modern continuous
gas analyzer of the absorption or chromatographic type.
After separation and drying, the crystalline ammo-
-nium-chloride-is-bagged-as quickly as possible to
minimize subsequent storage and application difficulties.
Figure 8.25. Ammonium Chloride Direct
Neutralization Process.
SCRUBBING WATER
-PROCESS WATER
TAIL 0AS
TO STACK
r
a- T
(T^
i
T
' C-
jH-ai
EFFLUENT
If "- TO WASTE
PRODUCT MM. CIT0 0R]E<*
Legend
A-^Aj Neutralizer-crystallizers F Primary scrubber
B-|, B2 Batch or continuous centrifuges G Secondary scrubber
C Mother-liquor tank H Vacuum pump
D Neutralizer teed pump ' Seal-pot
E Splitter feed box J Product conveyor
252
Recent trials have shown that anticaking agents such as -
certain fatty acid derivatives or inert powders, either
applied to the crystals after drying or added to the
saturated, can be helpful in reducing caking tendencies after
manufacture. Granulation by roll compaction would
provide a good material for direct application.
In accordance with the purity of the feed materials
(plus any reworked product) and provided the plant has
been properly designed and maintained in good
condition, the direct-neutralization method will produce
ammonium chloride of high purity. For example, in one
Indian plant a product of a quality well in excess of
British Pharmacopea specifications can be achieved,
Production of ammonium chloride could be a convenient
way to use byproduct HCI which often has a low value
and poses a difficult disposal problem.
8.6.4.8 Miscellaneous Processes - Ammonium
chloride can be made from ammonium sulfate and
sodium chloride according to the reaction:
(NH4)2S04 + 2NaCI -> Na2S04 + 2NH4CI
Another method is the use of SO2 or sulfite liquor in
conjunction with ammonia and sodium chloride, as
shown below:
S02 + 2NH3 + H20 + 2NaCl -* 2NH4CI + Na2SQ3
However, both methods are quite expensive and can be
justified only for the manufacture of small quantities of
pure material and not for large tonnage fertilizer
production,
Although the deliberate production of ammonium
chloride for fertilizer use is rare in regions other than east
Asia, it is a very common constituent of compound
fertilizers (granular or liquid) in Europe and North America.
It is formed in NPK fertilizers by reaction of ammonium
nitrate and/or ammonium sulfate with potassium
chloride:
NH4NO3 + KCI -► NH4CI + KNO3
(NH4)2S04 + 2KCI -* 2NH4CI + K2S04
These reactions go substantially to completion in most
granulation processes, in nitrophosphate processes, and
in liquid compound fertilizer processes. Ando et al. found
that ammonium chloride was one of the most common
forms of nitrogen in representative grades of NPK
granular fertilizers in the United States [65], Thus, the
production and use of compound fertilizers containing
ammonium chloride is well established on a worldwide
basis even though some people in the industry are not
aware of it.
Licensers and contractors of the available processes
for production of nitrates and ammonium salts are listed
in reference [66]. Sites of the plants are listed in
reference [67],
8.7 References
1. Aleinov, D. P. 1993. "The Russian Nitrogen
Industry," Paper presented at the International Fertilizer
Industry Association, Limited (1FA), 1993 Regional
Conference for Europe, Vienna, Austria.
2. Chernyshov, V. I., and 1. M. Kisil, 1993. "Platinum
Metals Catalytic Systems in Nitric Acid Productions-
System Optimisation in Non-Concentrated Acid
Plants," Platinum Metals Review, 37(3):136-143.
3. British Sulphur. 1993. The Competitive
Performance of the Nitrogen Plants in the Former
U.S.S.R., London, England.
4. Ullmann's Encyklopadie der techntschen Chemie.
1972. 4th ed., 20:305-332.
5. Reference book of the nitrogen industry specialist,
2nd ed., V2, Moscow, Chimia, 1987 (in Russian),
pp. 12-38,
6. Ferti/izer/nremariona/, No. 292, December 1990.
7. Harvin, R. L., D. G. Leray, and L. R. Roudier. 1978.
"Single or Dual Pressure Nitric Acid - An Objective
Comparison," Presented at the 71st Annual
Meeting of American Institute of Chemical Engineers,
Miami Beach, FL, U.S.A.
8. Hopfer, Klaus, and 1. Dayanger. 1980. Lecture
Series on "Recent Advances in Inorganic Acids
Industry, " Manufacture of nitric acid: Recent advances in
ammonia conversion efficiency and NOx reduction,
Indian Chemical Manufacturers' Association.
9. Atroschenko, V. 1., et al. 1985. Technology of Fixed
Nitrogen. Kiev, Vischa Shkola (in Russian), 327 pp.
10. Graham, H. J., V. E. Lyons, and H. L. Faucett.
1964, "Concentrated Nitric Acid," Chemical
Engineering Progress (New York), 60 (7):77-84.
11. "Urea as a Pollution Control Agent." 1975.
Nitrogen, 93:32-36.
12. Rodier, L., N. Durand, and B. Mouille. 1982,
"Nitric Acid Recovery From Waste Nitrous Gases by
the COFAZ Process," Fert. Nitrogen: Proceedings,
British Sulphur Corporation International
Conference of Fertilizer Technology, pp. 561-569,
13. Fertilizer International, No. 300, August 1991.
14. Berkley, Neal E., and Franklin D. Gates. 1991. "New
Filter Medium Improves Nitric Acid Process,"
FINDS, Third Quarter, Stokes Engineering, U.S.A.
253
15. Honti, G. D. 1976. The Nitrogen Industry.
Properties, pp. 409-413, Akademia Kiado, Budapest,
Hungary.
16. Nitrogen, No. 177, January-February 1989.
17. Fertilizer Focus, March 1990.
18. Zhukov, M. F., V. J, Smolyakov, and B, A, Uryukov.
1973. Electric Arc Heaters for Gas (Plasmotrones),
Moscow, Nauka, 232 pp.
19. Ganz, S. P., and V. D. Parkhomenko. 1976.
Production of Fixed Nitrogen in Plasma. Kiev, pp, 11-63:
20. Keleti, C. 1985. Nitric Acid and Fertilizer Nitrates.
Marcel Dekker Inc., New York, NY, U.S.A.
21. Landoh - Bomstein, Erg, Bd. 11-b, p. 1495, 5thEd.,
Springer Verlag, Berlin, Germany.
22. Hendriks, Posnjak, Kracek, 1932. J. Am, Chem.,
54:2766-2786.
23. Reference book of the nitrogen industry specialist,
2nd Ed., V2, Moscow, Chimia, 1987 (in Russian),
p. 154.
24. Safety in Works. The Fertiliser Society of London,
Proceedings No, 137, London, England.
25. The Development of Legislation Affecting the
Production, Distribution, Storage and Use of
Fertilizers. Fertiliser Society "of London," ProceedingsrNur
267, London, England,
26. Packing, Handling, Transportation, Bulk Storage
and Use of Ammonium Nitrate Fertilizer. The
Fertilizer Institute, 1015 18th Street N. W.,
Washington, D.C., U.S.A.
27. Code for the Storage of Ammonium Nitrate. NFPA
No. 490, National Fire Protection Association 60
Battery March Street, Boston, MA, U.S.A.
28. The Storage of Ammonium Nitrate, APEA -
Technical Committee.
29. Olevsky, V. M., et al. 1978, Technology of
Ammonium Nitrate, Moscow, Khirnia, 312 pp. (in Russian).
30. Pagani, G., et al. 1981. NSM Ammonium Nitrate
Plant, Paper presented at 4th International
Conference on Fertilizer Technology.
31. Ulrichs, K. 1985. "AN-Neutralization," Paper
presented at Ammonium Nitrate Pollution Study Group,
Edmonton, Alberta, Canada.
32. Nebel, R. 1985. "Reduction of Nitrogen Losses in
Plants for the Production of Ammonium Nitrate,"
Fertiliser News, pp. 41-47,
33. SPI Report No. 127 Al, Ma 1980.
34. Bovens, J. L., and F. van Hecke. 1992. "The
CARN1T Ammonium Nitrate Process," Paper
presented at the Fertiliser Society Meeting, London,
England.
35. Indian Patent 1N-170567, 11.04.1992.
36. Arion, N. 1986. "Fertilizer Plant Waste Water
Treatment by Ion Exchange," Nitrogen.
37. Carter, R.W.R., and A. G. Roberts. 1969. The
Production of Ammonium Nitrate Including Handling
and Safety, The Fertiliser Society of London, England,
38. "The Granulation of Nitrogenous Fertilizers,"
Nitrogen, May-June 1981,
39. Bruynseels, J. P. 1981. "Granulate in Huid Bed,"
Hydrocarbon Processing, pp. 203-208.
40. German Patent DE-3811913 CI, 12/10/1989.
41. Spanish Patent ES-553311, 24/03/1986.
42. United States Patent US-3,317,276, 02/05/1967.
43. United States Patent US-3,647,412, 07/03/1972.
44. Olevsky, V, M. 1992. "New Results and Modern
Technologies for Nitric Acid, Nitrogen Fertilizers and
Caprolactam Production," Paper presented at the
International Meeting on Chemical Engineering and
—_BiotechnoIogy,-ACHEMASIA,92.
45. Olevsky, V. M., and L. A. Taran, 1994. "The Effect
of Certain Types of Insoluble Modifiers Introduced
Into Nitrogen-Containing Fertilizer Melts on the
-Quality Performances of Prills," Paper presented at
the International Meeting on Chemical
Engineering and Biotechnology, ACHEMA - 94,
46. Vogel, E. 1986. "The Fluidized Drum Granulation
Process," Nitrogen, 161:28-31, May-June.
47. "Opinion - AN/CAN Production technology."
1986. Fertilizer Focus, Vol. 3, No. 9, October
1986.
48. Bertilsson, G, 1989. "Nitrogen Transformations and
Nitrogen Balances in Scandinavian Soils," The
Fertiliser Society of London, Proceedings No. 287,
London, England,
49. Ettle, G. W. 1949. "Some Aspects of Ammonium
Sulfate Production," Proceedings of the Fertiliser
Society of London, No. 5, London, England.
50. Buckley, H. E. 1951. Crystal Growth, John Wiley
and Sons Inc., New York, NY, U.S.A.
51. Keating, K. B. 1964. "Mechanisms of Crystal
Growth," Chemical Engineering Progress
254
Symposium, Series 60, No. 48. American Institute
of Chemical Engineers. New York, NY, U.S.A.
52. Rumford, F, and J. Bain. 1959. "Controlled
Crystallization of Sodium Chloride," Fluid Handling,
(117):284-186.
53. Palermo, J. A., and G. F. Bannet. 1964.
"Crystallization," Industrial and Engineering Chemistry,
56(10):38.
54. Svanoe, H, 1940. "Krystal Classifying Crystallizer,"
Industrial and Engineering Chemistry, 32(5): 636.
55. Bennet, R. C. 1962. "Product Size Distribution in
Chemical Crystallizers," Chemical Engineering
Progress, 58(9):76-80.
56. Nitrogen, No. 168, July-August 1987.
57. Pratt, C. J. 1964. "Ammoniated Phosphate Type
Fertilizers," "Ammonium Sulfate, Nitrate and
Chloride Fertilizers," IN Fertilizer Nitrogen, Vincent
Sauchelly (Ed.), pp. 196-200, 222, 232-236,
Reinhold Publishing Corp., New York, NY, U.S.A.
58. Rao, D. G. 1977. "Technoeconomic Evaluation of
Alternate Uses of Byproduct Gypsum," FAI-1FDC
Fertilizer Seminar Proceedings.
59. Hardy, W. L. 1957. "Sulfur From Gypsum Not
Feasible in United States but May Be Abroad,"
Industrial and Engineering Chemistry, 49(2):57a—,
60. George, K. C, and N. D. Gopinath, 1963.
"Manufacture of Ammonium Sulfate," Paper
prepared for Conference on the Development of the
Fertilizer Industry in Asia and the Far East, United
Nations Economic Commission for Asia and the Far
East, Bombay, India.
61. "Leaving the Byproduct Ammonium Sulfate Out of
Caprolactam Manufacture." 1977. Nitrogen,
108:33-36.
62. UNIDO. 1969. "The Ammonium Chloride and Soda
Ash Dual Manufacturing Process in Japan,"
Fertilizer Industry Series Monograph No. 4.
63. "Ammonium Chloride for More Crops." 1977.
Japan Chemical Week, 18(7):875.
64. "Ammonium Chloride: A Minority Product, but
Important in Asia." 1978. Nitrogen, 111:31-32.
65. Ando, J., J. P. Smith, M, R. Siegel, and J. E.
Jordan, 1965. "Quantitative Analysis of Mixed
Fertilizers by X-ray Diffraction," Journal of Agricultural
and Food Chemistry, 13:186-195.
66. British Sulphur. 1992. N-P-K-S Process and Plant
Suppliers, 3rd Edition, British Sulphur Publishing,
London, England.
67. British Sulphur. 1987. World Fertilizer Atlas, 8th
Edition, The British Sulphur Corporation Ltd., Lon-
don,-Eng!and
255
Chapter 9. Urea
Table of Contents
Page
9.1 introduction 257
9.2 Properties of Urea ._ , r ,......ii.J,....,!. 258
9.3 Process Operating Variables 258
9.4 Urea Processes 259
9.4.1 Once-Through and Partial-Recycle Processes 259
9.4.2 Total-Recycle Processes 260
9.4.3 Stripping Process-Based Plants 263
9.5 Urea Finishing Processes 266
9.5.1 Prilling 266
9.5.2 Granulation 267
9.6 Economics 268
9.7 References 268
256
Chapter-9. Urea
9.1 Introduction
Urea was first identified in 1773 when it was isolated
by crystallization from urine. It was first prepared
synthetically in 1828 by Wohler from ammonia and cyanu-
ric acid III:
NH3 + HCNO-CO(NH2)2
This preparation was a milestone in science since urea
became the first organic compound prepared by
synthesis from inorganic materials. Previously it was
believed that organic compounds could be produced only
by living organisms. The present method of
synthesizing urea from ammonia and carbon dioxide has been
known in principle since 1868, but commercial
production by this method started in 1922 in Germany, in 1932
in the United States, and in 1935 in England, However,
there was some commercial production in Canada (by
DuPont) starting in 1920 using calcium cyanamide
according to the reaction:
CaCN2 + 3H20 -> COJNHzk + Ca(OH)2
Use of urea as a fertilizer developed rather slowly at
first, partly because early processes were cumbersome
and expensive and partly because of some doubt about
its agronomic suitability. Urea has been considered a
slow-release fertilizer in Europe since it must undergo
two transformations in the soil before it becomes
available to most crops [1], The first transformation is
hydrolysis:
CO(NH2)2 + H20 - 2NH3 + C02
The second transformation is nitrification in which
ammonia is oxidized in the soil by microbiological means
first to nitrite and then to nitrate. These reactions
proceed rapidly in warm, moist soil, but they are quite slow
in cool soils, which are characteristic of temperate
climates (northern Europe) in the spring season.
Under some circumstances urea can be phytotoxic,
and many cases of severe damage to crops have
occurred, especially when the urea was placed close to the
seeds. These cases were mainly associated with
"combine drilling," which is a common practice in some
European countries, The practice consists of drilling fertilizer
with small grain seed. The phytotoxicity may be caused
by locally high concentrations of ammonia during the
hydrolysis stage, or it may be caused by accumulation of
nitrite during the nitrification stage, A possible third cause
is the presence of excessive amounts of biuret as an
impurity in urea.
Aside from toxicity, poor agronomic results may be
caused by loss of ammonia to the atmosphere when
urea is applied on the surface of the soil or as a
topdressing to growing crops. This loss is caused by the
formation of ammonia by hydrolysis under such
conditions that part of it escapes to the atmosphere rather
than being adsorbed by the soil. A primary use for straight
nitrogen fertilizer in the United Kingdom and many
European countries is for topdressing cereals and grass.
Studies in England and the Netherlands have shown that
on the average urea is only 80%-85% as effective as
ammonium nitrate for this use.
For the reasons mentioned above, urea has been
unpopular in most European countries, and it still finds
little use in northern Europe as a straight nitrogen
fertilizer, However, recent studies have shown that urea is as
effective as ammonium nitrate when incorporated in the
soil at or before planting time,
In the United States the general conclusion of agrono-
-mists-is-that-urea-is-as-good-asany other nitrogen
fertilizer if properly used. However, it is not recommended
for some uses, such as in placements in contact with or
near seeds.
Urea is generally satisfactory for rice and preferable
to nitrates for flooded rice because nitrates are reduced
to N20 or N2 in the anaerobic zone of the rice paddy
and hence lost to the atmosphere. Furthermore, the
rice plant, unlike most other crops, can utilize the
ammonium form of nitrogen efficiently. In tropical,
subtropical, and warm temperate zones, hydrolysis and
nitrification (in aerobic soil conditions) are rapidly
completed; thus, there is no delayed-release effect. For these
reasons and because of its high concentration and
favorable production cost, it has become the most
popular nitrogen fertilizer in Asia and in many countries on
other continents. An excellent discussion of the
agronomic effects of urea has been presented by Tomlinson
who concludes that urea can be used efficiently, but its
use requires a higher degree of understanding than is
the case with simple inorganic salts 12].
On a worldwide basis urea is the most popular solid
nitrogen fertilizer, and its use grows much more rapidly
than that of other materials. More than 50 million tonnes
of urea is now produced annually. More than 16 million
tonnes is produced in the Indian subcontinent, more than
257
10 million in China, and more than 4 million in Indone.-
sia. More than 70,000 tonnes of daily capacity has been
installed in the past 10 years.
Urea is used as a cattle feed supplement where it is a
cheap source of protein. It is used both in prill form
(microprill at 0.2/0.4-mm diameter) and as a liquid in a
mixture of urea (±75% solution), molasses, and
phosphoric acid. It is the feed material for melamine plastic
and for various glues. The glues are either urea-
formaldehyde or urea-melamine-formaldehyde. The
latter is waterproof and is used for marine plywood.
9.2 Properties of Urea
Some properties of urea that are of interest for
fertilizer use are as shown in Table 9.1.
Table 9.1. Properties of Urea
Molecular weight
Nitrogen content, %
Color
Specific gravity
Melting point, °C
Solubility in water, parts per 100
parts of water by weight at
0°C
20°C
40°C
60°C
80°C
100°C
Critical relative humidity at
20°C
30°C
Specific heat at 20°C, cal/g °C
Heat of solution in water
(endothermic), cal/g
60.06
46,6
white
1.335
132.7
66 7
108.0
167.0
251,0
400.0
733.0
81%
73%
0.320
-57.8
The relatively low specific gravity, compared with that
of other fertilizer materials, must be considered in
calculating storage space requirements. For instance,
storage space requirements per unit of nitrogen are about
the same for urea as for ammonium nitrate because the
higher analysis of urea is offset by its lower specific
gravity. Urea is less hygroscopic than ammonium nitrate but
more hygroscopic than ammonium sulfate; it requires
protection from humid atmosphere in some climates.
The coating of prilled urea with clay, oil, or Ureasoft™
gives relatively good protection. Many producers now
add formaldehyde to the urea melt just before prilling
and obtain very satisfactory results in storage.
If the product is dedusted and the producer has made
good prills with high impact and crushing strengths, it is
possible to ship uncoated bulk urea long distances with
no problems (i.e., Houston to Brazil).
9.3 Process Operating Variables
Temperature - Conversion of ammonium
carbamate to urea in the absence of excess ammonia increases
with temperature to a maximum of about 50% at 170°-
190°C when the pressure is sufficiently high to keep the
reactants in the liquid state. The rate of reaction increases
with temperature; it is slow at 150°C and below (with
stoichiometric NH3:C02 ratio) and quite rapid at 210°C,
A satisfactory approach to equilibrium can be obtained
in the temperature range of 180°-200DC in 0.3-1.0 hours
or at lower temperatures with excess ammonia,
Corrosion difficulties increase with temperature, and a range
of 180°-210°C is generally accepted as optimum for
most processes.
Pressure - At constant temperature, conversion
increases with pressure up to the critical point which is
the point at which the vapor phase is substantially
eliminated and the reactants are in the liquid state. A further
increase in pressure is not beneficial. The critical
temperature is a complex function of the temperature and
composition of the reactor's contents. For example, at
150°C a pressure of about 100 atm might be near
optimum for a stoichiomeiric NH3-.C02 ratio, but at this
temperature the rate of reaction is unacceptably slow, At
the preferred temperature of 180°-210°C, pressures of
140-250 atm are commonly used.
Mole Ratio of NH3:C02 - Excess NH3 above the
stoichiometric mole ratio of 2 favors the rate of the
reaction. The percentage of CO2 converted to urea is
increased but, of course, the percentage of NH3 converted
to urea is decreased. Because recycling of excess NH3 is
relatively simple (as compared with that of. C02, which
remains as carbamate), most processes use 50% or more
excess ammonia (a mole ratio of 3:1 or more). Today all
processes account for a balance of both CO2 and NH3
conversion to reduce total recycling to a minimum
plantwide (i.e., reactor and synthesis).
Other Factors - The presence of water decreases
conversion; therefore, most processes are designed to
minimize the amount of water recycled to the reactor.
The presence of small amounts of oxygen decreases
corrosion; all processes use this method of minimizing
corrosion.
Optimum Conditions - It is generally not
economical to maximize the percentage conversion in the
reactor because this would require an excessive retention
time. The aim therefore is to attain maximum quantity
258
of urea production per unit of time with due regard to
the cost of recycling unreacted CO2 and NH3 and the
cost of increased reactor size and corrosion difficulties,
which increase with temperature. Typical operating
conditions are: temperature, 180°-210°C; pressure, 140-
250 atm; NH3:CC>2 mole ratio, 3:1-4:1; and retention
time, 20-30 minutes.
9.4 Urea Processes
Basically all new plants use total-recycle processes.
However, once-through or partial-recycle processes may
still be preferred in some countries, and in some cases
stripping can be considered a refinement of total recycle.
9.4.1 Once-Through and Partial-Recycle
Processes
The once-through method is the simplest and least
expensive (in both capital investment and operating costs)
of the three basic types of processes. A typical unit
flowsheet (synthesis section only) is given in Figure 9.1,
Liquid ammonia and gaseous carbon dioxide are pumped
into the urea reactor at about 200 atm. The reactor
temperature is maintained at about 185°C by regulating
the amount of excess ammonia; about 100% excess NH3
is required, and about 35% of the total NH3 is converted
to urea (75% of the CO2 is converted). The reactor
effluent solution contains about.80%_urea after,
carbamate stripping. The unconverted NH3 and CO2 are driven
off at moderate pressures by steam heating the effluent
solution in the carbamate strippers.
Even though this process is the simplest of the urea
processes, it is the least flexible and cannot be operated
unless some provision is made to utilize the large amount
of off-gas ammonia. Thus, it must be used in
conjunction with the coproduction of some other material, e.g.,
ammonium sulfate, ammonium nitrate, nitric acid, or
ammonium phosphate, for which the ammonia can be
used, One case in which the system can be used is the
production of urea-ammonium nitrate solution; the
unconverted NH3 is used to make ammonium nitrate
solution, which is then mixed with the urea solution. Even
in this case, most new plants use a total-recycle process^-
ln the partial-recycle process, part of the off-gas
ammonia and carbon dioxide from the carbamate strippers
is recycled to the urea reactor. Recycling is accomplished
by absorbing the stripper gases in a recycle stream of
partially stripped urea effluent, in process-steam
condensate, or in mother liquor from a crystallization
finishing process. In this manner, the amount of NH3 in
off-gas is reduced. Any proportion of the unreacted
ammonia can be recycled; typically, the amount of
ammonia that must be used in some other process is
reduced to about 15% of that from a comparable
once-through unit.
The Mitsui Toatsu partial-recycle process flowsheet is
typical of the first method and is shown in Figure 9.2.
Liquid NH3 and gaseous CO2 are pumped to the urea
-reactor-at-200-atm.-The-temperature of the reactor is
maintained at about 185°C by proper balance of excess
NH3 and carbamate solution recycle feed. About 100%-
110% excess NH3 is used; about 70% of the NH3 and
$y
Effluent
Urea
Reactor
Liquid Annon I a
Gaseous
Carbon Dioxide
cz>
u^
h
Dff Gas (High Pressure)
<=>
Dff Gas (Low Pressure)
To
-f=^ Coproduct
Synthesis
A
Ste
an j^K )HX3—( Sj
S-fcean
Urea Solut1 on
S^
£>
High Pressure Low Pressure
Carbamate Strippers
To
Finishlng
Section
Figure 9.1. Typical Once-Through Urea Process.
259
AnmonIa
High-Pressure
Absorber
Water
LI qu 1 d
Ammon i a
.&-
^T^~^
-&■
Urea
Reactor
Si
a
C^
Steam
Heater
Gaseous
Carbon Dioxide
{> K^"
Heater
High-Pressure
Separator
HIgh-Pressure
Carbamate S"tr Ipper
Dff Gas -to
Coproduct Synthesis
a
CZ^
Steam
Low-pressure
Carbamate Stripper
Urea Solution
<To Finishing Section)
i=>
"Q-
Carbamate Solution Recycle
Figure 9.2. Typical Partial-Recycle Process.
87% of the CO2 are converted to urea. The remaining
30% of the NH3 must be used in some other process.
The reactor effluent contains about 80% urea.
Unreacted NH3 and C02 are separated from the urea
solution in the high-pressure separator and in two to
three steam-heated carbamate strippers at successively
lower pressures. The off-gas from the separator and the
first-stage stripper is absorbed in the high-pressure
absorber by a side stream of partially stripped reactor
effluent from the high-pressure separator. Heat evolved
in the absorber reaction is removed (to increase
absorption capacity) by the addition and expansion of part of
the liquid ammonia feed at this point. Pure gaseous
ammonia from the top of the absorber is also recycled
to the urea reactor after being condensed.
Since the amount of ammonium carbamate that can
be absorbed in the absorber solution described above is
limited by its solubility in the system H20-urea-NH3, part
of the ammonia and carbon dioxide cannot be recycled
and must be used in the production of a coproduct
nitrogen material, As in the once-through process, the
operation of the urea plant still must coincide with that
of the coproduct plant.
Other partial-recycle processes differ in detail but
accomplish similar results. Although the investment cost is
somewhat lower than that for total recycle, this
advantage apparently does not compensate for the
inflexibility arising from the necessity of operating a coproduct
plant with mutual interdependency problems. However,
the partial recycle processes continue to find
application, particularly where UAN solution is a coproduct.
9.4.2 Total-Recycle Processes
In total-recycle processes, all the unconverted
ammonia-carbon dioxide mixture is recycled to the urea
reactor (conversion is about 99%), and no nitrogen co-
product is necessary. This is the most flexible of the
urea processes because it depends only upon the CO2
and NH3 supply from its supporting ammonia plant for
operation. However, it is also the most expensive in
investment and operating costs. Therefore, if the
production of other materials requiring ammonia is planned,
an integrated once-through or partial-recycle unit would
have lower investment and perhaps lower operating
costs. The disadvantages are decreased reliability
arising from mutual dependence of two plants, inflexibility in
proportions of coproducts, and difficulties in synchronizing
260
the operation of two plants. Because of these
difficulties most manufacturers prefer a total recycle process,
even when a second nitrogen product is desired.
The urea reactor effluent contains urea and water
resulting from the synthesis reaction; it also contains
unconverted carbamate and excess ammonia. These
ingredients must be separated to give a urea solution
reasonably free from the other materials and to recycle
the CO2 and NH3 to the synthesis reactor. In order to
separate carbamate from urea, it must be decomposed
according to the equation:
NH2CO2NH4 % CO2 + 2NH3
This reaction is the reverse of the first step of the
synthesis process and is strongly endothermic (37.7 kcal/
g-mole). The decomposition is accomplished by various
combinations of supplying heat, lowering pressure, and
"stripping" which lowers the partial pressure of one or
more ingredients. The NH3 and C02 are removed from
the urea solution as gases accompanied by some of the
water in vapor form. Naturally the CO2 and NH3 will
recombine (releasing heat) when the temperature is
decreased or the pressure increased. Hence, condensing
by cooling and/or compressing a gaseous mixture of
CO2, NH3, and H2O produces a carbamate solution.
Total-recycle processes can be classified in five groups
according to the recycle principle: (1) hot-gas mixture
recycle, (2) separated-gas recydeT(3) slurry-recycle,-
(4) carbamate-solution recycle, and (5) stripping. The
first four groups use carbamate decomposition steps
basically similar to those of the once-through and partial-
recycle processes, whereas the last one differs even in
this respect.
Hot-gas recycle of mixed CO2, NH3, and H2O was
used in Germany between the two World Wars by I. G.
Farbenindustrie at Oppau. The hot gas was compressed
in five stages by reciprocating compressors with
interstage cooling to an end temperature of 260°-270°C
and a pressure of 120-130 atm. It was then cooled to
160°C to condense the gases (with carbamate
formation), and the heat was recovered as steam. The
process was not very successful; when the plant was
destroyed during the last war, it was not rebuilt. The
idea was revived by Chemical Construction Company
with the proposal that the compression be done with
large centrifugal compressors that became available in
the 1960s using new materials of construction that can
operate at high temperature (400°-540°C) without
interstage cooling. The proposed process seems
technically sound, but centrifugal compressors of this sort are
feasible only in such large sizes that the minimum scale
would involve a urea plant of about 1,200-tpd capacity.
Because smaller scale development was not feasible, no
organization was willing to risk using the untried
process on such a large scale.
The separate-gas recycle method was developed to
overcome the difficulties of the mixed hot gas recycle
process. The CO2 and NH3 can be compressed
separately without difficulties caused by carbamate
formation. Processes of this type were developed by lnventa
(Switzerland) and CPI-AIlied (United States). The
principle of the processes is that CO2 in the gas mixture
from the decomposers is absorbed selectively in a
solvent such as monoethanolamine (MEA). The NH3
remaining after CO2 removal is compressed and recycled
to the synthesis reactor. The CO2 is desorbed from the
MEA solvent by heating, and it is recycled separately
[3].
The process has the advantage that conversion is not
reduced by recycling water to the reactor and that the
problem of recycling corrosive solution to the reactor is
avoided. Offsetting this is the difficulty in recovering heat
and cost of MEA makeup. The number of plants using
the method is relatively small, and it is not known to be
in use in any of the large plants (1,000 tpd and up) built
in recent years.
The principle of the slurry-recycle process is that the
CO2-NH3-H2O gas mixture goes to a reactor to which a
light paraffin oil is added. Carbamate, formed in the
reactor as an oil suspension, which contains 35%-40%
solids, is pumped into the urea synthesis unit with fresh
CO2 and NH3. The mixture then goes through the car-
-bamate"decompos'ersrandihe-oiI is separated from the
urea solution by decantation for reuse. The process was
developed by Pechiney (France) and has been used by
that organization.
The carbamate-solutiori-recycle system became the
most popular of the original total-recycle processes.
There were several proprietary processes (Stamicarbon,
Mitsui Toatsu, Montedison, Snamprogetti, etc.) which
have been offered by their developers and licensees. They
differed mainly in engineering details, methods for heat
recovery, and means for energy conservation. In
general, all solution-recycle processes involve absorbing CO2
and NH3 in water and recycling it to the synthesis step
as an aqueous carbamate solution. The amount of
water must be kept to a minimum, however, because
addition of water lowers the percentage of conversion to
urea. In addition, the evaporation of additional water
has a negative impact on the economy of the process.
Some years ago there was considerable variation in
the design features of the various solution-recycle
processes; these differences have gradually disappeared.
Today most of the "conventional" processes are much
the same. All use similar reactor conditions
(temperature about 185°C and pressure about 200 atm),
maintain an NH3:C02 mole ratio of about 4:1 in the synthesis
loop, and obtain about the same conversion (65%-67%)
261
of CO2 to urea for each pass through the synthesis re-,
actor. Overall conversion of NH3 to urea is 99% or more,
All reduce the reactor effluent pressure to an
intermediate level and then pass the solution through two or three
stages of decomposition (by heating) at successively lower
pressure levels. In each stage, the evolved gas mixture is
condensed (or absorbed in weak solution condensed in
a later stage), and the resulting solutions are returned
through the system to the reactor. The excess ammonia
(from the excess used in the initial reactor feed) passes
through the absorbers, is condensed, and is fed back to
the reactor.
Although these primary steps are common to the
various conventional methods, there is considerable
difference in the carbamate solution-recycle systems - in
pressure and temperature levels of the decomposition
steps, equipment arrangement, and process flow. This
phase of the development is still in a state of flux; even
for a given company, the flowsheet for a current plant
will likely be somewhat different from that of the
immediately preceding one. The general design objectives are
to:
1. Maximize heat recovery.
2. Minimize amount of carbamate solution recycled
(smaller pumps and less power) and amount of
water returned to the reactor (better conversion).
3. Minimize power requirement- - — —
4. Maximize ammonia recovery (lower operating cost
and less pollution).
Since another primary objective, of course, is to
minimize investment, the problem becomes the usual one of
finding the best balance between utility consumption and
maintenance on the one hand and investment on the
other.
Several parameters are involved in the design of the
carbamate-solution-recycle system, and they are so
interrelated and interdependent that it is difficult to
analyze them separately, Changing one parameter in the
direction of improvement almost always changes one
or more of the others in an adverse direction, and the
extent of the adverse effect can only be determined by
somewhat complicated calculations. Hence, it is difficult
to evaluate quantitatively the various schemes that have
been developed.
One important consideration is the number of
decomposition stages. Reducing the number lowers plant
investment but increases the amount of water returned to
the reactor, makes heat recovery less attractive
(decomposer pressures generally lower), and results in higher
ammonia loss in gaseous or liquid effluents. The current
trend is to three stages as the optimum number. The
third stage generally involves both decomposition of
carbamate and evaporation of water, with vacuum
applied to remove the ammonia down to a very low level
as a means of minimizing atmospheric pollution. The
flashed gas is passed through a water-cooled condenser,
the condensate stripped of ammonia, and the stripped
condensate preferably discarded rather than returned
to the reactor. Such a procedure produces only traces
of ammonia in the gaseous and aqueous effluents.
The point of heat recovery also varies. The main
source of heat in the system is carbamate formation in
the reactor. In some past designs, recovery or removal
of heat directly from the reactor was practiced - by
water coils in the reactor or a cooling jacket outside.
Today, however, the recycled ammonia and carbamate
solution take up the reaction heat and carry it out of the
reaction zone.
In the decomposition section, heat must be added in
order to get an adequate rate of carbamate
decomposition. Much of this is heat released when the evolved
gases are recondensed, and it is at this point that heat is
usually recovered. The recovery is limited to the first
decomposition stage, however, because the gases are at
such a low pressure in the later stages that the
condensation temperature is too low for economical recovery
of the heat.
Thus, the usual source for heat recovery is hot con-
"densed'irquor fronTthe first-stage absorber. Practice
varies as to the stream used to absorb this heat. In some
cases, water is heated and steam is produced: in other
published flowsheets a process stream is involved.
Gas release procedure can have an important effect
on the amount of water recycled to the reactor. The
simplest arrangement - merely releasing pressure,
flowing the solution into a vessel, heating it, and allowing
the evolved gases to escape - is relatively inefficient
because it gives maximum evaporation of water. Two
systems have evolved, both of which minimize water
evaporation, The first involves a sequence, in each stage,
of (1) pressure reduction, (2) gas release, (3) heating,
and (4) further gas release. The advantage is that gas
evolved by release of pressure alone comes off at a lower
temperature than in the heated decomposer. The partial-
pressure relationships involved are such that this
procedure gives less evaporation of water.
In the second system a rectifying column is used as
the decomposer: relatively cold incoming solution flows
downward in countercurrent flow to the hotter gas
evolved in a heated section (or reboiler) at the bottom.
Thus, the composition of gas leaving the column
approaches equilibrium with the incoming solution, which
has a relatively low partial pressure of water because of
the reduced temperature.
262
Because of the large number of processes offered and
frequent changes in flowsheets, it is not feasible to show
flow diagrams for all processes, Figure 9.3 shows a flow
diagram for the Mitsui Toatsu total-recycle process
(Process C). No implication is intended that this process is
necessarily superior to others.
9.4.3 Stripping Process-Based Plants
In 1966 Stamicarbon of the Netherlands introduced
the CO2 stripping process with a 220-tpd unit built for
its parent company Dutch State Mines (DSM). In 1968
a 1,000-tpd plant was designed and built for DSM,
Shortly after this, Snamprogetti designed and built a
small plant utilizing NH3 as the stripping agent. (The
company later switched to thermal stripping, which is
possible due to the very, high NH3 ratio.) Next, Toyo
Engineering Corp, of Japan utilized CO2 for stripping.
Since that time, over 95% of all completed urea plants
have utilized these three technologies. For that reason,
these will be covered in this chapter. Over 140,000
tonnes rated daily capacity has been installed with
stripping. Actually most of these plants are operated above
their ratings and also are operated well over the 330
days usually used to calculate an annual capacity. A
capacity of 50 million tpy from the stripping-based plants
is conservative.
Plant sizes have increased drastically. Toyo:s largest
unit rating is 1,760 tpd, Snamprogetti has a 1,925 rated
unit, and Stamicarbon has several 2,000-tpd units. (One
of these is currently being revamped to 2,850 tpd.)
After in-depth consultation with its equipment vendors (i.e.,
centrifugal compressors, centrifugal and reciprocating
high-pressure pumps, and high-pressure vessels),~~
Stamicarbon is prepared to offer units (single train) which
have capacities up to 3.500 tpd,
Each of these three licensers has different approaches,
and each has revised and improved its technology
through the years. It is apparent that further
improvements will be made.
All three processes closely approach stoichiometric
values in raw material consumptions, and all have
Absorber k—*
K
Absorber ■ *—
Cooler
cw tX
Knockout
Drum
Compressor Reboller
Decomposer Product
Seal Product
Tank Tank
75 7.
<=> Urea
Solution
Figure 9.3. Typical Total-Recycle Urea Process (TVA Plant).
263
reduced their steam consumption to a minimum
apparent economic level. (Steam use could easily be reduced
further but with an unfavorable increase in capital costs.)
The last avenues available for further improvements
appear to be in reduction of capital costs, improved
reliability and efficiency of mechanical equipment, and
metallurgical advances.
Stamicarbon is presently prepared to offer
technology that utilizes a pool reactor to reduce the number of
high-pressure vessels from four to two. This drastically
reduces both equipment and construction costs. The flow
sheets shown in this chapter for the Stamicarbon,
Snamprogetti, and Toyo processes (Figures 9.4, 9,5,
and 9.6) are for the basic design used by each licenser
in the past 10 years. As can be seen, Snamprogetti and
Toyo, with their high NH3/CO2 ratios require two
decomposition stages; Stamicarbon continues to use a
single stage. The possible problem of more upsets due
to one stage has been solved with a patented
proprietary N/C ratio control instrument. Operating
conditions and process requirements for the three principal
synthesis processes are given in Table 9.2,
All processes still require use of oxygen for
passivation in the synthesis loop. Metallurgical advances have
reduced the amount required. Snamprogetti now
utilizes a bimetallic zirconium/25-2 2-2 (Ni, Cr, Mo) tube in
its stripper. The corrosion rate for zirconium in urea
service is nil. Toyo utilizes a duplex alloy (ferrite-austen-
ite), which requires less oxygen. Stamicarbon, working
with the Swedish steel producer Sandvik, has patented
a proprietary material called Saferex, which requires very
little oxygen; future plants will use this new material,
A very good example of the results of these licensers'
research arid improvements can be shown by fhe~facF
that NH3 emissions have been reduced from 8-pIus kg/
tonne of final product to 0.7 kg, and steam use has
been reduced,
The best source of information on the very
complicated thermodynamics and phase equilibria involved in
the urea process is contained in the paper by
Kaasenbrood and Chermin [4].
Interest in totally integrated NH3/urea plants has
dropped as most producers want to continue the flexibility
Carbon Dioxide
Ammonla
Inerts
Amman la
fron BL „_
=>—£T^
185 deg C
138 bar
N/C = 2,9
Reactor
J—*$ c=>
X
¥-*
£T^
Scrubber
Ejector
1 5 bar Steam
tAmman Ja, Water
Carbamate Recycle
Ammonla /
Carbon Dioxide /
>^, Water
T>
X
<i
Recycle
Carbon Dioxide
+ Ammonia Flash Gas
ZL
Gas
■ivaporat I on
rocess
Condensate
Treatment
Hydro lyser
Urea So LutI on
Urea for
Pr1 I ting or
GranulatI on
Treated
Process
Condensates
Figure 9.4. Stamicarbon CO2 Stripping Process.
264
High Pressure £-
Urea Sol., Carbonate,
Carbon Dioxide, Ammonia
-> Low Pressure
AmnonI a
from B.L.,
c=>
Inert Gas
190 deg C
160 bar
N/C 3,6
Reactor
o
Air
Carbon
Dioxide
-ca
Ejector
5 bar Steam
G
"Q*
Carbamate
Carbon
D1 ox Jde/
AmmonI a
fc-ST
H>
T^
AmnonI a
Amman I a
Rece i vei—
Condenser
Carbamate
Absorbers-
Condensers
Vent
Scrubbers
^
I—aft—
il/Str Ipper
K
-j
|-*i
-ST
h>
■^3-1
E
■^
Recyc le
Precon cen trator
EvaporatI on
Process
Condensate
Treatment
Hydrolyser
Solution Tankage
L, P , Decomposer
Carbamate
Condenser
H,P, Decomposer
<=^
86 Z_
-c=>
Urea for Treated
PrI 11ing or Process
GranulatI on Condensates
Figure 9.5. Snamprogetti Thermal Stripping Urea Process.
.....-.Water- / Hydrogen—/—Qxygen—/-
N I trogen / Methane
Carbon Dioxide /
Amnon la
Inerts
Scrubber
Reactor
175 bar
190 deg C
N/C 4.0
^—£T~1
Anmonia
from B,L.
Air
5 bar Steam
Carbanate Recycle
->T<-
H,P,
Decomposer
r
Stripper
Carbamate Condensers
-STM
F>
T
■$$-
18 bar
s
x
L,P,
Decomposer
¥
Carbon
Dioxide
\m
.STM
X
^
cw ■
—^
87 •/.
Urea
so In ,
<-
T^-
M, P, Absorber
"7T
Gas
Evaporation
Process
Condensate
Treatment
Hydrolyser
^
c
Carbon Dioxide
L,P, Absorber
CW
<=)
Urea for
PrI 11ing or
Granulation
Treated
Process
Condens.
-£T
Figure 9.6. TEC ACES Process.
265
Table 9.2. Urea Process Operating Conditions/Requirements [5]
Reactor pressure, atm
Reactor temperature, °C
Molar NH3/CO2 ratio
Molar H20/CO2 ratio
CO2 conversion in reactor, %
NH3 conversion in reactor, %
C02 conversion in synthesis, %
NH3 conversion in synthesis, %
No. of high-pressure vessels -
synthesis
Recirculation - stages
NH3 consumption, t/t
CO2 consumption, t/t
Import steam, t/tb
Cooling water, t/tb
Electricity, kWh/tb
Liquid effluent
Free NH3, ppmw
Urea, ppmw
Hydrolyzer steam pressure, bar
Note: NA = not available.
Snamprogetti
Thermal Stripping
156
188
3,3-3.6
0.5-0.6
64
41
84
47
5
2
0.5663
0.735a
0,950
75
21-23
2
2
38
Stamicarbon
CO 2 Stripping
140
183
2.95
0.39
60
36
79
79
4
1
0.566a
0.7333
0.920
70
15
1
1
25
a. Based on final product-urea granules containing ±4.5 kg formaldehyde/tonne product,
TEC ACES
Process
175
190
4.0
0.6
6.8
?4
NA
NA
5
2
0.568
0735/0.740
0,80
80
15
5
5
25
using UF85 (urea+biuret
b, Depending on plant location and available utilities, these figures can vary greatly. The plants can easily be
designed for minimum steam or minimum electric power; the decision is on a cost basis.
they have with independent units. The few integrated
units built have not been successful. There are some
plant areas where integration appears attractive. An
example would be in wastewater purification.
9.5 Urea Finishing Processes
Urea can be prilled, granulated, flaked, and
crystallized. At the present time only prilling and granulation
can be considered important. Most new plants that plan
to ship internationally utilize granulation because of its
far superior handling and storage qualities.
Comparative product characteristics are shown in Table 9.3.
9.5.1 Prilling
Prilled urea is made by using a spinning bucket, shower
heads, or acoustic vibration (19 plants). The most
common method is the spinning bucket. Stamicarbon uses
its own design for the buckets; Snamprogetti and Toyo
both use the turtle bucket, which was initially developed
by Malcolm Turtle and Premier Petrochemical (Pasadena,
Texas) in 1964 and 1965. Toyo also will provide the
acoustic vibration unit. In prilling, the urea melt is
concentrated via vacuum evaporation to 99.8% and fed as
quickly as possible into the bucket to minimize biuret
formation. The liquid forms drops that then fall down a
cylindrical concrete tower that has either induced, forced,
or natural draft air flow. The prills solidify and are
removed at the bottom by belt conveying to storage. Some
plants have a fluidized-bed cooler in the prill tower
bottom and others use an in-line cooler before storage. If
low biuret product is to be produced, the urea melt from
the last decomposition stage of the synthesis plant is first
crystallized and the crystals are then melted just before
prilling.
All prill towers have a dust problem, and even those
with dust collection systems may have difficulties in
meeting environmental standards. Properly designed prill
towers utilizing natural draft can usually meet environmental
standards without a dust collection system. Since prills
are not as strong as granules in either crushing or impact
266
able 9.3* Urea: Comparative Product Characteristics
EC ACE
Process
.75
.90"
4.0
0.6
6.8
34
NA
NA
[oisture, %
iuret, %
ormaldehyde (injection;
.verage size, mm
Irushing strength, kg
%
Prilled
(Standard)
0.30
0.90
0.3-0.4
1.70
0.6 (2 mm)
. Used, for example, for forest application (3-5 mm size).
Granular
(Bulk Blend)
0.20
0.70
0,45
2.50
3.0 (2.5 mm)
Granular
Large Granule3
0.25
0.70
0,45
Up to 8.0
10,0 (6.3 mm)
5 xength, many of the new plants are using granulation
2 rocesses for finishing.
„nc/An If in order to improve the prill quality Stamicarbon
- on tilizes a seeding system, fine urea dust is blown into the
,n rill tower at a point about two-thirds above the bottom,
his forms a nucleus for proper crystal growth. The
renting prill contains long interlocking crystals improv-
ig the crushing and impact strength greatly.
Many prill producers also add formaldehyde upstream
f prilling in either the evaporators or to the melt. This
-nproves the quality greatly and reduces dust emission
id caking tendencies in bulk storage. Other materials
(urea+biiided either before plant bulk storage or just before
agging and/or bulk shipment-are-clays, UreasofPS-er-
an easilviineral oil.
80
15
5
5
25
9.5.2 Granulation
There have been many granulation processes
developed and operated through the years. These include
TVA pan granulation, C&I Girdler spherodizer spray-
drum, Norsk Hydro pan granulation, and Fisons.
In the period from 1976 to 1979, NSM of the
Netherlands developed a fluid bed granulation system that
has been used in several plants. It produces excellent
quality, and its single-train capabilities are up to the
3,500-tpd size that urea plant licensers are sizing up to.
This process is now called the Hydro-Agri process.
In recent years Toyo Engineering Corporation devel-
-oped-a-spouted-bed-procesSr-whichwas used in Japan
and New Zealand. A few years ago they redesigned and
able 9.4. Granulation Process Requirements
provide
melt is c
%andfeJectridty
!imize bar R steam
n fall dow"
uced, fori
:orage,&ooIin9^ater
ill tower
agitive dust return
. ^ed solution
-ea melt f'^ a^3tives (as formaldehyde)
is plant iSroduct
2d tust be,....
3 Nitrogen content
Moisture
jdeventl5^
ultiesinnfushinS strength (2.5-mm granule)
3ned prill tfi^nsity
•nvironme Dust returned as a 45% solution,
n. Since ] Dust returned as a 73% solution.
ling or im Hydro-Agri 6.3-mm granule = 10-kg
Hydro-Agri
37 kWh/tonne
35 kg/tonne
0.2 m3/tonne
none
40 kg/tonnea
96% urea
0,45%
46.2% wt.
0.2%
0.7%-0.8%
+3 kg
780 kg/m3
crushing strength;
Toyo Engineering
23 kWh/tonne
not available
not available
none
not available
98.5%
0.4%-0.5%
46.2% wt.
0,23%
0.71%
3kg
780 kg/m3
others would be in the same
Stamicarbon
38 kWh/tonne
11 kg/tonne (4 bar)
21 kg/tonne
(12 bar)
0.15 tonne/tonne
none
69 kg/tonneb
98.5%
0.18
46.4% wt.
0,05%
0.80%
+3 kg
780 kg/m3
range.
267
now offer a spouted-fluid bed system {Figure 9.7). A 1,200-
tpd plant has been very successful in Germany, and the
New Zealand plant has been enlarged from 470 tpd to
750 tpd and converted to spouted-fluid bed. Toyo has
considered 1,760 tpd as the maximum single-train size.
Granulation process requirements are given in Table 9,4.
Stamicarbon developed a fluid bed system in 1976
and demonstrated its quality in a 50-tpd pilot plant. Due
to various commercial matters, this system was never
commercialized in a large-scale plant. With present
commercial conditions, they are now prepared to license it
with full guarantees on quality, quantity, and raw
material/utility consumptions, etc. They also consider
single-train units to 3,000 tpd no problem.
At this time fluid bed technology is the only one that
can offer single-train units in sizes matching current urea
plant sizes. In today's market, it can thus be considered
the most acceptable type of granulation process.
Figures 9.8, 9.9, and 9.10 are flow sheets for the
three available processes, Hydro-Agri, Toyo
Engineering (spouted-fluid bed), and Stamicarbon.
Figure 9,11 shews the "heart" of the granulation plant; the
granulator, as offered by Hydro-Agri.
9.6 Economics
The price of a urea plant with granulation varies greatly
depending on client requirements, contractors' workloads; 5
and vendor shop workloads at the time of bidding,
Recently five bidders submitted for a plant (urea/
granulation) of +1,700 tpd. Three were utilizing one
licenser and two were bidding with another. All five were
using the same granulation technology.
For one process the three bids varied from about US
$135 million to about US $165 million. For the other
process they varied from about US $155 million to 185
million. AH, of course, were bidding from the same
client bid documents.
9.7 References
1. Honti, G. D. 1976. "Urea," INThe Nitrogen
Industry, Akademia Kiado, Budapest, Hungary.
2. Tomlinson, T. E, 1970. "Urea-Agronomic
Implications," Proceedings of the Fertiliser Society
(London), No. 113.
3. Slack, A. V. 1969. "Urea Technology, A Critical
Review," TVA Circular Z-4, Proceedings of the
Seminar on Fertilizer Technology, New Delhi, India,
4. Kaasenbrood, P.J.C., and H.A.G. Chermin. 1977.
"The Urea Stripping Process, Stripping Technology,
Phase Equilibria, and Thermodynamics,"
Proceedings of the Fertiliser Society (London), No. 167.
~PersonaHx>mmunications with the three process
developing firms. 1996.
TEC Multi-Stage Spout-Fluid Bed Granulator
TEC Dust Scrubber
A
Clean air
Recycle
granul'
inlet
CD Spouted bed
Perforated plate
Spray nozzle
Air header
© Fluidized bed
induced fan
Demister
Spray nozzle
Packed bed
Figure 9.7. TEC Granulator and Scrubber.
Water
feed
Circulating pump
Urea solution I Air + urea dust
268
fj
T
Process Condensate
c=^
Recycle Solution
<=i
to Synthesis Plant
Scrubber
Steam
Air
■£3"^
Steam
Air
£X
Heaters
Urea Solution
} /KT>
Granulator
t
Cooler
^T>
N
w
Screen
Crusher
A
Urea
to
Granules
Storage
Air
-<=■
Figure 9.8. Hydro Agri Urea Granulation.
Recovered
Urea
Solution
Feed Urea
Solutlon
Atm.
T
Dust Scrubber iqq|
ST
X>
Granulatar
<J
Air
■£J
„, Screen
Crusher
C.W.
Product
- Cooler
Product
Figure 9.9. TEC Urea Granulation Process Flow Diagram.
269
Sprayer Process
Fluid- air Urea condensste off-gas Off-gas
ization | |jsolution i A f
i!£-»|Granulation| H Scrubbing"1
Cooling
^ines
Air
-ines
Screening
Coarse
Crushing
Screening
-H Scrubbing
■*■ Final product
Process
condensate
Fines
Steam 11, r
—*\ Dissolving]—►
Recycle to
urea plant
Figure 9.10. Stamicarbon Fluid-Bed Granulation.
Exhaust air
Recycle malarial
in
(fines/crushed)
Fluidizalion air
Figure 9.11. Hydro Agri Fluid-Bed Granulator.
270
Chapter 10. Liquid Fertilizers and Nitrogen Solutions
Tabic of Contents
Page
10.1 Introduction 272
10.2 Nitrogen 274
10.2.1 Anhydrous Ammonia 274
10.2.1.1 Anhydrous Ammonia Dealer Operations 274
10.2.1.2 Application of Anhydrous Ammonia 276
10.2.2 Aqua Ammonia 276
10.2.3 Nonpressure Nitrogen Solutions 277
10.2.3.1 Production of Nonpressure Urea-Ammonium Nitrate Solutions 277
10.2.4 Application of Nitrogen Solutions 278
10.3 Fluid Phosphates 279
10.3.1 Ammonium Polyphosphate Solutions 279
10.3.2 Solution Mixtures 281
10.4 Suspension Fertilizers 283
10.4.1 Use of Granular Materials in Suspension 284
10.4.2 Satellite Plants 287
10.4.3 Transportation and Application of Suspensions 287
10.5 Specialty Fluid Fertilizers 289
10.5.1 Fluid Limestone ; 289
10.5.2 Acid-Type"Fluids ".T."":.. ~ 7.: ~-—.::". 289
10.5.3 Micronutrients in Fluid Fertilizers 289
10.5.4 Mixtures Using Potassium Hydroxide 292
10.5.5 Fluid Fertilizers With Sulfur 292
10.6 investment Costs 292
10.7 Summary 293
10.8 References 293
271
Chapter 10. Liquid Fertilizers and Nitrogen Solutions
10.1 Introduction
The large-scale manufacture and use of fluid
fertilizers began about 40 years ago. Fluids - the major source
of nitrogen in the United States - are rapidly gaining
popularity in France, United Kingdom, Canada, Spain,
and Israel. Fluids are used to a lesser degree in Italy,
Portugal, Denmark, Sweden, the Netherlands, Saudi
Arabia, Brazil, and Colombia [1].
The former Soviet Union, now the Commonwealth
of Independent States (CIS), was the second largest
consumer of liquids; the CIS, however, comprises several
different countries. The East European countries also
consume significant amounts of fluid fertilizers.
Fluid fertilizers are usually divided into two distinct
types: solutions and suspensions. Solutions are defined
as fluids, the ingredients of which are in solution.
Solutions may be clear or of a particular color. Sometimes a
coloring agent is added so that a particular liquid can be
distinguished from another liquid. Sometimes color is
imparted by soluble impurities. The important factor is
that all ingredients are in solution and it is necessary
that they remain in solution. A suspension is defined as
a saturated solution with~TmaD" particles of nutrient-
bearing materials suspended in the saturated solution.
Gelling clays are used to cause conditions for good
suspension of the particles in the fluid.
The term "fluid fertilizers" as used in this chapter
refers to fertilizers such as anhydrous ammonia, aqua
ammonia, nonpressure nitrogen solutions (28% to 32%
N), liquid mixed fertilizer, and suspensions. Production
of anhydrous ammonia, urea, and ammonium nitrate
are presented in other chapters; however, the use of
these materials to produce fluids and their application
will be discussed in this chapter.
The fluid fertilizer industry started emerging as a
significant industry in the United States during the early
1960s. By 1965 fluid consumption amounted to more
than 5 million tonnes and represented about 18% of all
fertilizers consumed. Table 10.1 gives the yearly
consumption of fluids (anhydrous ammonia + aqua
ammonia + nitrogen solution + solution mixtures + suspensions)
during the period 1965-93.
These data show a major growth of fluid
consumption from 1965 to 1985. In 1993, the consumption of
fluids was about 18 million tonnes, representing about
40% of the total fertilizer consumed in the United States.
From 1965 to 1993 fluid consumption in the United
Table 10.1. Fertilizer Consumption in the United
States From 1965 Through 1993
Crop
Year
1965
1966
1967
1968
1969
1970
1971
1972
1973
1974
1975
1976
1977
1978
1979
1980
T9"8T~
1982
1983
1984
1985
1986
1987
1988
1989
1990
1991
1992
1993
Total Fluids
Total Fertilizer
(thousand tnnnp.«?l
5,352
6,530
7,676
8,557
8,937
9,977
11,132
10,840
11,124
12,645
12,189
14,928
15,680
14,706
16,328
17,847
18,887
17,847
14,402
18,390
18,514
15,756
15,928
16,602
16,592
17,490
17,880
18,175
18,294
30,315
33,071
35,324
37,126
37,280
37,945
39,564
39,546
41.823
44,964
40,606
46,894
49,098
45,621
49,342
50,491
51,760
46,812
40,428
48,178
47,127
42,692
41,272
42,679
42,762
45,310
44,588
45,533
46,586
Fluids,% of Total
(%)
17.7
19,7
21.7
23.0
24.0
26.3
28,1
27.4
26.6
28.1
30.0
31.8
31.9
32.2
33.1
35.3
36.5
38.1
35,8
38.2
39.3
36.9
38.6
38.9
38,8
38.6
40.1
39.9
39.3
States tripled. Fluid fertilizer's percentage of total
consumption more than doubled between 1963 and 1993.
This healthy growth was partly due to the following
reasons:
- Low-cost materials are used in the manufacture of fluid
fertilizers.
- Because fluid fertilizers can be applied as starter
fertilizers in row application or applied through irrigation
systems, they allow the efficient use of plant nutrients
to minimize environmental problems.
272
- Fluids are excellent carriers of micronutrients because
a small amount of micronutrients can be
homogeneously dispersed in the fluid; it is therefore easy to
obtain uniform application of the micronutrient.
- Fluid fertilizers are excellent carriers of pesticides and
are widely used in the application of herbicides. By
using fluid fertilizer-pesticide mixtures, it is possible to
reduce the number of applicator passes across the field.
Because fluid fertilizers can be uniformly applied, it is
possible also to uniformly apply the pesticide for
uniform weed or insect control, which is not always
possible when using granular fertilizers,
- Fluid fertilizers are usually much easier to handle than
solid materials. For example, it would be much safer
and easier to ship nonpressure urea-ammonium
nitrate solutions and unload them than to ship either
ammonium nitrate or urea.
However, fluids also have some disadvantages. The
main disadvantages in using fluids are:
- They require special transportation, mixing, and
storage equipment.
- Some of the fluids such as anhydrous ammonia and
suspensions require special application equipment.
The United States uses the most fluid fertilizers. Table
10.2 summarizes fluid consumption by type in the United
States during the period, 1960-93 [2]. These and-other-
data indicate that in 1993 about 40% of the total
fertilizers applied in the United States were in the fluid form;
over one-half of the nitrogen was in the fluid form. The
data also show that the most popular fluid in the United
States is anhydrous ammonia; its use remained constant
for several years and decreased slightly during 1993.
The popularity of anhydrous ammonia for direct
application is essentially nil in all other countries except
Canada. The next most popular fluid in the United States
is a nonpressure nitrogen solution that contains between
28% and 32% nitrogen (N).
The efficient use of fertilizers will continue to be
stressed as a means of minimizing the effect of fertilizer
on the environment. Two of the agricultural practices
now being promoted are:
• Accurate measurement and placement of fertilizers to
obtain maximum economic yield without adversely
affecting the environment.
• Multiple application of nitrogen fertilizers to obtain
more efficient use of nitrogen fertilizer.
A solution can be accurately measured, whereas itis.
difficult to accurately measure granular fertilizer. It is
easier to accurately place fluids than to place solids. It is
much easier to add fluids to irrigation units than to use
solids for this purpose. For these reasons, the use of
fluid fertilizers will increase, and their portion of the
total consumed will also increase. In the United States,
there will be a continued trend to use less anhydrous
ammonia and more nitrogen solution. This shift is partly
due to the precautions required in shipping, handling,
and application of ammonia. A small amount of
ammonia, which can cause a detectable odor, is released
during handling at dealer locations. Therefore, it is expected
that in the future the major source of fluid fertilizer
nitrogen in the United States will be urea-ammonium
nitrate (UAN) solutions (28%-35% N).
The use of nitrogen solutions is growing rapidly in
-other-countries-such-as the CIS, France, United
Kingdom, Canada, Spain, and Israel. The world
consumption of nitrogen solutions increased by 112% between
1974 and 1990 [1]; it is expected to increase
significantly during the next 5 years. However, nitrogen
solutions still represent only about 2% of total world N
consumption. In the United States in 1993 about 23%
of total N was applied as nitrogen solution and about
32% of total N was applied as anhydrous ammonia.
About 59% of the total N applied in the United States is
in the fluid form. Phosphate solutions are reasonably
popular in the United States, France, Canada, United
Table 10.2. Consumption of Fluids by Kind in the United States
Thousand Tonnes of Material 121
Nutrient
Materials
Anhydrous ammonia
Aqua ammonia
Nitrogen solutions
Ammonia polyphosphate
solutions
1960
583
387
590
-
1979
4,431
443
5,444
-
1992
4.544
295
7,356
1,156
1993
3,964
300
7900
1,206
1993
3,262
60
2370
372
273
Kingdom, Spain, and some of the CIS states. Most of
the phosphate solutions (11-37-0 or 10-34-0) are mixed
with nitrogen solutions and potash to produce NPK
solutions and suspensions. Usually when nitrogen solutions
become acceptable, the use of fluid mixtures soon
follows; fluids will become more popular as emphasis on
efficient use of fertilizer increases.
10.2 Nitrogen
10.2.1 Anhydrous Ammonia
Some of the physical characteristics of liquid
anhydrous ammonia are shown in Table 10.3.
In the United States 3.3 million tpy of nitrogen as
anhydrous ammonia is consumed by direct application
to the soil; the popularity of anhydrous ammonia for
this purpose decreased from 40% of total N in 1980 to
32% in 1993. It is still the lowest priced nitrogen source,
but because of safety and environmental problems many
dealers are switching to other nitrogen sources. Those
who continue to use anhydrous ammonia are fully aware
of the dangers and difficulties of using this product.
Liquid ammonia can cause severe skin, lung, and eye
damage due to freezing and its caustic action and dehydration
on tissue. It has been known to cause severe damage to
the lungs and eyes.
Most users of anhydrous ammonia have found that
safety problems can be avoided if the following-ten-agri---
cultural safety commandments [3] are followed:
Table 10.3. Physical and Chemical
Characteristics of Anhydrous
Ammonia
Characteristics
Boiling point3
Freezing point3
Latent heat of evaporation3
Vapor pressure barsb
-18°C
0°C
38°C
Specific gravity
-18°C
0°C
38°C
Explosive mixture
Value
-33°C
-78°C
* 327.2 kcalAg
0.32
3.24
13.60
0.6749
0.6385
0.5831
16%-25%NH3inair
a. At atmospheric pressure.
b. Gauge pressure.
1. Always have ample clean water available.
2. Always avoid hose and valve openings.
3. Always wear gloves and goggles when transferring
ammonia.
4. Always close valves and disconnect hoses when a
loading station is unattended.
5. Always ensure that pressure is relieved before
disconnecting hoses or parts.
6. Never fill a tank to more than 85% of its capacity.
7. Never leave transfer operations unattended.
8. Never tamper with relief valves or other safety
devices.
9. Use only approved ammonia equipment.
10. Never tow a trailer without secure connecting parts
and safety chains.
Anhydrous ammonia is transported in the United
States through gas pipeline systems, jumbo-size tank cars,
refrigerated barges, and tank truck. Figure lO.lisapho-
tograph of a refrigerated barge [4]. Most regional
storage tanks for anhydrous ammonia are of the atmospheric
storage type. Usually the dealer storage tanks are of the
pressure type.
10.2.1.1 Anhydrous Ammonia Dealer
Operations - Usually most anhydrous ammonia dealers have
pressure-type storage tanks varying in size from 45 m3
to 114 m3. The working pressure in these tanks should
not exceed a gauge pressure of about 1.8 MPa. Liquid
ammonia is transferred from the railway tank car to the
storage tank by means of an ammonia compressor or a
positive displacement pump. Use of an ammonia
compressor is the most common method. Transfer is
accomplished by removing vapor from the storage tank
and pumping it into a railway car. Removing vapor from
the storage tank causes its contents to cool-
compressing the gas causes it to be heated; and hot gas causes
the contents of the tank car to increase in temperature.
These temperature changes cause a pressure
differential between the railway tank car and the storage tank;
this pressure differential allows the liquid ammonia to
be easily transferred from the tank car to storage.
Pressure tanks having a capacity of 3.8 m3 to 7.7 m3
are often used to transport ammonia from a dealer's
terminal to a farm. At a farm ammonia is transferred
from nurse tanks to applicator tanks. Figure 10.2 is a
photograph showing how a vapor transfer pump is used
to transfer ammonia from a nurse tank to an applicator.
Some farmers fill the applicator by bleeding ammonia
gas from the applicator tank into the atmosphere. Thus,
the vapor pressure of the ammonia in the tank causes
274
Figure 10.1. Anhydrous Ammonia Barge.
Figure 10.2. Transfer of Ammonia From Nurse Tank to Farmer's Applicator.
275
the liquid to be transferred to the applicator. However,
the loss of ammonia, even though small in amount, has
generally caused the dealer to start using gear pumps to
transfer ammonia to the nurse and applicator tanks.
10.2.1.2 Application of Anhydrous Ammonia-
Direct application of anhydrous ammonia started with
rather humble equipment in the early 1940s. A horse-
drawn applicator with a laboratory, 20-pound gas
cylinder was used first. As the agronomic effectiveness of
anhydrous ammonia was proven, more sophisticated
equipment was developed and used.
Because it is applied as a volatile liquid, anhydrous
ammonia must be injected 15 to 30 cm below the
surface of the soil; this usually is accomplished by an
application knife such as those shown in Figure 10.3. Often
in sandy, loose soil ammonia is applied by an ammonia
chisel, also shown in Figure 10.3. Anhydrous ammonia
is usually metered by a variable orifice-type meter or by
a piston pump, The rate of application using the orifice
meter is determined by the speed of the applicator, the
swath width, and the orifice opening. Piston pumps are
usually actuated by a drive-chain operated by a sprocket
attached to a wheel of the applicator. Application rate is
changed by changing the length of stroke of the piston;
the rate is independent of the applicator's speed.
BACKSWEPT FRONT SWEPT
Figure 10.3. Sketch Showing Anhydrous
Ammonia Application Knifers.
Ammonia applicators range in size from small 5-row
rigs to large rigs that have swath widths up to 65 feet
and are pulled by high-powered tractors as shown in
Figure 10.4 [5]. The estimated application cost for
anhydrous ammonia is about US $15/ha. This cost varies
widely; however, most companies charge about twice
as much for applying anhydrous ammonia as compared
with applying nonpressure solutions.
10.2.2 Aqua Ammonia
Aqua ammonia is not as popular as anhydrous
ammonia; however, interest in aqua ammonia is increasing.
because it is safer to use than anhydrous ammonia. The
most popular aqua ammonia solution contains 20% N
and exerts no gauge pressure at temperatures below
about 36°C. It does lose ammonia when exposed to the
atmosphere; therefore, aqua ammonia of this
concentration is stored in covered nonpressure storage tanks.
These tanks usually are constructed to withstand 0.35
bars gauge pressure and are equipped with pressure and
vacuum safety valves, which are set to open at 1.051
and 0.991 bars absolute pressure.
Aqua ammonia is usually produced in a plant in which
anhydrous ammonia and water are continuously mixed
with recycled cool aqua ammonia in a simple pipe-type
mixing chamber. Enough water is added to adjust the
liquid's specific gravity to that of aqua ammonia
containing 20% nitrogen or other desired concentrations.
-The--product-is usually cooled in a conventional heat
exchanger or plate-type cooler. Usually a 45-tonne tank
car of anhydrous ammonia can be converted to 187
tonnes of aqua ammonia in approximately 5 to 8 hours.
The rate of conversion is dependent upon the cooling
capacity of the plant.
Because aqua ammonia has a relatively low vapor
pressure, it does not have to be injected as deeply into
the soil as does anhydrous ammonia. Most operators
have found that they can avoid excessive ammonia losses
if they inject aqua ammonia about 6 to 12 cm beneath
the surface. Applicators used for applying aqua
ammonia are similar to those for anhydrous ammonia in that
they have injection knives; however, since these knives
penetrate about one-half the depth of anhydrous
ammonia knives, much less power is required to operate
them. Also, aqua ammonia can be applied at a much
faster rate than anhydrous ammonia because deep
injection of this solution is not required. Many operators
have found that they can apply aqua ammonia in
operations such as plowing, disking, etc., without high
ammonia loss. One company uses large tank-type
applicators and can apply aqua ammonia at a rate of 16
ha/hour.
Some companies apply aqua or anhydrous ammonia
to ditch irrigation systems. This is done at very low
^i^-Vf^'**"*'^ *» ***-*ji **
* - ^-.^ . ^ * • ■
v*
* «*■
*"i
Figure 10.4. Anhydrous Ammonia Applicator With 65-Foot Swath.
concentrations and during the early spring when the
temperature of irrigation water is low.
10.2.3 Nonpressure Nitrogen Solutions
These solutions are gaining in popularity in several
countries. The reasons for the increased popularity are
as follows:
• Safer to use.
• Easier to inject into various types of irrigation systems.
• Safer to handle and store. Special materials are not
required for tanks and other equipment.
• Can be surface applied and uniformly applied at higher
application speeds compared with those of anhydrous
ammonia or solid fertilizer.
• Exhibit the same advantages as given for all fluids
earlier in this chapter.
Nitrogen solutions are usually produced from urea,
ammonium nitrate, and water. They usually contain a
corrosion inhibitor and can be stored and used in mild
steel (carbon steel) equipment. Solutions usually sold in
the United States have three concentrations: 32%, 30%,
and 28% N. Their salt-out temperatures vary directly
with their plant nutrient concentrations. Some of the
physical and chemical characteristics of the three
nonpressure solutions are shown in Table 10.4 [5[.
One inhibiting agent that is frequently used in these
solutions is a small quantity of anhydrous ammonia;
usually about 5 kg of ammonia/tonne of product is added
Table 10.4. Physical and Chemical
Characteristics of Urea-
Ammonium Nitrate Solutions
Grade. % N
28
30
32
Composition, % by weight
Ammonium nitrate
Urea
Water
Specific gravity, 16°C
Salt-out temperature, °C
40.1
30.0
29.9
1.283
-18
42.2
32.7
.25.1
1.303
-10
44,3
35,4
20,3
1.32
-2
to adjust the pH of the solution to 7.0. Another
effective inhibiting agent is ammonium phosphate; only a
small quantity of ammonium phosphate (0.1% P2O5) is
required to inhibit the solution. This phosphate material
reacts with the mild steel tank to form an iron
phosphate film, which is a barrier to further corrosion of the
tank. There are several other inhibiting agents; they are
listed in a handbook of specialty chemicals [6].
10.2.3.1 Production of Nonpressure Urea-
Ammonium Nitrate Solutions - Two types of
production processes are used - batch and continuous. Both
are fairly simple; in each process concentrated hot urea
and hot ammonium nitrate solutions are measured;
mixed, and then cooled. In the batch process, solutions
277
are weighed in a mix tank; the inhibitor is weighed
separately and added to the mix tank. Finished product is
cooled after it is mixed. The continuous process is
similar except that the two nitrogen solutions, water, and
inhibiting agent are metered and fed continuously to a
mixing chamber similar to the simple baffled mixer shown
in Figure 10.5. Product from the mixing chamber is
cooled and pumped to storage,
The production of nitrogen solution from prilled urea
and ammonium nitrate has sparked some interest. When
producing solution from these solid materials in a batch
mix tank, hot water is required to speed the dissolution
of the materials. Usually enough heat is supplied so that
all of the solid materials will be dissolved at the end of
the 30-minute mixing time. About 23 kg of saturated
steam per tonne of product is required for a reasonable
mixing time. There is a mixing cost for this process;
therefore, there must be special pricing policies that make
Ammonium nitrate solution
-IX—
Urea solution
m
■X-
M-l
Inhibiting agent
Water
Cooling water out
E-l
y Cooling water to
HX—
Cool product
Legend:
M-l Baffle mixer
E-I Cooler
Figure 10.5. TVA Continuous Urea-Ammonium
Nitrate Solution Plant.
it advisable to produce a nitrogen solution from solid
materials.
One ammonia pipeline company that also has a river
terminal close to the pipeline considers that it may be
more economical to produce hot ammonium nitrate
solution from ammonia at the pipeline and mix it with
prilled urea received by barge. Anhydrous ammonia
would be converted to nitric acid and then to hot
ammonium nitrate solution. This hot solution could then
be mixed with the prilled urea to produce the nonpressure
UAN solution.
10.2.4 Application of Nitrogen Solutions
Most nitrogen solutions are used for direct
application; however, a substantial quantity is used to produce
fluid mixtures. Most are applied by broadcasting using
various types of nozzles. Figure 10.6 is a photograph of
the commonly used spray nozzles. The nozzle on the
right is a fan-type that emits fine droplets.
Because they receive uniform response from the
nitrogen and uniform kill of weeds, some applicator
operators prefer fan-type nozzles to apply mixtures of
nitrogen solution and herbicides. Other operators
report that when the wind is blowing moderately, there is
too much fertilizer drift with these nozzles; they prefer
to apply the solutions through flooding nozzles such as
that shown on the left side of Figure 10.6. Flooding
_noz2Jes_e_mitjlropIets about the same size as that of
average rain drops, There is little or no drip and a uniform
application across the swath is obtained. This is the same
type of nozzle that is used to broadcast fluid mixed
fertilizers and suspensions.
Figure 10.6. Liquid Fertilizer Spray Nozzle.
278
of the phosphate markets in the United States and to
some degree in the United Kingdom, France, and to a
much lesser degree in a few other countries. The usual
pattern is for nitrogen solutions to first become
established and to then be followed by the phosphate solutions.
10.3.1 Ammonium Polyphosphate Solutions
Ammonium polyphosphate solutions are the most
popular phosphatic solutions now in use. The usual
grades are 10-34-0 and 11-37-0. One company that
uses a rather pure rock to produce phosphoric acid,
which is used in the production of polyphosphate
solution, has found it can produce a 12-40-0 grade of good
quality. These ammonium polyphosphate solutions are
used for direct application or as phosphate sources for
NPK solution and suspension mixtures. Ammonium
polyphosphate solutions are to the solution mixture
industry as DAP is to the granular bulk-blend industry, This
solution is usually produced in regional plants that sell to
dealers. The dealer sells it to farmers who use it for
direct application, or the dealer mixes it with nitrogen
solution and potash to produce NPK fluids.
Most of the ammonium polyphosphate solutions are
produced from wet-process superphosphoric acid,
ammonia, and water. The reaction between the acid and
ammonia is usually carried out in a Tennessee Valley
Authority (TVA) pipe reactor [7] ("Tee" reactor). The
superphosphoric acid is produced by concentrating
"merchant-grade ortfiophosphoric acid (54% P2O5) to
superphosphoric acid in a vacuum or atmospheric
concentrator. The superphosphoric acid usually contains
Figure 10.7. Sclf-Propelled-Type Applicator for Fluid Fertilizers.
Applicator wagons used to broadcast nitrogen
solutions vary in size from small ones pulled behind farm
tractors to the large self-propelled high-flotation
applicators (Figure 10.7).
High-flotation type tires minimize compaction of the
soil during fertilizer application so that the fertilizer can
- be applied during wet periods. These large applicators
are capable of applying fertilizer solutions at a rate of
about 0.5ha/min.
Nonpressure nitrogen solutions and other fluids are
added through various types of irrigation systems such
as sprinkler, gated pipe, drip tubes, and ditch. This
practice often has been referred to as "spoon feeding" of
the crop because the solution is added with irrigation
water several times during the growing season.
Apparatus for feeding these solutions to the irrigation unit
usually consists of a storage tank and a piston-metering
pump. The rate is varied by changing the length of stroke
and speed of the piston pump.
Some nitrogen solutions are mixed with other clear
liquids, such as ammonium polyphosphates of grades
10-34-0 and 11-37-0 and potash, to produce clear
liquid mixtures. Nitrogen solutions are also used to
produce suspension mixtures.
10.3 Fluid Phosphates
The use of fluid phosphate has not had the worldwide
popularity of fluid nitrogen fertilizers (mainly UAN
solution). However, fluids have captured a significant amount
279
about 68%-70% total P205 of which 20°/^35% is present
as polyphosphate. Physical and chemical characteristics
of a typical superphosphoric acid are given in Table 10.5.
Essentially all of the polyphosphoric acid content of
the wet-process superphosphoric acid is in the form of
pyrophosphate; the remaining phosphate is present as
orthophosphoric acid. Conversion to superphosphoric
acid increases the cost somewhat, but with the long
shipping distances in the United States, the higher analysis
of the superphosphoric acid generates a saving on freight
that reduces or eliminates the extra cost of
concentrating phosphoric acid from 54% to 70% P2O5.
Table 10.5. Properties of Superphosphoric Acid
Total P2Os, %
Polyphosphate, % of total P205
Sulfate (S04), %
Aluminum (AI2O3), %
Iron (Fe203), %
Magnesium (MgO), %
Fluorine (F), %
Solids (Insol. in CH3OH), %
Solids (Insol. in H20), %
Sp. gr. at 24°C, g/ml
Viscosity centipoises at 52°C
70.0
30.0
3.8
1.1
1.0
0.4
0.27
0.15
0.01
1.96
400
More than 100 U.S. plants use the pipe reactor
process to produce an estimated 1.2 million tonnes of
product per year. Two typical plants are shown in Figure
10.8; the plant on the left has a combination mix tank-
cooler design,
The upper part of the tank consists of a section filled
with plastic "Pall Ring" packing; liquid is recirculated to
this section while air is drawn through the section to
partially cool the liquid. Liquid from the bottom of the
tank is passed through a heat exchanger, where it is
further cooled before it is pumped to storage.
Anhydrous ammonia is passed through this same heat
exchanger, vaporized, and then passed into the tee section
of the pipe reactor Superphosphoric acid is pumped by
a positive displacement pump to this same tee section
where the acid and gaseous ammonia react to form a
hot melt at 316°C. About 60% of the ammonia is added
to the pipe reactor, and the remaining 40% is added to
the hot well as aqua ammonia to adjust the pH of the
liquid to 6.0 for the production of 10-34-0 or 11-37-0.
The water content is controlled by the addition of water
to the recirculation line and observing the specific
gravity of the product.
The plant on the right of Figure 10.8 uses a separate
mix tank and an evaporative cooler. The mix tank is
used for mixing the hot melt from the pipe reactor with
recirculating liquid and for the addition of ammonia or
Secondary ai r
yVAAAA
M-6
PrI nary a Ir
!==>
R-l
ffll
Superphosph,
acid rr-r
==>cj R_2
P-3
>
0|0
EEEE
t
Cooled Product
cz>
L1quId
Jl Annan I a
10-34-0 to cooler
P-4
E-7
-<-Ex!
Amman la
Gas
P-S
Legend 1
R-l Pipe Reactor
R-3 Pipe '-tee'
P-3 Variable speed gear pump
P-4 Circulation Pump
P-5 Product Pump
M-6 Integral Mix Tank, Cooler, Scrubber
E-7 Ammonia Vaporizer
P-6
Legendi
R-l Pipe Reactor
R-£ Pipe 'tee*
E-3 Annan I a Vapor 1zer
M-4 Melt Mix Tank
S-5 Scrubber
P-6 Recirculating Pump
C-7 Evaporative Cooler
P-8 Product Pump
Figure 10.8. Typical Pipe-Reactor Plants for Production of Ammonium Polyphosphate Solution.
280
aqua ammonia. The separate mix tank allows a high
liquid temperature, 180°F, to be maintained, which
enhances mixing of the melt into the liquid and also provides
hot solution to evaporate and superheat the anhydrous
ammonia used in the pipe reactor. Data indicate that
plants with a separate mix tank usually produce an
ammonium polyphosphate liquid of slightly higher
polyphosphate content than those with the
combination mix tank-cooler, probably because of the high
temperature of the ammonia used in the pipe reactor.
Ammonia that is not added to the pipe reactor is usually
added as liquid or aqua ammonia to the mix tank; this
tank is equipped with a small scrubber in which cooled
10-34-0 is used to scrub the exit gases from the mix
tank.
Both plants have efficient, inexpensive evaporative
coolers. Essentially no contaminants are lost from
either of the plants; a considerable amount of water is lost
as steam and water vapor, which contains traces of
ammonia, Some companies use plate- or pipe-type
coolers in which the ammonium polyphosphate solution is
passed through the inside of the plates or pipes and
water on the outside surface of the pipe or plate.
Cooling is accomplished by either air or evaporation of
water from the outside surfaces of the pipe or plate. There
is no loss of ammonia from these units because the
cooling air does not contact the hot ammonium
polyphosphate solution.
Physical and chemical characteristics of a typical
ammonium polyphosphate solution of 10-34-0 grade made
by this process are given in Table 10.6.
Phosphate base suspension will be discussed later in
this chapter under a section on suspension.
10.3.2 Solution Mixtures
Most of the ammonium polyphosphate liquids (10-
34-0 or 11-37-0) are used in small mix plants to
produce NPK mixtures, A typical plant is shown in Figure
10.9. Ammonium polyphosphate solution is mixed with
nitrogen solutions (UAN solution) and potash to
produce various clear liquid grades such as: 7-21-7, 8-8-8,
and 21-7-0.
Table 10.6. Physical and Chemical
Characteristics of 10-34-0
Nitrogen, %
P205, %
Polyphosphate, % of total P205
Viscosity, centipoises at 24°C
Specific gravity at 27°C, g/ml
Salt-out temperature
10
34
65-70
75
1.4
<0°C
Urea annonlum nitrate
.solutions
"=>
AnnonIum pa Iyphosphate
k solutIon
c=>
11-37-0
or
10-34-0
3E-0-0 or
2S-0-Q or
30-0-0
T-l
T-S
H-3
M-4
o
U-B
Legend t
T-l Urea annonlum nitrate solutions tank
T-2 Annonium palyphosph, base sain, tank
M-3 and M~4 Meters
M-5 Mixing Tank
SC-6 Screw Conveyor
P-7 Recirculation and product punp
W-8 Weigh scales
-^/W\AA-
SC-6
Sol id potash
-EX3-
M-5
I—xj-
P-7
-tx-
Product to storage
or appl Icator
Figure 10.9. Liquid Fertilizer Mix Plant.
281
Formulas for these solution-type mixtures and others
are given in Table 10.7.
The estimated salt-out temperatures shown in the
above tabulation were calculated using the solubility
curves shown in Figure 10.10 [8,9]. This is the
conventional triangular solubility diagram with lines of constant
solubility. The numbers on the contour lines represent
the total percentage units (N+P205-i-K20) that will
remain in solution at OcC. There are boundary lines
(broken lines) to show the crystal phases at the various
nutrient ratios and concentrations. The function on
Figure 10.10 shows the solubility adjustment factors
(coefficients) that are used to calculate the actual salt-out
temperatures at various nutrient concentrations, which
would have salt^out temperatures other than 0°C.
Similar solubility systems have been developed in which
other sources of supplemental nitrogen are used instead
of UAN. Also, systems that use orthophosphate rather
than polyphosphate have been developed. Some of these
systems are:
Urea - ammonium polyphosphate - potash - water
Ammonium nitrate - ammonium polyphosphate
potash - water
Urea - ammonium orthophosphate - potash - water
Ammonium nitrate - ammonium orthophosphate^— .
potash - water
Urea - ammonium nitrate - ammonium orthophosphate -
potash - water
References 5, 8, 9, and 10 give detailed instructions
and examples concerning the use of these solubility
systems.
Sometimes the liquid mix plant produces a potash
base solution such as a 2-6-12 or 4-11-11 and
transports it to a satellite station where it is mixed with
nitrogen solution, containing 28%-32% N and 10-34-0 to
produce NPK mixtures, At the satellite station each
liquid is metered and mixed in the farmer's nurse tank.
Equipment used to broadcast solution-mixed
fertilizers is essentially the same as that used to broadcast
nitrogen solution. Sometimes a pesticide (herbicide or
insecticide) is transported separately in a can to the farm
and mixed with the liquid at that location. In this way
the danger of transporting a pesticide-fertilizer mixture
across roadways is avoided. Some applicators are
equipped with a small eductor for the addition of
pesticide to a recirculating stream of liquid from the applicator.
Many farmers in the U.S. Corn Belt and areas with
short-growing seasons prefer to add some liquid
mixtures, usually of grade 7-21-7, in the row with the seed
to enhance early "pop up" of the crop. A substantial
portion of the clear liquids used in the United States is
consumed for this purpose. During planting, liquid flows
from a constant head tank by gravity and through an
orifice plate. Frequently part of the liquid is added
directly with the seed and part is placed to the side of the
seed.
Figure 10.11 shows a barrel that has been adapted as
a constant head tank for addition of solutions to ditch
Irrigation systems; sometimes, this barrel is used on
farming equipment for dribbling liquids in the seed row.
This equipment is designed using the principle of
"Marriott's bottle" and is similar to those used in
laboratories. It has a breathing tube and an orifice plate at its
discharge; with this equipment a constant head is
maintained at the orifice plate. This metering equipment has
Table 10.7. Formulas for Solution Mixtures
N:P205:K20 Ratio
Grade
Formula, % total weight:
UAN solution (32-0-0}a
l0-34-0b
Potash
Water
Salt-out temperature, °CC
1-1-1
8-8-8
17.6
23.6
12.9
45.9
7
1-3-1
7-21-7
2.6
61.7
11.3
24.4
-6
3-1-0
21-7-0
59.2
20.6
20.2
<-20
1-3-6
2-6-12
0,8
17.7
19.3
62.2
-13
8-22-22
4-11-11
2.4
32.3
17.8
47,5
0
a. Urea-ammonium nitrate solution 32-0-0 grade.
b. Made from wet-process superphosphoric acid and ammonia.
c. Estimated using solubility curves, 70% polyphosphate.
282
100% Pt0»
11-37-0 from electric furnace process
numbers on contour lines mdkite
% htttl plant nutrient soluble
(N + P,0, + KiO>
Ttff Rjljphrwphate
b coetficl«nttt-F
Polmiim Hilrott (KNQjl ,ZI
Ammonium NHrgli (NH4NO)} .14
Potatittm ChforMi (KCI) .OB
Ammonium Chloride (HH4CI) ,05
(NH^^PjC^'ZH^) .05
Salt OutTemp = [(TPF -TPF from Fig.)
Hr b - coef.] + 32"F
Onto Iron Stack, P»lt», Shofdr
NH4NOs
17 I |SV00%
Figure 10.10. Solubility Equilibrium Curves, System 11-37-0, UAN Solution, KCI, Water at 0°C.
been used in Mexico and other countries to meter
solutions into ditch irrigation units; it should have some
application in other developing countries,
10.4 Suspension Fertilizers
Use of suspensions has grown very rapidly in the
United States during the past 5 years. Some of the main
reasons for their increased popularity are the same as
for other fluids. However, some of the reasons they are
used in preference to solution-type mixtures are:
- Cheaper, less pure materials can be used to produce
suspensions.
- Higher analysis grades can be produced. This is
particularly true when grades containing potassium are
to be used.
- Usually larger quantities of micronutrients can be
incorporated into suspensions than can be dissolved in
solution fertilizers. Therefore, when suspensions are
used, all of the micronutrient requirements can
usually be applied with the suspension fertilizers.
- Powdered herbicides and insecticides that are not
normally soluble in solution fertilizers can be suspended
and uniformly distributed throughout the suspension.
The main reason for the early production of
suspensions was to produce high potash grades for use in
regions that require relatively large quantities of potassium.
The most popular suspension grades are those that have
a high potash content such as the 7-14-21, 3-10-30,
and 4-12-24 grades. High nitrogen suspensions are also
popular. Grades such as 14-14-14, 20-10-10, 21-7-7,
and 24-8-0 are frequently produced. Surveys of fluid
fertilizer manufacturers show that about 70% of the fluid
fertilizer plants in the United States produce suspensions
and 95% produce solutions. These plants use the
materials listed in Table 10.8 to produce suspensions.
The most popular phosphate material for suspensions
is still ammonium polyphosphate solutions. However,
283
Nipple
Machined union
Flat orifice
plate
DETAIL A
Breather pipe
Pipe union machined
to take flat orifice plate
(see detail A)
Hose to
knife
Figure 10.11. Barrel Adapted as a Constant-
Head Tank.
Table 10.8. Materials Used to Produce
Suspensions
Materials
Grade
Potash
Nitrogen solutions
Ammonia
Ammopoly phosphate solution
Phosphoric acid
Solid phosphates (DAP & MAP)
0-0-62
28-0-0 or 32-0-0
82-0-0
10-34-0 or 11-37-0
0-54-0 or 0-52-0
18-46-0 or 11-52-0
economic pressures have encouraged the use of other
low-cost materials. The next most popular phosphate
source is monoammonium phosphate (11-52-0 MAP)
followed by diammonium phosphate (18-46-0 DAP) and
merchant-grade phosphoric acid (0-52-0 and 0-54-0).
Many companies that formerly used 10-34-0 for the
production of suspensions now plan to use either
phosphoric acid or granular ammonium phosphate
materials or combinations of these materials. Some of the
smaller producers plan to use ammonium orthophos-
phate base suspension (10-30-0 or 11-33-0) for the
production of their suspensions.
Companies that use ammonium polyphosphate
solution 10-34-0 or an orthophosphate base suspension (10-
30-0 or 11-33-0) use a simple plant such as the one
shown in Figure 10.12. In this plant the base phosphate
material (10-34-0 or 11-33-0) is mixed with nonpressure
nitrogen solution, containing 28%-32% N and potash.
AH materials in the formulation are weighed and mixed
in the mix tank. This plant has relatively low capital cbstT"
and there are a number of them located throughout the
United States. Probably the most economical source of
phosphate materials for these plants is ammonium
orthophosphate suspension of grade 10-30-0 or 11-33-0
produced from MAP and ammonia.
Most companies that use merchant-grade
phosphoric acid (0-54-0) for suspensions use a batch ammonia-
tion process for the production of base suspensions or
NPK mixtures. They neutralize the acid with anhydrous
ammonia and add dry potash [51. A sketch of a typical
batch plant that uses phosphoric acid and ammonia is
shown in Figure 10.13. This process includes a stainless-
steel (type 316) mix tank, stainless-steel recirculation
pump, and a wooden evaporative cooler.
In using this process rapid cooling to 60°C is effected
by"the~evaporative~cooler. The mixture is recirculated
with the pump while gelling clay. Acid is ammoniated to
an N:P205 weight ratio of 0.33:1. With this procedure
all of the crystals in the suspension are small DAP
crystals, An example of the formulation for a 12-12-12
suspension produced in this type of plant is given in Table
10.9.
10.4.1 Use of Granular Materials in Suspension
The use of granular material for the production of
suspensions is well established. Granular material such
as MAP, DAP, and urea have been used.
Probably the main reason for using the granular
materials is that they are usually the most economical source
of phosphate delivered to the use areas. Also, when
ammonia is added to the suspension the material cost
usually is less than the comparable cost for bulk-blended
(dry mix) materials. Other reasons given for the
conversion of granular materials to fluids are:
- Many merchants prefer to add the pesticide to the
fertilizer mixture after it has been delivered to the farm.
Pesticides can be safely mixed with fluid fertilizers on
the farm.
- A fluid can be applied more uniformly and accurately
than a granular mixture. This is important when
284
Clay
Trash and oversize potash
c=>
Legendi
T-l Storage tank 10-30-0
T-2 Storage tank 32-0-0
SI-3 Clay hopper
SF~4, SF-11 Screw conveyors
P-5, p-6, P-10 Pumps
M-7 Mixing tank with agitator
W-B Ueigh scale
T-9 Product storage
BC-1S Bucket elevator
SC-13 Vibrating screen
T-14 Tankcar
Figure 10.12. Cold Mix Plant for Production of Suspension Mixtures.
Clay ^
SC-10
Sol id Potash
Urea-Annonlun nitrate solution
<=i
Water
, <=.
Phosphoric acid
<^
AmmanI a
——C=i
Product to application
c=>
Legendi
SI-1, SI-4 Storage bins
W-2, U-5 Weigh scales
SF-3j SF-6 Screw conveyors
P-7 Pump
E-8 Evaporative-type cooler
M-9 Mixing tank
SC-10 Screw Conveyor
Formulation for 12-12-12 suspension
Drder of Materials
addltion
1
2
3
4
5
S
Water
Phosphoric acid (54 Y. P2Q5)
Aqua-ammonia <20/i N)
Clay
Potash ittV, K2D)
UAN C28>: N)
#/ton
531
445
97
40
387
500
Figure 10.13. Batch Plant Using Liquid Ammonia and Phosphoric Acid.
285
Table 10.9. Formulation for 12-12-12 Suspension
Order of Addition
Materials
Kg/t of Suspension
Water
Phosphoric acid (54%)
Aqua-ammonia (20% N)
Clay
Potash (62% K20)
UAN (28% N)
266
222
49
20
193
250
herbicide is incorporated into the fertilizer mixture since
nonuniform application can cause toxicity in some
spots in the field and ineffective weed control in others,
- Small quantities of micronutrients can be uniformly
applied as fluid mixtures. This is difficult to
accomplish with bulk-blended materials [11].
- Many companies report that they have fluid fertilizer
application equipment for nitrogen solutions, and, in
order to use it more effectively, they must convert solids
to fluids.
A typical mix plant for the conversion of MAP and/
or DAP to suspensions is shown in Figure 10.14. A
dominant feature of this mix plant is the large pump
used to recirculate liquid within themix tank. "Som&plants"
have used liquid grinders while the others have high
intensity agitators. The tank in Figure 10.14 is equipped for
the addition of ammonia and phosphoric acid. This plant
can readily convert solid materials such as MAP, DAP,
ammonium sulfate, and urea to fluids.
Most suspension producers prefer to produce
mixtures having the highest possible grade without
exceeding practical viscosity limits. Application tests show that
this viscosity should not exceed 8 g/cm-sec (800
centipoises) to avoid nonuniform application and
difficulty in pumping and handling the suspension. Crystals
formed in the suspension should be small and light
enough to avoid excessive settling and plugging of nozzles
during application. In producing suspensions, it would
be desirable to adjust the N:P2C>5 weight ratio to the
poinf"of~highest solubility~(0:3~:1). However, it is more
important that the suspensions be ammoniated to an
Phosphor ic ac I ol
i=>
HXr
Water
t=i
Granular ammonium phosphate
<■=£
<MAP or DAP)
Product
c=>
/ is>i /■ Annan I a f ron storage
P-4
■^X—£
w-5
P-3
Legend •■
SF-1 Screw conveyor
T-2 Mixing tank with agitator
P-3, P-4 Pumps
U-5 Weigh scale
Figure 10.14- Mix Plant for Production of Suspensions From Granular MAP/DAP (12-Tonne Batch).
286
N:P2C>5 weight ratio of 0.33:1 so that all of the crystals -
in the suspension are DAP. Figure 10.15 is a
photograph of MAP and DAP crystals. It is obvious that DAP
crystals would have less tendency to plug a nozzle. Also,
DAP is lighter that MAP (densities 1.619 versus 1.803)
and should have less tendency to settle during storage
and transport.
Typical formulations for the production of 11-33-0
suspension from MAP, DAP, or APP are given in Table
10.10.
When either MAP or APP materials are used, only
anhydrous ammonia is required to adjust the N^Os
ratio; however, when DAP is used, some phosphoric
acid must be added to the formulation to lower the
N:P205 ratio so that the solubility of the ammonium
phosphate portion of the mixture will be improved. APP
was formerly made by TVA and it contained about 20%
polyphosphate. This polyphosphate shortened the mix-
i*'
N. "-
Figure 10.15. Microscopic Appearance of MAP
and DAP.
ing time and improved the storage qualities of the 11-
33-0. A noncomplicated process is now available
whereby basic phosphate producers can produce APP
10.4.2 Satellite Plants
Some companies produce NPK base grades (3-10-
30, 4-12-24, and 7-14-21) and NPK base materials (13-
38-0 or 11-33-0 suspensions or 10-34-0 solutions) and
ship them along with nitrogen solutions to a satellite
station such as that shown in Figure 10,16, In this plant
base materials and nitrogen solutions are mixed and
weighed in a small mix tank that is mounted on scales.
With these base materials, it is possible for a small
merchant to install an inexpensive plant for production of
NPK suspensions or solution mixtures. Storage tests
show that cone-bottom storage tanks are ideal for
storage of suspensions; however, they are more expensive
than flat-bottom tanks. Frequently companies use air
spargers that consist of open-end pipes installed so that
they introduce sparging air close to the bottom of the
tank. Tanks that have cone bottoms also have spargers.
Experience has shown that it is preferable to agitate the
suspensions once a day by blasting 1.15 m3 of air at 0,7
MPa into the suspension so that it becomes well mixed.
10.4.3 Transportation and Application of
Suspensions
When suspensions were first introduced to the United
States, they settled excessively during transport. It was
found that some means of agitation during transit is
desirable but not always necessary, Figure 10.17 shows a
trailer truck that is similar to trucks used to transport
powdered bulk cement.
The cone bottom of the truck is equipped with air
spargers that can be used to re-suspend materials that
Table 10.10. Formula for 11-33-0 Suspension
Phosphate Material
11-52-0 (MAP)
18-46-0 (DAP)
11-55-0 (APP)
Phosphoric acid (54% P2Os)
Anhydrous ammonia
Water
Gelling clay
MAP
11-52-0
634.5
48.5
302
15
DAP
18-46-0
(formulation, kg/tonne of product)
502
183.5
23.5
276
15
APP
11-55-0
600.0
53.5
330.5
15
Total, kilograms
1,000
1,000
1,000
287
Nitrogen (solution or suspension)
F lexlb le hose
Legend:
K-l Air compressor
M-l NPK Base tank
M-2 Nitrogen tank
M-3 Mixing tank <scale-mounted)
W-4 Weigh scale
P-5 Pump
S-6 Strainer
T-7 Applicator truck with injector
P-8 Nitrogen soln. or suspension punp
P-9 NPK base soln. or suspension punp
Figure 10.16. Suspension Satellite Plant.
Top air
valve
I )( ) Closed
Air compressor
Figure 10.17. Cone-Bottom Transporter.
288
tend to settle during transport. Another type of
transportation truck has a round bottom but is equipped with
a recirculation sparger; the material that passes through
the sparger sweeps the bottom of the tank and keeps
the contents of the tank well mixed.
Applicators for suspensions are quite similar to the
ones normally used for the application of nitrogen
solutions; in many instances the same equipment is used.
When suspensions are applied, a flooding-type nozzle
must be used so that the nozzles will not become plugged.
One of the larger applicators will apply suspensions at a
rate of about 0.5 ha/minute.
10.5 Specialty Fluid Fertilizers
There are several types of fluid fertilizers and liming
agents that deserve special discussion and application.
The ones that will be discussed are:
10.5.1 Fluid limestone
10.5.2 Acid-type fluid fertilizer
10.5.3 Micronutrients in fluids
10.5.4 Solution using potassium hydroxide as a source
of potassium
10.5.5 Fluids with sulfur
There are other specialty types of liquids, but these
are the ones in which agriculturists, have shown the_most_
interest,
10.5.1 Fluid Limestone
Agronomists' studies have shown that to be effective,
a liming agent must be of a fine size [5[. Industry
agronomists report that to be 100% effective, limestone must
be less than 0.2 mm with at least 75% less than 0.15
mm. It is generally agreed that the smaller the particle
size of the liming agent, the quicker it reacts in the soil
to adjust the pH to a suitable level for optimum crop
growth. Problems occur with dusting and with drifting
of the dust when this very small size material is applied.
Obviously one way to avoid this problem with dust is to
produce a suspension using it.
The mixing equipment normally used for the
production of fluid limestone is the same as that used to
produce other suspensions. Preferably, the mix tank is
equipped with a large pump with a recirculation rate of
about 1,900 liters per minute. Recirculating fluid enters
tangentially to walls of the tank. Although the
recirculating fluid causes most of the mixing, most operators also
prefer to have an agitator to assist in mixing. Usually
the fluid lime contains 50°/cr60% solids and l%-2%
gelling clay (attapulgite clay, sepiolite clay, sodium bento-
nite clay, zanthan gum, etc.). It is stored and applied in
tanks and equipment used to produce suspensions.
A typical formulation for fluid limestone and some of
its physical characteristics are given in Table 10.11.
10.5.2 Acid-Type Fluids [12]
These fluids are usually solutions and have a pH of
less than 2.0. Some of the advantages of these acid
solutions are: solution fertilizers can be produced from
impure acids, larger quantities of micronutrients can be
dissolved in them, they are less likely than neutral
solutions to cause troublesome precipitates in irrigation
systems that use water of high hardness, and it is possible
to produce high nitrogen solutions that contain urea-irr
a form that will not cause germination damage or lose
its nitrogen when the solutions are surface applied [13].
Table 10.11. Formula for 10-Tonne Batch of
Fluid Limestone
Material
Limestone3
Gelling clayb
Water
Total
Suspended solid, %
Gelling clay, %
Specific gravity (20%), g/ml
Viscosity, g/cm-sec
Kq Per Batch
5,000
200
4,800
10,000
50
2
1.44 to 1.68
<6.0
a. Particle size 100% <0.2 mm and 75% <0.15 mm.
b. Attapulgite clay.
The main disadvantage of these liquids is that they
corrode mild steel and stainless steel. It is recommended
that they be stored and handled in tanks, pipes, and
equipment made of plastic (PVC, polyolefins, etc). In
the production of NPK acid liquid mixtures probably the
best combination of ingredients is UAN, solid urea,
merchant-grade phosphoric acid, and potash. Typical
formulations using these ingredients are given in Table 10.12.
The pH of all of these liquids is less than 2.0 and their
specific gravities are close to 1.2 g/ml.
10.5.3 Micronutrients in Fluid Fertilizers
The need for micronutrients is growing in some
countries because of intensive cropping, the shift to high-
289
Tabic 10.12. NPK Acid Solutions From UAN Solution, Urea, Phosphoric Acid, and Potash [10]
Ratio
Grade
Water
Urea (46% N)
UAN (32% N)
Phosphoric acid (54% P205)
KCI (62% K20)
Nitrogen from urea, %
Nitrogen from AN, %
Maximum mix temp, °C
Mixing time, min.
Crystal precipitation after
2 days at 0°C
1-1-1
No
1-2-1
No
1-4-1
1-3-1
No
No
1-3-3
No
3-1-2
8-8-8
1,036
232
172
300
260
83
17
27
30
7-14-7
900
200
152
520
228
83
17
27
30
5-20-5
7-21-7
840
144
108
744
164
83
17
29
30
640
200
152
780
228
83
17
27
30
3-9-9
1,208
76
88
336
292
79
21
27
30
9-3-6
1,240
256
196
112
-196-
83
17
27
30
No
analysis fertilizers that do not contain micronutrients,
improved methods of identification of micronutrient
deficiencies, and new crop varieties that have higher
micronutrient requirements.
Correction of these micronutrient deficiencies may be
accomplished by soil or foliar application. Boron,
copper, zinc, manganese, and molybdenum are usually
applied to the soil. Molybdenum. is_required_in_such_small_
quantities that it is often dusted on seeds. Iron is usually
added as a chelated material and is foliar applied,
Most micronutrients are mixed with the macronutri-
ent materials (N, P, and K) and applied as a starter
(banded close to the seed), a band between rows, through
irrigation systems, or broadcast. Application with fluid
fertilizers is a convenient method of uniformly
spreading small quantities of micronutrients over a large area.
TVA conducted research to determine the solubility
of micronutrients in fluids [5,14,15]. It was found that
some sources form insoluble compounds that have low
—soInbilitiesiniiqaJd^fertilizerand must be applied as
suspensions. Generally, solubility data show that most
micronutrients were more soluble in ammonium
polyphosphate solutions than in conventional orthophos-
phate solutions. Table 10.13 gives a comparison of the
Table 10.13. Solubility of the Micronutrients
Solubility % by Weight of Element (Zn, Cu, Fe, Mn, B, Mo)
Material Added
Zinc oxide
Zinc sulfate
Zinc carbonate
Cupric oxide CuO
Copper sulfate CuS04»5H20
Ferric sulfate Fe2(S04)3*9H20
Manganous-manganic oxide MmO*
Sodium molybdate Na2Mo03-2H20
Borax Na2B4O7*10H2O
11-37-03
3.0
2.0
3.0
0.7
1.5
1.0
0.2
0,5
0.9
Base Solution
10-34-0b
2,25
1.30
2.25
0.53
1.13
0.80
0.15
0.38
0.90
8-24-0c
0,05
0.05
0.05
0.03
0,13
0.08
0.02
0.50
0.90
a. 11-37-0 made from electric furnace superphosphoric acid; contains 70% polyphosphate.
b. 10-34-0 that contains 45% polyphosphates made from wet-process superphosphoric acid.
c. Made from electric furnace orthophosphoric acid; contains no polyphosphates.
290
amount of micronutrient elements (% by weight Zn, Cu,
Fe Mn, B, and Mo) that are soluble in three ammonium
phosphate solutions, which are currently used or have
been used to produce NPK solutions by mixing with other
nutrient material such as UAN solution (28% to 32%)
and potash (62% K2O).
The 11-37-0 in Table 10.13 is an ammonium
polyphosphate liquid made from superphosphoric acid,
which was produced from elemental phosphorus. The
10-34-0 is the most common ammonium polyphosphate
solution currently in use. It is produced from
conventional wet-process superphosphoric acid, and the 8-24-
0 liquid was produced from orthophosphoric acid made
from elemental phosphorus.
These data show that the solubility of the micronutri-
ents was substantially higher for the ammonium
polyphosphate solutions (11-37-0 and 10-34-0) than
for the orthophosphate solution (8-24-0). The 10-34-0
in these tests contained 45% polyphosphate, Later when
it became possible to produce 10-34-0, which contained
70% polyphosphate using the TVA pipe reactor
process, field tests confirmed that the solubilities shown for
10-34-0 in the above tabulation are conservative, and
these are the values currently used. All of these liquids
store well at 0°C.
These data are used to determine the quantities of
micronutrients that will remain in NPK solutions made
from 10-34-0 [16]. Plant-scale tests indicate that in most-
instances the solubilities in NPK solutions can be
calculated using the quantity of 10-34-0 used in the
formulation and the amount of the micronutrient that can be
dissolved in 10-34-0. The operator can empirically
calculate the amount of micronutrient soluble in the NPK
solution according to the following example. In this
example, determine the amount of zinc as zinc oxide that
will remain in a 7-21-7 produced from 10-34-0, 32-0-
0. potash, and water as follows:
1. The quantity of 10-34-0 used to produce a tonne of
7-21-7 is calculated to be 617,7 kg.
2. This 10-34-0 will dissolve 2.25% as zinc oxide.
3. The percentage of Zn as zinc oxide that can be
dissolved in 7-21-7 is calculated as follows:
617.7x0.0225x100 -, oQ
1000 " L'6J
A similar empirical method has been used to
determine the amounts of several micronutrients that can be
dissolved in liquids made from 10-34-0. The directives
used are as follows:
- Never exceed the maximum amount of each
micronutrient that can be dissolved in the 10-34-0.
- The sum of all the micronutrients should not exceed
3% of the amount of 10-34-0 used in the mixture.
With these criteria and the procedure used above, the
operator can calculate the estimated amount of several
micronutrients that can be added to solutions made from
10-34-0,
The amounts of micronutrients that can be added to
a suspension without adversely affecting its uniformity.
of application must be determined through trial and
error and small-scale tests. Application tests show that to
avoid poor performance of a spray nozzle, the viscosity
of the suspension must be less than 8 g/cm-sec (800
centipoise) and preferably less than 5 g/cm-sec (5Q0
centipoise). At viscosities greater than these levels, the
nozzle emits a nonuniform spray pattern. A test was
conducted in which several micronutrient materials were
added to a 15-15-15 suspension. The percentage of
micronutrient material added and material used to
supply this amount of element is given in Table 10.14.
Table 10.14. Suspensions With Micronutrients
-Addition-of-Mixture'ofMcronutrients
to 15-15-15 Suspension
% Micronutrient
as Element
0.1 B
0.2 Cu
0.6 Fe
0.6 Mn
0.3 Zn
Material That Supplied Element
(Na2B407»5H20i 14,3% B)
(CuS04*5H20)
(Fe2SCV9H20)
(MnS04»XH20)
(ZnS04, 36% Zn)
The freshly prepared 15-15-15 (0AB-0.2Cu-0.6Fe-
0.6Mn-0.3Zn) had a viscosity at 21CC of 2.00 g/cm-sec
(200 centipoise) and after 1 day of storage it was 4.7 g/
cm-sec. With further storage time, the viscosity increased
beyond 8 g/cm-sec (800 centipoise), beyond the
tolerance for accurate and uniform application.
These data show that the viscosity of the suspension
increased with storage time. However, if it is applied
soon after it is made (< one day), no problems with
uniform application and pumping should occur. It is
recommended that all suspensions that have
micronutrients added to them be applied within one day.
291
Similar results were obtained when zinc oxide was
mixed with 5-15-30 to produce a 5-15-30-2 Zn, 5-15-
30-3 Zn, and 5-15-03-4 Zn, These results are given in
Table 10.15. These data show that the 5-15-30-2 Zn is
probably the best grade to produce, and it should be
applied as soon as it is mixed.
10.5.4 Mixtures Using Potassium Hydroxide [5]
Tests have shown that when liquid mixtures are made
from KOH and phosphoric acid (technical grade}, one
kilogram of K20 as KOH will neutralize 1 kg of P2O5
from acid. For example, the 0-1-1 ratio is an 0-25-25
grade. For grades containing N, some or all of the
nitrogen can be supplied by urea and/or ammonia.
In the production of a 1-2-1 grade, for example, there
is insufficient KOH required to neutralize the acid, and
some ammonia must be added to complete the
neutralization.
When phosphoric acid that is produced from
elemental phosphorus (furnace-grade phosphoric acid) is used
to produce these liquids, the products have a clear
appearance. The same is true when wet process
superphosphoric acid is used. The grades are higher in
analysis when superphosphoric acids are used in
preference to orthophosphoric acid.
Typical grades of liquid fertilizers that have low-chlorine
content and are made from - superphosphoric acid-and—
potassium hydroxide solution are given in Table 10.16,
The data show that it is possible to produce high-
analysis mixtures with a wide range of nutrient ratios
from these materials.
The main advantages of these clear solutions from
KOH as compared to conventional solutions are:
- Higher analysis liquids,
- Possible to produce no-nitrogen and low-nitrogen to
P2O5 ratios.
- Agronomic tests show that there is significantly less
foliage burn caused by these liquids than by liquids
made from potassium chloride.
10.5.5 Fluid Fertilizers With Sulfur
Much of the sulfur used in fluid fertilizers is added as
ammonium thiosulfate solution (12-0-0-26S grade). This
product is produced in a specially designed plant that
produces the solution by the following steps:
• Burning sulfur with air to produce sulfur dioxide.
• Absorbing SO2 in water to form sulfurous acid.
• Ammoniating this acid to form ammonium sulfite.
• Reacting ammonium sulfite with sulfur to produce
ammonium thiosulfate.
This clear liquid is used to supply sulfur to clear
mixtures such as an 8-20-5-5S or 26-0-3-3S. It is also used
as a direct application of nitrogen and sulfur.
Another fairly common practice is to use ammonium
sulfate solution of 8-0-0-9S grade, which is prepared by
dissolving crystalline ammonium sulfate in water.
Sulfur is also added to suspensions. Small particle size
-elemental-sulfur-js-suspended in a slurry using a gelling
clay by the procedures described earlier.
10.6 Investment Costs
The investment costs of installations and equipment
used in the production and application of liquid fertilizers
Table 10.15. Aging of Zn-Suspensions
Viscosities of 5-15-30 XZn Mixtures (g/cm-sec at 21°C)
Grade
5-15-30-2Zn
5-15-30-3Zn
5-15-30-4Zn
Freshly
Prepared
4.39
6.79
8,35
One-Day
Storage3
9.66
14,36
Too thick to measure
or agitate by air
sparging
One-Week
Storageb
8,38
12.90
Two-Week
Storage
7.98
12.34
a. Material not agitated prior to viscosity measurement.
b. Viscosity taken after agitation by air sparging.
292
Table 10.16. Low Chlorine Liquid Fertilizers
Typical formulations for low-chloride liquid
fertilizers from superphosphoric acid
and potassium hydroxide [51
Ratio
0:1 = 1
1:1:1
1:2:1
1:2:2
1:2:3
1:3:1
1:3:2
1:3:3
1:4:2
1:4:4
1:6:6
2:4:5
Maximum
Grade3
0-25-25
11-11-11
10-20-10
7-14-14
6-12-18
8-24-8
8-24-16
6-18-18
6-24-12
5-20-20
3-18-18
6-12-15
a. Maximum grade that was stored for 7 days at 0°C
and 30 days at room temperature without salting out.
in Table 10.17 are based on information received from
industry [17]. The Swift and Marshal index was used to
adjust the costs to the 1994~level. '
10.7 Summary
Fluid fertilizers are a major part of the fertilizer
industry in the United States with about 60% of the total
nitrogen and 20% of the mixtures being supplied in the
fluid form. Other countries have also experienced growth
in fluid fertilizer, particularly nitrogen solutions. It is
anticipated that the use of nitrogen solutions will continue
to grow throughout the world and that other fluids
(phosphates and NPK mixtures) will soon follow in
popularity. Fluids can be accurately measured and provide a
means for efficient use of plant nutrients.
In the future, it is anticipated that fluids will be applied
through the global positioning of applicators. The agri-
services in the region or country, having all the
necessary meteorological data, would be advised by a network
applicator (farmer or service company) on grades,
methods, and fertilizing intensity for particular crops to be
applied at the optimum period of time, ——'
1.
2,
3.
10.8 References
International Fertilizer Industry Association. 1992.
Fertilizer Product Consumption Forecasts, A/92/
116 Paris, France.
Tennessee Valley Authority, 1994, Commercial
Fertilizer Consumption for Year Ended June
30,1993, TVA NFERC 93/6 Bulletin-234.
The Fertilizer Institute. 1966. Agricultural Anhydrous
Operations Manual, Washington D.C., U.S.A.
4. Achorn, F. P., andH. L. Kimbrough. 1977. "Latest
Application Techniques for Applying Anhydrous
Ammonia," TVA Fertilizer Conference, Kansas City,
MO, U.S.A.
~5~ AX'hoTnrFrFTrMichael"F; Bro'der, and Dan Henley.
1994. ARA Professional Dealers Manual for Fluid
Fertilizer, Agricultural Retailer Association, St.
Louis, MO, U.S.A.
6. Handbook on chemical specialties.
7. Meline, R. S,,.R. G. Lee, and W. G. Scott. 1972.
"Production of Liquid Fertilizers with Very High
Polyphosphate Content," Fertilizer Solutions,
16(2):32-45.
Table 10.17. Investment Costs of Equipment and Installations Used in the Production and
Application of Liquid Fertilizers
Equipment and Installation (20 tph capacity)
Typical pipe-reactor plants for production of ammonium polyphosphate
solution
Liquid fertilizer mix plant
Cold mix plant for production of suspension mixtures
Batch plant using liquid ammonia and phosphoric acid
Mix plant for production of suspensions from granular
MAP/DAP
Suspension satellite plant
Investment Costs
<US$)
400,000 flimited storage)
275,000
400,000
400,000
400,000
200,000
293
8. Slack, A. V, J. M. Potts, and H. B. Shaffer, Jr. 1965.
"Effect of Polyphosphate Content on Properties and
Use of Liquid Fertilizers,'1 J. Agri Food Chem.,
13:165-71.
9. Slack, A. V., J. D. Hatfield, H. B. Shaffer, Jr., and
J. C. Driskell. 1959. "Solubility Relationships in
Liquid Mixed Fertilizer System," J. Agri Food Chem.,
7:404-408
10. Kachelman, D. L. 1989. Fluid Fertilizer Reference
Manual, TVA Bulletin Y-210.
11. Achorn, F P., and J. J. Mortvedt. 1977. "Addition
of Secondary and Micronutrients to Granular
Fertilizer," Conference Granular Fertilizers and their
Production, pp. 304-332, International
Conference, London, England, November.
12. Achorn, F P., and C. A. Cole. "Production of Acid
Fertilizer Solutions," U.S. Patent 4,531,926,
Tennessee Valley Authority.
13. Gasser, J.K.P, and A. Penny. 1967. "The Value of
Urea Nitrate and Urea Phosphate as Nitrogen
Fertilizers for Grass and Barley," Journal Agricultural
Science, 69:139-146,
14. Achorn, F P. 1969. "Use of Micronutrients in Fluid
Fertilizer," N.F.S.A. Conference, Kansas City, MO,
U.S.A.
15. Giordano, P. M., and J. J. Mortvedt. 1966. "Zinc
Availability and Concentration in Macronutrient
Carriers," SoiV Science Society of America
Proceedings, 30(5):649-653.
16. Achorn, F P. 1969. "Use of Micronutrients in Fluid
Fertilizers," Presented at the Conference of the
National Fertilizer Solutions Association, Kansas
City, Missouri, July 22-23, Published in NFSA
Additives and Fluid Fertilizers '69 Round-Up.
17. Personal communications with equipment
manufacturers, 1990.
294
Chapter 11. Sulfuric and Phosphoric Acids
Table of Contents
Page
11.1 Sulfuric Acid 296
11.1.1 Introduction , 296
11.1.2 Production of Sulfuric Acid From Elemental Sulfur 296
11.1.3 Economics of Sulfuric Acid Production Capital Costs 301
11.1!4 Production of Sulfuric Acid From Pyrites or From Smelter Operations 302
11.1.5 The Production of Sulfuric Acid by Wet Catalysis 305
11.1.6 Production of Sulfuric Acid From Calcium Sulfate 306
11.1.7 Sulfuric Acid Storage, Sea-Transport Prices 310
11.1.8 Projections of Sulfuric Acid Production Trends and Technology
Improvements 310
11.1.9 Process Options 311
11.2 Wet-Process Phosphoric Acid 311
11.2.1 Introduction , 311
11.2.2 Chemistry of the Wet Process 312
11.2.3 Heat Released in Reaction , 312
11.2.4 Types of Wet Processes 313
11.2.5 Description of the Dihydrate Process 314
11.2.6 Hemihydrate and Two-Stage Processes 326
11.2.7 Materials of Construction 331
11.3 Superphosphoric Acid 332
11.4 Shipment of Phosphoric-Acid-.-...... -..-.-...-.-:.-.- ::■.■■.■;■: .—-.-.—:-.-;-.-.-..- 333
11.5 Use of Byproduct Gypsum 336
11.5.1 Use for Building Materials 336
11.5.2 Plaster - Board Products 336
11.5.3 Use as Cement Additive 338
11.5.4 Agricultural Use 338
11.6 Utilization of Fluorine 339
11.7 Uranium Extraction ... 340
11.8 Purification of Phosphoric Acid 341
11.8.1 Removal of Organic Materials 343
11.8.2 Defluorination 1 343
11.8.3 Solvent Processes 343
11.9 Production of Phosphoric Acid Using Acids Other Than Sulfuric 345
11.9.1 Dissolution and Mechanical Separation of Insoluble Residue 345
11.9.2 Liquid-Liquid Contacting 346
11.9.3 Acid Concentration 347
11.9.4 Solvent Recovery From Spent Calcium Chloride Brine 347
11.9.5 Construction Materials 347
11.9.6 Quality of HCl-Route Phosphoric Acid 347
11.9.7 Capital Investment 347
11.9.8 Process Requirements 347
11.10 Phosphoric Acid Production by the Electric Furnace Process 348
11.11 Phosphoric Acid Production by the Blast-Fumace Process 350
11.12 Wet-Process Licensers 351
11.13 References 351
295
Chapter 11. Sulfuric and Phosphoric Acids
11.1 Sulfuric Acid
11.1.1 Introduction
Sulfuric acid is an important raw material for
phosphate fertilizer production and to a much lesser extent
for nitrogen and potassium fertilizers. World production
of sulfuric acid was about 158 million tonnes of H2S04
in 1991 [II, from which 58% was used in fertilizer
production.
About 65% of the world's production was based on
elemental sulfur, 16% on pyrite, and 19% on other
sources. Of the other sources, the principal one was
byproduct sulfuric acid recovered from smelting
operations,
The most important consumers of sulfuric acid are:
North America (29%), Eastern and Central Europe and
the Commonwealth of Independent States (CIS) (20%),
and southeast Asia (18%).
In general terms, sulfuric acid is produced by catalytic
oxidation of sulfur dioxide (SO2) to sulfur trioxide (SO3),
which is subsequently combined with water to form
sulfuric acid (H2SO4), In practice the SO3 is absorbed in
sulfuric acid^that^ is kept at a controlled concentration
(usually 98%) by water addition.
There are no major variations of commercial interest
on this basic chemistry. There are alternatives
regarding the source of SO2 and the method of conversion to
S03.
The two principal processes for conversion of the SO2
are known as the chamber and the contact processes.
The older chamber process, which was introduced in
Europe near the middle of the 18th century, uses
nitrogen oxides as oxygen-carrying catalysts for the
conversion of S02 to SO3 12,3]. The reactions that produce
the SO3 and sulfuric acid take place within huge lead
chambers (from which the process is named) or in packed
towers that may be substituted for the chambers. Major
disadvantages of the chamber process are limitations in
throughput, quality, and concentration (usually 60° Be
or about 78% H2S04). All known new plants use the
contact process although some older chamber process
plants may still be in use.
In the contact process SO2 is converted to SO3 by use
of a metal or metal-oxide catalyst. Platinum was once
widely used as a catalyst, but because of its excessive
cost and susceptibility to "poisoning," it has largely been
replaced by vanadium pentoxide. The S03 is passed to
an absorption tower where it is absorbed in
recirculating concentrated acid. There are many variations in the .
contact process depending upon the types of raw
materials available and other considerations; also,-a number
of engineering variations are in use by the many
different design/construction firms offering services in this
field. The main advantages of the contact process are
that concentrated acid (98% H2SO4) of high purity can
be produced directly and that compact plants of quite
high capacity have now become rather commonplace
and capacities up to about 3,000 tpd are not unusual.
11.1.2 Production of Sulfuric Acid From
Elemental Sulfur
Elemental sulfur, also called "brimstone," is the
preferred raw material for sulfuric acid production
whenever it is available at a reasonable cost. Elemental sulfur
may be mined by the well-known Frasch process or
recovered from volcanic ores, "sour" natural gas, or oil. It
is also possible and sometimes commercially feasible to
produce elemental sulfur from pyrites, other sulfide ores,
and coal.
Commercial sulfur is usually 99,9% or higher in
purity. "Dark" sulfur contains hydrocarbon impurities up
to about 0,5%; "bright" sulfur contains less than about
0.1% (measured as carbon). Dark sulfur causes
difficulties in some types of sulfur-burning plants. However,
methods for using dark sulfur without difficulty have been
developed. Another quality factor is the ash content,
which should be quite low to avoid dust that will
accumulate in the catalyst bed. Solid impurities can be
removed from molten sulfur by filtration 14], Alternatively,
by using a hot gas filter, dust arising from ash in the
sulfur can be removed from the hot gas leaving the
sulfur burner.
Most sulfur-burning plants are designed to use sulfur
in liquid form although plants with solid feed have been
used. In many cases the sulfur is transported in liquid
form by ships, barges, or railcars that are specially
equipped for that purpose. In this case, the sulfur is stored
in liquid form at the plant's receiving terminal until it is
used. When the sulfur is received in solid form, it is
usually melted before use.
In producing sulfuric acid from sulfur, heat is released
in various steps of the process as noted in Table 11.1.
Some additional heat is released by dilution of the
sulfuric acid to the usual concentration of 98% or 93%,
but this is relatively small. The total heat released is
equivalent to about 1.3 million kcal/tonne of H2SO4.
Recovery of a maximum portion of this heat as usable
296
Tabic 11.1. Reactions in Sulfuric Acid Process
Reaction
S + 02 -> S02
2S02 + 02 ^ 2S03
S03 + H20 -> H2SO4
Total reaction
S+ 1-1/2 02 + H20 -+ H2S04
Heat Released,
kcal/mole of H2SO4
70.9
23.5
32.8
126.2
energy is an important objective of the production
technology.
Before describing particular industrial processes, it
should be noted that each process is based on
information supplied by a different engineering and
construction organization. Each of the organizations offers a
range of processes to meet various client needs. Several
other companies offer sulfuric acid processes, and there
is no intention to imply that processes offered by the
companies mentioned by name are necessarily superior
to those offered by other companies and does not imply
any kind of endorsement by UNIDO or IFDC.
In a typical sulfur-burning, single-contact sulfuric acid
plant (Figure 11.1), the molten sulfur is burned with dry
Sulfur
Legend 1
C-l Drying -tower
E-2 Sulfur burner ft. waste heat boiler
B-3 Air blower
R-4 Converter
E-5 No 2 waste heat boi ler
C-6 Absorber
E~7 Econonizer
T-8 Acid pump tank
E-9 Acid coolers
Figure 11.1. Sulfur-Burning Single-Contact Sulfuric Acid Plant.
air. The air is dried in a drying tower by contact with
concentrated sulfuric acid. The sulfur is burned in a
refractory-lined combustion chamber with excess air at a
temperature of 950°-1100°C, a combustion gas
containing about 10% SO2 is produced.
The gas is cooled in a boiler, which generates steam,
to about 420CC, the desired inlet temperature'to the
catalytic converter. Some of the excess air may be
bypassed around the burner and boiler to control the
combustion chamber temperature and to decrease the
required size of the boiler. Alternatively, excess air may_
be added between catalyst beds to control the
temperature during conversion.
Normal combustion of sulfur creates nitric oxides,
which can be harmful to many processes. The
formation of NOx is proportional to the gas temperature, i.e.,
directly to the S02 concentration [3].
Figure 11.2 presents the formation of NO during
normal combustion of sulfur. There are some special
methods of sulfur combustion that minimize the
formation of nitric oxides. The catalytic conversion of S02 to
SO3 usually is carried out in three or more steps
(catalyst beds); the gas is cooled between steps to keep the
temperature within the desired range of 420°-450°C.
The conversion steps are carried out by contact of the
gas with successive beds of vanadium
_oxide_ catalyst, which are often
arranged in sections of a single tower.
The gas leaving the first catalyst bed
may be at a temperature of 580°-
600°C and must be cooled to a range
of 420°-450°C to promote efficient
conversion in the second bed because
of unfavorable equilibrium at higher
temperatures. Cooling may be done
by injecting cool air or by heat
exchange to produce more steam.
Likewise, cooling between the second,
third, and successive beds is required,
but the temperature rise is less than
that of the first bed,
The gas leaving the tower is cooled
further in a heat exchanger
(economizer) before entering the absorption
tower where the SO3 is absorbed in a
recirculated stream of concentrated
sulfuric acid. The sulfuric acid is
maintained at the desired concentration
(usually 98% H2S04) by water
addition, and its temperature is controlled
in the desired range of 70°-90°C
measured at the tower inlet by
cooling the recirculated acid. Some of the
297
10 11
13 14 15 16 17
Vol % Sulfur Dioxide
23 21
Mile:
FtKise vol % NOx valuee "W rat)' a little, because they depend also
on tfieclher parameters (particularly on dispersion of liquid sulfcr
tengtiural and cooling condilions of resulting gases) therefore this
Sgure ie only a demonslralive one
Figure 11.2. Formation of NO During
Combustion of Sulfur [3].
acid goes to the air-drying tower mentioned previously
where moisture from the incoming air supplies some of
the water needed in the reaction. In the above-described
single-absorption process, the recovery of sulfur as
sulfuric acid is 97%-98%; the remainder is lost to the
atmosphere as SO2- In most countries the discharge of
this amount of SO2 is environmentally unacceptable.
Therefore, most plants use a double-contact, double-
absorption (DC/DA) system as shown in Figure 11.3.
The gas, after passing through three catalyst beds, goes
to the first absorption tower where the SO3 is removed.
The gas is then reheated to about 420°C, passed through
the fourth catalyst bed, and then cooled and sent to a
second absorption tower. The theoretical principle of
the double-contact process depends on the law of mass
action:
P[SOs
Kp =
P [SOd x P [OaT*
Where:
- PfSOjJ, PPd, and P[S03] are partial pressures of
the individual reactants in the gas phase, and
- Kp is the equilibrium constant.
To exit gas stack
Legend 1
E-l Air blower
C-2 Drying "tower
X-3 Sulfur burner
E-4, E-5, E-9 Bo I Lers
R-6 Converter
E-7, E-8 Heat exchangers
C-10 Intei—absorbing tower
E—11 Econonlzer
C-12 Final absorbing tower
E-13j E-16 Acid coolers
T-14j T-15 Acid punp tanks
Figure 11.3. Sulfur-Burning Double-Contact, Double Absorption Sulfuric Acid Plant.
298
After a preliminary SO2 conversion, the SO3 formed -
at this stage is removed by intermediate absorption so
that the equilibrium is shifted in favor of SO3 formation.
The temperature-conversion functions for different
steps of catalytic reaction are given in Figure 11.4.
The DC/DA process reduces the SO2 loss to less than
2 kg of SC>2/tonne of H2SO4. High- efficiency mist
eliminators are also required to limit the loss of H2SO4 mist
to less than 0.05 kg/tonne of H2SO4. Thus, the
recovery in a DC/DA plant should be at least 99.7%.
The use of the DC/DA system adds 10%-15% to the
cost of the plant in comparison with the older single-
absorption process. It also uses more energy and
produces less steam or other recoverable energy. The
residual quantities of SO2 can also be removed by
scrubbing the stack gases with an ammonia solution. The
resultant ammonium sulfite/bisulfite solution is then
acidulated with sulfuric acid to produce ammonium
sulfate and SO2.
403 450 503 5£0 fflO 650 700
Gas temperolue. degress C (contact-tayerexlr)
Figure 11.4. Diagram of Conversion Functions [4].
The liberated S02 is returned to the sulfuric acid plant,
and the remaining concentrated ammonium sulfate
solution may be used in a fertilizer plant.
Alternatively, the ammonium sulfite-bisulfite solution
may be acidulated with phosphoric acid, producing an
ammonium phosphate solution. There are numerous
other tail-gas scrubbing processes that produce various
byproducts or waste products [5].
Operation of a sulfuric acid plant under pressure has
some advantages; the equipment is smaller and less
expensive, less catalyst is required, and equilibrium
conditions and reaction rates are more favorable in the
conversion and absorption steps. The first pressure plant
was built by Produits Chimiques Ugine Kuhlman near
Lyon, France. It began operation in 1972 at a capacity
of 550-575 tpd. The plant used a double-contact, double-
absorption process and operated at 0.5 MPa pressure,
measured at the air compressor exhaust. The
conversion efficiency was 99.80%-99.85% during the first 5
years of operation. It was estimated that the investment
cost was 10% less than for a conventional (nonpressure)
plant, but for larger capacities up to 2,000 tpd, an
investment saving of up to 17% was possible. About two-
thirds of the energy required for compression was
recovered by expansion of the reheated tail gas in a
turbine that drives the compressor. Operating
parameters are summarized below in Table 11.2 [6].
It was noted that the plant was designed in 1970
before the energy crisis, and some improvements in heat
and energy recovery would still be possible and
economically desirable under current conditions.
Another pressure process is called the C1L process
(Chemetics International Ltd., Canada). The process
operates at 0.8 MPa and uses a single-contact, single-
absorption system. The unique feature of the process is
that SO2 remaining in the gas leaving the converter is
absorbed in the sulfuric acid in the absorption tower.
The acid containing dissolved SO2 then goes to the air-
drying tower where the dissolved SO2 is stripped from
the acid into the airstream and thereby recycled through
the sulfur burner to the converter.
Table 11.2. Pressure Sulfur Plant Operating
Parameters
Sulfur consumption
Electric power
Byproduct steam (at 40 atm)
Process and cooling water
Maintenance
Operating labor
Acid concentration
330 kg/tonne
65 kWh/tonne
990 kg/tonne
Same as in conventional
processes
396-4% of capital cost
2 men/shift
99.0%-99.5%H2SO4
299
The solubility of SO2 in sulfuric acid increases with
the increase of pressure and with the decrease in
temperature. In a conventional plant operating at 1-atm
pressure and with an acid temperature of 110°C, the
solubility of SO2 in sulfuric acid is only 8 ppmw.
However, by increasing the pressure to 0.8 MPa and
lowering the temperature to 49°C, the SO2 solubility is
increased to 190 ppmw. Under these conditions, a
substantial amount of S02 can be transferred in the acid
stream to the air-drying tower and then to the incoming
airstream. Cameron et al. [7] point out that there is no
theoretical limit to the amount of SO2 that can be
recovered and recycled; it depends on the rate of
recirculation of acid between the absorber and air-drying towers.
In a conventional plant, each tower has its own acid
recirculation system (Figure 11.1) with only enough
interchange between the systems to maintain the acid
concentrations at the desired level.
In the CIL system [4], most of the recirculation is
between the two systems. It is claimed that this system can
readily attain or exceed the 99.7% efficiency that is
required to meet U.S. pollution control standards.
The CIL process has the advantage of a pressure
process, which was pointed out in describing the Kuhlman
process, and the additional advantage of requiring only
single-contact and single-absorption equipment, which
would obviously decrease capital costs and simplify plant
operation. However,- maintaining the relativelyJow-add-
temperature (about 50°C in the absorber tower) would
require more cooling. Even though the CIL process is
technically interesting, no practical use has been found
for it.
Before the energy crisis of the 1970s, the typical
energy recovery from sulfur-burning interpass plants was
55%; steam production amounted to about 1.1 kg/kg
of acid made. In the 1980s Monsanto Enviro-Chem 18]
raised the energy recovery potential up to 70%) and
steam production to about 1.35 kgAg of acid made.
This was accomplished by the introduction of the
following features:
• High S02 gas strength up to 12% for sulfur-burning
plants and 14%-15% for metallurgical plants.
• A ring-type catalyst to reduce pressure drop by 50%.
• Low-temperature economizers.
• Boiler pressure of 6.0 MPa and steam superheat to
450°C.
• Suction drying towers.
• Boiler feedwater preheating.
• Improved mist eliminators.
• Economically optimized plant pressure drop.
These features have been introduced in new plants and
can be made available in existing plants as the Retrofit
Energy Enhancement Program (REEP). The payback
period for these retrofits amounts to 1-3 years. In 1984
Monsanto Enviro-Chem patented the Heat Recovery
System (HRS). The HRS is based on the discovery of a
range or "window" of sulfuric acid concentration
sufficiently wide to achieve high absorption efficiency and a
low corrosion rate. This is to be accomplished while
operating at a high temperature (over 120°C) in an
absorption tower.
The process flowsheet, as shown in Figure 11.5,
consists of a packed tower, recirculating pump tank (not
shown), and boiler. The equipment is constructed of
Dl [u-tlon wa-t
Legend>
—X—l-Ex+st+ng-eeonoi»i-zei--or -go
C-E Kent rpcnvpry ta»er
E-3 3d I I Br
C-4 Existing absorbing "toirer
Figure 11.5. Monsanto Heat-Recovery System.
common stainless steel alloys; hence, anodic protection
is not needed [9]. The tower is referred to as the heat-
recovery tower (HRT) to distinguish it from the other
towers in the acid plant. In a sulfur-burning interpass
plant, the HRT is located after the economizer and
replaces the interpass absorbing tower (1PAT). In a single-
absorption plant, the HRT is located before the absorbing
tower. As shown in Figure 11.6, sulfuric acid of
controlled concentration enters the top of the HRT at point
A. Absorption of sulfur trioxide increases the
concentration and temperature and acid leaves the tower at
point B. The hot concentrated acid is cooled by
generating steam in a boiler, and the cooled acid exits the
boiler at point C. Acid product is removed after the boiler,
and the remaining acid is diluted with water prior to
returning to the tower at point A. Points A, B, and C
define the operating cycle [7]. Instead of 304 stainless
steel, equivalent alloy steels may be used [10].
300
97 W.5
98.5 9? 99.5 100 100.5 101
Weight* Sulfuric Acid
Figure 11.6. HRS Operation Cycle.
The HRS can produce steam at pressures up to 1.0
MPa from heat normally lost in acid cooling systems,
About 0.5 kg steam/kg sulfuric acid can be made this
way, thus boosting overall steam production in sulfur-
burning plants to about 1.85 kg/kg of H2SC>4made.
When this steam and the higher pressure steam from
an energy-efficient sulfuric acid plant are used for co-
generation, an additional amount of power may be
produced as given in Table 11.3.
For new plants of different capacity, these figures can
be scaled proportionally and will vary according to local
plant conditions. There are a number of new major (over
1,000 tpd) acid plants based on sulfur burning using
improved heat recovery technology including the HRS.
Table 11.3. HRS Energy Efficiency
Plant Capacity Power Export HRS Addition Total Power
_l,000tpd 8.2 MW 3.1 MW 11.3 MW
11.1.3 Economics of Sulfuric Acid Production
Capital Costs
The estimated capital cost of DC/DA sulfuric acid
plants based on elemental sulfur is shown in Figure 11.7.
The lower curve shows a battery-limits cost for a
developed-industrialized country. The estimate is based
on 1992 costs that include an allowance for a 4-week
storage of sulfur and sulfuric acid [111.
The estimate does not include a cooling tower for
reuse of cooling water. The upper curve is based on a
battery-limits cost plus 50% to allow for auxiliary, and
support facilities, site preparation, etc.; these costs will
vary with location and coexisting facilities. When the
sulfuric acid plant is part of an industrial or fertilizer
complex, this allowance probably is adequate. For a
location in a developing country, costs should be increased
by locational factor, e.g., 25% or more to provide for
the increased cost of delivery and construction.
The plant normally produces enough steam to
operate the main air supply compressor and boiler feedwater
pumps and about 1.2 tonnes of additional steam per
tonne of H2SO4. This excess steam can be used for
generation of electricity, concentration of phosphoric acid,
or other purposes.
Production Costs - An estimate of the major cost
components of producing sulfuric acid from sulfur in a
plant rated at 1,200 tonnes of H2SC>4/day and
operated at full capacity, 325 days/year, is given in Table
11.4,
Assuming a sulfur cost of US $75/tonne delivered at
the plant, the estimated plant-gate production cost of
sulfuric acid from an 1,800-tpd plant would be US $30/
500
1.000 1,500 Z000
CAPACITY, TONNE PER DAY
Z500
Figure 11.7. Investment Cost of Sulfuric Acid
Plants.
301
Table 11.4. Process Requirements for Sulfuric Acid Production
Investment
Product
Sulfuric acid
Sulfuric acid
Production
Cost Elements
He mental sulfur
Sulfur dioxide gas
Catalyst
Hectricity
Steam
Cooling water
Process water
Labor
Process
Sulfur burning
Iron pyrite gas
Units
t/t
t/t
US$/t
kWh/t
t/t
mVt
m3/t
workhours per t
Capacity
390,000 tonne/year
320,000 tonne/year
Investment Cost (BL)
(US $ 10b>
23.5
42.7a
Value
Sulfur Burning
0.33
-
0.02
(176)
(0,6)
75
0.6
0.32
Iron Pyrite Gases
0.66
0.02
52
(0.18)
65
0.5
0.38
a. Roasting excluded; only gas treatment.
Notes:
1. Capacity: in 100% H2S04.
2. Operating days per year: 325 (sulfur burning, pyrite roasting).
3. Production level: 1,200 tpd of 93%-96% sulfuric acid calculated on 100% H2S04 (sulfur burning).
4. Production level: 1,050 tpd of 93%-96% sulfuric acid calculated on 100% H2S04 (pyrite gas treatment).
5. Basis: 1993-West Europearrcosts. — ------
tonne of H2SO4 for a developed country location or US
$34/tonne for a developing country, assuming that the
plant capital cost is 25% higher. Cost estimates for
different plant capacities are given in Table 11.5.
Even though sulfuric acid plants in general are not
difficult to operate at full capacity for extended periods,
maintaining a high capacity utilization depends on the
reliability of production units that use the product and
many other factors. Table 11.6 shows the effect of
capacity utilization on transfer price, assuming a sulfur cost
of US $75/tonne.
It is evident that low capacity utilization can increase
the cost significantly. For instance, operation at 60% of
capacity increases the transfer price by about US $14/
tonne in comparison with operation at 90% capacity
utilization for a 1,200-tpd plant in a developing country
location. Since about 3 tonnes of sulfuric acid is required
per tonne of P2O5 produced as phosphoric acid, the
effect of low capacity utilization can be quite serious in a
plant where the two units are interdependent.
11.1.4 Production of Sulfuric Acid From
Pyrites or From Smelter Operations
When the source of the SCVcontaining gases is
roasting of pyrites (FeS2), pyrrhotite (approximately FesSg),
or nonferrous sulfide ores, the sulfuric acid plant is
similar to that described above (Figures 11,1 and 11.3) with
the following differences [12,13]:
1. The sulfur-burning furnace is omitted.
2. The incoming gas must be cooled and scrubbed or
otherwise cleaned to remove all impurities that might
poison the conversion catalyst or clog the catalyst
bed.
3. The gas must be dried in a tower that uses sulfuric
acid as the drying agent,
4. The clean, dry gas must be heated to conversion
temperature (about 420°Q. There is usually enough
heat generated in the conversion step to preheat
the incoming gas by heat exchangers.
302
Table 11.5. Impact of Plant Capacity on Cost of Sulfuric Acid
Capacity
Investment cost (BL)3
Developed Country
tpd 600 1,200 1,800
US $ 106 19.5 30.0 37.5
Developing Country
600
24.5
1,200
37.5
1,800
47.0
Cost Elements
US $/tonne of sulfuric acid 100%
600
1,200
1.800
24.77
-14.64
8,71
18,25
37.09
3.0
40.0
24.77
-14.64
6.60
13.24
29.97
3.0
33.0
600
1,200
Capacity, tpd
Raw materials...
Utilities13
Labor*
Capital cost
Plant-gate cost
Sales cost
Transfer price
a. Investment cost in developing countries, assumed to be 25% higher than in developed countries.
b. Utilities; process and cooling water, electricity and steam produced,
c. Labor cost assumed to be inversely proportional to the 0,4 power of plant capacity increase.
1,800
24.77
-14.64
5.62
11.70
27.45
3.0
30.0
24.77
-14.64
8.71
22.93
41.77
3.5
45.0
24.77
-14.64
6.60
17.55
34.28
3.5
38.0
24.77
-14.64
5.62
14.66
30.41
3.50
34.0
Table 11.6. Effect of Capacity Utilization on
Transfer Price of Sulfuric Acida
Capacity utilization,
% of nominal rate'd
capacity, tpd 600
100% 40
90% 43
75% 49
60% 58
1,200
-(US $/tb)
33
35
40
46
1,800
30
32
36
42
a. Calculated from Table 11.5, assuming that labor
and capital-related costs are constant on an annual
basis, and raw material and utilities costs (credits) are
constant on a per-tonne basis.
b. Values for developed countries; for developing
countries multiply by 1.25.
5. Since the SO2 concentration of the gas is often lower
than that from sulfur burning, all equipment must
be correspondingly larger.
As in the case of sulfur-burning plants, the sulfuric acid
plant may use double-contact or tail-gas scrubbing to
conform to pollution control requirements. A plant
using sulfur dioxide from sulfide roasting is likely to cost
about 50% more than a sulfur-burning plant including
gas cleaning but excluding the roasting operation. Heat
recovery depends mainly on how much heat can be
recovered from the roasting operation. In general, the
amount of heat recovered as steam or in other useful
forms is somewhat less for a pyrites-based plant than
for a sulfur-burning plant.
—Pu-r-e-pyrite-(FeS2)-Gontains53,4% S and 46.6% Fe.
However, unlike sulfur, pyrite ores contain numerous
impurities that affect their value, either positively or
negatively. After mining and (usually) beneficiation, a
commercial grade of pyrite may contain 40%-50% S, The
most common valuable elements associated with pyrite
are copper, lead, and zinc. However, the ore may
contain many other elements (usually as sulfides) such as
nickel, cobalt, cadmium, bismuth, arsenic, and small
percentages of silver and gold.
An example of partial analysis of Spanish pyrite [12]
is given in Table 11.7. The recovery of the valuable
metals and iron plays an important part in the economics of
Table 11.7. Composition of Spanish Pyrite
Sulfur (S)
Copper (Cu)
Lead (Pb)
Zinc (Zn)
Gold (Au)
Silver (Ag)
Crude Pyrite
48%
0.8%-1.2%
0.5-1.5%
1.5-2.5%
1 g/tonne
30 g/tonne
Floated Pyrite
48%
0.3%
0.3%
0.4%
1 g/tonne
30 g/tonne
303
processing pyrites. Arsenic is an undesirable impurity;
during roasting it tends to form volatile compounds that
foul heat exchangers and ducts. However, methods of
dealing with this problem have been developed, of which
the most important one is dearsenifying roasting.
When pyrites are relatively rich in copper or other
valuable metals, the ore may be separated by beneficia-
tion to provide a concentrate of nonferrous sulfides,
which is treated separately. Alternatively, the cinder
(residue) after roasting may be treated by one of several
methods to extract valuable elements. Since the cinder mainly
consists of iron oxide, it may be used by the steel
industry as an iron ore. However, since several impurities are
objectionable for use as iron ore, treatment after
roasting may serve the dual purpose of recovering valuable
elements and purifying the cinder for use in the steel
industry.
Figure 11.8 shows a simplified flow diagram for
production of sulfuric acid from pyrites, The diagram shows
a single-contact, single-absorption process. In most
locations either stack gas scrubbing or a second contact-
absorption stage would be necessary to prevent
atmospheric pollution. The treatment or disposal of the
cinder, although important, is beyond the scope of this
manual,
In spite of the large quantities of sulfuric acid offered,
a well-defined demand exists for acid of special purity.
This means low mercury acid with 0.1 ppmw Hg is at a
premium (5 DM per tonne in 1994) over typical
merchant-grade product, which has up to 0.5 ppmw
mercury |11]. A specification for technical-grade
sulfuric acid is given in Table 11.8,
The capital cost of the plant including the pyrite
roasting step is about 2.6 times the cost of an equivalent
sulfur-burning plant [12]. Based on the estimates in Table
11.5, the capital-related operating costs would be higher
than for a sulfur-based plant by about US $20/tonne of
H2SO4 for a 1,200-tpd plant in a developing country.
Labor and other costs would also be higher.
Assuming a total differential is US $25/tonne of H2SO4, it is
evident that, for equal production costs, the cost per
Sulfur dI ox i de
Strong acid storage
<=>
Legend 1
T-l Pyrites storage
BC-2 Bucket elevator
GR-3 Dre grinder
BF-4 Feeder
R-5 Roaster
S~6 Dry cyclone
E-7 Uaste heat boiler
S-B Dust PPT
C-9 Scrubber
v-10 Weak acid settler
E-ll Cooler
S-12 Mist PPT
C-13 Drying tower
B-14 Blower
R-15 Converter and heat exchangers
E-16 Heat Recovery Exchanger
E-17 Strong acid cooler
C-18 Absorption tower
Figure 11.8. Production of Sulfuric Acid From Pyrites.
304
Tabic 11.8. Prevailing Sulfuric Acid Specification
Compounds
Units
Value
Sulfuric acid
- summer, season
- winter season
Nitrogen oxides (N203)
Dry residue
Iron compounds as Fe
Arsenic compounds as As
Lead compounds as Pb
Chlorides as CI
Suspended matters
%
%
%
%
%
%
%
%
cm3/dm3
>96
92-96
<0.002
<0.003
<0.006
<0.0002
<0.005
<0.01
0.5
tonne of sulfur contained in pyrites would have to be
US $75/tonne less than for elemental sulfur unless some
value is assigned to the cinder.
Lasaosa presented data showing that the net cost of
producing sulfuric acid from Spanish pyrites, after
allowing credit for byproducts, was less than from sulfur
in 1972 [12]. No generalized conclusion can be drawn
because of the wide variation in quality of pyrites, value
of byproducts, and local conditions. Typical process
requirements for pyrite-based (and sulfur-burning) plants
are shown in Table 11.4.
The recovery of byproducts from pyritic ores requires
a high level of technology and may be a difficult
undertaking for a developing country. Some countries that
rely mainly on pyrites as a source of sulfuric acid are
Finland, Norway, Sweden, Spain, Portugal, Italy, China,
and the Commonwealth of Independent States. Some
other countries, such as Japan, produce large quantities
of sulfuric acid in smelting operations. The classification
between pyrites and nonferrous ores is ill defined. In
some countries a company that processes ore
containing 1% copper might be classified as a copper smelter-
producing byproduct sulfuric acid; a similar operation in
another country might be classified as a sulfuric acid
producer with byproduct copper production.
The Outokumpu process, which was developed in
Finland, consists of flash roasting pyrites in a nonoxidiz-
ing atmosphere in a fluidized bed. About half of the
sulfur content is recovered as elemental sulfur, and the
remainder is in the residue, pyrrhotite, a magnetic iron
sulfide. The pyrrhotite may be roasted in an oxidizing
atmosphere to recover the remaining sulfur as sulfur
dioxide.
11.1.5 The Production of Sulfuric Acid by Wet
Catalysis
In contrast with the conventional contact sulfuric acid
that operates with dry sulfur dioxide/air mixtures, wet
gas is used in the wet contact process 113]. The
hydrogen sulfide in the initial gas is first burned to S02 and
Hp.O, The sulfur dioxide is then converted to SO3, which
combined with the steam that is formed yields sulfuric
acid. The process flowsheet is given in Figure 11.9.
Additional
heating
i=0
Gas containIng
Sulfur dioxide
and water vapor,
440 degrees CC]
Hydrogen
Sulfide Gas
H-l
->H->
Air
E-2
Conversion in
the converter■
more than SB'/.
Legend 1
H-l Combustion furnace
E-E Waste heat bo I ler
R-3 Converter
C-4 Condensation tower
F-5 Fi Iter
E-6 Cooler
T-7 Intermediate tank
P-B Circulating pump
Figure 11.9. Wet Catalysis Sulfuric Acid Plant.
R-3
PI
Waste gas
<=>
F-5
/TC~
C-4
CirculatIng
acid
Sulfuric acid
product i on
c=>
P-8
305
Waste gases containing at least 10% H2S from
various sources can be processed directly to sulfuric acid.
These sources include cokeries, mineral oil refineries,
fuel gasification or low-temperature carbonization plants,
natural gas cleaning installations, carbon bisulfide
production plants, and synthetic fiber plants. Gases with a
lower H2S content have to be burned with additional
heating (e.g., with fuel gas, oil, or sulfur).
The sulfur dioxide and water vapor-containing gases
enter the converter at about 440°C in which SO2 is
catalytically oxidized to SO3 as in the conventional
process (conversion efficiency above 98%).
The reaction temperature in each bed is maintained
at a designated value by the addition of cold air to achieve
an optimum conversion efficiency. The water vapor and
S03-containing gas flows into a condensation tower
sluiced with sulfuric acid. The condensation heat and
the sensible heat are removed by coolers from the
circulating sulfuric acid. Part of the circulating acid is
continuously discharged as product acid. After passing
through the condensation tower, the sulfuric acid mist is
eliminated by using special filters. The concentration of
the product sulfuric acid is 78%.
This concentration corresponds to the H2O/SO3
ratio of complete condensation, but 93% H2SO4 can also
be produced from wet gases by means of special
equipment using the principle of hot condensation. The
lifetime of the catalyst is up to 10 years [13J.
11.1.6 Production of Sulfuric Acid From
Calcium Sulfate
Sulfuric acid can be manufactured from calcium
sulfates of all kinds including natural anhydrite, gypsum,
and also phosphogypsum; portland cement is a
byproduct of this process. Formerly the calcium sulfate-
based process was used in several plants in some
European countries and in South Africa, but these installations
have been closed.
Nevertheless, the process based on calcium sulfate as
a raw material has potential if its economics can be
improved. A simplified flow diagram of the process is shown
in Figure 11.10.
The process is carried out in a rotary kiln that is
similar to cement kilns. When gypsum is used, it is first
dehydrated in a separate kiln. When phosphogypsum is
used, part of the fluorine is discharged and may be
GYPSUM DR
PHDSPHDGYPSUM
STORAGE
Atmosphere
-C=>
Stack
Legend 1
RF-lj RF-8abcde Feeders
H-2, H-13 KlIns
C-3, C-19 Scrubbers
GR-4 Crusher
D-5, D-6 Dryers
SI-7abcde Dry storage silos
BC-9 Conveyor
GR-10 MlU
M-ll Mixer
E-14 GR-18
X-12 Pel Letlzer
E-14, E-17 CaoLers
S-15ab Dry cyclones
S-16 Dry precipitator
GR-19 Cenent mlU
S-2Q Wet preciptator
C-21 Drying tower
E-22, E-2S Acid coolers
E-23, E-24 Heat exchangers
R-25 Converter
C-26 Absorber
S-27 Mist separator
Figure 11.10. Sulfuric Acid Production From Gypsum [16].
306
recovered or disposed of. When anhydrite is used, the
precalculation step is not necessary.
The charge to the rotary kiln consists of anhydrite (or
calcined gypsum), coke, silica, and shale or other sources
of iron and aluminum oxide. The charge must be
proportioned-precisely to give the required ratios of CaO,
S1O2, AI2O3, and Fe2C>3 that are required for good
quality cement.
The charge is mixed, ground, and pelletized to avoid
dust losses. The kiln may be fired with coal, oil, or gas.
The maximum temperature in the kiln is just short of
fusion which may be approximately 1400°C. The
cement clinker is discharged to a cooler and then finely
ground and mixed with about 5% gypsum (a set retarder).
The sulfur is discharged as sulfur dioxide and emerges
in the kiln exhaust gas, which also contains oxygen,
nitrogen, carbon dioxide, water vapor, and a substantial
amount of dust. The gas is cleaned and cooled in a
system of cyclones, dry electrostatic precipitators, wet
scrubbers, and wet electrostatic precipitators. Then air is added
for oxidation of SO2 to SO3. At this point the SO2
content of the gas is about 5.5%. The gas is dried, reheated
to conversion temperature, and passed through the
sulfuric acid plant which is similar to that described
previously under "Sulfuric Acid from Pyrites." Because the
SO2 concentration in the inlet gas is lower, all
equipment must be larger. The sulfuric acid is produced at the
usual concentration of 96%-98%-H2SCM14I.
The overall reaction by which sulfur is volatilized from
calcium sulfate is:
2CaS04 + C -*■ 2CaO + 2S02 + C02
The reaction is believed to proceed in two stages, First,
part of the calcium sulfate reacts with the carbon (coke)
to form calcium sulfide:
CaS04 + 2C -► CaS + 2C02
At somewhat higher temperatures the calcium sulfide
reacts with the rest of the calcium sulfate:
3CaS04 + CaS -* 4CaO + 4S02
At still higher temperatures, the CaO reacts with the
other charge ingredients to form the desired compounds
in Portland cement, mainly tricalcium silicate, dicalcium
silicate, tricalcium aluminate, and calcium ferrite.
The approximate consumption figures for the
process are shown in Table 11.9 [15]. The process
produces approximately equal quantities of cement and
sulfuric acid. The largest kiln operating in 1968 at the
Marchon plant, Whitehaven, England, had an annual
capacity of 90,000 tonnes of sulfuric acid and the same
quantity of cement [16]. The other plant, which used
Table 11.9. Consumption Figures for Gypsum-
Derived Sulfuric Acid
Inputs
Units
Value
Anhydrite ore
Gypsum3
Shale
Coke
Sand
Fuel for anhydrite
Fuel for gypsum
Cooling water
Electricityb
Labor
t/t
t/t
t/t
t/t
t/t
GJ/t
GJ/t
t/t
MWh
workhours
1.6-1.7
2.0-2.2
0.29
0.10
0.06
6.3
10.5
58
0.25
0.9
a. Does not include gypsum for addition to cement.
b. Includes 42 kWh for grinding cement clinker.
Capital cost: US $550 million for 1,000-tpd sulfuric
acid plant.
Basis: West European location, 1976, battery limits [15[.
native anhydrite, had five kilns with a total production
capacity of 400,000 tpy of sulfuric acid and cement. In
the 1960s another large plant was in operation at
Billingham, England, and a third in Wolfen, Germany,
all based on anhydrite. A fourth plant located in Austria
used-natural-gypsum-or-at-times- a mixture of natural
gypsum and phosphogypsum, and a fifth in Poland was
based generally on natural anhydrite with some
admixture of phosphogypsum.
At that time (1968) no plant was known to have used
phosphogypsum exclusively for extended periods of
operation although some plants had done so for short
periods.
In commenting on the use of phosphogypsum in the
cement-sulfuric acid process. Ashburner made the
following points [16]:
a. The byproduct, phosphogypsum, usually contains
15%-25% free moisture in addition to about 21%
combined water (dry basis). Thus, the weight ratio
of water to CaSO^ is between 0.38 and 0.58
(assuming no impurities). Removal of this water
substantially increases the fuel requirement in comparison
with anhydrite, which is quite dry as mined.
b. The P2O5 content of phosphogypsum should be
quite low because P2O5 has a deleterious effect on
the setting properties of cement. The upper limit is
not precisely known, but a maximum level of 1%
P2O5 in the cement has been set by one
organization [15]. To attain this level the phosphogypsum
should contain not more than about 0.5%. This level
307
is difficult to reach in dihydrate plants but may be
attained by recrystallization in dihydrate-
hemihydrate or hemihydrate-dihydrate processes of
phosphoric acid. Thorough washing to remove
soluble P2O5 is necessary.
c. Fluorine is undesirable in the cement kiln charge
since it lowers the melting point and may cause ring
formation in the kiln. A specification of 0.15% F in
the phosphogypsum is suggested [15]. Most of the
fluorine may be removed by drying and calcining
the phosphogypsum, which is necessary in any case
to drive off the hydrated water. In addition, fluorine
compounds in the kiln gases should be completely
removed before they enter the sulfuric acid plant to
prevent impairment of the effectiveness of the
vanadium oxide catalyst.
d. Other impurities such as silica and aluminum
compounds which are commonly present in
phosphogypsum, are not objectionable, but they need to be
considered in formulating the kiln charge, which
must be controlled very precisely,
A grave objection to producing cement exclusively
from phosphogypsum results from the radium content
in phosphogypsum. For example, Central Florida
phosphogypsum contains the equivalent of 25 - 30
picocuries/gram of radium Ra 226. Radium 226
disintegrates to produce radon gas, which has been related
to lung cancer, and it is~currehtly limited in building ma-
terials to 10 picocuries/gram in the United States, Since
2 tonnes of gypsum is required to produce one tonne of
cement, the Ra 226 content in phosphogypsum would
have to be less than 5 picocuries/gram [171. The main
advantage of sulfuric acid and cement from
phosphogypsum is that the byproduct phosphogypsum is
automatically available at a phosphoric acid plant at no cost,
and also because the use of phosphogypsum solves a
disposal problem.
The U.S. phosphate industry produces about 35
million tpy of phosphogypsum as the byproduct of wet-
process phosphoric acid production. In Florida, which
accounts for about 83% of U.S. phosphoric acid
production, nearly all of this waste, roughly 800 million
tonnes, accumulates in gypsum stacks. Six million tpy
of sulfur is added to these stacks.
Furthermore, environmental regulations have made
gypsum stacks increasingly expensive. IMC in the early
1990s paid US $7 million to prepare a new gypsum
stack base, while Cargill Fertilizer, Inc., paid US $5.5
million to close a mature stack. The total cost for
emplacement drainage, revegetation, and stack
maintenance has been estimated at US $2-$4/tonne of
phosphogypsum [18].
In countries where alternative sources of sulfuric acid
are very expensive and fuel costs are low, the process
might well be considered. In special cases there may be
advantages favoring the use of phosphogypsum that are
difficult to evaluate such as:
- Saving in foreign exchange.
- Independence from foreign sources.
- Stimulation of domestic employment.
- Lack of an environmentally acceptable alternative
means for disposal of phosphogypsum.
The main disadvantages of the sulfuric acid cement
process are the high capital cost and high energy (fuel)
requirement. A comparison should be based on separate
production of sulfuric acid and cement if both are needed.
The fuel requirement for cement production from
phosphogypsum is about 2.5 times that required for
cement production from the usual raw materials
(limestone, shale, etc.). Whereas production of sulfuric acid
from sulfur produces a substantial amount of energy,
usually in the form of byproduct steam, there is no
export steam from the gypsum-based plant. No exact
comparison of capital cost is available, but it is evident that
the combination would be more expensive than
separate plants since both the cement kiln and sulfuric acid
plant would need to be larger and more complicated in
the combined process than in separate production of
cement from limestone and sulfuric acid from sulfur.
Estimates of the total capital investment for the
combined process range from a ratio of 5:1 to 10:1 when
compared with sulfuric acid from sulfur.
The problem of using phosphogypsum as a raw
material for combined sulfuric acid and cement production
has drawn the attention of various companies. A cement/
sulfuric installation was proposed in 1990/91 for the
Pine Level Project at Consolidated Minerals, Inc. [17]. It
was to be a part of the integrated complex comprising a
1.0 million tpy P2O5 phosphate fertilizer plant, a 2.35
million tpy portland cement plant, a 660-MW coal-fired
power station, and a 4.5 million tpy preconcentrate
phosphate mine, with 0.9 million tpy of sulfur
equivalent recycled.
The idea of this project is shown in Figure 11.11.
The integration is the key to the economic feasibility of
such a cement-sulfuric acid type of sulfur recycle
process. As shown in Table 11.10 [17], the integrated project
saves considerable capital cost compared with the
conventional approach of developing the capacities
separately. The capital cost of the Pine Level Project was
estimated primarily at about US $900 million. Hence
the savings in capital costs alone amounted to 25%,
Science Ventures, Inc., has developed a new process
for recovering the sulfur from phosphogypsum in the.
308
Water (feed and recycled!
X-l Sulfuric plant
X-2 Phosphate mine
X-3 Phosphate processing plant
X-4 Sulfur recovery plant
X-5 Kilns
X-6 Cement plant
X-7 Power plant (600 MW export power)
X-8 Water well
X-9 Raw materia] storage
X-l 0 Slimes Pond
X-l 1 Sand-Clay mixing station
X-12 Solid fertilizer plant
Figure 11.11. Integrated Fine Level Industrial Complex.
Table 11.10. Cost-Effectiveness of Integrated
Project
Area
Transport
Energy
Other infrastructure
Total
Savings
(US $ million)
120
20
160
300
form of sulfuric acid; the process was named FLASC
for Flash Sulphur Cycle. The process is carried out in a
reactor resembling a flash copper smelter. Pulverized
coal is premixed with calcined phosphogypsum and
fluxing minerals and sprayed into a flame, where most of
the desulfurization takes place. Excess fuel reduces the
calcium sulfate to its oxide; thus, sulfur dioxide gas is
released. The minerals fuse together and drain from the
reactor as a molten slag, The slag is quickly quenched to
form a hard glassy material, which resists leaching and
radon emanation. Its hardness on the Mohs scale is 5.5
309
to 6, and it could be valuable as an aggregate for road
construction [18].
There have been several attempts to recover sulfur
from phosphogypsum by means of biochemical
processes. Bacterial reduction to solid sulfur has generally
been abandoned as being too slow. In India, where there
are no known sulfur deposits, advances in
biotechnology have revived interest in the possibilities of
recovering sulfur from phosphogypsum by means of sulfate-
reducing bacteria 119].
11.1.7 Sulfuric Acid Storage, Sea-Transport
Prices
The terminals for maritime trading of sulfuric acid are
located in practically all main ports throughout the world.
They belong to various companies and their capacities
vary notably from port to port.
The worldwide trading of sulfuric acid is dominated
by three companies - Boliden Chemtrade, lnteracid, and
MG Chemical. In 1993 the Boliden group traded
approximately 2.6 million tonnes of acid: of this about 1.4
million tonnes was seagoing. Boliden owns two
terminals, in Tampa and in Rotterdam, each of which has a
40,000-tonne storage capacity.
lnteracid traded about 2 million tonnes of acid in 1993.
The company's terminal, operated by SATCO, in
Tampa, has a storage capacity of 60,000 tonnes. The
company plans to open another "termlnarhaving a"
40,000-tonne storage capacity in northern Chile by late
1994.
In 1993 MG traded approximately 1.5 million tonnes
of acid, some 60% of which was seagoing. Total
storage capacity of the company in Europe is 150,000-
200,000 tonnes with facilities at each of the company's
production installations. From these sites the acid is taken
by barge or rail either directly to the buyer or to a spot-
chartered seagoing tanker.
Practically all sulfuric acid traders charter all or most
of the vessels for seagoing transportation. These are
tankers up to 35,000 tonnes. The shipping of sulfuric
acid in bulk in ocean-going special bulk chemical
carriers began in 1954. At present, a fleet of chemical
tankers is available. The tanks are made of mild steel and
lined with a plating of molybdenum-alloyed stainless steel
or constructed entirely from this material. The freight
rates and prices for sulfuric acid may vary significantly.
In early March 1994, freight indications for sulfuric acid
were: Helsingborg to S. Spain US $22-$23/tonne of
cargo, 4,000-5,000 tonnes; Rotterdam to Venezuela
US $30-$35/tonne of cargo, 7,000-7,500 tonnes. In
September 1994 the prices of sulfuric acid were:
ex-terminal Tampa (U.S.A.) US $25-$30/tonne, f.o.b.
Mediterranean port US $30-$35/tonne, all calculated to 100%
H2S04.
11.1.8 Projections of Sulfuric Acid Production
Trends and Technology Improvements
Forecasts made by McKinsey Co. in 1992 predict that
the world production of sulfuric acid from all sources of
sulfur will reach a level of 182.5 million tonnes
(calculated to 100% H2S04) in the year 2000. This is an
increase of 15% over the production level of J991.
The growth in sulfuric acid production in any country
depends not on whether the country possesses natural
sulfur deposits of any form but rather on how much it
needs the acid for different industrial purposes. Ofcourse,_
some increase in sulfuric acid capacity may result from
waste sulfur dioxide recovery, promoted by more
stringent environmental regulations affecting smelter
operations, power plants, cokeries, and many other industrial
activities. But most of all, growth will be dependent on
the increase in wet-process phosphoric acid production.
The most significant growth will occur in countries that
implement programs of increased phosphate fertilizer
production, based on phosphoric acid.
The regions where the production of sulfuric acid is
to increase the fastest are: Middle East (Jordan, Iraq,
Israel, Iran) from 4.0 million tonnes in 1991 to 9.6
million tonnes in 2000, increase 140%; North Africa
(Morocco) from 15.0 million tonnes in 1991 to 21.1 million
tonnes in 2000, increase 40%; Far East (China) from
29.1 million tonnes in 1991 to 36.9 million tonnes in
-2000rincrease-27%7
In North America the demand for sulfuric acid will
remain at about the present level, and in Western
Europe it is likely to decrease.
At present, the most common method used in
sulfuric acid production is the double-absorption process based
on oxidation of sulfur dioxide to sulfur trioxide on
vanadium pentoxide catalyst. This process will remain the
prevalent method of sulfuric acid production in the
future. New sulfuric acid installations will be aimed mainly
at increasing the output from production units,
maximum heat recovery, and operational reliability of
installation, particularly through precise selection of
extra-resistant alloys and special noncorrosive
materials. Further increases in SO2 to SO3 conversion
efficiency would do little to improve emissions because the
high efficiency of present processes already achieves very
low SO2 emissions.
Commercial development of sulfuric acid production
based on utilization of phosphogypsum is not foreseen
until sulfur from other sources is inaccessible. On the
other hand, more and more sophisticated methods will
be developed for use of sulfur dioxide contained in stack
gases and from heat and power-generating plants for
sulfur or sulfuric acid production.
310
Furthermore, it seems that the pressure method of
sulfuric acid production, which appeared promising in
the early 1970s, will not be successively developed,
mainly due to the cost of compression energy and for
construction reasons considering the large capacities of
modern sulfuric acid installations.
11.1.9 Process Options
Practically all processes of sulfuric acid production
presently in use are based on catalytic oxidation of
sulfur dioxide to sulfur trioxide and subsequent absorption
in recirculating sulfuric acid to form H2S04. The
process of oxidation is accomplished most commonly in
multibed converters on vanadium pentoxide catalyst.
The principal difference in the various processes is
the source of sulfur material that is processed in
particular installations. From this point of view the
installations for sulfuric acid production can be divided into
four main groups.
1. Sulfur-burning installations
At present all licensers offer very high rates of
SCVconversion, up to 99.8%, and heat recovery
as much as 90%. Production-scale capacities are
usually between 1,000 tpd and 3,000 tpd. At the
normal operating time of about 330 days per year
this amounts to 330,000-990,000 tpy of sulfuric
acid calculated as 100% H2SO*.
2. Installations processingoutlet'gasesfrom ifofrsul"
fide roasting plants
Dust-laden gases from a roasting plant may
range from 5.5% to 12% SO2 after cleaning,
depending on the type of roaster and the process
employed. The rate of SCVconversion may be as much
as 98% or more. The installations' capacities differ
according to the scale of the roasting operation, but
installations up to 1,000 tpd are in use.
3. Installations based on gases from base metal sulfide
smelter operations
Installations vary from smelter to smelter
depending on the technology used for the non-ferrous
metal production.
4. Installations using waste hydrogen sulfide, based on
wet-catalysis process
This process can deal directly with gases
containing at least 10% H2S from cokeries and other
operations. Gases with a lower H2S-content have to
be burned with additional heating (e.g., with fuel
gas, oil, or sulfur). S02-conversion usually does not
exceed 98%. Acid concentration is 78% and 93%,
according to raw gas composition.
All licensers guarantee the lifetime of the catalyst for
a minimum of 10 years and SO3 absorption above 99.9%
for sulfuric acid production from elemental sulfur.
Concentrations of sulfuric acid produced may be, at the
operator's discretion, in the range of 93%-98% of
H2SO4. The surplus heat of reaction in sulfuric acid plants
based on sulfur combustion is removed from the system
in the form of high-pressure steam of 4.0-6.0 MPa
pressure and a temperature of 400°-500°C.
In sulfuric acid plants based on roasting gases such a
surplus of heat is not available since the total heat
produced by the catalytic reaction is required to preheat the
cold gases to the reaction temperature. Only at higher.
SO2 concentrations, or if the HRS is installed, surplus
heat can be available in the superheater or economizer
to produce high-pressure steam in the boiler system.
The heat available at a low temperature level in the
absorbers, normally at an acid temperature of 70°-120°C,
can be used for preconcentration of phosphoric acid,
feed-water preheating, seawater desalination, or for
integrated town heating systems.
Sulfuric acid processes are offered by the following
engineering companies: Biprokwas, Chemetics, Haldor
Topsoe, Hitachi Zosen, Hugo Petersen, Krebs, Lurgi,
MM, Monsanto Enviro Chem Systems, Monsanto
Europe S.A., Nissan Engineering, Poseidon, Siry Chamon,
Stratco, Tim J. Browder and others.
UNIDO would like to acknowledge receipt of infor-
mation, which was useful in preparation of this chapter,
from the following companies:
1. BIPROKWAS Engineering Ltd,, 44-100 Gliwice, 11
Konsytucji Str., Poland.
2. LURGI Gesellschaft, D-6000 Frankfurt/Main, 17-
19 Gervinusstrasse, Germany.
3. Monsanto Enviro-Chem, St. Louis, Missouri, 63178
U.S.A., and Monsanto Europe S.A., Avenue de
Tervuren 270-272 B-1150, Brussels, Belgium, a
wholly owned subsidiary of Monsanto Co.
11.2 Wet-Process Phosphoric Acid
11.2.1 Introduction
In the last three decades, phosphoric acid has become
the most significant source of phosphate fertilizer
production, and this trend is expected to continue
worldwide in the foreseeable future, Growth is particularly
expected in southeast Asian countries, which are
implementing national programs to become self-supporting
in the production of fertilizers.
World phosphoric acid production has stabilized in
the past few years with, however,- a slight decrease from
35.5 million tonnes P205 in 1990 to 33.6 million tonnes
P2O5 in 1993. According to projections by the
311
International Fertilizer Industry Association (IFA),
production of phosphoric acid will increase to 37.5 million
tonnes P205 in 1999 and to 40,0 million tonnes P205
after 2000 [1[.
The chief use of phosphoric acid is in the production
of phosphate fertilizers, mainly ammonium phosphates
(DAP and MAP). In 1993 the total world production of
DAP and MAP amounted to 21 million tonnes P2O5,
which represents 63% of phosphoric acid use. The
above-mentioned forecast indicates that this pattern of
phosphoric acid use will continue in the near future.
There are two basic types of processes for the
production of phosphoric acid; furnace processes and wet
processes. Furnace processes include the blast-furnace
process and the electric-furnace process. The
blastfurnace process has not been used commercially since
1938. The electric-furnace process is used extensively
to make elemental phosphorus, most of which is
converted to phosphoric acid for nonfertilizer uses. Since it
is unlikely that furnace processes will be competitive for
producing phosphoric acid for fertilizer use, except
possibly in unusual circumstances, these processes will be
described only briefly.
Wet processes may be classified according to the acid
used to decompose phosphate rock. Sulfuric, nitric, and
hydrochloric acid are used in commercial processes.
Processes using nitric acid will be described under
"Nitro phosphates" (Chapter 13). Processes using~hydro-
chloric acid are not competitive for fertilizer purposes,
except under unusual conditions, and will be described
briefly in this chapter. Processes using sulfuric acid are
by far the most common means of producing
phosphoric acid for fertilizer use (and sometimes for other uses);
therefore, these processes will be described in more
detail, However, the scope of this manual precludes
extensive detail of even the most important processes. For
more detail, readers should consult Phosphoric Acid,
edited by A. V. Slack [2], and other references listed at
the end of this chapter.
11.2.2 Chemistry of the Wet Process
The main chemical reaction in the wet (sulfuric acid)
process may be represented by the following equation
using pure fluorapatite to represent phosphate rock:
Cai0F2(PO4)6 + IOH2SO4+ 10nH2O^ 10CaSO4^iH2O
+ 6H3PO4 + 2HF
where n = 0, 1/2, or 2, depending on the hydrate form
in which the calcium sulfate crystallizes.
The reaction represents the net result of two stages.
In the first stage, phosphoric acid reacts with the apatite
forming monocalcium phosphate; in the second stage
monocalcium phosphate reacts with sulfuric acid to form
phosphoric acid and calcium sulfate. These two stages
do not necessarily require two reaction vessels; they
usually take place simultaneously in a single reactor.
As mentioned in Chapter 5, phosphate rock contains
many impurities" both in the apatite itself and in
accessory minerals. These impurities participate in numerous
side reactions. Most phosphate rocks have a higher
CaO:P205 ratio than pure fluorapatite. The additional
CaO consumes more sulfuric acid and forms more
calcium sulfate. The HF formed by the reaction reacts with
silica and other impurities (Na, K, Mg, and AI) Jo. form
fluosilicates and other more complex compounds. A
variable amount of the fluorine is volatilized as SiF4, HF,
or both. The amount volatilized and the form depend
on phosphate rock composition and process conditions.
As a result of side reactions, numerous impurity
compounds (some of them very complex) are formed. For a
complete discussion of the nature of impurities, see
Phosphoric Acid by A. V. Slack [2[.
11.2.3 Heat Released in Reaction
The reaction involved in producing phosphoric acid
from fluorapatite and sulfuric acid by the'dihydrate
process may be represented by the following equation:
Ca10F2(PO4)6 (s) + 10H2SO4 (Hq) + 20H2O (liq) -
10CaSO4»2H2O (s) + 2HF (aq) + 6H3PO4 (aq)
The heat of reaction may be calculated by using the
heats of formation of reactants and products (Table
11.11) [3,4,5]. The heat of reaction so calculated is
256.94 kcal/g-mole of apatite which is equivalent to
255 kcalAg of apatite or about 600 kcal/kg of P205.
The heat required to raise the temperature of the
gypsum (Cp = 0.272) and phosphoric acid (30% P205; Q, =
0.703) from 25° to 82°C is calculated to be 197 kcal/
kg of P205 [6,7]. Thus, about 403 kcal/kg of P205
remains to be dissipated, and most processes provide a
means of removing the excess heat. In practice, some
of the heat is lost by convection and conduction, On the
Table 11.11. Heat of Formation (HF) of the
Reaction Components
_ Compound HF at 25°C References
(kcal/gmol)
Ca10F2(PO4)6 (s) 3,267.2 Farr and Elmore [3)
HaSCMl) 193.91 NBS [4)
CaSQ4 x 2H20 (s) 483.06 NBS [4l
H3P04 (a) 30% P205 308.25 Egan and Luff [5]
HF (aq) 75.56 NBS [4]
H20(I) 68.317 NBS [4]
312
other hand, some heat may be introduced by use of
heated wash water, or if the wash water is not heated,
some of the heat in the gypsum is transferred to the
recycled weak acid and thus returned to the reaction.
Additional heat will be generated by reaction of
additional sulfuric acid with impurities in the rock. Most
phosphate rock contains 10% - 20% more calcium than that
required to form pure fluorapatite with the phosphorus
in the rock, which may result from substitution of
carbonate for phosphate in the apatite or presence of cal-
cite or both. Reaction of this amount of calcium with
sulfuric acid to form gypsum would increase the net heat
of reaction per kilogram of P2O5 by about 11% -16%.
Hydrogen fluoride is shown as a product of reaction
in the first equation, It reacts with the silica present as
an impurity in phosphate rock to form fluosilicic acid
which, in turn, forms fluosilicates and other compounds
with impurities in the rock. The thermal effect of these
reactions is negligible.
The net heat of reaction is influenced appreciably by
the concentration of the sulfuric acid used as indicated
in Table 11.12. If the conditions are such that the
calcium sulfate crystallizes in the form of anhydrite or hemi-
hydrate rather than gypsum, the excess heat to be
dissipated is about 100 kcal/kg of P2O5 less than the
values given above.
Table 11.12. The Net Heat of Reaction as a
Function of Sulfuric Acid
Concentration
Concentration of
Sulfuric Acid
(% H2SQ4)
100
98
93
90
85
80
75
Net Heat
of Reaction
(kcal/gmol
of apatite)
256.94
247.54
224.54
211.54
191.94
174.24
160.74
Excess Heat
to be Dissipated
(kcalAg P2O5)
403
385
329
299
253
211
180
11.2.4 Types of Wet Processes
Commercial wet processes may be classified
according to the hydrate form in which the calcium sulfate
crystallizes:
Anhydrite
Hemihydrate
Dihydrate
- CaS04
- CaS04*y2H20
- CaS04*2H20
Before starting to describe particular industrial processes,
it should be noted that each process is based on
information supplied by a different engineering and
construction organization. Each of the organizations offers a
range of processes to meet various client needs. In
addition, several other companies, not mentioned, offer
phosphoric acid processes, and there is no intention of
implying that processes offered by the companies
mentioned by name are necessarily superior to those offered
by other companies and does not imply any kind of
endorsement by UNIDO or DFDC.
The hydrate form is controlled mainly by
temperature and acid concentration, as shown in Figure 11.12.
This graph presents only approximation of production
features because sulfuric acid concentration and
impurities also have an influence.
At present there is no commercial use of the
anhydrite process, mainly because the required reaction
temperature is high enough to cause severe corrosion
difficulties. Processes in commercial use are given in Table
11.13. From the very beginning, straight dihydrate
processes are by far the most popular worldwide because
they are relatively simple and adaptable to a wide range
of grades and types of phosphate rock; hence they will
be described in the most detail.
Hemihydrate processes have the significant advantage
of producing phosphoric acid with a relatively high con-
"cerTfrafion without using~ariy concentration step. There
is also some interest in two-stage processes that involve
crystallization in the hemihydrate form followed by re-
crystallization in the dihydrate form (or vice versa), with
0 5 10 15 20 25 30 35 -10 45 50 55 60
Percent Phosphorus Pentoxide
Figure 11.12. Dependence of Calcium Sulfate
Crystallization on Temperature
and P2O5 Concentration.
313
Table 11.13. Types of Commercial Processes.
Crystal form(s)
Dihydrate
Hemihydrate
Hemihydrate-dihydrate
Hemihy drate-dihyd rate
Dihy drate-he mihy drate
Separation Steps3
1
1
1
2
2
Concentration
of Acid, % P2Q5
26-32
40-50
26-30
40-50
35-38
Reactor Temperature, °C
70-85
85-100
90-100
90-100
65-70
Recrystallizer
Temperature, °C
50-60
50-65
90-100
a. Filtration or centrifuging steps.
or without intermediate separation by filtration or
centrifuging.
11.2.5 Description of the Dihydrate Process
The description of phosphoric acid production will be
divided into the following steps:
1. Selecting phosphate rock.
2. Selecting source of sulfuric acid.
3. Receiving and storing raw materials.
4. Grinding and otherwise preparing the rock.
5. Reacting the phosphate rock and sulfuric acid.
6. Filtering to separate phosphoricffcid from gppsurnr"
7. Concentrating and clarifying the phosphoric acid.
8. Sludge treatment.
Selection of Phosphate Rock - Many phosphoric
acid plants are built in countries where phosphate rock
must be imported. The plant is often designed on the
basis of a single phosphate rock; however, it is often
prudent to build into the plant sufficient flexibility to
permit the use of rocks from different sources. This
versatility will enable the producer to take advantage of
competitive situations and to avoid disruption of supply
when the intended source is inadequate or interrupted
by hostilities, disasters, or other circumstances.
Many plants find it advantageous to use a blend of
rocks from different sources. The extra expense of
making the piant more versatile usually can be repaid many
times over by savings resulting from freedom of choice
in the world market. Some examples of steps to increase
the versatility of the plant are:
1. Extra grinding capacity for harder rock.
2. Extra filtration capacity to provide for rocks that cause
less rapid filtration or have lower P2O5 content.
3. Slurry handling systems that will cope with acid-
insoluble impurities in the rock.
4. More corrosion-resistant construction for rocks that
have corrosive impurities,
When the plant is built at or near the mine, there is still
the likelihood that the rock composition will vary. In
addition, there are other questions to be considered
relating to the economic optimum balance between cost
of extra beneficiation as compared with the cost of
using lower grade rock [8],
The selection of phosphate rock source is sometimes
viewed as a simple matter of obtaining a given amount
of P2O5 in the rock delivered to the plant at the lowest
_price._rJowever,_phosphate rock is a complex raw
material that affects plant operation in numerous ways,
some of which may be unpredictable. Therefore, a
thorough evaluation of all quality factors should be made
before selecting a phosphate rock or changing from one
source to another [9],
A complete chemical and mineralogical analysis of a
phosphate rock is helpful in evaluating its usefulness for
making phosphoric acid. However, this information is
not sufficient in itself; trial runs in a plant or pilot plant
are needed for a reliable evaluation unless the rock is
one that has been used extensively in other similar plants
with known results [10].
The following quality factors may provide a general
guide for selecting phosphate rock for phosphoric acid
production. The economic effect of many of the factors
can be evaluated quantitatively to arrive at a
comparative value of alternative sources of phosphate rock.
'Starting with a standard grade of rock, the more
common quality factors for wet-process phosphoric acid
production and their effect are:
1. Lower grade (% P2O5) means that more tonnage
must be purchased, transported, handled, and
(usually) ground.
314
2. An increase in the CaO^Og weight ratio increases
the sulfuric acid requirement. (Any CaO present as
CaSC>4 should be excluded in calculating this ratio.)
3. Magnesium oxide forms precipitates with fluorine
in the reactor, which may blind the filter cloth;
therefore, high MgO content is considered undesirable.
When phosphoric acid is used to produce
ammonium phosphates or polyphosphates, water-insoluble
(but citrate-soluble) magnesium ammonium
phosphate compounds may be formed, These
compounds form troublesome impurities in liquid
fertilizers.
4. Increases in the Fe2C>3 + AI2O3 content above 2%-
3% decrease the plant capacity, often decrease the
P2O5 recovery, and cause post-precipitation
problems (sludge). However, up to about 5% may be
tolerable. From the other side AI2O3 and MgO are a
bonus in some way because they reduce the
corrosivity of the acid by forming complex ions with
free fluorine ions.
5. It is desirable to have enough reactive silica (S1O2)
to form SiF4 and/or fluosilicates to avoid formation
of free HF, which is very corrosive. Excessive silica
or other acid-insoluble impurities may cause
erosion of equipment and possible accumulations in
digestion vessels, depending on particle size, character,
and plant design. In addition,-a high percentage-of-
silica in the rock would increase the required filter
area.
6. Chlorine contents above about 0.03% cause
increased corrosion of stainless steel especially in the
case of the high-strength, high-temperature
processes. More expensive alloys may tolerate CI
contents of 0.10% or perhaps higher.
7. High organic matter may increase foaming
problems (by stabilizing the foam), increase viscosity, and
hinder filtration. The effect depends on both the
character and quantity of organic matter. Some rocks
must be calcined to remove organic matter to make
them usable.
8. Carbon dioxide (CO2) contributes to foaming and
increases consumption of antifoam reagents.
9. All commercial phosphate rocks contain fluorine (F);
no special effect has been noted due to variations in
fluorine content within the range of experience,
Effects of fluorine on scaling, corrosion, and post-
precipitation are related to other elements that
combine with fluorine, including Na, K, Al, Mg, and Si.
10. Upon acidulation, some rocks that contain sulfides
release hydrogen sulfide (H2S), a toxic gas. These
sulfides tend to increase corrosion.
11. Strontium and lanthanides (rare earths), found in
igneous rocks, inhibit rehydration of the hemihy-
drate to gypsum, which can cause problems in
certain phosphoric acid processes. Moreover strontium
causes problems in the concentration sections
because strontium sulfate has a minimum solubility in
40% P2O5 acid. An extremely thin film of SrS04
causes a very pronounced reduction in the capacity
of the concentration unit.
12. High contents of toxic impurities in phosphate rock
used (for example, cadmium compounds)
may-render the resulting phosphoric acid unsuitable for
fertilizer production.
13. Hardness is a factor since harder rocks require more
grinding capacity.
14. The particle size of the rock as-received affects the
amount of crushing and grinding required. Very fine
particle size may lead to dust losses in handling.
15. Low reactivity of the rock may require finer grinding.
16. Filterability of the rock-acid slurry is one of the most
important characteristics of a phosphate rock for
use in phosphoric acid production. Factors
influencing filterability are complex and not completely
understood. However, if a plant is to be designed to
use a specific rock, an acceptable filtration rate can
—— usually-beattained-throughexperimental means by
adjusting operating conditions, addition of crystal
modifiers, or pretreatment of the rock.
Table 11,14 gives the range of composition and
median values of a group of 15 phosphate rocks from
Table 11.14. Typical Analysis of Commercial
Phosphate Rocks
Constituent
p2o5
CaO
SiQ2
AI2O3 + Fe203
MgO
Na20
C02
F
CI
S03
CaO:P205 ratio
Range of
Content, %
29-38
46-54
0.2-8,7
0.4-3,4
0,1-0.8
0.1-0.8
0.2-7.5
2.2-4.0
0.0-0,5
0.0-2.9
1.35-1.70
Average
Content, %
33
51.02
2,0
1.4
0.2
0.5
4.5
3,7
<0.02
1.0
1.5
315
commercial sources. Although the group is
representative, compositions outside this range have also been used.
Assuming 94% overall P2O5 recovery, the amount of
phosphate rock required per tonne of P2O5 recovered
as phosphoric acid is given in Table 11.15.
Calculation of Sulfuric Acid Requirement -
Although the sulfuric acid requirement for the production
of phosphoric acid from any given rock is best obtained
experimentally, it is sometimes necessary to calculate it
from the chemical analysis of the rock. For a first
approximation the sulfuric acid requirement may be equated
to that required to combine with the calcium in the rock
to form calcium sulfate. This calculated value is often
close enough for planning purposes. The requirement
per tonne of P2O5 recovered should be adjusted
according to the expected recovery. The overall recovery is
seldom more than 94% if mechanical and sludge losses
are included.
Table 11.15. Phosphate Rock Consumption as
Function of Phosphate Rock
Quality
Grade of Rock P2O5 Content Rock Consumption
(t/t of P205 in Acid)
Low-
Median
High
(%)
29
33
38
3.67--—--
3.22
2.80
If a complete analysis of the rock is available, a more
exact calculation may be made. The method is illustrated
in Table 11.16 and is explained below:
1. Assuming 94% overall P2O5 recovery, 1,064 kg of
rock P2O5 is required per tonne of P2O5 recovered.
2. If the rock contains 33% P205, 3,224 kg of rock is
required.
3. The CaO content of the rock is calculated. If the rock
contains any other cation that forms an insoluble
sulfate (such as barium), its CaO equivalent should-be-
added.
4. The CaO equivalent of the SO3 content (not total S)
should be considered.
5. Typical filter cake contains about 3.3% of the input
P2O5 in insoluble forms of which 1% may be
unreacted rock and 2.3% CaHP04 cocrystallized with
gypsum. The aggregate weight ratio of CaO
combined with P2O5 is about 1.0,
6. The empirical assumption is that 15% of the fluorine
combines with CaO to form CaF2- Actual reactions
are much more complex; Ca4S04SiFeAlF6 (OH)
•I2H2O is an example of a complex insoluble
compound found in filter cake.
7. Items 4, 5, and 6 are totaled.
8. Item 7 is subtracted from 3 to give the net amount of
CaO for reaction with H2SO4.
Table 11.16. Calculation of H2S04 Required Per Tonne of P2O5 Recovered as Phosphoric Acid Using
Median Rock Analysis
Step
1. P205 required in rock at 94% recovery: 1,000/0.94
2. Kg of rock required per tonne of P2O5 recovered: 1,064/0,33
3. CaO in rock: 3,224 x 0.51
4. CaO equivalent to SO3: 3,224 x 0.01 x 56/80
5. CaO combined with P205 in filter cake: 0.033 x 1,064
6. CaO combined with fluorine: 0.15 x 0.037 x 3,224 x 56/19 x 2
7. Total CaO not combined with sulfate
8. Net CaO for reaction with H2S04: 1,644 - 84.1
9. H2SO4 required for CaSQ4: 1,559.9 x 98/56
10. Excess H2SO4: 1,5/30 x 1,000
11. Total H2SO4 required
12. H2S04 required based on total CaO only: 1,644 x 98/56
kg/tonne of P2O5 Recovered
1,064
37224
1,644
22.6
35.1
26.4
84.1
1,559.9
2,729.8
50.0
2,779.8
2,877
316
9. The H2SO4 equivalent of the CaO is calculated.
10. The amount of excess H2S04 is calculated by
assuming that the 30% P2O5 acid contains 1.5% free
H2SO4.
11. Total H2SO4 requirement is item 9 plus item 10.
12. For comparison, step 12 of Table 11.16 shows the
H2SO4 requirement based simply on total CaO.
In Table 11.17 the sulfuric acid requirement for
median-grade rock is taken from Table 11.16 (2.78
tonnes of H2SO4 per tonne of P2O5), and requirements
for rocks of other Ca^Os ratios are estimated in
proportion to that ratio.
Table 11.17. Consumption of H2SQ4 for
Different Rock Grades
Grade of Rock High Median Low
P2O5 content, % 38 33 29
Rock required, tonne/tonne
0fP2O5 2.8 3.2 3.6
CaO:P205 ratio 1.35 1.5 1.70
H2SO4 tonne/tonne
0fP2O5 2.50 2.78 3.15
Source of Sulfuric Acid - Although sulfuric acid
production is discussed in section 11.1, some aspects of
the source of the acid will affect plants for phosphoric
acid production. Most, but not all, phosphoric acid plants
have onsite facilities for producing sulfuric acid from sulfur
or pyrites. In this case, heat is recovered from the
sulfuric acid plants in the form of steam, which is available
for concentrating phosphoric acid and other uses.
Finally, sulfuric acid from pyrites, smelter operations,
or other byproduct sources may contain impurities that
may or may not be deleterious for phosphoric acid
production. In at least one case, zinc in smelter acid proved
useful since the fertilizer produced from phosphoric acid
contained enough zinc, mainly derived from the smelter
acid, to improve crop yields in zinc-deficient areas. The
same benefit applies to another micronutrient, copper.
Receiving and Storing Raw Materials - An
efficient system for bulk handling and storing phosphate
rock and other raw materials is necessary for a modern
phosphoric acid plant. Other raw materials are discussed
elsewhere. The criteria to be met are:
a- Rapid unloading of ships or other delivery units;
b- Negligible loss of rock;
c. Easy storage with the ability of separating shipments
or blending shipments as desired;
d. Efficient retrieval from storage;
e. Protection against wind, rain, snow and freezing
weather;
f. Protection from contamination with other raw
materials, windblown dust, soil, etc.; and
g. Provision for expansion if future needs warrant.
When phosphate rock is received dry, it is usually desit
able to keep it dry by covered storage, especially if it is
to be used in a dry grinding system to avoid the expense
of redrying. If open storage is used, wind or heavy rains
can cause losses of rock that may amount to several
percent if it contains much fines. However, relatively
coarse rock can be stored in open piles, particularly if it
is to be wet ground. The storage capacity should be at
least IV2 times the largest shipment to allow for delays.
Even larger storage capacity may be advantageous for
blending shipments.
Rock Grinding and Preparation - The choices in
rock grinding seem to be dry grinding, wet grinding, or
no grinding. Several processes claim the ability to use
rock without grinding if it is finer than 35-mesh or in
some cases 20-mesh (Tyler) screen size (approximately
equivalent to the standard 425 and 850 mm sizes listed
-in-Ghapter—l-8)r-Somerville-suggests that such coarse
rock is suitable for single-tank digester processes when
sulfate control is good, but finer grinding is needed for
multicompartment digesters and when sulfate control is
poor [111. Houghtaling states that older Prayon-type
plants (which use multicompartment digesters) required
grinding to 60% minus 200-mesh (0.074 mm). Newer
plants of the same type specify only 25% minus 200-
mesh, 60% minus 100-mesh, and all minus 35-mesh
(Tyler) 112].
Most of the older plants and some of the new ones
use dry grinding, Ring roller mills or ball mills are often
used with air classification. The power requirement
naturally depends on the initial size of the rock, its hardness,
and the desired particle size. For grinding Florida rock
to 55% minus 200-mesh, a requirement of 15-20 kWh/
t of rock has been suggested, including air classification
and pneumatic conveying to ground rock storage. Softer
rocks may require one-half to two-thirds as much power.
There is a general tendency toward wet grinding in
newer plants that are located near the mine. The wet
grinding is done in a ball mill; a slurry containing 62%-
70% solids is produced and fed to the digester via a
surge tank. Advantages of wet grinding are 30%-40%
reduction in power requirement and elimination of dust
losses, atmospheric pollution by dust, and the necessity
317
of drying the rock. The main disadvantages are
somewhat faster wear of the balls and mill lining and a
decrease in the amount of recycled wastewater that may
be used in phosphoric acid production and which may
contain some ions of value.
It is also necessary to maintain reasonably close
control of the water: solids ratio in grinding. The power
requirement for wet grinding 163 tph of Florida rock to
minus 35-mesh was given by Shearon as 1,865 kW for
closed-circuit grinding and 2,835-2,984 kW for open-
circuit grinding [13]. The corresponding energy
consumption is 11.4 kWh/t and about 18 kWh/t for closed-
and open-circuit wet grinding, respectively.
There is some difference of opinion about the need
for fine grinding of very unreactive rocks such as
igneous apatite. Lutz and Pratt [141 suggest that such rock
should be ground to 80% minus 200-mesh; whereas,
Somerville considers that rock reactivity is not a major
factor. According to Somerville, unground Meramec
(Missouri) apatite (minus 150-mesh) is satisfactory. The
explanation of this difference of opinion probably lies in
the type of digester used [11].
Calcining of phosphate rock usually is considered part
of beneficiation. However, some phosphoric acid
producers who purchase rock also calcine it to eliminate
organic matter or to decrease carbonate content or both.
One purpose in calcining is to improve the color of
products such as liquid fertilizer or_nonfertiIizer products_such_
as sodium tripolyphosphate. However, Stern stated that
one phosphoric acid plant was able to increase
production by 30%-40% by changing from uncalcined to
calcined rock [15]. A saving in foam-control reagents is
another advantage.
Reaction System - There are so many types of
reaction systems in use throughout the world that no
attempt will be made to identify all of them, The objective
in designing the reaction system is to carry out the
reaction between phosphate rock and sulfuric acid so as to
recover a maximum percentage of the P2O5 from the
rock as product phosphoric acid in the simplest and least
expensive manner. Since the filtration step is the most
critical and expensive step in the process, a primary
objective in the reaction step is to form gypsum crystals of
such size and shape that the filtration and washing can
be carried out rapidly and efficiently.
Maximizing recovery means minimizing losses. Three
types of P2O5 losses are recognized: (1) unreacted
phosphate rock, (2) P2O5 cocrystallized with gypsum through
isomorphic substitution of HPO4" for SO4", and (3)
phosphoric acid lost in the gypsum due to incomplete
washing. Perhaps a fourth source of loss should be
mentioned - mechanical losses due to spillage, leakage,
washing of filter cloth, piping, and equipment for scale
removal, and losses as sludge.
The purpose of the reaction step is not only to
extract the phosphate from the rock but also to ensure
slow growth of gypsum crystals to a relatively large size.
To attain this goal, reaction systems are designed to
prevent direct contact between the two reactants,
phosphate rock, and sulfuric acid. A high concentration of
free sulfuric acid would result in coating the phosphate
rock with calcium sulfate reaction product, thus
blocking further reaction.
A serious case of "reaction blocking" in a phosphoric
acid plant can take several hours or even days to
correct. On the other hand, a high concentration of cal-
cium ions (low sulfate) in the slurry will increase the
amount of phosphate cocrystallized with the gypsum.
Hence, the aim of designers and operators of reaction
systems is to maintain a uniform composition of the
slurry, avoiding pockets of high sulfate or calcium
concentration. The liquid phase usually consists of
phosphoric acid (about 30% P2O5) with about 1.5% free
sulfuric acid; the optimum concentration of free sulfuric
acid varies with rock composition. The solid phase is
mainly gypsum. The proportion of solids in the slurry is
about 35%-45%. Phosphate rock particles introduced
into this slurry dissolve rapidly in the phosphoric acid in
the liquid phase, which causes supersaturation with
calcium sulfate and results in the growth of gypsum crystals.
To approach this ideal situation, the incoming streams
x>Lsulfuric_acid_and. phosphate rock are mixed with the
slurry (directly or indirectly) as rapidly and completely as
possible, and the slurry in the reaction system is
agitated to ensure homogeneity.
The phosphate rock may also be premixed with
recycled weak phosphoric acid or with recycled reaction
slurry. Sulfuric acid may be sprayed on to the surface of
the slurry in the reactor vessel.
In many older plants, the sulfuric acid was diluted,
sometimes to 55% - 60% H2SO4 and cooled in a heat
exchanger before use. Most modern plants use the
sulfuric acid at the concentration at which it is received,
usually 96% H2S04.
When strong sulfuric acid is premixed with weak
recycled phosphoric acid, much heat is released, and this
is accompanied by evaporation of water and
volatilization of fluorine compounds (mainly S1F4 and HF). In some
plants this step is carried out in a flash vacuum cooler; a
rich stream of fluorine compounds is provided in the
vapor, which can be recovered as fluosilicic acid for sale
or further processing.
The various dihydrate processes differ essentially in
the reaction step. The reactor design generally falls into
one of two categories, multicompartment reactors or
single-tank reactors. Processes using more than one tank -
318
or compartment include the Prayon Mark IV dihydrate
process, which led to the development of the Prayon
pH range of hemihydrate processes and the Norsk
Hydro dihydrate processes, from which the Norsk Hydro
HH and HDH processes were developed. In the Prayon
Mark IV dihydrate process, phosphoric acid is produced
at a concentration of about 28% P2O5. The reactants
are fed to the multicompartment attack tank (Figure
11.13), which is constructed of concrete and lined with
rubber and carbon brick. Specially designed openings
are provided in the attack tank inner walls so that the
reaction slurry can flow from one compartment to the
next. Each compartment is provided with a single
agitator of special design to fulfil the functions of mixing,
solids suspension, and foam breaking.
phosphate
Sulfuric acid 93%)
vacuum syslem.
flash cooler
Figure 11.13. Reaction Section in the Prayon
Mark IV Process.
The attack tank is cooled by circulating the slurry
through a low-level flash cooler, in which the reaction
slurry is cooled by evaporation of water under vacuum.
Circulating power requirements are kept to a minimum
by using an axial-flow circulation pump and by the low
elevation of the flash cooler above the attack tank. The
temperature in the attack tank is controlled by varying
the vacuum applied to the flash cooler.
Slurry from the tank overflows to the digestion
system, where the calcium sulfate crystallizes, The
digestion section can be a single tank, depending on plant
capacity. For larger plants it will comprise two or three
digestion tanks of rubber-lined carbon steel; each is
equipped with a single agitator.
Among processes using a single-tank reactor, some
processes are the conventional type and others the so-
called "isothermal" type. These first include Rhone-
Poulenc's conventional dihydrate system containing a
single, noncompartmental tank with a central agitator.
The reaction tank (Figure 11.14) is constructed of
rubber-coated steel or concrete and is lined with carbon
bricks. Baffies are fitted onto the walls to prevent the
slurry from rotating bodily as a single mass inside the
tank. The cover of the reactor is constructed of
polyester or ebonite-coated panels. The phosphate rock is fed
by a special duct within a cylindrical shroud at one or
two points, according to the size of the tank, and into
the turbulence zone of the central agitator on the
opposite side to the gas extraction hood. The sulfuric acid is
introduced into one, or several, independent discs fixed
to the drive shafts of some of the surface coolers. The
proprietary equipment distributes the acid so evenly over
the entire surface of the tank that 98% acid can be
introduced directly without prior dilution. There is no risk
of local sulfuric acid concentration excess or
temperature peaks, which can adversely affect the crystallization.
Sulfuric acid
Phosphate
—Slurry-cooler
Fume to scrubber
=E==E
[i)
to filter
m
(1) - Sulfuric add disperse!
Figure 11.14. Rhone Poulenc Phosphoric Acid
Reaction System.
Temperature control is provided by a flow of air over
the surface of the slurry in the reactor. The tank cover,
positioned between 1 and 1.2 m above the slurry level,
is perforated to allow the entry of atmospheric air across
about one-half the diameter of the tank and is fitted
with a gas outlet hood on the opposite side of the tank.
A fan provides the circulation of air. Rhone-Poulenc's
DM-O process [16] is a variation of the single-tank
process (Figure 11.15). It is based on the same principles
319
Sulfuric acid
To atmosphere
ft
Phosphor I
c acid Gypsum r° scrubbing unit
Figure 11.15. The Rhone-Poulenc Speichim DIPLO Phosphoric Acid Process.
as the single-tank process but differs in that two attack
tanks are employed in series with no recirculation
between them. The process has been developed to handle
low-grade, less-reactive, or unground phosphates. The
two processes (single-tank and D1PLG) developed by
Rhone-Poulenc were acquired by Speichim, which
offers them as Speichim - Rhone-Poulenc processes.
Similar in some respects to the above-described
Rhone-Poulenc system is the process developed by
Societe Industrielle d'Acide Phosphorique et d'Engrais
(SIAPE, Tunisia), which also features a single tank in the
reaction section although its construction is somewhat
different. The reaction system comprises a cylindrical
tank divided into a central compartment, (into which
the phosphate rock, sulfuric acid, and returned acid are
fed), and an outer ring-shaped compartment. The tank
is usually constructed of concrete and is coated on the
bottom and sides with rubber, which is then covered
with carbon bricks.
The process was specially developed to use the low-
grade Gafsa rock, which has a relatively high carbonate
content. The carbon dioxide released in the attack
section promotes slurry circulation. Because of the high
gas concentration, a slurry low-density zone is created.
By having one opening at the bottom, a natural draft is
set up, which moves the slurry out in a continuous flow.
This circulation is further enhanced by an axial-radial
double-impeller agitator working as a pump.
Since the quality of indigenous rock has continued to
decrease, SIAPE has modified its process by adding a
digestion tank with two agitators (Figure 11.16). Slurry
at 78D-80°C is fed from the outer section of the reactor
to the digestion tank, where it is cooled to 72°-73°C
before being returned to the central compartment of
the reactor, This arrangement allows a temperature
gradient to be maintained between the recycle slurry and
the slurry in the attack tank, which is necessary for good
crystal growth [17,18].
Another type of single-reactor system is Jacob's dihy-
drate phosphoric acid process comprising an annular
reactor with separate cooler seal and filter feed
compartments [18]. The reactor design allows phosphate
rock and sulfuric acid to be added at several points. The
reactor is equipped with multiple agitators, and cooling
is generally provided by low-level flash coolers (Figure
11.17). The combined action of the cooler circulation
pumps and back-mixing from agitator to agitator
provides the necessary degree of recirculation in the reactor.
320
To filter
Slack
Principal
reactor
Figure 11.16. SIAPE Phosphoric Acid Reactor
With Additional Tank.
Cooler
pumps
lb filter
figure 11.17. Jacobs - Dorco II Phosphoric
Acid Reactor System.
The system allows easy sulfate control, good crystal
growth, and low nucleation rates.
A good example of an isothermal process is the
Raytheon Isothermal Reactor process. The temperature
in the reactor is maintained at a constant value - hence
the name "Isothermal" - by keeping the contents in
rapid circulation. These reaction conditions give rise to
a number of advantages in comparison with more
conventional reactor conditions: raw material use efficiency
is enhanced, and sulfate and product compositions are
easier to control. The slurry solids concentration in the
reactor, and thus the filtration rate, are more stable. Ther
reactor consists of one reaction compartment
containing a draft tube and a single circulating impeller (Figure
11.18). Rock slurry is pumped from a storage tank or
premix tank and introduced at the bottom of the
reactor near the center of the draft tube, which surrounds
the impeller. This feed point is most suitable because
the rock is dispersed very efficiently into the circulating
slurry as it flows up through the impeller.
Cooling water
[1] ■ Water (if required far dry rock)
(2| - Phosphate rock |wet or dry]
T-] Rock slurry premix tank
P-2Pump
R-3 Raytheon isothermal reactor
X4 Vacuum system
T-5 Filler feed tank
Figure 11.18. The Raytheon Isothermal Reactor.
A controlled flow of 93%-98% sulfuric acid is
introduced to the reactor inside the draft tube, just above the
propeller The turbulent flow at this point ensures
maximum dispersion of the acid. The slurry temperature is
maintained by regulating the reactor pressure, which is
maintained by either a steam ejector or vacuum pump
through the vacuum system.
321
The reactor slurry level is fixed by an overflow nozzle
located on the shell of the reactor above the top of the
draft tube. The resulting slurry, containing 29% P2O5
and 38%-40% solids, overflows through a self-venting
pipe, which is sealed below the liquid level in the filter
feed tank. The filter feed tank and a surge tank are
between the reactor and filter.
The high circulation rate in the reactor is maintained
by a propeller-type, top-mounted agitator equipped with
a specially designed vacuum shaft seal at the reactor top
and an externally mounted steady bearing at the reactor
bottom. The impeller is within the draft tube, near its
bottom. The specially-designed, water-cooled,
high-durability rubber steady bearing is used to maintain precise
centering of the circulator shaft.
The circulation ratio of the isothermal reactor is about
ten times that occurring in most conventional
multicompartment reactors. The large difference in
circulation rate results in uniform temperatures, uniform
sulfate concentration, and larger gypsum crystals [18].
Previously known as the Swenson (Gulf) Isothermal
Reactor and offered by Badger, it is now offered by
Raytheon Engineers and Constructors, U.S.A.
Two processes somewhat related to the isothermal
process are the Kellogg - Lopker process and the
process proposed by R. L. Somerville.
In the Kellogg - Lopker process the reaction-system-
comprises two vessels - a dissolver and an evaporator
(cooler) (Figure 11.19). The phosphate rock and recycle
Sulfuric acid
To vacuum
system
£.
Evaporator
Carbon dioxide and Fluorine
compounds (to scrubber)
Return phosphoric acid
Shut-off valve
Slurry
to filter
t=-Qtt.
X Circulation pump
Figure 11.19. Kellogg - Lopker Reaction
System.
phosphoric acid are introduced into the dissolver, which
works under atmospheric pressure, and sulfuric acid is
introduced into the vacuum evaporator. Neither vessel
contains an agitator; the necessary turbulence is
provided by circulation of the slurry, which is pumped from
the bottom of the dissolver and injected tangentially into
the evaporator just below the liquid level, inducing a
swirling motion. It then returns under gravity to the
dissolver and is injected in the same way to maintain a
similar vortex. The difference between the liquid levels
in the two vessels corresponds to the difference in their
operating pressures. The Kellogg-Lopker system-is-dis--
tjnguished by being able to accept very coarsely ground
phosphate rock and for its low residence time (IV2 hours
compared with 8 hours for the Prayon process).
In the Somerville process (Figure 11.20) phosphate
rock is introduced into an agitated digester containing
slurry under atmospheric pressure and is then drawn by
vacuum into the cooler, which is a stirred evaporator.
Sulfuric acid and recycle phosphoric acid are added and
the slurry is then pumped back into the digester.
Sulfuric acid
\ Concrete-lined steel tank
Figure 11.20. Somerville Phosphoric Acid
Reactor.
The processes described above are believed to be fairly
representative of dihydrate processes. While most plants
operate with a small excess of sulfuric acid, it is possible
to operate with a deficiency of sulfuric acid but with an
excess of S04 by replacing part of the sulfuric acid with
an equivalent amount of ammonium sulfate (or other
soluble sulfate), About 10%-15% of the sulfuric acid can
be replaced by ammonium sulfate. This process
322
modification may be advantageous for using small
amounts of byproduct ammonium sulfate. A further
advantage is lower corrosion rates. A disadvantage is longer
reaction time (up to 18 hours). The phosphoric acid
produced by this process contains ammonium
phosphate; therefore, its use is limited to production of
ammonium phosphate or compound fertilizers.
Reaction Time and Retention Time - Somerville
states that the average life of a phosphate rock particle
in a typical reaction system may range from 15 seconds
to 3 minutes. Nevertheless, retention times in industrial
plants range from 1.5 to 12.0 hours or more 111]. One
of the reasons relates to the formation of good gypsum
crystals, as discussed previously. Another reason is the
difficulty of close control of free sulfuric acid (SO4"2)
content of the liquid phase when the reaction time is short.
Close control of this value is extremely important.
Although the optimum level of control may depend on
the character of the rock, a level of about 1.5% is
typical. Serious upsets can occur when the S04~2 level
varies appreciably from the optimum. Obviously, the shorter
the reaction time, the faster (and more often) problems
can arise. The success of the lV^-hour reaction time in
the Kellogg-Lopker process is likely related to the use of
. an automatic sulfate analysis instrument that permits
close control and rapid adjustments.
Filtration - The function of the filtration step is to
separate the gypsum (and any insoluble materials
derived from phosphate rock or formed in the reaction)
from the phosphoric acid product as completely,
efficiently, and economically as possible. All modem plants
use only continuous horizontal vacuum filters.
The most popular types of filters are the tilting-pan
rotary filters, rotary table filters, and belt filters. In each
of these filters, the cycle proceeds through the following"
steps: (1) deposition of the phosphoric acid-gypsum slurry
on the filter, (2) collection of product acid by application
of vacuum, (3) two or three countercurrent washes to
complete the removal of phosphoric acid from the
gypsum, (4) discharge of the washed gypsum, and (5)
washing of the filter cloth to prevent accumulations of
scale-forming materials. The sequence of operations is
illustrated in Figure 11.21. In the washing sections,
successively weaker solutions of phosphoric acid are
collected. The last wash is with fresh water or sometimes
with water recycled from a gypsum pond or from sumps
that collect cloth-washing water and spillage or drippings.
SuLfurIc odd
X
Recycle acid
M-l
Exhaust
Phosphate rack
c=>
Water
CO
-3
C-E
R-5
fl
Waste
■»—£T
Legend 1
H-l Mixer
C-2 Scrubber
B-3 Exhaust blower
E-4 Vacuum cooler
R-5 Reactors
P-6 Pump
F-7a - F-7d Pnn fI Iter
E-B Vacuum evaporator
P-6
F"-7a |F-7b
Water
f!lZc F~7d Gypsum
Steam
Water
X
307. P2D5
acid
Waste
c=>
Waste
c=>
E-8
34X P2D5 acid
c=>
Figure 11.21. Typical Wet-Process Phosphoric Acid Plant.
323
The very weak acid collected in the last section
is.returned to the preceding section with the filtrate from
the first wash being recycled to the reaction vessels. Some
of the product acid also may be recycled to the digestion
step to control the percentage of solids in the slurry at a
manageable level, usually 35%-45%.
Filters are usually rated according to their active
surface area, which may range up to about 320 m2. The
rate of rotation (in a rotary filter) or the rate of travel (in
a belt filter) is variable to permit adjustments as required
by the filtration characteristics of the slurry and other
factors.
The only types of filters that are suitable for
phosphoric acid production (that can perform the sequence of
all operations desired in the process of filtering gypsum)
are the horizontal belt vacuum filters, which are offered
by companies such as Fimco, Delkor, and Pannevis; the
Bird tilting-pan vacuum filters, offered by Bird and
Profile, and the UCEGO rotating-table vacuum filters,
offered by Rhone-Poulenc.
The production rate may vary widely, but a common
design factor is 6.5 tonnes of P20s/m2/day. The
filtration rate is affected primarily by the size and shape of
gypsum crystals which, in turn, are affected by
conditions in the reaction section including the type of
phosphate rock, use of crystal shape modifiers, control of
reaction conditions, etc, Insoluble impurities in the rock,
such as clay, may affect-filtration rates adversely-[19}r-
The filtration rate is also affected by the temperature,
concentration, viscosity of the acid, and the desired
recovery. While many plants strive for maximum
recovery, in specific plants there is often an economic optimum
operating rate at which increased production is attained
at some sacrifice of recovery.
Filtration rates also depend on the design of the filter,
amount of vacuum, and numerous other factors.
Moraillon et al. give illustrations ranging from 2 to 18
tonnes/m2/day [20]. Shearon mentions rates ranging
from 7.8 to 9.8 t/m2/day for Florida plants [13].
Concentration and Clarification - Phosphoric acid
produced by most dihydrate processes contains 26%-
32% P2O5 (filter acid). Acid of this concentration can be
used in some fertilizer processes, but for most purposes
it is economically preferable to concentrate it by
evaporation of part of the water content. The desired
concentration depends on the use; the requirements are given
in Table 11.18. The above concentrations are merely
guides to standard practice; it is quite possible to use
other concentrations in most cases. For instance, 30%
P2O5 acid has been used for TSP production by a
process requiring extensive drying of the product. However,
energy is usually more efficiently used by concentrating
the acid than by drying the product with high rates of
Table 11.18. Phosphoric Acid Concentrations
Required in Downstream Processes
Application
Triple superphosphate - den process
Triple superphosphate-slurry process
Diammoniurn phosphate
Monoammonium phosphate
[depending on process)
Shipment [merchant grade)
Superphosphoric acid for shipment or
liquid fertilizer production
Acid Concentration
(% P2O5]
50-54
38-40
about 40
40-54
q/la
68-70
a. Although 54% P2O5 is the usual standard for merchant-
grade acid, variations are in the range of 50%-60%.
recycle. This is especially true when energy is available
in the form of steam from an adjacent sulfuric acid plant.
Precipitates form in phosphoric acid before, during,
and after concentration. Compounds precipitating
before concentration are likely to be mainly calcium
sulfate and fluosilicates. A wide variety of compounds may
-form-during-and-after-concentration, depending on acid
concentration. These compounds are collectively known
as "sludge" and cause many difficulties in handling and
use of the acid. They also form scale in evaporators.
Therefore, many manufacturers clarify the acid and
either recycle the sludge or use it in fertilizer products
where it causes the least trouble. Acid for shipment, in
particular, should be well clarified. Phosphoric acid
produced by hemihydrate processes (40%-50% P2O5) is
reported to be relatively free from sludge.
The amount of fluorine removed during
concentration from 30% to 54% P205 may be 70%-80% of that
originally present in the acid, most of which is
volatilized and recovered in the condensate. Much of the
fluorine is volatilized during evaporation and must be
recovered to prevent pollution. In some cases saleable
fluorine byproducts are produced such as fluosilicic acid,
fluosilicates, cryolite, aluminum fluoride, hydrofluoric
acid, and even liquid hydrogen fluoride.
Phosphoric acid concentrators may be classified as
direct-fired or indirectly heated. In direct-fired
evaporators, combustion gases come into direct contact with
the acid, as in a spray tower, or submerged combustion
evaporators. Use of this type of evaporator has been
abandoned because of the difficulty of cleaning the
exhaust gases to recover acid mist and fluorine compounds,
324
Most phosphoric acid concentration processes heat
the acid with steam in a heat exchanger under vacuum
(Figure 11.22), When hot water from heat recovery in
sulfuric acid plants is to be used, an acid can be
concentrated in two stages from 28% to 35% P2O5 with hot
water and further with steam. Commonly used are
tubular evaporators with forced circulation; the tubes can
be of graphite or stainless steel. The impregnated
graphite tubes are cheaper but are fragile and crack during
operation. There was an opinion of users that over a
period of a few years the capital and replacement costs
for both systems were about the same. Now the
situation has changed somewhat in favor of graphite tube
exchangers because better materials are being used. The
other type of exchanger is the carbon block.
Concentration from 30% to 54% P2O5 using steam heating may
be carried out in one, two, or three stages, sometimes
with interpass crystallizers, to decrease scale formation
in the heat exchangers.
Concentration from 30% to 54% P2O5 requires about
1.9 tonnes of steam per tonne of P2O5 in the acid
concentrated. This amount is usually available from the
sulfuric acid manufacture if the acid is produced by burning
sulfur. Electric power requirements may range from 11
to 16 kWh/tonne of P2O5, depending on the scale of
operation. About 6 tonnes of cooling water per tonne
of P2O5 is required for condensing the water evaporated
from the acid.
Utilization of Sludge - As mentioned previously,
sludge impurities precipitate in phosphoric acid before,
during, and after concentration. If the acid is used onsite
for fertilizer production, it may be possible to use the
acid without separating the sludge. However, in some
cases the amount of sludge may be so great as to lower
the grade of fertilizer products below that desired.
Sludge solids that form in filter acid (30% P2O5) are
mainly gypsum and fluosilicates and may, in some cases,
be returned to the phosphoric acid production unit
without serious interference with its operation. Sludge forrn^
ing after concentration is likely to contain a high
proportion of iron and aluminum phosphate compounds.
One example is (AI,Fe)3KHH(P04)8 • 4H20. Lehr has
identified 38 distinct crystalline compounds occurring in
sludge from wet-process acid [21], The return of iron
and aluminum compounds to the acid-production unit is
likely to cause some difficulty. When this sludge must be
separated, as is usually the case for shipment, it is often
used for the production of TSP. Most of the P2O5 in the
sludge solids is citrate soluble but not water soluble;
therefore, this solution is not advantageous when the TSP is
sold on the basis of water solubility.
The sludge may be used in the production of
nongranular monoammonium phosphate (MAP) which,
in turn, is used as an intermediate in the production of
compound fertilizers. There is no standard grade for MAP
Phosphor 1 c a.c\d
feed from fI Iter
t=b
Steam
£
E-l
Condensate
cz>
S-3
E-2
^T^
Product add
<
■>-Q
Exhaust
E-5
C-4
P-6
Coo I Ing water
=>
Legend 1
E-l Heat exchanger
E-2 Evaporator
S-3 Separator
C-4 Scrubber
E-5 Condenser
P-6 Vacuum punp
Oi
FLuosI Ucic acid
>=>
Figure 11.22. Typical Phosphoric Acid Concentration Unh.
325
to be used as an intermediate; the user can formulate
compound fertilizers on the basis of actual analysis. In
this case also, the iron, aluminum, and magnesium
compounds are not water soluble. In fact, there is no
economical method for using sludge solids in countries where
phosphate fertilizer is sold on the basis of water solubility.
Precipitation after concentration to 54% P2O5 is slow
and never so complete but that more precipitate will
form on further storage. However, clarification
methods are available that reduce the sludge problem in
merchant-grade acids to manageable levels.
Dihydrate Process Requirements - Raw material
and utilities requirements vary among dihydrate
processes, but the values shown in Table 11.19 may be
considered mid-range values,
11.2.6 Hemihydrate and Two-Stage Processes
As with dihydrate processes, there are a number of
hemihydrate and combined systems developed by
various companies, and no attempt is made to describe them
all in detail. However, for simplicity it may be taken as a
rule that the basic equipment for both hemihydrate and
combined processes is the same, and differences exist
only in technical parameters, additional equipment,
general layout, and to some extent in materials of
construction used.
Hemihydrate Process (HH)
The hemihydrate reaction proceeds in two distinct
zones. It is therefore necessary to have at least two
separate vessels or compartments in the reaction section.
The preferred volumetric ratio is 2:1. The first zone is
often divided into two identical compartments or
vessels, 1A and IB.
Phosphate rock is fed to reactor 1 A; sulfuric acid ancT
dilute phosphoric acid from the filter are fed to reactor
2 (Figure 11.23). Slurry from reactor 2 is recycled
through a flash cooler to reactor 1A, thus exposing the
phosphate rock to sulfate ions under controlled
chemical conditions. Slurry overflows from compartment 1A
to IB. Heat is removed by vacuum cooling (or by air
with omitting flash cooler) to maintain the reaction slurry
temperature at 98°-100°C,
The product acid at between 40% and 50% P205,
depending on downstream requirements and
hemihydrate gypsum, is separated by a horizontal vacuum filter
Table 11.19. Process Requirements of the Dihydrate Process
Product: Phosphoric Acid
Capacity: 534 tpd (52% P205)
160,000 tpy
Operation time: 82%
Working capital: 5.5 US $ million
Inputs
Phosphate rock (32% P205)
H2SO4 (100%)
Lime
Antifoaming agent
Electric power:
- Grinding
- Process
- Concentration
Steam:
- Process
- Concentration
Cooling water
Process water
Labor
Units
t/t
t/t
t/t
US$/t
kWh/t
kWh/t
kWh/t
t/t
t/t
m3/t
m3/t
workhours/t
Process: Dihydrate
Investment cost: (BL)
Grinding: US $1.5 million
Process: US $30.0 million
Concentration: US $6.0 million
Total; US $37.5 million
Consumption Per Tonne of P2O5
3.29
2.80
0,15
0.5
20
70
10
0.15
1.75
70
7
0.38
Basis: 1993 West European costs.
326
Phosphate rock
Sulfur ic acid
R-1q
Legendi
R-la Reactor la
R-lb Reactor lb
R-2 Reactor £
F-3 Fi Iter
R-lb
R-E
F-3
Process water
<-
U n S J
~a
£1
Cake discharge
^-c=>
±X
Product acid
c=>
Figure 11.23. The Hydro HH Process.
with three countercurrent wash stages. The product acid_
from the filter passes directly to storage. It does not
require clarification or solid removal and may be used
directly as concentrated acid without evaporation.
However, there are some disadvantages that have
tended to restrict the popularity of the hemihydrate route,
among them the following:
Filtration rate:
P2O5 losses and
water balance:
Scaling:
Hemihydrate crystals tend to be
smaller than those from dihydrate
processes; hence, hemihydrate slurry
can be more difficult to filter.
The water balance is more critical;
thus the amount of wash water that
can be used is restricted, Amounts of
both soluble and cocrystallized P2O5
remaining in the filter cake are
greater because of the higher P2O5
concentration of the slurry being
filtered.
Hemihydrate is not a stable form of
calcium sulfate, and it tends to revert
to gypsum even before the acid has
been filtered off. During washing,
conditions are even more in favor of
-— - ^rehydration, which may lead to
scaling of piping and equipment.
Corrosion: At the higher temperature and acid
concentration in a hemihydrate
reaction system, there is more rapid
wear of equipment, particularly of
agitators and slurry pumps.
However, apart from the reduction or elimination of the
evaporation heat requirement, the process has certain
advantages:
Capital saving:
Purer acid:
Lower rock
grinding
requirements:
Less evaporation equipment is
needed, if any.
The acid contains substantially less
free sulfate and suspended solids than
the evaporated dihydrate-process
acid of the same strength and
somewhat lower levels of aluminum and
fluorine contents.
Under more severe reaction
conditions, phosphate rock feed reacts
much more quickly, and a
satisfactory rate of reaction can be achieved
from much coarser rock.
327
Three single-stage hemihydrate processes have been in
use in commercial-scale plants. They are the Norsk
Hydro Licensing (formerly Fisons Fertilizer) Process, Prayon
Process, and the Occidental Process. Average process
inputs for hemihydrate processes are shown in Table
11.20,
Hemidihydrate Processes
Hemihydrate-dihydrate processes without
intermediate filtration, so-called hemihydrate with recrystalliza-
tion (HRC), are widely used in the countries of East Asia
and Oceania. The plant layouts for these processes
resemble those of multiple-reactor dihydrate processes.
An exception is that the attack and digestion reactors
operate under hemihydrate conditions while
succeeding reactors operate under conditions favoring the
rehydration of hemihydrate to gypsum, which is
encouraged by seed dihydrate crystals recycled in slurry from
the filter feed. The product acid is not any more
concentrated than that obtained from the dihydrate process
because of the need to crystallize easily filterable crystals
in the presence of the product acid, but the gypsum is
much purer and therefore of greater use in, for example,
plaster manufacture or as a cement-setting retarder. This
advantage is important for countries where natural
gypsum is scarce, wholly or partly imported, and expensive.
The process also provides a very high recovery of
P2O5 from the rock since losses in the gypsum are very
low. The value of the 2%-3% increase in P2O5 recovery
depends on the cost of the rock. The disadvantages are
the higher cost and increased complexity of the
process. Also some phosphate rock contains impurities that
stabilize the hemihydrate, thereby preventing recrystal-
Iization to gypsum at an acceptable rate.
This process was developed in Japan by Mitsubishi
Chemical Industries Ltd,, Nippon Kokan KK, and Nissan
Chemical Industries Ltd. The Nissan "H" process is
typical.
Hemihydrate-Dihydrate Process With
Intermediate Filtration (HDH)
The first stage of the process is almost identical to the
HH process already described. In the transformation
stage the hemihydrate cake is discharged from the filter
into an agitated vessel (Figure 11.24), The operating
conditions are controlled to ensure complete transformation
Table 11.20. Process Requirements of the Hemihydrate Process
Product: Phosphoric Acid
Process: Hemihydrate
Capacity: 534 tpd (52% P205)
160,000 tpy
Operation time: 82%
Working capital: 5.5 US $ million
Inputs
Phosphate rock (32% P2O5)
H2S04 (100%)
Lime
Antifoaming agent
Electric power:
- Grinding
- Process
- Concentration
Steam (LP):
- Process
- Concentration
Cooling water
Process water
Labor
Units
t/t
t/t
t/t
US$/t
kWh/t
kWh/t
kWh/t
t/t
t/t
m3/t
m3/t
workhours/t
Investment cost: (BL)
Grinding: US $0
Process: US $33.0 million,
Concentration: US $3.0 million
Total: US $36,0 million
Consumption Per Tonne of P2O5
3.29
2.78
0.17
0.5
0
70
10
0.11
0.49
22
4
0.42
Basis: 1993 West European costs.
328
Phosphate rock Sulfuric acid
fl
fl
Sulfuric acid
^-3 fl A
1
HH
cake
f
u—r^j—j
L-Q~
L-£I
-Q"
R-la
R-lla
R-2
Product acid
Process water
fl
F-6
it i
i—n—u
JT
T-4
CZ>
T-5
-Q
L£I
i
Cake discharge
Legendi
R-la, R-lb. R~£ Reactors
F-3 HH Fl L-ter
T-4, T-5 Transformation tanks
F-6 DH FlIter
Rgure 11.24. Nissan "C" Hemihydrate-Dihydrate Process.
of hemihydrate gypsum to dihydrate and to allow
sufficient time for the dihydrate crystals_to_grow. ._.
The rate of transformation is increased by the
addition of a small feed of sulfuric acid. Nearly all the lattice
P2O5 co-precipitated with the hemihydrate is released
into the liquid phase. The dihydrate gypsum is then
filtered off and the cake washed with process or pond
water. The filtered and the released P205 is returned to
the hemihydrate reaction stage as the last wash on the
hemihydrate filter
The extra filtration step increases the cost and
complexity of the plant, but this disadvantage may be offset
by decreasing or eliminating the concentration step
because of the high P205 concentration of about 45% in
the phosphoric acid produced.
Moreover, the dihydrate gypsum obtained is much
purer than that from HH or DH processes and similar
to HRC gypsum and may be used in the production of
building materials.
Such a solution has been adopted in the Singmaster
and Breyer, Prayon, Fisons Fertilizers, Norsk Hydro
Licensing, and Nissan "C" ("New Nissan") processes and
a later development of the Nippon Kokan process. In
commercial use are the Fisons HDH process, the Nissan
"C" process, and a whole scale of Prayon's PH three-
stage processes: PH2, PH3, PH11, PH12 with very pure
hemihydrate, anhydrite 11, or a mixture of the two [22],
Jmpurity.distrib.utions_inthe.acid and filter cake are shown
in Table 11.21 for the Norsk Hydro processes. Median
hemidihydrate process requirements are given in Table
11.22.
Dihydrate-Hemihydrate Process (DHH)
Although the attack and digestion sections are run
under dihydrate conditions, it is not desirable to effect a
very high degree of P2O5 recovery during the
separation of the acid from the dihydrate because the
succeeding dehydration stage requires about 20%-30% P2O5
and 10%-20% H2S04. A centrifuge is therefore used
instead of a filter to produce a thickened slurry of
gypsum in phosphoric acid of the correct concentration,
and it is not of critical importance to produce highly
filterable crystals in the first stage. Thus, it is possible to
make a product of up to about 35% P2O5, compared
with a maximum of about 32% for the ordinary
dihydrate process, The transformation of dihydrate into
hemihydrate is not hindered by the impurities in Kola apatite
and other igneous rocks for which the process is very
suitable.
The dihydrate-hemihydrate process has about the
same advantages and disadvantages as hemihydrate-
dihydrate except that the hemihydrate byproduct may
be more useful than gypsum in some cases. On the other
hand, the product acid concentration is somewhat lower.
329
Table 11.21. Raw Material and Product Analyses for Norsk Hydro Fertilizers Phosphoric Acid
Processes (wt %)
DH+C
DH+C
HH
HH
HDH
HDH
Components
P2O5
CaO
S04
F
SiQ2
Fe203
A1203
MgO
Na20
K20
Water
Solids
Na20
Rock3
31,6
45.8
1.2
3.6
7,5
1.18
1.4
0.45
0.55
0.1
1.0
-
0.55
' Acid
50,0
0.2
4.8
1.3
0.1
1,77
1.76
0.65
0.08
0.08
-
4,3
0.08
Cakeb
0.7
30.9
52.8
1.1
4,3
0.15
0.2
0.05
0.3
0.08
25
-
0.3
Acid
50.0
0.2
2.0
0.7
0,1
1.75
0.9
0.65
0.08
0.09
-
<1
0.08
Cakec
1.4
34.4
54.5
0,7
4.28
0.14
0.6
0.04
0.26
0.07
20
-
0.26
Acid
50.0
0.2
2.0
0.7
0.1
1.78
1.49
0.67
0.09
0.1
-
<1
0.09
Cakeb
0.2
30.8
52.5
0,7
-3,78 -
0.06
0.32
0.01
0,032
0.02
25
-
0.032
Note: DH+C - Dihydrate process and concentration
HH - Hemihydrate
HDH - Hemidihydrate
a. Florida 68% BPL, 100% through 1.6 mm.
b. Gypsum, dry basis,
c. Hemihydrate, dry basis.
Table 11.22. Process Requirements of the Hemidihydrate Process
Product: Phosphoric Acid
Capacity: 534 tpd (52% P205)
160,000 tpy
Operation time: 82%
Working capital: 5,5 US $ million
Inputs
Phosphate rock (32% P2Os)
H2SQ4 (100%)
Lime
Antifoaming agent
Electric power:
- Grinding
- Process
- Concentration
Steam:
- Process
- Concentration
Cooling water
Process water
Labor
Units
t/t
t/t
t/t
US$/t
kWh/t
kWh/t
kWh/t
t/t
t/t
m3/t
m3/t
workhours/t
Process: Hemidihydrate
Investment cost: (BL)
Grinding: US $0
Process: US $38.0 million
Concentration: US $3.0 million
Total: US $41.0 million
Consumption Per Tonne of P205
3.17
2,74
0.12
0.5
0
90
10
0.10
0.49
27
6
0.42
Basis: 1993 West European costs.
330
This route has been investigated by Marchan (later
Albright and Wilson), but the only commercial process
is that developed at first by the Japanese Central Glass
Company and Societe de Prayon, of Belgium and
subsequently jointly finished as the Central-Prayon Process.
plant Engineering/Construction
Three companies provided information on recent
phosphoric acid plant activities.
1. The Raytheon Isothermal Reactor process described
above is offered by Raytheon Engineers and
Constructors, Tampa, Florida. Single-train capacities
available are 80,000 to 330,000 tpy P205. The 54%
P2O5 product acid contains less than 1% suspended
solids, with further clarification available. Wet
grinding of rock is preferred if grinding is needed. One
highlight is a drier gypsum cake containing only 25%
water. Raytheon has built 7 plants, revamped at least
12 and is now building two plants of 400 and 950
tpd P2O5 capacity.
2. The various Prayon processes, as summarized in Table
11.23, are offered by Kvaerner Process Technology,
London, England. Since 1984 Kvaerner (formerly
Davy McKee) has engineered six plants of 100- to
1,310-tpd P2O5 capacity and provided engineering
and supervision of construction for up to 59 wet-
process acid plants in prior years.
3.
B1PROKWASEngineering, Ltd., Gliwice, Poland,"oF
fers a single-reactor dihydrate process with
capacities of 30,000- to 200,000-tpy per train. The product
is 54% P2O5 acid containing about 1.5% F.
BIPROKWAS has built eight phosphoric acid trains
and revamped two, the latest a 160,000-tpy unit.
11.2.7 Materials of Construction
Choice of construction materials is very important
since it will affect the degree of maintenance and
downtime of a phosphoric acid plant.
Corrosion rates in a plant are variable and depend
largely on the chloride and free fluoride content of the
acid.
Typical materials of construction for various items of
equipment are as follows [23],
Reactors:
Vessels:
Pipework:
Agitators:
Pumps:
Concrete, with acid-resistant
aggregate such as siliceous saridand"
gravel, rubber lined or RLMS (rubber-
lined mild steel) protected by carbon
bricks.
RLMS, propylene, FRP (fiber-
reinforced polypropylene).
Polypropylene, FRP, rubber.
Alloy 20, 904 L, HV9, Sanicro 28,
Ferralium 255, 317L, Uranus B6.
Alloy 20, alloy 28, HV9, Sanicro 28,
high-density polyethylene, ferralium
255, 317 L, Hastelloy C.
Heat exchangers: Impregnated graphite reinforced
with carbon fiber as Diabon (Sigri),
Bigilor, Graphilor BS (Le Carbone-
~ Lorraine).
Alloy materials commonly used in phosphoric acid
service are given in Table 11.24.
The most vital and vulnerable portions of the
phosphoric acid plant are agitators, pumps, and filters.
Table 11.23. Features of the Prayon/Davy Processes
Process/Features
Dihydrate (DH)
P2O5 efficiency, %
Phosphate rock
Rock feed
Reactor system
Unit capacity, tpd P2Os
Filter acid strength, % P205
Quality: acid and phosphogypsum
96.5
All grade sedimentary
and igneous
Dry or wet
Multi-compartment with
separate sections for attack
and digestion
Up to 1,800
29
Standard
Hemihydrate [HH) Hemidihydrate [HDH)
93.0
Selected, coarser grinding
acceptable
Only dry
As for DH with high and
low temperature attack
zones
Up to 1,300
42
Acid of high purity
98.5
Igneous not suitable,
coarser grinding
acceptable
Dry or moist
Two-reactor system:
and 1. as for HH
2. for recrystallization
HHtoDH
Up to 1,300
45
Gypsum of high
purity
331
Table 11.24. Alloy Materials Used in
Phosphoric Acid Equipment
Alloy
Lewmet 25
Lewmet 15
Sanicro
CD4MCu
Ferralium
Hastelloy G
Incoloy 825
Jessop 700
Carpenter 20
Cb-3
Alloy 20
Cr
29
28.5
27
26
25
22
21.5
21
20
20
Mo
4.5
2.25
3.5
2.0
2.5
6.5
3.0
4.5
2.5
2.5
Note: The above table ranks
Cr+Mo
33,5
30,75
30.5
28.0
27.5
28.5
24.5
25.5
22.5
22.5
Matrix
Austenitic
Duplex-austenitic
and ferritic
Austenitic
Duplex austenitic
and ferritic
Duplex austenitic
and ferritic
Austenitic
Austenitic
Austenitic
Austenitic
Austenitic
alloys according to their
chromium plus molybdenum content in descending
order from top to bottom.
Corrosive conditions are the most severe for agitators;
however, agitators can be replaced with relative ease
and low cost. Filters, on the other hand, are large and
expensive and not so easily replaced or repaired.
Corrosive conditions are somewhat less severe for~filte"rs"~
than for agitators because the average temperature is
lower and erosion is a lesser factor.
For many years, 316L stainless steel has been a
common construction material for agitators, filters, and the
other equipment coming in direct contact with
wet-process phosphoric acid or reaction slurry. However, there
is a growing tendency to use more resistant alloys in
new plants, particularly when the rock source may be
subject to change or more severe conditions of
operation are provided.
Obviously these improved alloys are more expensive;
for example, the cost of the alloy 317L has been about
10% higher than 316L; Ferralium, 25% higher; and
UB6, 50% higher, However, this extra cost can easily
be justified by longer life, fewer delays for repairs, and
greater flexibility in choice of rock and operating
conditions.
11,3 Superphosphoric Acid
Phosphoric acid when concentrated above 54% P2O5
forms superphosphoric acid (SPA). This name is given
to phosphoric acid in which an appreciable proportion,
usually 30% or more, of the P2O5 is in the form of
condensed or polyphosphoric acids [general formula Hn+2 I
(Pn03n+i)I- A variety of concentrations of SPA can be
manufactured from wet-process phosphoric acid;
generally they are in the range of 69%-76% P2O5.
Essentially, production of SPA first involves removal of physical
water from the weaker acid and then the removal of
chemically bound water. The latter step can be
represented by the equations:
2H3PO4 + Heat -»■ H4P207 + HaO <g)
H3PO4 + H4P207 + Heat -> H5P3Oi0 + H20 (g)
where H3PO4 is orthophosphoric acid, H4P2O7 is pyro-
phosphoric acid, and H5P3O10 is tripolyphosphoric acid.
At an SPA concentration of about 70% P2O5, the
conversion of H3PO4 to other forms is of the order of 25%-
45%.
For concentration from 54% to 70% P2O5, about 1
tonne of high-pressure steam (about 2.7 MPa pressure
and 230°C temperature) is required per tonne of P2O5.
Power requirements are about 24 kWh/tonne of P2O5.
When a Dowtherm heat transfer medium is used, the
fuel requirement is about 2.7 GJ/tonne of P2O5,
Several types of evaporators may be used for SPA
production, but the most popular is a forced-circulation
system (Figure 11.25) developed by the Swenson
Evaporator Co. In production of superphosphoric acid (69%-
72% P2O5) by concentrating wet-process acid, most of
_the_fluorine_is_volatilized so that the acid contains only
0.2%-0.3% F. By adding reactive silica during
evaporation to enhance fluorine volatilization, the fluorine
content can be further decreased to about 0.1%. Such acid
is suitable for the manufacture of animal-feed
supplement products, such as dicalcium phosphate or
ammonium phosphate, and is used for that purpose. Other
advantages of superphosphoric acid are:
a. Savings in freight per unit of P2O5 compared with
54% acid.
b. Sludge is eliminated. The polyphosphoric acids
sequester most common impurities; however, in some
acids, titanium or magnesium pyrophosphates may
precipitate,
a Superphosphoric acid is much less corrosive than acid
of lower concentrations.
d. Superphosphoric acid is suitable for production of
clear liquid fertilizers (ammonium polyphosphate
solutions) because the polyphosphate sequesters
impurities that otherwise would precipitate upon
ammoniation.
e. Superphosphoric acid is suitable for production of
clear liquid fertilizers with micronutrients because of
the ability to sequester metal ions.
332
Water
/;
E-3
T-2
KVE
h-, U=D
■Q-
54K PED5
Clarlfler
^r^
To mi- ejector
c=>
£
To hot we I{
i=>
Water out
Coolino water
<rs
T-4
-£T
72/i P£D5
acid
storage
Legendi
H-l Dowthern heater or stean boiler
T-S Surge tank
E-3 F.c, evaporator
T-4 Cool 1ng tank
Figure 11.25. Swenson System for Wet-Process Superphosphoric Acid.
The main disadvantages of superphosphoric acid are
the energy requirement, corrosion in some types of
evaporators, and high viscosity. The viscosity depends
on temperature, concentration and impurity content;
some superphosphoric acids must be heated to 60°C or
higher to permit pumping with centrifugal-type pumps.
An example of viscosity variations due to impurities and
temperature is shown in Figure 11.26,
The compositions of superphosphoric acids produced
from several types of phosphate rock are shown in Table
11.25.
11.4 Shipment of Phosphoric Acid
Until the early 1970s, phosphoric acid trade was
largely confined to sales between companies in the
United States and trade among countries in Western
Europe. During the period 1973 to 1978 the volume of
merchant-grade phosphoric acid more than tripled from
1.03 million tonnes of solution in 1973 to more than
3,5 million tonnes in 1978. Since 1978 world trade in
phosphoric acid has continued to expand; annual trade
volumes increased in each subsequent year until 1985
when trade was reduced to 80% of the previous year's
1,000,000
500,000
200,000
100,000
50,000
20,000
10,000
5,000
2,000
1.000
70% (phosphorus pentoxide
(S.5i%Jmpulities;.FIiiorine,..
s.Sulfurtrioxide, Aluminum oxide,
E(nd Ferrib oxide):
72% Phosphorus pentoxic
(5.6 % impurities: Fluorine,
TSfulffiflrtoxideVATumm
and Fjerric oxjde)
20 40 60 80 100 120 140
(-7) (4) (16) (27) (38) (49) (60)
Temperature, degrees F (degrees C)
Figure 11.26. Effect of High Impurity Content
on Viscosity of SPA.
333
Table 11.25. Chemical Composition of Superphosphoric Acids
Type of Rock
Calcination
Total P2Q5 %
Ortho P205 %
Fe203, %
A1203, %
F,%
S03 %
MgO, %
Color
Polyphosphate content,
% of total P2P5
Florida
No
72,9
31.3
2.2
1.8
0.3
2.0
0.3
Black
56
Western
U.S.A.
Yes
69.5
535
0.9
2.5
0.5
2.1
0.3
Green
23
North
Carolina
Yes
71,2
37.6
1.4
1.3
0.4
3.4
0.6
Green
47
Morocco
No
72.4
25.1
0.6
0.4
0.1
2.7
1.1
Green
65
Togo
No
73.0
35.3
1.9
0.9
0.1
1.7
0.1
Dark
52
Taiba
No
72.1
27.1
2.4
0.5
-
3:3
0.1
Dark
62.5
level as a result of the recession in fertilizer markets. In
1987, however, trade reached a new high of 6.25
million tonnes as demand for downstream phosphate
fertilizers resumed its increase. Seaborne trade accounted
for more than 85% of merchant-grade acid trade in
1987, After 1987 the level of trade became rather stable
with some limited fluctuations. In 1992 world trade
totaled 3.7 million tonnes P2O5 (about 7 million tonnes
solution) and in 1993 - 3.3 million tonnes P2O5 (about
6.2 million tonnes solution),-Morocco was-the-largest-
phosphoric acid exporter in 1993 - 1.4 million tonnes
P205 (43.5% of total), Tunisia - 0.5 million tonnes P205
(15.0%), and United States - 323.5 thousand tonnes
P2O5 (the sum of merchant-grade acid and super-
phosphoric acid, 9.8%). In 1993 the main importers
were China - 1.1 million tonnes P2O5, France - 0.27
million tonnes P205, and Turkey - 0.21 million tonnes
P205 [241.
Advantages of phosphoric acid as a source of P2O5
are versatility, rapid loading and unloading of ships, and
high concentration. Phosphoric acid may be used to
produce any desired phosphate or compound fertilizer
to meet local needs; TSP or ammonium phosphates are
less versatile .
Most of the acid shipped overseas has been of 54%
P2O5 concentration although some "superphosphoric"
acid, 69%-72% P205, has also been shipped.
Compared with importing raw materials, 1.0 tonne
of P2O5 as phosphoric acid requires shipment of only
1.85 tonnes of 54% P205 or 1.43 tonnes of 70% P2O5
acid versus about 4.3 tonnes of raw materials (3.3 tonnes
phosphate rock plus about 1 tonne of sulfur).
Rapid loading and unloading decrease costs by saving
labor, decreasing port time, and decreasing congestion
in ports. Handling of phosphoric acid (or any liquid) is
dust free, thereby avoiding atmospheric contamination
by dust and minimizing losses.
Some disadvantages are the requirement for specially
equipped ships and special terminals with pumps and
storage tanks at both shipping and receiving points. The
need for further processing by the importer limits the
market to countries that have sufficient demand to
warrant such facilities.
Phosphoric acid for shipment should be relatively free
of sludge-forming solids, preferably less than 1%. To
meet this requirement the acid usually must be clarified,
as discussed previously in this chapter. The amount of
sludge depends on the composition of the phosphate
rock and the phosphoric acid production process and,
in some cases, clarification is unnecessary.
Two means of protection against the corrosion of tank
walls are currently in common usage:
• the lining of mild steel tanks with sheets of self-
vulcanizing chloroprene - based rubber;
• the lining of mild steel tanks with a plating of
molybdenum-alloyed stainless steel (mainly 317L) or
constructing the tank itself entirely from this material.
Trends in choice of containment system are difficult to
discern since both have their merits and drawbacks. In
general, the cheaper construction cost, anticipated long-
term employment in phosphoric acid, and restrictive
shipping schedules have made vessels with rubber-lined
tanks more appealing to the producer-exporter while
the cargo flexibility of stainless-steel plating has proved
attractive to the independent parcel tanker owners.
Approximately 2.2 million tonnes of world shipping
capacity (stainless steel and rubber-lined tanker ships)
334
was available by the late 1980s for the transportation of
phosphoric acid (although phosphoric acid obviously
competes with other cargoes, such as acetic and nitric
acid, phenol, ethanolamine and formic acid for space in
stainless tanks)- Rubber-lined tanks can carry only
phosphoric acid; at the end of 1987, stainless-steel capacity
amounted to some 94% of the total 125]. For long
distance shipment, large vessels are preferred, up to
40,000-tonne capacity.
A report issued by 1FA in 1991 lists 270 ships that
are suitable for transport of phosphoric acid (and other
corrosive liquids); cargo capacities range from 500 to
39 000 tonnes. Table 11,26 shows the number of ships
in various capacity ranges.
Table 11.26. Shipping Potential for Phosphoric
Acid
Cargo Capacity
in Tonnes
950 - 2,000
2,001-5,000
5,001 -10,000
10,001 - 20,000
20,001-30,000
over 30,000
Total
Number of Ships
17
70
90
46
31
--— -16--—-
270
Under the International Maritime Organisation QMO)
bulk chemical code, merchant-grade phosphoric acid
requires a moderate degree of containment due to its
corrosive nature and its high specific gravity (typically 1.7).
In addition, a vessel must have a double bottom and
wing tanks on the side if the tank section is to be used
for acid. Because impurities in the acid tend to form a
thick, viscous sludge, which is difficult to remove, tanks
used for transport (and storage) must also be equipped
with agitators to keep the acid in motion.
Superphosphoric acid is usually heated during transit
to avoid a long period of reheating prior to discharge;
thus, tankers for SPA transportation require heating
equipment.
FerrJlizantes Mexicanos (FERTIMEX) was the first
phosphoric acid producer to invest in its own ships with the
acquisition of a 23,400-DWT vessel in 1968, but the
fleets of Marphocean, the acid shipping arm of OCP,
Morocco, and Tunisia's Gabes Chimie Transport are of
greater significance today. There are other captive
phosphoric acid fleets, among others in Brazil, India, the
United States (Occidental), and the Commonwealth of
Independent States.
Three major chemical ship operators dominate the
noncaptive fleet for phosphoric acid transportation, Stolt-
Nielsen, Odfjell-Westfal Larsen, and Jo Tankers together
operated over one-half of some 1.2 million tonnes of
stainless-steel capacity, i.e., potential phosphoric acid
carrying capacity, at the end of 1987.
Freight rates for ocean shipment of phosphoric acid
are not published; the larger cargoes are moved under
long-term contracts in custom-designed vessels. It is_r_ea^_
sonable to assume that freight costs are higher for
phosphoric acid than for bulk solid cargoes because of the
special construction required. A study made in the past
assumed that the cost would be 40% higher for a short
haul (north Africa to northern Europe) and 25% higher
for a long haul (United States to India). Now, because
there is a much larger number of ships, the differential
may be lower. Obviously, the storage capacity at
terminals must be at least equal to the size of the largest
shipment although ships may load and unload at more than
one terminal. A survey issued by 1FA in 1991 listed 124
maritime terminals with an aggregate storage capacity
of 3.0 million tonnes.
For construction of storage tanks, rubber-lined steel is
common although stainless-steel linings may be used. In
some cases, ponds or lagoons are used for storage. The
-ponds-are-Iined-with.heavy. sheets of rubber or plastic
underlaid with gravel with drainage to a sump so that
any leakage can be detected and returned to another
pond. One such installation near Tampa consisted of
four ponds with a total capacity of 11,000 tonnes. The
ponds had inflatable plastic covers to protect them from
rain or other contamination. Most storage tanks have
facilities for agitating the acid occasionally to prevent
settling of solids.
It is difficult to compare the terminal cost for
phosphoric acid with that for solid products such as triple
superphosphate (TSP) or monoammonium phosphate
(MAP). The cost of storage facilities for the same
number of tons of solids (30,000 tonnes) has been estimated
to be about 40% of the cost for phosphoric acid [261.
However, a substantial investment in mechanical
equipment would be required to reclaim bulk solids from
storage and convey them to a ship. In addition, a substantial
amount of labor would be required for operating the
equipment; whereas, loading and unloading costs are
negligible for phosphoric acid. For a developing-coun-
try receiving terminal that may not be well equipped
with mechanical devices, the total of unloading and port
storage costs may well be higher for solids. On balance,
it seems likely that overall terminal storage and
handling costs may be about the same for acids as for bulk
solids.
335
11.5 Use of Byproduct Gypsum
In the production of wet-process phosphoric acid, 4.5 -
5.0 tonnes (dry basis) of byproduct gypsum is produced
per tonne of P2O5 recovered as phosphoric acid. The
global output of 40 million tonnes P2O5 per year in the
form of wet-process phosphoric acid is equivalent to
the production of about 150 million tonnes of
phosphogypsum, of which only about 15% is reused.
Phosphogypsum retains at least 20% of free water by
weight. The disposal of this material as a waste product
is discussed in Chapter 19. This chapter will briefly
review ways for using the byproduct. The principal means
for using phosphogypsum are to:
• Make ammonium sulfate by reaction of the gypsum
with ammonia and carbon dioxide (discussed in
Chapter 8).
• Make cement and sulfuric acid by calcining the
gypsum with coke and clay or shale (discussed in section
11.1).
• Make plaster or plasterboard for building materials or
make pressed or cast blocks for construction purposes.
• Use in cement as a set retardant.
• Use as a fertilizer filler.
• Use for direct application to farmland when the soil
requires it.
11.5.1 Use for Building Materials
Plaster consists mainly of gypsum that has been
dehydrated to hemihydrate (CaS04 • 1/2 H20) under
carefully controlled conditions so that it will rehydrate rapidly
when mixed with water, The dehydrated gypsum
usually is finely ground and sometimes mixed with a filler
before use. Phosphogypsum must be purified for this
use: the extent of purification depends on the amount
and character of the impurities and how the plaster is to
be used.
When plaster is used as a coating on interior walls, a
bright white color is often desired. Organic impurities
originating from some phosphate rocks may cause an
undesirable dark color. Some phosphogypsum may be
purified sufficiently by slurrying in water and passing the
slurry through a hydrocyclone to recover the coarser
fraction; the undersize has a high impurity content and
is discarded. When the gypsum is sufficiently pure, simple
washing to remove residual acid may be sufficient. The
last trace of acid may be neutralized with lime and the
wash water separated by filtration.
For wallboard production, rapid setting is especially
necessary, and phosphogypsum with a high P2O5
content is unsuitable. Gypsum produced by a hemihydrate-
dihydrate process usually has a sufficiently low P2O5
content for this purpose.
Aside from impurities, the main disadvantage of
phosphogypsum for use as plaster is the high moisture
content, which results in a high fuel cost for drying. For
this reason there has been comparatively little use of
phosphogypsum for building materials in countries where
natural gypsum is abundant. In Japan, where there are
no domestic supplies of natural gypsum, phosphogypsum
has long been used as a plaster and cement additive.
More recently the rising cost of environmentally accept"
able disposal methods has caused some European
countries to undertake utilization. The literature on the subject
of production of plaster products from phosphogypsum
is voluminous.
In general, the processes consist of purification of
phosphogypsum including, in some cases, the addition
of chemicals such as lime to neutralize acidity, thermal
treatment to convert gypsum to hemihydrate or
anhydrite or some combination of the two, and preparation
for the market, which may include grinding or
agglomeration and, in some cases, drying-
11.5.2 Plaster - Board Products
About 14 million tpy of gypsum is used for making
plaster or products based on plaster.
—-Hemihydrate-exists in two crystalline forms. The
alpha form is produced when wet phosphogypsum is
heated under pressure in an autoclave to about 130° -
160°C. The beta form is prepared by drying and
calcining at about 140°C under controlled conditions. Either
form can be used for making plaster products, but the
alpha form produces denser and harder plaster. Most
calcination processes are likely to produce a mixture of
beta hemihydrate and anhydrite, but such mixtures are
acceptable for most plaster uses and may be preferred
for some.
Several processes for making plaster products from
phosphogypsum are known, Some of these processes
were used commercially in several European countries.
The C&F Chemie process was used in France in a plant
of 130,000-tpy capacity mainly to make plasterboard.
Phosphogypsum was wet screened to remove large
particles such as quartz, washed to remove soluble and
organic impurities, neutralized with lime water, and
dewatered by filtration. It was then dried and calcined in
a series of three cyclones with hot air and ground to a
fine powder. Another process, developed by Rhone-
Poulenc, was used in two plants in France with a total
capacity of about 300,000 tpy.
Purification procedures depend on the character of
the phosphogypsum; a minimum treatment involves
336
separation of larger particles, washing to remove soluble
impurities, neutralization with lime, and dewatering by
filtration or centrifuging. For phosphogypsum with more
impurities, repeated washing with slime removal or
flotation may be used. The purified material is dried and
calcined in one step or two. An advantage of the two-
step process is that some of the dried phosphogypsum
can be removed after the first (drying) step for use as
cement additive, Either a direct-fired calciner or a
fluidized-bed calciner heated with hot air may be used.
The Knauf processes were offered by the West
German company, Gebrueder Knauf Westdeutche
Gipswerke, Three different processes were used in two
plants in Germany and one in Belgium with a total
capacity of nearly 1 million tonnes of various plaster
products including gypsum partition blocks. The three
processes differed mainly in the degree of purification.
For example, one of the processes received hemihy-
drate from the Central Prayon process, which is already
quite pure. The extent of purification is minimized by
additives that precipitate phosphates in an inert form.
This reaction is slow and is carried out in a reaction silo
after partial dehydration of the dihydrate. One unusual
feature is that products intended for construction
plaster are pelletized in a pan granulator to a particle size of
at least 20% plus 0.2 mm after adding a small amount
of water to rehydrate some of the hemihydrate. This
coarse particle size is preferred for construction plaster.
The Centre d'Etudes et de Recherches des Phosphates
Mineraux (CERPHOS) process was used in a plant of
30,000-tpy capacity in Senegal. It appears to be very
similar to the CdF Chemie process except that more
extensive purification of the phosphogypsum was used,
and this involved wet screening, flotation, two washes,
and calcium carbonate addition. The product was dried
with heated air in a flash dryer and calcined in an
indirect-fired kiln.
The 1C1 process was used in two large plants in
England, but both were closed because of difficulties
resulting from changes in composition of the phosphate rock.
The process used standard methods of washing and
neutralization to purify the phosphogypsum followed by
calcination to beta hemihydrate. The company also
developed a wet-phase dehydration process to produce
alpha hemihydrate, but it was not used commercially.
Other processes, not known to be in commercial use,
have been developed by FC1 (India) and Allied Chemical
(United States). The latter process, which is intended
specifically for plasterboard manufacture, includes the
unusual feature of neutralization of acid components of
the phosphogypsum with ammonia.
Processes used in Japan for making plaster products
are influenced by the prevalence of hemihydrate-
dihydrate phosphoric acid processes that produce an
unusually pure gypsum; therefore, the purification step
can be simplified.
From the above brief summary, it is apparent that
processes to make plaster products by the dry (beta
hemihydrate) route may vary widely depending on the
impurity content of the phosphogypsum which, in turn,
depends on the composition of the phosphate rock and
the process used to convert it to phosphoric acid. The
general tendency toward use of lower-grade rocks is likely
to result in more complicated phosphogypsum
purification processes. A substantial portion of the
phosphogypsum may be lost in the purification process; the
recovery may be as low as 70%.
For the above reasons process requirements vary
widely, but those given in Table 11.27 as average
requirements for the Rhone-Poulenc process may be
illustrative [27],
The only known commercial process for producing
alpha hemihydrate from phosphogypsum is the Giulini
process that was developed in West Germany [28] and
was used in two plants in that country and one in
Ireland. As mentioned previously, alpha hemihydrate is
formed by dehydration of gypsum in an aqueous
suspension in an autoclave.
The purification step of the Giulini process, as with
otherprO"cesses7~depends on the impurity level of the
incoming phosphogypsum and the type of plaster
product to be made. It may consist of washing or flotation or
both, After purification, the gypsum is pumped to an
autoclave as a slurry, which is operated at 120°C and a
pH of 1-3. The temperature is maintained by injection
of steam. Dehydration and recrystallization occur in the
autoclave, releasing cocrystallized impurities (mainly
phosphate), which dissolve in the liquid phase. The size
and shape of the alpha hemihydrate crystals that are
formed in the autoclave are important and are controlled
by additives. The slurry is withdrawn from the autoclave
continuously and sent to a filter where the crystals are
washed and dewatered to 10%-20% moisture. The
filtrate contains an appreciable amount of P2O5 and may
Table 11.27. Consumption Figures in Gypsum
Plaster Production
Inputs
Phosphogypsum
Lime
Electric power
Water
Fuel oil
Units/t of Plaster
kg
kg
kWh
m3
kg
Consumption
1,500
5-10
50
3
45
337
be returned to the phosphoric acid plant. The treatment
of the wet crystals from the filter depends on the desired
end product, Cast building blocks are produced by
adding a controlled amount of water to the filter cake and
pouring the slurry into molds where it solidifies as the
hemihydrate rehydrates to dihydrate. For production of
dry plaster powder, the crystals must be dried and ground
after which the powder can be stored for use as
plasterboard or various other plaster products.
The main process requirements per tonne of alpha
hemihydrate are given in Table 11.28. If a dry product
is required, an additional 10 kWh of electric power and
200,000 kcal of fuel are needed per tonne of product.
Table 11.28. Consumption of Inputs Per Tonne
of Alpha Hemihydrate
Inputs
Steam (LP)
Hot water (90°C)
Process water
Electric power
Units/t
t/t
m3
m3
kWh
Consumption
0.4-0.6
0.5
2.0
25
The 1CI alpha hemihydrate process, which has not
been used on a commercial scale, is generally similar to
the Giulini process. However, it uses two autoclaves in a
series, which are operated at 150DC, and the product
crystals are separated from the liquid phase by centri-
fuging. As does the Giulini process, it makes use of
crystal modifiers to control the size and shape of the crystals.
Plaster blocks are usually cast with smooth faces of
about 1/3 square meter and 75 to 100 mm thick. They
are tongued and grooved to allow a smooth-surfaced
wall, to be constructed using plaster "glue" to bond them
together. The blocks have limited load-bearing capacity
and are generally used for internal walls within framed
buildings. In Europe there were three commercial
operations using phosphogypsum for plaster blocks, but
all have been cbsed or reverted to natural gypsum.
Plasterboard consists of a sandwich of gypsum
between sheets of paper or cardboard. The thickness is
about 10 mm, and sheets of about 2 m2 are produced.
The boards are used for internal walls or ceilings,
usually nailed to a wooden frame. In Europe there is only
one plasterboard plant using phosphogypsum. However,
in Asia, notably in Japan, a large proportion of the
plasterboard is based on phosphogypsum, which is often
imported. Other plaster products, for example, spray
plaster, tunnel linings, and dental products have been
manufactured using phosphogypsum,
Most phosphate rocks, particularly of sedimentary
origin, contain minor concentrations of uranium, and
part of this passes to phosphogypsum. Uranium decays
to radium, which in turn decays to the radioactive gas
radon. Radon is released in very small quantities from
plaster products. This is of greatest concern from
plaster blocks, which contain a larger mass of plaster per
unit of wall area. For buildings having limited ventilation
radon concentrations have been detected at levels above
those considered safe. This has been used as an
argument against phosphogypsum building materials
although similar levels occur naturally in certain locations^
11.5.3 Use as Cement Additive
Introduction of phosphogypsum as an additive to
cement accounts for about 4 million tonnes per annum.
Portland cement usually contains about 5% gypsum,
which is added to control (retard) the setting time,
Phosphate, fluoride, and organic impurities in the
phosphogypsum are undesirable and should be reduced
to acceptable levels. Material from double crystallization
phosphoric acid processes is satisfactorily employed in
Belgium and Japan.
A process for treating phosphogypsum from dihydrate
processes to make it suitable for use as cement additive
(and other purposes) has been described 129]. It consists
of calcining the phosphogypsum to hemihydrate and
then rehydrating it with addition of limewater, Ca(OH)2.
Recrystallization during dehydration releases the
cocrystallized P2O5, and the lime converts the P2O5 to
inert forms. The lime also converts fluorine compounds
to inactive forms. Requirements for the process per tonne
of treated gypsum are:
Quick lime (CaO)
Fuel oil
Electricity
55 kg
45 liter
15kWh
As a variation in the process, the lime may be added to
the gypsum before calcining, which eliminates fluorine
evolution during calcining. The product may be
granulated during rehydration for convenience in handling,
11.5.4 Agricultural Use
Small amounts of phosphogypsum are used as a filler
or additive to compound fertilizers. Calcined gypsum is
sometimes added to assist in granulation or to increase
granule strength. In other cases the purpose may be to
supply sulfur for agronomic reasons. Granular gypsum
is available in some countries for use in bulk blends.
Gypsum is used in fairly large amounts on some soils
to combat the effects of salinity or alkalinity or to
reclaim soil that has been inundated by seawater. Clayey
soils tend to retain sodium from salt water; use of gypsum
338
replaces sodium with calcium. Gypsum is also a good
source of sulfur for use on sulfur-deficient soils.
Some crops, such as groundnuts, benefit from soluble
calcium in gypsum. Wet phosphogypsum is difficult to
handle and apply; the cost of drying is an economic
disadvantage that often leads to a preference for natural
■ gypsum. In dry climates the phosphogypsum can be air-
dried in the sun. Drying to about 6% moisture is
sufficient to make it free flowing-
Despite the numerous uses mentioned above, only a
small percentage of the phosphogypsum is actually used
on a worldwide basis; in most cases it seems to be
economically preferable to dispose of the byproduct in
ponds, in other land disposal areas, or in the sea.
11.6 Utilization of Fluorine
Most phosphate rocks of the fluoroapatite - type
contain a significant quantity of fluorine, usually 3%-4% F
by weight. In some cases up to 60% of this can be evolved
during the manufacture of wet-process phosphoric acid.
The remainder of the fluorine is retained in the gypsum
(depending mainly on the rock composition), and most
of the remainder is in the filter acid [30]. The fluorine is
evolved from various stages of phosphoric acid processes:
from the reactor slurry surface, in the flash cooler, and
in the concentration plant. In a dihydrate process the
proportions are: . . .
Slurry surface:
Flash cooler:
Concentration plant:
(up to 45% P205)
3% - 5%
8% -10%
15% - 20%
In hemihydrate or hemidihydate processes
(producing 45% P2O5 acid at the filter) the proportions are:
Slurry surface:
Flash cooler:
12%-15%
15% - 20%
In a typical case, about 50 kg of F is volatilized per tonne
of P205, usually as SiF4 or HF, or some mixture of the
two. The compositions of the vapors emitted from the
reaction/filtration section and the evaporator are
different. During acidulation of phosphate rock, the fluoride
is first converted to hydrogen fluoride, which subsequently
reacts with active silica to form silicon fluoride:
4HF + SiQ2 = SiF4 + 2H20
This is partially emitted as vapor in preference to
hydrogen fluoride because of its higher vapor pressure. The
remainder reacts further to form fluosilicic acid, which
remains in the product acid, or insoluble fluosilicates,
which are removed in the filter cake.
3SiF4 + 2H20 = 2H2SiF6 + SiQ2
If the silicon tetrafluoride vapor leaving the reaction
section is washed with water, this reaction will take place in
the scrubber also and insoluble silica will form. The silica
will cause scaling and eventually plug the scrubber.
Therefore, the usual procedure is to scrub with a dilute
solution of fluosilicic acid, in which silica remains in colloidal
suspension. A scrubber design, such as cyclone or ven-
turi, that is virtually free of internal obstructions, which
might become fouled, must be used in the first stage to
remove the bulk of the fluorine. A second, highly
efficient stage, such as a spray tower or tower with mov^
able packing, removes most of the remaining traces of
fluorine and avoids fouling (Figure 11.27). More dilute
vapors such as air from the hood over the first filter
stage and from the first filtrate separator can be
introduced directly into the second-stage scrubber.
About two-thirds of the fluorine in the filter acid is
volatilized when the acid is concentrated to merchant
strength (50%-55% P205). Under the conditions of high
temperature and reduced pressure obtained in vacuum
evaporators, the fluosilicic acid decomposes and both
silicon tetrafluoride and hydrogen fluoride are evolved.
■ GASES EX HASH COOLER
-MAKE-UP FSA
- CONTAMINATED FSAT0 REACTOR
-TO FIRST STAGE STORAGE TANK
- C/T GASES TO FLASH COOLER CONDENSER
- LigUOR FROM FINAL STAGE COOLER
S-lVenluii scrubber
S-2 Droplet separator
S-3Rrsl stage scrubber
S-4 Second stage scrubber
S-5 Droplet separator
T-6-T-9 Seal tanks
Figure 11.27. Norsk Hydro Licensing's Two-
Stage System for Fluorine
Scrubbing.
339
H2SiF6 = 2HF + SiF4
However, at acid concentrations of less than 50% P2O5,
more silicon tetrafluoride is evolved (creating silica in
circulated fluosilicic acid) owing to the relationship
between its vapor pressure and that of hydrogen fluoride.
At acid concentrations of 50%-55% P2O5, the molar
ratio HF : SiF4 is approximately 2, while at higher acid
concentrations hydrogen fluoride predominates [30J.
There is least danger of problems with silica deposition
in the scrubber if the HF : SiF4 ratio is at least 2, since
the only product of scrubbing will be fluosilicic acid, while
it is undesirable to allow it to exceed 2 by too much,
since the product will then contain free hydrogen
fluoride. Because the scrubbing solution used is fluosilicic
acid, it is desirable to maintain a high concentration from
the point of view of transport costs arid use of the
product. To avoid dilution by the water from the evaporator,
the scrubber, which is interposed between the
evaporator and the condenser, must be operated at a high
temperature at which water will not significantly condense.
In practice, this sets a maximum of about 18%-22%
H2SiFe on the concentration of the scrubbing medium
because at higher concentrations the equilibrium vapor
pressures of hydrogen fluoride and silicon tetrafluoride
are too high for efficient fluorine removal.
The void spray tower type of scrubber, originally
developed by Swift and Co. and further developed by Fisons
and others, is often used. The scrubber is conveniently
mounted atop the evaporator and receives vapors from
the entrainment separator, which returns any droplets
or mist particles of phosphoric acid to the acid system.
Fluorine scrubbers typically operate at an efficiency of
90%-93%; the remainder of the fluorine vapors is largely
removed in the condenser into which the vapors
subsequently pass. The condenser is usually of the barometric
direct-contact type, but after cooling the water must be
directed to a wastewater treatment installation to remove
the contamination.
Numerous processes for recovering saleable fluorine
compounds have been proposed and developed
experimentally; some of these processes are used on an
industrial scale. A description of all of these processes is
beyond the scope of this manual.
Fluorine is usually recovered in the form of an
aqueous solution of fluosilicic acid, HgSiFg. The
concentration may be as high as 20%-25%. In some countries the
fluosilicic acid is used directly for "fluoridation" of
municipal water supplies to prevent tooth decay, The acid
is shipped to various municipalities in rubber-lined rail-
cars. Salts of fluosilicic acid, such as sodium, potassium,
and ammonium fluosilicates, have various uses and can
be readily produced from the acid. Sodium fluosilicate is
used for fluoridation of municipal water supplies, but
fluosilicic acid is generally preferred.
Processes have been developed for making aluminum
fluoride (AIF3) and cryolite (NaaAlFg) from fluosilicic acid,
which are used by the aluminum industry in substantial
quantities. However, these materials must be quite pure
for this purpose; in particular, the silicon and
phosphorus must be very low. This requirement complicates
production from byproducts of the phosphate industry.
Calcium fluoride may be produced and used instead of
natural fluorspar for production of hydrogen fluoride
(HF), which is the basic material for producing
numerous organic and inorganic fluorine compounds or for
metallurgical purposes [311. There are also processes to
produce hydrofluoric acid solutions or anhydrous
hydrogen fluoride from fluosilicic acid solutions.
In general, the economics of producing chemical-grade
fluorine compounds from byproduct fluosilicic acid is
marginal to unfavorable for small phosphoric acid plants.
However, large plants may find recovery profitable.
Where several phosphoric acid plants are operating
within an economical shipping distance, the crude
fluosilicic acid may be shipped to a central point for
production of refined fluorine compounds. For more details
on fluorine use, see reference [30].
11.7 Uranium Extraction
Uranium occurs in most phosphate rocks, but its
concentration varies from deposit to deposit. Some
sedimentary rocks show notably higher concentrations than
most igneous rocks. The most uranium-rich rocks found
to date are those of Florida (up to 300 ppmw U),
Morocco (up to 230 ppmw U), and Jordan (up to 240 ppmw
U) [32,33[. In comparison, conventional uranium
deposits such as pitchblende typically have a uranium
content of 1,000-3,000 ppmw. When the phosphate rock
is acidulated, up to 80% or 90% of the uranium passes
into solution in the phosphoric acid. The exact amount
of PR acidulated depends on its characteristics and the
parameters of the phosphoric acid process employed.
Examples of the uranium contents of different phosphate
rocks and of phosphoric acids produced from them are
indicated in Table 11.29.
The first commercial plant to recover uranium by
precipitation in a sodium phosphates operation was built in
Illinois, U.S.A. in 1952. Subsequently, in 1955 IMC
built a commercial plant based on solvent extraction in
Florida; another was operated by U.S, Phosphoric
Products.
In the early 1970s, several factors stimulated new
interest in uranium recovery. Among these factors were
the growth of nuclear programs in the United States
340
Table 11.29. Typical Uranium Contents of
Phosphate Rocks and Phosphoric
Acids (30% P205)
Rock Source
Algeria
Brazil
Israel
Jordan
Morocco
Tunisia
Florida
N. Carolina
U3Os ppmw
in Rock
110-140
80
50-150
120-150
90-140
50-100
180-150
80
U3OS ppmw
in Acid
130
80
165
165
140
80
190
80
and other countries, the steep and continuing increase
in the cost of conventional hydrocarbon fuels since 1973,
and a significant increase in the capacity of individual
phosphoric acid plants. The price of uranium peaked at
about US $95/kg in mid-1978, after having remained
static at US $15.5/kg for several years until 1975.
In the early 1980s eight commercial plants in the
United States and one in Canada were recovering
uranium from wet-process phosphoric acid. At about the
same time, a commercial uranium facility was constructed
at the Chimie Rupel subsidiary-of-Societe de Prayonirr
Belgium, and others were planned in France by Rhone-
Poulenc and APC, using their own technologies, and in
Japan by a consortium headed by the Power Reactor
and Nuclear Development Corporation, using its own
process.
The technology for the commercial plants is based on
solvent extraction although other methods have been
developed. Much of the development work on solvent
extraction was done by the U.S. Government-owned
Oak Ridge National Laboratory (ORNL) in Tennessee
134,351. Most of the processes use either octyl pyro-
phosphoric acid solvent (OPPA), as in the earliest
processes in the United States, or various combinations of
solvents, developed later by ORNL, di(2-ethylheksyl)
phosphoric acid (DEPA), trioctyl phosphine oxide
(TOPO), and octylphenylphosphoric acid (OPAP).
The ORNL research program resulted in the
development of two basic processes. These processes are
similar as far as equipment is concerned, and they differ
only in the solvent used [36]. Uranium extraction is
achieved in a process that comprises two cycles (Figure
11.28). In the first cycle, uranium is extracted from
phosphoric acid with an organic solvent in five stages and
then stripped from this solvent with fresh phosphoric
acid,
Because the phosphoric acid from the stripping
section is more concentrated in uranium than the original
acid, it passes to the second cycle where extraction with
an organic solvent is again performed to separate the
uranium, which is finally recovered as U3O8. According
to the process, the solvent used in the second cycle is
the same as that used in the first cycle and is either a
synergistic combination of DEPA and TOPO in
kerosene or a mixture of mono- and dioctylphenyl
phosphoric acid (OPPA), also in kerosene [37].
The different commercial processes can be generally
divided into three categories:
1. Those using only OPPA as solvent included the IMC
and U.S. Phosphoric Products processes, but recently
only Gardinier, Inc., has used this extractant,
2. Those using a DEPA/TOPO mixture include the IMC/
Prayon, Freeport Uranium Recovery Co., Wyoming
Mineral Corp., and COGEMA-APC processes.
3. Those in which a DEPA/TOPO mixture is used in
one cycle and OPPA in another, such as the UNC
Recovery Corp. and the Earth Sciences, Inc.,
processes. Several other companies have also
considered processes of this type.
UNC Recovery Corp. developed a single-stage process
that uses an alkyl pyrophosphoric acid extractant; this
-proeess-wa5-intended for-commercial use by Prodeco
Inc., a wholly-owned subsidiary.
11.8 Purification of Phosphoric Acid
For most fertilizer production processes, purification
of wet-process phosphoric acid is not necessary.
However, there are two common fertilizer uses that may call
for partial purification:
a. "Merchant-grade" acid that is shipped by rail, barge,
or ocean vessels and is often stored at shipping and
receiving terminals should be purified sufficiently so
that formation of insoluble precipitates (sludge)
during shipping and storage is minimized.
b. Phosphoric acid to be used in the production of
liquid fertilizers, such as ammonium polyphosphate
solution, sometimes requires partial purification to
prevent formation of precipitates upon ammoniation
or during storage of the ammoniated solution.
Although ammonium polyphosphate sequesters most
of the common impurities, excessive amounts of some
impurities (especially magnesium and organic matter)
cause precipitate formation. Superphosphoric acids
usually do not form sludge, but magnesium and titanium
have been known to cause sludge-forming precipitates.
341
32% P205 (<100 ppmw organics)
l<
WET PROCESS
PHOSPHORIC
ACID PLANT
PRE-
TREATMENT
Extractant - 200 gal/m i
32% P205 uranium product
solution - 8 gal/min
0.09 lb U308/gal
URANIUM
EXTRACTION
(5 STAGES)
uranium-free P2O5
URANIUM
STRIPPING
(3 STAGES)
POST-
TREATMENT
Fe metal - 8 gal/min
(DEPA-TOPO process)
54% P205 + NaC103
(OPAP process)
Zl
EXTRACTION
SCRUBBING
Water in
To treatment
STRIPPING
. 1 Ammonia
Solvent
Ammonium carbonate
Carbon dioxide
* FILTRATION
CALCINATION
basis: 1,000 short tons/d of P205
yield - 1,000 lb/d of U308
(NH4)4U02(C03)3
u3o8
* - Solvent: 0.3 M DEPA + 0.075 M TOPO in refined kerosene
** - 32% P205, 400 gal/min (0.0017 lb U308/gal)
1- First cycle
II - Second cycle
Figure 11.28. Flow Diagram of the Oak Ridge Uranium Extraction Process.
A major fraction of sludge in most merchant-sludge
acids is the compound (Fe,AI)3KHl4(P04)8 • 4H20. It
precipitates slowly over a period of several weeks;
therefore, long storage periods are required to ensure
reasonable completion of the precipitation reaction.
In the production of sodium tripolyphosphate and
other condensed phosphates for use as builders in
detergents, the whiteness of the product and all metal ions
(without sodium and potassium) are the principal
concern. For use in human food processing and animal feed
supplement production, the content of toxic impurities
must be diminished to insignificant levels. These include
fluorine, arsenic and any heavy metals that are present
in the phosphate rock and sulfuric acid. When purified
acid is required only for the production of phosphates,
impurity removal is facilitated by neutralization, since
many impurities are rapidly precipitated as insoluble
phosphates. When it is not permissible to neutralize the
342
acid, it is necessary to rely on physical treatment such
as solvent extraction or ion exchange, with or without
chemical treatment. Phosphoric acid manufacturers
purifying phosphoric acid for sale have inclined towards
this type of treatment, usually based on solvent
extraction. In most cases when chemicals are used (e.g., in the
case of removing arsenic), they react with the impurity
alone and do not chemically alter the phosphoric acid.
11.8.1 Removal of Organic Materials
In the oxidizing and dehydrating environment of the
attack section, organic impurities tend to be decomposed
to carbon; if the rock has a relatively high organic
content, the resultant acid will be black. Two methods of
removing this discoloration include calcining the rock,
which destroys a good proportion of the organic
matter, and treating the acid with active carbon, with or
without a flocculating agent. Conducting the latter
treatment at a moderate temperature (60°-80°Q increases
the efficiency of organics removal to the extent that it
may be possible to avoid calcining some high-organic
rocks. Other techniques that have been proposed rely
on using a special flocculating agent or hydrogen
peroxide in the presence of a mixed, metal oxides catalyst.
11.8.2 Defluorination
Even if wet-process phosphoric acid is concentrated
to the superphosphoric acid stage, it still contains too
much fluorine for production of feed phosphates aL_
though the other impurity levels may be acceptable for
animal feed. For animal feed preparation, it is desirable
that the phosphorus: fluorine ratio should be at least
100 P : IF, but normal wet-process phosphoric acid
has a P : F ratio of between 15 : 1 and 54 : 1,
depending on its concentration, the composition of the rock
from which it is made, and its production conditions.
Several procedures have been proposed to remove
fluorine from phosphoric acid based on volatilization or
chemical precipitation, in the latter case with or without
other impurities. A commercial technique developed by
Occidental Chemical Co. involves feeding silica and
steam into hot 54% P2O5 phosphoric acid and
removing the volatilized fluorine compounds by scrubbing with
fluosilicic acid.
11.8.3 Solvent Processes
Precipitation- in this type of process, a large amount
of water-miscible organic solvent is added to the
phosphoric acid, which causes settling of many of the
dissolved impurities out of solution and enables the
acid-solvent mixture to be separated,
Particularly, if methanol is used, alkali metal or
ammonium ions must be present in sufficient quantities to
convert the sludge impurities into less-soluble double salts.
Other solvents that could be used include acetone,
methyl ethyl ketone, other lower alcohols, and dioxane.
Various processes of this route have been reported;
these processes include Chemische Fabrik Budenheim,
TVA (methanol/ammonia), Goulding (methanol/
potassium dihydrogen phosphate), and Rupel (methanol/
potassium chloride).
The inconvenience of this type of process is that the
phosphoric acid must be separated from a large volume
of solvent, usually by stripping, which is expensive.
Extraction - The alternative method of purifying
phosphoric acid by means of organic solvents is liquid/
liquid extraction; crude phosphoric acid is brought into
countercurrent contact with a partially or substantially
water-immiscible solvent in a series of mixer-settlers. In
general, the partition coefficient of phosphoric acid
between the aqueous solution and the solvent is very
unfavorable; thus the crude acid is usually concentrated before
processing and only a relatively small proportion of the
acid is extracted. The remaining partially depleted
raffinate, containing most of the impurities, is usually
disposed of in fertilizer manufacture.
Depending on the degree of purification required, the
extract may be washed with purified phosphoric acid
and is then usually contacted with water, into which the
majority of the acid passes. The end product is a some-
-what-weaker-but-much-purer acid than the original crude
acid and a depleted solvent phase, which is recycled.
In the Prayon process (Figure 11.29), acid
purification is carried out using a mixed organic solvent, di-
isopropyl ether (DIPE) and tri-n-butyl phosphate (TBP)
after pretreatment of the acid to remove these
impurities that affect the coefficient of distribution between
the organic and aqueous phase (F, SO4 and As). Acid
purification involves four operations: solvent extraction;
re-extraction; separation of solvent from purified acid;
and color clarification. Concentration follows
purification. Four volumes of solvent (50%-95% DIPE/5%-50%
TBP by volume) are contacted countercurrently with one
volume of acid at 5°-25°C. This yields two phases; one
is an aqueous raffinate, containing most of the
impurities, which is stripped in an evaporator to release, for
recycle, any ether it contains and to provide a raffinate
return acid stream that is sent to fertilizer-grade acid
storage. The second phase is organic and contains the
solvent and acid. The purity of acid in the organic phase
is further increased by washing this phase with water.
Re-extraction of the acid is favored by a slight
temperature increase and involves countercurrent washing
with water to produce a purified acid. The final steps in
the process are stripping to remove residual traces of
solvent, addition of a solid chemical absorbent, filtration
343
Ground Floccu[at InB
phosphate rock agent Silica Defoaner
U
C=>^
REACTION
AND
STORAGE
G
SOLIDS
SETTLING
REMOVAL -} RKfillm
Additive
^> ^
ACID PRETREATMENT
Legend'
V-l Washer
C-2 Stripper
C-3 Stripper
E-4 Evaporator
T-5 Solvent buffer vessel
ARSENIC
REMOVAL
TREATMENT
8, SETTLING
Return acid
acid
(Prayphos)
Cake
ACID EXTRACTION, COLOR REMOVAL
AND EVAPORATION
Figure 11.29. Prayon's Process for Phosphoric Acid Purification.
to remove any organic matter (which gives a yellow
discoloration), and concentration (which is effected in a
vacuum concentrator). The resultant technical acid,
Prayphos P, after defluorination gives a food-grade acid,
Prayphos P5. A pharmaceutical grade is also possible.
The firm, Albright and Wilson, is an early pioneer of
solvent-extraction technology in the United Kingdom.
Its first designed plant (40,000 tpy P2O5) began
operation in 1976. The company's second plant (90,000 tpy
P2O5), intended mainly for sodium tripolyphosphate
(STPP) manufacture, began operation in 1979. The third
plant, which came into operation in 1987, produces
food-grade phosphoric acid. All three plants are at
Whitehaven, where a wet-process phosphoric acid plant
is located. The first U.S. plant based on the solvent-
extraction process began production in 1990 at Aurora,
N.C. Owned by Purified Acid Partners, this unit is a joint
venture of Texasgulf Inc., Albright and Wilson Ltd., and
Olin Corporation. The construction costs for the unit,
which has a capacity of 109,000 tpy P2O5 of purified
acid, amounted to US $40 million 138,39].
The industrial phosphoric acid used in Aurora requires
no purification for organics or sulfate removal, but
fluorine must be removed by further evaporation in the
presence of active silica.
In the Albright and Wilson process the impure acid is
concentrated to the level of 74%-80% of total acidity (%
H3PO4 + % H2SO4, 54% - 57% P2O5) and then
clarified. Next, it is contacted with 1.2-1.6 parts by weight
of methyl isobutyl ketone (MIBK) in a reactor to give an
organic extract of phosphoric acid while leaving most
of the impurities and a proportion of the P2O5 in the
aqueous phase or raffinate (Figure 11.30).
Multistage countercurrent extraction is carried out in
a vertical cylindrical column equipped with rotating-disc
agitators and stator rings. Acid enters near the top of
the column and solvent near the bottom; the acid-laden
solvent leaves the top of the column and a dense
aqueous phase is discharged at the bottom. The organic
extract, which contains 50%-60% (by weight) of P2O5, is
scrubbed with a relatively pure aqueous solution of
phosphoric acid in a multistage countercurrent scrubbing
system, using 0.3-0.5 units of P2O5 for each unit of P2O5
in the extract,
The used scrub liquor passes back to the first stage,
the extraction column, where it enters near the top and
emerges in the aqueous impurity-containing raffinate.
The raffinate is then stripped to recover the MIBK, and
the impure phosphoric acid is used in the phosphatic
344
Solvent
s
EXTRACTION
*
SOLVENT
RECOVERY
BACKWASH
Water
i
.
ACID
REEXTRACTION
Acid
'■
SOLVENT
RECOVERY
Raffinate Purified
to fertilizer phosphoric
manufacture acid
Figure 11.30. Purification of Wet-Process
Phosphoric Acid by Solvent
Extraction.
fertilizers. About 0.4 tonne of P2O5 is found in the
raffinate for each tonne of P2O5 in the impure feed acid.
The solubility of M1BK in phosphoric acid is low, less
than 2%, so that little steam is required for stripping,—
The scrubbed organic extract is re-extracted with water
in a two-stage system to give the required purified
phosphoric acid product, which also needs stripping for
solvent removal. In addition, evaporation is necessary to
concentrate the pure acid for sale. The MIBK solvent,
after P2O5 recovery, is recycled to the extraction stage.
However, the solvent gradually accumulates impurities,
and occasionally a quantity is removed from circulation
for distillation; which consists of evaporation and
condensation without reflux,
When there are no possibilities to use raffinate in
fertilizer production, it must be strongly acidified with
sulfuric acid before additional extraction; most of the P2O5
is driven into the solvent phase. Impurities remain in
the acidified aqueous phase, which is neutralized with
lime before disposal as waste.
11.9 Production of Phosphoric Acid Using
Acids Other Than Sulfuric
Phosphate rock can be dissolved by several organic
and inorganic acids to produce phosphoric acid. The
use of nitric acid for this purpose is described in
Chapter 13. Commercial nitrophosphate processes produce
phosphoric acid that contains nitrates; hence, these
processes are used to produce compound NP or NPK
fertilizers. It is technically feasible to produce phosphoric acid
that is substantially free of calcium or nitrates by
separation methods involving solvent extraction. One such
process using tertiary amyl alcohol as the solvent was
developed in Finland and described by Lounamaa [40];
however, no commercial use has been reported..
Several processes using hydrochloric acid have been
developed or patented, but only that developed by the
Israel Mining Industry (IMI) has been used commercially
[41]. The IMI process has been described in a UNIDO
publication [42]. A brief description of the main stages
of the process follows.
1. Dissolution of phosphate rock by hydrochloric acid,
which results in an aqueous solution of calcium
chloride and phosphoric acid;
2. Liquid-liquid contacting in a number of solvent
extraction steps to obtain a solution of substantially pure
phosphoric acid; and
3. Acid concentration to obtain 95% H3P04 (69% P2Os).
The raw materials and reagents used are as follows:
1. Phosphate rock (any commercial grade). The P2O5
recovery is more than 98%.
2. Hydrochloric acid for acidulation can be used as a
.spj.utiojipf^20_%_HCI or higher or in gaseous form by
combining absorption with reaction. For economic
reasons, concentrated acid is preferred because most
of the water accompanying the acid must be
evaporated in a later stage of the process. HCI
consumption is dependent on the composition of the rock.
Acid consumption for Florida rock of 34% P2O5 is
about 2 tonnes HCI (calculated as 100%) per tonne
ofP205,
3. Solvent. Several solvents can be used for extraction.
Those preferred are technical isoamyl alcohol (IAA),
n-butanol, or a mixture of both. Solvent makeup is 4
kg/tonne P2O5.
4. Process water.
5. Auxiliary reagents. Depending on the type of rock
and the method of separation of insoluble residue
from dissolution liquor, minor quantities of filter aids
or flocculating agents may be required.
11.9.1 Dissolution and Mechanical Separation of
Insoluble Residue
The dissolution of phosphate rock is essentially
decomposition of fluorapatite by HCI according to the
following equation:
CaioF2(P04)6 + 20 HCI -* 2 HF + 6 H3PO4 + 10 CaCl2
345
Other acid-soluble components of the rock, such as
CaCC>3, decompose simultaneously.
The rock is dissolved by hydrochloric acid. The
insoluble residue amounts to a small percentage of the
rock feed and consists mainly of silica, silicates, and
insoluble organic matter. The insoluble matter can be
separated from the dissolution liquor by filtration, followed
by washing of the cake or by sedimentation in a
thickener, followed by countercurrent decantatjon washing
of the sediment. The choice of the proper method of
separating solids depends on the character of the
insoluble residue and on economic considerations. The
dissolution liquor is fed to the subsequent section.
Figure 11.31 shows a typical flowsheet of the HCI
phosphoric acid process.
11.9.2 Liquid-Liquid Contacting
This stage consists of several operations: extraction,
purification, washing, and stripping.
Extraction - Extraction is performed by a counter-
current contact of dissolution liquor with the selected
solvent. Phosphoric acid transfers selectively from the
aqueous dissolution liquor to the organic solvent phase;
the resultant extract and calcium-chloride brine (raffinate)
contain substantially all the impurities, such as fluorine
and iron.
Purification - The solvent extract, which contains
small amounts of Ca++ and some other impurities, is
purified further by countercurrent contact with an
aqueous phase.
Washing - The acid of the purified extract is
transferred into water. The solvent that leaves this stage is
virtually free of acid.
Stripping- The acid-free solvent stream extracts the
residual acids present in the raffinate and is recycled to
extraction. The spent calcium-chloride brine is stripped
by steam to recover any dissolved solvent,
Phosphate ^^
rock
SOLVENT RECOVERY
Figure 11.31. Flowsheet of the IMI Phosphoric Acid Process (HCl-Route).
346
11.9.3 Acid Concentration
The dilute aqueous acid emerging from washing
consists of an aqueous solution of HsPOq, HC1, and some
dissolved solvent. This solution is concentrated to 95%
H3PO4, which is the end product, The separation of
H3PO4 from other components of the solution is
essentially a distillation operation; this permits a full recovery
of the minor quantity of solvent that is dissolved in the
aqueous phase on washing and of the HCI, both
maintained in closed cycle in the process.
The main requirement of this operation is heat
economy, and a multiple-effect evaporator is used to
achieve this. The amount of steam used is less than 0.5
tonne/tonne of water evaporated. The complete absence
of dissolved solids in the solution being concentrated
permits the maintenance of high heat-transfer
coefficients. All of the volatile streams from the system are
recycled to the previous steps of the process.
11.9.4 Solvent Recovery From Spent Calcium
Chloride Brine
The residual brine leaving the stripping stage contains
a small amount of dissolved solvent, which must be
recovered for economic reasons. The solvents used form
an azeotrope with water on rectification so that the
simplest system to be applied is steam stripping. The costs
of this operation are reduced by the recovery of heat
from the brine leaving the system. The recovered
solvent is recycled to the liquid-liquid ..contacting, section,-,
and the brine is discarded.
11.9.5 Construction Materials
In those parts of the process where solvent is present,
acid-resistant construction materials that are also
solvent resistant are required. These parts included the
liquid-liquid contacting section and a part of the sections
where acid is concentrated and where solvent is
recovered from the brine.
Rubber-lined steel is the least expensive material for
the dissolution and mechanical separation of insoluble
residue. In the liquid-liquid contacting section, rigid
polyvinyl chloride (PVC) is very satisfactory. In the parts of
the system operating at elevated temperatures,
impervious graphite can be used for the heat exchangers. Other
construction materials include thermosetting resins and
lined steel.
11.9.6 Quality of HCl-Route Phosphoric Acid
HCl-route phosphoric acid is much cleaner than wet-
process acid, and its analysis is similar to that of thermal
acid {Table 11.30). By making slight adjustments in the
process, food-grade acid can be obtained. The
composition of wet-process acid is dependent on the rock as
raw material; whereas, almost the opposite is true for
HQ-route phosphoric acid.
Table 11.30. Comparison of Analysis of HCl-
Route Phosphoric Acid and Wet-
Process Acid
Components HCI Route, % Wet Process,
HsPCm
p2o5
Heavy metals as Pb
CaO
Fe203
AI2O3
Mg
H2SO4
SiQ2
F
95
69
0.002-0.01
0.008-0.04
0.003-0.05
traces
traces
traces
traces
traces
69-77
50-56
0.5-1.5
0.014-0.35
0.86-2.3
0.3-2,45
0.0-0.8
1.0-5.6
0,04-0.10
0,25-1.10
11.9.7 Capital Investment
The capital investment required for a plant may vary
from location to location. However, for comparative
purposes, it will be noted that the capital cost for the HCI
process is about 35% higher than for the standard
(H2SO4) wet process when production of the acids is
excluded.
If_iLCl_wer.e_ayaiIable__as..a.byproduct from another
process, the capital cost would be lower than for a wet-
process plant including H2SO4 production facilities,
However, when using byproduct HCI, the scale of the
operation would be limited by the amount of byproduct
HCI available.
11.9.8 Process Requirements
Operating costs may be estimated from the process
requirements, which are given in Table 11.31 for a plant
of 100-tpd capacity.
Table 11.31. Process Requirements for the
HCl-Based Process
Inputs
Phosphate rock (34% P2O5)
HCI [as 100%)
Solvent (IAA)
Steam
Electric power
Cooling water
Process water
Labor
Units/t
of P205
kg
kWh
m3
m3
workhours
Consumption
3.0
2,0
4.0
4.3
100
165.5
3
1.0
347
If the plant is located adjacent to the sea, disposal of
CaC^ into the sea may be acceptable and economical;
for an inland location disposal may be difficult and
expensive.
HCI-route phosphoric acid has certain disadvantages
as compared with wet-process acid. Its production is
economic only in places where HCI is available or where it
can be produced at a moderate price. Transport of HCI
in the form of an aqueous solution of perhaps 33% HCI
is possible only in pipes or railcars lined with rubber,
PVC, or similar materials.
However, HCI-route phosphoric acid has some
advantages over wet-process acid. Unlike wet-process acid,
it contains no scale-forming components, and its
composition and quality are practically independent of the
type of phosphate rock used. Superphosphoric acid
(70%-72% P205) can easily be produced from HCI-route
phosphoric acid.
HCI can be used where it is available as a byproduct.
This is important for developing countries producing
NaOH, where there is no captive market for the
chlorine that is produced simultaneously. Byproduct
hydrochloric acid is sometimes available from other sources
and may even create disposal problems. In such cases
the production of phosphoric acid by the acidulation of
phosphate rock with hydrochloric acid can be
advantageous if the quantity of the byproduct is adequate for an
economical scale of operation and disposal or use of
the calcium chloride brine is economically feasible.
An interesting possible source of hydrochloric acid is
through calcination and hydrolysis of magnesium
chloride according to the following equation:
MgCl2 + H20 = 2HCI + MgO
Magnesium oxide could be useful for production of
refractories.
Another possible source of hydrochloric acid is from
the production of potassium phosphate from
phosphoric acid and potassium chloride, which is described in
Chapter 15.
At present the only plants using the HCI process are
relatively small ones, and most of the product is used to
make industrial phosphates rather than fertilizers.
11.10 Phosphoric Acid Production by the
Electric Furnace Process
The first step in the production of furnace acid is to
produce elemental phosphorus in an electric furnace
(Figure 11.32). Phosphate nodules or other lump
Phosphate
mater i a Is
CO gas to kiln
Legendi
M-l Mixer
BC-2, BC-6, BC-11 Conveyors
G-3 Roll compactor
CR-4 Breaker
SC-5 Screen
X-7 Grate calclner
H-8 Rotary ki In
C-9 Fluorine scrubber
E-10 Cooler
H-12 Electric furnace, steel shell
S-13 Electrostatic olust precipitator
T-14 Phosphorus sunp
E-15 Phosphorus condenser
Figure 11.32. Manufacture of Elemental Phosphorus.
348
phosphate material, silica pebble, and coke are mixed
and fed to the furnace. The electric current that is
supplied to the furnace through carbon or graphite
electrodes fuses the rock and silica, and the carbon in the
coke reduces the phosphate. A mixture of phosphorus
vapor and carbon monoxide gas is withdrawn
continuously from the furnace. The phosphorus is condensed
to a liquid that is converted to phosphoric acid in a
separate plant, often located far from the phosphorus plant,
Molten calcium silicate slag and an iron-phosphorus
compound known as ferrophosphorus are tapped from
the furnace periodically. The following equation
represents the principal reaction in the furnace:
CaioF2(P04)6 + 15 C + 6 SiQ2 -> 1.5 P4 + 15 CO +
3(3CaO • 2SiG>2) + CaF2
One advantage of the furnace process is its ability to use
low-grade phosphate rock provided that the principal
impurity is silica. Iron oxide and alumina are much less
objectionable in the furnace process than in the wet
process. Siliceous phosphate rock containing about 24%
P2O5 is used in several plants; such rock may be
obtained at a very low cost in some locations. Rock
containing as much as 7% AI2O3 is acceptable.
If lump or pebble rock of suitable size (about 0.6-4.0
cm) that is resistant to decrepitation on heating is
available, the cost of agglomerating the charge may be
avoided. However, such rock is seldom available; "there7"
fore, the rock usually is agglomerated and calcined or
sintered before charging it to the furnace. Carbon
monoxide gas, which is a byproduct from the furnace, is the
usual fuel for the calcination. Even so, this step is
expensive.
The recovery of P2O5 as elemental phosphorus
usually is in the range of 86%-92% of that charged to the
furnace. The loss of P2O5 in the slag is about 3%. From
2%-8% of the P2O5 charged is recovered as
ferrophosphorus, which contains about 23% phosphorus, 70%
iron, and small amounts of manganese, silicon, and other
metallic elements, depending on the charge
composition. The amount of ferrophosphorus formed depends
on the iron oxide content of the charge. The
ferrophosphorus is sold to the steel industry, but the
income only partially compensates for the loss of
phosphorus production.
Of the phosphorus recovered as elemental
phosphorus, about 5% is in the form of sludge, even after a
series of settling steps to separate sludge from clean
phosphorus. This sludge phosphorus may be recovered
by burning it separately to produce impure phosphoric
acid, by distillation, or by dewatering and returning it to
the furnace.
The main disadvantages of the furnace process are
the relatively high capital cost of the plant and the
scarcity of locations where low-cost electricity is available.
For this reason the electric furnace process is used
almost exclusively to produce phosphorus and
phosphoric acid for industrial chemicals, insecticides, detergents,
and food or animal feed additives.
Production of phosphoric acid from elemental
phosphorus is relatively simple. It is carried out by burning
liquid elemental phosphorus in air and hydrating the
resulting P2O5 to H3PO4. A diagram of a typical plantis_
shown in Figure 11.33. All the process equipment is
made of stainless steel, usually type 316. The overall
reaction is:
P4 + 5 02 + 6 H20 -* 4 H3PO4
Typical process requirements per tonne of P2O5
produced as phosphoric acid, assuming 86% overall
recovery for a plant of about 100,000 tonnes P2Os/year
capacity, are given in Table 11.32.
Fuel consumption is negligible - about 1.2 million kcal,
depending on efficiency of use of byproduct carbon
monoxide gas.
To stack
Demlster j
Dilute
acid
H-l combustion chamber
B-2 Combustion air blower
R-3 Hydrator
5-4Venturi
C-5 Separator tower
T-6 Dilute acid lank
P-7, P-8 Pumps
E-9 Product acid cooler
Figure 11.33. Manufacture of Phosphoric Acid
From Elemental Phosphorus.
349
Table 11.32. Consumption Figures for
Phosphoric Acid From the Electric
Furnace Process
Inputs Units Consumption
(per tonne
ofP205)
Phosphate rock
(31.2% PaOs)
Silica rock, 95% Si02
Coke, 86% C
Carbon/graphite electrodes
Electric power
Cooling water
Steam
Labor
t/t
t/t
t/t
kg/t
MWh/t
t/t
t/t
workhours/t
3.73
1.1
0.6
25
6.7
110
1
4
If phosphate rock is available that is satisfactory for
use without agglomeration and calcining, the plant cost
would be 25%-30% lower, maintenance and labor costs
would also be 25%-30% lower, and fuel requirements
would be virtually eliminated. The byproduct carbon
monoxide gas from the furnace would be more than
sufficient for drying coke, silica r and-rock- Some-roeks-that—
have been used successfully in electric furnaces without
agglomeration, calcining, or sintering are screened
Florida pebble (plus 6 mm), Florida hard rock, and
Montana hard rock (crushed and screened). Use of uncalcined
rock may increase the electric power consumption in
the furnace by as much as 10%, depending on the CO2
and combined water content.
The Tennessee Valley Authority <TVA) began
development of the electric-furnace process for producing
phosphate fertilizers in 1933 and produced
phosphorus and phosphoric acid from 1934 to 1977. At one
time five furnaces were in operation. In 1977
operation of all furnaces was discontinued by TVA since the
process could no longer compete with the wet process
for fertilizer production.
There have been other North American producers of
phosphorus: FMC, Monsanto, Occidental Chemical,
Stauffer Chemical, and Albright and Wilson. The two
largest producers: FMC and Monsanto have had their
phosphorus furnace plants in Idaho based on local
phosphate rock deposits. For economic reasons Monsanto
closed its phosphorus plant in Tennessee in 1986 but
has since expanded production in Idaho by debottle-
necking. Stauffer Chemical (later Rhone-Poulenc Basic
Chemicals) has had phosphorus plants in Tennessee and
Montana. Occidental Chemical had a phosphorus
furnace plant in Quebec. Almost aD the output from these
furnaces has been used for production of industrial
phosphates (direct derivatives and thermal acid).
11.11 Phosphoric Acid Production by the
Blast-Furnace Process
A flow diagram of a TVA pilot plant for producing
phosphoric acid by the blast-furnace process is shown
in Figure 11.34. The scale of the pilot plant was about
1 tonne of P2O5 per day [431.
In general, the blast-furnace process differs from the
electric furnace in the following aspects:
a. Coke is used for both fuel and phosphorus
reduction. The estimated coke requirement for a large-
scale unit is 2.5 tonnes/tonne of P2O5 recovered as
phosphoric acid (allowing for ferrophosphorus losses).
About 0.6 tonne of coke is consumed in reduction of
P2O5 to phosphorus, and the remainder generates
heat by combustion with preheated air to form
carbon monoxide.
b. As with the electric furnace, the charge - phosphate
rock, coke and silica - must be in lump or
agglomerated form, but it is not necessary to calcine or dry
the charge since there is sufficient heat for this pur-
pose in the ascending gases in the furnace shaft.
c. The gas from the furnace contains about 37% CO
and 1.0%-1,5% P4 by volume, The remainder is
mainly nitrogen. Although recovery of elemental
phosphorus by cooling and condensation is feasible,
it would be difficult to recover a high percentage
because of the low concentration in the gas. In the TVA
pilot plant, phosphoric acid was recovered after
preferential oxidation of the phosphorus in the gas with
air.
d. The gas remaining after phosphoric acid recovery
contains about 34% CO, l%-2% 02, and the
remainder N2 (dry basis). About 40% of this gas can be used
advantageously for preheating the air to the blast
furnace. The remainder would be available for other
uses.
The blast-furnace process was used commercially to
produce phosphoric acid for industrial and chemical
products from 1929 to 1938 by the Victor Chemical Works,
now Stauffer Chemical Company. The plant was located
at Nashville, Tennessee (United States).
The use of the blast furnace to produce phosphoric
acid for fertilizer purposes seems unpromising at present
due to the high cost of coke. However, with some
improvements it might be considered in certain
350
Legendi
H-l Blast furnace
S-2 Rough dust catcher
H-3ab Blast stoves
R-4 Preferential oxidation chamber
C-5 Acid recovery to*er
E-6 Aftercooler
B-7 Blower
T-8 Weak acId sunp
X-9 Skip car
Strong phosphoric
acid product
Figure 11.34. TVA Experimental Phosphoric Acid Blast-Furnace Plant.
circumstances [44]. As does the electric furnace it can
use low-grade siliceous ore with moderately high
alumina and iron oxide content.
11.12 Wet-Process Licensers
The principal licensers of wet processes for
phosphoric acid are: Badger/Raytheon, Tampa, USA; B1PROK-
WAS/1CHN Gliwice, Poland; Davy/Prayon, London,
England; Hydro Agri International Licensing (HAIL)/
Norsk Hydro Licensing, Oslo, Norway; Jacobs/Dorrco,
Lakeland, Florida, USA; Prayon Rupel, Engis/Liege,
Belgium; Rhone Poulenc, Courbevoie, France; SIAPE,
Tunisia.
They offer:
Raytheon
BIPROKWAS
HAIL
- DH isothermal reactor
- DH monotank reactor
- DH, HH, HDH multireactor system
Jacobs
Prayon
- DH, HH monotank reactor
- DH,HH,HDH multicompartment
reactor
Speichim-Rhone - DH monotank reactor arid DIPLO
Poulenc Process two-reactor system
SIAPE - DH two-compartment (inner and
outer) annular reactor
11.13 References
References to Sulfuric Acid Section
1. Sheldrick, W. F "World Sulfur Survey," World Bank
Technical Paper No. 24, Washington, D.C., U.S.A.
2. Bixby, D. W., D. L. Rucker, and S. L. Tisdale. 1966.
"Phosphatic Fertilizers - Properties and Processes,"
Technical Bulletin No. 8, The Sulphur Institute,
Washington, D.C., U.S.A.
351
3. Duecker and West. 1959. Manufacture of
Sulfuric Acid. Rheinhold Publishing Company, New York,
NY, U.S.A.
4- Ketzien, G. T. 1974. "Modern Sulfuric Acid
Practice," Proceedings of the Fertiliser Society,
(London), No. 140.
5. "Sulphuric Acid Plant Technology." 1985.
Chemetics International Company, Toronto,
Canada.
6. Bauer, R. A., and B. P. Vidon. 1978. "The Ugine
Kuhlmann Pressure Process," Chemical
Engineering Progress, 74:68-69.
1, Cameron, G. M., P. D. Nolan, and K. R. Shaw.
1978. "The C1L Process for Acid Manufacture,"
Chemical Engineering Progress, September:
74:47-50.
8. McAlister, D. R., A. G. Corey, L. I. Ewing, and S.
A. Ziebold. 1986. "Economically Recovering
Sulfuric Acid Heat," Chemical Engineering Progress,
July: 34-38.
9. "Protecting Equipment in Sulphuric Acid Plants."
1988. Sulphur.
10. "Sandvik SX - Sulphuric Acid Steel." 1988.
EDMESTON Materials System Engineering.
11. "Quantity-vs Quality," 1994: Sulphur, 231r21-247-
12. Lasaosa, C. M. 1972. "New Techniques in the Use
of Spanish Pyritic Ores as Raw Materials,"
Proceedings of the 1972 1SMA Technical Conference,
Seville, Spain.
13. "Process Highlights," Lurgi Ges., C 2123/10,83.
14. Donovan, J. R., and D. R McAlister. 1982. Sulfu-
ric/Phosphoric Acid Rant Operations. AIChE
Technical Manual.
15. "Getting Rid of Phosphogypsum, Part II - Portland
Cement and Sulfuric Acid." 1977.Phosphorus and
Potassium, 89:36-44,
16. Ashburner, D. S. 1968. "The Production of Cement
and Sulfuric Acid by the Marchon Process," pp- 72-
77, Proceedings of the 18th Annual Meeting of
the Fertilizer Round Table, Washington, D.C., U.S.A.
17. "Clean, White Phosphogypsum and a Way to Use
It" 1991. Phosphorus and Potassium, 172:28-32.
18. "Phosphogypsum: Liability or Profitable Byproduct."
1993, Sulphur, 224:39^4.
19. Ashar, N. G. 1991. "The Recovery of Sulfur from
Phosphogypsum Using Biotechnology," Sulphur 91:
British Sulphur International Conference, New
Orleans, LA, U.S.A.
References to Phosphoric Acid Section
1. Survey of Processed Phosphate Capacities. 1994.
International Fertilizer Industry Association (IFA),
Paris,
2. Phosphoric Acid. 1968. A.V. Slack (Ed.), Marcel
Dekker, Inc., New York, NY, U.S.A.
3. Farr, Thad D., and Kelly L. Elmore. 1962. "System
CaO-P205-HF-H20: Thermodynamic Properties,"
Journal of Physical Chemistry, 66(2):315-318.
4. Rossini, Frederick D., et al. 1952. "Selected Values
of Chemical Thermodynamic Properties," National
Bureau of Standards, Circular No. 500, U.S.
Department of Commerce, Washington, D.C., U.S.A.
5. Egan, E. P., Jr., and B. B. Luff. 1961. "Heat of
Solution of Orthophosphoric Acid," Journal of
Physical Chemistry, 65(3):523-526.
6. Kelly, K. K. 1934. "Contributions to the Data on
Theoretical Metallurgy. II. High-Temperature
Specific-Heat Equations for Inorganic Substances,"
Bureau of Mines Bulletin 371, U.S. Department of
Commerce, U.S. Government Printing Office,
Washington, D.C.,.U.S.A.
—7"EganrET-P.TiJr—Bt Bt Luff, and Z, T. Wakefield.
1958. "Heat Capacity of Phosphoric Acid Solutions,
15° to 80°," Journal of Physical Chemistry,
62(9):1091-1095.
8.-"WPA Production Using Phalaborwa Phosphate
Rocks." 1993. Phosphorus and Potassium,
184:23-33.
9. "Phosphate Rock Grade and Quality." 1992.Pfios-
phorus and Potassium, 178:28-36.
10. "The Acid Test." 1993. Phosphorus and
Potassium, 188:21-32.
11. Somerville, R. L. 1973. "Fundamentals of Wet
Process Phosphoric Acid Plant Design," Paper
presented before the American Chemical Society,
Division of Fertilizer and Soil Chemistry, Chicago,
1L, U.S.A.
12. Houghtaling, S. V. 1973. "DPG-Prayon Modern
Dihydrate Process," Paper presented before the
American Chemical Society, Division of Fertilizer
and Soil Chemistry, Chicago, IL, U.S.A-
13. Shearon, G. B. 1975. "Wet Grinding and Feeding
of Phosphate Rock - Plant City Phosphate
Complex," IN Proceedings of the 25th Annual Meeting
352
of the Fertilizer Industry Round Table, pp. 164-
169, Washington, D,C. (U.S.A.).
14, Lutz, W. A.., and C. J, Pratt, 1968. "Principles of
Design and Operation," IN Phosphoric Acid, A,V.
Slack (Ed.), pp. 159-212, Marcel Dekker, Inc., New
York, NY, U.S.A.
- 15. Stern, S. 1965, "The Use of Calcined Rock in
Phosphate Processing," IN Proceedings of 1SMA
Technical Conference, Edinburgh, Scotland.
16. "Phosphoric Acid Plant Revamps." 1990.
Phosphorus and Potassium, 170:28-32.
17. "Phosphoric Acid Manufacture-Updating Process
Technology," 1986. Phosphorus and Potassium,
143:25-33.
18. "Reactors, Agitators and Filters for Phosphoric Acid
Plants." 1991. Phosphorus and Potassium, 174:
23-37.
19. "Effect of Ionic Impurities on Gypsum Rlterability."
1990. Phosphorus and Potassium, 168:20-21.
20. Moraillon, P., J, F, Gielly, and B. Bigot. 1968.
"Principles of Filter Design and Operation," IN
Phosphoric Acid, A. V. Slack (Ed.), pp. 407-442, Marcel
Dekker, Inc., New York, NY, U.S.A.
21. Lehr, J. R. 1968. "Nature of Impurities," IN
Phosphoric Acid, A.V. Slack (Ed.), pp. 637-686, Marcel
Dekker, Inc., New York, NY, U.S.A.
22. "Prayon Displays its Phosphate Technology"aricT
Operations." 1991. Phosphorus and Potassium,
174:38-43.
23. "Phosphoric Acid Equipment-II." 1991.
Phosphorus and Potassium, 176:26-40.
24. Processed Phosphate Statistics. 1993. International
Fertilizer Industry Association (1FA), Paris.
25. "More Trade, More Ships?" 1989,Phosphorusand
Potassium, 160:11-14.
26. Chariton, W. T, J. D. Crerar, and R. C. Akroyd.
1973. "The Shipment of Phosphatic Materials—
Some Technical and Economic Aspects,"
Proceedings of the Fertilizer Society (London), No. 138.
27. "Getting Rid of Phosphogypsum." 1978.
Phosphorus and Potassium, Part 111, 94:24-29, 32-39; Part
IV, 96:30-39,
28. Scaife, C. W., and D, Kitchen. 1968. "As Raw
Material for Plaster and Cement—European Practice,"
IN Phosphoric Acid, A,V. Slack (Ed.), pp. 531-540,
Marcel Dekker, Inc., New York, NY, U.S.A.
29. Yamaguchi, T 1972. "Phospho-Gypsum Beneficia-
tion Process," IN Proceedings of the ISMA
Technical Conference, Seville, Spain.
30. Sanders, M. D. 1968. "Recovery of Fluorides as
By-Products," IN Phosphoric Acid, A.V. Slack (Ed.),
pp. 765-778, Marcel Dekker, Inc., New York, NY,
U,S,A.
31. "Production of Synthetic Fluorspar from Waste
Fluosilicic Acid," 1976. Paper No. 22. ISMA
Technical Conference, The Hague, Netherlands.
32. Kouloheris, A. P. 1979. "Uranium Recovery from
Phosphoric Acid (a Process Engineering Review),"
Proceedings No. 187. The Fertiliser Society,
London, England.
33. Wrobicki, J, 1979, "Assessment of Feasibility of
Uranium Extraction from Phosphates in the Middle
East," Written submission read in absentia at the
British Sulphur Corporation's Third International
Conference on Fertilizers, London, England.
34. Hurst, F J., D. J. Crouse, and K. B. Brown. 1972.
"Recovery of Uranium from Wet-Process
Phosphoric Acid," Ind. Eng. Chem. Process Des. Develop.
11(1):122-128.
35. Hurst, F. J., W. D. Arnold, and A. D. Ryon. 1976.
"Progress and Problems of Recovering Uranium
from Wet-Process Phosphoric Acid," pp. 100-108,
26th Round Table, Atlanta, GA, U,S.A.
36. "Uranium Recovery: Oak Ridge Laboratory
Developing Two Extraction Processes." 1977.
Phosphorus and Potassium, 88:40-41.
37. Hurst, F, J., and F. A. Posey. 1981. "Uranium from
_ H3PO4: A Decade of Change and its Meaning for the
^Future," AIChE, New Orleans, LA, U.S.A.
38. "Wet Process Acid Cleaning Comes of Age." 1990.
Phosphorus and Potassium, 170:20-22.
39. "A New Era Dawns." 1990. Phosphorus and
Potassium, 169:12-15,
40. Lounamaa, N., and L. Niinimaka, 1971. "Typpi
Oy's Solvent Extraction Process for Producing
Compound Fertilizers," Paper No. 1D/WG99/20,
Presented at the Second Interregional Fertilizer
Symposium (UN1DO), Kiev, U.S.S.R.
41. "Phosphoric Acid Production from Hydrochloric
Acid." 1987. Negev Phosphates Ltd. Marketing
Division, Israel.
42. "New Process for the Production of Phosphatic
Fertilizers Using Hydrochloric Acid." 1969.
Fertilizer Industry Series Monograph No 5, UNIDO,
Vienna, Austria.
43. Hignett, T. P. 1948. "Development of Blast
Furnace Process for Production of Phosphoric Acid,"
Chemical Engineering Progress, 44(10):753-764;
44(ll):821-832; and 44(12):895-904. .
44. Hignett, T. P. 1968. "Use of the Blast Furnace for
Production of Phosphoric Acid," Phosphorus and
Potassium, 36:20-21,24.
353
Chapter 12. Fertilizers Derived
From Phosphoric Acid
Table of Contents
Page
12.1 Introduction 355
12.2 Triple Superphosphate 355
12.2.1 Introduction .",,355"
12.2.2 Fundamentals of TSP Production ,. 356
12.2.3 Technology of TSP Production 357
12.2.4 Direct Slurry Granulation , 360
12.3 Ammonium Phosphates 361
12.3.1 Fundamentals of Ammonium Phosphates 361
12.3.2 Early Technology for the Manufacture of MAP/DAP 361
12.3.3 Jacobs-Dorrco Industrial Process 363
12.3.4 Subsequent Developments 364
12.3.5 TVA Pipe-Cross Reactor 365
12.3.6 Uhde GmbH Process 366
12.3.7 S.A. Cros Technology 367
12.3.8 ERT - Espindesa Technology , 367
12.3.9 AZF (Now Grande Paroisse) Process 368
12.3.10 Norsk Hydro Process 370
12.3.11 Raytheon Process i^^^^i^r ■'"• :i " 370
12.4 "Nongranular map ..::";;.:.:.::: .::.::. ~:~~~:~ : ~".7.7.".~".".." ■ 370
12.4.1 Fisons Process 371
12.4.2 Swift Process 371
12.4.3 Scottish Agricultural Industries Process 371
12.5 Ammonium Polyphosphate 373
12.6 Comparative Economics of TSP and DAP 374
12.6.1 General Comparison 374
12.6.2 Cost Components of the TSP and DAP Processes ,... 374
12.6.3 Comparison of the Physical Properties of TSP and DAP 374
12.7 Other Fertilizers Made From Phosphoric Acid 376
12.7.1 Ammonium Phosphate-Sulfates 376
12.7.2 Ammonium Phosphate-Chloride , 377
12.7.3 Ammonium Phosphate-Nitrate 377
12.7.4 Urea-Ammonium Phosphates 378
12.7.5 Use of Phosphoric Acid in Granulation Processes 380
12.7.6 Miscellaneous Fertilizer Uses for Phosphoric Acid 380
12.8 Process Licensors and Contractors 381
12.8.1 Process Licensors 381
12.9 References 381
354
Chapter 12. Fertilizers Derived
From Phosphoric Acid
12.1 Introduction
The production of fertilizers derived from phosphoric
acid has increased significantly in the last 50 years
because, among other things, these are high-analysis
products, thanks to the removal of calcium as byproduct
calcium sulfate in phosphoric acid production. Moreover,
technical breakthroughs in the field of phosphoric acid
and ammonium phosphate manufacture, plus
economies of scale, have resulted in high capacity "world size"
plants, which produce a limited range of products at
very competitive prices.
If we consider the situation from an environmental
view, the tendency toward large plants has favorable
aspects for several reasons:
- The sulfur used is increasingly a byproduct of oil and
natural gas cleaning.
- The calcium sulfate remains near the phosphate mine
and in some cases is used to fill it.
- The liquid and gaseous emissions are better controlled^
and much lower per unit of production than in small
local plants.
- Higher analysis products are more efficiently
transported.
- Precision blending of high-analysis materials based on
soil testing permits lower, more efficient application
rates and decreases non-point-source pollution from
farming.
Pollution control has been a major objective in the
last 15 years. As a result of innovation and
development, process improvements have refined scrubbing
operations of MAP/DAP/NPK fertilizer plants so that
effluents have decreased vastly [1,2]. This has been
achieved by improvements in equipment but primarily
by careful management of the scrubbing fluids to the
extent that scrubbing has almost become a process by itself.
Nearly two-thirds of the P205 in fertilizers was
derived from phosphoric acid in 1988. In fact this figure is
around 80% or more in North and Central America,
North Africa, and West and South Asia, and around
50%-60% in other areas except Oceania (14%) and
China (1%). Moreover, in 1992, 70% of the P205 in
fertilizers worldwide came from phosphoric acid-based
products.
With minor exceptions, the commercial fertilizer,
products are triple superphosphate (TSP), ammonium
phosphates, and other compound fertilizers (some of the
minor exceptions are potassium phosphates and
magnesium ammonium phosphate [MgNF^PO^). Use of
phosphoric acid in compound fertilizers will be described-
under subject headings "Compound Fertilizers"
(Chapter 16), "Liquid Fertilizers and Nitrogen Solutions"
(Chapter 10), and "Nitrophosphate Fertilizers" (Chapter 13).
The present chapter will deal mainly with TSP and solid
ammonium phosphates.
12.2 Triple Superphosphate
12.2.1 Introduction
In the period 1965-75, TSP supplied approximately
15%-20% of the fertilizer phosphate used worldwide.
This declined to 13.3% in 1988 and to 107% in 1992,
primarily as a result of a continuous increase in the use
of ammonium phosphates, mainly diammonium
phosphate (DAP).
One of the advantages of TSP is that it is the most
highly concentrated straight phosphate fertilizer
available, with 44% to 48% available P205 and 40% to 45%
water-soluble P2O5. Another advantage is that part of
its P2O5 content is derived directly from phosphate rock,
a relatively low-cost source. The percentage of P2O5 in
TSP that is derived directly from rock varies from about
25% to 30%, depending on the CaO:P205 ratio in the
rock, the impurity content of the rock and acid, and
other factors. On the other hand, with a given amount
of phosphoric acid, a greater amount of fertilizer P2O5
can be produced as TSP than as ammonium phosphate.
The manufacture of TSP is quite similar to that of
single superphosphate (SSP) and has the same
advantages of simplicity, low technical skill requirement, and
small capital investment.
TSP has three main disadvantages:
- The total nutrient content is lower than that of
ammonium phosphates.
- Its acidic character may cause deterioration of some
types of bags (hemp and paper).
- It is not well suited for blending with urea because of
reactions that cause deterioration of physical condition.
355
12.2.2 Fundamentals of TSP Production .
The reactivity of phosphate rock is of more
importance in TSP production than in phosphoric acid
production. Unreactive rocks may require unusually fine
grinding or long reaction times or both. Even so,
acceptable completion of reaction may be difficult to
achieve with some igneous apatites.
Rocks containing carbonates or carbonate
substitutions in apatite release CO2 during reaction. The
released gases result in a porous structure of the
superphosphate made by den processes. This is
considered desirable when the superphosphate is to be used in
making compound fertilizers. When the rock contains
very little carbonate, the superphosphate may be hard
and dense, leading to granulation difficulties and poor
ammoniation characteristics,
TSP may be prepared in either granular or nongranular
form. The nongranular form is preferred for use as an
intermediate for production of compound fertilizer by
granulation processes, whereas the granular form is
preferred for direct application or for blending. The basic
chemical reaction involved in production of TSP is as
follows:
Ca3(P04)2 + 4H3P04 + H20
172.58 kcal
3 Ca(H2P04)2*H20 +
For simplicity, the phosphate source in the reaction
is shown as tricalcium phosphate. See Chapter 5 for
compositions of carbonate-substituted fluorapatites. In
most processes, a large percentage of the fluorine
remains in the product, probably as fluosilicates and
possibly as calcium fluoride. If some of the calcium is
converted to calcium fluoride or fluosilicate, somewhat less
phosphoric acid is required than indicated by the
equation. However, phosphate rock concentrate usually
contains a higher CaO^Os ratio than does fluorapatite
alone. The proportion of acid to rock often is calculated
to yield a P205:CaO mole ratio of 0.95 to 1.0 (weight
ratio = 2.41 to 2.54) according to the formula:
Acid P2O5 + Rock P2Q5
Rock CaO
= 2.41 to 2.54 (weight ratio) _
However, various impurities in the acid and rock cause
variations in the optimum acid:rock ratio. The product
will contain - in addition to monocalcium phosphate -
iron, aluminum, and magnesium phosphates; probably
a small amount of dicalcium phosphate; unreacted rock;
calcium sulfate originating from free sulfuric acid in the
phosphoric acid and sometimes from rock impurities;
and various other impurity compounds.
The economically optimum acid:rock ratio is best
determined by test methods and will depend on whether
the commercial value is based on solubility in water,
ammonium citrate, or other solvents. When water
solubility is the criterion, both the rock and acid should be as
low in iron and aluminum as is economically feasible.
The effects of CaO:P205 ratio of the rock and grade
of rock on the proportions of rock and phosphoric acid
and on the grade of the TSP product are given in Table
12.1. As the CaO^Os weight ratio increases from 1.35
to 1.70, the percentage of P2O5 derived from rock
decreases from 30% to 24% while the percentage derived
Table 12.1. Effect of Grade and CaOcPaOs Ratio of Rock on Proportions of Rock and Phosphoric
Acid
Weight Ratio
CaO:P205 in Rock
1,70
1.50
1.35
1.50
1.50
% Total P2O5 in
Product From
Rock Acid
24.0
27.0
30.2
27.0
27.0
76.0
73.0
69.8
73.0
73.0
Grade of
Rock, % P205
33
33
33
28
38
Tonnes/Tonne of
Product P205
Rock Acida
0.73
0.82
0.92
0.965
0.71
1.40
1.35
1.29
1.35
1.35
Grade of
Product,
% Total P205b
47.0
46.1
45.2
43.0
48.5
a. Phosphoric acid containing 54% P2O5. Acidulation mole ratio P205:CaO = 0.97.
b. The grade will be increased by loss of volatile ingredients in the rock and by loss of free moisture; the grade in
terms of "available" P2O5 will be decreased by citrate-insoluble P2O5 in the product. These two factors may
approximately offset each other depending on the composition of the phosphate rock and acid.
356
from acid increases from 70% to 76%; the grade of the
product TSP increases from 45% to 47% P205. As the
grade of the rock increases from 28% to 38% P2O5
(with the CaO:P205 weight ratio constant at 1.5), the
grade of the product increases from 43,0% to 48.5%
P2O5. These calculations are based on phosphoric acid
of average impurity content and rock with the usual
amounts and types of impurities. The calculations are
intended only for illustration of general trends; accurate
values can be obtained only from experimental data
derived during tests with the specific phosphate rock
and phosphoric acid in question.
12.2.3 Technology of TSP Production
Powder or Granular TSP by the Den Process -
The manufacture of TSP by this route involves the
following three (or four) operations:
1. Reaction - Very finely ground phosphate rock (95%
to 98% < 100 mesh) is mixed with phosphoric acid.
With rock of 34% P205 content, about 2.6 kg of
acid P2O5 is required per 1 kg of rock P2O5, The
phosphoric acid used is merchant-grade acid at 52%
P2O5 concentration. Many plants use the cone-mixer
process that was originated by TVA [3,4]. Figure 12.1
shows a flow diagram of the process. A somewhat
similar process is known as the Kuhlmann process;
in this case, the mixer is a small cylindrical vessel
equipped with a high-speed stirrer.
2. Denning - The fluid material from the mixer goes
to a den where it solidifies. Solidification results from
the continued reaction and crystallization of
monocalcium phosphate, The process is faster than
with SSP, and denning times of 10-30 minutes are
suitable for TSP as compared with 30 minutes to 2
hours for SSP. Special belt conveyors are sometimes
used for TSP rather than conventional dens. In any
case, the belt or den must be enclosed and connected
to a fume exhaust system to direct fluorine-containing
gases to a scrubber.
3. Storage/Curing - The product is removed from
the den and conveyed to storage piles for final curing,
Phosphor 1c qcid
>=>
Legend ■■
FM-1 Magnetic meter
SI-2 Rock bin
SF-3, SF-5 Screw feeders
W-4 Weigh feeder
M-6 Cone mixer
BC-7 Belt conveyor
GR-8 Disintegrator
8C-9 Belt conveyor
T-l0 Storoge p1le
S-ll Fume scrubber
Phosphate rock
<=>
Exhaust
CZ>
S-ll
Water
Bgure 12.1. Manufacture of Run-of-Pile Triple Superphosphate.
357
Cured triple superphosphate
Water
BF-1 T }
Legendi
BF-1, BF-i5 Belt feeders
BC-2, BC-5, BC-8, BC-13 Bucket elevators
GR-3, GR-14 Crushers
SC-4, SC-13 Screens
SI-6 Surge hopper
W-7 Weigh feeder
G-9 Granulator
D~10 Dryer
S-ll Fune scrubber
BF-15
Figure 12.2. Granulation of Cured Run-of-Pile Triple Superphosphate.
which requires 3-6 weeks depending on the nature
of the raw materials (more or less soft rock, harmful-
impurities like Fe2C>3, AI2O3, MgO; useful
carbonates). During curing, the reaction approaches
completion. The free acid, moisture and unreacted rock
contents decrease, and the available and water-soluble
P2O5 contents increase. Small amounts of fluorine
compounds continue to be evolved during storage
curing, and good ventilation is needed to remove the
fluorine from the working area. Scrubbing of the
exhaust gas may be necessary to prevent atmospheric
pollution,
After storage curing, the TSP is reclaimed with a power
shovel and disintegrated in a cage or chain mill to pass a
6-mesh screen (3.3 mm). The disintegrated TSP
(sometimes called run-of-pile TSP or ROP-TSP) may be used
for making compound fertilizer by agglomeration
granulation, or it may be used as is for direct application. In
most countries, farmers prefer a granular form because
the TSP is dusty if it is too dry, and it cakes if it is too
moist.
Granulation - Granulation of powder or ROP-TSP
may take place before or after curing. Cured TSP is
granulated by the process shown on Figure 12.2. After
milling and screening, the cured powder TSP is
conveyed to a rotary drum granulator. Water is sprayed onto
the bed of material and steam is sparged underneath
the bed to provide wet granular material. The wet gran-
Hies are dischargea,~to"a~rotary dryer. The dried granules
are screened, and the oversize is milled and returned
with the fines to the granulator. Dust and fumes from
the dryer are scrubbed in a water scrubber. Alternatively,
dust may be removed by a bag filter prior to the wet
scrubbing.
In a process variation, phosphate rock and
phosphoric acid are fed to the granulator to supply a portion of
the phosphates; production cost is lowered and
granulation is improved, but greater investment is required.
The typical consumption figures per tonne of product
are summarized in Table 12.2.
Table 12.2. TSP Granulation Process
Consumption Figures
Inputs
Cured TSP, tonne
Steam, kg
Cooling water, kg
Fuel, GJ
Electrical energy, kWh
Operating labor, workhours.
Consumption Per
Tonne Product
1.02
75
250
0.67
29
0.3
358
Ex-Den Granulation - In ex-den granulation, the
acidulation and denning steps are similar to those
described for producing nongranular TSP except that the
rock may be somewhat more finely ground and the den
retention time is longer (25-45 minutes vs 10-30
minutes). Also, the product from the den goes directly to a
granulator rather than to storage. After granulation, the
product is dried, screened, and conveyed to storage.
Drying is controlled to yield a product of 4% - 6%
moisture. Under these conditions, some further reaction takes
place in storage.
The literature 15] describes a plant of this type that is
capable of producing 20-35 tph of TSP, SSP, or
mixtures of the two. It can also make PK compound
fertilizers by the addition of potash at the granulator,
A simplified flow diagram of a typical direct ex-den
granulation system is shown in Figure 12,3, Typical data
for the production of TSP by ex-den granulation are
given in Table 12.3.
Table 12.3. Typical Values for Production of
TSP by Ex-Den Granulation Process
Process Data
Phosphoric acid concentration
Ratio of recycle
Moisture content, ex-den
Final moisture content of TSP
Water-soluble P205
- After curing
- Ex-plant
Steam consumption
Water consumption
Power consumption
Labor required
Granule size
Units
%
-
%
%
%
%
%
kg/t
kg/t
kWh/t
workhours/t-
mm
Value
>50
1.25-1.0
10-12
5-6
>46
Qtf
94
50-60
60-65
38
0.25
1.6-4
a. Including rock grinding (10 kWh/t of TSP).
Ground Phosphate rock
c=>
Phosphorlc ac id
(50 •/. P2u5>
c=>
Sulfuric acid
<opt I ana. I)
Gas to scrubber
Fresh
superphosphate
P H-fe
BC-4
Legend■
M-l Mixer
X-3 DEN
BC-4 Belt conveyor
BC-5 Bucket elevator
G-6 Granu Lator
D-7 Dryer
SC-8 Screens
GR-9 Crusher
BC-10 Bucket elevator
E-ll Cooler
BC-12 Belt conveyor
Gas to scrubber
>=>
Gas to dust collector
and scrubber
-> 1=>
SC-8
Gas to dust collector
and scrubber
^ ^nE~H
Product to storage
<=i <-
GR-9
cr>
Dust from collectors
■a
BC-12
Fines
HJ
BC-10
D
Figure 12.3. Ex-Den Granulation of TSP.
359
Ground
Phosphate rock
=>
Phosphoric
acid
c=S
To scrubber
c^
R-l
In
R-2
SF-4
S-6
fl^
BC-3
D-5.
Underslze recycle
"N
X
.. SC-£
EC-7
<I
„ E-10
Vs-i
To scrubber
5
Dverslze
GR-9
cr
JD-
JD
BC-ll
BC-1B
>f<-
Product
to storage
D
BC-14
Legendi
R-l, R-2 Reactors
BC-3, BC-7 Bucket elevators
SF-4 Blunger or rotary drum
D-5 Dryer
S-6, S-13 Cyclones
SC-B Screens
GR-9 Crusher
E-1D Cooler
BC-ll, BC-13, BC-14 Belt conveyors
Figure 12.4. Slurry Process for the Manufacture of Granular Triple Superphosphate.
The plasticity and heat content of fresh TSP (or SSP)
make it much easier to granulate than cured TSP; less
recycle, water, and steam are required. Presumably, less
fuel is required for drying. Total electric power
consumption is somewhat lower, and labor requirements are only
36% of that required for the "conventional" two-step
process. The product is said to be superior in hardness,
shape, uniformity, and smoothness.
12.2.4 Direct Slurry Granulation
When granular TSP is the desired end product, it is
usually preferable to produce it directly rather than by
granulation of powder TSP. Some advantages of direct
granulation processes are:
- Cost is usually lower,
- Granules are denser and stronger.
- Granulation equipment can be used interchangeably
for producing TSP and ammonium phosphates.
There are two main disadvantages of direct granulation:
- Owing to the limited reaction time, unreactive rocks
are poorly suited for use in the direct granulation
process.
- Greater losses of soluble P2O5 may occur owing to
incomplete reaction, or a higher ratio of phosphoric
acid to phosphate rock may be needed to prevent this
loss.
The first slurry-type granulation process developed was
the Jacobs-Dorrco process, formerly known as the Dorr-
Oliver process. A simplified flow diagram is shown in
Figure 12.4. Ground phosphate rock and phosphoric
acid, 38%-40% P205, are fed to the first of a series of
two or three steam-heated, stirred reaction vessels. The
overall retention time is about 30 minutes, and the
temperature is about 90°C. The thick slurry is fed to a blunger
or rotary drum granulator together with a high
proportion of recycle. The moist granules are dried and
screened, and the product size material is cooled and
sent to storage.
Leyshon and Mangat have described some
improvements in the process [6\. An "aging conveyor" is used to
transport the granules from the granulator to the dryer.
A small amount of moisture is evaporated on the
conveyor, and moisture is absorbed into the interior of the
granule. The result is that the granules are less sticky
when they reach the dryer and, hence, less likely to clog
feed chutes or cake on the walls of the dryer. Single-
deck screens are used; the oversize is separated on one
360
screen, crushed in a chain mill, and recycled. The stream
of undersize, including the product size, is split into two
streams; one portion is withdrawn for recycle to the
granulator, and the other is screened to separate fines,
which are recycled, and product size, which is cooled, A
final "polishing screen" is used following the cooler for
more complete removal of fines and oversize. As with
all granulation systems, the dust and fume removal
system has been improved to increase efficiency.
Recycle ratios (ratio of recycle:product) are 10-12:1
for blunger granulation and about 8:1 for rotary-drum
granulation. The lower ratio for rotary-drum
granulation is ascribed to moisture evaporation in the drum
granulator enhanced by a countercurrent sweep of air.
The estimated utility requirements per tonne of
product are about 40 kWh for electric power (including
phosphate rock grinding), about 125,000 kcal of fuel oil for
drying, and about 20 kg of steam, mainly for heating
the reactors.
Another slurry process reported to have been
developed in Europe is similar to the Jacobs-Dorrco process
[7]. However, granulation and drying are combined by
spraying the slurry onto a cascading curtain of granules
at the feed end of a cocurrent rotary dryer.
12.3 Ammonium Phosphates
12.3.1 Fundamentals of Ammonium Phosphates
Ammonium phosphates, particularly DAP, are the
most popular phosphate fertilizers worldwide because
of their high analysis and good physical properties. The
compositions of the pure salts - monoammonium
phosphate (MAP) and DAP - are given in Table 12.4.
The standard grade for DAP is 18-46-0. This is the
"commodity" grade, and products analyzing lower in N
or P2O5 may not be sold as DAP. There is no standard
grade for MAP; grades range from 11-55-0 to 10-50-0
made from high-sludge acid. A prevalent median grade
is 11-52-0. Grades containing both MAP and DAP also
are produced; examples are 13-52-0 and 16-48-0.
Table 12.4. Nutrient Content of Pure
Ammonium Phosphates
. Product N, % P2Q5, %
Monoammonium phosphate (MAP) 12,17 61.71
Diammonium phosphate (DAP) 21.19 53.76
Relatively small amounts of pure DAP and MAP are
made by crystallization processes using phosphoric acid
made by the electric-furnace process or using wet-process
acid purified by any of various processes. The pure, fully
soluble ammonium phosphates are used mainly for
specialty liquid fertilizers.
Both MAP and DAP usually have very good physical
properties when made from wet-process acid. For both,
storage properties and ease of granulation depend on
the impurity content; a gel-like structure of impurities,
mainly aluminum and iron phosphates, promotes
granulation and serves as a conditioner to prevent caking,"
even at a moderately high moisture content (about 3%).
On the other hand, pure ammonium phosphates are
difficult to granulate and tend to cake badly in storage,
even with a very low moisture content, unless coated
with a conditioner. It has been demonstrated that the
addition of impurities, particularly compounds
containing aluminum, can improve granulation and product
quality when there are insufficient impurities in the acid
for this purpose. Also, the addition of a small
proportion of phosphate rock to the phosphoric acid before
ammoniation can improve granulation. To determine
the influence of acid impurities on ammonium
phosphate products, a study was made of carefully "spiked"
samples of base merchant-grade acid [8]. The
conclusion was that the effects of aluminum, iron, and
magnesium were simply cumulative and not multiplicative. Thus,
-if-one-impurity-is-increasing, its effect can be
compensated by a decrease of the other impurities. Another
finding of this work is that citrate- insoluble P2O5 is more
influenced by the operating conditions than by iron,
aluminum, and magnesium content. Moreover, higher
fluorine levels tend to reduce citrate-insoluble P2O5 as well
as reactor viscosities.
Ammonium phosphates have become the major
phosphate fertilizers and in 1988 supplied over 16 million
tonnes of P205 or nearly 40% of the fertilizer P205 used
worldwide; in 1992, these figures became 18.7 million
tonnes and nearly 50%.
12.3.2 Early Technology for the Manufacture of
MAP/DAP
TVA Basic Process - Granular DAP is commonly
produced by a slurry process; the process developed by
TVA and illustrated in Figure 12.5 is typical. The
average concentration of the wet-process acid is about 40%
P2O5; however, most plants use part of the acid at 54%
P2O5 and part at 30% P2O5. The acid reacts with
ammonia in a preneutralizer where the mole ratio of
NH3:H3PC>4 is controlled at about 1.4. This ratio
corresponds to a point of high solubility {Figure 12.6).
The heat of reaction raises the slurry temperature to
the boiling point (about 115°C) and evaporates some
361
H3PD4 feed (30-40 V. P2D5)
BC-15 Product
n Ti c=>
to storage
Legendi
S-l Scrubber
R-2 Preneutralizer
T-3 Surge tank
G-4 Gmnu Ictor
S-7j S-ll Cyclones
SC-9 Screens
GR-10 Crusher
E-12 Cooler
BC-5, BC-8 Bucket elevators S-13 Scrubber
D-6 Dryer BC-14, BC-15, BC-16 Belt conveyors
Figure 12.5. TVA DAP Process.
s
.c
«
o
il
c w
o<5
E o
E o
'J5
_g
o
100
90
80
70
60
50
40
= 30
20
_4 : ■ --■■
\ i
0.4 0.6 0.8 1 1.2 1.4 1.6 1.8 2
NH3:H3P04 mole ratio
Figure 12.6. Effect of NHaiHsPO* Mole Ratio on
Solubility of Ammonium Phosphate
at 75°C.
moisture. The hot slurry containing about 16% - 20%
water is pumped to the granulator where more
ammonia is added to increase the mole ratio to approximately
2.0. Additional heat is generated, evaporating more
moisture. The decreased solubility in going from 1.4 to
2.0 mole ratio assists granulation. The moist granules
from the granulator are dried and screened, the product
size is cooled, and the undersize and crushed oversize
are recycled. The usual ratio of recycle to product is
about 5:1. Ammonia escaping from the granulator, dryer,
and preneutralizer is recovered by scrubbing with weak
acid (30% P2O5), and the scrubber solution is added to
the preneutralizer.
The same equipment can be used to make MAP by
one of two procedures:
- The preneutralizer is operated at an NH3:H3PC>4 mole
ratio of 0.6 (a point of high solubility) and the balance
of ammonia is added in the granulator.
- The preneutralizer is operated at a mole ratio of about
1.4, and phosphoric acid is added in the granulator to
decrease the ratio to 1.0,
362
In producing MAP, ammonia recovery by acid
scrubbing is not necessary, but all gaseous effluents are
scrubbed to recover dust and fumes.
Other Earfy Alternatives- An improvement in the
TVA-type process for making DAP is to substitute a pipe
reactor for the preneutralizer. Ammonia and
phosphoric acid react in a pipe which discharges directly into the
granulator. Steam generated by the reaction is released
in the granulator and swept out with a current of air.
This arrangement is simpler and less expensive than the
use of a tank preneutralizer. An additional advantage is
that it uses more concentrated phosphoric acid; thus,
slurry discharged into the granulator contains less water
and the recycle ratio is decreased. Fittel and
Hollingsworth report that a plant in Australia using the
pipe reactor has a recycle ratio of 3:1 (as compared
with a 5; 1 ratio for tank preneutralization) 19]. A
somewhat similar system is used in Spain by the firm of S.A.
Cros to produce DAP and other grades of compound
fertilizers [10]. The use of pipe reactors in granulation
processes will be described further in a later section of this
chapter and in the chapter "Compound Fertilizers" (16),
Danos of Jacobs Engineering Group Inc. has described
a process for DAP production that involves use of a
pipe reactor and eliminates the need for drying [11].
This pipe-reactor process is similar to one demonstrated
by TVA in 1978 [12].
12.3.3 Jacobs-Dorrco Industrial Process
The original Dorr-Oliver (now Jacobs) slurry
granulation process for DAP production resembled the TVA
process with the following exceptions:
- Ammoniation was carried out in reaction vessels.
Three vessels were operated with NH3:P04 ratios of
0.6, 1.4, and 1.85.
- Granulation of the slurry with recycle was carried out
in a blunger.
The recycle ratio was about 8:1. As in the TVA process,
ammonia losses were recovered by acid scrubbing. MAP""
and grades between MAP and DAP could be produced
by adjusting the mole ratio in the reaction vessels. In
subsequent modifications, ammonia was added in the
blunger, or an ammoniator-granulator drum was
substituted for the blunger. Other improvements have been
mentioned uin the discussion of TSP and in the
description of the Jacobs Engineering pipe-reactor process.
Both the original TVA process and the original Dorr-
Oliver process have been modified and improved; in
addition, other organizations have developed similar
slurry granulation systems using similar basic principles.
A basic flowsheet for the improved Jacobs slurry
granulation process is shown in Figure 12.7. This and other
slurry granulation processes are adaptable to production
To scrubber .
-> c=>
To scrubber
To scrubber or stack
—_ ,~v> c^
S-12 i—•—£J
Product
to
storage
Sol id raw water I a is
c=>
Liquid NH3 (for DAP)
Phosphoric acid
Phosphate rock
^(for TSP)
Scrubber
solution
P-E
Le9endl BC-9, BC-14 Bucket elevators SC-15 Polishing screen
R-l Reactor S-3 Dust cyclone 1-10 Dryer BC-16, BC-17 Belt conveyors
P-2 Slurry punp SC-6 Overs Ize screen S-ll Dryer cyclone BC-1B Aging conveyor
G-3 Granulator SC-7 Screen S-12 Cooler cyclone
FC-4 Fines conveyor GR-8 Crusher E-13 Cooler
Figure 12.7. Jacobs-Dorrco Slurry Granulation Process.
363
of a variety of compound fertilizers by the addition of
potash salts and urea, ammonium nitrate, or
ammonium sulfate. Sulfuric acid can be used in the amount of
about 50 kg/tonne in view of adjusting the grade to 18-
46-0. Without sulfuric acid, a DAP analysis of 18,4% -
18,8% N and 47.2% - 47.5% available P205 can be
attained using clarified phosphoric acid. However, when
unclarified acid from some low-grade rocks is used, it
may be difficult to attain a grade as high as 18-46-0
[131.
12.3.4 Subsequent Developments
The efficient use of a pipe reactor, the most
significant development in ammonium phosphate and NPK
technology of recent years, provides a means of
improving the water balance and the energy efficiency as
well as eliminating the preneutralizer. The growth of the
use of the pipe reactor in both the retrofitting of
existing plants and the design of new plants has been rapid
[14]. Not that the concept is new - a patent issued to I.
G. Farben mentioned the concept in 1927. Widespread
use has been limited by concerns about scaling and
corrosion, but these have now been almost completely
overcome, and the rising cost of energy has increased the
interest in optimizing use of the chemical energy of the
reaction. The heat of reaction is of the same order as
that required to evaporate the water in the phosphoric
acid, as can be shown by a simple calculation. If wet-
process phosphoric acid is fed-at 40% P205"and-4%-
H2SO4, the reactions will be written:
1. H3PO4 + 2NH3 gas -> (NH4)2HP04 dry + 46 kcal
2. H2SO4 + 2NH3 gas -* (NH4)2S04 dry + 46.5 kcal
2,500 grams of phosphoric acid will contain 1,000
grams of P2O5 or 14.08 moles of H3PO4; 14.08 moles
x 46 = 648 kcal of reaction energy; 2,500 grams x
0,04 = 100 g H2SO4 = 1.02 moles x 46.5 = 47.4 kcal
of reaction energy. At 40% P2O5, the acid contains about
36% water or 2,500 x 0.36 = 900 g H20, which will
require 630 x 0.9 = 567 kcal to evaporate.
The heat requirement to evaporate that amount of
water represents:
567
695.4
= 81.5% of the reaction energy
Thus, by providing for energy conservation in the plant
design, the process may become autothermal, perhaps
with a slight increase in the concentration of the acid
used,
A pipe reactor is, literally, just that - a length of pipe
into which raw materials are introduced to react. The
most common embodiment is the T-reactor, which has
a T-shaped mixer at one end. Alternatively, the mixer
head may be cross-shaped. In a T-shaped reactor
(Figure 12.8), ammonia is introduced to the mixer in the
direction of the horizontal axis; the other feed -
phosphoric acid and, sometimes, small quantities of sulfuric
acid - is added to the mixer head at a right angle to the
ammonia.
While in the pipe, ammonia and phosphoric acid
react to produce a slurry, which is discharged from the
end of the pipe directly into the granulator. Further
ammoniation and incorporation of other solid
materials, in the case of NPKs particularly, take place in the
granulator, which is generally a drum granulator.
Flange for
Reaction Pipe
2.5 cm SCH 40s
NH3 Inlet
Figure 12.8. T-Shaped Reactor.
364
The pipe reactor is, in most instances, a replacement
for the preneutralizer. It is simpler to operate, avoids
the need to pump slurry, and is cheaper too, The main
advantage is that the pipe reactor can produce a more
concentrated slurry than can a preneutralizer, and thus
the specific process water requirement is much less,
Consequently, less water needs to be introduced with
the raw materials - 54% P2O5 phosphoric acid may be
used instead of 40%-42% acid - and the recycle ratio
can thus be reduced. This, in turn, reduces the size of
the materials handling equipment needed or, in an
existing plant, permits capacity to be increased.
Because reaction is confined in such a small space,
the heat balance of the process is generally improved as
well. In that much of the water is vaporized in the
reactor itself by the heat of reaction, product leaving the
granulator is much drier and energy consumption for
drying can be reduced. The main advantages of the pipe-
reactor process, compared with the preneutralizer
process, can be summarized as follows [14]:
• Lower investment cost:
- no preneutralizer
- low recycle ratio
• Lower operating cost:
- autothermal operation (no heating energy)
- low electric power consumption
- lower citrate-insoluble P2O5 _
- high efficiency in ammonia consumption
• High adaptability concerning feedstocks:
- suitable for phosphoric acids from various origins;
even some sludges may be used
- can be fed exclusively with merchant-grade acid at
52%-54% P2O5 and so is well adapted for plants
that import their phosphoric acid
• High operating flexibility and stability:
- well-proven scrubbing system
- effective control of granulation conditions
• Wide variety of product formulations;
- MAP, DAP, or various types of NPK
• Low environmental impact:
- low emission values in accordance with
Environmental Protection Agency (EPA) standards (U.S.A.)
Typical utilities consumptions of the preneutralizer and
pipe-reactor processes are given in Table 12.5.
Another point worth noting is that the P205 in DAP
produced by the pipe reactor is almost completely
citrate soluble. Much of the early work to use the pipe
reactor for ammonium phosphates and NPKs was
carried out by TVA, and many processes have been based
on this work [15].
Table 12.5. Comparison of Utility
Requirements in the Preneutralizer and
Pipe-Reactor Processes
Utilities
Power, kWh/t
Fuel, GJ
Process water, kg
Preneutralizer Pipe Reactor
45
0.3
135
35
0
35
Source: Phosphorus and Potassium, No. 144,
July-August 1986.
12.3.5 TVA Pipe-Cross Reactor [16]
In the pipe-cross reactor, as in the T-reactor,
ammonia enters the pipe along the horizontal axis and
phosphoric acid enters at right angles. There is, however, an
additional inlet directly opposite the phosphoric acid inlet,
trirough which another feed can be added at a right angle
to the ammonia stream. This arrangement was
developed to allow sulfuric acid to be added to the reaction
mixture.
Typically, pipe-cross reactors are operated at below
one atmosphere (gauge) pressure. For the last few years,
TVA has been examining the operation of the pipe-cross
reactor at pressures of 0.2-0.7 MPa. The following ad-
"vanta^eT'hav^beeTTnotedi
- The slurry has a higher boiling point, which reduces
ammonia loss when the material is sprayed into the
granulator and, because the slurry is more viscous,
improves its uniform distribution (and hence product
quality).
- Because the slurry has a low moisture content (4% -
6%), less moisture enters the bed of granulating
material, and the recycle rate can be reduced and
production rate increased.
The amount of moisture in the bed of material in the
granulator is also reduced because there is some flash
cooling as the slurry leaves the pipe. The particles that
are sprayed from the pipe are small, and there is thus a
large surface area for moisture to be disengaged from
the slurry,
The overall flow diagram for a process incorporating
the pipe-cross reactor (Figure 12.9) is not dissimilar to
that of one using a T-reactor, except that slurry from
the gas scrubbers can be fed directly to the reactor
trirough the additional inlet. Discharge from the reactor
goes directly into an ammoniator-granulator, Partial
cooling is recommended before screening, after which
final cooling is carried out before storage. Electricity
365
Phosphoric add [30 % P205) from saunters
[ Insulation
7hoephwicacid(54%P205)
10-ta. 5landardType316I-pipe
Figure 12.9. TVA Pressure Pipe Reactor for
Granulation of MAP/DAP.
consumption in the process is some 90 kWh/tonne,
but product drying is not necessary.
The pressure reactor is fabricated from 316 L
stainless steel pipe, 25.4 cm in diameter and 13.72 m long.
Some 10.36 m of the pipe is outside the granulator and
is inclined at an angle of 10 degrees; this section is fully
insulated. Gaseous ammonia is fed to the pipe. Slurry
discharges from the pipe about 0.92 m above the bed
of material in the granulator. TVA recommends that the
velocity of the air flow through the granulator be about
1.22 m/second.
12.3.6 Uhde GmbH Process
To provide stable operating conditions in its
pipe-reactor process, Uhde of Dortmund developed a computer
program, which has shown the following measures to
be effective: control of ventilation air in the granulator,
a separate liquid circuit for the granulator scrubber, an
oversized granulating drum, and use of liquid ammonia
in the pipe reactor [17].
The acid from the scrubbing section, together with
the main acid stream, is fed to the pipe reactor, to which
ammonia and sulfuric acid are added. For a 1,000-tpd
DAP plant, two pipe reactors, each capable of
producing 25%-60% of the total load, are used (low
production loads can be met by one reactor on its own). Slurry
from the pipe reactors discharges onto recycle in the
granulator. The recycle ratio is commonly 3-4, and the
granulation temperature is maintained at 100°-110DC
by ventilating the granulator with air. Moisture content
of the product is typically 2.6% -2.8%.
After leaving the granulator, product is dried and cooled
in a countercurrent flow of air at ambient temperature.
It is then screened, oversize and fines are recycled, and
on-size material is further cooled in a fluidized-bed cooler.
Mechanical features of the plant include only one
elevator in the granulation loop; no recycle conveyor - the
recycle flows by gravity; single-deck screens; and a lump
crusher that is outside the main recycle stream and can
thus be serviced while the plant is operating.
In essentially the same plant it is possible to produce
a wide variety of NPK products simply by adding
additional raw materials. Recycle ratios of 1.5 - 2 may be
achieved in NPK production. Depending on the
product, the additional raw materials may be solid or liquid.
For solids, appropriately sized material (< 2 mm) is added
to the recycle system; liquid material is fed directly into
the granulator.
Typical consumption of raw materials and utilities is
given in Table 12.6,
Table 12.6. Raw Materials and Utilities
Consumption of the Uhde GmbH
Process
Cost Components/Product
Raw Materials:
Phosphoric acid (42% P205), kg/t
Sulfuric acid (100% H2SO4), kg/t
Ammonia, liquid, kg/t
Ammonium nitrate (96%), kg/t
Potassium salt (60% K20], kg/t
Utilities:
Process water, kg/t
Steam (LP], kg/t
Power, kWh/t
Natural gas, Nm3/t
Instrument air, Nm3/h
DAP
18-46-0
1,035
50
222
0
0
5
30
35
_c
55
NPK11
17-17-17
383
36
61
362
286
144
22
35
3.7
55
a. Nominal capacity 1,000 tpd.
b. Nominal capacity 1,200 tpd,
c. During the startup of the plant:l?000 Nm3total (not per tonne).
Reference plants:
650 tpd plant at BAFGAS, Bandirma (Turkey),
1,000 tpd plant at SASOL, Secunda (South Africa].
500 tpd plant at NCZ, Kafue (Zambia).
Source: [14).
366
12.3.7 S.A. Cros Technology
The pipe-reactor process developed by Cros S.A., of
Barcelona, and licensed by Incro S.A., of Madrid, has
been used in a number of plants. For DAP production,
the process is essentially that as previously outlined, with
the pipe reactor replacing the preneutralizer. Slurry
leaving the pipe reactor contains some 4% to 5% moisture
(from a preneutralizer, it is typically 12% - 14%). If the
water balance is considered on its own, then the recycle
ratio would typically be about two. However, although
air is drawn through the granulator to reduce the
temperature, it is not sufficient to keep the temperature
below 90°C, which is necessary for good granulation.
Hence, cooled recycle must be used to control
temperature, and the recycle ratio is increased [18].
In many ammonium phosphate plants, there must also
be the possibility of producing multi-nutrient NPK
fertilizers. Although this can be achieved using a standard
pipe-reactor process, Cros has developed a mixed
process that uses both a pipe reactor and a preneutralizer.
Depending on the product and capacity, the pipe
reactor and preneutralizer are used together or individually.
A 1,200-tpd plant at ENGRAIS DE GABES (Tunisia)
uses this process.
12.3.8 ERT - Espindesa Technology
One particular feature of the process developed by
ERT - Espindesa, of Madrid, is that, unlike other
processes, reaction to MAP or DAP is completed witKirT
the pipe reactor and thus further ammoniation is
unnecessary (Figure 12.10). Because no additional
ammonia is needed, powdered or granular product can
generally be made easily, For a powdered product, the
pipe is discharged at the top of a tower. A plant of this
type has been producing MAP in Spain since 1981,
The pipe reactor is located near the top of a 17-m-high
tower and fed with phosphoric acid and ammonia. The
NH3:H3P04 molar ratio is adjusted to give that required
for the product, and the moisture content of the
phosphoric acid is controlled to ensure that the product
contains 4% - 6% moisture. Powdered MAP is removed-
from the bottom of the natural draft-type tower at about
60°C. Production of powdered DAP in a similar system
has been carried out in a pilot plant of 400 kg/hour,
and the existing commercial powdered MAP plant is
now being converted to produce DAP [19].
The process for granular DAP has an unusual
feature: all the phosphoric acid feed is used in the two-
stage ammonia scrubber, where most of the ammonia
lost from the granulator is recovered. The partially
neutralized acid from the scrubber has an NHarHaPCU
molar ratio of about 0.25 and is fed to the pipe reactor
where the ratio is raised to 1,9 - 2.05, depending on
the impurities present in the acid.
Depending on the impurities in the phosphoric acid,
the pipe reactor can be made of 316 L stainless steel or
Uranus B6. Pipe diameter and length are variable ac-
"corcling to the design rate. For 25 tph of DAP, the
Off-gas
>=>
Product to storage
■—1=>
P-2
Legendi
M-l Mixing tank
P-2 Circulation punp
P-3 Reactor punp
R-4 Tubular reactor
C-5 MAP tower
Figure 12.10. ESPINDESA MAP Production Process.
367
diameter is 10.2 cm and the length is 6.1 m, of which
only 1.52 m is inside the granulator.
Discharge from the pipe reactor is fed directly onto
recycle in a rotary drum granulator. As indicated, no
ammonia is added to the granulator. The recycle ratio
can be kept at 2.5 - 3,5, and at the exit of the
granulator the moisture content of the DAP is below 3%,
Drying is carried out in a rotary dryer, after which the product
is screened.
Gas from the granulator is fed through an ammonia
scrubber and then a final scrubber before it is vented.
Exhaust gas from the dryer also passes through the final
scrubber before it is vented to the atmosphere.
Raw materials and utilities consumption per tonne of
DAP is given in Table 12.7.
12.3.9 AZF (Now Grande Paroisse) Process
CdF Chimie AZF, of Paris, or, more precisely, one of
the group of companies (GESA) that was merged in 1983
to form that organization, has been operating pipe
reactors since 1974. Initially, a single pipe reactor
discharging into the granulator in a conventional manner
was used. For the most part, this arrangement was
successful for fertilizers such as 6-15-30 or 16-20-0;
however, when higher analysis products were manufactured -
for example, 17-17-17, 18-22-12, and 23-23-0, which
are based on ammonium phosphate and ammonium
Table 12.7. Raw Materials and Utilities
Consumption of the ERT-
Espindesa Process
Consumption Per Tonne
Cost Components/Product DAP (18-46-0)
Raw Materials:
Ammonia (100%)
Phosphoric acid
(asl00%P2O5)
Utilities:
Steam
Power
Fuel oil
221 kg
463 kg
1 kg
25kWh
2 kg
Reference plant:
Powder MAP - 500 tpd plant at Huelva (Spain).
Source: Phosphorus and Potassium, No. 144, July-
August 1986.
nitrate - it was found necessary to have a high recycle
rate, perhaps even higher than for a conventional
process with preneutralizer. This high recycle was
attributed to the introduction of slurry and steam at high
temperature into the granulator, which raises the
temperature of the granulating material and increases the
solubility and liquid phase.
This problem can be overcome by arranging for some
of the heat to be released elsewhere. This was
accomplished by placing a second pipe reactor in the system.
In the AZF dual pipe-reactor process, this second_.pip.e_
reactor is located in the dryer (Figure 12.11) [20,21,
22,23,24,251.
The pipe reactor in the granulator is designed to
receive part of the phosphoric acid feed, part of the
ammonia feed (liquid or gaseous), and all the other liquid
feeds - sulfuric acid, if required, recycled scrubbing
liquor, and, possibly, concentrated solutions of
ammonium nitrate or urea, although these can also be added
directly to the granulator. The ammoniatJon rate varies,
according to the product, between 0.6 and 1.4. Further
ammoniatJon is carried out in the granulator.
In the dryer, the pipe reactor is fed with ammonia
and phosphoric acid only. The N:P ratio is controlled at
1.05, so that essentially MAP is produced. The back
pressure fluctuates from 3 to 5 bar.
Gases from the granulator and dryer are scrubbed in
venturies with recirculating ammonium phosphate,
ammonium sulfate, or ammonium sulfo-phosphate solution.
Makeup sulfuric and phosphoric acid are added as
necessary, and excess solution is fed to the granulator pipe
reactor. Gas is finally vented through a cyclonic column
sprinkled with an acidic solution.
When producing DAP, about half the phosphoric acid
is fed to the pipe reactor in the dryer. The distribution of
raw materials over the process units in the AZF process
is given in Table 12.8.
Most of the MAP formed in the dryer pipe reactor
crystallizes in the dryer or adheres to the fine particles
and is subsequently removed by screening for recycle to
the granulator. The DAP is actually formed in the
granulator. However, by producing part of the MAP in the
dryer, the recycle ratio can be reduced (typically it is
about 3) and the heat of reaction and crystallization are
used fully in drying the product. The N:P ratio at various
positions around the granulation loop is also shown in
Figure 12.11.
Raw materials and utilities consumption per tonne of
DAP is given in Table 12.9.
368
So Lid/11 qui"1 raw materials
Legend!
R-l Pipe reactor
G-2 Granulator
S-3 Scrubber
R-4 Pipe reactor
D-5 Dryer / cooler
£-6 Cyclone
BC-7 Bucket elevator
SC-B Primary screen
GR~9 Crusher
SC-1D Final screen
BC-11 Belt conveyor
BC-11
Product
Figure 12.11. AZFDAP/NPK Process.
Table 12.8. Distribution of Raw Materials for
DAP Production in the AZF Process
Process Units Phosphoric
(%)
Dryer pipe reactor 50
Granulator pipe reactor 37
Granulator -
Scrubber 13
a. Mainly losses from granulator.
Source: [14[.
Acid
Ammonia
(%)
28
29
43
(18)a
Table 12.9. Raw Materials and Utilities
Consumption of the AZF Process
Cost Components
Raw Materials:
Ammonia (as 100%)
Phosphoric acid
(asl00%P2O5)
Sulfuric acid (100%)
Utilities:
Steam
Fuel
Reference plants:
Consumption Per Tonne
DAP (18-46-0)
220 kg
468 kg
5 kg
50 kg
10 kg
1,200-tpd plant at Grande Paroisse, Rouen (France).
1,600-tpd plant at Saepa, Gabes (Tunisia).
4- x 1,200-tpd plant at Maroc Phosphore, Jorf/Lasfar
(Morocco),
369
12.3.10 Norsk Hydro Process
Another approach to limit energy consumption is the
use of pressure reactors as promoted by Norsk Hydro
Fertilizers [26]. They claim the following advantages:
- The solubility of ammonium phosphate increases with
temperature.
- The boiling points of solutions increase with increased
pressure.
Therefore, by applying pressure to the reaction
system, the temperature of the ammonium phosphate
solution can be elevated above its atmospheric boiling point.
In this way, a pressure reactor can be operated at much
lower water contents relative to atmospheric reactors
because solubilities can be achieved that are not
possible under atmospheric conditions. Figure 12.12 shows
the Norsk Hydro fertilizer draft tube reactor used as a
pressure reactor in a slurry granulation process for
manufacturing a wide range of formulas such as 18-46-0
PAP); 16-20-0 (MAP + AS); 8-26-26 and 11-33-22
(NPKJ.
12.3.11 Raytheon Process
This is a typical application of the TVA basic process
incorporating many industrially proven developments.
Like the basic TVA process, it operates the preneutralizer
■ Reaction
steam vent
Phosphoric acid
>n n
liquid level
Figure 12.12. Norsk Hydro Fertilizers Draft
Tube Reactor.
at a mole ratio of 1.4 and feeds the balance of the
ammonia to the granulator to complete the reaction to a
1.95 mole ratio. Some of the developments claimed by
Raytheon [27] are as follows:
- A two-stage reactor-granulator scrubbing system to
ensure high ammonia recovery and good water
balance control and to minimize fluoride emissions.
- A discharge trommel or dryer, which destroys lumps
without a lump crusher.
- Improved dryer lifting flight design. —
- Improved process screen arrangement that permits
higher efficiency.
- Adjustable venturi throats on scrubbers, which can be
altered to improve environmental emissions while in
operation.
- A simplified and effective dust control system.
- A large sump used to collect wash water for return to
the process. It also is used to heat water for total plant
wash-down.
- Distributive control system with auto-sequential startup
and shutdown feature, including data logging,
graphing process variables, and printing periodic
production reports.
-—The-^oIIowing-plants use the Raytheon process:
1,300-tpd plant for CHEVRON (U.S.A.)
2 x 900 tpd plant for (formerly) FERTIMEX (Mexico)
2 x 600 tpd plant for Jordan Fertilizer lnd. Co, Ltd.
(Jordan)
12.4 Nongranular MAP
Another development has been the production of
nongranular MAP for use as an intermediate in
producing compound fertilizers. World capacity was estimated
at 3.4 million tpy in December 1993, including plants
under construction. In most cases, the product is made
in large plants located adjacent to phosphoric acid plants.
Often the product is shipped to smaller granulation plants
for use as raw material to be granulated with others in
an agglomeration granulation of compound fertilizers.
Processes for making nongranular MAP have been
developed by Scottish Agricultural Industries (SAI), Hson's
Ltd., Swift Agricultural Chemicals, Nissan and ERT -
Espindesa (described periodically, and in reference 28).
In general, all processes aim at a simple, low-cost method
by eliminating granulation, recycling, and drying.
However, the product should have sufficiently good physical
370
properties to permit storage, handling, and
transportation without excessive caking or dust problems.
Although production of powdered MAP is declining,
it is still produced in some plants as a cheap and
efficient method to solidify sludge phosphoric acid into a
fertilizer intermediate or a feed material. MAP is the
most concentrated P2O5 (52%) product and can be
considered as an important component for the production
of complex fertilizers in developing countries.
12.4.1 Fisons Process
In the Fisons process (Figure 12.13), phosphoric acid
of about 50% P2O5 concentration is reacted with
gaseous ammonia under 2.1 kg/cm2 gauge pressure. The
heat of reaction drives off part of the water as
superheated steam. The remaining slurry contains 9%-10%
water, the temperature is 170°C, and the pH is 3.5-
4.0. This hot slurry is released into a spray tower through
a special spray nozzle. More water is flashed off and
evaporates as the droplets cool and solidify by falling
through an ascending airstream. The product (trade
name - Minifos) contains about 6% moisture; the grade
ranges from 10-50-0 to 12-56-0, depending on the
impurity content of the acid. The product is in the form
of small round particles (microprills) ranging from 0.1 to
1.5 mm.
12.4.2 Swift Process
In the Swift process (Figure 12.14), phosphoric acid
(50% P2O5) and liquid ammonia react in a two-fluid
nozzle, which discharges into a reactor pipe. The
mixture of finely divided MAP and steam is injected into a
cooling tower where a countercurrent airstream carries
away the water vapor formed by the heat of reaction
and cools the product, The product moisture content is
3%-5%. The Nissan process is also a spray tower
process, in which droplets of phosphoric acid react with
ammonia in an ascending airstream.
12.4.3 Scottish Agricultural Industries Process
The Scottish Agricultural Industries (SAI) process
(Figure 12.15) consists of a reaction vessel in which
phosphoric acid (about 50% P2O5) is neutralized with
ammonia to a mole ratio of about 1.35, and the
resulting hot slurry is mixed with more phosphoric acid in a
specially designed twin-shafted mixer somewhat like a
pugmill, which disintegrates the mass into small particles
releasing water vapor. Water is evaporated in both steps.
The product (trade name "PhoSAl") typically contains
6% moisture, 11% N, and 50% water-soluble P2051291-
The process can be modified to produce a nongranular
diammonium phosphate called "Di-PhoSAI" or an
ammonium phosphate-sulfate.
To stack
<^
Stean (startup only)
C-3
Air
Phosphoric- acid
i=>
_ BC-4 Product to storage
Legend:
E-l AnmonI a vaporizer
R-£ Pressure reactor
C-3 Spray tower
BC-4 Bel-fc conveyor
Figure 12.13. Fisons "Minifos" Process.
371
Slurry
Phosphor I c . s|/
acid
■=>
Liquid ammon l a ,^7* ^-
=5 ^i^J—^
[1 P-i
l><l
^r
P~2
T-4
Air
Legend■
P-l, P-E, P-3 Punps
T-4 Surge tank
R-5 Pipe reactor
C-6 MAP tower
S-7 Scrubber
R-5
C-6
S7
~7K
Vt
P-3
^r
S-7
To stack
■=>
Water
Ta process or storage
^>
Figure 12.14. Swift Powder MAP Process.
Phosphoric acId
c_>
Annonla (gas)
i=>
^r
B-l
S-E
7^
S-3
A"J
R-4
Legendi
B-l, B-6 Fans f
S-£ Separator
S~3 Scrubber
R-4 Reaction vessel
S-5 Moisture disengagement unit
BC-7, BC-11 Belt conveyors
SC-8 Screen
GR-9 Crusher
BC-10 Bucket elevator
Exhaust
c=>
Phosphoric Exhaust
ac I a
J.
r~\
BC-10
Product
Figure 12.15. SAI Process for Producing Nongranular MAP.
372
The storage and granulating properties of MAP are
affected by the various manufacturing processes used
[30,31]- Better properties of the product made by the
lower temperature process (SA1 process) were attributed
to precipitation of impurities in a gelatinous form that
coated the MAP crystals.
12.5 Ammonium Polyphosphate
TVA developed a process for producing granular
ammonium polyphosphate, and in late 1973 the process
was put into operation in a demonstration-scale plant
with a capacity of 13-17 tph. The plant produced straight
ammonium polyphosphate and urea-ammonium
phosphate alternately. A flow diagram is shown in Figure
12.16. The process uses the heat of reaction of
phosphoric acid (54% P2O5) with gaseous ammonia to
evaporate water and dehydrate the ammonium phosphate,
thereby forming a melt that can be granulated with or
without urea or other additives.
The main reaction takes place in a pipe reactor where
the temperature reaches 210° - 230°C. The melt
usually contains 15%-25% of the P2O5 as polyphosphate,
but the polyphosphate content can be increased to
almost 50% by preheating the acid and ammonia or by
using a more highly concentrated phosphoric acid. The
melt was granulated in a pugmill in the demonstration-
scale plant, but a rotary granulator was used in later
pilot plant tests. The usual grade produced in _th_e_
demonstration-scale plant was 11-55-0; higher grades
(such as 12-57-0) were made in the pilot plant using
phosphoric acid with a lower impurity content. By the
addition of urea, 28-28-0 and 36-17-0 are produced.
The principal advantage of the process is that
products with very low moisture content are made without
drying. Elimination of the rotary dryer and its appurtenances
Melt (11-55-0)
Steam and noncondensab les
545J H3PD4
NH3 (gas)
97X-99Z Urea solution
Product to storage
cz>
£8-28-0
11-55-0
GR-10
Legend 1
G-l Pugnlll granulator R-7 Spray reactor
E-2 Cooler SC-8 Oversize screen
S-3 Wet scrubber SC-9 Product screen
E-4 Preheater GR-10 Crusher
R-5 Pipe reactor
S-6 Vapor dlsengager
Figure 12.16. TVA Pipe Reactor-Pugmill Process for Production of Ammonium Polyphosphate.
373
substantially decreases the investment cost and the.
energy requirement (fuel and electrical energy). Another
advantage of the process is that the product has
exceptionally good storage properties, which are attributed to
the low moisture content and the polyphosphate
content of the product.
TVA estimates that the saving in capital cost as
compared with a slurry process would be $740,000 for a
30-tph plant or $1,120,000 for a 50-tph plant. This is
equivalent to 20%-25% of the battery-limits cost of a
granulation plant. The saving in energy cost was
estimated at 7 kWh of electrical energy and 140,000 kcal
of fuel/tonne of product (11-55-0). The fuel saving would
be partially offset by an increased steam requirement
for concentrating the phosphoric acid to about 54% P2O5
as compared with an average of about 40% for the slurry
process.
Norsk Hydro has developed a method for air-prilling
MAP melt containing some polyphosphates [32]. The
melt is produced in a pipe reactor, The grade is 11%-
12% N and 57°/cr58% P2Os depending on the acid
composition.
12.6 Comparative Economics of
TSP arid DAP
12.6.1 General Comparison ~^~
A question often arises regarding the choice of a
phosphate product to be produced from phosphoric acid.
With established technology, the choice often lies with
DAP, TSP, or compound fertilizers based on these
products. All of these products can be made in a slurry-type
granulation plant; therefore, it is possible to build a single
plant that can make the three products alternately
although the plant cost would be somewhat higher than
that of one designed for a single product. When there is
likely to be a market for two or three products, it is
probably desirable to have this flexibility, and many plants
are so equipped. In large plants there may be two or
three granulation lines, but even so it is well to be able
to use some lines interchangeably for different products
so that the product mix can be altered to suit the market
demand.
A given granulation plant will have different
capacities for different products. For instance, the production
rate may be only 65%-70% as much for TSP as for
DAP because of the higher recycle ratio for TSP.
Alternatively, a granulation plant for production of TSP by
the slurry process should be larger than for DAP if the
same output is required.
Because TSP requires finely ground rock, the cost of
equipment to grind the rock should be added. If the TSP
374
unit is associated with a wet-process phosphoric acid
plant, it is sometimes possible to prepare ground rock
for both units in the same equipment. However,
phosphoric acid plants often use wet grinding, coarse
grinding, or even no grinding, whereas TSP requires dry, finely
ground rock, Also, in many plants a higher grade of
rock is used for TSP than for acid production.
Therefore, separate rock-grinding facilities often are required.
In addition to the factors outlined above, any
economic comparison will be influenced by the overall plan,
for example, whether there are coexisting phosphoric
acid or ammonia production facilities and whetherlhe"
plant is located adjacent to a phosphate rock mine.
When the net cost of P2O5 in ammonium phosphates
is compared with that of TSP by crediting thenitrogen
cost at the cost of an equivalent amount of urea, it is
evident that DAP is the most economical source of P2O5.
Because of its high concentration of total plant
nutrients, DAP provides further savings in storage, bagging,
and transportation. These savings are illustrated by Table
12.10, which indicates costs, after leaving the plant
production unit, for 1 tonne of DAP as compared with 1
tonne of TSP plus 0.39 tonne of urea. The latter
combination provides the same amount of N and P2O5 as
DAP.
Naturally, the cost of transport will depend on the
method and distance, and the cost of bags will depend
on the type aricTsize"of bags required by the market
conditions. However, Table 12,10 shows that a total
saving in delivered cost of up to $35/tonne would result
under the assumed conditions by producing and
marketing 0.18 tonne of N and 0.46 tonne of P2O5 in the
form of DAP as compared with TSP and urea^ The
illustration does not assume that TSP and urea are mixed.
The mixture (blend) would have poor physical
properties because the two materials are incompatible.
12.6.2 Cost Components of the TSP and DAP
Processes
The unit costs given in Table 12.11 represent
features of the average process. The actual consumption
figures and investment cost are functions of the local
conditions and the technology selected as well as the
engineering company involved. However, the figures
presented in Table 12.11 could be used in the early
development program and in the decisionmaking process.
12.6.3 Comparison of the Physical Properties
of TSP and DAP
The chemical composition and physical properties
given in Table 12.12 are for illustration only. In some
countries, fertilizer properties have been standardized;
however, commerce in fertilizers is organized around
Tabic 12.10. Cost of Storage, Handling, Baggingand Shipping of DAP Versus TSP Plus Ureaa
Cost Components
Regional Trade Regional Trade Interregional Trade Interregional Trade
(US$/t)
Material
Storage cost
Reclaiming from storage,
bagging and.loading
Transportation costs
Port charges, unloading,
storage
Reclaiming from storage
Transportation costs to the
dealer
Total delivery costs
DAP
3,15
22.50
30.00
55.65
TSP/urea
4.38
31.27
41.70
77.35
DAP
3.15
22.50
30.00
20.00
5.00
10.00
90.65
TSP/urea
4.38
31.27
41.70
27.80
7.00
13.90
126.05
a. The costs for 1 tonne of DAP (18-46-0) are compared with costs of 1 tonne of TSP (0-46-0) and 0.39 tonne of
urea (46-0-0) handled separately. Comparison is made for bagged products.
Table 12.11. Cost Components of the TSPand-DAP-Processcs-
Investment Cost3
Battery limits
Storage
DAP (18-46-0)
US $18.3 million
US $7 million
TSP (0-46-0)
US $15.5 million
US $5 million
Consumption of Inputs:
Inputs
Ammonia
Phosphate rock (33% P2Os)
Phosphoric acid (P2O5)
Coating oil
Packaging
Electric energy
Steam
Process water
Fuel
Labor
Units
kg/t
kg/t
kg/t
US$/t
US$/t
kWh/t
kg/t
kg/t
GJ/t
workhours/t
DAP
222
467
1
12
72
0.38
0.15
TSP
400
345
bulk
40
60
65
a. Calculations for both products are based on 1,000-tpd capacity and operation time of 90%
0.25
375
Tabic 12.12. Basic Properties of DAP and TSP*
Properties
P2O5 content, %
- limits, %
- solubility, %
Nitrogen content, %
Granulation (size), mm
Crushing strength, kg/granule
Abrasion resistance, % degradation
Impact resistance, % degradation
Flowability, % nonfIowable,d minutes
25%
50%
75%
Moisture absorption,8 mg/cm2
TSP
min. 38
(44-46)
min. 93
2A
4.5-8b
2.5-3c
0-1.0b
2.5-3.0c
0-1,0
180
240
300
235
DAP
46
(45-46)
min. 95
18
(17-20)
2-4
3.0-5,_0_
0.5-2.0
0.5-1.5
70
130
180
175
a. All physical properties tests are described in Chapter 18.
b. TSP by accretion process.
c. TSP by agglomeration of run-of-pile TSP.
d. At 30°C and 90% RH.
e. At 30°C and 80% RH, for 72 hours.
nutrient content, the physical properties having_seconcU-
ary character, Table 12.12 gives some basic properties
of TSP and DAP.
12.7 Other Fertilizers Made From
Phosphoric Acid
12.7.1 Ammonium Phosphate-Sulfates
A group of fertilizers known as ammonium phosphate-
sulfates has been popular for many years and is still
popular in many areas. The best known grade is 16-20-0,
which essentially consists of MAP and ammonium
sulfate (AS). One reason for its popularity is that it is
relatively nonhygroscopic. Hygroscopicity, as measured by
the critical relative humidity (CRH) of some phosphate
and nitrogen fertilizers and combinations, is discussed
in Chapter 18.
It is evident that MAP is one of the least hygroscopic
of the phosphate materials and that AS is the least
hygroscopic of the straight nitrogen materials. When a
fertilizer with a higher N:P205 ratio than that of DAP
(0.4:1.0) is needed, the MAP plus AS combination is
the least hygroscopic.
Another-advantage of-ammonium phosphate-sulfate
is the sulfur content, which is agronomically useful for
many crops and soils. Ammonium phosphate-sulfates
have been produced by the Dorr-Oliver slurry process
(previously discussed) since 1933 and more recently by
other slurry granulation processes like the AZF - Grande
Paroisse dual pipe-reactor process. The usual method
involves reaction of sulfuric and phosphoric acid with
ammonia, although ammonium sulfate from byproduct
sources can be used. In addition to 16-20-0 and 11-48-
0, several NPK grades are produced such as 14-28-14,
13-36-12, and 13-13-13.
In TVA's pipe-cross reactor system, illustrated in
Figure 12.17, most of the reaction of phosphoric and
sulfuric acids with ammonia is carried out in a pipe, which
discharges a melt into the drum granulator. Steam
generated by the heat of reaction is swept out of the
granulator by an airstream. One advantage of the process is
that the heat of reaction is utilized to dry the product,
and thus no dryer is necessary. Another advantage over
slurry processes is the comparatively low recycle ratio,
in the range of 2-3:1 for 12-48-0 or 1-2:1 for 13-13-
13 or 6-24-24.
The process developed by S. A. Cros in Spain is
somewhat similar [10]. In both processes, part of the acid is
sprayed on the bed of material in the rotary granulator
376
Atmosphere
<=>
Recirculated
Ammonia
and water
Phosphoric
acid
■=>-
Legend:
BF-1 Solids feeder
BF-2 Recycle feeder
BC-3, BC-B Bucket elevators
BC-4 Belt conveyor
G-5 Drum granulator
D-6 Dryer (used as cooler)
R-7 Pipe-cross reactor
E-9 Cooler
SC-10 Screens
EC-11 Bucket elevator
GR-12 Chain mill
E-13 Acid preheater (optional)
S-14 Scrubber
Figure 12.17. The TVA Ammonium Phosphate-Sulfate Process.
and reacted with ammonia that is injected under the
bed, thereby promoting granulation and supplying more
chemical reaction heat for drying.
12.7.2 Ammonium Phosphate-Chloride
Ammonium chloride is used in Japan and some other
countries, both as a straight nitrogen fertilizer and as an
ingredient of compound NP, NPK, and PK fertilizers.
Ando described the operation briefly [33]. He mentioned
that, as compared with ammonium sulfate, ammonium
chloride was 10% cheaper per unit of nitrogen (in
Japan in 1970) and more concentrated (25% vs 21% N).
Filter-grade, wet-process phosphoric acid is ammoniated
to form a MAP slurry, which is fed to a pugmill along
with ammonium chloride, recycle, potassium chloride
(optional), and other fertilizer materials. Ando mentioned
that granulation in the pugmill is not as easy as with
ammonium sulfate but noted that the difficulty had been
overcome. The recycle ratio ranges from 2-4:1. The
moisture content of the granulator product ranges from
5% to 6% before drying and 0.5% to 0.8% after drying.
The main NP grade is 18-22-0; NPK grades include 14-
14-14 and 12-18-14 134]
12.7.3 Ammonium Phosphate-Nitrate
There are several processes that produce fertilizers
containing ammonium phosphate and ammonium
nitrate, but most of them are used to produce NPK grades
and will be described further under Chapter 16
"Compound Fertilizers."
Leyshon and Bowers, in describing slurry granulation
in the blunger in 1967, mentioned a plant in Romania
that produced 23-23-0 and several others that produced
various NPK grades [35]. The slurry was produced by
ammoniation of phosphoric and nitric acids. Detune
described a Pechiney - Saint-Gobain process in which
concentrated ammonium nitrate solution (97%) and
ammonium phosphate slurry were fed to a rotary-drum
granulator [36]. The ammonium phosphate slurry was
produced by ammoniating phosphoric acid to an
NH3:PC>4 mole ratio of 0.6 in a preneutralizer; more
ammonia was added in the granulator to raise the mole
ratio to 1.05. The principal product was 17-17-17. TVA
operated a demonstration-scale plant for several years
producing 25-25-0 and 30-10-0 ammonium phosphate-
nitrate (APN) grades. The slurry or concentrated
solution was prepared by reacting ammonia with nitric and
377
phosphoric acid, concentrating the solution to about 5%
water by evaporation, and granulating the resulting slurry
in a pan granulator.
The production rate was about 20 tph. Mixed
phosphoric and nitric acids were neutralized with ammonia
in a first stage to a pH of 1.6, then concentrated, and
then neutralized in a second stage to a pH of about 5.6
to prepare the hot (170°C) concentrated solution for
granulation [37].
The AZF - Grande Paroisse dual pipe-reactor process
introduces ammonium nitrate as a solution that is
directly sprayed onto the bed of granules in the
granulator. SAf has also developed a system for coneutralization
of phosphoric and nitric acids to produce a concentrated
APN solution, which is granulated with potash in a
combination granulator dryer consisting of two concentric
drums with internal recycle [38].
APN solutions are readily produced by neutralizing
phosphoric acid with ammonia-ammonium nitrate
solutions. This method has been used in many small
granulation plants in the United States, but the solution is
used as supplemental feed for compound fertilizer
production. Porter and Sheldrick described Hson's melt
granulation process for producing APN such as 24-24-
0 [39]. Prilling of APN melts has been carried out by
Monsanto Chemical Company Processes for prilling APN
melts, with the addition of potash, have been developed
by Stamicarbon and Albright and Wilson. APN-melts-
may contain some polyphosphate, which lowers the
melting point.
12.7.4 Urea-Ammonium Phosphates
Combinations of urea with ammonium phosphate
represent the last step, with available materials, in
progress toward higher analysis fertilizers. Fertilizers
based primarily on urea and ammonium phosphate have
been produced in Japan for many years, Ando described
a variety of processes that were in use in 1970 [33].
Ammonium phosphate was supplied either as a slurry
produced in the plant by ammoniation of phosphoric
acid or in solid form as MAP or DAP, Urea was supplied
as a solid (crushed prills or crystals}, as a melt, or as a
concentrated solution. Several types of granulators were
in use; rotary drums were the most common, but pan
granulators, pugmills, and other types were used in some
plants.
A later paper gave a detailed description of a
granulation plant that produces urea-ammonium phosphate
(UAP) grades, such as 28-28-0, 22-22-11, 18-18-18,
etc. [40]. The main raw materials are crushed urea prills,
spray-dried ammonium phosphate (12-50-0), and
potash salts, One unusual feature of the plant is a methylene-
urea reactor, which is used for production of some NPK
grades. Part of the urea is fed into the steam-heated
reactor with formaldehyde solution to produce a
methylene-urea slurry containing unreacted urea,
monomethylene diurea, dimethylene triurea, and
trimethylene-tetraurea. The purpose of this step is to
facilitate drying, improve the physical properties of the
products, and provide some slow-release nitrogen.
Another unusual feature of the plant is a rotary
ammoniator-mixer containing roller shafts. Its function
is to receive the solid raw materials, the recycled fines,
and the methylene-urea slurry (if used) and mix them
thoroughly by a kneading action. Ammonia is addecTirT
the mixer although, in the example given, the amount
of ammonia is small (6 kg/tonne of 18-18-18). From
the mixer, the product goes to a rotary granulator and
then to a dryer, screening facilities, a cooler, and a
coating drum. The moisture content of the granules leaving
the granulator typically is about 3%, and this is
controlled by the addition of steam and/or water in the
granulator or mixer and by the moisture content of the
methylene-urea slurry. The temperature in the
granulator is about 63°C, and the recycle ratio is 2.0 - 2.5:1.
Formulations given in the paper [40] indicate that the
methylene-urea reactor is not used for 28-28-0; it is
used for several NPK grades in which the mole ratio of
urea:formaldehyde is 3.7:1. The paper also mentioned
that gypsum may be added as a granulation aid,
magnesium or manganese is added to some grades, and
nitrification inhibitors are added in some products,
TVA pursued the development of UAP processes for
several years. The first approach was to incorporate urea
into their DAP slurry granulation process. In pilot-plant
tests of this method, UAP grades ranging from 38-13-0
to 21-42-0 were produced, Urea was added in the
granulator either as concentrated solution or solids (crystals
or prills). This general method has been used in at least
two plants in India to make 28-28-0 and other grades
using solid urea. Coromandel Fertilizers Limited (CFL)
in India implemented the TVA technology using a
preneutralizer as well as operation with a pipe reactor
[41]. The specification for UAP (28-28-0) produced at
CFL is given in Table 12.13.
Table 12.13. Specification of UAP Produced by
CFL (India)
Concentration, %
Total nitrogen
Nitrates
Ammoniacal N (min.)
P2O5 (min.)
Water-soluble P2O5 (min.)
Free moisture
Value
28.0
Nil
9.0
28,0
25,2
1.5
378
The basic concept of the process is that slurry
obtained in the reactor (preneutralizer or pipe reactor), at
a NH3:H3PC>4 ratio of 1.4-1.45 and water content of
16%-18%, is pumped into the granulator where urea,
recycled materials, and ammonia are added, Granules
are dried, sieved, and bagged. Unreacted ammonia from
the reactor and granulator as well as the fine particles
from the dryer and cooler cyclones are recovered in a
scrubber by washing with circulated 30% phosphoric
acid and water. The continuous stream of weak acid is
fed back to the reactor. The parameters of the
operation are given in Table 12.14.
The same system has been used to produce NPK 14-
35-14. Operating results with the two processes,
preneutralizer and pipe reactor, are compared in Table
12.15.
In TVA's production of UAP by a melt granulation
process, mentioned previously, ammonium
polyphosphate melt and molten urea were cogranulated in
a pugmill. The principal grade was 28-28-0, produced
at a rate of 16 tph; 35-17-0 was also produced. The
production rate was limited by the capacity of the urea
synthesis unit. TVA aIs"o prilled a molten mixture of UAP
in a pilot-plant oil-prilling unit. Norsk Hydro developed
a process on a pilot-plant scale for prilling UAP in air
with or without potash addition [42[, In the TVA work,
ammonium polyphosphate melt was premixed with urea
melt immediately before prilling. In one variation of the
Norsk Hydro process, preheated solid MAP is premixed
with urea melt before prilling; alternatively preheated
solid urea is premixed with MAP melt. -The- prills are-
relatively large (1.8 mm, average), hard, and dense.
Grades of 29^29-0 and 38-16-0 are produced, A
diagram of the Norsk Hydro process is shown in Figure
12.18.
The AZF - Grande Paroisse dual pipe-reactor process
introduces urea as a solution that is sprayed directly onto
the bed of granules in the granulator.
Tabic 12.14, UAP Process Parameters at CFL Plant
Parameters
Temperature, °C
NH3:P205 ratio
pH
Specific gravity, t/m3
Free moisture, %
Air flow, Nm3/h
Reactor ...___ _.
116-120
1.40-1.45
5.0-5.5
1.5-1.55
16-18
. _Scrubber .__
50-55
1.1-1.2
1,27-1.29
__ Granulator
75-79
1.6
6.5-7
2.5-3,0
13,600
Dryer
200-220
75-80
1.6
1.7-1.9
60,000
Table 12,15. Comparison of the Preneutralizer and Pipe Reactor in UAP Production at CFL (India)
Parameters
Slurry temperature entering
granulator, °C
Moisture of slurry entering
granulator, %
Temperature of granulator bed , °C
Temperature of dryer inlet, DC
Consumption of fuel oil, kg/t
Crushing strength of granule, kg/granule
Preneutralizer
116-120
16-18
75-79
200-220
10
0.8-1.0
Pipe Reactor
140
5
85-90
110
5
1,2-1.3
379
So I Id urea
z=$
> KCI (optional)
-s
i
£_4 Recycle fines
S-3
MAP neli
R-2
^ Stean
to condenser
NH3 (gas)
cz^_
Partial ly
neutral I zed H3PD4
H3PD4 <54/i P2D5)
c=$
Legendi
C-l Scrubber
R-2 Pipe reactor
S-3 Separator
E-4 Preheater
M-5 Mixer
PT-6 PrI I IIng tower
S-7 Cyclone
SC-8 Screens
C-l
To stack —
c=>
Product
c=>
Figure 12.18. Norsk-Hydro UAP Process.
12.7.5 Use of Phosphoric Acid in Granulation
Processes
Phosphoric acid often is used in granulating compound
fertilizers to supply part of the P2O5 in formulations in
which the remainder of the P2O5 is supplied by single or
triple superphosphate or ammonium phosphates. The
acid usually is sprayed into the granulator, and
ammonia or ammoniating solution is added during
granulation to neutralize it. The heat of reaction promotes
granulation and moisture evaporation. Both merchant-
grade (54% P2O5) and superphosphoric acid (69% - 72%
P2O5) have been used in this way. This approach is
described in detail in Chapter 16 "Compound Fertilizers."
12.7.6 Miscellaneous Fertilizer Uses for
Phosphoric Acid
A potentially promising use for phosphoric acid is in
the production of potassium phosphates. Substantial
amounts but relatively small percentages of phosphoric
acid are used for direct application to the soil, especially
alkaline soils.
Slow-reiease fertilizers, for example, MgNH^PCU and
MgKPC"4 (or mixtures of the two salts), represent another
use. Compounds of the general formula MNH4PO4,
where M may be a divalent metal ion, such as Fe, Mn,
Cu, or Zn, have been tested as slow-release sources
380
d micronutrients. Urea phosphate CO(NH2)2*..
H PO4. is an interesting compound that has been
considered for use as a fertilizer. However, a more promis-
inq use is as an intermediate for production of
high-analysis solid and liquid fertilizers. These
possibilities have been studied by TVA and others 112,431.
Other important uses for phosphoric acid are
covered in other chapters, i.e., for production of liquid
fertilizers (Chapter 10) and for production of mixed-acid
nitrophosphates (Chapter 13).
12.8 Process Licensors and Contractors
12.8.1 Process licensors
The mention of the names of companies does not
imply UN1DO/1FDC endorsement for any purpose. The
selection is only indicative, and only companies
operating worldwide have been mentioned. British Sulphur has
developed a list of regional and country licensors [44].
TSP
Amfert, Amsterdam, Netherlands
Grande Paroisse, Paris, France
Hydro Agri Licensing, Brussels, Belgium
Jacobs Engineering, Lakeland, Florida, U.S.A.
Kemira Agro, Helsinki, Finland
Norsk Hydro, Oslo, Norway
Prayon Technologies, Engis, Belgium
Uhde GmbH, Dortmund, Germany
DAP
Cros, Madrid, Spain
Espindesa, Madrid, Spain
Grande Paroisse, Paris, France
Hydro Agri International, Brussels, Belgium
Jacobs Engineering, Lakeland, Florida, U.S.A.
Norsk Hydro, Oslo, Norway
Raytheon Engineers and Constructors, Tampa,
Florida, U.S.A.
Uhde GmbH, Dortmund, Germany
Weatherly, Atlanta, Georgia, U.S.A.
Contractors
Most contractors are able to build factories for any
of the processes discussed; a few are listed below.
Chiyoda Chemical Engineering and Construction,
Tokyo, Japan
Coppee - Lavalin, Brussels, Belgium
Jacobs Engineering, Lakeland, Florida, U.S.A.
John Brown Engineers and Constructors Ltd, London,
U.K. including Davy Powergas Ltd, London, U.K.
and John Brown Deutsche Engineering GmbH,
Essen, Germany
Krebs, Montigny-Ie-Bretonneux, France
Lurgi Chemie und Huettentechnik, Frankfurt-am
Main, Germany
Mitsui and Co Ltd, Tokyo, Japan
Raytheon Engineers and Constructors, Tampa,
Florida, U.S.A.
Snamprogetti s.p.a., Milan, Italy
Technip - Speichim, Cergy-Pontoise, France
Uhde GmbH, Dortmund, Germany
12.9 References
1. Benes, J. A., and H. Franzrahe. 1994. "Modifying
Existing DAP/NPK Fertilizer Plants to Comply With
New Environmental Regulations," IFA Technical
Conference Proceedings, Amman, Jordan.
2. Houghtaling, J., and V. J. Margiotti, Jr. 1994.
"Advanced Ammonia Phosphate Scrubbing With
Minimum Water Discharge," IFA Technical Conference
Proceedings, Amman, Jordan.
3. Bridger, G. L., R. A. Wilson, and R. B. Burt. 1947.
"Continuous Mixing Process for the Manufacture
of Concentrated Superphosphate," Industrial
Engineering Chemistry, 39:1265-1269.
4. Bridger, G. L, 1949. "Development of Processes
for Production of Concentrated Superphosphate,"
Chemical Engineering Report 5, TVA, Muscle
Shoals, AL, U.S.A.
5. Sinte Maartensdijk, A. 1976. "Direct Production of
Granulated Superphosphates and PK Compounds
From Sulphuric Acid, Phosphoric Acid, Rock
Phosphate and Potash," 1SMA 1976 Technical
Conference Proceedings, The Hague, Netherlands.
6. Leyshon, D. W., and 1. S. Mangat. "Innovations in
Slurry Granulation Plants," Ibid.
7. "Superphosphate: Its History, Chemistry and
Manufacture." 1964. U.S. Department of Agriculture and
TVA, pp, 105-106.
381
8. Handley, M. M. 1984, "Effects of Impurities on
Production of Diammonium Phosphate," 1FA
Technical Conference Proceedings, Paris, France.
9. Fittel, R. S., and L. A. Hollingswprth. 1977.
"Manufacture of Ammonium Phosphates Using a Pipe
Reactor Process," Proceedings of the 27th Meeting
of the Fertilizer Industry Round Table, pp, 70-80.
10, "The Cros Fertilizer Granulation Process." 1977.
Phosphorus and Potassium, 87:33-36.
ll.Danos, R. J. 1978. "Pipe Reactor Making
Diammonium Phosphate Now," Chemical
Engineering, 85, N22, 81-83.
12. TVA. 1978. "New Development in Fertilizer
Technology," Bulletin 136:52-55, TVA, Muscle Shoals,
AL, U.S.A.
13. "Predicament Posed by Poor Quality Phosphate
Rock." 1978. Chemical Engineering 85, N22, 67-
69.
14. "Improved Techniques for Ammonium Phosphate
Production." 1986. Phosphorus and Potassium,
144(JuIy-August):27-33.
15. Achorn, F P., andD. G. Salladay, 1982.
"Optimizing Use of Energy in the Production of Granular
Ammonium Phosphate Fertilizer," IFA Conference
Proceedings, Kallithea, Greece. -
16. Salladay, D. G., and W. H. Paulson. 1984.
"Development of TVA Pressure Reactor for Production of
Ammonium Phosphate," Proceedings of the 34th
Annual Fertilizer Round Table Meeting, Baltimore,
MD, U.S.A.
17. UhdeGmbH. 1985."Diammonium Phosphate and
Compound Fertilizer Plants: The Uhde Pipe
Reactor Concept," Uhde GmbH, Dortmund.
18. Loste, R,, and J, L. Toral. 1983. "Improvements in
the S.A. Cros Pipe Reactor Technology," British
Sulphur International Conference Fertilizer '83,
November.
19. Marzo, L. M., and J. L. Lopez-Ninio. 1986,
"Powdered or Granular DAP," IN New Diammonium
Phosphate Technology Proceedings N245, The
Fertilizer Society, London.
20. Moraillon, P. H., and Y. Cotonea. 1984. "Energy
Conservation in Fertilizers Granulation," 1FA
Technical Conference Proceedings, Kallithea, Greece.
21. Chinal, P., Y, Cotonea, and C. Debayeux. 1984.
Proceedings of AIChE Meeting, Clearwater, FL,
U.S.A.
22. Chinal, P., and Y. Cotonea. 1984. "New
Development in the Dual Pipe Reactor Process," 1FA
Technical Conference Proceedings, Paris, France.
23. Sundaravadivelu, M. 1985. Communication to the
Fertiliser Association of India, New Delhi, India.
24. Chinal, P., et al. 1985. "AZFProcess for-the
Manufacture of Granular Fertilizers Using Two Tubular
Reactors," United Nations Seminar, Istanbul.
25. Chinal, P., et al. 1986. "Dual Pipe Reactor Process
for DAP, NP, NPK Production," IN ..._.Ne_uz_
Diammonium Phosphate Technology,
Proceedings N245, The Fertilizer Society, London.
26. Ivell, D. M,, and N. D. Ward. 1984. "The Use of a
Pressure Neutralizer for Slurry Granulation," IFA
Technical Conference Proceedings, Paris, France.
27. Raytheon Engineers and Constructors, Tampa, FL,
U.S.A. 1994. Private communication.
28. Lopez-Ninio, J. L., and L. M. Marzo. 1986.
"Nongranular or Granular MAP and DAP Through
a Pipe Reactor," IFA Technical Meeting
Proceedings, Port El Kantaoui, Tunisia.
29. Brownlie, I. A., E. Davidson, and T. R. Dick. 1977.
"Developments in Ammonium Phosphate
Technology," Proceedings N162, The Fertilizer Society,
Londonr————
30. Kolmeyer, N, W,, andP. H. Anderton, 1976.
"Powder Monoammonium Phosphate Production at
Resources Tunisie S.A.," Phosphorus and Potassium
86:39-43.
31. "Caking in Powder Monoammonium Phosphate."
1976. Phosphorus and Potassium, 86:45-47.
32. Freng, T, and O. H. Ue. 1974. "Urea Based NP/
NPK Fertilizers by Air Prilling," American Chemical
Society Meeting Proceedings, Atlantic City, NJ,
U.S.A.
33. Ando, J. 1970. "Development in Granulation of
Mixed Fertilizers in Japan," Fertilizer Industry Round
Table Proceedings, Tokyo, Japan, 85-92.
34. UN1DO. 1969, "The Ammonium Chloride and Soda
Ash Dual Manufacturing Process in Japan,"
Fertilizer Industry Series Monograph N4, UNIDO, Vienna,
Austria.
35. Leyshon, D. W., and Q. D, Bowers, 1967,
"Concepts of Ammoniation and Granulation in the
Blunger," Fertilizer Industry Round Table, 17th
Annual Meeting Proceedings, 39-44.
382
36 Detune, Y. "Manufacture of 17-17-17 High
Analysis Fertilizers." M-
37 Meline, R- S., T. W. McCamy, J, L. Graham, andT.
' S Sloan. 1968. "Plant-Scale Production of
Fertilizers in a Pan Granulator," Journal of Agricultural
and Food Chemistry, 16:235-240.
38 Whyte, G. B. 1972. "Low Recycle NPK Granula-
Eon Design and Practical Aspects," Proceedings
N127, The Fertilizer Society, London.
39 Porter, S. J., and W. F. Sheldrick. 1966. "Fisons'
Melt Process for Manufacture of Concentrated
Granular Fertilizers," Fertilizer Industry Round Table,
16th Annual Meeting Proceedings, 104.
40. Kuwabara, M., S. Hayamizu, and A. Hatekeyama,
1977. "Trends in Urea-Based Granular Compound
Fertilizer Technology," IN Granular Fertilizers and
Their Production, pp. 125-147, British Sulphur
Corporation, London, England,
41. Ramadurai, S. 1990. "Operational Experiences With
NP/NPK Granulation at Coromandel Fertilisers
Limited - India," IN J. J. Schultz and G. Hoffmeister
(Eds.), Urea-Based NPK Plant Design and
Operating Alternatives, Workshop Proceedings, pp. 21-
26, SP-15, IFDC, Muscle Shoals, AL, U.S.A.
42. "UreaBasedNPandNPKFertilizers." 1975.Phos-
phorous and Potassium, 76:48-54,
43. TVA. 1974. "New Developments in FertiEzer
Technology," 10th demonstration Bulletin Y-81, TVA,
Muscle Shoals, AL, U.S.A.
44. British Sulphur. 1992. List of licensing and
contracting companies in the field of fertilizers technology.
383
Chapter 13. Nitrophosphate Fertilizers
Table of Contents
Page
13.1 Introduction 385
13.2 Fundamentals of Nitrophosphates 385
13.3 Nitrophosphate Processes :.. ."386"
13.3.1 Selection of Phosphate Rock 386
13.3.2 Process Alternatives 387
13.4 Odda Process With Calcium Precipitation 387
13.4.1 Dissolving Section 387
13.4.2 Crystallization Section 388
13.4.3 Neutralization Section 388
13.4.4 Finishing (Forming or Pandiculation) Section 389
13.4.5 Prilling of Melt 390
13.4.6 Process Requirements of the Odda Process , 390
13.4.7 Calcium Nitrate Conversion and Calcium Ammonium Nitrate (CAN) Unit 391
13.5 The Mixed-Acid Process , 392
13.5.1 Phosphate Rock Digestion and Ammoniation 392
13.5.2 Further Processing : 394
13.5.3 Product Quality 394
13.6 Other Processes 395
13.6.1 Removal of Calcium by Sulfate-Addition ™tt7::.".: 395
13.6.2 Removal of Calcium by Carbon Dioxide Addition 396
13.6.3 Removal of Calcium by Ion Exchange 396
13.7 Advantages and Disadvantages of the Nitrophosphate Route 397
13.8 Development in Quantities and Market Share , 398
13.9 References , 398
384
Chapter 13. Nitrophosphate Fertilizers
13.1 Introduction
"Nitrophosphate" is the generally accepted term for
any fertilizer that is produced by a process involving
treatment of phosphate rock with nitric acid. The
nitrophosphate process was originally developed in Norway
by Erling Johnsen as a means of avoiding the diluting
effect of the sulfate ion in superphosphate. The process
was named for the town of Odda, where it was
developed, and that is still the generic name of certain
nitrophosphate processes that embody its central
principle.
After the invention of this principle in 1928, Erling
Johnsen transferred his patent to Norsk Hydro A.S.,
which developed it in the 1930s and introduced its own
technology in 1938. Norsk Hydro was among the first
to produce multinutrient fertilizers - NPs and NPKs -
via the nitrophosphate route.
Nevertheless, the beginnings were quite slow, and it
was not until the sulfur shortage of the early 1950s that
nitrophosphates became the focus of widespread
interest and a number of variants of the process were
developed. The principal steps of the nitrophosphate.
process are compared with the sulfuric acid-based process
in Figure 13.1.
13.2 Fundamentals of Nitrophosphates
The basic (and simplified) acidulation reaction can be
represented by the following reaction equations:
Ca3(P04)2 + 4 HNO3 -► 2 Ca(N03)2 + Ca(H2P04)2
+ 20.2 kcal (1)
Ca(H2P04)2 + 2 HNO3 -+ Ca(N03)2 + 2 H3PO4 +
2.05 kcal (2)
overall
Ca3(P04)2 + 6 HNO3 -*■ 3 Ca(N03)2 + 2 H3PO4 +
22.25 kcal (3)
a) Sulfuric route
Sulfur ^
Phosphate rock
1
SULFURIC
ACID
PLANT
ACIDULATION
FILTRATION
Gy
Ammonia
psum
AMMONIATION
Potash
Nitrogen
Ingredients
'
GRANULATION
NP or NPK
product
b) Nitrophosphate route
Ammonia Phosphate rock
ACIDULATION
FILTRATION
CALCIUM
CRYSTALLIZATION
OR
PRECIPrTATION
SEPARATION
Potash
Ammonia Nitrogen
1 ingredients
AMMONIATION
iRANULATIC*
NP or NPK
product
Insoluble matter
Calcium values
n'um value!
Figure 13.1. Comparison of NP/NPK Production by Sulfuric and Nitrophosphate Routes.
385
After separation of the insoluble material,
phosphoric acid is neutralized with ammonia to produce a
fertilizer. If the calcium nitrate is left in the solution, it reverts
to dicalcium phosphate upon ammoniation following the
reaction:
2H3PO4 + Ca(N03)2 + 4NH3 -+ CaHP04 +
(NH4)2HP04 + 2NH4NO3 + 66.67 kcal (4)
Dicalcium phosphate is insoluble in water but soluble
in ammonium citrate solution and is therefore regarded
as a source of "available" P2O5, at least in the United
States. However, fertilizer specifications often require
high water solubility, and this type of product is limited
to 50% water solubility of the P2O5.
Furthermore, the calcium is non-nutrient in terms of
N, P, and K and is therefore seen as a diluent. For these
reasons alone, it is desirable to remove calcium from
the solution. But there is another, more important
reason. If the calcium nitrate is left in the solution, when it
is neutralized the N:P ratio will be fixed. To produce
grades with lower N:P ratios, it is necessary to remove
calcium nitrate, whereas if higher nitrogen grades are
required, the removed calcium nitrate can be converted
to ammonium nitrate and returned to the solution.
Therefore, most nitrophosphate processes include some means
of removing calcium nitrate from the solution. With
maximum calcium nitrate removal, it is possible to
produce grades with N:P ratios ranging from about 0.6:1
(when none of the nitrate is returned) to about 2:1 (when
all the calcium nitrate is converted to ammonium nitrate
and returned).
This is possible with the Odda-type processes, in which
the solution is cooled so that most of the calcium nitrate
crystallizes. About 60% of the calcium is removed from
the solution at 20°C and 85%-90% at -5°C.
Alternatively, the calcium can be precipitated
chemically by adding ammonium sulfate to the solution. In
this case only calcium rather than nitrate is removed;
therefore, the range of grades that can he produced is
restricted to the higher end of the N:P range.
It is also possible to precipitate only the calcium using
carbon dioxide.
Ca(N03)2 + 2 NH3 + C02 + H20 -*■ CaCQ3 +
2NH4NO3 + 39.88 kcal (5)
In this case, care has to be taken to suppress
reversion to tricalcium phosphate, which is citrate-insoluble
and water-insoluble.
2 CaHP04 + CaC03 - Ca3(P04)2 + H20 + CO2 +
9.03 kcal (6)
Other ways to influence the N:P20s ratio are to use a
mixture of nitric and sulfuric or phosphoric acids or to
remove the calcium by ion exchange. These
alternatives will be discussed later.
13.3. Nitrophosphate Processes
13.3.1 Selection of Phosphate Rock
In general, reactivity of the phosphate rock is no
problem; even igneous apatites dissolve readily in nitric acid.
The rock need not be finely ground; rock finer than 1
mm is satisfactory, and some operators even accept
particles up to 4 mm. In general, the rock need only be fine
enough to prevent rapid settling in stirred reaction
vessels- High-silica rock can be used if the equipment is
designed for that purpose. Most nitrophosphate plants
include a silica removal step. Coarse silica particles can
be very abrasive to pumps and piping, and this fact should
be considered in plant design.
It is desirable that the..CaO:Pg05 ratio in the rock
should be as low as economically feasible to minimize
the amount of calcium that must be removed or offset
(in mixed-acid processes). While additional calcium
requires more nitric acid, it does not necessarily involve a
direct economic penalty because the nitrate is
subsequently converted to ammonium nitrate either in the
nitrophosphate product or in a coproduct.
Carbonates in phosphate rock cause foaming, which
is usually dealt with by using mechanical foam breakers.
However, foaming can be a difficult problem with some
rocks.
Organic matter is undesirable in nitric phosphate
processes; it reacts with nitric acid with emission of
nitrogen as NO2 or other nitrogen oxides.
Iron and aluminum oxides present no special
problem within the range of occurrence in commercial
phosphate rocks; these oxides usually are dissolved in nitric
acid and reprecipitated during ammoniation as citrate-
soluble phosphates. TVA tested "Ieached-zone" Florida
phosphate containing a high percentage of aluminum
phosphate minerals in a special nitrophosphate process
[II.
Chloride is generally limited to 300 ppmw to prevent
pitting corrosion, but phosphate concentrates with about
500 ppmw chloride have been used 12].
386
13.3.2 Process Alternatives
The two commercially important nitrophosphate
processes differ in the way they solve the problem of
phosphate water solubility caused by the presence of calcium
nitrate in the slurry resulting from the reaction of
phosphate rock with nitric acid. The first process,
historically is the Odda process wherein calcium nitrate is
precipitated and separated, The "mixed acid" process does
not separate the calcium nitrate; the phosphate water
solubility is increased by adding phosphoric acid to
decrease the CaO:P205 ratio.
13.4 Odda Process With
Calcium Precipitation
The principal developers of the Odda process (Figure
13.2) have been BASF and Norsk Hydro, In the
following account of the Odda process, the descriptions of the
dissolving and crystallization sections were originally
written for the BASF process 13]. The BASF and Norsk
Hydro processes, however, are similar in these two
sections.
13.4.1 Dissolving Section
In the dissolving section phosphate rock and nitric
acid are mixed together in the dissolving reactors. Nitric
acid of about 60% concentration is used in slight
stoichiometric excess. The temperature in the reactors
is kept constant at 60°-70°C by cooling or heating nitric
acid. In addition to fresh nitric acid, wash acid from the
inerts filter and from the calcium nitrate tetrahydrate
(CNTH) filter is fed to the reactors.
The dissolving solution contains suspended solids,
mostly quartz, originating from the rock. Quantity and
size of the solids vary with the source of rock. Inerts act
as an undesirable diluent of the nutrients in the final
product and can cause damage to equipment and
piping by erosion.
Inerts are separated from the dissolving solution by
gravity in lamella separators; the clear solution overflows
Potass 1wn
Annon|a
<=>
Nitric acid
Phosphate rock
NP planti Odda
AnnonI a
CaHaon El oxide
S) jSC-lg
4^
NP/NPK
c^>
G-15
"a
CAN
—c=>
G-28
NP planti Conversion
Legendi
R-l Dissolving reactor V-7 Neutral Izer
T-2 Solution tank M-B Mixing tank
S-3 Sand separator G-9, G-22 Granulator
CR-4 Crystal!i zer D-10, D-23 Irving drun
F-5 CN FlIter
CAN plant
D-23
T-6 Storage tank
GR-13, GR-26 Crusher T-19 Storage tank
E-14, E-27 Fluid bed coaler E-20 Evaporation unit
G-15, G-28 Coating drun M-21 Mixing tank
C-16 Carbonation tower
BC-11, BC-24 Bucket elevator R-17 Conversion reactor
SC-12, SC-25 Screen
F-18 Line fI Iter
Figure 13.2. Simplified Nitrophosphate Process Concept.
387
Dissolving solution
n=>
Dissolving solution
n=$
S-3
—$h
a
HND3
Water / condensate
-<=■
i i i i
<^H
D+
F-4
S-5
Waste water
^
P-E
Legendi
T-l Solution tank
P-2 Pump
S-3 Clarlfier
F-4 F!Iter
S-5 Separator
Sand
^=>
Figure 13.3. Inert Removal in BASF Odda Process.
into the dissolving solution storage tank, and a
thickened inerts slurry is washed out to a belt filter or to
hydroclones. Sand is washed with nitric acid and a small
amount of water, and, if necessary, washed to neutral in
a batch washing tank. The liquid effluent from this
washing tank is sent to the effluent treatment plant, Inerts
arc sold, e.g., to the building industry figure 13.3).
The submerged part of the reactor may be made of
low-grade stainless steel The top part of the reactor,
which is in contact with reaction gases that contain NOx
and fluorine compounds, must be made of appropriate
more resistant material.
13.4.2 Crystallization Section
Dissolving solution (NP solution) is fed intermittently
to a number of batch-operated standard crystallizers.
Cooling for crystallization is obtained by evaporating
ammonia for the NP solution neutralization and calcium
nitrate (CN)-conversion sections. The balance is supplied
by a refrigeration system, if required.
The crystallization process is entirely computer-
controlled. The coldest crystallizer, having obtained the
required final temperature, discharges to the filter head
tank. The final temperature is fixed, e.g., -2° to -5°C
when about 80% water-solubility is required, or +2°C
when about 70% water-solubility is sufficient.
Separation of crystals is done on a belt filter using several
washing zones or with drum filters in series. Cold nitric acid
and CN-soIution are used as washing liquid. NP acid,
the product from the filter, is stored in the NP acid
storage tank. To fine tune the NP-acid quality (CaCyT^O^-
ratto), dissolving solution is passed over the crystals. The
separated CNTH crystals are dissolved in dilute
ammonium nitrate solution to form the CN solution.
13.4.3 Neutralization Section
In the neutralization section, the nitrogen and
phosphorus elements in the NP solution are converted to the
form they will have in the product. Correct operation of
this section is important because the N:P20s ratio of
the final product is controlled here. This control is
achieved by mixing NP acid obtained from the CNTH-
filters with ammonium nitrate solution and with an
388
original dissolving solution. Neutralization by gaseous
ammonia occurs in a pressurized reactor at 1.5-2.5 bar
and a temperature of 150°-180°C or in forced-circulation
neutralizes. Because of the heat of reaction, water and
ammonia are evolved during neutralization; this
decreases the water content of the slurry which is then
further concentrated in a series of circulating evaporators,
The neutralization and evaporation operations have
their own scrubber system for off-gases. The scrubbing
liquor is composed mainly of ammonium nitrate
solution, which is later recycled to the neutralization section
for nutrient recovery.
13.4.4 Finishing (Forming or Particulation)
Section
The final slurry after ammoniation and evaporation is
formed into granules, with or without addition of
potash salts, by a variety of methods including:
• Granulation in a pugmill or blunger.
• Ammoniation and granulation in a rotary drum.
• Granulation and drying in a Spherodizer®.
• Granulation and drying in a spouted bed system .
• Prilling of a melt.
These granulation methods will be described in more
detail under granulation of compound fertilizers in
Chapter 16. However, it may be useful to mention a few
characteristics guiding the choice of the techniques for
the granulation of nitrophosphates,
Drum Granulation and Pugmill-The advantage
of rotary drum and pugmill granulators is that
ammoniation may be carried out in the bed, The heat of
reaction may cause some water evaporation in the granula-
tor and provide a hotter feed to the dryer. The pugmill
requires considerably more electrical power than the
drum, and the ammonia sparger must be more strongly
mounted in the pugmill.
Spherodizer® Granulation - The Spherodizer®,
which was developed as a proprietary granulator by C
& 1 Girdler, is a spray drum granulator in which
granulation and drying are combined. It can be operated as a
cold sphero," when it is swept by a current of cold air
in the case of melt granulation or as a "hot sphero,"
when hot air is used for its drying effect in the case of
slurry granulation. Large capacities require very large
or multiple units, but the capacity of the Spherodizer®
to produce onsize granules (up to 75% between 2 and 4
mm) and to dry them during granulation allows it to
operate with low recycle rates. Hence, the capacity of a unit
4-5 m in diameter by 12.0 m long can reach 600 tpd [4].
Spouted Bed Granulation - The spouted bed
system represented in Figure 13.4 consists of injecting the
slurry to be granulated upward into a "spouted bed"
conical granulator concurrently with a stream of hot gas.
At the center of the bed, where the gas velocity is
highest, the granules travel upward; at the periphery of the
bed they travel downward, thus producing a circulating
action. Each passage through the spray area adds a thin
coating to the granules. This process has been reported
by Arzani (Montecatini) and Berquin (PEC) [5,6,7]. More
recently, Agrimont claimed economically competitive
results for this process as long as it is applied to pumpable-
slurries [8] stating:
One may definitely conclude that the spouted bed
process is perfectly fitted to nitrophosphates with a
N:P205 ratio varying between 2:1 and 1:1.
For products with a higher P2O5 content (MAP,
DAP), the process seems less advantageous because
it is necessary to operate with diluted slurries at the
highest degree of ammoniation. In such a case, the
process is only competitive if you start operation
with weak phosphoric acid.
Cental gasjet stream with entrained product
|fines and crushed
Product to screens
Model, of spouted
bed in movement
Slim? sprayer
Figure 13.4. Operating Principle of a Spouted
Bed Granulator.
389
13.4.5 Prilling of Melt
This process is used by Norsk Hydro, which cites the
following advantages:
• Very high single-train capacities possible (up to 4,500
tpd).
■ Good properties of the prills (smoothness, low
dusting during handling).
• Advantageous granulometry of the prills (90% between
2 and 4 mm with an average diameter of 3 mm).
The spreading characteristics of this product are stated
to be at least as good as those of a granulated product.
The prilling head is of the spinning bucket type. The
offsize amounts to only 16% of the prills leaving the
tower. The dust content of the exhaust air is less than 5
mg/m3, which is low enough to require no cleaning
before discharge [9,10] because the total dust emission
is less than 5 kg/h for a 4,000-tpd plant (Figure 13.5).
Some details of the preceding description are part of
the BASF technology. The Norsk Hydro process differs
in that jt uses \9\:
• Hydrocyclories to remove the insolubles.
• Drum filters to remove the CNTH.
• Addition of urea to suppress NO* formation.
• A prilling tower rather than a Spherodizer®.
13.4.6 Process Requirements of the Odda
Process
Several process and equipment alternatives are used
in practice of the Odda process; Table 13.1 gives the
unit process consumption values for an average Odda
nitrophosphate plant.
Potassium salt
a=$
LIquId amnonla
[==>
Phosphate rack
Wash water
^->
K?
N-16
BC-18
GR-20
E-21
NPK product
isOm =>
Calcium carbonate
e=>
Legendi
SI-1 Rock bin
W-2 Belt scale
T-3 Digestion tank
S-4 Hydracyc I on e
S-5 Washing drum
T-6 Feed tank
CR-7 Crystal. I Izer
to AN or CAN production
M-16 Mixing
T-8 Filter feed tank PT-17 Prilling tower
F-9, F-10 Filters BC-18 Bucket elevator
T-ll Wash acid tank SC-19 Screen
T-12 CN nett tank GR-20 Crusher
R-13, R-14 Neutralization E-21 Cooler
E-15 NP Evaporation C-22 Coating drum
(optional)
E-E3 NH3 Evaporation
C-24 Absorption tower
R-25 Conversion reactor
T-26 Filter feed tank
F-27 F I Iter
T-2B AN Surge tank
Figure 13.5. The Norsk Hydro Process.
390
Tabic 13.1. Process Requirements of the Odda
Nitrophosphate Process
Parameters
Units
Value
Product NPK 1 16-16-16
Capacity tpd 1,250
Annual operation time h 7,200
Investment cost (battery limits) US $ million 35a
Cost Components
Raw Materials:
Ammonia
Nitric acid
Carbon dioxide
Phosphate rock (P2O5)
Potash
Coating agent
Byproducts:
Ammonium nitrate
Calcium carbonate
Energy
Electrical energy
Steam
Process water
Fuel
Disposal:
Off-gases
Units
kg
t
t
kWh
kg
m3
GJ
Nm3
Unit/t
0.224
0.696
0.189
0.495
0.268
3-4
0.491
0.365
140
270
3.0
0.16
3,500
a. Does not include the ammonia and nitric acid plants.
13.4.7 Calcium Nitrate Conversion and Calcium
Ammonium Nitrate (CAN) Unit
The CN-conversion and CAN units contain the
following sections:
• CN Conversion Unit
- Ammonium carbonate preparation section
- CN-conversion section
- Lime separation section
• CAN Unit
- AN concentration section
- Additives preparation section
- Mixing, granulation (or prilling), and drying section
- Cooling, screening, and coating section
- Off-gas treatment section
As shown in Figure 13.6, the CN-conversion section
begins with the preparation of ammonium carbonate
cm
MH3-Gas
CARBONlZATtGN
Atf-Soluta
CN-CONVERSION
CK-Sdtatlun
Off-gas
OFF-GAS
TREATMENT
Addlttres
i'
SEPARATION OF LTME
(AN 65 W)
T
AN' EVAPORATION
T
MIOTGIN
GRANULATION
& DRYING
1
1
Lime
COOLING, SCREENING
& COWING
CAY-Product
Figure 13.6. Odda-Process CN-Conversion/
CAN-Granulation Sequence.
solution in a dilute ammonium nitrate solution in a packed
carbonation tower with external circulation. Heat
exchangers are used to control the temperature gradient
over the tower. Raw materials are carbon dioxide and
gaseous ammonia evaporated in the refrigeration
section. The required ammonium carbonate solution is taken
from the circulation loop and sent to the conversion
reactor with the corresponding quantity of CN solution.
A lime settler and a vacuum filter separate the reaction
products, dilute ammonium nitrate solution, and calcium
carbonate (lime). The AN-soIutjon obtained here requires
a second filtration step on precoat filters before AN-
concentration. The precoat is established with the
product lime itself. After this second filtration step the
remaining ammonium nitrate is stored in the AN-solution
tank; from there it is pumped to the AN evaporation
391
section and to the CNTH-filter to dissolve fresh calcium
nitrate tetrahydrate crystals.
The CN-conversion section has its own packed off-
gas scrubber with external circulation. The scrubber
liquid is an acidified dilute AN-solution, which is returned
to the process.
The AN-evaporation section consists of several
falling film evaporators in series. The first part of this
section produces a concentrated AN-solution of 93-94 wt
% AN. Depending on the capacity and cost of energy,
this step may consist of double- or triple-effect
evaporation. Each falling film evaporator set consists of a
preheater, heater/evaporator, vapor separator and
transfer pump. A two-stage water ring vacuum pump
provides the necessary vacuum, and a steam saturator,
operating at 0-9 MPa absolute (175°C condensing
temperature), provides the necessary energy for the
concentration unit.
The ammonium nitrate solution at 93-94 wt % is stored
and pumped to the second part of the evaporation unit
and/or to the NP-unit. This second part is composed of
one falling film evaporator with the separator operating
at 0,3 bar (absolute) and concentrating up to the
required concentration of about 98 wt %. Steam is
removed from a separate steam saturator at 9 bar
(absolute) . The vacuum system of this section can be combined
with that of the first part.
CAN-slurry is produced in a mixing section, which
consists of dissolving vessels for additives and feeding
equipment for gypsum, which is added to the lime.
Dissolved additives, lime/gypsum mixture and concentrated
AN-melt are delivered to a mixing vessel with an
agitator. From there it flows into a second vessel and is then
circulated back to the mixing vessel. CAN-slurry for
granulation is taken from this circulation loop.
The CAN granulation section uses a granulation drum
with internals to produce a screen of falling materials,
on which the concentrated CAN slurry is sprayed. The
granules that are produced fall by gravity into a counter-
currently operated drying drum. The drying drum is
operated autothermally, which means that no external heat
source is required to preheat the drying air. Off-gas from
the dryer and granulator is first dedusted in cyclones,
and then sent to the same gas scrubber used for
scrubbing the off-gas from the CN-conversion section.
Dry granules are screened over double-deck screens.
Fines, crushed oversize, and part of the onsize are
returned to the granulator. A two-stage fluidized bed cooler,
of which the second stage is operated with chilled and
conditioned air, cools the product to the desired final
temperature. The waste air from the fluidized bed cooler
must be treated to remove dust.
Coating takes place in a rotating coating drum to
improve product characteristics during storage, From the
coating drum, product is sent to storage.
The BASF granulation process for CAN can use
either "AN-wet" lime - lime from the lime filter, which is
washed with AN solution, or dry lime, which is water-
washed lime. For either alternative the residual water
content of the AN-melt must be adjusted.
The advantage of using "AN^wet" lime is that a
considerable amount of energy and capital is saved, A
saving of energy occurs because no dilution of AN-solution
with wash-^water occurs and no lime drying takes place.
Investment is reduced because lime drying equipment is
not required.
In prilling CAN, the AN solution is premixed with dry
lime immediately before prilling. A rotating, perforated
bucket is the preferred type of drop-forming apparatus.
Prill towers for both CAN and AN commonly are 46-56
m high although shorter ones are also used. For high-
density prilling using 99.7% solution, prilling towers that
are 15-30 m tall may be used. Cooling may be
conducted in a rotary cooler or in a fluidized bed either in
the bottom of the prill tower or in a separate unit.
13.5 The Mixed-Acid Process
This process is very flexible and is able to produce
various grades of fertilizers with a varying degree of
phosphate water solubility. The Kemira Oy process is
described below [11,12]. This nitrophosphate slurry-based
process uses mixed acids. The general flowsheet of the
process is given in Figure 13.7.
13.5.1 Phosphate Rock Digestion and
Ammoniation
The first step of the process is the digestion of
phosphate rock with nitric acid, which results in a solution of
phosphoric acid and calcium nitrate (first reactor).
Ca3(P04)2 + 6HNO3 -► 3Ca(N03)2 + 2H3PO4 +
22,25 kcal (7)
Depending on the type of phosphate rock, formation
of acid gases containing, for example, nitrogen oxides
and compounds of fluorine takes place during the
digestion. In the second reactor the overflow from the first
reactor is ammoniated, and scrubber liquor is added.
The acid slurry is ammoniated with gaseous
ammonia along the following reactions.
392
Product
Legendi
R-l - R-3 Reactors BC-10 Bucket elevator
T-4 Buffer tank SC-11, SC-12 Screens
C-5, C-7 Gas scrubbers GR-13 Crusher G-17 Coating drun
M-6, M-B Mixers BF-14, BF-15 Belt conveyors S-1S Cyclones
G-9 SpherodIzer E-1G Cooler S~19 Dedustlng system
BF-15
Figure 13.7. Mixed Acidulation Nitrophosphate Process.
HN03 + NH3 -»■ NH4NO3 + 22.27 kcal (8)
H3PO4 + 2NH3 -> (NH4)2 HPO4 + 33.52 kcal (9)
2H3PO4 + Ca(N03)2 + 4NH3 -»■ CaHP04 +
(NH4)2 HPO4 + 2NH4NO3 + 66.67 kcal (4)
The third reactor provides for final ammoniation of
overflow from the second reactor. Phosphoric and
sulfuric acids are added and the KC1 dissolved (when NPK
is produced).
If sulfuric acid is introduced, the sulfate ions induce
the precipitation of calcium sulfate following the reaction:
Ca(N03)2 + H2SO4
9.37 kcal
2HN03 + CaSQ4 +
(10)
This calcium sulfate can be removed by filtration, but
generally it is left in the slurry where it may be
considered as a diluent that supplies two secondary nutrients:
calcium and sulfur.
Any micronutrients to be incorporated in the
formulation are added at this point, A buffer tank is used as a
liquor feed tank for the Spherodizer® and as a
receptacle for recovering fertilizer dust from the bag filters
and cyclones.
The water solubility of P2O5 in the product can be
adjusted by varying the phosphoric acid/phosphate rock
ratio in the formulation. A wide range of grades may be
produced; these grades include: for minimum nitrogen
content, 8-24-14 grade; and for maximum nitrogen
content, 30-10-0 grade. Standard grades such as 17-
17-17 and 23-23-0 may be produced.
After neutralization other components, e.g.,
ammonium phosphates, superphosphates, ammonium sulfate
and compounds containing potassium and magnesium,
may be added. Most of these materials may also be added
before or during neutralization, but if the raw material
contains chloride, the pH-value of the slurry should be
5-6 to avoid development of hydrogen chloride.
The design of the reactor battery can vary from a few
large reactors to many small reactors, but at present the
three-reactor system is considered optimal. A common
393
feature for all the designs is that the row of reactors
ends with a buffer tank, Depending on the type of raw
material, the amount of gas scrubber liquid to be
recycled, and the degree of ammoniation, the water
content of the slurry in the buffer tank can vary between
5% and 30% and the temperature from 100°C to 140°C.
13.5.2 Further Processing
Granulation and Drying- The slurry in the buffer
tank typically contains about 10% of water and the
temperature is about 140°C. Granulation and drying occur
simultaneously in a combined granulator-dryer called a
Spherodizer®. The principle of Spherodizer®
operation was described previously. To improve fuel economy,
the hot exhaust gas is recycled to the dryer inlet via a
bag filter,
Screening, Crushing, and Recycle Handling -
Product sized 2-4 mm is separated from the granulator
discharge by screens. The oversize material is crushed
and recycled with undersize to the granulator Part of
the product-size material is also recycled to keep the
recycle rate constant. The product that is not recycled
goes to the cooler. The cooler is often a fluidized-bed
cooler rather than a rotary-type cooling drum. The
fluidized-bed cooler has higher operating costs; however,
it has a lower investment cost and requires less area in
the plant. The product from the cooler is coated with
anticaking additives in a small.rotating drum,-—-—-
Nutrient Recovery From Gas Streams- A
multistage scrubbing system captures fumes from the
reactors and any dust that escapes the cyclones. The
nutrient content of the scrubber liquor increases as it moves
countercurrently through the reactor gas scrubbing
system to the granulator exhaust gas scrubber. Nutrient salts
in scrubber liquor are recycled to the reactors. There
are no liquid effluents from the plant.
Process Requirements - Flaw material and utility
requirements for the mixed-acid process are given in
Table 13.2.
13.5.3 Product Quality
The nitrophosphates - obtained by either the Odda
route or the mixed-acid route - cover a range of
formulations with N:P20s ratios ranging from 0.5 to 2.0;
moreover, the P2O5 water solubility can be controlled - al- ■
though at increasing costs - from 30% to 90%.
The most popular are the following grades:
NP: 20-20-0 to 25-25-0; 28-14-0; 20-30-0
NPK: 15-15-15 to 17-17-17
20-10-10; 10-20-20; 15-20-15; 12-24-12
Table 13.2. Process Requirements of the
Phosphonitric Process
Parameters
Units
\Mie
Product NPK
Capacity
Annual operation time
Investment cost (battery limits)
Cost Components
Raw Materials:
Ammonia
Nitric acid
Phosphoric acid (P2O5
Phosphate rock (P2O5)
Sulfuric acid
Potash
Coating agent
Others
Energy:
Electrical energy
Steam
Process water
Fuel
Disposal:
Off-gases
1
tpd
h
US $ million
Units
kWh
kg
m3
GJ
Nm3
-15-15-15
1,700
7,900
35
Unit/t
0.108
0.285
0.037
0.055
0.015
0,251
0,007
0,025
70
20
0.5
0.38
3,500
Note that the mixed-acid route allows N:P205 ratios
smaller than 0.5 such as 8-24-14 grade. The European
Council Directive 76/116/EEC defines the quality
requirements as summarized in Table 13.3.
The nitrophosphates are exclusively manufactured in
granular form (size 2-4 mm) for direct application by
the farmer or use in bulk-blending operations. Because
of the hygroscopic nature of the ammonium nitrate that
is always present in the nitrophosphate, storage must
be protected from moisture. The very presence of
ammonium nitrate imposes its manufacturing, handling, and
storing conditions that are summarized in the booklets
edited in 1992 by 1FA and EFMA [13,14].
The nitrophosphates are generally packed in
watertight bags for delivery to the farmers. These are
generally plastic bags that can keep the product in good
condition even if stored for a period of time in the open air,
394
Table 13-3* European Union Nitrophosphate Quality Requirements
(a) NPK fertilizer is a product obtained chemically or by blending without addition of organic nutrients of animal
or vegetable origin:
Total
Minimum content of nutrient
20
N
(% by weight)
3
(b) Declared forms and nutrient content required:
Nitrogen P2O5
Total nitrogen
Nitrate nitrogen
Ammoniacal nitrogen
Ureic nitrogen
Cyanamide nitrogen
Water soluble
Ammonium citrate soluble
Mineral acids soluble
Alkaline ammonium citrate soluble
2% citric acid soluble
Minimum 75% soluble in 2% citric acid
p2o5
5
-K20
5
K2O
Water soluble
(c) Identification data (declaration obligatory):
Nitrogen P2Q5
K20
Total nitrogen
Any amount of
nitrogen over 1%
All under 2% solubility
in ammonium citrate
, Water solubility,
Water solubility
Chlorine content
Low chlorine means less than 2% CI
13.6 Other Processes
Some processes that have been developed and
commercially operated remove the calcium from solution in
a different way. These routes have not been as
successful, however, as those described previously.
13.6.1 Removal of Calcium by Sulfate Addition
The solution obtained by reaction of nitric acid with
phosphate rock can be treated by the addition of a soluble
sulfate to precipitate part or nearly all of the calcium as
calcium sulfate (gypsum or hemihydrate). In commercial
processes, ammonium sulfate, potassium sulfate, and
sulfuric acid have been used. Langbeinite
(K2S04»2MgS04) has been used experimentally. The
calcium sulfate may be separated by filtration or allowed
to remain in the product. In most plants, the calcium
sulfate is removed to produce a higher grade product.
Chemical reactions are:
(NH4)2 SO4 + Ca (N03)2 -*■ 2 NH4 NO3 + CaSQ4 +
11.90 kcal (11)
K2 SO4 + Ca (N03)2 -► 2 KNO3 + Ca SO4 +
11,37 kcal (12)
The reaction using sulfuric acid is shown in equation
10.
Potassium sulfate and ammonium sulfate solution
obtained as a byproduct from caprolactam production are
used industrially. In the Veba phosphoric acid process
(Figure 13.8), phosphate rock is reacted with a mixture
of sulfuric and nitric acids under conditions that form
calcium sulfate in the hemihydrate form, which is re:
moved by filtration [15]. In this process, part of the
sulfuric acid may be replaced by ammonium sulfate.
When ammonium sulfate is used to precipitate
calcium as gypsum, the gypsum can be treated with
ammonia and carbon dioxide to regenerate ammonium
sulfate, which is recycled, and to convert the calcium to
calcium carbonate:
CaS04»2H20 + 2NH3 + C02 -*■ CaCQ3 +
(NH4)2 SO4 + H20 + 24,51 kcal (13)
395
H2SD4
i=3
HND3
c=>
Phosphate rack
^>
Air
!=}
Legend:
R-l Reactor
C-2, C-3 Scrubbers
F-4 Rotary tiIting pan fI Iter
Phosphoric acid
Containing Nitric acid
CqSD4 * 0.5 H2D
Figure 13.8. The Veba Phosphoric Acid Process.
This is the basis for the "sulfate recycle process," which
was developed by TVA on a pilot-plant scale [16]. One
disadvantage of this process is that the N:P20s ratio in
the product is fixed at about 2:1 (28-14-0 grade).
13.6.2 Removal of Calcium by Carbon Dioxide
Addition
A process known as the "carbonitric process" has been
used commercially but has not gained much success,
mainly because of the relatively low analysis and the
absence of water soluble P2O5 in the end product.
Nevertheless, CO2 is primarily the cheapest precipitant
for calcium. The process consists of four steps:
1. Dissolving phosphate rock in nitric acid.
2. Ammoniating the solution from the first step to
precipitate essentially all of the P2O5 as dicalcium
phosphate; the remainder of the calcium remains in
solution as calcium nitrate.
3. Adding ammonia and carbon dioxide to convert the
calcium nitrate to ammonium nitrate and calcium
carbonate.
4. Granulating and drying.
The final product consists of a mixture of dicalcium
phosphate, ammonium nitrate, and calcium carbonate.
The grade is about 16-14-0. None of the P2O5 is water
soluble, but nearly all of it is citrate soluble.
13.6.3 Removal of Calcium by Ion Exchange
The firm Superfos (now KEMIRA-Denmark) has
developed an ion-exchange process for calcium removal
[17]. The phosphoric acid-calcium nitrate solution is
passed through a potassium-loaded resin that absorbs
calcium and releases potassium. The resin is
regenerated by a potassium chloride solution; calcium chloride
is discharged to waste. A simplified flow diagram of the
process is shown in Figure 13.9.
The process can be represented by the following
reactions.
Digestion: Ca3(P04)2 + 6 HNO3 -+ 3 Ca(N03)2 +
2H3PO4 + 22.25 kcal (3).
396
phosphate rock
Nitric add
potassium chloride
Ammonia.
Figure 13.9.
—*~
Ammc
Sur.
pha
digestion
■
Phospho
CalduE
IM.
1
lie add
ni Irate
Fe]
ION EXCHANGE
Nitric ac
Phosphoru
Potassium
id
add
dlrate
AMMOKIATION
mum phosphal
Potassium e
Ammonium
>erfos loi
te Proce
, monobasic
dlrate
nitrate
lExchan
ss Used
Calcium chloride
(Al, Ferric chloride]
to discard
ge Nitrophos-
in Denmark.
Ion exchange: 2 KC1 + Ca(N03)2 -+ 2 KNO3 +
CaCl2 + 13.1Q kcal (14)
Ammoniation: H3PO4 + 2 NH3 -► (NH4)2 HPO4 +
33.52 kcal (9)
HNO3 + NH3 ->■ NH4NO3 +
22.70 kcal (8)
If the rock contains cationic impurities other than
calcium, such as iron and aluminum, these elements may
also be removed by the ion-exchange process. After ion
exchange the solution, which contains phosphoric acid,
potassium nitrate, some excess nitric acid, and perhaps
some residual calcium nitrate, is ammoniated, dried, and
granulated. Grades ranging from 21-9-12 to 17-17-17
are produced,
The solution leaving the ion-exchange unit has a
K2OP2O5 weight ratio of about 1.8:1.0. When lower
ratios are desired in the final product, the current
practice is to add phosphoric acid from another plant unit
before ammoniating. An alternative is to remove part
of the potassium nitrate by cooling the solution to
crystallize KNO3, which can be marketed as a separate
product.
One advantage of the process is the production of
low-chloride fertilizers (less than 0.6% CI). Such
products are agronomically desirable for some crops and soils.
Another potential advantage is the ability to use phos-
phate rocks of high iron and aluminum content.
13.7 Advantages and Disadvantages
of the Nitrophosphate Route
The relative economics of fertilizer production by the
nitrophosphate and sulfuric routes have been a matter
of discussion for many years, especially at times of
sulfur shortage when prices tend to be high. The balance
swung sharply away from nitrophosphates and in favor
of the sulfuric route for most of the 1960s and 1970s,
The reason for this change was first, because sulfur prices
declined and then remained stable at a low level for
several years; the second reason was because of the sharp
rises-in-energy-and-arnmonia -feedstock prices (which
directly affect nitric acid production costs) from about
1974 onward. Interest revived considerably when a
sulfur shortage caused prices to increase very sharply.
Although the acute phase of the shortage proved to be
shortlived, sulfur prices have settled to a level that is
fairly high in comparison with their 1970s levels; on the
other hand, energy and feedstock prices have declined
considerably from their peak. In the mid-1990s, sulfur
prices declined, but energy prices remained stable, thus
creating a more balanced competition. Under these
conditions, several other factors besides mere process
economics can influence the ultimate choice of the
nitrophosphate route; just recently it has been evident
that this has been happening in some cases.
Prominent among the other factors are the
comparative logistics and security of sulfur and ammonia
feedstock supplies and the difficulty and cost of disposing
the phosphogypsum byproduct. The former was
important in the choice of the process for large fertilizer
complexes in Central Europe and the Indian subcontinent in
the 1960s and 1970s. The latter is assuming greater
importance today in many areas as a result of
environmental regulations.
As a result of developments in recent years, the
nitrophosphate process of today is more economically
397
and environmentally competitive. It claims advantages
such as raw material flexibility and efficiency,
adaptation to increasingly stricter environmental requirements,
and avoidance of byproduct disposal problems.
However, the process has its limitations in that it
combines phosphate and nitrogen processing. The
advantage of being sulfur independent is counterbalanced by
the need for carbon dioxide, which is normally obtained
from an ammonia plant.
The summary of advantages and disadvantages is given
in Table 13.4.
13.8 Development in Quantities
and Market Share
World consumption of nitrophosphates increased from
3.46 million tonnes of P2O5 in 1975 to 3.9 million
tonnes in 1988; this represents an increase of 13% in
13 years, and nitrophosphates supplied less than 10%
of world fertilizer P2O5 in 1988 [18].
Changes in the relationship between the prices of
sulfur and costs of feedstock and energy, which occurred
in the mid-1980s, reactivated interest in nitrophosphates.
Even though the process was not successful in
America, BASF and Norsk Hydro promoted it in
Western Europe. Plants were operating in several-countries-^4:
of Western and Eastern Europe before 1980. Since
1980, licenses have been granted for factories in
Russia, China, and India [9,19].
Under these influences, world consumption of
nitrophosphates increased to 4.33 million tonnes of
P2O5 in 1990; this represented 10,5% of world
fertilizer P2O5. These figures decreased to 3.2 million tonnes
P2O5 and 8.5% of the world production in 1992.
With a reduction of 26%, nitrophosphates were more
severely affected by the crisis than the average of
fertilizers. The reason for this seems to be that their main
market was in Europe, where the fertilizer market
decreased more than the world average under the
combined influences of fertilizer use restrictions in Western
Europe and farm economy disturbances in Eastern
Europe and Russia.
5:
13.9 References
Hignett, T. P, M. R. Siegel, T M. Kelso, and R. S.
Meline. 1957. "Phosphate Ore: Fertilizer from
Leached - Zone Ore," Journal of Agricultural and
Food Chemistry, 5(8):587-591.
Richmann, R. 1993. "The BASF Nitrophosphate
Process," IN Nitric Acid-Based Fertilizers and the
Environment, International Workshop Proceedings,
pp. 203-210, R. G. Lee (Ed.), SP-21, International
Fertilizer Development Center, Muscle Shoals, AL,
U.S.A.
UHDE G.m.b.h. 1994. Nitrophosphate - UHDE
Technology Based on the BASF Process."
-B-erquin-YrFrpand J. Burks. 1974. "Hot Sphero-
dizer Processes and Complex Fertilizers,"
Proceedings 0/ the Fertilizer Industry Round
Table, pp. 110-115.
Berquin, Y. F. 1961. "Nouveau Procede de
Granulation et son Application dans le Domaine de la
Fabrication des Engrais," G&nie Chimique, p. 45.
Table 13.4. Advantages and Disadvantages of the Nitrophosphate Route [11]
Advantages of DAP
Advantages of Nitrophosphate
Higher product nutrient content
Higher location flexibility (all raw materials
may be delivered from outside)
Higher flexibility of nutrient content
Independence of sulfur
Higher energy efficiency
No byproducts disposal problem
All commercial grades of phosphate rock are acceptable
Large size rock particles are acceptable
CAN granulation is an autothermal process
398
5. Swanstrom, S. 1986. "The Kemira NPK Process,"
IN Phosphorus and Potassium, No. 145.
6 Arzani, A. "New Developments in Fluid Bed
Granulation of High Analysis Fertilizers," Paper presented
at the 158th National Meeting of the American
Chemical Society, New York, NY, U.S.A.
7 Berquin, Y F. 1977, "Prospects for FulI-Scale
Development of Spouting Beds in Fertilizer
Granulation " IN Granular Fertilizers and their
Production, pp. 296-303, British Sulphur Corporation,
London, England.
8 Brusasco, G., R, Monaldi, V. De Lucia, and A.
Barbera. 1986, "Production of NPK Fertilizers With
a Spouted Bed Granulator Dryer," Proceedings of
1FA Technical Meeting held in Port El Kantaoui,
Tunisia.
9. Conradsen, A., and G. Kongshaug. 1993. "Nitro-
phosphate Technology and the Environment. An
Overview of Potential Sources of Pollution From an
Integrated Nitrophosphate Fertilizer Production
Complex," IN Nitric Acid-Based Fertilizers and the
Environment, International Workshop Proceedings,
pp. 135-151, R. G. Lee (Ed.), SP-21, international
Fertilizer Development Center, Muscle Shoals, AL,
U.S.A.
10. "Fertilizers by the Nitrophosphate Route," 1988.
IN Phosphorus and Potassium, No. 155.
11. E. Aasum. 1988. "Nitrophosphates Versus
Ammonium Phosphates," IN NPK Fertilizer Production
Alternatives, International Workshop Proceedings,
pp. 29-40, J. J. Schultz and E. D. Frederick (Eds.),
SP-9, International Fertilizer Development Center,
Muscle Shoals, AL, U.S.A.
12. Kemira Engineering Oy. 1994. "Private
Communication," Helsinki, Finland.
13. 1FA and EFMA. 1992. "Handbook for the Safe
Storage of Ammonium Nitrate-Based Fertilizers," Paris,
France,
14. FA and EFMA. 1992. "Selected Tests Concerning
the Safety Aspects of Fertilizers," Paris, France.
15. Kurandt, K. 1976. "The VEBA Phosphoric Acid
Process," Paper presented at 1SMA Technical
Conference, The Hague, Netherlands.
16. Meline, R. S., H. L. Faucett, C. H. Davis, and A. R.
Shirley, Jr. 1971. "Pilot Plant Development ofJhe_
Sulfate Recycle Nitric Phosphate Process, "Journal
of Industrial and Engineering Chemistry, Process
Design Development, 10:257-264.
17. Knudsen, K. 1977. "The Case for Chloride - Free
Fertilizer Materials," IN Granular Fertilizers and
Their Production, British Sulphur Corporation,
London, England.
18. Schultz, J. J., D. I. Gregory, and O. P. Engelstad.
1992. Phosphate Fertilizers and the Environment -
A Discussion Paper, P-16, International Fertilizer
Development Center, Muscle Shoals, AL, U.S.A.
19. Diehl, L. 1988. "Ateliers de nitrophosphate.
Concept de recyclage pour minimiser la pollution de I'air
et de I'eau," Paper presented at the FA Technical
Meeting, Edmonton, Alberta, Canada.
Other Sources:
Diehl, L., K. F. Kummer, and H. Oertel. 1986.
"Nitrophosphates With Variable Water Solubility:
Preparation and Properties," Fertiliser Society
Proceedings, No, 243,
Durocher, A. H., L, Diehl, andH. J. Eisen, 1984.
"Product Grade vs. Variable Manufacturing Cost,"
Presented at the FA Technical Meeting, Paris, France.
399
Chapter 14. Other Phosphate Fertilizers
Table of Contents
Page
14.1 Single Superphosphate (SSP) , 401
14.1.1 Fundamentals of SSP 401
14.1.2 Suitability of Phosphate Rocks 401
14.1.3 Chemistry of SSP 401
14.1.4 Production Methods ........ . 402
14.1.5 Product Properties 405
14.1.6 Licensers and Contractors 405
14.1.7 Enriched Superphosphate 405
14.2 Phosphate Rock as a Fertilizer 405
14.2.1 Ground Phosphate Rock :...., 405
14.2.2 Calcined Aluminum Phosphate , 407
14.2.3 Defluorinated Phosphate Rock 408
14.2.4 Partially Acidulated Phosphate Rock 408
14.3 Basic Slag 408
14.4 Potassium Phosphates 409
14.5 Bone Meal 410
14.6 Fused Calcium Magnesium Phosphate 410
14.7 Rhenania Phosphate 410
14.8 Calcium Metaphosphate , 411
14.9 Dicalcium Phosphate „_ 411
14.10 Magnesium Phosphates'" .....7Z1~ .777 412
14.11 Urea Superphosphate (USP) 412
14.11.1 Introduction 412
14.11.2 Identification of the Reaction Products : 412
14.11.3 Development of the Process 412
14.11.4 Qualities of the Product: 20-10-0 USP 413
14.11.5 Storage Properties 413
14.11.6 Agronomic Interest 414
14.11.7 Advantages of the Process 414
14.12 References : 414
400
Chapter 14. Other Phosphate Fertilizers
14.1 Single Superphosphate (SSP)
14.1.1 Fundamentals of SSP
Single superphosphate (SSP), also called normal or
ordinary superphosphate, has been the principal
phosphate fertilizer for more than a century and supplied
over 60% of the world's phosphate as late as 1955.
Since then its relative importance has declined steadily.
In 1975, it supplied only 20% of the phosphate
fertilizer and this figure fell to 17% in 1988. The decline in
actual tonnage has been small, but most of the new
facilities have been built to produce other, higher analysis
products. For the world as a whole, TVA estimated 1972
SSP production at 7,87 million tonnes of P205p and 1FDC
mentions a figure of 7.083 million tonnes in 1988, which
means a decrease of 10% over 16 years [1),
Another decrease of 10% reduced the production to
6.3 million tonnes in 1992, which was about 16% of
the 38.6 million tonnes of P205 produced in 1991/92.
Thus, SSP is still an important phosphate fertilizer and
is likely to remain so even though its relative
importance will decrease.
The advantages of SSP are:
l.The process is simple, requiring little technical skill
and small capital investment.
2. The economies of scale are minor; thus, small plants
can be economical.
3. Since the process is not capital intensive, there is little
advantage of a high percentage utilization of
capacity. In fact, many SSP plants operate on a planned
seasonal schedule.
4. The fertilizer effectiveness of SSP is unquestioned. In
fact, it is a standard of comparison for other
phosphate fertilizers.
5. SSP supplies two secondary elements, sulfur and
calcium, which are sometimes deficient in the soil.
Despite these impressive advantages, the
disadvantage of low analysis, 16% - 22% P2O5, and consequent
high distribution costs have caused declining interest in
its production because the delivered cost at the farm
level is usually higher per unit of P205 than that of TSP
or ammonium phosphates.
SSP will still be a logical choice in several situations
such as;
1. Where both P205 and sulfur are deficient, SSP may
be the most economical product to meet these needs.
This is the case in much of Australia and New Zealand,
some parts of the United States, and Brazil. It is likely
that more locations where sulfur is deficient will be
identified.
2. In small countries or remote regions where demand
is insufficient to justify an economical scale of
production of concentrated phosphate fertilizers and-
where importation is expensive, SSP can be the most
economical means of supplying local needs.
3. In many cases, SSP can be an attractive way to use
byproduct sulfuric acid that cannot be used to
produce more concentrated products because the quality
or quantity of the acid is unsuitable. Likewise, SSP
can use deposits of phosphate rock that are too small
to justify a more expensive plant.
14.1.2 Suitability of Phosphate Rocks
Since the grade of the rock determines the grade of
the product SSP, a high-grade rock is desirable.
Reactivity is also important; unreactive rocks must be ground
more finely. It is extremely difficult to produce SSP from
some igneous apatites. Iron and aluminum compounds
^cBri^e^tf5leTated~uff"to*er point although they decrease
the P2O5 water solubility. Silica has no adverse effect
other than decrease in grade. An increase in CaO: P2O5
ratio raises the sulfuric acid consumption per unit of P2O5
and decreases the grade. High-chloride rocks (up to 0.5%
CI and perhaps higher) can be used without serious
disadvantage since corrosion is not a serious problem in
SSP production.
14.1.3 Chemistry of SSP
The main overall chemical reaction that occurs when
finely ground phosphate rock is mixed with sulfuric acid
in the manufacture of SSP may be represented by the
following equation.
Ca3(P04)2 + 2H2S04 + H20 -* Ca(H2P04)2 • H20 +
2CaS04 + 108.44 kcal
It is generally agreed that the reaction proceeds in two
stages: (1) the sulfuric acid reacts with part of the rock,
forming phosphoric acid and calcium sulfate and (2) the
phosphoric acid formed in the first step reacts with more
phosphate rock, forming monocalcium phosphate. The
two reactions take place concurrently, but the first stage
is completed rapidly while the second stage continues
for several days or weeks.
401
The calcium sulfate is mainly in the anhydrous form.
Most of the phosphate in the rock is fluorapatite, and
the fluorine reacts with the sulfuric acid to form
hydrogen fluoride. The hydrogen fluoride reacts with silica in
most rocks, and part of it is volatilized, usually as S1F4.
The remainder may form fluosilicates or other
compounds in the SSP. Usually 25% or more of the fluorine
is volatilized and must be recovered to prevent
atmospheric pollution. In some cases recovery as
salable fluorine compounds is feasible, but more often the
scrubber liquor is disposed in a pond by neutralizing it
with lime or limestone. A technical curiosity among SSPs
is the "Kotka superphosphate." "Kotka superphosphate"
is a mixture of superphosphate and phosphate rock. It
is named for the city of Kotka, Finland, where it was
originally made. It has the advantage that little curing is
needed, and the free acid content is low. Its
effectiveness generally is equal to that of equivalent amounts of
fully acidulated superphosphate plus raw phosphate rock
applied separately. Kotka superphosphate is essentially
the same as partially acidulated phosphate rock, which
is discussed later in this chapter.
Table 14.1 shows the chemical composition of one
sample of Kotka superphosphate and five typical samples
of SSP. SSP usually contains 6% -10% moisture;
therefore, its grade could be increased by drying, but this would
be too expensive compared with the value of the SSP.
- Another specialty is a "serpentine superphosphate-A-
"Serpentine superphosphate" has been produced in New
Zealand by mixing serpentine (a mineral consisting of
hydrous magnesium silicate) with SSP. The usual
proportion is one part of serpentine to four parts of SSP,
The serpentine improves the physical properties of SSP
by reacting with the free acid, and it supplies
magnesium to crops. Various other minerals or chemical
compounds sometimes are added to supply magnesium or
micronutrients that may be needed locally.
14.1.4 Production Methods
The manufacture of superphosphate involves the-fol-
Iowing three (or four) operations.
1. Finely ground phosphate rock (90% < 100-mesh) is
mixed with sulfuric acid. With rock of 34% P2O5
content, about 0.58 kg of sulfuric acid (100% basis) is
required per kilogram of rock. Sulfuric acid is
available commercially in concentrations ranging from
77% to 98% H2SO4- The acid usually is diluted to
68% - 75% H2SO4 before it is mixed with the rock,
or in the case of the cone mixer, the water may be
added separately to the mixer, When concentrated
sulfuric acid is diluted, much heat is generated; many
plants cool the acid in heat exchangers to about 70°C
before use.
2. The fluid material from the mixer goes to a den where
it solidifies. Solidification results from continued reac-
——t-ion-and-Grystallization of monocalcium phosphate.
The superphosphate is excavated from the den after
Table 14.1. Composition of Single Superphosphates
Source of Rock
Composition
P2O5, total
P2O5, available
P2O5, water
soluble
Free acid
Water
CaO
SO3
N203
F
Florida
(granular)
19.9
19.6
17.5
2.4
5.9
27.1
28.4
1.3
Florida
21.5
20.7
17.4
0.6
1.1
30.5
30.7
2.3
1.6
Morocco
(0/n ki,
Morocco
19.8
18.8
2.0
8.4
21.4
20.2
1.7
9.8
Ocean
Island
22.8
20.8
4.6
10.6
Morocco
and Kotka3
22.8
14.6b
14,5
1.3
8.9
a. Superphosphate plus additional phosphate rock.
b. Alkaline citrate soluble.
402
0.5 - 4.0 hours. At this time it is still somewhat
plastic, and its temperature is about 100CC.
3 The product is removed from the den and conveyed
to storage piles for final curing, which requires 2-6
weeks, depending on the nature and proportions of
the raw materials and the conditions of manufacture.
During curing, the reaction approaches completion.
The free acid, moisture, and unreacted rock contents
decrease, and the available and water-soluble P2O5
contents increase. The material hardens and cools.
After curing, the product from storage is fed to a
disintegrator, usually of the hammer mill or cage mill
type. The product from the mill is discharged onto an
inclined screen of about 6-mesh size. The material
that fails to pass the screen is returned to the mill for
further grinding.
4. If granular superphosphate is desired, the product is
granulated either before or after it is cured.
Granulation before curing has the advantage that less water
or steam is required. After granulation, the product is
dried in a direct contact dryer and screened; the fines
are returned to the granulation unit.
For many years SSP was produced only by batch
mixing methods; however, most modern plants use
continuous mixing and denning processes. There is a wide
variety of both batch and continuous mixers and dens;
no attempt will be made to describe them all. More
detail may be found in the book, Superphosphate: Its
History, Chemistry and Manufacture [2].
One popular batch system is shown in Figure 14.1.
The rock and acid are weighed and discharged into a
Ground phosphate rode
ROCK
HOPPER
Sulfuric add
ROCK
SCALE \ / \ /ACID
SCALE
Figure 14.1. Batch Manufacture of Single
Superphosphate.
pan mixer, which may have a capacity of 1 - 2 tonnes
per batch. After mixing about 2 minutes, the fluid mix is
discharged into a box den, which may hold 10 - 40
tonnes. When the den is filled, one side is removed and
the den is advanced slowly on a track to a mechanical
cutter, which shaves thin slices of superphosphate from
the block and discharges them to a conveyor or elevator.
With automated weighing and pan discharge, a 3 -
minute mixing cycle is feasible; with a 2-tonne mixer a
40-tonne den can be filled in 1 hour. Some plants have
two dens so that one is being filled while the other is_
being emptied. This arrangement gives a production rate
of 40 tph.
Batch mixing has practically disappeared in favor of
continuous mixing, but there are two cases where it
remains very competitive. They are as follows:
1. When the only rock available is igneous rock, the batch
mixing and associated denning system are preferred
because they allow precise control of the mixing
conditions and because the den can be made tight enough
to contain the very fluid slurry delivered by the mixer.
2, When the purpose is to develop a small phosphate
resource in a remote country, the batch process can
be built at low cost and is easy to operate; these two
qualities will make it a good choice in that case.
Figure 14.2 shows a flow diagram of a popular type
"of"continuo'Us"den~the^"Broadfield den is a well-known
example. The mixer may be a cone mixer, as shown, a
paddle mixer (pugmill), or sometimes a cone mixer with
a mixing impeller. Retention time in such dens usually
ranges from 30 minutes to 1 hour and can be varied by
changing the speed of the slat conveyor. This type of
den is also suitable for making triple or enriched
superphosphate.
The production of 1 tonne of SSP of 20% available
P2O5 content would require 626 kg of ground
phosphate rock (34% P2Os), 390 kg of sulfuric acid (93%
H2SO4), and 90 kg of water, The reaction generates
considerable heat. Approximately 8%-10% of the weight
of the ingredients (water vapor and volatiles) is lost in
the manufacturing and curing steps.
A typical continuous mixer plant to produce 20 tonnes
of nongranular superphosphate per hour would have a
60-kW electrical load. One operator, two laborers, and
a part-time supervisor per 8-hour shift would be required
to operate the plant, By applying prevailing unit costs, a
rough approximation of the direct cost of producing
superphosphate in a specific location can be obtained.
The operating requirements per tonne of
superphosphate are given in Tables 14.2 and 14,3,
The capital cost for SSP production will vary widely
depending on the battery limits adopted. The cost is
403
Ground phosphate
"=>
Legendi
SI-1 Rock storage silo
BC-2 Bucket elevator
SI-3 Surge hopper
SC-4 Metering screw
W-5 Weigh feeder
M-6 Cone mixer
X-7 Slut conveyor continuous DEN
BC-8 Belt conveyor
S-9 Fune scrubber
T-1D Superphosphate storage pile
Exhaust
i=>
FluosiIiclc acid
solution
c=^
Single superphosphate
T-10
Figure 14.2. Continuous Manufacture of Single Superphosphate.
Table 14.2. Process Requirements for Powdered
SSP
Parameters
Product SSP
Capacity
Annual operation time
Units
1
tpd
h
Investment cost US $ (million)
(battery limits)
Cost Components
Raw Materials
Phosphate rock (33% P205)
Sulfuric acid (96%)
Energy
Electrical energy
Process water
Disposal
Off-gases
Units
kg
kg
kWh
m3
Nm3
Value
0-18-0
800
7200
10
Unit/t
626
390
19
0.1
350
Table 14.3. Process Requirements for Granular
SSP
Parameters
Product SSP
Capacity
Annual operation time
Investment cost
(battery limits)
Cost Components
Raw Materials
Phosphate rock (33% P205
Sulfuric acid (96%)
Energy
Electrical energy
Process water
Steam
Fuel
Disposal
Off-gases
Units
1
tpd
h
US $ (million)
)
Units
kg
kg
kWh
m3
kg
kcal
Nm3
Value
0-18-0
800
7200
20
Unit/t
626
390
34
2
55
62
350
404
much greater if the battery limits include the investment
for sulfuric acid manufacture; in fact SSP plants often
use byproduct sulfuric acid derived from a plant that is
not a part of the SSP plant. Also, small SSP plants may
purchase sulfuric acid from a larger plant that supplies
several customers or use byproduct sulfuric acid from
other industries (e.g,, metal industry, or organic industry).
When several SSP plants are planned or in use, the
phosphate rock may be ground at the mine or at a port
and shipped to individual plants to take advantage of
economies of scale in grinding. When in-plant rock
grinding facilities are necessary, the cost depends on the
initial size and hardness of the rock.
Storage curing costs will partially depend on the
extent of fluorine emission control that is required.
Whether the SSP should be granulated depends on
local preference. In some countries nongranular SSP is
acceptable. Also, in many cases the SSP will be used as
an ingredient for producing granular compound fertilizer.
When granular SSP is desired, the ex-den granulation
system described in Chapter 12 is suitable. According
to Sinte Maartensdijk, the recycle ratio in this plant was
0.63:1.0 [31.
The SSP bulk production cost, by the P2O5 content,
is equivalent to the cost of P2O5 in TSP. The bulk cost
equivalence is quickly eroded by the cost of bagging,
transportation, and storage because the mass of SSP
required is more than twice that of TSP. Thus, it may be
concluded that large-scale production and distribution
of SSP is seldom economical in comparison with TSP
or DAP, unless there are special circumstances such as
an agronomic requirement for sulfur that would render
the SSP more valuable.
On the other hand, small SSP plants to serve small
local markets can be economical where suitable raw
materials are available and where the alternative of
importing more concentrated materials is very expensive.
14.1.5 Product Properties
The European Council Directive 76 / 116 / EEC
indicates that single superphosphate must contain at least
16% of P2O5 soluble in neutral ammonium citrate of
which at least 93% is water soluble. SSP may be either
powder form for use as a raw material in the
manufacture of compound fertilizers or for application by the
farmer, or granular (2 - 4 mm) for use as a raw material
in a bulk:blending operation or for application. SSP may
be shipped in bulk and in bags, provided it is protected
from moisture.
14.1.6 Licensers and Contractors
The mention of the names of companies does not
mean endorsement by UNIDO or 1FDC. The
companies that are listed have cooperated with UNIDO on
technical assistance and project implementation and have
contributed directly or indirectly to the manual.
- Licensers
Amfert, Amsterdam, Netherlands
Grande Paroisse, Paris, France
Hydro Agri Licensing, Brussels, Belgium
Jacobs Engineering, Lakeland, Florida, U.S.A.
Kemira Agro, Helsinki, Finland
Prayon Technologies, Engis, Belgium
- Contractors
Coppee - Lavalin, Brussels, Belgium
Jacobs Engineering, Lakeland, Florida, U.S.A.
John Brown Engineers and Constructors Ltd.,
London, U.K.,
• including Davy Powergas, Ltd., London, U.K. and
John Brown Deutsche Engineering G.m.b.h., Essen,
Germany
Kemira Oy, Helsinki, Finland
Krebs, Montigny-le-Bretonneux, France
Lurgie Chemie und Huttentechnik, Frankfurt-anvMain,
Germany
Mitsui and Co, Tokyo, Japan
Uhde G.m.b.h., Dortmund, Germany.
—1-4—1t7 Enriched~Superphosphate
"Enriched" superphosphate is essentially a mixture of
SSP and TSP, usually made by acidulation of phosphate
rock with a mixture of sulfuric and phosphoric acids.
Theoretically, any grade between SSP and TSP can be
produced, but the usual range is 2.5%-35% P2O5.
Processes and equipment are about the same as for SSP
[4].
Enriched superphosphate may be a useful product for
application in sulfur-deficient areas where SSP would
supply more sulfur than necessary. One advantage is
that mixed acid of the proper concentration can be
obtained by mixing concentrated sulfuric acid (93% or 98%
H2SO4) with dilute phosphoric acid (30% P2O5), thereby
avoiding the need for concentrating the latter.
14.2 Phosphate Rock as a Fertilizer
14.2.1 Ground Phosphate Rock
Ground phosphate rock is not classified as a fertilizer
in most countries and is not included in fertilizer
consumption statistics reported by most countries.
However, FAO reports consumption of ground rock
phosphate separately; in 1976 reported consumption was
405
equivalent to 1.2 million tonnes of P2O5, about 5% of
phosphate fertilizer consumption.
It is likely that actual consumption of phosphate rock
for direct application is substantially higher than reported
due to unreported consumption or, in some countries,
inclusion with fertilizer use.
Considerable difference of opinion exists as to the
merits of ground rock phosphate as a fertilizer. In some
countries, the chemical phosphate fertilizer industry
perceives ground rock as a threat to its prosperity and
has urged government restrictions of its use. In other
cases, industry or government authorities have promoted
its use.
The main purpose of the latter policy is to enable
much less costly sources of phosphate rock to be brought
into use. This plays an important role in countries with
large reserves of phosphate rock, but with inadequate
financial resources to invest in industrial production of
phosphoric acid, TSP, and ammonium phosphates.
Some of the factors that contribute to the difficulty of
making an impartial appraisal of the merits of direct
application of ground rock phosphate are:
1. Phosphate rocks vary widely in their reactivity hence
their agronomic value varies,
2. The agronomic response to phosphate rock strongly
depends on the type of soil and, tosome extentTorf
the crop and climatic factors.
3. The response depends on timing, method of
application, and particle size.
4. The residual value of a single application or
cumulative value of repeated applications is important with
all phosphate fertilizers, but this is not easily
evaluated. Ground phosphate rock often has a more
favorable long-term than short-term effect.
5. Agronomic and economic studies of long-term use
on food crops are generally lacking.
The principal advantage of ground phosphate rock is
its low cost. When both must be imported, ground rock
may cost about one-half as much as TSP; when
indigenous rock is available, the cost differential may be
greater. Other advantages are;
1. A very low capital investment is required for processing.
2. No particular technical skills are required.
3. The energy requirement is small.
4- There is little or no loss in processing.
5, Rocks unsuitable for chemical processing are in some
cases suitable for direct application.
6. The delay involved in building chemical processing
plants can be avoided.
7. Economy of scale is relatively unimportant.
8. Ground phosphate rock has a liming value on acid
soils.
The main disadvantages are uncertainty as to
agronomic value, inconvenience of handling and applying
the fine, dusty material, and relatively low P2O5 content
compared with TSP or ammonium phosphates.
It is generally agreed that ground phosphate-rack-is -
effective only on acid soils (pH 6 or less). This statement
applies to apatitic rocks, not to calcined aluminum
phosphate ores that are effective on neutral or calcareous
soils.
Phosphate rocks are also more effective in warmer
climates, in moist soils, and on crops that have fairly
long-term growing patterns. They are less effective for
short-season crops grown under cool soil temperatures,
particularly in the first year of application.
It is generally agreed that the rock should be finely
ground and well mixed with the soil. However, there is
some difference of opinion as to the usefulness of very
fine grinding. The majority opinion seems to be that
there is little to be gained by grinding finer than about
90% through 100-mesh (0.147 mm), although there
~are~some-who-cIaim thatveryfine grinding such as 80%
through 320-mesh (0,043 mm) is worthwhile.
Ground rock that has been granulated after grinding
has given rather poor first-crop results even when the
granules disintegrate in the soil, presumably because
granulation reduces the area of contact with the soil.
However, in most of the tests, the granules have been in
the range of 1-4 mm.
While it is generally agreed that reactivity is
important, there is some disagreement as to how important it
is and how to measure it. Chemical methods for
evaluating reactivity are discussed later. The importance of
reactivity is greatest for the first crop or season; the
long-term or residual effectiveness does not seem to be
closely related to reactivity. Rocks of relatively low
reactivity have shown good long-term effectiveness.
Some investigators have attributed the response to
phosphate rock to annual rainfall; better results were
obtained on well-watered soils.
In the early part of the 20th century, several long-
term experiments were.conducted in the United States
with ground phosphate rocks in Tennessee, which is
one of the less reactive sedimentary rocks. Hopkins has
reported results from experiments in four states of the
United States that show the increased value of crops
406
qrown in a rotation with phosphate rock added exceeded
the cost of the phosphate rock by factors ranging from
about 5:1 to 10:1.
When superphosphate was used, the ratio of the value
of increased yield to cost was much lower, primarily
because the superphosphate cost was about four times as
much per tonne of P205 as the cost of ground
phosphate rock.
As a result of these tests, use of ground phosphate
rock increased in the United States to a maximum of
more than 1 million tpy in 1953. However, more
recently use has decreased sharply, and in 1976
consumption amounted to only about 37,000 tonnes, including
"colloidal phosphate," a fine material recovered from
Florida waste ponds.
The decreased use is attributed to two factors. First,
large-scale production of high-analysis phosphates (TSP
and DAP) has brought the delivered cost of these
materials down to the point that ground phosphate rock has
little cost advantage, particularly when transported over
long distances. Secondly, the granular phosphates are
much easier to handle and apply to the soil than the
finely ground phosphate rock.
Ground phosphate rock has been advocated and used
for reclaiming low-phosphorus soils of abandoned farms
or of new (previously uncultivated) land of low native
phosphorus fertility. For this purpose a heavy
application is recommended, such as 1-3 tonnes/ha, which
may be repeated at 5- to 10-year intervals. Also,
phosphate rock is used in Europe as a replacement for basic
slag to maintain soil fertility, usually by relatively large
applications at intervals of several years. In either case
there may be supplemental application of soluble
phosphate fertilizers, depending on crop needs.
In tests with single-season crop results, the most
reactive phosphate rocks have shown effectiveness nearly
equal to superphosphate with some crops and soils.
In the past few years a considerable amount of
research has been done to evaluate the agronomic effects
of Latin American phosphate rocks. The results
indicate that it is feasible to apply ground phosphate rocks
directly, especially on permanently cropped acidic soils
that predominate in tropical zones.
14.2.2 Calcined Aluminum Phosphate
Ores consisting mainly of hydrated aluminum
phosphate minerals are useful for direct application after being
calcined at a controlled temperature. The calcining may
be done in a rotary kiln or in a fluidized bed calciner.
Calcining removes the combined water and thereby
enhances the grade and destroys the crystallinity of the
phosphate minerals, thereby improving the reactivity of
the phosphate.
At present, only two aluminum phosphate ores are
known to be used for direct application after calcining.
One of these occurs in Senegal near Thies. The ore, as
mined, contains about 29% P2O5 on a dry basis; after
calcination it contains over 34% P2O5. A
partial'analysis of the calcined product is given in Table 14.4.
Table 14.4. Chemical Analysis of Calcined
Product
Components
P2O5
AI203
CaO
Fe203
SiQ2
TiOz
MgO
% Weight
34.6
35.9
10.9
9.1
2.9
1.9
0,3
After calcination, the ore is ground to about 95%
minus 100-mesh and marketed for direct application
under the trade name "Phosphal." About 75% of the
P2O5 is soluble in alkaline ammonium citrate, Field tests
showed that fertilizer effectiveness of the product was
approximately equal to that of superphosphate on
calcareous, neutral, and acid soils. Superphosphate was
marginally better immediately after application while
Phosphal was better in long-term tests. The product is
used mainly in France, Senegal, and some nearby
countries.
A similar ore occurs in the upper stratum ("C-grade") of
the phosphate deposit on Christmas Island. The C-grade
ore contains about 25% P2O5 dry basis; the composition
range of this ore after calcination is given in Table 14,5.
Table 14.5. Composition of Calcined "C-
Grade" Phosphate
Components % Weight
P2O5 29-33
A1203 29-34
CaO 15-21
Fe203 H-19
C02 0.9-1.0
F 0.6-0.8
407
It is composed almost completely of iron and
aluminum phosphates (mostly crandallite, Ca (Fe, AI)3 (POsfe
(0H)5*3H2O, and millisite Ca (Na,K) (Fe, Al)5 (P05)2
(OH)5*3H20) and is altogether unsuitable for
conventional phosphoric acid/soluble phosphates production.
All the accessible reserves of phosphate rocks on
Christmas Island have been significantly depleted and will
suffice for 16 to 17 years at most.
Calcination is carried out in a fluidized bed.
Experiments showed that maximum citrate solubility was
obtained in the range of 400°-600°C. The maximum
solubility in alkaline ammonium citrate solution was about
70%; the solubility in 2% citric acid solution is much
lower, about 20%-30% [5]. The product is used for
direct application after being ground to pass a 100-mesh
(0.15 mm) screen.
Both the "Phosphal" from Senegal and the
Christmas Island product may be shipped in bulk after
calcination to be ground in the importing country.
Some of the ground product is used in mixtures with
other fertilizer materials. However, if the mixture is
granulated to the usual size (1-4 mm), the agronomic
effectiveness is lower, at least for the first season after
application.
TVA conducted experiments with Florida "Ieached-
zone" ore, which also contains a high percentage of
aluminum phosphate minerals-millisite, crandaUite^and^
wavelite. It was found that maximum P2O5 citrate
solubility of 70%-79% was obtained by calcining at 500°-
600°C. However, the leached zone material is low"grade
and variable in composition and hence poorly suited for
commercial use,
14.2.3 Defluorinated Phosphate Rock
There is a substantial production of defluorinated
phosphate rock for fertilizer usage in Japan (about 100,000
tpy). Ground, high-grade rock is mixed with small
proportions of sodium carbonate or sulfate and wet-process
acid. The mixture is calcined at a temperature of 1350°C
in an oil-fired rotary kiln 45.0 m in length and 2.7 m in
diameter The product contains 38%-42% P205 of which
more than 90% is soluble in neutral ammonium citrate
solution. Substantially all of the fluorine is driven off.
Sodium bifluoride (NaHF2) is recovered as a byproduct.
A similar product is made in the United States, but it is
mainly used for animal feed supplement. The principal
phosphate compound in the product is tricalcium
phosphate.
Requirements per tonne of product containing 41%-
42% total P205 are:
Phosphate rock (37% P205), kg 900
Wet-process acid, kg (as P2O5) 95
Sodium carbonate, kg 120
Heavy fuel oil, liters 200
The product is said to be an effective fertilizer when
applied in finely ground form on acid soils.
TVA has studied defluorination of lower grade
phosphate rock through fusion processes. Ten pilot plants
and two demonstration-scale plants were built and
operated. The more successful plant operated for 10 years
(1945-55) and produced about 170,000 tonnes of
product containing 28% P2O5 from low-grade Tennessee.
rock. The results of the studies have been published [6].
14.2.4 Partially Acidulated Phosphate Rock
In some instances, an indigenous phosphate rock may
prove unsuitable for direct application and require the
addition of a more soluble form of phosphate. An
alternative is partial acidulation to render its P2O5 more
available. This option is of particular interest since the crop
response is often similar to that obtained when using
fully acidulated products such as SSP or TSP. In this
situation, less acid is used, and production capacity may
be increased.
The partially acidulated phosphate rock (PAPR)
process depends on treating ground phosphate rock with
only a portion of the stoichiometric value of acid, for
example 50% PAPR. The amount of water-soluble phos-
"phate_in~PAPR"varies according to the degree of
acidulation.
Sulfuric and phosphoric acids are the most common
acids used for partial acidulation. Possibilities exist for
using three processes: a conventional run-of-pile
process followed by granulation; single-step acidulation and
granulation; and a slurry granulation triple
superphosphate-type process.
For reasons of economics, the use of sulfuric acid for
acidulation and a run-of-pile process (Figure 14.1) are
the most common choices.
14.3 Basic Slag
Basic slag, also called Thomas slag, is a byproduct of
the steel industry. Iron made from high-phosphorus ore
is converted to steel in a Thomas converter by oxidation
in contact with a basic (high CaO) slag. The usual range
of P2O5 content in slag that is used for phosphate
fertilization is 10%-20%. Sometimes phosphate rock is
deliberately added to the blast furnace charge to increase
the phosphorus content of the iron and thereby increase
the P2O5 content of the slag.
408
Basic open-hearth slag also may contain P2O5 up to .
10%_12%, and it is used in agriculture in some
countries both for liming and phosphorus supply.
Since most of the high-phosphorus iron ores occur in
Western Europe, most of the basic slag is produced and
used there. A typical range of composition for high-
grade basic slag is given in Table 14,6.
Table 14.6. Composition of Basic Slag
Components
P2O5
AI203
CaO
Fe203
SiQ2
MnO
MgO
% Weight
15-20
0.5-2.5
42-50
9-13
4-6
3-6
2-4
The P2O5 in basic slag is mainly present as calcium
silicophosphates - silicocarnotite (5CaOP205«SiC>2) and
nagelschmitite (7CaOP205*Si02). Small amounts of
fluorspar (CaF2) may be added to slags to decrease .their
viscosity during the steel-refining process. Such slags
contain fluorapatite and are likely to be less suitable for
fertilizer use.
The Wagner test, which measures the solubility of P2O5
in 2% citric acid, is widely accepted for evaluating the
suitability of basic slag for fertilizer use. P2O5 solubility
in this reagent ranges from 85% to 98% for English
basic slags [7[. The consumption of agricultural-grade
basic slag was equivalent to 1.2 million tonnes of P2O5
in 1973 and varied only slightly from this level for many
years. However, the available supply later decreased
because of changes in steel-making processes and
importation of low-phosphorus iron ore. In 1977 world
prcductionwas about 572,000 tonnes of P205, less than
half of the 1960-65 average [8]. More recently, in 1988
this figure dropped another 65% to 205,000 tonnes or
0.5% of the P205 in fertilizers [1], In 1992 the figures
were 175,000 tonnes and 0.46%. Slag is regarded as a
good phosphate fertilizer on acid soils and is also valued
for its liming effect and micronutrient content. It is
usually applied in a finely ground state although
granulation with potash has been practiced to some extent.
14.4 Potassium Phosphates
Potassium phosphates are excellent fertilizers, and
their very high analysis is an advantage that has
stimulated much research in an effort to find an economical
production process. However, no process has been
developed that is economical enough to result in
widespread production; therefore, present use is limited to
special purposes for which the high cost can be justified.
At present, most of the potassium phosphates used
in fertilizers are produced from potassium hydroxide or
carbonate and phosphoric acid and are used in liquids
for foliar application or other specialty uses.
Some of the alternative salts of potassium phosphates
are given in Table 14.7.
Table 14.7. Phosphate Potassium Salts
Compound Formula Grade
Monopotassium phosphate KH2PO4 0-52-35
Dipotassium phosphate K2HP04 0-40-54
Tetra potassium pyrophosphate K4P207 0-43-57
Potassium metaphosphate KPO3 0-60-40
In addition, a potassium polyphosphate solution of 0-
26-27 grade has been produced from superphosphoric
acid and potassium hydroxide; it contains a mixture of
ortho, pyro, and higher polyphosphates.
TVA, SAI, and others have produced potassium
metaphosphate in pilot plants by high-temperature reaction
of KC1 and phosphoric acid. The pure material, KPO3,
has a grade of about 0-60-40 and, thus, a 100%
nutrient content (on an oxide basis).
In a process developed jointly by Goulding (Ireland)
and Pennzoil (United States), potassium chloride is
treated with concentrated sulfuric acid to produce
potassium bisulfate [9,10]:
KCI + H2SQ4 -► KHSO4 + HCL
After removal of hydrogen chloride as a dry gas, the
potassium bisulfate is reacted with more sulfuric acid and
phosphate rock to produce a mixture of monopotassium
phosphate and phosphoric acid. The latter can be am-
moniated to obtain a chloride-free NPK fertilizer, such
as 8-48-16, or monopotassium phosphate can be
separated from the phosphoric acid by precipitation in
methanol solution and marketed separately.
409
The metaphosphate and Pennzoil processes are not
in commercial use.
14.5 Bone Meal
A relatively small amount of bone meal is used as
fertilizer mainly by home gardeners, It is much too
expensive for farm use. Most bone meal is marketed for use in
animal feeds.
14.6 Fused Calcium
Magnesium Phosphate
In a TVA-developed process, a mixture of phosphate
rock and olivine or serpentine (magnesium silicate) is
fused in an electric furnace [11]. The molten product is
quenched with water and used in a finely divided state
as a fertilizer. The product, a calcium magnesium
phosphate (CMP) glass, contains about 20% P205 and 15%
MgO. Over 90% of the product is soluble in citric acid.
CMP is produced in several plants in Japan where
the annual production is about 500,000 tonnes. It is
also produced in Korea; Taiwan,-China, Brazil-and-South-
Africa. Either electric or fuel-fired furnaces are used.
The theoretical compositions of some magnesium-
containing minerals that can be used to produce CMP
are:
Olivine
Serpentine
Garnierite
Magnesite
(Mg, Fe)2 SiQ4
Mg3H4Si209
(Mg, Ni) H2Si04
MgCOa
The minerals are variable in composition; iron, nickel,
and sometimes manganese may substitute for
magnesium. A sample of Japanese serpentine contained 38%
MgO, 38% Si02, 8% Fe203, and 14% ignition loss [12].
Magnesium oxide, obtained by calcining magnesite or
extracting it from sea water, can be used in the process;
in this case, silica must be added in sufficient quantity to
result in 20%-30% Si02 in the product. Huang reported
that ratios of serpentine to phosphate rock in the range
of 6:10 to 8:10 gave the highest P205 solubility in citric
acid, using phosphate rock from Christmas Island (39%
P205) or Lao Kay (33% P2Os) [12]. Moulton reported
using ratios of olivine to phosphate rock of 1 : 2 with
Montana phosphate rock (30°/^32% P2Os) [13]. Walthall
and Bridger recommended a ratio of olivine to
phosphate rock of 0.46:1.00 using Tennessee phosphate
rock (33% P205) and North Carolina olivine (45% MgO
and 44% Si02) [11]. About 30% of the fluorine was
volatilized, but the product P2O5 solubility was not
related to its fluorine content. In tests in which magnesia
and silica were supplied separately, it was found that
0.24 kg of MgO and 0.25 kg of Si02/kg of phosphate
rock gave a product P2O5 solubility of 96% (in citrated
ammonium nitrate solution). Also, 0.28 kg of MgO and
0.21 kg of Si02 gave essentially complete solubility. In
Japan, CMP is produced in electric-are furnaces-of-the-
type used for the manufacture of calcium carbide. The
furnace charge is prepared by crushing and mixing
phosphate rock and serpentine or olivine, About 850 kWh/
tonne of product is required for the fusion process. It is
essential to quench the molten material rapidly, and this
is usually accomplished in a trough provided with high-
velocity jets of water. Approximately 10 tonnes of quench
water, which may be recycled, is required per tonne of
product. The quenched material is allowed to drain and
is then dried and ground. The specified fineness is at
least 70% through a 100-mesh screen.
Ando reported tests in which charges of garnierite,
phosphate rock, gypsum, and coke were fused in a blast
furnace or electric furnace to produce CMP and nickel
matte, a mixture of sulfides of nickel and iron
containing 20%-25% Ni, 60%r66% Fe, and 14% -17% S 114].
"Th^7Ticl^llrTatte"was"pfocessed further to recover the
nickel. The coke reduced the gypsum and the iron and
nickel oxides to form the sulfides. When the process
was carried out in the blast furnace, combustion of
additional coke supplied the necessary heat for the fusion
process. A blast-furnace process is used in China also to
produce CMP with separate recovery of iron and nickel.
Greenhouse tests made by the U.S. Department of
Agriculture showed that the product is, on the average,
more effective than superphosphate when used on acid
soils. Field tests in Japan have given favorable results on
many different crops and soils. The product has a
liming value equivalent to 0.5 - 0.7 tonne of calcium
carbonate per tonne of material. The magnesium oxide
content is available to growing plants. In some
situations, the soil-soluble silica may be an advantage.
14.7 Rhenania Phosphate
Rhenania phosphate is another thermally produced
phosphate fertilizer. It is made by calcining a mixture of
phosphate rock, sodium carbonate, and silica' in a
rotary kiln at 1250°C [15]. Enough sodium carbonate is
used to form the compound CaNaP04 and enough silica
410
to form Ca2Si04 with the excess calcium, Typical charge
proportions are one part of sodium carbonate to three
parts of phosphate rock and enough silica to raise the
Si02 content of the product to about 10%. The product
contains 28%-30% P2O5, which is nearly all soluble in
neutral or alkaline ammonium citrate solution even
though much of the fluorine remains in the product. It is
applied to the soil in pulverized form or granulated in
small granules with potash salts. Some grades are
produced containing magnesium or boron, which are added
during granulation as kieserite or borax, respectively. A
substantial quantity is produced in European countries,
particularly West Germany.
A somewhat similar product, Roechling phosphate,
uses a soda slag that is a byproduct from the steel
industry as the source of sodium. Also, the naturally
occurring minerals, trona (sodium sesquicarbonate) or natron
(sodium carbonate), may be used. Experiments have
shown that a similar product can be made by sintering
potassium carbonate with phosphate rock and silica to
produce a product grade of 0-25-25. The phosphate
compound in this product is presumed to be CaKPCU-
The overall reaction in producing Rhenania phosphate
is assumed to be:
Cai0F2(PO4)6 + 4Na2C03 + 2SiQ2 -
6CaNaP04 + 2Ca2Si04 + 2NaF + 4C02
Any grade of phosphate rock can be used, but since the
grade of the product is determined by the grade of the
rock, a high grade is preferred.
Estimated consumption figures using an igneous
apatite are given in Table 14.8.
The product has been reported to be substantially more
effective than superphosphate on several acid tropical
soils in Costa Rica, Liberia, Congo, Zaire, Ghana, and
Malawi perhaps because of its alkalinity and resistance
Table 14.8. Process Requirements for
Rhenania Phosphate 0-29-0 Grade
Raw Material/Utility
Phosphate rock (38.7%)
Soda ash (100% Na2C03)
Sand (97% SiQ2)
Electrical energy
Steam
Fuel oil
Units
kg
kg
kg
kWh
kg
GJ
Unit/Tonne
749
289
77
36
10
2.4
to fixation by the soil [161. In some crops or soils the
sodium or soil-soluble silica may be beneficial.
14.8 Calcium Metaphosphate
For several years TVA produced calcium
metaphosphate, Ca(P03)2, in a demonstration-scale plant. The
process consisted of burning elemental phosphorus and
reacting the resulting P2O5 vapor with phosphate rock.
The molten product was tapped out of the furnace and
solidified on a water-cooled steel drum [17]. The
resulting vitreous flakes were cooled further and crushed to
pass a 10-mesh screen (about 1.6 mm). Development
of a process for production of calcium metaphosphate
involved three pilot plants and three demonstration-scale
plants and a considerable amount of laboratory- and
bench-scale work [18]. The third demonstration-scale
plant was technically successful and operated about 16
years, starting in 1949. A total of nearly 1 million tonnes
was produced, including relatively small amounts from
the first and second demonstration-scale plants. The
process was economically competitive with TSP when both
products were based on elemental phosphorus made by
the electric-furnace process.
Pure calcium metaphosphate contains 71,7% P2O5;
the TVA product contained about 65% P2O5 because of
impurifieTirTthe ro~ck.~Th~e material was not water soluble
but hydrolyzed slowly in water or moist soil, forming
water-soluble compounds [19]. About 98% or more of
the P2C>5 was soluble in neutral ammonium citrate.
The main disadvantage of the process was its
dependence on elemental phosphorus, which has become too
expensive for fertilizer use in most situations. Also its
agronomic effect depends on the rate of hydrolysis in
the soil, which may be too slow for short-season crops.
Calcium metaphosphate glass may also be produced
by heating TSP to fusion; crystalline structures, which
are not citrate soluble, are formed at lower temperatures.
14.9 Dicalcium Phosphate
Dicalcium phosphate is a common constituent of
nitrophosphate fertilizers and of compound fertilizers
formed by ammoniation of superphosphates. There is
a relatively small but substantial production of straight
dicalcium phosphate in Europe, which is based on use
of byproduct hydrochloric acid. The process consists of
dissolving phosphate rock in hydrochloric acid and then
precipitating dicalcium phosphate by stepwise addition
411
of limestone and slaked lime. The product is recovered
by filtration and washing, and the remaining solution of
calcium chloride may be used or discarded.
Various other methods for producing dicalcium
phosphate "are known, but none are known to be used
commercially for fertilizer production. Direct neutralization
of pure or defluorinated phosphoric acid with lime or
limestone is used to produce feed- or food-grade
dicalcium phosphate.
14.10 Magnesium Phosphates
Monomagnesium, dimagnesium, and trimagnesium
phosphates are known to be effective fertilizers, but there
is no known commercial production of these materials
for fertilizer use. No doubt small percentages of these
compounds are formed in processing phosphate rock
containing magnesium.
14.11 Urea Superphosphate (USP)
14.11.1 Introduction
A newcomer in this field is the USP process disclosed
by A2F GRANDE PAROISSE at the IFA technical
meeting in Amman [20] in 1994.
Even though mixing urea and superphosphate is not
recommended because the products react to form lumps
and a sticky mixture, GRANDE PAROISSE and their
partner ARMINES found that as early as 1934 Dalman
[21] had reported that urea and sulfuric acid form the
following complexes:
CO(NH2)2 • H2S04 and 2CO(NH2)2 • H2SO4
There are two eutectics El and E2 (Figure 14.3) that
correspond respectively to 3,6 moles of urea to 1 mole
of H2SO4 and 1.8 mole of urea to 1 mole of acid. While
the melting point of urea is 132.7°C, both eutectics have
a melting point of about 10°C.
The preparation of the mixtures of urea, sulfuric acid,
and water at the mole ratios, 3.6:1 and 1.8:1, is
exothermic in both cases. Heat release with the first ratio is
lower than with the second one and allows the
preparation of the mixture under stable and reliable conditions
at an equilibrium temperature of 60°-70°C, which is ideal
to acidulate phosphate rock.
140
130
120
110
100
90
60
70
60
50
*\"
.1.1,1.1.1.1.1.1.
■
-1/N
|ei
E2
- \
- „
10 --
100% UREA
C2
100% SULFURIC ACID
Figure 14.3. Urea/Sulfuric Acid Eutectics.
In the manufacture of USP, the reaction of acidula-
^urrmay-be-written--as-follows, -
Ca3(P04)2 + 2H2S04 + (8a + 2f) CO(NH2}2 + (e + 2bx)
H20 -+ 2a [CaS04 • 4CO(NH2)2] + 2b(CaS04 • xH20)
+ eCafHsPO^ • H20 + f[Ca(H2P04)2 • 2CO(NH2)]
with a + b = 1, and e + f = 1.
It will be noticed that urea is associated with calcium
sulfate rather than water of hydration [22], But the
sulfuric acid to rock ratio has not changed.
14.11.2 Identification of the Reaction Products
X-ray analysis of the product showed that:
• There is no more free urea.
• There is a substantial amount of tetra urea calcium
sulfate.
• P2O5 as monocalcium phosphate may be linked to
two ureas.
14.11.3 Development of the Process
The process was studied on laboratory scale and
further developed in a pilot plant with a capacity of 100 kg
USP per hour. It was also demonstrated in an industrial
plant at the rate of 15 tph. The superphosphate plant
used for this demonstration was equipped with a paddle
mixer and a drum den (Figure 14.4).
412
Urea
Scrubbing liquid to mixing tank
SI-1
W-2
Sulfuric acid
T-3
-er
P-4
El
Phosphate rock
<=z
SI-7
R)M
W-8
M-5
Reagent
M-9
~~£ii to mixing
P-6
X-10
-14
-ET
B-13
Off-gas
i=>
S-1Z
Makeup water
C=i
P-ll
BC-15
T>
USP to storage
!=>
Legend:
SI-1 Urea bin
W-2. W-8 Weigh feeders
T-3 Sulfuric acid tank
P-4, P-6, P-ll Pumps
M-5 Mixing tank
SI-7 Rock bin
M-9 Rotary mixer
X-10 Drum DEN
S-12, B-13, H-14 Gas scrubbing system
BC-15 Belt conveyor
Figure 14.4. USP Pilot-Plant Technological Process.
It was necessary to add only a 12 m3, 316L stainless
steel agitated tank, into which 94% sulfuric acid and
urea were introduced. Operating conditions were the
same as those of the pilot plant. The residence time was
about 1 hour. No evolution of gas was detected, and this
observation was confirmed by fluorine determinations.
The fluorine contained in the rock was entirely
recovered in the powdered product.
After delumping, powdered USP was fed to a
granulation loop. It has been granulated alone and with
addition of other materials such as phosphoric and/or sulfuric
acids, ammonia, potassium salts (any fertilizer except
nitrated salts), fillers such as gypsum and sand, and mi-
cronutrients. The following compound fertilizers were
produced: 14-14-14; 14-7-14; 9-17-24; 8-18-26; 8-
15-22. The recycle rate was 2,5 to 4, depending on the
formulation used.
14.11.4 Qualities of the Product: 20-10-0 USP
USP simultaneously supplies urea nitrogen, sulfur,
calcium, and phosphate; 95% of the citrate soluble
phosphate is soluble in water. A typical analysis of the
product after granulation is given in Table 14.9.
Table 14.9. Properties of USP 20-10-0
Properties
Total nitrogen
Urea nitrogen
Ammoniacal nitrogen
Total P205
Citrate-soluble P205
Water-soluble P205
S03
H20
% Weight
20.9
19.3
> 1.6
10.2
9.7
9.2
16.1
1.0
14.11,5 Storage Properties
USP can be used as produced, i.e., in powdered form,
or as a granular material. In the latter case, its physical
properties are quite similar to those of urea-based NP
and NPK grades. The product stores well. Its critical
relative humidity is 65%-70% at 20°C; consequently, it is
suitable for bulk storage.
413
14.11.6 Agronomic Interest
To determine whether this new fertilizer with urea in
the molecular structure has agronomic properties
typical of traditional fertilizers, agronomic tests were done
with maize and rice (Figures 14.5 and 14.6).
USP was tested in comparison with the same
quantities of nitrogen and phosphate supplied by DAP and
urea. In both cases the same input of potassium was
supplied by potassium chloride (KCl) containing 60%
K2O. Tests were carried out in five different
combinations of clay, silt, sand, and loam soils.
An increase in yield was found at the optimum
nitrogen input, Thus, for a yield of 11,500 kg/ha of maize,
the fertilization rate can be reduced by 40 kg/ha of
nitrogen when using USP.
USP of the 20-10-0 grade with 60% K20 potassium
chloride was compared with a mixture comprising
ammonium sulfate, TSP, and potassium chloride. Only one
0
N 11,000
'5
2 10,000
_e 9,000
5* a™
==< 8,000
<g 7,000
seeds in yield, 500 kg/ha s??' '
^^
.
■s^
US£^
standard
—
50
100
150
200
250
Nitrogen [kg/ha]
Figure 14.5. Maize Fertilization With USP.
7,000
6,500 -
01
o
if 6,000
Jf 5.500 -
CD
& 5,000
O 4,500
4,000
seeds in yield, 550 kg/ha^--
USP^^^
seeds in yield, 220 kg/ha ^^ _ - - " "
Jl^^
^<r^-'''
■
^---''standard
0
70
140
Nitrogen [kg/ha]
Figure 14.6. Rice Fertilization With USP.
type of soil was used for this comparison: a loam soil
composed of clay, sand and silt, With the same
fertilization rate of 140 kg/ha nitrogen, the yield was increased
by 10%. The tests also showed that splitting the
application of nitrogen, which was advisable in traditional
fertilization, was no longer necessary with USP.
The tests have shown that USP affects maize and rice
fertilization very positively. At constant yield the
consumption of nitrogen can be cut by at least 10%.
14.11.7 Advantages of the Process
Zero liquid effluents, near zero fluorine emission.
Because the fluorine in the phosphate rock is entirely
recovered in the USP, a single-stage scrubbing unit
satisfies the most stringent standards while SSP
requires three or four stages. Moreover, the scrubbing
liquor is recycled into the preparation of the urea-
sulfuric acid mixture.
* The phosphoric acid route is avoided.
This is one of the rare processes that allow for the
production of a urea-based compound fertilizer
without using phosphoric acid, thus avoiding its costs and
nuisances.
* Granulation plants can be retrofitted to operate the
USP process.
•"THeTJSP process is"cost'effective.
USP is cost effective because it uses the lowest cost
raw materials based on concentrated sulfuric acid, it
produces a drier product that requires no additional
drying when used in powdered form or saves 40% of
the drying energy when it is granulated. The
production technology is simple and requires limited capital
cost.
* It can be produced in SSP or TSP plants after an easy
and cheap revamping.
14.12 References
1. Schultz, J. J., D. 1. Gregory, and O. P. Engelstad.
1992. Phosphate Fertilizers and the Environment-
A Discussion Paper, P-16, International Fertilizer
Development Center, Muscle Shoals, AL, U.S.A.
2. U.S. Department of Agriculture and Tennessee
Valley Authority. 1964. Superphosphate: Its History,
Chemistry, and Manufacture, U.S. Government
Printing Office, Washington, D.C., U.S.A.
3. Sinte Maartensdijk, A. 1977. "Direct Production of
Granular Superphosphates and PK Compounds
414
from Sulfuric Acid, Phosphoric Acid, Rock
Phosphate, and Potash," Proceedings of 1976 ISMA
Technical Conference, The Hague, Netherlands.
4 Yates, L. D., F. T Nielsson, E. J. Fox, and R. M.
Magness. 1953. "Enriched and Concentrated
Superphosphate," Industrial and Engineering
Chemistry, 45(3):681-690.
5. Doak, B. W., P. J. Gallaher, L. Evans, and F B.
Muller. 1965. "Low-Temperature Calcination of C-
Grade Phosphate From Christmas Island," N, Z.
Agrtc, 8:15-29.
6. Brosheer, J. C, and T. P. Hignett. 1953.
"Development of Processes for Production of Fused
Tricalcium Phosphate," TVA Chemical Engineering
Report No. 7, Tennessee Valley Authority, Muscle
Shoals, AL, U.SA
7. Brown, G. G., and K. F. Thatcher. 1967. "The
Production and Properties of Basic Slag," Proceedings
of the Fertiliser Society (London), No. 96.
8. ISMA, "Phosphate Fertilizer Statistics, 1978," ISMA
Economics Committee, Paris, France.
9. Thompson, W. H. 1971. "New Route Cuts Costs
for Potassium Orthophosphates," Chemical
Engineering, 78(8):83-85.
10. Drechsel, E. K. 1973. "Potassium Phosphates: The
New Generation of SUPER Phosphates," Paper
presented to the American Chemical Society, Division
of Fertilizer and Soil Chemistry, Chicago, IL, U.S.A.
11. Walthall, J. H., and G. L. Bridger. 1943. "Fertilizer
by Fusion of Rock Phosphate with Olivine,"
Industrial and Engineering Chemistry, 35(7):744-777.
12. Huang, T. H. 1953. "Serpentine Fused Phosphate,"
Journal of Agricultural and Food Chemistry,
l(l):62-67.
13. Moulton, R. W 1949. "Electric Furnace Fertilizer -
Ca - Mg - Phosphate," Chemical Engineering,
56(7): 102-104.
14. Ando, J. 1959. "Simultaneous Production of Nickel
Matte and Calcium Magnesium Phosphate,"
Industrial and Engineering Chemistry, 51(10):1267-
1270.
15. Werner, W. 1967. "DieRhenania-Dunger," Verlag
M & H Schaper, Hannover, West Germany.
16. Werner, W- 1969. "Die Bedeutung Kalk-ynd
Silikathaltiger Phosphatdunger for die Dungung von
Latosolen," Der Tropenlandwirt, 57-81.
17. Yates, L. D., L. F. Roy, and R. S. Meline. 1951.
"Improved Fertilizer Plant Design," Chemical
Engineering, 58(6):435-437.
18. Brosheer, J. C. 1953. "Development of Processes
for Production of Calcium Metaphosphate," TVA
Chemical Engineering Report No, 6, Tennessee
Valley Authority, Muscle Shoals, AL, U.S.A.
19. Brown, E. H., J. R. Lehr, J. P. Smith, W. E. Brown,
and A. W Frazier. 1957, "Crystalline Intermediates
in the Hydrolytic Degradation of Calcium
Polyphosphate," Journal of Physical Chemistry,
61(12):1669-1670.
_20J-imousin,_L_,_B_Neveu,_and J. B. Peudpiece, P.
Achard, and Y Schwob. 1994, "A New Way to
Produce Urea-Superphosphate Fertilizers: The AZF
USP Process," pp. 172-186, Proceedings of IFA
Technical Conference, Amman, Jordan,
21. Dalman, L. H. 1934. "Ternary Systems of Urea
and Acids," JACS, 56:549-553.
22. Frazier, A. W., J. R. Lehr, and J. P, Smith. 1967.
"Urea-Monocalcium Phosphate, a Component of
Mixed Fertilizers," J Agr, Food Chem., 15(2):345-
347.
415
Chapter 15. Potash Fertilizers
Table of Contents
Page
15.1 Introduction 417
15.2 Potash in Agriculture , 417
15.3 Potash Production, Consumption, and Price „.,_418_
15.4 Product Quality 420
15.4.1 Nongranular Materials 420
15.4.2 Granular Potash Materials 421
15.5 Other Potassium Fertilizers 424
15.5.1 Potassium Sulfate 424
15.5.2 Potassium Sulfate Production 424
15.5.2.1 Mannheim Process 424
15.5.2.2 Recovery of Potassium Sulfate From Natural Complex Salts 424
15.5.3 Potassium Nitrate 427
15.5.4 Compound Fertilizers 430
15.6 Chemical-Grade Potash ._,..-.. '. 430
15.7 References _.^. 431
416
Chapter 15. Potash Fertilizers
15.1 Introduction
The term "potash" generally refers to potassium
chloride but it is also loosely applied to other potassium
compounds that may be differentiated by the words
muriate of potash, sulfate of potash, etc. Also, when
referring to ores, or in geology, all of the naturally
occurring potassium salts are called "potash ores." This
confusion began early since "potash" originally only
referred to crude potassium carbonate, which was
recovered by the leaching of near-seacoast wood ashes in
large pots. The ashes of inland plants were generally
higher in sodium carbonate, which gave rise to the
Arabic word for soda ash, al kali. The term was then carried
over after potassium was discovered to form the Latin
word for it, "kalium." The recovery of potash from ashes
became a thriving small cottage industry throughout the
world's coastal areas, and people of developing
economies, such as the early settlers in the United States, were
able to generate much-needed income from its recovery
and sale.
This industry was rapidly phased out with the advent
of the LeBIanc process for producing soda ash in 1792,
and the discovery about the same time of the massive
sodium-potassium nitrate deposits in the Atacama Desert
of Chile. During the 1800s many "officinas" were
established throughout the deposit to produce crude
potassium nitrate, which became the world's source of
potash for industrial, agricultural, and most of all, gun
powder needs. This remained the case until the large
buried carnallite (KCI • MgCb • 6H2O) deposits were
found by drilling in the Stassfurt, Germany, area.
Afterward, buried deposits and brines became the world's
dominant potash sources. With the rapidly expanding
world population and subsequently more intensive
farming, the need for potash has rapidly increased, and an
ever-increasing number of potash deposits have been
discovered and exploited, which gives rise to the very
large industry that exists today, Potash has become one
of the world's largest tonnage chemicals.
The size and economic attractiveness of the world's
commercial potash operations vary considerably, and
their pattern of development and continued production
have often been only partially based upon true economic
merit. This has led to considerable overcapacity in the
industry, primarily because the industry is dominated by
nationalistic considerations of jobs, foreign exchange,
etc. A second distinguishing feature of the potash
industry is that the generally poor economics and similarity
of mining and processing do not allow for much R&D;
therefore, cost reduction and efficiency changes have
been comparatively infrequent. Finally, increasing
maintenance costs and usually much higher mining costs are
incurred as potash operations age and face dwindling
reserves, declining ore grade, longer mining distances,
and often thinner or deeper ore. The purpose of this
chapter is to review the role of potash as a fertilizer and
production in different chemical and physical
commercial forms, The potash mineralogy, description of
deposits, and the potash ore beneficiation are given in
Chapter 5.
15.2 Potash in Agriculture
By far most of the world's potash production is used
in agriculture [1\. Over 95%-97% of it is sold to improve
the world's food, fiber, and other farm output.
Potassium is one of the three major plant nutrients and as
such must be added to all intensive farming soils as it
becomes depleted. Some potassium-containing
minerals such as clay, feldspar, and mica are found naturally
in soils, and the potassium slowly becomes available with
weathering. Iflhen goes~into solution or is in an ion
exchangeable form, both of which are available to the
plants. The potassium from fertilizers may also become
ion exchanged with clays or organic matter (Table 15.1)
near the.surface and thus not be very mobile; therefore,
the placement is important in many soils. Finally, the
function of potassium in plant metabolism is different
Table 15.1. Cation Exchange Capacities of
Clays and Organic Matter Found
in Soils (Munson, 1980)
Material
Clay Mineral
Vermiculite
Montmorillonite (Smectite)
Biotite
Muscovite
Kaolinite
Soil Organic Matter
Cation Exchange
Capacity
(meq/100 g)
150
100
40
20
5
50-250
417
from that of the other major nutrients. The other
nutrients become part of the plant structure, but potassium
largely remains as an ion in the cells and sap. The
function of potassium is to help control the plant's water
intake and metabolism, Potash is as vital to the plant as
the other fertilizers and is removed from the soil in the
same manner, even though its action in the plant is
different. For these reasons fertilization with potash is
somewhat more complex than with the other nutrients [2].
Some of the specific effects of potash are to increase
root growth; improve drought resistance by reducing
water loss, wilting, and respiration (maintaining "turgor");
and also lower the plant's energy losses. Potash helps
form cellulose and reduce lodging, enhances many
enzyme actions, aids in photosynthesis and food
formation, helps in the translocation of sugars and starch, helps
increase the starch and/or protein content of plants,
and helps retard crop diseases. It is sometimes called
the "quality" nutrient because of these many beneficial
functions. To attain maximum effectiveness, primary
nutrients must be supplied to crops in essentially the
same proportions as they exist in most plant life, where
the ratio of nitrogen to potassium is about 2:1. Thus,
among the commercial fertilizers, about one-half as much
potash is used as nitrogen, except when soil is capable
of supplying potash. Thus, the ever-increasing use of
nitrogen fertilizer necessitates the proportional
application of potash.
15.3 Potash Production,
Consumption, and Price
Table 15.2 lists the potash production from the
major producing countries 13]. World production has
declined with the economic transformation occurring in
Central and Eastern Europe and the Commonwealth of
Independent states (CIS) as a result of less consumption
by those countries and production problems with Russia
and East Germany. By 1994 the trend toward a higher
percentage of total production from Canada and less
from Russia and Germany had considerably increased.
The consumption of potash, as indicated by Table 15.3,
is dominated by Western Europe, Russia, Asia, and North
America. Data on both imports and exports are listed in
Table 15.4. The latter two areas represent the largest
import markets; Europe and Russia are primarily
supplied by their own production. The U.S. price of
granular potash is shown in Figure 15.1, (f.o.b. Saskatchewan),
and it was fairly stable until Canada and Russia entered
the market with large plants. Since then the oversupply
has made the price quite erratic, but at least it had risen
by 1994 to a point where most of the operators could
make a profit,
Projections for the short-term consumption (Table
15.5) are from a World Bank publication summarizing
the joint FAO/UNIDO/World Bank Working Group
results [4].
Table 15.2. Estimated World Potash Production in '000 t K20
Country
1986
1987
1988
1989
1990
1991
1992
Brazil
Canada
Chile
China
England
France
Germany
Israel
Italy
Jordan
Russia
Spain
United States
Total
10
6,697
20
24
390
1,620
5,646
1,250
109
661
10,220
702
1,172
28,507
37
7,266
20
39
428
1,539
5,730
1,252
122
722
10,888
739
1,218
29,964
56
8,327
20
62
460
1,502
5,801
1,245
125
766
11,300
766
1,461
31,891
109
7,360
20
56
463
1,191
4,384
1,273
152
742
10,233
■ 742
1,580
29,335
68
7,002
20
47
488
1,300
4,850
1,311
68
686
9,037
686
1,654
27,354
102
7,398
20
98
494
1,200
3,902
1,270
32
585
8,562
585
1,692
26,153
100
7,327
20
25
450
1,130
3,427
1,300
100
600
7,300
600
1,705
24,327
418
Tabic 15.3. Consumption of Potash in
Total
Region
Western Europe
North America
Russia
Asia
Others .
1973
24.32
21.9
16.28
9.78
15.74
of the
1991
20,42
21.62
20.73
24.24
12.99
Projection of a given country's consumption can be
made on the basis of projections of the nitrogen
consumption. For a diversified crop mix one can expect
that consumption of K2O should be 50% of nitrogen
consumption.
150
140
130
120
— 110
CD
i 100
^ 90
CD
i 80
CO 70 -
60 "
50 "
40
30
20
J I.
1960 1965 1970 1975 1900 1985 1990
Years
Figure 15.1. Granular Potash U.S. Prices.
Table 15.4. Trade in Potash Worldwide
.19.91
15.88.
1984
Canada
England
France
Germany, East
Germany, West
Italy
Russia
Spain
United States
Canada
England
France
Germany, East
Germany, West
Italy
Russia
Spain
United States
Imports
21
298
915
210
387
0
115
3,663
Imports
31
445
338
0
267
348
0
3
4,703
Exports
6,153
350
236
3,010
33
2,708
323
647
1978
Exports
6,268
106
323
2,734
1,583
109
2,401
332
774
Imports
('000
16
365
798
5
396
530
10
75
4,160
Imports
Exports
6,281
296
393
2,829
1,368
148
3,558
428
466
1975
Exports
-- - f'finn t ~* w.riA.^A
21
410
401
0
129
197
0
7
3,584
4,277
45
662
2,252
918
46
2,493
143
823
Imports
20
367
752
0
298
472
13
3
4,933
1972
Imports
62
512
479
0
57
210
0
3
4,891
Exports
6,841
104
347
2,860
1,571
120
3,156
372
552
Exports
4,200
16
695
1,820
1,304
29
1,706
230
482
419
Table 15.5. Short-Term Potash Consumption Projections
1991/92
1994/95
1997/98
Reqion
World
Africa
America
Asia
Europe
CIS
Oceania
S C B
(million tonnes K2O)
27.8 23.5 +4.3
0 0.5 -0.5
11,2 6.7 +4.5
2.1 5.8 -3.7
5.3 1.8 +3.5
7.4 5.0 +2.4
0 0.3 -0.3
S - supply potential.
C - consumption.
B - balance.
S C B
— (million tonnes K20)—
26.9 21.3 +5.6
0 0.6 -0.6
11.2 6.8 +4.3
2.2 5.6 -3,4
6,2 4,8 +1.4
7.2 3.1 +4.1
0 0.3 -0.3
S C
— (million tonnes
27.3 23.4
0 0.6
11.5 7.2
2,3 6.4
5.7 4.9
7.7 4.0
0 0.3
B
K20)---
+3.9
-0,6
+4.3
-4.1
+0.8
+3.7
-0.3
15.4 Product Quality
15.4.1 Nongranular Materials
During much of the history of potash production from
the 19th century to the early 1950s, particle size was of
little consequence. The material called "standard" had
an average size of 0.8 mm. In the 1960s when bulk
blending was increasing in the United States, producers
developed "coarse1' material~with a typical size range of
0.8-2.0 mm. Introduction of granular fertilizers for bulk
blending required an increase in the size of potash
particles. The "coarse" material was hardly compatible with
other fertilizers. The adequacy of the sizes is shown in
Figure 15.2.
Obviously the quality and size of particles depend on
the flotation and purification methods. Crystallization is
the dominant method in Germany because of the
quality of the raw material. Recent crystallization
technology allows production of rounded grains of about 1-mm
size, which is suitable for compaction.
Most potash is sold without detailed "quality"
specifications as to either purity or particle size. Potassium
chloride is guaranteed to have at least 60% K20 (and
potassium sulfate 50% K20), but this is only a 95%-
96% purity. The impurity is primarily assumed to be
NaCI, but there are no specifications for it. With the
technical (industrial) grades, however, the specifications
for various uses can be very demanding; for example,
limits on heavy metals in KCl that is sold to KOH
producers, KC1 in low-sodium food use, etc.
Table 15.6 [131 lists general K20 limits and typical
U.S. customer expectations on particle size ranges for
the most common fertilizer grades. Obviously, there is
100
Granular
Area between narrow lines
in graph shows the range of
typical panicle sizes of major
U.S. concentrated phosphates
S 10 12 14 16 18 20
Tyler screen [mesh]
Figure 15.2. Comparison of Sizes of Fertilizer
Granular Material With "Coarse"
and Granular Potash.
Table 15.6. Nominal U.S. Potash
Specifications (Searls 1991)
Name
Blend
Granular
Coarse
Standard
Special standard
Soluble/suspension
Chemical
Nominal
Particle,
Mesh
6-14
6-20
8-28
14-65
35-150
35-150
-
Size Range,
mm
1.19-3.36
0.841-3.36
0,595-2.38
0.210-1.19
0.105-0.420
0.105-0.420
-
%K20
60
60
60
60
60
62
63
420
still an unusually large overlap in the particle sizes of the
various grades, which is a carryover from the days when
run-of-the-plant K2O content (i.e., in Germany it was
commonly 50%) and screen size (such as 16-150 mesh)
were all that was available. This will probably change in
time because of the competitive advantages of purer
and more closely sized potash grades and the
comparative ease in obtaining them.
An undesirable aspect of product quality is that
potash tends to cake, and there is also some unavoidable
crystal breakage with shipping and handling, which
generally results in a dust problem. An interesting effect
from the strong adsorption of amine groups to potash
is the fact that the flotation reagents used are also
effective anticaking agents. However, to enhance the effect
most companies include amounts of amines in the
different grades of product before shipment and an oil to
help reduce dust problems (Table 15.7) [5]. For those
special grades in which such impurities are not allowed,
a more closely sized and drier product is shipped.
15.4.2 Granular Potash Materials
Compaction/granulation is now an important stage
in the overall potassium chloride production/beneficiation
process. Compaction implies the agglomeration of
particles under force to produce a densified and coherent
sheetlike material referred to as flake. In this case,
granulation refers to the dry milling of flake into a prescribed-
size distribution employing a screening step.
Compaction/granulation of potash began in the 1950s as an
economic alternative to the thermal processes
(sintering, melting). Currently, about 40% of the total world
capacity of potash production is compacted; this amounts
to about 5% of total world capacity of granular fertilizers.
The general flowsheet of potash
compaction/granulation is shown in Figure 15.3 [6\. The system is
composed of four groups of equipment for the following
process steps [7], 18]:
• Storage and feeding.
• Compaction.
• Size reduction and classification.
• Finishing.
Storage and Feeding - The section usually includes:-
• Material storage hopper allowing the undersize
material from the granulation section to be recycled.
• Feeding hopper system, possibly with magnet and
rough screening system.
• Control feeding system.
Compaction - The section usually includes:
• Feeder,
• Compacting rolls.
• Flake breaker.
There are two types of feeders: gravity and force-type
feeders.
A gravity sys'temTis" composed of a slightly diverging
chute located above the rolls and an adjustable vertical
feed control tongue to keep the level constant.
The force feeders are equipped with single or multiple
screws. These screws may be positioned vertically, at an
angle, or horizontally. Tapered screws deaerate and
Table 15.7. Anticaking Additives
Anticaking Reagent
Quantity
Granular product
Coarse product
Standard
Special standard
Soluble
Antidusting reagent
Quantity, q/t
Armeen C
s/t
108
108
108
108
227b
oil
-
75% Armeen C in
s/t
225
225
320
320
400
oil
1.2
Glycol3
Armeen HT Flake
No
s/t
100
100
100
100
100
2 fuel oil
1.3
Amine in Oil
s/t
73c
73c
140"
140d
oil
0.45-1.0
a. Plus 10% HC1 for soluble product,
b- Plus 900 g/t glycol,
c 8% amine in oil,
d. 25% amine in oil.
421
NPK-Components
From Fresh Feed Bins
SI-13
Legend:
M-l Mixer
SI-2 Feed bin
SI-3 Recycle bin
SF-4 Screw feeder
X-5 Compactor
BC-6 Belt conveyor
GR-7 Coarse disc crusher
BC-S Bucket elevator
SC-9 Double-deck screen.
D-10 Polishing drum
SC-11 Single-deck screen
D-12 Conditioning drum
SI-13 Silo
GR-14 Oversize crushers
Figure 15.3. General Flowsheet for Potash Compaction/Granulation Plant.
predensify the feed to the compactor, Force feeders
facilitate automation of the process by regulating of the
speed-of-the-screw.Both-gravity and force-feeders_are_
deaerated through ports connected to the dust system.
The amount of the air removed depends on the size
of material and compression ratio. In case of
compacting potash from specific gravity of 1 g/cm3 to 2 g/cm3,
the amount of air is about 0.5 Nm3/t of product.
The compactors are two counterrotating rolls. One
roller is located in a set of fixed bearings- the other is a
floating-bearing unit, The feed passed between the two
rollers is progressively transformed from a loose to a
dense state. The rolls can be smooth or corrugated,
waffled, or have pocketed surfaces. The chevroned
surfaces increase flake production and allow the nip angles
to be increased. The nip angle also establishes the
compression ratio. Compression ratios range between 1.5
and 3. Table 15.8 gives ranges of compaction
parameters [8].
The selection of equipment depends on the material
and its properties [6], including particle shape, size, size
distribution, and compaction force needed. For
compaction the general rule is that the larger particles should
be accompanied by fines to fill in the larger pores or
open space. The van der Waals attraction forces are
often not sufficient to produce flake with adequate
strength. Sometimes binders are added, or creation of
crystalline bridges is used.
The temperature of potash feed determines its
plasticity. In comparison with colder feed the warmer feed
-may_tequite.Iess_pressure toobtain product with a given
strength and density, or, at the same energy input,
produce material with greater strength and density. Elevated
temperatures are beneficial for the formation of crystal
bridges.
In general compaction is defined as a dry
agglomeration process. Sometimes the addition of water may be
beneficial; however, it is rare to observe compaction of
material with a water content of more than 2%. The
compaction of KG is accomplished essentially in a dry
Table 15.8 Variations in Compaction
Parameters
Parameters
Roller diameter
Roller width
Compaction pressure
Roller speed
Flake thickness
Capacity
Drive power
Recycle ratio
Flake density
Units
m
m
kN/cm
rpm
mm
tph
kW
1
g/crn3
Maximum
1.2
0.8
120
22
25
100
750
3.5
2.5
Minimum
0.6
0.2
30
10
2
10
55
2.5
0.8
422
state. Table 15.9 gives the compaction parameters for
potassium salts [9].
The product from the compaction process is the flake.
The thickness of the potash flake varies from plant to
plant but on average is about 20 mm. After compaction
the flake is cured in the conveying system. For potash
the normal design of the plant provides about 3 minutes
of curing time. The flake is broken into smaller pieces
immediately below the roller, Pin-type breakers and
coarse tooth roll crushers are used to break the flakes.
Table 15.9. Compaction of the Potassium Salts
Pressing Moisture
Product Temperature Force Particle Feed
Potassium chloride,
60% K20
Potassium sulfate
Potassium nitrate
(°Q
120-140
90
20
70-100
20
(kN/cm)
50
60
70
70
100
[%)
dry
dry
dry
1
0.5-1.0
(mm)
<1
<1
<1
<0.5
<1 .
Granulation - The granulation section is essentially-
composed of crushing and screening equipment.
Potash granulation mainly consists of primary and
secondary crushers in closed circuit with a multi-deck screening
system. Two-stage milling decreases the recycle ratio.
The primary crusher grinds large materials from the
compactor, and the secondary crusher is fed with
oversize from the screen. Hammer mills, cage mills, or chain
mills are used as the primary crushers. Roll crushers with
toothed rolls are often used as secondary crushers.
The roll crusher parameters are important, in
particular the rotational speed, size, and shape of the crusher
teeth. Usually the mills are fitted with variable speed
drives. The discharge from the compression (roll) crusher
is controlled by the gap setting. Evaluation of circuits
using roll crushers indicates higher yields than from those
equipped with impact crushers.
Finishing Section - This section includes:
• Polishing unit.
• Coating unit.
• Final product storage.
The particles after granulation have sharp edges and
are of irregular shape. To diminish the crushing of the
material during further handling and dust creation the
potash particles are quenched, dried, and passed through
the polishing screen. Quenching consists of wetting
particles with water or brine by direct spraying on the
conveyer or mixing in screw conveyers (maximum 5% but
usually about 1%). During the quenching stage the
sharper corners of the particle break off and a shell of
dissolved salt envelops the particles, After wetting the
product is dried in a rotary drum or fluid bed dryer at a
temperature as high as 200DC. Dry product is passed
over a polishing screen to remove the fines.
In the final steps the product is cooled and coated in a
rotary drum with anticaking agents (amines and oils).
Amines depress the caking tendency of potash during
transportation, and oils prevent the formation of dust
clouds at the handling points.
Dust Collection System - Major dust sources are
the hopper in which the payloader dumps the raw
material, the crushers, the transfer points, the mixer, and
the screens. The amount of air needed in the dust
collection system depends on the number and types of
collection points. The system consists of a fan, cyclones,
and filter bags connected by air ducts.
The velocity of the air in the ducts must be kept high,
a minimum of about 1,000 m/min. The fan is sized on
the basis of the volume of air required and the pressure
drop through the system, The fan is installed on the
clean air side of the cyclone or filter bags.
Process Requirements -Process unit requirements
for a large potash compaction plant are given in Table
15.10.
Table 15.10. Process Requirements of the
T1MAC Compaction/Granulation
Plant, Saint-Malo, France [8]
Parameters
Units
Value
Product:
Granular potash 1 0-0-60
Capacity tpd 1,250
Annual operation time h 7,200
Investment cost (battery' limits) US $ million 4.8
Cost Components
Raw materials
Potash (60% K20)
rmergy
Electrical energy
Process water
Fuel
Units
kg
kWh
■ ^
GJ
Unit/t
1,001
35
10
0.06
423
15.5 Other Potassium Fertilizers
15.5.1 Potassium Sulfate
Potassium sulfate is the second largest tonnage
potassium compound, and it is also used primarily as a
fertilizer. The sulfate or other nonchloride forms of
potassium are preferred for certain crops that do not
tolerate the chloride ion well, e.g., tobacco and some fruits
and vegetables. Nonchloride potash sources are also
needed in areas where chloride accumulation in the soil
is a problem. This is important in arid areas where
chloride salts from irrigation water accumulate or in areas of
very intensive agriculture, e.g., in the Netherlands.
Potassium sulfate may be preferred because of its sulfur
content where soils are deficient in both potassium and
sulfur.
15.5.2 Potassium Sulfate Production
15.5.2.1 Mannheim Process-Historically
potassium sulfate has been made primarily from KC1 and
sulfuric acid (and a small amount from KC1 and SO2) when
the byproduct HC1 was the dominant product. However,
over the years the HCI market has had more
competition, and "natural" K2SO4 with lower capital and
operating costs has begun to dominate its production in some
countries with natural complex salts.
The Mannheim process was originally developed from
sodium sulfate production by reacting NaCl wTfh sulfuric
acid. Replacing NaCl with KCI produces potassium
sulfate. The reaction is two-stage:
a. Exothermic reaction
KCI + H2SO4 -*■ KHSO4 + HCI
b. Endothermic reaction
KHSO4 + KCI -> K2SO4 +HC1
The potassium chloride reacts during slow mixing in the
heated Mannheim furnace with sulfuric acid, producing
gaseous HCI and K2S04. The furnace is heated by
natural gas or fuel oil. The product K2S04 is cooled in a
cooling drum. Lump material from the cooler is crushed
and finished or can be compacted and granulated as
with KCI. Although the price of agricultural grade
potassium sulfate is twice as high as potassium muriate,
granulation would add about 18 US $18/tonne to the
processing costs. However, considering the difference
of 25% between prices of coarse and granulated
material, the process seems to be feasible.
The HCI gas is cooled in a graphite heat exchanger
and absorbed in water in two stages to produce 33%
hydrochloric acid as a byproduct. The process gives an
excellent quality that contains over 50% K2O and less
than 1% chlorine. Emissions are well controlled and the
process is computerized. The process as operated by
Kemira Oy [10] is shown in Figure 15.4. Process
requirements for the Kemira Oy plant are given in Table
15.11.
15.5.2.2 Recovery of Potassium Sulfate From
Natural Complex Salts - The chief natural complex
salts that are the source of the potassium sulfate are:
• Kainite (KCI*MgS04»3H20)
• Langbeinite (K2S04»2MgSO4)
• Carpathian polymineral ores
The natural process [11] involves the initial conversion
with recycled K2SO4 end liquor of "mined" kainite (from
the solar evaporation of Great Salt Lake brines, or
deposits in Sicily, and Carpathia), or langbeinite (from
Carlsbad) to form an intermediate product, schoenite
(or leonite if done hot). All processes are based on
intercrystalline reactions of ion exchange.
The basic reactions leading to potassium sulfate from
kainite by transformation of the kainite into schoenite
and later water leaching are:
2KCI»MgS04«3H20 -*■ K2S04*MgS04»6H20 + MgCI2
K2SO4»MgS04»6H2O -*■ KaSC^ + MgS04 +6H20
The Jtalkali!s Pasquasia potassium sulfate process based
on the latter alternative in Figure 15.5 [12] The process
comprises four basic units:
• Preparation of the ore and flotation;
• Production of schoenite and its recovery;
• Leaching of the schoenite to potassium sulfate;
8 Liquor treatment.
The kainite is repulped with recycled brine, screened,
and directed to ball mills and hydroclassifiers. Overflows
go to a thickener and main filter and underflows to
flotation and filtration, Hoat material, after filtration, is
combined with the solid fraction from the main filter and
directed to the schoenite reactors and separating
cyclones. After a two-step hydroseparation, centrifugation,
and filtration, schoenite is directed to the leaching
reactors. After decomposition of the schoenite, product is
directed to a thickener. The underflow solids are sent
directly to final centrifuges and a dryer; the overflows
are cooled and crystallized. After additional thickening,
the product is centrifuged and dried. The product
specification ensures that the K20 content is not lower than
50% and the chlorine content is less than 1%.
In the recovery unit, Italkali forms syngenite
[K2Ca(S04)2*H20] to moderately increase the recovery
424
Sulfuric field
■=>
Fuel Dff-gas
Legendi
BC-1 Chain conveyor
W-2 Belt weigher
SF-3 Screw feeder
H-4 Mannlnein furnace
D-5 CaalIng drum
GP.-6 Hanner ni11
D-7 Mixing drum
E-8 Graphite cooler
C-9j C-1D Absorption colunns
T-ll Storage tank
Figure 15.4. Kemira Oy Potassium Sulfate Process [10].
Table 15.11. Process Requirements of the
Kemira Oy Potassium Sulfate
Plant [10]
Parameters
Units
Value
Product:
Potassium sulfate
Capacity per unit
Annual-operation time
Investment cost (battery limits)
per line
1 0-0-50
tpd 30
h 7,900
US $ million 1.5
Cost Components
Raw materials
Potash (60% K2Q)
Energy
Electrical energy
Cooling water
Process water
Fuel
Units
kg
kWh
m3
kg
GJ
Unit/t
850
45
60
77
4.1
Kalnfie Ore -9 mash
1
REPUIPER
SCREENS
28 MESH
OFlo
BALL MILLS
SCREW AND
HYDROCLASSIFIERS
OFlo
THICKENER,
FILTER
FLOTATION,
FILTER
Float
SCHOENtTE
REACTOHS,
CYCLONES
26'C
HTOROSEPARATOFL, 1«m
HTOROSEPAHATOH. 35m
UFIo
CENTRIFUGES, 3
BELT FILTERS. 2
SCHOENrTE LEACH
12 REACTORS
]«"C
COOUNG
CRYSTALLEER
— THICKENER
fCentrata |UFk) f
CENTRIFUGES,
DRYER
Potassium
Sulfate
SYNGENtTE
REACTORS
RLTER.
Product
End Liquor
To Disposal
1 Solidst Gypsum
SYNGENTTE
LEACH
FILTERS
t Water
SLIMES
THICKENER
1
UFlo
1 | FIL
J
OFlo
DISCHARGE FILTER
__J
Solida Slim
as
Figure 15.5. Potassium Sulfate Recovery From
Kainite.
425
of schoenite from the plant's end liquor. The brine from
the schoenite filter is reacted with recycling gypsum. The
schoenite formed is combined with main flow to the
leaching reactors.
Other processes involve adding.sylvite to kainite,
langbeinite, kieserite, etc. The schoenite intermediate can
be formed by reacting KCI with mined kieserite
(MgS04«H20) or with epsomite. A similar
intermediate, glaserite, is formed from the reaction of KCI with
salt cake or glauber salt, Na2(S04)» 10H2O (Searles Lake,
Spain, Canada). Either double salt can be transformed
into pure K2S04 by a partial leach or in greater yield by
reacting it with additional KCI. Where solar or plant
evaporation can be done economically, the yields can
be further improved by evaporating the schoenite or
glaserite end liquor and recycling the salts.
The reactions are as follows:
a. by mixing kainite and sylvite
KCI + KOMgS04*3H20 -* K2S04 + MgCl2 +3H2Q
b. by mixing sylvite with kieserite and other
magnesium salts to give kainite
KCI + MgS04*H2O + 2H2Q -»■ KCI-MgS04*3H20
A complex process for production of potassium
sulfate from potash ores has been implemented on an
industrial scale in Russia in the Kalush plant [14]. The
natural ores are composed of calcium sulfate anhydrite,
epsomite, halite, kainite, kieserite, langbeinite, polyhalite,
sylvite, and clay. The treatment of such an ore requires-
permanent analytical services and the development of a
large number of formulations for different compositions
of the raw material and for the kind of salts intended to
be produced. Additional sylvite must be added in
varying amounts to maintain the right proportions for
crystal formation. The basic process concept is to produce
schoenite from all available salts. The remaining
products or processes are subjugated to this basic process.
The process is shown in the flowsheet, Figure 15.6.
Insoluble ores:
Langbeinite. Polyhalite, Halite
<=
Mixed run of ores
from preliminary reduction
Washed clay
to discharge
<=i—
Overflow soluble ores:
Kainite, Sylvite, Epsomite,
Sodium salts and clay
S-2
Synthetic
Kainite
Water
Sodium sulfate and
Magnesium liquor
end products
Saturated
Magnesium sulfate,
Potassium sulfate
Schoenite end product
Legend;
X-l Dissolution chamber
S-2 Dorr settler
5-3 Countercurrent washer
CR-4 Vacuum crystallizer
F-5 Filter
E-6 Evaporator
S-7 Centrifuge
Potassium sulfate
end product
Figure 15.6. Flowsheet of Carpathian Ore Treatment [14].
426
The Carpathian ore contains about 9% potassium and
15% clay. The ore is leached with hot "synthetic kain-
ite" solution in a dissolution chamber. The langbeinite,
polyhalite, and halite remain undissolved and are
discarded. The overflow from the dissolution chamber
containing salts and clay is directed to a Dorr-Oliver settler
where clay is settled and directed to a washer and
discarded, The solution is crystallized at the proper cation
and anion proportions to produce crystalline schoenite.
To avoid crystallization of potassium chloride and
sodium chloride, the saturated solution of potassium and
magnesium sulfates is added to the Dorr-Oliver settler.
The slurry of schoenite is filtered, and crystals are leached
with water to produce K2SO4 crystals, which are centri-
fuged and recycled, and a liquor of potassium and
magnesium sulfates. Also, liquid phase from filter is recycled
and added to the schoenite liquor from vacuum
crystallization. Part of the schoenite liquor is evaporated to
produce crystalline sodium sulfate and discard the
magnesium chloride liquid end products. The slurry from the
evaporation unit is recycled as "synthetic kainite." This
process permits the use of the Carpathian ores to
produce several commercially valuable products such as
potassium sulfate, potassium-magnesium sulfate,
potassium chloride, sodium sulfate, and magnesium chloride
liquors. Neither the economic evaluation of the process
nor any of the consumption figures have been published.
The production of potassium sulfate from Iangbeinite
is possible with a large amount of muriate of potash-by-
mixing Iangbeinite and sylvite:
4KC1 + K2S04»2MgS04 -*■ 3K2S04 + 2MgCl2
2KC1 + 2(K2S04»2MgS04) -► 3(K2S04*MgS04) + MgCl2
The Bureau of Mines (U.S.A.) developed the process
[13]. The principles of the process are given in the block
flowsheet shown in Figure 15.7.
The Iangbeinite ore is separated from sylvite and
halite by selective washing, froth flotation, or heavy media
separation, The commercial Iangbeinite used in the
process must be pulverized in ball mills, and fine powder is
mixed with a solution of the muriate of potash. The
muriate of potash is dissolved and clarified in a separate
unit. The reaction in the presence of water yields
potassium sulfate in a crystalline form and brine. Crystals are
centrifuged or filtered, dried in a rotary dryer, sized, and
finished. The finishing methods either produce coarse
material or granulated product. The brine is evaporated,
crystallized, and filtered. The mixed salts are added to
the sulfate reactor. The liquor is discarded as a waste.
Raw material consumption at 80% conversion per
tonne of potassium sulfate is given in Table 15.12.
Consumption of utilities and capital costs has not been
published.
Langbeinite fines
Muriate fines
PULVERIZING
SECTION I
DISSOLUTION AND
CLARIFICATION
SECTION II
Water
SULFATE
REACTION
SECTION III
DEBRINE
SECTION IV
Mixed salts
EVAPORATION
CRYSTALLIZATION
AND FILTRATION
SECTION V
SULFATE DRY,
SIZE STORAGE
SECTION VI
Waste Liquor
Discard
Figure 15.7. Potassium Sulfate Process From
Langbeinite.
Table 15.12. Raw Materials Required for the
Bureau of Mines Process
Theoretical Estimated
Raw Material Units Consumption Consumption
Langbeinite (96%) kg/t 0.788
Sylvite (60% K20) kg/t 0.568
1.056
0.780
15.5.3 Potassium Nitrate
The third most widely used potassium salt in
agriculture is potassium nitrate, An ore containing sodium
nitrate, potassium nitrate, some chlorides, and sulfates is
mined in Chile; KNO3 is produced by the process shown
in Figure 15.8 [15]. The ore is leached and part of the
sodium nitrate is crystallized and removed. Potassium
chloride is added to the brine, and the resulting sodium
chloride is separated. Cooling to 5°C crystallizes the
potassium nitrate, which is then recovered with
centrifuges. Residual brine is concentrated by solar
evaporation to remove salt and sodium sulfate, more KCI is
added, and KNO3 is again crystallized. KCI or K2SO4
may also be used in fractional crystallization processes
with NH4N03 or Ca[N03)2 to produce potassium nitrate.
427
CRUSHING,
SCREENING
•a mesh
2' -8 ma Eh
VAT LEACHING.
OOUNTERCURRENT
-STRONG BRINE
Ore
Brine
40-C
VATS. WEAK BRINE
LEACH. DRAIN
. Ore
VATS, WASH
EMPTY
X
LEACHING
SCREW MIXER
FILTER
MOOR6LEAF
Fines to
Tailings
COOUNG
CRYSTALLIZATION
FILTERS
DISSOLVES,
CRYSTALLIZED
FILTER
Filtrate
COOLING
CRYSTALUZER
CENTRIFUGES. 5"C
Filtrate
SALT CAKE PLANT
FILTERS
Sodlim
Suffate
Product
I Brine
IODINE
SOLAR POND
HARVESTING
Astrakanita, NaCI
Satis to
Tailings
Brine
DISSOLVERS.
CRYSTALUZER,
FILTER
NaCI lo
Tailings
COOLING
CRYSTALUZER,
CENTHIFUGES, 5"C
Filtrate
1 - Water
2 - Ore to tailings
3 - NaCI to tailings
Potassium Nitrate Product
Iodine
Figure 15.8. Recovery of Potassium Nitrate
From Natural Salts Deposits.
Potassium nitrate is made synthetically in Israel by
Israel Mining Industries (IMI) by low temperature reaction
of potash with nitric acid with solvent extraction of the
coproduct hydrochloric acid 116]. The HCIis re-extracted
from the solvent with water and then distilled as about a
20% HC1 solution. The solvent is recycled to the first
extraction stage {Figure 15.9).
Nitric acid reacts with potassium chloride at low
temperature according to the equation:
KCI + HNOs ^ KN03 + HCl
Potassium chloride and a stoichiometric quantity of
chilled 60%-70% nitric acid are fed into the first reactor
at 5°-10°C. Recycled brine and solvent are added to the
reactor. In the presence of the solvent, the reaction goes
almost to completion. During the process potassium
nitrate crystallizes from solution, Solid product is
separated in a decanter and directed to a centrifuge and dryer.
It can be sold in the powder form or melted and prilled.
The hydrochloric acid and the unreacted nitric acid are
dissolved in the liquid phase. Obviously both nitric acid
and hydrochloric acid are soluble in the solvent, but
distribution coefficients differ sufficiently for the hydrochloric
acid to be removed in a countercurrent liquid extraction
system by water. The extraction is carried out in the
mixer-settler extraction system vessels. The remaining
nitric acid and solvent are recycled through a
refrigeration unit to the first reactor. The water is stripped from
the solvent, which is also recycled. The low
concentration hydrochloric acid is evaporated in a multiple effect
evaporator to a concentration of 22%. This acid is_used_
in another plant to produce phosphoric acid by a
hydrochloric acid attack. The latter process is described in
Chapter 11.
The raw materials consumption figures, utilities, and
investment costs have not been published.
In another process 117], [18] the same reactants are
used, except at a higher temperature to take advantage
of the oxidizing power of nitric acid. In a complex
process with exotic corrosion-resistant equipment, chlorine
is produced as a byproduct with the potassium nitrate.
The process flowsheet is given in Figure 15.10,
Potassium chloride is slurried with 65% nitric acid,
which has been previously chilled to prevent a reaction
occurring before the slurry is fed into the reactor. In the
reactor, which operates at about 0.18 MPa, the slurry is
-iieated-with nitricacid vapor to about 75°C, whereupon
the reaction takes place, according to the following
equation:
3KCI + 4HN03 -> 3KN03 + Cl2 + NOCI + 2H20
Approximately 90% of the chlorine is removed in
gaseous form. Because of the extreme corrosiveness
prevailing in the reactor, this vessel, which is in fact an
agitated autoclave, has to be fabricated from titanium
and lined with acid-resistant brick.
The solution from the reactor flows to the chloride-
stripping column where it is heated with more nitric acid
vapor to its boiling point of about 150°C. This
treatment takes the reaction to completion and gives rise to
a stripped solution containing less than 10 ppmw of
chlorine. If this degree of completion is to be obtained,
it is necessary to maintain an excess of nitric acid
corresponding to a concentration of 55% in the solution.
The gaseous mixture, containing nitrosyl chloride and
chlorine from the agitated reactor, is oxidized in the gas
reactor by using hot nitric acid at a concentration of at
least 80% at 150°C. The reaction that occurs yields
nitrogen dioxide and more chlorine as follows:
NOCI + 2HN03 -> 1/2 Cl2 + 3N02 +H20
428
Wash water
Crystal wash
^.water
KN03 bulk
storage
S-10 Stripping mixer-settlers
X-ll Refrigeration unit
E-12 Cooler
XE-13 Multiple-effect evaporator
Legend:
BC-1 Belt conveyor
E-2 Chiller
R-3, R-4 Conversion reactors
S-5 Decanter
S-6 Centrifuge
D-7 Dryer
S-8 Extraction mixer-settlers
S-9 Washing mixer-settlers
Figure 15.9. IMI Potassium Nitrate Production Process.
65%
HN03
KC1 from
storage
Recycle gas BrCl bleed
(N0C1.N02C1 + N204.C12.BrCl) stream
c^>to barometric condensers
62% HN03 recycle
Legend:
H-l Mixer
R-2 Agitated primary reactor
R-3 Gas reactor
E-4 Reflux condenser
E-5 Total condenser
r_7 l'st Fractionating column
W 2-nd Fractionating column
C-8. C-9 HN03 Absorption towers
to storage
C-20 Chloride stripping column
E-21 HN03 vaporizer
R-10 Agitated reaction tank
C-11 Acid distillation column I
C-12 Acid distillation column II
CR-13 - CR-15 Vacuum crystal 1izers E-22 HN03 Melter & vaporizer
S-16 Cyclone thickener BC-23 Bucket elevator
V-17 Saturator E-24 Melter
S-18 KN03 Centrifuge PT-25 Prilling tower
D-19 Direct-fired dryer E-26 Rotary cooler
Figure 15.10. High Temperature Potassium Nitrate Process.
429
Water formed in the oxidation is condensed and fed
to the primary reactor. The chlorine and nitrogen
dioxide are separated into liquid products; the chlorine is fed
to storage while the nitrogen dioxide is oxidized with air
and absorbed in water to produce 65% nitric acid. This
oxidation step is characterized by the following
chemical equation:
2N02 + H20 + l/202 -+ 2HN03
The overall reaction through the process is given by:
2KC1 + 2HN03 + l/202 -+ 2KN03 + CI2 + H20
In the gas section of the process, two distillation
columns are used to separate the pure chlorine from pure
nitrogen dioxide. Chlorine is removed from the top of
the first column and nitrogen dioxide from the bottom
of the second column while in the wet section the
potassium nitrate-nitric acid solution is concentrated in the
acid distillation column, It has been practical to
concentrate the solution up to 81% nitric acid; the weak acid
vapors in the overhead fraction are subsequently
concentrated to about 62% HNO3 in a second distillation
column. Bottoms from the first acid distillation column
are fed to a battery of vacuum crystallizers where
potassium nitrate is precipitated and separated by a
centrifuge. The product is dried and may be stored directly or
melted and prilled at 340°-350°C in a 35-ft (10.7-m)
tower. Either technical grade (99.3%) or agricultural grade
(99%) potassium nitrate may beproduced.-
15.5.4 Compound Fertilizers
Potash is often applied in mixtures with other
nutrients to provide the specific fertilizers needed by crops
or soil and to allow placement in one application. To
meet this need most fertilizer dealers have modest
blending equipment, but to prevent segregation the fertilizers
must be in the granular or coarse form. Some fertilizer
manufacturers make certain blends such as the German
combination of potash with kieserite when both are
produced at the same mine. In the United States two
operators also sell naturally occurring langbeinite as a similar
mixture. The langbeinite ore is separated from its
companion salts by either dissolving the others (with only a
10%-15% langbeinite loss) or by heavy media
separation of the langbeinite.
15.6 Chemical-Grade Potash
About 4%-5% of potash production is used in
industrial applications. The industrial potash (chemical grade)
has a different purity from fertilizer-grade potash. The
composition of chemical-grade potash is given in Table
15.13 [5],
Table 15.13. Chemical Grade Potash Analysis
Component
KCI
K20
H20 (at 105°Q
H20 (at 700DQ
Water insolubles
Acid insolubles
Sodium
Bromine
Sulfate (SO4)
Calcium
Calcium and magnesium
Iron
Lead
Copper
Nickel
Chromium
Molybdenum
Vanadium
Titanium
Unit
%
%
%
%
ppmw
ppmw
ppmw
ppmw
ppmw
ppmw
ppmw
ppmw
ppmw
ppmw
ppmw
ppmw
ppmw
ppmw
ppmw
Standard Content
>99.90
>63.12
<0.07
<0.67
<75
<75
<150
<700
<10
<10
<30
<5
<3
<0.5
<0.5
<0.1
<0.1
<0.1
nil
Product is shipped in bags or in bulk form in modified
hopper cars called spargers (in slurry form) or solution
cars (in liquid form).
Chemical-grade potash has the following
consumption pattern:
Detergents and soaps
Glass and ceramics
Textiles and dyes
Chemicals and drugs
Other
35%-30%
25%-28%
20%-22%
13°/crl5%
7%-5%
Most of the chemical-grade potash is used for
production of potassium hydroxide. Potassium hydroxide
(KOH) and its derivative potassium carbonate are the
next largest industrial potassium compounds. The KOH
is made by the electrolysis of KCI in installations similar
to caustic soda/chlorine production. The main use of
caustic potash is in the manufacture of liquid soaps;
textile operations; production of grease, catalysts, alkaline
batteries, electropolishing, and rubber production.
Several other potassium compounds have a limited
use in agriculture but much wider use in industrial or
430
commercial applications. Potassium phosphate, for
instance is used in some high-analysis, low-salt content
fertilizer mixtures. It is not yet a large tonnage fertilizer,
but several companies over the years have announced
plans to produce it for that purpose. Potash is reacted
with sulfuric acid, and the HCl is removed at the KHSO4
stage. This salt is then reacted with more H2SO4 and
phosphate rock [Ca3(P04)2] usually to produce the more
easily crystallized monopotassium phosphate (KH2P04).
However, the yields are low because of K losses with
many of the impurities in the rock, and the process is
corrosive and complex. By far the widest use of
potassium phosphates has been as an additive to heavy-duty
detergents, predominantly as low molecular weight
polymers created by fusing various KOH and H3PO4
mixtures,
Potassium carbonate is used primarily in the glass
manufacture, e.g., of televisions and similar display tubes.
Potassium carbonate solution (0-0-30 grade) is marketed
in the United States as a specialty liquid fertilizer.
Potassium carbonate is produced by carbonating KOH with
CO2. Some potassium carbonate is further carbonated
to produce KHCO3 (potassium bicarbonate), which is
used largely in the food and pharmaceutical industries.
15.7 References
1. Munson, R. D. 1980. "Potassium Availability and
Uptake," Potassium in Agriculture, Potash and
Phosphate Institute, pp. 67-108.
2. Garrett, D. E, 1995, Potash; Deposits,
Processing, Properties and Uses, Chapmen & Hall, New
York.
3. "Statistical Supplement," Phosphorus and
Potassium, 1986-1992, British Sulphur Corp., London,
England,
4. IBRD. 1993. "World and Regional Supply and
Demand Balances for Nitrogen, Phosphate, and
Potash for 1991/1992-1997/1998," World Bank
Technical Paper N 206.
5. Potash Corp. of Saskatchewan, 1991. "Product
Specifications," PCS Sales, Canada.
6. Zisselmar, R. 1988. "Compacting/Granulation of
Fertilizers," IN NPK Fertilizer Production
Alternative, Proceedings of an international workshop, pp.
46-56, SP-9, Madras/Bombay, India, International
Fertilizer Development Center, Muscle Shoals AL,
U.S.A.
7. Pietsch, W. 1990. "Granulation of Fertilizers by
Compaction," IN Urea-Based NPK Plant Design
and Operating Alternatives, Proceedings of
international workshop, pp. 89-98, J. J. Schultz and G.
Hoffmeister (Eds,), SP-15, International Fertilizer
Development Center, Muscle Shoals, AL, U.S.A.
8. Fayard, C, and P. Hervieu. 1990. "Compaction/
Granulation of Fertilizers," IN Urea-Based NPK
Plant Design and Operating Alternatives,
Proceedings of international workshop, pp. 99-108, J. J.
Schultz and G. Hoffmeister (Eds.), SP-15, lnterna-
tional Fertilizer Development Center, Muscle Shoals,
AL, U.S.A.
9. Klein, M.O. 1990. "The Manufacture of Fertilizers
by Compaction/Granulation," IN Urea-Based NPK
Plant Design and Operating Alternatives,
Proceedings of international workshop, pp, 119-132, J. J.
Schultz and G. Hoffmeister (Eds.), SP-15,
International Fertilizer Development Center, Muscle Shoals,
AL, U.S.A.
10. Swanstroem, S. 1994. "Private Communication,"
Kemira Oy.
11. Cormode, G. A. 1992. "Personal Communication,"
Cominco Fertilizers.
12. Carcara, D. 1992. "Personal Communication,"
——Italkali,-Pasquasia. - —
13. Searls, J. P. 1991. "Potash," Mineral Industry
Surveys, Bureau of Mines, U.S. Department of
Interior, Washington, D.C., U.S.A.
14. "Technical Advances by the U.S.S.R. Potash
Industry." 1972. Phosphorus and Potassium, 59:41-45.
15. Crozier, R. D. 1981. "ChileanNitrate Mining,"Min-
ing Magazine, September, pp. 160-173.
16. Anonymous. 1991. "SOQUIM1CH Increases its
Potassium Nitrate Capacity," Phosphorus and
Potassium, 173:37-40.
17. Anonymous. 1971. "Routes to Potassium Nitrate:
Parts land 2," Phosphorus and Potassium, 51:50-
57.
18. Araten, I, Y., A. Baniel, and R. Blumberg. 1967.
"Potassium Nitrate," The Fertiliser Society
Proceedings, London, England.
19. Medemblik, L. 1992. "Personal Communication,"
Mines de Potasse d'Alsace.
20. Mireau, R. M. 1992. "Personal Communication,"
Cominco Fertilizers.
431
Chapter 16. Compound Fertilizers
Table of Contents
Page
16.1 Introduction .... 433
16.2 Trends in Supply and Demand for Compound Fertilizers 433
16.3 Role of Compound Fertilizers 433
16.3.1 Convenience 433
16.3.2 Crop Nutrient Requirements , 433
16.3.3 Government Policy Objectives i^34_
16.3.4 Economics 434
16.4 Compound Fertilizer Production Technology 434
16.4.1 Agglomeration-Type Processes 434
16.4.2 Accretion-Type Processes 434
16.5 Physical and Chemical Parameters for Producing Agglomerated NPKs 435
16.5.1 Raw Material Particle Size and Surface Characteristics 436
16.5.2 Liquid Phase ,436
16.5.2.1 Estimating Liquid Phase Values 438
16.5.3 Heat of Chemical Reaction 438
16.5.4 Insoluble Binders 438
16.5.5 Liquid Phase Control 439
16.5.6 Acid/Ammonia Neutralization Methods 440
16.5.6.1 Direct Neutralization in Granulator 440
16.5.6.2 Tank-Type Neutralizes 440
16.5.6.3 Pipe-Type Reactors 440
16.5.7 Preparing the Production Formula 441
16.6 Processes for Manufacturing Compound Fertilizers 441
16.6.1 Steam/Water Granulation 441
16.6.2 Chemical Granulation .-.„.-.^m ^.Tr..-.-; 443
16.6.3 Drop Formation (Prilling) 443
16.6.4 Compaction Granulation , 444
16.6.5 Dry Mixing (Blending) 446
16.6.5.1 Producing High-Quality Blends., 446
16.6.5.2 Blending Plant Technology 446
16.6.5.3 Blending Complements Granulation 447
16.7 Unique Requirements for Manufacturing Urea-Based Granular Compound Fertilizers 447
16.7.1 Solid Urea Feedstock 448
16.7.2 Urea Solution or "Melt" 449
16.7.3 Other Solid Raw Materials 449
16.7.4 Preneutralizer ' 449
16.7.5 Granulator (Rotary) ,..449
16.7.6 Cocurrent Dryer , 449
16.7.7 Countercurrent Process Cooler (Second-Stage Dryer) 449
16.7.8 Screening 450
16.7.9 Oversize Crushers 450
16.7.10 Product Cooling 451
16.7.11 Product Conditioning 451
16.7.12 Bulk Storage and Process Plant Dehumidification 451
16.7.13 Bagging 451
16.8 Investment and Operating Costs 451
16.8.1 Premises and Assumptions 451
16.8.2 Fixed Capital Investment Estimates 451
16.8.3 Conversion Cost Estimates 451
16.8.4 Estimated Raw Material Cost 452
16.8.5 Estimated Total Production Cost 453
16.8.6 Impact of Capacity Utilization 453
16.9 References 454
432
Chapter 16. Compound Fertilizers
16.1 Introduction
The total annual worldwide production of all fertilizer
materials amounts to about 350 million tonnes (1995),
containing about 125 million tonnes of nutrients (N +
p205 + K2O) [II. Of this total, compound fertilizers,
excluding physical mixtures (bulk blends), account for about
14% or about 50 million tonnes of product annually.
The production and marketing of compound fertilizers
are unique compared with commodity-type fertilizers
such as urea, ammonium phosphates, and potash.
Unlike commodity-type fertilizers, compound fertilizers are
usually manufactured (formulated) to meet local or
regional crop requirements. Often, in addition to
containing various ratios of the primary nutrients (N + P205 +
K2O), they contain certain secondary and micronutri-
ents specific to the crop needs in a particular agroclimatic
region,
16.2 Trends in Supply and Demand for
Compound Fertilizers
Supply/demand data on compound fertilizers are not
routinely or uniformly reported. Therefore, such data
must be obtained through ad-hoc surveys and informal
sources.
IFDC surveys conducted in 1990 and 1995 indicated
that compound fertilizer production (exclusive of dry
mixed blends) occurred in at least 50 countries, and the
total production during the 1990-94 period amounted
to about 45-50 million tonnes of product annually. These
results are generally corroborated by other surveys
conducted by various producers and industry associations [2].
Based on the IFDC surveys, it is estimated that dry
mixed compound fertilizers (bulk blends) account for an
additional 40-50 million tonnes of product annually to
bring the total production of all types of compound
fertilizers to about 100 million tonnes annually (Figure 16.1).
Growth in the NPK granulation industry has been
stagnant-to-declining during the past decade while the
bulk blending of NPKs has increased significantly,
particularly in Asia, Europe, and Latin America. The total
number of granular compound fertilizer plants currently
operating throughout the world is estimated at about
300 excluding numerous, perhaps as many as 1,000,
very small village level-type units reportedly operating in
China. The combined annual production of these small
Chinese units may be as much as 1 million tonnes.
Straight Materials
(178 mllll
Fluids1
/1C mil I .An tnnnae)
Products2 -
illion tonnes)
SranularNPKs3
[46 million tonnes)-
Slends
llion tonnes)
World Total: 330 million tonnes product (1994)*
1. Single and multiple nutrient fluids, including anhydrous ammonia.
2. Ammonium phosphate products.
3. Steam/water, chemical, and compacted granular products.
4. Nutrient production (1993/94 reporting year) amounted to
131.5 million tonnes (N + P£Os + K20).
Source: IFDC data file.
Figure 16.1. Estimated World Production of
Fertilizers by Product Type.
16.3 Role of Compound Fertilizers
The decision to use compound fertilizers is usually
driven by one or more of the following factors:
1. Convenience.
2. Crop nutrient needs.
3. Government policy objectives.
4. Economics.
16.3.1 Convenience
Compound fertilizers are frequently used because it is
more convenient to purchase, transport, store, and
apply one product than several as is the case if one chooses
to use individual nutrient sources such as urea,
ammonium nitrate, ammonium phosphate, and potash,
However, in many instances a single dose of a compound
fertilizer will not meet the nutrient needs of the crop
over the entire growing season.
16.3.2 Crop Nutrient Requirements
Compound fertilizers are often a good choice for
providing a basal application of nutrients, including
433
secondary and micronutrients, prior to or at planting
time. However, because most crops benefit from higher
doses of nitrogen than other nutrients, the basal dose of
compound fertilizer often needs to be followed by
subsequent doses of nitrogen timed to meet the nitrogen
requirements of the crop. Additionally, compound
fertilizers, especially the homogeneous granulated
products as opposed to dry mixed (blended) compounds,
provide a means for uniformly distributing a basal dose
of relatively small quantities of secondary and
micronutrients in the soil without the risk of segregation, which
could be detrimental to the crop.
16.3.3 Government Policy Objectives
In some cases, compound fertilizers are specified
under subsidized pricing programs as a means for
achieving an approximation of balanced nutrition in cases
where farmer education and extension are lacking or
where the cost of single-nutrient products (for example,
urea, ammonium phosphate, and potash} varies widely.
A wide variation in the farm-level cost of individual
nutrients often leads to the excessive and unwarranted use
of the least cost nutrient. Thus, the required use of
compound fertilizers in a government-controlled market
provides a means for avoiding such price-driven distortions
in fertilizer use. The current global trend toward free
and competitive markets is expected to diminish the
influence of government policy as it relates to the choice
of a particular fertilizer product.
16.3.4 Economics
The simplicity of purchasing, transporting, storing, and
applying a single compound product compared with
several single- or double-nutrient materials clearly has
economic merit. However, it is important to note that
compound fertilizers, on a nutrient basis, are almost
always more expensive than single-nutrient products.
Furthermore, the economics of fertilizer use must be viewed
in a holistic way; not only the cost of the fertilizer but
also the cost of labor, fuel, water, pest control, and, of
course, the price received for the crop (refer to Chapter
2) must be considered. Therefore, the increased cost of
compound fertilizers compared with the usually less costly
single- or double-nutrient products may not be of
overriding significance.
Finally, compound fertilizers are uniquely suited for
the fertilization of plantation crops (for example, oil palm
and rubber) and forests using aerial application
techniques. Large, free-flowing granules of homogeneous
compound fertilizer facilitate uniform distribution and
penetration of the plantation or forest canopy. Aerial
application, and therefore the increased need for
homogeneous compound fertilizers, is expected to increase
in the plantation sector as the cost of labor and
conventional application of single nutrient materials continue
to increase.
16.4 Compound Fertilizer
Production Technology
The method used for granule formation has a
pronounced impact on the design and operation of the
granulation process equipment. Therefore, a good
knowledge of the primary mechanisms of granule
formation, growth, and consolidation is essential in
determining the design features of the granulation process.
The following is a brief description of the two major
granule formation mechanisms encountered in most
fertilizer granulation processes. Granulation
by-drop-formation (prilling) and pressure roll compaction is treated
separately (refer to sections 16.6.3 and 16.6.4).
16.4.1 Agglomeration-Type Processes
With most granular NPK products (excluding the slurry-
based nitrophosphate-type processes), agglomeration is
the principal mechanism responsible for initial granule
formation and subsequent growth (Figure 16.2). In most
agglomeration-type NPK formulations, 50%-75% of the
raw materials are fed as "dry" solids. These solid
particles are assembled and joined into agglomerates
(granules) by a combination of mechanical interlocking and
cementing - much as a stonemason fashions a stone
wall by using stones of various sizes and shapes and
mortar as the cementing agent. The cementing medium
for fertilizer granules is derived from salt solutions, for
example, a preneutralized ammonium phosphate slurry
and/or the dissolution of salts on the moist surface of
the soluble solid particles. The size, shape, surface
texture, strength, and solubility of the solid particles vary
widely (Figure 16.3) and have a profound influence on
the granulation characteristics of the mixture.
16.4.2 Accretion-Type Processes
Accretion refers to the process in which layer upon
layer of a fluid material (for example, an ammonium
phosphate slurry) is applied to a solid particle causing it
to grow in size. The slurry-type granulation processes
used to produce DAP, MAP, TSP, and some nitro-
phosphate compounds are examples of accretion-type
granulation processes. The accretion process is quite
different from the agglomeration process with respect
to the mechanism of granule formation and growth. As
a result, the required process parameters for optimum
operation of these slurry-type accretion granulation
processes are often quite different from those used in
agglomeration processes. With a slurry-type granulation
process, a relatively thin film of moist slurry, or a nearly
anhydrous melt, is repeatedly applied, dried, and
hardened to a relatively firm substrate consisting of granules
that are often product size or nearly product size. In this
process, layer upon layer of new material is applied to a
particle, giving the final granule an "onion-skin"-like
structure (Figure 16,2). In the process, of course, some
434
Photo of Actual
Fertilizer Granule (Agglomeration)
Seals:. UnE ,
Pholo of Actual
Fertilizer Granule (Accretion)
oMi„ 1 mm
Scale: i \
Salt Bridges Between
Larger Particles.
insoluble Binders Can
Often be Used lo
Strengthen the Salt
Bridges Between Particles.
Layer-Type
Granule Growth
Granule Formed by
Agglomeration
Figure 16.2. Principal Mechanisms for Granule Formation.
Granule Formed by
Accretion
agglomeration of particles also occurs, but this is not
the predominant granule formation mechanism.
The recycle-to-product ratio required for accretion-
type granulation is normally higher than that required
for agglomeration-type processes. Accordingly, for a
given production rate, the material handling capacity of
the process equipment must be larger for accretion-type
granulation plants than for most agglomeration-type
plants. However, because of particular temperature- and
relative humidity-related processing requirements for
some agglomerated NPKs, certain equipment, especially
the dryer and process cooler, may actually be larger in
some agglomeration-type plants to achieve the same
production rate as in the accretion-type processes (refer
to section 16.7).
Granules formed by accretion are almost always
harder, more spherical, and more durable than those
formed by agglomeration. For example, a typical well-
formed NPK, DAP, or TSP granule produced by
accretion-type granulation may have a crushing strength
of about 4-8 kg, whereas the crushing strength of an
agglomerated granule may not only be less (often less
than 3 kg) but also more variable depending upon its
raw material composition and a number of specific
factors related to granule formation. Some examples of
the variability in granule strength for a number of
fertilizers are shown in Table 16.1.
16.5 Physical and Chemical Parameters
for Producing Agglomerated NPKs
A discussion of the key physical and chemical
parameters required for the production of agglomerated NPK
products follows. Refer to section 16.7 for parameters
specific to the production of most urea-based NPKs and
435
i.T
' ~V$-~*^S9|
AMMONIUM SULFATE
(Standard-Grade Crystalline]
MONOAMMONIUM PHOSPHATE - MAP
(Powdered ■- Spray Tower Process)
BEACH SAND
SINGLE SUPERPHOSPHATE
(Run-of-Pile)
POTASSIUM CHLORIDE - KCI
(Standard-Grade Crystalline)
Magnification Approximately 15X.
Figure 16.3. Surface Texture of Materials Commonly Used in NPK Granulation Formulas.
other NPKs that exhibit similar high solubility,
temperature sensitivity, and low critical relative humidity (CRH)
characteristics. CRH is the ambient relative humidity
bebw which a material loses moisture to the atmosphere
and above which the material absorbs moisture from
the atmosphere. The CRH of a material varies with
temperature.
16.5,1 Raw Material Particle Size and Surface
Characteristics
Because much of the initial (in-process) and final
mechanical strength of the agglomerated NPK granule is
obtained by the mechanical interlocking or fitting of the
individual particles, the particle size, size distribution, and
surface characteristics of the solid raw materials are very
important. If the final product is in the size range of 2-5
mm, then the raw materials should be quite widely
distributed within a range of about 0.2-3 mm. An example
of the particle size distribution of solid materials frequently
used in agglomeration-type NPK granulation plants
without further size reduction (crushing) is shown in Table 16.2.
16.5.2 Liquid Phase
Although mechanical interlocking of the particles
within the granule structure must be optimized through
selection and/or processing (crushing) of the raw
materials (and sometimes recycled material), cementing is also
needed to permanently bond the particles into strong
agglomerates (granules). The liquid phase is derived from
(1) soluble-salt solutions added to the granulator, for
example, an ammonium phosphate slurry and/or a
solution of urea or ammonium nitrate and (2) dissolution of
a small portion of material on the moist surface of the
soluble raw material and recycle particles- This
dissolution is caused by the combination of heat and water
contained in the above solutions or by steam or water
fed to the granulator. Solubility data for some of the
more common fertilizer salts are given in Table 16.3.
Liquid phase control is the key to achieving the desired
level of granulation efficiency and product quality.
Ideally, after drying, the liquid phase (salt solution) forms
strong crystal bonds (salt bridges) between the particles
of the agglomerate that are mechanically well-fitted and
interlocked - again, the concept of a stone wall.
436
Table 16.1. Typical Granule Strength Data for Various Granular Fertilizers'
Granular Fertilizer
Diammonium phosphate (DAP)
Triple superphosphate (TSP)
10-30-10b
10-2O20b
Triple superphosphate (TSP) .
Single superphosphate (SSP)
15-15-15
17-17-17
14-6-21-4 MgO
12-19-9
Principal Method of
Granular Formation
Accretion
Accretion
Accretion
Accretion
Agglomeration of
run-of-pile TSP
Agglomeration of
run-of-pile SSP
Agglomeration
Agglomeration
Agglomeration
Agglomeration
Typical Crushing
Strength
(kg/granule)
3.4-4.9
4,6-8.1
5.0-5.5
4.8-5.2
2.4-2.9-
2.0-3.2
■1.5-2.9
2,0-3.0
2.0-4.0
2.5-3.0
a. Typical values for commercial materials tested by the International Fertilizer Development Center (IFDC)
according to IFDC Test Method S-115 (2.36- to 2.80-mm granule size). These values are shown as examples
only; crushing strength can vary considerably depending on moisture content, degree of aging, granule shape,
porosity, composition, and other specific factors.
b. Produced using slurry (accretion) process; could also be produced by agglomeration.
Table 16.2. Typical Particle Size Data for Commercially Available Materials Frequently Used to
Produce Granular NPKs
Percent Retained on Indicated Mesha
Material
Ammonium sulfate
-(crystalline)
Diammonium phosphateb
(granular)
Monoammonium phosphate
(nongranular)
Potassium chloride
(standard)
Potassium chloride
(special standard}
Potassium sulfate (standard)
Single superphosphate
(run-of-pile)
Triple superphosphate
(run-of-pile)
Urea (prilled)b
4 (4.75)
0
0
0
0
0
0
3
7
0
8 (2.36)
0
22
1
0
0
0
11
14
15
16 (1.00)
1
98
7
6
0
15
25
19
92
28 (0.60)
7
100
30
55
5
75
36
26
95
48(0.30)
75
100
65
90
35
95
52
51
100
100(0.15)
98
100
90
99
90
100
76
80
100
a- Tyler mesh, opening size in mm indicated in parentheses.
rushing of these materials is preferred to obtain a more uniform (homogeneous) NPK product.
437
Table 16.3. Solubility of Common Fertilizer Salts
in Water*
Fertilizer Salt
Ammonium nitrate
Ammonium sulfate
Diammonium phosphate
Monoammonium phosphate
Potassium chloride
Potassium nitrate
Potassium sulfate
Urea
a. Values indicated are for pure
Approximate
Concentration of Saturated
<rc
54
41
30
18
22
12
6
41
salts.
Solution at Indicated
Temperature
20°C 100°C
(%)
66 90
43 51
41 - 58
27 63
25 36
24 71
10 19
52 88
16.5.2.1 Estimating Liquid Phase Values -
Experience has shown that there are considerable
differences in the amount of liquid phase generated by the
various materials normally used in the production of
agglomerated NPKs. Several years ago (during the 1960s),
the Tennessee Valley Authority (TVA) examined a wide
variety of NPK production formulations that were known
to granulate quite well and devised a numerical value to
express empirically the '-apparent" liquid-phase-eontri—
bution that could be expected from a number of
materials commonly used to produce NPKs. These "liquid phase
factors" are shown in Table 16.4. Experience has shown
that, when these values are used as a guide, a liquid
phase of about 300 kg/tonne of product is about
optimal for most agglomeration-type NPK formulations. Of
course, it should be appreciated that liquid phase, while
important in granule formation, is only one of the
criteria that must be carefully evaluated when the
granulation characteristics of a particular formulation are
estimated.
16.5.3 Heat of Chemical Reaction
The level of liquid phase is also closely linked with
another criterion, i.e., the expected amount of heat
created by various chemical reactions that occur during the
granulation of a given NPK formulation. The amount of
heat generated, particularly within the granulator, can
have a marked effect on the solubility of the fertilizer
materials and the amount of liquid phase formed and,
therefore, the resulting granulation characteristics of the
mixture. In general, to achieve optimum granulation,
the calculated total liquid phase for a formulation, using
the data in Table 16,4, should be lowered if the
formulation produces a large amount of chemical heat of
reaction in the granulator. However, the optimum
Table 16.4. Liquid Phase Factors for Selected
Materials Frequently Used in NPK
Granulation (Agglomeration)
Formulas
Material
Anhydrous ammonia
Ammonia/ammonium nitrate solutions
(various compositions)
Ammonium nitrate (prills)
Wet-process phosphoric acid
Sulfuric acid
Superphosphoric acid
Water or steam
Ammonium sulfate (crystalline)
Single superphosphate (run-of-pile)
Triple superphosphate (run-of-pile)
Potassium chloride (coarse or granular)
Potassium chloride (standard)
Diammonium phosphate (granular)
Monoammonium phosphate (nongranular)
Urea (prilled) __^_
Liquid
Phase
Factor
(kg/ks)
0,50-
1.00
0.30
1.00
1.00
1.00
2.00
0.10
0.10
0.20
0.30
0.00
0.25
0.20
0.30
To obtain the total weight of the liquid phase in a
-feranulation^multiply-the-weight of each raw material
in the formula (kg) by the appropriate liquid phase
factor. A total liquid phase weight value of about 300
kg/tonne is considered optimal in many cases.
relationship between liquid phase and heat of reaction
for a specific formulation must be learned from actual
operating experience.
The most important heat-generating chemical
reaction in most NPK granulation plants is' the
neutralization of acidic materials with ammonia inside the
granulator. The approximate net amount of heat released
when ammonia reacts with some common acids and
other fertilizer materials is shown in Table 16.5, As with
liquid phase, experience has shown that if the amount
of heat released in the granulator is equivalent to about
45,000-50,000 kcal/tonne of product (not including
recycle), conditions are generally favorable for
obtaining optimum granulation. Of course, as with liquid phase,
the proper level of heat is just another one of the many
critical criteria that must be determined by experience and
that must be met to obtain optimum granulation efficiency.
16.5.4 Insoluble Binders
In some cases, the mechanical and crystal (salt bridge)
bonding of particles can be greatly improved by adding
438
16.5. Approximate Net Amount of Heat Released When Ammonia Reacts With Various
Materials Commonly Used to Produce Granular NPKs
jufatgrial Reacted With Ammonia
Wet-process phosphoric acid (54% P205)
Wet-process phosphoric acid (54% P205)
Monoammonium phosphate (MAP)
Triple superphosphate (TSP)
Single superphosphate (SSP)
Sulfuric acid (100%)
Reaction Product (Solid)
Monoammonium phosphate (MAP)
Diammonium phosphate (DAP)
Diammonium phosphate (DAP)
Ammoniated TSP
Ammoniated SSP
Ammonium sulfate
Heat Released (Net)
NH3Gas NH3 liquid
- - (kcal/kg NH3 reacted)- -
1,890
1,510
1,130
1,580
1,460
2.165
1,370
990
610
1.06G-
940
1,645
a small amount of a finely divided insoluble binder
powder, for example, kaolin or attapulgite clay or finely
ground phosphate rock, to the granulating mixture. The
binder powder helps to fill the many small voids between
the fertilizer particles and acts as a saturated wick in
helping to join the particles (Figure 16,2). This concept
works particularly well with NPKs that contain large
amounts of crystalline ammonium sulfate, potassium
chloride, potassium sulfate, and/or kieserite (magnesium
sulfate monohydrate) and relatively low levels of highly
soluble salts or solid binders such" as ammonium
phosphate slurry or superphosphate, respectively.
Depending upon the characteristics of the binder and the
materials being granulated, the amount of binder used
may need to be approximately 2%-15% of the total
formula weight to be effective. It is important to note,
however, that some insoluble binders (some clays, for
example) have the capacity to retain moisture and thus
make subsequent drying more difficult. Finely ground
phosphate rock that contains high levels of iron and
aluminum impurities is a very effective binder that also
adds a primary nutrient, albeit slowly available, to the
product.
16.5.5 Liquid Phase Control
In all NPK granulation formulations, most of the
liquid phase is obtained from materials that are introduced
to the process at a fixed rate to achieve a final product
with the desired chemical analysis. The resulting liquid
phase can, of course, be adjusted within rather specific
limits through the selection of raw materials or by
controlling the free water content and/or chemical
composition of the slurry (for example, the NH3:H3P04 mole
ratio as shown in Figure 16.4). However, once this is
established (optimized), the flow rates of the liquids must
remain constant to ensure the correct analysis of the
final product. For this reason, all agglomeration-type
Degree ol Ammaniation, kg NHj/kg PjOj
D.1 D.Z D.3 0.4
as
0 0.2 0.4 16 0.8 1.0 1.2 1.4 1.6 1.8 2.0 21
NfcHjPO, Mole Ratio
Figure 16.4. Effect of Mole Ratio on Solubility
of Ammonium Phosphate.
formulations should allow for a moderate degree of
liquid phase "tuning" performed by the operator using
steam and/or water fed directly to the granulator. The
discretionary use of a small amount of steam and/or
water by the operator helps to compensate for
variations in granulation efficiency caused by changes in the
temperature of the materials, quantity and particle size
of the recycled material, and minor (but normal) upsets
within the overall processing system. This fine tuning of
the process by the operator is the basis for the
observation: "NPK granulation by agglomeration is more of an
art than a science." The unique skill of an experienced
439
granulator operator often greatly overrides the
effectiveness of the most costly and sophisticated process
design and engineering skills.
16.5.6 Acid/Ammonia Neutralization Methods
As' indicated earlier, the acid/ammonia neutralization
reactions create heat that contributes to the overall
liquid phase conditions in the granulator and therefore
greatly influences the efficiency of the granulation
process. The method used for neutralization (reacting
ammonia) can significantly influence the overall
performance of the granulation process. A brief discussion
of the most common methods used for neutralization in
agglomeration-type NPK granulation plants follows.
16.5.6.1 Direct Neutralization in Granulator-
This was one of the most common methods used for
reacting ammonia in the many NPK granulation plants
that were operated in the United States and elsewhere
during the 1960s and early 1970s. Direct
neutralization in the granulator is particularly well suited for NPK
grades containing large amounts of superphosphate (SSP
or TSP) and a relatively low level of nitrogen. With
direct neutralization, optimum operation is usually obtained
if the amount of ammonia reacted in the granulator does
not exceed the equivalent of about 50 kg/tonne of
product.
In the direct neutralization process, ammonia is
distributed using a perforated pipe (sparger) positioned
beneath the bed of material in the granulator. If sulfuric
acid is used, it too is usually distributed through a sparger
beneath the bed of material whereas the phosphoric
acid, if used, is most often sprayed or dribbled on top of
the bed of material. When sulfuric acid is used,
precautions should be taken to ensure that the acid is added at
a particular location with respect to the ammonia to
ensure quick and uniform neutralization and thus
minimize the unwanted reaction of sulfuric acid with muriate
of potash (MOP) that is usually present in most NPK
formulations. This acid/MOP reaction causes the
formation of very corrosive hydrochloric acid, which reacts
rapidly with ammonia to form a dense fume of
ammonium chloride that is very difficult and costly to collect in
the plant's emission control (scrubbing) system.
Rotary drum-type granulators are best suited for
direct neutralization because the submerged spargers can
be more easily positioned beneath the bed of material
and the reactions contained within the relatively deep
bed of material. When using a pugmill- or pan-type
granulator, the positioning and effectiveness of submerged
spargers are often less than optimum because of the
mechanical configuration of the equipment and the
relatively shallow bed of material.
16.5.6.2 Tank-Type Neutralizes - The use of an
atmospheric or pressurized tank-type neutralizer offers
440
maximum flexibility in managing the acid/ammonia
reactions and obtaining the critical heat/liquid phase
criteria needed for good granulation when producing a wide
variety of granular NPK grades. Because the acid/
ammonia reactions are most often only partially
completed in these tank-type neutralizes, they are often
referred to as "preneutralizers." Such preneutralizers are
commonly used in most of today's ammonium
phosphate plants and in many NPK plants.
When a preneutralizer is used, large amounts of acid
can be partially reacted with ammonia. The degree of
reaction performed in the preneutralizer is determined
by a number of factors; however, the most important
criterion is the production of a fluid slurry that is easy to
transport (pump) to the granulator and uniformly
distribute onto the rolling bed of material in the granulator.
The fluidity of the preneutralized slurry is maintained
through careful control of the NH3:H3P04 mole ratio
(Figure 16.4), temperature, and free water content of
the reacted slurry. The neutralization reactions that are
only partially completed in the preneutralizer are
completed in the granulator where additional ammonia is
added beneath the rolling bed of material. In some cases,
phosphoric acid may be added to the granulator to
adjust the NH3:H3PC>4 mole ratio to achieve optimum
granulation.
When sulfuric acid is reacted in combination with
—phosphor-ie-acid-in the preneutralizer, .special
precautions must be taken to select construction materials that
will resist the more corrosive environment caused by
the presence of sulfuric acid. Type 316L stainless steel
(SS) is not a suitable construction material if sulfuric acid
is neutralized in combination with phosphoric acid; a
more noble alloy is required. The selection of
construction materials for the preneutralizer system should be
made only after careful testing of possible construction
materials under actual operating conditions. Also, at the
higher mole ratio and pH when sulfuric, acid is present
(for example, about 1.5 and 6.8, respectively), the
presence of ammonium sulfate crystals tends to thicken the
slurry and make pumping difficult; thus, operation at a
lower NH3:H3P04 mole ratio and pH (about 0.4 and
2.0, respectively) is often preferred, when sulfuric acid
is fed to the preneutralizer.
16.5.6.3 Pipe-Type Reactors -In the early 1970s,
TVA demonstrated the feasibility of replacing a
conventional tank-type preneutralizer with a novel device
referred to as a pipe or "tee" reactor [3]. This type of
reactor was a radical departure from the conventional
tank-type preneutralizer normally used to react large
amounts of ammonia with phosphoric acid. The pipe
reactor consists basically of a length of corrosion-resistant
pipe (about 5-15 m long) to which phosphoric acid,
ammonia, and often water are simultaneously added to one
BT^
end through a piping configuration resembling a tee,
thus the name "tee reactor." The acid and ammonia
react quite violently, pressurizing the unit and causing
the superheated mixture of ammonium phosphate slurry
f:'melt") and water vapor to forcefully discharge from
the opposite end of the pipe that is positioned inside
the granulator. Uniform distribution of the "melt;' on
top of the rolling bed of material in the granulator is
achieved by varying the configuration and orientation
of the discharge opening(s) of the pipe. A primary
advantage of the pipe reactor over conventional
preneutralizers is that the preneutralized slurry pump
and piping system is eliminated and a much more
concentrated slurry can be delivered directly to the
granulator. Thus the chemical heat of reaction is more effectively
used to evaporate unwanted water from the process
compared with the operation of a conventional preneutralizer.
The tee reactor was modified by TVA to also accept an
additional flow of sulfuric acid through another pipe
inlet located opposite the phosphoric acid inlet, giving the
unit a "cross" configuration and thus the name "pipe-
cross reactor" (PCR) [4,5].
Use of the PCR makes it possible to react a wide
variety of phosphoric/sulfuric acid mixtures with
ammonia. This capability is particularly useful in NPK
granulation plants and allows a greater choice in the
selection of raw materials to improve granulation and
optimize the overall cost of production. In addition, the
problem of ammonium chloride fumes is eliminated be^
cause the sulfuric acid does not come in direct contact
with the MOP that may be in the formulation.
In general, the mixture discharged from the PCR does
not require further reaction with ammonia in the
granulator. In some cases, however, the level of reaction in
the PCR may be altered (decreased) to minimize the
escape of ammonia or to obtain improved granulation
characteristics of the "melt" when it is combined with
the solids in the granulator.
Several variations of pipe-type reactors (and
materials of construction) are currently used in NPK, DAP, and
MAP plants; sometimes the pipe-type reactor is used in
combination with a conventional tank-type
preneutralizer. Perhaps one of the greatest advantages
offered by the use of pipe reactor technology in the NPK
industry is that it provides an opportunity to effectively
use a greater variety of raw materials including, for
example, larger quantities of dilute acids and scrubber
liquor, This added flexibility in raw material choices can
often result in more favorable production costs and at
the same time provide a method for disposing of certain
problem materials" such as excess scrubber liquor. It
should be noted, however, that the technology does not
nt all situations equally well. Therefore, its potential
should be carefully examined with regard to the
particular circumstances.
16.5.7 Preparing the Production Formula
According to the foregoing discussion, a large
number of raw material and process variables must be
considered when developing NPK production formulations
that result in good granulation characteristics. As with
the operation of an NPK granulation plant, formulation
too, requires a considerable amount of skill and an
element of "art" to ensure that the particular formulation
will yield the desired results in a specific situation.
A given NPK fertilizer can be formulated in many ways
depending on the available raw materials and specific
equipment system. Table 16.6 shows some examples
of NPK production formulations that have been
successfully used in commercial practice, Because the
performance of these formulations will depend heavily upon a
number of factors as described herein, these examples
are offered only to illustrate the variability that should be
considered in the planning and design of an NPK
fertilizer granulation plant.
16.6 Processes for Manufacturing
Compound Fertilizers
16.6.1 Steam/Water Granulation
In the steam/water granulation process {Figure 16.5),
granules are formed by agglomeration. The solid raw
materials are proportioned (weighed) and usually
premixed before being fed to the granulator where
agglomeration is initiated, In some plants, the raw
materials are crushed either before or after weighing to obtain
a more uniform particle size distribution. In the
granulator (usually a rotary drum or a pug mill) steam and/or
water or scrubber liquor is added to provide sufficient
liquid phase and plasticity to cause the dry raw materials
to agglomerate into product-size granules. In some
processes, a pugmill may be used to premix the solids and
liquids prior to granulation in a rotary drum unit. In other
cases a small amount of ammonia may also be added
during granulation to react with superphosphate to
promote granulation and improve product quality by
decreasing the acidity and increasing the CRH. The moist
and plastic granules are dried, usually in a rotary drum-
type, fuel-fired dryer, and screened to remove the
product-size fraction. The oversize material is crushed and
recycled to the granulator along with the undersize
fraction. To ensure a uniform particle size distribution of the
material returned to the granulator, it is best to return
the crushed oversize material to the screening unit so
that only material passing the product screen is recycled
to the granulator. In some cases it is necessary to cool
the material before screening depending on the
fertilizer grade and local conditions. If cooling is required, it
is usually performed in a rotary drum-type unit that is
very similar to the rotary dryer. Fluid bed-type coolers
may be used to cool product-size material, but they are
Table 16.6. Examples of Typical Commercially Proven NPK Production Formulas in Which Agglomeration is the Principal Mechanism for
Granule Formation and Growth5
4^
to
Material as Fed to Process'
Anhydrous ammonia — 82% N
Ammonia/ammonium nitrate solution — 46% N
Urea (prills}—46%N
Urea solution—35%N
Ammonium sulfate (crystalline}— 21% N, 24% S
Sulfuric acid — variable % H2SO4
Wet process phosphoric acid — 54% P2O5
Single superphosphate (ROP) — 18% P2O5. 12% S
Triple superphosphate (ROP) — 46% P2Oft
Monoammonium phosphate (powdered) — 10% N,
50%PyO5
Diammonium phosphate (crushed granules) -
18% N, 46%PK05
Phosphate rock (ground)— 32% P20&
Potassium chloride (standard) — 60% K2O
Potassium sulfate (standard} — 50% K20. 18% S
Sulfate ol potash-magnesium (standard) — 22% K2O.
ll%Mg,22%S
Magnesium sulfate (kleserile) —16% Mg, 22% S
Magnesium oxide — 50% Mg
Insoluble binder
Micronutrient mix (various elements as required)
Conditioning agent (coating on product)
Subtotal
Evaporation
Total (product basis)
Direct Ammoniation in Granulator
Pipe-Cmss Reactor (PCR)1,
Tank-Type PreneutraliKer (PN)11
Urea Solution/Steam
(No Chemical Read ion)
3-9-18
(kg/tonne
37
.
-
-
63
(93%HaSOfl)
-
5-20-20 13-13-13
finished product)11
52
.
-
-
50
-
170
-
145
-
205
64
(78% H2SO4)
63
8-24-24
(kg/lonne finis
66
(90% to PCR)
i
T
:
i2i
40
(78% H2SO4)
(100% to PCR)
443
(90% to PCR)
13-13-13
led product^
85
(100% to PCR)
»
-
-
300
192
(78%H2S04)
(100% to PCR)
250
(85% to PCR)
15-15-15
17-17-17
{kg/tonne finished product
127
(75%-80% to PN)
.
105
-
261
(96%H2S04)
(100% to PN)
292=
82
(65%-70%toPN)
.
231
-
108
(9G%H2S04)
(100% to PN)
330°
12-12-17-1. 2Mq
-. (kg/tonne
.
115
155
-
-
-
14-6-2 l-2.4Mq 16-0-30
finished product}11
-
.
153 240
204 156
_
508
332
124
342
216
130
221
11
402
320
110
10
1,048
-48
1,000
1,070
-70
1,000
10
1,054
-54
1,000
223
255
239
1,083
-83
1,000
30
10
1,090
-90
1,000
15
1,055
-55
1,000
15
1,055
-55
1,000
87
247
276
-
191
353
25
110
10
15
1,040
-40
1,000
150
500
130
10 15
1.0G1 1,041
-61 -41
1.000 1,000
a. Examples intended to partially illustrate large number of formulation possibilities depending upon specific process equipment system, available raw materials, agronomic
product composition guarantees, and other local factors.
b. Hows of acid and ammonia to PCR and PN may vary; indicated flows typical for commercial practice. The addition of steam and/or water to the granulator is generally
granulation efficiency.
c. All materials are fed directly to granulator unless otherwise noted, indicated composition is typical of industry practice.
d. Values rounded for simplicity.
e. Phosphoric acid is first fed to fume scrubbing system and then onward to PN.
requirements,
required to optimize
To Atnosphere
Solid Materials
Product
Figure 16.5. Typical NPK Fertilizer Granulation Plant Using Steam and/or Water.
not recommended for cooling material having a wide
particle size range.
16.6.2 Chemical Granulation" ~
Chemical granulation is the most complex method
for preparing granular NPKs {Figure 16.6). The
chemical granulation process is very similar to the previously
described steam/water granulation process except that
most of the liquid phase required to achieve granulation
is obtained by reacting ammonia with phosphoric,
sulfuric, and/or nitric acid. In some cases, a concentrated
solution of urea or ammonium nitrate may also be used
(refer to 16.7), Some processes also involve a
significant reaction between ammonia and single or triple
superphosphate (SSP or TSP). Much of the ammonia-acid
reaction is often performed outside the granulator
either in a tank-type preneutralizer or in a pipe-type
reactor. In many cases steam, water, scrubber liquor, and/or
additional ammonia and acid are also fed to the
granulator to optimize the granulation characteristics of each
particular formulation. In most NPK chemical
granulation plants, a significant amount of solid raw materials is
also used; therefore, the granules are formed primarily
by agglomeration. The relationship between the
consumption of solid and liquid raw materials is determined
by a number of variables, including (1) required nutrient
ratio (fertilizer grade) and nutrient solubility requirements,
(2) liquid phase requirements, (3) heat of reaction and
temperature limitations, and (4) process plant equipment
capacity and operating features. The granulation
process shown in Figure 16.6 also incorporates the design
features recommended for the production of NPKs
containing relatively large amounts of urea or other very
"s^IubIe~aTTd"hpgro"s^opiE"m"aterials:
In some chemical granulation processes, the solid raw
materials, for example MOP, are partially dissolved in
an ammonium phosphate and/or ammonium nitrate
slurry and the mixture is then sprayed onto a bed or
curtain of material in the granulator which is usually a
heated rotary drum, for example, a Spherodizer®. In
this process, granules are formed primarily by accretion
(refer to Chapter 13).
16.6.3 Drop Formation (Prilling)
The formation of NPK granules by prilling using
nitrophosphate-type processing is practiced quite widely
in Europe (refer to Chapter 13). In this process the NPK
mixture (solution) is concentrated to approximately 96%-
98% solids before it is introduced to the top of the
prilling tower through either a nozzle assembly or a
perforated vessel referred to as a "prilling bucket." The
nozzle or prilling bucket assemblies are designed to
produce droplets of the "molten" fertilizer mixture that, upon
solidification, will yield the desired granule (prill) size.
NPKs produced by the prilling process are very
homogeneous with respect to nutrient content. However, due
to the practical limitations of the drop formation and
solidification process, prilled NPK products usually
exhibit a smaller particle (granule) size, typically 1,3 mm-
443
Phosphoric Acid
Urea Solution/Melt
Preparation System
Transfer Conveyor
(Belt-Type)
Figure 16.6. NPK Fertilizer Granulation Plant Designed for Maximum FlexibiHty m the Use of
Raw Materials/Including-Urea: —— -
3.0 mm in diameter, than do NPKs produced by other
granulation processes.
16.6.4 Compaction Granulation
In this process (Figure 16.7) mechanical force is used
to form dense particles (granules) from finely divided
(nongranular) solid raw materials. With compaction
granulation the dry materials are first proportioned and
thoroughly mixed (blended) to achieve the desired
nutrient ratio (fertilizer grade). This step of the process is
identical to that normally used in the steam/water
granulation process. The mixture is then continuously fed to a
pressure-roll compaction machine that forms the
powdered mixture into a dense, hard sheet of material
usually about 2-3 cm thick and 60-100 cm wide. The
compaction machine consists of two horizontally
opposed rollers that turn inward toward each other, The
rollers may be as much as 100 cm wide and about the
same diameter. The shaft of one roller has a stationary
shaft while the other is movable. Pressure is applied by
a hydraulic system to the movable roller shaft and
bearing assemblies, which in turn determines the pressing
force applied to the fertilizer material fed to the
machine, The compacted sheet of material is crushed in a
controlled manner to form smaller particles. The crushed
material is screened to obtain the desired product-size
fraction. The oversize material is crushed and recycled
to the screens and the undersize material is returned
(recycled) to the compaction machine after first being
thoroughly mixed with the fresh raw material feed. No
chemical reaction is required for the process although
the raw material properties (especially chemical
compatibility, thermal characteristics, and plasticity) have a
major influence on the performance of the process. The
pressing force of the compaction rollers required to
produce an acceptable granular product is measured in terms
of tonnes of force per centimeter of roller width. Refer
to Table 16.7 for typical pressing forces required for
various fertilizer materials and mixtures.
Granular fertilizers prepared by compaction have a
more irregular particle shape as compared with the more
smooth and rounded (spherical) granules produced by
other granulation processes, The irregular particle
surface and shape, characteristics of compacted products
may promote caking during storage because of the
444
Bucket
Elevator
Dust
Collector
^
Ai r to
Atmosphere
Conditioning Agent
(clay & binder)
<=■
Conditioner
Drum
NPK Product
c=3
Raw Materials
^3
Raw Material
Weighing, Mixing,
and Continuous
Feed System
Figure 16.7. Typical NPK Fertilizer Compaction Granulation Plant.
Table 16.7. Typical Pressing Forces for Fertilizer Compaction
Feed Material
Ammonium sulfate
Potassium chloride
Feed temperature >120°C
Feed temperature 20°C
Potassium sulfate
Feed temperature >70°C
Potassium nitrate
Calcium nitrate
Urea
Compound fertilizer containing
- No raw phosphate rock
- Raw phosphate rock
- Urea
Pressing Forcea
(kN/cm)0
100-120
45-50
70
70
100
60
30-40
30-80
>80
30-40
Water Content
(%)
0.5-1.0
nil
nil
1.0
0.5-1,0
nil
nil
<1.0
<1.0
<i.o.
Feed Particle Size
(mm)
<1.0
<1.0, with max.
of 3% <0.06c
<0.5
<1.0
<1.0
1-3
<1.0
<1.0
<1.0
a. Indicated pressing force is for machine having 1.0-m diameter rollers.
b. 1 kN/cm = approximately 0.1 tonne/cm.
c. Size criteria applies to material feed temperature as indicated.
Source: Koppern Equipment, Inc., U.S.A.
445
generation of fines during handling and because of the
increased surface area of the irregular particles
compared with the more rounded granules produced by other
granulation processes. The irregular shape of compacted
fertilizer granules may cause some resistance among
users who are accustomed to the more traditional
spherical fertilizer granules. However, experience has shown
that market resistance to compacted products can be
largely overcome through refinements in the process,
for example, tumbling/abrasion, to round the rough
edges and produce more spherical granules and through
promotion and customer education,
16.6.5 Dry Mixing (Blending)
This technology refers to the physical mixing
(blending) of dry fertilizer materials without- the deliberate
introduction of chemical reactions or the enlargement of
the material particle (granule) size. The blending of solid
and liquid fertilizer materials is also practiced in some
instances to produce fluid multinutrient products.
However, the production and marketing of fluid fertilizers
are beyond the scope of this examination (refer to
Chapter 10).
16.6.5.1 Producing High-Quality Blends - The
materials used to prepare dry solid blends (often referred
to as bulk blends) are usually granular in form and are
also often sold as finished or "straight" products, for
example, urea, DAP, and MOP. In some instances,
nongranular or semigranular materials are used to
prepare blends; however, this practice usually leads to a
lower quality product. In the context of this discussion,
a distinction is also made between "prilled" and
"granular" materials such as urea, ammonium nitrate, and
potassium nitrate. While technically speaking prilled
materials are granular, the particle size of most prilled
products is too small (often less than 1.5 mm) to remain
homogeneously mixed with other common granular
materials such as DAP and MOP, which are significantly
larger in particle size (usually in the range of 2 to 5 mm).
Because of the importance that particle (granule) size
plays in the preparation of high quality, homogeneous
blends needed for balanced plant nutrition, many
material suppliers provide the customer with very specific
particle size data to help the blender closely match the
various materials used to prepare a blended NPK
product. The Size Guide Number (SGN) is one such type of
particle size information widely used in the industry. The
SGN, developed in Canada, refers to the particle size of
a material expressed in millimeters multiplied by 100,
which divides a sample of material into two equal halves
on a weight basis [6]. For example, if the mid-point or
average particle size (weight basis) of a sample of
material is 2.50 mm, the SGN would be expressed as 250.
In this example, the blender would try to select all other I
ingredients in the blend with an SGN as close to 250 as
possible. In practice, a variation of about 25 points from
the desired SGN will usually result in an acceptable blend;
for example, if an SGN of 250 is ideal an SGN of 225-
275 will be acceptable.
Another indicator to assist in the selection of
materials for the preparation of high-quality blends is the
Uniformity Index (UI), also developed in Canada 17]. A Ul
of 100 would indicate that all particles in a sample are
the same size. In practice a Ul of about 50 is typical. A
UI of 50 means that the size (diameter) of the smallest
particles in the sample is one-half (50%) the size~fdiam-"
eter) of the largest particles in the sample. Typical UIs in
commercial practice range from 35 to 60.
16.6.5.2 Blending Plant Technology - Blending,
particularly in the United States, Central and South
America, and Asia, is normally done on a batch basis
with batch sizes varying from 1 to 5 tonnes (Figure 16.8).
However, continuous blending is becoming quite
popular, especially in Europe (Figure 16.9). Continuous
blending units usually have a capacity in the range of 30-60
tph. A third alternative is on-f arm manual or hand
blending. This practice is often-appropriate in cases where
labor is abundant and the quantity of material to be
blended is small.
Because of the simplicity of the blending process and
its relatively low investment and operating cost, blend-
ing plants are ofterTlocated in the immediate area they
serve. For example, in the United States approximately
5.000 blending plants are in operation, serving the needs
of some 2 million farms, including about 400 million ha
(about 1.0 xlO9 acres) of land. In the United States
scenario, on average, a blender rarely serves a farmer more
distant than 40 km from the blending plant site. This
micromarketing approach to blending results in very
prompt and personalized service. The importance of
timely service tailored to the customer's needs cannot
be overemphasized regardless of the country location
or farming practice. The fertilizer blender is often
engaged in providing a broad range of products and
integrated services to the farmer in addition to fertilizers. In
the United States, for example, these products and
services often include the supply and application of plant
protection chemicals, seeds, machinery repair parts and
service, soil testing, and crop advisory services. Thus,
the custom blending of fertilizers to meet specific crop/
soil needs may be more appropriately viewed as a
customer service rather than a production technology.
In some settings, large centralized blending plants are
most appropriate. For example, in Ireland nine relatively
large blending plants, each with an annual production
ranging from 50,000 to 250,000 tonnes, supply about
I 50%-55% of the total Irish fertilizer market [8],
446
Bucket
Elevator
Feed Materials
-*
Lump Breaker
^>
Swivel Spout
Optional Direct Bagging
sJtxI MultT- Compat
^"^ (Cluster) He
rtment
lopper
4-6 Hoppers Typical
Batch Weigher
I>
Conveyor
% Product
^X^ Bagging Hopper
Product
Bagging Station
Figure 16.8. Typical Batch-Type NPK Fertilizer Bulk-Blending Plant.
Large, centralized blending plants are also very
appropriate in locations where the transport infrastructure
is weak. In such instances, it is'usually more practical to
blend and bag the product near the source of supply (for
example, at an ocean or river port, or at a basic
fertilizer production complex) and transport the finished
product, in bags, to distribution points in lots consistent with
the capacity of the transport, storage, and marketing
infrastructure.
16.6.5.3 Blending Complements Granulation -
The NPK granulation processes (steam/water,
chemical, and compaction) all suffer from the lack of being
able to economically produce a relatively small quantity
of a specific product to meet an individual customer's
needs. However, these NPK granulation processes can
be used to supply the blender with granular "base
formulations" such as ammoniated SSP fortified with such
secondary and micronutrients as magnesium, sulfur,
boron, and zinc. These granular "base formulations" can
be used by the blender to uniformly incorporate small
quantities of micronutrients throughout the total blend
without fear of segregation, which could result in
unbalanced plant nutrition. For example, a blender may use
425 kg of a micronutrient-fortified granular
ammoniated SSP mixed with 375 kg of ammonium nitrate and
200 kg of MOP to arrive at a blend containing
approximately 12% N, 6% P205, 12% K20, and the desired
micronutrients.
The benefits of granulation and blending can often be
optimized by operating both processes in concert with
each other. In such a system, the granulation unit is used
to convert nongranular materials into high-quality
granular products, which can be sold directly or incorporated
into a wide variety of nutrient ratios by blending with
other materials. Such a system offers maximum
flexibility in raw material utilization and the ability to produce a
large number of nutrient ratios (grades) to meet the
often changing needs of the marketplace [9].
16.7 Unique Requirements for
Manufacturing Urea-Based
Granular Compound Fertilizers
The wide availability of urea at competitive prices
makes it an attractive source of nitrogen for the
producer of compound fertilizers. If the particle (granule)
size of urea is compatible with other fertilizer materials
447
Air to Atmosphere
Coating Agent
(Clay and Binder)
*
-cr^Dust
Dust Col lector
-H
Raw Material Hoppers
and Continuous Weighers
(4 to 6, typical)
Mixing.and
Coating Drum
I Polishing Screen
e=£> Oversize
Product
Bagging Station
Figure 16.9. Typical Continuous NPK Fertilizer Blending Plant.
and precautions are taken to avoid chemical
incompatibility, quality physical mixtures (blends) can be prepared
and marketed without incident.
However, when urea is used to produce compound
fertilizers using steam/water, chemical, or compaction
granulation processes, precautions must be taken to
avoid process and product quality problems caused by
the presence of urea in the formulation. As little as 2%-
5% urea in a compound fertilizer formulation will often
be quite noticeable with respect to increased hygroscop-
icity and plasticity (especially during production) of the
product. The adverse impact of urea in a compound
fertilizer is significantly increased if MOP and/or kieserite
are also present in the formula. The hygroscopicity and
plasticity characteristics of urea-containing compound
fertilizers may seriously interfere with the operation of
the drying, screening, and crushing equipment unless
this equipment is specifically designed and operated.
Furthermore, the storage properties of urea-containing
compound fertilizers are often inferior to those of
compounds that do not contain urea. The tendency to
absorb moisture from the atmosphere in the case of bulk
product and the caking of bagged product are the two
most undesirable characteristics of compound fertilizers
containing urea.
Despite these inherent characteristics of urea-based
compound fertilizers, high-quality compound products
containing more than 30% urea can be successfully
produced and marketed provided certain precautions are
taken during the production, storage, and bagging steps.
The following is a summary of the critical design and
operating criteria that should be considered when
producing urea-based compound fertilizers. A process flow
diagram of an NPK plant specifically designed to
accommodate the use of significant amounts of urea in
the formulations is shown in Figure 16.6. A discussion
of the most important features that should be
incorporated into a urea-based NPK granulation process
follows [10].
16.7.1 Solid Urea Feedstock
Prilled urea is preferred because its small particle size
helps to facilitate its relatively homogeneous incorporation
448
into the NPK granule structure. Very small and broken
prills are the most desirable.
16.7.2 Urea Solution or "Melt"
If the urea content of the formula is more than about
20% it is-preferable to dissolve a portion of the urea to
produce a hot (105°C) 75%-80% urea solution. The
availability of urea solution adds considerable flexibility
to the process. The solution is sprayed on top of the
bed of material in the granulator. In most instances, a
solution of urea is preferred over an almost anhydrous
urea "melt" because it is easier to handle and a solution
more effectively promotes agglomeration of the other
solid materials used in the formulation.
16.7.3 Other Solid Raw Materials
Standard-grade materials are preferred. Nongranular
run-of-pile (powdered) monoammonium phosphate
(MAP) and superphosphate are recommended, If
superphosphate is used in combination with urea, it should
be first fully ammoniated to minimize unwanted urea-
superphosphate reactions that result in the release of
water of crystallization contained in the superphosphate.
However, as a general rule, the use of superphosphate
in combination with urea should be avoided, even if the
superphosphate is ammoniated. Standard-grade
muriate of potash is preferred because of its usually good
flow characteristics and more optimum particle-size
distribution. Good flow characteristics of all solid raw
materials are highly desired to- facilitate" handling "arid-
accurate metering.
16.7.4 Preneutralizer
A standard, atmospheric tank-type preneutralizer is
preferred. An NH3:H3P04 mole ratio of about 0.5 to
0.6 is recommended in the preneutralizer to achieve a
low free water content while still maintaining a fluid and
pumpable slurry. This is especially important if a
significant amount of sulfuric acid is also neutralized in the
unit. The preneutralized slurry at a mole ratio of about
0.5 to 0.6 should be about 127°C and contain no more
than 15% free water. The preneutralizer and its
auxiliary equipment (agitator, pumps, and piping) should be
constructed of corrosion-resistant materials to facilitate
the use of a mixture of phosphoric and sulfuric acid,
thus adding considerable flexibility to the process (refer
to section 16.5.6.2). In general, if a higher mole ratio
(for example 1.5) is used, especially if sulfuric acid is
also present, the free water content of the slurry will
have to be higher to facilitate pumping because the
ammonium sulfate crystals tend to thicken the slurry.
16.7.5 Granulator (Rotary)
The length-to-diameter ratio should be at least 3. The
greater length, compared with granulators used in most
ammonium phosphate and many North American NPK
Plants, facilitates granule formation and gives the
operator more flexibility in controlling the agglomeration
process. The NH3:H3P04 mole ratio of the material
discharged from the granulator may be quite variable
depending upon the properties of the raw materials.
However, a mole ratio between 1.0 and about 1.8 is
expected to be optimum. The lower mole ratio (1.0) will
minimize the evolution of ammonia from the granulator
and thus simplify operation of the scrubbing system and
tend to improve control of the process. The free
moisture of the product discharged from the granulator will
usually be in the range of about 2% to 3%. The recycle-
to-product ratio is expected to vary from about 3 to~6.
A ratio of 6 is recommended for design. If the process is
based on a solid ammonium phosphate source (for
example, powdered MAP) and a preneutralized slurry is
not used, then a design recycle-to-product ratio of 3 is
usually sufficient.
16.7.6 Cocurrent Dryer
The length-to-diameter ratio of this rotary unit should
not exceed about 6. The superficial velocity of the air
(at outlet conditions} should not exceed 2.4 m/sec
maximum (2.0 m/sec preferred). The maximum
temperature of the outlet air should not exceed 80°C, and the
RH at this temperature should not exceed 15%. An outlet
air temperature of 75°C at 15% RH is recommended as
the basis for design, The moisture of the material
discharged from the dryer should not exceed 1.0%; a value
_of_O.S%~is-recom mended for design provided a second-
stage dryer (process cooler) is used. The temperature
and humidity profile in the dryer is extremely
important, and the optimum values will vary from product to
product primarily depending on the CRH of the
fertilizer material (Figure 16.10). It is important to note that
if the material becomes overheated, "melting" begins to
occur and material will stick to the interior walls and
flights of the dryer near the discharge end, thus a length-
to-diameter ratio of no more than 6 is recommended to
avoid "overdrying" and possible melting of the material
near the discharge end of the dryer.
16.7.7 Countercurrent Process Cooler (Second-
Stage Dryer)
This unit is essential because it performs two
important functions in a urea-based NPK granulation plant.
First, it acts as a low-temperature second-stage dryer to
ensure that the product moisture is 0.6% or less; and
second, the retention time in the unit allows the
relatively soft and plastic material to harden, thus
improving the operation of the screening and oversize crushing
systems.
The length-to-diameter ratio of the process cooler
should not be less than 6; 7 to 8 is preferred. The inlet
air should be dehumidified and/or heated to ensure that
the RH is 60% or less as it enters the process cooler.
449
80
70-
I* 60
"E
© 50
>
§ 40
CO
o
O
30-
20-
, / Monoammonium Phosphate
^ (11-55-0)
Urea
Ammonium Phosphate NPK
(17-17-17)
Nitrophosphate NPK
-{17-6-18-2MgO)
u
—i 1 1 1 1 1 1 1—i 1—i—
20 30 40 50 60 70
—i 1 1 p
80 90
TemperafurepCT
Figure 16.10. Effect of Temperature on Critical Relative Humidity of Selected
Fertilizer Products.
The superficial air velocity should not exceed 2.0 m/
sec. The low velocity is recommended because of the
relatively large amount of minus 1.0-mm particles in
the material. It is preferred that these small particles be
removed (separated) by the screens rather than by the
airflow/dust collection system. The unit should be
designed to achieve a material (discharge) temperature of
not more than about 54°C at a free moisture content of
no more than 0.6%. Further cooling of the product
fraction (after screening) is performed in a separate operation.
16.7.8 Screening
Single-deck horizontal gyratory-type screening units
are recommended, The screen wire should be stainless
steel and of the square-mesh style to obtain "precision
screening" and minimize the amount of irregular shaped
particles that lead to caking during long-term storage. If
inclined, electrically (or motor) vibrated screens are used,
they should be for oversize separation only, not for
"precision screening" of the product fraction. The hourly
loading of the oversize screen should not exceed about
20 t/m2, and the loading of the horizontal gyratory-
type product screen should not exceed 50% of this value
(25%-30% preferred).
16.7.9 Oversize Crushers
Double rotor chainmill-type crushers or double row
cage mills are preferred. The discharge assembly of the
mill should not be restricted and should be constructed
of flexible rubber (conveyor belting) panels that can be
flexed from the outside by an operator using a hammer.
A flared-type discharge assembly for the crushers.is
recommended to help avoid the accumulation of solids. The
crushed oversize should be recycled to the oversize screen
on a closed-loop basis to ensure that only the fine-
material fraction (undersize) from the screens is returned
450
to the granulator as recycle. With good control of
granulation the production of oversize is minimized. This is
important because the production of too much oversize
material disturbs the solids surface/liquid-phase ratio in
the granulator, which leads to the further production of
excessive quantities of oversize material.
16.7-10 Product Cooling
Either a rotary-drum or fluidized-bed unit is
recommended. A single-pass, counter cur rent, cascade-type
cooler is also acceptable. The cooling unit should be
located immediately ahead of the product conditioning
unit. The RH of the cooling air at inlet conditions should
not exceed 50%. The temperature of the product
discharged from the cooler should not exceed about 43°C.
In all cases the temperature of the cooled product should
be about 5°C above the average ambient temperature
to avoid absorption of atmospheric moisture on the
surface of the material when it is stored in bulk for a short
period prior to bagging.
16.7.11 Product Conditioning
A standard rotary drum-type product conditioning unit
is recommended. Screw-type mixing units should be
avoided because they tend to grind and break the
product granules. Kaolin clay applied in the order of about
0.5% (weight bases) is usually sufficient for most urea-
based NPKs. An oil- or wax^type .liquid-binder may_also-
be sprayed into the product prior to the application of
the clay conditioner to help adhere the clay to the
surface of the granules, thus decreasing the evolution of
dust during handling.
16.7.12 Bulk Storage and Process Plant
Dehumidification
If ambient conditions normally exceed about 50% RH
for extended periods (more than about 8 h), provisions
should be made to dehumidify the process plant and
bulk storage buildings. Cooling and proper ventilation
may also be necessary for worker comfort and safety.
Adequate ventilation is especially important because all
buildings should be tightly constructed and closed to
maintain a dry inside environment (RH of 40%-50%).
16.7.13 Bagging
The urea-based compound fertilizer products should
be bagged in moistureproof bags shortly after
production. Direct bagging from the production unit is not
recommended because off-specification product could
inadvertently be bagged and flexibility is lost in handling
product during grade-change periods. In addition, bag
set (caking) is minimized if the fresh product is allowed
to "pile set" for a short period of time (10-12 h).
16.8 Investment and Operating Costs
The economics of the four basic compound fertilizer
production processes (bulk blending, compaction
granulation, steam/water granulation, and chemical
granulation) are compared in terms of (1) required fixed
capital investment, (2) conversion cost (not including raw
materials), and (3) production cost (conversion cost plus
raw material cost). The premises and assumptions used
in this evaluation and a discussion of the main economic
characteristics of the processes follow.
16.8.1 Premises and Assumptions
All estimates (mid-1995 US $) are based on a
grassroots production facility in a developing or transition
economy country with an existing industrial
infrastructure where the investment cost is assumed to be similar
to that of a U.S. Gulf Coast location. Convenient access
to an ocean or inland port is assumed and the cost of
land is not included. All raw materials are assumed to be
purchased from international sources at the indicated
free-on-board (f.o.b.) prices which, of course, can vary
quite widely, The f.o.b. raw material prices were
increased by US $30/tonne for solid materials and US
$40/tonne for liquid materials to arrive at an assumed
delivered cost at the plant site. Storage facilities
(capacity) for dry and liquid raw materials are based on the
receipt of raw materials in 3,000- to 5,000-tonne lots
_and an_app_roximate_2-month inventory at the plant site.
The base case capacity of each NPK production unit
is 120,000 tpy while operating at 75% capacity
utilization. This translates to 160,000 tpy at 100% capacity
utilization assuming 330 days/year.
16.8.2 Fixed Capital Investment Estimates
As indicated in Table 16.8 the estimated total fixed
capital investment for the four production schemes
varies from a low of US $3.83 million for a batch-type
bulk-blending plant to a high of US $19.37 million for
the chemical granulation facility. In the case of the bulk-
blending plant, the storage facilities represent about 65%
of the total fixed capital investment, whereas storage
facilities account for only about 20%-24% of the total
fixed investment in the more costly compaction, steam/
water, and chemical granulation units.
16.8.3 Conversion Cost Estimates
The estimated unit consumptions (not including raw
materials) for the four compound fertilizer production
processes are summarized in Table 16.9. Using these
unit consumptions and typical mid-1995 U.S. costs, the
conversion cost, based on a production of 120,000 tpy,
including bags and bagging but not raw materials, varies
from about US $26/tonne for bulk blending to about
US $63/tonne for chemical granulation. In all cases fixed
451
Table 16.8. Estimated Fixed Capital Investment for Various NPK Production Processes - 120,000
tpy at 75% Capacity Utilization3
NPK Production Process
Battery-limits process unit
Bulk storage (dry raw materials and products)*1
Bagged product storagec
Liquid storage (ammonia, phosphoric acid, and
sulfuric acid)d
Auxiliary and support facilities6
Total Installed Cost
Project management and startup*
Interest during construction9"
Total Fixed Capital Investment
a. Mid-1995 costs assuming a U.S. Gulf Coast location.
b. 22,000 tonnes total, except 15,000 tonnes for chemical granulation.
c. 5,000 tonnes total.
d. 3,000 tonnes each for ammonia, phosphoric acid, and sulfuric acid.
e. 15% of cost of process unit and total storage facilities,
f. 5% of total installed cost,
g 8% of total installed cost.
Bulk
Blending
0.47
1.89
0.59
_
0.44
3.39
0,17
0.27
3.83
Compaction
Granulation
(US $
5.44
1.89
0,59
1,19
9.11
0.46
0.73
10.30
Steam
Granulation
6.98
1.89
0.59
1.42
10.88
0.54
0.87
12.29
Chemical
Granulation
11.12
1.30
0.59
1.89
2.24
17.14
0.86
1.37
19.37
Table 16.9. Estimated Unit Consumptions (Excluding Raw Materials) for Various NPK Production
Processes - 120,000 tpy at 75% Capacity Utilization
NPK Production Process
Labor (includes maintenance), workhours
Overhead and general expenses
Electricity, kWh
Steam, t
Water, t
Fuel, million kcal
Bags, each
Bulk
Blending
0.14
100% of labor
5.0
0.00
0.00
0.00
20,1
Compaction
Granulation
Steam
Granulation
- (unit consumption/tonne product) -
0,27
100% of labor
50.0
0.00
0.00
0.00
20.1
0.28
100% of labor
30.0
0.06
0.25
0.18
20.1
Chemical
Granulation
0.31
100% of labor
50.0
0.03
0.25
0,10
20.1
capital recovery (based on a 15-year plant life and a
15% annual interest rate) represents the largest fixed
conversion cost item and ranges from about 21% of the
total conversion cost for bulk blending to about 44% for
chemical granulation. It is interesting to note that the
cost of bags represents the largest variable conversion
cost item.
16.8.4 Estimated Raw Material Cost
Typical production formulas (raw material
consumption) for an NPK 15-15-15 produced by the four
processes are shown in Table 16.10. It is difficult to
precisely evaluate the cost of raw materials for the four
compound fertilizer production processes examined
because of large variations in prices caused by
452
Table 16.10. Typical Production Formulas (Raw Material Consumption) for 15-15-15 — Various
NPK Production Processes9
NPK Production Process
Raw Material3
Prilled urea - 46-0-0
Granular urea - 46-0-0
Nongranular monoammonium phosphate -
10-50-0
Granular diammonium phosphate - 18-46-0
Standard ammonium sulfate - 21-0-0
Granular ammonium sulfate - 21-0-0
Standard muriate of potash - 0-0-60
Granular muriate of potash - 0-0-60
Ammonia - 82-0-0
Sulfuric acid - 96% H2S04, 4% H20
Phosphoric acid - 52% P2Os, 20% H2Q
Conditioning clay
Conditioning clay binder
Totalb
Bulk
Blendinq
_
40
-
331
-
354
-
255
-
-
-
15
5
1,000
Compaction
Granulation
133
-
304
_
288
-
255
.
-
-
-
15
5
1,000
Steam
Granulation
- - (kg/tonne)
133
-
304
_
288
-
255
-
-
-
-
15
5
1,000
Chemical Granulation
Feed Basis
105
-
■ ■
_
-
.
255
-
127
261
303
15
5
Product Basis
105
-
-——
_
-
-
255
-
127
251
242
15
5
1,000
a. Nutrient content of product (as formulated) is about l%-2% higher than theoretical to compensate for process
losses and/or raw material variations.
b. Free water content of finished product is typically 1.5% to 2,0%.
international market conditions, quantity of purchase,
ocean freight rates, and a variety of time- and site-specific
conditions. However, for the purpose of illustration, the
cost of raw materials, using typical mid-1995 U.S. costs,
is the highest for bulk blending (about US $183/tonne
of 15-15-15), whereas the raw material cost for
compaction, steam/water, and chemical granulation is
about US $ 12-$26 per tonne less than that of blending.
It is important to emphasize that the compaction,
steam/water, and chemical granulation processes offer
considerable potential for raw material cost savings if
the opportunity for buying distressed, off-specification,
or byproduct materials exists. Such materials can often
be purchased at a significant discount and, then by
processing, be upgraded to high-quality compound
fertilizer products. Bulk blending does not offer this advantage
because the production of high-quality blended products
is dependent on the use of high-quality granular raw
materials that are priced accordingly. However, as
mentioned in section 16.6.5.3, the combination of
granulation and bulk blending at the same facility may be very
effective in transferring some raw material economies
to bulk blending.
16.8.5 Estimated Total Production Cost
Using typical mid-1995 U.S. costs as an example, a
summary of the estimated total production cost for the
four compound fertilizer production processes, using 15-
15-15 as an example, is shown in Table 16,11. These
costs include all fixed and variable conversion cost items
(including raw materials, bags, and bagging) and vary
from a high of about US $234/tonne for chemical
granulation to a low of about US $201/tonne for
compaction granulation.
16.8.6 Impact of Capacity Utilization
The above example of production cost data is based
on an annual production of 120,000 tonnes while
operating at 75% capacity utilization (160,000 tpy
design capacity}. The effect on the total production cost
(including bagging) caused by increasing or decreasing
the annual plant capacity is shown in Table 16,12. As
seen in Table 16.12, in the most capital-intensive plant
(chemical granulation), a decrease in capacity utilization
to 50% (80,000 tpy) increases the total production cost
to US $255/tonne compared with about US $234/
tonne at the base case condition. The bulk-blending plant,
because of its low fixed capital investment, is least
affected by changes in capacity utilization while the
453
Table 16.11. Estimated Total Production Cost for Producing 15-15-15 Using Various NPK
Production Processes at 75% Capacity Utilization3
NPK Production Process
Bulk Blending Compaction
Steam
Granulation
Chemical
Granulation
(US $/tonne 15-15-15)
Fixed conversion .cost
Variable conversion cost (less raw materials)
Raw material cost
Total (Bagged Product)
9,29
16.55
183.48
209.32
24.64
18.55
157.47
200.66
28.21
20.49
157.47
206.17
42.13
21.15
1-70-78-
234.06
a. Refer to Tables 16.9 and 16.10 for estimated conversion and raw material unit consumption details. Values
are indicative of typical mid-1995 U.S. conditions.
Table 16.12. Effect of Capacity Utilization on Production Cost
NPK Production Process
Capacity
Utilization
(%)
25
30
35
40
45
50
55
60
65
70
75a
80
85
90
95
100
Yearly
Production
(tpy)
40,000
48,000
56,000
64,000
72,000
80,000
88,000
96,000
104,000
112,000
120,000
128,000
136,000
144,000
152,000
160.000
Bulk
Blending
227.90
223.26
2X9.94
217.45
215.52
213.97
212.70
211.65
210.75
209.99
209.32
208.74
208.23
207.78
207.37
207.00
Compaction
Granulation
249.94
237.62
228.82
222.22
217.08
212.98
209.62
206.82
204.45
202.42
200.66
199.12
197,76
196.55
195.47
194.50
Steam
Granulation
1 CL_1 CL_ 1 c.\ - -
262.59
248.48
238:41
230.85
224.97
220,27
216.42
213.22
210.51
208.18
206.17
204.40
202.85
201.46
200.23
199.11
Chemical
Granulation
318.32
297.25
282.20
270.92
262.14
255.12
249.38
244.59
240.54
237.07
234.06
231.42
■ 229,10
227.03
225.19
223.52
a. Base case. Illustration based on typical mid-1995 U.S. costs.
compaction and steam/water granulation units are
moderately affected compared with the other processes.
16.9 References
1. Food and Agriculture Organization of the United
Nations. 1995. FAOSTAT«PC, Computerized
Information Series, Rome, Italy.
2. Personal Communications With Various Producers
and Industry Associations, March-June 1995.
Salladay, D. G., and W. K Paulson. 1984.
"Development of TVA Pressure Reactor for Production of
Ammonium Phosphates and Its Retrofit in
Conventional Plants," 34th Annual Meeting of the
Fertilizer Industry Round Table, October 30 - November
1, 1984.
Green, H., D. J. Brunner, R. O. Britt, and A. P.
Super. 1978. "Panel Discussion: Recent Pipe Cross
Experiences," IN Proceedings of the 28th Annual
Meeting Fertilizer Industry Round Table, pp. 46-
54, Atlanta, GA, U.S.A.
454
5 Salladay, D. G,, M. S. Traweek, and N. H. Louizos.
1985. "Production of Monoammonium Phosphate
Sulfate With TVA Pressure Pipe-Cross Reactor," IN
Proceedings of the 35th Annual Meeting Fertilizer
Industry Round Table, pp. 102-113, Atlanta, GA,
U.S.A.
- 6. Cheval, J. L. 1981. "Quality Control in Bulk
Blending Blenders Point of View," IN Proceedings of
the 31st Annual Meeting Fertilizer Industry Round
Table, pp. 120-132, Washington, D.C., U.S.A.
7. Canadian Fertilizer Institute. 1986. The CFI Guide
of Material Selection for the Production of Quality
Granular Blends, Ottawa, Ontario.
8. Leonard, J. E., and T. M. Young. 1989. "Fertilizer
Blending in Ireland-Potential Application of Its
Unique Features to Developing Country Locations,"
IN Supplying Quality Multinutrient Fertilizers in
the Latin American and Caribbean Region -
Emphasizing Bulk Blending and the-
Complementary Role of Granulation, Workshop Proceedings,
pp. 142-172, J, J. Schultz and E. D. Frederick
(Eds.), SP-14, international Fertilizer Development
Center, Muscle Shoals, AL, U.S.A.
9. Rodriguez, C. M. 1989. "Development of
Compaction and Bulk Blending in Guatemala," IN
Supplying Quality Multinutrient Fertilizers in the
Latin American and Caribbean ReQion
-Emphasizing Bulk Blending and the Complementary
Role of Granulation, Workshop Proceedings, pp.
72-82, J. J, Schultz and E. D. Frederick (Edsrh~SP-
14, International Fertilizer Development Center,
Muscle Shoals, AL, U.S.A.
10. Schultz, J. J, 1989. Production of Granular NPKs
in Ammonium Phosphate Plants-Some
Important Differences, Technical Bulletin T-36,
International Fertilizer Development Center, Muscle Shoals,
AL, U.S.A.
455
Chapter 17. Secondary Nutrients and Micronutrients
Table of Contents
Page
17.1 Secondary Nutrients , 457
17.1.1 Calcium and Magnesium 457
17.1.2 Sulfur : ".". : "458
17.1.3 Incorporation in Granular Fertilizers 459
17.1.4 Bulk Blending or Direct Application 459
17.1.5 Addition to Fluid Fertilizers 460
17.2 Micronutrients 460
17.2.1 Micronutrient Applications for Crops 460
17.2.2 Products 461
17.2.3 Methods of Application 462
17.3 Preparation of Fertilizers Containing Micronutrients 462
17.3.1 Reactions of Micronutrient Materials With Fertilizers 463
17.3.2 Dry Mixing 463
17.3.3 Bulk Blending 464
17.3.4 Incorporation of Micronutrients in Granular Fertilizers 464
17.3.5 Coating of Micronutrients on Granular Fertilizers 465
17.3.6 Fluid Fertilizers 466
17.4 Other Useful Elements 467
- 17.4.1 Cobalt.....;;:-.:;-....;.... ::;::;- ~7...:."..."..."..: 467
17.4.2 Silicon 467
17.5 Acknowledgment 468
17.6 References 468
456
Chapter 17. Secondary Nutrients and Micronutrients
Increased knowledge about secondary nutrients and
micronutrients, including plant requirements, nutrient
sources, and methods of application, has resulted in their
increased use. Improvements in soil testing and plant
analyses have provided more knowledge about plant
needs and the wide variations in plant responses to these
nutrients. Higher crop yields and the use of high-analysis
NPK fertilizers also have resulted in increased needs for
these nutrients.
The secondary nutrients are calcium, magnesium, and
sulfur. Concentrations of these nutrients in plant tissues
generally are lower than those of the primary nutrients
(nitrogen, phosphorus, and potassium) but are higher
than those of the micronutrients. The seven
micronutrients are boron, chlorine, copper, iron, manganese,
molybdenum, and zinc, Because chlorine deficiencies
rarely occur in nature, most discussions on supplying
micronutrient fertilizers are confined to the other six
micronutrients.
17.1 Secondary Nutrients
Calcium, magnesium, and sulfur are designated as
secondary nutrients. Plants require these nutrients in fairly
substantial quantities for normal growth, but fertilizer
sources generally are not applied at rates as high as
those of the primary nutrients. Actual requirements and
uptake of secondary nutrients vary with plant species
and soil conditions. Deficiencies of magnesium and
sulfur are becoming more common, while those of
calcium are not reported. ..__
17.1.1 Calcium and Magnesium
Calcium is relatively abundant in soils, and calcium
rarely limits crop production per se. Low levels of
exchangeable calcium in soils result in increased soil
acidity, which usually results in reduced growth of most
crops. Using lime applications to correct soil acidity to
recommended soil pH levels will provide sufficient
calcium for crops because liming materials contain calcium
(Table 17.1).
Magnesium deficiencies are found mainly on acid,
sandy soils and on organic soils containing free calcium
carbonate. Magnesium deficiencies also can be
accentuated by high levels of available potassium or on soils
that have been limed for many years with calcific
limestone, which is very low in magnesium.
Products - Fertilizer sources of calcium include
calcium nitrate, a highly soluble nitrogen product, and
Table 17.1. Some Calcium Sources
Source
Chemical Formula
Ca
Lime Materials
Blast furnace slag
Calcitic limestone
Dolomitic limestone
Hydrated lime
Marl
Fertilizers
Calcium nitrate
Calcium ammonium nitrate
Phosphate rock
Superphosphate, normal
Superphosphate, triple
Soil Amendments
Gypsum
CaSiOs
CaCQ3
CaC03 + MgCOa
Ca(OH)2
CaCQ3
Ca(N03)2
NH4NO3 + CaC03
3Ca3(P04)2*CaF2
Ca(H2P04)2+CaS04*2H20
Ca(H2P04)2+CaS04*2H2O
CaS04-2H20
29
33
21
46
24
19
33
20
13
22
Adapted from FoIIett et al. [1],
457
Table 17.2. Some Magnesium Sources
Source
Formula
Wt % Mg
Form
Dolomite
Magnesium chloride
Kieserite
Magnesium sulfate (anhydrous)
Epsom salts
Magnesium hydroxide
Magnesium nitrate
Magnesium oxide
Magnesium oxysulfate
Sulfate of potash magnesia
Magnesium carbonate (or magnesite)
CaC03»MgC03
MgCI2
MgS04-H20
MgS04
MgS04»7H20
Mg(OH)2
Mg(N03)2*2H20
MgO
MgO,MgS04
K2S04*2MgS04
MgCQ3
S-20
25
18-26
20
10
35-45
13
54-58
28 or 36
11
28
Powder
- Flake
Powder
Crystal
Crystal
Powder
Hake —
Powder
Granule
Powder
Powder
Adapted from Follett et al. [II.
normal and triple superphosphate. Phosphate rock (PR)
also contains calcium; however, because its solubility is
quite low, PR must be finely ground and applied to acid
soils to be available to plants. Gypsum is an important
source of calcium for groundnut. Although its solubility
is somewhat limited, gypsum is sufficiently available for
plants. Gypsum also is a soil amendment for reclaiming
sodic soils for agricultural production.
The most economical way to correct magnesium
deficiencies on acid soils-is to-apply-dolomitic-limestoner-
However, if soil pH levels are above 6.0, the sources
listed in Table 17,2 can be used. Magnesium sulfate,
magnesium oxide, and potassium-magnesium sulfate are
the most common magnesium sources [2].
Recommended application rates for magnesium range from
10 to 40 kg/ha, depending on the magnesium
requirement of the crop as well as soil test levels [3[.
Benefits of Liming - Liming materials provide ample
supplies of calcium (and of magnesium if dolomite is
used) for crops and also increase the soil pH to
recommended levels; thus, liming has additional benefits for
plant nutrition [4]. For example, nitrogen fixation by
legume crops and nitrification of ammoniunniirrogen
to nitrate-nitrogen are microbial processes which are
optimal in neutral soils. Similarly, phosphorus
availability is highest in soils with a pH of 6 to 7; below this pH
range, phosphorus reacts with aluminum and iron
oxides to form insoluble compounds in soil, and insoluble
calcium phosphates are formed above this range.
Likewise, availability of most micronutrients is highest in soil
with a pH range of 6 to 7. Except for molybdenum, the
availability of the micronutrients decreases with an
increase in soil pH. Toxicities of some micronutrients,
especially manganese, also occur in very acid soils.
Conversely, overtiming soils can result in micronutrient
deficiencies.
17.1.2 Sulfur
Most of the soil sulfur is in the soil organic matter and
is highest in the surface soil. Sulfur in organic matter
must be mineralized to the sulfate form to become
available to plants. Conversely, sulfate can be immobilized
when bacteria decompose crop residues high in carbon.
Sulfate-sulfur also can be converted to unavailable
sulfides under reducing conditions caused by poor
drainage and flooded soil conditions [5].
-—Re"corrrmenr[ed-appIication rates for sulfur range from
10 to 50 kg/ha, depending on the level of available
sulfur in the soil and the sulfur requirements of the crop.
Sometimes a general recommendation for 10 pounds
of sulfur per acre is made without conducting soil tests
for available sulfur. Knowledge of other inputs, such as
sulfur contained in N-P fertilizers, atmospheric
deposition of sulfur, and sulfate-sulfur in irrigation water, as
well as crop needs and levels of available sulfur in soil
should be considered when deciding if sulfur
applications to soil are warranted.
Products - There are many sulfur sources for
application to soil (Table 17.3), Normal superphosphate
contains as much as 12% sulfur as a result of the
manufacturing process using sulfuric acid. Most high-
analysis phosphate fertilizers contain very little sulfur,
although inclusion of sulfuric acid in the granulation
process results in 2%-3% sulfur in the final products,
The main sulfur sources are ammonium sulfate,
ammonium thiosulfate, potassium sulfate, and potassium-
magnesium sulfate, which contain 17%-26% sulfur [6[.
Elemental sulfur also is used, but it must be applied to
soil in powder form to be quickly oxidized to the sulfate
form. This microbial process also results in the
formation of acid, which reduces the soil pH. The micronutrient
sulfates also provide available sulfur, but their application
458
Table 17-3. Some Sulfur Sources
Source
Ammonium sulfate
Ammonium thiosulfate
Ammonium polysulfide
Epsom salt
Gypsum
Potassium-magnesium sulfate
Potassium sulfate
Sulfur, elemental
Sulfuric acid
Superphosphate, normal
Superphosphate, triple
Chemical Formula
(NH4)2S04
(NH4)2S203
(NHflfeS*
MgS04»7H20
CaS04»2H20
K2S04*2MgS04
K2S04
S
H2SQ4
Ca(H2PO4)2+CaS04»2H2O
Ca(H2P04)2+CaS04»2H20
%S
24
26
"40
13
19
22
18
30-100"
33
12-14
1
Adapted from FoIIett et al. [1].
rate usually is so low that they do not provide adequate
sulfur for crop needs on sulfur-deficient soils.
17.1.3 Incorporation in Granular Fertilizers
The International Fertilizer Development Center
conducts an annual survey of NPK granulation plants in the
United States. By 1995 the number of operating plants
decreased to only 25, from about 200 in 1965. No
estimate has been made of the number of NPK
granulation plants worldwide, but aImostall-of-these-plants,-pIus-
all nitrophosphate plants, incorporate secondary
nutrients, primarily calcium and/or sulfur, in their products
as the preferred, least expensive raw materials.
Magnesium is different and is usually incorporated as a special
additive.
Calcium is most often incorporated in granular NPK
grades as single superphosphate (SSP), which contains
about 19%-22% calcium depending on the PR source.
A grade such as 8-8-8 based on ammoniating solution,
sulfuric acid, and SSP contains about 7% calcium. The
use of nongranular triple superphosphate (TSP), which
contains about 13% Ca, in NPK formulations is
declining because production of nongranular TSP is decreasing.
Nitrophosphate products, either granular or prilled,
contain calcium in the NP(K) grades and in the
ammonium nitrate coproduct (see Chapter 13). NPK grades
such as 13-13-13 retain some of the calcium originally
in the PR because the calcium nitrate is never completely
removed in the Odda process crystallization step. The
residual calcium is converted primarily to dicalcium
phosphate when ammoniation is carried out to produce the
NPK products. The separated crystalline calcium nitrate
is dissolved and converted to ammonium nitrate
solution and solid calcium carbonate by addition of
ammonia and carbon dioxide. The ammonium nitrate solution
is concentrated and prilled or granulated with addition
of calcium carbonate to produce calcium ammonium
nitrate (CAN). CAN typically contains 26% or 27% N and
20% to 24% calcium carbonate. In some processes, a
small amount of gypsum is mixed with the calcium
carbonate prior to addition to the concentrated ammonium
nitrate solution [1\.
Most of the magnesium-containing materials shown
in Table 17.2 may be used for incorporation in granular
fertilizers. E^Iolnit^and kiesefite are added to
nitrophosphates to obtain grades such as 12-12-17-1.2
Mg and 13-9-16-2.4 Mg [8]. The most common source
of magnesium for U.S. granulation plants is probably
potassium magnesium sulfate, also called sulfate of
potash magnesia. For granulation without a pipe-cross
reactor, magnesium chloride should be avoided in
formulations using sulfuric acid because of the
possibility of producing corrosive hydrogen chloride vapor or
ammonium chloride aerosol. Magnesium nitrate should
not be used in significant proportion in dry fertilizers
because of its fire and explosion risk.
The predominant sources of sulfur in NPK products
are sulfuric acid, which forms ammonium sulfate in the
ammoniator-granulator, and SSP, which contains about
12% S as gypsum, Byproduct crystalline ammonium
sulfate (24% S) is also frequently used. Gypsum is used,
including natural gypsum, recovered gypsum from flue
gas desulfurization, and, where environmental
regulations permit, phosphogypsum. Of course, all the sulfate
salts listed as magnesium sources in Table 17.2 may
also be used as sulfur sources.
17.1.4 Bulk Blending or Direct Application
In addition to secondary nutrients that are
incorporated in granular mixtures, secondary nutrient materials
459
are also used for direct application and bulk blending.
Powdered sources are normally used for direct
application only; bulk blending requires granules 2-4 mm in
size, crystals, or compacted material. These large
particle size materials are also excellent secondary nutrient
sources for direct application. The following are some
of the more important secondary nutrient sources for
direct application and bulk blending;
Direct application only
Crushed dolomite, 20% Ca, 12% Mg
Basic slag, up to 33% Ca
SSP, 20% Ca
Ground phosphate rock, 30%-35% Ca
Nongranular TSP, 13% Ca
Calcium nitrate, 19% Ca
Fine potassium magnesium-sulfate, 11% Mg, 22% S
Gypsum, 23% Ca, 19% S
Fine ammonium sulfate, 24% S
Bulk blending or direct application
Granular SSP and TSP
Pelletized dolomite
Granular gypsum
Ammonium sulfate, granular or coarse crystal
Potassium magnesium sulfate, compacted or coarse
crystal
Calcium ammonium nitrate, granular, 9% Ca
Also, some of the magnesium sources listed in Table
17.2 may be applied directly: ~"~ - —~~~- "
17.1.5 Addition to Fluid Fertilizers
Secondary nutrients are an important component of
the fluid fertilizer market, and many source materials
are available for use in clear solution and suspension
formulations. Most of the materials for clear solutions
may also be used in suspensions, but they are seldom
used because they are generally more expensive. The
polysulfide solutions should not be mixed with acidic
materials - dangerous hydrogen sulfide gas may be
evolved! The following list gives secondary nutrient
sources for solutions and suspensions are [9]:
Calcium in solutions
Chelate solutions and powders, 5%-10% Ca
Calcium nitrate, granular or solution
Calcium nitrate plus ammonium nitrate solutions
Calcium lignosulfonate solution
Calcium in suspensions
Fluid lime (limestone-clay suspension)
Gypsum, 50% flowable emulsion
Magnesium in solutions
Epsom salts, MgS04*7H2O
Chelated solutions and powders, l%-6% Mg
Magnesium sucrate solubilized granules
Magnesium nitrate, flake or solution (7-0-0-6 Mg)
Magnesium chloride, MgCl2*6H20, flake or solution
Magnesium in suspensions
Magnesium oxide
Potassium magnesium sulfate, fine
Magnesium carbonate
Fluid lime (dolomitic)
Sulfur in solutions
Ammonium thiosulfate, 12-0-0-26S solution
Ammonium sulfate, crystals or 8-0-0-9S solution
Epsom salts, 13% S
Ammonium polysulfide, 20-0-0-40S solution with aqua
or anhydrous ammonia
Potassium polysulfide, 0-0-22-22S solution
Potassium thiosulfate, 0-0-25-17S.
Sulfur in suspensions
Elemental sulfur,.52%, flowable emulsion
Elemental sulfur, 90%, wettable powder or degradable
granule
Potassium magnesium sulfate, fine
Potassium sulfate
17.2 Micro nutrients
Deficiencies of micronutrients in crops have been in-
creasing throughout the world, Some reasons include
Tiigher crop yields, use of high-analysis NPK fertilizers,
and decreased use of animal manures on many
agricultural soils. Also, micronutrient deficiencies have been
verified in many locations through increased use of soil
testing and plant analyses.
17.2.1 Micronutrient Applications for Crops
. When micronutrient deficiencies are compared with
regard to the worldwide importance of various crops,
deficiencies of zinc, manganese, and copper are most
important, especially for cereal crops. Boron is of
greatest concern for some legume crops, cotton, and root
crops such as groundnut and sugarbeets. Iron deficiency
is of greatest concern for crops grown on calcareous
soils. Molybdenum is especially important for legumes
because of its role in nitrogen fixation.
Boron -Recommended boron application rates range
from 0.5 to 2.0 kg/ha and should be carefully followed
[10]. Crop species vary considerably in their boron
requirement as well as in their tolerance to over-
applications. Residual effects of applied boron also vary
with soil conditions, with the lowest effects found on
acidic sandy soils in areas of high rainfall. Some crops
with high boron requirements are alfalfa, cotton,
peanuts, irrigated corn, root crops, soybean, and some fruits
and vegetables.
460
Copper - Most copper deficiencies are found on or-
anic soils and on sandy soils. Recommended copper
application rates range from 1 to 10 kg/ha. Residual
ffects of copper are very marked, with responses be-
ina noted up to 8 years after application, so annual ap-
nlications-usually are not necessary [3]. Soil tests should
be used to monitor the copper buildup in soils where
copper is applied. Some crops with high copper
requirements are cereals, corn, clover, and some fruits and
vegetables.
Iron - Although iron is the most abundant element in
soils levels of available iron often are limiting in
calcareous soils, and to a much lesser extent in sandy soils in
high-rainfall areas. Soil applications of most iron sources
are not effective for crops, so foliar sprays are the
recommended control method [3]. Plant species vary
considerably in their susceptibility to iron chlorosis. Growing
iron-tolerant species or varieties within a species is one
of the main methods of controlling iron chlorosis on
low-iron soils.
Manganese - Deficiencies of manganese are found
mainly on well-drained neutral or calcareous soils or
organic soils. Recommended manganese application rates
range from 2 to 20 kg/ha. There are no residual effects
from applied manganese because of oxidation of the
available divalent form to the tetravalent form, which is
unavailable to plants [3]. Some crops with high
manganese requirements are cereals, cotton, peanuts, soybean,
sugarcane, and fruits and vegetables.
Molybdenum - Deficiencies of molybdenum are
found on acidic soils and may be corrected by liming
soils to pH 6.0. Because the amounts needed to correct
molybdenum deficiencies are very low, seed treatment
(supplying 60-120 g/ha) is the recommended method
[3]. Deficiencies are mainly found in legume crops,
because molybdenum is essential for nitrogen fixation.
However, some vegetable crops also are sensitive to
molybdenum deficiencies.
Zinc - Deficiencies of zinc are more widespread than
those of the other micronutrients. Deficiencies occur in
many soil types with pH levels > 6,0, especially in soils
with low organic matter [11]. As with copper, residual
effects of applied zinc are substantial, with responses
found at least 5 years after application. Recommended
zinc application rates range from 1 to 10 kg/ha [3],
Some crops with high zinc requirements are corn,
citrus, field beans, rice, and some fruits and vegetables,
17.2.2 Products
Micronutrient sources vary considerably in their
physics' state, chemical reactivity, cost, and availability to
plants [12]. There are four main classes of
micronutrient sources - inorganic, synthetic chelates, natural
organic complexes, and fritted glass products (frits).
Inorganic sources include oxides, carbonates, borates,
molybdates, and metallic .salts such as sulfates, nitrates,
and chlorides (Table 17.4). The sulfates are the most
commonly used inorganic sources and are sold in
crystalline or granular form. Oxides of zinc and manganese
also are commonly used and are sold as fine powders
and in granular form. Because oxides are water-insoluble,
their immediate effectiveness for crops is rather low in
granular form, Also, the divalent form of manganese
will oxidize to unavailable forms in soil, so there is~rio"
residual availability of manganese fertilizers.
Synthetic chelates are formed by combining a
chelating agent with a metal through coordinate bonding.
Stability of the metal-chelate bond affects availability to plants
of the chelated micronutrients (copper, iron, manganese,
and zinc). An effective chelate is one in which the rate
of substitution of the chelated metal for cations in the
soil is quite low; thus, the metal is maintained in chelate
form. The relative effectiveness for crops per unit of
micronutrient as soil-applied chelates may be two to five
times higher than that of the inorganic sources, while
relative costs may be 5 to 100 times higher.
Natural organic complexes are made by reacting
metallic salts with some organic byproducts of the wood-
pulp industry or related industries. Several classes of these
"compio'urfds~are~theii'gno'sulfon'ates, phenols, and
polyflavonoids. The type of chemical bonding between
the metal and the organic compounds is not well
understood. Although these complexes are less costly per unit
of micronutrient than the chelates, they also are usually
less effective than the chelates.
Fritted micronutrients (frits) are glassy products in.
which solubility is controlled by particle size and matrix
composition. Frits generally are used only on sandy soils
in regions of high rainfall where leaching occurs, This
class of micronutrients is more suited for maintenance
programs than for correcting severe micronutrient
deficiencies. Therefore, frits have only a very small share of
the market.
Industrial byproducts now are being used as
micronutrient fertilizers in the United States because they are
less costly per unit of micronutrient than products
manufactured specifically for the purpose [13]. Oxides of zinc
and manganese are the most common byproducts used.
Because these oxides are dusty and difficult to handle,
they are partially acidulated with sulfuric acid and are
called oxysulfates. Acidulation results in formation of
water-soluble sulfates, which may be more available to
plants. The percentage of water-soluble zinc or
manganese in these oxysulfates is directly related to the degree
461
Table 17.4. Some Micronutrient Sources
Source
Solubility in H2O
% Element
Boron
Na2B407»5H2O (fertilizer borate)
Na2B4O7»10H2O (borax)
Ca2B60n»5H20 (colemanite)
Copper
CuS04»5H2O
CuO
Iron
FeS04*7H20
Fe2(S04)3*9H2O
FeEDDHA (chelate)
Manganese
MnS04«xH20
MnCQ3
MnO
Mn oxysulfate
Molybdenum
Na2Mo04*2H20
(NH4)2Mo04
Mo03
Zinc
ZnS04»H20
ZnSO4*7H20 - .- -.-
ZnO
Zn oxysulf ate
ZnEDTA (chelate)
Soluble
Soluble
Slightly soluble
Soluble
Insoluble
Soluble
Soluble
Soluble
Soluble
Insoluble
Insoluble
Variable
Soluble
Soluble
Insoluble
Soluble
-Soluble- . . -
Insoluble
Variable
Soluble
20
11
10
25
75-
20
20
6
24-30
31
41-68
30-50
39
49
66
36
22
60-78
18-60
6-14
Adapted from Mortvedt [12],
of acidulation of the oxide by sulfuric acid. Research
results have shown that at least 40% of the total zinc or
manganese in granular oxysulfates should be in water-
soluble form to be effective for crops [HI.
17.2.3 Methods of Application
Methods of micronutrient application include
application directly to soil, in foliar sprays, and as seed
treatment. The most common application method for crops
is soil application [12]. Because recommended
application rates usually are less than 10 kg/ha (on an
elemental basis), it is difficult to achieve uniformity when
individual micronutrient sources are applied separately
in the field. Therefore, both granular and fluid fertilizers
are commonly used as carriers of micronutrients.
Including micronutrients with mixed fertilizers is a convenient
method of application, and it allows a more uniform
distribution with conventional application equipment.
Costs also are reduced by eliminating a separate
micronutrient application.
Micronutrients can be combined with NPK fertilizers
by dry mixing, bulk blending with granular fertilizers,
coating onto granular fertilizers, incorporation during
the manufacturing process, and mixing with fluid
fertilizers [12],
17.3 Preparation of Fertilizers Containing
Micronutrients
Micronutrients can be applied in many ways
including foliar application, seed treatment, root dipping of
transplanted seedlings, and application with pesticides.
However, the most popular method is to apply the
micronutrients in admixture with the primary nutrient
462
fertilizer that the farmer regularly uses. The first reason
for this popularity is convenience; the farmer does not
have to devote extra labor to micronutrient application
if the micronutrient carrier is a fertilizer that he is
already using. A second reason is that uniformity of
application is much easier when the micronutrient material
is mixed with a much larger volume of fertilizer. The
purpose of this section is to describe some of the
methods that are used to produce fertilizer mixtures
containing micronutrients and to discuss their advantages and
disadvantages.
17.3.1 Reactions of Micronutrient Materials With
Fertilizers
It should be recognized that when micronutrient
materials are mixed with other fertilizers, chemical
reactions are likely to occur. Lehr [14] has described many
of the numerous chemical reactions. The effect of these
chemical reactions may or may not be important. A
water-soluble micronutrient source may be partially or
wholly converted to a water-insoluble compound.
Conversely, water-insoluble sources may be converted to
water-soluble forms. The gain or loss of water solubility
may or may not be important. Some examples follow.
Soluble salts of copper, manganese, iron, and zinc
are likely to become insoluble when incorporated in
ammonium phosphates or ammoniated mixed fertilizers.
The reaction forms one of several metal ammonium
phosphates such as ZnNH^PCU. In general, the water
solubility decreases with increase in pH of the fertilizer
product. Loss of water solubility does not necessarily
imply loss of effectiveness but may delay it. Sodium
borate when incorporated in ammoniated fertilizers
containing calcium may become partially or wholly insoluble
presumably because of f ormation of calcium borate, {The
boron in calcium borate is insoluble in cold water but
soluble in boiling water) This effect has been noted with
nitrophosphate fertilizers and may occur with other
formulations.
Many water-insoluble micronutrients (oxides,
carbonates, and silicates) become at least partially soluble when
incorporated in superphosphates or mixed fertilizers
containing unammoniated superphosphate.
Some insoluble oxides become soluble when
incorporated in ammonium polyphosphate fertilizers. In
practice, the ammonium polyphosphate liquid fertilizers are
widely used in some countries, and zinc oxide often is
added and dissolved in them. However, solid fertilizers
containing ammonium polyphosphate also will convert
zinc oxide (or carbonate) to a soluble form,
Zinc oxide and cuprous oxide (Cu20) become
partially soluble when incorporated in ammonium nitrate
or nitrogen solutions such as urea ammonium nitrate
solutions, The solubility can be increased by adding
enough ammonia to keep the solution pH at 7 to 8.
The soluble compounds formed are presumed to be zinc
nitrate amine and copper nitrate amine. Because the
addition of copper compounds to ammonium nitrate is
said to sensitize its decomposition, copper is not used in
some countries for solid fertilizers containing a high
percentage of both ammonium nitrate and chloride [15]. In
TVA tests, the addition of zinc to ammonium nitrate did
not cause any increase in explosibility.
Coating of micronutrient materials on granular
fertilizers would be expected to result in less reaction than
would incorporation, but even so, substantial gain or
loss of water solubility of the micronutrient has been
found to occur with coated materials.
When chelated micronutrients are incorporated in
fertilizers, there is less likelihood of reactions that cause
loss of water solubility. Some granulation processes,
however, involve high temperature and use of ammonia
and acids which can cause decomposition or the organic
chelate and consequent loss of availability, Frits are
ordinarily insoluble and remain so when incorporated in
neutral fertilizers, but an increase in solubility was
observed when frits were incorporated in triple
superphosphate.
17.3.2 Dry Mixing
Perhaps the simplest method for producing mixtures
containing micronutrients is to dry-mix the
micronutrient material with the primary nutrient materials. This
method works well with nongranular materials.
Segregation usually is not serious when all materials are fine,
such as less than 1 mm in particle size. Fine materials,
however, are likely to cake, and some micronutrient
materials may promote caking. Caro et al. [16] noted
increased caking of some formulations of dry-mixed
fertilizer when zinc sulfate was added.
Nongranular dry-mixed fertilizers are not popular in
most areas but are still used in some. One of these areas
is in Florida where there are multiple micronutrient
deficiencies. Hundreds of formulations are used, often
custom mixed, so granulation is impractical.
Dry mixing by farmers may be practical in some
countries. Bautista et al. [17] reported that in the
Philippines farmers were supplied with fine granular zinc
sulfate heptahydrate (22% Zn) in 5-kg bags and were
instructed to mix it with the fertilizer used for basal
application for rice to provide about 1 kg of Zn per
hectare, The paper did not say what the primary nutrient
fertilizer was, but prilled urea is the most popular
fertilizer in the Philippines.
463
17.3.3 Bulk Blending
Bulk blending is a form of dry mixing in which all of
the nutrients are granular (e.g., 1.0-3.3 or 2-4 mm).
Micronutrient materials are available in granular form
for use in bulk blends. One problem is segregation;
unless all materials are closely matched in particle size,
segregation will occur in piles, in bins, in spreader trucks,
or during mechanical spreading. If the blends are bagged
from a bin, disparity in particle size will lead to wide
variation in micronutrient content from one bag to
another. This variation can cause poor results because of
oversupply in some spots and undersupply in others.
Hoffmeister [18[ has outlined some methods for
preventing segregation of blends. A blending system that is
used in Ireland effectively minimizes segregation. The
materials for blending are fed continuously from
separate hoppers by weigh belts to a connecting belt where
the materials form layers. The collecting belt discharged
into a continuous mixer which discharges to a small
hopper over the bagging machine. Since the bagging
hopper is being continuously filled and emptied, there is
little chance of segregation. Segregation can still occur
in bags, but it is not likely to be serious unless there is
extreme disparity in particle size. Segregation can also
occur in the field by the action of some types of
mechanical spreaders, but this is not likely to be a problem
in developing countries.
Another problem wim. blends Js.the. sparse_distrihu-_
tion of micronutrient carriers. For example, only one
granule in thirty may be a micronutrient carrier. The
larger the granules the less likely that any one plant will
have a micronutrient granule within reach of its root
system. Also, the higher the concentration of
micronutrient material, the fewer the granules required to
provide a given application rate. This problem is not unique
to bulk blends but would also be encountered in direct
application of granular micronutrient materials. One
method for coping with the problem is intentional
dilution of the micronutrient with either an inert material or
a primary nutrient material. For example,
micronutrient chelates are granulated with clay or vermiculite to
produce granules containing 1%=5% of a micronutrient
element or similar percentages of two or more micro-
nutrients. Several products are available that contain 1%-
10% of one or more micronutrients granulated with one
or more primary nutrients. These products may be used "
in blends.
17.3.4 Incorporation of Micronutrients in Granular
Fertilizers
In most cases incorporation of micronutrients in
granular fertilizers containing one or more primary elements
is not technically difficult. However, it is often
uneconomical to produce small lots of special grades in
large granulation plants, so the practice is economical
only when there is a substantial demand for micronutri-
ent-enriched fertilizers. In several countries in Europe,
there is a need for boron for root crops such as sugar
beets and fodder turnips. Because these crops are
important ones, there is sufficient demand to justify an
economical scale of operation. The boron often is
incorporated in a superphosphate-based PK mixture in
amounts to supply 0.2%-0.5% B. One company in
Germany produces a granular 0-15-25 grade containing
2.5% borax (about 0.3% B) in which the phosphorus is-
supplied by Rhenania phosphate. Production of ground
and granulated PR containing added "trace elements"
has been reported in France. Copper deficiencies often
are encountered in Denmark, and NPK fertilizers
containing copper are marketed there. One German
company has produced an NPK fertilizer in which scrap metal
filings or turnings are incorporated (copper, zinc, or
brass). One company in Ireland produces a fertilizer based.
on superphosphate and ammonium sulfate-containing
boron added as colemanite.
Several companies in the United States market
"premium" fertilizers containing small percentages of two,
three, or more micronutrients. For example, mixtures
containing manganese, iron, and zinc are intended for
soybeans. One company markets premium fertilizer
containing polyphosphates with zinc and iron incorporated
-4n-the-polyphosphate. -Boron is recommended for
cotton in portions of Alabama, Georgia, and Mississippi,
and mixed, granular fertilizers are marketed containing
0.2% or 0.3% B. In general, no important technical
problem would be expected in incorporating the small
amounts of micronutrients that are commonly used.
When larger percentages of micronutrients are
incorporated, some problems may occur. TVA has made a
series of tests aimed at producing materials with
relatively large percentages of micronutrients for use in bulk
blending, Concentrated superphosphate was granulated
with steam in a conventional drum granulator with
addition of anhydrous sodium tetraborate (Na£B407); a small
amount of ammonia was added to decrease the free
acid content of the superphosphate. The scale of the
operation was 10 tph, The product after drying
contained 47% available P205 and 3.4% B [19]. No unusual
problems were encountered when using the anhydrous
borate. When the pentahydrate was used, however, large
balls formed in the dryer, and the granules were soft
and weak. This condition was attributed to release of
water of hydration in the dryer. It was concluded that
the anhydrous sodium tetraborate should be used for
production of this product.
In pilot-plants tests ammonium nitrate was granulated
with zinc oxide, borax, or both to produce granules
464
containing 2.3% Zn and 0.5% B, or 1.9% Zn and 0.7 B
F20l The micronutrient materials were added to hot
concentrated ammonium nitrate solution (95%
NH4NO3), and the mixture was granulated in a pan
oranulator. The granules were dried and screened, and
the fines and crushed oversize were recycled to the granu-
Iator. The boron content of the products was fully water
soluble, and the zinc content was 30%-40% water
soluble. The compound 3Zn(OH)2»NH4N03 was
identified in the water-insoluble portion of the zinc-containing
products. The water-soluble zinc may have been zinc
amine nitrate, Tests showed that the physical properties
of the products were as good as straight ammonium
nitrate and that the sensitivity of ammonium nitrate to
detonation was not increased by borax or zinc oxide. In
subsequent work, granular ammonium nitrate
containing up to 8% Zn was produced by addition of zinc oxide.
One company now markets a product containing 30%
N and 10% Zn.
Zinc oxide was incorporated in ammonium
polyphosphate (15-60-0} during granulation without difficulty
at levels of l%-3% Zn; 80%-100% of the zinc was
water soluble [20]. Although the zinc oxide did not react
with ammonium polyphosphate in absence of water,
when the granules were placed in the soil the
ammonium polyphosphate and 80% of the zinc dissolved and
diffused in the soil. In similar tests with diammonium
phosphate-zinc oxide granules, most of the diammonium
phosphate dissolved and diffused -into-the soil-while-t-he—
zinc remained at the granule site as ZnNH}P04.
Substantial percentages of iron, manganese, and
copper were soluble when appropriate compounds of these
elements were incorporated in granular ammonium
polyphosphate.
17.3.5 Coating of Micronutrients on Granular
Fertilizers
When small percentages of micronutrient materials
are to be added to granular fertilizers, they may be added
as a coating on the surface of the granules. This method
has several advantages. The coating may be added to
homogeneous granular compound fertilizers, to bulk
blends, or to straight (single nutrient) fertilizers. The
coating may be added just before shipment, thereby
avoiding storage of additional grades. Each granule is coated
with a micronutrient as opposed to bulk blends
containing granular micronutrient materials in which only one
granule in thirty may be a micronutrient carrier. The
operation is simple, and the equipment is inexpensive.
Conceivably the coating could be done at the village
level or by individual farmers.
One drawback of the coating method is that the
addition of a micronutrient material (whether coated or not)
lowers the primary nutrient grade. This is a problem in
countries where only prescribed, registered grades can
be marketed. Bulk blenders, however, can easily deal
with this problem. In areas where they are required to
make only registered, whole-numbered grades, the grade
is often adjusted by adding a filler such as crushed,
screened limestone; thus, dilution by a micronutrient can
be compensated for by adding less filler. Another method
for grade adjustment is to use two materials of different
concentration, such as ammonium sulfate and urea, in
varying proportions. Finally, the problem can be solved
by legislation or regulation if the appropriate officials
recognize the problem.
In some states of the United States, bulk blenders are -;
not required to produce guaranteed grades; the farmer
is invoiced for the separate materials, and the merchant
is responsible only for the analysis of the materials used
in the blend. He will then mix the materials as a service
to the farmer. This system has the advantage that
prescription mixing is easy. Disadvantages are that
infractions such as adulteration or errors in proportions are
difficult to detect and the merchant has no incentive to
produce uniform mixtures. In addition, bulk blending by
local retailers has some disadvantages in developing
countries; bulk materials cannot be transported within
the country without loss or deterioration of quality. The
alternative - to transport materials in bags to a local
mixer who will make various mixtures and bag them - is
obviously expensive. __
Some micronutrient materials will adhere to some
granular fertilizers without a binder. One example is a
finely powdered zinc oxide (80% Zn) which was applied
as a coating to granular ammonium nitrate in a rotary
drum such as is commonly used for coating fertilizers
with clay or other conditioning agents. Up to 8% Zn
was applied as a zinc oxide coating with up to 93%
adherence in industrial-scale equipment [19]. However,
adherence decreased to 47% after 6 months' bagged
storage. The addition of steam in the coating drum
increased adherence after 6 months' storage to 72%. More
complete adherence was obtained in pilot-plant tests with
lower percentages of zinc oxide or by using a small
amount of 70% ammonium nitrate solution as a binder.
Achorn and Balay [21] have described plant practices
for adding micronutrients to bulk blends.
Most micronutrients require a binder for good
adherence on the surface of granular fertilizers. The binder
may be oil, wax, water, or fertilizer solution. TVA has
developed and studied procedures for coating. A batch
method was selected because most bulk blenders in the
United States use a batch mixer. The batch method
consisted of the following steps [22]:
1. Charge the mixer with the granular fertilizer to be
blended and the powdered micronutrient.
465
2. Blend dry for 1 minute by rotating the drum mixer.
3. Add the liquid binder through a spray nozzle while
continuing rotation of the mixer (1 minute).
4. Continue mixing for 1 minute.
5. Discharge the coated material.
This procedure gave a more uniform coating than did
the addition of the binder before mixing. Silverberg et
al. [23] reported the results of tests with this procedure
in some detail. In general the best results were obtained
when the micronutrient material was finely ground
(minus 100-mesh or finer). Oils ranging from No. 2 fuel oil
to used motor oil gave good results, but the less viscous
oils were absorbed into the more porous granular
fertilizer causing some loss of adherence with time. A 1:2
mixture of Nos. 2 and 6 fuel oil and a 1: 2 mixture of
microcrystalline wax and No. 2 fuel oil gave the best
long-term adherence. The amounts of binder ranged
from 0.5% to 5,0% of the mixture. In some cases, the
addition of 2% clay improved adherence when water
was used as a binder. Ammonium polyphosphate
solution (11-37-0) was an excellent binder for zinc,
manganese, and iron oxides. The oxides reacted with the
solution to give a hard, smooth coating. As much as
13% of a mixture of these oxides was coated on
granular TSP using 3% of the APP solution as a binder.
Adherence was 100% even after 2 weeks' storage-Aehorn-
and Balay [21] have described some U,S. plant
practices for coating micronutrients on blends.
Use of a 64% solution of ammonium nitrate as a binder
for coating micronutrients on bulk blends has been
described [24], Over 97% adherence was obtained. The
use of liquid fertilizers as a binder was patented [25],
and the process - trade named "Micro-Charger" - may
still be in commercial use.
Coating with oil and clay is a common practice in
European plants for both bulk blends and chemically
granulated mixtures. The usual proportions are about
0.5% oil and 1.0% clay. The coating usually is done in a
continuous drum mixer. The oil is specially formulated
for the purpose. One company in the United States
produces specially formulated oils for dust control on
granular fertilizer [26]. At least one bulk blender coats
micronutrients on blends using clay and water or oil as a
binder [27],
In some developing countries an oil coating is
objectionable to the farmer because it soils the fertilizer bags
which he wishes to reuse for grain storage. A possible
solution to this problem is to use a waxy material that is
a solid at atmospheric temperatures. For example,
adherence of 5% of a powdered micronutrient frit was
satisfactory in laboratory tests with 1% of either
petrolatum or a petrolatum-rosin-paraffin wax mixture as a
binder [28]. The granules were preheated to 49°C. the
molten wax mixture was poured over them in a rotating
mixer, and then the frit was added. Possible further study
is needed to identify acceptable, low-coat binders. Also
most Asian farmers use urea, and methods, for coating
micronutrients on urea seem to have received little
attention. Some micronutrient materials (e.g., zinc sulfate)
form adducts with urea, which might be advantageous
in coating or incorporation.
17.3.6 Fluid Fertilizers
Fluid fertilizers are used in substantial amounts in only
a few developing countries. Two types of fluid fertilizers
are recognized:
1. Clear liquids are fluids in which all or nearly all of the
ingredients are in aqueous solution.
2. Suspensions are fluids that contain solid particles. The
solids may be soluble salts suspended in their
saturated solution, they may be insoluble materials, or
both types of solids may be present,
Fluid fertilizers may be used for foliar application or
for application to the soil. Micronutrient sprays are
often used for correcting deficiencies particularly for tree
crops. A soluble salt or chelate of the micronutrient
material may be dissolved in water to form a solution of
^uital3'leT;r3ri'centratibri7 Firiely'pbwdered insoluble
materials also may be used for foliar application. Because
some metal salts form acidic solutions, the slightly soluble
basic salts may be preferable for foliar application [291.
An example is CuS04»3Cu(OH)2'H20, a basic copper
sulfate,
It is common practice to combine foliar application of
micronutrients with pesticide sprays or with foliar
application of primary nutrients. When two or more
materials are combined for foliar application^ care must be
taken to ensure that the materials are compatible. Many
pesticides are incompatible with solutions of
micronutrients. Incompatibility means that some chemical or
physical change takes place that renders the mixture unusable
or harmful, In general, micronutrient solutions should
be applied separately unless compatibility is shown.
Liquid fertilizers containing micronutrients and one
or more of the primary nutrients are suitable for
application to the soil or for foliar application when diluted
sufficiently to avoid leaf burn. Such liquid fertilizers may
be produced merely by dissolving fertilizer salts in water.
Dry mixtures of water-soluble fertilizer salts are available
that may be marketed as such and dissolved in water
prior to use. However, for large-scale use, it is more
common for the manufacturer to prepare the liquid
mixed fertilizer at his plant for shipment to the farmer.
466
In formulating liquid mixed fertilizers, it is not
sufficient to know that all ingredients are water soluble. Many
reactions may occur that result in formation of water-
insoluble compounds of micronutrients.
In qeneral, most micronutrients are soluble in aqua
ammonia or in solutions containing ammonium nitrate
and urea provided that proper choice is made of the
micronutrient compounds and that free ammonia is
present or added to keep the solution pH above 7. Hester
[30] describes the formulation and preparation of a
solution based on aqua ammonia containing all
micronutrients except iron. The solution contained 17.5% N as
ammonia and ammonium sulfate, 0.29% Mo, 1.1% Cu,
2.0% Mn, 1.9% Zn, 0.9% B, and 0.12% Co. The
metallic elements were added as sulfates, but they were
present in the solution as complex metal amine sulfates.
Boron and molybdenum were added as boric acid and
molybdic acid.
Silverberg et al. [23] have discussed the solubility of
micronutrients in nitrogen solutions and in various NP
and NPK liquid fertilizers. In general, only boron (borax)
and molybdenum (sodium molybdate) were appreciably
soluble in nearly neutral ammonium orthophosphate
solutions. Copper, iron, and zinc, however, were soluble
in ammonium polyphosphate solutions to the extent of
l%-3%, and manganese was soluble to the extent of
0.2%. The production of liquid fertilizers including
ammonium polyphosphate solution has been discussed by
Hignett [31] and in a group of 12 papers in Products
and Techniques for Plant Nutrient Efficiency [32].
Several of these papers discuss the potential advantage of
liquid fertilizers in tropical countries and the
incorporation of micronutrients in liquids.
When micronutrients are incorporated in suspension
fertilizers, solubility is not a technical problem although
it may be an agronomic problem. Soluble or insoluble
compounds of micronutrient elements are added to
suspension fertilizers using materials of small enough
particle size that they are easily suspended and will not clog
spray nozzles. Production of suspension fertilizers
containing micronutrients has been described by Silverberg
et al. [23].
17.4 Other Useful Elements
Although only 17 elements are considered to be
essential for plant nutrition at this time, many other
elements are known to occur in plant tissues. Positive effects
°f some of these elements have been reported by
numerous researchers. Whether any of these elements
eventually will be discovered to be essential for plant
growth remains to be seen. Current criteria for an
element to be considered essential are (a) it must be present
for the plant to complete its life cycle; (b) its action must
be specific and unable to be replaced by that of another
element; and (c) its action must be direct [33],
Another term, beneficial elements, has been proposed
to describe some elements that appear to have specific
functions in plant nutrition but do not meet all of the
three criteria required for essentiality as described above.
Two such elements (cobalt and silicon) will be discussed
here.
17.4.1 Cobalt
Cobalt is essential for animal nutrition, but it has not
been established as essential for plant growth.
Ruminant animals require cobalt for the synthesis of vitamin
B12 by their rumen microflora. This was established about
1935, but an essential role of cobalt in plants was not
demonstrated until 1960 [33]. Cobalt has been found
to be essential for the growth of legumes which rely on
symbiotic nitrogen fixation.
Field responses to cobalt applications by subterranean
clover were reported on sandy soils of South Australia
and Western Australia, Later, it was shown that narrow-
leafed lupins were even more sensitive to cobalt
deficiency. Concentrations of cobalt are less than 1 ppmw
in many plant tissues, which is even lower than those of
molybdenum, a micronutrient. Cobalt application rates
-al5G-are-quite-4ow~Iess--than-l-kg/ha. Although it is
possible to prevent cobalt deficiency of livestock by
applying cobalt-containing fertilizers to pastures, it may be
more practical to supply the cobalt directly to animals in
the form of a "cobalt bullet" given orally to young
animals in cobalt-deficient areas [33].
17.4.2 Silicon
Silicon is the second most abundant element on earth,
and there are sufficient supplies of available silicon in
most soils. Some plant species absorb large quantities
of silicon for example, up to 4% by flooded rice [331.
Grasses grown under upland conditions also absorb
significant quantities of silicon. In such crops, silicon is found
in leaves and stems and is credited with increasing stalk
strength. Sugarcane also is known to have a high silicon
requirement.
Highly weathered soils in the tropics and volcanic soils
generally contain the least silicon. Growth reductions
and "leaf freckle" of sugarcane have been reported on
such soils, which are low in extractable silicon.
Amending these soils with silicate materials has become a
common practice, especially for sugarcane and rice
production. Rates of 5 to 30 t/ha have resulted in
significant increases in sugar production from sugarcane
in Hawaii, for example [34].
467
Other beneficial effects reported on various plant
species include improved resistance to fungus diseases and
insect attack. This may be related to deposition of
silicon dioxide in cell walls of leaf and stem tissues to give
them increased rigidity [33]. Reduction in manganese
toxicity symptoms in crops grown on acid, weathered
soils also has been reported after silicate applications,
Reduced pollen viability due to low silicon uptake has
been reported on several crops. Further research is
needed to better understand the effects of silicon on
plant growth and reproduction,
17.5 Acknowledgment
Section 17.3 of this chapter, Preparation of
Fertilizers Containing Micronutrients, arid appropriate
references, were reprinted from the paper, "Sources and
Production of Micronutrient Fertilizers," by T. P. Hignett
and G. H. McCIellan, 1985, IN Micronutrients in Tropin
cat Food Crop Production, P.L.G. VIek(Ed.), Martinus
Nijhoff/Dr, W. Junk Publishers, Dordrecht, The
Netherlands. All rights reserved. No part of this publication
[Section 17.3] may be reproduced, stored in a retrieval
system, or transmitted in any form or by any means,
mechanical, photocopying, recording, or otherwise,
without the prior written permission of the publishers.
Reprinted by permission of Kluwer Academic
Publishers, . ..... .-_ .
17.6 References
1. Follett, R. K, L. S. Murphy, and R. L. Donahue.
1980, Fertilizers and Soil Amendments, Prentice-
Hall Inc., Englewood Cliffs, NJ, U.S.A.
2. Portsch, S. (Ed.). 1991. The Role of Sulphur,
Magnesium and Micronutrients in Balanced Plant
Nutrition, Potash and Phosphate Institute of
Canada, Saskatoon, Saskatchewan.
3. Mortvedt, J. J., and F. R. Cox. 1985. "Production,
Marketing and Use of Calcium, Magnesium and
Micronutrient Fertilizers," IN Fertilizer Technology
and Use, O. P. Engelstad (Ed.), 3rd. Ed., Soil
Science Society of America, Madison, WI, U.S.A.
4. Adams, F. (Edj. 1984. Soil Acidity and Liming,
2nd Ed. Agronomy Monograph 12. American
Society of Agronomy, Crop Science Society of
America, and Soil Science Society of America,
Madison, WI, U.S.A.
5,Tabatabai, A. (Ed,) 1986. Sulfur in Agriculture,
Agronomy Monograph 27, American Society of
Agronomy, Crop Science Society of America, and
Soil Science Society of America, Madison, WI.
U.SA,
6. Beaton, J. D.; R. L. Fox, and M. B, Jones. 1985.
"Production, Marketing and Use of Sulfur Products,"
IN Fertilizer Technology and Use, O. P. Engelstad
(Ed,), 3rd Ed., Soil Science Society of America,
Madison, WI, U.SA.
7, R. Richmann. 1994. "The BASF Nitrophosphate
Process," IN Nitric Acid-Based Fertilizers and the
Environment, Proceedings of an International
Workshop, R. G. Lee (Ed.), pp. 203-210, SP-21,
IFDC, Muscle Shoals, AL, U.S.A.
8. J. Platz, 1994. "Solid and Liquid Product
Formulation Options with the Nitrophosphate Process," IN
Nitric Acid-Based Fertilizers and the Environment,
Proceedings of an International Workshop, R. G.
Lee (Ed.), pp. 233-238, SP-21, IFDC, Muscle
Shoals, AL, U.S.A.
9, Farm Chemicals Handbook. 1995, Vol. 81, Meister
Publishing Co., Willoughby, OH, U.S.A.
10. Mortvedt, J. J, and J. R. Woodruff. 1993,
"Technology and Application of Boron for Crops," IN
Boron and its Role in Crop Production, U. C.
Gupta (Ed.), CRC Press, Ann Arbor, MI, U.S.A.
11. Mortvedt, J. J., andR. J. Gilkes. 1993.
"ZincFertilizers," IN Zinc in Soils and Plants, A. D. Robson
(Ed.), Kluwer Academic Publishers, Dordrecht, The
Netherlands.
12. Mortvedt, J. J. 1991. "Micronutrient Fertilizer
Technology," IN Micronutrients in Agriculture, J. J,
Mortvedt et al. (Eds.), 2nd Ed., Soil Science Society
of America, Madison, WI, U.S.A.
13. Mortvedt, J, J. 1992. "Use of Industrial By-Prod-
ucts Containing Heavy Metal Contaminants in
Agriculture," IN Residues and Effluents: Processing
and Environmental Considerations, R. G. Reddy,
W. P. lmrie, and P. B. Queneau (Eds,), The
Minerals, Metals and Materials Society, Lakewood, CO,
U.S.A.
14. Lehr, J. R. 1972. "Chemical Reactions of
Micronutrients in Fertilizers," IN Micronutrients in
Agriculture, J. J, Mortvedt et al. (Eds.), Soil Science Society
of America, Madison, WI, U.S.A.
15. Knudsen, K. C. 1972. "NPK Production by Ion
Exchange," Paper presented at 1SMA Technical
Conference, Seville, Spain, November 1972.
16. Caro, J. H., H. P. Freeman, and J.H.L. Marshall.
1960. "Zinc Induced Caking in Mixed Fertilizer and
its Counteraction," Agr. Chem., January.
468
17. Bautista, A. C, J. C. Bunoan, Jr., and R. Feuer.
1980, "Development of the Zinc Extension
Component for Irrigated Rice in the Philippine Masagana
99 Production Program," Presented at the
Symposium on Paddy Soils, Nanjing, China, October 19-
24, 1980.
- 18. Hoffmeister, G. 1973. "Quality Control in a Bulk-
Blending Plant," IN TVA Fertilizer Bulk-Blending
Conference, pp. 59-70, Bull. Y-62, TVA, Muscle
Shoals, AL, U.S.A.
19. McCollum, J. A., R. S. Meline, and B. V. Durham.
1966 "AddingNutrientstoFertilizers,"Chem. Eng.
Progress, 62(9):130-132.
20. Hignett, T. P, 1964. "Problems in Production of
Micronutrients Enriched Fertilizers," IN Proc. 14th
Ann, Meeting of the Fertiliser Industry Round
Table, pp. 50-55.
21. Achorn, F. P., and H. L. Balay. 1973. "Plant
Experience in Adding Pesticides, Micro- and Secondary
Nutrients to Bulk Blends," IN TVA Bulk Blending
Conference, pp. 70-79, Bull. Y-62, TVA, Muscle
Shoals, AL, U.S.A.
22. Young, R. D. 1969. "Providing Micronutrients in
Bulk-Blended, Granular Fertilizers," Commercial
Fertilizer, 118:21-24.
23. Silverberg, J., R. D, Young, and G, Hoffmeister-~
1972. "Preparation of Fertilizers Containing
Micronutrients," IN Micronutrients in Agriculture, J. J,
Mortvedt et al, (Eds.), Soil Science Society of
America, Madison, Wl, U.S.A.
24. Gilbert, R. L., H. R Nau, and T. R. Cox. 1968.
"Coating Micronutrients on Bulk-Blended
Fertilizers," IN Proc. 18th Ann. Meeting of the Fertilizer
Industry Round Table, pp. 66-68,
25; Nau, H. H. 1967. "Method for Preventing
Segregation of Mixed Fertilizer," U.S. Patent No.
3,353,949.
26. Frick, J, O. 1977. "Petroleum-Based DCA's to
Control Fugitive Dusts," IN Proc. 27th Ann.
Meeting of the Fertilizer Industry Round Table, pp.
94-97.
27. Poulton, J. W. 1975. "Bulk-Blending Practices in
the United Kingdom," IN Proc. 25th Ann,
Meeting of the Fertilizer Industry Round Table, pp.
136-140.
28. Hignett, T. P. 1965. "Bulk Blending of Fertilizers:
Practices and Problems," Fert. Soc. Proc. No. 87.
29. Nikitin, A. A. 1960. "Production and Use of Trace
Salts in Fertilizers," IN The Chemistry and
Technology of Fertilizers," V. Sauchelli (Ed,), pp. 435-
445, Reinhold Pub. Co., New York, NY, U.S.A.
30. Hester, J. B. 1962. "Ammoniacal Trace Element
Solution for Agriculture," Agricultural Ammonia
News, May-June, pp, 8-9.
31. Hignett, T. P, 1972, "Liquid Fertilizers: Production
and Distribution," Chemtech, 2:621-637.
32. British Sulphur Corporation, Limited. 1978,
Products and Techniques for Plant Nutrient Efficiency,
British Sulphur Corp. Ltd., London, England.
33. Asher, C. J. 1991. "Beneficial Elements, Functional
Nutrients and Possible New Essential Elements," IN
- ^Micranutrients-in-Agr-iculture, J. J. Mortvedt et al.
(Eds.), 2nd Ed., Soil Science Society of America,
Madison, WI, U.S.A.
34. Fox, R, L, J. A. Silva, O. R, Younge, D. L, Plunknett,
and.G. D. Sherman. 1967. "Soil and Plant Silicon
and Silicate Responses by Sugar Cane," Soi7 Set.
Soc. Am. Proc, 31:775-779,
469
Chapter 18. Physical Properties of Fertilizers
Table of Contents
Page
18.1 Introduction 471
18.2 Physical Properties of Solid Fertilizers , 471
18.2.1 Particle Size 471
18.2.1.1 Effects on Agronomic Response 471_
18.2.1.2 Effects on Granulation and Process Performance 472
18.2.1.3 Effects on Storage, Handling, and Application Properties 472
18.2.1.4 Effects on Blending Properties 472
18.2.1.5 Particle-Size Analysis 473
18.2.2 Density , 473
18.2.2.1 Bulk Density , 473
18.2.2.2 Apparent Density 476
18.2.2.3 True Density 476
18.2.3 Angle of Repose 477
18.2.4 Granule Hardness 478
18.2.4.1 Crushing Strength 478
18.2.4.2 Abrasion Resistance , 479
18.2.4.3 Impact Resistance 481
18.2.5 Hygroscopicity 482
18.2.5.1 Critical Relative Humidity (CRH) 482
18.2.5.2 Moisture Absorption-Penetration Characteristics , 484
18.2.6 Caking Tendency 485
18.2.6.1 Causes of Caking 487
18.2.6.2 Factors "Influencing Caking....,"," ""."..".'...".:: 483
18.2.6.3 Solutions to Alleviate Caking 490
18.2.6.4 Anticaking Agents 490
18.2.6.5 Evaluation of Caking Tendency 491
18.2.7 Dustiness 492
18,2,7,1 Dust Control Agents 492
18.2.8 Other Properties 493
18.2.8.1 Chemical Compatibility in Blends : 493
18.2.8.2 Physical Compatibility in Blends 493
18.2.8.3 Sphericity 494
18.2.8.4 Surface Area 494
18.2.8.5 Porosity 494
18.2.8.6 Melting Point 494
18.3 Physical Properties of Fluid Fertilizers 494
18.3.1 Density/Specific Gravity 495
18.3.2 Viscosity 495
18.3.3 Crystal/Particle Size and Type 497
18.3.4 Crystallization Temperature 497
18.3.5 Settling (Sedimentation) 497
18.3.6 pH 498
18.3.7 Gel Strength 498
18.3.8 Other Properties , 498
18.3.8.1 Clarity , ..498
18.3.8.2 Syneresis :. 498
18.3.8.3 Solidification Temperature 498
18.3.8.4 Pourability , 498
18.3.8.5 Vibrational Settling 498
18.4 References 499
470
Chapter 18. Physical Properties of Fertilizers
18.1 Introduction
Physical quality is an important criterion used by a
consumer in selecting a particular fertilizer. The
acceptability of a fertilizer in the marketplace depends not only
on its nutrient content but also on its physical quality.
Although crop response to the available nutrient
content is the ultimate reason for the use of fertilizers,
physical quality is often the reason for selecting one fertilizer
over another. Good physical condition ensures the
consumer of easier, faster, more uniform, and less
expensive application to the field, Additionally, in a fertilizer
distribution system, it is important that fertilizers remain
free-flowing (noncaking), that they be relatively nondusty,
and that they withstand a reasonable amount of
exposure to normal atmospheric humidity. Many production
techniques, including various physical "conditioning"
treatments, have been developed especially to provide
favorable physical properties [1].
The consumer cannot detect whether a fertilizer
actually meets the guaranteed nutrient content; however,
federal or state laws normally regulate the nutrient
content and thereby give some protection to the consumer.
In contrast, physical condition usually is a matter only of
agreement between purchaser and supplier. Normally,
fertilizer regulatory laws do not regulate fertilizer
physical properties. However, the consumer can certainly
evaluate the physical condition of a fertilizer. Simply by
observation, he can see whether a fertilizer is caked or
free-flowing, dusty or dust-free, wet and sticky or dry.
The quality of a fertilizer product is basically judged by
two criteria: chemical properties and physical
properties. The chemical properties (nutrient content, form,
arid availability to the crop) and their effectiveness
(agronomic response) are the ultimate reasons for the use
of a fertilizer. Good chemical properties are reflected in
the agronomic response. In contrast, the physical
properties of a fertilizer product and its ability to resist
deterioration are important with respect to processing,
handling, storage, field application, and agronomic
response [2].
The most frequently encountered problems resulting
from deficiencies in physical properties are caking
(agglomeration or lump formation), dustiness, poor
flowability, excessive hygroscopicity (moisture
absorption characteristics), and segregation (nonuniformity of
composition throughout a fertilizer lot).
The physical quality of a fertilizer can be evaluated by
many different methods. These methods of
measurement can vary from simple observation to sophisticated
techniques. Producers have adopted and/or developed
methods to evaluate their particular products.
International, national, and regional organizations have adopted,
developed, and/or published procedures intended for
general application to a variety of fertilizer products and
raw materials [1,3,4,5,6,7,8,9,10]. The International
Organization for Standardization (ISO), Technical Corn~
mittee 134/Subcommittee 3 (Fertilizers and Soil
Conditioners/Physical Properties), has been engaged
over the past 15-20 years in developing and adopting
international standard methods of analyzing various
physical properties of fertilizers. Thus far, only six methods have
been designated as international standards [8,10].
This chapter defines the various physical properties;
discusses the effects and importance of these physical
properties on product quality; briefly reviews the types
of methodology used in measuring these properties; and
gives some typical values for most of these properties
for various fertilizers. Literature references are given,
indicating where more detailed information can be
obtained.
18.2 Physical Properties
of Solid Fertilizers
In the following section, most of the physical
properties of solid fertilizers will be discussed.
18.2.1 Particle Size
Particle size distribution of fertilizer products and/or
fertilizer raw materials is defined as the particle
diameter range of the material. Particle size analysis is
typically measured by sieving, a process of separating a
mixture of particles according to their size fraction [11].
Particle size affects agronomic response; granulation and
process performance; and blending, storage, handling,
and application properties. Some of the reasons for size
control follow.
18.2.1.1 Effects on Agronomic Response -
Fertilizer of very low water solubility generally must be
ground to small particle size to ensure sufficiently rapid
dissolution in the soil and utilization by plants. For
example, the effectiveness of raw phosphate rock
generally increases with fine grinding down to a particle
diameter of about 150 um; below that, little further
benefit has been established [12]. Other materials of low
solubility that require relatively fine grinding include
basic slag, limestone, dolomite, dicalcium phosphate, and
fused phosphates [13,141. Micronutrient or secondary
471
nutrient sources of low solubility, such as sulfur, metallic
oxides, and glasses ("frits"), likewise require fine
grinding [1].
The fine grinding required for these materials often
results in undesirable dustiness and other handling
difficulties. Therefore, some research and development has
been directed toward regranulating the pulverized
materials. For example, in the United States, there are
currently a few small commercial limestone granulation
plants. Methods of dust control other than granulation
include spraying the pulverized materials lightly with oil,
water, or amine formulations.
Other fertilizers that benefit agronomically from
particle size control are some of the sparsely soluble slow-
release nitrogen fertilizers such as urea-formaldehyde,
isobutylidene diurea, and oxamide. The rate of
dissolution, and hence the rate of nitrogen availability from
these materials, has been shown to be dependent on
particle size; the larger the particles, the slower the
release.
18.2.1.2 Effects on Granulation and Process
Performance - In the production of granular NPK
products, the agglomeration process is one of two principal
mechanisms utilized, the other being the slurry-based
nitrophosphate-type process. In the agglomeration
process, 50%-75% of the raw materials are fed as "dry"
solids. Because much of the initial (in-process) and final
mechanical strength of the agglomerated granules is
obtained by the mechanical interlocking or fitting of the
individual particles, the particle size and size distribution
of the solid raw materials are very important. If the final
product is in the size range of 2-5 mm, then the raw
materials should be quite widely distributed within a range
of about 0.2-3.0 mm [15].
Compaction is a dry granulation process in which
mixed raw materials are agglomerated by pressure. One
of the characteristics of the feed raw materials that
affects compactibility is particle size, Generally, in order
to obtain optimum compaction, the feed raw materials
should fall within a wide range of particle sizes,
preferably in the range of 0.1-1.0 mm. Material smaller than
0.1 mm will likely contain too much air, and particles
larger than 1.0 mm will require energy to crush them to
a smaller size [16,171,
18.2.1.3 Effects on Storage, Handling, and
Application Properties - Particle-size control of
fertilizers is important to ensure satisfactory storage,
handling, and application properties. Before about 1950,
almost all fertilizers were produced as relatively fine
powders or small crystals. As a result, fertilizers usually were .
dusty during handling and very susceptible to hard
caking during storage in piles or bags. Considerable labor
usually was required to break up the lumps and make
the products suitable for field application. The rapid
growth of granulation in the early fifties, however,
resulted in great improvement in storage, handling, and
application properties. This growth of granulation was
paralleled by improvements in application equipment
that took advantage of the better flow properties and
reduction of caking in granular products [1]..
In the United States, the typical size range of granular
fertilizer products is around 1.00-3.35 mm. The
Association of American Plant Food Control Officials defines
"Granular Fertilizer" as one in which 95% or more of
the product is retained on a series of sieves within the
range of 4.75 mm openings to and including 850 urn
openings, and in which the largest particle passes
through a sieve having an opening not larger than four
times that of the sieve which retains 95% or more of
the product [13[. In European countries and Japan,
granular fertilizers generally are produced in somewhat
larger particle size; sizes reported are generally in the
range of 2.0 to 4.0 mm [18,19,20].
Fertilizers preferably should be free from particles so
small that they generate air-borne dust during handling
and application, not only to ensure farmer acceptance
but also to prevent unhealthy working conditions and
environmental damage around fertilizer plants and bulk-
handling operations,
18.2.1.4 Effects on Blending Properties - Since
_ihe_adventTDf' bulk blending as an important system of
mixing and distributing granular fertilizers, control of
particle size has assumed additional importance as a
method for reducing the segregation tendency of blends.
In some early blending operations, materials were
blended without regard to matching of particle sizes, with
the result that the blends were very susceptible to
segregation (unmixing) during handling. Subsequent studies
identified particle-size matching of blend ingredients as
by far the most important factor in producing a blend
that is resistant to segregation. The effects of mismatches
in other physical properties, namely density and
particle shape, were insignificant in comparison with the
effect of mismatch in particle size [9,21,22,23].
Size range is not sufficiently restrictive to ensure good
size matching for bulk blending. It has been found that
materials for blending should not only agree in regard
to their upper and lower size limits but should also be
reasonably similar in particle-size distribution between
these limits [241.
Mismatched particle sizes in raw materials used for
blending can result in segregation mainly by three
mechanisms: (1) vibration, (2) coning, and (3) ballistic action
[25,26,27].
Fertilizers are subject to vibration during their
transportation by truck, rail, or other means. Various studies
472
have shown, however, that such vibration is not a
significant cause of segregation in most fertilizers,
including typical bulk blends, Segregation due to vibration
becomes significant only when the size differences
between blend ingredients are extreme to the extent that
narticles of one ingredient are small enough to "sift"
downward through the void spaces between particles of
another, larger ingredient [1].
The type of segregation most often encountered in
handling fertilizers is due to flow of material over itself.
This often is referred to as segregation due to "coning"
because in the buildup of conical storage piles there is a
maximum opportunity for this type of segregation to
occur when material dropped on the apex of the pile
flows downward over the pile surface. Particle-size
classification (segregation) occurs as the material flows; the
smaller particles in the fertilizer, being retarded to a
greater extent by frictional resistance of the pile
surface, tend to remain behind and come to rest, whereas
the larger particles continue to travel farther down the
pile surface before coming to rest. The result is a size-
classified (segregated) pile of material [1].
When fertilizer is propelled through the air, such as
by the action of fan-type fertilizer spreaders, particles of
different physical properties follow different paths
because of varying effects of gravity and air drag. The
result is segregation due to ballistic action. Particle-size
differences are the greatest cause of ballistic., segr_ega^_
tion of granular fertilizer blends during spreading; the
larger granules tend to travel farther from the spreader
than do the smaller ones 121,231. Thus, matching of
the particle size of blend ingredients is a sufficient
measure to minimize segregation by both coning and
ballistic actions, the two most troublesome causes of fertilizer
segregation. The fact that fertilizer particle size has a
much greater effect on ballistic segregation than does
particle density is not surprising when consideration is
given to the relative effects on granular weight and thus
on inertia of moving granules. Increasing granule
diameter from 1.18 mm to 3,35 mm increases granule weight
more than twentyfold, whereas the usual range of
fertilizer granule densities (1.3 to 2.7 g/cm3) represents only
about a twofold difference [28]. Air drag, although less
on a small particle, is, according to Stake's law, reduced
only in direct proportion to particle diameter [291.
IS.2.1.5 Particle-Size Analysis - Particle-size
distribution is normally measured by conducting a "screen
analysis" (sieve analysis) of a representative sample on
20-cm-diameter sieves. The sample size recommended
for testing on these sieves varies according to the size
range of the material. The sieves selected for use are
stacked, with sieve apertures increasing in size from
bottom to top in the stack. The sample is placed on the
uppermost sieve of the stack, and the stack is placed on
a stand which is subjected to controlled shaking. During
shaking, each particle in the sample gravitates
downward through screen apertures until it reaches a screen
with apertures too small to allow its passage. At the end
of a specified shaking period, the material on each screen
is weighed individually and the particle-size distribution
of the sample is thus determined. In cases where sieve
analysis of a raw material with micron-size particles is
required (such as phosphate rock), it may be necessary
to perform a "wet" sieve analysis using a wet sieve shaker
[21.
Most countries have standard sieve specifications and
sieve analysis procedures. These specifications and
procedures are usually generic and can be used for a wide
variety of products, including fertilizers. The ISO has a
series of international standards for test sieves [10]
including (1) Test sieves - Woven metal wire cloth and
perforated plate - Nominal sizes of apertures (ISO 565);
(2) Test sieves and test sieving - Vocabulary (ISO 2395);
(3) Test sieving (ISO 2591); (4) Test sieves - Technical
requirements and testing (ISO 3310/1); and (5) Solid
fertilizers and soil conditioners - Test sieving (ISO 839 7).
The ISO sieve series is shown in Table 18.1.
Finally, in the past 10-15 years, methods have been
developed to analyze particle size "on-line" to improve
process control [30,31,32,33,34].
_18.2.2_Density__^_ -
Density is the mass per unit volume of a material.
Three types of density measurements can be determined
for fertilizer products and fertilizer raw materials: bulk
density, apparent density, and true density.
18.2.2.1 Bulk Density - Bulk density is the mass
per unit volume of a fertilizer and includes the voids
between particles. It is of interest in bag/package sizing,
in calibrating volumetric feeders or applicators, and when
considering the capacity of storage bins and transport
vehicles. Bulk density is the most commonly used
density value for fertilizers.
Bulk density is determined by weighing a container,
of a known volume, that is filled level-full with the sample.
There are two types of bulk density measurements -
"loose pour" and "tapped."
Loose pour bulk density is defined by ISO as the mass
per unit volume of a material after it has been tipped
freely into a container under clearly specified conditions.
Loose pour bulk density represents the minimum
density {greatest volume occupancy) expected. To avoid
designing equipment and bags that are too small, loose
pour bulk density is the most commonly used value.
Tapped bulk density is defined by ISO as the mass per
unit volume of a material tipped into a container and
473
Table 18.1. ISO Sieve Series - Nominal Apertures (ISO 565)
Principal
Sizes
(R 20/3}a
liiil
!l!2i
Supplementary
Sizes
(R 20)b
.(mm) -
112
100
80.0
71.0
56.6*
50.0
"Wo1
35.5
28.0
25 0
24!
zO.O
18.0
12 5 - —■
10.0
9 00
IP O05B 5 IZ
7,10"
6.30
5~0<)' '
4.50
5.55
3.15
£50'
2.24 f
' LS0 '
1.60
' i.25!'
1.12
Supplementary
Sizes
(R 40/3)c
106
75.0
53.0
37.5
26.5
"*"M2*
19 0
13.2
9.50
6.70
4.75
3.35
2.36
1.70
1.18
Principal
Sizes
[R 2Q/3)a
^ =E
l- 7b-
Supplementary
Sizes
(R 20)b
-(urn)
900
800
630:
560
■I
450
400
315
280
160
140
71
II
56
36
32
28
25
22
20
Supplementary
Sizes
(R 40/3)c
850
600-
425
300
212
150
106
75
38
32
26
22
a. ISO designation for principal sizes with a ratio difference between sieves of approximately 1.41.
b. ISO designation for principal sizes with a ratio difference between sieves of approximately 1.12.
c. ISO designation for principal sizes with a ratio difference between sieves of approximately 1.19,
474
then compacted under clearly specified conditions.
Tapped bulk density represents the maximum density
(smallest volume occupancy) expected. Generally, when
measuring the bulk density of granular and prilled
fertilizers one can expect tapped bulk density to be 6%-12%
higher than loose pour bulk density.
Dimensions (approximate) In millimeters
tf 300
Figure 18.1. Apparatus for the Determination
of Bulk Density (Loose) of
Fertilizers (ISO-3944).
The ISO has a series of international standards for
bulk density 110J including (1) Fertilizers -
Determination of bulk density (loose) (ISO 3944)- (2) Fertilizers -
Determination of bulk density (tapped) (ISO 5311); and
(3) Fertilizers - Determination of bulk density (loose) of
fine-grained fertilizers (ISO 7837). Figures 18.1, 18.2,
and 18.3 illustrate the ISO equipment for measuring
bulk density. Figure 18.4 is an illustration of an
apparatus developed by the Tennessee Valley Authority (TVA)
for measuring bulk density [3].
Dimensions in millimeters
Rubber sleeve
Measuring-cylinder
holder with guide
clamp
Sleeve
Anvil
Camshaft
Collar
Figure 18.2. Apparatus for the Determination
of Bulk Density (Tapped) by
Machine Tapping (ISO-5311).
475
(a) Closed Position
1 Measuring cylinder
Internal diameter
Internal height
2 Intermediats piece
Internal diameter
Height
3 Hinged cover
4 Filling device
Lower Internal diameter
Upper internal diameter
Height
(b) Open Position
d, = 87 mm ± 1 mm
fy corresponding to a
capacity of 1,000 cm3
± 5 cms
o^ = 87 mm ± 1 mm
h% = 135 mm ± 1 mm
d3 = 79 mm ± 1 mm
d4 = 99 mm ± 1 mm
h$ = 199 mm ± 1 mm
5 Spring-suspended locking lever
Figure 18.3. Apparatus for the Determination
of Bulk Density (Loose) of Fine-
Grained Fertilizers (1SO-7837).
Bulk density values for fertilizers normally range from
750 to 1,500 kg/m3. Typical bulk density values for
some common fertilizers are listed in Table 18-2.
18.2.2.2 Apparent Density - Apparent density is
the mass per unit volume of a fertilizer, excluding voids
between particles. Apparent density is not a property
that is measured frequently, but it has been of special
Straight Edge
Metal Box
Figure 18.4. Metal Box (0.0283 m3) for
Measuring Bulk Density of
Fertilizers.
interest in connection with studies of particle
segregation characteristics and in the development of
granulation processes. For a given product, variations in density
can result in variations in hardness, moisture-holding
capacity, and storage properties.
Determinations of granule apparent density are made
in a special apparatus by submerging a known weight of
the granules and measuring the volume of mercury that
is displaced. Figure 18.5 is an illustration of this
apparatus.
Apparent density values for fertilizer granules typically
range from 1.22 to 2.65 g/cm3. Typical apparent
density values for some common.fertilizer materials are listed
in Table 18.3.
18.2.2.3 True Density - True density is the mass
per unit volume of a fertilizer material, excluding voids
between particles and the pores within the particles. It
is of interest in process control and design of process
equipment. The true density can be determined with an
air-cornparison pyenometer. The pyenometer has two
sample chambers of equal size. One chamber is flooded
with a measured volume of air. The other chamber is
filled with a weighed amount of the ground test sample
and then flooded with a measured volume of air, The
difference in air volumes is equivalent to the sample
volume. The sample weight and volume are used to
calculate the true density. Figure 18.6 is an illustration of a
Beckman air-comparison pyenometer. Typical true
density values for some common fertilizer materials are listed
in Table 18.4.
476
Table 18.2. Typical Bulk Density Ranges of Some Common Fertilizer Materials
Fertilizer
Type
Grade
Prilled urea
Granular urea
Prilled ammonium nitrate (high density)
Crystalline ammonium sulfate
Granular ammonium sulfate
Granular diammonium phosphate
Granular monoammonium phosphate
Powdered monoammonium phosphate
Granular triple superphosphate
Single superphosphate (run-of-pile)
Phosphate rock
Granular potassium chloride
Coarse potassium chloride
Standard potassium chloride
Granular potassium sulfate
46-0-0
46-0-0
34-0-0
21-0-0
21-0-0
18-46-0
11-55-0
10-50-0
0-46-0
16%-20%P2O5
28%-35% P2Os
0-0-60
0-0-60
0-0-60
0-0-50
Bulk- Density
Loose-Pour Tapped
(kg/m3) ~
720-820
720-820
850-975
1,000-1,100
785-1,040
875-1,100
900-1,100
850-1,000
950-1,200
900-1,200
1,200-1,600
950-1,200
1,050-1,150
1,075-1,200
1,150-1,360
820-900
820-900
900-1,025
,100-1,200
850:1,100
,000-1,200
,000-1,200
1,050-1,350
1,400-1.800
i,ooai,2oo
1,100-1.200
1,150-1.300
1,360-1.500
vent
I Stopcock "C"
Vacuum
Vacuum*
Stopcock "B"
He
Overflow Trap
Capillary With
Reference Mark \
Ground-Glass
Ball Joint1
Sample Chamber/
{about 2D mL)
Ground-Glass /^
Ball Joint
5 mL Graduated
' Mlcroburetle
Stopcock "A"
Capillary
Figure 18.5. Apparatus for Determination of
Apparent Density of Fertilizer
Granules.
18.2.3 Angle of Repose
Angle of repose (static) is defined by ISO as the angle
at the base of a cone of fertilizer obtained by allowing a
sample to fall onto a horizontal base-plate under speci-
"fied condftionsTATess rigiH"Hefinitfori is the angle with
the horizontal at which the fertilizer will stand when
poured or dropped into a pile from a fixed overhead
point [1]. For the second definition, the pile of fertilizer
does not have to form a cone to have an angle of
repose and, in fact, this is the most common method of
storage for a large quantity of bulk fertilizer.
Angle of repose is of interest when considering
storage capacity and the design of hoppers, chutes,
conveyors, and sloped roofs of bulk-storage buildings
[35,36,37]. The angle of repose of fertilizers is
influenced mostly by particle shape, size, and surface
texture [38,39].
Angle of repose can be determined by the ISO
procedure, "Solid Fertilizers - Measurement of Static Angle
of Repose" (ISO 8398). This procedure involves
pouring a sample through a fixed funnel onto a level
baseplate, measuring the diameter and height of the conical
pile, and calculating the base angle of the cone from
these measurements. Figure 18.7 is an illustration of the
ISO apparatus for measuring the static angle of repose.
Angle of repose values for fertilizers normally range
from about 25° to about 40°. Spherical products, such
as prilled urea, usually have low angle of repose values
(<30°). Irregularly shaped products, such as granular
477
Table 18.3. Typical Apparent Density Values of Some Common Fertilizers
Fertilizer
Type
Grade
Apparent Density
(g/cm3)
Prilled urea
Granular urea
Granular ammonium sulfate
Crystalline ammonium sulfate
Prilled ammonium nitrate (high density)
Prilled ammonium nitrate (low density)
Granular ammonium nitrate
Granular diammonium phosphate
Granular monoammonium phosphate
Granular triple superphosphate
Granular potassium chloride
Coarse potassium chloride
Granular potassium sulfate
Potassium-magnesium sulfate
46-0-0
46-0-0
21-0-0
21-0-0
34-0-0
34-0-0
34-0-0
18-46-0
11-55-0
0-46-0
0-0-60
0-0-60
0-0-50
0-0-22
1.30-1.32
1.22-1.30
1.58-1.65
1.75
1.65-1.6-7-
1.29
1.50
1.63-1.65
1.67-1.78
1.93-2.12
1.96-1,99
1,96
1.76
2.65
J78 Coupling
Va,ve .Valve
Counter
Sample
Compartment
Sample
Cup
Coupling Purge
Valve Valve
Sample Holder
Clamp Handle
Reference
Hand Wheel
Differential
Pressure
Indicator
Starting
Number
_ Measuring
Hand Wheel
Counter
Figure 18.6. Beckman Air-Comparison
Pycnometer for Measuring True
Density of Solids.
potassium chloride, usually have high angle of repose
values (>35°). Typical angle of repose values for some
common fertilizers are listed in Table 18.5,
~T87274~Granule~Harcuiess
Granular fertilizers should have sufficient mechanical
strength to withstand normal handling and storage
without significant fracturing of granules and creation of
excessive dust. The mechanical strength of fertilizer is
influenced by its chemical composition, method of
production, granule porosity, granule shape, surface
crystals, and moisture content. Three distinct types of
mechanical strength are recognized as desirable: (1)
granule crushing strength, (2) abrasion resistance
(sloughing), and (3) impact resistance [40,41,42].
18.2.4.1 Crushing Strength- Crushing strength
is defined by ISO as the minimum force required to crush
individual particles. It is useful in predicting the expected
handling and storage properties of a granular fertilizer.
Crushing strength is measured by applying pressure
to individual granules, usually of a specified size range,
and noting the pressure required to fracture each
granule. The degree of refinement varies from simple
application of finger pressure to the use of calibrated crushing
test machines [1,8,43,44,45,46]. Use of a simple
finger test, which can be quite useful as a quick field
measurement, is described as follows [47]:
A granule which can be crushed between the thumb
and forefinger is classified as 'soft/ If it can be crushed
478
Table 18.4. Typical True Density Values of Some Common Fertilizer Materials
Fertilizer
Type
Prilled urea
Granular urea
Ammonium sulfate
Ammonium nitrate
Diamrnonium phosphate
Monoammonium phosphate
Triple superphosphate
Potassium chloride
Phosphate rock, central Florida
Phosphate rock, Morocco
Phosphate rock, North Carolina
Phosphate rock, Senegal
Phosphogypsum (various rock sources)
Grade
46-0-0
46-0-0
21-0-0
34-0-0
18-46-0
11-55-0
0-46-0
0-0-60
31%P205
33% P205
30% P205
36% P2Os
-
True Density
(g/cm3)
1.33
1.33
1.77
1.71
1.71-
1,86
2.22
2.00
2.94
3.16
2.74
3.11
2.25-2.75
Counterweight <&=
Funnel
Support
Figure 18.7. Apparatus for the Determination
of Angle of Repose of Fertilizer
(ISO-8398).
with the forefinger on a hard surface, it is regarded
as being of 'medium hardness.' If it remains intact
when subjected to pressure by the forefinger against
a hard surface, it is classified as 'hard.'
A commercial compression tester or a simple kitchen
scale may be used, although the latter is less accurate.
Figure 18.8 is an illustration of a typical commercial
compression tester.
Experience has shown that particles (2.36-2.80 mm
diameter) with a crushing strength less than about 1.5
kg tend to fracture easily and form dust during handling,
particles with a crushirig~'"slTength'bf about 1.5-2.5 kg
are acceptable with special handling precautions, and
particles with a crushing strength greater than about 2.5
kg are highly desirable.
Typical crushing strength values for some common
fertilizers are listed in Table 18.6. When making
comparisons of crushing strength data, it is important to
compare only granules of equal size because crushing strength
increases significantly with increase in particle size.
18.2.4.2 Abrasion Resistance - Abrasion
resistance is the resistance to the formation of dust and fines
and to granule fracturing as a result of granule-to-granule
and granule-to-equipment contact during handling.
Abrasion resistance is determined by measuring the
percentage of dust and fines created by subjecting a sample to
abrasive-type action. There are numerous methods,
mostly developed by producers, for determining
abrasion resistance. Generally, these methods can be divided
into two types: rotary drum type or screen type. Both
types normally use steel balls or steel rods as an
abrading medium. Values obtained from such methods are
useful in estimating expected product degradation
during processing, handling, storage, and application.
In the rotary drum-type methods, a prescreened
sample is weighed and placed in a drum with an abrading
479
Table 18.5. Typical Angle of Repose Values (Ranges) of Some Common Fertilizer Materials
Fertilizer
Type
Prilled urea
Granular urea
Granular ammonium sulfate
Crystalline ammonium sulfate
Prilled ammonium nitrate
Granular diammonium phosphate
Granular monoammonium phosphate
Powdered monoammonium phosphate
Granular triple superphosphate
Granular potassium chloride
Coarse potassium chloride
Standard potassium chloride
Granular potassium sulfate
Phosphate rock (various rock sources)
Grade
46-0-0
46-0-0
21-0-0
21-0-0
34-0-0
18-46-0
11-55-0
10-50-0
0-46-0
0-0-60
0-0-60
0-0-60
0-0-50
Angle of Repose
(degrees)
27-28
34-38
36-38
29-36
29-38"
27-37
28-37
30-34
28-35
32-41
31-35
28-32
28-35
30-35
Kilogram Dial Gauge
Flat-End Rod
Mounted Flat Surface
Handwheel
Flat-End Rod
Fertilizer
Granule
Figure 18.8. Chatillion Compression Tester for
Measuring Granule Crushing
Strength.
medium. The drum is then rotated at a specified speed
for a predetermined period of time. The sample and
abrading medium are removed from the drum, and the
abrading medium is separated from the sample (usually
by hand sieving}. The abraded sample is then
mechanically sieved to separate the dust, fines, and fractured
granules created during the test from the granules that
remained intact.
In the screen-type methods, a prescreened sample is
jveighed and_pJac.ecLon..a- sieve with an abrading
medium. The sieve containing the sample and abrading
medium is placed in a mechanical shaker and shaken
for a predetermined time at a specified amplitude and
frequency. The dust, fines, and fractured granules are
collected in a pan nested below the sieve.
The numerous methods used to measure abrasion
resistance illustrate very well the need for international
standard methods not only for abrasion resistance but
for other physical properties as well. In 1981H. Rieschel
and K. Zech of Maschinenfabrik Koppern GmbH &
Company KG, Germany, published abrasion resistance
data obtained from evaluating four samples with twelve
different methods used by various potash producers [48].
One of the potash samples had abrasion resistance
values ranging from 3.93% to 70.31% degradation,
depending on the method used. Figure 18.9 is an illustration
of one type of rotary drum used to determine abrasion
resistance.
Typical abrasion resistance values obtained using the
rotary drum illustrated are listed in Table 18.7. Urea
prills, which have low single-particle crushing strengths
(Table 18.6), also showed relatively high degradation in
the abrasion resistance test. Likewise, diammonium
phosphate granules, which have high single-particle
crushing strengths (Table 18.6), also showed relatively
480
Table 18.6. Typical Crushing Strength Values (Ranges) of Some Common Fertilizers
Fertilizer
Type
Prilled urea
Granular urea
Granular ammonium sulfate
Prilled ammonium nitrate
Granular diammonium phosphate
Granular monoammonium phosphate
Granular triple superphosphate (accretion process)
Granular triple superphosphate (steam granulation)
Prilled potassium nitrate
Granular potassium chloride
Granular potassium sulfate
Grade
46-0-0
46-0-0
21-0-0
34-0-0
18-46-0
11-55-0
0-46-0
0-46-0
13-0-44
0-0-60
0-0-50
Crushing Strength
(kg/granule)
0.8-1.2
1.5-3.5
1.5-2.5
1.2-1.7
3.0-5.0
2.0-3.0
4.5-8,0
1.5-3,0
1.5-2.0
3.0-5.0
3.0-4.0
Cotter Pin for
Drum Attachment,
to Motor Assembl/^Q
Sleeve tor. w
2-cm Shaft
3-mm-thick
Stainless Steel
19 cm
6-mm Medium Soft Rubber
Glued to 23-cm-diameter
Back Plate of 3-mm-thick
Stainless Steel
5-cm-diameter Opening
Rubber Stopper
Six Flights Equally
Spaced (13 mm high by 2 mm thick)
Motor
Drive
(30 rpm) ^
VIEW DISASSEMBLED
Figure 18.9. Rotary Drum Used in Abrasion Resistance Test.
low degradation in the abrasion
resistance test. However, potassium
-chloride-granules, which have high
single-particle crushing strengths
(Table 18.6), showed relatively high
degradation in the abrasion
resistance test, probably because of the
irregular, block-like particle shape.
18.2.4.3 Impact Resistance -
Impact resistance is the resistance
of granules to breakage upon
impact against a hard surface. It is of
interest when fan-type fertilizer
spreaders are used, when a
material is discharged from an overhead
point such as loading into a ship-
hold, and when bags of material are
dropped during handling.
Impact strength is determined by
measuring granule breakage after a
sample is subjected to a
standardized impact. The impact can be
imparted by dropping a sample
from a given height onto a steel
plate or by impinging a sample
against a steel plate [1,8,46,49].
The impact resistance is normally
calculated by determining the
481
Table 18.7. Typical Abrasion Resistance (Rotary-Drum Method) Values (Ranges) of Some Common
Fertilizers
Fertilizer
Type
Prilled urea
Granular urea
Granular ammonium sulfate
Crystalline ammonium sulfate
Prilled ammonium nitrate
Granular diammonium phosphate
Granular monoammonium phosphate
Granular triple superphosphate (accretion process)
Granular triple superphosphate (steam granulation)
Prilled potassium nitrate
Granular potassium chloride
Granular potassium sulfate
Grade
Abrasion Resistance
46-0-0
46-0-0
21-0-0
21-0-0
34-0-0
18-46-0
11-55-0
0-46-0
0-46-0
13-0-44
0-0-60
0-0-50
(% degradation)
10.0-30.0
0.2-3,0
0.2-1.0
6.0-10.0
1.5-27.0
0,5-2.0
0.5-2.0
ai-r.o
1.0-5,0
10.0-20.0
2.0-5,0
5,0-7.0
percentage difference in round granules (sphericity
discussed later in this chapter) before and after the impact
test or by prescreening the sample to a specified size
before the impact test and then rescreening the sample
after the test to determine the amount of breakage.
Figure 18.10 is an illustration of the equipment used
in a typical drop-type impact resistance test. Typical
impact resistance values (based on the illustrated drop-
type equipment using the screening procedure) for some
common fertilizers are listed in Table 18.8.
18.2.5 Hygroscopicity
Hygroscopicity is defined as the moisture absorption
properties of a fertilizer under specified conditions of
humidity and temperature, Most fertilizer products are
hygroscopic to some extent because of their normally
high water solubility. However, the more hygroscopic a
fertilizer is, the more problems one can expect during
storage and handling. Factors that normally influence
the degree of hygroscopicity in fertilizers are (1)
chemical composition, (2) moisture content, (3) ambient
temperature, (4) relative humidity, (5) particle structure and
porosity, (6) exposure time, and (7) particle surface area
150,51,52].
The hygroscopic properties of a fertilizer can be
quantified and qualified by measuring the critical relative
humidity and its moisture absorption-penetration
characteristics,
18.2.5.1 Critical Relative Humidity (CRH)-The
CRH of a material is defined as the relative humidity of
15-cm-diameter
Pipe
200-mL Graduated
Cylinder Containing
Sample
10.7 M (35 ft)
Pipe Cap
Metal Plate
(5 mm thick)
Figure 18.10. Impact Resistance Test for
Measuring Strength of Granules.
the atmosphere at which the material begins to absorb
moisture from the atmosphere and below which it will
not absorb atmospheric moisture. The major factors that
dictate the CRH of a fertilizer are its chemical
composition and the ambient air temperature [2].
All soluble salts, including fertilizer salts, have
characteristic CRHs, Chemically speaking, the CRH of a salt is
482
Table 18.8. Typical Impact Resistance Values (Ranges) of Some Common Fertilizers
Fertilizer
Type
Prilled urea
Granular urea
Granular ammonium sulfate
Prilled ammonium nitrate
Granular diammonium phosphate
Granular monoammonium phosphate
Granular triple superphosphate
Prilled potassium nitrate
Granular potassium chloride
Granular potassium sulfate
Grade
46-0-0
46-0-0
21-0-0
34-0-0
18-46-0
11-55-0
0-46-0
13-0-44
0-0-60
0-0-50
Impact Resistance
(% shattered granules)
5.0-15.0
0.1-1.0
0.1-0.5
3,0-6,0
0.5-1.5
0.5-1.5
0.0-1.0
5.0-10.0
2.0-5.0
5.0-10.0
that humidity of air at which the partial vapor pressure
of water in the air exactly equals the equilibrium water
vapor pressure above a saturated solution of the salt at
any given temperature [1].
For a fertilizer, a relatively high CRH is an advantage
because such a material can be exposed and handled
under more humid atmospheric conditions without
becoming wet and nonflowable or without absorption
of moisture that might later promote caking, The CRH
of a fertilizer affects, to a large extent, (1) wetting of
bulk-pile surfaces; (2) the mass transfer of moisture within
a pile or bag; (3) sticking and buildup on equipment;
(4) compatibility in bulk blends; and (5) the choice of
handling in bulk or bag and, if bagged, the type of bag
required. However, the importance of CRH in other
regards should not be overestimated. For example, CRH
is sometimes mistakenly considered to be a universal
measure of caking tendency in fertilizers. Actually, if a
fertilizer is stored in a moisture-resistant bag or in a
protected (plastic covered) bulk storage pile, atmospheric
humidity is effectively excluded and CRH is of relatively
little importance. In those situations, caking when it
occurs is related to other factors, such as constituent
moisture content of the fertilizer, chemical reactions, ambient
air temperature, storage pressure, presence of fines, and
efficiency of any conditioning treatment. Even in regard
to bulk exposure of fertilizer, CRH is not the only
property that governs behavior under humid conditions. CRH
is strictly a quantitative measure indicating whether or
not moisture will be absorbed by a material at a
specified relative humidity and temperature. The CRH says
nothing as to how well or how poorly the fertilizer will
tolerate the absorbed moisture. A fertilizer has other
properties (discussed later in this section) that can be
determined to more fully define its hygroscopic
-properties, _______.._ .
The simplest, most relevant method by which to
measure the CRH of a fertilizer is to expose a sample to
progressively higher relative humidities at a
predetermined temperature. The lowest relative humidity at which
a "significant amount of moisture" is absorbed
(determined by frequent weight checks) is taken as the CRH.
A significant amount of moisture for a fertilizer can vary
depending on the type and nature of material being
tested. What is significant for one fertilizer may not be
significant for another fertilizer The determination is
most conveniently made in a laboratory temperature-
humidity chamber equipped with forced air circulation
and mechanical refrigeration for humidity control. In the
absence of a prefabricated environmental chamber, CRH
determinations can be done in a simple, insulated,
moisture-tight cabinet equipped with an electric circulating
fan, an electric heater, a wire-mesh sample shelf, and a
large glass dish to hold a humidity-controlling salt
solution. However, use of this equipment can result in data
that are not reproducible, and the procedure is slow and
time-consuming.
Several other procedures have been reported for
determination of CRH of fertilizers and pure fertilizer salts
[53,54,55,56,57,58]. In general, these are static,
indirect methods that do not simulate practical exposure
483
conditions and cannot distinguish true CRH from
secondary absorptions due to impurities.
Data obtained from typical CRH determinations
utilizing the method described above are shown in Figure
18.11. The data obtained for prilled urea are typical of
relatively pure materials, in that the critical point is quite
definite. There was no moisture absorption in 3 hours
at 70% relative humidity, but there was continuous
absorption at 75%. The data shown for the fertilizer grade
diammonium phosphate, on the other hand, illustrate
typical behavior of fertilizers that contain small amounts
of soluble impurities. It is obvious that the CRH of the
main constituent is between 70% and 75%; for
practical purposes, however, it would have to be recognized
that exposed product would pick up some moisture at
relative humidities between 60% and 70%. At 70%
relative humidity, a maximum of 2% would be absorbed.
For most diammonium phosphate products, this is
insufficient to cause intergranule transfer of moisture; thus,
only the surface granules would be affected in a bulk
12
glDr-
£
f 8
n
1 6
Prilled Urea
Hie Sharp Definition of
CHH (70%-75%) IS
Typical ol a Relatively
Pure Material
Diammonium Phosphate
The Lack ol Sharp Definition of CRH
(65%-75%) is Typical of Products Thai
Contain Soluble Impurities
of 70%-75% at 30°C) where the CRH of a mixture of
these two fertilizers is approximately 18%. Table 18.9
also lists CRH ranges of some commercial fertilizer
products [2].
The CRH of most fertilizers decreases with increase
in temperature. Figure 18.13 shows the effect of
temperature on the CRH of some typical commercial
fertilizers [60,61],
18.2.5.2 Moisture Absorption-Penetration
Characteristics - Determination of CRH definesjhe^-
humidity above which a fertilizer will absorb moisture
from the atmosphere, However, the CRH gives no
information as to how rapidly moisture will be absorbed
or what effect the moisture absorption will have on the
physical condition of the fertilizer. Fertilizers vary
considerably in their ability to tolerate absorbed moisture.
When a fertilizer is exposed to relative humidities above
its CRH, the factors that most affect the moisture
absorption-penetration characteristics of a fertilizer are its
chemical composition, particle porosity,
particle surface area, and degree of crystallinity.
Moisture absorption-penetration characteristics
are important when considering conditions at
which a fertilizer is to be stored, when
predicting its flowability during handling and
movement through the distribution system, and
during field application [28,62,63,64],
0 1
■ * t i -T-+-*
23012301230123
65% 70% 75%
60%
Hours of Exposure at Indicated Relative Humidity |30°C).
Figure 18.11. Data Obtained From CRH Measure
ment of Fertilizer Grade Urea and
Diammonium Phosphate.
pile. One of the chief advantages of this method is this
ability to distinguish between true CRH and secondary
absorptions due to impurities.
Mixtures of fertilizers usually have lower CRHs than
either of the constituents. The chart given in Figure
18.12 shows typical CRH data for commercial
fertilizers and mixtures of these fertilizers [591. The effect of
mixing fertilizers is most dramatic in the case of
ammonium nitrate (CRH of 55%-60% at 30°C) and urea (CRH
Laboratory Absorption-Penetration
Test
The surfaces of bulk storage piles frequently
are exposed to humid atmospheres; thus, it is
of interest to know how rapidly moisture will
be absorbed and how rapidly and to what depth
wetting and physical deterioration will progress.
The laboratory absorption-penetration test
provides a method for evaluating these effects of
pile exposure [1,3,8],
The laboratory absorption-penetration test
involves exposing a bulk fertilizer surface of
known area to moving air at a controlled
temperature and humidity for an extended period
of time in a constant temperature-humidity
chamber. Samples are exposed in glass cylinders as
illustrated in Figure 18.14. Samples are normally
evaluated periodically during the extended exposure time. The
samples are evaluated by measuring (1) the rate of
moisture absorption per unit of fertilizer surface; (2) the depth
of moisture penetration into the fertilizer; (3) the
moisture-holding capacity of the individual fertilizer particles;
and (4) the integrity of the wetted granules. Typical data
from this test for some common fertilizer materials are
given in Table 18.10,
484
.Urea
I 46-0-Q
Ammonium Nitrate
AN M-°-°
Ammonium Nitrate Limestone
QAN gS-O-Ol
Ammonium Sulfate
AS 21-0-0
Ammonium Chloride *
26-0-0
Triple Superphosphate
TSP 0-46-0
Diammonium Phosphate
DAP 1B-46-0
Monoammonium Phosphate
MAP _ lg-50-0
Potassium Chloride
MOP 0-0-60
Potassium Sulfate
BOP
0-0-50
Sodium Nitrate
16-0-O
Nitric Phoephste
20-20-0
Nitrale NPK
20-10-10
Nitrate NPK
Sulfate NPK
13-13-13
Urea Ammonium phosphate
UAP 2B-28-0
Urea Ammonium Phosphate
UAP 35-17-0
% Relative Humidity
* Reagent Grade Salt
Note: Determinations were made on commercial materials. CRH
Values are approximate and may vary several points depending
on production method and source of material.
Figure 18.12. Critical Relative Humidities of
Commercial Fertilizers and of
Mixtures at 30DC. '"—
It is interesting to note that neither rate of moisture
absorption nor depth of moisture penetration correlate
with CRH. Neither did depth of moisture penetration
correlate with rate of moisture absorption; this is a
result of differences in "moisture-holding capacity."
Moisture-holding capacity represents the maximum
amount of moisture that a granule will absorb before it
becomes so wet that moisture will be transferred to
adjacent granules by capillary action. High
moisture-holding capacity is a desirable characteristic that can offset
the effects of high rate of moisture absorption.
Moisture-holding capacity apparently is related to both the
chemical composition and the porosity of the granules.
Pure crystalline fertilizer salts such as urea and
ammonium nitrate generally are nonporous and have low
moisture-holding capacities. Some impurities, for
example, iron and aluminum phosphates from
wet-process acids, decrease the crystalline phase and increase
the amorphous phase in fertilizers and are beneficial in
increasing moisture-holding capacity.
Results of the laboratory absorption-penetration tests
are indicative of expected bulk fertilizer behavior under
steady, high-humidity conditions, but it should be
realized that under cycling conditions, such as occur in
actual storage, the results may be altered by crusting
(self-sealing) of pile surfaces of some materials during
dry cycles. Also, it should be realized that under such
cycling conditions products with high CRH values will
be nonabsorbing a greater portion of the time than will
products with low CRH values,
Flowability Test
In addition to pile exposure, fertilizers are also
frequently exposed to humid environments during handling"
and movement through the distribution system and
during field application. In those operations, the effect of
moisture on flowability is the major concern. Even though
two fertilizers may have similar CRH values, they may
differ significantly in their ability to remain flowable
under humid conditions. The flowability test provides a
method for evaluating the ability of a fertilizer to remain
free flowing under humid conditions [1,8]. In this test,
flowability is determined by measuring the length of time
a material will remain flowable in a rotating drum under
elevated humidity conditions (in a constant temperature-
humidity chamber). Figure 18.15 is an illustration of the
rotary drum used in this procedure to measure flowability.
Typical flowability data for some common fertilizers are
given in Table 18.11. In addition to determination of
free-flow time, the sample can be analyzed at the end of
__the_test-to-deter.mineJiie.-moisture-content at which the
product became nonflowable,
Several other methods have been developed,
including small-pile storage tests and drillability tests, to
evaluate the.degree of moisture tolerance of fertilizers. All of
these tests have some merit and can ..be found in the
literature [1,2,3,8,65,66,67,68,69,70L
18.2.6 Caking Tendency
The ISO defines caking as "the formation of a
coherent mass from individual particles" [11]. Fertilizers,
between the time of production and field application, must
be stored, either in bulk or in bags. Storage times can
vary from a few days to a year or more. It is essential
that, during storage, either the fertilizer remain
completely free flowing or the caking be so minimal that a
small amount of normal handling will restore the
original free-flowing condition. It is not possible to give a
universal criterion as to what degree of caking is
tolerable because requirements differ widely in different
areas and for different uses. Where machine application
is employed, complete freedom from lumps is highly
desirable, although a few (up to perhaps 15%) light lumps
may be acceptable. For hand application, where labor
is available and each bag can receive individual treatment,
a higher percentage of lumps and the presence of lumps
of medium hardness may not be considered intolerable.
485
Table 18.9. Critical Relative Humidity (CRH) of Some Typical Fertilizer Products
Grade
Composition3
CRH (at 30°C)
46-0-0
34-0-0
21-0-0
18-46-0
12-50-0
0-46-0
0-0-60
13-0-44
0-0-50
10-10-10
8-32-16
10-5-18-2MgO
20-10-10
28-28-0
20-20-0
16-0-30
18-18-10
17-17-17
19-19-19
15-15-15
12-12-17-2MgO
12-12-17-2MgO
Urea
Ammonium nitrate
Ammonium sulfate
DAP
Monoammonium phosphate
TSP
KCI
Potassium nitrate
Potassium sulfate
Ammonium sulfate, ammonium phosphate, KCI, sand
Ammonium sulfate, ammonium phosphate, KCI, sand
Ammonium sulfate, phosphate rock, KCI, kieserite
Ammonium nitrate based
Urea, APP
Urea, DAP, phosphate rock
Urea, KCI
Urea, DAP, phosphate rock, KCI, neem cake, filler
Urea, ammonium sulfate, DAP, KCI
Urea, APP, KCI
Urea, DAP, KCI, sand
Urea, phosphate rock, KCI, kieserite
Nitrophosphate
70-75
55-60
75-85
65-75
70-75
75-85
-70=8tr
80-85
75-80
65-75
65-75
6O70
55-60
55-65
50-60
45-55
45-55
45-55
50-60
45-50
40-50
60-65
a. DAP = diammonium phosphate; TSP
polyphosphate. - - -—-.—-
triple superphosphate; KCI = potassium chloride; APP = ammonium
80
70-
60-
"E
o
50'
> 40-
tr
-= 3<H
20-
10-
o-hv
Monoamrnoraum Phosphate
(11-52-0)
Urea-Potash NK
(16-0-30)
Nitrophosphate NPK
(17-6-18-2 MgO)
30
40
1 1
50 60
Temperature,
—p.
70
80
Figure 18.13. Effect of Temperature on
Critical Relative Humidity of
Selected Fertilizers.
Moisture
Penetration
20 cm
6.8 cm
Inside
Diameter
Figure 18.14. Glass Cylinder Used in Measuring
Moisture Absorption and
Penetration in a Fertilizer.
486
Table 18.10- Moisture Absorption-Penetration Characteristics of Some Typical Granular Fertilizer
Products
Moisture Absorption-Penetration Characteristics
(3Q°C, 80% Relative Humidity for 72 h)
Grade
46-0-0
21-0-0
18-46-0
0-46-0
0-0-60
6-24-24
10-10-10
13-13-13
28-28-0
17-17-17
12-19-9
15-15-15
12-12-17-2MgO
Composition11
Urea
Ammonium sulfate
DAP
TSP
KC1
Ammonium sulfate, ammonium phosphate,
KCl, sand
Ammonium sulfate, ammonium phosphate,
KCl, sand
Ammonium sulfate, ammonium phosphate,
KCl, sand
Urea, APP
Urea, ammonium sulfate, MAP, KCl
Urea, phosphate rock, KCl
Urea, phosphate rock, KCl, sand
Urea, phosphate rock, KCl, kieserite
Moisture
Absorption
(mg/cm2)
350
100
175
235
135
280
270
365
370
580
450
490
445
Moisture
Penetration
[cm}
15
0
■2
2
3
2
4
4
3
6
■ 5
6
5
Holding
Capacity
(%)
3
-
12
12
5
15
7
9
15
12
8
8
7
Granule
Integrity15
Fair-good
Excellent
Fair-good ■
Excellent
Good
Fair
Poor
Fair
Poor
Poor
Poor
Poor
Poor
a. DAP = diammonium phosphate; TSP = triple superphosphate; KQ « potassium chloride; APP = ammonium polyphosphate;
MAP = monoammonium.phosphate.
b. Granule integrity is a qualitative observation based on the strength of the top layer (surface] of granules after exposure for
72 h.
Concentric circles etched on back
wall o1 drum Indicating percent
nanllnwability when trial line
becomes visible during lent time.
75%(l25cm3)
50% (250 cm3)
25% (375 cm')
0% (500 cm')
Figure 18.15. Rotary Drum for Measuring
Flowability of Fertilizer When
Exposed to Humid Conditions.
18.2.6.1 Causes of Caking - Caking of fertilizer
is caused by the formation of contact points between
the particles (granules, prills, tablets, briquettes,
powder, crystals, etc.). These contact points differ in nature
and basically have three mechanisms, namely, phase
contacts, adhesive contacts, and surface diffusion [71].
Phase contacts (salt bridges) are crystal bridges formed
at the contact points between the fertilizer particles
[72,73]. The most troublesome caking of fertilizers is
believed to be caused by crystal bridging. Crystal bridges
develop during storage as a result of continuing internal
chemical reactions, dissolution/recrystallization
processes, and/or thermal effects [74,751.
Adhesive contacts (capillary adhesion) are formed as
a result of molecular attraction between the surfaces in
contact [76,77]. The forces of attraction involved in this
phenomenon, known as Van der Waals forces, are
considered to be relatively weak. This type of contact is
influenced mostly by the plasticity of the particles and
the pressure exerted on the fertilizer material when it is
stacked in bags or piled in bulk, usually referred to as
bag or pile set. The material normally reverts to a free-
flowing form rather easily with a minimal amount of
handling.
487
Table 18.11. Rowability (During Humid Exposure) of Some Typical Granular Fertilizer Products
Flowability (Minutes at 30°C and 90% RH)
Grade
46-0-0
34-0-0
21-0-0
18-46-0
11-52-0
0-46-0
6-24-24
10-10-10
19-19-19
12-6-22-3MgO
12-6-22-3MgO
Composition3
Urea
Ammonium nitrate
Ammonium sulfate
DAP
Monoammonium phosphate
TSP
Ammonium sulfate, ammonium phosphate,
KCI, sand
Ammonium sulfate, ammonium phosphate,
KCI, sand
Urea, APP, KCI
Urea, phosphate rock, KCI, kieserite
Ammonium nitrate based
25% Nonflowable
5
7
175
70
SO
ISO
155
75
10
31
37
50% Nonflowable
10
12
220
130
165
240
175
90
20
38
43
75% Nonflowable
15
" 16
280
180
190
300
205
105
30
40
48
a. DAP = diammoniLim phosphate; TSP = triple superphosphate; KCI = potassium chloride; APP = ammonium
polyphosphate.
Surface diffusion is a result of water-salt complexes
consisting of pairs of hydrated ions that are transported
within an adsorbed phase and then form contacts with
adjacent granules. The diffusional mechanisrrrofraking"
in fertilizers is greatly influenced by the porous structure
of the particles [78,79,801.
18.2.6.2 Factors Influencing Caking - A
number of factors influence the tendency of a fertilizer to
cake, These factors can be divided into internal factors,
related to the physical-chemical constitution of the
fertilizer, and external factors, related to the
environmental conditions to which the fertilizer is exposed during
handling and storage, Obviously some of these factors
are interrelated. Identification and review of factors that
have an influence on caking tendency have been the
subject of numerous publications [71,72,73,76,81,82,
83,84,85,86],
Internal Factors
1. The chemical composition of fertilizers has an effect
on the caking tendency. For example, it has been
shown that the caking tendency of ammonium nitrate-
based and urea-based NPK fertilizers is greater than
that of ammonium sulfate-based and ammonium
phosphate-based NPK fertilizers [87,88,89,90], Even
impurities may affect caking. Fertilizer products made
from wet-process phosphoric acids characteristically
contain significant proportions of iron and aluminum
phosphate impurities, which have been shown to
serve as effective internal anticaking agents in those
products [91,92,931- The iron and aluminum
phosphates are found in the products as amorphous "gels"
"^"alrharde'nlherproductsand apparently immobilize
solution phases. Formation of the iron and
aluminum phosphates under relatively high pH and low
temperature conditions promotes the gel-type
structure rather than crystalline forms [94].
The amount of moisture allowed to remain in a
fertilizer at the time of its manufacture has a great
effect on its tendency to cake in storage. For most
caking mechanisms, the presence of moisture, in the
form of solution phase, is essential. The higher the
degree of drying at the time of manufacture, the less
active the caking mechanisms will be. The extent of
drying required to effectively inactivate caking
mechanisms varies rather widely with the composition and
physical makeup of the fertilizer. Generally, those
fertilizers that contain high proportions of nitrogen
salts require a greater degree of drying. This is
particularly true for fertilizers that contain ammonium
nitrate or urea. The following tabulation offers some
very general guidelines on maximum product
moisture content for granular fertilizers. These values
should be used only in a general way because
numerous processing variations alter the effects of
moisture on storage and handling properties of a given
fertilizer composition. The values given represent
"free water" content (nonhydrate water).
488
Product Moisture, 0%-0.5%
Ammonium nitrate
Urea
Ammonium sulfate
Calcium nitrate
Sodium nitrate
Potassium chloride
Product Moisture, 0.596-1.0%
Mixed fertilizers that contain urea or ammonium
nitrate
Product Moisture, 1.096-1.5%
Mixed fertilizers with N:P20s ratios greater than 1:1
that contain no urea or ammonium nitrate
Product Moisture, 1.5%-2.0%
Mixed fertilizers with NiPzOs ratios less than 1:1 that
contain no urea or ammonium nitrate
Product Moisture, Above 2.0%
Mixed fertilizers containing little or no nitrogen
Superphosphates
3. The size, shape, and structure of the particles are
also important. If the partides-are-relatively-Iarger
well formed, and uniform in shape and size with very
little fine material, the specific surface area is reduced
[95], Consequently, forces of attraction and points
of contact between adjacent particles are reduced,
lowering the tendency to cake.
4. The mechanical strength or hardness of the particles
has an effect on the caking tendency. Weak granules
may break down under stack or pile pressure
(crushing strength) or during handling (abrasion and
impact strength) [95], As a result, a substantial quantity
of fines can be created and thereby increase the
number of contact points between particles,
5. The hygroscopic properties of the product can have
an effect on the degree of caking [96], All fertilizers
have a CRH above which they will absorb moisture.
Caking as a result of moisture absorption is usually
along the pile surface and with prolonged exposure
to elevated humidities can become quite deep.
6. The temperature of the product when placed in
storage is another important factor having an effect on
caking tendency [97,98,99,100]. Higher
temperatures increase the chemical reactivity, such as the re-
evaporation of water, which results in recrystallization
and formation of solid crystalline bridges.
Additionally, a high product temperature can promote the
development of plastic-like particles that deform
under pressure. This deformation promotes both
crystal bridging and capillary adhesion. After conducting
extensive research on the caking tendency of urea
Van Kijfte stated, "Urea being fed to the stockpile at
50°C to 70°C will definitely form strong cakes. The
lower the feed temperature, the lower the tendency
to cake. The conclusion of these studies was that if
the urea is cooled below 30°C before entering
storage, there is less agglomeration and, mainly, the
agglomerates are softer" [101]. Diammoniiim.pho.sz_
phate, on the other hand, usually needs to be cooled
only to about 70°C.
External Factors
1. The warehouse or storage temperature is important
with respect to caking tendency. Higher ambient
temperatures lower the CRH of a fertilizer material and
thereby increase its hygroscopicity. For example, the
CRH of a 15-15-15 nitrophosphate is approximately
55% at 30°C, whereas it is approximately 45% at
40°C. Conversely, raising the temperature of
existing warehouse air will reduce the relative humidity
{RH). This method can be employed to lower the
warehouse RH below the CRH of the fertilizer.
2. The humidity of the surrounding atmosphere has an
—effec1~on_cakingT~AsTri'entioned previously, when a
fertilizer is exposed to a RH above its CRH,
absorption of moisture will take place. Saturated solutions
will then be formed at the granule surface,
promoting capillary adhesion and crystallization processes
due to changes in temperature or subsequent
evaporation. Here the severity of caking depends mainly
on the rate of absorption. The rate of absorption is
dependent on factors such as (1) the difference
between the RH of the air and the CRH of the
fertilizer, (2) the movement of air with a constant RH
over the fertilizer, (3) the moisture-holding capacity
of the fertilizer as influenced by the granulometry and
porosity, and (4) the rate of penetration into the bulk
fertilizer pile [85].
3. The length of storage time influences caking, In most
cases, the tendency of a fertilizer to cake is highest
during the first few weeks after production.
However, if a fertilizer has a tendency to cake, prolonged
storage periods will generally result in a significant
increase in caking.
4. The pressure exerted at the bottom of a stack or pile
of fertilizer has a definite effect on caking [102]. As
with storage time, if a fertilizer has a tendency to
cake, excessive and prolonged pressure will result in
a significant increase in caking. Under pressure,
489
particle deformation may occur, resulting in increased
contact area.
18.2.6.3 Solutions to Alleviate Caking -
Various measures by the fertilizer industry have proven
beneficial in alleviating caking, including the following:
1. Various drying processes to obtain a product with a
low moisture content,
2. Various cooling processes to obtain a product with a
low temperature.
3. Various granulation, prilling, and pelletizing processes
to produce larger particles thereby decreasing the
surface area and number of contact points between
particles,
4. The use of screening equipment to obtain a more
uniform particle size thereby decreasing the surface
area and number of contact points between particles.
5. The control of storage conditions such as RH,
temperature, pile height, and storage time.
6. Packaging fertilizer products in moisture-resistant
bags.
7. The addition of anticaking agents (conditioners).
As indicated, much can be done to decrease the cak-
ing-tendency by improving-both process-and-storage-
conditions. However, there is always a practical and
economical limit to the improvements that are possible.
Thus, in many cases the use of an anticaking agent in
combination with process and storage control is the
obvious answer to caking problems. However, it should
be emphasized here that an anticaking agent cannot be
used to compensate for a poorly produced or handled
fertilizer.
18.2.6.4 Anticaking Agents - An anticaking agent
is a material added to a fertilizer to promote the
maintenance of good physical condition (flowability) during
storage and handling. Anticaking agents can be classified
into two categories according to the method of
application: coating agents and internal conditioners.
Coating Agents
Coating agents are conditioning materials that are
applied uniformly onto the surface of the fertilizer
particles. Most coating agents are either very finely divided
inert powders (dusts) that adhere to the particle surfaces
or are liquids that are sprayed onto the surface. These
anticaking agents function by various mechanisms.
Inert powders such as clays (kaolin and china), diatoma-
ceous earth (kieselguhr), and talc (basic magnesium
silicate) function as mechanical barriers between
particles and also serve to absorb, spread, and inactivate
any solution phase that may occur on particle surfaces.
Where caking bonds do occur, the presence of dust-
type anticaking agents usually weakens the bonds; thus,
caking is less severe. Liquid coating agents usually
function either as crystal modifiers to inhibit or weaken
crystal growth on and between the particles or as
hydrophobic barriers to inhibit moisture absorption.
Inert Powders- Clay anticaking agents are extremely
fine (typically 90% less than 10 urn and 50% less than 1
um) and thus adhere well to the fertilizer granules.
Kaolin clays are widely available and relatively inexpen-
sive. When used alone, they are usually sufficiently
effective for use on NP or NPK fertilizers and on urea.
They are not normally considered effective for use on
ammonium nitrate or other high-nitrate products.
However, kaolin clay combined with certain organic
additives can be used with these products; organically treated
kaolin is an accepted conditioner for ammonium nitrate
[103,104].
Diatomaceous earth (also referred to as kieselguhr) is
coarser than most clays (typically 90% minus 20 urn
and 50% minus 3 um) and thus does not usually adhere
as well as clay. However, diatomaceous earth has good
absorption properties and is an effective anticaking agent
for ammonium nitrate, The major disadvantages to
using inert powders as anticaking agents are their diluting
effect on the product analysis and their dustiness.
Adherence of inert powders often can be improved
by spraying the fertilizer with a small amount of oil or
wax-free binders (usually 0.1%-0.3%). Results are best
with moderately to fairly viscous oils (25 to 200 MPa«s).
Liquid Coating Agents - These agents include
organic surface active agents (surfactants) and nonsurface
active agents [105],
Surfactants function by altering the interfacial tension
between the solid (particles) and liquid (surfactants). Their
action as anticaking agents is not clearly understood,
and various mechanisms have been proposed -
protection from moisture, spreading of liquid film,
modification of crystal makeup/behavior, inhibition of dissolution
and crystallization, and modification of bond tensile
strength.
Because surfactant molecules comprise a nonpolar
hydrophobic (water repellent) group and one or more
polar hydrophilic (having a strong affinity for water)
groups, they can be subdivided into two classes
according to their polar structure: (1) ionic, which can be
further classified according to the polarity of the charge
carried on the active part of the molecule (anionic if the
charge is negative or cationic if the charge is positive)
and (2) nonionic, where the molecule is electronically
neutral.
490
The anionic surfactants commonly employed are
mainly sulfonates, particularly alkyl aryi sulfonates
[106,107,108,109,110,111]. It is primarily due to their
hydrophobic nature that the anionic surfactants act as
anticaking agents; i.e., this increases the contact angle
of the fertilizer solution and reduces the tensile strength
of the caking bond.
Cationic surfactants are dominated by the fatty amines,
especially those with a long carbon chain like
octadecyclamine [112,113,114]. Caking is prevented
by three different mechanisms: by the formation of a
hydrophobic coating on the surface of the particles, thus
improving water repellency; by reducing capillary
adhesion between particles; and by inhibiting nucleation or
otherwise modifying crystal growth.
The largest class of nonionic surfactants is the
polyoxyethylene condensates, but these have only a
moderate effect and are not widely used. Silicone fluids may
be considered as nonionic surfactants; although they are
used as anticaking agents for many powders, their use
on fertilizers is limited due to their high cost. Other
nonionic surfactants include fatty acid esters, substituted
ureas, and aldehydes and ketones with low molecular
weight [115,1161.
Nonsurface active coating agents are organic
compounds that do not exhibit surface activity but do form a
moisture-resistant layer on the surface of the fertilizer
particle [117,118,119,120,121], Typical nonsurfaee-
active coating agents include paraffin wax, synthetic
polymers, and oils. They can be used alone or in
combination with an inert dust.
Internal or Chemical Conditioners
This type of conditioner (anticaking agent) is added to
the fertilizer during processing. These conditioners act
internally, usually as hardeners or crystal modifiers to
improve storage properties [122,123,124,125,126].
For urea conditioning, a popular practice in some
countries is the inclusion of 0.3%-0.5% of
formaldehyde in the final product. The formaldehyde is added to
the molten urea in the form of a 37% formaldehyde
solution or concentrated urea-formaldehyde (UF85
containing 26% urea, 59% formaldehyde, and 15% water).
Formaldehyde addition also reduces the formation of
dust in the finishing (granulation) process because the
granules are harder and more resistant to abrasion and
breakage than is untreated material [127,128,1291.
In the case of ammonium nitrate fertilizer, internal
conditioners are used to inhibit or modify the effects of
crystal phase inversions that result from temperature
cycling during storage; the inversion that occurs at 32°C,
in particular, can cause untreated ammonium nitrate prills
to shatter and cake seriously under cycling storage
temperatures [126,130,131,132,133,134], For ammonium
nitrate the most popular internal conditioner is
magnesium nitrate. A treated product typically contains about
1.8% magnesium nitrate [135].
As discussed previously, fertilizer products made from
wet-process phosphoric acid characteristically contain
significant quantities of iron and aluminum phosphate
impurities, which serve as effective internal conditioners.
18.2.6.5 Evaluation of Caking Tendency-
Excessive caking can cause problems in (1) removal of
material from storage bins, railcars, trucks, and shiphoIdsj_
(2) field application; and (3) bagging, operations.
Methods for evaluating the caking tendency of fertilizers can
be divided into three types, namely, large-bag storage
tests, small-bag storage tests, and accelerated caking
tests.
Large-Bag Storage Test
The caking tendency of a fertilizer can be evaluated
by subjecting a standard-size bag to a predetermined
pressure for a specified period of time. The time of
storage is usually based on what the actual storage period is
expected to be (usually 1-12 months). Usually, enough
samples are placed in storage so that evaluations can be
made at certain intervals (for example, 1, 3, 6, and 12
months) during the test. The storage temperature can
be controlled or not controlled, depending on the
expected conditions of the fertilizer in actual storage. Af-
"ter storage, fnirte~sYs~ampTes are evaluated for "bag set"
and then dropped to simulate normal handling
procedures. The caking tendency is then determined by
measuring the percentage and hardness of lumps created
during storage [1,2,3,8].
Small-Bag Storage Test
The disadvantages of the large-bag method (i.e,, need
for large quantities of material, a large test area, and a
considerable amount of labor} can be avoided by
performing a small-bag storage test. In this procedure, an
1,800-cm3 sample is sealed in a moisture-resistant bag
and stored under a predetermined pressure for a
specified period of time to simulate actual storage conditions.
The remainder of the procedure and evaluation are
essentially the same as the large-bag method [1,2,3,8].
Figure 18.16 is an illustration of the equipment used
in the small-bag storage tests.
Accelerated Caking Test
The major disadvantage of the large- and small-bag
methods is the long period of storage required (usually
1-12 months), There have been numerous attempts at
devising a quicker method for evaluating caking tendency
in fertilizer [1,3,76,136,137,138,139,140].
Unfortunately, time cannot be accelerated, so most of these
491
1Bcm
-Test Bag
Figure 18.16. Storage Rack to Measure
Caking Tendency of Fertilizer
Using Small-Bag Method.
methods employ an increase in temperature, pressure,
and/or humidity to speed up caking. To date, most of
these methods have not produced reliable results. These
accelerated methods can be used as "screening
methods." That is, if the test sample cakes in an accelerated
method, it will probably cake under normal storage
conditions; if it does not cake in an accelerated test, it may
still cake under normal storage conditions. An
accelerated method can also be useful as a "screening method"
when evaluating a number of anticaking agents.
18.2.7 Dustiness
Because of the large quantities of fertilizer products
and raw materials handled in bulk, their dustiness is of
particular concern and can cause significant problems
[141,142]. First, significant quantities of material can
be lost during processing, handling, and application
resulting in lost revenues. Second, environmental
pollution and exposure of employees to hazardous levels of
dust are not indicative of a responsible organization.
The most common sources of dust in granular
fertilizers are (1) inefficient screening operations, (2) weak
granules, (3) poor conditioner (anticaking agent) adherence,
(4) granule surface crystals which abrade easily when
handled, and (5) granule surface dust from the process.
The dustiness of a fertilizer material is normally
measured by passing a sample through a countercurrent
airflow inside a "dedusting tower" and noting the amount
of weight loss [1,3,8]. The countercurrent airflow is
typically adjusted so that it will entrain a specified particle
size (dust) while allowing the granules to fall to the
bottom of the tower. Figure 18.17 is an illustration of a
"dedusting tower" used to measure dustiness. This
equipment can also be used to evaluate the ability of a powder-
type conditioner (anticaking agent), such as kaolinxlayr
to adhere to a granular fertilizer product.
Air and Dust £$&,
Discharge
64 cm
Pouring Jar With
Funnel Discharge
Glass Tube
8.5-cm Diameter
Grids of 13-mm Hardware
Cloth (seven, spaced
7.6-cm apart)
Upward Air
Velocity 1 m/s
Tangential Air
Inlet 2.5-cm
Diameter
Prtot Tube
Stopper' Pressure Taps
Figure 18.17. Apparatus for Measuring
Dustiness.
18.2.7.1 Dust Control Agents - It is preferable to
produce nondusty fertilizer without use of dust-control
treatment. However, when this cannot be accomplished,
it is sometimes necessary to resort to antidust treatments
[143,144,145,146,147]. This treatment involves
spraying the fertilizer with some liquid that will cause dust
particles to adhere to granules or to agglomerate and
thus not become airborne during handling, The most
common liquids used are petroleum oil-based. The most
492
effective oils are moderately to fairly viscous and conse-
auently have greater binding effectiveness and less
tendency to be absorbed into granules during storage with
resultant loss of effectiveness.
Oils of high paraffin content are particularly effective.
Naphthenic-based oils, if used, require the use of special
oil-resistant rubber belting on conveyors. Oils
containing added amines are said to have enhanced
dust-control properties.
Liquids other than oils that have been used for dust
control include Iignin sulfonate liquors, liquid fertilizers,
and water. These liquids are suitable if the water
introduced does not cause caking during subsequent storage.
They are sometimes used in bulk-blending plants, where
the fertilizer is intended for immediate application.
Some companies market special lines of dust control
agents [81].
18.2.8 Other Properties
There are a number of other physical properties of
solid fertilizers which are of importance for various
reasons. These physical properties are briefly discussed
below.
18.2.8.1 Chemical Compatibility in Blends -
The first step toward making a bulk-blended fertilizer of
good quality is choice of ingredients that are chemically
compatible. Fortunately, there are only a few cpmbina-_
tions of fertilizer materials that may give trouble in this
respect, The chemical compatibility of some common
fertilizer materials used in bulk blends is shown in Figure
18.18.
[T]= Incompatible
rrn = Llmlied Compatibility
(See Text)
m = Compatible
Figure 18.18. Chemical Compatibility of Blend
Materials.
The only completely incompatible combination is
ammonium nitrate and urea, which results in a mixture
with an excessively low CRH of 18%. However,
combinations of urea and superphosphate can also be
completely incompatible depending on the water content
(free water plus hydrate water) of the superphosphate
[148]. The cause of the incompatibility is a chemical
reaction between urea and monocalcium phosphate
monohydrate, the main constituent of superphosphate;
this reaction releases water of hydration and causes
severe stickiness. Mixtures of diammonium phosphate with
superphosphates also are shown in. the figure to be of
limited compatibility because, in some long-term
storage tests in bags, reactions between these materials have
caused caking [1,87,881.
Chemical compatibility can be evaluated either in the
large- or small-bag storage test described previously or
by a simple "bottle test" [8,148], In the bottle test, a
freshly made blend is tightly capped in a glass- bottle,
stored in a moderately heated cabinet (30°C), and
inspected after periods varying from 1 day to several
months. Inspection reveals any wetting, caking,
disintegration, or noxious gas formation.
18.2.8.2 Physical Compatibility in Blends -The
physical compatibility of bulk blends is the ability of two
or more materials to remain thoroughly mixed during
storage, handling, and application. As discussed
previously JnJhejOTtion_on particle size, segregation can be
a major problem in the handling of bulk-blended
fertilizer, Segregation of materials in a bulk blend is normally
caused by mismatched particle sizes. The most common
method to determine physical compatibility of bulk-blend
ingredients is to perform a particle-size analysis of each
ingredient and compare the data. There are basically
two techniques used to make the data comparison, i.e.,
the cumulative particle size distribution and the size-guide
number [1,7,8,149,150,151,152,153],
The cumulative particle size distribution technique
entails comparing each cumulative size fraction of one
ingredient with the equivalent cumulative size fraction
of the other ingredients). For these cumulative size
fractions, the differences in percentage retained are noted,
and the largest of these differences is used to determine
compatibility. The larger this difference, the higher the
segregation tendency. The following general guidelines
can be used in determining compatibility:
Largest Cumulative Size
Fraction Difference
0%-10%
ll%-20%
>20%
Expected Compatibility
Good compatibility
Moderate compatibility (special
handling precautions may
reduce segregation tendencies)
Incompatible
493
Figure 18,19 illustrates how blend ingredients are
evaluated for physical compatibility according to
cumulative particle-size distribution.
The size-guide number technique, developed by the
Canadian Fertilizer Institute, entails determining the
median particle size of each blend ingredient by beating
the 50% cumulative retained point from the size
distribution curve. The particle size (in millimeters) at the 50%
cumulative retained point is multiplied by 100 and
rounded to the nearest 5. This number is referred to as
the SGN (size guide number) of that blend ingredient.
The SGN for each bulk-blend ingredient is compared,
and the blends are evaluated by the following guidelines.
Size Guide
Number Difference Expected Compatibility
0%-10% Good compatibility
ll%-20% Moderate compatibility (special
handling precautions may reduce
segregation tendencies)
>20% Incompatible
Figure 18.20 illustrates how blends are evaluated for
physical compatibility according to the SGN.
18.2.8.3 Sphericity - Sphericity is a measure of
particle roundness in granular fertilizers. Sphericity is
useful in estimating processing efficiency and coating,
handling, and storage properties of a fertilizer. To
determine sphericity, a sample of granules is distributed over
an inclined moving belt. The round granules roll down
the incline and are collected at the bottom of the belt,
The irregularly shaped or broken granules are carried
upward and discharged at the top of the belt. Figure
18.21 is an illustration of typical sphericity equipment.
18.2.8.4 Surface Area - The specific surface area
of a material is its surface area per unit mass; it
indicates the fineness and/
or porosity of a
material. It is particularly
useful in determining the
fineness and porosity of"
phosphate rock and
phosphogypsum in
phosphoric acid
production processes. The
data can be used to
predict reaction efficiencies
and filtration rates.
18.2.8.5 Porosity-
Porosity is a measure of
the pore space in
fertilizer granules. Excessive
porosity is often the
reason for weak
granules. Also, in fertilizer
compacting and
granulating systems, porosity
is an indication of the
compaction and
granulation efficiency.
Porosity is determined by measuring a material's apparent
density and true density (both discussed previously) and
calculating the difference. Typical porosity values are
listed in Table 18.12.
18.2.8.6 Melting Point-The melting point of
fertilizers is of interest in connection with prilling or other
melt-granulation processes in which a fluid melt is
necessary. The melting point is also of interest in drying
fertilizers that are granulated by other processes because
it limits the maximum temperature in the dryer. Typical
melting point values are listed in Table 18.13.
18.3 Physical Properties of Fluid Fertilizers
Although fluid fertilizers do not comprise a major part
of the market in most countries, some mention should
be made of their physical properties. Methods of
analyzing physical properties of fluid fertilizers are used to
obtain data for (1) controlling product quality; (2)
predicting storage, handling, and application
characteristics; and (3) providing basic data for pump, tank, and
application equipment design 15,6]. A brief description
100
60
ce 60
Diammonium Phosphate vs. "Granular" Potash DIammanlum Phosphate vs. "Coarse" Potash
40
20
<y v v i/ n> N- v v
Sieve Opening (mm)
&
■f
•9
-1
A
1 A..
1? Pnlnle /
I
/>
s
Ivergence7|
V-TJ-,
.Divergence
9 DIammonium Phosphat
■ "Granular" Potash
□ "Coarse" Potash
«s
57 Po
Diver
i
S
J L
nts
encf
/
i '
Y
/
--J.
A
i
«V- «v* S' V *-•
Sieve Opening (mm)
Figure 18.19. Physical Compatibility of Bulk Blend Ingredients
According to Cumulative Particle-Size Distribution.
494
Diammonlum Phosphate vs. "Granular" Potash Diammonlum Phosphate vs. "Coarse" Potash
1UU
-o 80
m
c
pj
S* rn
a, 50
|40
ZJ
3
" on
0
3
3
S
/y
•
A
'/
-/
• Diammonium Ptinsphs
■ "Granular" Potash
□ "Coarse" Potash
3» ^ A <§> -£.*♦.#
^" V "V V" *■•' **" ** ^~
1 Slavs Opening (mm)
5 3.0 2.5 >.D 1.5 1.0 0
Particle Diameter (mn
0
300
250
200
150 100 5
SIzb Guide NumbB
53
03
r
j
/-
S
—J
;
/
/
/
/
/
A
r"
(
S
\
A
*
§> ^ £> ♦ <3>
N* *S" *V "V
Sieve Opening (mm
.5 3.0 2.5 2.0 1.5 1.0 0
l
Particle Diameter |n
50
300
2511
200 150 100 5
Size Guide Number
.5
nm)
0
210 205
210
140
Figure 18.20. Physical Compatibility of Bulk Blend Ingredients
According to Size Guide Number.
Feed Hopper
Hand-Controlled Lever
Dish Pan Reject Rake-Type \
Granules Deflector 10* Inclination
True
Granules
Figure 18.21.
Sphericity Apparatus for
Measuring Roundness of
Granular Fertilizer.
of some of the more common physical properties of
fluid fertilizers follows.
18.3.1 Density/Specific Gravity
Density is the mass per unit volume of a fluid at a
specified temperature, ft is of interest in the calibration
of volumetric meters, as a quality control method in
determining nutrient concentrations of liquid feeds and
scrubber liquors, or in evaluating the storage and
handling characteristics of a fluid fertilizer. Typical methods
for measuring the density of a fluid fertilizer use either a
density bottle (pycnometer) or a hydrometer. Figure
Table 18.12. Typical Porosity Values (Ranges)
of Some Common Fertilizers
Fertilizer
Type
Prilled urea
Granular urea
Granular ammonium sulfate
Crystalline ammonium sulfate
Prilled ammonium nitrate
Granular diammonium phosphate
Granular monoammonium phosphate
Granular triple superphosphate
Granular potassium chloride
Grade
46-0-0
46-0-0
21-0-0
21-0-0
34-0-0
18-46-0
11-55-0
0-46-0
0-0-60
Porosity
(% of Pores]
1-3
5-8
8-10
0.5-1.0
2-4
2-6
5-10
10-15
1-2
18.22 shows a typical pycnometer used for measuring
density of fluids.
Typical density values for some common fluid
fertilizer grades are listed in Table 18,14 (solution fertilizers)
and Table 18.15 (suspension fertilizers).
18.3.2 Viscosity
Viscosity is the internal resistance to flow exhibited
by a fluid. Viscosity is a useful measurement in
evaluating the storage and handling characteristics of a fluid
fertilizer, or as a quality control method in liquid or slurry
495
Table IS.13. Melting Points of Some Fertilizer Products
Ammonium nitrate
Urea
Sodium nitrate
Potassium nitrate
Calcium nitrate (tetrahydrate)
Sulfur
Urea-ammonium phosphate
Urea-ammonium phosphate
Urea-ammonium phosphate
Nitrophosphate
Nitrophosphate
Nominal Grade
33.5-0.0
46-0-0
16-0-0
13-44-0
12-0-0
21-42-0
36-18-0
17-27-17
26-13-0
20-20-0
Melting Temperature
(°Q
167
136
308
333
43
120
153
130
143
148
152
Capillary far
Volume Expansion
Glass PycnomelBr
Stopper
Calibrated
Pycnometer
Bottle
Figure 18.22. Gay-Lussac Type Pycnometer for
Measuring True Density of
Liquids.
feeds to a granulation process. For solution fertilizers,
glass capillary-type viscometers are preferred. For
suspension fertilizers, rotating spindle-type viscometers are
required.
Typical viscosity values for some common fluid
fertilizer grades are listed in Table 18.14 (solution fertilizers)
and Table 18.15 (suspension fertilizers). For fluids that
are to be applied directly to the soil, the viscosity must
not exceed 800 MPa*s at 27°C and 900 MPa«s at 0°C.
The viscosity of base grades that are primarily for use in
-production-of-fluid-blends-mustnot exceed 1,000 MPa»s
at 27°C and 1,500 MPa*s at 0°C. Field tests have shown
that fluid blends that do not meet the above viscosity
criteria usually cannot be uniformly applied to the soil,
and base grades that do not meet these viscosity criteria
usually cannot be satisfactorily drained from storage tanks
Table 18.14.
Grade
8-24-0
10-34-0b
ll-37-0b
7-21-7b
7-7-7c
5-10-10c
32-0-0^
28-0-Od
Typical Physical Properties
Density
(g/ml at 24°C)
1.26
1.37
1.40
1.33
1.24
1.25
1.33
1.27
of Various Solution Fertilizers3
Viscosity
(MPa-s at 24°C)
30
50
80
50
40
40
50
23
Crystallization
Temperature
(°C)
-8
<-l8
<^18
-13
-5
-1
0
-17
PH
6.6
6.0
6.0
6.5
6.6
6.5
7.5e
7.5e
a. Based on thermal phosphoric acid.
b. Contains polyphosphate.
c. Supplementary nitrogen from urea-ammonium nitrate solution.
d. Urea-ammonium nitrate solution.
e. Ammonia added to control corrosion.
496
Table 18.15. Typical Properties of Various Suspension Fertilizers3
Grade
Density
(g/ml at 24°C)
Viscosity
(MPa.s at 24°C)
pH
12-40-0b-
13-38-0
9-32-0b
10-30-0
31-0-0C
18-0-18
13-13-13
4-12-24
0-0-3 ld
1.44
1.44
1.40
1.37
1.32
1.37
1,40
1.41
1.30
700
800
200
250
150
160
600
400
360
6.0
6.4
6,7
6.3
8.0
7.4
6.3
6.3
6.8
a. Based on wet-process orthophosphoric and polyphosphoric acids. Properties may vary with impurity content of
raw materials used and amount of suspending clay added.
b. Contains polyphosphate.
c. Urea-ammonium nitrate solution.
d. Potash suspension.
or transferred from one container to another by pumping
[5].
18.3.3 Crystal/Particle Size and Type
Fluid fertilizers are considered to be unsatisfactory if
they contain any crystals, either initially or after
storage, that exceed 850 um in size, because the large crysr
tals can stop up distribution pipelines, spray nozzles,
orifice meters, and other types of flow metering or flow
regulating equipment. Suspension fertilizers require an
abundance of small crystals of the precipitating phase
to avoid the development of excessively large crystals.
The type of crystals in fluid fertilizers is also important
because crystals vary in shape from long needle-like to
cubical blocks and to thin sheets. The long needle-type
crystals are avoided because they cause stoppages in
equipment more readily than do crystals of other shapes.
The thin rectangular shaped crystals are preferred
because they have a higher surface area-to-volume ratio
and are therefore less difficult to suspend. The size and
shape of crystals can be determined by microscopic
analyses [5].
15.3.4 Crystallization Temperature
Crystallization temperature is that temperature at
which a component in a solution fertilizer will
precipitate or salt-out. This is a useful measurement in deter-
mining the optimum storage temperature range of a
solution fertilizer. Crystallization temperature is
determined by slowly cooling a solution fertilizer until crystal-
nation occurs. Typical crystallization temperatures of
some common solution fertilizers are listed in Table
18.14.
18.3.5 Settling (Sedimentation)
The solid phases present in some suspension
fertilizers have a tendency to settle. Factors that affect this
property are crystal/particle size, nature of the fluid
phase, and/or the effectiveness of the suspending agent.
J.LLis_desirabIe_that_all-cn;staIs-in- suspension fertilizers
remain suspended at all times. For a suspension to be
considered satisfactory, no crystals can settle and pack
on the bottom of a container during static storage and a
maximum of only 2% by volume of crystals can be settled
after vibration, which occurs during transit by rail or truck.
A suspension is measured in the laboratory for settled
and packed crystals by pressing a stirring rod to the
bottom of a test container to determine if any resistance is
encountered in reaching the bottom of the container. If
settled crystals are very loose and are capable of being
redistributed in the suspension by recirculation or air
sparging, the suspension is rated satisfactory. If the settled
crystals are packed and difficult to redistribute, the
product is rated unsatisfactory.
Crystals of any type are undesirable in solution
fertilizers. To ensure against nucleation and growth of
fertilizer salt crystals in solution fertilizers, crystallization
temperatures are determined, and the concentrations
of the solutions are adjusted to facilitate production of
the highest possible satisfactory solution grades.
However, solutions that are prepared from wet-process
phosphoric acids contain impurities that precipitate slowly as
very fine crystals or sludge. Because precipitation of these
impurity materials is almost impossible to avoid, some
precipitated solids are permitted [5].
497
18.3.6 pH
The pH measurement is used in the fluid fertilizer
industry as a grade control method and to a lesser extent
to evaluate the potential storage and handling properties.
18.3.7 Gel Strength
Suspension fertilizers are composed of a gelling agent
dispersed in a solution of fertilizer salts - all of the
solution is saturated, and both crystals of fertilizer salts and
impurities are present. In production of the suspension
fertilizers, a suspending agent, which is usually a gelling-
type clay, is incorporated in a slurry to form a gel that is
strong enough to suspend the solids in the saturated
solution but not too strong to prevent pumping,
pouring, and application to the soil. Gel strength is the force
required to break the gel [5[.
18.3.8 Other Properties
Several other physical properties of fluid fertilizers are
of importance for various reasons. Some of these
physical properties are briefly discussed.
18.3.8.1 Clarity - Fluid fertilizers that are produced
from wet-process phosphoric acids derived from
uncalcined phosphate ores are black in color due to the
presence of finely divided carbonaceous material. The
black color has no effect on the nutrient value of the
fertilizers, but it does restrict the sight identification of
solid material in solution fertilizers that could clog the
equipment used for application. Solution fertilizers are
often used for row application, whereas most
suspension fertilizers are used for broadcast to the soil.
Solution fertilizers often are gravity fed, and the distribution
equipment, orifice meters, pipelines, and nozzles used
for row application usually are smaller than those used
for broadcast application of suspension fertilizers.
Because the application equipment is smaller, it is more
likely to get stopped up by large crystals or foreign
particles; therefore, the need to see these solid particles in
the solution fertilizers is much greater than it is in
suspension fertilizer.
In production of solution fertilizers, samples of the
product are taken and measured for clarity, which is the
amount of visible light that passes through the sample
without being absorbed. Measurements for clarity are
made with a spectrophotometer. The object of the
measurement is to determine whether or not the fertilizer is
clear enough for fertilizer producers, farmers, or others
that handle or apply solution fertilizers to the soil to see
large crystals, or foreign matter, that might stop up
orifice meters, or other equipment, that is used in handling
or applying the solution to the soil.
Clarity is expressed as the percentage of light
transmitted at the desired wavelength of the liquid
absorption spectrum. A liquid with 25% light transmittance, as
compared with 100% transmittance for distilled water,
is considered acceptable [5].
18.3.8.2 Syneresis - Suspension fertilizers
sometimes are affected by syneresis, which is formation of
clear liquid, usually on top of the suspension with the
remainder of the suspension being uniform throughout.
The presence of the clear liquid layer does not
necessarily cause a suspension to be unsatisfactory, but it is
undesirable because with decrease or fluctuations in
temperature or other conditions that cause changes in
the concentration of the liquid phase, growth of
excessively large crystals occurs at the clear liquid layer
interface. Provided the crystals do not grow to exceed 20
mesh (850 urn) in size, syneresis is not objectionable if
recirculation or air sparging will remix the clear liquid
and suspension. Generally, syneresis is caused by either
insufficient clay concentration or improper gelling of clay
[5].
18.3.8.3 Solidification Temperature - If a fluid
fertilizer is produced for winter-time storage in the colder
regions of a country, its solidification temperature must
be lower than the expected low temperature of that
region. Solidification temperatures of fluid fertilizers are
measured in the laboratory by cooling them to
solidification over a period of 1-1/2 to 2 hours with an
acetone or ethanol-dry ice bath [5].
18.3.8.4 Pourability - Fluid fertilizers are
evaluated in the laboratory for pourability to determine
whether or not they can be drained from their container
by gravity or pumped or otherwise transferred in the
field from one container to another. This determination
is made by rotating a stirring rod twice around the
inside surface of the storage container, generally an 8- or
16-ounce sample bottle, to apply gentle agitation to the
fluid. Rotation of the stirring rod is intended to supply
no more agitation than would be supplied by air sparging.
The container then is turned downward at a 45° angle
for 1 minute and the content (% by volume) that pours
out is determined. Field tests have shown that fluid
products that are at least 98% pourable by this procedure
will flow freely by gravity from their storage container
and can be easily transferred from one tank or container
to another by pumping [5].
18.3.8.5 Vibrational Settling - Some suspension
fertilizers that have been known to store satisfactorily
for long periods of time under static conditions have
undergone settling when subjected to vibration such as
occurs during shipment by rail; the crystals settled
excessively and became packed on the bottom of the
railroad tank cars. Settling of crystals during vibration is
related to the weight, size, and shape of the crystals; the
498
density of the solution phase of the suspension; and the
strength of the gel [5].
Other physical properties of fluid fertilizers that may
have some specific importance are vapor pressure,
specific heat, wettability, surface tension, refractive index,
and conductivity.
18.4 References
1. Hoffmeister, G. 1979, Physical Properties of
Fertilizers and Methods for Measuring Them,
TVA Bulletin Y-147, Tennessee Valley Authority,
Environmental Research Center, Muscle Shoals,
AL, U.S.A.
2. Rutland, David W. 1991. "The Effect of Fertilizer
Physical Properties on Product Quality and the
Methods Used to Evaluate Them," Presented at
the FADINAP Asia Pacific Regional Symposium
on Fertilizer Legislation, Ho Chi Minh City,
Vietnam.
3. Tennessee Valley Authority. 1970. TVA
Procedures for Determining Physical Properties of
Fertilizers, Special Report No. S-444,
Environmental Research Center, Muscle Shoals, AL,
U.S.A.
4. The Fertilizer Institute. 1982. Fertilizer Sampling
and Analytical Methods, Fourth Edition:" Prod=~
uct Quality Committee, 1015 18th Street, N.W.,
Washington, D.C., U.S.A.
5. Potts, J. M. (Ed.). 1984. Fluid Fertilizers, TVA
Bulletin Y-185, Tennessee Valley Authority,
Environmental Research Center, Muscle Shoals, AL,
U.S.A.
6. Palgrave, D. A. 1984, "Importance of Measuring
Physical Properties in Fluid Fertilizers," Paper No.
203, 98th Meeting of AOAC International,
Washington, D.C., U.S.A.
7. Canadian Fertilizer Institute. 1986. TheCFI Guide
of Material Selection for the Production of
Quality Granular Blends, Suite 301, 280 Albert
Street, Ottawa, Ontario K1P5G8, Canada.
8. Rutland, David W. 1993. Manual for
Determining Physical Properties of Fertilizer, Reference
Manual 1FDC-R-10, Second Edition, International
Fertilizer Development Center, P.O. Box 2040,
Muscle Shoals, AL, U.S.A.
9. Hofstee, J. S. 1993. Physical Properties of
Fertilizer in Relation to Handling and Spreading,
Wageningen Agricultural University, Wageningen,
The Netherlands.
10. International Organization for Standardization.
Central Secretariat, 1, rue de Varembe, Case
Postale 56, Ch-1211 Geneve 20, Switzerland.
11. International Organization for Standardization.
1984. Fertilizers and Soil Conditioners -
Vocabulary, ISO 8157, Central Secretariat, 1, rue
de Varembe, Case Postale 56, Ch-1211 Geneve
20, Switzerland.
12. Khasawneh, F. E., and E. C. Doll. 1978. "The
Use of Phosphate Rock for Direct Application to
Soils," Advances in Agronomy, 30:159-206.
13. Association of American Plant Food Control
Officials. 1994. Official Publication, No. 47.
Copies may be purchased from North Carolina
Department of Agriculture, 4000 Reedy Creek
Road, Raleigh, NC, U.S.A.
14. European Union (formerly European Economic
Community). 1976. Official Journal of the
European Communities, Volume 19, No. L24,
Council Directive 76/116/EEC, Office of
Official Publications of the European Union, L-2985,
Luxembourg.
15. Schultz, James J. 1989. Production of Granular
NPKs in Ammonium Phosphate Plants, T-36,
International Fertilizer Development Center, P.O.
——Box-2040,-Muscle-Shoals,-ALJ U.S.A.
16. Lupin, M. S,, and N. D. Le. 1983. Compaction,
Alternative Approach for Granular Fertilizers,
T-25, International Fertilizer Development
Center, P.O. Box 2040, Muscle Shoals, AL, U.S.A.
17. Klein, Maurice O. 1991. "The Manufacture of
Fertilizers by Compaction/Granulation," IN Urea-
Based NPK Plant Design and Operating
Alternatives, Workshop Proceedings, pp. 119-132,
SP-15, International Fertilizer Development
Center, P.O. Box 2040, Muscle Shoals, AL, U.S.A.
18. Berquin, Y., and J. Burko. 1974. "Hot
Spherodizer Processes and Complex Fertilizers:
Recent Developments," Proceedings of the 24th
Annual Meeting of the Fertilizer Industry Round
Table, pp. 110-112, Washington, D.C, U.S.A.
19. Kelly, W J. 1974. So/ids Handling and
Metering in an NPKPrilling Plant, Proceedings of the
Fertilizer Society, (London), No. 141.
20. Maartensdijk, Sinte. 1976. "Direct Production of
Granulated Superphosphates and PK Compounds
from Sulphuric Acid, Phosphoric Acid, Rock
Phosphate and Potash," Paper No. TA/76/12,
Presented at the International Superphosphate
499
Manufacturers' Association Technical Conference,
The Hague, Netherlands.
21. Hoffmeister, George. 1962, "Compatibility of
Raw Materials in Blended Fertilizers Segregation
of Raw Materials," Proceedings of the 12th
Annual Meeting of the Fertilizer Industry Round
Table, pp. 83-88, Washington, D.C., U.S.A.
22. Hoffmeister, George. 1973. "Quality Control in
a Bulk Blending Plant," Proceedings of the TVA
Fertilizer Bulk Blending Conference, TVA
Bulletin Y-62, pp. 59-70, Tennessee Valley
Authority, Environmental Research Center, Muscle
Shoals, AL, U.S.A.
23. Hoffmeister, George, S. C. Watkins, and Julius
Sllverberg. 1964. "Bulk Blending of Fertilizer
Material: Effect of Size, Shape, and Density on
Segregation," Journal of Agricultural and Food
Chemistry, 12(l):64-69,
24. Hoffmeister, G. H. 1982. Particle Size
Requirements for Bulk Blend Materials, TVA Circular
Z-146, Paper presented at the 36th annual
meeting of the Association of American Plant Food
Control Officials, August 3-4, Columbus, OH,
U.S.A.
25. Hoffmeister, G. H, 1981. "Evaluating and
Correcting Segregation in Bulk Blends," CustomJKp^
pllcator, February.
26. Balay, H. L. 1983. "Fertilizer Properties Related
to Bulk Storage arid Handling," Custom
Applicator, February.
27. Cheval, John. 1994. "Top Quality Blends,"
presented at the 5th Latin America Fertilizer
International Conference, April 17-19, Palm Beach,
FL, U.S.A.
28. Tikhonovich, Z. A., and N. N. Bogdanova. 1991.
"Some Aspects of the Hygroscopicity of
Fertilizers," The Soviet Chemical Industry, 23(2):89-90.
29. Perry, R. K, C. H. Chilton, and S. D. Kirkpatrick
(Eds.). 1984. Perry's Chemical Engineers
Handbook, Sixth Edition, McGraw-Hill Book Company,
New York, NY, U.S.A.
30. Stanley-Wood, N. G., and G. J. Llewellyn. 1982.
"ln-Stream and On-Line Particle Size Analysis,"
Chemical Society, Analytical Proceedings,
19(ll):527-528, November.
31. Bura, K. J. 1984. "Improved Methods of Particle
Size Analysis," Particle Size Analysis of
Construction Materials, Analytical Proceedings,
Volume 21, pp. 133-134, April.
32. "Particle Size Analyzers: Out of the Lab, Into the
Plant." 1988. Chemical Engineering, pp, 95-98,
November 7.
33. Frydenberg; Wilhelm. 1989. "The Development
and Use of an On-Line Particle Analyses in a
Prilling or Granulation Plant," Paper read before The
Fertilizer Society of London, October.
34. J0rgensen, T. 1991. "A Particle Analyser for
Measuring Particle Size Distribution and Shape,
On-Line or in the Laboratory," Fertilizer
Research, 28:109-114.
35. Carr, R.L. 1965. "Evaluating How Properties of
Solids," Chemical Engineering, pp. 163-168,
January 18.
36. Lauzon, Michael. 1983. "How to Avoid Flow
Problems in Hoppers and Feeders," Canadian
Chemical Processing, 67(4):31-32, June.
37. KOhnemund, B. 1984. "Bin Storage of Bulk
Materials/' Pit & Quarry, 76(8):57-59, 62, February.
38. Saxena, R. C, and S. Varma. 1973. "Effect of
Moisture on the How Characteristics of Granular
Fertilizers," Technology, 10(l&2);42-45.
39. De, Dipankar. 1989. "How Behaviour of
Chemical Fertilizers As Affected by Their Properties,"
Journal-Agricultural Engineering Research,
42:235-249.
40. Bhatti, Muhammad Essa. 1991. "Quality Control
Measures for Developing of 10:20:20 Grade
Fertilizer," Fertilizer Research, 28:213-216.
41. Ibrahim, Y. A. 1992. "Product Quality
Improvement on Urea Prills," Paper presented at the 1991
IFA Technical Conference, The Hague,
Netherlands, October 6-8.
42. Rahman, M. Jalilur, P. Bozadjiev, and Y. Pelovski.
1994. "Studies on the Effects of Some Additives
on the Physicomechanical Properties of Urea-
Ammonium Sulphate (4UAS) Pellets," Fertilizer
Research, 38:89-93.
43. Smith, P. G. 1980. "Apparatus for Determining
the Strength of Granules," Laboratory Practice,
pp. 743-744, July.
44. Ivanov, M. E., A. Sh. Berkovich, A. B, Ivanov,
and T. N. Kozlova. 1985. "Determination of the
Static Strength of Ammonium Nitrate Granules,"
The Soviet Chemical Industry, 17(6):348-350.
45. Murthy, D.V.S., and A. P. Rao. 1989. "Effect of
Binding Agents in NP Granulation," Indian
Journal of Technology, Vol. 27:121-124, March.
500
46 Borisova, L. 1., M. P. Talkhaev, and S. Ya
Gal'perina. 1989, "Quality Control of
Phosphorite Pellets," Khimicheskaya Promyshlennost,
21(10):751-754.
47. Fruhstorfer, A, 1961. "Testing Granular
Fertilizers for Hardness," Paper No. LE/61/58. The
International Superphosphate Manufacturers'
Association, Wiesbaden, Germany.
48. Rieschel, H., and K. Zech. 1981. "Comparison
of Various Test Methods for the Quality Control
of Potash Granulate," Phosphorus and Potassium
No. 115:33-39, September/October.
49. Willems, M., and R. van Hardevell. 1981.
"Production of High Quality Urea Prills," Proceedings
of the 31st Annual Meeting of the Fertilizer
Industry Round Table, pp. 64-72, Washington, D.C,,
U.S.A.
50. Hegner, P., and L. Jager. 1976. Hygroscopicity
of Fertilizer Materials, Research Institute of
Inorganic Chemistry, 400 60 Usti nad Labem,
Czechoslovakia.
51. Rutland, D. W. 1984. "Comparison of
Hygroscopic Properties of Mixtures of Granular
Materials (Bulk Blends) and Granulated Mixtures,"
Proceedings of the 34th Annual Meeting of the
Fertilizer Industry Round Table, pp. 89-98,
Baltimore, MD, U.S.A. ■■ ■ ■ ""—"-
52. Babin, J. J. 1989. "Contribution of the
Understanding of Hygroscopicity of Fertilizers,"
Hungarian Journal of Industrial Chemistry, 17:61-71.
53. Merz, A. R., W H. Fry, J. O. Hardesty, and J. R.
Adams. 1933. "Hygroscopicity of Fertilizer Salts,"
Industrial and Engineering Chemistry,
25(2):136-138.
54. Yee, J. Y. 1944. "Determining Hygroscopicity of
Fertilizers," Industrial and Engineering
Chemistry, Analytical Edition, 16(6}:367-369.
55. Dunmore, F W. 1939. "An Improved Electric
Hygrometer," Research Paper RP1265, Journal
of Research of the National Bureau of
Standards, 23:701-714.
56. Geissler, P. R. 1968. "Hygroscopicity of
Complex Fertilizers - Determination of Critical
Relative Humidity of Multicomponent Systems,"
Journal of Agricultural and Food Chemistry,
16(3):378-383.
57. Geissler, P. R. 1967. Method for Determining
the Critical Relative Humidity of Fertilizer, U.S.
Patent 3,304,767.
58. Pustil'nik, G. A., V. S. Talanova, and Y. A.
Vakhrushev. 1973. "Accelerated Method for
Determining Hygroscopic Points of Fertilizers and
Salts," Khim. Prom. (Moscow), 49(ll):844-845
(Russ.); Soviet Chemical Industry, 5(11):708-
709.
59. Clayton, W. E. 1984. "Humidity Factors
Affecting Storage and Handling of Fertilizers," 1FDC-P-
5, International Fertilizer Development Center,
P.O. Box 2040, Muscle Shoals, AL, U.S.A.
60. Rutland, D. W 1991. "Storage and Handling-
Characteristics of Urea-Based NPK Fertilizers," IN
Urea-Based NPK Plant Design and Operating
Alternatives, Workshop Proceedings, pp. 82-88,
SP-15, International Fertilizer Development
Center, P.O. Box 2040, Muscle Shoals, AL, U.S.A.
61. Hoffmeister, G., and C. P. Harrison. 1982,
"Critical Humidity-Temperature Relationships for
Several Fertilizers." TVA circular Z-143, Paper
presented at the 184th National Meeting of the
American Chemical Society, September 12-17,
Kansas City, MO, U.S.A.
62. Idnani, M, A., and O. P. Chawla. 1968.
"Moisture Absorption and Caking in Ammonium
Sulphate," Fertiliser News, pp. 26-28, November.
63. Bach. Bjgrn. 1982. "Packaging, Transportation,
and Storage of Fertilizers," Seminar on Fertilizer
Quality Control and Handling held in New Delhi,
India, pp. 313-329.
64. Kuvshinnikov, I. M. 1985. "Quantitative
Evaluation of the Hygroscopicity of Fertilizers," The
Soviet Chemical Industry, 17(3):153-155.
65. Mehring, A. L. 1929. "Factors Affecting the Drill-
ability of Fertilizers," Industrial and Engineering
Chemistry, 21(12):1219-1223.
66. Mehring, A. L. 1931. "Measurement of
Disability of Fertilizers," Industrial and Engineering
Chemistry, Analytical Edition, 3(l):34-38.
67. Mehring, A. L., and G, A. Cumings. 1930.
Factors Affecting the Mechanical Application of
Fertilizers to the Soil, U.S. Department of Agriculture,
Technical Bulletin No. 182, Superintendent of
Documents, U.S. Government Printing Office,
Washington, D.C, U.S.A.
68. Rapp, H. F, and J. O. Hardesty. 1957.
"Granulation of Mixed Fertilizers in Experimental
Equipment and Determination of Storage and Drilling
Characteristics of the Products," Journal of
Agricultural and Food Chemistry, 5(6):426-433.
501
69. Gantt, C. W, W. C. Hulburt, R E Rapp, and J.
O. Hardesty. 1958. Determining the Dril
lability of Fertilizers, U.S. Department of Agriculture,
Production Research Report No. 17,
Superintendent of Documents, U.S. Government Printing
_ Office, Washington, D.C., U.S.A.
70. Hoffmeister, George, and C. P. Harrison. 1977,
"Physical Properties of Granular Urea-Based NP
and NPK Fertilizers," Proceedings of the 27th
Annual Meeting of the Fertilizer Industry Round
Table, pp. 162-170, Washington, D.C., U.S.A.
71. Kurshinnikov, 1. N., and G. F. Chelikid. 1978.
"Methods of Eliminating the Caking of
Fertilizers," IN Proceedings of the Soviet-Swedish
Symposium on the Beneficiation of Phosphate Rock,
pp. 180-186, Tallinn, Estonia.
72. Bookey, J. B., and B. Raistrick. 1965. "Caking
of Mixed Fertilizers," IN Chemistry and
Technology of Fertilizers, Vincent Sauchelli (Ed.), pp.
454-479, Reinhold Publishing Corporation, New
York, U.S.A.
73. Silverberg, Julius, J, R, Lehr, and George
Hoffmeister, Jr. 1958. "Microscopic Study of the
Mechanism of Caking and Its Prevention in Some
Granular Fertilizers," Journal of Agricultural and
Food Chemistry, 6(6):442-448.
74. "The Complex Phenomenon of Caking," 1987-^-
Fertilizer Focus, pp. 36-37, 39, July.
75. Tikhonovich, Z. A., A. Ya. Syrchenkov, V. F
Kabanov, A. 1. Grapas, and I. M. Gurman. 1989.
"Study of the Physicomechanical Properties of
Nitrophoska," Khimiya Promyshlennost,
21(9):671-673.
76. Thompson, D. C. 1972. Fertilizer Caking and
Its Prevention, Proceedings of the Fertilizer
Society (London), No. 125.
77. Mackay, P. A., and K. S. Sharpies, 1985. The
Use of Special Oils and Coatings to Prevent
Caking of Fertilizers, Proceedings of the
Fertilizer Society, (London), No. 239.
78. Kuvshinnikov, I, M., Z. A. Tikhonovich, S. A.
Troitskaya, and V. A. Frolkina. 1984,
"Mechanism of the Modifying Action of Surfactants Used
to Eliminate the Tendency of Complex Fertilizers
to Cake," The Soviet Chemical Industry,
16(l):25-27.
79. Kuvshinnikov, I. M., V. A. Timofeev, and M. P.
Komarov. 1987. "Theoretical and Technological
Foundations of the Elimination of the Cakeability
of Mineral Fertilizers," Mendeleev Chemistry
Journal, 32(4):51-55.
80. Kuvshinnikov, 1. M., V. G. Dubinin, L. B. Geladze,
V. T. Kukushkin, and M. P. Komarov. 1987.
"Structure of Granules of Complex Fertilizers and
Their Caking," Journal of Applied Chemistry
of the USSR, 60(6): 1384-1386, June.
81. Rutland, D. W. 1991. "Fertilizer Caking:
Mechanisms, Influential Factors, and Methods of
Prevention," Fertilizer Research, 30:99-114.
82. Adams, J. R., and W. H. Ross, 1941. "Relative
Caking Tendency of Fertilizers," Industrial and
Engineering Chemistry, 33(1):121-127. —
83. Whynes, A. L., and T, P. Dee. 1957. "The
Caking of Granular Fertilizers: An Investigation on a
Laboratory Scale," Journal of the Science of
Food and Agriculture, 8:577-591.
84. "Using Anticaking Agents," 1983. Nitrogen, No.
146:21-23, November-December.
85. Rosenblom, Jan, and Stig Zettervall. 1978.
"Anticaking Treatments of Granular Inorganic
Salts Such as Phosphate Based Complex
Fertilizers and Ammonium Nitrate," IN Proceedings of
the Soviet-Swedish Symposium on the
Beneficiation of Phosphate Rock, pp. 158-179, Tallinn,
Estonia,
86. Gamondes, J. P., and J. B. Van't Hoff. 1977.
-How-to-Prevent Fertilizer Caking," Nitrogen, No.
105:32-35, January-February.
87. Rutland, D. W., and J. R. Polo. 1990. "Urea in
NPK Fertilizers: How Much Can You Use?"
Phosphorus & Potassium, 166:25-32, March-April.
88. Rutland, D. W., and J. R. Polo. 1989.
"Comparative Properties of Urea-Based NPK Fertilizers,"
Proceedings of the 39th Annual Meeting of the
Fertilizer Industry Round Table, pp. 159-172,
Atlanta, GA, U.S.A.
89. Kuvshinnikov, 1. M., A. V. Kononov, V. A.
Frolkina, S. A. Troitskaya, M. P. Lobacheva, and
L. 1. Evdokimova. 1989. "Physical Properties of
Diammospho5ka," Khimiya Promyshlennost,
21(9):674-676.
90. Kuvshinnikov, I. M., A. V. Kononov, L. I.
Evdokimova, V. A. Frolkina, M. P. Lobacheva,
and S. A. Troitskaya. 1989. "Balanced Compound
Fertilizers Made From Ammonium Phosphates
and Urea," Khimicheskaya Promyshlennost,
21(10):747-748.
91. Tennessee Valley Authority. 1970. "Effect of
Aluminum and Iron on the Physical Properties of
Ammonium Phosphate Fertilizers," IN New
Developments in Fertilizer Technology, 8th
Demonstration, p. 14, TVA Bulletin Y-12, TVA,
NFDC, Muscle Shoals, AL, U.S.A.
92- Borisov, V. M., Yu. V. Azhikina, and L. S. Gerke,
1978, '"Methods for Reducing the Cakeability of
Phosphorus-Containing Fertilizers," The Soviet
Chemical Industry, 10(8):590-591-
93. Borisov, V. M,, Yu, V. Azhikina, B. M. Maslen-
nikov, S. B. Kapilevich, L, S. Gerke, and A. A,
Brodskii, 1982. "Physicochemical Fundamentals
of Technology for Noncaking Complex
Fertilizers Based on Monoammonium Phosphate," The.
Soviet Chemical Industry, 14(6}:346-348.
94. Ando. Jumpei, Mitsuhiko Omura, and Takashi
Akiyama. 1965. "Precipitates from the Ammo-
niation of Wet-Process Phosphoric Acid and the
Viscosity of the Product Slurry," Kogyo Kagaku
Zashi, 68:2327-2331.
95. "Using Anticaking Agents," 1983.Nitrogen, No.
146, November-December;
96. Venkatesan, T. N. 1987. "Fertilizer Conditioning:
Need of the Hour," Fertilizer Industry, Annua/
Review, 10:213-216.
97. Koltashov, N. A. 1978. "Caking of Urea as a
Function of Loading Temperature and Packaging
Method," Khimiya v sel' sham khozyaistve,
16(8):25-28. —
98. Visvanathan, T. R., S, Balasubramaniam, and J,
Bennett. 1978. "Problem of Caking in NPK
Granular FertiIizers,"Ferti/iserNeu;s,23(8):37-40.
99. Saxena, R. C 1982. "Let Your Granules Glide,"
Self-Reliance, 8(3):6-8.
100. "Caking: Complex Problem," 1984. Fertilizer
Focus.
161, Van Hijfte, Willie H.P. 1981. "The Coating of
Straight Nitrogen Fertilizers," IN Proceedings of
the 31st Annual Meeting of the Fertilizer
Industry Round Table, pp. 181-187, Washington,
D.C, U.S.A.
102. Ahmed, S. M. 1990. "Caking of CAN Fertilizer -
Its Prevention," Technology and Development
(Kuwait), 15(l):75-84.
103. Hoff, J. B. van't. 1986. Practical Approach to
Anticaking in Nitrogen Fertilizers, The British
Sulphur Corporation, Ltd.
104. "The Marketing of Coating Agents." 1993.
Fertilizer Focus, pp. 18, 20-21, 24-25, 27, March.
105. "Conditioning Solid Fertilizers." 1993. Fertilizer
International, No. 327, pp. 20-23, November.
106. Kuvshinnikov, 1. M,, S. A. Troitskaya, V. A.
Frolkina, G. S. Gol'din, and K. O. Averbakh.
1973, "Effect of Surface-Active Agents in
Caking Tendency of Nitrophoska," The Soviet Chem i-
cal Industry, 5:7, July.
107. Blouin, G, M. 1986, "Production of High-
Strength, Storage-Stable Particulate Urea,"'U.S.
Patent 4,587,358, May 6.
108. Krut'ko, N. P., O. V. Shulyakovskaya, F. F.
Mozheiko, and V N. Avilor. 1988. "Effect of Li-
gnosulfonates Modified by Urea on Properties-of
Granulated Potassium Fertilizers, "Journal of
Applied Chemistry of the USSR, 61:2:2, p. 394-
397,
109. Iwasaki, Tetsuji, and Hitoshi Hosokawa. 1989.
"Caking - Preventing Agent for Fertilizer," U.S.
Patent 4,812,158, March 14.
110. Detriot, William i. 1989. :'LignosuIfonate Treated
Fertilizer Particles," U.S. Patent 4,846,871, July
11,
111. Sanford, Michael E, 1991. "Modified Lignosul-
fonate Conditioning Agent for Urea Particles,"
U.S, Patent 5,032,164, July 16.
112. Kawashima, Kazuo, T. Takeno, and K. Kurita.
1984. "Anticaking Agent Composition for Po-
tassium Salt," Canadian Patent 1,166,436.
113. Aleksandrovich, Kh. M., A. P. Yanovskaya, and
G, S, Shakskikh. 1990, "Intensification of the
Effect of Amines as Anticaking Agents in
Potassium Fertilizers," Khimicheskaya Promyshlen-
ndst, 22(ll):663-665.
114. Spelt, J. K.,G, Strathdee, and A. W. Neumann.
1991. "Wetting and Spreading of Conditioning
Reagents on Potash Products," Presented at KALI
91, 2nd International Potash Technology
Conference, Hamburg, Germany, May 26-29.
115. "Fertilizer Caking: Kao Corp. Tests Decylaldehyde
as Urea Anticaking Agent." 1987. Nitrogen, No.
166, March-April.
116. Kuvshinnikov, I. M., Z. A. Tikhonovich, N. N.
Bogdanova, A. A. Alekseev, and O. V Bratashova.
1987. "Elimination of Caking of
Nitrogen-Phosphorus-Potassium Fertilizer by Encapsulation with
Urea-Formaldehyde Resins," Khimicheskaya
Promyshlennost, 19(2):27-29,
117. Ackermans, Wilhelmus H.J., and Michael H.
Willems. 1981. "Process for Reducing the
Caking and Dusting Tendencies of Urea Granules as
Well as Urea Granules Obtained by this Process,"
European Patent Application 0047556.
503
118. Komarov, M. P., and I. M. Kuvshinnikov. 1984.
"Conditioning Nitroammophoska with
Ammonium Sulfate," The Soviet Chemical Industry,
16(4): 216-217.
119. Backhand, Peter S. 1986. "Coated Fertilizer
Particles," U.S. Patent 4,565,564, January 21.
120. "Product Finishing." 1988. Fertilizer
International, No. 266, October.
121. Kuvshinnikov, 1. M., M. P. Komarov, and V. A.
Timofeev. 1991. "Mechanism of Conditioning of
Granulated Fertilizer With Inorganic Substances,"
Khimicheskaya Promyshlennost, 22(4):209-
212.
122. Tarkhanova, L. S., Z. S. Shpileva, and G. D.
Makzushin. 1984. "Improving the Quality of
Urea," The Souiet Chemical Industry, 16(3): 151-
153.
123. Van Hijfte, Willie H.P. 1985. "Process for
Making Granules Containing Urea as the Main
Component," U.S. Patent 4,500,336, February 19.
124. Blouin, G. M., and A. W. Allen. 1985. A Study
of Anticaking Treatments for Urea, TVA
Circular Z-190, Presented at the 190th National
Meeting of the American Chemical Society, September
9-12, Chicago, 1L, U.S.A.
125. Orlov, N. 1., N. G. Zhavoronkova, L:VrKuznetsovr1~T3K
E. E. Agafonova, M. I. Kucha, and A. F. H'chenko.
1987. "Study of the Possibility of Using
Phosphogypsum as a Conditioning Agent for
Ammonium Nitrate," Khimicheskaya Promyshlen-
nost, 19(10);21-24.
126. "Ammonium Nitrate: Magnesium Nitrate Used to
Improve the Properties of Prills." 1983.
Nitrogen, No. 141, January-February.
127. Allgever, Kurt, and Ferdinand Weinrotter. 1963.
"Free-Flowing, Storage-Stable Granular or Pellet-
ized Urea," U.S. Patent 3,112,343.
128. Tennessee Valley Authority. 1976. "Physical
Properties of TVA Granular Urea," IN New
Developments in Fertilizer Technology, 11th
Demonstration, pp. 35-36, TVA Bulletin Y-107,
TVA, NFDC, Muscle Shoals, AL, U.S.A.
129. Van Hijfte, Willie H.P, and R. Goethals. 1973,
"Improvements in or Relating to Urea Crystals,
Pellets, Prills, and the Like," British Patent
Specification 1,334,871.
130. Brown, M. L., A, W. Green, and Ladelle Blanton.
1968. "Stabilizing Ammonium Nitrate Against
Crystalline Change," Journal of Agricultural and
Food Chemistry, 16(3):373-377.
131.
132.
133.
134.
135.
136.
137.
139.
140.
141.
142.
143.
144.
C&I Girdler Corporation, 1967. "The
Stabilization of Ammonium Nitrate Prills," Nitrogen, No.
46:33-35.
Griffith, E. J. 1963. "Phase Transitions of the
Ammonium Nitrate-Magnesium Nitrate System,"
Journal of Chemical Engineering Data, 8(1):22-
25.
"Conditioning Ammonium Nitrate for Handling
and Storage." 1985. Nitrogen, No. 156, July-
August.
Van Hijfte, W. 1988. Storage and Distribution
of Straight Ammonium Nitrate Fertilizers in
Bulk, Proceedings of the Fertilizer Society,
(London), No. 265.
"Conditioning Ammonium Nitrate for Handling
and Storage." 1985. Nitrogen, No. 156:28-34,
July-August.
Gilbert, Richard L, Jr., and Paul W. Knapp. 1970.
"Development of an Accelerated Caking Test for
Urea," Journal of Agriculture and Food
Chemistry, 18(3): 397-400.
Ha cour, Ph., and J. van't Hoff. 1983. "The
Prevention of Fertilizer Caking: An Original Method
to Determine Its Effectiveness," Nitrogen, No.
145, September-October.
"Masse, Gary MX, and Cheng H. Chuang. 1984.
A New Accelerated Caking Test for Granular
Urea, CIL Inc., Chemical Research Laboratory,
2101 Hadwen Road, Mississauga, Ontario,
Canada LSK 2L3.
Lafei, Ali, K. Guruz, andH. Yucel. 1988.
"Investigation of Factors Affecting Caking Tendency of
Calcium Ammonium Nitrate Fertilizer and Coating
Experiments," Fertilizer Research, 18(l):63-70.
"The Latest in Fertilizer Cake Prevention." 1990.
Nitrogen, No. 187, September-October,
Bhatti, Muhammad Essa. 1992. "Physical
Properties Comparative Study of Urea of Different
Companies in Pakistan," Fertilizer Research,
32:13-17.
Strathdee, Graeme G. 1994. "Managing Potash
Product Quality in Global Markets," Phosphorus
& Potassium, No. 193, September-October,
"Anti-Dust Conditioning of DifficuIt-to-Granulate
Fertilizer Materials." 1981. Phosphorus and
Potassium, No. 114:33-34, July-August.
Robinson, Susan K. 1989. "Edible Oils Prove
Value as Dust Suppressants, "Agribusiness
Worldwide, pp. 12-13, 15-17, April.
504
145 Krut'ko, N. P., G\ N. Opanasenko, F, F. Mozbeiko,
V. N. Avilov, T. A. Zus'kova, 1.1. Basalyga, and E.
V. Moshkova. 1989. "The Effect of Petroleum
Hydrocarbons on the Properties of Potassium Fer-
tilizers," Khimicheskaya Promyshlennost,
21(6):430-434.
146. Van de Walle, Richard H. 1990, "The Benefits of
Using Binders/Conditioners in Fertilizer
Granulation," Fertilizer Focus, pp. 86, 88-89, 91,
September.
147. Skvirski, L. I., A. A. Chistyakov, and Z. L. Kozel.
1991, "Production of Non-Dusting and
Non-Caking Potash Fertilizers," Presented at Kali 91, 2nd
International Potash Technology Conference,
Hamburg, Germany, May 26-29.
148. Hoffmeister, George, and G. H. Megar. 1975.
"Use of Urea in Bulk Blends," Proceedings of
the 25th Annual Meeting of the Fertilizer
Industry Round Table, pp, 212-226, Washington,
D.C., U.S.A.
149. Cheval, J. L. 1986. "Material Selection for the
Production of High Quality Blends," Paper
presented at the 36th Annual Meeting of the
Fertilizer Industry Round Table, Baltimore, MD, U.S.A.
150. Hester, Lance,. Michael F. Broder, and Carl A.
Cole. 1990. Particle Size Characteristics of
Alabama Fertilizer Materials -1989, TVA Circular
Z-285, Paper presented at the 40th Annual
Meeting of the Fertilizer Industry Round Table,
November 12-14, Baltimore, MD, U.S.A.
151. Cheval, J. L. 1991. Update on the Canadian
Fertilizer Quality Assurance Program and SGN
Industry View, Association of American Plant
Food Control Officials, Official Publication No. 44.
152. Terry, D. C. 1993. "Size Guide Number and Bulk
Blend Quality," Paper presented at the 43rd
Annual Meeting of the Fertilizer Industry Round Table,
October 25-27, New Orleans, LA, U.S.A.
153. Cheval, J. L. 1994. "A Blender's Tool for Quick
SGN Determination," Paper presented at the 44th
Annual Meeting of the Fertilizer Industry Round
Table, Orlando, FL, U.S.A.
505
Chapter 19. Environmental Protection and
Pollution Prevention
Table of Contents
Page
19.1 Introduction :;.. -...: v.-.-tt-SGT—
19.2 Environmental Issues Related to the Use of Fertilizers ,.,'. 508
19.2.1 Soil Protection by Nutrient Balance 508
19.2.2 Adequate Time of Application of Fertilizers 510
19.2.3 Nitrogenous Fertilizer Use and the Environment 510
19.2.4 Phosphorus Fertilizer Use and the Environment 511
19.2.5 Fertilizer Benefits to the Human Environment 512
19.3 Environmental Impact of the Fertilizer Industry 512
19.3.1 Ammonia 513
19.3.2 Nitric Acid 514
19.3.3 Sulfuric Acid 519
19.3.4 Phosphoric Acid 520
19.3.5 Fertilizers 524
19.4 Phosphogypsum 535
19.4.1 Introduction 535
19.4.2 Disposal of Phosphogypsum 536
19:4:3 Other Applications.-.■■■-TTTTTTTT7.- -tt^7~::...:. 536
19.4.4 Transformation Technologies 536
19.5 Environmental Impact Assessment 537
19.5.1 Objectives of EIA (E1S) 537
19.5.2 Methodology 537
19.5.3 Content of EIA (EIS) 538
19.5.4 Instrumental Application of EIA/EIS 539
19.5.5 Investment in Revamping and Improvements 539
19.5.6 Prevention/Preparedness 539
19.6 The Role of International Organizations 540
19.7 Best Available Technology (BAT) 540
19.8 ISO 14000 542
19.9 References :.... 543
506
Chapter 19. Environmental Protection and
Pollution Prevention
19.1 Introduction
The concept of ecologically sustainable industrial
development motivates producers and consumers to use
products and operate industry using the best
technologies and techniques to minimize adverse environmental
impact II].
Production and use of fertilizers require activities
including mining, mechanical and/or chemical
processing, material transport and handling, and, ultimately,
soil application. Therefore, fertilizer producers and
users are faced with a number of potential points where
adverse impacts on the environment may occur. For
example, fertilizer production processes may release
emissions containing potential pollutants that may have
local environmental impact (e.g., acid rain, water
acidification and eutrophication, groundwater contamination,
etc.) and theoretically may contribute to global
environmental problems (e.g., greenhouse effect).
It is extremely difficult to generalize about the adverse
environmental impact of fertilizer production,
distribution, and use activities. This difficulty arises from-several-
factors. Primarily among these is the fact that the
industry has evolved over the course of more than a century
and over time has responded to changing public
interest and concerns. Conversely, current environmental
awareness has evolved and intensified only in the past
2-3 decades. The fertilizer industry operates facilities with
different levels of environmental safety and,
consequently, varies considerably from one production
complex to another. Similarly, fertilizer use practices have
evolved over time and under changing crop production
systems and public concerns (e.g., low-cost food and
fiber, reducing adverse environmental impacts, budget
consideration, etc.). Thus, fertilizer use practices vary
considerably as to real or potential adverse environmental
impact(s). Therefore, if fertilizer production processes
and use practices are to minimize adverse
environmental impact, both locally and globally, it is important that
a full range of pollution prevention processes are used
and operated with the highest standards of operation
and maintenance. The same criteria apply to fertilizer
use practices.
Although new, more environmentally friendly
technologies have been developed for all basic fertilizer
production processes, these have not been fully adopted
and implemented in all potential applications. This
relatively slower rate of adoption (as compared to other
industries) can be attributed, in large part, to the
economic conditions faced by the industry in the past few
years. Due to a general slackening of demand and the
resulting excess capacity, few completely new fertilizer
factories have been constructed. In addition, until
recently, governmental regulations and international stan—
dards emphasized limits on industrial emissions and
"end-of-pipe solutions." There are similar parallels to
the adoption of more environmentally sensitive
fertilizer use practices.
However, as environmental awareness and sensitivity
intensifies, priority is being placed on minimizing total
adverse environmental impact. This shift in frame of
reference necessitates that environmental protection is
a priority in all stages of industrial development (process
development, design, construction, and operation) and
in fertilizer use. In this setting, pollution control is only
an instrument to ensure that the industry complies with
local regulations.
Increasingly, local standards and regulations are
complying with internationally adopted standards and
guidelines. At the same time, fertilizer traders and financial
~in^tiffitlbrTs'afe""coTKidering"ihe "environmental impact
of alternative suppliers in making purchase and
financial decisions to avoid unfair competition and reduce
the chance of being an unwilling contributor to
environmental exploitation.
The net effect of these factors is that all producers
and users are under increasing pressure to develop and
implement environmentally sensitive fertilizer
production and use, technologies, and more efficient pollution
abatement processes and installations. As retrofitting and
expansions of existing facilities and new developments
are contemplated, there will be significant scope for
improving the contribution of the fertilizer industry to
sustainable development.
This chapter is technology oriented. In subchapters
the emissions from each production process are
described, and available limits are given for selected
countries. These limits (targets) have only indicative character;
however, it remains that locally developed and approved
standards on limits and guidelines on targets should
consider the following issues:
• Trends of the limitations in the regulations of
developed countries and professional organizations (IFA,
EMFA, etc),
• Trends and limitations recommended by the
international organizations,
507
• Concentration limits of harmful substances in air,
water, and soil indicated by the World Health
Organization and United Nations Environment Programme
(UNEP).
• Protection of water and soil- from nonremovable
impurities.
• Protection of the aesthetic values of the environment,
In some cases costs of the environmental protection
installations are given. However, it is difficult to
generalize on the costs of environmental protection measures
in the fertilizer industry because the costs depend on
several factors:
a. The emission target or limit to be achieved.
b. Raw materials used.
c. Type of process and plant capacity.
d. Any other industrial emissions in the production area.
e. Whether the plant is new and environmental
protection has been included in plant design, or if it is an
existing plant, the additional pollution abatement
investments required.
Hence, costs given are indicative; an environmental
impact assessment should be prepared as a part of the
feasibility study to reveal the most economical
approaches to resolving environmental protectonjssu_es,._
19.2 Environmental Issues Related
to the Use of Fertilizers
There are concerns, both genuine and imaginary, that
soil fertility management practices of modern, high-
yielding cropping systems are harmful to the soil
environment and, as a consequence, only conventional
agricultural production is sustainable. Results from long-
term fertilizer experiments, designed to assess the
influence of fertilization on various soil properties in relation
to sustainable yields, tend to dispel such concerns. For
example, Japanese research reveals that NPK
fertilization did not negatively affect physical, chemical, and
biological soil properties, and yields were increased and
maintained at levels double those of unfertilized soils [2],
NPK fertilizers, organic materials, and soil amendments
have resulted in additional yield increases, While the
relative merits of fertilizer use and the sustainability of
agriculture are subject to debate, it is evident that the
potential adverse impact of fertilizer use practices for
both organic and chemical fertilizers can be minimized
and the sustainability of agriculture enhanced by
increased environmental sensitivity,
19.2.1 Soil Protection by Nutrient Balance
Nitrogen forms a part of chlorophyll, the focal
element in plant photosynthesis. Nitrogen is needed in DNA
and RNA for storing and processing genetic
information, in the amino acids that constitute all proteins, and
in enzymes that control all the transformations in the
living world.
Phosphorus is involved in a wide range of plant
processes - from permitting cell division to the
development of a good root system to ensuring timely and
uniform ripening of the crop. It is needed primarily by_
young, fast-growing tissues and performs a number of
functions related to growth, development,
photosynthesis, and use of carbohydrates. It is a constituent of ADP
and ATP, two of the most important substances in the
life processes.
Gains and losses of nutrients in natural ecosystems
are roughly in balance so that continued biological growth
or net fixation of carbon depends upon the cycling of
nutrients between the biomass and the organic and
inorganic stores. Removing or harvesting portions of the
biomass from the ecosystem without replacing the
nutrients contained in the harvested biomass fraction
ultimately depletes one or more of the nutrients.
Consequently, the biological yields are reduced.
It is obvious that nutrients are lost in the ecosystem
through crop removal, leaching, denitrification, volatil-
- -izatiorrrand'erasion? ""' ""
Nutrient removal by the crop is the largest factor
accounting for nutrient depletion from well-managed crops.
Fertilization practices are generally targeted to
replenishing these nutrients consistent with economic
considerations.
Leaching is a serious factor in all light-textured and
well-drained soils. Leaching primarily affects potassium,
magnesium, and calcium but can also be a factor for
other nutrients, in particular, boron and nitrogen.
Denitrification occurs as a result of the conversion of
nitrate N into nitrous oxide and nitrogen. Under poorly
aerated conditions where an initially well-aerated soil
becomes wet and poorly aerated, losses of N can be
large.
Volatilization only affects ammonia. Losses can be very
high where ammonia or ammonia-producing fertilizers
are improperly applied.
Erosion is the largest single factor responsible for soil
degradation, including nutrient loss, Phosphorus is the
nutrient most affected by erosion.
Nutrient depletion and soil fertility can result in
degradation of the environment. Depletion of soil nutrients is
508
a worldwide concern. In Africa there is an annual
nutrient deficit, in Brazil nutrients applied by fertilizers meet
35% of the computed nutrient needs, and in India only
24% In China large-scale depletion of phosphorus and
potassium is observed. Even in the United States the
nutrient budget shows a deficit.
The application of fertilizers to protect the soil from
depletion and to enhance the environment requires that
several conditions be fulfilled:
• Nutrient ratio, e.g., proper fertilizer quantity.
• Ratio of biomass:mineral fertilizers.
• Time of fertilizer application.
Consequences of plant nutrient mismanagement for
the environment at the farm level result from plant
nutrient transfer out of the soil/crop system, and induce
harmful modification of the conditions prevailing in the
system affected by those transfers:
Nitrogen in the surface water:
Nitrogen in ground water:
quality of the drinking
water
eutrophication
quality of drinkable
water
eutrophication
Phosphorus in surface water:
Greenhouse gases to atmosphere: theoretical climate
change
Nutrient Ratio
The soil provides at least 13 essential nutrients to the
plants, partly from its own resources and partly by
channelling nutrients added through fertilizers, manures, and
other sources. All of these nutrients are needed in the
specific proportions to satisfy demand of different plants.
Nitrogen is the nutrient most widely deficient,.and its
initial application often results in very large yield
increases. However, nitrogen application does not
contribute to a buildup of soil fertility. On the contrary, the
unbalanced use of nitrogen relative to other nutrients is
currently causing soil nutrient depletion. It has been
shown that application of 174 kg/ha of N increased the
rice yield by a factor of 2.9 but increased removal of P,
K, and S by factors of 2.6, 3.7, and 4.6, respectively
[3]. The results are given in Table 19.1.
On the other hand, a deficit of P in soil can reduce
nitrogen efficiency. In addition, inadequate supplies of
P may lead to higher amounts of nitrate carryover in
the soil and increase the probability of nitrate leaching
into groundwater. In a large number of trials there were
no responses to K in the absence of P application.
Negative interaction between P and Zn is observed where
high levels of P application reduce the concentration of
available Zn; therefore, a balance of all nutrients must
be ensured by good soil management.
Table 19.1. Depletion of Nutrients at Single
Nitrogen Application
Nutrient Removed
by the Crop kg/ha
Without Fertilizer
Nutrient Straw Grain Total
Nutrient Removed
by the Crop kg/ha
With 174 kg/ha N
Straw Grain Total
N
P205
K20
S
Grain yield
Straw yield
IS 34 52
2 10 12
59 10 69
0,8 1.0 1.8
3,4t/ha
2.8t/ha
75 145 218
5 26 31
232 26 258
3,3 4.9 8.2
9.8 t/ha
8.2 t/ha
Ratio of Biomass to Mineral Fertilizers
The sources of natural nutrients are soil, water,
atmosphere and biomass and farmyard manures (FYM).
The sources of nitrogen for worldwide crop
production are given in Table 19.2 [4]. Soils are the source of
multiple nutrients; however, resources of nutrients in the
soil are always limited and must be supplemented. The
atmosphere supplies some nitrogen, sulfur dioxide, and
chlorides near ocean shores. Water supplies some
quantities of calcium, magnesium, and potassium. All of these
sources should be considered in the selection of soil man-
_agement_prac_tices...
Organic fertilizers (biomass and FYM) are important
elements of the nutrient contribution. The organic
matter that is applied has a very complex effect on soils and
plant growth. In general, the effects are as follows:
• Improvement of the soil physical properties (better soil
structure, water-holding capacity, soil aeration,
buffering soil surface temperature, erosion reduction, etc.).
• Improvement of chemical properties (supply of
nutrients in balanced ratios, slow release of nutrients, etc.).
Table 19.2. Sources of Nitrogen for Crop
Production
Source of N
Biological N-fixation
Mineral fertilizers
Aerial fixation
FYM/biomass
Mineralization of soil
organic matter
Total
%
16.3
45.7
8.1
13.6
16.3
100
Amount
(million of tonnes)
30
84
15
25
30
184
509
• Improvement of the soil's biological activity
(stimulation of soil flora and fauna).
However, the amount of biomass and FYM is limited,
and with increasing urbanization more and more organic
matter is not recycled to the farm site.
The substitution of the present supply of mineral
fertilizers by FYM would require a fourfold increase of the
livestock worldwide. This is not possible due to the
limitation of the feed available, and it is not advisable
because of environmental pollution. For example, some
European countries have developed very large livestock
herds based on imported feed, and manures from
concentrated production have resulted in incidences of
water and air pollution. This has led the European
Community to limit the number of livestock per hectare
of land.
Application of organic matter as a fertilizer has some
negative aspects;
• Under continuously reducing conditions (poorly drained
rice fields) organic acids and other organic products
may retard plant growth.
• City compost and sewage slurries may be
contaminated by the toxic organic compounds and heavy
metals,
• FYM is a source of cadmium.
• Heavy use of FYM may cause bacterial pollution of
groundwater and eutrophication of surface waters.
• The application of biomass requires transportation and
disposal of large volumes; thus, it is a labor- and energy-
intensive operation.
19.2.2 Adequate Time of Application of Fertilizers
Over their life cycle plants require different nutrients
with varying intensity; when the supply does not cover
the demand, yields are lower and in case of oversupply
the unused part of nutrients may pollute the
environment, e.g., there is generally no agronomic reason to
exceed 150 kg/ha of N in grain production. From an
environmental perspective it is risky to apply more than
200 kg/ha of N under European climatic conditions [5].
Plant nutrient supply from various sources should cover
immediate plant nutrient demand. If the risks from
leaching, volatilization, denitrification, or fixation are high, such
as in rainy, tropical climates, it is important to operate in
a supply/demand mode rather than in terms of total
nutrient doses, The uptake of nutrients by cereals during
their developmental phases is given in Figure 19.115].
Daily uptake of N shows an important increase
between tillering and jointing in the amount of 6.4 kg/ha/
day of N. The second crucial period is between panicle
J —,
.
/
h
HI
11
/
I
1
1
1 .-
'-'/
/.'/
■;
/
-:/
/
'
N_
r
/
/ "jP
I
J /
J "'
4*--5-
' ■
^ s; "
\
\
\
\.
' '
0 10 20 30 40 50 60 70 80 90 100
Days after germination
Emergence Jointing Flowering Harvest
Tillering Panide initiation Ripening
Developmental phases
Figure 19.1. Dynamics of the Uptake of
Nutrients by Cereals.
initiation and flowering (demand equals 1.6-1.8 kg/N/
-ha/day-of-N)r—
Phosphorus demand grows after sucker settlement;
however, to produce rich roots phosphorus is necessary
from the very beginning. Between half-time tillering and
jointing and the preparatory phase of panicle initiation,
the demand is about 1 kg/ha/day of the P2O5. After
flowering, initiation and grain growth, the demand is
0.2-0.3 kg/ha/day of the P205.
The consumption of K2O takes place during the first
2 weeks, and supply must reach 15 kg/ha/day of K2O.
19.2.3 Nitrogenous Fertilizer Use and the
Environment
Nitrogen in mineral and organic fertilizers is converted
by soil microorganisms to ammonium and nitrate since
these are almost the only forms of N that can be used
by crops. They are highly soluble in water and are readily
available for plant uptake. The ammonium form is
attracted to and held by soil particles. If the ammonium
form is not used by the plant, it is converted to nitrate.
The unused nitrates move with the soil water and can
lead to accumulation in the groundwater. Heavy rains
may remove nitrogen in any form and deposit it into
surface waters. Organic nitrogen, especially that
originating from mineralization of the organic matter, is the
main source of N loss into the water. Leaching of the
510
nitrogen leads to eutrophication of the surface water
and the contamination of drinking water.
Increasing biological production in the surface waters
consumes dissolved oxygen and causes eutrophication,
Alqae present in the waters with excess nutrients (mainly
leached nitrogen and phosphorus from soil erosion) grow
rapidly and consume most of the oxygen preventing
development of other forms of life, e.g., fishes. In some
cases eutrophication can lead to the total extinction of
life in the waters and can make surface waters unusable.
Nitrate leached from the soil may be present in the
drinking water supplies since the standard treatment
processes do not remove nitrates from water. Nitrates
in the human alimentary system are reduced to nitrites,
which transform blood hemoglobin into an inactive form
that is unable to participate in the oxygen-exchange
process. This is particularly dangerous for bottle-fed
babies. Therefore, the amount of nitrates in drinking
water is limited by the European Union to the amount of
50 mg of NO3/L The WHO advisable limit is 45 mg of
NO3/I. However, water is not the only source of nitrates
in the human diet, and the daily dose of nitrate may
amount to 200 mg of NO3 per day, Fruits and vegetables
transform nitrates into harmless compounds [6]. The
leaching of nitrogen by coincidence is minimal at the
economic optimum of the fertilizer application as shown
in Figure 19.2,
Yield of wheat, t/ha
Leaching of N, kg/ha
90
0 50
100
Fertilization
Yield
Leaching, kg N/ha
150
kg N/ha
Leaching, g N/1 Okg of
20D
grain
Figure 19.2. Leaching of Nitrogen From Soil at
Agronomically Optimal Conditions.
Use of fertilizers also causes emission of gases to the
atmosphere. Nitrous oxide and other oxides of nitrogen
in the atmosphere are transformed into NO2, which
reacts with ozone in the upper zones. However, the
impact of nitrogen oxides on the ozone layer is
insignificant in comparison with that of other gases [4].
Use of urea may cause emission of ammonia into the
atmosphere. In some cases emission of 50% of the dose
applied has been reported. Ammonia emissions
(estimated total of 4.5 million tonne/year) do not contribute
significantly to the greenhouse effect. Ammonia is quickly
removed from the atmosphere by wet and dry surfaces
and by dissolution in precipitation, It is estimated that
only 10%-20% of ammonia emissions reach the
atmosphere and are oxidized to the various nitrogen gases.
19.2.4 Phosphorus Fertilizer Use and the
Environment
Phosphorus fertilizers may contain impurities; among
those are some heavy metals that are of concern. In
particular, cadmium (Cd) has received attention during
the past few years. The level of cadmium content in
fertilizers has been more or less arbitrarily limited to the
concentration of 50 mg CdAg of P2Os [7]. WHO has
limited the daily intake of Cd to 1 microgram/kg of body
weight per day [7]. The current average intake in
Europe is lower than this limit [8].
Detailed studies of the origin of cadmium and its con-
~terit"in crops" have'beencarhed but in "Great Britain [9].
Research has not yet solved the problems of origin
and transformation of cadmium in the soil and crops. It
has been observed that deposition of the Cd from air is
higher than that from mineral fertilizers. Where FYM
has been used the total deposition of Cd has been higher
than the combined atmospheric deposition and the
contribution of mineral fertilizers. However, the behavior of
Cd of different origins in the soil has not been
investigated. Soil organic matter increases the retention of Cd
in the soil. The content of cadmium in grain (wheat and
barley) has been of the same magnitude (about 40
microgramsAs) when mineral fertilizers or FYM has
been used. In the case of herbage, NPK contributed a
cadmium concentration of 81 micrograms/kg of dry
matter, and for FYM reported data are 227 microgramsAs-
Phosphorus also contributes to the eutrophication
process of the surface waters. The eutrophic "threshold
value" is considered to be in the range of 0.020-0.050
ppmw of P; most surface waters exceed this value [10].
The P content in sewage waters containing detergents,
animal wastes, and plant residues contributes to the high
phosphorus content of surface waters. Phosphorus from
fertilizers could reach the surface waters only by erosion
since P does not leach through the soils in a significant
amount [11]. To prevent phosphorus losses in
agriculture, soil erosion control measures should be employed.
511
19.2.5 Fertilizer Benefits to the Human
Environment
The potential negative environmental aspects of
fertilizers as presented in previous paragraphs are minor
when fertilizers are used in the proper quality, at the
proper time of the cropping season, and in the adequate
quantity. The misuse and overuse of fertilizers could not
be an argument against their application. The proper
use of fertilizers requires the active participation of
governments in broad-based education and advertising
programs.
Fertilizers make significant positive contributions to
the human environment [12]. Some of these
contributions are described in the following sections.
• Improvement of Farming Efficiency
Farmers' incomes can be increased by the use of
adequate land management procedures. Application
of fertilizers is one of the leading parameters of
successful land management. Use of the economic
optimum levels of fertilizer is consistent with a minimum
of nitrate leaching.
■ Improvement of Soil Quality
Long-term experiments in Great Britain, Denmark,
and Japan have shown that adequate fertilization
improves soil quality. The soils that are tested are more
productive after many years of fertilizer application
. than at any time before. The aggregating actionfrom-
enhanced root proliferation and the greater amount
of decaying residues have been reported to help make
soils more friable, tillable, and water retentive.
• Improvement of Crop Quality
The mineral, protein, and vitamin contents of crops
may be improved by judicious fertilization.
• Retardation of Soil Erosion
Densely growing crops on slopes are less erosion
prone and have a more prolific root system, which
protects the soil against water and wind loss. The
residual effects of greater organic production improves
soil aggregation.
• Conservation of Water
Efficient cropping systems using fertilizers require
minimum amounts of water per volume of product.
Only well-nourished plants use water efficiently through
the expanded root system and decreased evaporation.
• Air Purification
Plants absorb carbon dioxide and produce oxygen,
A maize field yielding 6 tonnes/ha of grain may
produce about 15 tonnes of oxygen when adequate
amounts of carbon dioxide are used. This is
approximately the amount of oxygen used annually by 30
people.
Issues of agricultural sustainability and minimal
environmental hazards should be addressed simultaneously.
Efficient fertilizer use can be the key to sustainable
productivity. A well-fertilized soil supports a dense canopy,
which protects the soil from erosion, absorbs more
carbon dioxide from the atmosphere, and releases more
oxygen, Minimizing leaching, erosion, and volatilization
losses of mineral and organic fertilizers and preventing
overfertilization should be future agricultural strategies.
19.3 Environmental Impact of
the Fertilizer Industry
The fertilizer production processes considered in this
chapter are shown in Figure 19.3.
Obviously a qualitative description of the emissions
would be given for the standard process. The
quantitative measure of emissions derives from the process basic
Hydrocarbon
Feedstock
Waler
Air /
Waser
Air
Rock
Phosphate
Rock
Sulfar
AMMONIA
PLANT
!
■
NITRIC ACID
PLANT
NITROPHOSPHATE
PLANT
Sate ofR,M&E
PHOSPHORIC ACID
PLANT
SULFURIC ACID
PLANT
P
josphate Hoc
i
—*■
UREA PLAMT
AMMONIUM NITRATE
PLANT
|
It
J
■
—w-
CALCIUM NITRATE
1 PLANT
NPK FERTILIZER
PLANT
AMMONIUM
PHOSPHATE
PLANT
SUPERPHOSPHATE
PLAMT
-*
—
Figure 19.3. General Scheme of Fertilizer
Production.
512
design where relevance to the process alternatives and
capacity emissions could be calculated. These should be
compared with the limits and targets defined in local
regulations (standards or guidelines) and respective
additional pollution-abating equipment selected and added
to the process design.
' 19.3.1 Ammonia
Raw Materials
Ammonia is produced from three basic raw materials:
1. Natural gas by the reforming or partial oxidation
processes,
2. High viscosity, sulfur-rich crude oil residue by the
partial oxidation process.
3. Coal by the gasification process.
Utilities
An ammonia plant needs water of two qualities:
process water for boilers and cooling water, Water-treatment
installations do not produce harmful wastes.
Waste Characteristics and Impacts
Atmospheric Emissions [13] - The main emission
to the atmosphere is carbon dioxide and small
quantities of nitrogen and sulfur oxides. A modern steam-
reforming process unit generates 2.2 tonnes of carbon
dioxide per tonne of ammonia,..whereas, the emission_
of NOx (as NO2) is less than 1 kg/tonne of ammonia.
The sulfur oxide emission is bw (0.2 kg as SC>2/tonne
of ammonia) and depends on the efficiency of the des-
ulfurization process. The partial oxidation of fuel and
coal gasification produce more carbon dioxide (2.7-2.8
t/tonne of ammonia), 1.8 kg of NO2 and 3 kg of SO2/
tonne of ammonia. The increased amount of emissions
originates from additional boilers and the Claus SO2
reduction process.
In principle no ammonia should occur in the
atmospheric emissions of a modern ammonia plant because
any flow containing ammonia is scrubbed and degasified
and the ammonia is recycled. However, because of
leakages from the faulty operation of equipment and
maintenance activities, some ammonia may be released to
the plant atmosphere.
The odor concentration of ammonia is between 18
and 35 mg/Nm3, and the limit on the workplace
concentration is below 10 mg/Nm3. Ammonia becomes
explosive at concentrations of 16%-25% volume in air,
which can occur as a result of indiscriminate liquid
ammonia loading and unloading operations and catastrophic
leakages from ammonia storage vessels I14J.
Wastewater - Modern steam-reforming plants
recycle process condensate and hence produce no wastes
except those from boiler blowdown, boiler water, and
cooling water treatments with negligible environmental
impact. Partial oxidation and gasification processes
produce water with suspended and dissolved impurities and
therefore must be treated in a full three-stage water
treatment plant (mechanical, chemical, and biological) to meet
the standards of the effluent to be disposed into open
waters.
Solid Waste - The steam-reforming process
contains up to 8-9 catalytic steps; catalysts are replaced
after 2-6 years of service. Partial oxidation and coal
gasification use 3-4 catalysts. The catalysts contain"
hexavalent chromium, nickel, zinc, iron, and mineral
supports; therefore these materials could not be disposed
into landfills, Companies that specialize in producing
catalysts or metal-processing companies customarily
recycle catalysts.
Spent resins from boiler feedwater treatment plants
may be returned to the resin producer or burned in high-
temperature kilns.
Hazardous Wastes - The metals contained in the
spent catalyst may be hazardous waste if disposed
indiscriminately,
The potassium carbonate solution used in carbon
dioxide removal contains inorganic and organic additives
that could be hazardous when released in larger
quantises._TJie_prp_cessitseIfdoes.not provide this opportunity.
Fugitive Emissions - Minor amounts of light
hydrocarbons, ammonia, hydrogen, and carbon oxides may
be released due to leaks from flanges and stuffing boxes,
especially during maintenance operations. The handling
of catalysts and chemicals may also cause minor releases.
Contaminants of Concern - No contaminants of
concern are present in the product.
Environmental Impact - Carbon dioxide is a
greenhouse gas, and sulfur dioxide and nitrogen oxides may
contribute to acid rain. In an aquatic environment
ammonia concentrations over 1.25 mg/1 are harmful to
fish.
Pollution Prevention and Control
a. Source Reduction - New ammonia plants consume
as little as 28 GJ/t of ammonia; therefore, further
reduction of carbon dioxide emissions will be
difficult, The same relates to the NOx and SOx from a
reforming unit,
b. Recycling and Byproduct Recovery -
Atmospheric emissions of carbon dioxide are decreased
by nearly one-half by its use in urea or nitrophosphate
plants. Spent catalysts should be recycled for metal
reclamation.
513
c. Hazardous Materials Handling, Management,
and Disposal - The only hazardous material
occurring in large quantities is ammonia, which must be
stored, transported, and handled in special tanks
under specific instructions and guidelines. The
handling and recycling of spent catalysts also require
specific guidelines.
d. Treatment Technologies - A new ammonia plant
can achieve a satisfactory level of emissions from
reforming sections without abatement of fuel gases.
Partial oxidation and gasification plants require
treatment of both gaseous and liquid discharges.
Occupational Health and Safety Issues
Natural gas, ammonia, and hydrogen present during
the process are explosive in mixtures with the air. Leaks
of gas mixtures may self-ignite and may cause
explosions; therefore, respective stations of the automatic fire-
fighting equipment must be located in. critical areas.
Ammonia is stored at low temperatures in Iarge^volume
tanks or under pressure in smaller storage tanks. In
consideration of the toxic properties of ammonia in
concentrations over 10 mg/1, the necessary safety equipment
(gas masks, eye wash bottles, showers, etc.) must be
located at the workplaces. Operators of ammonia plants
should be highly trained workers and have experience
in industrial operations. Detailed operating manuals and
guidelines should be prepared and workers must be
retrained regularly.
Guidelines of Discharge Requirements
There are no specific emission limits and guidelines
for ammonia plants in Europe; however, because of their
high thermal input, they have limits corresponding to
those of electric power plants. Examples of such
standards for Germany are given in Table 19.3 [13].
Target/Projected Guidelines
At present the target technology is an ammonia
synthesis plant that uses desulfurized natural gas and a re-
Table 19.3. Emission Limit Values Applied
for Combustion Plants in Germany
Pollutant
S03
NOx
Type of Plant
Gaseous Fuel Installations
>100 MW
New: >100 MW
>300 MW
Existing: >100 MW
>300 MW
Limit Value
35 mg/Nm3
200 mg/Nm3
100 mg/Nm3
350 mg/Nm3
100 mg/Nm3
forming (with pre-reforming and partial oxidation)
process that requires low amounts of energy (28 GJ/t) and
has special burner facilities to decrease NO* to nil
concentrations.
Monitoring Requirements
The reformer units, auxiliary boilers, and. sulfur
recovery units should be monitored for NOx and SOx
concentrations. The monitoring frequency depends on local
regulations.
19.3.2 Nitric Acid _.__
Raw Materials
Nitric acid is produced from the three basic raw
materials - anhydrous ammonia, air, and process water.
Utilities
A nitric acid plant needs water that has three
qualities: process water for steam turbine condensation,
process makeup water, and cooling water. The water
treatment installations do not produce harmful wastes.
Recycled process condensate or demineralized water is
used by the absorption tower. The cooling water must
also be of high quality especially regarding the
concentration of chlorides. Sometimes cooling water operates
in a closed circuit and is cooled by poor-quality water.
The production of nitric acid produces a surplus of
energy in the form of high-pressure steam.
Characteristics and Impacts of Wastes
Atmospheric Emissions [13] - The main emissions
to the atmosphere are oxides of nitrogen (NOx) and
nitrous oxide (N2O). The concentration of NOx in
emissions varies between 75 and 2,000 ppmv. The
concentration of NOx depends on final acid
concentration, absorption tower pressure and design,
temperatures of the cooling tower water, quantity and quality of
process water, and degree of tail-gas treatment, if any.
Wastewater - Wastewater from the process can
originate from blowdown of cooling tower water to control
dissolved solids and from boiler blowdown and water
treatment plants. In all cases the water will contain
dissolved salts that have a low environmental effect.
Solid Waste - The platinum/rhodium catalyst
requires treatment after a certain campaign length
depending on the combustion pressure and, due to its high cost,
is returned to the manufacturer for credit. Deposits of
catalysts can be recovered from various parts of the plant;
these are also returned to the catalysts' manufacturer
for recovery of platinum and rhodium. Spent water
treatment resins may be returned to the resin producer or
burned in high-temperature kilns.
Hazardous Wastes - The process does not
produce hazardous solid wastes.
514
Fugitive Emissions - Small amounts of ammonia
are released from vaporizer blowdown and from
maintenance operations, Similarly, there can be small
amounts of nitric acid released during maintenance,
Contaminants of Concern - There are no
contaminants of concern present in the product.
Environmental Impact [14] - The main impact on
the environment is from NOx emissions to the
atmosphere. NOx may contribute to acid rain and ground-
level ozone. Nitrous oxide could theoretically contribute
to greenhouse effects or affect the stratospheric ozone
layer; however, N2O emissions from nitric acid plants
are small compared with other sources.
Of the total N converted in the nitric acid plants, 0.6%-
0.9% is lost as NOx and 0.4%-1.5% is lost as N20 to the
atmosphere,
Pollution Prevention and Control
a. Source Reduction - Most emissions to the
atmosphere can be reduced by plant design and optimal
operation. Makeup and cooling water temperature
will affect the absorption stage and hence emissions
of NOx,
b. Recycling and Byproduct Recovery - Catalyst
wastes are recycled,
c. Hazardous Materials Handling, Management,
and Disposal - Nitric acid should be stored in closed-
top stainless steel tanks. The plant areas should have
impermeable flooring with all surfaces draining to a
neutralization pit to deal with small acid discharges
from maintenance operations. It is also important to
prevent ammonia vapor emissions from unloading,
storage, and handling facilities. Small amounts of
nitrate salts produced from the neutralization pit would
normally be discharged with cooling water blowdown
to waste.
d. Treatment Technologies - New high-pressure
nitric acid plants can achieve satisfactory emission
levels of NOx without treatment of the tail gas.
For various other plants abatement methods are
available to reduce NOx emissions:
* Alkaline Absorption and Extended Absorption -
Alkaline absorption involves treating the tail gas with
sodium hydroxide in a scrubber. After washing,
concentrations of NOx as low as 200 ppmv in tail gas can
be achieved. The byproduct of the washing process is
a low concentration solution of sodium nitrite/nitrate
that requires safe disposal or further use, The capital
cost of the absorption process is 4.3% of the total
investment cost of a dual-pressure nitric acid plant.
The net operating cost, considering higher
maintenance costs yet higher acid recovery, is not expected
to increase. Depending on the absorption pressure,
the processes of BASF, 1C1, and others may use
alkaline absorption. Ammonia scrubbing is used in the
United States, Goodpasture (U.S.A.) developed a
process in which the tail gas is scrubbed with an
ammonium nitrate solution with the addition of ammonia in
the scrubbing unit. Part of the NOx may be recovered
as ammonium nitrate, and part may be reduced to
nitrogen. Norsk Hydro developed a scrubbing process
in which the scrubbing medium is an aqueous solution,
of urea and nitric acid; the loss of fixed nitrogen in the
process is a disadvantage [15],
In the industrialized countries there is a growing
preference for extended absorption as a method to
control NOx in tail gas. The method consists simply of
increasing the efficiency of the absorption system by
adding a second absorption tower, by adding more
sections to the absorption tower, or in some cases by
reducing the temperature in the last absorption stages
by cooling coils using chilled water or other coolant.
One company uses refrigerated potassium carbonate
solution as the coolant. Hydrogen peroxide can also
be used in the end stage of absorption to increase the
efficiency of the process. These methods can be used
with either new or existing plants; with new plants
there is greater flexibility in selecting the economic
—optimurn-Gembination-of-parameters, including
increased pressure. It has been reported by Chemical
Works Tarnow (Poland) that substantial reduction of
NOx has been achieved by saturation of scrubbing
liquids with oxygen [16]. Several organizations,
including Friedrich Uhde (Germany), Societe Chimique de
Grande Paroisse (France), C&l Girdler (United States),
D. M. Weatherly and Co. (United States), and
Institute of Mineral Fertilizers (INS - Poland), offer nitric
acid plant designs with extended absorption, which
will give tail-gas NOx concentrations below 200 ppmv.
This concentration is low enough to satisfy the present
requirements of the United States or any West
European country. The extended absorption method has
the obvious advantage that recovery of nitrogen as
nitric acid is increased by 1.0%-1.5% as compared
with the former practice.
• Non-Selective Catalytic Reduction (NSCR) [17]-
Hydrogen or hydrocarbons are burned in tail gas over
platinum/rhodium catalysts to remove NOx using
excess oxygen. Reduction to nitrogen requires 1.1-1.25
excess fuel component in relation to the NOx amount.
Application of hydrogen is environmentally safe;
however, it is a rather costly process. Utilization of the
hydrocarbons produces tail gas containing carbon
monoxide and hydrocarbons. Natural gas is usually
515
used as a fuel for the NSCR method, The following
reactions are illustrative for this method:
1. 2 04 + CH4 -* C02 + 2 H20 + 802 kJ [1]
2. 2NO2 + CH4^N2 + CO2 + 2H20 + 331kJ [21
3. 4NO +CH4^2N2 + C02 + 2H20 + 443kJ [31
Tail gas contains about 2%-4% oxygen, which also
reacts with the added fuel (reaction 1). For complete
reduction of NOx (reactions 2 and 3), enough fuel gas
must be added to consume all of the oxygen in the tail
gas, Being highly exothermic this method is often
designed with two or more catalyst beds in a series with
intercooling to prevent excessive temperatures.
The NSCR process supplied by the State Institute
of Nitrogen Industry (GIAP) incorporates a catalyst
reactor with two catalyst beds without intercooling to
create a high reaction temperature for more efficient
energy recovery. This is possible because of the
composition of the catalyst; AI2O3 with 2% Pd is used for
the first bed and AI2O3 for the second. The
temperature of the gas leaving the reactor is in the range of
680°-800DC, depending on the modification of the
process. This method generates much heat at a high-
temperature level. The energy is recovered by a high-
temperature tail-gas expansion turbine and wasteheat
boiler The tail gas vented to the atmosphere may
contain up to 0.15% CO and 0.02% CH^More th_an_
100 nitric acid plants in Russia and other Central and
East European countries are equipped with GIAP
NSCR units.
• Selective Catalytic Reduction (SCR) [17] -
Ammonia is used as a reducing agent over a catalyst to
convert the NOx gases to nitrogen. These processes
can reduce the concentration of NOK in tail gas to
100 ppmv and lower. Existing plants with medium-
pressure absorption can be economically revamped
using this process. The capital cost of the selective
catalytic reduction (SCR) process to remove NOx from
a concentration of 500-200 ppmv would increase the
capital costs of a dual-pressure nitric acid plant by 2%
and operational costs by US $0.30/tonne of nitric
acid, The SCR method needs ammonia for reduction
of NOx. The following reactions occur in the process
of selective reduction of NOx:
1. 4 NH3 + 6 NO -* 5 N2 + 6 H20 + 1810.6 kJ [4]
2. 8 NH3 + 6 N02 -* 7 N2 + 12 H20 + 2743 kJ [5]
If the correct catalyst is chosen, ammonia does not
react with the oxygen present in the tail-gas; as a
result less heat is generated. The temperature of
reaction is usually in the range of 200°-450°C.
516
For the processes developed in Russia (GIAP), two
different catalysts are used: alumo-vanadium (AVK) and
alumo-copper-zinc (AMC) catalysts.
SCR has also been used successfully in several
commercial plants in Japan, the United States, and
Western Europe, Commercial processes are offered by Gulf
Oil Chemicals, Inc. (United States); Mitsubishi (Japan);
BASF (Germany); Grand Paroisse and Rhone-Poulenc
(both France); Espindesa (Spain); and others. A small
residual quantity of NH3 may be present in the tail gas
vented to the atmosphere after the SCR unit.
Because of more strict pollution control regulations
in Russia [17], preference was given to NSCR and
SCR NOK abatement methods. Since the early 1970s
catalytic reduction units, either NSCR or SCR, were
incorporated in all Russian-designed nitric acid plants.
At the same time, all older plants (except those
operating at atmospheric pressure and already equipped
with alkali scrubbing) were supplied with SCR units.
Both methods, NSCR and SCR, are effective in
reducing the tail-gas NOx concentration well below 100
ppmv.
• Adsorption Processes - Adsorption by silica gel or
molecular sieves is possible. The process requires
regeneration of the adsorbent and permits return of the
NOx to the process, An interesting version of "wet"
adsorption scrubbing principle is the Compagnie
Francaise de I"Azote"(COFAZ) process [18].
Two examples of the NOx treatment process units
that combine the high efficiency absorption columns
and SCR reactor implemented by Uhde and Rhone-
Poulenc are described in the next section.
Rhone-Poulenc Processes (RP France) [19]
NOx abatement of tail gases from nitric acid plants
and other NOx sources (e.g., adipic acid, nicotinic acid,
nitrates calcination, etc.) has been implemented during
the past 10 years in about 40 projects in 18 countries
by applying two processes:
1. High-efficiency absorption (HEA column).
2. Catalytic destruction of NOx (DCN process).
These two processes which are applied to gases from
the absorption tower, are given in Figure 19.4 and could
be applied separately or jointly depending on the local
NOx emission limits.
The principle of the high-efficiency absorption (HEA)
column is liquid-phase oxidation and absorption. The
product is a dilute nitric acid, which is recycled to the
main absorption system. The nonabsorbed gases are
heated and directed to the catalytic reactor (Rhone-
RECOVERY
DESTRUCTION
To Atmosphere
A HND3
Legend i
C-l Absorption Column
C-2 High Efficiency Absorption <HEA>
E-3 Heat Exchanger
R-4 DCN Reactor
K-5 Turbine
ST-6 Stack
N2, H2D to Turbine
HEA CoLunn - Reduction of the NDx
content In the tail gas with NDx
recovery as nitric acid
DCN Reactor - Destruction of renaming
NDx according to level required by the
most stringent International standards
Figure 19.4. Rhonc-Poulenc NOK Abatement Process.
Poulenc code: DN110 and DN115). The reaction
between the NOx and NH3 ensures full reduction of the
oxides. The reduced tail gas passes through the turbine
and out the stack.
The cost of NOK pollution abatement depends on the
efficiency of the original absorption system; estimated
costs for a 365-tpd nitric acid unit are given in Table
19.4 [191.
Institute of Mineral Fertilizers (INS Poland)
Process [20]
The process is a double-pressure 0,5/1.5 MPa
process. A high-efficiency absorption tower ensures 99,9%
efficiency. After treatment the gas contains 40 ppmv of
NOK. The double catalyst system (1 step: Pt-RH, II step:
Tabic 19.4. NOx Abatement Cost Estimate
Process Investment Cost
(US $ million)
HEA 0.4
DCN 1.0
Consumption Per Tonne
of 100% Nitric Acid
Energy,
kWh/tonne NH3 kg/tonne
4.5
Total cost of tail-gas cleaning: HEA 0.6 US $/tonne
DCN 1.3 US $/tonne
Pd) ensures the minimum losses of platinum (20-40 mg/
tHN03).
Occupational Health and Safety Issues
—NQ7farh"es^aTe~highiy~toxicrTh"e exposure threshold
limit value (TLV) during an 8-hour period is 3 ppmv and
10 minutes limit of 5 ppmv. Breathing NOx fumes should
be avoided, and a breathing apparatus should be worn
whenever necessary. Nitric acid is extremely corrosive
to all materials, When handling the acid a fully
protective suit, goggles, face shields, PVC gloves, and boots
must be worn.
Eye wash bottles and showers should be provided at
strategic places throughout the plant. Gaseous emissions
from safety devices such as ammonia gas relief valves
must be vented to a safe place.
Operators of the nitric acid plant should be highly
trained workers with experience in industrial operations.
Detailed operating manuals and guidelines should be
prepared and workers regularly retrained.
Guidelines of Discharge Requirements
The specific air emission limits and guidelines for
existing nitric acid plants in Europe are given in Table 19.5
and for new plants in Table 19.6 [13].
Target and Projected Guidelines
At present the target technology is a nitric acid plant
without a special abatement process unit with an NOx
concentration of 200 ppmv in the tail gas. Medium-
pressure plants can vent 500-800 ppmv of NOx in tail
517
Table 19.5. Air Emission Limits for Existing Nitric Acid Plants
Countrv
Germany
France
Netherlands
United Kingdom
Ireland
Denmark
Spain
India
Turkey
Thailand
U.S.A.
Greece
Limit Value
450 mg/m3 dry NOx
as NQ2 (219 ppmv)
4.5 kg HN03/tonne
of 100% HNOs
600 ppmv
1,000 ppmv
200 ppmv (NCU
Limit values set for
each plant
20 kg NOx/tonne
HN03
3 kg NOx/tonne of
weak acid
800 mg/m3
2,000 mg/m3
1.5 kg NOx/tonne
HNO3
8 kg NOx/tonne
100% HNO3
Averaging Time Implementation Date
Remarks
24 h
lh
3/1986
1992
1992
1976
1981
Case by case
Limit not to be exceeded
at any time of operation
Table 19.6. Air Emission Guidelines for New Nitric Acid Plants in Europe
Country
Germany
France
Netherlands
>500 tpd
United Kingdom
Denmark
Spain
Portugal
Greece
Limit Value
450 mg/m3 dry NOx
as N02 (219 ppmv)
4.5kgHN03/tonne
of 100% HNO3
220 ppmv
200 ppmv
200-225 ppmv
3 kg/NOy/tonne
of 100% HNO3
400 mg/m3 N02
5 kg NOx/tonne of
100% HNO3
Averaginq Time
24 h
lh
2h
Implementation Date
3/1986
7/1974
1987
1987
Expected
1975
Remarks
Double 2% time
400 h/year
48 h 6 kg/tonne
No limits at shutdown
and startup
Limit not to be exceeded
at any time of operation
518
oas A smaller low-pressure plant may emit up to 2,000
ppmv when unabated. The standard of 200 ppmv for
new plants is recommended as a realistic target.
Monitoring Requirements
Continuous monitoring of NOx levels in the stack gas
should be provided. The system that measures the sum
" of all NOx and NO2 separately is recommended to allow
for a higher degree of plant operational control
19.3.3 Sulfuric Acid
Raw Materials
Sulfuric acid is produced from three basic raw materials:
a. Elementary sulfur.
b. Pyrites,
c. Tail gases from the metallurgical industry.
Utilities
The production of 1 tonne of 100% sulfuric acid
requires 0.33 tonne of sulfur and creates up to 1.8 tonnes
of high-pressure steam.
Sulfuric acid plants need water that has three
qualities: demineralized water for boiler feed, process makeup
water to absorb SO3, and cooling water. The water
treatment installations do not produce harmful wastes.
Recycled process condensate or demineralized water-is-used—
for the absorption tower. The cooling water amount and
quality depend on the type of heat exchangers used and
water available.
Waste Characteristics and Impacts
Atmospheric Emissions - The process has two
emissions to the atmosphere: sulfur dioxide and acid
mist, both of which are released with the waste gas from
the final absorber tower.
Wastewater - Apart from boiler blowdowns and
water treatment plant regeneration, this process does
not produce liquid effluent if the basic raw material is
elemental sulfur. If other raw materials are used, there
are waters containing chemicals that must be treated.
Aqueous effluent from the sulfuric acid plant can
originate from spills, leaking pumps, or flanges; the degree
of contamination depends on the operating and
maintenance standards.
Solid Waste - The oxidation process uses vanadium
catalyst that must be periodically removed and screened
for dusts. A 1,500-tpd plant produces 20 m3 of the spent
catalyst annually.
Used catalyst and dusts are returned to the catalyst
manufacturer for recovery of vanadium or safe disposal.
Vanadium compounds, especially oxides and the sulfide,
are toxic if inhaled.
In case of other raw materials (metal sulfides), solid
wastes are quite extensive; however, they are also used
in metallurgical operations.
Hazardous Waste - The process does not produce
hazardous solid waste if the spent catalyst is handled
carefully.
Fugitive Emissions - Small amounts of sulfur dust
are produced when the sulfur is stored in the open air.
Similarly, small amounts of sulfuric acid can be releasecT
during maintenance.
Contaminants of Concern - There are no
contaminants of concern present in the product.
Environmental Impact - Sulfur dioxide and acid
mist released to the atmosphere contribute to local and
regional acidification of the atmosphere and may
contribute to acid rain. However, SOx emissions from
sulfuric acid plants are small compared with large-scale power
stations burning coal and high-sulfur fuel oil.
There is little impact on local groundwaters if leaks
are collected such as by a sump and returned to the
process.
Pollution Prevention and Control
a.~SbUrc«~Redu^ioff^Mostemissions to the
atmosphere can be reduced by selection of the raw
materials. Low ash sulfur requires less screening of catalyst
and less solid waste. In other cases liquid sulfur
filtration and SO2 gas filtration are necessary before
conversion. Yellow sulfur is preferred before other colors
that have organic impurities. The latter produces, a
mist, which exits the absorption towers and is
difficult to remove.
b. Recycling and Byproduct Recovery - Catalyst
waste is recycled or vanadium is removed from
dumped catalyst.
c. Hazardous Materials Handling, Management,
and Disposal - Sulfuric acid of 96% strength and
higher may be stored in mild steel tanks. The plant
areas should have impermeable flooring with all
surfaces draining to a neutralization pit to deal with small
acid discharges from maintenance operations.
d. Treatment Technologies - The new sulfuric acid
plants can achieve satisfactory emission levels of SO2
and mist using a double conversion/double
absorption system with high efficiency mist eliminators
after the final absorption. Fiber mist eliminators having
low gas velocities are used to remove all particles
above 9 microns and 99% of all smaller size.
519
Electrostatic precipitators are very efficient; however,
they have a high capital cost. In specific locations
final tail-gas scrubbing with ammonia or caustic soda
solutions is necessary.
For the upgrading of existing facilities based on single
absorption, three options exist:
1. Conversion to double absorption.
2. Switching to a cesium-type catalyst.
3. Addition of alkaline tail-gas scrubbing.
All of these changes may account for about 20%-25%
of the investment costs of a new installation. Tail-gas
scrubbing is the lowest cost option (15% of the total
revamping cost); however, this generates a liquid
effluent that needs to be processed.
The full revamping program increases the efficiency
of operation but not to the extent of being justifiable on
economic grounds alone.
Occupational Health and Safety Issues
Concentrations of sulfur dioxide in excess of 27 mg/
Nm3 are known to be strong irritants, and the
maximum safe concentration for industrial safety is
considered to be one-half of this value.
For sulfuric acid mist, maximum safe concentrations
for a 24-hour period are considered to-be-Oi-l-4-ppmv-.—
When the acid is handled, a fully protective suit,
goggles, face shields, PVC gloves, and boots should be
worn. Eye wash bottles and showers must be provided
at strategic places throughout the plant.
Operators of the sulfuric acid plant should be highly
trained workers with experience in industrial operations.
Detailed operation manuals and guidelines should be
prepared, and workers should be regularly retrained.
Guidelines of Discharge Requirements
The specific air emission limits and guidelines for
existing sulfuric acid plants in several countries are given
in Table 19.7 [131.
Target and Projected Guidelines
At present the target technology is a sulfuric acid plant
with double conversion and double absorption with mist
elimination, The 99.5% sulfur recovery may be achieved
by this process structure. This gives a release of 3.3 kg
SCVtonne of 100% sulfuric acid.
Monitoring Requirements
Continuous monitoring, displaying, and recording of
the SO2 level in the stack gas should be ensured to
control the efficiency of the plant.
Acid mist and SO3 slip from the final absorber demister
should be measured at least weekly.
19.3.4 Phosphoric Acid
Raw Materials
Phosphoric acid is produced from two basic raw
materials: sulfuric acid and phosphate rock concentrate.
The sulfuric acid does not introduce harmful
impurities. The phosphate rock depending on origin can
contain either radioactive elements [U, Th, Rd] or heavy-
metals such as cadmium nickel, copper, etc. Also, the
crystalline structure of the phosphate rock influences the
process, its efficiency, and the composition of the
byproducts. The source of the raw material should be
considered carefully when a phosphoric acid plant is
established, and the technology should be adapted to
this particular source.
Utilities
The production of 1 tonne of P2O5 in phosphoric
acid requires 7.1 tonnes of makeup water; this includes
the acidulation process and washing requirements. The
additional water may be necessary to pump the
phosphogypsum slurry to the dumping site or sea. A
phosphoric acid plant needs water that has two
qualities: process water and cooling water. The water treat-
^nentjnstallations do.not produce harmful waste.
Waste Characteristics and Impacts
Atmospheric Emissions - Phosphate rock usually
contains 3%-4.5% of fluorine by weight. Hydrogen
fluoride released during the acidulation of the phosphate
rock combines immediately with the available silica
contained in the reaction slurry, Use of low-silicate
phosphate rock produces free hydrogen fluoride-also.
Both are harmful fluoride emissions. The reactor
fluorides are usually absorbed in water or in diluted
solutions of fluosilicic acid. The modern absorbing equipment
allows production of concentrated solutions, which could
be processed to synthetic cryolite, aluminum fluoride,
and various fluorosilicates. If not sold as a byproduct,
the fluosilicic acid can be neutralized by liming. The
neutralized slurry may require further treatment, such as
settling, before it is discharged.
Wastewater - In most cases the water used to
transport phosphogypsum to storage is recirculated back to
the process. The phosphogypsum stacks require
treatment of the run-off water for several years after the
phosphoric acid plant has ceased production.
Maintaining the water in the phosphoric acid plant is
an important part of the know-how of plant operation.
520
Table 19-7- Sulfuric Acid Emission Guidelines
Country
Denmark
Germany
Greece
Spain
France
United Kingdom
India
Thailand
Tunisia
Turkey
Jordan
Mexico
U.S.A.
S02
5 kg/t H2SO4 (1)
97.5-99.5 sulfur conversion
reate (4}
6 kg/t H2S04 (1)
10kg/tH2SO4(2)
1,425 mg/m3 (2)
2,858 mg/m3 (1)
1,425 mg/m3 (3)
6 kg/t H2SO4 (7)
Sulfur as SO2+SO3
<0,5% sulfur burned
4 kg/t H2S04
500 ppmv
13kg/tH2SCU(8) '
2 kg/t H2SO4 (9)
2 kg/t H2SO4
3 kg/t H2SO4
2 kg/t H2SO4
SO3
0.5 kg/t H2SQ4
60-120 mg/m3
0.5 kg/t H2SO4
0.8 kg/t H2S04
500 mg/m3 (2)
300 mg/m3 (1)
150 mg/m3 (3)
0.5 kg/t H2S04
35 mg/m3
(1)
(1)
(2)
(7)
1.5kg/tH2S04(8)
72 g/t H2S04
0.5 kg/t H2SO4
75 g/t H2SO4
Acid Mist
615 mg/Nm3
50 mg/m3
35 mg/m3
75 g/t H2S04
75 g/t H2SQ4
(1) New plants.
(2) Existing plants.
(3) Plants built after 1980.
(4) Depending on SO2. _"— ""
(5) No limitation,
(6) H2SO4.
(7) These figures are used as guidelines by licensing authorities.
(8} Single absorption.
(9} Double absorption.
Aqueous effluent from the phosphoric acid plant can
originate from spills, leaking pumps, or flanges;
contamination depends on the operation and maintenance
standards,
Solid Waste - Approximately 5 tonnes of
phosphogypsum dry mass is made per tonne of
phosphoric acid (calculated per 11 of P205). When it is
deposited, this waste contains about 40% water, some
phosphoric acid, and trace elements from the rock:
radioactive elements and heavy metals like cadmium. Other
solid waste is produced during plant cleaning from scale
deposits and deposits of phosphogypsum in storage
tanks. The problem of phosphogypsum waste treatment
is given in section 19,4,
Hazardous Waste - Radioactive elements and heavy
metals may leach if phosphogypsum stacks are not
isolated from groundwater.
Fugitive Emissions - Small amounts of fluorine
derivatives are released into the atmosphere. Similarly
there can be small amounts of phosphoric acid and sludge
released during maintenance.
Contaminants of Concern - All phosphate ore
contains traces of radioactive elements, and some
contain a number of metals. These impurities are studied in
relation to their impact on health and the environment.
During the processing of the phosphate rock they are
partitioned between ore beneficiation process waste, acid
process waste, and final product.
The cadmium level in fertilizers made from
phosphoric acid is increasingly causing concern, and this may
influence the choice of raw materials. Igneous phosphate
rock typically contains very little cadmium (<1 mg Cd/
kg P), whereas sedimentary sources contain much higher
but widely varying amounts (from 43 mg Cd/kg P to
521
380 mg CdAg P). However, the amount of Cd entering
into the ecosystem in Europe (European Union
countries} with fertilizers accounts for only 6% of the total
balance of cadmium. It has been shown that the
deposition of cadmium from the air in Great Britain during the
last 40 years has been equal to that introduced with the
fertilizers [9].
The regulations or voluntary limits on cadmium for
selected countries are given in Table 19.8 [13].
Because cadmium sulfate is water-soluble and cadmium
phosphate is acid soluble, most of the cadmium in
phosphate rock concentrate stays in phosphoric acid and in
the products made from the acid.
Environmental Impact - The phosphoric acid
process produces large amounts of phosphogypsum. The
latter requires either a large land surface for disposal or
a transportation system for disposal into deep sea. Dis-
Table 19.8. Limits on Cadmium in European
Countries in mg Cd/kg P2O5 in
Fertilizers
Country
Austria
Denmark
Finland
Germany
Norway
Switzerland
Sweden
Value
120
48
22
75
44
22 (NP-NPK)
44 (TSP)
22 (NP-NPK)
44 (PK)
posal into the sea is controversial, and some
governments established limits for this operation.
The phosphogypsum stacks should be deposited on
specially lined surfaces to prevent leakage of
contaminated wastewater to the groundwater. Any excess water
from the stack, especially from the rain deposits, must
be drained and neutralized by liming before being
released.
Typical impurities in phosphoric acid used in the
fertilizer industry are given in Table 19-9.
Table 19.9. Range of Impurities in Phosphoric
Acid
Components
H3PO4
P2O5
Heavy metals
CaO
Fe203
A1203
Mg
H2SO4
Si02
F
Content, %
■ 69-77
50-56
0.5-1.5
0.014-0.35
0.86-2.30
0.30-2.45-
0.00-0.80
1.0-5.6
0.04-0.1
0.25-1.10
Pollution Prevention and Control
a. Source Reduction - Most of the emissions of
fluorides to the atmosphere can be reduced by selection
of efficient absorption equipment.
The hemihydrate (HH) process produces lower
quantities of phosphogypsum and a higher
concentration of phosphoric acid; however, differences in
pollution problems are not substantial.
_The_wastewater-reIeased -from the transportation
of the phosphogypsum slurry must be carefully
circulated.
b. Recycling and Byproduct Recovery - The proper
recycling of wastewaters from the process and
maintaining the water balance should be two of the
technology targets,
Fluorides should be transformed into useful
industrial products whenever possible. In critical cases when
there is no market for such a product, wash waters
must be returned to the process and discharged with
phosphogypsum.
Phosphogypsum can be processed and used as a
construction material or converted to cement and
sulfuric acid. The assessment of this process is given
in Chapter 11.
c. Hazardous Materials Handling, Management,
and Disposal - Phosphoric acid is highly corrosive
to mild steel. Much of the plant is fabricated using
stainless steel, rubber-lined mild steel, plastic piping
and valving, and vessels. All storage tanks should be
inside containment areas.
The plant areas should have impermeable
flooring; all surfaces should drain to a neutralization pit to
deal with small acid discharges from maintenance
operations.
522
i Treatment Technologies - Processes are in
commercial use for recovery of uranium from
phosphoric acid.
There are presently no commercial processes for
removal of cadmium from phosphoric acid; however,
extensive research is carried out in view of expected
stricter regulations on cadmium content.
Gaseous contaminants (fluorides) are removed by
scrubbing the gases and transforming fluorides into
useful products, The remaining fluorides from sewage
waters and from phosphogypsum stacks are removed by
two-stage lime treatment.
The existing dihydrate plants could be converted to
the hemihydrate-dihydrate (HDH) process at a cost of
about 50% of a new HDH facility. The cost of liming
the recirculated water to pH 3.5 is one of the primary
cost elements and equals US $70/tonne of P2O5. The
cost of building a new gypsum stack, which has a single-
bottom liner, a 20-year life, for a production of 3 million
tonnes of gypsum/year, is about US $20 million. The
cost of closing a gypsum stack is site dependent, but a
recent closure in the United States cost US $5.5 million
with an annual maintenance budget of US $250,000
[211-
Occupational Health and Safety Issues
Phosphate rock dust, fluorides, acid, and radioactive
elements are the main health hazards in a phosphoric"
acid plant. The threshold limit value (TLV) of industrial
exposure to hydrogen fluoride for daily intake has been
established at 5-6 mg/Nm3; however, considering other
inputs from drinking water and food, the reasonable limit
of daily intake has been established at levels of 2 mg/
day of fluorides ingestion.
The testing of workers must be conducted at regular
intervals. The first signs of chronic fluorosis in man is
mottling of the teeth and later ossification of the
ligaments.
Animals such as cattle are known to be affected by
concentrations of fluorides in excess of 30 mg/Nm3;
however, there are other sources of intake, artificial or
natural, and in case of overdoses the animals contract
osteosclerosis.
Vegetation is more sensitive to exposure than
animals or human beings. Fluoride concentrations as low
as 0.015-0.04 mg/Nm3 will damage some pine and fruit
trees.
If instrument control of emissions is not possible near
the phosphoric acid plant, the industrial sites should use
garden plots to assess pollution by fluorides near the
plant.
The radionuclides concentration in phosphate rock
varies considerably, depending on the geographical area
from which it was mined. The median content of the
radionuclides surveyed in 1968 in the United States had
the following values:
U 59mg/kg
Th 8 mgAg
Ra 18 mgAg
It has been established that about 60% of the
radionuclides remain in beneficiation tails. Two-thirds of those
remaining in the beneficiated phosphate rock is trans-—
ferred to the phosphoric acid, and the remaining third
is disposed of with the phosphogypsum [22].
There are processes allowing, through the
concentration of the phosphoric acid, sedimentation of the
uranium in the form of "yellow cake"; however, the process
is not economically viable. The analytical review of NPK
produced in Finland has shown that the annual
contribution of U-238 contained in NPK fertilizers was about
0,25% of the total U naturally occurring in the surface
10 cm of soil layer. Similar results have been reported
in Belgium where it was found that Ra-226
contamination in phosphate fertilizers added to the soil represents
only 0.25% for 14 kg/ha of P and 0.96% for 54 kg/ha
of P of the total Ra-226 in the upper 20-cm layer of the
soil [22].
—The-long-term-effects-of-phosphate fertilization on
radioactivity have been studied in the United States, TSP
produced from Florida phosphate rock and applied at
the rate of 30 kg/ha of P during more than 50 years did
not change the concentrations of U, Th, and Ra in corn
leaves and grain, wheat grain and straw, or soybean
leaves and bean in comparison with nonfertilized plots,
The soil conditions facilitating radionuclides uptake by
the crops have not been studied in detail; however, it is
obvious that radionuclides present in the soil solutions
are absorbed by the plants.
In case of use of phosphate rock containing higher
radionuclides in production of fertilizers, the
radioactivity of phosphoric acid and phosphogypsum must be
measured because the radioactive components of the
rock are concentrated to a degree in various parts of
the plant during processing, particularly during vacuum
filtration, To avoid ingestion of radioactive elements, a
high level of hygiene should be observed when
maintenance is carried out in these parts of the plant and when
scale is removed.
The limits of radiation that should be observed are as
follows: when handling the acid a fully protective suit,
goggles, face shields, PVC gloves, and boots must be
worn. Eye wash bottles and showers should be provided
at strategic places throughout the plant.
523
Operators of the phosphoric acid plant should be
highly trained workers with experience in industrial
operations. Detailed operating manuals and guidelines
should be prepared and workers regularly retrained.
Guidelines of Discharge Requirements
Some fluorine discharge limits for phosphoric acid
plants are given in Table 19.10,
Table 19.10. Guidelines on Fluorine Emissions
From Phosphoric Acid Plants
Effluents
Liquid
Gaseous
Total (U.S.A.)
50 ppmw
25 ppmv
10g/tP2O5
HF in mg/m3
5-10
Target and Projected Guidelines
At present the target technology of phosphoric acid
will depend on the rock sources, the site, and the
discharge point of the effluent. The water balance of the
plant and further use of phosphoric acid-would- play-a-
primary role in determining the possible (potential)
targets for effluent. Disposal of phosphogypsum to the sea
is only agreed upon in Europe. The North Sea
Declaration calls for 70% reduction of cadmium to the North
Sea by 1995 and further reduction has been targeted to
90% by the year 2000. The established target for plants
near the North Sea is 0.5 g cadmium/tonne of gypsum
disposed to the sea, and this can serve as a guide
elsewhere-
Regarding fluoride emissions to the air from the
phosphoric acid plant, the recommended target should be
10 g/tonne P205.
Monitoring Requirements
Daily monitoring, displaying, and recording of the
fluoride level is obligatory. Typical monitoring of the
discharge waters from the phosphogypsum storage is given
in section 19.4.
19.3.5 Fertilizers
Solid fertilizers are produced in two stages:
1. Synthesis is performed by the following:
• Reaction of ammonia and CO2 (ammonium
carbonate and urea).
• Reaction between sulfuric and/or phosphoric acid
with phosphate rock (SSP and TSP).
• Reaction between acids (sulfuric, phosphoric, and
nitric) and ammonia.
2. Providing the physical form of the product by
crystallization, granulation, or prilling.
It is not economically feasible to eliminate all effluents
and emissions during production of fertilizers.
Raw Materials
The principal raw materials for finished solid fertiliz
ers are ammonia; nitric, sulfuric, and phosphoric acids;
phosphate rock; and potassium chloride.
Utilities
The production of fertilizers requires steam, fuel for
drying, and water for scrubbing of gases, mist, and dust
from granulation or prilling units.
Waste Characteristics and Impacts
Atmospheric Emissions
1. Simple Superphosphate/Triple
Superphosphate - Phosphate rock usually contains between
3% and 4,5% of fluorine by weight. Released during
the acidulation of phosphate rock, hydrogen fluoride
is usually converted into fluosilicic acid by silica in the
rock, most of which is retained in the TSP process,
Krt^Bouf~25%~is released in SSP production. Wet
scrubbers are required for production of SSP. In
addition, fluoride emission continues during the curing
process. Feedstock-handling bins for phosphate rock
must be equipped with individual bag filters from
which recovered dust is recycled.
Efficient scrubber designs allow recovery of the
H2S1F6 as a concentrated solution, which could be
processed to synthetic cryolite, aluminium fluoride,
and various fluorosilicates. If no market is available
for the acid or fluoride derivatives, the fluosilicic acid
can be neutralized by liming. The neutralized slurry
may require further treatment before discharge.
2. Ammonium Phosphates (DAP/MAP) - The
ammonia-acid reaction produces steam containing
ammonia and fluorine; these are scrubbed by water
and/or acids. In granulation and prilling equipment
the gases from dryers contain dust; they must be
filtered by cyclone and bag filter systems when dry, To
prevent condensation of water from drying gases,
dust recovery equipment is insulated and heated
externally. Most of the recovered material is recycled
to the process.
3, Nitrophosphates - The production of nitro-
phosphate in all stages of production emits the
following gases:
524
a. Acidulation of the phosphate rock with nitric acid
produces NOx and fluorine compounds. An
example of NOx treatment for a nitrophosphate plant
is shown in Figure 19.5.
Off gases from the nitric acid attack section and
from calcium nitrate filtration are scrubbed; the
remaining nitrites are decomposed in the reactor
Ammonium nitrate solution is recycled to the process.
b. Evaporation (condensation) produces emission of
fluorine compounds and ammonia.
c. Prilling and granulation processes produce dust and
ammonia emissions.
4. Ammonium Nitrate, Calcium Ammonium
Nitrate, Ammonium Sulfate (AN/CAN/AS) - The
main emissions to the atmosphere include the following:
♦ From the reaction and evaporation systems: steam
containing ammonia and ammonium nitrate; these
are in small quantities and treated in the scrubbing
system. Scrubbing waters are recycled to the
reaction/evaporation system.
• Ammonium nitrate mist is released from the
prilling tower. The dust in the cooling air disperses into
the atmosphere and reaches soil many kilometers
in radius from the prilling tower. Ammonium
nitrate dust can be extremely harmful to pine trees.
The amount emitted from specially equipped
prilling towers (dust collection and Brinks filter system)
may be between 0.25 and 0.5 kg of AN/tonne of
fertilizer,
5. Urea - The main air pollution in urea plants
originates from the prilling tower. The vented hot air
amounts to 10,000-15,000 Nm3/tonne of urea
containing an average of 500-1,000 mg of urea/Nm3
of air before treatment, Dust removal.systems-sueh
as the impinger-type baffle-plate system may decrease
concentrations of dust to 200-300 mg of urea/Nm3
of air. The remaining dust is very fine (less than 10
micrometers); therefore, dry cyclones are not
effective in further reducing emissions.
Improved dust removal systems developed recently
may reduce the emissions down to 30 mg of urea/Nm3
of air and bring the losses to 0.3 kg/tonne of urea.
Wastewater - Direct-process liquid effluents
originating from fertilizer processes are rare, In most cases
in urea and ammonium nitrate production, wet
scrubbers are operated at low concentrations to allow
economic recovery. Solutions from scrubbers are
concentrated by adding screened fines and dust to
Attack Section
c=>
C-l
CN Fi L-tra-tlon
B-7
B-10
□Ffgas to Atmosphere
r^>
C-2
E-3
-<=>
P-8
NH3
E-4
Legendi
C-l. C-2 Columns
E-3. E-4, E-5 Heat Exchangers
R-6 Reactor
B-7 Circulation Blower
P-8, p-9 Punps
B-10 Exhaust Blower
E-5
NITRITE
-^DECOMPOSITION
REACTOR
R-6
-<-
B
P-9
AN Solution to Process
cr>
Figure 19.5. The NOx Treatment Section From the Uhde Nitrophosphate Plant.
525
increase the concentration for recycling. Adequately sized
holding tanks are required to prevent recyclable effluent
from overflowing to the sewer during shutdown or
abnormal conditions. Aqueous effluent from the fertilizer
plant can originate from spills, leaking pumps, or flanges.
The severity of leakage depends on operating and
maintenance standards.
Solid Waste - Solid wastes are not generally
produced in finished fertilizer production processes because
offsize material is recycled to the process,
Hazardous Waste - There are no hazardous wastes
in fertilizer production other than the cadmium contained
in certain fertilizers.
Fugitive Emissions - Small amounts of fluorine
derivatives are released into the atmosphere. Similarly
there can be small amounts of fertilizers released during
maintenance.
Contaminants of Concern- There are no
contaminants of major concern in fertilizer production. The
cadmium level in fertilizers produced using phosphoric acid
is increasingly causing concern, and this may influence
the choice of raw materials.
Environmental Impact - Fertilizer production
processes that are suitably abating emissions do not release
material in harmful quantities to the atmosphere. The
following emissions that have negative impact on the
environment could be expected:
• Ammonia and acidic fumes may create mists in the
plant's vicinity and can cause damage to vegetation,
• Fluoride emissions cause damage to vegetation and
harm to livestock that consume vegetation.
• If the dust released into the atmosphere is excessive,
it may cause damage to vegetation, especially to the
pine forests.
• If plant nutrients are released to the aquatic
environment from the scrubber system or runoff water, it is
possible that eutrophication of water resources may
take place, especially in lakes and closed reservoirs.
Pollution Prevention and Control
The legal limits on emissions in selected countries are
given in Table 19.11 [13].
a. Source Reduction - Most emissions of fluorides
into the atmosphere can be reduced by selecting
efficient absorption equipment.
NO2 emissions from the nitrophosphate process
can be controlled by adding urea to the digestion
Table 19.11. Fertilizer Processes - Discharge Guidelines in Selected Countries
Components
Dust
NH3
Nm3
HF
F
NH4+ as N
N03" as N
Cd
Belgium
India
Germany
Taiwan
Province
Turkey
Tunisia
150 mg/Nm3 55-75 mg/Nm3 50 mg/Nm3 200 mg/Nm3 200-700 mg/m:
50-300 mg/Nm3 [1) 50 mg/Nm3 200-700 mg/m:
300-600 mg/1 10 mg/1
150 mg/] 50 mg/1
225 mg/1
0.3 mg/1 (5)
2 mg/1
P 300 mg/1 (5)
50 mg/1 5 mg/1
COD (6) 450 mg/1 (5)
300 mg/1
Suspended solids 200-600 mg/1 100 mg/1
nH 5-9.5 6.5-8
5 mg/Nm3
1 kg/t P205 (2)
^niy/i 2 kg/t N
10-20 mg/1 (4) 2 kg/t N
15 mg/1
30 mg/1
100 mg/t P205
0.5 kg/t P2Os
100 mg/1
pH
200 mg/1
30 mg/1
6-9
15 mg/1
50 mg/1
800 mg/m3
0.5 mg/1
35 mg/1
100 mg/1
6-9
'3-4 kg/t P205 (3}
11 mg/1
20 mg/1
6-7
(1) Limit at discretion of local authorities.
(2} Limit at the best available technology.
(3) Phosphoric acid production,
(4) Higher value is applicable to phosphate fertilizers unit.
(5) Lower value pertains to brackish water applications.
(6) Chemical oxygen demand.
526
stage. Gases from the digestion stage are treated in
wet scrubbers.
Waste can be minimized by a high level of
operation and maintenance to avoid spillages. Any
spillage, whether solid or liquid, should be returned to
the process.
b Recycling and Byproduct Recovery - All
materials resulting from fertilizer production can be recycled.
Efficient equipment for scrubbing and dust recovery
must be utilized.
c. Hazardous Materials Handling, Management,
and Disposal - If they are manufactured according
to international standards, fertilizer products are
generally of low hazard. Ammonium nitrate and high
ammonium nitrate fertilizers are considered to be
oxidizing agents and require special transport and
storage measures. They should not in any case be mixed
with hydrocarbons or carbohydrates. It is necessary
to avoid any contact of ammonium nitrate with open
flame.
As much as possible, the fluorides should be
transformed into useful industrial products. In critical cases
when there is no market for such a product, wash
waters must be returned to the process and discharged
with phosphogypsum.
d. Treatment Technologies - The precise
combination of abatement installations and the required
treatment will be dependent on the types of processes
available and limits and targets of the pollution
allowed.
To remove ammonium nitrate fumes, low-velocity
filters (Brinks mist eliminators) may be necessary. The cost
of such an installation for a 1,200-tpd plant amounts to
US $750,000 with a filter replacement cost of US
$90,000 every 3 years.
For urea dust a venturi plate scrubbing unit may be
used with an expected cost of US $1,2 million and an
additional annual operating and maintenance cost of
US $155,000 and US $12,000, respectively, for a plant
of 1,000-tpd capacity.
Dust generated in the process can be passed through
cyclones to return the larger particles to the process.
For finer particles a bag filter or wet scrubber may be
required.
Other gases, mist, and fumes may be treated by
water scrubbing or, in case of ammonia, water containing
phosphoric acid. In this case installation requires an
anticorrosive lining. The scrubber liquors may be
concentrated and recycled to the process. When recycling
is not possible, wastewaters must be treated before they
are returned to the aquatic environment. Removal of
the radionuclides from phosphoric acid is operational
industrially by the concentration of the phosphoric acid
or extraction. There are at present no commercial
processes for the removal of cadmium from phosphoric
fertilizers; however, extensive research is being conducted
in view of expected stricter regulations on cadmium
emissions.
Gaseous contaminants (fluorides) are removed by
scrubbing the gases and transforming fluorides into
useful products. The remaining fluorides from sewage
waters are removed by a two-stage lime treatment.
The cost of pollution abatement equipment added to
the existing plants can be 10%-20% of the total cost of
the fertilizer plants. The operating and maintenance costs
relating to environmental protection can be 10%-20%
of the total production cost.
In new plants the process design would include the
environmental protection measures in all process units
with the need for high efficiency and productivity;
however, environmental protection costs can hardly be
expected to be lower than 10% of total investment and
operation costs.
In the next section the commercial processes will be
discussed. UN1DO has either received information on
these processes directly from licensors or collected it
-Jrom-paperspresentedatinternationalconferences.
Unfortunately not all licensing companies surveyed by
UN1DO provided information; therefore, the
technology presentation given in the next section does not
represent the complete package of technologies presently
available on the market. However, concerning the
principles applied in pollution abatement, the presented
sample seems to be fairly representative from an
engineering point of view.
A. Urea
Toyo Engineering ACES Process (TEC Japan) [23]
Major pollutants from the urea plant are NH3 and
urea in the liquid and gaseous effluents. The sources of
pollution are as follows:
1. Gland cooling water from the reciprocating and
centrifugal pumps.
2. Process condensate from the concentration section.
3. Effluent air from the prilling tower or granulator,
To improve treatment of these streams, Toyo
Engineering Company and Mitsui Toatsu Company
developed an integrated pollution control system of a urea
plant, which is given in Figure 19.6.
527
To Vent
Vapor fron
Final
Separator
■i ■
Mixed Gas to LP
Decomposer
0
P-l
Fron Chemical Sewer
Legend:
P-l Reciprocating Pucip Stuffing Box
E-2 Cooler
S-3 D|I Separator - 1
S-4 DlI Separator - 2
C-5 Final Absorber
J-6 Ejectors
To LP To Dust Blow Down
Absorber Scrubbsr
E-7 Surface Condensers
T-8 PC Tank
C-9 PC StrIpper
R-10 Urea HydroLyzer
Figure 19.6. TEC Integrated PoUutioiiXontroLSystem-in-a-Urea-Plantr-
1. Gland Cooling Water From the Pumps - Gland
cooling water from the stuffing boxes of the
reciprocating NH3 and carbamate pumps is contaminated
with ammonia, urea, and lubrication oil, but this is
not the case when centrifugal pumps are used. The
leakage of the process fluids to cooling water through
the seals of pumps may cause a high concentration
of urea in cooling water depending on the types of
seals and maintenance adequacy. To abate this
contamination a closed circuit of the gland cooling water
system has been adopted. The lubrication oil in gland
cooling water is removed through an oil separator
installed on the cooling water circulation line. A
blowdown stream containing urea and ammonia is
discharged to the process condensate treatment
section.
2. Process Condensate-The largest source of liquid
pollution in the urea plant is process condensate in
the concentration section.
Water formed by urea synthesis and that fed to
the recovery system as an absorbent is evaporated.
under a vacuum in the concentrator or evaporator.
Evaporated water with an entrained mist of urea is
condensed in a multistage surface condenser.
The uncondensed gas from the surface condenser
is vented to the atmosphere through the final
absorber where CO2 and NH3 accompanied by the
inerts are absorbed into process condensate from the
first stage of the surface condenser under atmospheric
pressure. The emission of NH3 from the scrubber is
less than 0.15 kg NHa/tonne of urea. The process
condensate formed in the second stage of the
surface condenser is treated in the process condensate
stripper at 3 MPa to remove NH3 and C02, Gas is
fed into the urea hydrolyzer at 16 MPa. The
overhead gaseous mixture from the process condensate
stripper is sent to the low-pressure decomposer for
recovery of NH3, CO2, and heat of water vapors.
3, Urea Dust - A primary source of the emissions is
the urea dust in the effluent air from the prilling tower
or the urea granulator. Without any treatment the
amount of urea dust contained in the emitted air
varies within the range of 50-100 mg/Nm3 of air. The
engineering design to reduce this dust must consider
the following parameters:
• The amount of air handled is substantial (e.g.,
600,000 Nm3/h for a 1,500-tpd urea plant).
• Urea dust contains fine particles of less than 1
micron in diameter.
528
• Lower pressure drop through the urea dust
scrubber minimizes the operational cost.
Considering these parameters TEC constructed a dust
scrubber to meet more strict environmental requirements;
the scrubber is shown in Chapter 9
The air from the prilling tower or granulator is scrubbed
on a packed bed with aqueous urea solution
(approximately 20% urea concentration}. Any mist in the exit
air is caught by a demister. Process condensate is used
as makeup water for the scrubber.
The combination of the above control methods
allows achievement of the following levels of effluents and
emissions.
• Liquid effluents.
- urea (3-5 ppmw).
- free ammonia (3-5 ppmw).
• Gas effluents.
- urea (30-50 mg/Nm3 of air).
The cost of implementing these measures is
determined by the following variables:
• Depreciation of the pollution control installation
(investment cost, US $4.5 million for a 1,500-tpd urea
plant).
• Utilities cost.
- electrical energy (6 kWh/tonne of urea),
- steam (0.02 tonne/tonne of urea).
• The total operations cost increase of urea
production is estimated at about US $1.60/tonne.
Foster Wheeler (FW USA) Process [24]
The Foster Wheeler process combines condensate
purification with air dedusting and is shown in Figure
19.7.
The key process unit is an FW Evaporative Scrubbing
System (ESS). The raw process condensate from the
urea unit is first steam stripped to reduce ammonia
content. The stripped process condensate is mixed with a
circulating stream of urea solution and enters the
distribution system of the ESS, which also acts as a cooling
tower. The air from the finishing process (prilling or
granulation) is introduced into the bottom of the ESS.
Particles entrained in the air are dissolved in the urea
To Final Condenser-Subcooler
<^ = --^-=—
Vapor fron First Urea Evaporator
c=£
Urea Solution to Evaporation Section
<=>
L.P, <3.5. ATM.. ) Stean
k
->
E-4
-H
NH3. CD2 3, H£D to Carbonate Recovery
<=■
Raw Process Condensate from
EvaporatI on CondensatI on
Stripping L,P. Steam
c=5
C-l
Str ippecl
Process
Condensate
Urea +
Traces
NH3, CDE
Air + Urea Dust from Urea
C-S
P-£
£T
Solidification Process
-Q"
B-7
Air + WaterL
ta Atmosphere
S-5
~7N
Urea So lutian
P-6
Air + Urea Dust
->■
Legendi
C-l Ammonia Stripper
P-2 Condensate Pump
E-3 First Condenser
E-4 Solution Steam Heater (Not required for granulation plants)
S-5 Evaporative Scrubber
P-6 Urea Solution Pump
B-7 Air/Dust Blower
figure 19.7. Foster Wheeler Combined Dedusting Process.
529
solution. The solution is also cooled in the scrubber as a
result of water evaporation. A portion of rich urea
solution from the bottom of the scrubber is sent to the urea
plant, The main stream from the scrubber is circulated
through a condenser in which most of the vapor from
the first urea evaporator is condensed and the
circulating scrubber solution is heated.
The amount of heat required for the operation of the
ESS is determined by the desired concentration of the
rich urea solution. In a practical design the heat from
the vapor condenser is sufficient to vaporize the
process condensate in the scrubber; therefore, in most cases
external heat is not necessary.
In a granulation system some additional heat is
necessary and is supplied by a small steam heater (the
balance is under 10% of total heat requirements). The
integrated system has advantages over the design with
separate condensate and dust treatment systems:
• Smaller synthesis equipment,
• Reduced cooling water consumption.
• Elimination of medium-pressure steam for urea
hydrolysis.
The above described system has been also applied in
dedusting of air from ammonium nitrate prilling or a
granulation plant.
The estimated cost for retrofitting the ESS system to
an existing plant is:
• Investment cost (BL) US $3.2 million for a 1,350-tpd
urea unit
• Depreciation US $074/tonne
- saving on utilities (US $0.40/tonne)
- credit on urea (US $0.20/tonne)
The total cost of the introduction of a new scheme:
increase US $0.14/tonne.
The cost of integrating the system in a new urea plant
is composed of the following elements:
• saving on utilities (US.$0.40/tonne)
* urea credit (US $0.20/tonne)
The total saving in new urea plant operating costs: US
$0:60/tonne.
Stamicarbon bv Process Water Treatment Unit
[25]
The process water containing ammonia (about 6%),
carbon dioxide (about 4%), and urea (about 1%) is
processed in a separate unit, which can be attached to any
existing installation. The process is composed of des-
orption and hydrolyzing units and is shown on Figure
19.8,
To Atmospheric Absorber
cr>
S-5
E-4
■fj
P-6
To Recirculation
Sect]on
c=>
Legend■
C~l 1st TJesorloer
C-e 2nd Desarber
C-3 Hydralyzer
E-4 Reflux Condenser
S-5 Separator
P-6, P-7 Punps
E-8, E-9 Heat Exchangers
To Users
Figure 19.8. Stamicarbon bv's Urea Process Water Treatment.
530
Process water (desorption feed) enters through the
heater to the first desorber where ammonia and carbon
dioxide are removed. The urea-containing effluent is sent
to the hydrolyzer where urea is decomposed at 200°C.
The liquid portion is sent to the second desorber and
the gaseous portion is sent to the upper part of the first
desorber and the vapor serves as a stripping agent in
the first desorber. All vapors are condensed in the
condenser where basically carbamate is produced. Part of
the carbamate is sent as reflux to the first absorber to
maintain its concentration at the required level. The gases
are vented after treatment in the atmospheric absorber.
The water effluent from the bottom of the second
absorber after cooling may be used as process water. The
amount of 0.4 MPa steam is about 200 kg/t of process
water and 1.8 MPa steam for the hydrolyzer is
equivalent to about 40 kg/t of process water. The operating
conditions are mild; therefore, regular stainless steel
would be used. The design value of the urea and
ammonia content in the effluent is 5 ppmw each. The
experience of operating installations has shown that it is
possible to maintain these levels below 1 ppmw.
B. AN/CAN
GIAPpollution abatement system [26}
A typical pollution abatement system for high-density
AN prilling used in many countries of the
Commonwealth of Independent States (CIS) is shown in Chapter
8 in Figure 8.14.
Vapor and hot air from the neutralizer and
evaporator contaminated with ammonia and AN are treated in
the same system with air from the prilling tower. The
scrubber solution is recirculated to increase its
concentration and eventually recycled to the AN solution
preparation step. The recovery of AN and ammonia is
reportedly up to 85%, The system meets the pollution
_ control requirements enforced in these countries.
Unfortunately, construction of a very large scrubber on top
of the prill tower notably increases the capital cost of
the plant, A very effective method of solving this
problem has been developed by the Co-Operative Farm
Chemical Association (CFCA) and is in use at its plants.
The fume abatement system consists of installing a bell-
shaped shroud around the spray head in the upper part
of the prill tower to collect fume-laden air from that part
of the tower where fume is formed when air contacts
hot AN solution or prills in the solidification process.
The airflow through this shroud is only about 25% of
the total airflow through the tower; the remaining 75%-
is practically free of dust and fume and is discharged
directly to the atmosphere. The air from the shroud is
drawn through a scrubber and Brinks high-efficiency mist
eliminators. Fume and vapor from the neutralizer and
evaporators are collected to the same scrubbing system.
The system recovers 3-7 kg of AN/tonne of product
from all sources; this recovery more than offsets the
operating cost (excluding capital cost). From a pollution
abatement viewpoint the system has met applicable
standards; an atmospheric emission of less than 0.5 kg/
tonne of product and opacity of less than 10% have
been attained.
C Complex Fertilizers (NP/NPK)
There are several process variations of NP/NPK
plants. They have been constructed in different periods
"of^rivironmenfalTegislaffon;'' and no one possible
solution exists to allow a plant to meet the present required
level of emissions.
Uhde Methodology
Therefore, Uhde [27] has developed a four-step
approach to evaluate and reduce plant emissions. They
consider the potential emissions related to specific
equipment and technological parameters that are listed in Table
19.12.
Table 19.12. Sources of Emissions on NP/NPK Plant
Process
Reactor
Neutralizer
Granulator
Drying
Solids handling
Scrubbers
Pollutant
Parameters
NGy, fluor compounds
NH3, fluor compounds
NH3, NOx, dust
NH3, dust
Dust
Fl uor compounds
Temperature, type of
acid, organic matter
Temperature, molar ratio
Temperature, molar ratio,
granulation parameters
Temperature, molar ratio,
granulation parameters
Granulation parameters
Temperature, molar ratio
531
The steps to evaluate optional methods of
improvement are as follows:
Step 1. Reduce or avoid the formation of pollutants at
the source.
Step 2. Select process conditions and/or equipment to
minimize emissions at the source,
Step 3. Contain pollutants in a minimum of carriers.
Step 4, Recover airborne pollutants.
The methodology used has proven efficient in several
plants when Uhde has been involved in the emissions
reduction program.
Beladune Fertilizers Limited Process (BFL
Canada)
The process is exclusively licensed to HiTech
Solutions, Inc., Lakeland, Florida, U.S.A. [28].
During the production of DAP about 110 kg of
condensate/tonne of DAP containing 2.5%-3.0% of
ammonia is released. This condensate must be internally
consumed in the plant with minimal heat losses. The
double mol scrubbing (DMS) system and BFL vaporizer
scrubber resolve the problem of the reactor/granulator
(RG) off-products. The system utilizes waste heat to
vaporize ammonia, scrub the fluorine, and provide hot
water for cake washing in the phosphoric acid plant
(see Figure 19.9).
The off-gases from the DAP reactor and granulator
are scrubbed separately in pipe (duct) sprays using as a
scrubbing liquor the recycle from the low mol scrubber,
Both flows enter the cyclonic separator (Hi Mol Scrub-
ber-HMS) where the liquor is separated from the gas
stream. The liquor drains back to the recirculation tankr
The gases then enter a Venturi scrubber followed by a
cyclonic separator (Low Mol Scrubber-LMS). The low
strength phosphoric acid is pumped and recirculated to
the venturi cyclone.
The excess of the low strength phosphoric acid is
recycled to the reactor. The gases from LMS enter the
BFL Vaporizer/Scrubber.
All the condensate water is drained to the seal tank
and recirculated to a single large spray nozzle at the
heat exchange inlet. The off-gases flow through the heat
exchanger, and the gas stream/condensed water enters
From Granulator
To Atmosphere
P-7 T-13
To Phos. Acid
Low Strength Phos, Acid
<J=i
Legend'
M-l, H-S Mixers
S-3 HI Mol Scrubber
S-4 LDU Mol Scrubber
T-5, T-9, T-13 Tanks
P-S, P-7, P-8 Pumps
X-10 BFL Vaporizer / Scrubber
B—11 Exhaust Blower
ST-12 Stack
Figure 19.9. BFL DMS Process.
532
a separator chamber equipped with a demister. The acidic
water is returned to the plant, and purified gas is
ventilated to the stack.
The following process parameters are published:
IMS'
Mole ratio (NH3:P205), 0,4-0.8
Scrubbing liquor temperature, 70°C
Recirculation ratio, 215 liters/100 m3
Scrubber gas exit temperature, 82°-90°C
HMS
Mol ratio (NH3:P205), 1.6-2.0
Scrubbing liquor temperature, 85°C
Recirculation ratio, 160 liters/100 m3
Scrubber gas exit temperature, 82°- 90°C
BFL vaporizer/scrubber
Entering gas temperature, 82°- 90°C
Exit gas temperature, 77°- 82°C
Recirculation rate, 1.4 m3/min
Condensate composition: 0.02-0.2% F
<2,000ppmwNH3
<l,000ppmwP2O5
Meld of condensate, 2 liters/tonne DAP
Emissions meet ail regulated amounts.
The costs of the full scheme are as follows:
- Investment cost for 1,000-tpd DAP plant: US $8
million
- Electrical energy consumption, 14 kWh/tonne
- Heat recovery, 0.5 GJ/tonne
- Water saving, 36 1/tonne
The total cost of implementing the BFL scheme
compared with that of the standard scheme, which does not
meet the emission regulations: US $1.40/tonne.
Uhde Closed Scrubber System [29]
The concept of a closed system has been applied in
the BGF AS plant in Turkey. The principal scheme is
given on Figure 19.10.
The exhaust gases from the pipe reactor (or
preneutralizer) and granulator enter the granulation
scrubber for cleaning by a recirculated solution. Gases
from the granulation scrubber enter the main scrubber
along with exhaust from the drying drum, and they are
washed by a circulating solution to which phosphoric
acid is added. The off-gases are washed in the final
scrubber with water and sulfuric acid. The surplus circulating
solution is returned to the pipe reactor or preneutralizer.
Off-gas
Exhaust drying drum
(1] - Exhaust pipe reactor or preneutralizer + granulator
[3] - Tb pipe reactor or preneutralfeer
Legend:
S-l GranuL scrubber
S-2 Main scrubber
S-3 Final scrubber
T-I,T-2.T-3 Tanks
P-l,P-2,P-3 Pumps
Figure 19.10. Uhde's Closed Scrubber System
for NPK/DAP Plants.
D. Nitrophosphate Fertilizers
Norsk Hydro nitrophosphate process emissions
treatment:
1. Liquid Effluents [30]
All washwaters from the wet section are collected,
and calcium hydroxide and calcium carbonate are
added to precipitate phosphates and fluorides in a
settling cone. A flocculant is added to increase the
rate of precipitation. The slurry is recycled to the
process, and water is reused as washwater, Thus, two
objectives are achieved:
- All liquid effluents are eliminated from the
digestion section.
- The efficiency of raw materials use is increased
(99.9% for P205).
The water vapors removed from neutralization and
evaporation stages are scrubbed with a recirculated
ammonium nitrate solution (60%); the vapors are then
condensed and ammonia is stripped and returned to
the neutralization section. The clean condensate is
discharged.
The typical composition of liquid effluents from a
NH nitrophosphate plant is given in Ta'ble 19.13.
533
Table 19.13. Effluent Limits From NH
Nitrophosphate Plant
Effluent
NH3
N03
F
Level of Impurities
<100ppmwof N
<200 ppmw of N
<50 ppmw
2. Gaseous Emissions
The gaseous emissions are treated separately:
- The emissions from digestion, crystallization,
separation, and filtration are scrubbed in several stages
by wash water, which is recycled as described above.
To cope with the excessive amounts of NOx, some
amount of urea is added to the scrubbing water.
- The emissions from the conversion section are first
scrubbed with recycled acidic ammonium nitrate
solution and in the second stage by recycled acidic
water.
- The emissions from granulation are cleaned with
conventional cyclones,
The emissions to the atmosphere-from, the -N-tL
nitrophosphate plant are given in Table 19.14.
Total effluents from the NH nitrophosphate plant are
given in Table 19.15.
The BASF Method of Nitrophosphate Process
Emissions Treatment [31]
Treatment of gaseous emissions is divided into two
systems:
- NO* removal
- NH3 and dust removal
Table 19.14. Emission to Atmosphere From
NH Nitrophosphate Plant
Effluent
Dust
NH3
N03
F
Level of Impurities
<100 ppmv
<150 ppmv of N
<150ppmvof N
<25 ppmv
Table 19.15. Total Effluents From NH
Nitrophosphate Plant
Element
Nitrogen as N
Phosphorus as P
Process
Condensate Vents to Atmosphere
(kg/tP205)
4.4
0.6
1.4
NCVcontaining waste air is treated in a two-stage
scrubbing system. Air from the digestion and inert
separation sections containing concentrated NOx enters the
first scrubber for washing by solution from the second
absorber. The concentration of NOx emerging from the
first scrubber can be as high as 2,000 mg/Nm3
calculated as NO2 but existing in the NO form. The air from
the cooling section and belt filters contains a high
proportion of NO2.
Gas from the first scrubber is mixed with that from
the cooling section and calcium nitrate filters; the
resulting mixture has an oxidation level of 40%-60%, which
is easy to absorb. The second scrubber is fed with
ammonium nitrate solution and makeup water. The
ammonium nitrite that forms may be decomposed by adding
urea.
The nearly saturated waste air from the neutralization
and evaporation sections and the waste air from the
granulation and drying sections are fed to a special
construction scrubber by means of separate gas
distributors. The scrubber is shown in Figure 19.11.
The recirculating AN solution liquor is kept acidic by
addition of 60% HN03. The AN solution produced is
recycled. The results of the treatment process are given
in Table 19.16.
Occupational Health and Safety Issues
As described previously, phosphate rock dust,
fluorides, acids, ammonia, and radioactive elements are the
main health hazards in fertilizer production. Fertilizer
products are of low hazard; however, ammonium
nitrate storage areas must be kept free of organic
materials. Coating materials such as crystalline silica are
hazardous if inhaled.
When handling acid a fully protective suit, goggles,
face shields, PVC gloves, and boots must be worn. Eye
wash bottles and showers should be provided at
strategic places throughout the plant.
534
19.4.2 Disposal of Phosphogypsum
The storage area for phosphogypsum disposal
depends on local conditions and regulations. The most
modern deposits can store 0.5 million tonnes of
phosphogypsum/ha of land. Even though it is
acceptable under the present regulations in the United States
and European Union, establishment of a
phosphogypsum pond and stack requires high investment
expenditures. Table 19.18 gives examples of current
establishment of three phosphogypsum deposits [33,34].
Sufficient comparable data do not exist to assess the
unit investment and operation costs of modern
phosphogypsum stacks. However, it would be safe to
consider that any technology of phosphogypsum
processing requiring US $75/tonne P2O5 (±50%)
investment and US $15/tonne (±50%) of operation cost would
be competitive with phosphogypsum storage.
The water system of the phosphoric acid plant is one
of the important issues to be tackled and resolved.
Water is required (1) for cooling the phosphoric acid
processing units and (2) for absorbing gaseous and particulate
emissions. The resulting wastewater is used for
pumping the phosphogypsum as a slurry to the storage site.
Table 19.18. Gypsum Pond Economics
Cases
Cost Component U.S.A. (1) France (2) Sweden (3)
Investment US $ million (1994]
Permits and approvals
Engineering/control
Land and improvements
Pump station
Plastics liner
Drainage/miscellaneous
Contingency
Total
7.1
6.9
25.4
9.51
16.9
9.2
2,8
77.8
12.0
7.9
42.9
1.6
74.5
Operation Cost US S/t of P205 (1994]-
Utilities 0.6(4) 1.1
Labor/maintenance 0.6(4) 6.3
Land royalties 4.3
Miscellaneous 0.7[4] 0.7
Depreciation and
financial charges 8.2 8.9
Total 10.1 21.3
54,0
1,7
51.8
3.6
111.0
0.2
2.8
0.9
0.8
13,7
1S.4
(1] IMC Fertilizers Inc., Tampa, Florida. Capacity 1.5 million
tpy of P205.
(2] Medium-size plant. Pond 14 km from plant.
(3) Pond close to small plant.
(4} UNIDO assessment.
A closed circuit water system is desirable; rainfall,
however, usually exceeds evaporation, resulting in a
surplus of pond water. This surplus is contaminated and
must be treated before discharge. The recycled
phosphogypsum water composition is given in Table
19.19 [34].
The excess pond water must be neutralized and
filtered. This problem is not yet properly developed, and
costs of neutralization were assessed at the value of about
US$70/tonneofP2O5.
Disposal of phosphogypsum in the sea raises
consideration of the impacts of gypsum, trace elements, and
the pH of the discharged water It has been shown that
in good tidal conditions or at open sea gypsum is quickly
dissolved in the water without changing the calcium
concentration. In addition, all heavy metals present in
phosphogypsum are already in the seawater, and
phosphogypsum disposal would increase the
concentration of these metals in 1 km3 of water by 0,l%-3%,
Changes of pH in the same volume have also been found
to be insignificant.
Table 19.19. Pond Water Composition
Component
Ranges
Low
High
(mg/1)
P2O5
F
S03.
CaO/MgO
Na20/K2O
Fe203/Al203
8,000
900
2,400
560
292
230
20,000
12,000
9,000
5,280
3,140
1,500
Average
12,000
10,000
4,000
2,400
2,250
450
pH
1.2
2.5
1.5
19.4.3 Other Applications
The other following applications have been described
in Chapter 11,
- Agricultural applications
- Cement retardant and other construction materials
additives
- Plasterboard products
19.4.4 Transformation Technologies
Phosphogypsum may be converted to lime and
elemental sulfur by heating it in a neutral atmosphere with
a reducing agent such as coal. The basic technological
process has been described in the Chapter 11. Below is
536
given an example of phosphogypsum processing in an
NPK plant.
Gujarat State Fertilizer Complex Process [35,36]
Another example of complex solid waste processing
originating from a phosphoric acid plant is the Gujarat
State Fertilizer Company, Ltd., Baroda, India. The
complex is composed of a Chemico DH phosphoric acid
plant, with an installed capacity of 165 tpd, two trains
of DAP with a capacity of 460 tpd, and an AS
(ammonium sulfate plant) with a capacity of 470 tpd.
The phosphogypsum originating from the
phosphoric acid plant is purified by repulping and filtering to
remove traces of P2O5 and make it suitable for use in
the ammonium sulfate (AS) process. Senegal phosphate
rock is used; thus, minimum impurities and adequate
crystal form are ensured. The AS production process
from phosphogypsum has been licensed by 1C1 (UK) and
designed by Hitachi Zosen, Ltd. (Japan). The
ammonium carbonate is produced from ammonia, water, and
carbon dioxide.
The ammonium carbonate solution is then mixed with
washed fine phosphogypsum crystals to form a slurry of
calcium carbonate in AS liquor, The slurry is filtered,
and the filtrate is clarified in a settler. The filter cake is
repulped with process effluent water and disposed of in
chalk pond. Excess ammonia in the filtrate is removed,
and the liquor is sent to a triple-effect evaporative
crystallization system to produce ammonium sulfate
crystals, which are centrifuged, dried, and bagged.
Extensive work has been done to use waste calcium
carbonate, and the following applications have been
found to be technically feasible:
• chemical lime 50% CaO
• building lime
• activated lime pozzolanic mixture
• cementation binder
• bitumen mastic (55% calcium carbonate)
• flooring tiles
Again the availability of natural chalk, credit for the
disposal costs, and transportation costs determine the
economic feasibility of any of these applications.
19.5 Environmental Impact
Assessment [37]
An environmental impact assessment (E1A) and an
officially presented document entitled "Environmental
Impact Statement (EIS)" are the instruments of risk
management at the enterprise or regional levels.
19.5.1 Objectives of EIA (EIS)
All chemical installations should be subject to a
periodical environmental impact review. The frequency of
the evaluation is established either by law or by internal
company regulations. The EIA becomes an EIS when it
is formally released by the company to the controlling
government organizations.
The objectives to be achieved by conducting an EIA
are as follows:
1. Determine the achieved level of protection of man
and the environment.
2. Identify discrepancies and their sources relative to
established legislation and internal rules.
3. Analyze emergency cases and check implementation
of the recommendations.
4. Check the implementation of related policies and
decisions.
5. Determine necessary adjustments and provide
information on justification and the efficiency of their
implementation.
6. Provide a basis for recognizing good and inadequate
performance.
7. Demonstrate management's commitmentto environ-
mental protection and provide motivation for
improvement.
8. Provide information on achievements in
environmental protection to public authorities and community
shareholders.
9. Provide input into the company's education and
training activities.
19.5.2 Methodology
Methodology of the EIA preparation differs from
company to company depending on its size and
organizational system. The point is who should prepare the EIA.
The three basic methodological approaches to
determine the preparer of the EIA are as follows:
1. In large companies a special safety or environmental
department assumes the responsibility for preparing
a regular EIS.
2. In medium-size companies a task force is convened;
this group is composed of the operational staff, safety
staff, and maintenance staff under the responsibility
of a technical manager.
3. In small companies a specialized auditing company
may be contracted; however, in this case
participation of the local staff is crucial for the success of the
study and implementation of the recommendations.
537
In all cases the group should be given access to all
technical documentation, environmental reports, and
regular water and air analysis results, reports of
technical deviations, accident reports, and all legislative
background related to factory operations.
Operational hazard studies or similar reviews should
be provided. Group members during the period of ElA
preparation should be freed from their everyday
functions and responsibilities.
The EIA group should act in the following sequence:
• Review the documents.
• Conduct a detailed physical audit of the installation.
• Prepare the questionnaire and discuss it with workers
and staff.
• Prepare the statistical review of the crucial parameters.
• Prepare the identification chapter for:
- Normal operation
- Incidents/accidents
• Discuss the identification chapter with plant
management,
• Review new legislation and identify new industrial
obligations.
• Prepare the recommendations chapter: ~
- Technology adjustment.
- Training and education.
- Equipment revamping.
- Adjustment of management procedures.
• Prepare the economic/financial analysis report:
- Specification of costs.
- Specification of penalties.
- Specification of yields.
- Economic efficiency of the adjustments,
- Financial resources and modalities of implementation.
• Discussion of the draft report with management.
• Editing and printing of the report.
• Dissemination and advertising.
19.5.3 Content of EIA (EIS)
A unified, obligatory format of the EIA does not exist.
Countries that introduced the regular auditing
obligation only recommended general issues that should be
reported in EIA.
Through a series of workshops, international
organizations (UNEP, UNIDO} are disseminating a general
methodology; however, the formal format of the EIA
table of contents has not been established. The number
of industries and their specific technological features
prevent such regulation.
Therefore, the format below should be tentatively
considered. In specific cases it should be adjusted to
local conditions, technical culture, and management rules
to comply with the objectives of EIA.
Executive Summary —
Chapter I. Review of the legislation and internal
company rules
- Risk assessment data
- Provisions for penalties
- Legislation in the preparation process
Chapter 11. Review of statistical data
- Statistical data on production
- Statistical data on controlled inside and
outside factory emissions
- Statistical data on penalties
- Statistical data on accidents/incidents and
—— —their-gravity-
- Labor health statistics
- Training and education reports
Chapter III. Review of the technological process
Review of the technological process is
carried out in a specific way:
-Analytical assessment of the raw
materials and contents of hazardous materials
-Technological tracing of the hazardous
materials and their end form
-Technological scheme of the emissions
(the flowsheet is analyzed from the point
of view of emissions)
- Material and energy balance
-Balance of emissions and comparative
analysis of both
- Elimination of discrepancies
-Product quality and content of the
hazardous materials
- Byproduct quality and content of the
hazardous materials
538
-Options to further processing of the
byproducts
- Emissions and content of the hazardous
materials
■ - Review of the emissions processing
(washing and treatment)
- Review of the new processes/equipment
for the emissions treatment
- Comparison of the technical process data
with the "statistical analytical data
- Review of failures and accident reports
-Listing of the hazardous operations and
review of the preventive measures
-Review of the records and the standards
of the maintenance works, especially in
the emission areas
- Review of processes/equipment
eliminating or diminishing emissions
-Proposal for revised technological scheme
-Revamping proposal (modalities of
implementation)
Chapter IV, Emissions, effluents and disposal - This
chapter describes the present situation
outside the factory area at the local control
points
- The air analysis
- Wastewater treatment efficiency
- Solid waste deposits
Chapter V. Economic and financial analysis
- Cost of environmental protection
• Pretreatment and treatment installations
• Regulated disposal costs
• Specific raw materials purchases
-Revamping proposals
• Operation costs
• Results
-Investment costs
-Economic efficiency of the adjustments
-Financial resources and modalities of
implementation
19.5.4 Instrumental Application of EIA/EIS
The cost of preparing an EIA/EIS is high.
Considering that an installation of average complexity includes
60-100 pieces of equipment, thousands of valves and
fittings, and processes three to ten substances, the
process review may require 3-6 months and cost
approximately US $60,000-US $100,000, Therefore,
legislation must consider this cost, and frequency
requirements must be reasonable. In addition, utilization of EIA
must be much wider than the scope of its preparation.
Instrumental applications of the EIA above the primary
scope allowing the recovery of part of all of the costs,
are given in the following section.
19.5.5 Investment in Revamping and
Improvements
Any installation requires regular updating. In principle
this is performed annually or during major maintenance
to improve product quality, decrease consumption of
raw materials and energy, and decrease labor
requirements. However, revamping of the installation requires
complex technical and financial documentation (e.g., a
feasibility study).
Preparation of an EIA gives basic technical
information for the intended revamping. Therefore,
management of the enterprise should instruct an auditing team
to consider and evaluate a wider scope of revamping.
This requires better cooperation with licensers, updat-
_ing. their-.processes,_andTormal contacts (inquiries and
offers) with equipment suppliers.
Widening the scope of the EIA would involve very
little extra time and cost of preparation. In the
meantime the costs of the EIA preparation may be
considered part of the investment cost of a newly revamped
installation; consequently, every company may easily find
the necessary financial resources (own or credit
facilities). This is also valid for Eastern and Central European
countries with economy in transition when they are
looking for strategic investors to change their production
strategy. Therefore, the preparation of the EIA study
should be combined with the restructuring program of
an industrial enterprise.
19.5.6 Prevention/Preparedness
As mentioned above an EIA may be prepared in the
case of accidents. This requires preparation of an
operational hazards (HAZOP) study, which indicates the
emissions during the accident. Obviously the
concentrations of the chemical substances in this case would greatly
exceed allowable levels inside the factory site and
outside the fences. The duration of this exposure would
have an impact on the environment and health of the
local population. This case requires preparation of
special plans, e.g., contingency plans. Because modern
539
societies use advanced technologies, the danger of a
disaster is much higher than the pre-industrial era.
Therefore, governments are preparing national contingency
plans which will mainly be implemented by local civil
defense organizations, fire departments, national guards,
etc. For preparation of a good contingency plan, the
following information is necessary:
- Identification and analysis of hazards and risk
assessment
- Definition of the emergency response resources
- Instructions on the emergency actions
Obviously plan preparation is financed from the
budget, but the crucial information required to develop such
a plan is included in the preparation of the HAZOP and
E1A studies. This may be a case whereby enterprises
may use state financial resources to improve the
environmental situation in everyday and emergency cases,
19.6 The Role of International
Organizations
The United Nations and its agencies and
organizations (UNEP, UNIDO, WHO) have undertaken practical
actions to improve environmental protection in concert
with industrialization progress. The challenge of
reconciling the demands of population growth, the desire for
continued industrial development, and the need to_pr_e-_ _
serve our environment can be met only by an approach
that fosters development and sustains the environment,
UNIDO has taken the general United Nations call for
sustainable development, contained in, for example,
General Assembly resolution 42/187, and translated it
into practical terms that relate to industrial development.
UNIDO calls this ecologically sustainable industrial
development, or ES1D. ES1D is a new approach to
industrial development that allows industry to contribute
economic and social benefits to the present generation
without compromising the ability of future generations
to meet their own needs and without impairing basic
ecological processes. To secure views of member states
on the issue of sustainable industrial development,
UNIDO convened the Conference on Ecologically
Sustainable Development at Copenhagen during 14-18
October 1991.
At the Conference, the member States agreed that
reduction of pollution intensity across all media (air, water
and land) within industry through cleaner production was
the key to achieving ESID. To secure the views of the
business community on sustainable industrial
development and to contribute to the United Nations
Conference on Environment and Development (UNCED),
UNIDO in cooperation with UNEP organized the
Second World Industry Conference on Environmental
Management (E1CEM II) at Rotterdam during 10-12 April
1991. The delegates to E1CEMII agreed to support the
Business Charter for Sustainable Development and
thereby committed themselves to improving their
environmental performance and to working towards
achieving sustainable development. The Industry Forum on
Environment and Development was organized and
conducted in Rio de Janeiro a few days before UNCED.
The 350-page bookFrom Ideas to Action contains over
150 examples of how industry has implemented the
Business Charter. The UNCED conference was held in Rio_
de Janeiro during 3-14 June 1992. At UNCED,
international governments agreed on several nonbinding
documents, including the Rio Declaration on the
Environment and Development and Agenda 21. Agenda 21
is a global action program designed to implement the
Rio declaration, In December 1992, the General
Assembly noted with satisfaction the report of UNCED and
endorsed the recommendations of the Rio Declaration.
This manual fulfills one of the recommendations on
the information and awareness dissemination in the field
of safe fertilizer production and agricultural application,
19.7 Best Available Technology (BAT)
The European Fertilizers Manufacturers' Association
(EFMA) has carried out extensive studies and published
_ -guidelines-on-BAT-that .are-agreed to by member
companies. The BAT comprises the achievable
environmental emissions levels and energy consumption figures for
the principal fertilizer manufacturing processes in
Europe, The BAT, being a combination of different
proprietary and public domain processes, should be available
for purchase by all operators at a price not entailing
excessive costs. These activities are supporting the
European Union in the framework of an Integrated
Pollution and Control Directive (PPC), where emissions limit
values will be set based on the BAT. For the fertilizer
industry, EFMA has prepared eight BAT booklets. They
cover the production processes of the following products:
• Booklet 1: Ammonia
• Booklet 2: Nitric acid
• Booklet 3: Sulfuric acid
• Booklet 4: Phosphoric acid
• Booklet 5: Urea and UAN
• Booklet 6: AN and CAN
• Booklet 7: NPKs by the nitrophosphate technology
• Booklet 8: NPKs by the mixed acid route
The booklets are available from EFMA [38]. The BAT
references would be approved by the EU Commission by
1998. The achievable emission levels for the European
fertilizer industry using BAT are given in Table 19.20.
540
Table 19.20. Achievable Emission Levels for the European Fertilizer Industry Using BAT
ppmv
75 (150)
as for combustion plants
Ammonia
Type of Emission
NOx to air
SQ2 to air
NH3 to water
Spent catalysts
Energy consumption: 32.5 GJ/t NH3 (new plants)
Nitric Acid
Type of Emission ppmv
NOx to air 150 (400)
mg/Nm3
150 (300)
ppmv
Sulfuric Acid
Type of Emission
502 to air
503 to air
Phosphoric Acid
Type of Emission
Fluoride to air
Dust to air
Note: Gypsum re-use or disposal on land may be allowed to continue
Urea
'""■-- ppmv
ppmv
Type of Emission
Granulator
Urea dust
NH3 to air
Prill tower
Urea dust
NH3 to air
Vents NH3 to air
Urea to water
NH3 to water
75 (250)
75 (150)
mg/1
100 (100)
kg/t of Product
0,45 (0.9)
0.2 (0.2)
mg/Nm3
300 (800)
mg/Nm3
mg/Nm3
5(30)
50 (150)
mg/I
mg/1
mg/1
kg/t of Product
1.6 (4.2) as 100%
. kg/t of Product
2-4 (10)
0.15(0.6)
kg/t of Product
0.04 of P2O5
mg/Nm3
50 (80)
50 (165)
50 (150)
50 (100)
mg/1
1 (150)
5 (150)
kg/t of Product
0.25 (04)
0.25 (0.83)
0.5(1.5)
0.5(1.0)
0.06 (0.75)
0.0005(0.1)
0.0025(0.1)
(Continued)
iUorscA r£^
541
Table 19.20. Achievable Emission Levels for the European Fertilizer Industry Using BAT (Continued)
Ammonium Nitrate
Type of Emission
Granulator/PriU
Tower
Dust
NH3 to air
Neutralizer Cooler/
Dryer
Dust
NH3 to air
Solids and CAN
Dust
NH3 to air
N to water
Nitrophosphate (NPK
Type of Emission
NH3 to air
N0X to air
Fluoride to air
Dust to air
P2O5 to water
NH3 to N to water
NO3 as N to water
Fluoride to water
NPK (Mixed Acids)
Type of Emission
NH3 to air
NOx to air
Fluoride to air
Dust to air
N to water
ppmv
ppmv
ppmv
mq/Nm3
15 (15)
10 (10)
30 (30)
50 (50)
50 (50)
50 (50)
mq/1
kq/t of Product
Total to Air
Dust 0.5 (0.5)
NH30.2(0.2)
100 (100)
0.2 (0.2)
mg/Nm3
50 (250)
500 (500)
5(5)
50 (50)
mg/Nm3
50(50)
70 (70)
5(5)
50 (50)
mg/I
28 (30)
60 (120)
15 (150)
-13-(-26)--
mg/1
0 (100)
kg/t of Product
0.3 (1)
0.2 (0.2)
0.02 (0.02)
0.3 (0.3)
0.06(0.11)
0.12 (0.5)
0.03 (0.3)
0,05 (0.05)
kg/t of Product
0.2 (0.2)
0.3 (0.3)
0.02 (0.02)
0.2 (0.2)
0.0 (0.2)
Note: The first value is for new plants; values in parenthesis are for existing plants.
19.8 ISO 14000
In 1993, the international Organization for
Standardization (ISO) set up a Technical Committee on
Environmental Management, TC 207, to develop standards on
a broad range of topics related to environmental
management, These standards were to become a group of
standards referred to as the "ISO 14000 series of
Environmental Management Standards." In 1996, five
standards in the ISO 14000 series were published with the
remaining 16 draft standards scheduled to be published
sometime between 1997 and 1999. All of the standards
except ISO 14001 will be guidance documents.
Companies only become registered to ISO 14001. The ISO
14000 series is intended to help companies improve
environmental performance and to keep
environmental issues from becoming trade barriers.
The motivation to prepare this group of standards is
to introduce uniform requirements for the operation of
industrial plants and establish a framework for
managing environmental impact, The standards or draft
standards feature a wide variety of environmental discipines
including these six major components [39]:
1. Environmental Management System (EMS)
2. Environmental Auditing
3. Environmental Performance Evaluation
4. Environmental Labeling
5. Life-Cycle Assessment
6. Environmental Aspects in Product Standards
542
As with all ISO standards, ISO 14000 standards will
be voluntary; however, it is expected that the European
Union as well as agencies of the U.S. Government will
decide upon registration, Therefore, companies who fail
to implement an effective environmental management
system may not be able to compete in many markets,
Companies intending to be certified under ISO 14001
should meet the specific requirements of the standard.
The basic activities under the EMS should be
implemented, documented in a special manual, and
respective training of all the personnel carried out. The
company should apply for registration with an acredited
certifying body; certain steps would be involved in
obtaining the registration:
- Document review
- Assessment/Registration Audit
- Registration
- Surveillance
It is assumed that a company may prepare the
necessary documents by internal auditing or using special
consultants, The audit for registration, however, would be
prepared by an authorized certifying body. The
standard term of the registration would be 3 years, after which
time a review/audit would be done to verify continuous
implementation of the environmental management plan.
Many analysts of ISO 14000 and ISO 9000 (the ISO
quality system series of standards) believe that the two
series of standards will be streamlined" in somermannen"
A joint task force has already been formed by the ISO
to study this possibility. Some believe that ISO 14000
will conform to ISO 9000 in theory and structure. It is
also possible that the provisions of ISO 14000 might
eventually become a portion of the overall ISO 9000
series. Incorporating ISO 14001 into the ISO 9000
series could provide some benefits for companies. In
the future, it might be possible to become registered to
both standards at once.
19.9 References
1. Conference on Ecologically Sustainable Industrial
Development. 1991. UNIDO 1D/WG.516,
Copenhagen, Denmark.
2. Fukushima Prefecture Agricultural Research Station.
1989. "Effect of Long Term Fertilization
Management on Physical, Chemical and Biological
Properties of Soil," Research Report, Japan.
3. De Datta, S. K. 1985. "Nutrient Requirement for
Sustained High Yields of Rice and Other Cereals,"
Proceedings of Colloquium Potassium in Agricultural
Systems of the Humid Tropics, pp. 97-120,
International Potash Institute, Switzerland.
4. Kimmo, I. J, 1993. "Nitrogenous Fertilizers and the
Environment," Proceedings of the Regional
FAD1NAP Seminar on Fertilization and
Environment, ST/ESCAP/1256, conducted September 7-
12, 1992, United Nations, New York, U.S.A.
5. Ange, A. L. 1993. "Environmental Risks of
Fertilizer Use, Overuse or Misuse," Proceedings of the
Regional FADINAP Seminar on Fertilization and
Environment, ST/ESCAP/1256, conducted
September 7-12,1992, United Nations, New York, U.S.A.
6. WHO. 1985. "Health Hazards From Nitrates in
Drinking Water," WHO meeting report, conducted
March 1984, Copenhagen, Denmark.
7. WHO. 1972. Technical Report Series N 5057
Geneva, Switzerland.
8. Hutton, M. 1982. "Cadmium in the European
Community," Monitoring and Assessment Research
Centre Technical Report N 26, University of London,
England.
9. Johnson, A. E., and K. C. Jones. 1992. "The
Cadmium Issue - Long Term Changes in the Cadmium
Content of Soils and the Crops Grown on Them,"
IN Phosphate Fertilizers and the Environment,
Workshop Proceedings, pp. 255-269, J. J. Schultz
(Ed.), SP-18, International Fertilizer Development
Center, Muscle Shoals, AL, U.S.A.
10. Karim, Z. 1993. "Phosphatic Fertilizers and the
Environment," Proceedings of the Regional
FADINAP Seminar on Fertilization and Environ-
ment ST/ESCAP/1256, held September 7-12,
1992, United Nations, New York, U.S.A.
11. MilIer,F.P. 1982. "Fertilizers and our Environment,"
pp. 21-44, The Fertilizer Handbook, The Fertilizer
Institute, Washington, D.C., U.S.A.
12. UNEP. 1993. "Fertilization," Terrestrial Ecosystem
Branch of UNEP, Proceedings of the Regional
FADINAP Seminar on Fertilization and
Environment, ST/ESCAP/1256, September 7-12, 1992,
United Nations, New York.
13. Norsk Hydro AG. 1993. "Pollution Prevention and
Abatement Guidelines for the Fertilizer Industry,"
UNIDO report UC/GLO/91/202, Vienna, Austria.
14. UNIDO. 1980. Fertilizer Manual, Development
and Transfer of Technology Series N13, N.Y.1980
67.I1.B.1,
15. "Urea as a Pollution Control Agent." 1975,
Nitrogen, 93:32-36.
16. Polish Chemical Industry Restructuring Conference.
1995, Zakopane, Private communication.
17. Aleinov, D. P. 1993. "Environmental Issues of the
Nitric Acid-Based Fertilizer Industry in Russia," IN
Nitric Acid-Based Fertilizers and the Environment,
Workshop Proceedings, pp, 285-292, R. G. Lee
(Ed.), SP-21, International Fertilizer Development
Center, Muscle Shoals, AL, U.S.A.
543
18. Roudier, L, M, Durand, and B. Mouille. 1982.
"Nitric Acid Recovery From Waste Nitrous Gases by
COFAZ Process," Proceedings of the Nitrogen
Fertilizers 4th British Sulphur International
Conference, pp. 561-565, British Sulphur 2.
19. Boisne, M. 1994. Rhone Poulenc SA, Private
Communication,
20. lnstytu Nawozow Sztucznych. 1995, Private
Communication, Pulawy, Poland.
21. Kleinschmidt, D. 1992, "Phosphogypsum Stack
Closure," IN Phosphate Fertilizers and the
Environment, Workshop Proceedings, pp. 185-192, J.
J. Schultz (Ed.), SP-18, International Fertilizer
Development Center, Muscle Shoals, AL, U.S.A.
22. Mortvedt, J, J. 1992. "The Radioactivity Issue -
Effects on Crops Grown on Mined Phosphate Lands,
P-Fertilized Soils, and Phosphogypsum-Treated
Soils," IN Phosphate Fertilizers and the
Environment, Workshop Proceedings, pp. 271-278, J. J.
Schultz (Ed.), SP-18, International Fertilizer
Development Center, Muscle Shoals, AL, U.S.A.
23. Uchino, Hidetoshi, and Haruyuki Morikawa, 1994.
"Advanced Technologies for Urea Production: 'The
ACES process,'" Unpublished technical information.
24. Pomfret, J. G. 1992. "Zero Water Discharge From
Urea and Ammonium Nitrate Plants," Unpublished,.
European fertilizer plant retrofitting conference,
Budapest, Hungary.
25. Lemmen, W. 1994. "The Environmental Impact of
a Stamicarbon 2000 MTPD Urea Plant,"
Unpublished, Stamicarbon B.V., AlChE Ammonia Safety
Symposium, Vancouver BC, Canada,
26. Plevsky, V, M., and M. K, Rustankov, 1991. "New
Technology Development in the Field of
Production of Nitric Fertilizers," Proceedings from 1FA-
AGrichim Conference, held October 8-10, 1991,
Moscow, Russia.
27. Benes, J. A., and H. Franzrahe. 1994, "Modifying
Existing DAP/NPK Fertilizer Plants to Comply With
New Environmental Regulations," UHDE GmbH,
1FA Workshop, held September 1994, Amman,
Jordan,
28. Houghtaling, S. V., and V, S. Margitt, Jr. 1994,
"Advanced Ammonium Phosphate Scrubbing With
Minimum Water Discharge," HiTEch Solutions
U.S.A., Workshop, held September 1994, Amman,
Jordan.
29. Hopfer, Klaus. 1994. "Environmental Aspects:
Closed Scrubber System for NPK/DAP Plants,"
Private Communication, UHDE GmbH, Germany.
30. Storen, H. 1992, "The Nitrophosphate Process -
An Alternative Route to Phosphate Fertilizers," IN
Phosphate Fertilizers and the Environment,
Workshop Proceedings, pp, 223-229, J. J. Schultz (Ed.),
SP-18, International Fertilizer Development
Center, Muscle Shoals, AL, U.S.A.
31. Diehl, L., R. E. Nitzschmann, and J.G.A. Reuvers.
1992. "The BASF Nitrophosphate Concept:
Experience and Environmental Aspects Related to Three
Recently Commissioned NPK Plants," IN Phosphate
Fertilizers and the Environment, Workshop
Proceedings, pp, 241-250, J. J. Schultz (Ed.), SP-18,
International Fertilizer Development Center, Muscle
Shoals, AL, U.S.A.
32. McFarlin, R. F. 1992. "Current and Anticipated
Research Priorities for the Utilization and
Management of Phosphate Process Byproducts and Wastes,"
IN Phosphate Fertilizers and the Environment,
Workshop Proceedings, pp. 179-184, J. J. Schultz
(Ed.), SP-18, International Fertilizer Development
Center, Muscle Shoals, AL, U.S.A.
33. Baretincic, J. M. 1992, "Engineering and Cost Data
for Lined Phosphogypsum Storage Site Being
Installed by IMC Fertilizer, Inc.," INPhosphate
Fertilizers and the Environment, Workshop Proceedings,
pp. 193-195, J. J. Schultz (Ed,), SP-18,
International Fertilizer Development Center, Muscle Shoals,
AL, U.S.A.
34. Isherwood, K. F. 1992, "Phosphate Industry and
the Environment," IN Phosphate Fertilizers and
the Environment, Workshop Proceedings, pp. 115-
124, J. J. Schultz (Ed.), SP-18, International
Fertilizer Development Center, Muscle Shoals, AL, U.S.A.
35. Vyas, V. M. 1992. "Environmental Management of
Phosphatic Group of Plants - Gujarat State
Fertilizers Company Limited (GSFC), India, INPhosphate
Fertilizers and the Environment, Workshop
Proceedings, pp. 197-207, J. J. Schultz (Ed.), SP-18,
International Fertilizer Development Center, Muscle
Shoals, AL, U.S.A.
36. Economic Commission For Europe. 1988. Use and
Disposal of Wastes From Phosphoric Acid and
Titanium Dioxide Production, ISBN 92-1-116433-
1, ECE/CHEM/65, New York, NY, U.S.A.
37. Kopytowski, J. A. 1994. "Environment Impact
Assessment: Methodology and Practice," Unpublished,
Regional Workshop on Chemical Safety, held July
1994, Warsaw, Poland.
38. EMFA, Avenue E. Van Nieuwenhuyse 4, B-1160
Brussels, Belgium, Fax (0322) 6753961.
39. ISO 14000, 1995. "The Groundwork for
Environmental Management" Perry Johnson Inc. WP/9/95.
544
Chapter 20. Planning for the
Development of a Fertilizer Industry
Table of Contents
Page
20.1 Introduction 546
20.1.1 Macroeconomic Assumptions and Indicators 546
20.1.2 Agricultural Assumptions and Indicators 546
20.1.3 Industrial Assumptions and Indicators 546
20.2 Strategies and Policies of Fertilizer Industry Development 547
20.2.1 General Methodology 547
20.2.2 Strategic Issues of Fertilizer Industry Development 547
20.2.3 Search for Industrial Structure 548
20.2.4 Policies to Ensure a Positive Benefit:Cost Ratio 548
20.2.5 Procedural Steps 549
20.3 Estimates of Demand and Requirements 549
20.3.1 Demand Estimates 549
20.3.1.1 FAO, UN1DO, and World Bank "World and Regional Supply and
Demand Balances for Nitrogen, Phosphate, and Potash1' 550
20.3.1.2 East-West "Centre (EWQ: TheT'Need-Based" Approach for Projecting
Long-Term Fertilizer Demand Based on Agronomic Considerations (NBA)" 550
20.3.1.3 The Food and Agriculture Organization Projection Methodology 552
20.3.1.4 FERTIS: UN1DO System of the Fertilizer Industry Development as
Part of an Agroindustrial Complex 553
20.3.2 Other Factors Affecting the Use of Fertilizers 556
20.3.2.1 Quality Assurance 556
20.3.2.2 Types of Fertilizers Required 556
20.3.2.3 Marketing and Distribution Network and Costs 556
20.4 Establishment and Development of the Fertilizer Industry : 558
20.4.1 Options to Establish a Fertilizer Plant 558
20.4.1.1 Granulation/Compounding Network 559
20.4.1.2 Small-Scale Ammonia Plants and Granulation/Compounding Network 559
20.4.1.3 Technological Concept for a Mini-Fertilizer Plant With Integration of the
Local Materials and Markets 560
20.4.1.4 Production of Multicomponent Fertilizers in a Moderately Centralized Manner 561
20.4.2 Raw Material Resources 561
20.4.3 Location of the Fertilizer Plant 562
20.4.4 Optional Government Policies 563
20.5 Paving the Way to Plant Operation 564
20.5.1 Decisionmaking Stage 564
20.5.2 Contractual Arrangements 565
20.5.3 Project Implementation 565
20.6 References 567
545
Chapter 20. Planning for the
Development of a Fertilizer Industry
20.1 Introduction
The fertilizer industry is a special kind of technical
operation; it belongs to the so-called agroindustrial
complex, which is composed of agricultural and industrial
sectors. Therefore, it is difficult to find the necessary
data and their assessment in many national statistical
reports. The management of the sector and available
data are dispersed among different ministries,
government agencies, international agencies, research
institutions, industrialists, wholesalers, and farmers. However,
the development and implementation of an intensified
agricultural production program requires an integrated
approach. The development of the agroindustrial
sector should be based on macroeconomic, agricultural, and
industrial assumptions and indicators.
20.1.1 Macroeconomic Assumptions and
Indicators
Macroeconomic assumptions and indicators have a
strategic character and correspond to the political trends
and decisions in the country. They are related to the
trends in the. growth of the assumed gross domestic
product (GDP) per capita and distribution of the GDP
between the agricultural and nonagricultural GDP and the
investment ratios to be provided for agricultural
development and processing of agricultural products. The
energy input of the food consumed by the population
and its distribution between the cereals and animal
proteins influence the structure of the country's agricultural
production,
20.1.2 Agricultural Assumptions and Indicators
The agricultural assumptions and indicators depend
on the actual and projected resources, including arable
land, harvested land, irrigated land, cropping intensity,
available labor, level of mechanization of agricultural
labor, crop diversification related to the kind and number
of livestock, permanent crops, etc.
These indicators would allow the calculation of the
agricultural production profile and the necessary
investment and inputs. Some of the inputs such as certified
seeds and animal breeds have an agricultural origin;
others have an industrial origin. Also environmental
protection measures originating from agricultural
development must be considered.
20.1.3 Industrial Assumptions and Indicators
The industrial subsectors contributing to the increase
of agricultural inputs should be identified and examined
collectively to evaluate the potential and organization of
the increase in agricultural production.
The industries and semi-industrial activities
contributing to increased food production include the following:
• Manufacture of agricultural machinery,
• Semi-industrial activities such as irrigation and soil
improvement.
• Fertilizer industry.
• Pesticide industry.
• Animal feed additives industry.
• Food processing industry.
• Packaging industry.
Therefore, to observe, closely the development of the
-fer^lizerJndustryjtequitesjheJdentification of the
conditions under which the agroindustrial complex will be
operated. The collective contribution of all elements is
so important that a nonintegrated approach to the
solution of the problem will not suffice.
If the high-yielding varieties of seeds continue to be
introduced, i.e., genetically more efficient, then the
availability of all industrial inputs must be increased
accordingly. High-yielding varieties quickly consume soil
nutrients, and without inputs of fertilizers (including mi-
cronutrients) soil fertility will rapidly decrease. The
intensive species are more susceptible to animal and plant
pests. Therefore, intensive agriculture is impossible
without very selective, planned pesticide applications.
Commercial agriculture often requires mechanized
harvesting of agricultural products. Also waste materials
resulting from large-scale food production can be used as
animal feed. If this is to be carried out in the most
efficient way, special fertilizers, pharmaceuticals, and other
chemicals are required.
Therefore, only an integrated approach can provide
the means to efficient food production- The production
of fertilizers and their beneficial use is only one of the
problems to be solved. However, to identify the analytical
data for complex studies, the impact of fertilizer industry
546
development must be assessed to provide the following
inputs:
• Projected amount and profile of crop production. This
information allows the assessment of the needs for
transportation, storage, and agricultural machinery.
• Program of crop processing into food and feed
products. This information would help establish the food
processing industry and develop the industry of food
and feed additives.
• Program of crop processing into industrial raw
materials and intermediates.
• Yields assessment (an extensive test program is
necessary), establishment of the optimum fertilization,
benefit:cost evaluation, and planning of policy
measures.
• An optimal fertilizer production program, which would
be adequate for consumption requirements and
considers import-export elements. This information would
allow the assessment of investment costs and
promotional policies for fertilizer application.
• Marketing and distribution network planning and
development, including the dealers' network and the
application of the necessary policy measures
regarding the storage of fertilizers.
Obviously, local production.of-fertilizers is an alterna=__
tive to importation, The decision to construct a local
fertilizer plant would depend not only on consumption
requirements but also on the international market
situation and the nearest point of potential importation,
A detailed review of international fertilizer market
trends has been given in Chapter 3.
20.2 Strategies and Policies of Fertilizer
Industry Development
20.2.1 General Methodology
The establishment of the development program, and
in particular the development program of the fertilizer
industry, requires not only the collection of data to be
processed using a specific methodology but also requires
self-control in the feedback system. There are
numerous examples of development programs established on
the basis of future or expected demand, which are not
correlated with the macroeconomic options and features
of the country's economy.
These programs were either never implemented or
their implementation increased debts or generated other
economic crises. On the other hand, there are examples
of failures when separate projects were implemented
based on the commercial feasibility of a specific project,
These examples have also proven to be inefficient
because of their deficiencies in technology, economy,
market assessment, or selection of priorities. This case-
by-case approach was transferred from developed
countries where a basic industrial structure already existed
and competing innovations change the industrial
structure and the overall consumption/production patterns
of the economy.
However, a perfect method of development
programming does not exist. The decisionmaker involved in the
industrialization process should not seek ideal or
optimum solutions but establishment of a reliable system for
monitoring program implementation. Political,
economic, logistic, and technological constraints impose
such pressure on any of the development programs that
only a proven, realistic and easy-to-test development
thesis can be implemented. This closed circuit of the
programming process should therefore follow the
procedure that can be institutionalized as the monitoring
methodology. However, when establishing such a
methodology, one should remember what are the objective
parameters/variables of the system and which are
subjective and dependent on the position and opinion of the
politicians or decisionmakers. Therefore, before the
procedure is analyzed, the features of the potentially
implementable methodology should be investigated. A well-
proven methodology of the prc^amming process estab-
"lishesxertam-chDices'thatrnust be made before determining
the industrialization process. The strategies, industrial
structure, and appropriate policies must be selected,
20.2.2 Strategic Issues of Fertilizer Industry
Development
Strategies are partially subjective and partially
objective elements of the programming methodology. Their
objective character is related to the country's
macroeconomic patterns, and their subjective character is related
to the choices of goals to be achieved. The strategic
issues of fertilizer industry development include the
following topics:
• Import substitution.
• Export promotion.
• Resource utilization.
• Technological options - labor intensive, capital
intensive, or advanced (high) versus standard (proven)
technology.
• Energy source and use efficiency.
• Market share selection (basic industries versus
consumer industries).
547
• Property (private or public sector support).
• Development financing.
Obviously, in each country the establishment of the
ranges of quantitative variables must be adjusted to a
particular economic feature. Establishment of the
fertilizer complex usually requires a mixture of several
strategies, namely import substitution combined with export
promotion, capital-intensive industrial development
addressed to the consumer, and oriented to involve both
private and public capital with selective participation of
foreign companies.
Implementation of the strategies requires selection and
application of a set of industrial policies, but simple
repetition of the existing policies established in
industrialized countries will not be feasible for many reasons, e.g.,
lack of capital market, lack of savings, and noncon-
vertibility of the national currency. Therefore, policies
should be specific for the promotion of the optimum,
specific industrial structure and would not suffice for the
development of any other type of structure.
20.2.3 Search for Industrial Structure
The second step in the programming methodology is
therefore the establishment of the optional (multi-
alternative) industrial structure (a technological network
for processing raw materials into fertilizers). This
programming step is an objective element of the
methodology, which is based on an existing set of technological
processes with well-defined production and investment
costs. Their analytical assessment will give insight into
the options and will also influence the strategy selected.
An example of a simple fertilizer network is given in
Figure 20,1,
If any of the options analyzed for the future industrial
structure do not meet objective efficiency parameters,
such as manufacturing value added (MVA) profits and
their ratios to investment, salaries, or capital formation,
the selected strategy should be revised or another one
selected to meet the needs of the given country.
However, the comprehensive strategy with the selected
option for the industrial structure depends on
implementation of appropriate policies.
20.2.4 Policies to Ensure a Positive
Benefit: Cost Ratio
This third methodological element requires another
consideration. Industrial policies are the indisputable part
of the instrument with which government controls the
trends of industrial development because many economic
processes are exponential in nature and they also lack
continuity. One important example of this feature is a
change of financial efficiency of the installation at
Hydrocarbon
Feedstock
Water
'
Air /
Water
Air
Bock
Phosphate
Rock
Sulfur
AMMONIA
plant
■
NITRIC ACID
PLANT
L
NnROPHOSPHATE
PLANT
Salts Of K.Mg,S
PHOSPHORIC ACID
PLANT
SULFURIC ACID
PUNT
—
|_
J
J
Phosphate Bock
UREA PLANT
AMMONIUM NTTRATF,
PLANT
|
CALCIUM NITRATE
PLANT
NPK FERTILIZER
PLANT
AMMONIUM
PHOSPHATE
PLANT
SUPERPHOSPHATE
PLANT
Figure 20.1. Fertilizer Production Network.
decreasing utilization of capacity (operation at a
breakeven point is not feasible). General industrial policies
serve to adjust economic process more or less to the
linearity.
Two types of policies support industrial development.
The two categories of the industrial policy instruments
are general macroeconomic and microeconomic
policies. General macroeconomic policies relate to taxation,
rate of interest, customs duties, depreciation and
dividends, exchange rate, and individual versus social
income, The selective, microeconomic policies include
special policies pertaining to subsidies on raw material
prices and rate of interest.
Each of the policies have several options and a
selection of policy implies the need for the establishment of
the necessary parameter expressed in a specific value.
If the policies are an objective element of the
programming process, the establishment of their parameters is a
subjective exercise if econometric models, allowing even
simple simulation, are not available. In our case, the
policies and their parameters can be checked in the
technological structures, preselected from the previous step.
548
Therefore, when considering the policies before
establishment of the fertilizer complex, computer
simulation should be made of the possible impacts of selected
policies on the program itself and also on the country's
budget and trade balance. Table 20.1 gives the basic
limits of the industrial policies to be applied before the
establishment of a fertilizer complex. Using the
econometric models, the necessary agreement between the
strategies, industrial structure, and policies could be
established. Certain examples show that a few repetitions
of the methodological steps may give full agreement
between the development objectives, strategies, policies,
and industrial structure.
Table 20.1. Policy Measures (Trends and Limits)
Policy Parameters
Custom duties
Capital tax
Income tax
MVA tax
Export credit facilities
Interest rate subsidies
(as part of prevailing
rate of interest)
Depreciation time
Subsidies on raw
material prices
Recommended Values
for Low Added
Value Products
Min. 0%
Min. 0%
Uniform
Min. 0%
Min. 1 month
Max. 50%
15-20 years
■ - — — "
Max. 20%
Recommended Values
for High Value
Added Products
Max. 35%
Max. 15%
Uniform
Max. 24%
Max. 6 months
Min. 0%
3-4 years
—_... .. -
Min. 0%
20.2.5 Procedural Steps
The macroeconomic planning features presented in
the UNIDO methodology, published in the Guidelines
for Industrial Planning in Developing Countries [1[,
show that the identification of an industrial structure
optional model is a central element of the comprehensive
program, which can be presented as a package to
national and foreign investors. Such models were
developed by several scientific institutes and consulting/
engineering companies, One particular specialized
package, Multicriterial Industrial Development Aid (M1DA),
was used in UNIDO projects to identify the business
opportunities in several developing countries [2].
However, every methodology used to establish the
production structure of the future industry needs to
identify some patterns of the actual and projected
consumption, which is well correlated with the country's or
region's situation. Thus, an estimate of the potential
market for the final consumer goods is necessary.
Methods of compiling these data are crucial for any
programming exercise in the chemical industry.
Establishment of the goals based on strategies and
respective supporting policies requires application of a
monitoring system, the "feedback" methodology.
Therefore, the whole investment promotion system
(independent of the economic pattern of the country) should be
based on trial-and-error, stepwise procedures. The
reason for such an approach is that it is impossible to
establish simultaneously the strategies (which are
independent variables of the development equation) and
to check the policies without having the evaluation of
the set of priority projects and their impact on the
strategy implementation results. Therefore, the following
basic steps are necessary to ensure identification of
appropriate business opportunities and promote foreign
investment:
1, Identification of the strategic goals and their
definition in the measurable parameters (macroeconomic
parameterization).
2, A sectoral/subsectoral consumption projection based
on macroeconomic individual patterns of
consumption or on the Leontieff matrix to identify markets.
3, Establishment of the technological network ensuring
consumption needs of the final consumer
commodities and goods, analytical evaluation of the network,
optimization of the industrial structure giving certain
scenarios of the constraints, and selection of the
priority investment projects.
^rSirnulation of the resulting structure efficiency under
different packages of policies and risk analysis testing
the impact of external variables such as prices and
demand changes.
The results, which may be presented in the form of
the master business plan, should be checked again
through the intersectoral flows and reviewed in terms of
the macroproportions elaborated by the strategies. Of
course, because of changeable external parameters
(prices and other countries' decisions influencing the
market situation), it is impossible to achieve full integrity
and stability of such a program. It is sufficient to
concentrate the planner's attention on two or three basic
industrial subsectors to elaborate the package of
policies supporting the main development strategy. A well-
integrated package of policies will also serve as a
motivation in other subsectors in following the given
development pattern.
20.3 Estimates of Demand
and Requirements
20.3.1 Demand Estimates
Multiple studies have proven that the growth of
agricultural crops primarily depends on the timely
application of properly selected fertilizers in the best potentially
549
available climatic conditions. Proper seeds and seedlings
must be selected, the necessary quantity of water
ensured during the growth period, proper plant protection
products used, and collection of the crops without
unnecessary losses ensured. Only then would the positive
impact of fertilizers be observed, without a negative
impact on the environment.
No unified methodology exists for assessing fertilizer
demand. In fact, when demand is assessed in a given
country, a very basic study must be prepared
considering all aspects of the operation of the agroindustrial
complex. However, the methodological approaches are
limited, and examples related to the target and time of
the projection include the following:
l.The World Bank/FAO/UNIDO/Industry Fertilizer
Working Group.
2. Regional assessment by the East-West Centre,
Honolulu, Hawaii, of the demand in Southeast Asia.
3. FAO's country projection of the development of the
agroindustrial complex.
4. FERTIS, the UNIDO system of the fertilizer industrial
development as a part of an agroindustrial complex.
There are well-established demand projection
methodologies developed by industrial organizations and
companies, however, they..were..not disseminated ip.r.
public use.
20.3.1.1 FAO, UNIDO, and World Bank "World
and Regional Supply and Demand Balances for
Nitrogen, Phosphate, and Potash" [3] - The FAO/
UNIDO World Bank Industry Fertilizer Working Group
includes a number of specialists who are experienced in
the analysis of trends in the production and
consumption of the primary fertilizer nutrients and fertilizer raw
materials. Other members of the Group represent
major industrial associations of the nitrogen, phosphate,
potash, and sulfur industries. Technical, production,
marketing, and agricultural interests are also represented
within the Group.
Demand projections result as a consensus of the Group
and consider a variety of methodologies, including trend
analyses, market surveys, agricultural programs, and
economic modeling. The Group's demand projections are
based on the scenario that considers these elements:
• Global economic growth projections.
* • Specific policy measures (e.g., environmental
protection measures).
• The balance of agricultural stocks and their reduction.
• Foreign exchange availability in developing countries.
• The transition to a free market economy in Central
and Eastern Europe and other policy measures in the
developing countries.
• Loss of capacities due to different reasons.
• Raw material prices (natural gas and crude oil) and
their impact on the benefit:cost ratio of fertilizer
application.
The Group provides statistical data for the following
geographical areas:
• World. ■ —■■
• Africa.
• America (with the subdivisions of North, South, and
Central America).
• Asia (with the subdivisions of West, South, and East
Asia).
• Europe (with the subdivisions of East, West Europe,
and the former Soviet Union [FSU]).
• Oceania.
Separate tables refer to countries in the regions.
Statistics on the following fertilizer components are
reported:
• Ammonia (including nonfertilizer use).
• Phosphoric acid (including nonfertilizer use).
• Other phosphate fertilizers.
• Potash (including nonfertilizer use).
Table 20.2 compares the demand of nutrients as
projected by the Group with the statistically reported
achieved demand. Substantial differences in projections
occurred due to the disruption of the fertilizer use
system after the introduction of world prices and the
removal of subsidies in Central and Eastern Europe and
the FSU. This transformation was not possible to
foresee in 1989 when projections were prepared. For the
case of stable consumption in Central and Eastern
Europe and FSU countries, the absolute error for the world
consumption projected in 1989 by the year 1992/93
would be for N +2.3%, P205 -2%, and K20 6.9%.
20.3.1.2 East-West Centre (EWC): The "Need-
Based" Approach for Projecting Long-Term
Fertilizer Demand Based on Agronomic
Considerations [4] - When considering the options of
committing scarce financial resources for fertilizer production
or other nation-building investments, decisionmakers
need to assess the long-term fertilizer demand/supply
outlook, However, fertilizer demand projection models
based on trend analysis, while effective for short-term
550
Table 20.2. World BankAJNIDO/FAO Fertilizer Consumption Projections [3]
1987/88
Consumption, 1992/93
Nutrients
World Total
Nitrogen
P2O5
K20
North America
Nitrogen
P2O5
K20
Production (N, P2O5, K20)
(million tonnes of nutrient)
73,84
35,84
26.54
10.85
4,35
5.00
Central and South America
Nitrogen 3,95
P2O5 2.80
K20 1.90
Western Europt
Nitrogen
P2O5
K20
Eastern Europe
Nitrogen
P2O5
K20
>
10.60
4.75
5.17
and CIS
16,34
11,42
9:93 -■
Projection
- -(million tonnes of
83.54
40.80
29.38
11.12
4,60
5.30
4.68
3.21
2.33
10.10
4.75
5.17
19.50
13.12
10.SI
Recorded
nutrient) -
73.63
31.50
20.66
11,58
4.64
4.95
3.58
2.34
1.95
9.22
3.75
4.11
7.20
4.37
3.8b
Absolute Error
(%)
-11.8
-22.8
-29.7
+ 4.2
+ 0.8
-6.6
-23.5
-27.1
-16.3
-8,7
-21.0
-24.0
-62.1
-66,0
-63.5
Note: To obtain the annual report of the Fertilizer Working Group, write to the IBRD/The World Bank, 1818
H Street NW, Washington, DC 20433, U.S.A.
projections, may be of limited value for such long-term
tasks. Thus, alternative approaches are needed. While
making any projection is "crystal ball gazing,"
investment decisions could be reinforced if a "second
opinion" confirms the first. A summary of the EWC method
for projecting long-term fertilizer demand based on
agronomic considerations follows |4]. The model has been
tested for Asian countries.
The model uses the following relationship:
NPK(D) =
APD - APRF
CR
Where:
NPK(D) = Total fertilizer demand projected, expressed
in million tonnes.
APD = Total agricultural production of crops desired,
expressed in million tonnes.
APRF = Agricultural production on residual soil
fertility, expressed in million tonnes.
CR = National average crop response to fertilizer
use.
An evaluation of all three elements of the equation is
made using the following procedures:
1. Total agricultural production desired - The concept
of the agricultural crop production per capita (APC)
is used to project total production in a similar
fashion as the FAO methodology uses calories per capita
to project food-grain needed. This is a typical
national parameter showing the crop consumption per
capita. Because of differences in crops grown,
however, APC should not be compared across the
countries. By multiplying the APC by the projected year's
population, it is possible to approximate total
agricultural target desired for each country and by the
projected year. In testing the model, projections and
551
actual consumption for 1990 are compared. The
value of APC during long periods remained stable
in Asia. The stability of the APC parameter may be
explained either because quick growth of
population does not create the possibility of increasing food-
grain consumption and/or the consumption pattern
does not change even when more food is available.
2. Agricultural production on residual soil fertility
(APRF) - The theoretical agricultural production on
residual soil fertility has been introduced to the
model. The average crop yield per hectare in any
country years ago when no chemical fertilizer was
used would approximate the yields. However,
changes in seed selection or new techniques changed
the APRF. Therefore, to approximate the current
APRF, the average crop yield per hectare is regressed
with the average fertilizer use per hectare over a
certain period of time (in testing the model the 1965-
90 period has been used), The theoretical crop yield
at the NPK intensity of zero approximates the past
APRC (by extrapolation).
It is possible to consider better crop management
practices by assuming slight improvement of the
APRC in future years. By subtracting APRC from
the total agricultural production of specific crops,
the approximate gap in agricultural production that
has to be filled with fertilizer use is determined.
3. Crop response to fertilizer use (CR) - The
regression analysis of the relationship between the
outputs and fertilization mentioned above gives the
possibility of establishing the function of CR against
fertilization intensity. The sbpe of the regression
curve is the CR for certain fertilization intensity,
following the normal pattern of the decreasing crop
response with fertilization intensity. However, this
parameter is dependent on the climatic and soil
conditions of each specific country. The value of this
parameter also may indicate the achievements in
crop management practices.
4. The projected long-term fertilizer demand: NPK{D)
- The NPK{D) is derived by dividing the gap in the
agricultural production to be met with fertilizer use
by the national crop response to fertilizers (CR).
Validation ofEWCmodel'-The regression
analysis yielded high R2 values (0.8 or better) in six countries
(Bangladesh, India, Pakistan, Indonesia, Malaysia, and
China) and somewhat lower values (0.77 to 0.67) in
another two countries (Sri Lanka and Thailand), thereby
indicating that a real relationship exists between
agricultural productivity and fertilizer use in these countries. In
some countries lack of relationship or difference in CR
can be explained by imprecise statistical data available,
due to the nonregistered trade in fertilizers between some
of the countries.
Consultation on practical implementation of the
methodology can be obtained from the East-West Centre,
1777 East-West Road, Honolulu, Hawaii 96848, U.S.A.
Comparison of the Calculated 1990 Fertilizer
Projection With Actual Data - The calculated and
reported data are given in Table 20.3. Differences
between the 1990 actual and projected values are 7% or
less in nine countries. Only in Sri Lanka is the
difference (23%) higher because of the very low level of initial
fertilization considered by the model.
20.3.1.3 The Food and Agriculture
Organization Projection Methodology [5] - After the FAO
conference in 1987 the document, Agricu/ture: Towards
2000, was prepared and published. The country
documents prepared in 1988 by the Global Perspective
Studies Unit (ESDG) describe the historical data and provide
projections on the production of different crops and
livestock and describe the economic parameters of local
agriculture at present and by the year 1990 and 2000.
One of the projection elements is fertilizer consumption.
The detailed methodology for preparing country tables
is described in the FAO publication 15]. A short
summary of the methodology is given here.
The country tables, prepared using statistical data from
the FAO AGROSTAT data base, have been
standardized. The projections have been made for the period
-May-4-986-to-April-1987and were based on data for
the 3-year average (1982-84); some data from 1986
have been used.
The general methodology is based on the scenario
method; three scenarios are developed for each
country (central case, pessimistic, and optimistic).
The production projections are made by estimating
net and gross cumulative investment for the projected
period to allow assessment of the macroeconomic
proportions. The gross value of crops is calculated and
inputs are analyzed. The crop production growth is
estimated by assessment of the sources of growth such
as yield per hectare, arable land growth, and cropping
intensity. This produces projected crops and, in
particular, cereal yield per hectare.
The projections of inputs growth rate are made by
the scenario method; the most probable dynamics of
the growth are selected. By comparing the ratio of the
fertilizer input contribution to the crops (in particular
cereals), the yield growth of the fertilizer input or its
efficiency at a given intensity could be analyzed.
The projections for the year 2000 for each country
are confidential and could not be published. To assess
the validity of the methodology, the results of projected
552
Table 20.3. Validation of the East-West Centre Model
Parameters
Bangladesh
India
Nepal
Pakistan
Sri Lanka
Population (in millions) 115.6 853.0 19.1 122.6
APC/capita (tonnes/capita) 0.36 0.66 0.49 0.58
Total APD (million tonnes) 41.1 562.3 9.3 71.1
Total HA (million ha) 13.7 163.9 3.5 71.1
APRF(t/ha) 2.3 1.8 1.8 2.5
APRF (million tonnes) 31.3 295.0 6.3 44.2
APC-APRF (million tonnes) 10.0 267.3 3.0 26.9
CR (tonne/tonne) - 11.5 20.9 40.0 13.5
NPK(D) (million tonnes) 0.87 12.78 0.075 1.99
1990 TFCa (million tonnes) 0.93 12.56 0.073 1.89
Error, % -6.4 +1.8 +2.7 +5.3
17.2
0.48
8,2
8.2
2.8
3.9
4.3
21:0-
0.21
0.17
+23.5
Parameters
Population (in millions)
APC/capita (tonnes/capita)
Total APD (million tonnes)
Total HA (million ha)
APRF (tonne/ha)
APRF (million tonnes)
APC-APRF (million tonnes)
CR (tonne/tonne)
NPK(D) (million tonnes)
1990 TFCa (million tonnes)
Error, %
Indonesia
184.2
0.7
128,9
23.2
3.5
81.2
47.7_
" 18,6
2.56
2.51
+ 2,0
Philippines
62.4
1.0
62.4
11.4
4.4
50.2
12.2
21.0
0.58
0.59
-1.7
Malaysia
17.9
0.76
13.6
4.9
1.0
4.9
8.7
9.0
0.97
0.95
+ 2.1
Thailand
55.7
1.58
88.0
16.9
2.8
47.3
40.7
"38.0
1.07
1.04
+2.9
China
,139.1
0.71
808.8
137.7
2.9
399.3
409.5
15.5
26.42
27.08
-2.8
a. Total fertilizer consumption.
data for selected countries by the year 1990 are given
inTab!e20.4[6].
Country data and consultation on the methodological
issues can be obtained from the Global Perspective
Studies Unit, FAO, Via delle Terme di Caracalla, Rome
00100, Italy.
20.3.1.4 FERTIS: UNIDO System of the
Fertilizer Industry Development as Part of an
Agroindustrial Complex [7] - The FERTIS program
was undertaken by UNIDO during 1990-92 in the
framework of the Industrial Development Decade for Africa
(1DDA), United Nations Program for Action for African
Recovery and Development (UNPAAERD) and the
Table 20.4. FAO Projection of Fertilizer (NPK)
Consumption (1984) [6,21,22]
Country
Benin
Burkina Faso
Mali
Niger
Togo
FAO
Projection
for 1990
(kg/ha)
5.6
4.6
8.9
0.6
7.7
FAO
Projection
for 1990
(tpy)
7,600
13,400
18,245
2,100
15,400
Recorded
in 1990
(tpy)
11,000
21,000
15,000
2,000
12,000
Error
%
+30
+36
-21
-5
+28
553
African Priority Program of Economic Recovery
(APPER), The program has been primarily oriented
toward African countries; however, it has developed tools
that could be used universally.
The basic equations were applied as reported by M.
S. Mudahar [8].
The FERTIS program combined the analytical
evaluation of the resource side, infrastructural elements,
technological elements, demand/production side, and the
Government strategies for the countries and assessment
of the policies necessary to increase the use and
efficiency of fertilizers in agriculture. The methodology
allowed the development of certain patterns of fertilizer
consumption/production.
The projections apply the economic parameters for
evaluation of the potential demand and define the local
policies necessary to transform the potential demand
into real consumption. The demand assessment could
be prepared in an integrated manner for all types of
crops (e.g., for all cereals) or could be oriented toward
the specific dominating crops in the country.
From the farmer's point of view the efficiency of
fertilizer application is determined by two factors:
1. Crop response to increased fertilization.
2. Price ratio between crops and inputs.
The evaluation of both elements establishes a
benefit: cost ratio that may motivate the farmer to use
fertilizer. The FAO uses three parameters to define this
benefit; cost ratio \9]:
1. Marginal rate of return (MRR).
2. VaIue:cost ratio (VCR).
3. Fertilizer-crop price ratios.
The FERTIS program uses corrected VCR
parameters or
[Value of the yield increase x r) - (cost of fertilizer)
VCR" =
Cost of fertilizer applied
Where:
r = scaling coefficient of the yield increase from
fertilization; its purpose is to adjust for
differences in yield observed between the test fields
and large area fertilizer applications.
At the long-term planning of the consumption/
production development, the unified methodology for
the crop response should be used, and the prices should
be assessed,
An integrated analytical review of the crop responses
has been elaborated by FAO in the late seventies and
the early eighties during the implementation of the FAO
Fertilizer Program [10,11]. A sigma-type function is well
acknowledged as the crop response relationship. This
function shows saturation when the marginal growth of
yields is equal to zero at a certain fertilization intensity.
This point is considered the agronomic optimum;
however, a direct relationship between the yields expressed
in kilograms per hectare (or monetary units per hectare)
and fertilization intensity expressed as kilograms per
hectare of NPK shows certain divergences for many-
countries, e.g., approximation is not satisfactory. This
is obvious because the crop response greatly depends ■
on climatic conditions, soil conditions, crop variety
(response of high-^yielding varieties is different from that of
standard varieties), and cereals represent different
species reacting in a different way, The soil/crop
management level differs from country to country.
These divergences are partially smoothed by the
application of proper proportions of NPK in applied
fertilizer. In many countries extension services have developed
recommended proportions and doses of nutrients for
different crops, soil conditions, and regions of the
countries [12].
Therefore, during the FERTIS system implementation,
better correlation can be obtained if yields from
harvested land are considered and if a relational function is
"denved'ffonTfhe pub"Iished"or "test data. Obviously this
function also has a sigmoidal character; however, the
results obtained are always related to specific agronomic
and climatic situations.
That function considers that at "no fertilization" on
specific soil and climatic conditions and at a specific level
of agronomic management, a specific level of soil
productivity can be retained. This concept is similar to that
used by EWC methodology production on residual soil
fertility, The "no fertilization" means that mineral
fertilizers are not used. The crops always receive some
amount of nutrients from air and rain and by
decomposition of soil minerals. On the maximum side the
agronomic optimum is used. The argument and function are
both expressed in percentages: the use of fertilizers in
the percent of fertilization ratio between zero and
agronomic optimum and the yield increase related to the
"no fertilization" and agronomic optimum. The
exemplification of the function is shown in Figure 20.2.
The function shown below has been prepared using
the data from the FAO Fertilizer Programme [9].
However, in each country local extension services can
elaborate its own function related to specific crops and use it
for the purpose of demand assessment.
The economic level of fertilization would depend on
the VCR" value. However, calculation of projected VCR"
554
Yield (%)
90 100
0 10 20 30 40 50 60 70
Fertilization ratio (96)
Figure 20.2. Fertilization-Yield FERTIS
Function.
does not give the assurance of thejjsepfiertilizers. There-.,
fore, it has been proposed to use the pattern VCR" value
(or alternative values) to establish Government policy
measures necessary to motivate farmers to use fertilizers.
The pattern VCR" value depends on Government
strategy. The optional exemplification of the strategies
and VCR" value is given in Table 20.5 [13].
It may be expected that at VCR" equal 4, all marginal
land would be harvested if other constraints are not
present (manpower availability, water availability,
storage, and transportation system). In other marginal cases
at very low VCR" values, the farmers would limit or even
abandon the use of fertilizers, bringing the soil to
residual fertility.
Which of the VCR" to select in the ranges of the given
strategy cannot be predicted by econometric analysis
Table 20.5. VCR Values at Different Strategies
Country Strategy VCR" Values
Maximum food independence
Economically efficient food production
Liquidation of food surpluses
3.0
2.0
1.2
4.0
-2.5
1.5
and each Government must experiment. However, the
economic impact of these experiments may only lead
to the shift of the incomes from other sectors of the
national economy to agriculture,
Obviously, the VCR" value can be regulated either by
establishing local prices for crops (by establishing
custom duties on imported products if cheaper than in-
country or establishing a complicated system of food
subsidies) or by fertilizer subsidies. These options will be
discussed later in the chapter.
The procedure for establishing the projections of
fertilizer demand in FERTIS methodology is as follows:
1. Following demographic projections and food
availability (kcal/capita), establish the target in time of
the production output of the concerned crop.
2. Following the harvested land availability, establish
the required crop yield,
3. Using the increased crop yield function, establish
the required growth in fertilization.
4. Check the agronomic optimum with the extension
services, and calculate the amount of fertilizer
required,
5. Assume the VCR" value (optional).
. __6,JJsing.ioternatipjiaLpricesi_or._NPK (specific for crop
proportion), establish the farm-gate price of the given
crop or VCR".
7. Compare the farm-gate price with the international
crop price or VCR" value with the strategic issues.
8. Establish possible custom duties on the crop and
determine if it is the internationally (WTO) accepted
value.
9. Determine if fertilizer importation is an alternative.
10. Prepare feasibility studies of fertilizer industry
development,
The validation of the FERTIS projections is given in
the Table 20.6.
Consultation and further information on the FERTIS
methodology of fertilizer demand assessment can be
obtained from UNIDO, Chemical Industries Branch, P.O.
Box 300, A-1400 Vienna, Austria.
All above-mentioned methodologies give approximate
results, which should be used for strategic planning only.
The particular, short-term and locally adjusted
recommendations on fertilizer application could be issued by
the local extension services only.
555
Table 20.6. Validation of the FERT1S Model
(1988 Projection) [13,22]
NP_K
Projection for Recorded for
Country 1993/94 1993/94 Error3
(tpy) (tpy) %
Indonesia 2,930,000 2.627,000 -11
Korea Republic 1,150,000 975,000 -18
Malaysia " 930,000 1,035,000 +11
Thailand 850,000 1,126,000 +25
Vietnam 660,000 900,000 +27
a. Error is calculated as ratio of difference between
recorded and projections consumption to the recorded
consumption.
20.3.2 Other Factors Affecting the Use of
Fertilizers
20.3.2.1 Quality Assurance - Most Governments
have established laws and regulations to specify and
enforce quality standards of fertilizers to ensure that
products of satisfactory quality are available for farmers and
that farmers know what they are'Wying and get what"
they pay for.
Most regulations are concerned with such subjects as
adherence to guaranteed analysis within specified limits
of tolerance; guaranteed weights; identification of
product source; and specification of grades, nutrients, and
methods of sampling and analysis.
Most laws specify penalties such as fines or
revocation of trading license for failure to conform to specified
standards. The special duties of regulatory officials should
be provided by legislation to control the quality of
fertilizers at any time and place. This is so important
because misrepresentation of fertilizer quality not only
destroys farmers financially but also the credibility of food
production programs. Special control must be ensured
when individual nutrients are imported and blended
locally.
The role of the extension service on farm-level use
cannot be overestimated because it educates farmers
on fertilizer quality and also promotes proper fertilizer
use. In some countries the extension service carries out
fertilizer tests to show the farmer the benefits and the
costs of using fertilizer. The farmer pays for fertilizers
only in cases when positive results and promised yields
have been achieved. Therefore, it is important that the
extension services employ highly qualified specialists,
who are paid adequately. The cost of fraud in
agriculture and respective losses of the budget are so high that
it is worthwhile to ensure properly operating
government extension services. Only in countries where
farmers are rich can they afford private advisory services.
20.3.2.2 Types of Fertilizers Required - At
present the number of variations of the composition of
fertilizers is very high. Even standard NPK products are
numerous, but any granulation plant could produce
special compositions of fertilizers upon request. The
selection of the NPK composition depends on the following
parameters:
• Type of crop and season of growth.
• Soil properties.
• Climatic conditions.
• Agronomic management.
• Marketing system organization and efficiency.
A diversified country situation requires large efforts
by the extension service to advise farmers on the proper
selection of fertilizer and requires the distribution
system to deliver on time. The balance of nutrients and
micronutrients plays a decisive role in the economic
efficiency of fertilizers. Efficiency of nutrient uptake by
-crops-has-enormous-economic-value. Specific crops are
using ammoniacal nitrogen at certain periods of growth
in a specific quantity and nitrate nitrogen during the entire
growth period. Therefore, for many crops ammoniacal
nitrogen in fertilizer must be transformed into nitrate,
which induces certain losses.
It has been proven that in some tropical conditions
nitrogen uptake from urea for rice is as low as 20%-
40%. Large fertilizer granules that have been coated
with sulfur and other nonsoluble agents are the first
answer in this field, A similar phenomenon is observed
when phosphate fertilizers are used on calcareous soils
and, especially in the presence of aluminum and iron,
the soluble phosphate will revert to insoluble compounds,
which are less available to the plant.
Therefore, proper agronomic management may save
farmers and the country millions of dollars in valuable
imports or production.
20.3.2.3 Marketing and Distribution Network
and Costs - Expanded fertilizer use requires
unconstrained availability of product at the farm level.
Fertilizer supply at the right time and price depends on an
efficient marketing and delivery system. In most
developing countries these systems are underdeveloped and
very costly.
556
The costs and logistic elements included in a
marketing and delivery system are given in Table 20.7.
Marketing costs vary from country to country. In many
countries delivery systems are still organized by the
public sector. This is the case in many Asian and African
countries.'Other countries have developed a system
owned by farmer cooperatives. In other countries the
dealer system is in private hands. A discussion of the
advantages and conditions for application of any
system is beyond the scope of this publication. However, if
any system is expected to be efficient for the farmer, it
must be highly competitive because any kind of
monopoly would lead to extravagant charges, aiming at
high profits not at turnovers. The importance of these
costs may indicate that fertilizer price in many
developing countries is twice as high as ex-factory (or f.o.b.,
foreign port of supplier) price, and ^threefold prices in
specific cases of landlocked countries have also been
observed [14].
Table 20.8 gives a summary of the evaluation of
delivery costs in selected Asian and African countries.
Table 20.7. Fertilizer Marketing and
Distribution Costs
Fixed Costs
Factory storage
Transportation system:
• roads
• vehicles
Intermediate storage
Unloading equipment
Final storage
Additional Fixed
Costs for Imports
Port storages
Operating Costs
Ex-factory price
Loading/unloading costs
Working capital storage costs
Dealers' fees (margins)
Transportation costs
Interest rate on farm credit
Distribution losses
Advertising
Promotional activities and training
Extension service to the marketing
system
Additional
Operating
Costs for Imports
C.I.F. price
Port costs
Custom duties
Table 20.8. Logistic Costs of Fertilizer Supply
(1995)
Landlocked Other
Countries Countries
(US $ per tonne)
Africa
Handling and storage 15-20 10-15
Transportation 60-120 40-60
Interest charges 18-30 18-30
Physical losses 15-20 6-9-
Other costs 30-60 15-30
Asia (landlocked and other countries)
Handling and storage 4-10
Transportation 6-20
Interest charges 16-22
Physical losses 2-3
Other 15-30
The prevailing freight costs of transporting fertilizers
from producer to the destination port are given in Table
20.9 [15].
The involvement of banks is crucial for the success of
-marketing-fertilizer-Positive-Asian examples show that
banks organized at the village level can provide
profitable credits for small-scale local industries and farmers.
This can be more efficient if a government credit
subsidy exists.
Table 20.9. Prevailing Freight Costs Between
the Most Common Ports (1994)
[15]
Product
From
To
Cost
Ammonia
Ammonia
Urea
Urea
Yushny (CIS) Greece
Umm Said Tuticorin
Yuzhny China
Persian Gulf India [WQ
Phosphate rock Casablanca Mexico (EC)
DAP
DAP
Sulfur
Sulfur
Potash
Potash
Tampa
Tampa
Jubail
Jubail
Hamburg
Hamburg
China
Viet Nam
Alexandria
Coromandel
Bombay
Nhava Sheua
(US $/tonne]
23-25
23-25
21-22
14
10
22
42
16,5
12,5
293
36
557
The expected investment costs to establish a reliable
delivery system must be evaluated depending on local
conditions and the number of distribution stages.
Scenario parameters are given in Table 20.10 of the
case study of the establishment of a marketing and
delivery system that includes an area, which is 30 km
radius and covers 60% of the land for farming, located
200 km from the fertilizer factory. The two-step
delivery system (intermediate regional storage and local
storages) operates at the medium fertilization rate of 120
kgNPK/ha.
Marketing and delivery costs in this case study amount
to between 30% to 50% of the cost of ex-factory
fertilizer. This assessment is similar to the reported costs of
Asian marketing systems. These costs are moderate only
in the case of adequate Government policy of support
and strict control of the monopolistic activities.
Integration of the delivery system for fertilizer with
that of other agri-inputs (pesticides and animal feed) and
outputs from farmers' cereals (rice, maize, wheat) may
substantially decrease the operational costs of the
delivery system. If crop surpluses obtained through fertilizer
application can be handled by the same system, a 50%
reduction in the costs can be expected.
Obviously the investment costs of roads and railways
and their, maintenance have been excluded from
marketing costs.
Establishment or development of the marketing and
delivery system requires accurate estimates of fertilizer
consumption in a given area (region). However, this is a
typical "egg and hen" case. Precise assessment of local
demand without an operational delivery system is very
difficult, and investment in this system is always
considered risky. Local piloting schemes must be supported by
the Government to show private entrepreneurs the
scheme's profitability; at the same time privatization of
the system must be allowed. In case competitive private
systems do not exist, profit margins must be controlled
by fiscal authorities to avoid overcharging the farmer. __
A transportation network is a condition for a good
delivery system. In many developing countries the
density of the roads is scarce (Africa 5 km/100 km2, Asia
45 km/100 km2, United States 95 km/km2, Europe
350 km/km2; therefore, the problem of plant location
is of strategic importance.
20.4 Establishment and Development of
the Fertilizer Industry
20.4.1 Options to Establish a Fertilizer Plant
Worldwide production of fertilizers has achieved a
highly sophisticated level, and improvements in the
technological processes are still observed. The production
patterns are well established; therefore, selection of
certain alternatives for particular countries does not pose
speciaTrisk^rHowever, everycouhtry presents its own
Table 20.10. Scenario Parameters of the Case Study to Establish Distribution System
Infrastructure Elements
Units
Volumes
Storages:
- Regional
- Local
Laboratory
Offices
Trucks, 40 tonnes
Working capital
Depreciation
Transportation costs
- Fuel
- Spare parts/maintenance
Labor (service, drivers and laboratory)
Staff
Insurance
Return on sales
Other
m2
units
US$
% of fixed capital cost
liters
% of trucks cost
men
men
% of fixed capital cost
% of sales cost
% of total
3,000 '
5x600
200
200
4
2 months storage volume financing
5% building
10 trucks
40
5
27
3
1
5
10
558
Table 20.11. Investment and Operational Costs
of Fertilizer Distribution as in Case
Study
Investment Cost Element
Buildings
- Storages
- Laboratory
- Offices
Trucks
Operation cost element
Labor and staff
Transportation
Depreciation
Financial costs
Insurance
Market promotion
ROS
Total
US$
2,000,000
120,000
100,000
800.000
US$/t
18.0
8.5
5.0
5.5
1.4
5.0
15.0
58.4
unique set of options and constraints. Therefore, any
consideration by the government to promote the
concept of fertilizer industry development-must be-studied-
very carefully. As many years of experience shows, the
time lag between the first decision to establish any kind
of fertilizer industry and factory startup may cover 8-10
years. From the beginning the programming studies must
be carried out in a professional manner to avoid later
discrepancies and investment inaccuracies. The amount
of information to be collected by the country planning/
promotional body is very extensive and related to the
different scientific and technical matters including
geological, mining, agronomic, marketing, engineering, and
economic know-how.
Therefore, the government planning/promotional
body must assemble a multiprofessional group to
develop a program and define a necessary plan of action
in manageable components. Technical assistance from
experienced expatriates is advisable; however, the
entire exercise must be formulated and prepared by
national experts. If found feasible in a given environment,
the following options to develop a fertilizer industry are
open for implementation.
20.4.1.1 Granulation/Compounding Network -
Small granulation compounding plants are established
in regions serving farmers in a radius of about 30 km.
At a ratio of harvested land to total area equal to 0,4-
0.6, the capacity of the granulation/compounding plant
may reach 6,000 to 8,000 tpy at the medium- to high-
fertilization rate (150 kg NPK/ha). Development of this
alternative requires the following:
• Establishment of the "mother" ammonia and
phosphoric acid plants supplying raw materials to the
granulation plants. Supplies of single-nutrient fertilizers are
also possible. In the beginning inputs to the
granulation plants could be imported. Regional plants are also
playing the role of extension services by advising
farmers on fertilizer use and adapting production profiles
(NPK ratios) to local crop requirements and periods of
necessary fertilization. Simple granulation fertilizers
are adding to the c.i.f. cost between US $18-$25/
tonne of bulk material.
• Establishment of the logistical structure (necessary
means of transportation, roads to regions, specialized
staff settlements, laboratories, storage, and
granulation facilities).
20.4.1.2 Small-Scale Ammonia Plants and
Granulation/Compounding Network - This
alternative may be considered in landlocked countries or
regions where raw materials are dispersed in the primary
fertilizer-consuming areas, e.g., small quantities of
natural gas resources or small but high-quality deposits of
phosphate rock. Demand in such an area should be high
enough to use the production from 500-tpd ammonia
and 100-tpd phosphoric acid installations without ex-
"c"essive^ari"sprjrtati"on~C'o'stsrDevelopment of this
alternative requires that the following infrastructure be
established,
• Small-scale ammonia plants at the source of raw
materials.
• Supplies of imported phosphoric acid or locally
produced phosphoric acid.
• Affiliated complex fertilizer granulation/compounding
plants.
In this case logistic problems are of limited
importance. The local centers are also playing the role of
extension services for farmers and are flexible enough to
adapt to local crop production patterns,
Basic parameters that will influence the technical and
economic solutions follow.
• Local natural gas and phosphate rock cost/price.
• Logistics of fertilizer distribution to the farmer from
the small-scale plant (own distribution network,
utilization/extension of existing network).
• Equity structure of the project (shareholders: public/
private, distributors, and importers),
559
■ Ability and conditions of fertilizer credit sales to
individual farmers by the fertilizer company (directly or
through a local bank).
• Detailed specification of the price difference between
the c.i.i. price of fertilizers (different grades needed by
the local agricultural production profile) and the farm-
gate price.
20.4.1.3 Technological Concept for a Mini-
fertilizer Plant With Integration of the Local
Materials and Markets - in fact, all fertilizer plants established
before 1960 may be considered minifertilizer plants
because only after this date were high-pressure
turbocompressors introduced, which solved the
problem of a high-capacity ammonia unit.
Although there is no theoretical definition of the
"minicapacity" of a fertilizer plant, in practice each
installation producing from 100 to 600 tpy of ammonia is
considered a small unit. All downstream ammonia
processing operations of this size are also considered to be
minifertilizer plants. The main technical differences
between small- and large-scale ammonia units are
summarized in Table 20,12 [16]. These differences (others of
minor importance were omitted) influence the
production cost, which is qualitatively assessed in Table 20.13.
Breakthroughs in small-scale capacity processes are
the Kellogg (KRES system) "and ICI Leading Concept-
Ammonia (LCA) process. The capacity of the referenced
installation is 457 tpd, and the total energy
consumption is estimated at 7.22 Gcal/tonne of ammonia.
Installation also produces carbon dioxide that has more
than 99% purity. The processes are described in
Chapter 6.
In the developing countries small-scale fertilizer
production has been practiced for many years, The
number of ammonia plants of 100- to 500-tpd capacity by
region was as follows (1977):
Latin America 9
Indian Subcontinent 18
Southeast Asia 8
Middle East 8
Africa 5
In 1991 there were more than 1,000 small-scale
ammonia plants in China with a total capacity of 12
million tpy. The unit capacity of such a plant is 30-60
tpd. The basic products of the plant are ammoniurrrcar-
bonate or other ammonium salts. Although the current
integrated data are not available, published cases show
that many of these old plants are closed. A complete
economic evaluation of the operation of such plants has
not been published.
The following countries have had valuable experience
in the construction and operation of small-scale
fertilizer plants: China, India, Pakistan, Indonesia, Turkey,
Peru, Mexico, Egypt, Syria, and Zimbabwe (electrolytical
hydrogen).
Basic technological and technical data collected
during the UNIDO workshop on "Minifertilizer Plant
Establishment," held in Lahore in 1983, show an alternative
means of developing the fertilizer industry and allow the
preliminary technical assessment of such a concept.
However, it is not possiBIe~to recommend an
economical size fertilizer plant if only unit production costs are
known, The cost of the marketing and delivery system
is a second component of the fertilizer price at the farm
gate,, and this price should be considered when
determining the size of the fertilizer industry operation.
Advantages of smaller plant establishments, which are
not always considered by financial analysis, are as follows:
1. Shorter construction time (2-3 years). This saves the
cost of pre-operating interest and recovers the invested
Table 20.12. Technical Patterns of Large/Small Scale Fertilizer Installation [16]
Process Unit
Large Scale
Small Scale
a. Reforming and gas processing Synthesis gas and high-pressure Synthesis gas production and steam as a
steam closed loop byproduct, LCA system obligatory
Pre-reforming optional
b, Gas compression Turbocom pressors Electrically-driven compressors
a Purge gas recovery
d. Synthesis
Included in installation
Multilayer ammonia
reactor optional
Only in higher capacity installations
Multilayer reactor obligatory. New
catalyst to be considered
560
Table 20.13. Cost Advantages of Large-/Small-
Scale Fertilizer Installations
Battery Limits:
-Cost Component
Advantage of
the Large Scale
Depreciation
Labor cost
Energy cost
Cost Component
Shorter construction period
Capacity utilization
Unit depreciation
Maintenance cost
Lower due to lower unit
investment cost
Lower due to higher labor
efficiency
Lower due to closed loop
Advantage of
Small-Scale Unit
Lower financial cost
Higher
Higher
Lower [spare parts locally
produced)
Off sites:
Cost Item Larqe Scale Small Scale
Distribution cost Higher
Produced grades Limited
Commercial chain Long -
Lower
Wider split
Short- -—
capital more quickly, thus influencing positively the
discounted NPV.
2. Higher capacity utilization of the small-scale plant.
Three factors influence this feature. They include
(a) an available market, (b) available infrastructure for
small-scale distribution, and (c) shorter plant shutdowns
because of operational difficulties.
This is especially true during the startup and the first
3-4 years of operation when the on-stream factor
(40%-50% denoted for large-scale plants) has a
consequent disastrous effect upon revenue, earnings, and
profitability.
3. Lower costs of spare parts (partially produced in the
country),
4. Lower cost of expatriate personnel and training costs
of local personnel.
In addition, the skid-mounted "serial" installations
concept (sometimes called modular) was practically applied.
The installation is constructed at the industrialized area
in the form of modules and later transported on barges
to the operation area. This is especially important in
cases where the small-scale plant is constructed in a
remote place without the necessary industrial
infrastructure, Standardized plants using skid-mounting will have
a positive impact on short-time leads, lower
engineering costs, ease of training, quicker startups, and more
precise prediction of the construction costs. However,
transportation difficulties and potential damages to the
equipment and piping/instrumentation excluded this
concept from wider implementation.
20.4.1.4 Production of Multicomponent
Fertilizers in a Moderately Centralized Manner - A
moderately centralized production alternative assumes
the establishment of large- (medium) scale complex
producing multicomponent fertilizers. All raw materials must
be transported to the large industrial complex, and also
large amounts of complex, multinutrient fertilizers have
to be transported to the farmer. The number of
alternative grades is obviously limited; therefore, only a
general application system has to be applied, Fertilizer
production takes place at long distances from the
consumer market. Extension services of ministries of
agriculture (MOA) would serve as intermediaries between
the producer and farmer. Industrial structures that must
be developed include: a system for transporting raw
materials to the large-scale fertilizer factories, large-scale
-complex-fertilizer-faetoriesr a transportation system
between factories and intermediate regional storage
warehouses, a transportation system between local distributors
and their storage facilities, and MOA extension services
or dealers.
Multinutrient fertilizers offer a number of agronomic
and logistic advantages; therefore, they have largely
replaced straight fertilizers for the purpose of basic
fertilization. Among these advantages are a simplified and
reduced workload for farmers, a more uniform nutrient
distribution in the field, and easier logistics at the
distribution/purchase level. However, different methods
of producing multinutrient fertilizers have a theoretical
and practical impact on fertilizer efficiency. The
technology of producing complex fertilizers is described in
relevant chapters.
The early fascination with complex fertilizers has been
presently moderated. The seasonal requirements of the
crops are different, and the optimum ratio of NPK also
differs substantially. Therefore, more and more often
options of establishing local granulation plants to meet
the requirements of the local agriculture are discussed.
20.4.2 Raw Material Resources
Raw material resources and the location of their
deposits have been discussed in detail in Chapter 5. In this
561
chapter only problems related to planning the
development of the fertilizer industry in a given country will be
discussed. In fact, the availability of national raw
materials is not a condition of the establishment of the local
fertilizer industry. Many countries import natural gas,
phosphate rock, and potash and are competitively
producing fertilizers. Actually, import of intermediates
(ammonia, concentrated phosphoric acid) is also possible at
a large scale and at competitive prices. Therefore,
fertilizer production should be established in cases where
imported fertilizers (bulk or bagged) would be more
expensive to the farmer than locally produced
materials. The possibility of producing more cheaply depends
on the implementation of modern technology that is
competitive to the world average, lower cost of energy
due to local energy production (e.g., hydropower), lower
labor costs, and lower logistic costs.
Obviously if a country possesses natural gas resources,
which have already been exploited, the advantage of
producing ammonia would increase and perhaps
fertilizers could also be exported, The cyclic fluctuation of
ammonia prices originates from voluntary investment
decisions that create oversupply and low prices. Less
efficient plants are closed, and a supply deficit occurs,
which causes prices to rise. Higher prices stimulate new
capacity, but up to 3 years is required to plan, build, and
start up the new plants.
Establishment of the phosphate mining and benefit
ciation operations only for one medium-size plant may
not prove competitive with imported phosphate raw
materials. Therefore, countries with large phosphate rock
deposits have developed national industries that export
phosphate rock, phosphoric acid, and fertilizers. These
industries would supply the world market with stable
volumes of raw materials at comparatively stable prices.
A similar situation exists with beneficiation of potash
and potash muriate.
20.4.3 Location of the Fertilizer Plant
Kendrick and Stoutjestijk [171 in 1978 developed
uniform, computerized methodology for selecting a plant
location and provided examples of optimal locations for
Egyptian fertilizer industries, The linear model
considers all production and logistic costs of raw material
supply and product distribution. Similar models have been
widely used [18]. It has been proven that fertilizer plant
location depends on the product and the location of
raw material resources. Low nutrient-containing
fertilizers should be produced near the users' area (e.g., SSP,
ammonium carbonate, ammonium sulfate). High-nutrient
fertilizers, in particular phosphate fertilizers, should be
produced as near as possible to the raw material source
to minimize transportation costs, In many cases it would
be feasible to produce ammonia and concentrated
phosphoric acid in a "mother" plant and process
intermediates" into fertilizers in small granulation plants, providing
fertilizers to meet the requirements of local crops. In the
case of imported sulfur and phosphate rock, the plant
may be located near port facilities. The origin of natural
gas is not as critical because pipe transportation of natural
gas is much cheaper than transportation of bulk
fertilizers.
The availability of utilities, such as water, steam,
electricity at the selected location, presents an advantage.
Fertilizer plants use much energy and water and dispose
substantial amounts of wastewater. The consumption of
external energy also depends on the production~strac-~ -
ture of the plant. Sulfuric acid production may provide
steam and energy to a phosphoric acid plant, and a
nitric acid plant may provide energy and steam to an
ammonium nitrate plant. In any case the establishment
of the fertilizer complex near existing electric power
stations provides a better opportunity for process selection
and optimization of overall energy use. Establishing
utility installations for the fertilizer plant alone would
increase a plant's investment cost by 30%-50%, as
compared with locating it near developed infrastructure.
Environmental protection units are cheaper when joint
(industrial and communal) water treatment stations are
constructed or utilized. In many cases, industrial
wastewaters from fertilizer plants provide the feed for active
bacteria in the treatment of communal sewage waters.
Some elements of plant location are related to site
parametersTA complex"? ertilizeffactory may require 25-
60 ha of land surface; therefore, the land cost would be
an important investment element. The problem of
property is also crucial and very much depends on local
regulations regarding converting from agricultural to industrial
use of land. The local community may have problems
accepting the location of a plant near dwellings;
sometimes protests are raised only after a plant has been
constructed. Therefore, the investor must consider this
sociopsychological element and advertise the
construction of a plant in advance to achieve a general consensus.
The soil's character and the underground water level
are important factors. High water levels and heavy soils
could increase plant construction costs by 7%-12% in
comparison with light sands with low water levels.
Existing transportation infrastructure, such as road
networks, navigable rivers, and railways, presents a great
advantage for locating a fertilizer plant. Today even
medium-scale plants should expect to transport more
than 1 million tonnes of material per year. Therefore,
access to a transportation network is very important for
investment costs and future farm-gate fertilizer prices.
Construction of a 1-km (6-m width) road may cost from
US $1-3 million, and no investor would be able to
recover these costs from the profits of fertilizer
production. Construction of railway or port facilities should
562
always be considered infrastructure development, which
is not the duty of a private investor.
Labor availability and education level are two of the
most important elements of selecting a plant location.
Construction of a plant in an uninhabited area requires
construction of the towns with dwellings and all the nec-
'essary infrastructure. Today, the selection of a location
in an uninhabited area is rather unlikely, except in the
case of an industry/energy linked closely with natural
resources; however, it was very common in the 1950s
and 1960s in many countries, On the other hand, a
plant should be located outside the safety zone of the
inhabited areas, also taking into consideration future
community development. The community in which a
plant is to be located should at least have a high school
and a developed system of professional training. It has
been proven by multiple examples that the higher the
general civilization level of the community in which a
plant is located the sooner the plant will achieve full
capacity, and it would be less likely to sustain industrial
accidents. Investors should consider the means to
recruit professional staff. The problem with professional
staff recruitment is always less acute when a plant is
located near a city with general infrastructure, and staff
may decide to settle there for a longer period of time. In
principle an investor must provide professional staff with
expensive specialized training abroad; therefore,
stability of the professional staff also represents a substantial
cost saving. General industrial infrastructure in a selected"
location is important from the perspective of plant
operation. In cases of poor industrial infrastructure, an
investor must consider establishing a maintenance
workshop, which requires additional employment,
machinery, and buildings. When the industrial
infrastructure is sufficient, all maintenance work and the
production of selected spare parts could be subcontracted
on a competitive basis. An assessment of these elements
of selecting a location has often produced the so-called
"Newton's law of location," which states: "The force of
attraction of location for industrial development is
proportional to the size and diversity of its infrastructure."
20.4.4 Optional Government Policies
There are many types of government policies, but
basically they are indirect and direct involvement.
Indirect involvement relates to the establishment of a
political atmosphere supporting increased food production
using different means such as fertilizers. This indirect
involvement includes the establishment and operation
of research and development programs related to soil
fertility and increased crop production. This is realized
by the establishment of an agricultural research institute
and agro-extension services within the MOA. An
extension service that has local laboratories should be
authorized to control and certify fertilizer quality (imported or
from a local dealer network). Indirect involvement also
includes promotion and support of farmer education and
local organizations, publication of the agricultural
research results, promotion of the use of agricultural
inputs, the organization of countrywide competitions and
prized expositions, and support of local financial
institutions (cooperative banks and cooperative trade
organizations}. Indirect involvement likewise includes the
establishment of the stock exchange(s} for agricultural
inputs and for agricultural products with the possibility
of concluding future transactions, In addition, support
of the organization of a dealer network by training and—
credit to establish the trade infrastructure would avoid
the establishment of a local parastatal or private
distribution monopoly.
The direct involvement of the Government is
controversial. A liberal policy promotes the position of total
Government neutrality concerning agricultural
production and applied inputs; however, this theoretical
position is not practical in industrialized countries that provide
direct financial support to agricultural prices. The
system of subsidies used by the European Union countries
and the United States is very complicated and perhaps
should not be reproduced in developing countries. It is
not the purpose of this manual to discuss these systems.
However, all countries should consider the possibility of
introducing selected policy instruments of direct
involvement to stabilize agricultural production in the country,
which would also influence the worldwide food situation.
Direct involvement is related to the following policies
[81:
1. Establishment of an agricultural fund as a public (or
mixed) trading organization. The task of the fund is
to buy agricultural products when prices are
declining, endangering farmers' income and their intentions
to produce in the following season, The fund would
sell the products at the change of seasons when prices
of food products on the market are increasing.
Therefore, the fund plays a double role - ensuring the
stability of farmers' income parity and ensuring the
stability of food prices at the local market in the
interest of the population. The regulatory role of the prices
of imported agricultural products is reduced because
food production in developing countries is less costly
than in international markets, even considering the
export price subsidies.
2. Establishment of an agricultural credit system to
facilitate the access of credit to farmers. Considering
the seasonal nature of agricultural production and the
risk factors, credit facilities should offer preferential
interest rates to farmers. The difference between the
market interest and agricultural credit cost should be
financed from the profits of the agricultural fund or
563
directly from the budget. Repayment of the debt should
be allowed in the form of products supplied to the
agricultural fund.
3, Establishment of a comprehensive, flexible system of
custom duties. The role of custom duties is to
motivate local production at a competitive level inside the
country; the export subsidies of other countries should
be considered; however, the market should be open
to process imported raw materials and exported
products.
4, Direct support to establish the fertilizer industry. The
fertilizer industry, as a raw material processing branch,
is highly capital-consuming with a smaller return on
investment than many other industries. Therefore, if
the establishment of the fertilizer industry in a
country has shown strategic value's, the Government should
consider two options of support: (a) establishment of
a parastatal shareholding company and construction
of a plant from budgetary sources or using
international financing. At the latter stage the company could
be privatized either by selling it to a strategic investor
or by the sale of stock exchange shares; (b)
establishment of a joint venture between public and private
capital (also foreign) and issuing Industrial
Development Bank guarantees to financial institutions. In this
case, preferential interest rates could be considered
for the local financing. Imported equipment and
materials could be free from.custom duties and_other.
local taxes; and (c) establishment of a preferential
industrial situation allowing a private investor to
undertake the establishment of the fertilizer plant. This
requires the establishment of long-term tax relief,
opening local credit facilities with preferential
conditions, government-financed technical support for the
investor, and special customs arrangements for
imported equipment and materials for export of the
product at the first stage of plant operation when demand
would not be equal to plant capacity.
The option should be selected on the basis of a
detailed economic and financial study covering mac-
roeconomic factors (e.g,, food self-sufficiency, foreign
trade balance, export promotion, employment, and
use of local resources).
5, Direct support to the marketing and distribution
system. Establishment of regional trading companies
(public or mixed). Initial investments should be
organized on preferential conditions similar to those of
fertilizer plant establishment.
20.5 Paving the Way to Plant Operation
There are numerous publications dealing with
industrial plant construction processes; therefore, the
decisionmaker is reminded of the crucial elements of
this process.
20.5.1 Decisionmaking Stage
Search for the optimum solution should be performed
to show the investor, Government departments, all
financial authorities, and other economic institutions the
alternatives and consequences at each decision stage.
Therefore, three stages of study leading to positive
conclusions and allowing a consensus to be reached
regarding the construction of a fertilizer plant among different-
groups can be delineated as follows:
1. Programming study composed of at least the
following elements:
• Review and evaluation of the present and forecasted
demand by type of fertilizer, related to the types of
soils and crops.
• Review and delineation of present sources of
fertilizer supply and an assessment of the adequacy for
future consumption,
• Review and evaluation of the logistic and financial
costs of the present and future modes of fertilizer
supply to the farmer and society,
• Establishment of a credible forecast of regional
fertilizer consumption.
• Evaluation of the costibenefit application of
increasing amounts of fertilizer and delineation of the policy
measures necessary to increase demand.
• Assessment of the availability of raw materials by
quantity, quality, and regional distribution.
• Evaluation of the cost: price situation in different
raw material deposits.
• Technological profiles of the fertilizer production
processes, allowing evaluation of technological,
technical, and economic features.
• Review and evaluation of the location of a
potential fertilizer installation, accounting for market and
raw material availability and other physical and
economic factors of plant location,
• Specification of potential investment projects in
hierarchical order:
- Basic products (ammonia and phosphoric acid).
- Other products (urea, DAP, CAN/AN, etc.).
- Final NPK compounds and compositions
(granulation compounding installations).
2. Study of the optimization and selection of priority
projects (composed of the following elements):
564
• Establish criteria and policy measures necessary for
project selection.
•' Prepare econometric model of fertilizer production/
distribution.
• Prepare the development scenarios,
• Assess and evaluate the scenario's features by
simulation experiments,
• Assess the project's priority taking into account
production, distribution, and consumption features
in the forecasted period.
• Select priority projects.
• Propose a strategy for fertilizer market development
and establishment of an effective distribution
network, promoting regional fertilizer consumption.
• Establish the methodological capability to continue
studies for future projects.
3. Feasibility study of the selected priority project. The
feasibility study should be prepared according to the
UNIDO manual on project preparation, evaluation,
and financing [19].
20.5.2 Contractual Arrangements
Establishment of a fertilizer plant in most cases is based
on technical assistance and design and delivery of the
equipment from industrialized countries. Therefore,-the^
conditions outlined in the contracts are important for
the project's success, UNIDO also has developed a
standard format for contractual arrangements between
licenser, contractor, and investor to facilitate the
negotiations and organize the transaction in a fair
manner [20], Very few developing countries can organize
and manage construction of a fertilizer plant using
national staff (e.g., provide technical design, produce/
purchase equipment, and supervise the construction and
startup). Therefore, in practice a local investor selects
the general contractor from engineering/contracting
companies in industrialized countries having a good
reputation in the industrial specialization required to
implement the project. Although it is not the task of this manual
to discuss advantages or disadvantages of different forms
of contracted execution of the fertilizer plant, the
principal forms of contracts will be identified. There are three
typical patterns of contracting construction of the
fertilizer plant.
1. Cost Plus Fee Contract- After the investor selects
the technology and purchases the licenses and basic
engineering, the contract is executed with the
general contractor for a complete set of services
necessary for the construction of the plant. The contractor
is paid either a firm fee for all services budgeted or a
percentage over the realized services. Selection of this
type of contract ensures the competition of the
construction on time and budget only when an investor
has enough qualified staff to control the
subcontracting process, has a good review of the equipment and
services market, and is able to coordinate the civil
works. During the implementation of the project,
permanent bidding for all equipment and services is
carried out, which at certain times may lead to the
establishment of the "zoological garden" of types and
trademarks of equipment in the plant leading to
negative consequences for maintenance services. An
investor is obliged to train the labor and staff in plant-
operation and maintenance.
2. Equipment and Services Contract- This
contract is concluded with an engineering/contracting
company from an industrialized country after
selecting the technology. All supplies and services are listed
in the contract, and a firm price is decided at the
signing of the contract (in some cases a price
escalation formula is also agreed upon). The civil works are
executed by local companies based on competitive
bidding, using the technical documentation prepared
by the general contractor. However, because the
design of civil works could be available at the end of the
overall engineering process but should be first at the
construction site, a realistic timetable for the
documentation supply and overall construction period
should be decided. In many cases at the beginning of
the-Gonstruetion—the-eivil work companies are
employed on the basis of cost reimbursable contracts,
using piecemeal documentation for foundations,
underground piping, and building structures. Five to
seven revisions of different documentation elements
with necessary changes in executed works should be
obtained from the general contractors. The investor
should have a national professional team capable of
supervising and coordinating the construction,
basically on the civil works and assembling sites. The
investor is obliged to train labor and staff, in plant
operation and maintenance.
3. Turn-Key Contract- The contract is concluded
after the technology has been selected. This is a firm
price contract (with a possible price escalation
formula) for all deliveries and services including civil
works, startup, and guaranteed test runs of the
complete fertilizer plant. The contract preparation requires
a large volume of work and time to define the scope
and specifics of deliveries and services. The investor
has little involvement in the construction process;
primarily the investor concentrates on training the
labor and staff for plant operation and maintenance,
20.5.3 Project Implementation
The process of contracting and designing the
fertilizer plant is complex, and timely implementation of the
565
project requires an experienced staff and good
management of the project. Before the feasibility study is
completed, offers from licensers and engineering companies
(which also normally undertake the function of the
general contractor to supply a complete set of equipment)
should be collected. However, this process should be
divided into two stages:
1. Collection of the preliminary offers from a wide range
of suppliers. The offers are not addressed to a
specific location but present only the basic technological
issues. The investment cost for "battery limits" is
provided with low accuracy; these offers serve for
preliminary selection of a few (two-three) suppliers of
each process.
2. Collection of the final offers will serve as the basis for
contractual negotiations. The preparation of the
final offer may cost US $150,000-$200,000;
therefore , the inquiries must be detailed and well prepared,
and the amount of investment should already be
decided by the investor. Otherwise, the engineering
company may ask for reimbursement of the cost of
proposal preparation if the plant is not constructed.
Preparation of a full-fledged inquiry requires the
preparation of a detailed locational study, definition of the
standards for equipment execution, indication of
local safety regulations, an estimate of labor efficiency,
and definition of the climatic conditions.
For the purpose of preselection and final selection of
the supplier, a uniform methodology of assessment
should be developed and approved by the decisionmaker.
Then the final offers may be requested. The activities
related to the preparation of inquiries and offers may '
require 9-18 month's. The data received from the offers
should be included in the feasibility study. The
feasibility study will serve as an instrument for negotiating loans
from banks and other financial institutions. The
contract is prepared and negotiated. It is not advisable to
have the supplier prepare the contract. The UN1DO
format for contracts should be adjusted to local conditions
and the type of contract, and the contract should be
negotiated. The local team of negotiators should be
established with precise terms of references. Although the
contract is an entity, in principle, negotiations are
carried out in two stages: a technical part and a
commercial part. During the negotiations all annexes are
completed using information from offers and additional
information supplied by the contractor. In principle
negotiations should be carried out with at least two
competing contractors. The final contractor selection is made
on the basis of a comparative evaluation of the
prepared contracts. The evaluation should be prepared by
an external group to the negotiation team. The
methodology of the comparative evaluation should be
approved by a decisionmaker before the startup of
negotiations. After the contract with the equipment
supplier has been signed, the following implementation
procedure is performed:
1. Preparation of the basic engineering (licenser and
general contractor).
2. Preparation of the civil works engineering data
(general contractor).
3. Preparation of the inquiries for the civil works
execution (investor).
4. Preparation of the technical design (general
contractor). -—
5. Subcontracting the equipment deliveries (general
contractor}.
6. Conclusions of the civil works contracts (investor).
7. Site preparations (investor).
8. Construction (investor).
9. Deliveries and services (general contractor).
10, Startup of operation and guarantee test run
(general contractor).
The 3-5 years' duration of the fertilizer plant
construction after the contract is signed should be
considered realistic, depending on the contract scheme and
the local infrastructure. An adequate financial scheme
should be developed to minimize credit costs.
—All-of-the-activities-on-the investor side would require
a special department to be organized within the
company. The typical composition of this department is as
follows:
• Planning and coordination section including
supervision of contract implementation (computerized
control systems).
• Documentation section.
• Technical supervision section, including quality and
safety control.
• Materials handling and storage (computerized control
system).
• Finance and accounting section (computerized
control system).
• Technological section.
• Recruitment and training section.
Experience shows that a minimum of 24-35 staff
should be employed in the fertilizer plant construction
department at the beginning; this number would be
increased later to the full operational plant assignments.
Different types of multiple tasks - technical and
managerial - require special training of the investor's
personnel. However, practical experience in plant construction
566
cannot be substituted by any kind of training; therefore,
recruitment of expatriate personnel in "seed" positions
is recommended when the local professional market
cannot provide enough specialists.
Technical assistance provided by experienced experts
from international organizations is highly recommended.
Professional staff working under the auspices of UNIDO
could be recruited from among the best multinational
specialists in each activity area. Therefore, their advice
would be neutral and would always consider the investor's
benefit. On the other hand, UNIDO could also provide
training of the investor's staff in a similar plant
construction abroad.
The managerial capability of the investor
organization is a deciding factor in the success of the fertilizer
plant construction,
20.6 References
1. UNIDO. 1988. Guidelines for Industrial Planning
in Developing Countries, Vienna, Austria.
2. Kopytowski, J. A., and M. Zebrowski. 1989, "MIDA:
Experience in Theory, Software and Applications
of Decision Support Systems in the Chemical
Industry," IN Lecture Notes-in Economic-and-
Mathematic System, A. Lewandowski and A. P.
Wierzbicki (Eds.), pp. 271-287, Springer Verlag,
New York, NY, U.S.A.
3. The World Bank/FAO/UNIDO/Industry Fertilizer
Working Group. 1991. "World and Regional
Supply and Demand Balance for Nitrogen, Phosphorus
and Potash," World Bank Technical Paper N144,
Washington, D.C., U.S.A.
4. Ahmed, S. 1994. "The Needs-Based Approach for
Projecting Long-Term Fertilizer Demand," Private
Communication, Paper presented at APO-RS1
Seminar on Fertilizer Policy, Manila, Philippines.
5. FAO. 1988, World Agriculture Towards 2000,
Alexandrotos, N. (Ed.), Behaven Press, London,
England.
6. FAO. 1988. World Agriculture Towards 2000,
Country Tables, (unpublished), FAO Global
Perspectives Study Unit, Rome, Italy.
7. UNIDO. 1990. "Industrial Development Strategies
for Fertilizer Industrial Systems in Africa,"
(unpublished), Programme Development Support Unit,
Vienna, Austria.
8, Mudahar, M. S. 1984. "Fertilizer Prices and
Subsidies Policy," (unpublished), 1FDC Fertilizer
Marketing Management Programme, IFDC, Muscle Shoals,
AL, U.S.A.
9. Survo, 1, 1993, "Economics of Balanced Fertilizer
Use," IN Proceedings of the Regional FAD1NAP
Seminar on Fertilizers and Environment,
Bangkok, Thailand.
10. FAO. 1981. "FAO Fertilizer Programme: 20 Years
of Increasing Crop Yields, 1961-1981," Rome, Italy.
11. Agri-Chemicals, News in Brief, ESCAP/FAOA
UNIDO. 1990. ESCAP UN Building Bangkok,
Thailand.
12. Ministry of Agriculture, Government of Thailand.
1984. "Agricultural Statistics of Thailand Crops,
1982/1983," Ministry of Agriculture and
Cooperatives Agricultural Statistics, No. 202, Bangkok,
Thailand.
13. Kopytowski, J. A. 1990. "Methodological Note on
Projections of Fertilizer Demand and Cost:Benefit
Ratios," Paper presented at APO-RSI Seminar on
Fertilizer Policy, Manila, Philippines.
14. lFDC-Africa and Agricultural Economics Research
Institute, LEI, 1988-90. Reports of annual meet:
ings of AFTMIN. Lome, Togo,
15. Fertilizer International 1994. 335:8, British
Sulphur, London, England.
16. Davister, A. 1991. "Technological Options for
Construction of Fertilizer Plants - Miniplants," UNIDO-
NFC Pakistan Workshop on Appropriate Strategies
for Fertilizer Technology and Development, Lahore,
Pakistan.
17. Kendrick, D. A., and A. J. Stoutjestijk. 1978. "The
Planning of Industrial Investment Programmes,"
Volume 1, Johns Hopkins University Press,
Baltimore, MD, U.S.A.
18. Skocz, M., M. Zebrowski, and W. Ziembla. 1989.
"Spatial Allocations and Investment Scheduling in
Development Programmes," IN Lecture Notes in
Economic and Mathematic Systems, A.
Lewandowski and A. P. Wierzbicki (Eds.), Springer Verlag,
New York, NY, U.S.A.
19. UNIDO. 1979, Manual on Feasibility Studies
Preparation, United Nations, New York, NY, U.S.A.
20. UNIDO. 1984, UNIDO Model Form for the
Contracts of a Fertilizer Plant, Vienna, Austria.
21. FAO Yearbook. 1994. Vol. 48, Rome, Italy.
22. FAO Yearbook. 1994. Vol. 44, Rome, Italy.
567
Chapter 21. Economics of Fertilizer Manufacture
Table of Contents
Page
21.1 Introduction 569
21.2 The Structure of Investment Cost - 57?_
21.2.1 Estimating Total Fixed Investment 571
21.2.2 Estimating Working Capital 574
21.3 The Structure of Production Costs 575
21.3.1 Variable Costs - 575
21.3.2 Fixed Costs 576
21.3.3 Effect of Capacity Utilization 577
21.4 Financial Analysis 577
21.4.1 Flow of Financial Resources 578
21.4.2 Project Financing 579
21.4.3 Cash Flow 580
21.4.4 The Net Income Statement and the Balance Sheet Statement 580
21.4.5 Discounted Cash Flow Analysis 582
21.4.6 Net Present Value 582
21.4.7 Internal Rate of Return 583
ELQA
21.5 Economic Analysis Structure ■ °OH:
21.5.1 Shadow Prices ,,,,,,,,. .-•■• .--. ;•-—•—.■■■: 58^
21.5.2 Distribution Impact 585
21.6 Use of Computers for Financial and Economic Analysis 586
21.7 Guidelines for Achieving Well-Established Projects 586
21.7.1 Feasibility Study • 586
21.7.2 Schedules for Financial Analysis 587
21.8 References 600
568
Chapter 21. Economics of Fertilizer Manufacture
21.1 Introduction
The capital-intensive nature of fertilizer production,
combined with seasonality and uncertainty of demand
and international prices, requires careful evaluation of
the financial and economic viability of industry
investments that form an essential part of both an individual
firm's operations and national economic development
programs. For the individual firm, the investment
opportunity objectives should always be the best
alternative use of funds for both the immediate and long-term
benefit of stakeholders - private and public equity
holders, farmer customers, employees, and society at large.
The long-term nature of fertilizer sector investments and
the continuing need for increased fertilizer supply mean
that each firm must generate sufficient capital
formation through retained earnings, new equity, and
attractiveness to lenders for sustaining business growth,
improving efficiency, and replacing assets.
From the viewpoint of national economic
development, complete appraisal of a project should
encompass at least six areas of analysis: sectoral framework;
market analysis; process technology; project scope;
management and personneI;-and -finance and econom--
ics [1]. Sectoral framework analysis assesses the impact
of sectoral and macroeconomic policies on the project
and the impact of the project on sectoral development.
This chapter is not intended to provide a complete
guideline to project appraisal and evaluation, as there are
many comprehensive published references available
[2,3,4]. Rather the purpose is to provide a guide to the
structure of fertilizer production economics and
investment cost.
Commercial profitability analysis is the first step in
the economic appraisal of a project from a national view-"
point. It is concerned with assessing the feasibility of an
investment based on its likely financial results for the
individual firm, This analysis comprises two parts: (a)
investment profitability analysis and (b) financial
analysis. These are complementary and non-substitutable.
Investment profitability analysis is a measure of the
return on a capital investment irrespective of the sources
of finance. Financial analysis takes into consideration
the sources of finance and disposal of the net cash flows
that accrue to service the finance in a manner that
allows smooth implementation and operation of a project.
Figure 21.1 summarizes this dichotomy.
The range of national development objectives, both
economic and social, also varies widely between
countries and over time, This requires a standard analytical
—formaUn-order-to-make. comparisons between
alternative investment projects. Although many national
objectives often cannot be measured in monetary terms and
for this reason are not directly comparable, economic
evaluation attempts to identify as much as possible the
Commercial Profitability Analysis
Investment
Profitability
Analysis
Simple
Methods
Discounted Cash
Flow Methods
Simple Rate
of Re I urn
Payback
Period
Financial
Analysis
Liquidity
Analysis
Capital
Structure
Analysis
Net Present
Value
Internal Rate
of Return
Figure 21.1 Commercial Profitability Analysis.
569
relationship between national development objectives
and the measurable characteristics of individual
investment projects.
21.2 The Structure of Investment Cost
- A business strategy is essential for both the
preparation and evaluation of an investment project and the
development of a marketing strategy. A business
strategy has a determining impact on the choice of location,
technical plant parameters, and resource requirements
[2]. Alternative project strategies should encompass
business objectives, cost and price competitiveness, product
quality differentiation and positioning in target markets,
and marketing structures. Market research examines a
preliminary project strategy from the marketing point
of view to identify alternative strategies and is an
essential early requirement in the prefeasibility research for
an investment project. This market research should
encompass the following:
• Assessment of the target market structure.
• Customer analysis and market segmentation.
• Analysis of distribution channels.
• Analysis of competition.
• Analysis of the socioeconomic environment including
government policies.
• Projections of marketing data, including gross
product demand, sales forecasts, and prices net of discounts.
• Risk analysis.
When alternative strategies have been identified and
the scope of projects established, preliminary cost
estimates for the investment project alternatives can follow
for opportunity or prefeasibility studies, together with a
preliminary Environmental Impact Assessment.
Reliability of capital and production cost estimates increase
as projects progress from one stage to the next,
Acceptable ranges of reliability are:
Opportunity study
Prefeasibility study
Feasibility study
+/- 30%
+/- 20%
+/- 10%
In the development of investment cost estimates the
following terms are used.
Erected Battery-Limits Plant is the main
production unit and includes all process equipment, delivered
and installed, with all instrumentation and controls,
piping, and electrical tie-ins. Battery-limits takes its name
from the concept that the main production unit lies within
boundaries or limits that raw materials, catalysts,
chemicals, utilities, product and byproducts must cross.
Utility Facilities are the facilities required to
support the battery-limits plant, This may include water
treatment, steam generation, electricity, and cooling for
process water and waste water treatment. Utility
facilities support production. Utility facilities can range from
35% of the battery-limits plant cost for grass-roots
installations to 10% for an addition to an existing
production site.
Raw Material and Product Storage are on-site
storage facilities for raw materials and for product.
Commonly, when on-site storage is required, storage
capacity is provided for 30 days, or more, of raw materials or
product. Typical storage investment costs are $90/t of
material for bulk storage and $140/t for bagged
material. If dehumidified storage is necessary, these costs are
about 10% higher.
General Service Facilities are nonproduction
facilities, and include administration buildings, security
fencing and lighting, fire-fighting equipment, laboratories,
maintenance shops, and change houses for personnel.
General service facilities can typically range from 15%
of the total battery-limits plant, storage, and utility
facilities for a grass-roots installation to 5% for an addition to
an existing site.
The Total Installed Cost is the sum of the costs for
the battery-limits plant, storage, utilities facilities, and
general service facilities.
Other Cost Components include (a) owners'
Project Management cost, which includes technical
and economic feasibility studies, environmental impact
studies, plant site selection, land procurement,
financing negotiations, preparation of technical specifications,
selection or recommendation of contractors, and
contract negotiations- (b) Preoperation and Startup
Expense, which provides for the costs incurred between
the end of construction and the production of a quality
product at design capacity; and (c) Spare Parts.
Preoperation expenses include training of personnel,
testing equipment and instruments, and adjusting or
modifying the process. The time and expense depend
on the complexity of the plant and the maturity of the
technology. Typically these expenses can be between
6% and 10% of the combined capital investment for
battery-limits plant and utility facilities.
A supply of spare parts is necessary for maintenance
and repairs. The amount of spare parts in inventory
depends on availability. In industrialized countries, spare
parts investment can generally be small, but in
developing countries a larger inventory is often required.
Typically, spare parts can range from less than 2% of the
total cost for a battery-limits plant and utility facilities in
an industrialized area to 4% in developing countries. The
570
investment in spare parts is sometimes included in
working capital. After construction is complete, the Initial
Charge of Catalysts and Chemicals is placed in the
plant. These form part of the operating expenses and
not initial capital investment; however, when there is a
likelihood, of rapid consumption, a complete spare
replacement may need to be in inventory. Such inventory forms
part of the working capital, not the investment capital
When a paid-up or lump sum royalty is paid to the
owner of a process technology, this forms part of the
capital investment. Running royalties based on
production form part of operating costs. From project
initiation through construction and startup of a plant, capital
costs are incurred. Usually the funds to pay for these
costs are borrowed, and interest charges are incurred.
These Interest Charges During Construction are
considered part of the capital investment. Interest
during construction is dependent on the interest rate, the
length of the construction period, and when funds are
borrowed. For simplicity, it is usual to calculate interest
during construction as though funds were borrowed from
the mid-point of construction.
The Total Fixed Investment is the total capital cost
of the plant. It includes land, the battery-limits costs,
storage, utilities and general service facilities, spare parts,
preoperational and startup cost, project management
and interest during construction. The Total
Depreciable Fixed Investment excludes the cost of land,
which is not a depreciable cost "item"." "" "
Working Capital is the capital required to fund
operations over and above the fixed investment capital in
land, buildings, plant and equipment. It is the capital
needed for cash in hand and to finance inventories of
raw materials, work in progress, finished products and
spare parts, and accounts receivable less accounts
payable. Working capital is part of the investment, and a
return must be earned on it. It is not deductible as an
expense, and it is not depreciable. It is not part of the
startup expenses, which are non-recurring, It is
considered a liquid asset that can be converted into a positive
cash flow when a project ends. During the life of a
project, working capital requirements will vary with
production rates, sales levels, accounts receivable
management, and other factors.
Total Capital Investment is the total of total fixed
investment and working capital.
21.2.1 Estimating Total Fixed Investment
All cost estimates should be made with separation of
national currency and foreign exchange components to
allow for later economic analysis. Order of magnitude
capital cost estimates for a battery-limits plant can be
made provided plant capacities are set at fairly
standardized levels and prices are available for plant and
equipment at such capacities. A schedule for a battery-limits
plant investment is prepared for a particular place, time,
and capacity as shown in Table 21,1 for an ammonia
plant in a US Gulf Coast location in 1994. Cost
estimates can be adjusted to account for changes in any of
these parameters.
The cost of a fertilizer plant is influenced by location.
-Gost-data-are-generally available for the United States
and for Western Europe but not for developing
countries. Costs in developing countries are generally higher
because of imported materials and equipment,
expatriate labor, and higher engineering and project manage-
Table 21.1. Ammonia Plant Investment Cost
Product
Capacity, tonnes/day
Investment Cost
Ammonia
1,500
Thousands US $
1. Battery-Limits Cost
2. Raw material and product storage (30 days at $90/t)
3. Utilities facilities (10% of 1)
4. General service facilities (5% of 1, 2, and 3)
5. Total Installed Cost
6. Spare parts (4% of 1 and 3)
7. Preoperation and startup expense (6% of 1 and 3)
8. Project management (5% of 5)
9. Interest during construction (18% of 5)
10. Total Fixed Investment
170,000
4,000
17,000
9,600
200,600
7,500
11,200
10,000
36,100
265,400
571
ment cost. Depending on the level of development, the
relative location factor with respect to the U.S. Gulf Coast
can be typically assumed as follows:
U,S,. Gulf Coast
Western Europe
Developing Countries
Type 1
Type 11
Type III
Location Factor
10
1.10
1.25
1.50
where Type I comprises countries already having
industrial experience for which outside help consists of
supervision and supplying personnel (e.g., Brazil,
Venezuela, Mexico),
Type II comprises countries with local labor having
good experience in civil engineering and public works
and with modern equipment in those fields (e.g.,
Indonesia, Philippines, Thailand)
Type 111 comprises those countries where the labor is
poorly qualified and where the equipment for civil
engineering and erection is nonexistent (e.g., some African
countries).
The above factors apply to capital cost of fertilizer
projects within 160 km of a major industrial or import
center, or both, in the designated country type. Within a
country, there may-be-considerable-variations-in-costs-that-
can be attributed to remoteness. Adjustments for
remoteness can be made by increasing the location factor by
increments of 10% for each 1,600 km that the new site is
situated away from a major industrial or import center.
Factors that influence a capital investment cost
estimate over time are inflation, workforce productivity, and
changing construction standards. The combined effects
of these factors are reflected in widely published indices.
The main indices in use are:
Chemical Engineering (CE) Plant Cost, U.S.A.
Chemical Engineering Equipment, Machinery, Supports
Chemical Engineering Buildings
Chemical Engineering, Engineering and Supervision
Chemische Industrie, West Germany
Engineering News-Record (ENR) Building Cost, U.S.A.
Marshall & Swift (M&S) Equipment Cost, U.S.A.
Nelson Materials, U.S.A.
Nelson Refinery Cost, U.S.A.
Process Engineering, United Kingdom
WEBC1, The Netherlands
The U.S. indices are prepared using various price
indicators published by the U.S. Department of Labor. The
most commonly used indices are the CE Plant Cost
Index for plant cost estimates. If the plant cost at some
time in the past is known, the equivalent present cost
can be determined by multiplying the original costs by the
ratio of the present index value to the index value
applicable when the original cost was obtained, as follows:
Present Cost = Original Cost x
(Present Index Value)
(Original Index Value)
If the cost is known at one capacity, the cost for
another capacity can be determined by applying a power
factor, for example 0.6, to the ratio of the two
capacities and multiplying the original cost as follows:
Cost at New Capacity = Cost at Old Capacity*
New Capacity ]°6
Old Capacity ]
The power factor method can be applied to individual
pieces of equipment, to process units, and to battery-
limits plant costs. The use of a power factor requires
some judgement. Generally 0.6 can be used as an
average for many applications, but the power factor can be
as high as 0.8 or 1.0 for such items as multiple units or
where costs depend strongly on capacity. The power
factor can be as low as 0.0 to 0.3 for very small plants
or where costs do not depend strongly on capacity. Some
power factors for types of equipment are as shown in
Table 21.2. Use of these indices should be checked
regularly against prices obtained from tendering.
Table 21.2 Power Factors for Individual Items
Item
Air fin coolers
Agitators
Blowers
Bucket elevators
Compressors
Conveyorsfbelt)
Conveyors (screw)
Cooling towers
Distillation towers
Drums
Dryers
Electric motors
Ejectors (5 stage)
Evaporators
Heaters
Heat exchangers
Instruments and controls
Piping
Pumps
Refrigeration units
Screens
Tanks(carbon steel)
Tanks (stainless steel)
Power Factor
0.80
0.50
0.65
0.85
0.75
0.85
0.82
0.80
. 0.70
0.65
0.50
0.80
0.50
0.50
0.80
0.60-0.95
0.00
0.70-0.90
0.60
0.75
0.70
0.44
0.68
Source: J. R. Polo. 1986."Cost Estimates: Definitions,
Types, Accuracies," IFDC Fertilizer Process
Economics Training Program, June 1986.
572
Table 21.3. Peters and Timmerhaus Method for Plant Cost Estimates
Direct Costs
1. Purchased equipment delivered, including fabricated
equipment and process machinery
2. Purchased equipment installation
3. Instrumentation and controls (installed)
4. Piping (installed)
5. Electrical (installed)
6. Building (including services)
7. Yard improvements
8. Service facilities (installed)
9. Land (if purchase is required)
10. Total Direct Plant Costs
Indirect Costs
11. Engineering and supervision
12. Construction expenses
13. Total Direct and Indirect Costs
14. Contractor's fee (about 5% of direct/indirect costs)
15. Contingency (about 10% of direct/indirect costs)
16. Total Fixed Capital (Installed Cost)
Solid
100
45
9
16
10
25
13
40
6
264
(224)a
33
39
336
(296)
17
(15)
34
(30)
387
(341)
Solid-Fluid
100
39
13
31
10
29
10
55
6
293
(238)
32
34
359
(304)
18
U5)
36
(31)
413
(350)
Fluid
100
47
18
66
11
1S_
10
70
6
346
(276)
33
41
420
(350)
21
(18)
42
(35)
483
(403)
a. Number in parentheses represents the corresponding cost without service facilities (i.e., battery limits process
unit only).
Source: M. S. Peters and K. K. Timmerhaus, Plant Design and Economics for Chemical Engineers, 3rd ed.,
p. 180, McGraw-Hill Book Company, Inc., New York, 1980.
Various factoral methods for estimating costs have
been advocated. These include the Lang Method, which
varies factors with the type of processing plant: solid,
solid-fluid, or fluid plant; the Hand Method, which uses
varying factors for equipment grouped by type, such as
heat exchangers, reactors, and pumps, and then uses
an installation factor for each group of equipment; the
Chauvel and Rueil Method, which recommends that an
additional size correction factor be applied for
equipment cost in mild steel and that the additional cost due
to use of other materials of construction be added later
to the total installed cost; the Chiltern Method, which
begins with the equipment installed cost; and the Peters
and Timmerhaus Method, which is a combination of
the Lang and Chiltern methods. It is based on delivered
equipment cost, but it retains Lang's classification of solid,
solid-fluid, and fluid plants. Table 21.3 shows the
factors to be used in estimating major process plant
additions to an existing site. The factors should be varied
within the ranges described previously for different
Iocational and other factors for prefeasibility and
opportunity studies. The most accurate estimate of fixed capital
investment cost is based on a detailed and complete
design of each project component, Competitive quotations
are usually not appropriate for a feasibility study but occur
during the implementation phase.
The schedule in Table 21.1 uses the battery-limits
plant cost as a starting point for determining total plant
investment, including all auxiliary and support facilities.
These include utilities, storage and handling facilities,
573
and general service facilities. Factoral estimating is used
in this example to estimate other investment costs as a
percentage of the battery-limits plant cost. Typical
factors for auxiliary/support facilities added to
battery-limits plants for existing and greenfield sites are provided in
Table 21.4. These do not include infrastructure and
support facilities outside the plant site boundary. These, in
developing countries, may include access road and
railroads; waterways and harbors; facilities for raw material
delivery; employee housing; educational, recreational,
and school facilities; temporary housing facilities during
construction; and off-site distribution warehouses,
The separate cost estimation of auxiliary/support
facilities item by item is a very time consuming and difficult
task. However, in certain cases, the capital cost for
facilities such as utility and storage facilities can be more
accurately estimated on the basis of their capacity and type.
Many auxiliary/support facilities are complex units;
in their own way, they can be as complex as the
primary production units they support. An estimate
starting with item by item equipment design could be as time
consuming as the primary plant estimate itself.
Fortunately, with available cost correlations, the job of
estimating costs associated with steam generating plants,
Table 21.4. Ratio Factors for Estimating
Auxiliary/Support Facilities Cost
Utility facilities (U)
% of B/L cost
Low
Average
High
Storage facilities (S)
% of B/L cost
Low
Raw material by
pipeline, little
warehouse space
Average
High
General service facilities (G)
% of (B/L + U + S)
Low
Average
High
Gr ass-
Roots
Plant
10
20-30
50
5
15-20
50
5
10-16
25
Battery-Limits
Addition to
Existing Site
3
6-14
30
0
2-6
20
0
■ 2-6
15
steam-electric generation plants, cooling towers, and
ammonia and phosphoric acid storage facilities separately
becomes relatively straightforward.
Site Expenses and Preproduction Expenses -
Fixed investment expenses also include site expenses
and preproduction expenses. Site expenses can
include the cost of land, site preparation, civil works,
engineering and design costs, project design costs, and
insurance and taxes related to civil works, Preproduction
expenses may include the cost of previous studies,
preliminary costs for issuing capital, project and site
management, preproduction marketing costs, preproduction
implementation costs, personnel recruitment and
training, administration overheads, startup and
commissioning expenses, and interest accrued during construction.
These costs are usually capitalized into the fixed
investment cost.
21.2.2 Estimating Working Capital
Estimates of working capital requirements fall into four
areas; inventories, accounts receivable, cash in hand,
and current liabilities. To estimate these, it is necessary
to consider the different production stages in which
materials can be found, which are (1) raw materials paid
for but not received (a portion of current assets); (2) raw
materials on hand but not paid for (a portion of current
liabilities); (3) materials in process; (4) finished products
in store whether on-site or off-site; and (5) finished prod-
ucts delivered to customers but not yet paid for (accounts
receivable). The calculation of the amounts of each of
these material inventories depends on such factors as
distance from raw material suppliers, types of contracts
for raw material purchases, raw material purchase
financing methods, quantity discounts and lot sizes
available for raw materials, available modes of transportation,
cost of storage facilities, plant size and capacity,
seasonality of sales volumes, marketing system, and customer
credit policies.
In general terms, storage time for raw materials can
range from 10 to 90 days, although natural gas supplies
from pipelines incur no storage time. Once the total
days of storage has been determined for each raw
material, the total cost of the raw material is calculated by
multiplying the unit cost of that raw material per tonne
of finished product by the daily plant production rate
and by the days of storage estimated.
The cost of finished product in bulk storage depends
on the nature of the material (some materials need
curing time before bagging} and on the capacity of the plant,
A bulk storage time of about 5 to 20 days is usually
assumed, The cost of this inventory is calculated by
multiplying the unit production cost of finished fertilizer,
excluding bags and bagging, by the daily production rate
and by the days of storage estimated.
574
The size of finished bagged product inventory depends
on the capacity of the plant and the marketing system
used. An average storage time of 30 days can be used
to estimate its total inventory cost, multiplying the unit
production cost, including bags and bagging, by the daily
production rate and by the days of storage estimated.
The cost of in-process materials is usually small
compared to the cost of finished products in inventory.
Adding one extra day to the bulk storage estimate is usually
sufficient to estimate this cost. When intermediate
products such as ammonia, nitric acid, or phosphoric acid
are produced for later processing, 5 to 10 days
production requirements are usually to be kept in storage.
The cost of spare parts inventory can be estimated at
between 2% and 4% of the total fixed investment cost.
Accounts receivable may vary from 25 to 35 days of
average daily sales revenues in well-managed domestic
marketing systems, but export sales, with long delivery
times, may require an allowance of 45 to 60 days for
accounts receivable. Many state-owned fertilizer
factories operate on a cash-only sales basis, and accounts
receivable are not applicable.
Cash-in-hand is often estimated at 5% of the total
working capital as calculated above. The calculation of
total working capital requirements is dependent on a
calculation of production costs.
21.3 The Structure of Production Costs
Production Cost or manufacturing cost is the sum
of all of the costs required to make a product. It can
usually be broken down into variable costs and fixed costs.
21.3.1 Variable Costs
Variable costs increase with production rate. These-costs-
are computed on a per-unit (usually tonne)-of-product
basis. Common variable costs include those of raw
materials, chemicals, and catalysts; utilities; and contract labor.
Raw Materials, Chemicals, and Catalysts are
usually the most important and largest component of
variable cost items. Care should be exercised in
calculation. Costs of these should include delivery costs and
' losses in storage and inefficiencies of the process. The
different available supply sources, material specifications,
lot quantities, and freight mode should be considered.
Estimated raw material requirements for different fertil-
izer processes are shown in Table 21.5. Operating sup-
Table 21.5. Raw Material Requirements for Selected Fertilizers
Sulfuric
Product and Process
Ammonia
Natural gas
Naptha
Fuel oil
Coal
Ammonium nitrate, prilled
Ammonium sulfate,
crystallization
Calcium ammonium nitrate,
prilled
Diammonium phosphate.
slurry granulation
Monoammonium phosphate,
slurry granulation
Nitric acid (60% HNO3) high
pressure
Phosphoric acid (54% P2O5),
di hydrate
Single superphosphate,
run-of-pile
Single superphosphate.
granular
Sulfuric acid (93% H2SO4)
double contact, double
absorption
Triple superphosphate,
run-of-pile
Triple superphosphate,
granular
Urea, prilled
Feedstock
(Gcal/t)
5.1
5,8
7.6
9.3
Ammonia
0.210
0.258
O.160
0.230
0.540
0.287
0.580
Nitric Carbon Phosphate Rock
Acid Dioxide Limestone Sulfur 32% P205
0.773
0.590 0,260
3.400
0.626
0.626
0.340 2.780
0.400
0.400
0.770
Acid
100%
0.744
0.363
0.363
0,340
0.340
Phosphoric Acid
100% P2O5
-
0.470
0.140
575
plies can be estimated at about 1% of raw material costs
for most processes,
Utilities include electricity, steam, process fuel,
process water, boiler feedwater, cooling water, deionized
water, compressed air, instrument air, refrigeration,
inert gas, and effluent treatment. The unit use is
dependent on the process technology, and the cost is site
dependent, For each utility, unit use and unit cost should
be recorded. The estimated use of utilities for different
fertilizer processes is shown in Table 21.6, Some off-
site utilities such as electricity are often priced with a
fixed cost component and a variable cost component.
The fixed and variable portions need to be calculated
separately to provide an average variable cost per unit
of production for a given annual production,
Care should be taken to avoid double consideration
of utilities. For instance, electricity included in the cost
of producing steam should not be included as electricity
for the process. For utility generation within a process
(e.g., steam in sulfuric acid production) a credit should
be given to the production cost at the rate it would cost
to produce or purchase the utility.
Contract Labor is a variable cost because when
production ends the contracted labor is no longer needed.
An example could be the bagging operation when it is
not performed by plant operators. Bags are also a
variable cost.
21.3.2 Fixed Costs
Fixed costs are not readily influenced by the
production rate. These costs are usually computed on an
annual basis and then allocated to products. The major
categories of fixed costs are discussed as follows.
Depreciation is an accounting method used to
distribute the initial investment costs of productive fixed
assets, except land, over the lifetimes of the assets, which
are usually considered as standard financial lifetimes.
Depreciation costs are calculated on the basis of the
original value of fixed investments, using rates for either
straight line, declining balance or accelerated deprecia-
Table 21.6. Utility, Catalyst, and Chemical Requirements for Selected Fertilizers
Product and Process
Ammonia
Natural gas
Naptfia
Fuel oil
Coal
Ammonium nitrate, prilkd
Ammonium sulfate,
crystallization
Calcium ammonium nitrate,
prilled
Diammonium phosphate,
slurry granulation
Granular NPK, steam
granulation
Monoamrnonium phosphate.
slurry granulation
Nitric acid (60% HNOa) high
pressure
Phosphoric acid (54% P2Os),
dihydrate
Single superphosphate,
run-of-pile
Single superphosphate,
granular
Sulfuric acid (93% HeSOJ
double contact, double
absorption
Triple superphosphate.
run-of-plle
Triple superphosphate,
granular
Urea, prilled
Electricity
(kWh/t)
35
50
50
150
20
36
20
40
24
50
10
150
20
35
35
20
60
130
Steam
ft/0
Self
Self
Self
Self
0.20
0.20
0.07
0.06
0.03
-0.04
2.50
0.055
-1.20
0.07
1.20
Fuel
(Gcal/t)
1.9"
2.0
1.4
-
SO
120
135
100
135
Cooling Boiler
Process Water Pond Feed Catalysts, Chemicals,
Water Circulation Water Water _and Supplies, 1986
.(t/t)
166
166
248
234
50.0
7.5
0.085
0.2
2.3
2.8
1.3
2.1
87
38
25
43.00
65.00
43.00
130.00
5.00
15.00
5.00
60.00
8.5
1.5
70
(US $/t)
3.0
3.5
2.0
2.0
2.5
1.5
2.5
1.0
0.75
1.0
2.5
1.6
0.5
0.75
0.5
0.5
1.0
1.5
576
tion adopted by management and approved by tax
authorities. Depreciation schedules should be constructed
for the battery-limits plant and off-site buildings and
structures, for equipment and machinery, and for office
equipment. Annual depreciation rates allowed vary for each
of these categories. Total annual depreciation costs need
to be shown separately from overhead costs so that they
can be used for calculation of both unit costs and
operating profit and omitted from financial cash flow
calculations.
Operating Labor and Supervision include the cost
of salaries and wages, premiums, overtime, and
benefits (medical insurance, meal allowances, holidays,
vacations, reserve for retirement pensions, unemployment
taxes, social security taxes). Detailed organization and
manning tables need to be prepared including shift
operations and specification of requirements for
management and for professional, skilled, and unskilled workers.
In some developing countries, the availability of
professional and skilled workers may require extensive initial
training (a pre-startup expense), and in all areas
on-going training costs will be incurred as an overhead. Only
the direct operating labor and supervision of plants,
utilities, and site services are included in this category of
fixed production costs. Generally, a good
approximation of the required personnel is achieved if the number
of actual operating positions is multiplied by a factor of
4.5 for the 40-hour workweek and 3.8 for the 48-hour
workweek: These calculations-result-inthe number-of-
operators to cover plant operation on a three-shift-per-
day basis, vacations, sickness, and a personnel turnover
of 10% per year.
Maintenance Costs consist of the costs for
material, craft labor, supervision, and scheduling (often
including central machine shops). The relative incidence
of these components in the total cost of maintenance is
about 50%, 40%, and 10%, respectively. Before a plant
is built, the maintenance cost can be estimated by
relating maintenance to the capital investment in the
battery-limits plant and in the other facilities, The percentage
to use for maintenance should be determined for
particular plants depending on the process and factors such
as materials of construction and environment. In
general terms, annual maintenance costs can be estimated
at a minimum of approximately 4% of fixed investment
cost. For corrosive processes, or those with extensive
instrumentation, this figure may be as high as 7% to
10%. In addition, the inventory of spare parts will form
part of the working capital requirements, and
depreciation of specialized maintenance equipment is included
in the depreciation schedule for equipment.
Administration Expenses and Supervision are
the costs that are not chargeable to a particular
production or maintenance operation. These costs include
administration, management, laboratory, accounting,
distribution, and marketing expenses for salaries, wages,
and benefits, along with annual operating costs. These
expenses can equal the cost of operating labor and
supervision.
Insurance and Taxes together typically account for
l%-2.5% of the Total Installed Cost.
It is now possible to calculate unit costs of conversion
for comparison with sales price per unit. For a single
product, project unit costs are simply calculated by
dividing total annual production costs by the number of"
units produced. Unit costs therefore reflect capacity
utilization, and this is a critical factor in calculating unit
costs. For multiple-product projects without any
historical data on which to base fixed cost allocations, it is
generally better to only calculate the contribution per
unit (sales revenue less variable cost) to covering fixed
costs and profit.
21.3.3 Effect of Capacity Utilization
One of the most important factors affecting
production cost is the capacity utilization of the plant.
Consider a product that has a cost of $ 150/tonne composed
of $75 for variable cost and $75 for fixed cost, when a
plant is operating at design capacity, 330 days a year.
This may be considered 100% capacity utilization for
plants that have outages of 35 days per year for sched-
-uled-maintenance-7-Gapacity utilization can be lower or
higher than 100%. Lower capacity utilization can be
due to operational problems or soft demand for the
product. Higher capacity utilization can be achieved by
operating more days per year or by operating at rates above
design capacity. Variable production costs per unit do
not change, but fixed production costs per unit fall as
capacity utilization increases, as illustrated in Table 21.7,
21.4 Financial Analysis
Investment has been defined as a long-term
commitment of economic resources made with the objective of
producing and obtaining net gains in the future.
Conventional methods used in comparing annual net profit
with capital invested do not take account of the time
value of money or risk associated with a project
investment. Commercial profitability analysis relies on the use
of discounted cash flows to account for time value of
money and risk in assessing the comparative
profitability of investments. Financial analysis should ensure that
the decisionmakers' strategic and profit objectives are
fulfilled within the confidence levels of a feasibility study
and that identification is made of (1) the most attractive
alternative, (2) the critical variables, (3) the flow of
financial resources during investment, startup, and
operational phases, and (4) the lowest cost financial
577
Table 21.7 Impact of Capacity Utilization on Average Unit Costs
Capacity Utilization
(%)
110
100
85
70
60
Variable Cost
75.00
75.00
75.00
75.00
75.00
Fixed Cost
68.18
75.00
88.24
107.14
125,00
Averac
e Total Unit Cost
143.18
150.00
163.24
182.14
200.00
Assuming that the product price is US $l70/tonne, the production would become nonviable at about 79%
capacity utilization.
resources and their most effective use. These objectives
are all interrelated.
The planning horizon for a project is determined
by its economic life, which in turn is determined by
factors such as duration of demand, raw material supply,
and equipment life and by the rate of technical progress,
industry life-cycle, and opportunities for alternative
investment. A 15-year planning horizon is commonly used
for substantial investments in fertilizer production
projects. Construction of a large fertilizer complex may
take 2 to 4 years beforercommissioning. Buring-this-
time, annual capital investments are made as
construction proceeds, and these have to be financed. Usually
the funds to pay for these costs are borrowed and
interest charges incurred. These interest charges during
construction are considered part of the capital
investment.
The pricing of inputs to and outputs from a project
is also an important consideration. Prices can be
defined as market or shadow prices, absolute or relative,
and as current or constant prices. In financial analysis,
market prices are used. Market prices are those present
in the market irrespective of whether they are
determined by supply and demand or set by the government.
Current and constant prices differ over time as a result
of inflation. Operational and financial cash flows are
usually projected using constant prices in the national
currency units and with separation of foreign and
national currency flows. Under" conditions of high
inflation, it is preferable to make cash flow forecasts using
current or nominal prices and then convert the nominal
net cash flow back to a net cash flow in real terms. This
is done because, under conditions of high inflation,
depreciation is overstated and working capital is
understated if all cash flow items are forecast in real terms.
Also, for projects dependent on imported raw
materials, these costs can be underestimated due to falling
exchange rates under high-inflation conditions. When
forecasts are made using current prices, anticipated
inflation rates should be determined for major cost and
revenue items, item by item.
Determing the price of a product which is not on the
market can be achieved by utilizing price comparison
with imported products on a nutrient basis. For multiple
nutrient products, new product prices can be determined
by calculating the price based on imported component
materials. For example, the price of a new multinutrient
-firoduGt4~-25v8-can-be-determined as follows:
Imported urea price, US $220/tonne =
nitrogen unit price, US $478/tonne
Imported TSP price, US $280/tonne =
P205 unit price, US $608/tonne
Imported KCI price, US $130/tonne =
K20 unit price, US $210/tonne
The assumed minimum price of the 4:25:8 product is
calculated as: US $478 *0.04 + US $608*0.25 + US
$210* 0.08 = US $188/tonne.
Risk and uncertainty have to be taken into account
in financial analysis because returns on investments are
related to future cash flows. Risk is present when
probabilities of outcomes can be assigned on the basis of
past performance; when risk probabilities have to be
assigned subjectively, then uncertainty exists.
21.4.1 Flow of Financial Resources
From the estimates for fixed capital cost and working
capital cost, a schedule of total investment costs can be
prepared. Then the sources and costs of financing these
investments must be examined in order to prepare a
flow of financial resources statement and a debt
servicing statement.
578
Cash flows for a project are either receipts (cash
inflows) or payments (cash outflows). For the purposes of
financial analysis it is necessary to distinguish between
cash flows representing the operation of the project
(operational cash flows) and financial cash flows that are
related to the financing of an investment. These are
defined in the schedule below:
Operational Cash Outflows
Increase in fixed assets (investment)
Increases in net working capital
Operating costs excluding
depreciation and interest
Marketing expenses
Production and distribution losses
Corporate (income) taxes
Financial Cash Inflows
Paid-in equity capital
Subsidies, grants
Long- and medium-term loans
Short-term loans and bank
overdrafts
Increase in accounts payable
Operational Cash Inflows
Revenues from sale of fixed
assets
Recovery of salvage values at
end of project
Revenues from decreases in
net working capital
Net sales revenues
Other income due to plant
operation
Financial Cash Outflows
Dividends paid
Buying back of shares
Repayments if required
Interest paid on loans and
other finance costs
Amortization of loans
Interest paid and repayment
of short-term loans and
overdrafts
Decrease in accounts payable
A distinction needs to be made between cash flow
statements and financial accounting statements such as
balance sheets and income (profit and loss account)
statements. In cash flow statements, expenditures
represent outflows of cash during a given time period, whereas
costs in accounting statements are not related to an
outflow of funds but represent the total expenditures
required to produce a product or service during a given
period, usually one year. The difference becomes clear
when expenditures and costs are compared for raw
materials and investment for a given period. Raw
material expenditures are related to the purchase of raw
materials during a year, but raw material costs reflect
the use of raw materials in processing during the year.
Invesiment expenditures are actual cash outflows at a
particular point in time, but investment costs are
accounted for by depreciating the investment expenditures
over a certain period of years in order to apportion
investment costs through annual depreciation charges,
Depreciation costs are therefore not cash outflows but
are a part of annual costs.
Annual debt-servicing costs, excluding amortization
(i.e., just interest and finance charges), are also
considered as costs, but these are part of the financial cash
outflows and should not be considered as part of the
operational cash outflows in financial analysis. However,
both depreciation and interest costs affect the taxable
income level and therefore tax payments and net
aftertax income. It is therefore necessary to project annual
income statements for the purposes of estimating tax
payments prior to preparing a cash flow statement for
either financial analysis or discounted cash flow analysis.
Revenues represent inflows of cash and are the
opposite of expenditures. Income is generally defined as
the remuneration received from sales of products or
services and is considered net income after the related
costs and direct taxes are deducted, Income may include
interest received and extraordinary income (e.g. sale of
assets), but for financial analysis purposes, income,
excluding any that is not derived from the productive use
of assets, is considered to be equal to revenue. Often
simplification is adopted in financial analysis in respect
to expenditures and revenues and costs and income,
i.e., it is assumed that, on average, the differences
between annual revenues and expenditures are the same
as the differences between annual income and costs
(annual net income) plus annual depreciation charges and
finance charges. This simplification is applicable only if
there are no significant changes in fixed and current
assets. —
Both operational and financial cash flows should be
estimated on an annual basis for comparative financial
analysis over the planning horizon. Financial analysis
examines the profitability of an investment both prior to
the financing and after financing, using cash flow
concepts.
21.4.2 Project Financing
In opportunity and prefeasibility studies, financial
analysis is conducted before considering the source of
financing a project. However, during these stages the
magnitude of capital required is established. How to
finance this capital requirement has to be considered in
the feasibility study stage.
In general terms, the initial fixed capital investment
and the minimum net working capital are covered by a
mix of equity and long-term loans and additional net
working capital from short- and medium-term loans or
from positive net cash flow (equity). Within this
structure, various combinations and permutations need to
be considered related to cost of finance, financial
flexibility, debt service, and taxation, Consideration should
also be given to leasing, supplier credits, and other
sources of finance. In all cases, a balance has to be struck
between equity and debt finance.
579
The cost of equity capital is determined by the
opportunity cost of capital, the expected risks, and the
expected benefits other than dividends for shareholders.
Equity capital may have dividends related to earnings
(ordinary or common shares) or only partially related to
earnings (preference shares). Debt service includes both
interest and amortization and is a fixed legally binding
cost to a firm which has to be paid irrespective of whether
the generation of cash is sufficient to meet the annual
commitments. The determination of the optimal capital
mix is therefore essential when a financing strategy is
designed. Two systems of debt servicing are also
available; periodic debt service with equal amortization
payments plus gradually declining interest; and periodical
debt service with constant payments (annuities). The first
system requires less total financing cost, but the initial
debt=service cost is high. The second system is
preferable for a new firm because the initial debt-service cost
is smaller even though the total finance costs are higher.
In determining the optimum finance mix, it is useful
to examine certain financial ratios from the projected
balance sheets, income statements, and cash flow
statements. The long-term debt/equity ratio is an
indicator of the financial project risk for both the equity and
the loan capital. Because the long-term debt service is a
legally binding commitment of a firm, the higher the
debt in relation to the equity, the higher is the risk to
both the firm and the lender. The ratio also indicates
the extent to which the outstanding debt is"covered'bir
the assets. For an existing firm, the earned surplus and
reserves must be added to the equity capital (net worth)
to reflect the true debt equity or long-term debt/net
worth ratio. A debt/equity ratio for large and medium
sized projects is often 50:50, but this is by no means
standard. Ratios of 67:33 or 75:25 or even higher can
be seen in fertilizer companies in some countries. High
debt/equity ratios reflect increases in shareholder
leverage because the smaller the equity capital, the higher is
the income per share unit. Equity owners therefore
favor higher ratios. Generalizations cannot be made, and
each case should be assessed on its own merits.
Current ratio is a liquidity measure computed by
dividing the current assets by current liabilities; it
measures short-term solvency or the ability of a firm to meet
current liabilities. Because current assets include
inventory that may or may not be convertible into immediate
cash, the quick ratio is frequently used in addition to
the current ratio. The quick ratio is calculated by
dividing cash plus marketable securities and discounted
receivables by current liabilities, Satisfactory values for these
two ratios are 1.2-2.0 for current ratio and 1.0-1.2 for
quick ratio.
Long-term debt-service coverage is defined as the
ratio of cash generation to debt service, and acceptable
ratios of 1.5-3.0 are normally considered sound.
Annual net cash flows should always be more than
sufficient to cover debt servicing by 1.5 to 3 times.
When financing sources and costs have been
determined, then an annual schedule of the flow of financial
resources and debt servicing can be prepared.
21.4.3 Cash Flow
The schedules for investment, flow of financial
resources, debt servicing, and operational cash flow are
combined to provide a cash flow for financial planning,
which shows annual cash inflows and outflows including
loan repayments and dividends and annual and
cumulative cash balances. As is seen in Schedule 8, the total
cash inflow includes funds, operational inflows, and other
income. This final category includes scrap value, if any,
of fixed assets at the end of the project. Total cash
outflows include increases in fixed assets, preproduction
expenses (net of interest paid), increases in current
assets, operating costs excluding depreciation and
interest, marketing costs, tax payments, interest payments,
loan repayments, and dividends paid. Tax and dividend
payments are normally paid in the year following the
income year they relate to. This cash flow schedule shows
whether the funding for a project is synchronized with
funding demand and is then used to prepare the
accounting statements and the discounted cash flow
schedule.
_21.4.4JheJNet_lnconie Statement and the
Balance Sheet Statement
The net income statement is used to compute the
annual net income or deficit of a project. The statement
differs from the cash flow schedule because it shows
incomes and costs and not revenues and expenditures
by period. The accrual concept is used in which income
from operations is associated with the costs needed to
produce the income during the same period. In
financial analysis for feasibility studies, it is usually assumed
that inventories are the same at the beginning and end
of each year. The derivation of costs, revenues, and
investments are shown in Figure 21.2. The income
statement is related to the balance sheet statement as shown
in Figure 21.3 such that the annual profit (or loss)
increases (or reduces) the net worth of the company. The
balance sheet statement shows the accumulated wealth
of a company (assets) and how these assets are financed
(liabilities). By definition both sides are equal.
The differences between the income statement and
the cash flow statement are shown as follows:
A. Income Statement
1. Total income
2. Less variable costs
3. Less fixed costs including depreciation
580
Direct material
Raw materials
Factory supplies
Direct labor
Factory and
administrative
Overhead labor overheads
Salaries and wages Management
Benefits and
social security
contributions
Functional staff
Factory supervision
Indirect labor
+ Depreciation
+ Financial costs
= Production costs
+ Marketing costs
_ Total costs of
products sold
and supplies
Utilities
Communications
Repair, maintenance
Rent
Insurance and taxes
1
Operating costs
1 1
|
Sales forecasting
r
Sales revenues
- Total costs
= Gross earnings
- Income texa
= Net earnings
Depreciation
Auxiliary materials Buildings
Machinery and
plant equipment
Tools
Office equipment
Vehicles
Net working capital
Current assets
less current liabilities
= Return on Equity
a. Calculate income (corporate) tsx as applicable.
Networking capital
+ Fixed investment
+ Preproduction
expenditures
= Total investment costs
- Borrowings
= Equity capital
I
Figure 21.2. Origin of Cost Items for Profitability Calculation (Return on Equity).
Income
Statement
Sales—,
Cost of
Sales .
= Gross Profit n
Operating Expenses _
_ Operating
Profit
Nonoperating Expenses
(except interest)
+
Other Income
Net Profit
■. Before Tax -
and Interest
Interest
Net Profit -
Before Tax
Tax _
= Net Profit -,
Balance
Sheet
Cash
Debtors
+
Inventory +
Other —I
Land
Buildings +
Equipment
Other +
Creditors
= Current Assets —,
=Fixed Assets —
%KO.I.
II - = Total Assets _.
%R.O.E.
BankO/D
Working Capital
+■ = Current Liabilities —
+
Long-Term Loans = Long-Term liabilities -
= Total Liabilities -
— Equity
(Shareholder Funds)
(Retained Profits)
(Capital Surplus)
Gearing
Figure 21.3. Relationship of the Income Statement to the Balance Sheet
Statement.
581
4. Operational margin
5. Less working capital interest
6. Net profit before tax
7. Less income tax
8! Net profit after tax
B. Operational Cash Flow Statement
B(i) Cash Inflows
1. Net profit after tax
2. Working capital interest added back
3. Depreciation added back
4. Working capital released at end of project
5. Residual or scrap value of fixed plant investment
B(ii) Cash Outflows
1. Fixed capital investment
2. Working capital investment
3. Preproduction expenses net of interest
B(i) less B(ii) = Net Operational Cash Flow
Discounted cash flow analysis can be completed on
the net operational cash flows for alternative
competing investment projects for opportunity and prefeasibility
studies.
21.4.5 Discounted Cash Flow Analysis
The basic assumption underlying the discounted cash
flow analysis is that there is a time value and a risk value
for money invested over time. For example, a given sum
of money available now is worth more than an equal
sum available in the future. The difference can be
expressed as a percentage rate indicating the relative
change for a year (or any other time period, if required).
Consider that a project may obtain a certain amount of
funds, F, which is required to be repaid after one year,
including an agreed amount of interest, I, then the total
sum to be repaid at the end of one year would be (F+I),
where
F + 1 = F(l+r)
and r is defined as the interest rate in percentage per
year divided by 100 (i.e., 12% equals .12). The nominal
value of the total repayment is equal to the present value.
Suppose now that CFn is the nominal value of a future
cash flow in the year n, and CFP is the value at the
present time (i.e., the present value) of this expected
inflow or outflow, then, assuming that r is constant,
CFp = CF„/(l+r)n
or CFP = CFn (l+r)n
The future CFn values are discounted over time to the
present time, There are two main discounting methods
used for the financial appraisal of investment projects:
the net-present-value method (NFV) and the internal-
rate-of-return method (1RR).
21.4.6 Net Present Value
The Net Present Value (NFV} of a project is defined
as the value obtained by discounting, at a constant
interest rate and separately for each year, the differences in
cash inflow and outflow (i.e., the annual net cash flows
[NCF]) throughout the life of the project. The annual^-
NCFs are discounted to the point at which the project is
supposed to start. The NPVs obtained for the years of
project life are summed to provide a total NFV as follows:
NPV = NCF0 + (NCF: x en) +(NCF2 xag) + + (NCFn xan)
n=j NCFn
or NPV = £
n=0 (I+r)n
where NCFn is the annual net cash flow of a project in
the years n= l,2,...,j, and an is the discount factor in the
corresponding years, relating to the discount rate
applied throughout the equation
an = (1+r)-"
Discount-factors-(an), may be obtained from present
value tables and computer software, including
spreadsheets, that provide for these calculations. A simple
example of NPV calculations at two discount rates is
provided in Table 21.8.
The discount rate should be equal to the actual rate
of interest on long-term loans in the capital market or
the average interest rate (cost of capital) paid by the
borrower. The discount rate should basically reflect the
opportunity cost of capital, which corresponds to
the rate of return an investor would obtain if the funds
were invested elsewhere with a similar level of risk. The
discount rate therefore represents the minimum rate of
return acceptable to the investor. When comparing
alternative investments with different perceived risks, the
discount rate can be increased for the more risky project
investment so that a comparison can be made between
the alternatives,
If a computed NPV is positive, the profitability of the
investment is above the cut-off or hurdle discount rate.
If it is zero, the profitability is equal to the discount rate.
If the NPV is negative, the profitability of the
investment is below the discount rate and should be rejected.
Where a choice is to be made between competing
alternative investments, the choice cannot be made entirely
on the basis of the largest NPV because the NPVs only
582
Table 21.8. Example of Cash Flow Discounting
Year
i-H
2
3
4
.. .. .5
6
7
8
9
10
11
12
13
14
15
16
17
18
Annual Cash
Flow
($'000)
(3,291)
. (5,127)
(88)
1,722
2,700
3,343
2,259
1,208
2,192
2,170
2,170
1,995
1,805
1,805
1,805
1,805
1,805
2,723
Discount Factor
@ 18%
1.000
.847
.718
.609
.516
.437
.370
.314
,266
.225
.191
.162
.137
.116
.099
,084
,071
.060
NPV
($'000)
(3,291)
(4,343)
(63)
1,049
1,393
1,461
836
339
583
488
414
323
247
209
177
152
128
163
Discount Factor
@ 20%
1.000
.833
.694
.579
.482
.402
.335
.279
.233
,194
.162
.135
.112
.093
.078
.065
.054
.045
NPV
($'000)
(3,291)
(4,271)
(61)
997
.--1,30-1-
1,344
757
337
511
421
352
269
202
168
141
117
97
123
Accumulated total
265
(486)
Note: Figures in parentheses are negative.
Source: UNIDO, Manual for the Preparation of Industrial Feasibility Studies, 1991.
indicate the total net benefits of the investments. The
efficiency of the alternative investments needs to be
estimated by relating the positive NPVs to the present
values of the alternative investments (PVI). This is calculated
with the net-present^value ratio (NPVR), which provides
a discounted rate of return.
NPVR =
NPV
PVI
The NPV concept has substantial advantages compared
with simple payback periods or annual rates of return
because it accounts for the timing of cash flows over the
whole project life and the NPVR can be considered as a
calculated investment rate that the profit rate of the
investment should at least reach. Some shortcomings
include the difficulty in selecting the appropriate discount
rate and the fact that the NPV does not show the exact
profitability of the project. In addition .the same NPV
can be obtained from two entirely different cash flow
arrays. It should therefore be used in conjunction with
the IRR.
21.4.7 Internal Rate of Return
The Internal Rate of Return (IRR) is the discount
rate at which the net present value of cash flows is equal
to zero. Mathematically, it means that in the NPV
equation one calculates the discount rate, r, at which the
NPV equals zero, The calculation is made by an iterative
process using discount tables or by a suitable computer
program. In Table 21,7, the NPV is positive at an 18%
discount rate and negative at a 20% discount rate, The
IRR is therefore between 18% and 20% and can be
calculated by interpolation.
The IRR can be considered as the annual net cash
return produced on capital outstanding per period or as
the highest rate at which a project could raise funds, An
investment proposal may be accepted if the IRR is greater
than the cut-off rate (i.e., the minimum acceptable
interest rate for the invested capital). When competing
alternative investments are being considered and the IRRs
are above the cut-off rate, it is not necessarily the project
with the highest IRR that should be selected, As with
NPV, different cash flow arrays can produce identical
IRRs; it is also possible for a project with a lower IRR to
be preferable to a project that has a higher IRR but an
undesirable cash flow structure. These ranking problems,
and the situation with mutually exclusive projects,
require that the use of IRR, NPV, and NPVR, must take
account of the financial objectives and decision criteria
of the investors.
Occasionally, one can come across a discounted cash
flow analysis in which the annual net cash flows change
583
from negative to positive, back to negative, and then
revert to positive. When this occurs, Newnan's law of
signs applies, which states that "there may be as many
positive values for r as there are sign changes in the net
cash flow." When this occurs, the problem may be
overcome by discounting the negative net cash flows at
nonzero time to zero time, using the appropriate discount
factor, and adding these discounted values to the zero
time investment.
Finally, in analyzing investment proposals, it is
necessary to identify and evaluate project sensitivity to changes
in major variables such as output prices, input prices,
sales and production volumes, etc. Sensitivity analysis
can assist in overcoming ranking problems in assessment.
21.5 Economic Analysis Structure
Financial analysis in real, present value terms is
generally sufficient for commercial calculations and is
essential prior to conducting an economic analysis in which
net national benefits arising from a proposal are
determined. In its most simplified form, economic analysis
uses net value added as a proxy for national welfare.
Net value added comprises two components: salaries
and wages and social surplus. Social surplus is the
portion of value added that is directed and distributed through
taxes to the treasury; dividends to shareholders; interest
on borrowed capital to financial institutions; rent; or
allocations for the expansion, reserves, and social welfare-
funds of individual firms. Distortions in domestic prices
are removed in economic analysis by using international
equivalent prices - border prices - for traded goods
and services and shadow prices for non-traded goods
and services. These provide an absolute efficiency test
and then relative efficiency tests are used to rank
alternative projects under constraints of capital, foreign
exchange, and skilled labor. The value added by a project
is measured against the efficient use of the scarce
production factor.
21.5.1 Shadow Prices
In a perfect market, the shadow price for any resource
would be its market price; in the real world, market
imperfections - caused, for example, by tariffs, quotas,
and monopolies - distort prices so that true economic^
values are not represented by market prices. The
estimation of border prices and shadow prices attempts to
remove these distortions. A central issue in economic
pricing is tradability of goods and services. The major
categories related to tradability are as follows:
Tradable: A good that would be imported or
exported in the absence of trade barriers,
Traded: A good that is actually traded.
Non-tradable: A good whose real domestic cost of
production together with its international
transport cost is too high to permit export and
too low to make import attractive.
Non-traded: A tradable that is not traded because of
the trade policies of the country but could
be traded if the policies changed,
These definitions apply equally to services. How these
categories impact on the valuation of shadow prices is
discussed fully in the UN1D0 Guidelines and
summarized below [2],
A Guide to Shadow and Border Pricing
Type of Good or Service
Type of Goods
Input
Type of Impact
Output
Valuation
Domestic (nontraded)
Production (supply)
Consumption (demand)
More from local
producers
Less to other local
users
Less by other local
producers
More to other local
users
Cost of production
Value to consumer
Foreign (traded)
Exports (supply)
Imports (demand)
Less export
More import
More export
Less import
Value of export( f.o.b.
Cost of Import (c.i.f.).
584
Examples of non-tradables include electricity, water,
maintenance cost, transportation, communications,
buildings and land, and local services such as insurance,
advertising, and legal services, Conversion factors are
often used to convert domestic market prices of a non-
tradable good into an economic border-equivalent
shadow price. The standard conversion factor (SCR is
an average ratio of border to domestic market prices. In
its simplest form it is the ratio of the two versions of a
country's foreign trade turnover: one exclusive of
import/export taxes and the other inclusive. Local market
prices of non-tradables are multiplied by the SCF to
produce an estimate of a good's border price on the world
market.
The calculation of border prices for traded goods
usually includes an adjustment to take account of domestic
transportation to a project or to the project's primary
market. For exports, the f.o.b. price is the total cost
expended to produce, transport to the border, and
prepare for transportation outside the country of origin.
For imports, the c.i.f. price is the landed cost of an
import including insurance but net of any additional
domestic tariffs or other taxes and fees. It should also be
adjusted for internal transport costs or savings from the
port of entry to the market if these costs are
significantly different from domestic factory-to-market costs,
and it may also be adjusted for additional inventory cost
required to cover delays or lumpiness in supply
compared to domestic shipments _______ _______
Labor and land costs are also subject to adjustment
although they are unlikely to impact greatly on fertilizer
projects. The principles of shadow pricing used for goods
apply equally to labor. A project has impacts on the rest
of the economy when it hires labor. A project may take
labor away from other users, it may stimulate the
emergence of new workers, or it may cause the importation
of workers. For the first type of impact the shadow price
of labor is the willingness of other users to pay for this
labor. The second type of impact is important in four
areas:
Employment of previously unemployed workers
Improved productivity of underemployed workers
Urban employment of rural workers
Skilled employment of previously unskilled workers
Unemployed workers can be considered to have a
minimum reservation wage rate equivalent to the value of 3
kilograms of grain per day; often, however, there are
other factors to take into account, such as existing
income from transfer payments, that increase the shadow
price of unskilled unemployed workers. The cost of
transforming an underemployed worker is the value of what
he may have produced in his former employment plus
the reservation wage. The cost of transforming a rural
worker to an urban worker is the social cost of
migration, which usually includes the cost of migration of
additional family members. The social service costs of the
migrants associated with producing an additional man-
year of labor in an urban area need to be accounted for
in the shadow price of labor for this circumstance. The
cost of transforming an unskilled worker into a skilled
worker is the cost of training, and this is usually accounted
for in project costs. The importation of skilled labor when
a project requires skilled managers, _echnicians_and_worlt-
ers not available domestically leads to shadow prices
equivalent to the wages they command. For further
discussion on the shadow pricing of labor, readers are
referred to [5] and [3].
The shadow price of foreign exchange needs to be
applied when foreign exchange is deemed to be more
valuable than indicated by the official exchange rate.
The shadow price is applied only to those goods that
were valued at border prices, since inputs and outputs
shadow priced with reference to domestic consumer
willingness to pay or cost of production already
implicitly include a premium on foreign exchange. Border-
priced shadow prices generally include all major inputs
and outputs and any major non-traded inputs with a
substantial foreign exchange component, For the
determination of foreign exchange shadow prices, see [5].
Where a parallel foreign exchange market exists in a
country, the market rate can often be considered to be
the shadow exchange rate.
The adjustments illustrated in Schedule 11 to market
prices afforded by shadow pricing enable the economic
net present value and economic internal rate of return to
be calculated from the adjusted financial analysis. This
completes the first stage of economic acceptability analysis.
21.5.2 Distribution Impact
As stated previously, the net value added is a simple
proxy for national welfare and comprises salaries and
wages and social surplus. The distribution of the net value
added should be considered as the gains and losses of
individual groups within society. These can be assumed
to be equal to the differences between shadow and
market payments to each input or output in the case of
physical resources or the distortion between price paid
and value received in the case of financial transactions.
Each gain is offset by an equal loss, For example, when
a project pays workers a market rate that is higher than
the economic rate the workers have a gain equal to the
project loss. The groups over which the distribution
income is measured.can be aggregated or disaggregated
to variable levels. UNIDO has suggested the following
groups as being a reasonable compromise [2]:
585
Project
Other private business
Government
Workers
Consumers
External sector
For each group, the data required for the income-flow
analysis derive from the adjustments made to move from
market prices to shadow prices including exchange rate
adjustments. The losses and gains for each group are
summed to provide a net impact as shown in Schedule
12,
Further economic analysis dealing with the savings
impact and income redistribution are beyond the scope
of this outline.
21.6 Use of Computers for
Financial and Economic Analysis
Today, process simulation/project
evaluation/financial evaluation software is available that can be applied
to a wide variety of projects in the chemical and
petroleum industries. The most sophisticated evaluation
systems contain built-in design systems, scheduling systems,
and up-to-date knowledge bases of international cost
and work-"hdur models."Software can work frorh~lTbrief~
outline of a project's scope and automatically develop
design details in the early stages of a project. Software
packages available can produce detailed cost estimates
within -5% to +14% of actual cost [6].
However, at present, there is no single software
package that can (1) design the process system, (2) develop
and evaluate project scope, and (3) develop the
financial and economic analysis. Therefore it is common for
several software programs to be used to develop and
evaluate the same project.
Since 1982, UNIDO has developed COMFAR1 from
a model for financial analysis at the enterprise level into
a complex system for financial and economic analysis
of investment projects for use on personal computers. It
features guiding the user through the data entry system
by requesting exactly the input required for the
computation of the system output as predefined by the user-
assisting with the analysis by allowing a comparison with
key data from similar investment projects; making en-
1. The UNIDO Computer Model for Feasibility Analysis
and Reporting. User licenses may be obtained from the
UNIDO Department of Industrial Operations, Feasibility
Studies Branch.
tries in different currencies; and preparing economic cost-
benefit analysis following different methodologies.
Use of spreadsheets is common and can be an
effective way to evaluate information quickly and efficiently.
Most spreadsheets have sophisticated financial functions;
thus, in the hands of a skilled analyst, a spreadsheet can
be an invaluable tool. Spreadsheets provide a high
degree of flexibility, contain a large number of valuable
time-saving functions, and can be used to organize and
evaluate large quantities of data quickly. However, there
are hazards in using spreadsheets. Common problems
include improper setup of problems, defective functions,"
misunderstood functions, functions based on improper
inputs, improper cross-referencing, and difficulty in
interpreting the design approach used in another's spreadsheet.
Due to these kinds of problems, many spreadsheets
have undetected errors. It is therefore important that
spreadsheets used for sensitive tasks be well documented
and reviewed. Spreadsheet users should incorporate
checks and balances within spreadsheets to ensure that
errors in design are eliminated.
21.7 Guidelines for Achieving
Well-Established Projects
The most important factors in achieving
well-established projects are having clear objectives, a defined
_scope7^rfd~a~weII:;defined; 'systematic methodology for
information collection and financial and economic analysis.
Objectives should be based on well-defined business
strategies with regard to all aspects of marketing,
production and supplies, financing, personnel, and
management and organization.
The scope of the project must be clearly understood
in order to prepare reliable forecasts on investment,
production, and marketing costs.
A systematic methodology is required to allow
decisionmakers to compare alternative projects. The
UNIDO Guidelines provide checklists and schedules for
each stage in opportunity, prefeasibility, and feasibility
studies. These are summarized in the following sections,
with examples of the main schedules required for
financial analysis. ■
21.7.1 Feasibility Study
Having established the first two requirements, i.e.,
objectives and scope, the steps in a feasibility study are
as follows:
1, Conduct market analysis and determine marketing
concept, including demand and sales forecasts,
competitor analysis, life cycle, marketing strategies,
marketing costs, and prices received.
586
2. Determine availability and cost of raw materials and
supplies.
3. Justify location site and environmental considerations
and costs related to site.
4. Consider engineering and technology related to
production program and capacity (determined by the
sales forecasts). Justify selected technology; quantify
equipment requirements and costs.
5. Identify organization and management required and
overhead costs,
6. Identify human resources required, skills, and costs.
7. Prepare a project implementation schedule and
identify critical actions for timely implementation.
8. Prepare the financial analysis arid investment
appraisal.
9. Prepare the economic analysis, if required.
21.7.2 Schedules for Financial Analysis
All schedules prepared for a financial analysis should
show both local and foreign costs and revenues with the
foreign components converted to local currency at the
chosen exchange rate.
Marketing: (1) Prepare a schedule of the
projected sales program including, for
both local and export markets,
- sales units,--prices","and"total"Tev=^
enues for each year.
(2) Prepare a schedule of projected
fixed and variable marketing costs,
Raw Materials: (1)
Site:
Engineering:
Prepare a schedule of projected
costs of raw materials and supplies
by year including variable and fixed
cost components per unit and units
consumed.
(1) Prepare a schedule of site
investment costs and environmental
investment costs.
(2) Prepare a schedule of site and
environmental annual operating
costs.
(1) Prepare a schedule of technology
costs either as lump sum payments
or royalties related to operating
costs or sales revenues.
(2) Prepare a schedule of plant
machinery and equipment investment
costs.
(3) Prepare a schedule of civil
engineering works investment costs
Manpower: (1)
Overheads: (1)
Prepare a manning table and a
schedule of operating labor
costs, maintenance labor costs,
and administration, marketing,
and management staff costs,
separating wages and salaries
from social overhead costs.
Prepare estimates of overhead
costs including site overheads,
administration overheads, a
depreciation schedule, and
financing cost overheads.
Prepare a production cost
schedule for each product.
Prepare a working capital
schedule derived from sales and
production cost schedules,
Summarize fixed and working
capital investment as shown in
schedule 1.
Summarize annual costs of
products sold as shown in
schedule 2.
Prepare a schedule of sources
of finance as shown in schedule
3.
-Prepare a schedule of total
financial flow as shown in
schedule 4,
Prepare a total debt service
schedule as shown in schedule 5.
Prepare a projected net income
statement as shown in schedule
6.
Prepare a projected balance
sheet as shown in schedule 7
Prepare a cash flow for
financial planning as shown in
schedule 8.
(9) Prepare a discounted cash flow
schedule for total capital invested
as shown in schedule 9.
(10) Prepare a schedule of
discounted return on equity
investment as shown in schedule 10.
The projections and math are only a small part of
project appraisal. An adequate understanding of any
project requires that all the information and data used
be subjected to critical evaluation so that the appraiser
is aware of the strengths and weaknesses of the inputs
to the analysis.
Production Costs: (1)
Working Capital: (1)
Financial Analysis: (1)
(2)
(3)
_ (4)-
(5)
(6)
(7)
(8)
587
Schedule 1 - Total Investment Cost
Investment Category
1. Total fixed investment
2. Total pre-production
Net of interest
Interest accrued
3. Total net working capital
Total Investment Cost
Foreign share, %
Total During Total During
Construction Production
264.33
38.36
22.47
16.83
341.98
40.00%
Construction Production
1 2 3
158.60
23.02
5.34
186.95
105.73
15.34
17,13
3.37 13,46
141,57
Assumptions
l,lt000-tpd ammonia/1,750-tpd urea plant; new site; developing location; Type I.
2. Operating 330 days per year.
3. Annual production 577,500 tonnes.
4. 90% capacity in year 1 all subsequent years 100% capacity.
5. Sales price $180.00/tonne.
6. Natural gas price $4.00/GcaL ™ ——-
7. Working capital based on: (a) finished product inventory 30 days.
(b) work in progress inventory 1 day.
(c) factory supplies inventory 45 days.
(d) catalysts and additives inventory 90 days.
(e) accounts receivable 45 days.
(f) accounts payable 30 days,
588
Schedule 2 - Annual Costs of Products Sold
Units Quantity $/unit $/tonne 1
Production Years ($ Millions)
6 7 8 9 10
11
12
13
14
15
Process gas
Combustion gas
Catalysts and additives
Inert gas
Boiier water
Cooling water
Electricity
Effluent treatment
Operating supplies
Gcais
Gcais
$A
$/t
m3/t
m3/t
kWh
$A
$/t
2.96
1.10
0.64
121.80 ,
150.00
4.00
4.00
3.24
0.02
0.20
0.02
0.05
0.15
0.16
11.83
4.41
3.24
0.02
0.13
2.44
7.50
0.15
0.16
5.28
1.97
1.45
0.01
0.06
1.09
3.35
0.07
0.07
5.86
2.18
1.60
0.01
0.06
1.21
3.71
0.07
0.08
5.86
2.18
1.60
0.01
0.061
1.21;
3.71!
0.07
0.08
5.86
2.18
1.60
0.01
0.06
1.21
3.71
0.07
0.08
5.86
2.18
1.60
0.01
0.06
1.21
3.71
0.07
0.08
5.86
2.18
1.60
0.01
0.06
1.21
3.71
0.07
0.08
5.86
2.18
1.60
0.01
0.06
1.21
3.71
0.07
0.08
5.86
2.18
1.60
0.01
0.06
1.21
3.71
0.07
0.08
5.86
2.18
1.60
0.01
0.06
1.21
3.71
0.07
0.08
5.86
2.18
1.60
0.01
0.06
1.21
3.71
0.07
0.08
5.86
2.18
1.60
0.01
0.06
1.21
3.71
0.07
0.08
5.86
2.18
1.60
0.01
0.06
1.21
3.71
0.07
0.08
5.86
2.18
1.60
0.01
0.06
1.21
3.71
0.07
0.08
5.86
2.18
1.60
0.01
0.06
1.21
3.71
0.07
0.08
5.86
2.18
1.60
0.01
0.06
1.21
3.71
0.07
0.08
Total Variable Costs
29.87 13.32 14.79 14.79 14.79 14.79 14.79 14.79 14.79 14.79 14.79 14.79 14.79 14.79 14.79 14.79
CJ1
Direct labor
Indirect labor
Maintenance
Depreciation
Insurance and taxes
Marketing costs
Plant overheads
Total Direct Costs
workhrs/tonne
workhrs/tonne
Total Production Cost
0.30
0.30
10.00
10.00
13.47
40.81
8.16
0.71
3.00
3.00
3.00
13.47
40.81
8.16
0.71.
3.00
72.15
102.02
1.49
1.49
6.67
20.20
4.04
0.35
1.49
35.71
49.04
1.49
1.49
6.67
20.20
4.04
0.35
1.49
35.71
50.50
1.49
1.49
6.67
20.20
4.04
0.35
1.49
35.71
50.50
1.49
1.49
6.67
20.20
4.04
0.35
1.49
35.71
50.50
1.49
1.49
6.67
20.20
4.04
0.35
1.49
35.71
50.50
1.49
1.49
6.67
20.20
4.04
0.35
1.49
35.71
50.50
1.49
1.49
6.67
20.20
4.04
0.35
1.49
35.71
50.50
1.49
1.49
6.67
20.20
4.04
0.35
1.49
35.71
50.50
1.49
1.49
6.67
20.20
4.04
0.35
1.49
35.71
50.50
1.49
1.49
6.67
20.20
4.04
0.35
1.49
35.71
50.50
1.49
1.49
6.67
20.20
4.04
0.35
1.49
35.71
50.50
1.49
1.49
6.67
20.20
4.04
0.35
1.49
35.71
50.50
1.49
1.49
6.67
20.20
4.04
0.35
1.49
35.71
50.50
1.49
1.49
6.67
20.20
4.04
0.35
1.49
35.71
50.50
1.49
1.49
6.67
1.79
4.04
0.35
1.49
17-30
32.09
Depreciation based on (a) straight line over 15 years for battery limits investment,
(b) straight line over 22 years for off-sites investment.
Schedule 3 - Sources of Finance
Yearl Year 2 Year 3 Total
Terms
Equity Capital
1. Equity local investor
2. Equity foreign investor
50.10
24.68
37.94
18.69
'88.04 First Payment yearl as lump sum, 12% dividend yield
'43.37 First Payment yearl as lump sum, 12% dividend yield
o
Loan Capital
1. Equipment suppliers credit
2. Local loan
3. Bank overdraft
Total
70.00
42.45
70.00
14.94
0
5.5
140.00 Repayment starting in year 3, 10% annual interest,10 year amortization
57.40 Repayment starting in year 3, 10% annual interest, 10 year amortization
5.5 Repayment starting in year 5, 15% annual interest, 5 year amortization
186.95 141.57 5,50 334.03
Schedule 4 - Total Financial Flow
Sources
Equity Capital Local
Equity Capital Foreign
Equipment Suppliers Credit
Commercial Banks
Bank Overdraft
Accounts Payable
Total Financial Flow
Construction
1 2
Total Disbursement
50.10
24.68
70.00
42.45
187.23
37.95
18.69
70.00
14.94
0.00
0.73
142.31
3
5.50
0.73
6.23
4
0.73
0.73
5
0.73
0.73
Production
9 10 11
12
13
14
15
16
17
0.73 0.73 0.73 0.73 0.73 0.73 0.73 0.73 0.73 0.73 0.73 0.73
0.73 0.73 0.73 0.73 0.73 0.73 0.73 0.73 0.73 0.73 0.73 0.73
J
Schedule 5 - Total Debt Service
Construction
1 2
Production
9 10 11
12
13
14
15
16
17
to
Long Term Loan
Disbursements
Repayments
Debt balance at end of year
Interest payable
Equipment Suppliers Credit
Disbursements
Repayments
Debt balance at end of year
Interest payable
Short Term Loans
Bank overdraft
Disbursements
Repayments
Debt balance at end of year
Interest payable
Reduction in accounts payable
Total Debt Service
Disbursements
Repayments
Debt balance at end of year
Interest payable
42.45 14.94
42.45
2.12
70.00
70.00
3.50
57.39
5.42
70.00
140.00
10.5
5,74
51.65
6.03
14
126
9.8
5.74
45.91
5.39
14
112
11-9
5.74
40.17
4.76
14
98
10.5
5.74
34.43
4.13
14
^4
9jl
5.74
28.70
3.50
14
70
7.7
5.74
22.96
2.87
14
56
6.3
5.74
17.22
2.24
14
42
4.9
5.74
11.48
1.61
14
28
3.5
5.74
5.74
0.98
14
14
2.1
5.74
0.00
0.34
14
0
0.7
0.00
0.00
0.00
5.5
5.5
0.41
0.00
5.50'
0.83
0
112.45 84.94 5.50 0.00
0.00 0.00 19.74 19.74
112.45 197.39 183.15 163.41
5.62 15.92 16.24 18.12
1.38
4.13
0.72
0
0.00
21.11
142.30
15.99
1.38
2.75
0.52
0
1.38 1.38
1.38 0.00
0.31 0.10
0 0
0.00 0.00
21.11 21.11
121.18 100.07
13.75 11.51
0.00
21.11
78.96
9.27
0.00
19.74
59,22
7,14
0.00
19.74
39.48
5.11
0.00
19.74
19.74
3.08
0.00
19.74
0.00
1.04
0.00
0.00
0.00
0.00
0.00
0.00
0.00
0.00
0.00
0.00
0.00
0.00
0.00 0.00
0.00 0.00
0.00 0.00
0.00 0.00
Schedule 6 - Projected Net Income Statement
Production
7 8 9
10
11
12
13
14.
15
Sales Revenue
Interest on securities
Other income
Total Income
Less Variable Costs
Material
Personnel
Marketing
Other
Total Variable Costs
Variable Margin
On % of total income)
Less Fixed Costs
Material
Personnel
Marketing
Depreciation
Other Fixed Costs
Total Fixed Costs
Operational Margin
(In % of total Income)
Less Costs of Finance
Gross Profit
Less Allowances
Taxable Profit
Tax
Net Profit
Dividends Payable
Retained Profit
Ratios
Gross Profit/Sales
Net Profit After Tax/Sales
Net Profit/Equity Capital
Net Profit + tnteiest/Investment
93.56
0.00
0.00
93.56
13.32
0.09
13.42
80.14
86%
6.67
2,97
0.26
20.20
5.53
35.62
44.52
48%
16.24
28.28
28.28
8.48
19.79
13.50
6.29
30%
15%
11%
103.95
0.00
0.00
103.95
14.79
0.10
14.89
89.06
86%
6.67
2.97
0.26
20.20
5.53
35.62
53.44
51%
18.12
35.32
35.32
10.60
24.72
15.77
8.95
34%
19%
13%
103.95
0.00
0.00
103.95
14.79
0.10
14.89
89.06
86%
6.67
2.97
0.26
20.20
5.53
35.62
53.44
51%
15.99
37.45
37.45
11.24
26.21
15.77
10.44
36%
20%
13%
103,95
0,00
0.00
103.95
14.79
0.10
14.89
89.06
86%
6.67
2.97
0.26
20.20
5.53
35.62
53.44
51%
13.75
39.69
39.69
11.91
27.78
15.77
12.01
38%
21%
13%
103.95
0.00
0.00
103.95
14.79
0.10
14.89
89.06
86%
6.67
2.97
0.26
20.20
5.53
35.62
53.44
51%
11.51
41.93
41.93
12.58
29.35
15.77
13.58
40%
22%
13%
103.95
O.00
0.00
103.95
14.79
0.10
14.89
89.06
86%
6.67
2.97
0.26
20.20
5.53
35.62
53.44
51%
9.27
44.17
44.17
13.25
30.91
15.77
15.14
42%
24%
13%
103.95
0.00
0.00
103.95
14.79
0.10
14.89
89.06
86%
6.67
2.97
0.26
20.20
5.53
35.62
53.44
51%
7.14
46.30
46.30'
13.89
32.41
15.77
16.64
45%
25%
12%
103.95
0.00
0.00
103.95
14.79
0.10
14.89
89.06
86%
6.67
2.97
0.26
20.20
5.53
35.62
53.44
51%
5.11
48.33
48.33
14.50
33.83
15.77
18.06
46%
26%
12%
103.95
0.00
0.00
103.95
14.79
0.10
14.89
89.06
86%
6.67
2.97
0.26
20.20
5.53
35.62
53.44
51%
3.08
50.36
50.36
15.11
35.25
15.77
19.48
48%
27%
12%
103.95
0.00
0.00
103.95
14.79
1
0.-10
14.89:
89.06
86%
6.67
2.97
0.26
20.20
5.53
35.62
53.44
51%
1.04
52.39
52.39
15.72
36.67
15.77
20.90
50%
28%
12%
103.95
0.00
0.00
103.95
14.79
0.10
14.89
89.06
86%
6.67
2.97
0.26
20.20
5.53
35.62
53.44
51%
0.00
53.44
53.44
16.03
37.40
15.77
21.63
51%
28%
12%
103.95
0.00
0.00
103.95
14.79
0.10
14.89
89.06
86%
6.67
2.97
0.26
20.20
5.53
35.62
53.44
51%
0.00
53.44
53.44
16.03
37.40
15.77
21.63
51%
28%
12%
103.95
0.00
0.00
103.95
14.79
0.10
14.89
89.06
86%
6.67
2.97
0.26
20.20
5.53
35.62
53,44
51%
0.00
53.44
53.44
16.03
37.40
15.77
21.63
51%
28%
12%
103.95
0.00
0.00
103.95
14.79
0.10
14.89
89.06
86%
6.67
2.97
0.26
20.20
5.53
35.62
53.44
51%
0.00
53.44
53.44
16.03
37.40
15.77
21.63
51%
28%
12%
103.95
O.OO
0.00
103.95
14.79
0.10
14.89
89.06
86%
6.67
2.97
0.26
1.79
5.53
17.21
71.85
69%
0.00
71.85
71.85
21.56
50.29
15.77
34.52
69%
38%
16%
Schedule 7 - Projected Balance Sheet
Total Current Assets
Inventory on materials and supplies
Work in progress
Finished products in stock
Accounts receivable
Cash in liand
Cash surplus
Securities
Total Current Assets
Construction
1
0.00
0.00
2
0.45
0.11
3.18
0.00
0.37
1.22
5.32
3
0.45
0.11
3.18
11.53
0.95
1.36
17.58
4
0.45
0.11
3.18
12.82
1.01
9-43
26.99
5
0,45
0.11
3.18
12.82
1.01
18,96
36.52
6
0.45
0.11
3.is
12.^2
1.01
30.05
47.61
7
0.45
0.11
3.18
12.82
1.01
42.71
60.27
8
0.45
0.11
3.18
12.82
1.01
56.94
74,50
Production
9
0.45
0.11
3.18
12.82
1,01
74.04
91.60
10
0.45
0.11
3.18
12.82
1.01
92.56
110.12
11
0.45
0.11
3.18
12.82
1.01
112.50
130.06
12
0.45
0.11
3.18
12.82
1.01
133.86
151.42
13
0.45
0.11
3.18
12.82
1.01
175.69
193.25
14
0.45
0.11
3.18
12.82
1.01
217.53
235.09
15
0.45
0.11
3.18
12.82
1.01
259.36
276.92
16
0.45
0.11
3.18
12.82
1.01
301.19
318,75
17
0.45
0.11
3.18
12.82
1,01
337.50
355.06
U1
Fixed investment
Construction in progress
Pre-produclion expenditures
Less accumulated depreciation
Net Fixed Assets
Accumulated losses brought forward
Loss in current year
Total Assets
Current Liabilities
Accounts payable
Bank overdraft
Total Current Liabilities
158.60 264,33 264.33 264.33 264.33 264,33 264,33 264,33 264.33 264.33 264,33 264,33 264.33 264.33 264.33 264,33
158.60 105.73 [
28.64 59.90 59.90 59.90 59.90 59.90 59.90 59.90 59.90 59.90 59.90 59.90 59.90 59.90 59.90 59.90 59.90
20.20 40.40 60.60 80.80 101.00 121.20 141.40 161.60 181.80 202.00 222.20 242.40 262.60 282.80 284.59
187.23 324,22 304.02 283.82 263.62 243.42 223.22 203.02 182.82 162.62 142.42 122.22 102.02 81.82 61.62 41.42 39.64
187.23 329.55 321.60 310.81 300.14 291.04 283.50 277.52 274,42 272.74 272.48 273.64 295.28 316.91 338.54 360.18 394,70
0.73
0.00
0.00 0.73
0.73
5.50
6.23
0.73
5.50
6.23
0.73
4.13
4.86
0.73
2.75
3.48
0.73
1.38
2.11
0.73
0.00
0.73
0.73
0.00
0.73
0.73
0.00
0.73
0.73
0.00
0.73
0.73
0.00
0.73
0.73
0.00
0.73
0.73
0.00
0.73
0.73
0.00
0.73
0.73 0.73
0.00 0.00
0.73 0.73
Total long-term debt 42.45
Suppliers credit 70.00
Total equity capital 74.78
Reserves, retained profit brought forward
Dividends payable
Retained profit
Net profit after tax
Total Liabilities
57.39
140.00
131.42
51.65
126.00
131.42
0.00
13.50
6.29
19.79
45.91
112.00
131.42
6.29
15,77
8.95
24.72
40.17
98.00
131.42
15.24
15.77
10.44
26.21
34,43
84.00
131.42
25.69
15.77
12.01
27-78
28.70
70.00
131.42
37.70
15.77
13.58
29.35
22.96
56.00
131.42
51.27
15.77
15.14
30.91
17.22
42.00
131.42
66.41
15.77
16.64
32.41
11.48
28.00
131.42
83.05
15.77
18.06
33.83
5.74
14.00
131.42
101.11
15.77
19.48
35.25
0.00
0.00
131.42
120.59
15.77
20.90
36.67
0.00
0.00
131.42
141.49
15.77
21.63
37.40
0.00
0.00
131.42
163,12
15.77
21.63
37.40
0.00
0.00
131.42
184.75
15.77
21.63
37.40
0.00
0.00
131.42
206.39
15.77
21.63
37.40
0.00
0.00
131.42
228.02
15.77
34.52
50.29
187.23 329.55 321.60 310,81 300.14 291.03 283.50 277.52 274.42 272.74 272.48 273.64 295.27 316.91 338.54 360.17 394.69
Check
Ratios
Equity/total liabilities
Long-term debt/net worth
Current assets/current liabilities
0 0.00 0.00 0.00 0.00 0.00 0.00 0.00 0.00 0.00 0.00 0.00 0.00 0.00' 0.01 0.01
40% 41% 42% 44% 45% 46% 47% 48% 48% 48% 48% 4E
1.50 1.50 1.35 1.15 0.94 0.75 0.58 0.43 0.30 0.18 0.08 0.00 0.00 0.00 0.00 0.00 0.00
2.32 4.33 7.52 13.68 28.62 101.94 125.34 150.68 177.97 207.20 264.44 321.68 378.93 436.17 485.85
41% 39% 36% 33%
Schedule 8 - Cash Flow for Financial Planning
Construction
1 2
Production
10 11
12
13
14
15
16
17
1. Inflow Funds
Total Equity
Total Long-Term Loans
Total Short-Term Finance
Total Funds Inflow
74.78 56.64
112.45 84.94
0.73 5.50
187.23 142.31 5.50
2. Inflow Operations
Sales Revenue
Interest on Securities
Other Income
Total Cash Inflow
Increase in Fixed Assets
- Fixed Investments
- Preproduction Expenses
Increase in Current Assets
Operating Costs
Marketing Costs
Corporate Tax Paid
Interest Paid
Loan Repayments
Dividends Paid
Total Cash Outflow
Surplus (Deficit)
Cumulative Cash Balance
93.56 103.95 103.95 103.95 103.95 103.95 103.95 103.95 103.95 103.95 103.95 103.95 103.95 103.95 103.95
187.23
158.60
23.02
5.62
187.23
0.00
0.00
142.31
105.73
15.34
4.10
15.92
141.09
1.22
1.22
99.06
12.11
28.48
0.35
8.48
16.24
19.74
13.50
98.91
0.14
1.36
103.95
1.35
29.95
0.35
10.60
18.12
19.74
15.77
95.88
8.07
9.44
103.95
0.00
29.95
0.35
11.24
15.99
21.11
15.77
94.41
9.54
18.98
103.95
o.do
29.^
5
0.3J5
11.91
13.75
21.ill
1
15.77
92.84
ll.ljl
30.08
103.95
0.00
29.95
0.35
12.58
11.51
21.11
15.77
91.28
12.67
42.75
103.95
0.00
29.95
0.35
13.25
9.27
21.11
15.77
89.71
14.24
56.99
103.95
0.00
29.95
0.35
13.89
7.14
19.74
15.77
86.84
17.11
74.10
103.95
0.00
29.95
0.35
14.50
5.11
19.74
15.77
85.42
18.53
92.63
103.95
0.00
29.95
0.35
15.11
3.08
19.74
15.77
84.00
19.95
112.58
103.95
0.00
29.95
0.35
15.72
1.04
19.74
15.77
82.58
21.37
133.95
103.95
0.00
29.95
0.35
16.03
0.00
0.00
15.77
62.11
41.84
175.79
103.95
0.00
29.95
0.35
16.03
0.00
0.00
15.77
62.11
41.84
217.64
103.95
0.00
29.95
• 0.35
16.03
0.00
0.00
15.77
62.11
41.84
259.48
103.95
0.00
29.95
0.35
16.03
0.00
0.00
15.77
62.11
41.84
301.32
103.95
0.00
29.95
0.35
21.56
0.00
0.00
15.77
67.63
36.32
337.64
Schedule 9 - Discounted Cash Flow Total Capital Invested
Construction
1 2
Prcxiuction
9 10
11
12
13
14
15
16
17
18
cr.
Sales Revenue
Interest on Securities
Other Income (Release of Working Capital)
93.56 103,95 103.95 103.95 ' 103.95 103.95 103.95 103.95 103.95 103.95 103.95 103.95 103.95 103.95 103.95
16.83
Total Cash Inflow
Increase in Fixed Assets
Fixed Investments
Prep reduction Expenses
Increase in net Working Capital
Operating Costs
Marketing Costs
Corporate Tax Paid
Total Cash Outflow
Net Cash Flow
Cumulative Net Cash Flow
Net Present Value @15%
Cummulative Net Present Value
NET PRESENT VALUE 9 15%
INTERNAL RATE OF RETURN
158.60
23.02
181.61
-181.61
-181.61
-181.61
-181.61
5.34
15.33%
105.73
15.34
3.37
124.45
-124.45
-306.06
-108.22
-289.83
93.56
12.11
28.48
0.35
8.48
49.43
44.12
-261.94
33.36
-256.47
103.95
1.35
29.95
0.35
10.60
42.25
61.70
-200.23
40.57
-215.90
103.95
0.00
29.95
0.35
11.24
41.54
62.41
-137.82
35.69
-130.21
103.95
0.00
29.95
0.35
11.91
42.21
61.74
-76.08
30.70
-149.52
103.95
0.00
29.95
0.35
12.58
42.88
61.07
-15.02
26.40
-123.12
103.95
0.00
29.95
0.35
13.25
43.55
60.40
45.38
22.70
-100.41
103.95
0.00
29.95
0.35
13,89
44.19
59,76
105.13
19.53
-80.88
103.95
0.00
29.95
0.35
14.50
44.80
59.15
164.28
16.82
-64.07
103.95
0.00
29.95
0.35
15.11
45.41
58.54
222.82
14.47
-49.60
103.95
0.00
29.95
0.35
15.72
46.02
57.93
280.74
12.45
-37.15
103.95
0.00
29.95.
0.35
16.03
46.34
57.61
338.36
10.77
-26.38
103.95
0.00
29.95
0.35
16.03
46.34
57.61
395.97
9.36
-17.02
103.95
0.00
29.95
0.35
16.03
46.34
57.61
453.58
8.14
-8.88
103.95
0.00
29.95
0.35
16.03
46.34
57.61
511.20
7.08
-1.80
103.95
0.00
29.95
0.35
21.56
51.86
52.09
563.29
5.57
3.77
16.83
0.00
16.83
580.12
1.56
5.34
Schedule 10 - Discounted Return On Equity Capital Invested
Cash Surplus (Deficit)
Dividends Paid
TOTAL CASH INFLOW
Equity Capifa] Paid
NET CASH RETUHN
Cumrroiative Net Cash Return
Net Present Value @ 15%
Cummulative Net Present Value
NET PRESENT VALUE @ 15%
INTERNAL RATE OF RETUHN ON EQUITY
Conal ruction
I
0.00
0
0.00
71.78
-74.78
-74.78
-74.78
-74.78
34.23
18.84%
2
1.22
0
1.22
56.64
-55.42
-130.206
-48.20
-122.979
3
0.14
13.5
13.64
0
13.64
-116.56
10,32
-112.66
4
3.07
15.7708
23.85
0
23.85
-92.72
15.68
-96.98
5
9.54
15.7708
25.31
0
25.31
-67.41
14.47
-82.51
6
11.11
15.7708
26.88
0
26.88
-40,53
13.36
-69.15
7
12,67
15.7703
28.44
0
28.44
-12.09
12.30
-56.85
3
14.24
15.7703
30.01
0
30,01
17.92
11.28
-45.57
Production
9
17.11
15.7703
32.88
0
32,88
50,80
10.75
-34.82
10
18.53
15,7708
34.30
0
34,30
85.10
9,75
-25.07
11
19.95
15.7708
35.72
0
35.72
120,82
8.83
-16,24
12
21.37
15.7708
37.14
0
37.14
157.96
7.98
-8.26
13
41,84
15.7703
57.61
0
57.61
215.58
10.77
2.51
14
41.84
15.7703
57,61
0
57.61
273.19
9.36
11.87
15
41.84
15.7708
57.61
0
57.61
330.81
8.14
20,01
16
41.34
15.7708
57.61
0
57.61
388.42
7.08
27,09
17
36.32
15.7708
52.09
0
52.09
440.51
5.57
32,66
■ 18
0.00
0
0.00
0
16.83
457.34
1,56
34,22
Schedule 11 - Adjustment to Cash Flow for Economic Analysis
Financial Economic Economic Exchange Rate Adjustment Exchange Net Project
Item
Net Cash Flow-Real
Operating Sources of Funds
Operating Profit
- Sales Value
- Costs
- Imported Materials
- Domestic Materials
- Operating Expenses
- Unskilled labor
Operating Use of Funds
- Current Assets
- Inventories
- Fixed Assets
- Land and Buildings
- Equipment
Net Cash Flow-Financial
Sources-Equity
Uses-Interest
- Taxes
- Dividends
NPV
©15%
$M
5.34
456.40
522.26
0.41
73.67
0.76
12.98
91.94
13.34
124.03
72.86
64.07
90.24
Price Adjusted
Adjustment
%
-20%
-20%
-15%
-50%
-20%
-10%
-10%
35%
-100%
-100%
NPV
©15%
$M
-115.96
-129.08
-104.45'
-0.08
-11.05
-0.38
-2.60
-9.19
-1.33
25.50
-64.07
. -90.24
Content
%
100%
100%
30%
0%
55%
0%
60%
39%
70%
0%
39%
Premium
%
10%
10%
10%
10%
10%
10%
10%
10%
10%
10%
10%
10%
10%
Weighted
Premium
%
10%
10%
3%
0%
6%
0%
6%
4%
7%
0%
4%
Rate
NPV
©15%
$M
54.48
55.99
52.23
0.04
2.21
0.00
0.71
0.00
0.80
4.84
5.10
0.00
3.52
Adjustment
$M
-56.14
383.31
52.23
-0.04
-8.84
-0.38
-1.88
-9.19
-0.53
4.84
30.60
-64.07
-86.72
Notes-.
1. Economic price adjustments used are hypothetical but typical.
2. Exchange rate adjustments based on a 10% over-valued exchange rate.
Schedule 12 - Income Flow Analysis
Item
Project Other Private
Adjustment Business Government Workers Consumers
Externa]
Net Cash Flow-Real
Operating Sources of Funds
Operating Profit
Sales Value
Costs
Imported Materials
Domestic Materials
Operating Expenses
Unskilled Labor
Operating Use of Funds
Current Assets
Inventories
Fixed Assets
Land and Buildings
Equipment
Net Cash Flow-Financial
Sources—Equity
Uses - Interest
- Taxes
- Dividends
Net Distribution Impact
52.23
-0.04
-8.84
-0.38
-1,88
-9.19
-0.53
4.84
30:60
-64.07
-86.72
-84.00
-52.23
-0.04
8.84
1.88
4.60
I
0.21
0.38
4.60
0.27
15.59
-12.24
64.07
-3.52
48.27
5.24
-52.23
-4.84
-18.36
90.24
67.04
21.8 References
1. UNIDO. 1978. Manual for the Preparation of
Industrial Feasibility Studies, 1st Edition.
2. UNIDO. 1991. Manual forthe Preparation of
Industrial Feasibility Studies, 2nd Edition.
3. Duvigneau, J. Christian, and Prasad, RangaN. 1984.
Guidelines for Calculating Financial and Economic
Rates of Return for DCF Projects, The World Bank
Technical Paper Number 33,
4. United Nations, 1989, Guidelines for Project
Evaluation, [Prepared by P. Dasgapta, S. Marglin and A
Sen], Sales No. 72.11.B.11.
5. UNIDO. 1986. Guide to Practical Project Appraisal -
Social Benefit-Cost Analysis in Developing Countries.
6. Stienberger, Robert L. 1994. "Reengineering
Investment," Chemical Engineering, October 1994,
McGraw Hill Inc.
600
Chapter 22. Challenges Facing the Fertilizer Industry
Table of Contents
Page
22.1 Introduction 602
22.2 Resolution of Macroeconomic Contradictions 602
22.2.1 National Income and Crop Prices -,.-..-.,,-602-
22.2.2 Subsidies 602
22.3 Fertilizer Production Capacity and Demand 603
22.4 Transformation From Public to Private 604
22.5 Establishment of New Facilities 605
22.5.1 Technology ..:.-. 605
22.5.2 Financing (Investment and Working Capital) 605
22.5.2.1 Financing the Construction of the Fertilizer Plant 605
22.5.2.2 Working Capital , 606
22.5.3 Project in Trouble 606
22.5.3.1 Inadequate Credit Schemes 606
22.5.3.2 Price Distortions and Debt Repayment Difficulties 606
22.5.4 Marketing and Distribution 607
22.6 Potential for Reducing Fertilizer Costs 607
22.6.1 Raw Materials 607
22.6.2 Investment Costs 607
22.6.3. Other Cost Elements ., .,,,_.,,,, ,_.„.,,.. „ , 607
22.6.4 Expected Price Changes 607
22.6.5 Biological Fixation of Nitrogen 608
22.6.6 An Alternate Supply of Other Mineral Nutrients 608
22.6,6.1 Enzymatic Phosphoric Solubility 608
22.7 General Conclusions 608
22.8 References 609
601
Chapter 22. Challenges Facing the Fertilizer Industry
22.1 Introduction
As a result of political and economic reforms in the
formerly centrally planned economies, structural
adjustment programs in the developing countries, and grain
surpluses in the industrialized countries, the fertilizer
industry is facing many challenges. These challenges
include, but are not limited to, sustainable growth in
fertilizer use and supply, management of environmental
impacts associated with fertilizer use, especially nonpoint
pollution, restructuring and rehabilitation of the
fertilizer sectors and the development of competitive
markets systems in transition economies (Eastern Europe
and former U.S.S.R.), and policy and organizational
reforms in developing countries. Some of these
challenges, and strategies to deal with them, are analyzed in
this chapter.
22.2 Resolution of
Macro economic Contradictions
The use - of fertilizers- and-other agricultural-inputs Js_
essential in any region of the world and, in particular, in
developing countries. Only agricultural inputs can help
in meeting the food needs of the world's growing
population, The principle of nutrient balance is an objective
law of nature; therefore, whatever is taken from soil must
be replaced to protect the environment and increase
food production. The concept that healthy food can only
be produced using organic fertilizers is not economically
viable worldwide and also not theoretically true. During
the next century it will be necessary to cope with the
most urgent needs of the poor populations worldwide.
Inorganic fertilizer is one of the materials required to
resolve the food problems of the poor. The safe and
judicious application of fertilizers may also produce
healthy food of adequate quantities [1].
22.2.1 National Income and Crop Prices
Food prices in the developing countries are still low
and, in particular, are those of staple foods such as rice,
cassava, maize, and wheat. Because most of the
population has a low income, they cannot afford expensive
food. On the other hand, poverty is induced by a large
proportion of the agricultural population or population
unemployed outside the agricultural sector. Most small
farmers cannot produce efficiently enough; therefore,
to keep food prices low the Government is forced to
keep farmers' income as low as possible. However,
agricultural restructuring in many countries to produce food
efficiently, which ensures on the one hand low prices
and on the other hand an adequately high income of a
limited number of farmers (e.g., 5%-7% of the total
labor force), requires the creation of a large number of
industrial and service posts, implementation of a large-
scale program of housing construction, and overa~II~de=-
velopment of infrastructure. Otherwise, small farmers
will become a potentially large unemployed labor force,
which cannot be accepted by any government.
Following this structural deficiency small farmers and the
overall agricultural infrastructure cannot afford to purchase
adequate amounts of agricultural inputs such as
fertilizers. More efficient farmers are not using adequate
amounts of fertilizers because of the low benefit:cost
ratio. Cheap prices for crops and feasible production
prices of fertilizers are generally not producing an
incentive for farmers to use fertilizers, Consequently, crop
yields and incomes are low, and the vicious cycle of
poverty and food deficits begins again.
International development agencies are encouraging
the development and implementation of policies that
-promote-the-em'eient-development of the fertilizer and
agricultural sectors. Policies can be developed that
promote privatization of fertilizer sectors. Thus, a favorable
environment can be established so that the private
sector can assume the responsibility for the fertilizer and
agricultural sector development. Only good macro-
economic management can resolve the problems of the
fertilizer sector, which is imperative for sustainable
development. Some parameters of macroeconomic
management will be discussed.
22.2.2 Subsidies
It has been proven that a favorable fertilizer:crop price
ratio stimulates food production and high returns.
Therefore, if crop prices cannot be raised, the only solution is
to lower fertilizer prices. This is accomplished by
applying fertilizer subsidies. The most common forms of
subsidies are:
• Direct fertilizer price subsidy.
• Storage and transportation subsidy.
■ Purchase credit subsidy.
An alternative to fertilizer price subsidies is a crop
price support. Regardless of the form of subsidy applied,
602
it requires a large-scale managerial effort, clear and
transparent administrative procedures, precise contracting/
accounting principles, and budgetary financial resources.
Hence, input subsidies are preferable to output subsidies.
Once applied subsidies have a great impact on the
country's overall economy; this impact has positive and
- negative elements, examples of which are given in Table
22.1.
Entering any subsidy scheme should be handled
carefully; macroeconomic models should be used to
simulate outcomes and to evaluate benefits from alternative
investments. Each government should be aware that
entering a subsidy scheme is difficult and requires many
regulations to ensure its success. Hence, reliance on
subsidies should be minimal.
Table 22.1. Macroeconomic Impact of
Fertilizer Subsidies
Positive Impact Negative Impact
Expansion of fertilizer use Waste of fertilizers
Increased demand for other Cost to the treasury
agri-inputs _.. .
Increased productivity Production surplus
lowering crop prices
Higher land value Mislocation of resources
Table 22.2. Internal Reasons for Undercapacity
Undercapacity Caused by
Faulty plant design
Lack of quality maintenance
Inadequately trained operation personnel
Infrastructural deficiencies
Irregular supply of raw materials
22.3 Fertilizer Production
Capacity and Demand
Establishment of a fertilizer factory should be
considered only when local or regional consumption at the
time of the startup will reach the level of the minimum
economic installation capacity, allowing for 10%-15%
of imports. Operation of the factory at 85% capacity is
conditional to its competitiveness. However, the
problem of capacity utilization represents a contradiction:
the fertilizer plant should be operated continuously^
throughout the year but fertilizer use is concentrated in
two or three periods of the year. Fertilizers are used in a
relatively short period of time. This poses problems of
storage capacity, distribution networks, and the
financing of the stored fertilizers. In fact, the working capital
necessary to cope with this situation is significantly higher
than that in other branches of industries where demand
correlates well with production. This additional cost would
generate a price increase; however, if the technology is
up to date and operation efficient, local fertilizer prices
may remain competitive with those of imported
products, which must incur the high cost of transportation
and loading/unloading operations and port demurrages.
However, over the market constraints of capacity
utilization and satisfying demand at competitive prices, there
are internal reasons for undercapacity operation. These
internal reasons are listed in Table 22.2.
Full capacity utilization would be the priority in any
program of restructuring the fertilizer industry. As has
been stated many times in this manual, fertilizer demand
of a Fertilizer Plant
Reason for the Cause
Wrong design data
Inexperienced engineering company
Unfair contractor/supplier
Lack of spare parts because of exchange
regulations or lack of funds
Untrained personnel
Late and/or inadequate training
Large personnel turnover
Unstable supply of electrical energy
Water deficit or inadequate quality
Transportation bottlenecks
Lack of foreign exchange
Transportation bottlenecks
603
is driven by the benefit:cost ratio. In free market
conditions only obvious profits can motivate farmers to
increase fertilizer use. Therefore, macroeconomic
governmental policies should take part of the burden
and risk from farmers, especially in countries where
farmers cannot pay cash for agricultural inputs. In more
developed countries, it is necessary to create convenient
credit schemes for farmers to purchase inputs and
systems for marketing outputs. Although the benefit:cost
ratio is fundamental for increased food production,
professional services are equally important to achieve a
balance in fertilizer use. The availability of soil analyses;
advisory services on crop selection; and the proper use
of fertilizers, pesticides, and other inputs are necessary
conditions to increase fertilizer demand. By conducting
demonstrations on local and regional fields, the
extension service can efficiently prove the potential of
fertilizer use. Although this requires budgetary inputs, this
input is much lower than extensive subsidies. The
combination of the supply-side factors and benefit: cost-driven
demand may ensure the best use of natural (mineral)
resources and manpower to efficiently produce food
sufficient for a country's population.
22.4 Transformation From
Public to Private [2]
Fertilizer industries in devebping countries have been
established by the governments as different forms of
parastatal enterprises, either fully administered by the
respective ministries of industry or economy or public
shareholding companies with the majority of the shares
owned by the Treasury or other constitutional state
owner. Establishment of the fertilizer industry by the state
has created the economic climate in which this industry
has been operating. Under such systems, the following
elements of the operation have been regulated:
• Fertilizer Prices - The required introduction of
custom duties and internal subsidies to motivate farmers
to increase fertilizer use has allowed the country
governments to control fertilizer prices.
• Distribution and Marketing System - To control
subsidies, to ensure continuous production and
storage of fertilizers, and to ensure subsidized credit for
farm inputs, governments have taken over the entire
distribution system.
• Fertilizer Production - To encourage investment
in fertilizer production, parastatals or state-owned
enterprises (SOEs) have been created.
The lack of market forces impacting the production
and distribution of fertilizer and other agricultural inputs
has led initially to undesirable and economically faulty
procedures and facts, including the following:
• Capacities were not fully utilized, and sometimes
lengthy periods of production downtimes were noted.
• Costs of fertilizer production were not reduced,
• Any economic actions taken by plant management
that led to cost reductions resulted in increases in the
state budget. This demoralized the staff, consumed
financial resources needed for maintenance,
restructuring, and modernization of the installations, and
increased fiscal burdens.
• Overstaffing.
• Limited management autonomy and motivation.
Therefore, many governments prepared programs for
restructuring the fertilizer industry. The common action
was the establishment of shareholding companies with
Boards composed of bank representatives, ministries,
and political parties. Shares were controlled by the local
Treasury (or Ministry of Finance/Economy). The Board
nominated directors of the company, who were
responsible for the factory's operation and product sales-, In
countries where these actions were accompanied by the
deregulation of foreign trade and introduction of the free
market system of foreign exchange, public sector
fertilizer companies began to be privatized. As the
revamping process began, unprofitable units were closed,
-capacity-utilizarjon-was-improved, and production costs
were reduced.
Next, deregulation of fertilizer marketing and trade
liberalization motivated public companies to further
reduce production costs. A new network of private
dealers and traders was established to compete with the state
system. In several countries where divestiture and
subsidy removal has been immediate, short-term fertilizer
use and production declined significantly; therefore, the
whole system requires time for adjustment and
achievement of a new balance.
The third step is the privatization of fertilizer
companies. There are few examples of full privatization of
fertilizer companies, e.g., when private concerns take over
a company from the government, The basic difficulty is
that the fertilizer subsector is very vulnerable to changes
in international markets (products and raw materials) and
very much depends on local government policies.
Therefore, the risk of purchasing a fertilizer company is high,
and the private owner is constrained to obtain an
adequate amount of money to pay for the assets, The
government is interested in selling its assets at the highest
possible price. Therefore, a very detailed assessment is
necessary to consider long-term government incomes
from value-added taxes and taxes of the operational
fertilizer factory on the one hand, and on the other hand
604
the potential earning capacity of an installation and the
investor's gains from possible restructuring of hardware
and introduction of new technology and products. Open
market auctions may provide true market values and
lessen the political pressure on the government agency
that is responsible for privatization,
The closure of a fertilizer plant should be considered
only as an extreme case, when the costs of continuing
production are higher than the cost of imported
material, and other opportunities for investment show greater
profitability.
22.5 Establishment of New Facilities
In the short-term a global surplus of capacities is
observed; however, the capacities of Central and East
European countries and the former Soviet Union (FSU),
which may not be operating in the future, are playing a
substantial role in this surplus. Asia and Latin America
show capacity deficits, and in the coming years,
worldscale fertilizer plants should be put under
construction. The overall investment costs of about US $18-22
x 109 in 5-8 years and the necessary financial
instrument would be available because it is a small part of
annual world investment. Therefore, the constraints to
the implementation of investment programs in the
fertilizer industry should be considered,
22.5.1 Technology
Although fertilizer production technologies are
considered established and they were not a priority of
research programs during the past 20 years, a variety of
new processes of fertilizer production were developed
that should meet the demand, A detailed review of these
technologies has been made in the respective chapters.
The attention of decisionmakers is drawn to the
following facts.
• The yields of products from raw materials are very
high; even in the most energy-consuming ammonia
process, methane consumption reached 75% yield,
Other intermediates and fertilizer processes reached
yields of 98%-99.5%.
• The environmental impact of large-scale fertilizer plants
when introducing the necessary treatment schemes
has been reduced to acceptable levels.
• The market of technology is diversified. Professional
capabilities have been established in many developing
countries where engineering organizations can meet
world competition on the quality and schedules of the
design and procurement of fertilizer installations. More
and more equipment could be constructed in
developing countries at competitive prices.
• New technologies have reduced the minimum
economic size of fertilizer installations; this would reduce
worldwide transportation costs of fertilizers in the
future and at new production sites.
• New alloys and polymers used in equipment
construction have increased the reliability of the operation and
reduced maintenance.
• The methodology of preventive maintenance has been
developed for the purpose of operating fertilizer plants.
It may reduce unexpected downtimes of installations
and increase overall annual operation time. _._.__
The transfer of adequate technology is no longer a
constraint of fertilizer industry development. Some
countries coordinate financial credit and the purchase of the
technology using a local licenser. These proposals must
be dealt with carefully because the technology offered
may not meet competitive standards, and its
deficiencies would negatively influence the position of the
fertilizer producer later. However, the internationalization of
the banking system reduces the need for such
arrangements.
22.5.2 Financing (Investment and Working
Capital)
22.5.2.1 Financing the Construction of the Fer-
~tilizer~Plaint~Th"e"fmancing scheme of fertilizer plant
construction poses serious problems. In developing
countries few private investors can afford construction of a
fertilizer plant. Because the minimum investment cost
of an NPK fertilizer complex or an ammonia-urea
complex can amount to US $350-$500 million, the
following obstacles appear:
• The amount of equity considered safe for any
investment is about 30% of the total value (debt:equity ratio
= 2.1), Therefore, an investor should collect about
US $100 million in assets. If this is possible, the other
investing opportunities are more profitable (e.g., in
beer production and the plastic industry), and the risk
of investing in a fertilizer project would transfer the
capital to other projects.
• The remaining debt should be covered by convenient
credit facilities (e.g., suppliers' credit). This credit
covers only 85% of the delivery cost and must be paid in
6-8 years after the startup of the installation or grace
period. An insurance premium is added to the credit
cost. The rate of interest may be preferential in case a
suppliers' country has such an export promotion
scheme. However, it is doubtful that international
banks, even under supplier's credit facilities, would
provide US $150-300 million to the small private
investor in a developing country. In any case the
605
national bank guarantees of the buyer's country should
be issued. Such an arrangement would be possible in
very few developing countries.
All local civil works and other infrastructural costs
should be financed locally. In only a few developing
countries could local banks finance part of a
construction project in the amount of US $100-200 million,
with a small local investment group as the debtor.
The total costs including interest at unfavorable
conditions (delay in construction and high rate of interest
of local credit) may easily double the fixed investment
costs.
Since the loans are guaranteed by the government
(Central Bank or Treasury), there is a practice to relend
the loan to an investing group at local interest rates,
which are much higher than that approved by the
supplier's foreign bank. The difference goes to the
budget through the taxed profits of the local
investment bank. This practice may raise the investment
cost over the level of minimum feasibility.
Therefore, establishment of the fertilizer complex by
a local private investment group may be an
exception, especially in Africa. A joint venture with a
serious international investment group would require
involvement of the government for the purpose of
stable agricultural policies ensuring demand after the
establishment of the plant. —— —
When large-scale investment in fertilizers is
considered in developing countries, especially in Africa,
government involvement may be necessary in those
countries where the fertilizer sector development is in
its infancy. However, this involvement and
guarantees must be given without seriously influencing the
investment process and management autonomy.
Therefore, the establishment of a public shareholding
company to carry out the whole investment
procedure and construction of the fertilizer plant should be
considered only as a last resort. After startup of the
factory, shares could be sold on the stock exchange,
leading to the privatization of the company.
Implementation of this alternative requires devoted and
professionally capable local staff and a liberal exchange
control policy,
The exchange control policies present an additional
difficulty in the establishment of the fertilizer plant,
The design and construction schedules obviously should
be tight to reduce interest charges as much as
possible. This requires a flexible policy regarding signing
of the contracts and issuing payments. If the Central
Bank exercises total control over the exchange in
release of foreign payments, the management of a large-
scale investment project is very difficult and inefficient.
22.5.2.2 Working Capital - Another element of
total investment cost is the working capital.
Considering the seasonal consumption of fertilizers, delayed
payments may be accrued only in 4-8 months on average
throughout the year from the production time. This
increases the usual value of working capital from 9%-l 1%
to 30%-40% of the sales value. Depending on the
prevailing interest rate of the local financial market, this
may increase the farm-gate price of fertilizers by 8%-
10%. The banking sector should ensure that the
production and marketing operations are not hampered by
the paucity of working capital. -—
22.5.3 Project in Trouble
Any industrial investment has its own procedure that
leads to a successful project. A fertilizer project also has
its systemic implications, If these are not considered in
planning the project implementation and the adequate
instruments to abate investment distortions are not
prepared, then ad-hoc measures may not avoid the losses,
22.5.3.1 Inadequate Credit Schemes - A
typical problem in the credit scheme is a down payment. In
almost all suppliers' contracts, the insurer requires that
15% of the contract value should be paid as a down
payment upon validation of the contract. This can be
paid from the equity if available in cash. However, the
equity in developing countries is usually in assets and
-obligations;-therefore, cash is not available. The
investor must arrange for another loan at international
financing institutions. Negotiations of this loan, depending
on bank guarantees, may delay implementation of the
suppliers' contract over the price validity term, and
contract renegotiations would begin again. Therefore,
arrangements for the down payment should be made
concurrently with the main suppliers' contract and
involve the financing institution in assessing the project's
feasibility.
Another inadequacy of the credit scheme is a
nonoptimal repayment schedule. It is not true that the
longer the grace period and delay in repayment of the
debt, the better is the financial position of the project.
Each credit scheme has its optimum, and the
optimization factor should be the project liquidity or earliest
possible date of net profitability. Computer models are
available to simulate credit conditions at different
assumptions of the sales and price risks. The investor should
use these models before beginning negotiations of the
credit arrangements. Considering the project's risks
after the optimal scheme is negotiated, a refinancing
scheme should be included in the financial agreement,
22.5.3.2 Price Distortions and Debt Repayment
Difficulties - Lack of stable industrial policies in the
promotion of locally produced fertilizers may result in
606
difficulties in plant operation when fertilizer prices on
the international market are dropping. During recession
periods many companies have sold their products for
the cost of the raw materials, utilities, and labor; this
practice will undermine local production even if it is
carried out in a normally competitive way. Obviously, a
local company should adjust its prices, but then profits
will be reduced and repayment of the debt will be in
danger. Then, only policy instruments, such as
antidumping judgments and penalty custom duties, may save the
company. Therefore, the government should
continuously watch the international fertilizer situation to avoid
disruption of the business and loss of incurred
investments.
22.5.4 Marketing and Distribution
Marketing and distribution networks should exist long
before the local fertilizer factory is established. The
government's role to ensure regulatory frameworks is
vital to avoid high costs of the distribution system.
Distribution and marketing costs may equal production costs,
and measures should be taken to maintain them at the
lowest possible level. In fact, there is a contradiction
between the requirements of the efficiency of fertilizer
use by farmers and a low-cost distribution system, A
distribution network that supplies farmers with
fertilizers on time and of the required quality, with necessary
advisory services requires large quantities of fixed and
working capital, Returns are realized
through-the-increased crop production yields even at fertilization rates
below the economic optimum. However, establishment
of such a system throughout the country is difficult, Io-
gistically and financially. Government involvement is
necessary to provide assistance in establishing local
storage and providing transportation. This system may be
established by a parastatal organization, which can be
privatized later. Another possibility requires the
establishment of a package of policies for a private investor:
satisfactory credit facilities, special repayment schedules,
and fiscal privileges. All measures should consider only
one goal: low distribution costs at realistic returns on
capital investment. The regulatory framework should be
established to promote competition and restrict
monopoly practices, Farmers should be encouraged to
develop viable cooperative networks.
22.6 Potential for Reducing
Fertilizer Costs
Fertilizer production costs are always specific to a given
factory. However, to show the possible trends in the
fertilizer production costs, the cost trends in major
elements are discussed [4] .
22.6.1 Raw Materials
As has been discussed the opportunities to lower costs
of the raw materials are limited. Current technologies
have achieved a high level of raw material utilization
and high reaction yields. Technology to convert
byproduct phosphogypsum into a salable product could
bring a substantial discount (if no additional costs).
Natural gas prices are stable or rising, and a reversal of the
trend is not likely. Phosphate rock prices are relatively
stable, and resources at these prices are limited to
existing mining operations. Therefore, with the exhaustion
of operational reserves, prices of phosphate rock should
increase,
22.6.2 Investment Costs
According to the U.S. chemical engineering plant cost
index [4], during the past 25 years the unit investment
cost of fertilizer plants has risen by a factor of 3, with
only a 1.5-2,0 times increase in fertilizer prices.
Therefore, a decrease in depreciation cost is not likely for.
new plants. New developments in ammonia technology
may keep unit investment costs stable for a period of
time; therefore, present investment decisions in the
fertilizer industry may be beneficial to the investor in
comparison with delayed construction.
22.6.3 Other Cost Elements
Labor and utility costs are a small part of total costs
for basic fertilizer producers. Newer sulfuric/phosphoric
acid plants are net exporters of energy. In solid fertilizer
production the heat of acid neutralization may be used
to save energy in the granulation/drying operations.
Therefore, it is difficult to expect any substantial change
in this already marginal cost. Financial costs may
increase, depending on interest rates and the storage
period of products and sales costs in which the growing
component of fertilizer marketing should be considered.
The overhead costs also include local taxes, rents,
research and development expenditures, maintenance
costs, and management costs. This element in fertilizer
cost calculation is relatively low. There are branches of
industries where this cost reached 25%-30% of
production costs. Therefore, there is little opportunity to
decrease the cost of this element.
22.6.4 Expected Price Changes
Following the logic of the previous analysis, it is not
likely that the cost of fertilizer production can be
drastically reduced. Price fluctuations relate to changes in
temporary demand, and are not linked with changes in cost
of production. In times of depression the producers are
charging only variable costs, labor and some elements
of the sales and financial costs, expecting a cyclic
increase in prices and then possibly to recover the
permanent costs and profits. Modern installations that are
607
nearly depreciated but well maintained are especially
privileged in this situation.
22.6.5 Biological Fixation of Nitrogen
A large part of the supply of nitrogen already comes
from biological fixation of nitrogen from air and soil.
Extensive research has been carried out for more than
20 years [5] to develop genetic varieties of basic crops
that can fix nitrogen directly from the air, The successes
are limited to a few species; however, even in the case
of success in this field, the testing of the environmental
impacts and reproduction of the new species and their
distribution worldwide may take considerable time.
One can also expect studies to continue on the
enzymatic fixation of nitrogen, The simple reaction of
nitrogen and water can produce ammonia in the enzymatic
process. However, efficient bacterial species must be
developed through genetic manipulation to produce
these enzymes. Installations including bacterial processes
are generally quite large and require a large-scale
investment, Therefore, the simplicity of the enzymatic
process of ammonia synthesis would likely be offset by the
cost of production of enzymes.
Therefore, the production of nitrogen fertilizer by
present means may continue for a long period.
22.6.6 An Alternate Supply of Other Mineral
Nutrients
Other than nitrogen, which could be naturally
supplied from the air, the remaining nutrients must be
regularly supplied through fertilization. There are numerous
detailed research results, which describe the extraction
of nutrients by crops [61, Artificial fertilization and
partial recycling of crop residues are the only solutions
supporting soil fertility. This is valid for such elements as
Ca, Mg, K, and the micronutrients (Fe, Cu, Mn, Co,
etc.). These elements must be supplied in soluble form,
or conditions must be created for their solubility in the
soil.
22.6.6.1 Enzymatic Phosphoric Solubility - In
the 1980s Canadian scientists [7] discovered that some
kinds of naturally occurring fungi in the soil are able to
solubilize the phosphate salts normally unavailable to
plants. In a radical way this may influence development
programs of the phosphatic industry. Many studies on
the use of fertilizers have shown that up to 70% of the
soluble phosphate applied by the farmer can become
adsorbed onto clay soils and organic matter and become
bound to the soil and therefore not readily available to
the plants. One of the naturally occurring
microorganisms (Fungus Penicilinum Bilaji) has the ability to
solubilize phosphate in the soil. Research has shown that this
microorganism can reduce the amount of commercial
phosphate required by up to 50% by solubilizing both
mineral and organic phosphate while maintaining crop
yields. It may be also expected that microorganisms can
make phosphorus directly available from phosphate rock,
which would lead to a substantial saving in investment,
especially in countries with phosphate rock resources
but with no possibility of establishing a feasible
phosphatic fertilizer plant. An additional effect, the large
development of roots, contributes to efficient plant growth
even in less favorable weather conditions. However, FAO
has been reluctant to undertake any confirmation tests,
and tests conducted by 1FDC have not been convincing.
Finally, the developing company has been purchased-
by a large multinational company, and since that time
no additional information has become available on the
product and process development.
In summary, it appears that opportunities for
reducing fertilizer production costs via new technologies are
limited. However, recent consolidations have resulted in
a few closures of high cost plants, and have contributed
to increased operating rates for the lower cost
producers. This has reduced costs and has increased the
percentage of fertilizer intermediates and finished products
which enter world trade. Importers have entered into
joint ventures with firms in energy (primarily natural gas-
rich countries) or with firms which have access to
phosphate or potash reserves. This also contributes to reduced
costs.
___Major_.opportunities .exist for reducing the total
fertilizer costs per unit of agricultural output by increasing
the efficiency of fertilizer distribution systems and by
increasing the efficiency of on-farm use.
22.7 General Conclusions
The consumption of fertilizer and, thus, increasing
yields of crops are primarily dependent on the
benefibcost ratio and government policies reducing the
farmers' risks. Establishment of these policies is difficult
and requires detailed research and preparation of a
decisionmaking computerized model in every country.
Only when stable agricultural policies are established and
fertilizer consumption approaches the minimum
capacity level is it reasonable to consider establishment of a
fertilizer plant. Grain overproduction in industrialized
countries and the problems with agricultural and export
subsidies have slowly decreased the consumption of
fertilizer in many countries with intensive agriculture,
leaving free capacities to supply the international market.
On the other hand, solution of the worldwide food
supply problem requires increases in fertilizer use.
Technologies have been improved and new concepts
implemented to produce high yields and better financial
efficiency. Therefore, the construction of national feruT
608
izer plants in the next decade will be necessary to cover
the growing demand of local markets. Obviously some
countries that are endowed with raw materials can
consider establishing a fertilizer industry (in particular, a
phosphate fertilizer industry) as an export-oriented
industry.
Experience has shown that the fertilizer industry has
been started as a public sector or mixed public/private
venture. The price cycles and over-capacities for many
years have reduced interest of financial and international
development organizations in the continuous
improvement of the market situation; technical assistance in the
fertilizer industry has been practically abandoned by
UN1DO and the World Bank, A decision to establish a
fertilizer plant requires an extensive programming and
planning effort from government decisionmakers
regardless of the future owner of the fertilizer plant. Credible
demand assessment, implementation of complex
agricultural policies, selection of the plant's location, raw
material supply identification, technology preselection
and identification of financing sources, and preparation
of the necessary guarantees are the challenges that the
governments must meet in the industrialization of
agriculture. International organizations should reinstate their
fertilizer programs and support actions of the developing-
country governments intending to consider construction
of fertilizer plants or revamping of the existing industry.
Both the country governments and international
organizations should create an enabling policy environment—
to promote investment in fertilizer production and
distribution. In this context, joint ventures between
developed and developing countries (North-South
collaboration) and among developing countries (South-South
cooperation) should be developed.
22.8 References
1. "Perceived Global and Regional Issues." 1993.
Fertilizer Industry/World Bank Roundtable Meeting, 9-
13 September. World Bank Report.
2. Gregory, D. 1.1994. "Issues in Privatization of Public-
Sector Fertilizer Production Units and Market
Liberalization," 1FDC, Muscle Shoals, AL, U.S.A.
(unpublished).
3. SRI International 1989. PEP Yearbook.
4. Chemical Engineering. 1995. December.
5. Aziz, Zahid. 1994. Development and Transfer of
Technology Series No. 17. UNIDO draft publication,
p. 47.
6. Tandon, H.L.S. 1993. "Assessment of Soil Nutrient
Depletion," Proceedings of the Regional FAD1NAP
Seminar on Fertilization and the Environment.
Chiang Mai, Thailand, 7-11 September 1992, United
Nations ST/ESCAP/1256.
_7.-Kucey,,R.M.N._1990. Agriculture Canada, Research
Branch, private communication.
609
Index
Agriculture
development of, 20-21, 46, 50-51
role of fertilizer in, 20-44
Ammonia
environmental and safety issues, 513-514
forecasts of production, 87-88, 159, 160-164
hydrocarbon and coal feedstocks, 85-90
. physical properties of, 160
production capacity (United States), 68
storage of (large-scale), 196-199, 200
trade in, 196
transportation of (large-scale), 196, 199-206
barge, 200-202
ocean vessel, 199-200, 201
pipeline, 202-205
rail, 205
truck, 205-206
Ammonia production, 159-192
based on coal, 184-187, 188
catalysts used in, 166-169, 172-177, 179-180,
181, 183-184, 192
economics of, 188-190
from electrolytic hydrogen, 187-188
energy consumption in, 164
environmental and safety issues, 513-514
feedstocks for, 85-90, 159, 160-164
flow diagram of, 165 —
fuel requirements for, 162-164
future developments in, 191-192
historical developments in, 159-160
by partial oxidation process, 182-184
in small-scale plants, 190-191
technology, 164-182
Ammonia synthesis, 172-182
converter design, 173-175
preparation of gas for, 165-172, 175-179
compression and drying of gas, 169
conversion of carbon monoxide, 168
removal of carbon dioxide, 168-169, 170-171
removal of excess nitrogen, 169, 171-172
steam reforming, 166-168
technology of, 173-175, 179-182
thermodynamics and kinetics of, 172-173
Ammonium chloride, 249-253
handling of, 250
manufacturing of, 250-253
properties of, 250
uses, 249-250
Ammonium nitrate, 220-236. See also Calcium
ammonium nitrate
handling, 224-225
hazards, pollution, and regulations for, 4, 223-224,
225, 236, 525-527, 531
properties of, 221-222, 223
uses and commercial forms, 221, 222-223, 226
Ammonium nitrate production, 225-236
chemistry of, 225-226
commercial processes, 227-236, 237, 531
emissions during, 525
process technology of, 226-236, 237
concentration and stabilization, 226-227
granulation, 234-236, 237
neutralization, 226, 228-230, 231, 232_
prilling, 227, 230, 232-234, 236
Ammonium phosphates, 361-380
commercial processes for granular, 361-370
AZF (Grande Paroisse), 368-369
Espindesa, 367-368
Jacobs-Dorrco, 363-364
Norsk Hydro, 370
Raytheon, 370
S. A. Cros, 367
TVA basic, 361-363
TVA pipe-cross reactor, 365-366
Uhde Gmbh, 366
commercial processes for nongranular
monoammonium phosphate, 370-373
Rsons, 371
Scottish Agricultural Industries, 371-373
Swift, 371, 372
economics, 374-375
emissions during production of, 524
grades and properties, 361, 376
production capacity (United States), 68
raw materials and utilities consumed, 366, 368, 369
Ammonium phosphate-chloride, 377
Ammonium phosphate-nitrate, 377-378
Ammonium phosphate-sulfates, 376-377
Ammonium polyphosphate, 279-282, 373-374
Ammonium sulfate, 242-249
handling of, 243-244
manufacturing of, 244-249
properties of, 242-243
specifications in CIS countries, 244
uses, 242-243
Anhydrous ammonia, 274-276, 277
Aqua ammonia, 276-277
Apatite. See Phosphate rock, mineralogy
Association of American Plant Food Control Officials
(AAPFCO), 6, 7, 8, 9, 10, 11, 12
Basic slag (Thomas), 408-409
Best available technology (pollution control), 540-542
Biomass, 509-510
Bone meal, 410
610
Cadmium, 511, 521-522, 524, 526, 527
Calcium ammonium nitrate
manufacturing of, 236-238
in nitrophosphate production, 391-392
Calcium magnesium phosphate, fused, 410
Calcium metaphosphate, 411
Calcium nitrate, 241-242, 391-392
handling of, 241,242
manufacturing of, 242
properties of, 242
uses, 241
Cation exchange, 26-27
Coal, 85-90
Cobalt, 467
Compound fertilizers (granular), 433-454
accretion, 434-435, 437
agglomeration process parameters, 435-441, 442
liquid phase, heat of reaction, insoluble
binders, 436, 438-440
neutralization, NPK production formulations,
440-441
raw material characteristics, 436, 437
economics of production processes, 434, 451-454
granule formation mechanisms, 434-435
manufacturing by specific processes, 441, 443-
447, 448
blending, 446-447, 448
chemical granulation, 443, 444
compaction granulation, 444-446
prilling, 443-444
steam/water granulation-,-441, 443"-- ~
role in agriculture, 433-434
supply/demand trends worldwide, 433
urea-based, unique requirements for manufacturing,
443, 444, 447-451
Cost estimates, devebping for fertilizer projects, 569-599
Diammonium phosphate. See Ammonium phosphates
Dicalcium phosphate, 411-412
Enriched superphosphate, 405
Environmental protection, 507-543. See also under
Pollution prevention and control
atmospheric emissions, 524-525
best available technology, 540-542
concerns for fertilizer industry, 507-508, 512-537
environmental impact assessment, 537-540
ISO 14000, 542-543
phosphogypsum, 522, 535-537
pollution abatement in commercial processes, 515-
517, 527-534
pollution control, general approaches, 526-527
role of international organizations, 540
wastewater and other wastes, 525-526
Farmyard manures, 509-510, 511
Fertilizer consumption, 55-63, 66, 71, 272-274
Fertilizer demand projections (1994-2005), 72-75
Fertilizer grade, 2-3
Fertilizer industry
definitions and terminology used in, 5-13, 116, 131
environmental concerns. See under Environmental
protection; Pollution prevention and control; and
Fertilizer use
evaluating economics of investment In, 569-599
history (development of), 46-50, 71-72, See also
under specific fertilizers
information and resources related to, 13-18
planning for development of, 546-567
assumptions and indicators to be used in, 546-547
demand estimates, 549-556
factors affecting fertilizer use, 556-558
governmental involvement, 563-564
location of plant, 562-563
methodobgy of development programming,
547-549
options for development, 558-561
raw material availability, 561-562
stages in planning, 564-567
contracting, 565
decisionmaking, 564-565
implementing, 565-567
steps in identifying opportunities, 549
restructuring, 66-68
Fertilizer industry, challenges, 602-609
•—^—considerations in-establishing new facilities,
605-607
financial, 605-607
marketing and distribution, 607
technological, 605
privatization in developing countries, 604-605
production capacity/demand factors, 603-604
Fertilizer nutrients. See Plant nutrients
Fertilizer prices, 64-65, 81
Fertilizer production
economics and investment cost, 569-599
emerging centers of, 65-66
statistical overview (1960-95), 51-55
Fertilizer raw materials, 85-152
Fertilizer regulations and specifications, 4-5. See also
Pollution prevention and control and specific fertilizers
Fertilizer supply projections, 75-78
Fertilizer supply-demand balances, 78-80
Fertilizer trade, 63-64, 68
Fertilizer use
economics of, 39-42
environmental issues, 508-512
benefits for environment, 512
nitrogen use, 510-511
nutrient balance, 508-509
phosphorus use, 511-512
time of application, 510
role in agriculture, 20-44
Fertilizers, compound. See Compound fertilizers
611
Fertilizers, fluid
consumption, 272-274
defined, 272
physical properties of, 494-499
uses, advantages and disadvantages of, 272-274
Fertilizers,, fluid [nitrogen solutions}
anhydrous ammonia, 274-276
characteristics, 274
handling, transporting, and applying, 274-276
application equipment, 276, 277, 278-279
aqua ammonia, 276-277
nonpressure solutions (advantages, characteristics,
production), 277-278
Fertilizers, fluid (phosphate solutions)
ammonium polyphosphate, 279-283
characteristics of, 281
grades and uses, 279, 281-283, 284, 290-291
production, 279-281
mixtures (formulas, solubility systems, and
application equipment), 281-283
Fertilizers, fluid (specialty)
acid-type, 289, 290
fluid limestone, 289
investment costs for production and application,
292-293
micronutrients in, 289-292
with potassium hydroxide, 292, 293
with sulfur, 292
Fertilizers, fluid (suspension)
materials and formulations, 283-284, 286-287
production, 284-287, 288" — ■■—— —
transportation and application, 287-289
Fertilizers, solid, physical properties of. See Physical
properties of solid fertilizers
Fluorine, evolution and uses, 339-340
Guidelines on emissions (various countries), 514, 518,
521, 524, 526, 534, 535, 541-542
Gypsum. See also Phosphogypsum
as byproduct in phosphoric add production, 336-339
use in ammonium sulfate production, 246-248
International Organization for Standardization (ISO),
471, 473, 474, 475, 476, 477, 479, 542-543. See
also Fertilizer industry, definitions and terminology
used in
Investment analysis and economic evaluation for fertilizer
projects, 569-599
computer as aid to analysis, 586
economic analysis, 584-586
feasibility study, 586-587
financial analysis, 577-584, 588-599
guidelines for establishing projects, 586-587
Investment analysis and economic evaluation for fertilizer
projects (continued)
investment cost estimates, 570-575
fixed investment, 571-574
terms used in developing, 570-571
working capital, 574-575
production cost estimates, 575-577, 578
capacity utilization, 577, 578
fixed costs, 576-577
variable costs. 575-576
Langbeinite, 148, 424, 425, 426-427, 430
Law of the minimum, 22-23, 27, 47
Liebig, Justus von, 22, 46-47
Liming of soil, 25-26, 458
Liquid fertilizers, 272-293. See also multiple entries for
Fertilizers, fluid
solutions, 273-283, 284
suspensions, 283-289
Magnesium phosphates, 412
Micronutrients, 23, 24, 460-467
application methods, 462
application rates recommended, 460-461
deficiencies of, 460-461
in fluid fertilizers, 289-292, 466-467
^-methods of-inclusion-in-fertilizers, advantages and
disadvantages, 462-467
reactions with fertilizers, 463
sources, 461-462
Monoammonium phosphate. See Ammonium phosphates
Naphtha, 161-162
Natural gas, 85-90, 161
Nitric acid, 209-220, 221, 222
hazards associated with, 517
manufacturing, 210-220
catalyst used in, 211, 213-214
chemistry of, 210-212
commercial processes for, 217-220, 221, 222
early developments in, 209
economics of, 217-218
environmental and safety issues, 514-519
materials used in, 210, 216-217
process technology of, 212-216
trends in, 220
properties of, 210, 211
uses, 209-210, 428
Nitrogen cycle, 28-30
612
Nitrogen fertilizers. See also Fertilizers, fluid (nitrogen
solutions)
environmental issues, 508-511
factors affecting use efficiency, 30-32
feedstocks, 85-90, 159-164
production, world (1920-90), 159
sources for crop production, 509
Nitrophosphate fertilizers
advantages and disadvantages of nitrophosphate
process, 397-398
calcium removal, 395-397
by carbon dioxide, 396
by ion exchange, 396-397
by sulfate, 395-396
chemistry, 385-386
consumption of, 398
environmental and safety issues, 524-525, 533-535
mixed-acid process technology (Kernira-Oy), 392-395
chemistry, 392-393
grades produced, 393
process requirements, 394
Odda process technology, 387-392
calcium nitrate conversion and CAN
production, 391-392
development of, 385-387
dissolving, crystallization, and neutralization,
387-389
finishing, 389-390
process requirements, 390-391
phosphate rock used in, 386
product quality, 394-395
uses of, 394 -— - -— -
Organic fertilizers, 509-510
Petroleum, 86-90
Phosphate rock, 90-126
beneficiation of, 102-107, 108
approaches and techniques used, 102-104
processes, examples of, 104-107, 108
economic and commercial viability of producing,
121, 124-126
geological origin, 90-91
mineralogy, 91-97
effect on further processing, 99-100
igneous apatites, 90, 96, 97
sedimentary apatites, 90, 91-96, 97
mining, 100-102
by surface methods, 100-102
by underground methods, 102
in phosphoric acid production, 314-318
potential for direct application, 99
production, world, 111-116, 120-124
quality, factors affecting, 107-111
reactivity of, 97-99
Phosphate rock (Continued)
reserves and resources, 116-120, 124
estimates and sources of data, 117-120
terminology used in classification, 116-117
used as a fertilizer, 405-408
calcined aluminum phosphate ores, 407-408
defluorinated, 408
ground, 405-407
partially acidulated, 408
Phosphogypsum, 521, 522, 535-537
chemistry, 535
in sulfuric acid production, 306-310
uses of, 336-339, 535 —
Phosphoric acid
environmental and safety issues, 520-524
fertilizers derived from, 355-381. See also specific
fertilizers
fluorine evolution, recovery, and uses, 339-340
growth projections, 311-312
gypsum (byproduct), uses of, 336-339
production by blast-furnace process, 350-351
production by electric-furnace process, 348-350
production by hydrochloric acid route, 345-348
production by wet process (sulfuric acid), 312-332
chemistry of, 312-313
process technology (dihydrate), 314-326
concentration step, 324-325
filtration step, 323-324
phosphate rock used in, 314-318
process requirements, 326
—— -reaction step and commercial processes,
318-323
sludge, use of, 325-326
sulfuric acid required, 316-317
process technology (hemihydrate and
combined), 326-331
advantages and disadvantages of, 327
commercial processes, 328-331, 351
construction materials, 331-332
process requirements, 328, 330
licensers, 351
purification of, 341-345
shipment of, 333-335
superphosphoric acid, 332-333, 334
uranium extraction by commercial processes, 340-
341, 342
uses of, 312, 380-381
Phosphorus fertilizer
environmental issues, 508-509, 511
factors affecting use efficiency, 33-35
Physical properties of fluid fertilizers, 494-499
clarity, 498
crystallization temperature, 496, 497
crystal/particle size and type, 497
density/specific gravity, 495, 496
gel strength, 498
pH, 498
pourability, 498
613
Physical properties of fluid fertilizers (Continued)
sedimentation, 497
solidification temperature, 498
syneresis, 498
vibrational settling, 498-499
viscosity, 495-497
Physical properties of solid fertilizers, 471-494, 495,
496
angle of repose, 477-478, 479, 480
caking tendency, 485, 487-492
alleviating, means of, 490-491
causes of, 487-488
evaluating, 491-492
factors that influence, 488-490
chemical compatibility in blends, 493
density, apparent, 476, 477, 478
density, bulk, 473, 475-476, 477
density, true, 476, 478, 479
dustiness, 492-493
granule strength (mechanical), 478-482, 483
abrasion resistance, 479-481, 482
crushing strength, 478-479, 480, 481
impact resistance, 481-482, 483
hygroscopicity, 482-485, 486, 487
critical relative humidity, 482-484, 485, 486, 489
definition of, and factors that influence, 482
moisture absorption-penetration characteristics,
484-485, 486, 487, 488
particle size, 471-473, 474
effects on agronomic response, 471-472
effects on blending properties, 47-2=4-7-3
effects on process performance, 472
effects on storage, handling, application
properties, 472
physical compatibility in blends, 493-494, 495
melting point, 494, 496
porosity, 494, 495
sphericity, 494, 495
surface area, 494
Pipe reactor, pipe-cross reactor, 230, 232, 279-281,
363, 364-369, 440-441
Plant nutrients
availability (definition), 3-4, 11-12
availability in soil, 21-36, 38-39
classification of, 2, 23-24
crop response to, 27-28
deficiencies of, 24, 28, 32, 35, 36, 37-39, 460-461
problems, diagnosis of, 37-39
role in agriculture, 20-21, 508-511
Plant tissue analysis, 37-38
Pollution prevention and control, 507-543, See also
under Environmental protection
ammonia, 513-514
emissions, guidelines (various countries), 514, 518,
521, 524, 526, 541-542
nitric acid, 514-519
handling, 515, 517
processes, 515-517
phosphogypsum, 535-537
Pollution prevention and control (Continued)
phosphoric acid, 520-524
sulfuric acid, 519-520, 521
Potash, chemical-grade, 430-431
Potash, fertilizer-grade. See also specific potassium
fertilizers
compaction/granulation technology 421-423
development of industry, 417
production, consumption, price, trade, 418-420
quality specifications, 420-421
role in agriculture, 417-418
use in compound fertilizers, 430
use of term "potash,"131, 417
Potash ores, 131-152, 153
beneficiation and processing , 140-150
of camallite ores and brines, 147-148, 149
crushing and grinding, 140-141
desliming, 141, 142, 143, 144
disposal of brines and tailings, 148
electrostatic separation, 146
flotation, 141, 143, 145
heavy media separation, 146
of sulfate ores, 148-150
thermal dissolution-crystallization, 146-147
deposits, geology, mineralogy, and origin, 131-139
brine or surface, 138-139
buried, 132-138
mining, 139-140
production, 150-152
reserves, 152, 153
Potassium nitrate, 427-430
"PoTlsaunrpfiospKafes, 409-410
Potassium sulfate, 424-427
processes for recovery from natural complex salts.
424-427
production by Manaheim process, 424, 425
uses, 424
Precision agriculture (site-specific management), 42-43, 293
Rhenania phosphate, 410-411
Secondary nutrients, 24, 457-460
calcium, 457-458, 459-460
magnesium, 457-458, 459-460
sulfur, 36, 457, 458-460
uses in fertilizer production, 459-460
Silicon, 467-468
Single superphosphate
advantages and disadvantages, 401
European product requirements, 405
licensers, 405
phosphate rock used to produce, 401
614
Single superphosphate (Continued)
production, 401-405
chemistry, 401-402
commercial processes, 405
emissions during, 524
process requirements, 404
process technology, 402-405
Site-specific management (precision agriculture), 42-43, 2
Sodium nitrate, 238-241
handling of, 239
manufacturing of, 239-241
of natural origin, 238-240
properties and commercial forms of, 239
use as fertilizer, 238-239
Soil
activity of K in, 35-36
activity of N in, 28-32
activity of P in, 32-35
activity of S in, 36
cation exchange in, 26-27, 31, 35
fertility (concepts of), 22-28
liming of, 25-26, 458
non-nutrient problems in, 36-37
organic matter content, 27, 28
pH, effect on nutrient availability, 24-26
productivity of, 21-22, 36-37, 43-44
Soil testing, 38-39
Sulfur, 126-131, See also Secondary nutrients
consumption, 131
production (worldwide), 129-131
production processes, 127-129— - ——
reserves and resources, 129, 131
sources, 126-127
uses, 126, 292
Sulfuric acid
effect on phosphoric acid production, 317
environmental and safety issues, 519-520, 521
supply, demand, trade, 310
Sulfuric acid production, 296-311
basic process and chemistry, 296
from calcium sulfate, 306-310
cement as coproduct, 307-308
chemistry, 307
economics of, 308, 309
process technology, 306-307
use of phosphogypsum in, 307-310
commercial processes and projections for
technology improvements, 310-311
from elemental sulfur, 296-302, 303
commercial processes, 297, 299-301
economics of, 301-302, 303
process technology, 296-299
Sulfuric acid production (Continued)
licensers, 311
from pyrites or smelter operations, 302-305
composition of pyrites, 303-304
economics of production, 304-305
process technology, 304
technical grade, 304, 305
by wet catalysis, 305-306
Sustainability (sustainable agriculture), 43-44
Superphosphoric acid, 279-280
Triple superphosphate
advantages and disadvantages of, 355
economics, 374-376
production, 356-361
chemistry, 356
den process, 357-360
direct slurry granulation process, 360-361
emissions during, 524
licensers, 381
properties of, 376
uses of nongranular and granular, 356
Uranium, extraction of, 340-341, 342
Urea. See also under Compound fertilizers
production, 257, 258-268, 269, 270
-commercial-processes ,~259-268, 269, 270
development of, 257
economics of, 268
emissions during, 525
finishing processes (prilling or granulation), 266-
268, 269-270
once-through and partial-recycle processes,
259-260
operating variables in, 258-259, 266
stripping process, 263-266
total-recycle processes, 260-263
properties of, 258
reactions in soils, 31, 257
uses, 257-258
Urea-ammonium phosphates, 378-380
Urea superphosphate, 412-414
advantages, 414
agronomic considerations, 414
process chemistry, 412
process development, 412-413
properties and qualities, 413
615