/


Text
FERTILIZER SCIENCE AND TECHNOLOGY SERIES
EDITORS
TRAVIS P.HIGNETT
Consultant
International Fertilizer
Development Center Muscle Shoals, Alabama
DEREK A. PALGRAVE
J. W. Chafer Ltd.
Doncaster. England
Vol. 1. Phosphoric Acid (in two parts), edited by A. V. Slack (Part II, out of print)
Vol. 2. Ammonia (in four parts), edited by A. V. Slack and G. Russell James
Vol. 3. Phosphates and Phosphoric Acid: Raw Materials, Technology, and Economics of the Wet Process, Pierre Becker
Other Volumes in Preparation
Phosphates and Phosphoric Acid
RAW MATERIALS, TECHNOLOGY, AND ECONOMICS OF THE WET PROCESS
Pierre Becker
Compagnie Franchise de I’Azote and
Duetag-France
Paris, France
With contributions by
TOBIAS NOGUEIRA PAUL ANTHONY SMITH
JEAN FROCHEN
Selected Illustrations by Nathalie Becker
MARCEL DEKKER, INC.
New York and Basel
Library of Congress Cataloging in Publication Data
Becker, Pierre.
Phosphates and phosphoric acid.
(Fertilizer science and technology series; v. 3) Includes bibliographies and index.
1. Phosphoric acid. 2. Phosphates. I. Title П. Series.
TP217.P5B4 1983 661'. 25 83-6219
COPYRIGHT © 1983 by MARCEL DEKKER, INC. ALL RIGHTS RESERVED
Neither this book nor any part may be reproduced or transmitted in any form or by any means, electronic or mechanical, including photocopying, microfilming, and recording, or by any information storage and retrieval system, without permission in writing from the publisher.
MARCEL DEKKER, INC.
270 Madison Avenue, New York, New York 10016
Current printing (last digit): 10 987654321
PRINTED IN THE UNITED STATES OF AMERICA
Foreword
It is a real pleasure for me to introduce this book by my friend, Pierre Becker, having myself worked for a long time in the field of wet process phosphoric acid production and use.
People who remember the status of this industry thirty-five years ago will realize what a long way we have come since then. Wooden reactors and wooden drum filters were commonly used, and in Europe plant output was in the range 3 to 10 tons of P2O5 per day. How far it was from the daily capacities of 500 to 1000 tons of P2O5 Per unit that are now common practice!
Phosphoric acid production is still growing at a rather rapid rate. World phosphate rock consumption increased from 74 million metric tons in 1969 to 130 million in 1979, and it is estimated that about two-thirds of this amount is now converted into wet process phosphoric acid. This is used mainly in the production of fertilizers, animal feed phosphates, and sodium phosphates. Such a tremendous development is obviously the consequence of increasing needs, but was made possible only by numerous improvements in the design of phosphoric acid plants, making the process economical.
Pierre Becker is well aware of all aspects of phosphoric acid manufacture and development, having worked in this field throughout his career, in operating, designing, and commissioning phosphoric acid plants in various countries, including Tunisia, Germany, the United States, and France.
Although there has been no major breakthrough in phosphoric acid technology since the publication in 1968 of the excellent book Phosphoric Acid, edited by A. V. Slack (Marcel Dekker, Inc., New York), there have been many improvements and developments, mainly in the design and size of equipment, the use of lower-grade rocks, the hemihydrate processes, the control of pollution, and uranium recovery.
Hi
iv Foreword
Many papers have been published on these subjects and the time has come to sum up all this scattered information in one handy book. But the main purpose of the author was something else. From his own experience, he felt that there was a lack of the practical information required to run a plant, such as detailed material and heat balances, and operating parameters and procedures, as well as a lack of advice on choice of the process, selection and sizing of equipment, and layout of the plant. For instance, for a given phosphate rock, how much recycle phosphoric acid must you feed into the reacting system? At what strength? And how do you control it? The answers to such questions are not readily available in the literature.
It is the aim of this book to fill this gap. The author shares the deep experience and practical know-how he has gained during almost thirty years of professional activity in the field. For some areas, the author has obtained the contributions of experts, skilled in the operation of the equipment and processes they describe. The economics of manufacture is not forgotten; it is the object of two chapters. An appendix contains valuable information on the characteristics of approximately forty commercial phosphate rocks.
This book will be a very useful manual for any worker in the field-chemist, engineer, technician, economist, or executive-and we must be grateful to the author and the contributors for the great task they have undertaken.
Philippe Moraillon
Preface
Almost fifteen years have passed since Marcel Dekker published A. V. Slack’s volume about phosphoric acid. Phosphoric acid technology during these years has not been stagnating: some systems became old-fashioned, others improved; some of the more elaborate processes succeeded while others experienced setbacks.
Energy and raw material prices have increased considerably and ore qualities have changed. New phosphoric acid production centers have been created. Countries such as Morocco and Tunisia, which formerly only mined phosphate ores, became large phosphoric acid producers; Jordan, Senegal, Togo, and Brazil are to follow a similar path.
New construction materials and equipment and better knowledge of technology resulted in improved and larger-sized production units.
Environmental problems such as calcium sulfate disposal and fluoride emission became of primary importance in industrialized countries, often outweighing the decision to implement a new project.
The technology of phosphoric acid nevertheless still remains very empirical. The authors of this book, having all participated in this evolution, felt it was time to make their experience available to others. We have had several primary goals:
To give an updated picture of phosphoric acid production technology in today's economic situation
To suggest methods for solving engineering and production problems that regularly occur in phosphoric acid technology and to illustrate them with many examples
To offer our engineering and plant experience
v
vi Preface ?
To show how the various kinds of commercial phosphate concentrates apply to present technology, by presenting detailed tables of phosphate rock analysis including specific industrial characteristic factors such as grinding capability, specific sulfuric acid consumption figures, filtration capacities, sludge formation from the concentrated acid, chemical and physical properties of produced acids, and so on
To maintain a link between technology and economics *
The reader will find throughout the book a considerable amount of data from production and pilot plant experience with phosphates of different origins. Project engineers as well as production engineers should find this volume to be a main source of helpful information.
I would like to express my appreciation to Michel Gauron and Michel Duthoit, who assisted in the preparation of Chapter 10.
Pierre Becker
Contents
Foreword (Philippe Moraillon) iii
Preface v
Chapter 1 Introduction to the Chemistry and Economics of Phosphoric Acid Production 1
1.1 Phosphoric Acid and Its Technology 1
1.2 Chemistry of Phosphoric Acid Production Using the Wet Process 6
1.3 Raw Materials 11
1.3.1 Phosphate Rocks 11
1.3.2 Sulfur 26
1.4 Current Developments 27
1.4.1 Factors Affecting Current Developments 27
1.4.2 Conclusions 27
References 33
Chapter 2 industrial Process Chemistry 35
2.1 Process Review 35
2.1.1 Review of Principles Governing a Phosphoric
Acid Plant Under the Dihydrate System 35
2.1.2 Nondihydrate Processes (Hemihydrate Processes) 38
2.2 Reaction and Crystallization 68
2.2.1 First Stage: Introducing the Reagents 70
2.2.2 The Three Reactions 71
2.2.3 The CaO/SO^ Diagram: Saturation and
Supersaturation 74
vii
Contents
via
2.2.4 Function of the Two Stages of the Attack System: Comparison of the Reaction Systems 92
2.2.5 Crystallization of Calcium Sulfate and Causal
Factors 99
2.3 Mathematical Approach to Crystal Growth and Size
Distribution-Comparison with Empirical Results 122
2.3.1 Crystal Growth 122
2.3.2 Crystal Population, Age, and Retention Time 124
2.3.3 Nucleation 125
2.3.4 Crystal Growth Function and Size Distribution
Diagram 126
2.3.5 Nucleation Density Estimation 128
2.3.6 Comparison of Calculated and Measured
Crystal Size Distribution 131
2.3.7 Effects of Feed Rate and Residence Time: Case
Study of Industrial Plant Size 132
2.3.8 Practical Conclusions 134
References 135
Chapter 3 Process Systems and Calculations 141
3.1 Material Balance 142
3.1.1 Preparation of the Data 142
3.1.2 Calculation Procedure and Case Study 143
3.1.3 Summary and Material Balance for a
1000-ton/day P2O5 Plant 153
3.2 Recycle Acid System 156
3.2.1 Definition and Impact Importance 156
3.2.2 System Instability and Control 156
3.2.3 Calculation Aid: Recycle Acid Nomograms 160
3.3 Heat Balance 160
3.3.1 Where the Heat Comes From 164
3.3.2 Where the Heat Goes 165
3.3.3 Heat Balance Calculation 167
3.3.4 Case Study 171
3.4 Рг°5 Losses 173
3.4.1 Definition of P2O5 Losses 173
3.4.2 Economic Impact 174
3.4.3 Acid Impregnation Losses 176
3.4.4 Mechanical Losses 177
3.4.5 Co-crystallized Losses 180
3.4.6 Unreacted Rock Losses 181
3.5 Fluorine 182
3.5.1 Chemistry of Fluorine 183
3.5.2 Scaling 186
3.5.3 Fluorine Balance in Product Acid Section 189
Contents ix
I
3.5.4 Fluorine Behavior During Storage and Concentration of Phosphoric Acid 191
Notation 193
References 194
Chapter 4 Phosphate Rock Grinding 195
4.1 Grinding Requirements 196
. 4.2 Mechanism of Breakage; Particle Size Distribution 200
4.3 Short History of Grinding 201
4.4 Energy Required to Grind Phosphate Rock 204
4.4.1 Effect of Rock Origin on Energy Requirements 205
4.4.2 Effect of Feed and Product Size on Energy Requirements; Theoretical and Practical Formulations 207
4.4.3 Effect of Dry Versus Wet Grinding on Energy Requirements 213
4.4.4 Effect of Open-Loop Grinding Versus Closed-Loop Operation on Energy Requirements 215
4.4.5 Energy Requirements and the Type of Comminution Equipment 216
4.4.6 Effect of Production Rate on Energy Requirements 218
4.5 Dry Grinding 219
4.5.1 Moisture-Level Tolerances 220
4.5.2 Fuel Requirements for Dry Grinding 221
4.5.3 Power Requirements for Dry Grinding 221
4.6 Wet Grinding 223
4.6.1 Dilution Requirements for Wet Grinding 226
4.6.2 Effect of Wet Grinding on Water Balances 232
4.6.3 Effect of Wet Grinding on Recovery and Operating Rates 233
4.6.4 Effect of Wet Grinding on Ball, Rod, and
Liner Wear 235
4.6.5 Effect of Wet Grinding on Reactor and Filtrate
Strengths 235
4.6.6 Developments in Acid Water Grinding 237
4.7 Closed-Loop Grinding 239
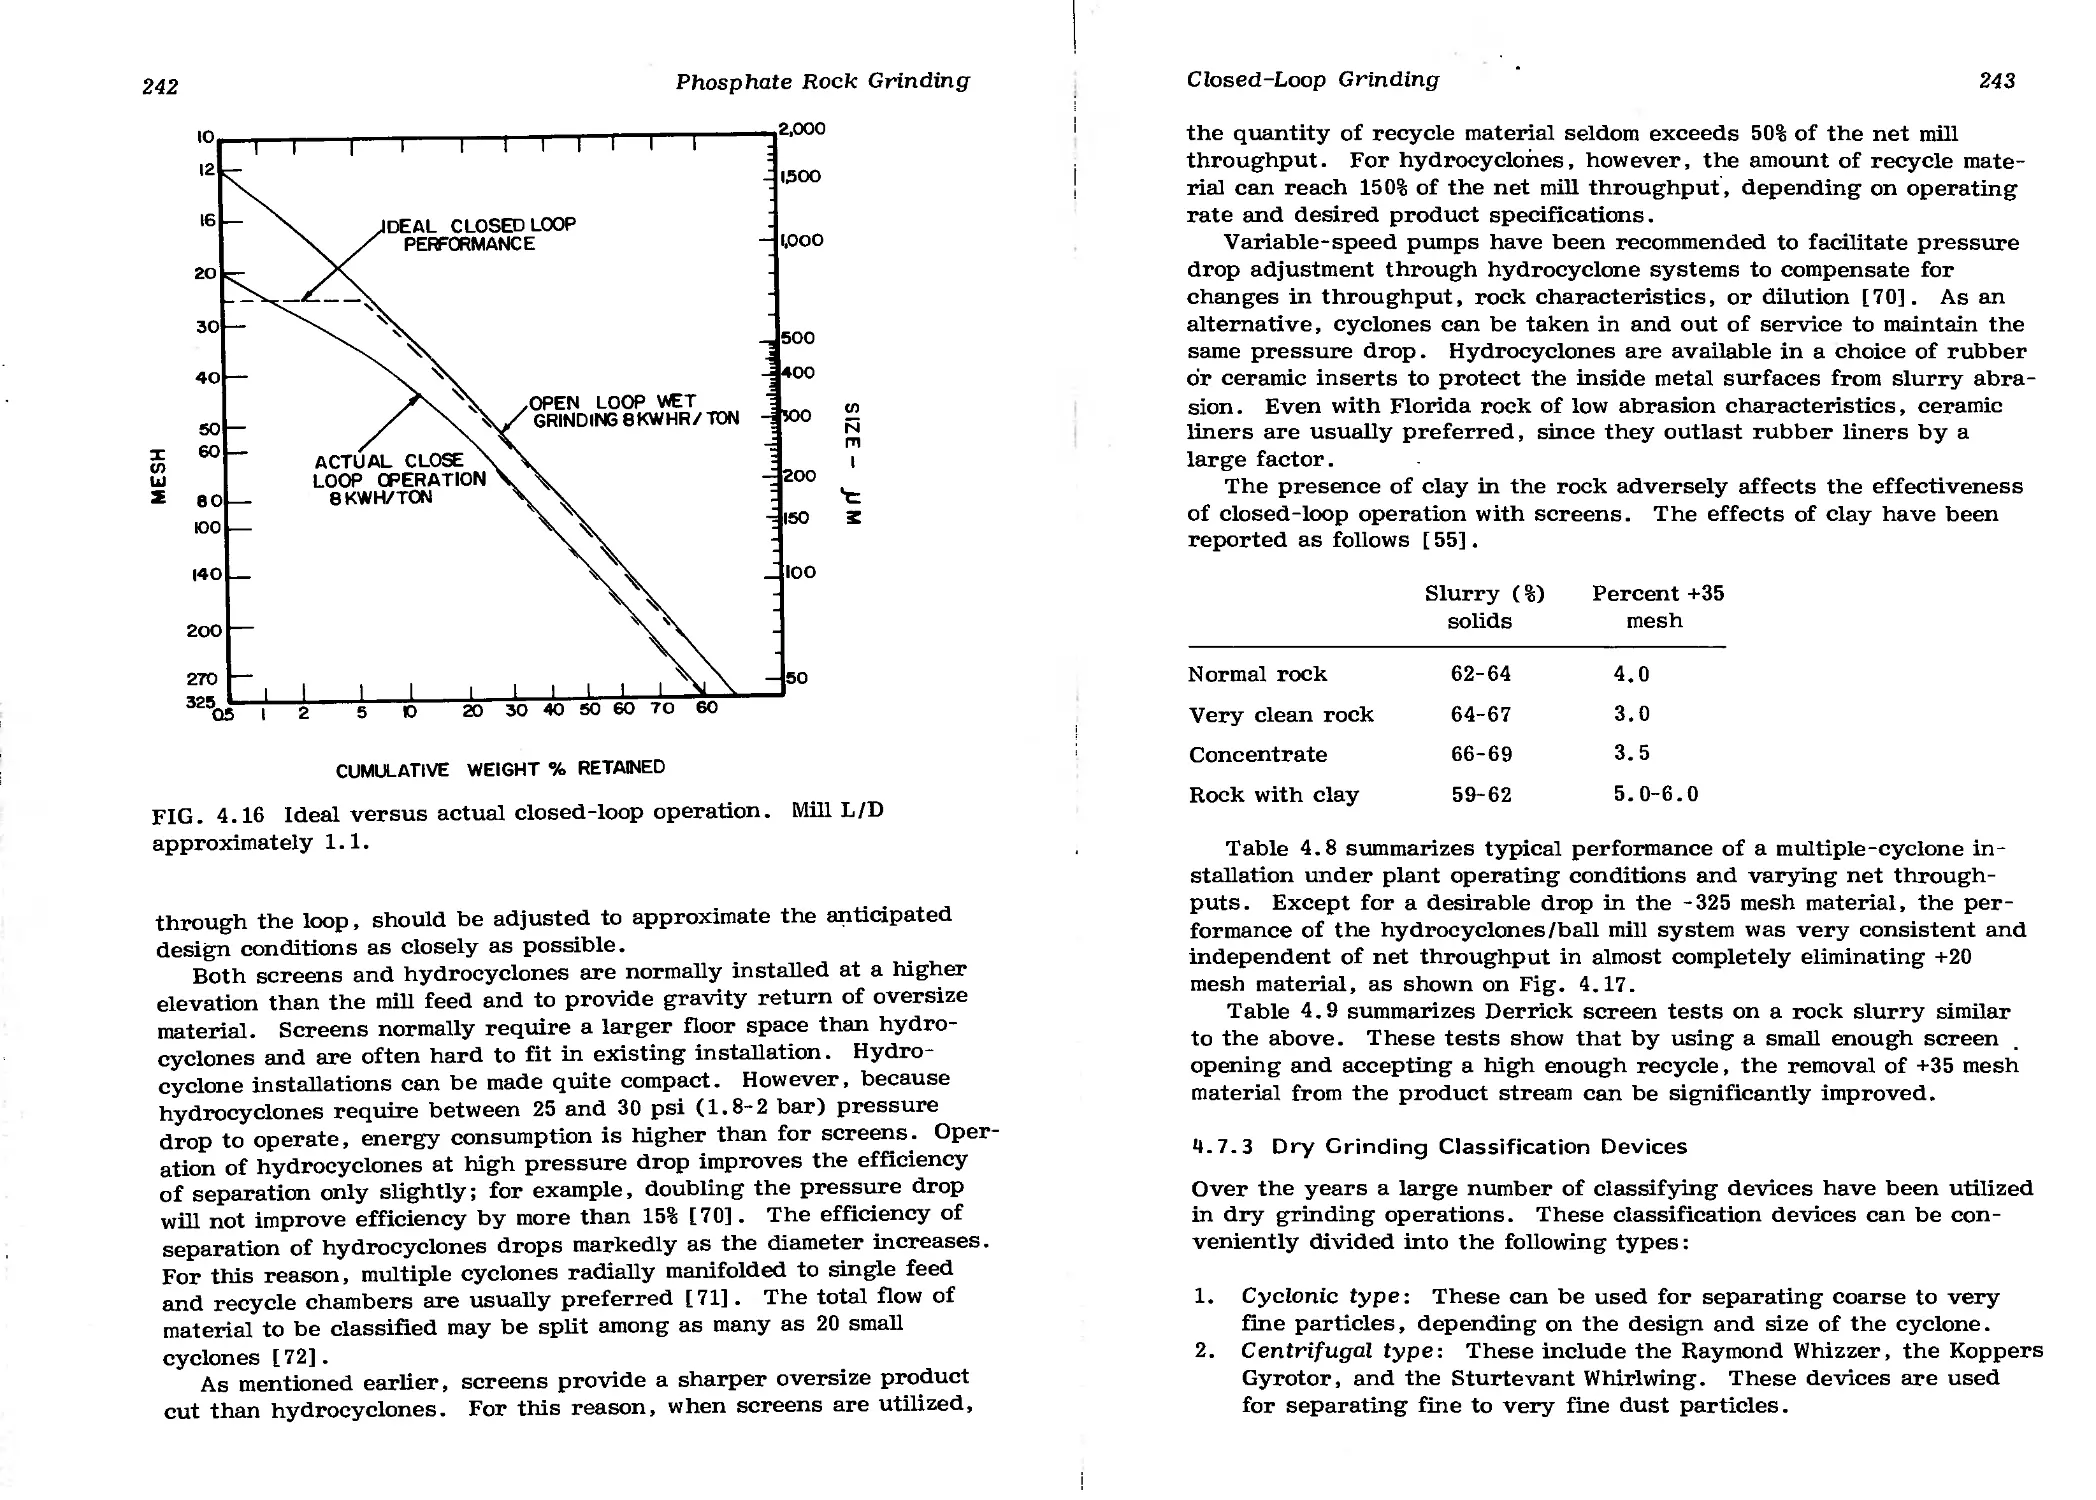
4.7.1 Consistency of Grinding Specifications 240
4.7.2 Wet Grinding Classification Devices 241
4.7.3 Dry Grinding Classification Devices 243
4.8 Ball Mills 245
4.8.1 Operating Parameters 247
4.8.2 Mill Selection 250
4.8.3 Applications 250
4.9 Rod Mills 257
4.9.1 Operating Parameters 257
X
Contents
4.9.2 Applications 258
4.9.3 Mill Selection 258
4.10 Pendulum or Ring Roller Mills 260
4.10.1 Description 262
4.10.2 Behavior of Phosphate Rock Particles
Under Grinding Pressure 265
4.10.3 Grinding Capacity 265
4.10.4 Phosphate Rock Quality Constants 266
4.10.5 Power Consumption 267
4.10.6 Economics 267
4.10.7 Case Study 268
4.10.8 Optimization 269
4.10.9 Capacity Evaluation When Changing Phosphate
Rock Quality 269
4.11 Roller Mills 270
4.11.1 Description 270
4.11.2 Capacity 270
4.11.3 Economics 273
4.11.4 Case Study: Mill Capacity Estimation 274
References 275
Chapter 5 The Reaction System 281
5.1 Raw Materials Feeding and Metering 281
5.1.1 Need for Accuracy 281
5.1.2 Metering Equipment 284
5.2 Slurry Reactor 287
5.2.1 Design Considerations 288
5.3 Agitation 299
5.3.1 The Functions of Agitation 300
5.3.2 Agitation Power, Agitation Flow, and
Impeller Types 301
5.3.3 Power-Speed-Dimension Models 306
5.3.4 Practical Use of Dimensionless Numbers 315
5.3.5 Case Studies 317
5.4 Mechanical Foam Breaking 320
5.4.1 Theoretical Background 320
5.4.2 Diameter, Speed, and Power Relationships
of Foam-Breaking Impellers 325
5.4.3 Upper Blade Setting: Power Consumption 325
5.4.4 Number of Foam Breakers to Install and
the Ratio of Surface Area to Production 326
5.4.5 Freeboard 328
5.4.6 Flow Pattern with Foam-Generating Rocks 328
5.4.7 Combination of Foam Breaking and Cooling 328
5.4.8 Economics 328
5.4.9 Case Study 329
Contents xi
5.5 Heat Removal 331
5.5.1 Heat Effects 331
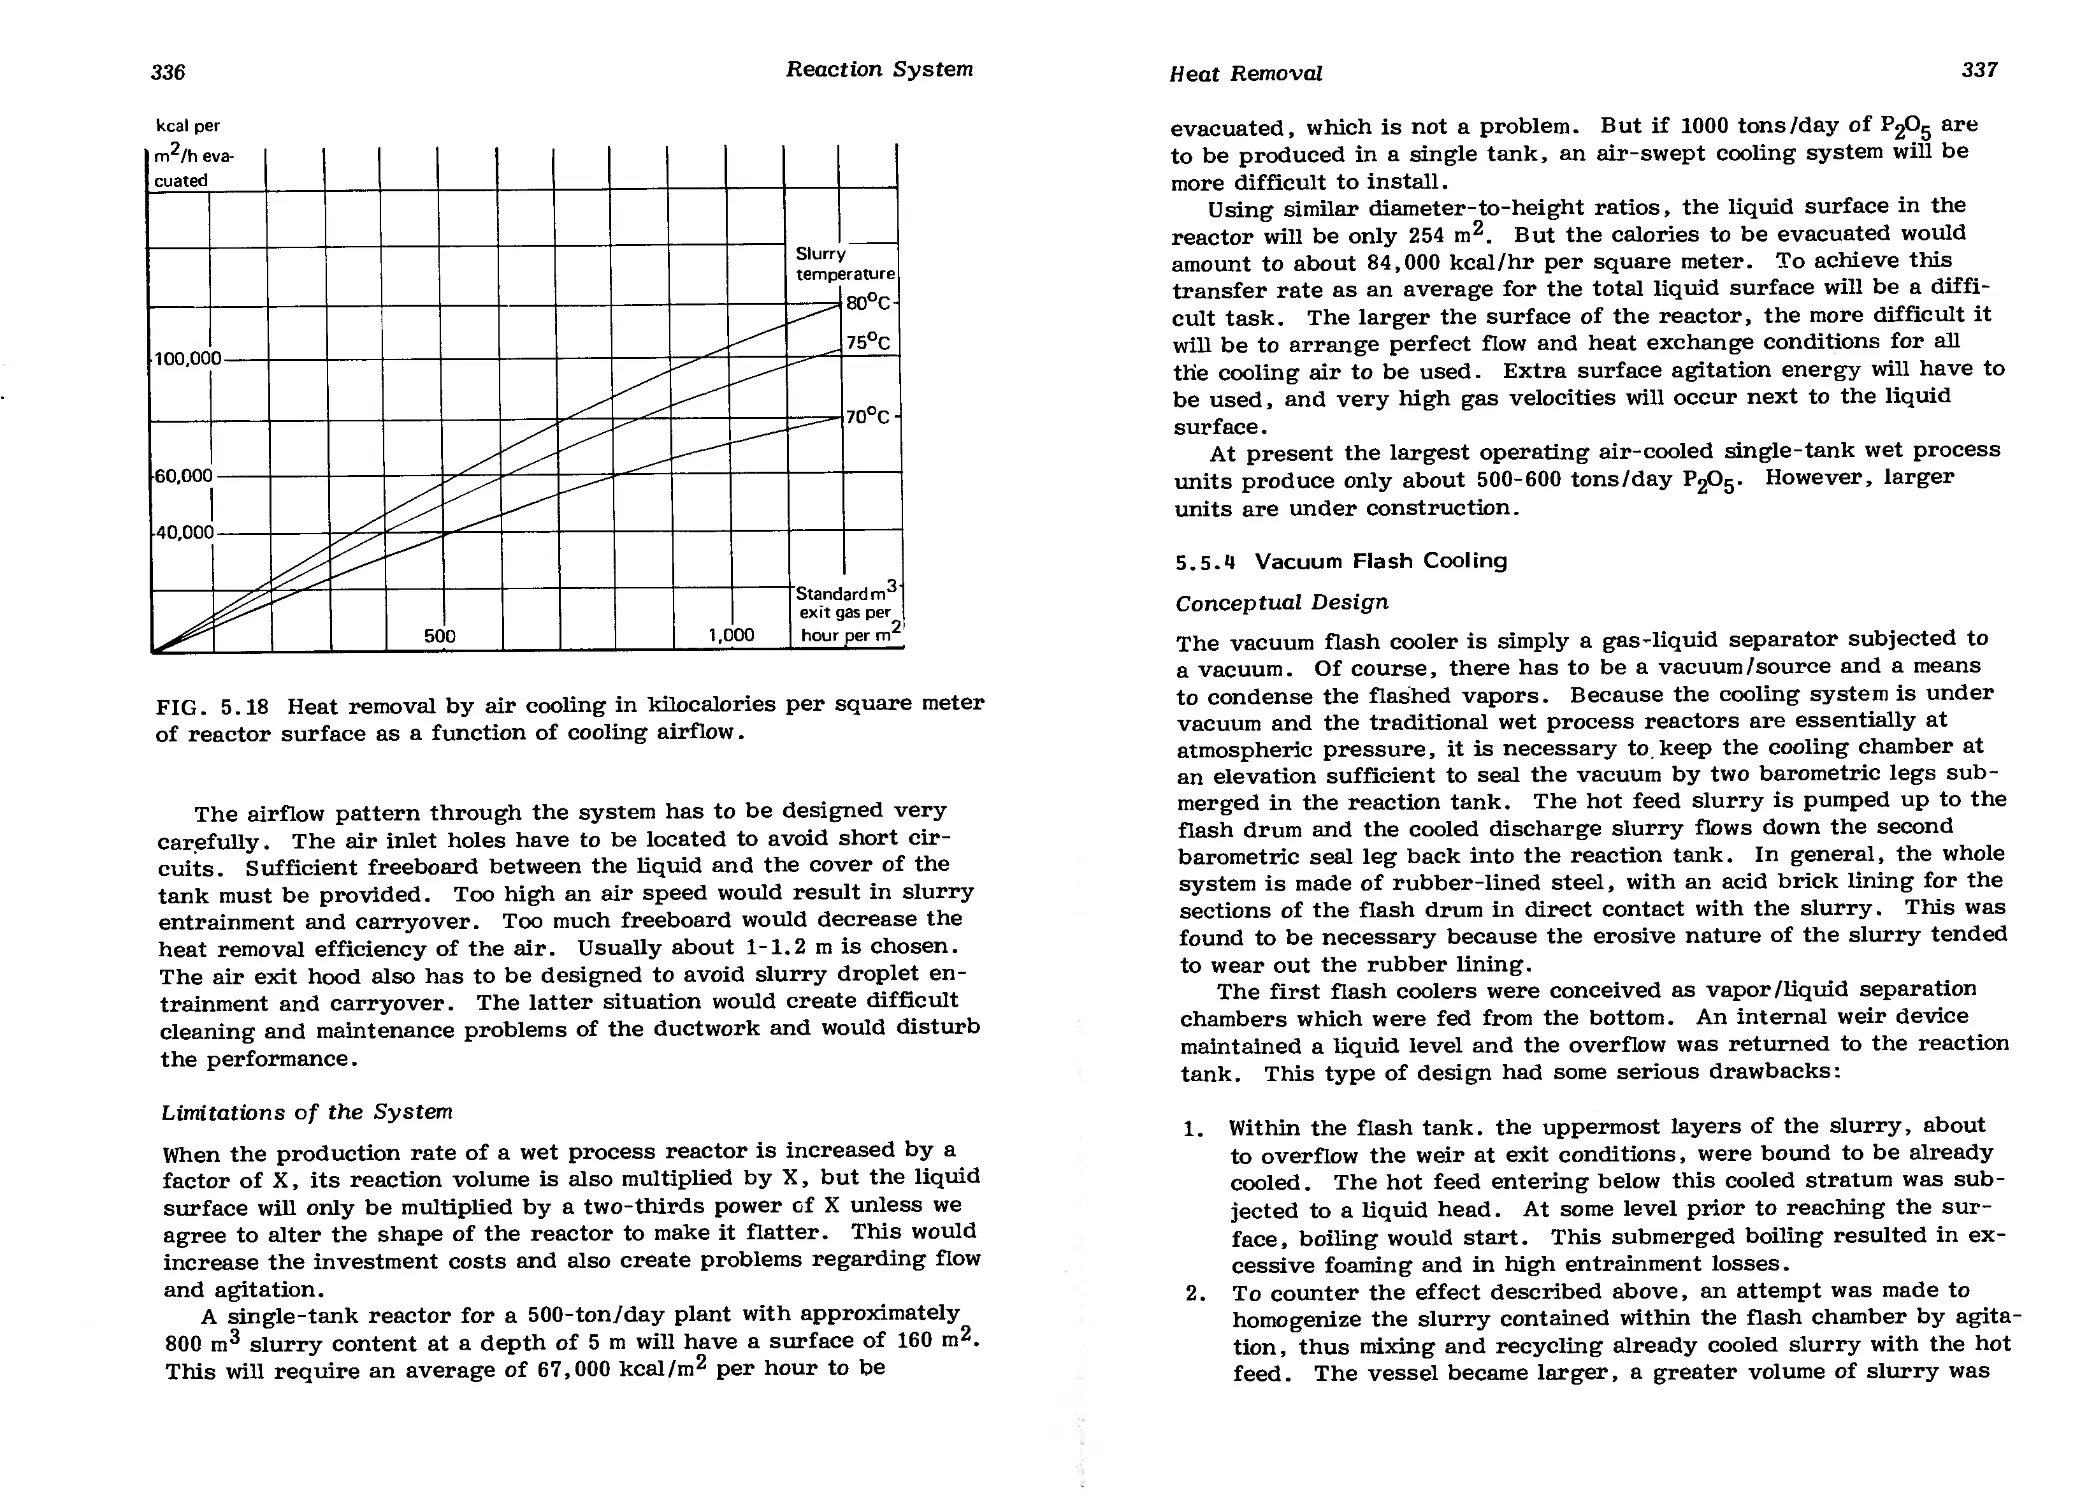
5.5.2 Current Heat Removal Practices Compared 331
5.5.3 Air-Swept Cooling 334
5.5.4 Vacuum Flash Cooling 337
5.6 Pumping and Circulating 340
5.6.1 Choice of Pumping or Circulating Equipment
According to the Design of the Reaction
System 341
5.6.2 Pumping Systems 343
5.6.3 Economics: Investment and Energy Consumption Costs 344
5.7 Fluorine Emission Control 345
5.7.1 Need for and Objectives of Gas Washing 345
5.7.2 Gas Washing Equipment 349
5.7.3 Case Study 361
Notation 365
References 366
Chapter 6 The Filtration System 369
6.1 Fundamentals 369
6.1.1 Aims and Criteria 369
6.1.2 Observations on the Filtration Equation 371
6.2 Factors That Influence Performance 376
6.2.1 Physical Properties of the Slurry 376
6.2.2 Use of Additives to Improve Filtration:
Flocculants 378
6.3 Filtration and Cake Wash Diagrams; PgOg
Balance Throughout the Filtration System 380
6.3.1 Filtration and Wash Diagrams 380
6.3.2 Cake Washing 385
6.3.3 Presuction 387
6.4 The Know-how and Daily Problems of the Operator 389
6.4.1 Running and Filter in Practice 389
6.4.2 Overloading a Filter 390
6.4.3 Crystallization with Poor Filtration Qualities 391
6.4.4 Filter Cloth Plugging: Chukhrovite 393
6.4.5 Scaling of Filter Piping System 395
6.5 Choosing a Filter 397
6.5.1 Types of Filters 397
6.5.2 Selection Criteria 399
References 403
Chapter 7 Acid Concentration Systems 405
7.1 Process Design Considerations 405
7.1.1 Factors Affecting Process Design 407
xii Contents
7.1.2 Single-Stage or Multistage? 409
7.1.3 Heat Balance and Energy Costs 410
7.2 Equipment Design Considerations 414
7.2.1 The Heat Exchanger 414
7.2.2 Vapor Body 421
7.2.3 Condenser 422
7.2.4 Vacuum Pump 423
7.2.5 Acid Circulation Pump 423
7.3 Sup er phosphoric Acid 425
References 426
Chapter 8 Product Acid Impurities and Sludge 427
8.1 Impurities in the Production Acid 427
8.1.1 Process Impurities 427
8.1.2 Common Impurities from Phosphate Rock 429
8.2 Wet Process Phosphoric Acid Sludge 435
8.2.1 How Sludge Originates 435
8.2.2 Composition of Common Sludge 436
8.2.3 Quantities to Be Expected 437
8.2.4 Quality Requirements for Acid 439
8.3 Sludge Removal Practices 440
8.3.1 Final Product Inclusion 440
8.3.2 Double Settling: Underflow Recycle 440
8.3.3 Settling Followed by Underflow Filtration 441
8.3.4 Intermediate Clearing 442
8.3.5 Minimizing Phosphate Precipitation in Sludge 444
8.4 Clarification Equipment 445
8.4.1 Traditional Clarification: Settling Tanks 445
8.4.2 Lamella Thickeners (Inclined Tray Settlers) 447
8.4.3 Filtration 451
8.4.4 Decanter Centrifuge 452
8.5 Uranium Recovery 455
8.5.1 Basis of Extraction Processes 456
8.5.2 Extraction Principle 456
8.5.3 Solvents 457
8.5.4 Strength of the Acid to Be Treated 457
8.5.5 T echnology 458
8.5.6 Main Processes in Use 462
8.5.7 Impact of Uranium Recovery on Phosphoric
Acid Plants 467
8.5.8 Economics of Uranium Recovery Plants 467
References 469
Chapter 9 What to Do with Gypsum 471
9.1 Dispersion into a Moving Body of Water 472
9.2 Impounding on Land 476
Contents xiii
9.2.1 Material Balance 478
9.2.2 Design Considerations 481
9.2.3 Percolation 484
9.2.4 Fluorine Emission 486
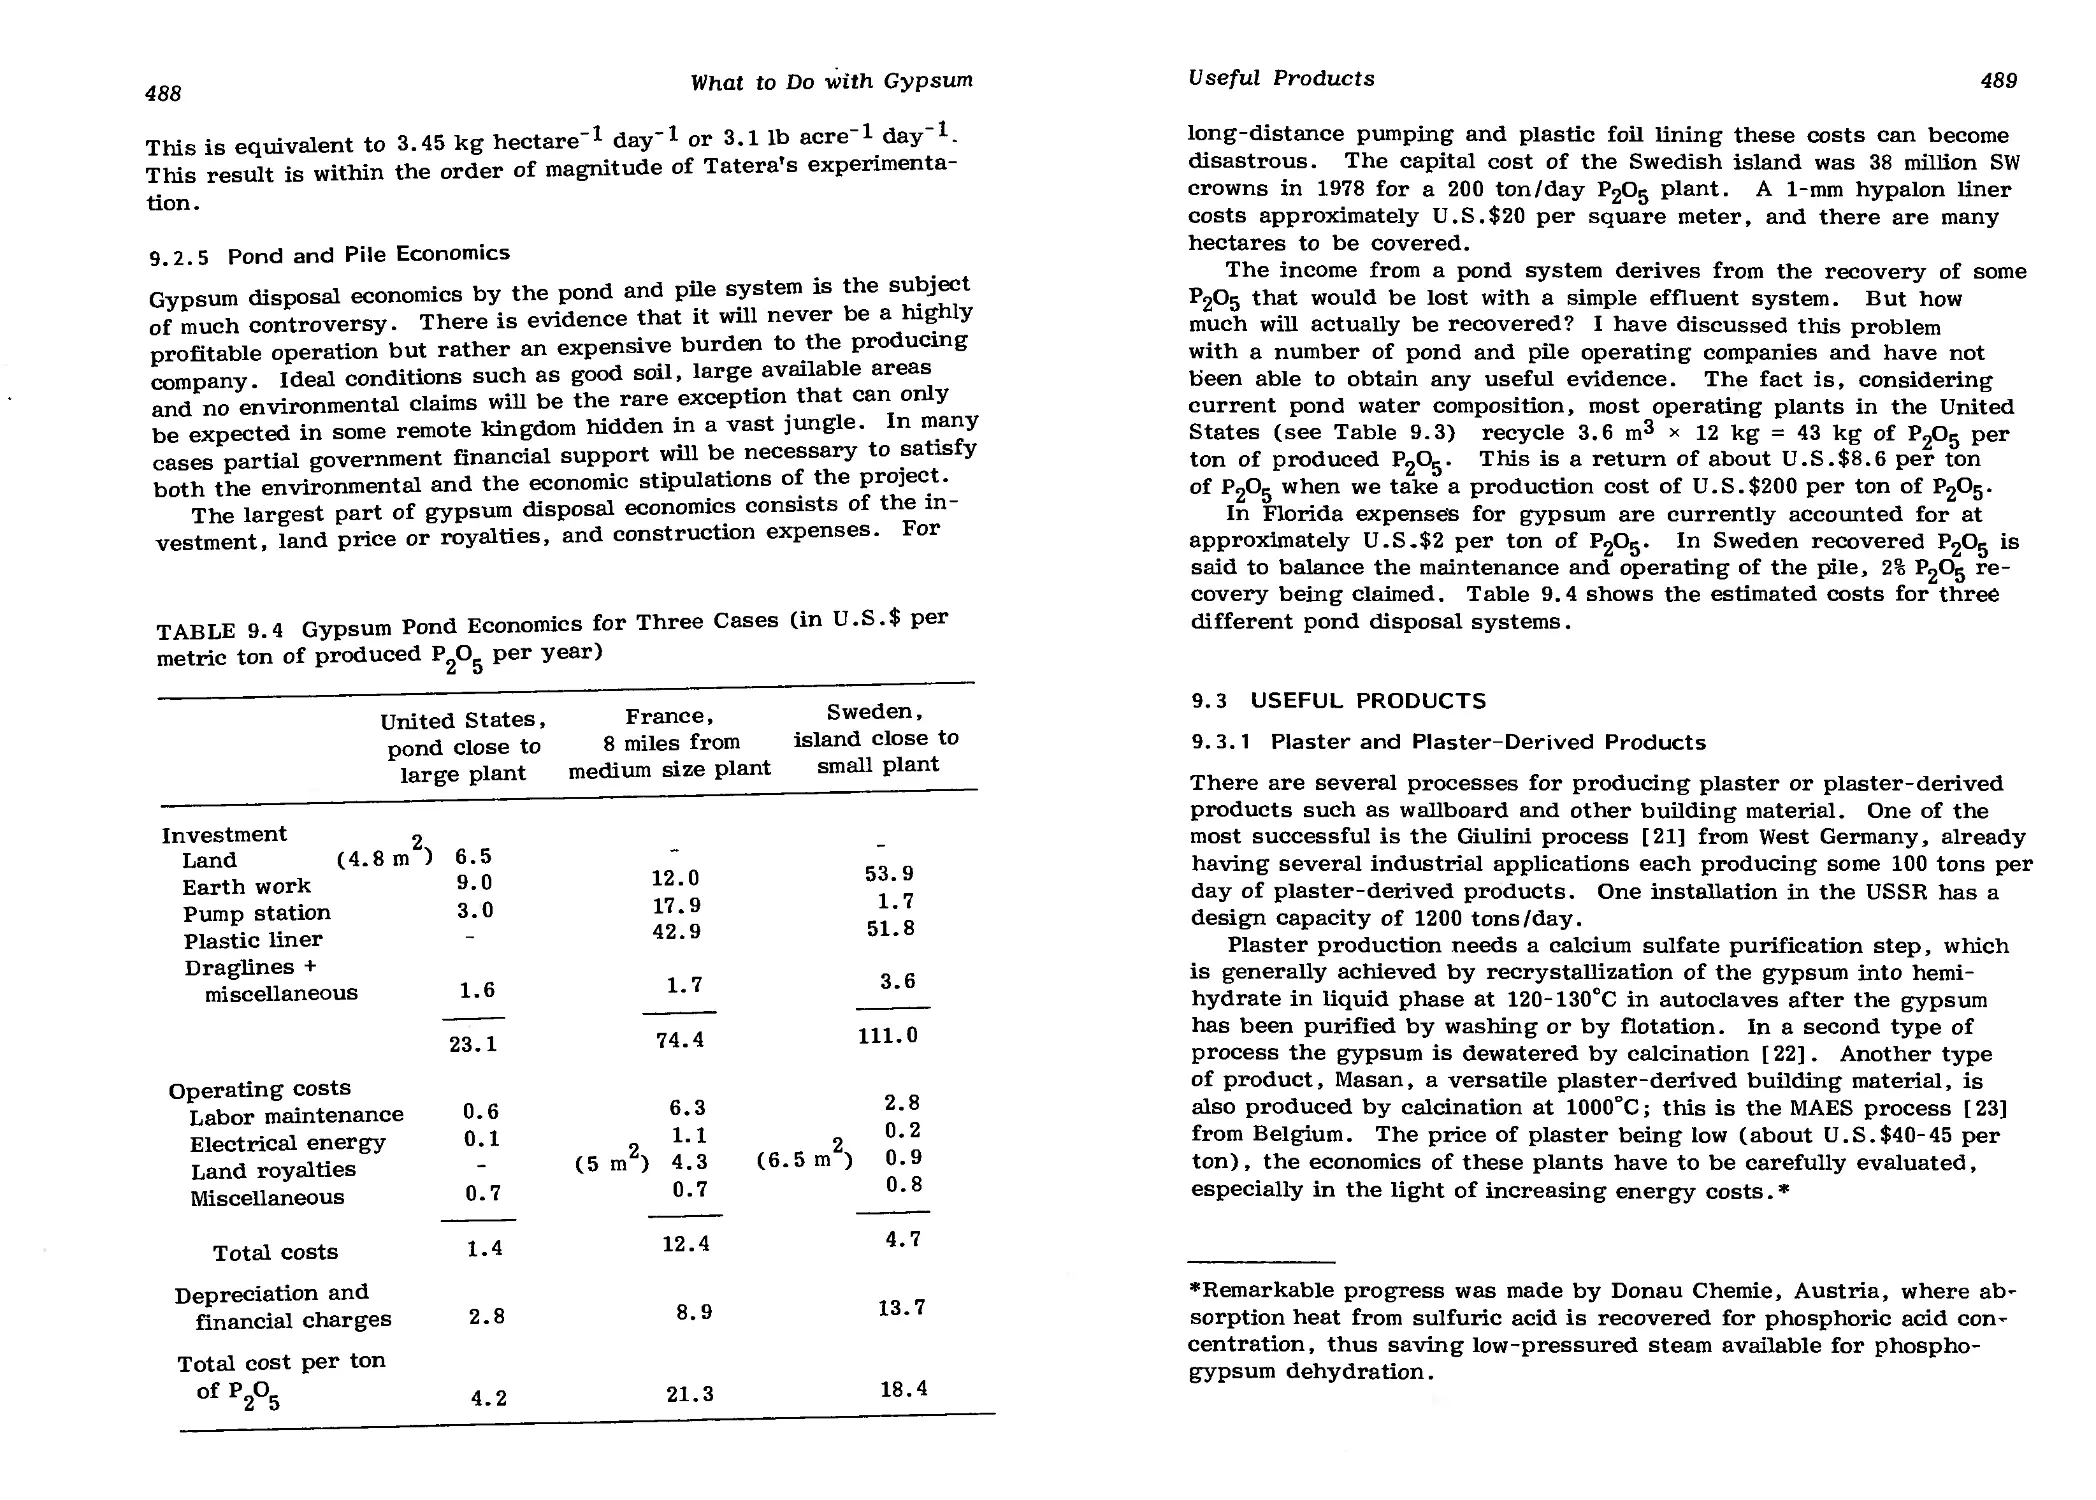
9.2.5 Pond and Pile Economics 488
9.3 Useful Products 489
9.3.1 Plaster and Plaster-Derived Products 489
9.3.2 Cement Retarder 489
9.3.3 Sulfuric Acid and Cement 490
9.3.4 Soil Conditioner 492
9.3.5 Ammonium Sulfate 493
References 494
Chapter 10 Corrosion 497
10.1 Corrosion with Phosphoric Acid Production 497
10.2 Contributing Factors 499
10.2.1 Peripheral Speed 499
10.2.2 Temperature 501
10.2.3 Sulfuric Acid 501
10.2.4 Fluorine 503
10.2.5 Chlorine 503
10.2.6 Reductive Nature of Phosphoric Acid 506
10.3 Instant Corrosion Monitoring 509
10.4 Recommended Alloys for Use with
Phosphoric Acid Production 509
References 511
Chapter 11 investment and Manufacturing Costs 513
11.1 Investment Costs 513
11.1.1 Definition and Site Factors 513
11.1.2 Investment Cost Curves 514
11.2 Manufacturing Costs 517
11.2.1 Cost Components 517
11.2.2 Case Studies 520
11.3 Maintenance Costs 522
11.3.1 Raw Materials 524
11.3.2 Size of Plant 524
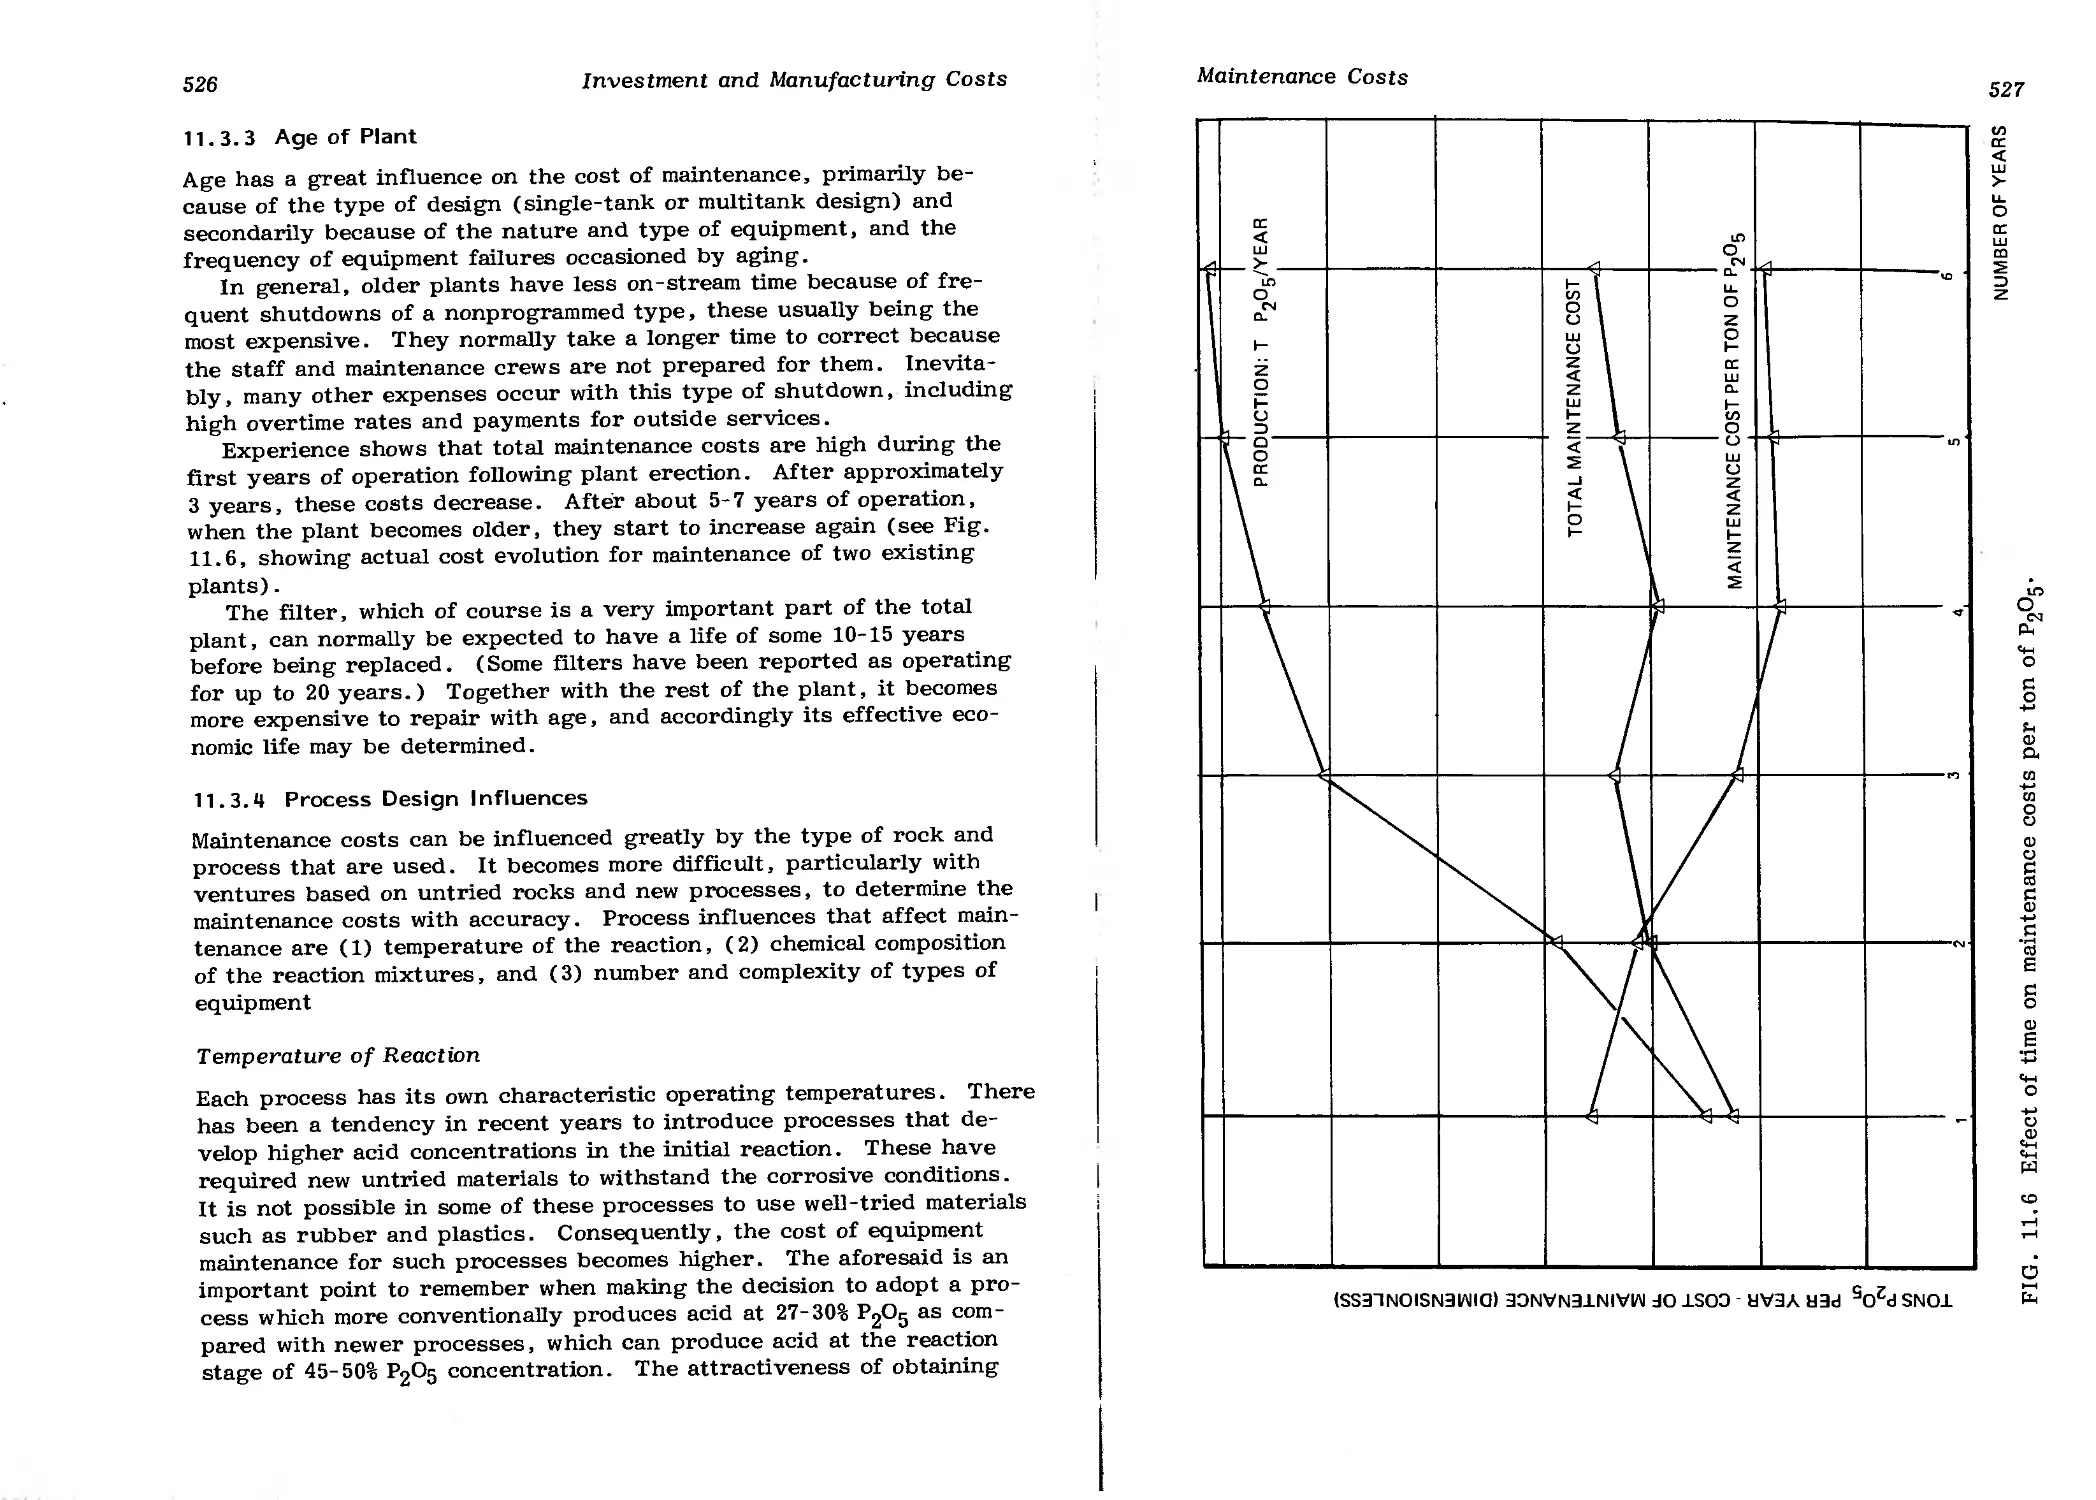
11.3.3 Age of Plant 526
11.3.4 Process Design Influences 526
11.3.5 Geographical Influence 528
11.3.6 Annual Shutdown 529
11.4 Economic Comparison of Different Rocks 530
11.4.1 First Step: Situation Analysis 530
11.4.2 Setting Up the Mathematical Model 531
11.4.3 Cost Comparison Calculation: Case Studies
with Two Different Rock Qualities 535
xiv
Contents
Notation Reference 541 542
Appendix A Phosphate Rock Data Sheets 543
A.l Guidelines for Use 543
A.1.1 Purpose 543
A. 1.2 Information Given and How to Use It 544
A.2 Data Sheets 547
1 Algeria: Djebel Onk 547
2 Brazil: Tapira 548
3 Finland: Apatite Siilinjarvi 549
4A Israel: Zin 550
4B Israel: Oron 551
5 Jordan: Jordan 73/75 552
6A Morocco: Khouribga 70-71 BPL 553
6B Morocco: Youssoufia 74-75 BPL 554
6C Morocco: Youssoufia 68-69 BPL 555
7 Senegal: Taiba 556
8A Togo: Togo 78-80 BPL 2 557
8B Togo: Dagbati 70 BPL 558
9 Tunisia:- Lave Mdilla 559
10A United States: Florida 72 BPL 560
10B United States: Florida 68-70 BPL 561
10C United States: Texas Gulf 72 BPL 562
10D United States: Calcined Double Float
North Carolina Concentrate 563
11 USSR: Kola 80 BPL 564
12 Syria: Khneifiss 68-72 BPL 565
Appendix В Useful Tables and Diagrams 567
B.l Tables 567
1 Price History of Phosphate Rock and
Phosphate Products 568
2 Conversion Table for Common Units 569
В. 2 Diagrams 567
1 Specific Gravities of Phosphoric Acid 571
2 Effect of P2O5 Concentration in Weight
Percent on Specific Gravity 572
3 Specific Heat of Phosphoric Acid 573
4 Effect of P2O5 Concentration and Temperature of Pure Phosphoric
Acid on Viscosity 574
5 Effect of P2O5 Concentration and Temperature of Crude Phosphoric Acid
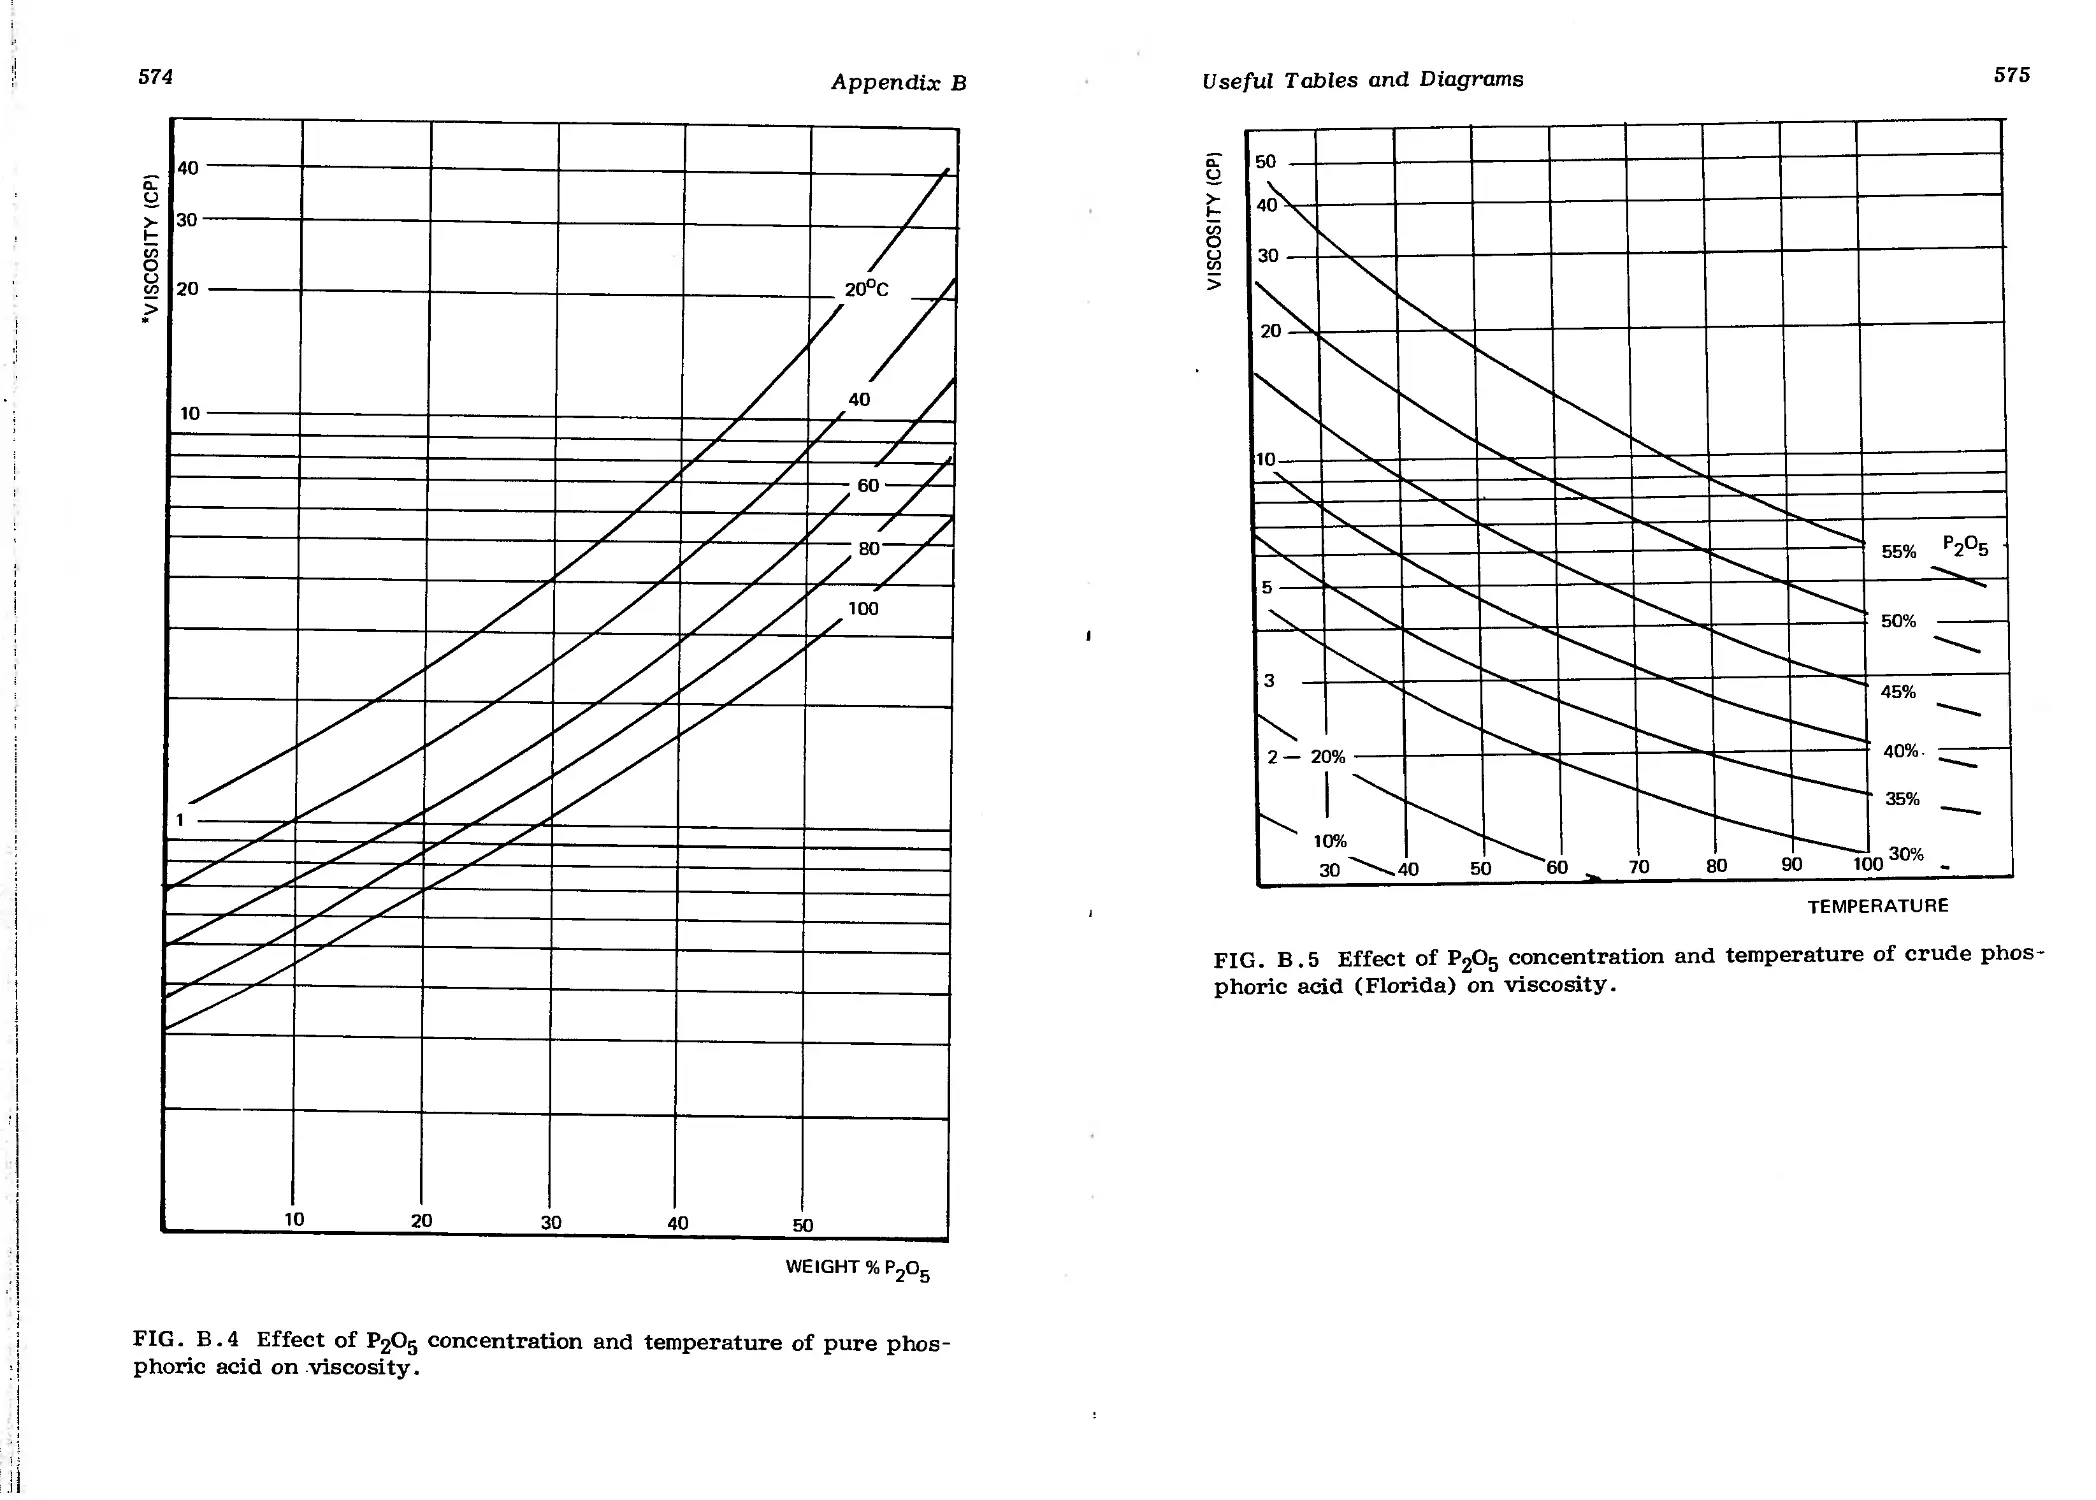
(Florida) on Viscosity 575
Contents
xv
6 Effect of Concentration of PgOg on Boiling Point of Florida Acid at Different Absolute Pressures 576
7 Effect of Concentration on Vapor Pressure of Pure Phosphoric Acid 577
8 Effect of Concentration on Vapor Pressure of Crude Acid (Florida) 577
Index 579
1
Introduction to the Chemistry and Economics of Phosphoric Acid Production
1.1 PHOSPHORIC ACID AND ITS TECHNOLOGY
Phosphoric acid is an important intermediate chemical product. It is used mainly by the fertilizer industry. In 1980 the worldwide production capacity for phosphoric acid yielded about 33 million tons of P2O5* equivalent.
About 90% of world P2O5 consumption involves the fertilizer industry (see Table 1.1) [ 1]. Although there are many technologies available to produce different kinds of phosphatic fertilizers, so that phosphoric acid is not an unavoidable intermediate, about 60% of the P2O5 equivalent contained in phosphate fertilizers is currently processed through a phosphoric acid route.
To produce such large tonnages, it is evident that phosphate ores, the raw material for phosphoric acid production, will be mined in many psrts of the world. Phosphate ores are of two major geological origins:
1. Sedimentary
2. Igneous and metamorphic
The most easily mined phosphate deposits are found in the great sedimentary basins. Studies of the formation of these phosphate deposits that occurred about 70 million years ago have led to many theories [2]; for example, climate, ocean currents, and geographical factors affect the deposition of the phosphates. Generally, these sedimentary
*P2Ot>: phosphorus pentoxide equivalent content in phosphate rocks and phosphatic fertilizers.
1
2
Introduction
TABLE 1.1 World Phosphate Consumption and Application, 1980
P2°5 ( x 1000 t) Percentage
Fertilizer 32,000 90
Detergents 1,590 4.5
Animal feed 1,180 3.3
Food and beverages 240 0.7
Surface treatment 230 0.6
Water treatment 90 0.25
Dentistry, toothpastes 80 0.22
Fire extinguisher 40 0.11
Others 110 0.3
Total 35,600 100
deposits are associated with matter derived from living creatures; thus they contain organic compounds. These phosphate ore bodies, widely varying in thickness, are intercalated with sedimentary stratas of other waste materials or similar ores interpenetrated by gangue minerals [ 3].
From the aforementioned it appears that the sedimentary phosphate ores are subject to many variations and to differing compositions within the same source. Phosphate ores with igneous and metamorphic origin also are subject to wide changes. They have almost infinite varieties of geological structures and complex mineral suites and are subject to a great number of substitution processes within their chemical composition [ 4]. These ores account for approximately 15% of total production.
Most phosphate ores, whatever their origin, have to be concentrated or beneficiated before they can be consumed or sold on the international phosphate market. Commercial phosphate ores or "phosphate rocks" have one property in common: their phosphatic content is a phosphate-fluorine-calcium combination of apatitic structure. The phosphate rock producers express the content of their products as BPL* grade. More recent literature uses the term TPL (total phosphate of lime).
Because of the increase in demand, the original sources of highgrade ore (essentially Morocco, the United States, and the USSR) are no longer sufficient and new deposits are being mined in approximately
*BPL is an abbreviation for "bone phosphate of lime" for CaglPO^. To convert BPL grades into P2O5 equivalent grade, divide by 2.183.
Phosphoric Acid and Its Technology
3
27 countries with considerable variation in quality and composition. The general rise in raw material prices in 1974 meant that certain phosphate deposits and qualities previously considered uneconomical or too low in quality are now being exploited. Consequently, lower-priced, lower-quality phosphates began to find a growing market.
At the beneficiation stage, different techniques may be used to treat the same ore for removal of the gangue and associated impurities. This gives rise to further varieties in the finished ore concentrate .product. It is clear, therefore, that phosphoric acid technology, having to rely on raw materials of great variety and of permanently fluctuating composition, has to readapt itself constantly.
Phosphoric acid can be produced from these raw materials via two major process routes: the wet process, using sulfuric acid attack, and the electric furnace process, using electrical energy to produce elemental phosphorus as a first stage. Because of current energy prices, the electric furnace process, although it can cope with lower-grade phosphate rocks, has been largely abandoned except in cases where elemental phosphorus is needed. The wet process, which is the subject of this book, accounts for 90% of the current phosphoric acid production.
By its nature, wet process technology conserves most of the impurities found in the original phosphate ore, which are then included in the phosphoric acid produced. Consequently, the variety of the phosphage ores influences not only the process used but also the composition and characteristics of the phosphoric acid produced.
Wet process phosphoric acid technology, which will be described in the next sections, essentially comprises sulfuric acid attack and separation of the phosphoric acid produced from the calcium sulfate crystals resulting from the reaction. Both the attack and the separation, which is effected by filtration, are easily characterized by the nature of the ore and its impurities.
Besides calcium phosphate, the phosphate ores contain 10-15 major impurities and another 10 or so trace elements.* Organic matter, also present in many ores, is not included in this estimation. Each element contained in the ore has its individual transfer coefficient into product acid and waste solids.
Without enumerating all the effects on the process due to the impurities , some of the more common ones are:
1. Effect on crystallization: the calcium sulfate crystal qualities, due to the presence of the various impurities, affect filtration rates by a factor of 4 from one phosphate ore to another.
*Mainly heavy metals and rare earth elements.
4
Introduction
TABLE 1.2 Chemical Composition of Some Phosphate Rock Concentrates3
Country Rock name BPL grade P2°5 F C°2
Australia Duchess 68 31.3 3.2 1.5
Brazil Jacupiranga — 35.3 1.3 7.3
Brazil Ar aka — 35.7 2.6 1.1
Brazil Catalao 88 40.3 2.6 0.2
Egypt Abu Tartur — 30.0 3.1 2.8
Finland Silin arvi 80 36.8 2.6 4.3
Iraq Akashat — 31.4 3.8 2.8
Jordan Russeifa 66/68 30.8 3.5 6.6
Morocco Khouribga 70/75 32.0 3.9 5.6
Nauru 81 37.2 3.4 2.4
Peru Sechura 66/67 30.5 2.9 4.6
South Africa Palabora 79/80 36.5 2.5 4.5
Sahara Bu craa 80 36.7 3.8 —
Senegal Taiba 80 36.7 3.7 1.8
Togo — 36.4 3.8 1.6
Tunisia Moulares lave 65 29.6 — 6.8
USSR Chilisaisk 52 23.8 3.0 5.3
USSR Kola 85 39.1 2.9 2.0
USSR Karatau 61 28.0 3.0 6.0
USSR Kingisepp 61 28.0 3.0 6.0
U.S. Florida 68 31.2 3.7 3.8
U.S. Florida 70 32.1 3.7 3.5
U.S. Florida 75 34.3 3.9 3.1
U.S. N. Carolina 72 32.9 4.0 2.2
U.S. Tennessee 74 33.7 3.0 8.6
Vietnam Kamdheng 78/79 36.1 2.2 4.5
aFor a more detailed analysis, see Appendix A.
Source: 1, British Sulphur; 2, World Bank; 3, International Superphosphate Manufacturers Association; 4, Author's files.
2. Scaling: vessels and pipework are subject to deposits of various kinds. Heat transfer coefficients, pressure drop in pipework, are subject to heavy alterations.
3. Sludge formation: some impurities are subject to delayed precipitation in the stored product acid or the final concentrated acid. These are sludges-a difficult problem for the phosphoric acid producer.
Phosphoric Acid and Its Technology
5
So3 Si°2 CaO Al О 2 3 Fe O„ 2 3 MgO Na О 2 Source
— 13.5 44.0 1.4 1.5 0.3 0.5 1
. 0.0 0.8 53.6 0.2 0.3 1.4 — 2
— 0.6 48.0 0.6 2.6 0.1 0.1 4
0.0 0.8 52.9 0.2 0.8 0.1 0.3 4
2.3 2.1 45.0 1.5 1.5 1.0 — 2
0.0 2.7 51.6 0.3 0.6 1.1 0.3 4
1.9 2.0 54.2 0.4 0.3 0.6 — 2
0.8 6.4 50.4 0.3 0.2 0.0 0.5 4
1.9 2.3 51.8 0.4 0.2 0.5 0.9 4
0.0 0.0 52.1 0.4 0.2 0.4 — 2
2.5 2.5 46.7 0.7 0.8 0.6 1.7 4
0.1 1.0 52.0 0.2 0.7 2.0 0.3 4
0.5 — 53.7 0.3 0.3 — — 1
0.0 5.0 50.0 1.1 0.9 0.0 0.3 4
0.3 4.5 50.5 1.0 1.0 0.1 0.2 4
3.3 2.8 50.4 0.4 0.4 0.7 — 4
— — 29.3 — 2.0 0.7 — 1
0.0 2.0 50.5 0.9 0.5 0.1 0.6 4
0.9 — 43.0 — 1.5 2.2 — 1
— — 29.3 — 2.6 0.7 — 1
1.1 9.0 46.7 1.1 1.5 0.5 0.5 4
1.1 8.0 47.2 1.1 1.4 0.5 0.5 4
0.9 3.7 49.2 1.1 1.1 0.3 0.5 4
2.2 — 52.8 0.5 0.8 0.6 1.0 4
— 7.5 47.6 1.8 2.2 0.1 — 1
0.0 0.1 51.2 1.7 0.8 0.3 — 2
4. Corrosion: in spite of the use of exotic alloys, pump impellers and agitator turbines can be subject to rapid deterioration by corrosion.
Many of the impurities, in spite of tedious procedures, cannot be analyzed quantitatively with accuracy, either from the phosphate rock or from the produced phosphoric acid. For example, it is possible for
6
Introduction
a 15 to 25% absolute deviation in iron and aluminum contents, respectively, to be found within the same ore sample as measured by different laboratories.
If the problems listed above characterizing phosphoric acid wet process technology are not discouraging enough, consider, too, the complications from dust, foam, toxic and corrosive fluoride gas formations, and so forth. These prohibitive items not only rule out the delicate equipment and instrumentation usually needed in a modern plant, but also make the industry an attractive cause for environmental protection agencies and others with ecological concerns.
From the foregoing it is obvious that the science of phosphates and the technology of phosphoric acid is somewhat esoteric. Words such as "technology" or "calculation," in this case, have to be employed very carefully. Sometimes traditional calculation methods can be used and sometimes one has to rely on experience and accept a simple estimation based on similar cases.
An understanding of what and how to calculate in phosphoric acid technology is the objective of this book. We hope the reader will derive some advantage from the many years the various authors have spent in the dust and effluent gases of phosphoric acid plants, watching filter cakes and plugging pipes!
Like human beings, phosphates are fascinating; they never behave consistently. They like to be treated differently every time. Once you are married, even if only to phosphates, you need to use a fresh approach day by day.
1.2 CHEMISTRY OF PHOSPHORIC ACID PRODUCTION
USING THE WET PROCESS
The production of phosphoric add by means of the wet process began to be developed intensively following World War II. As a simple transformation of calcium from a phosphate to a sulfate, the reaction is:
(PO ) Ca + 3H SO + 6H О + 3SO Ca • 2H О + PO H (1)
4 2 3 24 2 4 2 43
The reality is, in fact, not as simple because of the technology that must be used. The phosphate attack and the formation of the calcium sulfate take place on their own, so to speak, but the calcium sulfate crystals (gypsum or hemihydrate) then have to be separated from the phosphoric acid that is produced.
This separation must be thoroughly completed since, at the current price of phosphoric add, even a small loss at the filter will show up quickly in the economics of the operation. A properly functioning plant will, under normal running conditions, lose 0.5% of the acid during filtration. This percentage is increased by startups, and the
Chemistry of Phosphoric Acid Production
7
measured average should not exceed 1% (measured average of the acid losses in the liquid effluents that accompany the rejected gypsum, which does not include the losses of combined P2O5 contained in the gypsum).
Good separation at the filter is achieved when crystallization at the reactor is good. This type of crystallization has not, however, proven easy to perfect; several decades of work have been required. The science of good crystallization in a phosphoric medium has been perfected only by means of experimentation, which explains its long, slow evolution. In mixing phosphate with sulfuric acid, early producers were forced to conclude that great caution was necessary in this operation on an industrial scale, for a number of reasons.
The phosphate, being very porous, reacts extremely quickly without allowing the sulfate crystals to grow in a regular manner. The reaction is very exothermic, and the calories must be evacuated since, if the medium is too hot, no more SC^Ca • 2H2O is created; but instead, semi- or hemihydrate or anhydrous material forms, which can recrystallize on the filter. Also, if the reaction becomes too hot, the phosphate is blocked in sulfate shells (coating) and the attacking yield is bad (large-scale losses of unattacked P2O5).
Similarly, one has to work in a relatively diluted medium (approximately 30% P2O5) and with reactive slurries that contain only 25 vol % calcium sulfate. In a more concentrated medium, the viscosity becomes too high and the partial vapor pressure too weak to allow normal calcium sulfate dihydrate reactions, so that other crystals will be formed which do not filter as well as gypsum crystals.
The first wet process phosphoric acid plants built between the World Wars I and П generally produced between 25 and 50 tons of P2O5 per day. The problems of mixing and agitation were poorly understood, so that the reactive media were not really homogeneous and were highly supersaturated. The poor crystals were therefore separated by decanting, an operation necessitating huge volumes of equipment.
I was able to see one of these installations before it was demolished. The reagents were mixed in premixers fitted with great wooden stirrers turning slowly and the reactions were completed in enormous reaction tanks. The gypsum was separated by decanting. The total size of the operation meant that 700 m^ was needed to produce 20 tons of P2O5 Per day in the form of 25% acid by using the high-grade phosphates available at that time. To reduce the problem of supersatura-tion in the premixers, slurry was recycled after the reactions has been completed in a long series of reaction tanks.
The problem of calcium sulfate crystallization within media with a greater concentration of P2O5 has fascinated many researchers and as far back as 1930, Nordengreen took out patents for the manufacture of more concentrated ( 40% P2O5) phosphoric acid by means of the
8
Introduction
formation of hemihydrate or anhydrite (CaSC>4 • O.5H2O, CaSC>4). Nevertheless, this process, like others, often ran into trouble on an industrial scale, and it was not until the 1970s that plants worked well with good yields from crystallizations other than calcium sulfate dihydrate.
It was the Japanese who after much research in this area managed to construct the first full-scale industrial units with an acceptable-yield by filtering gypsum recrystallized from hemihydrate precipitated in the first stage. The idea of having purer gypsum for subsequent use was one of the main reasons for the development of this technique. Natural calcium sulfate, a rare mineral in Japan, is used in the production of cement.
In the 1960s there was a proliferation of hemihydrate-dihydrate processes (or vice versa), most of them involving double separation of the calcium sulfate. The economics of these processes have sometimes been dubious since a 2% recovery gain (U.S.$6 per ton of ₽2°5) and a few percentage points more concentration from plants which often produce a by-product steam that can be used for the phosphoric acid concentration process do not necessarily justify additional investment and increases in maintenance costs.
But difficult goals seem to create human incentives, and in spite of the great number of technical problems and a certain number of industrial failures with a consequent reconversion back to the dihydrate route, about 60 phosphoric acid plants among the total of about 300 plants in the world now work with nondihydrate routes. This is 20% of the total number of plants, but less than 20% of the capacity because most of them are medium-sized or small units. Most of these nondihydrate units, about one in two, use the Japanese Nissan process, a hemihydrate into dihydrate recrystallizing process with one filtration operation. A recent significant event should be mentioned here: a Dutch phosphoric acid producing company had two plants operating simultaneously, one a dihydrate and the other a hemihydrate single-stage process. In 1982 they decided, after considering their specific energy economics, to convert their dihydrate plant into a second hemihydrate operation.
In the field of dihydrate processing, the importance of mixing and agitation gradually improved and, toward the end of the 1960s, a French company developed a plant with a single reaction tank, demonstrating that rapid attack and good crystallization could take place together at the same time, provided that dispersion and the reactive volume were sufficient. The statistical age distribution of the crystals arriving at the filter did not seem to be as important as in the past.
The idea of a single reaction tank was very attractive to engineers, and even those who had believed in multitank operations brought these together in the form of compartments within a single shell while carrying on circulation by means of pumps. The new single-tank reactors
Chemistry of Phosphoric Acid Production
9
allowed their disciples plenty of scope to use their imagination, and extraordinary shapes were patented, ranging from egg-shaped to cigar-shaped. Of these, only the flat cylinder, the rectangular parallelepiped, and the egg have survived in any numbers. The others have more or less disappeared, being too large to find any room in a museum.
The evolution of stirring techniques can be gauged from the amounts of energy consumed per cubic meter in reaction as well as 'from the total volume in reaction compared to daily production. As late as the end of the 1950s, certain engineering firms were still proposing seven cubic meters of reaction volume per ton of P2O5 Per day. Today it is common to recommend 1.5-1. 8 m^ for the dihydrate process. This leaves something in reserve, because many plants work below 1 щЗ when overloaded (1 m^/ton per day represents in theory about 2 1/2 hr of reaction time).
More or less comparable dihydrate techniques have been developed in parallel in five geographical areas: Florida, Belgium, France, England, and Tunisia. Belgium and Florida developed the same process, the Prayon process, which accounts for the largest in size and the greatest number of dihydrate plants throughout the world (almost half of total phosphoric acid production). The Rhone-Poulenc process from France comes next with some 50 plants, followed by Jacobs-Dorr (formerly Dorr-Oliver) with 27 plants. Fisons, England, and Tunisia follow with the SIAPE process developed at Sfax in Tunisia, which is especially adapted for low-grade, foaming rock (Fig. 1.1). A new process, the Gulf-Swenson isothermal process, appeared some years ago and is utilized by six plants.
During the late 1960s and the 1970s plant sizes increased and a 1000-metric ton P2O5 plant gradually become the standard size. But the increasing size of the production units brought with it problems associated with the relative decrease in surface area. Cooling, which was previously carried out by bubbling with air boxes (a crude system that should not be allowed outside the laboratory, if at all), is a function of the surface area of the slurry. The system demands a lot of energy (large volumes of air have to be forced through the slurry)
FIG. 1.1 View of the SIAPE plant in Sfax, Tunisia. (Courtesy of SIAPE, Sfax, Tunisia, 1980.)
10
Introduction
and the resultant thermal exchange is poor. Consequently, it was necessary to discharge large volumes of polluted air (70,000 m3/hr for every 100 tons of P2O5 per day.
At the same time, still using air circulation, ways were developed to get rid of the calories by spraying the slurry through the air, which is more economical of energy. Nevertheless, cooling still needs a certain amount of air and, in the reactor, the necessary surface area-to-volume ratio tends to bring large plants close to the geometric norms of Camembert cheese.
Vacuum cooling, in which the slurry is pumped into a vacuum chamber, where evaporation (whence the cooling) is instantaneous and not related to the surface area of the reactor, allows systems to be enlarged more easily. However, it is more expensive, and large quantities of polluted cooling water are extracted instead of air.
Filtration techniques have improved greatly thanks to improvements in filters, especially circular filters, which can be sized to suit production capacities of 1200-1800 tons of P2O5 per day and even more with new projected filter sizes. Counterflow washings with hot water being recycled one or two times produce very good filtration recoveries. The appearance of plastic materials in the 1960s meant that one could replace stainless steel tubing and separators, thereby reducing capital and maintenance costs.
Filter speeds are now higher and, since the rate of filtration increases with the speed of revolution of the filter, it has been possible to increase substantially the number of tons filtered per square meter of effective filtration area. A filter revolving at one revolution every 4 min will filter 1.4 times more per square meter than a filter turning once every 8 min.
This fact, combined with improvements in filter cloth, means that it is now easy to produce 7 tons of P2O5 per square meter (at a speed of one filter revolution every 4 min) with a Florida phosphate, and with a filtration recovery greater than 99%, whereas 20 years ago this figure would have seemed a daydream in spite of the quality of phosphates, which was then quite superior.
Current developments deviate slightly from the direction that phosphoric acid techniques had long been following. This is due to the appearance of poorer quality raw materials, which are sometimes different in their origins. As a result of price increases, numerous deposits which were known but not previously exploited for reasons of quality or profitability are now supplying increasing tonnages, mostly in national markets. As a result, new plants have to be simple, robust (often the new minerals are more corrosive), and easy to operate (the local farmer should be able to operate them after suitable retraining) (Fig. 1.2).
These new developments have given added impetus to the dihydrate process which 15 years ago was thought to be doomed to slow extinction because of more elaborate processes. Today, even with exotic
Raw Materials
11
FIG. 1.2 Overall view of SAEPA complex producing phosphoric acid in Gabes, Tunisia. (Courtesy of Heurtey Industries, Paris, 1979.)
newcomers appearing in the phosphate rock world market, it is still a reliable process capable of guaranteeing economical production of phosphoric acid.
1.3 RAW MATERIALS
1.3.1 Phosphate Rocks
World Phosphate Rock Production and Resources
In 1981 the world's phosphate rock production was estimated to be 138 million tons of commercial ore. Phosphorus is the eleventh most frequent element in the earth's crust. There are some 200 minerals containing more than 1% P2O5, but the most important for the phosphoric acid industry is the Apatite group [ 5]:
Cai8(P°4)6-x <CO3>X (OH’F)2X
If mined at 1975 prices, the world reserves of commercial-grade phosphate rock would be 117,000 million metric tons.* Consequently, the current growth rate for phosphate rock production should not be limited by considerations for scarce ore deposits.
As mentioned previously, there are two main types of Apatite deposits: sedimentary and igneous. Sedimentary deposits are the most important for phosphate rock production; about 85% [6] of the present
♦Based on data from the U.S. Bureau of Mines.
12
Introduction
world production is of that origin. Both sedimentary and igneous phosphate ores are associated with a large number of impurities.
Sedimentary rocks exhibit a wide range of chemical composition because of the various types of associated gangues. As compared with igneous ore, sedimentary rocks contain more carbonates and fluorides and usually more iron and aluminum. They present as a porous material and offer a large surface for chemical reaction. Most of the time they contain organics, which are responsible for the consequent coloring and foaming that occurs in the acid and finished products.
The largest sedimentary rock mining areas are in Florida and Morocco, both areas producing together about 60 million tons of commercial rock. Igneous rocks are produced mainly in the USSR (Kola), South Africa, and Brazil.
Mining and Beneficiation
To bring a phosphate rock onto the international market, the ore has to be mined, concentrated, and transported to the nearest port, from where it is shipped to a phosphoric acid plant or some other type of phosphate-consuming industry. Minability of a deposit from an economic point of view is possible when the sum of the costs of these operations fits the current economics of the phosphate industry and when the phosphate rock meets a certain number of quality standards.
Mining is done by either open cast mining or underground mining. Open cast mining (Figs. 1.3 and 1.4) consists of removing the overburden covering the phosphate bed and recovering the ore by mechanical shovels or by hydraulic methods. The economics of open cast mining depend essentially on the thickness of the overburden layer and the ore bed as well as the yield of recovery of the P2O5 contained in the mined ore bed.
3
Economic conditions can allow up to 1.5-2 m of material to be removed per ton of reclaimed ore. When the overburden is too large, underground mining has to be chosen, which has been done, for example, in Tunisia, Jordan, and Egypt, and for the igneous Kola rock in the USSR (Figs. 1.5 and 1.6).
Beneficiation or upgrading of the phosphate ore has called for a number of different techniques. In the most favorable cases, to reach commercial grades of some 30% of P2O5, only screening and drying is necessitated (e.g. , in Morocco, Nauru, and Christmas Island). However, in most cases the ore quality is not that good and removal of some by-product impurities has to be undertaken. For sedimentary rock, in most cases, suitable techniques for economic ore concentration are: crushing and screening or grinding, followed by pneumatic particle size selection and washing and desliming by hydrocyclones or classifiers. These techniques are based on particle size selection. The phosphate ore particles usually occur within particle size ranges between 60-80 pm and 1000-1400 pm.
FIG. 1.3 Removal of overburden in Togo. (Courtesy of Compagnie Togolaise des Phosphates, Senegal, 1980.)
FIG. 1.4 Open cast mining in Morocco.
13
14
Introduction
FIG. 1.5 Old-time underground mining in Tunisia. (Courtesy of Compagnie des Phosphates de Gafsa, Tunisia.)
Flotation, another ore concentration technique, also is applied with phosphate ores. It can be used when silica has to be removed from the ore. Most igneous rocks are beneficiated by flotation. Calcite (СОзСа), a very frequent by-product of phosphate ores, is difficult to separate by flotation.
Raw Materials
15
A less frequent technique is calcination. It is sometimes selected to destroy calcite, but even though CO2 is released, CaO remains with the ore and is not easy to leach out by washing. Calcination also destroys organics and prevents foaming in the later chemical rock treatment; therefore, it is still used in several plants (e.g., in Israel and North Carolina) (Fig. 1.7).
Preliminary Chemical Valuation
The ideal phosphate, without impurities and giving high filtration rates and low sulfuric acid consumption factors, does not exist. Each one has its own character. "Phosphate is a living ore," said J. Frochen, a French expert, and this is what makes phosphate technology so diverse and variable according to the phosphate ore origin. Each rock has its own behavior when ground, attacked, crystallized, and filtered. The resulting phosphoric acid will have its own color, viscosity, and impurities. The impurities contained in the phosphate rocks are the main responsible factors for the individual behavior of each ore.
FIG. 1.6 Modern underground mining in Tunisia. (Courtesy of Compagnie des Phosphates de Gafsa, Tunisia.)
16
Introduction
FIG. 1.7 Phosphate rock beneficiation by calcination in Israel.
Usually, when considering a phosphate rock as a potential raw material, the first approach is to analyze its chemical composition, i.e., the P2°5 content and its impurities. This permits only a very preliminary assessment. The following criteria concern the most common impurities. Detailed evaluation of the effects of the impurities will be seen in Sections 2.2.6, "Effect of Impurities," 3.5, 3.1.6, 5.7, 6.2.2, 8.1-8.5, 10.2, and Appendix A. The preliminary criteria for appreciating the quality of a rock depends on the final product we want to manufacture. To produce phosphoric acid, the main criteria for phosphate ore are:
P2O5 content or TPL (BPL) grade: when above 33% P2O5 (72 TPL), up to 38% P2O5 (83 TPL), or even 39% (85 TPL) the rock is considered as a high grade. The current grade is 30-33% P2O5 (65-72 TPL). From 26 to 30% (57-65 TPL) is considered low grade. There is very few commercial grade below 26% P2O5 (56 TPL).
CaO content: affects the sulfuric acid consumption. Each percent of CaO needs an equivalent of 17.5 kg H2SO4 per ton of rock. High CaO has an economic effect only. Relatively pure acid can be produced from ore containing very large amounts of calcite.
Fluorine: usually occurs in sedimentary rock as 10% of the P2O5 weight. Fluorine can be a corrosive component if not enough reactive silica is also present. With a high sodium content (1% or more) most of it will precipitate during the phosphoric acid reaction. About half the remaining part in the product acid escapes when concentration by evaporation occurs.
Raw Materials
17
SO3 (sulfates): only a dead weight. The existing SO3 in phosphate rock will save the corresponding amount of sulfuric acid during the acidulation.
Chlorine: an undesirable impurity, because of corrosion danger. Usually becomes dangerous beyond 0.1%, sometimes only at higher values because its corrosive action is enhanced by interactions with other impurities.
SiO2'- as quartz, only a dead weight. As reactive silica (from clays), an undesirable obstacle to filtration. Needs flocculant treatment of slurry.
Д12Оз and Ке2Оз: not a problem during phosphoric acid manufacture but afterward when using the phosphoric acid. Sludge formation with the concentrated acid; builds water-insoluble components in the phosphate fertilizer. Usual upper merchant-grade limit to be considered:
Al O„ + Fe O„
2 3 2 3
P О
2 5
0.08 - 0.1
MgO: stays with the acid phase. Increases viscosity strongly. MgNH4PO4 formation when the acid is ammoniated. Difficult manufacture of superphosphoric acid beyond a certain threshold.
Na2O: precipitates as Na2SiFg from the acid.
Organics: foaming during reaction, dark cloudy solids suspended in product acid.
Trace elements: can affect crystallization and recrystallization by adsorption on crystal surfaces (can be dramatic in case of nondihy-drate processes with recrystallization). They may have toxic effects in specific final products (animal feed or fertilizer).
Production Costs, Sales Prices, and CIF Prices
for Phosphate Rocks
Production Costs. The production cost analysis for commercial phosphate rock can be assessed by considering the following items:
1. Mining: removing of overburden or underground operations, excavation of the phosphate ore
2. Transportation: from the mine to the beneficiation plant by truck, transportation belt, or liquid pumping
3. Beneficiation: crushing, screening, washing, flotation, and calcination
4. Waste disposal: slimes, tails, to be piled or settled
5. Utilities: water, energy supply, and so forth
Гос nyC-. • науч..о-т хкн . 6 < •(' <
18
Introduction
6. Transportation to loading port and storage: truck, railway, conveying belt, and so on
7. Administrative taxes and miscellaneous costs
8. Financial charges: depreciation and interest
Whereas it is easy to obtain comprehensive cost sheets from mining operations in Florida, it is rather difficult to obtain these figures from other countries, especially when the mining operation is government-owned. Consequently, not much information is available from the literature. Besides, it is very difficult to give a general view of phosphate rock mining costs. There are wide variations because of the geological nature of the deposits and the type of mining used. The overburden to be removed can be very little or as high as 25-30 m. The thickness of the ore bed, the composition of the ore, the transportation distance between the mine and the beneficiation plant, and the yield of recovery during beneficiation bring a lot of additional cost variations. Even within a given mine, the costs can vary widely from one deposit to another because of these factors. Table 1.3 shows some mining characteristics of six major phosphate deposits.
In some countries taxes on mining have been raised, such as the severance tax in the United States, which accounted for as much as U.S.$2/ton of concentrate in 1982.
The total investment cost for a rock mine adds another variable cost factor. Whereas a figure of U.S.$50/ton of phosphate rock concentrate produced annually can be considered economical for a new mining site, some new projects account for as much as U.S.$180-200/ton.
Having described the difficulties in getting a general cost estimate for mining and beneficiation, I do not want to leave this section without attempting to give a picture of the production costs. Table 1.4 shows, for each of the listed items, low, mean, and high expenses that could be made available from operating mines and implemented projects. Nevertheless, the numbers from Table 1.4 have to be used carefully. It is evident that there are very few mines operating exclusively under favorable conditions—low expenses—and there will evidently be no mine with all unfavorable conditions—high expenses. Among those with unfavorable economic conditions are the underground mining operations in Tunisia, which also have high beneficiation costs and long-distance transportation to the loading port and the Brazilian Valep mine, operating in a very remote place with a low ore grade and, consequently, heavy beneficiation and transportation costs.
It is evident that depreciation and capital charges are subject to subsequent variations. Furthermore, they are difficult to estimate for old sites or extensions of old sites with existing infrastructures. In these cases, the capital costs can be substantially reduced. Consequently, the numbers from Table 1.4 are not simply additional costs. Actually, the effective production costs of the major producers, including depreciation and financial charges, range approximately between U.S.$15 to U.S.$30/ton of commercial ore concentrate.
Raw Materials
19
со
'со
о
Q
Ф
Л
со
о
о
’аГ
Е о ел
CO
CO
ca
ca
Ы) g c
Ы ►J CQ
o¥=
ф тз аз
Ьл
Ф о с
О Ф О -ГН ф о ей О
ф
к о
аз
е ф о а
о
аз
О
ф
О
Ё
ф
ф
О
со со ф с X о 2
ф Ы) аз
Ф >
E
Ф
Ф > о
о
Ф
со О Л ф Q
Ф
аз
о
аз С
О
ей
О
03
аз л
аз ел
о
О
2
о Jh О
о
аз
& с <
20
Introduction
TABLE 1.4 Phosphate Rock Production Costs Items (in U.S.$)
Favorable conditions Mean Unfavorable conditions
Mining 2-5 Opencast, Togo Jordan, Florida 6-9 Morocco 10-15 Underground (Tunisia)
Transportation 0.5-0.8 0.8-1.2 1.2
Beneficiation 1-2 Togo 2-5 Florida 5-10 Senegal-Tunisia
Waste disposal 0.2 0.3-1 2
Utilities 0.5 1 2
Transportation to loading port 1 1-2 6-11 Tunisia-Jordan
Port loading costs 0.5 0.5-0.75 1-2
Administrative taxes and miscellaneous costs 1 1-2 2
Capital costs per annual ton of rock produced 40-50 Florida-Morocco 50-80 N. Carolina Tunisia 80-200 Brazil
Capital charge per ton or rock 4-6 5-8.8 8-22
Sales Prices. Until 1972, phosphate rock was sold at very low prices. The general price increases for raw materials and energy have induced a considerable phosphate rock price escalation ending at its peak in 1975 with a 30% drop in phosphate fertilizer consumption in developed countries (see Fig. 1.8 and Table 1 of Appendix B). This was followed by a subsequent price leveling. Between 1977 and 1980, consumption had recovered and the initial growth rate of 5% seemed to be reconfirmed. But another attempt in 1980/81 to re-increase to higher prices by an additional U.S.$11-18 on FOB* basis, this time initiated
♦Free on board: price for phosphate rock loaded on board vessel in export harbor.
Raw Materials
21
FIG. 1.8 Phosphate rock FOB, price variation.
by the U.S. phosphate rock producers, failed and turned into another setback in phosphate fertilizer consumption. This time, the compulsory effect of the major economic factors—high interest, high U.S. dollar currency rate, and sluggish fertilizer markets-have led to a very severe fall in consumption and prices for both finished products and raw materials.
22
Introduction
The 1982 FOB price level for 70-72 Florida rock, for example, has fallen to about U.S.$33 and the same grade of Morocco rock to U.S.$38 (both prices to meet a common CIF European port price).
Price Variations Related to the P2O5 Grade and Composition of Commercial Rock. It is evident that phosphate rock prices are subject to variations according to their P2O5 grade. These price levels are derived from the official price lists.
For 1981, for example, Florida rock prices and grades were listed as follows:
Price (FOB) in
Grade (BPL) U . S . $ /metric ton
73-75 70-72 68-70 66-68 64-66 49-51 46 44-46 42-44 40
Physical qualities, phosphate rock composition, and impurities also affect the prices, but these variations are to be negotiated case by case because they are related mainly to the purchaser's plant economics.
The factors subject to price reduction can be items such as dust formation (size analysis when plant is close to residential area), grindability (plant with bottleneck at grinding section), CaO/PgOj ratio (sulfuric acid consumption), organics (foaming, color of acid), iron and aluminum content (sludge formation), heavy metals content (animal feed), and others. In these cases, a discount on the phosphate rock price must compensate for the additional expenses of the purchaser for the incriminating characteristic or impurity. In Section 11.4, some case studies with calculated price variations illustrate this economic aspect. Table 1.5 shows the world deliveries of phosphate rock by grade.
Listed and Contracted Prices. Phosphate rock producers publish phosphate rock price lists every calendar year. However, these are only reference prices. Each consumer usually negotiates, on a one-calendar-year basis, with the rock supplier that was chosen, the price for the potential tonnage to be purchased. The producer usually agrees for discounts related to the tonnage the purchaser will take. These discounts can become relatively important during periods in which prices peak (up to U.S.$8-14 discounts have been reported for 1976).
Long-term supply arrangements, such as barter deals or cash sales, are also common, but since the price hikes of 1974, they are on
Raw Materials
23
TABLE 1.5 World Deliveries by Grade, 1981 (in 1000 t)
65 BPL or below 32,876
66-68 35,031
69-72 26,336
73-77 8,085
78 and over 27,556
World total 129,884
Source: International Superphosphate Manufacturers Association.
renegotiable bases. These long-term arrangements are essentially aimed at guaranteeing that the purchaser gets a definite phosphate rock quality or grade.
Special attention must be paid to U.S. domestic prices, which appear to be substantially lower than U.S. export prices. Also, these price differences versus TPL grades are not consistent. The reasons for these inconsistencies originate from several facts:
The U.S. domestic market is mainly a captive market: the producing mine and the consumers plant belong to the same company.
The export market is based on negotiated sales contracts between the phosphate rock producers and independent buyers.
Some of the domestic phosphate rock delivery contracts are based on tolling (ore price contracted on effective mining costs).
Higher-grade phosphate rocks are usually reserved for export. If the export market is weak these grades will be consumed locally. The local market nevertheless will not pay the same price increment for high grades as does the overseas market (freight charges).
For lower grades the argument works in reverse. Table 1.6 shows phosphate rock list prices for Florida and Morocco rock for 1978-1979 and 1980 by grades, and Table 1.7 shows the U.S. export and domestic prices practiced in 1979 and 1980 for the various Florida rock grades.
CIF Costs.* The phosphoric acid manufacturer has to support the phosphate rock transportation costs between the producer's loading
*Cost-insurance-freight; CIF prices include phosphate rock concentrate, loading, insurance, and freight costs to unloading port.
24
Introduction
TABLE 1.6 Listed Prices for Phosphate Rock (in current U.S.$ by Grade)
Origin Grade 1978 1979 1980
Florida 75 34.55 34.00 44.00
72 32.55 30.00 40.00
70 30.55 26.00 30.00
68 28.55 25.00 34.00
Khouribga 76/77 41.0 43.00 55.00
75/76 37.0 42.0 54.0
72/73 32 40.0 52.0
Youssoufia 74/75 — 42.0 53.0
68/69 30.0 35.85 43.0
port and his own production plant. Usually, if the plant is not integrated into a mining area, this is achieved by sea transportation. The common size for phosphate rock transportation vessels is between 10,000 and 40,000 metric tons, according to the depth of the loading and unloading ports, the yearly phosphate rock consumption, and the size of the consumer's storage facilities.
Freight charges can account for as high as 25-50% of the CIF costs in unfavorable cases (e.g., transportation from the United States or central Africa to India). Because of the number of factors affecting freight charges, they are extremely variable. Some of these factors are:
TABLE 1.7 Export and Domestic Sales Prices of Florida Rock (in current U.S.$)
Grade ВPL 1979 1980
Domestic Export Domestic Export
Over 74 22.09 30.85 24.90 37.11
72/74 22.76 26.40 25.72 33.83
70/72 20.37 23.62 22.11 30.61
66/70 17.65 23.48 19.63 27.83
60/66 22.90 21.06 24.98 24.53
Raw Materials
25
Geographical location of the producer's mine and the purchaser's plant
Possibility of getting return freight for the unloaded vessel Unloading port characteristics (draft limits, size of vessels) Size of vessels used
General freight market trends (availability of vessels)
Table 1.8 indicates some freight charges from major loading ports. The freight market is a very important cost factor for phosphate rocks.
Traditionally, and also because of the price hikes of the last few years, the phosphate rock market is a buyers' market. It will probably be that way in the future. Consequently, the CIF price at major unloading ports sets the phosphate rock price pattern. Florida and Morocco, for example, have to cope with a common CIF Rotterdam price with subsequent differing FOB prices.
Chemical Composition of Commercial Phosphate Rocks
Table 1.9 shows some of the major commercial phosphate rock grades found in the world market or consumed by integrated phosphoric acid production plants. Detailed data sheets of the more important commercial phosphate rocks are found in Appendix A. These data sheets are
TABLE 1.8 Freight Rates for Phosphate Rock Transportation (in U.S.$ per metric ton)
Loading port Destination Freight rates, 1980 Freight rates, 1981
Casablanca West coast India 20-39 25.5-41
Casablanca Gela (Sicily) - 10.50
Casablanca China 35.5 -
Aqaba West coast India 19.75-21.0 12.5-22
Aqaba Chitagong - 24.75
Tampa West coast India 51-60 38.5-60
Tampa Australia (West) 31.5 25.5
Tampa Varna - 30.25
Tampa Central America 20
Tampa Continent 11 -
Dakar West coast India 33.7-43 26.75-42
26
Introduction
TABLE 1.9 World Production of Commercial Phosphate Ore Concentrate by Countries (in 1000 metric tons)
Country 1979 1980 1981
Algeria 1082.8 1025.4 857.7
Australia — — 14.7
Banaba 419.8 — —
Brazil 1694.6 2921.3 2763.5
China 8517.0 10,726.0 11,500.0
Christmas Islands 1367.4 1713.3 1442.6
Colombia 6. 3 5.3 14.7
Curacao 47.8 0.0 0.0
Egypt 645.1 658.3 720.3
Finland 2.1 124.8 200.9
India 514.1 427.2 429.2
Israel 2215.6 2610.5 2372.5
Jordan 2825.6 4242.7 4243.6
Korea 500.0 500.0 500.0
Mexico 362.0 330.0 251.5
Morocco 20.175.1 18.824.2 19,696.0
Nawru 1828.4 2086.7 1480.0
Peru 5.0 13.9 12.0
Senegal 1618.5 1459.0 1927.4
South Africa 3221.0 3282.0 3033.5
Syria 1169.5 1319.4 1320.5
Togo 2915.8 2932.8 2244.4
Tunisia 4040.4 4581.9 4596.3
Turkey 26.7 21.3 43.0
U.S. 50,996.5 53,362.8 52,242.3
USSR 24,448.0 24,668.3 25,200.0
Vietnam 0.0 400.0 500.0
Other 187.8 213.3 233.2
Total 130,832.9 138,450.4 137,839.8
Source: Phosphate rock statistics 1981, ISMA Ltd. International Superphosphate Industry Association, Paris.
suitable for a preliminary investigation when choosing a rock for a given production plant or vice versa.
1.3.2 Sulfur
Besides phosphate rock, sulfur by means of sulfuric acid is the second raw material needed for phosphoric acid production. Wet process phosphoric acid is the major world sulfur consumer, with nearly 50%
Current Developments
27
TABLE 1.10 World Sulfur in All Forms of Production, 1980 (in million tons)
Western Europe 7.84
Africa 0.88
Asia 4.36
Oceania 0.18
North America 19.83
Latin America 2.7
Total Western world 35.82
Communist world 19.40
World total 55.20
of the total production. Sulfur is produced from brimstone (37 million tons per year as S), pyrites (11.4 million tons as S), and other forms (9.1 million tons of S).
The world sulfur production and prices have been subject to strong variations well before the price cycles of phosphate rock and fertilizers (see Table 1 in Appendix B). The prices of the world "sulfur-in-allforms" production are, consequently, strongly affecting phosphoric acid economics. Roughtly 0.8-1 ton of sulfur is consumed to produce 1 equivalent ton of P2O5 by the wet process. Offer and demand have been estimated to balance closely within growth rate of 5.2%, which, so far, is to be considered on the high side. Table 1.10 indicates the world sulfur production by geographical areas.
1.4 CURRENT DEVELOPMENTS
1.4.1 Factors Affecting Current Developments
Current developments are affected by many simultaneous influences: (1) the phosphate rock market price, (2) the phosphoric acid market, (3) improvements in phosphoric acid technology, (4) energy costs, (5) environmental problems, (6) financial problems, and (7) political problems.
1.4.2 Conclusions
Phosphate Rock Market and Prices
In 1981, some 138 million tons of phosphate rock was mined. The mean annual increase,during the 1971-1981 decade, was very close to
28
Introduction
5%. Unido, FAO, and World Bank predictions for mean world consumption growth rates in phosphate fertilizers were 4.9, 5.4, and 5.0, respectively, for a period of time between 1980 and 1985.
These growth rates were estimated to be 3-4% after 1985, on a world consumption basis. This was meant for both developed and developing countries. However, the rates will still be much higher in developing countries, about 7% as compared to 2% for developed countries, due to because there are still low application rates in these countries. Developing countries currently account for about 32% of the world phosphate fertilizer consumption.
During the 1981/1982 world economic crisis, the growth rates have been revised and the forecasted values of 4. 5-5.5% may now be considered by some as overestimated (Fig. 1.9). Until 1972, the fertilizer application rates resulted from cheap fertilizer prices and from the consideration of their economic balance with food prices. The application ratio between the three fertilizer nutrients, nitrogen, phosphorus, and potassium, had developed to approximately 1.0:0.6:0.5 (expressed as N, P2O5, arid K2^) on a world consumption basis.
From 1972 to 1980, phosphate fertilizer prices have increased by fourfold in current U.S. dollars. This was a mean price increase of 19% per year. Energy and nitrogen fertilizer prices have done even worse while food prices have increased at a lower rate. In 1973, a U.S. farmer could purchase a ton of ammonia with 40 bushels of corn, whereas in 1980, it was 80 bushels [ 8].
After the first price peaks (1975), the farmers seemed to stick to their almost traditional fertilizer application and application growth rates, but the last price peak (1980/1981) (Fig. 1.8) led them to consider a more economical approach for the use of fertilizers. There is no doubt that farmers will have to reevaluate their returns on investments for each fertilizer nutrient to be applied.
The outcome of these economics is not easy to predict. While nitrogen has to be applied regularly year by year (nitrogen is lessivated from soils by rain), phosphates tend to be fixed in the soil by chemical combinations (with a questionable factor of further availability to the plant). New application ratios between the nutrients may result from these considerations.
What will be the economic conclusion of the farmers in Holland, France, Brazil, the United States, India, and so on? The answer to this question will define the application and growth rates for phosphate fertilizers for the coming years —and concomitantly their prices.
The dominant phosphate rock producers will still be the United States, Morocco, and the USSR. Proven reserves indicate that the world will not run short of phosphate rock. But, whereas 1979-1980 prices were an incentive to get new mines on stream, 1982 prices have put a severe setback on these new investments, especially on those investors who will not be able to face eventual U.S.$30 FOB prices on a long-term basis.
Current Developments
29
FIG. 1.9 World total phosphate rock and phosphoric acid consumption.
Consequently, this situation will promote phosphate rock mining projects in those countries where absence of land royalties eases the invested capital costs (e.g. , government projects in Tunisia, Morocco, etc.) or where scarceness of industrial projects does not permit any other choice of projects (e.g., Senegal, Togo, Jordan) and lower return on investments would be accepted.
Another factor promoting particular mining projects lays within the growing phosphoric acid market, that is, the possibility of producing and selling phosphoric acid of good quality out of a "difficult-to-export" phosphate rock (e.g., low-grade rock with high organics or rock mined at a remote place). Tunisia and Brazil are two examples of this kind of situation. In conclusion, phosphate mining as well as
30
Introduction
mining with integrated phosphoric acid production will probably develop more in those areas where the described prevailing condition exist.
If the increase in the demand for phosphate fertilizers is on the high side (i.e., 4.5-5.4%) more new mines and consequently some of the more capital extensive ones will come on stream and set the FOB prices to a value in the lower 40's. If the growth rate remains on the low side, 3% or less, prices will possibly stabilize at the present 1982 level.
Phosphoric Acid Market
The current phosphoric acid installed production capacity is equivalent to 72% of the total ₽2О5 world consumption. (Fig. 1.9). This capacity, however, has never operated at full load for both technical and commercial reasons. The growth rate of installed capacity and production yielded an average of over 9% per year between 1970 and 1980. The phosphoric acid installed production capacity in 1970 was less than 50% of the world ₽2°5 consumption. Now that the existing capacities are equivalent to as much as 72%, the expected growth rate should equalize with the growth rate of the phosphate rock production. Existing and projected capacities are shown on curve 2 of Fig. 1.9 (projected capacities on dotted line). From 1982 to 1986, an additional 5 million tons capacity per year of P2O5 equivalent as phosphoric acid has been projected. These investments will essentially be in the form of wet process acid plants.
Geographically, the main increasing areas will essentially be (figures given in million tons of P2O5 equivalent):
Africa
North America
Asia
Eastern Europe South America Central America
Total
+ 1.6
+ 1.2
+ 0.8
+ 0.7
+ 0.2
+ 0.4
+4. 9
The countries with large increase capacities are the United States, Morocco, the USSR, India, Tunisia, Brazil, Algeria, Senegal, Togo, and Poland.
The rated world phosphoric acid capacity increase is only about 3%. With the uncertainty of the total phosphate market, growth rates, and the actual production of the existing capacities, it is hard to forecast whether the phosphoric acid market will be a buyers' or a sellers' market. In any case, there is a feeling that offer and demand will balance out.
Phosphoric acid producers in Western Europe, with a capacity of over 5 million tons of P2O5, so far have been in a price-squeeze
Current Developments
31
situation between raw materials and fertilizers. They have not projected any increase in plant capacities. The future for Western Europe lies in acid purchasing.
Phosphoric acid transportation has developed considerably during the past decade. There are, presently, over 150 stainless steel or rubber-lined vessels suitable for phosphoric acid transportation. Their capacities usually range from 2,000 to 18,000 tons. The growing phosphoric acid market and carrying capacity of the transportation system offer to the potential consumer the possibility of choosing between pur- chase and production. If he has no phosphate rock of his own, it may well be cheaper to pay acid transportation costs instead of phosphate rock plus sulfur. High capital investments and eventual environmental problems are also saved. To promote such development the North African producers, for example, have invested in their own shipping capacities for their phosphoric acid exports.
Improvements in Phosphoric Acid Technology
Phosphoric acid technology has developed new processes for several reasons: higher recovery of P2O5, higher acid concentration, and lower energy consumption, with varying results. Nevertheless, more sophisticated technology does not necessarily cope with lower rock quality and larger plant sizes. Often the lower quality of the rock, being a barrier to rock sales, is the incentive to build a local phosphoric acid production plant that will permit phosphoric acid exports. If it is in a developing country or at a remote place, the required technology has to be simple and robust. But there are many cases to promote higher quality technology: the need for acid with higher purity levels, high yields of P2O5 recovery (expensive phosphate rock because of high transportation costs), pure calcium sulfate by-product, and higher product acid concentration (to save steam energy).
Energy Costs
Energy costs have been increasing steadily for over 6 years. The industrial world, which enjoyed low energy costs for so many years, could not achieve the necessary changes in such a short time. Adaptation is still in progress, and this is also true of the phosphoric acid industry.
Electric furnace phosphoric acid production is decreasing slowly. Energy recovery has become one of the major incentives and concerns for wet process technicians. No more waste steam will be blown into the air, and increasingly even low-level energy will be recovered. It is very likely that absorption heat from the sulfuric acid plants will be used to concentrate weak phosphoric acid, thus saving all the sulfuric acid boiler steam for other purposes.
32
Introduction
Uranium recovery is another aspect of the energy problem. Many phosphate rocks contain some 120-200 g of UgOg per ton of rock and may be eventually suitable for the recovery of uranium.
Environmental Problems
The two major environmental problems of phosphoric acid production are effluent gases containing fluorides and large quantities of waste water containing calcium sulfate (phosphogypsum). Whereas efficient washing of effluent gases is a possible issue, waste gypsum disposal is a serious problem in countries where the phosphoric acid industry has to be integrated into areas with high population density. The price of land then makes the solution of a disposal pond system too expensive or impossible. Dumping into rivers is no longer acceptable, and pumping into the sea is currently "put back on trial." Some countries accept and do it, but others think it is disastrous. Consequently, there is a tendency to concentrate high production capacities in locations where a large gypsum pile will not be harmful to the eye and not take the last dollar out of investors' pockets.
Political Problems
In spite of poor economic conditions and lack of raw materials, some countries will continue to produce and even invest in additional phosphoric acid capacity in order to keep some independence from the phosphoric acid producers. President Carter's stop order on Occidental's superphosphoric acid deliveries to the USSR certainly reinforced this feeling.
On the other hand, some countries of the Western world which are leaders in phosphoric acid production but also depend on improving their trade with developing countries will accept a shift of their production into the countries where the raw material originates. The raw material trade will be changed into an intermediate on finished product trade. This position is being considered by some of the European countries.
1.4.2 Conclusions About Current Developments
Although it is not presently possible to estimate the magnitude of the expected growth rate, the phosphoric acid market and production capacity will continue to increase. Revamping of older plants added to new investments produces a forecase of an additional 5 million tons of PgOg equivalent world capacity within the next 4 years. Whereas the capacity of developed and developing countries without phosphate deposits will stagnate or increase only slightly, there have been large projected increases in capacity in the United States, the Middle East, and the USSR. Eastern Europe will probably follow a more political than economic path, consequently pursuing an increase in capacity, which is not necessarily the most economical way.
References
33
It is not presently forecasted whether the projected investment in phosphoric acid production capacity will cover the total increase in demand for phosphoric acid. This could lead to either a sellers' or buyers' market within the next 5 years.
Among the new investments, dihydrate systems will continue to dominate because of their safe technology required for many new projects with new rocks in remote places. Nevertheless, advanced technology will also progress, essentially in plants with high CIF phosphate rock costs and particular energy problems.
REFERENCES
1. Dipl. Chem. Dieter Roe, Der Phosphatmarkt zeigt sich elastisch, Chem. Ind. 34, West Germany, May 1982.
2. M. G. de Belinko, Some Thoughts on the Genesis of Sedimentary Marine Phosphate Beds. Phosphorus and Potassium, No. 106, British Sulphur, March/April 1980.
3. J. R. Lehr and C. McClellan, Phosphate rocks: Important factors in Their Economic and Technical Evaluation. CENTO, Symposium of the Mining and Beneficiation of Fertilizer Minerals, Nov. 19-24, 1973, pp. 194-142.
4. J. R. Lehr, Phosphate Rax Material — A Look Ahead. TVA short course in modern fertilizer technology. June/July 1977 Tennessee Valley Authority, Muscle Shoals, Alabama.
5. M. C. Mew (Ed.), World Survey of Phosphate Deposits, 4th ed., The British Sulfur Corporation Ltd.
6. W. F. Sheldrick and H. Stier, World Phosphate Survey, Background Papers.
7. W. F. Stowasser, Phosphate Rock, Bureau of Mines Minerals Yearbook, U.S. Department of the Interior.
8. J. Douglas, Fertilizer Cost 1985 - Can Farmers Afford Them? Tennessee Valley Authority, Fertilizer Progress, 1982, p. 14.
2
industrial Process Chemistry
2.1 PROCESS REVIEW
2.1.1 Review of Principles Governing a Phosphoric Acid Plant Under the Dihydrate System
Phosphoric acid dihydrate processes have been the subject of a large number of descriptions by many authors [1,2]. Whatever its origin, a dihydrate process can be considered to be made up of the following sections:
1. Phosphate grinding section
2. Metering of the raw materials and recycled wash acid from the filter 3. Phosphoric acid reaction section, where gypsum is formed
4. Filtration section, where the 28-30% P2O5 product acid is separated from the gypsum crystals
Two flow diagrams, including material and energy balances for units of 500 and 1000 tons of P2O5 per day, will serve as a good introduction to the principle of the dihydrate process (Figs. 2.1 and 2.2).
The reactor, whether single- or multitank, contains an agitated reaction volume in circulation. Often a small buffer tank, out of the circulation and installed before the filter, is supposed to give an additional margin of safety to the total retention time of the phosphate particles.
Generally speaking, reaction volumes correspond to ratios of 1.5-2.5 m^/ton of P2O5 produced per day. However, by "pushing" production, plants can sometimes be found working at a ratio of less than 1 щЗ/ton of P2O5 produced per day.
Since crystallization is often spread unevenly among the various tanks or reaction sections, precipitation rates per cubic meter are
35
36
Industrial Process Chemistry
FIG. 2.1 Material balance in tons and cubic meters per hour for a 500-ton/day P2O5 un^ (20.84 tons of Р2Од Per hour) with 94.5% yield of total recovery using a phosphate rock with 29.5% P2O5, 49.0% CaO, 3.0% SO3, 5.5% CO2, 3.5% F, and 1.5% H2O.
Process Review
37
FIG. 2.2 Material balance in tons and cubic meters per hour for a 1000-ton/day P2O5 unit (41.66 tons/hr) with a yield of recovery of 95% using phosphate rock from Florida with 32% P2O5.
38
Industrial Process Chemistry
sometimes very high. In older premixer tanks figures of more than 1 ton of SC^Ca • 2H2O per cubic meter were common, whereas modern single-tank units work at about 0.09-0.180 ton of gypsum per cubic meter per hour.
The cooling necessary to maintain a temperature of 70-80°C in the reactor and 70-75 °C at the filter is provided either by a cooling airflow or by a vacuum cooling system of pumped slurry cycle. Air cooling is based on various ratios according to the technology involved: 30,000-70,000 n)3/hr per 100 tons of P2O5 per day (30,000 m^ is low, while 70,000 m^ is far too high).
Vacuum coolers work at various slurry flow rates, which calls for a different temperature difference in each case. In practice At is between 2 and 10°C. Cooling system scaling problems are obviously greater with 10°C than with 2°C.
Filtration, too, is subject to a large variety of ratios according to the nature of the process, but above all it is a function of phosphate quality. The use of additives (flocculants) can sometimes improve these values. Poor phosphates operate at around 2 tons of P2O5 per day per square meter of filtration area; the most common, commercial phosphates, 4-5 tons; good ones, 7 tons, and the best, about 9 or even 10 tons of P2O5 Per day per square meter of filtration section.
All these values are based on filters working at a filtration cycle time of 4 min with a washing yield of recovery PgOg close to 99% with 28-30% acid. Faster filters improve on these figures, and slower ones lower them. Belt filters are used mainly for small plants and tilting pan or table filters for the others. The largest of these are 160-200 m^ and can achieve production rates of up to 1800 tons of P2O5 Per day.
The recycles acid varies as a function of the P2O5/CaO ratio in the phosphate. The lower this ratio, the more P2O5 has to be recycled to keep the slurry composition within the necessary standards. Figures 2.1 and 2.2 depict two dihydrate process systems, one a 500-ton/day P2O5 unit with air cooling using phosphate rock from Tunisia and another producing 1000 tons of P2O5 per daY with vacuum cooling using rock from Florida.
2.1.2 Nondihydrate Processes (Hemihydrate Processes)
State of the Art, 1980
Traditionally, phosphoric acid has been produced under reaction conditions of 28-32% P2O5 and temperatures of 70-80°C; the calcium sulfate being essentially precipitated as dihydrate. Local requirements in Japan caused the need for modification of this technique and some low-strength hemihydrate recrystallization processes were developed that produced a high-quality calcium sulfate for gypsum board manufacture. These processes were still limited to approximately 30-35% P2O5 in the product acid.
Process Review
39
More recently, in a number of differing cases of local requirements, the incentive to produce an acid of high strength (40-52% P2O5) without the use of steam has caused a number of companies to accept the challenge of high-strength hemihydrate technology. With the increasing cost of oil and power, the economic advantages of this type of process will definitely grow and, with the experience gained from existing units, the fears of unproven technology will gradually be replaced by a less conservative attitude.
Hemihydrate technology does require a higher level of design and operational technique, as any pockets of hemihydrate solids will convert during a shutdown. However, the actual control of an operating plant does tend to be simpler than a dihydrate plant, as the sulfuric acid consumption is not as sensitive to variations in sulfate level, giving more stable operation.
One point should be made at this time about on-line time or utilization. The utilization of the reaction/filtration system of a typical dihydrate plant is normally of the order of 85-95% of available operating time. This excludes one 2-week or two 1-week shutdowns. Thus the operating time is from 298 to 333 days/year. There is a large variation due to standards of maintenance, proximity of suppliers, and the scaling/corrosion tendencies of each phosphate. It is a well-known fact that, whatever the process or product, the longer the process train (number of items of equipment without intermediate buffer storage) , the lower the utilization factor. Thus any processes with two filtration stages can only expect a utilization on the order of 80-90%, or 289-316 days/year. Thus the plant size of any two-stage process will need to be of the order of 5% greater in instantaneous capacity to give the same annual production rate as a single-stage plant.
Another point to be made is that the difference in capital costs related to the type of the phosphoric acid process is a relatively insignificant part of the production costs. Raw materials consumption is highly weighted.
Hemihydrate Processes Available
Process Routes [3-13]. In order to compare the many hemihydrate processes and dihydrate processes, it has been necessary to classify them into five "process routes." This generalization, although aiding evaluation, does not account for the specific advantages or disadvantages of each process in plant performance, process, or engineering considerations. This treatment is intended only as a preliminary guide; the advantages or disadvantages quoted should be confirmed by discussions with each individual process licensor.
Each process route is defined by the process philosophy: attack conditions and number of filtration stages. It is not intended to imply that all processes within each process route perform in the same manner. However, the physical chemistry is essentially the same and
40
Industrial Process Chemistry
differences in product and by-produce quality and raw material consumption should in general be small for a given phosphate.
The five basic process routes are designated as follows:
DH (dihydrate): conventional dihydrate process, either single- or multitank, normally producing acid 28-30% P2O5 (e.g. , Prayon, Fisons DH, SIAPE, Rhone-Poulenc, Gulf-Swenson, Jacobs-Dorr, and others)
HRC (.hemihydrate recrystallization): single filtration stage; reaction in hemihydrate regime followed by recrystallization to dihydrate and filtration to produce 30-32% P2O5 acid (e.g., Nissan H, NKK [14-23])
DH/HH (dihemihydrate): reaction as dihydrate at a slightly higher strength (32-35% P2O5); separation of product acid without cake washing; conversion to hemihydrate and countercurrent washing of hemihydrate cake (e.g., Central Prayon [24-28])
НИ (hemihydrate): Single-stage hemihydrate process producing
40-50% P2O5 acid directly from the filter (e.g., Fisons HH, Oxy-Hemihydrate [29-43])
HDH (hemidihydrate): reaction in hemihydrate regime, filtration to produce 46-52% acid; countercurrent wash and repulping of hemihydrate cake in recrystallization tank; recrystallization to recover lattice loss and filtration of dihydrate cake (e.g., Fisons HDH, Jacobs-Dorr HYS, Nissan C, Oxy-Recrystallization [44-60])
Typical block flowsheets outlining process steps are shown in Fig. 2.3. A comparison of the technologies available tabulated by process route is demonstrated in Table 2.1. The advantages and disadvantages of each process route are listed in Table 2.2.
Case Studies. Every production unit for phosphoric acid has its own requirements regarding raw materials, utilities, product quality, and by-product quality. The five process routes can be classified into four specific cases when considering these aspects.
1. Weak acid: impure gypsum; process route: dihydrate. Under these restraints the proven dihydrate processes are normally still superior even with increasing power costs, provided that steam is available for evaporation. Process modifications have enabled coarser grinds of rock to be used, wet rock grinding can be employed, and agitation power and circulation power is being used more effectively. The flexibility of phosphate source is also advantageous to producers who are buying phosphate on the open market. Although the dihydrate process cannot be claimed to be trouble-free, the problem areas are well known and can be catered for. The maintenance costs and on-line time can be defined fairly accurately for any phosphate source and level of maintenance expertise. This process route suffers most where a high-purity gypsum is required. Under specialized local conditions
Process Review
41
WEAK ACID PROCESSES
iwsheets of the five process routes.
TABLE 2.1 Summary of Phosphoric Acid Processes Available, Divided by Process Routes
Code Process route Process licensor Number Comments
DH Dihydrate Prayon Rhone-Poulenc Jacobs-Dorr SIAPE Fisons Singmaster and Breyer Gulf-Swenson Kellogg-Lopker Somerville 136 52 27 11 8 7 4 1 In construction Not commercialized
HRC Hemi-recrystallization: low-strength hemi reaction, recrystallization and single-stage filtration Nissan H NKK Mitsubishi Heurtey 26 11 7
DH/HH Dihemihydrate: low strength, reaction as DH, separation of product acid, conversion to HH, and filtration Central Prayon 11
НН
Hemihydrate: single-stage hemihydrate, producing acid 40+%
HDH
Hemidihydrate: two-stage reaction as HH, filtration, conversion to DH, filtration; produces acid 40+%
Fisons HH
Oxy-Hemihydrate
Russian HH
Taki
NKK
TVA-Foam process
Fisons HDH
Nissan C
Jacobs-Dorr HYS
Oxy -R ecry stalli z ation
NKK-Lummus combination
Albatros
S and B/Heurtey
2
2
Many Not exported
1 Own
- Industrial trial only
- Lab scale only
3
2 + 1 in construction
1 Converted to DH
Pilot study only Lab scale only
1 Shut down
Patent only
Industrial Process Chemistry Process Review
44
Industrial Process Chemistry
TABLE 2.2 Advantages and Disadvantages of the Various Process Routes
Process route Advantages Disadvantages
DH Simple design Flexible on rock source Proven process Ease of operation/ shutdown Requires a lower grade of stainless steel Wet rock grinding possible Acid has high levels of Al and F Produces acid at 28-30% P2°5 Requires steam for evaporation Efficiency of the order of 95% May require rock grinding Requires 30% storage and evaporator Postprecipitation before and after evaporation Requires clarification for merchant-grade acid production
HRC Single-stage filtration Proven process on sedimentary rocks Produces a pure gypsum Higher efficiency 97% Slightly higher acid strength, 30-32% p2°5 Lower sulfuric acid consumption Low filter area £ Requires a fine rock grind Requires sulfuric acid dilution Recrystallization difficult with igneous rocks Large recrystallization volume required May solubilize higher levels of partially soluble impurities Requires 32% storage and evaporation Postprecipitation before and after evaporation Requires clarification for merchant-grade acid Rock slurry feed unacceptable, can accept moist rock Requires sophisticated materials of construction
Process Review
45
TABLE 2.2 (Continued)
Process route Advantages Disadvantages
DH/HH Flexible as to rock source Proven process Produces a pure hemihydrate Higher efficiency (98%) Higher acid strength (32-33% P2O5) Lower sulfuric acid consumption Two-stage acid separation, lower utilization High capital cost Requires steam for conversion Requires 35% storage and evaporation Postprecipitation before and after evaporation Requires clarification for merchant-grade acid production Rock slurry feed unacceptable Low wash water ratio Requires final rehydration of hemihydrate to gypsum Limited to plant size of 500 tons/day maximum Normally requires rock grinding Solubilizes more impurities Care required in design and shutdown Requires sophisticated materials of construction
HH Single-stage filtration Produces strong acid directly, 40-50% p2°5 Produces a purer acid (lower SO4, Al, and F) No intermediate storage So far, limited number of rocks processed industrially Large filter area required for 50% P2O5 acid High lattice loss, low efficiency (92%) Produces impure hemihydrate
46
Industrial Process Chemistry
TABLE 2.2 (Continued)
Process route Advantages Disadvantages
Limited postprecipitation/simple clarification Uses coarse rock Ease of operation Wash water flow limited Rock slurry feed unacceptable Cannot use wet rock with 50% acid production Requires higher-grade alloys Care required in design and shutdown A flooded filter causes high losses Sulfuric acid consumption very sensitive to overall efficiency Cannot use weak sulfuric acid
HDH Produces strong acid directly, 46-52% P2°5 Produces a purer acid (low SO4, Al, F) Limited postprecipita-tion/simple clarification Uses coarse rock Ease of operation Very low sulfuric acid consumption High efficiency (98.5+%) Uses more wash than HH and DH/HH Produces a purer gypsum Recrystallization tank acts as catch tank for losses from HH filter Two-stage filtration, lower utilization HH filter cloths washed with filtrate from DH filters Recrystallization difficult for igneous rocks So far, limited number of rocks process industrially Requires higher-grade alloys Care required in design and shutdown High reaction/recrystalliza-tion volume Cannot use rock slurry and produce 50% P2Og ac*d Recycling of organics between filters
Process Review
47
all four other process routes may be competitive, but careful evaluation should be made before discarding the DH process.
2. Weak acid: pure calcium sulfate; process routes: hemihydrate-recrystallization and dihemihydrate. These two process routes can be joined in commercial comparisons. They are both noted by the high-quality calcium sulfate they produce, the higher overall recovery, and slightly higher acid strength produced. The disadvantage is a very complex process train. However, as the main aim is to produce pure calcium sulfate, it saves equipment that would be required for gypsum cleanup.
These processes have many of the disadvantages of hemihydrate processes and still produce a relatively weak acid (30-35% P2O5). As such, their competitiveness will tend to decline as experience with the high-strength two-stage HDH processes gradually increases.
Processes available are:
HRC: Nissan H (Fig. 2.4), NKK (Fig. 2.5), and, Mitsubishi (Fig. 2.6) DH/HH: Central Prayon (Fig. 2.7)
3. Strong acid: low efficiency; process route: hemihydrate. The hemihydrate processes have severely limited applications, especially as the two-stage HDH hemidihydrate processes develop commercial references. The hemihydrate process suffers from a high lattice loss and limited wash water. The higher the acid strength produced, the greater the problem. The sulfuric acid consumption is about 1.7% less than a typical dihydrate plant at the same efficiency. However, the HH processes normally have a lower efficiency than the DH processes.
If a HH process has an efficiency of about 3.5% less than a DH process, the sulfuric acid consumptions are the same. The difference in efficiency generally tends to be more than 3.5%, so there is normally a penalty in sulfuric acid consumption. The capital cost of the reaction and filtration sections tends to be marginally higher than a dihydrate plant, but ancillary equipment for grinding, evaporation, storage, and clarification normally makes the dihydrate plant more expensive.
The saving grace of the process is the ability to produce 40-52% ^2^5 acid directly from the filter. On a site where off-gases from a smelter are used to make sulfuric add or sulfuric acid is imported, this is a significant saving. This process has advantages provided that the price of rock is low. An interesting case is where large quantities of super acid are produced and the steam balance is such that extra steam is required even though sulfur is used as a feedstock.
Thus this process has a low efficiency, but has a commercial edge where the cost of rock is low, the grind is acceptable to be fed directly to the plant, where steam raising from oil is required, and where the acid purity is a valuable asset.
FIG. 2.4 Nissan H process.
FILTER
STACK
VACUUM
*2S04 I-
FLASH COOLER
FUME SCRUBBER
GYPSUM
WATER
'I • »
STEAM
SEAL TANK
WASH WATER
GROUND PHOSPHATE
ACTIVE SILICA
DIGESTION TANKS
HYDRATION TANKS
PHOSPHORIC ACID (30% p2o5)
GYPSUM SEED CRYSTAL UNIT.
FIG. 2.5 NKK process.
WASTE GAS
FIG. 2.6 Mitsubishi process.
FIG. 2.7 Central Prayon process.
52
Industrial Process Chemistry
Processes available are:
Fisons HH (Fig. 2.8)
Oxy-Hemihydrate (Fig. 2.9)
NKK-Lummus (Fig. 2.10)
Both Fisons and Oxy have units in commercial operating. The NKK-Lummus process so far has not been commercialized. Fisons has a 240-metric ton/day unit at Windmill in Holland that has been operating for 10 years and a 100-metric ton/day unit is now operating in Cyprus. Oxy has two plants both operating on North Florida rock of 320 and 1300 metric tons/day.
4. Strong Acid: pure gypsum, high efficiency; process route: hemidihydrate. This process route might be considered as the ultimate in phosphoric acid technology; it produces strong acid directly from the filter, it has the highest efficiency, it has the lowest sulfuric acid consumption, produces a purer acid than the dihydrate process, and has a gypsum quality superior to dihydrate gypsum. However, there are a number of potential problem areas.
Lack of reference plants
Lack of knowledge of rock performance
No large-scale (>600 tons/day) plants operating Recrystallization sensitive to impurity levels Recrystallization difficult for igneous rocks Possible recrystallization on the HH filter Possible fluosilicate scaling on the HH filter Difficult to satisfactorily wash the HH filter cloths Problems with recycling of organics between the two filters
At the present time, there is a gradual increase in momentum regarding the use of this process route. Depending on the performance of the plants and operating companies, this may be the beginning of a new era. On-line time will eventually decide the fate of this process route.
The following processes are available:
Fisons HDH (Fig. 2.11)
Nissan C (Fig. 2.12)
Jacobs-Dorr HYS (Fig. 2.13)
NKK-Lummus combination (Fig. 2.14)
Oxy-Recrystallization
The NKK-Lummus combination process has not been commercialized, and the Oxy-Recrystallization process has been tested only in pilot plants. The Jacobs-Dorr HYS was built at Rikkihappo in Finland, but the problems with recrystallization of Kola rock caused it to be
FIG. 2.8 Fisons HH process.
53
FIG. 2.9 Oxy-Hemihydrate process, reaction section.
FIG. 2.10 NKK-Lummus hemihydrate process.
ргоД
FIG. 2.11 Fisons HDH process.
FIG. 2.12 Nissan C process.
FIG. 2.13 Jacobs-Dorr HYS Hemidihydrate process.
FIG. 2.14 NKK-Lummus combination process
60
Industrial Process Chemistry
converted to a dihydrate process. The Nissan C process has a 40-ton/ day plant and a Nissan H plant at Rasa was converted to the C process. Fisons has two units built, 180 metric tons/day at Trepca, Yugoslavia, and 520 metric tons/day at Albright and Wilson in England. CSBP in Australia has built a 300-(600) metric ton/day expandable plant in Australia to the Fisons HDH process. Pivot, also in Australia, has built a 100-(150) metric ton/day Fisons HDH unit. If this process route overcomes the initial problems, it could catch on, and since in the phosphoric industry problems are solved by experience in operation, the design of future plants will depend on the performance of present units.
Evaluation of High-Strength Processes
When comparing the various processes for phosphoric acid production, the following aspects of the hemihydrate and hemidihydrate processes should be considered: (1) capital costs, (2) maintenance costs and on-line time, (3) raw material costs, (4) utility costs, (5) product quality, and (6) by-product quality.
Capital Costs. It is easily noticeable comparing the block flowsheet (Fig. 2.3) of the hemihydrate processes with the other processes how simple the process is from an equipment point of view, and the capital cost compared with a dihydrate plant reflects this. The use of relatively coarse rock (>1.6 mm) may eliminate the rock grinding unit, and there are no intermediate-strength storage tanks and no evaporator if filter acid strength is equal to usage strength. Clarification to produce merchant-grade acid, an expensive optional extra, is also simpler.
The two-stage hemidihydrate processes do have additional recrystallization and filtration equipment and some licensors have claimed that even so, the other savings, similar to the HH processes, offset this and the process is still cheaper than a dihydrate unit with rock grinding, evaporation, and storage. This claim may not always be true, as it depends on local conditions. However, it can be concluded that the capital cost is not too different from a dihydrate unit.
Materials of Construction. Materials of construction do tend to be a little more sophisticated, increasing the capital cost marginally. The hemihydrate process and the first stage of the HDH processes operate at high strengths and temperatures (50% P2O5 and 100°C) compared with the dihydrate case (30% P2Og and 80°C).
The difference in corrosion rate is not as marked as might be expected and depends on the chloride level. The acid in the higher-strength processes normally contains less fluoride than the equivalent dihydrate acid, and there is thus a tendency for a reduction in corrosion provided that the chloride level is low. However, the increased temperature does augment the corrosion rate, and in fact the overall
Process Review
61
effect in acids with low chloride is about the same as the dihydrate case. At higher chloride levels the corrosion rate of hemihydrate acids does tend to be greater. This is primarily due to the lower water content. A phosphate that produces a 30% P2O5 acid with 600 ppm chloride will produce a 1000 ppm acid in a hemihydrate reactor operating at 50% P2O5.
The reactors are normally carbon steel, rubber- and carbon brick-lined; the temperature drop across the brick is sufficient to allow natural rubber to be used. Flash coolers and slurry piping have to operate at 90-100°C and thus require more sophisticated rubber linings, such as butyl.
The second stage of HDH processes operate at low temperatures (60°C) and low strengths of P2O5 (less than 15%); thus corrosion is not a serious problem. However, fluorine and sulfate levels are relatively high, and normally stainless steels of at least 316L are required.
The recrystallization reactor does not necessarily need to be brick-lined, and at its operating temperature natural rubber lining is satisfactory.
Maintenance Costs and On-Line Time. Maintenance costs vary with the capital cost, local conditions, corrosion rates, and materials of construction.
The hemihydrate processes have a relatively low capital cost, and even though the materials of construction are more sophisticated and corrosion rates are often higher, this type of plant normally has a lower maintenance cost than a dihydrate plant if rock grinding and concentration are included in the dihydrate case.
The HDH processes have a higher level of investment. The first stage requires the same maintenance as a hemihydrate plant. The second stage is relatively simple and increases maintenance costs only marginally.
The on-line time of these two hemihydrate processes depends on the phosphate source, its scaling and corrosion properties, and local conditions.
One of the major fears of production people without experience in hemihydrate processes is the filtration of hemihydrate slurries and the possibility of conversion on the filter. Igneous phosphates have a relatively low transformation rate and no such problems were encountered on Kola phosphate in the Dorr HYS process. Fisons patented a conversion retarder for use when processing sedimentary phosphates (Togo, Morocco, Florida), and this is dosed at controlled rate into various parts of the filter circuit. Oxy uses an additive during the attack and crystallization stages of their process to maintain a low level of supersaturation, and this seems to prevent hydration on the filter with their North Florida phosphate. The results of these commercially proven units shows that filtration can be effected in such a way as to avoid problems of conversion to dihydrate on the filter. In fact, one unit
62
Industrial Process Chemistry
operating on Togo phosphate has virtually no scaling in the filter circuit and in fact requires less frequent filter wash cycles in comparison with a dihydrate plant using the same phosphate.
As with dihydrate processes, the filter wash cycle does depend on the phosphate. Both Fisons and Nissan have quoted fluosilicate scale deposition with some phosphates in the strong wash sections of the hemihydrate filter, and both of them claim to have been able to reduce this by process modifications. The extent of this problem does seem to depend on the impurity levels in each phosphate, as Oxy has stated that they do not have this problem in their plants, which both operate on North Florida phosphate. Physical chemistry suggests that this problem should be largely independent of process.
Corrosion also affects on-line time and this, too, is dependent on the phosphate. Togo phosphate, containing about 1000 ppm chloride in the concentrate, which has 37% P2O5, has been successfully processed using alloys such as HV-9A for the wetted parts of slurry pumps, giving a reasonable life.
Overall it can be considered that the effect of maintenance costs on overall production cost is small and largely dependent on the phosphate and not the process. The on-line time of two-stage processes does tend to be lower than the single-stage processes, and installed capacity will need to be of the order of 5% greater to obtain the same annual production rate. However, as the capital cost is not very significant in the overall production cost, this fact has little effect on economics provided that allowance is made during the selection of plant capacities.
Raw Material Costs
Phosphate. Coarse phosphate can be fed directly to the plant but this does not necessarily mean that a grinding unit is not required. For example, Florida pebble could not be fed directly. If grinding is required, wet rock grinding cannot be used, as it is not acceptable to the water balance. The low efficiency of the HH processes increases the consumption of phosphate, while the high efficiency of the HDH processes decreases consumption compared with DH processes. If high-strength acid (48% P2°5 Plus) is to be produced in a HH process, the phosphate feed must be dry to allow ample cake wash water, but the HDH process can accept a moist feed (up to 10% H2O) due to the extra 1J moles of water of crystallization. Oxy is at present producing 42% acid in their HH unit using a moist phosphate. Slurry feed cannot be tolerated by either process route while still producing strong acid.
Igneous phosphates do have a tendency to be more difficult to recrystallize from hemihydrate to dihydrate (see Section 2.2.5, "Hemihydrate and Dihydrate").
Nissan, in its low-strength H process (HRC mode), claims to have overcome this problem in the case of Kola phosphate by operating at lower sulfate levels during recrystallization. The Dorr HYS process did not operate satisfactorily on Kola due to low levels of
Process Review
63
recrystallization, but progressively the effect of impurities and process conditions on conversion should become better defined, and it is possible than this limitation may well be overcome.
In single-stage hemihydrate processes igneous phosphates perform well, as proven by the number of Soviet plants operating on Kola phosphates in the hemihydrate mode.
Sulfuric Acid. Due to the lower sulfate: P2O5 ratio in the product acid, the high-strength process shows a saving in sulfuric acid consumption compared with the dihydrate processes, at the same efficiency. In fact, the HH processes show a saving even when their efficiency is up to 3.5% lower than the DH processes. Further savings in specific cases may apply due to changes in cake impurities but this depends on the phosphate source.
The HDH processes have the lowest sulfuric acid consumptions of all processes due to the very high efficiency and an acid quality similar to that of the HH processes in terms of sulfate: P2O5 ratio.
Typical figures for sulfuric acid consumption at various efficiencies for the three processes (DH, HH, and HDH) are shown in Fig. 2.15.
Sulfuric acid added to the hydration tank in a HDH process replacing the lattice loss of the hemihydrate effectively increases recovery and reduces the overall sulfuric acid consumption per ton of P2O5 produced. The loss of sulfuric acid together with the water-soluble P2°5 is slightly higher than the DH process due to the higher SO 4: ₽2°5 ratio in the hydration tank, but this is not significant in overall terms.
Additives. The high-strength processes often require additives to control reaction, crystallization, and recrystallization conditions.
Defoamer is often required to control "gassing" in the case of phosphates with high organic and CO2 contents. The stronger acid is more viscous than the equivalent DH acid even though it is normally 90-100°C in place of the 70-80°C of DH units. Oxy also uses a premix tank to reduce gassing in their draft-tube reactor.
A crystal habit modifier is used by Oxy in its process with North Florida phosphate. It is added to the reactor and crystallizer and controls the level of supersaturation of hemihydrate.
Fisons do not use a habit modifier, but normally a recrystallization retarder is added to the filter circuit to prevent scaling on the filter.
The hemidihydrate processes often require active silica addition to the hydration tank to combine with free fluorine and enable reasonable conversion rates to be obtained.
Utility Costs
Steam. The major effect of the high-strength processes on utilities is the reduction in steam consumption. There are three cases of how this affects the overall economics of a fertilizer complex.
64
Industrial Process Chemistry
FIG. 2.15 Sulfuric acid consumption versus overall efficiency of DH, HH, and HDH processes.
Process Review
65
If the complex is self-sufficient in power without steam-raising boilers, any increase in steam available for power generation can be valued only in terms of additional power exported, a relatively low value.
If the complex has a negative power balance and imports power, the additional steam can be valued at the cost of imported power.
If steam is raised by burning fuel oil or another feedstock to produce power or for use in the concentration of phosphoric acid, the saving in steam can be directly calculated as a saving in fuel.
Figures 2.16 and 2.17 show the effect of the strength of phosphoric •acid from the filter of strong acid processes compared with a 30% P2O5 acid from a dihydrate plant on the amount of steam required for concentration, for various product acid strengths. Figure 2.16 shows the effect in terms of the value of power (based on condensation instead of pass-out steam) and Fig. 2.17 in terms of the reduction in usage of fuel oil.
Many dihydrate plants operate at strengths below 30% Pg1-15 and clearly in these cases the savings will be considerably greater.
Water. The effect of high acid strengths on the overall plant water balance depends very much on the type of water circuit being used
FIG. 2.16 Savings in production cost based on steam savings due to production of acid at strengths above 30% P2Og: electric power.
66
Industrial Process Chemistry
FIG. 2.17 Savings in production cost based on steam savings due to production of acid at strengths above 30% Pg^s1 fuel oil.
and on the disposal technique of the calcium sulfate. Generalities cannot be drawn as to the effect in economic terms without evaluating each case on its own merits.
Electric Power. The power consumptions of the various HH processes in general are lower than that of the DH case. If recrystallization is included, as in the case of HDH processes, the power consumption may be higher than the DH case, depending on the phosphate source, its hydration rate, and if grinding is required for the DH case.
Product Quality. The quality of acid from a single-stage HH process is normally considerably superior to that of a DH process at the outlet of the evaporator. It has a lower content of CaO, SO3, F, and AI2O3. Postprecipitation in the storage tanks is strongly reduced, as the acid is essentially at equilibrium when filtered.
The two-stage HDH processes produce an acid of superior quality compared with DH acid, but it tends to be marginally inferior to that of a HH process on the same phosphate.
The differences in acid qualities produced by the three processes routes (DH, HH, HDH) using three types of phosphate are shown in Table 2.3.
Process Review
67
The value of this superior acid quality depends on the utilization of the acid. On a fertilizer complex producing superphosphates and ammonium phosphates, the value is much lower than on a unit where the sole product is merchant-grade acid, or where more valuable products are concerned.
If the acid is to be used for feed-grade products and requires defluorination, the low aluminum and fluorine contents are of considerable value, as they reduce the cost of defluorination.
The low level of postprecipitated solids together with the low impurity levels is of considerable value if merchant-grade acid or solvent extraction is being contemplated. The viscosity of the acid is much lower and the problems of precipitated solids accumulating at the solvent interface is reduced.
The strong acid processes can also be designed to produce two acid strengths simultaneously. The strong acid wash is of the order of 40% P2O5 and can be exported directly at this strength if required. A plant can produce 40 and 50% P2O5 acid simultaneously while favorably increasing the wash ratio on the filter.
TABLE 2.3 Comparison of Acids Produced by Dihydrate, Hemihydrate, and Hemidihydrate Processesa
Percent P2°5 Percent SO 4 Percent A12°3 Percent Fe2°3 Percent MgO Percent solids
Morocco, 73-75 BPL DH 50.2 4.3 0.5 0.4 0.5 4.3
HH 50.1 1.9 0.1 0.3 0.4 <1
HDH 50.0 2.0 0.1 0.4 0.4 <1
Florida, 75 BPL DH 50.5 4.5 1.3 1.5 0.3 4.5
HH 50.0 1.8 0.2 1.4 0.3 1.0
HDH 50.0 2.0 0.4 1.45 0.3 1.0
Togo, 80 BPL DH 50.0 4.5 0.9 1.5 0.2 4.8
HH 50.0 2.0 0.1 1.6 0.1 <1
HDH 50.0 2.0 0.2 1.6 0.1 <1
aValues are presented in weight percent solids (free basis).
Source: Courtesy of Fisons, Ltd., Felixstowe, England.
68
Industrial Process Chemistry
TABLE 2.4 Calcium Sulfate Analyses (Feedstock 73-75 BPL Morocco)
Cake analysis on dry basis
(. DH process gypsum) HH process (hemihydrate) HDH process (gypsum)
P2°5 °-7 1.4 0.2 max.
CaO 32.5 37.0 32.0
SO4 52.8 60.1 55.8
F 1.5 0.8 0.5
SiO2 0.5 0.7 0.4
Fe2°3 max. 0.1 max. 0.1 max.
AI2O3 0.1 max 0.3 max. 0.3 max.
MgO 0.1 max. 0.1 max. 0.1 max.
Free H2O 25.0 wet basis 20.0 wet basis 25.0 wet basis
Source: Courtesy of Fisons, Ltd., Felixstowe, England.
By-Product Quality. The gypsum quality of the two-stage HDH processes is chemically superior to that of DH processes in terms of purity. Nissan has stated that gypsum from their C process (HDH mode) is suitable for gypsum board manufacture.
The analysis of calcium sulfate from the three process routes (DH, HH, and HDH) based on Moroccan phosphate is outlined in Table 2.4.
2.2 REACTION AND CRYSTALLIZATION
The objective of this section is not to describe different wet process phosphoric acid systems, but to analyze in detail the different chemical phases of phosphoric acid production. These different phases occur within the various acid processes, whether calcium sulfate is crystallized as dihydrate or in another form.
Phosphoric acid is produced by reacting sulfuric acid with naturally occurring phosphate rock. The reaction combines calcium from the phosphate rock with sulfate from sulfuric acid, and the resulting calcium sulfate is separated from the reaction solution by precipitation. Most of the time, it is calcium sulfate with two molecules of water-dihydrate. The naming of the dihydrate process originates from this compound. If CaSO4 • 1H2O is precipitated, it is a hemihydrate process.
A simplified reaction equation for the dihydrate process can be depicted as
Ca (PO.) + 3H SO + 6H О - 2H PO + 3CaSO • 2H О (1)
«5 £1 Li *1 Li «5 *1 *X Li
Reaction and Crystallization
69
The reaction occurs in the presence of an excessively large amount of H3PO4. Equation (1) is an oversimplification of what actually takes place. The real occurrences within the reaction medium may be better described by subdividing Eq. (1) into three parallel and simultaneous reactions:
1. When sulfuric acid is dispersed in the reaction medium: + 2-
H2S°4 * 2H + SO4 (2)
2. H+ ions attack the phosphate rock particles which are introduced and dispersed in the slurry:
nH+ + Ca3(PO4)2 + 2H3PO4 + (n - 6)H+ + 3Ca2+ (3)
The H+ ions participating in this reaction "belong" to the sulfuric acid as well as to the excessive phosphoric acid in the slurry.
There are about 25 times more H3PO4 than H2SO4 molecules.
3. Ca^- ions encounter SC^" with consequent crystallization:
2+ 2-
Ca + SO4 + 2H2O - CaSO4 • 2H2O (4)
These three reactions are well defined and have to be examined thoroughly one by one. All reactions take place in slurry reactors. Wehn a degree of crystallization is achieved, the crystals are separated by filtration. In the case of a dihydrate process, phosphoric acid with a concentration of 25-31 wt % P2O5 will be obtained, according to the quality of the phosphate rock. With hemihydrate processes, this concentration can be substantially improved.
The separated crystals have to be washed thoroughly to yield at least 99% recovery of the Altered phosphoric acid. This is economically necessary because of today's raw material and energy costs. The primary objective during the reaction and crystallization operations is, respectively, to obtain a high yield of phosphoric acid from the phosphate ore and to maximize the recovery of P2O5 during filtration by optimizing the conditions that lead to the formation of easily filtrable crystals.
Looking at a dihydrate reaction system, we can distinguish two hypothetical stages as follows:
First stage: mixing and dispersion of the reagents within a large volume of slurry accompanied by a rapid reaction, complete within 85-95% of the total yield.
Second stage: the slurry from the first stage contains unattacked rock particles and gas bubbles and is supersaturated and hot. In the
70
Industrial Process Chemistry
second stage, the reaction will be completed and the slurry will be deaerated, cooled, and desupersaturated to be recycled back to the first stage.
2.2.1 First Stage: Introducing the Reagents
Sulfuric Acid
Sulfuric acid is generally fed into the reactor at a concentration of 98% and that means a concentration of 1.793 g/liter. Within the reaction medium the sulfuric acid concentration is only between 10 and 40 g of H2SO4 per liter of 30% H3PO4.* Consequently, there has to be a very efficient dispersion of sulfuric add in the slurry (about 90 volumes to 1 in the case of a 20-g liter concentration). If this dispersion is not realized in good conditions, there will be spontaneous formation of crystal nuclei because of a state of what can be called "hypersaturation" due to SO^ ions.
By its dilution heat, sulfuric acid is responsible for most of the total heat of reaction. Overheated partial volumes of the slurry have to be avoided. Every contact between concentrated sulfuric acid and crystals results in immediate dehydration (opaque crystals are distinctly visible under the microscope). All this shows the necessity for vigorous and effident dispersion of the sulfuric acid when it is fed into the slurry.
Fortunately, sulfuric acid helps itself in its intense dispersion. The violent generation of heat accompanied by vapor release creates intense turbulence where the sulfuric acid encounters the more dilute phosphoric acid. But this is not sufficient. Effective agitation (both flow and microdispersion) have to complete a perfect distribution of the H2SO4 within the reacting slurry volume. This is espedally true for highly reactive rock, like that from Israel or Tunisia which needs more care in this respect than Florida rock, for example.
Another important factor has to be considered for both a high recovery of P2O5 from the rock and good crystallization; the sulfuric acid has to be fed into a medium where a certain sulfuric acid concentration limit already exists. We shall see why later.
To ease the sulfuric acid dispersion, it is generally mixed first before being introduced into the slurry with recycle acid, a diluted phosphoric acid of about 16% P2O5 concentration, recycled from the filtration and cake wash sectors. The mixture of diluted H3PO4 and
♦Sulfuric acid or SO4 concentration mentioned in this book is always indicated as total acid or SO4 as a result of gravimetric analysis. The acidimetric titration of H2SO4 in phosphoric acid does not indicate total SO4; it is influenced by the impurities in the technical-grade acid. Sometimes, confusion results from the two methods.
Reaction and Crystallization
71
98% H2SO4 reaches boiling point and releases some of the dilution heat in the form of vapor, which is evacuated from the reactor with other gaseous effluents.
For quite a long time it was believed that a preliminary dilution of the sulfuric acid from 98% to 80% with water would favor better crystallization. In fact, if the recycle acid/sulfuric acid mixture is properly operated, the H3PO4 concentration entering the reactor is exactly the same because of the total material balance. (The water added for sulfuric acid dilution has to be taken away from the filter cake wash water, and consequently the recycle acid is more concentrated.) The difference resulting from sulfuric acid dilution is noticed only in the heat balance; the heat removed by the sulfuric acid dilution-cooler does not have to be removed from the reactor. Furthermore, the practice of H2SO4 dilution, coupled with water balance constraints, reduces the availability of filter wash water. Consequently, higher P2O5 losses during filtration could be expected. The use of wet rock grinding and feeding has definitely killed the practice of sulfuric acid dilution; it would completely upset the filter wash water balance.
Phosphate Rock
Phosphate rock has also been subjected to sophisticated techniques for introduction into the reactor. Nowadays it is dumped in as it comes into the agitated slurry reaction tank, and it has never behaved as well. Prewetting with recycle acid as well as with recirculated slurry (for gradual attack) has been abandoned.
Phosphate rock particle size is another factor. This is a question of rock origin and also of process and equipment size. The rock fineness has to be sufficient to allow total recovery of the P2O5 by acid attack and avoid coating (see Section 2.2.3, "Introduction of the Phosphate Rock"). Large well-agitated tanks accept coarser rock for treatment. Some manufacturers just screen their rock through 0.4-0. 5 mm and grind only the oversize; but most of the time particle size distribution is about 30-40% over 125 pm.
If phosphate rock is fed into a separate tank with recycled slurry, the sulfuric acid concentration of the recycled slurry has to be high enough to ensure that the reacted slurry leaving the tank still has a convenient SO42’: Ca2+ ratio (generally over 1). It is an important rule which will be explained later using CaO/SC>4 graphs.
2.2.2 The Three Reactions
The first reaction, ionization of sulfuric acid, is instantaneous as the acid is dispersed within the slurry.
2- +
H SO, * SO, + 2H (5)
2 4 4
Industrial Process Chemistry
72
The second reaction, to separate the calcium ion Ca2+ from the rock particles, takes more time and is slow enough to be measurable. Nevertheless, it is faster than was thought for a long time. Most phosphates, when ground to the usual fineness for phosphoric acid production, react 95% in less than 5 min, whereas the total retention time in the reaction vessels is generally 4-6 hr:
Ca (PO ) CaF + nH+ -> 2H Po' + F H + 4Ca2+ + (n - 6)H+ (6)
0 4 z 2 £ A
The reaction needs a certain excess of H+. But if in fact the balance of the reaction is asymptotic, it is mainly because of a phenomenon called coating. Phosphate rock particles can be covered by gypsum crystals, protecting them from further attack by the acids. Coating is essentially a question of phosphate rock origin (physical constitution, such as porosity) but is also subject to the concentration of the SO42’ ions and the slurry temperature (see Section 2.2.3, "Introduction of the Phosphate Rock").
As for the third reaction, once the Ca2+ ion diffuses from the solid into the liquid phase it will be surrounded by a crowd of SO42’ ions and the liquid itself that contains a large number of crystals. Both SO42- ions and the crystal surfaces will offer the Ca^+ ion some sort of attachment. The crystal surfaces will offer a position in their lattice; the SO42- ion, by forming a crystal nucleus, will also offer a position.
But in spite of the great number of crystals (there are usually between one and two hundred million in 1 cm2), a rather short distance between them (10-20 x 10 ^ cm), and a comparatively high mobility of the Ca2+ ions, the positioning into the crystal lattice is a slower reaction than its liberation from the solid phase. The same is true for the positioning of the SO42* ion.
But Ca2+ and SO42- can also combine to build a new crystal nucleus. Nuclei formation needs a certain energy potential; it happens only once a certain threshold is passed. This threshold can be a minimum concentration limit for SO42- and Ca2+.
The third reaction, being the slowest* of the three, tends to let the SO^‘ and Ca2+ ions accumulate in the liquid phase. Consequently, a certain level of supersaturation appears. Supersaturation increases the regular crystal growth mass transfer and after a certain supersaturation limit, spontaneous formation of nuclei will occur. According to Dahlgren [61], beyond this threshold, the supersaturation limit, there is an exponential speeding up of the spontaneous nucleation.
The more sulfuric acid and phosphate are fed into a unit volume of slurry, the more Ca2+ and SO4 ions will appear and the higher the
*The third reaction has a low energy potential.
Reaction and Crystallization
73
supersaturation will be. Beyond a given feed ratio, the super saturation limit will be passed and spontaneous formation of nuclei will occur, multiplying the total number of crystals.
This supersaturation can be measured and characterized by the solubility product. When calcium sulfate crystals are suspended in a phosphoric acid solution, we can write the solubility product [62] :*
SO2' x Ca2+ = К 4
(7)
As a matter of convenience, instead of the traditional molar concentration, we can simply use the percentages of SO4 and CaO. (The К number will then be written as Ks.)
At 75°C, with crude wet process acid, this gives
К = SO„% x CaO% = 0.83 s 4
(8)
In reacting slurry, К supersaturation.
increases substantially because of a state of
♦Kurteva and Brustus [62] found that
ССа(СБ°4)П = Ks
where
n = 1.25 - O.Olt (t = temperature)
\ = “•“° 2'40.M26 ‘
Cp2°5
100
2+
C = concentration of Ca , wt % Ca
2-
C = concentration of SO, , wt %
SO. 4
4
P О
2 5
= concentration of P О , wt
2 5
s
From crude acid the author could not find similar values but applied the solubility product (SO4)(Ca) = Ks with an accuracy acceptable for industrial purposes.
74
Industrial Process Chemistry
2.2.3 The СаО/БОц Diagram: Saturation and Supersaturation
Description of the Diagram
The CaO/SO4 diagram (Fig. 2.18) shows Ca2+ and SO42 solubility concentration lines in 30% P2O5 wet process phosphoric acid with a calcium sulfate crystal suspension (when it forms the slurry). Usually, there are 25 vol % crystals.* As a matter of convenience the concentrations on the diagram are expressed as a percentage weight of CaO and SO4 in the phosphoric acid.
The у axis represents the CaO concentration, the x axis the SO4 concentration. Thus 1% of SO4 on the diagram is equivalent to 13 g of SO4 per liter of phosphoric acid and 9.75 g/liter of slurry (because of the 25% solids in the slurry). When there is no reaction, the crystals and the solution are in equilibrium:
2+ 2- .
Ca + SO4 + 2HgO 5 CaSO4 • 21^0 (9)
2+ 2-
As we saw in Section 2.2.2, the solubility product of Ca and SO4 can be written:
(% CaO) x (% SO4) - 0.83 (10)
at 75°C, in 30% P2Og technical wet process phosphoric acid when calcium sulfate crystals are in agitated suspension but no reagents are added. This is shown by the S line of Fig. 2.18.
When SO^' and Ca2+ ions are introduced into this system, which is in equilibrium, their concentration will increase and the coordinates of the solubility product will increase. Simultaneously, SO42” and Ca2+ ions will settle and build up the crystals in what we shall call here a regular crystal growth (RCG) reaction.
The solution is then in a state of supersaturation. The more ions appear, the higher the supersaturation will be, up to a level where spontaneous nucleation will take place. This limit is shown by the SSL (supersaturation limit) line. This line has been measured by instant filtration of slurries within the reacting medium, both with pilot and industrial plant slurries. Porous glass filters have been submerged into the operating reactors and vacuum applied. The recovered filtered acid, already containing precipitated solids, has been analyzed for its P2O5, CaO, and SO4 content. Similar solubility product figures, all corresponding to line SSL, are found whatever the rate of introduction of Ca2+ and SO^’ was, provided that it was large enough to reach or pass the SSL line.
♦Specific gravity of gypsum 2.32 and phosphoric acid 1.30 for 30% P„O, crude acid at 75°C.
z 5
Reaction and Crystallization
75
WEIGHT % SO.
4
FIG. 2.18 Saturation and supersaturation diagram CaO/SO^in 30% P2O5 phosphoric acid at 75°C. Precipitation speed lines in kilograms of gypsum per cubic meter of slurry per hour.
76
Industrial Process Chemistry
It appears clear from what we have just said that whatever goes outside the boundary of the SSL line will be exposed primarily to spontaneous nuclei formation (SNF). The experimental results plotted on line SSL can be mathematically represented as follows:
KOCT = [CaO] x [SO.] - 1.30 (11)
with CaO and SO4 expressed as a percentage weight in 30% P2O5 phosphoric acid. When compared to the saturation line, corresponding figures are more than 50% higher, which is considerable.
As we know, beyond the SSL line is where nuclei start to be produced at a very high rate. Hence as far as possible, we shall avoid going beyond the SSL line, and operate within the boundaries of the saturation and the supersaturation zones, located between the S and SSL lines.
We also measured the crystallization speed on the line SSL. This was done by adding a fixed amount of sulfuric acid all at once into a bench-scale reactor and analyzing the Ca^+ and SO^' concentrations as a function of time. It could also be checked from a multitank unit with a known recirculation rate where the Ca^+ and SO^~ concentrations were measured from tank to tank (unattacked rock content was also controlled). These analyses are not easy to handle and not very accurate. Only by doing a great number of them can statistical results be evaluated. Nevertheless, the corroboration of the two evaluation methods was positive. A crystallization rate could be extrapolated within 90-120 kg (average 105) of CaSO4 • 2H2O per cubic meter of slurry per hour (agitated slurry, about 0.8 kW/m® and 75°C). This crystallization speed is supposed to occur on the SSL line within the SO4 concentration range of 2-4%. Below the SSL line the crystallization speed slows down and we could draw a number of parallel lines (isokinetic lines*), each for a definite crystallization speed rate, the S line having the speed rate zero (Fig. 2.18). The crystallization speed is a linear function of the difference of the solubility product of the isokinetic line under consideration and the S line.
Ф(К - К ) = Q (12)
ss s
where
К = solubility product of the supersaturated solution (in percent-SS age weight CaO and SO^)
К = solubility product of the saturated solution (in percentage
s weight CaO and SO^)
*Lines with same reaction speed.
Reaction and Crystallization 77
Q = quantity of gypsum, kg/m3 slurry per hour, crystallized without spontaneous formation of nuclei- (RCG reaction)
Ф = crystallization mass transfer constant equivalent to 214 kg(m3)-l when 25% solids by volume in 30% acid slurry at 75°C
This relationship is very important because it can be utilized for sizing reaction tanks and recycling volumes, as will be demonstrated later. Beyond the SSL line the calcium sulfate formation is too fast to be measured with present technical possibilities. Nevertheless, it is obvious that, while nucleation takes place, RCG reaction should also be present, at a higher speed than what had been measured on the SSL line.
With higher temperatures and higher phosphoric acid concentration, the diagram changes. The solubilities increase for both the S and SSL lines when the temperature raises. With hemihydrate the super saturation zone widens between the S and SSL lines.
Interpretation of the CaO/SO Diagram
To illustrate the application of the CaO/SO4 diagram, consider a phosphoric acid slurry; with all constituents held constant, the addition of sulfuric acid will result in a hypothetical horizontal move to the right along the abscissa. In Fig. 2.19, if one starts from point A on the saturation line S and adds 3% of SO4 at once, the resulting CaO/SO4 coordinates, assuming no precipitation, will be defined by point Bp However, once a solution exceeds supersaturation, beyond the SSL line, spontaneous precipitation will occur in addition to RCG reaction, in this case at a point В along the locus of line ABp Beyond B, with the continued addition of SO4, the concentration, instead of proceeding to Bp will be deflected along the SSL line to C because the calcium sulfate above the SSL line precipitates spontaneously. Point C can be defined as the point where the SSL line is intersected by the theoretical CaSO4 • 2H2O precipitation line drawn through point В 4. The slope of this line is the stoichiometric ratio 56:96, the respective molar weights of CaO and SO4. The amount of precipitation can be calculated either from the CaO level of В and C on the SSL line or from the SO4 level of B4 and C (in Fig. 2.19 it is 0.13% CaO or 0.22% SO4, corresponding to 3.9 kg of gypsum per cubic meter of slurry.)
The amount of precipitation or crystallization related to a move on the diagram between, for example, point x and point у is calculated with the weight balance of either the SO^_ or the Ca2+ ions between x and y. The quantity of calcium sulfate precipitated during that move is proportional to the sum of the ions fed into the system minus the concentration increase between x and у on the diagram.
At C, continued precipitation will proceed along the extension of line BjC to D. Line CD depicts the crystallization of calcium sulfate from the SSL line, through the supersaturated area, to the S line.
78
Industrial Process Chemistry
—
Ш * J - * *4 Ш 4v/
u. ———^ co
_ SS*- It - .% QseJ 1СЧ "*
0 Э u c M 5
OB0 % 1H9I3M
FIG. 2.19 Introduction of H SO and phosphate rock into phosphoric acid slurry.
Reaction and Crystallization
79
This CD portion will take some 14-16 min, with an agitated slurry having 25 vol % crystals, at a temperature of 75°C.
At point D, the CaO and SO4 constituents in the phosphoric acid/ gypsum slurry are in equilibrium. With the addition of phosphate rock amounting to 1.75% CaO (equivalent to 3% SO4), also added at once, there will be a vertical rise of CaO (concentration from D to a hypothetical point Ej crossing the supersaturation zone and intersecting the SSL line at E. Instead of following the dashed line to point Ej at 1.75 + 0.15 = 1.90% CaO, once again the locus of changing concentration will go along the SSL line from E to F with concomitant spontaneous precipitation of gypsum. Point F is where the CaSO^ precipitation line drawn through point E^ intersects line SSL. The major assumption in the aforesaid is that all the rock has been dissolved instantaneously. The gypsum precipitated can be calculated from the different sulfate levels at E and F or from the theoretical CaO level at Ej and at F.
Finally, with continued precipitation beyond F on line EjF, the solution concentration will return to point A on the saturation line, and the cycle will be completed, all of the 3% added sulfate being precipitated as calcium sulfate.
Introduction of Sulfuric Acid
Addition of Sulfuric Acid. To illustrate on the diagram the introduction of sulfuric acid into the slurry, we will consider a sulfuric acid dispersion within saturated slurry (the S line) at a ratio of 15 kg of H2SO4 per cubic meter of slurry. This is a normal mixing ratio; for example, with a traditional multitank or multicompartment system equipped with recirculation, where the sulfuric acid feed is mixed with recycled slurry before the latter flows into the rock attack compartment It corresponds to 20 kg/m^ liquid-phase phosphoric acid or a 1.54 SO4 percentage weight change on the diagram.
In Fig. 2.20, if we start from A^ on the S line, 1.54% of SO4 will be added to the 2% SO4 already existing in the slurry. If the mixing is done at once (e.g., acid mixing within a pipe mixer), the SSL line will be exceeded with a margin of 0.42% SO4 (BjCp and will produce spontaneous nucleation (CjDp, that is, 0.035% CaO or 1.05 kg of CaSO4 • 2H2O per cubic meter of slurry.
If we start from point A2 with 3% initial SO4 instead of Ap the total amount of sulfuric acid can be fed without exceeding the SSL line and spontaneous nucleation will not occur. But if we start from A3, most of the sulfuric acid added will contribute to spontaneous nucleation because of the narrowing range of orderly crystallization, the region between the S and SSL lines when approaching low SO4 concentrations. The dashed line C3D3 represents much more spontaneous nucleation of CaSO^ • 2H2O than does the line CjDp The more nuclei produced, the smaller will be the mean size of the final crystals, for the simple reason
80
Industrial Process Chemistry
from three different residual sulfate levels.
Reaction and Crystallization
81
that there will be fewer crystallizing ions available for the growth of each nucleus.
This illustration shows clearly why it is important to add sulfuric acid to a medium where the existing sulfate level is at a certain minimum. This is true for dihydrate and nondihydrate processes when we want to build crystals at an optimum size.
The assumption that mixing is instantaneous and that supersaturation limits may in reality be exceeded holds true for the case when the sulfuric acid is mixed with a recycled slurry in a circulation pipe, a small premixer, or in a flash cooling system. The effect of mixing time was not taken into consideration in these examples. Conditions are different when sulfuric acid is added to an agitated tank with a certain volume or, consequently, retention time.
Effects of Recirculation Rate of the Slurry and Volume of the Sulfuric Acid Mixing Compartment. Recirculation is pumping slurry from one of the final reaction sections back into the front sections where most of the reaction takes place. The slurry recirculation rate is usually expressed in numbers equivalent to produced slurry. A production rate of 1000 tons of P2Og Per day produces some 350 m3 of slurry per hour, which are sent to the filter. If the slurry recirculation pump handles some 3500 m3/hr, the recirculation rate is said to be 3500/ 350 = 10.
The benefit of slurry recirculation has been recognized for many years and the most common recirculation rate is around 20-25 when multicompartment reactors are used. Modern multicompartment units, taking advantage of the performances of modern large pumps, have pushed the recirculation rates up to as high as 40. The higher the recirculation rate, the lower will be the SC^/slurry ratio at the mixing point.
The higher the rate of recirculation, the lower the rate of increase in SO4. Starting with a slurry of 2% residual SO4, the addition of sulfuric acid when the recirculation rate is 10 will be more than 3% of SO4. This will obviously pass the SSL line. With a recirculation rate of 25, the increase in SO4 will be only 1.6%, and with 40, as little as 0.8%. In this case it will be much easier to stay inside the two lines, avoiding too much nucleation. The foregoing applies to instant continuous mixing, such as the introduction of sulfuric acid into a pipe with flowing slurry.
In most processes sulfuric acid is fed into the reaction system* by mixing with the slurry in a special agitated mixing tank of a certain
*Only a few processes introduce sulfuric acid into a pipe with flowing slurry or into the flash cooling system [63], where the reaction volume is very small. Most processes feed the sulfuric acid into a separate agitated tank which is within the cycle of flowing slurry, preferably upstream of the phosphate rock mixing tank [64]. Some processes feed the sulfuric acid into the same tank as the phosphate rock [65].
82
Industrial Process Chemistry
retention time. When the slurry leaves that tank or mixing section after several minutes of retention, its total sulfate content has been increased by the added sulfuric acid as it happened in the pipe. Nevertheless, the difference lies in the fact that the addition of sulfuric acid was made within a much larger and agitated mixing volume.
The mixing tank (Fig. 2.21C) can be considered as an additional recirculation loop, with a very high flow rate, attached to the main recirculation cycle of the reactor. The mixing tank recirculation cycle consumes a part of the added sulfuric acid excess and, because of the large numbers of crystals in its volume, will "digest" it by regular crystal growth reaction.
The consequence is less spontaneous nucleation. In practice, with an agitated tank two mixing points will be considered: one where the acid is mixed with the large flow from the tank agitation and one where the incoming slurry, with its lower residual SO4 value, mixes with the slurry from the tank, with its increased SO4 level. To demonstrate the foregoing, we can calculate examples for the three cases shown in Fig. 2.21. All cases refer to incoming slurry with 2% residual SO4 on the S line, consequently with 0.41% of CaO.
1. 110 tons of SO4 mixed with a slurry flow rate of 3500 m^/hr. The SO4 concentration increase is +3.1% (Figs. 2.21A, and 2.22, line ACj). Spontaneous nucleation is equivalent to 0.15% CaO (Fig. 2.22, line CjC) or 15.7 tons of calcium sulfate dihydrate per hour for the total flow.
2. 110 tons of SO4 mixed with a slurry flow rate of 7000 nr/hr. The SO4 concentration increase is +1.55% (Figs. 2.21B, and 2.22, line AB4). Spontaneous nucleation is equivalent to 0.043% CaO (ВдВ) or 9 tons of CaSO4 • 2H2O per hour for the total flow.
3. 110 tons of SO4 mixed into a 118-m3 agitated tank with a 3500-m3/ hr slurry throughput. The maximum RCG reaction is 118 x 0.105 = 12.4 tons/hr, which is less than the total amount precipitated from the SO4 addition. The working points of the tank will consequently be mainly below the SSL line (Figs. 2.21C and 2.22) with the following lines: AX when the slurry enters the tank, XYZ inside the tank; XY sulfuric acid introduction, YZ crystallization, and ZX mixing with incoming slurry. To illustrate the working of that tank, let us assume that it has an internal agitation flow cycle of some 11,682 m3/hr or 99 rotations per hour. The mean retention time in the tank is 118 x 60/3500 = 2.02 min.
Q
Consider a hypothetical unit of slurry volume of 1 m ; upon entering the tank it will stay 2.02 min, cycle 3.33 times, and leave the tank. (36 sec per cycle) When entering the tank the slurry will correspond to point A in Fig. 2.22 and mix with slurry from Z. The mixing ratio at the tank entrance being 3500-11,680 m3, the resulting mixture will be at X, which is at 70% of AZ and below the SSL line. Our cubic
Reaction and Crystallization
83
Mixing tank. Part of the S04 ions cycling in the tank, end positioning themselves on the existing crystals.
FIG. 2.21 Effect of recirculation rate of the slurry and volume of the mixing compartment.
84
Industrial Process Chemistry
WEIGHT % S04
FIG. 2.22 Effect of recirculation rate of the slurry and volume of the sulfuric acid mixing compartment, as related to cases A, B, and C of Fig. 2.21.
Reaction and Crystallization 85
meter will now cycle 3.33 times (each cycle XYZ) within 2.02 min and get at each cycle 1/3.33 of its SO4 share or a 3.1/3.33 = 0.93% SO4 increase (line XY). Each time line XY will intersect the SSL line and induce some SN: 0.01% CaO corresponding to 0.3 kg of CaSO4 • 2H2O for our 1 m3 of slurry, per cycle, or 3.5 tons/hr for the system. During each cycle of 36 sec there is also 0.036% CaO = 1.07 kg of RCG reaction per cubic meter of slurry or
1.07 x 118 3600
----7—^--- x — - = 12.6 tons of calcium sulfate per hour 1UUU------ob
for the mixing tank system (0.036% CaO per internal cycle).
From the three case studies we have seen that a tank with 2.02 min of retention time has a better result with nucleation reduction than an additional recirculation flow amounting to an increase equivalent to another 10 production flow rates of slurry recycle.
Introduction of the Phosphate Rock
The introduction of phosphate rock into the slurry will promote a vertical move of the operating point due to the liberation of calcium from the raw material. In spite of the great speed of attack by the H ions, the Ca2+ ions will not appear instantaneously in the solution as the SO42" do. The phosphate particles have to be dispersed and impregnated by the phosphoric acid. These rock particles, even finely ground, are rather large compared with the size of the molecules. The average rock particle shape can be considered spherical, with diameters ranging between 20 and 200 pm. Since the H+ ions are about four to five times faster than the SO42” ions, it is to be expected that the rock particles will have their porous cavities filled with a liquor containing many Ca2+ ions. Consequently, ideal conditions for nucleation exist right on the surface of the rock particles. The resulting nuclei, growing into large crystals, take root in the original rock particles, cover the latter, and delay further calcium "liberation.”
The phosphate rock attack kinetics are slow enough to be measured. Figures 2.23 and 2.24 show that ground rock (70-80% > 152 pm is generally decomposed by more than 90% in less than 5 min. The initial reaction speed is always high; it is the asymptotic final stage of the diagram that characterizes individual rock behavior. In fact, this is due mainly to the coating phenomenon, which is an overvigorous crystallization, completely enveloping the phosphate rock particle, protecting it from further rapid action by the attacking H+ ions. It appears clearly under the microscope, looking like a sea urchin, made of gypsum needles with a phosphate core. Further attack is resisted or slowed down even after hours of retention time (see Fig. 2.25). Coating is emphasized both by particle size and sulfuric acid concentration (Fig. 2.26).
86
Industrial Process Chemistry
FIG. 2.23 Kinetics of attack of Tunisian rocks. 1, Laboratory; 2, plant; 3, plant with high H2SO4 excess (3% SO4).
On a CaO/SO4 diagram (Fig. 2.27) the addition of phosphate rock will liberate Ca2+ ions which will induce a vertical shift off the working point. To illustrate this, let us consider the addition of 18 kg of phosphate rock, containing 9 kg of CaO to 1 m2 of slurry (this is a comparable order of magnitude to the addition of 15 kg of H2SO4 in Fig. 2.20). If we start at point A with 3.25% SO4, there will be enough sulfate ions to combine with all the Ca2+ ions originating from that rock addition.
Addition of phosphate rock is always done in a vessel or compartment having a certain retention time, which allows a certain yield of crystallization as RCG reaction. The larger the compartment, the longer the retention time and the more gypsum crystallized by RCG reaction. If we assume in our example a retention time of 6.5 min, each effective reacting cubic meter in the reactor will allow some 105 x 6.5/60 = 11.4 kg of gypsum to crystallize as RCG. This would represent 0.37% CaO on the у axis of the diagram.
Reaction and. Crystallization
87
FIG. 2.24 Kinetics of attack for various rocks in 30% P2O5 acid at
C. 1-4, Tunisia; 5, USSR. 1, Gafsa, 30% over 152 2, Redey-
eff, fraction between 125 and 200 pm. 3, Redeyeff, fraction between 400 and 800 pun. 4, Kaala Djerda, fraction between 400 and 800 pm.
5, Kola rock.
88
Industrial Process Chemistry
% CONVERSION
FIG. 2.25 Kinetics of attack of North Carolina rock (coating effect) acid 400 g/liter of P2O5. 1» ±0 H2SO4; 2, +10 g/liter H2SO4; 3, +20 g/Iiter H2SO4.
Reaction and Crystallization
89
FIG. 2.26 Coating effect as a function of particle size and sulfate concentration in phosphoric acid of 29% P2O5 concentration and 75°C. Time of attack: 4 min. 1, Florida rock with 10% > 200 ym, 65% > 125 pm, 94% > 100 pm (Tampa). 2, Florida rock with 20% > 200 pm, 45% > 125 pm, 55% > 100 pm (Jacksonville). 3, North Carolina rock 6% > 200 pm, 43% > 125 pm, 65% > 100 pm.
The addition of a total of 18 kg phosphate rock with a 50% CaO analysis will provide a potential 0.90% CaO. This amount of CaO will be distributed in the following manner (Fig. 2.27):
Line AB: From the S line to the SSL line, 0.14% CaO, no crystallization.
Line BC: RCG reaction. Instead of crossing the SSL line up to B , this portion of the reaction takes place along the SSL line; it corresponds to the previously calculated 0.37% CaO or 0.63% SO4. The portion corresponding to regular crystal growth reaction RCG is depicted below the SSL line. During this phase, 0.37% CaO precipitate, dashed triangle above, together with 0.63% SO4 (SO4 concentration shifts from 3.25% back to 2.61%). The solubility of CaO moves up by 0.08% on the SSL line.
90
Industrial Process Chemistry
FIG. 2.27 Introduction of phosphate rock into phosphoric acid slurry.
Reaction and Crystallization
91
Line CD: Since RCG reaction cannot retract all the CaO fed into the slurry, the remainder of CaO will be subject to spontaneous nucleations. From the introduced CaO: 0.90%, the remaining part is 0.90 - 0.14 - 0.08 - 0.37 = 0.31% CaO, which will represent the vertical dashed line from C toC”. Not all the 0.31% will precipitate as spontaneous nuclei (SN) because the slopes of the solubility lines increase asymptotically in the lower SO4 concentration area. From the diagram we read a 0.23% CaO change as the result of spontaneous nucleation.
Line DE: Desupersaturation with RCG reaction: 0.15% CaO. The CaO remaining in solution is 0.15% higher than from starting point A. This move only occurs once the slurry has left the rock mixing section and the absence of feed allows desupersaturation.
Balance of added CaO from the rock mixing section, 18 kg of rock per cubic meter or 0.90% of CaO:
Introduced RCG reaction (0.64% SO4) SN reaction RCG desupersaturation Remaining in solution 0.90% CaO 0.37% CaO 0.23% 0.15% 0.15%
Total 0.90% 0.90%
The foregoing example is based on the assumption that all the phosphate rock decomposes within the given retention time. In most cases, this is not very far from what happens. Nevertheless, the kinetics of phosphate rock decomposition in the slurry can vary and be strongly reduced in some special cases. Most of the time, more than 95% of the phosphate rock is attacked within 5 min of being fed. The major factor controlling the reaction speed is the specific surface area of the phosphate rock. If the rock is coarse and not porous, the reaction speed can be low. If the rock is very porous and the sulfuric acid in greater excess and the temperature high, the coating phenomenon can reduce the reaction speed very strongly. North Carolina rock, for example, is a porous reactive rock (Figs. 2.25 and 2.26) with more than 99% of decomposition within 2 min, but it is very sensitive to sulfuric acid excess and the reaction speed can be slowed down to less than 90% in 10 min with a 20-g/liter H2SO4 content, which is a rather normal sulfate level. In such a case the lower reaction speed will have an impact on the crystallization characteristics of the system.
Referring to the preceding example, upon the addition of 18 kg of a 50% CaO phosphate rock, instead of a 0.9% CaO change potential a lower figure would be expected. For example, only 85% would go into solution, resulting in a 0.76% CaO change potential.
92
Industrial Process Chemistry
2.2.4 Function of the Two Stages of the Attack System: Comparison of the Reaction Systems
As noted earlier, the function of the reactor can be considered in two stages:
1. Mixing and dispersion of the reagents accompanied by the greater part of the reaction and crystallization
2. Completion of the reaction, desupersaturation, defoaming, emulsion breaking, and slurry cooling (in other words, to prepare the slurry for another cycle through the reactor)
The distribution of these two functions within a reactor depends on its type and accordingly can vary widely. To make this evident we are comparing here three imaginary types of slurry reactors based on the same production figures with the same rock (see Fig. 2.28) and calculating their respective crystallization balances. Spontaneous nucleation, the reaction that is to be minimized as much as possible, occurs only in the first stage.
The following data are common for the three systems:
Production rate: 1000 tons of P2O5 per day
Slurry production (to filter): 364 m^/hr (25% gypsum in volume, spe-
cific gravity of acid at 75°C: 1.30)
H2SO4 consumed: 120 tons/hr as SO4
Rock consumed: 148 tons/hr (70.0 tons/hr of CaO)
Total gypsum precipitated: 212 tons/hr (3 tons/hr remains in solution) Recycle acid to reactor: 317 m^/hr (58.9 tons of P2O5 per hour)
System 1 (Figs. 2.28A and 2.29)
Eight compartments of 250 each
Rock into first compartment with 85% of reaction
3000 m^/hr slurry recirculation
Total slurry flow, including produced slurry, 3364 m^/hr carrying
3279 tons/hr of product acid, liquid phase
To simplify calculations we can assume a constant flow of 3364 m^/hr of slurry through all the compartments of the reactor and calculate the following equivalences:
1% SO4 in liquid phase = 58.7 tons of CaSO^2HgO per hour (13)
= 32.8 tons of SC>4 per hour (14)
1% CaO in liquid phase = 100 tons of CaSO^H^O per hour (15)
= 32.8 tons of CaO per hour (16)
Reaction and Crystallization
93
FIG. 2.28 Effect of compartment size distribution and recirculation rates. (A) System 1: eight compartments of 250 m3 each, recirculation 3000 m3/hr. (B) System 2: 100-1100 m3 and 600 m3 compartments. 8000 m3/hr recycle. (C) System 3: Single 1800-m3 compartment.
94
Industrial Process Chemistry
FIG. 2.29 Crystallization diagram of multicompartment system of Fig. 2.28A.
Reaction and Crystallization
95
First Stage
a. Sulfuric acid introduction into the recycled slurry: line ABC: 120 tons of H2SO4 per hour; according to Eq. (14), 3.66% SO4; C is beyond the SSL line; SN formation 0.17% CaO according to Eq. (15) equivalent to 17 tons/hr of CaSO4 • 2H2O.
b. Rock mixing compartment: line CD: RCG reaction—250 of reaction tank volume will crystallize on the SSL line. 250 x 0.105 = 26 tons of CaSO4 • 2H2O; according to Eq. (15), 0.26% CaO, or Eq. (14), 0.44% SO4. Line DE: SN equivalent to total calcium introduced minus RCG equivalence and the solubility difference of CaO between points C and E.
Total calcium 70 x 0.85 = 59.5 tons/hr CaO = 1.81% CaO
RCG reaction - 0.26
Solubility difference -0.24
SN formation 1.31
which is, according to Eq. (15), 131 tons/hr of calcium sulfate.
Second Stage (Remaining Seven Compartments) . Line EA: final reaction of the 15% remaining phosphate rock and desupersaturation with concomitant RCG reaction. From the diagram we can read 0.69% SO4 equivalent to [Eq. (13)] 40 tons/hr of calcium sulfate.
Crystallization Balance for System 1
RCG SN
HgSO^ mixing pipe — 17
Rock feed compartment 25 132
Compartments 2 to 8 40 —
Tons of calcium sulfate precipitated per hour 65 148
The crystallization balance shows clearly that most of the crystals are precipitated within the SN regime (69%).
System 2 (Figs. 2.28B and 2.30)
Three compartments: H2SO4 mixing tank 100 m^, rock mixing tank
1100 m3, 98% rock attack, final tank 600
Q
Slurry recirculation: 8000 m /hr
Total flow: 8364 m^/hr
Liquid-phase flow: 8155 tons/hr
96
Industrial Process Chemistry
0*0 % 1Н01ЭМ
FIG. 2.30 Crystallization diagram of three-compartment system of Fig. 2.28b.
Reaction and Crystallization
97
Equivalences:
1% SO^ in liquid phase = 146 tons of CaSO^ • 211^0 per hour (17) = 81.6 tons of SC>4 per hour (18)
1% CaO in liquid phase = 250 tons of CaSO^ • 2H^O per hour (19) = 81.6 tons of CaO per hour (20)
. First Stage
a. Sulfuric acid mixing compartment: 100 m3 of agitated volume. Line ABC: RCG reaction 100 x 0.105 = 10 tons/hr of calcium sulfate equivalent [Eq. (19)] to 0.04% CaO; CL is only 0.03% CaO above SSL line, which is less than equivalence to RCG reactions, so there is no SN formation.
b. Rock mixing compartment: 1100 m3 of agitated volume. Line CDE: 98% rock attack-due to sufficient retention time. Total calcium into solution 70.0 x 0.98 = 68.9 tons CaO equivalent [Eq. (20)] to 0.84% in liquid phase.
c. Line CD: RCG reaction —1100 m3 x 0.105 = 115.5 tons/hr of calcium sulfate or [Eq. (19)] 0.46% CaO and [Eq. (17)] 0.79% SO4.
d. Line DE: SN formation equivalent to total calcium liberation into the rock mixing tank minus calcium taken by RCG reaction, which is 0.84 - 0.46 = 0.38% CaO. Both 0.79% SO4 and 0.38% CaO will position Di starting from C. The SN formations will be along the dashed line DE, equivalent to 0.19% CaO or [Eq. (19)] 47 tons/hr of calcium sulfate.
Crystallization Balance for System 2
RCG SN
H^SO^ mixing compartment 10 —
Rock mixing compartment 115 48
Final compartment 39 —
Total (212 tons/hr) 164 48
System 3 (Figs. 2.28C and 2.31)
Single compartment of 1800 т3-а11 reactants fed into the same volume. In such a large tank, mixing is not instantaneous. The agitation flow rate per hour can be as high as 15-25 times the tank volume. In the present case this would mean 27,000-45,000 m^/hr. There will not be great differences in concentrations for the different sections of the tank, and the diagram will simplify itself to a small working zone with
98
Industrial Process Chemistry
FIG. 2.31 Crystallization diagram of single-compartment reactor (Fig. 2.28C).
Reaction and Crystallization
99
fluctuations related to the mixed feeds of the reactants, balanced by the RCG reaction and a little SN reaction. The working zone will be located on the SSL line, because the mean crystallization rate lies above the 105 kg/щЗ value.
Figure 2.31 shows, in somewhat magnified form, sulfuric acid introduction, AB; the RCG reaction, BC; and phosphate rock attack, CA. Values for AB, BC, and CA depend on agitation flow of the tank.
Crystallization Balance for System 3
RCG reaction: 1800 x 0.105 = 189 tons/hr
SN reaction: 212 - 189 = 23 tons/hr
Conclusion
The three crystallization balances illustrate clearly where the best crystal growth medium is achieved; it is the system that allows a maximum of diffusion or expansion of both SO^' and Ca2+ ions that are fed into solution.
2.2.5 Crystallization of Calcium Sulfate and Causal Factors
Within a phosphoric acid process unit the most important operation by far is that of crystallization. A properly operating cyrstallization section results in a high yield of P2O5 recovery from the rock within the attack tank slurry, the production of maximum P2O5 concentration (with subsequent energy savings upon concentration), and the formation of crystals that filter easily and efficiently (minimizing soluble P2O5 losses). Properly functioning filtration correlates to the production of crystals with surface-to-volume ratios which are not too high, and which build a cake with sufficient porosity to allow the phosphoric acid to flow through with ease.
The surface-to-volume ratio and filter cake porosity are governed by crystal shape and size distribution. Very large crystals coexisting with some very small ones in the absence of intermediate sizes will offer poor filtration characteristics. Most phosphates, after having reacted in the phosphoric acid slurry, show table-like elongated crystals, with typical dimension ratios of 160 x 40 x 10. Flat crystals (Fig. 2.32) have difficult filtration characteristics. Often crystals appear as a mixture of different shapes. A certain number look like spheres covered with small pyramids, commonly called clusters. The latter will cause channels to exist among the flat material; these channels enhance the flow of the filtration liquid.
A high proportion of intermediate-size crystals improves filtration by forming a "precoat" layer on the filter cloth, preventing the very small crystals from plugging the cloth. The best crystals are those that look like balls. Their surface-to-volume ratio is at a minimum.
100
Industrial Process Chemistry
FIG. 2.32 Most common gypsum crystal shapes. 1, Needle-type crystals. Igneous rock or low content of aluminum (Zin rock, Israel;
Arachat, Brazil; Tapira, Brazil). 2, Small thin lozenges - slurry with high Ca^/SO^- ratio. 3, Rhombic and X-shaped swallowtail twins (Morocco). 4, Flat table-like (Tunisia). 5-6, Clusters (Florida) or other rock with addition of Al’^+ and active silica. 7, Thick rhombic type (Florida).
Furthermore, unlike the flat crystals, in between balls there is always a void space allowing acid to flow through. For a given rock, the factors that control the size and the shape of calcium sulfate crystals in a phosphoric acid reaction slurry medium are: (1) particle size distribution, (2) concentration of the phosphoric acid, (3) solids content in the slurry, (4) sulfuric acid excess in the slurry acid, (5) impurities in
Reaction and Crystallization
101
the acid originating from the phosphate rock, (6) temperature, and (7) the reaction system, feed-to-volume ratios, agitation, and recirculation. What follows is a detailed analysis of all these factors.
Effect of Phosphate Rock Particle Size
The effect of phosphate rock particle size on crystallization was explained briefly in Section 2.2.3. Particle size, the relative speed of H+ and SO^~ and Ca^+ ionization were discussed. In general, the .smaller the particles, the greater their number and the larger the surface of phosphate rock available for attack by H+ ions. The particle size distribution of a phosphate rock has a specific optimum range based on rock origin and the process route or system utilized. Particle size should be as regular as possible. Fines as well as coarse fractions are not appreciated. Fines lead to too high a reaction speed, whereas coarse particles, especially above 200 pm, have a strong tendency to coat. In 1 cm3 of phosphoric acid slurry there will be some 100- 200 million crystals of calcium sulfate and the mean distance between them will be about 15-18 pm, a distance that is acceptable for the freedom of movement of the Ca^4- and SO42~ ions. If all the rock particles were to have an average diameter of 200 pm, the addition of 18 к of phosphate rock to 1 m3 of slurry would introduce only 2000 particles of rock per cubic centermeter to the slurry. The mean distance to be covered by an individual Ca2+ ion would be as much as 250 pm. Similarly, grinding to an average diameter of 80 would reduce the mean traveling distance to about 100 pm.
Most phosphoric acid reactors use a phosphate rock fineness characterized by the 160-, 125-, or 80-pm size screens. Typical distributions such as 20-30% over 160, 30-40% over 125, and 40-60% over 80 are in common use (see "Phosphate Rock Grinding").
As we have seen in the preceding sections, the size of the rock mixing compartment is important because of its effect on supersaturation. Hence, larger tanks or compartments, or greater recirculation rates, can accept a coarser grind. It is claimed that some of the properly designed and dimensioned dihydrate attack systems and also some of the hemihydrate systems (where the phosphate rock is added into a hot slurry with a very low sulfate content) are able to use unground phosphate rock. Only coarse particle "scalping," by screening, has to be installed. The screening is usually done at about 400-500 pm, sometimes at 1000 pm. The oversize is separately ground and recycled as feed.
Effect of Phosphoric Acid Concentration in the Reaction Slurry
The optimum economic concentration of a phosphoric acid produced in a wet process unit is a function of local energy, raw material, and finished product costs (balance between costs for further concentration by evaporation and ₽2®5 l°sses due to a system producing acid at a higher concentration).
102
Industrial Process Chemistry
Usually, increasing the P2O5 concentration will lead to smaller and irregular crystallization of calcium sulfate after a threshold of concentration is passed. The effect of the impurities in the phosphate rock is noteworthy. Pure 30% P2O5 phosphoric acid contains 58.6% water. Wet process acid, also at a 30% P2O5 concentration, contains H2SO4, ^SiFg, Al^*, Fe^+, Mg2+, Ca^+, and so on, all at the expense of water.
Higher viscosities, resulting from the higher impurity content, will lead to higher supersaturation because of reduced ion mobility. This is probably why phosphate rocks with high reactivity suffer more from impurities than the rocks with low reactivity; the higher reaction speed calling for higher ion mobility. It is easier to produce 30% acid with a Florida rock than with a Tunisian rock having similar or even lower ratios of impurities. But there is no precise rule, and again it will be up to a trial-and-error program to test the optimum concentration to be produced. The problem becomes more sensitive with higher concentrations of P2O5 in the acid because of the higher ratio of water substitution required by the impurities (pure 40% acid contains only 44.7% of water and 52% acid as little as 28.2% water).
The CaO/PrjOg ratio denotes the ratio of tons of crystals per cubic meter of acid produced and thus, because of the allowable solids content limit of the slurry, the amount of P2O5 to be recycled from the filter to the reactor (see Section 3.2). The higher the CaO/P2Og ratio, the more water will be needed for the filter cake wash and the more P2O5 will be recycled to the reactor. Consequently, a lower acid concentration in the reactor will ease the production conditions and the recovery of ₽2°5 from the filter cake in this case.
The phosphoric acid concentration utilized in traditional dihydrate processes is usually maintained at 28-30% P2O5 for most of the commercialized phosphate rocks. But in some cases, P2O5 concentrations as low as 25-26% can be encountered, with low-grade rocks having high CaO/P2C>5 ratios and poor crystallization qualities.
Solid Content in the Slurry
Most phosphoric acid producers express solid content in the slurry on a weight percent basis. This practice leads to a certain degree of confusion because of the specific gravity variations of the acid, due to the concentration of H3PO4 and the impurities contained in the acid. It is more convenient to express the solid content in volume percent of calcium sulfate, which is independent of the liquid's specific gravity, and most of the time close to 25% (specific gravity of gypsum, 2.32; hemihydrate, 2.67; anhydrite, 2.52).
The solid content of 25 vol % does not vary much between processes and plants. The highest encountered by the author was 28%, in the presence of very good crystallization (with thick crystals, the solid content can be held even higher without getting too high a viscosity of the slurry). The lowest solid content the author has been able to observe was 22% with a needle-type crystallization.
Reaction and Crystallization
103
To elaborate further, it is recommended that a solids content of 24 vol % be the lower working limit. This solid/liquid ratio is controlled by the recycled product acid flow from the Alter. The lower the solids content maintained in the slurry, the more P2O5 or product acid will have to be recycled from the Alter. This recycled phosphoric acid has to be refiltered and, for the same tonnage of acid produced, a greater tonnage of P2O5 will circulate around, overloading the filter and increasing the risk of higher Altration losses. With decreasing solids content in the slurry, the surface of crystals per cm3 siurry offering settling places to the SO^- and Ca^+ ions will also decrease, and consequently the level of supersaturation will increase because the normal crystal growth reaction will be slowed down. This leads to more nucleation and smaller crystals.
As pilot plant studies reveal, the crystallization speed (mass transfer via crystal growth reaction) is controlled by the transition of the Ca2+ and SO^ ions from the liquid to the solid phase. If the solid content varies from 25 to 24%, the total crystal surface per unit of slurry will decrease by 4%. RCG reaction will decrease from 105 to 101 kg/hr per cubic meter, and consequently more spontaneous nucleation will take place. More nuclei will be born and the mean crystal size will be reduced. Low solid content also seems to change the shape of the crystals, by stretching them toward a needle shape and more frequently to a starlike shape. The solid content of 25 vol % seems to be an almost universal optimum between the effects of viscosity (mechanical qualities of the slurry) and supersaturation.
To conclude, solids content is an important factor to be closely observed because it has a double effect on the filtration qualities of the phosphoric acid slurry:
1. It controls the total volume of slurry to be filtered.
2. It controls crystal surface per unit volume of slurry, thus the amount of RCG reaction and the mean size of the crystals.
2~
It also controls the mean distance to be covered by the SO4 and Ca2+ ions, but the effect of this factor is negligible as compared with the other two. The foregoing points can be clearly demonstrated by comparing two slurries with differing solids content.
With 25% With 22.5%
solid content solid content
Volume to be filtered 1 1.11
P2O5 to be recycled per ton of P2O5 1.76 2.15
produced; CaO/P2O5 =1.66
3 3
RCG reaction 105 kg/hr/m 94.5 kg/hr/m
Mean distance to be covered by 1.000 1.036
ions (1 for 25 vol %)
104
Industrial Process Chemistry
Effect of Excess Sulfuric Acid
The excess of sulfuric acid in the reaction slurry is the most important factor governing crystallization quality. Its effect is not only on crystal shape and size, but also upon co-crystallized P2O5 losses (the highest P2O5 loss among other lost P2O5 values; see Section 2.4) plus the unattacked P2O5 losses due to the coating effect.
Through the solubility product relationship, the SO4 concentration controls the Ca2+ concentration, and both crystallization speed (RCG reaction) and crystal size depend on these concentrations. Crystallization, whether it is RCG reaction or SN reaction, needs both SO^2' and Ca2+ ions. The ionic mass transfer thus passes through a maximum when the molar SO42* concentration equalizes the molar Ca2+ concentration. This occurs when the SO42 concentration is between 1.15 and 1.6 wt % in 30% P2O5 acid (depending on the location on the S line or the SSL line).
9- 2+
The effect of the molar SO4 and Cs equalization is clearly demonstrated by the recrystallization speed curve (Fig. 2.33). This curve results from a hemihydrate-dihydrate recrystallization reaction which the author tested with different sulfate concentration levels. The time taken for the total conversion reduces to a minimum when the stoichiometric concentrations of SO42- and Ca2+ are realized.
The size of the crystals obtained during the same experiment followed a completely different equation. In spite of the small speed of recrystallization when operating at very low sulfate levels, only small crystals of the lozenge type were produced, whereas with increasing sulfate levels, the size of the crystals increased both in length and also in size up to the point when they became visible to the naked eye. It can be concluded from these experiments that excess Ca2+ favors nucleation even at low supersaturation conditions. In the subject experiments, supersaturation did not originate from the introduction of reagents but from hemihydrate dissolution.
It is evident that this will also happen when supersaturation is a result of mixing sulfuric acid and phosphate rock into a slurry with a low residual sulfate level, and indeed, it is so. In most cases, higher sulfate levels increase the size of the crystals. But with increasing sulfate levels, the shape of the crystals stretches most of the time, ultimately to become needle-shaped. Needle-shaped crystals have a higher surface-to-volume ratio, wide interstices on forming a filter cake, and substantially increase the viscosity of the slurry (pumping problems). Once again, the manufacturer has, by trial and error, to find out what is the best sulfate level for the specific installation and the rock in use.
A very important question is related to choosing the location where the sulfate analysis sample is to be taken. This depends on the characteristics of the plant: the acid and rock mixing points, the size of the compartments, and the volume of recirculated slurry. Figure 2.34
Reaction and Crystallization
IOS
FIG. 2.33 Hemidihydrate recrystallization time and crystal size.
106
Industrial Process Chemistry
FIG. 2.34 Influence of recycling on sulfate level in various compartments .
demonstrates the problem of choosing the analysis sample location and the comparative value of the sulfate levels for two identical plants, except for differing recirculation rates, working with the same phosphate rock.
A final remark about analyses: If sampling is automatic, followed, for example, by a Technicon-type continuous analyzer, the SO4 values found are close to SSL line values from hot slurry. If the samples are taken manually, filtered, and analyzed within a certain time needed for that purpose, the SO4 values can vary substantially—up to about 40% lower if the sample is taken from the phosphate mixing tank.
Reaction and Crystallization
107
Effect of Impurities
The influence of impurities (in the phosphoric acid) on crystallization is undeniable. These impurities originate mainly from the phosphate rock, but some can also come from the added sulfuric acid, the process water, or even corrosion of the equipment.
Many authors think [66,67] that these impurities will be adsorbed on certain crystal faces, impeding their growth rate (mainly the fast growing faces). If so, the adsorbed impurities will have a regulating function, because with pure phosphoric acid solutions there are generally great differences in growing rates between the different faces, resulting in needle-type crystal growth.
The effect of the impurities will be only one of the many factors controlling habitus and size of the crystals. Different impurities may also create conflicting influences, and the final picture will be the result of a complicated series of interactions. For this reason it is not possible to forecast the effect of the impurities of a given phosphate rock. Trials have to be made, even though we do know some of the effects that generally occur with a given type of impurity.
The most active impurities and those which we will consider here are: Al34-, Fe3+, Mg2+, Ca2+, rare earth, organic impurities, SO42", SiF42~, and F~.
Aluminum (Al3+). Phosphate rocks always contain some aluminum, but the content of commercial rock can vary widely, usually from 0.2 to 3% as A12O3. Unfortunately, most of the aluminum goes into solution during the phosphate rock attack. Usually, some 70-90% of the aluminum from the rock is found again in the 30% phosphoric acid. In some rare cases, surprisingly with low aluminum content, only 60% was found in the acid. The remainder stayed with the gypsum, but in a water-soluble form, partially dissolved during the cake washing by water on the filter. It can be deduced therefrom that the insoluble aluminum was precipitated from the phosphoric acid solution, probably as an aluminum hexafluoride, AlFg3*.
The presence of aluminum in phosphoric acid has a positive influence on the crystals habitus, size, and consequently filterability. Aluminum is said to promote regular crystal growth in all directions, by yielding much thicker crystals. This reduces the surface-to-volume ratio of the calcium sulfate, improving filtration rates.
For example, Florida phosphates, usually having high aluminum as a major impurity, actually enjoy comparatively high filtration rates. Fisons [68] has obtained a patent on crystal shape control by regulation of the AI2O3/P2O5 ratios (1 to 50). The patent claims that needle-type crystals change into cluster-type crystals with improved filtration and crystal wash qualities.
Zin rock from Israel, when beneficiated, has low AI2O3 content and shows a needle-type crystallization with the dihydrate route (Fig. 2.32). Addition of clay containing 30% AI2O3 and 50% of active silica changes
108
Industrial Process Chemistry
crystal size and habitus (Figs. 2.35 and 2.36), although it is dubious which of the two influences,-aluminum or silica, is more effective.
Aluminum also has the benefit of reducing corrosion, probably due to the formation of AlFg3- from F" and Al3+ ions. F* ions are known to be highly corrosive.
Iron (Fe ). Like aluminum, iron is present in most commercial phosphate rocks in variable percentages ranging from as low as 0.1% up to 2%. Usually, there is a little less iron than aluminum. Nothing conclusive can be stated about the influence of iron on crystallization. Most of the iron from the rock generally ends up in the phosphoric acid (usually as much as 60-90%). Iron has a strong influence on viscosity, but this becomes more of a problem during concentration. Nevertheless , the filtration rate of 30% acid is apparently already suffering from an increase in viscosity, particularly where the hemihydrate route with concentrated acid has been chosen. No particular comments on crystal habit modification by iron could be found in the literature. Fisons [69] states that needle and rhombic crystals were produced with rocks containing as much as 2% of F2O3, but those crystal shapes are common to many cases.
Magnesia. Most phosphate rocks contain about 0.2-0.6% of magnesia expressed as MgO. It is often said that Mg2’ impedes filtration of wet process acid either by affecting the crystal shape and size or by increasing the viscosity of the phosphoric acid. Besides the problems with filtration of the acid, the major concern for magnesium in phosphoric acid is, of course, the effect downstream on finished products, such as diammonium phosphate, where ammonium magnesium phosphate precipitates (MgNH^PO^). Analytical data of phosphoric acids show that all the magnesium is solubilized and stays with the 30% acid. No magnesium was found in the gypsum. Only after cooling in storage does MgSiFg • 6H2O precipitate.
Since magnesia content is expected to increase in phosphate rocks to be mined in the future in central Florida, International Mineral Chemical Corporation has made pilot plant and industrial plant scale studies with phosphoric acid production from rock with a high MgO content, 1.5%, with a MgO/₽2O5 ratio up to 0.053 [70]. During these test runs the overall efficiency of the P2O5 recovery dropped compared with other Florida rocks. The filtration rates were not said to deteriorate much; in fact, the filtration losses increased to about 0.5-1% of the total PjOg. Actually, this could be expressed as a decrease in filtrability of some 5% of the filter load to recover the previous yield. In spite of this, the filtrability remained above the figure of 7 tons of P2O5 per square meter per day at a filter speed of 4 min per revolution, and an acid concentration of 27-28% P2O5. The solids content of the slurry was 30 vol %, which is extremely high and indicates crystals with a low surface-to-volume ratio. Cluster formation was observed
Reaction and Crystallization
109
FIG. 2.35 Crystals from phosphate with low silica and aluminum content: Zin rock, Israel.
FIG. 2.36 silicate.
Same phosphate as Fig. 2.35 after addition of aluminum
110
Industrial Process Chemistry
under the microscope, but this cannot be decisively proven as resulting from the presence of magnesium, since cluster shape crystals very often form with Florida rock. No abnormal signs of scaling were observed and the magnesium silicofluoride MgSiFg • 6H2O only precipitated from the 30% acid after cooling in storage. The viscosity of the acid increased in a way that indicates the strong effect of magnesium on this physical property.
Davister and Houghtaling [71] have also reported on phosphate rock containing high ratios of MgO^Og, more than 0.1. Wet process acid, they conclude, could be produced by accepting a weaker product acid, higher filtration temperatures, and thinner filtration cakes.
Calcium and Sulfate Ions. Calcium and sulfate ions come to an equilibrium governed by the solubility product (see Section 2.2.3) and it is not possible to consider the effect of these two separately. For reasons described previously, crystallization is generally operated in an excess SO42* medium. When Ca2+ ions are in excess instead of the SO4 ions, only small, thin, losenge-type crystals with poor filtration performances appear.
Fluorides and Silica. Fluorides and silica are present in all phosphate rocks. Fluorides generally occur within F/P2O5 ratios between 0.05 and 0.13, but most of the time around 0.10. Silica varies much more because it is not part of the phosphate compound. It is usually part of the clay present with the ore, or as quartz (sand). The silica content in commercial rocks varies from less than 1% to more than 10%.
If active silica is present in large amounts (SiO2:F ratio higher than 0.53), F can be considered totally as H2SiFg. (Active silica is a reacting silica, such as contained in days or in acid-soluble silicates.) It has been demonstrated that the presence of F entirely as H2SiFg instead of HF or HF + H2SiFg mixtures produces great changes with the crystal habit. Fisons has patented [68] F/active silica ratios controlled by the addition of active silica to the phosphate rock. Figures 2.35 and 2.36 show a typical crystal habit modification from needle type to cluster type by changing the F/SiO2 ratio (addition of clay to phosphate rock).
Rare Earth Compounds (Ce^+, La3+}. Not much is known about the effect of rare earths on crystallization. Nevertheless, their influence (impeding crystallization) has been recognized, especially during the recrystallization phase with nondihydrate routes [ 72].
Like aluminum, it seems that some insoluble compound is formed in the concentrated acid phase (40% P2O5) which redissolves during the lower concentration recrystallization phase. Only large amounts of added fluorides (in excess of H2SiFg) could provide some improvements. The amount to be added is too high to be economically viable.
Reaction and Crystallization
111
Strontium (Sr2+~). Strontium, although the mechanism could not be proved, has a recrystallization-inhibiting action [73]. There is some interaction between Sr2+ and SO2~.
Organics. Organics either originate from the phosphate rock or consist of additives introduced into the slurry as crystal modifiers. Organics from the phosphate rock stabilize foam and emulsions, thus impeding the effect of agitation, with consequent higher local supersaturations.
Organics used as crystal habit modifiers have been used in some specific cases. Dorr-Oliver was granted a patent [74] for the use of alkyl aryl sulfonates back in 1965. The use of such surface-active agents, they claimed, was not universally applicable but only with some specific phosphate rocks. Fisons [69] cites the example of Phalaborwa rock, where surface-active agents such as alkylbenzene sulfonates brought a complete change of habit from the needle type to the rhombic type. The same rock was said to exhibit only little change in gypsum crystal habits when inorganic modifiers were used. But the use of organics cannot be generalized; for example, Youssoufia rock produces needle-shaped crystals when the dihydrate route is used, and organic habit modifiers have little effect, whereas inorganic modifiers can change crystal shape from needle-like to rhombic.
Effect of Temperature
The influence of temperature on crystallization is manifold and has direct and indirect effects on crystal habit and size. These effects can be listed as follows:
1. Effect on physical properties of the slurry (e.g., viscosity of the acid
2. Stability of foam and emulsion
3. Solubility of Ca^4" and SO^~
4. Reaction speed: rock attack and crystallization (coating effect of rock)
5. Partial pressure of H2O from the phosphoric acid and the calcium sulfate crystals, thus controlling crystallization water (for dihy-drate-hemihydrate)
6. Composition of the calcium sulfate crystals (effect on HPO^ content of the crystals or lattice losses) [67]
7. Corrosion behavior of the phosphoric acid; variation of impurity level in the acid (both from equipment corrosion and phosphate rock)
8. Scaling-based on temperature, scaling compounds will crystallize in the reaction and the filtration systems
112
Industrial Process Chemistry
Considering these manifold effects, it is not possible to act on temperature with the sole purpose of regulating crystal habits. A compromise has always to be considered among the various effects. Nevertheless, in practice the problem of choosing an operating temperature is somewhat simplified by the small freedom for temperature variations acceptable to the chosen process route.
For a dihydrate system the lower operating temperature limit is set to avoid the formation of stabilized foam which could occur in the reaction system, and result in heavily decreased filtration rates. This usually happens when the actual reaction of filtration temperature goes below 68-70°C. The upper limit is often set to avoid the coating effect (over 75°C), but it is also governed by the hemihydratedihydrate equilibrium (generally over 80°C for 30% P2O5 acid). Consequently, the operator of a dihydrate system has to determine his optimum operating temperature by trial and error within a very small margin.
Hemihydrate processes have to choose at least two, sometimes three temperatures: one for the phosphate rock attack section, one for the crystallization section of hemihydrate, and if there is recrystallization of gypsum, a third temperature for this last operation.
Phosphate rock dissolution at a higher temperature, as with hemihydrate processes, has to cope with a strong coating tendency. The choice of the temperature will be a compromise between the coating effect and the necessity for the somewhat higher hemihydrate operating temperature. Crystallization of hemihydrate will have its lower temperature limit according to the equilibrium CaSC>4 • 2H2O - CaSO^ • 5H2O [61]. The third temperature, recrystallization from hemihydrate to gypsum, will be determined according to the choice of a maximum recrystallization speed. All these limitations and criteria do not leave wide margins of temperature variation to the operator.
The main effect of temperature on crystallization is probably due to the fact that the reaction speed of the phosphate attack increases with a subsequent increase of local supersaturations. As a result, cluster formation as well as needle stretching have been observed.
Effect of the Reaction System
In Section 2.2.4 we calculated the effect of the reactor compartment size and slurry recycles on spontaneous nucleation and consequently on crystal size.
There is a second effect on crystallization due to the statistical retention time of the crystals in the different compartments of the reaction system. Crystals grow differently in the various sections of the reactor. With a low circulation rate, the retention time of the crystals is more uniform, compared with a high circulation rate, bringing some of the newborn crystals to the filtration section.
Reaction and Crystallization
113
Besides the fact that a uniform crystal size distribution does not necessarily lead to the best filtration rate, we should not forget the dominating effect of supersaturation which results from the compartment size and the recirculation rate. The effect of the statistical retention time of the crystals in the various reaction sections, although it does have an influence, has not yet been subject to special studies or serious attention.
Hemihydrate and Dihydrate
Hemihydrate Formation. Calcium sulfate crystallization in phosphoric acid can have three different molecular compositions:
CaSO4 • 2H2O dihydrate
CaSO^ • 0.5Н2<Э hemihydrate
CaSO^ anhydrite
Whereas dihydrate is a well-defined crystal, hemihydrate is a solid solution. The water molecules are statistically inserted in the crystal pattern in poorly defined proportions. Usually, when produced in a wet process acid plant there is at least O.5H2O, but it can vary in practice from 0.15 to 0.66 molecule of H2O [75] according to the water concentration in the medium. Again, anhydrite is a well-defined crystal. From a phosphoric acid producer's standpoint, only dihydrate and hemihydrate are of importance; there is, at present, no plant working with anhydrite.
Dihydrate normally crystallizes when enough water molecules are available for its equilibrium and when the temperature of the crystallization media does not prohibit its formation. If the partial pressure of H2O °f the crystal becomes higher due to temperature, dihydrate crystals will dehydrate. Increasing H3PO4 concentration will reduce the partial pressure of the water molecules in the solution, and this will affect the temperature of the dehydration equilibrium.
Figure 2.37 depicts the thermodynamic equilibrium curves for dihydrate, hemihydrate, and anhydrate in phosphoric acid. This diagram has been discussed by a great number of authors and figures in many papers describing dihydrate and nondihydrate processes [76-81]. Curve 1 (Fig. 2.37), representing the dihydrate hemihydrate transition equilibrium, is the most important. All dihydrate processes work somewhere along that curve to produce the highest possible phosphoric acid concentration without hemihydrate formation.
But thermodynamic equilibrium is not the sole factor resonponsible for the different hydrate formations. To build a crystal there first has to be nucleation, and nucleation depends on solubilities and supersaturation. Now, each hydrate has its own solubility curve and each
114
Industrial Process Chemistry
2
120 SYSTEM CaSO4- HjPC
\3
4
40 —.
2 0 40 50
WEIGHT % P2Og
FIG. 2.37 System СаБО^/НзРО^/НзО. 1, Thermodynamic dihydratehemihydrate equilibrium curve. 2, Phosphoric acid boiling point.
3, Hemihydrate anhydrite curve. 4, Metastable anhydrite curve.
(From Ref. 1.)
particular solubility curve is affected by phosphoric acid concentration and temperature. This, of course, complicates the system. Solubility and supersaturation limit lines affected by sulfate concentration and temperature are depicted in Fig. 2.38.
Consequently, if calcium sulfate is precipitated, its hydrate type will be that of its nucleation, the latter depending on the solubility diagram , even though precipitation occurs in a thermodynamically different zone. Dahlgren [83] and Vesteegh and Boontze [81] have explained these phenomena well in Slack's book. Table 2.5, resulting from Taperova's work [78,79] , illustrates some dihydrate and hemihydrate solubility values according to temperature and concentration.
Reaction and Crystallization
115
WEIGHT % S04
FIG. 2.38 Effect of sulfate concentration and temperature on calcium sulfate solubility and supersaturation limit lines in phosphoric acid slurries with 25% solid content in volume and 30%
P2O5 in liquid phase. (From Ref. 82.)
116
Industrial Process Chemistry
TABLE 2.5 Solubilities of CaSC>4 Hydrates in Phosphoric Acid According to Taperova and Shulgiva (in wt %)
Temperature (°C)
Acid concentration (wt % P О ) Z 3 25 40 60 80 90
DH HH DH HH DH HH DH HH DH HH
5 0.50 - - - - - 0.85 - - -
15 0.70 - - - - - 1.4 - - -
25 0.70 - - - - 1.5 1.45 - - -
30 0.60 1.05 0.8 - 1.0 1.25 1.35 1.38 — 1.4
35 0.45 0.85 0.65 0.9 0.9 1.0 1.25 1.15 - 1.2
40 0.40 0.6 0.55 0.7 0.75 0.80 1.05 0.9 - 0.95
45 0.30 0.4 0.5 0.5 0.65 0.6 0.9 - - 0.75
50 0.25 0.2 0.4 0.4 0.55 0.4 — — — 0.5
Source: Ref. 1.
The reactivity of the phosphate rock is one of the variables promoting local supersaturation. This may explain why hemihydrate and dihydrate formation vary with the rock origin, although they may be precipitated in similar thermodynamical conditions. For example, dihydrate can be precipitated at higher temperature with Taiba rock than with Tunisian rock at the same acid concentration.
Hemihydrate-Dihydrate Recrystallization. When hemihydrate crystals are brought into a medium where temperature and phosphoric acid concentration equilibrate with the dihydrate phase (below curve 1 in Fig. 2.37), there will be recrystallization by means of dissolution:
ЗН О + 2CaSO, О -> 2Ca2+ + 2SO* 2 + 4HO + 2CaSO, • 2H„O (21)
2 4 2 4 2 4 2
At 60°C and 30% P2O5, for instance, the solubility of hemihydrate is well above that of dihydrate and the S line resulting from the presence of hemihydrate crystals provides enough supersaturation to ensure both dihydrate crystal growth and nucleation. Nevertheless, hemihydrate dissolution will never provide as high local supersaturaiton as that resulting from sulfuric acid or phosphate rock mixing with the slurry, and consequently nucleation of dihydrate seeds will be the factor limiting the speed of recrystallization.
Reaction and Crystallization
117
Since recrystallization of hemihydrate to dihydrate operates via dissolution, all variables affecting the solubility of Ca2+ and SO42’ will also affect the recrystallization speed: temperature, phosphoric acid concentration, Ca2+/SO42- ratio, solid content of the slurry, and the presence of impurities.
Variables Governing Hemihydrate to Dihydrate Recrystallizatiariion
Temperature. Temperature, affecting the partial pressure of the water molecules in the phosphoric acid solution and in the calcium sulfate crystals, is responsible for the equilibrium between the phases at a given phosphoric acid concentration. Temperature is also responsible for the reaction speed of a given medium. Last, but not least, temperature affects the solubility of calcium and sulfate ions, which are the vehicles for the rehydration reaction. This triple effect of temperature explains why there is an optimum temperature for each recrystallization. Figure 2.39 shows some rehydration times at different temperatures. From an industrial point of view, hemihydrate recrystallization has to take account of the problem of slurry cooling and of strongly decreasing filtration speed below 60°C because of increasing viscosities.
Concentration of Phosphoric Acid in the Reaction Slurry The higher the phosphoric acid concentration, the lower will be its partial pressure of H2O. Phosphoric acid concentration decreases the hydration speed by decreasing the reaction potential and by increasing viscosity. Figure 2.39 depicts some recrystallization speeds at various P2Og concentrations.
Presence of Dihydrate Seed Crystals. Reaction (21) can work only when there is sufficient dihydrate body to settle Ca2+ and SO42- ions. If we start with a pure hemihydrate crystal suspension, dihydrate nuclei have first to be formed in sufficient number to receive all the ions leaving the hemihydrate phase. But nuclei formation requires higher energy levels and a minimum of time, so that the recrystallization starts slowly and reaches a reasonable speed only when sufficient dihydrate crystal surfaces are present. Figure 2.40 shows how recrystallization speed varies when it starts from a pure hemihydrate suspension [Eq. (21)] or from dihydrate seeded hemihydrate suspension. Toward the end of the recrystallization, the speed slows down again because of the limited dissolution surface of the remaining hemihydrate crystals. Figure 2.40 shows batch recrystallization. Under continuous operation in industrial practice there are always enough seeds to ensure the presence of sufficiently large receiving surfaces.
Free Sulfuric Acid Excess. Free sulfuric acid excess affects the solubility product and controls both Ca2+ and SO^2- concentration.
118
Industrial Process Chemistry
TIME IN MINUTES
FIG. 2.39 Effect of temperature and sulfuric acid concentration on hemihydrate-dihydrate recrystallization time. 1, 28% P2Og Tunisia 70°C. 2, 20% P2O5 Taiba 80°C. 3, 15% P2O5 Taiba 80°C. 4, 20% P2O5 Taiba 50°C. 5, 15% P2O5 Taiba 50°C.
Reaction and Crystallization
119
FIG. 2.40 Hemihydrate-dihydrate conversion: Tunisian acid 28% p2°5’ 70°c- Without dihydrate seeds; 2, with dihydrate seeds.
Optimum crystallization speed is achieved when
~ Li~
nv[Ca ] = n v [SO^ ] = maximum
(22)
where
n, n' = number of ions
v, v* = speed of corresponding ion
The highest recrystallization speed always occurs with SO42~ concentrations that are above those of Ca2+; sometimes SO^' concentrations are a multiple of Ca2+ concentrations. The SO^~:Ca2+ ratio governing the best recrystallization speed varies with the H3PO4 concentration of the acid. Figure 2.39 shows the effect of SO4 concentration on recrystallization time. The lower the H3PO4 concentration, the higher the SO42 concentration has to be to achieve optimum recrystallization speed.
Impurities. Some impurities affect recrystallization severely. Their influence can be such that recrystallization can be completely blocked and a recrystallization process becomes unserviceable because of the presence of this kind of impurity. So far, this blocking mechanism is not understood. It is supposed to be a kind of superficial ionic adsorption on active crystal surfaces, blocking further buildup. The
120
Industrial Process Chemistry
most common impurities having such an action are fluorides, but many other elements have been noted even if they occur in very low concentrations [85].
The cycle of impurities in double crystallization systems can be very complicated and subject to uncontrolled variations. This is one of the risks that has to be taken into consideration when choosing a recrystallization process with a phosphate rock that has not yet been used in such processes. From practice it is known that sedimentary rocks recrystallize better than igneous rocks and that Tunisian and Moroccan rocks recrystallize better than Florida or Taiba rocks, probably due to the nature and the concentration of the impurities occurring in the corresponding phosphate ores [85].
Extensive work on this subject was done by Uusitalo et al. in Finland, where they tried to operate a hemidihydrate plant with igneous rocks [86]. It was found that lanthanum (La3+), cerium (Ce^+), and possibly aluminum affected the speed of recrystallization. In the hemihydrate phase lanthanum and cerium occur in the solid phase, redissolving when the dihydrate phase is reached and hampering the recrystallization into gypsum.
Addition of fluoride up to an amount of 2% related to apatite had a favorable effect on the recrystallization speed by binding lanthanum and cerium (Fig. 2.41). Nevertheless, in industrial operation this becomes uneconomical.
FIG. 2.41 Effect of fluoride on conversion of hemihydrate to dihydrate (Kola phosphate). Reaction temperature, 50°C; reaction time, 15 hr. (From Ref. 86.)
Reaction and Crystallization
121
TEMPERATURE (°C>
170
80 .s'
\Cl
—
3 0 \ 6 0
WEIGHT % Po0_ z □
FIG. 2.42 Operating zones of the different phosphoric acid processes.
A, Dihydrate; B-C, hemi-dihydrate; D-E, hemihydrate-dihydrate; F-G, dihydrate-hemihydrate.
Igneous rocks usually contain less fluoride and more metallic impurities, such as the rare earths.
Dihydrate-Hemihydrate Recrystallization. Although less commonly used in phosphoric acid practice, dihydrate-hemihydrate recrystallization is used in some processes [24-28]. In this case, the temperature of the suspension has to be elevated in order to raise the crystallization water's partial pressure. The advantage of this procedure lies in the fact that recrystallization at these higher temperatures will contain very low P2O5 lattice losses.
Where the Different Phosphoric Acid Processes Operate. Figure 2.42 is basically the diagram already represented in Fig. 2.37.
122
Industrial Process Chemistry
Dihydrate processes operate below the hemihydrate-dihydrate curve— zone A in the figure. Hemihydrate-dihydrate recrystallization processes from the same medium (without intermediate filtration) operate with simple slurry cooling to promote recrystallization. Hemihydrate is precipitated at zone В and cooling is operated until C is reached. Hemihydrate-strong acid processes operate at D, where filtrable hemihydrate crystals can be obtained. Hemihydrate-dihydrate processes, recrystallizing calcium sulfate after intermediate filtration, can consequently recrystallize in a more diluted medium: zone E. Dihydrate-hemihydrate processes precipitate calcium sulfate dihydrate at F and reach recrystallization after filtration at G.
2.3 MATHEMATICAL APPROACH TO CRYSTAL GROWTH AND SIZE DISTRIBUTION-COMPARISON WITH EMPIRICAL RESULTS
A number of problems of industrial crystallization can be much better understood after a mathematical examination of the function governing retention times, crystal growth, and size distribution. The following mathematical analysis gives the essential factors governing crystal sizes and size distribution. Useful information on how to control the factors responsible for stable and efficient filtration rates is also presented in this section.
2.3.1 Crystal Growth
From the time a crystal is born, it will grow until it leaves the supersaturated medium. If the reactor is a single-compartment or a high-circulation reactor, supersaturation will be almost consistent throughout the system and the crystals will grow at a uniform rate. If the system is a low recycle rate, multicompartment type, the crystals will pass high/Iow supersaturation zones and be subject to alternate high/ low crystal growth periods until they leave the system.
According to McCabe's AL law [87] crystal growth in homogeneous supersaturated media (regular feed and dispersion of the reactants into the media) is linear, when the growth rate is expressed via a characteristic size L (e.g., length of tabular crystals or diameter of cluster type). In other words, in a given system, it takes the same time for a crystal to grow from 40 to 50 pm as to grow from 70 to 80 pm L size.
L = gt + L (23)
Б 0
where
L = characteristic crystal size of age t, in pm, diameter of a cluster or length in needle or tabular type
Reaction and Crystallization
123
Lq = characteristic size of nucleus (negligible) t = time (generally in min) g = growth rate, in pm/min
In a given system, g is constant, provided there is a constant supersaturation rate, agitation, temperature, and chemical composition of the liquid phase. It changes with the feed rate of the system, because the latter affects the supersaturation rate. Figure 2.43, line 1, shows a crystal size L as a function of time with a typical growth rate of 0.055 'pm/min.
The crystal's volume or mass, nevertheless, being a function of the third power of the size L, will grow accordingly and the volume or weight added by growing from 70 to 80 pm, for instance, will be 2.77 times the weight added by growing from 40 to 50 urn, although the growth time is the same for both cases.
v = к L3 = к g3t3 (24)
о v v
v_> = volume of individual crystal
к = volumic shape factor, characteristic for a crystal type
FIG. 2.43 Effect of retention time on age and size distribution.
1, Crystal size L; 2, retention time distribution with Cl; 3, retention time distribution with C2; 4, volume size distribution with Cl; 5, volume size distribution with C2; 6, cumulative volume size distribution (same as 5) .
SIZE OF CRYSTALS L, IN pm
124
Industrial Process Chemistry
A 10-pm crystal, flat tabular type, will have a volume of 1 x 10 8 mm3, a 40-pm sized, 6 x 10“ 7 mm3, and a 125-pm as much as 195 x io-? mm3,
with a volumic shape factor kv of 0.01.
2.3.2 Crystal Population, Age, and Retention Time
The retention time of the crystals in the active reaction system is limited and governed by the residence time distribution function:
nt = no (C)
(25)
where
t = time (the minute, as a time unit, gives results with acceptable accuracy)
nt = generation density, number of crystals per unit volume of slurry (cm3), originating from time 0 and remaining in the system at time t
nQ = nucleation density, number of crystals born (nuclei) during one unit of time t, min
C = extinction factor, dimensionless, calculated by
(26)
where
V = active reaction volume of the system
v = slurry production (flowing out of the reactor) per unit of time, min
Example 1. Single tank reactor 1500 m3 active volume. Slurry pro-
duced: 3.91 m3/min. Extinction factor C is calculated:
C = 15001"Л 9i =0-"74 (27)
For 60 min: n__ = n_ (0.9974)69 = n_ 0.8554 (28)
OU (J и
means that from 10,000 crystals born at time zero, 8554 remain in the system after 60 min.
The mean retention time tm> also called the mean residence time, is equivalent to:
Reaction and Crystallization
125
when
C = 0.9974, t = 384 min m
Equation (25) is represented in Fig. 2.43 for two different extinction factors: = 0.9961 (curve 2) and C2 = 0.9974 (curve 3). C-^
correspond to a system with 1.5 m3 of reaction and crystallization volume per ton of P2O5 produced per day and C2 with 2.25 m3. These curves represent the decreasing population of a crystal generation as a function of time. After 600 min, for example, 9.59% of a crystal generation remains with curve 1 and 20.97% with curve 2.
The mean retention times, t^ and tm2, are on a vertical line that divides the surfaces confined by curves 2 and 3 into two equivalent parts; according to ( 29) , they are calculated:
*т2
1
1 - 0.9974
= 384.6 min
(31)
When the mean retention time is up, 63.26% of the corresponding crystal generation has left the system (Fig. 2.43).
2.3.3 Nucleation
The size of crystals depends on nucleation. The more nuclei are born, the smaller will be the individual crystals. The smaller the crystals, the more difficult will be filtration (see Table 2.6). Not much is known about nucleation. There is no fundamental theory for nucleation. Nucleation rates can only be indirectly measured and the method depends entirely upon empiricism.
TABLE 2.6 Effect of Small Crystal Size Fractions (Minus 40 pm) on Filtration Rates (Taiba Rock)
Percentage of crystals smaller than 40 pm Size rates < 40 40-80 Filtration rates in t of produced 2 -1 P О Im (day) 2 5 4 min cycle
40-50 0.4-0.8 5-6
30-40 0.5-1.0 6-8
20-30 0.8-1.5 8-10
126
Industrial Process Chemistry
Nucleation results from
1. Passing a threshold of supersaturation. This is called spontaneous nucleation, or primary nucleation.
2. Breakage of crystalline agglomerates and fluid shear breeding (nuclei resulting from fluid shear along a growing crystal face). This is called secondary nucleation.
We have seen how to approach the problem of spontaneous nucleation (Section 2.2.4) but almost nothing can be said for secondary nucleation control.
We have seen that crystallization mass transfer rates from liquid to solid depend on the degree of supersaturation; see Eq. (12). In fact, regular crystallization growth rates in moderate supersaturation conditions occur with concomitant secondary nucleation.
According to Garside [88] secondary nucleation nQ jj as a function of supersaturation can be expressed:
_ concentration: supersaturated ^b
Oil concentration: saturated
where
0.5 < b < 2. However, to be pragmatic, we shall confine ourselves to the empirical nucleation estimation which will be demonstrated next.
2.3.4 Crystal Growth Function and Size Distribution Diagram
Calling the number Пц, the population of the generation of crystals born during 1 min between t = -1 and t = 0, and considering Eq. (24) and (25), the total volume Vot of a crystal generation aged t min is given by
t ч - Q
Vo, = n_(c) к (gt) x io 3 + Vo (33)
t 0 V
where
Vot
= total volume of a "one minute generation," aged t min, present in the active reaction system, in mm^/cm^
g = linear growth rate of the crystals in the supersaturated media under consideration, in pm/min (usually about 0.03-0.1)
к = volumic shape factor
v
needles
flat tabular
tabular
cluster
0.005 - 0.05 (Tapira, Israel, Jordan)
0.05 - 0.10 (Florida)
0.10 - 0.20 (Taiba)
0.20 - 0.40 (Taiba) Florida)
Reaction and Crystallization
127
per cubic centimeter of slurry
Vo = total volume of a nucleated generation, at time of birth unknown so far but negligible as compared with the volume of the older generations
The corresponding weights can be obtained by multiplying the volumes by the respective specific gravities:
Уо^ x 2.32 for dihydrate (34)
Vo^ x 2.63 for hemihydrate
The volume of a crystal generation, Vq t, Eq. (33), present in a system, is growing from the original nucleation volume Vq to a maximum and then decreasing asymptotically to zero. The extent of the function along the time axis depends on the extinction factor C. The maximum (peak) of the function occurs when
t = 3t (35)
max m
The total volume of all the present crystal generations, for 1 cm3 of slurry, is equivalent to the integral of the function (33)
t — CO t = 03
-9 3
Vo dt = 10 n„ (g) к t 0 v
J J (c/a)3 dt
(36)
t = 0
t = 0
Actually, when C = 0.996, it is sufficient to integrate up to t = 3000 min and with C = 0.997 to t = 4500 min.
In a given system, the total solids in the slurry are constant. In most cases, there are currently 250 mm3 of solids per ст\ so that we can write
Vo^ dt = 250 mm
(37)
t = 0
Пц, g, and kv are constant within a reaction system that operates in stable production conditions (constant supersaturation), but they can differ from one case to another and are not precisely known. Consequently it is more convenient to plot a diagram for the relative generation volume (RGV) as a function of time:
128
Industrial Process Chemistry
_ V°t
RGV 250
(c/g)3
(38)
f (C) (t) dt t = 0
RGV represents the volume as well as the weight percentage of a crystal generation of age t, compared with the total volume or weight of the crystals present in the slurry. But since the crystal size L is said to be a linear function of time, L = gt, we can also plot RGV as a function of the crystal size L. Equation (38), RGV, is plotted in Fig. 2.43 for C = 0.9961 (curve 4) and for C = 0.9974 (curve 5). The dominant generation (by volume) is at tmax at 3 x 256.4 = 769 min and 3 x 384.6 = 1154 min, respectively [89].
The crossing of line 1 with tmax indicates the size L of the dominant generations: 41 pm for curve 4 and 61 pm for curve 5. It demonstrates theoretically that the typical size of a crystal population is an effect of the extinction factor C, the latter being a direct function of the effective reaction and crystallization volume per ton of produced P2O5. However, this is true only if the relative nucleation rate will remain the same.
2.3.5 Nucleation Density Estimation
Nucleation density or nucleation number Пц was mentioned in several of the preceding equations (25,35,36). It represents the number of nuclei that are bom per unit of crystallization volume and time.
The number of nuclei bom in a continuous system is necessarily equivalent to the number of crystals leaving the system. Consequently if it is possible to estimate the total number of crystals leaving the system we will know the nucleation rate. But, whereas it is possible to estimate the number of the larger-sized crystals, it is very difficult to do the same with the small sizes. There is not much reliable equipment to separate and count particle sizes below 30 pm. Traditional equipment has been improved, and new equipment has been developed such as wet screening (up to 3 pm) multicycloning, selected settling, micro-trac particle sizing, countercoulter and computerized microscopic analysis. But, because of the presence of insoluble impurities, differing crystal shapes and for other reasons, the accuracy of these techniques is still not very reliable for the smaller sizes and consequently for nuclei.
Actually, the method for estimating the nucleation rate is based on a mathematical interpretation of fraction distribution of the measurable range of crystal sizes.
Calculations are based on:
1. Assumptions:
a. The system is homogeneous (perfect mixing).
b. Crystal shape is independent of size.
c. Crystal growth is constant and independent of size.
Reaction and Crystallization
129
2. Empirical determinations:
a. Crystal shape factor (microscope).
b. Cumulative size analysis (screening, settling, microtrac, countercoulter, etc.): weight percentage as a function of characteristic size L.
3. Mathematical equations:
Residence time distribution function (25)
The calculation comprises the following operations:
1. Volume size fraction estimation of two of the larger characteristic sizes ALp AL2
2. Population density calculation of the two size fractions: ALp AL2
3. Calculation of residence time difference (age difference) between size fraction ALX and size fraction AL2
4. Calculation of growth rate g
5. Age (retention time) calculation of size fraction ALX
6. Calculation of nucleation density Пц, with the residence time distribution function (25)
Case Study for a Nucleation Density Calculation
Basic Information
Reaction system: reaction and crystallization volume 2.25 m3 per ton of produced P2O5; C = 0.9974; see Eq. (26). Perfect mixing, no classification, outflow is equivalent to content
Crystal shape: 60 x 10 x 5
Volume shape factor:
v (60)3
Measured cyrstal size distribution: cumulative by screen analysis (same as line 1, Fig. 2.44).
Solid content in the slurry: 25% by volume
Size Fraction Estimation. From line 1, Fig. 2.44, the angle measured at the 100 pm size chosen for ALX is corresponding to an increase of 0.737% per micrometer of characteristic size. At 150 pm, chosen for AL2 it is 0.1956%.
Population Density of Size Fractions ALX and AL2. With 25% by volume there are 250 m3 of solids per cm3 of slurry. Consequently the volumes of the populations of the size fractions are
ALX (1 pm) = 250 x 0.00737 = 1.84 mm3 (40)
AL2 (1 pm) = 250 x 0.00196 = 0.490 mm3 (41)
130
Industrial Process Chemistry
The respective individual crystal volumes are
for AL^, (0.100)3 x 0.01389 = 13.89 x ю'6 mm3 (42)
for AL2> (0.150)3 x 0.01389 = 46.88 x Ю*6 mm3 (43)
The population densities are
1 84 3 3
for AL , n = -----:------g- = 132.3 x 10 units per cm (44)
13.9 x 10
0 490 3 3
for AL , n = -----'-----—— = 10.45 x io units per cm (45)
2 2 46.9 x io*b
Growth Rate g. During the time needed to grow from 100 to 150 pm characteristic size L, a crystal generation is subject to a population extinction of
^2= 10.45 x IQ3 nl 132.3 x io3
0.0792
(46)
Taking the extinction (25) we can write
factor C of the present system 0.9974 and Eq.
(0.9974/ = 0.0792
(47)
150 pm.
where t = 974 min, which is the growth time to increase the characteristic size L from 100 to According to (23)
50
g = —ту - 0.0513 pm
B 974
. -1 mm
or 3.08 pm hr 4
(48)
Nucleation Rate Number. The age of the population of size fraction ALX (100 pm) is
100
0513 = 1949 mm
(49)
The size fraction population AL^ corresponding to a size increase of 1 pm is equivalent to a production time of
Reaction and Crystallization 131
0.0513 ~ 19’5 min (50)
The population being aged 1949 min originates from [Eq. (25)] 1949 9
nn AT x (0.9974) = 132.3 x 10 (51)
U, A Li i
where
n0,AL1 = 21.14 x Ю6 for 19.5 min (52)
n^ = 1.08 x ю6 min 1 (cm3)
2.3.6 Comparison of Calculated and Measured Crystal Size Distribution
The statistical size distribution of a large number of bench scale and industrial scale units have been depicted in Fig. 2.44. These results have been plotted as a function of characteristic size L as it is currently done in practice. The current crystal sizes range from few microns up to a maximum of 250 pm, with about 50% between 50 and 100 pm. The continuous line (1) is the calculated line (according to
'"C - —“'S----'—‘—
80
cn
OU 2 / /
• /
40 " / /1
/ /
20
5 0 1 00 1! 50 2 30 2 Б0
CHARACTERISTIC SIZE L
FIG. 2.44 Cumulative size distribution. 1, Calculated; 2, empirical.
132
Industrial Process Chemistry
Eq. (38). The empirical results are scattered along and between the dotted line (2) and the continuous line (1).
The empiric line (2) is characterized by a steeper starting angle than the theoretical. This indicates that there is actually more smallsized material (< 20 pm) than calculated. This can result from
1. Insoluble impurities from phosphate rock.
2. Lower growth rate g for the smaller sizes.
A lower growth rate for crystals of very small size sounds logical. Their solid to liquid differential displacement (sedimentation speed) is much smaller because of a higher surface to volume ratio, so that the liquid to solid ionic mass transfer of Ca3+ and SO^“ will be reduced. The effect of differential liquid to solid displacement on growth rates has been demonstrated by Lefaucheux and Robert [ 90].
2.3.7 Effects of Feed Rate and Residence Time: Case Study of Industrial Plant Size
In this section we shall examine the effects of feed rate and residence time on crystal growth, nucleation rate, crystal size distribution, and consequent filtration rate. The effect of the feed rate (reactant fed per unit of reaction and crystallization volume) on crystal size distribution is very important. Every phosphoric acid producer is obliged to adapt the feed rate to plant requirements and this often leads to operation at higher or lower rates than those the plant has been calculated for.
From the preceding sections, we know that the crystal size distribution will change when the feed rate changes. In this section it will be seen how the different parameters have been affected by feed rate variations and how it compares with the mathematical approach. The study was made through a comprehensive examination of crystal size distribution and supersaturation measurements on an operating plant at different feed rates with calcined North Carolina rock.
Plant Description and Operating Conditions
о
Reactor 9 compartments, 1200 m total volume; recirculation rate, 3000 m3 per hour; feed rates, 50-95 tons of rock per hour (0.33 P2O5, 0.52 CaO). Rock + acid are fed into compartment 1. Super saturation was measured on "life" samples (see Section 2.2.4, by Ca3+ and SO^3-titration. Filtration rates were tested on laboratory standard test funnels expressed as tons of P2O5 per day and per m3 at 4 min. cycle. Crystal size distribution was measured by wet screening.
Reaction and Crystallization
133
Dimensionless Scale Y
FIG. 2.45 Effect of feed rate on supersaturation, filtration rate, and crystal size. 1, Sup er saturation solubility product Kss = Y/100;
2, filtration rates F in tons of ₽2Од/т2 per day, 4 min cycle f = Y/10;
3, size fraction (percent) of <40-pm crystals.
Measured Effect of Feed Rate on Supersaturation,
Crystal Size, and Filtration Rate
While the plant was operating at phosphate rock feed rates ranging between 50 and 95 tons per hour, supersaturation, filtration rates and crystal size distribution were measured in the reaction compartment.
The measured supersaturation values expressed by solubility product, Kss (see Section 2.2.4), the filtration rates F, and the crystal size distribution are shown in Fig. 2.45.
The supersaturation expressed by Kss increases as a linear function of the feed rates. The filtration rates F decrease from 5.5 to 3.5 t(m2)”1day”^. The small-sized crystal fraction (< 40 pm) increases from 20 to 35%.
134
Industrial Process Chemistry
Growth Rate Estimations
The cumulative crystal size distribution was plotted for both feed rates 50 and 95 t/hr, and the growth rate for crystals has been calculated as demonstrated in Section 2.2 for different size fractions. It was found that the growth rate g was not constant but affected by both crystal and supersaturation expressed as (Kss-Ks) [See Eq. (12)]
Feed rate 50 t/h 95 t/h
Supersaturation Kss 1.18 1.50
Super saturation Ksg-Ks 0.35 0.67
Characteristic size (pm)
Growth rate (pm min )
20-40 0.027-0.039
40-80 0.030-0.051
80-125 0.041-0.080
Nucleation Density Estimation
Using the method developed in Section 2.9.6 nucleation density was calculated for both feed rates of 50 and 95 t/hr. For this estimation, nevertheless, the effect of different growth rates was taken into consideration for the age calculation of generations, Eqs. (23,49). With a crystal shape factor of 0.05, the following nucleation densities have been calculated:
R Q -1 — 1
n0,50t/h= °’4 X 10 (Cm }
n0,95t/h = 1-6 X 1()6 (СП'* 1 2 3)’1 min’1
2.3.8 Practical Conclusions
1. Filtration rates are affected by crystal sizes and crystal size distributions, both of which depend on nucleation density, n0, crystal growth rate g, and retention time t.
2. Nucleation density ng controls the total number of crystals. If ng increases, the characteristic size of the crystals L decreases, because there are more particles. When ng is multilied by X, L is to be divided by X-^3. Nucleation density increases with supersaturation , e. g., when the feed rate increases.
3. Crystal growth rate g increases with supersaturation resulting from higher feed rates. But higher feed rates reduce retention time and consequently growth time. The two effects are compensating each other somewhat, but the larger crystal sizes result from the lowest feed rates.
References
135
4. Retention time (which is a function of feed rate) controls supersaturation and crystal growth time.
5. Specific filtration rates are mainly affected by the smaller-sized crystals (< 40 pm) and the ratio between the <40 pm and 40-80 pm sizes)
6. Increased feed rate means more slurry of lower quality to be sent to the filter, a good reason for a large security margin to be chosen for this equipment.
7. To achieve a stable crystal size distribution, constant production conditions have to be maintained for a period of time at least equivalent to the sixfold mean residence time.
REFERENCES
1. A. V. Slack, Ed., Phosphoric Acid, Vol. 1, Part I, Marcel Dekker, New York, 1968, Chaps. 1-3.
2. (a) Cresswell, J. A. Hallsworth, and P. A. Smith; (b) C. Djol-olian; (c) Q. D. Bowers and E. M. Edwards; and (d) D. J. MacLodd, in Fertilizer Acids, Proceedings of the British Sulphur Corporation's 3rd International Conference on Fertilizers, London, November 12-14, 1979.
3. Hemihydrate and Anhydrite Processes, In Phosphoric Acid, Vol. 1, Part I (A. V. Slack, Ed.), Marcel Dekker, New York, 1968, Chap. 4.
4. Fertilizer Manual, International Fertilizer Development Center. Muscle Shoals, Ala., 1980.
5. S. G. Beveridge and R. G. Hill, Phosphoric Acid, Chem. Process Eng. 49(6):61-73 (July 1968).
6. Q. D. Bowers, B. Fitch, and R. L. Kulp. A New Look at Phosphoric Acid, Farm Chem. 132(3) :48-56 (1969).
7. В. B. Roy and A. K. Roy, Processes for Direct Production of High Concentration Phosphoric Acid and Their Prospects, Fertilizer Association of India, New Delhi, April 1973.
8. В. B. Roy, Evaluation of Various Wet-Process Phosphoric Acid Manufacturing Techniques, Chem. Age India 21(3):298-309 (1970).
9. R. L. Kulp, Third Generation Phosphoric Acid Processes, 20th Annual Fertilizer Industry Round Table, 1970, pp. 25-30.
10. T. P. Hignett, Production of Wet-Process Phosphoric Acid, Proceedings of the 2nd International Congress on Phosphorus Compounds, Boston, 1980, pp. 401-429.
11. J. Kronseder, Phosphoric Acid Plant Design, Chem.Eng. Prog. 63(10): 52-57 (1967).
12. J. Kronseder, Effect of Wet-Process Phosphoric Acid Technology on Fertilizer Production and Distribution Cost, Chem. Age India 18(11) :826-834 (1967).
136
Industrial Process Chemistry
13. J. Kronseder, Economics of Phosphoric Acid Processes, Chem. Eng. Prog. 64(9):97-102 (1968).
14. T. Yasuda and M. Miyamoto, Nissan Process, in Phosphoric Acid, Vol. 1, Part I (A. V. Slack, Ed.), Marcel Dekker, New York, 1968, Chap. 4, I-C.
15. Nissan Chemical Industries Process for Wet Phosphoric Acid, Phosphorus & Potassium, No. 4, December 1972, pp. 32-35.
16. Acide phosphorique par le procede Nissan, aspects economiques et techniques, Inf. Chim., No. 106, March 1972, pp. 95-102.
17. R. M. Daniel and M. Miyamoto, Nissan Process Offers Superior Wet Process Acid Economy, AIChE/IIQPR Meeting, Tampa, Fla., May 1968.
18. R. M. Daniel, The Hemihydrate Process and the Gypsum Challenge, 19th Annual Fertilizer Industry Round Table, 1969, pp. 11-15.
19. K. Shindo and Y. Harada, NKK Process, in Phosphoric Acid, Vol. 1, Part I (A. V. Slack, Ed.), Marcel Dekker, New York, 1968, Chap. 4, I-D.
20. Nippon Kokan Process for Phosphoric Acid, Phosphorus & Potassium, March 1963, pp. 33-35.
21. H. Takeuchi and I. Tayama, Mitsubishi Process, in Phosphoric Acid, Vol. 1, Part I (A. V. Slack, Ed.), Marcel Dekker, New York, 1968, Chap. 4, I-B.
22. Mitsubishi Wet Phosphoric Acid Process, Phosphorus & Potassium, April-May 1966, pp. 32-34.
23. S. A. Heurtey, French Patent No. 1,409,405, 1965.
24. Central Glass Co., Belgian Patent No. 667,963.
25. Societe de Prayon, British Patent No. 1,111,708.
26. M. Hayakawa, CGC Process-Method for Manufacturing Wet Process Phosphoric Acid, JPN. Chem. Q. 4(2) :26-29 (1968).
27. E. Pavonet and A. Davister, An Account of Twenty Months of Phosphoric Acid Manufacture by a New and Original Process, International Superphosphate Manufacturers Association Technical Conference, Brussels, September 1968.
28. Largest Central-Prayon Plant in Europe-Built for Boliden by Sim-Chem, Phosphorus & Potassium, No. 66, July-August 1973, pp. 25-28.
29. N. Robinson, U.S. Patent No. 3,418,077 (assigned to Fisons Fertilizers Ltd.).
30. Fisons' New Hemihydrate Phosphoric Acid Process, Phosphorus & Potassium No. 31, September-October 1967, pp. 23-27.
31. N. Robinson and S. M. Janikowski, The Production of 50% vijw P2O5 Phosphoric Acid Directly by the Wet Process: Fisons' Hemihydrate process, Internation Superphosphates Manufacturers Association Technical Converence, Brussels, September 1968.
32. S. M. Janikowski and N. Robinson, Single Stage Process for the Production of 50% P2O5 Phosphoric Acid, Proceedings No. 112, The Fertilizer Society, London, 1964.
References
137
33. W. E. Blumrich, Developments in Phosphoric Acid Technology and the Fisons' Hemihydrate Process, FAI Seminar on Recent Advances in Fertilizer Technology, New Delhi, January 1972, pp. 140-148.
34. H. O. Crawford, С. H. M. Vinke, and P. van Hagen, The Commercial Production of 50% P2O5 Phosphoric Acid Directly by the Single Stage Hemihydrate Process, International Superphosphates Manufacturers Association Technical Conference, Seville, 1972.
35. F. Ore, et al., U.S. Patent No. 4,132,760 (assigned to Occidental Petroleum Corp.).
36. M. B. Caesar and H. C. Smith, Occidental's Hemihydrate Plants, Joint Peninsular and Central Florida Sections, AIChE Meeting, Clearwater Beach, Fla., May 1980.
37. F. Ore, Development of the Occidental Heftihydrate Phosphoric Acid Process, in Fertilizer Acids, Proceedings of the British Sulphur Corporation's 3rd International Conference on Fertilizers, London, Novenber 12-14, 1979.
38. M. B. Caesar, H. C. Smith, and L. E. Mercando, The Oxy Hemihydrate Phosphoric Acid Process, Proceedings No. 192, The Fertilizer Society, London, 1980.
39. F. Ore, Oxy Hemihydrate Process; Crystallization Kinetics and Slurry Filterability, 28th Annual Fertilizer Industry Round Table, Atlanta, 1978, pp. 58-64.
40. Phosphoric Acid by the NKK-Lummus Processes, Phosphorus & Potassium, No. 66, July-August 1973, pp. 43-46.
41. R. Long, U.S. Patent No. 3,453,076 (assigned to the Lummus Corp.).
42. A. V. Grinevich, N. N. Boldenko, A. F. Vokhrin, and Ya. E., Vil'nyanskii, Industrial Production of Phosphoric Acid Containing 40-45% P2O5, Khim. Prom. (Moscow) 48(7):547 (1972).
43. A. V. Grinevich, Ya.E. Vil'nyanskii, and M. N. Gafarov, Production of 34-40% Extraction Phosphoric Acid by the Hemihydrate Method, Khim. Prom. (Moscow) 48(3):194-195 (1972).
44. N. Robinson, British Patent No. 1,250,191 (assigned to Fisons Fertilizer Ltd.).
45. W. E. Blumrich, J. D. Crerar, and G. N. Quinton, The Fisons' Hemihydrate (HDH) Phosphoric Acid Process, Technical Conference, Prague, September, 1974.
46. V. Lasovic, M. L. Parker, N. Robinson, G. N. Quinton, and P. A. Smith, Fisons' HDH Phosphoric Acid Process, Operating Experience with a 160 mtpd Plant at Trepca (Yugoslavia), Technical Conference, The Hague, September, 1976.
47. E. W. Schwehr and В. T. Crozier, The Development of Fisons Hemihydrate Processes, 28th Annual Fertilizer Industry Round Table, Atlanta, 1978, pp. 69-87.
48. E. W. Schwehr, W. E. Blumrich, and H. J. Koenig, Full-Scale Application of the Fisons' HDH Phosphoric Acid Process, Chem. Eng. Prog. 74(11) :58-61 (1978).
49. M. Miyamoto, Practice of New Nissan Phosphoric Acid Process, ANDA Technical Conference, Sao Paulo, Brazil, April 1975.
138
Industrial Process Chemistry
50. M. Miyamoto, Performance and Operation of New Nissan Phosphoric Acid Plant, Technical Conference, The Hague, September, 1976.
51. 40/50% Acid from Low-Grade Rock by New Nissan Process, Phosphorus & Potassium, No. 83, May-June 1976, pp. 48-49.
52. M. Miyamoto and M. Kubo, The Commercial Use of Kola Phosphate in Nissan-C Process (New Nissan Phosphoric Acid Process) Plant, Technical Conference, Orlando, Fla., October 1978.
53. W. E. Goers, New Technique/Old Technology, Nissan "C" Hemihydrate Process, 28th Annual Fertilizer Industry Round Table, Atlanta, 1978, pp. 99-107.
54. E. R. Landgraf, Why Convert to the New Nissan Hemihydrate process? Joint Peninsular and Central Florida Sections, AIChE Meeting, Clearwater Beach, Fla, May 1979.
55. W. C. Weber, E. J. Roberts, I. S. Mangat, and E. Uusitalo, The Dorr-Oliver HYS Phosphoric Acid Process, Proceedings No. 112, The Fertilizer Society, London, 1969.
56. 42% P2O5 Phosphoric Acid in Yields over 97%, Phosphorus & Potassium, No. 22, April-May 1966, p. 35.
57. E. Uusitalo, Experiences in Phosphoric Acid Production with Hemihydrate and Dihydrate Process, Technical Conference, Orlando, Fla., October 1978.
58. R. Chelminski and R. L. Somerville, The New Singmaster and Breyer Phosphoric Acid Process, AIChE Meeting, Dallas, September 1966.
59. SA Heurtey Develops a New Hemihydrate Route to Phosphoric Acid; Singmaster and Breyer Process Modified, Phosphorus & Potassium, No. 63, January-February 1973, p. 25.
60. T. Ishihara, et al. U.S. Patent No. 3,653,826 (assigned to Nissan Kagaku Kogyo Kabushiki Kaisha).
61. S. E. Kahlgren, Chemistry of Wet-Process Phosphoric Acid Manufacture, in Phosphoric Acid, Vol. 1, Part I (A. V. Slack, Ed.), Marcel Dekker, New York, 1968, Chap. 2, II-B.
62. Kurteva and Brutsbus Zh. Prikl. Khin. 34:1714 (1961); cited by S. E. Sahlgren, Chemistry of Wet-Process Phosphoric Acid Manufacture, in Phosphoric Acid, Vol. 1, Part I (A. V. Slack, Ed.), Marcel Dekker, New York, Chap. 2, V, after work done by
V. Reppestam, Boliden Aktiebolag, Reymersholmsverken, Helonig-borg, Sweden.
63. Robert L. Sommerville and Roman Chelminski, Singmaster and Breyer, in Phosphoric Acid, Vol. 1, Part I (A. V. Slack, Ed.), Marcel Dekker, New York, 1968, Chap. 3, II-E.
64. (a) A. V. Slack, Prayon; (b) T. Yasuda and M. Miyamoto, Nissan Process; and (c) S. M. Janicowski, Fisons, in Phosphoric Acid, Vol. 1, Part I (A. V. Slack, Ed.), Marcel Dekker, New York, 1968, Chaps. 3, II-C; 4, I-C; 3, II-B.
References
139
65. SIAPE process, Societe Industrielle d'Acide Phosphorique et d'Engrais, Sfax, Tunisia; Rhone-Poulenc S. A., Neuilly-sur-Seine, France; Dorr-Oliver, Jacobs Engineering Group, Inc., Lakeland, Fla.
66. J. Frochen and P. Becker, International Superphosphate Manufacturers Association Technical Conference, Stockholm, September 1959, paper LE 59/59.
67. Richard L. Gilbert, Jr., Crystallization of Gypsum in Wet Process Phosphoric Acid, Ind. Eng. Chem. Process Des. Dev. 5(4):388 (October 1966).
68. Fisons, U. K. Patent Appl. No. 824,954; filed August 15, 1977.
69. N. Robinson, Fisons' Experience on the Effect of Phosphate Rock Impurities on Phosphoric Acid Plant Performance, International Superphosphate Manufacturers Association Technical Conference, Orlando, Fla., October 1978.
70. F. T. Nielsson, Some Operating Experience Using High Magnesia Phosphate Rock in Wet Process Phosphoric Acid Manufacture, in Fertilizer Acids, Proceedings of the British Sulphur Corporation's 3rd International Conference on Fertilizers, London, November 12-14, 1979, paper XVI.
71. A. Davister and S. V. Houghtaling, A Route Saving Raw Materials and Energy Makes P2O5 Available Through Wet Phosphoric Acid Process, International Superphosphate Manufacturers Association Technical Conference, Orlando, Fla., October 1978.
72. E. Vusitalo et al., Experiences in Phosphoric Acid Production with Hemihydrate and Dihydrate Process, International Superphosphate Manufacturers Association Technical Conference, Orlando, Fla., October 1978.
73. Mitsuya Miyamoto, The Commercial Use of Kola Phosphate in Nissan C Process, International Superphosphate Manufacturers Association Technical Conference, Orlando, Fla., October 1978.
74. U.S. Patent No. 3,192,014; issued to David Leyshon, Jacobs Engineering Group, Inc., Lakeland, Fla, 1965.
75. J. J. Gardet, B. Guilhot, and M. Sonstelle, Etude des formes hydratees du sulfate de calcium, Bull. Soo. Chim. Fr., No. 549, Octobre 1970, pp. 3377-3382.
76. Sanfourche and A. Krapivine, Bull. Soc. Chim. Fr., 53:970 (1933).
77. S. E. Dahlgren, J. Agric. Food Chem. 8:411 (1960).
78. A. A. Taperova, Zh. Prikl. Khim. 13:643 (1940).
79. A. A. Taperova and N. M. Shulgius, Zh. Prikl. Khim. 18:521 (1945).
80. H. Lehreche, Chem. Fabrik 6:505 (1933).
81. P. M. R. Versteegh and J. T. Boontje, Hemihydrate and Anhy-drate Processes in Europe, in Phosphoric Acid, Vol. 1, Part I (A. V. Slack, Ed.), Marcel Dekker, New York, 1968, Chap. 4, II 82. P. Becher, unpublished work.
140
Industrial Process Chemistry
83. S. E. Dahlgren, Chemistry of Wet-Process Phosphoric Acid Manufacture, in Phosphoric Acid, Vol. 1, Part I (A. V. Slack, Ed.), Marcel Dekker, New York, 1968, Chap. 2.
84. J. Frochen, J. Laine, H. Aliyot, and G. Gosse, Procede de fabrication d'acide phosphorique concentre par double crystallisation, Inf. Chim., No. 118, March 1973, p. 105.
85. Keiichi Murakami and S. Hori, General Description, in Phosphoric Acid, Vol. 1, Part I (A. V. Slack, Ed.), Marcel Dekker, New York, 1968, Chap. 4, I-A.
86. E. Uusitalo, M. Loikkanen, T. Karjalainen, and E. Hanninen, Experiences in Phosphoric Acid Production with Hemi-hydrate Process, International Superphosphate Manufacturers Association Technical Conference, Orlando, Fla., October 1978.
87. A. D. Randolf, How to Approach the Problems of Crystallization, Chem. Eng., May 4, 1970, p. 84.
88. T. Garside, Secondary Nucleation Kinetics, Crystallization Technology, Section D. 26 June-1 July 1982, Amsterdam Centre of Prof. Advancement, East Brunswick, N.J.
89. J. Garside End A. Randolf, The Mixed Suspension, Mixed Product Removal, Crystallizer, Crystallization Technology, JG1-19, 26 June-1 July 1982, Amsterdam Centre of Prof. Advancement, East Brunswick, N.J.
90. F. Lefaucheux and M. C. Robert, L'Hydrodynamique, une Compo-sante dens la Croissance DES Cristaux en Solution, Rev. Phys. Appl. 14:(12):949 (1979).
3
Process Systems and Calculations
In this chapter we demonstrate material and energy balance calculations. As stated in Section 1.1, calculations with phosphates and phosphoric acid are individual and particular in character, mainly because there are a large number of uncertainties and inaccuracies the moment one starts to deal with phosphates.
First, we have to rely on the chemical analysis of a phosphate ore sample. The sample is taken either from an operating mining or beneficiation plant or from some trenches from an area that is supposed to become a mine. The few grams of the sample will have to stand for the millions of tons that will be mined and beneficiated in the future. There is no rule giving standard deviations between samples and reality; deviations for the main components of the ore can exceed 10%.
Components of secondary importance, such as iron and aluminum, often differ by over 100%. Once the representativeness of the sample has been agreed upon, the problems proceed to laboratories, methods of analysis, and corresponding deviations. Table 1 of Appendix A shows the typical uncertainties of the methods and the between-labora-tory error for the most important components of phosphate ore. Estimated overall uncertainties for a phosphoric acid material balance are given in Table 3.1.
The phosphate rock user lives in a permanent state of doubt and suspicion about phosphate rock composition and analysis. Whatever will happen in a plant or with the quality of a commercial product, the user's first reaction often is: "Hasn't the rock changed?" In fact, the rock is sometimes a welcome scapegoat—without a defender.
Once the phosphate ore is sent into the phosphoric acid plant, things do not improve; they get even worse. The components of the phosphate ore split into a three-phase system, each component having its own splitting coefficient. Solids, liquids, and gases leaving the
141
142
Process Systems and Calculations
TABLE 3.1 Overall Uncertainties for Material Balances of a Phosphoric Acid Production Calculation (in percent)
P O_ balance 2 5 Calcium sulfate ±1 - 2 + 1 - 2.5
Fluorides ±10 - 20
Heat balance ±5 - 8
phosphoric acid reaction system are not pure substances; they are complex mixtures.
Some of the phosphate rock remains unattacked within the calcium sulfate. The calcium sulfate produced is not pure but a mixed crystal containing dicalcium phosphate, and these crystals are mixed with a number of other crystallized substances, such as sodium silicofluorides.
The liquid phase, the product acid, contains, besides phosphoric acid, most of the impurities that originate from the phosphate rock and the process water, plus some of the sulfuric acid. However, these impurities are subject to further precipitation, called sludge, while the product acid is cooling and aging in the storage tanks.
The physical and chemical properties of phosphoric acid depend in large part on the impurities remaining with the acid. In heavily loaded acids the sum of impurities can amount to some 30 wt % compared to the P2O5 content of the acid. During concentration by evaporation, further changes occur. Fluorides and chlorides escape partially into the gas phase and other complex compounds precipitate as sludge, this time including complex phosphate compounds.
It is obvious that calculations that can be applied to phosphoric acid production have to be approached with great care and experience, and with proven methods. The aim of this chapter is to demonstrate a method of calculation and estimation.
3.1 MATERIAL BALANCE
3.1.1 Preparation of the Data
The first step is to have at hand the information on which the material balance calculation will be based, as follows:
1. Production capacity in tons per day of P2O5. This capacity is a function of process design and feed phosphate rock characteristics. The two are inseparable. An existing installation with a proven capacity based on a specific rock need not necessarily produce at the same capacity with a different rock.
Material Balance
143
2. Phosphate rock composition information should be as complete as possible. As a minimum, P2O5, CaO, and SO3 content must be known. Reference can be made to rock data in Appendix A.
3. Reactor slurry solid content and P2O5 content (in the liquid phase}. If no actual information is available, use 25% solids and 30% P2O5 in the liquid phase.
4. Gypsum quantity (better still, total solids) produced per ton of feed rock should be known. It is best to determine this value through bench-scale testing because theoretical calculations are not always representative of reality. Nevertheless, a calculation procedure will be presented in the following section. The water content of the gypsum cake at filter discharge should be known or assumed.
5. P2O5 losses, if not already known, should be estimated with values based on experience-from a typical rock. For further information, refer to Section 3.4.
3.1.2 Calculation Procedure and Case Study
The material balance calculation procedure will be developed concurrently with a case study.
Basic Information and Assumptions
1. Phosphate rock composition, weight percent (dry basis):
P2°5 CaO SO3 SiO2 32.0 49.0 2.0 3.0 (half of SiO2 as quartz or unreactive silica)
F A12°3 Fe2°3 MgO 3.6 0.7 0.7 0.5
Phosphate rock moisture 1.5 content
2. Sulfuric acid:
H SO, 98%
2 4
3. Reactor slurry:
Solids content P2Og concentration Specific gravity Excess sulfuric acid 25 vol % 30% or 390 kg/щЗ (in the liquid phase) 1.30 (liquid phase only, at 72°C) 2.5% (liquid phase only)
144
Process Systems and Calculations
4. Gypsum:
Specific gravity 2.32 (dry basis)
5. P О losses (as percei 2 5 nt PO based on P О in feed rock): 2 5 2 5
Unattacked losses Lattice losses 0.5 3.0
Total insoluble losses 3.5
Filtration losses Spillage and mechanical losses 1.0 0.5
Total soluble losses Total P O, losses 2 5 1.5 5.0
This 5% loss, equivalent mal production run in a ' 6. Molecular weights: * to 95% P2O3 recovery, is acceptable for a norwell-maintained modern unit (see Section 3.4).
H3P°4 ₽2O5 CaO SO3 H2SO4 Gypsum (CaSO4 • 2H2O) ai2o3 Al Fe2°3 Fe MgO Mg SiO2 H2SiF6 F 98 142 56 80 98 172 102 27 160 56 40.3 24.3 60.1 144.1 19
Phosphate Rock Consumption
daily production (tons P О /day) Z э
Rock consumption rock/100) (%P О recovery/100)
(tons/day) 2 5 2 5
(1)
*The atomic and molecular weights have been rounded off according to the accuracy of the calculations.
Material Balance
145
For this case study, rock consumption will be calculated for the production of 1 ton of P2O5 as filtered acid. The equation can be reduced to
_ 100_______
rock (f ) (% REC) *2 5
(2)
where
trock ~ phosphate rock consumption (dry basis) per ton of PgOg
produced (called the "rock factor") = weight fraction P О in the rock
Z Э
fp °
Z «3
% REC = overall P O_ recovery = 100 - percent total losses
2 5
Applying Eq. (2) to our numeric example, we have
‘rock = (0.32)(95) = 3-2® ton® ₽hosphate rock/ton P^ produced
(3)
Sulfuric Acid Consumption
This is essentially defined by the CaO, PgOg, and SOg content of the rock. Sulfuric acid consumption per ton of P2O5 produced into the storage tank can be calculated by the following experimental formula:
< 1Л32**СаО ^3
------. СУ----------- 1.225 -^ + 0.062
lP2°5 CaO P2°5
'H2SO1
100
100 - % SL
(4)
Where
>h2s°4
f CaO
= consumption, tons 100% H2SO4 per ton of P О produced out of the filter “ J
= weight fraction CaO in the rock
= weight fraction P.O in the rock
Z э
♦The figure 1.732 corresponds to the HgSOjj/CaO ratio multiplied by an empirical correction factor of 0.9897.
146
Process Systems and Calculations
'SO3
% SL
= weight fraction SO^ in the rock
= percent soluble P O_ losses (filtration + spillage) 2 5
Equation (4) has provisory factors to account for an excess of 1.8% by weight free H2SO4 being present in the liquid phase of the reaction product slurry and for a mean value of co-crystallized and unattacked P2O5 losses. Needless to say, the best measure for sulfuric acid consumption would be to conduct a bench-scale test. Nevertheless, in the absence of such a test, the Eq. (4) should provide a good approximation. The fact that a constant value for co-crystallized or lattice losses is taken introduces a slight error, which is nevertheless inferior to the accuracy obtainable from the phosphate rock analysis. For our sample example:
tH2S°4
1.732 x 0.49
0.32 - 0.02 x 0.49
-1-220y2°---°2 + 0.062
100
100 - 1.5
= 2.76 (5)
Thus the result is: 2.76 tons of 100% H2SO4 per ton of P2O5 product fed into the storage tank.
Gypsum Cake Production
Gypsum cake production can be defined as the production of solids following sulfuric acid attack of the rock. Once again, actual bench-scale test results would be preferable to a theoretical calculation, since calcium determination in phosphate rock is not very accurate and it is difficult to predict the behavior of the secondary constituents and impurities in the rock. This is especially true if the SiO2 content is high and the quartz content or the reactive fraction of silica is not known. Also, some calcium stays in solution in the 30% P2O5 acid, to the extent of 4-6 kg expressed as CaO per cubic meter of acid. In this case a correction can be made. The resulting formula is
- -M * 0-98> * 'is
<e>
where
Gy ~ tons of solids per ton rock (commonly called the "gypsum factor")
f = weight fraction insolubles in the rock
IS
172 = gypsum/CaO mole ratio
56
Material Balance
147
For the case under consideration, of the rock constituents, half of the SiO2 will not go into solution. Thus
172
Gy = (0.49 x 0.98) + 0.015 = 1.490 tons of solids/ton (7)
Эи
of rock
Reactor Slurry Production
In the absence of experimental measurement this quantity is based on the gypsum solids production, using a 25:75 solids-to-liquids volume ratio. Most phosphoric acid units operate at approximately this ratio.
V = _____________ С ел
s 0.25 X 2.32 ' J
where
Q
Vs = volume of reactor slurry product, m /ton of rock
2.32 = specific gravity of gypsum
Consequently, the volume and weight of the slurry liquid phase can be calculated as well.
For our sample calculation:
1 490 4
Vs = n V 9 49 = 2,57 m /ton Of rOCk (9)
U . Lit) л' Zj . Oil
Recycle Acid Requirements
Recycle acid can be construed as the combined sum of product acid recycled from the filter to maintain the solids-to-liquid ratio of the slurry, and of the quantity of process water required to make up the needs of gypsum (CaSO4 • 2H2O) crystallization, vaporization cooling of the reactor slurry, and the dilution (water content) of the product acid. For a more detailed discussion, see Section 3.2.
Product Acid Recycle from the Filter. The amount of P2O5 in the recycle acid is set by the difference between P2O5 content of the slurry and the P2O5 production available from the phosphate rock attack. This difference is made up by recycling part of the product acid from the filter. PgO^ reaction losses which have already taken place in the reaction tank have to be accounted for, since P2O5 production has already suffered by an equivalent amount. The losses to be considered are the insoluble ones: co-crystallized or lattice losses and. unattacked losses.
148
Process Systems and Calculations
recycled = P^O^ in
slurry " ₽2®5 from rock
P О slurry
2 t)
= (slurry volume - volume of solids) x cone. P„Or in acid
2 5
P2°S
from rock = P О in 2 5
rock - insoluble losses
For our case study (per ton of rock fed into the system):
Slurry volume = 2.57 m3 [see Eq. (8)] (per ton of rock)
P-О- slurry 2 5 = 2.57(1 - 0.25)0.390 = 0.752 t/t rock (10)
p O rock = 0.320 - 0.320 x 0.035 = 0.309 t/t rock (11)
P O, recycled 2 Э = 0.752 - 0.309 = 0.443 t/t rock (12)
P O_ recycled 2 Э °^=1.43 0.309 (13)
P_O_ produced 2 5
0.443 3 Volume of product acid recycled - ~ 1.136 m /ton of (14)
phosphate rock fed into the system
Water of Crystallization: H2Ocry. This is related to the CaSO4 • 2H2O formed during the reaction. As noted in our discussion of gypsum cake production, Ca2+ staying in solution has to be corrected, as well as CaSC>4 assumed to be present in the incoming rock, reported as SO3 in the rock analysis.
HO = 0.643(f л - 0.70f _ ) - 0.003
2 cry CaO SO3
(15)
where H2Ocry is the water of crystallization in tons per ton of rock and 0.003 is the correction for Са^+ remaining in product acid.
Applying Eq. (14) to our example, we obtain
H О - 0.643(0.49 - 0.70 x 0.02) - 0.003
2 cry
= 0.303 ton/ton of rock
(16)
Water for Vaporization Cooling of Reaction: H2O vap. The reaction heat to be removed is 190,000 kcal/ton of 100% H2SC>4 fed into the system in order to maintain a 72°C temperature of reactor contents.* The cooling system utilized, vacuum flash or air swept, will have an effect on the makeup water equipment. The needs of an air-swept system are 15% less than those of a vacuum flash system. The latter will be used in our case.
*See also Section 3.3.
Material Balance
149
190,000 x t
HO =-------------------
n2 vap AH„ x t . r HgO rock
(17)
where
но
2 vap
ДН
H2°
= evaporated water for reaction cooling, tons per ton of rock
= heat of evaporation of water—for our purposes, 560,000 kcal/ton
For our example:
H2°vap = = °'285 ton/ton of rock (18)
Water of Dilution: Water °f dilution, is the
quantity of water required to adjust the ₽2®5 concentratiorl of the phosphate rock/sulfuric acid reaction product acid to its actual level in the liquid phase of the slurry. Nominally, this corresponds to the 30% PgOg concentration used in our case study.
The presence of soluble impurities in the rock complicates the establishment of Н20<щ by mathematical means, because the behavior of these impurities is not uniform. If solubilized, these impurities become part of the liquid phase of the slurry and substitute equivalent amounts of water from the 30% Р2Ц5 solution. It is best that the value of be obtained experimentally through azeotropic distillation.
Nevertheless, an approximate HgO^j can be estimated by deducting the weight of the chemical components (H3PO4 and impurities) from the bulk acid weight. The balance is assumed to be water.
The weight of impurities to be deducted from the acid weight should be obtained from the product acid analysis. If no analysis is available, these can only be made from an estimation based on the solubilization factor for each of the impurities arrived at through experience. Nevertheless, the error resulting in the water-of-dilution calculation is small, due to the relatively low weight percent of individual impurities compared to the total amount of water.
The following relationship can be used for the latter case, for an impurity in acid:
P2C>5 in acid
Impurity in rock x ——— --------— x dissolution factor (19)
c Dll in mnk
Table 3.2 gives some of the most common dissolution factors.
150
Process Systems and Calculations
TABLE 3.2 Dissolution Factors
Component in the rock Component in the product acid Dissolution factor
A12°3 Al3+ 0.8
Fe2°3 Fe3+ 0.9
MgO Mg2+ 1.0
F H2SiF6 0.3-0.95 mean value: 0. 5
Let us now focus our attention on the case study at hand. The weights of the known components in 1 m3 of product acid, 30% P2O5, will be calculated. The P2Og acid to P2O5 available from rock ratio is equivalent to 390/310 = 1.26 (lattice losses deducted from P2O5 from rock). In other words, 1.26 tons of rock is to produce 1 m3 or product.
3 Total weight of 1 m product acid = 3 Tons/m
1.300 (20)
H3PO4: 390 x 2 x 98 -3 142 X 10 = 0.5383 (21)
2.5% H„SO, in solution: 2 4 0.025 x 1.300 = 0.0325 (22)
0.7% Al-O in the rock, 80% solubilized 2 0
as Al3+:
0.8 x ^*227 x 0.007 x 1.26 = 0.0037 (23)
0.7% Fe О in the rock, 90% solubilized 2 «5
as Fe3+:
2 x 55.8
0.9 x • x 0.007 x 1.26 = 0.0056 (24)
159.6
0.5% MgO in the rock, 100% solubilized 2+
as Mg :
Material Balance
151
1.0 x x °’005 x 1‘26 = 0.0038 (25)
*iu. '
3.6% F in the rock, 50% solubilized
as H SiF :
2 6
144.1
°’50 X 6 x 19 X °-036 X 1>26 = 0.0286 (26)
5 kg CaO per cubic meter of 30% acid, solubilized as Ca2+:
5x^xio’3 = 0.0036 (27)
56 _______
Total weight of the components 0.616 (28)
Dilution water:
Water content in 30% P„O_ product acid: l 5
Q
1300 - 0.616 = 0.684 t/m (29)
per ton of rock:
2 dll v
H2°dil = °-68r26=°-54t (30)
Total Process Water. Total process water is the sum of Eqs. (16), (18), and (30):
HO + H„O + H O = total process water (31)
2 cry 2 vap 2 dil
In our case study:
0.30 + 0.28 + 0.54 = 1.12 t/ton of rock (32)
The water content from sulfuric acid and the moisture from the rock have to be deducted:
1. Sulfuric acid per ton of rock [Eq. (5) divided by Eq. (3)]:
0.02 = 0.017 m3 (33)
«5 • 2У
3
2. Moisture from phosphate 1.5%: 0.015 m
152
Process Systems and Calculations
Total process water fed per ton of phosphate rock consumed:
3
HO = 1.12 - 0.03 = 1.09 m /ton (34)
2 process
Volume and PgO^ Concentration of Recycle Acid. Having defined all the components of recycle acid, its total volume per ton of rock can be defined only approximately [Eqs. (14) + (34)]:
V„ . = V . . . , . + H O (35)
RecA prod acid recycled 2 process
because there is a slight shrinkage of volumes (about 0.5%) on intermixing and a certain error would be introduced if the concentration calculation were based on calculated volumes. It is best that P2O5 concentration of the recycle acid be calculated through the calculated weights of the recycled P2O5 and water components of the mixture. Density is best established by direct measurement, experimentally.
Hence percent P2Og of the recycle acid for our case study is calculated as follows:
P„OC content [Eq. (12)] z Э
Weight of 30% PQO_ component [Eq. (14)] Li О
0.443 _
0.30
Weight of water components =
0.443 ton
1.477 ton
(36)
HO
2 process
[Eq. (34)] =
1.090 ton
B p О = 0-443 x 100
2 5 1.48 + 1.090
= 17.3%
(37)
Quantity of recycle acid:
1.47 + 1.090 = 2.56 tons/ton of rock
(38)
From Table 2 of Appendix B, the specific gravity is 1.16 tons/m3.
= 2.20 m3/ton
1.16
(39)
or alternatively, by addition of recycled product acid [Eq. (14)], plus total process water [Eq. (34)], multiplied by the shrinkage factor 0.995:
0 443 3
(ГзЙ + 1,09) * °-"5 = 2-21 m /ton
(40)
Material Balance
153
Total Water Requirement-. Filter Feed Water. To complete the process water balance of the reaction filtration system, a word on residual moisture in the filter cake. This is the water that stays impregnated in the filter cake. The quantity involved is far from negligible and it is theoretically not calculable. The quantity of water retained by the cake is influenced by the crystallization characteristics of the gypsum, the effect of the impurities therein, the vacuum of the filter, cake thickness, and filter speed.
The residual moisture content can be 20-25% for easily filterable crystals or up to 50% for difficult filtrations, which are usually loaded with matter of organic and/or reactive silicic origin. The given percentages are based on humid cake. The corresponding water consumption can vary 0. 5-1.5 ton/ton of phosphate rock, although for calculations purposes a mean figure of 30% retained may be used.
Hence, carrying on with our case study, water retained as cake moisture would be
0 3 0 3
H_O , = > G = > 1.49 = 0.64 ton/ton of rock (41)
2 cake 0.7 у 0.7
For Gy, see Eq. (7).
Therefore, the total allowable wash water fed to the filtration section would be
HO
2
1 + HO , = H„O„. = total water on filter
process 2 cake 2 filter
1.13 + 0.64 = 1.77 m3/ton of rock
(42)
3.1.3 Summary and Materisl Balance for a 1000-ton/day P2O5 Plant
Recap
To summarize, we have knowledge of the flow rates and compositions of the product acid system, that is, the major flow streams of the reaction and filtration areas. The information requirements, given in Section 3.1.4, are normally obtained through laboratory (bench-scale) testing of a rock. The most significant assumption made dealt with P2O5 losses.
We are now in a position to construct a material balance for any given plant capacity. Information, given or calculated, is available on the following:
Rock: composition and consumption
Sulfuric acid: composition and consumption
Gypsum: quantity produced and silica content
154
Process Systems and Calculations
Reactor slurry: flow rate and composition
Recycle acid: flow rate and composition
Product (30% P2O5) acid: flow rate and composition
Wash water: flow rate
Filter cake: quantity
1000 Tons/Day PpOg Material Balance
Choosing a plant capacity of 1000 tons/day of P2O5, the material balance is calculated on an hourly basis for a 24-hr production day.
1.
Phosphate rock:
a. Composition: as given in Section 3.1.2, "Basic Information and Assumptions"
b. Consumption (dry basis):
x 1000
t x ---------
rock 24
= 3.29
1000
24
= 137.0 tons/hr
(43)
Note: Rock consumption is the basic multiplier for the material balance of this section and is used without further reference.
2. Sulfuric acid:
a. Composition:
b. Consumption
*Н28О4 *
98% H2SO4
[100% basis and according to Eq. (5)]:
122° = 2.76 x 122° = 115.0 tons/hr (44)
24 ^4
3. Gypsum and slurry solids [according to Eq. (7)]—quantity produced:
137 x Gy = 137 x 1.49 = 204 tons/hr (45)
4. Reactor slurry [according to Eq. (9)]:
a. Flow rate:
137 x vs = 137 x 2.57 = 352 m3/hr (46)
b. Liquid phase of slurry (75% liquid phase)—flow rate:
352 x 0.75 = 264 m3
or
1.30 x 264 = 343 tons/hr
(47)
Material Balance
155
5. Composition of product acid (wt 8):
H3P°4 41.4
P2°5 30.0
H2S°4 2.5
H2° 49.5
H2SiF6 2.2
ai2+ 0.3
3+ Fe 0.4
Mg2+ 0.3
Ca2+ 0.3
6. Recycle acid [according to Eq. (38)]:
a. Flow rate:
137 x 2.560 = 351 tons/hr
b. Composition [according to Eq. (37)]:
P „0, content = 17.3% 2 5
Product acid or 30% P00_ acid constituent = 57.5 wt % £ 5
Process water constituent = 42.5 wt %
7. Product acid transferred from filter to storage:
Qn = I38-9 tons/hr or 107 m3/hr
0 • О V и 4
8. Wash water on filter [according to Eq. (42)]—flow rate:
137 x 1.77 = 242 tons/hr
9. Wet filter cake (at point of discharge) —quantity:
137(Gy + H О , ) = 137 (1.49 + 0.64) 2 саке
= 292 tons/hr
(48)
(49)
(50)
(51)
(52)
(53)
156
Process Systems and Calculations
3.2 RECYCLE ACID SYSTEM
3.2.1 Definition and Importance
Recycle acid, also called return acid, is the liquid phase resulting from washing filter cake with process water. Thus the recycle acid contains the process water plus the amount of product acid that was retained within the filter cake before washing.
Process water going into the system satisfies the total water requirements for:
Product acid water content (or dilution water—about 50% by weight in
30% P2O5 acid)
Gypsum crystal water
Vaporization cooling of the reaction slurry
But process water alone would not be sufficient liquid phase to prepare a fluid reaction slurry with 30% P2O5 acid. This is where the recycled cake wash acid from the filter plays its role. Besides the fact that the filter cake leaving the system should be free of any remaining phosphoric acid for economic reasons, the recycled product acid will contribute to maintain an appropriate liquid-to-solid ratio in the slurry.
The liquid-to-solid ratio in the slurry is a very important factor. It controls the rheological properties of the slurry and consequently the micro or shear agitation, most important for the nuclei formation and crystal growth reactions (see Section 2.2.5).
The filter cake retains an unpredictable and variable amount of product acid before going to the wash section, as it does with the process water at the end of the filter cycle. It is not possible to rely on stable filtration flows. The recycled acid, as well as the process water in the return acid, have to be monitored and controlled on a permanent basis to obtain a constant flow of return acid with a stable concentration value.
As noted earlier and as defined in Section 3.1.2, the return acid is to be considered as the sum of process water plus recycled product acid for fluidity. In fact, recycling more or less product acid only changes the liquid/solid ratio in the slurry; the process water controls the P2O5 concentration of the liquid phase in the reaction slurry.
A simplified diagram (Fig. 3.1) facilitates the description of the recycled product acid and process water flow.
In the pages that follow, the recycle acid system is discussed in detail. The various factors that affect system stability, balance, and control are qualified. Nomograms that facilitate system optimization are presented for three typical rocks.
3.2.2 System Instability and Control
To have a smoothly operating phosphoric acid unit means having a smoothly operating return (or recycle) acid system. The problem is
Recycle Acid System
157
FIG. 3.1 Simplified flow diagram of recycle acid function
how to do this, because the recycle acid system is subject to destabilizing factors and consequently is difficult to control.
Recycle acid is transferred directly from the operating filter; there is no surge capacity, and it is subject to fluctuations both in flow rate and P2O5 composition, due to the following: (1) cake filterability variations, (2) residual cake moisture variations, and (3) operating inaccuracies such as filter slurry load, slurry composition, wash water load, filter speed, positioning of the wash rows.
These three factors also interact. If the operator controls wash water flow, he or she knows the water loading on the filter but does not know the amount of water that will go into the system, because the filter cake carries some of it away as residual cake moisture. The latter is dependent on crystal qualities, cake thickness, temperature, filter speed (drying time) and vacuum.
Also, at the end of the first filtration section (product acid section) and the amount of phosphoric acid remaining in the cake is variable,
158
Process Systems and Calculations
which in turn causes variability in the volume of filtrate available for transfer as product acid and as recycle acid. This amount of acid held up in the cake at the end of the first filtration section depends on:
1. Crystal or cake quality
2. Viscosity of the phosphoric acid (dependent on concentration and impurities)
3. Temperature of the slurry
4. Filter load or cake thickness
5. Solid content of the slurry
6. Filter speed
7. Vacuum of the filter system.
The operator has no instantaneous information as to how much of the acid remains in the filter cake. Also, the operator cannot control most of the factors responsible. (A complete analysis of the impact of residual PgOg on the filtration system material balance is presented in Section 6.2.1.) For the foregoing reasons, an automatic system of controlling the volume and concentration of the recycle acid has had to be adopted.
The automatic monitoring system has to cope with two dominant facts: (1) variable cake impregnation with product acid leaving the first section of the filter (product acid section) and (2) variable cake impregnation with process water at the filter outlet, resulting in unstable process water flow from the cake wash into the system.
The following steps were taken to get these independent variables under control (Fig. 3.2):
1. The product acid filtration section is slightly oversized. This permits completed drying of the cake, leaving the least possible amount of acid in it. The resulting return acid will consequently need a systematic makeup of product acid (which will be recycled from the first filtrate).
2. Recycle acid flow and concentration are calculated to obtain an appropriate preset solid content in the reactor slurry.
3. The flow of recycle acid is preset according to the previously calculated requirement of the reactor. It is automatically controlled by the F1CR (flow indicator, controller recorder).
4. The P2Og concentration, here given as specific gravity, is also preset, but it controls the recycle flow of product acid filtrate into the return acid. DIC (density indicator controller) controls product acid valve to recycle pump feed tank.
5. The water flow on the filter is considered as the makeup to complete the mixture volume; it is adjusted automatically to complete the flow volume by a pump tank level indicator controlling the automatic water feed valve on the filter.
FIG. 3.2 Automatic return acid recycle control system.
159
160
Process Systems and Calculations
3.2.3 Calculation Aid: Recycle Acid Nomograms
Recycle acid flow and concentration, solid content of the slurry, and product acid concentration can be estimated on a nomogram for a given phosphate rock (see Figs. 3.3, 3.4, and 3.5). These nomograms, which are calculated in the same way that the recycle acid balance was calculated, are helpful when a phosphoric acid unit is to be optimized. The plant operator wants maximum throughput with a given filter while maintaining the highest possible product acid concentration and the highest P2O5 recovery.
Once a phosphoric acid unit has been started up with a given phosphate rock, the optimized operating conditions have to be found by trial and error. These operating conditions— P2O5 concentration and solid content of the slurry—are dependent on control of the recycle acid. The recycle acid nomogram is a calculation aid with which the operator can estimate the relevant operating conditions, for a given rock: the concentration and the flow rate of the recycle acid.
The solid content, expressed as volume percent in the slurry, is usually at 25%. With good crystal quality (low surface-to-volume ratio) the solid content can be increased. With Florida rock, for example, it is possible to operate at a solid content as high as 28%, because the crystals have lower surface-to-volume ratios. As we can see from the Florida rock nomograms, a much lower recycle acid flow can be utilized. In this case a higher efficiency per area of effective filtration surface can be expected because there will be less slurry to be filtered per ton of P2O5 produced (12% less slurry per unit of P2O5 produced).
Along the abscissa, the concentration of P2O5 in both recycle acid and product acid increases and decreases with constant solid-content parameters. The recycle acid concentration, however, shows a more pronounced variation than that of the product acid. For example, using Zin rock (Fig. 3.4) and a slurry containing 24% solids and product acid P2O5 concentrations of 380 g/liter and 400 g/liter, the respective P2O5 concentrations in the recycle acid would be 192 and 209 g/liter. Notice that the relative change in concentration is almost double. This demonstrates the advantage of controlling the phosphoric acid strength in the phosphoric acid reactor by monitoring the P2O5 concentration and flow rate of recycle acid instead of the outgoing product acid.
3.3 HEAT BALANCE
Heat balance for wet process phosphoric acid processes is difficult to calculate with sufficient accuracy from thermodynamic tables. The composition of the raw materials and the heavy impurity load of the phosphoric acid makes evaluation inaccurate. We have consequently chosen a more pragmatic approach by taking the basic data for heat release from plant experience. By comparing a great number of heat
FIG. 3.3 Recycle acid nomogram: Florida rock.
161
FIG. 3.4 Recycle acid (RA) nomogram: Zin rock.
162
FIG. 3.5 Recycle acid (RA) nomogram: Taiba rock.
163
164
Process Systems and Calculations
balances from operating plants, we evolved a simple method for the determination of heat balance with sufficient accuracy, both for engineering design and for the operating of a wet process unit. Most of the heat released from the reaction medium originates from sulfuric acid dilution, and the reaction heat itself is, again, directly tied to the amount of consumed sulfuric acid. It is obvious subsequently that the heat/HgSO4 ratio will be more consistent than the heat/P2Og ratio. Consequently, the heat equations we shall propose here will be based on that assumption.
3.3.1 Where the Heat Comes From
In decreasing order of magnitude the heat originates from the following factors:
Sulfuric Acid Dilution
One metric ton of H2SO4 as 98% acid diluted to 4% acid releases 405,000 kcal (736,000 Btu). Since the acid is not diluted that far and the dilution is made with a phosphoric acid solution, the heat release will be much smaller. With industrial acid it will be even less than with pure acid since at the same concentration of P2O5, it does not contain as much dilution water. Pure acid at 30% contains 58.6% water, whereas industrial wet process acid, depending on the amount of impurities going into solution contains 5-10% less in most cases.
Phosphate Rock Decomposition and Calcium Sulfate Formation
The precipitated calcium sulfates CaSO4*2H2O and CaSO4*JH2O have lower energy levels than the original calcium compounds from the rock. Of the two, calcium sulfate dihydrate has the lower level and there will be a higher heat release when dihydrate rather than hemihydrate is crystallized. This difference accounts for some 50,000 kcal/ton of sulfuric acid fed into the reaction system.
Iron, aluminum, magnesia, and other impurities contribute slightly to the main heat release effected by the calcium compounds, but the order of magnitude of their contribution is rather small.
Enthalpy of the Ingoing Reactants: Preheated Filter Cake Wash Water
The filter cake wash water is usually heated to 50-60°C to obtain better cake washing efficiencies. Per ton of P2O5, about 3.5-4.0 tons of process water is used. Thus the calories involved in process water heating are relatively important—about 60,000 kcal/ton of H2SO4. Sulfuric acid has a low specific heat of 0.35 kcal/kg of 98% acid, usually fed at about 60°C.
Nevertheless, it is not process water that goes into the reaction section but recycle acid, which is the mixture of process water and
Heat Balance
165
product acid from the filter section. But process water and product acid have passed through the vacuum piping system of the filtration section and have equilibrated their temperature with the boiling temperature of their corresponding vapor pressure equilibrium. For return acid that means about 60°C with a specific heat of 0.85 and a specific gravity of 1.18 when using the dihydrate route.
As a consequence of the foregoing, the enthalpy of the process water does not have to be taken into account; it only guarantees that the boiling equilibrium temperature of the recycle acid has to be taken.
Phosphate rock having a specific heat of only 0.22 kcal/kg is usually fed from a phosphate rock bin or from a grinding plant at 30-40°C, unless wet grinding is used, in which case cold slurry is fed into the system.
Mechanical Energy Converted into Heat
Agitation energy is converted into friction heat. Per ton of P2Og per day there is some 1.5-2 m3 of slurry reaction volume with an average of 0.8-1.5 kW/m3 consumed for agitation and pumping. That is about 30-70 kWh, or a heat input of 30,000-60,000 kcal/ton of P2Og or 12,000-24,000 kcal/ton of sulfuric acid fed into the system.
3.3.2 Where the Heat Goes
Reaction Slurry Cooling System
Most of the heat input is evacuated by the reactor cooling system, by cooling air evaporating some of the slurry water content, or by vacuum evaporation, also taking water from the slurry. With 72°C slurry to the filter, there are 190,000 kcal to be evacuated from the reaction section per ton of H2SO4 into the system as 98% acid (1.02 tons of 98% acid), with filter water, sulfuric acid, and phosphate rock at 50°C.
According to the H2SO4/produced P2O5 ratios, this is 475,000-570,000 kcal/ton of P2O5 produced. This figure is derived from a great number of heat balances measured on operating plants, working with dihydrate systems.
Filter Feed Slurry
The filter feed slurry is the second heat outlet of the reaction system. Dihydrate units feed the filter with 3.03 m3 of slurry per ton of H2SO4 (100%) fed into the system. This ratio is constant when 25% of gypsum in volume is considered as the standard solid/liquid ratio in the slurry, The slurry is fed to the filter at a minimum temperature of 68-70°C, up to 80°C for dihydrate systems, and up to 90°C with hemihydrate systems. Specific heat for dihydrate slurry with 30% acid is as follows (see Table 3.3):
166
Heat Balance
167
(vol %) x (specific gravity) x (specific heat)
Liquid: 0.75 x 1.32 x 0.65 = 0.64
Solid: 0.25 x 2.32 x 0.27 = 0.16
0.80 kcal/liter
(54)
1.58 0.43 Hemihydrate 22 i.oi
Ш 00 cq co
о
If the slurry temperature varies by ± 10°C, the heat release varies by ±24,000 kcal/ton of sulfuric acid fed into the system. This is 12.6% ‘of the total heat released.
3.3.3 Heat Balance Calculation
The basic model can be written
QH + QAg + Q(R+D) QCool + QS1u + QLoss
where
Q = enthalpy of ingoing reactants rl
QAg
Q(R+D)=
heat from agitation energy
heat of reaction and sulfuric acid dilution
Qcool = release to be evacuated by the cooling system
Q = enthalpy of the slurry leaving the reactor* oiU
QT = heat losses of the plant Loss
Applying Eq. (55) to 1 ton of H^SO^, we obtain
Q = 1000 x 0.35 x t + R x 0.22 xt +V„ x 0.8 x t (56)
H Sulf R Ra Ra
where
0.35 = specific heat of 98% sulfuric acid
R = number of tons of rock used per ton of H SO
0.22 = specific heat of phosphate rock
V.Ra = volume of recycle acid per ton of rock fed
t„ „ = temperature of the reactants, °C
Sulf,Ra,R
*See Table 3.3 for specific heat and densities.
168
Process Systems and Calculations
QS1U=3-O3X 0-79xtSiu=2-39tsiu (57)
where
3.03 = cubic meters of slurry produced with 1 ton of H2SO4, when the slurry contains 25 vol % of solid CaSC>4 • 2H2O
0.79 = specific heat of slurry (by volume) when 30% P2O5 in acid and 25 vol % of solids
t = temperature of slurry, °C
Qloss 1s more important for small units than for large units because of their greater surface-to-volume ratio. For a 100-ton/day plant, a reactor with 200 m3 of reaction volume would have some 150 m3 of cooling surface (excluding the base of the tank). Because of the thickness of the brick-lined walls, only a low temperature difference with the ambient air will be left. If the outside reactor temperature is at 40°C and At is 25, the heat losses would be
AthS = QT (58)
Losses
where h is the mean heat loss per square meter and per degree Celsius of temperature difference per hour, about 5 kcal.
25 x 5 x 150 = 18,750 kcal/hr (59)
The fact that the total heat release for a 100-ton/day plant is some 2 million kcal/hr shows that the losses account for only 1%. For larger plants it becomes lower, so Qi,osses can be neglected.
For operating plants it is only the heat removed that can be measured. The mean value formed from a great number of measurements when operating with the dihydrate route is
Q„ , = 190,000 kcal/ton H SO (60)
Cool 2 4
The value is per ton of 100% H2SO4 fed into the system as 98% acid when the slurry leaving the reactor at 72°C has a liquid phase containing 30% P2O5 and a solid content of 25 vol %, the filter wash water being heated so that the recycle acid temperature is at its maximum temperature according to vacuum and P2O5 concentration (—60°C).
With Eq. (60) we can calculate the reaction heat Qp by setting QCool lnto Eq’ (55) 311,1 calculating Qh« ^Ag’ т<1 Qsiu at the conditions where Eq. (60) has been measured.
Heat Balance
169
Q :
1. Sulfuric acid at 25°C, 0.35 specific heat, kcal/kg: 1000 x 0.35 x 25 = 8800 kcal (61)
2. Phosphate rock at 25°C, 0.22 specific heat, kcal/kg: 1230 x 0.22 x 25 = 6800 kcal (62)
3. Recycle acid at 60°C, 0.81 specific heat (kcal/liter) specific gravity 1.15: 2150 x 1.15 x 0.81 x 60 = 120,000 kcal (63)
4. Total for Q = 136,000 kcal (64) rl 3 Q : With 2m of agitated slurry per ton of P2O5 Per day with a ° mean value of 1 kW/m3s We can write 2 x 24 x 860 x (2.7)-1 = 15,300 kcal (65)
where
860 = heat equivalence for 1 kWh, kcal 2.7 = tons of H „SO per ton of P O_ produced Z "t Э QSlu: 3.03 x 0.79 x 72 x 1000 = 172,300 kcal (66)
where
3.03 = number of cubic meters of slurry produced with 1 ton of H2SO4
0.79 = specific heat, kcal/liter of slurry
72 = temperature of slurry leaving the reactor
Now
Q = Q + Q - Q - Q 4(R+D) Cool ^Slu 4Ag
(67)
170
Process Systems and Calculations
By substituting the corresponding values, we get
q(r + d) = 211’000 kcal
(68)
When hemihydrate is crystallized and leaves the system as such, the reaction heat becomes smaller. Also, hemihydrate processes working with higher phosphoric acid concentrations have less dilution heat from the introduction of sulfuric acid. With hemihydrate and 40% PgOg acid,
Q(r + D) = 15°.°°° kcal/ton H2S°4 (69)
and with 50% P O_ acid, Z Э
= 120,000 kcal/ton Н„БОЛ
QIC + U) z ч
(70)
The variation of Q(R+D) due to the difference in the heat of dilution can be seen in Fig. 3.6 according to sulfuric and phosphoric acid concentration.
Fig. 3.6 Effect of sulfuric and phosphoric acid concentration on dilution heat.
Heat Balance
171
3.3.4 Case Study
To be calculated: QcOOl’ the heat release of a phosphoric acid plant producing 800 tons of P2Og per day using a dihydrate process.
Production acid concentration
Solid content of slurry
Slurry temperature
Sulfuric acid
Concentration
Temperature
Specific sulfuric acid consumption
Phosphate rock fed at 25°C
Yield of recovery
Return acid
Temperature
Flow
Agitation
29% P2O5
25 vol %
75°C
96% H2SO4
40°C
2.7 tons/ton P2Og
31% P2O5
95%
65°C
2.15 m3/ton rock
2000 kW for total reaction tahk
Taking Eqs. (67) and (68), we can write
Q = 211,000 + Q + Q - Q 4Cool ’ 4Ag ^Slu
Calculation of Q„ (in kcal/hr): rl
1. Sulfuric acid:
a. Consumption:
800 x 2.7 nn „ .. ,„4
---------- = 90 tons/hr ( 72)
24
b. Enthalpy at 40°C:
90 x 0.35 x 40 x 1000 = 1.26 x Ю6 kcal (73)
2. Phosphate rock:
a. Consumption:
800
0.31 x 0. 95 x 24 - 113,2 tons/hr
(74)
b. Enthalpy at 25°C:
r?
113.2 x 1000 x 25 x 0.22 = 0.62 x 10 kcal (75)
172
Process Systems and Calculations
3. Recycle acid: a. Flow [Eq. (74) x 2.15]: Q 113.2 x 2.15 = 243 m /hr (76) b. Enthalpy: 243 x 1000 x 1.15 x 0.81 x 65 = 14.7 x 10⁶ kcal (77)
4. Total QH = (73) + (75) + (77): Q = 16.58 x 10⁶ kcal/hr (78) Г1 2000 kWh are equivalent to 2000 x 860 = 1.72 x 10⁶ kcal (79)
for the total system. Per ton of sulfuric acid fed, it becomes [Eq. (72)]
1 79 x 1П6 - 90 = 19,100 kcal/hr (80)
Q : Slurry produced per hour [Eq. (72) x 3.03]: Sill
Q
90 x 3.03 = 272.7 m /hr
Enthalpy:
272.7 x 72 x 0.79 x 1000 = 15.5 x Ю6 kcal/hr (81)
We now calculate Q . With 98% H SO. and 30% P О acid, (R + D) 2 4 25
Q(R+D) = 211,000 kcal/ton H2SO4
With 95% H2SO4 we can see from Fig. 3.6 that there is a decrease of some 17,000 kcal (there is less dilution heat).
Q(r+D) = 211,000 - 17,000 = 194,000 kcal (82)
and for the total system we multiply [Eq. (72)]
90 x 194,000 = 17.46 x 10° kcal/hr (83)
P^>5 Losses
173
Heat balance for the system (in 10® kcal/hr):
In Out
Q(R+d) 17'46 -
QH 16.58
Q 1.72
Ag
Q - 15.50
blu _____ _______
Total 35.76 15.50
Balance = Q„ , 20.26
Cool
The cooling system will have to remove
20.26 x Ю6 kcal/hr (84)
3.4 P2O5 LOSSES
3.4.1 Definition of PjO5 Losses
Before dealing with the problem of P2O5 losses, we must first define what various groups of people understand by the term "losses."
When one buys a phosphoric acid plant, the engineering contractors, in the heat of competition, guarantee a certain maximum level of P2O5 losses. These losses are measured, by means of certain procedures, laid down in the contract, during the days where the test run occurs. During the test run, monitoring is, of course, at its most efficient level; there are usually no startups and shutdowns, and consequently the resulting value for the yield of recovery will be higher than under normal operating conditions. However, when it comes to normal production conditions, many factors intervene, such as startups, breakdowns, shutdowns, technical hitches, spills, cleaning, and so on, and thus the overall losses measured throughout the year will be quite a bit higher.
Finally, when the plant accountant balances the books with respect of purchases and sales of ^2^5’ or s^e find even more losses. If the plant is well managed, the increase in losses compared with the chemically measured losses will be only 0.5-1% of the total P2O5. Nevertheless, cases of losses in this category have been reported as high as 4% above measured losses (frequently during the initial production year). In general, however, once the plant has formed its normal
174
Process Systems and Calculations
operating rhythm, these losses stabilize around the 1% mark and when measuring losses, it is a common practice to add this percentage to the measured losses. This added percentage is called "mechanical loss."
It is thus imperative that we resort to the accountant's figures for a true picture of the actual losses. It is this type of losses that we will consider throughout this section on P2Og losses.
3.4.2 Economic Impact
At 1981 prices, P2O5 acid cost many producers up to U.S.$350 per ton P2Og losses mean spending the same amount of money for less production than would otherwise be the case. Thus, if 1 ton of P2Og is lost as acid, the company loses 100% of the $350 spent for production. In the case of unlimited sales, the loss is even higher because it will be compared with the sale price.
Losses are classified in the following categories:
Type of loss
Explanation
P2Og as acid losses; usually 0.5-2.0%, but can be as high as 3.0-6.0% during startup or change of rock P2O5 as CaHPOj losses; usually 3.0- 3.5% with the dihydrate process, less with doublecrystallization processes Gypsum cake impregnation or filtration losses, plus mechanical losses Lattice losses or co-crystallized P2Og, in the calcium sulfate crystal pattern
PgOg as Ca^(PO^)losses; usually 0.5% Unattacked rock particles
The most costly of all these losses are the P2Og acid losses, because the cost of production, at this level, has already entailed the full use of all the cost components to make the acid:
Phosphate rock
Sulfuric acid
Chemical additives
Electric power
Labor
Maintenance
Direct and indirect costs
Capital costs
Only steam for concentration has not been consumed. One ton of P2Og lost as acid costs at least the FOB (freight on board) price of P2Og, less steam for concentration. At times of full production, the
175
Р О Losses 2 5
sales price should be used as the basis for calculation and it may be considerably higher. At today's plant sizes (often close to 1000 tons/ day) 1% P2O5 acid losses means that about U.S.$1 million per year is lost in revenue. If you run a plant with an average recovery of about 92%, you will certainly need less than U.S.$1 million to bring it up to 93%, whatever the reason for the low yield. The following pages present many examples and explanations, generally taken from real case histories.
The most important losses in terms of quantity are usually the cocrystallized losses. This P2O5 has crystallized within the calcium sulfate crystal lattice as dicalcium phosphate. This is therefore a less costly P2O5 loss since the sulfuric acid consumption for this P2O5 is slightly reduced.
Normally, P2O5 produced as acid consumes, according to the rock composition, about 2.7 tons of sulfuric acid for each ton of P2O5 as acid. Co-crystallized P2O5, which is combined with one Ca2+ ion, saves one SO42' ion. Thus 1 ton of P2O5 as co-crystallized compound consumes
2.7 - ^2 x 98 = 2.0 ton of H^SO^ (which is 0.7 ton less)
Compared to acid losses, co-crystallization saves about
0.7 32
~Sq~ x n-no = 0-229 ton of sulfur per ton of PO (about U.S.$30) Уо U.Уо Z Э
Unattacked rock is the least costly P2Og loss. The cost is the CIF (cost including freight) rock price, plus grinding and handling. Compared with the other losses described above, this figure is small, because these losses concern limited quantities and low prices.
For rock with a CIF price of U.S.$55 and 30% P2O5 (including handling and grinding) 1 ton of P2O5 costs U.S.$183.3 as raw material.
Taking the example of a 1000-ton/day P2O5 plant producing 310,000 tons/year and working with a total recovery of 95%, we find approximately the following distribution:
1% cake impregnation losses
0.5% mechanical losses
3% co-crystallized losses
0.5% unattacked losses
5% total P-CL losses 2 э
and the following annual cost (at U.S.$350 per ton Р2°5 as acid):
176
Process Systems and Calculations
1% + 0.5% P„O_ as acid Z 5
3% P2O5 as CaHPO4
0.5% PO as Ca (PO )
Total cost of P„O_ losses 2 5
4650 x 350 = U.S.$1,627,500
9300 x 320 =
1550 x 183 =
2,976,000
283,650
U.S.$4,887,150
If the turnover of the plant is 310,000 tons of P2O5 at U.S.$350 per ton (a total of $108.5 million), the 5% total P2Og losses repreesnt 4.5% of the turnover.
3.4.3 Acid Impregnation Losses
Acid impregnation losses result from inadequate filtration. They may be occasional or chronic. If they are occasional, this generally means that some control or control instrument is unreliable. It could be the phosphate or sulfuric acid control or the return acid control. Losses may also be due to variations in the rock composition, although this cause is more often stated than is true in practice. Losses may also just be a question of the technical capability and organization of the plant management.
If high acid loss is chronic, this is more serious. Then management becomes involved, for various reasons:
1. The plant is running at permanent and deliberate overcapacity (which may be acceptable when the market is not limited and prices are good).
2. The phosphoric acid filtration area is too small for the rock quality that is used.
3. The production process is not yet well established (the plant has been working for less than a year, or the process is not suited to the rock).
4. There is a new rock quality consumed in a remotely located plant exploiting a captive phosphate mine.
The way to operate with minimum gypsum impregnation losses and optimum crystallization quality is described in Sections 2.2 and 3.2 and in Chapter 6.
If a new plant starts with a traditional process, the acid losses measured at the filter exit should be well under control within a year.
This does not mean that the optimum is reached within this period, but a reasonable figure somewhat below 2% losses should be reached with a traditional medium-grade rock, or about 3% with a low-grade rock (28-29%). By the second and third year, major improvements should be made and the figures should improve to around 1% and 1.5% filter losses, respectively. (In this case loss is measured directly from the pulp leaving the filter.)
P2°5 Losses
177
FIG. 3.7 Effect of the time (plant experience) on yield of P2O5 recovery. Ap Bp reaction recovery (insoluble losses). A2, B2: total recovery (insoluble + filtration losses). A: high-grade rock;
B: low-grade rock.
These measured losses, which are also the most common method of checking the filter washing efficiency, should be made by sampling and analyzing the gypsum pulp leaving the phosphoric acid plant (when gypsum is repulped), because acid impregnation losses measured on gypsum cake, sampled on top of the filter, show much lower values, in fact about 30% less. The P2Og hidden in pan corners and gaskets, under the filter cloth, and so on, escapes this sampling process.
3.4.4 Mechanical Losses
Mechanical losses include all the P2O5 that the plant manager does not find in the storage tank when production figures are evaluated and compared with the amount of money paid for the rock used in production. So mechanical losses can mean a lot of different things, all leading to a low level in the finished product tank.
178
Process Systems and Calculations
In some plants having heavy mechanical losses, years are required to find out where the P2O5 is escaping, especially when production and loss inventories fluctuate. When irregular losses occur, it is generally impossible to measure them with accuracy. Theoretically, this should not be so, but in practice it is. Human factors may also interfere here. It is easy to show true and accurate figures when the recovery yield is constant and high; then the occasional analysis will show the same figure as continuous sampling.
It is different when great variations occur. The analytical scale is no longer suitable for all the data. The time and frequency of the sampling have an influence and there may be systematic interference. For this reason, fully automatic P2O5 loss detection may be very helpful. Besides an immediate alert to losses, cause-and-effect relationships may be quickly detected.
What is the nature of mechanical losses? The word "mechanical" implies that they are mainly due to mechanical operations such as cleaning a storage tank. In fact, since these "mechanical" losses include all the P2O5 that is not detected from the effluent analysis, it often happens that a large proportion of mechanical losses are, in fact, undetected filter losses. During startup and shutdown periods, sampling is not necessarily made at the correct frequency. As a result, some startup and shutdown losses may be systematically forgotten. Also, as mentioned before, if a plant works irregularly with fluctuating production and loss, it is very difficult to get a true picture of the effective losses.
Another reason may be the location of the sampling. If, for example, one takes the gypsum sample from the pans before they tilt in order to determine soluble losses, one will find only about 70% of the real losses. All the P2O5 located within the lower layers of gypsum, in the cloth, under the cloth, and in the pan bottom will be washed out without being detected. Soluble losses should always be sampled in a repulped gypsum slurry.
Real mechanical losses occur when the plant is shut down and washed for descaling the filter. The acid from the filter pump tank can be partially recovered only. If the pump tank is big, the losses can be considerable. In fact, these tanks require only the volume of the barometric vacuum column and space to locate the pump if it is a submerged model. Tank overflow should be a rather rare cause of mechanical losses. Nevertheless, it has happened, especially formerly, when multitank units with draft tubes were used. Because of this, foam could not overflow from one vessel to another, so it usually escaped by overflowing. But this belongs to the history of phosphoric acid techniques.
Nevertheless, overflowing still happens within the vacuum cooling systems, especially because of foaming or emulsion formation in the slurry inside this part of the plant equipment. Upstream working sys-
РО Losses 179
О
terns are more susceptible to this type of overflow than are downstream working systems (see Section 5,5.4). When hot slurry comes into the flash drum, bubble formation occurs far below the surface level and lifts the slurry, which under some conditions can overflow the vapor outlet and mix with the condenser water, thus flowing to the pond or to the sea. I once watched 20 tons of slurry overflowing within a couple of minutes during startup at a 400-ton/day unit. It happens most often during startup because the colder slurry first gives rise to a higher vacuum in the condenser system. Later the warmer slurry, from the starting reaction, shows a violent boiling effect, allowing vigorous bubbling to start in the lower liquid levels. Antifoaming agents can help somewhat with this problem.
Entrainment of slurry can also occur regularly with such a cooling system. When the foam breaks, little droplets can be carried out of the flash drum with the exhaust gases. A cyclone separator can improve this situation, provided that it has been correctly sized (see Section 5.5.2). Entrainment of slurry droplets can also occur with air cooling systems. With large units (over 600 tons/day) the surface-to-volume ratio becomes smaller and it is difficult to keep a low air speed at the cooling air outlet of the reactor. Large hoods have to be installed to avoid entrainment.
Losses occasioned by periodic tank cleaning can be avoided with proper plant design and good cleanup procedures. A surge tank should be provided in every plant to recover almost everything containing P2O5 and gradually send it back to the reactor tank.
Most mechanical losses and filtration impregnation losses are to a great extent recovered when a gypsum pond is used (see Chapter 9). The repulped gypsum and all the waste waters flow to the pond and, after having settled and cooled, are recovered by the plant to be utilized as process water and partially again as gypsum repulping water. The pond water thus circulates about three times for repulping and is then used as process water. In this way, P2O5 builds up in the pond water to a certain concentration and stabilizes at a level which is, to a certain extent, in line with the P2Og losses of the plant. In a way, the P2O5 level in the pond water is a good indicator of the yield of soluble recovery for the whole plant. The pond water currently has a P2O5 concentration close to 0.8-1.5% of P2O5- Since process water amounts to about 3.7 m3/tons of P2Og produced with dry grinding and 2.6 m3 with wet grinding, the respective amounts of P2O5 thus recycled are 37 and 26 kg/ton of P2Og produced. This represents 3.7% and 2.6% of the total P2Og. Pond water also recycles the condenser water of the concentration plant and other effluents, thus collecting more losses. Nevertheless, these figures are high when compared to the actual measured losses of the plant. It indicates once more the possible order of magnitude of mechanical losses.
180
Process Systems and Calculations
З.Ц.5 Co-crystallized Losses
Together with J. Froehen, I gave a paper on this subject in 1959 at the Stockholm ISMA conference, demonstrating the factors that control the P2O5 content as CaHPO4 within the gypsum crystal lattice [ 1].
Co-crystallized losses are often the greater part of the losses if one makes a classification. Usually, co-crystallized losses amount to between 3.0 and 3.5% of the total P2O5 brought into the system.
Co-crystallized P2Og variations
Factor as factor increases
P O, acid concentration Increasing substantially
H2SO4 acid concentration in slurry Decreasing substantially
Percent gypsum in slurry Feed ratio: rock/reactor volume (supersaturation) Decreasing Increasing
Slurry circulation in reaction system Decreasing
Temperature 3+ 3+ Foreign ions (Fe , Al ) Decreasing Increasing
Rock quality Strong effect, decreasing with igneous and hard rock, increasing with high reactive rock
Unfortunately, most of these factors are virtually imposed by process economics (P2°5 concentration, percent gypsum in slurry, feed ratio), by the rock (foreign ions, Ca/P2Og ratio), or by the reaction system itself (temperature, sulfuric acid excess). Not much room is left to maneuver.
The fact is that many modern dihydrate units work with large single-tank reaction volumes or high recirculation rates and use the feed ratio factor to decrease co-crystallized P2O5 a little. Some processes try to work with a high SO^” level in the first crystallization tank, getting it down in a later tank, whereas others use a buffer tank* to add a little part of the rock feed before filtration. There will be a partial saving of co-crystallized P2C>5 losses provided that the rock will in the first tank, without too much coating, react and crystallize
*Diplo process, Rhone-Poulenc.
P£>5 Losses
181
without building poorly shaped crystals. Not all types of rock are suitable for this type of processing.
This somewhat "balanced state of loss" has led many inventors to discover new processes that avoid the high impregnation of co-crystallized P2O5 into the gypsum crystal lattice.
The principle in most cases is simple in theory. The crystals being build up in the 30% or more concentrated acid, thus containing cocrystallized PgOg, are brought into a medium with different conditions of temperature and concentration, where they redissolve and recrystallize in such a way that P2O5 does not co-crystallize, or does so in a limited way only. The Central Prayon process first makes dihydrate crystals in 30-32% acid and recrystallizes hemihydrate in medium with 20% P2O5 at 95-100°C with high sulfuric acid excess. The hemihydrate contains only about 0.1-0.2% P2O5, which is equivalent to about 0.OS-О. 1% co-crystallized losses.
The Nissan process first crystallizes hemihydrate and later, in large recrystallization tanks, makes a slow conversion from hemihydrate to dihydrate at a lower temperature. In this process, of course, a -relatively high P2O5 concentration is present with both crystallization systems. It is the low crystallization rate per unit of volume which obtains a lower co-crystallized ratio in the crystal lattice in spite of a low temperature acting as a P2Og concentrator.
We saw in Section 2.2 that most dihydrate attack and crystallization tanks operate at a gypsum crystallization rae of more than 100 kg/m3, and sometimes up to several hundred kg/m3. The Nissan recrystallization tanks work with an approximate figure о only 25-30 kg/m3. Supersaturation is very low and only 2% or less of co-crystallized P2O5 remains with the gypsum. Double-crystallization processes naturally claim a much higher P2Og yield of recovery, especially compared to the co-crystallized P2°5 losses with a dihydrate plant.
But the question of whether the lower losses make up for the difference in investment, production, and maintenance costs, and still leave a profit, is not easily answered.
Rock quality is also an important factor. The lower the rock grade, the more difficult it is to use sophisticated processes. Therefore, each plant has to optimize its own operating conditions according to the co-crystallization tendencies of the rock quality to find its most economic pattern.
3.4.6 Unreacted Rock Losses
We saw in Section 2.2 that when rock is attacked by H3PO4/H2SO4 mixtures, the reaction is sometimes blocked by a gypsum crystal coating of the bigger rock particles. The following factors are responsible for this: (1) rock quality and fineness, (2) H2SO4 concentration, and (3) reaction temperature. Unreacted rock retained in the gypsum leaving the reactor is generally found only in very small quantities. The proportions are about 0.2-1.0 g/kg of gypsum, which corresponds
182
Process Systems and Calculations
to about 0.1-0.5% of the total PgOg fed into the system. Since it is unreacted rock, it is economically the cheapest of the P2O5 losses.
Nevertheless, when reactive rock with a high specific surface is used, it can become an important phenomenon to be controlled rigorously. Coating can block much of the rock, leading to higher and higher excess sulfuric concentration, completely disorganizing the reaction system. The crystals produced become unfilterable, high losses occur, and production has to be stopped to reestablish the right chemical operating conditions. If such high-specific-surface rock is to be used, one should ensure regular grinding with a very small percentage of coarse particles (particle sizes above 200 pm are the most sensitive).
Systematic testing of rock fineness and sulfuric acid excess has to be done to select and control the optimum conditions. Excess temperature is to be avoided. In general, 75°C is the upper limit for phosphate rock qualities that are sensitive to coating. For these cases the current rock fineness used should be around 25-40% over 0.125 pm, depending on rock quality, temperature, and process.
Critical sulfuric acid values have to be tested. Sometimes they are close to less than 1% of total SO42-. Large reaction vessels are able to accept higher sulfuric acid excesses than are small vessels (lower feed ratio, less supersaturation).
Besides coated rock, bare unreacted rock PgOg *s rare- Unreacted rock is very difficult to determine with accuracy. The coated rock particles are by far the biggest particles in the slurry and therefore settle or separate very quickly. Depending on the sampling location, one can find very different values, sometimes changing by 100%. The recommended sampling location is from the filter feed slurry.
3.5 FLUORINE
Phosphate rock always contains fluorine. For F/P2O5 ratios, the fluorine content in rock of sedimentary origin ranges in general from 0.10 to 0.14. Rock of igneous origin shows lower ratios, from 0.04 to 0.06 (see Appendix A).
Calculating with fluorides or establishing the fluorine balance of a phosphoric acid plant is a very difficult matter, for the following reasons:
1. Analyses of fluorine and fluorides are tedious and often inaccurate. 2. Fluorides, once they have entered the reaction system, become volatile compounds, partially escaping the phosphoric acid slurry in various proportions.
3. Fluorides enter into many complex compounds, such as AlFfi3+ and SiFR2". о
4. Fluorides build many compounds with limited solubility in phosphoric acid, varying with temperature and phosphoric acid concentration,
Fluorine
183
so that fluorides are permanently found in gas, liquid, and solid phases [ 2].
For example, if we want to know the fluorine content of the liquid phase in the reactor, we have to take a "live" sample from the reacting slurry by submerging a vacuum-connected filtration funnel. A normal slurry sample carried to the laboratory for filtration would give an erratic picture.
3.5.1 Chemistry of Fluorine
When the phosphate rock reacts within the phosphoric acid slurry, hydrofluoric acid is first produced:
+ 9+
(PO.).Ca F + 20H -> 6PO H + lOCa + 2FH (85)
b IV Z ‘t «j
HF is a weak acid,
(H+).(FJ= 10-3.2 HF
But HF does not remain as such in the phosphoric acid slurry because of its strong tendency to react with silica.
With most phosphate rocks there is enough silica to allow a total hydrofluosilicic acid conversion:
2- +
6HF + SiO_ -> H„SiF -» SiF + 2H (87)
z z b b
H2SiF6 *s a stron&> totally dissociated acid.
To complete this reaction, silica has to be reactive silica, such as that contained in clays. If the silica content of the rock were only of the quartzite type, the reaction speed (because of the much lower surface area of the quartzite) would be too slow and hydrofluoric acid would remain in solution. In this case, HF will cause high corrosion rates on all the stainless steel parts of the equipment. Normally in such a case, the phosphoric acid producer adds reactive silica to complete the hydrofluosilicic reaction and to stop corrosion (see Section 10.2.4).
Because of the foregoing, the acid producer can thus assume that the fluorine in the acid is in practice present as ^SiFg. As a strong acid, HgSiFg participates in the reaction with the rock, but SiFg2- ions also have a strong influence on crystallization of the gypsum, probably because of selective adsorption on crystal surfaces. The precise mechanism is not known and only experimental results can be
184
Process Systems and Calculations
reported on crystal shape changes related to ^SiFg (see Section 2.2.5, "Effect of Impurities" and "Hemihydrate and Dihydrate").
The concentration of ^SiFg in the reaction slurry is controlled by the alkaline cations Na+ and K+, both precipitating compounds with limited solubilities in phosphoric acid:
+ 2-
2Na + SiF. -* Na SiF (sodium silicofluoride) (88)
6 2 6
+ 2-
2K + SiF + К SiF„ (potassium silicofluoride) (89)
6 2 6
The solubilities of both compounds are shown in Fig. 3.8, but they vary from one author to another and probably with the rock origin and its impurities transferred into the acid.
We can write the molal solubility product:
+ 2 2-
(Na ) x (SiF^ ) = К (90)
О
According to Fig. 3.8, in 30% P О acid, Z 0
K(73°C) = 194 x i(f6 (91)
K(30°C) = 29 x io’6 (92)
According to Lehr [4],
K(25°C) = 3 x 10*6 (93)
From plant practice, for technical-grade acid as it comes out of the acid plant, we have found that
K(60°C) = 500 x io
(94)
Another reason for this large variety of values is probably the very slow stabilization of equilibrium of the solubility of these compounds. It takes about 1 week to end fluoride precipitations from the liquid as 30% PgOg crude acid phase. Thus, it is highly probable that in practice the values we encounter in the slurry flowing to the filter are supersaturated values. Sodium and potassium silicofluorides are known as the main compounds responsible for scaling of the reaction and filtration system, this confirming in a way the supersaturated state of the fluorides in the product acid.
Fluorine
185
FIG. 3.8 Effect of phosphoric acid concentration and temperature on solubility of sodium fluosilicate (solid lines) and potassium fluosilicate (dashed lines). (From Ref. 3.)
Al, Mg, and Ca may also build fluorides, but they tend to appear during filtration, aging of the acid, and during concentration by evaporation.
186
Process Systems and Calculations
3.5.2 Scaling
How to Predict the Scaling Tendencies of Rocks
Usually, there is much more sodium than potassium in phosphate rock and Na2SiFg is the dominant precipitating fluoride compound during the reaction and filtration stage of phosphoric acid production. Every acid producer is familiar with the large, white, scaling plates of Na2SiFg which occur along reactor walls, agitator shafts, and especially in the 30% product acid pipes, which have to be washed about once a week (speed of dissolution about 1 mm/hr with 30°C open cycle water). Usually, there is very little potassium content in phosphate rock and K2SiFg is therefore less common.
Occasionally, phosphate rock might be contaminated due to shipping or handling in storage (e.g., with KC1) and this can change the picture. In this case, the water wash sector pipe of the filter usually plugs completely, once a day, with K2SiFg and NaKSiFg.
Sodium is contained in most of phosphate rocks but may be increased by the use of process water containing sodium. This happens frequently in North Africa and in the Middle East, where the locally mined rock is converted into phosphoric acid and the local water currently contains more or less sodium chloride. This can bring great changes into the fluorine distribution ratio between the liquid and the solid phase in the slurry. 6F“ precipitate with 2Na+, so, small sodium values cause greater fluorine variations. Let us take four examples with different rock and process water qualities to illustrate this (Table 3.4).
Taking Eq. (94), we can calculate the sodium silicofluroide precipitation rates and the amount of fluorides remaining in solution. We can write for the precipitation equilibrium:
TABLE 3.4 Fluoride and Sodium Content of Various Phosphate Rocks and Process Water
Analysis (grams per kg or liter) Tunisia Florida Israel Togo
Rock P О gr/kg Z «э 290 320 305 364
Rock F 33 37 37 38
Rock Na 7.4 6.0 8.0 1.5
Water Na 0.8 0.3 0.0 0.3
Acid P„OC z □ 370 380 370 365
Specific gravity kg/liter 1.31 1.32 1.30 1.31
Fluorine
187
+ 2 2-
(Na - 2x) (SiF - x) = 500 x 10 6
(95)
where x represents the gram-moles per liter of precipitated Na2SiFg.
For the purpose of simplification we shall take for all four cases an amount of 3,5 m3 of process water per ton of produced P2O5, a yield of 97% for the recovered P2O5 in the slurry, and 5% of the total fluorides released with the effluent gases. The concentration of Na+ and SiFg3-in the acid solution will be calculated with the P2O5 rock/acid ratios.
Taking Tunisian rock (Table 3.4) for our case study, we can calculate as follows. For sodium (Na+) from the rock,
290 x 0 97 = 9-7 £/Uter of Product acid (96)
and from the process water,
370
0.8 x 3.5 x -QQQ =1.0 g/liter of product acid (97)
For total sodium per liter of product acid.
9.7 + 1.0 = 10.7 g/liter of product acid (98)
equivalent to
10.7
23 = 0.47 g mol/liter (99)
2-
For the silicofluorides (SiF. ),
0
33 n q°7 95 = 41.2 g/liter of product acid (100)
or
419 9
= 0.36 g mol/liter of SiF^
114 b
(101)
Setting both sodium and silicofluorides in Eq. (95) we can calculate x, the number of gram-moles that precipitates:
(0.47 - 2x)2 (0.36 x) — 500 x ю'6
x = 0.206
(102)
188
Process Systems and Calculations
Since 1 g mol of Na2SiFg is 191 g, this means that 191 x 0.206 = 39 g (103)
of sodium silicofluorides precipitate from each liter of product acid from Tunisian rock.
Fluorides remaining in solution will be calculated from Eq. (101) minus Eq. (102).
0.36 - 0.206 = 0.15 g mol/liter (104)
or
0.15 x 114 = 17.1 g/liter of F (105)
or 17 1
dmo =1-3wt%F (106)
Similar calculations for the other three phosphate rocks are shown in Table 3.5.
These calculations are not very accurate but they give a preliminary estimation about the scaling tendencies of a phosphate rock, taking into account the quality of the process water that is to be used. Table 3.5 shows Togo rock with very little scaling tendency. Actually, a phosphoric acid plant working with Togo rock can run twice as many operating days between the descaling washes. Rocks such as those of Israel and Florida need a wash of 8 hr/week.
TABLE 3.5
Rock Sodium silicofluoride precipitated as weight Fluorine in liquid phase percent of product acid as weight percent of F
Tunisia 2.98 1.3
Florida 2.28 1.9
Israel 2.8 1.7
Togo 0.51 2.6
Fluorine
189
How to Cope with Scaling
One of the typical aspects of phosphoric acid practice is the problem of scaling. The large number of impurities contained in the produced acid, often in a supersaturated state, contribute to scaling precipitation along almost the entire reaction, filtration, storage, and concentration line. The pioneering years of the phosphoric acid industry were in large part a desperate struggle between engineers and plugged pipework.
Consequently, dimensioning of pipes is not a question of hydraulics but one of knowledge about scaling. The most usual compounds responsible for scaling are alkaline fluosilicates because their solubility varies widely with temperature (see Fig. 3.8).
In most phosphate rocks there is enough sodium (usually 0.2-0.9% NagO) to get high sodium fluosilicate deposits. We have also seen that about 20-30 g of Na2SiFg per liter of 30% acid produced can be precipitated. For a 1000-ton/day P2O5 unit, this represents a precipitation potential of 50-75 tons/day. Fortunately, not all of this goes to scale the piping system.
The reaction system is subject to scaling primarily when the slurry cools off during plant stops. The deposits, which occur principally along the walls of the rock feeding compartment, show typical "layers" from where the number of shutdowns can be counted as one counts the rings in a felled tree. The composition of the scale is far from pure fluosilicate; it also contains other components, such as calcium sulfate.
The depth of the deposit is usually such that one annual cleaning is sufficient. It varies with the rock quality and yields in general from a few inches to 1-2 ft in the rock feed compartment. The other compartments or sections are also subject to such wall deposits but to a lesser extent.
Removal can be done mechanically or by dissolution. The mechanical way consists in cutting the scale down with a high-pressure water jet. Pressures up to 4000 psi (270 kg/cm2) are used. The job should take no more than a week when done this way.
The second procedure consists of dissolving the scale by running the plant with an open water cycle. The operating agitators provide the necessary flow agitation for dissolution. A 300-m^/hr water flow at 30°C will carry up to 2 tons/hr of scale out of the system. A 4-day washing usually does the job unless the scale has a very slow dissolution speed, sometimes said to originate with igneous phosphates.
More about scaling, especially in the filter piping section, is presented in Section 6.4.5.
3.5.3 Fluorine Balance in Product Acid Section
There has been much controversy about fluorine emission with the reactor fumes. Since there is a strong and very unpleasant smell, it was
190
Process Systems and Calculations
long assumed that there is a high degree of hydrofluoric or hydro-fluosilicic acid emission. In fact, with dihydrate processes this generally amounts only to about 3-10% of the total fluorine content of the rock, mostly about 5% as hydrofluosilicic acid. In the gas phase the latter is split into SiF4 and HF. Most of the fluorine emission occurs near the sulfuric acid and the rock feed.
A large part of the fluorine goes into the solid phase by various precipitations from the product acid slurry. Frazier et al. [5] of the Tennessee Valley Authority indicate about 12 possible fluoride compounds precipitating eventually from 30% product acid.
In the presence of sufficient Na+, a great part of the fluorine precipitates and leaves the system via the filter as Na2SiFg, thoroughly mixed with the gypsum cake. But during filtration and washing of the gypsum cake, the solubilities of fluorine compounds vary strongly because of the PgOg ac^ concentration changes. This applies to Na2SiFg, whose solubility approximately doubles when the PgOg con" centration falls from 30% to about 7%, but decreases again with pure water. Thus some of the Na2SiFg is dissolved by the filter cake washes and reintroduced into the reaction system; nevertheless, most will be dissolved later by the cake transportation water or pond water.
In practice, acid producers encounter mainly Na2SiFg and eventually two or three more compounds during filtration: l^SiFg, NaKSiFg, and chukhrovite[Ca4SO4AlSiFi3(A-)H2O] (see Section 6.4.4). Chuk-rovite is a complicated mixed crystal containing mainly Ca2+ and SiFg2” but also Al2+ and SO^ , and where (A*) figures to equilibrate the formula, some authors insert OH”. Chukrovite crystallization from 30% acid is sometimes reported [ 4], but it is not confirmed by industrial experience. Phosphoric acid manufacturers usually encounter chukhro-vite plugging the filter cloth. Chukhrovite crystallizes during the very low P2Og concentration phases of the filter tail washes.
The same is to be said for potassium silicofluorides, which precipitate more frequently in the weaker acid wash pipes than in the product acid pipes. The last wash, low in P2O5 concentration, dissolves Na2SiF6; the increased SiFg2” concentration from that dissolution then precipitates K2SiFg, whose solubility varies only slightly with P2O5 concentration (see Fig. 3.8).
The fluorine chemistry in the gypsum pond (see Section 9.2) is even more complicated. Lehr [4] indicates about 13 different compounds possibly precipitating from pond water. Fluoride precipitation from pond water is very welcome because it lowers the partial pressure of fluorides, which are responsible for air pollution. According to Lehr's study, CaF2 and chukhrovite should be the main precipitating compounds in pond water.
If calcium is precipitated as CaF2, SO^Ca is dissolved and SO^2 recycled to the plant with the process water. In fact, it is known from practice that the pond water recycle to the plant saves sulfuric acid
Fluorine
191
FIG. 3.9 Typical fluorine balance in metric tons of fluorine per hour for a 1000-ton/day P2O5 dihydrate plant.
(up to some 2% of the total sulfur consumption). This fact seems to confirm calcium fluoride formation from the pond water solution.
A typical fluorine balance based on Florida rock is depicted in Fig. 3.9.
3.5.4 Fluorine Behavior During Storage and Concentration of Phosphoric Acid
During the storage period, the 30% P2°5 product acid will be subject to further precipitation, mainly as sodium and potassium silicofluorides, together with some other fluorides (e.g., Ralstonite, MgNaAlFg) in minor quantities and calcium sulfate. These sludge deposits originating from 30% acid usually contain as much as 40-48% fluorine. The amount of 30% acid sludge and the fluoride contents vary according to the rock origin. A mean figure for the precipitating solids is 1-3 wt % of the 30% P2O5 acid. When concentrating phosphoric acid by evaporation , the partial pressure of the fluorides increases and fluorides are released with the vapor leaving the concentration system.
More than 50% of the fluorides contained in the original 28-30% product acid usually leave the liquid phase. Most of the fluoride
192
Process Systems and Calculations
FIG. 3.10 Fluroine balance in metric tons of fluorine per hour for a 1000-ton/day three-stage concentration plant.
Notation
193
departures occur during the last concentration phase, between 40 and 50% P2°5 concentration. Fluoride recovery can be operated economically at this stage because of its concentration in the gas phase. The ratio of fluorides leaving to fluorides remaining in the concentrated acid depends on the final concentration of ₽2®5 but also on the impurities contained in the acid. So far, no rule has been established. The actual fluorine balance for phosphoric acid concentration has to be measured case by case. Figure 3.10 depicts a fluoride balance for a phosphoric acid concentration unit operating with Florida rock.
After concentration further precipitation occurs, but only few fluorides are involved in these final sludge formations (also called postprecipitation), as can be seen from sludge analysis from various acids (see Table 8.1).
NOTATION
Section 3.1
f weight fraction
Gy gypsum factor; quantity of solids produced per ton of phosphate rock
H„O . 2 cake cake water; cake impregnation water when cake leaves the filter
H2°cry crystallization water; needed for gypsum crystallization per ton of rock
H2°dil dilution water for product acid makeup
HO 2 process total process water per ton of rock
H„O 2 vap evaporation water resulting from slurry cooling
IS insoluble compounds in phosphate rock
PA product acid (weak acid, or 30% acid)
REC recovery
RecA recycle acid; cake wash acid returning from filter to reaction section
SL soluble losses
t rock tons of rock per ton P O, produced 2 5
V volume
V s volume of slurry produced per ton of rock
194
Process Systems and Calculations
Section 3.3
h heat losses, kc (m^)-! t-1 hr 1
QAg heat from agitation energy, kcal ton~l
^Cool heat release, evacuated by cooling system
QH enthalpy of ingoing reactants
^Loss heat losses of the plant
Q(R+D) heat of reaction and dilution of sulfuric acid 34-l
QS1u enthalpy of reaction slurry, kcal(m )
S cooling surface of reactor (losses)
t , t , ra slu temperature of recycle acid, slurry, °C
V ra volume of recycle acid
REFERENCES
1. J. Frochen and P. Becker, Crystallization and Co crystallization in the manufacture of Wet Process Phosphoric Acid, International Superphosphate Manufacturers Association Technical Conference, Stockholm, September 1959.
2. J. R. Lehr, Nature of Impurities, in Phosphoric Acid, Vol. 1, Part II (A. V. Slack, Ed.), Marcel Dekker, New York, 1968, p. 637.
3. D. D. Morris, В. P. Sutherland, and С. H. Wright, Can. Chem. Metall. 21:271 (1937).
4. J. R. Lehr, Fluorine Chemical Redistribution in Relation to Gypsum Storage Pond Systems, TV A, March 1978.
5. William Frazier, James R. Lehr, and Ewell F. Dillard, Chemical Behaviour of Fluorine in the Production of Wet Process Phosphoric Acid, National Fertilizer Development Center, TVA, Muscle Shoals, Ala.
4
Phosphate Rock Grinding
The reaction of strong acids or acid salts with phosphate rock is a surface reaction. Only at the surface and through the larger pores of the rock particle can acids gain access to the undissolved rock.
In the production of phosphoric acid, the primary purpose of rock comminution is to expose or create sufficient free and large pore surface area to allow complete dissolution of the rock in a relatively short period of time, at the conditions of acid strengths and temperature prevalent in the reactor or attack circuits. Provided that the particle shape remains constant, the outside surface area per unit of mass of a ground material is inversely proportional to the particle size. Thus a collection of particles 0.1 mm in size will have 10 times the surface area per kilogram of weight as a collection of particles of similar shape 1 mm in size. Rock reactivity and conversion have been correlated to the external surface area available per unit of weight or rock [1-3].
A secondary purpose of rock comminution is to reduce the power input to the agitators in the attack circuits. To achieve a uniform suspension, power requirements of agitation devices escalate tremendously with particle size. For example, to produce a uniform suspension of +35 mesh, particles can require a power input per unit volume of liquid an order of magnitude higher than the power required to suspend -200 mesh particles [4,5].
Size reduction, in general, is desirable for most rocks. However, there are exceptions. Overgrinding of highly porous rocks, in addition to wasting valuable energy, can lead to hyperreactivity, localized depletions of sulfate levels, and increased co-crystallization losses. Overgrinding can also result in the formation of small, poorly filtering gypsum crystals [6]. Finally, because the rheological properties of slurries depend not only on the percent solids but on the particle size as well, it is possible to subdivide rock to the point where slurries become extremely thick and difficult to handle [7,8].
195
196
Phosphate Rock Grinding
In addressing grinding applications, we should also distinguish between two types of problems. The first type of problem is the design problem. This consists of specifying the style, size, and number of grinding units and the power requirements necessary to grind a specified feed size to a desired product size.
The second type of problem is the optimization or operational problem. This consists of specifying the operating conditions to achieve a desired objective, given existing equipment and rock feed. This desired objective may be to reduce power, improve size distribution, or achieve an economic balance for the plant as a whole.
The design of a grinding circuit must therefore be integrated with the overall raw material/process requirements. Although optimization is possible for a particular rock/process combination, a high degree of flexibility should also be provided to accommodate changes in rock supplies.
4.1 GRINDING REQUIREMENTS
Rock delivered from the mines seldom has the desired particle size distribution. For obvious economic reasons, mining operations avoid crushing and grinding beyond the "liberation size." This is the size where the ore is broken down into its valuable constituents, and the less valuable (or useless) constituents, the "gangue." This subdivision may be necessary prior to beneficiation.
Some natural deposits contain phosphates in small size agregates in their natural state. Such small size deposits occur in northern Florida and North Carolina in the United States and in Tunisia and Morocco [3]. Typical sizes of rock delivered from various sources are shown on Table 4.1.
The extent to which phosphate rock needs to be further subdivided depends on a number of factors:
1. The degree of phosphate recovery required: If rock is inexpensive compared to electricity, it may be more economical to provide less grinding and accept higher unreacted rock losses.
2. The rock origin: Highly porous rocks have high internal pore areas available for acid attack. Fine grinding of these rocks is not only unnecessary, but can create sulfate control problems. High-density igneous rock have, for all practical purposes, no internal pore surface area and must be ground finer than sedimentary rocks. The level of grinding required to achieve comparable reactivity for rocks of various origins can be determined from laboratory and pilot plant tests [ 9].
Grinding Requirements
197
TABLE 4.1 Typical Rock Feed Sizes from Various Sources (Percent Retained)
Source Size Sample
Aa В C D
Central Florida 1/2 in. _ — 2.33
pebble +6 mesh 19.2 19.6 19.2 15.7
+20 mesh 61.1 64.5 65.2 57.3
+65 mesh 91.3 91.5 91.3 90.0
-65 mesh 8.7 8.5 8.7 9.5
E F
Central Florida
concentrate +14 mesh 0.7 0.1
+20 mesh 3.9 0.6
+28 mesh 13.2 3.5
+35 mesh 33.5 12.2
+48 mesh 65.3 53.4
+65 mesh 81.6 59.4
+100 mesh 95.3 87.9
-100 mesh 4.7 12.1
Calcined Uncalcined
North Carolina +35 mesh 3.0 8.0
+48 mesh 7 26
+65 mesh 29 60
+100 mesh 71 88
+150 mesh 94 94
+200 mesh 98 99
G H
North Florida +10 mesh 0.3
+14 mesh 2.4 0.8
+20 mesh 9.1 3.5
+28 mesh 18.7 11.0
+35 mesh 41.5 28.0
+48 mesh 77.5 54.0
+65 mesh 93.5 84.0
+100 mesh 98.1 95.0
198
Phosphate Rock Grinding
TABLE 4.1 (Continued)
Source Size Sample
Uncalcined Gafsa
Tunisia [9] +10 mesh 0.4
+14 mesh 0.2 1.4
+20 mesh 0.7 3.0
+28 mesh 5.9 5.7
+35 mesh 17.2 11.0
+48 mesh 27.8 19.2
+65 mesh 39.0 35.9
+100 mesh 69.7 58.0
+150 mesh 92.5 81.7
+200 mesh 94.7 95.9
K-70 Y-68
Morocco [3] +8 mesh 4.5 0.7
+10 mesh 5.5 1.1
+14 mesh 6.0 1.9
+20 mesh 7.5 3.4
+28 mesh 9.0 5.7
+35 mesh 12.5 10.0
+48 mesh 20.0 16.0
+65 mesh 41.0 26.0
+100 mesh 70.0 46.0
+150 mesh 86.0 86.0
+200 mesh 94.0 95.5
Source
Western USSR South
Size U.S. Kola Africa Togo Senegal
+10 mesh
+14 mesh 0.3
+20 mesh 2.5 0.5
+28 mesh 10.0 4.0
+35 mesh 20 0.2 2.0 2.5 11.0
+48 mesh 35 0.7 7.8 5.0 22.0
+65 mesh 50 4.0 20.2 11.0 39.0
+100 mesh 65 13.0 35.2 34.0 55.0
+150 mesh 80 26.0 64.5 74.0 70.0
+200 mesh 90 37.8 87.0 90.0 90.0
aCapital letters refer to individual samples taken.
Grinding Requirements
199
3, The process employed: Table 4.2 summarizes some of the published particle size requirements for several commonly employed processes. These published requirements should be used with caution. Variations within each process, as discussed below, allow a certain amount of flexibility in this area.
4. Variations within each process: Certain factors can be used to adjust for variations in the available rock size and/or reactivity: a. Reactor detention time and circulation can be increased or decreased during the design stage to adjust for reactivity. After a plant is in operation, the circulation rate through the attack circuit can be increased for rocks of higher reactivity/smaller size, or reduced for coarser, less reactive rocks.
b. The level of agitation in the reactor(s) can be increased to compensate for coarser or denser rock. For highly reactive
TABLE 4.2 Rock Grinding Requirements for Various Processes
Process Rock size required
1. Fisons-Lurgi [10] a. Dihydrate (DH) b. Hemihydrate (HH) c. Two-stage hemihydrate 100% less than 1.6 mm (10 BSS) 60% less than 150 mm (100 BSS) 100% less than 1.6 mm (10 BSS) 100% less than 1.6 mm (10 BSS)
2. -Badger [11]
Swenson isothermal reactor 3% +35 mesh (Tyler) maximum 40-50% -200 mesh (Tyler)
3. Davy McKee/Prayon [12] a. First generation b. Second generation 60% -200 mesh (Tyler) 0.5 +35 mesh (Tyler) maximum 60% -100 mesh (Tyler) 25% -200 mesh (Tyler)
4. Nissan [13,14] a. Two-stage hemihydrate 100% -32 mesh (Tyler) [13] 1% +16 mesh (Tyler) [ 14]
5. Jacobs Engineering Group [9] a. Normal losses b. With 0.5% additional Cl losses c. With 1.0% additional Cl losses 0.5-1.5% +35 mesh (Tyler) 60% -200 mesh (Tyler) 3-5 +35 mesh (Tyler) 50% -200 mesh (Tyler) 8-10% +35 mesh (Tyler) 40% -200 mesh (Tyler)
200
Phosphate Rock Grinding
rocks the power split between lower agitator blades and the upper foam-breaking blades can be modified.
c. Location of the attack system exit point. A number of plants have been built where the exit point from the reactor circuit is located on a high or overflow point. Under these conditions, coarser, unreacted phosphate rock is trapped and circulated within the attack system. As the unreacted rock circulates, it becomes a nucleous for the growth of successive layers of sodium silica fluoride scale. These rounded pebbles or "fish eyes" can clog an attack system within a few days. The solution to this problem is to reduce the amount of coarser material fed to the attack system or to lower the exit point from the system.
d. A great deal of experimentation has taken place with variations of the points of sulfuric acid and rock addition, to compensate for higher operating rates, rock grind, and rock quality. The benefits of these variations have not been well documented, however.
4.2 MECHANISM OF BREAKAGE;
PARTICLE SIZE DISTRIBUTION
According to Orr [15], there are three basic mechanisms by which solids are mechanically reduced in size: compression or impact, chipping, and abrasion. In both compression and impact, the load is directed along an axis passing through the center of mass of the particle. In compression, the load is applied relatively slowly; in impact, the load is applied rapidly, as in a blow. Compression and impact lead to the formation of particles similar in dimensions. In chipping, the load is applied along an axis far removed from the center of mass of the particles. Chipping leads to the formation of particles of dissimilar dimensions. In abrasion, the load is directed parallel or almost parallel to the surface of the particles. Very fine particles, orders of magnitude different in size from the original material, are produced by abrasion.
All of the mechanisms noted above involve stressing and deforming the material beyond its yield point. (For brittle materials, as opposed to ductile, the elastic limit, yield point, and rupture point almost coincide.) The existence of cracks and pores in the parent material lowers substantially the load required to break the material. Pores and cracks provide stress intensification points where the material yields first and the crack or pore progagates [ 16]. The microstructure of the rock is therefore very important in establishing the minimum stress required for breakage.
Short History of Grinding
201
The results of comminution, whether natural or human-made, are usually expressed by sieve analysis. There are small differences in the opening size between Tyler, U.S. Standard, and British Standard sieves, and for accurate work in the small size range these differences should be taken in consideration.
Sieve analysis can be conveniently plotted on paper with a logarithmic scale along the abscissa (x axis) and an arithmetic scale on the ordinate (y axis). The cumulative percent retained is marked along the abscissa and the screen size along the ordinate. For naturally occurring materials and for products of certain types of mills, such as ball mills, such a plot will yield a smooth S-shaped curve, as shown on Fig. 4.1a. This curve can be linearized somewhat by plotting percent retained and opening size on paper graduated with logarthmic scales along both axes (Fig. 4.1b). Further linearization of the particle size distribution can be obtained by the use of specially designed paper on which the ordinate axis is logarthmic and the abscissa is graduated on a linearized cumulative normal distribution scale as shown on Fig. 4.1c. Details on the construction of these scales can be found in Ref. 17 and 18.
Particle size distributions that plot as straight lines on log-normal probability paper (also called Prolog paper) are said to have a lognormal or "natural" particle size distribution. Because of its ability to linearize the extreme values of particle size distributions, lognormal probability paper is very useful in analyzing grinding problems where the primary concerns are the excessive production of oversize and fine material. Most of the particle size distribution plots in this chapter were made on log-normal probability paper.
Ц.З SHORT HISTORY OF GRINDING
Civilization, agriculture, and the mechanical grinding of cereals with the power of draft animals started in the Middle East at least 6000 years B.C. In Roman times, hydraulic power, in the form of waterwheels , replaced draft animals in many areas. The largest grain mill in Roman times was located at Barbegal, near Arles in southern France. The mill consisted of eight pairs of waterwheels spaced along the side of a hill, which drove two enormous grinding stones. The wheels were fed by an aqueduct specially constructed for that purpose.
In 1530, Georg Bauer, better known to latter generations as Agricola, published his monumental work De Re Metallica, which was to become the miner's bible for the next 250 years. This book contains perhaps the first illustrations and description of water power use in all phases of ore processing, including rock grinding.
202
Phosphate Rock Grinding
WEIGHT % PASSING
I
I
Short History of Grinding
203
FIG. 4.1 Graphical representation of particle size distributions, sieve analysis, (a) Particle size on log scale, percent retained on linear scale, cumulative percent, (b) Particle size on log scale, percent retained on log scale, (c) Particle size on log scale, percent retained on linearized, cumulative normal distribution scale.
During the nineteenth century the ball mill and the rod mill were invented, and early in the twentieth century centrifugal and spring-loaded roller mills were developed.
In the production of phosphoric acid, the first mills were flint pebble mills which ground rock mixed with dilute phosphoric acid. The mills were constructed of wood and acid proofed with silex-covered concrete. During the 1930s and up to the 1950s, ring roller mills and dry grinding became popular. Dry grinding grew in parallel with the production of superphosphates, since a single drying and grinding plant could be shared by phosphoric and superphosphate plants. During the 1960s in the United States, the construction of larger and larger single-train phosphoric acid plants favored a shift toward dry
204
Phosphate Rock Grinding
grinding in rod and ball mills. In the 1970s, the rapid escalation of prices and the shortage of fuel provided a tremendous impetus for the conversion of dry grinding systems to wet grinding, with its accompanying savings in fuel costs for drying. Most plants in the United States, when located near the mine site, employ wet grinding of rock.
Wet grinding of rock has not been a panacea. Severe acid water surplus problems have developed in many plants. Calculations show that the additional water required in the ball mill is responsible for the water surplus. At the same time, the treatment cost of surplus acid pond water has escalated tremendously. In the United States, intense efforts are currently under way by operating companies and consultants to develop schemes that will permit the grinding of rock with acid water.
4.4 ENERGY REQUIRED TO GRIND PHOSPHATE ROCK
In a typical phosphoric acid plant in the United States approximately 40% of the total electrical energy is utilized for grinding. Possibly, no other area of the phosphoric acid plant offers greater opportunity and challenges for reductions in the electricity consumed [19]. Basically, six factors determine the energy required for grinding. These are:
1. The origin of the phosphate rock
2. The initial or feed size and the final or product size
3. The type and size of equipment utilized
4. The type of process (i.e., wet versus dry grinding)
5. The type of circuit (i.e., open versus closed)
6. The loading on the equipment (i.e., whether fully loaded or partially loaded to its rated capacity)
For the purpose of comparison, statements as to the required horsepower or kilowatt-hours per ton are not entirely meaninful, unless the items listed above are completely specified. Of special importance is that the energy requirements of all the components of the grinding system be included in the reported total. This is generally done on dry grinding systems, where blowers and clasifier requirements are generally included [20]. However, in wet grinding installations, the energy consumed by slurry pumps, classifiers, surge tank(s), agitators, and feed pumps are seldom included in the total. These items can increase wet grinding energy requirements by 10%.
Rather than emphasize specific experiences, the approach that follows concentrates on fundamentals and on calculation methods of wide applicability.
Energy Required to Grind Phosphate Rock
205
4.4.1 Effect of Rock Origin on Energy Requirements
The origin of the rock plays a crucial roll in establishing the energy required for grinding in three ways: (1) it sets the size of the feed to the milling operation, (2) it establishes the fineness of grinding required for a given process, and (3) for a particular ratio of feed to product size, rock characteristics determine the energy consumed. Reported energy requirements per ton of rock by operating plants normally include the three effects combined (Tables 4.3 to 4.5 and 4.10 to 4.12).
' The finer the rock feed, the lower the energy required. Similarly, the coarser the rock specification for a particular process, the less energy will be consumed in preparing the feed. (The mathematical relationships among feed, product size, and energy consumption are discussed in the next section.)
Rock characteristics establish the grinding fineness required for most processes. Although the external surface area of the rock is not the only factor that determines rock reactivity, it is of some importance. For Florida, Nauru, and Moroccan rock, an external surface area of at least 50 m2/kg has been reported as required for high conversions of rock to phosphoric acid [1,2]. In Fig. 4.2, the external
MEAN PARTICLE SIZE, JiM
FIG. 4.2 Rock external surface area and size. A slope of about -1 indicates that the surface area is inversely proportional to the size. (From Ref. 2.)
206
Phosphate Rock Grinding
surface area versus sieve size for two rock groups has been plotted. This plot indicates that, ideally, Taiba, Morocco, Nauru, Togoland, and Florida rocks should be ground to roughly 100-150 pm for high conversions. Actual plant operating experience indicates, however, that such fine grinding is unnecessary. In Agrico's Faustina plant we have clearly established a good correlation only between the coarsest feed, +20 mesh and unattacked rock losses (Fig. 4.3). This is also consistent with the experience of north Florida and North Carolina rock users, which find it necessary to separate and grind only the +20 mesh fraction of the rock feed. In the case of north Florida rock, the +20 mesh is roughly 16% of the rock feed, and for calcined or partially calcined North Carolina rock, it is generally less than 2%.
Users of fine size concentrates have found that in some cases these naturally occurring fine size particles exhibit a hardened surface that prevents acid attack. This phenomenon seems to be exhibited when iron is present in a pyrite form and with rock calcined at high temperatures. Under these conditions grinding may be required despite the small particle size of the deposit.
In grinding phosphate rock, it is ironic that porous materials which require the least amount of grinding to assure proper reactivity
FIG. 4.3 Unattacked rock losses and the +20 mesh fraction. Data points have been controlled for reactor sulfate and P2O5 concentration. (Agrico Chemical Company, Tulsa, Okla., unpublished data.)
Energy Required to Grind Phosphate Rock 207
are also the easiest to grind. Homogeneous phosphate rock of igneous origin not only requires finer grinding, but it is also more difficult to grind. The energy required for grinding rocks of different sources increases with increasing rock density and decreases with increasing heterogeneity and porosity.
Tables 4.3, 4.4, and 4.5 show typical performance of ball mills, and closed- and open-loop rod mills for rocks of various origins. The energy requirements vary from a minimum of 2 kWh/ton to a maximum of 27 kWh/ton for high-silica Florida rock, which is extremely hard and abrasive.
Ц.Ц.2 Effect of Feed and Product Size on Energy Requirements; Theoretical and Practical Formulations
Relationships to predict the energy required to effect comminution derive from the assumption that the energy involved in a change in size of a particle is inversely proportional to the particle size raised to some power n. Thus
dE = -K —
Dn
(1)
where E is the energy, D is the characteristic dimension of the particle, and К is a proportionality constant.
If we further assume that n = 2, integration leads immediately to Rittinger's law:
1
D2
E = К
(2)
or
E = К (A - A ) 1 z 1.
(2a)
where and D2 are, respectively, the initial and final characteristic dimensions of the particles, Ai and A2 are the initial and final surface area of the particles, and К and Kj are proprotionality constants. Rittinger's law was formulated axiomatically in 1867 [21]. It states simply that the energy required to effect a comminution process is proportional to the new surface area created.
If in Eq. (1), we assume that n = 1, then upon integration we obtain Kick's law:
Di
E=K2 lnD-2
(3)
TABLE 4.3 Performance of Conical Ball Mills Closed-Loop Operation, Dry Grinding
Product size (% retained) for mesh size:
Location Feed size 35 48 65 100 200 hp/ton
Queensland, -i in, 45.5% -35 mesh 3.5 6.4 11.0 19.5 42.4 9.5
Australia 0.2 0.4 1.1 3.5 19.1 19.8
South Africa -20 mesh, 98% -35 mesh — 0.2 0.8 4.4 23.3 16.7
"0
United States гэга
Western rock -3/8 in, 40.8% -35 mesh 0.6 2.0 5.6 13.3 33.6 11-8 -g
Florida -i in, 30. 9% -35 mesh 1.5 4.2 9.6 19.2 36.6 14.0 £
1.9 5.1 11.5 22.0 40.3 i2.4 ®
2.1 5.9 12.2 33.8 41.8 12,4 °
2.5 6.7 13.4 24.2 42.5 12.0 Л*
-J in, +35 mesh 2.6 6.4 11.7 20.0 37.0 О 13.4 3.
-| in, 19.7% -35 mesh 0.5 1.7 4.5 11.3 19.9 19.0 &
0.5 1.3 3.4 8.3 26.0 20.0 <q
65 BPL -3/4 in, 30% -35 mesh 0.4 1.6 5.0 13.2 34.0 17.0 ft
1.6 4.0 20.0 22.0 43.6 13.5 2 ra 4
0.4 1.4 3.5 8.0 23.6 18.5 4
2.0 4.8 10.4 19.4 39.0 15.0 ft ra
68 BPL -3/4 in, 8.8% -35 mesh 0.4 1.5 6.1 16.0 42.4 15.6 £
0.3 0.5 1.8 6.9 29.3 20.5 3 ra
— 0.2 0.5 1.9 13.0 24.2 Q.
68 BPL pebble -i in, 4.5% -35 mesh - 0.8 4.0 12.0 38.0 16.0 о a
75 BPL M/X -J in, 51.2% -35 mesh — 3.6 8.4 17.4 28.3 15.2 3. 2
Q.
Agrico -3/8 in, 14.6% -35 mesh 2.0 3.4 11.5 21.0 40.1 13.7 ft
3.2 7.5 14.3 22.9 41.4 13.6 о Co
4.1 9.7 18.0 18.3 47.4 12.2 ft y
Florida, о ra
high silica -10 mesh, 4.8% -35 mesh 0.2 5.2 37.0 ft
0.2 0.9 10.9 33.9 о о
0.1 0.6 2.0 13.4 26.7 ft
1.0 3.4 8.8 30.0 19.0
0.4 2.2 7.6 15.9 39.5 17.5
Source: Data courtesy of Koppers Company, York, Pa.
TABLE 4.4 Performance of Rod Mill Closed-Loop Operation, Wet Grinding
Rock source Feed size (in.) Recycle screen — size (mesh) Product size (% retained) for mesh size:
28 35 48 100 hp/ton
Agrico -1 34 0.3 1.8 6.9 28.7 9.1
0.4 1.7 5.1 23.1 10.4
0.3 1.2 4.0 19.0 12.7
35 0.2 0.3 2.0 17.3 12.6
- 0.1 1.8 18.1 10.5
28 0.2 1.1 3.5 17.0 12.2
Morocco -0.371 18 0.4 4.4 15.2 53.9 3.1
Source: Data courtesy of Koppers Company, York, Pa.
TABLE 4.5 Performance of Rod Mill Open-Loop Operation, Wet Grinding
Rock source Feed size (in.) Product size (% retained) for mesh size:
8 14 28 48 100 hp/ton
Morocco -0.371 — — 0.6 10.6 52.0 3.9
0.3 5.0 26.1 65.7 2.3
0.2 3.9 23.6 63.4 2.8
— 2.2 18.7 59.4 3.4
0.9 12.7 52.6 4.1
Senegal -1 2 1.6 14.4 39.8 59.9 4.4
Florida -3/4 1.0 13.3 43.5 8.9
pebble 2.0 20.4 47.7 8.5
2.1 20.4 47.7 8.5
Source: Data courtesy of Koppers Company, York, Pa.
2^0 Phosphate Rock Grinding Energy Required to Grind Phosphate Rock
212
Phosphate Rock Grinding
which states that the energy required is proportional to the natural logarithm of the ratio of feed to product size [22], Only a limited number of grinding data can be described by either Rittinger's or Kick's law.
Again if in Eq. (1) we choose a value of 3/2 for the-exponent n, we obtain Bond's law [23]:
E = K2
d-172-d-172
2 1
(4)
Bond's law indicates that the energy effectively applied in breakage is inversely proportional to the square root of the particle size. This expression is in general agreement with a vast quantity of crushing and grinding data.
Bond's law can be translated into a more practical expression as follows:
W = lOWi P 172 - F 172j
(5)
where P and F are, respectively, the sieve opening in microns through which 80% of the product and feed will pass, and Wi is a "work index," which represents the theoretical work input required to crush an infinitely large particle size down to 80% passing a sieve with 100-pm openings, or
W1 100
(6)
The Bond work index can be determined from standard laboratory procedures [23,24]. The index was developed and is applied most successfuly to ball and rod mills. The use of the Bond work index in designing ball and rod mill installations is described later in this chapter. For other types of mills the use of the Bond work index is of questionable validity, and other approaches should be employed to predict performance. Published and calculated work indexes for phosphate rock are listed in Table 4.6.
The Bond work index can also be determined for other sieve openings besides the 100 pm. As a matter of fact, in phosphoric acid production, where coarser material can lead to unattacked rock losses, the Bond work index should be determined for the 20, 28, and 35 mesh sizes as well. This is especially important if the designer is contemplating the use of an open-loop arrangement. In general, the Bond work index is not constant, but a weak function of the particle size [25].
Power requirements are only one aspect of mill selection. The other aspect is throughput expressed in terms of mass flow of product
Energy Required to Grind Phosphate Rock
213
through the mill per unit of time. For example, for tumbling mills (ball and rod mills) the maximum total throughput, including recycle if any, is a function of the diameter and slope, speed or revolution, feed and discharge trunnion size, percent ball loading, and material consistency. Under most circumstances the mill net throughput is limited by the grind size required and rock characteristics, not by the maximum tonnage per hour which can pass through the mill without spilling at the feed end. However, if the ratio of feed size to product size is small, or if the rock is soft, the capacity of the mill may be limited by throughput and not by the required grind size.
4.4.3 Effect of Dry Versus Wet Grinding on
Energy Requirements
The Bond work index normally reported is directly applicable to wet grinding. To correct for dry grinding the wet work index is multiplied by 1.3. It is important to understand the significance of this higher work index for dry grinding versus wet grinding [15(p. 334),
TABLE 4.6 Bond Work Indices for Various Rocks3
kWhr/ton
Florida, high silica 18.5-20.0
South African 32.0
Florida, concentrate 15.2
Florida, pebble 17.5-18.2
Tunisia 17.5-18.7
Senegal 12.4
Morocco 12.5
North Carolina, calcined 13.7
aActual energy required is given by
W = 10Wi(p’1/2 - F’1/2)
where P and F are the sieve opening in mesh size through which 80% of the product and feed passes, respectively. For additional correction factors, see the text. The values given are for estimating purposes only.
214
Phosphate Rock Grinding
24,26] . The following is a list of what this increase for dry grinding means:
1. During the design phase, for a specified rock grinding rate, feed size distribution, and desired product size distribution, it is possible to select a smaller mill installation which will draw 23% less horsepower when operated in a closed-loop mode with wet grinding than when operated in a closed-loop mode with dry grinding.
2. When a dry closed-loop mill is converted to a wet closed-loop system , up to a 30% increase in throughput capacity can be expected with the same power input and feed size. In some instances, however, a shift in the product distribution toward more oversize and less fines has occurred when throughput was increased more than 20%.
3. When a dry closed-loop mill is converted to a wet open-loop system , the inefficiency of the open-loop arrangement can offset the benefits of wet grinding in terms of increased net capacity. This effect of the open-loop arrangement seems to depend on the length-to-daimeter ratio of the mill. For long mills (L/D = 2) a 15% increase in capacity can be obtained. For short mills (L/D = 1) a change of -5 to +5% may be observed (Figure 4.4).
4. When a dry closed-loop mill is converted to a wet open-loop arrangement, the actual horsepower drawn by the mill will not
FIG. 4.4 Estimated increased capacity, conversion from dry closed-loop grinding to open-loop wet grinding. Graph assumes that feed and product size plus rock characteristics are held constant.
Energy Required to Grind Phosphate Rock
215
decrease. The power drawn by the mill is fixed by the mill dimensions , ball charge, rpm, and to a very slight degree by throughput.
Finally, we should emphasize that 30% increase of the Bond work index for dry grinding does not mean that all dry mills use 30% more energy than wet mills. The change in work index is directly applicable only to rod and ball mills. There are considerable operating data for other types of dry mills which shows less energy use than wet ball or rod mills (see Section 4.4.5).
4.4.4 Effect of Open-Loop Grinding Versus Closed-Loop Operation on Energy Requirements
The work index developed by Bond is only applicable directly to closed-loop operations, where, after leaving the mill, oversize material is separated and returned for regrinding.
When oversize material is not returned to the mill, a correction factor needs to be applied [15(p. 334),24,25]. This is especially important when concern for oversize limits the product size to, say, 0% +20 mesh, 3% +35 mesh, in addition to, for example, 80% passing 200 mesh. When control of the oversize is important, the following procedure should be employed:
1. The work index should be determined for the mesh size in question, for example, +20 mesh.
2. The energy requirements are then determined from
where S.O. is the sieve opening, in micrometers.
3. The correction factor shown on Fig. 4.5 is then applied. It depends on the degree of control of the oversize required. The corrected work index is then
Wc = fcW ( 8)
Please note that with open-loop grinding it is practically impossible to eliminate all oversize, regardless of the power input. For these reasons trommel screens are almost invariably installed in the mill discharge to catch and direct to a reject hopper or chute grossly oversize material, worn-out balls, or pieces of rods and debris. Trommel screens, however, can seldom be sized finer than say 5- to 8-mm openings, because they would plug up very easily. Therefore, oversize material passing through the trommel screen and appearing on the
216
Phosphate Rock Grinding
FIG. 4.5 Work index correction factor, open-loop versus closed-loop circuit. (Data from Ref. 15.)
mill discharge of an open-loop system will be less than the opening on the trommel screen (unless the screen is worn out and has holes in it) [26].
Tracer studies have been conducted in one mill to gain a better understanding of open-loop grinding [27]. The results of one test are shown on Figure 4.6. The interpretation of this residence-time distribution curve to a pulse of tracer indicates that the material does not flow through the mill in the form of a plug. On the contrary, the tracer studies indicate short circuiting, dead spacing, and a considerable amount of backmixing on an almost periodic basis [28].
When compared to open-loop grinding in a short mill, the advantages of closed-loop grinding are higher net capacity with the same mill and energy usage or a smaller mill and lower energy usage for the same net throughput, in addition to better control of oversize and fines in the product stream.
4.4.5 Energy Requirements and the Type of Comminution Equipment
Very little of the energy consumed by milling equipment actually is used in the creation of new surface area. Most of the energy consumed is actually lost by elastic deformation of the charge and equipment and in the mechanical losses of the drive components.
Energy Required to Grind Phosphate Rock
217
The relationship between the energy required to drive the equipment at zero throughput and the additional energy consumed at optimum throughput has been reported as [29]:
Fraction to total energy
Zero Optimum throughput throughput
Ball mill Ring roll mill Impact mill 0.9 0.1 0.4 0.6 0.25 0.75
Based on extensive data, Lowrison [30] has ranked milling equipment in order of increasing efficiency as follows:
Approximate relative energy requirements
Jaw crushers, gyratory crushers, ball 3.0
mills, and rod mills
Hammer and vibration mills
Roll crushers, ring roll, and ring ball mills
1.0
MINUTES
FIG. 4.6 Residence-time distribution in a ball mill. (From Ref. 27.)
218
Phosphate Rock Grinding
These relative rankings do not include auxiliary equipment such as blowers and classifiers. When these items are included, the relative energy consumptions are brought closer together. For example, for a comparable grind of phosphate rock, dry closed-loop ball mills may consume 20 kWh/ton and a dry closed-loop ring roll mill may consume 15 kwh/ton, a ratio of less than 1.5, instead of 3.0.
Another important aspect of the type of equipment utilized in grinding is the size distribution of the product. It has been known for a long time that it is possible to "set" roll-type equipment to change the product size distribution and adjust the production of fines. These adjustments are generally not possible on tumbling mills (rod and ball mills), where product particle size distribution generally follows a "natural" distribution curve [31]. Of the tumbling mills, it has been reported that rod mills produce a narrower size distribution, with less oversize and fine production, than do ball mills [30(p.228),31(p.72)]. In fact, in the opinion of some operators the performance of open-loop rod mills is comparable to the performance of closed-loop ball mills.
In a thermodynamic sense, grinding is a highly irreversible process. Of the mechanisms of breakage, compression requires the least excess energy to crack the material. We should, therefore, expect equipment that uses compression as the primary means for grinding to be more efficient than equipment that utilizes impact or abrasion.
4.4.6 Effect of Production Rate on Energy Requirements
The effect of throughput on energy requirements varies with the type of equipment utilized. Roll-type mills start at approximately 40% of full motor load when empty, and the energy consumed, between 40% and full load, varies with throughput. Similarly, impact mills (hammer, etc.) start at approximately 25% of full motor load when empty and the power drawn varies with throughput. However, power drawn by tumbling mills (rod and ball mills) is insensitive to throughput. In tumbling mills the power drawn increases slightly with decreasing throughput up to the point where throughput is approximately less than one-half of the rated capacity. In tumbling mills, the energy consumption per ton of rock is, therefore, for all practical purposes, inversely proportional to production rate.
Maximum energy efficiency for all mills, but in particular for rod and ball mills, is obtained when throughput is at the maximum consistent with the degree of grind required for the process. With a properly designed recycle system the energy efficiency of the mill also improves slightly as the amount of recycle is increased, with no sacrifice in the fineness of the grind.
The energy efficiency of ball and rod mills suffers greatly at reduced throughput. A typical rod or ball mill operating at half capacity will consume at least twice the energy per ton as when operated at full capacity. For this reason, most energy efficiencies for rod and ball
Dry Grinding
219
mills can be misleading. Actual operating data from plants are impossible to compare unless the loading on the mill is known. Mills are designed for the maximum expected operating rate, and perhaps a little more. The energy requirements quoted for ball and rod mills are invariably their best efficiency at maximum throughput. However, phosphoric acid plants seldom average the maximum throughput of the mill. For this reason, average kWh/ton values are always higher than the energy consumption at maximum rates. The above is also a strong argument for the use of multiple grinding units which can be brought in and out of service as required to maintain full loads at the point of maximum efficiency.
4.5 DRY GRINDING
In the United States, the change from wet grinding with dilute phosphoric acid to dry grinding started in the 1930s and was to become the standard for the industry for the next 50 years. The shift was motivated by several factors:
1. A desire to produce phosphoric acid in higher concentrations.
Earlier Dorr-Oliver wet process plants, which employed countercurrent decantation of the gypsum in thickeners utilized the last wash to grind phosphate rock. This last wash recycle improved recovery, but was one of the causes of the low strength of the acid produced.
2. Developments in the design of dry grinding equipment which provided higher capacities in a single unit than had been available with wet grinding pebble mills, plus the lower maintenance and operating costs, which accompanies larger units.
3. The growth of the superphosphate industry, since plants that produced both phosphoric acid and superphosphates found that sharing a single grinding and drying facility for both products was economically advantageous.
Up to the late 1950s in Florida, roller-type mills of both centrifugal and spring-loaded design were very popular. The speed (and horsepower) of these mills can be adjusted to compensate for grind requirements and rock origin. Ring roller mills or pendulum mills are discussed in detail later in the chapter.
In the early 1960s dry ball mills made their appearance in the phosphate industry. Compared with roller mills, very high capacities in a single piece of equipment were available in dry ball mills. These higher capacities and the following combination of other factors eventually shifted the entire industry in Florida to tumbling mills:
220
Phosphate Rock Grinding
1. The relative uniform grinding characteristics of Florida rock mined during the 1960s. This uniformity did not require the flexibility of roller mills in adjusting to rock grinding characteristics. Plants elsewhere in the world, which operated with rocks of various origins, were not able to give up the ability to adjust grinding conditions to match rocks of different characteristics.
2. The mechanical simplicity of tumbling mills compared to roller mills and its concomitant reduction in the cost of level of maintenance skills required.
3. The relatively low cost of energy during the 1960s, which made the power consumption of tumbling mills of secondary importance.
Dry mills, specifically dry roller mills, have a definitive advantage when rock must be dryed or calcined at the mine site prior to shipment. Their primary advantages are:
1. The ability to tailor the grinding process to rock characteristics and product size requirements (roller type only).
2. Lower overall electrical and steam energy requirements (roller mills only) and better turndown energy efficiency.
3. Higher volumes of tailwash water can be used in the filter without lowering reactor strength. Water-soluble ₽2°5 losses are generally lower.
4. The ability to handle abrasive rocks in a less abrasive dry form.
5. Lower inputs of fresh water to the plant as a whole, which in wet areas results in a lower volume of contaminated surplus water to be treated prior to disposal.
The main disadvantage of dry grinding for plants close to the mine site is, of course, the fuel required to dry the rock. This disadvantage is so overwhelming and so obvious that currently, no plant in Florida practices dry grinding, despite all the other problems that wet grinding has created.
4.5.1 Moisture-Level Tolerances
During the early development of grinding it was discovered that only materials with water below a certain moisture level could be ground in dry form. If the moisture content of the material is above a critical moisture level, it will turn "pasty" or lumpy, and flow through the grinding equipment will either stop or, in the case of ball mills, the entire charge and balls may suddenly avalanche out of the mill. (For this reason wet ball mills are usually interlocked with the water and rock flow.)
The moisture content at which the material becomes pasty is a function of the particle size of the mill contents and the surface tension of water. The finer the grind, the lower the moisture required to turn
Dry Grinding
221
the charge pasty. The tolerance of different types of equipment to pastiness, and thus to moisture levels, varies. For rod mills it.is in the range of 4-5% water. For ball mills the range of critical moistures is lower, around 2% [32]. The moisture tolerance level of grinding equipment creates the need and extent for rock drying prior to or during grinding.
4.5.2 Fuel Requirements for Dry Grinding
Rock delivered from a mine will contain varying amounts of water, depending on its origin and previous processing and handling history. Florida rock may contain 6-13% moisture with an average of about 9.5%. The amount of water Wa which needs to be evaporated prior to dry grinding per ton of rock can be simply calculated by
= _ kg of water /___1_________1___\
"a 1000 kg dry rock I 1 ~ M01 1-M02/
where is the initial moisture expressed as a fraction (i.e., %/100) and Mq2 is the final moisture required by the grinding equipment expressed as a fraction also. The energy required per ton of rock is then given by
E = W ~ a Те
(10)
where H is the heat of vaporization of water and Те is the thermal efficiency factor.
The thermal efficiency depends on whether the drying is carried out as a part of the grinding process or in a separate production step. When drying is carried out in a rotary or fluidized bed dryer, thermal efficiencies as high as 85% are possible. When drying is performed as part of the grinding process, typical efficiencies are 40-50%.
In Fig. 4.7 a typical heat balance for a combined drying and grinding operation is shown. Florida phosphoric acid producers, prior to conversion to wet grinding, typically consumed 2.5-3.5 gal of fuel per ton of rock or as much as 9 gal of fuel per ton of P2O5 [12,33]. Thermal efficiencies of these drying operations were obviously low.
4.5.3 Power Requirements for Dry Grinding
Florida rock power requirements for ball mills operating on dry closed-loop circuits have been reported by one manufacturer as [3(p. 177)]:
50% passing 200 mesh: 13-15 kWh/ton
80% passing 200 mesh: 22-24 kWh/ton
222
Phosphate Rock Grinding
Out
Heat generated in mill 4.45 Heat losses 5.35
Heat from fuel 35.00 Exhaust heat 4.40
Rock heating 9.30
Evaporation 20.40
39.45 mm Btu 39.45 mm Btu
FIG. 4.7 Heat balance for a drying/milling combined operation
(mm Btu/hr) (Adapted from Ref. 20, p. 100.)
The above includes 3-5 kWh/ton for the classifier and mill auxiliaries. Another manufacturer lists them as [20 (p. 99)] :
Product below 200 Tyler mesh (%) Power consumption (kWh/ton)
50 60 70 85 13.5 13.0 15.5 19.2
when grinding -J in. (12.5 mm) +100 Tyler mesh Florida pebble rock.
Wet Grinding
223
The power requirements of Raymond mills operating on Florida pebble rock are shown in Fig. 4.8a, for dry closed-loop ball mills in Fig. 4.8b and c and for dry open-loop mills in Fig. 4.8d.
4.6 WET GRINDING
The idea for wet grinding was developed early in 1973 at Agrico Chemical Company, South Pierce plant. Higher fuel prices made it clear that it was illogical to utilize fuel to dry rock which almost immediately was to be wetted in the attack tank. Also, the development of vacuum cooling of the reactor, in place of dilution acid coolers, provided a substantial amount of water evaporation from the reactor. This volume of water could then be used for rock grinding with a net reactor/filter water balance identical to that of plants using graphite heat exchanger to remove the heat of dilution of sulfuric acid [34-37].
The first ball mill with the capability of dry grinding and wet slurry feed was designed for the South Pierce plant by the Jacobs Engineering Group, Lakeland Office (formerly Pridgeon Engineering) and was operated in early 1973. The operational data for this mill were to be the basis for Agrico Chemical's Faustina plant wet grinding system, which in 1973 was developed jointly by Davy McKee and Agrico. On November 16, 1973, Davy McKee, with Agrico's implicit acquiescence, applied for a U.S. patent on a process employing wet grinding. An ammended patent application was submitted in July 21, 1975, and in August 23, 1977, the patent was issued. From 1973 to 1979 Davy McKee applied for and was issued similar patents in numerous countries, including Belgium, South Africa, Morocco, New Zealand, Spain, and Jordan [38-44]. The interested reader should consult the original patents for specific details on disclosures and claims.
The great advantage of wet grinding is, of course, the elimination of fuel consumption for rock drying. Other benefits claimed for the process have been described as follows:
1. The elimination of dust and pollution control equipment; a reduction of 1000 Ib/day of particulate matter emission from rock grinding operations
2. A reduction in the size of the mill and associated horsepower requirements for the same throughput (compared to dry ball mills)
The problems associated with wet grinding are many:
1. Decreased P2O5 recovery; from 0.75 to 1.0% higher losses
2. Very difficult control of oversize material (+35, +28, and +20 mesh) even when operated in a closed-loop arrangement
3. Reduced P2O5 reactor strength, requiring in many cases the expansion of evaporator facilities and increased evaporation steam consumption
(a) CUMULATIVE WEIGHT % RETAINED
(b)
CUMULATIVE WEIGHT
% RETAINED
FIG. 4.8 (a) Raymond mill operating on Florida pebble rock. (Courtesy of Agrico Chemical Co., Tulsa, Okla.) (b) Dry, closed-loop ball mill performance, Florida pebble rock (L/D - 1.2). (Courtesy of Agrico Chemical Co., Tulsa, Okla.) (c) Dry closed-loop ball mill performance, Florida pebble rock (L/D = 2.5). (d) Dry open-loop ball mill performance, Florida pebble rock (L/D = 2.5). (c,d Data from B. Vaughn, private communication, August 26, 1981 [46]).
Wet Grinding
225
(c) CUMULATIVE WEIGHT % RETAINED
CUMULATIVE WEIGHT % RETAINED
SIZE- JJM
(d)
226
Phosphate Rock Grinding
4. Very low tolerance to rocks containing clay
5. Reduced volume of tailwash and higher tailwash specific gravities 6. Overgrinding of soft porous rocks, which results in unpumpable slurries unless diluted, and rock hyperreactivity
7. Production of highly abrasive slurries when operated on phosphate rocks of igneous origin
8. Increase in the amount of contaminated surplus water that must be treated at very high costs prior to discharge
9. Increase in the unavailable water-soluble P2O5 which continuously accumulates in the gypsum storage areas
Nevertheless, because of the tremendous savings in fuel costs and despite its disadvantages, many plants in the United States have adopted wet grinding. Worldwide, however, dry grinding installation far outnumber wet grinding installations (see Table 4.9).
4.6.1 Dilution Requirements for Wet Grinding
Just as dry grinding requires a minimum degree of dryness in the rock, so wet grinding requires a minimum degree of wetness. Ball and rod mills, because of their tumbling action, can grind pulps with little water and high consistency. Pumps and classification devices (screens, hydrocyclones), however, require for their operation more dilute slurries, as we shall discuss below. Reported percent solids by weight in wet grinding installations varies between 62 and 70% [45].
Concentrated slurries behave like Bingham plastics. They possess a yield stress or minimum stress below which they behave as a solid and will not flow, and they also exhibit an apparent viscosity.
In Fig. 4.9a, the relationship between shear stress and shear rate is shown for a Bingham plastic. The у intercept on the shear stress axis is called the yield stress. The slope of the lines is designated as the coefficient of rigidity. As the average particle size of the slurry decreases, the yield stress of the slurry increases.
In Fig. 4.9b, the apparent viscosity versus shear rate has been plotted. As the rate of shear increases, the apparent viscosity converges toward the coefficient of rigidity of the slurry. At low shear rates or for very small particle sizes, the apparent viscosity will depend both on the shear rate and the particle size. As the shear rate increases, the viscosity becomes independent of the particle size.
The viscosity at high shear has been extensively correlated with the volume fraction occupied by the slurry solids. Table 4-7 lists several correlations and their range of applicability. For slurries of nonswelling solids, the volume fraction is given by
_________________% solids/100 SSG________________ s ~ (% solids/100 SSG) + [(!-% solids)/100 LSG]
Wet Grinding
227
(a)
SHEAR
STRESS
(b)
APPARENT VISCOSITY =
SHEAR STRESS
SHEAR RATE
FIG. 4.9 Sheer stress versus sheer rate for a Bingham plastic.
where
fs = volume fraction occupied by the solids
SSG = solids specific gravity
LSG = liquid specific gravity
For slurries of nonswelling solids, we should, therefore, expect the slurry viscosity to be a function of percent solids at constant solids specific gravity as shown on Fig. 4.10. From the above we can also conclude that slurries of higher specific gravity rock will exhibit lower viscosities at the same solids percent by weight.
228
Phosphate Rock Grinding
TABLE 4.7 Slurry Viscosity/Solids Volume Fraction Correlations
= viscosity of slurry, M = viscosity of liquid, exp ( )
Wet Grinding
229
FIG. 4.10 Slurry viscosity as a function of percent solids. (From
Ref. 52.)
For rock slurries containing clays or other materials that swell in water, the effective volume fraction of solids is best calculated from the slurry's specific gravity and the percent solids by weight:
L _ % solids , ' 100
f _ SLSG s ’ LSG
(12)
where
f = effective volume fraction occupied by the solids s
SLSG = slurry specific gravity
LSG = liquid specific gravity
230
Phosphate Rock Grinding
Sample Calculations (.Effect of Percent Solids and Rock SPG on Viscosity)
EXAMPLE 4-1
a. Calculate fse for a water/phosphate rock slurry with 69.8% by weight solids and a 1.823 specific gravity.
= t _ 1.823
se 1.0
69.8\
100 )
= 0.4495
b. Assuming that the viscosity of water is 1.0 centipoise (cP), estimate the viscosity of the slurry by equation 6 in Table 4.7.
Viscosity = 1 + 2.5f + 10.f2 + e^2’^s^ s s
- 1.82fs)
= 1 + 2.5(0.45) + 10(0.45)2 + e (6>216)
= 504 cP
For slurries with average particle size below 50 pm or -325 mesh, the yield stress has been found to be proportional to the cube of the solids volume fraction and inversely proportional to the mean particle diameter [7] as shown on Figure 4.11. The yield stress therefore increases rapidly with increasing solids volume and decreasing particle size. As in the case of the viscosity, rocks of higher specific gravity will exhibit lower yield stresses than rocks of lower yield stresses than rocks of lower specific gravities, at the same percent solids by weight.
For slurries of less than 50 pm average size, when the solids volume increases above 30% of the total volume, the slurry may change from shear-thinning (thixotrophic) to shear-thickening (rheopectic) [7,53]. This should be considered in the design of a closed-loop wet grinding system, since recirculation of the charge could increase its viscosity to impractical levels.
Since centrifugal pumps cannot generally handle fluids with viscosities in excess of 2000 cP [54] or slurries with high yield stress, the upper limit on the solids percentage is set by the amount of near-colloidal material (-325 mesh) present in the slurry and the rock specific gravity, which establish both the viscosity and the yield stress of the slurry. Slurries having high viscosities or yield points are considered unpumpable and must be diluted with water. Thus over-grinding of soft rocks, which leads to the formation of large quantities
Wet Grinding
231
MEAN PARTICLE DIAMETER, WEIGHT BASIS, JJM
FIG. 4.11 Slurry yield stress and mean particle size. (From Ref. 7.)
of -325 mesh particles, will also render the slurry conventionally un-pumpable and should be avoided. An effect similar to overgrinding can be obtained with rocks containing an excessive amount of clay which can also reduce the efficiency of separation devices, such as screens [ 55].
Of course, there are other types of pumps besides centrifugal pumps which could handle thicker slurries without dilution, such as progressive cavity, diaphragm, and plunger pumps. However, even with these types of pumps, there is an upper limit to the maximum percent colids that the mills can handle. In mills, with overflow discharge, this limit appears to be roughly 72%. With grated discharge mills upward to 75-80%, solids can be ground without ball loss.
Various additives have been proposed to modify the rheological properties of slurries. The effectiveness of these additives can depend on their ability to coagulate or agglomerate fine colloidal or near-colloidal particles. The net effect of this agglomeration is to increase the mean particle size of the slurry and thus reduce its yield stress. Additives can also be effective in reducing clay particles swelling by neutralizing surface charges and thus effectively shrinking their hydrodynamic radius. The result is an apparent increase in the slurry particles specific gravity. This shrinkage in the effective volume fraction
232 Phosphate Rock Grinding
occupied by the slurry solids is accompanied by a reduction in viscosity and yield stress.
4.6.2 Effect of Wet Grinding on Water Balances
When wet grinding is utilized, the amount of water in the most dilute wash or tailwash of the filter must be reduced by the same volume as the amount of water used in the ball mill and the volume of water used for diluting the mill pulp for pumping.
This reduction in the quantity of wash is necessary to maintain reactor strength and can be calculated by a simple material balance. We start by calculating the tons of rock required per ton of P2O5:
tons rock ________1_____ 1
ton P.O. BPL x 0.4576 R 1 J
2 Э
where BPL is expressed as a fraction (i.e., % BPL/100) and R, the overall plant yield, is also expressed as a fraction. The quantity of water per ton of rock flowing to the reactor is given simply by
tons of water _ (1 - % solids in slurry)/100 .1 ..
tons of rock % solids in slurry/100
Combining Eqs. (13) and (14), we obtain
. 1 (1 - % solids in slurry)/100 1
tons water —--------- > ---------------------—--— x -------
tons waiex BpL x R % soljds in slurry/100 0.4576
The expression above indicates that the amount of wash water reduction per ton of P2O5 is a function of three variables: the rock assay, the overall plant recovery, and the percent solids in the rock slurry fed to the reactor. In Fig. 4.12 we have plotted the reduction in wash water required to maintain reactor strength.
Experience indicates, however, that few, if any, phosphoric acid plants designed or converted to wet grinding have in fact reduced the amount of tailwash to the filter as required to maintain a 30% P2O5 evaporator feed strength. Typical evaporator feed strengths for plants employing wet grinding are in the range 27-28%. Plants designed or converted to wet grinding should therefore be provided with the additional evaporator capacity required by this dilution, or the additional filter area required to compensate for the reduction in tailwash volume.
There is another aspect of wet grinding which is of considerable importance in the United States, where phosphoric acid plants are not allowed to discharge any acid-contaminated water without treatment. The fresh water added through the grinding mill represents a net input
Wet Grinding
233
ROCK SLURRY WEIGHT %
FIG. 4.12 Required reduction in wash water to maintain reactor strength. Plot is for a plant with a 93% overall recovery.
of water to the system which must be disposed of. In dryer climates, evaporation from the contaminated water impounding areas and the gypsum stack may be sufficient to bring the total phosphoric acid plant complex into a negative water balance, and no detrimental effects will be experienced from wet grinding. However, in areas such as Louisiana, where annual rainfall exceeds evaporation, all freshwater inputs to the system become contaminated and must eventually be treated at a cost in 1981 as high as U.S.$10.00/1000 gal or U.S.$2.6/m3 [52,56,57].
4.6.3 Effect of Wet Grinding on Recovery
and Operating Rates
The reduction in tailwash volume per ton of P2O5 on the filter may or may not increase water-soluble P2O5 losses, depending on filter loads and filterability of the gypsum cake. There is also a question as to whether prewetting the rock prior to feeding to the attack tank increases the reactivity of the rock to the point where cocrystallization losses increase. The following has been reported on the effect of wet grinding on P2O5 recovery [55].
234
Phosphate Rock Grinding
Dry rock Wet rock
Digestion loss citrate-insoluble (%) Crystallization loss citrate-soluble ( %) Filter loss water-soluble (%)
0.5-1.2
2.3-3.5
0.6-1.7
1.1-2.8
1.7-3.6
2.6-5.7
The subject of the effect of wet grinding on recoveries is an area of controversy, and contradictory experiences have been observed from plant to plant. Agrico's earlier tests showed an increase from 1.45% water-soluble losses to 2.25% when the tailwash volume was reduced by the same volume as the volume of water contained in the rock slurry. The change in tailwash volume did not affect either citrate-soluble or unreacted rock losses [37]. Current typical filter losses at Agrico's Faustina plant are as follows:
Insoluble losses: 0.5
Citrate-soluble losses: 2.0
Water-soluble losses: 2.3
(unconverted rock losses)
(lattice losses)
(filtration losses)
Plants contemplating a change from dry to wet grinding can very simply test the effect of wet grinding on water-soluble recoveries by reducing the volume of tailwash by the same volume as the volume of water admitted through a wet mill. Other effects can be tested, under their own operating conditions, by preparing and feeding to the reactor a rock slurry with comparable size distribution and percent solids.
In addition to the above, when operators use the specific gravity of the most dilute wash as a criterion for the adequacy of filtration, the effect of wet grinding is twofold:
1. Operators are generally reluctant to give up the lower specific gravity in the most dilute wash, since they are generally convinced that a lower specific gravity means better recovery. As a result, plants employing wet grinding tend to run at lower reactor strengths than plants employing dry grinding. This lower strength will normally improve filtration rates; however, because it also overloads the evaporation system, especially the first stage, it coult limit overall plant production and/or increase carryover losses from the evaporators.
2. Again, because of the increase in the specific gravity of the tailwash with wet grinding, the operator may limit reactor dilution by reducing filter operating rates in order to restore the specific gravity to its former lower value.
The additional steam evaporation requirements are seldom considered important in plants which are not evaporator limited and which have a
Wet Grinding
235
surplus of 55 psig (3.7 bar) steam available from their sulfuric acid plants [ 58]. However, if a plant produces electricity from the steam generated in the sulfuric acid plant, the additional steam required for evaporation may become very costly. Furthermore, if a plant is limited by the actual or rated capacity of its evaporators, an effort to evaporate additional amounts of water, as resulting from wet grinding, may result in staggering (3.5-5%) evaporator carryover losses. These losses can be reduced, but not entirely eliminated, by the use of defoamers in the evaporator's feed acid.
4.6.4 Effect of Wet Grinding on Bail, Rod, and Liner Wear
Ball, rod, and liner wear rates are higher for wet grinding than for dry grinding [24,30(p. 107),31(p. 72),59]. For ball mills, the ball and liner wear is reported to be 4 to 6 times higher for wet than for dry grinding. For rod mills, rod wear is reported from 7 to 10 times higher and liner wear from 5 to 7.5 times for wet versus dry grinding, respectively.
Ball, rod, and liner wear can be expressed in two forms:
1. Wear per kilowatt-hour of energy input. This has been correlated with an abrasion index as shown on Fig. 4.13. For Florida pebble the abrasion index is generally low, 0.25. Typical rates of wear are:
Ball mill, balls
Ball mill, liners
Rod mill, rods
Rod mill, liners
0.056 lb/kWh
0.005 lb/kWh
0.015 lb/kWh
0.010 lb/kWh
0.025 kg/kWh
0.0024 kg/kWh
0.068 kg/kWh
0.0045 kg/kWh
2. Mass of balls lost per ton of rock ground. This has been reported as [3(p. 177),55] :
Dry grinding 0.1 Ib/ton 0.05 kg/100 kg
Wet grinding 0.4-0.8 Ib/ton 0.2-0.4 kg/100 kg
Wet rock grinding therefore slightly increases the iron content of the final acid produced. It also produces a more abrasive slurry than that of the dry product.
4.6.5 Effect of Wet Grinding on Reactor and
Filtrate Strengths
We briefly mentioned earlier that plants with wet grinding operate at lower reactor and evaporator feed phosphoric acid strengths. A material balance can be quickly performed to determine the effect of the
236
Phosphate Rock Grinding
ABRASION INDEX
0.05 0.10 0.15 0.20 0.25 0.30 0.35
METAL WEAR LB / KWH
FIG. 4.13 Component wear and abrasion index. (From Ref. 31.)
rock dilution water on the strength of evaporator feed and reactor filtrate. The required information is as follows:
1. Tons of water per ton of rock fed to the reactor. This is the amount of water required to make the slurry pumpable.
2. Tons of rock per ton of evaporator feed phosphoric acid produced. This is calculated from the BPL of the rock and the combined attack-filter recovery.
3. Gypsum produced per ton of evaporator feed phosphoric acid product. This is calculated from the CaO/ton of phosphoric acid (TPA) ratio and item 2 above.
4. Expected free moisture in the filter cake. This is determined from experience.
5. Tons of water evaporated in the reactor flash coolers per ton of phosphoric acid produced. This depends on the sulfuric acid strength and consumption per ton of phosphoric acid.
Wet Grinding
237
6. Expected dilution across the filter. This depends on the type of filter, filter loading, and number of washes.
7. Volume of water required to produce a tailwash of the desired specific gravity. This is established from experience and depends on the filterability of the gypsum, filter type, operating rates, and overall condition of the filtration system, plus the initial specific gravity of the wash water.
A published [60] water balance may underestimate this last item. Current operating practice in some plants is to limit the specific gravity of the last wash filtrate to roughly 1.08, and this is usually done by increasing the volume of wash water and lowering the reactor strength.
Ц.6.6 Developments in Acid Water Grinding
Almost all phosphoric acid plants in the United States are required to contain and store by-product gypsum in gigantic stacks covering hundreds of hectares and in Florida reaching 30 and even 60 m in height. Gypsum is slurried in "gypsum water" and pumped to the disposal stack, where it is partially dewatered by gravity and the drained water is recycled for further slurrying of gypsum. In most plants this gypsum storage area also serves the function of cooling the water recycled through the phosphoric acid plant barometric condensers.
Over a period of time these stacks accumulate basically a large part of the soluble P2O5 l°sses an<^ can reach concentrations higher than 2% P2O5. Normally, for the purpose of recovery, this gypsum water is used as the most dilute wash on the filter. In addition to recovery, this water is used on the filter as a means of keeping the entire system in a precarious water balance.
During periods of high rainfall or in areas where rainfall exceeds evaporation, this precarious water balance is broken and it becomes necessary to treat the excess water at a high cost.
There is little question that wet grinding with fresh water, now almost universally adopted by plants in Florida, has tilted the water balance toward the surplus-treatment side, with its concomitant high treatment costs. A desire to redress the water balance altered by the conversion to wet grinding and the possibility of recovering P2O5 has provided the impetus in the search of practical techniques for substituting gypsum pond water in lieu of fresh water in the ball mill. Actually, the concept is not new. During 1910s and 1920s, as described by Waggaman, all phosphoric acid plants ground rock in dilute phosphoric acid [61].
Several alternatives are open to resuscitate this old technique:
1. Use of a ball mill constructed of corrosion-resistant alloys and the use of corrosion-resistant balls
238
Phosphate Rock Grinding
2. Use of rubber liners in existent mills and corrosion-resistant balls 3. Prepartial neutralization of the gypsum water with calcium carbonate or lime
4. Partial replacement only of fresh water with pond water and the use of existing equipment
5. The Lang process
All of the foregoing processes share two advantages: (1) a reduction of surplus acid water treatment costs, and (2) PgOg and sulfate recovery. The current status of these developments is as follows:
1. In cooperation with Koppers, Agrico has investigated the fabrication in 3161 stainless steel of a 300-ton/hr ball mill. The estimated cost of a new installation using such a mill appears 20% higher than with the use of conventional carbon steel for the mill shell. Main concern at the present time is the possibility of work hardening the stainless steel under continuous use [62-64].
Agrico, in cooperation with American Magottaux, has tested Duromax 10 balls for this service. These are balls with a 31% chrome content and a martensite structure [65,66]. Weight loss tests in a laboratory mill indicate that these balls will be entirely satisfactory for grinding in Agrico's Faustina works acid cooling pond water [67,68].
2. The use of rubber liners in phosphate rock ball mills is common. Manufacturers such as Koppers or Skega can acid-proof a ball mill.
3. Agrico has conducted full-plant-scale tests with acid cooling pond water, partially neutralized with calcium carbonate or lime as makeup to the ball mill. No adverse effects have been observed in the grinding or in the attack-filter circuits.
4. At Agrico Faustina's phosphoric acid plant rock mill, between 30 and 50% of the makeup water to the mill is straight acid cooling pond water. As in the case of partially neutralized pond water, no adverse effects have been noted. On the contrary, increased recoveries of P2O5 (0.5%) have been observed.
5. The Lang process is currently being offered by Davy McKee. The process involves partial neutralization of the acid pond water with the feed rock, followed with more complete neutralization with ammonia [69]. Primary concerns with this process are (a) possible increased corrosivity of the water with the ammonia addition, and (b) effect of the ammonia on the rest of the phosphoric acid plant (even though some producers use ammonium sulfate partially in lieu of sulfuric acid).
Closed-Loop Grinding
239
4.7 CLOSED-LOOP GRINDING
The effectiveness of grinding mills can be greatly enhanced if oversized material produced in a first pass through the mill is classified out of the product stream and returned to the mill for additional grinding (see Fig. 4.14). The quantity of material that needs to be recycled, also called circulating load, is basically a function of the feed/product size ratio, the efficiency of the classification devices, and the mill's length-to-diameter ratio.
If the maximum size of feed to maximum desired product size ratio is relatively small, say less than 5, the benefits of closed-loop grinding are less pronounced. If the ratio of coarser feed size to maximum desired product size is over 10, a closed-loop operation is generally essential for efficient grinding. As discussed earlier, closed-loop grinding generally requires a smaller mill and less horsepower than openloop grinding. There are exceptions, however.
The effectiveness of the product classification device is also crucial. If the classification device gives a very sharp cut of the oversize material, only a small percentage of the net throughput will need to be recycled. If the separation is less sharp, oversize materia] will appear in the product stream unless a large proportion of product size material is also recycled with the oversize.
As the length-to-diameter ratio of the mill increases, the benefits of closed-loop grinding are reduced, and for length-to-diameter ratios greater than 2.0, they quickly disappear. For dry grinding, which
FIG. 4.14 Estimated increased capacity: conversion of open-loop wet grinding to closed-loop wet grinding. Graph assumes feed and product size plus rock characteristics are held constant.
240
Phosphate Rock Grinding
generally operates with high circulating load, the closed-loop method has limited production in some ball mills with a 2.5 length-to-diameter ratio [46].
4.7.1 Consistency of Grinding Specifications
Insofar as possible, product size specifications should be consistent with the rock feed and grinding equipment characteristics. Single point specifications, such as "100% less than 1.6 mm" or "80% -100 mesh" are always consistent. However, multiple point specifications may or may not coincide with the rock and grinding equipment idiosyncrasies. For example, when ground in a wet open-loop ball mill, Florida pebble rock will typically exhibit the size distributions shown in Fig. 4.15,
CUMULATIVE % RETAINED
FIG. 4.15 Performance of a wet open-loop ball mill. Data are for a cylindrical mill with a L/D = 1.39 operating on Florida pebble rock. (Agrico Chemical Co., Tulsa, Okla., unpublished data, 1978, 1979.)
Closed-Loop Grinding
241
with higher energy inputs producing finer grinds. Now consider the following product specifications:
0.5% +35
40% +100
75% +200
25% -200
This product specification is inconsistent with the rock and equipment grinding characteristics. To meet the +35 mesh specification will require 18 kWh/ton of rock, whereas to meet the 100 and 200 mesh specifications requires only 12 and 8 kWh/ton, respectively.
Classification devices can improve, within limits, the consistency of product specifications that do not parallel the typical size distribution of product from a particular rock/equipment combination. Ideally, oversize classification devices should exhibit a sharp cutoff, and the product size distribution of the mill classification device combination should exhibit a flattening effect at the upper size portion of product size distribution.
However, as we discuss next, classification devices are never 100% effective in separating product sizes except in the case of coarse dry screens lightly loaded. Separation of the oversize material usually requires recycling from 25 to 150% of on-size product. As a consequence, rather than a flattening of the product size distribution, an actual shift is observed. The larger the fraction of on-size material returned with the oversize, the less flattening and more shifting will occur, as shown in Fig. 4.16.
4.7.2 Wet Grinding Classification Devices
Two types of classifying equipment are currently in use with wet milling installations, screens, and hydrocyclones. Neither wet screen nor hydrocyclones are absolute classification devices, although wet screens can obtain a sharper separation of oversize from product size material.
The literature on screens and hydrocyclones is extensive [70-77]. • However, because screens and hydrocyclones operate at very high concentrations of solids in phosphate grinding applications, there is currently no reliable method available for predicting their performance other than pilot plant testing [70].
Manufacturers of both screens and hydrocyclones provide testing services that can be utilized to collect the data required to design a closed-loop installation. Reliable data are very hard to gather since, as discussed earlier, rock slurries can exhibit thixotropic or rheopec-tic behavior at high solids concentrations. For this reason it is very desirable that the tests be conducted with an ample initial supply of slurry to eliminate the need to reuse the test material. Also, operating conditions, such as pressure drop and the amount of recycle slurry
242
Phosphate Rock Grinding
CUMULATIVE WEIGHT % RETAINED
FIG. 4.16 Ideal versus actual closed-loop operation. Mill L/D approximately 1.1.
through the loop, should be adjusted to approximate the anticipated design conditions as closely as possible.
Both screens and hydrocyclones are normally installed at a higher elevation than the mill feed and to provide gravity return of oversize material. Screens normally require a larger floor space than hydrocyclones and are often hard to fit in existing installation. Hydrocyclone installations can be made quite compact. However, because hydrocyclones require between 25 and 30 psi (1.8-2 bar) pressure drop to operate, energy consumption is higher than for screens. Operation of hydrocyclones at high pressure drop improves the efficiency of separation only slightly; for example, doubling the pressure drop will not improve efficiency by more than 15% [70]. The efficiency of separation of hydrocyclones drops markedly as the diameter increases. For this reason, multiple cyclones radially manifolded to single feed and recycle chambers are usually preferred [71]. The total flow of material to be classified may be split among as many as 20 small cyclones [72].
As mentioned earlier, screens provide a sharper oversize product cut than hydrocyclones. For this reason, when screens are utilized,
Closed-Loop Grinding 243
the quantity of recycle material seldom exceeds 50% of the net mill throughput. For hydrocyclones, however, the amount of recycle material can reach 150% of the net mill throughput, depending on operating rate and desired product specifications.
Variable-speed pumps have been recommended to facilitate pressure drop adjustment through hydrocyclone systems to compensate for changes in throughput, rock characteristics, or dilution [70]. As an alternative, cyclones can be taken in and out of service to maintain the same pressure drop. Hydrocyclones are available in a choice of rubber dr ceramic inserts to protect the inside metal surfaces from slurry abrasion . Even with Florida rock of low abrasion characteristics, ceramic liners are usually preferred, since they outlast rubber liners by a large factor.
The presence of clay in the rock adversely affects the effectiveness of closed-loop operation with screens. The effects of clay have been reported as follows [ 55].
Slurry (%) solids Percent +35 mesh
Normal rock 62-64 4.0
Very clean rock 64-67 3.0
Concentrate 66-69 3.5
Rock with clay 59-62 5.0-6.0
Table 4.8 summarizes typical performance of a multiple-cyclone installation under plant operating conditions and varying net throughputs. Except for a desirable drop in the -325 mesh material, the performance of the hydrocyclones/ball mill system was very consistent and independent of net throughput in almost completely eliminating +20 mesh material, as shown on Fig. 4.17.
Table 4.9 summarizes Derrick screen tests on a rock slurry similar to the above. These tests show that by using a small enough screen opening and accepting a high enough recycle, the removal of +35 mesh material from the product stream can be significantly improved.
4.7.3 Dry Grinding Classification Devices
Over the years a large number of classifying devices have been utilized in dry grinding operations. These classification devices can be conveniently divided into the following types:
1. Cyclonic type: These can be used for separating coarse to very fine particles, depending on the design and size of the cyclone.
2. Centrifugal type: These include the Raymond Whizzer, the Koppers Gyrotor, and the Sturtevant Whirlwing. These devices are used for separating fine to very fine dust particles.
244
Phosphate Rock Grinding
TABLE 4.8 Hydrocyclone Performance
Cyclone overflow Cyclone underflow Cyclone feed Cyclone overflow Cyclone underflow Cyclone feed
150 tons/hr 175 tons/hr
Specific 1.679 1.887 1.822 1.683 1.897 1.841
gravity % Solids 61.32 72.73 69.15 61.56 73.26 70.20
+20 mesh 0.90 2.70 2.10 0.30 5.00 2.60
+28 mesh 1.30 4.30 3.20 0.70 7.40 4.20
+35 mesh 2.10 7.10 4.90 1.80 11.50 6.60
+100 mesh 15.30 37.60 29.00 14.80 44.40 33.50
+200 mesh 42.40 58.90 57.20 35.10 62.70 56.30
+325 mesh 57.00 72.90 67.20 55.50 75.40 67.50
-325 mesh 43.00 27.10 32.80 44.50 24.60 32.50
220 tons/hr 270 tons/hr
Specific 1.678 1.889 1.847 1.691 1.931 1.870
gravity % Solids 61.78 72.80 70.50 62.00 75.10 71.80
+20 mesh 0.50 0.80 3.70 0.30 7.30 7.20
+28 mesh 0.90 8.20 5.80 0.70 11.10 10.00
+35 mesh 2.00 12.90 9.50 1.80 17.30 14.60
+100 mesh 22.10 48.70 41.80 27.80 57.00 49.50
+200 mesh 45.00 65.50 60.80 51.70 70.80 69.10
+325 mesh 62.10 77.60 73.40 71.70 82.80 76.70
-325 mesh 37.90 22.40 26.60 28.30 17.20 23.30
290 tons/hr
Specific 1.691 1.925 1.876
gravity % Solids 62.00 74.80 71.60
+20 mesh 0.50 8.20 7.40
+28 mesh 1.20 12.40 11.10
+35 mesh 2.30 18.30 15.60
+100 mesh 26.30 58.30 51.70
+200 mesh 51.30 76.20 71.80
+325 mesh 63.00 82.50 79.00
-325 mesh 37.00 17.50 21.00
Source: Ref. 78.
Ball Mills
245
FIG. 4.17 Performance of a wet closed-loop ball mill. Data are for a cylindrical mill with a L/D = 1.39 and hydrocyclone classifiers operating on Florida pebble rock. (Agrico Chemical Co., Tulsa, Okla., unpublished data, 1980.)
3. Inertial type: These include the double-cone classifier and the baffled dust settling chambers. These classifiers are utilized for coarse or oversize materials separation.
4. Screens: These can be used for coarse and intermediate sizes.
A vast literature for both cyclonic and inertial-type separators has been accumulated in connection with air pollution control operations. Details of construction, calculation methods, and selection criteria can be readily found elsewhere [80-90] and will not be discussed further in this chapter. Operation of centrifugal-type separators is discussed in more detail in Section 4.10.
4.8 BALL MILLS
Ball mills consist in their simplest form, of a hollow double conical, cylindrical, or cylindroconical shell set with its axis in a horizontal or near horizontal position. The shells are no more than half full with "balls," which are generally spheres but can be cylinders or cubes as well. Material to be ground is fed through a hollow trunnion at one end and leaves the mill through another hollow trunnion at the other end.
246
Phosphate Rock Grinding
TABLE 4.9 Derrick Screen Performance on Ground Rock Slurry
Source: Ref. 79.
Ball Mills
247
(15)
As the mill is rotated, the charge of balls is raised along the shell up to a certain height, from where they tumble by rolling (cascade) over the other balls or are projected through the air to strike the toe of the charge (cataract). Experience has shown that the best mill performance is obtained when cataracting balls strike the toe of the displaced charge and not the shell. Coarse material tends to accumulate at the toe of the charge, and the impact of the cataracting balls is a very important part of the total grinding mechanism [30(p. 240)].
The inside surfaces of the mill are usually lined with an abrasion-and/or corrosion-resistant material such as manganese steel, Hi-hard, or thick rubber pads. Mills lined with rubber operate quieter and can be fully acid-proofed to allow for operation on low-pH water. Inside liners are usually designed with small projections to increase the effective friction between the charge and the liner and permit operation of the mill at lower rotational speeds.
4.8.1 Operating Parameters
Mill Speed
The critical speed of a mill is the speed at which the centrifugal force will hold the charge against the mill's shell without tumbling. This speed is given by [26(p.243)].
= 42.305
Cs D 1/2 m and
76.63 s -Dftl/2 where
C = mill speed, rpm s
D = diameter, m m = diameter, ft
Actual operating speeds vary from 80% for small, 1-m diameter ball mills to 66% for large-diameter (6-m) mills.
Ball Size
Maximum ball size should be at least from 30 to 40 times the size of the coarsest aggregate fed to the mill, to allow for abrasion and compression grinding. Feed material larger than approximately 0.035 the
(16)
248
Phosphate Rock Grinding
maximum ball size can only be broken by impact at the toe of the charge by the larger cataracting balls [30(p. 240)].
Ball Charge and Power Requirements
Ball mills are operated with 40-50% of the shell volume occupied by the charge. The power drawn by a ball mill is a function of the percent ball charge, as shown in Fig. 4.18, and of other mill characteristics, as given by the following equations [24,26(p.256)]:
kW = 4.879D0,3(3.2 - 3V )fcs|l - I + S (17)
m p I 9-10f I s
1 \ 2 cs/
and
0 3
kWn = 3. ID (3.2 - 3 V )f ft-lb p cs
0.1 \
-9-10f I
2 cs/
(18)
1 -
+ S
s
where
PERCENT OF MILL OCCUPIED BY BALL CHARGE
FIG. 4.18 Power requirements versus ball charge. (From Ref. 26.)
Ball Mills
249
kWm = kilowatts per metric ton of balls (1000 kg)
kWft jb = kilowatts per short ton of balls
D = diameter, m m
D„ ,, = diameter, ft
ft-lb
V = fraction of mill volume occupied by balls P
f = fraction of critical speed
Ss is a ball size factor applicable to large-diameter mills which is given by
S = 1.102 B Tn12R 50P <19>
S DU . о
where
В = ball diameter, mm
D = mill diameter inside lines, m
Sg = kilowatt-hours per metric ton of balls
In terms of В in inches and mill diameter in feet, the power per ton of
balls is given by
_ В - 3D/20
s 2
(20)
The price of balls per ton is fairly constant between 1.5 and 10 cm. Above 4 in. (10 cm) the price of balls increases. For this reason balls are seldom specified larger than 4 in. (or 10 cm). This generally means that balls smaller than optimum size are generally used when coarser phosphate feeds are to be ground. The best way to compensate for this factor is to increase the toe area by increasing the length-to-diameter ratio of the mill.
As the mill operates, balls wear down. When charging a new mill or recharging an old mill, the initial ball size distribution should approximate the expected ball charge size distribution after the mill is in operation. After the mill is in operation, the charge is replenished only with large balls [ 24].
Other correlations are available [15] for mill power. The important fact about these correlations is that the mill power is expressed in terms of kilowatts per ton of ball charge, not per ton of rock ground. In other words, it depends on the mill speed of rotation, diameter, and percent ball charge and is basically independent of material throughput.
250 Phosphate Rock Grinding
Corrections for Grate Type
The following grate correction factor should be used with Eqs. (17) and (18):
For wet grinding and a low-level discharge grate, multiply by 1.16.
For dry grinding and a full-discharge grate discharge, multiply by 1.08.
4.8.2 Mill Selection
Length-to-Diameter Ratio
For phosphate rock the following length-to-diameter ratios have been found most satisfactory:
L/D
Dry open loop
Dry closed loop
Wet open loop Wet closed loop
2.0-2.5
0.8-1.2
2.0-2.5
1.35-1.65
Mill Volume
The volume of the mill has to be sufficient to accommodate a ball charge which will draw the energy required by the grinding duty. For calculation purposes the following bulk densities of the ball charge can be utilized [26].
q q
kg/пг lb/ft
Forged steel and cast steel 4646 290
Cast iron balls 4165 260
The calculations can be carried out by a trial-and-error procedure which involves selecting mill sizes and rotational speeds until the power drawn by the mill matches the energy requirements determined from application of the Bond work index formulas with correction factors. Conversely, tables prepared by manufactures for various mill proportions and sizes can be used to expedite the calculations.
4.8.3 Applications
Table 4.10 lists typical ball mill installations worldwide.
Сб ф
S.g
3 g
и Q
3 g
т.сс, DG сп сс > с io с > о С > с DG со,сс СП СС ) ) ) )
Я
О
Q
Я
й о
сб О о
С Й
Е О
Сб Й й Сб
Й О CZ2
Сб
Сб Xi сб Й Й
0)
<P
Я
Ф
Й й
Сб
Й О
£ s
bDO Й ‘
m
ф ьо
сб Ы)
ew
Й
° £
сб 75
сб Й
сб Й сб
ф
* « .£ " й
ф е со
о»
Ьо Е
ф Я
0>
Ф
CZ2
О и §
<D
ф о й ф
сб
Ф Я сб
о ф
Xi ф й О’
й о
Я
И
3s
Ф
О О
е ф
S -E
CZ2
и ф й
Й сб
ф
2 .£
О fa
Л й Й л Й сб
СО Й я
251
№ СП № TABLE 4.10 (Continued)
Capacity
Location „ a Type Size (ft) hp (tons/hr) Rock feed Product Notes
France Azotes-Produits C,CC, 15 J : x 15 2600 100 (metric) 95% -16 mesh 70% -200mesh Florida
Chimiques (APC) Rouen, Seine DC 106 (metric) 92% -16 mesh 70% -200 mesh Moroccan
Maritime Satec LeBoucau, C,CC, 10 x 84 500 35 (metric) 92% -16 mesh 80% -100 mesh Moroccan
Basses Pyrenees DG
Holland: U.K.F., Rotterdam C,CC, DG 14 x 15i 2200 85 (metric) 95% -16 mesh 80% -100 mesh Moroccan (Khouribga)
India: Fert. & Chem. T.CC, 10 x 9 500 21 (metric) -378 in. 95% -100 mesh
Travancore, Kerala DG 8i
Indonesia: Spie CO 13 x 96 1500 35 (metric) -4 mesh 80% -200mesh Florida
Batignolles for Petrokimia Moroccan
Iraq: States CO 13 x 131 2200 187 (metric) 95% -4mesh 75% -AFNOR Iraqui
Organization for Mineral 5% -325mesh 22
Korea 90% -100 mesh
Chin Hae, Ulsan, T,CC, 11 x 3 600 30 (metric) -1 in.
S. Korea DG 6 x 10
Yong-Nam Chem. T.CC, 11 x 3 600 30 (metric) -1 in. 90% -100 mesh
DG 6 x 10
Lebanon: Lebanon Chem. C,CC, DG 12 > < 191 1800 60 (metric) 64 -5 mesh -5 mesh 75% -200mesh 75% -200mesh Moroccan 75 BPL Kneffis
Mexico Fertilizantes C,CC, 15i x 12 2000 115 (metric) Florida 60% -200mesh
Fosfatados Mexicanos Fertilizantes DG C,OC, 14 > : 22 2250 80 (metric) 100 (metric) pebble -i in. -20 mesh 80% -6 mesh 80% -200mesh 97-99% Florida or Moroccan
Mexicanos S.A. Morocco: Moroc- WG c,cc, 15i x 15 2700 100 (metric) 97% -20mesh -35 mesh 90% -100 mesh Moroccan
Phosphate, Safi Poland Polimex-Cekop, DG C,CC, 121 x 14 1300 60 (metric) 95% -3/16 in. 72% -200mesh (Youssafia)
Police and Lubori Polimex-Cekop, DG C,CC, 121 x 15 1400 57 (metric) Florida 70% -200mesh
Ubocz plant Siarkopol plant Spain: Phosphorico DG CO,CC, 12 x 11 1300 45 (metric) pebble 67-70 BPL 80% -3mesh 95% -16mesh 90% -100 mesh Moroccan
Espanola, Huelva Tunisia Sepa, Gabes DG CO.CC, 13 x 96 1500 120 (metric) -4 mesh 35% -125mesh Tunisian (Gafsa)
Spie Batignolles DG CO.CC, 10 x 84 500 51 (metric) 90% -20mesh 70% -115mesh Tunisian (Gafsa)
pour Industries Chimiques Maghrebines, Gabes DG 61 (metric) 55% -115 mesh
253
TABLE 4.10 (Continued)
Capacity
Location Type Size (ft) hp (tons/hr) Rock feed Product Notes
Unites States
Agrico, Donaldsonville, La. C,CC, WG 16} x 23 4000 200 -} in. 85% -35mesh 0.8% +35 mesh
Allied Corp., Helene, Ark. co,cc, DG 10 x 84 500 31 -} in. 60% -200mesh
Beker Industries, Taft, La., C,OC, DG 11 x 27 1750 130 11.9% +6 mesh 23.8% +10 mesh 47.8% +20 mesh 11.1% -100 mesh 0.6% +20mesh 4.9% +40 mesh 27.1% +70mesh
Beker Industries, Taft, La. C,OC, WG 17 x 38 6000 240 6.2% +} in 51.3% +30mesh 65.8% +40 mesh 85.4% +70mesh 1.6% +40 mesh 9.8% +70 mesh 90.2% -70mesh 78.3% -100mesh 47.9% -200mesh
CF Industries, Plant City, Fla. C.CCS, WG 14 x 24 2500 180 85% -3mesh 3% +35 mesh
Davison Chem., Ridgewood, Fla. T,CC, DG 12} 6 x x 11 Hi 1750 100 -3/4 in. 60% -200mesh
Des Plaines, Chicago, Ill. CO.CC, DG 10 x 72 450 23 -} in. 90% -100 mesh
El Paso Natural Gas, Soda T,CC, DG Hi 6 x x 5 101 900 60 -3/8 in. 70% -200mesh
Springs, Idaho
Farmland Industries, Bartow, C.OC, DG 14 x 24 3000 110 87 -} in. 2% +35 mesh 0.8% +35 mesh Converted to wet grinding
Fla.
Freeport Sulphur, C,OC, 151 * 15 2500 150 -} in. 60% -200mesh Converted to closed-
Uncle Sam, La. DG loop wet grinding
IMC, New Wales, C,OC, 16} x 17 3000 150 85% -3mesh 0.5 +35 mesh Converted to closed-
Fla. DG loop wet grinding
IMC, Noralyn, T,CC, 12} x 6 1250 70 (metric) -3/4 in. 65% -200mesh
Fla. DG 6 x 11}
Miss. Chem., T,CC, lli x 5 900 55 -3/8 in. 60% -200mesh
Pascagoula, Miss. DG 6 x 10}
Montana Phosphate, 10} x 15 900 66 80% -20mesh 80% -200mesh
Sherryl, Mont.
Montana Phos- CO,CC 6 x 36 60 34 80% -200 mesh
phate, Sherryl, DG
Mont.
Mountain Fuel CO,CC, 8 x 48 200 10 Calcined, 65% -200mesh
Supply, Salt DG -} in.
Lake City,
Utah
Occidental,
Lake City, Fla. T,CC, 11} x 4 800 45 (metric) -10 mesh 85% -100 mesh
DG 6 x 10}
Pasadena Chem., T,CC, 11} x 5 900 55 -} in. 65% -200mesh
Pasadena, Tex. DG 6 x 10}
Fortetex, CO,CC, 10 x 72 450 25 -} in. 60% -200 mesh
Pasadena, Tex. DG
San Franc. Chem., CO,CC, 10 x 84 500 30 -48 mesh 95% -100 mesh
Monteplier, Idaho DG
Sinclair Petro- T,CC, 12} x 6 1250 80 -} in. 55% -200mesh
chemicals, Fort DG 6 x 11}
Madison, Iowa
255
Rod Mills
257
и OJ
о Z
Л
И
Ф
О e
о
о
о 03
1
Pm o\°
о
T3
Ф J iJ
РФ Рм Рм
£Q И
о 00 CO
О co t—
Рм
4.9 ROD MILLS
Rod mills are similar to ball mills in details of construction and operating principles, except for the requirements that the mill body must be of cylindrical shape and the length-to-diameter ratio should be 1.4: 2.5 to prevent rod entanglement. In addition, current manufacturing limitations place a limit of 6.8 m or 20 ft on the maximum rod length. Maximum current diameters of rod mills would be, based on the foregoing limitations, 6.8 x 4.8 meters or 20 x 14 ft.
4.9.1 Operating Parameters
Mill Speed
Rod mills are operated at a smaller percentage of the critical speed than are ball mills, typically 73% for 1-m diameter mill and 67% for a 4.5-m diameter mill.
Rod Diameter and Length
Rod diameter varies from 25 to 150 mm. The required size is roughly related to the feed size by the ratio
rod diameter ,, , .
• Г .1 4. ~ (21)
maximum feed diameter
However, experience has indicated that rods with diameter less then 4 cm do not survive long without being broken. Broken rods must be removed periodically from the mill to maintain control particle size distribution.
Rods length should be from 5 to 25 cm shorter than the length of the shell.
Rod Charge and Power Requirements
Rod volumes that give optimum milling conditions are approximately 35% of the shell volume or with normal voidage about 45% of bulk volume. The optimum percent decreases as the rods wear down [30(p. 233)].
As in the case of ball mills, the power drawn by a rod mill is a function of the rod charge, diameter, and rotational speed. The following equations can be used [26(p.248)J:
о 3ч
kW = 1.752D (6.3 - 5.4V )f (22)
m m p cs
and
hp 700
o’ О Ен’ 0 Q - о о 6 о О Q
° о
О й о СО £
Z к .. СО
□ CO CO i C . <3 и '!> QQ
и CO Д о Л СО
И C6 c ?M Л и о о •гЧ f-.fl г* &м О
Ф Ь < Й ° > t-у OJJ ><
и О о
о
О ьо
о со
О &
256
258
Phosphate Rock Grinding
0 33
kW л = 1.07D ' (6.3 - 5.4V )f (23)
Ib-ft ft p cs
where
kW - kilowatts per metric ton of rods (1000 kg) m
kW_ = kilowatts per short ton of rods ft-lb
D = mill diameter, m
m
Df = mill diameter, ft
V = fraction of the mill occupied by rods P
f = fraction of the critical speed
As in the case of a ball mill power, requirements are basically independent of throughput.
4.9.2 Applications i
Table 4.11 lists typical rod mill installations in the United States and
Morocco.
4.9.3 Mill Selection
i
The experience available with rod mills on phosphate rock is limited. The main advantage to be expected from rod mills is a narrower size distribution of product particle size. This is shown in Fig. 4.19, where the performance of a rod mill is compared with a ball mill at the same power input.
Mill Volume
The procedure for calculating the required mill size is similar to ball mills, with one exception. The Bond work index must be determined from a different procedure than for ball mills [24,30(p. 233)]. For calculation purposes, the following bulk densities can be utilized:
Meters Feet , , 3 kg/m 3 lb/ft
New rods - - 6247 390
Worn in charge 0.91-1.83 3-6 5847 365
1.83-2.74 6-9 5766 360
2.74-3.66 9-12 5606 350
3.66-4.57 12-15 5446 340
Notes Tailings й сб О о о й о 'S
Л Л
Л М и
-4—1 И ф ф
о 'О Е £ о Е о
0 о CVJ о
й cq । «Н
Ph ' о\о
о\о О о\о
о о о
ОО о
Л
Ф с м •
Ф .д Ф Й
тТ £
Д4 О о
o со со со
о + + 1
й о\о О сл°
о «ч
cq ।
'й
л со
о Сб и £ £ сб о 67 12-1 120 О
о +-
О о о co
д о со о rH
тГ Ю тГ
гН
Нм
о Н*
ф СЧ СО гН
со
X X
Й X х __
со Нм
00 ’tr ОО
о о о и
Ф а & & & &
>> * *
В fc о о о
О' О О о
со
1 С • Ш
Й О "Й о “л S . «в » 2 Рч , Д • Ё g « й и “ Ф
о и Й S Ё -о z _, 5 Я Ф +4 Я - J с .ci си _, п ф й г1“| '-< йч О 2 5 а и g § g tn о О Cw о Сб О СД й
й S и -1 О
Р S
as
ОС, open cycle; WG, wet grinding.
259
260
Phosphate Rock Grinding
FIG. 4.19 Comparison of the performance of a closed-loop ball mill with an open-loop rod mill. (Data courtesy of Koppers Company, York, Pa.)
Again, as in the case of ball mills, tables available from manufactures will expedite the design effort.
4.10 PENDULUM OR RING ROLLER MILLS
Pendulum mills were very common during the 1950s and 1960s when phosphoric acid units where of small size. Their technical approach to rock grinding and their great flexibility make the system very economical. Most of the existing European phosphoric acid plants actually use pendulum mills. Unfortunately, their limitation lies in the size and capacity of the unit. The largest pendulum mill will only grind some 35-40 tons/hr at the required fineness for phosphoric acid when, for example, Florida rock is to be used (Fig. 4.20).
Since the modern standard size of a phosphoric acid unit is close to 1000 tons/day of P2°5> some 140-160 tons of phosphate rock per hour have to be ground, and this would need a grinding plant with a series of four to five pendulum mills. In some cases it has been done
Pendulum or Ring Roller Mills
261
and it is not necessarily uneconomical in comparison with other large grinding equipment. This is because pendulum mills currently have a lower energy consumption per ton of ground rock.
However, pendulum mills need better quality operating control and thorough maintenance. The cost comparison with ball and rod mills still stands for plants where the qualifications of operating and maintenance staff are of a high level.
FIG. 4.20 Ring roller mill (Indutec), 30-40 tons/hr.
Indutec, Monchen gladbach, West Germany, 1980.)
(Courtesy of
262
Phosphate Rock Grinding
4.10.1 Description
The principle of a pendulum mill (Fig. 4.21) consists of vertical shaft rollers, circulating inside a grinding ring. This ring, sometimes called a bull ring or die ring, is the grinding medium. The rotation of the rollers along the inner side of the grinding ring generates a centrifugal force, pressing the roller against the grinding ring. Phosphate rock is.collected from the mill base by ploughs, one circulating with each roller, and is thrown toward the roller/ring interface. The roller and ring section is air swept and the ground rock particles are immediately fed pneumatically to the upper part of the mill, where a particle size selector will collect and recycle the coarse particles of the entrained rock to the grinding level (Fig. 4.22).
The rollers are generally three in number, but mills with four, five, and even six rollers have been built. The rotating grinding rollers are supported by the roller carrier (sometimes called a spider) by simple trunnion bearings. The roller carrier is fitted to the central shaft by which the rotating movement is transmitted.
Controlled rock feed to the mill is made by either rotary or vibrating feeders. Most of the time the amperage of the mill motor is taken as the control factor for the feed rate.
Pneumatic rock transportation through the system is achieved by a constant airflow, cycling from the mill fan, through the grinding ring, the mill separator, the cyclone collector, and back to the fan (Fig. 4.23). The air enters via the mill basement, usually consisting of a spiral - shaped, solidly designed cast-iron air inlet chamber. Rock grinding and the ventilation to extract ground material both take
FIG. 4.21 Grinding principle of ring roller mill. 1, Grinding ring; 2, roller; 3, plow lifting coarse rock; 4, recycled airflow; 5, air plus ground rock.
Pendulum or Ring Roller Mills
263
FIG. 4.22 Cross section of an Indutec three-roller mill equipped with a whizzer-separator. 1, Unground rock inlet; 2, recycled air inlet;
3, plow; 4, whizzer blades; 5, recycled coarse particles; 6, air and ground rock outlet; 7, gear; 8, motor; 9, main shaft and spider;
10, pendulum roller assembly; 11, grinding ring; 12, motor and gear for whizzer.
place at the same time, avoiding overgrinding and consequently working with a maximum of efficiency.
When passing the grinding ring section, the air loads itself with ground rock particles and passes the separator where the coarse rock
264
Phosphate Rock Grinding
particles are removed by centrifugal effect to be sent back to the grinding rollers. The separator is generally a whizzer-separator (rotating blades with variable speed control). The air leaving the mill will only carry ground phosphate rock. This ground rock will be collected by a welded steel cyclone which will release it via a rotary valve or other air-trapping device. Clean air leaving the cyclone collector will close the pneumatic cycle by returning to a multiblade, heavy-duty fan. The pneumatic cycle is not airtight; there are several air inlets which also protect the various mill bearings from dust. The rollers and main shaft assembly are provided with fresh-air-swept interfaces. This fresh air, at atmospheric pressure, enters the pneumatic cycle because the latter is maintained under partial vacuum by continuous air extraction, realized by a second, smaller fan. The extracted air is filtered and released to atmosphere.
The speed of the air circulating within the pneumatic cycle varies slightly with the mill engineers. Usually, there is an air speed of 4-5 m/sec through the grinding ring section, considered as free section. This corresponds to about 16,000-18,000 m^/hr for small units
FIG. 4.23 Flow diagram for a ring roller mill. 1, Unground rock bin; 2, ring roller mill; 3, main air fan; 4, cyclone; 5, exhaust air filter; 6, ground rock bin; 7, air inlet.
Pendulum or Ring Roller Mills
265
(6-8 tons/hr) and 50,000-60,000 m2/hr for large units (35-40 tons/hr). Exhaust air leaving the cycle is about 5-8% of the total flow.
Pendulum mills are constructed in many countries. Among others there are Raymond, United States; Bradley, England; Stein Roubaix, France; and Indutec, West Germany.
4.10.2 Behavior of Phosphate Rock Particles
Under Grinding Pressure
The main grinding effect of the pendulum mill is obtained by the pressure of the rollers passing on a phosphate rock layer.
When compressing coarse phosphate particles in a laboratory, the volumetric compression, due to crushing particles filling the interstices with the resulting crushed material, is nearly a linear function of pressure until the interstices are filled. The function then undergoes a quick change and becomes an exponential function with a very high pressure increase with very little volume compression. The change from the first to the second function shows strong "elbows" on the diagram. The elbows usually correspond to pressure levels between 30 and 60 kg/cm2.
The practical meaning of this phenomenon is that up to a certain limit, pressure increases of the rollers will affect proportionately the amount of rock ground. Once this limit is passed, a further pressure increase will not substantially increase the grinding capacity.
4.10.3 Grinding Capacity
The grinding capacity of a pendulum mill can be expressed as follows:
Q = M„K К (24)
V r I
where
Q = grinding capacity, tons/hr
M = milling capability number of the equipment
= phosphate rock quality constant
= phosphate rock fineness constant
Mq , the milling capability of the equipment, depends on the centrifugal pressure of the rollers and the grinding ring surface covered by the sum of the rotating rollers per unit of time. Thus
Mc = FS
(25)
г
266 Phosphate Rock Grinding
where
F = centrifugal force, tons (applies to one roll)
S = surface covered by the sum of the rollers, m2/min
F can be calculated:
Pf 2
F = 7~77 (W) R (26)
У. ol
where
P = unit weight of a roller assembly
w = main shaft revolution speed, where w= 2ttN/60 with N = rpm of the main shaft
9.81 = gravity acceleration constant
R = rotation radius of the rollers (half of inner grinding ring diameter minus roller diameter)
f = gravity center correction factor for the roller weight because of its upper support in the bearing (mean value 0.754 to be taken if no measured number is available)
The covered surface S can be calculated as follows:
S = vrDhNn (27)
where
D = inner grinding ring diameter
h = grinding ring width
N = revolutions per minute of the main shaft
n = number of rolls
7T =3.14
By summarizing the equation, we can write
M = 0.00351PfN3RDhn (28)
Cz
The model is very informative; it shows the important effect of the mill speed.
4.10.4 Phosphate Rock Quality Constants
From Eq. (24) we have seen that the grinding capacity of a mill with a given phosphate rock depends on two rock constants: one for the rock quality of origin, and one for the fineness ratio (in and out).
Pendulum or Ring Roller Mills
267
So far, these constants cannot be calculated theoretically or even measured by some laboratory test; they can only be calculated from grinding experience with a given pendulum mill with known dimensions. Table 4.12 will show KpKf coupled values for different rocks at different finenesses. It is obvious that in case of phosphates like Florida rock or Moroccan rock, where different qualities are blended, the KrKf products will range within a rather wide gap.
4. 10.5 Power Consumption
The power consumption is mainly in the mill and the fan motor. Whiz-zer-separators and phosphate rock feeders consume very little energy.
The pneumatic cycle usually has a total pressure drop of about 300-350 mm water gauge. Per unit of 10,000 m^/hr of air, about 15-20 kW is installed.
Installed power for mill motors accounts for 8-10 kW for each IOOMq (milling capability). Actual power consumption in kW/hr is not constant for a given Mq of a mill. It also varies with the phosphate rock quality or grindability which affects the compression work of the rollers along the grinding ring.
4.10.6 Economics
Investment Costs. A 1000-ton/day P2O5 unit needs some 150 tons of rock per hr to be ground. In that case a grinding plant with four mills in the case of a soft rock, and with five mills in the case of a hard rock. Would be needed.
The investment costs (1981 prices) with five units and a phosphate rock with a grindability comparable to Florida rock would be:
Cost of equipment Electric motors Supports and bins Civil work
U.S.$ 1,950,000
190,000
625,000
450,000
U.S.$3,215,000
Production Costs. dudes the following:
Production costs (per ton of ground rock) in-
Electric power
Labor and supervision
Spare parts
Maintenance labor
15kWh/ton 0.012 hr/ton
U.S.$0.08
U.S.$0.17
268
Phosphate Rock Grinding
TABLE 4.12 Phosphate Rock Characteristic and Particle Size Constant Product for Various Phosphates and Fineness
Particle size of К к
Rock origin ground material r f
Tunisia, Gafsa 90% < 50 pm 0.0075-0.0085
80% < 50 pm 0.0085-0.0095
90% < 125 pm 0.011-0.012
80% < 125 pm 0.015-0.018
70% < 125 pm 0.021-0.023
Morocco, Khouribga 90% < 152 pm 0.009-0.013
80% < 152 Pm 0.011-0.017
70% < 152 pm 0.017-0.023
Israel (Zin), Jordan 90% < 152 pm 0.012-0.014
80% < 152 pm 0.020-0.023
Togo, Taiba 90% < 152 pm 0.020-0.023
85% < 152 pm 0.023-0.028
Florida 95% < 152 pm 0.004-0.006
75% < 80 pm
90% < 152 pm 0.005-0.007
50% < 80 pm
80% < 152 pm 0.006-0.010
70% < 152 pm 0.0085-0.012
60% < 152 Pm 0.0090-0.014
4.10.7 Case Study
Let us calculate the grinding capacity of a pendulum mill when grinding Florida concentrate 70 BPL at a fineness of 80% through 152 pm.
Grinding ring
Diameter (D): 1.935
Height: 0.290 m
Rollers
Number: 4
Diameter (d): 0.64 m
Weight: 1.40 tons
f: 0.754
Main shaft speed: 92 rpm KyKf for Florida
80% < 152 pm: 0.008
Pendulum or Ring Roller Mills
269
Surface area per minute covered by the four rolls:
2
S = 3.14 x 1.935 x 0.29 x 4 x 92 = 649 m /min (29)
Centrifugal force:
F = 1.4 x. 0.754 x (2lT*.-? )x 1-935 ~ 0-64 = 6.46 tons (30) \ oU / 2
M = FS = 649 X 6.46 = 4197 (31)
V/
Q = McKrKf = 4197 x °. 008 = 33.6 tons (32)
Mill motor to be installed:
4197 x 8 = 336 kW use 355-kW motor (33)
(next standard size above) .
4.10.8 Optimization
If a pendulum mill is not rotating at its optimum speed, there is a waste of energy. We have to make sure that the rollers work with sufficient grinding pressure. Since we cannot measure the part of the roller's surface which is compressing the rock and actually grinding, we have arbitrarily taken the surface value of h x a x 0.06 to calculate a pressure in ton/m2. Since this value is used only to compare one mill with another, it can be arbitrary. Calculating
F 2
й ' л „ л nc = roller pressure on rock layer (ton/m ) (34)
И x Q x U. Uu
2 we find for the high-efficiency mills, numbers around 550-600 tons/m or 55-60 kg/cm^. With mills operating at lower values, the mill can be speeded up according to Eq. (26) and the throughput will increase almost to the third power of the speed increase.
4.10.9 Capacity Evaluation When Changing Phosphate Rock Quality
With known KrKf values, the capacity of a mill, when changing rock, will be as follows:
S
%
к к.
_ ra fa
“ К . К
rb fb
(35)
270
Phosphate Rock Grinding
where
a = rock quality a b = rock quality b Q = capacity of the mill
К K. = phosphate rock constants r i
4.11 ROLLER MILLS
Roller mills work similarly to pendulum mills: the phosphate rock is ground by a hard steel roller passing with high pressure over a phosphate rock layer on a grinding table. In the case of roller mills, the latter is a rotating dish or steel plate, also called the grinding table. Like pendulum mills, the capacity of the roller mill is a result of the product of pressure x surface area (covered by the rollers). Nevertheless, the layer of rock, being on a horizontal plate, is more uniform. The pressure of the rollers is obtained by mechanical means such as springs. But a more recent development from Loesche, West Germany [ 92], uses hydropneumatic devices. The hydropneumatic system allows control of the grinding pressure of the rollers and adjustment to the optimum grinding efficiency. Pressure regulation or variation can be achieved during operation.
The roller mill system makes it possible to design very large units (Fig. 4.24). The largest roller mill operating on phosphate rock grinds some 85 tons/hr in one unit. Engineers, following their experience with limestone, say that a unit size of over 900 tons/hr is feasible.
4.11.1 Description
As compared with the pendulum mill, the grinding mechanism differs. The rollers rotate on inclined fixed shafts, positioned by the horizontal grinding table (Fig. 4.25); they are pressed on by mechanical means (Fig. 4.26). The system design-air sweeping, ground rock feed, dynamic selector, cyclonic separator, exhaust air, and filters— are similar to that of the pendulum mill system (see Section 4.10, especially Fig. 4.23).
4.11.2 Capacity
The roller mill operates with a higher-pressure load per roller than the pendulum mill. This permits operation with a thicker rock layer between the rollers and the grinding table. With a thicker rock layer the relative effective grinding surface of the rollers increases. In fact, grinding is achieved with pressure rates of some 50 kg/cm2 depending on the constructors. [This is effective pressure—not to be
Roller Mills
271
FIG. 4.24 Rollers of a large Loesche mill. (Courtesy of Loesche Hart-zer-Kleinerungs und Zementmaschine K.G., Dusseldorf, West Germany, 1974.)
compared with the arbitrary pressure calculated with Eq. (34).] The rotating speed of the grinding table is lower than the speed of the pendulum mill shaft. The grinding capacity can be written
Q=MCKrKf
(36)
where
Q = capacity of the mill, tons/hr Mc = milling capability number
272
Phosphate Rock Grinding
FIG. 4.25 Loesche mill type LM 17 with hydropneumatic spring mechanism: (a) mill gear box, (b) grinding table, (c) grinding rollers, (d) spring mechanism, (e) roller in swung-out position, (f) Louvre ring, (g) buffer stops, (h) classifier. (From Ref. 92.)
and
M = FS
X-z
(37)
where
F = grinding pressure per roller, tons per roller
S = surface covered per minute by the sum of the rollers, m^/min
К К = phosphate rock constants (see Table 4.1) r f
Roller Mills
273
The use of Eq. (36) for roller mills is limited to small sizes where the roller pressure can be compared with those of ring roller mills. Large units operate with very high pressure rates, far above those of ring roller mills. The Loesche, Lm 21/1600 type (85 tons/hr), for example, operates with 55 tons per roller. This is equivalent to a multiple of the pressure used with ring roller mills. With increasing roller pressures, the grinding effect of phosphates decreases sharply after a threshold value. Consequently the pressure effect cannot be taken as a linear function for such a wide extrapolation. Loesche, for example, uses its own grinding capacity numbers with a similar formula, also using a rock quality and a rock fineness number.
4.11.3 Economics*
The investment costs for a 1000-ton/day P2O5 plant, consisting of a single grinding unit (140-160 tons/hr) are as follows:
FIG. 4.26 Hydropneumatic spring system. (Courtesy of Loesche Hartzer-Kleinerungs und Zementmaschine K.G., Dusseldorf, West Germany, 1974.)
*1981 prices.
274
Phosphate Rock Grinding
Equipment costs Electrics Supports, bins Erection
Civil engineering
U.S.$2,200,000
365,000
250,000
430,000
150,000
Total investment costs U.S.$3,395,000
4.11.4 Case Study: Mill Capacity Estimation
From the characteristic data of a small roller mill, the grinding capacity with different phosphates is to be calculated:
Roller grinding unit with three rollers
Roller width: 0.25 m
Operating radius (external): 0.57 m
Roller pressure: F = 7.72 tons
(when dye plate operating, rock loaded)
Dye plate speed 44 rpm
KyKf for Israel rock: 80% < 152 pm: 0.021
KrKf for Tunisia rock: 80% < 125 pm: 0.0165
KpKf for Morocco rock: 70% < 152 pm: 0.020
According to Eq. (36), Q = M К K_, with Eq. (37) yielding
Vz Г I
M„ = FS
and
F = 7.72 tons
S = [(0.57)2 - (0.57 - 0.25)2] тг x 44 x 3 = 92.3 m2/min
FS = 7.72 x 92.3 = 712
Grinding Israel Zin rock at a fineness of 80% < 125 pm and К К
0.0165 yields Г
Q = 712 x 0.021 = 14.9 tons/hr
Grinding Tunisia rock at 80% < 125 pm and К К = 0.0165 yields : r t
Q = 712 x 0.0165 = 11.7 tons/hr
Grinding Morocco at 70% < 152 pm and Kj.Kf = 0.020 yields
Q = 712 x 0.020 = 14.2 tons/hr
References
275
REFERENCES
1. S. E. Dahlgren, Chemistry of Wet-Process Phosphoric Acid Manufacture, in Phosphoric Acid, Vol. 1, Part I, (A. V. Slack, Ed.), Marcel Dekker, New York, 1968, Chap. 2.
2. S. M. Janikowski, N. Robinson, and W. F. Sheldrick, Insoluble Phosphate Losses in Phosphoric Acid Manufacture by the Wet Process: Theory and Experimental Techniques, Proceedings No. 81, The Fertilizer Society, London, 1964.
' 3. W. A. Lutz and C. J. Pratt, Principles of Design and Operation [of Dihydrate Processes], Phosphoric Acids, Vol. 1, Part I (A. V. Slack, Ed.), Marcel Dekker, New York, 1968, p. 173.
4. L. E. Gates, J. R. Morton, and P. L. Fondy, Selecting Agitator Systems to Suspend Solids in Liquids, Chem. Eng., May 24, 1976.
5. J. Y. Oldshue, Solid-Liquid Mixing in Hydrometallurgy, in Unit Processes in Hydrometallurgy, Gordon and Breach, New York, 1964.
6. S. Stern, The Use of Calcined Rock in Phosphate Processing, International Superphosphate Manufacturers Association Technical Conference, Edinburgh, September 1965.
7. D. G. Thomas, Non-Newtonian Suspensions, Ind. Eng. Chem. 55(11): 25 (1963).
8. J. M. Smith, Non-Newtonian Technology, in Chemical Engineering, 2nd ed., Vol. 3 (J. M. Coulson and J. F. Richardson, Eds.) , Permagon, Elmsford, N. Y., 1979, p. 479.
9. D. Leyshon, private communication, August 28, 1981.
10. Lurgi Express Information 1995/4.78, Lurgi Chemie und Hutten-technik GmbH,
11. R. Danos, private communication, July 30, 1981.
12. S. V. Houghtaling, DPG-Prayon Modern Dihydrate Process, ACS, Division of Fertilizer and Sludge Chemistry, Chicago, August 1973.
13. M. Miyamoto, Performance of New Nissan Phosphoric Acid Process Plant, International Superphosphate Manufacturers Association Technical Conference, The Hague, September 1976.
14. G. Landgraf, private communication.
15. C. Orr, Size Reduction, in Kirk-Othmer Encyclopedia of Chemical Technology, Vol. 18, Wiley, New York, 1969, p. 327.
16. A. F. Grand, Lecture Notes in Linear Fracture Mechanics, Purdue University, West Lafayette, Ind., 1981.
17. P. J. Falivene, Graph Paper for Sieve Analyses, Chem. Eng., February 23, 1981, p. 87.
18. W. J. Dixon and F. J. Massey, Introduction to Statistical Analysis, 2nd ed., McGraw-Hill, New York, 1957, pp. 55-57.
19. C. Churchman and J. Martines, Economic Energy Savings in New Phosphoric Acid Plants, Joint Peninsular and Central Florida Sections, AIChE Meeting, Clearwater Beach, Fla., 1981.
276
Phosphate Rock Grinding
20. W.C. Weber and C. J. Pratt, Phosphate Rock, Handling and Storage, in Chemistry and Technology of Fertilizers (V. Sauchelli, Ed.), Reinhold, New York, 1960.
21. P. R. von Rittinger, Lehrbuch der Aufbereitungskunde, Berlin, 1867.
22. F. Kick, Das Gesetz der proportionalen Widerstande und seine Anwendung, Leipzig, 1885.
23. F. Bond, The Third Theory of Comminution, Mining Eng. 4: 484-494 (1952).
24. F. Bond, Crushing and Grinding Calculations, Allis Chalmers publication 07R9235C.
25. S. R. S. Sastri and K. S. Narasinham, Predicting Grinding Mill Energy Use, Chem. Eng., September 1, 1975, p. 103.
26. C. A. Rowland and D. M. Kjos, Rod and Ball Mills, in Mineral Processing Plant Design (A. Mulard and R. Bappu, Eds.), Society of Mining Engineers, Denver, Colorado, 1978, p. 264.
27. P. S. O'Neil, Residence Time Profile of Faustina Phosphate Rock Ball Mill, Agrico Interoffice Communication, June 2, 1980.
28. D. M. Himmelblau and К. B. Bischoff, Process Analysis and Simulation, Wiley, New York, 1968, p. 69.
29. H. Heywood, Chemical Engineering Practice, Vol. 3 (H. W. Cramer and T. Davies, Eds.), Butterworth, London, 1957.
30. G. C. Lowrison, Crushing and Grinding, CRC Press, Cleveland, Ohio, 1974, p. 62.
31. A. Ratcliffe, Crushing and Grinding, Chem. Eng., July 19, 1972, p. 66.
32. Koppers Engineered Products, unpublished data.
33. G. D. Loughrie, Wet Grinding of Phosphate Rock Joint Peninsular and Central Sections, AIChE Meeting, Clearwater Beach, Clearwater, Fla., May 14, 1976.
34. С. O. Ingebretson to F. Hughes, Cost Impact of Wet Grinding Rock, Agrico interoffice correspondence, February 1, 1973.
35. K. D. Clevenger to F. Hughes, Filter Wash Water Reduction-Effect on Filter Losses, Agrico interoffice correspondence, March 9, 1973.
36. С. O. Ingebretson to S. A. Savage, Rock Slurry Test at South Pierce, Agrico interoffice correspondence, April 13, 1973.
37. K. D. Clevenger to A. Jaeggi, Rock Slurry Test at SPCW, and Second Rock Slurry Test at SPCW, Agrico interoffice correspondence, May 11, 1973.
38. U.S. Patent No. 4,044,107, August 1977.
39. South African Patent No. 74/6769, 1976.
40. Morocco Patent No. 16,769, 1974.
41. New Zealand Patent No. 175,932, 1976.
42. Spanish Patent No. 431,984, 1976.
43. Iran Patent No. 13,602, 1977.
44. Jordan Patent No. 721, 1974.
References
277
45. Fertilizer Manual, International Fertilizer Development Center, Muscle Shoals, Ala., p. 167.
46. B. Vaughn, private communication, August 26, 1981.
47. J. Vand, J. Phys. Colloid Chem. 52:277 (1948).
48. J. F. Richardson and W. H. Zaki, Trans. Inst. Chem. Eng. (Lond.) 32:35-53 (1954).
49. H. C. Brinkman, Appl. Sci. Res. 1A-.27 (1947).
50. P. G. W. Hawkesly, Some Aspects of Fluid Flow, Arnold Press, New York, 1950.
51. A. T. Nogueira, unpublished data, Agrico Faustina Works, 1981.
52. J. Chang, Viscosity Study of Rock Slurry, Agrico interoffice communication, May 29, 1981.
53. A. B. Metzner and M. Whiltock, Trans. Soc. Rheol. 2:239-246, (1958).
54. C. Thurlow HI, Centrifugal Pumps, Chem. Eng., October 11, 1971.
55. G. B. Shearon, Wet Grinding and Feeding of Phosphate Rock, 25th Annual Fertilizer Industry Round Table, November 1975.
56. G. A. Mooney, A. T. Nogueira, and C. G. Thompson, Laboratory and Pilot Treatment of Phosphoric Acid Wastewater, Joint Peninsular and Central Florida Sections, AIChE Meeting, Clearwater Beach, Fla., May 1977.
57. G. A. Mooney, C. G. Thompson, and A. T. Nogueira, Removal of Fluoride and Phosphorus from Phosphoric Acid Waste with Two-Stage Lime Treatment, 33rd Indust ial Waste Conference, Purdue University, Lafayette, Ind., 1973.
58. S. V. Houghtaling and J. C. Kelley, Wet Rock Grinding Provides Energy Reduction in Phosphoric Acid Plants, Fert. Rev., December 1978.
59. F. C. Bond, Metal Wear in Crushing and Grinding, 54th Annual AIChE Meeting, Houston, December 1963.
60. S. V. Houghtaling, Phosphate Rock Preparation for the Use in the Production of Phosphoric Acid, Davy McKee, Innisbrook Seminar, Innisbrook, Fla., April 1977.
61. W. C. Weber, The Manufacture of Phosphoric Acid by the Wet Process, in Phosphoric Acid, Phosphates and Phosphatic Fertilizers (W. H. Waggaman and Sanchelli, Eds.), Reinhold, New York, 1952.
62. Koppers Mineral Processing Systems Division, Proposal No. 80-228-JD to Agrico, January 29, 1981.
63. Farrow Engineering, Cost Estimate New Ball Mill Installation for Faustina, February 1981.
64. R. Brown to J. Brooks, Stainless Steel Ball Mill, Agrico interoffice communication, March 20, 1981.
65. P. Ragaus, (American Magotteaux) to E. Dolan (Agrico), private communication, May 5, 1981.
66. American Magotteaux Bulletin, Nashville, Tenn.
278
Phosphate Rock Grinding
67. A. Knighten to E. Dolan, The Corrosion Rate of Steel Balls When Acid Cooling Pond Water Is Used in Rock Grinding, Agrico interoffice communication, May 18, 1981.
68. P. S. O'Neill to C. W. Weston, Lab-Ball Mill Tests Using Recycled Water, Agrico interoffice communication, May 13, 1980.
69. W. R. Parish and J. V. Galluzzo, A Concept for Wet Rock Grinding Using Pond Water: The LANG Process, Central Florida and Peninsular Sections, AIChE Meeting, Clearwater Beach, Fla., 1981.
70. B. Svarovsky, Advances in Solid-Liquid Separation, Chem. Eng., July 16, 1979.
71. Krebs Engineers, Bulletin No. 21-130.
72. R. A. Atherthon, The Sizing of Hydrocyclones, Krebs Engineers publication, October 1976.
73. D. Bradley, The Hydrocyclone, Pergamon Press, Oxford, 1965.
74. D. A. Dahlstrom, Fundamentals and Applications of the Liquid Cyclone, C.E.P. Symposium Series, Vol. 50, No. 15.
75. A. Zanker, Hydrocyclones: Dimensions and Performance, Chem. Eng., May 9, 1977.
76. K. Nageswara Rao and T. C. Rao, Estimating Hydrocyclone Efficiency, Chem. Eng., May 25, 1975.
77. A. J. Lynch and T. C. Rao, Modelling and Scale-up of Hydrocyclone Classifiers, llth International Mineral Processing Congress, Sardinia, Me у 1975.
78. J. Alexander, J. Chang, and B. Hamilton, Closed-Loop Grinding Test Run, Agrico interoffice communication, November 25, 1980.
79. G. M. Lloyd, Jr., Derrick Screen Test on Ground Rock Slurry, Agrico interoffice communication, January 24, 1979.
80. R. Jackson, Mechanical Equipment for Removing Grit and Dust from Gases, British Coal Utilisation Reasearch Association, Leatherhead, England, 1963.
81. W. Straus, Industrial Gas Cleaning, Pergamon Press, Oxford, 1966.
82. G. D. Sargent, Gas/Solid Separations, Chem. Eng., February 15, 1971.
83. J. M. Peters, Predicting the Efficiency of Fine-Particle Collectors, Chem. Eng., April 16, 1973.
84. C. Doerschlag and G. Miczek, How to Choose a Cyclone Dust Collector, Chem. Eng., February 14, 1977.
85. W. H. Kich and W. Licht, New Design Approach Boosts Cyclone Efficiency, November?, 1977.
86. T. I. Horzella, Selecting, Installing and Maintaining Cyclone Dust Collectors, Chem. Eng., January 30, 1978.
87. Y. M. Shah and R. T. Price, Calculator Program Solves Cyclone Efficiency Equations, August 28, 1978.
88. R. H. Perry, Engineering Manual, 2nd ed., McGraw-Hill, New York, 1959, pp. 5-46 to 5-61.
References 279
89. American Air Filters, Cyclone Dust Collectors, Bulletin 267.
90. Air-Pol, Airclone Collectors, Bulletin DC-2.
91. W. H. Waggaman and Sanchelli, Eds., Phosphoric Acid, Phosphates and Phosphatic Fertilizers, 2nd ed., Reinhold, New York, 1952, p. 250.
92. G. Eicke, Mahlenlagen zur Erzeugung von Spezialmehlen [Grinding plants for special powders], Aufbereit-Tech. 20(2):99-103 (1979).
5
The Reaction System
5.1 RAW MATERIALS FEEDING AND METERING
Phosphate rock, sulfuric acid, and recycle acid have to be fed regularly and with accuracy into the reaction tank in order to keep reaction conditions as constant as possible.
Variations within the feed ratio are likely to disturb regular crystal growth. They are responsible for coating or increased co-crystal-lized losses, and also for producing variable filtration characteristics of the gypsum cake, resulting consequently in higher soluble losses (losses as acid in cake). A large part of the "art" of maintaining good conditions for the production of phosphoric acid depends on uniform feeding of the constituents to the reaction.
A rock weigh feeding and metering control system represents an approximate investment of U.S.$20,000—equivalent to 2% of a 1% P2O5 loss in 1 year, for a 1000-ton/day P2O5 plant. Consequently, there is no doubt that investing in quality equipment in the raw material feeding system quickly pays off.
The objective of this section is to explain the function of metering the flow of rock, H2SO4, and recycle acid, and to indicate figures for the degree of accuracy it is necessary to achieve.
5.1.1 Need for Accuracy
Usually, the plant laboratory checks the excess sulfate content and the P2O5 level in the reactor slurry every 2 hours. Some plants use continuous sulfate level metering by a Technicon analyzer, but it is not yet a common practice.
The feeding accuracy should be such that in a 2-hr period, there will not be in the reaction system a difference in sulfate level which
281
282
Reaction System
could affect the reaction stability. The range of concentration fluctuations, which will have a marked effect on the reaction, varies with the type of rock. Reactive or porous rock are more sensitive than others. Some begin to show visible signs of different behavior with a sulfate-level variation of about 5 g/liter H2SO4. This figure represents the maximum acceptable error in sulfuric acid and rock feeding. This 5 g/liter in 30% add corresponds to about 1% of the total sulfuric acid fed into the system, as can be seen from the following calculation.
One liter of slurry contains 25 vol % of gypsum and 75 vol % of 30% ^2°5 ac’d- The amount of sulfuric acid fed into the slurry to produce the gypsum is:
1000 cm3 x 0.25 x 2.32 = 330 g H SO (1)
where
0.25 = volume percent of gypsum in slurry 3 2.32 = specific gravity of gypsum, tons/m 98
= molar ratio of H2SO4 to &УР8игп
About 5-10 g have to be added to this figure to compensate for free sulfuric acid excess in the phosphoric acid, adding up to 335-340 g of H2SO4 per liter of slurry. A difference of ±5 g/liter in phosphoric acid is equivalent to ±3.75 g/liter for slurry (0.75% liquid), and 3.75 g out of 335 g is 1.1% of the total acid fed.
Usually, a phosphoric reaction tank has a retention time of 3-6 hr, which corresponds to a specific reaction volume between 1 and 2 m3/ ton of P2O5 produced per day. In the case of the smaller volume, the change of sulfate level will be evident more quickly when feeding is inaccurate.
If the reactor volume is 1.5 m3/ton of P2O5 per day and the amount of slurry produced per hour is 0.35 m3/ton of P2O5 produced, a shift of X% in the acid-to-rock ratio will be subject to a sulfuric acid concentration change according to the equation
С « C* - (C* - OB1 (2)
where
C = concentration of H SC) at instant t
t 2 4
C' = concentration limit of H2SO4 that would result from the change of the feeder if the X% change is continuous
C = original concentration of H2SO4
g = 1 - (v/V) + (v/V)3, where v = slurry flow m3/min, V = effective volume of reactor, and t = time, min
Raw Materials Feeding and Metering
283
If we take 1 min as the time unit, the slurry volume produced leaving the reactor, being 0.35 m^/hr per ton of P2O5 produced per day, is equivalent to 0.0058 m3/min.
If the reaction tank has a specific volume of 1.5 m^/ton of P2Og produced per day:
В = 1 -
0.0058
1.5 +
/о.0058
I 1.5
2
= 0.996
(3)
Considering a change of the feed rate of the sulfuric acid feeder of +2%, the amount of 340 kg/m3 of slurry will become 346.8 kg. If the free sulfuric acid from the acid in the slurry was +10 g/liter with 340 kg of sulfuric acid, it would become +18 with the new figure. (Theoretically, the value would be +19 g/liter, but about 1 g is precipitated by Ca2+.) In our example:
C = +10
C' = +18
With Eq. (2) we can calculate how the change of free sulfuric acid operates with time. After 60 min, we will have
18 - (18 - 10)(0.9962)6° = 11.6 (4)
and after 120 min,
120
18 - (18 - 10)(0.9962) = 12.9 (5)
In other words, with a 2% change, the free sulfuric acid deviation becomes +2.9 g/liter after 2 hr. If the maximum permissible deviation is about 5-6 g/liter of free sulfuric acid within 2 hr (time difference between two sulfuric acid analyses), the 2% change of the feeder has to be considered as a maximum limit since the rock feeder can also originate another 2% shift. This indicates, for this example, the necessity of a reliability of 2% minimum for each acid and rock feeder.
The accuracy of the recycle acid flow control has to be adjusted according to the water balance and solid content in the slurry. Usually, the recycle acid flow is continuously measured and registered by magnetic flow meters, continuous specific gravity recording instruments, are either gamma-ray or, mor usually, instruments of the differential density type.
The recycle acid should provide a constant flow within ±2% reliability. Only about half of the water contained in the recycle acid goes into the production acid as dilutation water, but all the variations directly affect this destination because the other "water consumers" take precedence in claiming their part: namely, gypsum crystallization water and water evaporated (i.e., water evaporated related to the
284
Reaction System
heat of reaction). Therefore, an inaccuracy of recycle acid flow of 1% brings about a 2% variation of the water going into the acid if the change in flow volume is due to a variation of the constituent process water. A 2% variation in the acid water balance changes the P2O5 concentration by ±0.3% P2O5 or ± 4.5 g/liter. Since the water balance depends not only on recycle acid flow but also recycle acid density, it is prudent to aim at the above-mentioned accuracy. If the plant works with a fluctuation of ±5 g/liter of P2O5 if will be satisfactory. But most do not; rather, they fluctuate ±10 g/liter of P2O5, which is still not too bad. As energy saving is an important goal for all producers, maintenance of uniform P2Og concentration at the highest possible level ensures minimum energy consumption in the subsequent concentration stage.
5.1.2 Metering Equipment
Sulfuric Acid Metering
In the preceding sections, the accuracy of the sulfuric acid flow was calculated to be at least ±2% for chemical and economic reasons. But there is another reason for obtaining even higher accuracy with the sulfuric acid flow: the plant's material balance evaluation. Sulfuric acid consumption is an important figure from which most of the other production figures can be calculated. By measuring the H2SO^/rock ratio on the bench-scale plant in the laboratory, an accurate check of the phosphate rock consumption can be made.
For this reason I would highly recomment the installation of the most reliable equipment to measure, record, and integrate the sulfuric acid flow. The most accurate instrument for this purpose is a volumetric egg-shaped cogwheel counter (Metra) [1]. Its accuracy is guaranteed ±0.5%, but up to 0.3-0.1% can be expected.
The more common design used for sulfuric acid flow and integration, called "turbines," also give reliable figures, but less accurate than the cogwheel counter.
Phosphate Rock Flow Metering
Phosphate rock flow metering has been responsible for some sleepless nights for phosphoric acid technicians. I know this from my own experience. Nevertheless, tremendous progress has been made in solid flow techniques and, with some care taken when designing the phosphate rock feeding section of the plant, no more problems should occur.
Basically, when continuous weigh belt feeders are used (and this is the most common type of equipment), they have to be fed with ground rock at a low pressure load. To fulfill this imperative condition, to avoid flushing material across the section of the belt weigher, only a small load of material (e.g., from a small hopper) has to be maintained continuously ahead of the weigh feeder. This small load, nevertheless,
Raw Materials Feeding and Metering
285
has to be quantitatively fed to the system in such a way that the feeder always gets its necessary supply at the aforesaid low-pressure load. The main problem of weigh feeding lies in understanding this very important point, because of the flow characteristics of ground phosphate rock.
Ground phosphate rock, when it leaves the proper grinding mill, is usually pneumatically transferred to storage or feed bins. It settles with a maximum of air voids between particles. This is seen from bulk density measurements showing figures such as 0.9 kg/liter (56 Ib/ft^), whereas after a certain time of settling or by vibrating the sample, the material will become much more compact, up to 1.4-1.6 kg/liter (86-100 Ib/ft^). Sometimes, according to the type of rock, air takes days to escape from the bulk ground rock. The release of air becomes more and more difficult with increasing level in the storage bin. Of course, the flow patterns of a highly aerated rock and, on the other hand, of a compacted, well-settled material are completely different. In practice, the bin and weighing system hss to be designed to be adaptable to both extremes: settled compact material and freely flowing aerated material.
To avoid and overcome variable dynamic pressure problems and to avoid "flooding" due to free-flowing material from the bin, three major considerations should be kept in mind:
1. Uniform, cross-sectional withdrawal of the material from the bin bottom to the intermediate small hopper ahead of the weigh belt has to be achieved. This can be enacted by (a) bin activators, and (b), drag chain extractor conveyors, both of which are normally controlled by a level control in the intermediate hopper that feeds the weigh belt.
2. Air originating from deaeration of the ground rock should be allowed to evacuate by pipes or vents.
3. Reliable flow control equipment should be chosen to supply the weigh feeder hopper, such as rotary valve or chain conveyors.
Figure 5.1 depicts a proven system, consisting of bin activator, aerator, and a rotary valve for flow control. Reliable results can also be achieved by drag-chain conveyors feeding the weigh belt, but higher equipment costs will be incurred. Another technique consists of aerating the rock bin to keep the ground rock at its maximum fluidity all the time. For this purpose, compressed air is fed into the bottom of the bin through porous plates. It helps considerably, of course, to evacuate the rock from the bin, but the flow behavior is like liquid, and consequently metering with a weigh belt becomes much more difficult. When weigh belt feeders are provided with a regular and constant low head of ground rock, of reasonably uniform density, they usually work properly and do reliable metering. Accuracy of ±1% should be easy to reach with a reliability of ±0.3-0.5%.
286
Reaction System
FIG. 5.1 Ground rock bin and weigh belt feeder. 1, Rock inlet to bin; 2, bin activator, 3, vibrator; 4, rotary valve; 5, level control;
6, load height set; 7, weigh roll; 8, shute to reactor; 9, variablespeed motor; 10, aeration pipe.
In the United States, another method of phosphate rock flow control is also used: batch weighing of rock, followed by a buffer bin, reregulating a constant flow to the reaction tank by means of a rotary valve, vibratory feeder, or similar device. The system is easy to
Slurry Reactor
287
engineer and, generally speaking, batch weighers are also much more accurate.
Wet grinding of rock is becoming increasingly favored in the United States, and from this development it is desirable to feed rock slurries directly to the reactor. Solid feeding is replaced by slurry flow control, and that also involves slurry composition control. Slurry composition is controlled by continuous specific gravity metering. It is done in a small tank from which the slurry is constantly overflowing. This constant-level tank is continuously weighed on a load cell which is automatically translated into slurry composition and recorded.
Feed slurry flow is metered by an electromagnetic flow meter. The accuracy of this system is not as good as with dry rock feeding, but these techniques are recent and will certainly improve. One of the major problems with such wet systems is the maintenance of uniform accurate rock concentration in the feed slurry. As intermediate storage tanks become larger, so do the problems of agitation to maintain uniform composition in the feed system.
Recycle Acid Metering
Recycle acid flow is usually measured by magnetic flow meters. Nevertheless, flow is not a sufficient control mechanism for the recycle acid; specific gravity also has to be measured in order to indicate the amount of ?2®5 ап^ water recycled to the reactor. Specific gravity can be measured by у-ray instruments or by differential pressure measurements in the pump feed tank of the return acid. The control system is fully described and depicted in Section 3.2.
When it arrives to the reaction tank, recycled acid is usually mixed intimately with the incoming sulfuric acid in cyclonic typed mixing cones or by jet spray devices.
5.2 SLURRY REACTOR
The slurry reactor is the heart of a phosphoric acid unit. The way it is designed and the way it will be operated determine its functional reliability, the yield of recovery, and the final product quality.
Whereas in most chemical processes the reactors develop toward a similar final type, phosphoric acid reactor technology still uses many different designs. Once again the characteristic aspect of the phosphate industry appears; the reactor design is often a result of the particular behavior of a locally mined phosphate ore. Foaming and high or low reactivity are factors that can lead to different design considerations. Nevertheless, and this may be significant, two processes have developed toward the simple technology of a genuine single reaction tank.
288
Reaction System
Like all energy consumed, agitation energy will be the subject of more thoughtful examination and especially slurry recycle pumping energy will be saved to a greater extent. Phosphoric acid reactor technology is still at an early stage of development.
5.2.1 Design Considerations
Volume and Retention Time
The production of 1 ton of Р2Од as acid a dihydrate system involves 9-10 m3 of slurry when a normal commercia] rock grade is used (30% PgOg. 50% CaO). This is equivalent to a slurry flow of 0.38-0.40 m3/hr (per ton of Р2Од produced daily) from the reaction system to the filter (see Section 3.1). Consequently, a reactor with Im3 effective reaction volume producing 1 ton of P2O5 per day would have a holding time of 2 1/2 hr (also called mean retention time').
Most of the traditional dihydrate systems operate with a specific reaction volume (SRV) of 1.5-2.0 m3/ton of P2Og produced daily, but a few operate with as little as 1 m3/ton. Whereas hemihydrate processes use reaction volumes similar to those of dihydrate systems, processes with a recrystallization system will need higher reaction volumes. For example, the Nissan process, which is composed of a hemihydrate section followed by a hemidihydrate recrystallization, needs, according to the phosphate rock origin, 5-6 m3 of SRV and even more, when slow recrystallization occurs, as with igneous phosphate ores.
So far, no precise method exists for evaluating the reaction volume. Most process engineers use standard values from their own experience, more or less related to the phosphate rock qualities they have been operating with. For a new phosphate rock the choice of the SRV is often a somewhat arbitrary consideration resulting from experience, pilot plant work with the new rock, economics, and safety margins.
The size of the reactor has to be large enough to:
1. Provide sufficient retention time for the phosphate rock to be completely converted (the remaining unreacted rock should be economically negligible, e.g., <0.1%)
2. Provide enough reaction or retention time for regular crystal growth and adequate crystal size.
3. Permit breaking of foam and emulsion of the slurry during and after the reaction section
Effect on Phosphate Rock Conversion. Most attention is generally paid to the first point: the reaction time for phosphate rock conversion. Extensive work on this subject has been done by Janikowski et al. [2]. Especially when undivided single-tank reactors are to be used, there is often the fear of unreacted rock shortcutting the reaction section.
Slurry Reactor
289
From the retention time diagram for rock particles in a single tank and the laboratory measured phosphate rock conversion diagrams, a simple, but tedious calculation to evaluate the amount of unreacted rock leaving a system is possible.
The individual phosphate rock particles as well as the calcium sulfate crystals in the reactor slurry have been held different lengths of time, depending on their random movements toward the tank outlet. However, the amount of material that remains statistically in the reactor can be calculated precisely.
If we consider a portion of rock, Pq, that is fed into the system during a unit period of time, at time zero, the material, after being dispersed within the total tank, will leave the reactor progressively with the outflow v. Every minute* a fraction equivalent to v/V of the said portion will leave the tank.
The remaining part will be
V
P ------
О V + v
= poc
(6)
where
3
v = flow out of the tank to the filter, m /min
3
V = single tank effective slurry volume, m
C = extinction factor, in this case related to a time unit of 1 min
After t minutes the remaining fraction of Pq will be
Pr.t = P0C' <’>
where
pr t = part of Pp remaining in the tank at time t
t = time after the portion of rock Pq has been fed into the reaction tank, min
But the phosphate rock particles will not only leave the reactor with the outflowing slurry, they will concomitantly be converted and dissolved by the acids from the liquid phase. The function that governs this conversion is also affected by time:
*The minute, as time unit, was chosen for convenience and accuracy.
290
Reaction System
P - P
0 ct
= Fof(t)
(8)
where
P^ = converted part of Pq after t, min
f(t) = asymptotic function, which can only be measured from labora tory tests with each considered phosphate quality and its particle size distribution.
Function (8) applies for a batch system.
In a continuously operating reactor, the conversion function only applies to the particles remaining in the system: P^; both functions operate concomitantly.
After t minutes, the unconverted rock originating from Pq and remaining in the reactor will be
<P«-PO,t,=P0 <C),,<,)
(9)
The part of unconverted rock originating from Pq leaving the reaction tank at time t and during a period of one minute will be
V tv
(Prt - pct) V = Po (c> f(t) V
(10)
The total losses of unreacted rock over the time period tp to t^ and related to the portion Pq will be the integral:
/t = °° г t — 00
(P - P ) ^ dt = / rt ct V J
t = 0 t = 0
t V
Po (C) f(t) - dt
(11)
It is obvious that the integral (11) not only applies for losses of a rock portion Pq but also for the considered rock quality in general.
Theoretically the integral is to be calculated from t = 0 to t = ” because the last particle leaves the tank at time t = “. Nevertheless, the losses corresponding to periods of more than 200 min are generally negligible.
To illustrate the above calculation, a case study based on a typical phosphate rock quality has been plotted in the diagram (Fig. 5.2).
Curve 1 represents the phosphate rock conversion which is similar to those of many common commercial qualities. Conversion is indicated as a percentage of dissolved rock.
Slurry Reactor
291
PERCENT (CURVE 4, 5)
FIG. 5.2 Effect of time on phosphate rock conversion, slurry age composition, and corresponding unconverted rock losses in a single-tank reaction system. 1, phosphate rock conversion; 2, percentage of phosphate rock fed at time t = 0 remaining in slurry at time t for a single-tank reactor with 2 m^/ton PgOg; 3, same as 2 for a reactor with 1 m^/ton P2O5; 4, instant unreacted rock losses in function of time derived from 2; 5, same as 4 derived from 3.
292
Reaction System
Curve 2 represents Eq. (8), the rock fraction remaining in the single tank as a function of time t in minutes. For this curve the SRV is equivalent to 2 m3 with an outflow of 58 x 10*^ m3/min. In Eq. (7), C becomes 0.99709, and, for example, Prt after 100 min is 74% of Pq. In other words, 100 min after introduction, 74% of Pq remains in the reactor-converted plus unconverted.
Curve 3 is the same equation as curve 2 but for an SRV of only 1 m3/ton of P2O5 (same outflow as with curve 2).
Even those particles going straight to the tank outlet will spend a minimum of time in the reaction tank because of the distance between the feed point and the outlet. In both cases (curve 2 and 3) it has been assumed that the first particles leaving the tank will spend at least 30 sec from the time that they have been fed into the system.
Curve 4, derived from curve 2, represents the instant losses per minute flow period as a function of time t, related to the rock portion Pq fed into the system at time t = 0 [Eq. (10)]. The losses are expressed as a percentage of the portion Pq. For example, during the first minute, 0.064% of Pq left the tank as unreacted rock. After 180 min the unreacted rock losses become negligible.
Curve 5 represents the same equation as curve 4 but is based on the case of curve 3 (reaction system with Im3 of SRV).
The total losses as unreacted rock leaving the system are to be calculated according to the integral (11). This has to be computed from the diagram: multiply empirical curve 1 with curves 2 and 3, respectively.
The total losses as unreacted rock, in percent, are represented by the surface area confined by the curves 4 and 5, respectively. For the 2 m3 SRV reactor in our case study, the total unreacted losses amount to 0.23% (curve area 4) of the P2O5 fed into the system, whereas the 1 m3 SRV reactor sums up to 0.51% (curve area 5).
Effect on Crystal Growth and Filtration Rates
Crystal Growth. Regular crystal growth reaction without too much nucleation needs a minimum of crystallization volume. From experience we know that ideal conditions are achieved when no more than 0.12 ton of calcium sulfate dihydrate are crystallized per cubic meter of slurry and per hour (Section 2.2). This is equivalent to some 1.8 m3 of reaction volume per ton of P2O5 produced daily as acid (SRV), when a normal commercial phosphate rock is used in an uncompartmented genuine single-tank reactor. However, with most phosphoric acid processes calcium sulfate crystallizes unevenly throughout the reaction system. Consequently, the value of 0.12 ton/m3 is very often passed in one part of the system, whereas it is not attained in the other part.
Currently under investigation (see Section 2.2.1) but rarely pointed out quantitatively is the effect of crystallization rate on filtration quality. In some operating units very high crystallization rates (e.g., close to 0. 8 or even 1 ton of calcium sulfate per cubic meter per hour) which are due to unbalanced reaction conditions have been reported
Slurry Reactor
293
with still acceptable filtration rates. Taiba rock, with a crystallization rate of 0.4 tons/m3 of calcium sulfate dihydrate, was reported as still filtrating at a rate of 8 tons/m3 of effective filtration surface, which is a high yield. Florida rock with 0.93 m3 of SRV with a genuine single tank has been reported with filtration rates of 5.5-6. 5 tons P2O5 per day per square meter of filtration area with a 4-min cycle (0.22-ton/m3 crystallization rate), whereas current volumes with 2 m3 of SRV are reported with filtration rates over 7 tons of P2O5 per square meter per day with the same cycle time (see also Section 2.3.7).
Side Reactions. Certain side reactions can affect the crystallization or filtration quality of the slurry. Some of these side reactions take more time than regular calcium sulfate crystallization and the filtration rates of the slurry can improve with increased retention time. However this is not a general rule; in fact, very little is known about such side reactions. M’Gaieth [3] reported that increased reaction time which is obtained by an added reaction tank improves the filtration rates economically with Tunisian phosphates.
Secondary reactions can possibly affect the calcium sulfate crystals or those impurities that reduce filtration by plugging the interstices of the crystal layers building the cake. It can be demonstrated by particle size analysis that a partial dihydrate to dihydrate recrystallization occurs under certain conditions. In such a case, the weight fraction of smaller crystals, such as 30 pm, decreases, whereas the 80-pm fraction increases. At the same time a decrease in co-crystallized P2Og is measured. One explanation of this phenomenon may be that the presence of higher lattice P2O5 in smaller crystals are an additional recrystallization driving force.
Reactive silica, if not balanced by a sufficient amount of fluorides (see Section 6.2.2), has a filter cake plugging effect that can easily be demonstrated. The use of flocculants can usually reestablish normal filtration rates. It also seems to be possible that amorphous silica flocculates "naturally" during additional reaction time.
No general rule can be given for this phenomenon; the problem has to be studied case by case.
Effect of Retention Time on Economics. For a 1000-ton/day P2Og plant, one additional hour of retention time corresponds to an agitated volume of 380-400 m3 of slurry. The annual costs for this additional hour of retention time can be summarized as follows:
Capital costs (10 years depreciation) U.S.$122,500
Interest 73,500
Interest on P2O5 in slurry 4,300
Electric energy 83,000
Maintenance costs (12% of investment) U.S.$147,000
Total
U.S.$430,300
294
Reaction System
The total costs are equivalent to more than 1000 tons of ₽2®5’ which represents about 0.3% of the total production of P2O5 as commercial product or about 0.8% of the phosphate rock costs. This shows that a very economical аррг^ДзЬ should be made before one takes the decision to increase or decrease the safety margin for the retention time by changing the reaction volume.
Agitation in the Reaction Tank
Agitation in the reaction tank has to provide good mixing of the slurry and the introduced reaction components in order to achieve the reaction conditions between the phosphate rock and the sulfuric acid. Agitation also has to ease the release of the gases from the slurry and to break down the foam. Adequate agitation also is an essential part of the cooling action when air cooling is used.
The detailed function of agitation is discussed in Sec. 5.3 and we emphasize here only how agitation has to be adapted to its reaction system. In the phosphate rock and sulfuric acid mixing section, most of the agitation energy is needed.
Once the reactants are mixed and the phosphate conversion is in an advanced stage, a much lower agitation energy level is required. This is well demonstrated in a Badger isothermal reactor [4] or in a Rhone-Poulenc [5] reaction system, both operating genuine single-tank reactors with a low specific agitation energy consumption (<20 kwh/ton P2O5 produced). In the case of the Badger isothermal reactor, phosphate rock is introduced at the suction side of the single paddle-type impeller, whereas the sulfuric acid is fed into the outlet stream of the same impeller.
The average energy consumption of the total reaction tank is only 0.3 kW/m^, but the distribution of this energy with respect to the total reactor volume is very uneven. In the zone where the reactants are introduced and mixed with the slurry, agitation energy density is highest. A comparable agitation energy distribution is characteristic for the Rhone-Poulenc reactor [6], where the phosphate is fed into the vortex section of the large impeller, and the sulfuric acid is sent onto slurry dispersers, located at the liquid surface level of the tank (Fig. 5.3).
Slurry Circulation
The important effect of slurry circulation is demonstrated in Section 2.2. Whereas in uncompartmented single-tank systems, agitation flow is primarily used, compartmented or multitank reactors are mainly provided with pump flow circulation. It is obvious that agitation flow is more economical than pumped flow. To achieve agitation flow no extra energy is needed; the system has to be consistently designed to avoid bottlenecks in the reactor. Narrow passages where slurry acceleration
Slurry Reactor
295
FIG. 5.3 Rhone-Poulenc reactor.
takes place lead to substantial consumption of flow energy. Furthermore, reaction energy can be utilized as it is with the SI APE process [7], where the release of CO2 induces convection circulation through specific gravity variations of the slurry.
To summarize, slurry circulation can be obtained by the individual or combined action of (1) pumping, (2) agitation, and (3) reaction energy flow.
Pumping. Traditionally, pumping is achieved by centrifugal pumps, or, when only a low pump head is needed, by axial flow pumps. Centrifugal pumps are expensive and limited in flow rate (5000 m3/hr), whereas low-headed axial flow pumps can operate up to 15,000 m3/hr.
Prayon [8,9] , using rectangular compartmented reactors, has combined slurry circulation and cooling by using low-headed axial flow pumps via a flooded flash cooling system. The low-level flooded cooler chamber works as a siphon, with its level being maintained by the vacuum (Fig. 5.4). This system can provide circulation rates up to 40 times the production flow.
Agitation Flow. Agitation in the reaction tank effects slurry circulation (Section 5.3.3). The flow resulting from an agitation system in a given tank is governed by the relation:
296
Reaction System
FIG. 5.4 Prayon process reaction section. (Courtesy of Society de Prayon, Rupel, Engis, Belgium, 1980.)
Q =KpnD3 where
(12a)
3
Q = flow, m /sec
К = pumping number, a dimensionless constant related to a given ₽ system (agitator + tank) n = agitator speed, in rev/sec
D = diameter of the agitator blades or impeller
Single-tank reactors equipped with a central agitator can operate at very high circulation rates (3). These rates are often indicated in terms of "rotations per hour" (one rotation being the time for the flow of the equivalent of the tank volume). Sometimes the flow is evaluated by the sulfuric acid homogeneity throughout the system (5) (high flow means little difference in SO^ concentration at two distant places in the reactor).
Agitation flow can also be operated throughout compartmented reactors. This will be achieved by a consistent arrangement of the
Slurry Reactor
297
impellers. This is shown, for example, in Fig. 5.5, where alternative radial and axial flow is used.
In such a case, the preceding function is still valid. The pumping number nevertheless will be smaller because the flow throughout the system is smaller than the induced flow inside of one compartment. This pumping number can only be measured in an operating plant or pilot plant. It will depend on not only impellers and tank compartments, but also on the orifices connecting the tanks.
To illustrate this by an example, let us consider the system depicted in Fig. 5.5:
Square tanks D/T = 0.38 (T is tahk side, m)
D/Z = 0.34 (Z is liquid level, m)
Overflow orifice = 14% of separation wall surface
Underflow orifice = 20% of separation wall surface
Measured pumping number = = 0.279
When applied to an impeller
D = 1.8 m
n = 1 rps
Q = 0.279 x (1.8)3 x 1 = 1.63 m3/sec
= 5,858 щЗ/hr
Several commercial reactor systems use agitation flow for slurry recirculation throughout their systems: SIAPE (Tunisia) (7), Dorr Oliver (U.S.A.) (9).
FIG. 5.5 Agitation flow induced by alternative radial and axial impeller arrangements.
298
Reaction System
FIG. 5.6 SIAPE reactor. (From Ref. 7.)
Reaction Energy Flow. Reactors using phosphates with high carbonates contents can take advantage of the CO 2 release to promote slurry circulation. This has been done with the SIAPE process in Tunisia (Fig. 5.6).
The high reaction speed of the phosphate rock conversion creates a slurry low density zone due to the high gas concentration. If this is realized in a bottom- and top-level opening compartment, a "natural draft" occurs moving out of the slurry in a continuous flow. The SIAPE system emphasizes this circulation by an axial radial doubleimpeller agitator working as a pump (Fig. 5.3).
Cooling
As discussed in Section 5.5, there are two traditional cooling systems applied in phosphoric acid technology: vacuum cooling and air cooling. Vacuum cooling can be adapted to any reaction tank system and reactor shape. Air cooling, however, has to be carefully adapted to the tank design because the heat exchange depends on the slurry surface in the tank.
With efficient surface agitation and airflow, a specific heat exchange of 100,000 kcal/hr and per square meter can be evacuated. But current mean values for the total reactor are generally lower. With increasing reactor sizes, the surface-to-volume ratio decreases. Consequently, for large units such as 700 tons of P2O5 per day and more, the cooling surface becomes a critical factor (see also 5.5.3).
Agitation
299
5.3 AGITATION
The objective of this section is to give to technicians, both phosphoric acid producers and construction engineers, a simple and practical approach to the understanding of the agitation problem within a phosphoric acid reaction system.
Although agitation is a widespread technology, its theoretical approach is a rather complicated science. We suggest simplifying theory in the study of its practical application in phosphoric acid slurry reactors. Certain criteria are common to all our cases, and consequently we believe that it is possible to eliminate a complicated theory or mathematical model.
During the early 1950s, when wet phosphoric acid units started to be built at an increasing rate, current opinion was that agitation had just to maintain the solids in liquid suspension. Consequently, in many plants agitation was poor, and important local concentration differences occurred in the mixing compartments, where sulfuric acid and phosphate rock were introduced. Also, at that time, premixers where used (small tanks with large agitators, where the reactants were mixed into a slurry flow). In these premixers, agitation was generally efficient but, because of the small volume, high supersaturation and consequently spontaneous nucleation occurred to a large extent (see Section 2.2).
Today we are in a position to design large reaction tanks with efficient agitation and we also know what kind of an agitation has to be adapted to, depending on the function of the agitation: dispersion, conversion of rock, crystallization, defoaming, and so on. Agitation has been improved significantly with respect to foam breaking and slurry cooling (see Section 5.4) and, last but not least, agitation can also provide slurry circulation in the reactor, saving expensive pumping equipment and energy.
All this is the result of the last 30 years of development, mainly based on experimentation on an industrial scale, because agitation cannot be studied without concomitant practice. Experimentation with plant-sized industrial scale agitators as they are used in phosphoric acid units has many inconveniences:
1. The physical and rheological properties of the slurry are difficult to evaluate (e.g., specific gravity when gases occur).
2. Vortex formation and cavitation introduce erratic readings.
3. Scale formation and deposits on the impeller and in the tank after power consumption.
4. Baffles and other tank internals, variations of liquid level, and different tank shapes modify the system characteristics.
All this explains why it took some 30 years to understand the behavior of a turbine rotating in slurry.
300
Reaction System
5.3.1 The Functions of Agitation
Dispersion of the Reactants
The sulfuric acid, ionizing instantaneously, needs thorough mixing and consequently very efficient agitation to avoid local supersaturation. Strong acid, 98% H2SO4, contains 1800 kg/m3 of H2SO4, which has to be dispersed to a very low concentration, some 10 kg/m3 within the slurry. This needs a great agitation or pumping flow as well as good shear agitation (micro-agitation). Some companies have designed special dispersing devices for the sulfuric acid feed, for example, hollow shaft and paddles to feed sulfuric acid through the tips of the blades [10] or high-speed dispersers (see Fig. 5.3).
The phosphate rock, especially when it has a high carbonate content, will tend to float on the surface because of the rising CO2 gas bubbles. Only turbulent agitation will keep the rock mixing section, homogeneous in spite of large gas releases. Within the zone of the reactant dispersion usually about 1.0 and sometimes up to 1.5 and even 2 kW/m3 of reacting slurry volume has been reported for installed electric power.
Foam and Emulsion Breaking
Beyond a certain threshold of revolution speed of a surface agitator, the kinetic energy of the slurry which is sprayed above the liquid level is high enough to destroy foam and emulsion. This phenomenon is used to control foaming and emulsion when processing rock containing both organics and carbonates.
Cooling
Surface agitation, by spraying the reaction slurry through air passing the slurry surface, provides a good heat exchange between the two phases. Air cooling, operating in this way, is more efficient than with bubbling boxes (see Section 5.5.3).
Slurry Circulation
Agitation can simultaneously provide slurry flow from compartment to compartment. Even though the dynamic pressure of the liquid obtained by agitation is low compared to pumping; efficient circulation can be achieved when no tank internals restrain the slurry flow (see Section 5.2.1, "Slurry Circulation").
Solid/Liquid Suspension
Last but not least, the crystals and rock particles have to be kept in suspension both for crystal growth and to avoid sedimentation. Crystal suspension nevertheless needs a much lower level of agitation energy than that required by the aforementioned functions.
Agitation
301
Homogenization
All alterations of the chemical composition due to reaction have to be permanently compensated for by homogenization of the slurry effected by diffusion-agitation.
5.3.2 Agitation Power, Agitation Flow, and Impeller Types
Factors Governing Agitation Power in General
Power consumption of an agitator depends on many factors:
1. Geometrical factors:
a. Tank: shape and size, liquid level
b. Impeller: type; number, size, and pitch of blades; diameter; number of impellers
c. System geometry: number and size of baffles or other tank internals; off-bottom clearance of the impellers; position of the shaft
2. Dynamic factors: speed of the agitator
3. Physical factors:
a. Specific gravity of the liquid
b. Occurrence of gas (emulsion)
c. Solid content (crystals)
d. Crystal habit (surface-to-volume ratio of the crystals)
e. Viscosity and temperature of the liquid or slurry
From the preceding list it can be seen that it will be difficult for a technician, even one who has basic knowledge in mixing and agitation, to design from scratch a suitable agitator mixer for a phosphoric acid reaction tank. It is more simple and generally more accurate to start from an existing or tested design and to scale it up to the dimensions needed.
Since phosphoric acid slurry agitators mostly operate under rather similar physical conditions, some simplifications can be made in a first approach. Consequently, we may look at the most current models applied within phosphoric acid technology and examine some case studies.
It is important to note that the equations and models apply only when the agitated tanks are fully baffled in order to avoid vortices, which would considerably modify most of the aspects and effects of any agitator. Inefficient baffling is the major reason why, in many cases, practice does not correspond with the models. Most studies [11-14] use four baffles each with a width equivalent to 8% of the tank diameter and 2% of the tank diameter as tank wall clearance. However, in most phosphoric acid reaction tanks the use of baffles is unnecessary.
302
Reaction System
Modern single-tank compartments, because of constructive constraints, are designed in irregular tank shapes, more or less affecting the systems. Like baffles, comparative effects are obtained by multi-agitator systems which are generally installed in large tanks. Nevertheless, multi-agitation is not always as efficient as baffling and complicates the agitation design somewhat.
Agitation Power Needed
Many experiments have been made to optimize a minimum of agitation energy needed in the different sections of a phosphoric acid reactor. Each engineering company uses its own empirical standards.
Whereas a crystallization from a homogeneous mother liquor needs only the agitation energy necessary to keep the solids suspended, phosphoric acid slurry preparation needs a much higher energy input into the reaction medium because of the required intense dispersion of the reactants, defoaming action, and high slurry circulation. The more reactive a phosphate rock, the quicker the disintegration of the rock particles in the slurry and the higher the tendency for local "hypersaturation" to occur. More power has to be installed for very reactive phosphate rocks. Once the reactants have dispersed and the phosphate rock is dissolved, the reaction slurry has to be desupersaturated and the resulting emulsion has to be broken down. The slurry has to be cooled before recycling it to the reaction section of the tank. This needs second-stage agitation, which can be lower than that of the first stage.
Installed motor power is always higher than the actual power consumed at the shaft; the agitator has to be capable of operating even when the slurry shows unusual physical properties (i.e., cold when starting after a long stop, or highly viscous after an erratic feed). At least 15%, but more often 20-30%, of safety margin should be applied to the motor drive.* Table 5.1 shows the most common specific power consumptions installed in phosphoric acid reaction systems calculated as kW/m^ of effectively moved slurry volume.
Agitation Flow in a Reaction Tank: Micro- and Macromixing
An agitator operating in a reaction vessel creates flow and turbulence. Chemical reaction and crystallization need both of them. The reactants have to be dispersed (micromixing) and transported to all parts of the reaction system (macromixing). The energy transferred by an
*V-belt drive takes 5% of power, cogwheels 1% per number of coupling wheels.
Agitation
303
о
о S
о 3
□ о
СП 3 о
2
с
и Е о
W
>> и
2 ’о
<
О Ч-< 0) О
И
3 Ьл
304
Reaction System
agitation system is shared by these two effects. The energy ratio of the two effects varies with the type and the speed of agitators.
Agitation flow is the pumped flow rate (Qj) of an agitator, which is, by definition, the liquid flow passing through the section of its impeller. The induced flow rate (Qg) *s additional flow resulting from entrainment from the pumping flow. The circulation rate (Q3) is the sum of both: Q3 = Qj + Q2-
Figure 5.7 depicts the cross-sectional flow pattern of a radial-bladed single and double impeller in a fully baffled cylindrical tank. The pumping rate, and consequently the circulation rate of an agitator, can be described by an equation of the general type
3
Q = К nD P
(12b)
where
Q = pumping Q| or circulation rate Q3, m^/sec
К = pumping number Kp or circulating number Kc, a constant depending on the system (impeller and tank geometry)
D = diameter of the impeller, m
n = number of revolutions per second of the impeller
Impeller Types
Impeller types can be classified in two groups: (1) turbine types (radial flow), and (2) propeller types (axial flow).
The turbine type consists of radial blades which can be either short blades, disk mounted (Fig. 5.8, type 1) or also disk-mounted blades
(c)
(a) (b)
FIG. 5.7 Agitation flow with disk-mounted vertical blades.
Agitation
305
Disk-mounted vertical blade impeller, so-called Ruhston type
1a w = D I 1 = D I 5 I T
Hub-mounted vertical blade impeller
Disk-mounted vertical blade impeller
3b w = D 1 = Л
8 I 2
Vertical curved blades
4a w = _D_ 5
4b w = D 8
Radial, pitched (45°) Blades
w = p 1 = D
8 2
FIG. 5.8 Impeller types.
306
Reaction System
covering the total diameter (Fig. 5.8, type 2). The blades can also be hub mounted and flat (Fig. 5.8, type 3), or hubmounted and curved (Fig. 5.8, type 4). The propeller type uses pitched blades (Fig. 5.8, type 5). Pitched blades produce other pumping flow patterns and higher pumping flow relative to the energy input.
The impellers shown in Fig. 5.8 have six blades, but often only four blades are used. The difference between using four or six blades will be seen later. Large propeller-type agitators sometimes use only three blades for reasons of design.
5.3.3 Power-Speed-Dimension Models
Preliminaries
Turbulent Agitation. The displacement of the agitator blades in the liquid creates a shear stress producing a flow: the agitation effect. If the blades' displacement is slow, the shear rate is low and the layers of the liquid slide over each other in an orderly manner, controlled by the viscous forces of the liquid. This is laminar flow agitation, also referred to as viscous flow agitation.
If the speed of the blades, and consequently the shear stress, increases, a critical point is reached where the laminar flow is disrupted and a swirling chaos of eddies and vortices is produced. This condition is called turbulent flow agitation.
In the technical literature the transition to turbulent flow is often defined as the prevalence of the inertial forces over the viscous forces. The transition point from laminar to turbulent agitation is characterized by the Reynolds number NRe-
The Reynolds number for a rotating agitator can be calculated:
9
p x n x D
(13)
where
= Reynolds number for impeller
p = specific gravity of liquid, kg/m
n = speed, rev/sec
D = impeller diameter, m
p = viscosity of the liquid, pascals (1 pascal = 10 poise = 1000 mPas = 1000 cP)
Turbulent agitation conditions occur when
N > 4000 Re
Agitation
307
Agitation in a phosphoric acid reactor has to be turbulent. In the case of turbulent agitation, the influence of viscosity can be ignored, and this is where our study can be simplified.
The viscosity of 30% P2O5 phosphoric acid at 65-80°C is about 0.02-0.03 poise (2-3 x 10*3 pascal). With 25 vol % of small-size solids (such as the crystals that occur in the phosphoric acid reaction slurry, the viscosity approximately doubles, to 0.04-0.06 poise (4-6 x 10*3 pascal).
Even in a very slow agitated phosphoric acid reaction tank an Np>e value of 4000 is by far exceeded, as can be seen from the example of a 1.0-m turbine rotating at 1 rps (which represents a low rotation speed for such diameter).
.155.02L_l.xQ)2 = 387,000
Re 4 x 10'3
(14)
Also in the case of a bench scale unit with a small turbine of only 10 cm diameter rotating at a current speed of 6.7 rps, we still have
9
= 1550 x.6:7x(0:». =
Re 4 x io'3
(15)
This is very important; it shows that throughout our field extrapolations we always stay within turbulent agitation conditions.
Tank Baffling. In order to make calculations with comparable systems of agitated tanks, another important criterion is that of the formation of vortices. The liquid in an agitated tank will tend to rotate with the agitator. With a rotating liquid, vortices appear and can reach the impeller. Air can then be sucked into the liquid and the system will become completely different from what it is supposed to be. To avoid this, baffled tanks (or devices equivalent to baffling) have to be considered in all cases.
Geometric Similarity. Geometric similarity between two systems, 1 and 2, is achieved when the same impeller type in a similar tank fulfils the following indentical criteria [ 15]:
Impeller: b^ =
number of blades
(16)
blade width/impeller diameter (17)
308
Reaction System
*bl D1 _ Jb2 "D2 blade length/impeller diameter (18)
al = a2 same blade pitch (19)
Tank: T D _ 2 T„ impeller/tank diameter (20)
1 \ т 2 Z __2_ T liquid level/tank diameter (21)
1 n, w D T1 2 b = %Wb T2 number multiplied by width of baffles to tank diameter (22)
s D1 S D2 off-bottom clearance of impeller-to-impeller diameter (23)
Tank shape same tank shape (24)
Diameter: Speed and Power
It is common practice within industrial phosphoric acid technology to express the specific power consumption W in terms of horsepower or kilowatts per cubic meter of agitated slurry. Experience has shown that good crystallization and filtrabilities are obtained when certain specific power consumption figures are respected. Experience has also shown that these specific power consumption figures can be extrapolated from one tank to a different sized but geometrically similar tank by following the equation
q о
W = KnD (25)
where
W = specific power consumed per cubic meter of agitated slurry, W*
♦The unit of power consumption in this chapter is the watt. Nevertheless , for convenience and because of the current usage of kilowatts in industry, the power consumption can be directly calculated in kilowatts by using the specific gravity unit in tons per cubic meter. This has been applied with the case studies in this chapter.
Agitation
309
n = revolutions per second D = impeller diameter, in m К = constant
If we
compare two systems where D
Wx n3D2 n3
= —g—2 = —£ specific power ratio for speed variation
2 ngD n% in an identical system (26)
or two systems where = D2
to increase the size of a system with constant specific power consumption W
(27)
The total power consumption P of an agitated tank being
P = V x W = K2D3W (28)
we can combine (25) and (28) to write
P = K1K2n3D5
(29)
and
V
P2
3 5
Vi
3 5
Vl
(30)
= D
2
where
P = power consumption at agitator shaft, in watts
V = effective volume of agitated liquid in the tank, m3
K^,K2 = constants
It is important to note that these models apply only when the two systems have geometrical similarity. It is erratic, for example, to calculate the enlargement of an impeller diameter within an existing tank with these models because the geometric similarity is not respected in
310
Reaction System
such a case. "Change of Impeller Diameter." Eq. (25) and (29) contain two constants, Kj and Kg. These constants are related to the specific gravity of the slurry: (P in kg/m^) and to a specific power consumption number of the agitator plus the tank system under consideration. This factor is called the power number, Np. If we write
K1K2 = pNP
then
x, 3 5
P = pNpn D
(31)
(32)
where
P = power consumed at agitator shaft, W p = specific gravity, in kg (m3)~l
Np = power number
The power number N_ is a characteristic number-a sort of quality label—of the whole system agitator plus tank. The higher the N_, the more agitation power is needed for a given diameter and speed of an agitator in a given tank.
In a specific baffled tank, each impeller type will have its own power number. Power numbers vary as a function of the Reynolds number, but beyond the value of Re = 10,000 they remain rather constant. Fortunately, this is the range where phosphoric acid reaction tanks operate. Figure 5.9 shows power numbers for the different impeller types which have been depicted in Fig. 5.8 for a standard, fully baffled cylindrical tank system [ 16]. The power number of a system is subject to many variables derived from the geometry of the system. In fact, all the factors mentioned earlier that affect geomet
rical aimilarity also affect the power number.
Table 5.2 shows some power numbers for the most typical impeller types used for agitation in fully baffled cylindrical tanks. Table 5.3 shows the effect of some variables on power numbers.
In most phosphoric acid reaction tanks there are no longer any baffles because of construction and plant operating problems (irregular tank shapes are supposed to replace them). Consequently, the power numbers measured in those tanks are different from those of the experimental fully baffled tanks, and they have to be measured empirically.
Liquid Level in the Tank: Impellers Off-Bottom Clearance
The height of the liquid covering the impeller influences the power number Np of a system. In most phosphoric acid reaction tanks the
Agitation
311
POWER NUMBER N
FIG. 5.9 Effect of Reynolds number on power numbers for different impeller types.
liquid level is approximately equivalent to some 3-4D. With increasing liquid levels, a single turbine agitator without vortex will consume the same power:
N = N
p(l)z(l) p(2)z(2)
(33)
Curve 1 2 3 4-5 6
Impeller la 2a 3a 2b, 4b 5b
(see Fig. 5.2)
With a rising level the power number of a multiple turbine shaft increases, especially when the upper turbine is close to the liquid level Z (see Section 5.4). This is because of the vortex effect, which is reduced with higher liquid levels covering the impeller.
If the impellers are placed very close to the bottom of the tank, the power number will be subject to changes, but this case is not common in systems designed for phosphoric acid reactors because of the deposits that usually occur in the reaction tanks. In most cases the impeller is arranged about ID above the bottom. Small deviations from that value do not substantially alter the power number of the system [16,18].
312
Reaction System
TABLE 5.2 Power Numbers for Various Impeller Typesa
Number of blades and width Disk-mounted radial blades Hub-mounted blades Pitched blades
w = l six, w = D/5 5 (la) 4 (2a) 2 (5)
four, w = D/5 4 3.2 1.6
six, w = D/8 3.1 (lb) 2.5 (2b) 1.5
four, w = D/8 2.4 2.0 1.0
aPower number related to the appropriate impeller types to be mounted according to standard conditions in a fully baffled cylindrical tank: T = 3-5D; Z = T; four baffles at 90° wb, 0.08T, 2% off wall clearance. Off-bottom clearance, 0.70D. Numbers and letters in parentheses refer to impeller types shown in Fig. 5.8.
Source: Holland standardization [17].
Impeller Type and Agitation Flow
We have seen that agitation flow is a function of ND3, but different types of impellers induce more or less agitation flow compared to the energy input or to the related ND3. In other words, according to function (34):
4
Q = К ND (34)
P
each impeller has its pumping number Kp. Table 5.4 shows pumping numbers for different impeller types.
Presence of Gases
GASES originate from the release of CO2 occurring during rock conversion. In a first phase, small bubbles build up on individual rock particles. If these bubbles are coalescing, they will merge to larger ones and leave the liquid phase easily. If they are smaller or not coalescing, they will be held up by the liquid phase. The presence of gases in the liquid phase considerably changes the power consumption of an agitator. The order of magnitude of the gas held up in the liquid phase can be estimated by specific gravity measurements. The change in power consumption resulting from the change in specific gravity can be higher than what could be expected.
Agitation
313
In Tunisia, where the local consumed phosphate rock can contain up to 9% of CO2 with 28% P2O5, a 500-ton/day P2O5 plant will produce some 4500 m^/hr of CO2 gas, which will be released into the agitated slurry medium. If this takes place within a rock feed compartment of 6.2 m diameter, the so-called superficial velocity of the gases (velocity equivalent to gas flow rate through empty cross section) will reach 0.04 m/sec, which is to be considered as a high value. The specific gravity of the slurry within the rock feed section can become as low as 0.9 ton/m3, compared to normal figures of about 1.45-1.50 in currently operating reactors and 1.55-1.58 for a slurry without a gas.
TABLE 5.3 Effect of System Geometry on Power Number for Turbulent Conditions
Variable Power number
Impeller diameter Increase to power 5 if no vortex interaction
Impeller blade width; w Increase—nearly proportionally
Impeller blade length; 1 Increase
Impeller blade pitch; a Decrease
Number of blades; n Increase by 1.26 when six blades instead of four
Off-bottom clearance; C No change when 1.5D>C>0.75D [Eq. (23)] [18]
Tank baffles; n, , w. b b Increase; maximum obtained when n^w^ = 0.5T [Eq. (22)] ; in fully baffled cylindrical tank, power number can be five times higher than in the same unbaffled tank [18,19]
Liquid level; Z Beyond Z = T, no significant change provided that impeller is fully covered [Eq. (33)]
D/T ratio 0.25-0.35; no changes in baffled cylinder; changes in square tanks or with insufficient baffling [16]
Presence of gases Strong decrease
Tank shape Square in shape, Np like cylindrical fully baffled tank, but affected by D/T ratio; triangular and trapeze type; Np higher; affected by D/T ratio
314
Reaction System
TABLE 5.4 Pumping Numbers for Different Impeller Types
Impeller type Six blades Four blades Three blades
Radial: vertical blades; w = D/5 0.84 0.79 -
Axial: pitched blades; w = D/5 0.97 0.86 —
Marine-type propeller — — 0.54
Since these gas bubbles are stabilized within the liquid by organics originating from the phosphates, they are recycled and their holdup time can be substantially increased until the whole tank content becomes an emulsion. More energy, adequate foam breaker, and even antifoaming agents may become necessary.
To study agitation of such a three-phase system, some new variables have to be introduced:
3
Qg gas formation rate, m of gas per second
U superficial gas velocity, m/sec, which is defined as the
equivalent velocity of the gas if the flow rate were distributed across the entire cross-sectional area of the tank without liquid
N aeration number, which is the gas flow divided by the pump-
ing flow of the agitator; equivalent to Q^/nD3, in cubic meters of gas per cubic meter slurry
P ZPft g 0
power reduction ratio due to the presence of gases
The example from Tunisia presented above is reported for the following figures:
% U
s
N.
Ae
3
= 1.25 m /sec
= 0.04 m/sec
3 3
= 0.36 m gas/m liquid
P /Р = 0.66 g o
Agitation
315
A very thorough study about gassed agitation was made by Dickey [20], who describes a phenomenon occurring with gassed agitation, called "flooding the impeller." Flooding occurs when the gas rate exceeds the ability of the impeller to disperse the gas into the liquid. The impeller rotates within a gas-enriched medium and its pumping flow rate decreases tremendously. It is the result of gas dominating the situation in a system that has been designed for liquid.
It is unnecessary to emphasize that the flooded state of agitation should be avoided with reaction tank agitation. If a substantial gas release is to be expected because of a high carbonate content of the phosphate rock, higher flow rates (ND-*) should be used. According to Dickey's study, rather than increasing pumping flow by speeding up agitation, it is more efficient to increase D or the blade width. Higher energy input per unit volume should therefore be provided. This is the reason higher specific agitation energy input is required with low-grade foaming rock with a high CO2 content,
5.3.4 Practical Use of Dimensionless Numbers
Extrapolation of Similar System: Use of
Extrapolation of geometrically similar systems can be done by applying equation [27]. For a given system, the n^D^ number is proportional to the specific energy consumption W and can be considered as an agitation quality criterion. In Fig. 5.10 the most common n^D^ products used in phosphoric acid reaction systems can be seen. It is a useful diagram which can be applied directly for speed variation within geometrically similar systems, and for system extrapolation with a constant specific power consumption W.
Change of Speed of an Existing System
It happens frequently that the speed of an agitator has to be altered to improve agitation efficiency or to adapt the power consumption to an existing gear and motor. In this case Dj = D2 and Eq. (30) is simplified. It follows that
where N = revolutions per minute. Power consumption P becomes a function of the ratios of speed to the third power.
Change of Impeller Diameter
Changing the impeller diameter D in an existing system is rather rare. It becomes necessary when an important increase or decrease of the
316
Reaction System
Revolutions per minute
FIG. 5.10 Speed of revolution as a function of impeller diameter with
constant n D o z
for most common numbers.
Agitation
317
agitation power is needed. Increasing the impeller diameter means changing the geometry and the similarity of the system. The power number Np may also change. If, however, the power number Np is supposed to be the same, and the same speed is used, the power consumption theoretically increases to the power of 5:
(37)
Nevertheless, when operating with the same tank dimensions this is not always true, because of the effect of liquid level 2. A larger impeller diameter related to the same liquid level may not have sufficient liquid supply for its pumping flow with consequent vortex formation, and the final power increase may be to the power 4.5 or even only to 4.0
(37)
Use of Power Numbers for System Design
Use of power numbers makes it possible to calculate the power consumption for an agitation system, provided that perfect similarity is respected and the power number is available. This, however, can be expected only for standard systems; for new systems the specific data may have to be evaluated by practical field tests.
This can be done by using one of the following methods:
1. To make an approximate estimation for design, followed by field adjustment in the plant with water instead of slurry before startup. This is suitable for small or medium-size power agitators, where the speed adjustment can be made easily, by exchanging V-belt pullies, for example.
2. To build a small-scale, geometrically similar agitated tank, where the target specific power consumption W can be matched by trial and error. Thereafter the power numbers can be measured and used for extrapolation.
5.3.5 Case Studies
Case Study 1: Extrapolation of a Geometrically Similar System
Considering an agitated system with an effective agitated volume of V that should be scaled up to a system with a volume of Vo, we can аРР1У the following equations:
318
Reaction System
1/3 T
= V'«
(38)
where Tj/Tp the ratio of the two tank diameters, is the geometrical extrapolation or scale-up factor, which shall define the term fe-
The liquid level in the tank follows the function:
Z„ = Z ,f 2 1 e
(39)
For the impeller diameter we can write
2 1 e
(40)
under the assumption of an equal specific power consumption,
W!=W2
(41)
The total power consumed P follows the function:
p2=p
/V2 4V1
= P (f )3
1 e
(42)
When the n3D2 number remains constant,
3 2 3 2
nlDl = n2D2
(43)
the agitation speed n follows the function:
П2
3 2\ 1/3 ‘iDi\ °2J
(44)
The preceding model case is demonstrated in Table 5.5.
Case Study 2: Calculation of a New System
The phosphate rock feed and attack compartment of a phosphoric acid reaction system has to be equipped with intensive agitation. From experience we know that for the rock under consideration the specific power consumption must be 1.3 kW/m3 of effective slurry volume (indicated power consumption measured at the shaft of the agitator). Specific gravity of the slurry can be as high as 1.57 tons/m3. The com-
. -2/3 = n f
1 e
Agitation
319
TABLE 5.5 Case Study 1: Extrapolation of a Geometrically Similar System
Item Reference system Extrapolated system
Tank shape Square Square
Tank volume (m^) V = 21.8 V2 = 175
Extrapolation factor, f e - M^1'3 - 2 \21.8/
Tank dimension (m) T = 2.7 T2 = 5‘4
Tank level (m) Z = 3.0 Z2 = 6‘°
Impeller diameter (m) D = 0.90 D2 = 1.80
Dimension (m) of blades 0.225 x 0.180 0.450 x 0.390
(four)
Speed, rpm rev/sec N = 102 ni = 1.7 N = 64.2 2 n = 1.07 2
Specific power, W (kW/m^) W = 1.38 W = 1.38
Total power consumed, P = 30 P„ = 242
P = V x w (kW) 2
partment has a square section of 3.5 m and contains 80 m^ of reaction slurry. A double-impeller agitator with four radial blades each and a power number of 8 has to be installed.
Now some calculations can be made. The total power consumed at the agitator shaft is
80 x 1.3 = 104 kW (45)
Referring to Eq. (32) we can write
3 5
104 = 8 x 1.57 x n D (46)
n3D5 = 8.28
If we take
D = 0.3T = 1.35 m
(47)
320
Reaction System
3 8.28
n =^= 1-84 (48)
n = 1.23 (49)
N = 76.6 rpm
The total power installed for 80% overall efficiency is
104 x 1.25 = 130 kW (50)
5.4 MECHANICAL FOAM BREAKING
5.4.1 Theoretical Background
The breaking down of foam and emulsions is achieved when gaseous bubbles are separated from the liquid phase in which they are retained. This separation can be achieved by either mechanical and/or chemical means. The additional capital-dependent cost for investment in the mechanical system in terms of equipment, and extra costs for the energy requirement are approximately equivalent to the annual expenditure for chemical defoamers. This is emphasized by the continuous price increase of these products [21]. In Florida, where antifoaming agents are generally used, mechanical foam breaking has become a quickly expanding practice.
The mechanical effort required to break down the foam is performed by a "foam breaker," which usually takes the form of a specifically designed agitator. Such agitators incorporate large upper impellers of precise diameter and depth, rotating at a very precise speed.
As it is apparent that the gas from the phosphoric acid slurry can escape only from the surface, it is necessary that the foam-breaking action is concentrated in the upper liquid levels of the slurry. Therefore, foam-breaking impeller blades are usually positioned at the surface or just slightly submerged below. They rotate at a sufficient speed for the gas/liquid mixture to be "centrifuged." Such action causes separation of the gas from the liquid. Additionally, they propel part of the slurry into the gas space above the liquid level, and the bubbles thrown up at high speeds in this way coalesce to become droplets.
The shaft, carrying the foam breakers which can have a depth of up to the order of 0.6D, also carries at a lower level a conventional-type agitator, which provides the necessary agitation for the lower portion of the reactor. The foam-breaking agitator supplements this agitation and also assists heat removel from the reaction system when air cooling is used.
Mechanical Foam Breaking
321
FIG. 5.11 Dual turbine agitator with foam-breaking blades.
Figure 5.11 indicates some typical dimensions of such a system which we will discuss. The upper blades are 0.6D deep, their top edge being at the surface of the liquid when the system is stationary. Initially, when the impellers commence rotating, both impellers exert a centrifugal pumping action and the power consumed by the shaft increases to the power of 3 of the revolution:
3 5 P = N n D PP
(see Section 5.3)
(51)
322
Reaction System
But both impellers will also work as a pump. For the upper impeller the pump flow rate is defined by
Q = К (nD ) (52)
1 P
where is the pump flow, in щЗ/sec.
Because of the pump flow and the increasing speed, the upper impeller will soon receive insufficient liquid supply and the level between the blades of the impeller will fall (Fig. 5.12). At this stage the supply of liquid to the upper blades, Q2, is achieved via the lower section of the upper impeller. The driving force for the supply of liquid is principally the differential level pressure outside and inside the section of the rotating blades. The centrifugal forces prevent from any radial liquid supply:
Q2 = | (iT)D2(2g Ai)1/2 (53)
where
Q2 = liquid supply to agitator g= 9.81
Ai = liquid-level difference inside and outside the upper blades
i = immersion of upper blades, expressed in D
According to these two equations (52,53) Qx will, with increasing speed nj, exceed Q2. Finally, the liquid level reaches the bottom edge of the foam-breaking impeller and stability of flow between the outside and the inside of the impeller takes place (Fig. 5.12).
Qx = Q2 (54)
Power consumption, as a function of the impeller speed nx starts from n = 0 with a nominal cube function for both impellers [Eq. (51) ; Fig. 5.13]. When the liquid level Ai falls inside the upper blades, the pumping activity of the upper impeller will be limited to the liquid supply Q2, which is controlled by Eq. (53). Therefore as the speed increases, the liquid supply Q2 will only increase slowly as well as the correlated power consumption.
The total power measured at the shaft, resulting from combined requirements of both impellers will approach a linear relationship until the inner liquid level has reached the bottom edge of the upper blades (between nx and n2 in Fig. 5.13).
Mechanical Foam Breaking
323
324
Reaction System
POWER P
FIG. 5.13 Power-speed diagram for dual turbine. Pp power consumption of lower turbine Pj = f(n)3; Pg, theoretical power consumption for dual turbine if the upper blades would not clear; P3, actual consumed power for dual turbine. [From О to n-j: P3 = f(n)3;
n-j to n3: upper blades are clearing, P3 = f(n) ; n2 to n3: blades have cleared P3 < f(n).]
Finally, when speed n2 is reached and the upper impeller is completely clear, only the lower impeller will make substantially increased power demands.
From the preceding demonstration it can be seen that calculations of power consumptions for these systems, incorporating foam-breaking impellers, is not by any means straightforward. The presence of gases, dispersed in the liquid, complicates the system even more.
To summarize, we can consider that the power consumption of a foam-breaking double-impeller agitator is related to three different power consumption regimes, following each other at increasing revolutions: (1) at lower speeds, before the upper blades start to clear themselves; (2) at intermediate speeds, when the upper blades go on to clear themselves; and (3) finally when the upper blades are completely cleared.
Mechanical Foam Breaking
325
The upper blades clear when the centrifugal forces become prevalent over the gravitational forces, and this can be characterized by the Froude number n2D/g or, since g is a constant, by n2D numbers. For example, with a blade width of 0.25D and an immersion degree i of 0.6D, the n2D value for a cleared state of the impeller is 1.72, whereas it is only 0.86 for an immersion degree of 0.3D.
Breaking down of foam and emulsion occurs only when a critical value of n2D is achieved or passed. Beside the n^D regimes proven from plant practice this can be seen at a laboratory scale from foam and emulsion samples that are centrifuged at various speeds.
From plant practice (mechanical foam and emulsion breaking was intensively practiced for Tunisian rocks) the n2B value of 2.25 is a good working basis. In practice, values ranging from 2 and up to as high as 4 have been reported. Foam-breaking blades with a n2D number of 2.80 in operation can be seen on Fig. 5.14.
5.4.2 Diameter, Speed, and Power Relationships of Foam-Breaking Impellers
From Eqs. (51),(52), and (53) and Fig. 5.13 it is obvious that the power consumption of foam-breaking blades follows a mathematical model different from that of a fully immersed impeller. Since most of the time there is foam breaker plus other impellers on the same shaft, the power consumption of the agitator will be the sum of the two individual contributions. The power consumption of the immersed impellers will follow the n^D^ values, but the upper blades will consume power according to their state of clearance, which is related to the n2D number.
Consequently, if we want to compare or safely scale up an agitator fitted with foam-breaking blades, we should do this only with similar n2D values. In other words, the power numbers Np of two similar foam-breaking systems are only identical when they operate with similar n2D numbers.
The uncertainty about the liquid level in the tank brings another power-varying factor. In practice, these uncertainties can be overcome by an adaptable upper blade setting that allows control and adaptation of the total power consumption to the desired value.
Power numbers for foam-breaking agitators with differing immersion degrees i for the upper blades can be seen from Fig. 5.14.
5.4.3 Upper Blade Setting: Power Consumption
The upper blades can be fitted in such a way as to make field adjustments possible. A simple device for upper blade setting with immersion control is shown in Fig. 5.15. Before starting the plant production, a preliminary test can be made with water. From the measured power consumption (which is within the specific gravity ratio of water and slurry) the final immersion degree of the blades can be decided.
326
Reaction System
2
FIG. 5.14 Operating foam-breaking impeller with an n D number of
2.80 (power test in water).
5.4.4 Number of Foam Breakers to Install and the
Ratio of Surface Area to Production
The quality and amount of foam can vary greatly depending mainly on the origin of the rock. There is not yet a test giving an accurate measurement of degree of foaming. The existing tests give only a rough qualitative comparison between rocks, and nothing can be de
Mechanical Foam Breaking 327
termined precisely about the physical characteristics of the foam. This means that the surface area and the number of the foam breakers to be used in the system become an arbitrary and somewhat subjective decision.
Rocks that create heavy foaming need robust mechanical foam-breaking equipment with a surface-to-production ratio of 0.4-0.5 m2 per daily ton of P2O5- This represents a surface of 400 m2 (e.g., one 22-m-diameter tank) for a 1000-ton/day P2O5 plant. As with cooling, effective mechanical foam breaking is proportional to the surface area. Tanks having tended to become larger in size, limitations arise in terms of both foam breaking and cooling, because of the decreasing surface-to-volume ratio for these larger sizes. But combined action such as mechanical and chemical foam breaking is also possible.
Other results with different phosphate rock qualities report that 1 kg of antifoaming agent could be replaced by 3 kWh of adequate mechanical foam-breaking energy (related only to the energy consumption of the foam-breaking blades).
The largest mechanical foam-breaking single-tank reactors, located at Gabes, Tunisia, are known as the SIAPE system [7]. Each unit
FIG. 5.15 Fitting of foam-breaking blades with immersion adjustment.
328
Reaction System
produces about 550 tons/day of P2O5 with a surface-to-production ratio of 0.36 m3/ton P2O5 per day, a little below the figures mentioned previously.
5.4.5 Freeboard
Foam-breaking systems need no less than an optimum height of freeboard above the slurry level. This is usually represented by a freeboard of at least 0.8-1.2 m, and this allows sufficient disengagement space for the spraying effect of the foam-breaking blades.
Normally, the splashing of the liquid causes erosion corrosion of the tank cover and some protection is desirable. However, in most instances the crystallization of sodium silicofluoride on the walls and cover of the tank, in the form of homogeneous uniform plates, assists in corrosion protection by covering and protecting the exposed surfaces, whatever material of construction is utilized.
5.4.6 Flow Pattern with Foam-Generating Rocks
We have seen previously that with mechanical foam breakers a reactor surface area of the order of 0.5 m^ of the surface area per ton of P2O5 per day is needed. In a multitank or compartmented tank, it is not possible for the foam to be completely destroyed in the first tank or compartment. It is essential, therefore, that the unbroken foam can overflow freely to the next tanks or compartments, where it can be subjected to further foam-breaking treatment.
Older systems with underflow connections between tanks and compartments are not satisfactory. Foam is then retained in the initial section and inevitably floods the tank.
5.4.7 Combination of Foam Breaking and Cooling
Some processes remove the reaction heat from the slurry by surface air cooling, involving large volumes of air passing over the slurry surface. Foam-breaking agitators produce an efficient liquid-to-air interface in such systems because of the spray they create, and increased heat exchange results from this phenomenon (see Section 5.5.3).
5.4.8 Economics
Installing foam-breaking blades on existing agitator shafts is rarely possible, either because the initial speed of revolution does not suit the diameter to be installed and an adequate n2D value, or just because the increased energy input needed for the foam breaker is not available from the existing gear and motor. Nevertheless, replacement by new equipment is still economical because of the antifoaming agents savings.
We have seen that some 3 kWh of foam-breaking energy can save
Mechanical Foam Breaking
329
1 kg of antifoaming agent. Taking corresponding investment costs and assuming a blade life of 1 year and 10 years for motor, gear, and shaft, the total cost would compare U.S.$0.20-0.25 for mechanical foam breaking against 1 kg of antifoaming agent.
5.4.9 Case Study
Situation
A fully baffled cylindrical tank with 200 m2 of effective reaction volume has an internal diameter D of 8 m and a liquid level Z of 4 m. A foambreaking agitator has to be installed for a medium-foaming rock type, working with an n2D number around 2.6. The total power consumption required should not exceed 1.2 kW/m3 or 240 kW.
Choice of Agitator
The situation described corresponds to system II in Fig. 5.16. Agitator A should be selected for its lower power number Np. In order to keep some field adjustment possibilities, we shall select an immersion level Z3.
The corresponding power number read from the n2D tables in Fig. 5.16 will be between 3.9 and 4.7, more precisely at 4.3 for a n3D number of 2.6 (by interpolation).
Diameter and Speed Calculation
Using the two equations
о
n D ' 2.6
P = 4.3 x 1.6 X 3 5 n D = 240 kW
by trial and error, we can select a proper diameter D:
With D = 2: /2.6\ П \ 2 / 1/2 = 1.14 P = 326 kW
With D = 1.8: /2.6\ n (i-eJ 1/2 = 1.20 P = 225 kW
Therefore, the speed selected is
N = 1.2 x 60 = 72 rpm
D = 1.8 m
(55)
(56)
(57)
(58)
(59)
(60)
FIG. 5.16 Power number for foam-breaking double-impeller systems at various liquid levels and speed. System I: irregular-shaped tank (square, triangular), D/T = 0.20. System II: cylindrical tank with four baffles, D/T = 0.30. w^ = 0.2D. Distance between two impeller blade centers: 2.2D; w2 = 0.75D; 1 = 0.25D.
Heat Removal
331
Water Test and Field Adjustment
Having installed the agitator in the tank, a test with water is operated. The measured power consumption is 118 kW; with the slurry density the power consumption will consequently increase to
118 x 1.6 = 189 kW
(61)
The installed power allows us to consume 240 kW at the shaft. We can consequently adjust the consumption by lowering the blades to position Z4, where the power number will increase up to about 5.0. The final power consumption will be:
5 0
P = 189 “ = 220 kW
(62)
5.5 HEAT REMOVAL
5.5.1 Heat Effects
The heat of dilution-of sulfuric acid and the reaction heat from phosphate rock decomposition is such that most of it has to be removed from the reactor in order to keep the reacting slurry medium at its optimum reaction temperature. The larger portion of the heat originates from the dilution effect and the reaction of sulfuric acid. The ratio of sulfuric acid used per ton of phosphate rock varies with the rock origin and the heat released per ton of P2O5 follows almost proportionally the specific sulfuric acid consumption. Consequently, the major variations originate from the CaO/PgOg ratio of the rock, because it controls the sulfuric acid consumption ratio, HjSO^ton of rock.
The reaction heat to be evacuated from the reactor can be calculated according to Section 3.3 with sufficient accuracy from the heat balance equation. A mean value of 190,000 kcal/ton of HgSO^ fed as 98% acid has to be evacuated (475,000-570-000 kcal/ton of produced PgOg) and less when a hemihydrate system is to be considered (see Section 3.3). A 1000-ton/day PgOg phosphoric acid plant has consequently to manage some 20-24 million kcal/hr to be evacuated from the reaction system. Needless to say, if the heat removal system is not efficient, the slurry will heat up with the evident consequences on crystallization, corrosion, filter cloth damage, and so on.
A 1000-ton/day P2O5 plant sends about 350 m3 of slurry per hour to the filter; a temperature difference of 10°C for that slurry is equivalent to 12% of the total heat that is to be evacuated.
5.5.2 Current Heat Removal Practices Compared
Air-swept cooling was the first technique applied to wet process reaction heat removal. During the first half of this century, wet process units were small and the reaction heat could be easily evacuated
332
Reaction System
together with the gas effluents of the reactor. When the reactors became larger in size, some improvements had to be made in order to increase the heat exchange between the air and the slurry. Bubbling boxes were devised and used for a certain period in spite of their high pressure loss and relatively poor heat transfer characteristics. The larger units of the 1960s definitely needed an improved technique for cooling. Vacuum flash cooling was developed, but air-swept cooling was not abandoned because of its simplicity. The heat exchange between air and slurry could be increased by slurry spraying agitation systems, which function as foam breakers as well. Both cooling systems, air swept and vacuum flash, have advantages and disadvantages that have to be considered prior to the design of the plant. Both cooling techniques are based on the evaporation of water from the reacting slurry. The partial pressure of water vapor from 30% P2O5 acid at 72°C is equivalent to 92% of the saturation pressure of pure water.
Air-swept cooling, in currently designed wet process reaction tanks, is accomplished by agitating the reacting slurry surface in such a way that large liquid-to-air interfaces are created to allow a high rate of heat exchange, due mainly to water evaporation. The air being heated up by the slurry to some 65-68°C will theoretically evacuate about 90 kcal/m3 of air at exit conditions. This number makes provision for both sensible heat and evaporative heat. In practice, however, measured values are sometimes about 40% below this theoretical figure. For large plants the disadvantage becomes obvious: very large amounts of gaseous effluents containing fluorides have to be scrubbed in order to comply with existing air pollution abatement standards.
Another disadvantage lies in the limitation of the system: the heat evacuation by air sweeping is correlated to the reactor's surface area and is consequently limited. Large reactors, at the 1000-ton/day plant size, have a rather small surface area compared to the heat exchange area required for efficient evacuation.
The advantage of the system lies in the low energy consumption. The surface agitation of the slurry can be considered as reaction agitation which is nonetheless required. The pressure drop of the airflow through the reaction system is very low. Most of the energy to be consumed will come from the exit-gas washing equipment.
The vacuum flash cooling system can be compared with a concentration by evaporation system. The hot slurry is pumped into an evaporation chamber under vacuum. Heat release is achieved by the boiling slurry and the evacuated vapor. The vapor is condensed downstream with large amounts of water.
The disadvantage of this second system, besides the fact that it is technically more sophisticated, lies in the large quantity of liquid effluent leaving the system at about 30-35°C (86-100°F) and containing some dissolved fluorides. The 1000-ton P2O5 plant [22] will pour out some 1200 m3/hr of liquid effluents. The energy consumption of this system
Heat Removal
333
is higher because of the slurry pumping rate through the evaporation system and also water pumping. Maintenance costs are also higher because of scaling problems with consequent programmed shutdowns in order to clean and wash out.
Nevertheless, size limitation is not a problem for vacuum flash cooling because two or even more systems can easily by installed on one reaction system. A reaction system with a capacity of 1000 tons/day P2O5 usually uses two evaporation chambers; the capacity size limit for one system seems to be close to 800 tons/day PgOg or 17 x 106 kcal/hr. The limitation is due to construction problems of very large rubber-lined evaporation chamber.
Table 5.6 shows the main characteristics of the two systems. The effluent treatment cannot be compared on a general basis because its investment cost depends heavily on local conditions. Water effluent, for instance, can be recycled into a cooling pond or pumped into the sea without any treatment. It can also be subject to neutralization.
TABLE 5.6 Comparison of Air-Swept and Vacuum Flash Cooling Systems for an 800-ton/day P2O5 Phosphoric Acid Unit (17 x 106 kcal /hr)
Cooling system Air-swept Vacuum flash
Approximate investment cost without effluent treatment No cost if mechanical foam breaking is installed; if no foam breaking, $150,000 U.S. $650,000
Approximate investment cost for effluent treatment 3 250,000 m /hr gaseous effluent, $670,000 No effluent treatment for liquids
Fluorine content of effluent before treatment 400-8000 mg/ actual m3 200-400 mg/liter
Fluorine content of effluent after treatment 10 ppm versus dry air -
Energy consumption Slurry spray in reactor: 300 kW Fan: 120 kW Water pump: 1000 m3/hr per 100 kW Slurry pumping: 180 kW Ejector: 2.7-ton steam or 150 kWh Water pumping: 1900 m3/hr per 180 kW
334
Reaction System
5.5.3 Air-Swept Cooling
Airflow Requirements
The heat to be removed by the humid effluent gases can be obtained from Fig. 5.17, which shows the enthalpy of humid air at different temperatures and different degrees of vapor saturation. The number of calories evacuated per cubic meter of effluent air will depend on the temperature and relative humidity of the inlet air and the temperature and degree of saturation of the outlet air. This dependence on ambient conditions hints at a major disadvantage of air-cooled systems; at some tropical locations, production may suffer because of high humidity. The ability of air to pick up water evaporated from the slurry, as an increase in its relative humidity, depends on the efficiency of the slurry spray heat exchange system. In single-tank systems with high-efficiency surface agitators, close to 90% relative humidity can be achieved, assuming that a thorough study of the airflow through the system has been implemented in the final design. If the airflow makes some partial shortcuts, the cooling efficiency will dramatically decrease. This is why a safety margin has to be provided.
From practice it can be seen that a large security margin of 40% over the theoretical figure is necessary. Most of the air-cooled plants designed with the theoretical figures have had cooling limitations—a rather difficult problem once the equipment has been installed.
Also, we should not forget that the heat removal requirement of the plant depends mainly on sulfuric acid consumption and consequently relies on the CaO/PgOg ratio of the rock. The latter is hard to guarantee on a long-term basis. Consequent to this consideration, an aircooled wet process phosphoric acid plant warrants the installation of sufficient air fan capacity to extract reactor discharge gases in the order of magnitude of 2400 standard cubic meters per ton of sulfuric acid (as 98% acid) fed into the system (dihydrate system, slurry to filter at 72°C). The 1000-ton/day P2O5 plant mentioned earlier would therefore need feed air equivalent to some 270,000 standard cubic meters per hour of effluent or at 60°C, 330,000 actual cubic meters per hour.
Equipment
The equipment to provide the interfacial dispersion of liquid into the air consists of surface impeller agitators. These can be of the same design as the mechanical foam-breaking equipment. The SIAPE process [7], cooling exclusively with air, and the Prayon process [23], cooling partially with air, use this spray-type upper impeller, which is described in Section 5.4. The Rhone-Poulenc process [6], also exclusively air cooled, uses specially designed surface spraying equipment consisting of vertical screw-type slurry lifting devices with centrifugal spraying dishes on top of the screws.
Heat Removal
335
FIG. 5.17 Enthalpy of moist air affected by temperature and relative humidity.
The rate of heat to be evacuated by the surface agitation is given in Fig. 5.18, which has been constructed with measured cooling rates from industrial-size plants. They are expressed in kilocalories per square meter of agitated liquid surface as a function of slurry temperature and specific gas flow per surface unit, the maximum load being about 100,000 kcal/hr per square meter, with slurry at 80°C (air flow limitation).
336
Reaction System
FIG. 5.18 Heat removal by air cooling in kilocalories per square meter of reactor surface as a function of cooling airflow.
The airflow pattern through the system has to be designed very carefully. The air inlet holes have to be located to avoid short circuits. Sufficient freeboard between the liquid and the cover of the tank must be provided. Too high an air speed would result in slurry entrainment and carryover. Too much freeboard would decrease the heat removal efficiency of the air. Usually about 1-1.2 m is chosen. The air exit hood also has to be designed to avoid slurry droplet entrainment and carryover. The latter situation would create difficult cleaning and maintenance problems of the ductwork and would disturb the performance.
Limitations of the System
When the production rate of a wet process reactor is increased by a factor of X, its reaction volume is also multiplied by X, but the liquid surface will only be multiplied by a two-thirds power cf X unless we agree to alter the shape of the reactor to make it flatter. This would increase the investment costs and also create problems regarding flow and agitation.
A single-tank reactor for a 500-ton/day plant with approximately 800 m^ slurry content at a depth of 5 m will have a surface of 160 m^. This will require an average of 67,000 kcal/m 2 per hour to be
Heat Removal
337
evacuated, which is not a problem. But if 1000 tons/day of P2O5 are to be produced in a single tank, an air-swept cooling system will be more difficult to install.
Using similar diameter-to-height ratios, the liquid surface in the reactor will be only 254 m^. But the calories to be evacuated would amount to about 84,000 kcal/hr per square meter. To achieve this transfer rate as an average for the total liquid surface will be a difficult task. The larger the surface of the reactor, the more difficult it will be to arrange perfect flow and heat exchange conditions for all the cooling air to be used. Extra surface agitation energy will have to be used, and very high gas velocities will occur next to the liquid surface.
At present the largest operating air-cooled single-tank wet process units produce only about 500-600 tons/day P2O5. However, larger units are under construction.
5.5.4 Vacuum Flash Cooling
Conceptual Design
The vacuum flash cooler is simply a gas-liquid separator subjected to a vacuum. Of course, there has to be a vacuum/source and a means to condense the flashed vapors. Because the cooling system is under vacuum and the traditional wet process reactors are essentially at atmospheric pressure, it is necessary to.keep the cooling chamber at an elevation sufficient to seal the vacuum by two barometric legs submerged in the reaction tank. The hot feed slurry is pumped up to the flash drum and the cooled discharge slurry flows down the second barometric seal leg back into the reaction tank. In general, the whole system is made of rubber-lined steel, with an acid brick lining for the sections of the flash drum in direct contact with the slurry. This was found to be necessary because the erosive nature of the slurry tended to wear out the rubber lining.
The first flash coolers were conceived as vapor/liquid separation chambers which were fed from the bottom. An internal weir device maintained a liquid level and the overflow was returned to the reaction tank. This type of design had some serious drawbacks:
1. Within the flash tank, the uppermost layers of the slurry, about to overflow the weir at exit conditions, were bound to be already cooled. The hot feed entering below this cooled stratum was subjected to a liquid head. At some level prior to reaching the surface, boiling would start. This submerged boiling resulted in excessive foaming and in high entrainment losses.
2. To counter the effect described above, an attempt was made to homogenize the slurry contained within the flash chamber by agitation, thus mixing and recycling already cooled slurry with the hot feed. The vessel became larger, a greater volume of slurry was
338
Reaction System
retained, and the vapor had to disengage from a greater slurry volume.
In addition, both systems described above were subject to unnecessarily high scaling conditions. Frequent shutdowns were required for cleaning and washing purposes, on the average once per month.
Gradually, a more logical design approach evolved. The hot feed slurry was introduced tangentially near the middle of the flash chamber. Better phase separation was achieved, the cooled slurry flowing directly down to a bottom outlet without being retained. The vapor was separated from a smaller slurry volume and more efficiently; consequently, better disengaging was obtained. Simultaneously, the liquid flow rates have been increased so that the temperature drop of the slurry is limited to some 2-3°C instead of 5-10°C for older systems. Scaling is reduced substantially.
Current design trends, as evidenced by a recent U.S. patent, are to utilize the lifting power of the vacuum to suck slurry up to flood the flash chamber without the need for high pumping energy. The flow energy to overcome friction losses, is provided by a marine propeller pump, pulling the slurry in the down flow leg back to the reaction tank [ 24].
Another recent development worthy of consideration is the Swenson isothermal reactor. The reactor is designed according to the principles of a vacuum crystallizer and thus has the advantage of simultaneous heat removal. An external flash chamber is not needed. However, the load on the vacuum system will be greater since all of the inerts evolved during reaction will be in the vapor space [4].
Process Considerations
The vacuum level maintained has a direct bearing on the amount of evaporation to be done, in accordance with the equilibrium of the partial vapor pressure of the slurry. The heat energy to be removed from the reaction slurry is dissipated as evaporative heat.
Furthermore, the vacuum system has to be capable of evacuating the inert gases that flash out along with the water vapor. These consist primarily of CO2, with quantities according to phosphate rock composition. Fluorine evolves as well, but to a much lesser extent. The amount of inert gases to be evacuated is related to the liquid flow rate, the slurry containing possibly up to 15 vol % gases.
In general, the vacuum level is maintained as the number of mmHg gauge pressure corresponding to the slurry discharge temperature required. The equilibrium temperature and vapor pressure vary slightly with the characteristics of the phosphate rock utilized (see Fig. 7. 8 of Appendix B).
The amount of evaporation to be done at a specified vacuum level is a function of two variables: the temperature drop and the feed rate
Heat Removal
339
of the slurry. From experience, temperature drop seems at 2-3°C to be an optimum operating criterion to abide by. During times of high production requirements, provided that there is enough overcapacity in the condensing and evacuation systems, higher temperature drops (or more heat removal) can be tolerated assuming that the accompanying ₽2^5 l°sses by entrainment are within an acceptable range. Temperature drops as high as 6-10°C, although not recommended, are encountered.
The amount of slurry circulating with such small temperature differences as 2°C is considerable. To remove 22 million kcal from a 1000-ton/day P2O5 reactor, 13,750 m^ of slurry has to flow through the flash chamber with a At of 2°C.
The volume of actual evaporation per unit volume of feed slurry can be roughly estimated using the following equation [63] , which is based on feeding a 70°C slurry (25 vol % solids) with 30% P2°5 in the liquid phase, assuming that the water vapor follows ideal gas behavior:
V w
= 4.95^P
(63)
where
V w
At
T P
3
= volume of water vapor m , evolved per unit volume of feed slurry, m3
= temperature drop of the slurry, °C
= absolute temperature of vapor space, К
= vapor pressure of water at slurry exit temperature and concentration, mmHg
Thus for each unit volume of 75°C slurry flashed down to 70°C, 46 unit volumes of water vapor will evolve at exit conditions at 70°C and 185 mmHg absolute. For the same slurry flashed down to 65°C, 112 unit volumes of water vapor will evolve at 65°C and 150 mmHg absolute. In the second case, twice as many calories are evacuated, but the vapor volume is twice as much and the liquid is cooler. The separation efficiency would be expected to suffer if both flashes were done in the same equipment, with lower temperatures and higher viscosity.
The foregoing demonstrates the effect of temperature drop on the process variables affecting separation. Furthermore, it should be stated that separation is also adversely affected by lower feed temperatures.
Knowing the temperature drop At it is possible to calculate the slurry feed rate, since the reaction heat removal requirements are already known
Q
V = —-— s At x C
(64)
340
Reaction System
where
V = volume of feed slurry, m^/hr s
Q = heat to be removed (see Section 3.3), kg-cal
C = volumetric heat capacity of slurry
= 790 kcal/m^ per degree Celsius for 25 vol % solids, 30% PgOg acid in slurry at 70°C (see Table 3.3)
For example, the slurry feed rate for a 1000-ton/day ₽2^5 Plan* with Q = 24 x 106 kcal/hr and a 3°C temperature drop with a 72°C feed slurry temperature is
= 24 x 106
Vs 3 x 790
Q
= 10,127 m /hr
(65)
Design Implementation
Circulation of the slurry through the flash cooler does contribute to the general circulation going on in the reactor. Nevertheless, the reactor must have an independent source of recirculation for adequate control during startup conditions when the reactor contents are cold.
Flash downsizing has to be done in a manner to effect efficient gas/ liquid phase separation, minimizing liquid entrainment and carryover. Adequate consideration should be given to disengaging space and vapor velocity for the extreme operating conditions that may arise, as demonstrated in the examples cited above.
Most industrial installations on the average evacuate some 100,000 kcal/m^ of flash space, and up to a maximum of 1000 kg of released water vapor per square meter of liquid surface has been measured, corresponding to some 550-560,000 kcal/m^; nevertheless, because of foaming tendencies, most work at the rate of 200,000 kcal/m^.
Finally, the vapor leaving the flash drum entrains fine droplets of phosphoric acid slurry that could lead to increased P2O5 losses in the plant (up to 1%). Cyclonic stainless steel or plastic fiber droplet separators collect the losses, which are fed back to the reaction system by means of a barometric leg.
5.6 PUMPING AND CIRCULATING
We know from phosphoric acid process chemistry (Section 2.2) that slurry circulation through the reaction system is required. In multitank systems circulation of slurry from tank to tank has generally been achieved by pump and pipe systems, which are extremely expensive
Pumping and Circulating
341
(investment and operating expenses) because of the high level of corrosion and abrasion occurring with the slurry in motion (see Chapter 10). Circulation from tank to tank needs pipes, height differences, and consequently higher pump heads and higher velocities of the impeller. That means investment, energy, corrosion, and high maintenance costs.
The use of large single tanks with or without compartments connected to each other by means of large holes has eased considerably the problem of slurry circulation. In the case of single-tank circulation, the level throughout the reaction system does not show much difference between the various sections, and the total pressure head for the circulation pump is very low. In some cases slurry circulation is realized by means of the dynamic pressure resulting from the agitation system. If the reactor is designed accordingly, the agitation flow can be maintained throughout the system with a very high flow capacity-quite a bit higher than a traditional pump can deliver [21] (see Section 5.2.2).
The usual rate or recirculation with the dihydrate route is about 20-25 times the production rate, but can be as high as 30 or even 40 times.
5.6.1 Choice of Pumping or Circulation Equipment According to the Design of the Reaction System
Phosphoric acid slurry pumping generally involves high flow rates. Consequently, it is advisable to design the circulation cycle with the lowest possible pressure drop. If the total head is 5 m or less, a propeller pump can be chosen. With higher heads, centrifugal pumps have to be installed.
When propeller pumps are installed from compartment to compartment or from tank to tank, the pipe design can save some of the pump head (Fig. 5.19A). A very ingenious system has been applied to the Fisons dihydrate reactor, where the pump has been incorporated within the reaction tank design itself. The body of the pump (Fig. 5.19B) is incorporated in the concrete of the reaction tank. The total pump head only needs 5 ft for a recycle ratio of 40:1, which is quite a high recirculation value. Similar design has been chosen for the I.I.T.P.C.C. reactor from Rumania [25].
Phosphoric acid reactors with vacuum cooling systems generally combine the cooling flow cycle with the circulation cycle. A vacuum cooling system (see Section 5.5.4) can be upflow or downflow. Most are downflow systems and need a higher pressure head, so that, in general, centrifugal pumps are installed. Such large-dimension centrifugal pumps necessitate considerable investment, especially if they are vertical submerged pumps. Prayon [9] has patented a vacuum cooling downflow system using marine propeller pumps. The design height is such that the vacuum holds the liquid level over the top of
342
Reaction System
FIG. 5.19 Slurry pumping systems. A, Traditional propeller pump; В, reactor-integrated propeller pump; C, flooded cooler with integrated pump; D, vertical submerged centrifugal pump; E, external horizontal centrifugal pump. [Compiled from Ref. 9 and S. M. Janikowski, in Phosphoric Acid (A. V. Slack, Ed.), Marcel Dekker, New York, 1968.]
Pumping and Circulating
343
the pipe legs inside the cooler evaporation chamber (Fig. 5.19C). (The vacuum effects flooding of the evaporation chamber of the cooler.)
The only pressure head needed for moving the liquid through the system is to balance the corresponding friction losses. Consequently, this system again allows the use of low-head propeller pumps, the latter being installed in the downstream pipe leg. This design protects the pump seal from slurry pressure. Recirculation rates of 30-40 times the production rate can be achieved using this system. The advantages of such high recirculation rates were described in Sections 2.2.3 and 2. 2.4.
If circulation is realized by the agitation system, the saving in equipment and energy is maximized. The flow rates also reach their highest figures. It is difficult to know accurate flow rate numbers because they can only be measured by tracers, sulfuric acid balance, or heat balance—a series of tedious methods. If an agitation flow has been chosen, the design of the tank must be such that any impediment to flow (internals, such as baffles, separation walls, etc.) will be kept to a minimum. The overall level of the reaction system will be almost the same, but friction losses will have to be balanced out.
Unfortunately, no precise method of calculating such a flow system actually exists and we have to rely on experience or experimentation (see also Section 5.2.).
5.6.2 Pumping Systems
Centrifugal Pumps
Two types can be selected: vertical submerged pumps or horizontal external pumps, both having advantages and disadvantages.
Vertical Submerged Pumps. These are usually installed on top of the tank and their shaft has to be long enough to cross the freeboard section and submerge the impeller into the slurry (Fig. 5.19).
Their advantages are: (1) they do not need any liquid seal and (2) they can produce high liquid heads.
Their disadvantages are: (1) in the case of gassed slurries (specific gravity below 1400 kg/m^), pump head drops, irregular flow and cavitation; and (2) they are expensive.
So far, the largest centrifugal phosphoric acid slurry pump unit can deliver a flow of 5000 m3/hr.
Horizontal External Centrifugal Pumps. These pumps are used more frequently than vertical pumps for phosphoric acid production. Their main disadvantage is that they require a mechanical seal. Usually, water is used as a barrier fluid to protect the seal from any abrasive particles caused by the slurry. The water pressure should be 10-15 psi (0.7-1 bar), higher than the maximum pressure behind the seal. The normal flow rate of the water added to the slurry is very small
344
Reaction System
and should not create a water balance problem (less than 0.1 gal/min). Nevertheless, the water supply has to be constant in flow and pressure.
Another disadvantage is that these pumps have to be connected by means of a perforation through the reaction tank, and consequently need valves between pump and reaction tank. The tank perforation, the valve, and the intermediate connection create spots that will plug through crystal settling. Some cleaning device has to be used (e.g., high-pressure water injection).
These pumps are less expensive than vertical pumps and their maintenance is easier because of their location at the side of the reactor. There is enough space to install a spare pump in parallel so that production shutdown is not necessary if the pump has to be removed and exchanged. This is generally not possible with vertical pumps installed on top of the tank, where only a little space is left between the agitator gears and the feed piping, the cooling system, and so on.
Propeller Pumps
The most efficient propeller pumps are those where the pump body is part of the flow pipe of the system, so that a minimum of pressure loss occurs within the system. The shaft of the propeller passes into the pipe at a suitable pipe elbow (Fig. 5.19C). Propeller pumps can offer much higher pumping capacities than those of centrifugal pumps. The largest can operate at a 15,000-m^/hr flow rate with a maximum head of 5 m, but usually operate at some 2-3 m.
5.6.3 Economics: Investment and Energy Consumption Costs
Comparative orders of magnitude for pumping system investment costs and energy consumption are given below. Costs for agitation circulation are not shown since there is no additional investment and no additional power requirement in this case.
Total investment costs and installed power for a 7000-m3/hr recirculation device (suitable for a 1000-ton/day P2O5 plant) are as follows:
Type of pump Investment cost (U.S.$) Installed power (kW)
Centrifugal Horizontal 250,000 230
Vertical 450,000 230
Propeller 200,000 90
Fluorine Emission Control
345
5.7 FLUORINE EMISSION CONTROL
5.7.1 Need for and Objectives of Gas Washing
The amount of fluorine emerging with the effluent gases from an operating dihydrate phosphoric acid reaction system is only 5-10% of the total amount of fluorine from the phosphate ore. This amount will increase whenever phosphoric acid with a higher concentration than 30% P2O5 is produced. Systems producing 45-50% acid will release up to 50-60% of the total fluorine from the reaction system.
Depending on the cooling system, fluorine will leave the reactor either with the vacuum cooler condenser water or with the cooling air. In the first case, most of the released fluorine will be transferred to the gypsum pond or will leave the plant with the liquid effluents. These cases are studied in Chapter 9. In the second case, effluent gas washing must be installed. When 30% P2O5 acid is produced, the larger part of the fluorine remains as hydrofluosilicic acid in solution with the phosphoric acid (Section 3.5). Because of its vapor pressure and the temperature of the slurry, a part of the fluorine is released into the vapor phase as HF and SiF4 (I^SiFg does not exist in vapor phase).
The high solubility of H2SiFg in water favors scrubbing fluorine from gases, but there are a number of phenomena that make efficient fluorine gas washing very difficult. Many of the phosphoric acid plants built before 1980 could only register fluoride contents with not less than some 50 mg of fluorine per cubic meter of effluent gas, and sometimes even more. However, because of the ecological impact, environmental control regulations have become more strict in most countries. Regulations vary from country to country but have in common the setting of higher standards. These standards are based primarily on studies of fluoride contamination on vegetation. In fact, vegetation shows a high fluoride sensitivity. This explains why there is often a wide gap between what can be realized in industrial practice and what environmental regulations demand.
Several reasons for low scrubbing efficiencies can be listed:
1. The effluent gases leaving the reactor are warm (65-75°C), almost saturated, and consequently difficult to cool. Unless very large amounts of scrubbing water in an open cycle can be used, with large quantities of contaminated water leaving the plant, the system will necessarily operate at temperatures close to 60-65°C. Partial pressures of H2SiFg liquors are very sensitive to the effect of temperature.
2. Scrubbing wash liquors containing hydrofluroic and hydrofluosilicic acids are readily subject to droplet entrainment and mist formation.
3. There is a tendency to precipitate silica at the front end of the system, possibly plugging the scrubbing system.
346
Reaction System
This increases the F/SiO2 ratio and subsequently the partial pressure of F in the following stages.
4. At low concentrations of H2SiF6 in the wash liquors (-0.1-1.0 g/ liter in the last washing stages of the scrubber), the equilibrium:
4H О + H SiF t 6HF + Si(OH). (66)
2 2 6 4
is pushed to the right and increases the partial pressure of fluorides in the gas phase due to the presence of HF in the liquid phase (HF has about a 100-fold partial fluoride pressure as compared to H2SiF6).
These effects explain why many of the scrubbers operate far below the yield that had been expected. High-efficiency effluent gas washing can be achieved only when we rely on proven equipment, systems, and operating conditions.
Ecological Impact of Fluorine Emission
The effect of fluorides from effluent gases is rather marked, especially on vegetation, which is more affected than living creatures because of a cumulative effect. A large series of experiments carried out in West Germany makes it possible to give some preliminary guidelines. These experiments were done by gassing various kinds of trees, grasses, vegetables, and flowers under plastic tents. The fluoride content of the air varied from 0.85 to 25 units for periods of time ranging from several hours up to some hundreds of hours (1 unit = 1 x 10’3 mg/m3). The results after fluorine exposure were examined in relation to (1) appearance (leaves, foliar bum), (2) fluoride accumulation (by analysis), (3) harvesting rate, and (4) growth rate.
Economic considerations, for example, based on these experiments and the results should be formulated very distinctly because each of these four considerations will have a different impact according to the kind of plant and the use for which it is cultivated. For example, com that accumulates fluorides in its leaves will not necessarily produce a reduced grain harvest. For flowers, of course, appearance is important, whereas grassland will be examined for fluoride accumulation principally because of its possible toxic effect when used as food for cattle.
From a general point of view, plants can be classified into three categories: slight, medium, and strong sensitivity to fluorides (see Table 5.7). This classification is based on the effect of fluorides as HF, considering both necrosis and leaf discoloration. (Some very sensitive flowers can even be chosen as fluoride emmission indicators: for example, gladiolus.)
Fluorine Emission Control
347
TABLE 5.7 Classification of Plants by Sensitivity to Fluorides
Group I: high sensitivity Group 11: medium sensitivity Group III: less sensitivity
Deciduous Japanese maple Mountain ash Vineyard Lilac Ash Copper beech Poplar Small-leaved European linden Common hornbeam Silver birch Norway maple Red oak Common beech Locust Mahonia European oak Field maple
Conifers White pine Common spruce Japanese larch Douglas fir Nordmann's fir Corsican black pine Common juniper Yew Yellow cedar
Fodder and vegetables Onion Alsike clover Purple clover White clover Timothy Lucerne Meadow fescue Cocks foot Perennial ryegrass Italian rye-grass Field pea Field bean Oats Winter barley Common vetch Spinach Fodder beet Winter wheat Winter rye Tobacco Green cabbage Marrowstem kale
Flowers Gladiolus Tulip Crocus S cilia Hyacinth Narcissus Begonia Lupin Chabaud carnation Summer aster Pansy Chrysanthemum Trifoliate ketmia Snapdragon Rhododendron
Source: Ref. 26.
348
Reaction System
TABLE 5.8 Fluoride Content Before and After Gassing for Various
Fodder Plants (milligrams per 100 g of dry material)
Plant variety Original fluoride content Fluoride gassing rate
0.85 pg, 384 hr 2.6 pg, 384 hr 40 pg, 75 hr 40 pg, 150 hr
Clover 1.9 4.6 18.8 — -
3.6 — — 105.9 172.3
Lucerne 2.0 5.1 15.0 — —
3.6 — — 80.3 132.7
Meadow fescue 2.1 6.8 21.8 -
Source: Ref. 26.
The cumulative effect of the fluoride content in a plant can be recognized by analyzing the fluoride content of dry material from the plants. Under normal conditions the fluoride content never passes 3-4 mg per 100 g of dry material (leaves dried at 55-60°C).
Whenever the figure of 3-4 mg per 100 g has been exceeded, there is a serious probability of fluoride contamination. The sensitivity limit for concentrating fluorides in leaves varies widely according to plant varieties, thus becoming possibly toxic even with very low fluoride concentration (Table 5.8).
Cereals are not as sensitive, and oats, for example, in spite of less foliar development due to fluoride contamination, did not show any diminution in harvest yield [26].
According to type, trees sometimes show very rapid signs of foliar burn, even with medium or low fluoride concentrations such as 1-2 pg/m^, Weymouth pines already show brown tail necrosis of their needles after 168 hr with 1.3 pg/m^. Foliar partial necrosis with trees does not necessarily mean an immediate drop in economic value, but an appreciable slowdown in growth, due to the reduction of the foliar surfaces, is almost certainly to be expected.
Vegetables have to be examined in view of crop production; they show variable reactions toward fluorides. For example, peas and onions are sensitive, sugar beet is not. V.D.I. (Verein Deutscher Ingenieure) in West Germany has published immission limit recommendations for three categories of plant sensitivities (Table 5.9).
Toxic concentration limits for human beings are far above those for plants because there is apparently no cumulative effect. Fluorides such as HF can be tolerated up to 0.2 mg of F per cubic meter for i hr, 0.1 for 24 hr, and 0.05 as a mean value over a full year.
Fluorine Emission Control
349
TABLE 5.9 Recommended Fluorine Immision Limit Concentrations (milligrams per cubic meter of air)
Degree of sensitivity of the plant Mean value for 24 hr Monthly mean value Mean for 7-month growth period
Very sensitive 0.002 0.0004 0.0003
Medium sensitive 0.003 0.0008 0.0005
Less sensitive 0.004 0.002 0.0014
Source: Ref. 27.
The fluoride immission limits tolerated by vegetation will hardly be met by the present capability of most gas washing equipment. The West German Office for Measurements and Immission Protection in Nordrhein Westfalen has published a fluoride air concentration map for the mean concentration of fluorides in the Oberhausen-Dortmund area for the year 1978 (about 1590 km2 or 620 square miles). About 8.5% of the total area showed more than 2 pg F per cubic meter and 47% between 1 and 2 pg of F per cubic meter. The question arises: Should the farmer select a crop according to the local fluorine forecast? Also an unanswered question is how to correlate the effect of emission values to immission values.
5.7.2 Gas Washing Equipment
Objectives
For wet process phosphoric acid plants the U.S. Environmental Protection Agency has limited the emission of fluorides to 10 g as fluorine per ton of P2Og fed into the process [28]. In the case of air cooling, where one expects to release about 7000 m3 of effluent gas per ton of P2O5, the stated value corresponds to 1.4 mg of fluorine per cubic meter of gaseous effluent. Similar concentration limits (2 mg of fluorine per cubic meter) have been set by European environment departments. It will be seen that this is a difficult goal to achieve.
Choosing a Wet Scrubber
Scrubbing Efficiency: Number of Transfer Units. The efficiency of scrubbing equipment is often evaluated by its number of transfer units, NTU:
C, - C
NTU = In * _~~2-
2 vap
(67)
350
Reaction System
C1
C2
Cvap
where
NTU = number of transfer units
fluoride concentration in inlet gas
fluoride concentration in outlet gas
fluoride concentration of the gas phase in equilibrium with the wash liquor of the scrubber
Any consistent fluorine concentration unit can be used with this equation.
The number of transfer units is a dimensionless number; it is the natural logarithm of the ratio of possible fluoride removal (Cj - Cvap) to the removal actually not achieved by the equipment (C2 ~ Cvap).
NTU numbers depend on the specific properties of the chemical compound that is to be scrubbed out, mass transfer coefficient, the wash liquor concentration used as the scrubbing medium, the temperature of the medium, the type of equipment (which creates the interface and provides the necessary energy for the mass transfer), and the speed of the gas through the equipment.
To illustrate, a scrubbing tower will increase its NTU number with a given effluent gas and a given washing liquor:
1. By increasing the liquid/gas interface (more spray nozzles, packing)
2. By increasing the liquid pressure (more liquid surface, higher speed of the droplets)
3. By decreasing the gas velocity (longer retention time of the gas in the tower)
4. By lowering the temperature of the wash liquor (lower partial pressure of fluorides over the liquor)
Table 5.10 shows some typical scrubbing systems and their corresponding NTU numbers.
Partial Pressure Equilibrium of Hydrofluoric and Hydrofluosilicic Acid Solutions. The partial pressure equilibrium diagram of fluorides over hydrofluoric and hydrofluosilicic acid solutions is important basic knowledge for the calculation of a scrubbing system. The literature provides some data for medium concentrated hydrofluoric and hydrofluosilicic acid solutions: Monaldi and Venturino [29], Lehr [30], Kothe and Muller [31], Brosheer et al. [32], and Munter et al. [33,34].
However, very little is available about low concentrated solutions such as 1 g/liter or less, which is the wash liquor concentration of the last stages of a high-yield scrubbing system. Furthermore, the partial
Ф
СО
Е
и
И
Е О •д р °" с Ф .д
о
о
ф
с 3
о со © о н со ш
© © © © © ’З*
о © © ТГ
© © ш ©
ф
со Е ‘Я о
© © © ©
© 00 © ©
S-i ф Л
U н
тз ф ф
СП
(superficial velocity)
351
352
Reaction System
vapor pressure of fluorides at these low concentrations cannot be extrapolated or calculated. The governing equation is subject to alterations which are probably due to the hydrolysis of H2SiFg occurring at low concentrations
H^SiFg + H2O J Si(OH)4 + 6HF (68)
Since the partial pressure of fluorides over HF solutions is about 100 times higher [33] than over H2SiFg solutions, the relative increase of the fluoride vapor pressure at low concentrations becomes obvious.
Also, the conclusions of the few published works about low concentrated solution are not very consistent. Whereas Kothe and Muller [31] state that the partial pressure over HF and H2SiFg solutions is equivalent to the sum of the individual pressures. Alloyer [35] states that the resultant partial fluoride pressure is greater than the sum of the individual pressures and recommends the use of a synergy coefficient, which he has not yet published.
In the case of effluent gas from a phosphoric acid reactor, the operating temperature of a scrubbing system will be close to its dew point temperature. In general, with a dihydrate system, this will be around 65°C. The F/SiO2 ratio of the gases will be close to 6:1. The fluoride concentrations in the effluent gases usually range between 500 and 1000 mg/m^ of dry air.
By selection of the available data and completion with unpublished works from the author, a partial pressure diagram ranging from 0.01 to 200 g/liter of fluorine as H2SiFg at 65°C and 20°C could be plotted (Fig. 5.20) and checked with operating multistage scrubbing systems.
Figure 5.20 shows that the ratio of fluorine in the gas phase to fluorine in the liquid phase increases at low fluoride concentration in the liquid. This explains the difficulty in obtaining low fluoride concentrations, such as 2-3 mg/m^, in the exit gases. It also demonstrates that only by multiple-stage scrubbing can such high yields be obtained.
The use of lime or caustic soda for the last stages has been suggested , but it introduces the risk of scaling in the pipes or packings of the scrubbing system. It can only be done to a very small extent in the last stage.
Temperature and Relative Humidity. The effluent gases leaving the phosphoric acid reactor have been equilibrated with the temperature and the partial vapor pressure of the reaction slurry: 70-75°C and 85% relative humidity at most. Consequently, it will be difficult to cool them below the dew point unless large amounts of cold water are available and can accept fluorine pollution. Consequently, in most cases the washing equilibrium has to be calculated at a temperature not below 65°C, which is the dew point of the gases. Unfortunately, the
Fluorine Emission Control
353
FIG. 5.20 Effect of fluoride concentration in wash liquor (HgSiFg) on fluoride content in gas phase.
partial pressure of fluorides increases substantially with temperature (they multiply by more than 3 with a temperature increase of 10°C).
Droplet Entrainment and Mist Formation. Fluoride scrubbing systems are readily subject to droplet entrainment and mist formation. It is vital to emphasize the necessity to avoid this phenomenon, which completely disorganizes the working efficiency of a scrubbing system and increases dramatically the fluoride concentration at the exit. Droplet entrainment generally originates from too high a gas velocity or from too highly pressurized sprays. In packed towers and cross-flow scrubbers, droplet entrainment has been reported at air speeds as low a little above 1.6m/sec.
To make sure that no droplet entrainment occurs between the washing stages, tracer tests can be operated. The recently developed Kimre pads are reported to be efficient for eliminating entrainments (see "Scrubber Accessories" below).
Solids Deposit, Plugging. The white amorphous solids that build up along walls, pipes, and in packings are well known in fluoride scrubbing practice. Analysis shows these to be pure silicium oxide. After several days, hardening and crust formation occur. These amorphous silicas appear to deposit mainly on solid surfaces of the equipment where (1) water condenses, and (2) no wash liquor flows.
л, ft ь
354
Reaction System
Condensed water has a higher pH than the wash liquor and promotes silica formation and deposits from SiF4 in the gas phase. Consequently, an evenly distributed wash liquor flow is the best guarantee for avoiding silica deposits.
Wash liquor flow control, free access, and easy cleaning are important criteria in selecting scrubbing equipment.
Types of Scrubbers Available
At present the most popular scrubbers used in the phosphoric acid industry are (1) spray towers, (2) packed towers, (3) spray crossflow scrubbers, (4) spray cross-flow packed-bed scrubbers, (5) venturi scrubbers, (6) cyclonic spray scrubbers, and (7) combined systems.
Spray Towers. Spray towers (Fig. 5.21) are the most traditional scrubbing systems. They are easy to design and to operate but are not very efficient for fluoride scrubbing. The washing liquor of all the spraying levels mixes on its way down to the tower bottom. Whatever the height of the tower, only one wash liquor concentration can be used. Consequently, for a multistage scrubbing system, each stage should be a separate tower.
In spite of the simple design, low energy consumption, and low pressure loss, spray towers become expensive when high-yield
Fluorine Emission Control
355
washing is required. To improve the efficiency of spray towers, high-pressure sprays have been used, but this increases droplet entrainment and mist formation.
Packed Towers. Packed towers (Fig. 5.22) are more efficient than spray towers, but their readiness to plug beds is such that they are no longer used for the purpose of fluoride washing except as the last of a multistage system where the F/Si ratio is higher and the concentrations very small.
Cross-Flow Scrubber. A cross-flow scrubber (Fig. 5.23) can be thought of as a horizontal spray tower. The advantage of this system lies in the fact that it can be very easily designed as a multistage scrubbing system. Higher liquid/gas ratios can be used, and the wash liquors of the different sections can be collected and recycled separately. Also, the horizontal design permits short, direct connecting pipes between the washing stages and good accessibility for cleaning and maintenance.
Spray Cross-Flow Packed Bed Scrubbers. Spray cross-flow packed bed scrubbers (Fig. 5.24) are among the most satisfactory fluoride control devices presently available for phosphoric acid plants [28]. The great advantage of the cross-flow packed bed scrubber lies in the
FIG. 5.22 Packed spray tower.
356
Reaction System
FIG. 5.23 Cross-flow spray scrubber.
fact that, due to the horizontal movement of the gases and the vertical flow of the liquids, higher liquid/gas ratios can be used and better irrigation of the packing is possible. High irrigation of the packing is the most efficient method of antiplugging control. Solids deposited near the front of the bed are washed off vertically and do not move into the rest of the bed.
FIG. 5.24 Packed cross-spray scrubber.
Fluorine Emission Control
357
Also, as compared with a vertical system, it is very easy to connect a series of washing stages using decreasing scrubbing liquor concentrations.
Cross-flow scrubbers also offer good accessibility and thus better cleaning and maintenance capability. The packed beds can be made of frame-mounted Kimre pads, which are easy to remove for eventual cleaning.
Spray cross-flow packed bed scrubbers operated in series can reach very high efficiencies. The first unit is in general an irrigated baffle unit because of the higher plugging probability with inlet gases.
Venturi Scrubbers. Venturi scrubbers (Fig. 5.25) are simple in design and low in investment cost. They provide a higher degree of ga/liquid mixing within a very short contact time by using high liquid or gas velocities. Consequently, they are high energy consumers. The energy input can be operated by gas or by water actuation. Water actuation is another high energy consumption factor and therefore gas-actuated scrubbers are generally used. Because of the high liquid/gas dispersion, venturi scrubbers have to be connected to an efficient demisting system. In most cases the latter is a cyclonic separating device.
Intensive studies on venturi scrubber use for the phosphoric acid industry have been made by Djololian and Billaud [ 36], and most of the phosphoric acid units in France use venturi scrubbers to treat effluent gases. The venturi scrubber is generally combined with a spray tower or cyclonic device for demisting. The number of transfer units of the venturi alone is reported to be within the order of magnitude of 2.4-3.6 NTU according to the gas velocities (18-38 m/sec) or pressure drop (200-250 mm water gauge). The U.S. Environmental Protection Agency [28] gives further values for venturi scrubbers ranging between 2 and 4 NTU, with a higher pressure drop, between 300 and 600 mm water gauge.
According to Djololian and Billaud [ 36], the pressure drop of a venturi scrubber can be calculated by the equation
Др = (pGVG2)(2g)‘1C1 (69)
where
Др = pressure drop of the venturi scrubber
pG = specific gravity of the effluent gas
VG = velocity of the effluent gas in the venturi
g = 9.81 m/sec3
= pressure loss factor of the venturi, where C| = (0.2 + 1.4LG'1), L being the liquid flow rate, liter/hr, and G the gas flow rate, m3/hr, to be applied for LG'1 ratios up to 2 (For LG'1 ratios exceeding 2, is about 2.5)
358
Reaction System
FIG. 5.25 Vertical venturi scrubber combined with a cyclonic liquid separation device. A, Gas inlet; B, liquid seal; C, venturi section; D, spin section; E, liquid separation section F, gas outlet; G, liquid head tank with supply control; H, wash liquor outlet.
Fluorine Emission Control
359
Cyclonic Spray Scrubbers. Cyclonic spray scrubbers or towers provide substantial liquid/gas contact by spraying the wash liquor into the moving gas phase. The tangential inlet induces a spinning motion to the gases from the bottom to the top of the scrubber. The resulting centrifugal force eliminates excessive entrainment of the scrubbing liquor (Fig. 5.26). Although their absorption capacity is higher than that of normal spray towers, it is still limited, for the reasons that have been described for spray towers in general.
D
FIG. 5.26 Cyclonic spray scrubber. A, Air inlet; B, spray nozzles; C, air outlet; D, liquid outlet.
360
Reaction System
Combined Systems. Today's environmental requirements cannot be obtained from a single-stage system; only multistage scrubbing units can achieve the required high yields of fluoride removal. Series of identical or of different unit types are to be combined. The NTU value of the system results from the sum of the individual values. The most common combinations are series of spray and packed towers (the packed tower for the final stages, where there is little risk of plugging), series of cross-flow scrubbers, and venturi scrubbers followed by cyclonic spray scrubbers. Series of venturis are less frequently used because of their high pressure drop and consequential energy consumption.
Scrubber Accessories: Spray Nozzles and Packing
Spray Nozzles. The spray nozzles have to be designed to be plugproof. The dispersion of the liquid is obtained by impingement or centrifugal effect; both devices permit large orifices (Fig. 5.27).
Packings. Various types of packings have been used more or less successfully. At the present time frequently used types are Tellerettes (Fig. 5.28) and Kimre pads (Fig. 5.29).
FIG. 5.27 Clog-proof spray nozzles.
Fluorine Emission Control
361
FIG. 5.28 Tellerettes packing for effluent gas washing equipment.
1 NTU per foot of layer when gas velocity is 4 ft/sec. (Courtesy of Ceilcote SARL, Paris, 1981.)
5.7.3 Case Study
With regard to the inaccuracy of knowledge of fluoride's partial pressure behavior over diluted hydrofluosilicic- wash liquids, combined with the uncertainties involved in any fluoride scrubbing system, there is no reason to use elaborate calculation systems. Nevertheless, to achieve a secure yield of washing efficiency, a simplified calculation is suggested in this case study. Since the partial pressure diagram of fluorides over hydrofluosilicic liquors follows an inconsistent curve, trial-and-error calculation has to be applied to find the most suitable series of washings capable of removing the required percentage of fluorides from the effluent gases. The present case study aims at a final fluorine content of less than 8 mg of fluorine per cubic meter of dry air.
For gases leaving the reactor:
Total actual gas flow Temperature Relative humidity Fluoride content
250,000 m3
70°C
85%
700 mg of fluorine per standard cubic meter of dry air
The scrubbing system chosen comprises packed cross-flow scrubbers in series. Each unit has a washing efficiency of 4 NTU.
The liquid effluent should, by definition, contain 40 g of fluorine per liter. Because of the relative humidity of the effluent gases, the wash liquor temperature will stabilize at 65°C.
FIG. 5.29 Kimre pads packing for effluent gas washing equipment. 3 NTU for 6 pad layers (6 in.) with 6 ft/sec gas velocity has been reported. (Courtesy of Kimre, Inc., Perrine, Fla., 1981.)
362
Fluorine Emission Control
363
At 70°C, 85% relative humidity is 26 vol %, so the dry gas flow at standard conditions can be calculated as follows:
-1 -1 3
250,000 x (100 - 26) x 100 x 273 (273 + 70) = 147,000 Nm (70)
The total amount of fluorine in effluent gas is
147,000 x 0.7 x Ю*3 = 102.9 kg (71)
The fluorine in the exit gas ('7 mg/щЗ dry air specification) is calculated as follows:
_ 3
147,000 x 0.007 x 10 = 1.03 kg (72)
The total fluorine collected by the wash liquor is found from Eq. (71) minus Eq. (72):
102.9 - 1.03 = 101.6 kg (73)
The amount of wash liquor is
= 2.540 m3/hr (74)
The partial pressure numbers of fluorine over H2SiFg liquors are taken from Fig. 5.20.
First Stage (4 NTU). The partial pressure of fluorine above
40 g/liter solution at 65°C is, from Fig. 5.20, 100 mg/Nm3.
The exit-gas concentration X^ from the first stage is calculated as follows:
3
X^ = 111 mg/Nm (76)
Second Stage (4 NTU). The wash liquor concentration is
Eq. (70) x Eq. (76) - Eq. (72)
Eq. (74)
or
14^0.00 x 111 X 10 6 - ^O3 =6.02 kg/m3 (77)
364
Reaction System
The partial pressure of fluorine over 6.02 kg/m^ is 22 mg/m®. The exit-gas concentration X2 leaving the second stage is
, Hl - 22 л ta X2 - 22 4 (78)
Q = 23.6 mg/m (79)
Third Stage (4 NTV). The fluorine in wash liquor is
147,000 x 23.6 x 10 6 - 1.03 _ , ,3 2.54 = 0.96kg/m (80)
The partial pressure of fluorine over the wash liquor is 10 mg/m . The exit-gas concentration X3 leaving the third stage is
, 23.6 - 10 . ln X, - 10 = 4 «J (81)
X = 10.25 mg/m «5 (82)
Fourth Stage. The fluorine in the wash liquor is
147,000 x 10.25 x lQ-6_- 1.Q3 = Q 3 2.54 6 (83)
The partial pressure of fluorine over the wash liquor is 7 mg/m®. The exit-gas concentration leaving the fourth stage is
. 10.25-7 „ X -7 =4 4 (84)
X4 = 7.06 mg/m^ (85)
The result [Eq. (85)] confirms the expected washing efficiency.
From the case study it can be seen that because of the particular behavior of the equilibrium curve of the partial pressure of fluorine (Fig. 5.20), washing stages operating with wash liquor concentration close to 0.1-1 g/liter can hardly reduce the fluorides substantially from the gas phase. A great number of washing stages should be used to overcome this difficult section toward lower concentrations.
Notation
365
To achieve very low fluoride concentration in effluents, such as 1-2 mg/m3 of dry air, wash liquor cooling or partial neutralization is called for. Wash liquor cooling will, however, cause so much of the water to condense that the final fluoride concentration will be extremely low, thus shifting the environmental problem to that of liquid effluent.
Partial neutralization must be carefully tested in a pilot plant operation to learn how to avoid scaling and plugging of the scrubbing system. The use of additives such as aluminum hydroxide, for example, to avoid plugging is currently being investigated.
NOTATION (for Sections 5.3 and 5.Ц)
a blade pitch
C off-bottom clearance, m
D impeller diameter, m
f scale-up factor
e 2 g 9.81 m/s
i immersion degree of blades, percent of D
Kp number of pumping
lb blade length, m
n impeller speed, rev/sec
n^ number of blades
N impeller speed, rpm
NAe aeration number (ratio of gas flow to pump flow of agitator) N Power number
P
N^e Reynolds number
P power consumption: W x V for total tank volume
Q agitation flow, m3/sec
Qs supply flow rate to agitator, m3/sec
Ql pumping rate of an agitator, m3/sec
Q2 induced flow rate, m3/sec
Q3 circulation rate, m3/sec r radius
366
Reaction System
T tank diameter, m
3
V tank volume, m
Vg superficial velocity, m/sec
w blade width, m
3
W specific power consumption, W/m ; for convenience, industrial case studies use kW/m3
Z liquid level in tank, m
p viscosity, Pa (1 Pa = 1000 cP)
p specific gravity, kg/m3 or t/m3 (see footnote, p. 308)
REFERENCES
1. Metra, publicity material, Bopp und Reuther Gmbh, Mannheim, West Germany.
2. S. M. Janikowski, N. Robinson, and W. F. Sheldrick, Insoluble Phosphate Losses in Phosphoric Acid Manufacture by the Wet Process: Theory and Experimental Techniques, Proceedings No. 81, The Fertilizer Society, London, 1964.
3. M. M'Gaieth, Improvements of SIAPE Process for the Manufacture of Phosphoric Acid, International Superphosphate Manufacturers Association Technical Conference, Vienna, November 1980, p. TA 80-5.
4. Q. D. Bowers and E. M. Edwards, The Isothermal Reactor for Phosphoric Acid from Igneous Phosphate Rock Concentrate, Proceedings of the British Sulphur Corporation's 3rd International Conference on Fertilizers, London, November 12-14, 1979.
5. Rhone-Poulenc, Les Procedes Rhone-Poulenc de production d'acide phosphorique, Inf. Chim., No. 207, November 1980.
6. Rhone-Poulenc Improves the Single Tank Phosphoric Acid Process-Single Agitator—Paster Filter, Phosphorus Potassium, No. 88, March-April 1977.
7. SIAPE, Tunisia, French Patent No. 1,592,005, November 18, 1968.
8. Societe de Prayon, Belgium, Phosphoric Acid Dihydrate Process for Tomorrow, [publicity material], Belgium.
8a. IITPIC Reactor: Reactors for Phosphoric Acid Plants, Phosphorus Potassium, No. 114, July-August 1981.
9. Societe de Prayon, Patent Appl. No. 78-18605, June 21, 1978. French Patent No. 2,407,891.
10. Prorea Process, in Phosphoric Acid, Vol. 1, Part I (A. V. Slack, Ed.), Marcel Dekker, New York, 1968, p. 328.
11. E. Gates, J. G. Fenic, and T. L. Henry, How to Select the Optimum Turbine, Chem. Eng., December 8, 1975.
References
367
12. D. S. Dickey and J. C. Fenic, Dimensional Analysis for Fluid Agitation Systems, Chem. Eng., January 5, 1976.
13. D. S. Dickey and R. W. Hicks, Fundamentals of Agitation, Chem. Eng. , February 1976.
14. A. Le Lan, Technique d'extrapolation des systemes d'agitation, Inf. Chim. , No. 171, November 1977.
15. R. L. Bates, P. L. Fondy, and J. G. Fenic, in Mixing Theory and Practice, Vol. 1, Academic Press, New York, 1956, p. 120.
16. R. L. Bates, P. L. Fondy, and R. R. Corptein, Ind. Eng. Chem. Process Des. Dev., 2:310 (1963).
17. F. A. Holland and F. S. Chapman, Liquid Mixing and Processing, Reinhold, New York, 1966.
18. D. E. Mack and A. E. Kroll, Chem. Eng. Prog., 44:189 (1948).
19. S. Nagata and T. Yokoyama, Mem. Fac. Eng. Kyoto Univ., 18:13 (1956).
20. D. S. Dickey, Turbine Agitated Gas Dispersion-Power-Flooding and Hold Up, 72nd Annual AIChE, Meeting, San Francisco, November 25-29, 1979, Paper No. 116d.
21. D. W. Leyshon, Recent Performance and Innovations in Dorrco Process Phosphoric Acid Plants, International Superphosphate Manufacturers Association Technical Conference, Orlando, Fla., October 1978.
22. G. Kleinman, Flash Cooling, paper presented on behalf of Swenson Evaporator Company, publication date unavailable.
23. A. V. Slack, Prayon, in Phosphoric Acid, Vol. 1, Part I (A. V. Slack, Ed.), Marcel Dekker, New York, 1968, Chap. 3, II-C.
24. U. S. Patent No. 4,188,366, February 12, 1980. Inventor: S. V. Houghtaling (assinged to Societe de Prayon).
25. IITPIC Reactor, Reactors for Phosphoric Acid Plants, Phosphorus Potassium, No. 114, July-August 1981.
26. R. Guderian, H. Van Haut, and H. Stratmann, Experimentelle Untersuchungen Ober Pflanzenschadigenda Fluorwasserstoff-konzentrationen, in Forschungsberichte des Landes Nordrhein Westfalen, Westdeutscher Verlag, Cologne, West Germany, 1969.
27. Verein Deutscher Ingenieure, VDI Richtlinien VDI 2310, VDI Kommission Rheinhaltung der Luft, Berlin Verlag GmbH, Dusseldorf, West Terman, 1978.
28. U.S. Environmental Protection Agency, Evaluation of Control Technology for the Phosphate Fertilizer Industry, EPA 600/2 79-169, August 1979. Available from National Technical Information Service, U.S. Dept, of Commerce, Springfield, VA 22161.
29. R. Monaldi and G. Venturino, Procede de recyclage des solutions de HgSiFg de recuperation de lavage des gaz vers la cave a superphosphate, International Superphosphate Manufacturers Association Technical conference, The Hague, September 1976.
368
Reaction System
30. J. R. Lehn, Fluorine Chemical Redistribution in Relation to Gypsum Storage Pond Systems, The Fertilizer Institute Environmental Symposium, New Orleans, La., March 6-8, 1978, pp. 277-312.
31. K. Kothe and L. Muller, Beitrag zur Ermittlung von Fluorwasser-stoffpartialdriicken, Nene Heute 18(6) :332 (1973).
32. J. C. Brosheer, F. A. Lenfesty, and К. I. Elmore, Vapor pressures of Hydrofluoric Acid Solutions, Ind. Eng. Chem., March 1947, p. 423.
33. P. A. Munter, О. T. Aepli, and R. Kossatz, Hydrofluoric Acid Water and Hydrofluoric Acid, Hydrofluoric Acid Water, Ind. Eng. Chem. 39:427 (1947).
34. P. A. Munter, О. T. Aepli, and R. Kossatz, Partial Pressure Measurements on the System Hydrogen Fluoride Water, Ind. Eng. Chem. 41:1504 (1949).
35. G. Alloyer, Advances in Gas Scrubbing the Recovery of Fluorine in Fertilizer Manufacture, Phosphorus Potassium, No. 110, November-December 1980.
36. C. Djololian and D. Billaud, Absorbing Fluorine Compounds from Waste Gases, Chem. Eng. Prog., November 1978.
6
The Filtration System
6.1 FUNDAMENTALS
6.1.1 Aims and Criteria
The purpose of the filter is to separate phosphoric acid from calcium sulfate crystals. This is achieved by loading the acid/crystal slurry onto a filter cloth, and then applying a vacuum to the underside. The atmospheric pressure forces the acid through the cloth-retained "crystal cake" to the vacuum side of the cloth, from where it is evacuated.
This separation should be as complete as possible; for acceptable performance not more than 0.5% of the produced phosphoric acid should be left with the separated calcium sulfate crystals. The 0.5% P2O5 loss incurred during normal daily operation tends to be higher when averaged out over longer periods of operation, since during startups and shutdowns, losses higher than normal will take place.
In fact, the 99.5% level of overall extraction, when compared to the total P2O5 fed to the system, appears to be much higher since the slurry is actually composed not only of phosphoric acid derived from the phosphate which has just formed the gypsum but also of the recycled acid which had already been filtered.
For example, in rock from Tunisia, a typical reaction system with a 25% by volume solids content in the slurry would require the recycling of 176 tons of P2O5 for 100 tons produced. Therefore it will be necessary to filter 100 + 176 = 276 tons of P2O5, relative to the gypsum corresponding to 100 tons of P2O5.
Thus, the recovery mentioned earlier refers only to every 100 tons produced (the industrial yield). A so-called recovery of 99.5%, as in
369
370
Filtration System
our example, corresponds in fact to a recovery of
100 + 176 - (100 - 99.5) =
100 +176 ’
relative to the P2O5 from the slurry.
This calculation demonstrates how important it is to watch the quality of filtration. The risk of loss is increased since P2O5 passes over the filter an average two and a half times for every one time the gypsum passes.
This becomes more significant when we operate with low-grade rocks or processes producing more concentrated acids directly. Since we must maintain in the slurry a solids content of about 25% (in volume), we must recycle and re filter part of the product acid: that much more p2(->5 which fhe incoming phosphate rock lacks. Consequently, the risk of losing P2O5 due to the occasional upset of the filtration system may invalidate the theoretical advantages of certain processes, when fed with lower grades of rock.
In general, the calcium sulfate filtration operation can be considered in four phases or sections:
1. Extraction of the production acid.
2. First washing with recycled acid/wash water filtrate from the previous washes. The filtrate from this wash, containing the residual product acid from the cake, is recycled as return acid to the reactor.
3. Second washing with the wash water filtrate resulting from the third washing.
4. Third washing with the process water. This phase has the double function of cake tail washing and process water feed, via filter and recycle acid system, into the phosphoric acid reactor.
These four phases are spread over four filter sectors, slightly differing in filtration surface area. In practice the following spread is often found:
Active Surface
Section of the Filter
1 27%
2 and 3 43%
4 30%
For a tilting pan filter, for example, the active surface is about 80% of the total surface, the remaining 20% being suitable for cake removal and filter cloth washing.
Fundamentals
371
6.1.2 Observations on the Filtration Equation
The Surface and Speed Equation
Filter size is set by empirical means, either by experience gained in existing units operating on the same phosphate or by bench scale and pilot plant studies.
Filter surface area and speed of rotation are the two prime criteria involved in Alter size selection and determine directly the quantity of slurry added per surface element (i.e., the quantity of Alterable gypsum per surface unit). This is where a very important factor intervenes , namely, the correlation between filtration speed and the thickness of the Alter cake.
Considering the cake as a porous media crossed by capillary channels, we can apply, for a given channel, Poiseuille's law:
where
V = volume of liquid Aowing through the capillar channel
P = pressure drop through the Alter cake and cloth
r = radius of the capillary channel
T = time
p = viscosity of the filtrate
£ = length of the capillary channel, proportional to specific Alter load or cake thickness
ТГ = 3.14
Per unit of effective cake-covered filtration area, there is a constant number of channels, with constant mean radiuses for a given slurry, so that we can write:
,, „ nr4 PTS
Alter 1 8p i
where
Vfilter = v°lume filtrate for the total filter and for one filtration cycle
S = effective filtration area of the filter
T = time for one filtration cycle
= proportionality constant
372
Filtration System
For a given slurry, К|(тгг^/8р) is constant and we can simplify Eq. (2):
V filter % 2 Z
where K2 is another proportionality constant.
Furthermore, for the cake thickness £, being a function of and S we obtain
£ = K3
Vffler v = £S
S filter K3
(3)
(4)
where K3 is another proportionality constant.
By combining Eq. (3) and (4):
or
V . filter
K2 PTS
£S
s
K3
pts2
(5)
V filter
1/2
(PT)1/2S
(6)
By changing the constant, we can use the same equation with Vfiifer becoming Vsiurry, the volume of slurry fed on the filter for one filtration cycle:
V , = K(PT)1/2 S
slurry
(7)
The filtration capacity Q or the amount of slurry filtered per unit of time relates to the number of cycles n operated per unit of time:
Q = nV , slurry
(8)
where
(9)
Fundamentals
373
The final equation then becomes
Q = K(PT)1/2 | (10)
or
Q = K(P)1/2 (T)'1/2 S (11)
where К = filtration constant, typical for each phosphate rock (see Section 6.5.2) and T = time for one filtration cycle.
This formula, which had been demonstrated earlier by Moraillon [ 1], the surface and speed rule, is very important because it shows the combined effect of both the filtration surface and the filtration cycle time (or the revolution speed of the filter) on the capacity of a filter.
The surface and speed rule is to be applied whenever a filter has to be sized. Also, the phosphoric acid plant operator should apply it to reach the highest yield of recovery from the filter. This will be achieved by operating with the highest cake thickness £ that allows the required product acid filtrate flow, and both the wash acid and process water to traverse the cake with a sufficient consecutive cake drying time (20-30% residual moisture in the filter cake left).
Applying Eq. (11) we can see that for a given filter, the filtration capacities Q vary according to the inverse ratios of the square root of their filtration cycle times.
As compared, for example, with a cycle time of 4 min and a flow rate Q4. the flow rates Q3, Q3, and Q4 become, respectively
Q3 = Q4<4) (3) =Q4 x 1.15 for a 3-min cycle (12)
Q2 = Q4(4)1/2 (2)’1/2 = Q4 x 1.41 for a 2-min cycle (13)
Q1 = Q4(4)1/2 <1)1/2 = Q4 x 2.0 for a 1-min cycle (14)
Performance of Typical Rocks To illustrate the surface and speed rule, filtration rates from oper-
ating plants and pilot plants were plotted against their corresponding filtration cycle times. The results are depicted in Fig. 6.1 for different phosphate ores.
Obviously when carrying out filtration tests or evaluating filtration rates from operating plants, the results will exhibit variations in filterability. Consequently the square root rule becomes apparent only when a large number of tests will be carried out. The "band" of the test points, however, follows the square root rule.
374
Filtration System
FIG. 6.1 Effect of square root function on filtration rates for some typical phosphate rock qualities.
Fundamentals
375
Consequences of the Surface and Speed Rule
The consequences of this rule are very important, particularly in the case of large units. When aiming for large daily capacities we can obtain them more easily if the filter can rotate more rapidly.
In 1950 the largest filter in the world (40 m2) rotated in 9 mins. Since 1975 we have been able to buy tilting pan filters of more than 160 m2 which rotate in less than 4 mins. Given the same phosphate quality this represents a sixfold increase in production per filtration unit. Current Prayon tilting pan filters with an effective filtration area of 180 m2 can rotate in 2 1/2 min.
Table filters are now mechanically capable of even higher speeds, up to twice those of tilting pan filters, giving them an advantage of 1.4 times the production for an identical surface to that of a tilting pan filter (provided that same vacuum is applied).
Are we therefore evolving toward "minute" ultra-rapid filters? Almost certainly not, for one obvious reason; it has to do with cake washing. If a filter revolves faster, the slurry is spread over a larger surface for a shorter time. The ratio of washing water to volume of slurry remains constant, but the wash flow through each element of cake decreases proportionally.
We can illustrate the comparison as follows: thick cake (low filter rotation speed) with each element represented by a cube of cake crossed by three cubes of washing water, as depicted in Fig. 6.2A; thin cake (high filter rotation speed) with each element represented by a cube of cake crossed by only one cube of water, as depicted in Fig. 6.2B.
In a rapid filtration cycle, each unit of gypsum is traversed by less washing water for a shorter period of time. If filtration obeyed the law of simple liquid displacement perfectly, all would be well. However, we now come up against those famous hidden channels in the cake from which the diffusion of P2O5 is slow. There is also the effect of the edges of the cells and filter, where the vacuum is weaker, and there are inconsistencies in the cake which make for preferential passages.
At a higher filter rotation speed, all of this leads to a lowering of the washing performance; what was of marginal importance now becomes important. The thinner the cake, the more pronounced will be the problems due to diffusion, vacuum distribution, and edge effects. Thus a limit is imposed. With a filtration cycle time close to, or below, 1 min, higher filtration losses start to rise, so these filter cycle velocities are normally not used in phosphoric acid production. Currently, large tilting pan filters have cycle times of about 3-4 min; table filters, 2 and sometimes 3 min; and small belt filters, only 1 min.
When cycle times are reduced, more powerful vacuum pumps are necessary. The arrival of a greater number of pans per minute necessitates greater evacuation of the air. At 4 min per cycle, a filter consumes 14-20 kg of air (at 160 mm Hg absolute pressure) per hour per
376
Filtration System
FIG. 6.2 Effect of filter speed on cake washing efficiency.
square meter of filtration surface area. If the speed increases, the cake becomes more permeable and, considering also the other factors mentioned, about 30 kg is necessary for a cycle of 1 min.
A good supply of vacuum pumps is therefore vital. Generally speaking, the vacuum system usually operates with 200-250 mm of mercury-absolute pressure gauge. At this pressure the boiling point of 30% acid is close to 70°C. An equilibrium is established between the acid temperature and the vacuum when the filtered acid temperature is above the equilibrium.
6.2 FACTORS THAT INFLUENCE PERFORMANCE
6.2.1 Physical Properties of the Slurry
The following factors are relevant: (1) the solid content, (2) the quality of the crystals, (3) the viscosity of the acid, (4) the temperature of the slurry.
Factors That Influence Performance
377
The Solid Content
Solid content was defined and discussed in Section 2.2.6. It varies little beyond the limits of 24% and 28% and is usually 25%, when expressed as a percentage of volume. Bearing in mind this solid content and the desired performance, the filtration of the phosphoric acid slurry depends on choosing a type of filter with a high leaching efficiency for the cake. The choice is limited to filters with large effective filtration surfaces and filtration cycle times currently ranging from 2 to 6 mins.
Crystallization Quality
Crystallization quality was discussed in Section 2.2.6. We must nevertheless emphasize at this point that, generally speaking, the texture of a gypsum cake, as a function of the crystal shape and size distribution, is such that the filtration and cake leaching effect do not correspond to a simple liquid displacement.
In fact, following a wash, the amount of residual P2O5 remaining in the cake suggests that there are preferential capillary channels, through which the washing solution passes easily and more or less obstructed or capillary channels, from which the P2O5 can only be extracted with difficulty. (See Section 6.3.1, "Conclusions from the Diagram Analysis.")
The curves of graphs showing the extraction of P2O5 generally reveal a rapid decrease in "residual P2O5" to a level equivalent to 99% recovery (measured as industrial performance, i.e., compared to P2O5 produced). Further extraction of the P2O5 is more difficult to obtain and is dependent on the crystalline shapes.
Viscosity
Viscosity is of fundamental importance. Once a particular phosphate has been selected, we have to accept its consequent acid viscosity. When choosing the phosphate, careful consideration must be given to the concentration of iron and aluminum, both of which are factors that increase viscosity.
Only the effect of temperature can help us with the problem of viscosity for a given phosphate. That is why the cake washing water is generally heated to about 60-70°C, thus keeping the filtration at a convenient temperature.
Temperature
Filtration speeds vary considerably with temperature. According to pilot plant studies, the lower limit should be around 68°C. However, in practice we more often encounter problems of excess temperature.
378
Filtration System
Beyond 80°C, in a dihydrate system, there is a risk of "burning" the filter cloth and causing considerable scaling. Most dihydrate installations work at about 72-75°C an optimum temperature. However, I have often come across temperatures as high as 78-80°C, even more in some particular cases, affected by the phosphate rock quality. Taiba rock, for example, processed in a dihydrate system, permits unusually high filtration temperatures without any particular problem (up to 92°C).
6.2.2 Use of Additives to Improve Filtration: Flocculants
How Flocculants Operate
Considerable improvement in filtration rates can be obtained [2] in some specific cases by the use of flocculants. These flocculants are, in general, anionic polyelectrolytes, such as polyacrilamides, or of the type
p CH - CH - - CH0 - CH -z 1
C = 0 1 C = 0 1
NH2 - n 0©
where n can be high enough to give a molecular weight of several million. Their chain length can attain several microns. These products, nevertheless, have to be used by means of a very diluted solution, such as 0.5 wt %. Higher concentration would generate too high a viscosity of the solution.
A few liters of the diluted solution, added to a cubic meter of slurry to be filtered, can improve filtration substantially. Depending on the phosphate rock origin, improvements of up to 30% have been reported for favorable cases.
The theory is that the effect of the flocculants, which consists of long-chain molecules with scattered electric charges, is to collect and wrap up impurities bearing opposite charges. These impurities, collected together as flocs, will no longer plug the filtration channels of the filter cake (Fig. 6.3).
For some time it was believed that these impurities were the organics of the phosphate rock because the action of flocculants was discovered while using Tunisian phosphates, which have high organic loads. In fact, flocculants eliminate organics from the product acid by floc formations retained within the filter cake.
Nevertheless, no positive results have been found with Florida rocks, which also have high organics. Furthermore, the filtration rates of phosphates without organics have also been improved by the use of flocculants (Patos de Minas, Brazil).
Factors That Influence Performance
379
FIG. 6.3 Collecting effect of flocculants.
From the author’s experience based on experiments with active silica and flocculants, it seems more probable that this effect of improving filtration is based on wrapping up of amorphous silica.
Operating Technique
An imperative condition for the successful use of flocculants is the location of their mixing point with the slurry. If the flocculant remains too long within the slurry before filtration, it is destroyed by the phosphoric acid. This destruction is very rapid, taking less than 4 min. Nevertheless, mixing with the slurry is very easy and the introduction of the flocculant solution into the slurry pipe feeding the filter can be carried out successfully (Fig. 6.4).
380
Filtration System
FIG. 6.4 Flocculant feeding system. 1, Flocculant solution preparation tank; 2, surge tank; 3, volumetric feed pump; 4, slurry filter feed pipe.
Economics
The amount of flocculant per ton of phosphate rock consumed is very low (some 40 g/ton of phosphate rock) and the economic impact is negligible (about U.S.$0.2 per ton of rock).
6.3 FILTRATION AND CAKE WASH DIAGRAMS;
P2O5 BALANCE THROUGHOUT THE FILTRATION SYSTEM
6.3.1 Filtration and Wash Diagrams
Preliminaries and Introduction to Case Study
The goal of filtration is to obtain the minimum of residual P2O5 in the gypsum. Consequently, we would like to know its function and the factors that govern it. It is not a simple function and it is therefore our view that it will be easier for the reader to study some typical examples derived from existing filters.
The values for the filter under consideration in our first case study were as follows (Fig. 6.5):
Size of the plant: 500 tons of P2O5 per day
Filter: tilting pan type with 70 m2 of active filtration surface; speed of the filter: 4 min per filtration cycle (270 mmHg vacuum abs.)
Filtration and Cake Wash Diagrams
381
i.
FIG. 6.5 Material balance for a 500-ton/day P2O5 filtration based on measurements with Taiba phosphate rock (in tons and cubic meters per hour.) For a filter with an effective filtration area of 70 m2. The filter pan figures relate to tons of P2O5 and cubic meters of liquid impregnating the cake.
382
Filtration System
Rock origin: Senegal, Taiba rock, high-grade, 38% P2Og
Acid produced: flow—72 tons per hour, 55 m3 per hour, 20.8 tons on ₽2O5 per hour; specific gravity 1316 kg per m3; P2O5 concentration 28.7% in weight, 378 g of P2°5 per liter
Slurry feed: flow 139.7 m3/hr, 221.4 tons/hr; specific gravity 1585 kg/m3; solids content 26.4% in volume 85.6 tons/hr; P2O5 content 17.52% or 38.8 tons/hour.
Return acid (recycle to reaction system): flow 120.3 m3/hr, 135.5 tons/hr; specific gravity 1126 kg per m3; P2Og content 13.36%, 18.0 tons/hr.
Filtration losses (soluble): Measured soluble P2O5 losses (as acid), 0.069 tons/hr.
To plot the diagram (Fig. 6.5), the P2O5 content was analyzed within the different washing acids and in the cake on the filter at the different stages of its washing. The samples were made up of several repeated samplings, so it is safe to consider them as a statisitcal sampling during the operation time.
Explanation of the Diagram
The filter is represented by four pairs of pans, plus a ninth, tipping out the gypsum (Fig. 6.5). Each pair of pans represents one of the filtration sections mentioned in Section 6.1.1, consisting of one loaded pan, filled with either feed slurry or cake plus washing solution, plus a second pan, after cake drying in the same filtration section.
The upper number in every pan corresponds to the residual acid in the cake, expressed in tons of P2Og per hour. The number below, also written in the pan, indicates the amount of liquid impregnating the cake when leaving the respective filtration sector. Two more fil-trations case studies, one with Tunisian and one with Morocco rock, are depicted in Figs. 6.6 and 6.7.
Analysis of the Diagram
The amount of acid extracted in the first sector is more than the rated product acid flow. This makes it easy to control the right return acid concentration by recycling some of the product acid. An amount of 8.19 tons P2O5 or 21.7 m3/hr is taken out of the product acid filtration section and fed into the recycle acid. We should note the ratios with which the P2O5 is evacuated from the cake in the two first sectors: 74.6% of P2Og fed to the filter by the first sector and 94% after the second.
However, comparing the residual P2O5 values with the produced P2O5 as much as 47% of the P2Og remains as it passes out of the first sector. The same residual P2O5 compared with the total P2O5 supplied to the filter represents only 25.3%. After drying, the next to last
384
Filtration System
FIG. 6.7 Material balance for a 500-ton/day P2O5 filtration based on measurements with Moroccan rock (in tons and cubic meters per hour.) For a filter with an effective filtration area of 120 m2. The filter pan figures relate to tons of P2O5 and cubic meters of liquid impregnating the cake.
Filtration and Cake Wash Diagrams
385
sector still contains 0.97 ton of ₽2®5 ₽er ^our> which 0.069 tons will definitely be lost on the way out of the gypsum. The industrial or economic performance of the filter is therefore 20,800/20,800 + 69 = 99.67% in this case. The effective performance of the filter is (38,900 - 69)738,900 = 99.82%, as related to the total P2Og fed to the filter. All along the filtration cycle, the solid content of the cake increases progressively: 58, 56, 59, and 60% solids, respectively, on the way out of each sector (expressed as volume percent).
The most remarkable fact lies in the comparison of the calculated concentrations of the residual cake impregnation liquids with the concentration of the washing liquors that have just passed the same cake. Thus, if there was simple liquid displacement, the concentration of the residual impregnation liquor would be the same as that of the washing liquor that has just passed the cake.
Stated in more concrete terms; the cake leaving the first acid wash section still contains 2.86 tons of P2Og and only 28.9 m® of liquid.
This is an average concentration of 99 g/liter. The wash acid, which was just sent onto this cake, passed and impregnated it, and came out at only 27.4 g/liter. This reveals a very important fact: Approaching the "tail" of the filtration operation the residual P2Og is basically made up of "hard-to-leach" product acid.
When we look at these numbers on the way out of the second acid wash section, we find 0.97 ton of P2Og in f^e cake with 25.6 m^ of liquid, at an average calculated concentration of 37.9 g/liter. The wash acid was 9 g/liter. "Hard-to-leach" P2O5 represents about 76% of the P2O5 remaining in the cake.
Conclusions from the Diagram Analysis
We can consider the P2Og t° be extracted from the gypsum within three categories:
1. The P2O5 extracted from the first sector: (the free liquid phase) 2. The impregnation P2Og, "easy to remove," rapidly extracted by washing (simple liquid displacement)
3. The "locked-in" P2Og, which seems to be difficult to leach.
Everything happens as if the cake were made up of "easy-to-leach," large-dimensioned channels, sided by capillary channels, which are "hard to leach" (Fig. 6.8). The large channels are washed in their entirety, by "piston effect" or simple liquid displacement; the capillaries exchange their content very slowly with the washing liquor.
6.3.2 Cake Washing
Phosphoric acid units, in the United States, often operate filters with only two cake washings: the tail water washing and one acid washing. Formerly, one was led to believe that the low price of phosphates and
386
Filtration System
FIG. 6.8 Residual PgOg or capillar effect on retention of product acid in the filter cake. Large channels (A) quickly evacuate the phosphoric acid they contain by simple displacement, whereas small capillary channels (Z) (according to Poiseuille's law) retain the mother liquor much longer.
sulfur in the United States was not conducive to research into higher recoveries. But in reality it would appear that the difference in yield of recovery of the two systems is extremely low, even negligible.
This becomes more likely in the light of the dual nature of the residual P2O5 in the filter cake:
1. Residual P2O5 in impregnation liquid, easy to leach
2. Residual P2O5 in "locked in," difficult to leach
The first of the two residual phosphoric acids will be eliminated from the cake by the tail water washing, whatever its P2O5 concentration: 1, 3, or 7%. Here a sort of piston effect is a good way of expressing the evacuation of this type of P2O5 (simple liquid displacement). The "hard-to-leach" P2Og, representing stronger acid concentrations in small cake cavities, will diffuse in roughly the same manner if there are two washings at two slightly different concentrations (3 and 1% P2O5) or with a single washing of the same duration as the two others, carried out at, say, 3% P2Og concentration.
Filtration and Cake Wash Diagrams
387
The single acid washing, replacing two acid washings of different concentrations, will be at the P2O5 concentration of the stronger of the two acid washes it replaces. This is to satisfy the overall material balance, which is the same in both cases. However, to achieve this, the pump feeding the acid wash liquor has to have the flow capacity of the two acid wash pumps it replaces, that is, twice the output of the water washing pump.
The size of the sectors of the acid washes generally accounts for slightly less surface area than twice that of the water wash; 116-120° as compared to 70° for a circular filter.
Furthermore we must ensure that in case of a single acid wash, the flow does not overload and overflow the corresponding feeded pan. When the filtration is good, with the filter working at an average speed, it might be possible for a single washing flow not to exceed the available loading capacity of the feed pan. Referring to the example of the Tunisian phosphate represented earlier (Fig. 6.6), the two washings combined would correspond to 286 m2/hr (filter with an effective filtration surface of 160 m2). With a filter turning at 6 min per revolution we would load
286 x 6
60 x 160
> 2
= 0.18 m /m
that is, 0.18 m in height of liquid, which is to be added to the cake thickness already present in the pan. If the depth of the cell is too small, a second feed pipe must be installed to feed a second filter cell at the same time.
6.3.3 Presuction
In the diagrams and calculations presented in this chapter we have not mentioned the "presuction" sector. This was not indispensable in the context of the subjects studied and does not alter anything dealt with so far. Nevertheless, presuction is used almost universally on tilting pan filters and must be given some consideration. What is the role of presuction?
Presuction consists of separating into two parts the sector of product acid filtration; in other words, the product acid filtrate is split into two streams leaving the central rotating filter valve in two separate pipes (Fig. 6.9). The first stream, generally equivalent to one-quarter of the second stream, serves to "rinse" the cell or "sweep away" the water remaining from the cell washing operation that followed the evacuation of the gypsum. Moreover, this first part of product acid is generally less clear, since it contains solids that get through the mesh of the filter cloth at the beginning of the filtration.
This first filtration part or presuction stream, which is thus a little
388
Filtration System
FIG. 6.9 Production sector calculation based on Tunisian rock 500-ton/ day P2O5 production.
more diluted and less pure because of the solids in suspension, can be bypassed and fed directly into the return acid. Product acid dilution is thus avoided with a consequent energy saving during the following operation. Naturally the amount of presuction will have to be lower than that of total recycled product acid to maintain control of the return acid balance. The opening in the vacuum distributor dedicated to presuction is equivalent to about 12-15°, compared to 50 to 60° for the rest of the product acid sector.
The second stream will serve as product acid extraction. The product acid will be of exactly the same concentration as the slurry acid and will produce very clear acid.
Know-How and Daily Problems of the Operator
389
6.4 THE KNOW-HOW AND DAILY PROBLEMS
OF THE OPERATOR
6.4.1 Running a Filter in Practice
We have seen that the objective of good filtration is to recover instantly 99.5% of the rated phosphoric acid from the feed slurry (equivalent to a monthly average of 99.0%). To obtain this performance, the operator must first of all ensure the following conditions:
Г. A well-adjusted reaction and crystallization section
2. The correct volume of slurry/filtration surface ratio (based on pilot tests or common values of the corresponding phosphate)
3. The right filter speed (by applying the square root rule) 4. The correct proportioning of the sectors for taking out product acids and washings (the product acid sector should account for at least 25% of the effective surface, currently about 27%)
5. Correct filter cloth (material, texture, permeability-current airtested permeability for phosphoric acid filter cloth is 4000-6000 m^/(m2)(hr) at 2-mm water gauge)
6. Appropriate slurry and washing water temperatures (influence of viscosity)
If there is doubt concerning the relationship of the surface of the filter to production (say, in the case of startup with a new phosphate), the filterability of the reactor slurry can be tested on bench scale test and the optimum conditions defined. In practice we would keep a small margin of safety since the crystallization of the reactor is always subject to some variations.
It is preferable to operate within this safety margin rather than to vary sporadically the hourly tonnages of filter feeds with the intention of optimizing the filtration operation. The best results in terms of monthly tonnages and yields of recovery are never obtained by running in a jagged manner. Therefore, if maximum production is to be attained, it is recommended that the filtration operation be kept regular and consistent within a margin of safety on the order of 5-10%. This safety margin is demonstrated by the amount of product acid recycled into return acid. If the recycling is to be stopped because of excels liquid phase for even a moment, it will mean that the strong acid filtration sector is overloaded and the product acid is not filtering properly through the gypsum cake. In fact, the whole filter then bfecomes overloaded. Such an operation is always accompanied by large losses.
The danger of working at the lower limits of product acid recycling is that no allowance is made for a guaranteed control of the composition of return acid and consequently for the slurry to be formed in the reaction system.
390
Filtration System
Control of filtration rests on three essential points:
1. Control of the concentration and the output of return acid (refer to Section 3.2). This ensures that the recycled P2Og and the feed of process water are correct.
2. Control of the losses of P2O5 in the gypsum waters. This ensures the correct yield in filtration.
3. Attention to a good spread of the washing liquors. This is primarily to ensure a good passage for the water through the cake washing operation. Next, the acid washes should be spread so as to cover the entire surface of the corresponding sectors. Some mixing of the two acid washes can be allowed. However, mixing of the last washing acid with the tail wash water must be avoided, as that would produce losses.
Now a word about control of P2O5 losses. Some operators are happy just to watch the density of wash water discharging from the tail water washing section. Apart from the fact that the density is very close to the density of water at this point, this does not make for sufficiently tight control. The density will, of course, show up a wash with high P2O5 impregnation characteristics, but, as discussed earlier, the characteristics of the residual P2O5 in the final cake is its poor accessibility. In no way will the density of the wash liquor reveal the "hard-to-leach" residual P2O5. Wash liquor density will only reveal overloaded filters.
From my point of view, it is satisfactory to do a test for water-soluble P2O5 every 2 hr from the gypsum slurry leaving the filter. It is possible to use simple test methods that the personnel in charge can use themselves and to increase the frequency of testing when abnormalities appear.
Obviously the installation of an automatic analyzer such as the Technicon is preferable. Although such an analyzer is expensive, it can pay for itself within a short period because of its rapid and continuous intervention. The average size of phosphoric units serves to reinforce this opinion. A 1% loss on a unit of 1000 tons /day of P2O5 represents U.S.$3500 per day or about U.S.$1 million per annum. The payback for the analyzer can be within weeks of installation.
6.Ц.2 Overlosding a Filter
The proper performance of some types of equipment, filters included, precludes overload conditions. Whereas it is always possible to increase substantially the throughput of a reaction tank, this is not possible with a filter. In the reaction tank, little change will occur within the outflowing reacted slurry. However, with a filter, as the diagram of the P2O5 losses as a function of filter load will show, the limit of permissible losses will soon be exceeded.
Know-How and Daily Problems of the Operator
391
Unfortunately, many phosphoric acid plants do not have a sufficient safety margin incorporated in the filter area. Consequently, once production is to surpass rated capacity (and this happens with most existing plants), the phosphoric acid filter will be an insurmountable bottleneck. Since it is not normally feasible to install another filter, the producer will try to overload the existing filter, as much as possible.
The first step is usually to increase the filter velocity to its maximum value. The second is to try to operate with increased cake thickness. Since the water balance of the reactor must be satisfied, the water wash section must then be increased at the expense of the weak acid wash section to give to the increased amount of water time to pass the increased cake thickness. More product acid P2O5 will remain in the cake leaving the production acid sector, and less weak acid washing will remove it before the cake enters the tail water wash section. All these factors lead to a sudden increase in soluble P2O5 losses.
The empirical diagram of Fig. 6.10 shows the variation of the soluble P2O5 losses from a filter normally working at a 3.75 tons/m^ per day. The load increase from 3.75 to 4.00 tons/m^ per day does not result in a great change of the soluble losses (less than 1%) ; but once the filter load is increased beyond 4.1 tons Р2О5/П12 per day, the soluble P2O5 losses rise asymptotically. At 4.6 tons/P2Og per day, the losses reach the dramatic number of 8%.
This diagram also confirms that during current operation a safety margin must be observed to compensate for the variations that occur within the slurry quality and that affect filtration capacity.
6.4.3 Crystallization with Poor Filtration Qualities
It sometimes happens that, in spite of new filter cloth and a filter in top condition, filtration does not operate as well as it should. In spite of normal plant test analyses, the operator has trouble in getting the normal feed rate filtered with a good PgOg recovery. The wash liquors and the wash water barely pass through the cake.
Several factors may be responsible for this occurrence. The first thing to do is to have a look at the crystals under a microscope. Three different cases are recognized: (1) a large number of the crystals look much smaller than usual; (2) the shape of the crystals is unusual (needles, small lozenges); and (3) the crystals look normal.
Large Number of Small Crystals
A large number of small crystals means that there are many more crystals and that more nuclei are being built somewhere by an unusual "hypersaturation." Most of the time the trouble is due to a defect in a device in which sulfuric acid and return acid are mixed, or an agitator having lost its lower turbine blades. The problem might also be due to
392
Filtration System
FIG. 6.10 Effect of filter overloading on cake losses (soluble losses only) for slurry
Know-How and Daily Problems of the Operator
393
a higher solid content of the slurry, which would make good mixing difficult. The slurry density meter may not be working accurately.
The items to be checked include (1) sulfate level, (2) solid content of the slurry, (3) sulfuric acid mixing devices, and, (4) agitators (ampmeters, power consumption)
Unusual Crystal Shape
When the shape of the crystal is unusual, it may be due to a change in the rock, but it is more likely that the accuracy of the production test analyses are off. Needle-shaped crystals often occur at higher sulfate levels or at higher temperatures. Lozenges appear because of a low sulfate level (see Section 2.2).
The items to be checked include (1) SO4 analyses by a different method or by reference samples, and (2) the reaction temperature
Normal Crystals, Poor Filtration
A case in which the crystals appear normal, but filtration is still very poor, is rare, but can happen. Filtration is strongly influenced by the presence of an excess of reactive silica. This happens when the rock has a low F/SiO2 ratio. In the latter case, amorphous silica can plug the capillary flow through the cake. The use of a flocculant can be of great help. Items to be checked include (1) the F/SiO2 ratio, active silica analysis; (2) effect of flocculants; (3) filter cloth inspection; and (4) vacuum-level check.
The microscope check, although of great help, has to be considered very carefully. The spot viewed in the microscope shows about 100 crystals, but in 1 cc® of slurry there are 100-200 million crystals. Before drawing any conclusions from microscope check, take several samples to be sure that what you are viewing is representative.
6.4.4 Filter Cloth Plugging: Chukhrovite
The Problem
Filter cloth plugging is a phenomenon common to all phosphoric acid producers, regardless of the phosphate rock and the type of filter cloth utilized. The only variable is the rate at which the filter cloth will plug. For a long time, the problem was misunderstood because the general thinking was that the plugging was due to calcium sulfate. It was accepted as long as it was not too severe.
However, with certain Florida phosphates, for example, having high iron and aluminum contents, plugging is frequent enough to become a severe economic problem. When the frequency of filter cloth change becomes less than 2 weeks, the economic impact due to downtime, maintenance labor, and material costs will have a sizable effect on production costs.
394
Filtration System
Viewed under a microscope, the crystals that embed themselves into the cloth resemble diamonds. These crystals belong to a complex salt composed of SO4, SiFg, AlFg, and Ca, called chukhrovite.
What Is Chukhrovite?
Although the exact chemical formula of chukhrovite is still uncertain, there is general agreement on the following structure:
CeSO • CaSiF • CaAlFc • (X) • 10H„O* (15)
(X being sometimes reported as rare earth). The absence of P2O5 is most striking. Furthermore, an H3PO4 medium would not have favored the formation of such a compound. In fact, chukhrovite is less soluble in water than in phosphoric acid. It is ironic that for a long time people concentrated their attention on the filter feed sector, with the hope of elucidating the causal factors of chukhrovite when they were actually to be found near the exit of the filter, at the inception of the tail water wash. The question remains how the constituent ions, SO42", Ca2+, SiFg2', and AlFg2', will all to be present at a convenient concentration to crystalize during the last stage of washing. The explanation is relatively simple in regard to the SO42" and Ca2+ ions since gypsum, CaSC^HgO is slightly soluble in water. SiFg2' is present in product acid and in all cake wash liquors, because it is dissolved from solid Na2SiF6 that occurs in the filter cake. Al24- or AlFg3', although we do not know from what dissolving cake compound they originate, will show across the filtration sections, a concentration profile similar to that of SiFg2“ (see Fig. 6.11).
Hence all the constituents needed for chukhrovite formation are present. The higher pH of the water wash will ease the precipitation of chukhrovite because its solubility decreases with increasing pH. The cooling of the cake during the final "drying" by air flow also favors chukhrovite formation because of its decreasing solubility with lower temperatures.
Preventive Measures
A crystallization equilibrium such as that of chukhrovite cannot be very stable, because of its many constituents. To avoid precipitation it is sufficient to upset this equilibrium.
To achieve this effect it would be enough to derive some of the sulfuric acid from the reaction section feed to the acid tail wash section of the filter. The result would be an increase in SO42' concentration and a concomitant decrease of the Ca2+. Likewise the pH at the cake exit is lowered, a condition that also hinders chukhrovite precipitation.
In actual practice, the feeding of 4-5% of the sulfuric acid in the prescribed manner, has resulted in prolonging filter cloth usage by a factor of 6 through chukhrovite prevention.
Know-How and Daily Problems of the Operator
395
FIG. 6.11 Development of the concentration of P2Og and Na2O during the filtration stages (in product acid, return acid, and washes).
6.4.5 Scaling of Filter Piping System
Alkaline fluosilicates, Na2SiFg, K2SiFg, have a tendency to cause pipe scaling. The part of the phosphoric acid plant most sensitive to scaling is the filter. The acid, when it comes into the vacuum piping system, is subject to sudden cooling because of the vacuum and its subsequent flash-cooling effect. The product acid pipe system builds up most of the scaling. The wash acid pipes are usually safe from that phenomenon unless greater amounts of potassium are found in the rock or arise from other sources.
396
Filtration System
FIG. 6.12 Rhone-Poulenc filtration system without pump seal tank. (Courtesy of Rhone-Poulenc, Puteaux, France, 1981.)
Choosing a Filter
397
This filter pipe scaling is such that periodic washing is carried out. Most plants shut down once a week, some only every 10 days; others prefer to wash a couple of hours every day. The choice of the periodic washing cycle depends on the dissolution speed of the scale, the amount of scale, and the dimensions of the pipes. With small pipes scaling makes the diameter shrink faster. Furthermore the inner surface left for redissolution of scales can become very small, with a resultant longer washing time. In most plants the dissolution speed is about 1 mm of scale per hour when the water temperature is at 35°C. At 40°C the dissolution can be speeded up by about 10%. All this is true only with open washing cycles, with enough water to avoid saturation of the solution (check by analysis when carrying out the first washing operation of a plant).
Daily short washing cycles have been recommended by Rhone-Poulenc, where the filter pipe and pumping system has a very small residual product acid volume (no pump seal tanks Fig. 6.12), minimizing P2O5 losses when starting a washing cycle. Filters with acid pump feed tanks at the foot of the barometric legs are usually washed weekly.
Nondihydrate systems can suffer gypsum scaling. Gypsum scale is more difficult to wash out because it has a very low dissolution speed. Filters showing gypsum scaling can be equipped with special washing devices operating continuously during production.
6.5 CHOOSING A FILTER
6.5.1 Types of Filters
The filter is the most important piece of equipment in a phosphoric acid unit. It is also, mechanically speaking, the most sophisticated part. Choosing the filter type is therefore of major importance; but the choice is simplified by the fact that there are only a few types of filter suitable for phosphoric acid filtration. The filter, including acid and vacuum piping and pumping, represents about 50% of the investment cost of a phosphoric acid dihydrate unit.
Three types of filters are available for phosphoric acid production: traveling belt, tilting pan, and rotating table filters.
Traveling Belt Filters
During the 1920s, traveling belt filters were generally used in phosphoric acid production units. These filters consist of an endless, plastic fiber reinforced natural rubber belt, operated around two large pulleys. The belt has two raised edges and is fitted with transverse sloping grooves running from both sides of the belt to the central axis, where perforations connect them with a longitudinal vacuum suction box. The belt supports the filter cloth on the ridges between the
398
Filtration System
grooves. The filter cloth, also endless, but a little wider (about 10 m) than the rubber belt, is fed onto the rubber belt by a tracking mechanism to control the correct positioning of the cloth onto the rubber belt. The driving force is applied to the cake discharge end pulley.
On the return side, the rubber belt and filter cloth separate and thorough full-cloth washing can be achieved. This is the one great advantage of this filter type, permanently having a completely clean filter cloth before the following filtration cycle.
The disadvantage of this type of filter is the long vacuum box, with a seal running the length of the filter. Special replaceable wear strips developed for this seal by some manufacturers have improved matters. Traveling belt filters are manufactured by Nordengren Patenter AB in Sweden, Philip in France, Parnevis in Holland, Delkor in South Africa, and others.
For many years this type of filter was limited to small surfaces because of the size limitation of the rubber belt. Reinforcement with polyester fiber has made it possible to build large belts. By running two or three belts, tight together in a parallel arrangement, the surface area can increase to even large figures. Nordengren [3] build up to 45 m^ of active surface, and Delkor to 100 m2 [4]. The simple mechanical principle of this filter type can, through high-speed use, offset some of the disadvantages of the relatively small surfaces compared with those of other filters (see Section 6.1.2).
Tilting Pan Filters
Tilting pan filters are not manufactured by many companies. Only two are well known in phosphoric acid use: Prayon [5] (Fig. 6.13) and Eimco.
They consist of a number of trapezoidal filter cells or pans in circular alignment, each equipped with its own cloth and connected by flexible hose (Prayon) or by a rotating joint (Eimco) to a central vacuum distribution box, all of which rotates. According to the position of a cell as it rotates, the central distributor connects it to the corresponding vacuum and acid evacuation pipes. After having been connected successively to the product acid piping sector and the two wash acids and tail water wash sectors, the vacuum is released and the cell is mechanically tilted, upside down, to remove the gypsum cake by gravity and to wash the filter cloth, still upside down, with a high-pressure water spray. This spray has a mechanical and a dissolving action. Sometimes warm water is used, sometimes pond water, the latter being at a low pH (about 1.5).
Because of the cell tilting operation, this type of filter cannot operate at a high speed as does a rotating table filter or belt filter.
Choosing a Filter
399
FIG. 6.13 Prayon tilting pan filter. (Courtesy of Societe de Prayon, Rupel, Engis, Belgium, 1981.)
Rotating Table Filters
The rotating table filter manufactured by UCEGO [6] (Fig. 6.14) works like a traveling belt filter, with a continuous cake. Instead of an endless belt, there is a large rotating disk. Along the outside circumference there is an endless rubber belt forming a rim. Along the inner circumference there is a metal wall. The disk is made of a series of individual troughs bolted together and covered with perforated stainless steel plates to support the cloth. The bottom of the troughs are sloped and connected individually to a central vacuum distribution valve, similar to those working with tilting pan filters.
The difficulty with this type of filter lies in the cake removal, since the disk is rigid. The endless rubber belt on the outside edge of the filter has to be deflected for that purpose, and this is achieved by a series of staggered pulleys. At the point at which the belt is deflected, the cake is scraped off the cloth by means of a rotating screw conveyor. The cloth cleaning is completed by a strong water spray system.
6.5.2 Selection Criteria
When choosing a filter type for a phosphoric acid unit, the following requirements must be considered:
400
Filtration System
FIG. 6.14 Rhone-Poulenc table filter. Manufactured by UCEGO. (Courtesy of Rhone-Poulenc, Puteaux, France, 1981.)
1. Capacity, function of surface and speed (Eq. 11)
2. Total investment costs, including filtration equipment, vacuum pumps, acid pumps, piping, instrumentation, and civil work
3. Water consumption
4. Maintenance costs, including filter cloth consumption
5. Corrosion and reliability
Capacity
It can be seen from Section 6.1.2 that the filtration capacity of a filter, whatever the type, is a function of active filtration area and the time for one filtration cycle:
Q = KP1/2ST’1/2
(15)
where
Q = filtration capacity, metric tons of P2O5 per day per square meter of the total active filtration area
К = slurry filtration number relative to a given rock quality, calculated from phosphate rock data sheets in Appendix A
P = pressure drop through cake and cloth
S = active filtration area (i.e., vacuum-connected area)
T = time for one filtration cycle; the time to travel over the vacuum-connected sector
Choosing a Filter
401
The specific filtration rates Qs of the rock tables in Appendix A indicate the filtration capacity in metric tons of P2O5 per day for 1 m2 of effective surface with a cycle time of 4 min, which is an industrial mean cycle time, and a current vacuum drop of 500 mm Hg gauge. Inserting the figures of 1 m2 and 4 min in Eq. (15), we obtain
Q =KP1/2(1)(4)’1/2 = KP1/2 (16)
S ~2~
or 2Qs = KP1/2 (17)
Combining (15) and (17) the capacity of a given filter becomes
Q = 2QsT1/2S
(18)
To illustrate this by an example, let us calculate the capacity of a filter with an active filtration area of 160 m2 and a filtration cycle time of 5 min with Florida rock, 70 BPL, having a Qs of 7 tons/m2 per day. (See Appendix A, Table 10A.) The daily capacity of the filter becomes, according to Eq. (18),
Q = 14(160)(5) 1/2 = 1002 tons of P О
2 5
(19)
[Equation (18) applies for consistent vacuum pressure drop, which is a current situation. If P is different from 500 mm Hg gauge, Q has to be multiplied by (500)“f^2(P)l^2.] According to size and type, every filter has its own maximum speed. Traveling belt filters and rotating table filters, because of their simple mechanical design, can work with higher speeds than can the mechanically more complicated tilting pan filter. This is why to achieve similar capacities smaller surfaces can be accepted for these filters.
As traveling belt filters have increased in size they have become more troublesome. As the width increases, so the available gradient from the side to the center decreases and drainage of filtrate becomes more difficult. Also, with larger filters there is increased friction between the belt and the vacuum box, which causes increased wear. However, a new development recently announced incorporates the concept of a series of narrower belts, each with its own vacuum box, running side by side. If this is successful, it could overcome some of the problems associated with very large belts.
Sacrificial wear belts have been developed. The development of plastic fiber reinforcement will permit greater mechanical strength and allow larger belts to be made.
A 100-m2 unit has been announced by Delkor, to be built in Australia [ 7]. This filter should be able to work with a 1-min and 30-sec cycle and could be equivalent to a 140-m2 tilting pan filter. At
402
Filtration System
a speed of 45 rn/min, which Delkor says is possible, the filtration cycle would become 0.7 min (42 sec) and the equivalent active surface compared with a filtration cycle time of 4 min would be 200 m2 equivalent surface. The yield of recovery of P2O5 in that case has to be demonstrated.
Total Investment
There is no fixed relationship between the cost of the filter and the total cost of the installation, which includes piping, pumps, civil work, building, and so on.
As far as the ancillary equipment is concerned-and this includes all the pipe work, filtrate collecting tanks, filtrate pumps, separating vessels, vacuum pumps, control gear, and so on—the investment is much the same whatever type of filter is installed. However, building costs vary because for the same capacity, filters are of different sizes and shapes. For 1000 tons of Р2О§ per day using Florida rock, a tilting pan with a 3-min cycle has an area of 123.7 m2, whereas a 1 1/2 min rotating table filter has an area of only 87.5 m2. The respective diameters are 20.4 m and 14.2 m, so there is an obvious building economy with the rotating table (provided both filters operate at same vacuum level. Rotating table filters often operate at lower levels: 400 mm).
By some thought and planning it is possible to economize on the height of the building, particularly by eliminating the vacuum seal tank and pumping directly from the barometric filtrate lines. This is illustrated in Fig. 6.12. It is also possible to save the vacuum separator by an adapted vacuum connection of the piping (Narrov angle, Y connection, liquid in straightline). Another arrangement involves connecting the vacuum to the top of the distribution valve (Prayon).
The total investment also depends on the size of the plant. Traveling belt filters are certainly the most suitable equipment for small filtration units, whereas the larger units are easier to build with circular filters.
Nevertheless, whenever a smaller filtration surface is needed (for example, for sludge filtration), or in order to increase an existing filtration surface with an additional filter, belt filters should be considered.
Water Consumption
Phosphoric acid is increasingly produced in the countries where the rock is mined. Those countries often do not have sufficient water available. Water consumption thus becomes one of the important factors when choosing a phosphoric acid filter.
References
403
Besides the process water consumption, which is the same for all types of filters, there are two other water-consuming factors which must not be ignored: (1) filter cake impregnation water, when it leaves the filter, and, (2) filter cloth washing water.
Rotating table filters, which scrape the gypsum from the cloth, have to remove the remaining 10 mm of cake by strong water sprays and usually need more water than other circular filter types. Water recycling still under investigation in this case is not easy because of abrasion with the high-pressure nozzles used.
Maintenance Costs; Filter Cloth Consumptions, Shutdown Time
Filter cloth deteriorates because of plugging, mechanical wear, and thermal deterioration.
A traveling belt filter, by separating the cloth from the rubber belt and washing it from both sides, provides the most effective cloth washing. Plugging by any type of crystals is unlikely because there is as much time left for cloth washing as for filtration. In such filters cloth life may be up to 2000-2500 hr.
In tilting pan filters, the cloth is washed with a high-pressure water spray having both mechanical and dissolving cleaning action. But the spray washing time is very short compared to the filtration time. Filter cloth life may be between 700 and 2000 hr (average 1400 hr). Rotary table filters, because of the gypsum-removing scrolls, have a shorter cloth life—700 hr.
A cloth with an active filtration area of 140 m2 costs about US$2500 and requires about 32 man-hours to install.
Shutdown time, especially for descaling the filter piping system by washing, should not differ for the three filter types.
Corrosion
For the bulk of the liquid/metal contact surfaces of these filters, neither high liquid velocities nor excessive temperatures are encountered. Consequently, no excessive corrosion should occur. It is usually satisfactory to use 316L stainless steel for the filter cells and troughs. In certain critical areas (e.g., pumps and central distribution valves) where there are high flow velocities, it is necessary to use more exotic alloys. (See also Table 10.1.)
REFERENCES
1. P. Moraillon, J. F. Gielly, and B. Bigot, Principles of Filter Design and Operation. (A. V. Slack, Ed.), Phosphoric Acid, Vol. 1, Part I, Marcel Dekker, New York, 1968, Chap. 5, I.
404 Filtration System
2. R. Krempf and A. Ben Salah, Amelioration de la filtrabilite des phosphates tunisiens, Compagnie des Phosphates et du Chemin de Fer de Gafsa, International Superphosphate Manufacturers Association Technical Conference, Brussels, 1972.
3. R. Nordengreen, Landskrona travelling Belt Filter for Wet Process Phosphoric Acid Production, Annual Meeting of the American Chemical Society, Chicago, 1973.
4. A. P. Bond, Large Horizontal Belt Filters, Fertilizer Acids, Part II, Proceedings of the British Sulphur Corporation's 3rd International Conference on Fertilizers, London, November 12-14, 1979.
5. The Bird Prayon Filter, Bulletin Bird Machine Co., South Walpole, Mass.
6. Rhone-Poulenc Improves the Single-Tank Phosphoric Acid Process, Phosphorus Potassium, No. 88, March-April 1977, pp. 30, 35.
7. Delkor Technik to Supply Two Belt Filters in Australia, Phosphorus Potassium, No. 105, January-February 1980, p. 36.
7
Acid Concentration Systems
7.1 PROCESS DESIGN CONSIDERATIONS
Phosphoric acid, when produced from the reaction and filtration sections of a dihydrate process unit at 27-30% P2O5, in most cases must be concentrated to a 50-54% P2O5 grade acid. This is done to meet either the current requirements of phosphoric acid trade or the necessary grade for triple-super phosphate manufi rturing by the so-called DEN-process. Other final products such as d.ammonium phosphate need only 40% concentrated acid.
The concentration operation is accomplished by evaporation under vacuum, normally using the by-product steam generated during sulfuric acid production as a source of energy. A sulfur-burning sulfuric acid production unit will produce, for each ton of 98% H2SO4, a total of about 1.15 to 1.5 tons of high-pressure steam. This steam is ducted across turbine blades to produce electrical or mechanical energy and released as the low-pressure steam that is required for phosphoric acid concentration by evaporation. The energy recovered during the steam reduction operation is either used partially to drive the blower in the sulfuric acid unit or completely to generate electric power (in the latter case the blower is electrically driven).
Phosphoric acid concentration usually consumes about 1.8-2 tons of low-pressure steam per ton of Р2Оц. Since 2.6-3 tons of sulfuric acid are needed per ton of P2Og produced, this supply of by-product steam at 3.9-4.5 tons per ton of P2Og is more than sufficient to satisfy the needs of phosphoric acid concentration. This is one reason among
*The amount of steam exported from the sulfuric acid unit depends on self-consumptions such as steam driven blower, pumps, and so forth.
405
406
Acid Concentration Systems
others why wet process phosphoric acid production units are built to form one integrated complex which has a common utilities network and off-site facilities.
With the advent of the energy crisis and resultant higher costs, the economics of exploiting alternative lower-level sources of energy have become more feasible. Similarly, nondihydrate process routes, producing phosphoric acid at higher concentrations, become increasingly attractive.
One alternative energy source is the heat generated in the absorption towers of a sulfuric acid plant. The common practice to date is to reject this heat to cooling water. Recently, efforts have been made to recover this heat for phosphoric acid evaporative duty.
When sulfuric acid is manufactured, the overall reaction is
S + 1.502 + H2O H2SO4 + 3. 985 x Ю6 kcal
(1)
for 1 ton of sulfur burned.
This energy is currently shared by:
Steam production, 57.5%
Exit gases, 3.0%
Production acid, 0.5%
Wasted heat to acid coolers, 39.0%
To illustrate the order of magnitude of this wasted heat, a 2000 metric tons/day H2SO4 plant can waste 4.2 tons of fuel equivalent per hour at its acid cooling system. Even partial recovery of such a high amount of energy should be quite economical.
Several ways for recovering that energy have been explored in relation to phosphoric evaporation concentration because this can be operated with low-level energy.
1. Hot water production from H2SO4 absorption heat as the source of first stage phosphoric acid evaporation. The sulfuric acid from the absorption tower flows through a heat exchanger system to be cooled, producing hot water which is sent to the phosphoric acid evaporation heat exchangers. Large pipes and short distances between the phosphoric and sulfuric acid plant are needed for the large water flow pumping. The system is tested presently on an industrial scale [1].
2. Low-pressure steam is produced when the hot sulfuric acid from the absorption tower is sent into low-pressure stainless steel boilers. The steam pressure can be upgraded by steam compressers and sent to the phosphoric acid evaporator heat exchanger. The
Process Design Considerations
407
sulfuric acid temperature is held as high as the process and the equipment allow, which is about 130°C. This system is tested also on an industrial scale [ 1].
3. Hot sulfuric acid from the absorption tower exchanger directly heats phosphoric acid in Dupont polypropylene heat exchangers. Theoretically, this is the most satisfactory system, but it is the most difficult to realize in practice. Corrosion problems prohibit the use of most of the stainless steels, and plastic materials have low heat transfer coefficients, thus necessitating the use of a great number of thin tubes. Scaling problems add more difficulties to that solution. This system is not yet operating on an industrial scale [ 2]. Other material such as Hastelloy G33 is currently being tested.
In all three cases more steam from the sulfuric acid plant boiler will be available for other energy-consuming purposes in the plant, or if there are none, for producing more electrical energy. The most economical use is when fuel consumption can be reduced. Electrical energy production is less economical in this case because the steam saved at the phosphoric acid evaporation plant is 3-5 bar of pressured steam, having a low electrical energy producing factor because of the condenser heat losses. Actually, an effective saving of some 60 tons of 5-bar steam per hour could produce about 9000 additional kW, a yearly saving of U.S.$2.5 million for a daily production of 2500 tons of H2SO^.
7.1.1 Factors Affecting Process Design
A phosphoric acid concentration unit (Fig. 7.1) consists of a heat exchanger, boiler chamber (or vapor body), condenser, vacuum pump, acid circulation pump, and connecting pipes. Basically, the system is very simple; corrosion and scaling problems encountered when handling phosphoric acid prohibit the use of sophisticated designs and equipment.
To provide evaporation, two objectives have to be achieved:
1. Thermal energy has to be transferred to the acid to make it possible to generate vapor.
2. Vapor must be separated from the liquid in such a manner as to avoid entrainment of acid.
Because of scaling problems it is essential that heat transfer take place under circumstances of low ДТ, without the liquid being allowed to boil within the tubes of the heat exchanger. This is achieved by maintaining the vacuum level in the vapor separator so that the liquid will boil at its surface at around 80-90°C while maintaining hydrostatic head of liquid in the separator so that the absolute pressure in the heat exchanger tubes is above the vapor pressure.
408
Acid Concentration Systems
FIG. 7.1 Phosphoric acid concentration system with shell-and-tube heat exchanger. 1, Heat exchanger; 2, steam inlet; 3, condensed; water outlet; 4, vapor body; 5, demister; 6, acid cycle; 7, pump;
8, finished product; 9, condenser; 10, condenser water; 11, barometric seal; 12, steam ejector or vacuum pump.
Also, to prevent boiling in the tubes, it is necessary to ensure that the temperature of the acid (and therefore the vapor pressure) does not rise greatly between the inlet and outlet of the heat exchanger. This is achieved by large recirculation of acid from the boiler chamber. The resulting higher velocity in the heat exchanger also improves the film coefficient and assists in maintaining the small ДТ required between tube inlet and tube outlet. Currently installed recirculation flow rates are between 100 and 360 m3/hr per ton of evaporated water.
The vapor separator is a large diameter vessel and a large surface of acid is exposed so that gentle ebullition can take place with low vapor velocities and in this manner, entrainment of acid droplets prevented. To maintain the correct absolute pressure over the liquid in the vapor separator so that the liquid boils at around 80-90°C, a vacuum is maintained by condensation of H2O (direct) and the inert gases are extracted, usually by a steam ejector or by a vacuum pump. The absolute pressure to be maintained is a function of acid concentration, acid quality (impurities), and boiling temperature.
Process Design Considerations
409
Florida acid, at 52% Р2(-)5> ^or example, is boiling at 92°C at an absolute pressure of 75 mmHg gauge. (See Fig. 6 of Appendix B.)
The scaling problems that can occur if this operation is not correctly carried out can be very serious. The scale, usually consisting of calcium sulfate and sodium silicofluorides, is difficult to remove. Overvigorous descaling can lead to tube breakages and expensive shutdowns.
7.1.2 Single-Stage or Multistage?
The capacity of the wet process reactor is generally higher than the usual capacity of a single evaporator. Currently, the largest single unit has an evaporative capacity range of 45-60 tons/hr of water, equivalent to the concentration of 700-900 tons of PgOg Per day from 29 to 52%. Thus, generally, two or three evaporators are installed. Since two or more evaporators are built anyway, the question arises whether the evaporators should work as single-stage evaporators in parallel, all operating directly from 27-30% up to 50-54%, or as one multistage concentration system, each evaporator doing its part of the concentration. If they work in multistage they will operate at two or three different concentration levels: 34%, 44%, and 54%, for instance. Consequently, only one stage will handle 54% acid, which is the concentration level where generally most of the scaling occurs, most of the fluorine evolves, viscosity is the highest, and thermal conductivity-is the lowest.
In fact, when evaporators work as a multistage unit, most of the problems often arise in the last evaporator. But the difference between the two systems is not always as pronounced as it would seem at first. Some authors even recommend parallel single stages [3] because of a better heat transfer coefficient. They explain that with the lower solubility of CaSO4 (anhydrite) at the concentration of 52%, the heat exchanger tubes experience less rapid scaling than the scaling due to CaSO4 • 1H2O precipitation, which occurs in the first stage of evaporation.
The choice between the two systems may also be dictated by the sludge treatment system. It seems at present that the most efficient sludge removal system is through an intermediate 40% P2O5 concentration and purification. At this concentration most of the impurities reach their lower level of solubility. Also, the acid is not yet too viscous and is still suitable for a filtration operation. If this type of sludge removal system becomes more generally used, single-stage evaporation will disappear accordingly, evaporation taking place in two stages: to 40%, then to final product strength, after clarification of the 40% acid.
410
Acid Concentration Systems
7.1.3 Heat Balance and Energy Costs
Amount of Water to Be Evaporated: Qw
The amount of water to be evaporated can be calculated using the formula
where
= amount of water to be evaporated per ton of PgO,.
C, = concentration of weak acid (P„O_)
1 Zb
Cg = concentration of strong acid (Р^Ц.)
If 30% acid is fed in and concentrated up to 53%,
Q„, = n4n ’ Ач = 1-447 tons/ton P O, (3)
W U.oO U.bo Z b
The effect of the feed acid concentration is important. If 29% acid is fed instead of 30%, Qw becomes 1.561, which means 0.114 ton (8%) more to evaporate. This demonstrates how energy can be saved by efficient controlling of reaction and filtration conditions for a continuous optimum of product acid concentration.
A little error is found in this evaporation water calculation because the formula does not take into account the hydrofluosilicic acid evolution which amounts to about 2-3% of the final concentrated acid weight.
The strong acid leaves the concentrator at a higher temperature than that of the feed acid. The corresponding energy consumption can be calculated from the specific heat diagram (Fig. 3. of Appendix B).
Heat transfer coefficients currently measured in phosphoric acid concentrators vary from 800 to 1200 kcal/m2 per hour per degree Celsius.
In fact, the problem is that scaling occasions a rapid decrease of the heat transfer coefficients during the first days of the operating cycle. The resulting effect will progressively reach a level that will implement the decision to shut down and wash.
Washing cycles, usually done with a hot 5% sulfuric acid solution, vary with rock origin and composition. Sometimes unusual difficulty in washing out scaling occurs and special washing liquors have to be developed. Washing cycles have to be operated with a continuous drain. The drain flow should be optimized by saturation control.
Process Design Considerations
411
TABLE 7.1 Heat Balance in Kilocalories for the Concentration of 1 ton
°f as 29-53% Add 2 5
kcal/ton of P„OC . & Э m kcal/ton of P„OC out
29% acid, 40°C, 3.448 tons 0.73 cal/g 100,700 -
53% acid, 87°C, 1.887 tons 0.54 cal/g — 88.700
Vapor, evaporated water (3.448 - 1.887 tons) 634 kcal/kg — 989,700
Low-pressure steam, 105°C 1. 95 tons 1.24 bar 640.7 kcal/kg 1,249,000 —
Condensed water from steam 105.08 kcal/kg — 206,100
Heat of concentration (see Table 7.2) — 2,300
Heat losses (balance) (about 4-5%) — 62,900
Total 1,349,700 1,349,700
Heat Balance
The heat balance per ton of P2O5 to be concentrated from 29% ₽2°5 to 53%, for instance, can be established as shown in Table 7.1.
From the aforementioned balance we can see that the steam or energy consumption is only slightly affected by the sensible heat of the incoming and outgoing phosphoric acid (see Table 7.2), and that an estimation with sufficient accuracy can be made using the equation
= i-05 IQ MH 1 steam st w w
where
Q . = amount of steam to be consumed per ton of PoOc
steam z э
AHgt = difference of enthalpy for condensing steam
412
Acid Concentration Systems
TABLE 7.2 Dilution Heat of Phosphoric Acid
Percent P O, 2 b in the acid kg-cal/kg P 0 2 b
72.4 (100% PO4H3) 0
70.0 0.50
65.0 1.52
60.0 2.5
55.0 3.3
50.0 4.1
45.0 4.6
40.0 5.2
35.0 5.5
30.0 5.9
25.0 6.2
20.0 6.5
15.0 6.7
10.0 6.9
5.0 7.2
1 7.3
Q = amount of water to be evaporated per ton of P„O
w 2Ь
ДН = difference of enthalpy for water vapors from acid
In practice, the attempt for more precise calculation of the steam consumption is unnecessary because of two typical sources of inaccuracies: fluctuating concentration and temperature of the product acid fed to the evaporation system. Subsequently, ample security margins have to be taken. To be on the safe side, a 2% P2O5 and a 15°C variation of the feed acid is advisable.
Energy Costs
The concentration costs depend primarily on energy costs. If the source of energy is the burning of sulfur, which it is most of the
Process Design Considerations
413
time, costs may also become a question of accounting philosophy. One may consider steam production from sulfur burning as an inevitable by-product energy, move all the costs to the sulfuric acid, and consider the production of steam to be free of charge. Some companies, frequently in the United States, still do so.
It seems more realistic to consider energy, like every product that is not indefinitely available in unlimited quantities, at its market price, and give credit toward the manufacture of H2SO4. Steam has a well-defined market price because it has a very precise level of energy, comparable to a kilowatt-hour of electricity or a gallon of gasoline. If there were not a concentration plant, the steam, as energy, could produce something else and would be accounted for at its regular energy value.
Steam generated from a sulfuric acid plant should be accounted for at the same price as steam produced from a fuel or other energy source. In practice, the total cost of concentrated 50-54% acid is not effected too much by the method used to price the steam because of the price credit to the sulfuric acid. If steam from the sulfuric add plant is considered free of charge, the sulfuric acid price will increase accordingly, and finally, the weak phosphoric acid production costs will carry the total burden.
This will be offset partly by lower concentration costs (i.e., no steam costs). Otherwise, if the sulfuric acid plant is credited for its high pressure steam, the concentrated phosphoric acid plant will pay only for its effective low-pressure steam consumption. In the latter case, 1 ton of P2Og will be charged only approximately 1.9 ton of low-pressure steam of a total of approximately 3.4 ton of high-pressure steam exported from the sulfuric acid plant.*
If one generates steam with fuel, about 0.076 ton of No. 2 fuel oil is burned to produce 1 ton of steam. Hence 0.076 ton of fuel has to be accounted for. With the present fuel prices of about $200-250/ton, it takes U.S.$15-19/ton of steam plus water treatment, and other miscellaneous costs. Total steam costs should then account for an average U.S.$20 figure.
Operating costs for concentration can then be summarized per ton of P2°5 (for a 1000-tons/day P2O5 plant) in the following example:
Steam costs for 1.95 tons (U.S.$20 per ton) U.S.$39.00 Electrical energy (60 kWh) 2.00
Cooling water (47 m3) 0.25
*1.5 tons of total steam production, 0.3 ton for sulfuric acid blower consumption per ton of H2SC>4 100%; since approximately 2.8 tons of H2SO4 is produced for each ton of P2O5, a total or 2.8 x 1.2 = 3.36 tons of steam will be exported from the sulfuric acid plant.
414
Acid Concentration Systems
Wages + overhead (0.08 man-hour) U.S.$ 1.50
Maintenance costs (0.04 man-hour) 0.70
Spare parts and external services 0.60
Total operating costs per ton of РгОц concentrated
U.S.$44.05
(These costs do not include sludge removal or storage expenses.)
7.2 EQUIPMENT DESIGN CONSIDERATIONS
7.2.1 The Heat Exchanger
The heat exchanger performs the most critical service within the concentration system. When evaluating heat exchangers designated for phosphoric acid duty, we look for the following:
High heat transfer coefficient
Low scaling
Little corrosion and erosion
Sufficient mechanical resistance to accept occasional mechanical pipe cleaning, handling, and so forth, without damage
Types of Heat Exchanger and Materials of Construction
The requirements of high heat transfer associated with high-corrosion resistant material severely limits the choice of material. Impregnated graphite is generally used, and to a lesser extent alloys high in nickel and chromium, such as Sanicro 28 or Hastelloy G. The latter has been used successfully in some concentration units working with Florida rock acid. It is evident that the possibility of using stainless steel for shell and tube heat exchangers would facilitate the construction of larger units.
When impregnated graphite is used, it is either as graphite tubes with a steel shell (acid being inside the tubes) or as graphite perforated cylindrical blocks, piled as high as 10 elements one upon the other [4]. The graphite heat exchanger type is usually installed, with the system corresponding to that shown in Fig. 7.1.
The most common type in the United States is the graphite tube type (Fig. 7.2). The impregnated graphite tubes, usually 1.5 in. wide, can be installed up to a length of 30 ft in spite of attendant mechanical fragility (material thickness 1/4 in). Breakage can occur with water slugging from the steam side of the exchanger or during mechanical tube cleaning. The speed of the circulating acid is maintained between 1.5 and 3.5 m/sec to achieve good heat tranfer and to avoid high rates of scaling inside the tubes.
Equipment Design Considerations
415
FIG. 7.2 Shell and tube (graphite) heat exchanger system.
Bubbles formation (boiling) within the tubes is another factor that speeds up scaling, and should be avoided. This is the reason a minimum liquid head has to be maintained over the exchanger between the highest tube level and the liquid level of the evaporation chamber (usually about 2 m).
The perforated graphite heat exchange system (Fig. 7.3) consists of cylindrical blocks perforated in two directions: vertically, for acid flow, and horizontally, for the steam. The diameters of the acid side perforations have been increased from 14 mm up to 35 mm, because of scaling and cleaning. The largest block size built to date approaches a diameter of 1.3 m and a height of 0.75 m. Piling 10 cylindrical blocks represents 650 m2 of heat exchange surface, a considerable improvement over the 150 m2 limitation for heat exchangers built some years ago.
416
Acid Concentration Systems
FIG. 7.3 Graphite block heat exchange system.
The main advantage of the graphite block system is its robustness compared with the graphite tube system, permitting higher temperature differences and evaporation rates. The main disadvantage is a higher and variable material thickness between the steam and acid sides because of the cross-flow perforation system. This results in a higher temperature difference between steam and acid with consequent nonuniformity of temperature along the acid-side flow paths. Also, smaller tubes need a higher pressure head for the pump and there is a higher risk of speed and temperature differences in between tubes, and consequently a higher scaling risk.
Maintenance costs also become higher when cleaning operations become more frequent. To clean the holes mechanically, the blocks have to be dismantled one by one and cleaned with a special perforation machine.
Both types of graphite heat exchanger have to work with a limited upper-temperature, 165°C (329°F) maximum, imposed by material sensitivity. Further developments, such as Teflon impregnated graphite, should allow higher temperatures (230°C or 446°F), but this has more impact on the manufacture of superphosphoric acid.
High-nickel and high-chromium steels have been successfully used by the Prayon system, which is based on a different design concept.
Equipment Design Considerations
417
The weak phosphoric acid is fed into an open-air acid heating pit equipped with stainless steel heat exchanger plates. This is possible because the acid is not heated to the atmospheric boiling point. The hot acid is then pumped upward into the vacuum flash chamber, which has a barometric seal leg. This system has the great advantage of allowing maintenance of the heat exchanger plates to take place without interrupting normal operations. Each heat exchanger plate can be individually isolated, dismounted, and replaced. This system was preferred because of the corrosion and steam leakage risk with alloys in highly concentrated phosphoric acid at high temperature (Fig. 7.4).
Whereas the graphite heat exchangers, irrespective of type, are integrated in a circulating acid cycle under vacuum, always incurring the risk of steam bubbling along the heating surface, the open-air acid heating pit is protected against this by the atmospheric pressure difference between the open air and the boiler chamber.
FIG. 7.4 Phosphoric acid concentration, Prayon system. 1, Open pit heat exchanger with flow pump; 2, vapor body; 3, finished product;
4, condenser; 5, condenser water; 6, steam ejector or vacuum pump.
418
Acid Concentration Systems
Recirculation Rates
When concentrating phosphoric acid from 30 to 54% 1-48 tons of
water needs to be evaporated for each ton of P2Og. This figure becomes 1.85 tons for 27% acid and 2.15 tons for 25% acid. To perform this evaporation, 1.15-1.20 tons of low-pressure steam is required for each ton of water evaporated. Hence when 1 ton of P2O5 as 27% P2O5 acid is concentrated to 54%, the heat requirement is
1.85 x 1.20 x 550,000 = 1.22 x 10⁶ kcal (5)
where "550,000" is the condensation heat of the steam.
This represents a theoretical temperature elevation of the 27% acid by
J'xVto^ 700 = 368°C (6)
i.Zo X o,(U x j Uv
where
1.28 = specific gravity of 27% acid
700 = sensible heat of 27% acid, in kcal per ton of acid and per degree Celsius (see Fig. 3 of Appendix B)
3.70 = weight, tons for 1 ton of P„OC as 27% P„OC acid 2 □ 2 5
This calculation shows clearly that heating of the acid to be concentrated and evaporation by boiling can be realized only by the use of a great number of cycles between the heat exchanger and the boiler chambers. To avoid boiling and scaling within the heat exchanger tubes, the vapor pressure of the acid should at no local point of the heating surface reach the evaporation temperature. If the boiler chamber works at an effective pressure level of, e.g., 100 mmHg (39 in. Hg), the liquid head between the boiler chamber level and the upper part of the heat exchanger must provide enough pressure to avoid premature boiling inside the heating tubes. This head is limited because of construction configurations. A liquid head of 2 m would theoretically allow heating up of the acid by 20°C over the boiling point (36°F), but in practice much lower incremental temperature increases are used because of possible local superheating. In practice, for each pass through the heat exchanger, the acid temperature increase ranges between 2°C at minimum, usually between 3 and 6°C, and a rare maximum of 10°C.
When a 3°C (about 5.5°F) temperature elevation per cycle is chosen, for concentrating 27% acid to 54% in a single stage system, the circulation flow of the system will be:
Equipment Design Considerations
419
1.22 x IQ6 3 x 420 x 1.65
= 587m3
(7)
where
V = recycle flow through the heat exchanger, in cubic meters per ton of P2Og to be concentrated from 27 to 54% P2O5
1.22 x 106 = heat requirement [see Eq. (5)]
3 = temperature elevation for one pass through heat exchanger
420 = sensible heat of 54% crude acid in kcal per ton and per degree Celsius (see Fig. 3 of Appendix B)
1.65 = specific gravity of 54% acid, tons/m3
A 587-m3 cycle means a transfer of
587 x 1.65 x 0.54 = 523 tons of P2Og
(8)
In other words, the acid has to cycle around 523 times during the concentration operation in order to be concentrated from 27 to 54%. Recycling is often expressed as a relation per ton of evaporated water. In this case it would be
58J_ = 301 m3/ton of H O evaporated (9)
X. Уэ z
This recycling has to be done within certain speed limits in the heat exchanger tubes. At too low a speed (below 1.5 m/sec, 4.9 f/sec) high scaling would occur [3,4]; with speeds which are too high, erosion problems preponderate. Usually, the speed is maintained at about 2 m/sec (6.6 f/sec), but speeds up to 3.5 m/sec (11.5 f/sec) are encountered.
Increased acid velocity in the tubes improves the heat exchange coefficient and permits a higher steam temperature, consequently increasing the evaporation capacity of the unit.
Guidelines to Sizing the Heat Exchanger
Tube length, diameter, and temperature difference between steam and acid are a compromise between manufacturers' imperatives, physical laws, and practical operating conditions. A large number of small tubes increases the surface, but it would be difficult to maintain the same liquid velocity through all the tubes and consequently the tendency to scale would be high in a certain number of the tubes and cleaning would be practically impossible. Too-large tubes would decrease the available heat exchange surface, resulting in longer tubes. But
420
Acid Concentrations Systems
tube length is limited by the tube manufacturer, and linked tubes become very fragile over a total length of 9 m (30 ft). Consequently, an optimum diameter has to be selected.
The heat exchange surface of a tube is given by
s = ttDI (10)
where
s = surface of the tube,
D = diameter, internal, m
7Г — 3.14
1 = length of the tube, m
V of acid flowing through the tube per second is
(11)
speed of the flowing acid, in m/sec. The heat the acid per second is found using the formula
SKAt nnDlKAt
О =_______Ш. = --------Ш (12)
4h 3600 3600
where
n = number of heat exchanger pipes
S = heat exchanger surface
К = heat transfer coefficient, kg-cal/hr per square meter per degree Celsius
At = logarithmic mean temperature difference between steam and m . , . acid in the pipe
The logarithmic mean temperature is calculated using the equation
_ Atr At2
Atm " ln(At1/At ) (13)
л Z
The volume
where v is the transferred to
where
In = natural logarithm
At^ = temperature difference between condensing steam and acid at heat exchanger inlet
Atg = temperature difference between condensing steam and acid at heat exchanger outlet
Equipment Design Considerations
421
The temperature elevation of the acid during one pass through the tubes will be
___________________heat transferred_______________ acid volume acid * sensible heat specific gravity_?
The temperature elevation for one pass through a tube will be
ttDIK At (l/3600)(l/v)
At =----------------------- (15)
one pass n(D2/4)lc p
P
which simplifies to
IK at
A*one pass 900DC pv
P
where
C = sensible heat of phosphoric acid (see Fig. 3 of Appendix B), P kcal/ton p = specific gravity of phosphoric acid, tons/m3
V = speed of acid in the heat exchange tubes, m/sec
The heat transfer coefficient К increases with the speed of the acid in the tubes, but its main variations originate from the strong scaling occurring in the tubes during the operating period. Between two stops for washing out the scale, the usual measures of the heat transfer coefficients range from 1200 kcal/hr per square meter (per degree Celsius) down to 800, respectively.
Heat exchangers are generally constructed with a very large safety margin. Because of the high scaling risk, heat exchanger tube inlets should always be protected by stainless steel grids to prevent solid particles from plugging the tubes.
7.2.2 Vapor Body
The function of the vapor body (evaporation chamber) is to achieve vapor/liquid separation between the evaporated water and the recirculating acid. The vapor body consists of a large rubber-lined chamber shared by the boiling liquid and the gas phase. The liquid phase, usually occupying one-third or one-fourth of the total vapor body volume, is fed near the top of the liquid level by the inlet acid pipe coming from the heat exchanger. It is important to feed the incoming hot acid close to the surface of the liquid level to avoid or minimize the danger of foaming due to subsurface boiling. Foaming aggravates entrainment and liquid carryover conditions, with a consequent loss
422
Acid Concentration Systems
of ₽2®5’ The cycling acid leaves the vapor body through a conical bottom. A certain liquid volume (1-2 m^/ton of water evaporated per hour) provides sufficient liquid phase to avoid high supersaturation and allows impurities to crystallize on suspended solids rather than on the walls. The concentrated finished product acid is withdrawn from the vapor body at an outlet located slightly below the feed level.
The total volume of the vapor body (large freeboard) is generally chosen with some safety margin because of the foam generated from the boiling of phosphoric acid containing organics or other foam stabilizing elements. The destruction of foam is not a precise science, and different engineers apply varying design volumes for the total volume of the vapor body. If 4 m^/ton of water evaporated per hour is a common figure, it can be seen that the range applied by constructors actually varies from 3 to 9.5 m^/ton of water evaporated per hour. There is no need to emphasize that there would be differences in investment resulting from such a wide range for acid-resisting vessels designed to withstand a vacuum. An entrainment separator downstream of the evaporation chamber is recommended. This separator is usually built as a cyclone, and often is directly mounted on top as an integral part of the body.
7.2.3 Condenser
The purpose of the condenser is to catch the vapor from the vapor body and to condense it with a large amount of cooling water (about 50 tons/ton of steam). Since almost all of the gaseous effluent from the vapor body is composed of steam, the condenser mainly plays the role of a vacuum pump. The actual vacuum pump, connected to the condenser only eliminates the noncondensable gases, accumulation of which would break the vacuum.
The temperature of the outflowing cooling water controls the vacuum level of the system. Usually the condensed steam heats the cooling water by about 20°C. If, for example, a vapor body releases 15 tons of steam at 85°C (enthalpy is 631), the heat transferred will be
15 x 1000 x (631 - 35) = 8.940 x io6 kcal/hr (17)
with outflowing condenser water at 35°C. If the cooling water was fed at 16°C, it removes 19 kcal/kg. The cooling water requirement was then
6
8.940 x IQ
19 x 1000
3
= 471 m /hr
(18)
The vacuum of the system will be a little above 42 mmHg absolute (which is the partial pressure of vapor above water at 35°C). The
Equipment Design Considerations
423
pressure drop of the system and the permanent presence of some non-condensable gases actually raises the theoretical absolute pressure by 10-20 mmHg. The outflowing condenser water is evacuated by means of a barometric seal pipe to maintain the vacuum. Inside the condenser, a baffle system provides sufficient contact surface between the gas and the liquid phase to have correct condensation.
7.2.4 Vacuum Pump
The purpose of the vacuum pump is to create initially the necessary vacuum to start boiling in the vapor body and to eliminate during normal operation the inert gases evolving from the heated acid. The inerts load being rather small, a limited-capacity vacuum pump is required. A typical design capacity would be 6 kg of air (dry basis) per ton of water evaporated. These gases have to be evacuated at the operating pressure of the concentrator.
Typical equipment used in this service would be either water ring type pumps or steam ejectors. The vacuum pump consumes energy at a level of about 2.5 kW/ton of water evaporated (approximately U.S.$0.15 per ton of P2O5). The steam ejector consumes 35-50 kg of high-pressure steam per ton of water evaporated (U.S.$0.40-0.50 per ton of P2O5).
To save energy, Rhone-Poulenc [5] has developed a very simple system utilizing the potential energy of the condenser water. By skillfull assembling of the condenser chamber with a barometric leg seal having a slightly overdimentioned diameter, the latter acts as the conduit for both downflowing "gargling" cooling water and trapped noncondensable gases. Steam ejector or vacuum pump can be saved in this case. The system has been proven in several industrial installations (Fig. 7.5). Another energy-saving system consists of variablespeed vacuum pumps controlled by the vacuum level of the evaporator.
7.2.5 Acid Circulation Pump
The type of acid circulation pump depends on the pressure drop of the heat exchanger. Shell-and-tube heat exchangers with large-diameter tubes can use propeller-type pumps with a low head and large flow capacity. The graphite blocktype of heat exchanger provides a higher pressure drop, and consequently needs pressure heads as high as 2-3 bar; centrifugal pumps are required in this latter case.
Because of the large flow rates of circulating acid, the greater part of the electrical energy to be accounted for phosphoric acid concentration is consumed by the circulation pump.
The metal parts of these pumps, especially the impeller, can be subject to intense corrosion effects. This is because corrosive elements like chlorides and fluorides become more concentrated and more active at the operating temperature of the evaporating acid. The corrosive activity passes at a maximum at 40% PgOg concentration because
424
Acid Concentration Systems
FIG. 7.5 Rhone-Poulenc phosphoric acid concentration system without vacuum pump or steam ejector. A, 30% P2O5 acid feed; B, 50-54% P2O5 acid outlet; F, hydrofluosilicic acid outlet; Sj, boiler chamber or vapor body; E, heat exchanger; S2S2, circulation pump; D, H2SiFg absorber;
Dp condenser and noncondensable gas evacuator; P, pump.
Superphosphoric Acid
425
both the chloride and fluoride concentrations peak at this P2Og level. At a higher P2Og concentration these compounds are released from the acid (see Sections 3.5.4, 8.1.2, 10.2.4, and 10.2.5).
7.3 SUPERPHOSPHORIC ACID
It is not within the scope of this book to give a comprehensive section on superphosphoric acid. Superphosphoric acid, also called polyphosphoric acid, has been amply described by R.F. Jameson [6], W. C. Scott, Jr. [7] and R. A. Shetler and J. M. Williams [8]. Extensive work on superphosphoric acid has been done by Tennessee Valley Authority from where detailed information can be obtained [ 9].
Commercial superphosphoric acid grade is obtained when phosphoric acid is concentrated up to 68-70% P2O5. At this concentration level a part of the orthophosphoric acid, H3PO4, has been dehydrated into pyrophosphoric acid, H4P2O7, and metaphosphoric acid, HPO3, as well as more complex combinations of the two (H5P3O4Q, HgP4O13, and so on) .
Superphosphoric acid, when made out of wet process phosphoric acid, has to be concentrated by evaporation at 180-200°C. From two original processes, the direct heating, oil-firing submerged combustion system has been largely abandoned because of energy costs. Indirect steam heating remains the current process. At this temperature rubber-lined or graphite equipment are no longer suitable. The heat exchanger and boiler chamber are made of alloys such as Inconel 625 or Hastelloy G. Medium pressure steam, 30 bars, must be used. At the commercial concentration of 68-70% P2Og about 25-50% of the acid is in the form on nonorthophosphoric acids.
Superphosphoric acid appears as a highly viscous liquid, dark green or brown, sometimes almost black. It must be at a minimum temperature of 35-50°C to be pumped by positive displacement pumps. (The common handling temperature is between 50-80°C.) The viscosity is affected by the impurities in the acid; therefore, before concentration the 50-54% feed acid has to be purified. The solids are centrifuged to a maximum of 1%. A typical superphosphoric acid from Florida rock has a viscosity of 1400 cp at 30°C. Heavy impurity-loaded acid can be much more viscous.
Superphosphoric acid is mainly used for liquid fertilizers because of its sequestrating properties with metallic ions. Impurities that would normally precipitate after ammoniation of the phosphoric acid remain in solution.
426
Acid Concentration Systems
REFERENCES
1. U. Sander and H. J. Koenig, Energy Savings and Waste Heat Utilization in Sulfuric and Phosphoric Acid Plants, Joint Meeting of AICHE-IMICO, Acapulco, Mexico, October 15-17, 1980.
2. Metallgesellschaft Aktiengeseelschaft, European Patent Office Publ. No. 0-005-875-A; Patent No. 79-200-235-4, May 14, 1979.
3. J. L. Martinez and H. A. Snell, Single Stage Evaporation, AICHE Joint Meeting, Daytona Beach, Fla., May 18, 1974, and AICHE Central Florida Section Meeting, Lakeland, Fla., November 12, 1974.
4. P. Moraillon and J. Roubinet, Concentration de L'Acide Phos-phorique: variantes possibles dans la conception des evaporateurs sous vide a circulation forcee, International Superphosphate Manufacturers Association Technical Conference, 1970.
5. Rhone-Poulenc, Ed., Acide phosphorique: precede de concentration [process publicity material], Neuilly-sur-Seine, France.
6. R. F. Jameson, Polyphosphoric Acid Chemistry, in Phosphoric Acid, Vol. I, Part II (A. V. Slack, Ed.), Marcel Dekker, New York, p. 985.
7. W. C. Scott, Jr., Polyphosphoric Acid, Production by Wet Process, Direct Heating, in Phosphoric Acid, Vol. I, Part II (A. V. Slack, Ed.), Marcel Dekker, New York, p. 1061.
8. R. A. Shetler and J. M. Williams, Polyphosphoric Acid, Use of Heat Transfer Surfaces, in Phosphoric Acid, Vol. I, Part II (A. V. Slack, Ed.), Marcel Dekker, New York, p. 1083.
9. Tennessee Valley Authority, Muscle Shoals, Alabama.
8
Product Acid Impurities and Sludge
8.1 IMPURITIES IN THE PRODUCTION ACID
Because of the wide varieties of phosphate rocks on the market with differing amounts and natures of impurities, the wet process phosphoric acid producer and consumer will always have to cope with problems caused by the presence of a large part of these impurities which have been transferred into the acid. To show the size of problems that impurities in wet process acid can cause, we have only to compare some of the physical characteristics of 30 and 50% acid for both pure and crude phosphoric acid (acid from Florida rock) (shown in Table 8.1).
Most impurities are not easily removed from phosphoric acid. To produce pure phosphoric acid out of crude wet process acid, sophisticated prepurification followed by solvent extraction processes have to be chosen.
For the purpose of the fertilizer industry or for the current phosphoric acid market, only a sludge-removing clarification is used, so that most of the impurities stay with the acid.
The wet process phosphoric acid impurities can be classified into the following three categories: (1) process impurities, (2) common impurities originating from the phosphate ore, and (3) trace elements originating from the phosphate ore.
8.1.1 Process Impurities
Process impurities originate from the reagents used for wet process acid production: sulfuric acid and process water.
427
428
Product.Acid Impurities and Sludge
TABLE 8.1 Comparison of Pure and Crude Wet Process Acid
Pure acid Crude acid (Florida)
Specific gravity of 30% P2O5 acid, 25°C 1.26 1.33
Specific gravity of 50% P2O5 acid, 25°C 1.56 1.675
Water vapor pressure of 50% P2O5 acid (mmHg gauge) 180 80
Water content of 50% P2O5 acid (%) 31 25.6
Viscosity of 50% P2O5 acid, 60°C (CP) 5-6 9
Color No color; transparent Dark brown, cloudy
Sulfuric Acid
Sulfuric acid is in fact the most common impurity in the wet process acid since the calcium separation needs a certain excess of sulfuric acid. This excess not only varies with the rock origin and quality but also with the phosphoric acid process. Sulfuric acid remaining with the produced phosphoric acid usually varies from 1 to 3% (as total sulfate) in the weak acid (30%PgO5).
Most of the time an excess of sulfates does not harm the final use of the phosphoric acid, but in some cases it becomes necessary to remove partially some of this excess because of the consequences resulting from it in the final product to be manufactured.
The concentration of the sulfates and the calcium ions are equilibrated by the solubility product (see Section 2.2), and this makes it possible to control the sulfate level to a certain extent. If this method is used, a special tank is interconnected between the reaction system and the filter. Some extra finely ground phosphate rock will be fed in and calcium sulfate will precipitate before the slurry goes to the filter. The disadvantage of this method lies in the fact that retracted SO42-will be replaced by Ca2+, which in some cases may not improve the acid quality. Nevertheless, the method can be used when very high sulfate levels are to be removed. An acid with 4% SO4 contains 0.20% CaO. When it is brought to stoichiometric conditions, there will be only 1% SO4 and 0.8% CaO, the total amount of impurity (1 + 0.8) being less than (4 + 0.2%.)
Impurities in the Production Acid
429
By cooling the acid, the solubility product of calcium sulfate decreases and CaSO42H2O will precipitate from 30% acid. We can see from Fig. 8.1 that between the equilibrium curve at 75°C and the curve at 30°C which represents cooled acid from the storage, some 0.2-0.25% of CaO can precipitate. This is equivalent to about 0.6-0.75% of solids. If that much does not usually precipitate, it is due primarily to the fact that most of the acid is not allowed or is not stored long enough to cool to ambient temperature.
Process Water Impurities
Impurities from process water are mainly sodium chloride when no pure water wells are available. Sodium is already in the phosphate rock, but any additional sodium will reinforce the initial effect on sodium silicofluoride precipitation (see Section 3.5). Chlorides must be monitored thoroughly because of their corrosive behavior. Before accepting chloride-containing process water, a corrosion test should be made, especially when the chloride concentration added to that of the phosphate rock will pass the threshold of 0.1% Cl compared to the phosphate rock. It becomes even more hazardous when the rock already has a corrosive behavior (e.g., high F and low SiC>2 + AI2O3 (see Section 10. 2. 5).
8.1.2 Common Impurities from Phosphate Rock
Aluminum
All commercial phosphate rock contains aluminum: a few tenths of a percent at least, up to 3% for heavily loaded ores. Not all of the aluminum goes into the product acid solution; some leaves the system with the gypsum. The proportion that stays with the solids varies according to the phosphate rock origin and not much is known about this inconsistent behavior of the aluminum compounds from one ore to another.
Referring to the diagram of the chemical composition of the filter washes (Fig. 6.11), we know that there is a compound containing aluminum which dissolves during filtration. Obviously, there has been some precipitation of an aluminum compound within the 30% acid reaction section. Hemihydrate processes working at higher P2O5 concentrations (40-50%) claim to produce phosphoric acid with less aluminum impurity than for the acid produced with the same rock by the dihydrate route. The possibility of AlFg^- compounds has been envisaged.
The part of the total aluminum transferring into the product acid 27-30% P2O5 is usually between 75 and 90%, but can be as high as 100%. The percentage of transferred aluminum is usually higher with high-aluminum-containing rock.
Е о
bfi с тз
сЗ
и
о ей О
•е1
О ел
saturated or slightly supersaturated acid.
430
Impurities in the Production Acid 431
Aluminum carries a certain number of disadvantages with it into the phosphoric acid. It has a high density-increasing factor [1]. According to Dahlgreen [2]', 1% as A12O3 increases 30% P2O5 acid density by 0.017 at 75°C. For 1 liter of 30% acid, that means that adding 5.3 g of Al will increase the total weight for 1 liter by 17 g. With high-aluminum-content-phosphoric acid, concentration by evaporation may be limited to less than 50% acid. Aluminum also affects the viscosity [1] of the produced acid. Aluminum can precipitate from concentrated phosphoric acid, as ralstonite (AlFgMgNa6H^3) from 30-40% PgOg acid or as X compound [(Al)3KH14(PO4)g-4H2O] from 50-54% acid.
Apart from the solvent purification processes, so far there is no economical way of eliminating aluminum from phosphoric acid. In most cases it is more efficient to insist on phosphate beneficiation than to try to eliminate aluminum from the acid. When the finished products are fertilizers, aluminum decreases the water solubility of the phos-phatic fertilizer but does not change the citrate solubility.
Iron
Iron and aluminum are often considered as belonging to the same impurity category. The term R2O3 (Fe2O3 + A12O3) is often used, because both Fe and Al reduce the water solubility of phosphate fertilizers. When the Rj^O-j/PjPg ratio reaches 0,09 or 0.1, some of the common finished products manufactured with the phosphoric acid start to show serious quality weaknesses. Diammonium phosphate (e.g., 18-46-0 grade) will hardly hold its standard nitrogen grade because the presence of too much Al^+ and Fe^+ does not leave enough of the first phosphoric acid valence to combine ammonia; furthermore, it overloads the fertilizer through the dead weight of these elements.
As with aluminum, almost all of the iron gets into the product acid, but the portion of iron transferred is not reduced when the acid strength increases by strong acid processing for example.
Beyond 50% of P2O5 concentration, iron can precipitate as X compound:
(Fe)KH (PO4) • 4H2O (1)
О о
As much as 30% of the total iron from the phosphate has been found precipitated as X compound in 50% acid sludges. Some have considered using this compound to remove iron and aluminum from phosphoric acid. If so, expensive P2O3 losses will have to be considered (4P2O5 for 3Fe). X compound is citrate soluble and could be used as a fertilizer component. In a reduced state, as Fe^4-, the X compound formation will be restrained. Fe^+ nevertheless is unstable in open air storage.
432
Product Acid Impurities and Sludge
Magnesium
Magnesium usually goes entirely into the acid during the wet process reaction. Magnesium is an undesirable impurity because of its influence on viscosity and the formation of insoluble compounds in many finished products (such as MgNH4PC>4 when phosphoric acid is ammoniated). Most phosphates contain less than 0.6% of MgO, but some qualities almost double this content. Magnesium removal from phosphoric acid has been studied but has not, so far, been proven easy and economical.
Allied Chemical Corporation [3] has taken out a patent for complex precipitation of a compound containing AI2O3, MgO, F, and ₽2°5- To achieve this precipitation, well-defined ratios of AI2O3, F, and MgO have to be realized by adding fluoride ions. Separation of the precipitate was reported to be possible by filtration at about 50°C.
Calcium
The calcium content in the product acid is a function of the sulfate level left in the acid. This subject was discussed for the sulfates in Section 8.1.1.
Potassium
Phosphate rock usually contains 0.02-0.15% potassium expressed as К 2O, and most of it will be found in the phosphoric acid solution that is produced. Potassium will reappear with the scales and the sludges originating from the 30 or 50% acid. When sodium is present in large quantities (over 0. 5% as Na2O) and potassium is also on the high side, sodium potassium fluosilicate can precipitate (NaKSiFg) and scale the filter pipes or the flash cooler pipes. However, this will not completely eliminate potassium from the acid.
When the phosphoric acid is concentrated by evaporation close to 50% of P2Og, another compound containing potassium will precipitate, (Fe,Al)3KH14(PO4) •4HJ3. This compound contains only 4% potassium and shows the possible effect of very small amounts of potassium on sludge precipitation in concentrated acid. This precipitation has been suggested for iron and aluminum removal from concentrated acid. Unfortunately, it also retracts large quantities of P2O5, the compound containing as much as 53-58% PgOg. The formation of the compound (Fe.AD^KHi^PO^lg^HgO is mostly considered as a problem of undesirable sludge. Attempts are made to minimize this precipitation by recycling H2SiFg from the concentration evaporator into the 30% P2O5 acid in order to precipitate most of the potassium as I^SiFg.
Chlorides
All phosphates contain traces of chlorides (usually as much as some 50-100 ppm), but in some cases their concentration can be much higher; up to 2000 ppm can occur, especially when the water used for phosphate rock beneficiation contains chlorides.
Impurities in the Production Acid
433
Chlorides are in general soluble and consequently go into the product acid. The problem of the chlorides lies in their corrosive behavior (see Section 10.2.5). Removal of chlorides from weak acid is difficult and uneconomical. If the problem of corrosion becomes too great, attempts must be made to remove the chloride from the rock rather than from the acid. If this is not possible, exotic alloys such as Hastelloy G (Section 10.3) should be used after careful corrosion testing of the rock. Chlorides are to a great extent released from phosphoric acid during concentration, especially between 40 and 50% P2°5-
Fluorine
See Section 3.5.
8.1.3 Trace Elements
Arsenic
Most rock phosphates contain 3-15 ppm of As which goes into the phosphoric acid solution during the reaction. Whereas the production of triple superphosphate (TSP), diammonium phosphate (DAP), or commercial 50-54% P2O5 acid does not require removal of such a low quantity of As, it can be necessary to lower its content when producing some other phosphates used in the animal food industry.
Arsenic can be removed from H3PO4 solution down to 2.5-5 parts for 10® parts of P2O5 by H2S treatment. Arsenic in the phosphoric acid occurs as As^+ and As®+, both reacting with S^":
3+ 2-
2As + 3S -> S3As2 (2)
2As5 + 5S2’ -> S,As (3)
5 2
The easiest way to produce S^" or HgS in the phosphoric acid is to introduce NagS. This is done with fHtered product acid in a special mixing tank. The arsenic sulfide will precipitate and settle; settling occurs under much better conditions when some gypsum material is to be settled simultaneously. The time needed for the reaction to complete depends on the acid temperature. Good conditions seem to be at around 56-58°C, where the reaction time to precipitate most of the arsenic does not exceed 40 min. has to be kept in excess of about 1. 50 kg of S per cubic meter of 30% PgOg acid.
The arsenic removal can be realized after gypsum filtration with the 30% warm acid in a mixing tank where Na2S is introduced. The precipitated arsenic sulfide will settle in a subsequent tank where other solids, such as gypsum and sodium silicofluoride, will also precipitate and settle. The underflow from the settler has to be filtered. Separated solids shall not be recycled into the phosphoric acid reaction system, where arsenic sulfides would redissolve.
434
Product Acid Impurities and Sludge
Cadmium
Cadmium occurs in all phosphates but in considerably varying amounts. Whereas some ores contain only a few ppm, others contain up to 90 ppm. Cadmium is responsible for a painful bone disease known as Itai-itai. Concentrations such as 1 mg/liter in water have led to that illness. Cadmium action is reinforced by zinc and copper [4]. If both elements are present together, the effect on fish is multiplied several times. In recent years some countries have become concerned about cadmium and choose their phosphate rock accordingly.
When producing phosphoric acid, most of the cadmium goes into the acid, but a part is always found with the gypsum (about 20%). Rather high concentrations of Cd are found in the sludge from 30% P2O5 acid. Unfortunately, we do not know what chemical compound it is.
The cadmium contained in the wet process acid is usually found as water-soluble cadmium in the fertilizer produced. A process for the removal of Cd is not yet available. Some countries intend to adopt a cadmium limitation of no more than 20 ppm in the fertilizer product as a preventive measure. So far a precise concentration limit cannot be justified.
Mercury
Mercury is found as a trace element in most phosphate rocks: 0.06-0.1 ppm.) It is a very toxic element. The Minamata disease due to mercury was first recognized in Japan as arising from mercury concentration that occurred within edible fish. The upper tolerable limit for mercury in water is considered to be as low as 0.1 mg/m^ (0.1 ppb). Fortunately, there is not too much mercury in phosphate rock, and it usually remains with gypsum as an insoluble mercury sulfide, HgS2. Except for microbiological decomposition, HgS 2 is known as a very stable compound.
Uranium
See Section 8.5
Copper
Currently between 25 and 200 ppm in rock. Most of the copper is transferred into the solid phase [ 5].
Zinc
Currently between 80 and 400 ppm in rock. Between 60 and 80% of the zinc is found in the product acid phase [ 5].
Lead
Currently between 2 and 20 ppm in rock. All the lead is found insoluble with the calcium sulfate solid phase [5].
Wet Process Phosphoric Acid Sludge 435
8.2 WET PROCESS PHOSPHORIC ACID SLUDGE
Sludge is the generic name for a large number of compounds that unavoidably appear as settled solids or deposits when wet process phosphoric acid is stored. In the absence of proper design and precautionary operating procedures, such sedimentation results in the undesirable plugging of tank outlet nozzles, connected piping, and inline equipment such as pumps and instrumentation. Furthermore, irregular acid quality is a consequence of these suspended or partially settled solids. This substantially imbalances the amount of impurities in the final product, whatever grade the latter may be. Many problems arise in the storage and transportation of such an acid.
In the 30% P2Og (acid), sludge consists mainly of calcium sulfate and alkaline silicofluorides. But in concentrated acid more compounds precipitate, including complex phosphates. This reduces the overall soluble P2O5 yield of final fertilizer products.
To sum up, problems caused by the presence of sludge fall into three general categories: (1) mechanical, (2) chemical, and (3) economic.
8.2.1 How Sludge Originates
Phosphoric acid from the filter as 26-30% acid contains some suspended solids. Smaller crystal particles pass through the filter cloth, and there are also occasional holes in the cloth which allow solids to pass through. Such suspended solids, usually in the size range of a few micrometers, currently amount up to 2 wt% of the acid. The composition is mainly calcium sulfate. With the dihydrate system, the filter feed acid temperature is between 70 and 80°C and is at its saturation composition principally with respect to calcium sulfate and silicofluorides. In the vacuum filtration system the temperature of the acid falls to about 50°C. The low-temperature acid filtrate becomes supersaturated and immediately starts to precipitate calcium sulfate and alkaline silicofluorides. Further cooling occurs within the storage tank and/or settler system, and precipitation continues, the amount of further precipitation being related to the cooling rate of the tank and the time spent in the tank. As the acid P2Og content increases during subsequent concentration, further precipitation of new components, sometimes of a rather complicated molecular structure, takes place.
At the present state of technical know-how, not much can be done to avoid precipitation; but we have to learn to live with it. ' What the phosphoric acid producer has to develop is the cheapest and easiest way to separate the solids from the acid while minimizing the concomitant P2Og losses.
Lehr [6] gives a detailed listing and description of wet process acid impurities which precipitate as sludge in the different acid grades. Only the most commonly occurring compounds will be discussed.
436
Product Acid Impurities and Sludge
8.2.2 Composition of Common Sludge
The following list shows the most common compounds occurring in phosphoric acid with concentrations ranging from 30 to 50% P^g.-
CaSO42H2O
Na2SiF6
KSiF
2 6
NaKSiF-
О
CaSO .CaSiFcCaAlFK(Na) 12H ,O 4 6 о *
CaSO4• H2O
CaSO„ 4
CaF2
MgAlF6Na6H2O
Fe3KH14(PO4)84H£>
A13KH14(PO4)84H2O
Fe(H2PO4)22H2O
Gypsum. Smaller crystals escape through the filter cloth. Precipitates during and after cooling in storage.
Sodium fluosilicate. Precipitation starts in the reactor according to the constituent concentration in the rock. Precipitates wherever slurry cooling occurs, such as in flash cooler pipes and storage tank. Scale forms readily on metal and plastic surfaces.
Potassium fluosilicate. Less common than Na2SiFg because K+ is usually a minor constituent in the rock. Occurs when the K+ content increases in the acid, for example when К is accidentally mixed with the feed rock (during shipping or storage). Scales pipes.
According to Na+/K+ ratios. Scaling on filter and in flash cooler pipes.
Chukhrovite: scales filter cloth; precipitates in filter wash acid. May be present instead of Na+, CaF+, Ca (OH)+, or rare earth.
Hpmihydrate. Precipitates during concentration of the acid.
Anhydrite. Precipitates during concentration of the acid.
Calcium fluoride. Precipitates during concentration, before reaching 40% P2Og.
Ralstonite, precipitates in 30% to 50% acid.
So-called X compounds. Precipitate in 50% acid, when high Fe- and Al containing phosphates are used. Precipitation is not immediate and may be delayed and occur only during transporation or further cooling (up to 14 days after production).
Precipitates when high-iron-containing phosphates are used.
Wet Process Phosphoric Acid Sludge
437
TABLE 8.2 Typical Sludge Compositions from Two Different Rocks: Tapira, Igneous Rock with Low Fluorine Content, and Florida, with High Fluorine Content
Tapira sludge from 30% acid Florida sludge from 30% acid (two samples) Tapira sludge from 52% acid Florida sludge from 52% acid
P2°5 0.47 2.8 1.3 27.7 28.6
S°3 47.5 21.7 28.7 23.8 15.5
F 0.17 12.7 25 3.8 9.4
S°2 0.17 6.9 0.17 2.4
CaO 33.9 15.6 22.3 17.9 3.5
Fe2°3 0.03 0.07 1.8 10.1 8.9
A12°3 0.13 1.39 0.5 0.4 1.9
MgO 0.01 1.07 0.03 0.08 1.1
Na^ 0.19 5.53 8.1 2.32 3.8
k2o 0.03 1.71 1.70 1.84 0.5
As stated before, the compounds listed above represent only the most common constituents. Many other compounds may be encountered in smaller amounts.
Nevertheless, in practice, complete knowledge of the various sludges is not necessarily of great help. Instead, it is important to know the quantity that precipitates, how the sludge is to be separated from the product acid, and what P2O5 losses are to be expected. Usually, if the sludge has a high P2O5 content (up to 45-50%), the responsible compound is of the (Fe,Al)3KH14(PO4)g.4H2O type. Table 8.2 shows some typical sludge compositions originating from two very different rocks. One is Florida, the second, of igneous origin, Tapira (Brazil). Tapira shows a low fluorine content and subsequently the amount of Na2SiFg is much lower in its sludge. In fact, the sludge from Tapira rock in 30% acid is almost pure gypsum.
8.2.3 Quantities to Be Expected
How much sludge is to be expected?
The amount of sludge in phosphoric acid depends on rock composition. Some constituents, such as calcium sulfate, are present in all cases and depend on P2O5 concentration, sulfuric acid excess, and the temperature of the slurry when it is filtered.
438
Product Acid Impurities and Sludge
Sodium, fluorine, and silica are encountered in all rocks. Consequently Na2SiFg is always expected to be present.
The acid from the filter contains about 1-2% suspended solids. For example, assuming that it is 2% (20 kg/ton) and the acid concentration is 26% PgOg, total suspended solids can amount to (20 x 1000)/260 = 76.9 kg/ton of ₽2°5’ compared to 33.3 kg suspended solids per ton of P2Og when the concentration of suspended solids and PgOg аге 1 30%, respectively. This demonstrates the importance of filter cloth maintenance and product acid concentration for the sludge originating from the filtration section.
However, sludge originates mainly from precipitation after filtration. The 28 or 30% acid from the filter will contain SO42' and Ca2+ ions in slightly supersaturated concentrations. CaO will be at an average figure of some 0.4% in the acid when it goes to the filter at a temperature of 70°C. When concentrated to 52% the saturation value for Ca2+ will be at a much lower level, such as 0.05% CaO. That means that the greater part of the Ca2+ ions will have precipitated, mainly as calcium sulfates.
The total amount of CaSO4 to be precipitated per ton of PgO5 will be
Ho100,1 "32-4keofCaSO4
(4)
where 136 and 56 are the molecular weights of CaSO4 and CaO, respectively.
The solubility of Na2SiFg (see the solubility diagram of Fig. 3.8) will drop from 0.7% F in 28% acid down to 0.2% F in 52% acid. Hence the amount of precipitated IS^SiFg can be calculated:
7 2 \ 188
180 ‘ 520/ 114
x 1000 = 34. 9 kg of Na„SiF_ per ton of P.O
2 6 2 5
(5)
where 188 and 114 are the molecular weights of Na2SiFg and 6F, respectively.
At this point, an estimate of potential sludge quantity based on suspended solids from filter cloth leaks, calcium sulfate, and sodiumsilicofluoride adds up to a minimum of 33 + 32 + 35 = 100 kg of sludge per ton of P2O5. If compounds such as chukhrovite, ralstonite, РезКН|4(РО4)8-4Н?О, and others also precipitate, the amount of sludge will surpass the estimated 100 kg/ton of PgOg quite easily. The compound (Fe,Al)KH14(PO4)g-4HgO can precipitate as much as 1-2 wt%of the 50-52% acid if there are high Fe2+ and Al^* concentrations [(FegOg + А12Оз)/Р2О5 in rock > 0.08)]. These compounds precipitate only in concentrated (50%) acid. They do not precipitate rapidly; sometimes
Wet Process Phosphoric Acid Sludge
439
they appear in concentrated acid only after several days or after cooling of the acid.
8.2.4 Quality Requirements for Acid
The amount of sludge to be separated depends on the original phosphate rock quality (its impurities) and the quality of the finished product to be produced from the phosphoric acid. The more soluble impurities remain in the final acid, the lower the residual sludge allowance that can be tolerated. Higher iron and aluminum contents in Florida phosphate rock, for example, make it necessary to eliminate sludges to less than 1% in concentrated acid, when 18-46-0 DAP grade is to be produced from the phosphoric acid under consideration.
The equipment to be installed in the plant to clarify or separate the sludge from the acid consequently depends on both the original quality of the phosphate rock and the nature of the finished product to be manufactured.
The most traditional equipment type used has been settling tanks. Sludge removal from the acid by settling involves acid quality splitting. Settling can clear one part of the acid only by concentrating sludges in another part. The settling of 50% acid usually delivers a concentrated underflow with 15% of solids (weight percent). The disadvantage of this type of clarification is evident; there has to be a low-quality acid-consuming operation, such as the production of triple superphosphate, a phosphatic fertilizer that can accept higher impurity content.
A formula to calculate the amount of clarified acid out of 100 tons of unsettled acid is
tc(U - Cl) = 100(U - Cr)
(6)
where
tc = % of clarified acid out of crude acid
U = % of solids in underflow acid
Cl = % of solids in clarified acid
Cr = % of solids in crude acid
With 8% solids in crude acid, 15% in the underflow and 1% in clarified acid, we would split 100 tons into 50 tons of clarified and 50 tons of underflow. The conclusion is evident: only about half of the P2O5 production will be available as quality acid suitable for products needing clear acid. The other half has to be used for producing triple superphosphate, or another product able to accept phosphoric acid loaded with higher amounts of impurities.
Merchant-grade acid requires a low solids content. The permis
440
Product Acid Impurities and Sludge
sible percentage in most contracts varies between 0.5 and 2% maximum. It is to be expected that, in the near future, that maximum will be reduced.
Diammonium phosphate production also requires relatively pure acid. If Florida rock is used, the amount of iron and aluminum in the acid gives a preliminary burden to the producer, and very little solids can be accepted to meet the 18-46-0 specification. To reach 18% N with 46% soluble PgO5 in the finished product, the PgOg grade of the acid should be not less than 62% on dry basis: PgOg in acid/acid weight minus dilution water. Another rule of thumb states that the ratio:
Fe2°3 + A12°3
2 p O— < 0.087*
2 5
(7)
8.3 SLUDGE REMOVAL PRACTICES
8.3.1 Final Product Inclusion
Triple superphosphate (TSP) or monoammonium phosphate production does not require sludge separation from the acid. When the total acid production is to be processed for such products, only agitated storage tanks are required to maintain the solids suspended in the liquid. TSP production, continuing to increase in world market statistics, is consequently still the most common sludge acid consumer. But plants producing exclusively TSP have become less common. Most of the current phosphoric acid plants are built to sell merchant-grade acid as a large part of their production. Furthermore, uranium recovery is slowly but surely becoming another reason to produce clear acid, because the solvent extraction process involved in such an operation requires clarified acid. Consequently, it has become necessary to explore better techniques for sludge separation in trying to avoid the undesirable low-grade-acid by-product.
The more recent practice of a real solid/liquid separation, eliminating the sludge to send them to waste, is not yet very common but it is a promising technique.
8.3.2 Double Settling: Underflow Recycle
The principle of double settling consists in clarification of both 30 and 50% acid by settling. Figure 8.2 shows this very common practice, nowadays considered obsolete, which has two major disadvantages:
*At this ratio Fe^+ and Al3+ balances 28% of H2PO4.
Sludge Removal Practices
441
1. The underflow from the 30% acid tank, usually containing 25-30 wt% solids, is recycled to the filter feed tank. This causes disturbances within the filtration system because these sludges have poor filtration qualities. Higher filtration losses occur.
2. The 50% acid sludge cannot be thickened much over a 15% wt solid/ liquid ratio. Settling speed slows down after this limit. The resultant sludge, recycled to the 30% acid settling tank, redissolves partially [in practice, all the (Fe.ADgKHj^fPO^g-4H2O]. Thus, the iron or aluminum impurities accumulate in the 30% acid tank, with another consequent precipitation increase within the 50% acid concentration section. Large amounts of sludge will recycle, provoking irregularities and a temporary "oversludge" acid. The merchant-grade acid will be of an irregular quality.
8.3.3 Settling Followed by Underflow Filtration
Filtration of 50% acid, although a logical idea, is not very common.
Poor filtration qualities of the solids and high viscosity of the acid may lead to high P2O5 losses and a difficult operation. Nevertheless, this practice has been chosen by the Tunisian phosphoric acid producers at Gabes to clarify the settler underflow. Tunisian acid fortunately has a viscosity that makes this practice permissible. During a preliminary aging period, agitation with suspended sludge increases the size of the crystalline solids, somewhat improving the filtrability. The effective filtration rate used is about 33 tons of total clarified P2P5 Per day per square meter with a 3-min filtration cycle. Usually, a belt filter with special filter cloth has to be used for that purpose (permeability, measured with air at 20-mm water gauge, 1300 rrP/hr per square meter instead of 4000-6000 m^/h used as 30% acid filter cloth). Cake washing is done by countercurrent, one water and two acid washes. The volume of water used is 0.6 m^/ton of Р2Од, resulting in a 30% acid. About 0.5-1% P2O5 is considered to be lost. The filtered sludge amounts to about 0.15 ton of dry solids per ton of P2O5. Tunisian rock has only
FIG. 8.2 Double settling.
442
Product Acid Impurities and Sludge
a low iron content in its acid, and consequently there is not much risk of precipitating (Рез)КН j4(PO4)g-4H2O.
8.3.4 Intermediate Clearing
A more recent practice includes a settling or filtration at an intermediate concentration (about 40%) rather than the final 50-52%. There are several advantages in operating at this level of concentration:
1. The acid viscosity is lower (settling and filtration is easier).
2. The specific gravity is lower (better settling).
3. P2O5 concentration is lower (less P2O5 losses in the sludge).
4. The solubilities of most impurities are already at a low level (there is not much more precipitation between 40 and 50%) (Fig. 8.3).
5. Complex phosphates such as РезКН44(РО4)д • 4Н2<Э do not yet precipitate.
CONCENTRATION OF P2O5
FIG. 8.3 Effect of phosphoric acid concentration on dissolved impurities .
Sludge Removal Practices
443
FIG. 8.4 Intermediate settling.
Figure 8.4 shows how this type of clarification is operated. The concentrators work with two stages. The first one recycles concentrated acid to the product acid settling tank, to keep it at 40% P2O5 concentration. The filter production acid is sent directly into the 40% acid concentration and at one precipitates most of its impurities.
After settling, the 40% acid overflow is further concentrated to 50- 54%. Final settling at 50- 54% will produce a much smaller amount of underflow than that produced by the traditional system.
According to Bearden [7], about one-third less solids is left in the final 50% acid with this system.
Forty percent acid underflow filtration on a separate filter is a further step in improving sludge removal (see Fig. 8.5). Essentially , it has the same settling and concentration diagram as before, but the 40% acid underflow, instead of being recycled to the reaction system, is filtered. The cake resulting from the removed solids in the acid is backwashed (two washes) with pond water.
The filtration surface needed for this operation is difficult to define and there is no precise method to estimate it, even with pilot plant operation, because it is very probable that the particle sizes of sludge in a pilot plant will not be comparable with those of a full-scale operation. The recycling and temperature effect in the concentrator has a great influence on this factor._
According to Yarnell and Hebbard [8], а 15-m^ belt filter is suitable for an average production of 1000 tons/day of P2O5 in the case of Florida rock. They reported that the clarifier underflow to be filtered was 38 tons/hr containing 12 tons of P/I5 (33.7%). The wet cake discharge was 11.4 tons/hr (—28% H2O). Pond wash water was 6 m^/hr.
According to their study the difficulties in comparing pilot plant work with plant size applied not only to particle size but also to sludge composition. The potential number of different compounds to be precipitated is great, and slight changes in temperature, saturation,
444
Product Acid Impurities and Sludge
FIG. 8.5 Intermediate settling with coupled filtration.
recycling, and so on, may completely disturb the percentual distribution of the various compounds, consequently giving rise to very different filtration qualities. Nevertheless, filtration in this case seems to be a successful sludge removal procedure, especially from an economic point of view. The P2O5 losses are low, less than 0.5% of the clarified acid.
8.3.5 Minimizing Phosphate Precipitation in Sludge
When phosphatic sludge formation occurs in 50% acid, it results in P2O5 losses and uncontrolled precipitation. This is especially when (Al,Fe)3 КН-£4(РО^)8-4Н2О crystallizes (also called X compound).
Since potassium is one of the ions responsible for this precipitation, the idea of eliminating K+ from the acid before the X compound starts its formation has been considered. The X compound never precipitates at less than 40% P^Og and even at 50% P2O5 starts only after some period of time or only after some cooling of the concentrated acid. Sometimes there is an increased precipitation rate during a plant stoppage, when the 50% acid storage, no longer receiving newly produced warm acid, cools off.
To eliminate K+ it was suggested to precipitate it as K2SiF6 by increasing the SiFg2' concentration in the 40% acid stage. In the laboratory using Florida acid, we confirmed this and decreased X compound formation by 25%. H2SiFg can be reclaimed from the evaporation system and recycled into the 40% acid tank.
Clarification Equipment
445
8.4 CLARIFICATION EQUIPMENT
The technology of sludge removal from phosphoric acid has become much more important than it was in past decades, for several reasons:
1. Phosphate rocks with higher grades of impurities are consumed. 2. Concentrated phosphoric acid has become a finished product. Any suspended or postprecipitating solid will occasion problems during or after transportation or storage. Tedious and costly cleaning of tanks, trucks, and ships has to be taken into consideration.
3. Higher purities of acid are required for some finished products.
These reasons explain why the traditional settling tank is no longer the universal answer to the problem of solids in the final acid.
Clarification technology is difficult because of the variability of the factors governing both the physical properties of the acid and those of the solids to be removed. The viscosity of 50-54% P2O5 acid at ambient temperature can be as high as 80 cP in certain cases and most of the solid particles to be removed are small, often with an order of magnitude of 10 pm. This explains why the use of chemical additives (flocculants) has become common practice. Generally, they are polyacrylamides added to the acid as a dilute solution (1 g/liter) at a rate of some 5-15 ppm.
8.4.1 Traditional Clarification: Settling Tanks
Traditional clarification consists of thickening, by gravitational settling, the solids suspended in the phosphoric acid. This operation creates two acid phases: one clarified with a low remaining solid content, and the thickened phase with some 15% (maximum 20%) of solids when 50% acid is settled. The disadvantage is evident: when phosphates with a high sludge formation are used, there will be a relatively large thick phase which has to be used economically somewhere.
Solids suspended in a liquid settle according to Stokes’ law:
2
. D (d - d,.)g - 1 so h 2 * * * 6
“ 18 p
(8)
where
v = settling speed of the solid particles, m/sec
D = particle diameter, m
dgQ,d^= specific gravities of solids and liquid, kg/m^
446 Product Acid Impurities and Sludge
p = viscosity of the liquid, pascal (1 Pa = 10 poises = 1000 cP) g = 9.81 m/sec^
Taking as an example a solid particle of 50 pm diameter and specific gravity 2.3, and a phosphoric acid with a viscosity of 20 cP and а specific gravity of 1.65, the settling speed will be 0.159 m/hr, and for a 10-pm particle only 0.006 m/hr, which is very low. These figures illustrate well why settling has taken such advantage of flocculation technology, where the buildup of flocs 'permits acceleration of the settling speed.
A typical settling tank is depicted in Fig. 8.6. The cross section shows four zones: (1) a feed zone, where the crude acid is fed into the system; (2) clear solution zone, which is overflowing the settling tank; (3) transition zone, where actual settling takes place; and (4) compression zone, where the settled solids thicken up, and from where the underflow is extracted with special sludge pumps. The surface and depth of a settling tank are defined by settling tests with samples of the acid to be clarified. Various test procedures exist, the most common being the long tube method [9].
Nevertheless, it is obvious that with the great number of variables that are involved in the settling speed of the solids, permanent attention must be given to the clarification operation. Even with the same phosphate rock origin, no one can ever be sure of constant viscosities and sludge formation. According to Stokes' law, the gravitational constant g will be the only value not subject to variations. Consequently, there is no way to draw up a definite general-purpose settling diagram. A brief look at the phosphoric acid quality tables in
FIG. 8.6 Traditional settling tank. 1, Feed; 2, feed zone; 3, transition zone; 4, compression zone; 5, clear solution; 6, overflow;
7, underflow.
Clarification Equipment
447
Appendix A will also show how widely viscosities and sludge formation vary from rock to rock.
Leyshon and Schneider [10] have given a settling speed diagram for various acid concentrations limited to Florida rock (Fig. 8.7). In their paper the authors recommend the use of hydrocyclones preceding the settling tanks.
Thickening limits for settlers depend on the concentration of the acid being clarified:
‘28-30% acid: 50 wt % 40% acid: 20-30 wt % 50-52% acid: 15 wt %
8.4.2 Lamella Thickeners (Inclined Tray Settlers)
Inclined Tray Settler Principle
Accelerated clarification, still using natural gravity, can be achieved with inclined tray settlers (called lamella thickeners [11]). This thickener uses the settling acceleration principle, which can be seen from comparing two test tubes both containing a solid liquid suspension, with one being held vertical and the other inclined. The inclined tube will show accelerated settling by forming a high solid content downward flow on the lower side of the inclined tube (Fig. 8.8).
Instead of tubes it is possible to use plates spaced 2 in. apart which can easily be fitted into a container of larger volume. Each space between two plates becomes an individual clarifier with a settling area corresponding to its horizontally projected area (Fig. 8.9). The sludge slides down along the upper surface of each plate into a collection hopper, from where the clarifier’s underflow is extracted by a volumetri-cally controlled pump flow. The slurry to be clarified has to be brought into the area between the plates at a level below the free settling zone. This is achieved by a rectangular feed-box (Fig. 8.10). The clarified effluent moves upward between the plates to the top of the thickener and exits through a number of throttling holes which ensure uniform flow along the different interfaces. An overflow weir establishes a level equilibrium between feed and clarified effluent. The thickened underflow is compacted with the assistance of a vibrating device. The underflow withdrawal has to be controlled more carefully than with a normal gravity settler. The quantity of acid in the system is much smaller and the underflow will consequently be subject to quicker variations of solid content (in both directions) than that of a large settling tank. As with other settling equipment, flocculants are also successfully used with lamella thickeners.
Equipment Size
The principle of the inclined blades permits a substantial saving in space and phosphoric acid storage capacity. The projected surface of
448
Product Acid Impurities and Sludge
FIG. 8.7 Clarification rates for Florida rock. 1, 28-30% acid with flocculants; 2, 28-30% acid without flocculants; 3, 52-54% acid with flocculants; 4, 52-54% acid without flocculants.
Clarification Equipment
449
FIG. 8.8 Inclined tube 2 settles more quickly than vertical tube 1. (Courtesy of Parkson, Ft. Lauderdale, Fla., 1976.)
FIG. 8.9 Inclined tray settling system. 1, Inclined trays; 2, feed with solids; 3, settling solids; 4, clear liquid upflow; 5, clear liquid leaving settling area; 6, projected settling surface. (Courtesy of Parkson, Ft. Lauderdale, Fla., 1976.)
450
Product Acid Impurities and Sludge
FIG. 8.10 Lamella settler. 1, Solid suspension feed; 2, vertical feed box; 3, inclined trays; 4, sludge hopper with vibrator; 5, underflow with solids; 6, flow regulating orifice plate; 7, overflow weir; 8, clarified acid outflow. (Courtesy of Parkson, Ft. Lauderdale, Fla., 1976.)
the equipment is only 1/10 to 1/12 of the equivalent conventional settling tank. Large lamella settlers compare with conventional settling tanks of up to 600 m^.
Investment Costs
York [12] presented a cost comparision based on a conventional 40 ft (12.8 m) settling tank and found conventional equipment to be 1.6 times the tray settler price.
Clarification Equipment 451
TABLE 8.3 Solid Content as Effect of Feed and Underflow Rate (Lamella)
Feed (m3/m3 projected settling area per hr) Underflow (vol %) Feed Clarified acid Underflow
0.21 25 1.98 0.04 7.0
0.32 17 2.05 0.13 11.7
0.42 17.5 2.47 0.16 13.4
0.48 17.7 2.35 0.26 12.3
0.53 16.0 2.61 0.55 13.6
Source: Courtesy of Parkson, Ft. Lauderdale, Fla., 1974.
Operating Results
Table 8.3 shows clarification results for various feed rates with 40% P2O5 Florida acid containing 1.98-2.52% suspended solids [12].
Lamella thickeners also exhibit disadvantages, among which we should mention the following [ 10]:
1. Underflow solid concentration is lower than with traditional settlers , although this has the advantage of reducing the risk of overthickening.
2. The scaling tendency of the stainless steel plates (plugged interfaces). The descaling procedure is very tedious (flush with pond water 4-6 hr every 7-10 days to prevent scaling).
3. A very low solids content in overflow is difficult to obtain.
8.4.3 Filtration
Concentrated phosphoric acid filtration for the removal of sludge has been repeatedly tried, more or less successfully, over the years and has not been retained as current practice for removing solids from the concentrated acid. The reasons for this probably lie in the fact that the high viscosity of most of the concentrated acids in combination with the small size of the solid particles does not permit economical filtration rates and good yields of recovery.
Nevertheless, the filtration technique applied to clarification is enjoying a comeback at present. It was recognized that most of the solids precipitate after the concentration of 40% PgOg is reached by evaporation, and at this concentration the viscosity is not yet too high for efficient filtration (see Section 8.3.4, especially Fig. 8.5). Furthermore, with phosphoric acid having low iron, aluminum, and magnesium content, filtration of even 50% acid is technically and economically possible.
452
Product Acid Impurities and Sludge
Consequently some of the large phosphoric acid producers in the United States and in North Africa have come back to the filtration technique for removing the solids from the concentrated acid. The great advantage of filtration lies in the fact that the solids can be removed from the acid with very little impregnating P2O5, whereas the settling technique has to recycle the solids with a substantial part of the produced Р/Э5. upstream or into some other section of the production line.
The types of filter used for concentrated phosphoric acid filtration (either 40 or 50% acid) are generally belt filters and occasionally table filters. Since the solids to be removed do not filter very well, the cake thickness will be small, especially when 50-54% acid is to be filtered. The crude acid is first thickened in a settling tank and the underflow is sent to the filter. The filter cloth is of lower permeability than phosphoric acid filter cloths (1300 m3 air flow (hr”l) 200 mm water gauge).
The size of the filter has to be defined by filtration tests, with an ample security margin. If the filtration tests are operated during a period of time when settlers work with an underflow recycle loop that allows crystal growth, the actual crystal sizes when the total amount of sludge is filtered off will be smaller, and consequently the filtration rates will be lower. Even the chemical composition of the sludge will change [8]. To give some idea of the order of magnitude, when operating 40% acid filtration, the installed filtration area has been some 15 m^ per 1000 metric tons of P2O5 produced with Florida rock. When 50% P2O5 concentrated acid is filtered, 30 m2 of active filtration area per 1000 metric tons per day total production of PgOg is installed for Tunisian rock. In both cases the filter operation has been connected with settling tanks; underflow only is filtrated.
8.4.4 Decanter Cent rifuge
The settling of solid particles in concentrated phosphoric acid can be substantially accelerated by a centrifugal force field obtained from a high-speed rotating bowl into which the acid to be clarified is fed. The settling velocity in a normal settling tank according to Stokes' law:
D2(d - d )g
V = —-------------H—
s 18 p
becomes
2 2
, D4(d - d )oj R
У _ 1 so h
c 18 p
(9)
(10)
Clarification Equipment
453
where
V >V = settling velocity, m/sec, for settling tank and centrifuges, s c respectively
D = diameter of the solid particles, m
d = specific gravity of solids, kg/m3 so
d^ = specific gravity of liquid, kg/m3
_ о g = gravity, m/s
ц = viscosity, pascal (1 Pa = 1000 cP)
R = bowl radius, m
co = rate of revolution, rad/sec
Phosphoric acid centrifuges operating at speeds of 2000-6000 rpm according to their bowl diameter, generate high multiples of g, such as 2300-3200.
The decanter centrifuge can be assimilated with a hypothetical settling tank with a higher equivalent settling surface area. The equivalent surface can be calculated from the equation
2
c _ 7ГШ 1 .„ 2 2, (11)
Se~ W ( Г1}
where
= equivalent surface of the settling tank, m3
1 = centrifugal bowl length, m
R = bowl radius, m
r j = liquid surface radius, m
How Centrifuges Operate
The technical objective of centrifugation is to remove in a continuous manner the settling solids moving toward the bowl wall from the clarified liquid. This has been achieved by nozzle centrifuges or by the solid bowl scroll discharge type of centrifuge. The nozzle centrifuge works somewhat like a settling tank, where the thick liquid, enriched with solids, leaves the tank by means of a throttled outflow and the clarified acid overflows the tank. The scroll discharge system is depicted, as a cylindrical conical helical conveyor type, in Fig. 8.11.
454
Product Acid Impurities and Sludge
FIG. 8.11 Decanter centrifuges. 1, Feed; 2, rotating cylinder (up; 3, rotating screw conveyor (cog)ujg # up 4, inlet to bowl; 5, cylinder weir; 6, beach; 7, casing; 8, motor. (Courtesy of Pennwalt, Ltd., Camberley, England.)
The horizontal cylindrical rotating bowl is equipped with a helical screw conveyor rotating at a speed which is slightly different from that of the bowl. Consequently, the screw is conveying the solids toward the conical exit of the rotating bowl. To be conveyed properly there has to be a correct balance between the frictional forces of the solids on the conveyor and those on the bowl wall. If the solids slide too easily along the bowl wall, there may be a buildup on the screw without moving out. As long as the solids are below the liquid surface, the buoyancy of the liquid reduces the radial force. Once the solids are lifted out of the acid into the beach, buoyant forces no longer act on them and the frictional forces may become too strong. In that case the liquid level can be adjusted by lifting it by means of adjustable overflow weirs. The clarified acid, having followed the screw path, leaves the centrifuge through the discharge holes at the end opposite to the conical beach.
This type of centrifuge is often used with phosphoric acid because it is suitable for liquids containing large amounts of solids with a wide range of particle sizes. The system, permitting drainage of the solids, delivers the sludge with a solid content as high as 50-55 wt %.
The flow rate that can theoretically be achieved by a centrifuge is given by the equation
(d - d,.)D2 Voj2R _ _ so h c
Q 90uh
(12)
Uranium Recovery
455
where
Q = flow rate of feed slurry, m3/sec
V = volume of liquid retained in the bowl, m3
h = liquid height in the bowl, m (R - r)
Dc = minimum particle size to be eliminated (critical)
p = viscosity of acid, Pa (1 Pa = 10 poise = 0.672 lb(ft)(sec)“l
Equation (4) is satisifed when 50% of the particles of diameter Dc are eliminated. Most of the particles with D > Dc will be eliminated and most of the particles with D < Dc will remain in the effluent. For a given centrifuge the critical particle size Dc can be calculated from
90Qph 1/2
9 •*
(d - d,.)Vw R
so 11
(13)
Practical Results
The solids of phosphoric acid vary widely in content, in particle size, and in composition (consequently in specific gravity). The liquid phase varies in specific gravity and viscosity. Viscosity in particular can be subject to very wide variations due to acid composition and temperature.
As can be calculated from Eq. ( 8), the settling velocity is very slow for small particle sizes such as occur in sludge. Consequently, the use of flocculants is determinant because it increases dramatically the size of the settling agglomerates or flocs.
Sludge removal by centrifuges should essentially be based on empirical studies. It is consequently not advisable to base calculations on the particle size and physical properties of the acid but instead to operate a number of settling tests with the concentrated product acid and extrapolate the results.
8.5 URANIUM RECOVERY
Uranium is the essential raw material for nuclear reactions for military as well as energy uses. Because of this, controlling the sources of uranium is considered of primary importance by sovereign states and energy-producing firms. Strenuous efforts have been made to find uranium ore beds; even if uranium is not rare, it is, in general, much too diluted in most rocks to be extracted economically.
In practice, only ores containing more than 0.2% uranium are treated. In general, phosphate rocks contain uranium. But except for autunite, found in France (CaO • 2UO3 • P2O5 • 8H2O), the uranium concentration in phosphate ores is small. This is particularly true for
456
Product Acid Impurities and Sludge
TABLE 8.4 Uranium Content of Various Phosphate Rocks
Phosphate rock origin Average content (ppm U3O8)
Central Florida 190
North Carolina 90
South Carolina 400
Tennessee 15
U.S. Western states 170
Morocco 170
Tunisia 90
Algeria 100
Jordan 170
phosphate rocks used for the manufacture of fertilizers and other chemicals, as can be seen from Table 8.4. Consequently, phosphate rock would be a very poor uranium source and would not be economically feasible if it was necessary to process it like normal uranium ores, by washing with alkali or more often with acid solutions.
Most phosphate rocks are used for the manufacture of phosphoric bcid by the wet process. Durine the digestion by sulfuric acid almost all uranium (85-95%) goes into the phosphoric acid solution, from which it can be extracted. This means considerable saving in the extraction process and explains why in spite of its low uranium content phosphoric acid producers became interested in uranium recovery from phosphoric acid.
8.5.1 Basis of Extraction Processes
Two main processes are available for making this extraction: (1) ion exchange on resins [13], and (2) transfer into a nonmiscible solvent. Only solvent extraction has been used commercially.
8.5.2 Extraction Principle
By thoroughly mixing prepurified acid with an appropriate organic nonmiscible solvent, uranium is transferred from the aqueous phosphoric acid phase into the organic phase. The phases are separated by settling. Uranium is extracted from the organic phase, which is recycled for extraction after regeneration. After the solvent extraction operation, the treated phosphoric acid is purified from remaining solvent traces and sent to its usual further processing.
Uranium Recovery
457
Uranium occurs in phosphates both as U4 and Ug. The proportion of the two valences varies according to the rock origin. Nevertheless, the solvents dissolve specifically one or the other valence compound. Consequently, according to the chosen solvent, before sending the acid to the extraction operation, all the uranium contained has to be oxidized or reduced to the desired valence. After the solvent extraction, uranium has to be stripped out of the organic phase.
To summarize, the complete recovery process includes (1) acid pretreatment, (2) valence fixing, (3) uranium solvent extraction, (4) uranium stripping from the organic phase, (5) and acid posttreatment.
8.5.3 Solvents
The solvents that can be used are all organophosphorous compounds, derivatives or orthophosphoric acid, pyrophosphoric acid, or phosphine. Among the most usual are:
For U-
4
Octylpyrophosphoric acid (OPPA) [14-17] Monooctylphenilphosphoric acid (MOPPA) Dioctylphenilphosphoric acid (DOPPA) A mixture of the last two (OPAP) [18,19]
For U :
Di-2-ethylhexylphosphoric acid (D-2EHPA), the extraction effect of which is reinforced by
Triocylphosphine oxide (TOPO)
In all cases the solvent is diluted in a kerosene-like product.
The characteristics required for the solvents are:
1. High extraction strength: which means that it should dissolve as much uranium as possible per unit of solvent.
2. Good selectivity: which means that it must dissolve as little as possible of products other than uranium [22].
3. Good stability: it should not be subject to alterations or decompositions during the extraction and stripping processes [ 22].
4. Low cost: even a stable solvent is not 100% recycled; there are mechanical losses to be replaced.
8.5.4 Strength of the Acid to Be Treated
It would be more economical to recover uranium from concentrated acid. The equipment size could be substantially reduced (about half for 50-54% acid). However, so far, no solvent working at high phosphoric acid concentration has been discovered. Consequently, the operating plants all operate with 30% filter acid [18,23,24].
458
Product Acid Impurities and Sludge
8.5.5 Technology
Acid Pretreatment
Filter acid (28-30% P2O5) contains, besides dissolved mineral salts;
(1) organic matter, either soluble (usually referred to as humic acids) or insoluble (referred to as bitumens), and (2) crystalline matter (sulfates, silicofluorides, etc.). According to the process used, all these impurities more or less impair the recovery efficiency.
Moreover, to get a good extraction yield, the acid temperature has to be rather low (30-50°C). This is less than the temperature of the usual filter add, which must be cooled. Consequently, the acid pretreatment includes:
1. Cooling—by heat exchangers or by vacuum coolers. The latter are more expensive, especially for small units, but the concomitant water evaporation in some way compensates for the dilution that sometimes occurs during the recovery process.
2. In some cases, getting rid of soluble organics, either by oxidizing them or by activated carbon treatment.
3. Getting rid of suspended matter, both mineral and organic, by filtration and/or settling, using flocculants.
Valence Adjustment
In order to oxidize U4 into Ug, several oxidizers may be used, either single or combined, for instance:
1. Air, which is not very efficient and which could induce troublesome emulsions.
2. Chlorates, which leave corrosive hydrochloric acid in the phosphoric add, harmful to stainless steel.
3. Nitric acid; but the excess needed would damage the rubber lining of the evaporator concentrators where the acid will be processed later. A urea treatment can alleviate this effect.
4. Hydrogen peroxide would be ideal but is expensive.
In practice, only nitric acid and hydrogen peroxide are used.
To convert Ug into U4, the best reducing agent would be hydrogen, but apart from its price, it could, like air, create emulsions. In practice the only reducing agent that is used is iron, although its use is not without problems (e.g., getting rid of all oil) and it introduces iron salts into phosphoric acid. This is an undesirable impurity for many final products that are manufactured with phosphoric acid.
Together with uranium, iron is oxidized or reduced and its oxidation level after treatment is the factor selected for the valence checking of uranium.
Uranium Recovery
459
FIG. 8.12 Mixer-settler with internal recycle.
Solvent Extraction
The extraction process is the same whatever valence for uranium has been selected and whatever solvent has been chosen. The principle is to mix thoroughly the acid (aqueous phase) and the diluted solvent in kerosene (organic phase). By settling, the two phases-barren acid and loaded solvent—separate. The distribution coefficient for uranium between the two phases depends on the solvent used and can vary from 5 to 40 [22].
The flow of organic phase entering the system is between 10 and 50% of the acid flow, but inside the system, the two phases must be approximately equal in volume. This means that the organic phase has to be recycled (Fig. 8.12). Furthermore, even with a well-performed acid pretreatment some impurities remain and accumulate in the settler along the interface. After some time this would baffle the decantation. The "gunk" that forms must be removed batchwise or continuously.
The completion of the uranium transfer from the acid into the solvent has to be realized through a series of mixer-settlers where the two-phase displacement operates countercurrently (Fig. 8.13).
Once uranium has moved into the organic phase, the final extraction can be made. But often the uranium concentration in the organic
460
Product Acid Impurities and Sludge
FIG. 8.13 Mixer-settlers in countercurrent.
phase is so small that it is more economical to retransfer it into a reduced flow of uranium-barren phosphoric acid, from which it can be reextracted under better conditions. For example, uranium can be oxidized to valence 6 for the first extraction, reduced to valence 4 for the retransfer into pure acid and reoxidized for the final solvent (Fig. 8.14). By this double-extraction process, the uranium concentration in the organic phase can be multiplied by 40-50.
Uranium Precipitation
After obtaining the highest possible uranium concentrate in the organic phase, uranium is precipitated by one of the following three agents:
1. Ammonia, which leads to ammonium diuranate (ADU)
2. Ammonium carbonate in an ammoniacal medium, which leads to ammonium uranium tricarbonate (AUT)
In both cases the product, after filtration, drying, and calcination, is converted to uranium oxide UO3 or U3Og (yellow cake), which is usually pure enough to be processed in uranium plants.
3. Hydrofluoric acid, which leads to uranium tetrafluoride (UF4) or green cake, which can be delivered to plants able to process this material. Otherwise, it can be refined by oxidative solubilization, solvent extraction followed by precipitation, filtration, drying, and calcination, which again results in a commercial yellow cake.
Acid Posttreatment
In most cases the further processing of the phosphoric acid after uranium extraction is concentration. This concentration is operated by vacuum evaporation in rubber-lined equipment.
Uranium Recovery
461
Barren Acid
FIG. 8.14 Uranium concentration in solvent.
462
Product Acid Impurities and Sludge
However efficient the settlers used in extraction, some kerosene always remains with the acid: 500 ppm or even more. Kerosene is very harmful to rubber linings and has consequently to be thoroughly removed from the acid. No more than 50 ppm should remain with the acid going to the concentration plant. This final kerosene elimination is achieved by extra settling, flotation, and filtration, with filter aids to absorb organics.
8.5.6 Main Processes in Use
Several processes have been tested in the laboratory, but so far only two have led to commercial plants: DEPA-TOPO and OPPA. The Atomic Energy Commisaion (ORNL) process, OPAP, seems to be very promising, but it is still in the development stage.
DEPA-TOPO Process [25]
The consecutive steps of this process are shown in a flowchart (Fig. 8.15):
1. Filter acid pretreatment, including cooling to about 50°C; purification by settling and/or filtration; elimination of humic matters by active carbon; and oxidation by nitric acid or hydrogen peroxide.
2. Primary extraction with a mixture of 10-15% of D-2EHPA and 5% of TOPO in kerosene, the organic phase flow being half that of acid. Extraction is performed in three or four mixer-settlers.
3. Uranium stripping from loaded solvent using a small flow of uranium barren acid made reducive with iron. For this stripping the necessary amount of acid is approximately 2% of the incoming acid. This step also needs three or four mixer-settlers.
4. Secondary extraction after oxidation of loaded acid, usually using DEPA-TOPO. This requires two or three mixer-settlers.
5. Uranium salt precipitation using ammonium carbonate, water, and ammonia, giving ammonium uranium tricarbonate (AUT). This is usually done in two or three mixer-settlers.
6. AUT settling followed by filtration.
7. Drying and calcination leading to uranium oxide (U3Og), a yellow powder (yellow cake).
8. Barren acid posttreatment, usually including settling and air flotation.
The main advantages of this process, which is the most commonly used in commercial practice, are:
Good stability of the solvent. There are only mechanical losses (entrainments , leakage, etc.).
Good quality of product (80% of U3Og in yellow cake).
Uranium Recovery
463
FIG. 8.15 Typical DEPA-TOPO process
464
Product Acid Impurities and Sludge
The disadvantages are:
DEPA-TOPO has poor extractive power, calling for a high concentration in the kerosene and a large flow of organic phase in which uranium concentration is very low. A second extraction is required to obtain higher uranium concentrations.
Three changes in uranium valence, implying difficult control.
D-2EHPA and TOPO are expensive.
OPPA Process [22]
The consecutive steps in this process are shown in Fig. 8.16.
1. Acid pretreatment, including cooling to about 35°C, settling and centrifugation, reduction by iron, and filtration with filter aid.
2. Extraction with 3% TOPO in kerosene, the organic phase flow being 10% of the incoming acid.
3. Uranium salt precipitation by 15% hydrofluoric acid, giving uranium tetrafluoride (UF4), which when dried is "green cake." When yellow cake is needed, green cake must be converted and refined, which is done in the folowing way:
4. Uranium attack by nitric acid, giving a solution of uranyl nitrate while hydrofluoric acid is precipitated as aluminum fluoride by hydrated alumine.
5. Aluminum fluoride withdrawal by filtration.
6. Extraction of uranium, converted to Ug by nitric acid, by a specific solvent such a tributyl phosphate (TBP).
7. Uranium stripping by acidic water.
8. Uranium precipitation by ammonia and water, giving ammonium diuranate (ADU).
9. As in DEPA-TOPO process, ADU filtration, drying, and calcination, giving uranium oxide (UO3), yellow cake.
10. Barren-acid posttreatment by filtration using gypsum as a filter aid.
This process is commercially used in one plant only. Its main advantages are:
OPPA has a high extracting power, allowing the use of a small amount of solvent.
It is a very simple process when only green cake is needed.
OPPA is cheap.
Its main disadvantage is that OPPA has little stability, due to hydrolysis of pyrophosphoric acid into orthophosphoric acid, caused specifically by hydrofluoric acid.
Uranium Recovery
465
Yellow cake
FIG. 8.16 Typical OPPA process.
OPAP Process [18,19]
The main characteristic of the OPAP process is the use, as a solvent, of a commercial mixture of MOPPA and DOPPA (OPAP), easily obtainable and rather cheap, with an extractive power much higher than DEPA-TOPO. OPAP extracts uranium with valence 4, so the acid must be reduced before extraction and the stripping must be done after oxidation. The stripping is not easy and requires a more concentrated acid than usual.
466
Product Acid Impurities and Sludge
FIG. 8.17 OPAP process.
The consecutive steps of the process should be (Fig. 8.17):
1. Filter acid pretreatment and reduction by iron.
2. Primary extraction with 10-12% of OPAP in kerosene.
3. Barren-acid posttreatment.
4. Acid evaporation.
5. Uranium stripping with oxidative concentrated acid.
6. Reextraction, and so on, from the loaded acid, as in the DEPA-TOPO process, but before this extraction the acid must be diluted (30%) to restore the best operating conditions.
Hurst et al. claim [26] that although this process has some disadvantages:
It requires concentrated acid with subsequent dilution.
The phase separation may be less easy and there may be a more troublesome gunk formation.
Uranium Recovery
467
It will be more economical, because:
It extracts uranium with valence 4, which is the prevailing oxidation state in fresh acid.
The solvent is a much stronger uranium extractant and is cheaper.
It can be operated with the same equipment as the DEPA-TOPO process.
8.5.7 Impact of Uranium Recovery on Phosphoric Acid Plants
Disadvantages
When installing a uranium recovery plant connected to a phosphoric acid plant, manufacturers must understand that they will face problems which are more or less new to them.
1. First, there is a problem due to uranium's radioactivity. Although the radioactivity is very low and the health hazard almost nil, special regulations are enforced by law for handling uranium and uranium salts. This can lead to psychological reactions. But uranium salts are poisonous, and great care must be taken in handling them.
2. Although not very inflammable, kerosene burns and care must be taken to prevent it from catching fire.
3. Defects in posttreatment of the acid can lead to damages in the following concentration equipment.
4. In the recovery process the acid is somewhat diluted and this requires a higher concentration capacity with consequent energy consumption.
Advantages
In the recovery process, many impurities (either organic or mineral) have been taken out of the acid, which is thus much purer than when it usually runs out of the wet process unit. Quite often when low- or medium-grade phosphate rock is used, the resulting phosphoric acid is so impure that it is difficult to meet the specification for high-grade fertilizers such as TSP, DAP, and some compound fertilizers. In such cases the purer acid that results from the uranium recovery plant may solve some of the problems.
8.5.8 Economics of Uranium Recovery Plants
Table 8.5 gives some economic information on uranium recovery plants. The difference in investment cost per pound of UgOg is partly due to the size of the plant, but it also depends greatly on the importance given to the acid pre- and post-treatment. In some plants the
468
Product Acid Impurities and Sludge
TABLE 8.5 Investment Costs for Uranium Recovery Plants
Plant Capacity (lb U О ) 0 0 Investments (U.S.$) Investments (per lb U О ) 0 0
Gardinier (Tampa, Florida) 425,000 20,000,000 47
Freeport (Uncle Sam, Louisiana) 690,000 38,000,000 55
Farmland (Bartow, Florida) 450,000 20,000,000 44
IMCa (New Wales, Florida) 750,000 50,000,000 60
CFa (Plant City, Florida) 630,000 35,000,000 60
CFa (Bartow, Florida) 630,000 35,000,000 60
aCF plants perform only the first extraction; in the IMC plant, uranium concentrate coming from the three plants is reextracted and purified.
investment cost for these treatments is about half the total cost of the plant. It could be reduced if purer acid was processed (e.g., by the use of calcined phosphate rock), but this has not been commercially tested.
Operating costs are given in the table without details and range from 25 to 35 U.S.$ per pound of UgOg.
To summarize, one may say that, on the average, a plant processing 500,000 tons of P2O5 per year and recovering 500,000 pounds of UgOg, would have the following figures for 1 lb of UgOg:
Return on capital, to be calculated on U.S. $55 investment
Operating cost: U.S. $30
In the second half of the 1970s, when most recovery plants were built, the price of uranium was in the range of 45 U.S.$ per pound of UgOg, and at that time it was thought in the United States that a recovery plant could be profitable if it produced at least 400,000 to 500,000 lb of UgOg per year. In Europe, plants in the range of 200,000 lb were considered but were not built.
References
469
In recent years, for economic and political reasons (in many countries nuclear energy programs were dropped or greatly reduced), the price of uranium went down to as low as 20 dollars. With such a price, it is obvious that no new recovery plant can be built (unless a new and much more economical technique is discovered), and even some e dsting plants have shut down.
REFERENCES
1. W. E. Cate and M. E. Deming, Effect of Impurities on Density and Viscosity of Simulated Wet Process Phosphoric Acid, J. Chem. Eng. Data 15(2) (1970).
2. S. E. Dahlgren, Chemistry of Wet-Process Phosphoric Acid Manufacture, in Phosphoric Acid, Vol. 1, Part II (A. V. Slack, Ed.), Marcel Dekker, New York, 1968, Chap. 2, VI-D.
3. W. P. Moore, R. MacGregor, and W. Sierichs (Allied Chemical Corporation), U.S. Patent No. 866,752, October 15, 1969.
4. F. Meinch, H. Stooff, and H. Kohlschutter, Les eaux rSsiduaires industrielles, Masson, Paris, 1977.
5. Z. Wakefield, Distribution of Cadmium and Selected Heavy Metals in Phosphate Fertilizer Processing, National Fertilizer Development Center, TVA, Muscle Shoals, Ala.
6. J. R. Lehr, Nature of Impurities, in Phosphoric Acid, Vol. 1, Part II (A. V. Slack, Ed.), Marcel Dekker, New York, 1968, Chap. 8.
7. Paul L. Bearden, Jr., Process Design for Control of Sludge Production from Wet Phosphoric Acid Processing, Society of Mining Engineers of the American Institute of Mining Metallurgical and Petroleum Engineers, October 14, 1966.
8. J. J. Yarnell and G. M. Hebbard, Experience with 40% Phosphoric Acid Clarification and Filtration, Central Florida Section, AIChE Meeting, February 13, 1979.
9. The Long Tube Method, in Perry's Chemical Engineering Handbook (Perry, Chilton, and Kirkpatric, Eds.), McGraw-Hill, New York, 1944.
10. D. W. Leyshon and R. T. Schneider, Phosphoric Acid Clarification Practice, in Fertilizer Acids, Proceedings of the British Sulfur Corporation's 3rd International Conference on Fertilizers, London, November 12-14, 1979.
11. Lamella Thickener, publicity material, Parkson Corporation, Fort Lauderdale, Fla.
12. William R. York, Clarification of Wet Process Phosphoric Acid Using an Inclined Tray Settler, Central Florida Section, AIChE Meeting, Fall 1974.
470
Product Acid Impurities and Sludge
13. R. S. Long and R. H. Bailes, Recovery of Uranium from Phosphoric Acid and Phosphate Solutions by Ion Exchange, U.S. Patent No. 2,770,520, November, 13, 1956 (assigned to U.S. Atomic Energy Commission).
14. D. A. Ellis, Recovery of Uranium from Industrial Phosphoric Acids by Solvent Extraction, U.S. Atomic Energy Commission DOW-81, 1952.
15. Henry M. Heidt, Donald E. Tynan, Robert F. McCullough, and Rodge Bart, Uranium Extractants: Preparation and Usein Phosphate System, U.S. Atomic Energy Commission RMO 2030, 1954.
16. Bruce F. Greek, Otis W. Allen, and Donald E. Tynan, Uranium Recovery from Wet-Process Phosphoric Acid, Ind. Eng. Chem. 49:628-638, 1957.
17. C. S. Cronan, Capryl Pyrophosphate Ester Extracts Uranium from Wet Phosphoric Acid, Chem. Eng. 66(9) : 108-111 (1959).
18. F. J. Hurst and D. J. Crouse, Recovery of Uranium from Wet-Process Phosphoric Acid by Extraction with Octylphenilphos-phoric Acid, Ind. Eng. Chem. Process Des. Dev. 13(3):286-291 (July 1974).
19. F. J. Hurst and D. J. Crouse, Recovery of Uranium from Wet-Process Phosphoric Acid by Oxydative Stripping, U.S. Patent No. 3,835,214, September 10, 1974; appl. August 15, 1972 (assigned to U.S. Atomic Energy Commission).
20. F. J. Hurst, D. J. Crouse, and К. B. Brown, "Solvent Extraction of Uranium from Wet-Process Phosphoric Acid, U.S. Atomic Energy Commission Report ORNL-TM 2522, April 1969.
21. F. J. Hurst and D. J. Crouse, Reductive Stripping Process for the Recovery of Uranium from Wet Process Phosphoric Acid, U.S. 3,711,591, January 16, 1973; appl. July 8, 1970 (assigned to U.S. Atomic Energy Commission).
22. A. P. Kouloheris, Uranium Recovery from Phosphoric Acid, Paper read before the Fertilizer Society of London, December 13, 1979.
23. F. Habashi, Velocity of Extraction of Uranium from Phosphoric Acid, J. Inorg. Nucl. Chem. 13:125-137 (1960).
24. D. M. Satef, Influence du procddd de fabrication d’acide phos-phorique sur 1'extraction de 1'uranium, Proceedings of the 2nd International Congress on Phosphorus Compounds, Boston, April 21-25, 1980.
25. F. T. Nielsson and A. Dubreuco, The IMC/Prayon Uranium Recovery Process, International Superphosphate Manufacturers Association Technical Conference, Vienna, November 1980.
26. F. J. Hurst, W. A. Arnold, and A. D. Ryon, Progress and Problems of Recovering Uranium from Wet Process Phosphoric Acid, 26th Annual Meeting of the Fertilizer Industry Round Table, 1976.
9
What to Do with Gypsum
Gypsum is an inevitable by-product of the manufacture of wet phosphoric acid, and all producers face the problem of gypsum disposal or usage if feasible. The method of disposal or usage to be adopted is not a simple question of economic feasibility, but a more complicated issue involving economic, environmental, legislative, and geographic criteria. For example, a solution to the disposal problem such as a gypsum pond, very common in the United States, may not be acceptable for a phosphoric acid plant operating on the Mediterranean coast of France. The real estate cost would be prohibitive and the environmental impact would be unacceptable for an area that depends on tourism for income.
The magnitude of the problem is evident when we consider the quantity of by-product gypsum produced, nominally between 4 and 6 tons for every ton of P2O5 Produced; the quantity varies according to the phosphate rock composition. This means that a phosphoric acid plant with a capacity of 1000 tons of P2O5 per day will have to manage 4000-6000 tons of waste product per day. Disposing of the waste product is the right expression in most cases, because there is unfortunately not much hope of making a profitable operation out of the by-product.
As the normal calcium sulfate consumption in the world is less than the total phosphogypsum produced, there is clear evidence for this statement (about 70 million tons of total consumption and more than 100 million tons of phosphogypsum produced as by-product). This is one of the reasons why many new factories producing phosphoric acid products are now being built near phosphate rock mines.
Disposal of calcium sulfate is generally achieved in two ways: (1) by pumping into rivers or seas, or (2) by impounding on land.
471
472
What to Do with Gypsum
Attempts to process it into salable products are often economic failures due to high operating costs and, in some instances, due to technical reasons. Those who have succeeded are generally small producers located in places where the gypsum disposal problem has become expensive, with an environmental issue restricting their alternatives.
Useful products that have been made out of waste gypsum are:
Plaster and associated products Plasterboard, building material Cement retarders
Cement and sulfuric acid
Ammonium sulfate
Soil additives for agricultural usage
When useful products can be made, the allocated raw material cost for untreated gypsum must be zero in order to improve the profitability of the venture, which has to be competitive against those using natural calcium sulfate as a raw material. Countries not having natural calcium sulfate deposits are obviously in a better competitive position for this type of venture (e.g., Japan).
9.1 DISPERSION INTO A MOVING BODY OF WATER
Pumping into rivers or seas can be technically and economically advantageous provided that the recipient body of water is a moving one and is close to the plant, and provided that there are no legal, environmental, or communal restrictions. Disposal costs, in the simplest case, would be the cost of slurrying the untreated gypsum with water and pumping it out to a nearby point of discharge. Conversely, this mode of disposal becomes economically less attractive if the recipient body of water is far away and/or strict effluent discharge regulations necessitate chemical treatment of the slurry. Another disadvantageous contingency to consider is the possible buildup of disposed gypsum on the floor of a waterway, thus presenting a hazard to navigation. In this case dredging costs may be incurred as well. To avoid this type of complication, gypsum disposal sites should be so located that quick dispersion takes place due to currents or tidal activity.
When considering the option of river or sea disposal, local and other applicable effluent control and environmental protection codes and restrictions must be consulted and observed.
Disposal of gypsum in the sea has the advantage that gypsum is more soluble in seawater than in fresh water. The solubilities are estimated to be 3.5 g/liter and 2.3 g/liter in seawater and fresh water,
Dispersion into Moving Body of Water
473
respectively [1]. However, some of the impurities in the gypsum do not dissolve; whereas quartz will just add a little more sand to the beach, organic matter has quite a visible effect on water, making it cloudy and dark.
Costs for disposal of gypsum can vary from minimal to as much as U.S.$25 per ton of PgOg produced, depending on the disposal method, or the need for neutralization facilities and chemicals, pumping costs, and so on. Any economic analysis comparing this disposal method with others should take note of the fact that, when discharging gypsum into a river or the sea, residual P2O5 and other values are lost forever.
No precise facts about the effect on marine life can be reported. In some areas fisherman have complained and claimed damages, in other places they concentrate their fishing close to the discharge point. Sometimes they do both, which makes fishing more economic. The residual PgOg seems to favor the growth of algae or plankton, thus attracting marine life. Furthermore, comments are often not very objective. In a conference at Damascus [2], it was stated that gypsum had killed all the lobsters in the Gulf of Gabes (Tunisia). In fact, there have never been any lobsters in those gulf waters, even before the gypsum dumping.
Seawater contains Ca2+ and SO^1 2- 3 ions (see Table 9.1) in large quantities, and dissolution of calcium sulfate should not be a chemical operation producing a consequent imbalance of the constituents [ 3]. Fluorine, which is one of the major impurities in phosphogypsum, will precipitate as calcium fluoride at the pH value of the seawater with calcium originating either from the dissolved calcium sulfate or from the seawater.
In aquariums the effect of soluble fluorides on marine life has been studied for four types of symptoms:
1. Variation of death rates.
2. Variation of growth rates.
3. Bio-accumulation of fluorides in bodies.
4. Effect on metabolism.
1. Effective variations of death rates occur only with fluoride concentrations above 60 ppm for most species [4,5]. Others resist at much higher values [6].
2. No influence on growth rates could be found with a fluoride concentration of 6 ppm. Few data are available for higher fluoride numbers. Turbot eggs developed normally with as high as 120 ppm of F [7].
3. Bio-accumulation of fluorides occurs mainly in parts of the body in direct contact with the water (gills, scales, spines) and where calcium is present in the structure. No significant accumulation could be
474
What to Do with Gypsum
TABLE 9.1 Elements Present in Solution in Seawater, Excluding Dissolved Gases
Element Concentration (g/metric ton) or parts per million
Cl Na Mg S Ca К Br C (inorganic) Sr (SiO2) В Si C (organic) Al F N (as nitrate) N (as organic nitrogen) Rb Li P (as phosphate) Ba I N (as nitrite) N (as ammonia) As (as arsenite) Fe P (as organic phosphorus) Zn Cu Mn Pb Se Sn Cs U Mo Ga Ni Th Ce 18,980 10,561 1,272 884 400 380 65 28 13 0.01-7.0 4.6 0.02-4.0 1.2-3.0 0.16-1.9 1.4 0.001-0.7 0.03-0.2 0.2 0.1 >0.001-0.10 0.05 0.05 0.001-0.05 >0.005-0.05 0.003-0.024 0.002-0.02 0-0.016 0.005-0.014 0.001-0.09 0.001-0.01 0.004-0.005 0.004 0.003 0.002 (approximate) 0.00015-0.0016 0.0003-0.002 0.0005 0.0001-0.0005 <0.0005 0.0004
Dispersion into Moving Body of Water
475
TABLE 9.1 (Continued)
Element Concentration (g/metric ton) or parts per million
V 0.0003
La 0.0003
Y 0.0003
Hg 0.0003
Ag 0.00015-0.0003
Bi 0.0002
Co 0.0001
Sc 0.00004
Au 0.000004-0.000008
Fe (in true solution) <10’9
Ra 2 x 10”11 - 3 x 10"10
Ge Present
Ti Present
W Present
Cd Present in marine'organisms
Cr Present in marine organisms
Tl Present in marine organisms
Sb Present in marine organisms
Zr Present in marine organisms
Pt Present in marine organisms
Source: Ref. 3, courtesy of Chemical Rubber Publishing Co., 1961.
found in liver, muscles, testicles, ovaries, eggs. Bio-accumulation is perceivable within very variable fluoride concentration limits in the water according to the tested species. It can start from as low as 3 ppm in a few cases and has to go up to 120 ppm for others. [6,8,9].
4. The effect on endocrine bodies is under investigation currently (Stanius's corpuscles and interrenal bodies). These bodies control the metabolism of calcium involved in muscle contraction, nervous transmission, and reproduction. Fluoride concentrations above 6 ppm affect the activity of these bodies and within periods of time exceeding 110 days can lead to partial destruction [10].
Nevertheless, 6 ppm of F in seawater is the upper limit that can only be found in the close vicinity of the effluent discharge pipe of phosphogypsum. In aquariums this concentration level was obtained after 6 hr of dissolution time when 10 kg of phosphogypsum was mixed with 1 m3 of seawater.
476
What to Do with Gypsum
TABLE 9.2 Percentage of Trace Element Transfer from Rock into Calcium Sulfate
Element Western Phosphates North Carolina North Florida Central Carolina
Cda 40 54 40 30
Cu 94 64 64 100
Zn 25 22 20 49
Pb 100 100 100 100
Cr 26 25 15 3
V 17 100 18 1
aMore recent European research has pointed out that only 20% of Cd is transferred into calcium sulfate, whatever the initial Cd content in the phosphate.
Source-. Ref. 11.
The question of trace elements remains a case-by-case study according to their nature and concentration in the effluent. Table 9.2 indicates some of the most common trace elements and their transfer coefficient from phosphate rock to gypsum [ 11].
9.2 IMPOUNDING ON LAND
The pond and pile solution to the gypsum disposal problem has been common practice in the United States. Although building up a gypsum stack might seem to be a rather simple operation it is tricky and tedious to implement.
Impounding the gypsum in a self-contained pond and pile consists of slurrying and pumping the gypsum with its sluice water to a large settling pond, collecting the overflowing water, and recycling it back to the cake discharge hopper of the phosphoric acid plant for another transportation loop. The sluice water thus recirculates between the pond and the plant (Fig. 9.1). Process water for the phosphoric acid plant is taken out of the recycling sluice water. Currently, the sluice water cycles three to four times before it is fed to the phosphoric acid plant as process water. At this stage the reclaimed sluice water contains, and thus recycles to the plant, all the compounds that can be dissolved from the solid phase.
Impounding on Land
477
The calcium sulfate crystals settle in the pond, elevating its level. The slurry feed is displaced gradually in order to obtain a consistent lifting of the level. Furthermore, the settling technique is organized so that the coarser material settles along the outer peripheral dikes for greater physical construction strength. Once a pond bottom level has lifted up a given height (2-3 m), the slurry is fed to an alternative pond. The first pond is then left to dry up and for further maintenance work to reelevate the dikes with a dragline.
The slope of the pile and the total height is affected by the physical properties of the soil.
A plant with a gypsum disposal, closed-cycle pond system would be considered as environmentally inconsistent if the cooling water were not also recycled within a closed system. Cooling water released from the flash cooler and the phosphoric acid concentration systems contains a large part of the fluorides, which we do not want to send out of the plant's system.
Moreover, the cooling pond, being a very suitable and large water reservoir, can be used as the necessary buffer for the fluctuating water level (due to rainfall) of the gypsum settling area. Furthermore, the cooling pond, if designed peripherally around the gypsum stack, will serve as a percolation water collector.
FIG. 9.1 Gypsum pile and cooling pond arrangement. 1, Phosphoric acid unit; 2, gypsum slurry pipe; 3, operating settling pond; 4, outfall tower; 5, liquid flow into ditch; 6, surrounding ditch; 7, cooling water outflow pipe; 8, cooling pond; 9, pumping station to plant; 10, dragline.
478
What to Do with Gypsum
9.2.1 Material Balance
A typical gypsum disposal and cooling pond material balance is depicted in Fig. 9.2. The numbers have been estimated and calculated from existing systems.
It may be surprising but there are very few plants, if any, that have been able to achieve a precise and consistent material balance in a phosphogypsum settling and cooling pond. Actually, there are many unpredictable variables, such as can be seen from the following:
Variables affecting water balance
Into cycle Out of cycle
Plant water input Evaporationa
Rainfall Percolation8 Process water reclaim Residual cake humidity at pilea
aThis variable is difficult to estimate.
Whereas the input is easy to measure, evaporation, percolation, and residual humidity in the pile are very difficult to evaluate. The evaporation rate of the cooling pond is higher than that of the settling pond because of the incoming warm condensed water.
Variables affecting P„O_ balance 2 5
Into cycle
Out of cycle
Soluble filtration losses Co-crystallized P2O5 Unattacked coated rock particles
Phosphoric acid droplet entrainments at cooling and evaporation systems
Process water reclaim Percolationa
Residual cake watera
PgOg remaining in solids® deposits
aDifficult to estimate.
Impounding on Land
479
и E сб
bD О s
OJ
о
2 E
P.O. produced as concentrated acid).
480
What to Do with Gypsum
P2Og contained in percolation water and in the residual settled cake and its impregnation water is difficult to estimate.
Furthermore, it has been pointed out that some of the crystals with a higher level of co-crystallized P2Og (currently the smaller sizes) are subject to a driving force that can result in a gypsum-to-gypsum recrystallization with a consequent release of P2Og into the liquid phase. Also, it is evident that coated rock particles will have their calcium phosphate core slowly dissolved by the low pH (1.5-1.8) liquid phase. Nevertheless, it will be almost impossible to measure the amount of P2Og that will be involved in these types of reactions. Experimentation in a laboratory [12] could yield a P2Og release from the solid phase of approximately 20-25% of the total P2O5 contained in the solids. The material balance depicted in Fig. 9.2 assumes a release of 8 kg of P2Og» out of a total of 38 kg per ton of dry solids.
The total soluble P2Og currently recovered from the recycled pond water as process water when compared to the measured filtration losses is always higher and confirms this solid-to-liquid transfer of P2O5.
Fluoride balance is affected by the following variables [13]:
Into cycle Out of cycle3
Na2SiFg content of the filter cake CaF2, chukhrovite, and other compound formation in the settling pond
H2SiFg from cooling pond H2SiFg and Na2SiFg in percolating and residual cake water
aDifficult to estimate.
The fluorides content in the filter cake depends on the presence of active silica and sodium in the phosphate ore and process water. With high sodium content most of the fluorides will remain as Na2SiFg in the filter cake leaving the plant; thus the fluorides content can yield up to 1.5-1.8% F in dry cake. With a current solid content of 15% in volume and a recycle rate of 3, the sluice water will not be sufficient to dissolve all the Na2SiFg (1 kg of solid phase containing 15-18 g of Na2SiFg to be mixed with 0.75 liter sluice water (see solubility diagram, Fig. 3.8).
There are substantial variations between material balances and consequently between pond water compositions of different disposal systems. Process considerations (hemihydrate or dihydrate), recovery of fluorides from the concentration plant, raw materials, operating
Impounding on Land
481
TABLE 9.3 Current Pond Water Composition (in mg/liter)
Low Typical High
P2°5 8,000 12,000 20,000
F 900 10,000 12,000
s°3 2,400 4,000 9,000
CaO 500 2,000 4,700
MgO 60 400 580
A12°3 120 300 400
Fe2°3 110 150 1,100
К 2° 12 250 440
Na2° 280 2,000 2,700
Ph 2.5 1.5 1.2
Source: Ref. 14.
practices, and other variables affect the concentrations of the main pond water components. This is illustrated by the large variety of pond water compositions shown in Table 9.3.
9.2.2 Design Considerations
Design considerations for implementing a gypsum settling pond are too numerous to be within the scope of this chapter. The information can be found in many publications that have responded to environmental concern. See, for example, the Proceedings of the International Symposium of Phosphogypsum [15]. Moreover, the study of settling pond should not be carried out without the assistance of geotechnical engineers having experience with phosphogypsum disposal.
As depicted in Fig. 9.1 two settling ponds are currently operated in parallel: one for the actual settling, the other for drying up the settled gypsum and reelevation of the dykes.
The total height of the stacks depends on the mechanical properties of the soil. Ideal soil conditions such as acid-proof rock (e.g., granite in Finland) occur only occasionally. Clay soils have good tightening properties, protecting the water table from percolation pollution, but they have poor mechanical properties.
482
What to Do with Gypsum
Calcite or limestone will react with the acidic pond water and can produce differing effects: crevices can be enlarged by dissolution and be subject to intense flows into the soil. However, calcite, when contained in quartz sand can also react to build a tightening cement that reduces percolation substantially and increases the mechanical strength of the soil.
Pure quartz sand soils have good mechanical properties, but they show high percolation rates.
The highest gypsum pile that presently exists is that of the Gar-dinier plant near Tampa (Florida). This pile is 60 m high (180 ft) (Fig. 9.3). For a 1000 ton P2O5 per day plant the surface of the operating pond is at least 20-30 hectares. If the total settling area is 100 hectares, the yearly elevation will be approximately 1.2 m/year (1.2 m for 1000 per ton of P2O5 Per day).
FIG. 9.3 One of the highest gypsum stacks in the world, the Gardin-ier plant, Tampa, Florida.
Impounding on Land
483
FIG. 9.4 Outfall tower with evacuation pipe.
The angle of repose of the material is usually close to 45 degrees but by the use of berms the mean angle of elevation is limited to 26 1/2 degrees only (1 to 2 of elevation ratio). This is to avoid dike breakages and consequent flooding of large areas with acidic waters, a dramatic accident that has sometimes occurred. The effective solid content of the settled material can be considered as being within 1.12 and 1.34tons/m3. The liquid phase (moisture) impregnating the final stack will be between 15 and 21% of the total weight [ 16].
The discharge point of the incoming slurry at the surface of the settling area will be regularly displaced so that a consistent leveling of the rising settling pond bottom will be achieved. Evacuation drains, also called outfall towers (Fig. 9.4), maintain an adequate liquid level for thorough decantation, so that the overflowing pond water is perfectly free from any solids. These evacuation drains are regularly reelevated to maintain a constant liquid depth.
The clear overflow usually joins the cooling water return from the adjacent cooling pond. The water cycle is totally closed and no effluents leave the plant, unless the local rainfall is very high.
The two cycles can also be operated in parallel as depicted in Fig. 9.2.
Cooling pond surfaces will have to be adapted to local climatic conditions. Heat release rates, ranging from 3500 up to 9000 kg-cal per day per m2 have been reported from Florida and North Carolina.
Since the gypsum pond and the cooling pond consist of very large areas, they collect rainwater in large quantities. In addition to the 1.000 m2 of gypsum settling area, another 300-400 m2 per metric ton of P2O5 per day have to be added for the cooling pond. If there are
484
V/hat to Do with Gypsum
500 mm of rainfall per year, this represents an average of 675 m3/year or 2.18 щЗ/ton of produced P2O5 (310 operating days), which is more than half of the process water. This is to show the impact of rainfall on pond water balance. In practice, evaporation losses are accounted for as well, and are dependent on geographical location. The rainfall is often concentrated within short periods of time and sufficient water retention capacity has to be provided to avoid overflowing. In Florida, where heavy rainfalls occur in short periods of time, special evaporation systems are being experimented with, to maintain the water balance of the system at times of heavy precipitation.
In Louisiana, where rainfalls are even higher than in Florida, the pond water balance cannot be equilibrated and periodic overflow has to be accepted. The overflowing effluent has to be neutralized by a two-stage calcium carbonate and lime treatment until pH 8.8 is reached where fluorine and phosphates remain as a few ppm only.
The size of the cooling pond depends on the cooling system of the phosphoric acid plant. When air cooling is used, only the phosphoric acid concentrator condenser water will flow to the cooling pond. When flash cooling is used, the flash cooler condenser water also has to go to the cooling pond. A 1000 ton ₽2Og Рег йаУ P*ant will discharge up to 65,000 m3/day of evaporator condenser water and 34,000 m3/day of flash cooler condenser water having respective heat loads of 960 million and 510 million kcal/day.
9.2.3 Percolation
Pond water percolation from the disposal pile into the water table is a subject that will certainly be controversial for many years. Not much literature about this subject is available [ 17].
The height of the pile imparts pressure to the liquids, producing increased rates of percolation unless some of the soil components prevent this, either by a natural tightness (clays) or by tightening caused by chemical reaction with the pond water (cement formation in the interstices). Clays that contain reactive iron and aluminum silicates, calcite, or dolomite containing carbonate, are soils that react with acidic pond waters. The resulting compounds, such as iron and aluminum phosphates, calcium phosphates, calcium fluorides, and amorphous silica (resulting from H2SiFg decomposition at higher ph) all have tightening properties. For example, this was demonstrated in Idaho in calcareous loess soils by a 100-fold reduction of percolation within a period of two weeks (18). Quartzite (sand) usually has a high percolation rate that will not alter with pond water interaction. The porosity of piled gypsum is high and soil percolation will not be reduced by the crystal layers of the deposit.
Material permeabilities are expressed in meters per second, by a permeability factor К, which is calculated from
Impounding on Land
485
where
3
Q = liquid flow through material, m /sec
2
S = surface of the flow section, m
H = liquid head over the material, m
L = thickness of material, m
For example, for quartz sand and phosphogypsum К — 10'6 (high) and for clays К - 10~8 (low).
Percolation of material has to be considered for two directions: vertical and horizontal. If horizontal percolation is greater than vertical, it allows more of the percolating pond water to collect in the peripheral ditches around the pile. This often happens in the soil under the pile. In such cases, large and deep ditches, or, even better, a cooling pond surrounding the pile, will collect most of the percolation water.
More secure but also more expensive impermeability was achieved by Supra in Sweden when they decided to build their gypsum island [19] in the Baltic Sea (Fig. 9.5). The incentive was the assumption that mercury from pyrites could, via sulfuric acid and calcium sulfate that was dissolved in the seawater, accumulate within the bodies of fish. (In the meantime mercury was also found in fossilized fish from preindustrial eras!)
The gypsum pile is lined underneath by a 0.3-mm polyethylene foil which has been carefully tested for its chemical, mechanical, and aging properties. A drainage system, consisting of a gravel bedded and perforated pipe system, covers the plastic foil. This protects the foil from any liquid pressure. The gravel layers are covered by a filter cloth before the calcium sulfate is piled on top. All drainage pipes merge into the peripheral collecting ditch. The pipes are 60 m long; there is one every 30 m. The groundwater table is also controlled via another similar drainage system which is installed below the surrounding collection ditch. Several well pumps control the groundwater level to protect it from abnormal rises. In this way both sides of the foil are pressure balanced and even in the case of a torn foil there cannot be much seepage.
The special feature of the Swedish system is that it includes a computer-controlled minor groundwater (seawater) intake (by chlorine analyses). The seawater intake guarantees the absence of percolation. Increase in the chlorine content has to be held below the corrosion threat (0.06% in 30% P2O5 acid). The peripheral ditches are hypalon lined (1 mm) (Fig. 9.6); they have to be sunshine proof.
486
V/hat to Do with Gypsum
FIG 9.5 Gypsum island in the Oresund, between Sweden and Denmark. (Courtesy of Supra, Sweden.)
9.2.U Fluorine Emission
Fluorine emissions from settling and cooling ponds occur as HF and SIF^. They are difficult to measure because of changing air velocity and direction and because of the concentration variation of the fluorides along the elevation over the pond water surface.
Alternative estimations based on fluoride vapor pressure are also difficult to make because of the wide variations in pond water composition and the lack of avsilable data.
B.S. Tatera [20] in 1970 made a thorough study based on a laboratory-scale pond model. According to his experiments, values of between 4 and 18 lb of fluorides per acre per day are to be expected with sir velocities varying from 200 to 600 ft/min. It was found that the influence of air velocity on total emission was more important than that of fluoride concentration in the pond water.
We can try to corroborate these numbers by evaporation calculations. The partial fluoride pressure of pond water at 20°C with 10 g/ liter of F is 0.8 mg/m3 air (Fig. 5.20). Approximate water evaporation rates from local water surfaces are usually available from weather stations. Taking the amoung of water evaporated over 1 m2 and the mean relative humidity of the air, we can estimate the number of cubic meters of air that collect the vapor phases over the pond surface. Assuming that the relative vaporization rates of the water and the
Impounding on Land
487
fluoride molecules are similar, we can estimate the fluoride emission. If the water evaporation rate is 900 kg/m^ per year and the mean relative humidity of the air 70%, the completion of saturation would result in a turnover of
900 3 „ .
(L00572 = 157,000 m of air
(where 0.00571 is the water evaporation capacity of air at 20°C with 70% of initial relative humidity (in kg/m3).
The comparative fluoride evaporation would be
157,000 x 0.8 x Ю’6 = 0.126 kg F (m2)'1 yr'1
(where 0.8 x 10"® is the fluoride evaporation capacity of one cubic meter of air crossing the pond).
FIG. 9.6 Hypalon lining by Varnamo Gummifabrik for Supra plant in Sweden. (Courtesy of Supra and Varnamo Gummifabrik, Sweden, 1979.)
488
What to Do with Gypsum
This is equivalent to 3,45 kg hectare-^ day'^ or 3.1 lb acre"l day‘1. This result is within the order of magnitude of Tatera’s experimentation.
9.2.5 Pond and Pile Economics
Gypsum disposal economics by the pond and pile system is the subject of much controversy. There is evidence that it will never be a highly profitable operation but rather an expensive burden to the producing company. Ideal conditions such as good soil, large available areas and no environmental claims will be the rare exception that can only be expected in some remote kingdom hidden in a vast jungle. In many cases partial government financial support will be necessary to satisfy both the environmental and the economic stipulations of the project.
The largest part of gypsum disposal economics consists of the investment, land price or royalties, and construction expenses. For
TABLE 9.4 Gypsum Pond Economics for Three Cases (in U.S.$ per metric ton of produced P О per year) Z Э
United States, pond close to large plant France, 8 miles from medium size plant Sweden, island close to small plant
Investment
Land (4.8 m ) 6.5 - -
Earth work 9.0 12.0 53.9
Pump station 3.0 17.9 1.7
Plastic liner - 42.9 51.8
Draglines +
miscellaneous 1.6 1.7 3.6
23.1 74.4 111.0
Operating costs
Labor maintenance 0.6 6.3 2.8
Electrical energy 0.1 2 1Л 2 °'2
Land royalties - (5 m ) 4.3 (6. 5m) 0.9
Miscellaneous 0.7 0.7 0.8
Total costs 1.4 12.4 4.7
Depreciation and
financial charges 2.8 8.9 13.7
Total cost per ton
°f P2°5 4.2 21.3 18.4
Useful Products
489
long-distance pumping and plastic foil lining these costs can become disastrous. The capital cost of the Swedish island was 38 million SW crowns in 1978 for a 200 ton/day P2O5 plant. A 1-mm hypalon liner costs approximately U.S.$20 per square meter, and there are many hectares to be covered.
The income from a pond system derives from the recovery of some P2O5 that would be lost with a simple effluent system. But how much will actually be recovered? I have discussed this problem with a number of pond and pile operating companies and have not been able to obtain any useful evidence. The fact is, considering current pond water composition, most operating plants in the United States (see Table 9.3) recycle 3.6 m3 * 12 kg = 43 kg of P2Og per ton of produced P2Og. This is a return of about U.S.$8.6 per ton of P2O5 when we take a production cost of U.S.$200 per ton of P2Os-
In Florida expenses for gypsum are currently accounted for at approximately U.S.$2 per ton of P2Og. In Sweden recovered P2Og is said to balance the maintenance and operating of the pile, 2% P2°5 recovery being claimed. Table 9.4 shows the estimated costs for three different pond disposal systems.
9.3 USEFUL PRODUCTS
9.3.1 Plaster and Plaster-Derived Products
There are several processes for producing plaster or plaster-derived products such as wallboard and other building material. One of the most successful is the Giulini process [21] from West Germany, already having several industrial applications each producing some 100 tons per day of plaster-derived products. One installation in the USSR has a design capacity of 1200 tons/day.
Plaster production needs a calcium sulfate purification step, which is generally achieved by recrystallization of the gypsum into hemihydrate in liquid phase at 120-130°C in autoclaves after the gypsum has been purified by washing or by flotation. In a second type of process the gypsum is dewatered by calcination [22]. Another type of product, Masan, a versatile plaster-derived building material, is also produced by calcination at 1000°C; this is the MAES process [ 23] from Belgium. The price of plaster being low (about U.S.$40-45 per ton), the economics of these plants have to be carefully evaluated, especially in the light of increasing energy costs. *
’Remarkable progress was made by Donau Chemie, Austria, where absorption heat from sulfuric acid is recovered for phosphoric acid concentration, thus saving low-pressured steam available for phosphogypsum dehydration.
490
What to Do with Gypsum
9.3.2 Cement Retarder
Natural gypsum is used in the cement industry as a setting retarder. Replacing it with by-product gypsum would be an interesting use because of the higher tonnages involved. However, as a cement component, phosphogypsum needs to be purified somewhat. At the present time Prayon in Belgium sells all its by-product gypsum production to the cement industry, their di-hemihydrate process producing a gypsum which is pure enough for that purpose. In Japan, a country not having natural gypsum, phosphogypsum has been used for that purpose for many years. Japanese processes are offered by Onoda [24] and Nissan [ 25].
9.3.3 Sulfuric Acid and Cement
The interesting aspect of this application lies in the fact that the sulfur component from the gypsum is recovered as sulfuric acid and is recycled back to the plant. As it saves foreign currency if sulfur has to be imported, this process has been attractive to countries that do not have sulfur, especially in periods when sulfur prices have risen sharply. Indeed, if the economics of this process are closely related to sulfur prices, they are also affected by:
1. Very high investment
2. Concomitant production of sulfuric acid and cement in a fixed ratio
3. High energy consumption
4. High dust pollution
5. Complicated processing
The first two reasons are responsible for the fact that there are only very few industrial applications of this process.
Another factor that affects this process adversely when compared to the standard sulfur-burning method is the ever-increasing cost of fuel. Whereas the production of H2SO4 from gypsum requires large amounts of fuel, the production of H2SO4 from sulfur generates energy. Therefore, as the cost of fuel (or energy) increases, the difference in cost between the two processes increases, notwithstanding the fact that sulfur has also greatly increased in cost in the last few years. For that reason alone, two plants in the U.K. (using natural anhydrite, not phosphogypsum) have been converted to sulfur in the last few years.
Only three existing plants are presently producing sulfuric acid and cement from phosphogypsum:
Cosvic Eastern Germany
Chemie Linz [14] Austria, 250 tons/day
Phalaborwa South Africa, 320 tons/day
Useful Products 491
Some new production capacities with 500-ton7day units are under construction in the USSR.
The principle of the process is to split CaSO4 into CaO and SO2, to reconvert SO2 to SO3 to produce sulfuric acid, and to combine CaO with silica to produce a cement clinker. The calcium sulfate reduction equation can be written
70П°С
CaSO4 + 2C •» CaS + 2CO2 (1)
CaS + 3CaSO4 4CaO + 4SO2 (2)
CaO becomes clinker:
CaO + SiO A1„O„, Fe О 1500 C > silicates + ferroaluminates (3) Z Li 3 Z 3
The SO„ gas is further processed to SO„ and HoSO.; Z О Z *x
2SO_ + О - 2SO_ (4)
Li Ci О
SO3 + H2O + H2SO4 (5)
Sulfuric acid is sent back to the phosphoric acid plant, where it recombines with calcium from the phosphate rock to build new gypsum.
The calcium sulfate produced in the phosphoric acid process (phosphogypsum) has to meet certain purity standards, mainly related to P2Og and fluorine because of the final cement quality. The calcium sulfate after rewashing should not contain more than 0.5% P2Og an<^ 0.15% F. If these standards cannot be met, natural calcium sulfate has to be blended with the phosphogypsum. The phosphogypsum, to be suitable for the cement kiln, is dried up to some 6% of total residual water content and blended with crushed coke (5%), silica (10%), and flue ash (7%).
The mixture is then fed to a rotary kiln, where it is heated by fuel burning to some 1500-1600°C during a residence time of 4 hr. At the outlet the solids consist of the clinker, the basic component of cement, still containing some 1-3% of residual SO3 as sulfate. An initial 2.1 tons of solid mixture produces 1 ton of clinker. The clinker, finely ground and mixed with gypsum and pouzzolane, will become the final commercial cement.
The gases leaving the kiln contain:
CO2 >20% O2 1%
SO2 7-8% CO 0.2%
492
What to Do with Gypsum
There are some 116 standard cubic meters per hour per ton of clinker produced per day. These gases, to be further processed to sulfuric acid, have to be dedusted, cooled, washed, upgraded in oxygen, and dried to allow the SOg-to-SOg conversion. (About 17% of air is added to the kiln exit gases.) The gas mixture has to be heated for entering the first catalyst layer at a convenient temperature (420°C). Because of the low oxygen/SO2 ratio (compared with conventional sulfuric and plants), the converter will have six catalyst layers instead of four. Even so, the total conversion rate is low (96%) and effluent gas treatment has to be installed (e.g., ammonium sulfate production).
The investment costs for such a plant are considerable. Beyond the fact that one is investing in a sulfuric acid plant plus a cement plant, there are a certain number of additional cost items, such as the complicated gas washing, a higher gas flow and more pressure drop (consequently higher energy consumption) a special heating system for startups, larger converter, effluent gas treatment, and phosphogypsum washing and drying plant.
The production cost comparison (Table 9. 5) shows what the sulfur price should be to make the cement plus sulfuric acid system economically equivalent. Even under present economic conditions (1981), with current sulfur prices in the range U.S.$130-160 per ton, sulfur prices are not yet high enough to balance the costs of the cement + sulfuric acid system. The sulfur price would have to reach U.S. $306 to compare, and this is based on the assumption that the cost of energy will not increase in the meantime.
To conclude on the gypsum/cement sulfuric acid process, it is important to be aware that if phosphoric acid producers decide to go ahead with it, they will first become cement producers. Consequently, it is more logical for cement producers to choose this process and to sell by-product sulfuric acid.
9.3.4 Soil Conditioner
Natural gypsum can be used as a soil conditioner to combat the effect of sodium. It is agreed that the Ca^4- ion from the calcium sulfate exchanges with 2Na+ and improves the permeability of clays. Great hope was given to this kind of application in Tunisia, where soil salinity and impermeability are common and a large series of agronomic tests have been made. Unfortunately, they failed, and the use of phosphogypsum for that purpose has been abandoned in that country. Conversely , more recent and successful applications were made in the United States and Australia [27].
Phosphogypsum can also be used as a liming agent, directly applied to the soil. In spite of the fact that no purification is needed for agricultural application, only very little is thus used at this time.
Useful Products
493
TABLE 9.5 Production Cost Comparison
Sulfur-sulfuric acid Cement-sulfuric acid
Units u.s.$ Units u.s.$
Sulfur 0.33 tons 43.0 — —
Phosphogypsum — — — —
Electrical energy 60 kWh 1.80 230 kWh 6.90
Fuel — — 0.2 ton 49
Coke — — 0.1 13
Additives — — 2
Water — 0.7 0.7
Labor 0.07 hr 0.6 4.8
Maintenance 0.08 hr 2.1 16.8
Other costs 2.0 4.0
Depreciation 3.6 30.0
(10 years) Financing costs 2.61 20.9
(14% interest)
Total cost 56.6 148.1
Production available for sale:
Sulfuric acid 1 ton 50.0 1 ton 50.0
Steam 1.5 tons 19.5 — —
Cement — — 0.9 ton 53.0
Total sales: 69.5 103.0
Balance3 +12.9 -45.1
43 + (45.1 + 12.9) = U.S.$306
Equivalent sulfur price: 0.33
aCalculated with sulfuric acid price U.S.$50/ton for each route.
9.3.5 Ammonium Sulfate
Production of ammonium sulfate from calcium sulfate is based on the reaction
(NH ) CO + CaSO * CaCO + (NH ) SO Z О * о
carried out in the liquid state in a series of reactors. Calcium carbonate, after the reaction has been completed, is filtered off and ammonium
494
Vlhat to Do with Gypsum
sulfate is separated from its mother liquor by crystallization. This process has been developed by Chemie Linz of Austria [28].
Another approach was taken by Continental Engineering, Netherlands [29] by introducing ammonia and carbon dioxide directly into an agitated gypsum slurry. ICI in the U.K. operated a similar process , but this plant has been shut down [ 30].
Unfortunately, the use of ammonium sulfate in the fertilizer industry as a source of nitrogen for crops is increasingly being replaced with ammonium nitrate and urea, which have a much higher concentration of nitrogen. The demand for ammonium sulfate is now so low that it does not offer a possible solution to the waste phosphogypsum problem.
REFERENCES
1. H. Beijer and W. Mak, European practice, in Phosphoric Acid, Vol. 1, Part II (A.V. Slack, ed.), Marcel Dekker, New York, 1968, Chap. 6.
2. Seminar of the Phosphate Fertilizer Industry, Damascus, September 2-6, 1979, organized by the Institutional Committee of the Chemists Syndicate of Syrian Arab Republic. Subject: Fertilizer industry: marketing and leftovers.
3. C. Hodgman, Handbook of Chemistry and Physics, The Chemical Rubber Publishing Co., Cleveland.
4. F. Melinck, H. Stooff, and H. Kohlschutter, Les Eaux Residu-aires Industrielles, 2d ed., Masson, Paris, 1977, p. 762.
5. B. Darmoul and P. Vitiello, Recherches sur la T oxicite Aigiie des Rejets de Phosphogypses sur Quelques Organismes Benthiques Marins. Bull. Just. Nat. Sci. Tech. Oceanogr. Peche Salambo 7:63-89 (1980).
6. D. J. Moore, The Uptake and Concentration of Fluoride by the Blue Crab Callinetes sapidus, Chesapeake Sci., 12:1-13 (1971).
7. D. A. Wright and A. W. Davison, The Accumulation of Fluoride by Marine and Intertidal Animals, Environ. Pollut. 8:1-13 (1975).
8. A. P. Vinogradov, The Elementary Chemical Composition of Marine Organisms, Mem. Sears Foundation Marine Res., New Haven, pp. 647.
9. J. L. Martin, A. M. Le Guellec, R. Cosson, Effets du Fluor et du Phosphogypse chez les Organismes Marine— LetalitS, Bioaccumulation, Centre Oceanologique de Bretagne, Brest Cedex, 1982.
10. E. Lopez, Etude Ехрёгипеп1а1е chez Salmo Gairdnerii-Effets Toxiques du FNa et du Phosphogypse sur les Corpuscules de Stannius, la Glande lnterr6nale et le Tissu Osseux, Museum d'Histoire Naturelie, Paris, 1982.
References
495
11. Z. Wakefield, Distribution of Cadmium and Selected Heavy Metals in Phosphate Fertilizer Processing, National Fertilizer Development Center, TVA, Muscle Shoals, Alabama.
12. P. Becker, Experimentation on gypsum—gypsum recrystallization with release of co-crystallized ₽2°5> unpublished data.
13. Calcium Fluoride Manufacture from Waste Fluorine Values, Phosphorus Potassium, 107, May-June 1980, Table III, p. 38.
14. James R. Lehr, Fluorine Chemical Redistribution in Relation to Gypsum Storage Systems, Proceedings of the Fertilizer Institute Environmental Symposium, New Orleans, March 6-8, 1978, pp. 277-312.
15. D. Borris and P. W. Boody, Eds., Phosphogypsum, Proceedings of the International Symposium on Phosphogypsum, Lake Buena Vista, Fla., November 5-7, 1980.
16. A. May, J. W. Sweeny, Assessment of Environmental Impacts Associated with Phosphogypsum in Florida, in D. Borris and P. W. Boody, Eds., Phosphogypsum, Proceedings of the International Symposium on Phosphogypsum, Lake Buena Vista, Fla., November 5-7, 1980.
17. A. E. Z. Wissa and N. F. Fuleithan, Control of Groundwater Contamination from Phosphogypsum Disposal Sites, in D. Borris and P. W. Boody, Eds., Phosphogypsum, Proceedings of the International Symposium on Phosphogypsum, Lake Buena Vista, Fla., November 5-7, 1980.
18. J. F. Cochrane, Hundred fold Reduction in Permeability Under a Gypsum Stack: J. R. Simplot Company, Pocatello, Idaho, Proceedings of the Fertilizer Institute Environmental Symposium, 1980.
19. Gypsum Island in the Oresund, Vag Och Vattenbyggaren, Sweden, 2, 1979.
20. B. S. Tatera, Parameters Which Influence Fluoride Emissions from Gypsum Ponds, Published on demand by University Microfilms, Ann Arbor, Mich., 1970.
21. H. J. Forster, Proceedings in Accordance with the Giulini Method of Synthetic Gypsums from Phosphoric Acid Production to High Grade Construction Materials, International Superphosphate Manufacturers Association Technical Conference, Prague, September, 1974.
22. B. Neveu, Air Industrie—Valorisation des phosphogypses—Procede des Charbonnages de France Chimie, International Superphosphate Manufacturers Association Technical Conference, The Hague, September, 1976.
23. Masan: A Versatile New Building Material, Phosphorus Potassium, No. 85, September-October 1976.
24. T. Yamagushi, Procede d'enrichissement du phosphogypse—Onoda Chemical Industries, International Superphosphate Manufacturers Technical Converence, The Hague, September, 1976.
496 What to Do with Gypsum
25. Nissan Process for Manufacturing Cement Additives, Phosphorus Potassium, No. 96, July-August 1978.
26. W. Binder, Utilisation du gypse residuaire pour la production de gaz SC>2 et de clinker de ciment Portland, International Superphosphate Manufacturers Association Technical Conference, Prague, September 1974.
27. The Utilisation of Phosphogypsum in Agriculture, Phosphorus Potassium, No. 113, May-June 1981.
28. E. Sacher, Ammonium Sulfate from Phosphogypsum, International Superphosphate Manufacturers Association Technical Conference, Brussels, 1968.
29. Continental Engineering Ammonium Sulfate Process, Sulphur, No. 85, November-December 1969, p. 29.
30. Phosphorus Potassium, No. 37, September-October 1968, pp. 26-28.
10
Corrosion
In spite of recent advances made in the field of construction materials, corrosion is still a major problem in phosphoric acid production. One of the reasons for this is the increasing demand for raw material. Phosphate rocks that in the past were avoided because of corrosive impurities are coming increasingly onto the market. Nevertheless, some progress has been made in developing new corrosion investigation methods which will be a helpful tool in selecting construction materials that can withstand the corrosiveness of certain rocks.
10.1 CORROSION WITH PHOSPHORIC ACID PRODUCTION
The corrosive behavior of wet process phosphoric acid is attributed to the impurities solubilized and contained in the produced acid, not to the pure acid itself [ 1]. Furthermore, the reaction tank contains a mixture of solids and liquid: the slurry. Consequently, mechanical abrasion of rotating metal surfaces removes the passive layer that normally would have resisted corrosive attack.
The two main types of corrosion that occur during phosphoric acid production, are a combination of abrasion and corrosion (also called erosion-corrosion) and pitting due to the presence of chlorides. Abrasion-corrosion leads to a regular disappearance of metal; pitting is a spot attack on the metal.
This chapter was presented at a symposium of the International Superphosphate Manufacturers Association (ISMA), Vienna, November 1980. Prepared with the assistance of Michel Gauron and Michel Duthoit, Compagnie Francaise de L'Azote, Paris.
497
498
Corrosion
FIG. 10.1 Simplified diagram for phosphoric acid dihydrate system corrosion spot.
Contributing Factors
499
Figure 10.1 is a simplified diagram showing those equipment components of a wet process phosphoric acid plant that have a current corrosion history. These are the agitators, slurry and acid pumps, the filter, and the concentration equipment (circulation pump and heat exchangers if made with stainless steel).
10.2 CONTRIBUTING FACTORS
Corrosion rate is the result of the combined effect of chemical and physical factors. The relation between them is very complex.
As stated above, phosphoric acid on its own is not very corrosive; it is the impurities concentrated in it that make it aggressive. These impurities or chemical factors are essentially sulfuric acid, fluorine, and chlorine.
The physical factors that reinforce the action of the chemical factors are mechanical wear (abrasion caused by movement of the liquid loaded with crystals, a function of the differential or peripheral speed) and temperature (when it rises it increases reaction speed, and consequently the aggressiveness of the medium). Physical factors only increase the existing aggressiveness. They do not reverse or modify an existing order [ 2].
10.2.1 Peripheral Speed
Peripheral speed is an important factor because abrasion corrosion increases heavily with it. The effect of speed on abrasion-corrosion was tested with bench-scale phosphoric acid reactors. The test results indicated that corrosion is an exponential function of speed, of the type
X
Abrasion-corrosion = K(nd)
(1)
where abrasion-corrosion is measured in millimeters per year of metal disappearance and
n = speed of revolution, rpm
d = diameter of impeller, m
К = constant
X — 2.4, exponential factor
Equation (1) indicates that statical tests, such as submerging a sample into a beaker containing acid, are not very representative.
FIG. 10.2 Effect of peripheral speed on abrasion-corrosion. Rock: Israel, F/S1O2 < 1.4 (weight ratio). (From Ref. 2.)
500
Contributing Factors
501
Peripheral speed varies to a great extent from one piece of equip-
ment to another. For example:
Filter cell*
Pipes
Agitators Pump impeller
30 rn/min
60 m/min 250-350 m/min 1000-1500 m/min
Comparing the filter cell to the pump impeller, the speed ratio is up to 45 times higher and the relative corrosion rate for a given alloy could be (1500/30)2-4 or 12,000 times higher for a pump impeller than the filter cell, all other conditions being the same. Figure 10.2 illustrates the effect of peripheral speed on corrosion rates.
10.2.2 Temperature
Temperature greatly accelerates corrosion. Its effect becomes particularly visible beyond 80°C. Often the value for 85°C is twice that for 70°C. On reviewing the information in the literature [3-5] and our own results [2], we found that the variation in corrosion according to temperature seems to be a relation of the type
C,1
(2)
1
where
ct0,t
1
abrasion-corrosion rate in millimeters of disappearing metal per year at temperature t-^ and tp
temperature of the corrosive medium
= exponential corrosion factor; equivalent to 0.25 when 70°C < tp, t} < 85° (current phosphoric acid operating temperatures )
10.2.3 Sulfuric Acid
Sulfuric acid is an extremely active corrosion agent (Fig. 10.3). Since it is always present in wet process phosphoric acid (usually between 10 and 40 g/liter), it can constitute the major determinant of corrosion intensiveness.
*Differential speed between slurry and filter pan rim during the filter feeding.
502
Corrosion
jeaA jad sjaiawi|infl
FIG. 10.3 Effect of sulfuric acid concentration on corrosion rates of a highly corrosive phosphate rock. (From Ref. 2.)
Contributing Factors
503
At 10 g/liter, expressed in total H2SO4, it is not very aggressive. This is probably because the SO4 ions are in equilibrium, principally with metal cations such as Ca3+, AI3+, Fe3+, etc. In general, the sum of these cations is in balance with about 20 to 30 g/liter of H2SO4. But we also have to take into account the presence of l^SiFg, which is equivalent to about 17-25 g of H2SO4. This coult explain the virulence of the sulfuric acid beyond 15-20 g/liter.
Whatever the reason, sulfuric acid enhances all aspects of corrosion. This is particularly true when the medium contains other corrosive impurities. Sulfuric acid, then, dramatically activates corrosion. Increasing the sulfuric acid from +20 to +40 g/liter can multiply corrosion by a factor from 4 to 10. Figure 10.3 is only an example, from which a rule cannot be made. It corresponds to an initially aggressive phosphate.
10.2.4 Fluorine
Fluorine is present in all phosphates in the proportion 10-14% of the P2O5. When the phosphate is attacked by sulfuric and phosphoric acids, it passes into solution in the form of hydrofluoric acid, which has a great avidity for silica.
6HF + SiOg - HgSiFg + 2HgO
HF, hydrofluoric acid, is a weak acid, (pKa = 3.2), whereas H2SiFg, hydrofluosilicic acid is a strong acid. However, as regards corrosion, it has been found in practice that hydrofluoric acid is much more aggressive than fluosilicic acid. This is very fortunate since it is easy to push the reaction toward HgSiFg simply by feeding enough reactive silica into the attack medium. The action of the AI3+ ions in forming AlFg3-, which is less corrosive than F", should also be noted.
The presence of sulfuric acid greatly enhances the aggressiveness of the fluorine. The H2SO4/S1O2 diagram (Fig. 10.4) for a phosphate rock with a fluorine content of 3.7% shows the correlations well. SiC>2 reduces the aggressiveness of the fluorine and H2SO4 strongly reinforces it. According to the SC^4 concentration required by the reaction, which should supply a readily filterable gypsum, there must be compensation by a greater or smaller quantity of reactive silica (for example, clays). From personal experience, it appears that acceptable corrosion rates can be obtained when the F to SiC^ weight ratio in the phosphate rock is held below the threshold value of 1.4.
10.2.5 Chlorine
For a long time, the idea of accepting the presence of chlorine in a phosphoric acid unit was totally rejected. Different authors gave 0.1%, or even 0.05%, as the maximum allowable content that would
504
Corrosion
H2SO4 (g/liter)
FIG. 10.4 Combined effect of H2SO4-F and S1O2 on abrasion corrosion in millimeters per year with a rock with a high F/SiO2 ratio, 316L stainless steel. Peripheral speed 140 m/min. (From Ref. 2.)
Contributing Factors
505
be acceptable in a phosphate rock. However, the arrival on the market of phosphates containing more chlorine than has been accepted until now makes this problem topical again. It is a problem that can also be linked with that of the chlorine contained in the process water in areas where pure water is not available.
Chlorine-induced corrosion is of a different appearance from that found with fluorine and phosphoric acid. Chlorine attacks more in pinpoints, known as pitting. The action of the chlorine is also intensified by the presence of sulfuric acid; the increase is often more than 10-fold when the level of sulfuric acid is doubled.
On the other hand, the effect of the physical factor of "speed" is surprising, because instead of increasing by the power of 2 or 2.5, for example, corrosion decreases with the peripheral speed at high chlorine concentrations (Figure 10.5). This emphasizes the difference between the mechanism of chlorine attack and that of normal abrasion corrosion.
The chlorine diagram for Florida phosphate (Fig. 10.6) defines the zones of strong and weak corrosion and, consequently, the acceptable tolerances for the chlorine according to the materials used.
Acceleration of corrosion due to the presence of a greater excess of sulfuric acid (40 instead of 20 g/liter) can also be seen very clearly.
The effect of temperature also remains an important corrosion multiplier (1.54 for Hastelloy, 2.40 for 316L stainless steel when it is raised from 70°C to 85°C). Xt = 0.16 and 0.32, respectively, for Eq. (2).
At a low chlorine concentration, 0.01% of Cl, the speed relationship returns to normal. Apparently, different corrosive functions superimpose upon each other.
The chlorine corrosion diagram for Florida phosphate shows that with 316L and a moderate excess of sulfuric acid, up to 0.1% of chlorine can be accepted. But the presence of sulfuric add, when it reaches 40 g/liter, will cause a dramatic increase. This explains the current accepted chlorine limit in the region of 0.05%. On the other hand, Uranus B6 allows 0.4% Cl or even more, at least in the range of the studied speeds. Hastelloy C has been found resisting to as high as 2% Cl related to the weight of Florida rock; however, this refers only to tested Florida phosphate.
Such curves can be constructed by means of a bench scale corrosion testing unit. Whenever a phosphate newcomer is to be processed, such a diagram should be investigated.
Figure 10.7 shows a more aggressive phosphate, which was tested with variable chlorine content and two different SiOg levels (+1% and +2% of SiO2 added to rock). The threshold of chlorine attack is at a higher level for Uranus В6 than for other exotic alloys.
506
Corrosion
FIG. 10.5 Effect of speed in chloride corrosion pitting. (From
Ref. 2.)
The combined action of F-HgSQj-Cl is extremely severe, as can be seen from Fig. 10.7, when the H2SO4 concentration reaches 45 g/liter.
10.2.6 Reductive Nature of Phosphoric Acid
Dramatic corrosion rates have been reported from phosphoric acid plants using calcined phosphates as raw material [6]. It can be demonstrated that the reduced state of a phosphoric acid could be responsible for the high corrosion rates of stainless steel.
Contributing Factors
507
CORROSION (mm/yr)
FIG. 10.6 Effect of chlorides on corrosion. (From Ref. 2.)
Corrosion
SOS
CORROSION (mm/yr)
FIG. 10.7 Effect of chlorides (corrosive rock with 3.7% F and low silica).
Recommended Alloys
509
It is suspected that even though the calciner operates with an oxygen excess, a carbon monoxide micro-atmosphere can occur within the porosity of the phosphate orfe particles as the carbon of their organics burns out. This phenomenon is reported to be responsible for reducing sulfates, iron, vanadium, and uranium compounds to their lower valence state.
The remedies in these cases consist of adding oxidizing agents such as manganese dioxide or ferric sulfate.
10.3 INSTANT CORROSION MONITORING
A continuous instant corrosion monitoring set was developed by IMI and the Institute for Research and Development, Haifa, Israel, with the cooperation of Negev Phosphates Ltd., Dimona, Israel [7]. The system is based on a linear polarization technique for measuring corrosion rates.
From the plant reactor, slurry is supplied by a small sampling pump into an erosion-corrosion cell. This cell consists of a cylindrical polypropylene vessel in which the specimen, which is identical to the alloy used in the plant, with the shape of a cylinder, is rotated about a vertical axis, while the jet of slurry from the sampling pump is impinged continuously onto the specimen. The impingement speed is controlled by interchangeable nozzles. The slurry in the cell is constantly agitated to avoid settling. The erosion-corrosion effects due to rotation and impingement are determined by varying the specimen's rotational velocity and the jet impact energy (by different nozzles and pumping).
A portable instrument measures the electrode potential and the corrosion current that develop in a three-electrode system composed of the specimen with its mercury contact, a specially designed horizontal reference calomel electrode and the auxiliary platinum electrode, both placed approximately 1 mm from the surface of the rotating specimen. Corrosion current can be converted instantly into a yearly corrosion rate.
10. Ц RECOMMENDED ALLOYS FOR USE WITH PHOSPHORIC ACID PRODUCTION
Table 10.1 lists the most commonly used alloys for phosphoric acid production equipment.
510
Corrosion
TABLE 10.1 Recommended Alloys for Use with Phosphoric Acid Production
Type Cr Ni Mo C Uses
Stainless steel
304 18-20 8-12 — 0.08 Only occasionally
304L 18-20 8-12 — for splash guards
316 16-18 10-14 2-3 0.08 At low speed and
316L 16-18 10-14 2-3 0.03 matured slurry, low -corrosive rock
317 18-20 11-15 3-4 0.08 Agitators, valves,
317L 446 18-20 23-17 '11-15 3-4 0.03 0.2 filter with low-corrosive rock Heat exchanger tubes
Hastelloy C 15.5 54 16 0.08 High Cl', agitator,
Hastelloy G 22 44 6.5 0.05 pump impellers;
Hastelloy Ggg 29.5 47.5 5.5 evaporators, hot acid
Nionel 21.5 42 3 0.03 Heat exchanger tubes
Sanicro 28 26.0 30.6 3.55 0.015 Pump impeller, agitator turbines when high Cl”
Durimet 20 19-22 27-30 2-3 0.07 Pump, impellers, H2SiF6
Durco 100 24-27 4-6 1.7-2.25 0.04 Pump, valves
Uranus
B6 PM 20 20 4.5 0.02 Agitator turbines, pump impellers
50 M 22 7-9 2.2-2.8 0.07 Pump impellers
55 M 25-27 4.5-6.0 1.5-2.5 0.05 Pump impellers
References
511
REFERENCES
1. Enrico Pelitti, Corrosion and Materials of Construction, in Phosphoric Acid, Vol. 1, Part II (A. V. Slack, Ed.), Marcel Dekker, New York, 1968, Chap. 10.
2. P. Becker, M. Duthoit, M. Gauron, and H. de Villele, Factors Governing the Rate of Corrosion of Stainless Steels During the Production of Wet Process Acid, International Superphosphate Manufacturers Association Technical Conference, Vienna, November 1980.
3. D. Dubertrand, Corrosion-abrasion en milieux phosphoriques industriels, Ind. MinGrale, March 15, 1976.
4. A. Borghese, Les aciers inoxydables dans la fabrication de H3PO4 par voie humide, Inf. Chim., No. 189, November 1975.'
5. S. O. Bernhardsson and R. Osterholm Sandvik, Un acier special destine a la concentration de H3PO4, Inf. Chim., April 1978.
6. L. W. Bierman and G. L. Long, Acute Corrosion in a Phosphoric Acid Plant Processing Calcined Ore, Phosphorus Potassium, No. 113, May-June 1981.
7. M. Schorr, Corrosion Manual: Corrosion Testing and Control in Fertilizer Intermediates and Products, Part 1: Wet Process Phosphoric Acid, International Fertilizer Development Center, Fertilizer Development Center, Fertilizer Technology Division, Muscle Shoals, Ala., June 1981.
Investment and Manufacturing Costs
11.1 INVESTMENT COSTS
11.1.1 Definition and Site Factors
A phosphoric acid production complex generally consists of the following components:
1. Sulfuric acid battery limits process unit, including sulfur melting.
2. Phosphoric acid production and concentration battery limits process unit, including fluorine abatement and by-product gypsum transfer facilities.
3. Bulk raw material receiving and transfer systems.
4. Sulfur storage and reclaim equipment.
5. Phosphate rock storage and reclaim equipment.
6. Sulfuric acid storage and transfer systems.
7. Phosphoric acid storage, transfer, and shipping systems.
8. Off-site and utility systems.
9. Gypsum disposal system; generally consisting of a gypsum stack and combined gypsum sluicing and cooling water pond, would include pond water recycle system and equipment, for gypsum stack management (land costs are not included).
10. Buildings, including laboratory and maintenance shops and facilities.
11. Infrastructure components, which vary according to site conditions. These items can include electric power generation, transport network such as roads and railroads, housing, medical facilities, docks with loading and unloading systems, and so on. The
513
514
Investment and Manufacturing Costs
scope of any specific infrastructure is heavily influenced by the prevailing degree of development of a projected site. Well-developed production areas such as central Florida would tend to require less investment in this category than other locations, such as a previously unexploited mine located in a totally non-developed uninhabited area.
In addition to the above, most complexes would include facilities to manufacture end products from phosphoric acid such as granulated triple superphosphate (GTSP). In some instances phosphoric acid production may be part of a much larger integrated complex, which would include facilities to produce ammonia, urea, and granulated N-P-K fertilizers. The scope of this chapter will be limited to the production of phosphoric acid per se, in accordance with the component parts listed above.
As stated previously, site factors have an important bearing on the final scope of a phosphoric acid project and consequently on investment costs, as well as other components of production cost, such as raw material, maintenance, labor, and supervision costs. As indicated in one publication [1], even on-stream time (productivity) is heavily influenced by the availability of experienced and well-trained operators in certain locations. Productivity has a direct and severe impact on production costs, since regardless of tons per day produced, semivariable and fixed costs stay the same.
The cost of land acquisition, including site clearing and grading, is totally excluded in the investment cost data that follow. Current trends indicate that most new projects will be located next to or near the mine sites, obviating shipping costs, especially when increasingly lower grades of ore are being utilized. Another factor backing this trend is the need for land and the environmental impact of gypsum disposal, which, incidentally, runs somewhat parallel to problems associated with mine acquisition and exploitation. Mined-out areas could be optional sites for gypsum disposal. Nevertheless, land acquisition costs, whether next to the phosphate mine or elsewhere, are subject to unpredictable variations and are not considered here.
11.1.2 Investment Cost Curves
The investment cost curves, Figs. 11.1 and 11.2, represent smoothed data from a number of completed projects as well as from other sources. All costs have been adjusted to U.S. Gulf Coast conditions for instantaneous procurement and erection in January 1981.
The information given is suitable for budgetary-type cost estimates, and has an accuracy of approximately ±25%.
Investment Costs
515
million U.S.$
FIG. 11.1 Investment costs H3PO4. Between 1 and 2, Dihydrate routeor hemihydrate single-stage, 2 and 3, nondihydrate, double flitration system.
Battery Limits Phosphoric Acid Unit
Figure 11.1 depicts investment costs for battery limit wet process phosphoric acid units. Included are equipment, design and engineering fees, civil works, erection, and startup costs. Not included are off-site, utility, and gypsum disposal systems. In all cases the product is concentrated (50-54% P2Og) phosphoric acid.
The range between curves 1 and 2 of Fig. 11.1 refers to phosphoric acid produced by the dihydrate and hemihydrate single-stage route, the capacity range being from 100 to about 1400 tons/day of P2Og Pro~ duction. The largest single unit capacities currently existing yield 1400 to 1800 tons/day of P2O5.
The range between curves 2 and 3 refers to the more elaborate, two-stage nondihydrate processes, investment costs being approximately equivalent or up to 25% higher than those for dihydrate
516
Investment and Manufacturing Costs
FIG. 11.2 Total plant investment. 1, H2SO4 + H3PO4; 2, storage included; 3, grass-roots investment; 4, remote place.
processes. Daily capacities of nondihydrate installations seldom approach the 1400 tons/day of dihydrate units.
Integrated-Phosphoric Acid Complex
The integrated phosphoric acid complex consists of the components listed and discussed above (definition and site factors).
Curve 1 in Fig. 11.2 refers to the combined investment cost of sulfuric acid and phosphoric acid battery limit units. The sulfuric
Manufacturing Costs
517
acid unit is based on the double-absorption process. The phosphoric acid unit presumes a common dihydrate process. As indicated above, some more elaborated processes could cost up to 25%more than dihydrate.
Curve 2, Fig. 11.2, is the cost of off-sites, utilities, storage, and ancillary facilities.
Curves 3 and 4 refer to the cost of a greenfield complex located in developed and remote sites, respectively. The wide gap between the two curves reflects the extra contingencies to be accounted for when considering a remote site; besides infrastructural elements, provisions have to be made for the unavailability of skilled construction labor and a longer construction period.
The anticipated usage of curve 1, Fig. 11.2, applies to cases where sulfuric acid and phosphoric acid battery limit units were to be added to existing facilities, such as an expansion on a developed site. The capability of existing utility and off-site systems to sustain such an expansion will have to be analyzed case by case.
11.2 MANUFACTURING COSTS
11.2.1 Cost Components
The bases for calculating the manufacturing costs, the cost components, are separated into three classes, as shown in Table 11.1: variable, semivariable, and fixed.
To facilitate or simplify the cost calculation, variable costs (consisting strictly of process-oriented consumables, such as raw materials, utilities, chemicals, and effluent treatment) are treated as the costs incurred during the production of phosphoric acid on a battery limit basis rather than those of an integrated complex. Hence it is sulfuric acid rather than sulfur that is considered as a raw material cost component. Similarly, steam generated in the sulfuric acid unit is considered as equivalent to steam generated in a package boiler, and is credited accordingly against the production cost of sulfuric acid. The semivariable costs are similarly oriented toward the production of phosphoric acid per se rather than that of an integrated complex. Conversely, fixed costs refer to the integrated facility or complex, as defined in Section 11.1.
This type of approach to manufacturing costs is justifiable considering that the information contained in this book pertains to the battery limit production of phosphoric acid. The practice of placing fixed costs on a total production complex basis is common among producers, especially when costs are being calculated for a final product. The individual cost components of Table 11.1 are defined as follows:
1. Phosphate rock: consumption calculated according to the procedures in Chapter 3. Given rock prices are on a plant-site-delivered basis, U.S.$ per ton (metric).
518
Investment and Manufacturing Costs
TABLE 11.1 Manufacturing Costs
Variable costs (cost component) Raw materials
1. Phosphate rock
2. Sulfuric acid
Energy
3. Electric power
4. Steam
Other variable costs
5. Industrial water
6. Chemicals
7. Effluent
Semivariable costs
8. Labor and supervision associated payroll costs
9. Maintenance
Fixed costs
10. Plant overhead
11. Miscellaneous, taxes, insurance
12. Depreciation and financial costs
Total cost of manufacture
£ 1-12
2. Sulfuric acid: consumption calculated according to the procedures in Chapter 3. Sulfuric acid prices include variable and semivariable costs, but exclude fixed costs. The latter is accounted for in the final manufacturing cost of phosphoric acid, as explained above. Steam production is treated as a by-product of sulfuric acid manufacture; consequently, given sulfuric acid prices include a credit for steam production, based on an energy price equivalent to steam from oil-fired boilers.
3. Electric power: may originate from the plant power station or may be imported. Consumption is in the range 120-160 kWh/ton of P2O5 produced. Power costs vary according to location.
4. Steam: usually generated, in quantities sufficient for phosphoric acid plant consumption, within the sulfuric acid plant. Prices are calculated at an equivalent cost to fuel-generated steam (based on prevailing fuel prices at a site).
Manufacturing Costs
519
5. Industrial water: can be a low-cost item it the water supply situation is favorable. At remote desert sites, water can become an important cost factor.
6. Chemicals: consist of additives such as antifoaming agents or flocculants, usually cost U.S.$1-2 per ton of P2O5 produced. The use of chemicals varies according to the type of rock and process used and can occasionally be a high-cost item (up to U.S.$16 per ton has been reported).
7. Effluents: very low to extremely high disposal costs, depending on disposal method utilized and site factors (refer to Chapter 9). Costs can vary from nil to U.S.$25 per ton.
8. Labor and supervision: varies with local salaries and the number of workers per shift. In developed sites in general, high salaries are paid but a smaller work force (production shift) is utilized. In developing countries, lower salaries are compensated by a larger work force. Refer to Fig. 11.3, which depicts labor and supervision costs on a dollar per ton basis as a function of production capacity for developed and remote site conditions.
9. Maintenance: a high, variable cost item which is treated in detail in Section 11.3. For quick estimates, refer to Fig. 11.5.
10. Plant overhead: plant overhead costs as a function of production capacity; see Fig. 11.4. This curve is an industrial average
u.s.s
. 4 n
• I U •
1
6
-о 2
z 51 30 1C JOO 1« 500
1 P2°5/day
FIG. 11.3 Labor costs as effect of plant capacity: 1, Developed countries; 2, developing countries.
520
Investment and Manufacturing Costs
compiled from a number of sources and includes such diverse cost items as management, laboratory, medical facilities, and plant security.
11. Miscellaneous, taxes, and insurance: vary widely according to local factors. In this study we have used U.S.$1 per ton for comparative purposes only.
12. Depreciation and financing charges: on a 12-year straight-line depreciation and a mean interest rate of 7% per annum. The combined effect of the two amounts to an annual 15. 3% of the investment cost.
11.2.2 Case Studies
Manufacturing costs for three different sites and conditions are given in Tables 11.2 , 11.3, and 11.4. Case 1 (Table 11.2) represents factors prevalent in a developed site: in this case a 1000-ton/day plant with a captive phosphate mine, located in Florida. Low raw material (phosphate rock) cost, low investment costs (developed site), and a high on-stream time (high production rate) are the features that produce the lowest manufacturing cost of the three cases studied.
Case 2 (Table 11.3) reflects the conditions usually encountered at a remote site, including a captive mine. Even though raw materials may be a relatively low cost item, the additional investment costs incurred due to
FIG. 11.4 Costs for overhead as effect of plant capacity.
Manufacturing Costs
521
TABLE 11.2 Case 1: Developed Sitea
Location: Florida Rock: Florida 68 BPL (31.15 P2O5) Capacity: 1000 tons/day 95% recovery Investment cost: U.S.$100 million Production rate: 317,000 tons/year
1. Phosphate rock ($14/ton) 3.38 tons U.S.$ 47.3
. 2. Sulfuric acid ($28/ton) 2.83 tons 79.2
Subtotal raw materials 126.5
3. Electric power (150 kWh/ton) x $0.04/kWh 6.0
4. Steam 2 tons ($22/ton) 44.0
5. Industrial water 0.5
6. Chemicals, antifoaming agents 0.5
7. Effluents (pond) 2.1
8. Labor and supervision 4.0
9. Maintenance costs 11.0
Subtotal variable costs (processing) 68.1
10. Plant overhead 3.5
11. Miscellaneous, taxes, insurance 0.4
12. Depreciation and financial costs 48.4
Subtotal fixed costs 52.3
Total manufacturing costs per ton’of P2O5 U.S.$246.9
aExtension to existing plant; integrated to existing mine.
infrastructural deficiencies help push manufacturing costs up to a level almost double that of case 1. Other contributing factors exist as well, such as higher costs for water and electricity (even though fuel is expected to be cheaper). The effect of unskilled labor is demonstrated by a lower P2O5 recovery efficiency and a shorter on-stream time (lower production rate).
Case 3 (Table 11.4) depicts the typical situation at a developed site utilizing older technology and, most important, without captive raw materials. The latter have to be imported. High raw material and energy costs completely outweigh the advantages to be accrued by being situated at a developed site and by having skilled operators available. Consequently, manufacturing costs are the highest.
522
Investment and Manufacturing Costs
TABLE 11.3 Case 2: Remote Site
Location: Middle East
Rock: 70 BPL 32.5% P2O5
Capacity: 1000 tons/day 94% recovery
Investment cost: U.S.$280 million
Production rate: 295,000 tons/year
1. Phosphate ($28/ton) 3.31 tons U.S.$ 92.6
2. Sulfuric acid ($28/ton) 2.79 tons 78.1
Subtotal raw materials 170.7
3. Electric power (160 kWh/ton) x $0.05/kWh 8.0
4. Steam 2.1 tons ($22/ton) 46.2
5. Industrial water 3.0
6. Chemicals 0.5
7. Effluent 1.0
8. Labor and supervision 1.8
9. Maintenance costs 11.0
Subtotal variable costs (processing) 71.5
10. Plant overhead 4.0
11. Miscellaneous, taxes, insurance 1.0
12. Depreciation and financial costs 145.2
Subtotal fixed costs 150.2
Total manufacturing costs per ton of PgOg U.S.$392.4
11.3 MAINTENANCE COSTS
Maintenance costs represent a large part of the total manufacturing costs, and are difficult to estimate in advance because of the variable influence of many factors.
When considering a new project, the potential plant management does not necessarily have the experience to make an accurate analysis of the maintenance costs that will arise. If a rule-of-thumb formula is used, such as yearly maintenance costs being 5 or 7% of the phosphoric acid plant investment cost, the resulting maintenance cost figure would be unrealistically low.
To complicate the issue, maintenance costs are usually regarded as confidential information and are not readily disseminated by process licensors. Even if this information were available, it is not certain that it would be applicable to a new plant in a different country with different organization, management, and operating skills.
Maintenance Costs
523
TABLE 11.4 Case 3: Older Developed Site
Location: Europe
Rock: 72 BPL 33% P2O5
Capacity: 500 tons/day 95% recovery
Investment cost: U.S.$70 million Production rate: 155,000 tons/year
1. 2. Phosphate ($61/ton) 3.19 tons Sulfuric acid ($30/ton) 2.69 tons U.S.$194.7 80.7
Subtotal raw materials 275.4
3. Electric power (150 kWh/ton) x $0.05/kWh 7.5
4. Steam 2.0 tons ($22/ton) 44.0
5. Industrial water 1.0
6. Chemicals 0.5
7. Effluent 12.0
8. Labor, supervision 7.8
9. Maintenance costs 11.5
Subtotal variable costs (processing) 84.3
10. Plant overhead 7.3
11. Miscellaneous, taxes, insurance 0.5
12. Depreciation and financial costs 67.7
Subtotal fixed costs 75.5
Total manufacturing costs per ton of P2O5 U.S.$435.2
Last but not least, maintenance costs are not always properly recorded. In the early days of plant operation there is inevitably confusion between real maintenance costs and modification costs. Very accurate coding of costs is necessary to achieve this, and this is not always possible when a new plant is being started up, and even in many cases where plants have been on-stream for some time.
For example, if an agitator has to be replaced, say, because of corrosion, its replacement may have some new features (e.g., a foambreaking device) to improve the operation; it is difficult to break down such an expense into real maintenance costs and investment costs. Such decisions are frequently influenced by overriding financial policies of the company, which perhaps is reluctant to approve a further increase in capital investment, and in this way the significance
524
Investment and Manufacturing Costs
of the real maintenance cost is lost. Nevetheless, since the maintenance cost account is not only an important one but may be very variable and can greatly affect the total production costs, it is very important to record the true cost of maintenance as accurately as possible.
The figure of 5 or 7% of phosphoric acid battery limits investment costs mentioned earlier as a basis of assessing maintenance costs is unrealistic for a phosphoric acid plant. For a plant producing 1000 tons of acid per day from a normal, well-known rock and operated under what could be regarded as normal conditions with proper management, it could be expected that the annual maintenance costs would be in the region of 10-12% of the capital investment in the plant. In many cases normal conditions are not achieved in the early days of operation, and consequently maintenance costs can reach abnormally high levels and have a profound effect on the total manufacturing costs.
Average maintenance cost figures for various phosphoric acid plant sizes of varying age are shown in Fig. 11.5.
11.3.1 Raw Materials
Raw materials have a very important effect on the cost of maintenance. This has been dealt with in the preceding section. However, at this stage it is appropriate to discuss (1) corrosion and erosion due to various impurities in the raw material, and (2) the effect of the raw material quality on the output from the plant.
Erosion and corrosion problems arise in the early stages of the plant, particularly associated with the grinding operations. High silica present as quartz in the rock generally contributes to a high degree of erosion. The geological origin of the rock is also very important in this respect. Erosion can affect maintenance costs by as much as U.S.$0.25-0.50 per ton. The effect of corrosion can represent up to as much as 50% of the total maintenance costs of a large plant.
The quality of a phosphate rock determines the amount of acid that can be made per day with a specific rock; related bottlenecks may appear in the areas of grinding capacity, foam control, filtration, and the necessity to shut down for descaling, and so on. Maintenance costs will vary inversely with the annual production figures.
11.3.2 Size of Plant
Plant size greatly influences the cost of maintenance. Many of the plants built today are by necessity of large production capacity. This way can the plant expect to operate with competitively low maintenance costs. Figure 11.1 clearly illustrates the effect of production capacity on maintenance costs.
Maintenance Costs
525
FIG. 11.5 Effect of plant size on maintenance costs. 1, Outside services and labor; 2, spare parts and materials; 3, Maintenance labor and overhead; 4, total maintenance cost.
526
Investment and Manufacturing Costs
11.3.3 Age of Plant
Age has a great influence on the cost of maintenance, primarily because of the type of design (single-tank or multi tank design) and secondarily because of the nature and type of equipment, and the frequency of equipment failures occasioned by aging.
In general, older plants have less on-stream time because of frequent shutdowns of a nonprogrammed type, these usually being the most expensive. They normally take a longer time to correct because the staff and maintenance crews are not prepared for them. Inevitably, many other expenses occur with this type of shutdown, including high overtime rates and payments for outside services.
Experience shows that total maintenance costs are high during the first years of operation following plant erection. After approximately 3 years, these costs decrease. After about 5-7 years of operation, when the plant becomes older, they start to increase again (see Fig. 11.6, showing actual cost evolution for maintenance of two existing plants).
The filter, which of course is a very important part of the total plant, can normally be expected to have a life of some 10-15 years before being replaced. (Some filters have been reported as operating for up to 20 years.) Together with the rest of the plant, it becomes more expensive to repair with age, and accordingly its effective economic life may be determined.
11.3.4 Process Design Influences
Maintenance costs can be influenced greatly by the type of rock and process that are used. It becomes more difficult, particularly with ventures based on untried rocks and new processes, to determine the maintenance costs with accuracy. Process influences that affect maintenance are (1) temperature of the reaction, (2) chemical composition of the reaction mixtures, and (3) number and complexity of types of equipment
Temperature of Reaction
Each process has its own characteristic operating temperatures. There has been a tendency in recent years to introduce processes that develop higher acid concentrations in the initial reaction. These have required new untried materials to withstand the corrosive conditions. It is not possible in some of these processes to use well-tried materials such as rubber and plastics. Consequently, the cost of equipment maintenance for such processes becomes higher. The aforesaid is an important point to remember when making the decision to adopt a process which more conventionally produces acid at 27-30% PgOg as com“ pared with newer processes, which can produce acid at the reaction stage of 45-50% P2O5 concentration. The attractiveness of obtaining
Maintenance Costs
527
FIG. 11.6 Effect of time on maintenance costs per ton of PgOg.
528
Investment and Manufacturing Costs
high-strength acid directly at the reaction stage must not be the overriding factor for decision making. The disadvantages should also be carefully weighed.
Chemical Composition of the Reaction Mixtures
Multitank or multicompartment systems usually employ one tank or compartment to introduce sulfuric acid. The slurry, containing excess H2SO4, is pumped or transferred to other tanks or compartments for further reaction with rock. Such highly acid slurries greatly enhance corrosion rates in the reactor and in the slurry pumps.
Type of Design
The types of equipment and design of a plant will influence maintenance costs, but because of wide variations in design, it is not possible to predict maintenance cost accurately. Similar plant capacity can be achieved with one large reaction tank or with a number of small tanks. The cost of maintenance will inevitably be different for each type of plant.
Over the years many different systems have been developed. Some of these have incorporated devices that turn out not to be really necessary. However, once they have been installed, they require maintenance and should be eliminated if experience shows this to be possible.
Sophisticated plants tend to have higher maintenance costs because of the greater variety and number of pieces of equipment. There again, experience may show that some of this equipment is not necessary, or if there are some advantages the operating costs may be higher than the benefits realized (e.g., for phosphate rock "wetting" devices with recycled slurry).
Sometimes, engineering companies, perhaps anticipating difficult commissioning of a plant, especially when untried raw materials are to be used, may insert "safety equipment" as a security margin during the startup period. Such equipment may turn out to be unnecessary after the plant is fully commissioned and if possible should be removed.
The nature of the equipment has of course great importance. For example, every type of filter, belt, tilting pan, or rotating table, has its own requirement for maintenance shutdown, and its own filter cloth lifetime. A careful check should be made of such costs, if possible by comparison with similar operations, and if something is clearly out of line, appropriate action should be taken.
11.3.5 Geographical Influence
Sheldrick [ 1] has given an excellent paper on the influence of geographical location on investment and production costs. Corrosion rates may be higher in certain geographical locations, because the local water may be high in chloride content or the local rock may have some particularly aggressive impurity. Remote locations generally
Maintenance Costs
529
require better maintenance facilities and larger stocks of spares. One has to be self-sufficient in such locations and generally this tends to increase the cost of maintenance.
In emergencies it is sometimes necessary to go to the costly procedure of flying in the necessary spare parts accompanied, if necessary, by expensive specialists. Administrative delays, import licenses, and so on, may impose additional time delays, thus increasing the plant downtime and the corresponding maintenance costs.
The reliability of services, power, water, and steam, particularly in developing countries, should be properly appreciated. Unreliable and inconsistent supplies of such services can affect maintenance costs directly and also indirectly by loss of production.
The quality of local craftsmen (particularly, for example, in the case of instrument maintensnce) is a matter that can greatly affect maintenance quality and cost. Too often it is the quality of training given to prospective craftsmen, which is not being given the proper attention. The consequences can be serious, particularly in relation to the maintenance of vital and delicate pieces of control equipment.
11.3.6 Annual Shutdown
It is usual to have an annual shutdown period for a phosphoric acid plant. This is necessary because certain large pieces of equipment such as filters and agitators cannot be overhauled effectively while the plant is operating. The normal weekly shutdown of say 8-10 hr for descaling the filter by water washing is too short a period for any major overhaul. Prior to the annual maintenance shutdown, the program should be carefully planned and organized to achieve the objectives in the minimum time. The management organization and the capability to plan such operations effectively can have a considerable impact on the cost of maintenance. The length of time that plants are shut down for their annual overhaul varies according to circumstances. The amount and nature of scale buildup, and the amount of descaling necessary, is usually one of the most important factors affecting the length of time necessary for the annual shutdown. This problem should be carefully studied and an optimum method should be developed to minimize the cost effect of the shutdown. Not only should actual operating techniques be studied, but also the accompanying labor costs, which may vary considerably according to the location of the plant, should be analyzed and optimized. The fact that some of the scale and deposits may be radioactive should not be overlooked and additional precautions may be necessary.
If proper planning has been carried out beforehand, no individual piece of equipment in a phosphoric acid plant should require more than 10 days to clean or repair.
530
Investment and Manufacturing Costs
11.Ц ECONOMIC COMPARISON OF DIFFERENT ROCKS
Any phosphoric acid producer, without a captive phosphate source, has continuously to reconsider the choice of raw material purchased in order to make sure that manufacturing costs are at the lowest possible level. To make this economic study, there is no standard equation to be applied; it is a case by case study. But there is a way to approach the problem, which consists of the following three steps: (1) situation analysis—the capability of the existing unit to handle alternate phosphate rocks, (2) setting up a mathematical model, and (3) use of a cost comparison calculation.
11.Ц.1 First Step: Situation Analysis
Effect of Finished Product Sales
When a plant switches on to a new phosphate rock the most significant impact on economics will be due to changes in the production capacity of the plant. The gross profit will change substantially because of the effect of the fixed costs on the production costs and the different number of tons that are available for marketing. A plant producing 1000 tons of P2O5 per day may lose U.S. $30 million turnover per year with a production cut of 10%. It is therefore essential that the sensitivity of sales to different market conditions be recognized and analyzed.
Two cases have to be considered:
1. A buyers' market condition prevails and actual finished product sales control or limit the production rate. Limited sales.
2. A sellers' market condition prevails, all the production is sold, and the plant’s capacity limits the production rate. No sales limitation.
The economic influence of the rock qualities will be different for the two cases. In case 1, the plant is not running at full capacity and can consequently use a cheaper raw material with lower production rates. In case 2 any improvement in capacity, or any loss of production, will be followed by a substantial change in gross profit, because the sales follow the production. In case 2 it will be hardly acceptable to change from one rock to another with a consequent loss of production capacity; the economic factor is too high.
Technical Limitations
Technical limitations involving the use of another rock can be of many different, and unexpected kinds: for example, flushing raw materials, heavy dust formation during unloading, and severe corrosion. The most common limitations that currently occur when the origin of the raw material has been changed are:
Economic Comparison of Different Rocks 531
H 2&O 4 consumption The H2SO4 plant may become unable to meet the required new production rate because the H2SO4/rock ratio is higher.
Grinding capacity Different rocks require different fineness to maintain similar kinetics of reaction, and may have varying degrees of grindability.
Reaction tank Foaming or heavy coating may slow down the feed rate to the reaction tank.
Filtration Filtration rates of different rock vary widely.
Product acid concentration A lower product acid concentration will require more steam for concentration.
P 0 losses Z 0 Increased losses can become an economic limitation.
Impurities in the acid Sludge formation. Finished product quality may suffer from higher impurity grade.
11.Ц.2 Setting Up the Mathematical Model
The models apply to plants that use rock a and study the economics of the eventual use of rock b.
Case of Limited Sales
Buyers; market conditions prevail and finished product sales limit the production rate. In this case, with both rock qualities the yearly production of P2O5 will have to be the same.
Production costs can be summarized as follows:
Sul + R + Vc + Fc = Pc (1)
a a a a
Sul + R + Vc + Fc = Pc (2)
b b b b
where
Sul = sulfuric acid prices x number of tons of sulfuric acid used per ton of produced P_O_.
I э
R = phosphate rock price x number of tons of rock used per ton of produced P2O5.
Vc = variable costs
Fc = fixed costs
Pc = production costs
a,b = related to rock a or rock b
532
Investment and Manufacturing Costs
All costs are expressed per ton of produced P2O5 as concentrated acid.
Rock b is economically equivalent to rock a when
Pc = Pc,. (3)
a b
in which case
Sul + R + Vc = Sul + R + Vc, (4)
a a a b b b
R =R + Sul - Sul + Vc - Vc (5)
ba a b a b
(Fixed costs are in this case identical to rock a and rock b.)
No Sales Limitation
Sellers' market conditions prevail and all the production is sold. Without sales limitation, the number of tons produced per year will depend on the plant's capacity, which is affected by the rock quality. In this case, the number of tons of P2O5 produced as concentrated acid, the sales price of the produced P2O5, the fixed costs, and the gross profit will have to be taken into consideration:
(Sul + R + Fc + Vc + G )n = Sal x n (6)
a a a a a a a
(Sul + R. + Fc + Vc. + G. )n = Sal x n (7)
о b b b b b b
where
G = gross profit per ton of P„O,. produced
n = number of tons of PgO^ produced
Sal = sales price of PgO,.
The economically equivalent value of rocks a and b is achieved when the same gross profit is made:
n G = n G (8)
a a b b
n G = Sal x n - Sul x n - n (R + Fc + Vc ) (9)
aa a aaaaa a
and same equation for b.
Economic Comparison of Different Rocks
533
Eliminating the fixed costs in this case as the products n Fc and nbFcb, which are equivalent:
naFcs = nbFcb <10>
We can finally write
Sal (n - n ) = Sul n - Sul n. + n (R + Vc ) ab aa bbaa a
-nb(Rb+VCb> (11)
The economically equivalent price for rock b can be calculated from
n
R = Sal - Vc - Sul - — (Sal - R - Vc - Sul ) (12)
b b b n a a a
b
Calculation of the Cost Factors
Phosphate Rock Consumption. Calculation of ta b number of tons of phosphate rock to be consumed per ton of ₽2®5 as finished product proceeds as follows:
t , = ~ ------------ (13)
a,b P„O_ in rock a, b - losses l b
Losses include co-crystallized or lattice losses in calcium sulfate, cake impregnation losses, unattacked P2O5, mechanical losses, and losses from sludge removal (total losses).
The P2O5 losses for rock a are known from the plant laboratory. Losses to be expected with rock b can be estimated if no actual consumption figures from other operating plants are available.
For estimated co-crystallized losses and filter impregnation losses of the calcium sulfate, we can write
a b
(losses)a = (losses)b ^5— (14)
a 2 5b
where
P О = PO content in rock a, b
2 5.25
a,b
CaO . = CaO content in rock a, b
a,b
534
Investment and Manufacturing Costs
The unattacked losses, generally low, should be considered as constant if no other actual plant or pilot plant data are available.
Losses from sludge removal can be estimated according to the total amount of sludge that precipitates with each rock. The content of AlgOj, and K2O of the rock are the major impurities responsible
for the insoluble P2O5 losses in the sludge.
Sulfuric Acid Consumption. Calculation of the number of tons of sulfuric acid to be consumed per ton of rock a and b proceeds as follows [see Eq. (4) in Chapter 3] :
tH2S°4 _ 1
t t
rock . a,b a,b
1.732CaO
P„OC - 0.02CaO
Z □
1.225SO3
0.062
100
100 - % SL
(15)
where CaO, P2O5, an^ are contents in the rock and % SL the soluble losses in the filter cake.
The accuracy of the equation is within +1%. If actual consumption data from operating units are available for both phosphates, they should be used. However, it is advisable to be consistent.
Grinding Costs. The jperating costs for a grinding plant can be considered as steady in time. If the grindability of the phosphate rock changes, it will be the throughput that will vary. This throughput will change proportionally with the grinding factor, and the costs per ton of rock accordingly will be
Gr f
= Gr L b b
(16)
a a
where
Gr = grinding costs
f = grinding factor (see rock data in Section A. 1.2 under "Grinding Factor")
If detailed grinding costs are not available, use U.S.$0.37 per ton of rock for variable costs of grinding, based on a 72-BPL Florida rock.
Reaction Cost. Reaction costs do not necessarily change with different rocks. Cost divergencies would be due mainly to the use of antifoaming agents. These costs cannot be calculated from the phosphate rock components, but can only be roughly estimated from
Economic Comparison of Different Rocks
535
practical experience obtained from other plants or by comparing test results with those from other typical foaming rocks.
Filterability. The filtration rates of different phosphate rocks vary widely. Filtration is not a flexible operation. High losses of P2O5 occur rapidly when the optimum load of the filter is passed.
Filtration is consequently not a variable cost factor but a typical capacity limitation for a given rock quality.
Product Acid Concentration. Product acid concentration varies with rock quality. For dihydrate systems most commercial phosphates yield 26-31% P2O5, and for nondihydrate processes between 30 and 50%. The lower the P2O5 concentration, the higher will be the steam consumption for concentration. If the plant has excess steam available, the correlated costs will be small; but if extra steam has to be produced, the costs will be at the level dictated by the corresponding source of energy (steam from oil-fired spare boilers costs some U.S.$20-25 per ton).
Sludge. Impurities in the rock control the amount of sludge that precipitates during concentration and storage. The costs to be accounted for depend on the process used to remove the sludge from the acid, and on the final product to be produced.
Sometimes sludge content prohibits commercial use of an acid because of final product quality deterioration.
11.4.3 Cost Comparison Calculation: Case Studies with Two Different Rock Qualities
Background Information
The following examples will illustrate how, in practice, the mathematical models are used to perform the economic comparison between two rocks having different technical characteristics. Two cases will be calculated, one with sales limitation, another with plant capacity limitation. For both cases we shall consider the same plant actually consuming rock a, and the eventual use of rock b.
The plant considered for the case studies consists of a sulfuric acid unit, phosphoric acid plant (dihydrate), concentration plant, and sludge removal facilities. P2O5 as finished product is sold as 52% acid. Besides concentrated phosphoric acid, the considered plant produces other products which are high steam consumers. Spare boilers, oil fired, have to generate steam to meet the total requirement.
The sulfuric acid plant can produce at a maximum capacity of 660,000 tons/year of H2SO4 100% and delivers 1.2 tons of steam per ton of H2SO4 produced. The production credits for 1 ton of H2SO4 + 1.2 tons of steam amount to U.S. $55.40, based on $32.0 and $19.5 per
536
Investment and Manufacturing Costs
ton, respectively, for sulfuric acid and steam. The steam price is the same as from oil-fired boilers, corresponding to the calorific equivalent with local oil prices.
Since the plant is consuming more steam than is produced by the sulfuric acid plant, makeup steam is required, which will be provided by oil firing at a cost of U.S. $19.5 per ton. Consequently, the sulfuric acid production will be given a credit of U.S.$19.5 for each ton of steam produced.
The phosphoric acid concentration plant will have to account for its steam consumption on the same basis.
Plant Characteristics
1. H2SO4 production 660,000 tons/year maximum capacity. Production cost U.S.$32 per ton (the price for the steam produced by the plant was deducted from the production costs of the H2SO^).
2. Phosphate rock grinding plant, capacity 140 tons/hr with rock a, ground at a fineness of 30% over 160 pm. Variable costs for grinding, energy, labor, and maintenance amount to U.S.$1.2 per ton ofp2°5- „
3. Phosphoric acid reactor, 1400 m3, mechanical foam-breaking devices.
4. Filter: 160 m2 effective filtration area; maximum speed for one revolution-3 min.
5. Concentration plant: shell-and-tube heat exchangers, three units each with a heat exchanger surface of 300 m2. The maximum daily evaporation capacity is 1360 tons of water.
6. Finished product manufactured from the phosphates is sold as 52% P2O5 acid. Sludges are removed by intermediate 40% acid filtration.
7. The mean sales price for 1 ton of P2O5 as concentrated acid FOB plant is U.S.$410.
8. Variable cost with rock a, per ton of P2O5: U.S.$41.
Typical Analysis and Factors for Rocks a and b
Rock a (%) Rock b ( %)
P2°5 32.0 31.5
CaO 47.0 51.3
s°3 1.3 1.6
A12°3 1.2 0.6
Fe2°3 1.0 0.4
MgO 0.4 0.5
K2° 0.05 0.01
Economic Comparison of Different Rocks
537
Rock a (%) Rock b (%)
F 3.7 3.2
Na2° 0.5 0.7
C°2 3.4 5.5
Organics 0.5 0.05
Grinding factor 1.0 1.4
Specific filtration rate (ton of P2°5^m2 per day ’ 4 ‘min cycle) 7.0 4.5
Recovery 94.0 9
Co-crystallization losses 3.0 ?
Soluble filtration losses 1.1 ?
Unattacked losses 0.4 9
Sludge filtration losses 0.5 ?
Sludge solid losses 0.5 ?
Mechanical losses 0.5 ?
Antifoaming agent consumption 0.5 kg/ton P.O z □ (U.S.$1) Preliminary foam test, say, rock such as Moroccan
Price (CIF) delivered to plant per ton of rock U.S.$60 ?
Case Study 1: Limited Sales Control Production
To be calculated: equivalent price for rock b. Same yearly production with rocks a and b: 190,000 tons of P2O5. Equation (5) is to be applied, the corresponding required cost factors to be calculated.
Rock Consumption. Amount of rock a actually used, ton/ton of PgOg finished product according to Eq. (13) .
*a 0.32 - 0.32 x 0.06 3-324 tonS
(17)
Amount of rock b: The losses have first to be calculated according to Eq. (14).
538
Investment and Manufacturing Costs
Rock a (%) Rock b (%)
Co-crystallized 3.0 on 32 51.3 3'° X47X 317Г 3.3
Soluble cake impregnation losses 1.1 ! lx32x51z3 = 47 31.5 1.2
Unattacked P„Or 0.4 (No change) 0.4
Sludge filtration 0.5 Less sludge estimated3 0.4
Sludge solids 0.5 No postprecipitation3 0.0
Mechanical losses (spillages) 0.5 (No change) 0.5
Total losses 6.0 5.8
aBecause of lower AI2O3 and ЕезОз content in the rock. Estimated figures.
*b
_________1__________
31.5 - 31.5 x 0.058
3.370 tons
(18)
Sulfuric Acid Consumption. Calculated with Eq. (15) and with the analytical data from rocks a and b, in tons of H2SO4 per ton of P2O5:
Rock a:
1 0.989
' 1.732 x 0,47
0.32 - 0.02 x 0.47
1.225 x 0.013 0.32
= 2.66
(19)
Rock b:
1 0.988
1.732 x Q.513
0.315 - 0.02 x 0.513
1.225 x 0:0 16 + 0 062
0. 315
= 2.95*
(20)
Grinding Costs. Rock b is easier to grind than rock a. The able costs with rock b will be [according to Eq. (16)]
vari
1.2 x |4= U.S.$0.86
1.4
(21)
*The influence of different lattice losses on sulfuric acid consumption has been neglected; they amount to only U.S.$0.15 per ton of P2O5.
Economic Comparison of Different Rocks
539
Reaction. Costs. Rock a has a high foaming tendency and needs 0.5 liter (U.S.$1) of antifoaming agents per ton of produced P2O5, whereas rock b, in spite of its high carbonate content, has little foaming tendency because of low organics. No accurate figure can be calculated; we have to accept an estimation. It is likely that the foambreaking devices will handle the job without chemical additives with rock b since the latter was said to behave like Moroccan rock.
Rock a-. U.S.$1.0 per ton of P-CL
2 5
Rock b: U.S.$0.0 per ton of P„O_
z 5
Filtration. Rock b reports a lower filtration performance—4.5 tons/ m^—instead of 7 for rock a. Those performances are expressed in tons of P2O5 per effective of filtration area when the time for one filtration cycle is 4 min. Our filter operates with a 3-min cycle. With that speed the filtration rate of rock b becomes (see Section 6.1.2 for correlation of filtrability speed)
vT 2
4.5 x --- =5.2 tons of P О per effective m
2 5
The effective surface of the filter being 160 , we can produce
160 x 5.2 = 832 tons of P2°5 per day
(22)
(23)
Consequently, the plant capacity can be maintained with rock b in spite of lower filtration performances. There is no additional cost involved.
Concentration. With rock a, 30% P2O5 acid is produced; with rock b, only 28%. For 1 ton of P2O5 to be concentrated up to 52% P2O5, an additional 0. 24 ton of water has to be evaporated per ton of P2O5, corresponding to an additional consumption of 0.29 tons of low-pressure steam per ton of P2O5. (See also p. 411.) This additional steam has to be produced from the spare boiler with oil firing.
Additional cost for rock b:
Cost for 1 ton of L.P. steam = U.S.$19.50
Additional cost per ton P„O_ = 0.29 x 19.5 = U.S.$5.65 2 5
(24)
540
Investment and Manufacturing Costs
Summary of the Cost Factors and Equivalent Rock Price Calculation (per ton of produced P2O5). Raw materials and variable costs Vca and Vcb for rocks a and b:
Rock a U.S.$ Rock b U.S.$
Raw materials Ton of rock per ton of 3.32 199.4 3.37 ?
produced P„O_ Z 5 Tons of H2SO4 per ton 2.66 85.12 2.95 94.4
°f P2°5 Variable costs Grinding Reaction Concentration (steam tp 1.69 1.2 1.0 32.96 1.98 0.86 0.0 38.61
Total variable costs 35.16 39.47
Taking Eq. (5), the equivalent price Rb for rock b will be
R, = 199.4 + 85.12 - 94.4 + 35.16 - 39.47 = $185.81 (25)
b
which is the price for 3.37 tons of rock b.
185 8
Equivalent price for 1 ton of rock b: = $55.14
Case Study 2: Unlimited Sales Possibilities—Plant Capacity Controls Production
To be calculated: equivalent price for rock b.
Limiting Factors. The production and the sales will depend on the plant's bottleneck. Examination of the limiting factors shows that capacity of the sulfuric acid plant will control P2O5 production capacity.
As a consequence of this, both phosphate rock alternatives, rock a or rock b, will consume the same amount of sulfuric acid but produce different quantities of РгС>5- Equation (12) can be simplified by eliminating the sulfuric acid costs.
n
R = Sal - Vc - — (Sal - R - Vc ) (26)
d b a a
Notation
541
Rock Consumption and Р%05 Production. Calculation of the P2O5 production (na and nfc) by dividing total H2SO4 production by Eqs. (18) and (19) proceeds as follows:
n = 66q= 248,000 t P О /yr with rock a (27)
a z • ou z э
n. = 66f’ff0= 223,700 t P О /yr with rock b (28)
D Z . УЭ Z Э
n = 1.108 (29)
Calculation of Variable Costs. From the plant characteristic data sheet we know that the total variable costs for rock a are U.S.$41 (p. 537). For rock b they will become
41.0 + (39.47 - 35.16) = U.S.$45.35 (30)
See variable-cost calculation for rocks a and b (p. 540), which also apply in this case.
Calculation of Economically Equivalent Price of Rock b. Setting Eq. (12) or (26), we have
R. = 410 - 45.31 - 1.108 (410 - 100.4 - 41.0) = 176.77 (31)
b
which is the price for 3.37 tons of rock.
Equivalent price for rock b: = U.S.$52.45 (32)
NOTATION
a,b related to rocks a and b
f grinding factor
Fc fixed costs per ton of produced Р2Од as concentrated acid
G gross profit
Gr grinding costs per ton of rock
n number of tons of P2O5 produced as concentrate acid
Pc production costs of 1 ton of P2O5 as concentrated acid
R phosphate rock price multiplied by the number of tons used to produce 1 ton of P2O5 as concentrated acid
542 Investment and Manufacturing Costs
Sal Sul sales price sulfuric acid price multiplied by the number of tons used to produce 1 ton of P2O5 as concentrated acid
Vc variable costs per ton of produced P2O5 as concentrated acid
REFERENCE
1. W. F. Sheldrick, Investment and Production Costs for Fertilizers FAO, August 1977.
appendix
Phosphate Rock Data Sheets
A.1 GUIDELINES FOR USE
A. 1.1 Purpose
The purpose of the phosphate rock data sheets is to provide typical phosphate rock data for a preliminary technical and economic evaluation of a considered rock in relation to phosphoric acid production. Most of the current marketable phosphate rock qualities are presented.
The data include the typical figures required to establish a material and energy balance or to make a preliminary size estimate of the principal equipment needed. Nevertheless, since phosphate ores are subject to continuous quality fluctuation, it is recommended that the user:
1. Compare an updated phosphate rock analysis with the data sheet. 2. Consider the statistical analytical deviation between laboratories.
(Table A.l) and evaluate the possible effect of inaccuracies for each typical calculation.
3. Take into account possible effects of the process involved.
4. Before taking any decisive action, cross-check by using a second estimation (such as pilot plant, operating plant information, complementary analysis).
These data sheets will be useful to:
Process engineers: for establishing a preliminary project and investment cost estimation for the chosen phosphate rock quality
Plant engineers (phosphate rock consumers) : for optimizing plant economics; for comparing the economics of a particular rock with that of other rock qualities that might be purchased.
Phosphate rock producers: competitive phosphate rock valuation.
543
544
Appendix A
In this appendix we show not only those phosphates already on the market but also some of those expected to come on the market in the near future. In general, we have only taken those phosphates which are produced in quantities equivalent to or greater than 1 million tons per year.
The reader will certainly understand if all the data sheets are not complete, in view of the difficulty in obtaining comprehensive information from certain sources.
A. 1.2 Information Given and How to Use It
Rock Origin and Source of Information
At the top of the data sheets are given the name of the phosphate rock, its country of origin, the location of its mine, the type of mining and beneficiation, the commercial grade, and the number of metric tons of commercial grade produced per year. On the left top side the source of information is indicated.
Screen Analysis
Screen or size analysis gives some indication about a probable size distribution . It can be subject to variation, especially with blended phosphate rock qualities such as Florida rock, which is usually a mixture of pebble and concentrate in various proportions according to the location of the mine and the grade of the commercial product.
Chemical Data
Phosphate Rock Analysis. The phosphate rock analysis indicates the content of the 12 most common elements in phosphate rock. The analysis is subject to inaccuracies for the following reasons:
1. For phosphate rock already on the market:
a. Variations in quality arise due to the continuous mining proc-cess uncovering crude ore layers subject to internal variations.
b. Beneficiation processes are subject to deviation from their normal practice for various technical or economic reasons.
c. Analytical differences arising from differing analytical methods and accuracies associated with each individual laboratory.
2. For new projected mines:
a. Sampling of new deposits will not necessarily reflect accurately the final grades of the phosphate ore.
b. Variations in crude ore can have an effect on beneficiation.
Phosphate Rock Data Sheets
545
TABLE A.l Statistical Deviations of Analytical Data of Phosphate Components Expressed in Percent of the Content of the Related Component
Component Between Possible deviation between 2 laboratories (%)
Repeatability laboratories Uncertainty (%)
(%) (%)
P2°5 0.3 0.5 0.6 2
SO3 0.4 0.9 1.0 5
CaO 0.3 1.0 1.1 3
Si°2 1.5 3.3 3.6 8
F 1.2 2.4 3.0 18
A12°3 2 7 8 25
Fe2°3 2 5 6 15
MgO 3 6 7 20
Source: G. Serrini and L. Haemers, The Certification of Total Phosphorus, Sulfates, Calcium, Silicon, Fluorine, Aluminum, Iron, and Magnesium in a Superphosphate, BCR information, BCR 33, Joint Research Centre ISPRA Establishment, Italy, 1980.
There is no generally applicable rule of statistics for the deviations arising due to geological differences. However, each laboratory has its own statistical deviation. Minimum and maximum deviations between laboratories have been established for each of the main phosphate rock components as shown in Table A.l.
30% P2O5 Product Acid Analysis. This analysis corresponds to a 27-30% P2O5 acid produced in normal dihydrate unit. It shows how much of the impurities remain with the acid. This relates mainly to Ее20з, А120з, and F, which are subject to greater uncertainties.
50% PpOg Concentrated Acid Analysis. This analysis corresponds to acid concentrated by evaporation. It shows the remaining impurities and their effect on properties such as viscosity, specific gravity, sludge formation at the indicated weight percent of P2O5. The indicated P2O5 concentration refers only to a particular sample; it is not a characteristic analytical number.
546
Appendix A
Main Vse of Rock
This table shows the msin existing uses currently operating with the considered phosphate rock.
Typical Characteristics (Industrial Key Factors)
Grinding Factor. The grinding factor gives the "grindability" of the phosphate rock shown. Taking into account a certain safety factor (15%), it allows us to estimate the size of the grinding equipment needed as well as to predict approximately the electrical energy consumed for grinding.
As the unit of reference a figure of 1 has been taken for Florida rock, although this choice is open to criticism because of the wide range of sizes and hardness occurring within that rock type. Florida rock usually shows variations in grindability of ±10%, and occasionally up to ±15%. Consequently, a more precise definition of this grinding factor would be as follows. A factor of 1 refers to a rock that needs 14 kWh/ton of rock to be ground to a fineness of 65% minus 150 pm, or 17 kWh/ton for 80% minus 150 pm. These figures are based on the use of a ring roller mill.
To use the grinding factor for the related phosphate quality, take:
Mill capacity = mill capacity with Florida rock x grinding factor
, .. Elec. ener. consump. Florida
Electrical energy consumption = --------:——----г—----------
grinding factor
Sulfuric Acid Consumption per Ton of Produced PgOg. The label "Ind." means data derived from industrial practice, which should be reliable because they are based on a large tonnage of rock that has been consumed. The label Calc, means calculated from the phosphate rock analysis shown on the data sheet and by the use of the model shown in Section 3.1.2, Eq. (4), and taking 99% of filtration recovery.
Filtration Capacity. Filtration capacities are expressed in tons of PgOg/m-2 of effective filtration area per day. They are given for filtration cycle times of 3 and 4 min respectively (number of brackets) . Vacuum is at 500 mm Hg. Soluble filtration losses are at 1%. (See also pp. 371, 400).
Phosphate Rock Data Sheets
547
A.2 DATASHEETS
DATA SHEET 1 Algeria: Djebel Onk
Country: Algeria Source of information: Sonarem Rock name: Mining location: Type of mining: Beneficiation: Primary ore: Concentrate: Tons/year produced: Djebel Onk Djebel Onk Open pit Washing 25% P2O5 29% P2O5 1,400,000
Screen Analysis of Commercial Chemical Data:
Rock (Cumulative) : Weak
Cone.
Over 400 gm 0.8% 250-400 gm 4% Rock acid acid
H2O 0.2
160-250 urn 18%
100-160 pm 52% P2O5 29.6 29.1 54.6
80-100 pm 64% SO3 2.4 2.4 1.9
F 3.7 1.6 0.8
Main Use of Rock: SiO2 2.4 0.7 0.01
Local Exported CO2 7.0 - -
Cl 0.02 0.04 0.015
Phos. acid x X CaO
TSP x X 48.5 0.17 0.06
DAP/MAP x Ai2°3 0.4 0.4 0.7
Other x X Fe2°3 0.4 0.4 0.8
MgO 1.4 1.4 2.5
Typical Characteristics: Na2O 1.4 0.14 0.11
k2o 0.15 0.08 0.06
Grinding factor 1.4-1.6
H2SO4/ton P2O5 calc. 2.95 Organics 0.3 -
Filtration rate [tons P2O5/(day) (m2)] 3-4.0 (4-min), 3.5-4.6 Sp. gravity, 20°C 1.31 1.75
(3-min) Sludges,kg/ton Р^О5 8 23
Viscosity, (cP)
20°C 7.6 517
50°C 3.8 102
80°C 2.2 29.2
548
Appendix A
DATA SHEET 2 Brazil: Tapira
Country: Brazil Rock name: Tapira
Source of information: Mining location Minas Gerais
Paulo Abib, Engenaria, Type of mining Open
Sao Paulo, Brazil Beneficiation: Flotation
Primary ore: 8% P2O5
Concentrate: 35-36% P2O5
Tons/year produced: 2 million
Screen Analysis of Commercial Chemical Data:
Rock (Cumulative) : 30% Cone.
Over 500 pm Rock acid acid
250 pm 3% —
100 pm 20% H2O 0.0
74 pm 90% p2°5 35.2 30.8 52.2
so3 1.3 1.5 2.4
Main Use of Rock: F 1.5 0.9 0.4
SiOo 2.1
Local Exported L 0.9
Cl 0.04
Phos. acid x No
TSP x No CaO 50.3 0.3 0.3
DAP/MAP x No AI2O3 0.47 0.34 0.66
Other No Ре2О3 2.07 1.39 2.37
MgO 0.66 0.53 0.88
Typical Characteristics: Na2O 0.13 0.05 0.08
„ a , „ KoO 0.06 0.02 0.04
Grinding factor 1.7 2
BaO 0.2
H„SO./ton P О,а Ind. 2.50 TiO2 0.92
1 Calc. 2.59
Organics 0.09 0.04 0.07
Filtration capacitya 4 - . as C . 5 (4-min)
[tons P2O5/(day) 5 .2 (3-min) Sp. gravity 1.7 1.34 1.67
(m2)] or bulk
density, 19 C
Expected amount 15 36
of sludge (kg/
ton P2O5)
Viscosity (cP)
25°C 4.5 27
50°C 2.5 12.6
aRefer to Section A. 1.2.
549
Phosphate Rock Data Sheets
DATA SHEET 3 Finland: Apatite Siilinjarvi
Country: Finland Rock name: Apatite
Source of information: Kemira Oy Mining location Type of mining: Beneficiation: Primary ore: Concentrate Tons /year produced: Siilinjarvi, Finland Open pit Flotation (Kemira process) 4.0% P2O5 36.8% P2O5 200,000 now 500,000 end 1982
Screen Analysis of Commercial Rock: Over 500 pm 250 pirn 3% 100 urn 25% 50 pm 50% Main Use of Rock: Local Exported Chemical Data Rock 30% Cone. acid acid
HoO F SiO2 co2 Cl (8.0)b 36.8 2.6 2.7 4.3 0.006
Phos. acid x TSP DAP/MAP Other Typical Characteristics: Grinding factora Used as is H2SO^/ton P2Oga 2.6 Filtration capacity8 5.4 (4-min) [tons P2O3/(day) 6.2 (3-min) (m2)] CaO ai2o3 Fe2O3 MgO Na?O K2O Organics as C 51.6 0.3 0.6 1.07 0.27 0.26 0
aRefer to Section A. 1.2.
'’Mined ore with 8% water. Analysis on dry basis.
550
Appendix A
DATA SHEET 4A Israel: Zin
Country: Israel Source of information Phosphate Ltd. : Negev Rock name: Mining location: Type of mining: Beneficiation: Concentrate: Tons/year produced: Zin Negev Open Washing 32% P2O5 2 million
Screen Analysis of Commercial Chemical Data:
Rock (Cumulative) : 30% Cone.
Over 800 pm 4% Rock acid acid
250 pm 40% —
150 ym 80% H2o 0.0
70 pm 88% P2O5 32.2 29.0 53.5
SO3 1.8 2.0 3.3
Main Use of Rock: F 3.7 1.7 0.5
Local Exported SiO2 1.2 CO2 6.4
Phos. acid x X Cl 0.06 0.01
TSP X
DAP/MAP Other x X X CaO 50.3 A12O3 0.4 0.2 0.4
Fe2O3 0.1 0.1 0.2
Typical Characteristics: a MgO 0.3 Na2O 0.7
Grinding factor 2 K2O 0.02
H2SO4/ton P2O5a Ind. 2.74 Calc. 2.81 Cd (ppm) 30
As (ppm) 2
Filtration capacity8 4.5-5.0 Organics 0.15
[tons P2O5/(day) (4-min) as C
(m2)] 5.2-5.8
(3-min) Sp. gravity, 1.3 1.33 1.63
20°C, or
bulk
density
Color Yellow Dark
brown brown
SRefer to Section A. 1.2.
Phosphate Rock Data Sheets 551
DATA SHEET 4B Israel: Oron
Country: Israel Source of information: Phosphate Co. Negev Rock name: Mining location: Type of mining: Beneficiation: Primary Ore: Concentrate: Tons/year produced: Oron Negev Open Washing Calcination 22-28% P2O5 33-34% P2O5 450,000
Screen Analysis of Commercial Chemical Data:
Rock (Cumulated): 30% Cone.
Over 800 pm 6% 250 pm 37% Rock acid acid
P2°5 33.8 28.9 52.0
100 pm 73%
70 pm 00% so3 2.0 3.0 4.2
F 3.7 1.1 0.2
Main Use of Rock: SiO2 1.0
Local Exported Cu2 Cl 0.7 0.1 0.13 0.03
Phos. acid x TSP DAP/MAP CaO 54.3
A12O3 0.32 0.11 0.27
Other x Fe2O3 0.04 0.06 0.12
MgO 0.16
Typical Characteristics: Na2O K2O 0.67 0.01
Grinding factora H?SO4/ton P2O5a Calc. 2.89 Organics 0.0
Filtration capacity3 4.6-5.0
[tons P2O5/(day) (4-min) Sp. gravity 1.55- 1.60
(m2)] 5.3-5.8 or bulk
(3-min) density
aRefer to Section A. 1.2.
552
Appendix A
DATA SHEET 5 Jordan: Jordan 73/75
Country: Jordania Rock name: Jordan 73/75
Source of information: Jordan Mining location El Hassa
Phosphate Mines Company Type of mining: Open pit
and ISMA Beneficiation: Washing
Primary ore:
Concentrate: 33-34% P2O5
Tons/year produced: 2 million
Tons expected: 4 million
Screen Analysis of Commercial Chemical Data:
Rock: 30% 50%
Over 500 pm 21% 250 pm Rock acid acid
H2O 1.5
200 pm 54%
100 pm P2O5 33.9 30.7 50
160 pm 68% SO3 1.3
50 pm 93% F 3.99 2.4 0.67
SiO2 3.15 1.2
Main Use of Rock: CO2 4.2
Local Exported CI 0.03
Phos. acid x CaO 52.2-51.3
X
TSP x X AI2O3 0.2 0.1 0.17
DAP/MAP X Fe2O3 0.17 0.17 0.28
Other MgO 0.13-0.27 0.18 0.3
Na2O 0.54 0.06
Typical Characteristics: K2O 0.02 0.04
Grinding factor& 1.6-1.8 MnO 0.01
H2SO4/ton P2O5a Ind. 2.78 Calc. 2.79 TiO2 0.04 U3O8 (ppm)
Cd (ppm)
Filtration capacity8 4-5.0
[tons P9OR/(day) (4-min) Expected -20
(m2)] 4.5-5.8 sludges, kg/ton
(3-min) P2O5
aRefer to Section A. 1.2.
Phosphate Rock Data Sheets
553
DATA SHEET 6A Morocco : Khouribga 70-71 BPL
Country: Morocco Source of information: Office Cherifien des Phosphates Rock name: Mining location: Type of mining: Beneficiation: Concentrate: Tons/year produced: Khouribga 70-71 BPL Khouribga Open and underground Partial washing 32% P2O5 15 million
Screen Analysis of Commercial Rock (Cumulative): Over 800 pm 10.5% 315 pm 27.5% 160 pm 76% 80 pm 97.8% Main Use of Rock: Local Exported Chemical Data: Rock Weak acid Cone. acid
H2O P2°5 SO3 F SiO2 co2 0.0 32.04 1.9 3.9 3.3 5.6 28-30 2.3 1.4 55 2.7 0.4
Phos. acid TSP DAP/MAP Other x Typical Characteristics: Grinding factora X X X X 1.6 Cl CaO ai2o3 Fe2O3 MgO Na2O K2O 0.03 51.8 0.40 0.24 0.50 0.93 0.08 0.4 0.36 0.24 0.3 0.12 0.05 0.03 0.76 0.43 0.57 0.01 0.01
H2SO4/ton P2O5 Ind. Calc. 2.80 2.93 Cd (ppm) 10-18
Filtration ratea 4.7-5. [tons P2O5/(day) 5.4-6. (m2)] 6 (4-min)As (ppm) 5 (3-min) Organics as C 5-13 0.21
Sp. gravity 1.67
Viscosity, 30°C (cP) 40
aRefer to Section A. 1.2.
554
Appendix A
DATA SHEET 6B Morocco: Yousoufia 74-75 BPL
Country: Morocco Source of information: Office Cherifien des Phosphates Rock name: Mining location: Type of mining: Beneficiation: Concentrate: Tons/year produced: Youssoufia 74-75 BPL Youssoufia Underground Calcination 34.14% P2OR
500,0( )0
Screen Analysis or Commercial Rock (Cumulative): Chemical Data: 30% Cone.
Over 500 pm 2.8% 315 pm 9.9% Rock acid acid
H2O 0.0
160 pm 58.0%
80 pm 96.6% ₽2°5 34.14 29-30 55-56
SO3 2.3 1.7 2.3
Main Use of Rock: F 4.1 1.2 0.3
Local Exported S1O2 co2 2.8 3.2
Phos. acid x Cl 0.03
TSP x DAP/MAP x CaO 53.8 1.0 0.22
Other x a12°3 0.3
he2u3 0.15 0.40
Typical Characteristics: MgO Na2O 0.46 0.85 0.1 0.02
Grinding factor8 1.4-1.6 K2O 0.07 0.03 0.04
H2SO4/tons P2O5a Ind. 2.70 Calc. 2.84 Cd (ppm) 20-30
Filtration capacity8 4.3-4.8 As (ppm) 2
[tons P2Os/(day) (4-min) (m2)] 5.0-5.5 Organics 0.16
(3-min) as C
Viscosity, 40
30°C (cP)
aRefer to Section A. 1.2.
Phosphate Rock Data Sheets
555
DATA SHEET 6C Morocco: Youssoufia 68-69 BPL
Country: Morocco Rock name: Youssoufia
Source of information: Office 68-69 BPL
Cherifien des Phosphates Mining location Youssoufia
Type of mining Underground
Beneficiation:
Concentrate: 31% p2o5
Tons/year produced: 5.5 million
Screen Analysis of Commercial Rock (Cumulative): Over 800 pm 5. 7% Chemical Data: Rock Weak acid Cone, acid
315 pm 18.7% 160 pm 68.9% h2o 0.0 28 55
80 pm 95.4% p2O5 31.17
so3 1.18 2.7 2.6
Main Use of Rock: F SiO2 4.05 1.9 0.4
4.04
Local Exported CO2 6.25 0.04
Cl
Phos. acid x x TSP x x CaO 51.2 0.14 0.05
DAP/MAP x x ai2o3 0.36 0.23 0.4
Other x Fe2O3 0.2 0.2 0.4
MgO 0.5 0.5 0.6
Typical Characteristics: Na2O 0.8 0.2 0.05
Grinding factor8 1.6 K2O 0.09 0.01
H2SO4/ton P2Oga Ind. 2.92 Cd (ppm) 10-20
Calc. 3.00
Filtration ratea 4.8 (4-min) As (ppm) 10
[tons PgOg/fday) 5.6 (3-min) (m2)] Organics as C 0.29
Viscosity (cP)
20°C 90
50°C 28
70°C 15
aRefer to Section A. 1.2.
556
Appendix A
DATA SHEET 7 Senegal: Taiba
Country: Senegal Rock name: Taiba
Source of information: 78-80 BPL
Compagnie Senegalsise des Mining location Taiba (near
phosphates de Taiba Beneficiation: Dakar) Washing and
flotation
Concentrate: 36-37% P2O5
Tons/year produced: 1.5 million
Screen Analysis of Commercial Chemical Data:
Rock (Cumulative): 30% Cone.
Over 500 pm 15% 250 pm 40% Rock acid acid
h2o 0.40
100 pm 72%
50 pm 93% p2°5 36.7 28.5 47.0
SO3 0.01 2.4
Main Use of Rock: F 3.7 2.3 1.2
Local Exported S1O2 co2 5.0 1.8
Phos. acid x Cl 0.003
X
TSP x X CaO 50.0
DAP/MAP X ai2o3 1.1 0.8 1.0
Other X Fe2O3 0.9 0.6 0.8
MgO 0.04
Typical Characteristics: Na2O 0.28
K9O 0.07
Grinding factor 2-3
H2SO4/ton P2O5 Ind. Calc. 2.49 2.51 MnO 0.02
TiO2 Cd (ppm) 0.14 60
Filtration capacity 8 (4-min) [tons P2O5/(day) 9.2 (3-min) Organics as C 0.37
(mz)l
Sp. gravity 1.325 1.604
or bulk density
Expected amount 11 64
of sludges
(kg/ton P2O5) Viscosity, 70°C 7
(cP)
a Refer to Section A. 1.2.
Phosphate Rock Data Sheets
557
DATA SHEET 8A Togo: Togo 78- 80 BPL 2
Country: Togo Rock name: Togo
Source of information: Office 78-80 BPL
Togolais des Phosphates Mining location Kpeme
Type of mining Open
Beneficiation: Washing
Primary ore: 30% p2o5
Concentrate: 36% P2O5
Tons/year produced: 3.5 million
Screen Analysis of Commercial Chemical Data:
Rock: 30%
Cone.
Over 500 um 6% 200 pm 17% Rock acid acid
H2O 1.15 - -
160 pm 25%
80 pm 90% p2°5 36.36 28 52
so3 0.32 3.3 4.5
Main Use of Rock: F 3.80 2.1 0.7
Local Exported S1O2 co2 4.50 1.64 0.2
Phos. acid No Cl 0.10 0.08 0.15
X
TSP No X CaO 50.50 0.4
DAP/MAP No X A12O3 0.98 0.6 0.6
Other No X Fe2O3 0.97 0.8 1.3
MgO 0.09 0.1
Typical Characteristics: Na2O 0.20
Grinding factor8 In most K2O 0.03
cases, no MnO 0.02
grinding TiO2 0.06
H2SO4/ton P2O5a Calc. 2.55 Ind. 2.56 U3O8 124 Cd (ppm) 53
Filtration capacity8 7-9 (4-min) Organics 0.02 0.014 0.04
[tons P2O5/(day) 8-10.4 (3-min)
(m2)] Viscosity, 25 C 3 30
(cP)
Sp. gravity 1.42- 1.31 1.67
or bulk density 1.58
15-30 50
Expected amount of sludges (kg/ton P2O5)
aRefer to Section A. 1.2.
558
Appendix A
DATA SHEET 8B Togo: Dagbati 70 BPL
Country: Togo Rock name: Dagbati
Source of information: Office 70 BPL
Togolais des Phosphates Mining location Near Kpeme
Type of mining Open
Beneficiation: Washing
Concentrate: 32% P2OR
Tons/year produced: 2 million to be
on stream
1984
Screen Analysis of Commercial Chemical Data:
Rock (Cumulative): 30% Cone.
Over 1000 Pm ~~ 10% 200 pm 38% Rock acid acid
H2O 0.0 52.7 20.7
160 pm - 45%
80 pm - 95% P2O5 33.8 28.7 51.7
SO3 0.4 2.1 2.8
Main Use of Rock: F 3.8 2.8 1.0
Local Exported S1O2 CO 2 8.0 2.5 - 0.2
Phos. acid x TSP x CI 0.08 0.6 0.01
DAP/MAP CaO 48.4 0.24 0.2
Other ai2o3 1. 5 1.3 1.6
Fe2°3 1.1 1.0 2.0
Typical Characteristics: MgO Na2O 0.15 0.3 0.1 0.08 0.2 0.03
Grinding factor8 1.7 K2O 0.03 0.04 0.03
H2SO4/ton P2O5a Calc. 2.61 Ind. 2.55 U3O8 (ppm) 130 - -
Cd (ppm) 28 - -
Filtration capacity8 5.0 (4-min) Organics 0.2 - -
[tons P2Os/(day) 5.8 (3-min) as C
(m2)] Expected sludges 50-70
Sp. gravity 1.36 1.675
or bulk density
8Refer to Section A.1.2.
Phosphate Rock Data Sheets
559
DATA SHEET 9 Tunisia: Lave Mdilla
Country: Tunisia Source of information: Compagnie des Phosphate de GAFSA Rock name: Mining location: Type of mining: Beneficiation: Primary ore: Concentrate: Tons/year produced: Lave Mdilla Mdilla Underground Washing 28-29%
Screen Analysis of Commercial Chemical Data:
Rock (Cumulative): 30% 50%
Over 2000 pm 1% 630 pm 4% Rock acid acid
H2O 1.84
250 urn 21%
160 pm 45% P2O5 28.8 29.3 53-55%
63 pm 97% SO3 3.8 1.3
F 3.6 0.96 0.45
Main Use of Rock: SiO2 3.3
Local Exported CO2 Cl 6.5 0.07 0.025
Phos. acid x x TSP x x CaO 49.7 0.12 0.15
DAP/MAP x x ai2o3 0.58 0.48 0.8
Other x x Fe2°3 0.28 0.25
MgO 0.62 0.6
Typical Characteristics: Grinding factor8 1.6-1.8 NaoO K2o
a C as 0.8 0.06
H2SO4/ton P2O5 Calc. 3.03 Ind. 3.09 organics
Filtration capacity8 3-4 (4-min) Sp. gravity 1.67
(4-min cycle) 3.5-4.6
(3-min)
aRefer to Section A. 1.2
DATA SHEET 10A United States: Florida 72 BPL
Country: United States Rock name: Florida 72 BPL
Source of information: Phosrock, Mining location: Central Florida
Phosphate Rock Export Type of mining: Open
Association, Florida Beneficiation: Primary ore: Concentrate: Tons/year produced: Tons expected: Washing flotation 10-14% P2O5 33% p2o5 > 3 million 1.7 million
Screen Analysis of Commercial Rock: Chemical Data: 30% Cone.
Florida 72 BPL can be of concentrates (0.2-2 min) Rock acid acid
H2O 0.0 16.9
or pebble (1-4 mm).
Consequently, Screen p2o5 33.0 28.0 54.2
Analysis can vary widely. so3 1.1 1.8 3.2
F 3.7 2.0 0.4
Main Use of Rock: SiO2 5.5 - -
Local Exported co2 Cl 3.4 0.007 -
Phos. acid x CaO 48.3 0.15 0.02
TSP x ai2o3 1.07 0.77 1.4
DAP/MAP x Fe2°3 1.19 1.0 1.2
Other x MgO 0.40 0.34 0.4
Na2O 0.47 0.26 -
Typical Characteristics: K2O 0.09 0.04 -
Grinding factora 1 As ppm 6-13
H2SO4/ton P2O5 Ind. 2.62 Calc. 2.66 Hg ppm 0. Cd ppm 06-0.11 5-16
Pb 16- 20
Filtration capacity8 7 (4-min) Zn 90-100
[tons P2Og/(day) 8 (3-min) Organics (%) 0.6
(m^)] with 4-min as C (%) 0.26
cycle Sp. gravity or 1.44 1.68
bulk density 25°C
Expected sludges, 80-120
kg/ton P2O5
Viscosity (cP) 20°C 50
50°C 19
80°C
aRefer to Section A. 1.2.
Phosphate Rock Data Sheets
561
DATA SHEET 10B United States: Florida 68-70 BPL
Country: United States Rock name: Florida 68-70 BPL
Source of information: Amax Mining location : Central Florida,
Manates County
Type of mining : Open
Beneficiation: Flotation mixing
with pebble 18%
Primary ore: Concentrate: 31-32% P2O5 to be
onstream in 1983
Tons/year
produced: 4 million tons
Screen Analysis of Commercial Chemical Data:
Rock (Cumulative): 30% Cone.
Over 500 urn 21% 200 pm 83% Rock acid acid
H2O 0.0
147 pm 91%
P2°5 31.3 27.4 50.3
Main Use of Rock: so3 1.5 1.7
F 3.6 2.2 0.9
Local Exported SiO2 5.6
Phos. acid ., . tsp Not yet CO? 4.5
Cl 0.02
_ . „ . . commercialized CaO
DAP/MAP 46.8 0.36
Other A12°3 1.3 0.94 1.8
Fe2®3 1.6 1.14 2.2
Typical Characteristics: MgO 0.5 0.45
Grinding factor8 1.0 NaoO K2O 0.8 0.14
H2S04/ton РгО5а Pilot 2.695 Calc. 2.699 MnO
TiO2
Filtration capacity 8-9 (4-min) U3°8 (PPm) 140 110 170
[tons PoOc/fday) 9-10 (3-min) Cd (ppm)
(m2)] Organics 0.4
as C
Sp. gravity or 1.44- 1.335 1.655
bulk density 1.60
Expected 100
sludges, kg/ton P2O5
aRefer to Section A. 1.2.
DATA SHEET IOC United States: Texas Gulf 72 BPL
Country: United States Rock name: Texas Gulf 72 BPL
Source of information: Texas Mining location : Lee Creek
Gulf Type of mining : Open
Beneficiation: Washing, flotation,
calcination
Concentrate: Tons/year 33%
produced:
Screen Analysis of Commercial Rock (Cumulated): Chemical Data: 30% Cone.
Over 500 pm 6% 210 pm 59% Rock acid acid
H2O 0.1 21.0
150 pm 85%
74 pm 99% p2O5 32.9 27.6 53.5
SO3 2.2 1.6 3.2
Main Use of Rock: F 4.0 0.9 0 i.3-0.6
Local Exported SiO2 CO2 4.1 2.2 0.3 0.02
Phos. acid x Cl 0.009 - 0.0015
TSP x CaO 52.8 0.1 0.1
DAP/MAP x ai2o3 0.5 0.4 0.6
Other Fe2O3’ 0.8 0.7 1.4
MgO 0.6 0.5 1.1
Typical Characteristics: Na2O 1.0 0.06
Grinding factor3 1.8 K2O 0.1 0.04
H„SO./ton P.O,3 Calc. 2.88 U3°8 <PPm) 80 50 91
2 4 2 5 Ind. 2.85 Cd (ppm) 40 20 36
Filtration capacity3 3.8- 4.5 Organics 0.1
[tons P2O5/(day) (4-min) dS C
(m2)] 4.4-5.2 Sp. gravity 1.6 1.68
(3-min) or bulk density (24 °C)
Expected sludges, 25
kg/ton P2Og
Color Light green
Viscosity (cP)
10°C 160
24°C 115
38°C 80
66°C 50
3Refer to Section A. 1.2.
Phosphate Rock Data Sheets
563
DATA SHEET 10D United States: Calcined Double Float North Carolina Concentrate
Country: United States Rock name: Calcined double
Source of information: North float North Carol-
Carolina Phosphate Corporation ina concentrate
Mining location: Aurora, North Carolina
Type of mining: Open pit
Beneficiation: Concentrate Washing and two-stage flotation-calcination
(uncalcined): Tons/year 30.5% P2O5
expected: 3.7 million
Screen Analysis of Commercial Chemical Data: Wt. %
Rock: 30%
Over 500 2% 250 Rock acid
H2O 0.3 -
200 32%
160 ₽2°5 32.26 28.0
100 82% so3 2.9 2.1
75 92% F 3.7 2.1
SiO2 3.9 1.1
Main Use of Rock: co2 3.9 -
Cl 0.02 0.02
Local Exported CaO 51.6 0.20
Phos. acid TSP X Al 2^3 Fe2O3 0.42 0.69 0.22 0.68
MgO 0.61 0.55
DAP /MAP NaoO 1.05 0.12
Other X K2O 0.10 0.05
MnO, ppm 150 —
Typical Characteristics: U3O8, ppm 80 -
Grinding factor: 1.7 Cd, ppm 40 20
TH „SO./ton P„O__: Ind. 2.85 Organic C, % 0.12 0.01
2 4 2 5 Calc. 2.90 Sp. gravity or 1.47 1.31
bulk density
Filtration capacity 6.5 (4-min)
[tons P2O5/(day) (m2)] 7.5 (3-min)
564
Appendix A
DATA SHEET 11 USSR: Kola 80 BPL
Country: USSR Rock name: Kola 80 BPL
Source of information: Mining location Kola Peninsula
a. Isma Conference, 1978, Type of mining: Open and
Orlando, Nissan Chemical underground
Ind. Paper 7 Beneficiation: Flotation
b. Phosrock Primary ore: 15% P2O5
Concentrate: 38% РгО5
Tons/year produced: -16 million
Screen Analysis of Commercial Chemical Data:
Rock: 30% Cone.
Over 150 pm -17% 80 pm -48% Rock acid acid
H2O 1.0
Main Use of Rock: ₽2°5 38.9 46.0- 51.7
Local Exported so3 F 0.0 8.9 1.7
Phos. acid x x TSP x No SiO2 co2 1.2 2.0
DAP/MAP NA x Other NA x CaO A12°3 50.5 >0.4 0.03 0.3-0.7
Typical Characteristics: Fe2°3 MgO >0.3 >0.1 0.2-0.5 0.06-0.3
Grinding factor8 Use as is Na2O 0.5 0.05
HgSO^/ton P2O5a Calc. 2.4 k2o 0.2 0.04
Filtration capacity8 4-6 (4-min) TiO2 0.5
[tons P2O5/(day) 4.6-7 (3-min) (m2)]
Phosphate Rock Data Sheets
565
DATA SHEET 12 Syria: Khneifiss 68-72 BPL
Country: Syria Rock name: Khniefiss
Source of information: 68-72 BPL
Mining location Ghadir el
Hamel
Type of mining Beneficiation: Open
Primary ore: 24.5% P2O5
Concentrate: 30-32% P2OR
Tons/year produced: 300,000
Screen Analysis of Commercial Chemical Data:
Rock: 30% 50%
Over 4000 pm 1% 160 pm 70% Rock acid acid
50 pm 10% H2° 0.0
p2°5 32.4 30.0
Main Use of Rock: so3 1.8
Local Exported F SiO2 3.6 3.6 2.0
Phos. acid x CO, 6.2
X 2 Cl 0.20
TSP x
DAP/MAP CaO 51.25
Other a12°3 1.20
Fe2°3 0.25
Typical Characteristics: MgO 0.35
Grinding factor8 Na2O K2O 0.53 0.06
H SO./ton P.O,8 Ind. 2.85 MnO 0.02
Calc. 2.87 TiO2 0.04
Filtration capacity8 4.3 (4-min) U3O8 (ppm)
[tons P2O5/(day) 5.0 (3-min) Cd (ppm)
(m2)] Organics 1.52
as C
8Refer to Section A. 1.2.
appendix
Useful Tables and Diagrams
B.1 TABLES
This book was written in 1980-1981, and if not stated otherwise, the economic valuation is in 1981 U.S.$ values. During that period currencies and product prices were subject to wide variations. Consequently, it is necessary to have a general picture of the magnitude of variations that have been occurring and that may possibly become an enduring feature, at least during the next few years.
Table В. 1 shows price variations for phosphate rock, sulfur, phos phoric acid, triple superphosphate (TSP) and diammonium phosphate (DAP) over the last 40 years.
Table В. 2 presents the conversion factors for the most common technical units used in phosphoric acid calculations.
B.2 DIAGRAMS
The illustrations in this section present various data of use in phosphoric acid technology:
Specific gravity of phosphoric acid
Specific heat of phosphoric acid
Viscosity of phosphoric acid
Boiling points of phosphoric acid
Vapor pressure of phosphoric acid
567
TABLE В. 1 Price History of Phosphate Rock and Phosphate Products
Useful Tables and Diagrams
569
TABLE В. 2 Conversion Table for Common Units
Acre 43,560 4,046 square feet square meters
Atmosphere 101,325 1,033.3 29.921 14.696 newtons per square meter grams per square centimeter inches of mercury at 32°F pounds per square inch
Barrel (oil) 0.15899 42 cubic meter gallons
Bar 0.9869 1 x 10⁵ 14.504 atmosphere newtons per square meter pounds bper square inch
BTU 2.93 x 10" 4 252 1,055.1 kilowatt-hour gram -calories joules
Calorie, gram 3.968 x Ю'3 4.1868 4.13 x Ю"2 Btu joules liter-atmosphere
Centigrade 1.8 Fahrenheit
Centimeter 0.03281 0.3937 foot inch
Centipoise 0.000072 n pound/(second)( feet)
Cubic foot per minute 1.699 7.482 cubic meter per hour gallons per minute
Foot 0.3048 meter ( second) ~ 2
g (gravitational constant) 9.8067 32.18 _ о meter (second) feet (second) "2
Gallon 0.003785 cubic meter
Gallon per minute 8.021 0.226 cubic feet per hour cubic meter per hour
Hectare 2.471 acres
Horsepower (British) 1.0139 (metric)
Horsepower (metric) 75 542.47 kilogram meters per second foot pounds per second
Inch 0.02540 meter
Inches of mercury (60°F) 3,376.9 newtons per square meter
570
Appendix В
TABLE В.2 (Continued)
Inches of water (60°F) 248.84 newtons per square meter
Joule 9.48 x 10⁻⁴ Btu
0.2388 gram calorie
2.778 x IO-7 kilowatt-hour
0.009869 liter- atmosphere
Kilocalorie 4,186.8 joules
Kilogram calorie/
(meter) 2( °C) (hour) 0.2049 Btu/(feet) 2( °F) (hour)
Kilogram force 9.807 newtons
Kilogram per centimeter 14.224 pounds per square inch
Kilometer 0.6214 mile
Kilowatt-hour 3,414 Btu
860 kilogram calories
Kilowatt 1.341 horsepower
Liter 0.03532 cubic foot
0.001 cubic meter
0.26418 gallon
Micrometer 1 x 10“6 meter
Newton 0.10197 kilogram
Pascal (viscosity) 1,000 centipoise
0.072 poun d / ( secon d) ( feet)
Pound 0.4536 kilogram
Pound/(inch) 2 0.0703 kilogram / (centimeter) 2
R (gas constant) 1.986 kilogram calorie/(°C)(kmol)
1.986 Btu/(°F) (lb) (mol)
Square foot 0.0929 square meter
Square inch 6.452 square centimeters
Short ton 0.907 Metric ton
Watt 3,413 Btu per hour
1 joule per second
0.10197 kilo gram-meter per second
Useful Tables and Diagrams
571
SPECIFIC GRAVITY
FIG. B.l Specific gravities of phosphoric acid. (Temperature 20°C.) 1, Florida; 2, Tunisia; 3, Zin-Israel; 4, Taiba; 5, pure acid.
WEIGHT PERCENT OF Р,ОК z □
FIG. В. 2 Effect of P2O5 concentration in weight percent on specific gravity. (For effect of temperature see Fig. B.l.) 1, Florida; between 1 and 2 Tunisia and Tapira; 2, Zin rock; 3, Taiba; 4, pure acid temperature 20°C.
Useful Tables and Diagrams
573
FIG. B.3 Specific heat of phosphoric acid.
574
Appendix В
VISCOSITY (СР)
FIG. В.4 Effect of P2O5 concentration and temperature of pure phosphoric acid on viscosity.
Useful Tables and Diagrams
575
VISCOSITY (СР)
FIG. B.5 Effect of P2O5 concentration and temperature of crude phosphoric acid (Florida) on viscosity.
576
Appendix В
TEMPERATURE (°C)
FIG. В.6 Effect of concentration of ₽2°5 on Ьо^пЕ point of Florida acid at different absolute pressures (in mm Hg).
FIG. В. 7 Effect of concentration on vapor pressure of pure phosphoric acid.
FIG. В. 8 Effect of concentration on vapor pressure of crude acid (Florida).
Index
Abu Tartur (rock), 4
Additives, 63
Agitation, 299-320
flow, 295, 301, 302, 312
power, 301, 302
Air-swept cooling, 334-337
Akashat (rock), 4
Algeria (rock), 547
Alloys used with phosphoric acid, 510
Aluminum, 17, 66, 107-108 effect on hemidirecrystalliza-
tion, 120
in acid, 429
Ammonium sulfate, from
gypsum, 493
Analytical deviations, 545
Anhydrite, 113
Apatite, 11
Arachat (rock), 4
Arsenic:
in acid, 433
in rock, 547-565
Australia (rock), 4
Ball mill, 245-256 applications of, 250-256 operating parameters, 247
[Ball mill]
selection of, 250
Beneficiation, 12
Boiling point (phosphoric acid), 576
Bond's law, 212
BPL, 16
Brazil (rock), 4, 548
Cadmium, in acid, 434
Cake, see Filtration cake
Calcination, 15
Calcite, 15
CaO content, 16
Calcium, in acid, 428, 432
Calcium sulfate solubility product, 73
Carolina (North) (rock), 562, 563
Carolina rock particle size, 197
Catalao (rock), 4
Cement production, from gypsum, 490-492
Cement retarder, from gypsum, 489
Central Prayon, 40, 42, 47, 51
Centrifuge, 4 52- 4 55
Cerium, 110, 120
Chilisaisk (rock), 4
579
580
Index
Chlorides, in acid, 432 Chlorine, 17
Chlorine, effect on corrosion, 505- 508
Chukhrovite, 190, 393-395, 436
Circulation of slurry, 340-343 Clarification equipment, 445-455
Clarification rates, 448 Clearing of acid, 441-455 40% acid clearing, 442
Coating, 85, 89
Co-crystallization losses, 104 Comparison of rock, economic, 530-542
Conversion of phosphate rock, 288
Conversion table, technical units, 569
Coolers:
air, 38
vacuum, 38
Copper, in acid, 434
Corrosion, 497-511
high-strength process, 62
hydrofluoric acid, 183
instant monitoring, 509
Costs:
CIF, of raw materials, 23
of labor, 519
of maintenance, 523-529
of overhead, 519
of raw materials with high-strength processes, 62 Crystal growth, 112, 135
effect of reaction volume, 292
function, 126 Crystallization, 68-135 Crystal modifier, 111 Crystal size, 133 distribution, 131
Dagbati (rock), 558
Decanter centrifuge, 452-455
Defoamer, 63
Di- 2-ethylhexylphosphoric acid (D-2-EHPA), 457 process, 462
Dihydrate (calcium sulfate), 113 process, 35-38, 68, 44 process material balance, 36-37 specific gravity, 166 specific heat, 166 systems, 35-38
Dihydrate-hemihydrate (DH-HH) processes, 40-45 recrystallization, 121 solubilities in phosphoric acid, 116
thermodynamic equilbrium, 114 Di-octylphenilphosphoric acid
(DOPPA), 457
Djebel Onk (rock), 547
Dorr-Oliver, 111
Dry grinding, see Grinding
Duchess (rock), 4
Durco, 510
Durimet, 510
Egypt (rock), 4
Electric power consumption with high-strength processes, 65-66
Environmental problems, 32
Feeding, raw materials, 132-133, 281-287
Filter, 397-403 corrosion, 403 investment costs, 402 maintenance costs, 403
Prayon, 399
Rhone-Poulenc, 400
scaling, 395
selection, 399
tilting pan, 398
traveling belt, 397
water consumption, 402
Filter cloth, consumption of, 403
Index
581
[Filter cloth]
plugging, 393
Filtration, 369-404
additives, 378
cake wash, 380, 385
capacity, 546
of concentrated acid for clarification, 451
diagram, 381, 383, 384
factors that influence, 376
flocculants, 378
overloading, 390
presuction, 387
recovery, 369
Filtration rate:
affect of feed rate, 133
affect of reaction volume, 292
affect of phosphate rock, 373 typical performances, see
Rock data sheets, 543-565
Finland (rock), 4, 549
Fish eyes, 200
Fisons, 9, 11
Fisons HH, 62, 40, 43, 52, 53
Fisons HDH, 43, 52, 56 Flocculants, 17, 378-380 Florida (rock), 560, 561 Florida rock
coating effect, 89
grinding constants, 268
particle size, 197
Flotation, 14
Fluorine, 16, 182-193
behavior during storage and concentration of phosphoric acid, 191
content in acid, 182, 543-547 content in acid, 182, 547-565 content in rock, 110, 186, 547-565 effect on marine life, 473 material balance in phosphoric
acid plant, 189-193
Fluorine emission, 190
control, 345-365
ecological impact, 346
from pond water, 486
Fluorine immission, 348
Foam breaking (mechanical) , 320-331 Freeboard, reactor, 328 Freight charges, 24
Gafsa (rock), 87
Gas washing equipment, 349-366 cross-flow scrubber, 355 cyclonic spray scrubber, 359 efficiency and price table, 351 packed tower, 355 spray-cross-flow packed-bed scrubber, 355 spray tower, 354 venturi scrubber, 357
Grinding, 195-279 classification devices, 243 energy, 204-219 effect of rock origin, 205 factor, 546 history, 201 mechanism of breakage, 200 open loop, 215 particle size distribution, 200
Grinding, dry, 219-223, 257-274 equipment type, 216 feed, 207 fuel requirements, 221 open/closed loop, 215 production rate, 218 product size, 207 power requirements, 221 versus wet, 213
Grinding mill:
ball mill, see Ball mill
flint pebble, 203
ring roller, see Ring roller mill roller, see Roller mill rod mill, see Rod mill
Grinding, wet, 223-243 abrasion index, 235 acid water grinding, 237 classification devices, 241 closed-loop, 239 dilution requirements, 226 effect on filtrate strength, 235 hydrocyclones, 244
582
Index
[Grinding, wet]
recovery, 233
water balance, 232
wear, 235
Gulf-Swenson, 40-42
isothermal process, 9
Gypsum:
cake calculation, 146 dispersion in water, 472-476 disposal of, 471-496 economics, 488 impounding on land, 476-489 soil conditioner, 492 usage of, 471-496
Hastelloy, 510
Heat balance, 160-173
Heat removal, 331-340
Hemidihydrate (HDH) processes, 40-46
recrystallization, 104
Hemihydrate (HH), 113 high-strength process, 39 hemihydrate-dihydrate recrystallization, 116 processes, 36-68, 40, 41, 44 recrystallization, 105, 116-121 single-stage, 40, 45, 47, 52 specific heat, 166 specific gravity, 166
Heurtey, 11, 42
High-strength processes, 60
capital cost, 60
material of construction, 60
maintenance costs, 61
on-line time, 61
HV-9A, 62
Hydrofluosilicic acid (H2SiF6), 183
droplet entrainment, 353
mist formation, 353
partial vapor pressure,
350-353
Impeller, 301
types, 305
Impurities:
in rock, 15, 107, 119, 132
in acid, 427-470
Investment costs, (phosphoric acid plants), 513-517
Irak (rock), 4
Iron (in acid), 108, 431
effect on corrosion, 509
Israel (rock), 550, 551 grinding constant, 268, 546
Jacobs-Dorr, 9, 40, 42
HYS process 40, 43, 52, 58, 62
Jacupiranga (rock), 4
Jordan (rock, 552
grinding constant, 268
Kaala Djerda (rock) , 87
Kamdheng (rock), 4
Karatau (rock), 4
Khneifiss (rock), 565
Khouribga (rock), 4, 553
Kick's Law, 207
Kimre pads, 362
Kingisep (rock), 4
Kola (rock), 4, 62, 63, 564
kinetics of reaction, 87
Labor costs, 519
Lamella thickener, 447, 451
Lanthanum, 110, 120
Lead, in acid, 434
Losses (P2O5), 144, 173-182
cake impregnation losses, 176
co-crystallized losses, 180
lattice losses, 180
mechanical losses, 177
unreacted rock, 181
Igneous phosphates, see Phosphates
Magnesium, 17, 108
in acid, 432
Maintenance costs, 523-529
Index
583
Manufacturing costs, 517-529
Material balance:
calculation of, 141-194
phosphoric acid plants, 36, 37
Mdilla (rock), 559
Mercury, in acid, 434
Metering:
equipment, 284
raw materials, 281-287
Mining, 12
open cast, 12
underground, 12
Mitsubishi, 47, 50
Mono-octylphenilphosphoric
acid (MOPPA), 457
Morokko (rock), 553, 554, 555
filtration diagram, 384
grinding constants, 268
size analysis, 198
Nauru (rock), 4
Nionel, 510
Nissan H, 62, 40, 42, 47, 48
Nissan C, 40, 43, 52, 57
NKK process, 40, 43, 47, 49,
52, 55, 59
Nondihydrate processes, 38-68
North Carolina (rock), 562, 563
coating of, 89
kinetics of reaction, 88
Nucleation, 125
density estimation, 128
Nucleus (crystal), formation, 72
Octylpyrophosphoric acid (OPPA), 457 process, 464
OPAP process, 465
Organics, 12, 15, 17, 111
Oron (rock), 551
Overburden, 12
Oxy-hemihydrate 40, 43, 52, 54
Oxy-recrystallization, 40, 43, 52
Peripheral speed, effect on corrosion, 499-501
Peru (rock), 4
Pendulum mill, 260- 270
Phalaborva (rock), 4, 111
Phosphate rock, 11-26
chemical composition, 25-26, 543-565
consumption calculation, 144
conversion, 288
external surface, 205
igneous, 1, 11, 62, 63, 199
introduction into reactor, 71, 85
kinetics of attack (reaction),
86-89
market, 27
metamorphic, 1
mining, 12
particle size, 71, 101
production costs, 17
quality constants for grinding, 266
sales prices, 20
sedimentary 1, 11, 12
unattacked losses, 206
Phosphoric acid:
boiling point, 576
chemical composition, 547-565
effect of concentration on recrystallization, 117
market, 30-32
prices, 568
quality requirements, 439
specific gravity, 571, 571
specific heat, 573
transportation of, 31
viscosity, 574, 575
water vapor pressure, 577
Plaster production (from gypsum), 489
Plant overhead (costs), 519
Potassium, in acid, 432
Potassium silicofluoride, 184
solubility in HgPO,}, 185
Power number (agitator), 310-315, 317, 330
Prayon, 40, 42
process, 9
reactor, 296
584
Index
Prices: ( miscellaneous)
DAP, 568
Phosphoric acid, 568
Phosphate rock, 568
CIF, 23
contracted, 22
FOB, 568
listed, 22
sales, 20
variation, 22
Sulfur, 568
TSP, 568
Pumping slurry, 340-344
Quality requirements for phosphoric acid, 439
Ralstonite, 436
Rare earth compounds, 110
Reactions in phosphoric acid production, 68-135
Reaction system, and effect on crystallization, 112
Reactor, 287-298
agitation in, 294
cooling, 298
retention time, 288
slurry circulation, 294
volume, 288
Reactor volume, economics of, 293
Recirculation of slurry, 81
Recycle acid calculation, 147
Recycle acid system, 156, 156-164
control, 159
Redeyeff (rock), 87
Retarder (of recrystallization), 63
Reynold's number for impeller, 306
Rhone-Poulenc, 40, 42 process, 9 reactor, 295
Ring roller mill, 260- 270 economics, 267 grinding capacity, 265 power consumption, 267
Rittinger's law, 207
Rod mill, 257-260
Roller mill, 270-274
Russeifa (rock), 4
Sanicro, 510
Saturation, 74-91
Scaling, 186-191
descaling washes, 188
Seawater composition, 474
Sechura (rock), 4
Senegal (rock), 556
Settling of phosphoric acid, 441
settling tanks, 445-447
Shutdown, annual, 529
Silica, 17, 183
active, 63, 183
SIAPE, 40, 42
foam-breaking, 327
process, 9
reactor, 298
Siilinjarvi (rock), 4, 549
Sludge, 427-455
amount to expect, 547-565
Slurry reaction:
calculation, 143
specific heat, 166
Sodium, 17
Sodium silicofluoride, 184, 436
solubility in H3PO4, 185
Soil conditioner, 492
Solvent extraction, 459
Solid content (in reaction slurry), 102
South Africa (rock) , 4
Specific gravity of phosphoric
acid, 571-572
Specific heat of phosphoric acid, 573
Spray nozzles, 360
Stainless steel, 510
Index
585
Steam consumption, 63
Strontium, 111
Sulfates, 17
Sulfur, 26-27
Sulfuric acid, 70-71
consumption of, 146
cost of, 518
in phosphoric acid, 428
effect on crystal size, 133
effect on corrosion, 501-503
production from gypsum,
490-492
specific consumption, 547-565
Supersaturation, 73, 74-91, 113
effect on crystal size, 133
Syria (rock), 565
Taiba (rock), 4, 556
filtration diagram, 381
grinding constants, 268
grinding fineness, 206
Tapira (rock, 548
Tellerettes, 361
Temperature:
effect on corrosion, 501
effect on crystallization, 111
effect on hemi-dihydrate recrystallization, 117
Tennessee (rock), 4
Thickener, lamella, 447-451
Togo (rock) 557, 558
grinding constants, 268
grinding fineness, 206
TPL, 16
Trace elements, 17
Tray settler, 447-451
Trioxylphosphine oxide (TOPO), 457
process, 462
Tunisia rock 4, 559
filtration diagram, 383
grinding constants, 268
kinetics of reaction, 86, 87
[Tunisia rock] particle size, 198
Units (conversion table), 569
Uranium, 455-470
recovery of, 32, 455-470
Uranus Bg, 510
U.S.A, (rock), 4, 560, 561, 562, 563
USSR (rock), 564
kinetics of reaction, 87
Utility costs, 63
Vietnam (rock), 4
Viscosity of phosphoric acid, 574, 575
Vapor pressure of phosphoric acid, 577
Vacuum flash cooling, 337-340
Water
cake impregnation (moisture), 153
filter feed, 153
of crystallization, 148
of dilution (acid), 149
of vaporization, 148
Weigh belt feeder, 286
Wet grinding, see Grinding
Wet scrubber, 349
X compound, 436
Zinc, in acid, 434
Zin rock, 550
Youssoufia (rock), 111, 554,
555