/


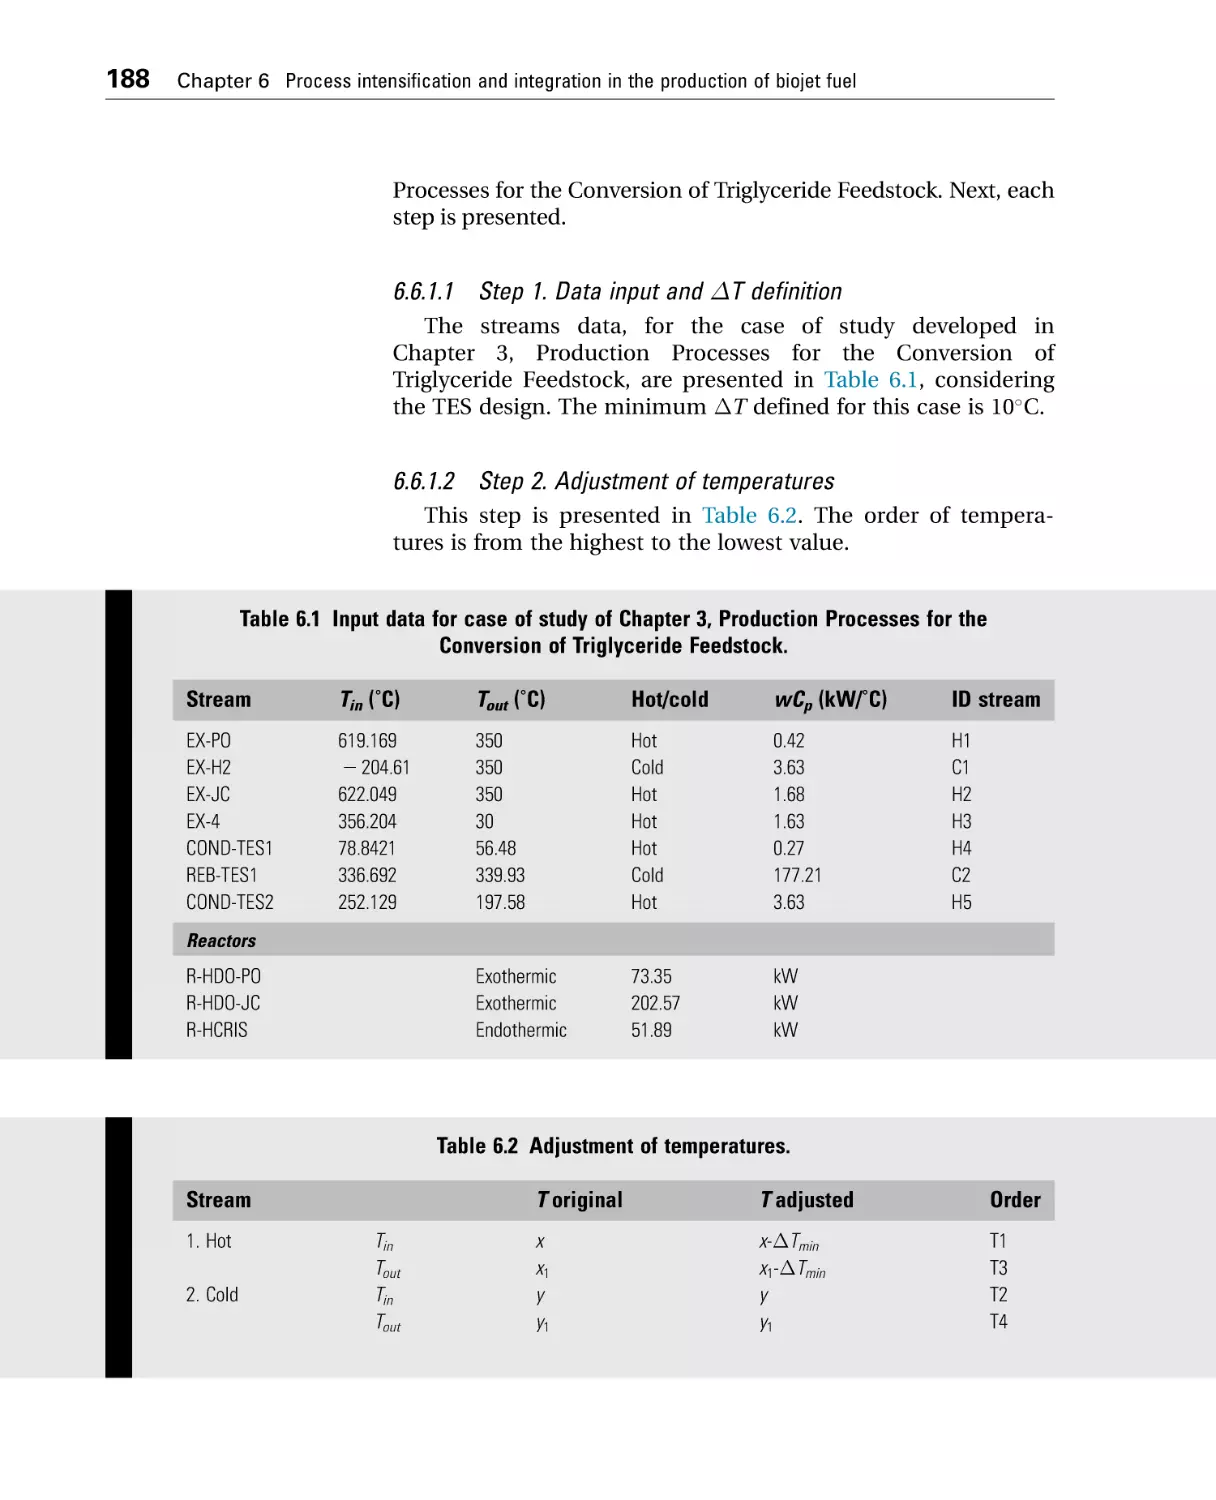

Author: Gutiérrez-Antonio C. Romero-Izquierdo A.G. Gómez-Castro F.I. Hernández S.
Tags: aviation
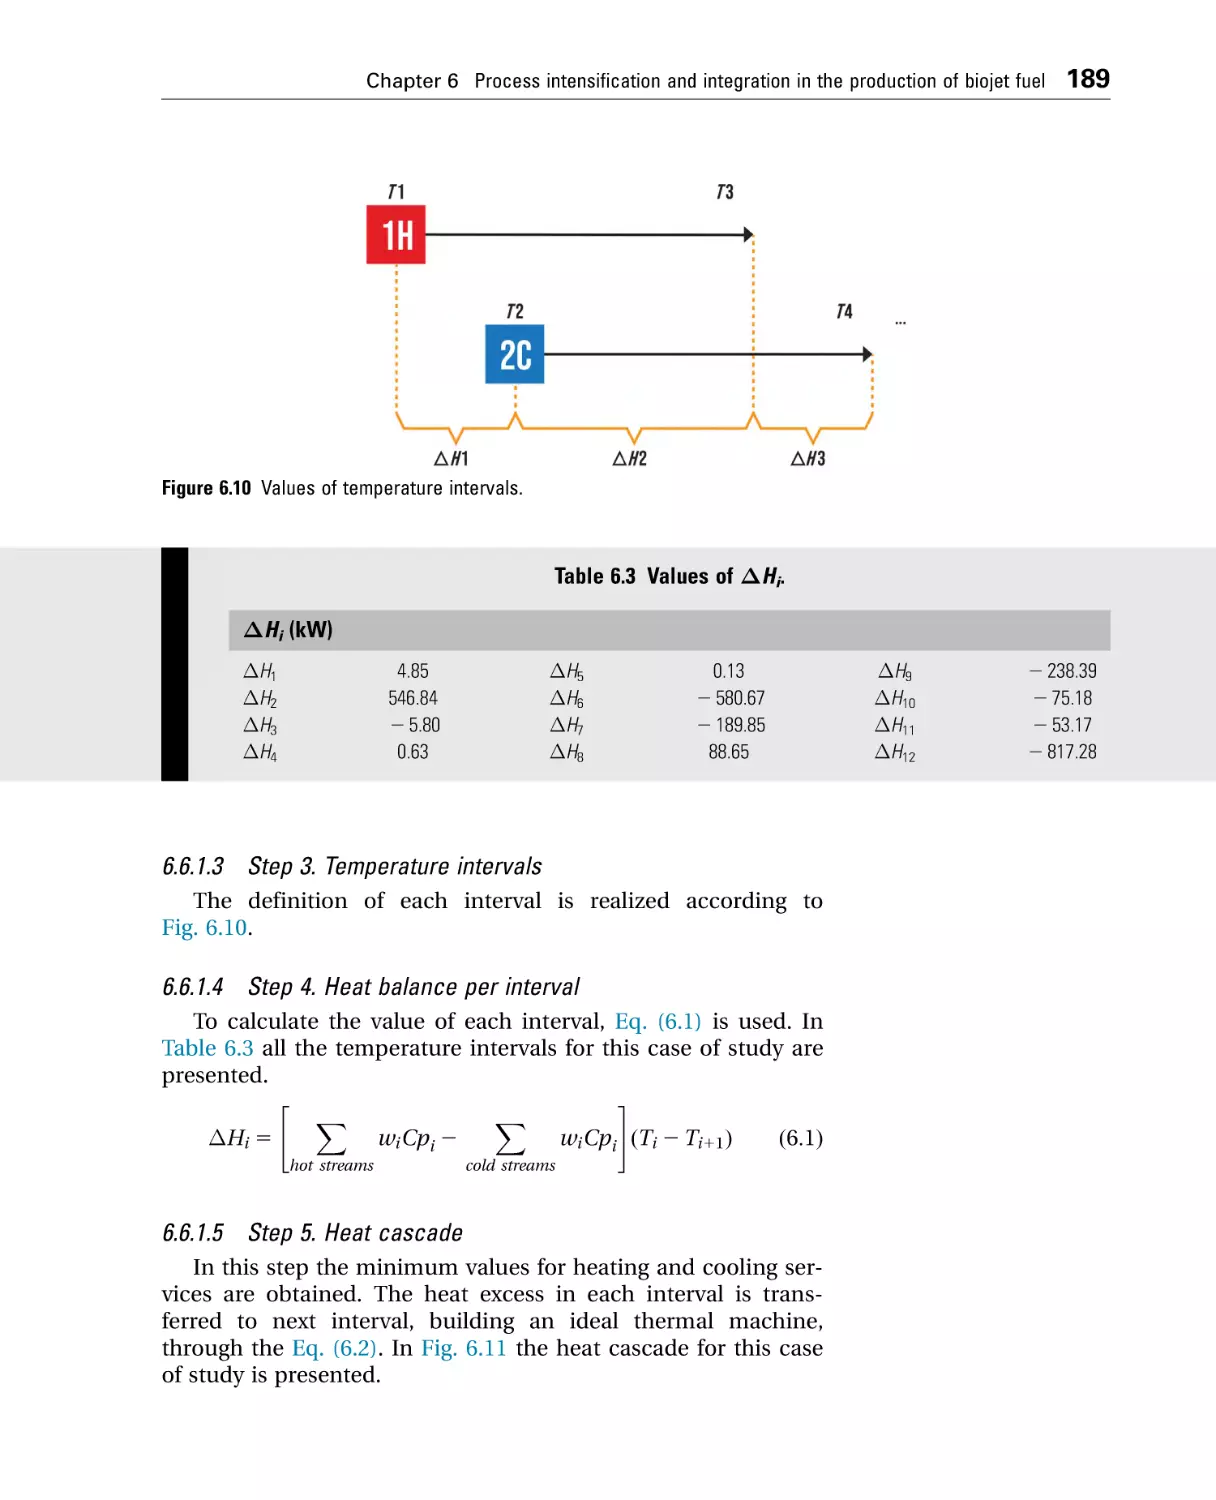
ISBN: 978-0-12-819719-6
Year: 2021


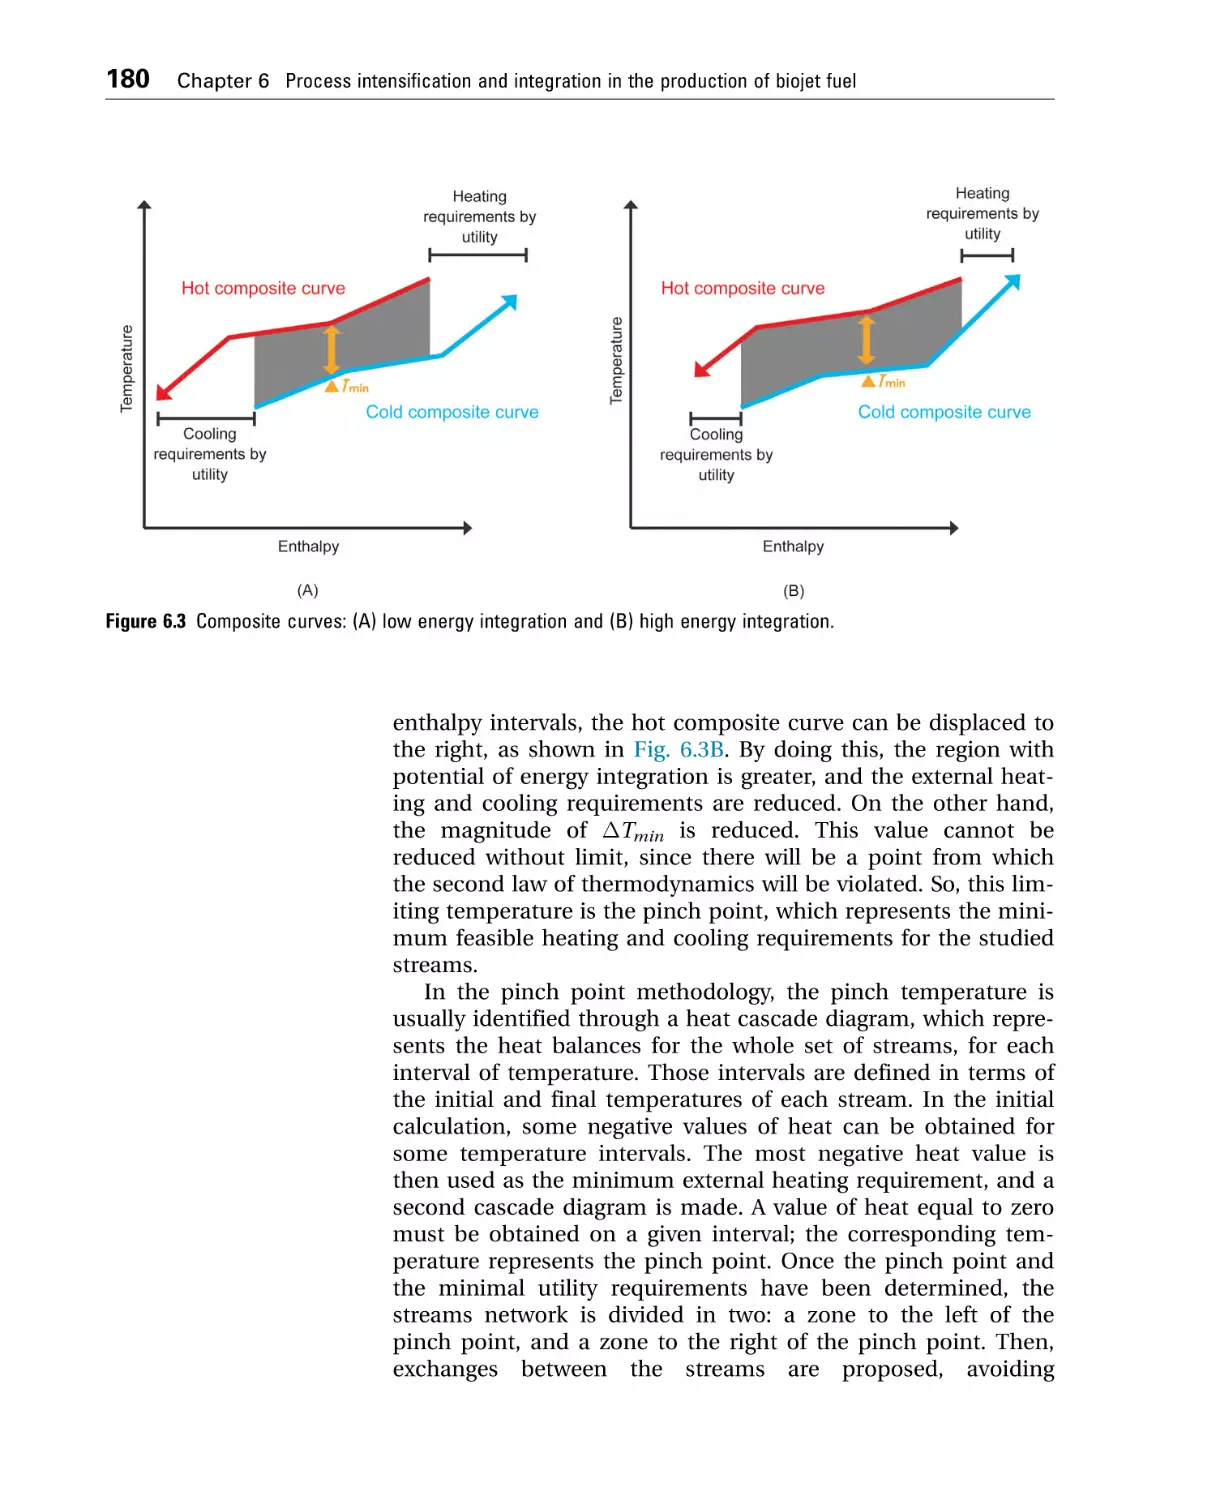
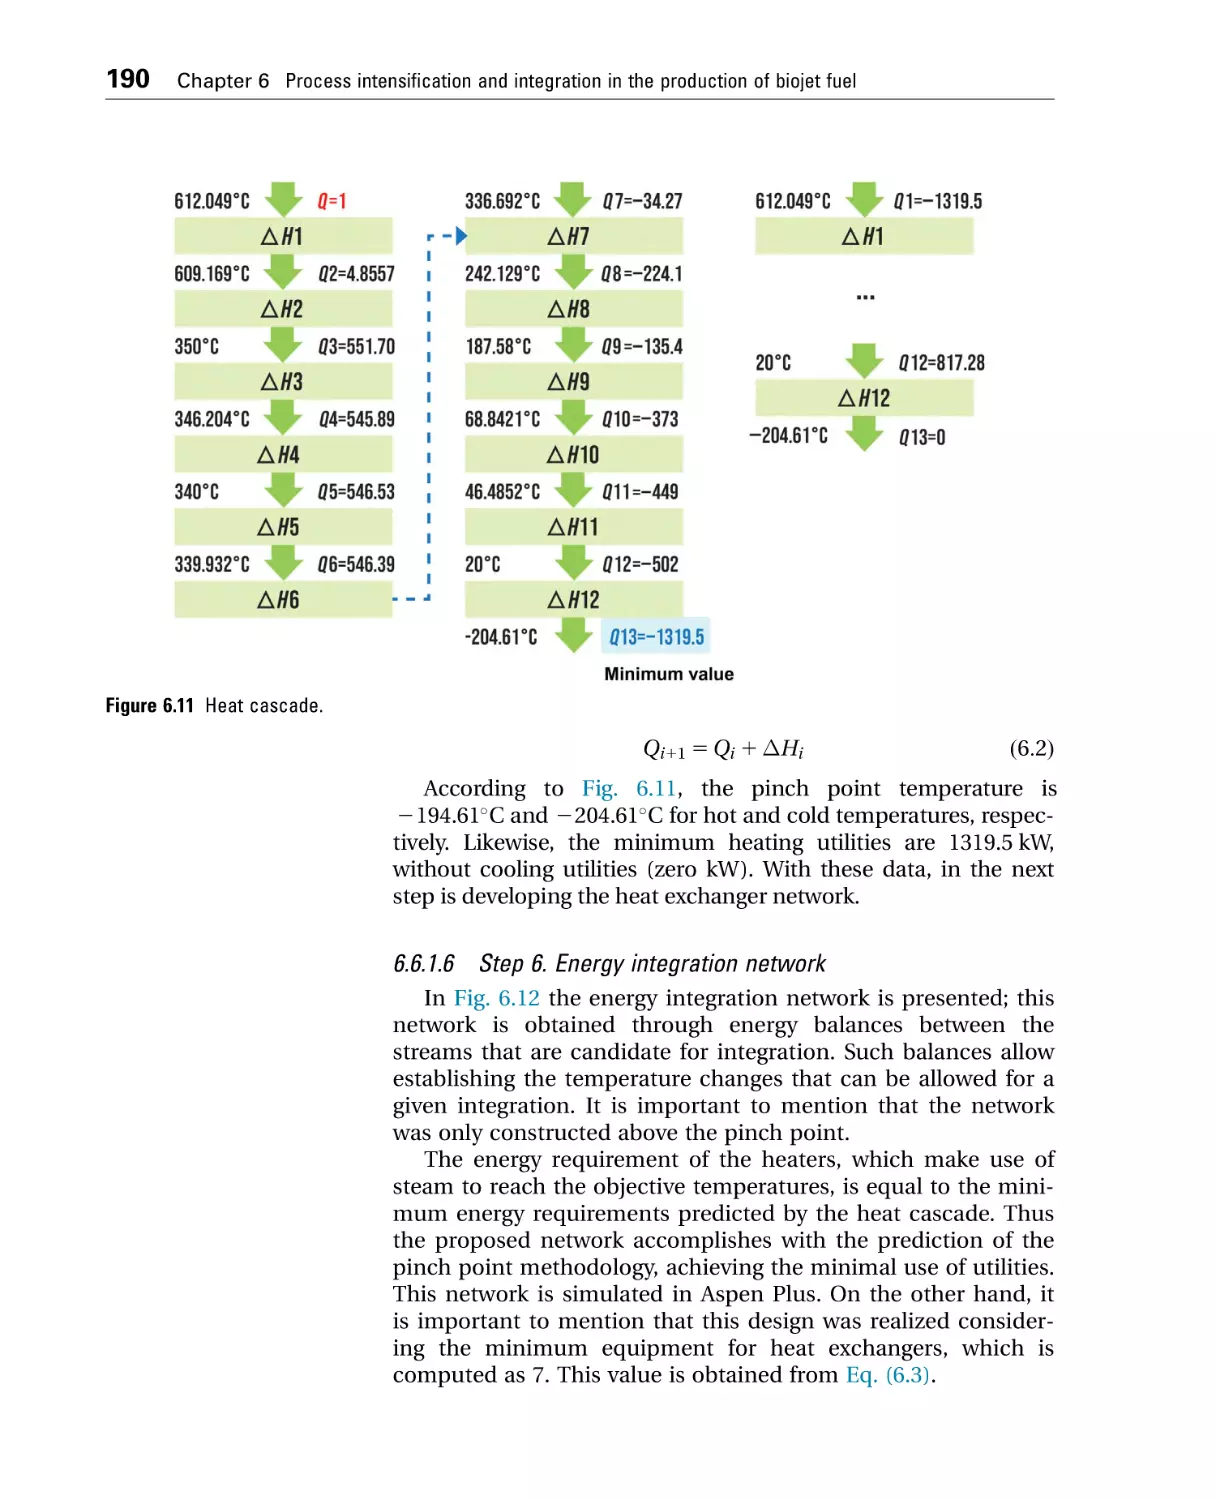
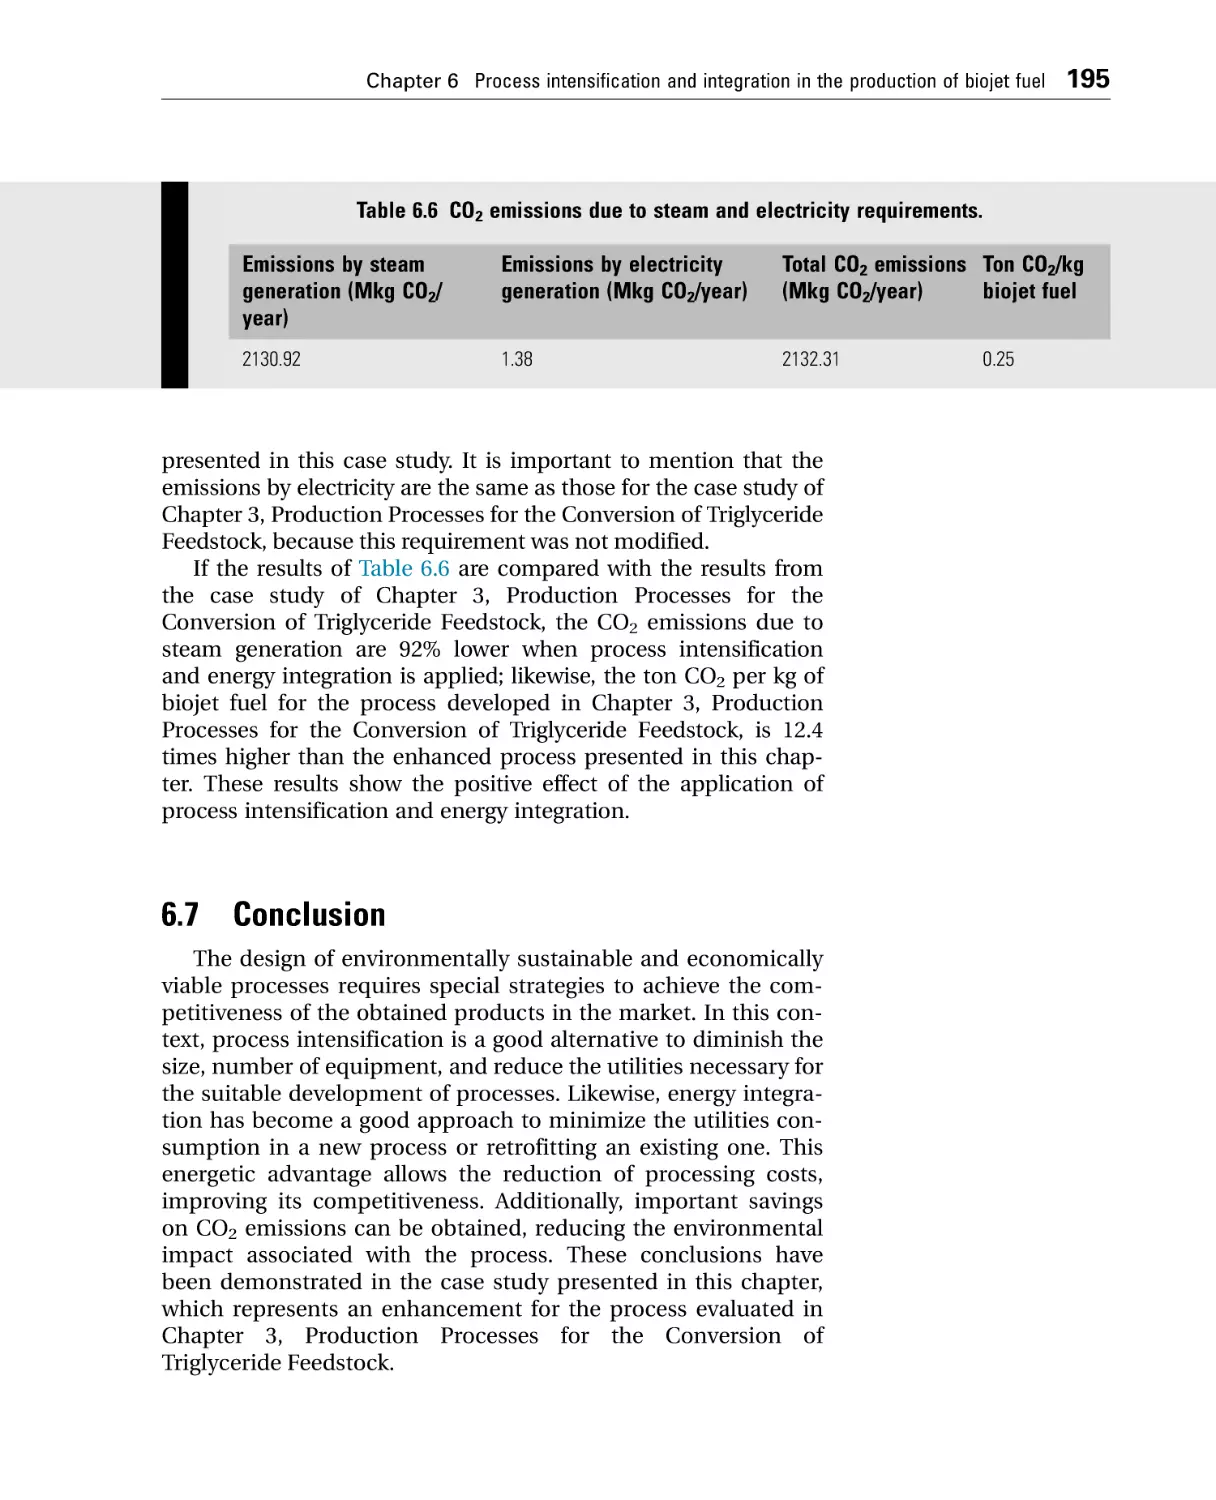
Text
PRODUCTION
PROCESSES OF
R E N E W A B L E AV I AT I O N
FUEL
PRODUCTION
PROCESSES OF
R E N E W A B L E AV I AT I O N
FUEL
Present Technologies and
Future Trends
CLAUDIA GUTIÉRREZ-ANTONIO
Chemistry Faculty, Universidad Autónoma de Queretaro, Querétaro, Mexico
ARACELI GUADALUPE ROMERO-IZQUIERDO
Chemical Engineering Department, Universidad de Guanajuato, Guanajuato, Mexico
FERNANDO ISRAEL GÓMEZ-CASTRO
Chemical Engineering Department, Universidad de Guanajuato, Guanajuato, Mexico
SALVADOR HERNÁNDEZ
Chemical Engineering Department, Universidad de Guanajuato, Guanajuato, Mexico
Elsevier
Radarweg 29, PO Box 211, 1000 AE Amsterdam, Netherlands
The Boulevard, Langford Lane, Kidlington, Oxford OX5 1GB, United Kingdom
50 Hampshire Street, 5th Floor, Cambridge, MA 02139, United States
Copyright © 2021 Elsevier B.V. All rights reserved.
No part of this publication may be reproduced or transmitted in any form or by any means, electronic or mechanical, including
photocopying, recording, or any information storage and retrieval system, without permission in writing from the publisher.
Details on how to seek permission, further information about the Publisher’s permissions policies and our arrangements with
organizations such as the Copyright Clearance Center and the Copyright Licensing Agency, can be found at our website: www.
elsevier.com/permissions.
This book and the individual contributions contained in it are protected under copyright by the Publisher (other than as may be
noted herein).
Notices
Knowledge and best practice in this field are constantly changing. As new research and experience broaden our understanding,
changes in research methods, professional practices, or medical treatment may become necessary.
Practitioners and researchers must always rely on their own experience and knowledge in evaluating and using any information,
methods, compounds, or experiments described herein. In using such information or methods they should be mindful of their
own safety and the safety of others, including parties for whom they have a professional responsibility.
To the fullest extent of the law, neither the Publisher nor the authors, contributors, or editors, assume any liability for any injury
and/or damage to persons or property as a matter of products liability, negligence or otherwise, or from any use or operation of
any methods, products, instructions, or ideas contained in the material herein.
British Library Cataloguing-in-Publication Data
A catalogue record for this book is available from the British Library
Library of Congress Cataloging-in-Publication Data
A catalog record for this book is available from the Library of Congress
ISBN: 978-0-12-819719-6
For Information on all Elsevier publications
visit our website at https://www.elsevier.com/books-and-journals
Publisher: Joe Hayton
Acquisitions Editor: Kostas KI Marinakis
Editorial Project Manager: Rachel Pomery
Production Project Manager: Kumar Anbazhagan
Cover Designer: Victoria Pearson
Typeset by MPS Limited, Chennai, India
Contents
1 Biojet fuel: Driving the aviation sector to sustainability...........................1
1.1 Motivation............................................................................................. 1
1.2 Basic concepts ...................................................................................... 3
1.3 ASTM standards................................................................................... 6
1.4 Combustion and flight tests .............................................................. 17
1.5 Summary ............................................................................................ 21
References ................................................................................................. 21
2 Renewable feedstock and its conversion routes to biojet fuel.............33
2.1 Introduction ........................................................................................ 33
2.2 Raw materials ..................................................................................... 34
2.2.1 Triglyceride feedstock ...............................................................35
2.2.2 Sugar and starchy feedstock .................................................... 37
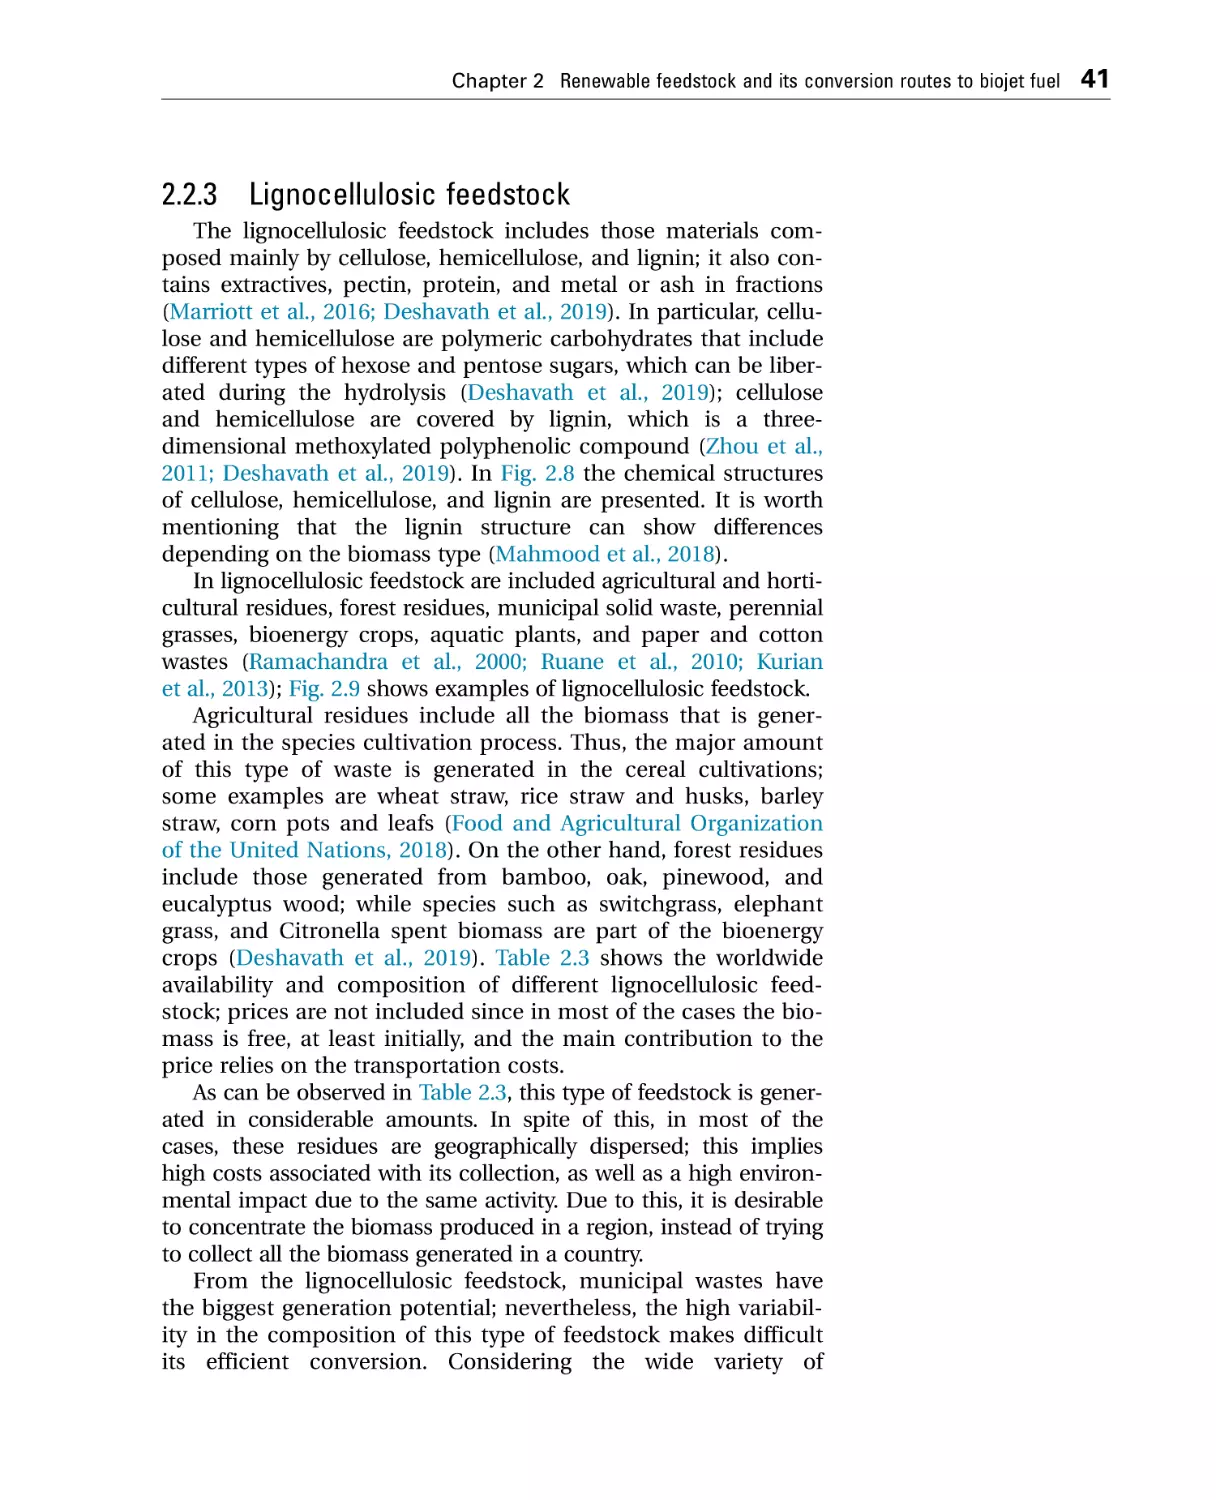
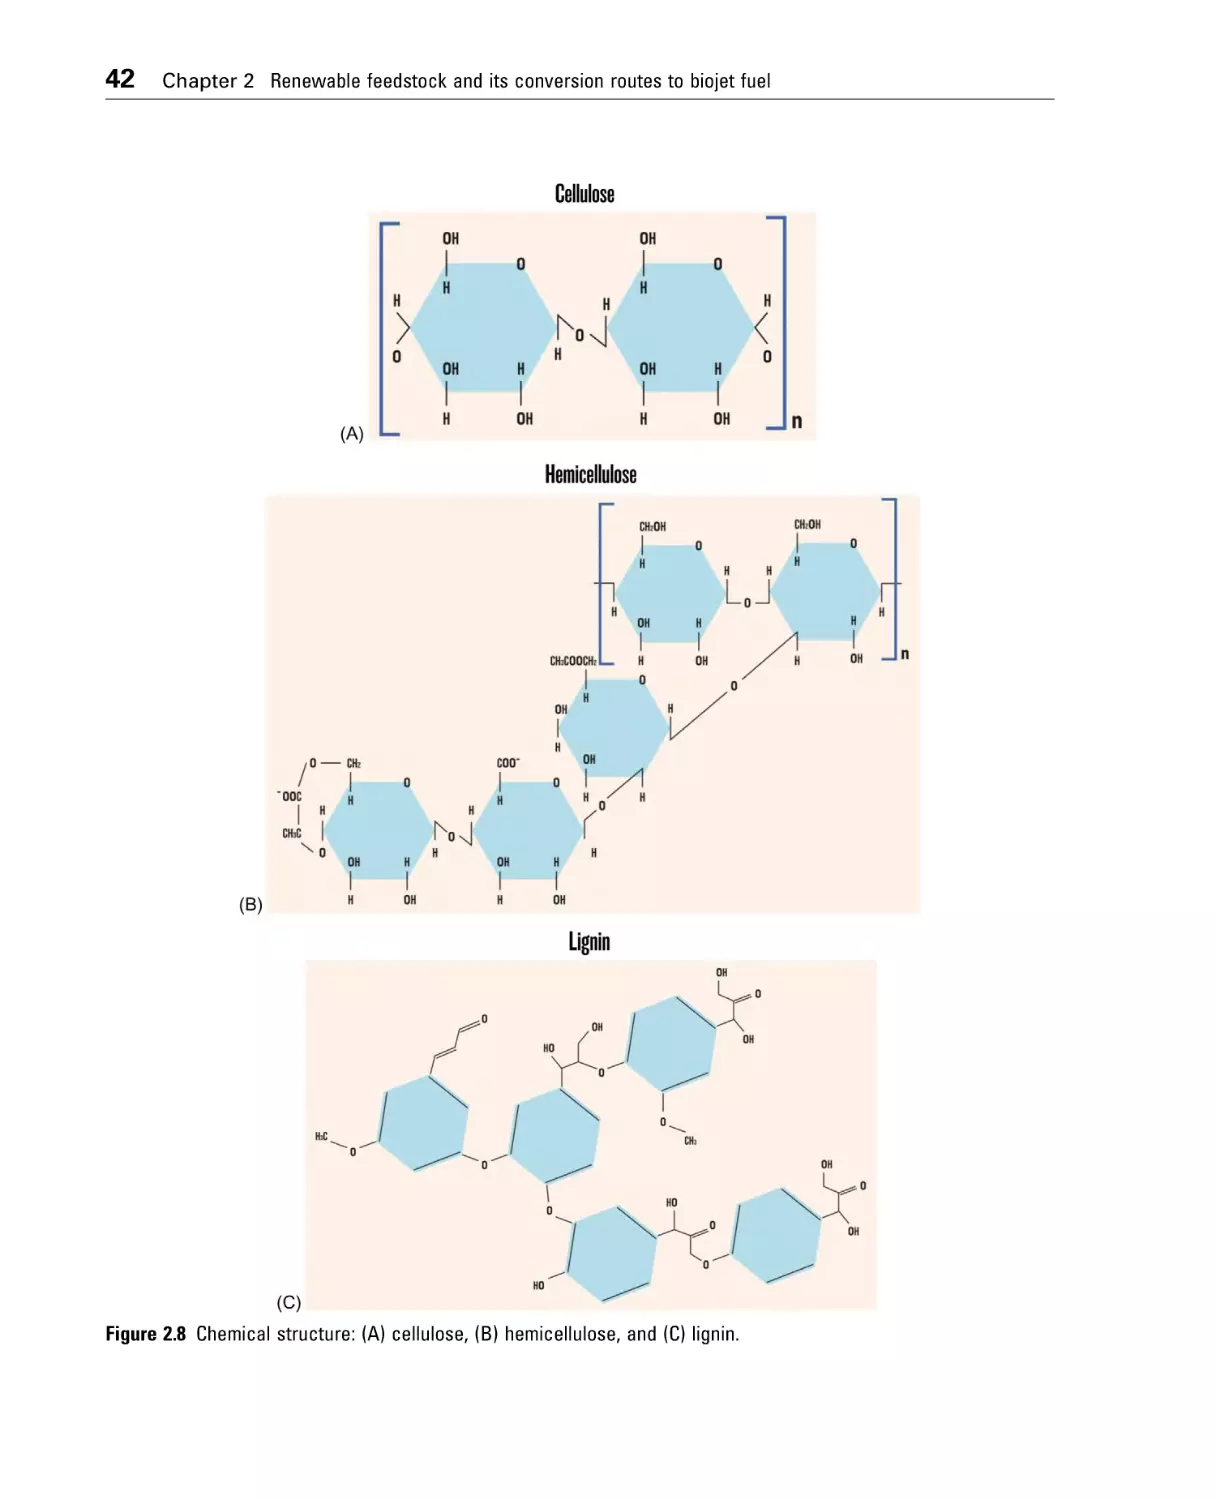
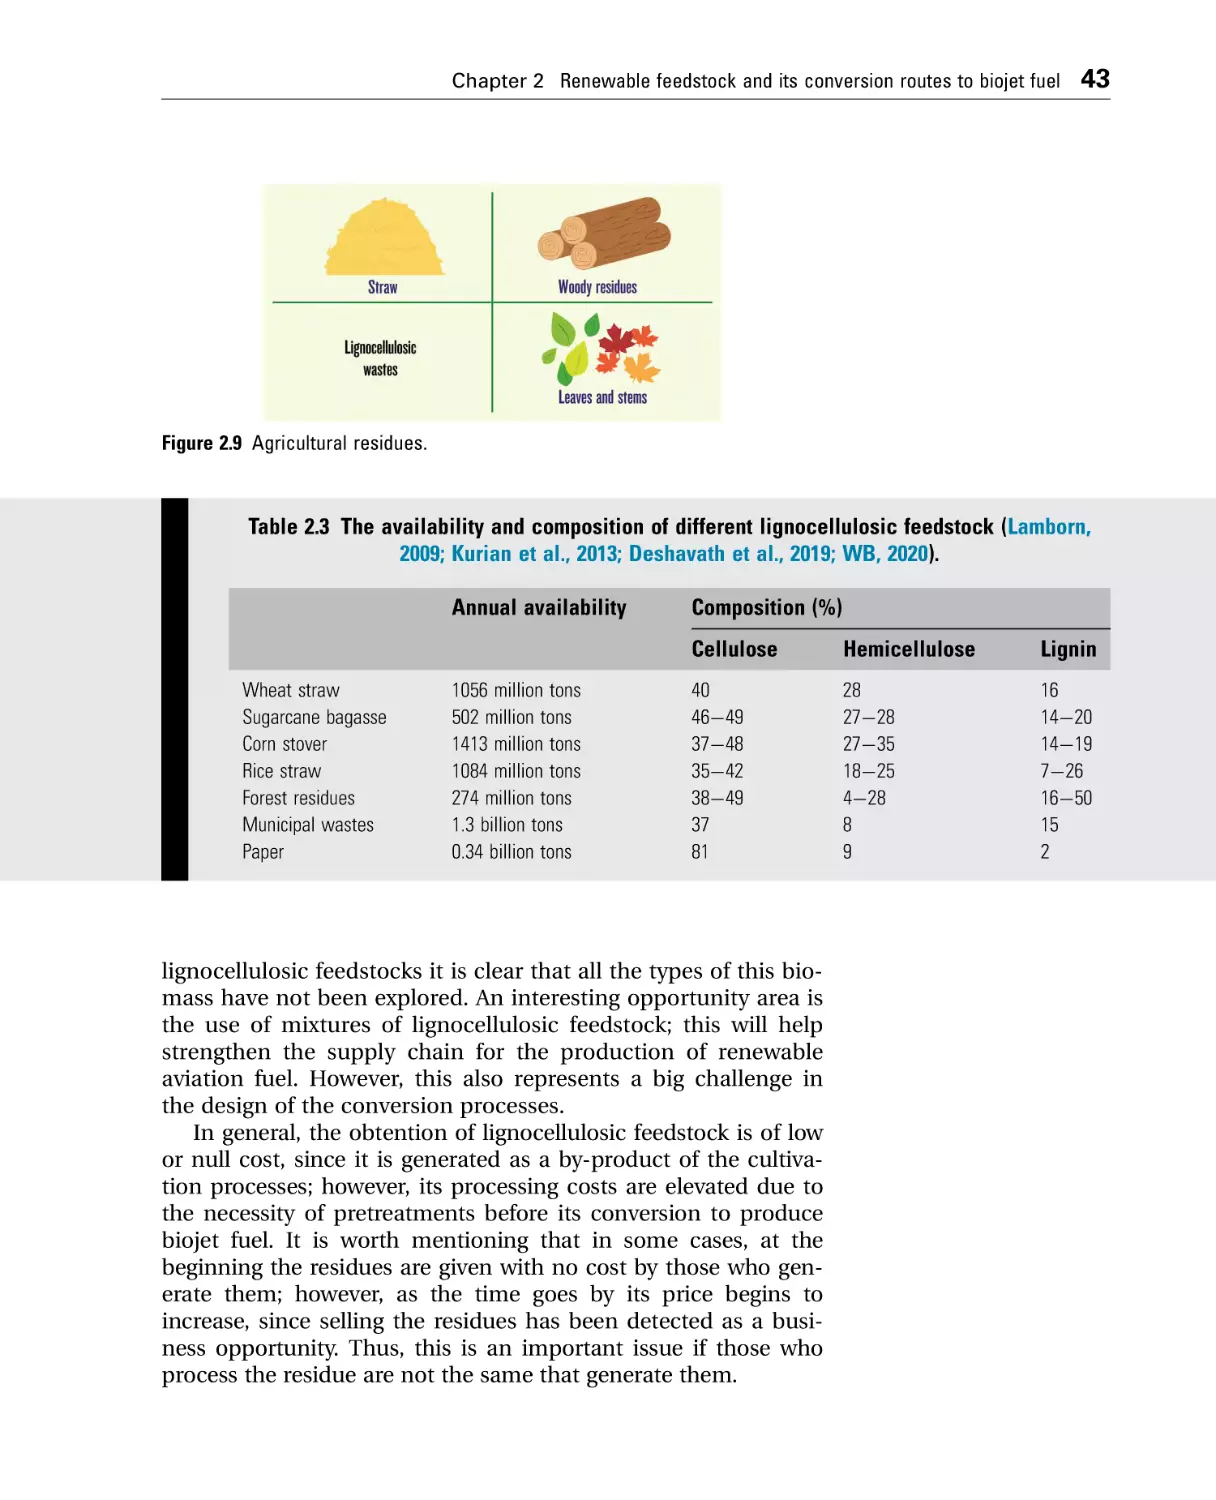
2.2.3 Lignocellulosic feedstock.......................................................... 41
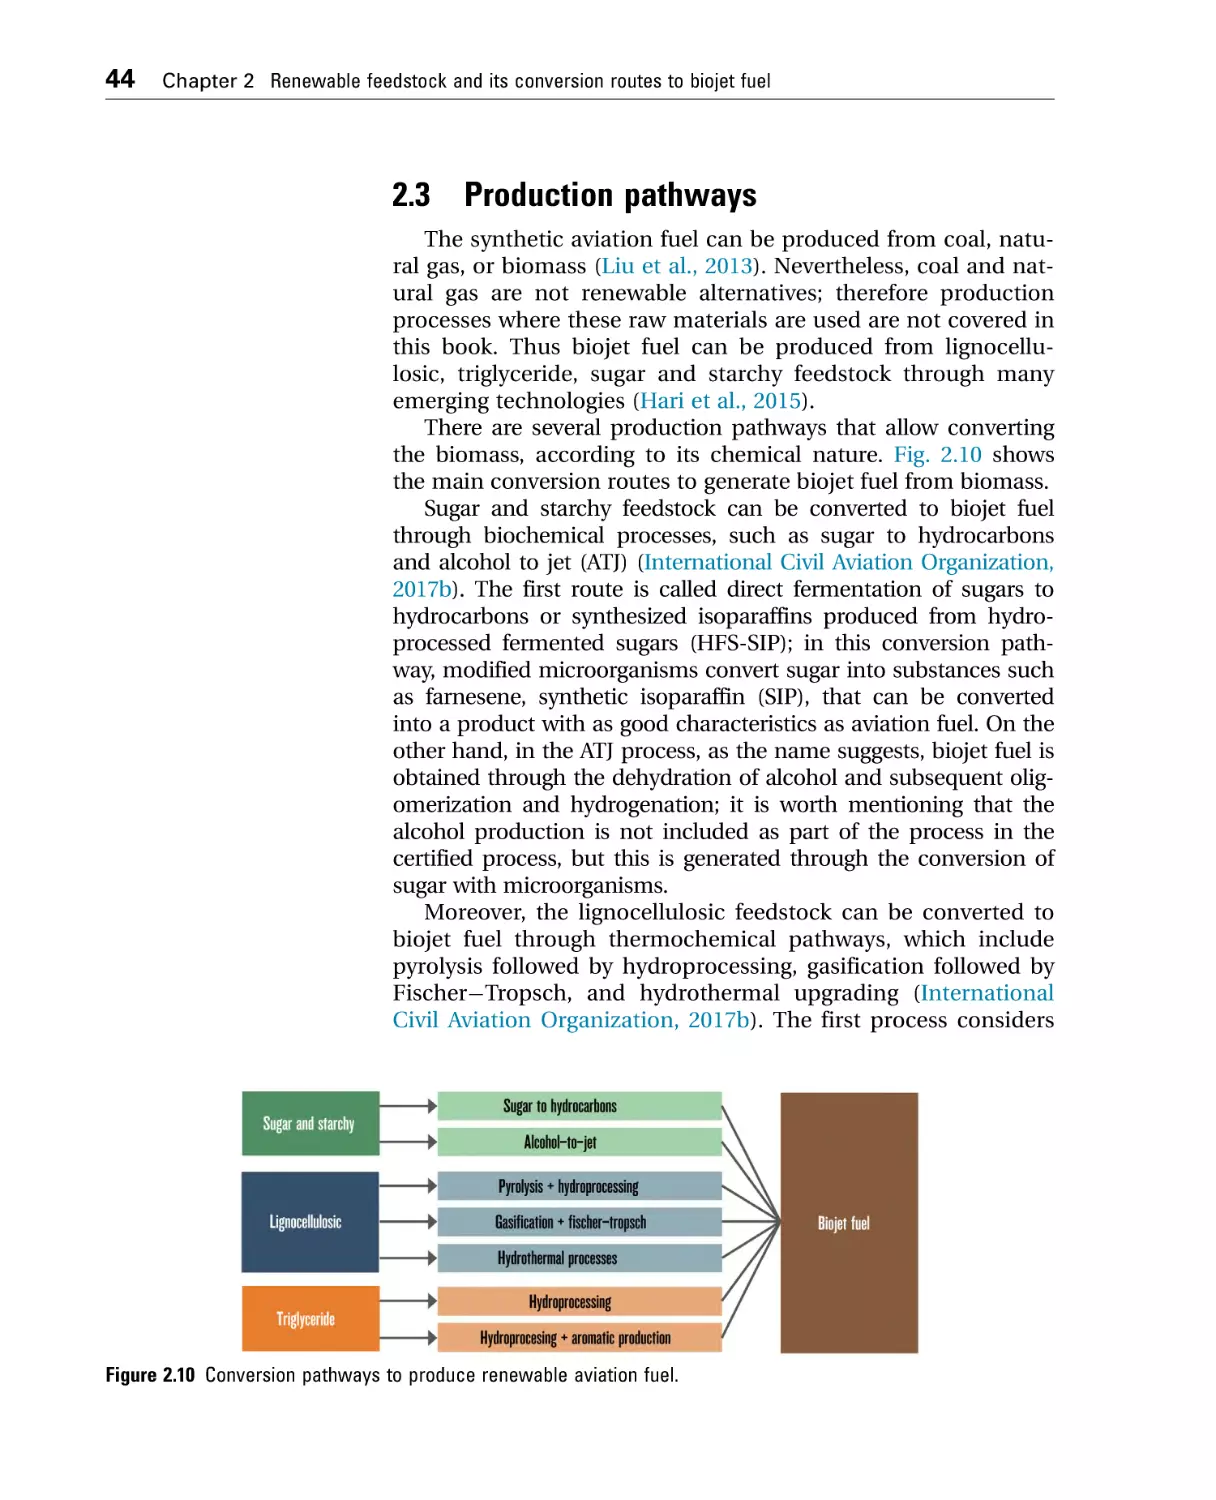
2.3 Production pathways ......................................................................... 44
2.3.1 Certified pathways.....................................................................47
2.3.2 Advances in the certification of new pathways ......................49
2.4 Summary ............................................................................................ 50
References ................................................................................................. 51
3 Production processes for the conversion of triglyceride
feedstock ..............................................................................................................55
3.1
3.2
3.3
3.4
3.5
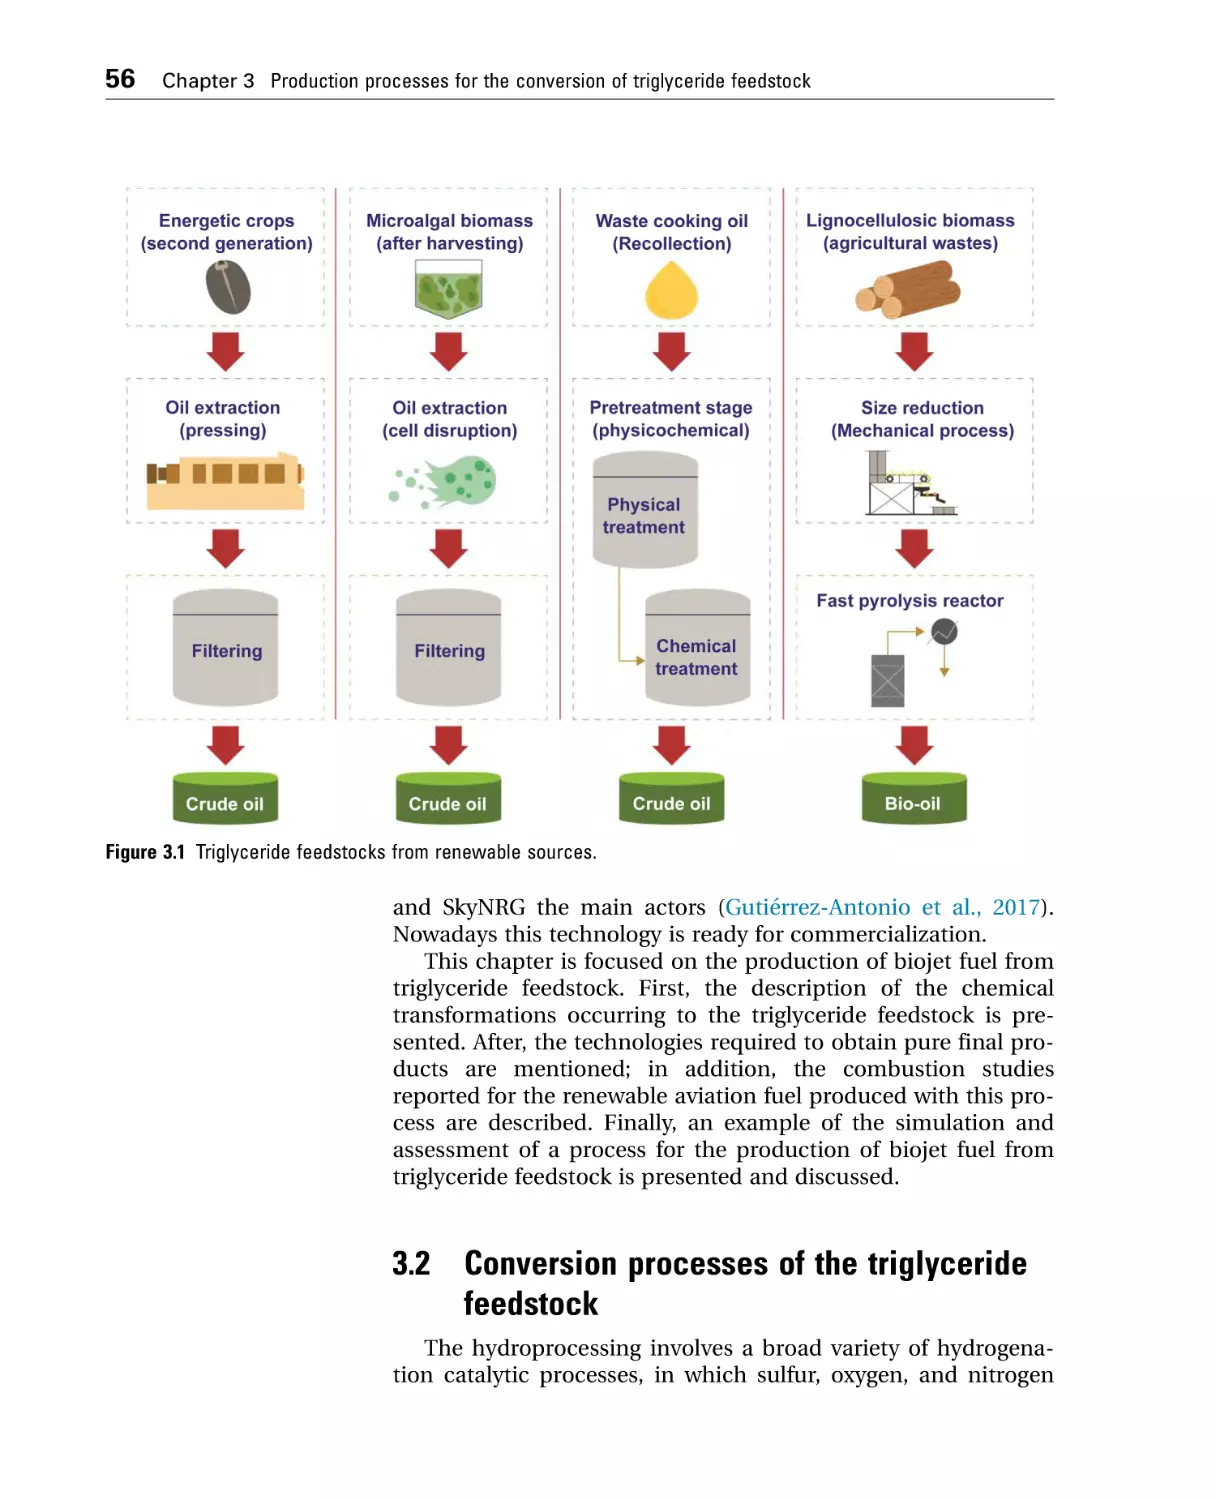
Introduction ........................................................................................ 55
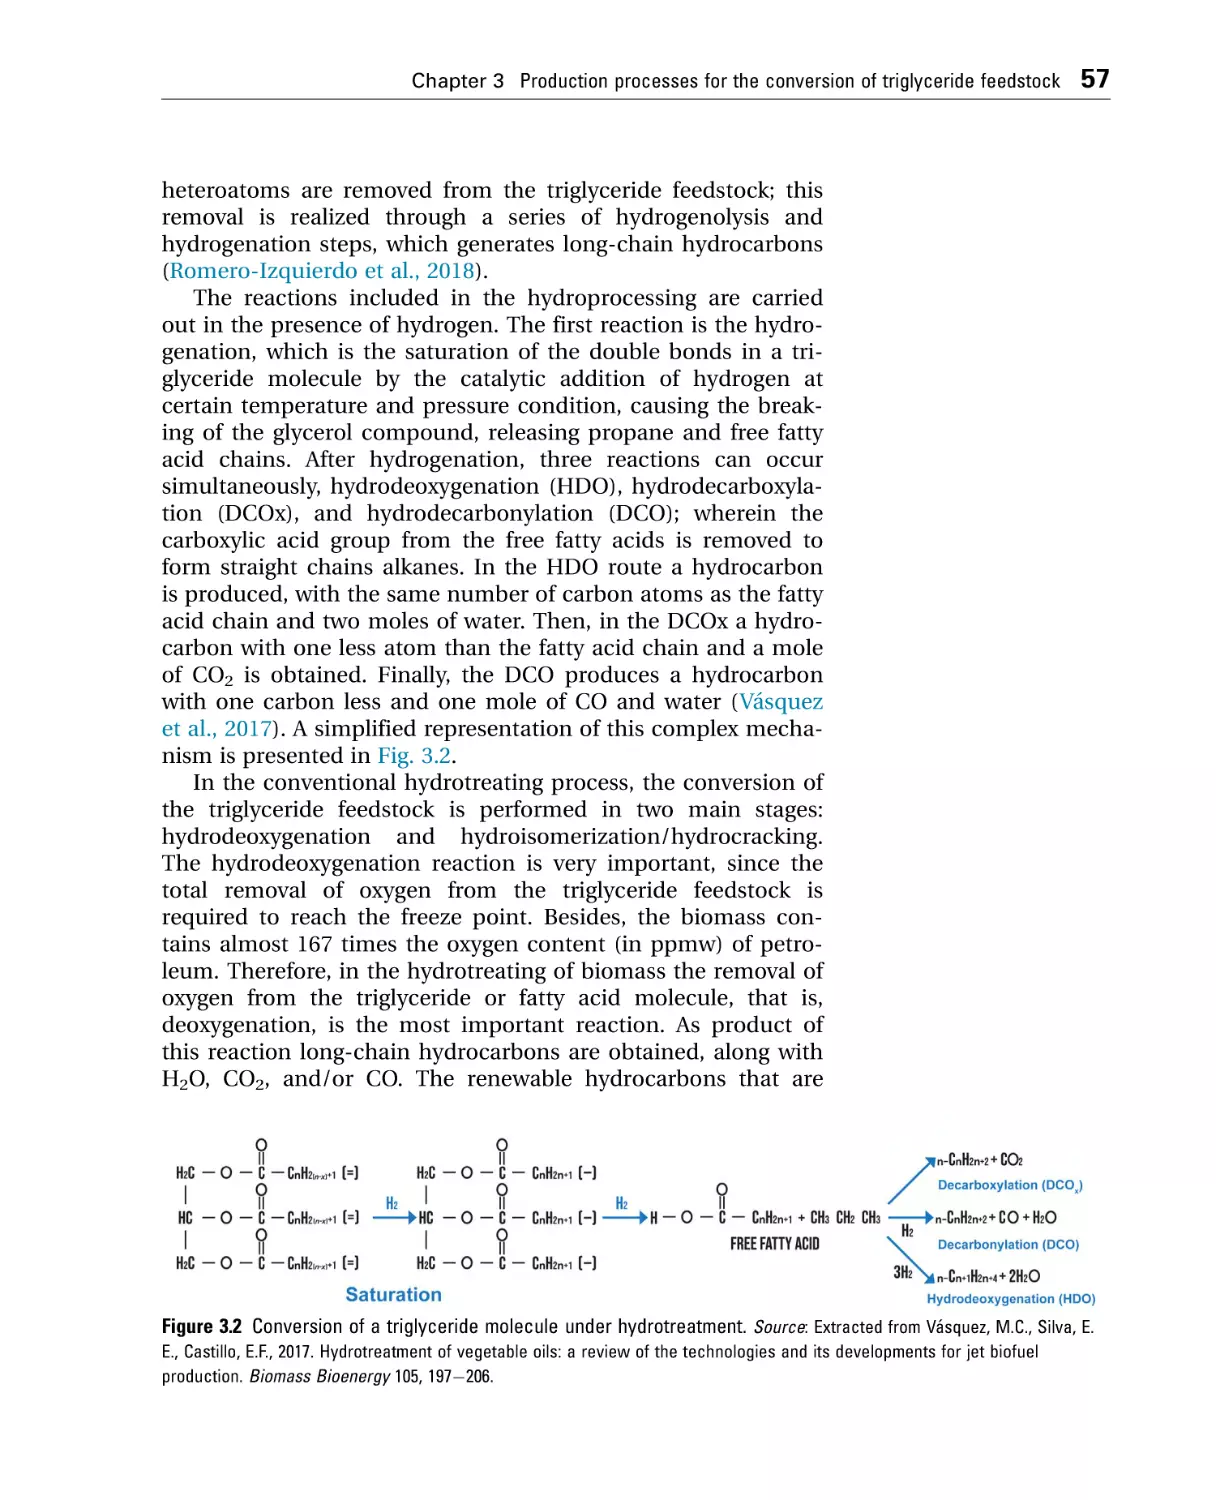
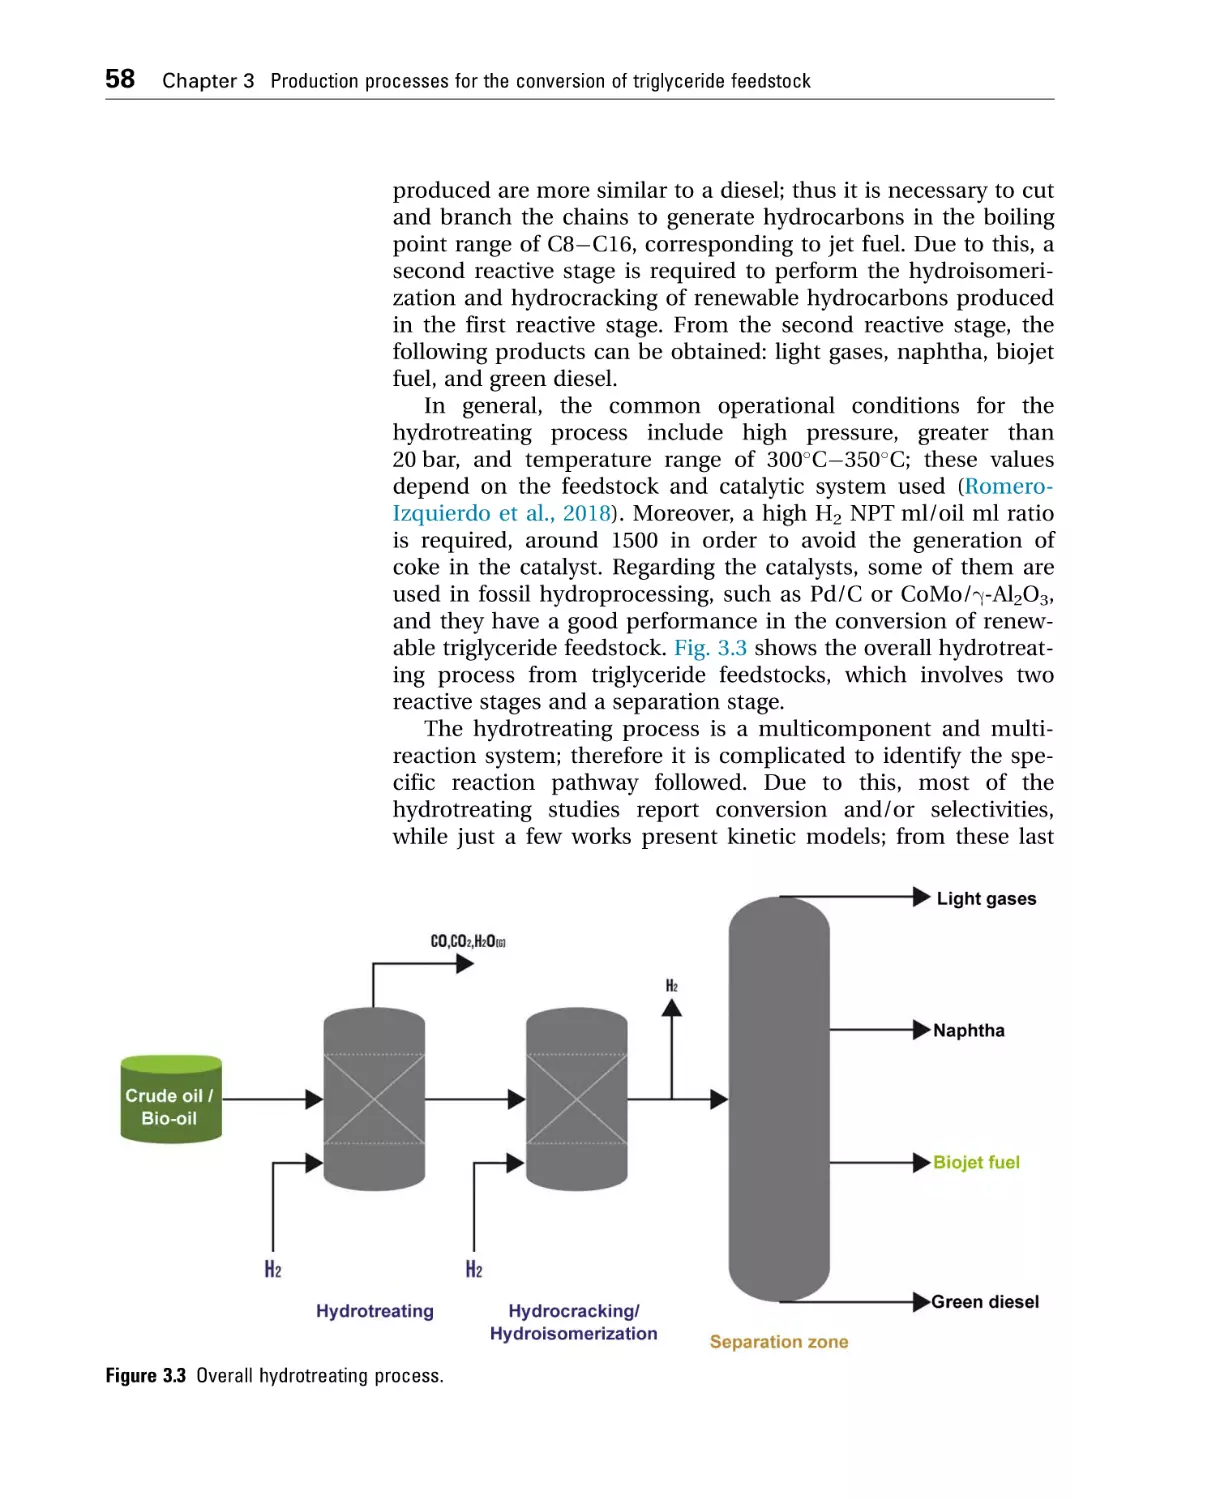
Conversion processes of the triglyceride feedstock ........................ 56
Conventional processes: state of the art .......................................... 60
Combustion tests for biojet fuel from triglyceride feedstock ......... 63
Case of study: hydroprocessing of a mixture of vegetable oils ..... 64
3.5.1 Problem statement ....................................................................64
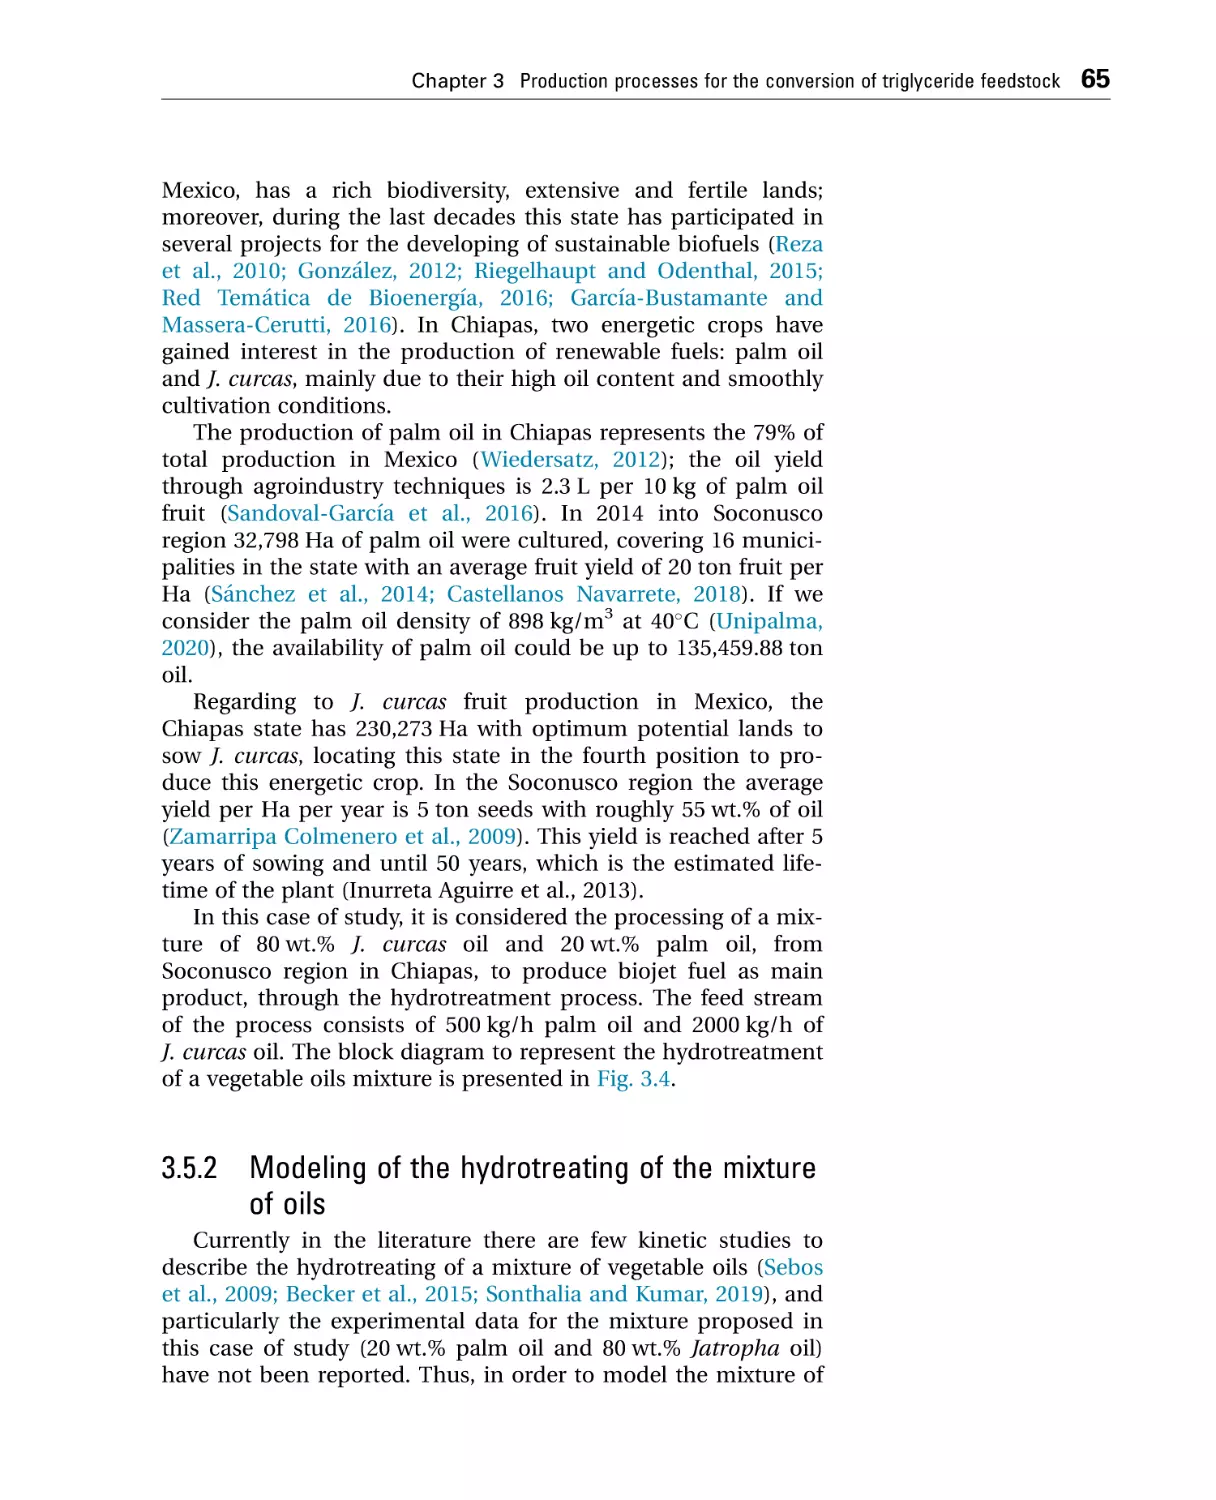
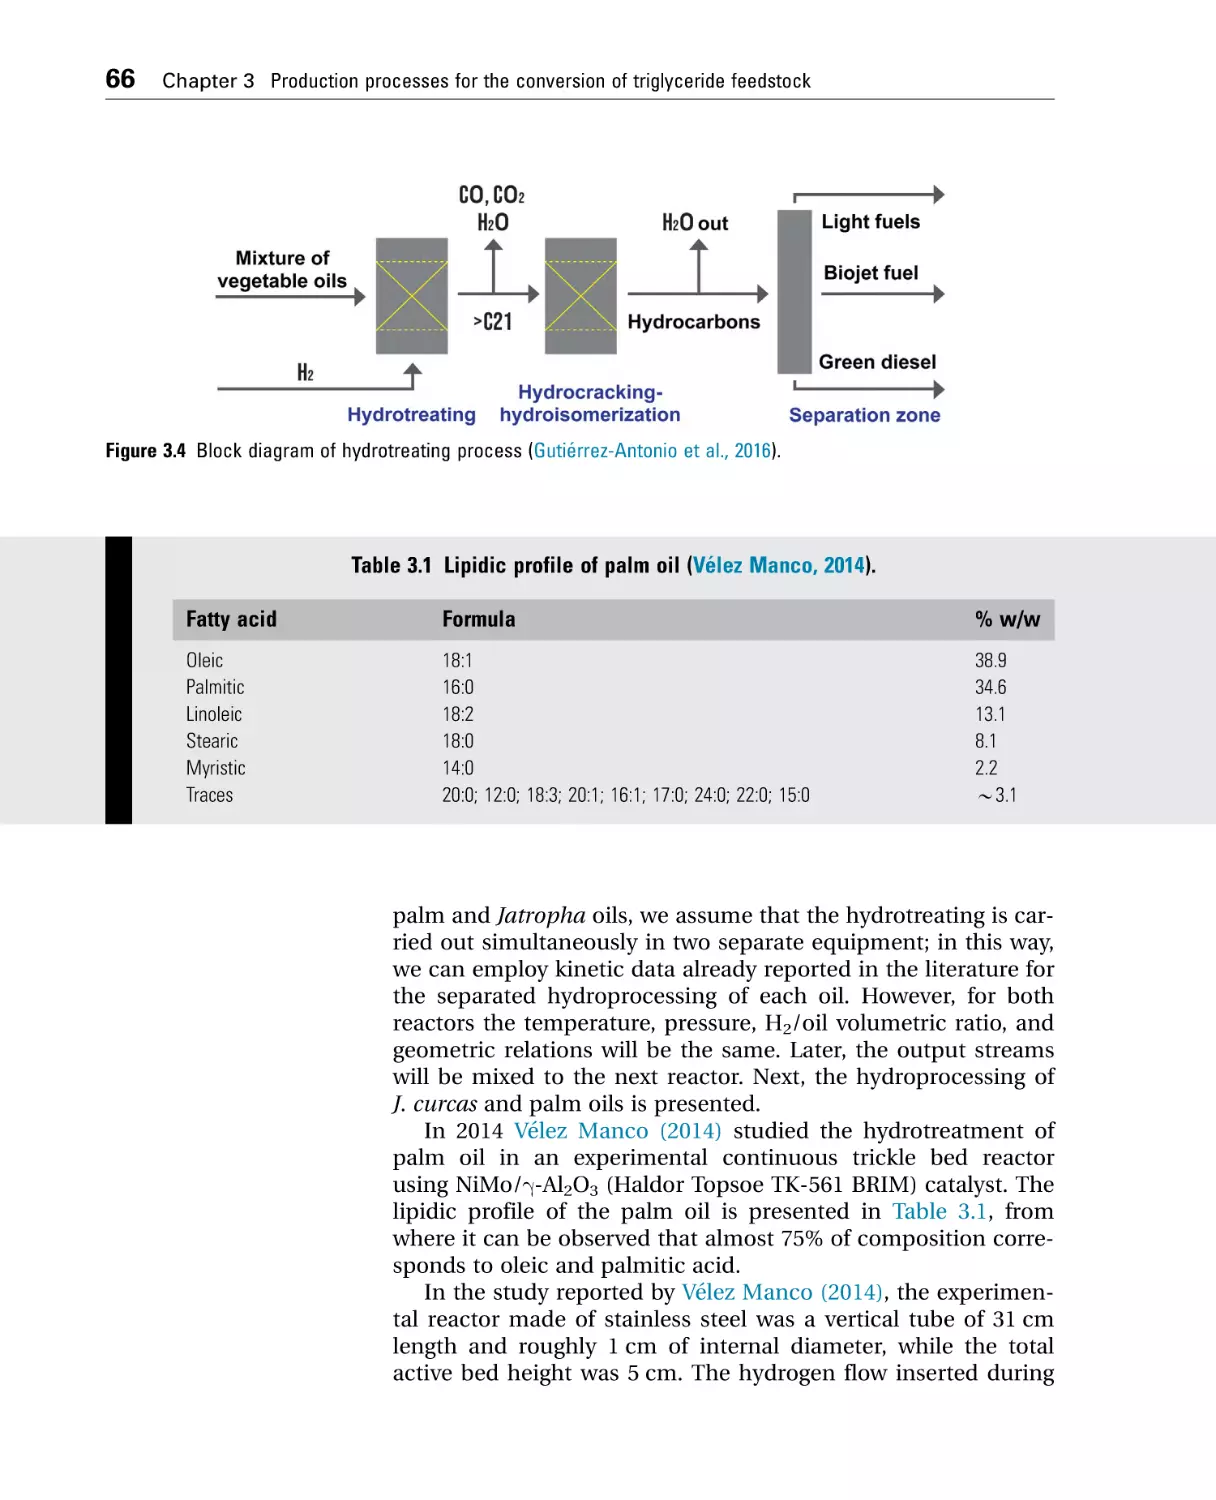
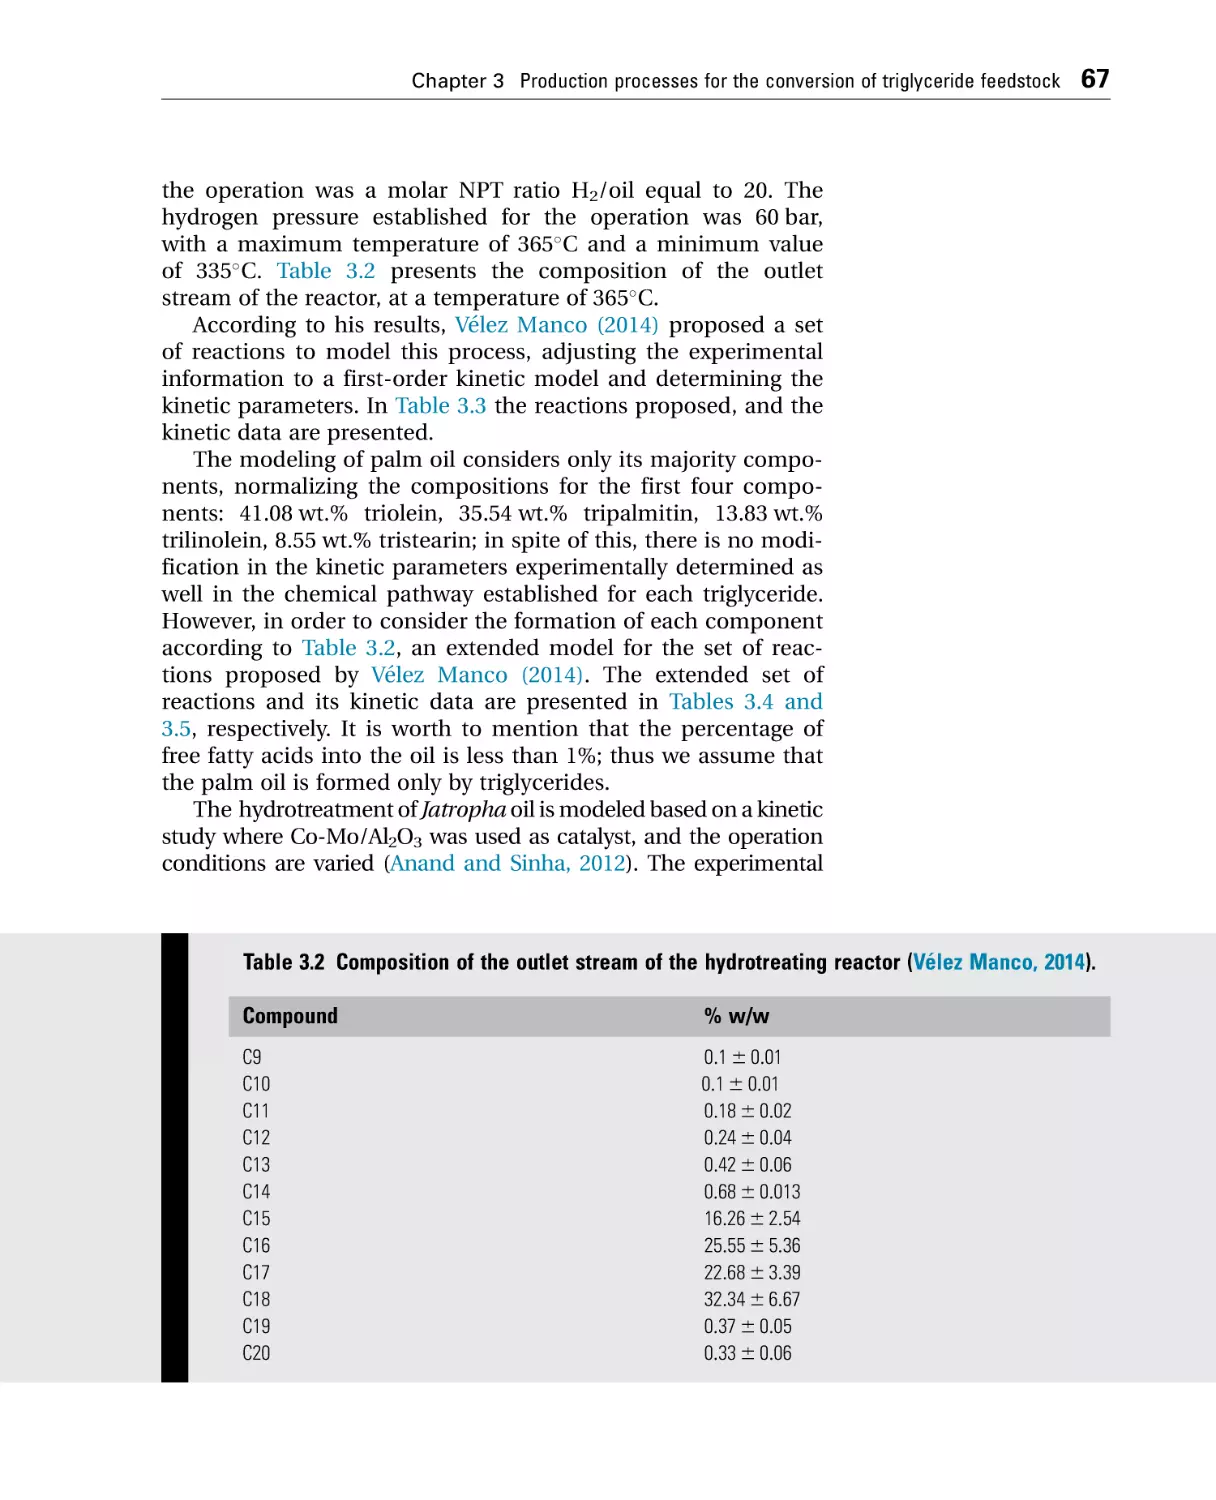
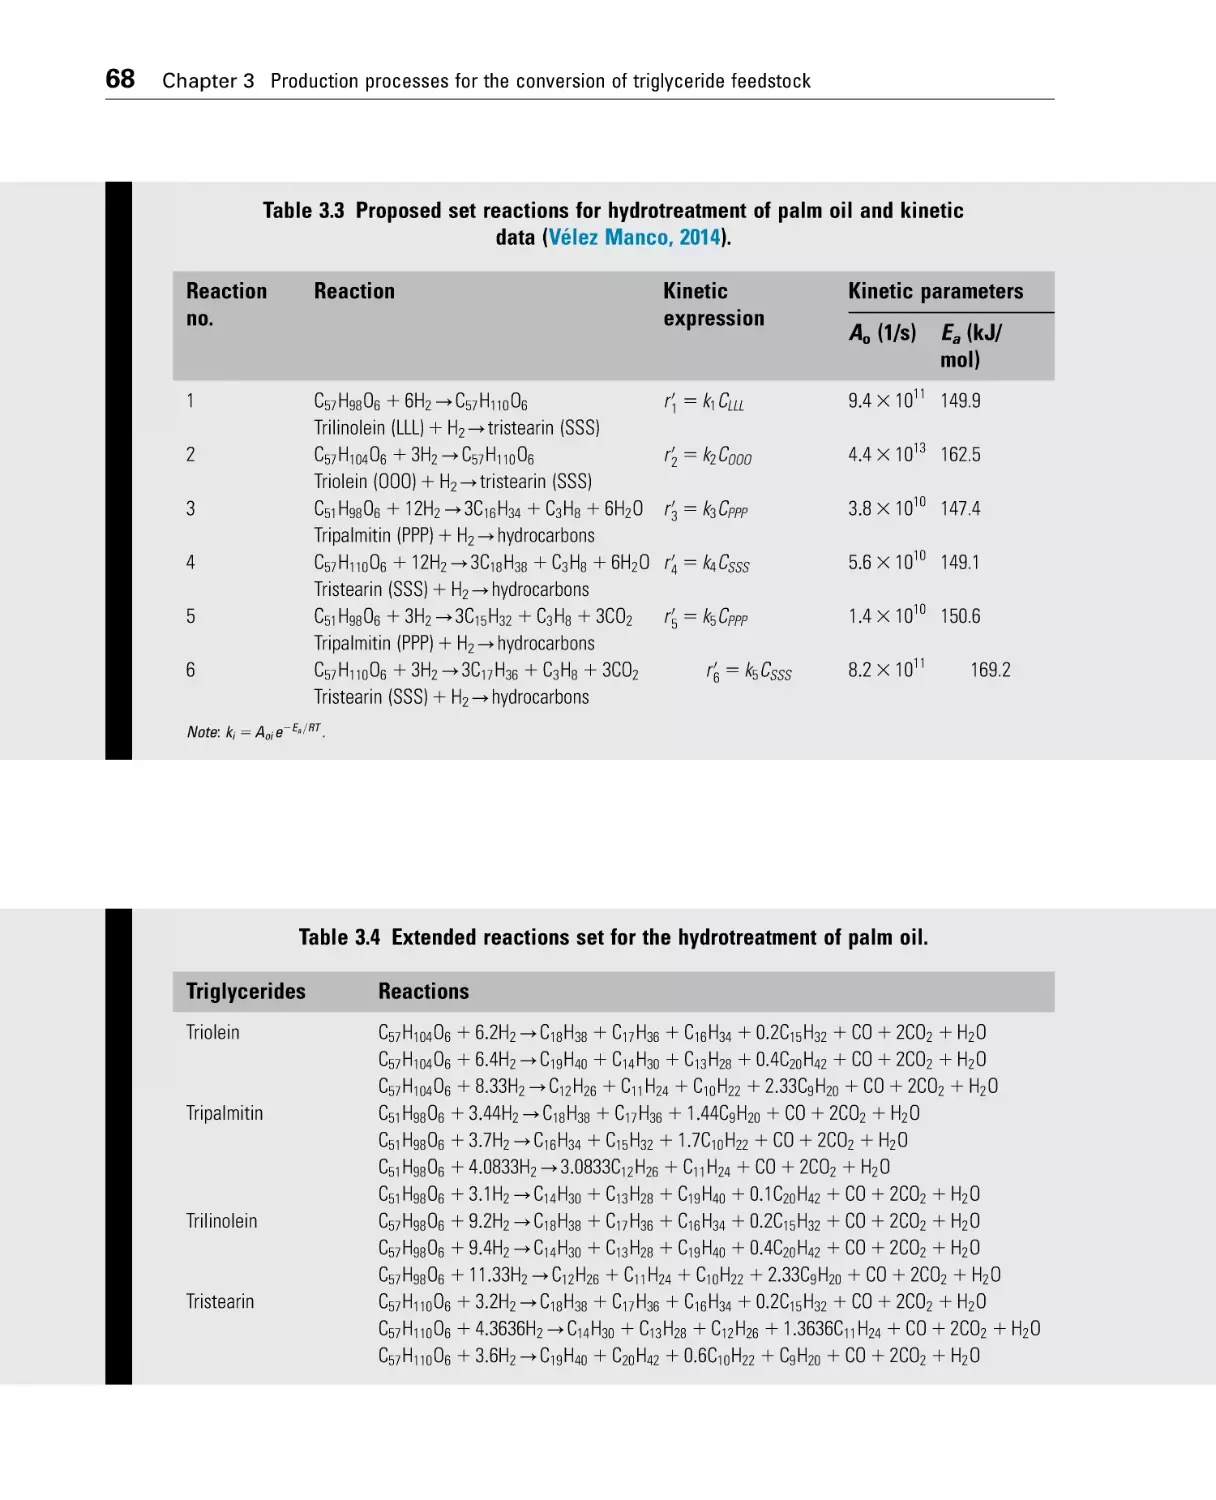
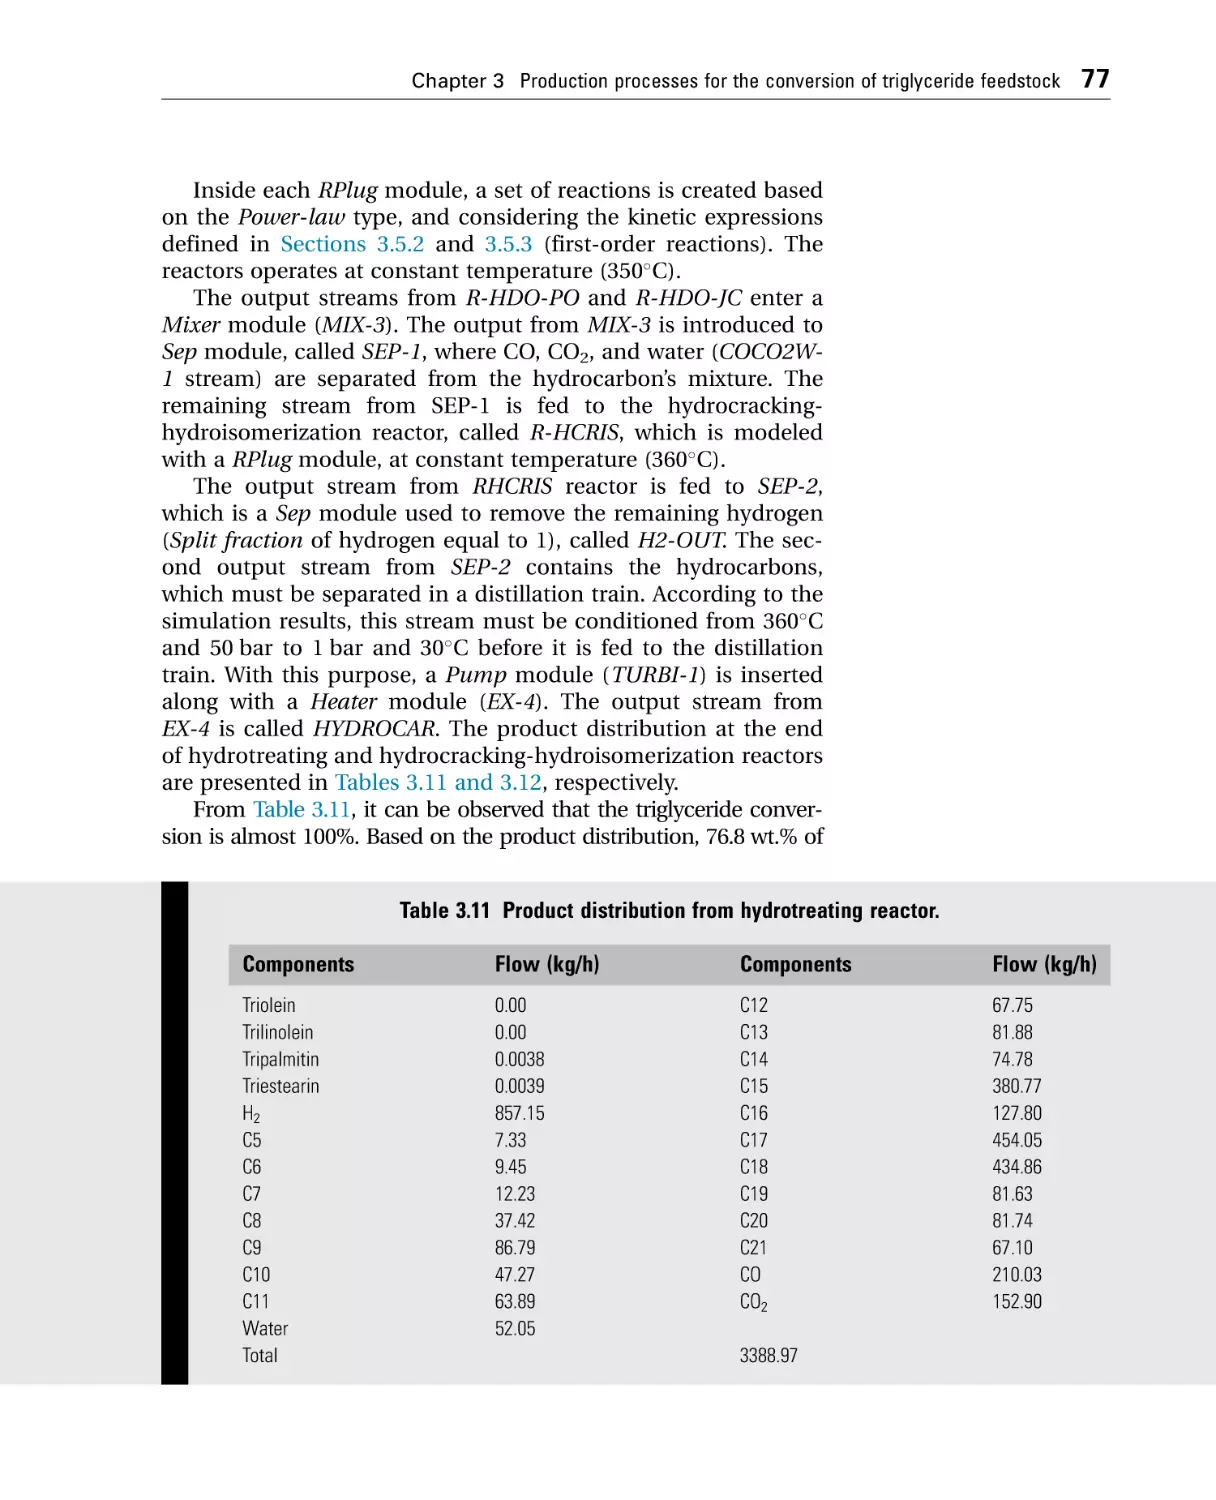
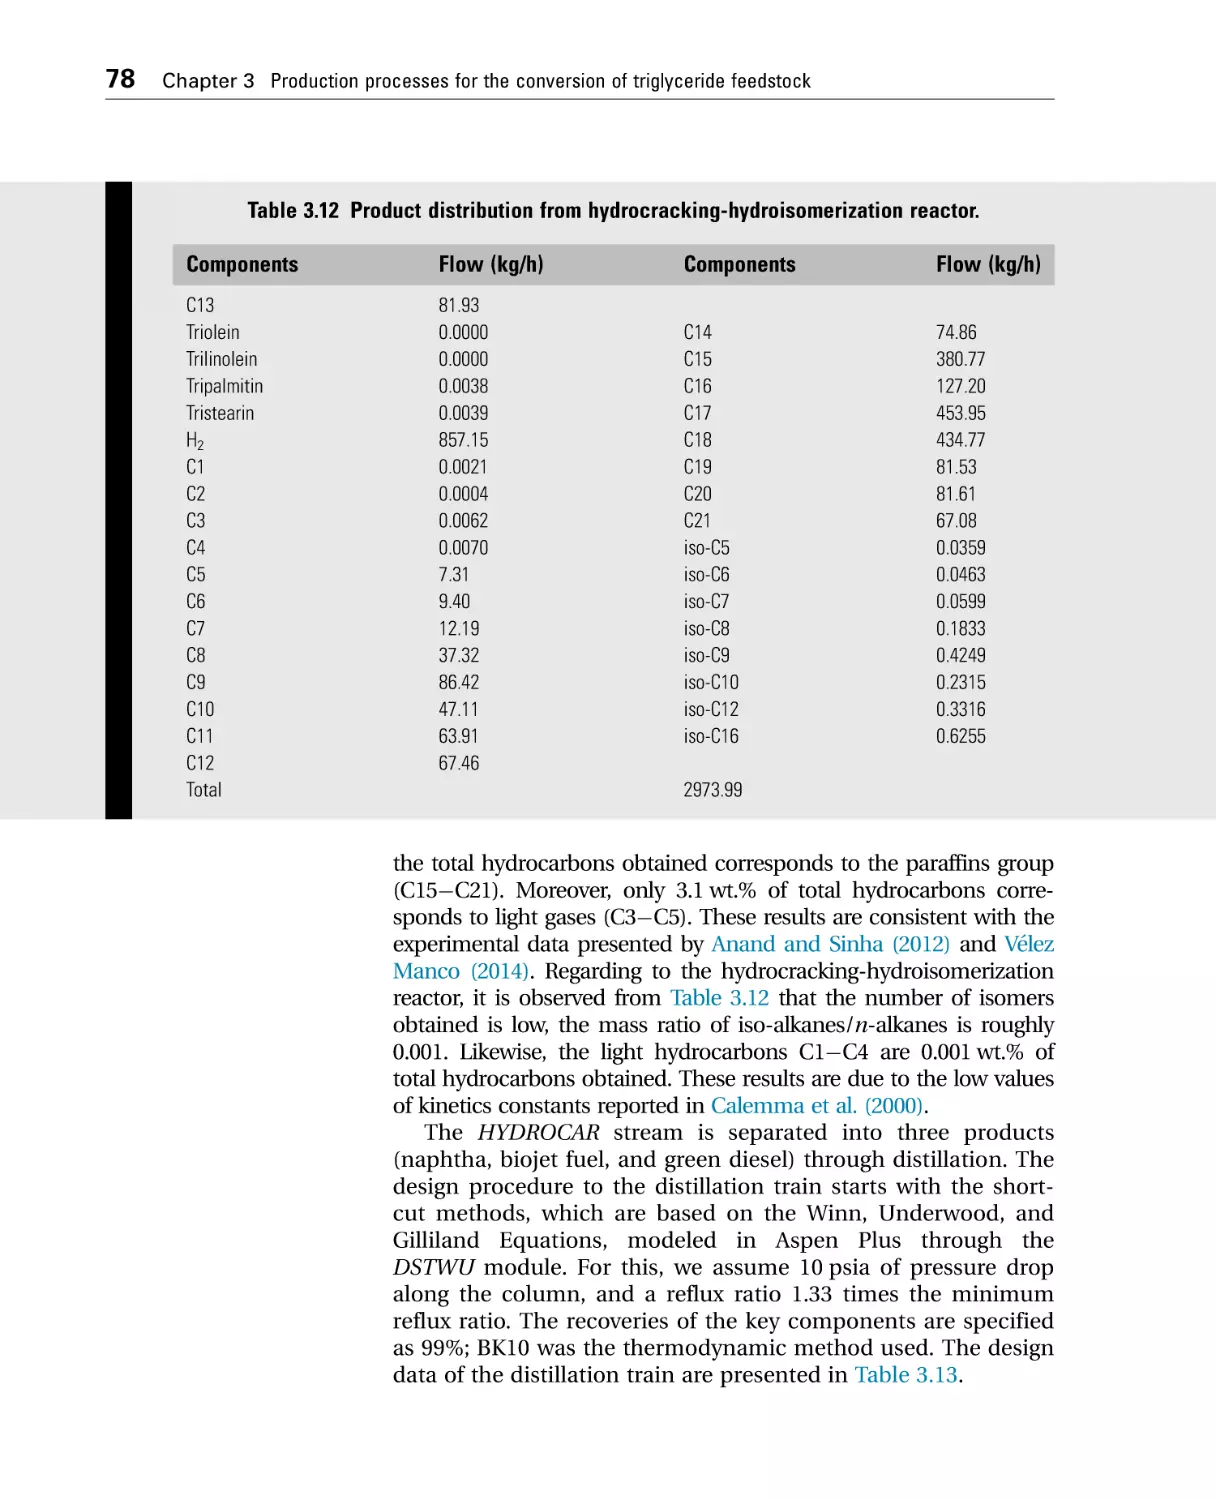
3.5.2 Modeling of the hydrotreating of the mixture of oils.............65
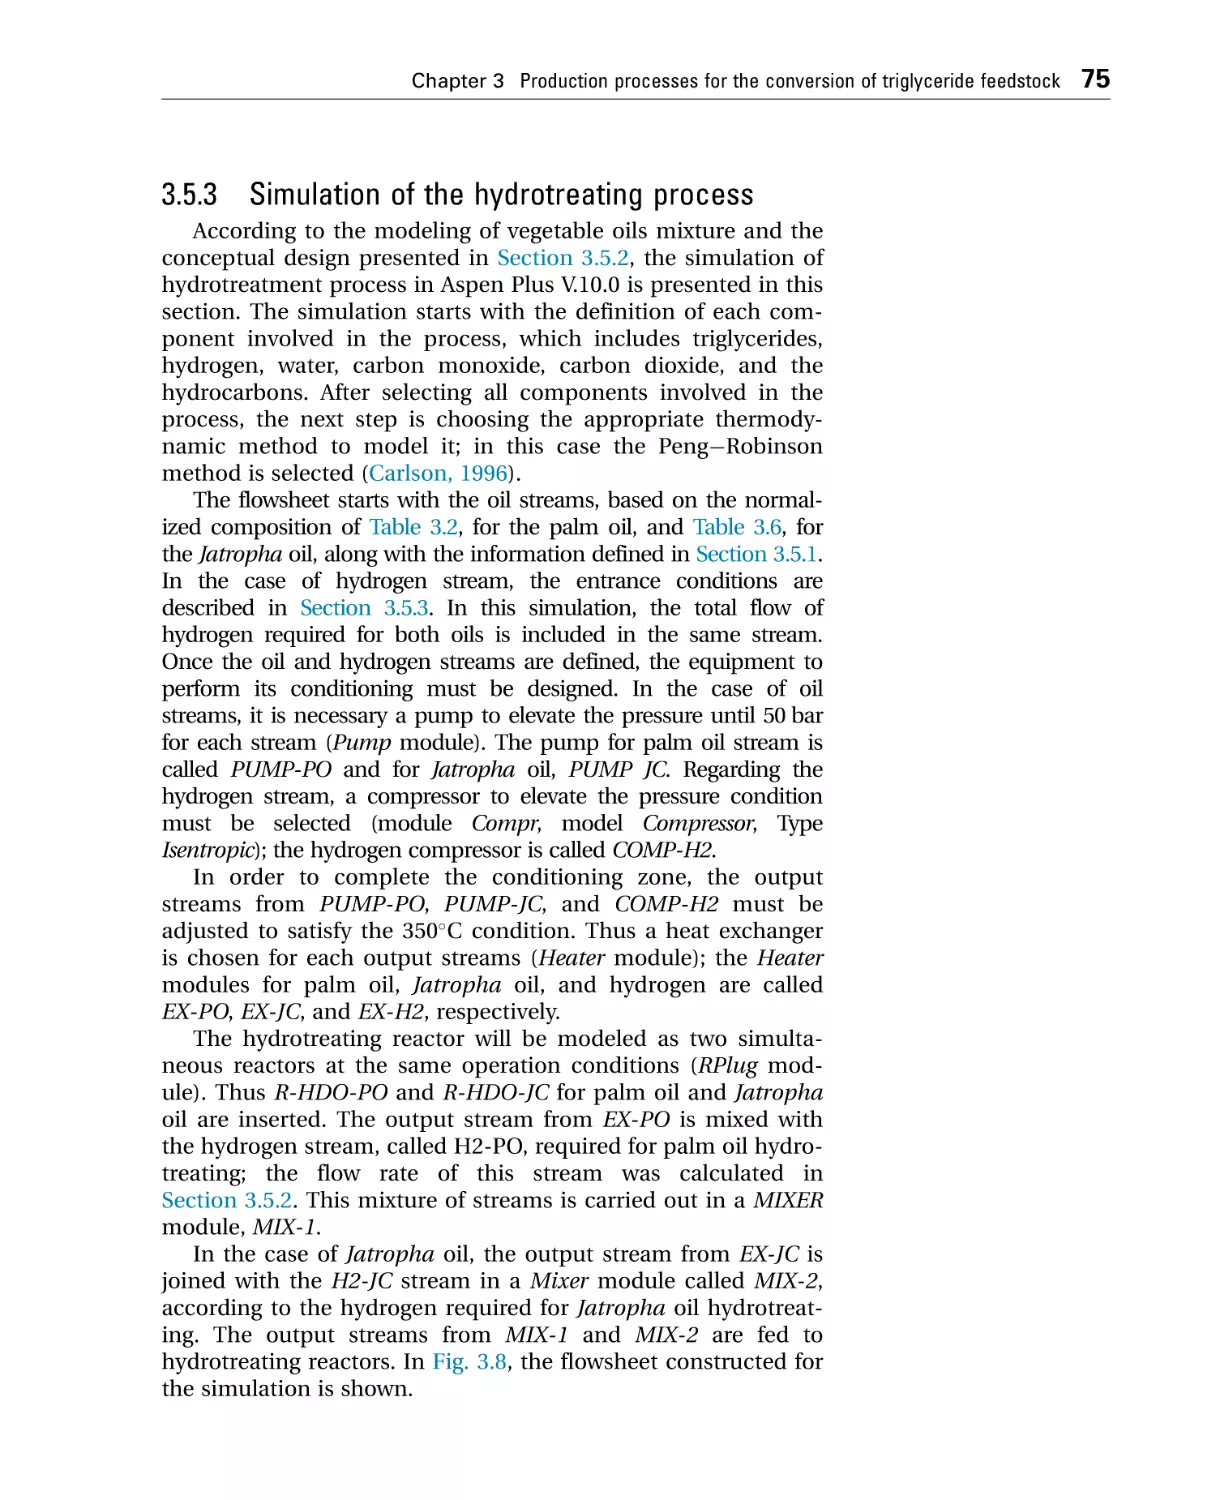
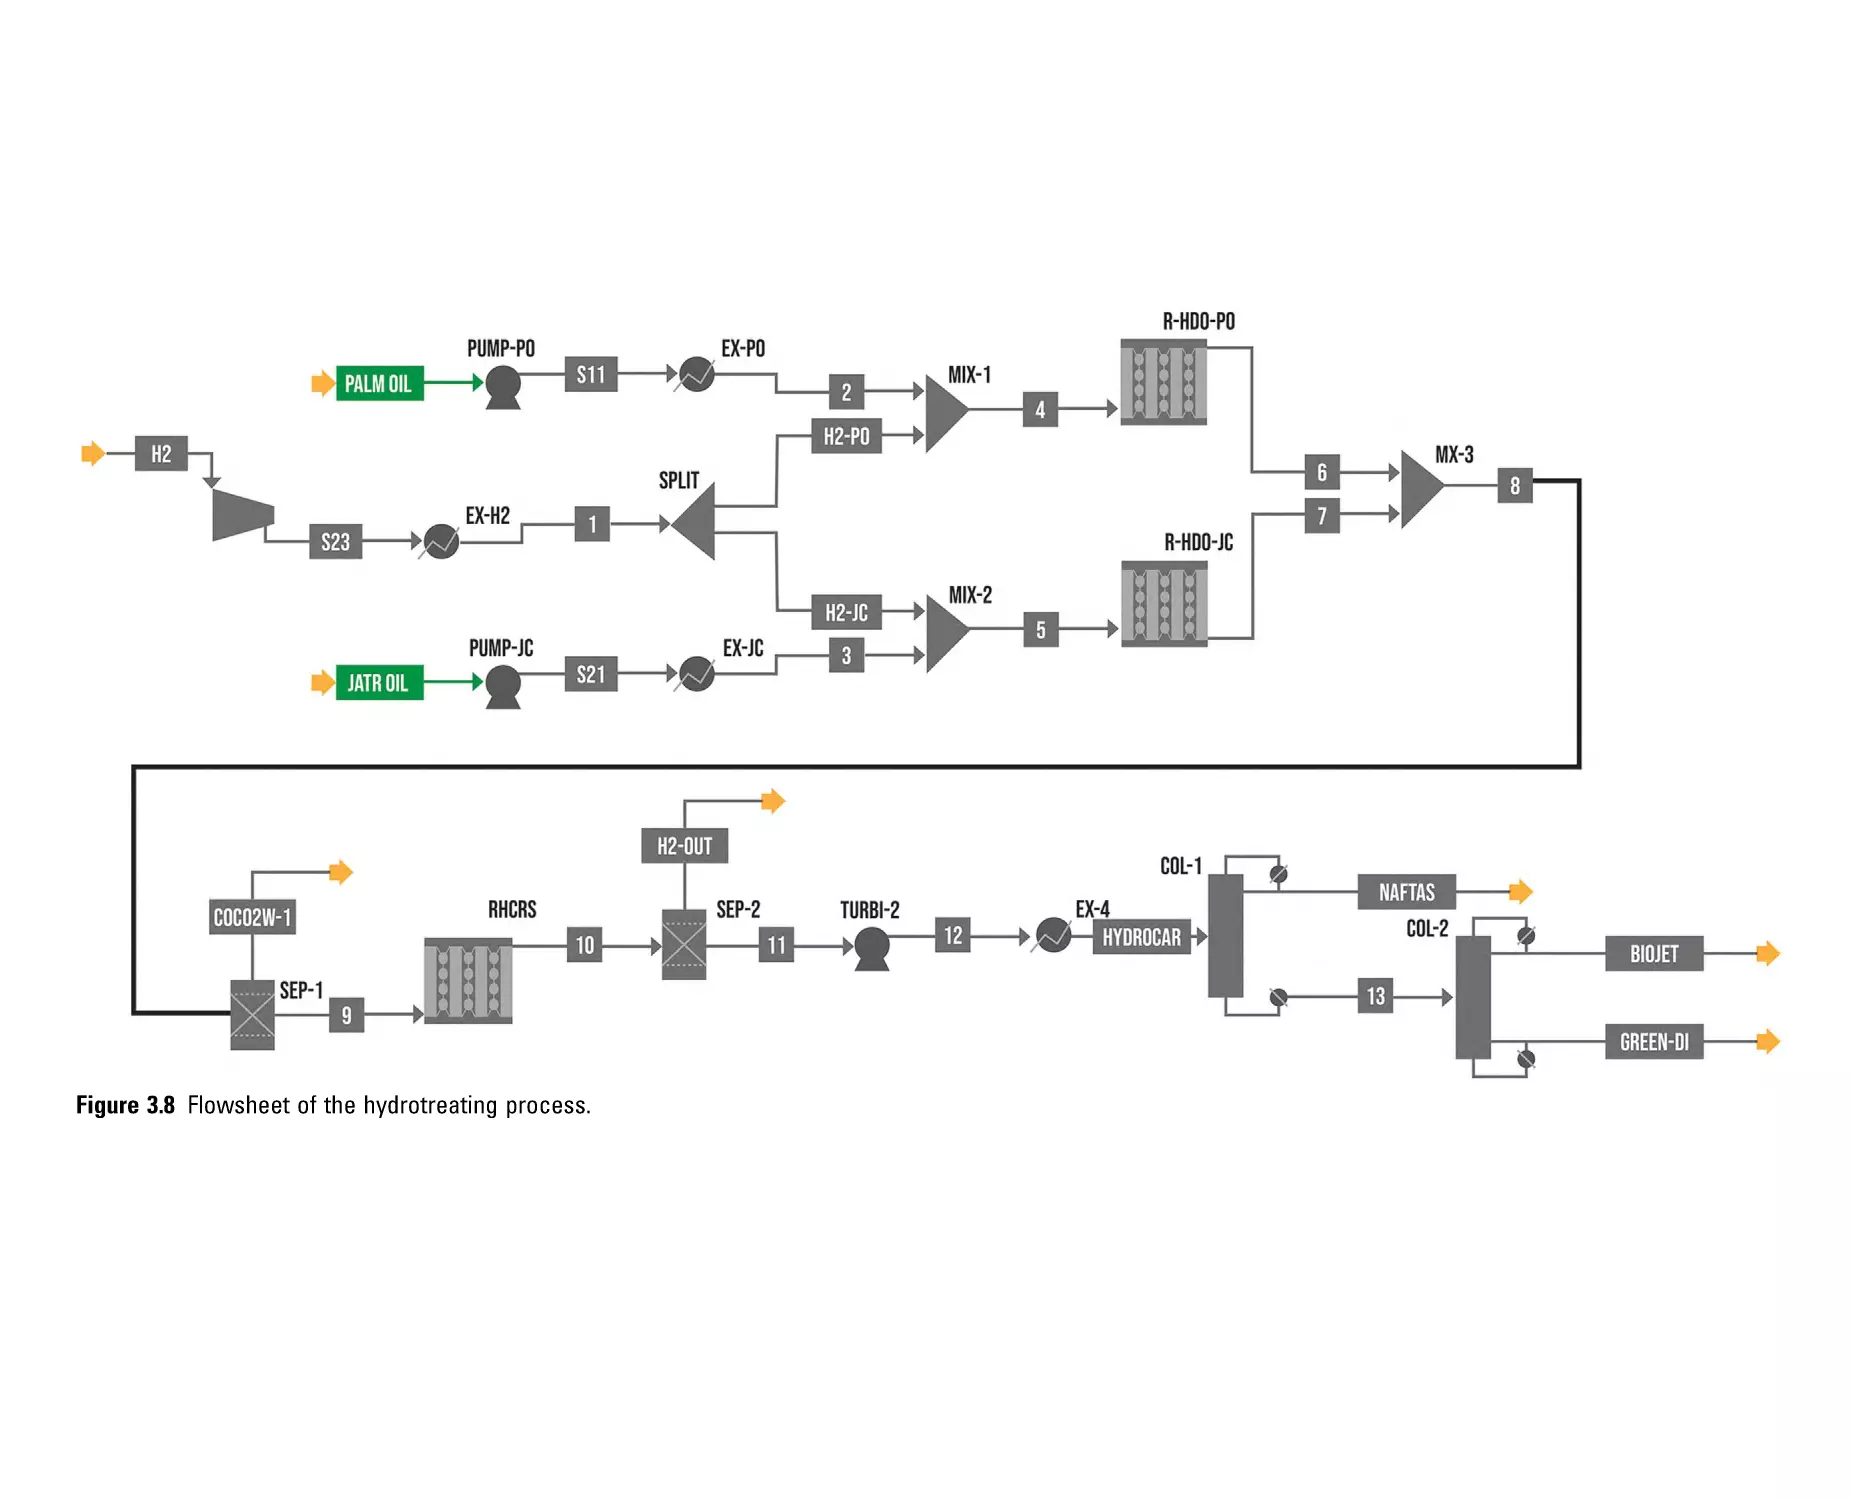
3.5.3 Simulation of the hydrotreating process.................................75
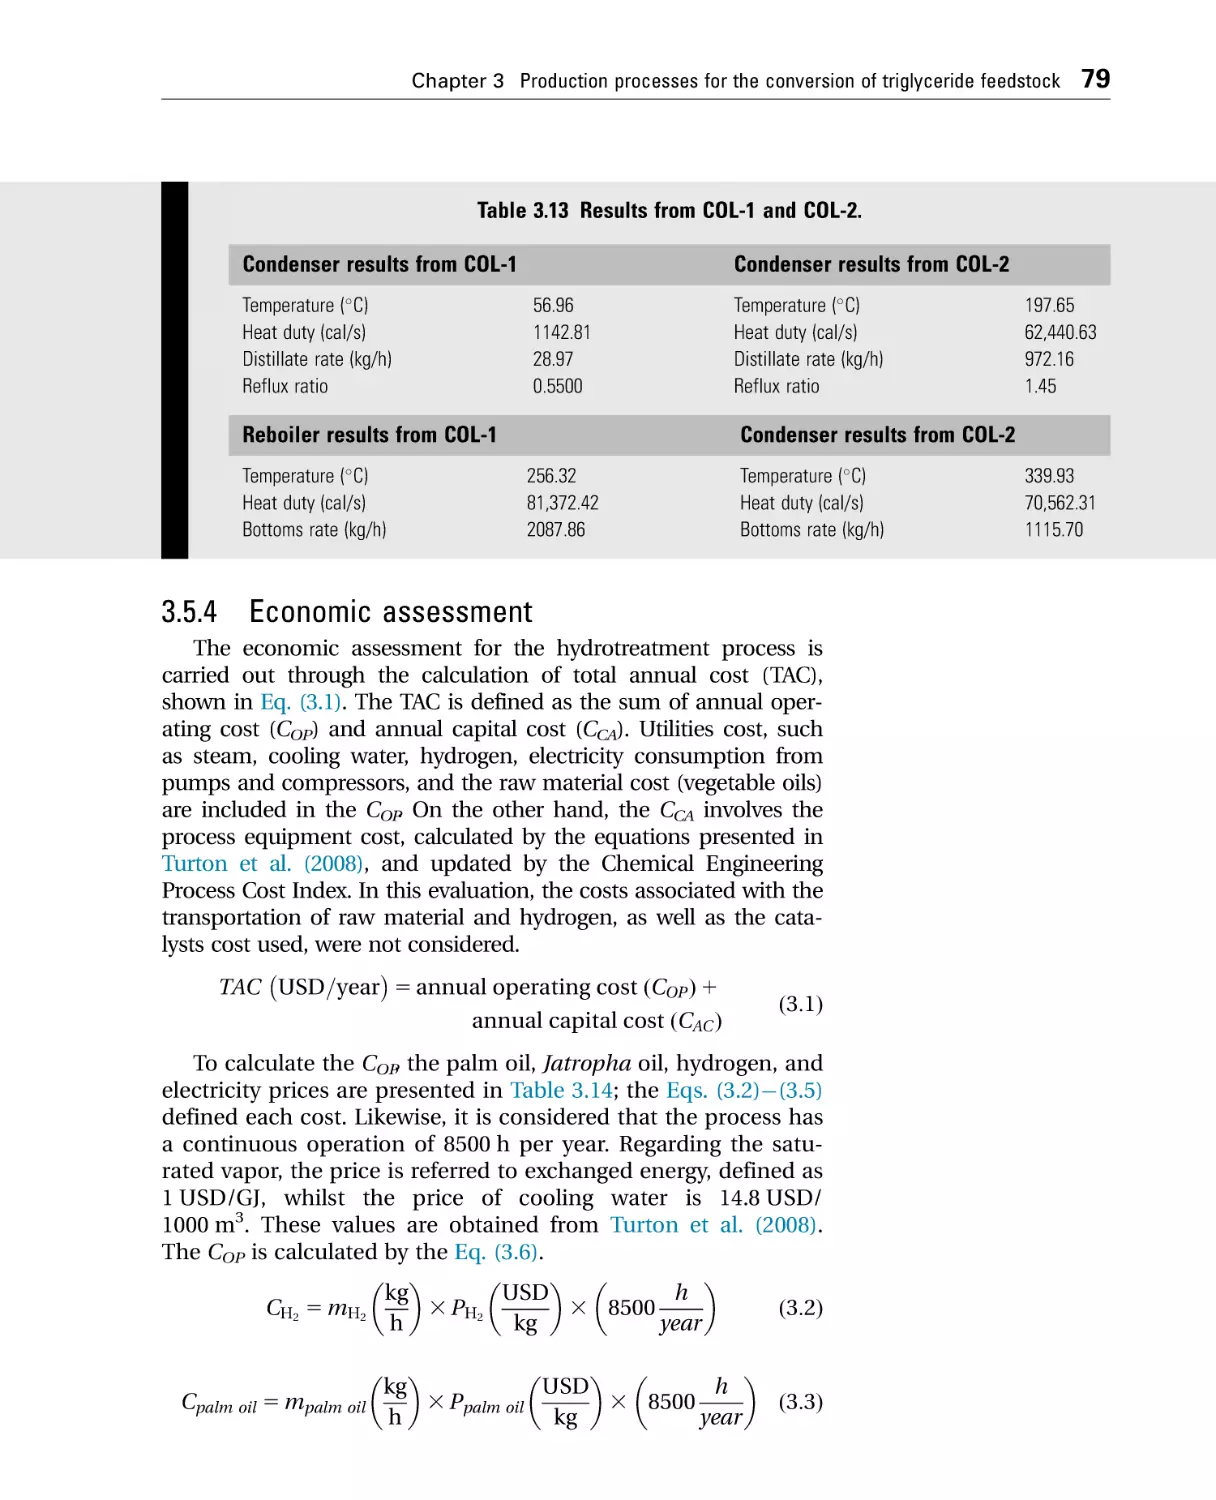
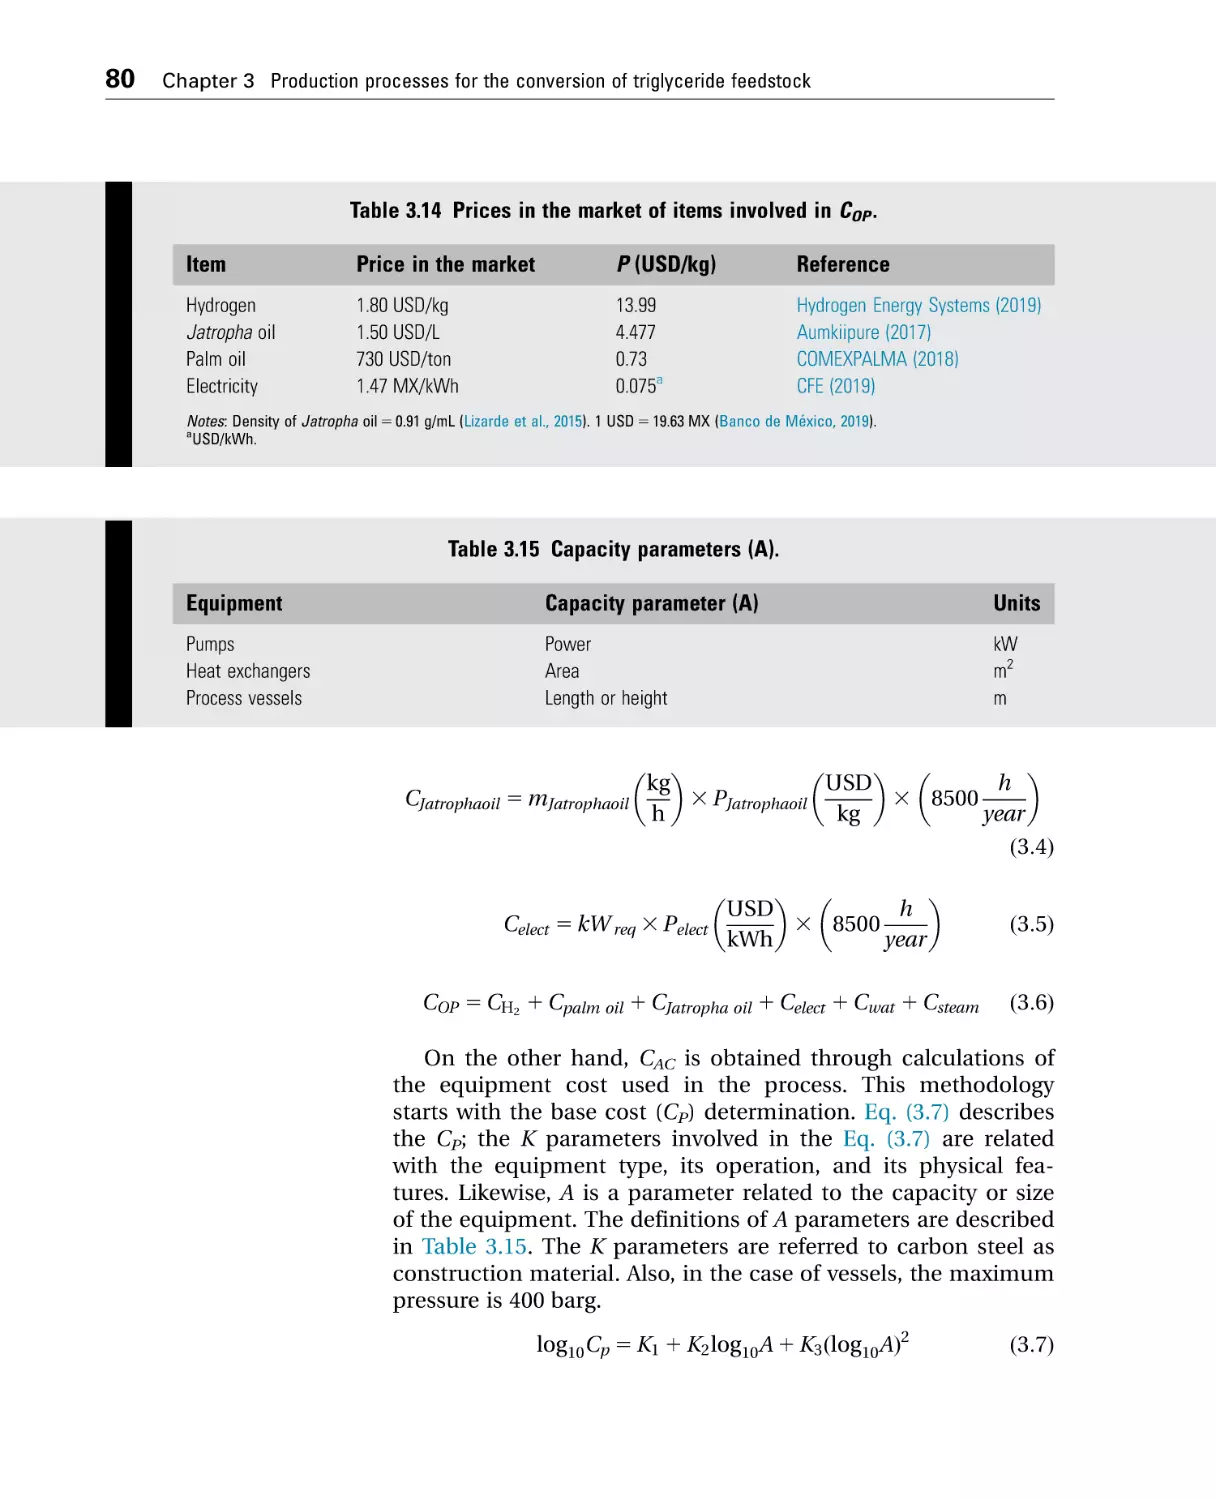
3.5.4 Economic assessment...............................................................79
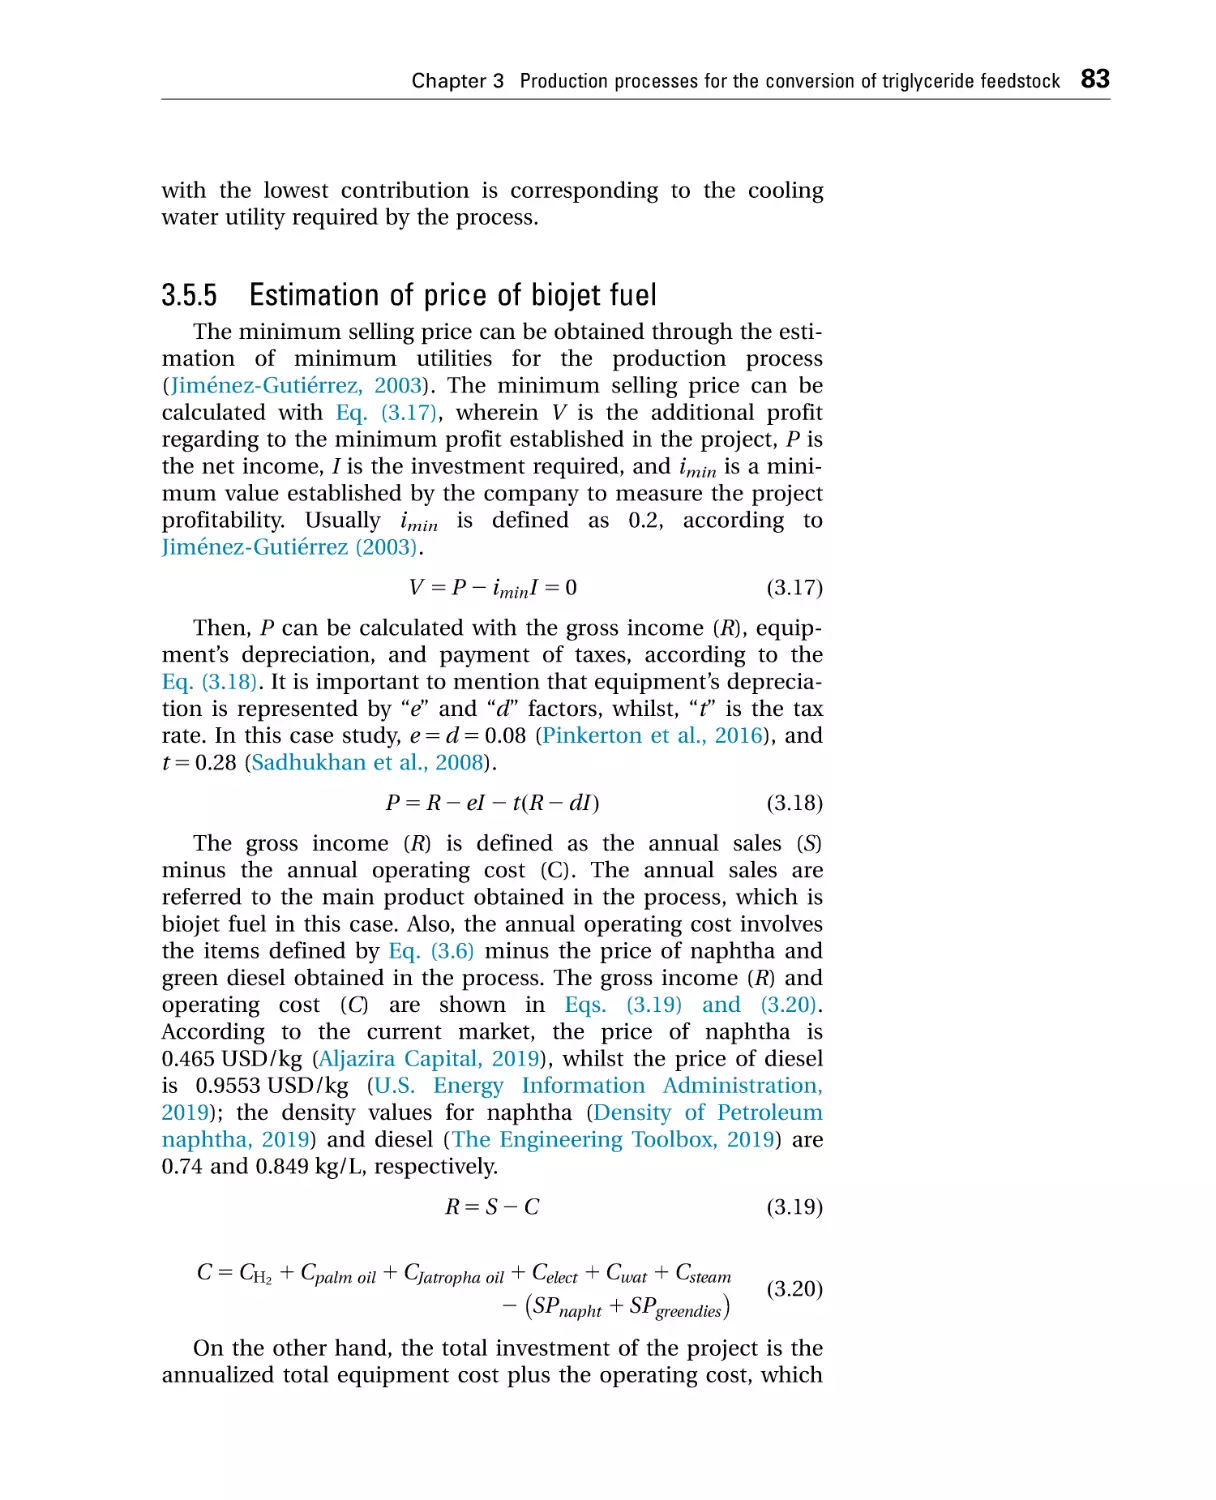
3.5.5 Estimation of price of biojet fuel..............................................83
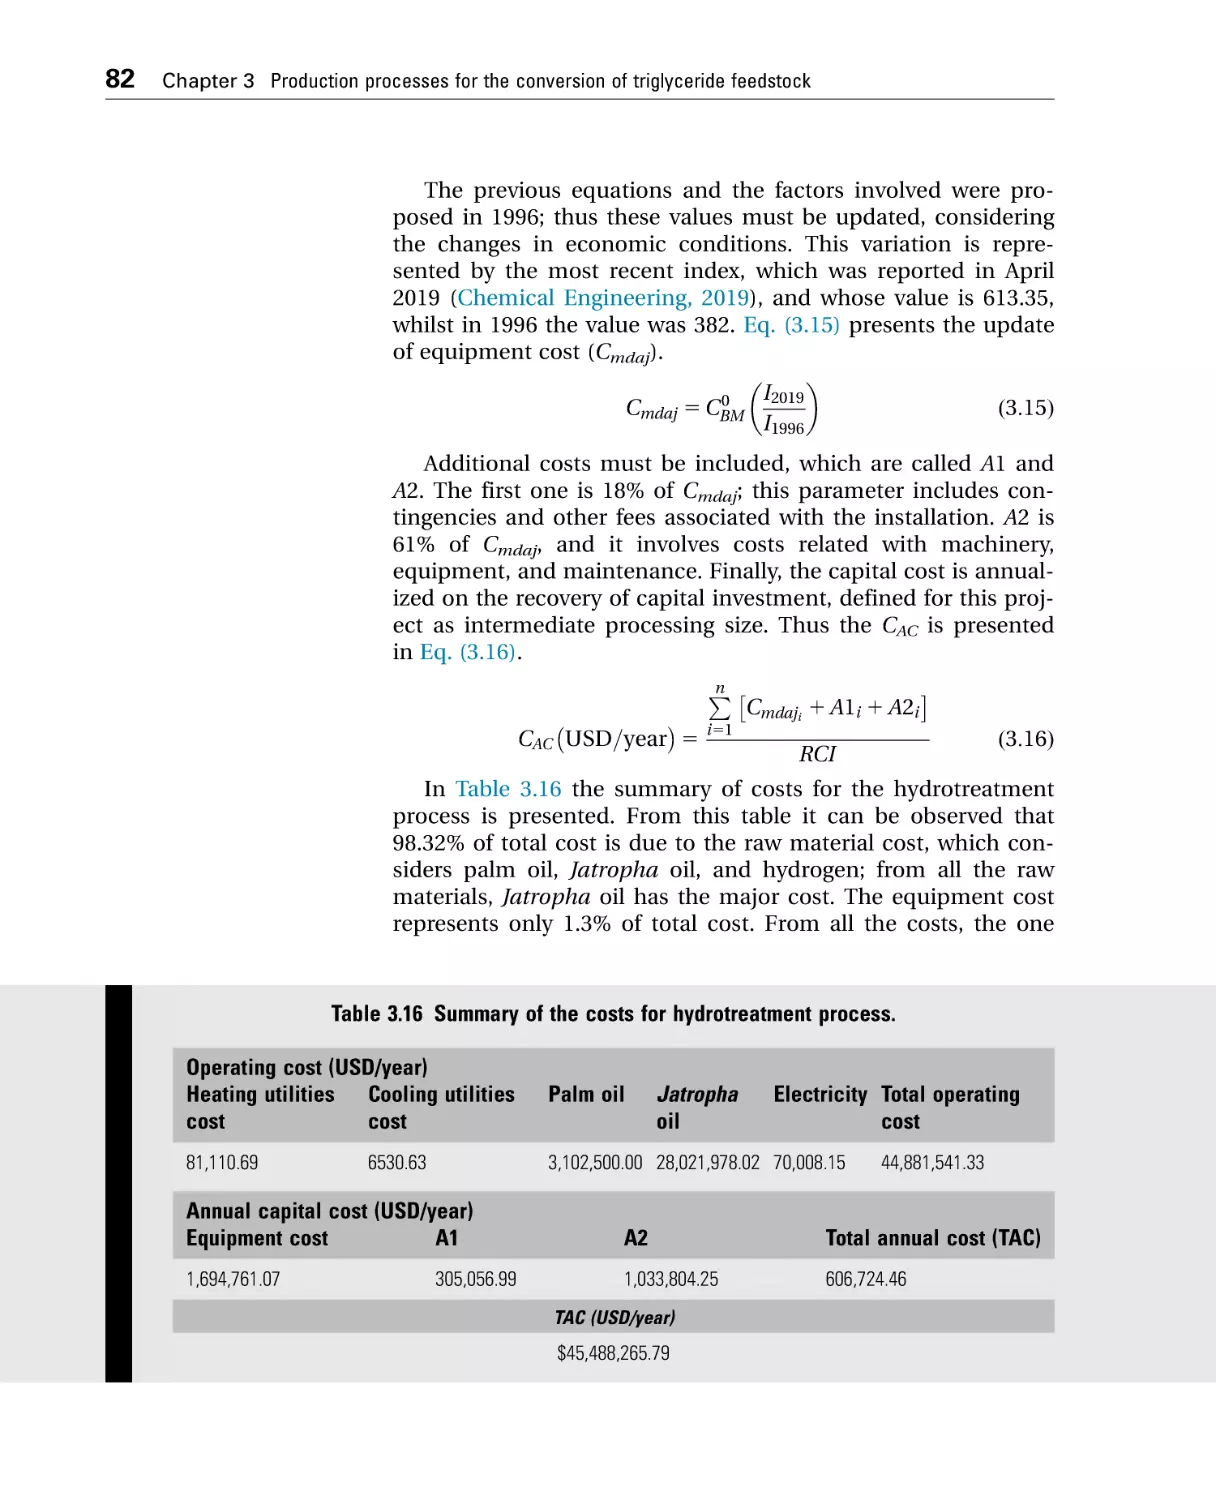
3.5.6 Environmental assessment: CO2 emissions............................84
v
vi
Contents
3.6 Conclusion .......................................................................................... 86
References ................................................................................................. 86
4 Production processes for the conversion of sugar and
starchy feedstock ...............................................................................................93
4.1 Introduction ........................................................................................ 93
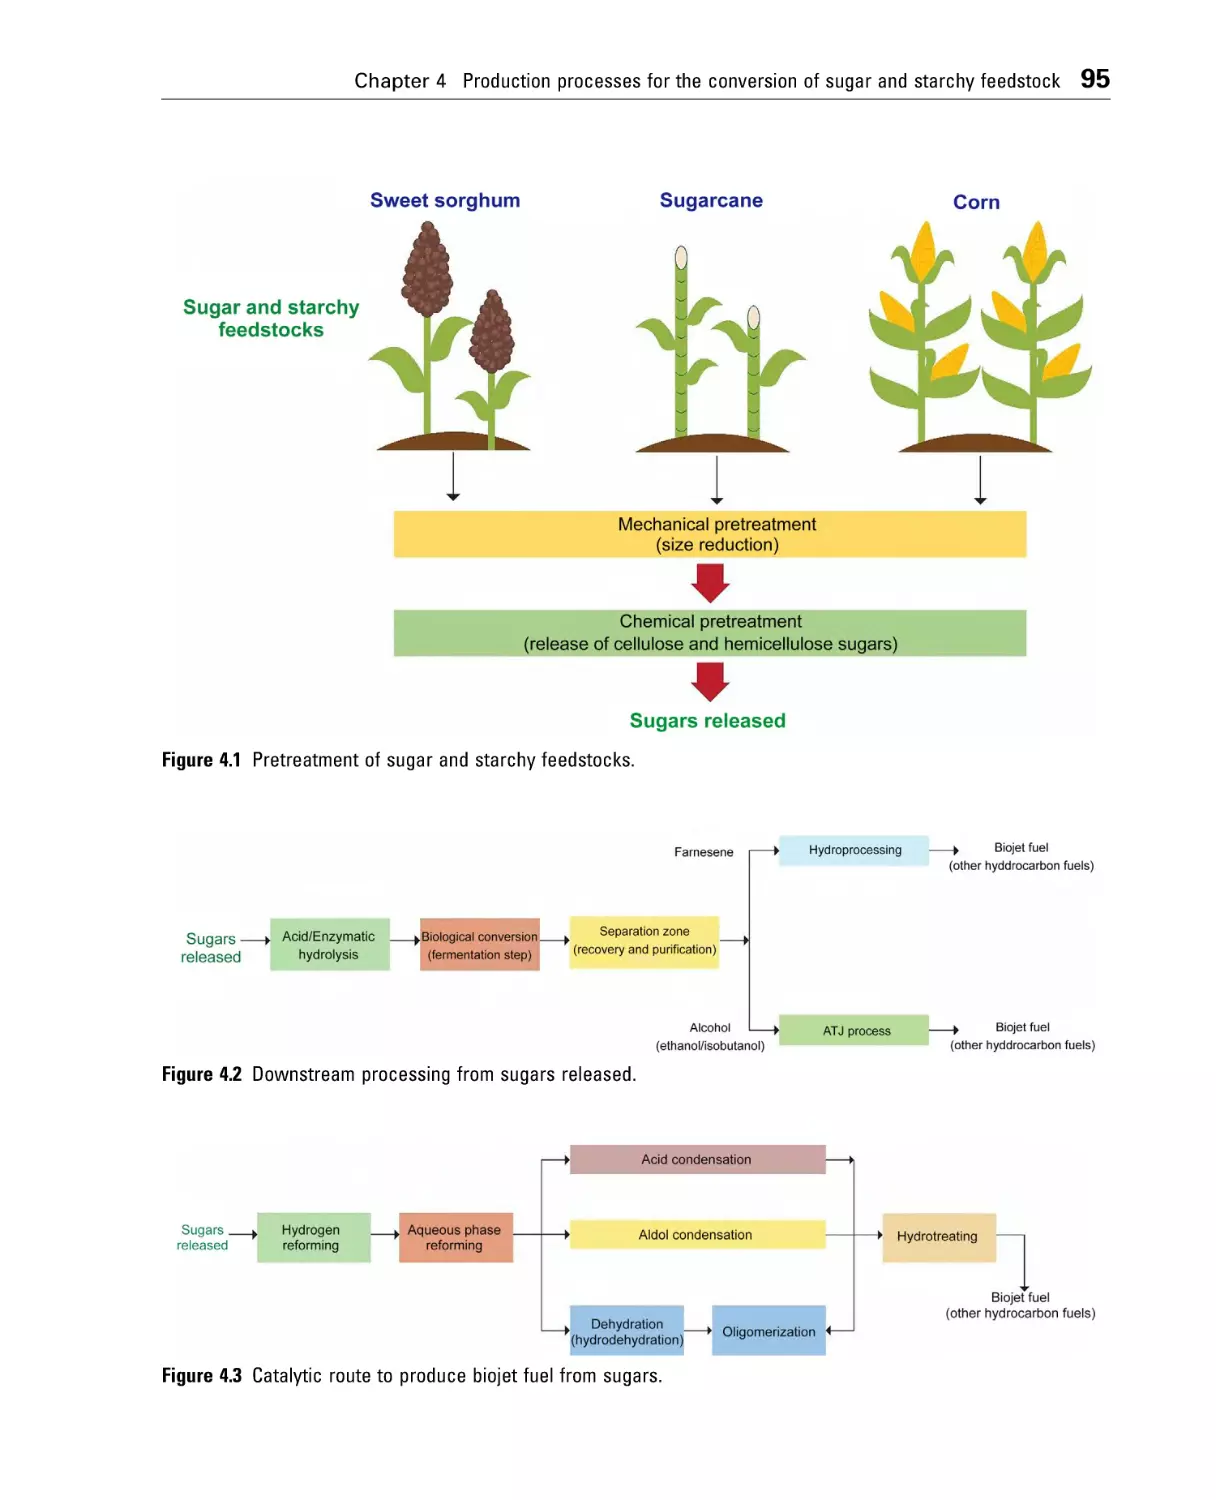
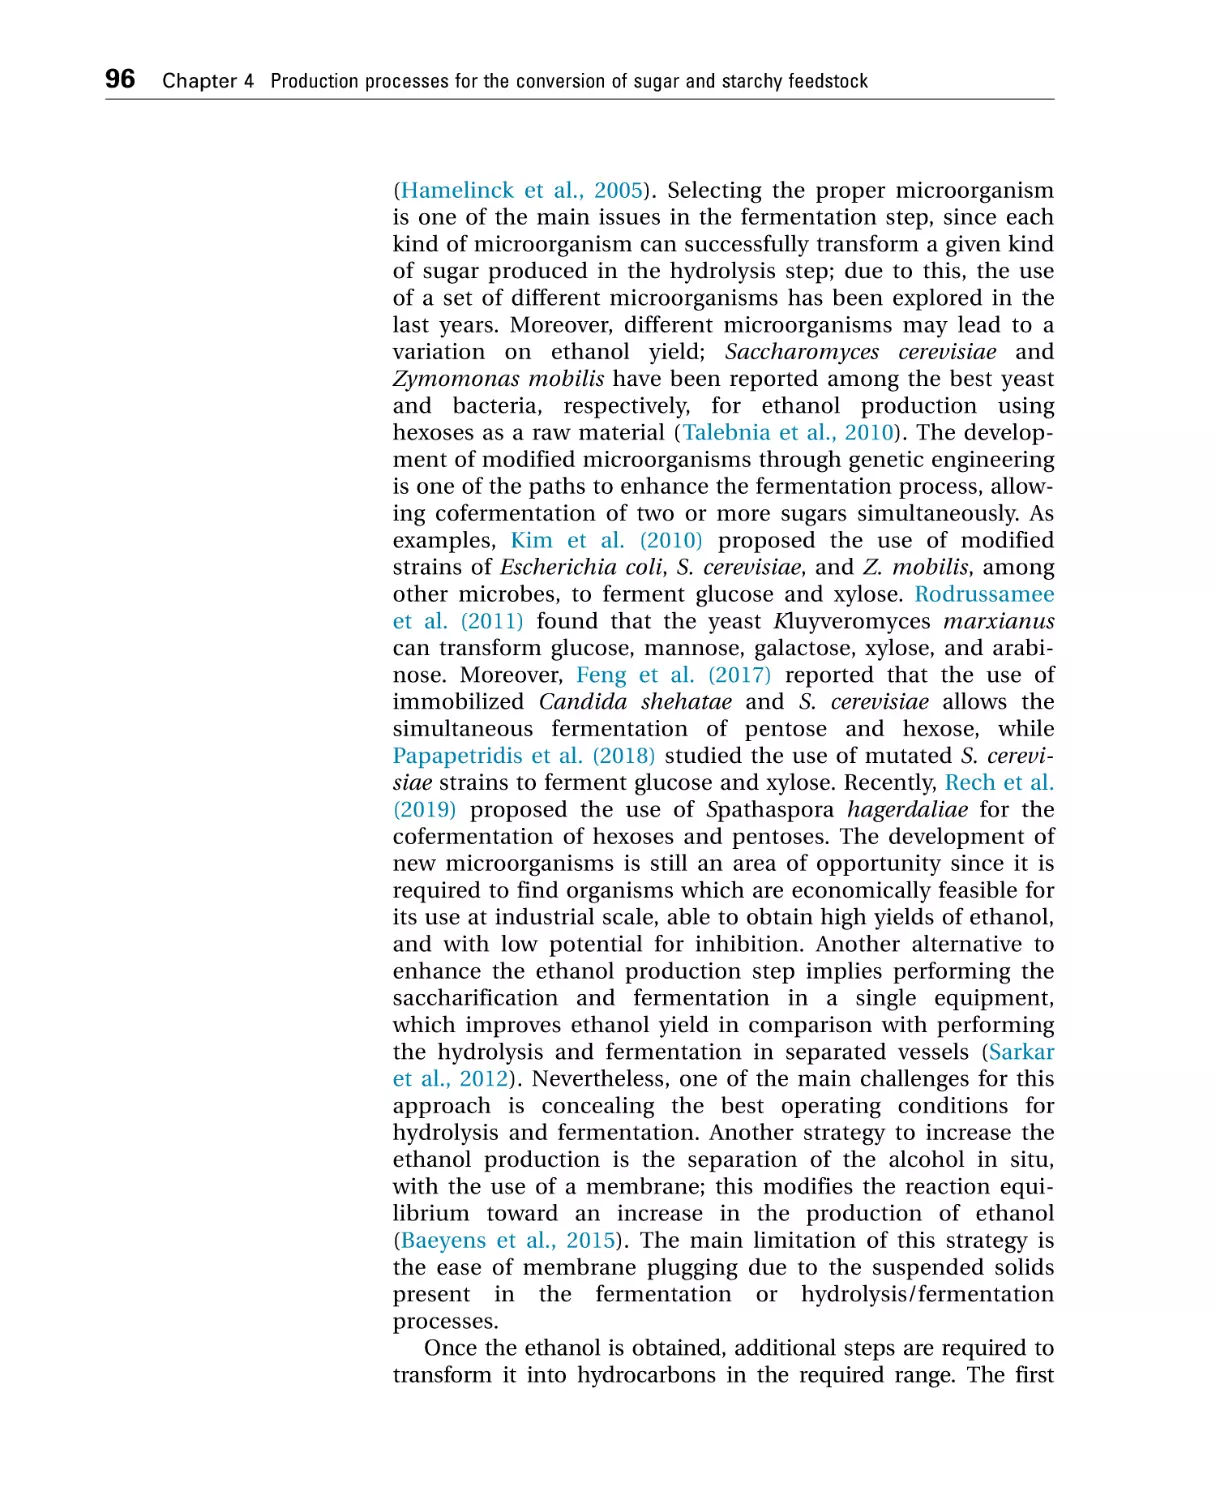
4.2 Conversion of sugars to biojet fuel................................................... 94
4.2.1 Alcohol-to-jet pathway.............................................................. 94
4.2.2 Sugar-to-jet pathways...............................................................98
4.3 Technologies on separation zone ................................................... 102
4.4 Conventional processes: state of the art ........................................ 103
4.5 Combustion tests for biojet fuel from sugar and starchy
feedstocks ......................................................................................... 105
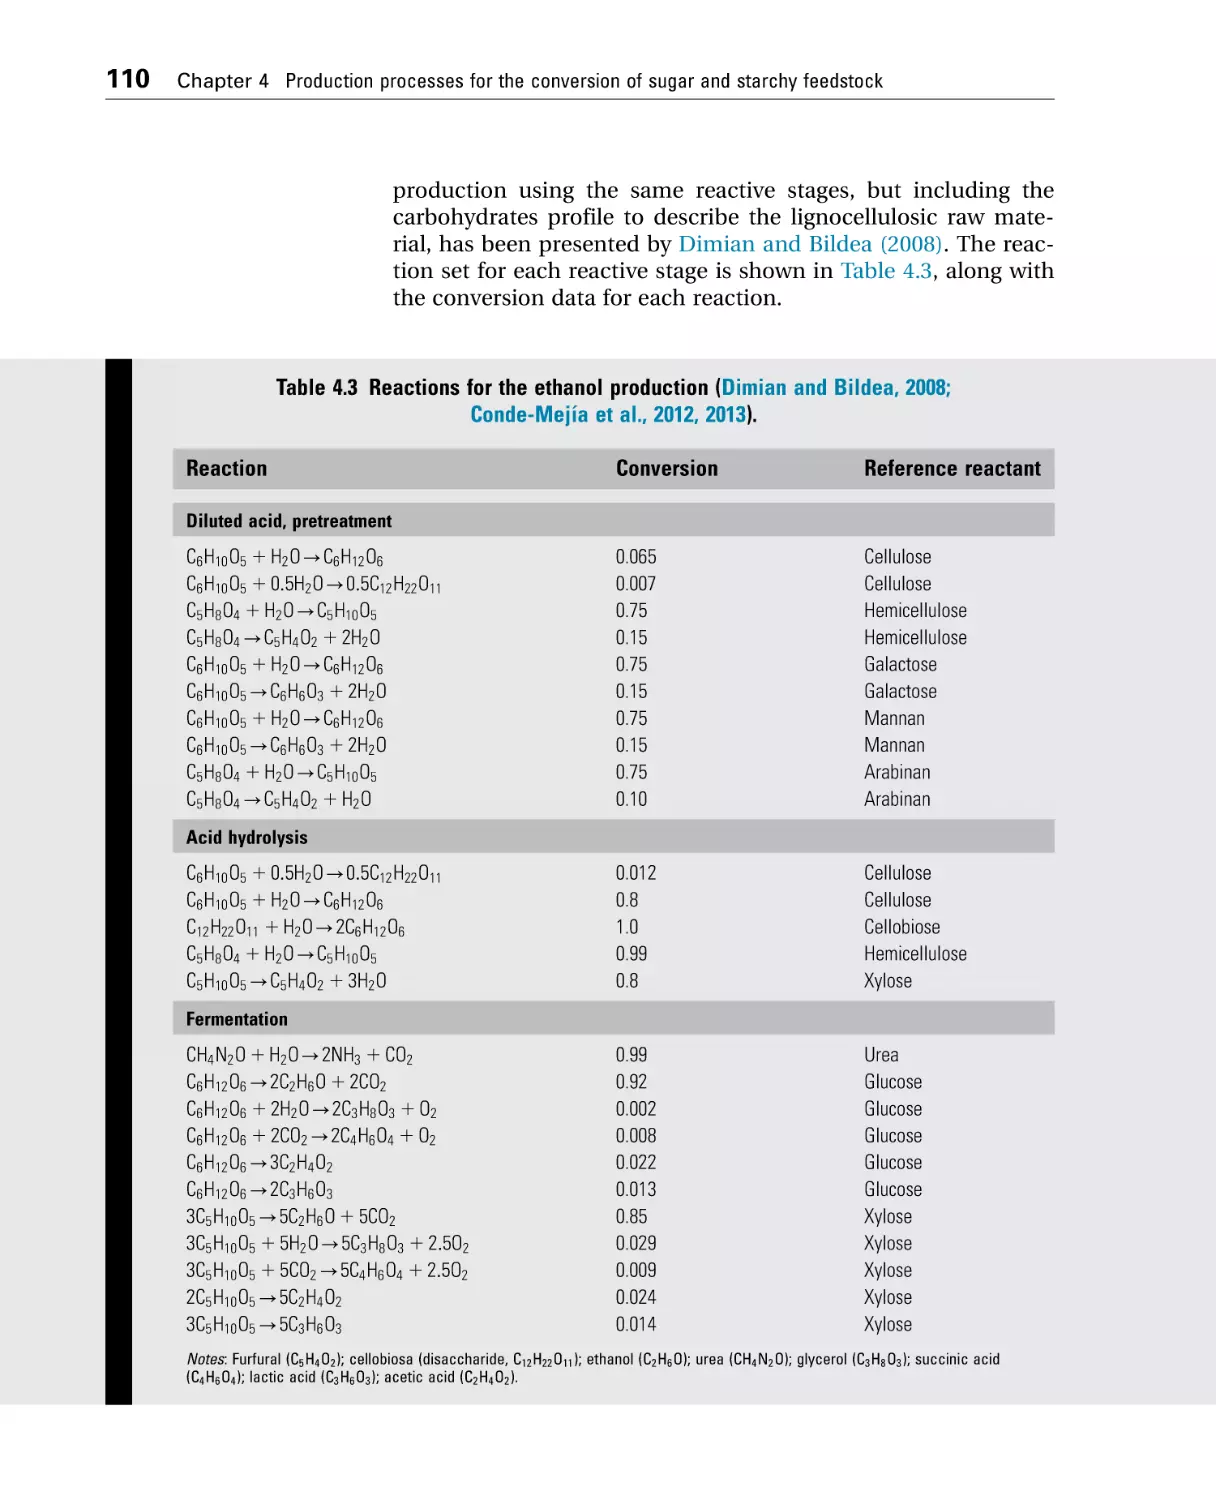
4.6 Case of study: conversion of sugar and starchy feedstocks ......... 106
4.6.1 Problem statement .................................................................. 106
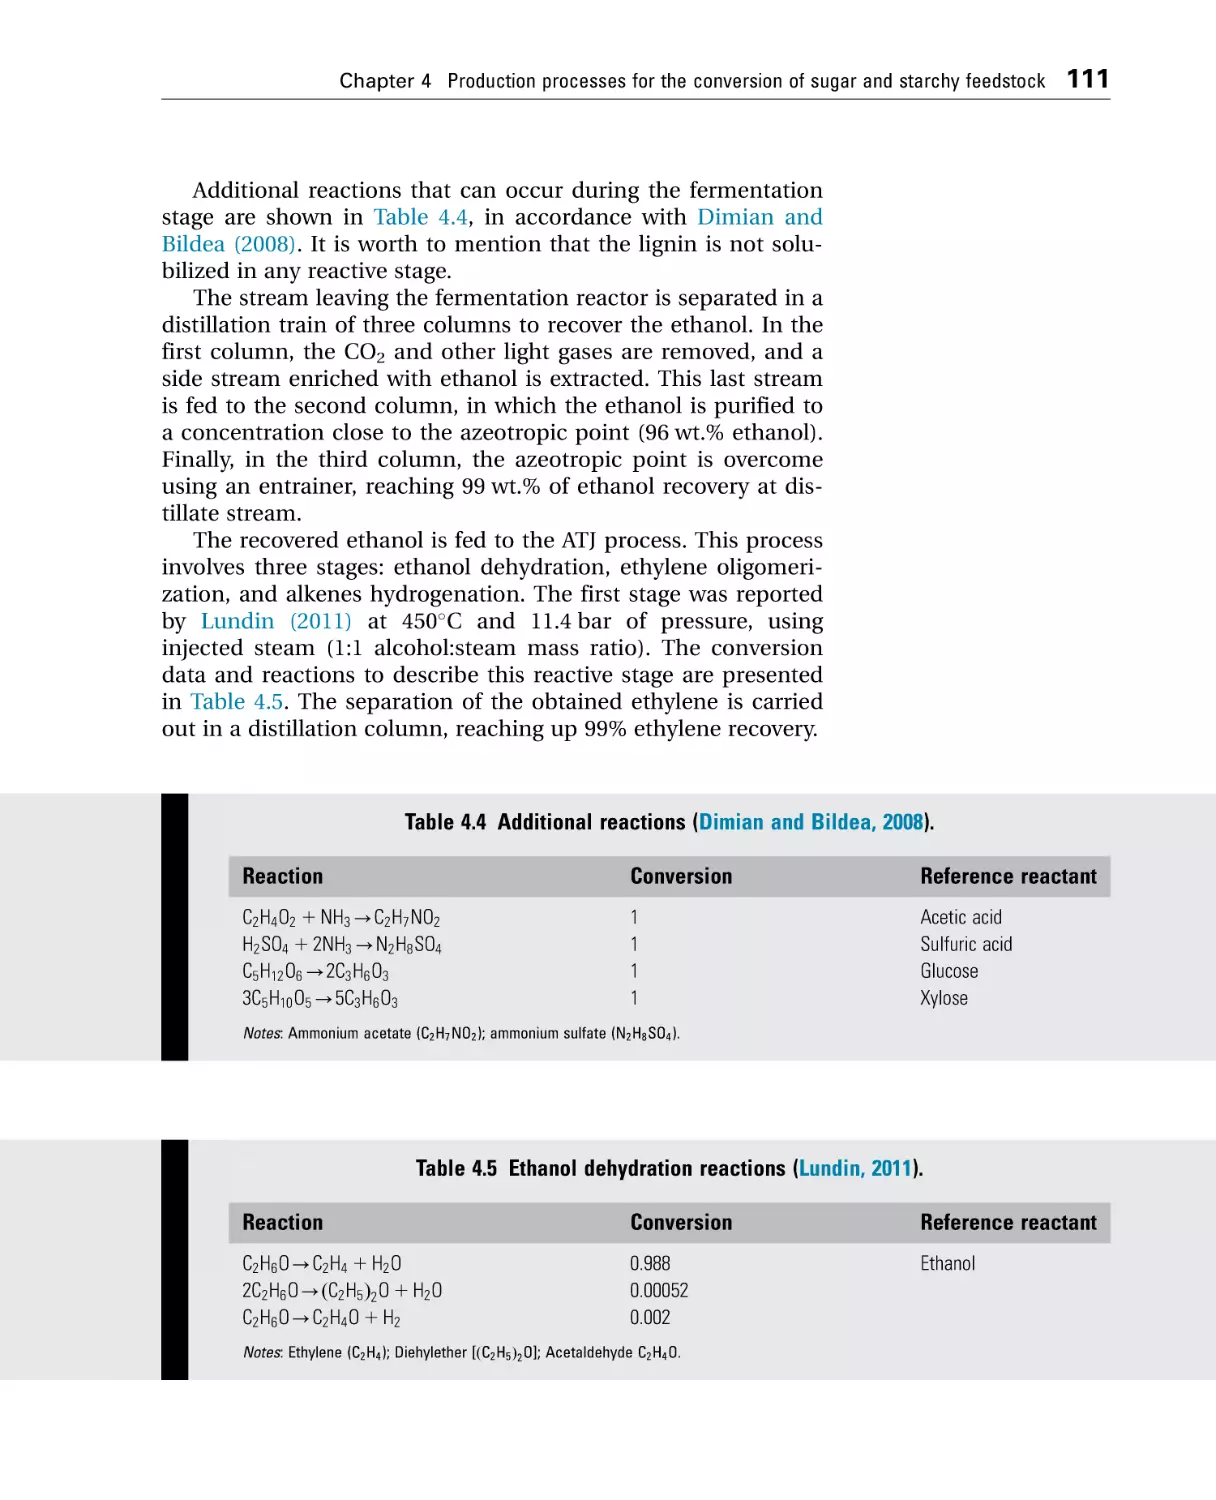
4.6.2 Modeling of sugar and starchy feedstocks ........................... 108
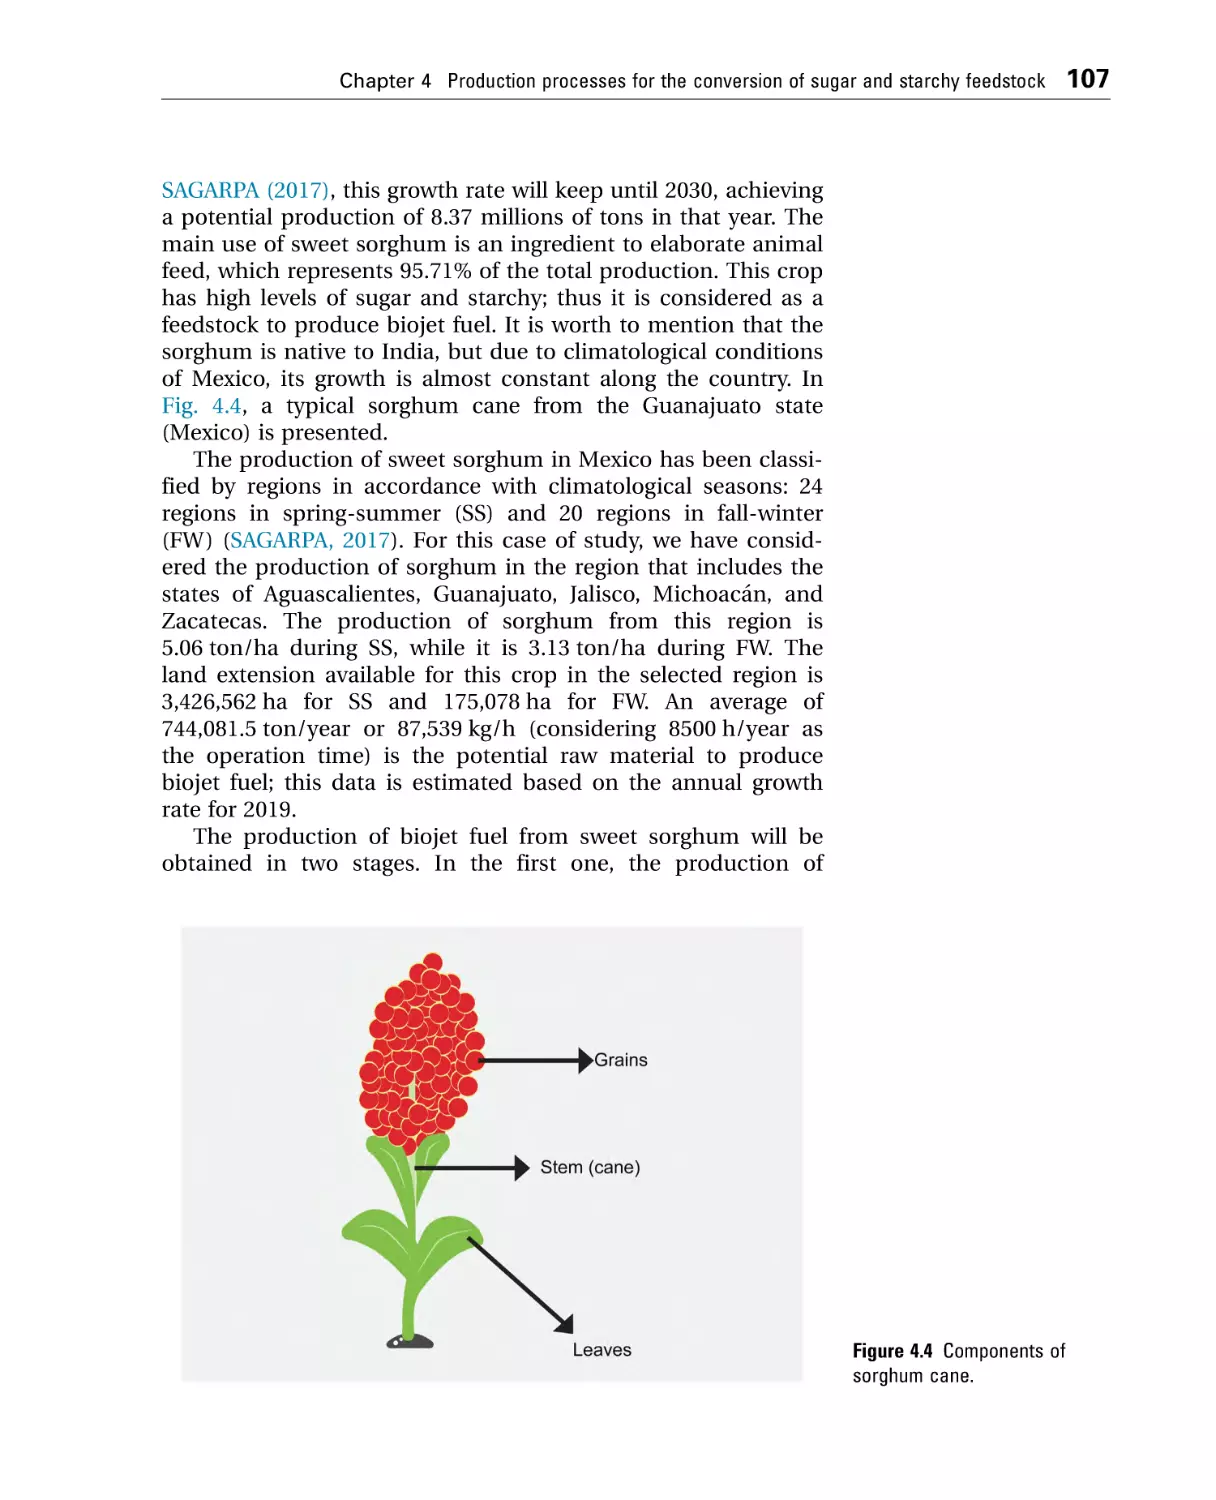
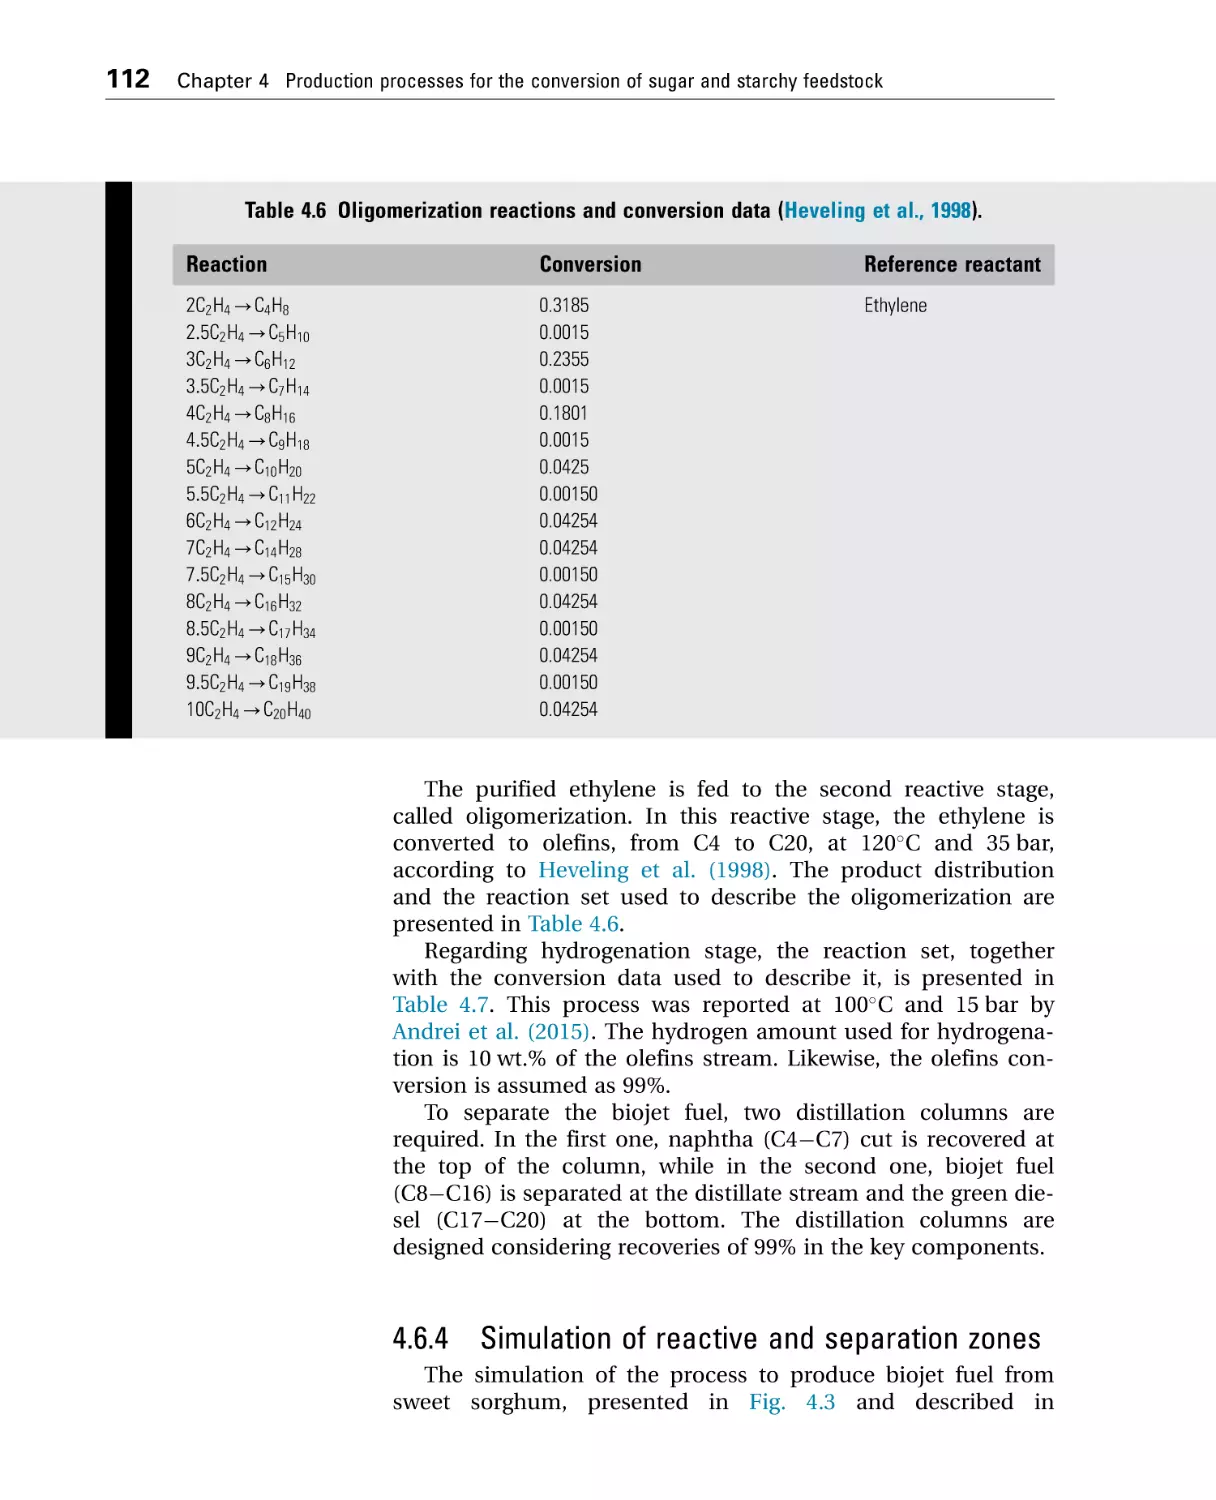
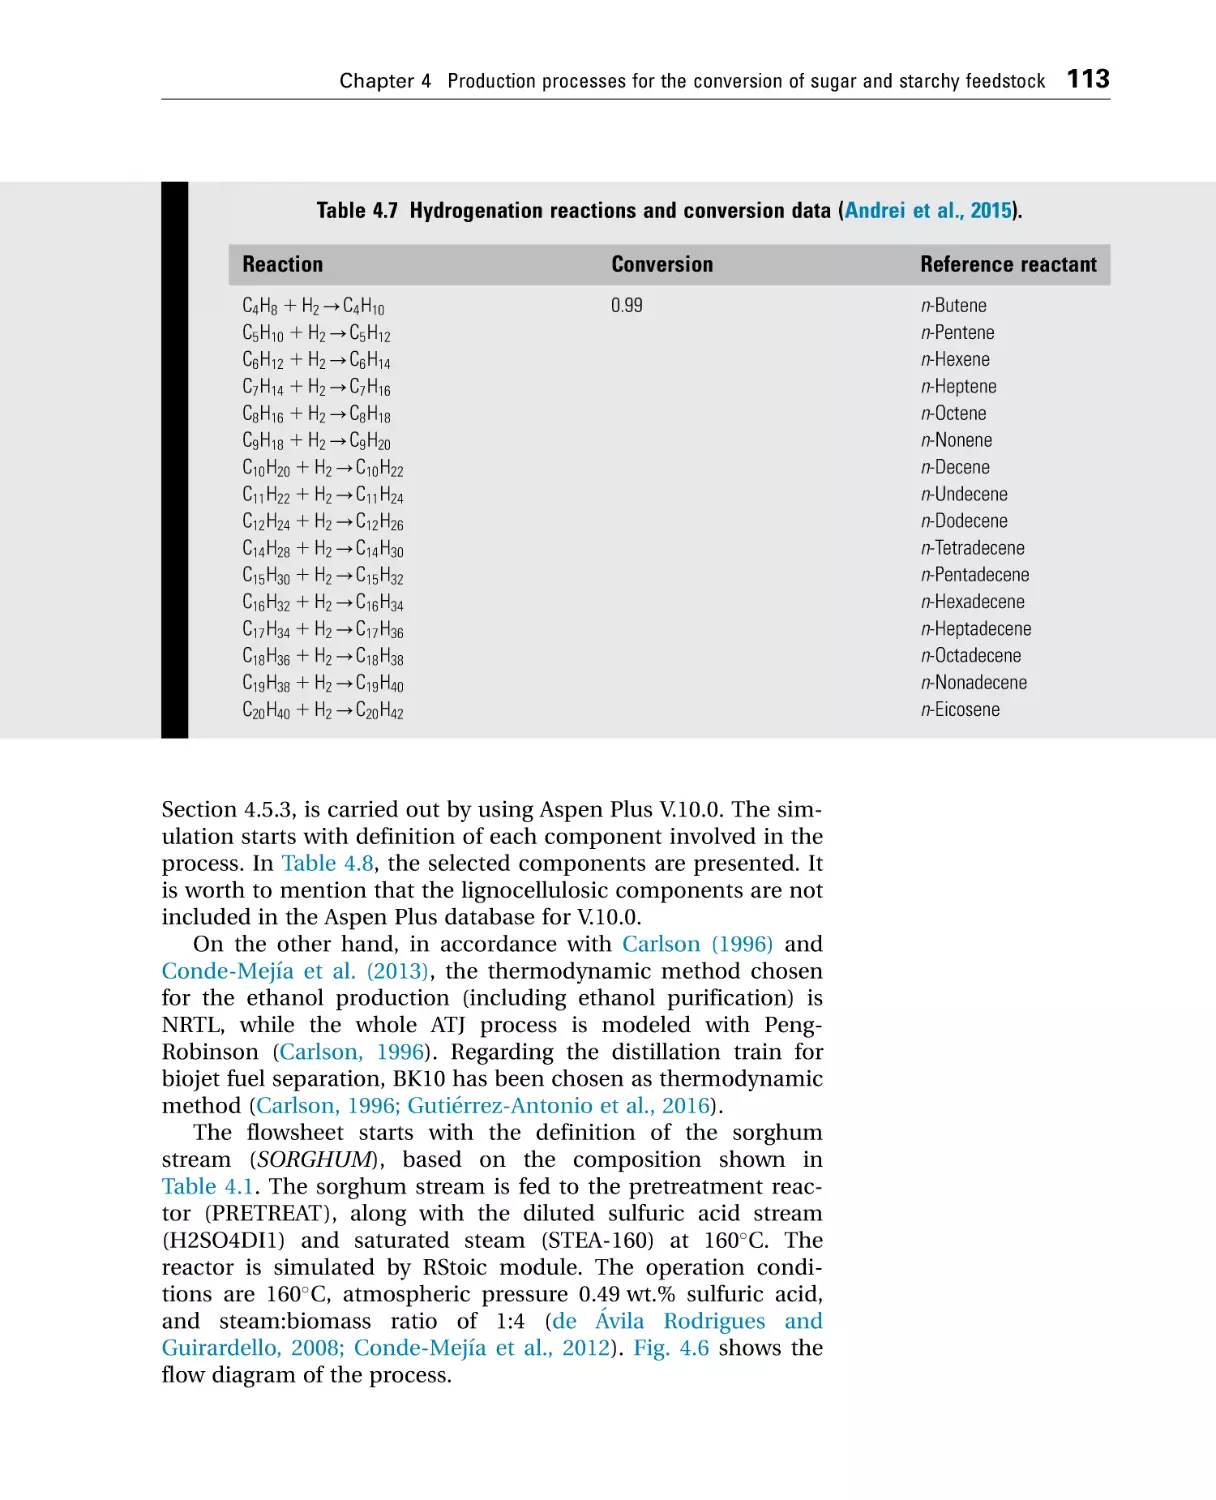
4.6.3 Production process: conceptual design.................................108
4.6.4 Simulation of reactive and separation zones........................ 112
4.6.5 Economic assessment............................................................. 118
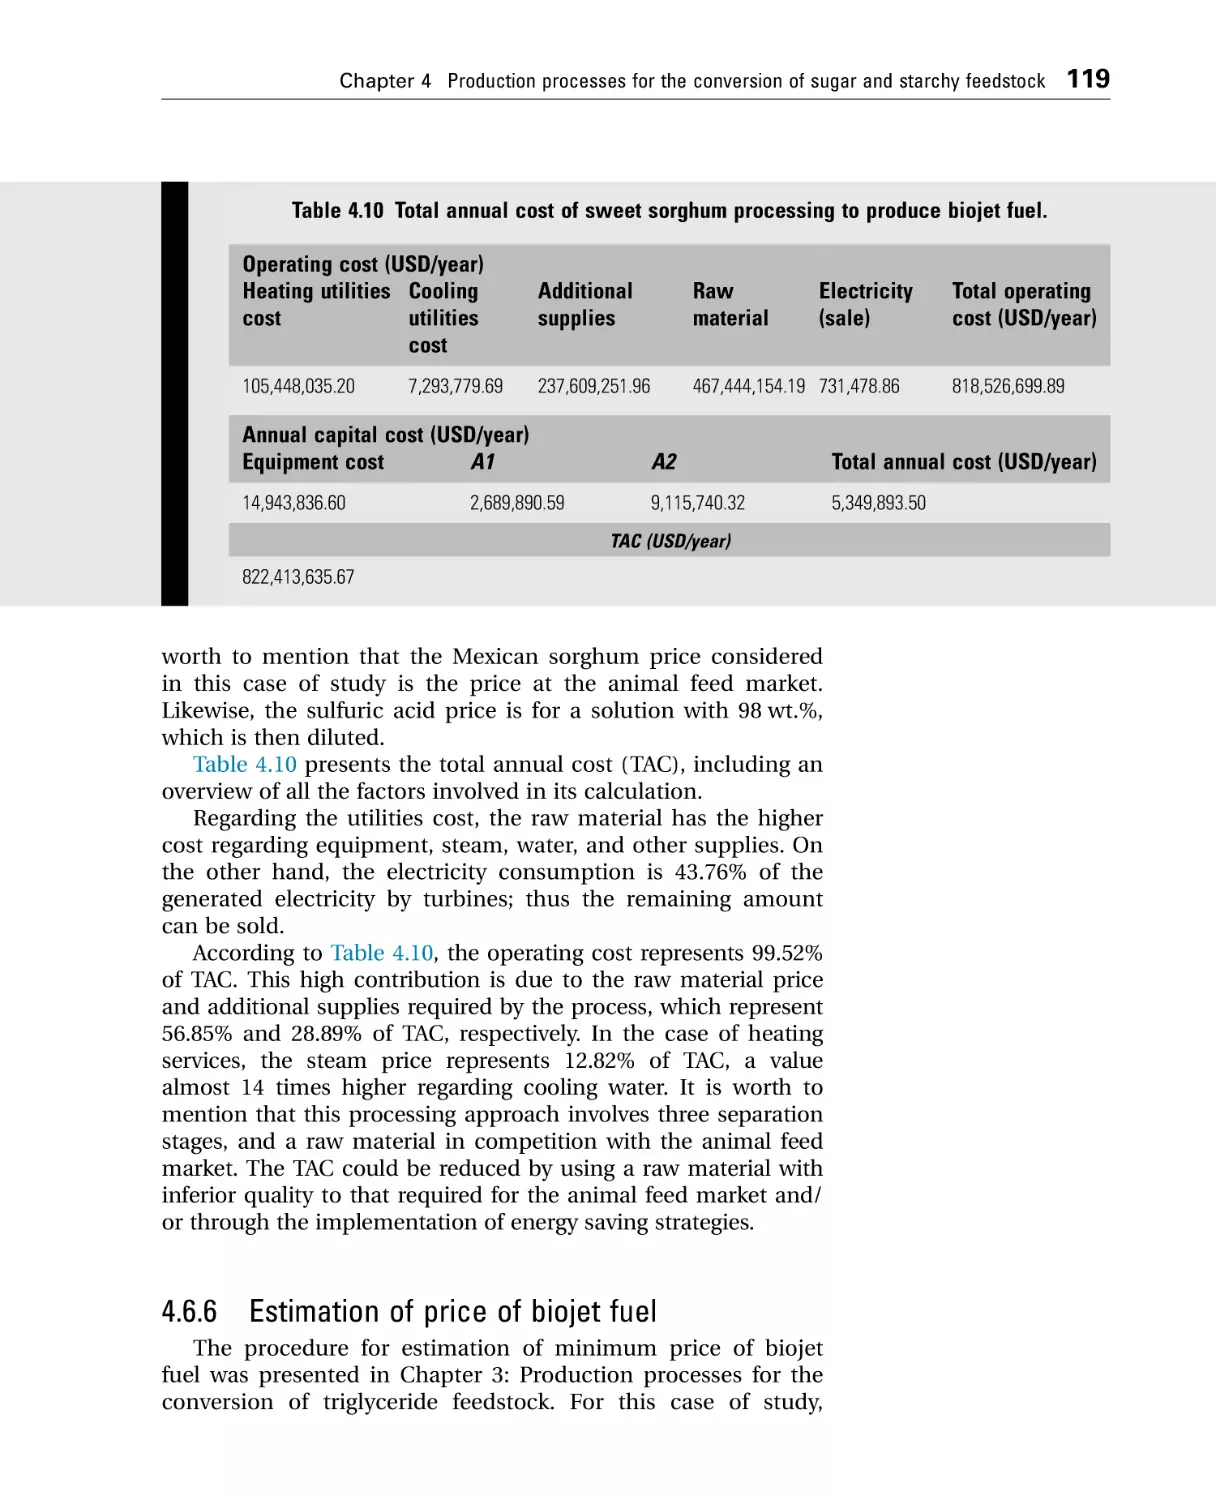
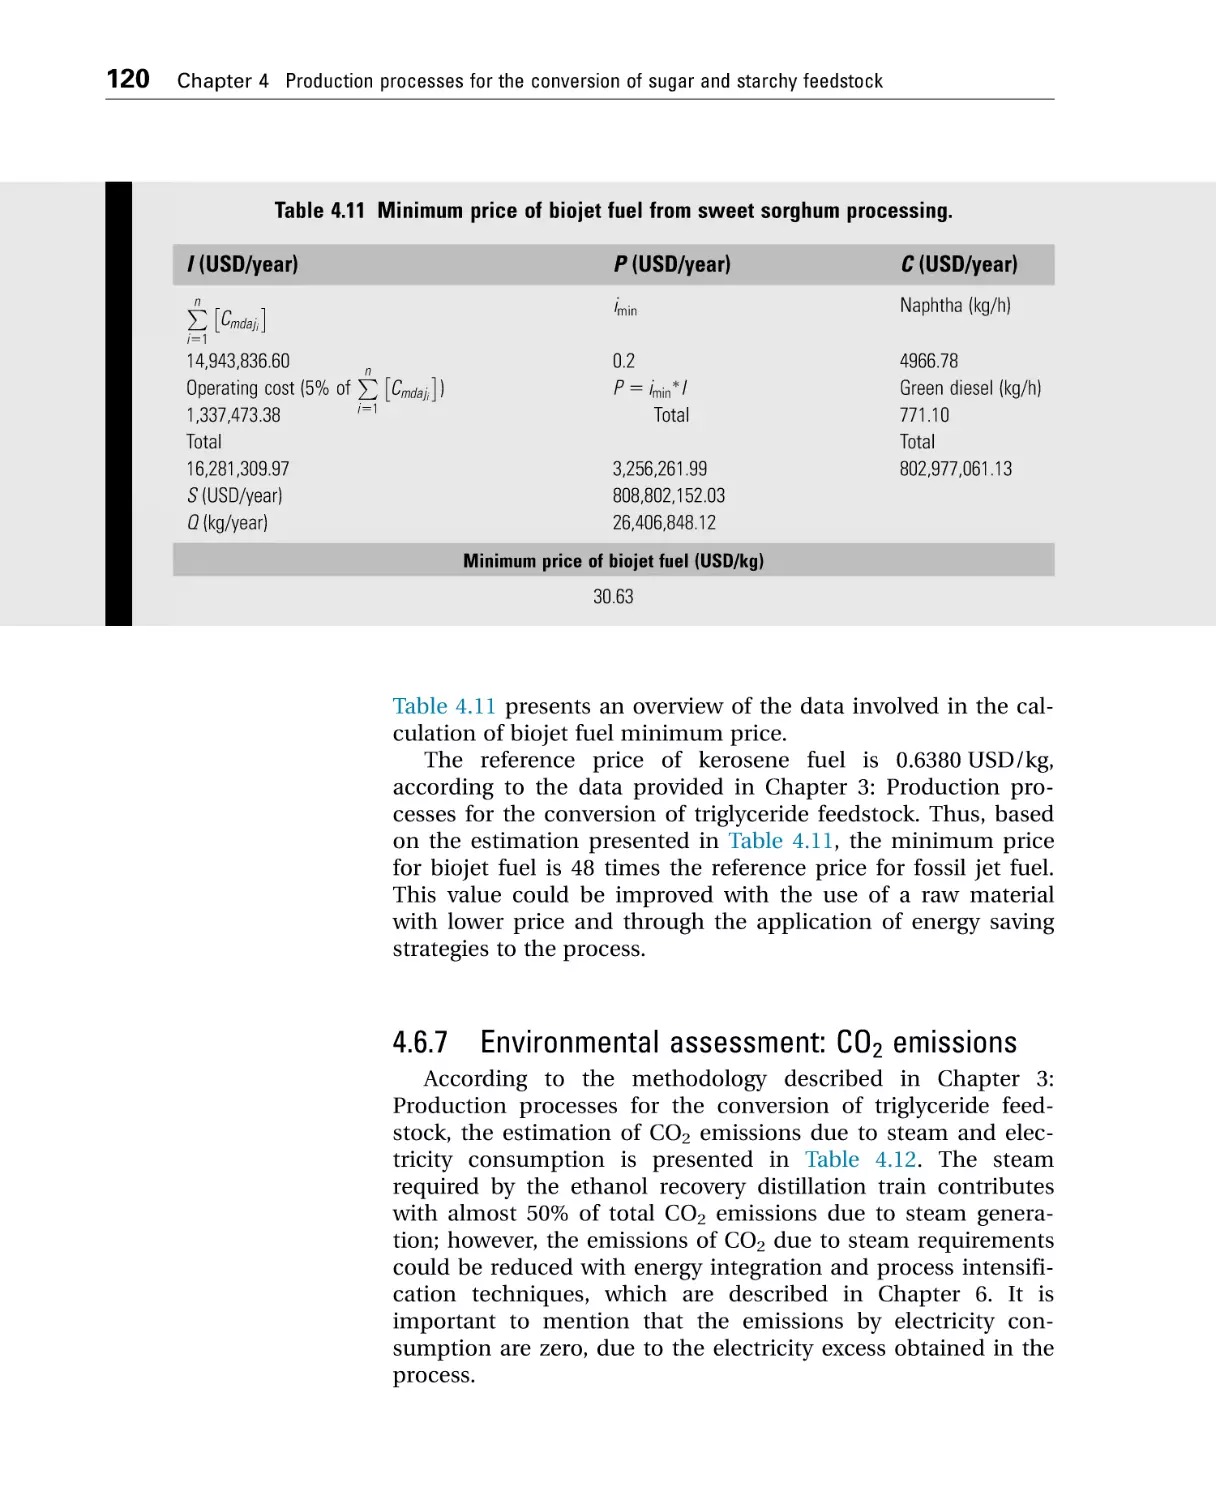
4.6.6 Estimation of price of biojet fuel............................................ 119
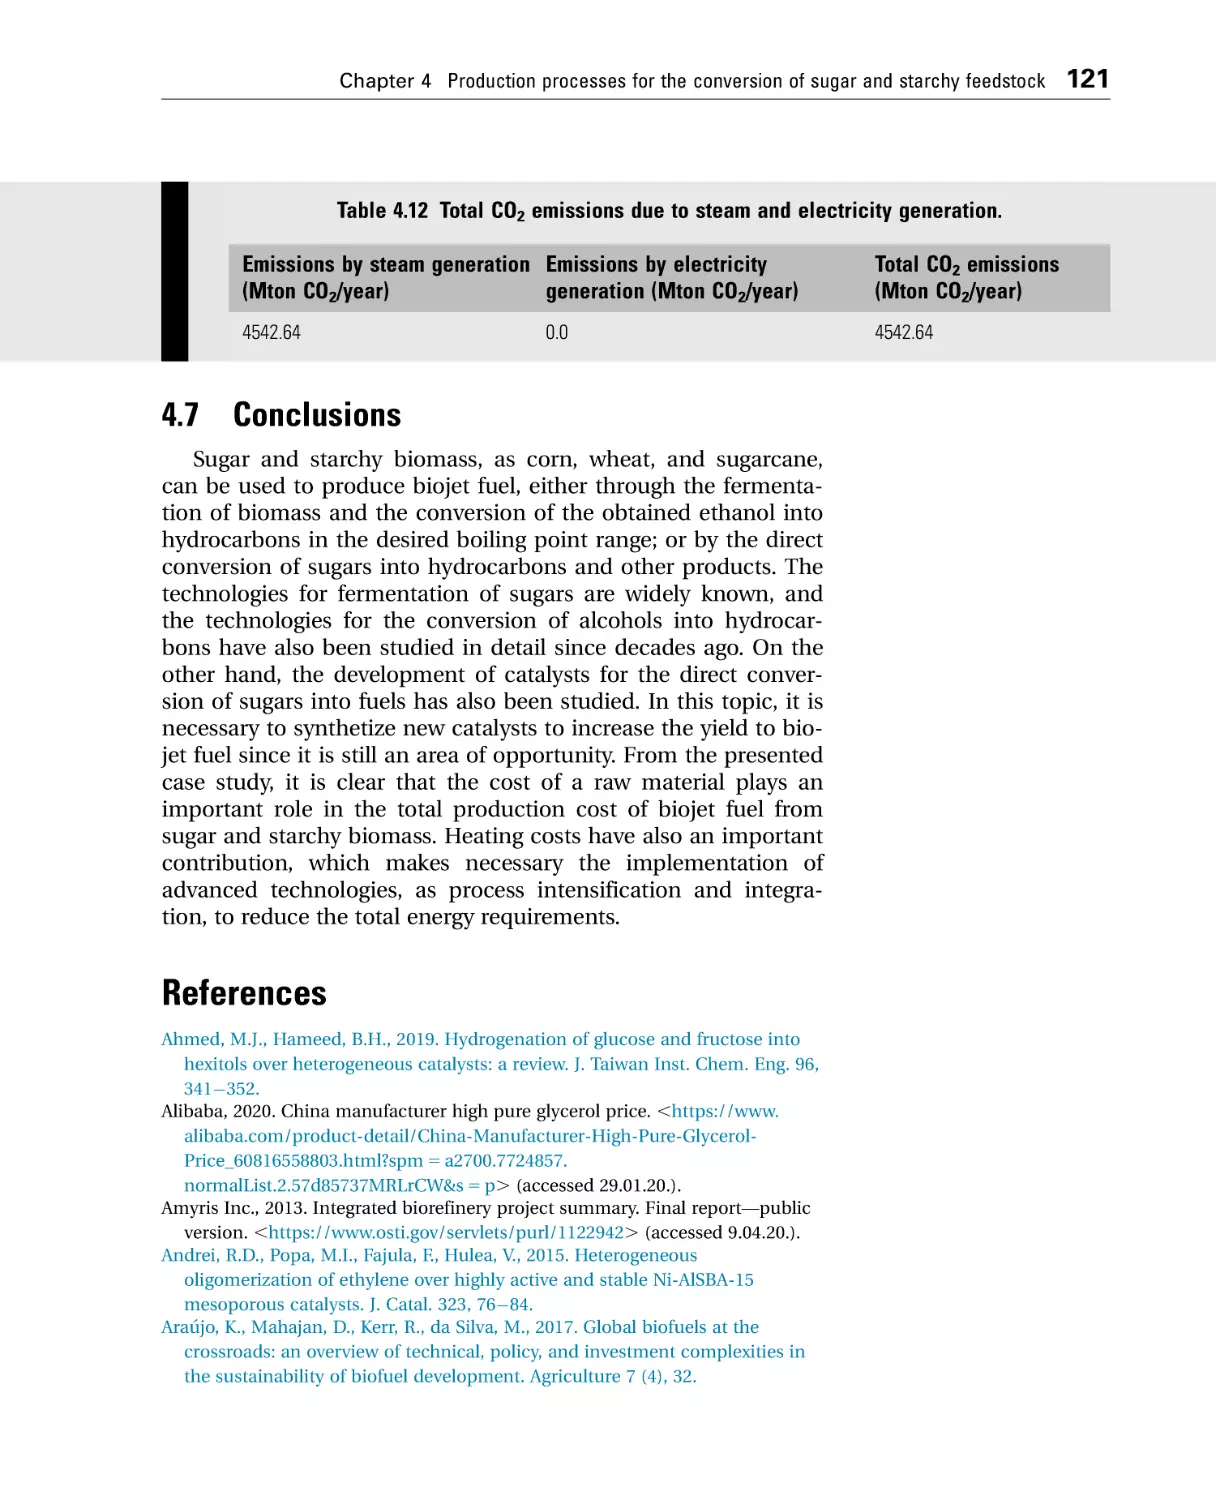
4.6.7 Environmental assessment: CO2 emissions.......................... 120
4.7 Conclusions ...................................................................................... 121
References ............................................................................................... 121
5 Production processes from lignocellulosic feedstock...........................129
5.1 Introduction ...................................................................................... 129
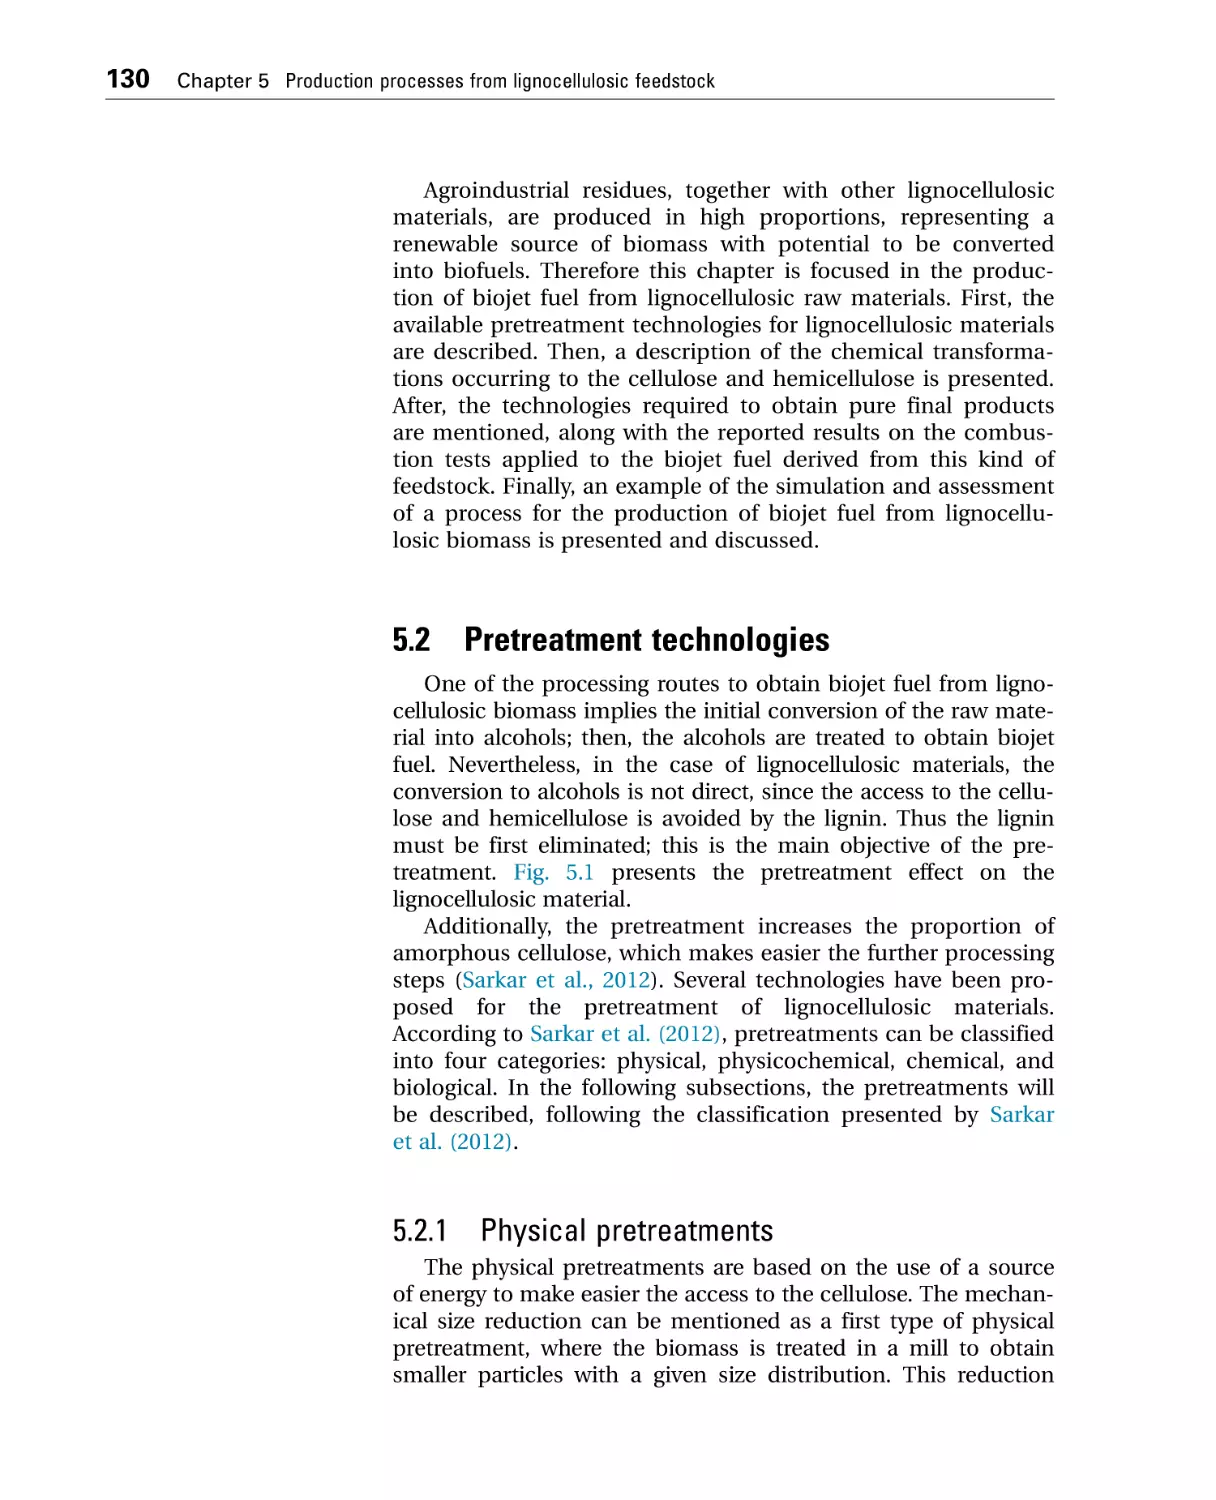
5.2 Pretreatment technologies .............................................................. 130
5.2.1 Physical pretreatments ........................................................... 130
5.2.2 Physicochemical pretreatments ............................................. 132
5.2.3 Chemical pretreatments.......................................................... 133
5.2.4 Biological pretreatments......................................................... 134
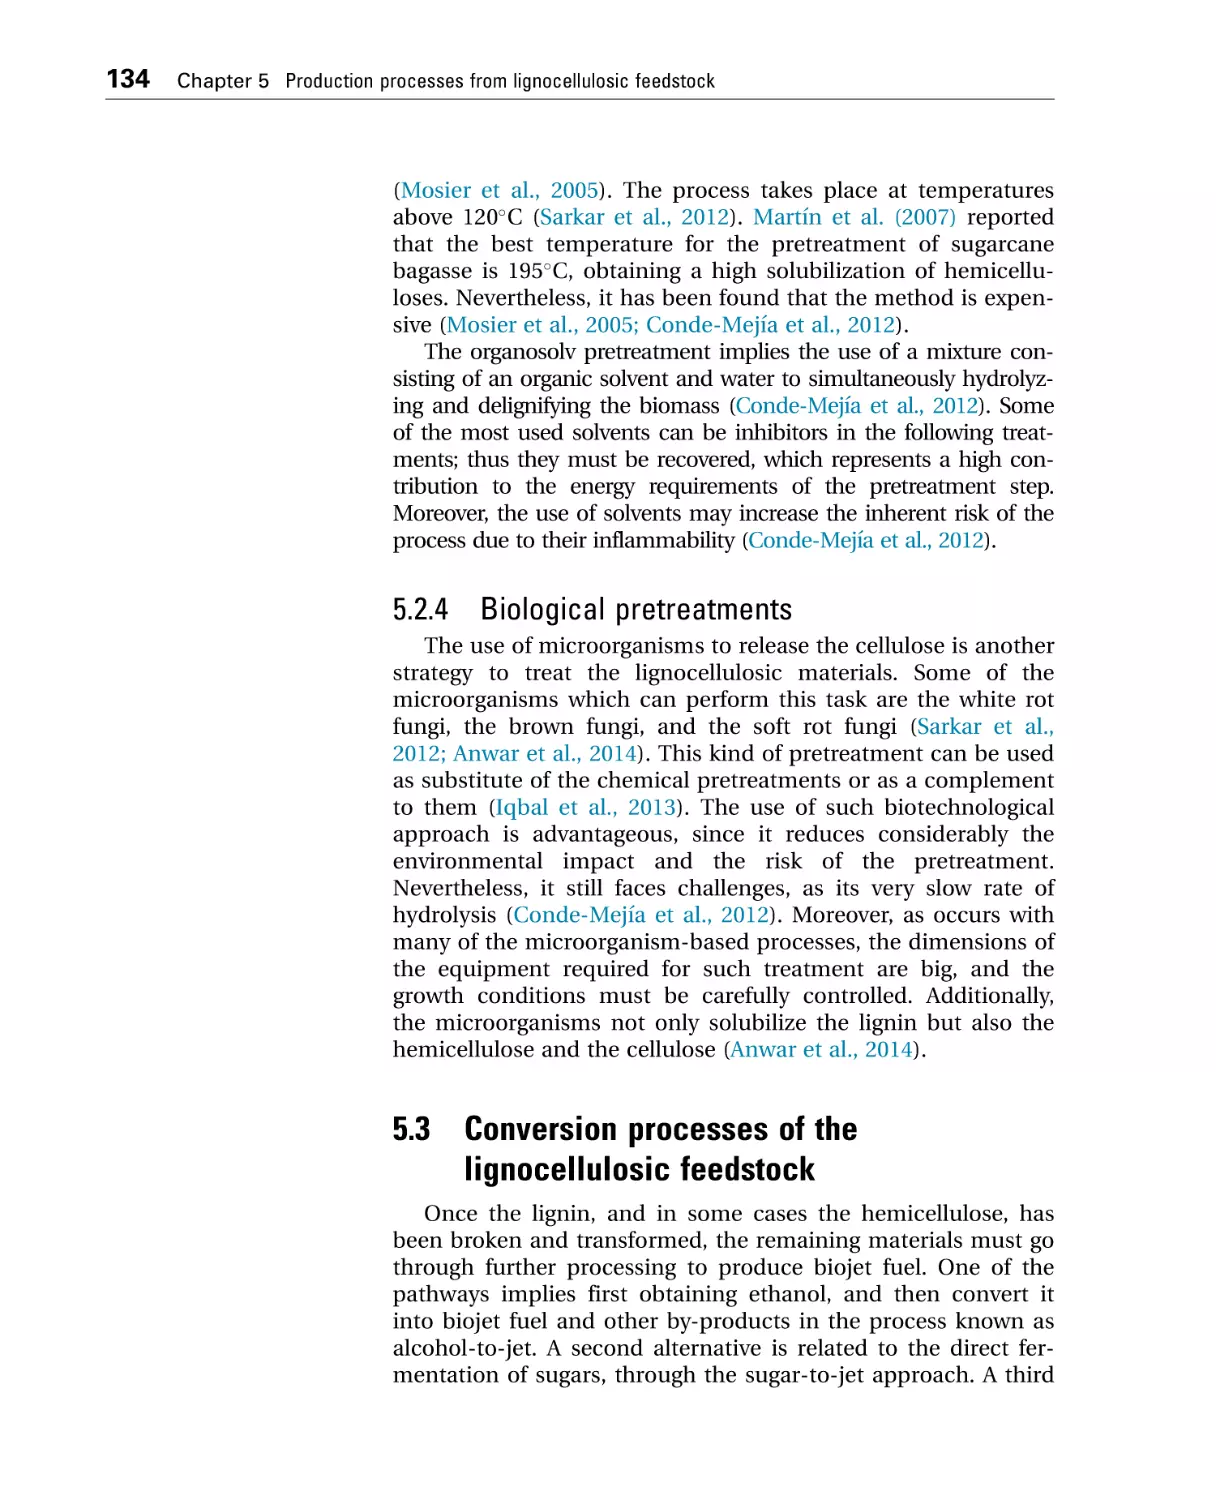
5.3 Conversion processes of the lignocellulosic feedstock................. 134
5.3.1 Alcohol-to-jet process ............................................................. 136
5.3.2 Sugar-to-jet process ................................................................ 136
5.3.3 Thermochemical route............................................................ 136
5.3.4 Lignin as a source for aromatics............................................ 138
5.4 Technologies on the separation zone............................................. 140
Contents
vii
5.5 Conventional processes: state of the art ........................................ 141
5.6 Combustion tests for biojet fuel from lignocellulosic
feedstock ........................................................................................... 142
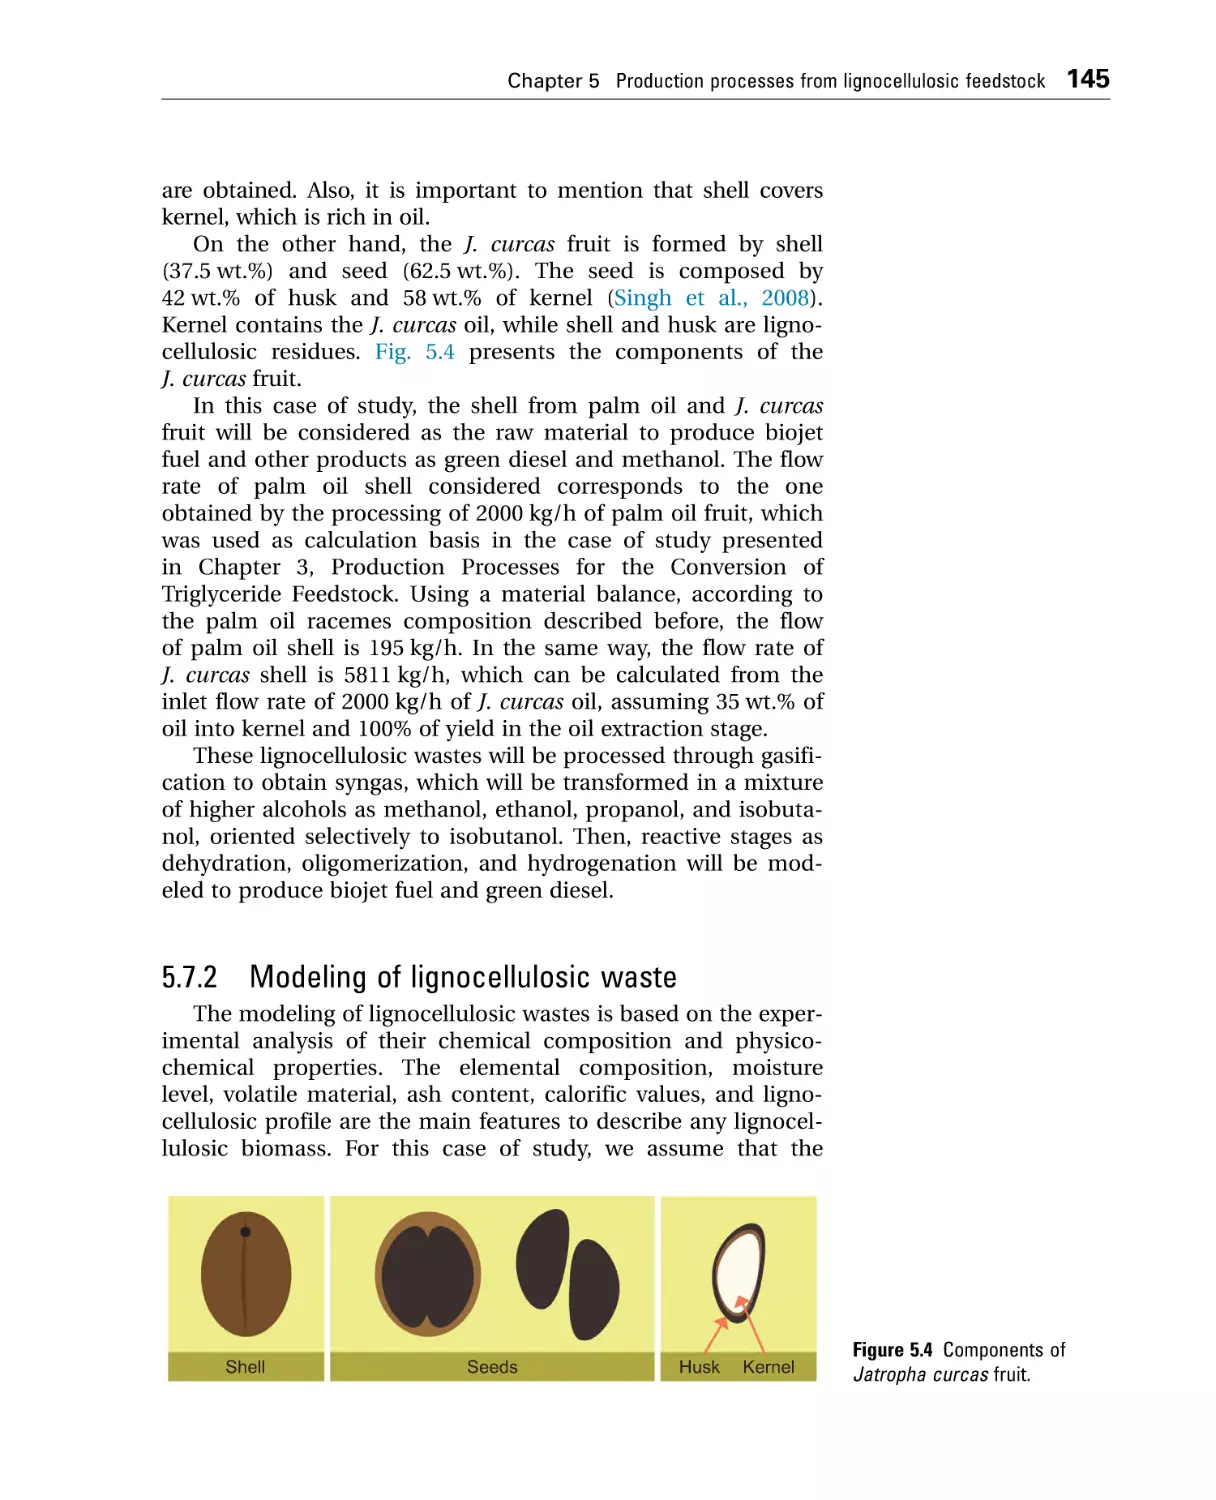
5.7 Case study: conversion of lignocellulosic waste ........................... 144
5.7.1 Problem statement .................................................................. 144
5.7.2 Modeling of lignocellulosic waste ......................................... 145
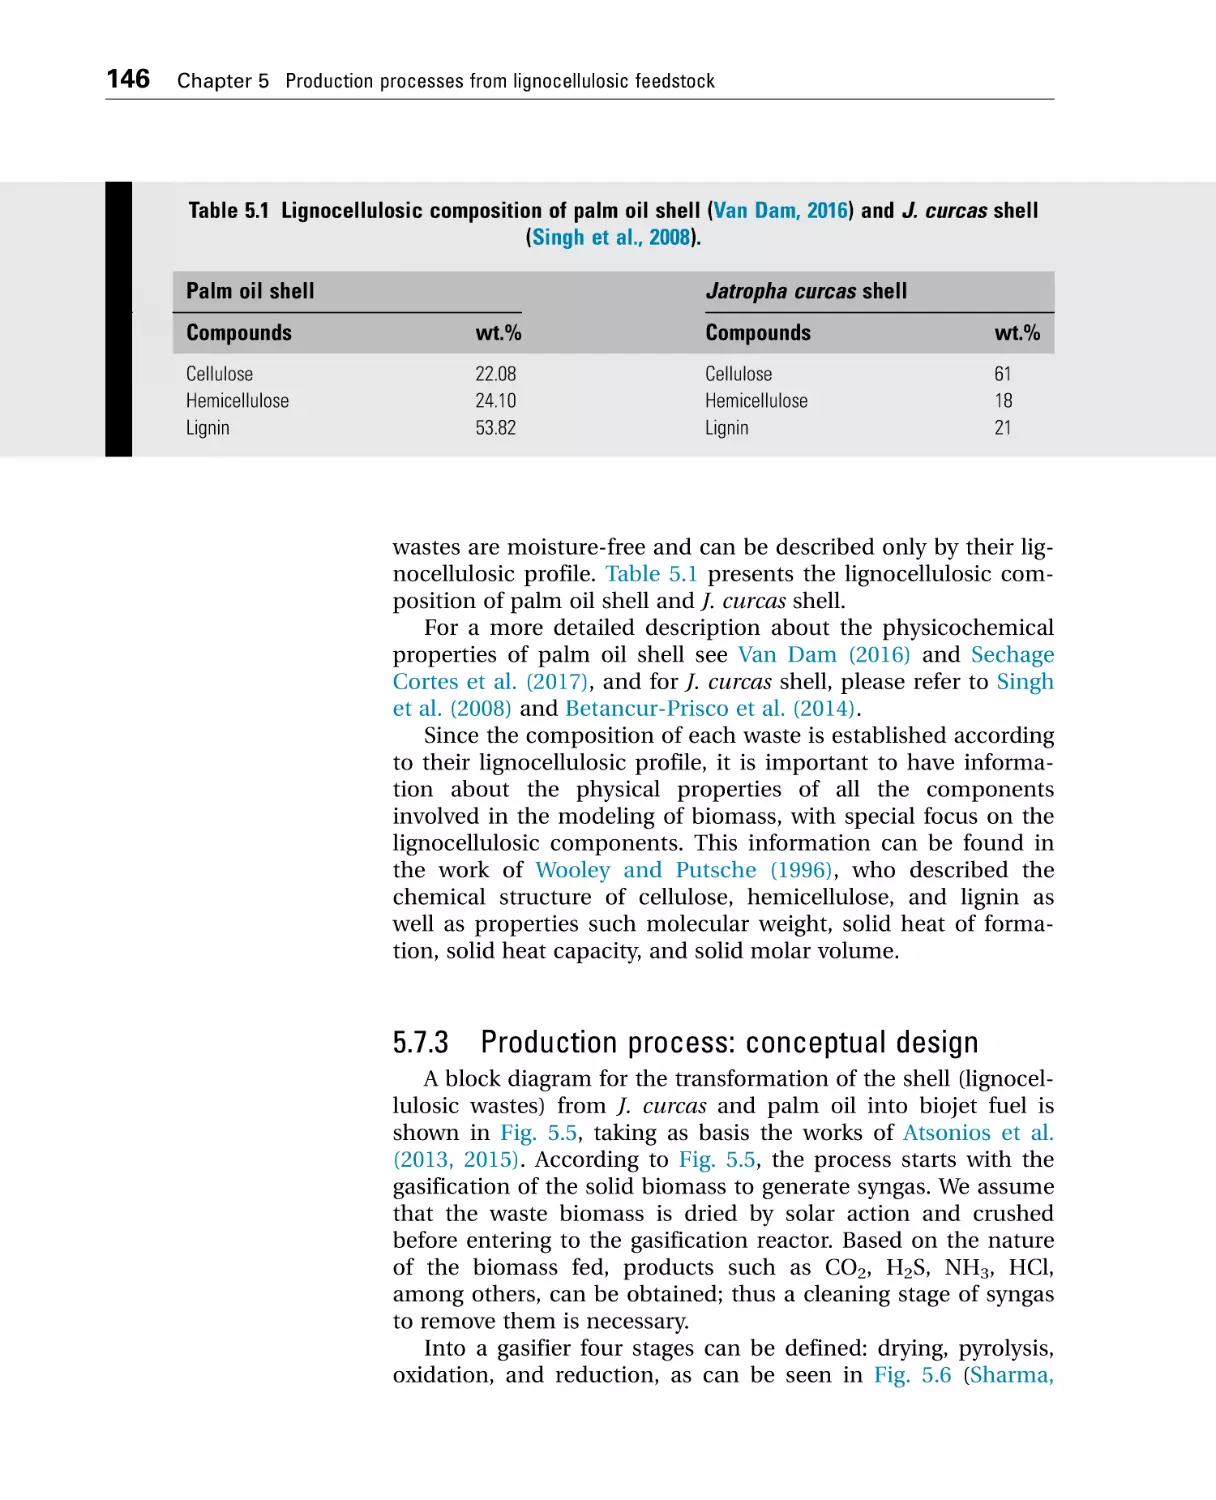
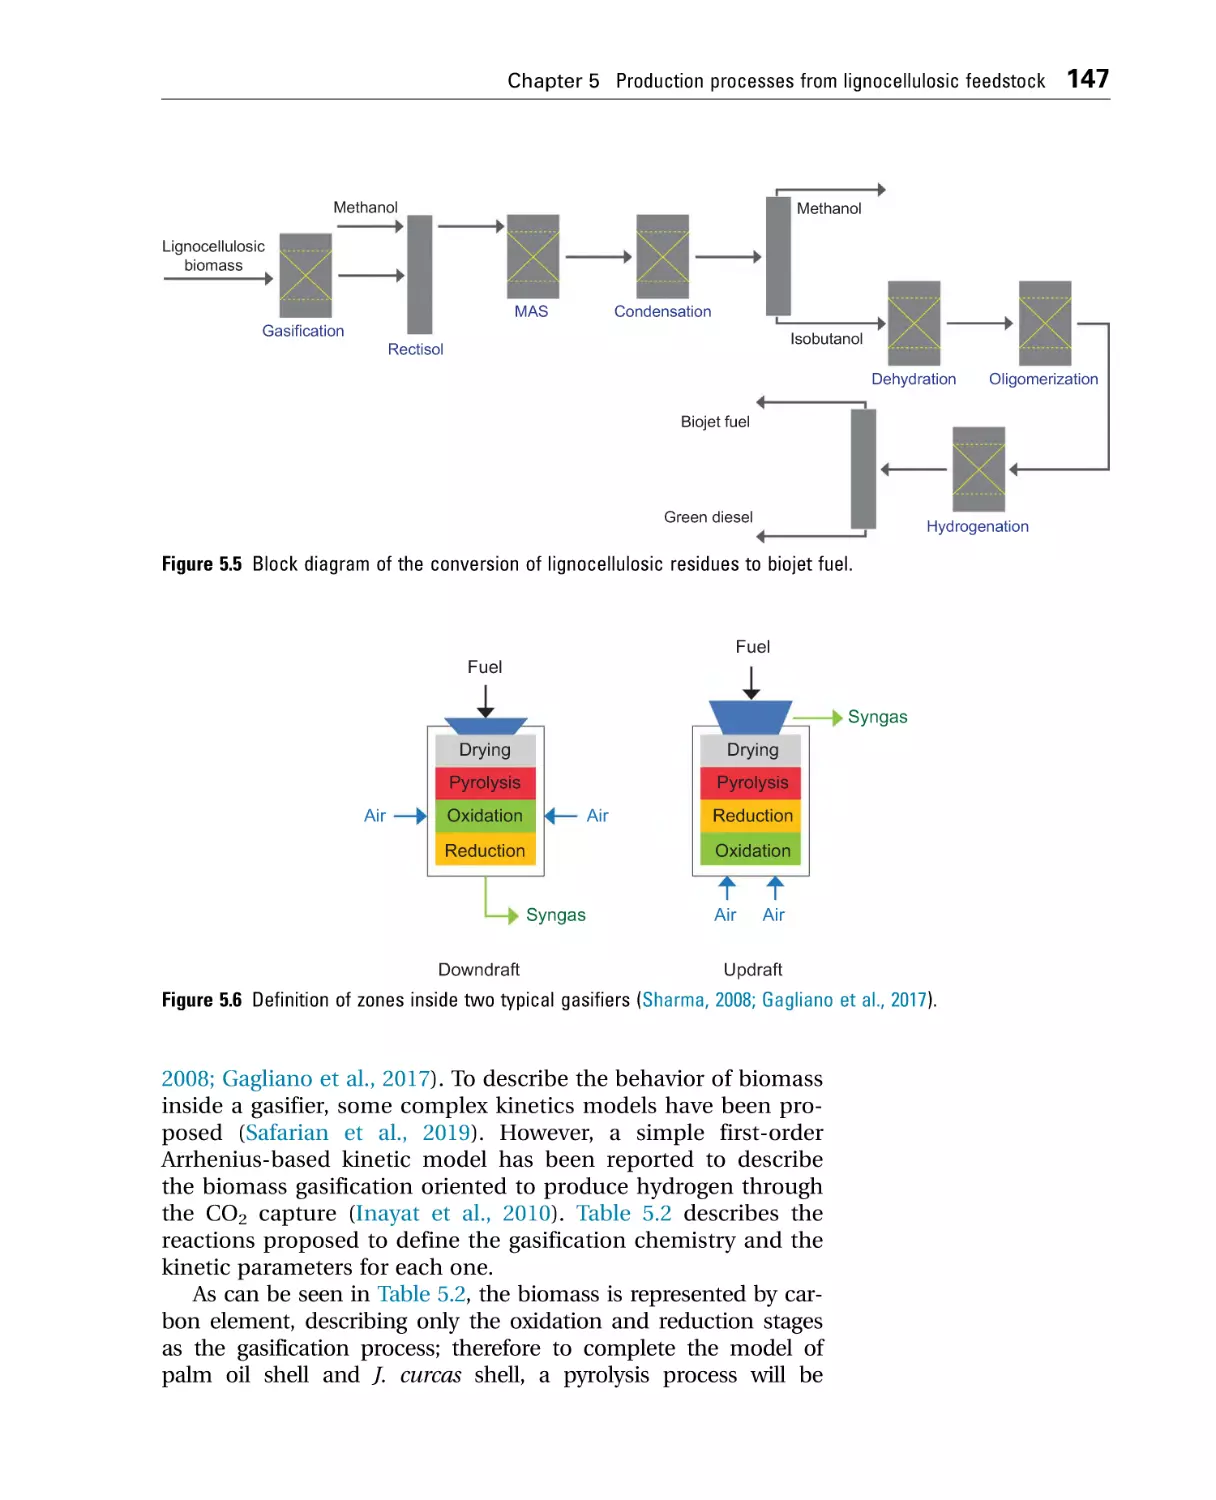
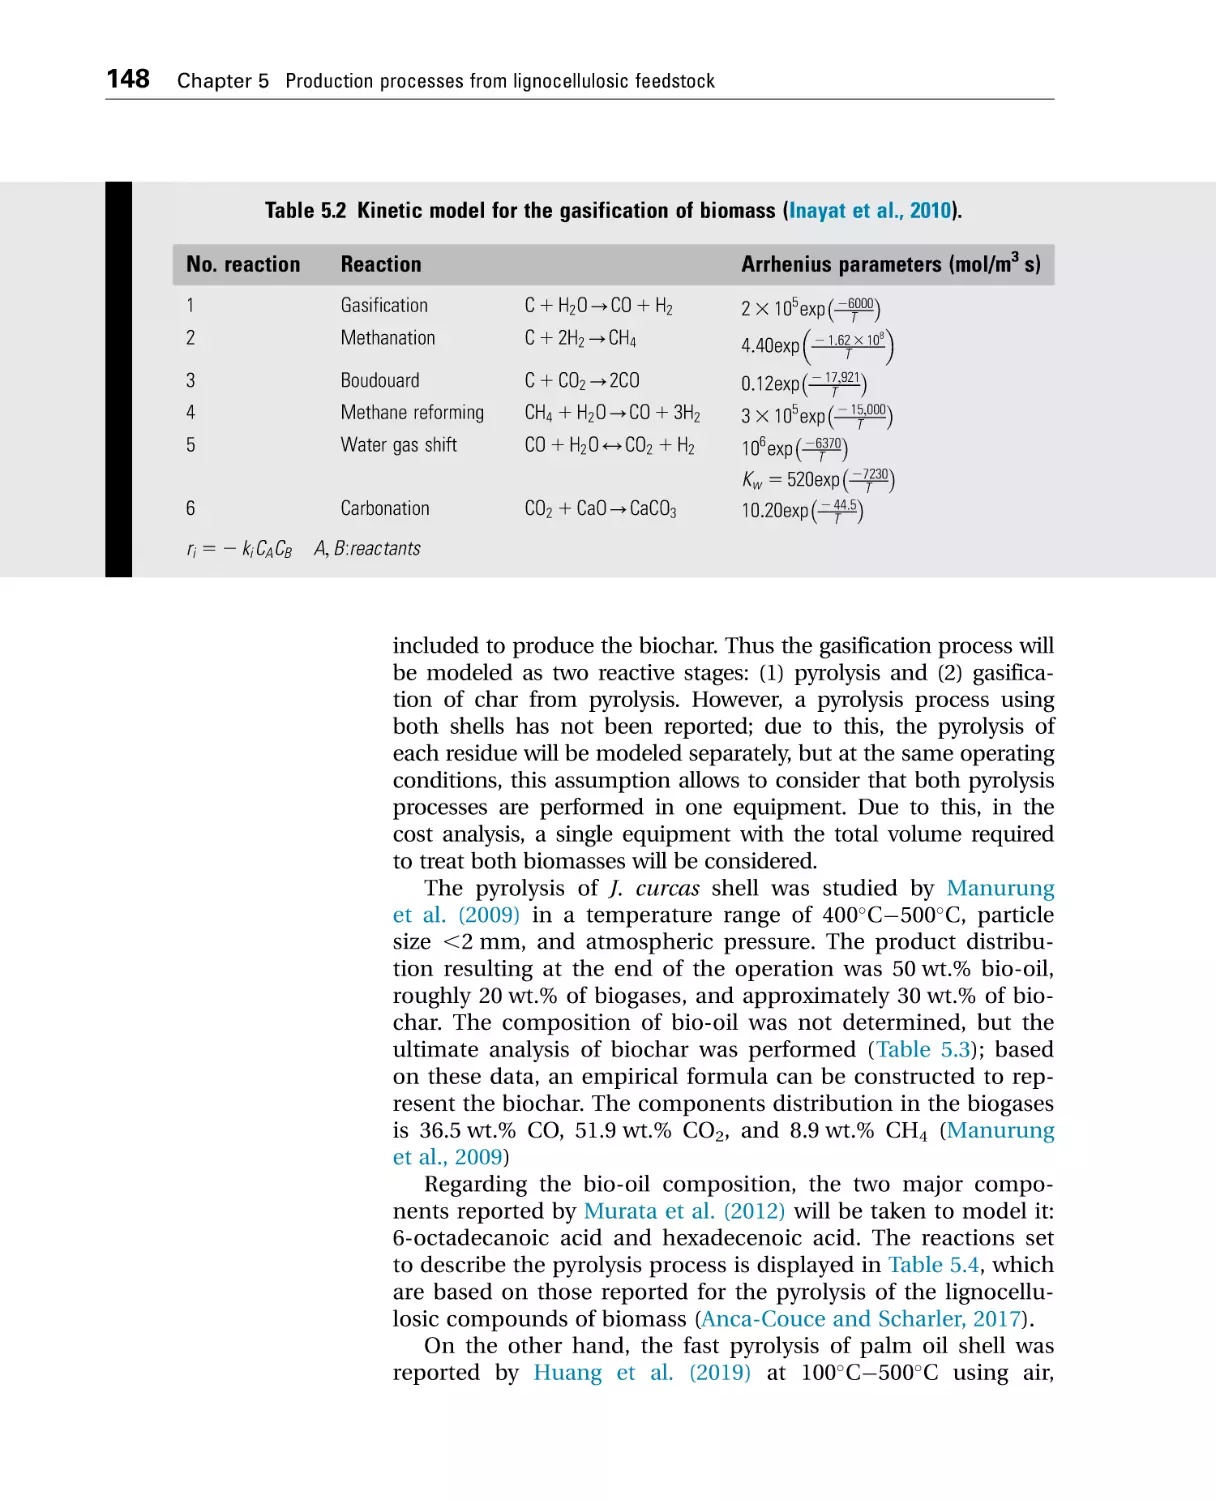
5.7.3 Production process: conceptual design.................................146
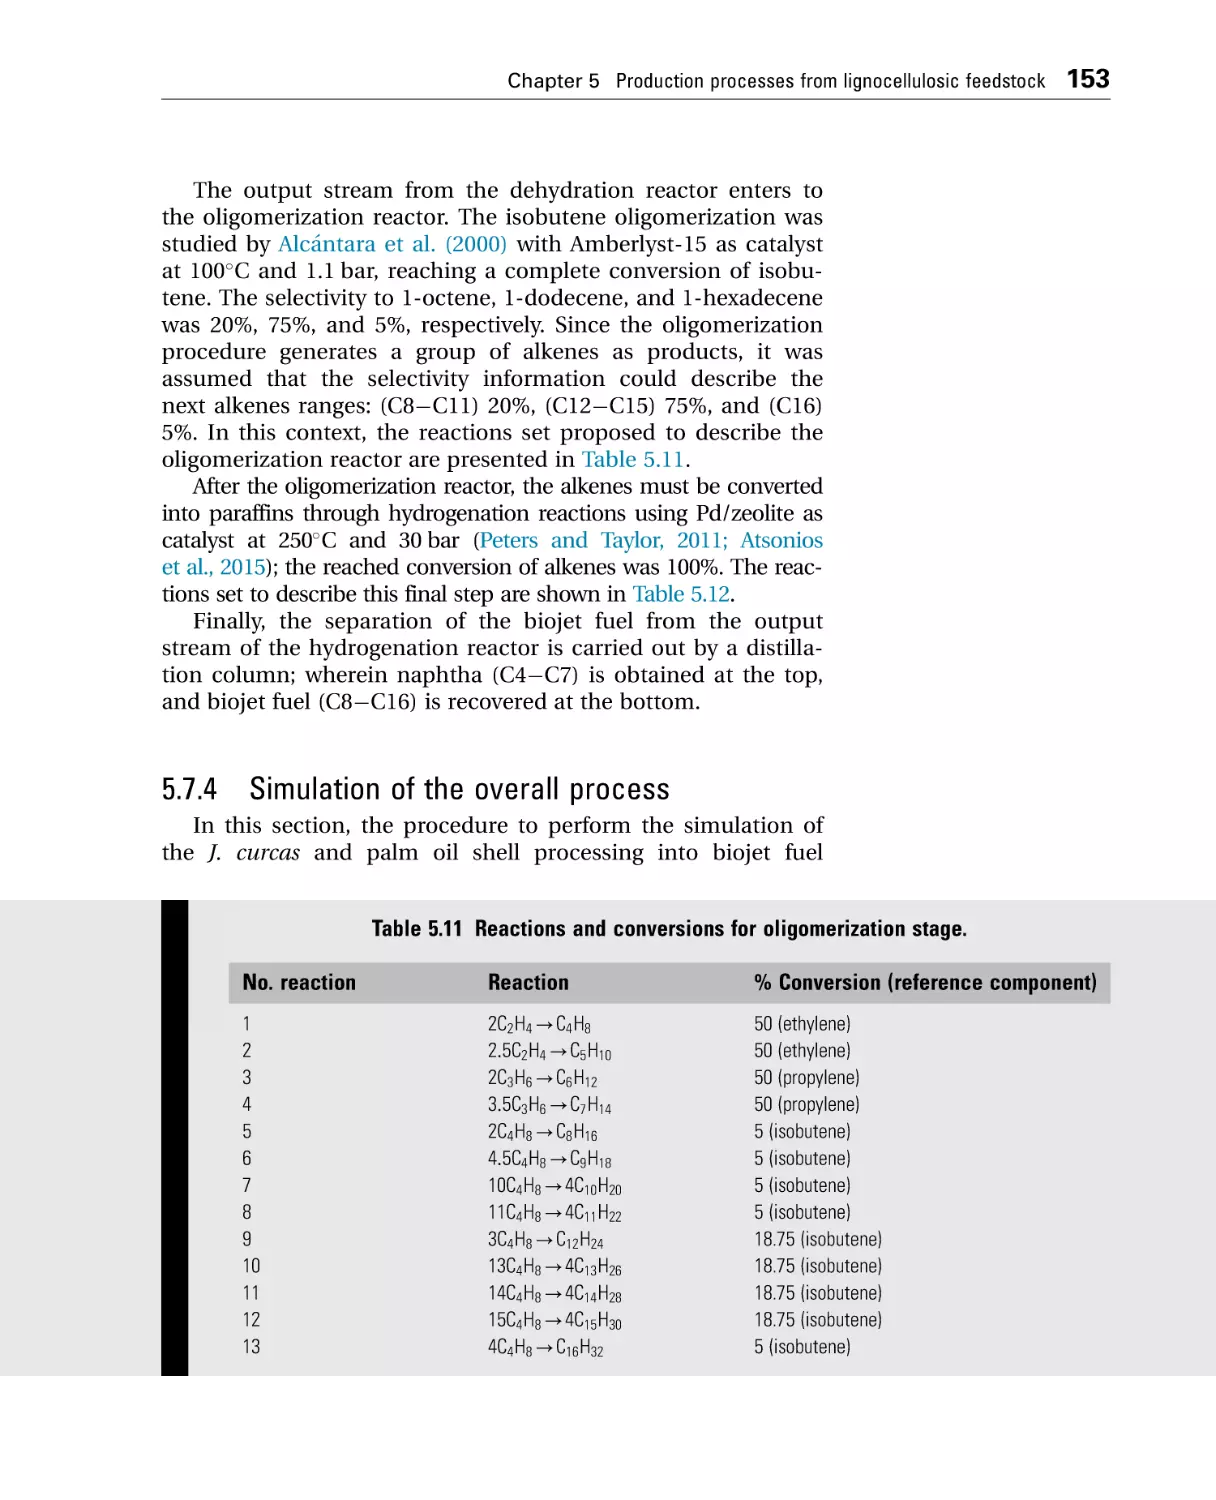
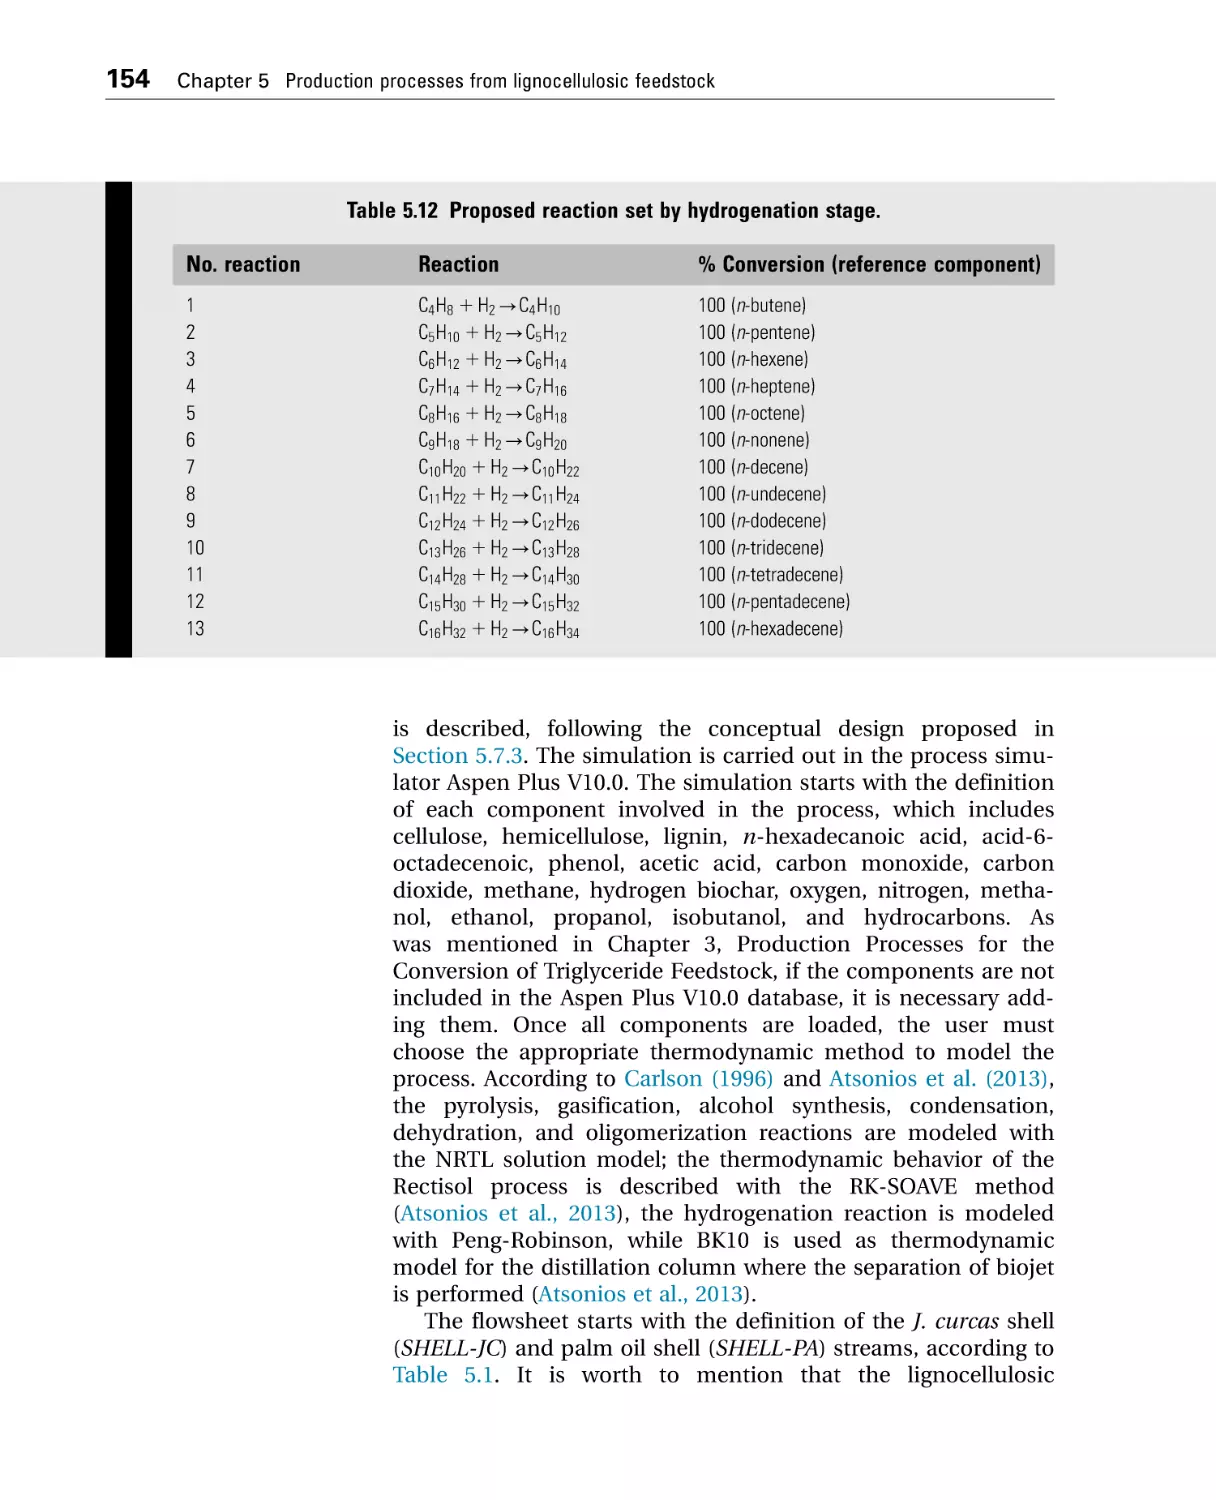
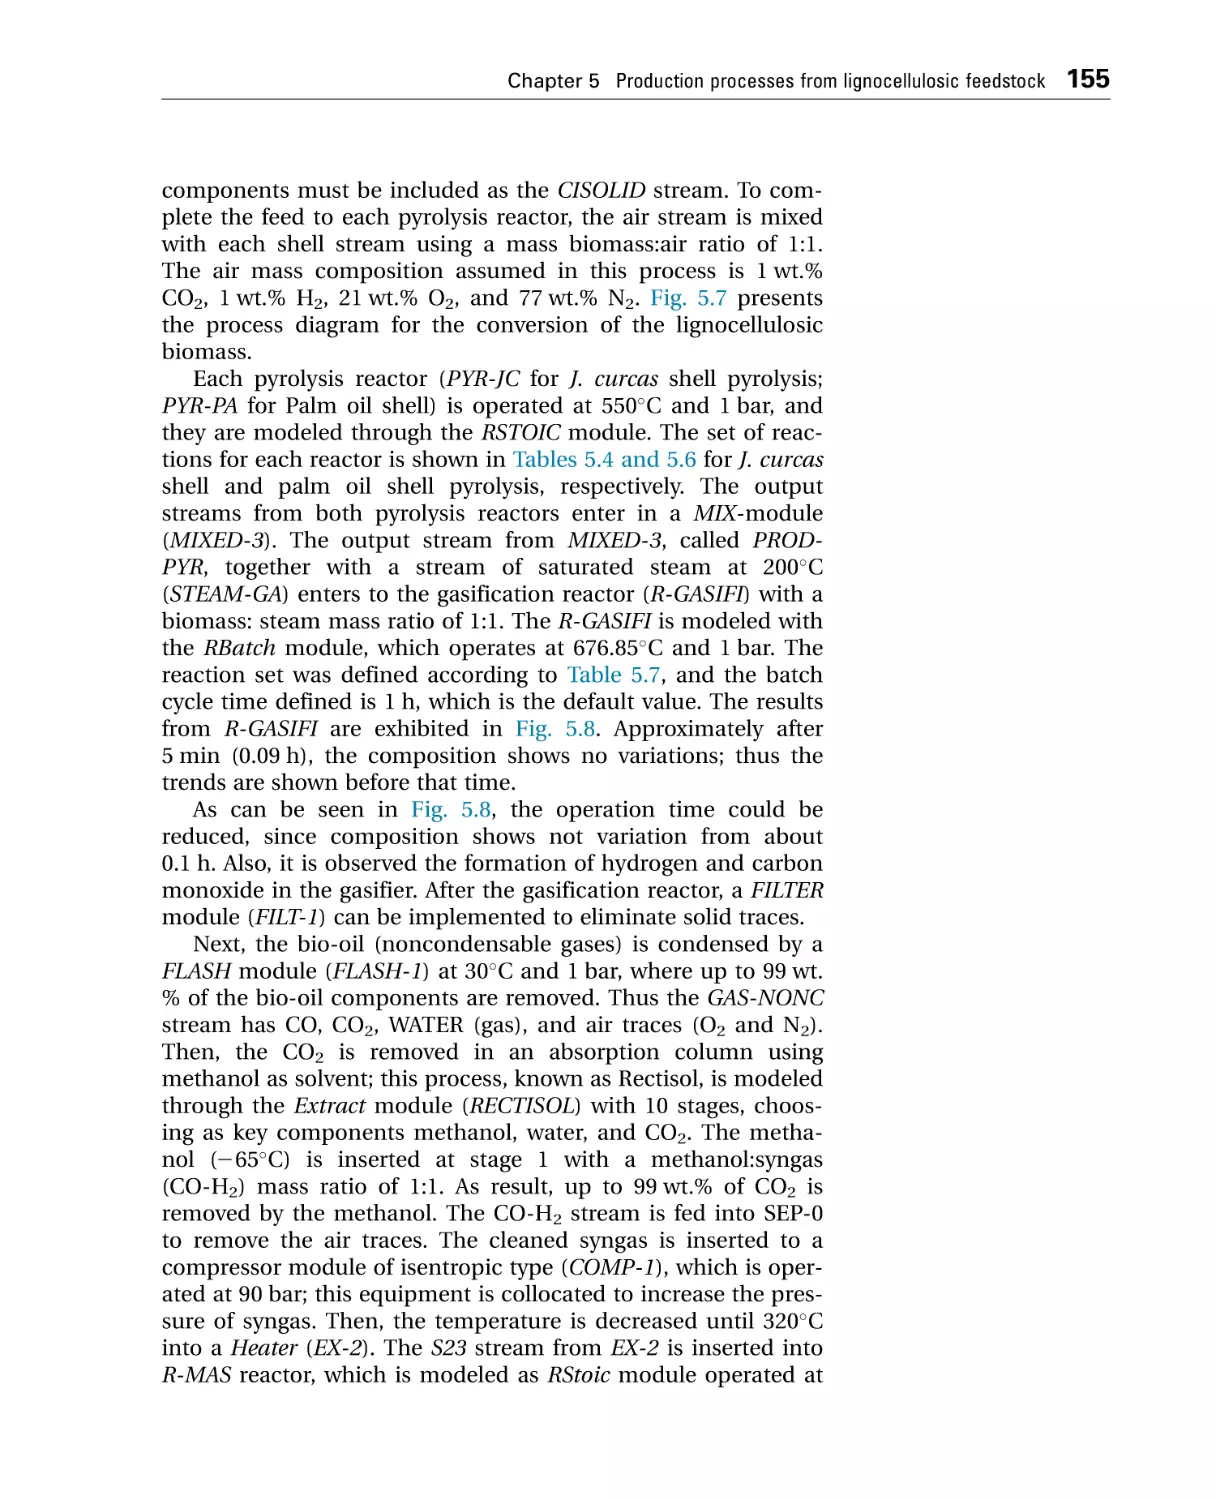
5.7.4 Simulation of the overall process .......................................... 153
5.7.5 Economic assessment............................................................. 159
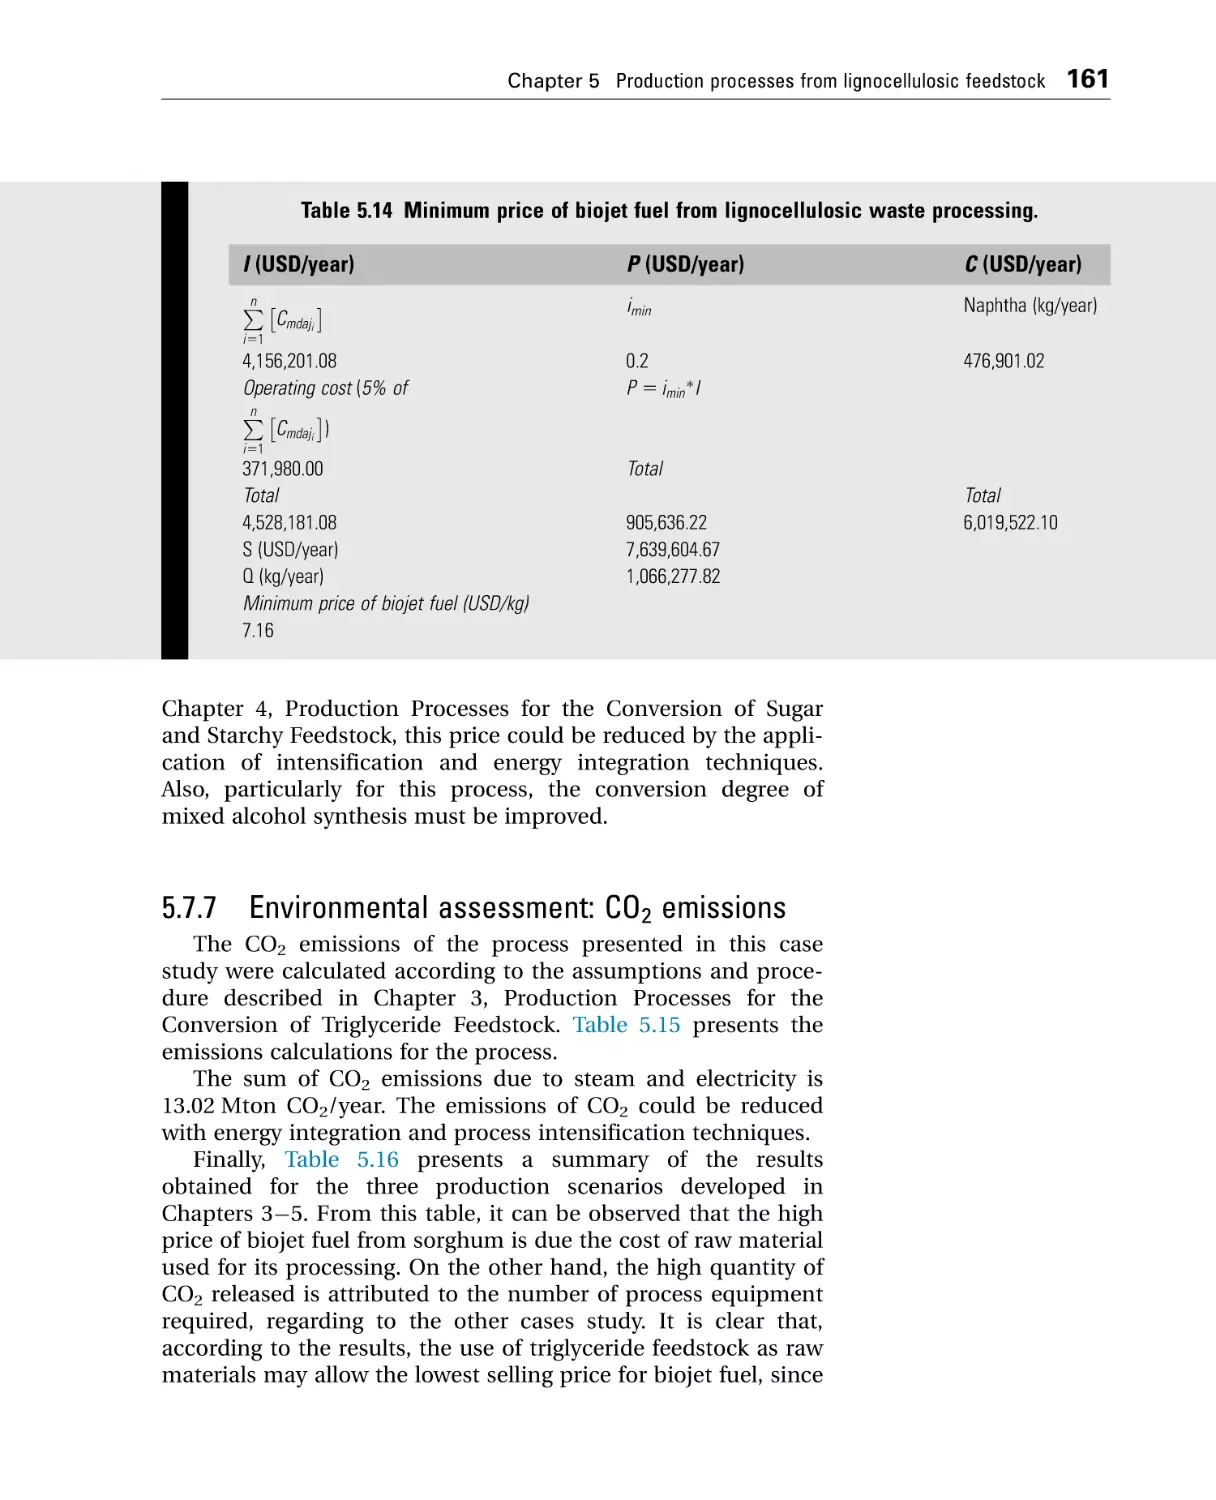
5.7.6 Estimation of price of biojet fuel............................................ 160
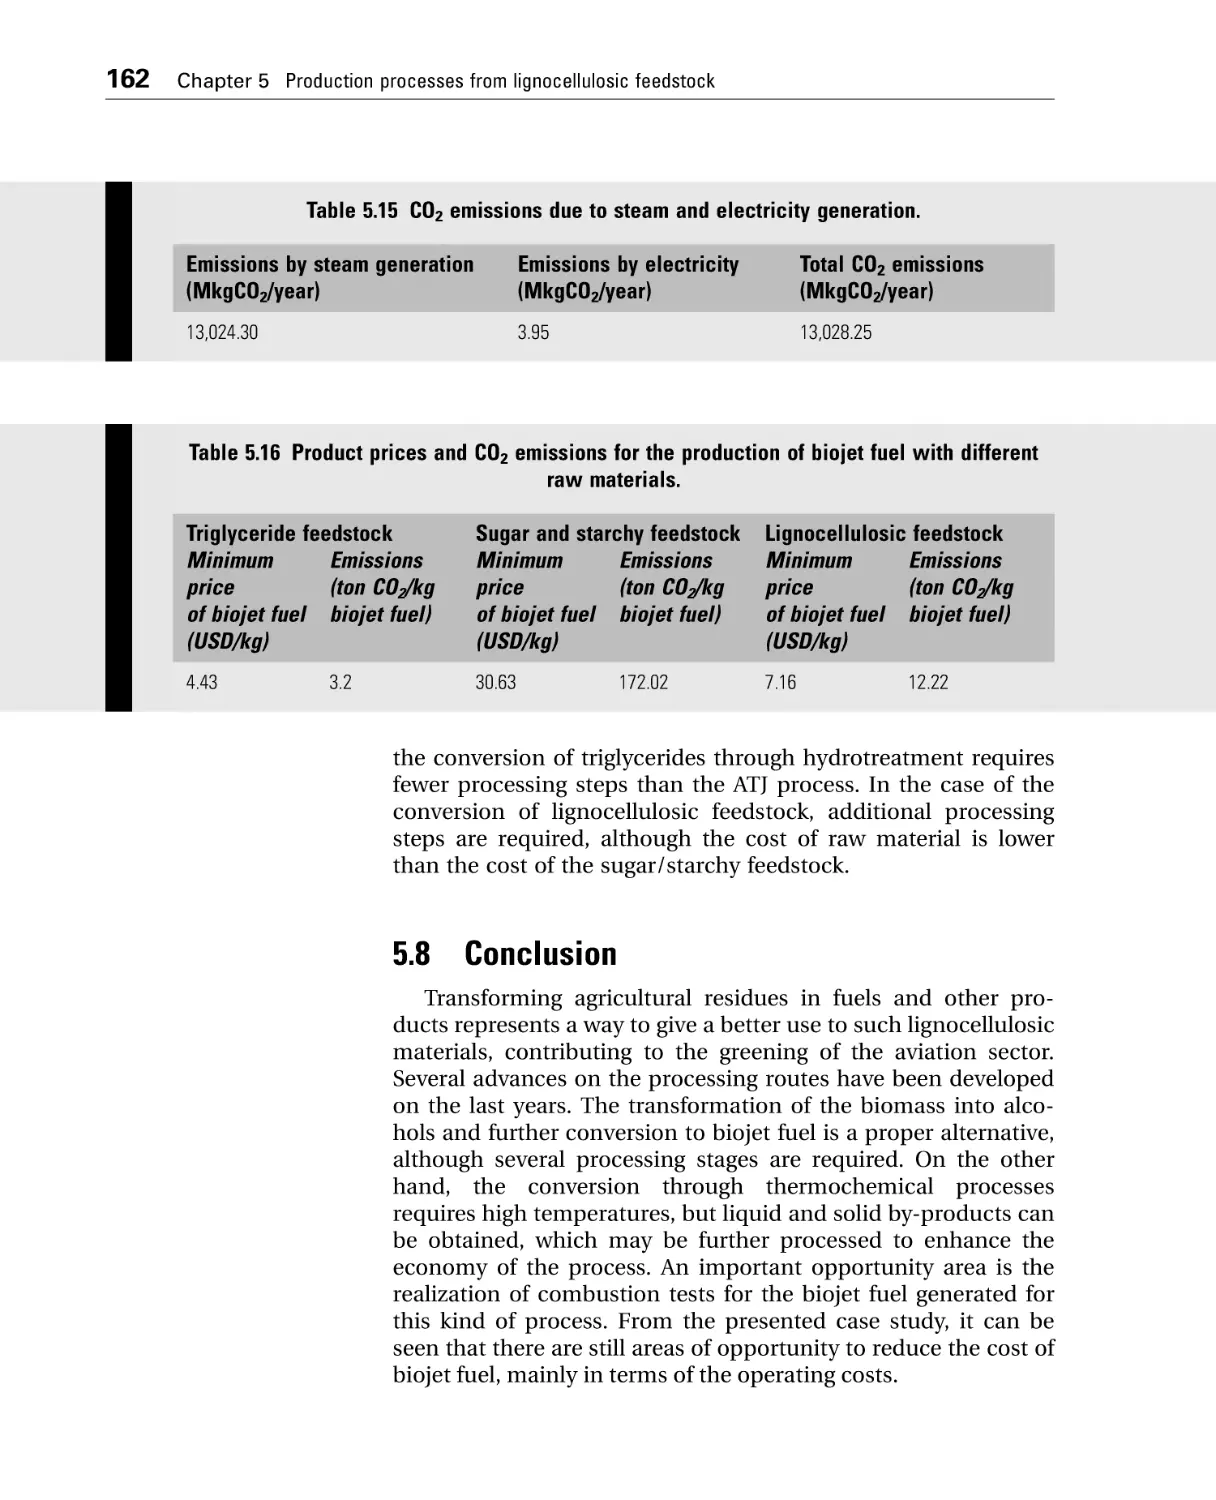
5.7.7 Environmental assessment: CO2 emissions.......................... 161
5.8 Conclusion ........................................................................................ 162
References ............................................................................................... 163
Further reading ....................................................................................... 169
6 Process intensification and integration in the production of biojet
fuel .......................................................................................................................171
6.1
6.2
6.3
6.4
6.5
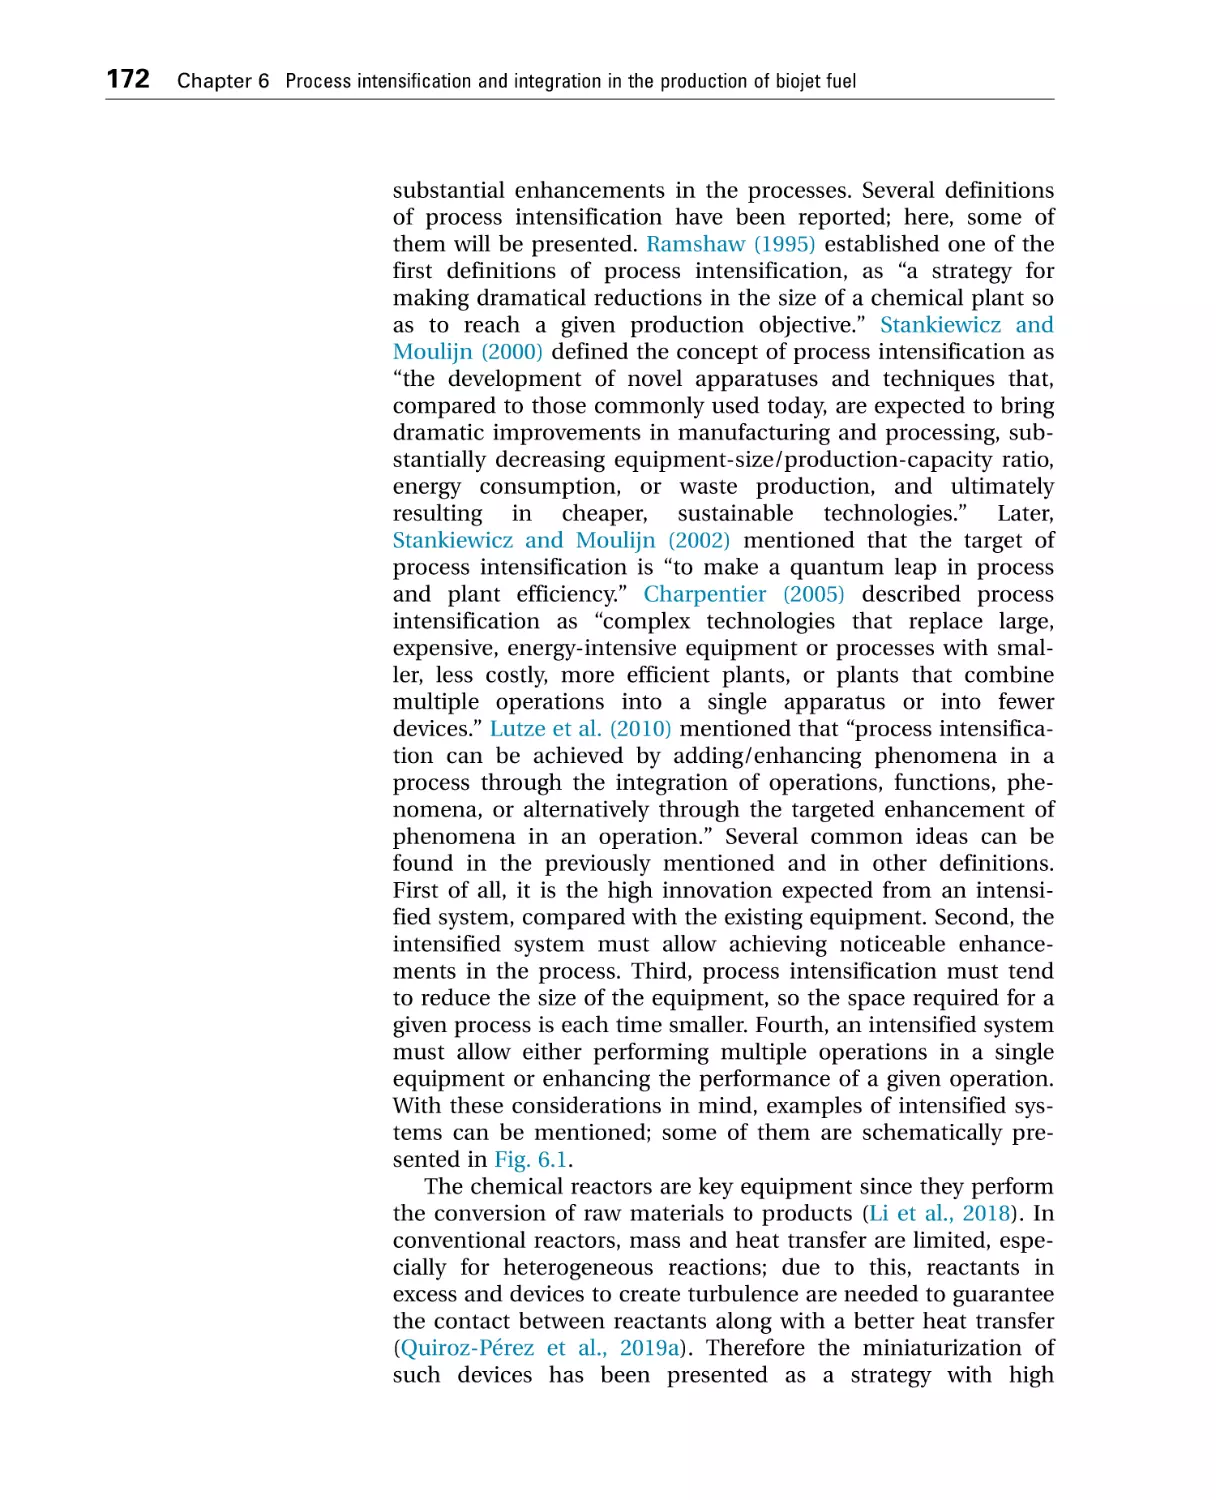
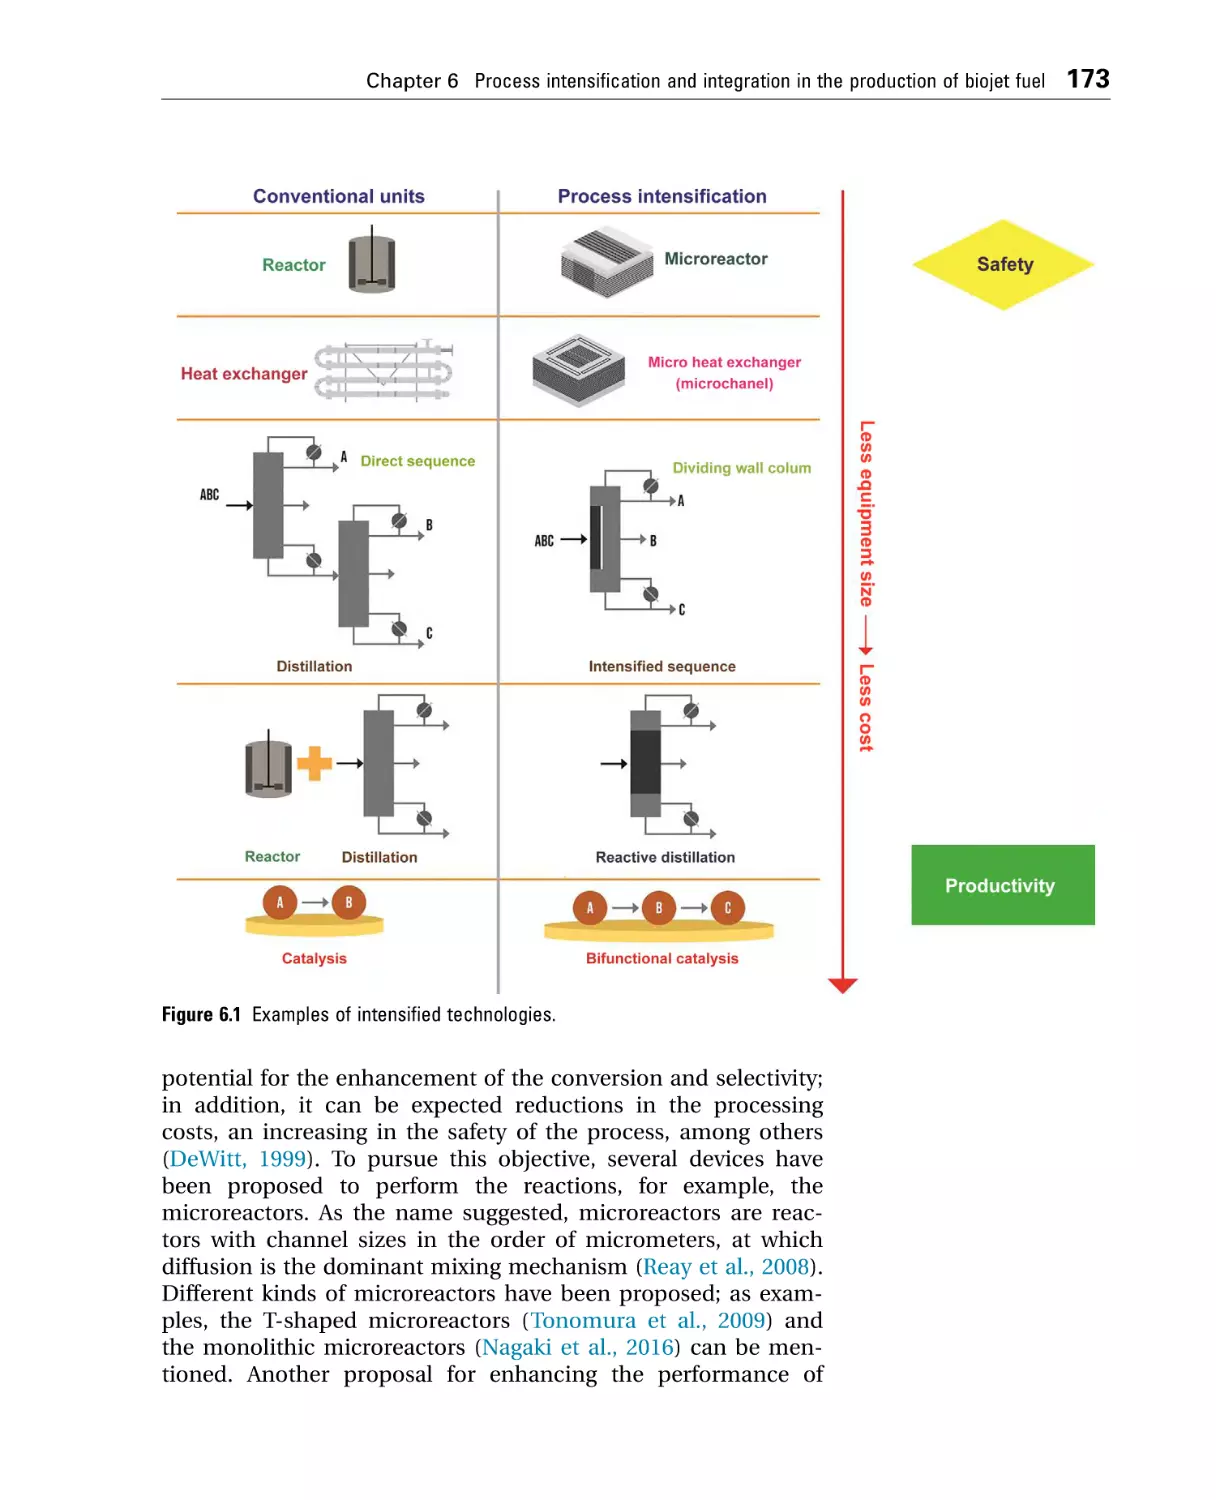
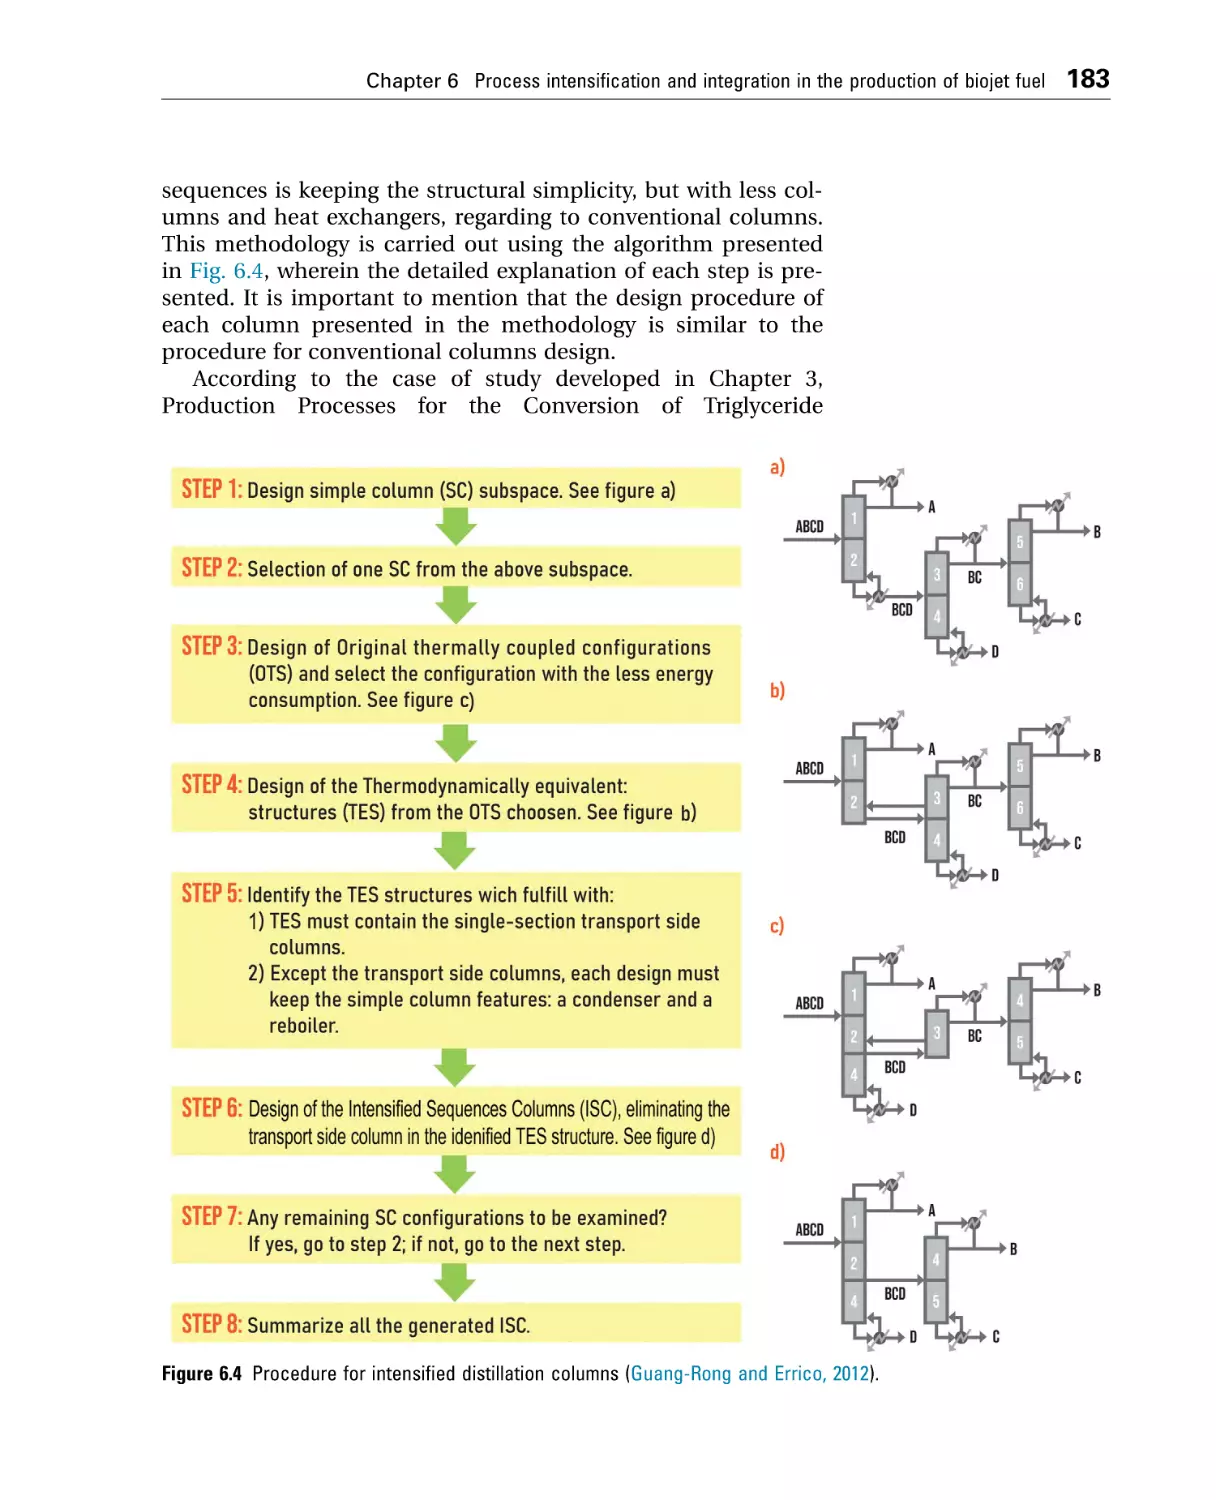
Introduction ...................................................................................... 171
Process intensification ..................................................................... 171
Process integration .......................................................................... 178
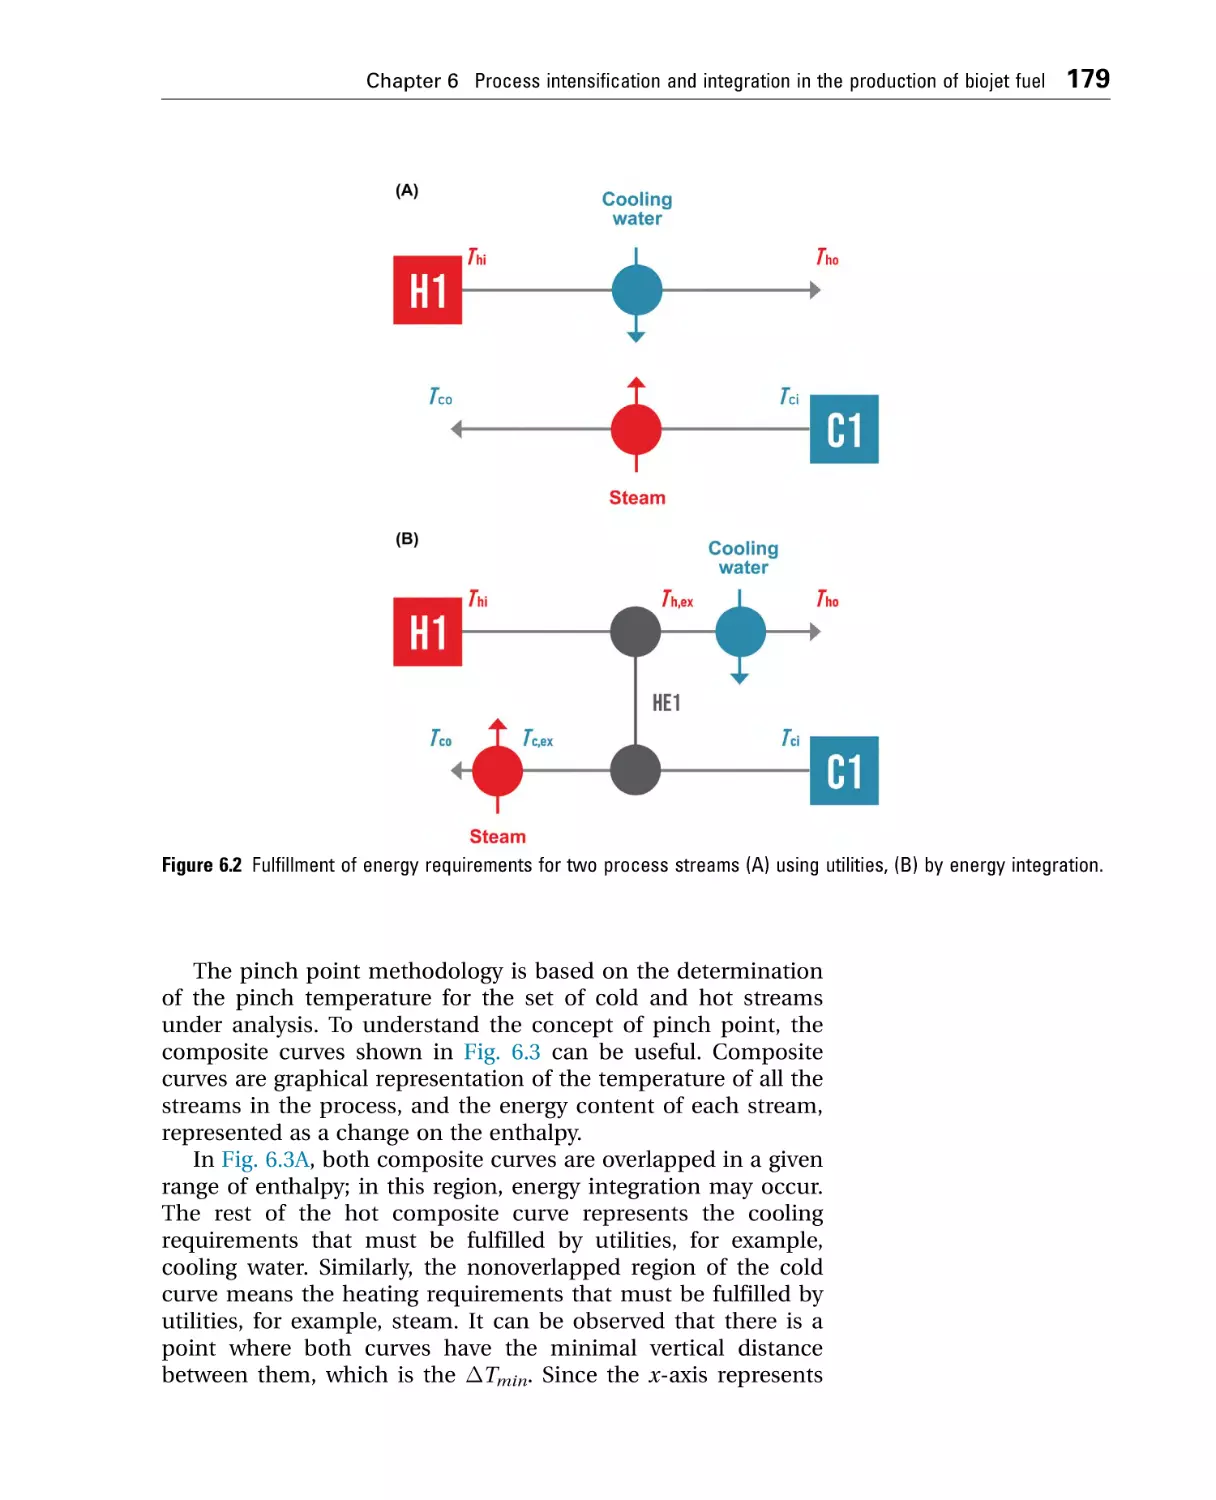
Techno-economic analysis of alternatives ..................................... 181
Application of process intensification to a hydrotreating
process .............................................................................................. 182
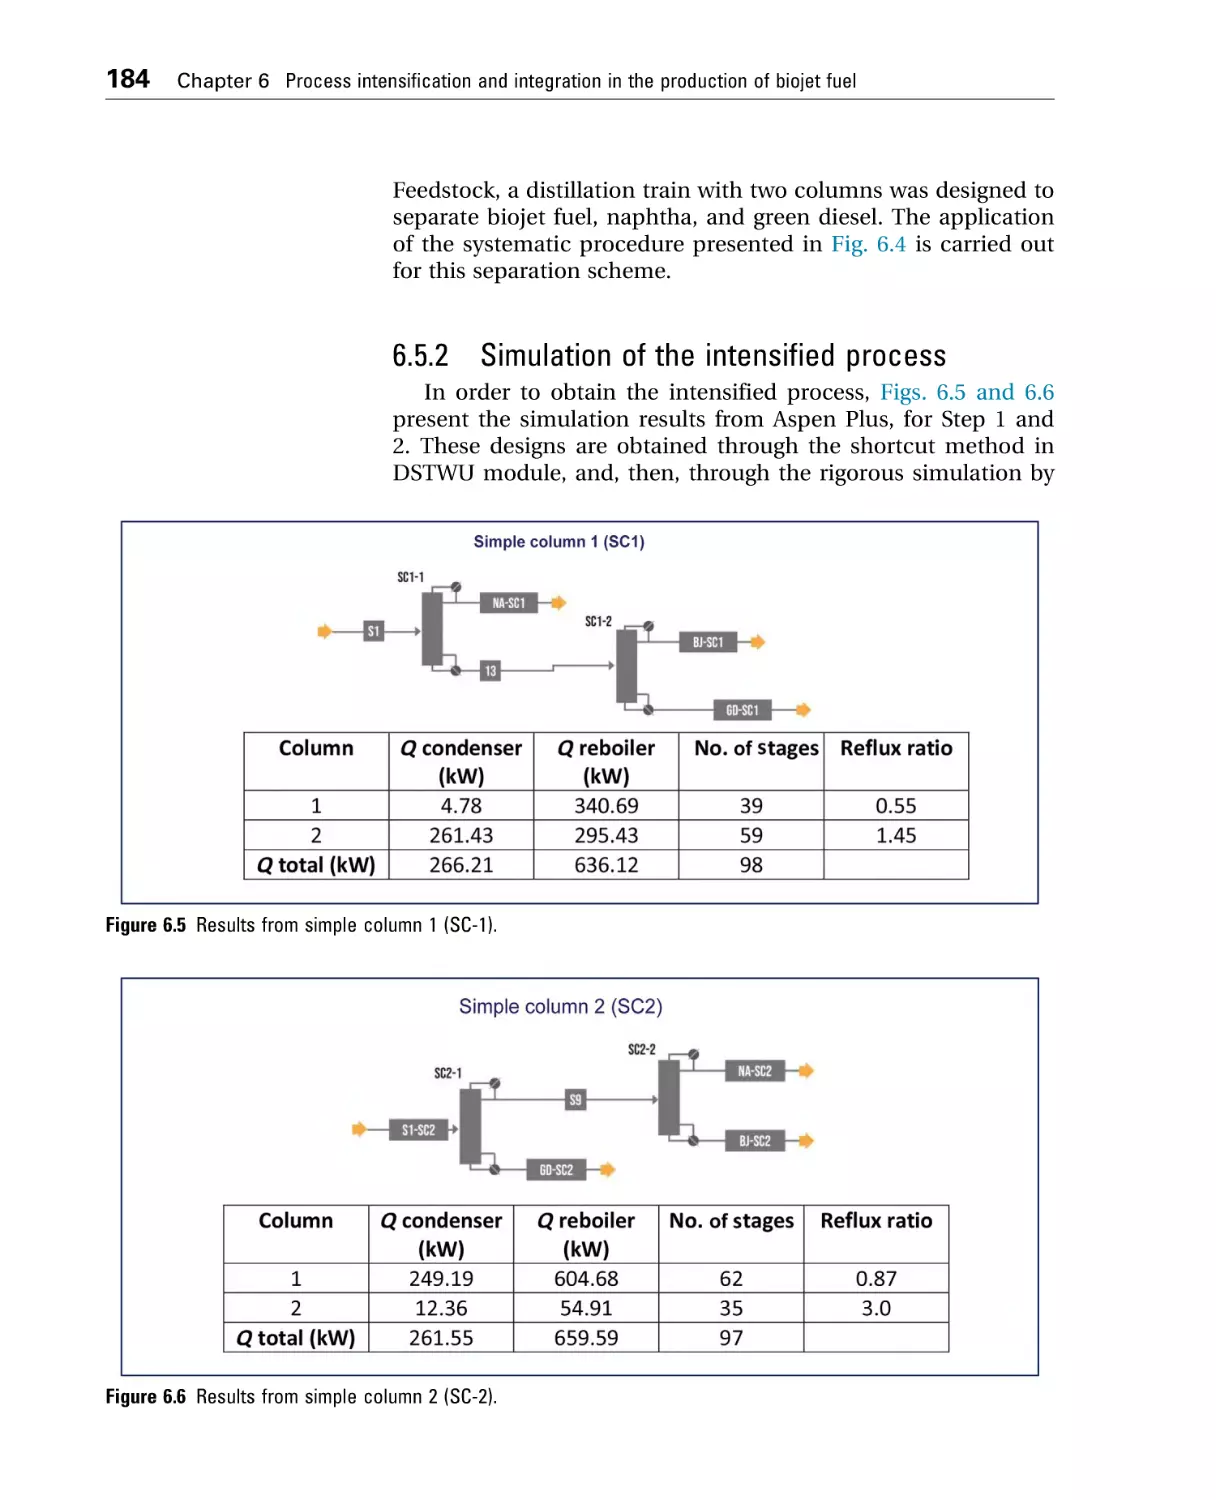
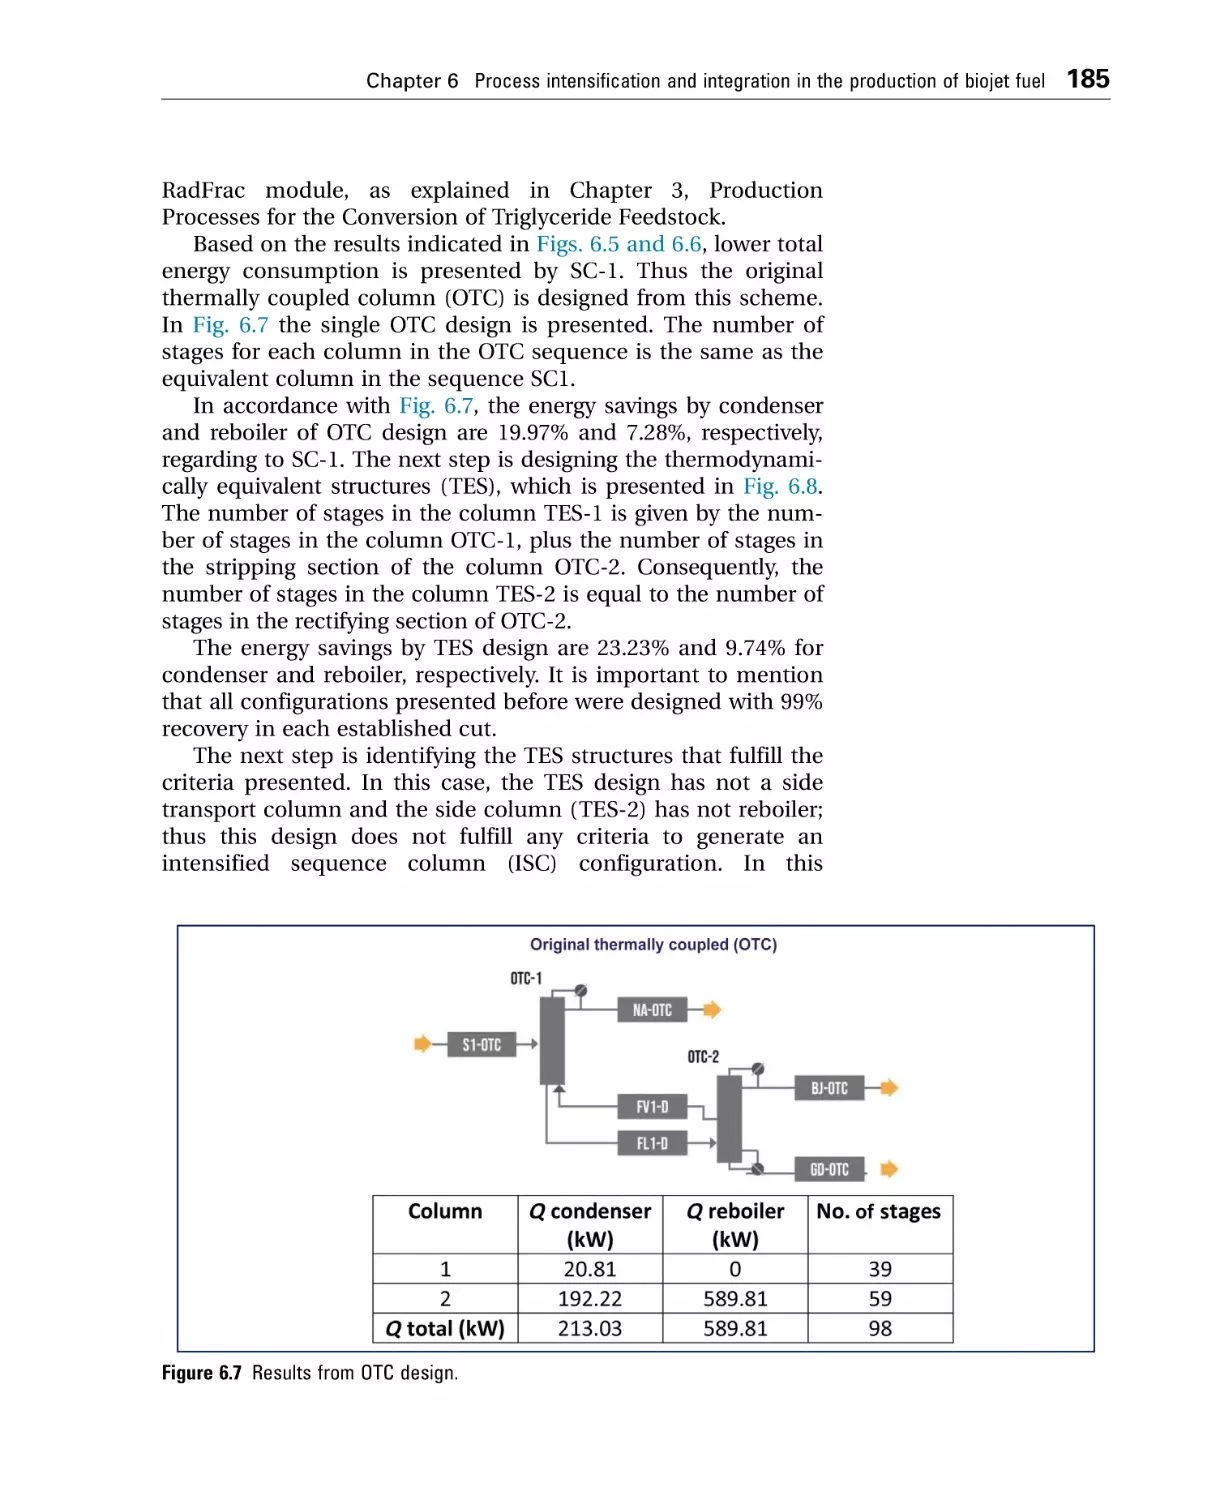
6.5.1 Conceptual design of the intensified process ....................... 182
6.5.2 Simulation of the intensified process .................................... 184
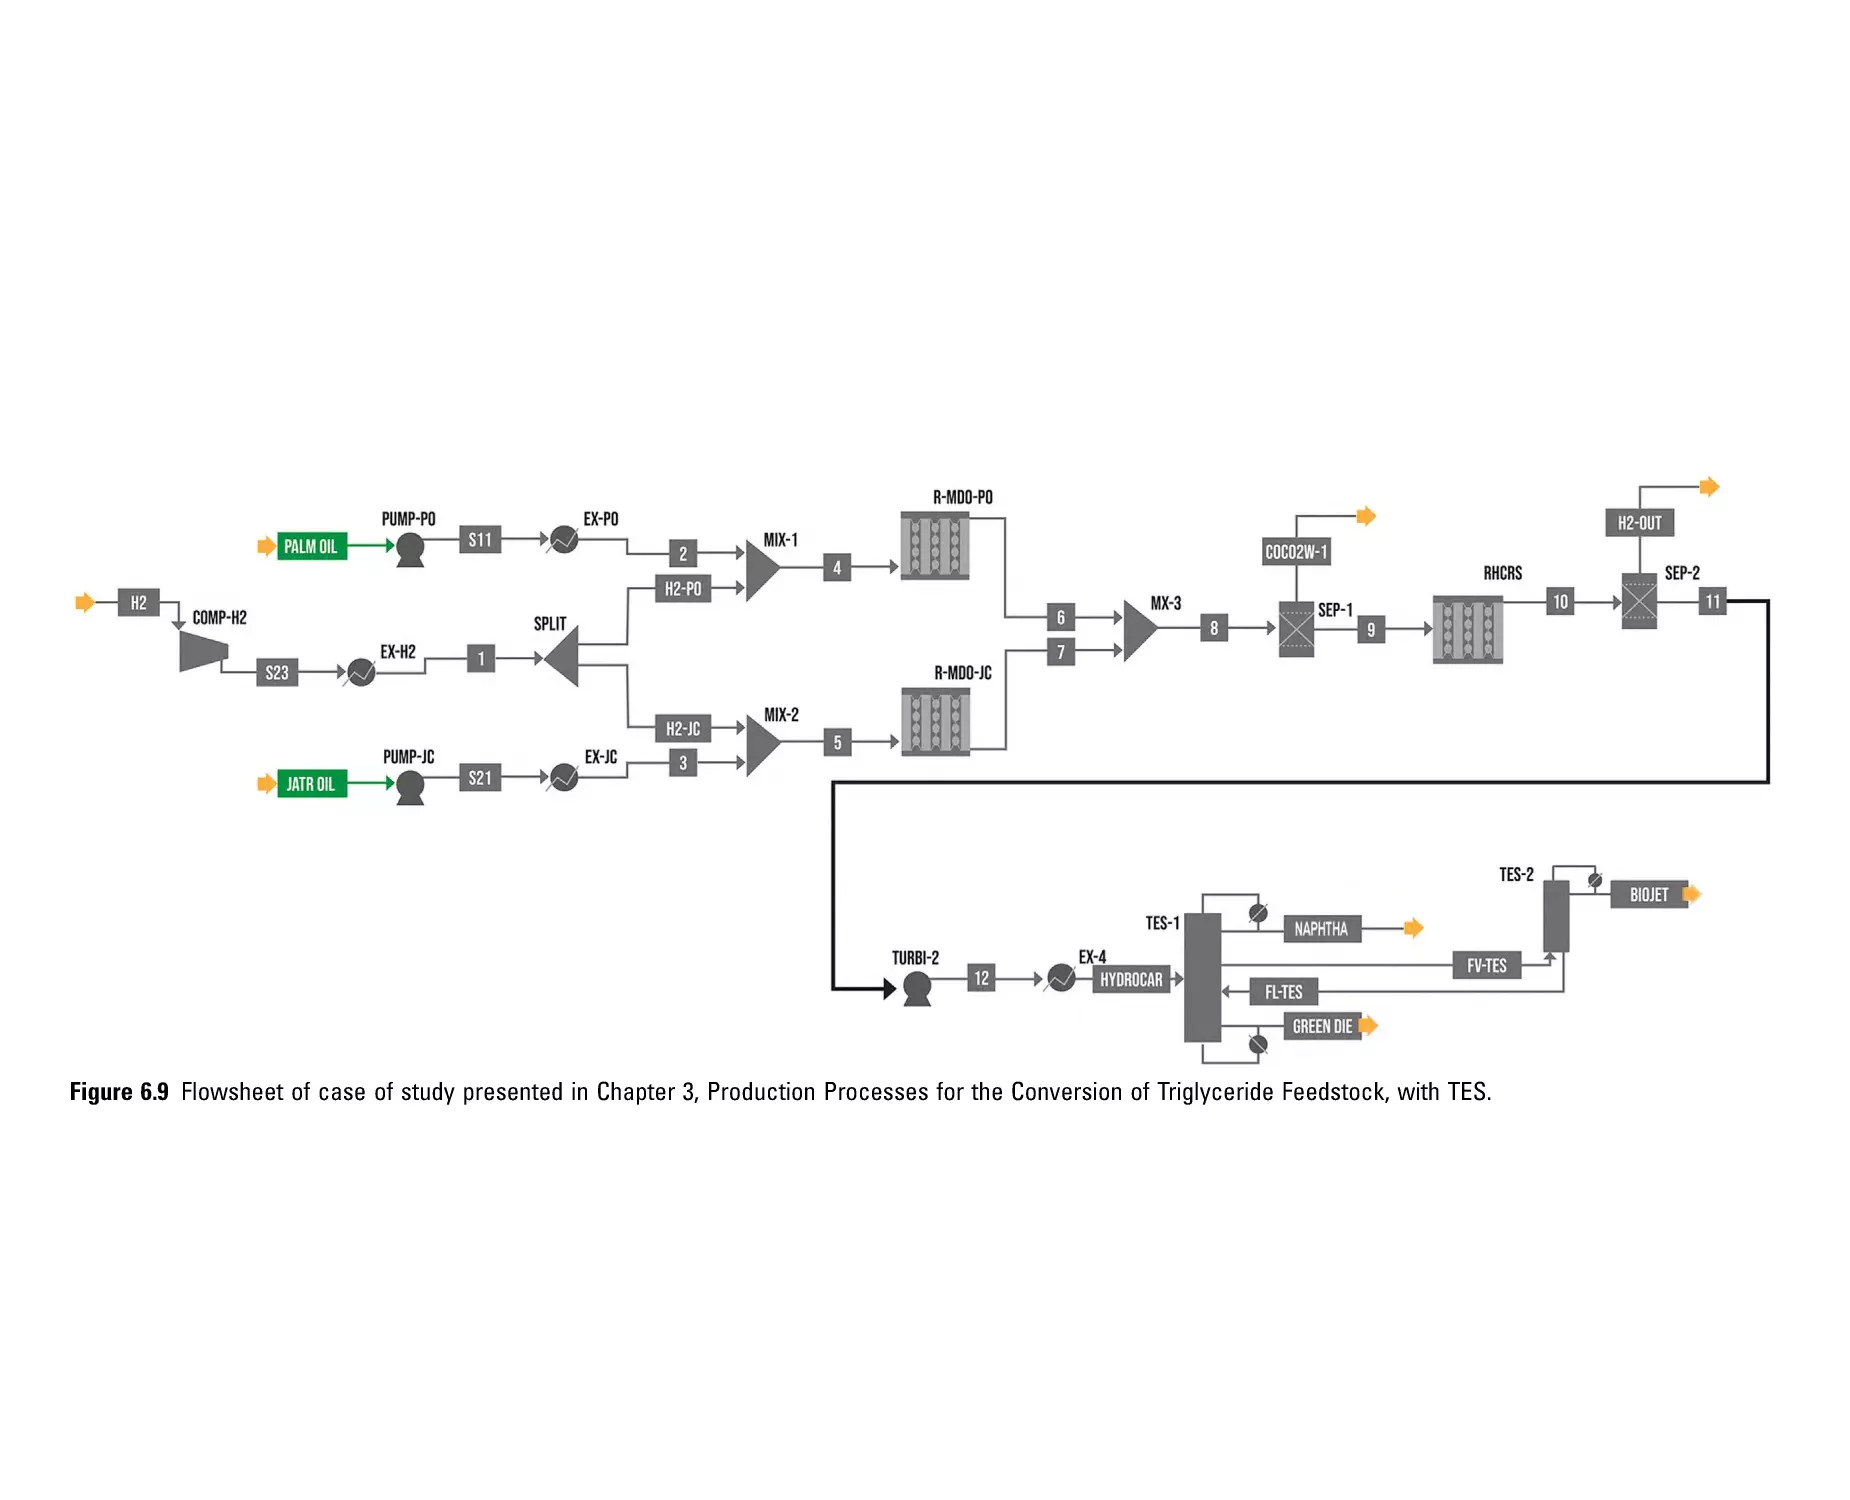
6.6 Application of process integration to a hydrotreating process .... 186
6.6.1 Conceptual design of the energy integration........................ 186
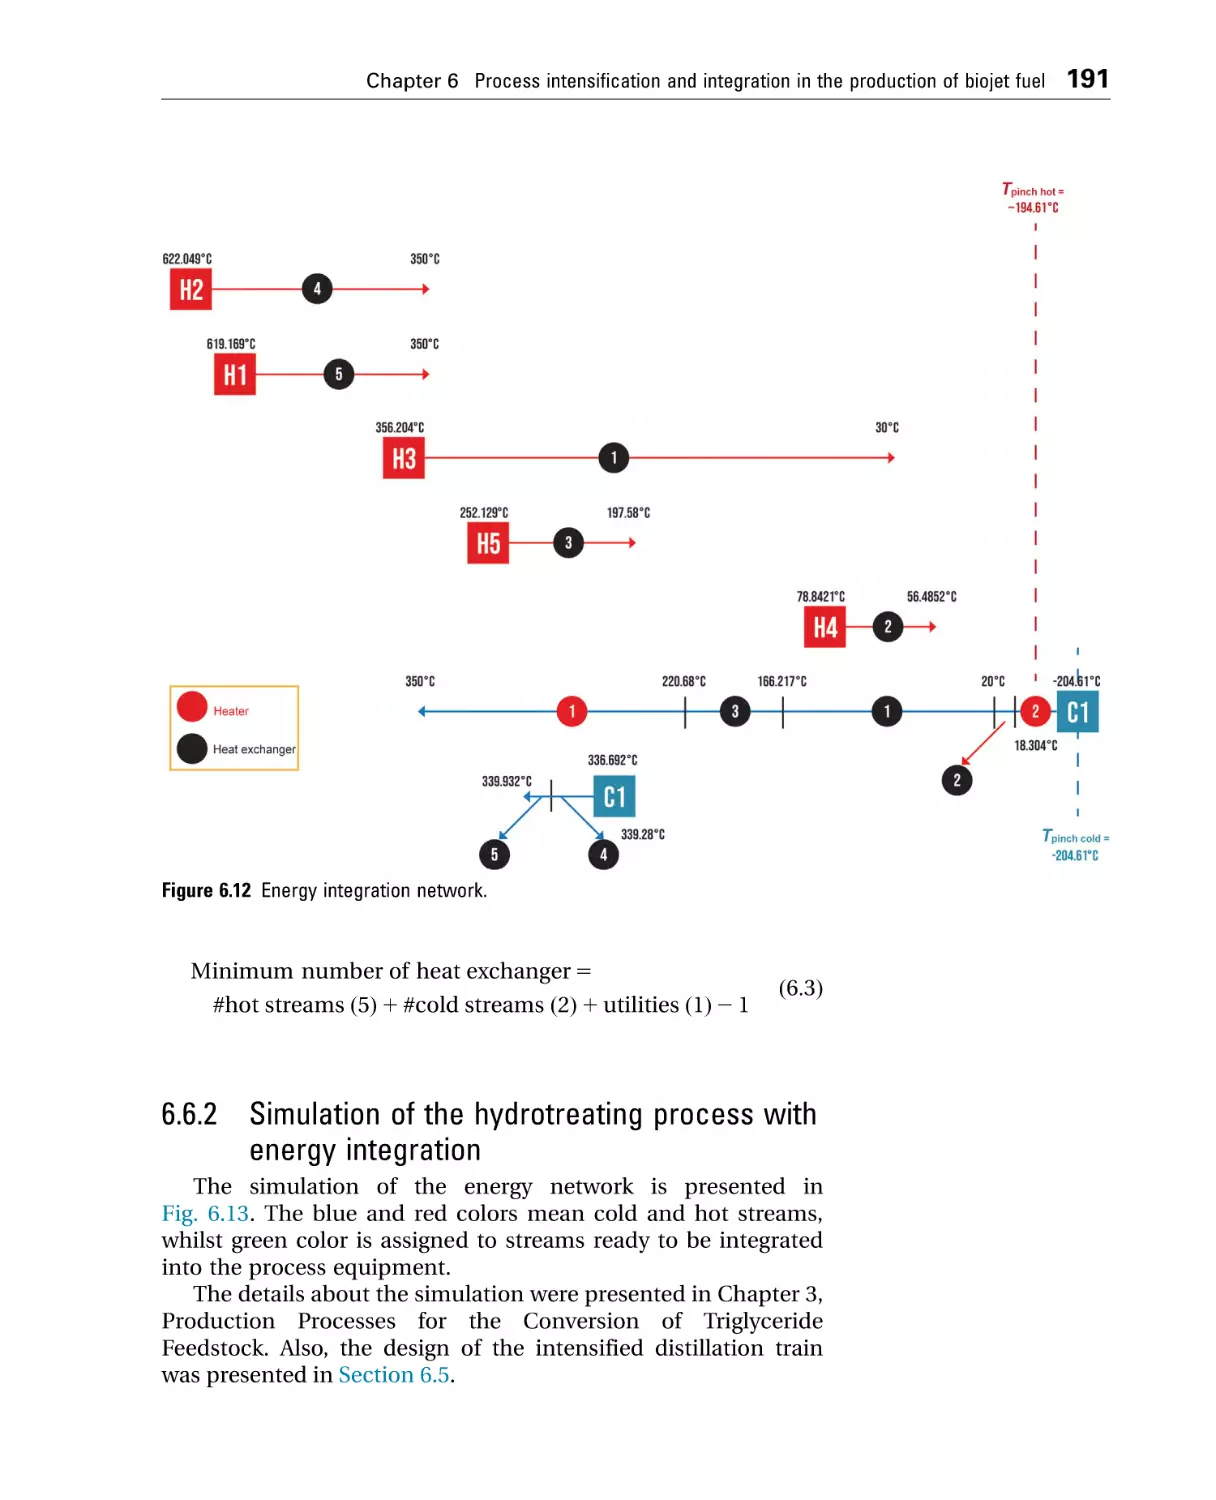
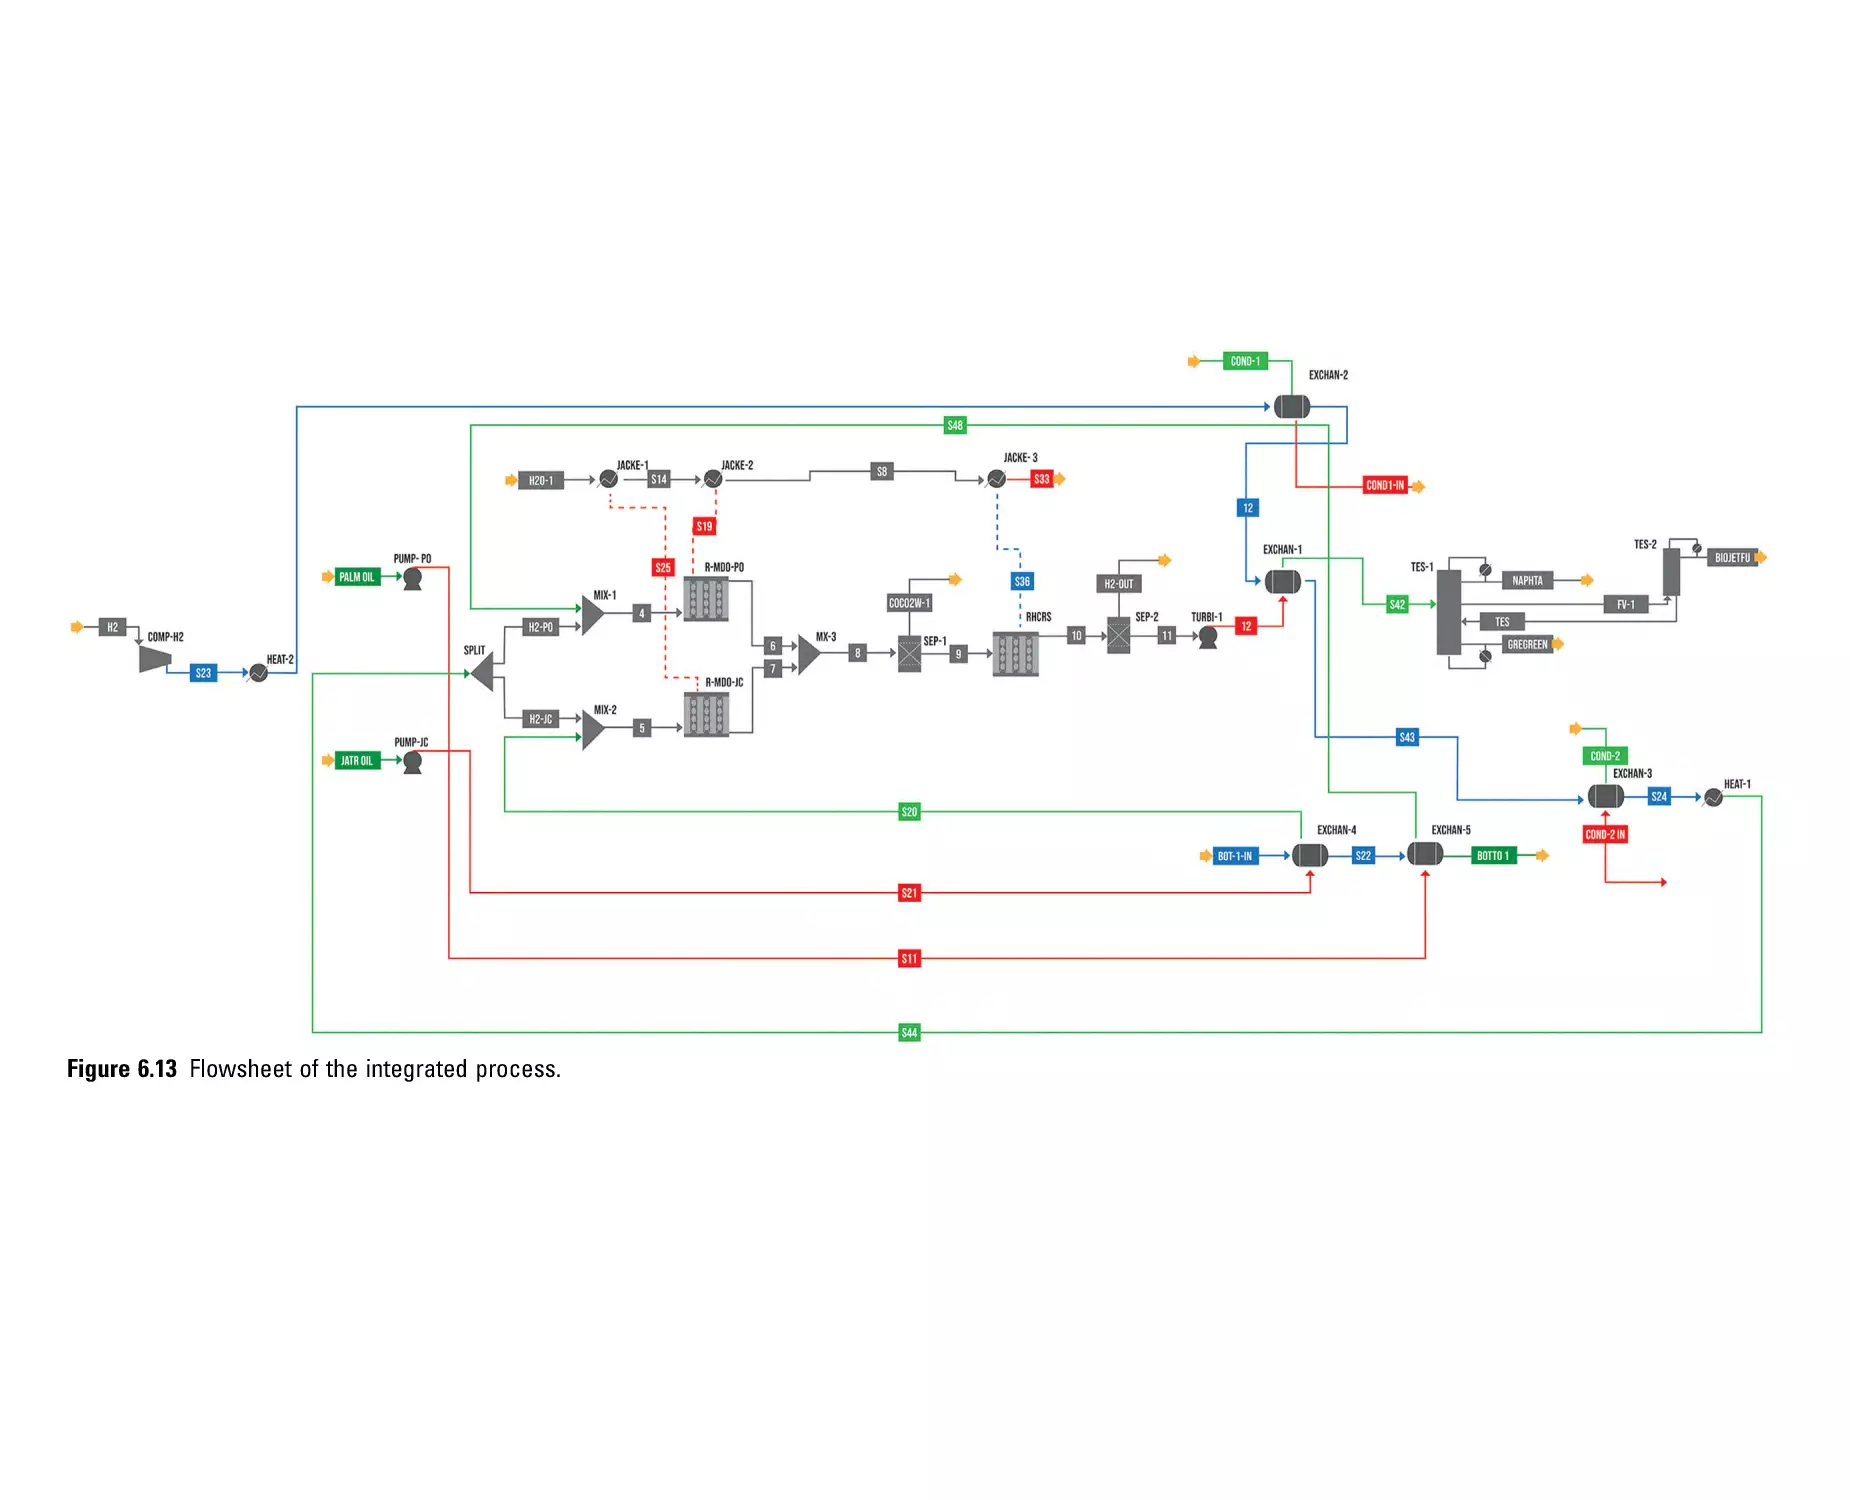
6.6.2 Simulation of the hydrotreating process with energy
integration................................................................................ 191
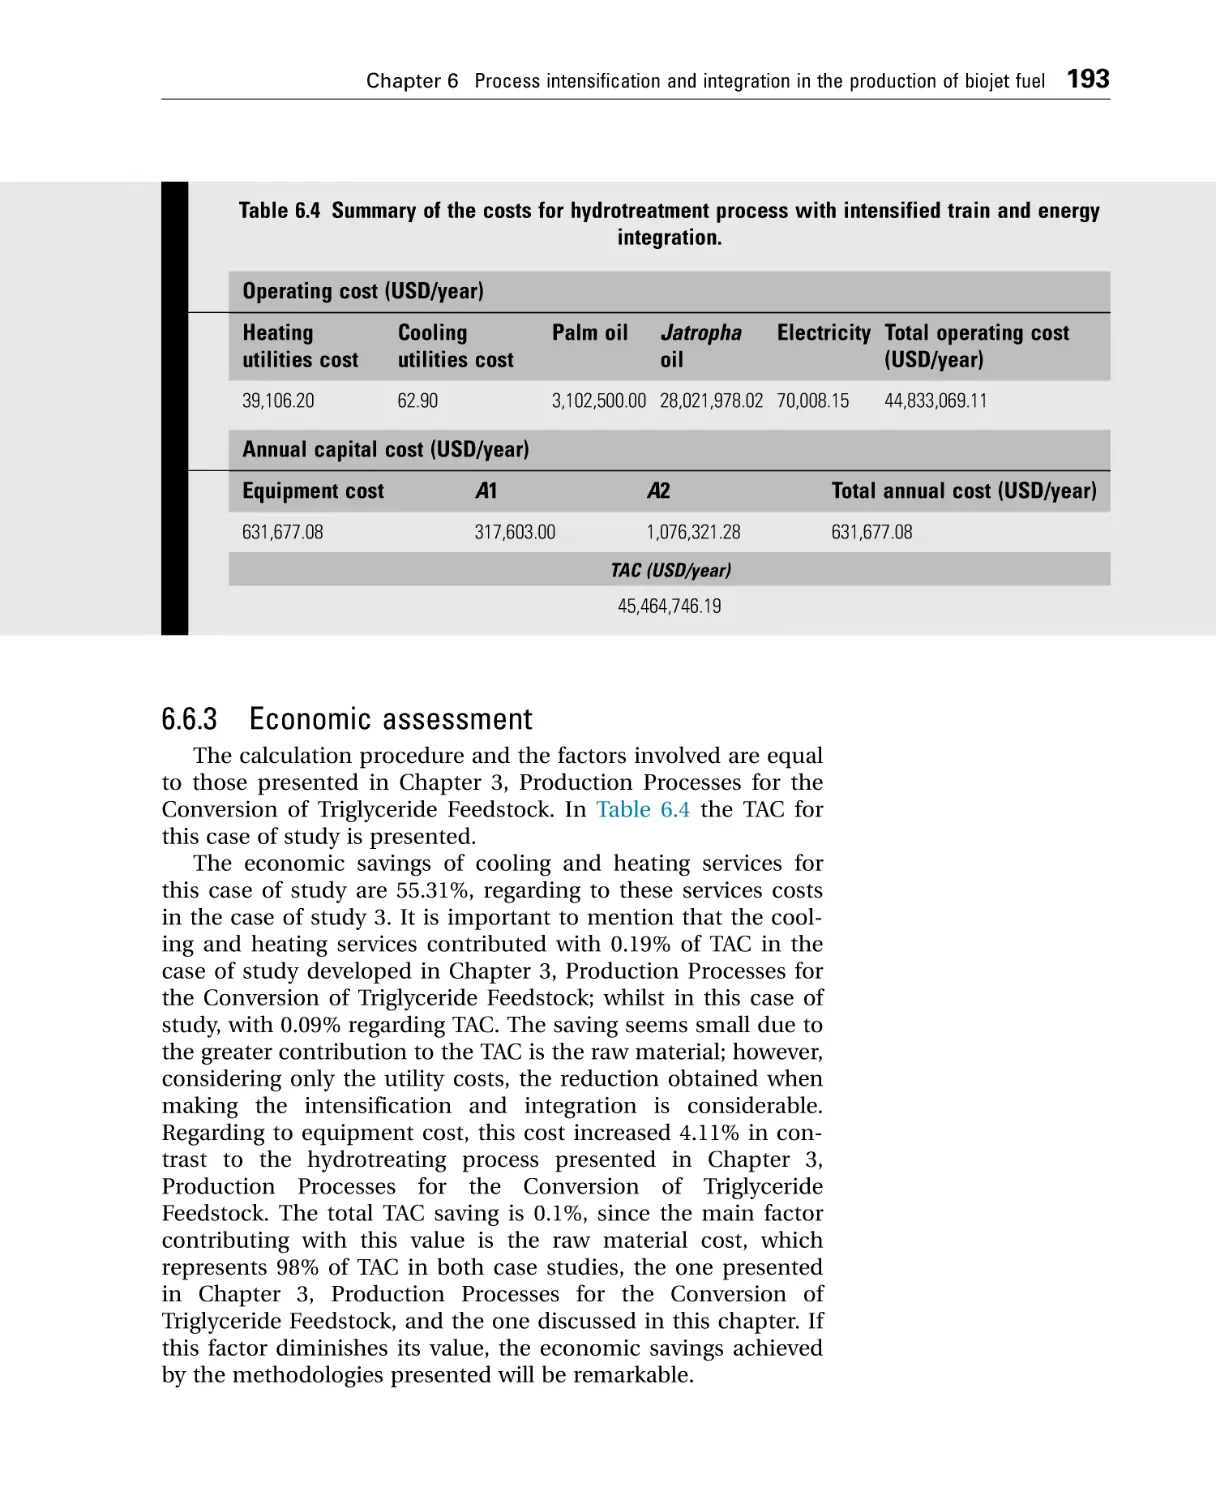
6.6.3 Economic assessment............................................................. 193
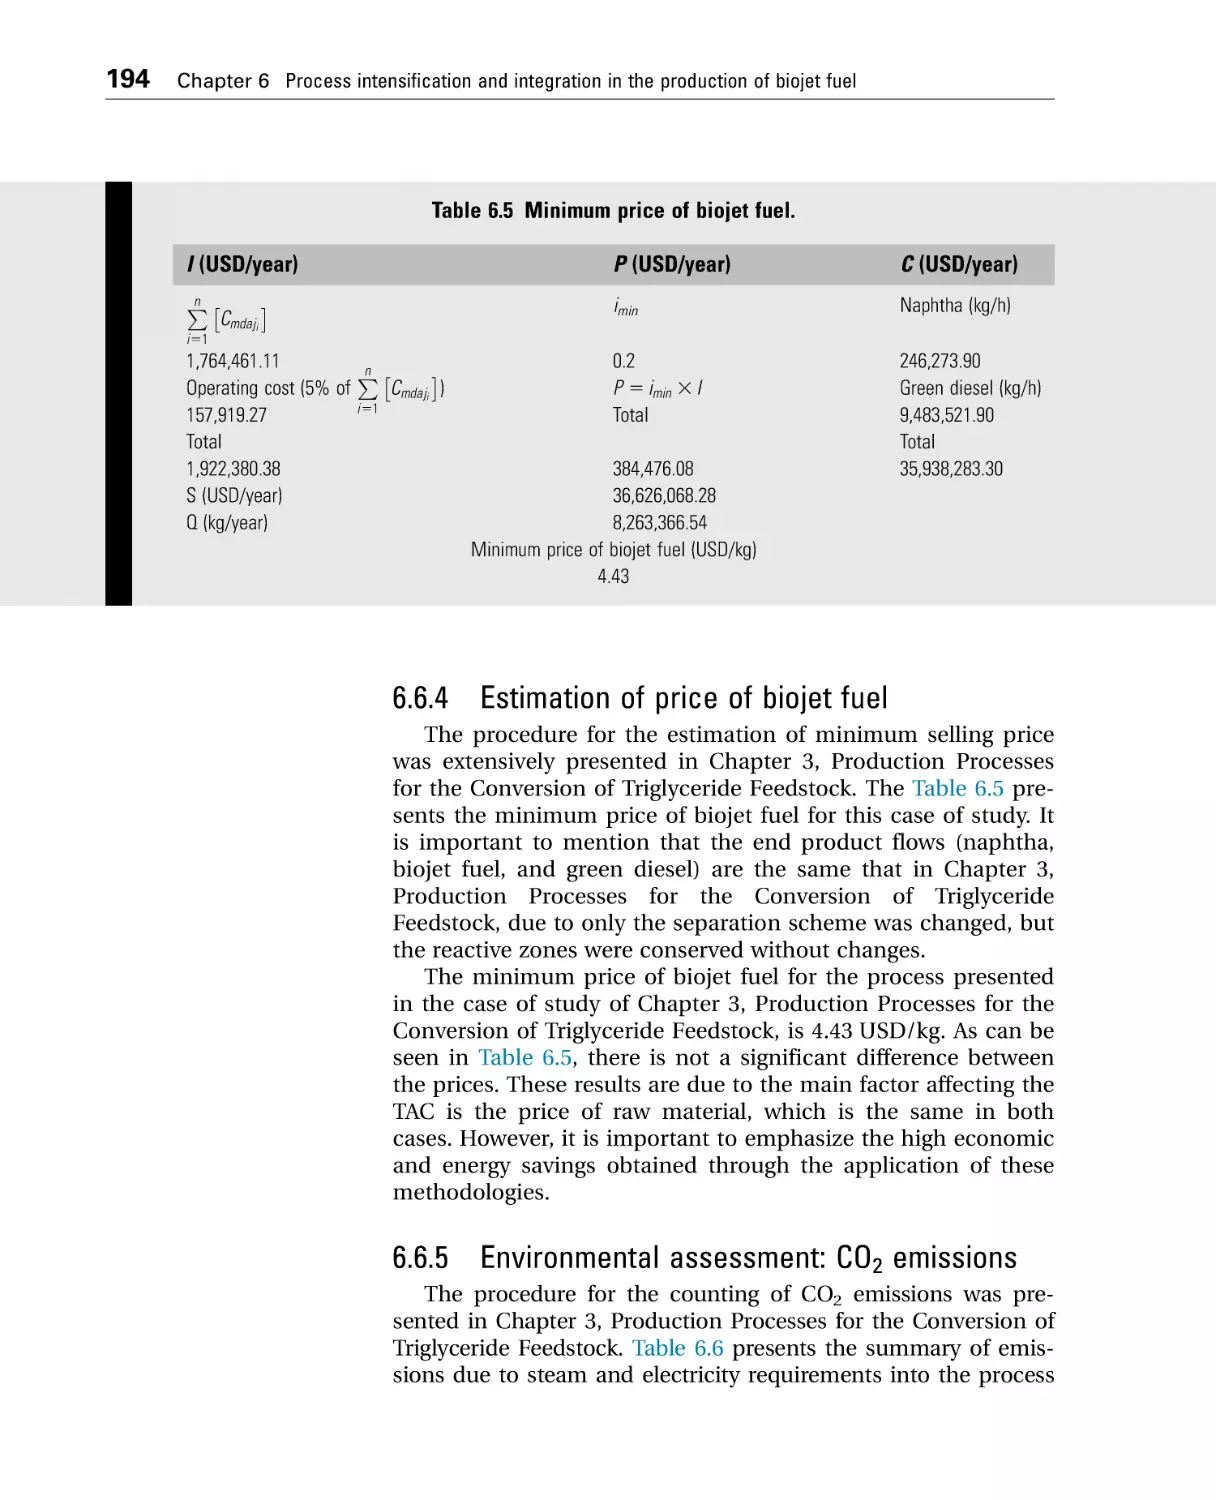
6.6.4 Estimation of price of biojet fuel............................................ 194
6.6.5 Environmental assessment: CO2 emissions.......................... 194
6.7 Conclusion ........................................................................................ 195
References ............................................................................................... 196
7 Supply chain for the production of biojet fuel .........................................201
7.1 Introduction ...................................................................................... 201
7.2 Elements of the supply chain to produce biojet fuel..................... 201
viii
Contents
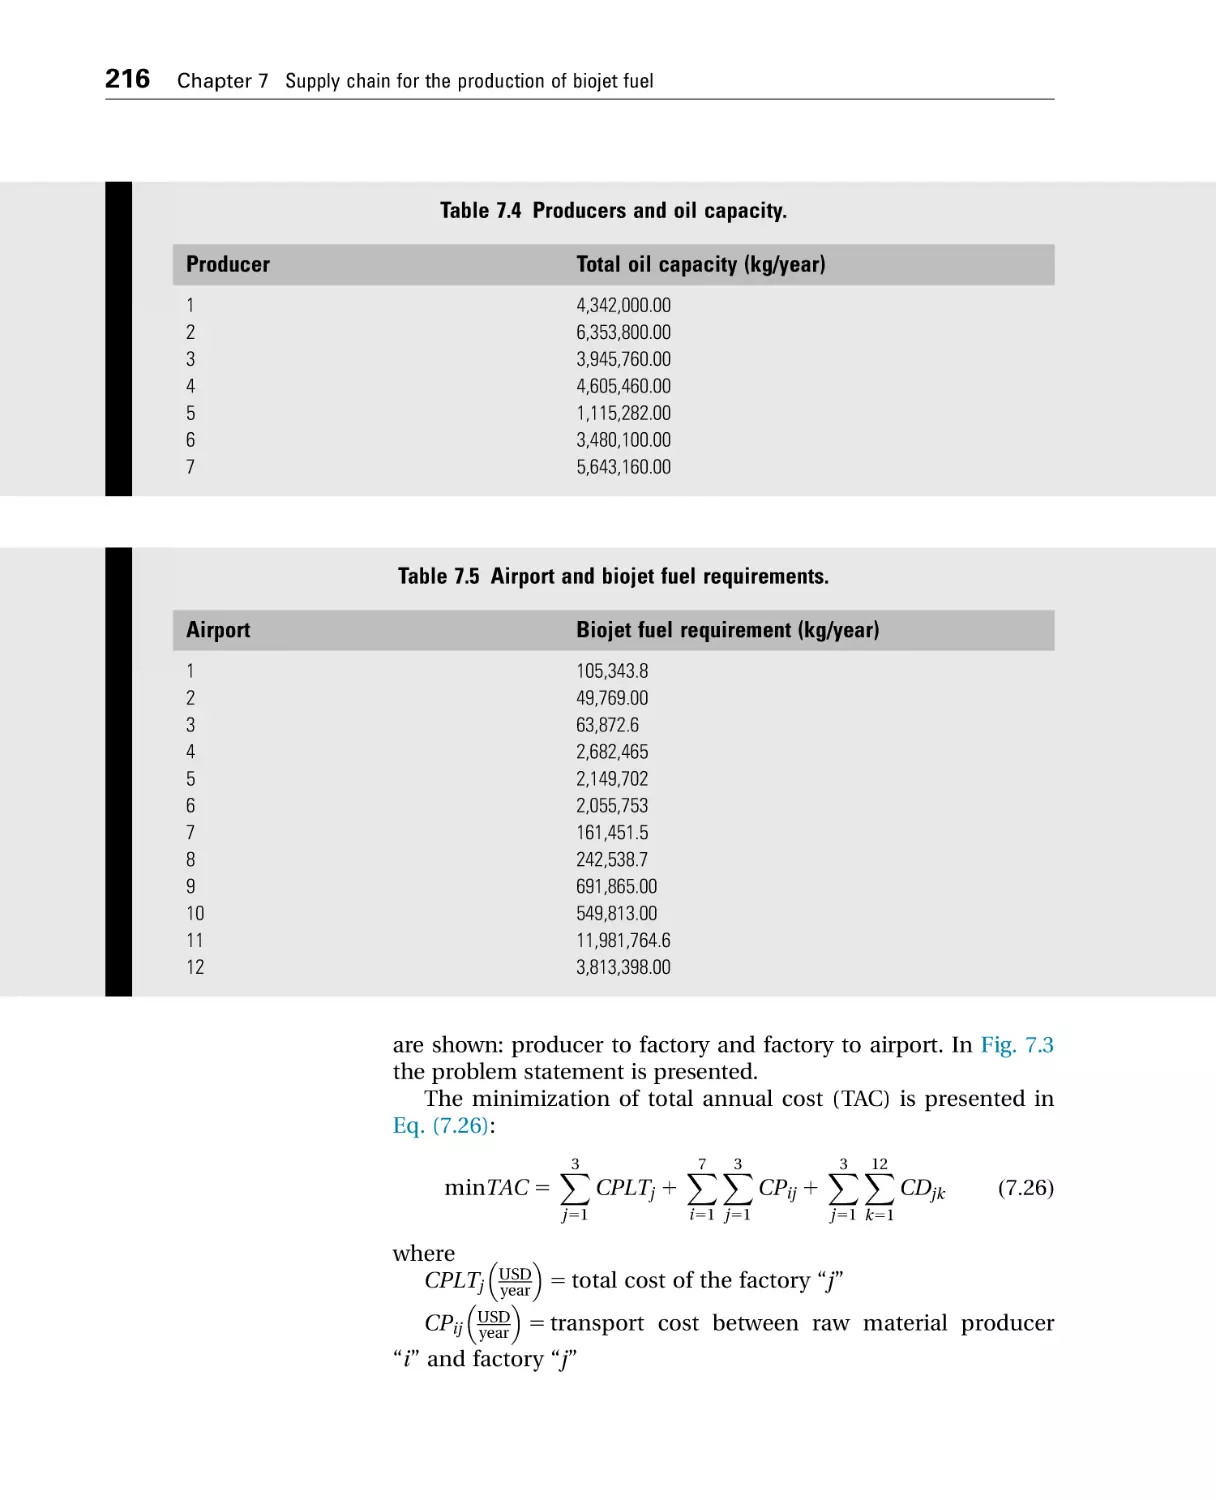
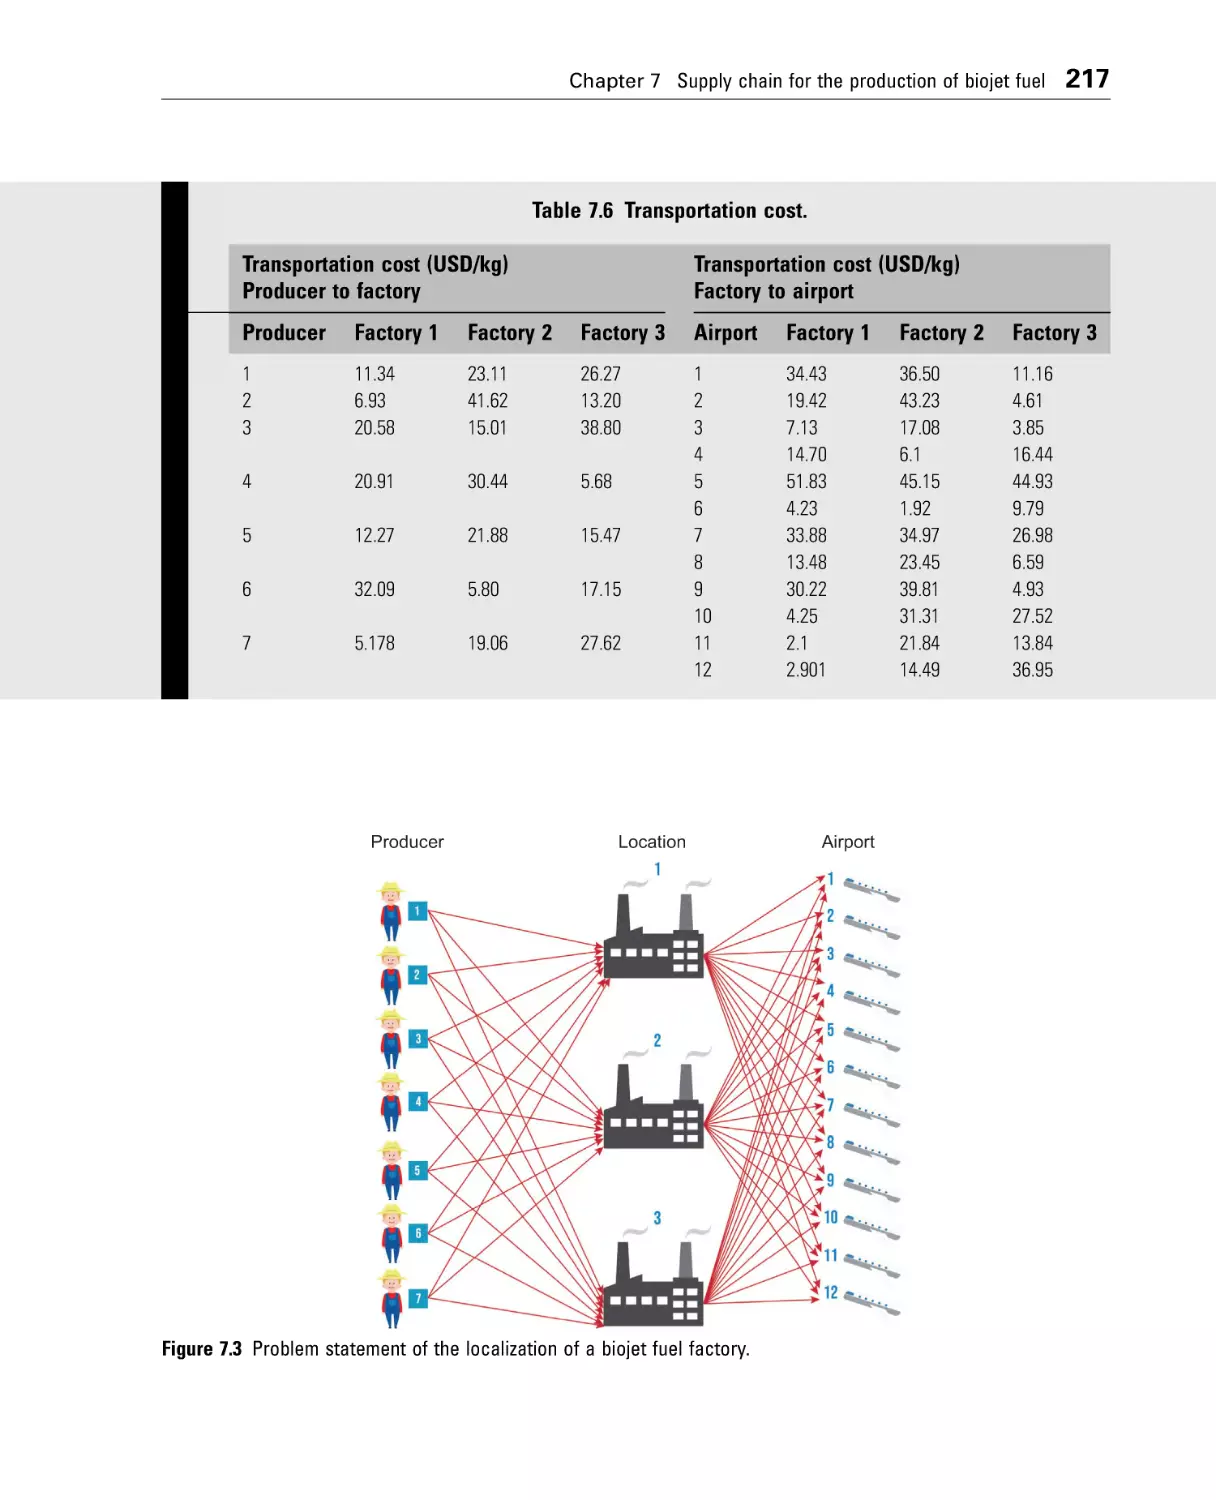
7.3 Data generation ................................................................................ 203
7.4 Standards for product certification ................................................. 204
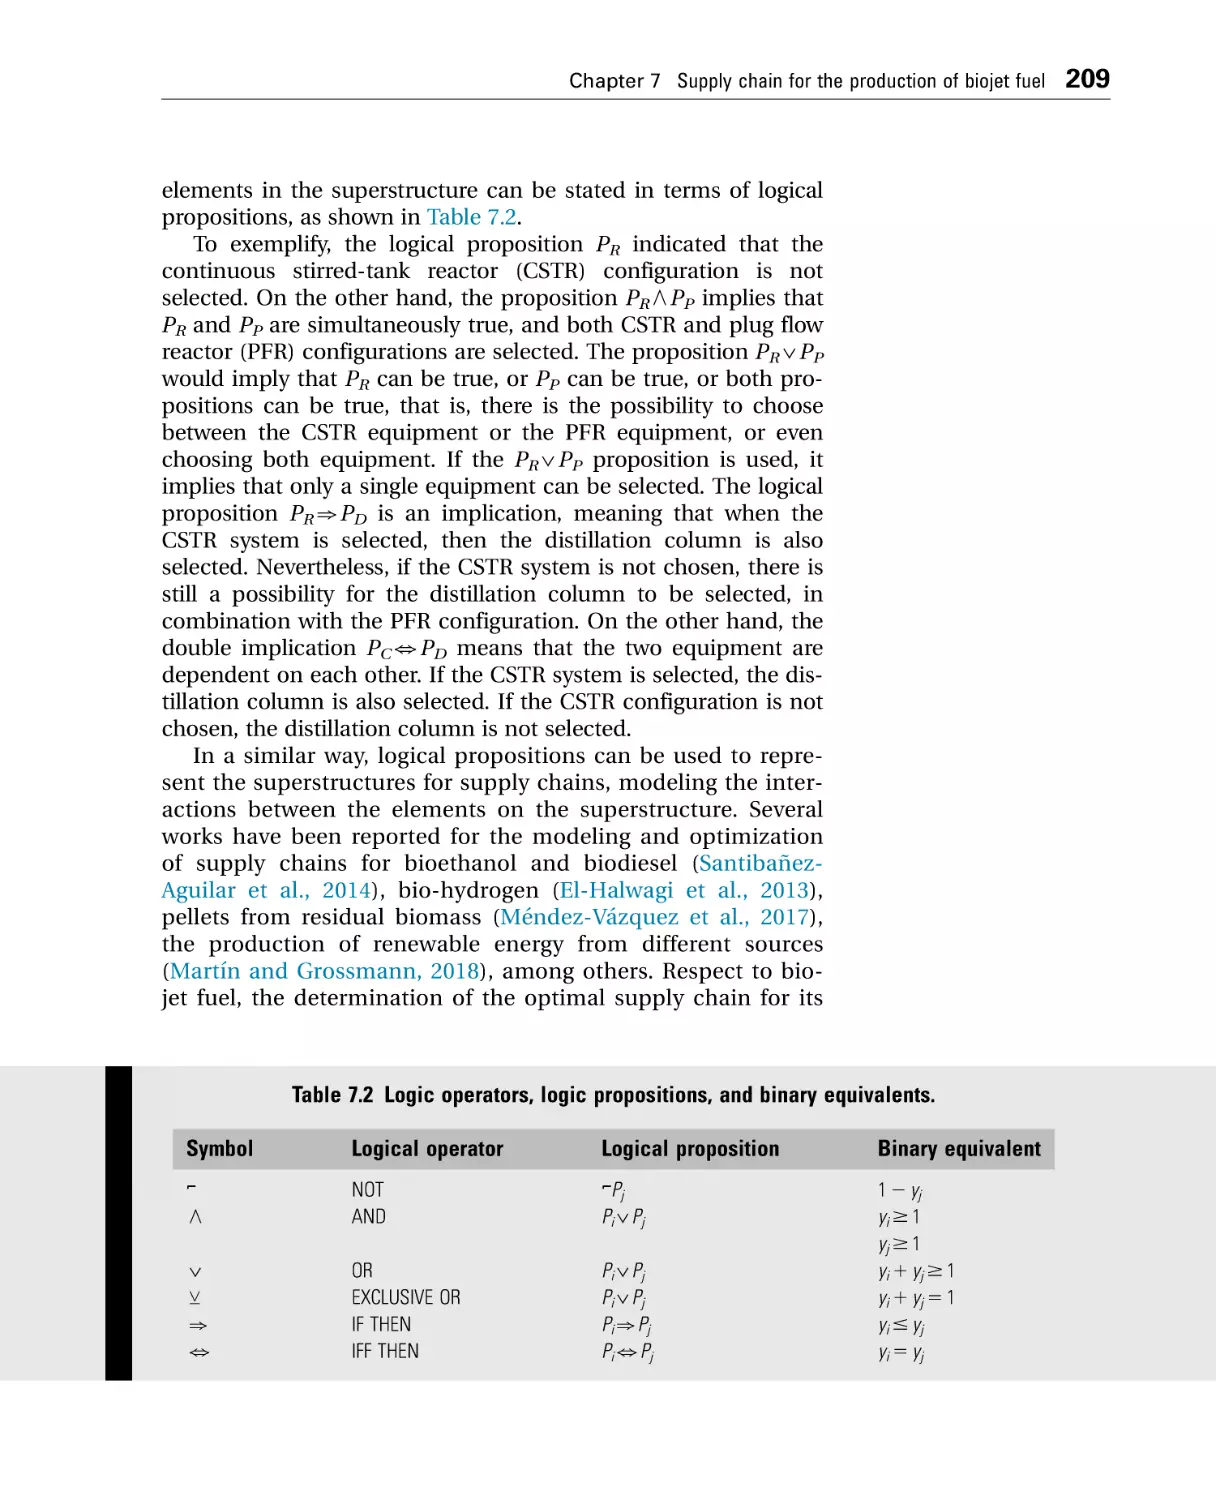
7.5 Modeling and optimization of the supply chain ............................ 207
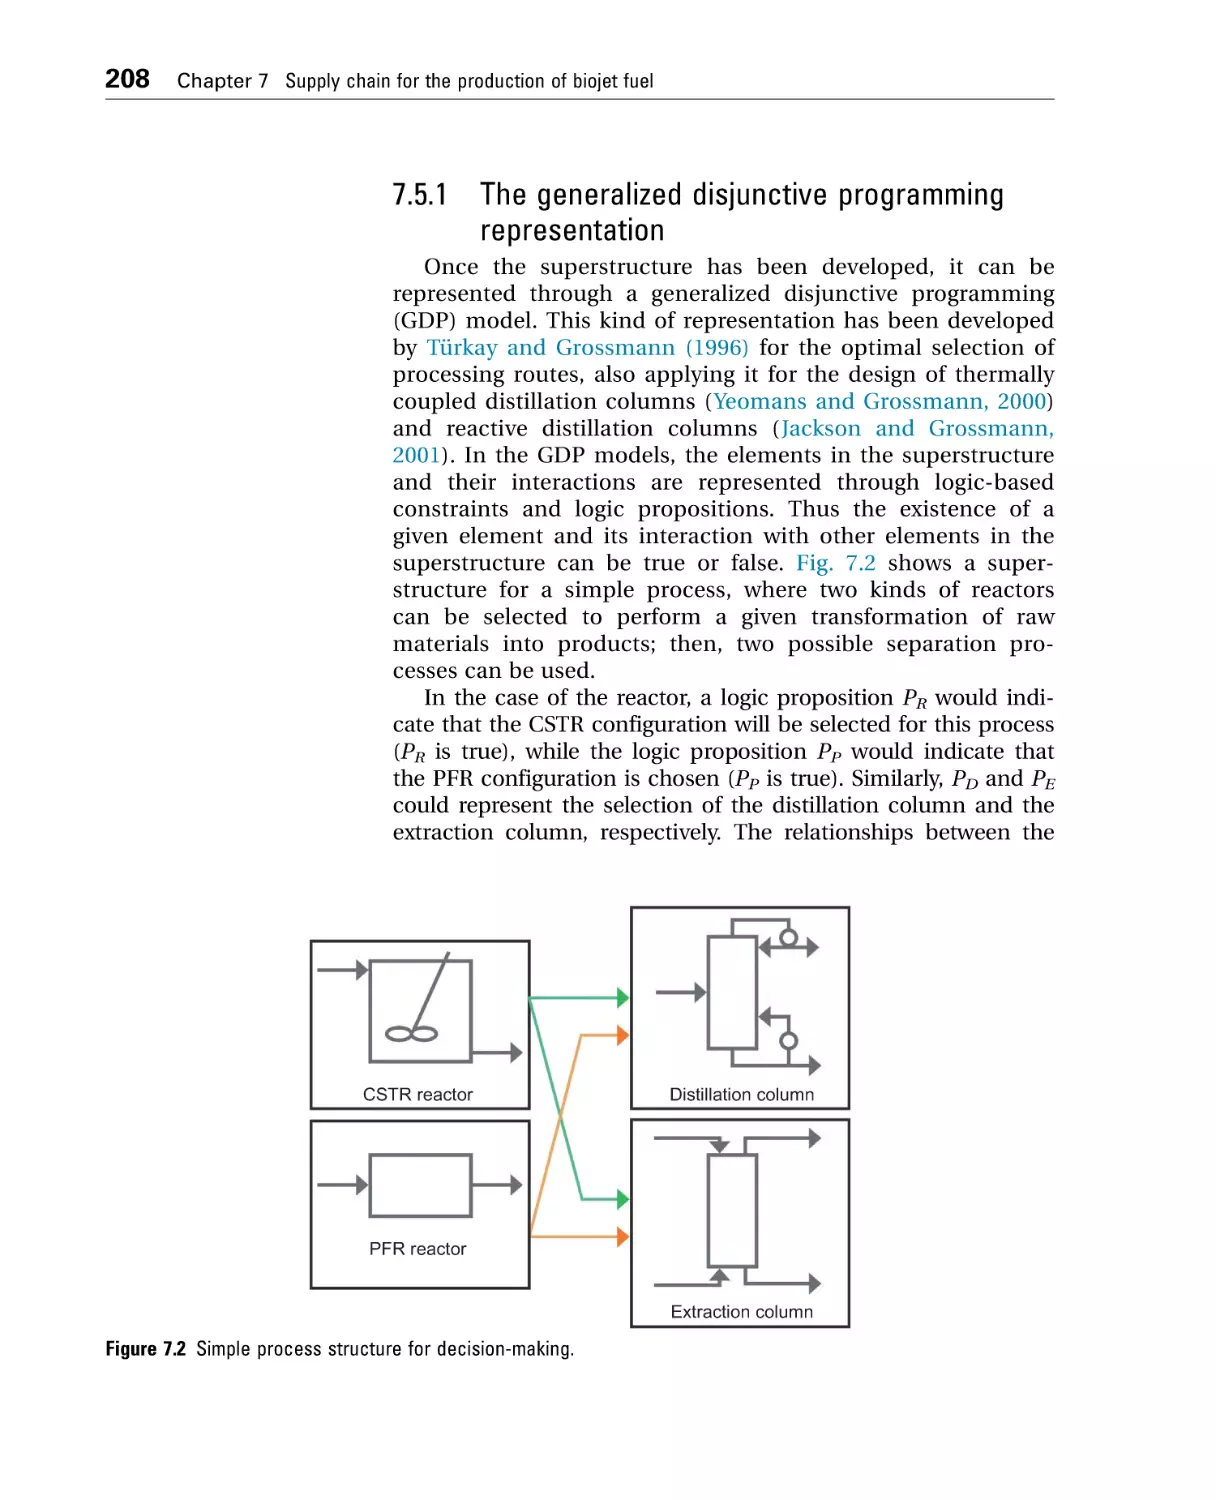
7.5.1 The generalized disjunctive programming
representation ......................................................................... 208
7.5.2 Relaxation of a generalized disjunctive
programming model ............................................................... 212
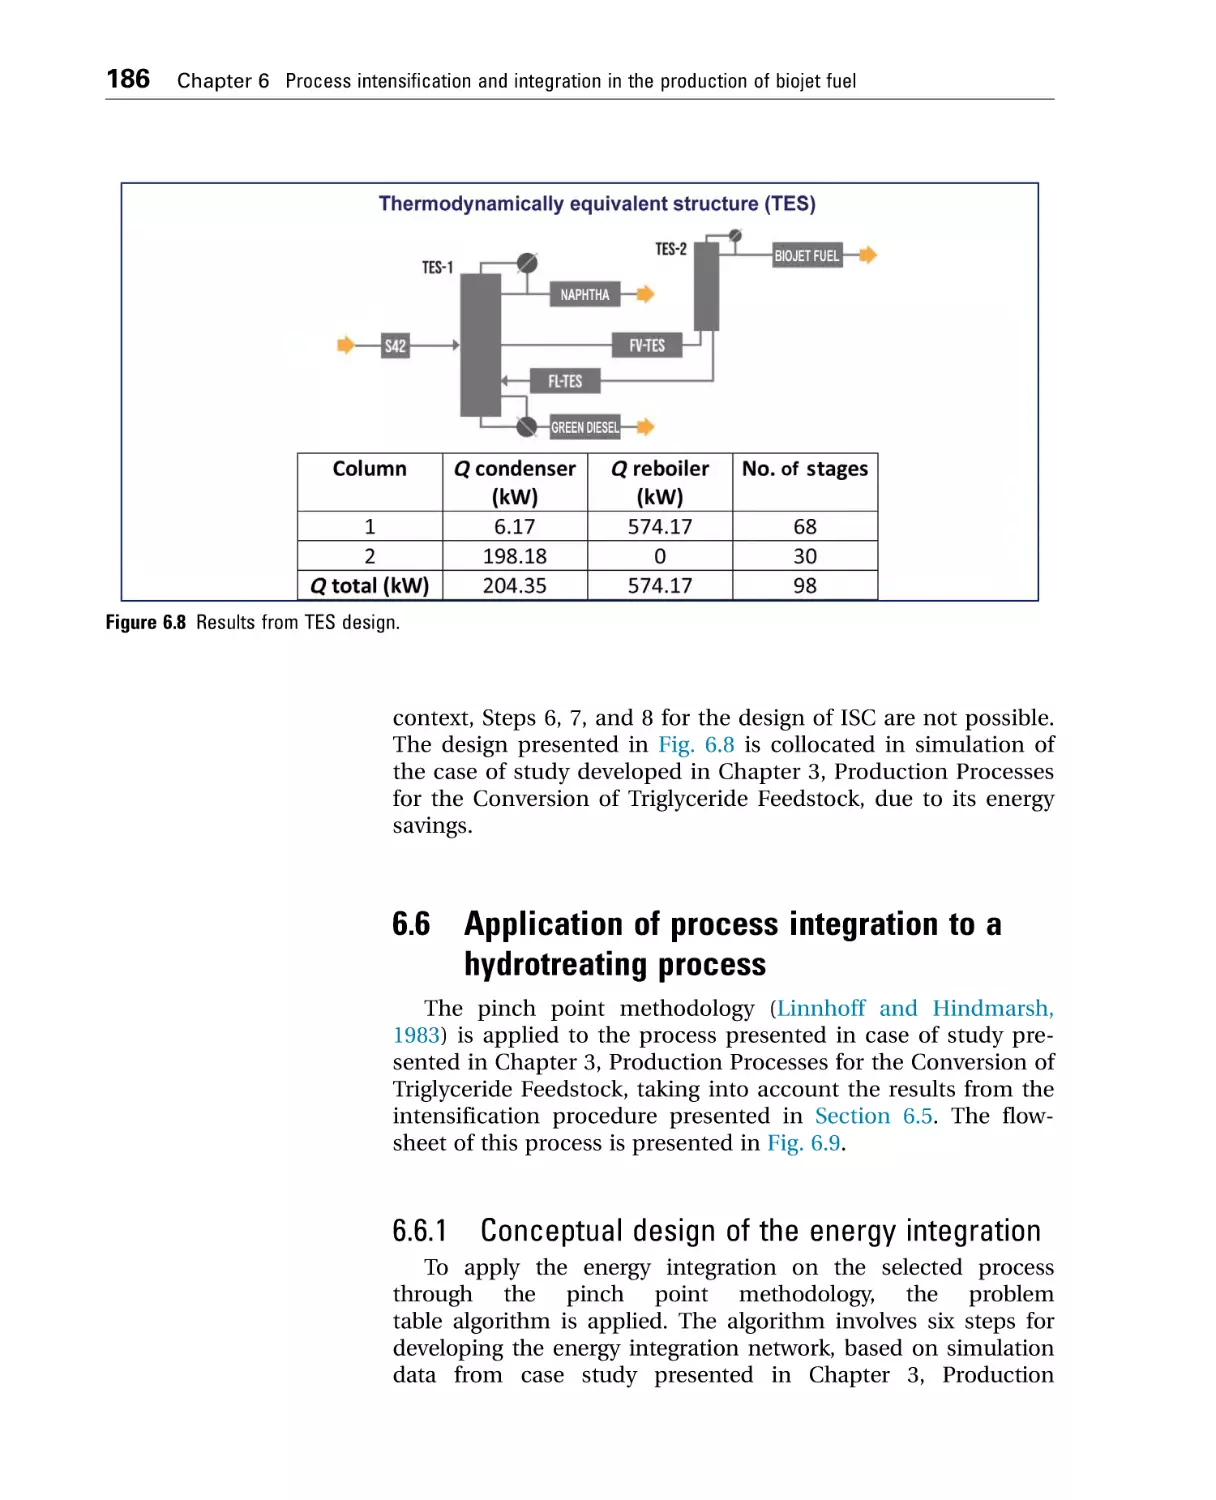
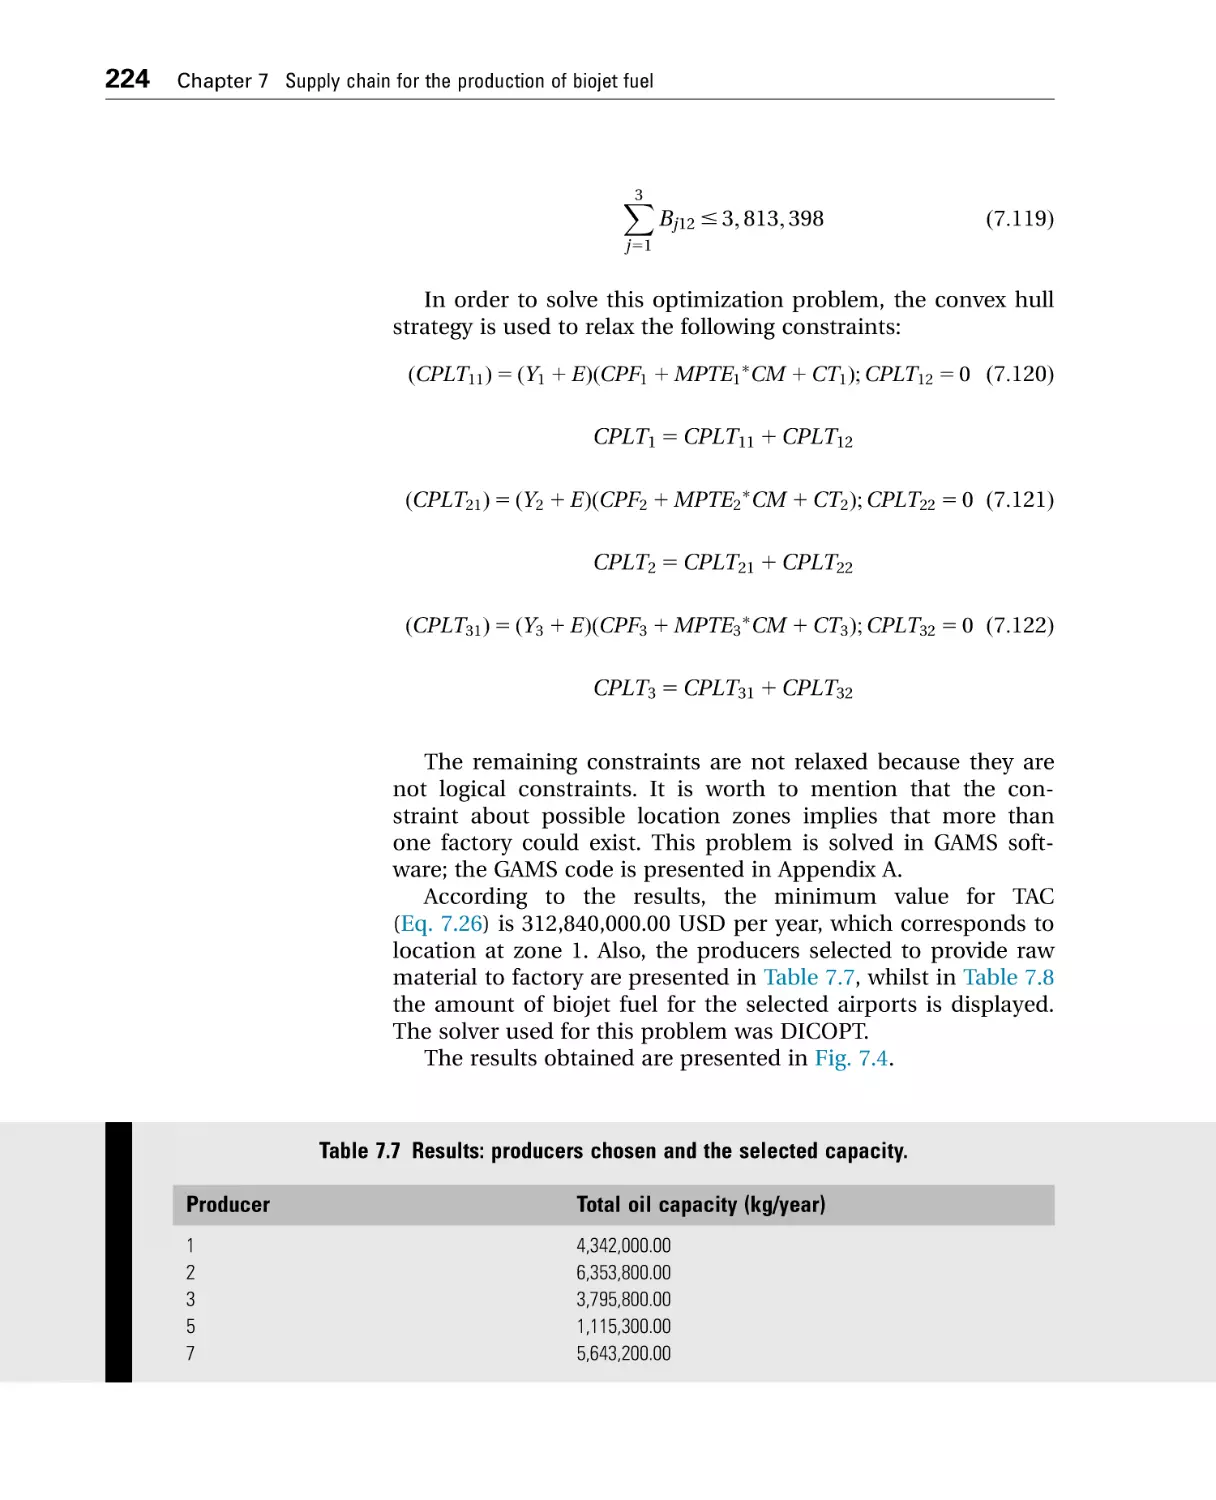
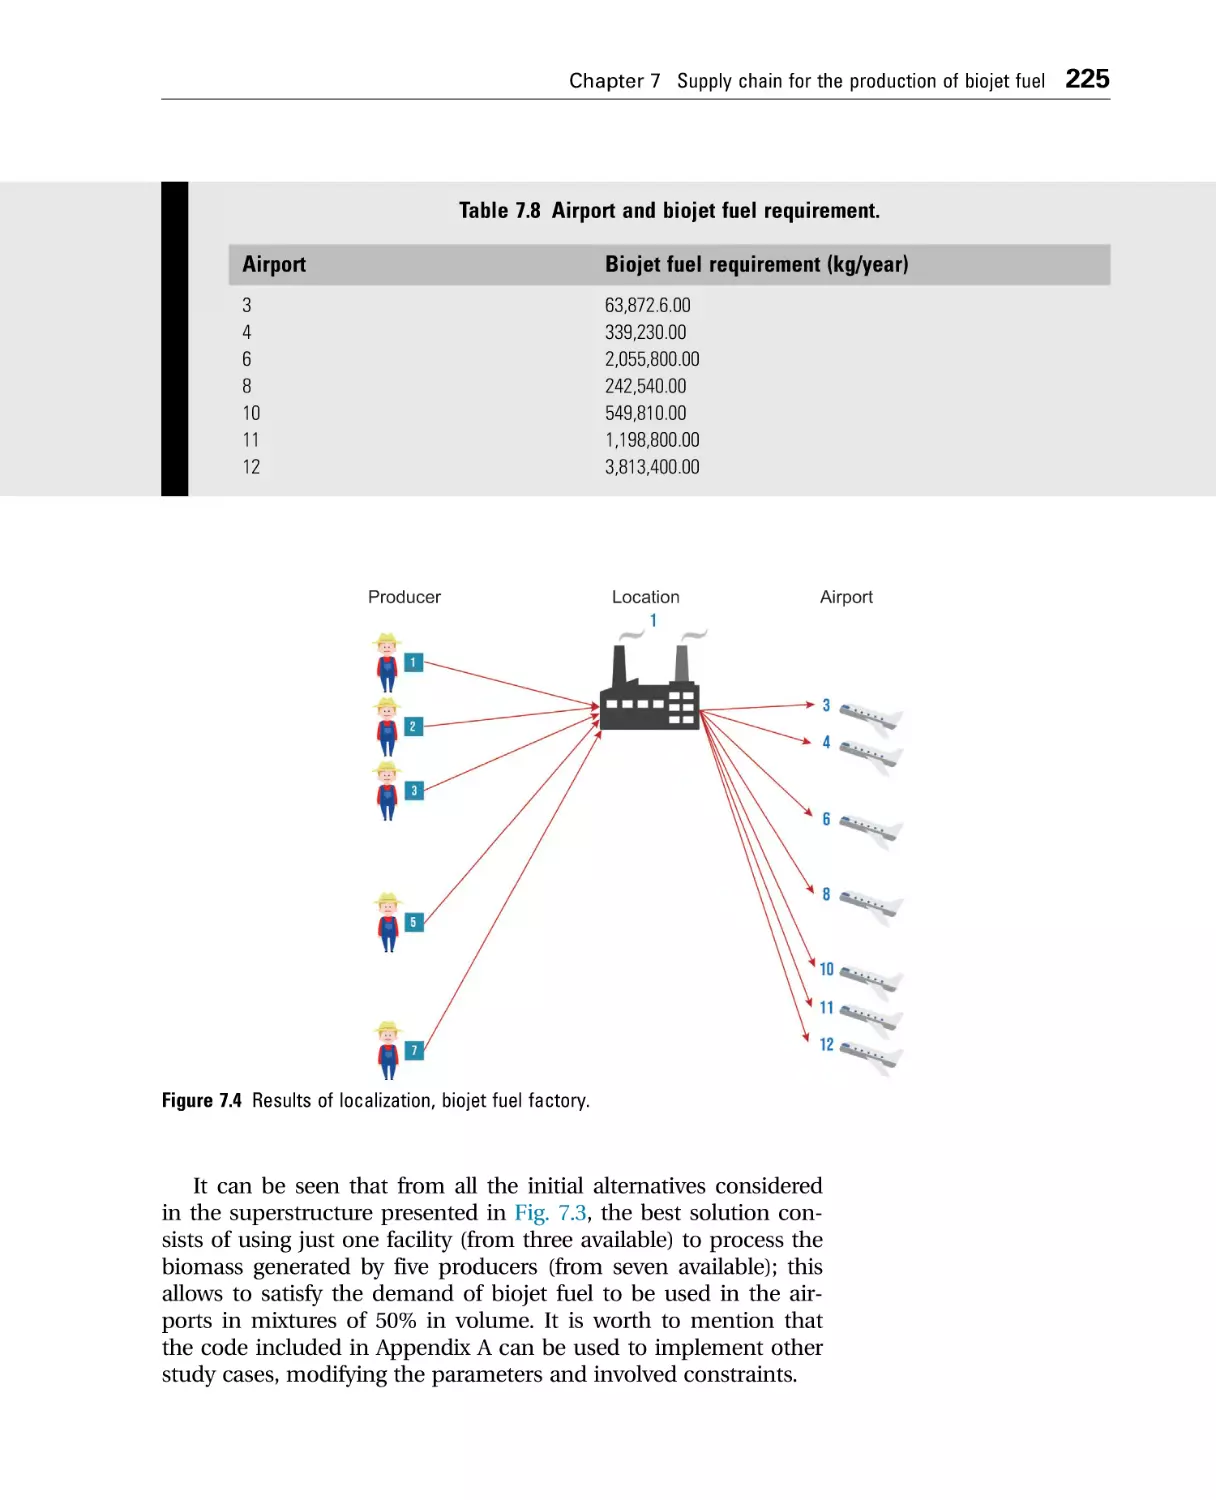
7.6 Case study: optimization of the biojet fuel supply chain
in Mexico .......................................................................................... 214
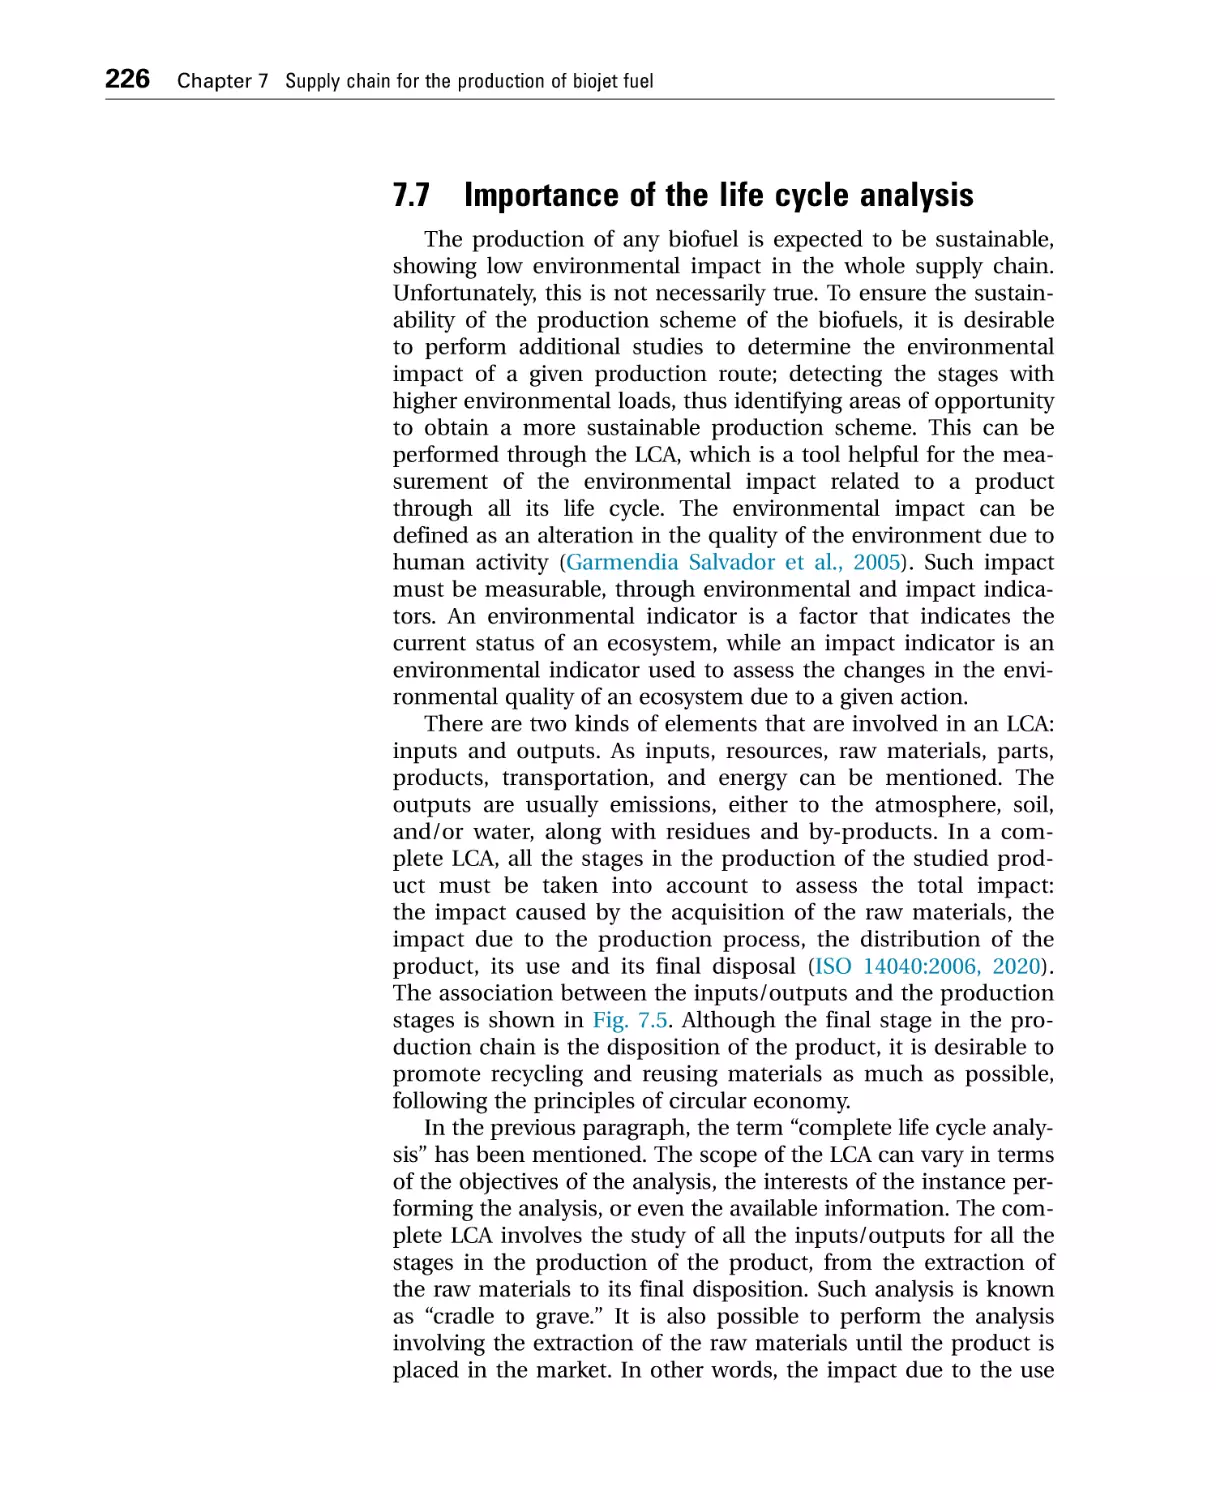
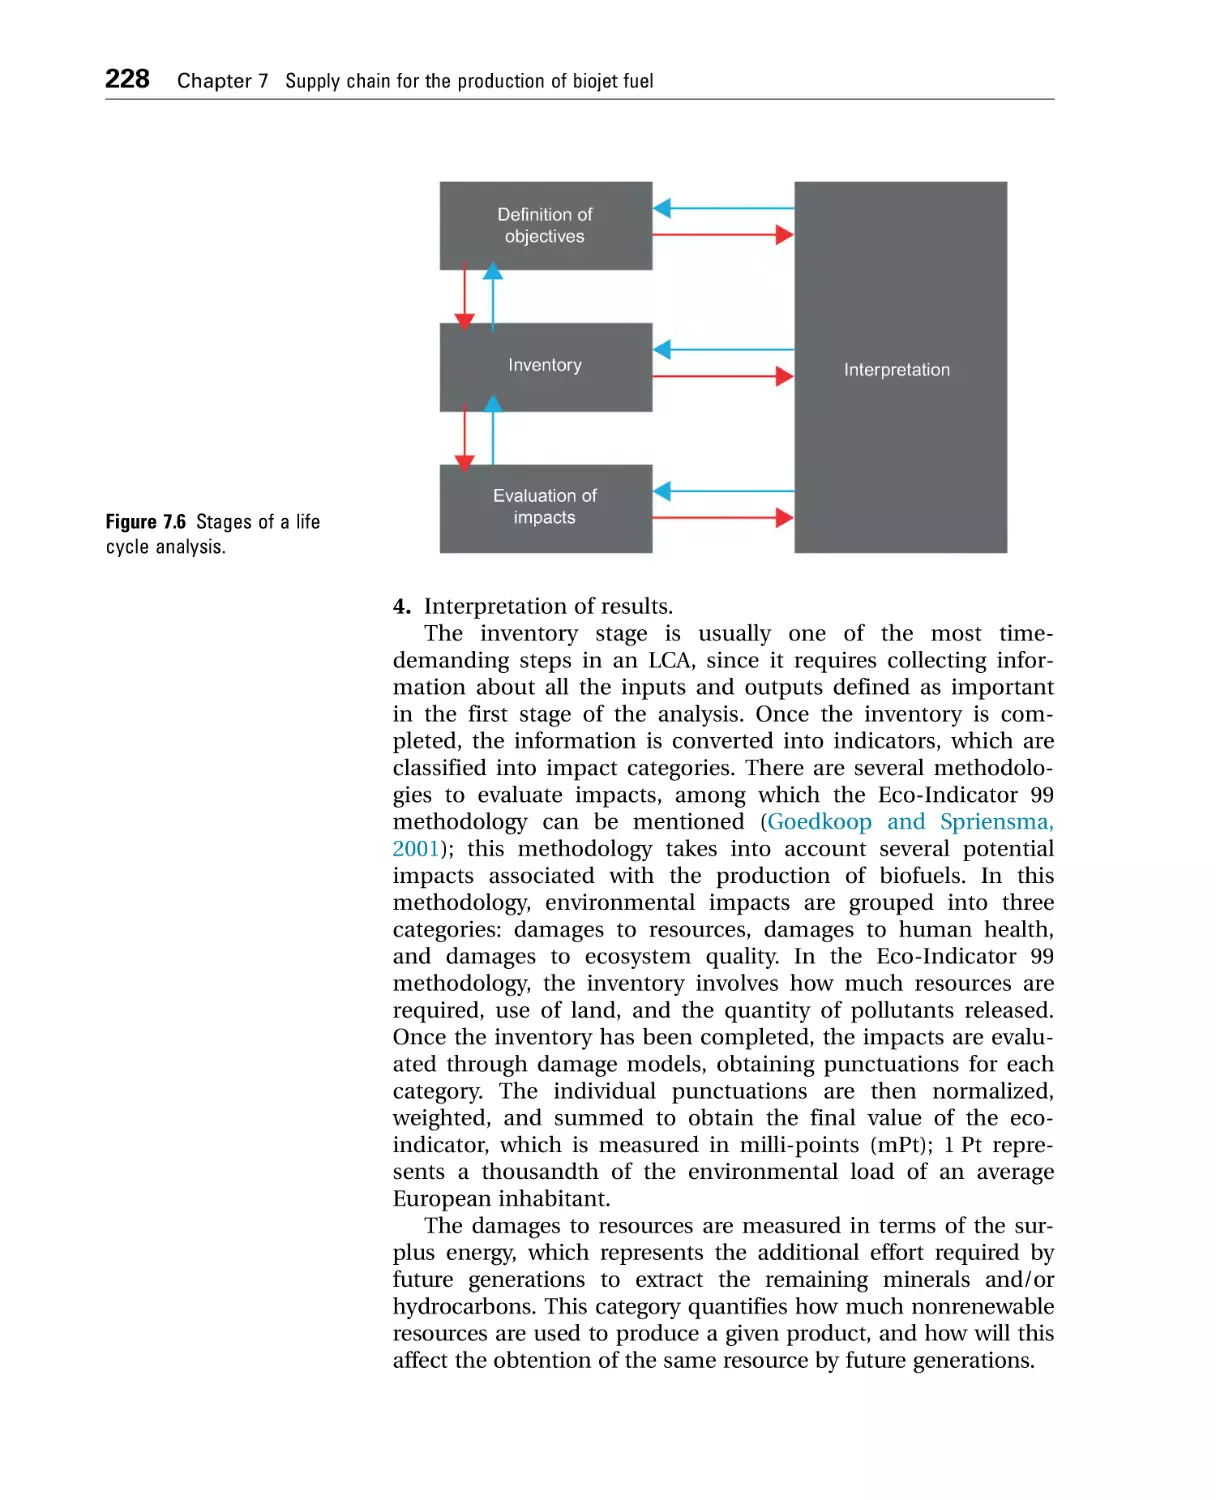
7.7 Importance of the life cycle analysis .............................................. 226
7.8 Conclusion ........................................................................................ 232
References ............................................................................................... 233
Appendix A.............................................................................................. 235
8 The future trends in the production of biojet fuel ...................................241
8.1 Introduction ...................................................................................... 241
8.2 Opportunity areas for raw materials............................................... 242
8.2.1 Triglyceride feedstock ............................................................. 242
8.2.2 Sugar and starchy feedstock .................................................. 243
8.2.3 Lignocellulosic feedstock........................................................ 243
8.3 Opportunity areas for processing routes ....................................... 244
8.3.1 Chemical pathways ................................................................. 244
8.3.2 Biochemical pathways ............................................................ 245
8.3.3 Thermochemical pathways .................................................... 245
8.4 Opportunity areas for supply chain ................................................ 246
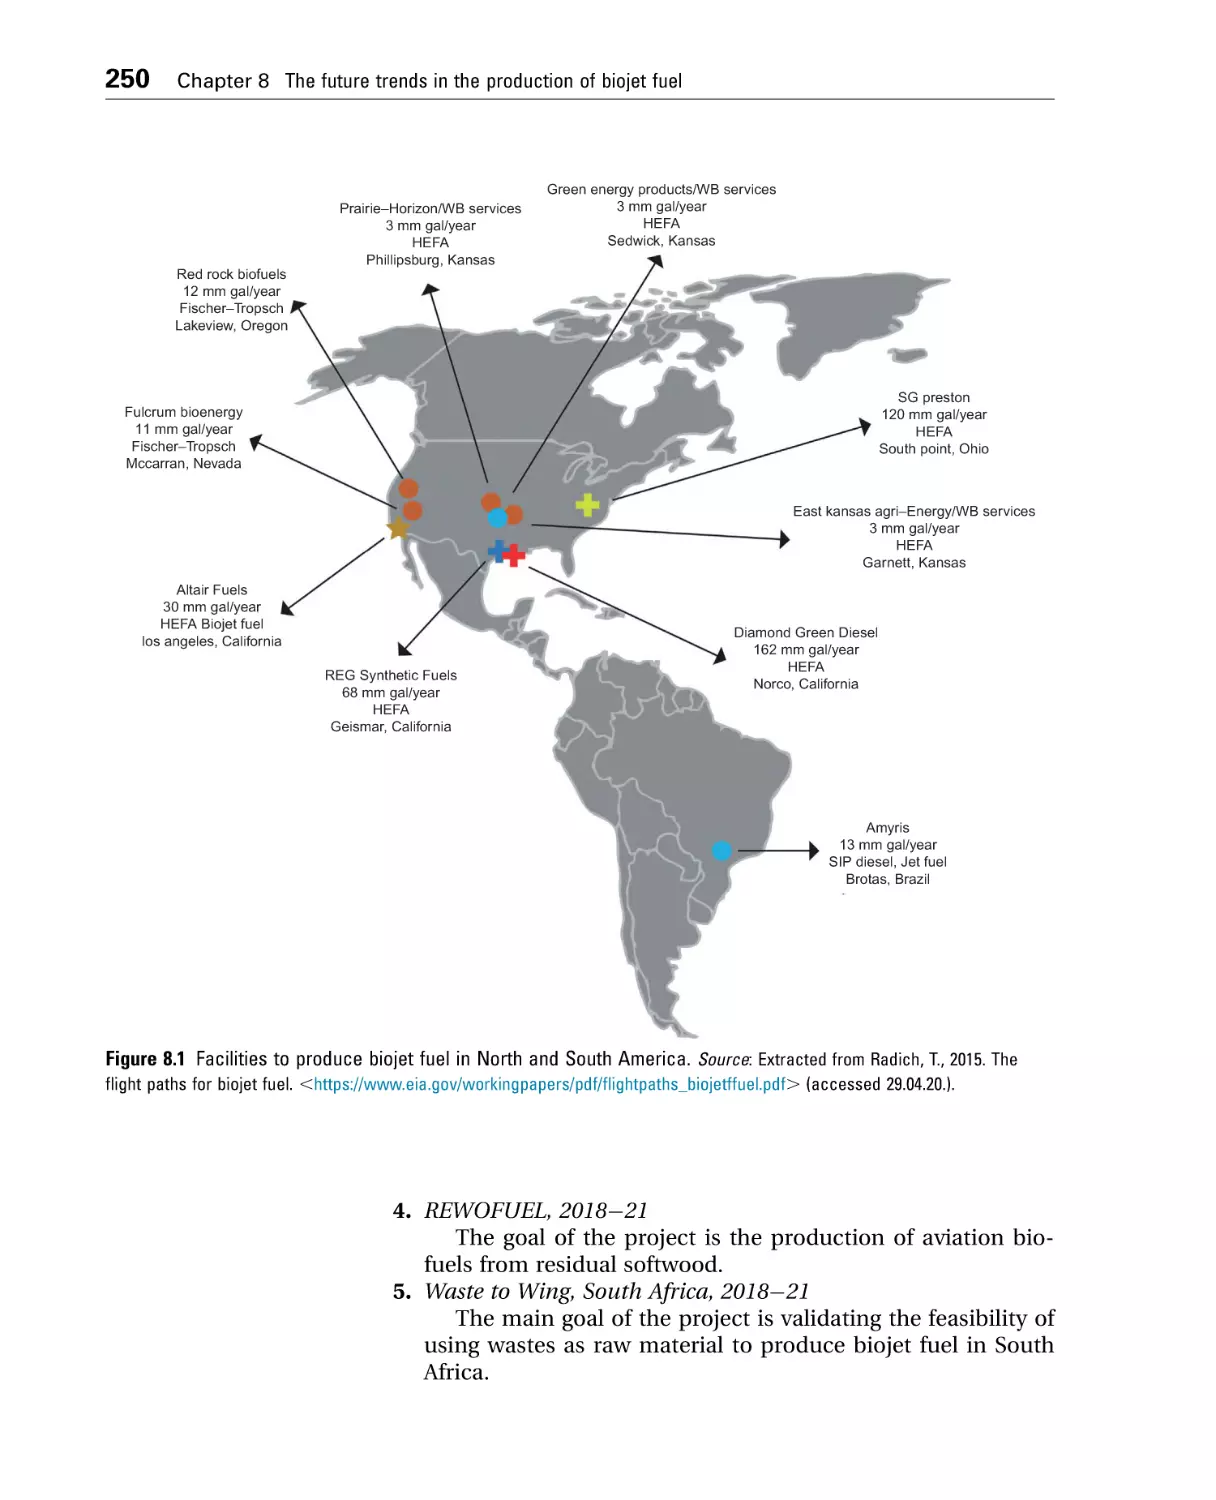
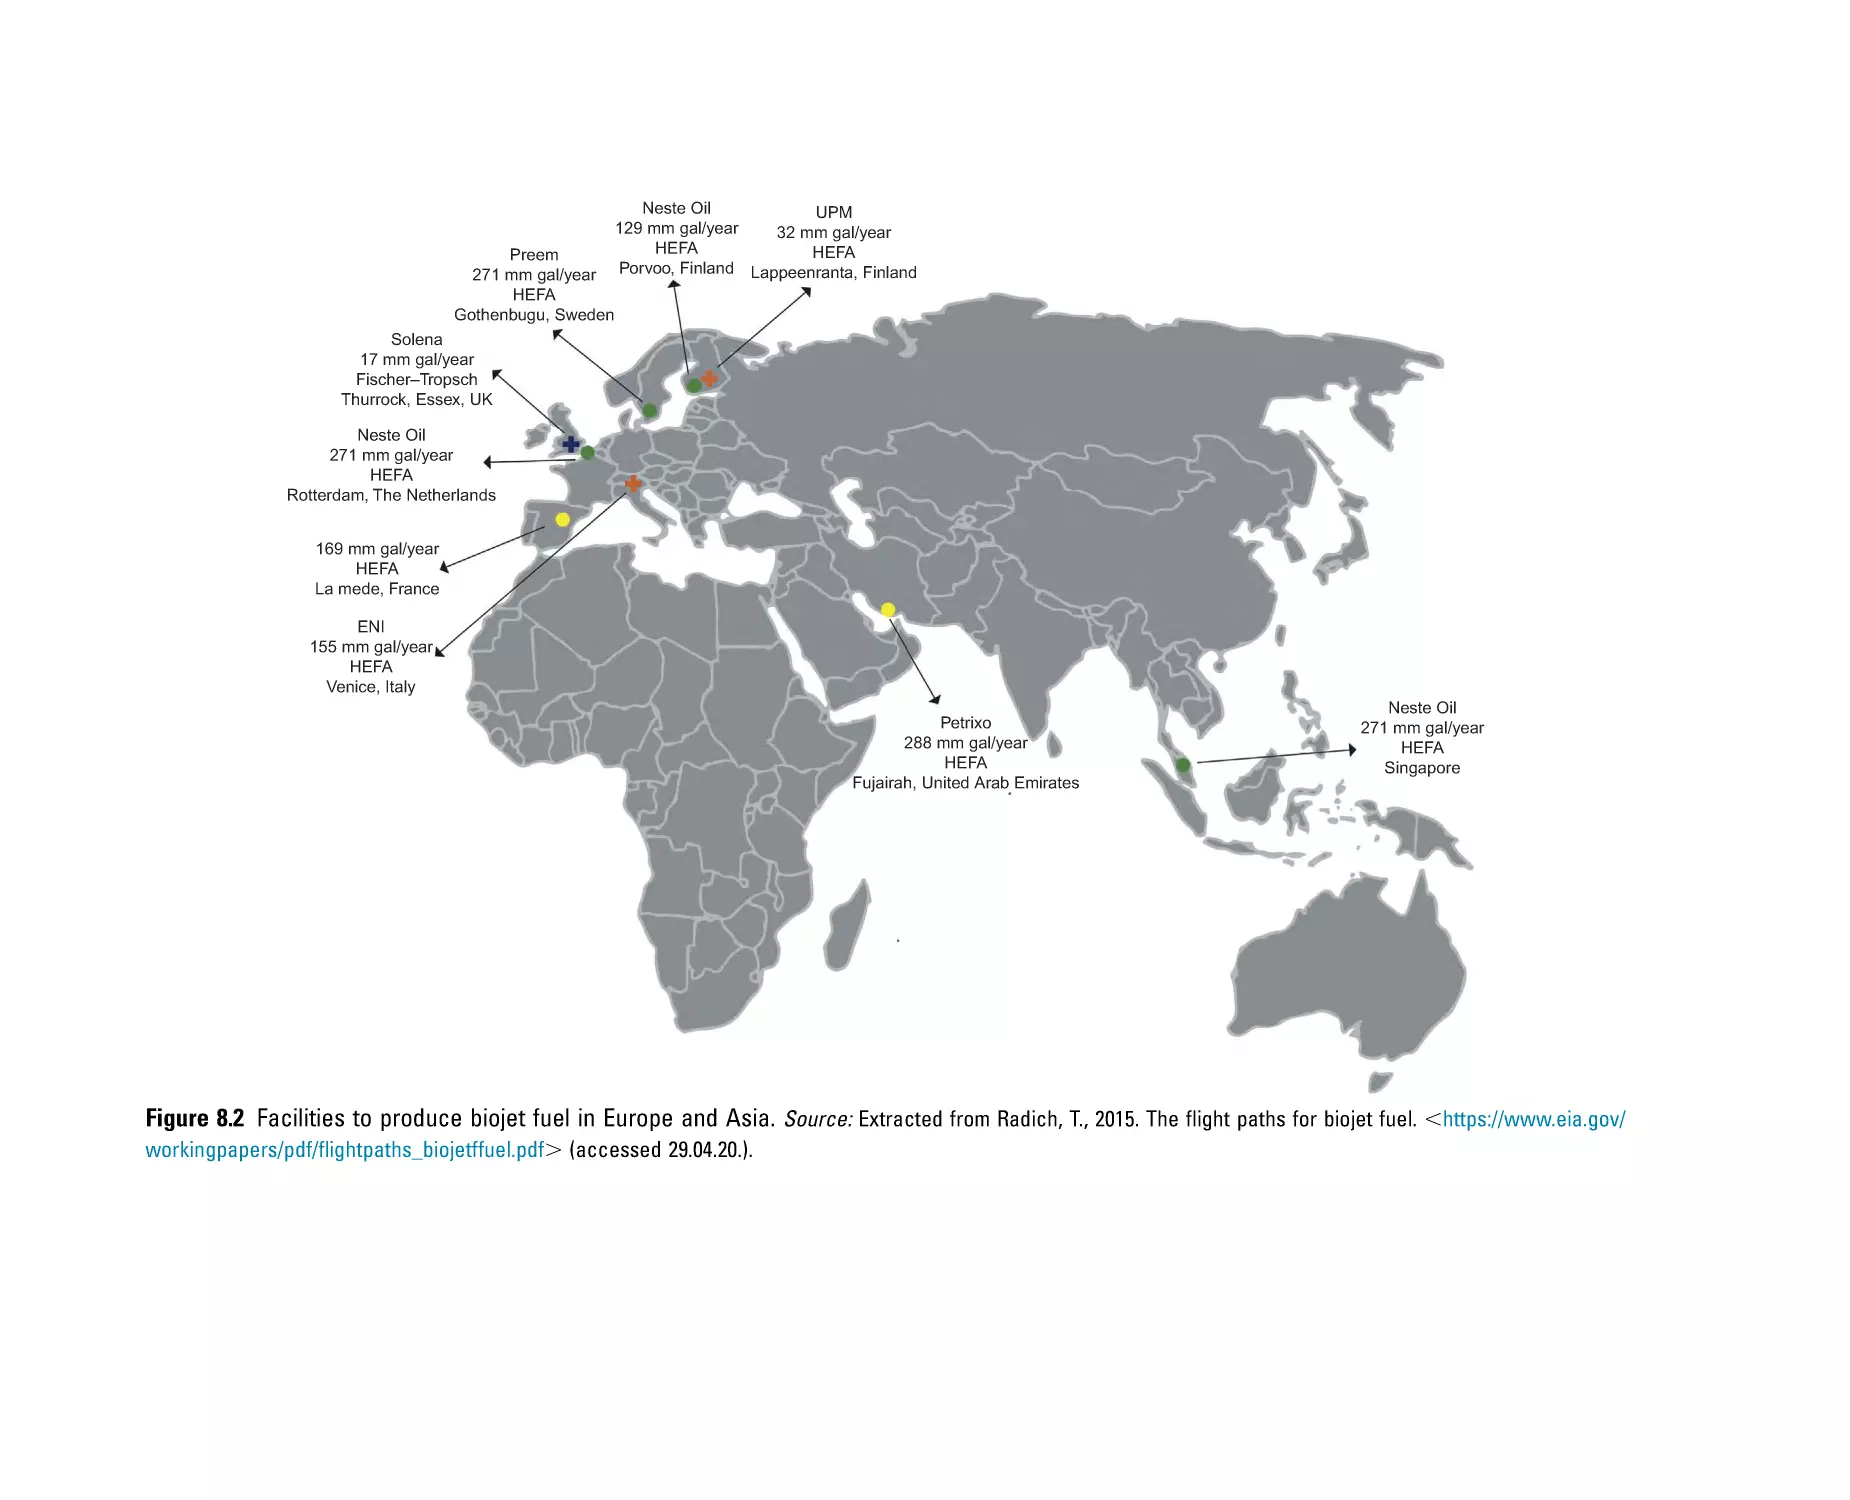
8.5 Worldwide industrial projects to produce biojet fuel.................... 246
8.6 Summary .......................................................................................... 252
References ............................................................................................... 252
Index........................................................................................................... 255
Biojet fuel: Driving the aviation
sector to sustainability
1.1
1
Motivation
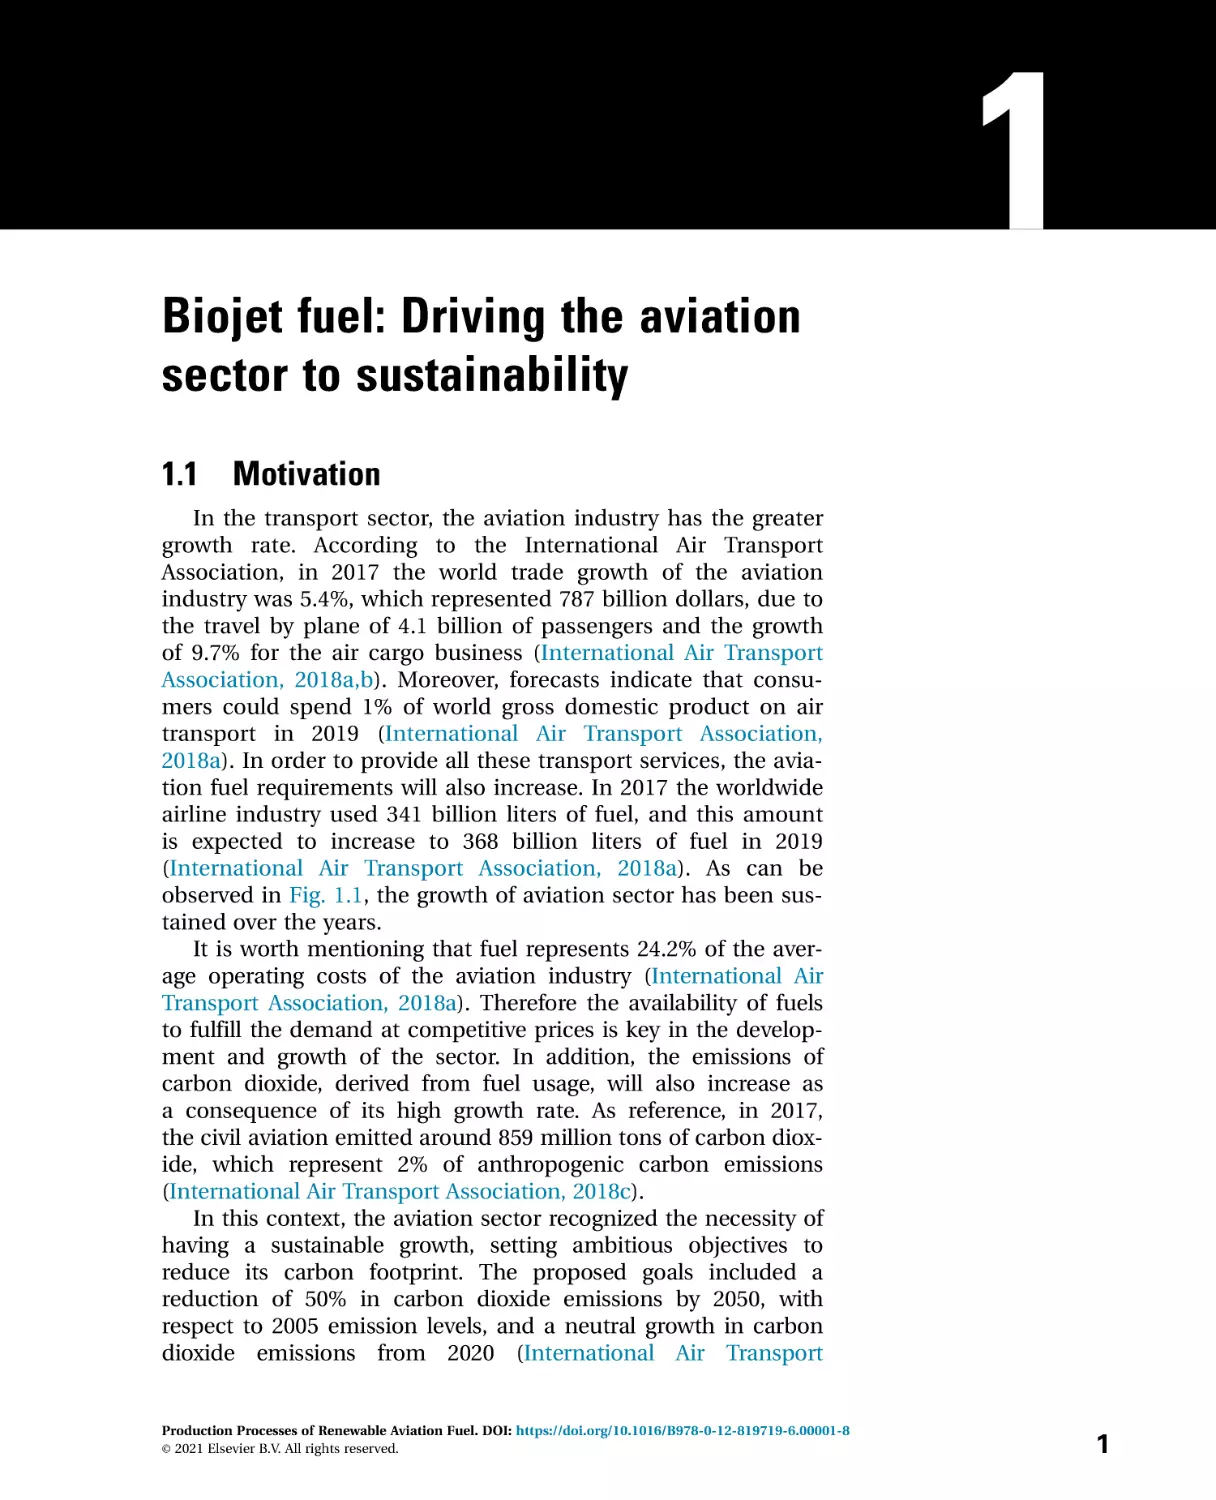
In the transport sector, the aviation industry has the greater
growth rate. According to the International Air Transport
Association, in 2017 the world trade growth of the aviation
industry was 5.4%, which represented 787 billion dollars, due to
the travel by plane of 4.1 billion of passengers and the growth
of 9.7% for the air cargo business (International Air Transport
Association, 2018a,b). Moreover, forecasts indicate that consumers could spend 1% of world gross domestic product on air
transport in 2019 (International Air Transport Association,
2018a). In order to provide all these transport services, the aviation fuel requirements will also increase. In 2017 the worldwide
airline industry used 341 billion liters of fuel, and this amount
is expected to increase to 368 billion liters of fuel in 2019
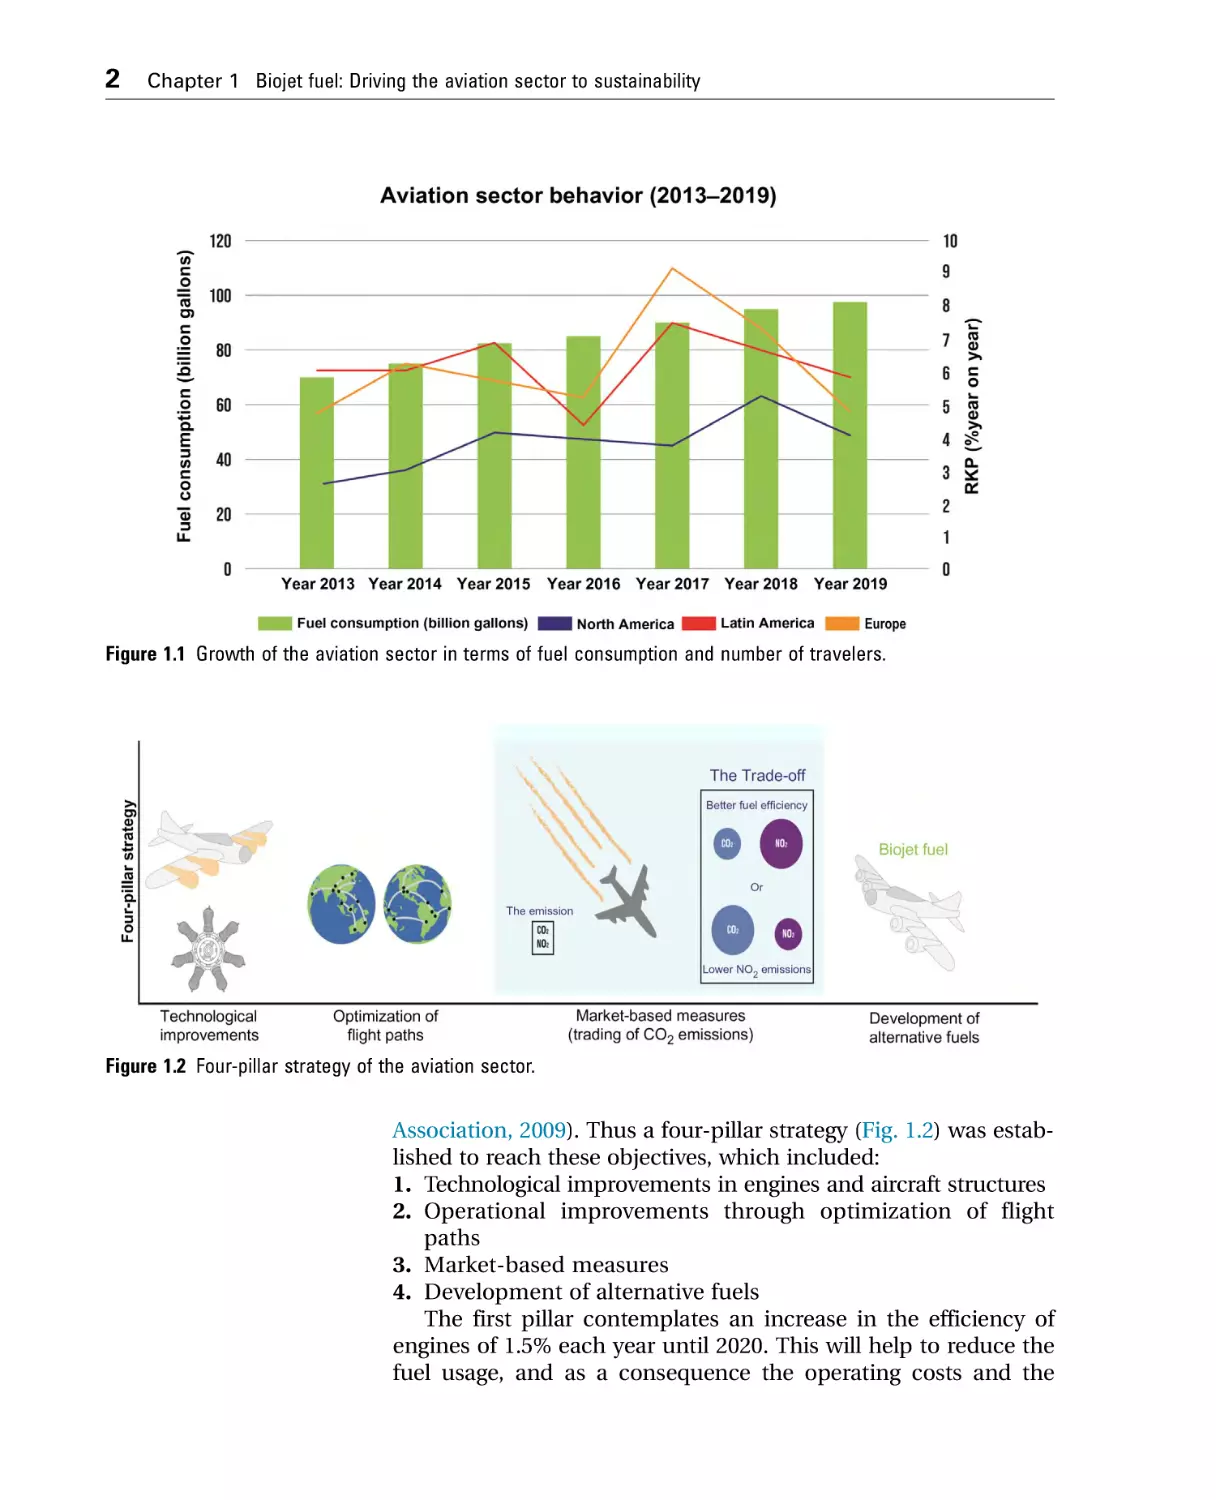
(International Air Transport Association, 2018a). As can be
observed in Fig. 1.1, the growth of aviation sector has been sustained over the years.
It is worth mentioning that fuel represents 24.2% of the average operating costs of the aviation industry (International Air
Transport Association, 2018a). Therefore the availability of fuels
to fulfill the demand at competitive prices is key in the development and growth of the sector. In addition, the emissions of
carbon dioxide, derived from fuel usage, will also increase as
a consequence of its high growth rate. As reference, in 2017,
the civil aviation emitted around 859 million tons of carbon dioxide, which represent 2% of anthropogenic carbon emissions
(International Air Transport Association, 2018c).
In this context, the aviation sector recognized the necessity of
having a sustainable growth, setting ambitious objectives to
reduce its carbon footprint. The proposed goals included a
reduction of 50% in carbon dioxide emissions by 2050, with
respect to 2005 emission levels, and a neutral growth in carbon
dioxide emissions from 2020 (International Air Transport
Production Processes of Renewable Aviation Fuel. DOI: https://doi.org/10.1016/B978-0-12-819719-6.00001-8
© 2021 Elsevier B.V. All rights reserved.
1
2
Chapter 1 Biojet fuel: Driving the aviation sector to sustainability
Figure 1.1 Growth of the aviation sector in terms of fuel consumption and number of travelers.
Figure 1.2 Four-pillar strategy of the aviation sector.
Association, 2009). Thus a four-pillar strategy (Fig. 1.2) was established to reach these objectives, which included:
1. Technological improvements in engines and aircraft structures
2. Operational improvements through optimization of flight
paths
3. Market-based measures
4. Development of alternative fuels
The first pillar contemplates an increase in the efficiency of
engines of 1.5% each year until 2020. This will help to reduce the
fuel usage, and as a consequence the operating costs and the
Chapter 1 Biojet fuel: Driving the aviation sector to sustainability
carbon dioxide emissions; in addition, the application of nano
coatings to airplanes to reduce its weight is also considered. The
second pillar includes the minimization of fuel requirements by
using online optimization strategies, which consider the actual
weather conditions. On the other hand, the third pillar takes into
account the trading of carbon dioxide emissions. Finally, the
fourth pillar looks upon the development of alternative fuels for
the aviation sector, which must be renewable and sustainable. In
addition, the development of these alternative fuels will help to
have independence of fossil fuels, at least partially. This is
expected to occur since the raw materials used to produce such
renewable fuels can be obtained in a local scale, making use of
the available materials in each region.
In particular, the International Air Transport Association
points out that the development of alternative fuels is the option
that contributes the most to the reduction of carbon dioxide
emissions in the aviation sector. Unlike other alternative fuels,
aviation fuel must be drop-in, which means that the chemical
composition and physicochemical properties must be, at least,
the same of the jet fuel. This is because redesigning the airplane
engines is not a feasible alternative for the manufacturers, due to
the high complexity of these systems; additionally, any change in
the airplanes will require a recertification, which is a timeconsuming and expensive process. Thus alternative aviation fuels
represent a viable option to begin the energy transition of the
aviation sector, simultaneously guaranteeing its sustainable
development without needing a recertification process of the aircraft infrastructure; other alternative energies, such as solar or
wind energies, are not directly contemplated for aviation sector,
since they are not compatible with the existing infrastructure.
Because of all the previously exposed reasons, the development of alternative fuels for aviation has received a lot of interest
in the last 11 years, and several books have been published in
topics such as logistics, markets, policies, and sustainability. This
book focuses on the detailed analysis of the production process
for renewable aviation fuel from a variety of sources, including
the application of intensification and energy integration strategies as well as the study of the supply chain. In the next section,
basic concepts of the alternative aviation fuels are presented.
1.2
Basic concepts
The aviation fuel is known as jet fuel, and it consists of
hydrocarbons in the range of C8 to C16. Jet fuel is obtained
3
4
Chapter 1 Biojet fuel: Driving the aviation sector to sustainability
from the hydroprocessing of one cut of crude oil, called kerosene, and it is composed of approximately 20% paraffins, 40%
isoparaffins, 20% naphthenes, and 20% aromatics (Bernabei
et al., 2003). There are several types of jet fuels. For commercial
airplanes there are Jet A and Jet A-1; the main difference
between them is that Jet A-1 is ultralow in sulfur content. For
military use there are JP-5 and JP-8 fuels. The main difference
between commercial and military aviation fuel is that the last
ones contain corrosion and freezing inhibitors as well as lubricants and antistatic agents.
In the search of a fuel to replace either partially or completely
the fossil jet fuel, several alternatives have been proposed, such
as hydrogen, bioacohols, and biodiesel. Nevertheless, none of
these previous alternative fuels have the adequate properties
(freezing point, thermal stability, volatility, among others) to be
used at the regular operating conditions of the turbine system of
the planes. As mentioned before, renewable aviation fuel must
be drop-in. Therefore compounds known as synthetic paraffinic
kerosene (SPK) have been developed, which contains hydrocarbons both lineal and branched, just like fossil jet fuel. Due to
this, the physicochemical properties of SPK are equal, and in
some cases superior, to those of fossil jet fuel. The SPK has been
established as the most viable alternative to replace fossil jet fuel.
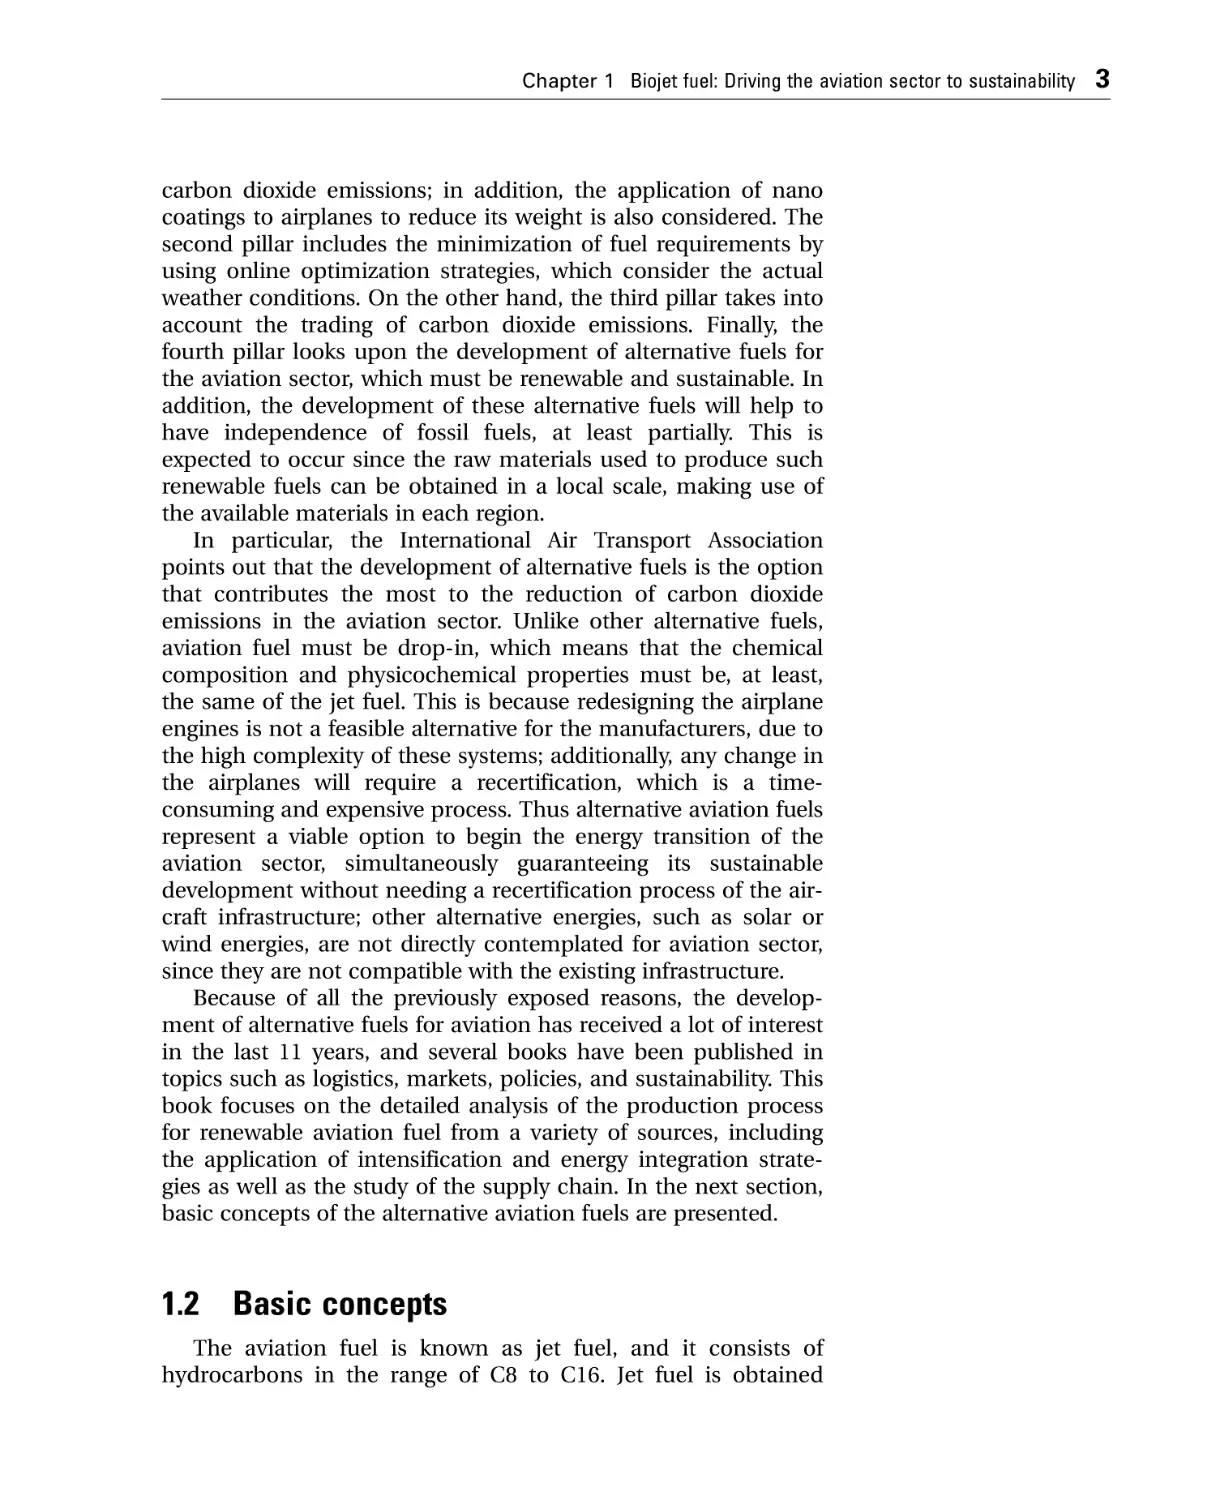
Biojet fuel has other names as SPK, renewable aviation fuel, aviation biofuel, biokerosene, or sustainable aviation fuel. Table 1.1
shows the main properties of fossil and renewable aviation fuel
(Agosta, 2002; Chevron, 2007).
Table 1.1 Some physicochemical properties of fossil and renewable jet fuel
(Agosta, 2002; Chevron, 2007).
Boiling range ( C)
Freezing temperature ( C)
Flash temperature (minimum, C)
Density at 15 C (kg/m3)
Viscosity at 220 C (maximum, mm2/s)
Energy content (MJ/kg)
Fossil jet fuel
Renewable jet fuel produced
from
Jet A
Jet-A1
Camelina
Jatropha curcas
170 300
240
38
775 840
8.0
43.28
170 300
247
38
775 840
8.0
43.28
188 263
263.5
42.0
751 840
3.33
44.0
172 243
257
46.5
751 840
3.66
44.3
Chapter 1 Biojet fuel: Driving the aviation sector to sustainability
One important advantage of renewable aviation fuel is that it
contains small amounts of sulfur, due to its renewable nature,
in comparison with fossil jet fuel; this means less contaminant
emissions. Moreover, the carbon dioxide emissions per Mega
Joule associated with the production and use of the renewable
jet fuel is between 12% and 56% lower than the ones reported
for fossil jet fuel (Holmgren, 2009). At this point, it is important
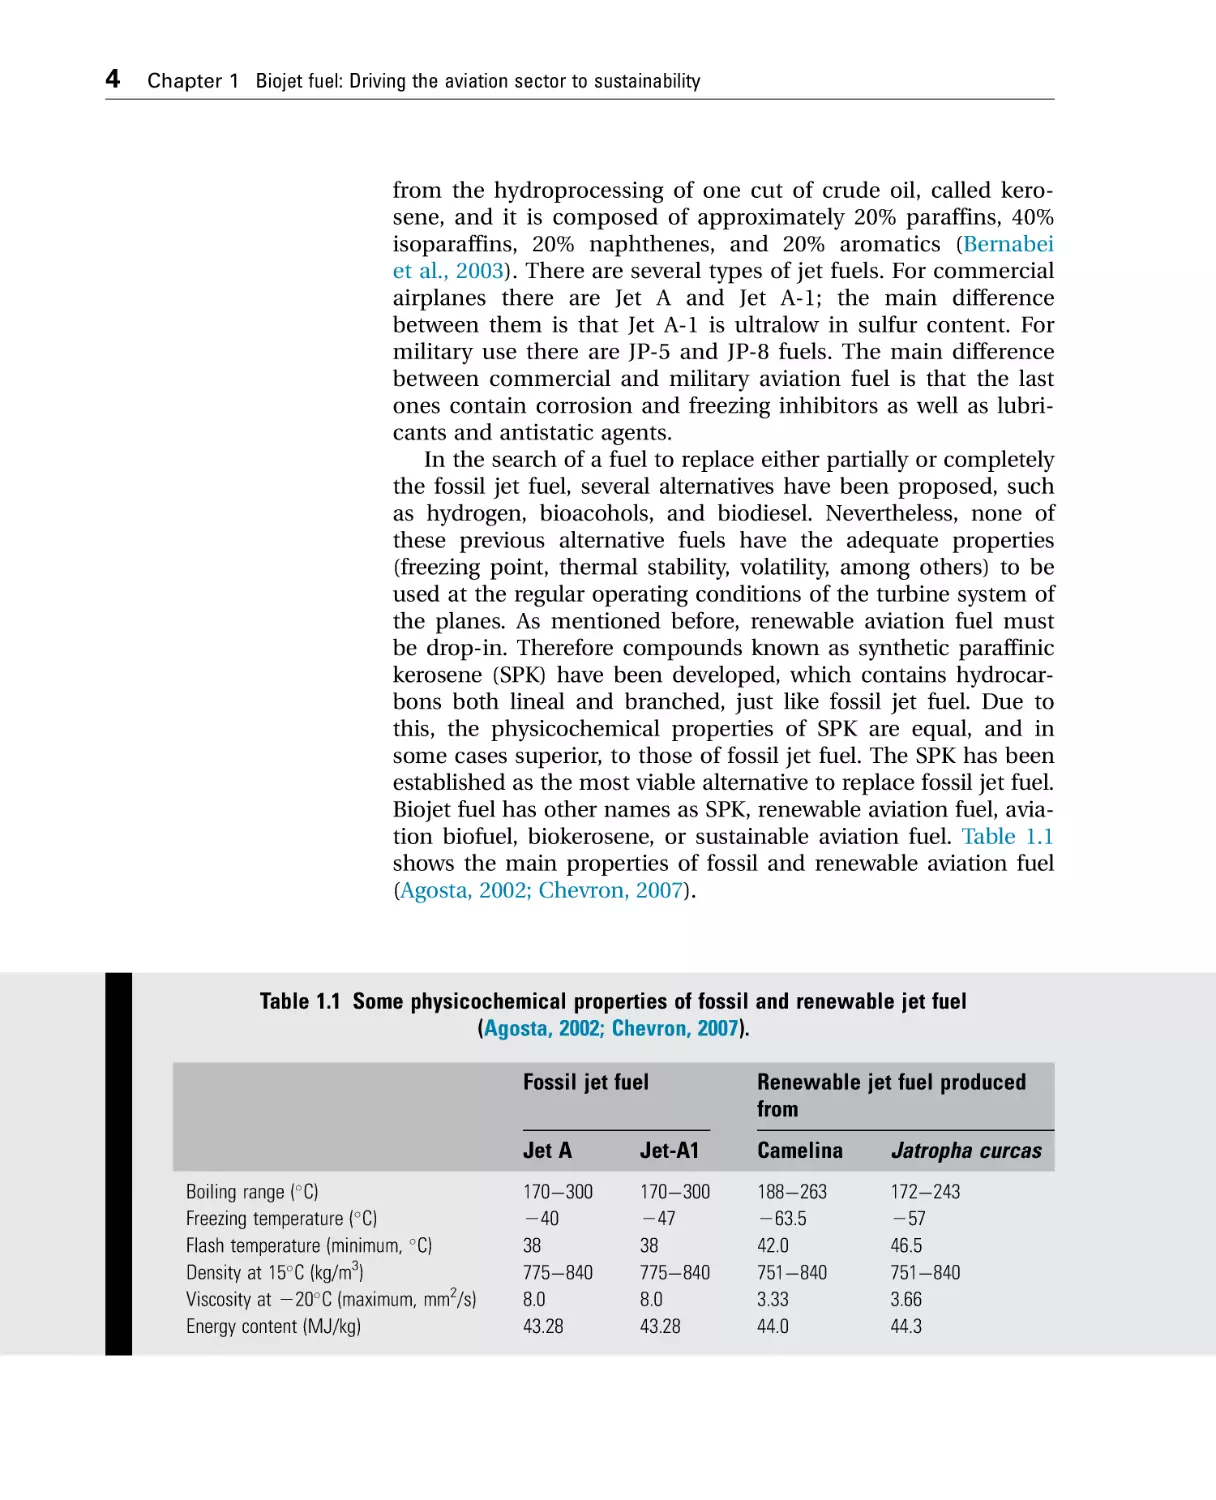
to remark that all the carbon dioxide emissions generated during the use of the renewable jet fuel are the same that are
absorbed by the crops during its growth; therefore the lifecycle
greenhouse gas emissions of the renewable aviation fuel can
be 80% lower than those of fossil jet fuel, as shown in Fig. 1.3
(International Air Transport Association, 2018c,d).
Therefore important reductions in carbon dioxide emissions
are observed, where specific value depends on the type of raw
material and the production pathway; these two factors play a
key role in the sustainability of the aviation fuels.
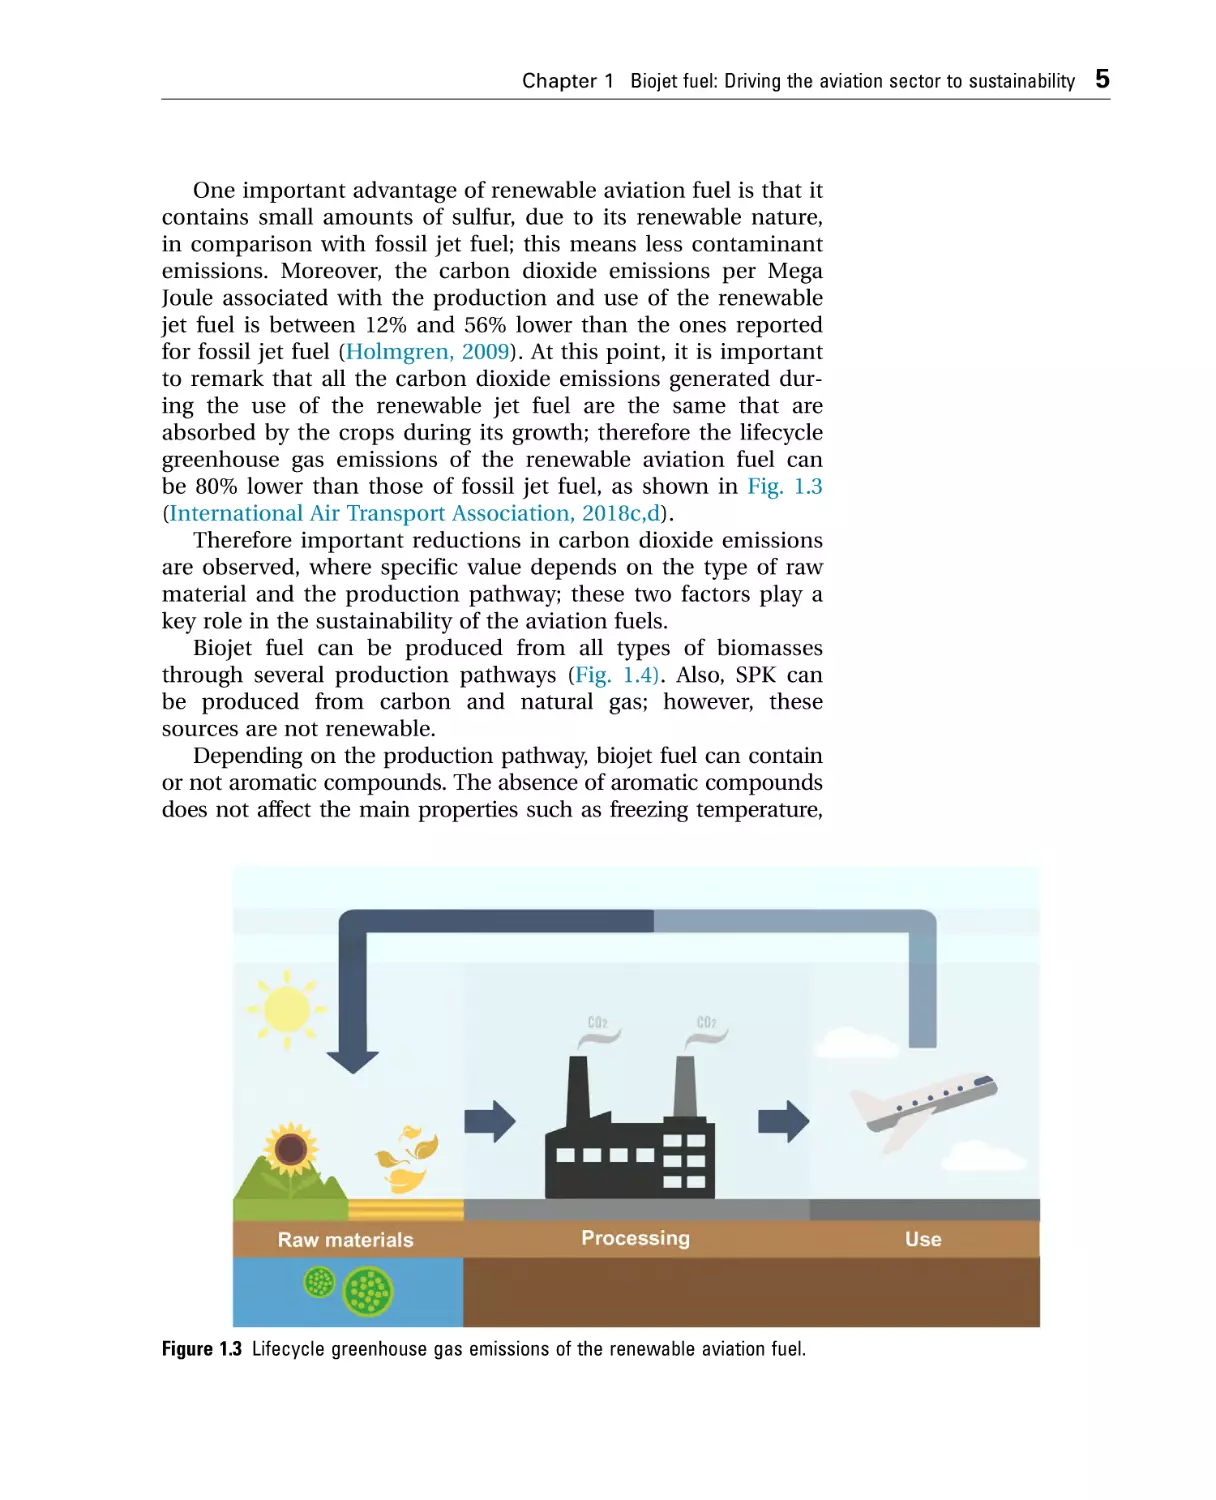
Biojet fuel can be produced from all types of biomasses
through several production pathways (Fig. 1.4). Also, SPK can
be produced from carbon and natural gas; however, these
sources are not renewable.
Depending on the production pathway, biojet fuel can contain
or not aromatic compounds. The absence of aromatic compounds
does not affect the main properties such as freezing temperature,
Figure 1.3 Lifecycle greenhouse gas emissions of the renewable aviation fuel.
5
6
Chapter 1 Biojet fuel: Driving the aviation sector to sustainability
Figure 1.4 General production
process to convert biomass to
biojet fuel.
viscosity, or energy content; however, it could cause leaks in the
fuel distribution circuit, since aromatic compounds expand the
elastomers (Gutiérrez-Antonio et al., 2016). Due to this, in commercial airplanes biojet fuel can be used in mixtures with fossil jet
fuel up to 50% in volume, according to ASTM-D7566 standard
(ASTM, 2019a). In addition to the content of aromatic compounds,
biojet fuel must complain with the same properties and tests of
fossil jet fuel, which are presented in the next section.
1.3
ASTM standards
To be acceptable to Civil Aviation Authorities, aviation turbine fuel must meet strict chemical and physical criteria
(International Air Transport Association, 2012). Therefore the
certification of aviation fuels is regulated through standards,
being the main reference those emitted by the American
Society for Testing and Materials (ASTM). There are five standards related to aviation fuels: ASTM D1655, ASTM D7566,
ASTM D7223, and ASTM D4054.
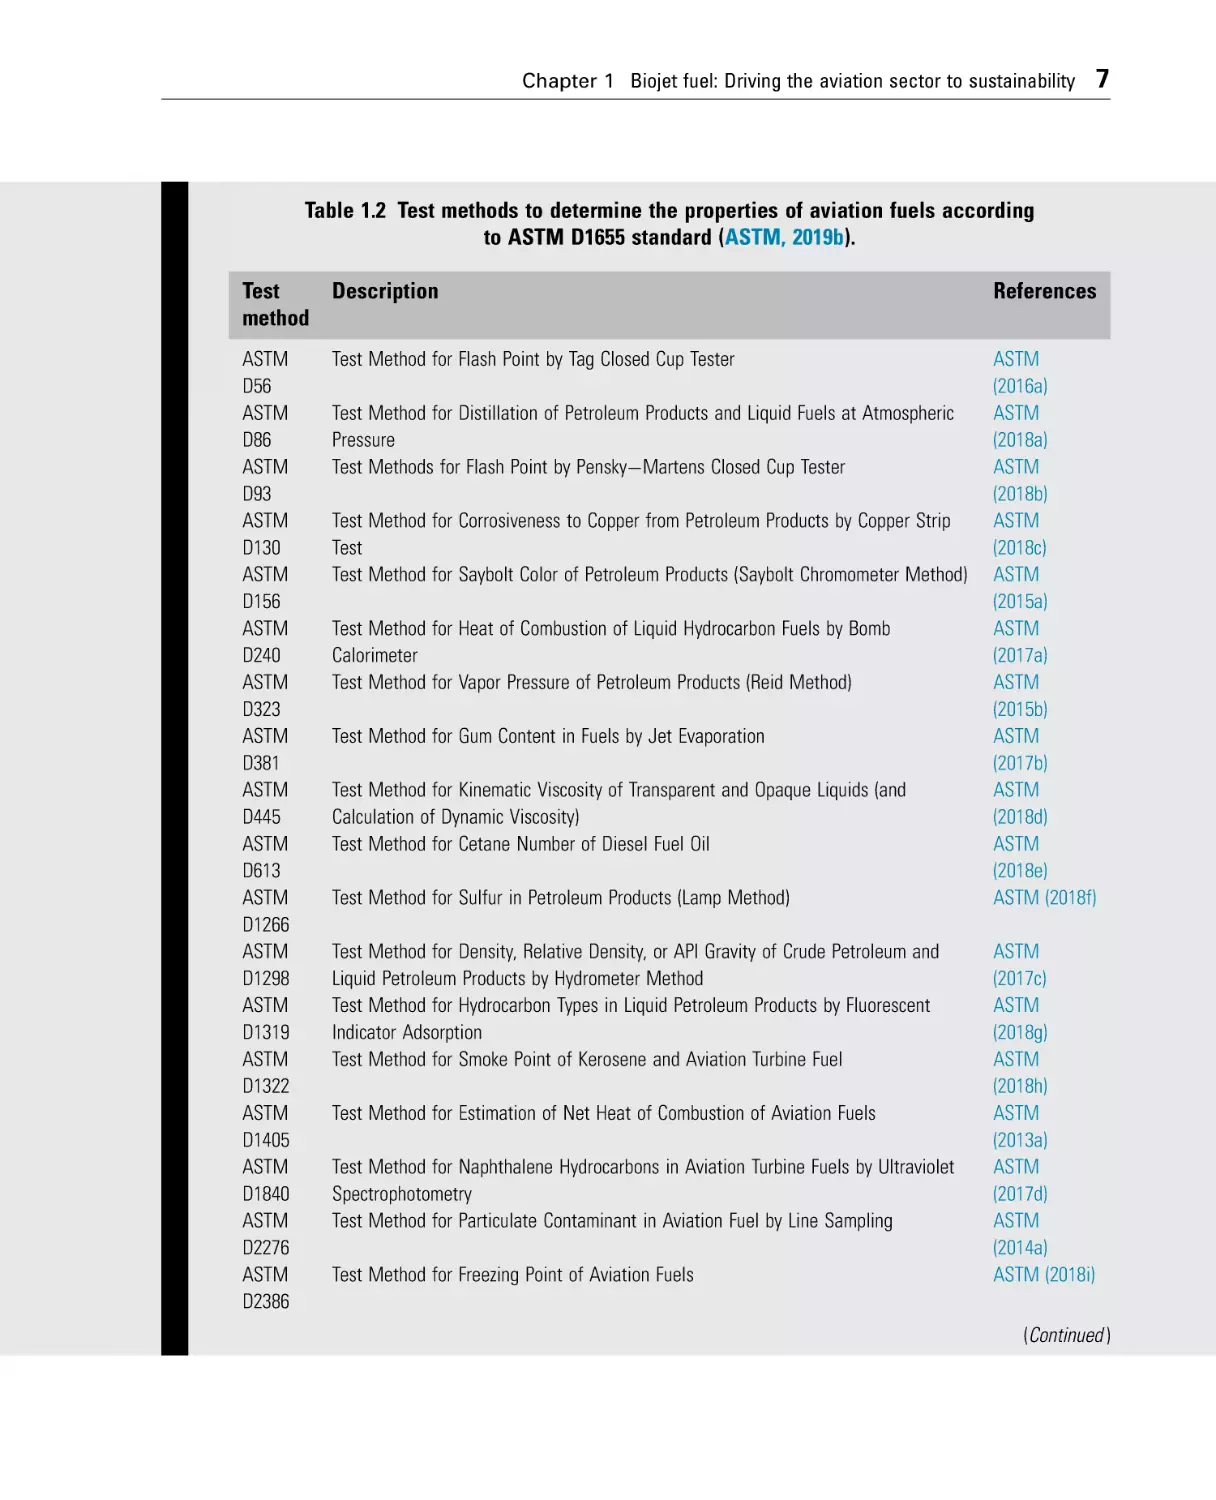
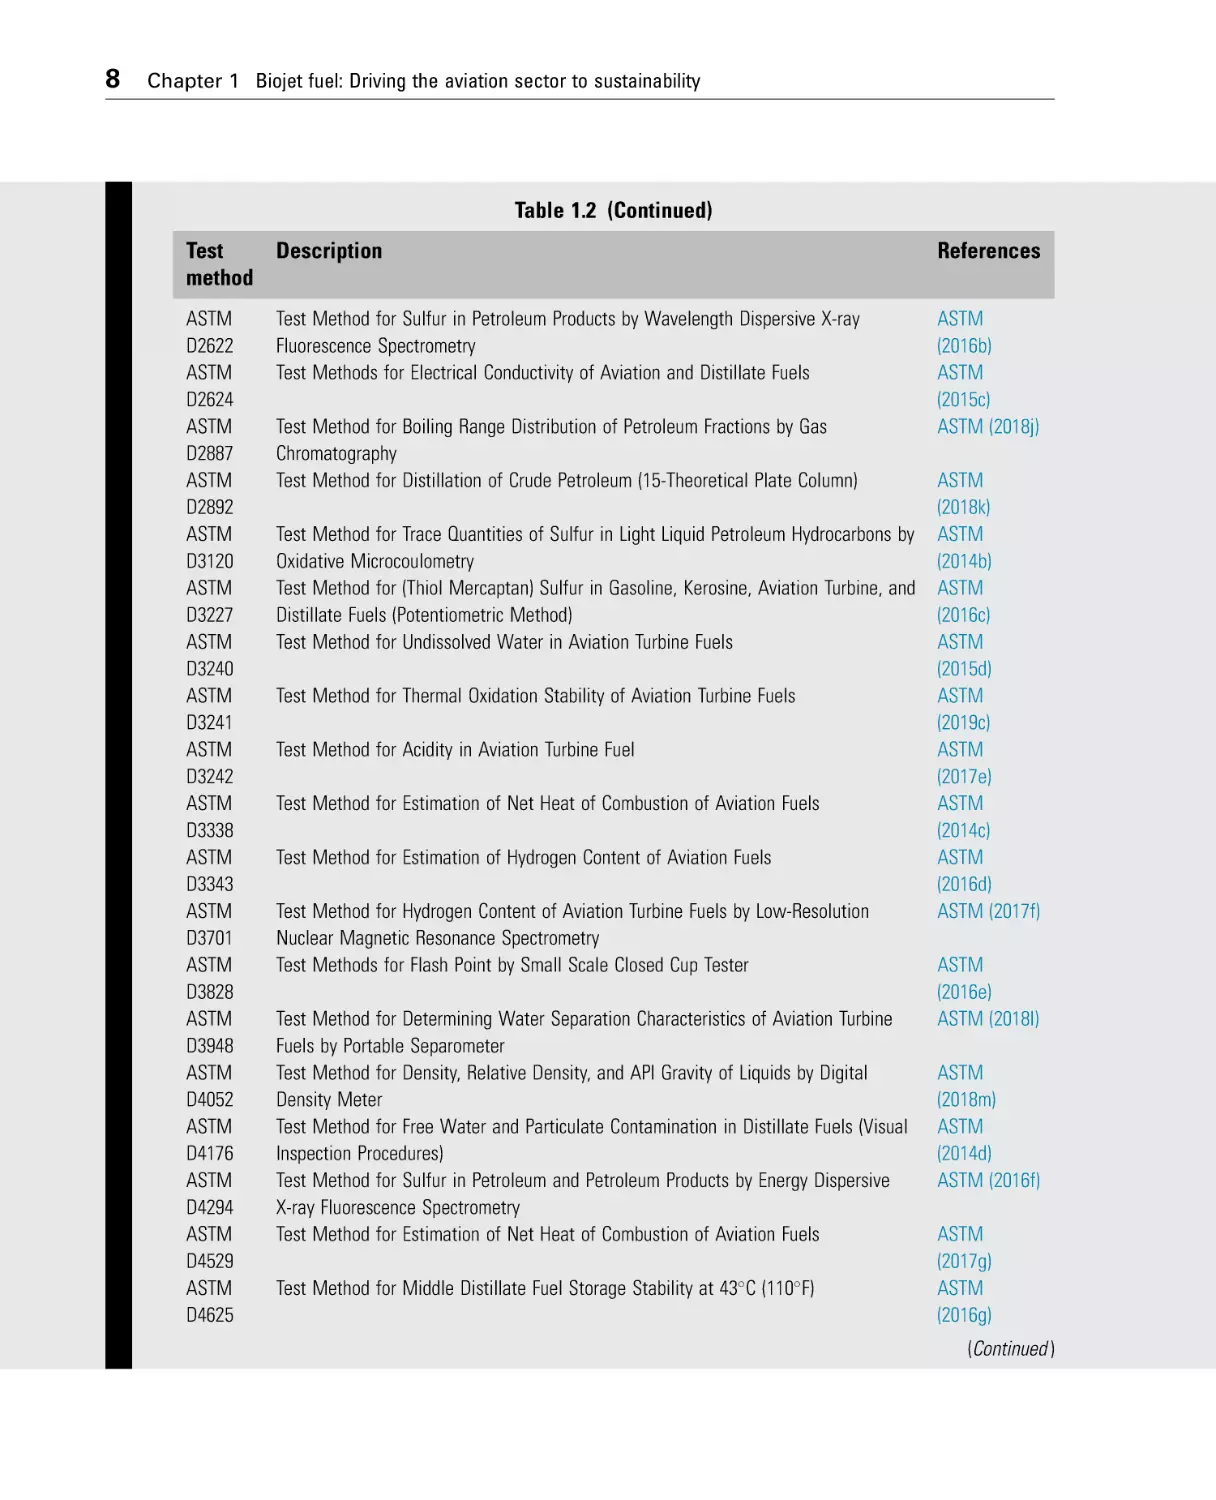
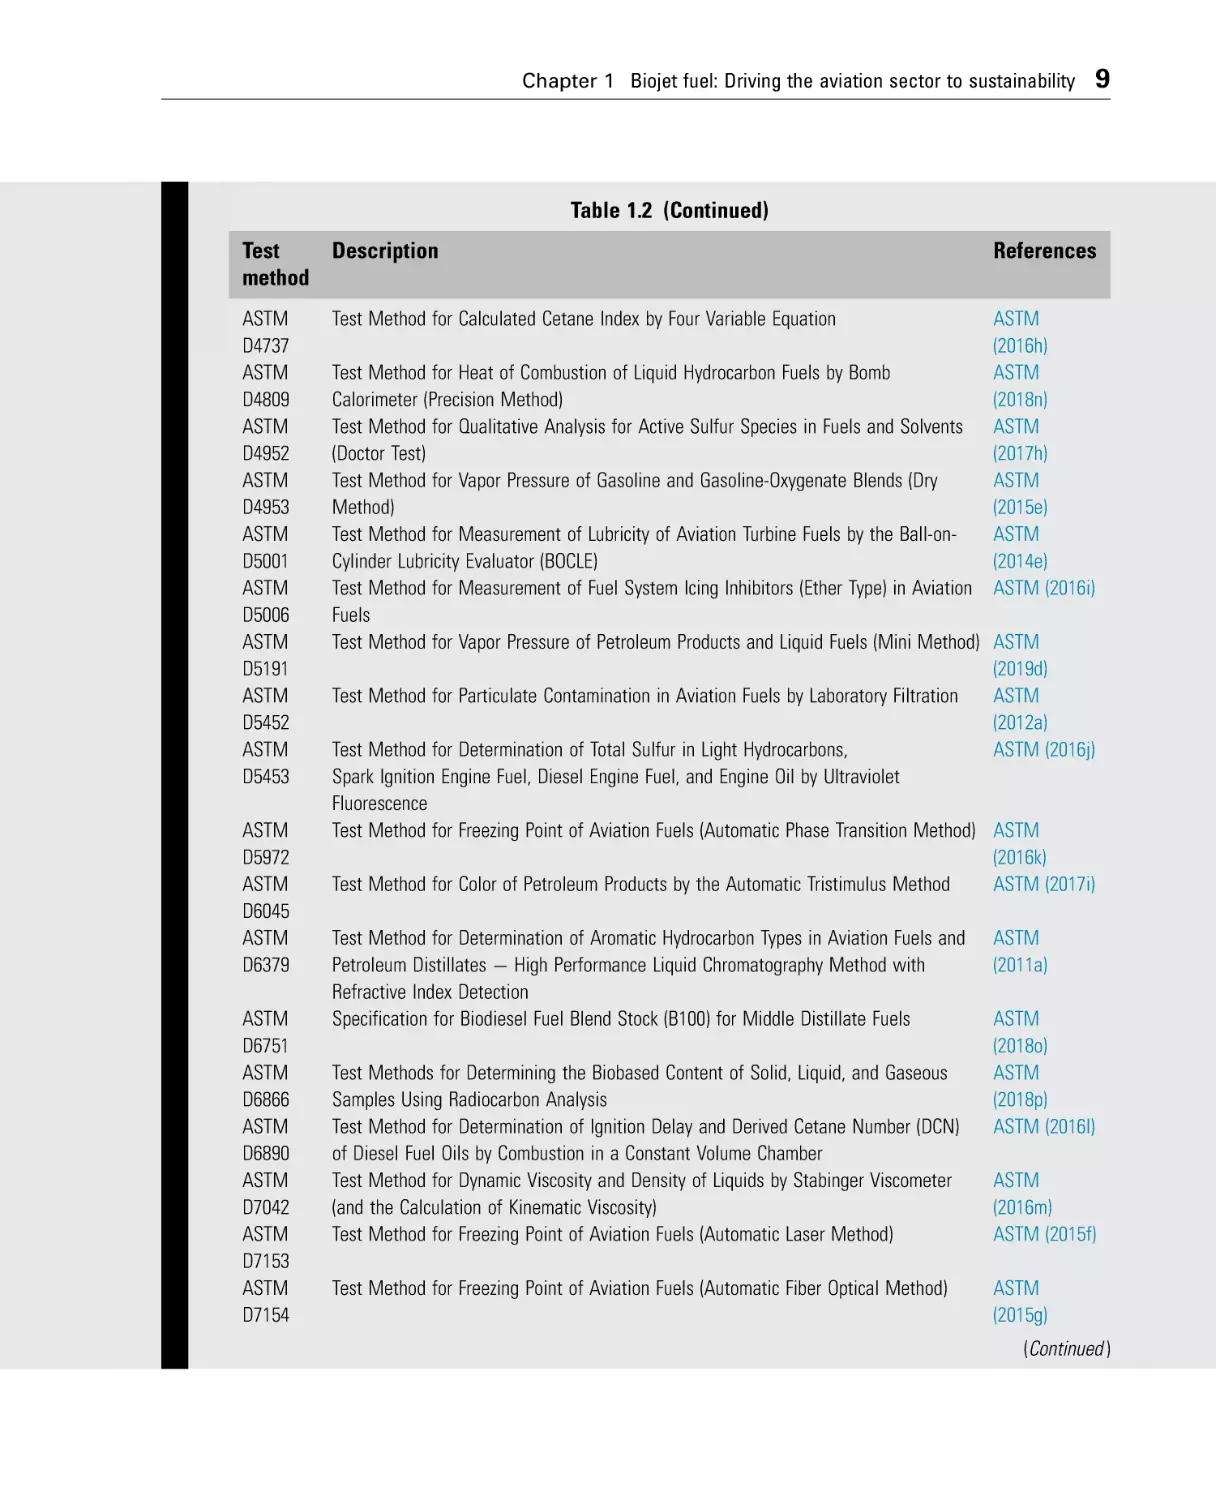
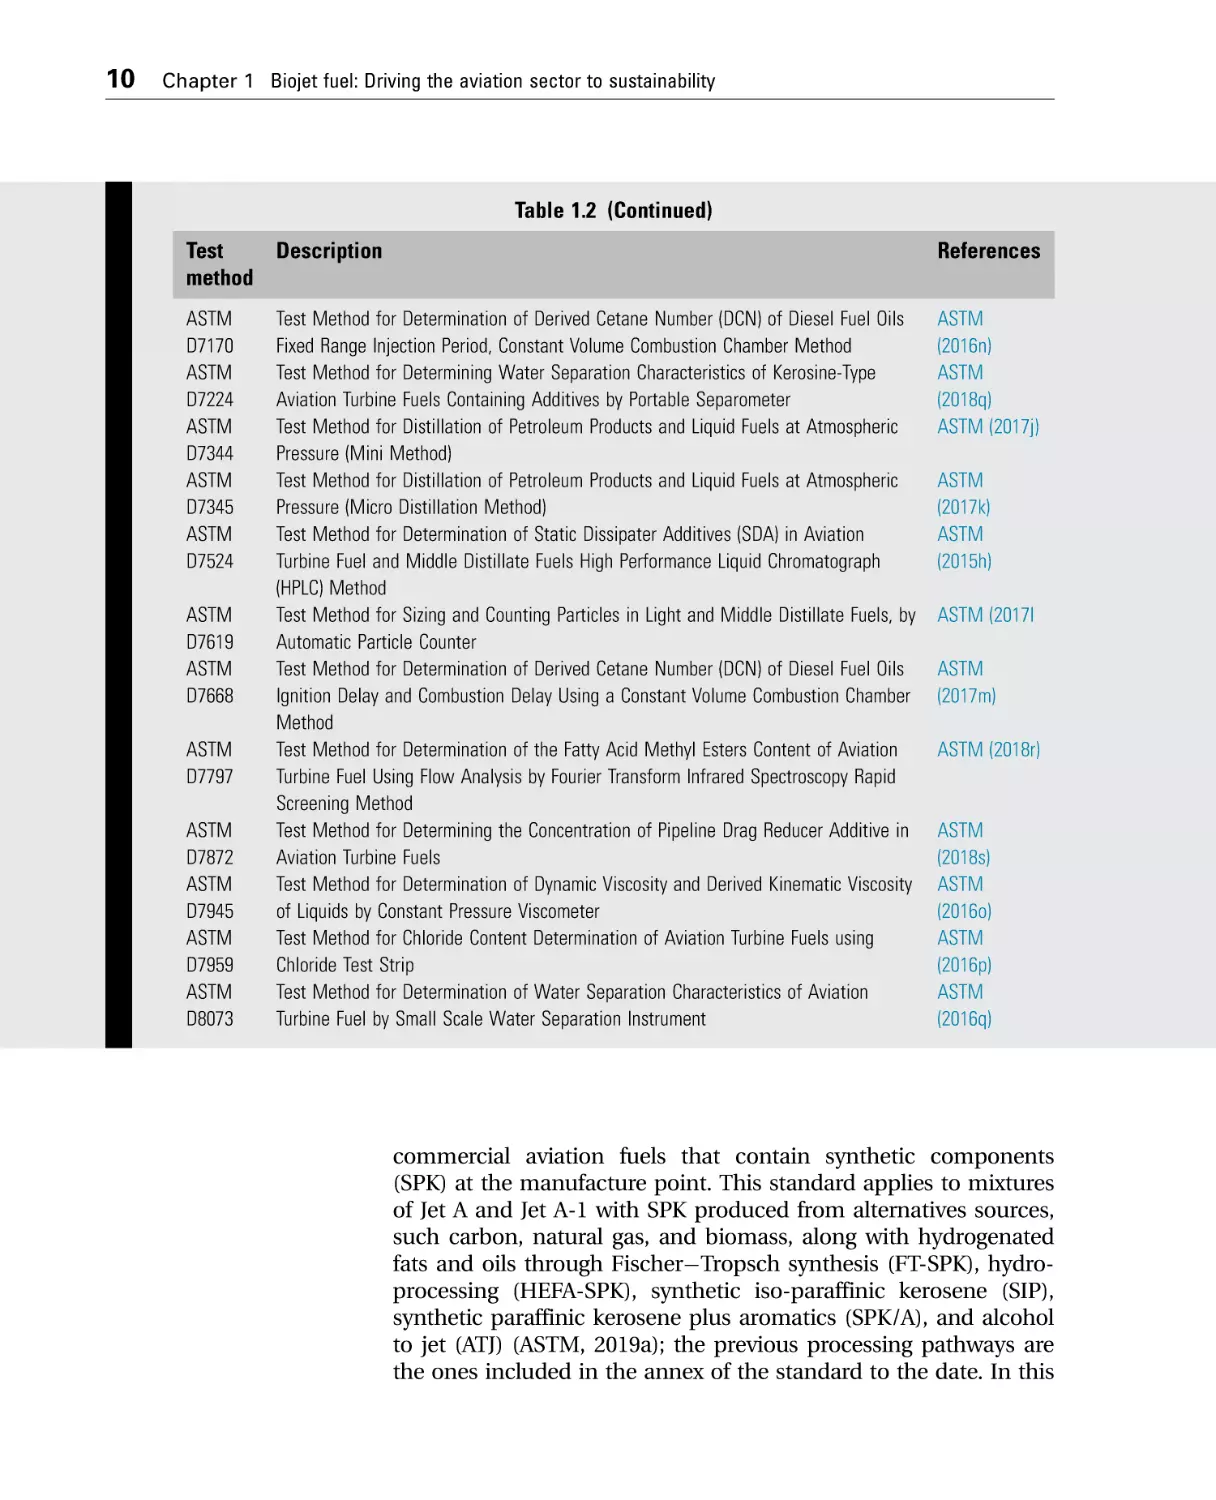
The ASTM D1655 standard, Specification for Aviation Turbine
Fuels, describes the required properties for the certification of
aviation fuels at the time and place of delivery (ASTM, 2019b).
This standard applies to derived fuels from conventional sources,
mainly Jet A and Jet A-1. The properties that need to be determined for the certification of aviation fuels include composition,
volatility, fluidity, combustion, corrosion, thermal stability, contaminants, and additives (ASTM, 2019b); the respective test methods for each one of these properties are presented in Table 1.2.
On the other hand, ASTM D7566 standard, Specification
for Aviation Turbine Fuel Containing Synthesized Hydrocarbons,
includes the required properties for the certification of
Chapter 1 Biojet fuel: Driving the aviation sector to sustainability
7
Table 1.2 Test methods to determine the properties of aviation fuels according
to ASTM D1655 standard (ASTM, 2019b).
Test
method
Description
References
ASTM
D56
ASTM
D86
ASTM
D93
ASTM
D130
ASTM
D156
ASTM
D240
ASTM
D323
ASTM
D381
ASTM
D445
ASTM
D613
ASTM
D1266
ASTM
D1298
ASTM
D1319
ASTM
D1322
ASTM
D1405
ASTM
D1840
ASTM
D2276
ASTM
D2386
Test Method for Flash Point by Tag Closed Cup Tester
ASTM
(2016a)
ASTM
(2018a)
ASTM
(2018b)
ASTM
(2018c)
ASTM
(2015a)
ASTM
(2017a)
ASTM
(2015b)
ASTM
(2017b)
ASTM
(2018d)
ASTM
(2018e)
ASTM (2018f)
Test Method for Distillation of Petroleum Products and Liquid Fuels at Atmospheric
Pressure
Test Methods for Flash Point by Pensky Martens Closed Cup Tester
Test Method for Corrosiveness to Copper from Petroleum Products by Copper Strip
Test
Test Method for Saybolt Color of Petroleum Products (Saybolt Chromometer Method)
Test Method for Heat of Combustion of Liquid Hydrocarbon Fuels by Bomb
Calorimeter
Test Method for Vapor Pressure of Petroleum Products (Reid Method)
Test Method for Gum Content in Fuels by Jet Evaporation
Test Method for Kinematic Viscosity of Transparent and Opaque Liquids (and
Calculation of Dynamic Viscosity)
Test Method for Cetane Number of Diesel Fuel Oil
Test Method for Sulfur in Petroleum Products (Lamp Method)
Test Method for Density, Relative Density, or API Gravity of Crude Petroleum and
Liquid Petroleum Products by Hydrometer Method
Test Method for Hydrocarbon Types in Liquid Petroleum Products by Fluorescent
Indicator Adsorption
Test Method for Smoke Point of Kerosene and Aviation Turbine Fuel
Test Method for Estimation of Net Heat of Combustion of Aviation Fuels
Test Method for Naphthalene Hydrocarbons in Aviation Turbine Fuels by Ultraviolet
Spectrophotometry
Test Method for Particulate Contaminant in Aviation Fuel by Line Sampling
Test Method for Freezing Point of Aviation Fuels
ASTM
(2017c)
ASTM
(2018g)
ASTM
(2018h)
ASTM
(2013a)
ASTM
(2017d)
ASTM
(2014a)
ASTM (2018i)
(Continued )
8
Chapter 1 Biojet fuel: Driving the aviation sector to sustainability
Table 1.2 (Continued)
Test
method
Description
References
ASTM
D2622
ASTM
D2624
ASTM
D2887
ASTM
D2892
ASTM
D3120
ASTM
D3227
ASTM
D3240
ASTM
D3241
ASTM
D3242
ASTM
D3338
ASTM
D3343
ASTM
D3701
ASTM
D3828
ASTM
D3948
ASTM
D4052
ASTM
D4176
ASTM
D4294
ASTM
D4529
ASTM
D4625
Test Method for Sulfur in Petroleum Products by Wavelength Dispersive X-ray
Fluorescence Spectrometry
Test Methods for Electrical Conductivity of Aviation and Distillate Fuels
ASTM
(2016b)
ASTM
(2015c)
ASTM (2018j)
Test Method for Boiling Range Distribution of Petroleum Fractions by Gas
Chromatography
Test Method for Distillation of Crude Petroleum (15-Theoretical Plate Column)
Test Method for Trace Quantities of Sulfur in Light Liquid Petroleum Hydrocarbons by
Oxidative Microcoulometry
Test Method for (Thiol Mercaptan) Sulfur in Gasoline, Kerosine, Aviation Turbine, and
Distillate Fuels (Potentiometric Method)
Test Method for Undissolved Water in Aviation Turbine Fuels
Test Method for Thermal Oxidation Stability of Aviation Turbine Fuels
Test Method for Acidity in Aviation Turbine Fuel
Test Method for Estimation of Net Heat of Combustion of Aviation Fuels
Test Method for Estimation of Hydrogen Content of Aviation Fuels
Test Method for Hydrogen Content of Aviation Turbine Fuels by Low-Resolution
Nuclear Magnetic Resonance Spectrometry
Test Methods for Flash Point by Small Scale Closed Cup Tester
Test Method for Determining Water Separation Characteristics of Aviation Turbine
Fuels by Portable Separometer
Test Method for Density, Relative Density, and API Gravity of Liquids by Digital
Density Meter
Test Method for Free Water and Particulate Contamination in Distillate Fuels (Visual
Inspection Procedures)
Test Method for Sulfur in Petroleum and Petroleum Products by Energy Dispersive
X-ray Fluorescence Spectrometry
Test Method for Estimation of Net Heat of Combustion of Aviation Fuels
Test Method for Middle Distillate Fuel Storage Stability at 43 C (110 F)
ASTM
(2018k)
ASTM
(2014b)
ASTM
(2016c)
ASTM
(2015d)
ASTM
(2019c)
ASTM
(2017e)
ASTM
(2014c)
ASTM
(2016d)
ASTM (2017f)
ASTM
(2016e)
ASTM (2018l)
ASTM
(2018m)
ASTM
(2014d)
ASTM (2016f)
ASTM
(2017g)
ASTM
(2016g)
(Continued )
Chapter 1 Biojet fuel: Driving the aviation sector to sustainability
9
Table 1.2 (Continued)
Test
method
Description
References
ASTM
D4737
ASTM
D4809
ASTM
D4952
ASTM
D4953
ASTM
D5001
ASTM
D5006
ASTM
D5191
ASTM
D5452
ASTM
D5453
Test Method for Calculated Cetane Index by Four Variable Equation
ASTM
(2016h)
ASTM
(2018n)
ASTM
(2017h)
ASTM
(2015e)
ASTM
(2014e)
ASTM (2016i)
ASTM
D5972
ASTM
D6045
ASTM
D6379
ASTM
D6751
ASTM
D6866
ASTM
D6890
ASTM
D7042
ASTM
D7153
ASTM
D7154
Test Method for Heat of Combustion of Liquid Hydrocarbon Fuels by Bomb
Calorimeter (Precision Method)
Test Method for Qualitative Analysis for Active Sulfur Species in Fuels and Solvents
(Doctor Test)
Test Method for Vapor Pressure of Gasoline and Gasoline-Oxygenate Blends (Dry
Method)
Test Method for Measurement of Lubricity of Aviation Turbine Fuels by the Ball-onCylinder Lubricity Evaluator (BOCLE)
Test Method for Measurement of Fuel System Icing Inhibitors (Ether Type) in Aviation
Fuels
Test Method for Vapor Pressure of Petroleum Products and Liquid Fuels (Mini Method) ASTM
(2019d)
Test Method for Particulate Contamination in Aviation Fuels by Laboratory Filtration
ASTM
(2012a)
Test Method for Determination of Total Sulfur in Light Hydrocarbons,
ASTM (2016j)
Spark Ignition Engine Fuel, Diesel Engine Fuel, and Engine Oil by Ultraviolet
Fluorescence
Test Method for Freezing Point of Aviation Fuels (Automatic Phase Transition Method) ASTM
(2016k)
Test Method for Color of Petroleum Products by the Automatic Tristimulus Method
ASTM (2017i)
Test Method for Determination of Aromatic Hydrocarbon Types in Aviation Fuels and
Petroleum Distillates High Performance Liquid Chromatography Method with
Refractive Index Detection
Specification for Biodiesel Fuel Blend Stock (B100) for Middle Distillate Fuels
Test Methods for Determining the Biobased Content of Solid, Liquid, and Gaseous
Samples Using Radiocarbon Analysis
Test Method for Determination of Ignition Delay and Derived Cetane Number (DCN)
of Diesel Fuel Oils by Combustion in a Constant Volume Chamber
Test Method for Dynamic Viscosity and Density of Liquids by Stabinger Viscometer
(and the Calculation of Kinematic Viscosity)
Test Method for Freezing Point of Aviation Fuels (Automatic Laser Method)
Test Method for Freezing Point of Aviation Fuels (Automatic Fiber Optical Method)
ASTM
(2011a)
ASTM
(2018o)
ASTM
(2018p)
ASTM (2016l)
ASTM
(2016m)
ASTM (2015f)
ASTM
(2015g)
(Continued )
10
Chapter 1 Biojet fuel: Driving the aviation sector to sustainability
Table 1.2 (Continued)
Test
method
Description
References
ASTM
D7170
ASTM
D7224
ASTM
D7344
ASTM
D7345
ASTM
D7524
Test Method for Determination of Derived Cetane Number (DCN) of Diesel Fuel Oils
Fixed Range Injection Period, Constant Volume Combustion Chamber Method
Test Method for Determining Water Separation Characteristics of Kerosine-Type
Aviation Turbine Fuels Containing Additives by Portable Separometer
Test Method for Distillation of Petroleum Products and Liquid Fuels at Atmospheric
Pressure (Mini Method)
Test Method for Distillation of Petroleum Products and Liquid Fuels at Atmospheric
Pressure (Micro Distillation Method)
Test Method for Determination of Static Dissipater Additives (SDA) in Aviation
Turbine Fuel and Middle Distillate Fuels High Performance Liquid Chromatograph
(HPLC) Method
Test Method for Sizing and Counting Particles in Light and Middle Distillate Fuels, by
Automatic Particle Counter
Test Method for Determination of Derived Cetane Number (DCN) of Diesel Fuel Oils
Ignition Delay and Combustion Delay Using a Constant Volume Combustion Chamber
Method
Test Method for Determination of the Fatty Acid Methyl Esters Content of Aviation
Turbine Fuel Using Flow Analysis by Fourier Transform Infrared Spectroscopy Rapid
Screening Method
Test Method for Determining the Concentration of Pipeline Drag Reducer Additive in
Aviation Turbine Fuels
Test Method for Determination of Dynamic Viscosity and Derived Kinematic Viscosity
of Liquids by Constant Pressure Viscometer
Test Method for Chloride Content Determination of Aviation Turbine Fuels using
Chloride Test Strip
Test Method for Determination of Water Separation Characteristics of Aviation
Turbine Fuel by Small Scale Water Separation Instrument
ASTM
(2016n)
ASTM
(2018q)
ASTM (2017j)
ASTM
D7619
ASTM
D7668
ASTM
D7797
ASTM
D7872
ASTM
D7945
ASTM
D7959
ASTM
D8073
ASTM
(2017k)
ASTM
(2015h)
ASTM (2017l
ASTM
(2017m)
ASTM (2018r)
ASTM
(2018s)
ASTM
(2016o)
ASTM
(2016p)
ASTM
(2016q)
commercial aviation fuels that contain synthetic components
(SPK) at the manufacture point. This standard applies to mixtures
of Jet A and Jet A-1 with SPK produced from alternatives sources,
such carbon, natural gas, and biomass, along with hydrogenated
fats and oils through Fischer Tropsch synthesis (FT-SPK), hydroprocessing (HEFA-SPK), synthetic iso-paraffinic kerosene (SIP),
synthetic paraffinic kerosene plus aromatics (SPK/A), and alcohol
to jet (ATJ) (ASTM, 2019a); the previous processing pathways are
the ones included in the annex of the standard to the date. In this
Chapter 1 Biojet fuel: Driving the aviation sector to sustainability
11
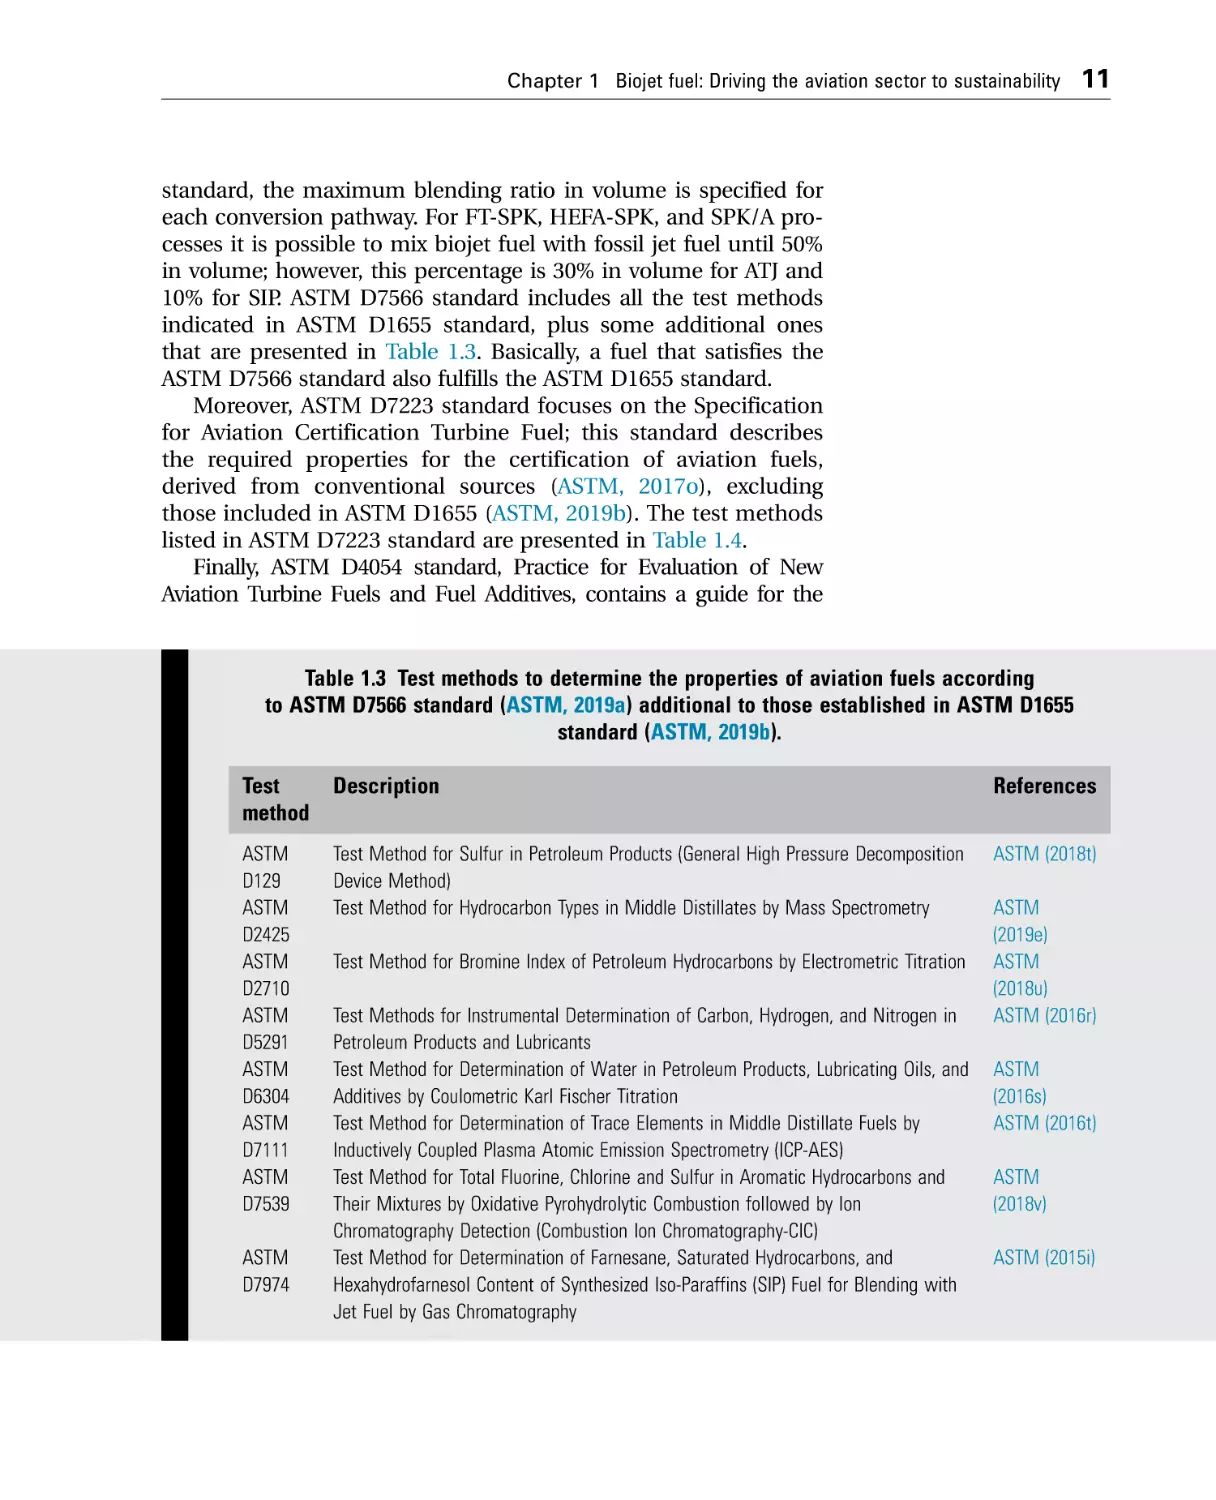
standard, the maximum blending ratio in volume is specified for
each conversion pathway. For FT-SPK, HEFA-SPK, and SPK/A processes it is possible to mix biojet fuel with fossil jet fuel until 50%
in volume; however, this percentage is 30% in volume for ATJ and
10% for SIP. ASTM D7566 standard includes all the test methods
indicated in ASTM D1655 standard, plus some additional ones
that are presented in Table 1.3. Basically, a fuel that satisfies the
ASTM D7566 standard also fulfills the ASTM D1655 standard.
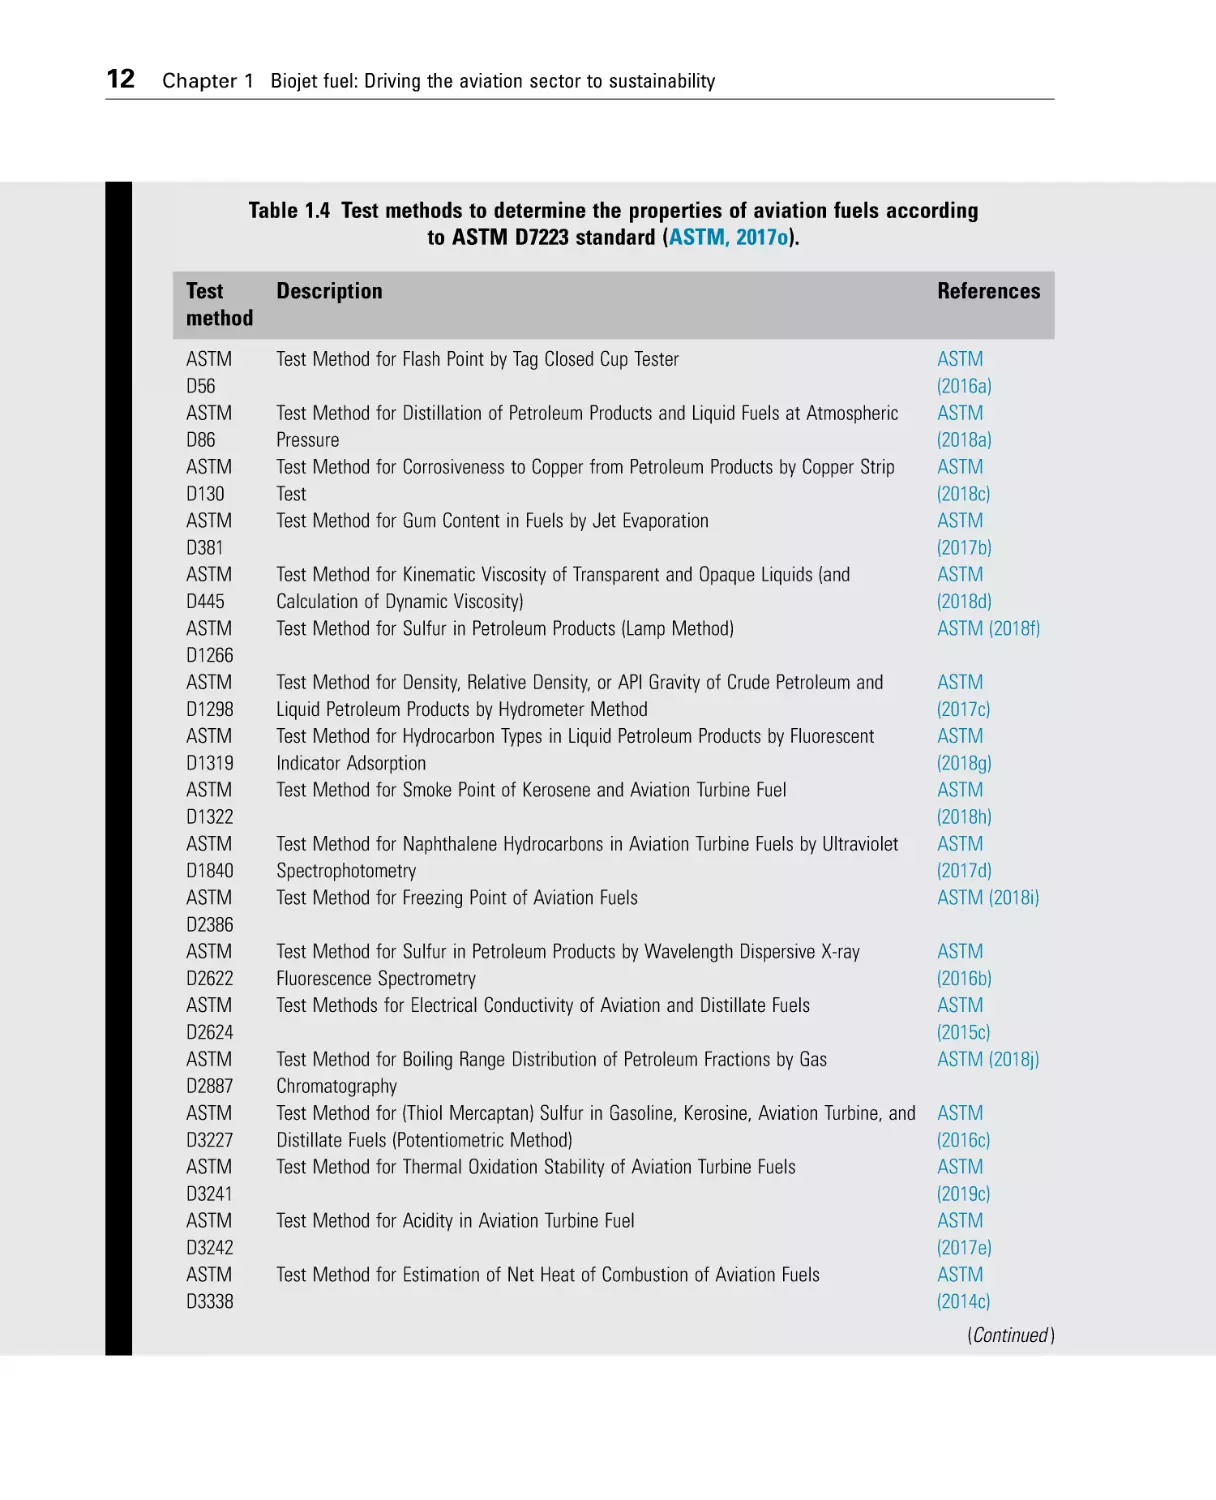
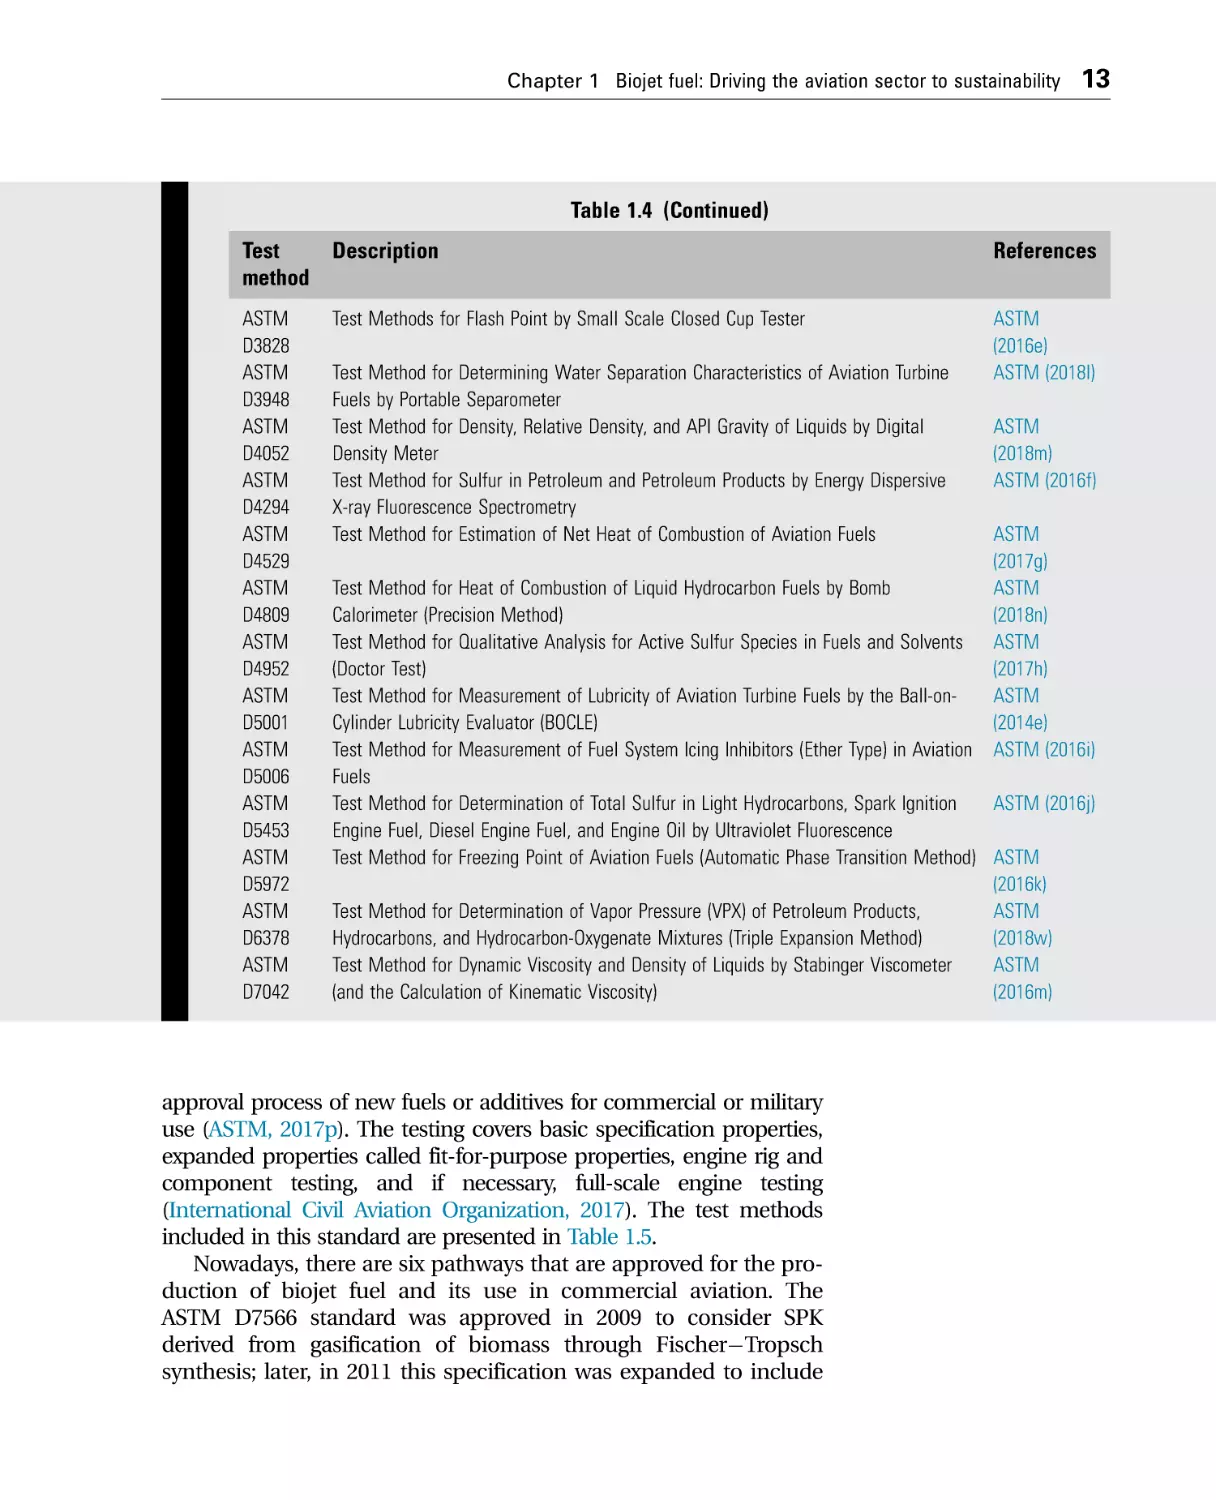
Moreover, ASTM D7223 standard focuses on the Specification
for Aviation Certification Turbine Fuel; this standard describes
the required properties for the certification of aviation fuels,
derived from conventional sources (ASTM, 2017o), excluding
those included in ASTM D1655 (ASTM, 2019b). The test methods
listed in ASTM D7223 standard are presented in Table 1.4.
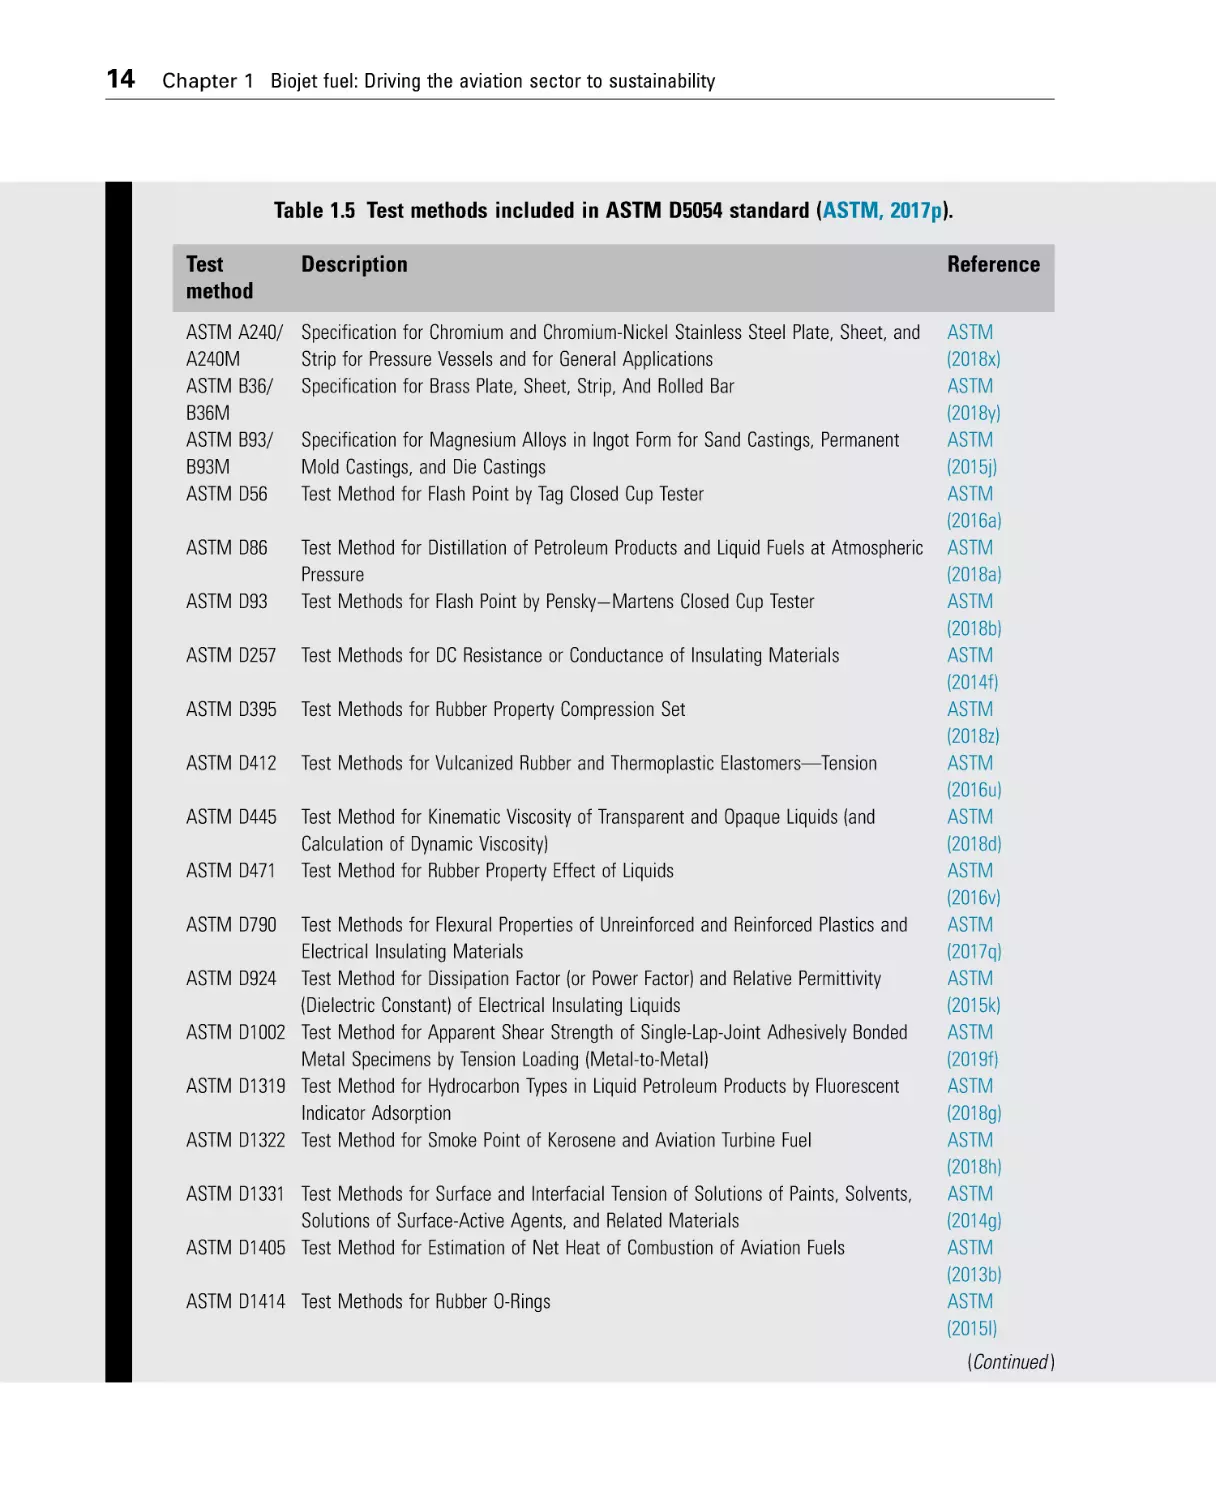
Finally, ASTM D4054 standard, Practice for Evaluation of New
Aviation Turbine Fuels and Fuel Additives, contains a guide for the
Table 1.3 Test methods to determine the properties of aviation fuels according
to ASTM D7566 standard (ASTM, 2019a) additional to those established in ASTM D1655
standard (ASTM, 2019b).
Test
method
Description
References
ASTM
D129
ASTM
D2425
ASTM
D2710
ASTM
D5291
ASTM
D6304
ASTM
D7111
ASTM
D7539
Test Method for Sulfur in Petroleum Products (General High Pressure Decomposition
Device Method)
Test Method for Hydrocarbon Types in Middle Distillates by Mass Spectrometry
ASTM (2018t)
ASTM
D7974
Test Method for Bromine Index of Petroleum Hydrocarbons by Electrometric Titration
Test Methods for Instrumental Determination of Carbon, Hydrogen, and Nitrogen in
Petroleum Products and Lubricants
Test Method for Determination of Water in Petroleum Products, Lubricating Oils, and
Additives by Coulometric Karl Fischer Titration
Test Method for Determination of Trace Elements in Middle Distillate Fuels by
Inductively Coupled Plasma Atomic Emission Spectrometry (ICP-AES)
Test Method for Total Fluorine, Chlorine and Sulfur in Aromatic Hydrocarbons and
Their Mixtures by Oxidative Pyrohydrolytic Combustion followed by Ion
Chromatography Detection (Combustion Ion Chromatography-CIC)
Test Method for Determination of Farnesane, Saturated Hydrocarbons, and
Hexahydrofarnesol Content of Synthesized Iso-Paraffins (SIP) Fuel for Blending with
Jet Fuel by Gas Chromatography
ASTM
(2019e)
ASTM
(2018u)
ASTM (2016r)
ASTM
(2016s)
ASTM (2016t)
ASTM
(2018v)
ASTM (2015i)
12
Chapter 1 Biojet fuel: Driving the aviation sector to sustainability
Table 1.4 Test methods to determine the properties of aviation fuels according
to ASTM D7223 standard (ASTM, 2017o).
Test
method
Description
References
ASTM
D56
ASTM
D86
ASTM
D130
ASTM
D381
ASTM
D445
ASTM
D1266
ASTM
D1298
ASTM
D1319
ASTM
D1322
ASTM
D1840
ASTM
D2386
ASTM
D2622
ASTM
D2624
ASTM
D2887
ASTM
D3227
ASTM
D3241
ASTM
D3242
ASTM
D3338
Test Method for Flash Point by Tag Closed Cup Tester
ASTM
(2016a)
ASTM
(2018a)
ASTM
(2018c)
ASTM
(2017b)
ASTM
(2018d)
ASTM (2018f)
Test Method for Distillation of Petroleum Products and Liquid Fuels at Atmospheric
Pressure
Test Method for Corrosiveness to Copper from Petroleum Products by Copper Strip
Test
Test Method for Gum Content in Fuels by Jet Evaporation
Test Method for Kinematic Viscosity of Transparent and Opaque Liquids (and
Calculation of Dynamic Viscosity)
Test Method for Sulfur in Petroleum Products (Lamp Method)
Test Method for Density, Relative Density, or API Gravity of Crude Petroleum and
Liquid Petroleum Products by Hydrometer Method
Test Method for Hydrocarbon Types in Liquid Petroleum Products by Fluorescent
Indicator Adsorption
Test Method for Smoke Point of Kerosene and Aviation Turbine Fuel
Test Method for Naphthalene Hydrocarbons in Aviation Turbine Fuels by Ultraviolet
Spectrophotometry
Test Method for Freezing Point of Aviation Fuels
Test Method for Sulfur in Petroleum Products by Wavelength Dispersive X-ray
Fluorescence Spectrometry
Test Methods for Electrical Conductivity of Aviation and Distillate Fuels
Test Method for Boiling Range Distribution of Petroleum Fractions by Gas
Chromatography
Test Method for (Thiol Mercaptan) Sulfur in Gasoline, Kerosine, Aviation Turbine, and
Distillate Fuels (Potentiometric Method)
Test Method for Thermal Oxidation Stability of Aviation Turbine Fuels
Test Method for Acidity in Aviation Turbine Fuel
Test Method for Estimation of Net Heat of Combustion of Aviation Fuels
ASTM
(2017c)
ASTM
(2018g)
ASTM
(2018h)
ASTM
(2017d)
ASTM (2018i)
ASTM
(2016b)
ASTM
(2015c)
ASTM (2018j)
ASTM
(2016c)
ASTM
(2019c)
ASTM
(2017e)
ASTM
(2014c)
(Continued )
Chapter 1 Biojet fuel: Driving the aviation sector to sustainability
13
Table 1.4 (Continued)
Test
method
Description
References
ASTM
D3828
ASTM
D3948
ASTM
D4052
ASTM
D4294
ASTM
D4529
ASTM
D4809
ASTM
D4952
ASTM
D5001
ASTM
D5006
ASTM
D5453
ASTM
D5972
ASTM
D6378
ASTM
D7042
Test Methods for Flash Point by Small Scale Closed Cup Tester
ASTM
(2016e)
ASTM (2018l)
Test Method for Determining Water Separation Characteristics of Aviation Turbine
Fuels by Portable Separometer
Test Method for Density, Relative Density, and API Gravity of Liquids by Digital
Density Meter
Test Method for Sulfur in Petroleum and Petroleum Products by Energy Dispersive
X-ray Fluorescence Spectrometry
Test Method for Estimation of Net Heat of Combustion of Aviation Fuels
ASTM
(2018m)
ASTM (2016f)
ASTM
(2017g)
ASTM
(2018n)
ASTM
(2017h)
ASTM
(2014e)
ASTM (2016i)
Test Method for Heat of Combustion of Liquid Hydrocarbon Fuels by Bomb
Calorimeter (Precision Method)
Test Method for Qualitative Analysis for Active Sulfur Species in Fuels and Solvents
(Doctor Test)
Test Method for Measurement of Lubricity of Aviation Turbine Fuels by the Ball-onCylinder Lubricity Evaluator (BOCLE)
Test Method for Measurement of Fuel System Icing Inhibitors (Ether Type) in Aviation
Fuels
Test Method for Determination of Total Sulfur in Light Hydrocarbons, Spark Ignition
ASTM (2016j)
Engine Fuel, Diesel Engine Fuel, and Engine Oil by Ultraviolet Fluorescence
Test Method for Freezing Point of Aviation Fuels (Automatic Phase Transition Method) ASTM
(2016k)
Test Method for Determination of Vapor Pressure (VPX) of Petroleum Products,
ASTM
Hydrocarbons, and Hydrocarbon-Oxygenate Mixtures (Triple Expansion Method)
(2018w)
Test Method for Dynamic Viscosity and Density of Liquids by Stabinger Viscometer
ASTM
(and the Calculation of Kinematic Viscosity)
(2016m)
approval process of new fuels or additives for commercial or military
use (ASTM, 2017p). The testing covers basic specification properties,
expanded properties called fit-for-purpose properties, engine rig and
component testing, and if necessary, full-scale engine testing
(International Civil Aviation Organization, 2017). The test methods
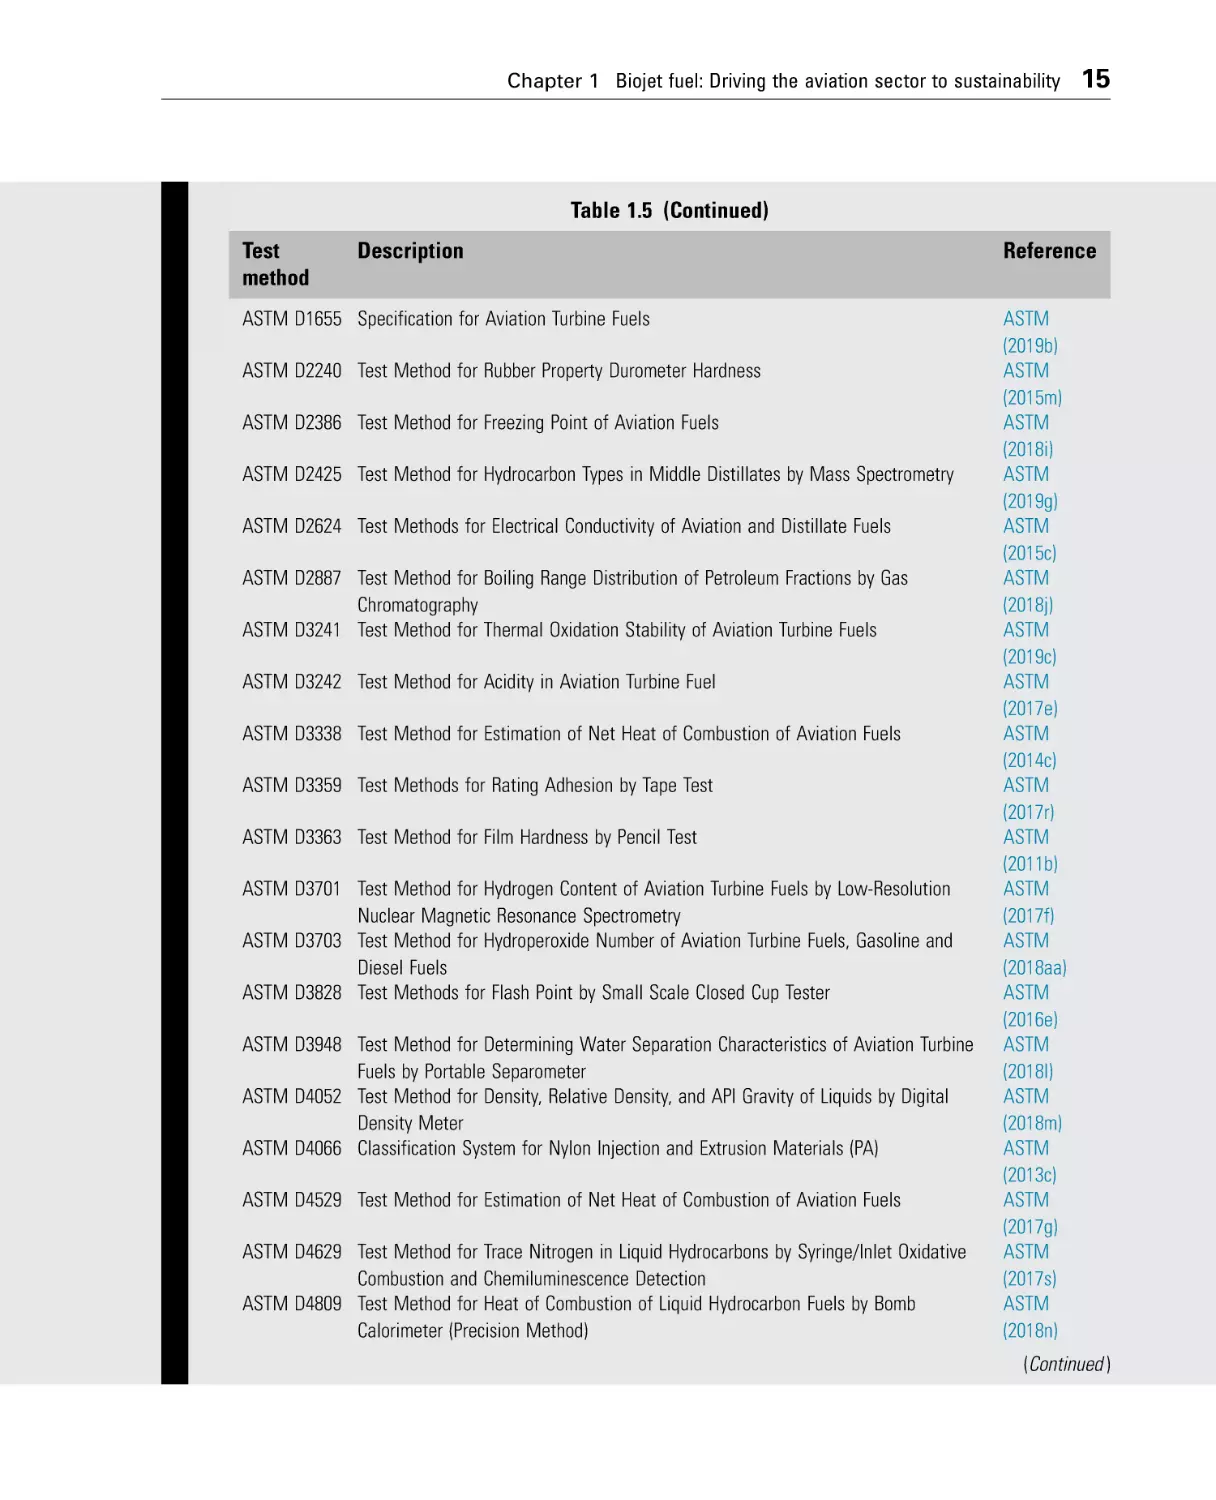
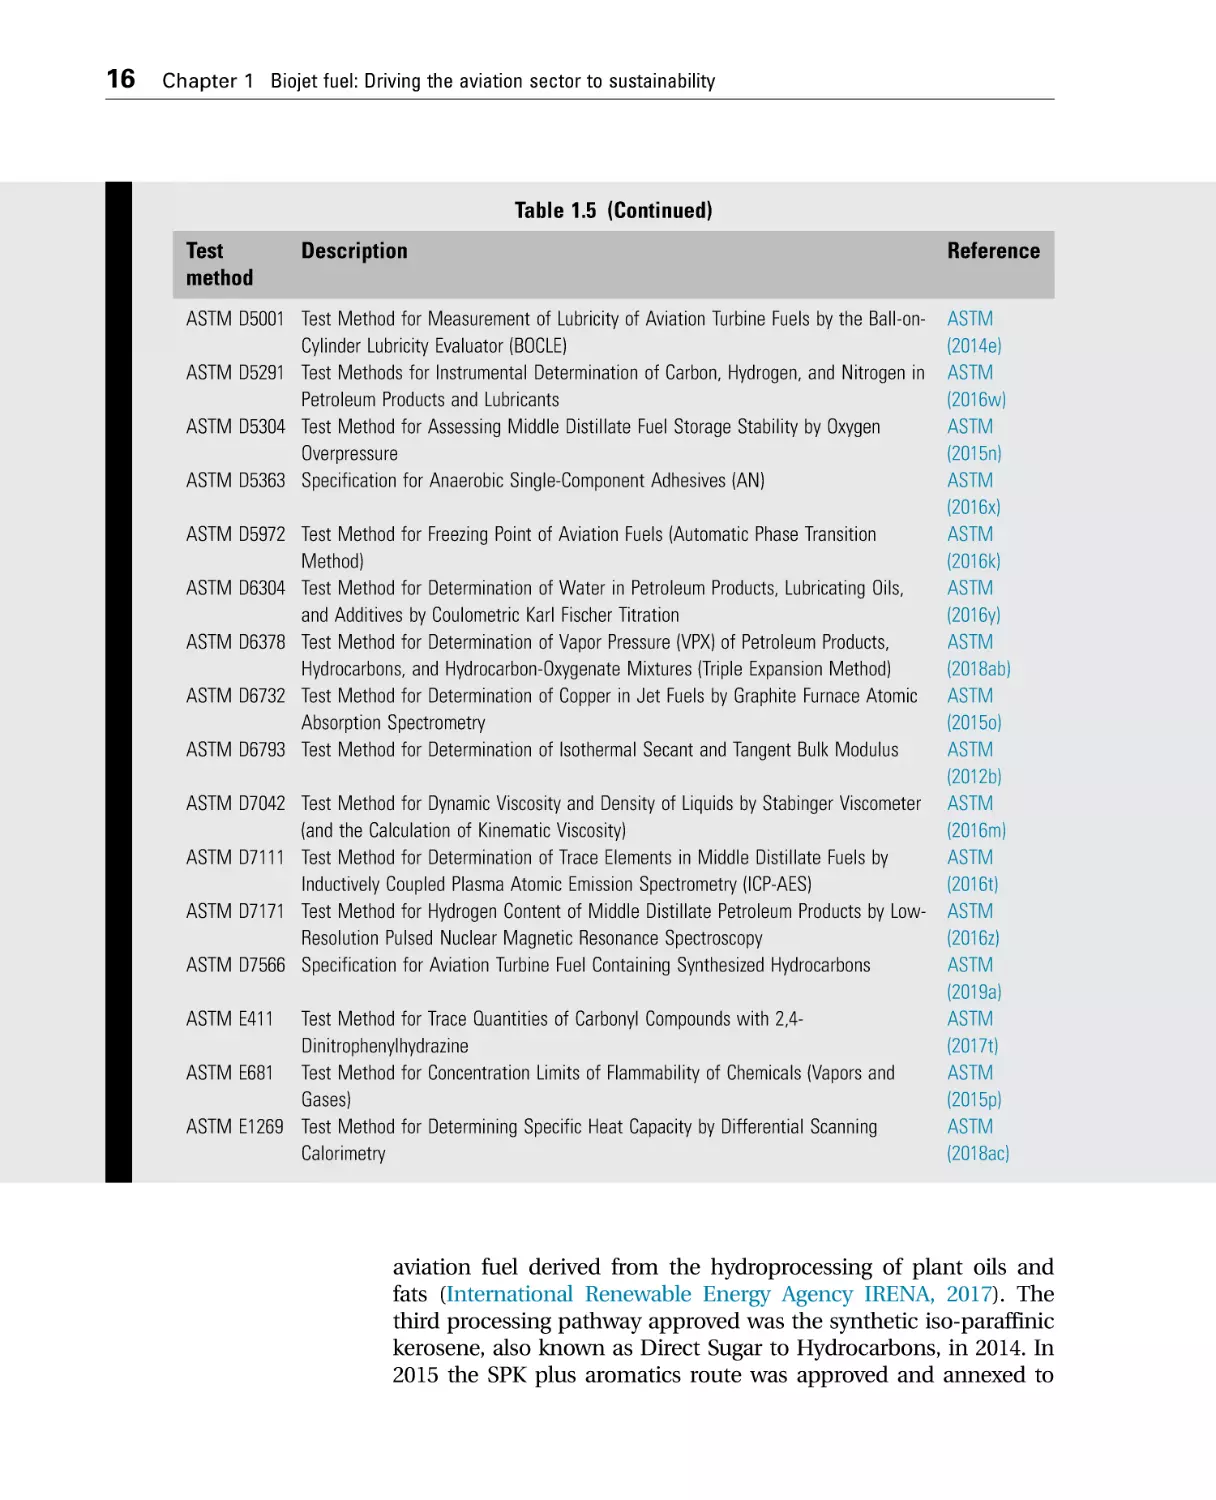
included in this standard are presented in Table 1.5.
Nowadays, there are six pathways that are approved for the production of biojet fuel and its use in commercial aviation. The
ASTM D7566 standard was approved in 2009 to consider SPK
derived from gasification of biomass through Fischer Tropsch
synthesis; later, in 2011 this specification was expanded to include
14
Chapter 1 Biojet fuel: Driving the aviation sector to sustainability
Table 1.5 Test methods included in ASTM D5054 standard (ASTM, 2017p).
Test
method
Description
Reference
ASTM A240/
A240M
ASTM B36/
B36M
ASTM B93/
B93M
ASTM D56
Specification for Chromium and Chromium-Nickel Stainless Steel Plate, Sheet, and
Strip for Pressure Vessels and for General Applications
Specification for Brass Plate, Sheet, Strip, And Rolled Bar
ASTM
(2018x)
ASTM
(2018y)
ASTM
(2015j)
ASTM
(2016a)
ASTM
(2018a)
ASTM
(2018b)
ASTM
(2014f)
ASTM
(2018z)
ASTM
(2016u)
ASTM
(2018d)
ASTM
(2016v)
ASTM
(2017q)
ASTM
(2015k)
ASTM
(2019f)
ASTM
(2018g)
ASTM
(2018h)
ASTM
(2014g)
ASTM
(2013b)
ASTM
(2015l)
ASTM D86
Specification for Magnesium Alloys in Ingot Form for Sand Castings, Permanent
Mold Castings, and Die Castings
Test Method for Flash Point by Tag Closed Cup Tester
ASTM D93
Test Method for Distillation of Petroleum Products and Liquid Fuels at Atmospheric
Pressure
Test Methods for Flash Point by Pensky Martens Closed Cup Tester
ASTM D257
Test Methods for DC Resistance or Conductance of Insulating Materials
ASTM D395
Test Methods for Rubber Property Compression Set
ASTM D412
Test Methods for Vulcanized Rubber and Thermoplastic Elastomers—Tension
ASTM D445
Test Method for Kinematic Viscosity of Transparent and Opaque Liquids (and
Calculation of Dynamic Viscosity)
Test Method for Rubber Property Effect of Liquids
ASTM D471
ASTM D790
Test Methods for Flexural Properties of Unreinforced and Reinforced Plastics and
Electrical Insulating Materials
ASTM D924 Test Method for Dissipation Factor (or Power Factor) and Relative Permittivity
(Dielectric Constant) of Electrical Insulating Liquids
ASTM D1002 Test Method for Apparent Shear Strength of Single-Lap-Joint Adhesively Bonded
Metal Specimens by Tension Loading (Metal-to-Metal)
ASTM D1319 Test Method for Hydrocarbon Types in Liquid Petroleum Products by Fluorescent
Indicator Adsorption
ASTM D1322 Test Method for Smoke Point of Kerosene and Aviation Turbine Fuel
ASTM D1331 Test Methods for Surface and Interfacial Tension of Solutions of Paints, Solvents,
Solutions of Surface-Active Agents, and Related Materials
ASTM D1405 Test Method for Estimation of Net Heat of Combustion of Aviation Fuels
ASTM D1414 Test Methods for Rubber O-Rings
(Continued )
Chapter 1 Biojet fuel: Driving the aviation sector to sustainability
15
Table 1.5 (Continued)
Test
method
Description
ASTM D1655 Specification for Aviation Turbine Fuels
ASTM D2240 Test Method for Rubber Property Durometer Hardness
ASTM D2386 Test Method for Freezing Point of Aviation Fuels
ASTM D2425 Test Method for Hydrocarbon Types in Middle Distillates by Mass Spectrometry
ASTM D2624 Test Methods for Electrical Conductivity of Aviation and Distillate Fuels
ASTM D2887 Test Method for Boiling Range Distribution of Petroleum Fractions by Gas
Chromatography
ASTM D3241 Test Method for Thermal Oxidation Stability of Aviation Turbine Fuels
ASTM D3242 Test Method for Acidity in Aviation Turbine Fuel
ASTM D3338 Test Method for Estimation of Net Heat of Combustion of Aviation Fuels
ASTM D3359 Test Methods for Rating Adhesion by Tape Test
ASTM D3363 Test Method for Film Hardness by Pencil Test
ASTM D3701 Test Method for Hydrogen Content of Aviation Turbine Fuels by Low-Resolution
Nuclear Magnetic Resonance Spectrometry
ASTM D3703 Test Method for Hydroperoxide Number of Aviation Turbine Fuels, Gasoline and
Diesel Fuels
ASTM D3828 Test Methods for Flash Point by Small Scale Closed Cup Tester
ASTM D3948 Test Method for Determining Water Separation Characteristics of Aviation Turbine
Fuels by Portable Separometer
ASTM D4052 Test Method for Density, Relative Density, and API Gravity of Liquids by Digital
Density Meter
ASTM D4066 Classification System for Nylon Injection and Extrusion Materials (PA)
ASTM D4529 Test Method for Estimation of Net Heat of Combustion of Aviation Fuels
ASTM D4629 Test Method for Trace Nitrogen in Liquid Hydrocarbons by Syringe/Inlet Oxidative
Combustion and Chemiluminescence Detection
ASTM D4809 Test Method for Heat of Combustion of Liquid Hydrocarbon Fuels by Bomb
Calorimeter (Precision Method)
Reference
ASTM
(2019b)
ASTM
(2015m)
ASTM
(2018i)
ASTM
(2019g)
ASTM
(2015c)
ASTM
(2018j)
ASTM
(2019c)
ASTM
(2017e)
ASTM
(2014c)
ASTM
(2017r)
ASTM
(2011b)
ASTM
(2017f)
ASTM
(2018aa)
ASTM
(2016e)
ASTM
(2018l)
ASTM
(2018m)
ASTM
(2013c)
ASTM
(2017g)
ASTM
(2017s)
ASTM
(2018n)
(Continued )
16
Chapter 1 Biojet fuel: Driving the aviation sector to sustainability
Table 1.5 (Continued)
Test
method
Description
ASTM D5001 Test Method for Measurement of Lubricity of Aviation Turbine Fuels by the Ball-onCylinder Lubricity Evaluator (BOCLE)
ASTM D5291 Test Methods for Instrumental Determination of Carbon, Hydrogen, and Nitrogen in
Petroleum Products and Lubricants
ASTM D5304 Test Method for Assessing Middle Distillate Fuel Storage Stability by Oxygen
Overpressure
ASTM D5363 Specification for Anaerobic Single-Component Adhesives (AN)
ASTM D5972 Test Method for Freezing Point of Aviation Fuels (Automatic Phase Transition
Method)
ASTM D6304 Test Method for Determination of Water in Petroleum Products, Lubricating Oils,
and Additives by Coulometric Karl Fischer Titration
ASTM D6378 Test Method for Determination of Vapor Pressure (VPX) of Petroleum Products,
Hydrocarbons, and Hydrocarbon-Oxygenate Mixtures (Triple Expansion Method)
ASTM D6732 Test Method for Determination of Copper in Jet Fuels by Graphite Furnace Atomic
Absorption Spectrometry
ASTM D6793 Test Method for Determination of Isothermal Secant and Tangent Bulk Modulus
ASTM D7042 Test Method for Dynamic Viscosity and Density of Liquids by Stabinger Viscometer
(and the Calculation of Kinematic Viscosity)
ASTM D7111 Test Method for Determination of Trace Elements in Middle Distillate Fuels by
Inductively Coupled Plasma Atomic Emission Spectrometry (ICP-AES)
ASTM D7171 Test Method for Hydrogen Content of Middle Distillate Petroleum Products by LowResolution Pulsed Nuclear Magnetic Resonance Spectroscopy
ASTM D7566 Specification for Aviation Turbine Fuel Containing Synthesized Hydrocarbons
ASTM E411
Test Method for Trace Quantities of Carbonyl Compounds with 2,4Dinitrophenylhydrazine
ASTM E681 Test Method for Concentration Limits of Flammability of Chemicals (Vapors and
Gases)
ASTM E1269 Test Method for Determining Specific Heat Capacity by Differential Scanning
Calorimetry
Reference
ASTM
(2014e)
ASTM
(2016w)
ASTM
(2015n)
ASTM
(2016x)
ASTM
(2016k)
ASTM
(2016y)
ASTM
(2018ab)
ASTM
(2015o)
ASTM
(2012b)
ASTM
(2016m)
ASTM
(2016t)
ASTM
(2016z)
ASTM
(2019a)
ASTM
(2017t)
ASTM
(2015p)
ASTM
(2018ac)
aviation fuel derived from the hydroprocessing of plant oils and
fats (International Renewable Energy Agency IRENA, 2017). The
third processing pathway approved was the synthetic iso-paraffinic
kerosene, also known as Direct Sugar to Hydrocarbons, in 2014. In
2015 the SPK plus aromatics route was approved and annexed to
Chapter 1 Biojet fuel: Driving the aviation sector to sustainability
the standard (International Civil Aviation Organization, 2017),
while in 2016 the alcohol-to-jet route was incorporated to ASTM
D7566 standard (International Renewable Energy Agency IRENA,
2017). Recently, the coprocessing of renewable lipids with crude
oil-derived middle distillates in petroleum refineries was approved
by the Committee (CAAFI, 2019); this pathway will be added to the
annex in the following edition of the standard.
Besides these pathways, there are others in the process of
approval by ASTM (International Air Transport Association,
2018c,d). One of them is the catalytic hydrothermolysis jet/high
freeze point HEFA, whose possible feedstocks are bio-oils, animal
fats, and recycled oils (International Civil Aviation Organization,
2017). Another conversion route is the coprocessing of bio-oils
(coprocessing) with conventional middle distillates of petrorefineries. Moreover, the route ATJ-SPK is also in approval
process; this process considers alcohol production, usually isobutanol, from biomass. Another pathway is ATJ-SKA, where the fuel
includes bio-aromatics looking for its use in higher percentages.
Finally, the process HEFA Plus (Green Diesel) is under evaluation,
and the first test flight with 15% of this new fuel already took
place (International Civil Aviation Organization, 2017).
It is worth mentioning that the certification of a new fuel
usually takes between 3 and 5 years, since it is a multistage and
multifactor process and requires up to 890,000 liters of blended
jet fuel to be completed (Pavlenko and Kharina, 2018). Thus it is
necessary to simplify and standardize the approval process, in
order to allow further diversification of conversion processes
and feedstocks to be used for aviation alternative fuels production (International Civil Aviation Organization, 2017).
1.4
Combustion and flight tests
As mentioned before, the renewable aviation fuel needs to be
tested in order to evaluate the fulfillment of the properties established in the standards ASTM D1655 (ASTM, 2019b) and ASTM
D7566 (ASTM, 2019a). Once that the alternative fuel has approved
this evaluation, combustion tests in jet engines must be realized.
The combustion performance of the renewable aviation fuel
will depend mainly on its composition and properties such as
heat of combustion, smoke point, and density. At the same time,
these properties will depend on the raw material and production
process. Therefore each of the alternative jet fuel can exhibit its
own unique behavior during combustion due to its properties
17
18
Chapter 1 Biojet fuel: Driving the aviation sector to sustainability
(Zhang et al., 2016). Due to this, it is necessary to perform combustion tests of these alternative fuels in jet engines.
The combustion tests are oriented to evaluate the performance of the alternative fuel inside the engine (lean blowout,
atomization, ignition, and altitude relight), and the combustion
products (emissions, smoke and carbon deposit) (Zhang et al.,
2016). In addition, long-term studies are required in order to
analyze the effect of the use of alternative fuels in the mechanical integrity of the jet engine. These studies must be performed
first in jet engines in the ground, and later on flight tests.
The ground engine tests allow to evaluate the reliability and
safety of alternative jet fuels; also, the combustion products are
measured (Zhang et al., 2016). The first time where biojet fuel was
used in a ground test by the Argentina’s Air Force was in 2006; the
test was realized at Buenos Aires using 20% of biojet fuel produced
from soy and rapeseed oils. From that test to the date many other
studies have been realized, and the findings indicate that the
engine performance is not affected by the use of alternatives fuels;
indeed, in the combustion of alternative jet fuels less molecular
classes are involved, in comparison with fossil jet fuels (Zhang
et al., 2016). Moreover, when alternative aviation fuel is used the
thermal efficiency is superior, the CO, NOx, and SOx emissions are
reduced and smaller soot particles are generated (Friedl, 2015;
Zhang et al., 2016). An interesting result was presented by
Corporan et al. (2012), reporting that it is possible to predict the
particle emissions of the combustion of alternative fuels based on
engine, engine setting, limited particle matter data, and fuel composition; this is an important functionality that can be used to
improve the design of the conversion processes of the biomass in
order to minimize particle emissions. However, the aromatic content has an important role in the density and neat heat combustion of biojet fuels; low aromatic content results in low density of
the fuel but high net heat of combustion (Yang et al., 2019).
Once that the renewable aviation fuel is tested in jet engines at
ground level, then flight test must be performed. The flight test is
the final testing step to demonstrate the use of a candidate jet
fuel on a flying aircraft (Zhang et al., 2016). To date, renewable
aviation fuel has been used in test and commercial flights all over
the world. In 2007 the first air test was performed at Nevada by
Green Flight International using canola oil with an aircraft
Aerovodochody L29 Delfin, which was a military training aircraft.
Nevertheless, the first test flight in a commercial aircraft (Boeing
747-400) was realized in 2008 by Virgin Atlantic; in this test flight,
20% of biojet fuel was used, which was produced from coconut
and babassu oils. The first commercial flight was realized in 2011
Chapter 1 Biojet fuel: Driving the aviation sector to sustainability
by KLM, using 50% of biojet fuel produced from used cooking oil;
the flight was from Amsterdam to Paris with an aircraft Boeing
737-800 (Gutiérrez-Antonio et al., 2017). The gap between the first
test and commercial flights was due to the time required for the
certification of the fuels, along with the availability of the quantities of biofuel required for the tests.
Between 2006 and 2013, 31 test flights were performed
(Gutiérrez-Antonio et al., 2017); from these flights, almost half
employed renewable aviation fuel produced with the hydrotreating process of UOP Honeywell, while 35% used jet fuel generated
with hydrotreated esters and fatty acids pathway from SkyNRG.
There were other biojet fuel suppliers for the realization of these
test flights; however, UOP Honeywell and SkyNRG were the main
actors, even though Fischer Tropsch technology was also certified by the ASTM for biojet fuel production. According to
International Air Transport Association, between 2011 and 2015,
22 airlines performed over 2500 commercial passenger flights
with blends of up to 50% biojet fuel from feedstock including
used cooking oil, jatropha, camelina, algae oils, and sugarcane
(International Air Transport Association, 2018c,d). Moreover, in
January 2016 a regular supply of renewable aviation fuel through
the common hydrant system started at Oslo Airport, being Neste,
SkyNRG, and Air BP the suppliers; recently a study reported that
this action helps to reduce the greenhouse gases of the airlines
by 10% 15% (Baxter et al., 2020). Later in March of the same
year, United Airlines became the first company to introduce biojet fuel in its normal operation in its daily flights from Los
Angeles Airport; the biofuel was provided by AltAir (International
Air Transport Association, 2018c,d). From this point, the incorporation of biojet fuel in several airports began to increase; in
December of 2018, more than 150,000 commercial flights have
been performed using renewable aviation fuel. In addition, several airlines have concluded long-term offtake agreements with
biofuel suppliers, most of which are reported as commercially
competitive (International Air Transport Association, 2018c,d).
According to the International Air Transport Association
(2015), some of the successful airlines/biofuel’s producer symbiosis are the following ones. The aircraft of United Airlines
uses renewable aviation fuel produced from AltAir; both companies signed in 2013 an agreement for the commercialization of
biojet fuel produced from nonedible natural oils and agricultural wastes. On the other hand, Solena Fuels constructed a
facility to produce biojet fuel for British Airways; the renewable
aviation fuel will be produced from landfill waste. On the other
hand, the airplanes of Air France will use renewable aviation
19
20
Chapter 1 Biojet fuel: Driving the aviation sector to sustainability
fuel produced by Total from Amyris’s renewable farnesane.
Finally, Fulcrum provides renewable aviation fuel to Cathay
Pacific, which is obtained from the conversion of household
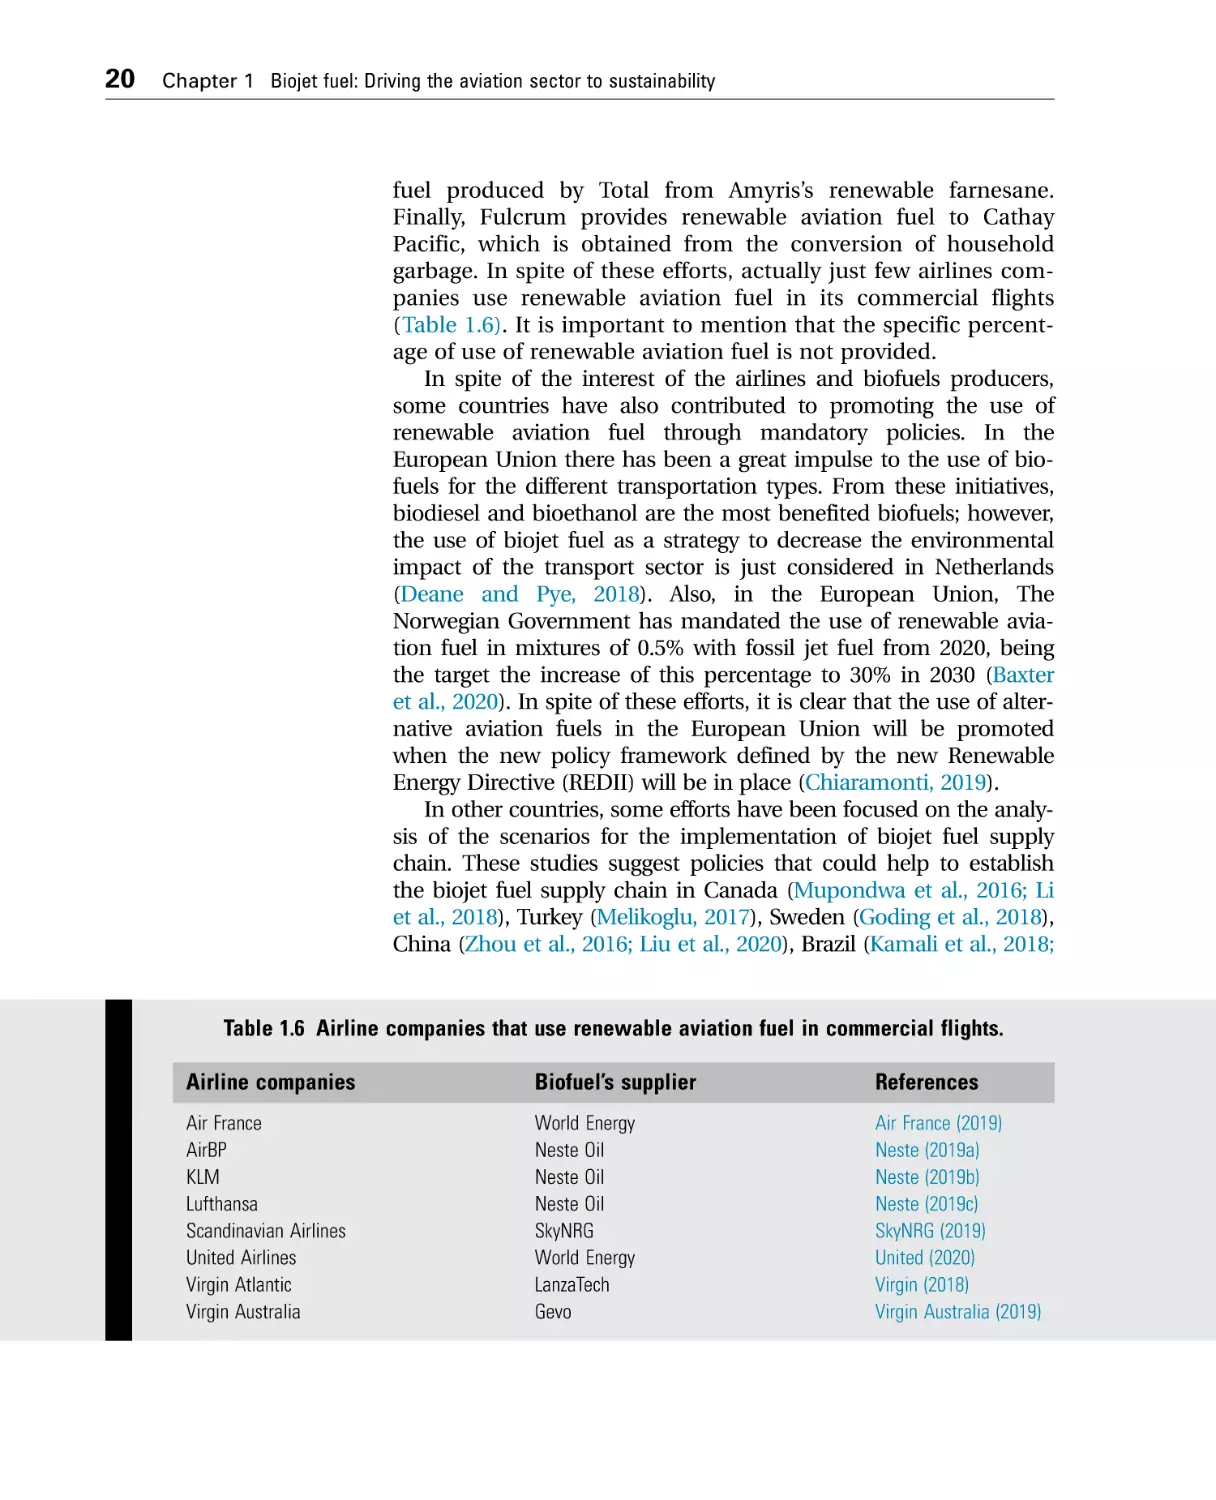
garbage. In spite of these efforts, actually just few airlines companies use renewable aviation fuel in its commercial flights
(Table 1.6). It is important to mention that the specific percentage of use of renewable aviation fuel is not provided.
In spite of the interest of the airlines and biofuels producers,
some countries have also contributed to promoting the use of
renewable aviation fuel through mandatory policies. In the
European Union there has been a great impulse to the use of biofuels for the different transportation types. From these initiatives,
biodiesel and bioethanol are the most benefited biofuels; however,
the use of biojet fuel as a strategy to decrease the environmental
impact of the transport sector is just considered in Netherlands
(Deane and Pye, 2018). Also, in the European Union, The
Norwegian Government has mandated the use of renewable aviation fuel in mixtures of 0.5% with fossil jet fuel from 2020, being
the target the increase of this percentage to 30% in 2030 (Baxter
et al., 2020). In spite of these efforts, it is clear that the use of alternative aviation fuels in the European Union will be promoted
when the new policy framework defined by the new Renewable
Energy Directive (REDII) will be in place (Chiaramonti, 2019).
In other countries, some efforts have been focused on the analysis of the scenarios for the implementation of biojet fuel supply
chain. These studies suggest policies that could help to establish
the biojet fuel supply chain in Canada (Mupondwa et al., 2016; Li
et al., 2018), Turkey (Melikoglu, 2017), Sweden (Goding et al., 2018),
China (Zhou et al., 2016; Liu et al., 2020), Brazil (Kamali et al., 2018;
Table 1.6 Airline companies that use renewable aviation fuel in commercial flights.
Airline companies
Biofuel’s supplier
References
Air France
AirBP
KLM
Lufthansa
Scandinavian Airlines
United Airlines
Virgin Atlantic
Virgin Australia
World Energy
Neste Oil
Neste Oil
Neste Oil
SkyNRG
World Energy
LanzaTech
Gevo
Air France (2019)
Neste (2019a)
Neste (2019b)
Neste (2019c)
SkyNRG (2019)
United (2020)
Virgin (2018)
Virgin Australia (2019)
Chapter 1 Biojet fuel: Driving the aviation sector to sustainability
Mendes de Souza et al., 2018; Mendes et al., 2020), México
(Domı́nguez-Garcı́a et al., 2017a; Domı́nguez-Garcı́a et al., 2017b),
United States (Smith et al., 2017; Leila et al., 2018; Chao et al.,
2019a; Chao et al., 2019b), and United Kingdom (Hudson et al.,
2016). All the studies converge on the necessity to continue the
research and development of new processes to produce biojet fuel
and also the need to count with governmental regulations and policies to promote the use of this biofuel (Dodd et al., 2018).
Finally, according to Scheelhaase et al. (2019), some potential policies for the impulse of the use of renewable aviation fuels include:
• Policies directly raising the use of renewable aviation fuel, like
mandatory use of blends of fossil and renewable jet fuels;
• Policies lowering the net production costs and associated risks
of renewable aviation fuel, such as subsidies for research and
development or investment aids;
• Policies improving the relative competitiveness of biojet fuels
by increasing the cost for conventional fuels.
1.5
Summary
Biojet fuel is the feasible alternative for the sustainable development of the aviation sector. Considering the high complexity
and the certifications involved in the operation of the airlines,
biojet fuel must be a drop-in fuel with the same or superior
properties than those of the fossil jet fuel. renewable aviation
fuel must comply with the ASTM standards established for fossil
jet fuel plus some additional ones related to the renewable
nature of the fuel. At the moment, six pathways are certified for
the production of biojet fuel and five more are into the approval
process. However, the process of certification of new aviation
fuels must be simplified in order to increase the use of renewable
aviation fuel in the airports worldwide, since numerous test and
commercial flights have proven the technical competitivity of
biojet fuel in comparison with fossil jet fuel. Finally, the government participation through the implementation of policies is of
vital importance to promote the use of renewable aviation fuel.
References
Agosta, A., 2002. Development of a chemical surrogate for JP-8 aviation fuel
using a pressurized flow reactor. Drexel University.
Air France, 2019. Air France plans flights from San Francisco fueled with
sustainable aviation fuel. ,https://corporate.airfrance.com/en/press-release/
air-france-plans-flights-san-francisco-fueled-sustainable-aviation-fuel.
(accessed 21.04.20.).
21
22
Chapter 1 Biojet fuel: Driving the aviation sector to sustainability
ASTM International, 2011a. ASTM D6379-11, Standard Test Method for
Determination of Aromatic Hydrocarbon Types in Aviation Fuels and
Petroleum Distillates—High Performance Liquid Chromatography Method
with Refractive Index Detection. ,www.astm.org. (accessed 14.05.19.).
ASTM International, 2011b. ASTM D3363-05(2011)e2, Standard Test Method for
Film Hardness by Pencil Test. ,www.astm.org. (accessed 14.05.19.).
ASTM International, 2012a. ASTM D5452-12, Standard Test Method for
Particulate Contamination in Aviation Fuels by Laboratory Filtration. ,www.
astm.org. (accessed 14.05.19.).
ASTM International, 2012b. ASTM D6793-02(2012), Standard Test Method for
Determination of Isothermal Secant and Tangent Bulk Modulus. ,www.astm.
org. (accessed 14.05.19.).
ASTM International, 2013a. ASTM D1405/D1405M-08(2013), Standard Test
Method for Estimation of Net Heat of Combustion of Aviation Fuels. ,www.
astm.org. (accessed 14.05.19.).
ASTM International, 2013b. ASTM D1405/D1405M-08(2013), Standard Test
Method for Estimation of Net Heat of Combustion of Aviation Fuels. ,www.
astm.org. (accessed 19.05.19.).
ASTM International, 2013c. ASTM D4066-13, Standard Classification System for
Nylon Injection and Extrusion Materials (PA). ,www.astm.org. (accessed
19.05.19.).
ASTM International, 2014a. ASTM D2276-06(2014), Standard Test Method for
Particulate Contaminant in Aviation Fuel by Line Sampling. ,www.astm.org.
(accessed 14.05.19.).
ASTM International, 2014b. ASTM D3120-08(2014), Standard Test Method for
Trace Quantities of Sulfur in Light Liquid Petroleum Hydrocarbons by
Oxidative Microcoulometry. ,www.astm.org. (accessed 14.05.19.).
ASTM International, 2014c. ASTM D3338/D3338M-09(2014)e2, Standard Test
Method for Estimation of Net Heat of Combustion of Aviation Fuels. ,www.
astm.org. (accessed 14.05.19.).
ASTM International, 2014d. ASTM D4176-04(2014), Standard Test Method for
Free Water and Particulate Contamination in Distillate Fuels (Visual
Inspection Procedures). ,www.astm.org. (accessed 14.05.19.).
ASTM International, 2014e. ASTM D5001-10(2014), Standard Test Method for
Measurement of Lubricity of Aviation Turbine Fuels by the Ball-on-Cylinder
Lubricity Evaluator (BOCLE). ,www.astm.org. (accessed 14.05.19.).
ASTM International, 2014f. ASTM D5001-10(2014), Standard Test Method for
Measurement of Lubricity of Aviation Turbine Fuels by the Ball-on-Cylinder
Lubricity Evaluator (BOCLE). ,www.astm.org. (accessed 14.05.19.).
ASTM International, 2014g. ASTM D1331-14, Standard Test Methods for Surface
and Interfacial Tension of Solutions of Paints, Solvents, Solutions of SurfaceActive Agents, and Related Materials. ,www.astm.org. (accessed 14.05.19.).
ASTM International, 2015a. ASTM D156-15, Standard Test Method for Saybolt
Color of Petroleum Products (Saybolt Chromometer Method). ,www.astm.
org. (accessed 14.05.19.).
ASTM International, 2015b. ASTM D323-15a, Standard Test Method for Vapor
Pressure of Petroleum Products (Reid Method). ,www.astm.org. (accessed
14.05.19.).
ASTM International, 2015c. ASTM D2624-15, Standard Test Methods for
Electrical Conductivity of Aviation and Distillate Fuels. ,www.astm.org.
(accessed 14.05.19.).
ASTM International, 2015d. ASTM D3240-15, Standard Test Method for Undissolved
Water in Aviation Turbine Fuels. ,www.astm.org. (accessed 14.05.19.).
Chapter 1 Biojet fuel: Driving the aviation sector to sustainability
ASTM International, 2015e. ASTM D4953-15, Standard Test Method for Vapor
Pressure of Gasoline and Gasoline-Oxygenate Blends (Dry Method). ,www.
astm.org. (accessed 14.05.19.).
ASTM International, 2015f. ASTM D7153-15e1, Standard Test Method for
Freezing Point of Aviation Fuels (Automatic Laser Method). ,www.astm.org.
(accessed 14.05.19.).
ASTM International, 2015g. ASTM D7154-15, Standard Test Method for Freezing
Point of Aviation Fuels (Automatic Fiber Optical Method). ,www.astm.org.
(accessed 14.05.19.).
ASTM International, 2015h. ASTM D7524-10(2015), Standard Test Method for
Determination of Static Dissipater Additives (SDA) in Aviation Turbine Fuel
and Middle Distillate Fuels—High Performance Liquid Chromatograph
(HPLC) Method. ,www.astm.org. (accessed 14.05.19.).
ASTM International, 2015i. ASTM D7974-15, Standard Test Method for
Determination of Farnesane, Saturated Hydrocarbons, and
Hexahydrofarnesol Content of Synthesized Iso-Paraffins (SIP) Fuel for
Blending with Jet Fuel by Gas Chromatography. ,www.astm.org. (accessed
18.05.19.).
ASTM International, 2015j. ASTM B93/B93M-15, Standard Specification for
Magnesium Alloys in Ingot Form for Sand Castings, Permanent Mold
Castings, and Die Castings. ,www.astm.org. (accessed 18.05.19.).
ASTM International, 2015k. ASTM D924-15, Standard Test Method for
Dissipation Factor (or Power Factor) and Relative Permittivity (Dielectric
Constant) of Electrical Insulating Liquids. ,www.astm.org. (accessed
19.05.19.).
ASTM International, 2015l. ASTM D1414-15, Standard Test Methods for Rubber
O-Rings. ,www.astm.org. (accessed 19.05.19.).
ASTM International, 2015m. ASTM D2240-15e1, Standard Test Method for
Rubber Property—Durometer Hardness. ,www.astm.org. (accessed
19.05.19.).
ASTM International, 2015n. ASTM D5304-15, Standard Test Method for
Assessing Middle Distillate Fuel Storage Stability by Oxygen Overpressure.
,www.astm.org. (accessed 19.05.19.).
ASTM International, 2015o. ASTM D6732-04(2015), Standard Test Method for
Determination of Copper in Jet Fuels by Graphite Furnace Atomic Absorption
Spectrometry. ,www.astm.org. (accessed 19.05.19.).
ASTM International, 2015p. ASTM E681-09(2015), Standard Test Method for
Concentration Limits of Flammability of Chemicals (Vapors and Gases).
,www.astm.org. (accessed 19.05.19.).
ASTM International, 2016a. ASTM D56-16a, Standard Test Method for Flash
Point by Tag Closed Cup Tester. ,www.astm.org. (accessed 14.05.19.).
ASTM International, 2016b. ASTM D2622-16, Standard Test Method for Sulfur in
Petroleum Products by Wavelength Dispersive X-ray Fluorescence
Spectrometry. ,www.astm.org. (accessed 14.05.19.).
ASTM International, 2016c. ASTM D3227-16, Standard Test Method for (Thiol
Mercaptan) Sulfur in Gasoline, Kerosine, Aviation Turbine, and Distillate
Fuels (Potentiometric Method). ,www.astm.org. (accessed 14.05.19.).
ASTM International, 2016d. ASTM D3343-16, Standard Test Method for
Estimation of Hydrogen Content of Aviation Fuels. ,www.astm.org.
(accessed 14.05.19.).
ASTM International, 2016e. ASTM D3828-16a, Standard Test Methods for Flash
Point by Small Scale Closed Cup Tester. ,www.astm.org. (accessed
16.05.19.).
23
24
Chapter 1 Biojet fuel: Driving the aviation sector to sustainability
ASTM International, 2016f. ASTM D4294-16e1, Standard Test Method for Sulfur
in Petroleum and Petroleum Products by Energy Dispersive X-ray
Fluorescence Spectrometry. ,www.astm.org. (accessed 16.05.19.).
ASTM International, 2016g. ASTM D4625-16e1, Standard Test Method for Middle
Distillate Fuel Storage Stability at 43 C (110 F). ,www.astm.org. (accessed
16.05.19.).
ASTM International, 2016h. ASTM D4737-10(2016), Standard Test Method for
Calculated Cetane Index by Four Variable Equation. ,www.astm.org.
(accessed 16.05.19.).
ASTM International, 2016i. ASTM D5006-11(2016), Standard Test Method for
Measurement of Fuel System Icing Inhibitors (Ether Type) in Aviation Fuels.
,www.astm.org. (accessed 16.05.19.).
ASTM International, 2016j. ASTM D5453-16e1, Standard Test Method for
Determination of Total Sulfur in Light Hydrocarbons, Spark Ignition Engine
Fuel, Diesel Engine Fuel, and Engine Oil by Ultraviolet Fluorescence. ,www.
astm.org. (accessed 16.05.19.).
ASTM International, 2016k. ASTM D5972-16, Standard Test Method for Freezing
Point of Aviation Fuels (Automatic Phase Transition Method). ,www.astm.
org. (accessed 16.05.19.).
ASTM International, 2016m. ASTM D7042-16e3, Standard Test Method for
Dynamic Viscosity and Density of Liquids by Stabinger Viscometer (and the
Calculation of Kinematic Viscosity). ,www.astm.org. (accessed 16.05.19.).
ASTM International, 2016n. ASTM D7170-16, Standard Test Method for
Determination of Derived Cetane Number (DCN) of Diesel Fuel Oils—Fixed
Range Injection Period, Constant Volume Combustion Chamber Method.
,www.astm.org. (accessed 16.05.19.).
ASTM International, 2016o. ASTM D7945-16, Standard Test Method for
Determination of Dynamic Viscosity and Derived Kinematic Viscosity of
Liquids by Constant Pressure Viscometer. ,www.astm.org. (accessed
16.05.19.).
ASTM International, 2016p. ASTM D7959-16, Standard Test Method for Chloride
Content Determination of Aviation Turbine Fuels using Chloride Test Strip.
,www.astm.org. (accessed 16.05.19.).
ASTM International, 2016q. ASTM D8073-16, Standard Test Method for
Determination of Water Separation Characteristics of Aviation Turbine Fuel
by Small Scale Water Separation Instrument. ,www.astm.org. (accessed
16.05.19.).
ASTM International, 2016r. ASTM D5291-16, Standard Test Methods for
Instrumental Determination of Carbon, Hydrogen, and Nitrogen in Petroleum
Products and Lubricants. ,www.astm.org. (accessed 18.05.19.).
ASTM International, 2016s. ASTM D6304-16e1, Standard Test Method for
Determination of Water in Petroleum Products, Lubricating Oils, and
Additives by Coulometric Karl Fischer Titration. ,www.astm.org. (accessed
18.05.19.).
ASTM International, 2016t. ASTM D7111-16, Standard Test Method for
Determination of Trace Elements in Middle Distillate Fuels by Inductively
Coupled Plasma Atomic Emission Spectrometry (ICP-AES). ,www.astm.org.
(accessed 18.05.19.).
ASTM International, 2016u. ASTM D412-16, Standard Test Methods for
Vulcanized Rubber and Thermoplastic Elastomers—Tension. ,www.astm.
org. (accessed 19.05.19.).
ASTM International, 2016v. ASTM D471-16a, Standard Test Method for Rubber
Property—Effect of Liquids. ,www.astm.org. (accessed 19.05.19.).
Chapter 1 Biojet fuel: Driving the aviation sector to sustainability
ASTM International, 2016w. ASTM D5291-16, Standard Test Methods for
Instrumental Determination of Carbon, Hydrogen, and Nitrogen in Petroleum
Products and Lubricants. ,www.astm.org. (accessed 19.05.19.).
ASTM International, 2016x. ASTM D5363-16, Standard Specification for
Anaerobic Single-Component Adhesives (AN). ,www.astm.org. (accessed
19.05.19.).
ASTM International, 2016y. ASTM D6304-16e1, Standard Test Method for
Determination of Water in Petroleum Products, Lubricating Oils, and Additives
by Coulometric Karl Fischer Titration. ,www.astm.org. (accessed 19.05.19.).
ASTM International, 2016z. ASTM D7171-16, Standard Test Method for
Hydrogen Content of Middle Distillate Petroleum Products by LowResolution Pulsed Nuclear Magnetic Resonance Spectroscopy. ,www.astm.
org. (accessed 19.05.19.).
ASTM International, 2017a. ASTM D240-17, Standard Test Method for Heat of
Combustion of Liquid Hydrocarbon Fuels by Bomb Calorimeter. ,www.astm.
org. (accessed 14.05.19.).
ASTM International, 2017b. ASTM D381-12(2017), Standard Test Method for Gum
Content in Fuels by Jet Evaporation. ,www.astm.org. (accessed 14.05.19.).
ASTM International, 2017c. ASTM D1298-12b(2017), Standard Test Method for
Density, Relative Density, or API Gravity of Crude Petroleum and Liquid Petroleum
Products by Hydrometer Method. ,www.astm.org. (accessed 14.05.19.).
ASTM International, 2017d. ASTM D1840-07(2017), Standard Test Method for
Naphthalene Hydrocarbons in Aviation Turbine Fuels by Ultraviolet
Spectrophotometry. ,www.astm.org. (accessed 14.05.19.).
ASTM International, 2017e. ASTM D3242-11(2017), Standard Test Method for
Acidity in Aviation Turbine Fuel. ,www.astm.org. (accessed 16.05.19.).
ASTM International, 2017f. ASTM D3701-17, Standard Test Method for
Hydrogen Content of Aviation Turbine Fuels by Low Resolution Nuclear
Magnetic Resonance Spectrometry. ,www.astm.org. (accessed 16.05.19.).
ASTM International, 2017g. ASTM D4529-17, Standard Test Method for
Estimation of Net Heat of Combustion of Aviation Fuels. ,www.astm.org.
(accessed 16.05.19.).
ASTM International, 2017h. ASTM D4952-12(2017), Standard Test Method for
Qualitative Analysis for Active Sulfur Species in Fuels and Solvents (Doctor
Test). ,www.astm.org. (accessed 16.05.19.).
ASTM International, 2017i. ASTM D6045-12(2017), Standard Test Method for
Color of Petroleum Products by the Automatic Tristimulus Method. ,www.
astm.org. (accessed 16.05.19.).
ASTM International, 2017j. ASTM D7344-17a, Standard Test Method for
Distillation of Petroleum Products and Liquid Fuels at Atmospheric Pressure
(Mini Method). ,www.astm.org. (accessed 16.05.19.).
ASTM International, 2017k. ASTM D7345-17, Standard Test Method for
Distillation of Petroleum Products and Liquid Fuels at Atmospheric Pressure
(Micro Distillation Method). ,www.astm.org. (accessed 16.05.19.).
ASTM International, 2017m. ASTM D7668-17, Standard Test Method for
Determination of Derived Cetane Number (DCN) of Diesel Fuel Oils—
Ignition Delay and Combustion Delay Using a Constant Volume Combustion
Chamber Method. ,www.astm.org. (accessed 16.05.19.).
ASTM International, 2017o. ASTM D7223-17, Standard Specification for Aviation
Certification Turbine Fuel. ,www.astm.org. (accessed 18.05.19.).
ASTM International, 2017p. ASTM D4054-17, Standard Practice for Evaluation of New
Aviation Turbine Fuels and Fuel Additives. ,www.astm.org. (accessed 18.05.19.).
25
26
Chapter 1 Biojet fuel: Driving the aviation sector to sustainability
ASTM International, 2017q. ASTM D790-17, Standard Test Methods for Flexural
Properties of Unreinforced and Reinforced Plastics and Electrical Insulating
Materials. ,www.astm.org. (accessed 18.05.19.).
ASTM International, 2017r. ASTM D3359-17, Standard Test Methods for Rating
Adhesion by Tape Test. ,www.astm.org. (accessed 18.05.19.).
ASTM International, 2017s. ASTM D4629-17, Standard Test Method for Trace
Nitrogen in Liquid Hydrocarbons by Syringe/Inlet Oxidative Combustion and
Chemiluminescence Detection. ,www.astm.org. (accessed 19.05.19.).
ASTM International, 2017t. ASTM E411-17a, Standard Test Method for Trace
Quantities of Carbonyl Compounds with 2,4-Dinitrophenylhydrazine. ,www.
astm.org. (accessed 19.05.19.).
ASTM International, 2018a. ASTM D86-18, Standard Test Method for Distillation
of Petroleum Products and Liquid Fuels at Atmospheric Pressure. ,www.
astm.org. (accessed 14.05.19.).
ASTM International, 2018b. ASTM D93-18, Standard Test Methods for Flash Point
by Pensky-Martens Closed Cup Tester. ,www.astm.org. (accessed 14.05.19.).
ASTM International, 2018c. ASTM D130-18, Standard Test Method for
Corrosiveness to Copper from Petroleum Products by Copper Strip Test.
,www.astm.org. (accessed 14.05.19.).
ASTM International, 2018d. ASTM D445-18, Standard Test Method for Kinematic
Viscosity of Transparent and Opaque Liquids (and Calculation of Dynamic
Viscosity). ,www.astm.org. (accessed 14.05.19.).
ASTM International, 2018e. ASTM D613-18a, Standard Test Method for Cetane
Number of Diesel Fuel Oil. ,www.astm.org. (accessed 14.05.19.).
ASTM International, 2018f. ASTM D1266-18, Standard Test Method for Sulfur in
Petroleum Products (Lamp Method). ,www.astm.org. (accessed 14.05.19.).
ASTM International, 2018g. ASTM D1319-18, Standard Test Method for
Hydrocarbon Types in Liquid Petroleum Products by Fluorescent Indicator
Adsorption. ,www.astm.org. (accessed 14.05.19.).
ASTM International, 2018h. ASTM D1322-18, Standard Test Method for Smoke Point
of Kerosene and Aviation Turbine Fuel. ,www.astm.org. (accessed 14.05.19.).
ASTM International, 2018j. ASTM D2887-18, Standard Test Method for Boiling
Range Distribution of Petroleum Fractions by Gas Chromatography. ,www.
astm.org. (accessed 14.05.19.).
ASTM International, 2018k. ASTM D2892-18a, Standard Test Method for
Distillation of Crude Petroleum (15-Theoretical Plate Column). ,www.astm.
org. (accessed 14.05.19.).
ASTM International, 2018l. ASTM D3948-14(2018), Standard Test Method for
Determining Water Separation Characteristics of Aviation Turbine Fuels by
Portable Separometer. ,www.astm.org. (accessed 16.05.19.).
ASTM International, 2018m. ASTM D4052-18a, Standard Test Method for
Density, Relative Density, and API Gravity of Liquids by Digital Density Meter.
,www.astm.org. (accessed 16.05.19.).
ASTM International, 2018n. ASTM D4809-18, Standard Test Method for Heat of
Combustion of Liquid Hydrocarbon Fuels by Bomb Calorimeter (Precision
Method). ,www.astm.org. (accessed 16.05.19.).
ASTM International, 2018o. ASTM D6751-18, Standard Specification for
Biodiesel Fuel Blend Stock (B100) for Middle Distillate Fuels. ,www.astm.
org. (accessed 16.05.19.).
ASTM International, 2018p. ASTM D6866-18, Standard Test Methods for
Determining the Biobased Content of Solid, Liquid, and Gaseous Samples
Using Radiocarbon Analysis. ,www.astm.org. (accessed 16.05.19.).
Chapter 1 Biojet fuel: Driving the aviation sector to sustainability
ASTM International, 2018q. ASTM D7224-14(2018), Standard Test Method for
Determining Water Separation Characteristics of Kerosine-Type Aviation
Turbine Fuels Containing Additives by Portable Separometer. ,www.astm.
org. (accessed 16.05.19.).
ASTM International, 2018r. ASTM D7797-18, Standard Test Method for
Determination of the Fatty Acid Methyl Esters Content of Aviation Turbine
Fuel Using Flow Analysis by Fourier Transform Infrared Spectroscopy—Rapid
Screening Method. ,www.astm.org. (accessed 16.05.19.).
ASTM International, 2018s. ASTM D7872-13(2018), Standard Test Method for
Determining the Concentration of Pipeline Drag Reducer Additive in Aviation
Turbine Fuels. ,www.astm.org. (accessed 16.05.19.).
ASTM International, 2018t. ASTM D129-18, Standard Test Method for Sulfur in
Petroleum Products (General High Pressure Decomposition Device Method).
,www.astm.org. (accessed 18.05.19.).
ASTM International, 2018u. ASTM D2710-09(2018), Standard Test Method for
Bromine Index of Petroleum Hydrocarbons by Electrometric Titration.
,www.astm.org. (accessed 18.05.19.).
ASTM International, 2018v. ASTM D7359-18, Standard Test Method for Total
Fluorine, Chlorine and Sulfur in Aromatic Hydrocarbons and Their Mixtures
by Oxidative Pyrohydrolytic Combustion followed by Ion Chromatography
Detection (Combustion Ion Chromatography-CIC). ,www.astm.org.
(accessed 18.05.19.).
ASTM International, 2018w. ASTM D6378-18a, Standard Test Method for
Determination of Vapor Pressure (VPX) of Petroleum Products,
Hydrocarbons, and Hydrocarbon-Oxygenate Mixtures (Triple Expansion
Method). ,www.astm.org. (accessed 18.05.19.).
ASTM International, 2018x. ASTM A240/A240M-18, Standard Specification for
Chromium and Chromium-Nickel Stainless Steel Plate, Sheet, and Strip for
Pressure Vessels and for General Applications. ,www.astm.org. (accessed
19.05.19.).
ASTM International, 2018y. ASTM B36/B36M-18, Standard Specification for Brass
Plate, Sheet, Strip, and Rolled Bar. ,www.astm.org. (accessed 19.05.19.).
ASTM International, 2018z. ASTM D395-18, Standard Test Methods for Rubber
Property—Compression Set. ,www.astm.org. (accessed 19.05.19.).
ASTM International, 2018aa. ASTM D3703-18, Standard Test Method for
Hydroperoxide Number of Aviation Turbine Fuels, Gasoline and Diesel Fuels.
,www.astm.org. (accessed 19.05.19.).
ASTM International, 2018ab. ASTM D6378-18a, Standard Test Method for
Determination of Vapor Pressure (VPX) of Petroleum Products,
Hydrocarbons, and Hydrocarbon-Oxygenate Mixtures (Triple Expansion
Method). ,www.astm.org. (accessed 19.05.19.).
ASTM International, 2018ac. ASTM E1269-11(2018), Standard Test Method for
Determining Specific Heat Capacity by Differential Scanning Calorimetry.
,www.astm.org. (accessed 19.05.19.).
ASTM International, 2019a. ASTM D7566-19, Standard Specification for Aviation
Turbine Fuel Containing Synthesized Hydrocarbons. ,www.astm.org.
(accessed 12.05.19.).
ASTM International, 2019b. ASTM D1655-19, Standard Specification for Aviation
Turbine Fuels. ,www.astm.org. (accessed 14.05.19.).
ASTM International, 2019c, ASTM D3241-19, Standard Test Method for Thermal
Oxidation Stability of Aviation Turbine Fuels. ,www.astm.org. (accessed
16.05.19.).
27
28
Chapter 1 Biojet fuel: Driving the aviation sector to sustainability
ASTM International, 2019d. ASTM D5191-19, Standard Test Method for Vapor
Pressure of Petroleum Products and Liquid Fuels (Mini Method). ,www.
astm.org. (accessed 16.05.19.).
ASTM International, 2019e. ASTM D2425-19, Standard Test Method for
Hydrocarbon Types in Middle Distillates by Mass Spectrometry. ,www.astm.
org. (accessed 18.05.19.).
ASTM International, 2019f. ASTM D1002-10(2019), Standard Test Method for
Apparent Shear Strength of Single-Lap-Joint Adhesively Bonded Metal Specimens
by Tension Loading (Metal-to-Metal). ,www.astm.org. (accessed 18.05.19.).
ASTM International, 2019g. ASTM D2425-19, Standard Test Method for
Hydrocarbon Types in Middle Distillates by Mass Spectrometry. ,www.astm.
org. (accessed 19.05.19.).
ASTM International, 2016l. ASTM D6890-16e2, Standard Test Method for
Determination of Ignition Delay and Derived Cetane Number (DCN) of
Diesel Fuel Oils by Combustion in a Constant Volume Chamber. ,www.astm.
org. (accessed 16.05.19.).
ASTM International, 2017l. ASTM D7619-17, Standard Test Method for Sizing
and Counting Particles in Light and Middle Distillate Fuels, by Automatic
Particle Counter. ,www.astm.org. (accessed 16.05.19.).
ASTM International, 2018i. ASTM D2386-18, Standard Test Method for Freezing
Point of Aviation Fuels. ,www.astm.org. (accessed 14.05.19.).
Baxter, G., Srisaeng, P., Wild, G., 2020. The use of aviation biofuels as an airport
environmental sustainability measure: the case of Oslo Gardermoen Airport.
Mag. Aviat. Dev. 8 (1), 6 17.
Bernabei, M., Reda, R., Galiero, R., Bocchinfuso, G., 2003. Determination of total
and polycyclic aromatic hydrocarbons in aviation jet fuel. J. Chromatogr. A 985,
197 203.
Chiaramonti, D., 2019. Sustainable aviation fuels: the challenge of
decarbonization. Energy Procedia 158, 1202 1207.
Commercial Aviation Alternative Fuels Initiative, 2019. Fuel qualification. ,http://
www.caafi.org/focus_areas/fuel_qualification.html. (accessed 30.09.19.).
Corporan, E., DeWitt, M.J., Klingshirn, C.D., Anneken, D., Streibich, R., Shafer, L.,
2012. Comparisons of emissions characteristics of several turbine engines
burning Fischer Tropsch and hydroprocessed esters and fatty acids alternative
jet fuels. In: Proceedings of the ASME Turbo Expo. Copenhagen. GT2012-68656.
Chao, H., Agusdinata, D.B., DeLaurentis, D.A., 2019a. The potential impacts of
Emissions Trading Scheme and biofuel options to carbon emissions of U.S.
airlines. Energy Policy 134, 110993.
Chao, H., Agusdinata, D.B., DeLaurentis, D., Stechel, E.B., 2019b. Carbon offsetting
and reduction scheme with sustainable aviation fuel options: fleet-level carbon
emissions impacts for U.S. airlines. Transp. Res. D Transp. Environ. 75, 42 56.
Chevron, 2007. Aviation fuels technical review. Chevron Products Company.
,https://www.chevron.com/-/media/chevron/operations/documents/
aviation-tech-review.pdf. (accessed 30.09.19.).
Deane, J.P., Pye, S., 2018. Europe’s ambition for biofuels in aviation a strategic
review of challenges and opportunities. Energy Strategy Rev. 20, 1 5.
Dodd, T., Orlitzky, M., Nelson, T., 2018. What stalls a renewable energy industry?
Industry outlook of the aviation biofuels industry in Australia, Germany, and
the USA. Energy Policy 123, 92 103.
Domı́nguez-Garcı́a, S., Gutiérrez-Antonio, C., De Lira-Flores, J.A., Ponce-Ortega,
J.M., El-Halwagi, M.M., 2017a. Strategic planning for the supply chain of
aviation biofuel with consideration of hydrogen production. Ind. Eng. Chem.
Res. 56 (46), 13812 13830.
Chapter 1 Biojet fuel: Driving the aviation sector to sustainability
Domı́nguez-Garcı́a, S., Gutiérrez-Antonio, C., De Lira-Flores, J.A., Ponce-Ortega,
J.M., 2017b. Optimal planning for the supply chain of biofuels for aviation in
Mexico. Clean Technol. Environ. Policy 19, 1387 1402.
Friedl, R.R., 2015. Aviation meteorology aircraft emissions. In: North, G.R.,
Pyle, J., Zhang, F. (Eds.), Encyclopedia of Atmospheric Sciences, second ed.
Academic Press, pp. 153 159.
Goding, L., Andersson-Franko, M., Lagerkvist, C.J., 2018. Preferences for bio jet
fuel in Sweden: the case of business travel from a city airport. Sustain. Energy
Technol. Assess. 29, 60 69.
Gutiérrez-Antonio, C., Romero-Izquierdo, A.G., Gómez-Castro, F.I., Hernández,
S., Briones-Ramı́rez, A., 2016. Simultaneous energy integration and
intensification of the hydrotreating process to produce biojet fuel from
Jatropha curcas. Chem. Eng. Process. Process Intensif. 110, 134 145.
Gutiérrez-Antonio, C., Gómez-Castro, F.I., de Lira-Flores, J.A., Hernández, S.,
2017. A review on the production processes of renewable jet fuel. Renew.
Sustain. Energy Rev. 79, 709 729.
Holmgren, J., 2009. Biofuels: unlocking the potential. In: The International
Conference on Biorefinery, Syracuse, New York.
Hudson, L., Jefferson, A., Bauen, A., Nattrass, L., 2016. Chapter 14 sustainable
aviation: a UK roadmap for sustainable aviation fuels. In: Chuck, C.J. (Ed.),
Biofuels for Aviation. Academic Press, pp. 315 337.
International Air Transport Association, 2009. A global approach to reducing
aviation emissions first stop: carbon neutral growth from 2020. ,www.iata.
org. (accessed 07.05.19.).
International Air Transport Association, 2012. IATA guidance material for biojet
fuel management. ,https://www.iata.org/publications/documents/guidancebiojet-management.pdf. (accessed 18.05.19.).
International Air Transport Association, 2015. IATA sustainable aviation fuel
roadmap. ,https://www.iata.org/contentassets/
d13875e9ed784f75bac90f000760e998/safr-1-2015.pdf. (accessed 18.04.20.).
International Air Transport Association, 2018a. Economic performance of the
airline industry end year report. ,https://www.iata.org/publications/
economics/reports/industry-econ-performance/iata-economic-performanceof-the-industry-end-year-2018-report.pdf. (accessed 06.05.19.).
International Air Transport Association, 2018b. Annual review 2018. ,https://www.
iata.org/publications/Documents/iata-annual-review-2018.pdf. (accessed
06.05.19.).
International Air Transport Association, 2018c. Reducing aviation’s carbon
footprint. ,https://www.iata.org/publications/tracker/june-2018/Pages/
corsia.aspx. (accessed 07.05.19).
International Air Transport Association, 2018d. Sustainable aviation fuels fact
sheet. ,https://www.iata.org/publications/tracker/june-2018/Pages/corsia.
aspx. (accessed 07.05.19.).
International Civil Aviation Organization, 2017. Status of technical certification
of aviation alternative fuels. In: Conference on Aviation and alternative fuels.
,https://www.icao.int/Meetings/CAAF2/Documents/CAAF.2.WP.007.1.en.
pdf. (accessed 18.05.19.).
International Renewable Energy Agency (IRENA), 2017. Biofuels for aviation:
technology brief. ,https://www.irena.org/documentdownloads/publications/
irena_biofuels_for_aviation_2017.pdf. (accessed 18.05.19.).
Kamali, F.P., Borges, J.A.R., Osseweijer, P., Posada, J.A., 2018. Towards social
sustainability: screening potential social and governance issues for biojet fuel
supply chains in Brazil. Renew. Sustain. Energy Rev. 92, 50 61.
29
30
Chapter 1 Biojet fuel: Driving the aviation sector to sustainability
Leila, M., Whalen, J., Bergthorson, J., 2018. Strategic spatial and temporal design
of renewable diesel and biojet fuel supply chains: case study of California,
USA. Energy 156, 181 195.
Li, X., Mupondwa, E., Tabil, L., 2018. Technoeconomic analysis of biojet fuel
production from camelina at commercial scale: case of Canadian Prairies.
Bioresour. Technol. 249, 196 205.
Liu, X., Hang, Y., Wang, Q., Zhou, D., 2020. Flying into the future: a scenariobased analysis of carbon emissions from China’s civil aviation. J. Air Transp.
Manag. 85, 101793.
Melikoglu, M., 2017. Modelling and forecasting the demand for jet fuel and biobased jet fuel in Turkey till 2023. Sustain. Energy Technol. Assess. 19, 17 23.
Mendes de Souza, L., Mendes, P.A.S., Aranda, D.A.G., 2018. Assessing the current
scenario of the Brazilian biojet market. Renew. Sustain. Energy Rev. 98, 426 438.
Mendes de Souza, L., Mendes, P.A.S., Aranda, D.A.G., 2020. Oleaginous
feedstocks for hydro-processed esters and fatty acids (HEFA) biojet
production in southeastern Brazil: a multi-criteria decision analysis. Renew.
Energy 149, 1339 1351.
Mupondwa, E., Li, X., Tabil, L., Falk, K., Gugel, R., 2016. Technoeconomic
analysis of camelina oil extraction as feedstock for biojet fuel in the Canadian
Prairies. Biomass Bioenergy 95, 221 234.
Neste, 2019c. Neste and Lufthansa collaborate and aim for a more sustainable
aviation. ,https://www.neste.com/releases-and-news/aviation/neste-andlufthansa-collaborate-and-aim-more-sustainable-aviation. (accessed 21.04.20.).
Neste, 2019b. Neste to supply KLM additional sustainable aviation fuel for
flights out of Schiphol. ,https://www.neste.com/releases-and-news/aviation/
neste-supply-klm-additional-sustainable-aviation-fuel-flights-out-schiphol.
(accessed 21.04.20.).
Neste, 2019a. Neste and Air BP ready to deliver sustainable aviation fuel to
Sweden. ,https://www.neste.com/releases-and-news/aviation/neste-andair-bp-ready-deliver-sustainable-aviation-fuel-sweden. (accessed
21.04.20.).
Pavlenko, N., Kharina, A., 2018. Policy and environmental implications of using
HEFA 1 for aviation, Working Paper 2018.06. The International Council of
Clean Transportation. ,https://www.theicct.org/sites/default/files/
publications/Green-Diesel-Aviation_ICCT-Working-Paper_20180321_vF.pdf.
(accessed 19.05.19.).
Scheelhaase, J., Maertens, S., Grimme, W., 2019. Synthetic fuels in aviation current
barriers and potential political measures. Transp. Res. Procedia 43, 21 30.
SkyNRG, 2019. SAS & Norgewian use biofuel from SkyNRG. ,http://skynrg.com/
nordic/sas-norwegian-use-biofuel-from-skynrg/. (accessed 21.04.20.).
Smith, P.M., Gaffney, M.J., Shi, W., Hoard, S., Ibarrola Armendariz, I., Mueller,
D.W., 2017. Drivers and barriers to the adoption and diffusion of sustainable
jet fuel (SJF) in the U.S. Pacific Northwest. J. Air Transp. Manag. 58,
113 124.
United, 2020. United Airlines expands industry-leading commitment to biofuel,
powering more flights with more biofuel than any other U.S. Carrier.
,https://hub.united.com/united-expands-commitment-biofuel-poweringflights-2637791857.html. (accessed 21.04.20.).
Virgin, 2018. Virgin Atlantic announces world first in race to develop new
sustainable aviation fuel. ,https://www.virgin.com/richard-branson/virginatlantic-announces-world-first-race-develop-new-sustainable-aviation-fuel.
(accessed 21.04.20.).
Chapter 1 Biojet fuel: Driving the aviation sector to sustainability
Virgin Australia, 2019. Virgin Australia’s sustainable aviation fuel flies one
million kilometres. ,https://newsroom.virginaustralia.com/release/virginaustralia%E2%80%99s-sustainable-aviation-fuel-flies-one-millionkilometres. (accessed 21.04.20.).
Yang, J., Xin, Z., He, Q., Corscadden, K., Niu, H., 2019. An overview on
performance characteristics of bio-jet fuels. Fuel 237, 916 936.
Zhang, C., Hui, X., Lin, Y., Sung, C.J., 2016. Recent development in studies of
alternative jet fuel combustion: progress, challenges, and opportunities.
Renew. Sustain. Energy Rev. 54, 120 138.
Zhou, W., Wang, T., Yu, Y., Chen, D., Zhu, B., 2016. Scenario analysis of CO2
emissions from China’s civil aviation industry through 2030. Appl. Energy 175,
100 108.
31
Renewable feedstock and its
conversion routes to biojet fuel
2.1
2
Introduction
Aviation grows at a vertiginous rate, which makes it the most
dynamic industry in the transport sector. According to the
International Air Transport Association (2019), in 2013 the consumption of fuel into aviation sector was 74 billion liters, while
in 2018 this value reached 95 billion liters; this means an
increase of 28% in just 5 years. At June of 2019, the consumption of fuel was reported as 97 billion liters (International Air
Transport Association, 2019). Therefore, major amounts of aviation fuel are necessary to guarantee the economic development
of the sector. However, this fuel must be renewable, in order to
have a sustainable growth. Finally, from the technical point of
view the renewable fuels must meet all the technical specifications of the fossil fuels, since it is not desirable to change the
configuration of the aircraft due to the costs associated with its
recertification. In brief, there is a growing demand of renewable
aviation fuel that fulfills the ASTM standards, and it can be generated from renewable sources in sustainable production
processes.
The renewable aviation fuel can be produced from any type
of biomass. According to Maity (2015), the biomass can be classified considering its chemical nature in triglyceride, lignocellulosic, sugar and starchy feedstock (Fig. 2.1).
The triglyceride feedstock includes oil and fats that are edible, nonedible, and wastes. On the other hand, the lignocellulosic feedstock considers different biomasses such as wood,
husks, straws, grasses, and kernels, among others. Moreover,
sugarcane and sugar beet are classified as sugar feedstock,
while corn and wheat are starchy feedstock. Based on the classification of the biomass, the conversion routes to produce
biojet fuel are grouped, in analogy with the classification proposed for biorefineries by Maity (2015); thus, there are three
types of processing routes to generate biojet fuel: triglyceride
Production Processes of Renewable Aviation Fuel. DOI: https://doi.org/10.1016/B978-0-12-819719-6.00002-X
© 2021 Elsevier B.V. All rights reserved.
33
34
Chapter 2 Renewable feedstock and its conversion routes to biojet fuel
Figure 2.1 Triglyceride, lignocellulosic, and sugar feedstock.
conversion processes, lignocellulosic conversion processes,
and sugar and starchy conversion processes. Each one of
these conversion processes considers different technologies
to generate biojet fuel. However, an interesting aspect of this
classification is that raw materials of the different generations could be processed under the same type of technology.
Thus, it could be possible to mix different raw materials of a
variety of sources in the same processing facility; this alternative could help to guarantee the supply of the raw materials to the processing plants. In the literature, the
transformation of these types of biomasses through different
conversion pathways has been reported (Gutiérrez-Antonio
et al., 2017). However, the technical feasibility of a production process to generate biojet fuel is not enough to use it
commercially; the latter is only possible when the conversion pathway is certified. For renewable aviation fuel two
types of certification are needed. The technical certification
is related to the composition and properties required for the
use of biojet fuel in airplanes, and the sustainability certification (International Civil Aviation Organization, 2017a) is
related to compliance with legal, environmental, and social
aspects in the whole supply chain for the production of the
biofuel.
Accordingly, in this chapter we present the different types of
biomasses (Section 2.2) that can be used to produce biojet fuel.
Moreover, in Section 2.3 a description of processing routes is
given, including the certified pathways and those under the certification process.
2.2
Raw materials
As mentioned before, biomass can be classified according to
its chemical nature. Thus, in this chapter we provide detailed
information about triglyceride feedstock (Section 2.2.1), sugar
and starchy feedstock (Section 2.2.2), and lignocellulosic feedstock (Section 2.2.3).
Chapter 2 Renewable feedstock and its conversion routes to biojet fuel
2.2.1
Triglyceride feedstock
The triglyceride feedstock consists of fatty acids, whose composition varies significantly depending on the source and geographical origin (Maity, 2015). The main types of fatty acids present in
this type of feedstock are oleic, palmitic, stearic, linoleic, linolenic,
and ricinoleic (Gui et al., 2008). In Fig. 2.2 the chemical structures
of oleic, palmitic, and stearic acids are presented.
In triglyceride feedstock vegetable oils, animal fats, microalgae
oil, and waste oils are included. Fig. 2.3 presents the chemical structure of a typical triglyceride of vegetable oils, which is triolein.
Vegetable oils are obtained from crops, which can be edible or
nonedible; for instance, the oils obtained from canola, sunflower,
and soybean are edibles, while those extracted from Jatropha,
castor, and palm are non-edibles. Also, in this category, the oil
extracted from algae, micro and macro, and insects, such as black
soldier fly larvae, are considered. In Fig. 2.4 some representative
second-generation vegetable oils and animal fats are shown.
Table 2.1 shows the content, yield, and price of oils from different cultivated triglyceride feedstock; also, this table presents
the time required for the source to reach its maturity, so it can
be used for oil production.
As can be observed in Table 2.1, these types of feedstock
are obtained from the direct cultivation of crops and/or
Figure 2.2 Chemical structure for oleic, palmitic, and stearic acids.
Figure 2.3 Chemical structure of triolein.
35
36
Chapter 2 Renewable feedstock and its conversion routes to biojet fuel
Figure 2.4 Examples of vegetable oils and animal fat.
Table 2.1 Oil content, yield, and price of oils from different cultivated triglyceride feedstock
along with its productivity time (Gallagher, 2011; Atabani et al., 2012, 2013; Ruiz et al., 2013;
Issariyakul and Dalai, 2014; Čičková et al., 2015; Wang, 2016; Dimian et al., 2019).
Soybean
Coconut
Jatropha curcas
Castor
Microalgae (low oil content)
Black soldier fly larvae (BSFL)
Oil content %
Oil yield
(L/ha/year)
Productivity time
Oil price
(USD/metric ton)
15
63
35
53
30
35
446
2
1892
1413
58,700
193,560,600
65 90 days
4.5 7 years
1 year
3 5 months
6 15 days
22 24 days
684
812
500
700
1706
1000a
20
65
40
40
a
Reference price for fish meal fabricated with BSFL, since the price of BSFL oil is not available in the literature.
microorganisms; due to this, its costs are usually elevated.
Moreover, the yields and productivity times vary considerably.
From the triglyceride feedstock, the oil extracted from BSFL is the
one with the biggest potential of production per area unit; this
value is even superior for microalgae with high content of oil
(70%), whose productivity is 136,900 L/ha per year (Atabani et al.,
2012). The idea of using BSFL for processing of organic waste was
proposed almost 100 years ago (Čičková et al., 2015); however, in
the last years, its use as biological treatment has gained attention,
and it is a very interesting source for triglyceride feedstock.
In order to guarantee the economic feasibility of using this
type of feedstock, it is suggested that the oil extraction is realized near to the places where biomass is produced. In this way,
the transportation costs and, also, the associated carbon dioxide
emissions are low.
Chapter 2 Renewable feedstock and its conversion routes to biojet fuel
Moreover, there are also triglyceride feedstock that are residues; for instance, there are tallow oil, pork lard oil, poultry
fat, and fish oil, along with waste oils from cooking and industrial processes. Unlike the cultivated biomasses presented in
Table 2.1, the amount of residues generated depends on each
country’s lifestyle and its consumption habits. For instance,
the United States and China lead the generation of edible
waste oil with 10 and 4.5 million tons per year, while Japan
and Malaysia around 0.5 million tons per year (Gui et al.,
2008). The amount of waste oils, for instance, is significative in
some countries, and it can be used to produce renewable aviation fuel. However, this type of residue usually requires a
chemical pretreatment, at least a filtration stage to remove the
food solid residues, and usually a drying stage to eliminate
water. Moreover, the main bottleneck is the recollection of the
raw material, which is usually dispersed inside the cities; thus
the costs associated with the recollection are elevated.
Considering that the first articles where biojet fuel was mentioned were published in 2009 (Markets and Business, 2009;
Marsh, 2009) it is clear that all the types of triglyceride feedstock have not been explored. An interesting opportunity area is
the use of mixtures of triglyceride feedstock; this will help
strengthen the supply chain for the production of renewable
aviation fuel. For instance, a mixture of Jatropha curcas and
waste cooking oils can be used to produce renewable aviation
fuel (Gutiérrez-Antonio et al., 2017); this also represents a
design challenge, since the production facility must be flexible
enough to deal with changes in the feedstock composition.
In general, the obtention of triglyceride feedstock is expensive; however, its processing costs are lower than the raw material cost. The low-cost alternatives of this feedstock are the
waste oil and fats; however, its processing costs are higher due
to the necessity of pretreatments before its conversion to produce biojet fuel.
2.2.2
Sugar and starchy feedstock
The sugar and starchy feedstock consist of all biomasses with
high contents of sugar/or starch (Maity, 2015); among sugars,
sucrose, glucose, and fructose are the most important (Zabed
et al., 2016). The chemical structure of the main monosaccharides
in the sugar is presented in Fig. 2.5. Likewise, in Fig. 2.6 the
chemical structure of the starch is presented. This type of biomass includes sugarcane, sweet sorghum, sugar beet, and sweet
37
38
Chapter 2 Renewable feedstock and its conversion routes to biojet fuel
Figure 2.5 Chemical structure of monosaccharides from sugar.
Figure 2.6 Chemical structure of starch.
potato, among others; some examples of them are shown in
Fig. 2.7, complementary to the sweet potato shown in Fig. 2.1.
Almost all the sugar and starchy feedstock include edible
crops. In some countries, such as Brazil and the United States,
the use of this feedstock to produce biofuels is commonly
accepted. However, in other countries the use of edible crops to
produce biofuels is forbidden or allowed under some circumstances. For instance, in Mexico, the use of corn to generate biofuels is just allowed when there is a surplus in the national
Chapter 2 Renewable feedstock and its conversion routes to biojet fuel
39
production (Diario Oficial de la Federación, 2019); in the last
decade, 20% of the corn consumed in Mexico is imported, which
indicates that this raw material is not promissory to produce
renewable aviation fuels in this country (Food and Agricultural
Organization of the United Nations, 2011).
Therefore the use of this type of feedstock for the production of renewable aviation fuel must be verified in each country, considering the availability of the raw material and also
the applicable legislation. Moreover, the use of edible crops
to produce biofuels could affect the food safety; in order to
overcome this dilemma, the study of Das (2017) suggests the
use of another raw material such as microalgae and algae.
Another important aspect is the productivity per hectare of
this type of sugar and starchy feedstock, which is presented
in Table 2.2.
As can be observed in Table 2.2, the prices of this type of
feedstock are minor than those for triglyceride feedstock;
however, these materials have in general low content of
sugars. Moreover, the yields and productivity times vary
Figure 2.7 Sugar and starchy feedstock.
Table 2.2 Sugar content, yield, and price of sugar and starchy biomasses along with its
productivity time (Appiah-Nkansah et al., 2019; Barros-Rios et al., 2015; Lai et al., 2013;
Paneque Ramirez, 2019; Food and Agricultural Organization of the United Nations, 2019a,b).
Sugar beet
Sweet sorghum
Sweet corn
Sugarcane
Sweet potato
Sugar content (%)
Crop yield
(ton/ha/year)
Productivity time
(months)
Crop price
(USD/metric ton)
21.8
17
6.43
17.6
8.41
100
60
98
85
40
6
6
3
18
3 6
56.75
268.54
220.25
185.72
855.31
40
Chapter 2 Renewable feedstock and its conversion routes to biojet fuel
considerably. From the sugar and starchy feedstock, sugar
beet and sweet corn are the ones with the biggest potential
of production per area unit; also, the productivity of sugarcane is close to that high value. Due to this, the use of these
raw materials to produce biofuels is of great interest. For
this type of feedstock, the main challenge is the availability
of an effective and efficient pretreatment, which allows
extracting the sugar contained in them; nowadays, this challenge remains.
Moreover, there are also sugar and starchy feedstock that are
residues; for instance, there are residues from fruits and vegetables, as well as sugar residues from confectionery industries.
Unlike the cultivated biomasses presented in Table 2.2, the
amount of residues generated depends on each country
and its consumption habits. Among food wastes, fruits and
vegetables have the higher wastage rate, which is 45% worldwide, while in North American and Oceania zones the percentage increases to 53% (Food and Agricultural Organization of the
United Nations, 2019a,b,c).
The amount of sugar and starchy residues is significative in
almost every country, and it can be used to produce renewable
aviation fuel. However, this type of residue usually requires a
pretreatment, in order to release the sugars contained in the
feedstock. In addition, the main bottleneck is the recollection of
the raw material, which is usually dispersed inside the cities;
thus the costs associated with the recollection are elevated.
Therefore it is clear that all the types of sugar and starchy
feedstock have not been explored, especially those that are residues. Similar to the triglyceride feedstock, an interesting opportunity area is the use of mixtures of residues, where it can help
strengthen the supply chain for the production of renewable
aviation fuel. However, the use of mixtures of residues could
complicate the processing, since there is not a pretreatment
that works properly for all types of biomass.
In general, the costs of obtention of sugar and starchy feedstock are intermediate, as well as the costs related to its processing. The low-cost alternatives of this type of feedstock are
residues; however, its processing costs are higher due to the
necessity of pretreatments and the recollection of these materials that are scattered in cities as well as cultivation areas.
Considering that most of the sources of this type of feedstock
are used for human feeding, the use of residues is one of the
most promissory alternatives to produce biojet fuel and also
solve the associated pollution problem.
Chapter 2 Renewable feedstock and its conversion routes to biojet fuel
2.2.3
Lignocellulosic feedstock
The lignocellulosic feedstock includes those materials composed mainly by cellulose, hemicellulose, and lignin; it also contains extractives, pectin, protein, and metal or ash in fractions
(Marriott et al., 2016; Deshavath et al., 2019). In particular, cellulose and hemicellulose are polymeric carbohydrates that include
different types of hexose and pentose sugars, which can be liberated during the hydrolysis (Deshavath et al., 2019); cellulose
and hemicellulose are covered by lignin, which is a threedimensional methoxylated polyphenolic compound (Zhou et al.,
2011; Deshavath et al., 2019). In Fig. 2.8 the chemical structures
of cellulose, hemicellulose, and lignin are presented. It is worth
mentioning that the lignin structure can show differences
depending on the biomass type (Mahmood et al., 2018).
In lignocellulosic feedstock are included agricultural and horticultural residues, forest residues, municipal solid waste, perennial
grasses, bioenergy crops, aquatic plants, and paper and cotton
wastes (Ramachandra et al., 2000; Ruane et al., 2010; Kurian
et al., 2013); Fig. 2.9 shows examples of lignocellulosic feedstock.
Agricultural residues include all the biomass that is generated in the species cultivation process. Thus, the major amount
of this type of waste is generated in the cereal cultivations;
some examples are wheat straw, rice straw and husks, barley
straw, corn pots and leafs (Food and Agricultural Organization
of the United Nations, 2018). On the other hand, forest residues
include those generated from bamboo, oak, pinewood, and
eucalyptus wood; while species such as switchgrass, elephant
grass, and Citronella spent biomass are part of the bioenergy
crops (Deshavath et al., 2019). Table 2.3 shows the worldwide
availability and composition of different lignocellulosic feedstock; prices are not included since in most of the cases the biomass is free, at least initially, and the main contribution to the
price relies on the transportation costs.
As can be observed in Table 2.3, this type of feedstock is generated in considerable amounts. In spite of this, in most of the
cases, these residues are geographically dispersed; this implies
high costs associated with its collection, as well as a high environmental impact due to the same activity. Due to this, it is desirable
to concentrate the biomass produced in a region, instead of trying
to collect all the biomass generated in a country.
From the lignocellulosic feedstock, municipal wastes have
the biggest generation potential; nevertheless, the high variability in the composition of this type of feedstock makes difficult
its efficient conversion. Considering the wide variety of
41
42
Chapter 2 Renewable feedstock and its conversion routes to biojet fuel
Figure 2.8 Chemical structure: (A) cellulose, (B) hemicellulose, and (C) lignin.
Chapter 2 Renewable feedstock and its conversion routes to biojet fuel
43
Figure 2.9 Agricultural residues.
Table 2.3 The availability and composition of different lignocellulosic feedstock (Lamborn,
2009; Kurian et al., 2013; Deshavath et al., 2019; WB, 2020).
Annual availability
Wheat straw
Sugarcane bagasse
Corn stover
Rice straw
Forest residues
Municipal wastes
Paper
1056 million tons
502 million tons
1413 million tons
1084 million tons
274 million tons
1.3 billion tons
0.34 billion tons
Composition (%)
Cellulose
Hemicellulose
Lignin
40
46
37
35
38
37
81
28
27
27
18
4
8
9
16
14
14
7
16
15
2
49
48
42
49
lignocellulosic feedstocks it is clear that all the types of this biomass have not been explored. An interesting opportunity area is
the use of mixtures of lignocellulosic feedstock; this will help
strengthen the supply chain for the production of renewable
aviation fuel. However, this also represents a big challenge in
the design of the conversion processes.
In general, the obtention of lignocellulosic feedstock is of low
or null cost, since it is generated as a by-product of the cultivation processes; however, its processing costs are elevated due to
the necessity of pretreatments before its conversion to produce
biojet fuel. It is worth mentioning that in some cases, at the
beginning the residues are given with no cost by those who generate them; however, as the time goes by its price begins to
increase, since selling the residues has been detected as a business opportunity. Thus, this is an important issue if those who
process the residue are not the same that generate them.
28
35
25
28
20
19
26
50
44
Chapter 2 Renewable feedstock and its conversion routes to biojet fuel
2.3
Production pathways
The synthetic aviation fuel can be produced from coal, natural gas, or biomass (Liu et al., 2013). Nevertheless, coal and natural gas are not renewable alternatives; therefore production
processes where these raw materials are used are not covered in
this book. Thus biojet fuel can be produced from lignocellulosic, triglyceride, sugar and starchy feedstock through many
emerging technologies (Hari et al., 2015).
There are several production pathways that allow converting
the biomass, according to its chemical nature. Fig. 2.10 shows
the main conversion routes to generate biojet fuel from biomass.
Sugar and starchy feedstock can be converted to biojet fuel
through biochemical processes, such as sugar to hydrocarbons
and alcohol to jet (ATJ) (International Civil Aviation Organization,
2017b). The first route is called direct fermentation of sugars to
hydrocarbons or synthesized isoparaffins produced from hydroprocessed fermented sugars (HFS-SIP); in this conversion pathway, modified microorganisms convert sugar into substances such
as farnesene, synthetic isoparaffin (SIP), that can be converted
into a product with as good characteristics as aviation fuel. On the
other hand, in the ATJ process, as the name suggests, biojet fuel is
obtained through the dehydration of alcohol and subsequent oligomerization and hydrogenation; it is worth mentioning that the
alcohol production is not included as part of the process in the
certified process, but this is generated through the conversion of
sugar with microorganisms.
Moreover, the lignocellulosic feedstock can be converted to
biojet fuel through thermochemical pathways, which include
pyrolysis followed by hydroprocessing, gasification followed by
Fischer Tropsch, and hydrothermal upgrading (International
Civil Aviation Organization, 2017b). The first process considers
Figure 2.10 Conversion pathways to produce renewable aviation fuel.
Chapter 2 Renewable feedstock and its conversion routes to biojet fuel
the conversion of lignocellulosic feedstock through pyrolysis,
where bio-oil is obtained and later converted to biojet fuel with
hydroprocessing technology. In the second process, the lignocellulosic biomass is gasified to obtain syngas, which is later
converted to biojet fuel, and other renewable hydrocarbons,
with Fischer Tropsch catalytic reaction followed by hydroprocessing. Finally, the hydrothermal liquefaction of biomass
allows generating bio-oil, which is subsequently converted to
biojet fuel through hydroprocessing. It is worth mentioning that
bio-oil generated by pyrolysis and hydrothermal liquefaction
differs between them in its chemical composition.
In the hydroprocessing pathway, the triglyceride feedstock
is transformed into biojet fuel through hydrodeoxygenation,
hydroisomerization, and hydrocracking to produce biojet fuel
(International Civil Aviation Organization, 2017b); depending on
the process conditions, triglyceride type, and catalyst, biojet
fuel could have aromatic compounds. Therefore a variant of the
hydroprocessing technology is the hydroprocessing plus aromatics, where an additional processing line is considered to
obtain aromatic compounds. In this way, the produced biojet
fuel contains all the compounds included in the fossil jet fuel;
this biofuel could be used without the necessity of mixtures
with the fossil jet fuel, but this is not approved for use in commercial flights under ASTM standards.
The conversion routes presented in Fig. 2.2 have different
advantages and disadvantages. In general, triglyceride feedstock
is expensive, but its processing costs are low, while lignocellulosic biomass is a low-cost feedstock with high processing costs
due to the necessity of many conversion stages. In addition,
biomasses with high contents of sugar and starchy are raw
materials with intermediate costs (between triglyceride and lignocellulosic feedstock) and also intermediate processing costs
(Gutiérrez-Antonio et al., 2017). In this context, the best raw
material is the one that is available in a proper amount to be
processed, since for all types of feedstock there are compromises between its acquisition and processing costs; it is worth
mentioning that raw materials costs and its transportation will
affect the supply chain, which plays an important role in the
financial viability of the production process of biojet fuel.
In the literature, the study of these conversion pathways under
different operating conditions, catalysts types, and raw materials
have been reported (Liu et al., 2013; Wang, 2016; Gutiérrez-Antonio
et al., 2017; Vásquez et al., 2017; Wei et al., 2019; Zhao et al., 2019).
Moreover, performance characteristics of biojet fuels have been
reported, such as low-temperature fluidity, thermal oxidation
45
46
Chapter 2 Renewable feedstock and its conversion routes to biojet fuel
stability, combustion characteristics, and fuel volatility (Deane and
Pye, 2018; Yang et al., 2019; Scheelhaase et al., 2019). In addition,
the study of current policies and drivers for the establishment of
the supply chain of the renewable aviation fuel has also been
reported (Domı́nguez-Garcı́a et al., 2017a,b; Deane et al., 2017;
Neuling and Kaltschmitt, 2018; Wei et al., 2019). However, the technical and economic feasibility are not enough to produce and commercialize renewable aviation fuel. Commercial aircraft are certified
to operate on specified fuel, which must be evaluated under the
process established in ASTM D4054 standard (ASTM International,
2017; Commercial Aviation Alternative Fuels Initiative, 2019); as a
result of this evaluation the maximum amount of the new fuel
allowed in the aircraft is defined, and then it is added
to ASTM D7566 standard (ASTM International, 2019). In this way,
a fuel is approved for use in all existing commercial aircraft
(CAAFI, 2020).
According to the International Civil Aviation Organization
(2017a,b), the fuel quality is based on two key concepts: batches
and traceability; the batches principle guarantees that a minimum volume is homogeneous, and traceability imposes a custody chain regarding the fuel specification. Thereby the quality
of new alternative fuels is evaluated with the process established in ASTM D4054 standard (ASTM International, 2017),
and it includes three phases according to Commercial Aviation
Alternative Fuels Initiative (2019).
During the first phase, a task force is integrated by the companies with similar transformation processes that are interested in
getting the certification; in this phase, the specification and the
fit-to-purpose properties are determined. The test’s results of the
levels 1 and 2 are compiled in a report that is sent to the Original
Equipment Manufacturers, which include companies as Safran,
Boeing, Honeywell, Rolls-Royce, and Airbus. The manufacturers
review this information to determine if the proposed renewable
aviation fuel is fit for purpose for use on aircraft and engines, and,
also, to identify the Phase 2 testing requirements (Commercial
Aviation Alternative Fuels Initiative, 2019).
In the Phase 2, more tests are realized oriented to evaluate
the component/rig (Level 3) and the engine auxiliary power
unit (Level 4). Again, all the results are integrated into a report
that is sent to the Original Equipment Manufacturers to review
and approval for use on aircraft and engines (Commercial
Aviation Alternative Fuels Initiative, 2019).
After all the tests and revisions, during the Phase 3 the US
Federal Aviation Administration review the approval of the Original
Equipment Manufacturers and initial balloting occurs at the
Chapter 2 Renewable feedstock and its conversion routes to biojet fuel
subcommittee level (Commercial Aviation Alternative Fuels
Initiative, 2019). After that, ASTM gives a period a time to receive
additional comments, which can be addressed or solved through
additional tests. Later, when all comments are attended there is a
final balloting at the committee level and ASTM adds the new fuel
to the D7566 standard as a new annex (Commercial Aviation
Alternative Fuels Initiative, 2019).
The certification process of a new fuel usually takes between
3 and 5 years, since it is a multistage and multifactor process
and requires up to 890,000 L of blended jet fuel to be completed
(Pavlenko and Kharina, 2018). Considering the operation conditions of airplanes and the high number of casualties in accident
cases, it is clear that a careful evaluation process of new alternative fuels must be conducted. However, this process must be
streamlined as much as possible in order to allow further diversification of conversion processes and feedstocks for the production of aviation alternative fuels (International Civil Aviation
Organization, 2017a,b).
Nowadays, there are six pathways that are approved for the
production of biojet fuel and its use in commercial aviation,
and there are others under evaluation for approval by ASTM;
these processes will be presented in Sections 2.3.1 and 2.3.2,
respectively.
2.3.1
Certified pathways
The first certified process for biojet fuel production was
Fischer Tropsch synthetic paraffinic kerosene (FT-SPK), and it was
approved in 2009. The feedstocks that can be used for this process
include natural gas, coal, and biomass (International Civil Aviation
Organization, 2017a,b). In this process, the feedstock is gasified to
obtain syngas, which contains carbon monoxide and hydrogen; the
syngas is transformed with Fischer Tropsch catalytic reaction and
later converted to biojet fuel, and other renewable hydrocarbons,
through hydroprocessing. The renewable aviation fuel produced
through FT-SPK can be used in mixtures with fossil jet fuel with
compositions up to 50% in volume, according to ASTM D7566 standard (ASTM International, 2019). The companies that have commercialization proposals for FT-SPK technology are Fulcrum
Bioenergy, Red Rock Biofuels, SG Preston, Kaidi, Sasol, Shell, and
Syntroleum (Commercial Aviation Alternative Fuels Initiative, 2019).
In the scientific literature the main raw materials studied for this
type of process include octacosane, hexatriacontane, subbituminous coal and blends of coal and various biomass sources such as
47
48
Chapter 2 Renewable feedstock and its conversion routes to biojet fuel
olive pits, switchgrass, and dried distillers’ grain (Gutiérrez-Antonio
et al., 2017).
In 2011 it was approved the hydroprocessed esters and fatty
acids synthetic paraffinic kerosene (HEFA-SPK) process. The feedstocks that can be used for this process include vegetable oils,
bio-oils from pyrolysis, waste oils, and animal fats (International
Civil Aviation Organization, 2017a,b). In this process, the triglyceride feedstock is converted to renewable hydrocarbons through the
reactions of hydrodeoxygenation, hydroisomerization, and hydrocracking; as products light gases, naphtha, biojet fuel, and green
diesel are obtained and purified through distillation. The renewable aviation fuel produced through HEFA-SPK can be used in
mixtures with fossil jet fuel with compositions up to 50% in volume, according to ASTM D7566 standard (ASTM International,
2019). The companies that have commercialization proposals for
this process are AltAir Fuels, Honeywell UOP, Neste Oil, Dynamic
Fuels, and EERC (Commercial Aviation Alternative Fuels Initiative,
2019). In the scientific literature, the main raw materials studied
are oils from soybean, J. curcas, castor, along with corn stalks biooil, cooking oil, and vacuum gas oil of vegetable oil mixtures
(Gutiérrez-Antonio et al., 2017).
The HFS-SIP, also known as direct sugar to hydrocarbons, was
the third approved process, in 2014, for biojet fuel production. The
feedstocks that can be used for this process include sugars and all
the biomass used for sugar production (International Civil Aviation
Organization, 2017a,b). In this process, the feedstock is converted
to farnesene, a C15 hydrocarbon, with the use of modified yeasts;
later, farnesene is hydrotreated in order to generate a biofuel that
can be used until 10% in volume in mixtures with fossil jet fuel,
according to ASTM D7566 standard (ASTM International, 2019).
The companies that have commercialization proposals for this process are Amyris and Total (Commercial Aviation Alternative Fuels
Initiative, 2019).
In 2015 the Fischer Tropsch synthetic paraffinic kerosene with
aromatics (FT-SPK/A) process was approved. The feedstocks that
can be used for this process are the same for FT-SPK technology,
and they include natural gas, coal, and biomass (International Civil
Aviation Organization, 2017a,b). In this process, the feedstock is
gasified to obtain syngas that contains carbon monoxide and
hydrogen. The syngas is transformed with Fischer Tropsch catalytic reaction followed by the alkylation of light aromatics (primarily
benzene) to create a hydrocarbon blend that includes aromatic
compounds; these compounds are required to ensure elastomer
seal swell in aircraft components to prevent fuel leaks (Commercial
Chapter 2 Renewable feedstock and its conversion routes to biojet fuel
Aviation Alternative Fuels Initiative, 2019). The renewable aviation
fuel produced through FT-SPK/A process can be used in mixtures
with fossil jet fuel until 50% in volume according to ASTM D7566
standard (ASTM International, 2019). For this process, Sasol is the
only company that has a commercialization proposal (Commercial
Aviation Alternative Fuels Initiative, 2019).
The alcohol-to-jet synthetic paraffinic kerosene (ATJ-SPK)
process was approved in 2016. This process uses as feedstock
all the biomass that is used for starch and sugar production,
and cellulosic biomass for alcohol production (Commercial
Aviation Alternative Fuels Initiative, 2019). In this process, the
dehydration of isobutanol or ethanol followed by oligomerization and hydrogenation are performed to produce a hydrocarbon jet fuel (Commercial Aviation Alternative Fuels Initiative,
2019). The produced biofuel can be used until 30% in volume in
mixtures with fossil jet fuel, according to ASTM D7566 standard
(ASTM International, 2019). The companies that have commercialization proposals for this technology are Gevo, Cobalt,
Honeywell UOP, Lanzatech, Swedish Biofuels, and Byogy
(Commercial Aviation Alternative Fuels Initiative, 2019).
Recently, in 2018 it was approved the coprocessing of renewable lipids (plant and animal fats) with crude oil-derived middle
distillates in petroleum refineries (Commercial Aviation
Alternative Fuels Initiative, 2019). The produced biofuel can be
used in mixtures with fossil aviation fuel up to 5% (Thion,
2019).
According to Thion (2019), among the certified technologies
FT-SPK, FT-SPK/A, and ATJ-SPK processes are at demonstration
level, while HEFA-SPK and HFS-SIP are at the commercialization stages. At the moment, the biojet fuel produced for any of
the approved pathways is not competitive in the market (Thion,
2019); therefore the efforts must be focused on the use of lowcost raw materials and the development of efficient conversion
processes.
2.3.2
Advances in the certification of new
pathways
The research and development of new processes for the production of renewable aviation fuel are highly dynamic. By
January of 2020, eight new pathways are in different phases of
evaluation, with the objective of getting the approval of ASTM
(Commercial Aviation Alternative Fuels Initiative, 2019).
49
50
Chapter 2 Renewable feedstock and its conversion routes to biojet fuel
In the first phase, the active force tasks of the processes
under evaluation are the following ones (Commercial Aviation
Alternative Fuels Initiative, 2019):
• high freeze point hydroprocessed esters and fatty acids synthetic kerosene (HFP HEFA-SK) impulsed by Boeing;
• hydrodeoxygenation synthetic aromatic kerosene (HDOSAK) lead by Virent;
• alcohol-to-jet synthetic kerosene with aromatics (ATJ-SKA)
promoted by Byogy and Swedish Biofuels;
• integrated hydropyrolysis and hydroconversion (IH2) presented by Shell; and
• hydroprocessed Esters and Fatty Acids Synthetic Paraffinic
Kerosene (HEFA-SPK) by IHI.
In the first phase there is another inactive task force lead by
KiOR with the pathway Hydrotreated depolymerized cellulosic
jet (HDCJ).
On the other hand, in the Phase 2 there is one active task force
lead by ARA for the catalytic hydrothermolysis synthetic kerosene
(CH-SK) process, while the hydrodeoxygenation synthetic kerosene (HDO-SK) process promoted by Virent is actually inactive
(Commercial Aviation Alternative Fuels Initiative, 2019).
From the eight processes under evaluation, three of them
employ sugar and cellulosic feedstocks (HDO-SK, HDO-SAK, ATJSKA), two of them use plant and animal fats, oils, and greases (CHSK, HFP HEFA-SK), one of them converts hydrocarbon-rich algae
oil (HEFA-SPK), and another one considers forest residues (HDCJ),
while the IH2 can process multiple feedstock (Commercial Aviation
Alternative Fuels Initiative, 2019).
2.4
Summary
Biojet fuel can be produced from all types of biomass, for
example, triglyceride, lignocellulosic, sugar, and starchy. There
are three main processing pathways for conversion of the biomass, which include chemical, biochemical, and thermochemical processes. Considering these conversion pathways, several
raw materials have been studied, and this research field has had
a fast growth. However, the production processes of biojet fuel
must be approved by ASTM for its use in commercial flights.
The certification process takes between 3 and 5 years, and
almost 900,000 L of renewable aviation fuel are required for the
tests during the certification process. Therefore in order to
increase the supply of renewable aviation fuel it is necessary to
Chapter 2 Renewable feedstock and its conversion routes to biojet fuel
continue researching in the development of new production
processes and in parallel to expedite the certification process.
References
Appiah-Nkansah, N.B., Li, J., Rooney, W., Wang, D., 2019. A review of sweet
sorghum as a viable renewable bioenergy crop and its techno-economic
analysis. Renew. Energy 143, 1121 1132.
ASTM International, 2017. ASTM D4054-17, Standard Practice for Evaluation of
New Aviation Turbine Fuels and Fuel Additives. ,www.astm.org. (accessed
18.05.19.).
ASTM International, 2019. ASTM D7566-19, Standard Specification for Aviation
Turbine Fuel Containing Synthesized Hydrocarbons. ,www.astm.org.
(accessed 12.05.19.).
Atabani, A.E., Silitonga, A.S., Badruddin, I.A., Mahlia, T.M.I., Masjuki, H.H.,
Mekhilef, S., 2012. A comprehensive review on biodiesel as an alternative
energy resource and its characteristics. Renew. Sustain. Energy Rev. 16 (4),
2070 2093.
Atabani, A.E., Silitonga, A.S., Ong, H.C., Mahlia, T.M.I., Masjuki, H.H.,
Badruddin, I.A., et al., 2013. Non-edible vegetable oils: a critical evaluation of
oil extraction, fatty acid compositions, biodiesel production, characteristics,
engine performance and emissions production. Renew. Sustain. Energy Rev.
18, 211 245.
Barros-Rios, J., Romanı́, A., Garrote, G., Ordas, B., 2015. Biomass, sugar, and
bioethanol potential of sweet corn. GCB Bioenergy 7, 153 160.
Commercial Aviation Alternative Fuels Initiative, 2019. Fuel qualification. ,http://
www.caafi.org/focus_areas/fuel_qualification.html#. (accessed 16.01.20.).
Čičková, H., Larry Newton, G., Curt Lacy, R., Kozánek, M., 2015. The use of fly
larvae for organic waste treatment. Waste Manag. 35, 68 80.
Das, G.G., 2017. Food feed biofuel trilemma: biotechnological innovation
policy for sustainable development. J. Policy Model. 39 (3), 410 442.
Deane, P., Gallachóir, B.O., Shea, R.O., 2017. Chapter 12 Biofuels for aviation:
policy goals and costs. In: Welsch, M., Pye, S., Keles, D., Faure-Schuyer, A.,
Dobbins, A., Shivakumar, A., et al.,Europe’s Energy Transition Insights for
Policy Making, Eds. Academic Press, pp. 79 88.
Deane, J.P., Pye, S., 2018. Europe’s ambition for biofuels in aviation a strategic
review of challenges and opportunities. Energy Strategy Rev. 20, 1 5.
Deshavath, N.N., Veeranki, V.D., Goud, V.V., 2019. Lignocellulosic feedstocks for
the production of bioethanol: availability, structure, and composition.
Sustain. Bioenergy Adv. Impacts 1 19.
Diario Oficial de la Federación, 2019. Ley del Desarrollo Rural Sustentable.
,http://www.diputados.gob.mx/LeyesBiblio/pdf/235_120419.pdf. (accessed
06.01.20.) (Spanish).
Dimian, A.C., Iancu, P., Plesu, V., Bonet-Ruiz, A.E., Bonet-Ruiz, J., 2019. Castor oil
biorefinery: conceptual process design, simulation and economic analysis.
Chem. Eng. Res. Des. 141, 198 219.
Domı́nguez-Garcı́a, S., Gutiérrez-Antonio, C., De Lira-Flores, J.A., Ponce-Ortega,
J.M., El-Halwagi, M.M., 2017a. Strategic planning for the supply chain of
aviation biofuel with consideration of hydrogen production. Ind. Eng. Chem.
Res. 56 (46), 13812 13830.
51
52
Chapter 2 Renewable feedstock and its conversion routes to biojet fuel
Domı́nguez-Garcı́a, S., Gutiérrez-Antonio, C., De Lira-Flores, J.A., Ponce-Ortega,
J.M., 2017b. Optimal planning for the supply chain of biofuels for aviation in
Mexico. Clean Technol. Environ. Policy 19, 1387 1402.
Food and Agricultural Organization of the United Nations, 2018. World Food
and Agriculture Statistical Pocketbook, Rome, 254. Licence: CC BY-NC-SA
3.0 IGO.
Food and Agricultural Organization of the United Nations, 2011. Agriculture
news from Latin America and the Caribbean. ,http://www.fao.org/in-action/
agronoticias/detail/en/c/490185/. (accessed 21.04.20.).
Food and Agricultural Organization of the United Nations, 2019a. Producers
prices annual. ,http://www.fao.org/faostat/en/#data/PP. (accessed
06.01.20.).
Food and Agricultural Organization of the United Nations, 2019b. Export prices
of wheat and maize generally firmer in November. ,http://www.fao.org/
giews/food-prices/international-prices/detail/en/c/1254994/. (accessed
06.01.20.).
Food and Agricultural Organization of the United Nations, 2019c. Key facts on
food loss and waste you should know! ,http://www.fao.org/save-food/
resources/keyfindings/en/. (accessed 06.01.20.).
Gallagher, B.J., 2011. The economics of producing biodiesel from algae. Renew.
Energy 36 (1), 158 162.
Gui, M.M., Lee, K.T., Bhatia, S., 2008. Feasibility of edible oil vs. non-edible oil
vs. waste edible oil as biodiesel feedstock. Energy 33 (11), 1646 1653.
Gutiérrez-Antonio, C., Gómez-Castro, F.I., de Lira-Flores, J.A., Hernández, S.,
2017. A review on the production processes of renewable jet fuel. Renew.
Sustain. Energy Rev. 79, 709 729.
Hari, T.K., Yaakob, Z., Binitha, N.N., 2015. Aviation biofuel from renewable
resources: routes, opportunities and challenges. Renew. Sustain. Energy Rev.
42, 1234 1244.
International Air Transport Association, 2019. Industry statistics. Fact Sheet,
June 2019. ,https://www.iata.org/pressroom/facts_figures/fact_sheets/
Documents/fact-sheet-industry-facts.pdf. (accessed 16.09.19.).
International Civil Aviation Organization, 2017a. Status of technical certification
of aviation alternative fuels. In: Conference on Aviation and Alternative Fuels.
,https://www.icao.int/Meetings/CAAF2/Documents/CAAF.2.WP.007.1.en.
pdf. (accessed 16.09.19.).
International Civil Aviation Organization, 2017b. Sustainable aviation fuels guide.
,https://www.icao.int/environmental-protection/knowledge-sharing/Docs/
Sustainable%20Aviation%20Fuels%20Guide_vf.pdf. (accessed 16.01.20.).
Issariyakul, T., Dalai, A.K., 2014. Biodiesel from vegetable oils. Renew. Sustain.
Energy Rev. 31, 446 471.
Kurian, J.K., Nair, G.R., Hussain, A., Raghavan, G.S.V., 2013. Feedstocks,
logistics and pre-treatment processes for sustainable lignocellulosic
biorefineries: a comprehensive review. Renew. Sustain. Energy Rev. 25,
205 219.
Lai, Y.C., Huang, C.L., Chan, C.F., Lien, C.Y., Liao, W.C., 2013. Studies of sugar
composition and starch morphology of baked sweet potatoes (Ipomoea
batatas (L.) Lam). J. Food Sci. Technol. 50 (6), 1193 1199.
Lamborn, J., 2009. Characterisation of municipal solid waste composition into
model inputs. In: Third International Workshop “Hydro-Physico-Mechanics
of Landfills,” Braunschweig, Germany.
Liu, G., Yan, B., Chen, G., 2013. Technical review on jet fuel production. Renew.
Sustain. Energy Rev. 25, 59 70.
Chapter 2 Renewable feedstock and its conversion routes to biojet fuel
Mahmood, Z., Yameen, M., Jahangeer, M., et al., 2018. Lignin isolation from the
spruce wood. Lignin as Natural Antioxidant Capacity. Intech, pp. 182 205.
Maity, S.K., 2015. Opportunities, recent trends and challenges of integrated
biorefinery: part I. Renew. Sustain. Energy Rev. 43, 1427 1445.
Markets and Business, 2009. Biokerosene takes off in aviation sector. Focus
Catal. 1, 2.
Marriott, P.E., Gómez, L.D., McQueen-Mason, S.J., 2016. Unlocking the potential
of lignocellulosic biomass through plant science. New Phytol. 209,
1366 1381.
Marsh, G., 2009. Small wonders: biomass from algae. Renew. Energy Focus 9 (7),
74 78.
Neuling, U., Kaltschmitt, M., 2018. Techno-economic and environmental
analysis of aviation biofuels. Fuel Process. Technol. 171, 54 69.
Paneque Ramirez, G., 2019. Cultivation harvesting and storage of sweet potato
products. Food and Agriculture Organization. ,http://www.fao.org/3/
T0554E/T0554E14.htm. (accessed 06.01.20.).
Pavlenko, N., Kharina, A., 2018. Policy and environmental implications of using
HEFA 1 for aviation. Working Paper 2018.06. The International Council of
Clean Transportation. ,https://www.theicct.org/sites/default/files/
publications/Green-Diesel-Aviation_ICCT-Working-Paper_20180321_vF.pdf.
(accessed 19.05.19.).
Ramachandra, T.V., Joshi, N.V., Subramanian, D.K., 2000. Present and prospective
role of bioenergy in regional energy system. Renew. Sustain. Energy Rev. 4,
375 430.
Ruane, J., Sonnino, A., Agostini, A., 2010. Bioenergy and the potential
contribution of agricultural biotechnologies in developing countries. Biomass
Bioenergy 34, 1427 1439.
Ruiz C.J.A., Medina G.G., González A.I.J., Flores L.H.E., Ramı́rez O.G., Ortiz T.C.,
et al., 2013. Requerimientos agroecológicos de cultivos. Libro Técnico Núm. 3.
Segunda Edición. Instituto Nacional de Investigaciones Forestales Agrı́colas y
Pecuarias, México, 564 pp.
Scheelhaase, J., Maertens, S., Grimme, W., 2019. Synthetic fuels in aviation
current barriers and potential political measures. Transp. Res. Procedia 43,
21 30.
Thion, S., 2019. Flying green sustainable aviation fuels. Offsetting the
environmental impact of a fast growing industry. ,https://www.irena.org/-/
media/Files/IRENA/Agency/Events/2019/May/biojet-EUBCE/5-Sthepane-Thion.
pdf?la 5 en&hash 5 D11D36850F29EA282D63ECDF9B122CDFEAA7AE26.
(accessed 18.01.20.).
Vásquez, M.C., Silva, E.E., Castillo, E.F., 2017. Hydrotreatment of vegetable oils: a
review of the technologies and its developments for jet biofuel production.
Biomass Bioenergy 105, 197 206.
Wang, W.-C., 2016. Techno-economic analysis of a bio-refinery process for
producing hydro-processed renewable jet fuel from Jatropha. Renew. Energy
95, 63 73.
Wei, H., Liu, W., Chen, X., Yang, Q., Li, J., Chen, H., 2019. Renewable bio-jet fuel
production for aviation: a review. Fuel 254, 115599.
World Bank, 2020. Trends in solid waste management. ,http://datatopics.
worldbank.org/what-a-waste/trends_in_solid_waste_management.html.
(accessed 12.01.20.).
Yang, J., Xin, Z., He, Q.S., Corscadden, K., Niu, H., 2019. An overview on
performance characteristics of bio-jet fuels. Fuel 237, 916 936.
53
54
Chapter 2 Renewable feedstock and its conversion routes to biojet fuel
Zabed, H., Faruq, G., Boyce, A.N., Sahu, J.N., Ganesan, P., 2016. Evaluation of
high sugar containing corn genotypes as viable feedstocks for decreasing
enzyme consumption during dry-grind ethanol production. J. Taiwan Inst.
Chem. Eng. 58, 467 475.
Zhao, X., Sun, X., Cui, X., Liu, D., 2019. Production of biojet fuels from biomass.
In: Rai, M., Ingle, A.P. (Eds.), Sustainable Bioenergy. Elsevier, pp. 127 165.
Zhou, C.-H., Xia, X., Lin, C.-X., Tonga, D.-S., Beltraminib, J., 2011. Catalytic
conversion of lignocellulosic biomass to fine chemicals and fuels. Chem. Soc.
Rev. 40, 5588 5617.
Production processes for the
conversion of triglyceride
feedstock
3.1
3
Introduction
As presented in Chapter 2, Renewable Feedstock and Its
Conversion Routes to Biojet Fuel, the triglyceride feedstock consists of fatty acids, whose composition varies significantly
depending on the source and the geographical origin (Maity,
2015). The triglyceride feedstock includes vegetable oils, animal
fats, microalgae oil, and waste oils; also, bio-oils obtained from
processes such as pyrolysis and hydrothermal liquefaction are
considered in this type of feedstock. In addition, the lipids
extracted from black soldier fly larvae are classified in this type
of raw material. In Fig. 3.1, a representative scheme of triglyceride feedstocks from different sources is presented; those materials can be used to produce biojet fuel through hydroprocessing.
The hydroprocessing of triglyceride feedstock allows generating renewable aviation fuel along with other renewable hydrocarbons. In this process, the triglyceride feedstock is converted
with hydrogen to produce renewable hydrocarbons; usually the
conversion process is carried out at high pressures and temperatures. Later, the produced renewable hydrocarbons, which
include light gases, naphtha, green diesel, and biojet fuel, are
separated by distillation columns.
In 2008 it was submitted the first patent document for a
hydrotreating process to produce biojet fuel, which was granted
in 2011 to UOP Honeywell company (McCall et al., 2011); in the
same year, this process was certified by ASTM for the production of biojet fuel that can be used for commercial flights. An
important characteristic of this process is its similarity with petro-refineries; therefore the facilities of petro-refineries can be
revamped to produce biojet fuel. In addition, almost half of the
demonstration flights have been performed with biojet fuel generated with hydroprocessing technology, being UOP Honeywell
Production Processes of Renewable Aviation Fuel. DOI: https://doi.org/10.1016/B978-0-12-819719-6.00003-1
© 2021 Elsevier B.V. All rights reserved.
55
56
Chapter 3 Production processes for the conversion of triglyceride feedstock
Figure 3.1 Triglyceride feedstocks from renewable sources.
and SkyNRG the main actors (Gutiérrez-Antonio et al., 2017).
Nowadays this technology is ready for commercialization.
This chapter is focused on the production of biojet fuel from
triglyceride feedstock. First, the description of the chemical
transformations occurring to the triglyceride feedstock is presented. After, the technologies required to obtain pure final products are mentioned; in addition, the combustion studies
reported for the renewable aviation fuel produced with this process are described. Finally, an example of the simulation and
assessment of a process for the production of biojet fuel from
triglyceride feedstock is presented and discussed.
3.2
Conversion processes of the triglyceride
feedstock
The hydroprocessing involves a broad variety of hydrogenation catalytic processes, in which sulfur, oxygen, and nitrogen
Chapter 3 Production processes for the conversion of triglyceride feedstock
57
heteroatoms are removed from the triglyceride feedstock; this
removal is realized through a series of hydrogenolysis and
hydrogenation steps, which generates long-chain hydrocarbons
(Romero-Izquierdo et al., 2018).
The reactions included in the hydroprocessing are carried
out in the presence of hydrogen. The first reaction is the hydrogenation, which is the saturation of the double bonds in a triglyceride molecule by the catalytic addition of hydrogen at
certain temperature and pressure condition, causing the breaking of the glycerol compound, releasing propane and free fatty
acid chains. After hydrogenation, three reactions can occur
simultaneously, hydrodeoxygenation (HDO), hydrodecarboxylation (DCOx), and hydrodecarbonylation (DCO); wherein the
carboxylic acid group from the free fatty acids is removed to
form straight chains alkanes. In the HDO route a hydrocarbon
is produced, with the same number of carbon atoms as the fatty
acid chain and two moles of water. Then, in the DCOx a hydrocarbon with one less atom than the fatty acid chain and a mole
of CO2 is obtained. Finally, the DCO produces a hydrocarbon
with one carbon less and one mole of CO and water (Vásquez
et al., 2017). A simplified representation of this complex mechanism is presented in Fig. 3.2.
In the conventional hydrotreating process, the conversion of
the triglyceride feedstock is performed in two main stages:
hydrodeoxygenation and hydroisomerization/hydrocracking.
The hydrodeoxygenation reaction is very important, since the
total removal of oxygen from the triglyceride feedstock is
required to reach the freeze point. Besides, the biomass contains almost 167 times the oxygen content (in ppmw) of petroleum. Therefore, in the hydrotreating of biomass the removal of
oxygen from the triglyceride or fatty acid molecule, that is,
deoxygenation, is the most important reaction. As product of
this reaction long-chain hydrocarbons are obtained, along with
H2O, CO2, and/or CO. The renewable hydrocarbons that are
Figure 3.2 Conversion of a triglyceride molecule under hydrotreatment. Source: Extracted from Vásquez, M.C., Silva, E.
E., Castillo, E.F., 2017. Hydrotreatment of vegetable oils: a review of the technologies and its developments for jet biofuel
production. Biomass Bioenergy 105, 197206.
58
Chapter 3 Production processes for the conversion of triglyceride feedstock
produced are more similar to a diesel; thus it is necessary to cut
and branch the chains to generate hydrocarbons in the boiling
point range of C8C16, corresponding to jet fuel. Due to this, a
second reactive stage is required to perform the hydroisomerization and hydrocracking of renewable hydrocarbons produced
in the first reactive stage. From the second reactive stage, the
following products can be obtained: light gases, naphtha, biojet
fuel, and green diesel.
In general, the common operational conditions for the
hydrotreating process include high pressure, greater than
20 bar, and temperature range of 300 C350 C; these values
depend on the feedstock and catalytic system used (RomeroIzquierdo et al., 2018). Moreover, a high H2 NPT ml/oil ml ratio
is required, around 1500 in order to avoid the generation of
coke in the catalyst. Regarding the catalysts, some of them are
used in fossil hydroprocessing, such as Pd/C or CoMo/γ-Al2O3,
and they have a good performance in the conversion of renewable triglyceride feedstock. Fig. 3.3 shows the overall hydrotreating process from triglyceride feedstocks, which involves two
reactive stages and a separation stage.
The hydrotreating process is a multicomponent and multireaction system; therefore it is complicated to identify the specific reaction pathway followed. Due to this, most of the
hydrotreating studies report conversion and/or selectivities,
while just a few works present kinetic models; from these last
Figure 3.3 Overall hydrotreating process.
Chapter 3 Production processes for the conversion of triglyceride feedstock
studies, only a few present kinetic models oriented to biojet fuel
(Romero-Izquierdo et al., 2018). Moreover, the scarce kinetic
models reported are lumped due to the complexity of the reactive system and the high number of products. It is important to
mention that experimental studies that focus on the hydrotreating of mixtures of triglyceride feedstock are missing in the
literature.
From the reactive zone of the hydrotreating process, four
products can be obtained: light gases, naphtha, biojet fuel, and
green diesel. Due to the thermodynamic characteristics, these
products can be separated through distillation. The design of
the distillation sequence must guarantee the minimum energy
consumption to allow a competitive price for the obtained fuels.
Due to this, from all the possible sequences for the separation
of these four products, the schemes with more potential are
those where the light gases are separated in the first distillation
column since the use of refrigerant is minimized.
In spite of all renewable fuels, obtained from the distillation
sequence, can be commercialized, all the research efforts have
been focused on the increase of the yield to biojet fuel; as reference, in the first patent for the hydroprocessing technology by
UOP Honeywell, the maximum yield to biojet fuel was reported
by McCall et al. (2011) as 36%. Next, information about the features of coproducts generated in the hydrotreating process is
presented.
The light gases generated in the hydrotreating process consist of hydrocarbons from C1 to C4; thus, methane, ethane, and
LPG (propane and butane) are included. The light gases can be
used as fuel in boilers, cooking devices, heating appliances,
power plants, and some vehicles with internal combustion
engines.
Naphtha, from fossil origin, consists of hydrocarbons with a
boiling temperature from 30 C to 200 C; indeed, it can be classified in light (30 C90 C, C5C6) and heavy naphtha
(90 C200 C, C6C12). In the hydrotreating process, the naphtha produced consists of hydrocarbons from C5 to C7, since
biojet fuel includes hydrocarbons from C8 to C16; therefore the
naphtha produced consists of light naphtha and some of heavy
naphtha. This product can be used as fuel and solvent, and
also, it is an important resource used to produce several petrochemical products (Lyu et al., 2014). According to Hua et al.
(2018), the pyrolysis of naphtha is the major source of ethylene
and another olefins feedstock.
On the other hand, green diesel consists of renewable hydrocarbons from C17 to C21. Unlike biodiesel, green diesel can be
59
60
Chapter 3 Production processes for the conversion of triglyceride feedstock
used as a replacement for fossil diesel, since it is composed of
hydrocarbons. Green diesel can be used as fuel in internal combustion engines, boilers and power plants. Moreover, this fuel
can also be used as raw material for the production of biojet
fuel through the hydrocracking process.
3.3
Conventional processes: state of the art
In this subsection the state of the art of the conventional
hydrotreating processes is presented. A conventional process
consists of a series of unit operations, where the conditioning,
reaction, and/or separation are performed one at a time in a
different vessel; thus no additional strategies to reuse energy or
make synergy between unit operations are proposed (QuirozPérez et al., 2019). It is worth to mention that it is desirable to
reduce both operation and capital costs in the processes, which
can be obtained through the application of process intensification tools; the use of the aforementioned tools for the production of biojet fuel will be discussed in Chapter 6, Process
Intensification and Integration in the Production of Biojet Fuel.
From all the processes to produce biojet fuel, the hydroprocessing is the most studied without any doubt. As mentioned
before, the hydrotreating process was developed with base on
the technology developed for petro-refineries. Therefore several
catalysts were already available to perform tests with
vegetable oils and animal fats.
In 2007 Holmgren presented the vision of UOP Honeywell to
produce renewable aviation fuels from second- and thirdgeneration raw materials in the International Symposium on
Biofuels (Holmgren, 2017). However, until 2009the first scientific
articles of the hydroprocesing technology were reported
(Markets and Bussiness, 2009; Marsh, 2009). At the date, a
search in Elsevier’s database (Sciencedirect, 2020) reveals that
more than 200 articles have been published related with the
production of renewable aviation fuel through hydroprocessing
technology. From the total, more than 35 are review articles,
which denote the growing interest of this topic in the scientific
community. In particular, several reviews focused on the production process of renewable aviation fuel (Liu et al., 2013; Hari
et al., 2015; Wang and Tao, 2016; Gutiérrez-Antonio et al., 2017;
Cruz Neves et al., 2019; Wei et al., 2019; Perkins et al., 2019),
and some of them specifically in the hydroprocessing technology (Vásquez et al., 2017; Romero-Izquierdo et al., 2018; Why
et al., 2019). From these works, it was identified that several
Chapter 3 Production processes for the conversion of triglyceride feedstock
triglyceride feedstocks have been considered for the production
of biojet fuel in both experimental and simulation studies; these
materials include oil from Jatropha curcas, castor, micro-algae,
soybean, camelina, carinata, coconut, babassu, inedible corn
oil, peanut, sunflower, macauba palm, cotton, palm (refined
and crude), tung along with chicken fat, vacuum gas oil of
vegetable oil mixtures, waste cooking oil, waste vegetable oils,
animal fats, microbial oils, and bio-oil from cornstalk and
Douglas fir pellets (Gutiérrez-Antonio et al., 2017, 2018; Zhao
et al., 2019; Moreno-Gómez et al., 2020; Dujjanutat and
Kaewkannetra, 2020; Mendes de Souza et al., 2020). An important finding is that most of the works reported the experimental
or modeling studies in two steps: hydrodeoxygenation followed
by hydroisomerization and hydrocracking (Gutiérrez-Antonio
et al., 2017). However, some works reported the one-step hydroprocessing, where all the reactions involved in the hydroprocessing are carried out in one vessel (Verma et al., 2011; Liu et al.,
2015; Hanafi et al., 2016). Respect to the catalysts, there have
been used those based on Ni, Mo, Co, Pd, Ro, Pt, and bimetallic
sulfide catalysts, such as Ni-Co-Fe, Mo-WU, NiMoS2, Ni-W/
SiO2, CoMoS2, and NiWS2 supported on Al2O3 (Anand et al.,
2016; Gutiérrez-Antonio et al., 2017; Zhao et al., 2019; Wei et al.,
2019). Recently, the use of a new catalyst SDBS-Pt/SAPO-11 was
proposed for the conversion of Jatropha oil (Li et al., 2019);
SDBS is sodium dodecyl benzene sulfonate. At the moment, the
major yield to biojet fuel (77%) have been reported for the conversion of microalgae oil with 5% NiO, 18% MoO3/H-ZSM-5
(micromesoporous)-HSASC (Verma et al., 2011); it is worth to
mention that this high yield is reached with the one-step hydroprocessing. Typically, pressures for hydrotreating of
vegetable oil range from 20 to 110 bar, and the temperatures
comprise from 250 C to 430 C (Romero-Izquierdo et al., 2018;
Zhao et al., 2019; Wei et al., 2019). Finally, respect to the hydrogen flow, the studies report from 800 to 2500 H2 NPTmL/oil mL
(Gutiérrez-Antonio et al., 2017).
In the same way, the technological development has a vertiginous rate of growth. The total number of patents related with
the production of renewable aviation fuel increased from 2 in
2008 to 60 in just 7 years; by January 2020, a search in the
PATENTSCOPE database of the World Intellectual Property
Organization generates 480 documents, when the words renewable aviation fuel, biojet fuel, biokerosene, and synthetic paraffinic kerosene are used (World Intellectual Property
Organization, 2020). The increase in the number of patents is
consistent with the increase in the task forces and companies
61
62
Chapter 3 Production processes for the conversion of triglyceride feedstock
behind them, issue discussed in Chapter 2, Renewable
Feedstock and Its Conversion Routes to Biojet Fuel. From the
500 patent documents identified previously, in 240 the hydroprocessing technology is considered. This result evidences that
the hydroprocessing technology is still the predominant one, in
spite of other processes are under research and development.
The raw materials reported in the document patents cover
vegetable oils, animal fats, algae biomass, feedstock with high
amounts of free fatty acids, feedstock that contains triglycerides,
free fatty acids and/or fatty acid alkyl esters, bio-oil, and even
biodiesel. Some of the reported catalysts employed Pd, Pt, Ni,
Mo, and Co supported on alumina, gamma-alumina, zeolitic
molecular sieve, or silicoaluminophosphate (Gutiérrez-Antonio
et al., 2017). The operating conditions (pressure and temperature) are similar to those reported in open literature. The major
yield to biojet fuel (80%) has been reported for the conversion
of biological feedstock with nanocoated palladium as a catalyst
supported by activated carbon at 69 bar and temperatures of
250 C360 C (Parimi and Nguyen, 2012, 2013).
In general, the hydrotreating pathway has been studied from
both catalysis and separation points of view; however, most of
the works are experimental, which is understandable since the
study of the involved reactions is relatively recent, especially for
renewable raw materials (Gutiérrez-Antonio et al., 2017).
Regarding the raw materials, the efforts must be focused on the
use of third-generation biomass, which can be cultivated in
wastewaters, and residues; these materials will allow a significant decrease in the operating costs and also the price of biojet
fuel. Moreover, a decreasing in the environmental and hydric
impacts of the production of renewable aviation fuel can be
achieved. Respect to the catalyst, there have been significant
advances from the 36% conversion reported in 2008, when the
patent document by UOP was submitted, to the 70% reported
in 2011 by Verma et al. (2011); another important aspect to
remark is that the high conversion reported by Verma et al.
(2011) was reached in a single vessel with a multifunctional
reactor. Finally, the use of mixtures of triglyceride feedstock, as
the one presented in the case study, represents a viable alternative to strengthen the supply chain for the production of the
renewable aviation fuel.
In brief, the technological and scientific advances in the
hydroprocessing of triglyceride feedstock have made it the most
mature technology for the production of renewable aviation
fuel. Another crucial aspect for the certification of the biojet
fuel is, without any doubt, the combustion tests of the fuels
Chapter 3 Production processes for the conversion of triglyceride feedstock
generated with this technology, a topic that will be discussed in
the next section.
3.4
Combustion tests for biojet fuel from
triglyceride feedstock
The combustion tests are oriented to evaluate the performance of the renewable aviation fuel inside the engine (lean
blowout, atomization, ignition, and altitude relight), and the
combustion products (emissions, smoke, and carbon deposit)
(Zhang et al., 2016). The performance of each of the alternative
jet fuel can exhibit its own, unique behavior during combustion
due to its properties (Zhang et al., 2016), that, at the same time,
are strongly affected by the chemical composition of the fuel,
which depends on the processing route and renewable feedstock (Vozka and Kilaz, 2018, 2020). Therefore it is necessary to
perform combustion tests of these alternative fuels in jet
engines. Among all alternative aviation fuels, biojet fuel
obtained from hydroprocessing has been widely studied from
the combustion point of view.
At the beginning of the past decade, Corporan et al. (2010)
determined the emissions of the combustion of JP8 military fuel
and a mixture of 50% of JP8 military fuel with biojet fuel produced with the hydroprocessing of beef tallow. They found that
there were not detected anomalies in the operation on the
engine. Moreover, a reduction of 30% in carbon monoxide and
50% of sulfur oxides was observed, while the nitrogen oxides
kept unchanged. Also, there was a decreasing of the particle
matter emissions, due to the lower aromatic content.
Later, Corporan et al. (2012) studied the emissions of the
combustion of renewable aviation fuel produced from
FischerTropsch and hydroprocessing pathways. Their study
confirmed the findings reported in their previous work of 2010
regarding the emissions. In addition, they concluded that it is
possible to model the particle number emissions from turbine
engines operated on alternative fuels based on engine, engine
setting, limited particulate matter (PM) data, and fuel composition (Corporan et al., 2012).
Two years later, Altaher et al. (2014) analyzed the emissions
of unburned hydrocarbons and carbonyl compounds of Jet A1,
and four alternative jet fuels, which were produced by gas-toliquid and hydroprocessing routes. The results showed that
formaldehyde and aromatic emissions were lower in the alternative fuels in comparison with Jet A1, while no differences
63
64
Chapter 3 Production processes for the conversion of triglyceride feedstock
were observed in acetaldehydes and acrolein emissions between
all the analyzed jet fuels.
Buffi et al. (2017) performed a study for the characterization
of the emissions of biojet fuel derived from the hydroprocessing
of used cooking oil and its blends with Jet A1. The results
showed that the hydroprocessed jet fuel can reduce emissions
and lead to a more compacted and homogenous heat release
zone, which also allows the decreasing of soot and nitrogen
oxides.
It was until 2019 when the first study of evaluation of the
effect of the raw material used to produce the renewable aviation fuel was presented. Sundararaj et al. (2019) reported the
combustion and emissions characteristics of blends of Jet A1
with biojet fuel derived from the hydroprocessing of Camelina
and J. curcas oils. For biojet fuel derived from Camelina, they
found that by increasing the concentration of that fuel, the net
heat of combustion increases, which elevated the combustion
temperature and NOx emissions; however, at these conditions
the soot concentration decrease. On the other hand, for
Jatropha-derived biojet fuel, as the concentration of the biojet
fuel increased, the carbon dioxide emissions augment but nitrogen oxides are reduced.
Recently, the autoignition characteristics of four conventional aviation jet fuels (Jet-A POSF-4658, Jet-A POSF-10325, JP5 POSF-10289, JP-8 POSF6169), five alternative jet fuels,
Syntroleum S-8 (S8), shell synthetic paraffinic kerosene (Shell
SPK), Sasol isoparaffinic kerosene (Sasol IPK), hydroprocessed
renewable jet (HRJ8), alcohol to jet (ATJ), and 50/50 vol.%
blends of JP-8/alternative jet fuels were explored (Kang et al.,
2019). The results indicated S8, Shell SPK, and HRJ8 provide
stronger low-temperature ignition, while Sasol IPK and ATJ
exhibit weaker low-temperature ignition characteristics, when
compared to conventional jet fuels. This result confirmed the
dependence of the performance of the biojet fuel of its production process and raw material
3.5
3.5.1
Case of study: hydroprocessing of a
mixture of vegetable oils
Problem statement
In Mexico, the production of vegetable oil from nonedible
energetic crops is an advantageous strategy to produce renewable fuels. In particular, Chiapas state, located at southwest of
Chapter 3 Production processes for the conversion of triglyceride feedstock
Mexico, has a rich biodiversity, extensive and fertile lands;
moreover, during the last decades this state has participated in
several projects for the developing of sustainable biofuels (Reza
et al., 2010; González, 2012; Riegelhaupt and Odenthal, 2015;
Red Temática de Bioenergı́a, 2016; Garcı́a-Bustamante and
Massera-Cerutti, 2016). In Chiapas, two energetic crops have
gained interest in the production of renewable fuels: palm oil
and J. curcas, mainly due to their high oil content and smoothly
cultivation conditions.
The production of palm oil in Chiapas represents the 79% of
total production in Mexico (Wiedersatz, 2012); the oil yield
through agroindustry techniques is 2.3 L per 10 kg of palm oil
fruit (Sandoval-Garcı́a et al., 2016). In 2014 into Soconusco
region 32,798 Ha of palm oil were cultured, covering 16 municipalities in the state with an average fruit yield of 20 ton fruit per
Ha (Sánchez et al., 2014; Castellanos Navarrete, 2018). If we
consider the palm oil density of 898 kg/m3 at 40 C (Unipalma,
2020), the availability of palm oil could be up to 135,459.88 ton
oil.
Regarding to J. curcas fruit production in Mexico, the
Chiapas state has 230,273 Ha with optimum potential lands to
sow J. curcas, locating this state in the fourth position to produce this energetic crop. In the Soconusco region the average
yield per Ha per year is 5 ton seeds with roughly 55 wt.% of oil
(Zamarripa Colmenero et al., 2009). This yield is reached after 5
years of sowing and until 50 years, which is the estimated lifetime of the plant (Inurreta Aguirre et al., 2013).
In this case of study, it is considered the processing of a mixture of 80 wt.% J. curcas oil and 20 wt.% palm oil, from
Soconusco region in Chiapas, to produce biojet fuel as main
product, through the hydrotreatment process. The feed stream
of the process consists of 500 kg/h palm oil and 2000 kg/h of
J. curcas oil. The block diagram to represent the hydrotreatment
of a vegetable oils mixture is presented in Fig. 3.4.
3.5.2
Modeling of the hydrotreating of the mixture
of oils
Currently in the literature there are few kinetic studies to
describe the hydrotreating of a mixture of vegetable oils (Sebos
et al., 2009; Becker et al., 2015; Sonthalia and Kumar, 2019), and
particularly the experimental data for the mixture proposed in
this case of study (20 wt.% palm oil and 80 wt.% Jatropha oil)
have not been reported. Thus, in order to model the mixture of
65
66
Chapter 3 Production processes for the conversion of triglyceride feedstock
Figure 3.4 Block diagram of hydrotreating process (Gutiérrez-Antonio et al., 2016).
Table 3.1 Lipidic profile of palm oil (Vélez Manco, 2014).
Fatty acid
Formula
% w/w
Oleic
Palmitic
Linoleic
Stearic
Myristic
Traces
18:1
16:0
18:2
18:0
14:0
20:0; 12:0; 18:3; 20:1; 16:1; 17:0; 24:0; 22:0; 15:0
38.9
34.6
13.1
8.1
2.2
B3.1
palm and Jatropha oils, we assume that the hydrotreating is carried out simultaneously in two separate equipment; in this way,
we can employ kinetic data already reported in the literature for
the separated hydroprocessing of each oil. However, for both
reactors the temperature, pressure, H2/oil volumetric ratio, and
geometric relations will be the same. Later, the output streams
will be mixed to the next reactor. Next, the hydroprocessing of
J. curcas and palm oils is presented.
In 2014 Vélez Manco (2014) studied the hydrotreatment of
palm oil in an experimental continuous trickle bed reactor
using NiMo/γ-Al2O3 (Haldor Topsoe TK-561 BRIM) catalyst. The
lipidic profile of the palm oil is presented in Table 3.1, from
where it can be observed that almost 75% of composition corresponds to oleic and palmitic acid.
In the study reported by Vélez Manco (2014), the experimental reactor made of stainless steel was a vertical tube of 31 cm
length and roughly 1 cm of internal diameter, while the total
active bed height was 5 cm. The hydrogen flow inserted during
Chapter 3 Production processes for the conversion of triglyceride feedstock
67
the operation was a molar NPT ratio H2/oil equal to 20. The
hydrogen pressure established for the operation was 60 bar,
with a maximum temperature of 365 C and a minimum value
of 335 C. Table 3.2 presents the composition of the outlet
stream of the reactor, at a temperature of 365 C.
According to his results, Vélez Manco (2014) proposed a set
of reactions to model this process, adjusting the experimental
information to a first-order kinetic model and determining the
kinetic parameters. In Table 3.3 the reactions proposed, and the
kinetic data are presented.
The modeling of palm oil considers only its majority components, normalizing the compositions for the first four components: 41.08 wt.% triolein, 35.54 wt.% tripalmitin, 13.83 wt.%
trilinolein, 8.55 wt.% tristearin; in spite of this, there is no modification in the kinetic parameters experimentally determined as
well in the chemical pathway established for each triglyceride.
However, in order to consider the formation of each component
according to Table 3.2, an extended model for the set of reactions proposed by Vélez Manco (2014). The extended set of
reactions and its kinetic data are presented in Tables 3.4 and
3.5, respectively. It is worth to mention that the percentage of
free fatty acids into the oil is less than 1%; thus we assume that
the palm oil is formed only by triglycerides.
The hydrotreatment of Jatropha oil is modeled based on a kinetic
study where Co-Mo/Al2O3 was used as catalyst, and the operation
conditions are varied (Anand and Sinha, 2012). The experimental
Table 3.2 Composition of the outlet stream of the hydrotreating reactor (Vélez Manco, 2014).
Compound
% w/w
C9
C10
C11
C12
C13
C14
C15
C16
C17
C18
C19
C20
0:1 6 0:01
0:1 6 0:01
0:18 6 0:02
0:24 6 0:04
0:42 6 0:06
0:68 6 0:013
16:26 6 2:54
25:55 6 5:36
22:68 6 3:39
32:34 6 6:67
0:37 6 0:05
0:33 6 0:06
68
Chapter 3 Production processes for the conversion of triglyceride feedstock
Table 3.3 Proposed set reactions for hydrotreatment of palm oil and kinetic
data (Vélez Manco, 2014).
Reaction
no.
Reaction
1
C57 H98 O6 1 6H2 -C57 H110 O6
Trilinolein (LLL) 1 H2-tristearin (SSS)
C57 H104 O6 1 3H2 -C57 H110 O6
Triolein (OOO) 1 H2-tristearin (SSS)
C51 H98 O6 1 12H2 -3C16 H34 1 C3 H8 1 6H2 O
Tripalmitin (PPP) 1 H2-hydrocarbons
C57 H110 O6 1 12H2 -3C18 H38 1 C3 H8 1 6H2 O
Tristearin (SSS) 1 H2-hydrocarbons
C51 H98 O6 1 3H2 -3C15 H32 1 C3 H8 1 3CO2
Tripalmitin (PPP) 1 H2-hydrocarbons
C57 H110 O6 1 3H2 -3C17 H36 1 C3 H8 1 3CO2
Tristearin (SSS) 1 H2-hydrocarbons
2
3
4
5
6
Kinetic
expression
Kinetic parameters
r 01 5 k1 CLLL
9:4 3 1011 149.9
r 02 5 k2 COOO
4:4 3 1013 162.5
r 03 5 k3 CPPP
3:8 3 1010 147.4
r 04 5 k4 CSSS
5:6 3 1010 149.1
r 05 5 k5 CPPP
1:4 3 1010 150.6
r 06 5 k5 CSSS
Ao (1/s)
8:2 3 1011
Ea (kJ/
mol)
169.2
Note: ki 5 Aoi e2Ea =RT .
Table 3.4 Extended reactions set for the hydrotreatment of palm oil.
Triglycerides
Reactions
Triolein
C57 H104 O6 1 6:2H2 -C18 H38 1 C17 H36 1 C16 H34 1 0:2C15 H32 1 CO 1 2CO2 1 H2 O
C57 H104 O6 1 6:4H2 -C19 H40 1 C14 H30 1 C13 H28 1 0:4C20 H42 1 CO 1 2CO2 1 H2 O
C57 H104 O6 1 8:33H2 -C12 H26 1 C11 H24 1 C10 H22 1 2:33C9 H20 1 CO 1 2CO2 1 H2 O
C51 H98 O6 1 3:44H2 -C18 H38 1 C17 H36 1 1:44C9 H20 1 CO 1 2CO2 1 H2 O
C51 H98 O6 1 3:7H2 -C16 H34 1 C15 H32 1 1:7C10 H22 1 CO 1 2CO2 1 H2 O
C51 H98 O6 1 4:0833H2 -3:0833C12 H26 1 C11 H24 1 CO 1 2CO2 1 H2 O
C51 H98 O6 1 3:1H2 -C14 H30 1 C13 H28 1 C19 H40 1 0:1C20 H42 1 CO 1 2CO2 1 H2 O
C57 H98 O6 1 9:2H2 -C18 H38 1 C17 H36 1 C16 H34 1 0:2C15 H32 1 CO 1 2CO2 1 H2 O
C57 H98 O6 1 9:4H2 -C14 H30 1 C13 H28 1 C19 H40 1 0:4C20 H42 1 CO 1 2CO2 1 H2 O
C57 H98 O6 1 11:33H2 -C12 H26 1 C11 H24 1 C10 H22 1 2:33C9 H20 1 CO 1 2CO2 1 H2 O
C57 H110 O6 1 3:2H2 -C18 H38 1 C17 H36 1 C16 H34 1 0:2C15 H32 1 CO 1 2CO2 1 H2 O
C57 H110 O6 1 4:3636H2 -C14 H30 1 C13 H28 1 C12 H26 1 1:3636C11 H24 1 CO 1 2CO2 1 H2 O
C57 H110 O6 1 3:6H2 -C19 H40 1 C20 H42 1 0:6C10 H22 1 C9 H20 1 CO 1 2CO2 1 H2 O
Tripalmitin
Trilinolein
Tristearin
Chapter 3 Production processes for the conversion of triglyceride feedstock
69
Table 3.5 Kinetic data for reactions sets extended.
Triglycerides
Kinetic expression
Kinetic parameters
r 01 5 k1 COOO
r 02 5 k2 CPPP
r 03 5 k3 CLLL
r 03 5 k4 CSSS
Triolein
Tripalmitin
Trilinolein
Tristearin
Ao (1/s)
Ea (kJ/mol)
8:2 3 1011
3:8 3 1010
9:4 3 1011
5:6 3 1010
169.2
147.4
149.9
149.1
Table 3.6 Lipidic profile of Jatropha oil
(Anand and Sinha, 2012).
Fatty acid
Formula
% w/w
Oleic (OOO)
Linoleic (LLL)
Palmitic (PPP)
Stearic (SSS)
18:1
18:2
16:0
18:0
45.4
27.2
19.5
7.9
reactor made of stainless steel with a 1.3 cm internal diameter and
30 cm of length was used to identify the reaction pathway for hydrotreating of Jatropha oil, evaluating its kinetic parameters. The composition of Jatropha oil is presented in Table 3.6.
In the study of Anand and Sinha (2012), temperature is varied from 320 C until 360 C, while the pressure range was from
20 to 80 bar; also, 5002000 NL/L were used as H2/oil volumetric ratio. According to the results, the maximum conversion of
Jatropha oil achieved was 99% using 360 C, 80 bar, and 1500 NL
H2/L oil. Likewise, the product distribution determined by chromatographic techniques indicates that the range of hydrocarbons formed was C5 until longer chains thanC21. The validated
reaction pathway is presented in Fig. 3.5; moreover, its kinetic
parameters arranged as a lumped kinetic model of pseudo-first
order are presented in Table 3.7.
To model the conversion of Jatropha oil during the hydrotreatment, it is necessary to follow the reaction pathway presented in Fig. 3.3 for each triglyceride and propose the
reactions set that describe it. It is important to note that the
free fatty acid’s behavior was not described in the reaction pathway, due to its low composition.
70
Chapter 3 Production processes for the conversion of triglyceride feedstock
Figure 3.5 Reaction pathway for hydrotreatment of Jatropha oil (Anand and Sinha, 2012).
Table 3.7 Kinetic parameters to describe the hydrotreating of Jatropha oil
(Anand and Sinha, 2012).
Kinetic expression
r 012tgi 5 k1 Ctgi
r 022tgi 5 k2 Ctgi
r 032tgi 5 k3 Ctgi
r 042tgi 5 k4 Ctgi
r 052tgi 5 k5 Ctgi
r 062tgi 5 k6 Ctgi
k (1/h)
Ao (1/h)
1
2
19
2
0.1
0.1
62:62 3 10
4:2 3 1010
13:73 3 104
N/D
14:58 3 104
Ea (kJ/mol)
5
83
127
47
N/D
47
Notes: tgi refers to each triglyceride in the oil. ki 5 Aoi e2Ea =RT . N/D, No data.
The reactions set proposed to describe the conversion pathway showed in Fig. 3.3 is presented in Table 3.8, indicating each
kinetic constant according to Table 3.7. It is important to mention that the set of reactions to describe the hydrotreating zones
must be constructed based on the reaction pathway and product distribution from the experimental procedure. Thus each
designer can propose a different set of reactions taking into
account the experimental data. Likewise, each chemical reaction must be well balanced.
Summarizing, the processing starts with the mixture of
500 kg/h palm oil and 2000 kg/h Jatropha oil in liquid phase at
1 bar, according to the information presented in Section 3.5.1.
Both oils are fed separately to the first reactive zone, which is
Chapter 3 Production processes for the conversion of triglyceride feedstock
71
Table 3.8 Reactions set proposed to describe the hydrotreating of Jatropha oil.
Triolein
k1
C57 H104 O6 1 9:375H2 - C5 H12 1 C6 H14 1 C7 H16 1 4:375C8 H18 1 CO2 1 H2 O 1 3CO
k2
C57 H104 O6 1 6:64286H2 - C9 H20 1 0:5C10 H22 1 C11 H24 1 0:5C12 H26 1 C13 H28 1 0:642857C14 H30 1 CO2 1 H2 O 1 3CO
k3
C57 H104 O6 1 5:1875H2 - C15 H40 1 0:1875C16 H34 1 C17 H36 1 C18 H38 1 CO2 1 H2 O 1 3CO
k4
C57 H104 O6 1 4:63158H2 - 0:631579C19 H40 1 C20 H42 1 C21 H44 1 CO2 1 H2 O 1 3CO
k1
k2
k3
k4
Trilinolein
k1
C57 H98 O6 1 12:375H2 - C5 H12 1 C6 H14 1 C7 H16 1 4:375C8 H18 1 CO2 1 H2 O 1 3CO
k2
C57 H98 O6 1 9:64286H2 - C9 H20 1 0:5C10 H22 1 C11 H24 1 0:5C12 H26 1 C13 H28 1 0:642857C14 H30 1 CO2 1 H2 O 1 3CO
k3
C57 H98 O6 1 8:1875H2 - C15 H40 1 0:1875C16 H34 1 C17 H36 1 C18 H38 1 CO2 1 H2 O 1 3CO
k4
C57 H98 O6 1 7:63158H2 - 0:631579C19 H40 1 C20 H42 1 C21 H44 1 CO2 1 H2 O 1 3CO
k1
k2
k3
k4
Tripalmitin
k1
C51 H98 O6 1 5:625H2 - C5 H12 1 C6 H14 1 C7 H16 1 3:625C8 H18 1 CO2 1 H2 O 1 3CO
k2
C51 H98 O6 1 3:21429H2 - C9 H20 1 0:5C10 H22 1 C11 H24 1 0:5C12 H26 1 C13 H28 1 0:214286C14 H30 1 CO2 1 H2 O 1 3CO
k3
C51 H98 O6 1 1:875H2 - C15 H40 1 0:375C16 H34 1 C17 H36 1 0:5C18 H38 1 CO2 1 H2 O 1 3CO
k4
C51 H98 O6 1 1:31579H2 - 0:315789C19 H40 1 C20 H42 1 C21 H44 1 CO2 1 H2 O 1 3CO
k1
k2
k3
k4
Tristearin
k1
C57 H110 O6 1 6:375H2 - C5 H12 1 C6 H14 1 C7 H16 1 4:375C8 H18 1 CO2 1 H2 O 1 3CO
k2
C51 H98 O6 1 3:64286H2 - C9 H20 1 0:5C10 H22 1 C11 H24 1 0:5C12 H26 1 C13 H28 1 0:642857C14 H30 1 CO2 1 H2 O 1 3CO
k3
C57 H98 O6 1 2:1875H2 - C15 H40 1 0:1875C16 H34 1 C17 H36 1 C18 H38 1 CO2 1 H2 O 1 3CO
k4
C57 H98 O6 1 1:63158H2 - 0:631579C19 H40 1 C20 H42 1 C21 H44 1 CO2 1 H2 O 1 3CO
k5
C18 H38 1 0:4444H2 - C14 H30 1 0:4444C9 H20
k1
k2
k3
k4
Heavy to middle
k5
C17 H36 1 0:4H2 - C13 H28 1 0:4C10 H22
k5
C16 H34 1 0:3636H2 - C12 H26 1 0:3636C11 H24
k5
C15 H32 1 0:5454H2 - C9 H20 1 0:5454C11 H24
k5
Middle to light
k6
C13 H28 1 H2 - C7 H16 1 C6 H14
k6
C12 H26 1 1:1666H2 - C5 H12 1 1:1666C6 H14
k6
C11 H24 1 0:8H2 - C7 H16 1 0:8C5 H12
k6
C10 H22 1 0:2857H2 - C8 H18 1 0:2857C7 H16
k6
72
Chapter 3 Production processes for the conversion of triglyceride feedstock
formed by two simultaneous reactors, one for each
vegetable oil. We consider 350 C and 50 bar as the operation
conditions to the hydrotreating zone, since the kinetic data for
palm oil and Jatropha oil cover these operation conditions.
Likewise, the hydrogen flow to each reactor is calculated based
on the same H2/oil volumetric ratio of 1500 NL/L for each oil,
which corresponds to 176.19 kg/h of hydrogen for palm oil and
712.66 kg/h for Jatropha oil; these amounts were calculated taking into account the density of hydrogen at 0 C and 1 bar
(Engineering Software, 2019). It is important to mention that
the hydrogen and oils must be conditioned before it is fed to
the first reactive zone until 350 C and 50 bar. Thus a pump, a
compressor, and two heat exchangers are chosen as conditioning equipment. The commercial hydrogen is sold at a pressure
of 10 bar (Dagdougui et al., 2018).
After the first reactive stage, the output streams are joined to
enter to the second reactive zone. The hydrocracking and
hydroisomerization of long-chain hydrocarbons are described
with the model molecules studied by Calemma et al. (2000). In
their study, a reaction pathway was proposed to describe the
hydrocracking and hydroisomerization of n-C16H34 (n-C16),
n-C28H48 (n-C28), and C36H74 (n-C36) long-chain paraffins. The
operation conditions were 345 C380 C and 80 bar, using
Pt/Al2O3-Al2O3 as catalyst. The reaction network validated by
the experimentation is presented in Fig. 3.6. Likewise, the
experimental kinetic data for n-C16 and n-C28 are presented in
Table 3.9.
For this case of study, we assume the hydrocracking reaction
is taking place by the (AE) and (AD) routes, while the hydroisomerization is performed through (AB) route; both reactions
are carried out at 360 C and 50 bar. The kinetic data for the
routes correspond to n-C16 and n-C28. Likewise, to describe
the behavior of these reaction pathways a set of reactions was
proposed, based on the product distribution after hydrotreating
reactor. The reactions set and the kinetic constant for each reaction are presented in Table 3.10. Similar to the hydrotreating
reactors, the set of reactions depends on the product distribution and reaction pathway experimentally obtained; also, this
proposal can be modified according to the designer criteria.
At the end of reactive stages, the separation of each biofuel
is performed by defining the appropriate splits. Based on the
product distribution from the reactive stages, as well as the
fuels specification provided by the Energy Government
Chapter 3 Production processes for the conversion of triglyceride feedstock
73
Figure 3.6 Reaction network
for the hydrocracking—
hydroisomerization of nparaffins (Calemma et al.,
2000).
Table 3.9 Rate constant for reaction network at 360˚C.
n-Paraffins
Kinetic expression
k (1/s)
n-C16
r 012C16 5 k12C16 CC16
r 042C16 5 k42C16 CC16
r 022C16 5 k22C16 CC16
r 012C28 5 k12C28 CC28
r 042C28 5 k42C28 CC28
8 3 1027
1:615 3 1027
1:8 3 1025
1:2983 3 1026
1:615 3 1026
n-C28
Note: ki 5 Aoi e2Ea =RT .
Institution in Mexico (Secretarı́a de Energı́a) (SENER, 2019),
three products must be separated:
1. Light fuels defined as naphtha: iso-C5, C5, iso-C6, C6, iso-C7,
C7, and traces of C1, C2, C3, and C4.
2. Biojet fuel: iso-C8, iso-C9, C8, C9, C10, C11, iso-C12, C12,
C13, iso-C16, C14, C15, and C16.
3. Green diesel: C17, C18, C19, C20, and C21.
For the separation of each fuel, a distillation scheme is commonly used. Thus a multicomponent distillation train with
three products must be designed. For this case of study, the
design of a direct distillation train with two columns will be
realized.
The block diagram for the hydrotreatment of the mixture of
vegetable oils (palm oil 1 Jatropha oil) defined in Section 3.5.1
is presented in Fig. 3.7. Each zone in this process is identified
by colored dotted line rectangles: red line to conditioning zone,
green line to hydrotreating zone, orange to hydrocrackinghydroisomerization zone, and blue line to separation zone.
Table 3.10 Reactions set proposed to hydrocracking—hydroisomerization.
Hydrocracking
k1-C28
C21 H44 1 H2 - C11 H24 1 C10 H22
k1 2 C28
C20 H42 1 H2 - C16 H34 1 C4 H10
k1 2 C28
C19 H40 1 H2 - C12 H26 1 C7 H16
k1 2 C28
k1-C16
C18 H38 1 0:6923H2 - C9 H20 1 0:6923C13 H28
k1 2 C16
C17 H36 1 0:6428H2 - C8 H18 1 0:6428C14 H30
k1 2 C16
k4-C28
C20 H42 1 H2 - C12 H26 1 C8 H18
k4 2 C28
C19 H40 1 1:2H2 - 1:2C10 H22 1 C7 H16
k4 2 C28
C20 H42 1 1:0714H2 - 1:0714C14 H30 1 C5 H12
k4 2 C28
C19 H40 1 1:8H2 - 1:8C10 H22 1 CH4
k4 2 C28
C20 H42 1 2:125H2 - 2:125C8 H18 1 C3 H8
k4 2 C28
k4-C16
C10 H42 1 1:6H2 - 1:6C5 H12 1 C2 H6
k4 2 C16
C8 H18 1 1:25H2 - 1:25C4 H10 1 C3 H8
k4 2 C16
Hydroisomerization
k2-C16
C5 H12 - isoC5 H12
k2 2 C16
C6 H14 - isoC6 H14
k2 2 C16
C7 H16 - isoC7 H16
k2 2 C16
C8 H18 - isoC8 H18
k2 2 C16
C9 H20 - isoC9 H20
k2 2 C16
C10 H22 - isoC10 H22
k2 2 C16
C12 H26 - isoC12 H26
k2 2 C16
C16 H34 - isoC16 H34
k2 2 C16
Figure 3.7 Block diagram of hydrotreatment process to the mixture of vegetable oils (palm oil 1 Jatropha oil).
Chapter 3 Production processes for the conversion of triglyceride feedstock
3.5.3
Simulation of the hydrotreating process
According to the modeling of vegetable oils mixture and the
conceptual design presented in Section 3.5.2, the simulation of
hydrotreatment process in Aspen Plus V.10.0 is presented in this
section. The simulation starts with the definition of each component involved in the process, which includes triglycerides,
hydrogen, water, carbon monoxide, carbon dioxide, and the
hydrocarbons. After selecting all components involved in the
process, the next step is choosing the appropriate thermodynamic method to model it; in this case the PengRobinson
method is selected (Carlson, 1996).
The flowsheet starts with the oil streams, based on the normalized composition of Table 3.2, for the palm oil, and Table 3.6, for
the Jatropha oil, along with the information defined in Section 3.5.1.
In the case of hydrogen stream, the entrance conditions are
described in Section 3.5.3. In this simulation, the total flow of
hydrogen required for both oils is included in the same stream.
Once the oil and hydrogen streams are defined, the equipment to
perform its conditioning must be designed. In the case of oil
streams, it is necessary a pump to elevate the pressure until 50 bar
for each stream (Pump module). The pump for palm oil stream is
called PUMP-PO and for Jatropha oil, PUMP JC. Regarding the
hydrogen stream, a compressor to elevate the pressure condition
must be selected (module Compr, model Compressor, Type
Isentropic); the hydrogen compressor is called COMP-H2.
In order to complete the conditioning zone, the output
streams from PUMP-PO, PUMP-JC, and COMP-H2 must be
adjusted to satisfy the 350 C condition. Thus a heat exchanger
is chosen for each output streams (Heater module); the Heater
modules for palm oil, Jatropha oil, and hydrogen are called
EX-PO, EX-JC, and EX-H2, respectively.
The hydrotreating reactor will be modeled as two simultaneous reactors at the same operation conditions (RPlug module). Thus R-HDO-PO and R-HDO-JC for palm oil and Jatropha
oil are inserted. The output stream from EX-PO is mixed with
the hydrogen stream, called H2-PO, required for palm oil hydrotreating; the flow rate of this stream was calculated in
Section 3.5.2. This mixture of streams is carried out in a MIXER
module, MIX-1.
In the case of Jatropha oil, the output stream from EX-JC is
joined with the H2-JC stream in a Mixer module called MIX-2,
according to the hydrogen required for Jatropha oil hydrotreating. The output streams from MIX-1 and MIX-2 are fed to
hydrotreating reactors. In Fig. 3.8, the flowsheet constructed for
the simulation is shown.
75
Figure 3.8 Flowsheet of the hydrotreating process.
Chapter 3 Production processes for the conversion of triglyceride feedstock
77
Inside each RPlug module, a set of reactions is created based
on the Power-law type, and considering the kinetic expressions
defined in Sections 3.5.2 and 3.5.3 (first-order reactions). The
reactors operates at constant temperature (350 C).
The output streams from R-HDO-PO and R-HDO-JC enter a
Mixer module (MIX-3). The output from MIX-3 is introduced to
Sep module, called SEP-1, where CO, CO2, and water (COCO2W1 stream) are separated from the hydrocarbon’s mixture. The
remaining stream from SEP-1 is fed to the hydrocrackinghydroisomerization reactor, called R-HCRIS, which is modeled
with a RPlug module, at constant temperature (360 C).
The output stream from RHCRIS reactor is fed to SEP-2,
which is a Sep module used to remove the remaining hydrogen
(Split fraction of hydrogen equal to 1), called H2-OUT. The second output stream from SEP-2 contains the hydrocarbons,
which must be separated in a distillation train. According to the
simulation results, this stream must be conditioned from 360 C
and 50 bar to 1 bar and 30 C before it is fed to the distillation
train. With this purpose, a Pump module (TURBI-1) is inserted
along with a Heater module (EX-4). The output stream from
EX-4 is called HYDROCAR. The product distribution at the end
of hydrotreating and hydrocracking-hydroisomerization reactors
are presented in Tables 3.11 and 3.12, respectively.
From Table 3.11, it can be observed that the triglyceride conversion is almost 100%. Based on the product distribution, 76.8 wt.% of
Table 3.11 Product distribution from hydrotreating reactor.
Components
Flow (kg/h)
Components
Flow (kg/h)
Triolein
Trilinolein
Tripalmitin
Triestearin
H2
C5
C6
C7
C8
C9
C10
C11
Water
Total
0.00
0.00
0.0038
0.0039
857.15
7.33
9.45
12.23
37.42
86.79
47.27
63.89
52.05
C12
C13
C14
C15
C16
C17
C18
C19
C20
C21
CO
CO2
67.75
81.88
74.78
380.77
127.80
454.05
434.86
81.63
81.74
67.10
210.03
152.90
3388.97
78
Chapter 3 Production processes for the conversion of triglyceride feedstock
Table 3.12 Product distribution from hydrocracking-hydroisomerization reactor.
Components
Flow (kg/h)
Components
Flow (kg/h)
C13
Triolein
Trilinolein
Tripalmitin
Tristearin
H2
C1
C2
C3
C4
C5
C6
C7
C8
C9
C10
C11
C12
Total
81.93
0.0000
0.0000
0.0038
0.0039
857.15
0.0021
0.0004
0.0062
0.0070
7.31
9.40
12.19
37.32
86.42
47.11
63.91
67.46
C14
C15
C16
C17
C18
C19
C20
C21
iso-C5
iso-C6
iso-C7
iso-C8
iso-C9
iso-C10
iso-C12
iso-C16
74.86
380.77
127.20
453.95
434.77
81.53
81.61
67.08
0.0359
0.0463
0.0599
0.1833
0.4249
0.2315
0.3316
0.6255
2973.99
the total hydrocarbons obtained corresponds to the paraffins group
(C15C21). Moreover, only 3.1 wt.% of total hydrocarbons corresponds to light gases (C3C5). These results are consistent with the
experimental data presented by Anand and Sinha (2012) and Vélez
Manco (2014). Regarding to the hydrocracking-hydroisomerization
reactor, it is observed from Table 3.12 that the number of isomers
obtained is low, the mass ratio of iso-alkanes/n-alkanes is roughly
0.001. Likewise, the light hydrocarbons C1C4 are 0.001 wt.% of
total hydrocarbons obtained. These results are due to the low values
of kinetics constants reported in Calemma et al. (2000).
The HYDROCAR stream is separated into three products
(naphtha, biojet fuel, and green diesel) through distillation. The
design procedure to the distillation train starts with the shortcut methods, which are based on the Winn, Underwood, and
Gilliland Equations, modeled in Aspen Plus through the
DSTWU module. For this, we assume 10 psia of pressure drop
along the column, and a reflux ratio 1.33 times the minimum
reflux ratio. The recoveries of the key components are specified
as 99%; BK10 was the thermodynamic method used. The design
data of the distillation train are presented in Table 3.13.
Chapter 3 Production processes for the conversion of triglyceride feedstock
79
Table 3.13 Results from COL-1 and COL-2.
Condenser results from COL-1
Condenser results from COL-2
Temperature ( C)
Heat duty (cal/s)
Distillate rate (kg/h)
Reflux ratio
56.96
1142.81
28.97
0.5500
Reboiler results from COL-1
Temperature ( C)
Heat duty (cal/s)
Bottoms rate (kg/h)
3.5.4
Temperature ( C)
Heat duty (cal/s)
Distillate rate (kg/h)
Reflux ratio
197.65
62,440.63
972.16
1.45
Condenser results from COL-2
256.32
81,372.42
2087.86
Temperature ( C)
Heat duty (cal/s)
Bottoms rate (kg/h)
Economic assessment
The economic assessment for the hydrotreatment process is
carried out through the calculation of total annual cost (TAC),
shown in Eq. (3.1). The TAC is defined as the sum of annual operating cost (COP) and annual capital cost (CCA). Utilities cost, such
as steam, cooling water, hydrogen, electricity consumption from
pumps and compressors, and the raw material cost (vegetable oils)
are included in the COP. On the other hand, the CCA involves the
process equipment cost, calculated by the equations presented in
Turton et al. (2008), and updated by the Chemical Engineering
Process Cost Index. In this evaluation, the costs associated with the
transportation of raw material and hydrogen, as well as the catalysts cost used, were not considered.
TAC USD=year 5 annual operating cost ðCOP Þ 1
ð3:1Þ
annual capital cost ðCAC Þ
To calculate the COP, the palm oil, Jatropha oil, hydrogen, and
electricity prices are presented in Table 3.14; the Eqs. (3.2)(3.5)
defined each cost. Likewise, it is considered that the process has
a continuous operation of 8500 h per year. Regarding the saturated vapor, the price is referred to exchanged energy, defined as
1 USD/GJ, whilst the price of cooling water is 14.8 USD/
1000 m3. These values are obtained from Turton et al. (2008).
The COP is calculated by the Eq. (3.6).
kg
USD
h
3 PH 2
3 8500
ð3:2Þ
CH2 5 mH2
h
kg
year
kg
USD
h
3 Ppalm oil
3 8500
ð3:3Þ
Cpalm oil 5 mpalm oil
h
kg
year
339.93
70,562.31
1115.70
80
Chapter 3 Production processes for the conversion of triglyceride feedstock
Table 3.14 Prices in the market of items involved in COP .
Item
Price in the market
P (USD/kg)
Reference
Hydrogen
Jatropha oil
Palm oil
Electricity
1.80 USD/kg
1.50 USD/L
730 USD/ton
1.47 MX/kWh
13.99
4.477
0.73
0.075a
Hydrogen Energy Systems (2019)
Aumkiipure (2017)
COMEXPALMA (2018)
CFE (2019)
Notes: Density of Jatropha oil 5 0.91 g/mL (Lizarde et al., 2015). 1 USD 5 19.63 MX (Banco de México, 2019).
a
USD/kWh.
Table 3.15 Capacity parameters (A).
Equipment
Capacity parameter (A)
Units
Pumps
Heat exchangers
Process vessels
Power
Area
Length or height
kW
m2
m
CJatrophaoil 5 mJatrophaoil
kg
USD
h
3 PJatrophaoil
3 8500
h
kg
year
ð3:4Þ
Celect 5 kW req 3 Pelect
USD
h
3 8500
kWh
year
COP 5 CH2 1 Cpalm oil 1 CJatropha oil 1 Celect 1 Cwat 1 Csteam
ð3:5Þ
ð3:6Þ
On the other hand, CAC is obtained through calculations of
the equipment cost used in the process. This methodology
starts with the base cost (CP) determination. Eq. (3.7) describes
the CP; the K parameters involved in the Eq. (3.7) are related
with the equipment type, its operation, and its physical features. Likewise, A is a parameter related to the capacity or size
of the equipment. The definitions of A parameters are described
in Table 3.15. The K parameters are referred to carbon steel as
construction material. Also, in the case of vessels, the maximum
pressure is 400 barg.
log10 Cp 5 K1 1 K2 log10 A 1 K3 ðlog10 AÞ2
ð3:7Þ
Chapter 3 Production processes for the conversion of triglyceride feedstock
Regarding the distillation columns, the determination cost
of these equipment includes the sum of shell, plates, reboiler,
and condenser. The base cost of each plate into the column is
calculated by the Eq. (3.8), wherein D is the diameter of the
column.
Cp 5 235 1 19:80D 1 75:07D2
ð3:8Þ
The base cost can be corrected by the Eq. (3.9), if the pressure of the equipment is different from the one established by
Guthrie or the equipment must be constructed using a material
different from carbon steel. Thus the base cost is modified to
0
obtain the bare cost module CBM
.
0
0
5 Cp FBM
5 Cp B1 1 B2 FM Fp
CBM
ð3:9Þ
0
is the bare cost module factor, Bi depends on the
Where FBM
equipment type, FM depends on type of material, and Fp is the
correction due to pressure. Regarding the plates of a distillation
0
column, the bare cost module CBM
is calculated with Eq. (3.10).
0
5 Cp NFBM Fq
CBM
ð3:10Þ
Where N is the number of stages of the column, FBM is a factor
dependent on plates material, and Fq is a quantity factor, which
is a function of N. In the case of compressors, the bare cost
0
module CBM
is calculated with Eq. (3.11).
0
5 Cp FBM
CBM
ð3:11Þ
The equation to consider the pressure correction is presented in Eq. (3.12). The variable P is the manometric pressure
of the equipment (barg).
log10 Fp 5 C1 1 C2 log10 P 1 C3 ðlog10 PÞ2
ð3:12Þ
In the case of pumps, the pressure correction is calculated
with Eq. (3.13).
Fp 5 C1 1 C2 log10 P 1 C3 ðlog10 PÞ2
ð3:13Þ
To adjust the pressure of the vessels, the pressure correction
is calculated with Eq. (3.14) when 3:7 , P , 400barg.
Fp 5 0:5146 1 0:6838log10 P 1 0:2970ðlog10 PÞ2 1 0:0235ðlog10 PÞ6
1 0:0020ðlog10 PÞ8
ð3:14Þ
Also,
If
20.5 , P , 3.7 barg,
P , 2 0.5 barg, Fp 5 1.25.
Fp 5 1.0,
whilst
for
81
82
Chapter 3 Production processes for the conversion of triglyceride feedstock
The previous equations and the factors involved were proposed in 1996; thus these values must be updated, considering
the changes in economic conditions. This variation is represented by the most recent index, which was reported in April
2019 (Chemical Engineering, 2019), and whose value is 613.35,
whilst in 1996 the value was 382. Eq. (3.15) presents the update
of equipment cost (Cmdaj).
I2019
0
Cmdaj 5 CBM
ð3:15Þ
I1996
Additional costs must be included, which are called A1 and
A2. The first one is 18% of Cmdaj; this parameter includes contingencies and other fees associated with the installation. A2 is
61% of Cmdaj, and it involves costs related with machinery,
equipment, and maintenance. Finally, the capital cost is annualized on the recovery of capital investment, defined for this project as intermediate processing size. Thus the CAC is presented
in Eq. (3.16).
CAC USD=year 5
n
P
Cmdaji 1 A1i 1 A2i
i51
RCI
ð3:16Þ
In Table 3.16 the summary of costs for the hydrotreatment
process is presented. From this table it can be observed that
98.32% of total cost is due to the raw material cost, which considers palm oil, Jatropha oil, and hydrogen; from all the raw
materials, Jatropha oil has the major cost. The equipment cost
represents only 1.3% of total cost. From all the costs, the one
Table 3.16 Summary of the costs for hydrotreatment process.
Operating cost (USD/year)
Heating utilities Cooling utilities
cost
cost
Palm oil
81,110.69
3,102,500.00 28,021,978.02 70,008.15
6530.63
Jatropha
oil
Electricity Total operating
cost
44,881,541.33
Annual capital cost (USD/year)
Equipment cost
A1
A2
Total annual cost (TAC)
1,694,761.07
1,033,804.25
606,724.46
305,056.99
TAC (USD/year)
$45,488,265.79
Chapter 3 Production processes for the conversion of triglyceride feedstock
with the lowest contribution is corresponding to the cooling
water utility required by the process.
3.5.5
Estimation of price of biojet fuel
The minimum selling price can be obtained through the estimation of minimum utilities for the production process
(Jiménez-Gutiérrez, 2003). The minimum selling price can be
calculated with Eq. (3.17), wherein V is the additional profit
regarding to the minimum profit established in the project, P is
the net income, I is the investment required, and imin is a minimum value established by the company to measure the project
profitability. Usually imin is defined as 0.2, according to
Jiménez-Gutiérrez (2003).
V 5 P 2 imin I 5 0
ð3:17Þ
Then, P can be calculated with the gross income (R), equipment’s depreciation, and payment of taxes, according to the
Eq. (3.18). It is important to mention that equipment’s depreciation is represented by “e” and “d” factors, whilst, “t” is the tax
rate. In this case study, e 5 d 5 0.08 (Pinkerton et al., 2016), and
t 5 0.28 (Sadhukhan et al., 2008).
P 5 R 2 eI 2 t ðR 2 dI Þ
ð3:18Þ
The gross income (R) is defined as the annual sales (S)
minus the annual operating cost (C). The annual sales are
referred to the main product obtained in the process, which is
biojet fuel in this case. Also, the annual operating cost involves
the items defined by Eq. (3.6) minus the price of naphtha and
green diesel obtained in the process. The gross income (R) and
operating cost (C) are shown in Eqs. (3.19) and (3.20).
According to the current market, the price of naphtha is
0.465 USD/kg (Aljazira Capital, 2019), whilst the price of diesel
is 0.9553 USD/kg (U.S. Energy Information Administration,
2019); the density values for naphtha (Density of Petroleum
naphtha, 2019) and diesel (The Engineering Toolbox, 2019) are
0.74 and 0.849 kg/L, respectively.
R5S2C
C 5 CH2 1 Cpalm oil 1 CJatropha oil 1 Celect 1 Cwat 1 Csteam
2 SPnapht 1 SPgreendies
ð3:19Þ
ð3:20Þ
On the other hand, the total investment of the project is the
annualized total equipment cost plus the operating cost, which
83
84
Chapter 3 Production processes for the conversion of triglyceride feedstock
Table 3.17 Minimum price of biojet fuel.
I (USD/year)
Pn
i51 Cmdaji
1,694,761.07
P
Operating cost (5% of ni51 Cmdaji )
151,681.12
Total
1,846,442.19
S (USD/year)
Q (kg/year)
Minimum price of biojet fuel (USD/kg)
4.43
P (USD/year)
C (USD/year)
imin
0.2
P 5 imin 3 I
Total
Naphtha (kg/h)
246,273.90
Green diesel (kg/h)
9,483,521.90
Total
35,975,742.90
369,288.44
36,636,358.89
8,263,366.55
P
is equivalent to 5% of equipment cost ( ni51 Cmdaji ). This last
value was extracted from Wang (2016).
Finally, in order to obtain the unit price of biojet fuel, the
annual sales (S) must be divided by the annual production volume of biojet fuel (Q), according to the Eq. (3.21).
Price biojet 5
S
Q
ð3:21Þ
In Table 3.17 is presented the overview of the variables
involved in the determination of biojet fuel minimum price.
According to IATA (2019), the market price of kerosene fuel
(jet fuel A1) is 0.4849 USD/L or 0.6380 USD/kg, considering
0.8075 kg/L the density of kerosene (The Engineering Toolbox,
2019). The price obtained in the case study is roughly 6.9 times
the price in the market, mainly due to the high operation cost
determined for the process. However, this price could be
improved with the application of energy integration and process
intensification strategies on the process.
3.5.6
Environmental assessment: CO2 emissions
The determination of CO2 emissions for the hydrotreatment
process considers those related with the generation of steam
and the use of electricity.
Regarding the emissions involved in the steam generation,
the mass of the fuel used in the boiler must be calculated; usually, the fuel considered is natural gas. The mass fuel is obtained
with the Eq. (3.22), where msteam is the steam mass required,
provided by the simulation; hv is the saturated steam enthalpy,
Chapter 3 Production processes for the conversion of triglyceride feedstock
which can be consulted on saturated steam tables (Compañı́a
Especialista en Vapor, 2019); hAA is the enthalpy of water fed to
boiler (25 C, 1 atm), which is 104.878 kJ/kg; Cpfuel is the calorific
capacity of the natural gas, which is 65.5738 kJ/kg; and η is the
boiler efficiency, defined as 80%.
mfuel 5
msteam ðhv 2 hAA Þ
Cpfuel η
ð3:22Þ
An emission factor of natural gas boilers to produce steam has
been determined by Oficina Catalana del Cambio Climático (2011).
This factor is 2.15 kg CO2/Nm3 (Fgn ) for natural gas. Thus the mass
of natural gas calculated by Eq. (3.23), must be converted in a volumetric value, according to the Eq. (3.22), where Vfuel is the natural
gas volume in Nm3, R is the ideal gases constant, T is 0 C, PM is
the molecular weight of natural gas, and P is 1 atm.
Vfuel 5
mfuel 3 R 3 T
PM 3 P
ð3:23Þ
Finally, the carbon dioxide emissions due to the generated
steam are obtained from Eq. (3.24).
kg CO2
5 Fgn 3 Vfuel
h
ð3:24Þ
On the other hand, the CO2 emissions due to electricity
required by the process are calculated by an emission factor,
associated with the electricity demand from the productive
activities for a country. In Mexico, the factor is 0.166 kg CO2/
kWh (MITECO, 2011). The emissions due to electricity are
obtained with the Eq. (3.25).
kg CO2
5 Felec 3 Power consumption ðkWhÞ
helec
ð3:25Þ
In Table 3.18 the CO2 emissions related by the steam and
electricity used in the process are presented.
Table 3.18 CO2 emissions due to steam and electricity generation.
Emissions due to steam generation (Mkg
CO2/year)
Emissions due to electricity (Mkg Total
CO2/year)
emissions
(Mkg CO2/
year)
26,440.25
1.387
26,441.64
85
86
Chapter 3 Production processes for the conversion of triglyceride feedstock
The sum of CO2 emissions due to steam and electricity is
26.442 Mton CO2/year. The emissions of CO2 could be reduced
with the application of energy integration and process intensification techniques.
3.6
Conclusion
Triglyceride feedstock can be converted to biojet fuel and
other hydrocarbon fuels through the hydroprocessing technology. The hydrotreating is the most mature and studied process,
which also has certification from ASTM. Additionally, most of
the processing equipment is the same used for petrochemical
processes; thus existing equipment could be used to process triglyceride materials. More than half of the test flights have been
realized with biojet fuel produced with hydroprocessing technology. Moreover, the combustion studies show advantages of
the use of hydroprocessed jet fuel in comparison with fossil jet
fuel. From the case study, it can be clearly seen that the price of
raw material has a great impact on the total annual cost. This
has driven research and technological developments for the
processing of other raw materials with lower cost.
References
Aljazira Capital, 2019, Oil & petrochemicals monthly. ,https://www.
aljaziracapital.com.sa/report_file/ess/SEC-624.pdf. (accessed 26.01.20).
Altaher, M.A., Li, H., Blakey, S., Chung, W., 2014. NMHC and VOC speciation of
the exhaust gas from a gas turbine engine using alternative, renewable and
conventional Jet A-1 aviation fuels. In: Proceedings of the ASME Turbo Expo.
Düsseldorf, GT2014-25445.
Anand, M., Sinha, A.K., 2012. Temperature-dependent reaction pathways for the
anomalous hydrocracking of triglycerides in the presence of sulfided
CoMo-catalyst. Bioresour. Technol. 126, 148155.
Anand, M., Farooqui, S.A., Kumar, R., Joshi, R., Kumar, R., Sibi, M.G., et al., 2016.
Optimizing renewable oil hydrocracking conditions for aviation bio-kerosene
production. Fuel Process. Technol. 151, 5058.
Aumkiipure, 2017. Jatropha biodiesel cost buy, sell Jatropha oil Jatropha
seed prices. ,http://www.aumkiipure.com/jatropha-biodiesel-cost.html.
(accessed 22.08.19).
Banco de México, 2019. SIE Mercado cambiario. ,https://www.banxico.org.
mx/tipcamb/main.do?page 5 tip&idioma 5 sp. (accessed 17.08.19) (Spanish).
Becker, P.J., Celse, B., Guillaume, D., Dulot, H., Costa, V., 2015. Hydrotreatment
modeling for a variety of VGO feedstocks: a continuous lumping approach.
Fuel 139, 133143.
Buffi, M., Valera-Medina, A., Marsh, R., Pugh, D., Giles, A., Runyon, J., et al.,
2017. Emissions characterization tests for hydrotreated renewable jet fuel
from used cooking oil and its blends. Appl. Energy 201, 8493.
Chapter 3 Production processes for the conversion of triglyceride feedstock
Calemma, V., Peratello, S., Perego, C., 2000. Hydroisomerization and
hydrocracking of long chain n-alkanes on Pt/amorphous SiO2Al2O3 catalyst.
Appl. Catal. A Gen. 190, 207218.
Carlson, E.C., 1996. Don’t gamble with physical properties for simulations.
Chem. Eng. Prog. 3546.
Castellanos Navarrete, A., 2018. Palma de aceite en tierras campesinas: la
polı́tica de las transformaciones territoriales en Chiapas, México. Rev. Pueblos
Front. Digit. 13, 134 (Spanish).
CFE, 2019. Tarifas CFE. ,https://app.cfe.mx/Aplicaciones/CCFE/Tarifas/
TarifasCREIndustria/Tarifas/DemandaIndustrialTran.aspx. (accessed
17.08.19) (Spanish).
Chemical Engineering, 2019. CEPCI Updates: May (prelim.) and April (final)Chemical Engineering | Page 1. ,https://www.chemengonline.com/2019cepci-updates-may-prelim-and-april-final/. (accessed 17.08.19).
COMEXPALMA, 2018. Mercado Mexicano de Aceite de Palma. ,http://www.
comexpalma.org/2019/index.php/situacion-nacional. (accessed 17.08.19)
(Spanish).
Compañı́a Especialista en Vapor, 2019. Calculadora: Tabla de Vapor Saturado
por Temperatura. ,https://www.tlv.com/global/LA/calculator/steam-tabletemperature.html. (accessed 17.08.19) (Spanish).
Corporan, E., DeWitt, M.J., Klingshirn, C.D., Anneken, D., 2010. Alternative fuels
tests on a C-17 aircraft: emissions characteristics. Air Force Research
Laboratory. ,https://apps.dtic.mil/dtic/tr/fulltext/u2/a536842.pdf.
(accessed 24.04.20).
Corporan, E., DeWitt, M.J., Klingshirn C.D., Anneken, D., Streibich, R., Shafer, L.,
2012. Comparisons of emissions characteristics of several turbine engines
burning FischerTropsch and hydroprocessed esters and fatty acids
alternative jet fuels. In: Proceedings of the ASME Turbo Expo. Copenhagen,
GT2012-68656.
Cruz Neves, R., Colling Klein, B., Justino da Silva, R., Alves Ferreira Rezende, M.
C., Funke, A., Olivarez-Gómez, E., et al., 2019. A vision on biomass-to-liquids
(BTL) thermochemical routes in integrated sugarcane biorefineries for biojet
fuel production. Renew. Sustain. Energy Rev. 119, 109607.
Dagdougui, H., Sacile, R., Bersani, Ch, Ouammi, A., 2018. Chapter 4 Hydrogen
Storage and Distribution: Implementation Scenarios, Hydrogen Infrastructure
for Energy Applications. Academic Press, pp. 3752.
Density of petroleum naphtha, 2019. [WWW Document]. ,https://www.aquacalc.com/page/density-table/substance/petroleum-blank-naphtha.(accessed
24.08.19).
Dujjanutat, P., Kaewkannetra, P., 2020. Production of bio-hydrogenated kerosene
by catalytic hydrocracking from refined bleached deodorised palm/palm
kernel oils. Renew. Energy 147 (Part 1), 464472.
Engineering Software, 2019. Hydrogen physical properties calculator. ,https://
www.engineering-4e.com/h2-physical-properties-calculator. (accessed
17.08.19).
Garcı́a-Bustamante, C.A., Massera-Cerutti, O., 2016. Estado del arte de la
bioenergı́a en México. ,http://rtbioenergia.org.mx/wp-content/uploads/
2016/12/Divulgacion_Estado-del-arte-de-la-bioenerg%C3%ADa-en-M%C3%
A9xico.pdf. (accessed 26.01.20) (Spanish).
González, I.S., 2012. Bioturbosina. Producción de cultivos energéticos para la
aviación comercial. Rev. Mex. Cienc. Agrı́c. 3 (3), 579594 (Spanish).
Gutiérrez-Antonio, C., Romero-Izquierdo, A.G., Israel Gómez-Castro, F.,
Hernández, S., 2016. Energy integration of a hydrotreatment process for
sustainable biojet fuel production. Ind. Eng. Chem. Res. 55, 81658175.
87
88
Chapter 3 Production processes for the conversion of triglyceride feedstock
Gutiérrez-Antonio, C., Gómez-Castro, F.I., de Lira-Flores, J.A., Hernández, S.,
2017. A review on the production processes of renewable jet fuel. Renew.
Sustain. Energy Rev. 79, 709729.
Gutiérrez-Antonio, C., Gómez-De la Cruz, A., Romero-Izquierdo, A.G., GómezCastro, F.I., Hernández, S., 2018. Modeling, simulation and intensification of
hydroprocessing of micro-algae oil to produce renewable aviation fuel. Clean
Technol. Environ. Policy 20 (7), 15891598.
Hanafi, S.A., Elmelawy, M.S., Shalaby, N.H., El-Syed, H.A., Eshaq, G., Mostafa, M.
S., 2016. Hydrocracking of waste chicken fat as a cost effective feedstock for
renewable fuel production: a kinetic study. Egypt. J. Pet. 25 (4), 531537.
Hari, T.K., Yaakob, Z., Binitha, N.N., 2015. Aviation biofuel from renewable
resources: Routes, opportunities and challenges. Renew. Sustain. Energy Rev.
42, 12341244.
Holmgren, J., 2017, Biofuels; unlocking the potential, International Symposium
on Biofuels, ,https://www.yumpu.com/en/document/read/30591464/
unlocking-the-potential-petrofedwinwinho. (accessed 02.07.20).
Hua, F., Fang, Z., Qiu, T., 2018. Modeling ethylene cracking process by
learning convolutional neural networks. Comput. Aided Chem. Eng. 44, 841846.
Hydrogen Energy Systems, 2019. Hydrogen fuel cost vs gasoline. ,https://
heshydrogen.com/hydrogen-fuel-cost-vs-gasoline/. (accessed 22.08.19).
IATA, 2019. Jet fuel price monitor. ,https://www.iata.org/publications/
economics/fuel-monitor/Pages/index.aspx. (accessed 24.08.19).
Inurreta Aguirre, H.D., Garcı́a Pérez, E., Uresti Gil, J., Martı́nez Dávila, J.P., Ortiz
Laurel, H., 2013. Potencial para producir Jatropha curcas L. como materia
prima para biodiesel en el estado de Veracruz. Trop. Subtrop. Agroecosyst. 16
(3), 325339 (Spanish).
Jiménez-Gutiérrez, A., 2003. Diseño de Procesos en Ingenierı́a Quı́mica. Ed.
Reverté (Spanish).
Kang, D., Kim, D., Kalaskar, V., Violi, A., Boehman, A.L., 2019. Experimental
characterization of jet fuels under engine relevant conditions part 1: effect
of chemical composition on autoignition of conventional and alternative jet
fuels. Fuel 239, 13881404.
Li, X., Chen, Y., Hao, Y., Zhang, X., Du, J., Zhang, A., 2019. Optimization of
aviation kerosene from one-step hydrotreatment of catalytic Jatropha oil over
SDBS-Pt/SAPO-11 by response surface methodology. Renew. Energy 139,
551559.
Liu, G., Yan, B., Chen, G., 2013. Technical review on jet fuel production. Renew.
Sustain. Energy Rev. 25, 5970.
Liu, S., Zhu, Q., Guan, Q., He, L., Li, W., 2015. Bio-aviation fuel production from
hydroprocessing castor oil promoted by the nickel-based bifunctional
catalysts. Bioresour. Technol. 183, 93100.
Lizarde, N.A., Alcaraz-Meléndez, L., Ángel, M., Escalante, A., Reynoso-Granados,
T., Cruz-Hernández, P., et al., 2015. Propiedades fisicoquı́micas del aceite de
semillas de Jatropha curcas de poblaciones silvestres en México. Rev. FCA
UNCUYO 47 (1), 127137 (Spanish).
Lyu, B., Kwon, H., Lee, J., Yoon, H., Jin, J., Moon, I., 2014. Forecasting of naphtha
demand and supply using time serial data causal analysis. Comput. Aided
Chem. Eng. 33, 829834.
Maity, S.K., 2015. Opportunities, recent trends and challenges of integrated
biorefinery: part I. Renew. Sustain. Energy Rev. 43, 14271445.
Markets and Bussiness, 2009. Biokerosene takes off in aviation sector. Focus.
Catal. 1, 2.
Chapter 3 Production processes for the conversion of triglyceride feedstock
Marsh, G., 2009. Small wonders: biomass from algae. Renew. Energy Focus. 9
(7), 7478.
Mendes de Souza, L., Mendes, P.A.S., Aranda, D.A.G., 2020. Oleaginous
feedstocks for hydro-processed esters and fatty acids (HEFA) biojet
production in southeastern Brazil: a multi-criteria decision analysis. Renew.
Energy 149, 13391351.
McCall, M.J., Kocal, J.A., Bhattacharyya, A., Kalnes, T.N., Brandvold, T.A., 2011.
Production of aviation fuel from renewable feedstocks. United States patent
US 8039682, UOP LLC, assignee.
MITECO, 2011. Guı́a para el cálculo de la huella de carbono y para la
elaboración de un plan de mejora de una organización. ,https://www.
miteco.gob.es/es/cambio-climatico/temas/mitigacion-politicas-ymedidas/guia_huella_carbono_tcm30-479093.pdf. (accessed 22.08.19)
(Spanish).
Moreno-Gómez, A.L., Gutiérrez-Antonio, C., Gómez-Castro, F.I., Hernández, S.,
2020. Production of biojet fuel from waste raw materials: a review. Process
Systems Engineering for Development of Biofuels. Wiley, In press.
Oficina Catalana del Cambio Climático, 2011. Guı́a práctica para el cálculo de
emisiones de gases de efecto invernadero (GEI). ,http://www.caib.es/
sacmicrofront/archivopub.do?ctrl 5 MCRST234ZI97531&id 5 97531.
(accessed 30.01.20) (Spanish).
Parimi, K., Nguyen, T.D.T., 2012. Methods of deoxygenation and systems for fuel
production. United States patent US 8236999, Energia Technologies, Inc.,
assignee.
Parimi, K., Nguyen, T.D.T., 2013. Systems for fuel production. United States
patent US 8597599, Energia Technologies, Inc., assignee.
Perkins, G., Batalha, N., Kumar, A., Bhaskar, T., Konarova, M., 2019. Recent
advances in liquefaction technologies for production of liquid hydrocarbon
fuels from biomass and carbonaceous wastes. Renew. Sustain. Energy Rev.
115, 109400.
Pinkerton, N., Schmid, K., Xamplas, J., 2016. Estimation of production cost and
revenue. ,https://processdesign.mccormick.northwestern.edu/index.php/
Estimation_of_production_cost_and_revenue. (accessed 24.08.19).
Quiroz-Pérez, E., Gutiérrez-Antonio, C., Vázquez-Román, R., 2019. Modelling of
production processes for liquid biofuels through CFD: a review of
conventional and intensified technologies. Chem. Eng. Process. Process
Intensif. 143, 107629.
Red Temática de Bioenergı́a, 2016. Bioenergı́a en el Sureste de México,
oportunidades y barreras para su desarrollo. ,http://rtbioenergia.org.mx/wpcontent/uploads/2016/12/Chiapas.pdf. (accessed 26.01.20) (Spanish).
Reza, D.H., Bueno, L.E.G., Valdivia, D.D.V., Silvestre, J.M.O., 2010. La producción
de biodiesel en el estado de Chiapas. Rev. Mex. Ecol. Agrı́c. Recur. Nat. 3,
7796.
Riegelhaupt, E., Odenthal, J., 2015. Inventario de proyectos y programas de
bioenergı́a En México 20022015. ,rtbioenergia.org.mx. (accessed 30.01.20).
Romero-Izquierdo, A.G., Gutiérrez-Antonio, C., Gómez-Castro, F.I., Hernández,
S., 2018. Hydrotreating of triglyceride feedstock to produce renewable
aviation fuel. Recent Innov. Chem. Eng. 11 (2), 7789.
Sadhukhan, J., Mustafa, M.A., Misailidis, N., Mateos-Salvador, F., Du, C.,
Campbell, G.M., 2008. Value analysis tool for feasibility studies of biorefineries
integrated with value added production. Chem. Eng. Sci. 63, 503519.
Sánchez, A., Águila, J., Martı́nez, J., Arévalo, O., 2014. En Acapetahua, Chiapas: el
caso de Propalma, Rev. Mex. Agron., 18, pp. 10521064 (Spanish).
89
90
Chapter 3 Production processes for the conversion of triglyceride feedstock
Sandoval-Garcı́a, A.M., Altamirano-Cárdenas, J.R., Aguilar-Ávila, J., Garcı́aMuñiz, J.G., 2016. Chemical characterization of oil obtained by homemade
methods from three African palm varieties (Elaeis guineensis Jacq.). Rev.
Fitotec. Mex. 39, 317322.
Sebos, I., Matsoukas, A., Apostolopoulos, V., Papayannakos, N., 2009. Catalytic
hydroprocessing of cottonseed oil in petroleum diesel mixtures for
production of renewable diesel. Fuel 88, 145149.
SENER, 2019. Sistema de Información Energética. ,http://sie.energia.gob.mx/
movil.do?action 5 temas&node 5 INFSENER. (accessed 17.08.19) (Spanish).
Sonthalia, A., Kumar, N., 2019. Hydroprocessed vegetable oil as a fuel for
transportation sector: a review. J. Energy Inst. 92, 117.
Sundararaj, R.H., Kumar, R.D., Raut, A.K., Sekar, T.C., Pandey, V., Kushari, A.,
et al., 2019. Combustion and emission characteristics from biojet fuel blends
in a gas turbine combustor. Energy 182, 689705.
The Engineering Toolbox, 2019. Fuels densities and specific volume. ,https://
www.engineeringtoolbox.com/fuels-densities-specific-volumes-d_166.html.
(accessed 24.08.19).
Turton, R., Shaeiwitz, J.A., Bhattacharyya, D., Whiting, W.B., 2008. Analysis,
Synthesis, and Design of Chemical Processes, fifth ed. Prentice Hall.
U.S. Energy Information Administration, 2019. Short-term energy outlook.
,https://www.eia.gov/outlooks/steo/outlook.php. (accessed 24.08.19).
Unipalma, 2020. Aceite de palma. ,https://www.unipalma.com/aceite-depalma. (accessed 25.01.20) (Spanish).
Vásquez, M.C., Silva, E.E., Castillo, E.F., 2017. Hydrotreatment of vegetable oils: a
review of the technologies and its developments for jet biofuel production.
Biomass Bioenergy 105, 197206.
Vélez Manco, J.F., 2014. Conceptual Design of a Palm Oil Hydrotreatment
Reactor for Commercial Diesel Production. Universidad Nacional de
Colombia, ,http://www.bdigital.unal.edu.co/51154/1/1017176429.2014.pdf.
(accessed 30.01.20).
Verma, D., Kumar, R., Rana, B.S., Sinha, A.K., 2011. Aviation fuel production from
lipids by a single-step route using hierarchical mesoporous zeolites. Energy
Environ. Sci. 4, 16671671.
Vozka, P., Šimáček, P., Kilaz, G., 2018. Impact of HEFA feedstocks on fuel
composition and properties in blends with jet A. Energy Fuels 32 (11),
1159511606.
Vozka, P., Kilaz, G., 2020. A review of aviation turbine fuel chemical
composition-property relations. Fuel 268, 117391.
Wang, W.-C., 2016. Techno-economic analysis of a bio-refinery process for
producing hydro-processed renewable jet fuel from Jatropha. Renew. Energy
95, 6373.
Wang, W.C., Tao, L., 2016. Bio-jet fuel conversion technologies. Renew. Sustain.
Energy Rev. 53, 801822.
Wei, H., Liu, W., Chen, X., Yang, Q., Li, J., Chen, H., 2019. Renewable bio-jet fuel
production for aviation: a review. Fuel 254, 115599.
Why, E.S.K., Chyuan Ong, H., Voon Lee, H., Yang Gan, Y., Chen, W.H., Tung
Chong, C., 2019. Renewable aviation fuel by advanced hydroprocessing
of biomass: challenges and perspective. Energy Convers. Manag. 199,
112015.
Wiedersatz, B., 2012. La Palma Africana en Chiapas (México): escenarios sobre el
uso del suelo, bajo cambio global. ,https://otrosmundoschiapas.org/lapalma-africana-en-chiapas-escenarios-sobre-el-uso-del-suelo-bajo-cambioglobal/. (accessed 30.01.20).
Chapter 3 Production processes for the conversion of triglyceride feedstock
World Intellectual Property Organization, 2020. Patentscope database. ,https://
patentscope.wipo.int/search/en/result.jsf?_vid 5 P12-K5UFEI-02221.
(accessed 25.01.20).
Zamarripa Colmenero, A., Ruı́z Cruz, P.A., Solı́s Bonilla, J.L., Martı́nez Herrera, J.,
Olivera de los Santos, A., Martı́nez Valencia, B., 2009. Biocombustibles:
perspectivas de producción de biodiesel a partir de Jatropha curcas L. en el
trópico de México. ,https://www.researchgate.net/profile/Jorge_Herrera13/
publication/285331994_Biocombustibles_perspectivas_de_produccion_de_
biodiesel_a_partir_de_Jatropha_curcas_L_en_el_tropico_de_Mexico_Tuxtla_
Chico_Chiapas_Mexico_instituto_nacional_de_investigaciones_forestales/
links/5785b88808aef321de2a9d83/Biocombustibles-perspectivas-deproduccion-de-biodiesel-a-partir-de-Jatropha-curcas-L-en-el-tropico-deMexico-Tuxtla-Chico-Chiapas-Mexico-instituto-nacional-de-investigacionesforestales.pdf. (accessed 30.02.20) (Spanish).
Zhang, C., Hui, X., Lin, Y., Sung, C.J., 2016. Recent development in studies of
alternative jet fuel combustion: progress, challenges, and opportunities.
Renew. Sustain. Energy Rev. 54, 120138.
Zhao, X., Sun, X., Cui, X., Liu, D., 2019. Chapter 5 production of biojet fuels
from biomass. In: Rai, M., Ingle, A.P. (Eds.), Sustainable Bioenergy. Elsevier,
pp. 127165.
91
Production processes for the
conversion of sugar and starchy
feedstock
4.1
4
Introduction
Biomass containing sugar and starch can be used as a raw
material to produce biojet fuel. Among the crops which can be
used as a source of such components are sugarcane, corn, sorghum, wheat, rye, and cassava (Siegmeier et al., 2019). Corn is a
widely produced source, with an approximate global production
of 1.04 billion metric tons during the period 201617, with the
United States and China being the main producers (Mohanty
and Swain, 2019). In the case of wheat, a global production of
755 million metric tons has been reported, with the European
Union and China as the main producers (Mohanty and Swain,
2019). In the case of sugarcane, a global production of around
1.8 billion tons has been reported by 2012, with Brazil being the
major producer, contributing in 39% to the global production
(Silalertruksa and Gheewala, 2018).
Sugar and starchy biomass have been widely used for
bioethanol production, with the United States and Brazil being
the main producers; these countries contributed with 50% and
28.8%, respectively, of the global bioethanol production in 2016
(Mohanty and Swain, 2019). Since most of the sugar and starchy
sources are part of the human diet, concerns about its use as
raw materials for biofuels production have been manifested.
There are reports predicting that the production of biofuels
from these sources would cause a rising in the food prices
(Chakravory et al., 2009), although other predictions indicate
that such rises would be caused by other factors (Timilsina and
Shrestha, 2011). To reduce such potential issues, governments
have developed proper politics. As an example, in Brazil the cultivation of sugarcane for bioethanol production is promoted on
marginal land and degraded pastures (de Oliveira Bordonal
et al., 2018). In the case of Mexico, the use of sources as corn
Production Processes of Renewable Aviation Fuel. DOI: https://doi.org/10.1016/B978-0-12-819719-6.00004-3
© 2021 Elsevier B.V. All rights reserved.
93
94
Chapter 4 Production processes for the conversion of sugar and starchy feedstock
and sugarcane is only allowed when there is a surplus in the
production of such crops (Diario Oficial, 2008). For the
European Union, in 2015 the European Commission established
a 7% upper limit for the usage of food-based biofuels in transportation by 2020 (Araújo et al., 2017).
Through additional treatment, bioethanol and other alcohols
can be transformed into biojet fuel; thus sugar and starchy biomass are sources for biojet fuel and other hydrocarbon-based
fuels. This production approach has been reported as having
high potential in countries with a well-developed infrastructure
for sugarcane production, as Brazil; although there is still the
need for financial and regulatory support to promote the production of biojet fuel from raw materials as sugarcane (Zanatta
Martini et al., 2018). On the other hand, pathways to directly
transform sugar and starchy biomass into jet fuels have been
developed, avoiding the production of bioethanol as intermediate product. In this chapter, both processing routes will be analyzed, that is, direct conversion of biomass to hydrocarbons and
the production of renewable jet fuel and other products from
biomass-derived ethanol.
4.2
Conversion of sugars to biojet fuel
Raw materials with high content of sugars can be processed
to obtain biojet fuel. Two main strategies have been reported
for this conversion: the alcohol-to-jet (ATJ) pathway and the
sugar-to-jet (STJ) pathway. In Fig. 4.1 is presented the conversion of sugar and starchy feedstocks into available sugars, which
are the internal raw material to produce biojet fuel at downstream processing. Then, Fig. 4.2 shows an overall diagram of
downstream processing to produce biojet fuel from the available sugars, while Fig. 4.3 presents the overall diagram of the
catalytic route to produce biojet fuel from sugars.
Each kind of process presented in Figs. 4.2 and 4.3 will be
described in detail in the following subsections.
4.2.1
Alcohol-to-jet pathway
The ATJ process includes fermentation of the sugars to an
alcohol, followed by dehydration, oligomerization, and hydrogenation. These steps are known as the alcohol-to-jet process
and will be discussed in this section. In the case of fermentation, different microorganisms, as bacteria, yeast, or fungi, can
transform sugars to ethanol under anaerobic conditions
Chapter 4 Production processes for the conversion of sugar and starchy feedstock
Figure 4.1 Pretreatment of sugar and starchy feedstocks.
Figure 4.2 Downstream processing from sugars released.
Figure 4.3 Catalytic route to produce biojet fuel from sugars.
95
96
Chapter 4 Production processes for the conversion of sugar and starchy feedstock
(Hamelinck et al., 2005). Selecting the proper microorganism
is one of the main issues in the fermentation step, since each
kind of microorganism can successfully transform a given kind
of sugar produced in the hydrolysis step; due to this, the use
of a set of different microorganisms has been explored in the
last years. Moreover, different microorganisms may lead to a
variation on ethanol yield; Saccharomyces cerevisiae and
Zymomonas mobilis have been reported among the best yeast
and bacteria, respectively, for ethanol production using
hexoses as a raw material (Talebnia et al., 2010). The development of modified microorganisms through genetic engineering
is one of the paths to enhance the fermentation process, allowing cofermentation of two or more sugars simultaneously. As
examples, Kim et al. (2010) proposed the use of modified
strains of Escherichia coli, S. cerevisiae, and Z. mobilis, among
other microbes, to ferment glucose and xylose. Rodrussamee
et al. (2011) found that the yeast Kluyveromyces marxianus
can transform glucose, mannose, galactose, xylose, and arabinose. Moreover, Feng et al. (2017) reported that the use of
immobilized Candida shehatae and S. cerevisiae allows the
simultaneous fermentation of pentose and hexose, while
Papapetridis et al. (2018) studied the use of mutated S. cerevisiae strains to ferment glucose and xylose. Recently, Rech et al.
(2019) proposed the use of Spathaspora hagerdaliae for the
cofermentation of hexoses and pentoses. The development of
new microorganisms is still an area of opportunity since it is
required to find organisms which are economically feasible for
its use at industrial scale, able to obtain high yields of ethanol,
and with low potential for inhibition. Another alternative to
enhance the ethanol production step implies performing the
saccharification and fermentation in a single equipment,
which improves ethanol yield in comparison with performing
the hydrolysis and fermentation in separated vessels (Sarkar
et al., 2012). Nevertheless, one of the main challenges for this
approach is concealing the best operating conditions for
hydrolysis and fermentation. Another strategy to increase the
ethanol production is the separation of the alcohol in situ,
with the use of a membrane; this modifies the reaction equilibrium toward an increase in the production of ethanol
(Baeyens et al., 2015). The main limitation of this strategy is
the ease of membrane plugging due to the suspended solids
present in the fermentation or hydrolysis/fermentation
processes.
Once the ethanol is obtained, additional steps are required to
transform it into hydrocarbons in the required range. The first
Chapter 4 Production processes for the conversion of sugar and starchy feedstock
step is dehydration. This stage implies the treatment of ethanol
in an acid catalyst to produce ethylene and water:
catalyst
C2 H5 OH - C2 H4 1 H2 O
ð4:1Þ
According to Phung and Busca (2015a), high temperatures
promote the ethanol dehydration to ethylene. Moreover, they
mention that zeolites, alumina, and silica-alumina catalysts
allow a dehydration mechanism from ethanol to diethyl ether
and diethyl ether to ethylene in a range between 180 C and
300 C. Nevertheless, Phung and Busca (2015b) reported that
zeolites and γ-alumina catalysts are more active than silica alumina. In other work, Phung et al. (2015) studied the synthesis of
ethylene with a yield of 99.9% using H-FER zeolite and faujasites at 300 C. Rodrigues de Oliveira et al. (2018) found that
ZSM-5 zeolites allow selectivity to ethylene close to 90% at
220 C. On the other hand, Austin et al. (2018) proposed the use
of nanocatalysts to perform the dehydration reaction, mentioning that such arrangements allow avoiding the formation of
diethyl ether.
Once the ethylene has been produced, the oligomerization
takes place. In the oligomerization step, several molecules of ethylene are converted to long-chain linear olefins, as shown in Eq. (4.2)
catalyst
nC2 H4 - C2n H4n
ð4:2Þ
Andrei et al. (2015) reported the use of a Ni_AlSBA-15 mesoporous catalyst for the oligomerization of ethylene to produce
C4C10 olefins. The optimal operation conditions are reported
as 150 C and 3.0 MPa for a continuous device. The authors also
mention obtaining 175 g of oligomers per gram of catalyst.
Later, Rozhko et al. (2017) presented the development of covalent organic frameworks to support nickel as a catalyst for ethylene oligomerization, obtaining high selectivity mainly to
C4C8 olefins, for a temperature of 50 C and a pressure of
15 bar. In the same year, Liu et al. (2017) developed a chromium
catalyst in a metal-organic framework, namely, MIL-100(Cr),
reaching a selectivity of 99% to C6, C8, and C10 olefins. In the
production of biojet fuel, it is desired to produce chain lengths
in a range between C8 and C16. Tomov et al. (2017) reported
the use of chromium-based complexes with bis(benzimidazolemethyl)amine ligands, which allows generating proportions up
to 10% for olefins with eight or more carbon atoms. Timken
et al. (2018) proposed an oligomerization step with an ionic liquid catalysis, mentioning that hydrocarbons in the range of
C10C55 are obtained.
97
98
Chapter 4 Production processes for the conversion of sugar and starchy feedstock
Once the olefins are generated, it is necessary to saturate the
hydrocarbon molecules. This is done through hydrogenation,
aiming to produce alkanes in the same carbon range of the
alkenes leaving the oligomerization reactor. According to Doyle
et al. (2003), low-pressure hydrogenation of alkenes occurs on
supported palladium nanoparticles, more than on single-crystal
palladium surfaces. On the other hand, Spielmann et al. (2008)
found that hydrogenation of alkenes may take place by using
organocalcium catalysts, at 20 C and 20 bar H2. Chirik (2015)
mentioned that more than using precious metals for the development of hydrogenation catalysts, efforts must be focused on
the use of transition metals, as iron or cobalt, due to environmental and economic aspects. Gieshoff et al. (2017) proposed
the use of iron nanocluster catalysts for the hydrogenation of
alkenes under conditions of 20 C and 14 bar. After hydrogenation, a set of saturated hydrocarbons is produced. The hydrocarbons must be then separated to obtain the desired fractions.
The purification step will be discussed in Section 4.3.
4.2.2
Sugar-to-jet pathways
There are two conversion strategies to directly transform
sugars into hydrocarbons: biological and catalytic. The biological route has fermentation as main step, potentially followed
by hydrotreating and/or hydrocracking/hydroisomerization,
while the catalytic route involves hydrogenation, reforming, either
condensation or dehydration followed by oligomerization, hydrotreating, and hydrocracking/hydroisomerization (Wang et al.,
2016).
For the biological process, the first step implies the biological conversion, either aerobic or anaerobic, of the sugars. In
this step, depending on the employed microorganism, several
products can be generated, as pentadecane, farnesene, fatty
esters, and fatty acids, among others. Rude and Schirmer (2009)
mentioned monoterpenes as potential components for jet fuel.
On the other hand, Peralta-Yahya and Keasling (2010) reported
pinene, sabinene, and terpinene, along with fatty acid and
isoprenoid-based biofuels, as potential replacements for jet
fuel. Ladygina et al. (2006) described the generation of hydrocarbons in a glucose-containing medium using several microorganisms, including S. cerevisiae and Pseudomonas fluorescens,
among others. Liu and Khosla (2010) presented the biological
pathways for the production of several glucose and xylose derivatives, as pinene, farnesol, and farnesene, among others, using
Chapter 4 Production processes for the conversion of sugar and starchy feedstock
E. coli. Farnesene (C15H24) is obtained through the mevalonate
pathway, following the general reactions (Blanch, 2012):
C6 H12 O6 1 6H2 O-6CO2 1 H2
ð4:3Þ
C6 H12 O6 1 4:8H2 -0:4C15 H24 1 6H2 O
ð4:4Þ
Once the farnesene is obtained, it is hydrogenated to farnesane, which then goes through hydrocracking and hydroisomerization to produce the biojet fuel (Wang et al., 2016).
Another biological alternative implies the conversion of the
sugars into triglycerides or fatty acids by using microalgae as a
fermentation organism (Westfall and Gardner, 2011). Babau et al.
(2013) reported the conversion of glucose and xylose to oleic
acid and palmitic acid, using Rhodotorula glutinis. If such pathway is followed, the next steps imply hydrotreatment and hydrocracking/hydroisomerization stages, as described in Chapter 3:
Production processes for the conversion of triglyceride feedstock.
Another alternative implies the use of modified E. coli to directly
produce hydrocarbons. Such an approach has been reported by
Schirmer et al. (2010), obtaining alkanes and alkenes in the range
C13C17. To produce hydrocarbons in the boiling point range of
biojet fuel, such alkanes and alkenes must go to a hydrocracking
stage, with hydroisomerization if necessary.
In the catalytic route, the first step is the hydrogenation of
the sugars into polyhydric alcohols (Wang et al., 2016).
Hydrogenation of glucose into sorbitol can be represented as
catalyst
C6 H12 O6 1 2H2 - C6 H14 O6
ð4:5Þ
Hydrogenation of sugars has been widely studied and several
catalysts have been proposed to perform it. Chao and Huibers
(1982) described the hydrogenation of glucose in solution with
a nickel catalyst, with pH between 7 and 13, temperatures in
the range of 130 C180 C and pressures between 500 and
2000 psig, with hydrogen/feed ratios between 1000 and 5000;
they reported that the conversion to sorbitol is at least 98 wt.%.
Degelmann et al. (1999) studied the hydrogenation of sugars
and sugar mixtures using a shell catalyst based on Raney
metals, as nickel, cobalt, copper, iron, or zinc. Elliott et al.
(2003) presented the hydrogenation of sugars derived from
sources as corn. The reaction occurs in the aqueous phase at
temperatures below 120 C in pressure preferably ranging from
250 to 1900 psig, using ruthenium-based catalysts. Liaw et al.
(2010) proposed an amorphous nanocatalyst of CoNiB and a
polyvinylpyrrolidone-stabilized CoNiB catalyst to hydrogenate a
99
100
Chapter 4 Production processes for the conversion of sugar and starchy feedstock
fructose/glucose mixture. According to their results, the proposed catalysts resulted much more active than Raney nickel,
NiB, and CoB catalysts. Sifontes et al. (2010) reported the hydrogenation of sugars in a pressurized slurry reactor with a Ru/C
catalyst; they pointed out that for a continuous operation such
configuration would allow better results than a fixed-bed reactor. Sifontes Herrera et al. (2011) studied the hydrogenation of
sugars such as D-galactose and L-arabinose, among others, on a
Ru/C catalyst, with its operating conditions ranging from 90 C
to 130 C and 4060 bar; as result, a 100% conversion of the
sugars is obtained. A detailed review of the different catalysts
used for the hydrogenation of glucose and fructose can be
found in the work of Ahmed and Hameed (2019); in that review,
it is indicated that Ru-based catalysts have the best results in
terms of conversion and yield, also having high stability with
potential to be reused in several cycles.
In the second stage of the catalytic approach, the polyhydric
alcohols are treated in an aqueous phase reforming system,
where several reactions may occur: reforming to hydrogen,
dehydrogenation, deoxygenation, hydrogenolysis, and cyclization (Wang et al., 2016).
According to Duarte et al. (2016), the selectivity to liquid
alkanes in the aqueous phase reforming can be increased by
promoting the C-O hydrogenolysis reactions and preserving the
CC bonds, which will be strongly influenced by the kind of
catalyst employed. Davda and Dumesic (2004) reported the
aqueous phase reforming of glucose to produce H2 using Pt/
Al2O3 as a catalyst; they mentioned that alternate reaction pathways may lead to the formation of alkanes and other products
such as organic acids, aldehydes, and carbonaceous deposits.
Huber et al. (2004) studied the production of alkanes by aqueous phase reforming with several catalysts. According to their
data, the highest yield to alkanes is obtained with Pt/SiAl and
Pd/SiAl catalysts, using a feed of hydrogen and operating at
pressures between 29.3 and 58.2 bar, with temperatures ranging
from 225 C to 265 C. Kirilin et al. (2012) presented a study
about the production of hydrogen by aqueous phase reforming
of xylitol and sorbitol, using a Pt/Al2O3 catalysis. Among their
results, it is mentioned that selectivity to alkanes is promoted at
low values for space velocity, reaching a maximum for selectivity close to 30%. Additionally, it is mentioned that the alkanes
produced from xylitol are mainly in the range C3C5. Zhang
et al. (2012) proposed the use of Ni/HZSM-5 catalysts to promote the formation of hydrocarbons in the gasoline range.
According to their results, the maximum yield to hydrocarbons
in the boiling point range of gasoline is 47.6%, with the reaction
Chapter 4 Production processes for the conversion of sugar and starchy feedstock
taking place at 240 C and 4 MPa, with high selectivity to isohexane. Qiu et al. (2019) described a Ru-MoO3-x/C catalyst as a promoter of the hydrogenolysis of sorbitol, reporting the highest
yield of 87.3% to C5C6 hydrocarbons at 280 C and 4 MPa,
with sorbitol conversion higher than 99.9%. Other products that
can be generated in the aqueous phase reforming are oxygenates; for instance, alcohols, ketones, aldehydes, furans, diols,
triols, and organic acids (Davis et al., 2015). These compounds
can be upgraded by condensation reactions.
The condensation reaction allows obtaining alkanes, isoalkanes, and aromatics from oxygenates (Wang et al., 2016).
Condensation reactions may occur together with ketonization
reactions. In general terms, by condensation/ketonization reactions, the small molecules can form larger molecules, in the
presence of acid or basic catalysts (Chheda et al., 2007), while
oxygen molecules are released from the oxygenates (Wang
et al., 2017). According to Bloomel and Cortright (2008), condensation with basic catalysts promotes the formation of hydrocarbons in the boiling point range of jet fuel and diesel. Besides
hydrocarbons, condensation may also produce alcohols and
ketones (Cortright and Blommel, 2015). Davis et al. (2015) mentioned that basic catalysts can be poisoned by organic acids,
thus recommending the use of acid catalysts. According to their
data, approximately 50% of the carbon in the stream from the
aqueous phase reforming can be converted into C8C14 hydrocarbons, using a catalyst based on a precious metal with a
mixed oxide support (Blommel et al., 2012; Davis et al., 2015).
Gayubo et al. (2004a,b) proposed the use of a HZSM-5 zeolite
catalyst to condensate alcohols, aldehydes, ketones, and acids.
Nevertheless, the produced hydrocarbons are mainly in the
boiling point range of gasoline. Kunkes et al. (2008) presented a
production system where oxygenates are treated with hydrogen
in a CuMg10Al7Ox catalyst, at 5 bar and 300 C. They reported
obtaining a 40% of conversion of the carbon in the feed stream
to C8C12 species, although the catalyst was deactivated due
to the presence of organic acids. Gürbüz et al. (2010) proposed
a two-bed system to transform oxygenates into hydrocarbons,
using a CeZrOx bed to perform ketonization, and a Pd/ZrO2 bed
to perform condensation/hydrogenation. Nesterenko et al.
(2012) studied the condensation of ethanol in a basic catalyst to
produce superior alcohols and olefins, mentioning that the
presence of the condensation products in the olefins stream
aids to increase the yield to C10 and higher hydrocarbons in a
subsequent oligomerization step. Zapata et al. (2012) proposed
a catalyst composed of basic oxide nanoparticles/carbon nanotubes, obtaining products in the range C8C13.
101
102
Chapter 4 Production processes for the conversion of sugar and starchy feedstock
Another pathway to treat the oxygenates implies dehydration
and hydrogenationdehydration reactions to obtain alkanes
and alkenes. Hydrogenation of ketones and aldehydes produces
secondary and primary alcohols. Such reactions can be performed in a separated way, using acid or base catalysts for
dehydration and metal-based catalysts for hydrogenation
(Chheda et al., 2007). On the other hand, both reactions can be
performed in a single equipment with the proper catalyst. West
et al. (2009) proposed the use of a Pt catalyst supported in Nbbased solid acids to dehydrate/hydrogenate sorbitol at 54 bar
and 257 C. According to their results, low space velocities allow
increasing the yield to alkanes. Gürbüz and Dumesic (2013)
reported that coupled dehydration and hydrogenation can be
performed with a bifunctional acid/metal catalyst, obtaining
alkanes. The dual-bed system proposed by Gürbüz et al. (2010)
has as final step a dehydration/hydrogenation reactor, where
ketones are converted into alkanes in a Pt/SiO2-Al2O3 catalyst,
obtaining in the final product 53% of alkanes in the range of
diesel. Alkenes generated after the dehydration/hydrogenation
can be further oligomerized (Wang et al., 2016), followed by
isomerization/cracking if necessary.
4.3
Technologies on separation zone
Once the desired products are obtained, it is necessary to separate them with the required purity; this is the main goal of the
separation zone. In the case of the ATJ process, three sections can
be noticed: ethanol production, ethanol dehydration, and ethylene oligomerization. Each section requires their own purification
equipment. In the ethanol production, most of the removal of liquid and gaseous byproducts can be performed by distillation,
until an azeotropic composition for the ethanol/water mixture
(around 96 wt.%) is reached. If higher purities were required,
technologies as extractive distillation or pervaporation could be
required (Conde-Mejı́a et al., 2016). Nevertheless, it has been
reported that the mixture of ethanol and water can be used as a
feedstock for catalytic dehydration (Pearson, 1983). Once the ethanol is dehydrated and ethylene is obtained, it can go through a
set of purification operations: quenching, scrubbing, and drying.
In the quenching step, most of the water is separated, together
with the remaining ethanol. In the scrubbing tower, traces of CO2
are removed by washing with sodium hydroxide. Finally, if highpurity ethylene is required, drying may take place by molecular
sieves (Mohsenzadeh et al., 2017). In the oligomerization step,
the main products are hydrocarbon chains. Thus, to obtain the
Chapter 4 Production processes for the conversion of sugar and starchy feedstock
desired cuts, heat-based separation processes, as distillation,
can be used. The main product in the ATJ process is biojet
fuel, which can be used as aviation fuel blended with fossil jet
fuel. Additionally, naphtha and green diesel are generated as
coproducts. Naphtha can be used as a solvent or further treated
to produce gasoline. Green diesel can be used as a substitute of
fossil diesel. Since it is composed of hydrocarbons, there is no
need to blend it with fossil diesel, as it occurs with biodiesel.
Additional uses of these products were described previously in
Chapter 3: Production processes for the conversion of triglyceride
feedstock.
In the case of the biological approaches for the conversion of
sugars to biojet fuel, if the sugars are first converted into triglycerides/fatty acids, the following hydrotreating and hydrocracking/isomerization steps are equal to those reported in Chapter 3:
Production processes for the conversion of triglyceride feedstock.
Thus the separation alternatives are also the same. A similar situation is observed if direct conversion to alkanes occurs; following
the hydrocracking/hydroisomerization stage, the resulting fractions can be purified through distillation. In the case of the conversion of sugars to farnesene, the stream leaving the reactor can
be separated into two phases by de-emulsification and
liquidliquid centrifugation to recover farnesene, which then
enters to a flash equipment (Amyris Inc., 2013). After hydrogenation of farnesene, the resulting stream goes to a hydrocracking/
hydroisomerization section, whose separation schemes have
been described in Chapter 3: Production processes for the conversion of triglyceride feedstock. In the case of the catalytic process, most of the required separations are needed with the
recovery of the different hydrocarbon fractions, thus distillation
can be used, as in the case of the hydrotreating process.
4.4
Conventional processes: state of the art
In this section, reported processes for the production of biojet
fuel from sugar containing biomass will be presented. First, cases
of commercial production of biojet fuel through the ATJ route
are presented. The company Gevo Inc. produces isobutanol by
fermentation of the sugars contained in grain crops, sugarcane,
and sugar beets. Then, the isobutanol is transformed into renewable gasoline, biojet fuel, and other products, by dehydration and
oligomerization reactions (Green Car Congress, 2010). The jet
fuel produced in this process meets the ASTM specifications
(Gevo, 2019). On the other hand, the company Byogy
Renewables Inc. produces biojet fuel from the ethanol derived
103
104
Chapter 4 Production processes for the conversion of sugar and starchy feedstock
from sugarcane. According to the company, their product can
directly be used in the jet engine, without blending with fossil jet
fuel (Green Air, 2014).
Additional to the commercial processes, information about
the production pathways can also be found in the scientific literature. Harvey and Quintana (2012) presented a process to
convert branched olefins, derived from the fermentation of biomass into jet fuel. Narula et al. (2012) studied a process to
obtain hydrocarbons from a biomass-derived alcohol, using a
catalyst consisting of a metal supported in zeolites. Pansare
et al. (2013) proposed a process for the transformation of alcohols, derived from biomass, into hydrocarbons, through a
hydrocondensation followed by a hydrodeoxygenation. The
product includes hydrocarbons in the range of jet fuel and
diesel. For hydrocondensation, a Pt/Pd catalyst supported in
silica-alumina is described. Peters and Taylor (2015) reported a
process for the fermentation of cellulose-containing biomass to
produce isobutanol, then dehydrating, oligomerizing, and
hydrogenating to obtain alkanes in the range C12C16. The
dehydration takes place using several catalysts, as sulfonic
acid resins and α-alumina, among others. On the other hand,
oligomerization is performed with sulfonic acid resins, acidic
zeolites, or solid phosphoric acid. Brooks et al. (2016) summarize the conversion pathways of ethanol to biojet fuel in four
categories:
1. With ethylene as intermediate, through dehydration, oligomerization, and hydrotreating stages;
2. With propylene as intermediate, where ethanol is first converted
into propylene, followed by oligomerization and hydrotreating
steps;
3. With a higher alcohol as intermediate, which may imply ethanol dehydrogenation, self-aldolization, dehydration, hydrogenation, and dehydration of the formed higher alcohol,
along with the oligomerization and hydrotreating;
4. With a carbonyl intermediate, where ethanol is dehydrated,
followed by hydroformylation and further dehydration, oligomerization, and hydrotreating.
Tao et al. (2017) studied the production of biojet fuel by the
ATJ process from corn grain, comparing it with the production
using corn stover as a raw material. A minimum jet fuel selling
price of 4.20 USD per gallon is reported for the biojet fuel from
corn grain, which is lower than the selling price estimated for
the biojet fuel from corn stover (6.14 USD per gallon). Geleynse
et al. (2018) evaluated different ATJ-based pathways from a
technoeconomic point of view. Among their results, they
Chapter 4 Production processes for the conversion of sugar and starchy feedstock
indicated that alcohol production contributes with approximately 80% to the total production cost. Additionally, they mentioned that the use of higher alcohols instead of ethanol may
help to reduce costs in the ATJ process.
In the case of STJ pathways, some industrial-level processes
have been reported. The company Amyris started running a
process, developed by Total, to produce a drop-in jet fuel which
accomplishes with the ASTM standard (Total, 2014). In the
Amyris process, sugars are aerobically fermented with yeast to
obtain farnesene (Wang et al., 2016), with further distillation
and hydrogenation (Westfall and Gardner, 2011). Santos et al.
(2018) described a similar process where sugars from sugarcane
are fermented to farnesene, which is then hydrocracked, with
the fractions further separated. The company LS9 also had a
one-step fermentation process to transform sugars into biojet
fuel (Wei et al., 2019), from which alkanes in the range of
C8C20 are generated, which can be further treated to produce
biojet fuel (Wesoff, 2010). Nevertheless, the company shifted
their production to other products (Mawhood et al., 2016). In
the case of the conversion of sugars into biojet fuel through catalytic STJ approaches, Bloomel and Cortright (2008) reported
the patented technology BioForming, which is owned by the
company Virent Energy Systems, Inc. The process’s core is the
aqueous phase reforming technology owned by Virent Energy
Systems, Inc., which makes use of a proprietary heterogeneous
catalyst. The process can handle different raw materials. If
sugar-based materials are used, they go first to a hydrogenation
stage, then to the aqueous phase reforming. If the desired product is biojet fuel, the following steps are condensation and
hydrodeoxygenation.
4.5
Combustion tests for biojet fuel from
sugar and starchy feedstocks
In this subsection, combustion tests developed for biojet fuels
derived from sugar/starchy biomass are presented. In terms of
the engine performance, Won et al. (2016) studied the combustion behavior for several biojet fuels, including a Gevo ATJ jet
fuel, and blends of those alternative fuels with JP-8. They performed three kinds of tests: global oxidative species profiles, diffusion flame extinction, and premixed flame initiation. Three
main parameters are analyzed: the cetane number, which measures the autoignition propensity of distillate range fuels; the
smoke point, which is related to the kind of hydrocarbons
105
106
Chapter 4 Production processes for the conversion of sugar and starchy feedstock
composing the fuels, where a high smoke point indicates that
the fuels tend to produce little smoke (ASTM, 2019); and the H/C
ratio, which is an indicator related to the burning velocity of the
fuel. According to the results presented by Won et al. (2016), the
biojet fuel produced through the ATJ process had the lowest
values for cetane number, in comparison with fossil-derived jet
fuels and other renewable jet fuels. On the other hand, the ATJ
biojet fuel showed higher smoke point than the fossil jet fuels,
but similar or lower smoke point than most of the other biojet
fuels, with a H/C ratio higher than that of fossil jet fuels.
Additionally, it is reported that the ATJ jet fuel had lower extinction strain rates. Richter et al. (2017) studied the laminar burning
velocity and ignition delay time of the Gevo ATJ biojet fuel. The
highest values for laminar burning velocity imply that the fuel
will combust faster (Cracknell et al., 2013). On the other hand,
for ignition delay time, which is defined as the time interval
between a starting reference point and the onset of ignition, low
values are desired (Zhang et al., 2016). According to the results
reported by Richter et al. (2017), both combustion properties
showed slightly lower values for the renewable jet fuel.
In the case of emissions due to the use of biojet fuel,
Zschocke et al. (2012) studied this topic considering jet fuel
obtained by direct fermentation of sugars (i.e., farnesane), using
a CFM56-5C4 engine. According to their results, CO emissions
are almost the same than those for keronese, while farnesene
showed slightly lower emissions of NOx than kerosene. BraunUnkhoff et al. (2017) mentioned that, in general terms, biojet
fuels show lower soot particle emissions than fossil jet fuel, but
emissions of CO, CO2, and NOx are similar for both kinds of aviation fuels. They indicated that the amount and type of aromatics have a strong influence on the soot particle emissions.
This is proved for the particular case of ATJ biojet fuel by
Schripp et al. (2019), who studied the soot particle emissions in
a CFM56-5C4 engine. According to their results, the use of the
renewable jet fuel, which has no aromatics, allowed reducing
70% the particle emissions in comparison with kerosene.
4.6
4.6.1
Case of study: conversion of sugar and
starchy feedstocks
Problem statement
In Mexico, the production of sweet sorghum has presented
an annual average growth of 3.74% since 2016; according to
Chapter 4 Production processes for the conversion of sugar and starchy feedstock
SAGARPA (2017), this growth rate will keep until 2030, achieving
a potential production of 8.37 millions of tons in that year. The
main use of sweet sorghum is an ingredient to elaborate animal
feed, which represents 95.71% of the total production. This crop
has high levels of sugar and starchy; thus it is considered as a
feedstock to produce biojet fuel. It is worth to mention that the
sorghum is native to India, but due to climatological conditions
of Mexico, its growth is almost constant along the country. In
Fig. 4.4, a typical sorghum cane from the Guanajuato state
(Mexico) is presented.
The production of sweet sorghum in Mexico has been classified by regions in accordance with climatological seasons: 24
regions in spring-summer (SS) and 20 regions in fall-winter
(FW) (SAGARPA, 2017). For this case of study, we have considered the production of sorghum in the region that includes the
states of Aguascalientes, Guanajuato, Jalisco, Michoacán, and
Zacatecas. The production of sorghum from this region is
5.06 ton/ha during SS, while it is 3.13 ton/ha during FW. The
land extension available for this crop in the selected region is
3,426,562 ha for SS and 175,078 ha for FW. An average of
744,081.5 ton/year or 87,539 kg/h (considering 8500 h/year as
the operation time) is the potential raw material to produce
biojet fuel; this data is estimated based on the annual growth
rate for 2019.
The production of biojet fuel from sweet sorghum will be
obtained in two stages. In the first one, the production of
Figure 4.4 Components of
sorghum cane.
107
108
Chapter 4 Production processes for the conversion of sugar and starchy feedstock
bioethanol by acid hydrolysis (AH) and fermentation occurs,
while in the second one, the conversion of bioethanol by the
ATJ process to produce biojet fuel takes place.
4.6.2
Modeling of sugar and starchy feedstocks
The composition of sweet sorghum (whole crop) is reported
by Sipos et al. (2009); this composition is taken in this study
with an adjustment to consider only the lignocellulosic and carbohydrate composition, dismissing the ash content. Regarding
the carbohydrate profile, a typical composition of sweet sorghum is reported by Vázquez-Garea (2017). Thus the composition considered for this case of study is presented in Table 4.1.
Information about the physical and chemical properties of sorghum grain and stem can be found in Garcı́a et al. (2019).
The carbohydrate components of sorghum are included in
the Aspen Plus database V.10.0; however, the lignocellulosic
components must be added by the user. In Table 4.2, the chemical formula of sorghum compounds is presented.
It is important to mention that all the components shown in
Table 4.1 must be specified as solids in Aspen Plus. Thus, for
each component of the carbohydrates profile, it is necessary to
add the “Solid heat capacity (DHSFRM),” which is taken as
2486,800,000 J/kmol (Chavelas and Garcı́a-Hernández, 2009).
4.6.3
Production process: conceptual design
In Fig. 4.5, the block diagram of the processing of sorghum
(whole crop) is presented, where sorghum was previously
grinded to improve the performance of the reactive stages.
Table 4.1 Composition of sweet sorghum (Sipos et al., 2009; Vázquez-Garea, 2017).
Compounds
wt.%
Cellulose
Hemicellulose
Lignin
Carbohydrates
27.56
15.37
14.11
42.93
Carbohydrates profile
Galactan
Mannan
Arabinan
9.41
3.62
29.90
Chapter 4 Production processes for the conversion of sugar and starchy feedstock
109
Table 4.2 Chemical formula of sorghum components.
Lignocellulosic profile
Cellulose
Hemicellulose
Lignin
C6 H10 O5
C5 H8 O4
C7:3 H13:9 O1:3
Carbohydrates profile
Galactan
Mannan
Arabinan
C6 H10 O5
C6 H10 O5
C5 H8 O4
Figure 4.5 Block diagram to produce biojet fuel from the conversion of grinded sorghum.
According to Fig. 4.5, the biojet fuel production is carried out
in two stages. In the first one, the ethanol is obtained, while in
the second one, the ethanol conversion through the ATJ process
to produce biojet fuel takes place. The ethanol production starts
with the pretreatment of grinded sorghum by diluted sulfuric
acid (DA, H2SO4 0.49 wt.%) at 160 C and atmospheric pressure;
this is one of the pretreatment methods commonly used for lignocellulosic material (Conde-Mejı́a et al., 2012). Next, the pretreated material is fed to AH stage at 220 C to extract the
fermentable sugars, which are converted into ethanol and other
subproducts into fermentation reactor, operated at 34 C. The
production of ethanol from lignocellulosic feedstock has been
reported by Conde-Mejı́a et al. (2012, 2013) taking into account
only the lignocellulosic compound, while the ethanol
110
Chapter 4 Production processes for the conversion of sugar and starchy feedstock
production using the same reactive stages, but including the
carbohydrates profile to describe the lignocellulosic raw material, has been presented by Dimian and Bildea (2008). The reaction set for each reactive stage is shown in Table 4.3, along with
the conversion data for each reaction.
Table 4.3 Reactions for the ethanol production (Dimian and Bildea, 2008;
Conde-Mejı́a et al., 2012, 2013).
Reaction
Conversion
Reference reactant
0.065
0.007
0.75
0.15
0.75
0.15
0.75
0.15
0.75
0.10
Cellulose
Cellulose
Hemicellulose
Hemicellulose
Galactose
Galactose
Mannan
Mannan
Arabinan
Arabinan
0.012
0.8
1.0
0.99
0.8
Cellulose
Cellulose
Cellobiose
Hemicellulose
Xylose
0.99
0.92
0.002
0.008
0.022
0.013
0.85
0.029
0.009
0.024
0.014
Urea
Glucose
Glucose
Glucose
Glucose
Glucose
Xylose
Xylose
Xylose
Xylose
Xylose
Diluted acid, pretreatment
C6 H10 O5 1 H2 O-C6 H12 O6
C6 H10 O5 1 0:5H2 O-0:5C12 H22 O11
C5 H8 O4 1 H2 O-C5 H10 O5
C5 H8 O4 -C5 H4 O2 1 2H2 O
C6 H10 O5 1 H2 O-C6 H12 O6
C6 H10 O5 -C6 H6 O3 1 2H2 O
C6 H10 O5 1 H2 O-C6 H12 O6
C6 H10 O5 -C6 H6 O3 1 2H2 O
C5 H8 O4 1 H2 O-C5 H10 O5
C5 H8 O4 -C5 H4 O2 1 H2 O
Acid hydrolysis
C6 H10 O5 1 0:5H2 O-0:5C12 H22 O11
C6 H10 O5 1 H2 O-C6 H12 O6
C12 H22 O11 1 H2 O-2C6 H12 O6
C5 H8 O4 1 H2 O-C5 H10 O5
C5 H10 O5 -C5 H4 O2 1 3H2 O
Fermentation
CH4 N2 O 1 H2 O-2NH3 1 CO2
C6 H12 O6 -2C2 H6 O 1 2CO2
C6 H12 O6 1 2H2 O-2C3 H8 O3 1 O2
C6 H12 O6 1 2CO2 -2C4 H6 O4 1 O2
C6 H12 O6 -3C2 H4 O2
C6 H12 O6 -2C3 H6 O3
3C5 H10 O5 -5C2 H6 O 1 5CO2
3C5 H10 O5 1 5H2 O-5C3 H8 O3 1 2:5O2
3C5 H10 O5 1 5CO2 -5C4 H6 O4 1 2:5O2
2C5 H10 O5 -5C2 H4 O2
3C5 H10 O5 -5C3 H6 O3
Notes: Furfural (C5 H4 O2 ); cellobiosa (disaccharide, C12 H22 O11 ); ethanol (C2 H6 O); urea (CH4 N2 O); glycerol (C3 H8 O3 ); succinic acid
(C4 H6 O4 ); lactic acid (C3 H6 O3 ); acetic acid (C2 H4 O2 ).
Chapter 4 Production processes for the conversion of sugar and starchy feedstock
111
Additional reactions that can occur during the fermentation
stage are shown in Table 4.4, in accordance with Dimian and
Bildea (2008). It is worth to mention that the lignin is not solubilized in any reactive stage.
The stream leaving the fermentation reactor is separated in a
distillation train of three columns to recover the ethanol. In the
first column, the CO2 and other light gases are removed, and a
side stream enriched with ethanol is extracted. This last stream
is fed to the second column, in which the ethanol is purified to
a concentration close to the azeotropic point (96 wt.% ethanol).
Finally, in the third column, the azeotropic point is overcome
using an entrainer, reaching 99 wt.% of ethanol recovery at distillate stream.
The recovered ethanol is fed to the ATJ process. This process
involves three stages: ethanol dehydration, ethylene oligomerization, and alkenes hydrogenation. The first stage was reported
by Lundin (2011) at 450 C and 11.4 bar of pressure, using
injected steam (1:1 alcohol:steam mass ratio). The conversion
data and reactions to describe this reactive stage are presented
in Table 4.5. The separation of the obtained ethylene is carried
out in a distillation column, reaching up 99% ethylene recovery.
Table 4.4 Additional reactions (Dimian and Bildea, 2008).
Reaction
Conversion
Reference reactant
C2 H4 O2 1 NH3 -C2 H7 NO2
H2 SO4 1 2NH3 -N2 H8 SO4
C5 H12 O6 -2C3 H6 O3
3C5 H10 O5 -5C3 H6 O3
1
1
1
1
Acetic acid
Sulfuric acid
Glucose
Xylose
Notes: Ammonium acetate (C2 H7 NO2 ); ammonium sulfate (N2 H8 SO4 ).
Table 4.5 Ethanol dehydration reactions (Lundin, 2011).
Reaction
Conversion
Reference reactant
C2 H6 O-C2 H4 1 H2 O
2C2 H6 O-ðC2 H5 Þ2 O 1 H2 O
C2 H6 O-C2 H4 O 1 H2
0.988
0.00052
0.002
Ethanol
Notes: Ethylene (C2 H4 ); Diehylether [ðC2 H5 Þ2 O]; Acetaldehyde C2 H4 O.
112
Chapter 4 Production processes for the conversion of sugar and starchy feedstock
Table 4.6 Oligomerization reactions and conversion data (Heveling et al., 1998).
Reaction
Conversion
Reference reactant
2C2 H4 -C4 H8
2:5C2 H4 -C5 H10
3C2 H4 -C6 H12
3:5C2 H4 -C7 H14
4C2 H4 -C8 H16
4:5C2 H4 -C9 H18
5C2 H4 -C10 H20
5:5C2 H4 -C11 H22
6C2 H4 -C12 H24
7C2 H4 -C14 H28
7:5C2 H4 -C15 H30
8C2 H4 -C16 H32
8:5C2 H4 -C17 H34
9C2 H4 -C18 H36
9:5C2 H4 -C19 H38
10C2 H4 -C20 H40
0.3185
0.0015
0.2355
0.0015
0.1801
0.0015
0.0425
0.00150
0.04254
0.04254
0.00150
0.04254
0.00150
0.04254
0.00150
0.04254
Ethylene
The purified ethylene is fed to the second reactive stage,
called oligomerization. In this reactive stage, the ethylene is
converted to olefins, from C4 to C20, at 120 C and 35 bar,
according to Heveling et al. (1998). The product distribution
and the reaction set used to describe the oligomerization are
presented in Table 4.6.
Regarding hydrogenation stage, the reaction set, together
with the conversion data used to describe it, is presented in
Table 4.7. This process was reported at 100 C and 15 bar by
Andrei et al. (2015). The hydrogen amount used for hydrogenation is 10 wt.% of the olefins stream. Likewise, the olefins conversion is assumed as 99%.
To separate the biojet fuel, two distillation columns are
required. In the first one, naphtha (C4C7) cut is recovered at
the top of the column, while in the second one, biojet fuel
(C8C16) is separated at the distillate stream and the green diesel (C17C20) at the bottom. The distillation columns are
designed considering recoveries of 99% in the key components.
4.6.4
Simulation of reactive and separation zones
The simulation of the process to produce biojet fuel from
sweet sorghum, presented in Fig. 4.3 and described in
Chapter 4 Production processes for the conversion of sugar and starchy feedstock
113
Table 4.7 Hydrogenation reactions and conversion data (Andrei et al., 2015).
Reaction
Conversion
Reference reactant
C4 H8 1 H2 -C4 H10
C5 H10 1 H2 -C5 H12
C6 H12 1 H2 -C6 H14
C7 H14 1 H2 -C7 H16
C8 H16 1 H2 -C8 H18
C9 H18 1 H2 -C9 H20
C10 H20 1 H2 -C10 H22
C11 H22 1 H2 -C11 H24
C12 H24 1 H2 -C12 H26
C14 H28 1 H2 -C14 H30
C15 H30 1 H2 -C15 H32
C16 H32 1 H2 -C16 H34
C17 H34 1 H2 -C17 H36
C18 H36 1 H2 -C18 H38
C19 H38 1 H2 -C19 H40
C20 H40 1 H2 -C20 H42
0.99
n-Butene
n-Pentene
n-Hexene
n-Heptene
n-Octene
n-Nonene
n-Decene
n-Undecene
n-Dodecene
n-Tetradecene
n-Pentadecene
n-Hexadecene
n-Heptadecene
n-Octadecene
n-Nonadecene
n-Eicosene
Section 4.5.3, is carried out by using Aspen Plus V.10.0. The simulation starts with definition of each component involved in the
process. In Table 4.8, the selected components are presented. It
is worth to mention that the lignocellulosic components are not
included in the Aspen Plus database for V.10.0.
On the other hand, in accordance with Carlson (1996) and
Conde-Mejı́a et al. (2013), the thermodynamic method chosen
for the ethanol production (including ethanol purification) is
NRTL, while the whole ATJ process is modeled with PengRobinson (Carlson, 1996). Regarding the distillation train for
biojet fuel separation, BK10 has been chosen as thermodynamic
method (Carlson, 1996; Gutiérrez-Antonio et al., 2016).
The flowsheet starts with the definition of the sorghum
stream (SORGHUM), based on the composition shown in
Table 4.1. The sorghum stream is fed to the pretreatment reactor (PRETREAT), along with the diluted sulfuric acid stream
(H2SO4DI1) and saturated steam (STEA-160) at 160 C. The
reactor is simulated by RStoic module. The operation conditions are 160 C, atmospheric pressure 0.49 wt.% sulfuric acid,
and steam:biomass ratio of 1:4 (de Ávila Rodrigues and
Guirardello, 2008; Conde-Mejı́a et al., 2012). Fig. 4.6 shows the
flow diagram of the process.
114
Chapter 4 Production processes for the conversion of sugar and starchy feedstock
Table 4.8 List of components involved in the production of biojet fuel from sweet sorghum.
Component
Chemical formula from
Aspen Plus V.10.0
Stage of
the process
Cellulose (solid)
Hemicellulose (solid)
Lignin (solid)
Arabinan
Galactan
Mannan
Galactose
Mannose
Arabinose
Cellobiose
Glucose
Xylose
Urea
Hidroximetilfurfural (HMF)
Furfural
Succinic acid
Glycerol
Acetic acid
Lactic acid
Ammonium acetate
Ammonium sulfate
Water
Sulfuric acid
Ethanol
Carbon dioxide
Oxygen
Ammonia
Ethylene
Diethyl ether
Acetaldehyde
Butene
Pentene
Hexene
Heptene
Octene
Nonene
Decene
Undecene
C6 H10 O5
C5 H8 O4
C7:3 H13:9 O1:3
C5 H8 O4 2 D1
C1:2 H2 O 2 N1
C3 HO3 2 N2
C6 H12 O6 2 N2
C6 H12 O6 2 N5
C5 H10 O5 2 D1
C12 H22 O11 2 D1
C6 H12 O6
C5 H10 O5 2 D2
CH4 N2 O
C6 H6 O3 2 N5
C5 H4 O2
C4 H6 O4 2 2
C3 H8 O3
C2 H4 O2 2 1
C3 H6 O3 2 D1
C2 H7 NO2
ðNH4 ÞSO4
H2 O
H2 SO4
C2 H6 O 2 2
CO2
O2
NH3
C2 H4
C4 H10 O 2 5
C2 H4 O 2 1
C4 H8 2 1
C5 H10 2 2
C6 H12 2 3
C7 H14 2 7
C8 H16 2 16
C9 H18 2 3
C10 H20 2 5
C11 H22 2 2
Raw material
Diluted acid
Acid hydrolysis
Fermentation
Ethanol dehydration
Oligomerization
(Continued )
Chapter 4 Production processes for the conversion of sugar and starchy feedstock
Table 4.8 (Continued)
Component
Chemical formula from
Aspen Plus V.10.0
Dodecene
Tetradecene
Pentadecene
Hexadecene
Heptadecene
Octadecene
Nonadecene
Eicosene
Butane
Pentane
Hexane
Heptane
Octane
Nonane
Decane
Undecane
Dodecane
Tetradecane
Pentadecane
Hexadecane
Heptadecane
Octadecane
Nonadecane
Eicosane
Hydrogen
C12 H24 2 2
C14 H28 2 2
C15 H30 2 2
C16 H32 2 2
C17 H34 2 D1
C18 H36 2 1
C19 H38 2 D1
C20 H40 2 D1
C4 H10 2 1
C5 H12 2 1
C6 H14 2 1
C7 H16 2 1
C8 H18 2 1
C9 H20 2 1
C10 H22 2 1
C11 H24
C12 H26
C14 H30
C15 H32
C16 H34
C17 H36
C18 H38
C19 H40
C20 H42
H2
The output stream from PRETREAT reactor is conditioned at
220 C, before the AH reactor (AC-HYDRO), using a heater (EX-1).
The AC-HYDRO reactor operates at 220 C through the RStoic
module.
The nonconverted biomass is removed by a Filter module
(FILT-1). Next, the liquid stream is fed to cooler equipment
(EX-2) to reduce its temperature until 34 C, which is the operation temperature of the fermentation reactor (FERMENTA)
where is added a stream of urea (UREA). The mass ratio of fed:
urea is 442.5:1, according to Conde-Mejı́a et al. (2012). It is
worth to mention that for the reactive stages defined before, the
reaction set and the conversion data for each one were
Stage of
the process
Hydrogenation
115
Figure 4.6 Flow diagram for the complete process.
Chapter 4 Production processes for the conversion of sugar and starchy feedstock
presented in Table 4.3. The output stream from the fermentation reactor is inserted to FILT-2, where the solid components
are removed. Next, the liquid stream is fed to a separation train,
which has three distillation columns to separate the ethanol. In
order to simulate each distillation column, the module RadFrac
is necessary. The first column (STRIPP-C) is designed with 33
stages without condenser, and the feed stream is located in
stage 1. The side stream rich in ethanol has a flow of 39,000 kg/h,
and it is extracted on stage 4. The operation pressure is 1 atm,
with a column pressure drop of 0.68 atm; the recovery of ethanol
is 99 wt.%. On the other hand, the ETOH-RICH stream is fed at
stage 22 of the second column, called RECTIFIC-C.
This column has 30 stages and a Partial-Vapor-Liquid condenser, with a reflux ratio of 3.3. The column pressure is 1 atm,
reaching 95 wt.% of recovery for the ethanol.
In the third column called RECOVERY, a glycerol stream is
added to overcome the azeotropic point. This column is designed
with 15 stages, reflux ratio of 0.3, and total condenser, which
allows reaching 99 wt.% of ethanol recovery. The rich ethanol
stream from the second column is inserted at stage 12, while the
glycerol column at stage 2. The ethanol:glycerol mass ratio is 1:1.
The operating pressure of the distillation column is 1 atm.
The ETOH-2 stream contains the ethanol available for the
ATJ process. This stream is inserted to a Pump module (PUMP-1)
and a Heater module (EX-3) to increase the pressure until 11.4 bar
and its temperature up to 450 C, respectively. The adjusted stream
is fed at the dehydration reactor (1S-ATJ, module RStoic), operated at 450 C, 11.4 bar, along with a stream of saturated steam at
11.4 bar (alcohol:vapor mass ratio of 1:1). The reaction set and
conversion data are presented in Table 4.5.
A turbine is collocated for diminish the pressure of the output stream from the 1S-ATJ reactor until 3 bar. This is done
through the module Compr (TURBI-1, model isentropic). The
resulting stream is rich in ethylene, which must be purified. The
ethylene recovery is carried out by a distillation column with
Partial-Vapor-Liquid condenser, called B4 (module RadFrac);
this distillation column has 14 stages, a reflux ratio of 4, and an
operating pressure of 3 atm. The ethylene stream (S14) is fed at
stage 2. The traces of components in the ETHYLE-1 stream are
removed by the equipment FLASH-1 (module Flash2), which
operates at 2103 C and 1 bar. The pressure of the purified ethylene (ETHYLE-2) is increased until 35 bar through compressor,
called COMP-1 (module Compr, model isentropic). Next, this
stream is heated at 120 C using EX-4 (module, Heater). These
conditions are suitable for the second reactor.
117
118
Chapter 4 Production processes for the conversion of sugar and starchy feedstock
The second reactive stage from the ATJ process is the ethylene
oligomerization. This reactor is modeled by the RStoic module
called 2S-ATJ. The operation conditions for this stage are 120 C
and 35 bar, while its reaction set was presented in Table 4.6.
The output stream from 2S-ATJ reactor is inserted at the
hydrogenation stage. This reactor is modeled by RStoic module,
called 3S-ATJ. In the hydrogenation stage, a hydrogen stream is
conditioned at 15 bar and 100 C, using the modules Compr
(COMP-2, model isentropic) and Heater (EX-5). The 3S-ATJ
reactor is operated at 100 C and 15 bar, according to the reaction set presented in Table 4.7.
The hydrogen excess in the output stream from 3S-ATJ
(called S15) is removed by Sep module (SEP-1). Also, the pressure is decreased until 1 bar, using a module Pump as turbine
(TURBI-2). This hydrocarbon stream is fed to a distillation train,
which separates the biojet fuel.
The distillation train includes two distillation columns, modeled by RadFrac module: COL-1 and COL-2. In the first one, the
naphtha cut is obtained at the top of the column with a recovery of 99 wt.%. This column is designed with 42 stages, a reflux
ratio of 0.23, 1 atm as operating pressure, and a total condenser.
The S25 stream is located at stage 23.
Finally, the distillation column COL-2 is designed with 87
stages, a reflux ratio of 0.4, total condenser, feed stream located
at stage 44, and 1 atm as operating pressure. At the top of the
column, the biojet fuel is obtained with 99 wt.% recovery, while
at the bottom, the green diesel is purified with 99% recovery.
4.6.5
Economic assessment
The calculation procedure and the prices of steam, cooling
water, hydrogen, and electricity were described in Chapter 3:
Production processes for the conversion of triglyceride feedstock. The prices of sorghum, urea, glycerol, and sulfuric acid
required in this case of study are presented in Table 4.9. It is
Table 4.9 Market price of supplies required for the process.
Item
Price in the market
References
Sorghum
Urea
Glycerol
Sulfuric acid
0.63 USD/kg
0.31 USD/kg
1 USD/kg
15.52 USD/L
Mercado Libre (2019)
Index Mundi (2020)
Alibaba (2020)
Restauro Online (2019)
Chapter 4 Production processes for the conversion of sugar and starchy feedstock
119
Table 4.10 Total annual cost of sweet sorghum processing to produce biojet fuel.
Operating cost (USD/year)
Heating utilities Cooling
cost
utilities
cost
Additional
supplies
Raw
material
105,448,035.20
237,609,251.96
467,444,154.19 731,478.86
7,293,779.69
Electricity
(sale)
818,526,699.89
Annual capital cost (USD/year)
Equipment cost
A1
A2
Total annual cost (USD/year)
14,943,836.60
9,115,740.32
5,349,893.50
2,689,890.59
TAC (USD/year)
822,413,635.67
worth to mention that the Mexican sorghum price considered
in this case of study is the price at the animal feed market.
Likewise, the sulfuric acid price is for a solution with 98 wt.%,
which is then diluted.
Table 4.10 presents the total annual cost (TAC), including an
overview of all the factors involved in its calculation.
Regarding the utilities cost, the raw material has the higher
cost regarding equipment, steam, water, and other supplies. On
the other hand, the electricity consumption is 43.76% of the
generated electricity by turbines; thus the remaining amount
can be sold.
According to Table 4.10, the operating cost represents 99.52%
of TAC. This high contribution is due to the raw material price
and additional supplies required by the process, which represent
56.85% and 28.89% of TAC, respectively. In the case of heating
services, the steam price represents 12.82% of TAC, a value
almost 14 times higher regarding cooling water. It is worth to
mention that this processing approach involves three separation
stages, and a raw material in competition with the animal feed
market. The TAC could be reduced by using a raw material with
inferior quality to that required for the animal feed market and/
or through the implementation of energy saving strategies.
4.6.6
Total operating
cost (USD/year)
Estimation of price of biojet fuel
The procedure for estimation of minimum price of biojet
fuel was presented in Chapter 3: Production processes for the
conversion of triglyceride feedstock. For this case of study,
120
Chapter 4 Production processes for the conversion of sugar and starchy feedstock
Table 4.11 Minimum price of biojet fuel from sweet sorghum processing.
I (USD/year)
P (USD/year)
C (USD/year)
n
P
imin
Naphtha (kg/h)
0.2
P 5 imin I
Total
4966.78
Green diesel (kg/h)
771.10
Total
802,977,061.13
i51
Cmdaji
14,943,836.60
n
P
Operating cost (5% of
Cmdaji )
i51
1,337,473.38
Total
16,281,309.97
S (USD/year)
Q (kg/year)
3,256,261.99
808,802,152.03
26,406,848.12
Minimum price of biojet fuel (USD/kg)
30.63
Table 4.11 presents an overview of the data involved in the calculation of biojet fuel minimum price.
The reference price of kerosene fuel is 0.6380 USD/kg,
according to the data provided in Chapter 3: Production processes for the conversion of triglyceride feedstock. Thus, based
on the estimation presented in Table 4.11, the minimum price
for biojet fuel is 48 times the reference price for fossil jet fuel.
This value could be improved with the use of a raw material
with lower price and through the application of energy saving
strategies to the process.
4.6.7
Environmental assessment: CO2 emissions
According to the methodology described in Chapter 3:
Production processes for the conversion of triglyceride feedstock, the estimation of CO2 emissions due to steam and electricity consumption is presented in Table 4.12. The steam
required by the ethanol recovery distillation train contributes
with almost 50% of total CO2 emissions due to steam generation; however, the emissions of CO2 due to steam requirements
could be reduced with energy integration and process intensification techniques, which are described in Chapter 6. It is
important to mention that the emissions by electricity consumption are zero, due to the electricity excess obtained in the
process.
Chapter 4 Production processes for the conversion of sugar and starchy feedstock
Table 4.12 Total CO2 emissions due to steam and electricity generation.
4.7
Emissions by steam generation Emissions by electricity
(Mton CO2/year)
generation (Mton CO2/year)
Total CO2 emissions
(Mton CO2/year)
4542.64
4542.64
0.0
Conclusions
Sugar and starchy biomass, as corn, wheat, and sugarcane,
can be used to produce biojet fuel, either through the fermentation of biomass and the conversion of the obtained ethanol into
hydrocarbons in the desired boiling point range; or by the direct
conversion of sugars into hydrocarbons and other products. The
technologies for fermentation of sugars are widely known, and
the technologies for the conversion of alcohols into hydrocarbons have also been studied in detail since decades ago. On the
other hand, the development of catalysts for the direct conversion of sugars into fuels has also been studied. In this topic, it is
necessary to synthetize new catalysts to increase the yield to biojet fuel since it is still an area of opportunity. From the presented
case study, it is clear that the cost of a raw material plays an
important role in the total production cost of biojet fuel from
sugar and starchy biomass. Heating costs have also an important
contribution, which makes necessary the implementation of
advanced technologies, as process intensification and integration, to reduce the total energy requirements.
References
Ahmed, M.J., Hameed, B.H., 2019. Hydrogenation of glucose and fructose into
hexitols over heterogeneous catalysts: a review. J. Taiwan Inst. Chem. Eng. 96,
341352.
Alibaba, 2020. China manufacturer high pure glycerol price. ,https://www.
alibaba.com/product-detail/China-Manufacturer-High-Pure-GlycerolPrice_60816558803.html?spm 5 a2700.7724857.
normalList.2.57d85737MRLrCW&s 5 p. (accessed 29.01.20.).
Amyris Inc., 2013. Integrated biorefinery project summary. Final report—public
version. ,https://www.osti.gov/servlets/purl/1122942. (accessed 9.04.20.).
Andrei, R.D., Popa, M.I., Fajula, F., Hulea, V., 2015. Heterogeneous
oligomerization of ethylene over highly active and stable Ni-AlSBA-15
mesoporous catalysts. J. Catal. 323, 7684.
Araújo, K., Mahajan, D., Kerr, R., da Silva, M., 2017. Global biofuels at the
crossroads: an overview of technical, policy, and investment complexities in
the sustainability of biofuel development. Agriculture 7 (4), 32.
121
122
Chapter 4 Production processes for the conversion of sugar and starchy feedstock
ASTM, 2019. ASTM D1322-19 Standard test method for smoke point of kerosene
and aviation turbine fuel. ,https://www.astm.org/Standards/D1322.
(accessed 14.04.20.).
Austin, N., Kostetskyy, P., Mpourmpakis, G., 2018. Design of highly selective
ethanol dehydration nanocatalysts for ethylene production. Nanoscale 10,
40044009.
Babau, M., Cescut, J., Allouche, Y., Lombaert-Valot, I., Fillaudeau, L., Uribelarrea,
J.-L., et al., 2013. Towards a microbial production of fatty acids as precursos
of biokerosene from glucose and xylose. Oil Gas. Sci. Technol. 68 (5),
899911.
Baeyens, J., Kang, Q., Appels, L., Dewil, R., Lv, Y., Tan, T., 2015. Challenges and
opportunities in improving the production of bio-ethanol. Prog. Energy
Combust. Sci. 47, 6088.
Blanch, H.W., 2012. Bioprocessing for biofuels. Curr. Opin. Biotechnol. 23 (3),
390395.
Bloomel, P.G., Cortright, R.D. 2008. Production of conventional liquid fuels from
sugars. ,http://www.etipbioenergy.eu/images/Virent_Technology_Whitepaper.
pdf. (accessed 10.04.20.).
Braun-Unkhoff, M., Riedel, U., Wahl, C., 2017. About the emissions of alternative
jet fuels. CEAS Aeronaut. J. 8, 167180.
Brooks, K.P., Snowden-Swan, L.J., Jones, S.B., Butcher, M.G., Lee, G.-S.J.,
Anderson, D.M., et al., 2016. Low-carbon aviation fuel through the alcohol to
jet pathway. In: Chuck, C.J. (Ed.), Biofuels for aviation: feedstocks, technology
and implementation. Academic Press, San Diego, CA, pp. 109150.
Carlson, E.C., 1996. Don’t gamble with physical properties for simulations.
Chem. Eng. Prog. 92, 3546.
Chakravory, U., Hubert, M.-H., Nostbakken, L., 2009. Fuel versus food. Annu.
Rev. Resour. Econ. 1 (1), 645663.
Chao, J.C., Huibers, D.T.A. 1982. Catalytic hydrogenation of glucose to produce
sorbitol. US Patent 4,322,569.
Chavelas, E., Garcı́a-Hernández, E., 2009. Heat capacity changes in
carbohydrates and protein-carbohydrate complexes. Biochem. J. 420 (1),
239247.
Chheda, J.N., Huber, G.W., Dumesic, J.A., 2007. Liquid-phase catalytic
processing of biomass-derived oxygenated hydrocarbons to fuels and
chemicals. Angew. Chem. Int. Ed. 46 (38), 71647183.
Chirik, P.J., 2015. Iron- and cobalt-catalyzed alkene hydrogenation: catalysis with
both redox-active and strong field ligands. Acc. Chem. Res. 48 (6), 16871695.
Conde-Mejı́a, C., Jiménez-Gutiérrez, A., El-Halwagi, M., 2012. A comparison of
pretreatment methods for bioethanol production from lignocellulosic
materials. Process Saf. Environ. Prot. 90 (3), 189202.
Conde-Mejı́a, C., Jiménez-Gutiérrez, A., El-Halwagi, M.M., 2013. Assessment of
combinations between pretreatment and conversion configurations for
bioethanol production. ACS Sustain. Chem. Eng. 1 (8), 956965.
Conde-Mejı́a, C., Jiménez-Gutiérrez, A., Gómez-Castro, F.I., 2016. Purification of
bioethanol from a fermentation process: alternatives for dehydration. In:
Zdravko Kravanja, Miloš Bogataj, (eds.), Computer Aided Chemical
Engineering, vol. 38, pp. 373378. Amsterdam, The Netherland: Elsevier.
Cortright, R.D., Blommel, P.G. 2015. Synthesis of liquid fuels and chemicals from
oxygenated hydrocarbons. US Patent 8,933,281 B2.
Cracknell, R., Head, B., Remmert, S., et al., 2013. Laminar burning velocity as a
fuel characteristic: impact on vehicle performance. In: IMeChE (Ed.), Internal
Chapter 4 Production processes for the conversion of sugar and starchy feedstock
combustion engines: performance, fuel economy and emissions. Woodhead
Publishing, London, pp. 149156.
Davda, R.R., Dumesic, J.A., 2004. Renewable hydrogen by aqueous-phase
reforming of glucose. Chem. Commun. 2004 (1), 3637.
Davis, R., Tao, L., Scarlata, C., Tan, E.C.D., Ross, J., Lukas, J., et al., 2015. Process
design and economics for the conversion of lignocellulosic biomass to
hydrocarbons: dilute-acid and enzymatic deconstruction of biomass to sugars
and catalytic conversion of sugars to hydrocarbons. Technical Report NREL/
TP-5100-62498.
de Ávila Rodrigues, F., Guirardello, R., 2008. Evaluation of a sugarcane bagasse
acid hydrolysis technology. Chem. Eng. Technol. 31 (6), 883892.
Degelmann, H., Kowalczyk, J., Kunz, M., Schüttenhelm, M. 1999. Process for the
hydrogenation of sugars using a shell catalyst. US Patent 5,936,081.
de Oliveira Bordonal, R., Nunes Carvalho, J.L., Lal, R., Barretto de Figueiredo, E.,
2018. Sustainability of sugarcane production in Brazil. A review. Agron.
Sustain. Dev. 38 (13), 123.
Diario Oficial, 2008. Ley de Promoción y Desarrollo de los Bioenergéticos
(Spanish).
Dimian, A.C., Bildea, C.S., 2008. Chemical Process Design. Wiley, Weinheim.
Doyle, A.M., Shaikhutdinov, S.K., Jackson, S.D., Freund, H.-J., 2003.
Hydrogenation on metal surfaces: why are nanoparticles more active than
single crystals. Angew. Chem. Int. Ed. 42 (42), 52405243.
Duarte, H.A., Sad, M.E., Apesteguı́a, C.R., 2016. Aqueous phase reforming of
sorbitol on Pt/Al2O3: effect of metal loading and reaction conditions on H2
productivity. Int. J. Hydrog. Energy 41 (39), 1729017296.
Elliott, D., Werpy, T.A., Wang, Y., Frye Jr., J.G. 2003. Converting sugars to sugar
alcohols by aqueous phase catalytic hydrogenation. US Patent 6,570,043 B2.
Feng, J., LingYan, F., Hao, W., JunJun, Z., YiMin, F., XiangYang, S., 2017. Cofermentation of pentose and hexose to ethanol by immobilized mixed yeasts
method. J. For. Eng. 2 (4), 9095.
Garcı́a, R., Hernández, S., Ortiz, I., Cercado, B., 2019. Use of hydrolysate from
agave bagasse for bio-hydrogen production in microbial electrolysis cells.
Rev. Mex. Ing. Quı́m. 18 (3), 865874.
Gayubo, A.G., Aguayo, A.T., Atutxa, A., Aguado, R., Bilbao, J., 2004a.
Transformation of oxygenate components of biomass pyrolysis oil on a
HZSM-5 zeolite. I. Alcohols and phenols. Ind. Eng. Chem. Res. 43 (11),
26102618.
Gayubo, A.G., Aguayo, A.T., Atutxa, A., Aguado, R., Olazar, M., Bilbao, J., 2004b.
Transformation of oxygenate components of biomass pyrolysis oil on a
HZSM-5 zeolite. II. Aldehydes, ketones, and acids. Ind. Eng. Chem. Res. 43
(11), 26192626.
Geleynse, S., Brandt, K., Garcia-Perez, M., Wolcott, M., Zhang, X., 2018. The
alcohol-to-jet conversion pathway for drop-in biofuels: techno-economic
evaluation. Chem. Sustain. Energy Mater. 11 (21), 37283741.
Gevo, 2019. Sustainable aviation fuel. ,https://aim-builds.s3.amazonaws.com/
gevo/Gevo 1 WP_aviation 1 fuel.pdf. (accessed 8.04.20.).
Gieshoff, T.N., Chakraborty, U., Villa, M., von Wangelin, A.J., 2017. Alkene
hydrogenations by soluble iron nanocluster catalysts. Angew. Chem. Int. Ed.
56 (13), 35853589.
Green Air, 2014. Avianca and Lufthansa team up with US next-gen biofuel
companies to support alcohol-to-jet fuel approval. ,https://www.
greenaironline.com/news.php?viewStory 5 1854. (accessed 8.04.20.).
123
124
Chapter 4 Production processes for the conversion of sugar and starchy feedstock
Green Car Congress, 2010. Gevo produces isobutanol, hydrocarbons and
renewable jet fuel from cellulosic biomass. ,https://www.greencarcongress.
com/2010/07/gevo-produces-isobutanol-hydrocarbons-and-renewable-jetfuel-from-cellulosic-biomassgevo-20100729.html. (accessed 8.04.20.).
Gürbüz, E.I., Dumesic, J.A., 2013. Catalytic strategies and chemistries involved in
the conversion of sugars to liquid transportation fuels. In: Behrens, M., Datye,
A.K. (Eds.), Catalysis for the conversion of biomass and its derivatives. Max
Planck Institute for the History of Science, Berlin, pp. 293359.
Gürbüz, E.I., Kunkes, E.L., Dumesic, J.A., 2010. Dual-bed catalyst system for C-C
coupling of biomass-derived oxygenated hydrocarbons to fuel-grade
compounds. Green Chem. 12, 223227.
Gutiérrez-Antonio, C., Romero-Izquierdo, A.G., Gómez-Castro, F.I., Hernández,
S., Briones-Ramı́rez, A., 2016. Simultaneous energy integration and
intensification of the hydrotreating process to produce biojet fuel from
jatropha curcas. Chem. Eng. Process. Process. Intensif. 110, 134145.
Hamelinck, C.N., van Hooijdonk, G., Faaij, A.P.C., 2005. Ethanol from
lignocellulosic biomass: techno-economic performance in short-, middleand long-term. Biomass Bioenergy 28 (4), 384410.
Harvey, B.G., Quintana, R.L., 2012. Turbine and diesel fuels and methods for
making the same. US Patent 2012/0209036 A1.
Heveling, J., Nicolaides, C.P., Scurrell, M.S., 1998. Catalysts and conditions for
the highly efficient, selective and stable heterogeneous oligomerisation of
ethylene. Appl. Catal. A Gen. 173 (1), 19.
Huber, G.W., Cortright, R.D., Dumesic, J.A., 2004. Renewable alkanes by
aqueous-phase reforming of biomass-derived oxygenates. Angew. Chem. Int.
Ed. 43 (12), 15491551.
Index Mundi, 2020. Urea—Monthly Price - Commodity Prices - Price Charts,
Data, and News. ,https://www.indexmundi.com/commodities/?
commodity 5 urea. (accessed 29.01.20.).
Kim, J.-H., Block, D.E., Mills, D.A., 2010. Simultaneous consumption of pentose
and hexose sugars: an optimal microbial phenotype for efficient fermentation
of lignocellulosic biomass. Appl. Microbiol. Biotechnol. 88 (5), 10771085.
Kirilin, A.V., Tokarev, A.V., Kustov, L.M., Salmi, T., Mikkola, J.-P., Murzin, D.Y.,
2012. Aqueous phase reforming of xylitol and sorbitol: comparison and
influence of substrate structure. Appl. Catal. A Gen. 435-436, 172180.
Kunkes, E.L., Simonetti, D.A., West, R.M., Serrano-Ruiz, J.C., Gärtner, C.A.,
Dumesic, J.A., 2008. Catalytic conversion of biomass to monofunctional
hydrocarbons and targeted liquid-fuel classes. Science 322, 417421.
Ladygina, N., Dedyukhina, E.G., Vainshtein, M.B., 2006. A review on microbal
synthesis of hydrocarbons. Process Biochem. 41 (5), 10011014.
Liaw, B.-J., Chen, C.-H., Chen, Y.-Z., 2010. Hydrogenation of fructose over
amorphous nano-catalysts of CoNiB and polymer-stabilized CoNiB. Chem.
Eng. J. 157 (1), 140145.
Liu, T., Khosla, C., 2010. Genetic engineering of Escherichia coli for biofuel
production. Annu. Rev. Genet. 44, 5369.
Liu, S., Zhang, Y., Han, Y., Feng, G., Gao, F., Wang, H., et al., 2017. Selective
ethylene oligomerization with chromium-based metal-organic framework
MIL-100 evacuated under different temperatures. Organometallics 36 (3),
632638.
Lundin, M.A.B., 2011. Process integration study of a biorefinery producing
ethylene from lignocellulosic, Master in Innovative and Sustainable Chemical
Engineering Thesis, Chalmers University of Technology.
Chapter 4 Production processes for the conversion of sugar and starchy feedstock
Mawhood, R., Gazis, E., Hoefnagels, R., de Jong, S., Slade, R., 2016. Technological
and commercial maturity of aviation biofuels: emerging options to produce
jet from lignocellulosic biomass. In: Rodrigues, L.T. (Ed.), Proceedings of the
14th International Conference on Sustainable Energy Technologies, 2527
August 2015, Nottingham, UK. ,https://spiral.imperial.ac.uk/bitstream/
10044/1/27746/2/SET2015%20Full%20manuscript%20-%20MAWHOOD_335.
pdf. (accessed 9.04.20.).
Mercado Libre, 2019. 1 kg Sorgo rojo en grano para alimentación o semilla de
hongo. ,https://articulo.mercadolibre.com.mx/MLM-746207055-1kg-sorgorojo-en-grano-para-alimentacion-o-semilla-de-hongo-_JM?quantity 5 1#
position 5 9&type 5 item&tracking_id 5 6af4c43f-9ca5-4357-bf24-1ef4ff04c305.
(accessed 29.01.20.).
Mohanty, S.K., Swain, M.R., 2019. Bioethanol production from corn and wheat:
food, fuel, and future. In: Ray, R., Ramachandran, S. (Eds.), Bioethanol
production from food crops. Academic Press, Cambridge, MA, pp. 4579.
Mohsenzadeh, A., Zamani, A., Taherzadeh, M.J., 2017. Bioethylene Production
from Ethanol: A Review and Techno-economical Evaluation. Chem. Bio. Eng.
Rev. 4 ( 2) 7591.
Narula, C.K., Davison, B.H., Keller, M., 2012. Zeolitic catalytic conversion of
alcohols to hydrocarbons. International Patent WO 2012/174205 A1.
Nesterenko, N., Minoux, D., Van Donk, S., Dath, J.-P., 2012. Method for
producing distillate from a hydrocarbon feed, comprising alcohol
condensation. US Patent 2012/0271085 A1.
Pansare, S.S., Dunn, B., Lotero, E., Platon, A., Gerritsen, L.A., Marshall, S., et al.,
2013. Renewable jet fuel derived from biomass. International Patent WO
2013/085980 A1.
Papapetridis, I., Verhoeven, M.D., Wiersma, S.J., Goudriaan, M., van Maris, A.J.A.,
Pronk, J.T., 2018. Laboratory evolution for forced glucose-xylose coconsumption enables identification of mutations that improve mixed-sugar
fermentation by xylose-fermenting Saccharomyces cerevisiae. FEMS Yeast Res.
18 (6), 117.
Pearson, D.E., 1983. Process for catalytic dehydration of ethanol vapor to
ethylene. Patent US4423270A, United States.
Peralta-Yahya, P.P., Keasling, J.D., 2010. Advanced biofuel production in
microbes. Biotechnol. J. 5, 147162.
Peters, M.W., Taylor, J.D., 2015. Renewable jet fuel blendstock from isobutanol.
US Patent 8,975,461 B2.
Phung, T.K., Busca, G., 2015a. Diethyl ether cracking and ethanol dehydration:
acid catalysis and reaction paths. Chem. Eng. J. 272, 92101.
Phung, T.K., Busca, G., 2015b. Ethanol dehydration on silica-aluminas: active
sites and ethylene/diethyl ether selectivities. Catal. Commun. 68, 110115.
Phung, T.K., Proietti Hernández, L., Lagazzo, A., Busca, G., 2015. Dehydration of
ethanol over zeolites, silica alumina and alumina: Lewis acidity, Brønsted
acidity and confinement effects. Appl. Catal. A Gen. 493, 7789.
Qiu, S., Wang, T., Fang, Y., 2019. High-efficient preparation of gasoline-ranged
C5-C6 alkanes from biomass-derived sugars polyols of sorbitol over RuMoO3-x/C catalyst. Fuel Process. Technol. 183, 1926.
Rech, F.R., Fontana, R.C., Rosa, C.A., Camassola, M., Záchia Ayub, M.A., Dillon,
A.J.P., 2019. Fermentation of hexoses and pentoses from sugarcane bagasse
hydrolysates into ethanol by Spathaspora hagerdaliae. Bioprocess. Biosyst.
Eng. 42 (1), 8392.
125
126
Chapter 4 Production processes for the conversion of sugar and starchy feedstock
Restauro Online, 2019. Ácido sulfúrico puro (H2SO4) 98%. ,https://www.
restauro-online.com/Acido-sulfurico-puro-H2SO4-98-1-Litro. (accessed
25.08.19.).
Richter, S., Naumann, C., Riedel, U. 2017. Experimental study on the
combustion properties of an alcohol-to-jet fuel. In: Proceedings of the 2nd
World Congress on Momentum, Heat and Mass Transfer, 68 April 2017,
Barcelona, Spain. ,http://www.avestia.com/MHMT2017_Proceedings/files/
paper/CSP/CSP_107.pdf. (accessed 14.04.20.).
Rodrigues de Oliveira, T.K., Rosset, M., Perez-Lopez, O.W., 2018. Ethanol
dehydration to diethyl ether over Cu-Fe/ZSM-5 catalysts. Catal. Commun.
104, 3236.
Rodrussamee, N., Lertwattanasakul, N., Hirata, K., Limtong, S.S., Kosaka, T.,
Yamada, M., 2011. Growth and ethanol fermentation ability on hexose and
pentose sugars and glucose effect under various conditions in thermotolerant
yeast Kluyveromyces marxianus. Appl. Microbiol. Biotechnol. 90, 15731586.
Rozhko, E., Bavykina, A., Osadchii, D., Makkee, M., Gascon, J., 2017. Covalent
organic frameworks as supports for a molecular Ni based ethylene
oligomerization catalyst for the synthesis of long chain olefins. J. Catal. 345,
270280.
Rude, M.A., Schirmer, A., 2009. New microbial fuels: a biotech perspective. Curr.
Opin. Microbiol. 12 (3), 274281.
SAGARPA (Secretarı́a de Agricultura y Desarrollo Rural), 2017. Sorgo Grano
Mexicano—Planeación Agrı́cola Nacional. ,https://www.gob.mx/cms/
uploads/attachment/file/256433/B_sico-Sorgo_Grano.pdf. (accessed
30.01.20.) (Spanish).
Santos, C.I., Silva, C.C., Mussatto, S.I., Osseweijer, P., van der Wielen, L.A.M.,
Posada, J.A., 2018. Integrated 1st and 2nd generation sugarcane bio-refinery
for jet fuel production in Brazil: techno-economic and greenhouse gas
emissions assessment. Renew. Energy 129 (Part B), 733747.
Sarkar, N., Ghosh, S.K., Bannerjee, S., Aikat, K., 2012. Bioethanol production
from agricultural wastes: an overview. Renew. Energy 37 (1), 1927.
Schirmer, A., Rude, M.A., Li, X., Popova, E., del Cardayre, S.B., 2010. Microbial
biosynthesis of alkanes. Science 329 (5991), 559562.
Schripp, T., Herrmann, F., Oβwald, P., Köhler, M., Zchocke, A., Weigelt, D., et al.,
2019. Particle emissions of two unblended alternative jet fuels in a full scale
jet engine. Fuel 256, 115903.
Siegmeier, T., Blumenstein, B., Möller, D., 2019. Bioenergy production and
organic agriculture. In: Chandran, S., Unni, M.R., Thomas, S. (Eds.), Organic
Farming: Global Perspectives and Methods. Woodhead Publishing, Duxford,
pp. 331359.
Sifontes, V.A., Rivero, D., Wärnå, J.P., Mikkola, J.-P., Salmi, T.O., 2010. Sugar
hydrogenation over supported Ru/C—kinetics and physical properties. Top.
Catal. 53, 12781281.
Sifontes Herrera, V.A., Oladele, O., Kordás, K., Eränen, K., Mikkola, J.-P., Murzin,
D.Y., et al., 2011. Sugar hydrogenation over a Ru/C catalyst. Chem. Technol.
Biotechnol. 86 (5), 658668.
Silalertruksa, T., Gheewala, S., 2018. Land-water-energy nexus of sugarcane
production in Thailand. J. Clean. Prod. 182, 521528.
Sipos, B., Réczey, J., Somorai, Z., Kádár, Z., Dienes, D., Réczey, K., 2009. Sweet
sorghum as feedstock for ethanol production: enzymatic hydrolysis of steampretreated bagasse. Appl. Biochem. Biotechnol. 153 (1), 151162.
Spielmann, J., Buch, F., Harder, S., 2008. Early main-group metal catalysts for the
hydrogenation of alkenes with H2. Angew. Chem. Int. Ed. 47 (49), 94349438.
Chapter 4 Production processes for the conversion of sugar and starchy feedstock
Talebnia, F., Karakashev, D., Angelidaki, I., 2010. Production of bioethanol from
wheat straw: an overview on pretreatment, hydrolysis and fermentation.
Bioresour. Technol. 101 (13), 47444753.
Tao, L., Markham, J.N., Haq, Z., Biddy, M.J., 2017. Techno-economic analysis for
upgrading the biomass-derived ethanol-to-jet blendstocks. Green. Chem. 19
(4), 10821101.
Timilsina, G.R., Shrestha, A., 2011. How much hope should we have for biofuels?
Energy 36 (4), 20552069.
Timken, H.-K.C., Chang, B.-K., Campbell, C.B., Thomas, A.M., Fernandez, M.A.,
Sessions, M. 2018. Ethylene oligomerization process for making hydrocarbon
liquids. US Patent 9,938,473 B2.
Tomov, A.K., Nobbs, J.D., Chirinos, J.J., Saini, P.K., Malinowski, R., Ho, S.K.Y., et al.,
2017. Alternating α-olefin distributions via single and double insertions in
chromium-catalyzed ethylene oligomerization. Organometallics 36 (3), 510522.
Total, 2014. Total and Amyris renewable jet fuel ready for use in commercial
aviation. ,https://www.total.com/media/news/press-releases/total-andamyris-renewable-jet-fuel-ready-use-commercial-aviation. (accessed 9.04.20.).
Vázquez-Garea, A., 2017. Study of the bioethanol production from different
types of lignocellulosic biomass: matrix of reactions and optimization
(Bachelor Degree thesis). University of Cantabria.
Wang, W.-C., Tao, L., Markham, J., Zhang, Y., Tan, E., Batan, L., et al., 2016.
Review of biojet fuel conversion technologies. Technical Report NREL/TP5100-66291.
Wang, S., Agirrezabal-Telleria, I., Bhan, A., Simonetti, D., Takanabe, K., Iglesia, E.,
2017. Catalytic routes to fuels from C1 and oxygenate molecules. Faraday
Discuss. 197, 939.
Wei, H., Liu, W., Chen, X., Yang, Q., Li, J., Chen, H., 2019. Renewable bio-jet fuel
production for aviation: a review. Fuel 254, 115599.
Wesoff, E., 2010. LS9s genetics breakthrough: will it produce biofuels at scale.
,https://www.greentechmedia.com/articles/read/ls9s-biofuel-productionbreakthrough. (accessed 9.04.20.).
West, R.M., Tucker, M.H., Braden, D.J., Dumesic, J.A., 2009. Production of
alkanes from biomass derived carbohydrates on bi-functional catalysts
employing niobium-based supports. Catal. Commun. 10 (13), 17431746.
Westfall, P.J., Gardner, T.S., 2011. Industrial fermentation of renewable diesel
fuels. Curr. Opin. Biotechnol. 22 (3), 344350.
Won, S.H., Veloo, P.S., Dooley, S., Santner, J., Haas, F.M., Ju, Y., et al., 2016.
Predicting the global combustion behaviors of petroleum-derived and
alternative jet fuels by simple fuel property measurements. Fuel 168, 3446.
Zanatta Martini, D., Oliveira e Cruz de Aragao, L.E., Del’Arco Sanches, I.,
Valadares Galdos, M., Urbano da Silva, C.R., Dalla-Nora, E.L., 2018. Land
availability for sugarcane derived jet-biofuels in Sao Paulo-Brazil. Land Use
Policy 70, 256262.
Zapata, P.A., Farı́a, J., Ruiz, M.P., Resasco, D.E., 2012. Oxygenates in water/oil
emulsions stabilized by nanohybrid catalysts. Top. Catal. 55, 3852.
Zhang, Q., Wang, T., Li, B., Jiang, T., Ma, L., Zhang, X., et al., 2012. Aqueous
phase reforming of sorbitol to bio-gasoline over Ni/HZSM-5 catalysts. Appl.
Energy 97, 509513.
Zhang, C., Hui, X., Lin, Y., Sung, C.-J., 2016. Recent development in studies of
alternative jet fuel combustion: progress, challenges, and opportunities.
Renew. Sustain. Energy Rev. 54, 120138.
Zschocke, A., Scheuermann, S., Ortner, J., 2012. High biofuel blends in aviation
(HBBA). Final Report ENER/C2/2012/420-1. ,https://ec.europa.eu/energy/
sites/ener/files/documents/final_report_for_publication.pdf. (accessed
14.04.20.).
127
Production processes from
lignocellulosic feedstock
5.1
5
Introduction
Lignocellulosic biomass consists of materials with high content of cellulose, hemicellulose, and lignin; such biomass is usually available as waste from agricultural activities. Each year,
various tons of lignocellulosic residues are produced, leading to
the necessity of their disposal. Direct burning of the residues
may have a serious environmental impact; thus other alternatives must be explored. Among those alternatives, the conversion of the agroindustrial wastes into fuels is an attractive path
in economic terms, giving a second use to the residues and contributing to the transition from a fossil-based economy to a circular economy. There are several crops which produce plenty
residues to obtain biojet fuel, or other biofuels, in an adequate
scale to, at least, partially satisfy the energy demand for the
transport sector. The kind of crops depends on the location of
the land and the climatologic characteristics of the region. As
example, for Mexico in 2006, a production of 75.73 million tons
of agricultural residues has been reported, with 79% of residues
corresponding to primary crops, such as corn, sorghum, sugarcane, among others (Saval, 2012). In Brazil, the sugarcane
industry has as by-products 200 million tons of bagasse and 220
million tons of stray per year, where sugarcane bagasse has a
content of cellulose between 40% and 50% (Nicodème et al.,
2018). According to Tye et al. (2016), there is a worldwide production of agricultural residues of 2839.5 million tons per year,
derived from crops as barley, corn, oat, rice, sorghum, wheat,
sugarcane, and oil palm. These residues have cellulose composition ranging from 14.7% to 56%, while the composition of lignin is between 5.5% and 53.6%, depending on the biomass
source (Tye et al., 2016). Anwar et al. (2014) also mentioned
newspapers (40%55% of cellulose), grasses (25%40% of cellulose), banana waste (13.2% of cellulose), and sponge gourd
fibers (66.59% of cellulose) as lignocellulosic materials.
Production Processes of Renewable Aviation Fuel. DOI: https://doi.org/10.1016/B978-0-12-819719-6.00005-5
© 2021 Elsevier B.V. All rights reserved.
129
130
Chapter 5 Production processes from lignocellulosic feedstock
Agroindustrial residues, together with other lignocellulosic
materials, are produced in high proportions, representing a
renewable source of biomass with potential to be converted
into biofuels. Therefore this chapter is focused in the production of biojet fuel from lignocellulosic raw materials. First, the
available pretreatment technologies for lignocellulosic materials
are described. Then, a description of the chemical transformations occurring to the cellulose and hemicellulose is presented.
After, the technologies required to obtain pure final products
are mentioned, along with the reported results on the combustion tests applied to the biojet fuel derived from this kind of
feedstock. Finally, an example of the simulation and assessment
of a process for the production of biojet fuel from lignocellulosic biomass is presented and discussed.
5.2
Pretreatment technologies
One of the processing routes to obtain biojet fuel from lignocellulosic biomass implies the initial conversion of the raw material into alcohols; then, the alcohols are treated to obtain biojet
fuel. Nevertheless, in the case of lignocellulosic materials, the
conversion to alcohols is not direct, since the access to the cellulose and hemicellulose is avoided by the lignin. Thus the lignin
must be first eliminated; this is the main objective of the pretreatment. Fig. 5.1 presents the pretreatment effect on the
lignocellulosic material.
Additionally, the pretreatment increases the proportion of
amorphous cellulose, which makes easier the further processing
steps (Sarkar et al., 2012). Several technologies have been proposed for the pretreatment of lignocellulosic materials.
According to Sarkar et al. (2012), pretreatments can be classified
into four categories: physical, physicochemical, chemical, and
biological. In the following subsections, the pretreatments will
be described, following the classification presented by Sarkar
et al. (2012).
5.2.1
Physical pretreatments
The physical pretreatments are based on the use of a source
of energy to make easier the access to the cellulose. The mechanical size reduction can be mentioned as a first type of physical
pretreatment, where the biomass is treated in a mill to obtain
smaller particles with a given size distribution. This reduction
Chapter 5 Production processes from lignocellulosic feedstock
Lignin
Pretreatment
Cellulose
Hemicellulose
Figure 5.1 Effect of pretreatment on lignocellulosic material.
is usually a first step in the pretreatment stage, since the particularization of the biomass enhances mass and heat transfer in the
following pretreatment steps, which can be of any of the four
categories. According to Cadoche and López (1989), a size particle in the range of 36 mm avoids the use of excessive amount
of energy in the mill. Nevertheless, the required particle size
would depend on the operation following the size reduction.
Ballesteros et al. (2002) report that for a steam explosion pretreatment, particle sizes in the range of 812 mm enhance the
cellulose recoveries. Nevertheless, for the pretreatment of corn
stover through the AFEX technology, Chundawat et al. (2008)
used a particle size smaller than 0.1 mm.
A second type of physical pretreatment is the pyrolysis,
where the biomass is treated at high temperatures to obtain a
set of by-products, which can later be treated to generate alcohols. Nevertheless, by controlling the pyrolysis conditions, biooil can be produced, which is then hydrotreated to directly
obtain biojet fuel. The most important variables in the pyrolysis
are the temperature, pressure, and residence time. According to
Jenkins et al. (2016), the operation in a temperature range
between 800 C and 1000 C with vapor residence time lower
than 0.5 s and particle size lower than 3 mm maximizes the
131
132
Chapter 5 Production processes from lignocellulosic feedstock
yield to bio-oil to 75 wt.%; this operation is also known as
flash pyrolysis, and the biochar yields are around 12 wt.%.
Moreover, the selection of the reactor configuration and its
proper design also have an effect on the bio-oil yield and purity
(Thangalazhy-Gopakumar and Adhikari, 2016).
Other physical pretreatment implies the use of microwaves
to heat the biomass, breaking the lignin and allowing the
release of cellulose; these operations enhance the potential to
extract sugars in a further step. Hu and Wen (2008) reported
that for switchgrass the microwave heating of the biomass
soaked in alkali allows obtaining a high yield of sugars, around
90% of the maximum potential sugars. Intanakul et al. (2003)
also found an increase in the production of sugars with the
microwave pretreatment for rice straw and sugarcane bagasse.
5.2.2
Physicochemical pretreatments
Among the physicochemical pretreatments, four can be
mentioned: steam explosion, liquid hot water method, ammonia fiber explosion, and CO2 explosion. In the pretreatment by
steam explosion, high-pressure saturated steam enters in contact with the biomass, under conditions in the range of
2050 bar and 160 C290 C (Sarkar et al., 2012). In this process, the hemicellulose is hydrolyzed, and the lignin structure is
altered, although not completely destroyed (Anwar et al., 2014);
this operation finishes with a sudden reduction in pressure
(Conde-Mejı́a et al., 2012). In the case of the liquid hot water
approach, the biomass enters in contact with pressurized water,
at temperature conditions in the range of 170 C230 C (Sarkar
et al., 2012). This method allows completely removing of the
hemicellulose, while leaving 65%40% of the lignin unremoved
(Mosier et al., 2005).
In the ammonia fiber explosion pretreatment, the biomass
enters in contact with high-pressure concentrated liquid ammonia. Once the lignin and hemicellulose are exposed, the pressure is reduced (Kumar et al., 2009), similarly to the final step in
the steam explosion process. The process takes place under
temperatures in the range of 60 C100 C (Sarkar et al., 2012);
its main drawbacks are the cost of ammonia (Holtzapple et al.,
1992) and its difficulty to treat materials with high content of
lignin (Anwar et al., 2014).
Other explosion-based pretreatment is the CO2 explosion,
which is similar to steam explosion and ammonia fiber explosion. It has been reported that this pretreatment has lower
yields than the other two explosion processes, but it has lower
Chapter 5 Production processes from lignocellulosic feedstock
costs and avoids the formation of inhibitory by-products that
are generated in the steam explosion (Hamelinck et al., 2005;
Prasad et al., 2007). For this kind of pretreatment, Gu et al.
(2013) studied operation pressures in the range of 75275 bar,
with temperatures between 40 C and 210 C; the pretreatment
conditions depend on the kind of biomass. Gu et al. (2013) also
reported the use of ionic liquids as solvents for lignocellulosic
biomass. Among the advantages of such approach is that the
operation can take place at low pressure and relatively low temperature. Depending on the used ionic liquid, it can be selective
to dissolve lignin, hemicellulose, or cellulose, or the three components simultaneously. Nevertheless, ionic liquids are still
expensive, and they may have a high environmental impact
since they are non-biodegradable. Moreover, they may act
as inhibitors for further treatments (Guragain et al., 2011;
Haykir et al., 2013).
5.2.3
Chemical pretreatments
In this classification, four pretreatments can be mentioned:
acid pretreatment, alkaline pretreatment, wet oxidation, and
organosolv pretreatment. In the case of the acid pretreatment,
the biomass interacts with either concentrated or diluted acids,
in a temperature range of 130 C210 C (Sarkar et al., 2012).
Although sulfuric acid is the most used in this kind of pretreatment, the use of hydrochloric acid, acetic acid, and nitric acid
has also been reported (Cardona et al., 2010). The acid tends to
hydrolyze the hemicellulose but produces a set of inhibitors
(Sarkar et al., 2012). The process may occur in a temperature
range of 160 C220 C (Mosier et al., 2005). Due to the use of
acids, the process may be hazardous and toxic; in addition, the
equipment may be corroded (Anwar et al., 2014). To avoid the
corrosion, Lloyd and Wyman (2005) proposed the use of very
diluted acids.
In the case of the alkaline pretreatment, sodium hydroxide,
potassium hydroxide, calcium hydroxide, or ammonium can be
used to digest the lignin, allowing further treatment for cellulose
and hemicellulose (Sarkar et al., 2012). This pretreatment can take
place under ambient conditions, although the process can take
hours or even days (Mosier et al., 2005). When the temperature is
increased, the residence time can be reduced (Chang et al., 1998).
On the other hand, wet oxidation is a method where the biomass is treated with water in an oxidant atmosphere, provided
by air or oxygen. This treatment is useful to break the association of lignin with cellulose, while dissolving hemicellulose
133
134
Chapter 5 Production processes from lignocellulosic feedstock
(Mosier et al., 2005). The process takes place at temperatures
above 120 C (Sarkar et al., 2012). Martı́n et al. (2007) reported
that the best temperature for the pretreatment of sugarcane
bagasse is 195 C, obtaining a high solubilization of hemicelluloses. Nevertheless, it has been found that the method is expensive (Mosier et al., 2005; Conde-Mejı́a et al., 2012).
The organosolv pretreatment implies the use of a mixture consisting of an organic solvent and water to simultaneously hydrolyzing and delignifying the biomass (Conde-Mejı́a et al., 2012). Some
of the most used solvents can be inhibitors in the following treatments; thus they must be recovered, which represents a high contribution to the energy requirements of the pretreatment step.
Moreover, the use of solvents may increase the inherent risk of the
process due to their inflammability (Conde-Mejı́a et al., 2012).
5.2.4
Biological pretreatments
The use of microorganisms to release the cellulose is another
strategy to treat the lignocellulosic materials. Some of the
microorganisms which can perform this task are the white rot
fungi, the brown fungi, and the soft rot fungi (Sarkar et al.,
2012; Anwar et al., 2014). This kind of pretreatment can be used
as substitute of the chemical pretreatments or as a complement
to them (Iqbal et al., 2013). The use of such biotechnological
approach is advantageous, since it reduces considerably the
environmental impact and the risk of the pretreatment.
Nevertheless, it still faces challenges, as its very slow rate of
hydrolysis (Conde-Mejı́a et al., 2012). Moreover, as occurs with
many of the microorganism-based processes, the dimensions of
the equipment required for such treatment are big, and the
growth conditions must be carefully controlled. Additionally,
the microorganisms not only solubilize the lignin but also the
hemicellulose and the cellulose (Anwar et al., 2014).
5.3
Conversion processes of the
lignocellulosic feedstock
Once the lignin, and in some cases the hemicellulose, has
been broken and transformed, the remaining materials must go
through further processing to produce biojet fuel. One of the
pathways implies first obtaining ethanol, and then convert it
into biojet fuel and other by-products in the process known as
alcohol-to-jet. A second alternative is related to the direct fermentation of sugars, through the sugar-to-jet approach. A third
Chapter 5 Production processes from lignocellulosic feedstock
135
pathway implies the thermochemical treatment of the biomass,
by gasifying it and then treating the effluent in a
FischerTropsch (FT) process, followed by hydrotreating and
isomerization/cracking steps. All the routes will be discussed in
the next subsections. Fig. 5.2 schematically presents both pathways to produce biojet fuel.
Lignocellulosic material
Mechanical pretreatment (size reduction)
Gasification
Hydrolysis
(acid/basic/enzymatic)
Recovery and purification
(ethanol/isobutanol)
ATJ pathway
Biological pretreatment
(fermentation stage)
Fischer–Tropsch reaction
Hydrotreating
Separation stage
Biojet
fuel
Figure 5.2 Biojet fuel production from lignocellulosic material.
Isomerization/cracking
Separation stage
Biojet
fuel
ATJ process
Other
hydrocarbon
fuels
Fischer – Tropsch pathwa
y
Chemical pretreatment
Other
hydrocarbon
fuels
136
Chapter 5 Production processes from lignocellulosic feedstock
5.3.1
Alcohol-to-jet process
Once the lignocellulosic biomass has been pretreated and
the lignin has been removed, two additional steps are required
to produce the ethanol: hydrolysis and fermentation. In the
hydrolysis stage, the biomass is treated with water in an enzymatic medium to release the sugars contained in the cellulose
and hemicellulose, mainly glucose, xylose, arabinose, galactose,
and mannose (Sarkar et al., 2012). The most common enzymes
used in the hydrolysis step are endoglucanases, exoglucanase or
cellobiohydrolase, and β-glucosidase (Prasad et al., 2007).
Glucoronidase, acetylesterase, xylanase, β-glucosidase, among
others are used to transform the hemicellulose (Duff and
Murray, 1996). It has been reported that enzymatic hydrolysis
works better at temperatures in the range 40 C50 C, with pH
between 4 and 5 (Neves et al., 2007). Another important parameter is the substrate concentration; increasing such concentration causes an increase in the yield and the reaction rate
(Cheung and Anderson, 1997). Nevertheless, a high concentration may cause inhibition, reducing the reaction rate (Prasad
et al., 2007). It is important to mention that the enzymes represent one of the highest contributions to the cost of the alcohol
production (Prasad et al., 2007).
Once the sugars are available, they are fermented to produce
ethanol. Then, the ethanol is dehydrated, oligomerized, and hydrogenated, as described in Chapter 4, Production Processes for the
Conversion of Sugar and Starchy Feedstock. The produced hydrocarbons are then separated to obtain the desired fractions, which
has already been discussed in Chapter 4, Production Processes for
the Conversion of Sugar and Starchy Feedstock.
5.3.2
Sugar-to-jet process
Like the alcohol-to-jet approach, in the sugar-to-jet pathway
for lignocellulosic biomass, the lignin must be first retired
through a proper pretreatment. Then, hydrolysis must take
place to extract the sugars. Once the sugars have been released,
the jet fuel can be obtained by one of the routes described in
Chapter 4, Production Processes for the Conversion of Sugar
and Starchy Feedstock.
5.3.3
Thermochemical route
In the thermochemical route, two main processing alternatives can be mentioned: the gasification/FT path and the
Chapter 5 Production processes from lignocellulosic feedstock
pyrolysis/hydrotreatment path. Both processing methods are
described in this section.
In the gasification/FT path, gasification occurs first. In gasification, the raw material is heated at high temperatures, above
700 C. Gasification is performed in a low-oxygen atmosphere to
avoid combustion (Nicodème et al., 2018). The main product of
the gasification is a mixture of gases known as syngas, which is
mainly composed by carbon monoxide and hydrogen; but it
also may contain small quantities of carbon dioxide, methane,
and water (Molino et al., 2016). Besides syngas, a liquid fraction,
known as tar, and a solid fraction, or char, are obtained. In gasification, five consecutive steps can be identified: dehydration
(around 100 C), pyrolysis (between 250 C and 700 C), and, as
temperature raises, oxidation, reduction, and additional reactions (Nicodème et al., 2018).
Once the syngas has been produced, it enters to the FT
reactor. In the FT synthesis, the carbon monoxide from the
syngas reacts with hydrogen, generating both linear long-chain
and branched hydrocarbons; nevertheless, most of the yield
corresponds to linear hydrocarbons. The general reaction can
be stated as follows (Demirbas, 2009):
m
nCO 1 n 1
ð5:1Þ
H2 -Cn Hm 1 nH2 O
2
where n is the average length of the hydrocarbon chain, which
will strongly depend on the operating conditions. According to
Nicodème et al. (2018), to produce gasoline and light olefins,
temperatures from 330 C to 350 C are required; while temperatures in the range 220 C250 C promote the production of
hydrocarbons in the diesel range. Iron and cobalt-based catalysts are among the most used for FT synthesis. Several developments have been reported to enhance the selectivity and
yield of the reaction. Wang et al. (2016b) studied the use of
Fe2O3 nanoparticles inside TiO2 nanotubes, claiming that the
confinement can be a useful strategy for the adjustment of the
product distribution of long-chain hydrocarbons. Li et al. (2016)
proposed a Co/ZrO2-SiO2 bimodal catalyst for the FT synthesis; their results indicated that adding 1-olefins as additives
enhances the selectivity to hydrocarbons in the boiling point
range of biojet fuel. Savost’yanov et al. (2017) reported the
development of a Co-SiO2 catalyst, mentioning that this catalyst
is stable under variable operational conditions; also, they indicated that their catalyst is recommendable for its use in industrial production. Rytter et al. (2019) proposed the use of a
catalyst of α-alumina impregnated with cobalt and rhenium.
137
138
Chapter 5 Production processes from lignocellulosic feedstock
Depending on the distribution of the products obtained in the
FT synthesis, it could be necessary to perform additional
steps, as hydrocracking and hydroisomerization, to produce the
highest yield to the jet fuel fraction, with the required proportion of branched hydrocarbons. Such chemical transformations
have already been described in Chapter 3, Production Processes
for the Conversion of Triglyceride Feedstock.
The second thermochemical route to produce biojet fuel
involves a pyrolysis step, followed by hydrotreatment, hydrocracking, and/or hydroisomerization. As in gasification, pyrolysis implies the thermal treatment of biomass, but in an
atmosphere with low concentration of oxygen, or even free of
oxygen. The main product of the pyrolysis of biomass is known
as bio-oil. Pyrolysis may take place under temperatures around
500 C, with low residence time, generating high yields of the
liquid product (bio-oil). This kind of treatment is known as fast
pyrolysis (Leibbrandt et al., 2011). On the other hand, to produce a high yield of char, vacuum pyrolysis can be used, operating at temperatures around 300 C, under large negative
pressure conditions (Cai et al., 2016; Nicodème et al., 2018).
Since the liquid fraction (bio-oil) is the one to be converted into
hydrocarbons, in the production of biojet fuel the flash pyrolysis is preferred. In fast pyrolysis, a water phase can also be
obtained (Zhang et al., 2005). The oil phase can then be
upgraded through hydrotreatment, which has been discussed in
Chapter 3, Production Processes for the Conversion of
Triglyceride Feedstock.
For the hydrotreatment of bio-oil, some reported catalysts
are CoMo/γ-Al2O3 and NiMo/γ-Al2O3 (Senol et al., 2005). In
terms of the composition of bio-oil, hydrocracking may also
take place with CoMoS/Al2O3 or HZSM-5 catalysts (Zheng et al.,
2015). The production of hydrocarbons in the boiling point
range of biojet fuel through the alkylation of aromatics from
bio-oil has been reported, using an ionic liquid to promote the
reaction (Wang et al., 2015).
5.3.4
Lignin as a source for aromatics
Wang et al. (2020) describes the treatment of lignin as a strategy to make use of this fraction of lignocellulosic biomass to produce aromatics and cycloalkanes; these compounds can be
blended with the hydrocarbons obtained by the treatment of cellulose and hemicellulose. The conversion of lignin includes steps
as depolymerization to generate monomers and dimers, followed
by coupling and hydrodeoxygenation of the monomers and
Chapter 5 Production processes from lignocellulosic feedstock
hydrodeoxygenation of the dimers. Chio et al. (2019) described
several methods for lignin depolymerization, including thermochemical methods, chemical/catalyst-based methods, and biological methods. Pyrolysis is mentioned as one of the most
studied methods for lignin depolymerization, requiring temperatures up to 800 C. Among the chemical/catalyst-based methods,
acid catalysis, basic catalysis, metallic catalysis, ionic liquid
assisted catalysis, catalysis assisted by subcritical or supercritical
fluids, and oxidative depolymerization can be mentioned. For
acid catalysis, the use of hydrochloric acid (Hewson and Hibbert,
1943) and diluted sulfuric acid (Mahmood et al., 2015) has been
reported. In the case of basic catalysis, Evans et al. (1999) proposed the use of strong bases as NaOH and KOH, since they
transformed more lignin than weaker bases. In the case of metallic catalysis, Song et al. (2013) reported the use of heterogeneous
nickel-based catalysts, such as Ni/C, Ni/SBA-15, and Ni/Al2O3, to
obtain monomeric phenols from native birch wood lignin. The
use of ionic liquid helps to stabilize the intermediates during the
depolymerization reaction (Chio et al., 2019), avoiding the oxidation of aldehyde products and increasing their yields (Liu et al.,
2013). According to Chio et al. (2019), oxidation is among the
most used methods for lignin depolymerization, with hydrogen
peroxide and potassium permanganate as the most used oxidants. In the case of the use of subcritical and supercritical
fluids, Wahyudiono and Goto (2008) studied the degradation of
lignin in water at critical conditions and conditions near to the
critical state. They reported that as reaction time is increased,
the amount of lower molecular weight fractions is also enhanced.
Yong and Matsumura (2013) studied the depolymerization of lignin in subcritical water (300 C370 C) and supercritical water
(390 C450 C). According to their results, under subcritical conditions the reaction rate is higher, but supercritical conditions
allowed a higher degree of depolymerization. For biological
depolymerization, several organisms have been studied, which
include bacteria, fungi, and enzymes. Unfortunately, such
approach has low efficiency on the conversion of lignin to monomers, which limits the industrial application of these methods.
However, this can be seen as an area of opportunity for the
development of modified microorganisms, which can perform
the depolymerization task with higher efficiency.
As a following step, lignin monomers can be coupled into
dimers and then hydrodeoxygenated, while the dimers are directly
hydrodeoxygenated. Wang et al. (2020) remark that special care
must be taken with coupling reactions to avoid the formation of
oversize molecules; this can be controlled through the proper
139
140
Chapter 5 Production processes from lignocellulosic feedstock
selection of catalyst. Yan et al. (2010) proposed the use of nanoparticle catalysts with ionic liquids to perform the hydrodeoxygenation of phenols. They reported that a catalyst based on Rh/Ru
nanoparticles in combination with the ionic liquid 1-butyl-3methylimidazolium bis(trifluoromethylsulfonyl)imide allowed
reaching conversion of 99%, with a selectivity of 99% to cyclohexane, at 130 C and 40 MPa H2. Zhang et al. (2005) presented the
use of a Ru/HZSM-5 catalyst to hydrodeoxygenate phenolic compounds. According to their results, conversions of 99.9% are
obtained, with selectivity of at least 95% to cyclohexane for temperatures higher than 120 C. Chen et al. (2015) proposed the use
of a Pd/C catalyst for the coupling reaction between phenols and
amines, generating as products secondary and tertiary cyclohexylamine derivatives. In the same year, Yao et al. (2015) reported the
use of a Ru/H-Beta catalyst for the hydrodeoxygenation of phenolic compounds. They found that at 140 C and 4 MPa H2, conversion up to 80.5% can be obtained, with a yield of 68.3% to
cyclohexane. Liu et al. (2016) studied the synthesis of magnetic
nitrogen-doped carbon supported cobalt nitride catalysts to perform the hydrodeoxygenation of phenols. They determined that at
200 C and 2 MPa H2, a yield of 99.1% to propylcyclohexane can
be reached if HZSM-5 is added to the reaction system. Wang et al.
(2016a,b) reported the use of ZnCl2 and Ru/C as cocatalyst to
transform lignin into phenolic products by depolymerization, followed by coupling and hydrodeoxygenation reactions to produce
more stable cyclic hydrocarbons. On the other hand, direct hydrodeoxygenation of anisole has been studied by Wang et al. (2017),
where conversions higher than 99 wt.% with NiMo/Al2O3 and Ru/
Al2O3 catalysts are observed. According to their results, most of
the products obtained with the NiMo/Al2O3 catalyst are phenol,
alkylphenols, benzene, and alkylbenzenes. On the other hand, the
Ru/Al2O3 catalyst promotes the formation of cycloparaffins.
5.4
Technologies on the separation zone
In the case of the gasification/FT approach, the generated products are mainly hydrocarbons; thus distillation can be used as
purification technology to separate the desired fractions. To remove
the CO2 in the syngas before entering the FT reactor, some
reported operations are the absorption with amines (Ai et al., 2005),
membranes (Franz and Scherer, 2010), or the Rectisol washing
approach (Sun and Smith, 2013). Additionally, to recover the hydrogen from the gas fraction of the hydrocracking step, the use of pressure swing absorption has been proposed (Diederichs et al., 2016).
Chapter 5 Production processes from lignocellulosic feedstock
For the pyrolysis-based process, the products are hydrocarbons;
therefore distillation is the predominant purification technology to
obtain the desired fractions.
In the case of the sugar-to-jet pathway, after hydrolysis it is
necessary to purify and concentrate the hydrolysate to satisfy
the needs of the following steps (Wei et al., 2019). To achieve
this, Davis et al. (2015) recommended the use of a microvapor
recompression evaporator, microfiltration, and ion exchange filtration. After obtaining the hydrocarbon fractions, further purification is required to obtain the biojet cut. This final refining
can be performed through distillation.
The main product in the analyzed approaches is biojet fuel,
which can be used as aviation fuel blended with fossil jet fuel.
Additionally, naphtha and green diesel are generated as coproducts. On the other hand, naphtha can be used as solvent, or
further treated to produce gasoline. Finally, green diesel can be
used as substitute of fossil diesel; since it is composed by
hydrocarbons, there is no need to blend it with fossil diesel, as
occurs with biodiesel.
5.5
Conventional processes: state of the art
In this section, a revision of the state of the art related to
conventional processes where lignocellulosic biomass is converted to biojet fuel is presented. It is worth to mention that the
term “conventional processes” is employed to designate those
processes which make use of traditional processing technologies, with no intensified equipment.
Rusek and Ziulkowski (2009) presented a process to obtain mesitylene and isopentane, by fermentation of biomass feedstock, producing either ethanol and then acetic acid, or directly acetic acid.
The acetic acid is then converted to acetone, and the acetone is
transformed to the final products, which are mentioned as potential
replacement for aviation fuel. Rusek et al. (2012) reported a process
to generate a replacement for jet fuel consisting on mesitylene and
alkanes, such as octadecane, octane, nonane, or tetradecane.
Wright et al. (2012) presented a process proposal for the oligomerization of butene using bis(cyclopentadienyl) zirconium dichloride
as catalyst. Peters and Taylor (2013) proposed a process for the production of renewable jet fuel by fermentation of biomass to isobutanol, dehydration, and oligomerization of the alcohol, and
subsequent hydrogenation. The authors mentioned that the production of renewable jet fuel either by separated reaction steps, or
by pairs of reaction sets taking place at the same reaction zone.
141
142
Chapter 5 Production processes from lignocellulosic feedstock
For the sugar-to-jet approach, Amyris Inc. (2013) reported
the production of farnesane from wood chip and wheat
straw in a pilot plant. According to their results, the wheat
straw reduced the fermentation yield and productivity, while
the use of wood chip showed similar yields to those
obtained by fermentation of sorghum syrup or dextrose.
Lane (2012) described the CASE (cold acid solvent extraction) process, from Virdia, which uses pine wood as raw
material to produce jet fuel (Wang et al., 2016a,b); however,
there is only little information about this approach. Baral
et al. (2019) proposed a processing route to transform sorghum biomass to jet fuel. The process includes the conditioning of biomass by milling, followed by a pretreatment
with an ionic liquid to allow dissolving the lignin fraction.
The obtained cellulose and hemicellulose are then hydrolyzed with Escherichia coli to generate limonene, linalool,
bisabolene, among others. Those products are then hydrogenated. It is mentioned that some of the obtained molecules
require additional treatment, as dehydration, hydrogenation,
dimerization, and isomerization.
In the case of thermochemical approaches, Cheiky and
Malyala (2011) and Cheiky et al. (2016) reported a process
where biomass is gasified in a number of stations, and the volatile components passes through a set of catalysts, intended to
produce renewable fuels, including jet fuel and diesel. Dayton
et al. (2013) presented a process involving the catalytic pyrolysis
of lignocellulosic biomass, using metallic oxides as catalysts,
followed by deoxygenation of the bio-oil. Cheiky et al. (2013)
studied a process where biomass is pyrolyzed into hydrocarbons and biochar; the hydrocarbons are upgraded into renewable fuels, and the biochar is processed to obtain dimethyl
ether.
5.6
Combustion tests for biojet fuel from
lignocellulosic feedstock
In this section, combustion tests developed for biojet fuels
derived from lignocellulosic biomass are presented. Biojet
fuels obtained from lignocellulosic feedstock by the alcoholto-jet and sugar-to-jet pathways are similar to those produced from sugar/starchy feedstock, whose combustion tests
have been already discussed in Chapter 4, Production
Processes for the Conversion of Sugar and Starchy Feedstock.
Thus the focus of this section is the tests for biojet fuels
Chapter 5 Production processes from lignocellulosic feedstock
obtained by thermochemical pathways. Unfortunately, to the
knowledge of the authors, there are no works dealing with
combustion tests of biojet fuel obtained from lignocellulosic
biomass. Nevertheless, Edwards et al. (2010) mentioned that
the biomass-based jet fuels obtained from a FT process are
not expected to differ from the FT jet fuels produced from
coal or natural gas, since the characteristic of the original
feedstock is destroyed in the gasification step. Thus some
studies related to the FT jet fuel performance will be mentioned here, even if the SPKs are not generated from lignocellulosic biomass. Hui et al. (2012) studied the combustion
characteristics of a variety of FT jet fuels, comparing them
with jet fuels obtained by hydrotreating and with conventional Jet A. According to their results, most of the FT fuels
showed lower ignition delay times than Jet A, except the IPK
from Sasol, which has large amounts of iso-paraffins and
cycloparaffins. In the case of the derived cetane number, the
FT fuels, except the Sasol IPK, showed higher values than
Jet A. This implies that the other FT jet fuels are more reactive than Jet A, and much more reactive than IPK. Won et al.
(2014) studied the extinction limits of diffusion flames and
the critical flame initiation radius of two FT jet fuels and
two hydrotreating-based jet fuels, comparing their performance with the conventional JP-8 jet fuel. It is mentioned
that the Sasol IPK showed the larger critical flame initiation
radius, implying that the ignition of that jet fuel would be
more difficult than that of the other jet fuels. On the other
hand, the Shell SPK showed the best performance among the
studied fuels. Thus the absence of n-paraffins in the Sasol
IPK affects its combustion performance.
In terms of emissions, Lobo et al. (2011) presented a study of
the particulate matter (PM) released when burning jet fuels in a
gas turbine engine. Particularly, an FT jet fuel, a 50-50 mixture
of FT jet fuel with Jet A-1, and mixtures of fatty acid methyl
esters with Jet A are studied and compared with Jet A-1.
According to the results, all the alternative jet fuels showed
lower emissions of PM than the fossil jet fuel. Nevertheless, the
FT jet fuel has higher emissions than the other analyzed fuels.
The 50-50 mixture of FT jet fuel and Jet A-1 showed the second lower value for PM. Khandelwal et al. (2013) studied the
greenhouse gas emissions of three jet fuels: Jet A-1, FT jet fuel
and a mixture of 50% FT jet fuel and 50% Jet A-1, used in a
gas turbine engine. Their results show that there is only small
difference in the emissions of CO2, CO, NOx, NO, and NO2 for
the three fuels.
143
144
Chapter 5 Production processes from lignocellulosic feedstock
5.7
5.7.1
Case study: conversion of lignocellulosic
waste
Problem statement
The sustainable production of jet fuel using lignocellulosic
wastes from edible and nonedible crops has become into a strategic route. Some processes have been developed to transform
wastes in biofuels, electricity, or high-value chemicals (Ge et al.,
2017; Mahmood et al., 2019; Raud et al., 2019). However, in
Mexico the use of energy from agricultural wastes is a strong
opportunity area. Currently, the use of wastes from the main
cultures as corn, sorghum, wheat, and barley is oriented to land
protection (roughly 50%), animal feed (approximately 27%), and
burning without any benefit (approximately 20%) (Garcı́a
Bustamante and Masera Cerutti, 2016). In this context, is important to recognize its energetic potential and orientate it toward
the production of biofuels, electricity, and other products.
Regarding the cultivation of energetic crops as palm oil and
Jatropha curcas, the harvesting stages and oil extraction are
important sources of lignocellulosic wastes. In the case of palm
oil, after removing the palm oil fruit from racemes, three lignocellulosic biomasses are obtained: racemes empty (called tusa
53.2 wt.%), fiber (32.3 wt.%), and shell without kernel (14.6 wt.%)
(Osorio Florez, 2013); Fig. 5.3 shows each one of these components. According to Del Hierro-Santacruz (1993), per 1000 kg of
fruit raceme, 600 kg of palm oil fruit, and 400 kg of solid wastes
Kernel
Palm oil shell
Fiber
Palm oil racemes
empty racemes (TUSA)
Figure 5.3 Components of palm oil fruit.
Palm oil fruit
Chapter 5 Production processes from lignocellulosic feedstock
are obtained. Also, it is important to mention that shell covers
kernel, which is rich in oil.
On the other hand, the J. curcas fruit is formed by shell
(37.5 wt.%) and seed (62.5 wt.%). The seed is composed by
42 wt.% of husk and 58 wt.% of kernel (Singh et al., 2008).
Kernel contains the J. curcas oil, while shell and husk are lignocellulosic residues. Fig. 5.4 presents the components of the
J. curcas fruit.
In this case of study, the shell from palm oil and J. curcas
fruit will be considered as the raw material to produce biojet
fuel and other products as green diesel and methanol. The flow
rate of palm oil shell considered corresponds to the one
obtained by the processing of 2000 kg/h of palm oil fruit, which
was used as calculation basis in the case of study presented
in Chapter 3, Production Processes for the Conversion of
Triglyceride Feedstock. Using a material balance, according to
the palm oil racemes composition described before, the flow
of palm oil shell is 195 kg/h. In the same way, the flow rate of
J. curcas shell is 5811 kg/h, which can be calculated from the
inlet flow rate of 2000 kg/h of J. curcas oil, assuming 35 wt.% of
oil into kernel and 100% of yield in the oil extraction stage.
These lignocellulosic wastes will be processed through gasification to obtain syngas, which will be transformed in a mixture
of higher alcohols as methanol, ethanol, propanol, and isobutanol, oriented selectively to isobutanol. Then, reactive stages as
dehydration, oligomerization, and hydrogenation will be modeled to produce biojet fuel and green diesel.
5.7.2
Modeling of lignocellulosic waste
The modeling of lignocellulosic wastes is based on the experimental analysis of their chemical composition and physicochemical properties. The elemental composition, moisture
level, volatile material, ash content, calorific values, and lignocellulosic profile are the main features to describe any lignocellulosic biomass. For this case of study, we assume that the
Shell
Seeds
Husk
Kernel
Figure 5.4 Components of
Jatropha curcas fruit.
145
146
Chapter 5 Production processes from lignocellulosic feedstock
Table 5.1 Lignocellulosic composition of palm oil shell (Van Dam, 2016) and J. curcas shell
(Singh et al., 2008).
Palm oil shell
Jatropha curcas shell
Compounds
wt.%
Compounds
wt.%
Cellulose
Hemicellulose
Lignin
22.08
24.10
53.82
Cellulose
Hemicellulose
Lignin
61
18
21
wastes are moisture-free and can be described only by their lignocellulosic profile. Table 5.1 presents the lignocellulosic composition of palm oil shell and J. curcas shell.
For a more detailed description about the physicochemical
properties of palm oil shell see Van Dam (2016) and Sechage
Cortes et al. (2017), and for J. curcas shell, please refer to Singh
et al. (2008) and Betancur-Prisco et al. (2014).
Since the composition of each waste is established according
to their lignocellulosic profile, it is important to have information about the physical properties of all the components
involved in the modeling of biomass, with special focus on the
lignocellulosic components. This information can be found in
the work of Wooley and Putsche (1996), who described the
chemical structure of cellulose, hemicellulose, and lignin as
well as properties such molecular weight, solid heat of formation, solid heat capacity, and solid molar volume.
5.7.3
Production process: conceptual design
A block diagram for the transformation of the shell (lignocellulosic wastes) from J. curcas and palm oil into biojet fuel is
shown in Fig. 5.5, taking as basis the works of Atsonios et al.
(2013, 2015). According to Fig. 5.5, the process starts with the
gasification of the solid biomass to generate syngas. We assume
that the waste biomass is dried by solar action and crushed
before entering to the gasification reactor. Based on the nature
of the biomass fed, products such as CO2, H2S, NH3, HCl,
among others, can be obtained; thus a cleaning stage of syngas
to remove them is necessary.
Into a gasifier four stages can be defined: drying, pyrolysis,
oxidation, and reduction, as can be seen in Fig. 5.6 (Sharma,
Chapter 5 Production processes from lignocellulosic feedstock
Methanol
147
Methanol
Lignocellulosic
biomass
MAS
Condensation
Gasification
Isobutanol
Rectisol
Dehydration
Oligomerization
Biojet fuel
Green diesel
Hydrogenation
Figure 5.5 Block diagram of the conversion of lignocellulosic residues to biojet fuel.
Fuel
Fuel
Syngas
Air
Drying
Drying
Pyrolysis
Pyrolysis
Oxidation
Air
Reduction
Oxidation
Syngas
Downdraft
Reduction
Air
Air
Updraft
Figure 5.6 Definition of zones inside two typical gasifiers (Sharma, 2008; Gagliano et al., 2017).
2008; Gagliano et al., 2017). To describe the behavior of biomass
inside a gasifier, some complex kinetics models have been proposed (Safarian et al., 2019). However, a simple first-order
Arrhenius-based kinetic model has been reported to describe
the biomass gasification oriented to produce hydrogen through
the CO2 capture (Inayat et al., 2010). Table 5.2 describes the
reactions proposed to define the gasification chemistry and the
kinetic parameters for each one.
As can be seen in Table 5.2, the biomass is represented by carbon element, describing only the oxidation and reduction stages
as the gasification process; therefore to complete the model of
palm oil shell and J. curcas shell, a pyrolysis process will be
148
Chapter 5 Production processes from lignocellulosic feedstock
Table 5.2 Kinetic model for the gasification of biomass (Inayat et al., 2010).
Arrhenius parameters (mol/m3 s)
No. reaction
Reaction
1
Gasification
C 1 H2 O-CO 1 H2
2
Methanation
C 1 2H2 -CH4
3
Boudouard
C 1 CO2 -2CO
4
Methane reforming
CH4 1 H2 O-CO 1 3H2
5
Water gas shift
CO 1 H2 O2CO2 1 H2
6
Carbonation
CO2 1 CaO-CaCO3
ri 5 2 ki CA CB
2 3 105 exp 26000
T
8
4:40exp 2 1:62T 3 10
0:12exp 2 17;921
T
3 3 105 exp 2 15;000
T
106 exp 26370
T
Kw 5 520exp 27230
2 44:5T
10:20exp T
A; B:reactants
included to produce the biochar. Thus the gasification process will
be modeled as two reactive stages: (1) pyrolysis and (2) gasification of char from pyrolysis. However, a pyrolysis process using
both shells has not been reported; due to this, the pyrolysis of
each residue will be modeled separately, but at the same operating
conditions, this assumption allows to consider that both pyrolysis
processes are performed in one equipment. Due to this, in the
cost analysis, a single equipment with the total volume required
to treat both biomasses will be considered.
The pyrolysis of J. curcas shell was studied by Manurung
et al. (2009) in a temperature range of 400 C500 C, particle
size ,2 mm, and atmospheric pressure. The product distribution resulting at the end of the operation was 50 wt.% bio-oil,
roughly 20 wt.% of biogases, and approximately 30 wt.% of biochar. The composition of bio-oil was not determined, but the
ultimate analysis of biochar was performed (Table 5.3); based
on these data, an empirical formula can be constructed to represent the biochar. The components distribution in the biogases
is 36.5 wt.% CO, 51.9 wt.% CO2, and 8.9 wt.% CH4 (Manurung
et al., 2009)
Regarding the bio-oil composition, the two major components reported by Murata et al. (2012) will be taken to model it:
6-octadecanoic acid and hexadecenoic acid. The reactions set
to describe the pyrolysis process is displayed in Table 5.4, which
are based on those reported for the pyrolysis of the lignocellulosic compounds of biomass (Anca-Couce and Scharler, 2017).
On the other hand, the fast pyrolysis of palm oil shell was
reported by Huang et al. (2019) at 100 C500 C using air,
Chapter 5 Production processes from lignocellulosic feedstock
149
Table 5.3 Ultimate analysis of biochar and its empirical formula (Manurung et al., 2009) from
Jatropha curcas shell.
Elements
%C
%H
%O
%N
wt.%
Normalized composition
(negligible %N)
43.18
6.13
44.67
1.57
Elements
%C
%H
%O
%N
wt.%
Empirical formula: C1:2 H2 O
45.95
6.52
47.53
0
Table 5.4 Reaction set of Jatropha curcas shell pyrolysis.
Lignocellulosic profile
Reaction
Cellulose
C6 H10 O5 1 O2 -5CO 1 CO2 1 5H2
6C6 H10 O5 1 3H2 -C18 H34 O2 1 C16 H32 O2 1 2CO2 1 11O2
C6 H10 O5 -5C1:2 H2 O
C5 H8 O4 1 32 O2 -CO 1 3CO2 1 CH4 1 2H2
8C5 H8 O4 1 H2 -C18 H34 O2 1 C16 H32 O2 1 6CO2 1 8O2
C5 H8 O4 1 6H2 1 7CO2 -10C1:2 H2 O 1 4O2
C7:3 H13:9 O1:3 1 3O2 -5:3CO 1 CO2 1 CH4 1 4:95H2
340C7:3 H13:9 O1:3 1 46H2 -73C18 H34 O2 1 73C16 H32 O2 1 75O2
60C7:3 H13:9 O1:3 1 143:5O2 -365C1:2 H2 O 1 52H2
Hemicellulose
Lignin
wherein the product distribution was 50 wt.% bio-oil, roughly
35 wt.% biochar, and 16 wt.% biogases; the normalized composition of biogases was 20.3 wt.% CO, 75.15 wt.% CO2, 4.47 wt.%
CH4, and 0.07 wt.% H2. Regarding to bio-oil composition, the
major compounds of bio-oil from palm oil shell at 650 C are
phenol and acetic acid (Chang et al., 2016). Finally, an ultimate
analysis of biochar from palm oil solid wastes is provided by
Liew et al. (2018) (Table 5.5).
The set of reactions used to describe the pyrolysis of palm
oil shell is presented in Table 5.6.
Thus the pyrolysis process of palm oil shell and J. curcas
shell operates at 550 C, 1 bar, and an air:biomass mass ratio of
1:1 for both pyrolysis reactors, using the reactions set shown in
Tables 5.4 and 5.6.
150
Chapter 5 Production processes from lignocellulosic feedstock
Table 5.5 Ultimate analysis of biochar and its empirical formula (Liew et al., 2018) from palm
oil shell.
Elements
%C
%H
%O
%N
wt.%
Normalized composition
(negligible % N)
64
5
30
1
Elements
%C
%H
%O
%N
wt.%
Empirical formula: C3 HO3
64.65
5.05
30.3
0
Table 5.6 Reaction set of palm oil shell pyrolysis (Anca-Couce and Scharler, 2017).
Lignocellulosic profile
Reaction
Cellulose
C6 H10 O5 1 O2 -5CO 1 CO2 1 5H2
2C6 H10 O5 -C6 H6 O 1 3C2 H4 O2 1 H2 1 1:5O2
C6 H10 O5 1 0:5O2 -2C3 HO3
C5 H8 O4 1 32 O2 -CO 1 3CO2 1 CH4 1 2H2
2C5 H8 O4 -C6 H6 O 1 2C2 H4 O2 1 H2 1 1:5O2
6C5 H8 O4 1 3H2 -10C3 HO3 1 19H2
C7:3 H13:9 O1:3 1 3O2 -5:3CO 1 CO2 1 CH4 1 4:95H2
2C7:3 H13:9 O1:3 1 3:5O2 -C6 H6 O 1 C2 H4 O2 1 6:6CO 1 8:9H2
30C7:3 H13:9 O1:3 1 90O2 -73C3 HO3 1 172H2
Hemicellulose
Lignin
Regarding the gasification reactor, Table 5.7 exhibits the
reactions set for biochar from both pyrolysis processes. The
operating conditions for this reactor are 676.85 C, air as gasifying agent (air:biochar mass ratio of 1:1), and 1 bar. The kinetic
parameters to describe each reactor are presented in Table 5.2,
without carbonation reaction. The output streams from both
pyrolysis reactors are the raw material to gasification reactor;
additional coproducts as NH3 or H2S are not considered, thus
the CO2 is the only compound that must be removed from the
syngas stream after the gasification.
The syngas is cleaned by removing the CO2 using the
Rectisol process described by Atsonios et al. (2013); the Rectisol
process is modeled as an absorption column with 10 stages,
Chapter 5 Production processes from lignocellulosic feedstock
151
which allows capturing until 99 wt.% of CO2 in a syngas mixture. The cleaned syngas is converted to a mixture of alcohols,
through a catalytic reactor called mixed alcohol synthesis
(MAS); this reactive system involves a complex chemical mechanism to produce a mixture of low carbon chain alcohols
(C2C4), methanol, hydrocarbons, and CO2, according to
the process conditions and catalyst type. The general and
simple reaction to describe this process is proposed by
Atsonios et al. (2015):
nCO 1 2nH2 -Cn H2n11 OH 1 ðn 2 1ÞH2 O
ð5:2Þ
In this case of study, the catalyst Cs-doped Cu/Zn described
by Kulawska and Skrzypek (2001) is used to model the conversion of syngas into long-chain alcohols. The operation conditions are 320 C and 90 bar, reaching a hydrogen conversion of
70.9%. The proposed reactions set to describe the behavior of
this system are shown in Table 5.8.
The catalytic action produces high levels of methanol; thus the
output stream from MAS reactor is fed into a condensation
Table 5.7 Set of gasification reactions.
No. reaction
Reaction
1
Gasification
2
Methanation
3
Boudouard
4
5
Methane reforming
Water gas shift
C1:2 H2 O 1 0:2H2 OðgÞ -1:2CO 1 1:2H2
C3 HO3 1 H2 OðgÞ -3CO 1 1:5H2 1 0:5O2
C1:2 H2 O 1 14H2 -12CH4 1 5O2
C3 HO3 1 5:5H2 -3CH4 1 1:5O2
C1:2 H2 O 1 CO2 -2:2CO 1 2H2 1 0:4O2
C3 HO3 1 CO2 -4CO 1 0:5H2 1 0:5O2
CH4 1 H2 O-CO 1 3H2
CO 1 H2 O2CO2 1 H2
Table 5.8 Set of mixed alcohol synthesis (MAS reactor).
No. reaction
Reaction
% Conversion of H2
1
2
3
CO 1 2H2 -CH3 OH
2CO 1 4H2 -CH3 CH2 OH 1 H2 O
3CO 1 6H2 -CH3 CH2 CH2 OH 1 2H2 O
51.66
13.64
5.6
152
Chapter 5 Production processes from lignocellulosic feedstock
reactor to obtain isobutanol as main compound. In the condensation reactor, the dimerization of alcohols (mainly methanol) with
liberation of water to generate branched alcohols as isobutanol
(Guerbet reaction) is carried out (AOCS, 2019). This process was
studied by Carlini et al. (2003) using Cu/MeONa [Cu-1955P] as
catalyst at 200 C and 30 atm, reaching 1.6% of propanol selectivity and 98.4% of isobutanol selectivity; moreover, 71.2% conversion of ethanol to propanol and 82% conversion of propanol to
isobutanol have been reported (Carlini et al., 2002). The proposed
reactions set to describe the condensation system are presented
in Table 5.9.
The products from the condensation reactor are separated by
a distillation column, to obtain methanol at the top of the column and isobutanol, while at the bottom of the column traces of
ethanol, propanol and water are obtained. The bottom stream is
fed to a dehydration reactor to convert the isobutanol into isobutene and 1-butene. Additional dehydration reactions take place
due to the presence of methanol, ethanol, and propanol traces.
The dehydration of isobutanol was studied by Taylor et al. (2010)
using γ-Al2O3 as catalyst; the operation conditions of 285 C and
1 bar allows to reach 99.8% of isobutanol conversion, and selectivity up to 95% and 5% to isobutene and 1-butene, respectively.
The proposed reactions set to describe the dehydration after condensation unit are shown in Table 5.10.
Table 5.9 Set of reactions to describe the condensation system.
No. reaction
Reaction
% Conversion
1
2
CH3 OH 1 CH3 CH2 OH-C3 H7 OH 1 H2 O
CH3 OH 1 CH3 CH2 CH2 OH-C4 H9 OH 1 H2 O
Ethanol 5 71.2
Propanol 5 82.0
Table 5.10 Reactions and conversions for dehydration stage.
No. reaction
Reaction
% Conversion (reference component)
1
2
3
4
5
6
2CH3 OH-CH3 OCH3 1 H2 O
CH3 OH-C2 H4 1 H2 O
CH3 CH2 CH2 OH-C3 H6 1 H2 O
C4 H9 OH-C4 H8 ðisobuteneÞ 1 H2 O
C4 H9 OH-C4 H8 ð1 2 buteneÞ 1 H2 O
CH3 OCH3 -C2 H4 1 H2 O
100 (methanol)
100 (ethanol)
100 (propanol)
95 (isobutanol)
5 (isobutanol)
100 (dimethyl ether)
Chapter 5 Production processes from lignocellulosic feedstock
153
The output stream from the dehydration reactor enters to
the oligomerization reactor. The isobutene oligomerization was
studied by Alcántara et al. (2000) with Amberlyst-15 as catalyst
at 100 C and 1.1 bar, reaching a complete conversion of isobutene. The selectivity to 1-octene, 1-dodecene, and 1-hexadecene
was 20%, 75%, and 5%, respectively. Since the oligomerization
procedure generates a group of alkenes as products, it was
assumed that the selectivity information could describe the
next alkenes ranges: (C8C11) 20%, (C12C15) 75%, and (C16)
5%. In this context, the reactions set proposed to describe the
oligomerization reactor are presented in Table 5.11.
After the oligomerization reactor, the alkenes must be converted
into paraffins through hydrogenation reactions using Pd/zeolite as
catalyst at 250 C and 30 bar (Peters and Taylor, 2011; Atsonios
et al., 2015); the reached conversion of alkenes was 100%. The reactions set to describe this final step are shown in Table 5.12.
Finally, the separation of the biojet fuel from the output
stream of the hydrogenation reactor is carried out by a distillation column; wherein naphtha (C4C7) is obtained at the top,
and biojet fuel (C8C16) is recovered at the bottom.
5.7.4
Simulation of the overall process
In this section, the procedure to perform the simulation of
the J. curcas and palm oil shell processing into biojet fuel
Table 5.11 Reactions and conversions for oligomerization stage.
No. reaction
Reaction
% Conversion (reference component)
1
2
3
4
5
6
7
8
9
10
11
12
13
2C2 H4 -C4 H8
2:5C2 H4 -C5 H10
2C3 H6 -C6 H12
3:5C3 H6 -C7 H14
2C4 H8 -C8 H16
4:5C4 H8 -C9 H18
10C4 H8 -4C10 H20
11C4 H8 -4C11 H22
3C4 H8 -C12 H24
13C4 H8 -4C13 H26
14C4 H8 -4C14 H28
15C4 H8 -4C15 H30
4C4 H8 -C16 H32
50 (ethylene)
50 (ethylene)
50 (propylene)
50 (propylene)
5 (isobutene)
5 (isobutene)
5 (isobutene)
5 (isobutene)
18.75 (isobutene)
18.75 (isobutene)
18.75 (isobutene)
18.75 (isobutene)
5 (isobutene)
154
Chapter 5 Production processes from lignocellulosic feedstock
Table 5.12 Proposed reaction set by hydrogenation stage.
No. reaction
Reaction
% Conversion (reference component)
1
2
3
4
5
6
7
8
9
10
11
12
13
C4 H8 1 H2 -C4 H10
C5 H10 1 H2 -C5 H12
C6 H12 1 H2 -C6 H14
C7 H14 1 H2 -C7 H16
C8 H16 1 H2 -C8 H18
C9 H18 1 H2 -C9 H20
C10 H20 1 H2 -C10 H22
C11 H22 1 H2 -C11 H24
C12 H24 1 H2 -C12 H26
C13 H26 1 H2 -C13 H28
C14 H28 1 H2 -C14 H30
C15 H30 1 H2 -C15 H32
C16 H32 1 H2 -C16 H34
100
100
100
100
100
100
100
100
100
100
100
100
100
(n-butene)
(n-pentene)
(n-hexene)
(n-heptene)
(n-octene)
(n-nonene)
(n-decene)
(n-undecene)
(n-dodecene)
(n-tridecene)
(n-tetradecene)
(n-pentadecene)
(n-hexadecene)
is described, following the conceptual design proposed in
Section 5.7.3. The simulation is carried out in the process simulator Aspen Plus V10.0. The simulation starts with the definition
of each component involved in the process, which includes
cellulose, hemicellulose, lignin, n-hexadecanoic acid, acid-6octadecenoic, phenol, acetic acid, carbon monoxide, carbon
dioxide, methane, hydrogen biochar, oxygen, nitrogen, methanol, ethanol, propanol, isobutanol, and hydrocarbons. As
was mentioned in Chapter 3, Production Processes for the
Conversion of Triglyceride Feedstock, if the components are not
included in the Aspen Plus V10.0 database, it is necessary adding them. Once all components are loaded, the user must
choose the appropriate thermodynamic method to model the
process. According to Carlson (1996) and Atsonios et al. (2013),
the pyrolysis, gasification, alcohol synthesis, condensation,
dehydration, and oligomerization reactions are modeled with
the NRTL solution model; the thermodynamic behavior of the
Rectisol process is described with the RK-SOAVE method
(Atsonios et al., 2013), the hydrogenation reaction is modeled
with Peng-Robinson, while BK10 is used as thermodynamic
model for the distillation column where the separation of biojet
is performed (Atsonios et al., 2013).
The flowsheet starts with the definition of the J. curcas shell
(SHELL-JC) and palm oil shell (SHELL-PA) streams, according to
Table 5.1. It is worth to mention that the lignocellulosic
Chapter 5 Production processes from lignocellulosic feedstock
components must be included as the CISOLID stream. To complete the feed to each pyrolysis reactor, the air stream is mixed
with each shell stream using a mass biomass:air ratio of 1:1.
The air mass composition assumed in this process is 1 wt.%
CO2, 1 wt.% H2, 21 wt.% O2, and 77 wt.% N2. Fig. 5.7 presents
the process diagram for the conversion of the lignocellulosic
biomass.
Each pyrolysis reactor (PYR-JC for J. curcas shell pyrolysis;
PYR-PA for Palm oil shell) is operated at 550 C and 1 bar, and
they are modeled through the RSTOIC module. The set of reactions for each reactor is shown in Tables 5.4 and 5.6 for J. curcas
shell and palm oil shell pyrolysis, respectively. The output
streams from both pyrolysis reactors enter in a MIX-module
(MIXED-3). The output stream from MIXED-3, called PRODPYR, together with a stream of saturated steam at 200 C
(STEAM-GA) enters to the gasification reactor (R-GASIFI) with a
biomass: steam mass ratio of 1:1. The R-GASIFI is modeled with
the RBatch module, which operates at 676.85 C and 1 bar. The
reaction set was defined according to Table 5.7, and the batch
cycle time defined is 1 h, which is the default value. The results
from R-GASIFI are exhibited in Fig. 5.8. Approximately after
5 min (0.09 h), the composition shows no variations; thus the
trends are shown before that time.
As can be seen in Fig. 5.8, the operation time could be
reduced, since composition shows not variation from about
0.1 h. Also, it is observed the formation of hydrogen and carbon
monoxide in the gasifier. After the gasification reactor, a FILTER
module (FILT-1) can be implemented to eliminate solid traces.
Next, the bio-oil (noncondensable gases) is condensed by a
FLASH module (FLASH-1) at 30 C and 1 bar, where up to 99 wt.
% of the bio-oil components are removed. Thus the GAS-NONC
stream has CO, CO2, WATER (gas), and air traces (O2 and N2).
Then, the CO2 is removed in an absorption column using
methanol as solvent; this process, known as Rectisol, is modeled
through the Extract module (RECTISOL) with 10 stages, choosing as key components methanol, water, and CO2. The methanol (265 C) is inserted at stage 1 with a methanol:syngas
(CO-H2) mass ratio of 1:1. As result, up to 99 wt.% of CO2 is
removed by the methanol. The CO-H2 stream is fed into SEP-0
to remove the air traces. The cleaned syngas is inserted to a
compressor module of isentropic type (COMP-1), which is operated at 90 bar; this equipment is collocated to increase the pressure of syngas. Then, the temperature is decreased until 320 C
into a Heater (EX-2). The S23 stream from EX-2 is inserted into
R-MAS reactor, which is modeled as RStoic module operated at
155
Figure 5.7 Flow diagram of the conversion process.
Figure 5.8 Composition versus reaction time at the gasification reactor.
158
Chapter 5 Production processes from lignocellulosic feedstock
320 C and 90 bar. The reaction set for this reactor is presented
in Table 5.8. The output stream from R-MAS is fed to SEP-1
(Sep module) to remove the CO-H2 traces. Then, to condition
the S31 stream before enters to R-CONDEN reactor, a turbine
(TURBI-1, Comp module) at 30 bar and a Heater module (EX-3)
at 200 C are implemented. The R-CONDEN reactor is modeled
as a RStoic module at 200 C and 30 bar. The output stream
from R-CONDEN consists of a mixture of alcohols, where methanol is the majority component with 80.79 wt.% followed by isobutanol with 10.25 wt.%. Since the next reactive stages use
isobutanol as raw material, the methanol must be removed
from the resulting mixture. Thus a RadFrac distillation column
(COL-REC1) is collocated. The design of this distillation column
has 70 stages (Atsonios et al., 2015), allowing to achieve a methanol recovery of 99% at the top of the column; the operating
specification of the column was distillate rate of 1433.52 kg/h,
feed stream located at stage 35 and a reflux ratio of 2.7. At the
bottom of the distillation column (ISOBU-RE), 99% of isobutanol is recovered with traces of methanol, ethanol, propanol, and
water. The ISOBU-RE is conditioned before entering to the
dehydration reactor, using a Heater module (EX-4), which
increases the temperature to 285 C. This temperature level is
defined as the operating temperature of the R-DESHID reactor
modeled through the RStoic module.
The output stream from R-DESHID has a high amount of
water; to remove this excess, a Flash module (FLASH-2) is
implemented. The stream from FLASH-2, with a lower amount
of water, is inserted to Sep module (SEP-3) to remove its traces.
Then, the free-water stream is fed to a Heater module (EX-5)
to adjust the temperature to 100 C before R-OLIGOM. The
oligomerization reactor is modeled with a RStoic module
(R-OLIGOM), due to the absence of kinetic parameters to
describe its behavior. The R-OLIGOM operates at 100 C and
1.1 bar, according to the set of reactions and degree of conversion presented previously.
The output stream from R-OLIGOM contains hydrocarbons
from C5 to C16 and must be conditioned before entering the
hydrogenation reactor. For this, a Heater module (EX-6), a
Comp module (COMP-2), and a second Heater module (EX-7)
are connected consecutively to adjust the temperature and
pressure values.
The EX-6 vaporizes the stream until 210 C, while the COMP2 increases its pressure until 30 bar; as a result, its temperature
increases until 315 C. This high temperature level must be
decreased to 250 C (by EX-7), which is the temperature required
Chapter 5 Production processes from lignocellulosic feedstock
at the hydrogenation reactor. In the hydrogenation reactor, a
hydrogen stream (H2) is fed to the process in a isobutanol:
hydrogen mass ratio of 1:1 at 10 bar. The H2 increases its temperature and pressure levels through a Comp module (COMP-3)
and Heater module (EX-8) connected consecutively; the goals
for temperature and pressure are 250 C and 30 bar. Finally,
the conditioned isobutanol and hydrogen streams are mixed
(MIX-5) and fed to the hydrogenation reactor; this equipment is
modeled with a RStoic module (R-HYDROG) operating at 250 C
and 30 bar. At the end of the reaction, the excess of hydrogen is
removed by a Sep module (SEP-2). The output stream of the
hydrogenation reactor allows generated hydrocarbons from C4
to C16.
The hydrocarbons stream after R-HYDROG must be separated to obtain the naphtha and biojet fuel in a distillation column. Before the distillation column, the pressure of the
hydrocarbons stream must be decreased at 1 bar through a
Pump module (TURBI-2). The design of the distillation column
is obtained with a DSTWU module, considering recoveries of
99%; the resulting designs are simulated in RadFrac module
(COL-1). The naphtha and biojet fuel flows are 56.10 and
125.44 kg/h, respectively.
5.7.5
Economic assessment
The economic evaluation of the process described in this
case study is performed through the calculation of the total
annual cost (TAC). The calculation procedure was presented in
the Chapter 3, Production Processes for the Conversion of
Triglyceride Feedstock, along with the prices of steam, cooling
water, hydrogen, and electricity; these values are used in the
case of study of the present chapter. Moreover, the equations to
obtain the equipment cost were also presented in Chapter 3,
Production Processes for the Conversion of Triglyceride
Feedstock. It is worth to mention that the shells employed as
raw material in this process are assumed as wastes; thus the
raw material cost involves only the hydrogen used as reactant
and the methanol employed as solvent. The summary of the
items involved in the calculation of the TAC is shown in
Table 5.13.
From Table 5.13, it can be observed that the higher cost for
the operating costs is that of the raw material, due to the need
of hydrogen for the operation of the reactor. Moreover, methanol price represents 17% of the total raw material cost; this low
cost is due to the assumption of the methanol being reused
159
160
Chapter 5 Production processes from lignocellulosic feedstock
Table 5.13 Total annual cost of lignocellulosic waste processing.
Operating cost (USD/year)
Heating utilities
cost
Cooling utilities
cost
Raw material
cost
Electricity
cost
Total operating cost
(USD/year)
49,644.3693
255,627.90
4,095,372.34
1,183,956.70
6,241,281.08
Annual capital cost (USD/year)
Equipment cost
A1
A2
Total annual cost (USD/year)
4,156,201.08
748,116.19
2,535,282.66
1,486,678.08
TAC (USD/year)
7,727,959.16
after the elimination of CO2. Also, the making up of the methanol stream as solvent is done by the methanol obtained in COLREC1.
On the other hand, the cooling utility defined for EX-1 was
taken from Aspen Plus as a refrigerant at extremely low temperature: 2102 C as inlet temperature and 2103 C as outlet temperature. The energy cost for this service defined by the
simulator was 8.45 3 1026 USD/kJ. Finally, it is worth to mention that the electricity cost was calculated as the electricity
purchased, according to the difference between the required
electricity (compressors) and the electricity provided by the
turbines in the process. So, the operating cost represents
80.76% of TAC.
5.7.6
Estimation of price of biojet fuel
The estimation of the minimum price of the biojet fuel
obtained in this case study was done according to the procedure described in Chapter 3, Production Processes for the
Conversion of Triglyceride Feedstock, taking as reference the
same market price of kerosene fuel of 0.4849 USD/L
(0.6380 USD/kg). Table 5.14 presents the minimum biojet fuel
price along with the main variables involved in the calculation.
The price obtained in this scheme is 11.23 times the price of
fossil jet fuel in the market, due to high operating cost required
for the process. As mentioned in Chapter 3, Production
Processes for the Conversion of Triglyceride Feedstock and
Chapter 5 Production processes from lignocellulosic feedstock
161
Table 5.14 Minimum price of biojet fuel from lignocellulosic waste processing.
I (USD/year)
P (USD/year)
C (USD/year)
n
P
imin
Naphtha (kg/year)
4,156,201.08
Operating cost (5% of
n
P
Cmdaji )
0.2
P 5 imin I
476,901.02
371,980.00
Total
4,528,181.08
S (USD/year)
Q (kg/year)
Minimum price of biojet fuel (USD/kg)
7.16
Total
i51
Cmdaji
i51
905,636.22
7,639,604.67
1,066,277.82
Chapter 4, Production Processes for the Conversion of Sugar
and Starchy Feedstock, this price could be reduced by the application of intensification and energy integration techniques.
Also, particularly for this process, the conversion degree of
mixed alcohol synthesis must be improved.
5.7.7
Environmental assessment: CO2 emissions
The CO2 emissions of the process presented in this case
study were calculated according to the assumptions and procedure described in Chapter 3, Production Processes for the
Conversion of Triglyceride Feedstock. Table 5.15 presents the
emissions calculations for the process.
The sum of CO2 emissions due to steam and electricity is
13.02 Mton CO2/year. The emissions of CO2 could be reduced
with energy integration and process intensification techniques.
Finally, Table 5.16 presents a summary of the results
obtained for the three production scenarios developed in
Chapters 35. From this table, it can be observed that the high
price of biojet fuel from sorghum is due the cost of raw material
used for its processing. On the other hand, the high quantity of
CO2 released is attributed to the number of process equipment
required, regarding to the other cases study. It is clear that,
according to the results, the use of triglyceride feedstock as raw
materials may allow the lowest selling price for biojet fuel, since
Total
6,019,522.10
162
Chapter 5 Production processes from lignocellulosic feedstock
Table 5.15 CO2 emissions due to steam and electricity generation.
Emissions by steam generation
(MkgCO2/year)
Emissions by electricity
(MkgCO2/year)
Total CO2 emissions
(MkgCO2/year)
13,024.30
3.95
13,028.25
Table 5.16 Product prices and CO2 emissions for the production of biojet fuel with different
raw materials.
Triglyceride feedstock
Emissions
Minimum
price
(ton CO2/kg
of biojet fuel biojet fuel)
(USD/kg)
Sugar and starchy feedstock
Minimum
Emissions
price
(ton CO2/kg
of biojet fuel biojet fuel)
(USD/kg)
Lignocellulosic feedstock
Minimum
Emissions
price
(ton CO2/kg
of biojet fuel biojet fuel)
(USD/kg)
4.43
30.63
7.16
3.2
172.02
12.22
the conversion of triglycerides through hydrotreatment requires
fewer processing steps than the ATJ process. In the case of the
conversion of lignocellulosic feedstock, additional processing
steps are required, although the cost of raw material is lower
than the cost of the sugar/starchy feedstock.
5.8
Conclusion
Transforming agricultural residues in fuels and other products represents a way to give a better use to such lignocellulosic
materials, contributing to the greening of the aviation sector.
Several advances on the processing routes have been developed
on the last years. The transformation of the biomass into alcohols and further conversion to biojet fuel is a proper alternative,
although several processing stages are required. On the other
hand, the conversion through thermochemical processes
requires high temperatures, but liquid and solid by-products can
be obtained, which may be further processed to enhance the
economy of the process. An important opportunity area is the
realization of combustion tests for the biojet fuel generated for
this kind of process. From the presented case study, it can be
seen that there are still areas of opportunity to reduce the cost of
biojet fuel, mainly in terms of the operating costs.
Chapter 5 Production processes from lignocellulosic feedstock
References
Ai, N., Chen, J., Fei, W.Y., 2005. Solubility of carbon dioxide in four mixed
solvents. J. Chem. Eng. Data 50, 492496.
Alcántara, R., Alcántara, E., Canoira, L., Franco, M.J., Herrera, M., Navarro, A.,
2000. Trimerization of isobutene over Amberlyst-15 catalyst. React. Funct.
Polym. 45 (1), 1927.
Amyris Inc., 2013. Integrated biorefinery project summary. Final report public
version ,https://www.osti.gov/servlets/purl/1122942. (accessed 04.09.20.).
Anca-Couce, A., Scharler, R., 2017. Modelling heat of reaction in biomass
pyrolysis with detailed reaction schemes. Fuel 206, 572579.
Anwar, Z., Gulfraz, M., Irshad, M., 2014. Agro-industrial lignocellulosic biomass
a key to unlock the future bio-energy: a brief review. J. Radiat. Res. Appl. Sci.
7 (2), 163173.
AOCS, 2019. Guerbet compounds. ,https://lipidlibrary.aocs.org/chemistry/
physics/lipid-chemistry/guerbet-compounds. (accessed 27.09.19.).
Atsonios, K., Christodoulou, C., Koytsoumpa, E-I, Panopoulos, K.D., Kakaras, E.,
2013. Plant design aspects of catalytic biosyngas conversion to higher
alcohols. Biomass Bioenergy 53, 5464.
Atsonios, K., Kougioumtzis, M.-A., Panopoulos, D., Kakaras, E., 2015. Alternative
thermochemical routes for aviation biofuels via alcohols synthesis: process
modeling, techno-economic assessment and comparison. Appl. Energy 138,
346366.
Baral, N.R., Kavvada, O., Mendez-Perez, D., Mukhopadhyay, A., Lee, T.S.,
Simmons, B.A., et al., 2019. Techno-economic analysis and life-cycle
greenhouse gas mitigation cost of five routes to bio-jet fuel blendstocks.
Energy Environ. Sci. 12 (3), 807824.
Ballesteros, I., Oliva, J.M., Negro, M.J., Manzanares, P., Ballesteros, M., 2002.
Enzymic hydrolysis of steam exploded herbaceous agricultural waste
(Brassica carinata) at different particule sizes. Process. Biochem. 38 (2),
187192.
Betancur-Prisco, J.C., Mira-Hernández, C., Parı́s-Londoño, L.S., 2014.
Propiedades fı́sicas y mecánicas de granos de Jatropha curcas cultivadas en
Colombia. Rev. Fac. Ing. 73, 187199. Spanish.
Cadoche, L., López, G.D., 1989. Assessment of size reduction as preliminary step
in the production of ethanol from lignocellulosic wastes. Biol. Wastes 30 (2),
153157.
Cai, Y., Fan, Y., Li, X., Chen, L., Wang, J., 2016. Preparation of refined bio-oil by
catalytic transformation of vapors derived from vacuum pyrolysis of rape
straw over modified HZSM-5. Energy 102, 95105.
Cardona, C.A., Quintero, J.A., Paz, I.C., 2010. Production of bioethanol from
sugarcane bagasse: status and perspectives. Bioresour. Technol. 101 (13),
47544766.
Carlini, C., Girolamo, M., Di, Marchionna, M., Noviello, M., Galletti, A.M.R.,
et al., 2002. Selective synthesis of isobutanol by means of the Guerbet
reaction: Part 1. Methanol/n-propanol condensation by using copper based
catalytic systems. J. Mol. Catal. A Chem. 184 (12), 273280.
Carlini, C., Di Girolamo, M., Macinai, A., Marchionna, M., Noviello, M., Raspolli
Galletti, A.M., et al., 2003. Selective synthesis of isobutanol by means of the
Guerbet reaction: part 2. Reaction of methanol/ethanol and methanol/
ethanol/n-propanol mixtures over copper based/MeONa catalytic systems.
J. Mol. Catal. A Chem. 200 (12), 137146.
163
164
Chapter 5 Production processes from lignocellulosic feedstock
Carlson, E.C., 1996. Don’t gamble with physical properties for simulations.
Chem. Eng. Prog. 92, 3546.
Chang, G., Huang, Y., Xie, J., Yang, H., Liu, H., Yin, X., et al., 2016. The lignin
pyrolysis composition and pyrolysis products of palm kernel shell, wheat
straw, and pine sawdust. Energy Convers. Manag. 124, 587597.
Chang, V., Nagwani, M., Holtzapple, M., 1998. Lime pretreatment of crop residues
bagasse and wheat straw. Appl. Biochem. Biotechnol. 74 (3), 135159.
Cheiky, M., Malyala, R., 2011. Method for making renewable fuels. US Patent
2011/0209386.
Cheiky, M., Malyala, R., Traxler, V.S., 2013. System and process for biomass
conversion to renewable fuels with byproducts recycled to gasifier. US Patent
2013/0121196.
Cheiky, M., Malyala, R., Sills, R.A., 2016. Method for making renewable fuels
including gasoline, diesel and jet fuel. European Patent EP2888339.
Chen, Z., Zeng, H., Gong, H., Wang, H., Li, C.-J., 2015. Palladium-catalyzed
reductive coupling of phenols with anilines and amines: efficient conversion
of phenolic lignin model monomers and analogues to cyclohexylamines.
Chem. Sci. 6, 41744178.
Cheung, S.W., Anderson, B.C., 1997. Laboratory investigation of ethanol production
from municipal primary wastewater. Bioresour. Technol. 59 (1), 8196.
Chio, C., Sain, M., Qin, W., 2019. Lignin utilization: a review of lignin
depolymerization from various aspects. Renew. Sustain. Energy Rev. 107,
232249.
Chundawat, S.P.S., Balan, V., Dale, B.E., 2008. High-throughput microplate
technique for enzymatic hydrolysis of lignocellulosic biomass. Biotechnol.
Bioeng. 99 (6), 12811294.
Conde-Mejı́a, C., Jiménez-Gutiérrez, A., El-Halwagi, M., 2012. A comparison of
pretreatment methods for bioethanol production from lignocellulosic
materials. Process. Saf. Environ. Prot. 90 (3), 189202.
Davis, R., Tao, L., Scarlata, C., Tan, E.C.D., Ross, J., Lukas, J., et al., 2015. Process
design and economics for the conversion of lignocellulosic biomass to
hydrocarbons: dilute-acid and enzymatic deconstruction of biomass to sugars
and catalytic conversion of sugars to hydrocarbons. Technical Report NREL/
TP-5100-62498.
Dayton, D., Gupta, R.P., Turk, B.S., Kataria, A., Shen, J.-P., 2013. Catalytic biomass
pyrolysis process. International Patent WO 2013/134391.
Del Hierro-Santacruz, E., 1993. Aprovechamiento de los sub-productos de palma
de aceite. Palmas 14, 149153 (Spanish).
Demirbas, M.F., 2009. Biorefineries for biofuel upgrading: a critical review. Appl.
Energy 86 (S1), S151S161.
Diederichs, G.W., Mandegari, M.A., Farzad, S., Görgens, J.F., 2016. Technoeconomic comparison of biojet fuel production from lignocellulose,
vegetable oil and sugar cane juice. Bioresour. Technol. 216, 331339.
Duff, S.J.B., Murray, W.D., 1996. Bioconversion of forest products industry waste
cellulosics to fuel ethanol: a review. Bioresour. Technol. 55 (1), 133.
Edwards, T., Moses, C., Dryer, F., 2010. Evaluation of combustion performance of
alternative aviation fuels. In: 46th AIAA/ASME/SAE/ASEE Joint Propulsion
Conference & Exhibit, 2528 July 2010, Nashville, TN. ,https://arc.aiaa.org/
doi/abs/10.2514/6.2010-7155. (accessed 17.04.20.).
Evans, L., Littlewolf, A., Lopez, M., Miller, J.E., 1999. Batch microreactor studies
of bases catalyzed lignin depolymerization in alcohol solvents. ,https://
www.osti.gov/servlets/purl/3334. (accessed 15.04.20.).
Chapter 5 Production processes from lignocellulosic feedstock
Franz, J., Scherer, V., 2010. An evaluation of CO2 and H2 selective polymeric
membranes for CO2 separation in IGCC processes. J. Membr. Sci. 359, 173183.
Gagliano, A., Nocera, F., Bruno, M., Cardillo, G., 2017. Development of an
equilibrium-based model of gasification of biomass by Aspen Plus. Energy
Procedia 111, 10101019.
Garcı́a Bustamante, C.A., Masera Cerutti, O., 2016. Estado del arte de la
bioenergı́a en México, Red Temática de Bioenergı́a/Imagia Comunicación,
Guadalajara, México (Spanish).
Ge, Y., Dababneh, F., Li, L., 2017. Economic evaluation of lignocellulosic biofuel
manufacturing considering integrated lignin waste conversion to
hydrocarbon fuels. Procedia Manuf. 10, 112122.
Gu, T., Held, M.A., Faik, A., 2013. Supercritical CO2 and ionic liquids for the
pretreatment of lignocellulosic biomass in bioethanol production. Environ.
Technol. 34 (1314), 17351749.
Guragain, Y.N., De Coninck, J., Husson, F., Durand, A., Rakshit, S.K., 2011.
Comparison of some new pretreatment methods for second generation
bioethanol production from wheat straw and water hyacinth. Bioresour.
Technol. 102 (6), 44164424.
Hamelinck, C.N., van Hooijdonk, G., Faaij, A.P.C. 2005. Ethanol from
lignocellulosic biomass: techno-economic performance in short-, middleand long-term. Biomass BioEnergy, 28 (4), 384410.
Haykir, N.I., Bahcegul, E., Bicak, N., Bakir, U., 2013. Pretreatment of cotton stalk
with ionic liquids including 2-hydroxy ethyl ammonium formate to enhance
biomass digestibility. Ind. Crop. Prod. 41, 430436.
Hewson, W.B., Hibbert, H., 1943. Studies on lignin and related compounds. LXV.
Re-ethanolysis of isolated lignins. J. Am. Chem. Soc. 65 (6), 11731176.
Holtzapple, M.T., Lundeen, J.E., Sturgis, R., Lewis, J.E., Dale, B.E., 1992.
Pretreatment of lignocellulosic municipal solid-waste by ammonia fiber
explosion (AFEX). Appl. Biochem. Biotechnol. 34 (5), 521.
Hu, Z., Wen, Z., 2008. Enhancing enzymatic digestibility of switchgrass by
microwave-assisted alkali pretreatment. Biochem. Eng. J. 38 (3), 369378.
Huang, Y., Gao, Y., Zhou, H., Sun, H., Zhou, J., Zhang, S., 2019. Pyrolysis of palm
kernel shell with internal recycling of heavy oil. Bioresour. Technol. 272,
7782.
Hui, X., Kumar, K., Sung, C.-J., Edwards, T., Gardner, D., 2012. Experimental
studies on the combustion characteristics of alternative jet fuels. Fuel 98,
176182.
Inayat, A., Ahmad, M.M., Yusup, S., Mutalib, M.I.A., 2010. Biomass steam
gasification with in-situ CO2 capture for enriched hydrogen gas production: a
reaction kinetics modelling approach. Energies 3, 14721484.
Intanakul, P., Krairiksh, M., Kitchaiya, P., 2003. Enhancement of enzymatic
hydrolysis of lignocellulosic wasted by microwave pretreatment under
atmospheric pressure. J. Wood Chem. Technol. 23 (2), 217225.
Iqbal, H.M.N., Kyazze, G., Keshavarz, T., 2013. Advances in the valorization of
lignocellulosic materials by biotechnology: an overview. BioResources 8 (2),
31573176.
Jenkins, R.W., Sutton, A.D., Robichaud, D.J., 2016. Pyrolysis of biomass for
aviation fuel. In: Chuck, C.J. (Ed.), Biofuels for Aviation: Feedstocks,
Technology and Implementation. Academic Press, London, pp. 191215.
Khandelwal, B., Ubogu, E., Akram, M., Blakey, S., Wilson, C.W., 2013.
Experimental analysis on emission production and performance of stressed
100% SPK, stressed fully formulated synthetic jet fuel and Jet A-1 in a small
gas turbine engine. In: 11th International Energy Conversion Engineering
165
166
Chapter 5 Production processes from lignocellulosic feedstock
Conference, 1417 July 2013, San Jose, CA. ,https://arc.aiaa.org/doi/abs/
10.2514/6.2013-3936. (accessed 17.04.20.).
Kulawska, M., Skrzypek, J., 2001. Kinetics of the synthesis of higher aliphatic
alcohols from syngas over a modified methanol synthesis catalyst. Chem.
Eng. Process 40, 3340.
Kumar, P., Barret, D.M., Delwiche, M., Stroeve, P., 2009. Methods for
pretreatment of lignocellulosic biomass for efficient hydrolysis and biofuel
production. Ind. Eng. Chem. Res. 48 (8), 37133729.
Lane, J., 2012. Virdia. Virent pionner new super-performing, parity-cost
renewable jet fuel pathway. ,http://www.biofuelsdigest.com/bdigest/2012/
03/27/double-drop-in-aviation-biofuels-virdia-virent-pioneer-new-superperfoming-same-cost-jet-fuel/. (accessed 15.04.20.).
Leibbrandt, N.H., Knoetze, J.H., Görgens, J.F., 2011. Comparing biological and
thermochemical processing of sugarcane bagasse: an energy balance
perspective. Biomass Bioenergy 35, 21172126.
Li, J., Yang, G., Yoneyama, Y., Vitidsant, T., Tsubaki, N., 2016. Jet fuel synthesis
via Fischer-Tropsch synthesis with varied 1-olefins as additives using Co/
ZrO2-SiO2 bimodal catalyst. Fuel 171, 159166.
Liew, R.K., Nam, W.L., Chong, M.Y., Phang, X.Y., Su, M.H., Yek, P.N.Y., et al., 2018.
Oil palm waste: An abundant and promising feedstock for microwave
pyrolysis conversion into good quality biochar with potential multiapplications. Process. Saf. Environ. Prot. 115, 5769.
Liu, S., Shi, Z., Li, L., Yu, S., Xie, C., Song, Z., 2013. Process of lignin oxidation in
an ionic liquid coupled with separation. RSC Adv. 3 (17), 57895793.
Liu, X., Xu, L., Xu, G., Jia, W., Ma, Y., Zhang, Y., 2016. Selective
hydrodeoxygenation of lignin-derived phenols to cyclohexanols or
cyclohexanes over magnetic CoNx@NC catalysts under mild conditions. ACS
Catal. 6 (11), 76117620.
Lobo, P., Hagen, D.E., Whitefield, P.D., 2011. Comparison of PM emissions from a
commercial jet engine burning conventional, biomass, and Fischer-Tropsch
fuels. Environ. Sci. Technol. 45 (24), 1074410749.
Lloyd, T.A., Wyman, C.E., 2005. Combined sugar yields for dilute sulfuric acid
pretreatment of corn stover followed by enzymatic hydrolysis of the
remaining solids. Bioresour. Technol. 96 (18), 19671977.
Mahmood, N., Yuan, Z., Schmidt, J., Xu, C., 2015. Hydrolytic depolymerization of
hydrolysis lignin: effects of catalysts and solvents. Bioresour. Technol. 190,
416419.
Mahmood, H., Moniruzzaman, M., Iqbal, T., Khan, M.J., 2019. Recent advances
in the pretreatment of lignocellulosic biomass for biofuels and value-added
products. Curr. Opin. Green Sustain. Chem. 20, 1824.
Manurung, R., Wever, D.A.Z., Wildschut, J., Venderbosch, R.H., Hidayat, H., van
Dam, J.E.G., et al., 2009. Valorisation of Jatropha curcas L. plant parts: nut
shell conversion to fast pyrolysis oil. Food Bioprod. Process. 87, 187196.
Martı́n, C., Klinke, H.B., Thomsen, A.B., 2007. Wet oxidation as a pretreatment
method for enhancing the enzymatic convertibility of sugarcane bagasse.
Enzyme Microb. Technol. 40 (3), 426432.
Molino, A., Chianese, S., Musmarra, D., 2016. Biomass gasification technology:
the state of the art overview. J. Energy Chem. 25 (1), 1025.
Mosier, N., Wyman, C., Dale, B., Elander, R., Lee, Y.Y., Holtzapple, M., et al.,
2005. Features of promising technologies for pretreatment of lignocellulosic
biomass. Bioresour. Technol. 96 (6), 673686.
Murata, K., Liu, Y., Inaba, M., Takahara, I., 2012. Catalytic fast pyrolysis of
jatropha wastes. J. Anal. Appl. Pyrolysis 94, 7582.
Chapter 5 Production processes from lignocellulosic feedstock
Neves, M.A., Kimura, T., Shimizu, N., Nakajima, M., 2007. State of the art and
future trends of bioethanol production, dynamic biochemistry, process
biotechnology and molecular biology. Global Sci. Books 1 (1), 114.
Nicodème, T., Berchem, T., Jacquet, N., Richel, A., 2018. Thermochemical
conversion of sugar industry by-products to biofuels. Renew. Sustain. Energy
Rev. 88, 151159.
Osorio Florez, C.E., 2013. Uso integral de la biomasa de palma de aceite. Palmas
34, 315323.
Peters, M.W., Taylor, J.D., 2011. Renewable jet fuel blendstock from isobutanol.
US Patent 8975461B2.
Peters, M.W., Taylor, J.D., 2013. Renewable jet fuel blendstock from isobutanol.
US Patent 8373012.
Prasad, S., Singh, A., Joshi, H.C., 2007. Ethanol as an alternative fuel from
agricultural, industrial and urban residues. Resour. Conserv. Recycl. 50 (1), 139.
Raud, M., Kikas, T., Sippula, O., Shurpali, N.J., 2019. Potentials and challenges in
lignocellulosic biofuel production technology. Renew. Sustain. Energy Rev.
111, 4456.
Rusek, J.J., Ziulkowski, J.D., 2009. Renewable engine fuel and method of
production thereof. International Patent WO 2009/152495.
Rusek, J.J., Ziulkowski, J.D., Catania, P.J., Bower, D.L., 2012. Biogenic turbine and
diesel fuel. International Patent WO 2012/078205.
Rytter, E., Borg, Ø., Enger, B.C., Holmen, A., 2019. α-Alumina as catalyst support
in Co Fischer-Tropsch synthesis and the effect of added water; encompassing
transient effects. J. Catal. 373, 1324.
Sarkar, N., Ghosh, S.K., Bannerjee, S., Aikat, K., 2012. Bioethanol
production from agricultural wastes: an overview. Renew. Energy 37 (1),
1927.
Saval, S., 2012. Aprovechamiento de residuos agroindustriales: pasado, presente
y futuro. BioTecnologı́a 16 (2), 1446 (Spanish).
Sechage Cortes, J.S., Gómez Sandoval, D.L., Rodrı́guez Meléndez, A.G., Mayorga
Betancourt, M.A., 2017. Modelamiento matemático para la pirolisis del
cuesco de palma aceitera. Ingenium 18, 4456 (Spanish).
Senol, O.I., Viljava, T.-R., Krause, A.O.I., 2005. Hydrodeoxygenation of methyl
esters of sulphided NiMo/γ-Al2O3 and CoMo/γ-Al2O3 catalysts. Catal. Today
100, 331335.
Safarian, S., Unnórsson, R., Richter, C., 2019. A review of biomass gasification
modelling. Renew. Sustain. Energy Rev. 110, 378391.
Savost’yanov, A.P., Yakovenko, R.E., Narochnyi, G.B., Bakun, V.G., Sulima, S.I.,
Yakuba, E.S., et al., 2017. Industrial catalyst for the selective Fischer-Tropsch
synthesis of long-chain hydrocarbons. Kinet. Catal. 58 (1), 81911.
Sharma, A.Kr, 2008. Equilibrium modeling of global reduction reactions for a
downdraft (biomass) gasifier. Energy Convers. Manag. 49, 832842.
Singh, R.N., Vyas, D.K., Srivastava, N.S.L., Narra, M., 2008. SPRERI experience on
holistic approach to utilize all parts of Jatropha curcas fruit for energy. Renew.
Energy 33, 18681873.
Song, Q., Wang, F., Cai, J., Wang, Y., Zhang, J., Yu, W., et al., 2013. Lignin
depolymerization (LDP) in alcohol over nickel-based catalysts via a
fragmentation-hydrogenolysis process. Energy Environ. Sci. 6 (3), 9941007.
Sun, L., Smith, R., 2013. Rectisol wash process simulation and analysis. J. Clean.
Prod. 39, 321328.
Taylor, J.D., Jenni, M.M., Peters, M.W., 2010. Dehydration of fermented
isobutanol for the production of renewable chemicals and fuels. Top. Catal.
53, 12241230.
167
168
Chapter 5 Production processes from lignocellulosic feedstock
Thangalazhy-Gopakumar, S., Adhikari, S., 2016. Fast pyrolysis of agricultural
wastes for bio-fuel and bio-char. In: Karthikeyan, O.P., Heimann, K., Muthu,
S.S. (Eds.), Recycling of Solid Waste for Biofuels and Bio-Chemicals. Springer,
Basel, pp. 301332.
Tye, Y.Y., Lee, K.T., Abdullah, W.N.W., Leh, C.P., 2016. The world availability on
non-wood lignocellulosic biomass for the production of cellulosic ethanol
and potential pretreatments for the enhancement of enzymatic
saccharification. Renew. Sustain. Energy Rev. 60, 155172.
Van Dam, J., 2016. Subproductos de la palma de aceite como materias primas
de biomasa. Palmas 37, 149156 (Spanish).
Wahyudiono, Sasaki, M., Goto, M., 2008. Recovery of phenolic compounds
through the decomposition of lignin in near and supercritical water. Chem.
Eng. Process. Process Intensif. 47 (910), 16091619.
Wang, H., Feng, M., Yang, B., 2017. Catalytic hydrodeoxygenation of anisole: an
insight into the role of metals on transalkylation reactions in bio-oil
upgrading. Green. Chem. 19 (7), 16681673.
Wang, J., Bi, P., Zhang, Y., Xue, H., Jiang, P., Wu, X., et al., 2015. Preparation of jet
fuel range hydrocarbons by catalytic transformation of bio-oil derived from
fast pyrolysis of straw stalk. Energy 86, 488499.
Wang, H., Zhang, Q., Deng, T., Ruan, H., Hou, X., Cort, J.R., et al., 2016a. ZnCl2
induced catalytic conversion of softwood lignin to aromatics and
hydrocarbons. Green. Chem. 18 (9), 28022810.
Wang, W., Ding, M., Ma, L., Yang, X., Li, J., Tsubaki, N., et al., 2016b. Fe2O3
nanoparticles encapsulated in TiO2 nanotubes for Fischer-Tropsch synthesis:
the confinement effect of nanotubes on the catalytic performance. Fuel 164,
347351.
Wang, H., Yang, B., Zhang, Q., Zhu, W., 2020. Catalytic routes for the conversion
of lignocellulosic biomass to aviation fuel range hydrocarbons. Renew.
Sustain. Energy Rev. 120, 109612.
Wei, H., Liu, W., Chen, X., Yang, Q., Li, J., Chen, H., 2019. Renewable bio-jet fuel
production for aviation: a review. Fuel 254, 115599.
Won, S.H., Veloo, P.S., Santner, J., Ju, Y., Dryer, F.L., Dooley, S., 2014.
Characterization of global combustion properties with simple fuel property
measurements for alternative jet fuels. In: 50th AIAA/ASME/SAE/ASEE Joint
Propulsion Conference, 2830 July 2014, Cleveland, OH. ,https://arc.aiaa.
org/doi/abs/10.2514/6.2014-3469. (accessed 17.04.20.).
Wooley, R.J., Putsche, V., 1996. Development of an ASPEN PLUS physical
property database for biofuels components. NREL, Springfield, VA.
Wright, M.E., Harvey, B.G., Quintana, R.L., 2012. Diesel and jet fuel based on the
oligomerization of butene. US Patent 2012/0209045.
Yan, N., Yuan, Y., Dykeman, R., Kou, Y., Dyson, P.J., 2010. Hydrodeoxygenation of
lignin-derived phenols into alkanes by using nanoparticle catalysts combined
with Brønsted acidic ionic liquids. Angew. Chem. Int. Ed. 49 (32), 55495553.
Yao, G., Wu, G., Dai, W., Guan, N., Landong, L., 2015. Hydrodeoxygenation of
lignin-derived phenolic compounds over bi-functional Ru/H-Beta under mild
conditions. Fuel 150, 175183.
Yong, T.L.-K., Matsumura, Y., 2013. Kinetic analysis of lignin hydrothermal
conversion in sub- and supercritical water. Ind. Eng. Chem. Res. 52 (16),
56265639.
Zhang, S., Yan, Y., Li, T., Ren, Z., 2005. Upgrading of liquid fuel from the
pyrolysis of biomass. Bioresour. Technol. 96, 545550.
Chapter 5 Production processes from lignocellulosic feedstock
Zheng, X., Chang, J., Fu, Y., 2015. One-pot catalytic hydrocracking of diesel
distillate and residual oil fractions obtained from bio-oil to gasoline-range
hydrocarbon fuel. Fuel 157, 107114.
Further reading
Conde-Mejı́a, C., Jiménez-Gutiérrez, A., Gómez-Castro, F.I., 2016. Purification of
bioethanol from a fermentation process: alternatives for dehydration.
Comput. Aided Chem. Eng. 38, 373378.
Mohsenzadeh, A., Zamani, A., Taherzadeh, M.J., 2017. Bioethylene production
from ethanol: a review and techno-economical evaluation. ChemBioEng Rev.
4, 7591.
Pearson, D.E., 1983. Process for catalytic dehydration of ethanol vapor to
ethylene. US Patent 4423270.
169
Process intensification and
integration in the production of
biojet fuel
6.1
6
Introduction
As any other industrial process, the production of biofuels
requires the use of external energy to accomplish several heating tasks. Nevertheless, only a fraction of the energy is used for
such purpose, and the other fraction is lost into the surroundings. This is particularly true for operations with low thermodynamic efficiency, for example, distillation, with the consequence
of requiring higher energy inputs to fulfill the separation tasks.
Such energy requirements are usually fulfilled with steam,
which is obtained by burning fossil fuels. This implies that, the
more energy is required in the process, more fuel is used, and
more carbon dioxide is released. Thus even if the raw material
employed to produce biofuels is renewable, the process itself
could have a high environmental load in terms of emissions of
the greenhouse gas. This leads to the need of more energyefficient processes, in order to obtain more sustainable production schemes. Process intensification and process integration
are tools that can be helpful to achieve such goal. Additionally,
process intensification may lead to economic savings, aiding to
turn the biofuels production more profitable. In this chapter, a
description of process intensification and process integration is
presented, together with a review on the application of such
tools on the production of biojet fuel. An example of the use of
such tools in a hydrotreating process is presented in detail, and
the impact of intensification and integration over the economic
and environmental indexes of the process is assessed.
6.2
Process intensification
Process intensification is a branch of Chemical Engineering
related to the development of production technologies to allow
Production Processes of Renewable Aviation Fuel. DOI: https://doi.org/10.1016/B978-0-12-819719-6.00006-7
© 2021 Elsevier B.V. All rights reserved.
171
172
Chapter 6 Process intensification and integration in the production of biojet fuel
substantial enhancements in the processes. Several definitions
of process intensification have been reported; here, some of
them will be presented. Ramshaw (1995) established one of the
first definitions of process intensification, as “a strategy for
making dramatical reductions in the size of a chemical plant so
as to reach a given production objective.” Stankiewicz and
Moulijn (2000) defined the concept of process intensification as
“the development of novel apparatuses and techniques that,
compared to those commonly used today, are expected to bring
dramatic improvements in manufacturing and processing, substantially decreasing equipment-size/production-capacity ratio,
energy consumption, or waste production, and ultimately
resulting in cheaper, sustainable technologies.” Later,
Stankiewicz and Moulijn (2002) mentioned that the target of
process intensification is “to make a quantum leap in process
and plant efficiency.” Charpentier (2005) described process
intensification as “complex technologies that replace large,
expensive, energy-intensive equipment or processes with smaller, less costly, more efficient plants, or plants that combine
multiple operations into a single apparatus or into fewer
devices.” Lutze et al. (2010) mentioned that “process intensification can be achieved by adding/enhancing phenomena in a
process through the integration of operations, functions, phenomena, or alternatively through the targeted enhancement of
phenomena in an operation.” Several common ideas can be
found in the previously mentioned and in other definitions.
First of all, it is the high innovation expected from an intensified system, compared with the existing equipment. Second, the
intensified system must allow achieving noticeable enhancements in the process. Third, process intensification must tend
to reduce the size of the equipment, so the space required for a
given process is each time smaller. Fourth, an intensified system
must allow either performing multiple operations in a single
equipment or enhancing the performance of a given operation.
With these considerations in mind, examples of intensified systems can be mentioned; some of them are schematically presented in Fig. 6.1.
The chemical reactors are key equipment since they perform
the conversion of raw materials to products (Li et al., 2018). In
conventional reactors, mass and heat transfer are limited, especially for heterogeneous reactions; due to this, reactants in
excess and devices to create turbulence are needed to guarantee
the contact between reactants along with a better heat transfer
(Quiroz-Pérez et al., 2019a). Therefore the miniaturization of
such devices has been presented as a strategy with high
Chapter 6 Process intensification and integration in the production of biojet fuel
Figure 6.1 Examples of intensified technologies.
potential for the enhancement of the conversion and selectivity;
in addition, it can be expected reductions in the processing
costs, an increasing in the safety of the process, among others
(DeWitt, 1999). To pursue this objective, several devices have
been proposed to perform the reactions, for example, the
microreactors. As the name suggested, microreactors are reactors with channel sizes in the order of micrometers, at which
diffusion is the dominant mixing mechanism (Reay et al., 2008).
Different kinds of microreactors have been proposed; as examples, the T-shaped microreactors (Tonomura et al., 2009) and
the monolithic microreactors (Nagaki et al., 2016) can be mentioned. Another proposal for enhancing the performance of
173
174
Chapter 6 Process intensification and integration in the production of biojet fuel
chemical reactions implies using waves with different frequencies, as high-frequency waves in sonoreactors (Gonze et al.,
1998) or microwaves (Cablewski et al., 1994). In sonoreactors
the application of ultrasound enhances the rates of chemical
reactions and eliminates or reduces the need of catalysts (Reay
et al., 2008). Due to ultrasound frequencies, the molecules of
the reactants vibrate faster, which increase the rate of the chemical reaction; since the interaction between reactants is guaranteed, there is no necessity for feeding one of them in excess.
Therefore a reduction in the operating costs, due to the
decrease in the reactant quantities and to avoiding the later
separation of the excess reactant, can be expected. Another
interesting intensified equipment is the spinning disk reactor, in
which the heat, mass, and momentum transfer is increased
since the reactants are present in very thin films on a rotating
surface (Reay et al., 2008). These reactors are very compact in
comparison to conventional reactors; however, its production
rates are the same because its residence times are small in comparison with the conventional reactors.
In the case of heat exchange devices, several efforts have
been presented in the development and design of compact heat
exchangers, such as plate-and-fin exchangers (Najafi et al.,
2011), plate-and-frame exchangers (Picón-Núñez et al., 2010),
among others. Compact heat exchangers have area densities in
the order of 20010,000 m2/m3 with hydraulic diameters of less
than 5 mm; despite their small size, the operation temperature
range covers from 250 C to 900 C (Reay et al., 2008).
In the case of unit operations, the thermally coupled distillation systems are examples of equipment where heat transfer is
enhanced. A thermally coupled distillation systems consist of
distillation columns that are linked between them through liquid and/or vapor interconnection flows. The interconnection
flows allow supplying the liquid and/or vapor requirements into
the distillation columns, and, at the same time, eliminating a
condenser or reboiler, respectively (Briones-Ramı́rez and
Gutiérrez-Antonio, 2009). Among the most known thermally
coupled systems, the dividing wall column (Dejanovic et al.,
2010) and the indirect and direct thermally coupled sequences
(Dünnebier and Pantelides, 1999) can be mentioned. In general,
a thermally coupled distillation system can have reductions in
the energy consumption between 30% and 50%, with respect to
the equivalent conventional system.
All the intensified equipment mentioned before allows to
perform one task (e.g., heating/cooling/reaction/separation)
with a significant increase in the heat, mass, and momentum
Chapter 6 Process intensification and integration in the production of biojet fuel
transfer. Moreover, there are other types of intensified equipment where two or more unit operations are performed in the
same equipment. In this case, the original operations must be
feasible at the same operating conditions, in order to share a
thermodynamic window where they may simultaneously
occur. One of the systems that allow performing reaction and
separation in the same equipment is the reactive distillation
(Malone and Doherty, 2000). In this equipment, the removal of
the products alters the reaction equilibrium toward the formation of more product, which promotes increasing the conversion and/or selectivity to the desired product. On the other
hand, the extractive distillation (Lei et al., 2003) allows the
purification of mixtures where it is necessary to use a solvent
to separate one of the components, due to the high nonideality
of the mixture. Additional efforts for the combination of thermal coupling and simultaneous operations have been
reported, for example, the reactive thermally coupled distillation systems (Mueller and Kenig, 2007; Miranda-Galindo et al.,
2011) and the extractive dividing wall column (Bravo-Bravo
et al., 2010). On the other hand, the heat exchanger reactor
constitutes a remarkable example of the synergy between heat
exchangers and reactors. A heat exchanger reactor is basically
a compact heat exchanger where a reaction takes place. In this
kind of equipment, the candidate reactions for heat exchanger
reactors must be fast, produce, or absorb heat and form byproducts, such as nitration, hydrogenations, and polymerizations
(Reay et al., 2008).
All the previously mentioned technologies accomplish with
at least one of the criteria to be considered intensified systems.
In the case of the processes focused on the production of
biojet fuel, only few applications of process intensification have
been reported. As seen in Chapter 3, Production Processes for
the Conversion of Triglyceride Feedstock, the hydroprocessing
of vegetable oils requires two reaction steps: hydrodeoxygenation/hydrodecarboxylation as first step, and hydrocracking/
hydroisomerization as second step. Nevertheless, efforts have
been done to synthesize bifunctional catalysts, which allow performing both sets of reactions with a single catalyst. Verma
et al. (2011) reported the conversion of a modified Chlorella
micro-algae to produce renewable aviation fuel in a single-step
process, where hydrodeoxygenation, hydroisomerization, and
hydrocracking reactions are carried out in the same vessel. The
used catalyst is 5% NiO, 18% MoO3/H-ZSM-5 (micromesoporous)-HSASC. The major yield to biojet fuel (78.5%) was
obtained at 410 C and 50 bar.
175
176
Chapter 6 Process intensification and integration in the production of biojet fuel
Liu et al. (2015) reported the use of a Ni/MCM-41-APTESUSY catalyst, obtaining yields around 80.3% for hydrocarbons
in the range of biojet fuel, at 300 C and 3 MPa. Sousa et al.
(2018) proposed the use of a thermally activated HBeta zeolite
catalyst to simultaneously perform the deoxygenation, cracking,
and isomerization of vegetable oils. A yield to hydrocarbons
between 80% and 96% is reported, at 350 C and 10 bar. Such
bifunctional catalysts may represent important reductions in
the cost of an industrial-scale production process, since only a
single equipment would be required to obtain the linear and
branched hydrocarbons, and, in some cases, also aromatics.
Moreover, by reducing the number of equipment, the safety of
the process can also be enhanced.
Other cases where process intensification has been applied to
the production of biojet fuel are focused on the purification
stage, where the different hydrocarbon fractions are separated by
distillation. Gutiérrez-Antonio et al. (2015) analyzed the use of
various thermally coupled schemes to separate the light hydrocarbons, biojet fuel, and green diesel fractions. They reported
that the best configuration for the intensified sequences is the
thermally coupled direct sequence, with energy savings around
16% in comparison with the optimal design of the conventional
direct sequence. For the analyzed mixture, the dividing wall column gave a bad performance in energetic terms. The dynamic
performance of such intensified sequences was studied by
Acosta-Solórzano et al. (2016), finding that the dividing wall column was the system with better control properties, but high heat
duty. Nevertheless, it is mentioned that the thermally coupled
direct sequence showed acceptable values for the dynamic properties under analysis, with the lowest heat duty among the studied sequences. The use of reactive distillation to perform the
hydrocracking/hydroisomerization reactions, while simultaneously separating the hydrocarbons into two fractions, has been
reported by Gutiérrez-Antonio et al. (2018a). The hydrocarbons
stream is the effluent of a reactor where Jatropha curcas oil is
hydrotreated. According to the results, the use of a dividing wall
column in the hydrotreating process may reduce equipment
costs up to 25% and utilities costs up to 57%, in comparison with
the conventional distillation train. Nevertheless, it is mentioned
that most of the total annual cost (TAC) is given by the raw
material. A process for the production of biojet fuel from microalgae oil has been proposed by Gutiérrez-Antonio et al. (2018b),
using a single reactor with a bifunctional catalyst and thermally
coupled distillation sequences in the separation stage, namely
the thermally coupled direct sequence and the thermally coupled
Chapter 6 Process intensification and integration in the production of biojet fuel
indirect sequence. According to the reported results, for such
separation processes, the conventional direct sequence has the
lowest costs, with equipment costs 39% lower than the thermally
coupled direct sequence, and utilities costs 4% lower.
Nevertheless, the thermally coupled direct sequence allows
reducing the carbon dioxide emissions by 34%, in comparison
with the conventional direct sequence.
The design of intensified equipment can be realized using
different strategies such as graphical methods, shortcut
methods, finite element, and optimization strategies.
For the design of microreactors, computational fluid dynamics (CFD) is a powerful tool, and its value has been proved in
different applications where reaction yield and heat and mass
transfer must be enhanced (Quiroz-Pérez et al., 2019b). On the
other hand, for the design of sonoreactors, the use of shortcut
methods (Son, 2017), CFD (Niazi et al., 2014; Khodaei et al.,
2018; Rahimi et al., 2019; Quiroz-Pérez et al., 2019a), and
computer-aided tools (Dähnke et al., 1999) has been reported.
Petlyuk (2004) proposed graphical methodologies for the
design of thermally coupled, azeotropic distillation, and extractive distillation columns. For reactive distillation columns,
Doherty and its research group led the efforts in the use of
graphical, shortcut methods, and computer-aided tools (Doherty
and Fariss, 1985; Barbosa and Doherty, 1988a,b; Doherty and
Buzad, 1994; Buzad and Doherty, 1994, 1995; Huss et al., 1999;
Gadewar et al., 2004). The use of stochastic optimization strategies has also been reported in the literature for the design of
thermally coupled distillation columns (Briones-Ramı́rez and
Gutiérrez-Antonio, 2009), extractive conventional and thermally
coupled distillation (Bravo-Bravo et al., 2010), reactive conventional and thermally coupled distillation (Miranda-Galindo et al.,
2011), hybrid distillation/melt crystallization process (BravoBravo et al., 2013), thermally coupled distillation sequences with
nonequilibrium model (Gómez-Castro et al., 2015), and azeotropic thermally coupled distillation columns (Gutiérrez-Antonio
et al., 2014).
It is important to mention that adequate heat and mass
transfer must be ensured, especially when intensified equipment are considered. To reach this objective, CFD is a powerful tool. CFD consists of the use of powerful computers and
numeric methods to solve the transport equations in fluid
systems (May-Vázquez et al., 2017). The analysis of fluid
flows, especially the reactive ones, is key to guaranteeing and
improving the adequate performance of equipment, in terms
of energy efficiency, product yields, or even carbon dioxide
177
178
Chapter 6 Process intensification and integration in the production of biojet fuel
emissions (Quiroz-Pérez et al., 2019b). In spite of all these
advantages, to the authors’ knowledge there is no reported
work on the literature about the use of CFD for the analysis
of intensified systems in the production of renewable aviation
fuel.
6.3
Process integration
Process integration, and particularly energy integration, is a
helpful approach to make a better use of the energy available in
a given process, or even in a set of processes, to partially fulfill
the heating and cooling requirements using the process
streams, instead of utilities. Fig. 6.2 shows a simple example of
process integration. There are two process streams: H1 needs to
be cooled, thus it is called “hot stream”; while C1 requires heating, and it is called “cold stream.” H1 is at a temperature Thi,
and it must be taken to a temperature Tho. On the other hand,
C1 needs to be heated from Tci to Tco. To achieve the desired
temperature levels, H1 is cooled down using cooling water,
while C1 is heated with steam, as shown in Fig. 6.2A.
An alternative of integrated scheme is shown in Fig. 6.2B. If
H1 and C1 coincide in a range of temperatures, H1 may transfer a part of its heat content to C1. To achieve such goal, both
streams enter into a heat exchanger HE1. C1 reaches a given
temperature Tc,ex and H1 is cooled down to Th,ex. If Th,ex . Tho,
additional cooling is required, which can be given by cooling
water. Similarly, if Tc,ex , Tco, additional heating must be provided by steam. Nevertheless, the heating and cooling requirements will be lower than those of the nonintegrated case,
since the energy content of the process stream has been used.
Of course, for a feasible integration, Thi must be higher than
Tc,ex and Th,ex must be higher than Tci. All the previous concepts are the basis for energy integration. Nevertheless, when
there are several cold and hot streams, a systematic method is
necessary to choose the best cold stream-hot stream combinations for integration. One of the most known strategies for
energy integration is the pinch point methodology (Linnhoff
and Hindmarsh, 1983). However, it is important to mention
that the pinch analysis was later extended to the optimization
of mass integration networks by El Halwagi and
Manousiouthakis (1989), along with other derived works that
employ optimization strategies, mainly with mathematical
programming techniques (Ahmetović et al., 2015; Zhang et al.,
2018; Klemeš et al., 2018).
Chapter 6 Process intensification and integration in the production of biojet fuel
179
Figure 6.2 Fulfillment of energy requirements for two process streams (A) using utilities, (B) by energy integration.
The pinch point methodology is based on the determination
of the pinch temperature for the set of cold and hot streams
under analysis. To understand the concept of pinch point, the
composite curves shown in Fig. 6.3 can be useful. Composite
curves are graphical representation of the temperature of all the
streams in the process, and the energy content of each stream,
represented as a change on the enthalpy.
In Fig. 6.3A, both composite curves are overlapped in a given
range of enthalpy; in this region, energy integration may occur.
The rest of the hot composite curve represents the cooling
requirements that must be fulfilled by utilities, for example,
cooling water. Similarly, the nonoverlapped region of the cold
curve means the heating requirements that must be fulfilled by
utilities, for example, steam. It can be observed that there is a
point where both curves have the minimal vertical distance
between them, which is the ΔTmin. Since the x-axis represents
180
Chapter 6 Process intensification and integration in the production of biojet fuel
Figure 6.3 Composite curves: (A) low energy integration and (B) high energy integration.
enthalpy intervals, the hot composite curve can be displaced to
the right, as shown in Fig. 6.3B. By doing this, the region with
potential of energy integration is greater, and the external heating and cooling requirements are reduced. On the other hand,
the magnitude of ΔTmin is reduced. This value cannot be
reduced without limit, since there will be a point from which
the second law of thermodynamics will be violated. So, this limiting temperature is the pinch point, which represents the minimum feasible heating and cooling requirements for the studied
streams.
In the pinch point methodology, the pinch temperature is
usually identified through a heat cascade diagram, which represents the heat balances for the whole set of streams, for each
interval of temperature. Those intervals are defined in terms of
the initial and final temperatures of each stream. In the initial
calculation, some negative values of heat can be obtained for
some temperature intervals. The most negative heat value is
then used as the minimum external heating requirement, and a
second cascade diagram is made. A value of heat equal to zero
must be obtained on a given interval; the corresponding temperature represents the pinch point. Once the pinch point and
the minimal utility requirements have been determined, the
streams network is divided in two: a zone to the left of the
pinch point, and a zone to the right of the pinch point. Then,
exchanges between the streams are proposed, avoiding
Chapter 6 Process intensification and integration in the production of biojet fuel
exchanges crossing the pinch point and taking care of not having temperature crossing in the exchangers. Moreover, the use
of heating utilities is only valid in the region to the right of the
pinch point; the use of cooling utilities is only acceptable in the
region to the left of the pinch point.
On the last years, energy integration has been proposed as an
excellent tool to reduce utilities costs in the biojet fuel production processes. Moreover, since the use of steam can be reduced,
the environmental impact is simultaneously reduced. GutiérrezAntonio et al. (2016a) presented a proposal for the energy integration of a hydrotreating process, using J. curcas as raw material. According to the results, the integrated process with a direct
distillation sequence allows savings in utilities costs up to 26% in
comparison with the nonintegrated schemes. Nevertheless,
when both utilities and equipment costs are considered, the best
scenario is a nonintegrated scheme, with savings in TAC up to
6% in comparison with the other analyzed cases. This is due to
the additional equipment required to integrate the process. In a
second approach, Gutiérrez-Antonio et al. (2016b) presented the
energy integration of a hydrotreating process with intensified
systems in the purification zone; once more, the raw material
was J. curcas. According to the reported results, the best case in
terms of utilities costs is the integrated process with a conventional direct distillation sequence, with savings of up to 32% in
comparison with the other process proposals. In terms of the
combined utilities plus equipment costs, the best alternative is
the nonintegrated process with a conventional direct distillation
sequence, with savings up to 13%. Nevertheless, if the emissions
of carbon dioxide are considered, the integrated process with a
conventional direct distillation sequence shows savings up to
90%. Villegas-Herrera et al. (2018) proposed the energy integration between the hydrotreating process and a one-step process
for the production of biodiesel with supercritical ethanol. As
preliminary results, it is reported that the integration between
both processes may allow savings around 60% in heating
requirements, by making use of the heat released by the hydrotreating reactor. Moreover, the cooling requirements could be
reduced up to 95%.
6.4
Techno-economic analysis of alternatives
As it can be deducted from the information provided in
Sections 6.2 and 6.3, neither process intensification nor process
integration is applicable for all the processing routes. When
181
182
Chapter 6 Process intensification and integration in the production of biojet fuel
proposing an intensification/integration alternative, it is necessary to evaluate if such proposal effectively enhances the process. Once the process has been properly designed, it must be
evaluated and compared with the conventional processing
route. This can be done through several criteria such as reaction
yield, energy requirements, TAC, selling price of the products,
profit, environmental impact, safety of the process, controllability, among others. When proposing intensification or integration in a given process, two of the initial criteria to take as
feasible the new system are the energy requirements (or the utilities costs) and the TAC (which includes the equipment costs).
This is because, if the intensified system has higher energy
requirements or higher TAC, it does not represent any enhancement for the traditional processing scheme. On the other hand,
if the integrated system reduces slightly the utilities costs but
greatly increases the equipment costs, the integration could not
be desirable for the studied process. The environmental impact
is directly related with the heating requirements, and it can be
an additional criterion to compare two or more systems.
As described in Chapter 3, Production Processes for the
Conversion of Triglyceride Feedstock, the equipment costs,
either for a conventional or an intensified/integrated process,
can be computed through the Guthrie method (Turton et al.,
2012). In the case of the costs of utilities, they can be obtained
from the total requirements of each utility and the unitary costs
in the region of interest. Environmental impact can be assessed
in several ways, but one of the most direct is the calculation of
the carbon dioxide emissions, through methodologies as that
proposed by Gadalla et al. (2005). For a more detailed analysis
of the environmental impact, a full life cycle analysis could be
performed, but this kind of analysis is out of the scope of an initial screening. Finally, the selling price of the products can be
obtained through the TAC and the internal rate of return, as
reported by Gutiérrez-Antonio et al. (2016b).
6.5
Application of process intensification to a
hydrotreating process
6.5.1
Conceptual design of the intensified process
A systematic methodology for applying process intensification on multicomponent distillation trains with zeotropic or
azeotropic mixtures was presented by Guang-Rong and Errico
(2012). The main objective in the construction of intensified
Chapter 6 Process intensification and integration in the production of biojet fuel
sequences is keeping the structural simplicity, but with less columns and heat exchangers, regarding to conventional columns.
This methodology is carried out using the algorithm presented
in Fig. 6.4, wherein the detailed explanation of each step is presented. It is important to mention that the design procedure of
each column presented in the methodology is similar to the
procedure for conventional columns design.
According to the case of study developed in Chapter 3,
Production Processes for the Conversion of Triglyceride
Figure 6.4 Procedure for intensified distillation columns (Guang-Rong and Errico, 2012).
183
184
Chapter 6 Process intensification and integration in the production of biojet fuel
Feedstock, a distillation train with two columns was designed to
separate biojet fuel, naphtha, and green diesel. The application
of the systematic procedure presented in Fig. 6.4 is carried out
for this separation scheme.
6.5.2
Simulation of the intensified process
In order to obtain the intensified process, Figs. 6.5 and 6.6
present the simulation results from Aspen Plus, for Step 1 and
2. These designs are obtained through the shortcut method in
DSTWU module, and, then, through the rigorous simulation by
Figure 6.5 Results from simple column 1 (SC-1).
Figure 6.6 Results from simple column 2 (SC-2).
Chapter 6 Process intensification and integration in the production of biojet fuel
RadFrac module, as explained in Chapter 3, Production
Processes for the Conversion of Triglyceride Feedstock.
Based on the results indicated in Figs. 6.5 and 6.6, lower total
energy consumption is presented by SC-1. Thus the original
thermally coupled column (OTC) is designed from this scheme.
In Fig. 6.7 the single OTC design is presented. The number of
stages for each column in the OTC sequence is the same as the
equivalent column in the sequence SC1.
In accordance with Fig. 6.7, the energy savings by condenser
and reboiler of OTC design are 19.97% and 7.28%, respectively,
regarding to SC-1. The next step is designing the thermodynamically equivalent structures (TES), which is presented in Fig. 6.8.
The number of stages in the column TES-1 is given by the number of stages in the column OTC-1, plus the number of stages in
the stripping section of the column OTC-2. Consequently, the
number of stages in the column TES-2 is equal to the number of
stages in the rectifying section of OTC-2.
The energy savings by TES design are 23.23% and 9.74% for
condenser and reboiler, respectively. It is important to mention
that all configurations presented before were designed with 99%
recovery in each established cut.
The next step is identifying the TES structures that fulfill the
criteria presented. In this case, the TES design has not a side
transport column and the side column (TES-2) has not reboiler;
thus this design does not fulfill any criteria to generate an
intensified sequence column (ISC) configuration. In this
Figure 6.7 Results from OTC design.
185
186
Chapter 6 Process intensification and integration in the production of biojet fuel
Figure 6.8 Results from TES design.
context, Steps 6, 7, and 8 for the design of ISC are not possible.
The design presented in Fig. 6.8 is collocated in simulation of
the case of study developed in Chapter 3, Production Processes
for the Conversion of Triglyceride Feedstock, due to its energy
savings.
6.6
Application of process integration to a
hydrotreating process
The pinch point methodology (Linnhoff and Hindmarsh,
1983) is applied to the process presented in case of study presented in Chapter 3, Production Processes for the Conversion of
Triglyceride Feedstock, taking into account the results from the
intensification procedure presented in Section 6.5. The flowsheet of this process is presented in Fig. 6.9.
6.6.1
Conceptual design of the energy integration
To apply the energy integration on the selected process
through the pinch point methodology, the problem
table algorithm is applied. The algorithm involves six steps for
developing the energy integration network, based on simulation
data from case study presented in Chapter 3, Production
Figure 6.9 Flowsheet of case of study presented in Chapter 3, Production Processes for the Conversion of Triglyceride Feedstock, with TES.
188
Chapter 6 Process intensification and integration in the production of biojet fuel
Processes for the Conversion of Triglyceride Feedstock. Next, each
step is presented.
6.6.1.1 Step 1. Data input and ΔT definition
The streams data, for the case of study developed in
Chapter 3, Production Processes for the Conversion of
Triglyceride Feedstock, are presented in Table 6.1, considering
the TES design. The minimum ΔT defined for this case is 10 C.
6.6.1.2 Step 2. Adjustment of temperatures
This step is presented in Table 6.2. The order of temperatures is from the highest to the lowest value.
Table 6.1 Input data for case of study of Chapter 3, Production Processes for the
Conversion of Triglyceride Feedstock.
Stream
Tin (˚C)
Tout (˚C)
Hot/cold
wCp (kW/˚C)
ID stream
EX-PO
EX-H2
EX-JC
EX-4
COND-TES1
REB-TES1
COND-TES2
619.169
2 204.61
622.049
356.204
78.8421
336.692
252.129
350
350
350
30
56.48
339.93
197.58
Hot
Cold
Hot
Hot
Hot
Cold
Hot
0.42
3.63
1.68
1.63
0.27
177.21
3.63
H1
C1
H2
H3
H4
C2
H5
Exothermic
Exothermic
Endothermic
73.35
202.57
51.89
kW
kW
kW
Reactors
R-HDO-PO
R-HDO-JC
R-HCRIS
Table 6.2 Adjustment of temperatures.
Stream
1. Hot
2. Cold
Tin
Tout
Tin
Tout
T original
T adjusted
Order
x
x1
y
y1
x-ΔTmin
x1-ΔTmin
y
y1
T1
T3
T2
T4
Chapter 6 Process intensification and integration in the production of biojet fuel
189
Figure 6.10 Values of temperature intervals.
Table 6.3 Values of ΔHi.
ΔHi (kW)
ΔH1
ΔH2
ΔH3
ΔH4
6.6.1.3
ΔH5
ΔH6
ΔH7
ΔH8
4.85
546.84
2 5.80
0.63
0.13
2 580.67
2 189.85
88.65
Step 3. Temperature intervals
The definition of each interval is realized according to
Fig. 6.10.
6.6.1.4
Step 4. Heat balance per interval
To calculate the value of each interval, Eq. (6.1) is used. In
Table 6.3 all the temperature intervals for this case of study are
presented.
"
#
X
X
wi Cpi 2
wi Cpi ðTi 2 Ti11 Þ
ð6:1Þ
ΔHi 5
hot streams
6.6.1.5
cold streams
Step 5. Heat cascade
In this step the minimum values for heating and cooling services are obtained. The heat excess in each interval is transferred to next interval, building an ideal thermal machine,
through the Eq. (6.2). In Fig. 6.11 the heat cascade for this case
of study is presented.
ΔH9
ΔH10
ΔH11
ΔH12
2 238.39
2 75.18
2 53.17
2 817.28
190
Chapter 6 Process intensification and integration in the production of biojet fuel
Figure 6.11 Heat cascade.
Qi11 5 Qi 1 ΔHi
ð6:2Þ
According to Fig. 6.11, the pinch point temperature is
2194.61 C and 2204.61 C for hot and cold temperatures, respectively. Likewise, the minimum heating utilities are 1319.5 kW,
without cooling utilities (zero kW). With these data, in the next
step is developing the heat exchanger network.
6.6.1.6 Step 6. Energy integration network
In Fig. 6.12 the energy integration network is presented; this
network is obtained through energy balances between the
streams that are candidate for integration. Such balances allow
establishing the temperature changes that can be allowed for a
given integration. It is important to mention that the network
was only constructed above the pinch point.
The energy requirement of the heaters, which make use of
steam to reach the objective temperatures, is equal to the minimum energy requirements predicted by the heat cascade. Thus
the proposed network accomplishes with the prediction of the
pinch point methodology, achieving the minimal use of utilities.
This network is simulated in Aspen Plus. On the other hand, it
is important to mention that this design was realized considering the minimum equipment for heat exchangers, which is
computed as 7. This value is obtained from Eq. (6.3).
Chapter 6 Process intensification and integration in the production of biojet fuel
Figure 6.12 Energy integration network.
Minimum number of heat exchanger 5
#hot streams ð5Þ 1 #cold streams ð2Þ 1 utilities ð1Þ 2 1
6.6.2
ð6:3Þ
Simulation of the hydrotreating process with
energy integration
The simulation of the energy network is presented in
Fig. 6.13. The blue and red colors mean cold and hot streams,
whilst green color is assigned to streams ready to be integrated
into the process equipment.
The details about the simulation were presented in Chapter 3,
Production Processes for the Conversion of Triglyceride
Feedstock. Also, the design of the intensified distillation train
was presented in Section 6.5.
191
Figure 6.13 Flowsheet of the integrated process.
Chapter 6 Process intensification and integration in the production of biojet fuel
193
Table 6.4 Summary of the costs for hydrotreatment process with intensified train and energy
integration.
Operating cost (USD/year)
Heating
utilities cost
Cooling
utilities cost
Palm oil
Jatropha
oil
Electricity Total operating cost
(USD/year)
39,106.20
62.90
3,102,500.00 28,021,978.02 70,008.15
44,833,069.11
Annual capital cost (USD/year)
Equipment cost
A1
A2
Total annual cost (USD/year)
631,677.08
317,603.00
1,076,321.28
631,677.08
TAC (USD/year)
45,464,746.19
6.6.3
Economic assessment
The calculation procedure and the factors involved are equal
to those presented in Chapter 3, Production Processes for the
Conversion of Triglyceride Feedstock. In Table 6.4 the TAC for
this case of study is presented.
The economic savings of cooling and heating services for
this case of study are 55.31%, regarding to these services costs
in the case of study 3. It is important to mention that the cooling and heating services contributed with 0.19% of TAC in the
case of study developed in Chapter 3, Production Processes for
the Conversion of Triglyceride Feedstock; whilst in this case of
study, with 0.09% regarding TAC. The saving seems small due to
the greater contribution to the TAC is the raw material; however,
considering only the utility costs, the reduction obtained when
making the intensification and integration is considerable.
Regarding to equipment cost, this cost increased 4.11% in contrast to the hydrotreating process presented in Chapter 3,
Production Processes for the Conversion of Triglyceride
Feedstock. The total TAC saving is 0.1%, since the main factor
contributing with this value is the raw material cost, which
represents 98% of TAC in both case studies, the one presented
in Chapter 3, Production Processes for the Conversion of
Triglyceride Feedstock, and the one discussed in this chapter. If
this factor diminishes its value, the economic savings achieved
by the methodologies presented will be remarkable.
194
Chapter 6 Process intensification and integration in the production of biojet fuel
Table 6.5 Minimum price of biojet fuel.
I (USD/year)
P (USD/year)
C (USD/year)
n
P
imin
Naphtha (kg/h)
0.2
P 5 imin 3 I
Total
246,273.90
Green diesel (kg/h)
9,483,521.90
Total
35,938,283.30
i51
Cmdaji
1,764,461.11
n
P
Operating cost (5% of
Cmdaji )
i51
157,919.27
Total
1,922,380.38
S (USD/year)
Q (kg/year)
6.6.4
384,476.08
36,626,068.28
8,263,366.54
Minimum price of biojet fuel (USD/kg)
4.43
Estimation of price of biojet fuel
The procedure for the estimation of minimum selling price
was extensively presented in Chapter 3, Production Processes
for the Conversion of Triglyceride Feedstock. The Table 6.5 presents the minimum price of biojet fuel for this case of study. It
is important to mention that the end product flows (naphtha,
biojet fuel, and green diesel) are the same that in Chapter 3,
Production Processes for the Conversion of Triglyceride
Feedstock, due to only the separation scheme was changed, but
the reactive zones were conserved without changes.
The minimum price of biojet fuel for the process presented
in the case of study of Chapter 3, Production Processes for the
Conversion of Triglyceride Feedstock, is 4.43 USD/kg. As can be
seen in Table 6.5, there is not a significant difference between
the prices. These results are due to the main factor affecting the
TAC is the price of raw material, which is the same in both
cases. However, it is important to emphasize the high economic
and energy savings obtained through the application of these
methodologies.
6.6.5
Environmental assessment: CO2 emissions
The procedure for the counting of CO2 emissions was presented in Chapter 3, Production Processes for the Conversion of
Triglyceride Feedstock. Table 6.6 presents the summary of emissions due to steam and electricity requirements into the process
Chapter 6 Process intensification and integration in the production of biojet fuel
195
Table 6.6 CO2 emissions due to steam and electricity requirements.
Emissions by steam
generation (Mkg CO2/
year)
Emissions by electricity
generation (Mkg CO2/year)
Total CO2 emissions Ton CO2/kg
(Mkg CO2/year)
biojet fuel
2130.92
1.38
2132.31
presented in this case study. It is important to mention that the
emissions by electricity are the same as those for the case study of
Chapter 3, Production Processes for the Conversion of Triglyceride
Feedstock, because this requirement was not modified.
If the results of Table 6.6 are compared with the results from
the case study of Chapter 3, Production Processes for the
Conversion of Triglyceride Feedstock, the CO2 emissions due to
steam generation are 92% lower when process intensification
and energy integration is applied; likewise, the ton CO2 per kg of
biojet fuel for the process developed in Chapter 3, Production
Processes for the Conversion of Triglyceride Feedstock, is 12.4
times higher than the enhanced process presented in this chapter. These results show the positive effect of the application of
process intensification and energy integration.
6.7
Conclusion
The design of environmentally sustainable and economically
viable processes requires special strategies to achieve the competitiveness of the obtained products in the market. In this context, process intensification is a good alternative to diminish the
size, number of equipment, and reduce the utilities necessary for
the suitable development of processes. Likewise, energy integration has become a good approach to minimize the utilities consumption in a new process or retrofitting an existing one. This
energetic advantage allows the reduction of processing costs,
improving its competitiveness. Additionally, important savings
on CO2 emissions can be obtained, reducing the environmental
impact associated with the process. These conclusions have
been demonstrated in the case study presented in this chapter,
which represents an enhancement for the process evaluated in
Chapter 3, Production Processes for the Conversion of
Triglyceride Feedstock.
0.25
196
Chapter 6 Process intensification and integration in the production of biojet fuel
References
Acosta-Solórzano, A.D.A., Guerrero-Farfán, O., Ramı́rez-Márquez, C., GómezCastro, F.I., Segovia-Hernández, J.G., Hernández, S., et al., 2016.
Controllability analysis of distillation sequences for the separation of
bio-jet fuel and green diesel fractions. Chem. Eng. Technol. 39 (12),
22732283.
Ahmetović, E., Ibrić, N., Kravanja, Z., Grossmann, I.E., 2015. Water and energy
integration: a comprehensive literature review of non-isothermal water
network synthesis. Comput. Chem. Eng. 82, 144171.
Barbosa, D., Doherty, M.F., 1988a. Design and minimum-reflux calculations for
single-feed multicomponent reactive distillation columns. Chem. Eng. Sci. 43
(7), 15231537.
Barbosa, D., Doherty, M.F., 1988b. Design and minimum-reflux calculations for
double-feed multicomponent reactive distillation columns. Chem. Eng. Sci.
43 (9), 23772389.
Bravo-Bravo, C., Segovia-Hernández, J.G., Gutiérrez-Antonio, C., Durán, A.L.,
Bonilla-Petriciolet, A., Briones-Ramı́rez, A., 2010. Extractive dividing wall
column: design and optimization. Ind. Eng. Chem. Res. 49 (8), 36723688.
Bravo-Bravo, C., Segovia-Hernández, J.G., Hernández, S., Gómez-Castro, F.I.,
Gutiérrez-Antonio, C., Briones-Ramı́rez, A., 2013. Hybrid distillation/melt
crystallization process using thermally coupled arrangements: optimization
with evolutive algorithms. Chem. Eng. Process. Process Intensif. 67, 2538.
Briones-Ramı́rez, A., Gutiérrez-Antonio, C., 2009. Pareto front of Petlyuk
sequences using a multiobjective genetic algorithm with constraints. Comput.
Chem. Eng. 33 (2), 454464.
Buzad, G., Doherty, M.F., 1994. Design of three-component kinetically controlled
reactive distillation columns using fixed-points methods. Chem. Eng. Sci. 49
(12), 19471963.
Buzad, G., Doherty, M.F., 1995. New tools for the design of kinetically controlled
reactive distillation columns for ternary mixtures. Comput. Chem. Eng. 19 (4),
395408.
Cablewski, T., Faux, A.F., Strauss, C.R., 1994. Development and application of a
continuous microwave reactor for organic synthesis. J. Org. Chem. 59 (12),
34083412.
Charpentier, J.-C., 2005. Process intensification by miniaturization. Chem. Eng.
Technol. 28 (3), 255258.
Dähnke, S., Swamy, K.M., Keil, F.J., 1999. Modeling of three-dimensional
pressure fields in sonochemical reactors with an inhomogeneous density
distribution of cavitation bubbles: comparison of theoretical and
experimental results. Ultrason. Sonochem. 6 (12), 3141.
Dejanovic, Lj, Matijasevic, Lj, Olujic, Z., 2010. Dividing wall column a
breakthrough towards sustainable distilling. Chem. Eng. Process. Process
Intensif. 49 (6), 559580.
DeWitt, S.H., 1999. Micro reactors for chemical synthesis. Curr. Opin. Chem.
Biol. 3 (3), 350356.
Doherty, M.F., Fariss, K.E., 1985. Distillation in the presence of non-equilibrium
reversible reactions. Chem. Eng. Sci. 40 (3), 532534.
Doherty, M.F., Buzad, G., 1994. New tools for the design of kinetically controlled
reactive distillation columns. Comput. Chem. Eng. 18 (Suppl. 1), S1S13.
Dünnebier, G., Pantelides, C.C., 1999. Optimal design of thermally coupled
distillation columns. Ind. Eng. Chem. Res. 38 (1), 162176.
El Halwagi, M.M., Manousiouthakis, V., 1989. Synthesis of mass exchange
networks. AIChE J. 35, 12331244.
Chapter 6 Process intensification and integration in the production of biojet fuel
Gadalla, M.A., Olujic, Z., Jansens, P.J., Jobson, M., Smith, R., 2005. Reducing CO2
emissions and energy consumption of heat-integrated distillation systems.
Environ. Sci. Technol. 39 (17), 68606870.
Gadewar, S.B., Tao, L., Malone, M.F., Doherty, M.F., 2004. Process alternatives for
coupling reaction and distillation. Chem. Eng. Res. Des. 82 (2), 140147.
Gómez-Castro, F.I., Segovia-Hernández, J.G., Hernández, S., Gutiérrez-Antonio,
S., Briones-Ramı́rez, A., Gamiño-Arroyo, Z., 2015. Design of non-equilibrium
stage separation systems by a stochastic optimization approach for a class of
mixtures. Chem. Eng. Process. Process Intensif. 88, 5869.
Gonze, E., Gonthier, Y., Boldo, P., Bernis, A., 1998. Standing waves in a high
frequency sonoreactor: visualization and effects. Chem. Eng. Sci. 53 (3),
523532.
Guang-Rong, E., Errico, M., 2012. Synthesis of intensified simple column
configurations for multicomponent distillation. Chem. Eng. Process. Process
Intensif. 62 (1), 117.
Gutiérrez-Antonio, C., Ojeda-Gasca, A., Bonilla-Petriciolet, A., SegoviaHernández, J.G., Briones-Ramı́rez, A., 2014. Effect of using adjusted
parameters, local and global optimums, for phase equilibrium prediction on
the synthesis of azeotropic distillation columns. Ind. Eng. Chem. Res. 53 (4),
14891502.
Gutiérrez-Antonio, C., Gómez-Castro, F.I., Hernández, S., Briones-Ramı́rez, C.,
2015. Intensification of a hydrotreating process to produce biojet fuel using
thermally coupled distillation. Chem. Eng. Process. Process Intensif. 88,
2936.
Gutiérrez-Antonio, C., Romero-Izquierdo, A.G., Gómez-Castro, F.I., Hernández,
S., 2016a. Energy integration of a hydrotreatment process for sustainable
biojet fuel production. Ind. Eng. Chem. Res. 55 (29), 81658175.
Gutiérrez-Antonio, C., Romero-Izquierdo, A.G., Gómez-Castro, F.I., Hernández,
S., Briones-Ramı́rez, A., 2016b. Simultaneous energy integration and
intensification of the hydrotreating process to produce biojet fuel from
Jatropha curcas. Chem. Eng. Process. Process Intensif. 110, 134145.
Gutiérrez-Antonio, C., Soria Ornelas, M.L., Gómez-Castro, F.I., Hernández, S.,
2018a. Intensification of the hydrotreating process to produce renewable
aviation fuel through reactive distillation. Chem. Eng. Process. Process
Intensif. 124, 122130.
Gutiérrez-Antonio, C., Gómez-De la Cruz, A., Romero-Izquierdo, A.G., GómezCastro, F.I., Hernández, S., 2018b. Modeling, simulation and intensification of
hydroprocessing of micro-algae oil to produce renewable aviation fuel. Clean
Technol. Environ. Policy 20 (7), 15891598.
Huss, R.S., Chen, F., Malone, M.F., Doherty, M.F., 1999. Computer-aided tools for
the design of reactive distillation systems. Comput. Chem. Eng. 23 (Suppl.),
S955S962.
Klemeš, J.J., Varbanov, P.S., Walmsley, T.G., Jia, X., 2018. New directions in the
implementation of pinch methodology (PM). Renew. Sustain. Energy Rev. 98,
439468.
Khodaei, B., Rahimi, M., Sobati, M.A., Shahhosseini, S., Jalali, M.R., 2018. Effect
of operating pressure on the performance of ultrasound-assisted oxidative
desulfurization (UAOD) using a horn type sonicator: experimental
investigation and CFD simulation. Chem. Eng. Process. Process Intensif. 132,
7588.
Lei, Z., Li, C., Chen, B., 2003. Extractive distillation: a review. Sep. Purif. Rev. 32
(2), 121213.
Li, J., Huang, W., Ge, W., 2018. Multilevel and multiscale PSE: challenges and
opportunities at mesoscales. Comput. Aided Chem. Eng. 44, 1119.
197
198
Chapter 6 Process intensification and integration in the production of biojet fuel
Linnhoff, B., Hindmarsh, E., 1983. The pinch design method for heat exchanger
networks. Chem. Eng. Sci. 38 (5), 745763.
Liu, S., Zhu, Q., Guan, Q., He, L., Li, W., 2015. Bio-aviation fuel production from
hydroprocessing castor oil promoted by the nickel-based bifunctional
catalysts. Bioresour. Technol. 183, 93100.
Lutze, P., Gani, R., Woodley, J.M., 2010. Process intensification: a perspective on
process synthesis. Chem. Eng. Process. Process Intensif. 49 (6), 547558.
Malone, M.F., Doherty, M.F., 2000. Reactive distillation. Ind. Eng. Chem. Res. 39
(11), 39533957.
May-Vázquez, M.M., Rodrı́guez-Ángeles, M.A., Gómez-Castro, F.I., Uribe
Ramı́rez, A.R., 2017. Hydrodynamic feasibility of the production of biodiesel
fuel in a highpressure reactive distillation column. Chem. Eng. Process.
Process Intensif. 112, 3137.
Miranda-Galindo, E.Y., Segovia-Hernández, J.G., Hernández, S., GutiérrezAntonio, C., Briones-Ramı́rez, A., 2011. Reactive thermally coupled distillation
sequences: Pareto Front. Ind. Eng. Chem. Res. 50 (2), 926938.
Mueller, I., Kenig, E.Y., 2007. Reactive distillation in a dividing wall column:
rate-based modeling and simulation. Ind. Eng. Chem. Res. 46 (11), 37093719.
Nagaki, A., Hirose, K., Tonomura, O., Taniguchi, S., Taga, T., Hasebe, S., et al.,
2016. Design of a numbering-up system of monolithic microreactors and its
application to synthesis of a key intermediate of Valsartan. Org. Process. Res.
Dev. 20 (3), 687691.
Najafi, H., Najafi, B., Hoseinpoori, P., 2011. Energy and cost optimization of a
plate and fin heat exchanger using genetic algorithm. Appl. Therm. Eng. 31
(10), 18391847.
Niazi, S., Hashemabadi, S.H., Razi, M.M., 2014. CFD simulation of acoustic
cavitation in a crude oil upgrading sonoreactor and prediction of collapse
temperature and pressure of a cavitation bubble. Chem. Eng. Res. Des. 92 (1),
166173.
Petlyuk, F.B., 2004. Distillation Theory and Its Application to Optimal Design of
Separation Units. Cambridge University Press.
Picón-Núñez, M., Polley, T.G., Jantes-Jaramillo, D., 2010. Alternative design
approach for plate and frame heat exchangers using parameter plots. Heat
Transf. Eng. 31 (9), 742749.
Quiroz-Pérez, E., de Lira-Flores, J.A., Gutiérrez-Antonio, C., 2019a. Microreactors:
design methodologies, technology evolution and applications to biofuels
production. Process Intensification Design Methodologies. De Gruyter,
pp. 125143, Chapter 5.
Quiroz-Pérez, E., Gutiérrez-Antonio, C., Vázquez-Román, R., 2019b. Modelling of
production processes for liquid biofuels through CFD: a review of
conventional and intensified technologies. Chem. Eng. Process. Process
Intensif. 143, 107629.
Ramshaw, C., 1995. The incentive for process intensification. In: Ramshaw, C.
(Ed.), Proceedings of the 1st International Conference on Process
Intensification for the Chemical Industry, 68 December 1995, Antwerp,
Belgium. BHR Group Limited, London, pp. 14.
Rahimi, M., Shahhosseini, S., Movahedirad, S., 2019. Hydrodynamic and mass
transfer investigation of oxidative desulfurization of a model fuel using an
ultrasound horn reactor. Ultrason. Sonochem. 52, 7787.
Reay, D., Ramshaw, C., Harvey, A., 2008. Chapter 5 reactors. Process
Intensification Engineering for Efficiency, Sustainability and Flexibility.
Butterworth-Heinemann, pp. 103186.
Chapter 6 Process intensification and integration in the production of biojet fuel
Son, Y., 2017. Simple design strategy for bath-type high-frequency sonoreactors.
Chem. Eng. J. 328, 654664.
Sousa, F.P., Silva, L.N., de Rezende, D.B., de Oliveira, L.C.A., 2018. Simultaneous
deoxygenation, cracking and isomerization of palm kernel oil and palm olein
over beta zeolite to produce biogasoline, green diesel and biojet fuel. Fuel
223, 149156.
Stankiewicz, A.J., Moulijn, J.A., 2000. Process intensification: transforming
chemical engineering. Chem. Eng. Prog. 2234.
Stankiewicz, A.J., Moulijn, J.A., 2002. Process intensification. Ind. Eng. Chem.
Res. 41 (8), 19201924.
Tonomura, O., Kubota, M., Kano, M., Hasebe, S., 2009. Design of T-shaped
microreactors by reduced order approach. Comput. Aided Chem. Eng. 27,
891896.
Turton, R., Bailie, R.C., Whiting, W.B., Shaeiwitz, J.A., Bhattacharyya, D., 2012.
Analysis, Synthesis and Design of Chemical Processes, fourth ed. Prentice
Hall, Michigan (Appendix A).
Villegas-Herrera, L.A., Gómez-Castro, F.I., Romero-Izquierdo, A.G., GutiérrezAntonio, C., Hernández, S., 2018. Feasibility of energy integration for highpressure biofuels production processes. Comput. Aided Chem. Eng. 43,
15231528.
Zhang, B.J., Tang, Q.Q., Zhao, Y., Chen, Y.Q., Chen, Q.L., Floudas, C.A., 2018.
Multi-level energy integration between units, plants and sites for natural gas
industrial parks. Renew. Sustain. Energy Rev. 88, 115.
199
Supply chain for the production
of biojet fuel
7.1
7
Introduction
The development of the biojet fuel industry, as it occurs for
any other biofuel, has several aspects to be included in the planning of the production and distribution. Even if the production
process has been properly designed by using modern technologies and methodologies, if the whole supply chain is not correctly planned, the biofuel production may not be economically
feasible, or environmentally friendly. Thus, the detailed study of
the supply chain, and its optimization through efficient techniques, is mandatory to choose the best distribution alternatives,
together with the best location of the facilities. The systematic
design and optimization of the supply chains for biofuels production have been appointed as a strategy to accelerate the transition to the large-scale and production of such renewable fuels
(Yue et al., 2014). This chapter is focused on the supply chain for
biojet fuel. First, the elements involved in a supply chain analysis
for biojet fuel are presented, and some insights about the generation of the required information are discussed. Then, standards
for product certification considering the supply chain are
described. The methodology for modeling and optimization of
the biojet fuel supply chain is presented, and a case study for
Mexico is developed. Finally, the importance of the life cycle
analysis (LCA) in the production of biojet fuel and its relationship
with the supply chain studies is discussed.
7.2
Elements of the supply chain to produce
biojet fuel
There are several elements involved in the supply chain for
the production of a biofuel, or various biofuels and bioproducts.
Those elements can be classified as:
• Raw materials
• Transportation of raw material to the facilities
Production Processes of Renewable Aviation Fuel. DOI: https://doi.org/10.1016/B978-0-12-819719-6.00007-9
© 2021 Elsevier B.V. All rights reserved.
201
202
Chapter 7 Supply chain for the production of biojet fuel
• Number and location of facilities
• Transportation of the product to the market
In the case of raw materials, it is important to know what
kind of materials can be used to produce the biofuels. It is also
necessary to know the available amounts of the raw material,
the zones where it can be obtained, and its unitary cost.
Moreover, if there is information about changes in availability
of the raw materials along the seasons, it can be quite useful for
planning purposes. If the biofuel will be produced from lignocellulosic biomass, it is important to know how much residue
can be obtained per hectare of crop, and the geographic regions
where such crop can be produced. In the case of biofuels
obtained from edible and nonedible vegetable oils, it is necessary to know the zones where the crops or plants can be produced, and the quantity of seeds that can be used to obtain the
oils. In the case of microalgae oil, it is necessary to identify the
geographic regions with potential for the installment of ponds,
mainly in terms of climate and water availability. If waste oils
are used, it is necessary to determine the potential for producing and collecting used oils in different zones. In any case, the
availability of raw materials does not remain constant, since it
may change under different climate conditions, or different
consumption patterns, in the case of waste oils. Thus, historic
data about changes in the availability of the raw materials can
be useful for a better planning on the production of biofuels
from a variety of biomass sources.
Once the potential raw materials, their location, and availability are determined, the next required information is about
how the materials will be transported to the facility (or facilities)
where they will be processed into biofuels and/or bioproducts.
Thus, it is necessary to know the distances between the biomass
sources and the potential locations of the facilities where the
biomass will be converted. Additionally, it is required to have
information about the kind of transportation device required,
commonly trucks or, in some cases, train. Necessary information about the transportation device includes capacity and fuel
consumption per kilometer, and the cost due to the transportation of a fully loaded truck/wagon. Moreover, since the supply
chain is expected to be not only economic but also having low
environmental impact, it is desirable to know how much greenhouse gases are released per kilometer traveled.
Another important aspect to consider in the supply chain is
the location of the facilities. In the case of bioprocesses and biorefineries, it is recommended to establish a distributed network,
due to the variations in raw materials and markets from region
Chapter 7 Supply chain for the production of biojet fuel
to region (Santibañez-Aguilar et al., 2012). Thus potential locations of the facilities must be defined. Depending on the detailed
level of the available data, the facilities are assumed as located in
a given municipality, state, or region of the country. Some information can be useful to eliminate alternatives from a first insight,
reducing the complexity of the problem. Since most of the bioprocesses require high quantities of water, regions with water
scarcity can be removed from the set of feasible locations. On
the other hand, zones with poor industrial infrastructure can also
be nonappropriated for the purposes of the study. Another kind
of information associated with the biomass processing is the
technology employed to obtain the biofuels. The detailed design
of each processing alternative is usually not performed in a supply chain analysis, but there must be knowledge about the mean
yields and purities that each technology can achieve, their
annual cost per unit of biofuel produced, and the utility requirements. Moreover, it is necessary to have information about the
costs for utilities, and even the cost of the industrial land for
each potential location. For a more detailed analysis, the emissions of greenhouse gases and other pollutants per unit of produced biofuel could also be necessary.
7.3
Data generation
All the data required to determine a proper supply chain for the
production of biojet fuel can be obtained from different sources.
Information about the availability of crops is usually reported
by government agencies, as the Department of Energy in the
United States, or the Service of Agrifood and Fisheries Information
(Servicio de Información Agroalimentaria y Pesquera, SIAP) and the
Ministry of Agriculture, Livestock, Rural Development, Fisheries
and Food (Secretarı́a de Agricultura, Ganaderı́a, Desarrollo Rural,
Pesca y Alimentación, SAGARPA) in Mexico. Moreover, scientific
papers and reviews can be found with reports on the availability of
sources of vegetable oils (e.g., Atabani et al., 2012) or lignocellulosic
biomass (e.g., Valdez-Vazquez et al., 2010; Tauro et al., 2018;
Deshavath et al., 2019). For some regions, reports about the availability of waste cooking oil can also be found (e.g., SheinbaumPardo et al., 2013; Khan et al., 2019).
For the transportation of raw materials to the facilities and
transportation of products from facilities to the final user, one
of the main data required for the supply chain is the distance
between the source and the destination. This information can
be easily acquired from different applications, such as Google
Maps. Other related data are the cost of transportation of raw
203
204
Chapter 7 Supply chain for the production of biojet fuel
materials per kilometer and per ton of raw material, and, if necessary, in terms of the objectives of the study, the emissions
associated with the transportation of biomass. Such information
can be found reported in literature for a number of cases,
for example, Börjesson (1996), Forsberg (2000), Kumar and
Sokhansanj (2007), and Méndez-Vázquez et al. (2017). For the
case of México, an interesting tool, that is in process of development in other countries, is the Geo-Space Platform (Plataforma
Geo-espacial del Cluster de BCS, 2020); in this tool the available
amount of biomass in a region specified by the user along with
its energetic potential and distances from the main processing
centers and/or final users is available.
In order to determine the number and location of the facilities, it is necessary to establish the potential locations of the
facilities. The number of potential locations can be high at a
first sight if, for example, the production of biofuels in a whole
country is considered. Nevertheless, the number of potential
locations can be reduced through the use of geographic information systems, which can discard infeasible locations, in
terms of factors such as accessibility to biomass, transportation
network, and accessibility to water bodies (Zhang et al., 2016).
In the case of the information related to the production process,
estimations for the yields from biomass to the desired product,
together with approximated production costs, can be found in
literature. The works of Wang et al. (2016), Gutiérrez-Antonio
et al. (2017), Pereira et al. (2017), and Vásquez et al. (2017) are
examples of reports where this information can be found for
the production of biojet fuel from a diversity of sources.
7.4
Standards for product certification
Any product, process, or service offered to a given market would
have more chances to be successful if it has been certified by a recognized instance. Certification makes the product, service, or process trustworthy, since it ensures a certain level of quality. In the
case of biofuels, one of the most recognized certifying instances is
the roundtable on sustainable biomaterials (RSB). RSB can certify,
among others, drop-in biofuels, as it is the case of biojet fuel, or
even a complete supply chain for biofuels. The RSB standard for
certification takes into account 12 principles (RSB, 2020a):
1. Legality
This principle implies that the development of the biofuel
production system accomplishes all the applicable laws and
regulations.
Chapter 7 Supply chain for the production of biojet fuel
2. Planning, monitoring, and continuous improvement
This principle requires that the project having a defined
strategy to continuously identify and mitigate environmental and social risks.
3. Greenhouse gas emissions
This principle involves that the production scheme
allows significant reductions in greenhouse gas emissions,
in comparison with the production of fossil fuels.
4. Human and labor rights
This principle implies that the project promotes proper
conditions for the workers involved in the whole production scheme, avoiding violations to human or labor rights.
5. Rural and social development
This principle implicates that the project contributes to
social and economic development, particularly for local,
rural, and indigenous communities.
6. Local food security
This principle entails that the project helps to improve
food security.
7. Conservation
This principle implies that the project avoids damages
to biodiversity and ecosystems.
8. Soil
This principle is referred to the development of strategies to maintain soil health, or to reverse soil degradation.
9. Water
This principle implies that the project respects the rights
for water-use of the people on the locality, promoting the
maintenance or enhancement of the quality and quantity
of surface and groundwater.
10. Air
This principle requires the project to keep air pollution
along the whole supply chain at minimum.
11. Use of technology, inputs, and management of waste
This principle calls for the development of strategies to
maximize the efficiency of all the procedures, while simultaneously minimizing the potential damages to environment and to society.
12. Land rights
This principle implicates that the project to respect traditional land rights of indigenous and local communities.
An important aspect of this standard is the fact that it
involves all the actors that participate in the supply chain: generators of biomass, producers of biomass, producers of biofuels,
and distributors of biofuels. So, the certification recognizes that
205
206
Chapter 7 Supply chain for the production of biojet fuel
a biofuel is produced sustainably. The main documentation
related with the global standard, which applies for production
in any country, is summarized in Table 7.1.
The standard for advanced fuels is referred to biofuels
generated from production residues, which is the case of solid
wastes and cooking oil. Thus, if biojet fuel produced from
those raw materials must accomplish this standard for its
certification.
The RSB certification also requires ensuring that the biofuel
production scheme has low impact due to the land use changes.
This is proved by demonstrating of accomplishing three categories: yield increase, unused or degraded land, and waste and
residues. In the case of yield increase, producers must demonstrate cultivating additional biomass to replace that used to produce biofuels. In the case of the category of unused or degraded
land, it must be proved that the biomass was produced on marginal land with null or little preliminary use for agriculture. For
the waste and residues category, it must be proved that the biomass used for the production accomplished the RSB standard
for wastes and residues.
• As reported by RSB (2020c), 11% of their certified products correspond to biojet fuel. Additionally, only two
commercial biojet fuel producers are certified, AltAir and
SkyNRG. AltAir received its certification by 2018, producing biojet fuel, green diesel, and gasoline from waste
feedstocks (RSB, 2018). According to the reported data,
their production allowed reductions in greenhouse gases
by more than 60%, in comparison with their fossil counterpart, which is higher than the minimum reduction
required by RSB, that is, 50%. On the other hand, SkyNRG
Table 7.1 Documentation related to the RSB global standard (RSB, 2020b).
Code
Document
RSB-STD-01-001
RSB-STD-30-001
RSB-PRO-60-001
RSB-STD-20-001
RSB-STD-04-002
RSB-STD-01-003-01
RSB-PRO-50-001
RSB-STD-01-010
Principles and criteria
Standard for participating operators
Procedure for risk management
Standard for traceability
Methodology for displacement effects
GHG calculation methodology
Procedure on communication and claims
Standard for advanced fuels
Chapter 7 Supply chain for the production of biojet fuel
has the RSB certification of biojet fuel produced from
used cooking oil and other feedstocks, which is valid until
2020 (RSB, 2020c).
7.5
Modeling and optimization of the supply
chain
The decision of the best supply chain for a given biofuel can
be taken aided by mathematical modeling and optimization
tools. The development of a proper model to achieve this purpose implies relating the interactions between the different elements of the supply chain, which have been mentioned in
Section 7.2. The model must allow deciding between choosing
or not a given raw material source, transporting the raw material to a given facility, and so on. To help the modeler to visualize all the potential interactions, a superstructure must be
developed. An example of a superstructure for the supply chain
of a biofuel is shown in Fig. 7.1, taking into account the basic
elements.
In Fig. 7.1, a given supplier can produce raw material 1, raw
material 2, and so on, or may produce only some of the raw
materials. The raw materials are processed in one or more facilities. The facilities transform the raw materials into different
products, which are then translated to the markets. It is clear
that, for a given case, some of the interactions between the elements on the superstructure may not exist, or other elements
can be included, as hubs to collect the raw materials, then
sending them to the facilities.
Supplier 1
Raw material 1
Facility 1
Product 1
Market 1
Supplier 2
Raw material 2
Facility 2
Product 2
Market 2
Supplier m
Raw material n
Facility o
Product p
Market q
Figure 7.1 General superstructure for the supply chain of a biofuel.
207
208
Chapter 7 Supply chain for the production of biojet fuel
7.5.1
The generalized disjunctive programming
representation
Once the superstructure has been developed, it can be
represented through a generalized disjunctive programming
(GDP) model. This kind of representation has been developed
by Türkay and Grossmann (1996) for the optimal selection of
processing routes, also applying it for the design of thermally
coupled distillation columns (Yeomans and Grossmann, 2000)
and reactive distillation columns (Jackson and Grossmann,
2001). In the GDP models, the elements in the superstructure
and their interactions are represented through logic-based
constraints and logic propositions. Thus the existence of a
given element and its interaction with other elements in the
superstructure can be true or false. Fig. 7.2 shows a superstructure for a simple process, where two kinds of reactors
can be selected to perform a given transformation of raw
materials into products; then, two possible separation processes can be used.
In the case of the reactor, a logic proposition PR would indicate that the CSTR configuration will be selected for this process
(PR is true), while the logic proposition PP would indicate that
the PFR configuration is chosen (PP is true). Similarly, PD and PE
could represent the selection of the distillation column and the
extraction column, respectively. The relationships between the
CSTR reactor
Distillation column
PFR reactor
Extraction column
Figure 7.2 Simple process structure for decision-making.
Chapter 7 Supply chain for the production of biojet fuel
elements in the superstructure can be stated in terms of logical
propositions, as shown in Table 7.2.
To exemplify, the logical proposition PR indicated that the
continuous stirred-tank reactor (CSTR) configuration is not
selected. On the other hand, the proposition PRXPP implies that
PR and PP are simultaneously true, and both CSTR and plug flow
reactor (PFR) configurations are selected. The proposition PR3PP
would imply that PR can be true, or PP can be true, or both propositions can be true, that is, there is the possibility to choose
between the CSTR equipment or the PFR equipment, or even
choosing both equipment. If the PR3PP proposition is used, it
implies that only a single equipment can be selected. The logical
proposition PR.PD is an implication, meaning that when the
CSTR system is selected, then the distillation column is also
selected. Nevertheless, if the CSTR system is not chosen, there is
still a possibility for the distillation column to be selected, in
combination with the PFR configuration. On the other hand, the
double implication PC3PD means that the two equipment are
dependent on each other. If the CSTR system is selected, the distillation column is also selected. If the CSTR configuration is not
chosen, the distillation column is not selected.
In a similar way, logical propositions can be used to represent the superstructures for supply chains, modeling the interactions between the elements on the superstructure. Several
works have been reported for the modeling and optimization
of supply chains for bioethanol and biodiesel (SantibañezAguilar et al., 2014), bio-hydrogen (El-Halwagi et al., 2013),
pellets from residual biomass (Méndez-Vázquez et al., 2017),
the production of renewable energy from different sources
(Martı́n and Grossmann, 2018), among others. Respect to biojet fuel, the determination of the optimal supply chain for its
Table 7.2 Logic operators, logic propositions, and binary equivalents.
Symbol
Logical operator
Logical proposition
Binary equivalent
⌐
X
NOT
AND
⌐Pj
Pi3Pj
3
=
.
3
OR
EXCLUSIVE OR
IF THEN
IFF THEN
Pi3Pj
Pi3Pj
Pi.Pj
Pi3Pj
1 2 yj
yi $ 1
yj $ 1
yi 1 yj $ 1
yi 1 yj 5 1
yi # yj
yi 5 yj
209
210
Chapter 7 Supply chain for the production of biojet fuel
production has been reported in the literature (Domı́nguezGarcı́a et al., 2017a; Domı́nguez-Garcı́a et al., 2017b; Neuling
and Kaltschmitt, 2018).
Implications are commonly used to represent the interactions between the components of the superstructure; sometimes, it is possible to formulate more complex implications,
which must be then converted into constraints in terms of
binary variables. To do this, it is necessary to modify the implications’ statement to derive a more convenient formulation,
known as the conjunctive normal form. To obtain that form, the
following steps are followed:
1. Transform all the implications into disjunctions, using
⌐Pi3Pj as equivalent for Pi.Pj.
2. Apply the DeMorgan’s theorem:
Pi XPj 5 Pi 3Pj
ð7:1Þ
Pi 3Pj 5 Pi XPj
ð7:2Þ
3. Distribute the OR operators over the AND operators.
The objective of the Step 3 is to obtain a set of disjunctions
united by AND operators, as exemplified in Eq. (7.3):
ð7:3Þ
Pi 3Pj XðPk 3Pl 3Pm ÞX?
The conjunctive normal form is useful to obtain the binary
equivalence of the implications, since, as shown in Table 7.2,
each logical proposition related by an AND operator will result
in a binary-based constraint. Thus the composed proposition
Pi 3Pj from Eq. (7.3) will be represented as a separate constraint
yi 1 yj $ 1, and so on.
To show the procedure, the scheme shown in Fig. 7.2 will
be analyzed. Either the CSTR or the PFR can be selected for
the processing of the raw materials. In any case, when a given
kind of reactor is selected, a separation process will follow,
either the distillation column or the liquidliquid extraction
column. This can be represented in terms of an implication:
ðPR 3PP Þ.ðPD 3PE Þ
ð7:4Þ
The implication is transformed into a disjunction:
ðPR 3PP Þ3ðPD 3PE Þ
ð7:5Þ
Applying the DeMorgan’s theorem to the disjunction on the left:
ðPR XPP Þ3ðPD 3PE Þ
ð7:6Þ
Chapter 7 Supply chain for the production of biojet fuel
Distributing the OR operators:
ðPR 3PD 3PE ÞXðPP 3PD 3PE Þ
ð7:7Þ
Each composed proposal will result in a binary-based constraint. The disjunction at the left side of the AND operator is
equivalent to:
1 2 yR 1 yD 1 yE $ 1
ð7:8Þ
yR 2 yD 2 yE # 0
ð7:9Þ
or
Eq. (7.9) implies that if the CSTR is selected (i.e., yR 5 1),
either the distillation column or the extraction column must be
selected to satisfy the constraint. On the other hand, if the
CSTR is not selected (i.e., yR 5 0), any of the separation systems
can still be selected. Similarly, the disjunction at the right side
of the AND operator in Eq. (7.7) is equivalent to:
1 2 yP 1 yD 1 yE $ 1
ð7:10Þ
yP 2 yD 2 yE # 0
ð7:11Þ
or
which can be interpreted similarly to Eq. (7.9). To indicate
exclusivity, that is, that if the CSTR reactor is selected, the PFR
cannot be simultaneously selected, or vice versa, the following
constraint must be added:
yR 1 yP 5 1
ð7:12Þ
For the distillation and extraction columns a similar constraint can be added:
yD 1 yE 5 1
ð7:13Þ
Once the interactions between the elements composing the
superstructure have been established, it is necessary to develop
the model for each element. Moreover, it is mandatory to determine the objective function for the optimization problem.
A general representation of the GDP statement is given by
Eq. (7.14).
X
minz 5
ci 1 f ðxÞ
i
s.t.
g ðxÞ # 0
211
212
Chapter 7 Supply chain for the production of biojet fuel
2
3
Yik
viAD 4 hik ðxÞ # 0 5
ci 5 γ ik
ð7:14Þ
kAK
ΩðY Þ 5 TRUE
xARn
Y AfTrue; False g
ci $ 0
The objective function is given by a general nonlinear function f ðxÞ and the sum of fixed costs ci. There can exist K disjunction constraints, and each of these constraints can be
related to I logical propositions. When a given logical proposition Yik is true, the set of constraints hik ðxÞ # 0 is also true, and
ci 5 γ ik . On the other hand, the constraints g ðxÞ # 0 depend only
on the continuous variables x and are not affected by the logical
propositions Yik . On this last set of constraints, those who relate
the elements in the superstructure must also be included.
Once the GDP model has been developed, it can be converted into an mixed-integer linear programming or mixedinteger non linear programming model through relaxation techniques, which are presented in the next subsection.
7.5.2
Relaxation of a generalized disjunctive
programming model
Although the GDP representation allows developing logical
models in a simple way, to solve the model it is better to have a
discrete equivalent, in terms of binary variables yik instead of
the logical variables Yik . Two approaches can be used to obtain
this equivalent: The Big-M approach and the convex hull
approach. These approaches will be described next.
7.5.2.1 The Big-M approach
Consider the disjunction shown as Eq. (7.15):
Yi
viAD
hi ðxÞ # 0
ð7:15Þ
Chapter 7 Supply chain for the production of biojet fuel
where hi ðxÞ is a nonlinear function. The disjunction (Eq. 7.15)
can be relaxed through the Big-M approach as:
ð7:16Þ
hi ðxÞ # Mi 1 2 yi
For the relaxation, the
term
on the right of the inequality is
simply replaced by Mi 1 2 yi . The parameter Mi is known as
the Big-M, and it takes a value big enough to surpass the region
where hi ðxÞ is defined. Thus if Yi is true, it implies that yi 5 1,
and the relaxed constraint remains as hi ðxÞ # 0, satisfying the
condition given by the logical proposal. If Yi is false, yi 5 0, and
the constraint is hi ðxÞ # Mi . Thus if Mi is big enough, it defines
a pseudo-infinite feasible region, where the solution will be
defined by the other logical propositions.
Notice that the constraint in Eq. (7.15) is an inequality. If
there is an equality in the proposition, as follows:
Yi
viAD
ð7:17Þ
fi ð x Þ 5 0
Before its relaxation, the inequality must be converted to an
equivalent set of inequalities:
2
3
Yi
ð7:18Þ
viAD 4 fi ðxÞ # 0 5
2fi ðxÞ $ 0
This way, two constraints in terms of the binary variable yi
are obtained:
fi ðxÞ # Mi 1 2 yi
ð7:19Þ
fi ðxÞ $ 2Mi 1 2 yi
ð7:20Þ
In this case, if yi 5 1, the constraints are fi ðxÞ # 0 and fi ðxÞ $ 0.
The only way to accomplish both constraints is if fi ðxÞ 5 0, which
is the original equality constraint. Otherwise, the constraints are
given by fi ðxÞ # Mi and fi ðxÞ $ Mi , which, once more, if Mi is big
enough, originates a pseudo-infinite feasible region, implying
that the solution will be given by the other logical propositions.
7.5.2.2
The convex hull approach
In the convex hull approach, each variable xj in the vector of
variables x is represented as the sum of a set of variables ν ji ,
known as disaggregated variables:
X
xj 5
ν ji
ð7:21Þ
i
213
214
Chapter 7 Supply chain for the production of biojet fuel
Each variable ν ji will be related to a logical proposition Yi .
The convex hull equivalent of the disjunction given by
Eq. (7.15) is:
νi
yi hi
#0
ð7:22Þ
yi
ν ji $ 0
ð7:23Þ
up
ν ji # ν ji yi
ð7:24Þ
up
ν ji
where ν i is the vector of disaggregated variables, and
is the
upper limit for the variable ν ji , which can be fixed in terms of
the upper limit for the corresponding variable xj . It can be seen
that, if yi 5 0, ν ji is set as zero, and the value of xj will be given
by the other disaggregated variables. If the constraint in the disjunction is an equality, as in Eq. (7.17), convex hull can be
applied directly, obtaining:
νi
yi fi
50
ð7:25Þ
yi
Of course, Eqs. (7.23) and (7.24) must be added to Eq. (7.25)
to complete the convex hull equivalent of Eq. (7.17).
Both, Big-M and convex hull approaches, can be used to
relax the disjunctions in a GDP model. The resulting constraints, containing the binary variables, are added to the constraints that are not dependent on the disjunctions. In general
terms, the Big-M approach is relatively easier to apply than convex hull. Nevertheless, the reliability of the results will strongly
depend on the values chosen for Mi. On the other hand, the
convex hull approach will generate additional variables and
constraints. Nevertheless, in the case of nonlinear constraints
inside the disjunctions, convex hull is better than Big-M, and it
is highly recommended in those cases.
7.6
Case study: optimization of the biojet fuel
supply chain in Mexico
In this section we present a case of study related to the determination of the optimal supply chain for the production of biojet
fuel in Mexico. The localization problem of a biojet fuel factory
in Mexico using mathematical optimization (GDP) is based in
the case of study presented in Chapter 3, Production Processes
for the Conversion of Triglyceride Feedstock; wherein the raw
Chapter 7 Supply chain for the production of biojet fuel
215
material flow is 21,250,000.00 kg/year (palm oil 1 Jatropha curcas
oil) and the TAC is 14,363,787.77 USD/year, without the raw
material cost. The biojet fuel produced, according to the simulation results, is 8,263,366.55 kg/year.
For this case of study, seven producers of J. curcas and palm
oil have been considered to supply these raw materials, which
are distributed along the country. Also, according to the higher
growth indexes registered in Mexico, three zones have been
selected as alternatives to establish the biojet fuel factory.
Regarding end consumers of biojet fuel, 12 airports alongside
the country have been selected to receive the biofuel.
The selection of the best zone for establishing the biojet fuel
factory is carried out by the TAC minimization. This economic
factor includes the equipment cost, the operating cost, which
involves the raw material cost, the steam and cooling water cost,
and the electricity; and the cost related with the raw material
transportation (production zone to possible location plant), the
biojet fuel transportation (possible location plant to airports) and
the land cost, required for each considered zone. Table 7.3 presents the overview of equipment and operating cost, whilst in
Tables 7.4 and 7.5 it is shown the raw material available from
each producer and the biojet fuel required for each selected airport, respectively, taking into account mixtures of fossil and
renewable jet fuel of 50 wt.%; this percentage is the maximum
volume of biojet fuel that can be used according to standard
ASTM D7566 (2019). Finally, in Table 7.6 the transportation costs
Table 7.3 Overview of operating and capital cost, excluding raw material cost.
Operating cost (USD/year)
Heating utilities cost
Cooling utilities cost
Electricity cost
Total operating cost
(USD/year)
81,110.68
6530.63
70,008.15
13,757,063.30
Annual capital cost (USD/year)
Equipment cost
A1
A2
Total annual cost (USD/year)
1,694,761.07
305,056.99
1,033,804.25
606,724.46
Total operating cost (USD/year) 1 total annual cost (USD/year)
14,363,787.77
216
Chapter 7 Supply chain for the production of biojet fuel
Table 7.4 Producers and oil capacity.
Producer
Total oil capacity (kg/year)
1
2
3
4
5
6
7
4,342,000.00
6,353,800.00
3,945,760.00
4,605,460.00
1,115,282.00
3,480,100.00
5,643,160.00
Table 7.5 Airport and biojet fuel requirements.
Airport
Biojet fuel requirement (kg/year)
1
2
3
4
5
6
7
8
9
10
11
12
105,343.8
49,769.00
63,872.6
2,682,465
2,149,702
2,055,753
161,451.5
242,538.7
691,865.00
549,813.00
11,981,764.6
3,813,398.00
are shown: producer to factory and factory to airport. In Fig. 7.3
the problem statement is presented.
The minimization of total annual cost (TAC) is presented in
Eq. (7.26):
minTAC 5
3
X
j51
CPLTj 1
7 X
3
X
i51 j51
CPij 1
3 X
12
X
CDjk
ð7:26Þ
j51 k51
where
CPLTj USD
5 total cost of the factory “j”
year
CPij USD
year 5 transport cost between raw material producer
“i” and factory “j”
Chapter 7 Supply chain for the production of biojet fuel
217
Table 7.6 Transportation cost.
Transportation cost (USD/kg)
Producer to factory
Transportation cost (USD/kg)
Factory to airport
Producer
Factory 1
Factory 2
Factory 3
Airport
Factory 1
Factory 2
Factory 3
1
2
3
11.34
6.93
20.58
23.11
41.62
15.01
26.27
13.20
38.80
4
20.91
30.44
5.68
5
12.27
21.88
15.47
6
32.09
5.80
17.15
7
5.178
19.06
27.62
1
2
3
4
5
6
7
8
9
10
11
12
34.43
19.42
7.13
14.70
51.83
4.23
33.88
13.48
30.22
4.25
2.1
2.901
36.50
43.23
17.08
6.1
45.15
1.92
34.97
23.45
39.81
31.31
21.84
14.49
11.16
4.61
3.85
16.44
44.93
9.79
26.98
6.59
4.93
27.52
13.84
36.95
Producer
Location
Figure 7.3 Problem statement of the localization of a biojet fuel factory.
Airport
218
Chapter 7 Supply chain for the production of biojet fuel
CDjk USD
year 5 transport cost between biojet fuel factory “j”
and airport
“k”
TAC USD
year 5 total annual cost of localization function
j 5 index for possible factories: 1, 2, 3 (see Fig. 7.1)
i 5 index for raw material producers: 1, 2,. . .,7 (see Fig. 7.3)
k 5index for airports: 1, 2,. . .,12 (see Fig. 7.3)
Mij USD
5 raw material from “i” to “j”
kg
USD
Mresi kg 5 raw material remaining in production place
(not required)
kg
5 total raw material to “j” (for each processing
MPTEj year
plant is 21,250,000.00 kg/year)
CTj USD
year 5 land cost in each zone “j” (zone 1 5 285,010.00
USD/year; zone 2 5 300,846.00 USD/year; zone 3 5 369,460.00
USD/year)
CPFj USD
year 5 equipment cost 1 operating cost (excluding the
raw material
cost, 14,363,787.77 USD per year)
USD
CM kg 5 raw material cost (palm oil 1 J. curcas oil,
2.38 USD per kg)
Yj 5
binary variable, existence of the plant “j”
kg
Bjk year
5 biojet fuel from “j” to “k”
kg
BTj year
5 biojet
fuel
obtained
in
(8,263,366.55 kg/year)
E 5 step size (0.001)
Subject to:
factory
Y1 1 Y2 1 Y3 $ 1
Y1
:Y1
3
CPLT1 5 CPF1 1 MPTE1 CM 1 CT1
CPLT1 5 0
Y2
:Y2
3
CPLT2 5 CPF2 1 MPTE2 CM 1 CT2
CPLT2 5 0
“j”
ð7:27Þ
Y3
:Y3
3
CPLT3 5 CPF3 1 MPTE3 CM 1 CT3
CPLT3 5 0
ð7:28Þ
ð7:29Þ
ð7:30Þ
The constraints for possible location zones are as follows:
CP11 5 M11 CR11
ð7:31Þ
CP12 5 M12 CR12
ð7:32Þ
CP13 5 M13 CR13
ð7:33Þ
Chapter 7 Supply chain for the production of biojet fuel
M11 1 M12 1 M13 # 4342000
ð7:34Þ
Mres1 5 4342000 2 ðM11 1 M12 1 M13 Þ
ð7:35Þ
CP21 5 M21 CR21
ð7:36Þ
CP22 5 M22 CR22
ð7:37Þ
CP23 5 M23 CR23
ð7:38Þ
M21 1 M22 1 M23 # 6353800
ð7:39Þ
Mres2 5 6353800 2 ðM21 1 M12 1 M23 Þ
ð7:40Þ
CP31 5 M31 CR31
ð7:41Þ
CP32 5 M32 CR32
ð7:42Þ
CP33 5 M33 CR33
ð7:43Þ
M31 1 M32 1 M33 # 3945760
ð7:44Þ
Mres3 5 3945760 2 ðM31 1 M32 1 M33 Þ
ð7:45Þ
CP41 5 M41 CR41
ð7:46Þ
CP42 5 M42 CR42
ð7:47Þ
CP43 5 M43 CR43
ð7:48Þ
M41 1 M42 1 M43 # 4605460
ð7:49Þ
Mres4 5 4605460 2 ðM41 1 M42 1 M43 Þ
ð7:50Þ
CP51 5 M51 CR51
ð7:51Þ
CP52 5 M52 CR52
ð7:52Þ
CP53 5 M53 CR53
ð7:53Þ
M51 1 M52 1 M53 # 1115282
ð7:54Þ
219
220
Chapter 7 Supply chain for the production of biojet fuel
Mres5 5 1115282 2 ðM51 1 M52 1 M53 Þ
ð7:55Þ
CP61 5 M61 CR61
ð7:56Þ
CP62 5 M62 CR62
ð7:57Þ
CP63 5 M63 CR63
ð7:58Þ
M61 1 M62 1 M63 # 3480100
ð7:59Þ
Mres6 5 3480100 2 ðM61 1 M62 1 M63 Þ
ð7:60Þ
CP71 5 M71 CR71
ð7:61Þ
CP72 5 M72 CR72
ð7:62Þ
CP73 5 M73 CR73
ð7:63Þ
M71 1 M72 1 M73 # 5643160
ð7:64Þ
Mres7 5 5643160 2 ðM71 1 M72 1 M73 Þ
ð7:65Þ
7
X
Mi1 5 Y1 MPTE1
ð7:66Þ
Mi2 5 Y2 MPTE2
ð7:67Þ
Mi3 5 Y3 MPTE3
ð7:68Þ
i51
7
X
i51
7
X
i51
The constraints for routes of raw material producers to factory are the next ones:
CD11 5 B11 CRD11
ð7:69Þ
CD12 5 B12 CRD12
ð7:70Þ
CD13 5 B13 CRD13
ð7:71Þ
Chapter 7 Supply chain for the production of biojet fuel
CD14 5 B14 CRD14
ð7:72Þ
CD15 5 B15 CRD15
ð7:73Þ
CD16 5 B16 CRD16
ð7:74Þ
CD17 5 B17 CRD17
ð7:75Þ
CD18 5 B18 CRD18
ð7:76Þ
CD19 5 B19 CRD19
ð7:77Þ
CD110 5 B110 CRD110
ð7:78Þ
CD111 5 B111 CRD111
ð7:79Þ
CD112 5 B112 CRD112
ð7:80Þ
12
X
B1K 5 8; 263; 366:55 Y1
ð7:81Þ
CD21 5 B21 CRD21
ð7:82Þ
CD22 5 B22 CRD22
ð7:83Þ
CD23 5 B23 CRD23
ð7:84Þ
CD24 5 B24 CRD24
ð7:85Þ
CD25 5 B25 CRD25
ð7:86Þ
CD26 5 B26 CRD26
ð7:87Þ
CD27 5 B27 CRD27
ð7:88Þ
CD28 5 B28 CRD28
ð7:89Þ
k51
221
222
Chapter 7 Supply chain for the production of biojet fuel
CD29 5 B29 CRD29
ð7:90Þ
CD210 5 B210 CRD210
ð7:91Þ
CD211 5 B211 CRD211
ð7:92Þ
CD212 5 B212 CRD212
ð7:93Þ
12
X
B2K 5 8; 263; 366:55 Y2
ð7:94Þ
CD31 5 B31 CRD31
ð7:95Þ
CD32 5 B32 CRD32
ð7:96Þ
CD33 5 B33 CRD33
ð7:97Þ
CD34 5 B34 CRD34
ð7:98Þ
CD35 5 B35 CRD35
ð7:99Þ
CD36 5 B36 CRD36
ð7:100Þ
CD37 5 B37 CRD37
ð7:101Þ
CD38 5 B38 CRD38
ð7:102Þ
CD39 5 B39 CRD39
ð7:103Þ
CD310 5 B310 CRD310
ð7:104Þ
CD311 5 B311 CRD311
ð7:105Þ
CD312 5 B312 CRD312
ð7:106Þ
k51
12
X
k51
B3K 5 8; 263; 366:55 Y3
ð7:107Þ
Chapter 7 Supply chain for the production of biojet fuel
The constraints for distribution routes from factory to airports are as follows:
3
X
Bj1 # 105; 343:8
ð7:108Þ
j51
3
X
Bj2 # 49; 769
ð7:109Þ
Bj3 # 63; 872:6
ð7:110Þ
Bj4 # 2; 682; 465
ð7:111Þ
Bj5 # 2; 149; 702
ð7:112Þ
Bj6 # 2; 055; 753
ð7:113Þ
Bj7 # 161; 451:5
ð7:114Þ
Bj8 # 242; 538:7
ð7:115Þ
j51
3
X
j51
3
X
j51
3
X
j51
3
X
j51
3
X
j51
3
X
j51
3
X
Bj9 # 691; 865
ð7:116Þ
Bj10 # 549; 813
ð7:117Þ
Bj11 # 1; 198; 764:6
ð7:118Þ
j51
3
X
j51
3
X
j51
223
224
Chapter 7 Supply chain for the production of biojet fuel
3
X
Bj12 # 3; 813; 398
ð7:119Þ
j51
In order to solve this optimization problem, the convex hull
strategy is used to relax the following constraints:
ðCPLT11 Þ 5 ðY1 1 E ÞðCPF1 1 MPTE1 CM 1 CT1 Þ; CPLT12 5 0 ð7:120Þ
CPLT1 5 CPLT11 1 CPLT12
ðCPLT21 Þ 5 ðY2 1 E ÞðCPF2 1 MPTE2 CM 1 CT2 Þ; CPLT22 5 0 ð7:121Þ
CPLT2 5 CPLT21 1 CPLT22
ðCPLT31 Þ 5 ðY3 1 E ÞðCPF3 1 MPTE3 CM 1 CT3 Þ; CPLT32 5 0 ð7:122Þ
CPLT3 5 CPLT31 1 CPLT32
The remaining constraints are not relaxed because they are
not logical constraints. It is worth to mention that the constraint about possible location zones implies that more than
one factory could exist. This problem is solved in GAMS software; the GAMS code is presented in Appendix A.
According to the results, the minimum value for TAC
(Eq. 7.26) is 312,840,000.00 USD per year, which corresponds to
location at zone 1. Also, the producers selected to provide raw
material to factory are presented in Table 7.7, whilst in Table 7.8
the amount of biojet fuel for the selected airports is displayed.
The solver used for this problem was DICOPT.
The results obtained are presented in Fig. 7.4.
Table 7.7 Results: producers chosen and the selected capacity.
Producer
Total oil capacity (kg/year)
1
2
3
5
7
4,342,000.00
6,353,800.00
3,795,800.00
1,115,300.00
5,643,200.00
Chapter 7 Supply chain for the production of biojet fuel
Table 7.8 Airport and biojet fuel requirement.
Airport
Biojet fuel requirement (kg/year)
3
4
6
8
10
11
12
63,872.6.00
339,230.00
2,055,800.00
242,540.00
549,810.00
1,198,800.00
3,813,400.00
Producer
Location
Airport
Figure 7.4 Results of localization, biojet fuel factory.
It can be seen that from all the initial alternatives considered
in the superstructure presented in Fig. 7.3, the best solution consists of using just one facility (from three available) to process the
biomass generated by five producers (from seven available); this
allows to satisfy the demand of biojet fuel to be used in the airports in mixtures of 50% in volume. It is worth to mention that
the code included in Appendix A can be used to implement other
study cases, modifying the parameters and involved constraints.
225
226
Chapter 7 Supply chain for the production of biojet fuel
7.7
Importance of the life cycle analysis
The production of any biofuel is expected to be sustainable,
showing low environmental impact in the whole supply chain.
Unfortunately, this is not necessarily true. To ensure the sustainability of the production scheme of the biofuels, it is desirable
to perform additional studies to determine the environmental
impact of a given production route; detecting the stages with
higher environmental loads, thus identifying areas of opportunity
to obtain a more sustainable production scheme. This can be
performed through the LCA, which is a tool helpful for the measurement of the environmental impact related to a product
through all its life cycle. The environmental impact can be
defined as an alteration in the quality of the environment due to
human activity (Garmendia Salvador et al., 2005). Such impact
must be measurable, through environmental and impact indicators. An environmental indicator is a factor that indicates the
current status of an ecosystem, while an impact indicator is an
environmental indicator used to assess the changes in the environmental quality of an ecosystem due to a given action.
There are two kinds of elements that are involved in an LCA:
inputs and outputs. As inputs, resources, raw materials, parts,
products, transportation, and energy can be mentioned. The
outputs are usually emissions, either to the atmosphere, soil,
and/or water, along with residues and by-products. In a complete LCA, all the stages in the production of the studied product must be taken into account to assess the total impact:
the impact caused by the acquisition of the raw materials, the
impact due to the production process, the distribution of the
product, its use and its final disposal (ISO 14040:2006, 2020).
The association between the inputs/outputs and the production
stages is shown in Fig. 7.5. Although the final stage in the production chain is the disposition of the product, it is desirable to
promote recycling and reusing materials as much as possible,
following the principles of circular economy.
In the previous paragraph, the term “complete life cycle analysis” has been mentioned. The scope of the LCA can vary in terms
of the objectives of the analysis, the interests of the instance performing the analysis, or even the available information. The complete LCA involves the study of all the inputs/outputs for all the
stages in the production of the product, from the extraction of
the raw materials to its final disposition. Such analysis is known
as “cradle to grave.” It is also possible to perform the analysis
involving the extraction of the raw materials until the product is
placed in the market. In other words, the impact due to the use
Chapter 7 Supply chain for the production of biojet fuel
Inputs
Energy
Raw
materials
Materials and
components
Production
Distribution
and selling
Use
Recycling
Final
disposal
Outputs
Residues
Emissions
Figure 7.5 Inputs, outputs, and production stages involved in a life cycle analysis.
and final disposition of the product is not included. This kind of
analysis is known as “cradle to gate.” Finally, an analysis can be
performed by only including the inputs/outputs related to the
production process, that is, the impact due to the extraction and
transportation of raw materials, and those associated with the
use and final disposition of the product are not included. Such
analysis is known as “gate to gate.”
Independently of the scope of the study, an LCA consists of
four stages, whose interaction can be observed in Fig. 7.6:
1. Definition of objectives.
2. Inventory: obtaining information about all the inputs and outputs for all the processes involved in the production system.
3. Evaluation of impacts: implies transforming the inventory
into indicators.
227
228
Chapter 7 Supply chain for the production of biojet fuel
Definition of
objectives
Inventory
Figure 7.6 Stages of a life
cycle analysis.
Interpretation
Evaluation of
impacts
4. Interpretation of results.
The inventory stage is usually one of the most timedemanding steps in an LCA, since it requires collecting information about all the inputs and outputs defined as important
in the first stage of the analysis. Once the inventory is completed, the information is converted into indicators, which are
classified into impact categories. There are several methodologies to evaluate impacts, among which the Eco-Indicator 99
methodology can be mentioned (Goedkoop and Spriensma,
2001); this methodology takes into account several potential
impacts associated with the production of biofuels. In this
methodology, environmental impacts are grouped into three
categories: damages to resources, damages to human health,
and damages to ecosystem quality. In the Eco-Indicator 99
methodology, the inventory involves how much resources are
required, use of land, and the quantity of pollutants released.
Once the inventory has been completed, the impacts are evaluated through damage models, obtaining punctuations for each
category. The individual punctuations are then normalized,
weighted, and summed to obtain the final value of the ecoindicator, which is measured in milli-points (mPt); 1 Pt represents a thousandth of the environmental load of an average
European inhabitant.
The damages to resources are measured in terms of the surplus energy, which represents the additional effort required by
future generations to extract the remaining minerals and/or
hydrocarbons. This category quantifies how much nonrenewable
resources are used to produce a given product, and how will this
affect the obtention of the same resource by future generations.
Chapter 7 Supply chain for the production of biojet fuel
The damages to human health are measured in units known
as DALYs (disability-adjusted life years), implying either the
reduction of the life expectation or the number of years living
with a disability, both caused by exposition to a pollutant. This
category includes damages to the respiratory system, cancer,
effects of climate change and depletion of the ozone layer on
the human health, and effects due to radiation by ionization.
The damages to ecosystem quality are measured in terms of
the percent of species, which will potentially disappear as a consequence of a given human activity. This category includes the effect
of ecotoxicity, acidification, and eutrophication. Additionally, the
effects due to land use and land use changes are included,
considering the effect of the action on the current use of the land
(local effect) and the effect of the action on the surroundings
(regional effect).
Since the three categories are measured with different units,
the impact of each category must be normalized. Additionally,
different levels of importance are given for each category through
weighting factors, whose value will depend on the cultural perspective, that is, the ideology of the decision-makers. Three cultural perspectives can be mentioned:
• Egalitarian, which is a long-term perspective. It gives greater
importance to the damage to the ecosystem quality.
• Individualist, which is a short-term perspective. It gives greater
importance to the damage to the ecosystem quality.
• Hierarchist, which is a mid-term perspective. It gives equal
importance to the damage to the ecosystem quality and the
human health.
The most common perspective is the hierarchist for both,
the damage models and the weighting factors, since it is a more
balanced perspective.
In summary, the discussed methodology implies the calculation of the eco-indicator, as follows:
EI99 5 ðDR ωR Þ 1 ðDHH ωHH Þ 1 ðDE ωE Þ
P
DR 5
i Ri IR;i
DHH 5
P
DE 5
k pk IE;k
1
ð7:124Þ
nR
P
P
j pj IHH;j
nE
ð7:125Þ
nHH
l Aocc;l tocc;l IE;l
1
ð7:123Þ
P
m Acha;m IE;m
ð7:126Þ
229
230
Chapter 7 Supply chain for the production of biojet fuel
where EI99 is the Eco-Indicator 99, DR, DHH, and DE are the
damages to resources, human health, and ecosystems, respectively. ωR , ωHH , and ωE are the weighting factors for resources,
human health, and ecosystems, respectively. Ri is the total
quantity of the resource i (e.g., petroleum, aluminum, zinc), IR,i
is the unitary impact due to the extraction of the resource i,
and nR is the normalization factor for resources. pj represents
the total mass released of the pollutant j affecting human
health, IR,i is the unitary impact caused by releasing the pollutant j, and nHH is the normalization factor for human health.
Here, it is important to recall that a given pollutant can
be released to air, water, and/or soil, causing different negative
effects to human health, and all the potential effects must be
included. pk represents the total mass released of the pollutant
k affecting the ecosystem quality, IE,k is the unitary impact
caused by releasing the pollutant k, Aocc,l is the area of the land
to be occupied, tocc,l represents the occupation years, IE,l is
the unitary impact due to the occupation of the land with area
Aocc,l, Acha,m is the area of the land whose use will be changed,
IE,m is the unitary impact due to the change in the use of the
land with the area Acha,m, and nE is the normalization factor for
ecosystem.
It is important to mention that the eco-indicator is more
useful to compare alternatives for the production of a given
product, since the best alternative in terms of environmental
impact is the one with the lowest value of the eco-indicator.
Also, eco-indicator can be useful to identify the step in the
whole production procedure with the highest contribution to
the environmental load. A more detailed description of the
methodology, together with the unitary impacts, the normalization factors, and the weighting factors, can be found in the
work of Goedkoop and Spriensma (2001).
If the production chain of biojet fuel is analyzed, several
impacts can be detected. Transportation of raw materials to the
production facilities, and the production process itself, causes
emissions of particles, carbon dioxide, and other greenhouse
gases, which may affect human health by causing either global
warming or respiratory affections. A similar effect occurs when
the biojet fuel is burned. Depending on the raw material used
to produce the biojet fuel, changes in land use to promote the
farming of a given crop, or changes in land use to construct the
production facility, would have an impact on ecosystem quality.
Additionally, the use of fossil fuels for the transportation of the
raw materials, or to produce the energy in the production process, together with the use of minerals to produce the materials
Chapter 7 Supply chain for the production of biojet fuel
for the construction of the processing plant, would have an
impact on the resources. Nevertheless, the production of biojet
fuel has a benefit in terms of CO2 captured by the crops
from which raw materials as oils or lignocellulosic residues are
obtained. From this simplified analysis, it is clear that, even if
an optimal supply chain has been obtained in terms of minimum cost or maximum profit, the potential environmental
impact must be measured and actions must be taken if highimpact stages are detected; to ensure that the production of the
biofuel has indeed less environmental load than the production
and use of the conventional energy sources.
Some works have been developed dealing with the LCA for the
production of biojet fuel. Agusdinata et al. (2011) reported that the
production and use of biojet fuel in 5050 blends is not enough to
reach the greenhouse gases (GHG) reduction target by 2050. They
recommend the development of additives and enhancement in the
fuel efficiency of the aircraft fleet. Fortier et al. (2014) performed an
LCA for the treatment of microalgae through hydrothermal liquefaction to produce biojet fuel. They proposed two locations for the
production process: a wastewater treatment plant and a refinery.
According to the reported results, most of the equivalent emissions
of carbon dioxide are due to the transportation of biomass and
waste nutrients; thus the lowest environmental load is obtained by
locating the production process in the treatment plant. Li and
Mupondwa (2014) reported an LCA for biodiesel and biojet fuel
from camelina oil, including the impacts associated with global
warming, human health, ecosystem quality, and use of energy
resources. Based on the reported results, the highest environmental
load is due to the activities related with the obtention of the camelina oil. Lokesh et al. (2015) reported a cradle-to-grave LCA for the
production of biojet fuel from different raw materials, using the
ALCEmB model with focus on the greenhouse gas emissions. Their
results indicated that reductions from 58% to 70% are obtained in
the life cycle by producing synthetic paraffinic kerosenes with
camelina, microalgae, and J. curcas oils, in comparison with the reference fuel Jet-A1; the use of camelina oil to produce biojet fuel
represented the highest reduction in greenhouse gases emissions.
Budsberg et al. (2016) performed a cradle-to-grave LCA for the conversion of poplar biomass into biojet fuel; additionally, hydrogen is
obtained. The analysis is based on the assessment of the equivalent
carbon dioxide emissions and the use of fossil resources. According
to the reported results, the production of hydrogen has the highest
contribution to the emissions of greenhouse gases and the usage of
fossil fuels. de Jong et al. (2017) reported an LCA for the production
of biojet fuel with different technologies, mentioning that the
231
232
Chapter 7 Supply chain for the production of biojet fuel
FischerTropsch processing route represents the highest reduction
in greenhouse gas emissions in comparison with fossil jet fuel.
Hydrothermal liquefaction and the alcohol-to-jet process also
showed important reductions in greenhouse gases. Cultivation of
the feedstock is indicated as one of the main factors contributing to
the environmental impact, together with hydrogen production.
Michailos (2017) presented a life cycle assessment for the production
of biojet fuel from sugarcane bagasse, through an alcohol-to-jet
approach. The author reports that the conversion of sugarcane
bagasse into jet fuel allows a reduction of 47% in greenhouse gas
emissions, in comparison with fossil jet fuel. Pierobon et al. (2018)
performed a cradle-to-grave LCA for the production of biojet fuel
from residual woody biomass. An important result from this study is
that the use of the residual biomass to produce biofuels significantly
reduces the impacts in categories as respiratory effects, carcinogenics, and ecotoxicity, since the direct burning of the residues is
avoided. In general terms, most of the LCA reported for the
production of biofuels are focused on the emissions of greenhouse
gases, coinciding in the fact that the whole life cycle of biojet fuel
shows lower emissions than that of fossil jet fuel. Additionally, one of
the main contributions to environmental impact in biojet fuel production is given by the cultivation of triglyceride-containing feedstocks. The use of lignocellulosic residues has been detected as an
area of opportunity to further enhance the environmental evaluation
in the life cycle, avoiding the disposal of those residuals by highly pollutant means, as direct burning. The production of the hydrogen
required in the production paths has also been detected as a great
contributor to the environmental load; thus the production of renewable hydrogen has been proposed. An additional factor that is important in the LCA of biofuels is the allocation of the products and
by-products, as has been indicated by Ubando et al. (2019).
7.8
Conclusion
When developing a biofuel production scheme, it is important
not only taking into account the production process itself, but
also all the supply chain involved, from the production of the
raw materials to the final use of the biofuel. This would allow a
global vision of the potential steps where the cost can be elevated. A more detailed analysis, through tools as the LCA, would
also allow to establish the steps in the supply chain where environmental impact is high. A strategy to determine the best supply chain in the biojet fuel production is the development of
logic-based mathematical models, with an appropriate objective
Chapter 7 Supply chain for the production of biojet fuel
function; this tool will help to find the best configuration of the
elements required in the supply chain to minimize one or two
objective functions of interest. To make the production of biojet
fuel sustainable, the objective function must include not only
economic aspects, but also environmental ones.
References
Agusdinata, D.B., Zhao, F., Ileleji, K., DeLaurentis, D., 2011. Life cycle assessment
of potential biojet fuel production in the United States. Environ. Sci. Technol.
45 (21), 91339143.
ASTM International, 2019. ASTM D7566-19, Standard Specification for Aviation
Turbine Fuel Containing Synthesized Hydrocarbons. ,www.astm.org.
(accessed 12.05.19.).
Atabani, A.E., Silitonga, A.S., Badruddin, I.A., Mahlia, T.M.I., Masjuki, H.H.,
Mekhilef, S., 2012. A comprehensive review on biodiesel as an alternative
energy source and its characteristics. Renew. Sustain. Energy Rev. 16 (4),
20702093.
Börjesson, P.I.I., 1996. Emissions of CO2 from biomass production and
transportation in agriculture and forestry. Energy Convers. Manag. 37 (6),
12351240.
Budsberg, E., Crawford, J.T., Morgan, H., Chin, W.S., Bura, R., Gustafson, R.,
2016. Hydrocarbon bio-jet fuel from bioconversion of poplar biomass: life
cycle assessment. Biotechnol. Biofuels 9, 170.
de Jong, S., Antonissen, K., Hoefnagels, R., Lonza, L., Wang, M., Faaij, A., et al.,
2017. Life-cycle analysis of greenhouse gas emissions from renewable jet fuel
production. Biotechnol. Biofuels 10, 64.
Deshavath, N.N., Veeranki, V.D., Goud, V.V., 2019. Lignocellulosic feedstocks for
the production of bioethanol: availability, structure, and composition.
Sustain. Bioenergy Adv. Impacts 119.
Domı́nguez-Garcı́a, S., Gutiérrez-Antonio, C., De Lira-Flores, J.A., Ponce-Ortega,
J.M., El-Halwagi, M.M., 2017a. Strategic planning for the supply chain of
aviation biofuel with consideration of hydrogen production. Ind. Eng. Chem.
Res. 56 (46), 1381213830.
Domı́nguez-Garcı́a, S., Gutiérrez-Antonio, C., De Lira-Flores, J.A., Ponce-Ortega,
J.M., 2017b. Optimal planning for the supply chain of biofuels for aviation in
Mexico. Clean Technol. Environ. Policy 19, 13871402.
El-Halwagi, A.M., Rosas, C., Ponce-Ortega, J.M., Jiménez-Gutiérrez, A., Mannan,
M.S., El-Halwagi, M.M., 2013. Multiobjective optimization of biorefineries
with economic and safety objectives. AIChE J. 59 (7), 24272434.
Forsberg, G., 2000. Biomass energy transport: analysis of bioenergy transport
chain using life cycle inventory method. Biomass Bioenergy 19 (1), 1730.
Fortier, M.-O.P., Roberts, G.W., Stagg-Williams, S.M., Sturm, B.S.M., 2014. Life
cycle assessment of bio-jet fuel from hydrothermal liquefaction of
microalgae. Appl. Energy 122, 7383.
Garmendia Salvador, A., Salvador Alcaide, G., Crespo Sánchez, C., Garmendia
Salvador, L., 2005. Evaluación de Impacto Ambiental. Pearson, Spain
(Chapter 1).
Goedkoop, M., Spriensma, R., 2001. The eco-indicator 99: a damage oriented
method for life cycle impact assessment. Publikatiereeks Produktenbeleid.
233
234
Chapter 7 Supply chain for the production of biojet fuel
Gutiérrez-Antonio, C., Gómez-Castro, F.I., de Lira-Flores, J.A., Hernández, S.,
2017. A review on the production processes of renewable jet fuel. Renew.
Sustain. Energy Rev. 79, 709729.
International Organization for Standardization, 2020. ISO 14040:2006
Environmental management life cycle assessment principles and
framework ,https://www.iso.org/standard/37456.html. (accessed 01.17.20.).
Jackson, J.R., Grossmann, I.E., 2001. A disjunctive programming approach for
the optimal design of reactive distillation columns. Comput. Chem. Eng. 25
(1112), 16611673.
Khan, H.M., Ali, C.H., Iqbal, T., Yasin, S., Sulaiman, M., Mahmood, H., et al.,
2019. Current scenario and potential of biodiesel production from waste
cooking oil in Pakistan: an overview. Chin. J. Chem. Eng. 27 (10), 22382250.
Kumar, A., Sokhansanj, S., 2007. Switchgrass (Panicum virgatum, L.) delivery to
a biorefinery using integrated biomass supply analysis and logistics (IBSAL)
model. Bioresour. Technol. 98 (5), 10331044.
Li, X., Mupondwa, E., 2014. Life cycle assessment of camelina oil derived
biodiesel and jet fuel in the Canadian Prairies. Sci. Total Environ. 481, 1726.
Lokesh, K., Sethi, V., Nikolaidis, T., Goodger, E., Nalianda, D., 2015. Life
cyclegreenhouse gas analysis of biojet fuels with a technical investigationinto
their impact on jet engine performance. Biomass Bioenergy 77, 2644.
Martı́n, M., Grossmann, I.E., 2018. Optimal integration of renewable based
processes for fuels and power production: Spain case study. Appl. Energy 213,
595610.
Méndez-Vázquez, M.A., Gómez-Castro, F.I., Ponce-Ortega, J.M., Serafı́n-Muñoz,
A.H., Santibañez-Aguilar, J.E., El-Halwagi, M.M., 2017. Mathematical
optimization of a supply chain for the production of fuel pellets from residual
biomass. Clean Technol. Environ. Policy 19 (3), 721734.
Michailos, S., 2017. Process design, economic evaluation and life cycle
assessment of jet fuel production from sugar cane residue. Environ. Prog.
Sustain. Energy 37 (3), 12271235.
Neuling, U., Kaltschmitt, M., 2018. Techno-economic and environmental
analysis of aviation biofuels. Fuel Process. Technol. 171, 5469.
Pereira, L.G., MacLean, H.L., Saville, B.A., 2017. Financial analyses of potential
biojet fuel production technologies. Biofuels Bioprod. Biorefin. 11 (4),
665681.
Pierobon, F., Eastin, I.L., Ganguly, I., 2018. Life cycle assessment of residual
lignocellulosic biomass-based jet fuel with activated carbon and
lignosulfonate as co-products. Biotechnol. Biofuels 11, 139.
Plataforma Geo-espacial del Cluster de BCS, 2020. Cluster de BCS, CEMIE-Bio,
Lı́nea 1, Oferta y Demanda de Recursos Biomásicos Sólidos para la
Generación de Calor y Electricidad. ,http://www.wegp.unam.mx/cemie/1/
Mexico. (accessed 03.02.20.) (Spanish).
RSB, 2018. World first as AltAir biojet fuel refinery achieves RSB certification.
,https://rsb.org/2018/01/29/altair-rsb-certification-biofuel-refinery/.
(accessed 04.08.20.).
RSB, 2020a. A guide to the RSB standard. ,http://rsb.org/wp-content/uploads/
2017/04/RSB-Guide-to-the-RSB-Standard.pdf. (accessed 23.01.20.).
RSB, 2020b. Working with the RSB standard. ,https://rsb.org/the-rsb-standard/
working-with-the-rsb-standard/. (accessed 23.01.20).
RSB, 2020c. Alternative aviation fuels. ,https://rsb.org/aviation/. (accessed
04.08.20.).
Santibañez-Aguilar, J.E., Ponce-Ortega, J.M., González-Campos, J.B., SernaGonzález, M., El-Halwagi, M.M., 2012. Synthesis of distributed biorefining
networks for the value-added processing of water hyacinth. ACS Sustain.
Chem. Eng. 1 (2), 284305.
Chapter 7 Supply chain for the production of biojet fuel
Santibañez-Aguilar, J.E., González-Campos, J.B., Ponce-Ortega, J.M., SernaGonzález, M., El-Halwagi, M.M., 2014. Optimal planning and site selection for
distributed multiproduct biorefineries involving economic, environmental
and social objectives. J. Clean. Prod. 65, 270294.
Sheinbaum-Pardo, C., Calderón-Irazoque, A., Ramı́rez-Suarez, M., 2013.
Potential of biodiesel from waste cooking oil in Mexico. Biomass Bioenergy
56, 230238.
Tauro, R., Garcı́a, C.A., Skutsch, M., Masera, M., 2018. The potential for
sustainable biomass pellets in Mexico: an analysis of energy potential, logistic
costs and market demand. Renew. Sustain. Energy Rev. 82 (Part 1), 380389.
Türkay, M., Grossmann, I.E., 1996. Logic-based MINLP algorithms for the
optimal synthesis of process networks. Comput. Chem. Eng. 20 (8), 959978.
Ubando, A.T., Rivera, D.R.T., Chen, W.-H., Culaba, A.B., 2019. A comprehensive
review of life cycle assessment (LCA) of microalgal and lignocellulosic
bioenergy products from thermochemical processes. Bioresour. Technol. 291,
121837.
Valdez-Vazquez, I., Acevedo-Benitez, J.A., Hernández-Santiago, C., 2010.
Distribution and potential of bioenergy resources from agricultural activities
in Mexico. Renew. Sustain. Energy Rev. 14 (7), 21472153.
Vásquez, M.C., Silva, E.E., Castillo, E.F., 2017. Hydrotreatment of vegetable oils: a
review of the technologies and its developments for jet biofuel production.
Biomass Bioenergy 105, 197206.
Wang, W.-C., Tao, L., Markham, J., Zhang, Y., Tan, E., Batan, L., et al., 2016.
Review of biojet fuel conversion technologies. Technical Report NREL/TP510066291.
Yeomans, H., Grossmann, I.E., 2000. Optimal design of complex distillation
columns using rigorous tray-by-tray disjunctive programming models. Ind.
Eng. Chem. Res. 39 (11), 43264335.
Yue, D., You, F., Snyder, S.W., 2014. Biomass-to-bioenergy and biofuel supply
chain optimization: overview, key issues and challenges. Comput. Chem. Eng.
66, 3656.
Zhang, F., Johnson, D., Johnson, M., Watkins, D., Froese, R., Wang, J., 2016.
Decision support system integrating GIS with simulation and optimisation for
a biofuel supply chain. Renew. Energy 85, 740748.
Appendix A
$Title Case of study 7 Supply chain for the production of biojet fuel
set i productors/1*7/;
set j factory/1*3/;
set k airport/1*12/;
parameter CR(i, j)/1.1 11.34, 2.1 6.93, 3.1 20.58, 4.1 20.91, 5.1
12.27, 6.1 32.09, 7.1 5.178, 1.2 23.11,
2.2 41.62, 3.2 15.01, 4.2 30.44, 5.2 21.88, 6.2 5.80, 7.2 19.06,
1.3 26.27,
2.3 13.20, 3.3 38.80, 4.3 5.68, 5.3 15.47, 6.3 17.15, 7.3 27.62/;
parameter MPTE(j)/1 21250000, 2 21250000, 3 21250000/;
parameter CT(j)/1 285012, 2 300846, 3 369460/;
parameter CPF(j)/1 14363787.77, 2 14363787.77, 3 14363787.77/;
235
236
Chapter 7 Supply chain for the production of biojet fuel
parameter CM/2.38/;
parameter CRD(j, k)/1.1 34.43, 1.2 19.42, 1.3 7.13, 1.4 14.707,
1.5 51.836, 1.6 4.23, 1.7 33.886,
1.8 13.48, 1.9 30.22, 1.10 4.25, 1.11 2.1, 1.12 2.901, 2.1 36.505,
2.2 43.23, 2.3 17.08, 2.4 6.1, 2.5 45.15, 2.6 1.92,
2.7 34.97, 2.8 23.45, 2.9 39.81, 2.10 31.31, 2.11 21.84, 2.12
14.49,3.1 11.16, 3.2 4.61, 3.3 3.85, 3.4 16.44, 3.5 44.93,
3.6 9.79, 3.7 26.98, 3.8 6.59, 3.9 4.936, 3.10 27.52, 3.11 13.84,
3.12 36.95/;
parameter BT(j)/1 8263366.55, 2 8263366.55, 3 8263366.55/;
parameter E/0.01/;
binary variables Y(j);
positive variables CP(i, j), M(i, j), CPLT(j), CD(j, k), B(j, k),
Mres(i); variable TAC;
equations OBJ, IMP1, IMP2, IMP3, IMP4, IMP5, IMP6, IMP7,
IMP8, IMP9, IMP10, IMP11, IMP12, IMP13, IMP14,
IMP15, IMP16, IMP17, IMP18, IMP19, IMP20, IMP21, IMP22,
IMP23, IMP24, IMP25, IMP26, IMP27, IMP28, IMP29,
IMP30, IMP31, IMP32, IMP33, IMP34, IMP35, IMP36, IMP37,
IMP38, IMP39, IMP40, IMP41, IMP42, IMP43, IMP44,
IMP45, IMP46, IMP47, IMP48, IMP49, IMP50, IMP51, IMP52,
IMP53, IMP54, IMP55, IMP56, IMP57, IMP58, IMP59,
IMP60, IMP61, IMP62, IMP63, IMP64, IMP65, IMP66, IMP67,
IMP68, IMP69, IMP70, IMP71, IMP72, IMP73, IMP74, IMP75,
IMP76, IMP77, IMP78, IMP79, IMP80, IMP81, Res1,
Res2, Res3, Res4, Res5, Res6, Res7, Res8, Res9, Res10, Res11,
Res12;
*Constraints for possible location zones
IMP1.. CP(‘1’,‘1’) 5 e 5 (CR(‘1’,‘1’)*M(‘1’,‘1’));
IMP2.. CP(‘1’,‘2’) 5 e 5 (CR(‘1’,‘2’)*M(‘1’,‘2’));
IMP3.. CP(‘1’,‘3’) 5 e 5 (CR(‘1’,‘3’)*M(‘1’,‘3’));
IMP4.. M(‘1’,‘1’) 1 M(‘1’,‘2’) 1 M(‘1’,‘3’) 5 l 5 4342000;
IMP5.. Mres(‘1’) 5 e 5 4342000-(M(‘1’,‘1’) 1 M(‘1’,‘2’) 1 M(‘1’,‘3’));
IMP6.. CP(‘2’,‘1’) 5 e 5 (CR(‘2’,‘1’)*M(‘2’,‘1’));
IMP7.. CP(‘2’,‘2’) 5 e 5 (CR(‘2’,‘2’)*M(‘2’,‘2’));
IMP8.. CP(‘2’,‘3’) 5 e 5 (CR(‘2’,‘3’)*M(‘2’,‘3’));
IMP9.. M(‘2’,‘1’) 1 M(‘2’,‘2’) 1 M(‘2’,‘3’) 5 l 5 6353800;
IMP10.. Mres(‘2’) 5 e 5 6353800-(M(‘2’,‘1’) 1 M(‘2’,‘2’) 1 M(‘2’,‘3’));
IMP11.. CP(‘3’,‘1’) 5 e 5 (CR(‘3’,‘1’)*M(‘3’,‘1’));
IMP12.. CP(‘3’,‘2’) 5 e 5 (CR(‘3’,‘2’)*M(‘3’,‘2’));
IMP13.. CP(‘3’,‘3’) 5 e 5 (CR(‘3’,‘3’)*M(‘3’,‘3’));
IMP14.. M(‘3’,‘1’) 1 M(‘3’,‘2’) 1 M(‘3’,‘3’) 5 l 5 3945760;
IMP15.. Mres(‘3’) 5 e 5 3945760-(M(‘3’,‘1’) 1 M(‘3’,‘2’) 1 M(‘3’,‘3’));
IMP16.. CP(‘4’,‘1’) 5 e 5 (CR(‘4’,‘1’)*M(‘4’,‘1’));
IMP17.. CP(‘4’,‘2’) 5 e 5 (CR(‘4’,‘2’)*M(‘4’,‘2’));
Chapter 7 Supply chain for the production of biojet fuel
IMP18.. CP(‘4’,‘3’) 5 e 5 (CR(‘4’,‘3’)*M(‘4’,‘3’));
IMP19.. M(‘4’,‘1’) 1 M(‘4’,‘2’) 1 M(‘4’,‘3’) 5 l 5 4605460;
IMP20.. Mres(‘4’) 5 e 5 4605460-(M(‘4’,‘1’) 1 M(‘4’,‘2’) 1 M(‘4’,‘3’));
IMP21.. CP(‘5’,‘1’) 5 e 5 (CR(‘5’,‘1’)*M(‘5’,‘1’));
IMP22.. CP(‘5’,‘2’) 5 e 5 (CR(‘5’,‘2’)*M(‘5’,‘2’));
IMP23.. CP(‘5’,‘3’) 5 e 5 (CR(‘5’,‘3’)*M(‘5’,‘3’));
IMP24.. M(‘5’,‘1’) 1 M(‘5’,‘2’) 1 M(‘5’,‘3’) 5 l 5 1115282;
IMP25.. Mres(‘5’) 5 e 5 1115282-(M(‘5’,‘1’) 1 M(‘5’,‘2’) 1 M(‘5’,‘3’));
IMP26.. CP(‘6’,‘1’) 5 e 5 (CR(‘6’,‘1’)*M(‘6’,‘1’));
IMP27.. CP(‘6’,‘2’) 5 e 5 (CR(‘6’,‘2’)*M(‘6’,‘2’));
IMP28.. CP(‘6’,‘3’) 5 e 5 (CR(‘6’,‘3’)*M(‘6’,‘3’));
IMP29.. M(‘6’,‘1’) 1 M(‘6’,‘2’) 1 M(‘6’,‘3’) 5 l 5 3480100;
IMP30.. Mres(‘6’) 5 e 5 3480100-(M(‘6’,‘1’) 1 M(‘6’,‘2’) 1 M(‘6’,‘3’));
IMP31.. CP(‘7’,‘1’) 5 e 5 (CR(‘7’,‘1’)*M(‘7’,‘1’));
IMP32.. CP(‘7’,‘2’) 5 e 5 (CR(‘7’,‘2’)*M(‘7’,‘2’));
IMP33.. CP(‘7’,‘3’) 5 e 5 (CR(‘7’,‘3’)*M(‘7’,‘3’));
IMP34.. M(‘7’,‘1’) 1 M(‘7’,‘2’) 1 M(‘7’,‘3’) 5 l 5 5643160;
IMP35.. Mres(‘7’) 5 e 5 5643160-(M(‘7’,‘1’) 1 M(‘7’,‘2’) 1 M(‘7’,‘3’));
IMP36.. sum(i, M(i,‘1’)) 5 e 5 MPTE(‘1’)*Y(‘1’);
IMP37.. sum(i, M(i,‘2’)) 5 e 5 MPTE(‘2’)*Y(‘2’);
IMP38.. sum(i, M(i,‘3’)) 5 e 5 MPTE(‘3’)*Y(‘3’);
*Constraints for factory location
IMP39.. Y(‘1’) 1 Y(‘2’) 1 Y(‘3’) 5 g 5 1;
IMP40..
CPLT(‘1’) 5 e 5 (Y(‘1’))*(CPF(‘1’) 1 MPTE(‘1’)*CM 1
CT(‘1’));
IMP41..
CPLT(‘2’) 5 e 5 (Y(‘2’))*(CPF(‘1’) 1 MPTE(‘2’)*CM 1
CT(‘2’));
IMP42..
CPLT(‘3’) 5 e 5 (Y(‘3’))*(CPF(‘1’) 1 MPTE(‘3’)*CM 1
CT(‘3’));
*Constraints for routes: raw material productors to factory
IMP43.. CD(‘1’,‘1’) 5 e 5 (CRD(‘1’,‘1’)*B(‘1’,‘1’));
IMP44.. CD(‘1’,‘2’) 5 e 5 (CRD(‘1’,‘2’)*B(‘1’,‘2’));
IMP45.. CD(‘1’,‘3’) 5 e 5 (CRD(‘1’,‘3’)*B(‘1’,‘3’));
IMP46.. CD(‘1’,‘4’) 5 e 5 (CRD(‘1’,‘4’)*B(‘1’,‘4’));
IMP47.. CD(‘1’,‘5’) 5 e 5 (CRD(‘1’,‘5’)*B(‘1’,‘5’));
IMP48.. CD(‘1’,‘6’) 5 e 5 (CRD(‘1’,‘6’)*B(‘1’,‘6’));
IMP49.. CD(‘1’,‘7’) 5 e 5 (CRD(‘1’,‘7’)*B(‘1’,‘7’));
IMP50.. CD(‘1’,‘8’) 5 e 5 (CRD(‘1’,‘8’)*B(‘1’,‘8’));
IMP51.. CD(‘1’,‘9’) 5 e 5 (CRD(‘1’,‘9’)*B(‘1’,‘9’));
IMP52.. CD(‘1’,‘10’) 5 e 5 (CRD(‘1’,‘10’)*B(‘1’,‘10’));
IMP53.. CD(‘1’,‘11’) 5 e 5 (CRD(‘1’,‘11’)*B(‘1’,‘11’));
IMP54.. CD(‘1’,‘12’) 5 e 5 (CRD(‘1’,‘12’)*B(‘1’,‘12’));
IMP55.. sum(k, B(‘1’,k)) 5 e 5 8263366.55*Y(‘1’);
IMP56.. CD(‘2’,‘1’) 5 e 5 (CRD(‘2’,‘1’)*B(‘2’,‘1’));
IMP57.. CD(‘2’,‘2’) 5 e 5 (CRD(‘2’,‘2’)*B(‘2’,‘2’));
237
238
Chapter 7 Supply chain for the production of biojet fuel
IMP58.. CD(‘2’,‘3’) 5 e 5 (CRD(‘2’,‘3’)*B(‘2’,‘3’));
IMP59.. CD(‘2’,‘4’) 5 e 5 (CRD(‘2’,‘4’)*B(‘2’,‘4’));
IMP60.. CD(‘2’,‘5’) 5 e 5 (CRD(‘2’,‘5’)*B(‘2’,‘5’));
IMP61.. CD(‘2’,‘6’) 5 e 5 (CRD(‘2’,‘6’)*B(‘2’,‘6’));
IMP62.. CD(‘2’,‘7’) 5 e 5 (CRD(‘2’,‘7’)*B(‘2’,‘7’));
IMP63.. CD(‘2’,‘8’) 5 e 5 (CRD(‘2’,‘8’)*B(‘2’,‘8’));
IMP64.. CD(‘2’,‘9’) 5 e 5 (CRD(‘2’,‘9’)*B(‘2’,‘9’));
IMP65.. CD(‘2’,‘10’) 5 e 5 (CRD(‘2’,‘10’)*B(‘2’,‘10’));
IMP66.. CD(‘2’,‘11’) 5 e 5 (CRD(‘2’,‘11’)*B(‘2’,‘11’));
IMP67.. CD(‘2’,‘12’) 5 e 5 (CRD(‘2’,‘12’)*B(‘2’,‘12’));
IMP68.. sum(k, B(‘2’,k)) 5 e 5 8263366.55*Y(‘2’);
IMP69.. CD(‘3’,‘1’) 5 e 5 (CRD(‘3’,‘1’)*B(‘3’,‘1’));
IMP70.. CD(‘3’,‘2’) 5 e 5 (CRD(‘3’,‘2’)*B(‘3’,‘2’));
IMP71.. CD(‘3’,‘3’) 5 e 5 (CRD(‘3’,‘3’)*B(‘3’,‘3’));
IMP72.. CD(‘3’,‘4’) 5 e 5 (CRD(‘3’,‘4’)*B(‘3’,‘4’));
IMP73.. CD(‘3’,‘5’) 5 e 5 (CRD(‘3’,‘5’)*B(‘3’,‘5’));
IMP74.. CD(‘3’,‘6’) 5 e 5 (CRD(‘3’,‘6’)*B(‘3’,‘6’));
IMP75.. CD(‘3’,‘7’) 5 e 5 (CRD(‘3’,‘7’)*B(‘3’,‘7’));
IMP76.. CD(‘3’,‘8’) 5 e 5 (CRD(‘3’,‘8’)*B(‘3’,‘8’));
IMP77.. CD(‘3’,‘9’) 5 e 5 (CRD(‘3’,‘9’)*B(‘3’,‘9’));
IMP78.. CD(‘3’,‘10’) 5 e 5 (CRD(‘3’,‘10’)*B(‘3’,‘10’));
IMP79.. CD(‘3’,‘11’) 5 e 5 (CRD(‘3’,‘11’)*B(‘3’,‘11’));
IMP80.. CD(‘3’,‘12’) 5 e 5 (CRD(‘3’,‘12’)*B(‘3’,‘12’));
IMP81.. sum(k, B(‘3’,k)) 5 e 5 8263366.55*Y(‘3’);
*Constraints for distribution routes: factory to airports
Res1.. sum(j,B(j,‘1’)) 5 l 5 105343.8;
Res2.. sum(j,B(j,‘2’)) 5 l 5 49769;
Res3.. sum(j,B(j,‘3’)) 5 l 5 63872.6;
Res4.. sum(j,B(j,‘4’)) 5 l 5 2682465;
Res5.. sum(j,B(j,‘5’)) 5 l 5 2149702;
Res6.. sum(j,B(j,‘6’)) 5 l 5 2055753;
Res7.. sum(j,B(j,‘7’)) 5 l 5 161451.5;
Res8.. sum(j,B(j,‘8’)) 5 l 5 242538.7;
Res9.. sum(j,B(j,‘9’)) 5 l 5 691865;
Res10.. sum(j,B(j,‘10’)) 5 l 5 549813;
Res11.. sum(j,B(j,‘11’)) 5 l 5 1198764.6;
Res12.. sum(j,B(j,‘12’)) 5 l 5 3813398;
*Objective function
OBJ.. TAC 5 e 5 sum(j, CPLT(j)) 1 sum(i, CP(i,‘1’)) 1 sum(i, CP
(i,‘2’)) 1 sum(i, CP(i,‘3’)) 1 sum(k, CD(‘1’,k)) 1 sum(k, CD(‘2’, k)) 1
sum(k, CD(‘3’,k));
*Binary variables initialization
Y.l(‘1’) 5 1;
Y.l(‘2’) 5 1;
Y.l(‘3’) 5 1;
Chapter 7 Supply chain for the production of biojet fuel
B.l(‘1’,‘1’) 5 13517.27167;
B.l(‘1’,‘2’) 5 13517.27167;
B.l(‘1’,‘3’) 5 13517.27167;
B.l(‘1’,‘4’) 5 13517.27167;
B.l(‘1’,‘5’) 5 13517.27167;
B.l(‘1’,‘6’) 5 13517.27167;
B.l(‘1’,‘7’) 5 13517.27167;
B.l(‘1’,‘8’) 5 13517.27167;
B.l(‘1’,‘9’) 5 13517.27167;
B.l(‘1’,‘10’) 5 13517.27167;
B.l(‘1’,‘11’) 5 13517.27167;
B.l(‘1’,‘12’) 5 13517.27167;
B.l(‘2’,‘1’) 5 13517.27167;
B.l(‘2’,‘2’) 5 13517.27167;
B.l(‘2’,‘3’) 5 13517.27167;
B.l(‘2’,‘4’) 5 13517.27167;
B.l(‘2’,‘5’) 5 13517.27167;
B.l(‘2’,‘6’) 5 13517.27167;
B.l(‘2’,‘7’) 5 13517.27167;
B.l(‘2’,‘8’) 5 13517.27167;
B.l(‘2’,‘9’) 5 13517.27167;
B.l(‘2’,‘10’) 5 13517.27167;
B.l(‘2’,‘11’) 5 13517.27167;
B.l(‘2’,‘12’) 5 13517.27167;
B.l(‘3’,‘1’) 5 13517.27167;
B.l(‘3’,‘2’) 5 13517.27167;
B.l(‘3’,‘3’) 5 13517.27167;
B.l(‘3’,‘4’) 5 13517.27167;
B.l(‘3’,‘5’) 5 13517.27167;
B.l(‘3’,‘6’) 5 13517.27167;
B.l(‘3’,‘7’) 5 13517.27167;
B.l(‘3’,‘8’) 5 13517.27167;
B.l(‘3’,‘9’) 5 13517.27167;
B.l(‘3’,‘10’) 5 13517.27167;
B.l(‘3’,‘11’) 5 13517.27167;
B.l(‘3’,‘12’) 5 13517.27167;
M.l(‘1’,‘1’) 5 125142.8571;
M.l(‘2’,‘1’) 5 125142.8571;
M.l(‘3’,‘1’) 5 125142.8571;
M.l(‘4’,‘1’) 5 125142.8571;
M.l(‘5’,‘1’) 5 125142.8571;
M.l(‘6’,‘1’) 5 125142.8571;
M.l(‘7’,‘1’) 5 125142.8571;
M.l(‘1’,‘2’) 5 125142.8571;
M.l(‘2’,‘2’) 5 125142.8571;
239
240
Chapter 7 Supply chain for the production of biojet fuel
M.l(‘3’,‘2’) 5 125142.8571;
M.l(‘4’,‘2’) 5 125142.8571;
M.l(‘5’,‘2’) 5 125142.8571;
M.l(‘6’,‘2’) 5 125142.8571;
M.l(‘7’,‘2’) 5 125142.8571;
M.l(‘1’,‘3’) 5 125142.8571;
M.l(‘2’,‘3’) 5 125142.8571;
M.l(‘3’,‘3’) 5 125142.8571;
M.l(‘4’,‘3’) 5 125142.8571;
M.l(‘5’,‘3’) 5 125142.8571;
M.l(‘6’,‘3’) 5 125142.8571;
M.l(‘7’,‘3’) 5 125142.8571;
model ProyFinal/all/;
solve ProyFinal using minlp minimizing TAC;
The future trends in the
production of biojet fuel
8.1
8
Introduction
Biojet fuel has been identified as the most promissory alternative for the sustainable growth of the aviation sector. The main
advantage of biojet fuel is its renewable nature; additionally, it is
expected that the use of biojet fuel in the aviation sector will allow,
at least, partial fuel independence (Gutiérrez-Antonio et al., 2017).
As described in the previous chapters, biojet fuel can be produced from all types of biomass through different conversion
processes. In particular, the study of the conversion processes
and related topics has gained the attention of the scientific and
technological community in the last years; in this context, several raw materials and technologies have been analyzed. In
spite of all the advances in the development of production processes, the use of biojet fuel in commercial flights is only possible if the production process that generated it is certified by
ASTM. At the moment, six conversion pathways have been certified for the production of biojet fuel, and others are under
evaluation. In addition, strategies such as process intensification and energy integration have been applied with the objective of decreasing the external energy requirements and/or
capital costs of the biojet production processes, simultaneously
reducing the environmental impact associated with emissions
of greenhouse gases in the process. Other advantages of applying process intensification are related to the reduction in the
required space, enhancement of the safety on the process, and,
in some cases, a better controllability.
Moreover, according to the International Air Transport
Association, between 2011 and 2015, 22 airlines performed over
2500 commercial passenger flights with blends of up to 50%
biojet fuel from feedstocks including used cooking oil, Jatropha,
camelina, or algae oils, and sugarcane (IATA, 2018). Also, some
studies have been reported regarding the determination of the
optimal supply chain for the production of biojet fuel.
Production Processes of Renewable Aviation Fuel. DOI: https://doi.org/10.1016/B978-0-12-819719-6.00008-0
© 2021 Elsevier B.V. All rights reserved.
241
242
Chapter 8 The future trends in the production of biojet fuel
Based on all the advances in the study of production processes of biojet fuel, in this chapter the identified opportunity
areas related to the use of raw materials, production processes,
and the supply chain are presented. Finally, a brief review of the
biojet fuel projects worldwide is discussed, mentioning their
main features.
8.2
Opportunity areas for raw materials
Several types of raw materials have been studied for the production of biojet fuel, such as vegetable oils, waste oils, animal
fats, microalgae oil, biomasses with high contents of sugar and
starchy, as well as lignocellulosic biomasses. Nevertheless, it is
important to clarify that not all the existent materials in each
category have been studied; therefore there are still many raw
materials that can be analyzed. Considering all types of feedstocks, the residues represent raw materials of great relevance,
since their costs are low and they are generated in great volume;
in this way, a contamination problem can be transformed into
an energetic alternative. Finally, the use of carbon dioxide for
the production of biojet fuel has not been reported in the literature. Considering the chemical stability of carbon dioxide,
photocatalysis is a promissory technology for its conversion
into hydrocarbons in the boiling point range of jet fuel.
Next, some raw materials still not explored for the production of biojet fuel are presented according to its chemical
nature.
8.2.1
Triglyceride feedstock
Among all raw materials, microalgae are a promissory one
since they have high biomass productivities in a short time
interval; besides, microalgae do not require fertile lands to grow
and consume carbon dioxide as part of its growth, contributing
to the reduction of the carbon footprint of the whole life cycle.
The main disadvantage of microalgae relies on the high costs
required for its cultivation and fractionation (oil and carbohydrate fractions). Thus, the use of microalgae for the treatment
of sewage water can help to reduce its production costs, since
the employed water is residual and allows to generate other
products in the process. Another important area of opportunity
is the use of native microalgae; this alternative has not been
reported in the literature, and it can be a robust option that
allows decreasing the production costs.
Chapter 8 The future trends in the production of biojet fuel
Regarding the waste oils, those generated in the cooking processes have been studied in literature as raw materials for biojet
fuel production. However, the residual oils generated in the
industries (from production machinery for instance) remains as
an opportunity area, which can be feasible for the production
of biojet fuel with an adequate pretreatment.
8.2.2
Sugar and starchy feedstock
The residues of the confectionery industry (sugar and starchy
feedstock) are also of interest for the production of biojet fuel.
A main advantage is that most of these residues are already simple
carbohydrates; therefore the number of pretreatments required
could be low and the operating conditions relatively soft.
On the other hand, according to the Food and Agriculture
Organization of the United Nations, roughly one-third of the
food produced in the world for human consumption, approximately 1.3 billion tons every year, gets lost or wasted (FAO,
2019). Among food wastes, fruits and vegetables have the higher
wastage rate, which is of 45% worldwide, while in North
American and Oceania zone, where Mexico is included, the percentage increases to 53% (FAO, 2019). In particular, fruits and
vegetable wastes can be used to produce biofuels, and it is the
type of residue with more potential for valorization according to
Ki Lin et al. (2013). Fruits and vegetables are interesting raw
materials for the production of biojet fuel, due to its high contents of sugar or starchy; also, they usually are located in specific places, therefore its recollection could be less expensive
than other residues. An important aspect of this raw material is
that usually its composition is variable, since the residues
include different types of fruits and vegetables; this represents a
challenge in the pretreatment of these residues, requiring the
development of technologies with the potential to treat a wide
range of components.
8.2.3
Lignocellulosic feedstock
In the lignocellulosic feedstock all the residues from agriculture, processing of crops, pruning, and forestry are included.
Also, the energetic crops such as grass are considered in this
type of feedstock. For the production of biojet fuel, this type of
feedstock is the less explored, and at the same time is the most
abundant and available. For this type of feedstock, the emphasis
must be put in a better use of the residues, maximizing its
exploitation for their conversion into useful products.
243
244
Chapter 8 The future trends in the production of biojet fuel
8.3
Opportunity areas for processing routes
The production of biojet fuel can be performed with chemical, biochemical, and thermochemical processes, which were
defined in the previous chapters. In general, all the conversion
pathways must be flexible for the processing of different raw
materials, or even mixtures of them; it would be desirable to
achieve this goal just by adjusting the operating conditions but
in the same infrastructure. Another opportunity area is the processing of raw materials to produce renewable aviation fuel
under a biorefinery scheme; this processing scheme allows generating fuels, energy, and also value-added products, whose
diversity enables increasing the rentability of the process. It
must be emphasized the application of energy integration and/
or process intensification tools to the production processes of
biojet fuel; these tools allow reaching a decrease in the energy
consumption of the process, and as a consequence on its environmental impact; moreover, the economy of the process is
enhanced, along with its safety.
According to the type of process, the potential improvement
areas are described next.
8.3.1
Chemical pathways
In the chemical pathways, the technical feasibility to produce biojet fuel has been proved. In order to enhance these
processes, it is important to achieve higher selectivities to biojet
fuel at softer operating conditions; therefore the development
of better catalysts regarding product conversion and selectivity,
as well as economically more competitive is required.
Additionally, reducing the hydrogen requirements is important
since it has a high contribution to the total annual cost, and its
transportation represents an additional challenge. Some recent
developments point to the development of processing routes
using nitrogen instead of hydrogen (Almeida Scaldaferri and
Duarte Pasa, 2019). Another important field is the application of
process intensification tools that allow an increase in the yield,
decreasing the operating conditions, or making thermodynamic
synergy due to the combination of unit operations. In this context, an important task is the development of multifunctional
catalysts, which allows performing all the hydrotreating reactions in the same vessel, and at softer operating conditions.
Also, the use of reactive distillation is an interesting intensification alternative, which has been reported only for the hydroprocessing of Jatropha curcas oil (Gutiérrez-Antonio et al., 2018).
Chapter 8 The future trends in the production of biojet fuel
Moreover, the application of extractive reaction, proposed for
biodiesel production, remains as an opportunity area for the
production of renewable aviation fuel. Even though the use of
thermally coupled distillation columns has been reported in the
literature (Gutiérrez-Antonio et al., 2015; Gutiérrez-Antonio
et al., 2016), such distillation systems are still not used in industrial applications for those processes. Moreover, the use of reactive thermally coupled distillation remains as an opportunity
area.
8.3.2
Biochemical pathways
The production of biojet fuel through biochemical pathways
has several opportunity areas. Regarding the alcohol-to-jet (ATJ)
process, the main improvement must be made in the production of the alcohol, which is an intermediate product. To
achieve this, a set of microorganisms must be tested in order to
increase the conversion of the sugar feedstock; also, the genetic
modification of the microorganisms is required so they can
digest any type of sugars, and not just certain types of them.
Moreover, the development of robust membranes for the in situ
remotion of bioethanol must be tackled; this could increase the
production of bioethanol without significantly elevating the
capital costs associated with the replacement of the membranes
due to plugging. Another opportunity area relies on the extraction of sugar and simultaneous reaction to produce bioethanol.
Once the alcohol is produced, a series of chemical reactions
must take place to generate biojet fuel; in this context, the
development of multifunctional catalysts is desirable.
On the other hand, the biological pretreatment has gained
attention recently. In particular, the cultivation of black soldier
fly is a promissory strategy for the conversion of organic residues, such as fruits and vegetables. The main advantage of this
pretreatment is the high conversion rate (at least 80%); moreover, during the conversion of the residues the larva of black
soldier fly is generated, which usually consists of proteins, carbohydrates, and lipids. Then, the larvae of black soldier fly can
be processed to generate biojet fuel, and better yields and lower
processing costs can be expected, in comparison with traditional processing.
8.3.3
Thermochemical pathways
In the case of thermochemical pathways, one of the main
drawbacks to the overall efficiency is the low conversion of the
245
246
Chapter 8 The future trends in the production of biojet fuel
pretreatments. Therefore the development of efficient and ad
hoc processes is mandatory; in this context, the use of renewable energies, such as solar, or the use of sonotrodes, an intensified equipment, could be promissory to reduce the costs
associated to the pretreatments.
Another proposal is the use of lignocellulosic residues to
generate fuel pellets; these pellets can be burned to generate
electricity and/or thermal energy. In addition, combustion gases
are generated, from which carbon dioxide can be extracted and
converted through biojet fuel with photocatalysis. Considering
that other products are generated, this pathway could be more
feasible from the economic point of view.
8.4
Opportunity areas for supply chain
Regarding the supply chain for the production of biojet fuel,
two main opportunities are detected. The first one is the development of local or regional production systems that allows
decreasing the associated costs for the transportation of biomasses and biofuels; in general, studies have shown that long
transportation distances eliminate the environmental benefit
and make biofuel production economically infeasible. When
studies for the supply chain of biojet fuel are developed, it is
important to consider the water footprint and the social impact
of the production scheme, along with the economics and the
environmental impact.
Another important aspect to be considered is the pursuit of
the Roundtable on Sustainable Biomaterials certification; as
mentioned in Chapter 7, Supply Chain for the Production of
Biojet Fuel, this certification involves the complete supply chain
and it is given for a product. Besides, the biojet fuel price must
be competitive, so it could be possible to access to fiscal incentives if the produced biojet fuel is certified as sustainable.
8.5
Worldwide industrial projects to produce
biojet fuel
In the last two decades, the number of projects of research
and development of technologies to produce biojet fuel has
increased, mainly due to the goals of sustainability established
by the aviation authorities (Wang et al., 2016). Those objectives
pointed out the gradual increase in the blending ratio of biojet
fuel-fossil jet fuel until 25% by 2020, 30% by 2030, and 50% by
Chapter 8 The future trends in the production of biojet fuel
2040 (Air Transportation Action Group, 2011). Furthermore,
according to some forecasts, 35% 100% of the global biojet fuel
demand could be covered by biojet fuel in 2050 (European
Commission, 2011). The high biojet fuel demand is derived from
the goals related to the reduction of carbon dioxide emissions by
the aviation sector until 50% by 2050, regarding to 2005 levels
(IATA, 2015). Thus the investment in the development of research
centers and processing plants to produce biojet fuel is climbing,
and this trend is expected to continue through the next years.
According to Abdelraheem-Elhaj and Lang (2014), in 2014,
nine projects to produce biojet fuel were developed worldwide,
which are presented next. It is important to mention that some
projects are currently under development, and some of them
have been concluded.
• ITAKA Project (United States)
In this project, the industrial facility has a production capacity of 4000 tons/year of biojet fuel from camelina oil as primary
feedstock, using the hydroprocessed esters and fatty acids
(HEFA) process; the project is headed by Neste Oil in agreement
with KLM. The main objective of this project was linked to the
supply chain and the biojet fuel demand, establishing good
relationships between feedstock producers, biofuels producers,
distributors, and airlines. The starting date of the project was
November 1st, 2012, and the ending date, October 31st, 2016
(Cordis, 2012).
• Petrixo Oil & Gas (United Arab Emirates, Fujairah)
Petrixo Oil & Gas started a new plant costing $800 million,
using the Honeywell UOP technology to produce biojet fuel and
green diesel. The processing capacity is 500,000 tons/year of
renewable feedstocks (UOP Honeywell, 2014).
• Algae.Tec (Australia)
Algae.Tec and Lufthansa invested into the construction of a
large-scale facility to produce biojet fuel from algae cultures.
The algae oil shall be certified by the ISCC Standard (US
Renewable Energy Directive) (Algae.Tec Limited, 2012).
• Dynamic Fuels (United States)
The facility owned by Dynamic Fuels, company of
Syntroleum Corporation and Tyson Foods, started on November
8th, 2010. This plant is located at Geismar, Louisiana, United
States. The current production is 2500 barrels of biojet fuel per
day, and also it is considered as the largest commercial renewable synthetic diesel fuel plant in North America. The feedstocks used in the facility involve animal by-products such as
pork lard, greases, beef tallow, and chicken fat (Chemicals
Technology, 2020).
247
248
Chapter 8 The future trends in the production of biojet fuel
• Byogy Renewables (United States)
Byogy Renewables produces biojet fuel through the ATJ process from any ethanol source. This facility is located at San José
California and Qatar Airways is an investor. The operation of
this facility is active (Byogy Renewables, 2020).
• Solazyme (United States)
The Solazyme’s unit called Solajet produces biojet fuel from
algae oil. This production is considered as the world’s first
microbially derived biojet fuel, which meets the ASTM D1655
specifications. The production capacity in 2015 was 500,000
metric tons of biojet fuel. This company had an agreement with
United Airlines to supply 75 million liters of biojet fuel by the
year 2014. Nowadays, Solazyme is still in the biojet fuel market,
and the company division dedicated to the biojet fuel production is Solajet (Solazyme, 2020).
• AltAir (United States)
The company AltAir has been the only that has a facility that
produces biojet fuel for commercial use since 2016. The raw materials are waste feedstocks converted in biojet fuel and green diesel
through the UOP Honeywell technology. According to its estimations, the renewable products obtained in this facility, including
the biojet fuel, are capable to reducing greenhouse gas emissions
by more than 60%, regarding to their fossil counterparts This facility is located at Paramount, California. In 2013 AltAir signed an
agreement with United Airlines to provide 18.75 million liters each
year for 3 years. Nowadays, this company is still producing biojet
fuel (RSB, 2020).
• GreenSky London Project
The main objective of the GreenSky London Project was the
construction of a processing plant to convert the municipal
wastes from London into biojet fuel; the conversion is performed
using a combination of plasma gasification and Fischer Tropsch
technology. This initiative was led by Solena and British Airways.
The production capacity was 50,000 tons of biojet fuel from
500,000 tons of waste. This project started in 2016 and closed in
2016 (ICAO Environment, 2016).
• Amyris Plant (Brazil)
The facility of Amyris was opened at Campinas, Brazil in
2010 as a demonstrative large-scale plant, with a capacity of
10,000 gallons per year. The raw material used was sugarcane,
and the biojet fuel produced in this plant was used in demonstration and testing flights. The biofuel obtained was supplied
to GOL airline and US Air Force. There is another Amyris facility
with the same functional principle in Brotas, Brazil (MIT
Technology Review, 2009).
Chapter 8 The future trends in the production of biojet fuel
According to the International Renewable Energy Agency
(IRENA Report, 2017), in 2017 there were about 100 initiatives to
produce biojet fuel; pointing out that in the period 2009 15, the
new ventures increased by 10 20 new projects. Among these
new initiatives, the use of novel raw materials gained interest.
For instance, the project developed by the Sustainable Bioenergy
Research Consortium (SBRC) has as main objective the creation
of a new alternative agriculture to produce biofuels, such as biojet fuel, in the United Arab Emirates (Etihad, 2020). This initiative
is supported by Etihad Airways, airline that had a commercial
flight from Abu Dhabi to Amsterdam operated with a blend of
fossil jet fuel and biojet fuel derived from Salicornial plants
grown in saltwater. On the other hand, another innovative project is the initiative to produce biojet fuel from the waste streams
of potato crops; this process, proved in a lab, is scaled and
achieved a viable production chain (Wageningen, 2020). This
project is led by Wageningen Food & Biobased Research, and it
started on May 1, 2017 to conclude on April 30, 2020.
Based on the report presented by Radich (2015), an overview
of the biojet fuel production facilities in North and South
America is presented in Fig. 8.1, including those in planning
stage. In the case of Europe and Asia, the facilities to produce
biojet fuel are shown in Fig. 8.2.
Another important initiative, which has derived in other novel
and viable projects, was proposed by KLM, called SkyNRG. This
initiative was created in 2010 to supply sustainable jet fuel to
KLM and other aircraft operators, mainly produced from used
cooking oil, through HEFA process. According to International
Civil Aviation Organization (2016), this company supplies most
of the biojet fuel flights worldwide. Some of the new projects
where SkyNRG is involved have been created to enhance the production and supply chain of biojet fuel; these are presented next
(Meijerink, 2020).
1. RENJET 3, 2019
Project to promote the renewable jet fuel supply chain
and flight operations.
2. Bio4A, 2018 22
Project developed to scale up the production (precommercial production), and the market of biojet fuel from
residual lipids in the United States.
3. FlexJET, 2018 21
The main objective of the project is providing technical
and economic validation to produce biojet fuel from a
diverse range of organic wastes feedstocks; also, the construction of a precommercial scale plant is included.
249
250
Chapter 8 The future trends in the production of biojet fuel
Prairie–Horizon/WB services
3 mm gal/year
HEFA
Phillipsburg, Kansas
Green energy products/WB services
3 mm gal/year
HEFA
Sedwick, Kansas
Red rock biofuels
12 mm gal/year
Fischer–Tropsch
Lakeview, Oregon
SG preston
120 mm gal/year
HEFA
South point, Ohio
Fulcrum bioenergy
11 mm gal/year
Fischer–Tropsch
Mccarran, Nevada
East kansas agri–Energy/WB services
3 mm gal/year
HEFA
Garnett, Kansas
Altair Fuels
30 mm gal/year
HEFA Biojet fuel
los angeles, California
REG Synthetic Fuels
68 mm gal/year
HEFA
Geismar, California
Diamond Green Diesel
162 mm gal/year
HEFA
Norco, California
Amyris
13 mm gal/year
SIP diesel, Jet fuel
Brotas, Brazil
Figure 8.1 Facilities to produce biojet fuel in North and South America. Source: Extracted from Radich, T., 2015. The
flight paths for biojet fuel. ,https://www.eia.gov/workingpapers/pdf/flightpaths_biojetffuel.pdf. (accessed 29.04.20.).
4. REWOFUEL, 2018 21
The goal of the project is the production of aviation biofuels from residual softwood.
5. Waste to Wing, South Africa, 2018 21
The main goal of the project is validating the feasibility of
using wastes as raw material to produce biojet fuel in South
Africa.
Preem
271 mm gal/year
HEFA
Gothenbugu, Sweden
Neste Oil
UPM
129 mm gal/year
32 mm gal/year
HEFA
HEFA
Porvoo, Finland Lappeenranta, Finland
Solena
17 mm gal/year
Fischer–Tropsch
Thurrock, Essex, UK
Neste Oil
271 mm gal/year
HEFA
Rotterdam, The Netherlands
169 mm gal/year
HEFA
La mede, France
ENI
155 mm gal/year
HEFA
Venice, Italy
Petrixo
288 mm gal/year
HEFA
Fujairah, United Arab Emirates
Neste Oil
271 mm gal/year
HEFA
Singapore
Figure 8.2 Facilities to produce biojet fuel in Europe and Asia. Source: Extracted from Radich, T., 2015. The flight paths for biojet fuel. ,https://www.eia.gov/
workingpapers/pdf/flightpaths_biojetffuel.pdf. (accessed 29.04.20.).
252
Chapter 8 The future trends in the production of biojet fuel
6. Assessment of likely Technology Maturation Pathways,
Canada, 2016 18
The project looks to establish a wider knowledge of biooil from wood residues to produce biojet fuel.
7. Flying on forest residues in Småland, Sweden, 2018 20
The objective of the project is to demonstrate the feasibility of biojet fuel local production, identifying the most promising supply chain.
8. Swedish Biofuels
The objective of the project is the design, construction, and
operation of a demonstration facility to produce biojet fuel
from woody biomass, municipal waste, bioethanol, or syngas,
in Sweden.
It is clear that the research and development, as well as the
investment to improve the overall factors and bottlenecks, in
the production of biojet fuel are important to achieve the environmental and economic competitiveness of biojet fuel.
Likewise, the government and airlines support are key pieces to
motivate the creation of new projects, which contribute to the
proper development of this important biofuel.
8.6
Summary
Biojet fuel is the only alternative for the sustainable development of the aviation sector. Until now, several production processes have been developed; some of them are certified and
others are under evaluation. Nevertheless, the main challenge is
producing biojet fuel with minimum environmental impact, a
competitive price, and economically profitable. Still, there are
many potential raw materials as well as many opportunities for
the improvement of existing conversion pathways, or even the
development of new ones. Therefore, without any doubt, the
development of production processes with high thermodynamic
efficiency and low environmental impact is one of the main strategies to drive the aviation sector to sustainability. Furthermore, the
production of biojet fuel at industrial scale requires the involvement of investors along with government policies, which allows to
establish the supply chain of aviation biofuel.
References
Abdelraheem-Elhaj, H.F., Lang, A., 2014. The worldwide production of biojet
fuels the current developments regarding technologies and feedstocks, and
innovative new R&D developments. Technical Report SD-ARC-WBA-001/2014.
Chapter 8 The future trends in the production of biojet fuel
Air Transportation Action Group, 2011. Beginner’s Guide to Aviation Biofuels,
second ed.
Algae.Tec Limited, 2012. Algae.Tec and Lufthansa sign collaboration agreement to
build biofuel production facility in Europe. ,https://www.prnewswire.com/
news-releases/algaetec-and-lufthansa-sign-collaboration-agreement-to-buildbiofuel-production-facility-in-europe-170274356.html. (accessed 29.04.20.).
Almeida Scaldaferri, C., Duarte Pasa, V.M., 2019. Hydrogen-free process to
convert lipids into bio-jet fuel and green diesel over niobium phosphate
catalyst in one-step. Chem. Eng. J. 370, 98 109.
Byogy Renewables, 2020. Company overview. ,http://www.byogy.com/abt.
(accessed 28.04.20.).
Chemicals Technology, 2020. Dynamic fuels renewable synthetic fuel plant.
,https://www.chemicals-technology.com/projects/dynamicfuelslouisian/.
(accessed 29.04.20.).
Cordis, 2012. Initiative towards sustainable kerosene for aviation. ,https://
cordis.europa.eu/project/id/308807/es. (accessed 28.04.20.).
Etihad, 2020. Etihad airways flies the world’s first flight using fuel made in the
UAE from plants grown in saltwater by Khalifa University. ,https://www.
etihad.com/en/about-us/etihad-news/archive/2019/etihad-airways-flies-theworlds-first-flight--using-fuel-made-in-the-uae-from-plants-grown-insaltwater-by-khalifa-university/. (accessed 29.04.20.).
European Commission, 2011. White paper on transport roadmap to a single
European transport area, towards a competitive and resource efficient
transport system. , https://ec.europa.eu/transport/sites/transport/files/
themes/strategies/doc/2011_white_paper/white-paper-illustratedbrochure_en.pdf. (accessed 29.03.20.).
Food and Agriculture Organization of the United Nations, 2019. Food loss and
waste facts. Food and Agriculture Organization of the United Nations.
, http://www.fao.org/resources/infographics/infographics-details/es/c/
317265/. (accessed 06.07.20.).
Gutiérrez-Antonio, C., Gómez-Castro, F.I., de Lira-Flores, J.A., Hernández, S.,
2017. A review on the production processes of renewable jet fuel. Renew.
Sustain. Energy Rev. 79, 709 729.
Gutiérrez-Antonio, C., Gómez-Castro, F.I., Hernández, S., Briones-Ramı́rez, A.,
2015. Intensification of a hydrotreating process to produce biojet fuel using
thermally coupled distillation. Chem. Eng. Process. Process Intensif. 88,
29 36.
Gutiérrez-Antonio, C., Romero-Izquierdo, A.G., Gómez-Castro, F.I., Hernández,
S., Briones-Ramı́rez, A., 2016. Simultaneous energy integration and
intensification of the hydrotreating process to produce biojet fuel from
Jatropha curcas. Chem. Eng. Process. Process Intensif. 110, 134 145.
Gutiérrez-Antonio, C., Soria Ornelas, M.L., Gómez-Castro, F.I., Hernández, S.,
2018. Intensification of the hydrotreating process to produce renewable
aviation fuel through reactive distillation. Chem. Eng. Process. Process
Intensif. 124, 122 130.
IATA, 2015. IATA sustainable aviation fuel roadmap. ,https://www.iata.org/
contentassets/d13875e9ed784f75bac90f000760e998/safr-1-2015.pdf.
(accessed 29.04.20.).
International Civil Aviation Organization, 2016. On board a sustainable future.
, https://www.icao.int/environmental-protection/documents/ICAO%
20Environmental%20Report%202016.pdf . (accessed 06.07.20).
253
254
Chapter 8 The future trends in the production of biojet fuel
International Air Transport Association (IATA), 2018. Reducing aviation’s carbon
footprint. ,https://www.iata.org/publications/tracker/june-2018/Pages/
corsia.aspx. (accessed 07.05.19.).
ICAO Environment, 2016. Project: GreenSky London. ,https://www.icao.int/
environmental-protection/GFAAF/Pages/Project.aspx?ProjectID 5 22.
(accessed 29.04.20.).
IRENA Report, 2017. Biofuels for aviation, technology brief. ,https://www.irena.
org/documentdownloads/publications/irena_biofuels_for_aviation_2017.
pdf. (accessed 29.04.20.).
Ki Lin, C.S., Pfaltzgraff, L.A., Herrero-Davila, L., Mubofu, E.B., Abderrahim, S.,
Clark, J.H., et al., 2013. Food waste as a valuable resource for the production
of chemicals, materials and fuels. Current situation and global perspective,
Energy Environ. Sci. 6, 426 464.
Meijerink, O., 2020. Current innovation projects. ,https://skynrg.com/trackrecord/current-innovation-projects/. (accessed 29.04.20.).
MIT Technology Review, 2009. Biofuel plants opens in Brazil. ,https://www.
technologyreview.com/2009/07/09/93965/biofuel-plant-opens-in-brazil/.
(accessed 29.04.20.).
Radich, T., 2015. The flight paths for biojet fuel. ,https://www.eia.gov/
workingpapers/pdf/flightpaths_biojetffuel.pdf. (accessed 29.04.20.).
RSB, 2020. World first as AltAir biojet fuel refinery achieves RSB certification.
,https://rsb.org/2018/01/29/altair-rsb-certification-biofuel-refinery/.
(accessed 29.04.20.).
Solazyme, 2020. Better products for people. ,http://solazymeindustrials.com/
solutions/fuel/#main-content. (accessed 29.04.20.).
UOP Honeywell, 2014. Honeywell UOP green fuels technology selected by
Petrixco to produce renewable jet fuel and diesel. ,https://www.uop.com/?
press_release 5 honeywell-uop-green-fuels-technology-selected-by-petrixoto-produce-renewable-jet-fuel-and-diesel. (accessed 27.04.20.).
Wageningen, 2020. Biojet fuel project aims at growth of biobased aircraft fuel.
,https://www.wur.nl/en/project/BioJet-Fuel-project-aims-at-growth-ofbiobased-aircraft-fuel.htm. (accessed 29.04.20.).
Wang, W.C., Tao, L., Markham, J., Zhang, Y., Tan, E., Batan, L., et al., 2016.
Review of biojet fuel conversion technologies, NREL. ,http://nrel.gov/docs/
fy16ost/66291.pdf. (accessed 29.04.20.).
Index
Note: Page numbers followed by “f” and “t” refer to figures and tables, respectively.
A
Acid hydrolysis (AH), 107 108
Acid pretreatment,
lignocellulosic feedstock,
133
Agricultural residues, 41, 43f,
129
Alcohol-to-jet (ATJ) process, 64,
118, 231 232, 245
lignocellulosic feedstock,
134 136
sugar and starchy feedstock,
94 98, 104 106
Alcohol-to-jet synthetic
kerosene with aromatics
(ATJ-SKA), 17, 50
Alcohol-to-jet synthetic
paraffinic kerosene (ATJSPK) process, 17, 49
Algae.Tec (Australia), 247
Alkaline pretreatment,
lignocellulosic feedstock,
133
AltAir (United States), 248
Amorphous cellulose, 130
Amyris Plant (Brazil), 248
Amyris process, 105
Arrhenius-based kinetic model,
146 147
ASTM standards, 6 17, 45
ASTM D1655 standard, 6, 7t,
11t
ASTM D4054 standard,
11 13, 45 46
ASTM D5054 standard, 14t
ASTM D7223 standard, 11,
12t
ASTM D7566 standard, 6 11,
11t, 45 49
ATJ-SKA. See Alcohol-to-jet
synthetic kerosene with
aromatics (ATJ-SKA)
ATJ-SPK. See Alcohol-to-jet
synthetic paraffinic
kerosene (ATJ-SPK)
process
B
Big-M approach, 212 214
Biochemical pathways, 245
Biodiesel, 20, 181, 209 210
Bioethanol, 20, 209 210, 245.
See also Sugar and
starchy feedstock
BioForming, 105
Biogases, 148 149
Bio-hydrogen, 209 210
Biojet fuel, aviation sector to
sustainability
ASTM standards, 6 17
basic concepts, 3 6, 4t, 5f, 6f
combustion and flight tests,
17 21, 20t
motivation, 1 3
four-pillar strategy, 1 2, 2f
fuel consumption and
number of travelers,
growth of, 2f
Biojet fuel, future trends in
production, 241 242
energy integration, 241
in Europe and Asia, 251f
in North and South America,
250f
opportunity areas for
processing routes,
244 246
biochemical pathways, 245
chemical pathways,
244 245
thermochemical pathways,
245 246
opportunity areas for raw
materials, 242 243
lignocellulosic feedstock, 243
sugar and starchy
feedstock, 243
triglyceride feedstock,
242 243
opportunity areas for supply
chain, 246
process intensification, 241
worldwide industrial projects,
246 252
Algae.Tec (Australia), 247
AltAir (United States), 248
Amyris Plant (Brazil), 248
Byogy Renewables (United
States), 248
Dynamic Fuels (United
States), 247
GreenSky London Project,
248
ITAKA Project (United
States), 247
Petrixo Oil & Gas (United
Arab Emirates, Fujairah),
247
Solazyme (United States), 248
Biological pretreatment,
lignocellulosic feedstock,
134
Bio-oils, 17, 44 45, 55, 138, 148,
155 158
Biorefineries, 33 34, 202 203
Byogy Renewables (United
States), 248
255
256
Index
C
Capital cost, 82
Carbonation reaction, 150
Carbon dioxide (CO2)
emissions, 1 2, 5
lignocellulosic feedstock,
161 162, 162t
process integration, 194 195,
195t
sugar and starchy feedstock,
120, 121t
Catalytic approach, 100
Catalytic hydrothermolysis
synthetic kerosene (CHSK) process, 50
Cellulose, 41
chemical structure, 42f
Certification process, 47
CFD. See Computational fluid
dynamics (CFD)
Char, 137
Chemical Engineering Process
Cost Index, 79
Chemical pathways, 244 245
Chemical pretreatment,
lignocellulosic feedstock,
133 134
CO emissions, 106
Cold acid solvent extraction
(CASE) process, 142
Cold stream, 178, 179f, 191
Compact heat exchangers,
172 175
Complete life cycle analysis,
226 227
Composite curves, process
integration, 180f
Compressor module of
isentropic type, 155 158
Computational fluid dynamics
(CFD), 177 178
Condensation reaction, 101
Condensation system, 151 152,
152t
Conjunctive normal
form, 210
Conventional direct distillation
sequence, 181
Convex hull approach,
213 214, 224
Corn, 93, 99 100, 104 105
Cradle to gate LCA, 226 227
Cradle to grave LCA, 226 227,
231 232
D
Data generation, for supply
chain, 203 204
Dehydration mechanism,
96 97, 103 104
Dehydration reactor,
lignocellulosic feedstock,
152 153
reactions and conversions for,
152t
DeMorgan’s theorem, 210 211
Depolymerization reaction,
138 139
Direct sugar to hydrocarbons,
13 17, 48
Disability-adjusted life years
(DALYs), 229
Disaggregated variables,
213 214
Dual-bed system, 102
Dynamic Fuels (United States),
247
E
Eco-Indicator 99 methodology,
228 230
Edible and nonedible
vegetable oils, 202
Energy integration, 178 181,
179f, 241
adjustment of temperatures,
188, 188t
conceptual design, 186 191
data input and ΔT definition,
188
energy integration network,
190 191, 191f
heat balance per interval,
189, 189t
heat cascade, 189 190, 190f
network, 190 191, 191f
simulation of, 191 192, 192f
temperature intervals, 189,
189f
Enthalpy, 84 85, 179 180
Environmental impact,
181 182, 226
Environmental indicator, 226
Escherichia coli, 94 96
Ethanol dehydration reactions,
111t
Ethylene, 97
Exchanged energy, 79 80
F
Farnesene (C15H24), 44, 48,
98 99, 103
Fast pyrolysis, 138
of palm oil shell, 148 149
Fatty acids, 35
Fermentation, 94 96, 98,
107 108, 111
Fischer Tropsch catalytic
reaction, 44 45
Fischer Tropsch (F T)
process, 134 138,
142 143, 231 232, 248
Fischer Tropsch synthetic
paraffinic kerosene (FTSPK), 47 48
Fischer Tropsch synthetic
paraffinic kerosene with
aromatics (FT-SPK/A)
process, 48 49
Fit-for-purpose properties,
11 13
Flash pyrolysis, 131 132, 138
FlexJET, 2018 21, 249
Food and Agriculture
Organization, 243
Fossil fuels, 230 231
G
Gasification, 147 148
kinetic model for, 148t
reaction set of, 151t
Generalized disjunctive
programming (GDP)
model, 208 212, 209t
Index
Big-M approach, 212 214
conjunctive normal form, 210
convex hull approach,
213 214, 224
relaxation of, 212 214
simple process structure for
decision-making, 208f
Genetic engineering, 94 96
Geo-Space Platform, 203 204
Gevo ATJ jet fuel, 105 106
Green diesel, 59 60, 73,
102 103, 141
Greenhouse gas emissions, 171,
205, 231 232, 248
lifecycle, 5f
GreenSky London Project, 248
Gross income, 83
Guthrie method, 182
H
Heat balance per interval, 189,
189t
Heat cascade, 189 190, 190f
Heat exchange devices, 174
HEFA Plus (Green Diesel), 17
HEFA-SPK. See Hydroprocessed
esters and fatty acids
synthetic paraffinic
kerosene (HEFA-SPK)
process
Hemicellulose, 41, 132
chemical structure, 42f
Heterogeneous reactions,
172 174
Hexadecenoic acid, 148
High freeze point
hydroprocessed esters
and fatty acids synthetic
kerosene (HFP HEFA-SK),
50
Hot stream, 178, 179f, 191
Hydrocarbons, 96 99, 140 141,
176 177
Hydrochloric acid, 138 139
Hydrocondensation, 103 104
Hydrocracking reaction, 60 61,
72, 137 138, 140 141
of n-paraffins, 73f
product distribution from, 78t
reactions set proposed to, 74t
sugar and starchy feedstock, 99
Hydrodecarbonylation (DCO), 57
Hydrodecarboxylation (DCOx), 57
Hydrodeoxygenation (HDO),
60 61, 138 140
sugar and starchy feedstock,
103 104
triglyceride feedstock, 57
Hydrodeoxygenation synthetic
aromatic kerosene
(HDO-SAK), 50
Hydrodeoxygenation synthetic
kerosene (HDO-SK)
process, 50
Hydrogen, 231 232
Hydrogenation dehydration
reactions, 102
Hydrogenation reactions, 57
proposed reaction set, 154t
sugar and starchy feedstock,
99 100, 112, 113t
triglyceride feedstock, 57
Hydrogenation reactor, 153
Hydroisomerization reaction,
60 61, 72, 99, 137 138
of n-paraffins, 73f
product distribution from, 78t
reactions set proposed to, 74t
Hydrolysis
alcohol-to-jet process, 136
sugar and starchy feedstock,
94 96
Hydroprocessed esters and fatty
acids (HEFA) process,
247
Hydroprocessed esters and fatty
acids synthetic paraffinic
kerosene (HEFA-SPK)
process, 48, 50
Hydroprocessed fermented
sugars synthetic isoparaffin (HFS-SIP), 44
Hydroprocessed renewable jet
(HRJ8), 64
Hydroprocessing technology,
44 45, 55, 57, 59
lignocellulosic feedstock,
44 45
257
of mixture of vegetable oils,
triglyceride feedstock,
64 86
kinetic data for reactions
sets extended, 69t
lipidic profile of Jatropha
oil, 69t
lipidic profile of palm oil,
66t
modeling of hydrotreating,
65 74
problem statement, 64 65
rate constant for reaction
network, 73t
Hydrothermal liquefaction, 55,
231 232
Hydrotreated depolymerized
cellulosic jet (HDCJ), 50
Hydrotreatment process
J. curcas, 176 177, 181
process integration, 186 195,
187f
adjustment of
temperatures, 188, 188t
CO2 emissions, 194 195,
195t
conceptual design,
186 191
costs for, 193t
data input and ΔT
definition, 188
economic assessment, 193
energy integration network,
190 191, 191f
estimation of price of biojet
fuel, 194, 194t
heat balance per interval,
189, 189t
heat cascade, 189 190,
190f
simulation of, 191 192,
192f
temperature intervals, 189,
189f
process intensification,
182 186
conceptual design,
182 184, 183f
costs for, 193t
258
Index
Hydrotreatment process
(Continued)
simulation, 184 186, 184f,
185f, 186f
triglyceride feedstock, 57 59,
57f, 58f, 66f, 74f
CO2 emissions, 84 86, 85t
composition of outlet
stream, 67t
economic assessment,
79 83, 80t, 82t
estimation of price of biojet
fuel, 83 84, 84t
flowsheet of, 76f
green diesel, 59 60
kinetic parameters,
Jatropha oil, 70t
Jet A1, 3 4, 63 64, 231 232
JP-5 fuels, 3 4
JP-8 fuels, 3 4
light gases, 59
naphtha, 59
operational conditions for, 58
palm oil and kinetic data,
proposed set reactions
for, 68t
palm oil, extended reactions
set for, 68t
reaction pathway for,
Jatropha oil, 70f
reactions set, Jatropha oil, 71t
simulation of, 75 78, 76f, 77t,
78t, 79t
I
Ketonization reactions, 101
Ignition delay time, 105 106
Integrated hydropyrolysis and
hydroconversion (IH2),
50
International Civil Aviation
Organization (ICAO), 46
International Renewable Energy
Agency (IRENA), 249
Isobutanol, 103 104
Isobutene oligomerization, 153
Isopentane, 141
ITAKA Project (United States),
247
J
Jatropha curcas fruit,
components of, 145, 145f
Jatropha curcas shell
biochar and its empirical
formula from, 149t
lignocellulosic feedstock,
composition of, 146t
pyrolysis of, 148 149
reaction set of, 149t
Jatropha oil
kinetic parameters, 70t
lipidic profile of, 69t
reaction pathway for, 70f
reactions set, 71t
Jet A, 3 4
K
L
Life cycle analysis (LCA),
226 232
complete life cycle analysis,
226 227
cradle to gate, 226 227
cradle to grave, 226 227,
231 232
egalitarian, 229
environmental impact, 226
hierarchist, 229
individualist, 229
inputs, 226, 227f
outputs, 226, 227f
production stages, 227f
stages of, 227 228, 228f
Light fuels, naphtha, 73
Lignin
chemical structure of, 42f
source for aromatics, 138 140
Lignocellulosic feedstock, 34f,
109 110, 202, 231 232,
243
biojet fuel production from,
135f
combustion tests for biojet
fuel from, 142 143
conventional processes,
141 142
conversion processes of,
134 140
alcohol-to-jet process, 136
lignin as, source for
aromatics, 138 140
sugar-to-jet process, 136
thermochemical route,
136 138
lignocellulosic waste,
conversion of, 144 162
CO2 emissions, 161 162,
162t
composition vs. reaction
time at gasification
reactor, 157f
condensation system,
151 152, 152t
dehydration stage,
reactions and
conversions for, 152t
economic assessment,
159 160
estimation of price of biojet
fuel, 160 161, 161t
hydrogenation stage,
proposed reaction set by,
154t
J. curcas shell, composition,
146t
kinetic model for
gasification, 148t
modeling of, 145 146
oligomerization reactor,
reactions and
conversions for, 153t
palm oil shell, composition,
146t
problem statement,
144 145
production process,
146 153, 147f
simulation of overall
process, 153 159, 156f
pretreatment technologies,
130 134, 131f
amorphous cellulose, 130
biological, 134
chemical, 133 134
physical, 130 132
Index
physicochemical, 132 133
raw materials
agricultural residues, 43f
availability and
composition of, 43t
cellulose, chemical
structure of, 42f
hemicellulose, chemical
structure of, 42f
lignin, chemical structure
of, 42f
separation zone, technologies
on, 140 141
thermochemical pathways,
44 45
M
Mesitylene, 141
Methanol, 151 152
Microalgae, 99, 242
Microreactors, 172 174
Mixed alcohol synthesis (MAS),
150 151, 151t
Mixed-integer linear
programming (MILP)
model, 212
Mixed-integer non linear
programming (MINLP)
model, 212
Modified Chlorella micro-algae,
175
Monosaccharides, chemical
structure of, 38f
Municipal wastes, 41 43
N
Nanoparticle catalysts, 139 140
Naphtha, 59, 73, 83, 102 103,
141
NRTL solution model, 153 154
O
6-Octadecanoic acid, 148
Olefins, 97 98, 103 104, 112
Oleic acids, chemical structure
for, 35f
Oligomerization reactor, 153
reactions and conversions for,
153t
Oligomerization, sugar and
starchy feedstock, 97,
103 104, 112t
Organosolv pretreatment,
lignocellulosic feedstock,
134
P
Palladium nanoparticles, 98
Palmitic acids, chemical
structure for, 35f
Palm oil
fruit, components of, 144f
lipidic profile of, 66t
kinetic data, proposed set
reactions for, 68t
extended reactions set for, 68t
palm oil shell, composition,
146t
Palm oil shell
biochar and its empirical
formula from, 150t
fast pyrolysis of, 148 149
lignocellulosic feedstock,
composition of, 146t
pyrolysis of, 149, 150t
Partial-Vapor-Liquid condenser,
117
Particulate matter (PM), 143
Peng Robinson method, 75
Petrixo Oil & Gas (United Arab
Emirates, Fujairah), 247
Photocatalysis, 242
Physical pretreatment,
lignocellulosic feedstock,
130 132
Physicochemical pretreatment,
lignocellulosic feedstock,
132 133
Pinch point methodology,
179 181, 186
Plasma gasification, 248
Plate-and-fin exchangers, 174
Plate-and-frame exchangers,
174
Process integration, 171,
178 181
cold stream, 178, 179f, 191
composite curves, 180f
259
energy integration, 179 181
hot stream, 178, 179f, 191
hydrotreating process,
186 195, 187f
adjustment of
temperatures, 188, 188t
CO2 emissions, 194 195,
195t
conceptual design,
186 191
costs for, 193t
data input and ΔT
definition, 188
economic assessment, 193
energy integration network,
190 191, 191f
estimation of price of biojet
fuel, 194, 194t
heat balance per interval,
189, 189t
heat cascade, 189 190,
190f
simulation of, 191 192,
192f
temperature intervals, 189,
189f
techno-economic analysis,
181 182
Process intensification, 171,
244 245
compact heat exchangers,
172 175
computational fluid
dynamics, 177 178
definitions, 171 172
energy savings, 176 177
examples of, 173f
graphical methodologies, 177
hydrotreating process,
182 186
CO2 emissions, 194 195,
195t
conceptual design,
182 184, 183f
costs for, 193t
economic assessment, 193
simulation, 184 186, 184f,
185f, 186f
microreactors, 172 174
260
Index
Process intensification
(Continued)
sonoreactors, 172 174, 177
spinning disk reactor,
172 174
techno-economic analysis,
181 182
thermally coupled direct
sequence, 176 177
thermally coupled distillation
systems, 174
thermally coupled indirect
sequence, 176 177
ultrasound frequencies,
172 174
Pyrolysis, 44 45, 55, 131 132,
138 139, 147 148
of J. curcas shell, 148 149,
149t
of palm oil shell, 149, 150t
R
Raw materials, 34 43
lignocellulosic feedstock,
41 43
agricultural residues, 43f
availability and
composition of, 43t
cellulose, chemical
structure of, 42f
hemicellulose, chemical
structure of, 42f
lignin, chemical structure
of, 42f
sugar and starchy feedstock,
37 40, 39f, 39t
triglyceride feedstock, 35 37
animal fat, 36f
oil content, yield and price
of oils, 36t
oleic acids, chemical
structure for, 35f
palmitic acids, chemical
structure for, 35f
stearic acids, chemical
structure for, 35f
triolein, chemical structure
for, 35f
vegetable oils, 35, 36f
Recertification process, 3
Rectisol process, 150 151,
155 158
Rectisol washing approach,
140 141
Renewable feedstock, 33 34
lignocellulosic feedstock, 34f
production pathways, 44 50,
44f
advances in certification of
new pathways, 49 50
certified pathways, 47 49
raw materials, 34 43
lignocellulosic feedstock,
41 43
sugar and starchy
feedstock, 37 40, 39f, 39t
triglyceride feedstock,
35 37
sugar feedstock, 33 34, 34f
sustainability certification,
33 34
technical certification, 33 34
triglyceride feedstock, 33 34,
34f
Renewable hydrocarbons, 55
RENJET 3, 2019, 249
REWOFUEL, 2018 21, 250
Rhodotorula glutinis, 99
Roundtable on sustainable
biomaterials (RSB),
204 207
air, 205
conservation, 205
documentation, 206t
greenhouse gas emissions,
205
human and labor rights, 205
land rights, 205
legality, 204
local food security, 205
planning, monitoring, and
continuous
improvement, 205
rural and social development,
205
soil, 205
technology use, inputs and
waste management, 205
for wastes and residues,
206 207
water, 205
RSB. See Roundtable on
sustainable biomaterials
(RSB)
S
Saccharification, 94 96
Saccharomyces cerevisiae, 94 96
Sasol isoparaffinic kerosene
(Sasol IPK), 64
Shell synthetic paraffinic
kerosene (Shell SPK), 64
SkyNRG, 19, 249 252
Sodium dodecyl benzene
sulfonate (SDBS), 60 61
Solajet, 248
Solazyme (United States), 248
Solena Fuels, 19 20
Sonoreactors, 172 174, 177
Spinning disk reactor, 172 174
Starchy, chemical structure of,
38f
Stearic acids, chemical
structure for, 35f
Sugar and starchy feedstock,
33 34, 34f, 37 40, 39f,
39t, 243
biochemical processes, 44
for bioethanol production,
93 94
catalytic route, 95f
combustion tests for biojet
fuel, 105 106
conventional processes,
103 105
conversion of sugars to biojet
fuel, 94 102
additional reactions, 111t
alcohol-to-jet (ATJ)
pathway, 94 98,
104 106
CO2 emissions, 120, 121t
complete process, 116f
conceptual design,
108 112
economic assessment,
118 119, 118t
Index
estimation of price of biojet
fuel, 119 120, 120t
ethanol dehydration
reactions, 111t
grinded sorghum, biojet
fuel from, 109f
hydrogenation reactions
and conversion data,
113t
modeling of, 108
oligomerization reactions
and conversion data,
112t
problem statement,
106 108
reactions for ethanol
production, 110t
simulation of reactive and
separation zones,
112 118
sugar-to-jet (STJ) pathway,
94, 98 102, 105
downstream processing, 95f
pretreatment of, 95f
technologies on separation
zone, 102 103
Sugarcane, 94, 105
Sugar-to-jet (STJ) pathway
lignocellulosic feedstock,
134 136, 141 142
sugar and starchy feedstock,
94, 98 102, 105
Supply chain for biojet fuel
production, 201
data generation, 203 204
elements of, 201 203
life cycle analysis, 226 232
complete life cycle analysis,
226 227
cradle to gate, 226 227
cradle to grave, 226 227,
231 232
egalitarian, 229
environmental impact, 226
hierarchist, 229
individualist, 229
inputs, 226, 227f
outputs, 226, 227f
production stages, 227f
stages of, 227 228, 228f
modeling, 207 214
generalized disjunctive
programming model,
208 212
general superstructure for,
207f
optimization, in Mexico,
214 225
airport and biojet fuel
requirements, 216t, 225t
operating and capital cost,
215t
problem statement of
localization of biojet fuel
factory, 217f
producers and oil capacity,
216t
producers chosen and
selected capacity, 224t
results of localization, 225f
transportation cost, 217t
standards for product
certification, 204 207
Sustainability certification,
33 34
Sustainable Bioenergy
Research Consortium
(SBRC), 249
Swedish Biofuels, 252
Sweet sorghum, 106 107
components of, 107f, 114t
carbohydrate, 108
chemical formula, 109t
composition of, 108, 108t
minimum price of biojet fuel
from, 120t
total annual cost of, 119t
Syngas, 44 45, 48 49,
137 138, 140 141, 146,
150 151
Synthetic iso-paraffin (SIP),
6 11, 13 17, 44
Synthetic paraffinic kerosene
(SPK), 4, 6 11
Synthetic paraffinic kerosene
plus aromatics (SPK/A),
6 11
Syntroleum S-8 (S8), 64
261
T
Tar, 137
Technical certification, 33 34
Thermally coupled direct
sequence, 176 177
Thermally coupled distillation
systems, 174
Thermally coupled indirect
sequence, 176 177
Thermochemical approaches,
lignocellulosic feedstock,
136 138, 142
F T synthesis, 137 138
gasification, 137
pyrolysis, 138
Thermochemical pathways,
245 246
Thermodynamic method, 113,
153 154
Total annual cost (TAC),
176 177, 216
of lignocellulosic waste
processing, 159, 160t
process integration, 181 182,
193
process intensification,
181 182
sugar and starchy feedstock,
119
of sweet sorghum processing,
119t
Transportation device, 202
Triglyceride feedstock, 33 34,
34f, 45, 187f, 242 243
combustion tests for biojet
fuel, 63 64
conventional process, 60 63
conversion processes of,
56 60
hydrodecarbonylation, 57
hydrodecarboxylation, 57
hydrodeoxygenation, 57
hydrogenation, 57
hydroprocessing, mixture of
vegetable oils, 64 86
kinetic data for reactions
sets extended, 69t
lipidic profile of Jatropha
oil, 69t
262
Index
Triglyceride feedstock
(Continued)
lipidic profile of palm oil,
66t
modeling of hydrotreating,
65 74
problem statement, 64 65
rate constant for reaction
network, 73t
hydrotreatment process,
57 59, 57f, 58f, 66f, 74f
CO2 emissions, 84 86, 85t
composition of outlet
stream, 67t
economic assessment,
79 83, 80t, 82t
estimation of price of biojet
fuel, 83 84, 84t
flowsheet of, 76f
green diesel, 59 60
kinetic parameters,
Jatropha oil, 70t
light gases, 59
naphtha, 59
operational conditions for,
58
palm oil and kinetic data,
proposed set reactions
for, 68t
palm oil, extended
reactions set for, 68t
reaction pathway for,
Jatropha oil, 70f
reactions set, Jatropha oil, 71t
simulation of, 75 78, 76f,
77t, 78t, 79t
input data for case of study,
188t
raw materials, 35 37
animal fat, 36f
oil content, yield and price
of oils, 36t
oleic acids, chemical
structure for, 35f
palmitic acids, chemical
structure for, 35f
stearic acids, chemical
structure for, 35f
triolein, chemical structure
for, 35f
vegetable oils, 35, 36f
from renewable sources, 55,
56f
Triolein, chemical structure for,
35f
T-shaped microreactors,
172 174
Typical gasifiers, 146 147, 147f
U
UOP Honeywell technology, 19,
55 56, 60 61, 248
V
Vegetable oils, 35
W
Wet oxidation, 133 134
Z
Zymomonas mobilis, 94 96