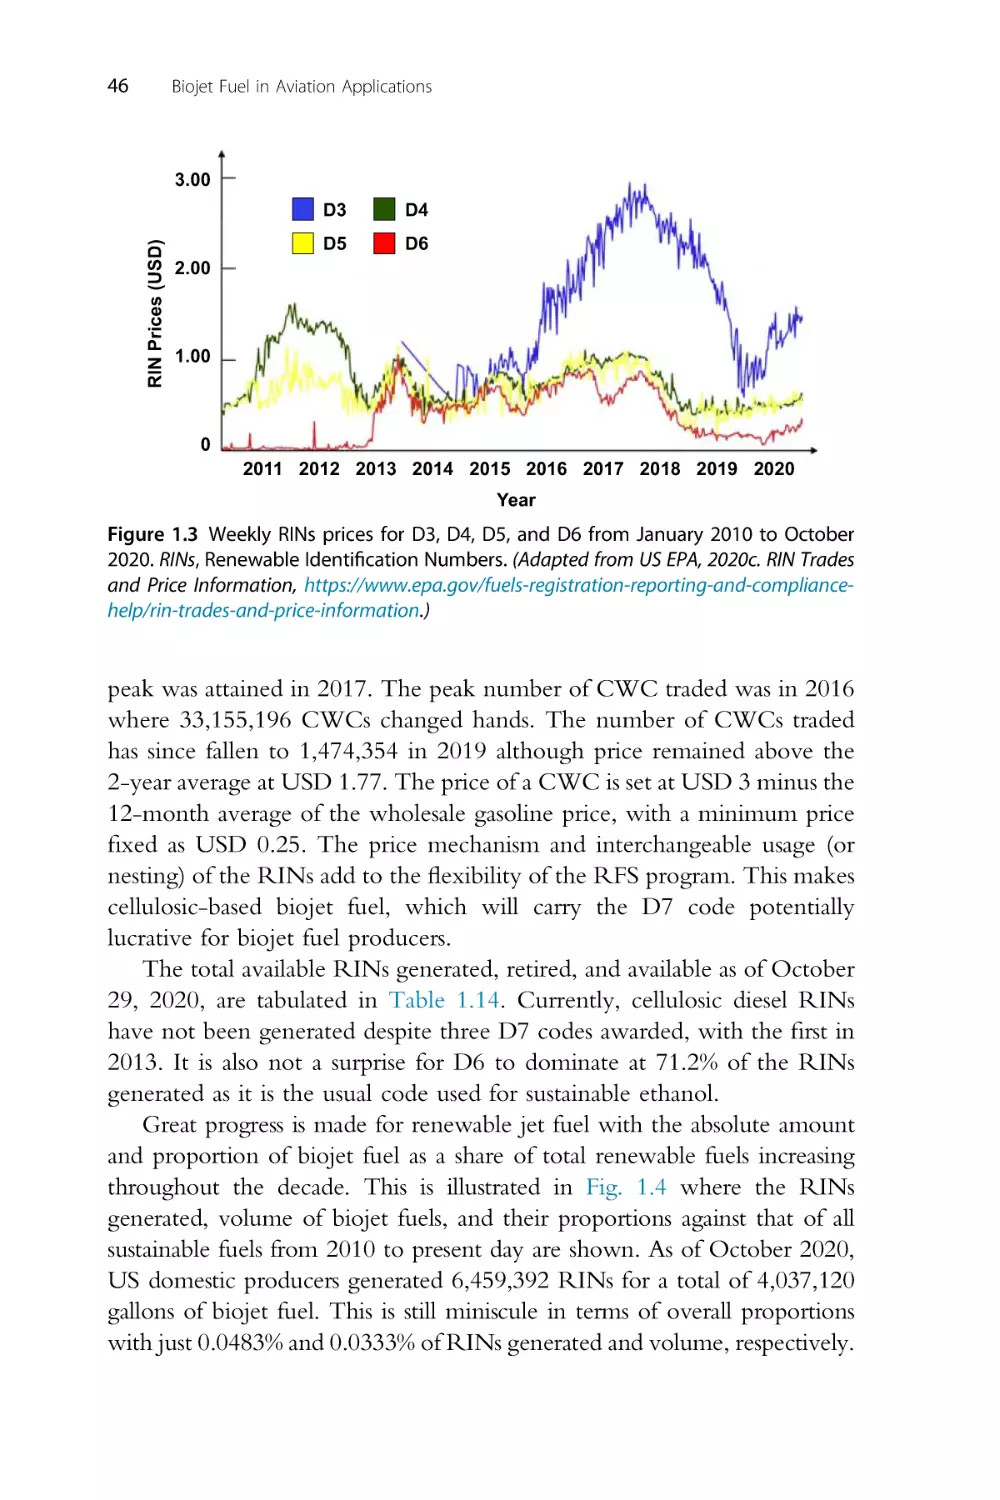
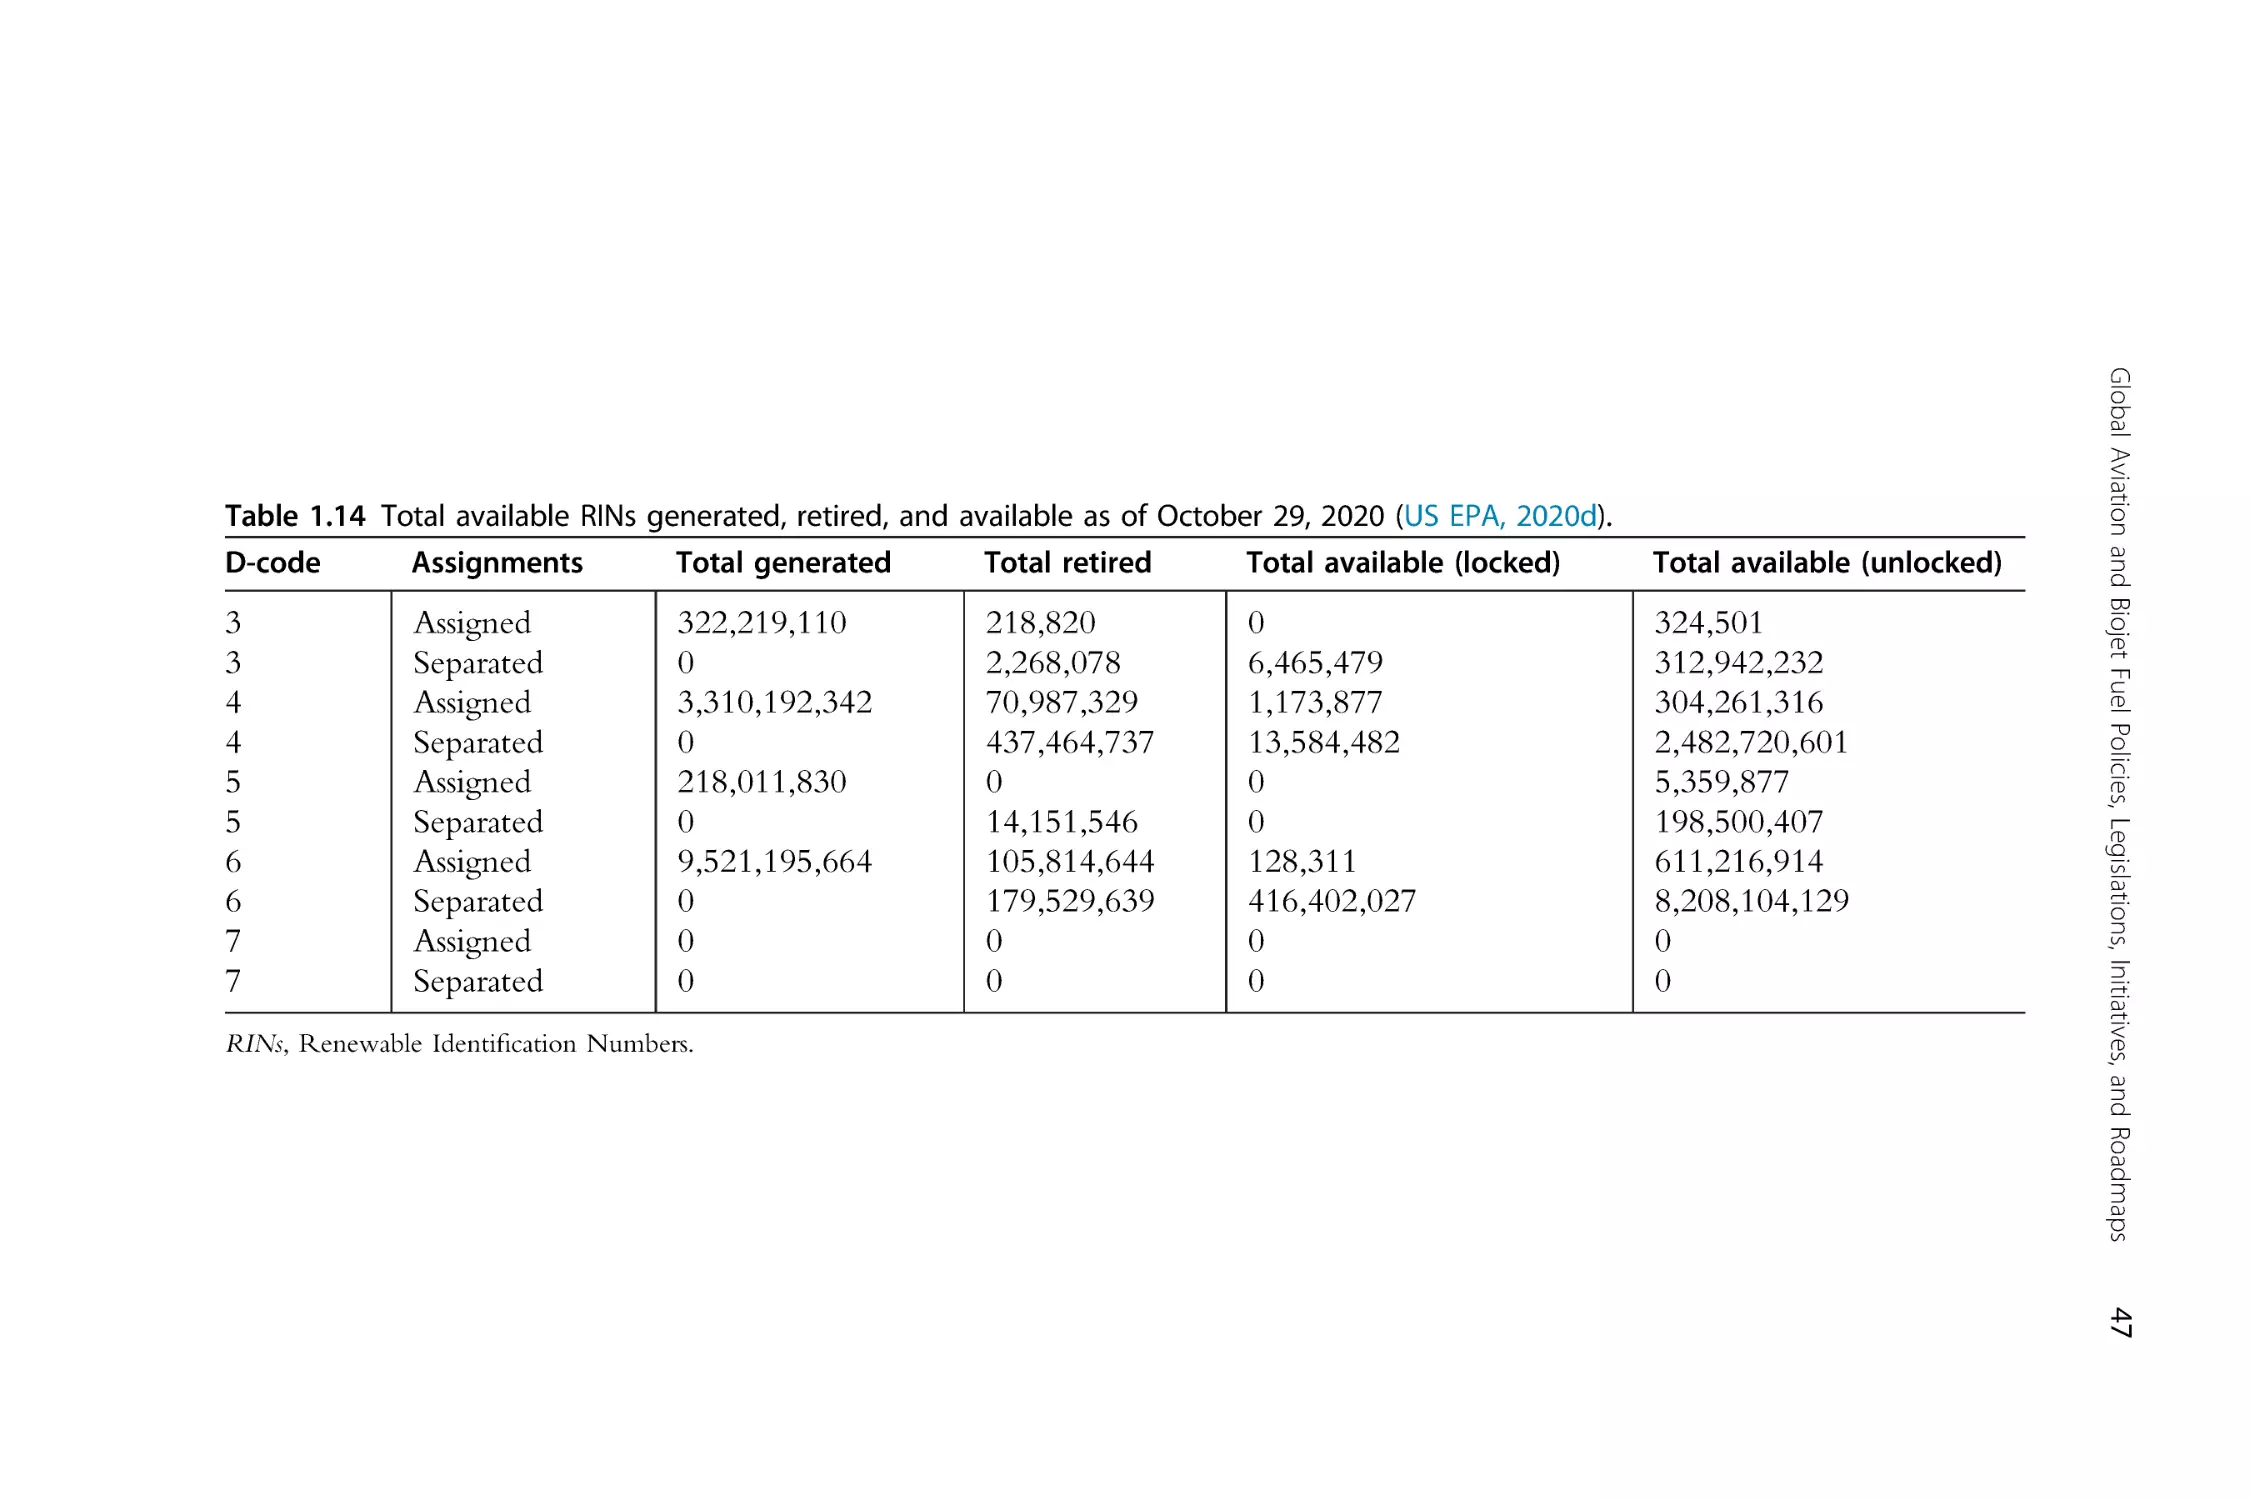
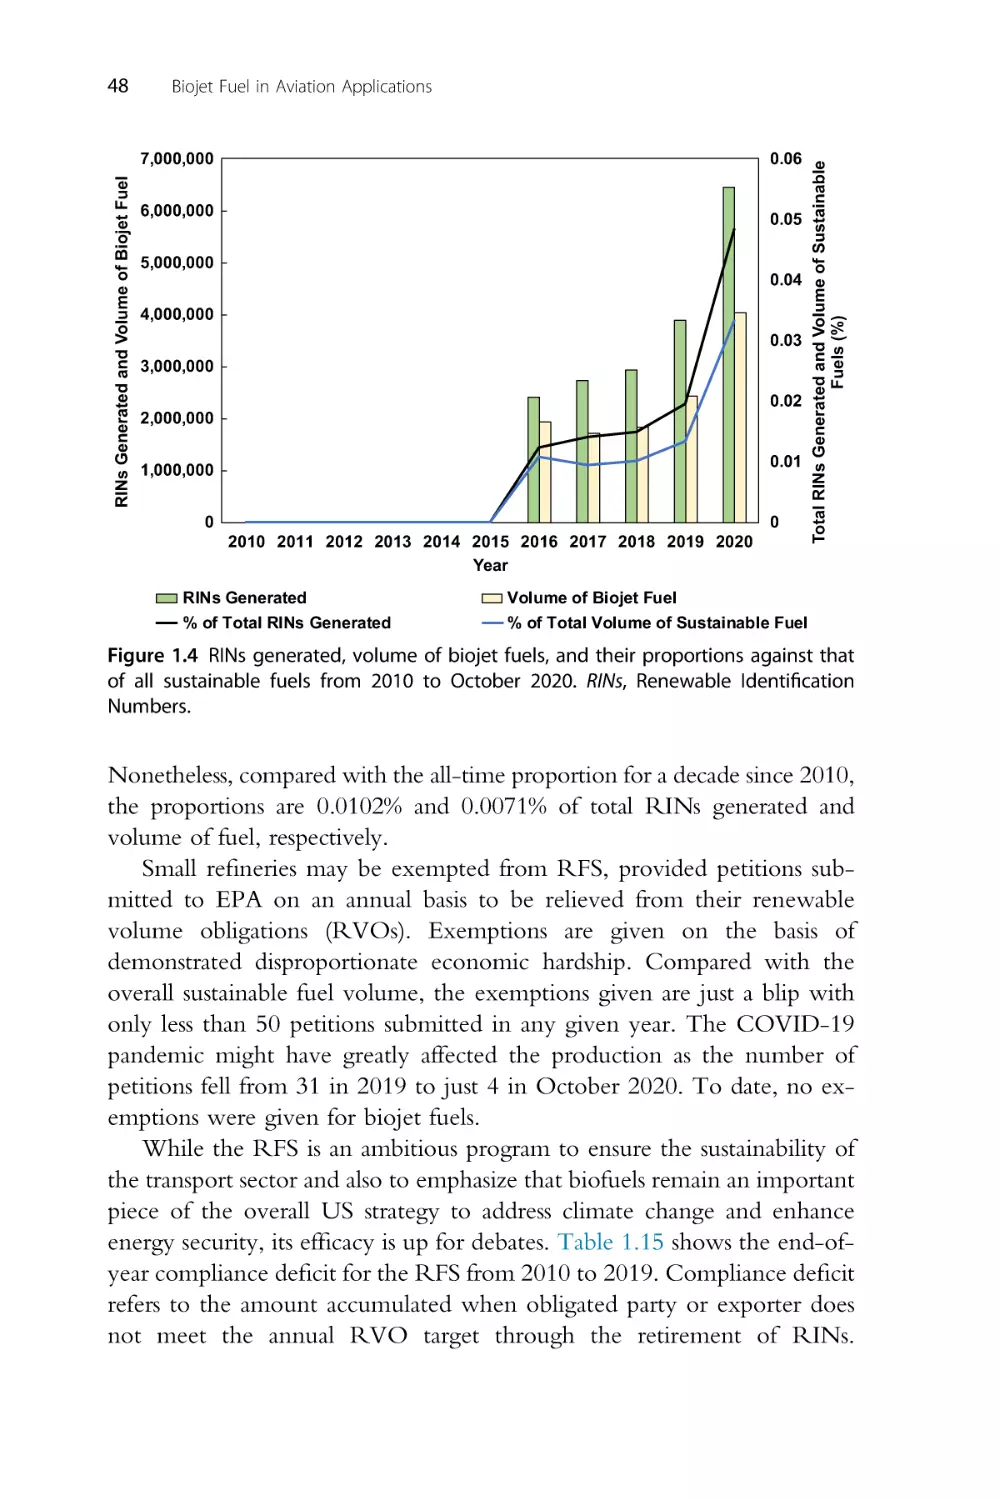
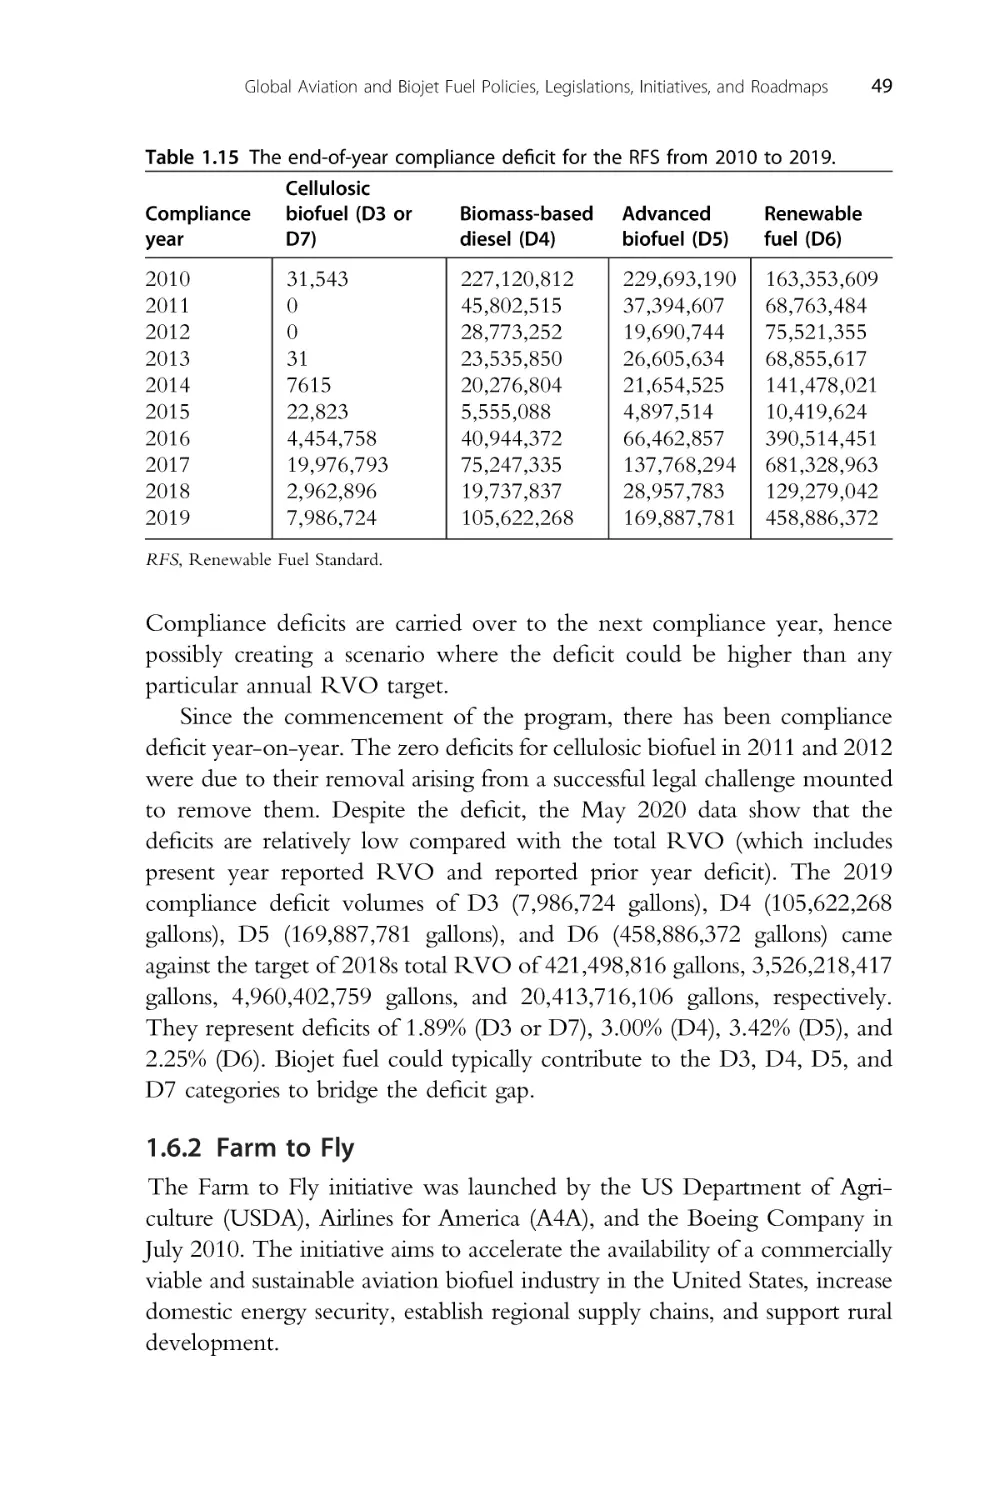
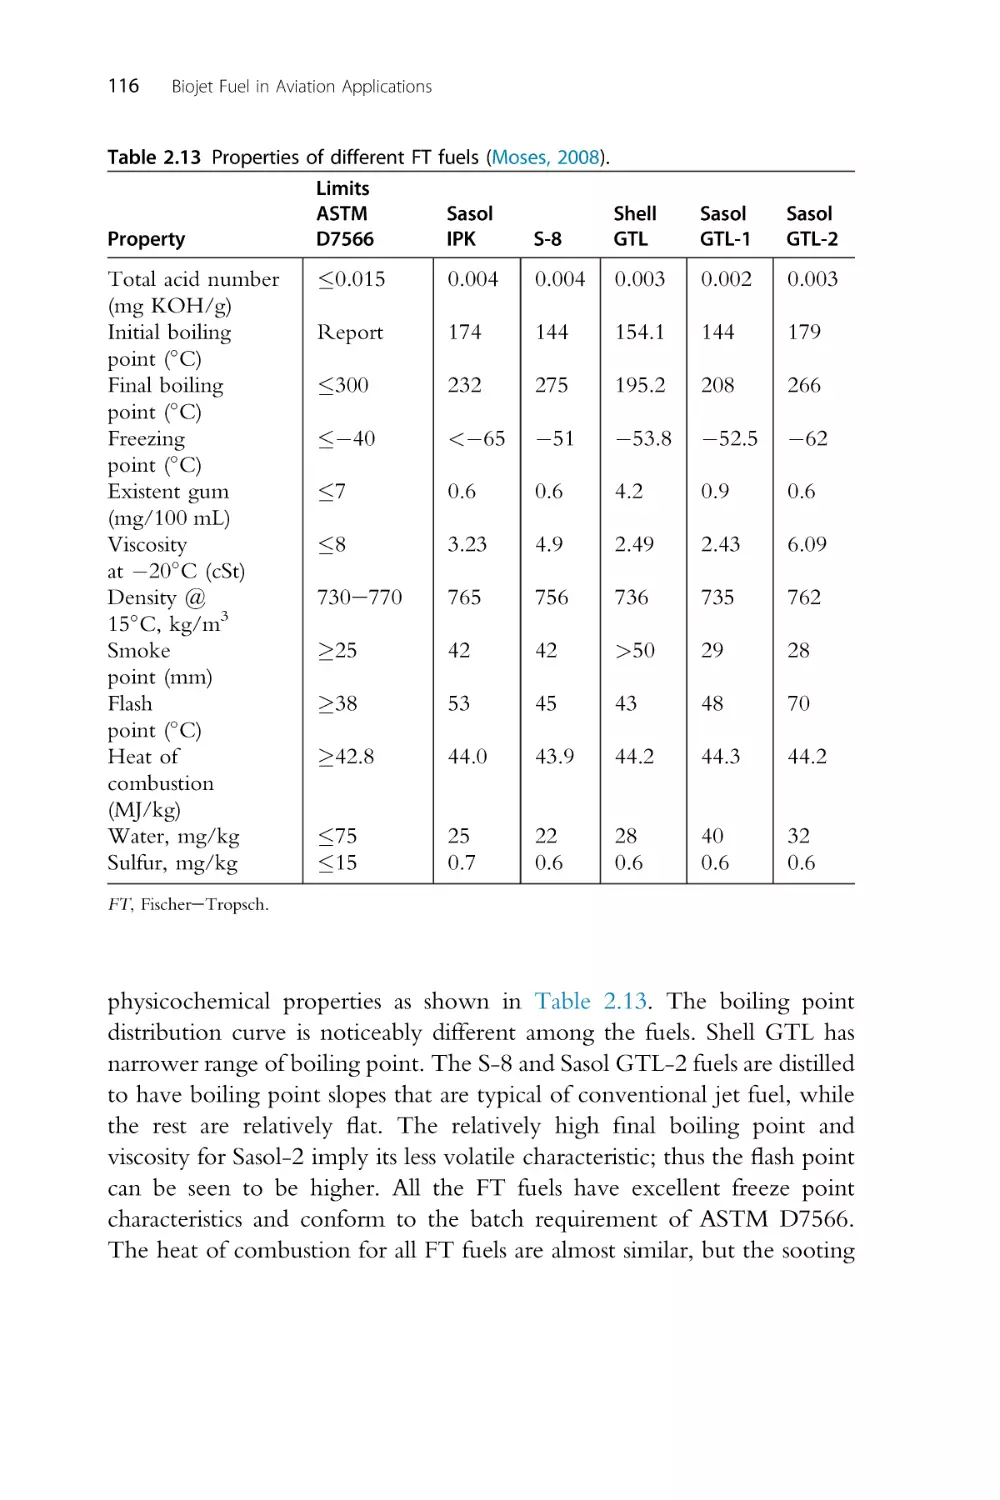
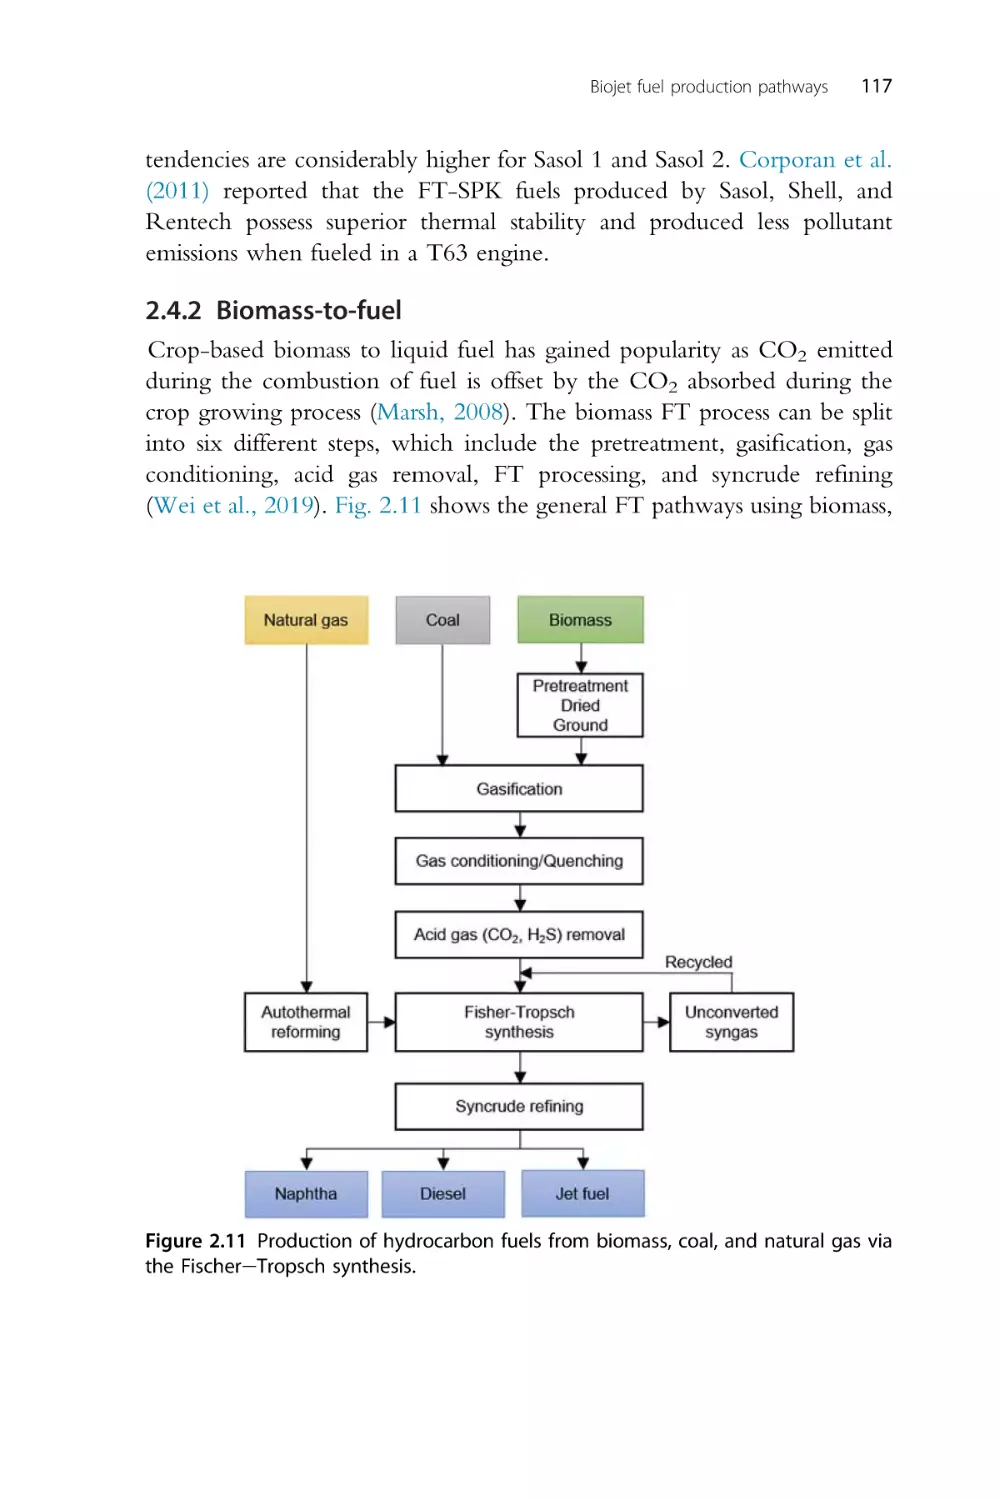
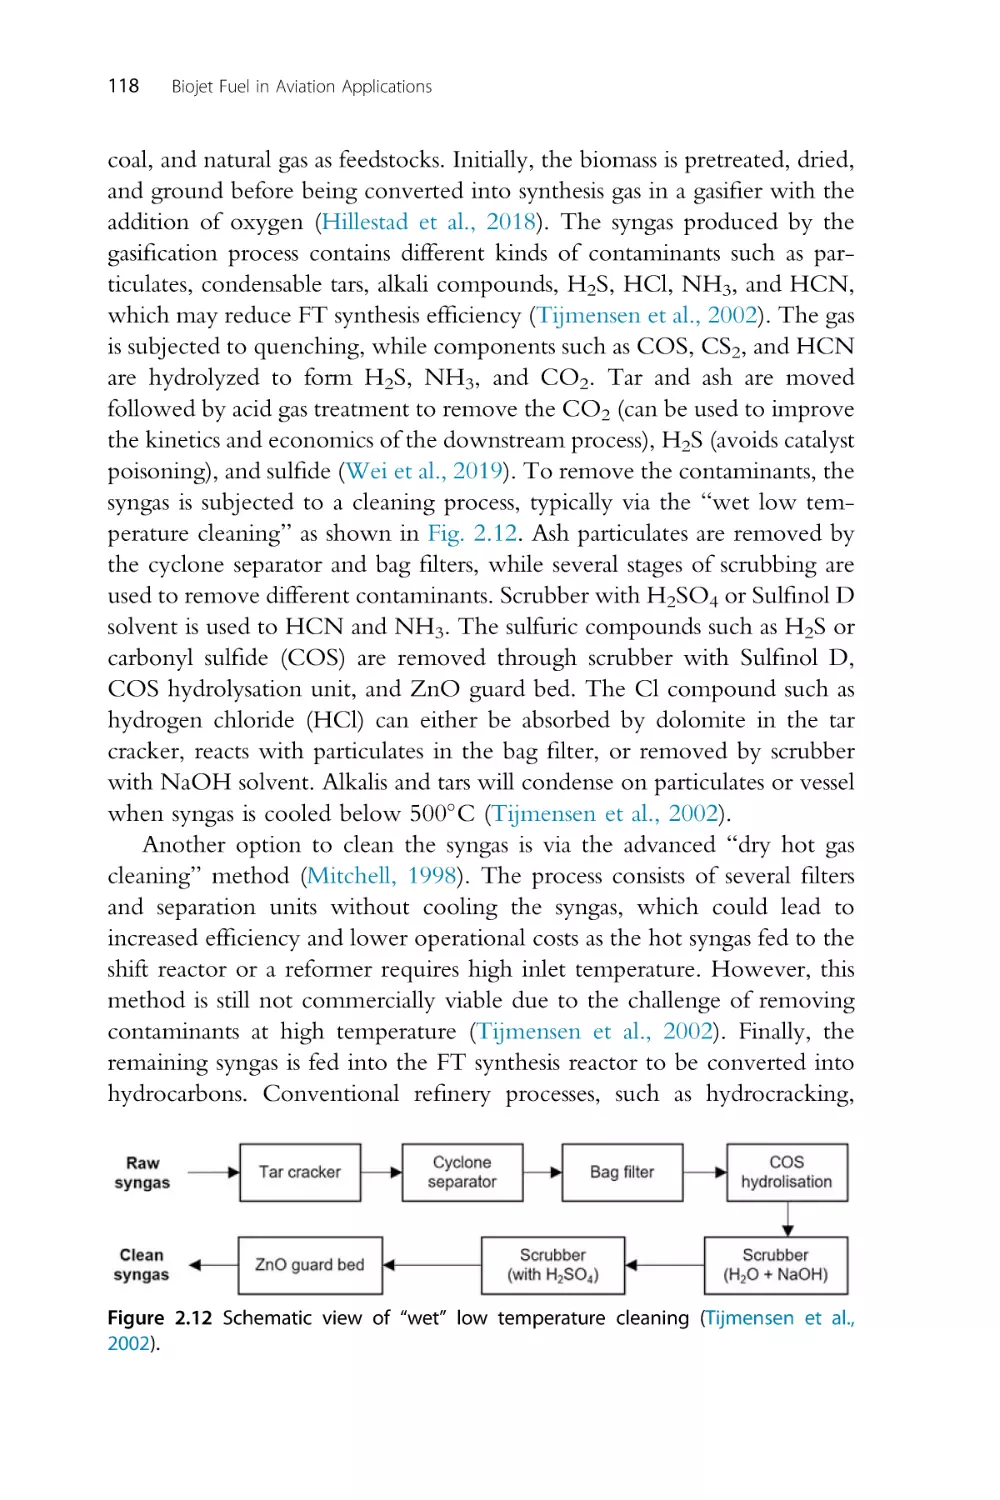
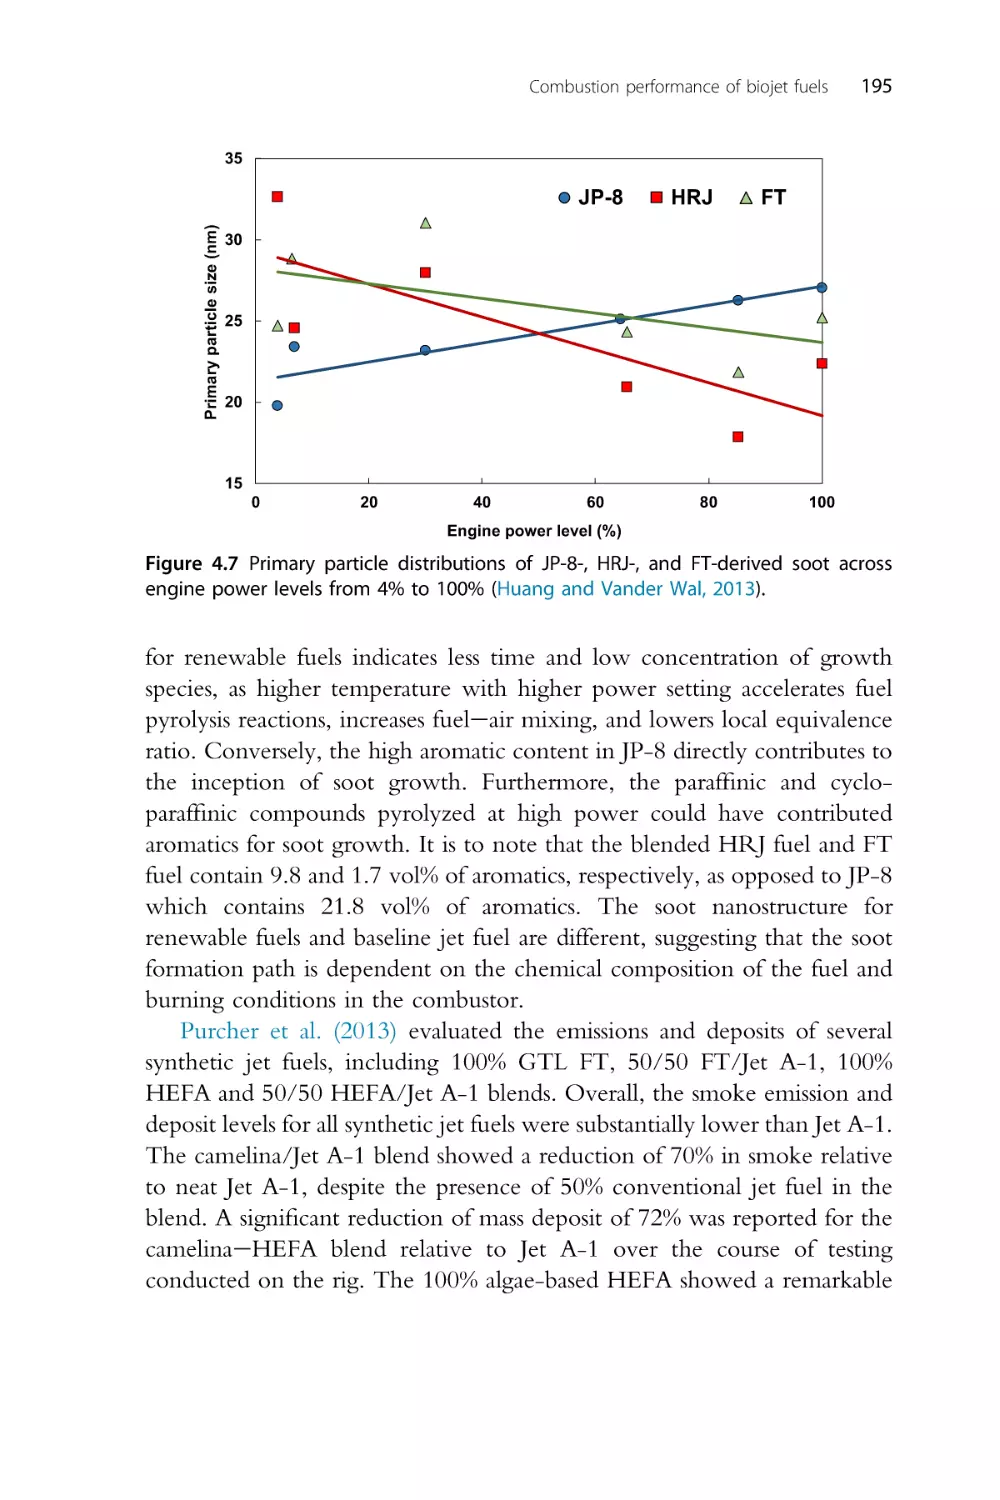
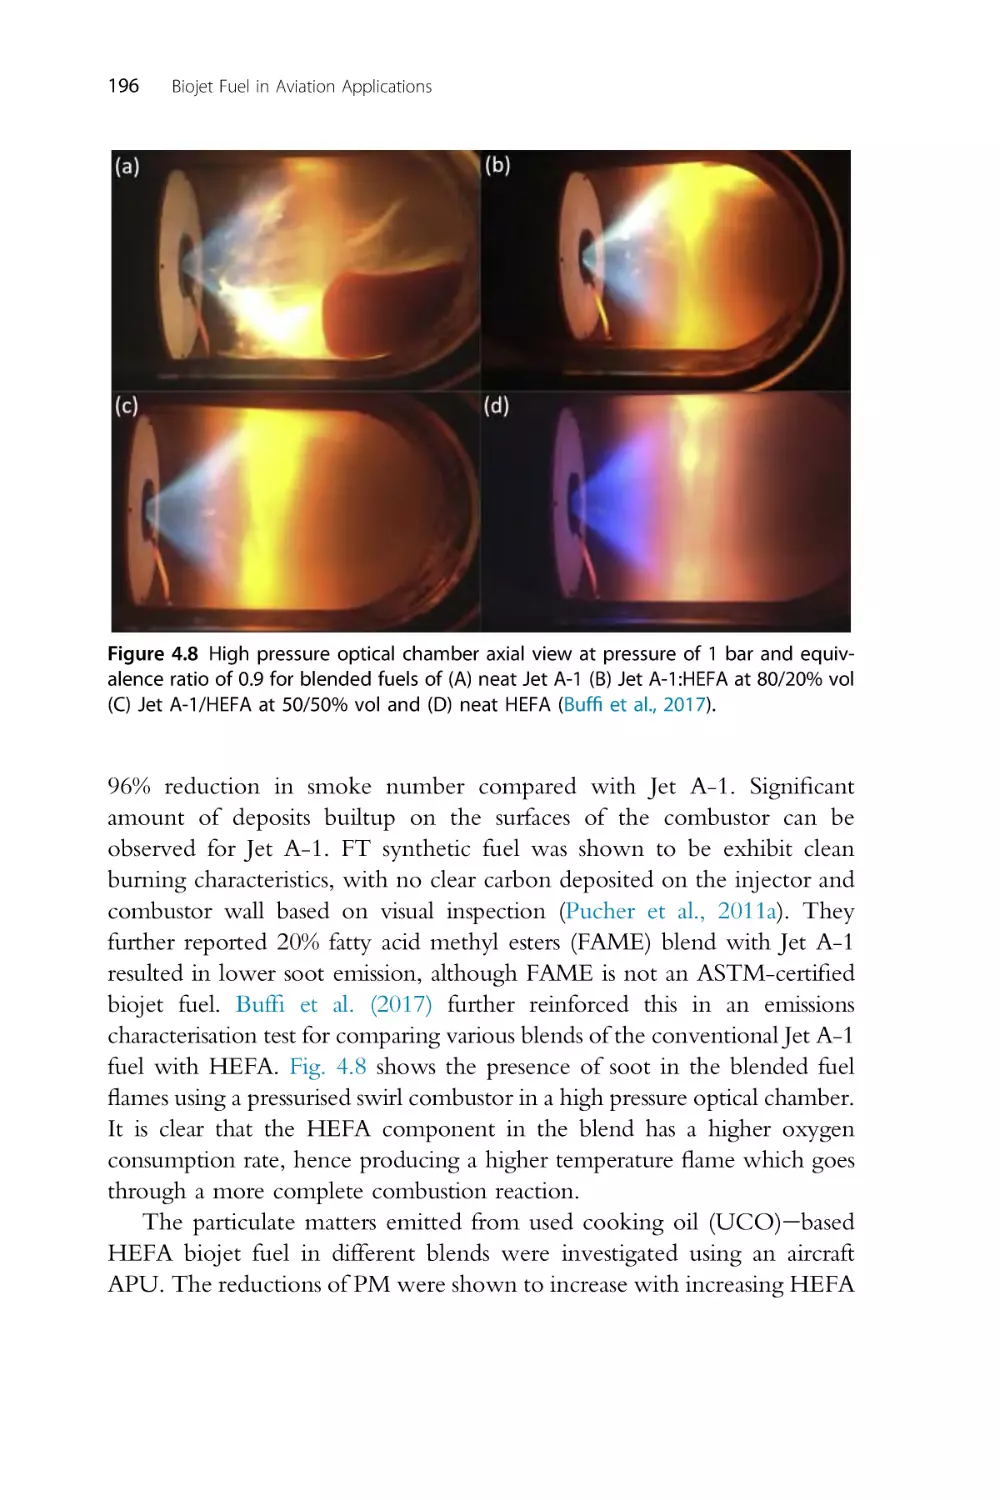
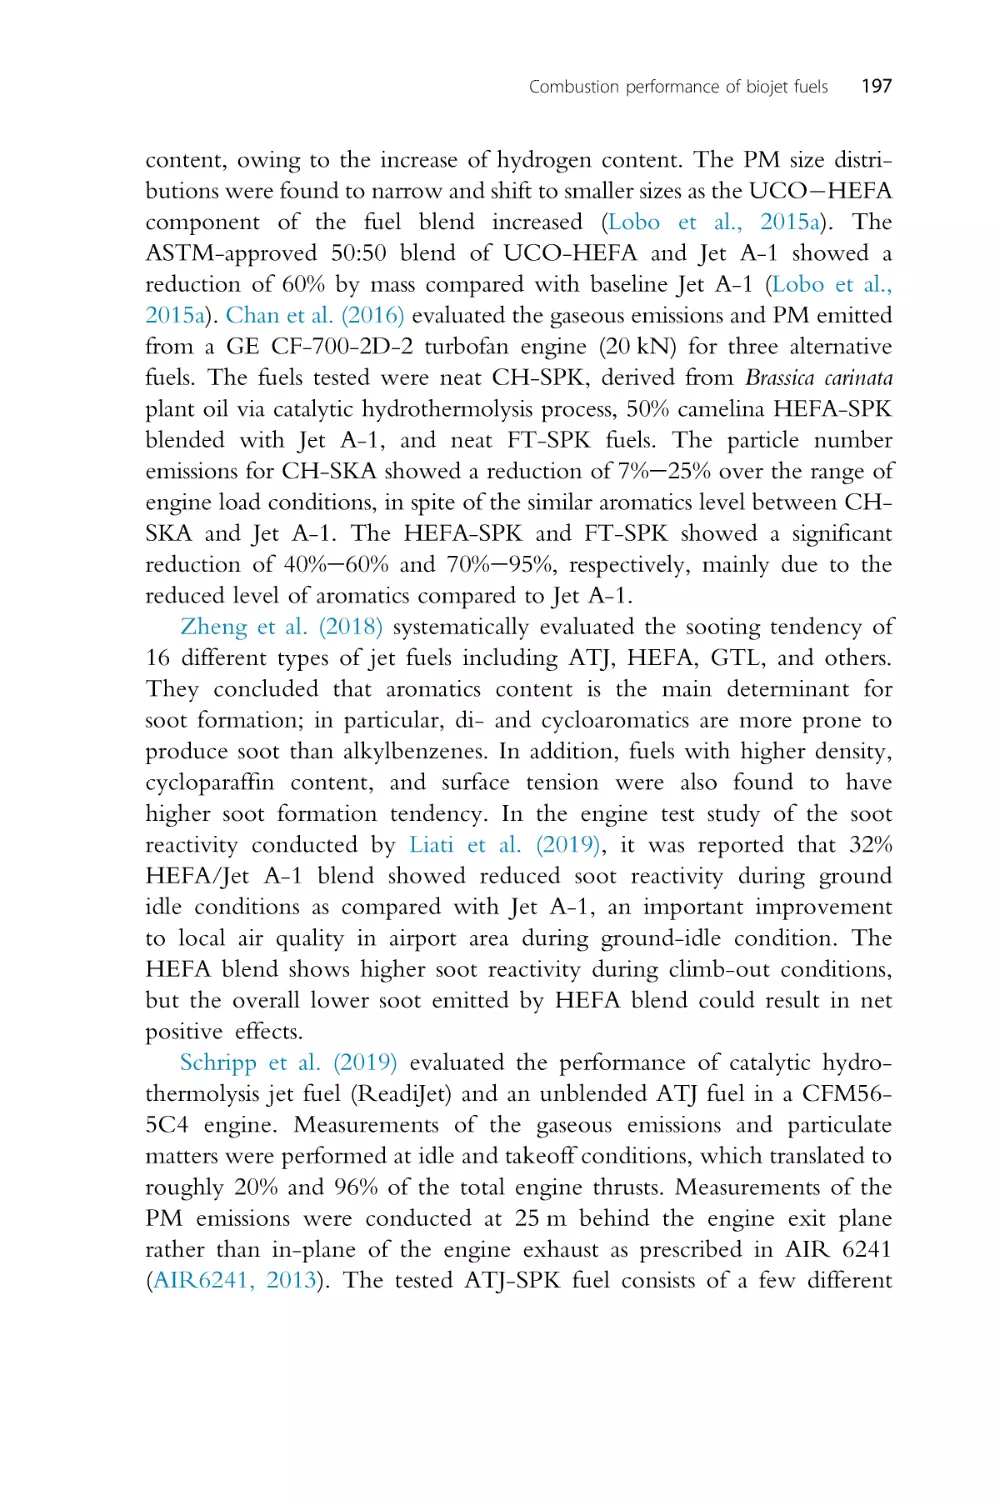
/


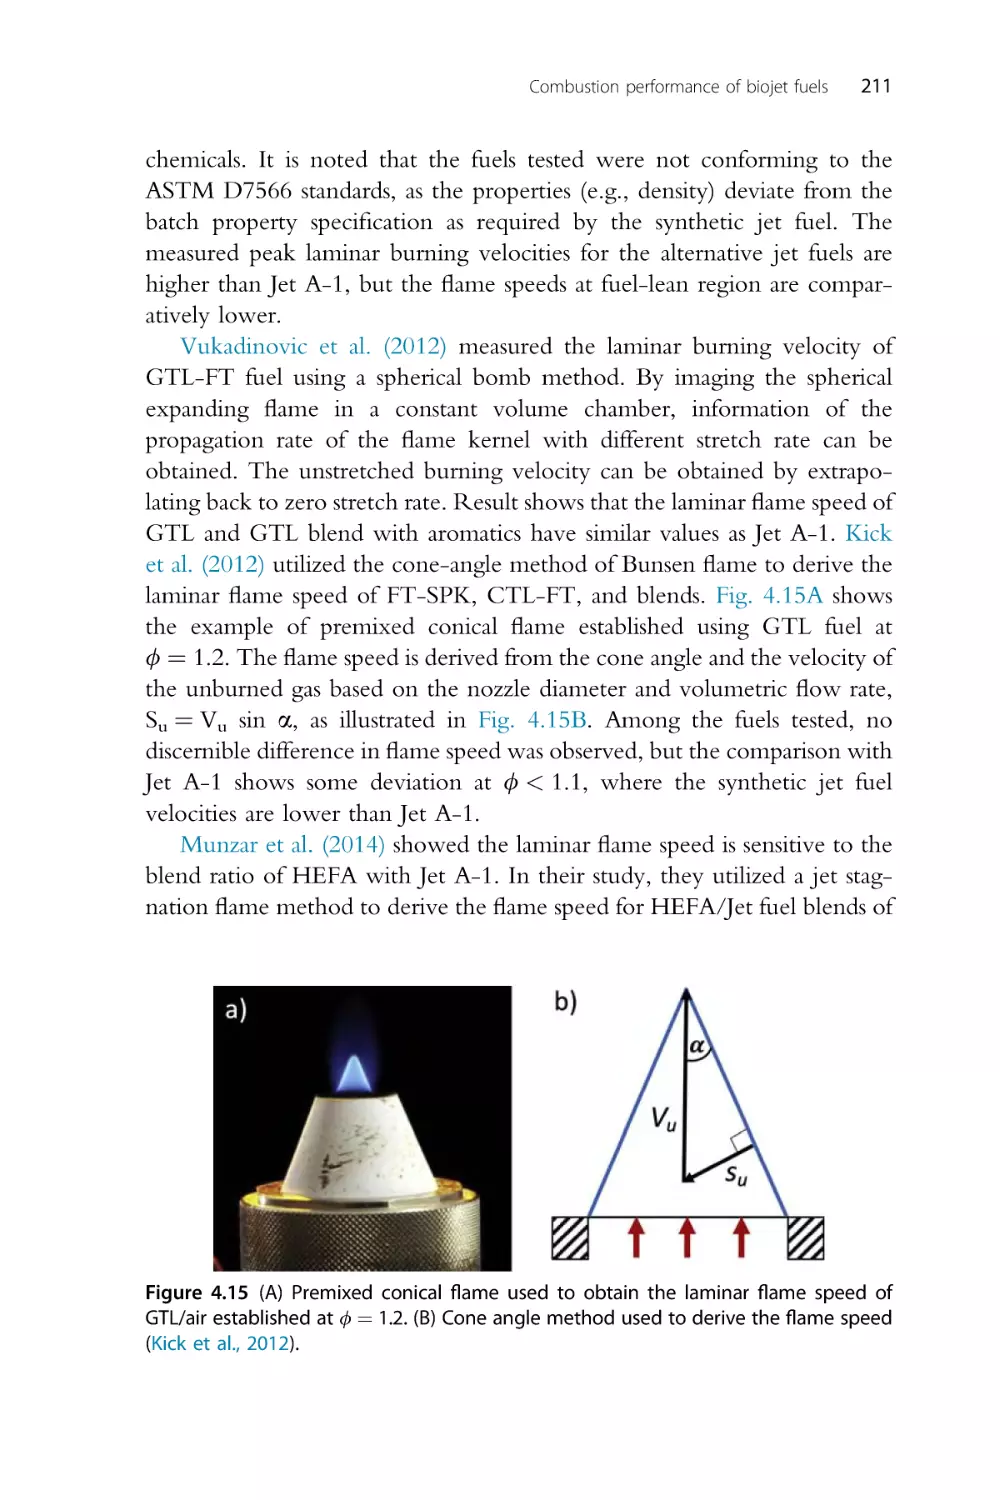
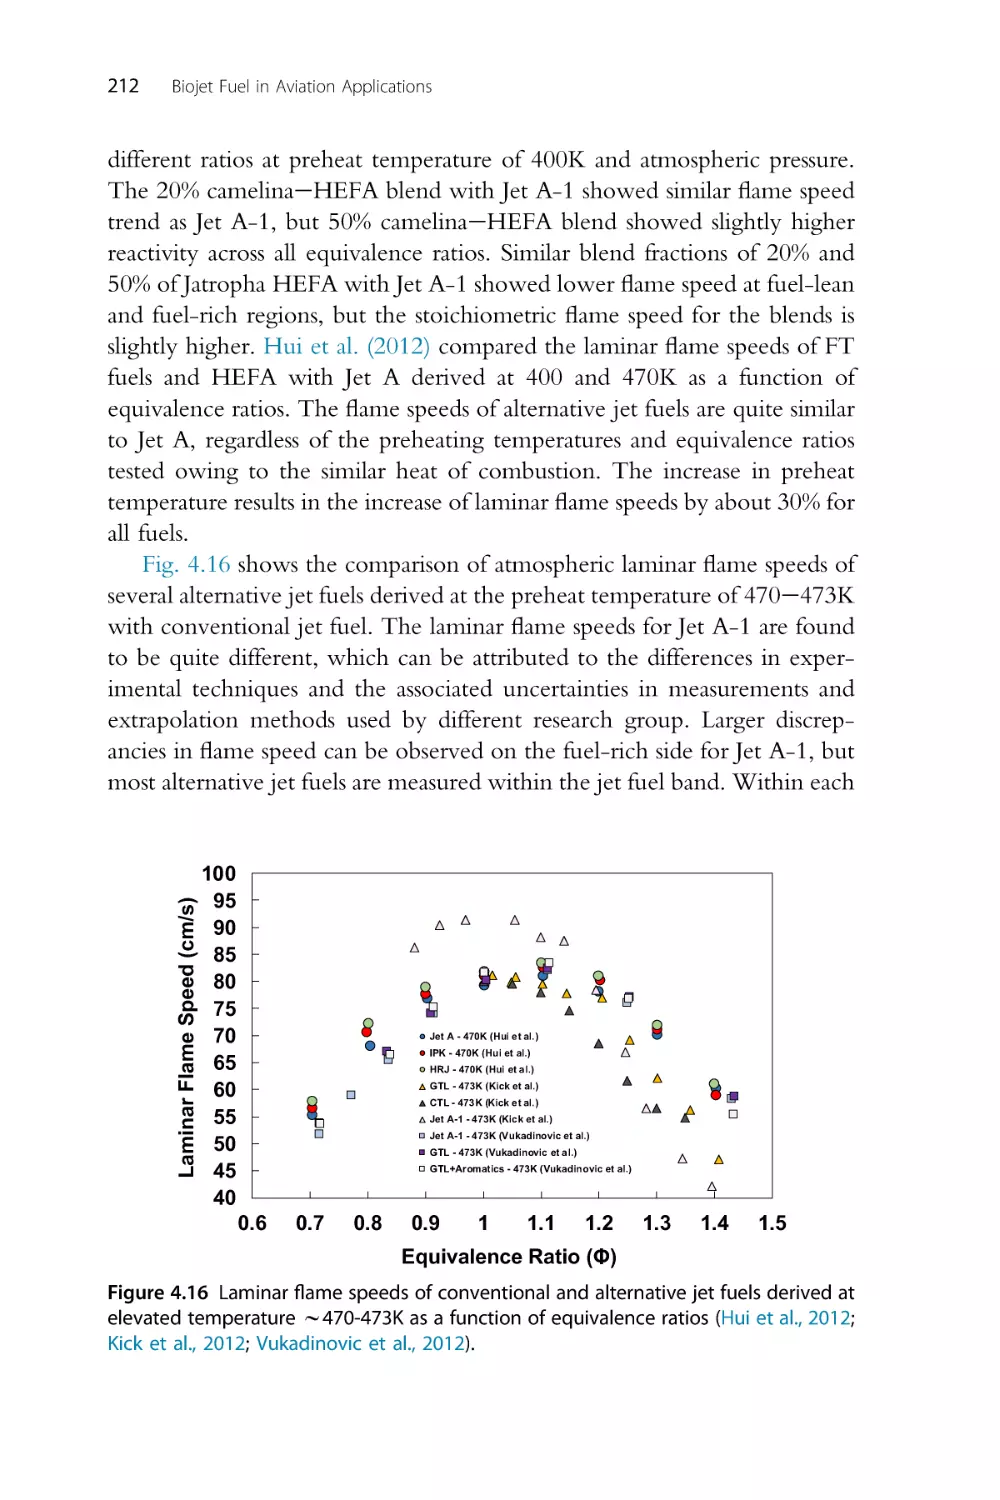
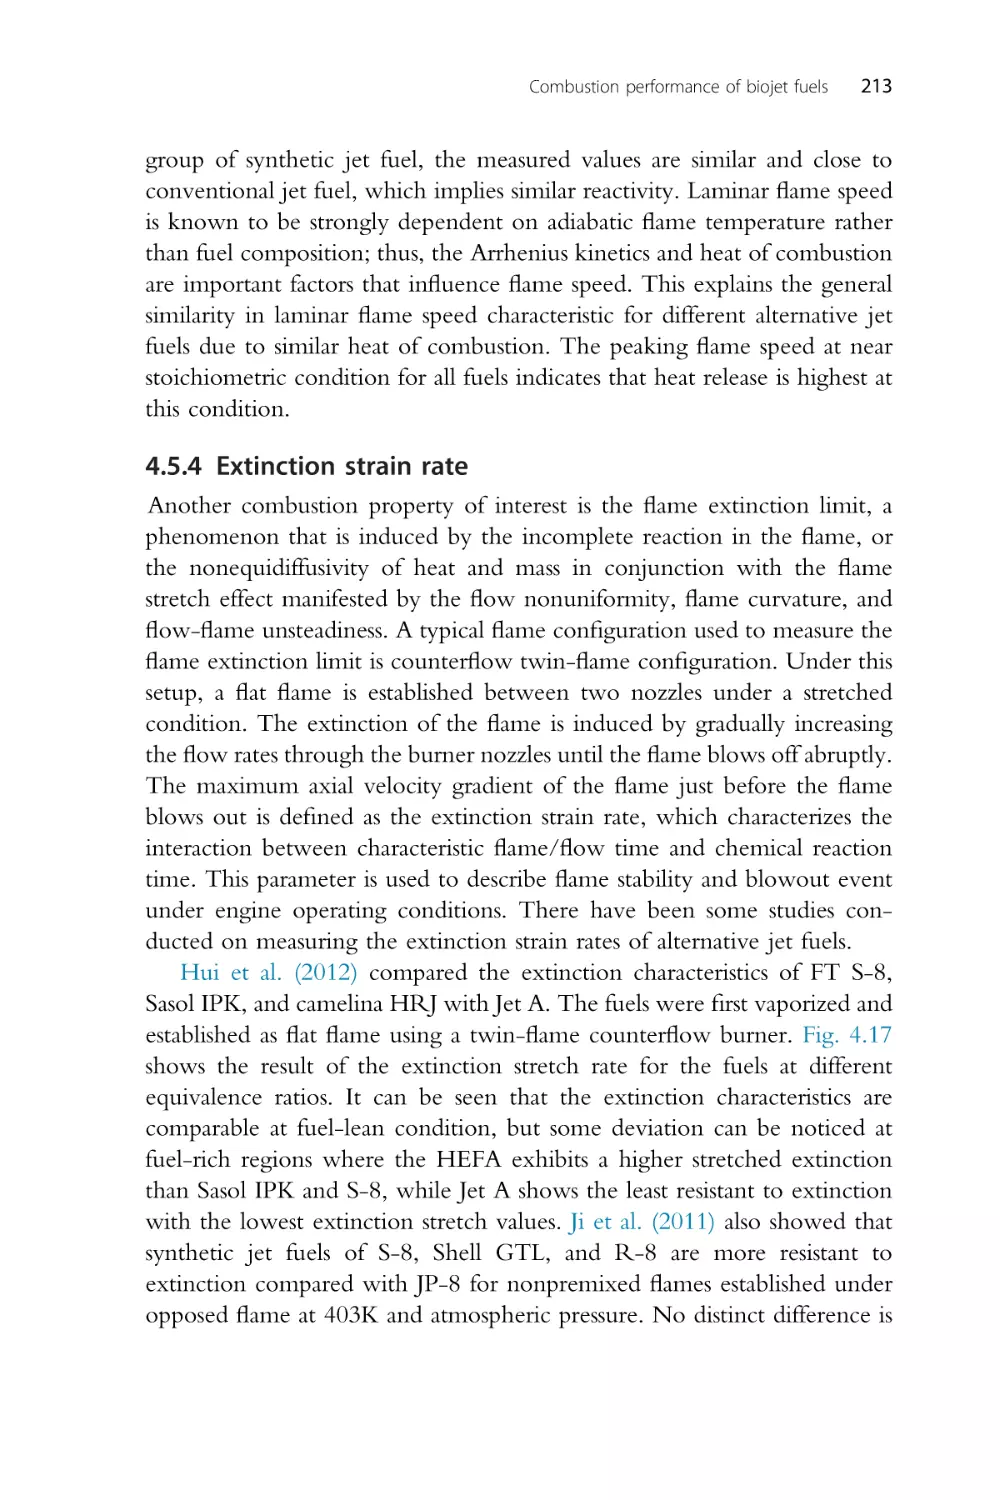


Text
BIOJET FUEL IN
AVIATION
APPLICATIONS
This page intentionally left blank
BIOJET FUEL IN
AVIATION
APPLICATIONS
Production, Usage and
Impact of Biofuels
CHENG TUNG CHONG
JO-HAN NG
Elsevier
Radarweg 29, PO Box 211, 1000 AE Amsterdam, Netherlands
The Boulevard, Langford Lane, Kidlington, Oxford OX5 1GB, United Kingdom
50 Hampshire Street, 5th Floor, Cambridge, MA 02139, United States
Copyright © 2021 Elsevier Inc. All rights reserved.
No part of this publication may be reproduced or transmitted in any form or by any
means, electronic or mechanical, including photocopying, recording, or any information
storage and retrieval system, without permission in writing from the publisher. Details
on how to seek permission, further information about the Publisher’s permissions
policies and our arrangements with organizations such as the Copyright Clearance
Center and the Copyright Licensing Agency, can be found at our website: www.elsevier.
com/permissions.
This book and the individual contributions contained in it are protected under
copyright by the Publisher (other than as may be noted herein).
Notices
Knowledge and best practice in this field are constantly changing. As new research
and experience broaden our understanding, changes in research methods, professional
practices, or medical treatment may become necessary.
Practitioners and researchers must always rely on their own experience and knowledge
in evaluating and using any information, methods, compounds, or experiments
described herein. In using such information or methods they should be mindful of
their own safety and the safety of others, including parties for whom they have a
professional responsibility.
To the fullest extent of the law, neither the Publisher nor the authors, contributors, or
editors, assume any liability for any injury and/or damage to persons or property as a
matter of products liability, negligence or otherwise, or from any use or operation of
any methods, products, instructions, or ideas contained in the material herein.
Library of Congress Cataloging-in-Publication Data
A catalog record for this book is available from the Library of Congress
British Library Cataloguing-in-Publication Data
A catalogue record for this book is available from the British Library
ISBN: 978-0-12-822854-8
For information on all Elsevier publications visit our
website at https://www.elsevier.com/books-and-journals
Publisher: Matthew Deans
Acquisitions Editor: Carrie Bolger
Editorial Project Manager: Aleksandra Packowska
Production Project Manager: Prasanna Kalyanaraman
Cover Designer: Greg Harris
Typeset by TNQ Technologies
Contents
Preface
Acknowledgments
vii
xi
1. Global Aviation and Biojet Fuel Policies, Legislations,
Initiatives, and Roadmaps
1
1.1 Introduction
1.2 GlobaldInternational Civil Agency Organization
1.3 European Union
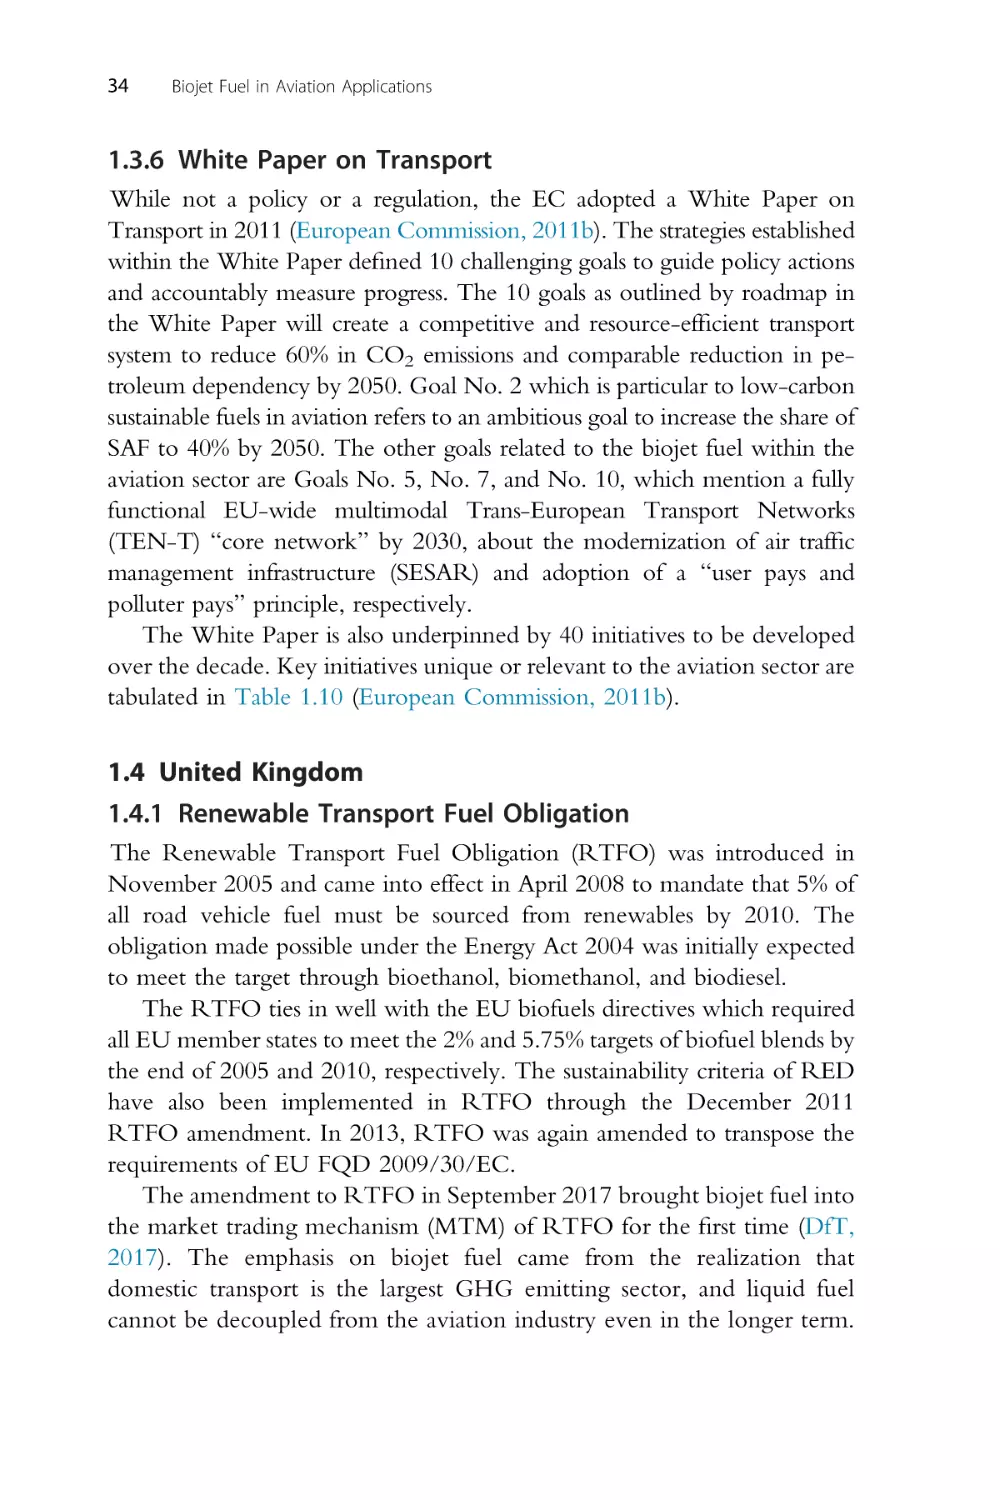
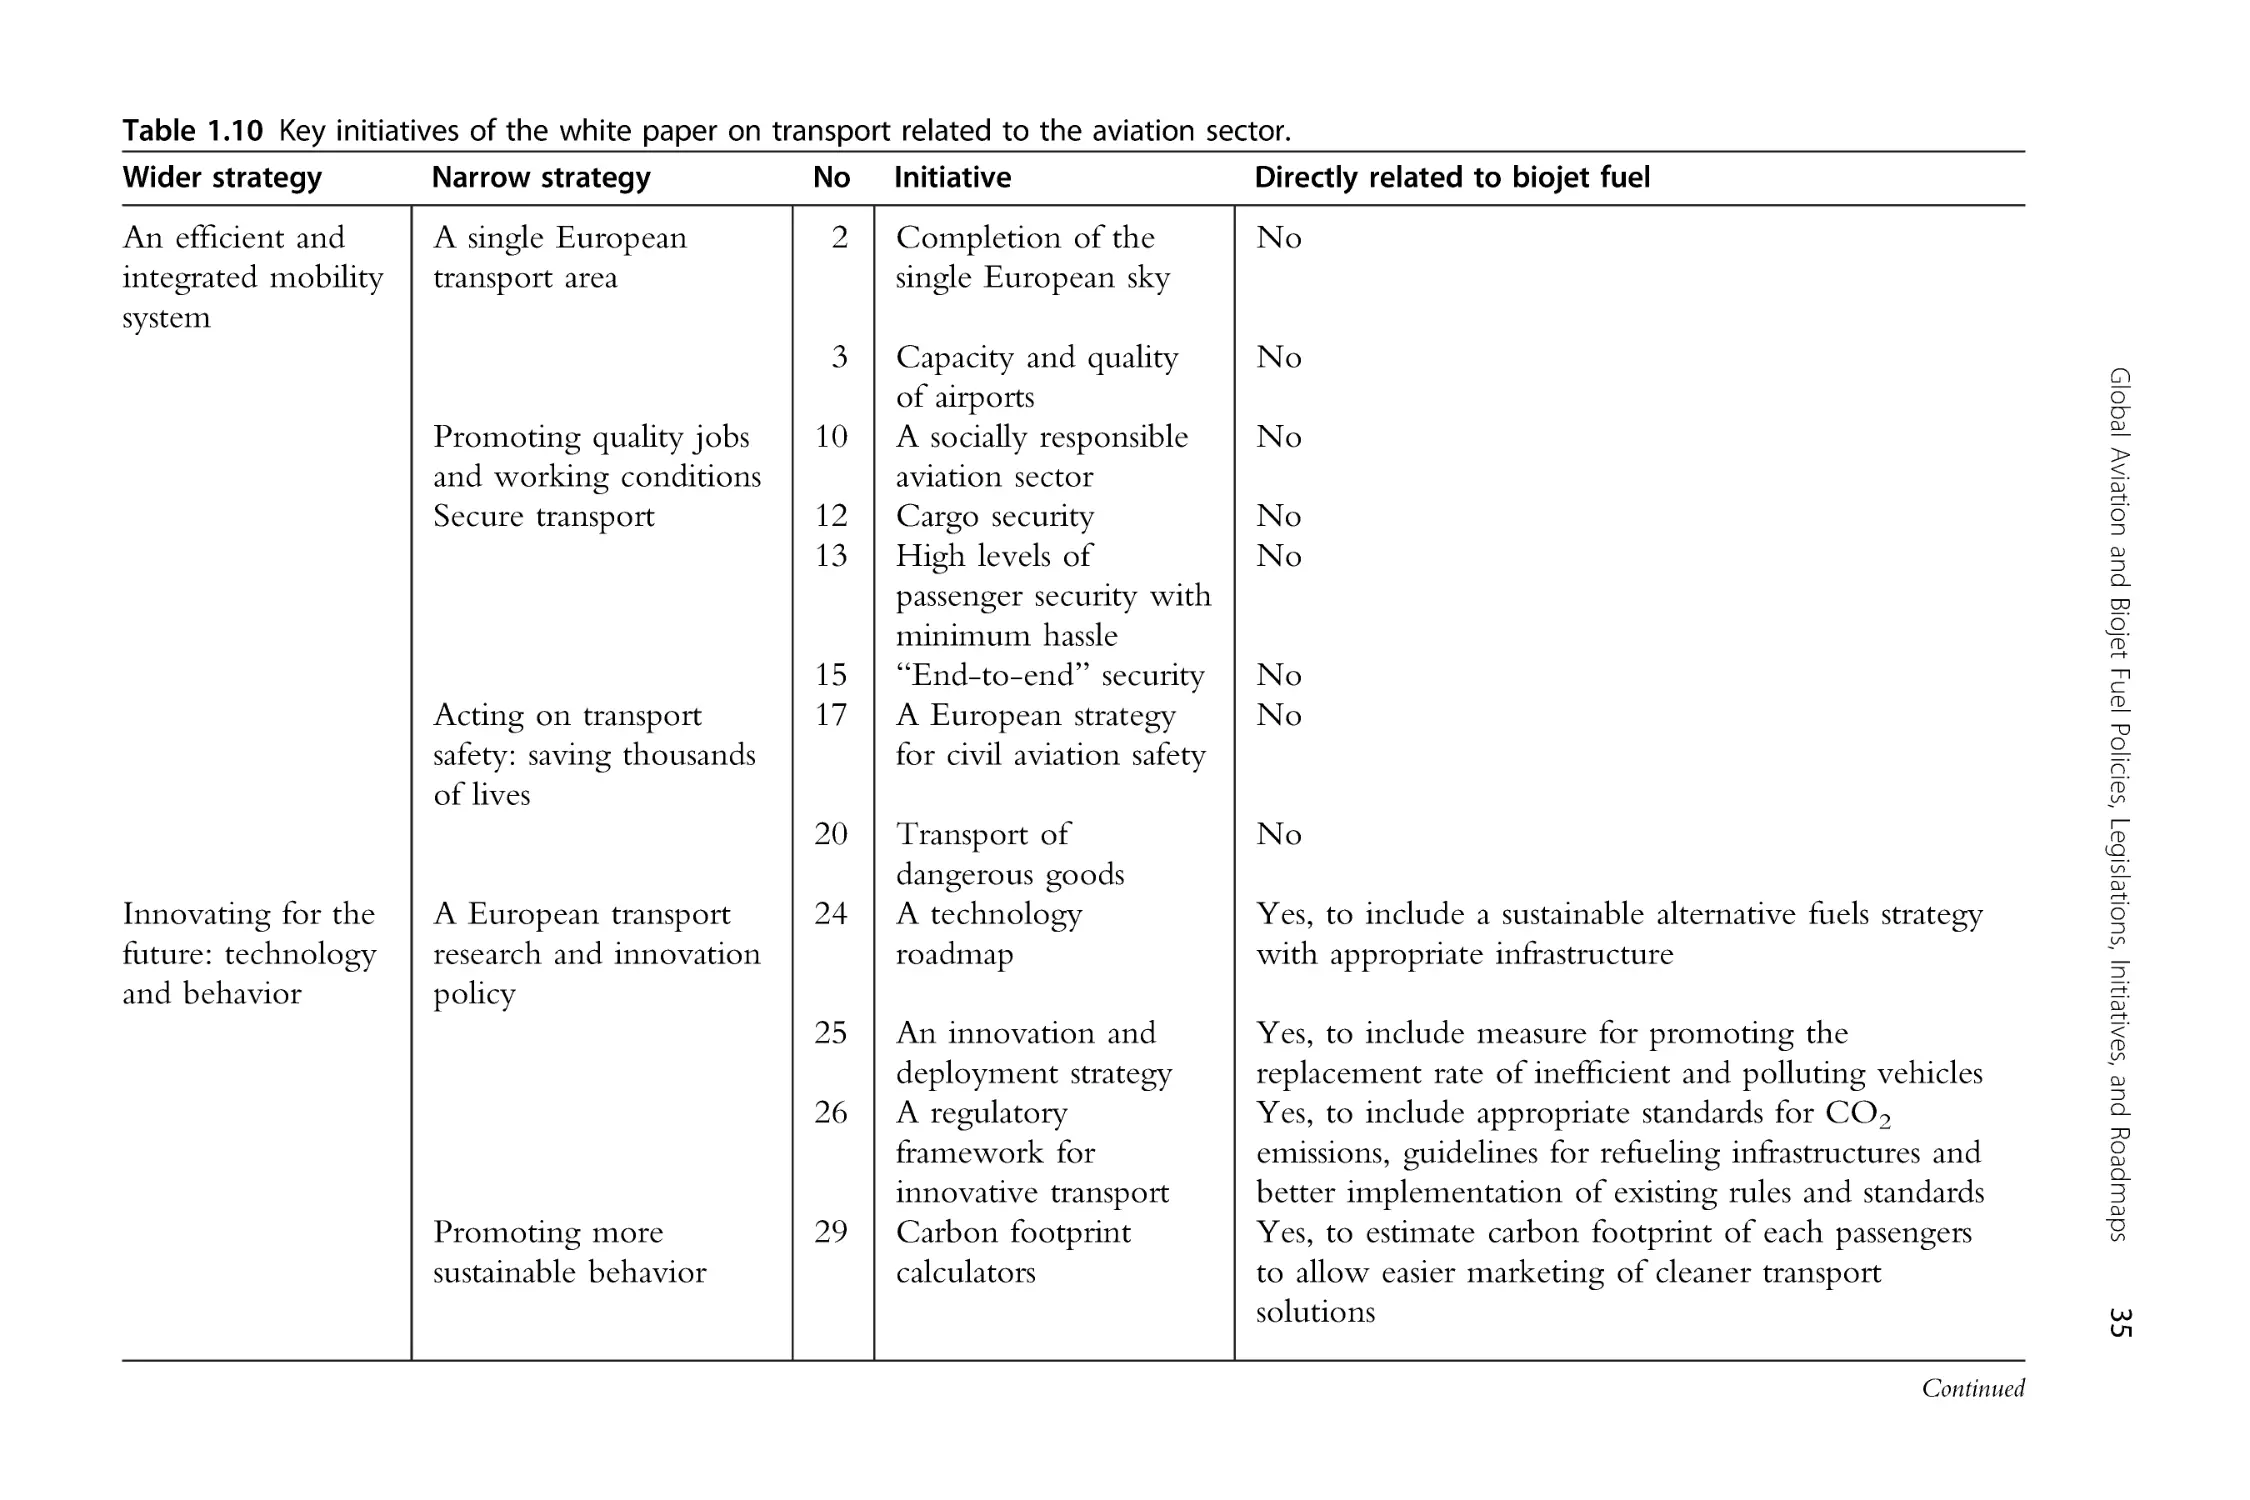
1.4 United Kingdom
1.5 Scandinavia
1.6 United States of America
1.7 Canada
1.8 Mexico
1.9 Brazil
1.10 Argentina
1.11 China
1.12 Malaysia
1.13 Japan
1.14 Indonesia
1.15 Australia
1.16 Summary
References
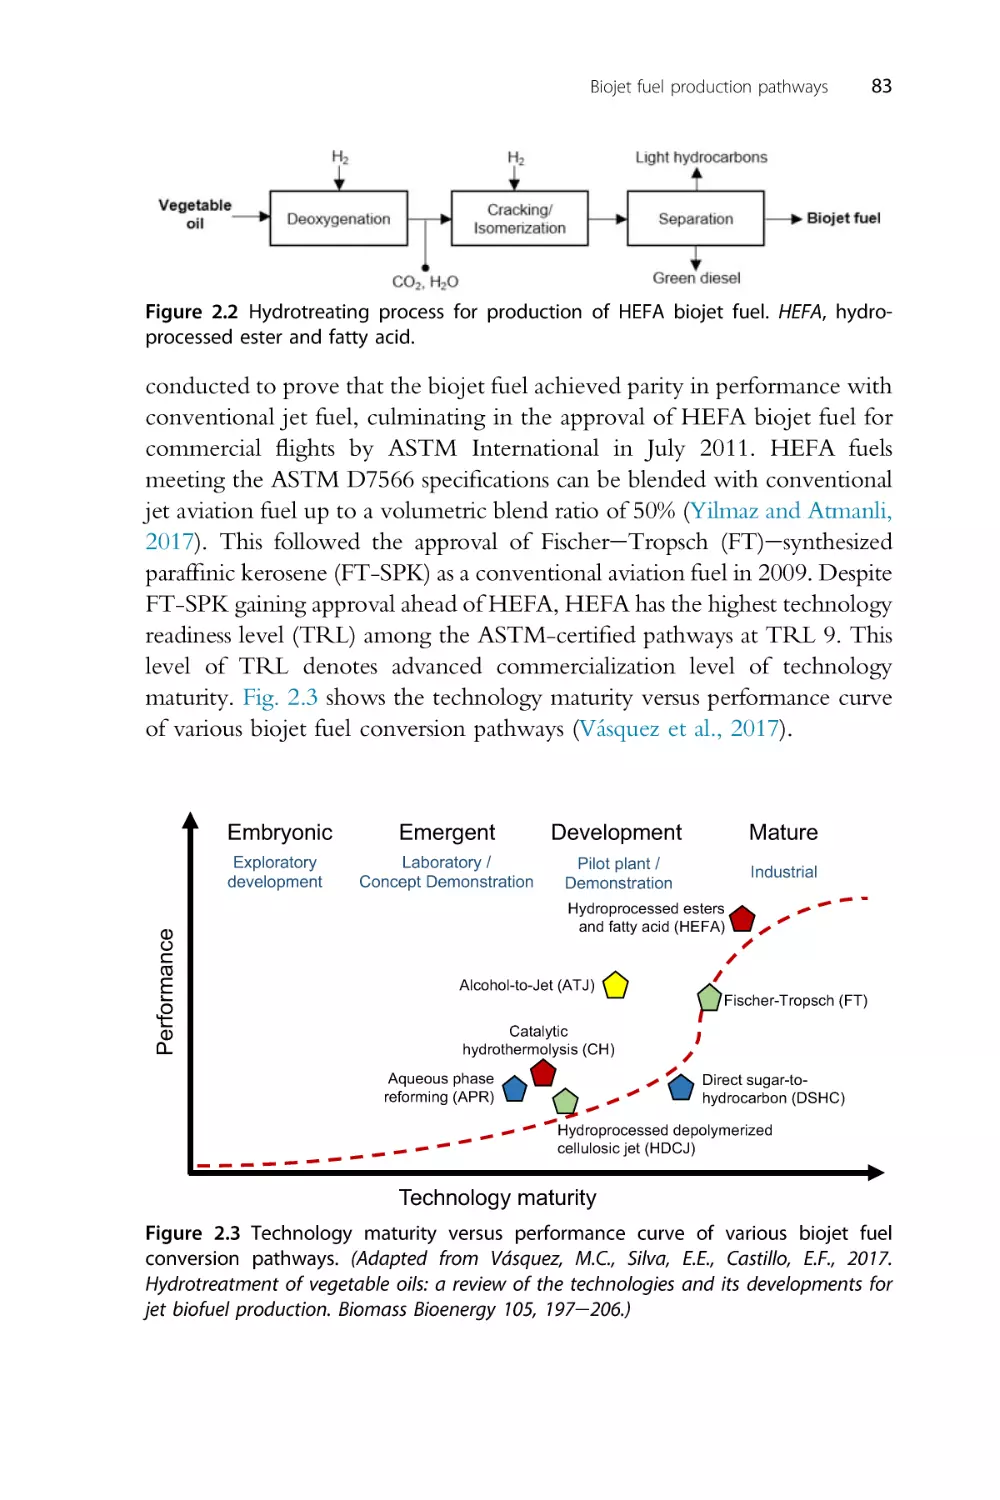
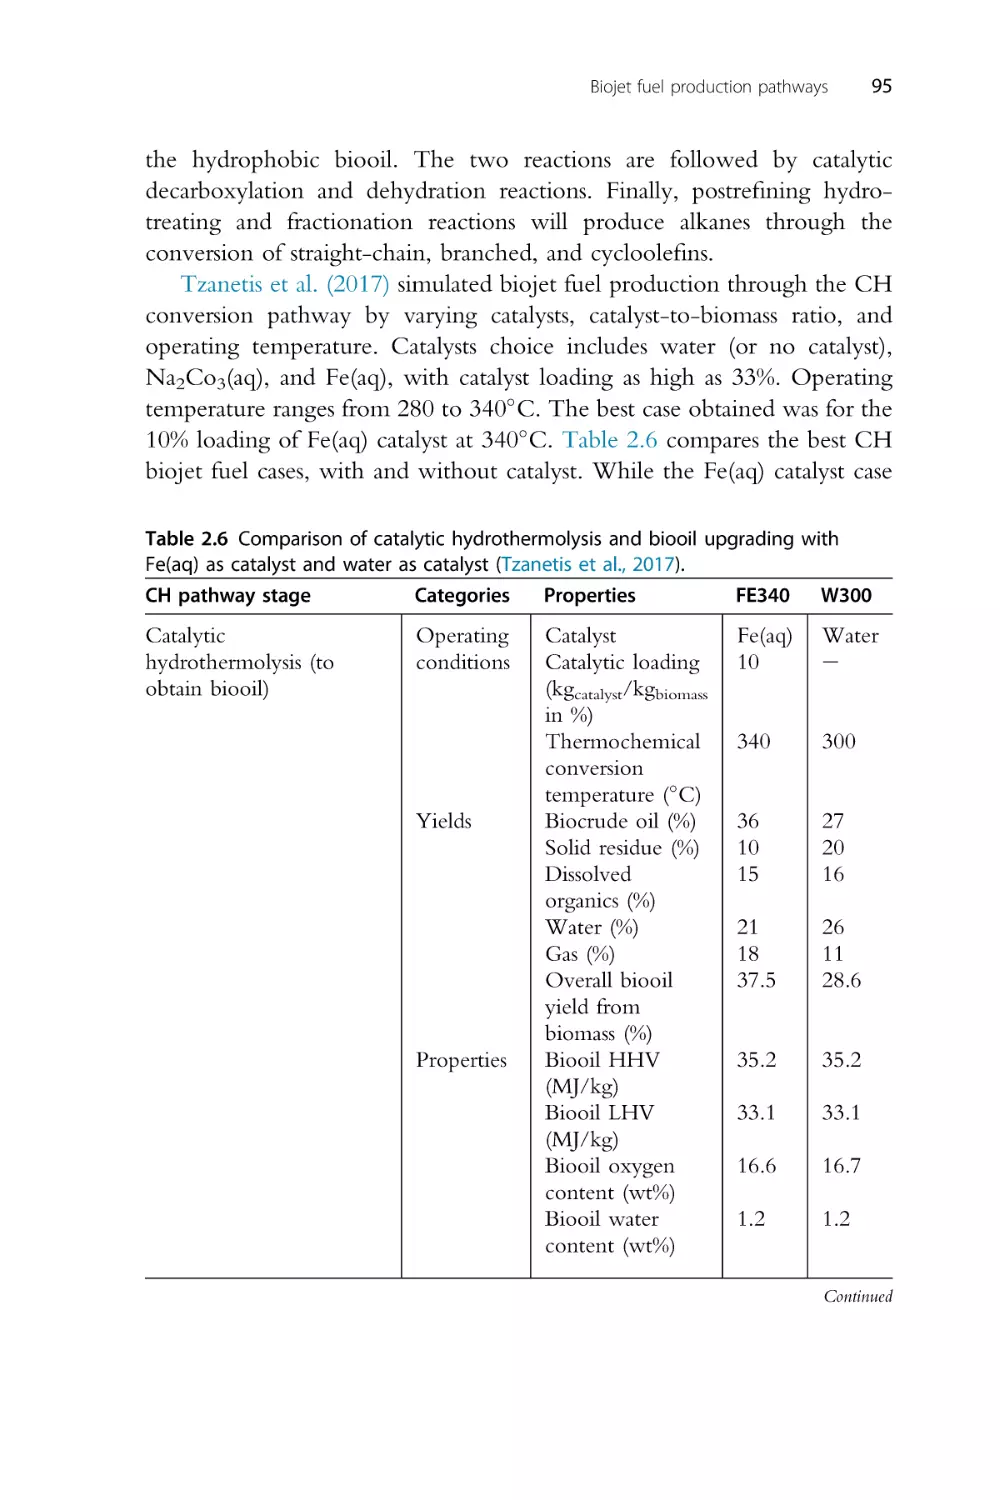
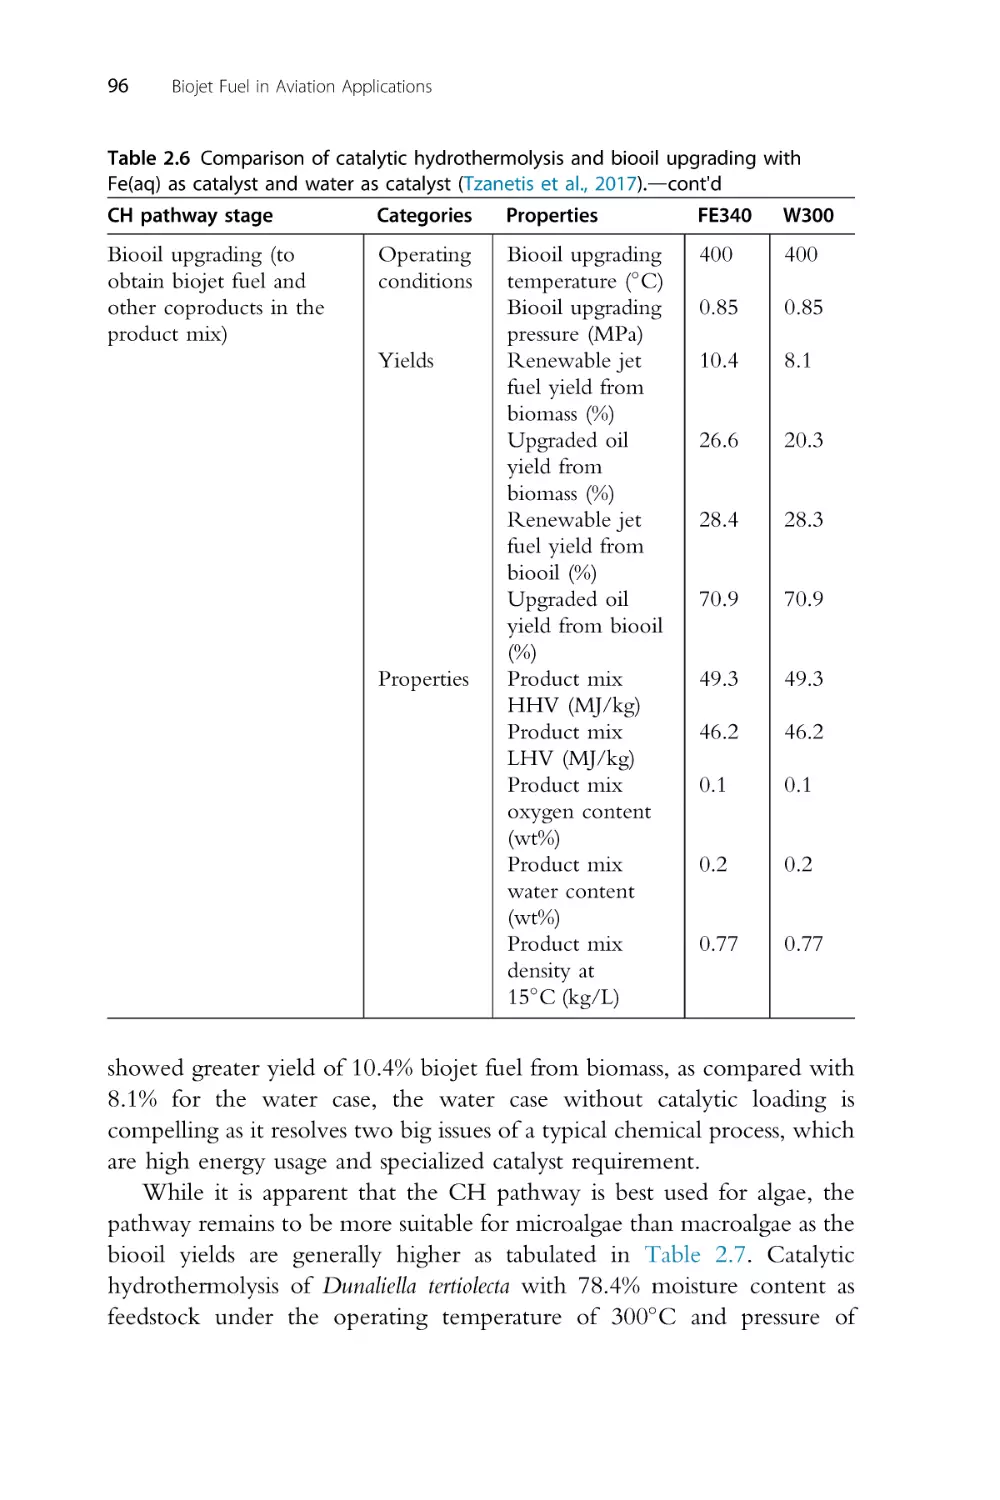
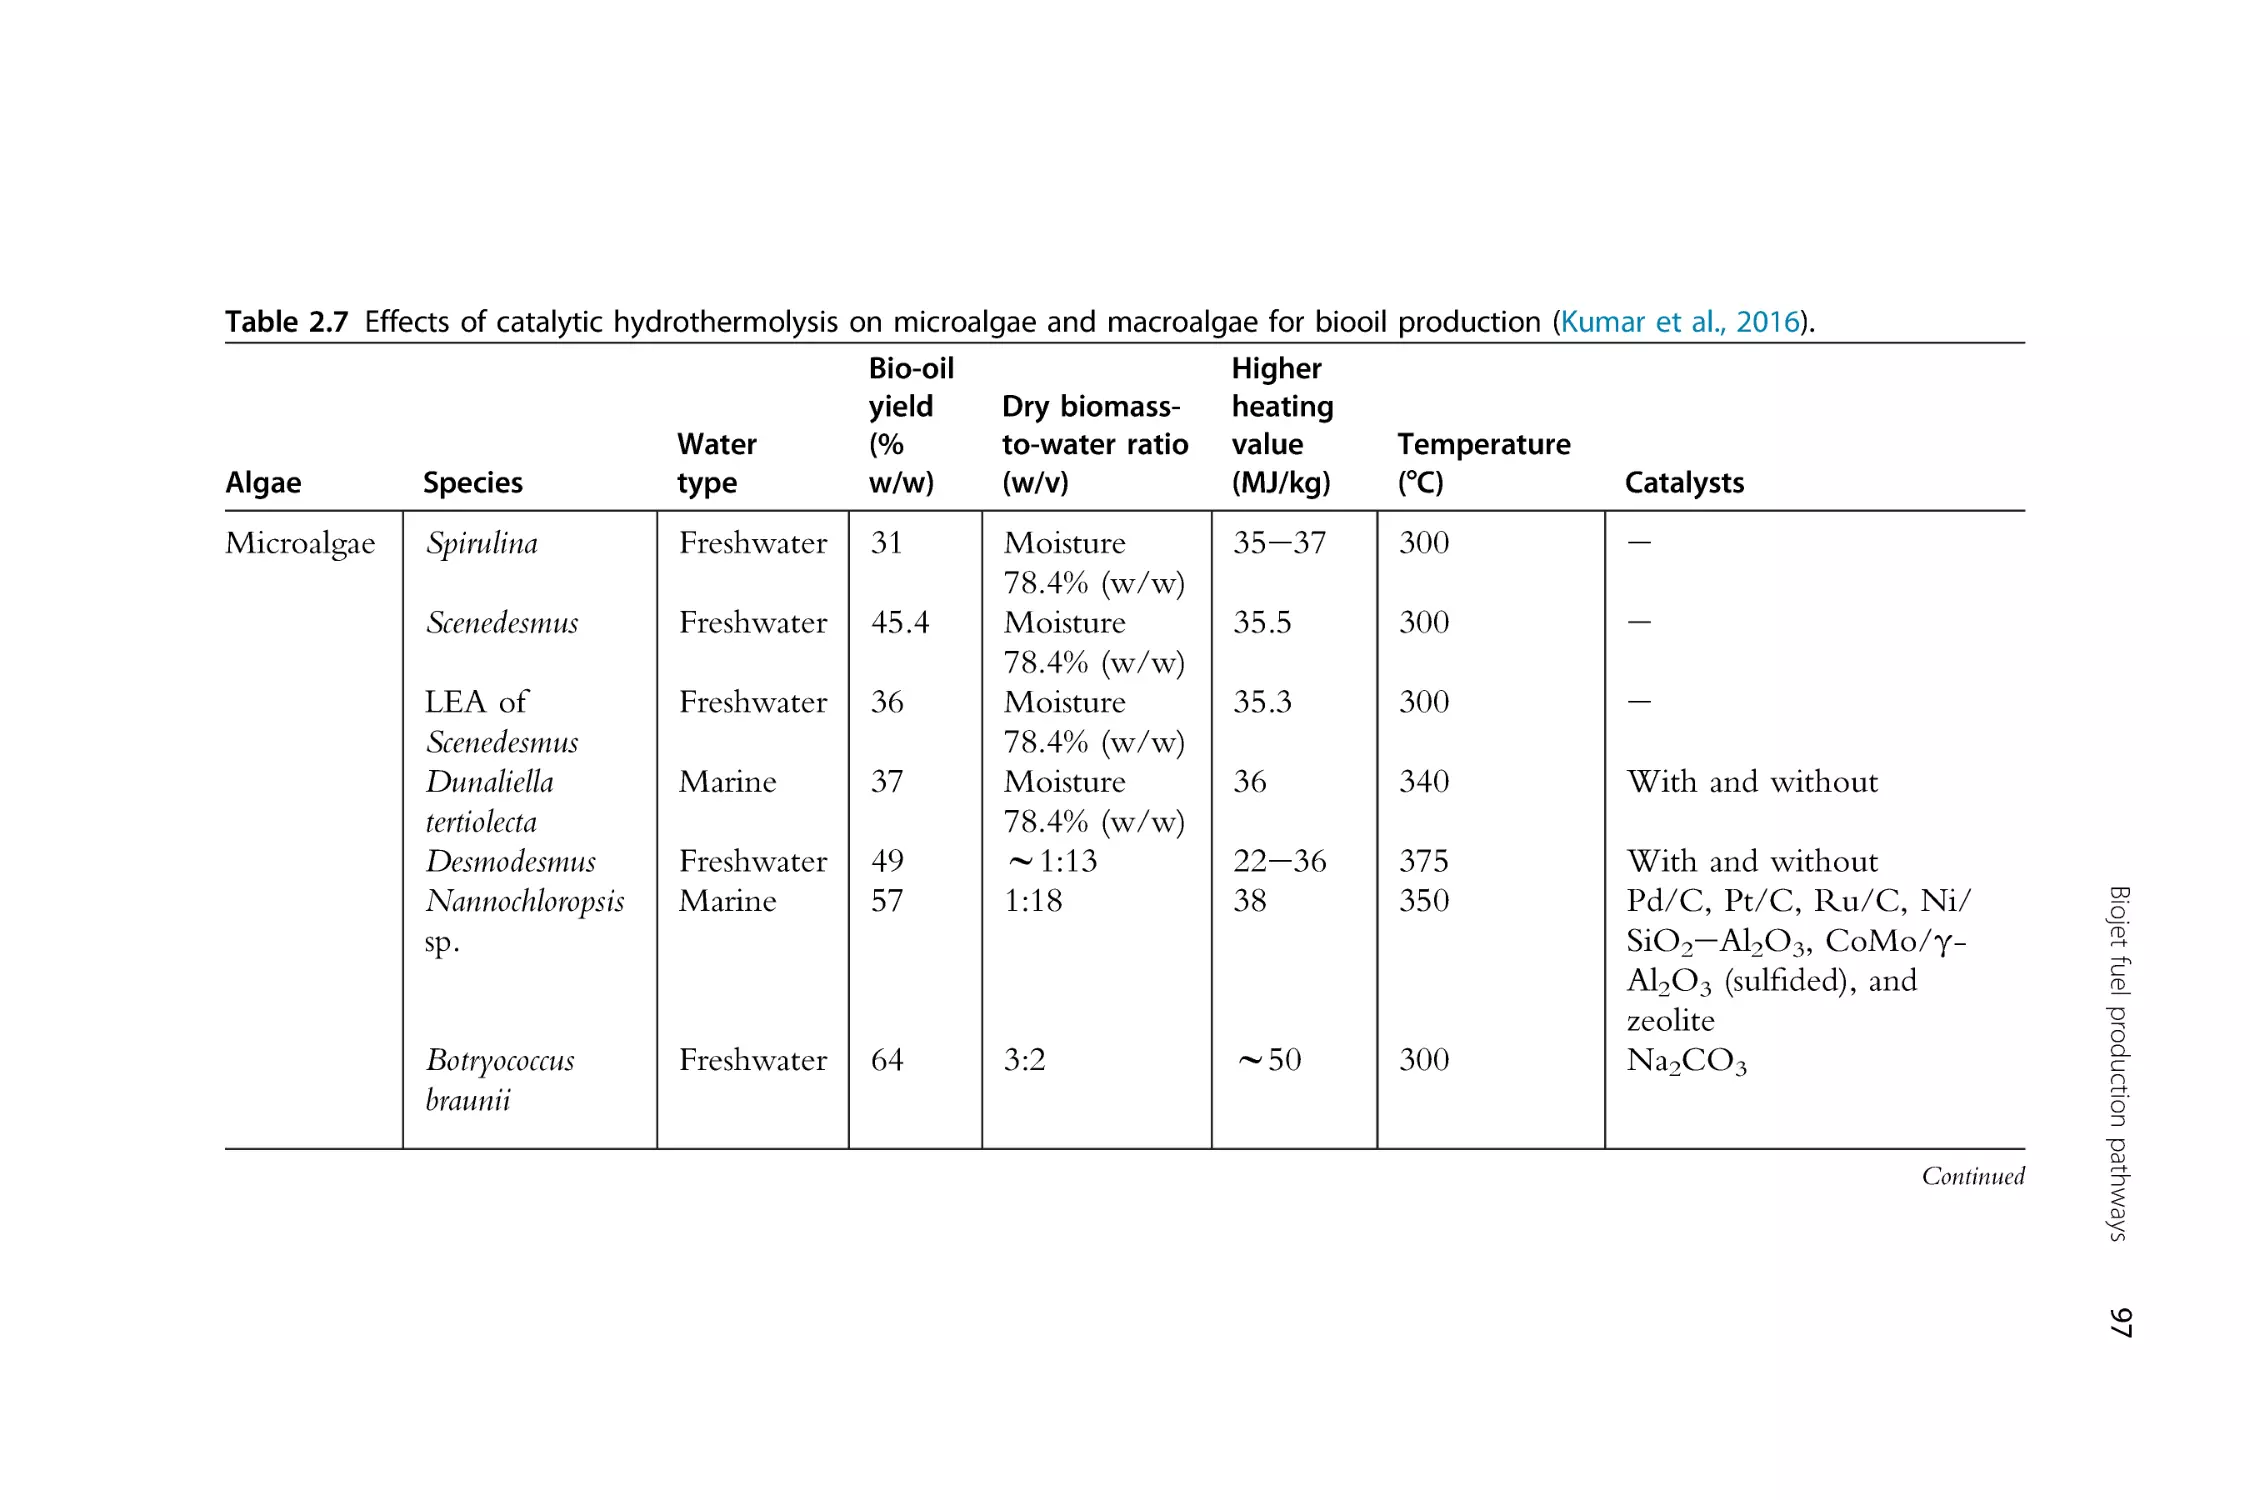
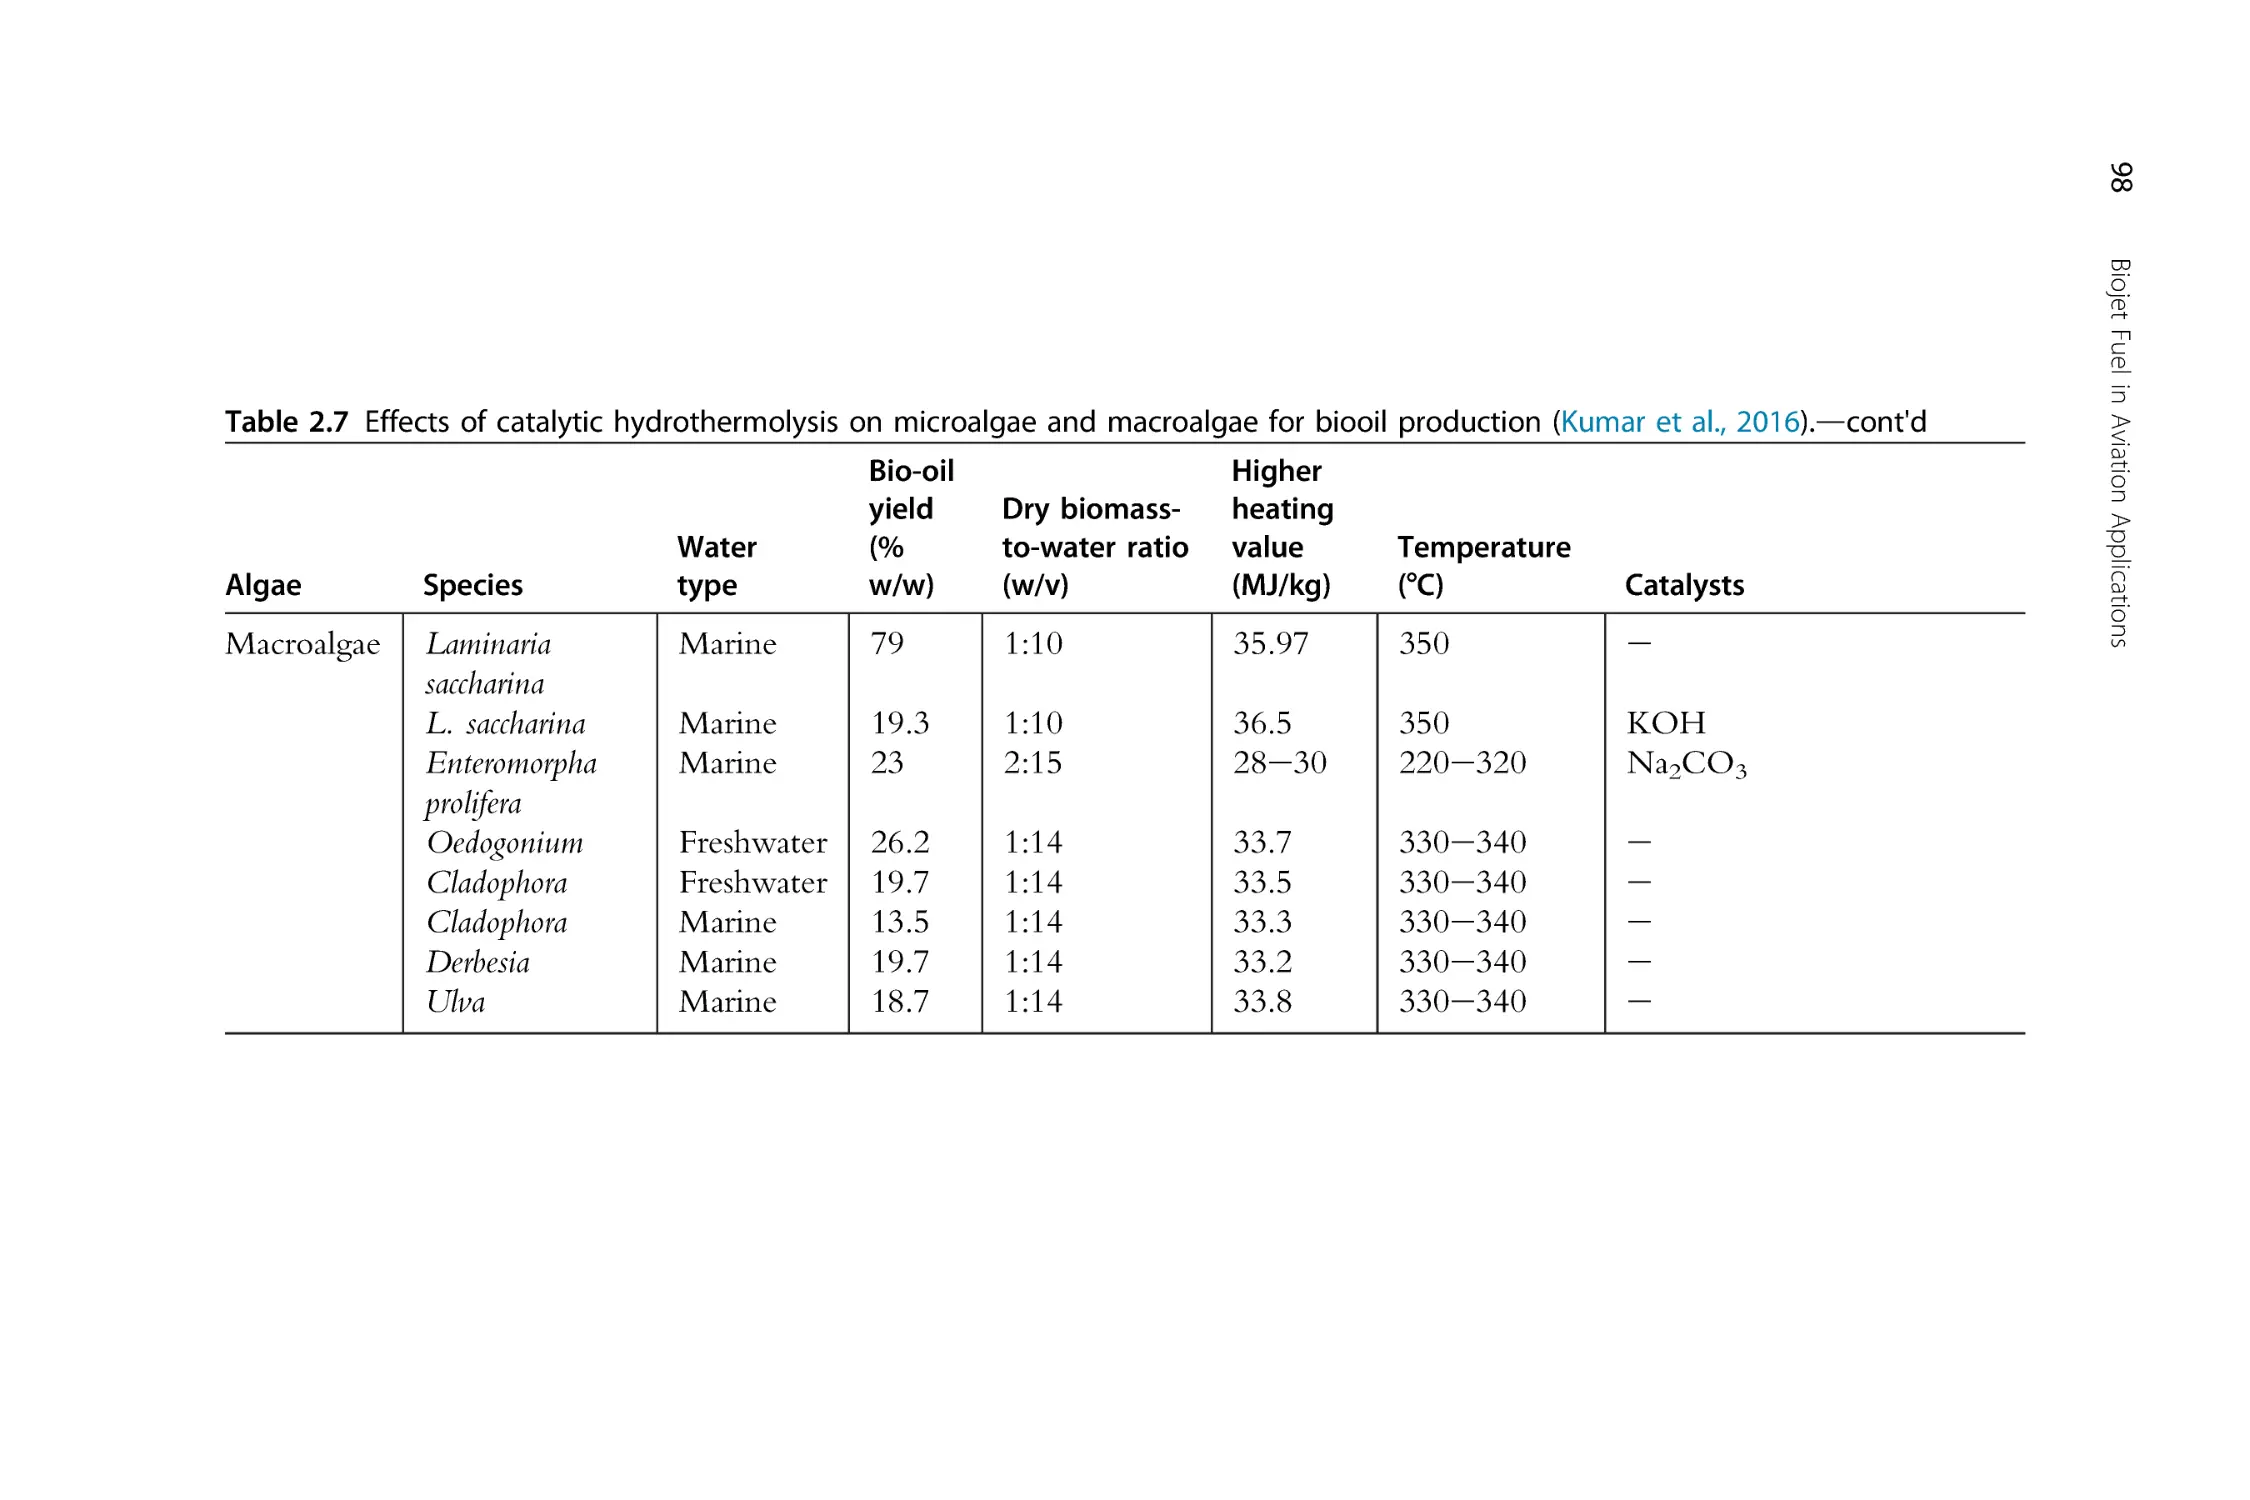
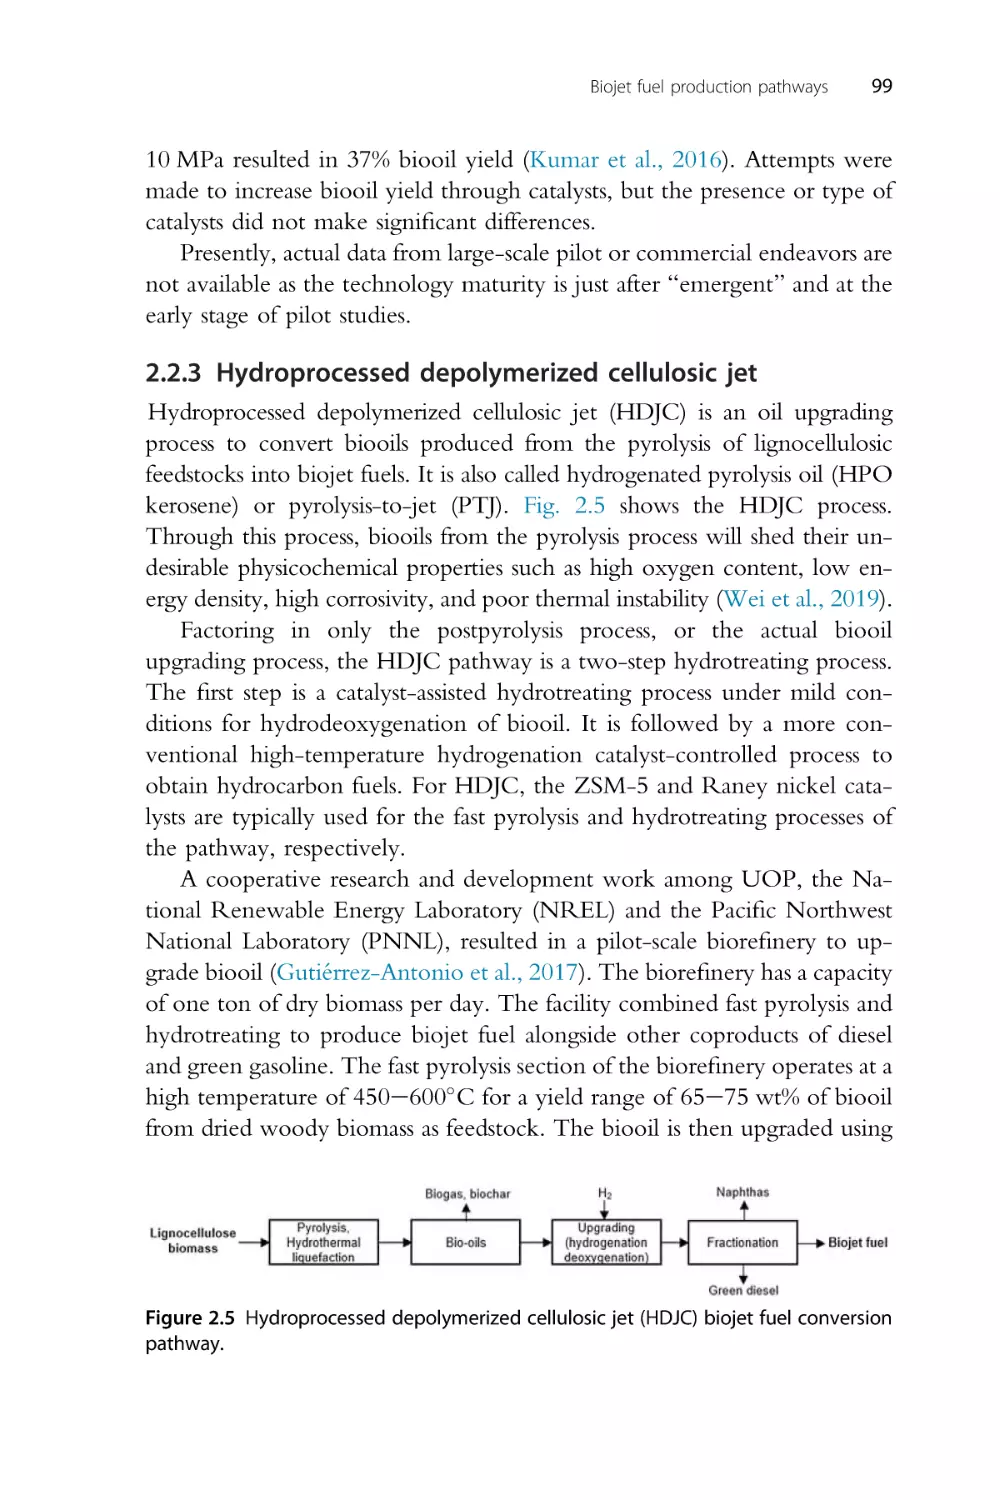
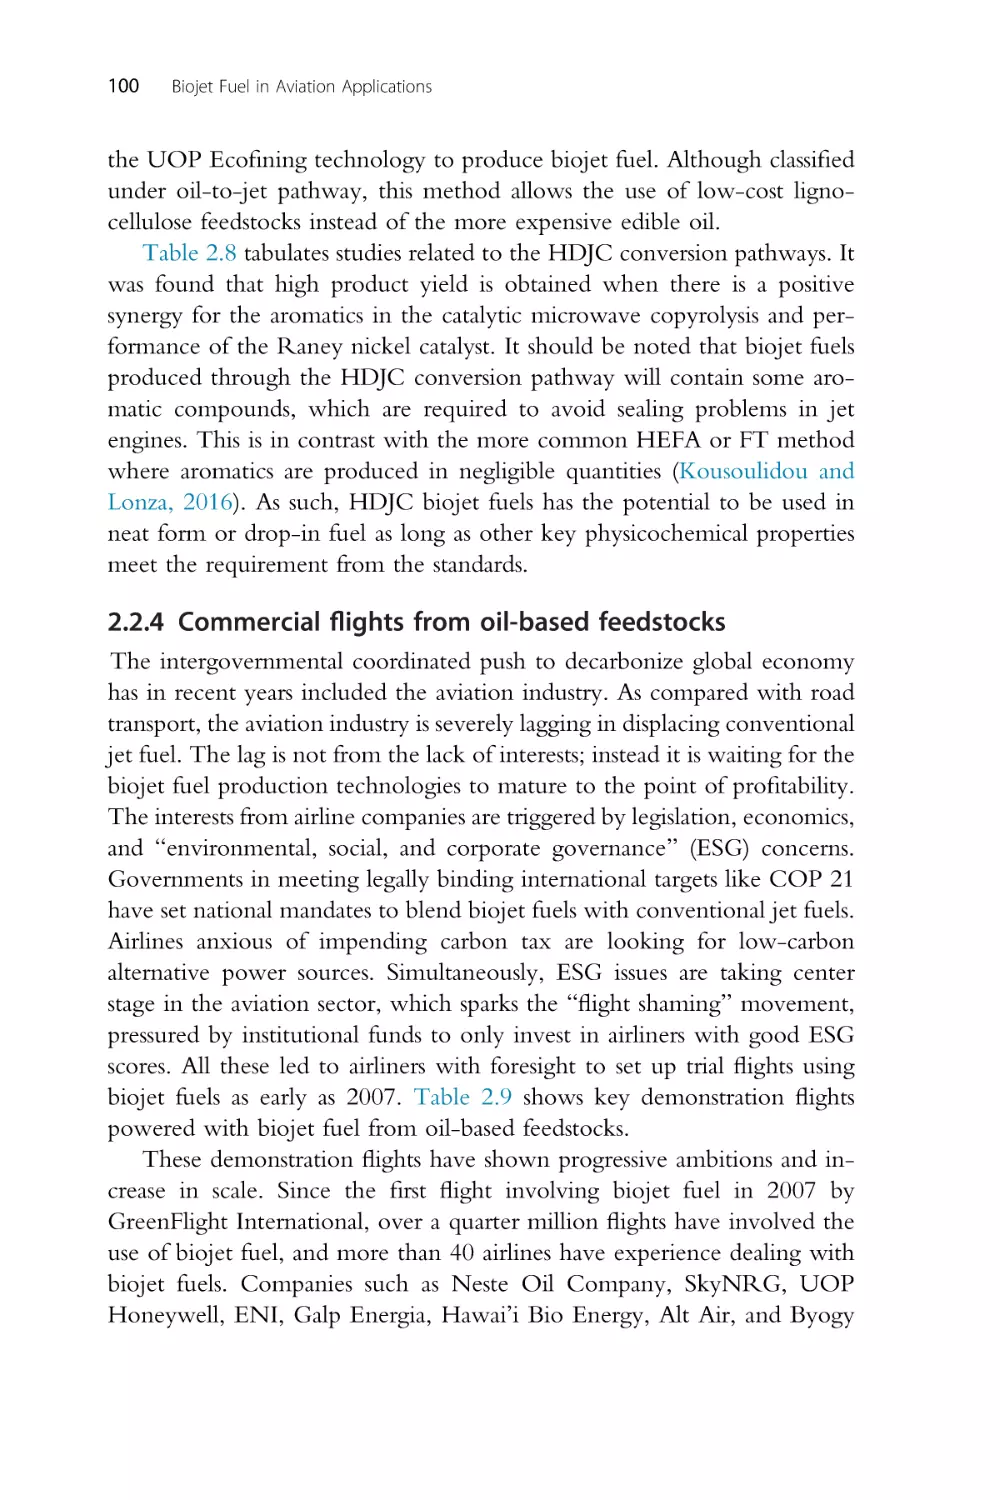
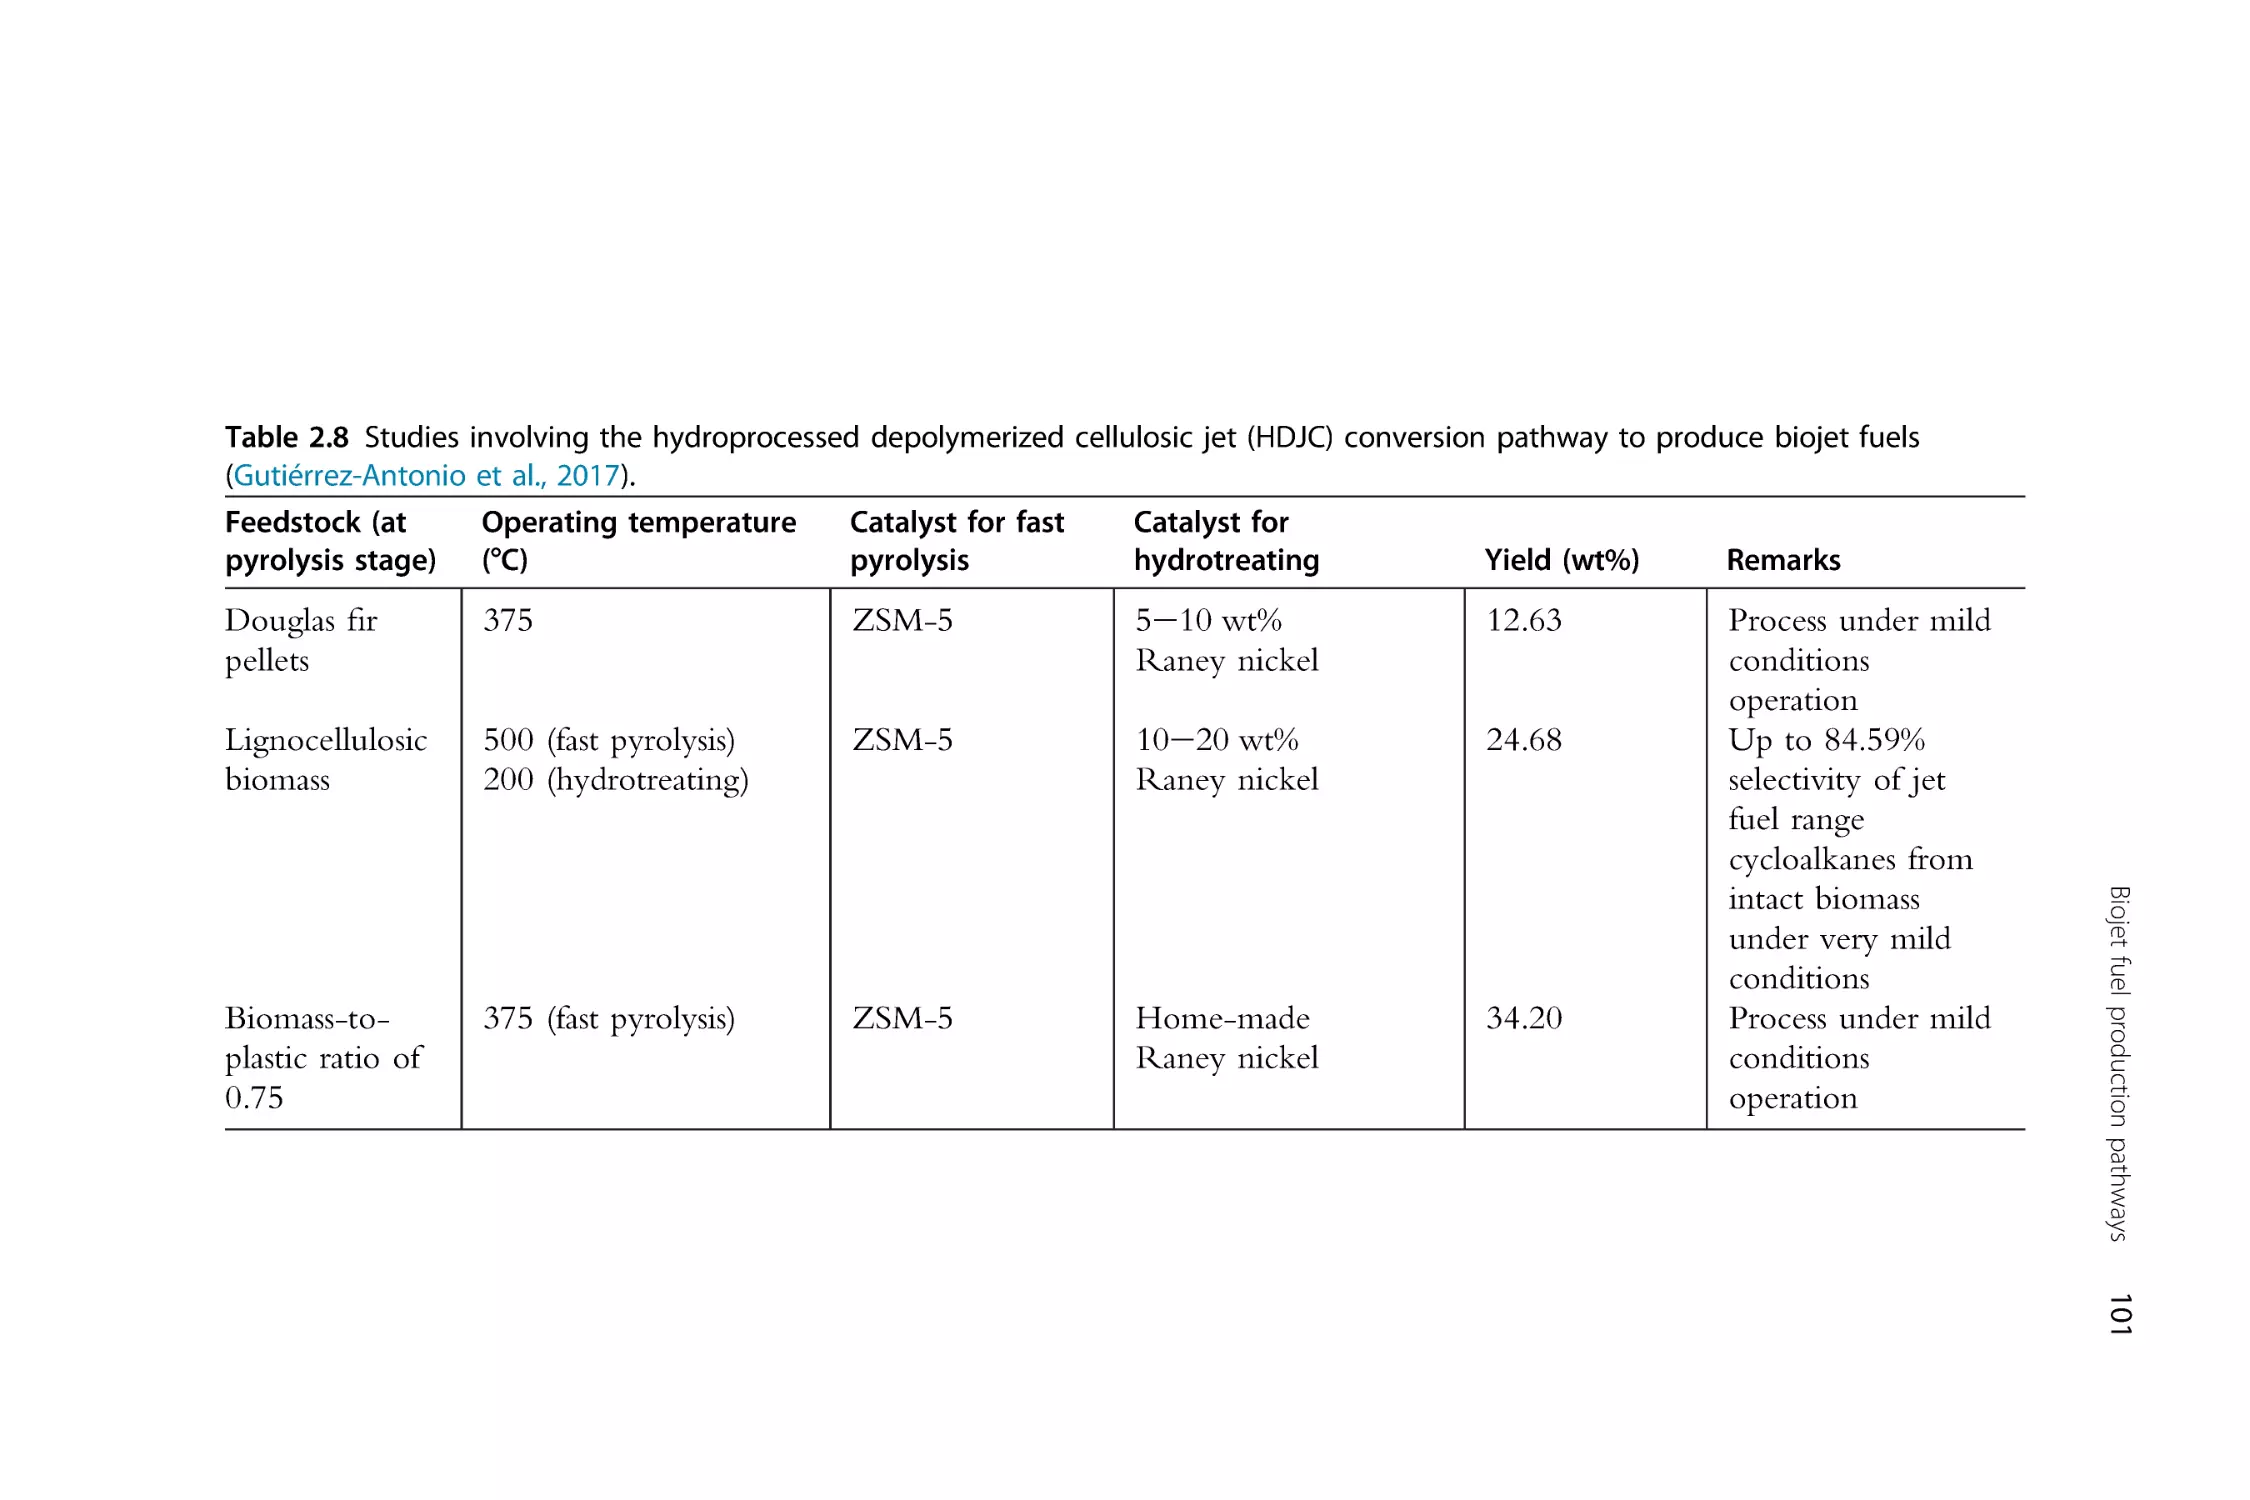
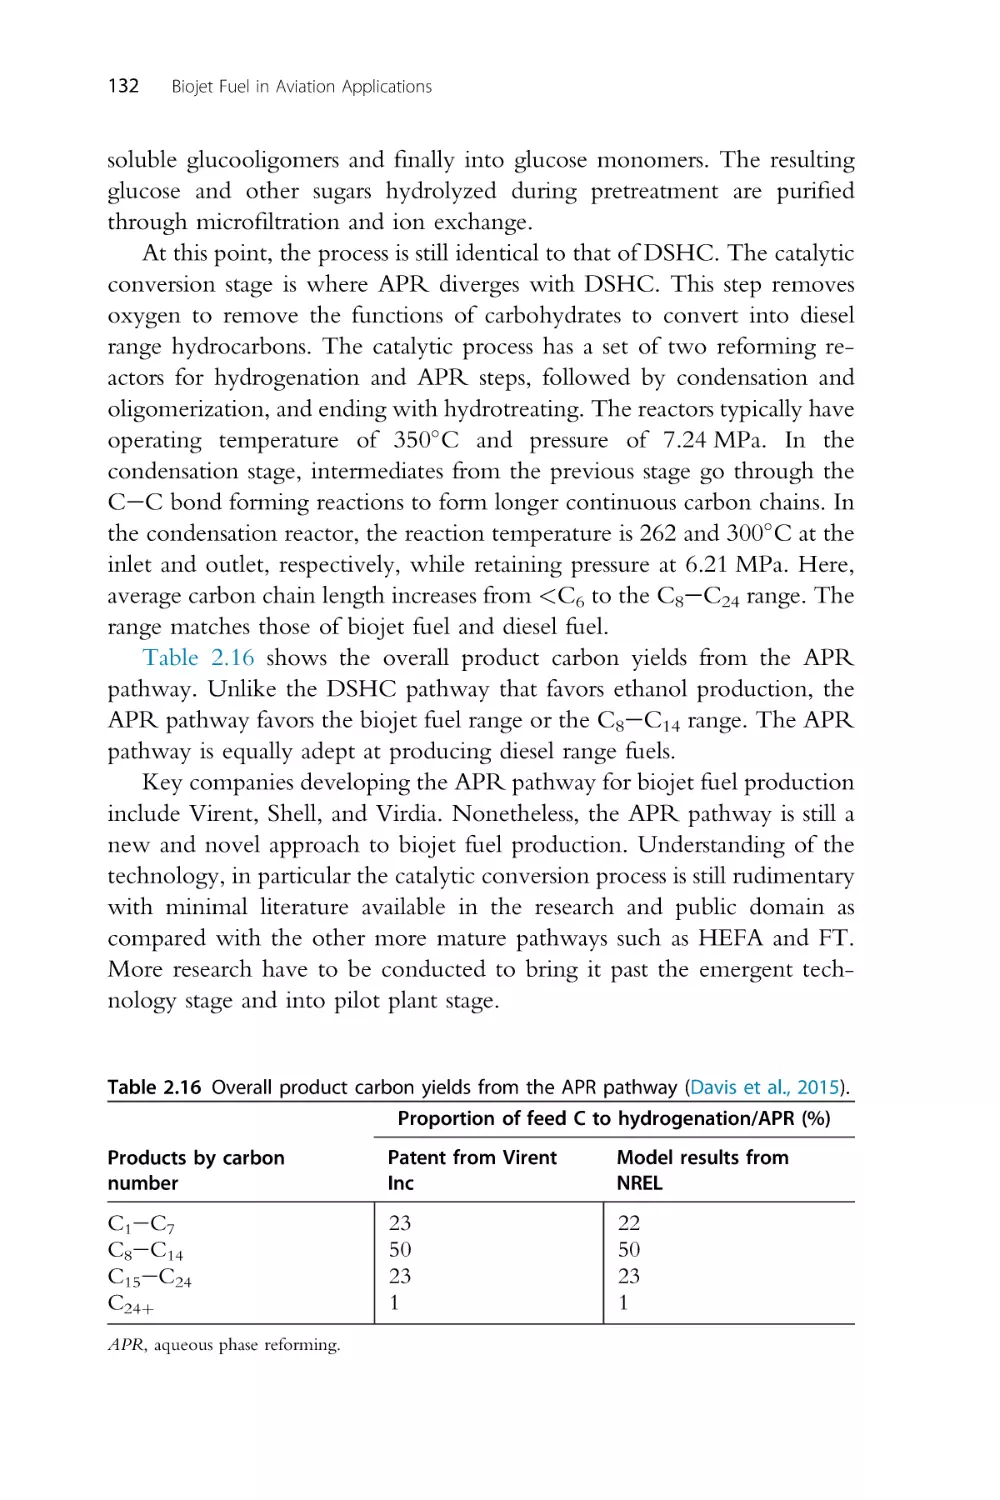
2. Biojet fuel production pathways
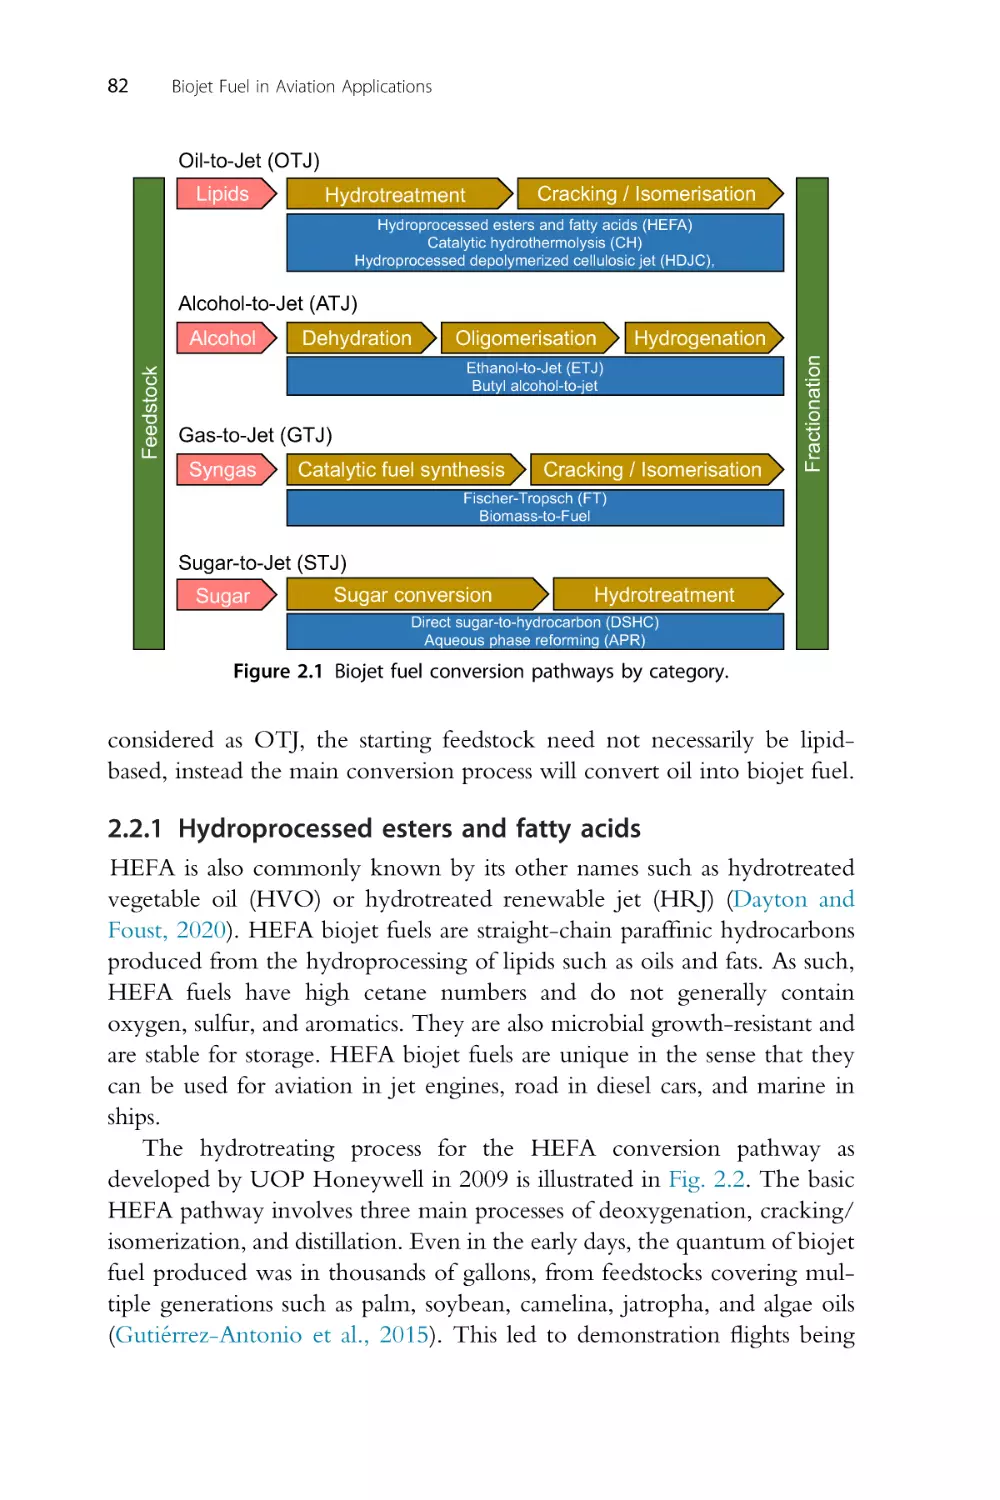
2.1 Introduction
2.2 Oil-to-jet
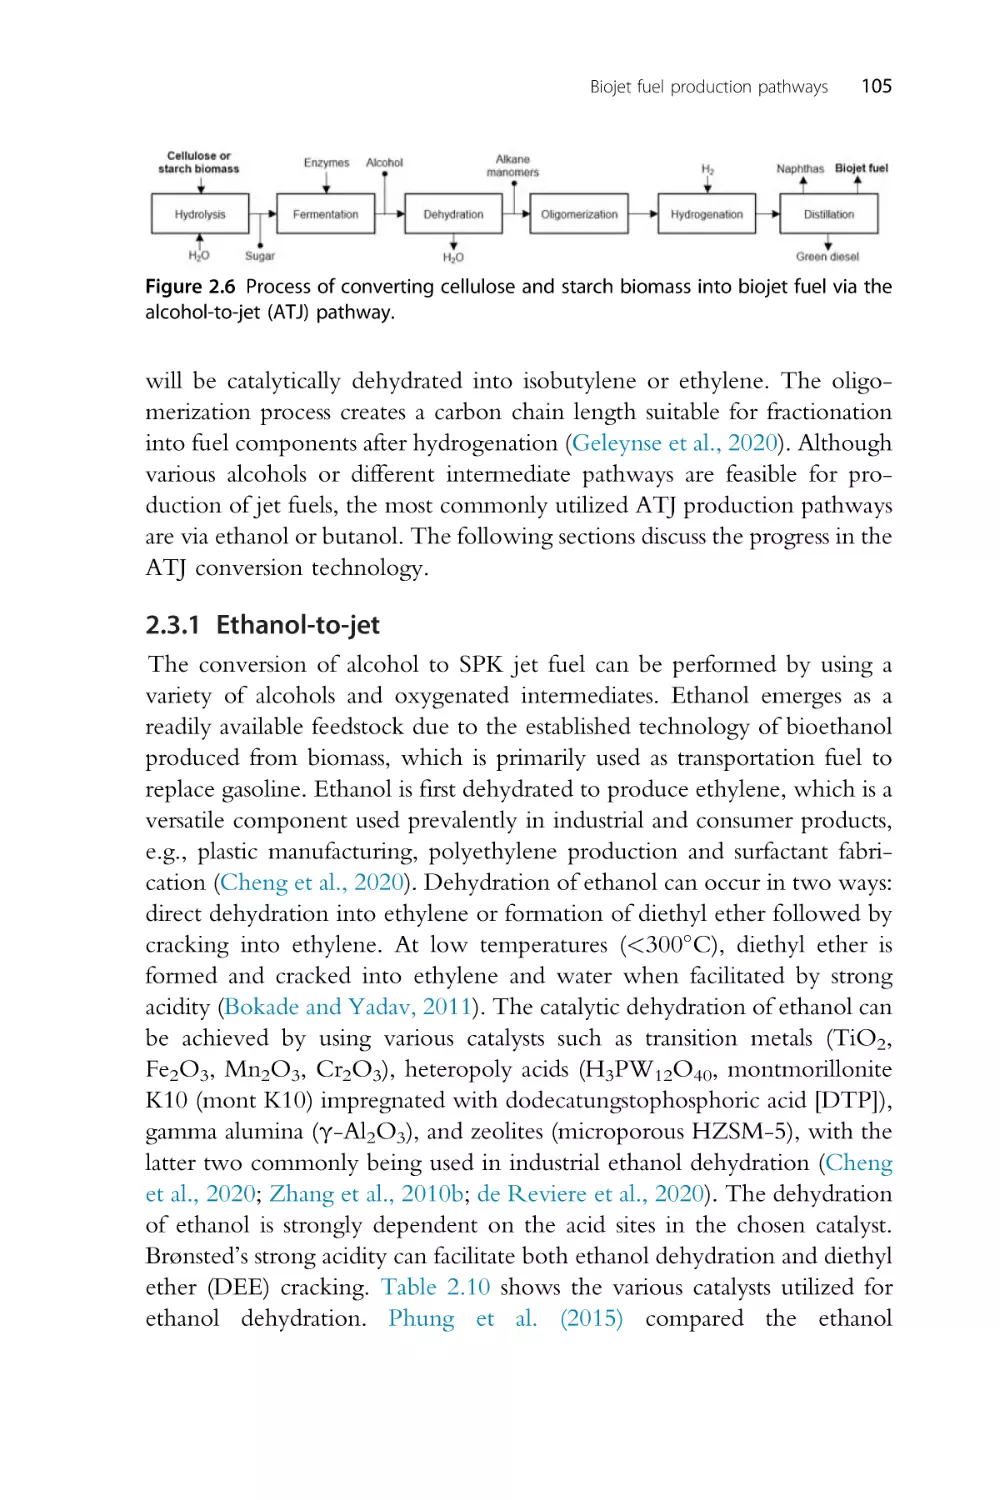
2.3 Alcohol-to-jet
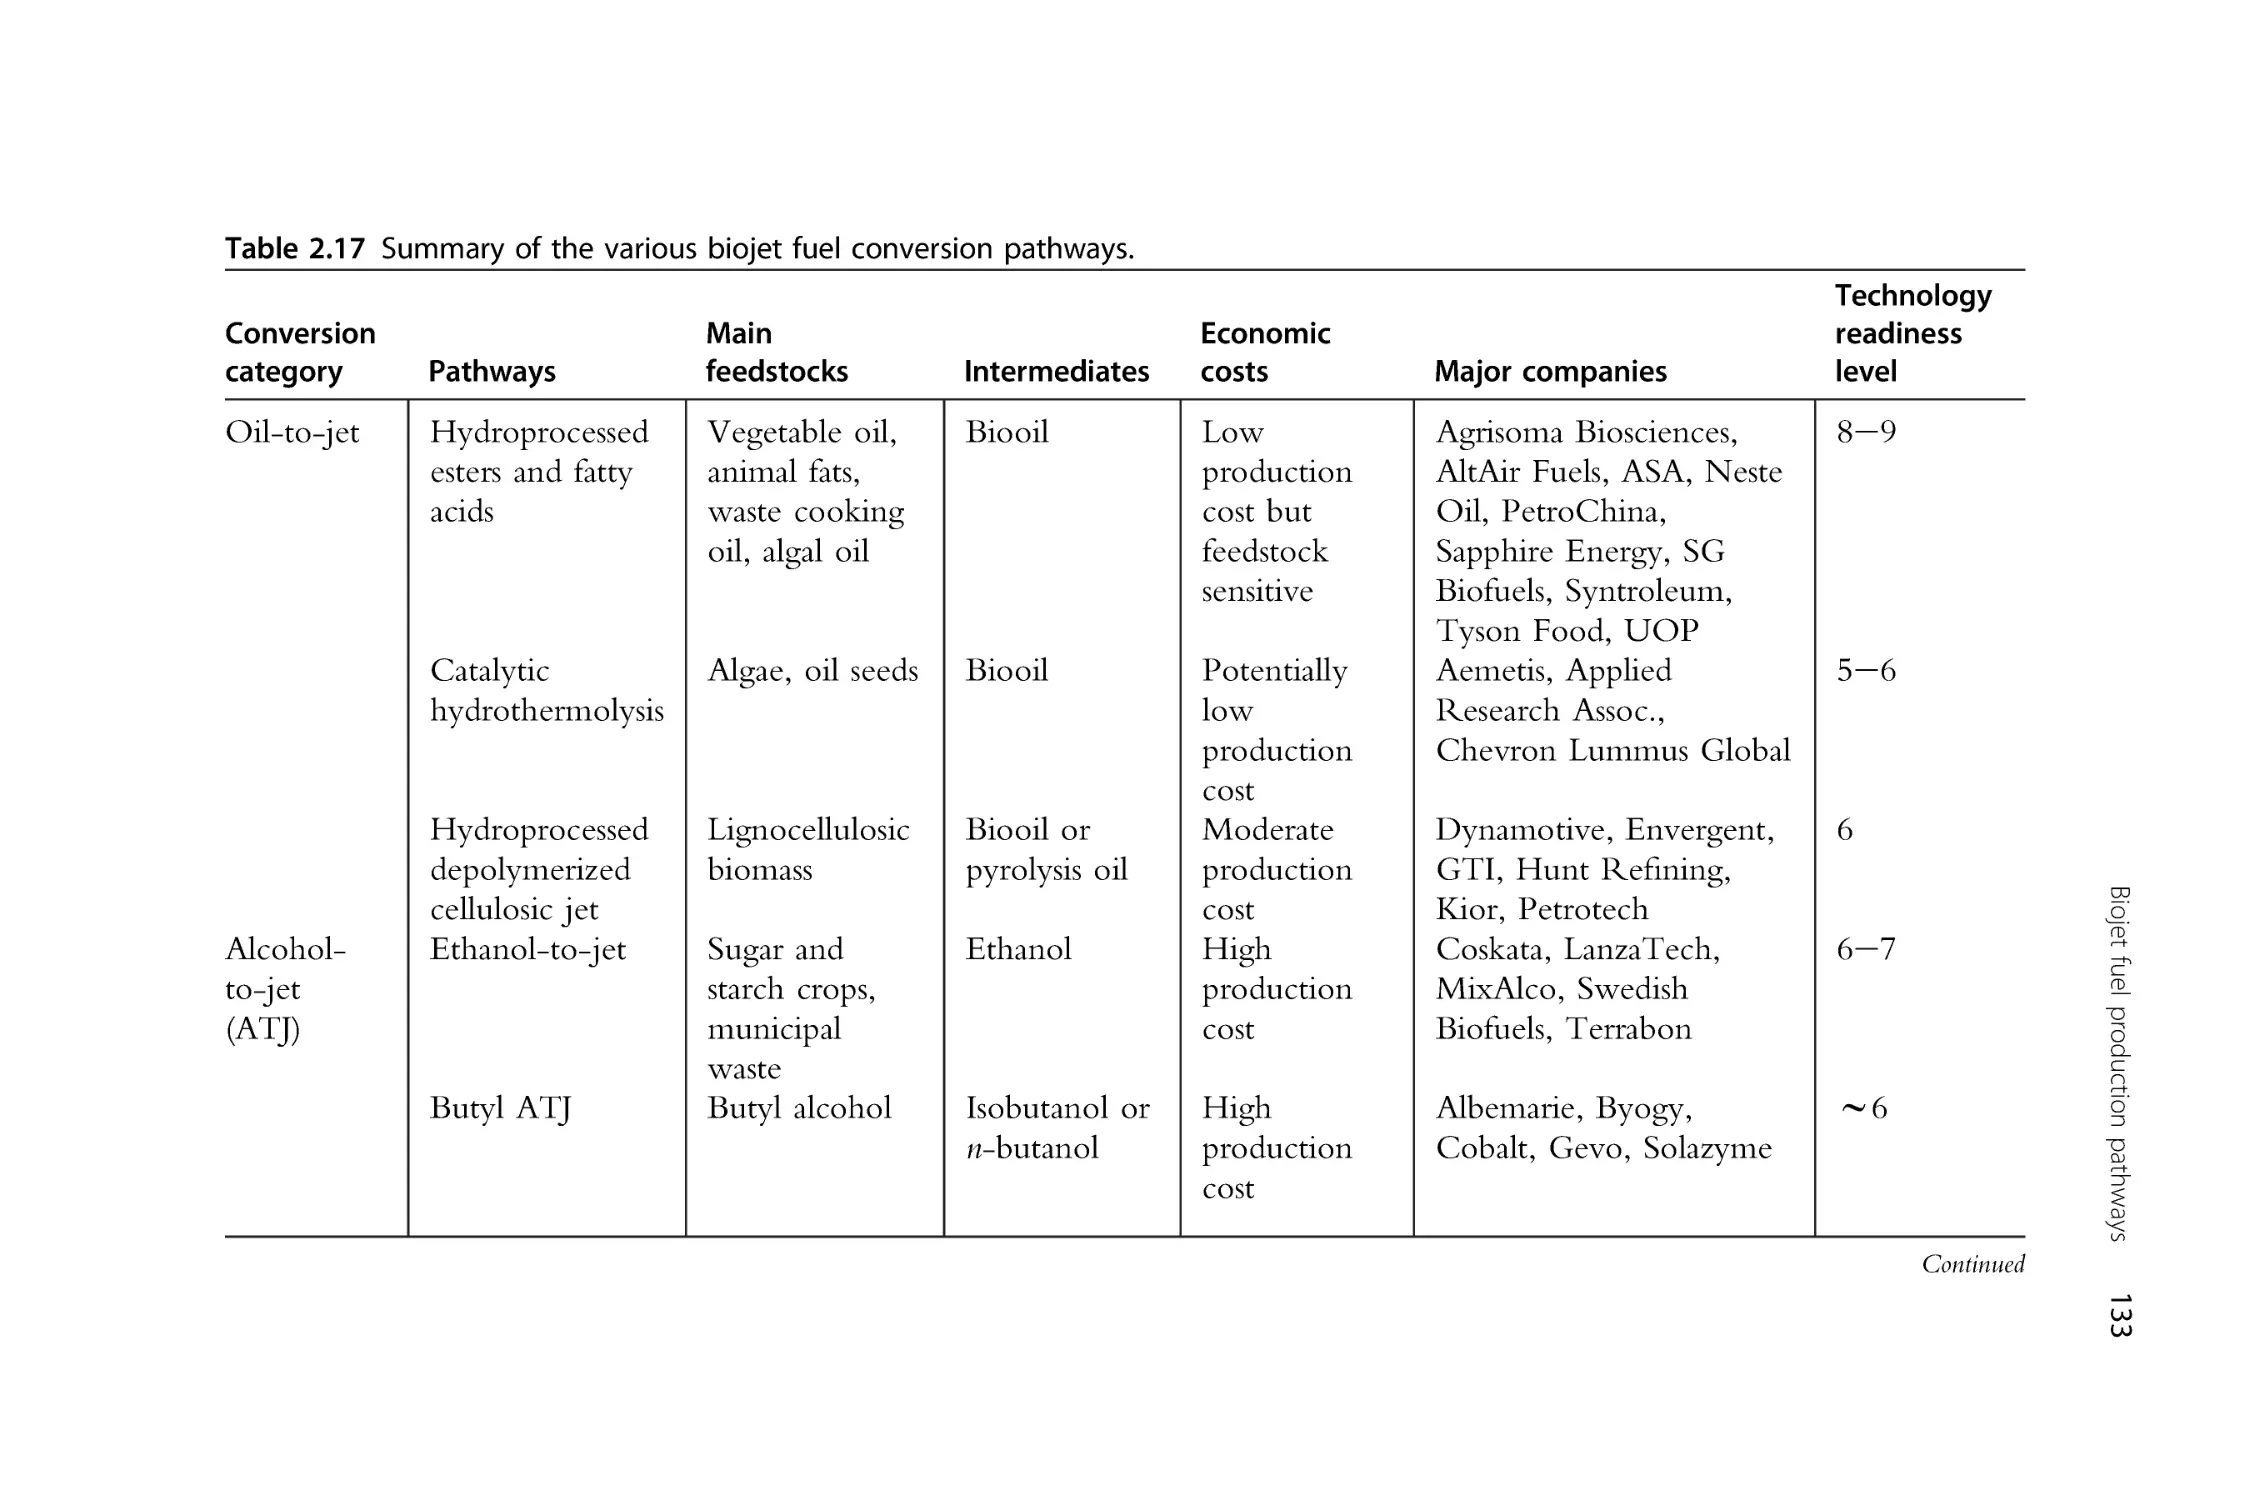
2.4 Gas-to-jet
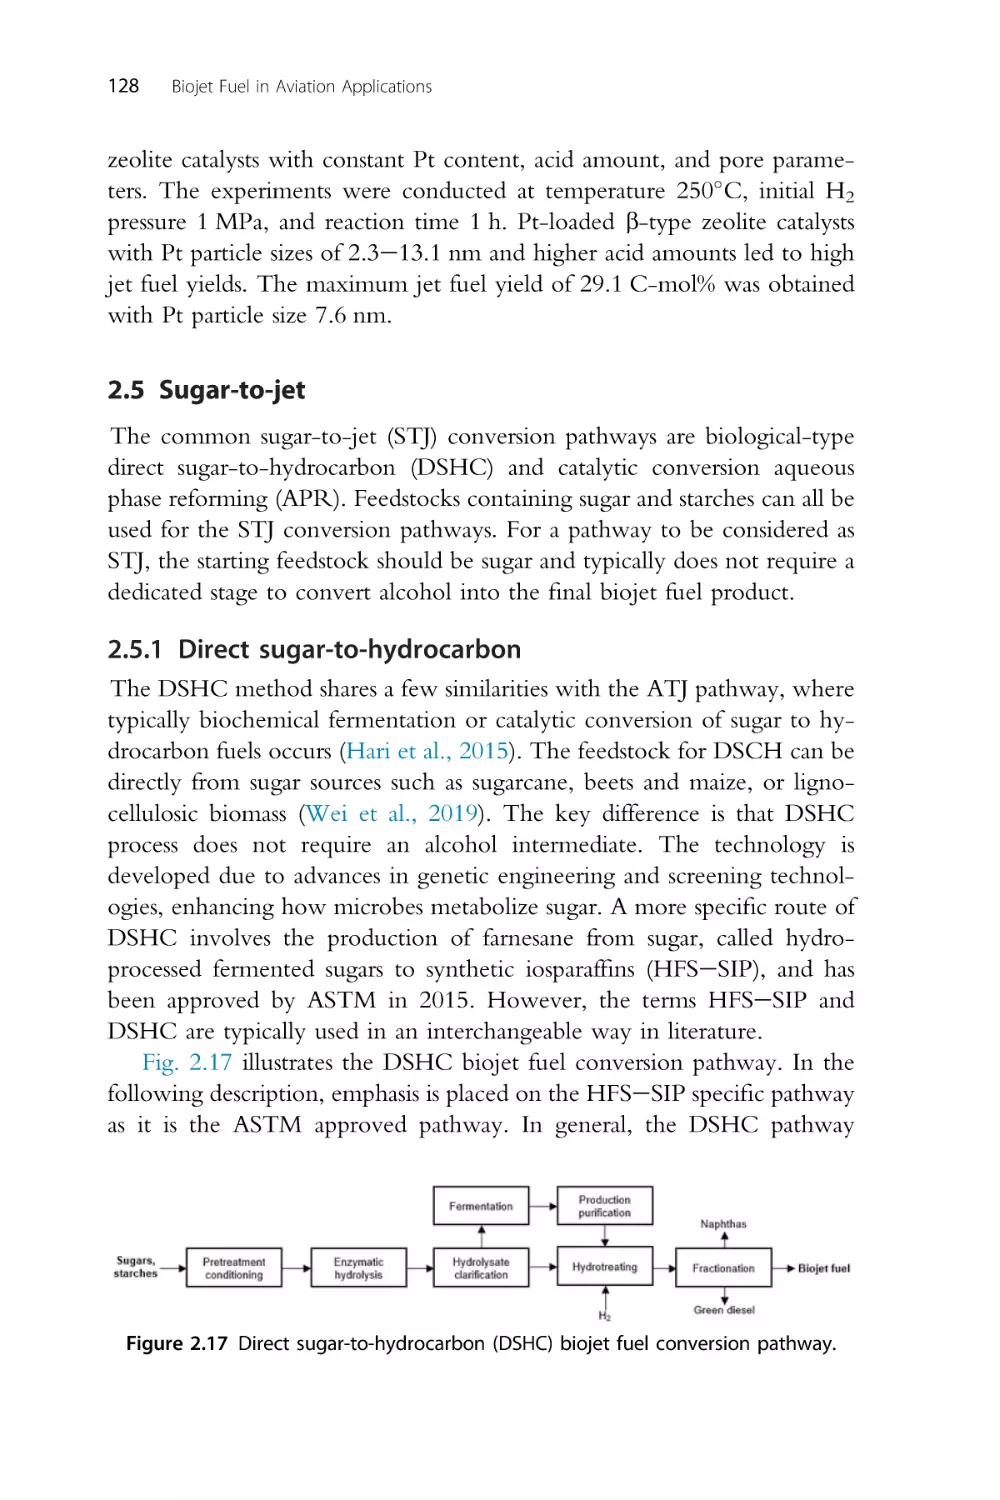
2.5 Sugar-to-jet
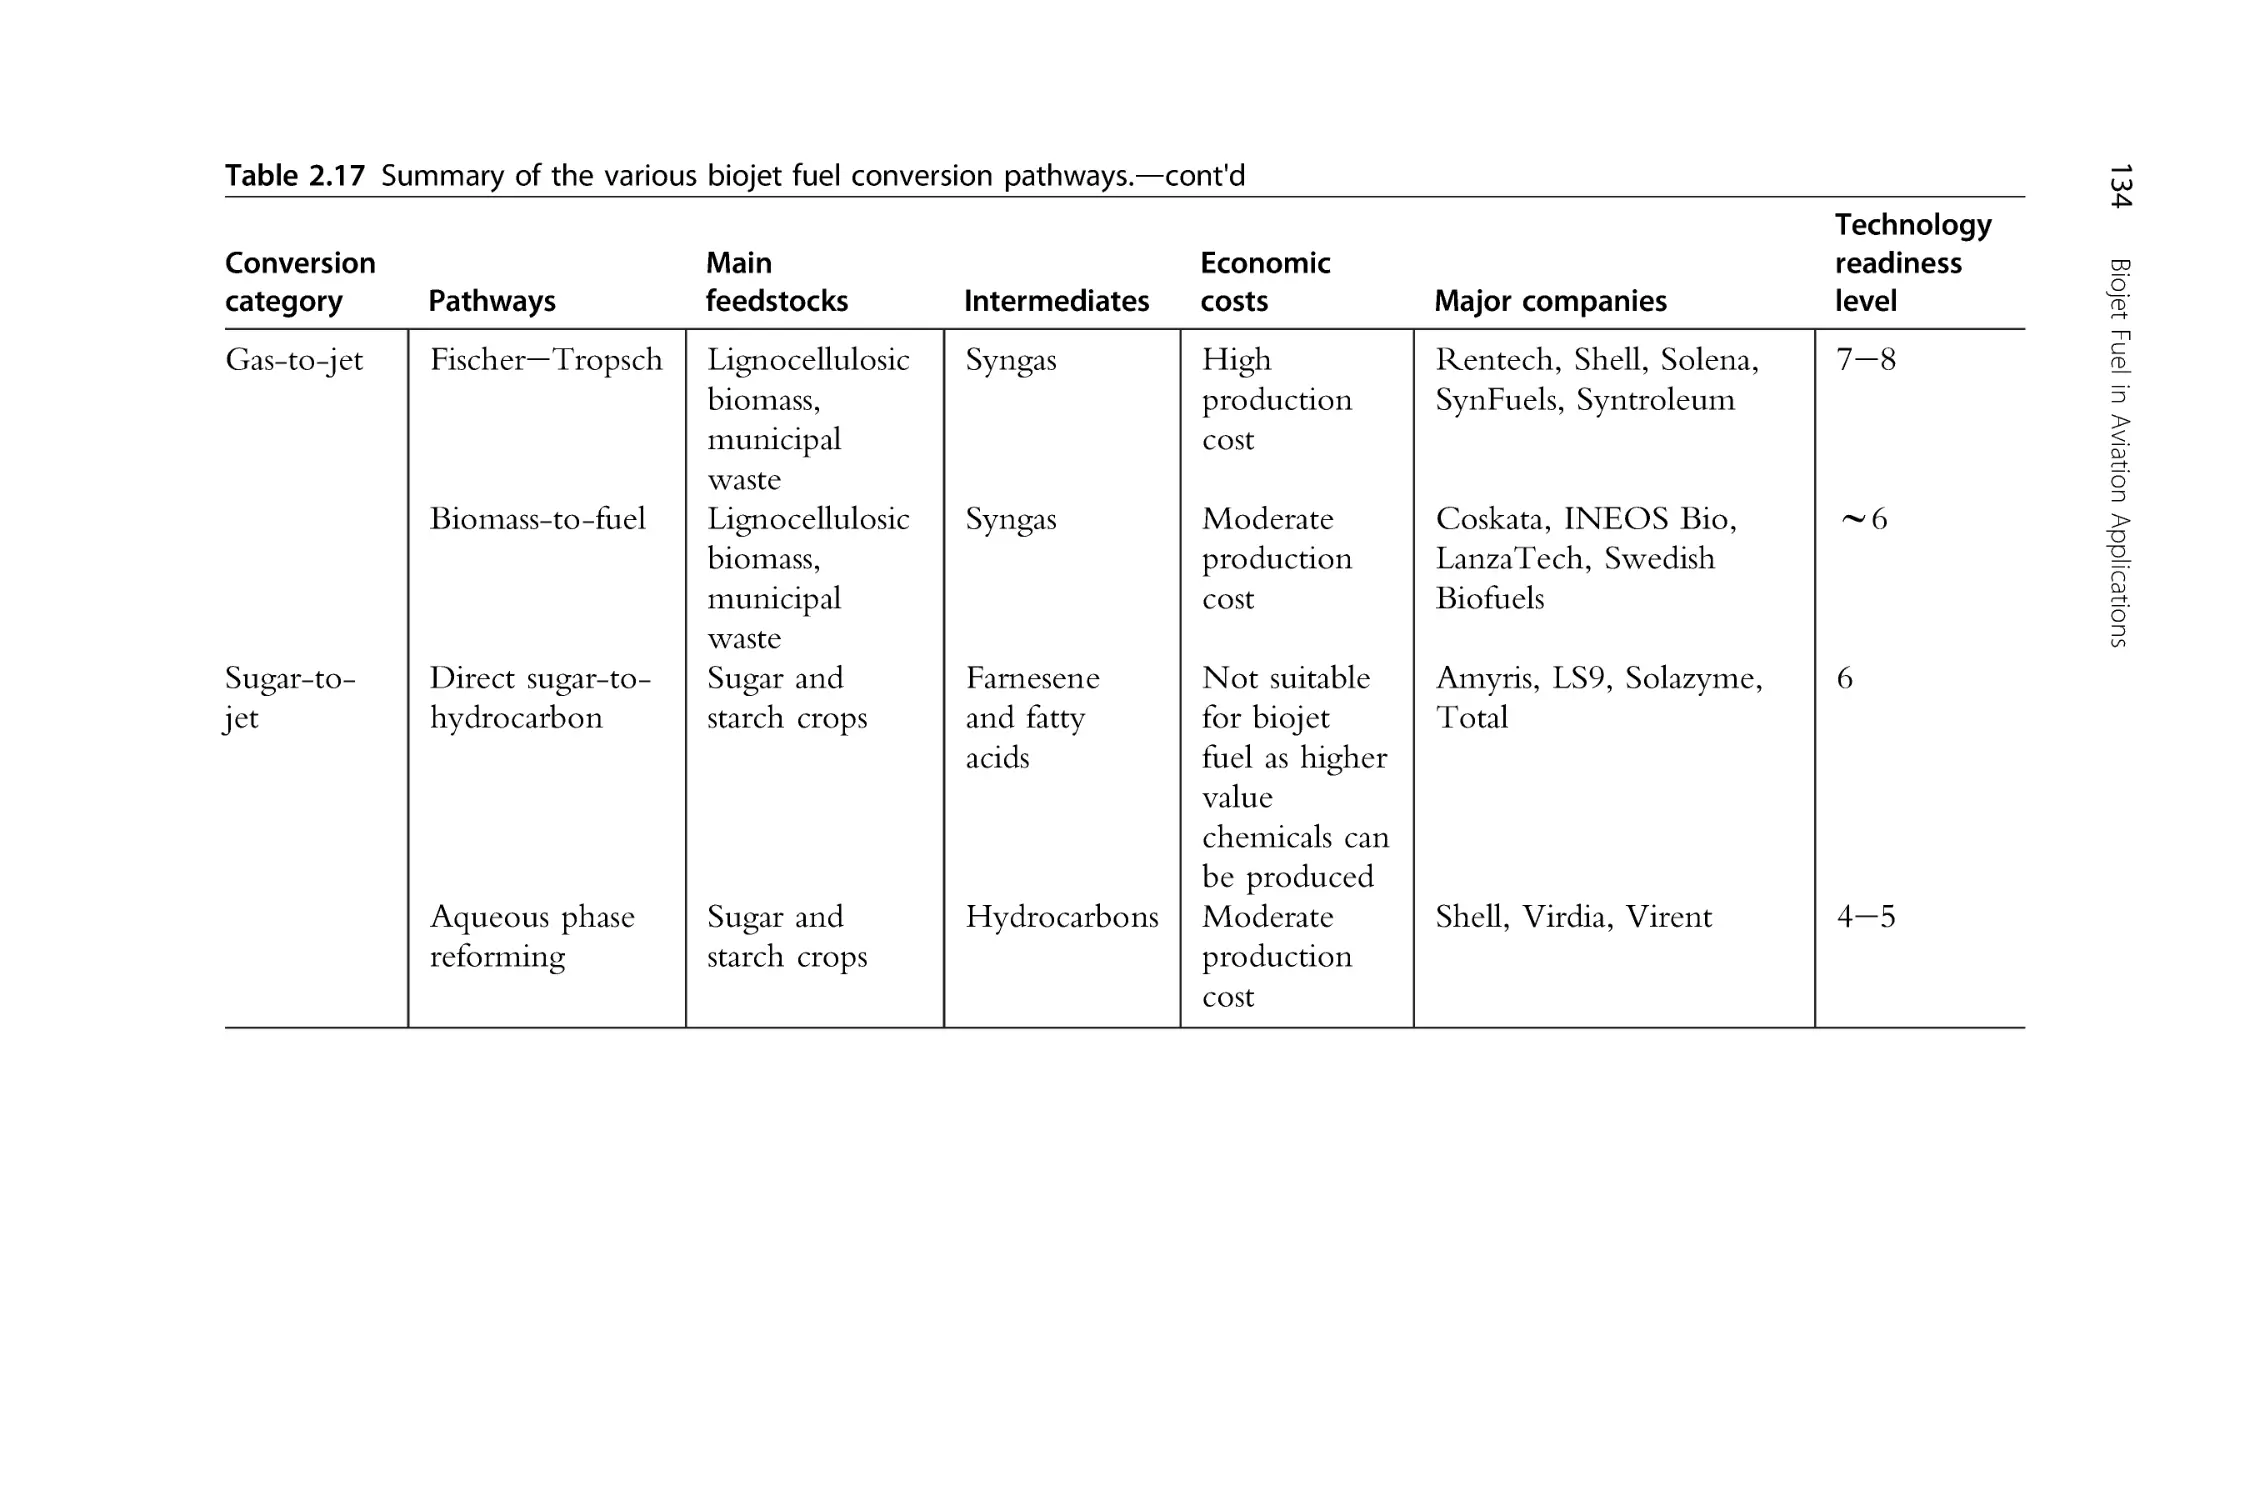
2.6 Summary
References
3. Property specifications of alternative jet fuels
3.1
3.2
3.3
3.4
Introduction
Jet fuel specifications
Jet fuel from nonconventional sources
Properties of synthetic jet fuel
1
1
16
34
40
41
57
60
60
66
67
70
71
73
74
75
76
81
81
81
104
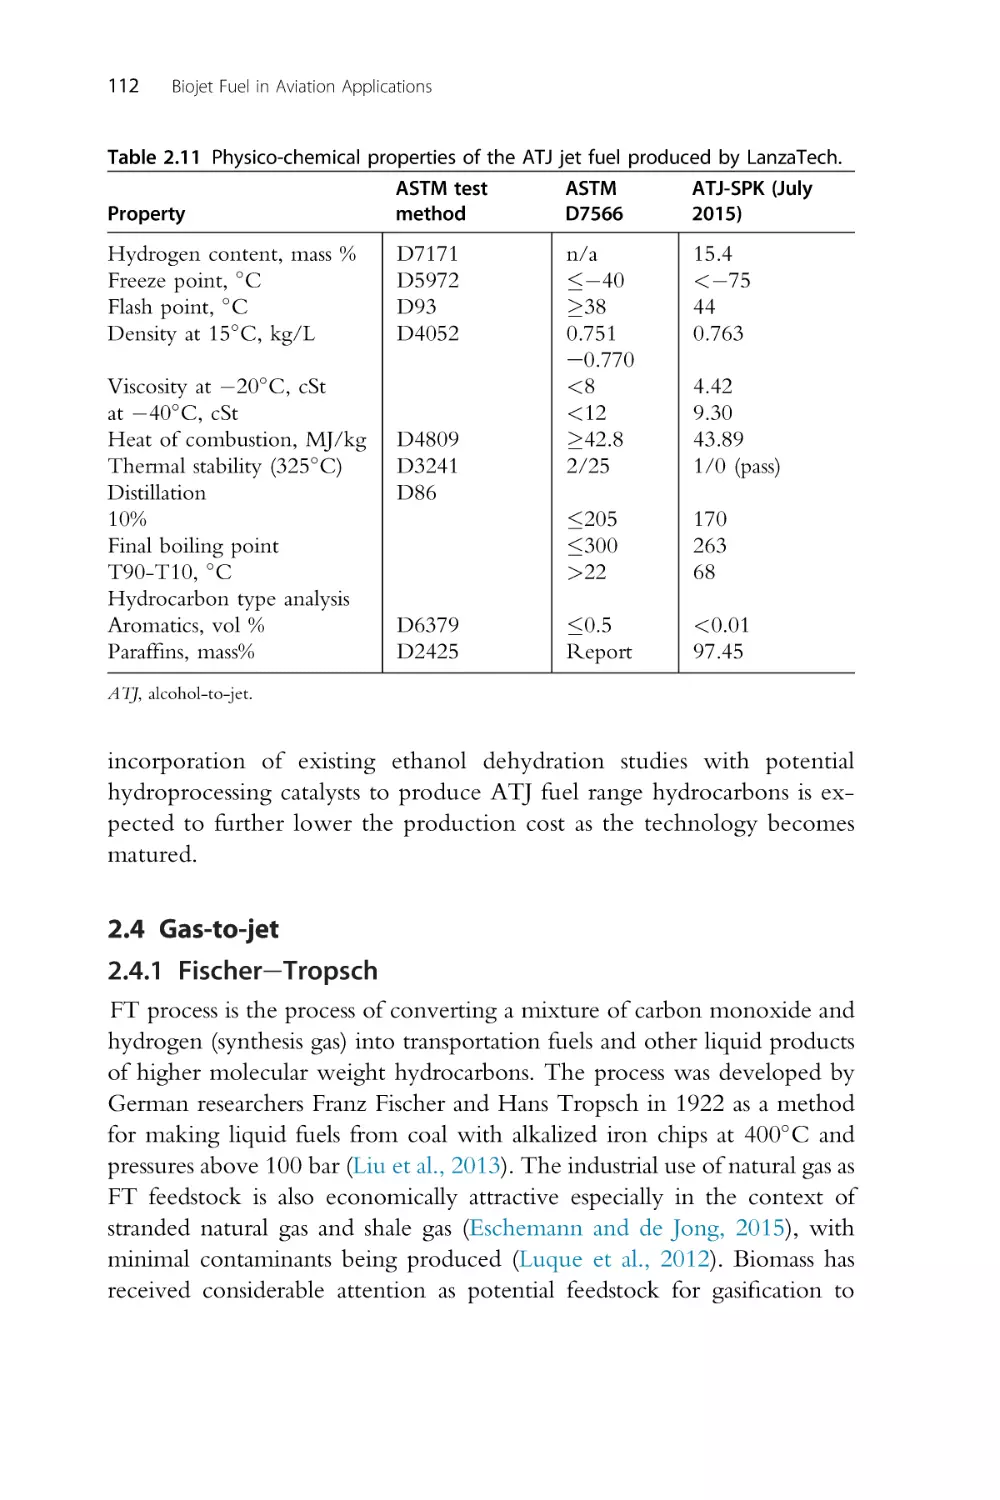
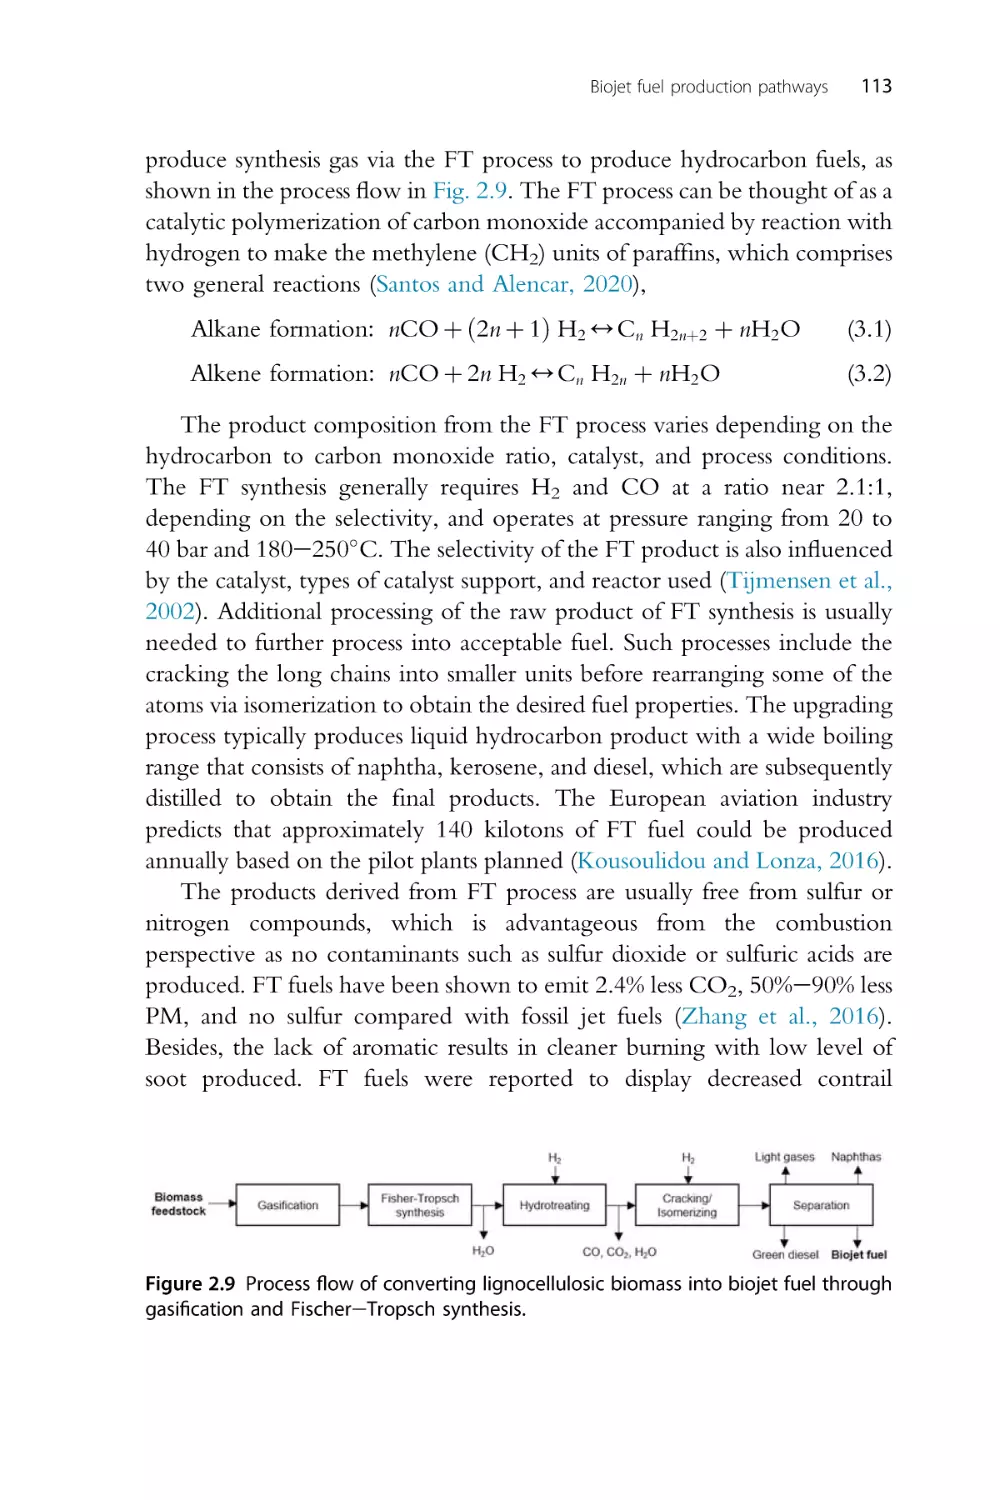
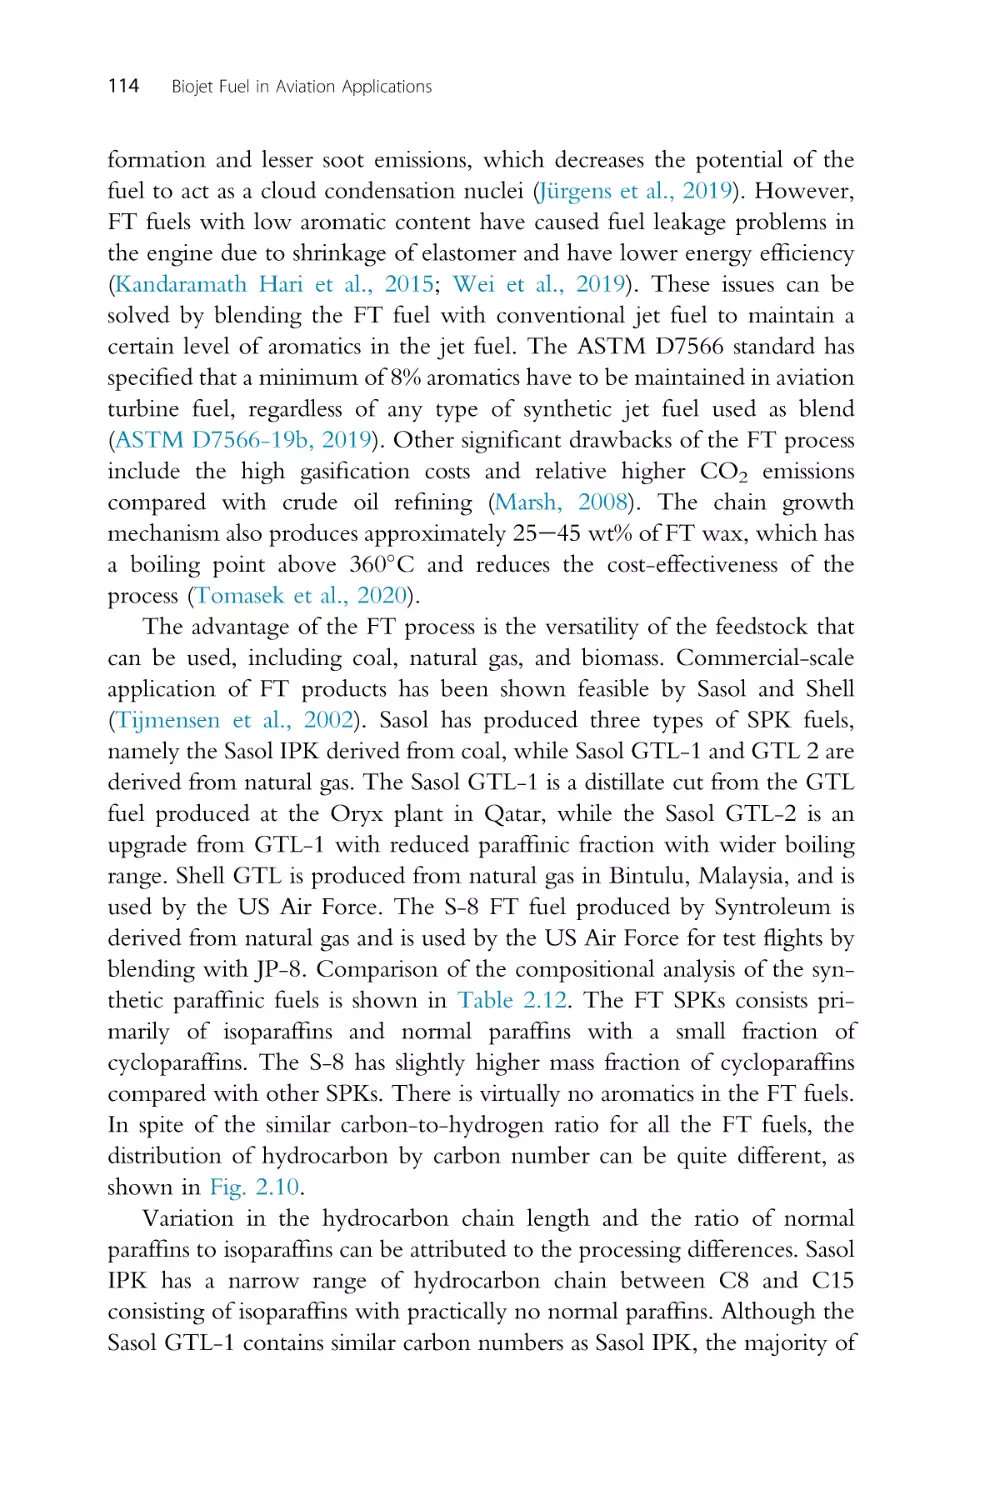
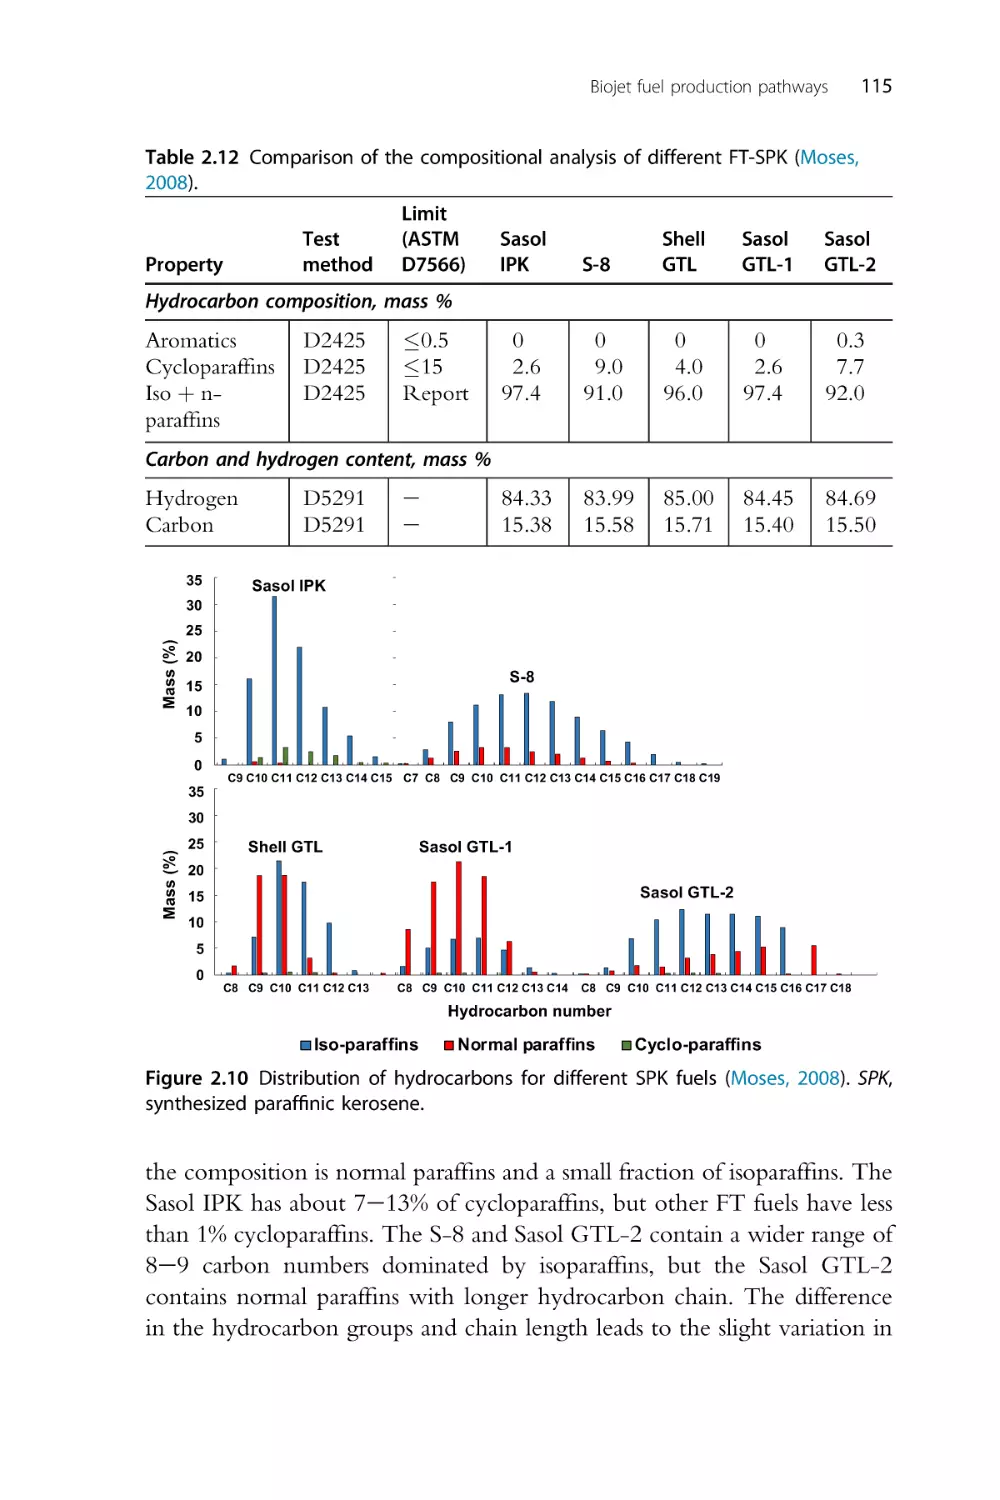
112
128
135
135
143
143
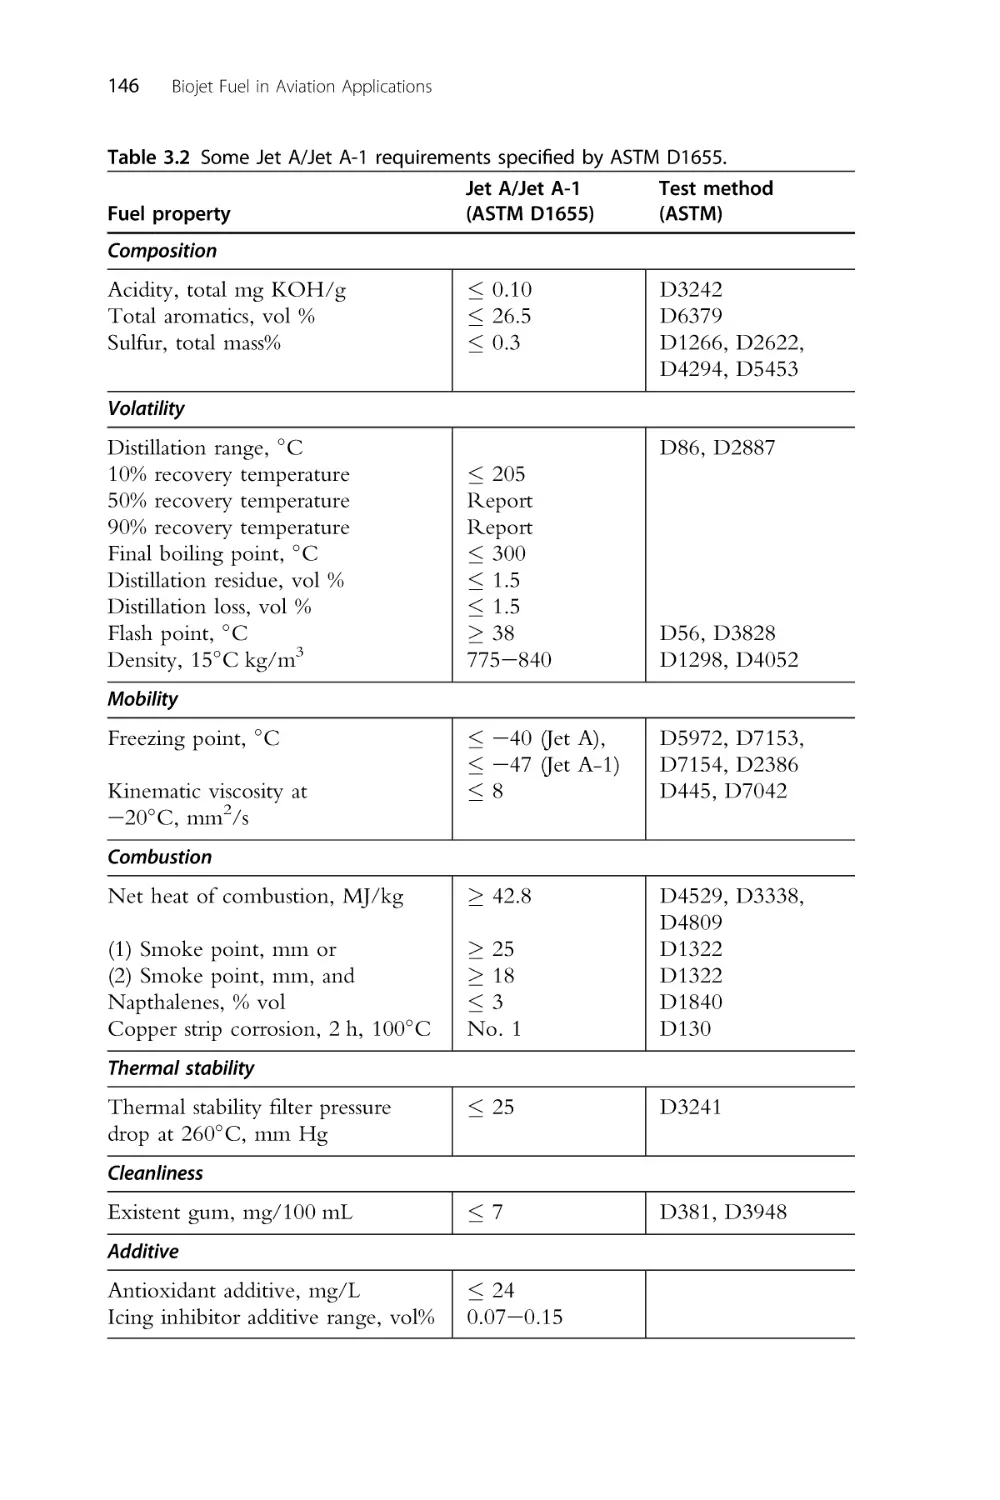
144
148
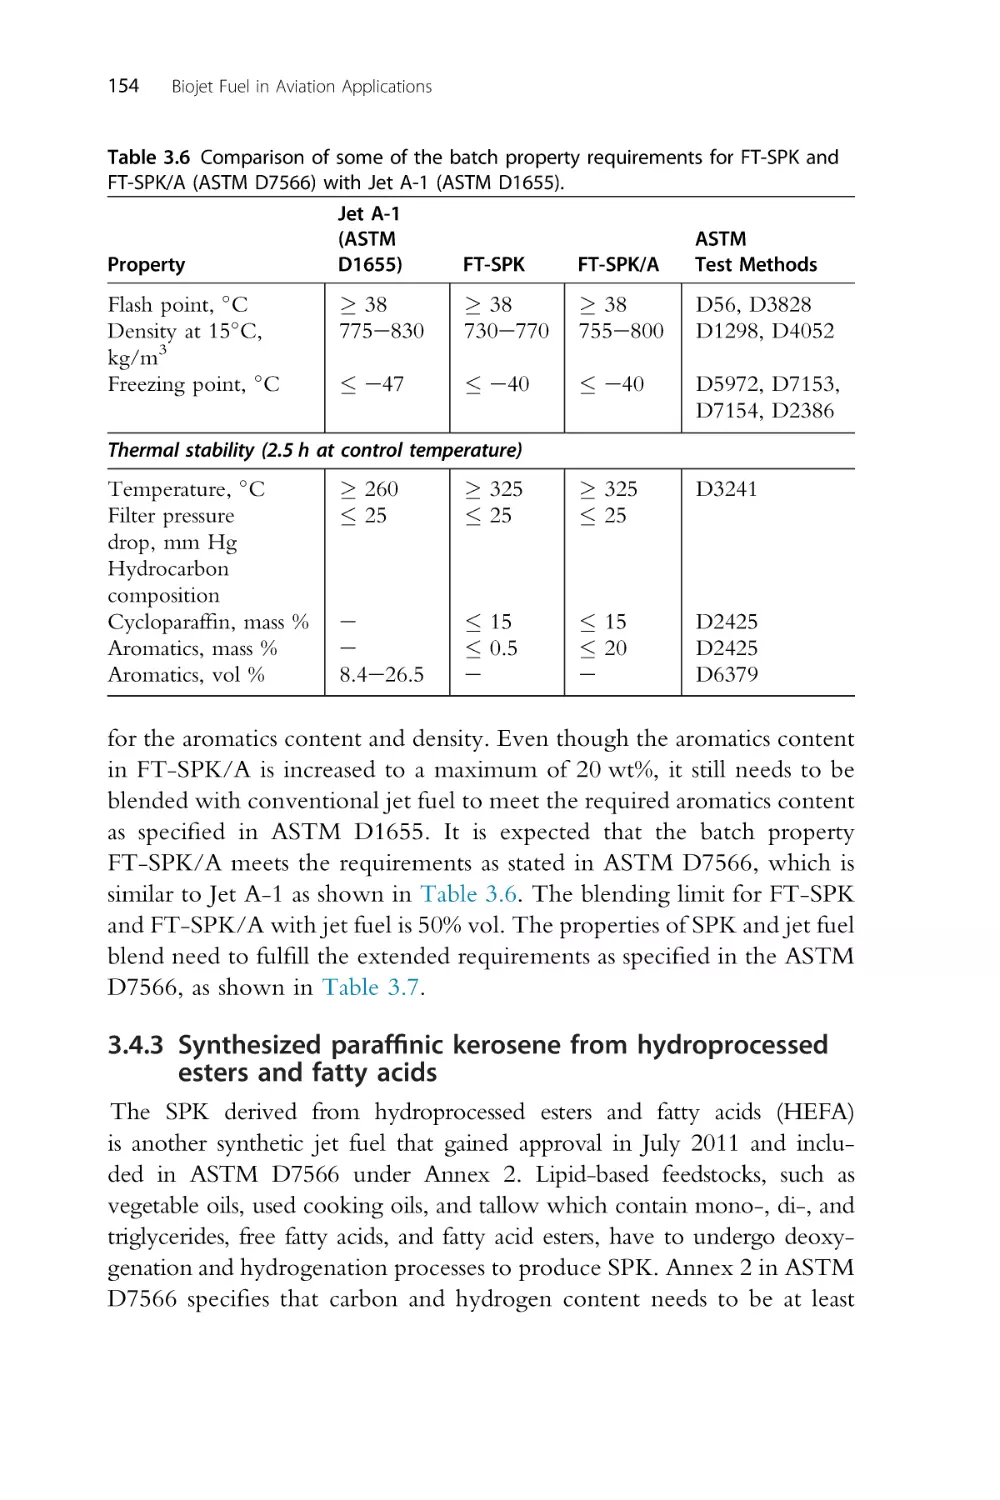
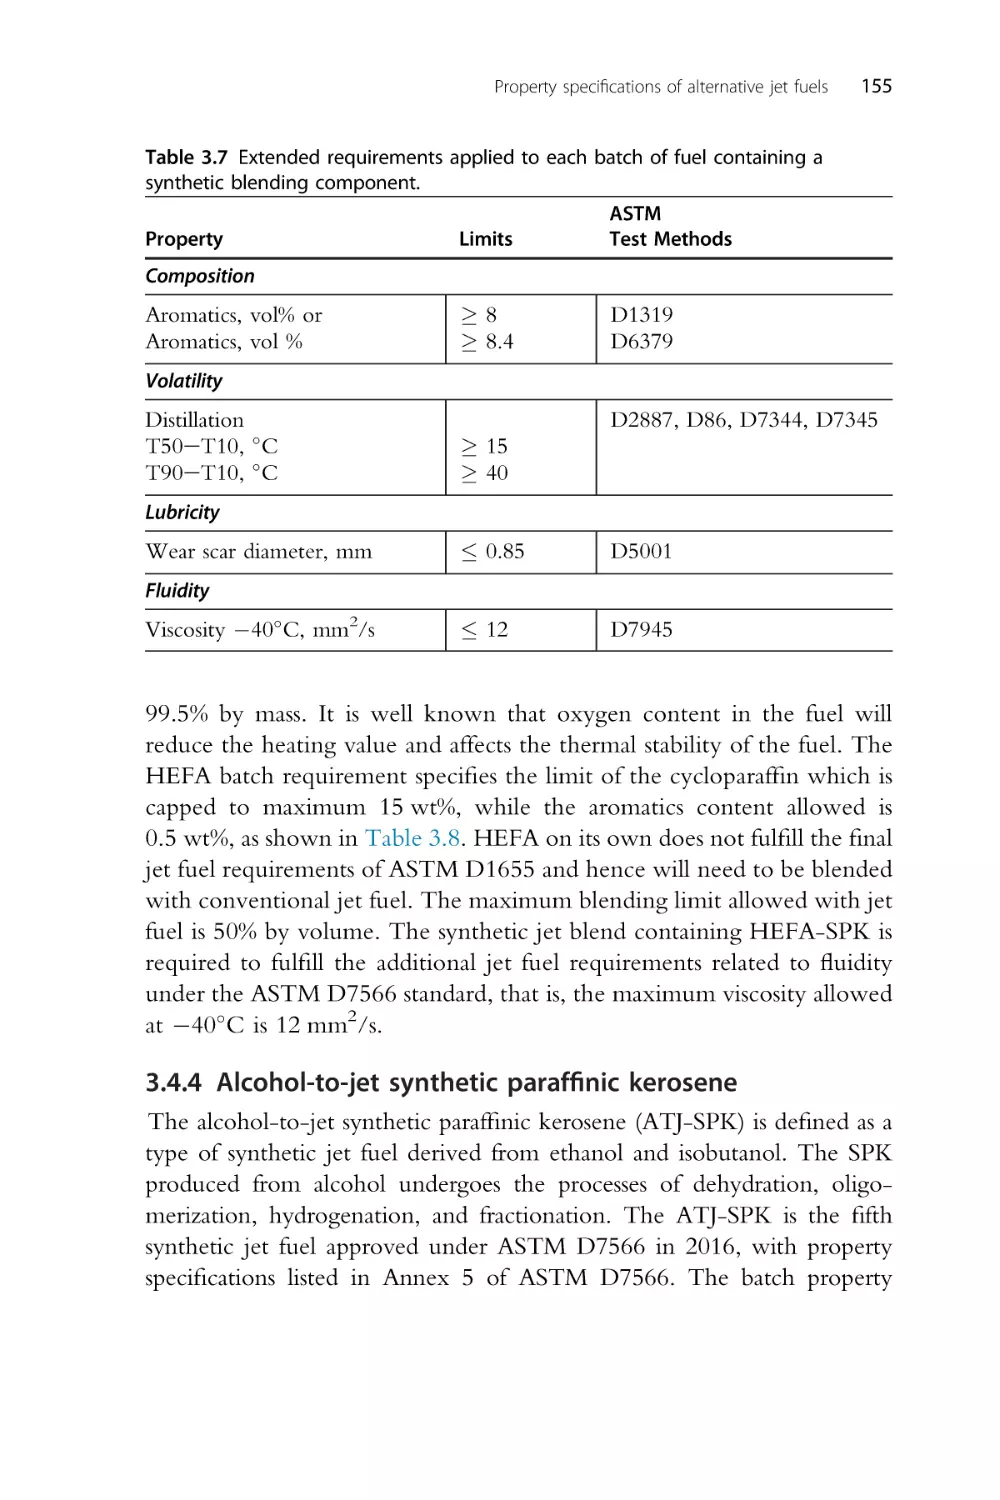
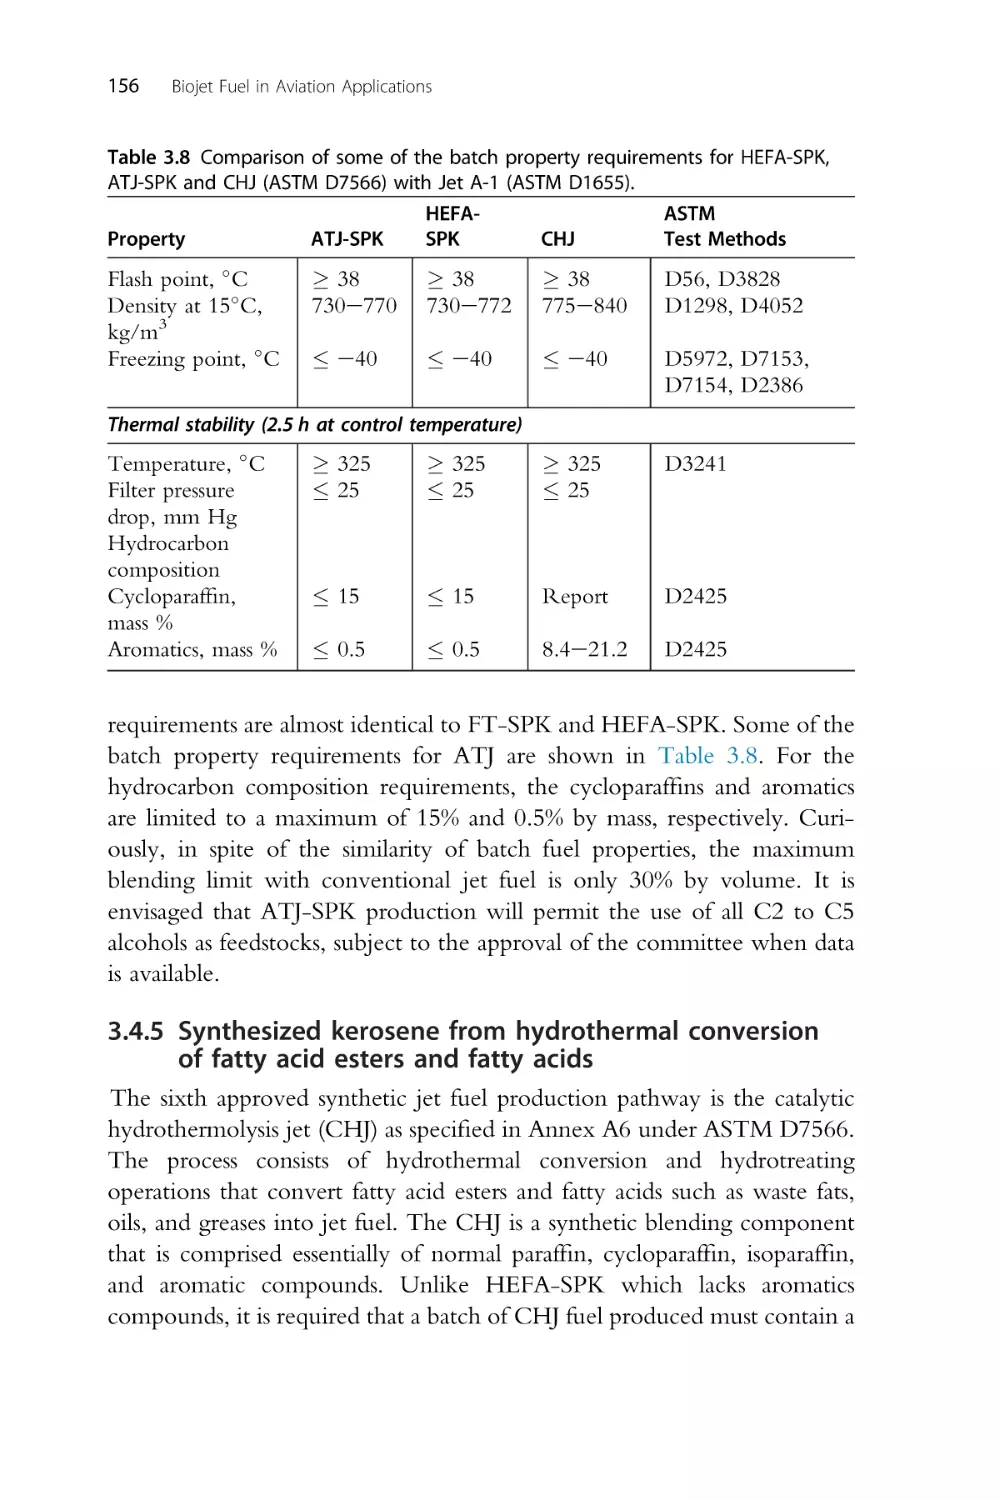
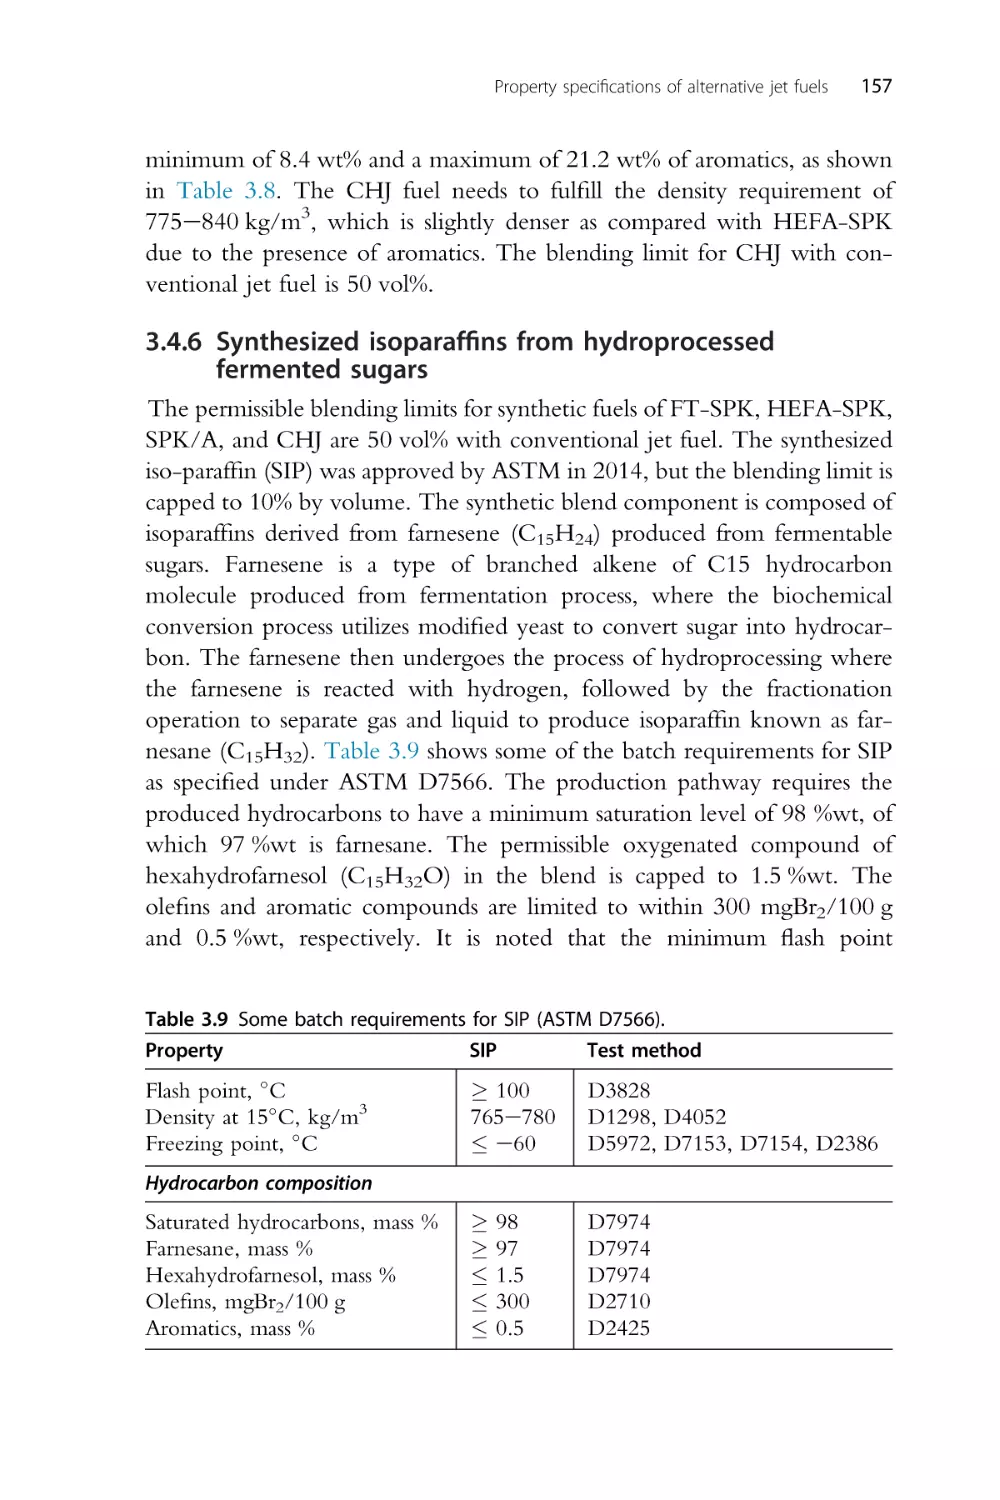
153
v
vi
Contents
3.5 Performance characteristics of aviation turbine fuels
3.6 Additives for alternative jet fuels
3.7 Jet fuel certification process
3.8 Summary
References
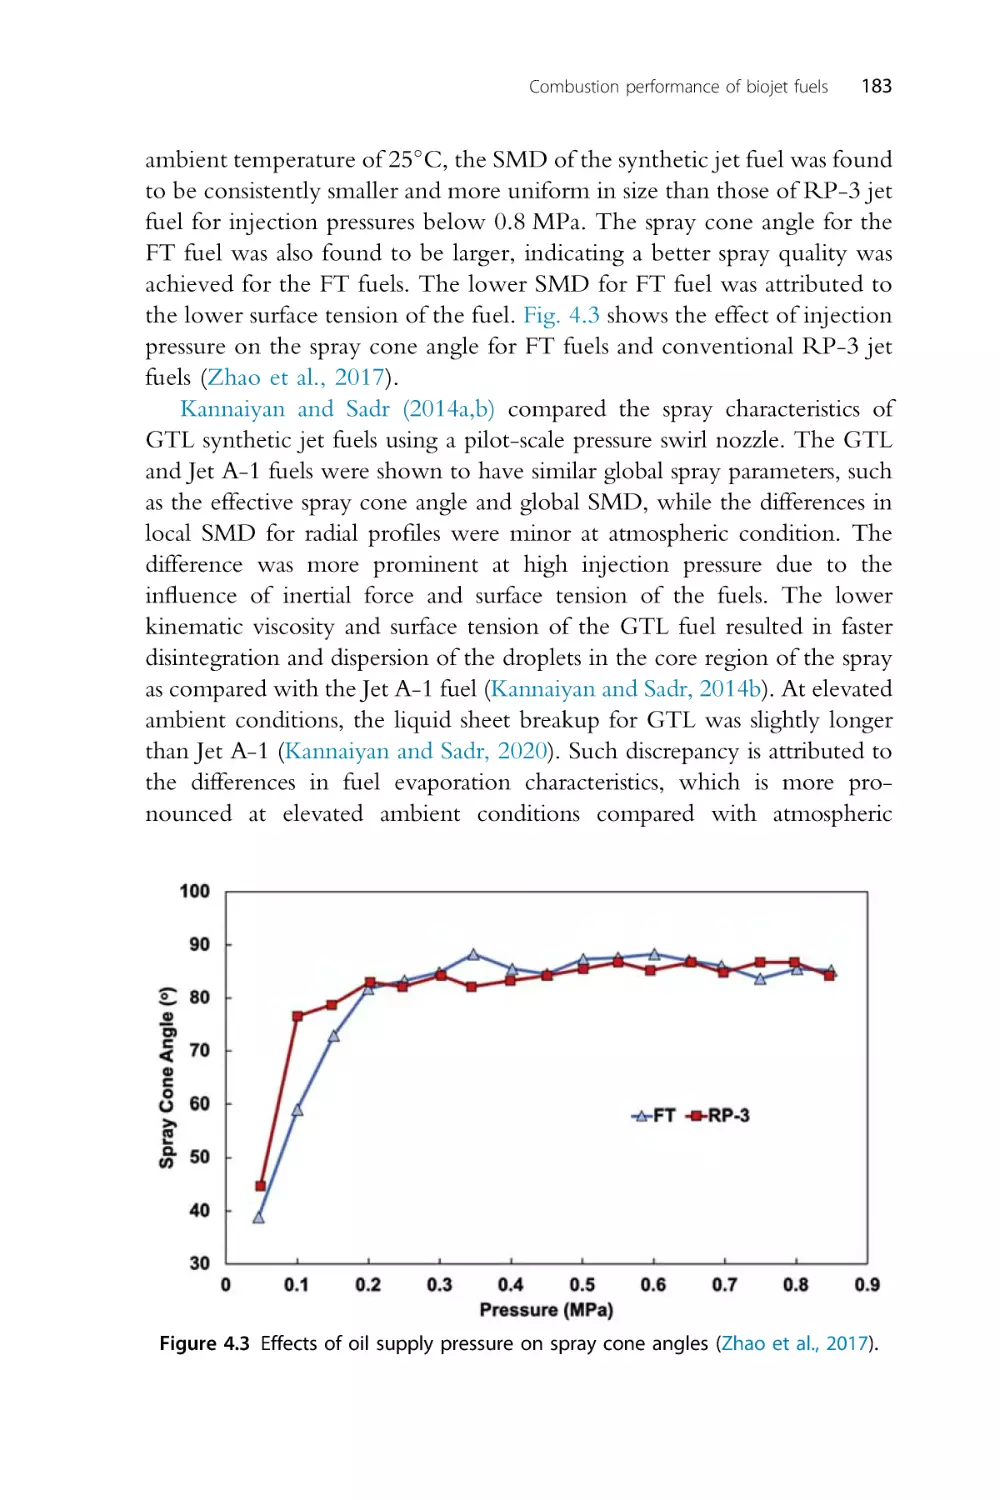
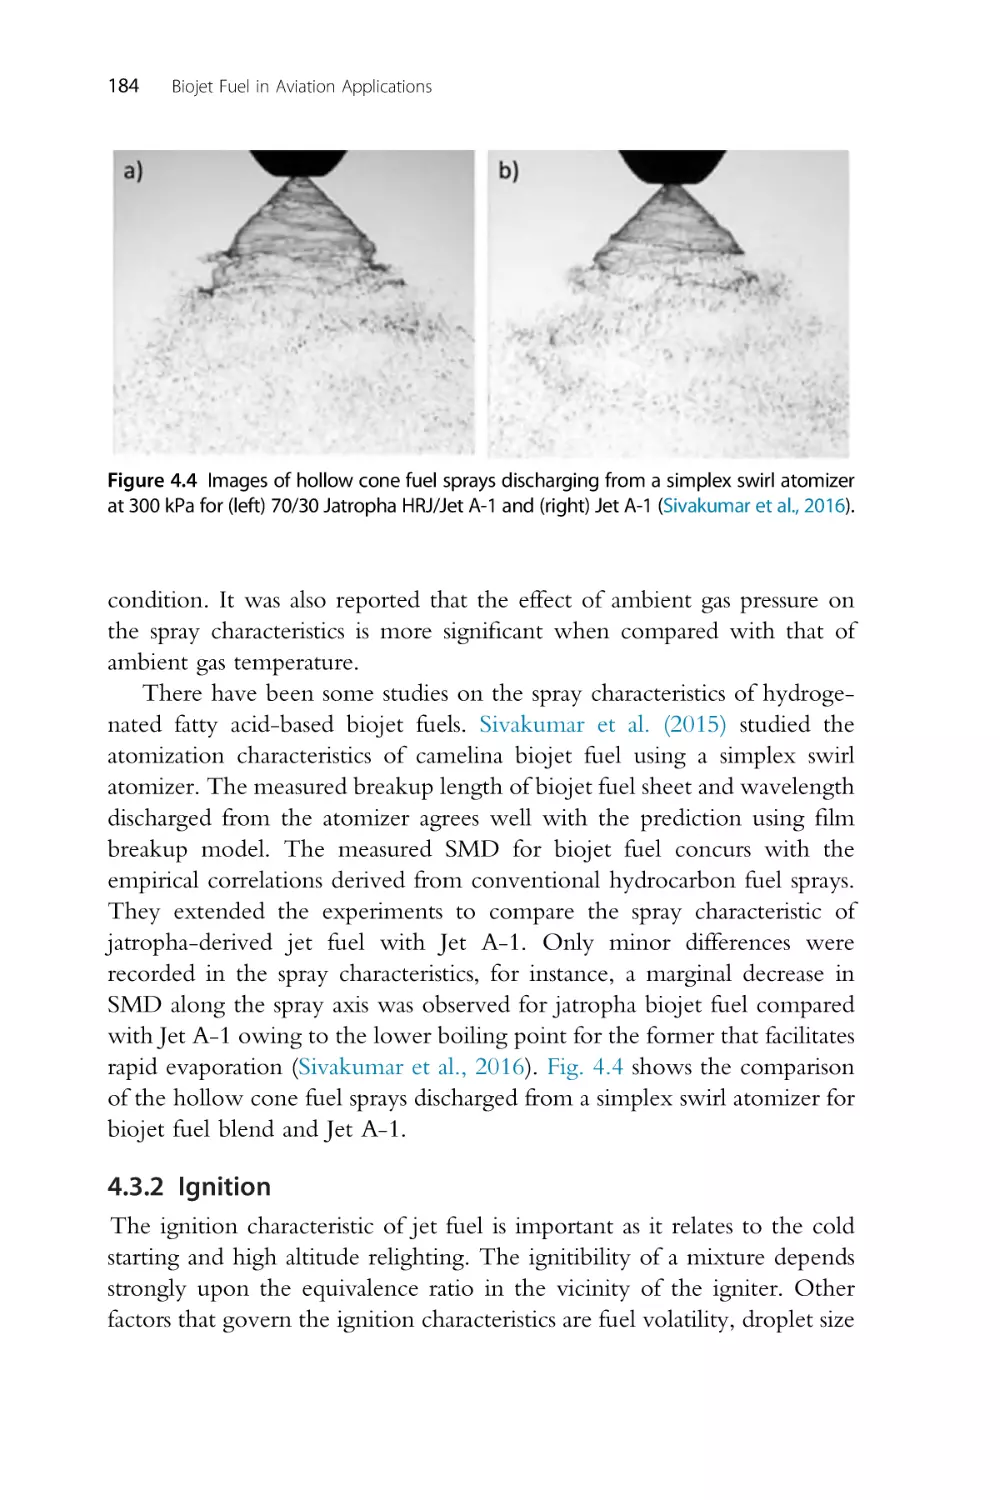
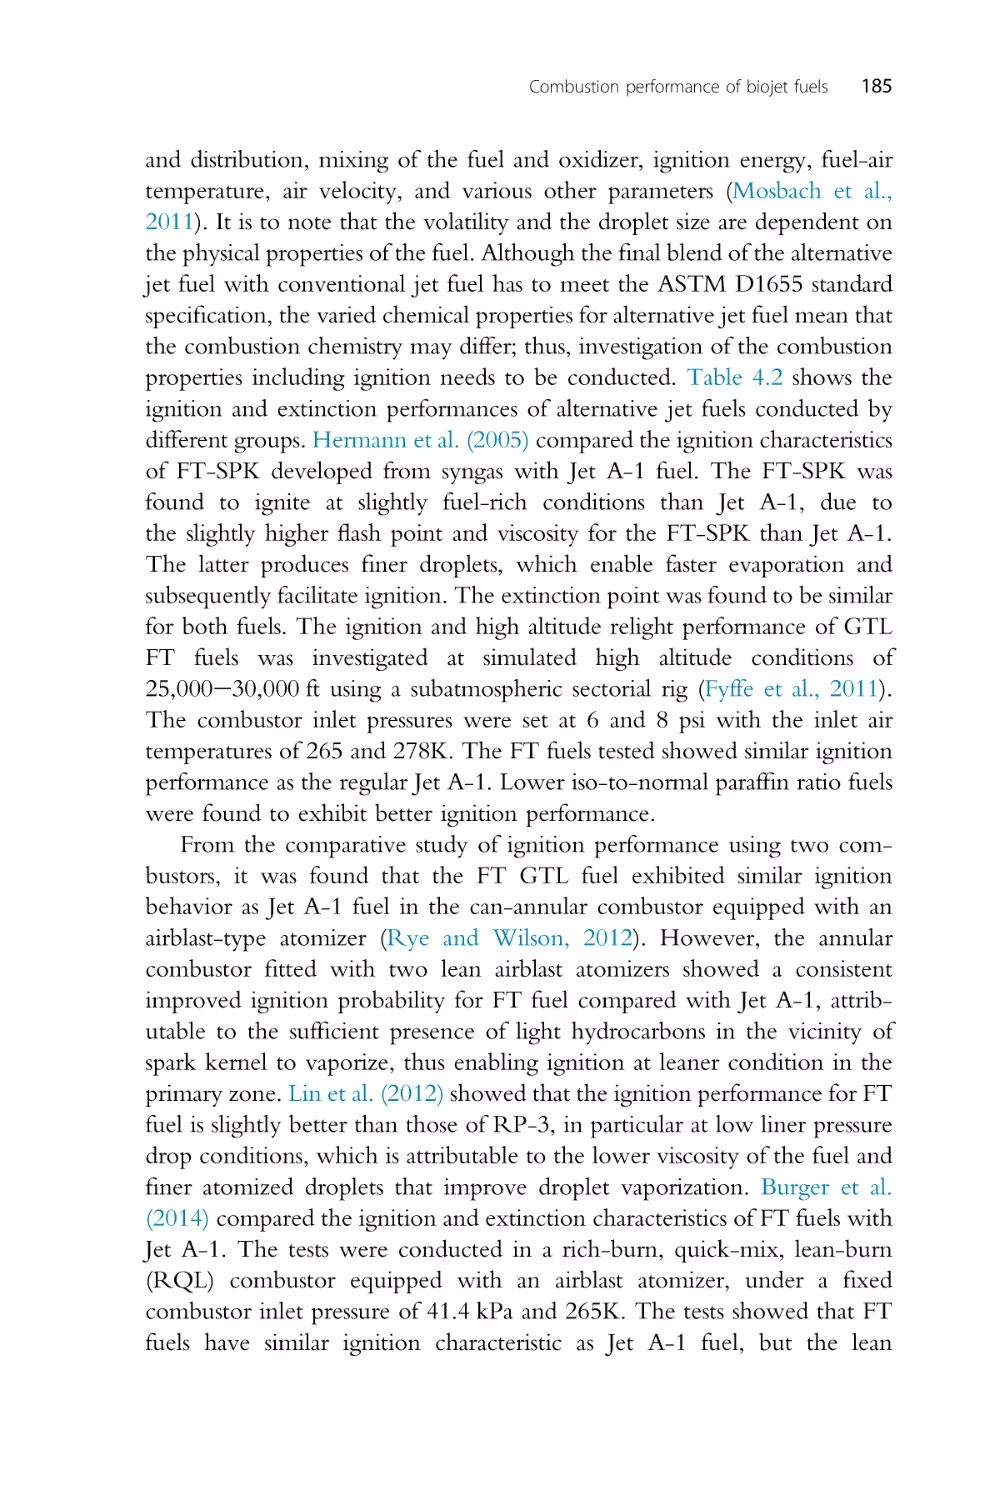
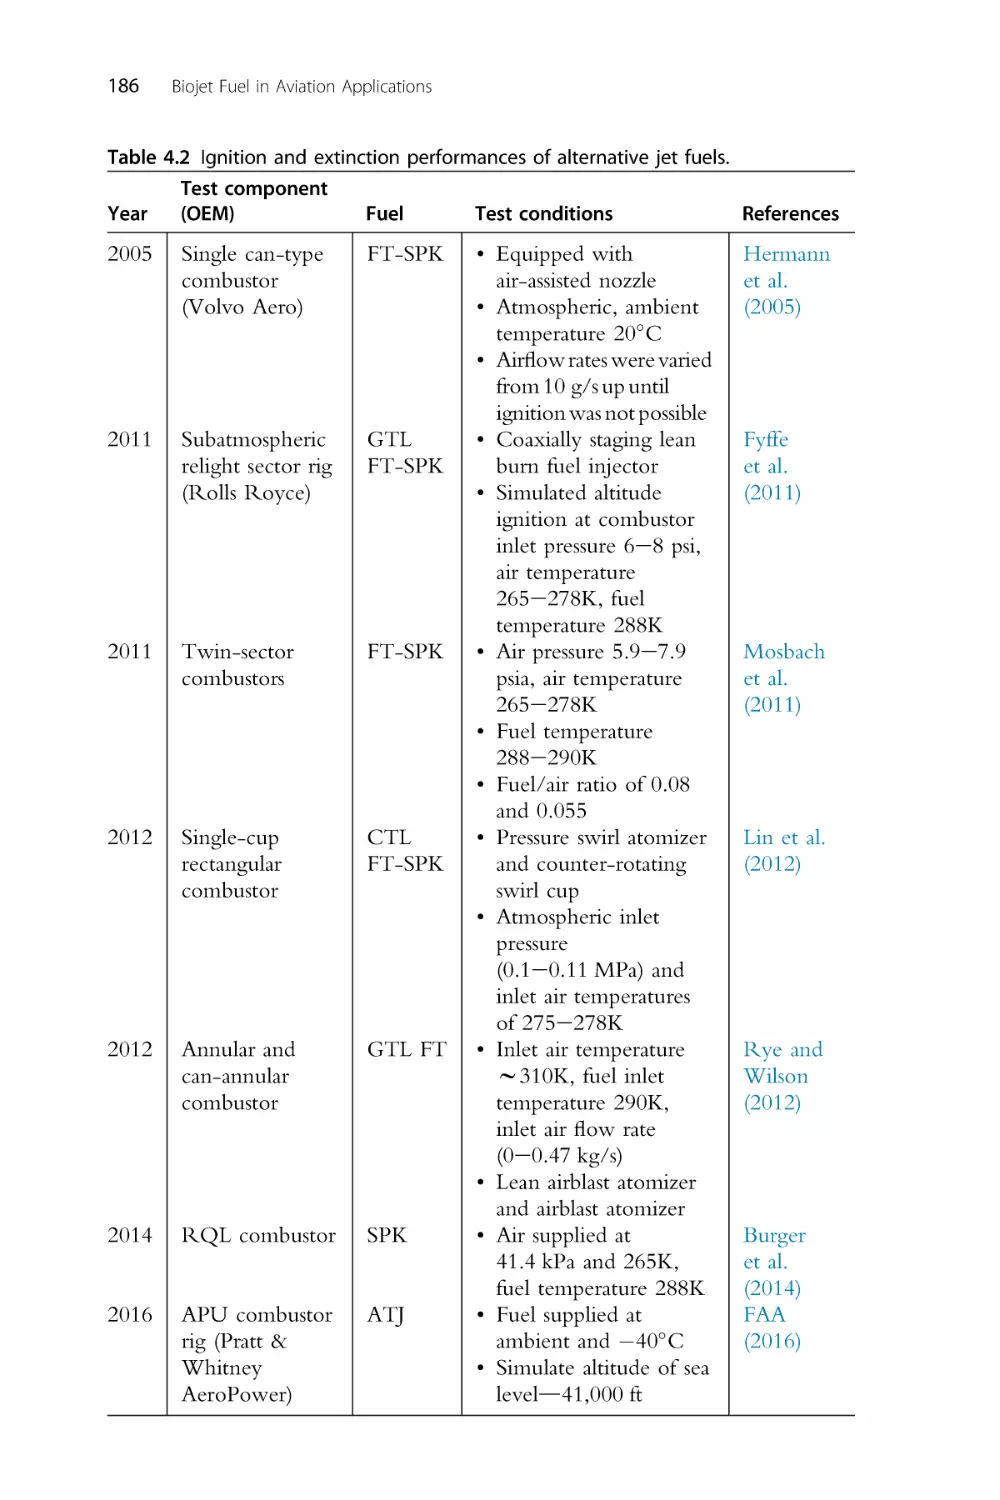
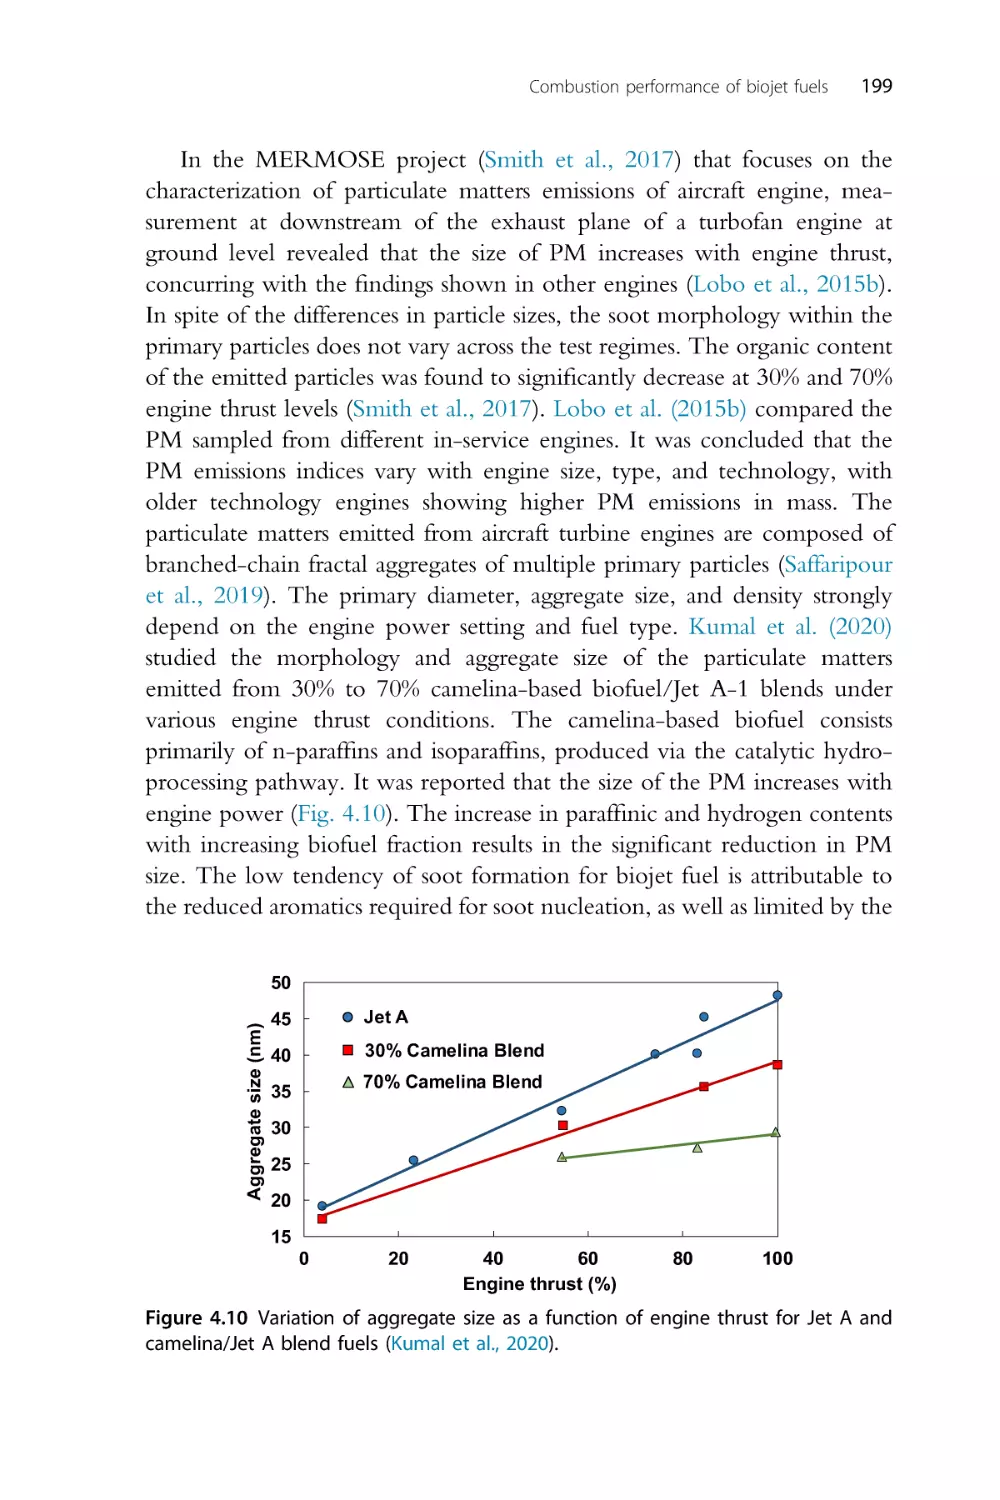
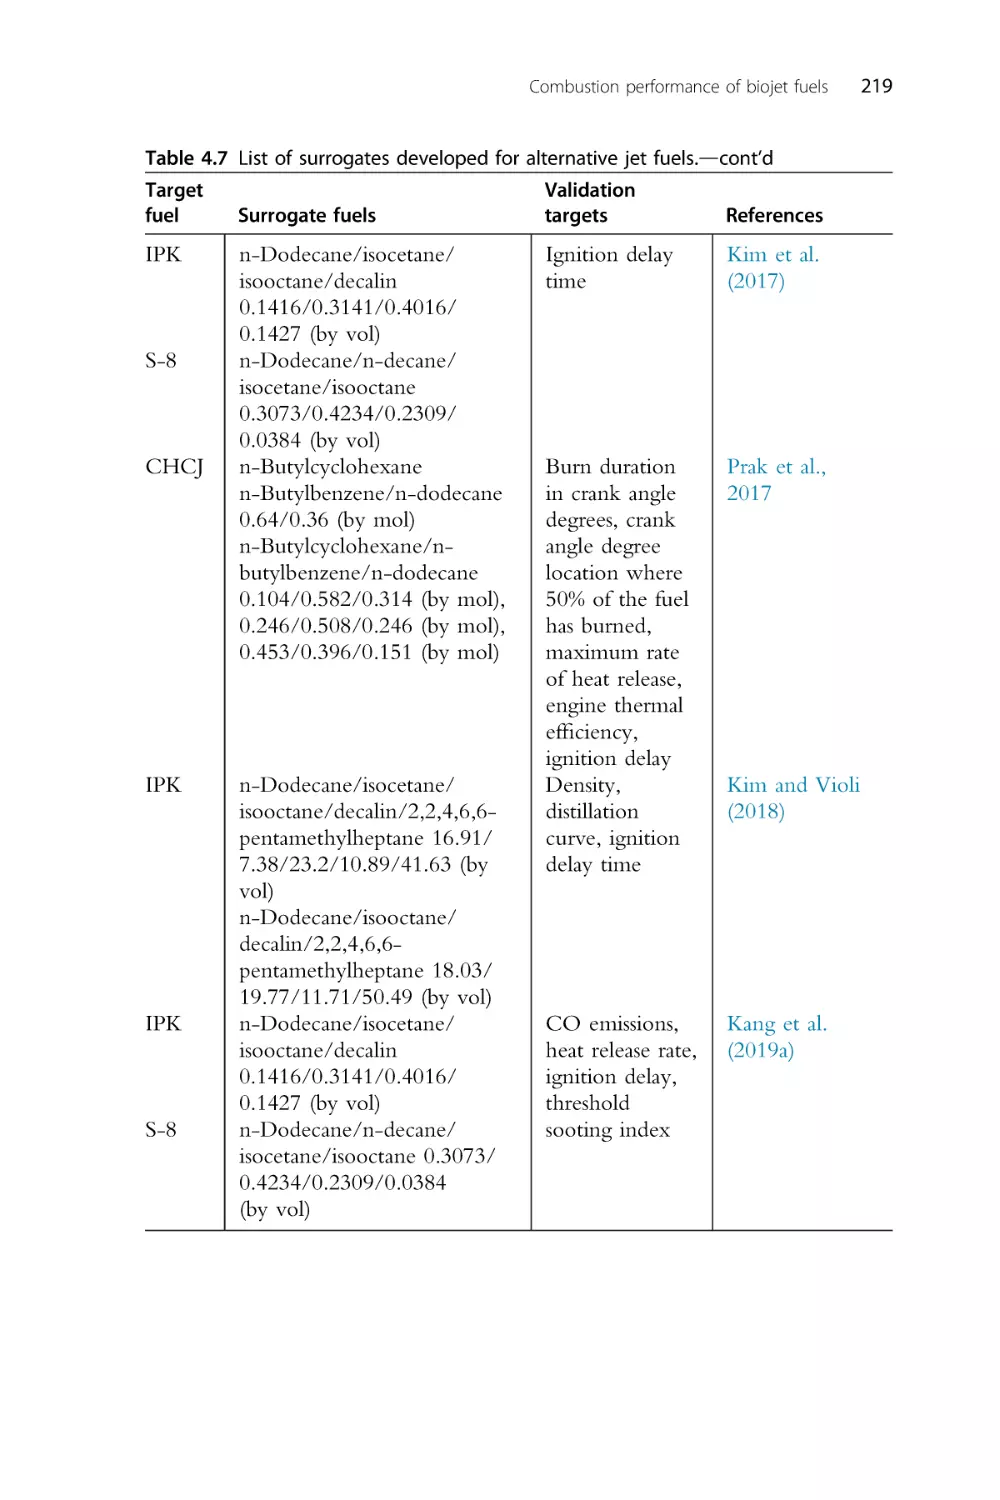
4. Combustion performance of biojet fuels
4.1 Introduction
4.2 Principles of aircraft emissions
4.3 Component or rig test for alternative jet fuel
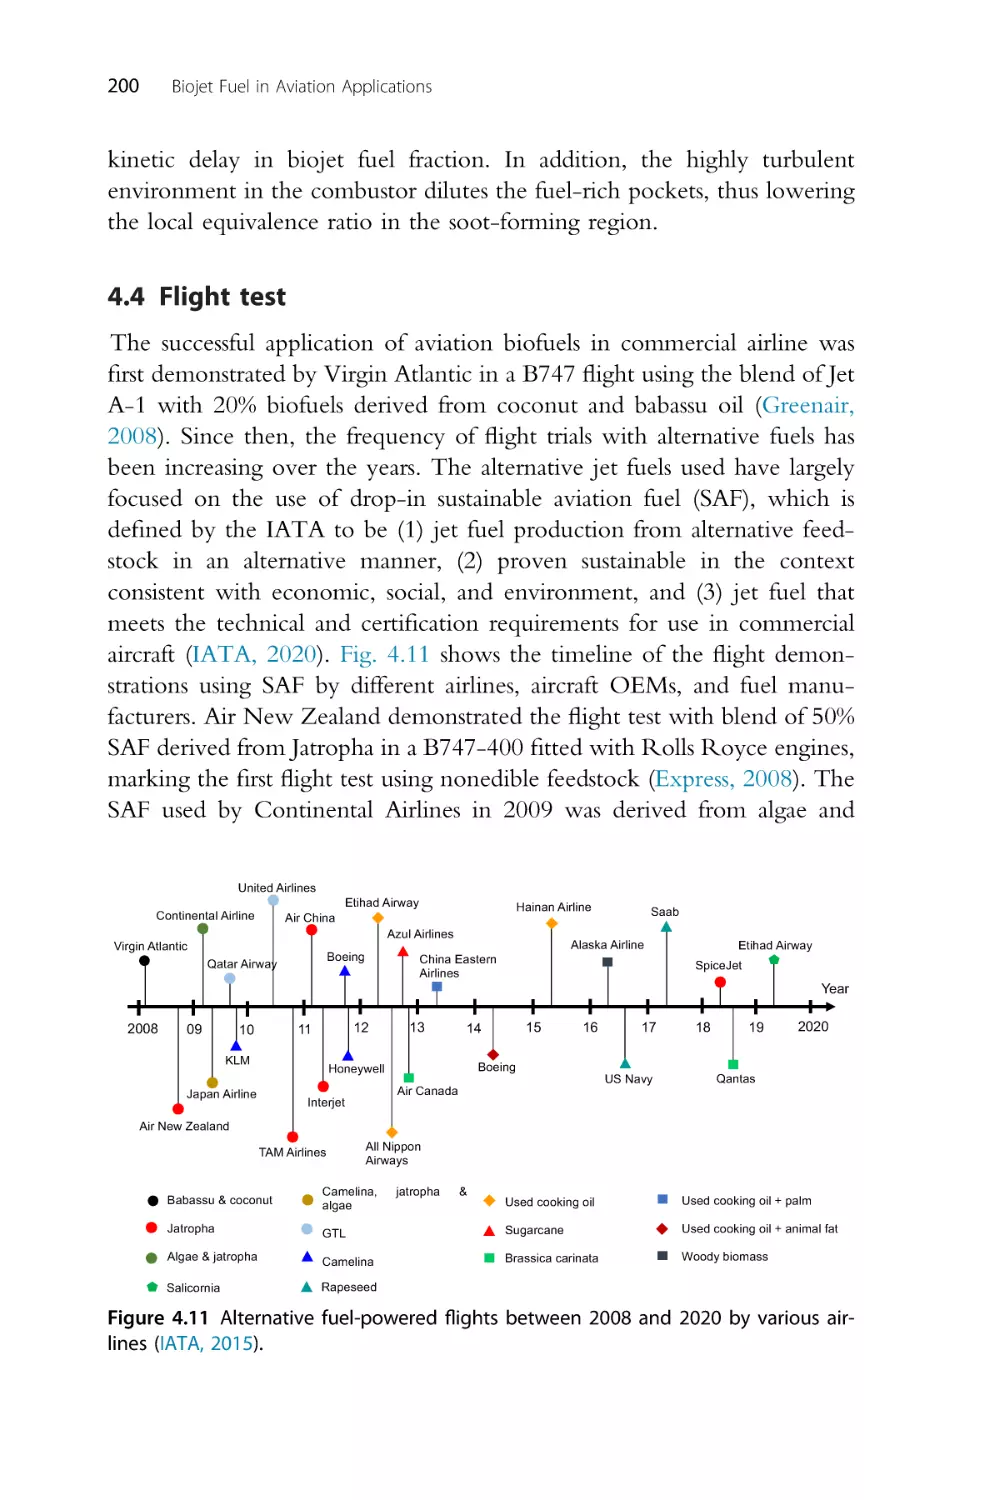
4.4 Flight test
4.5 Fundamental combustion properties
4.6 Summary
References
5. Economics of biojet fuels
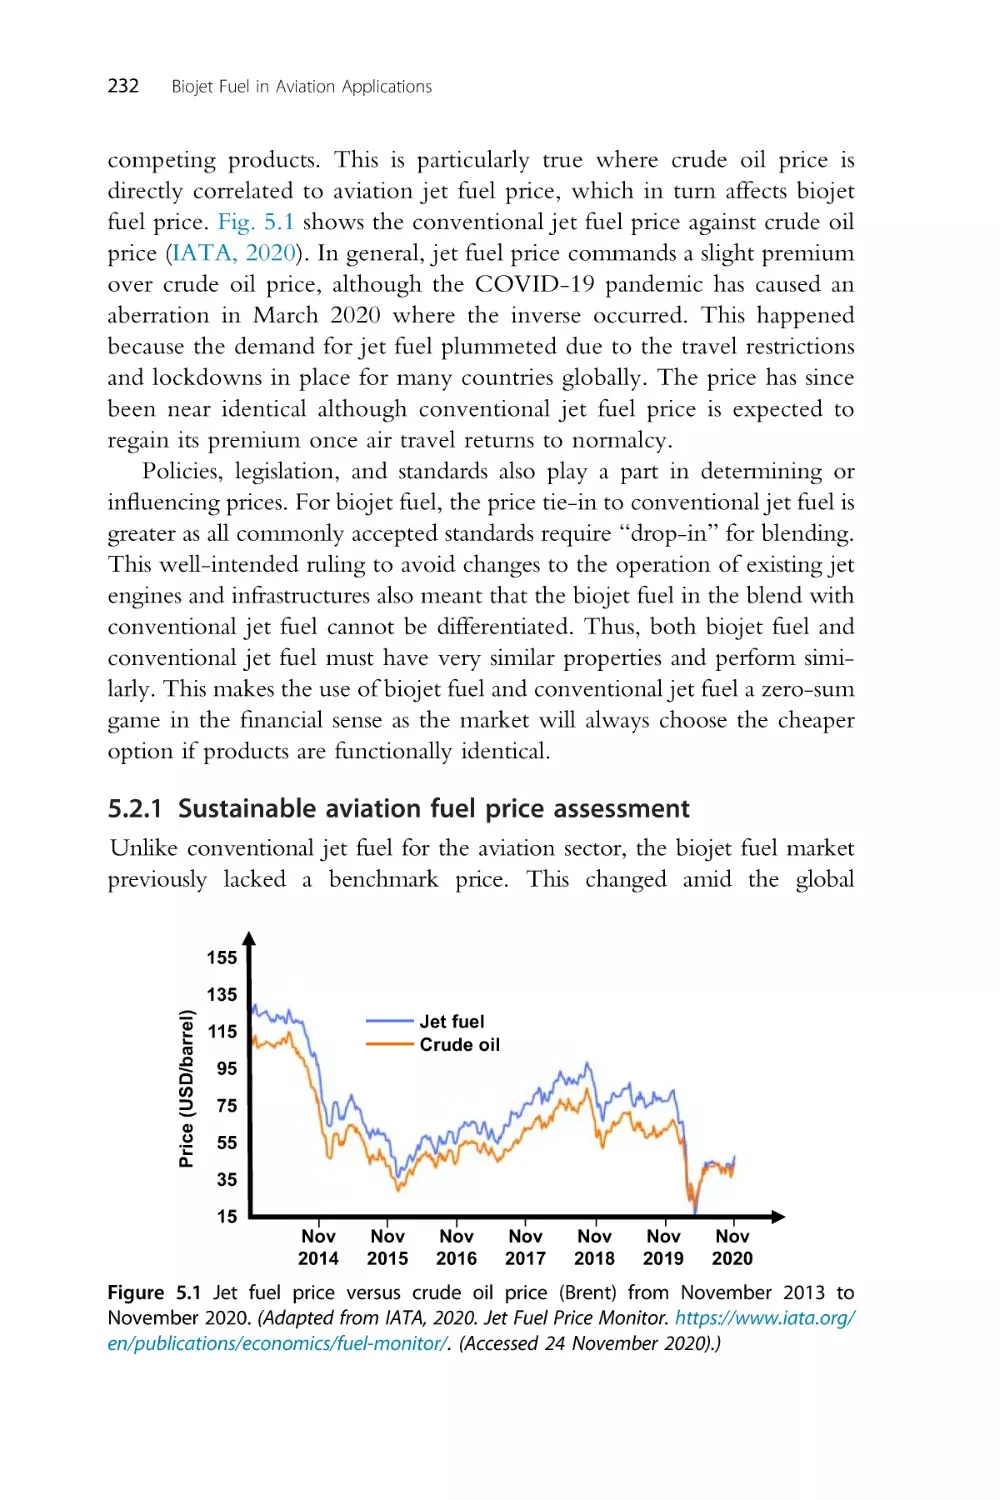
5.1 Introduction
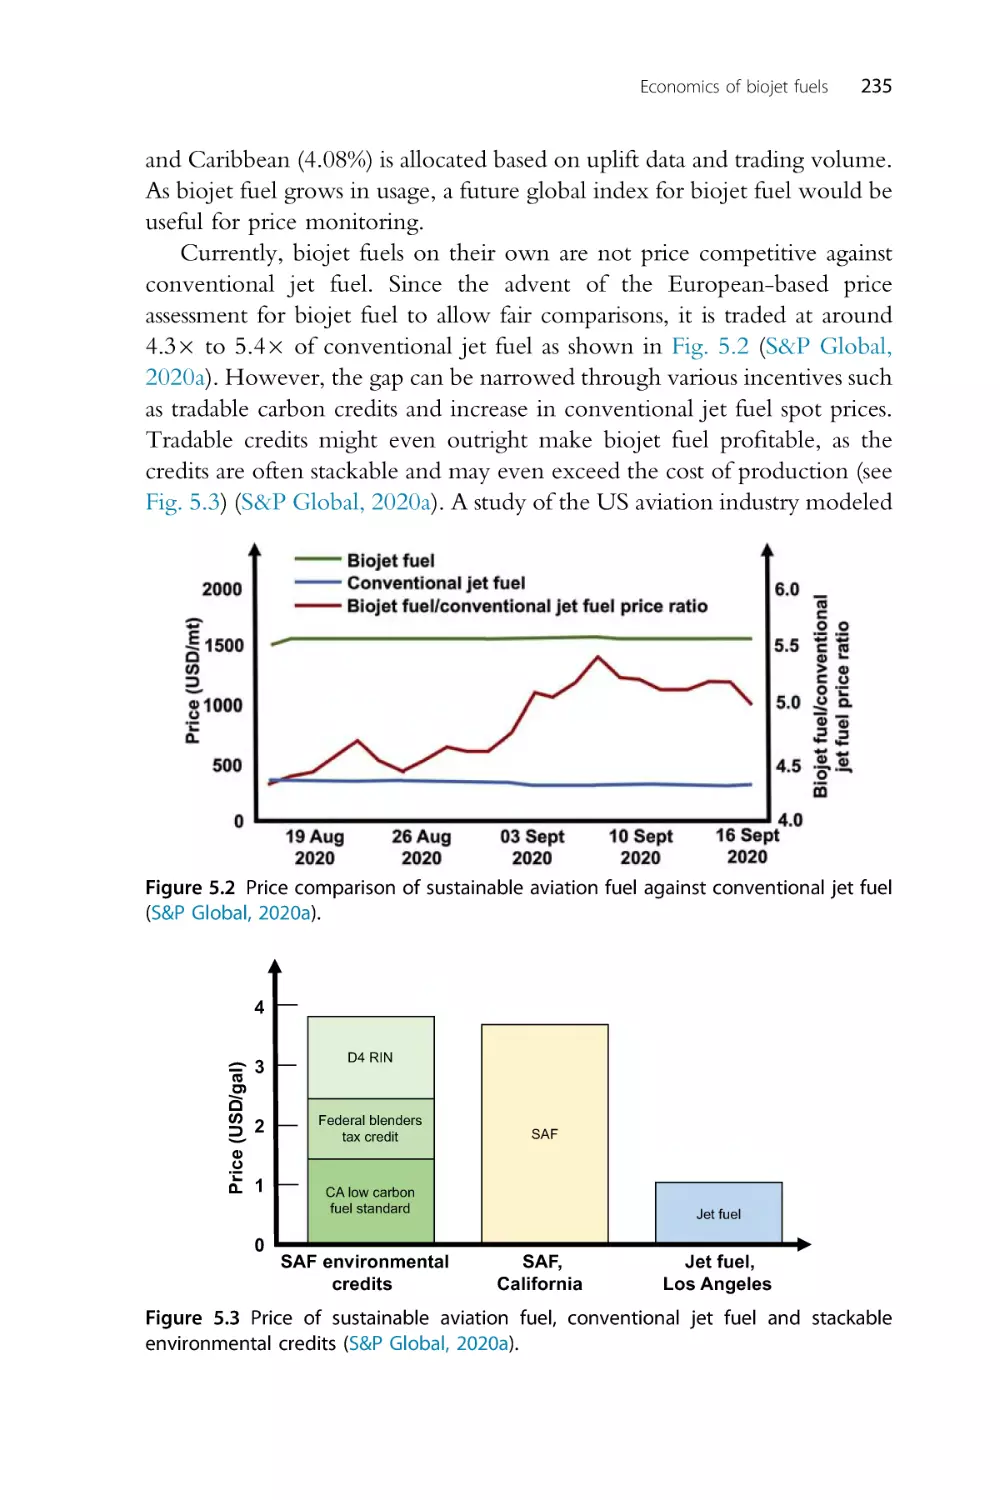
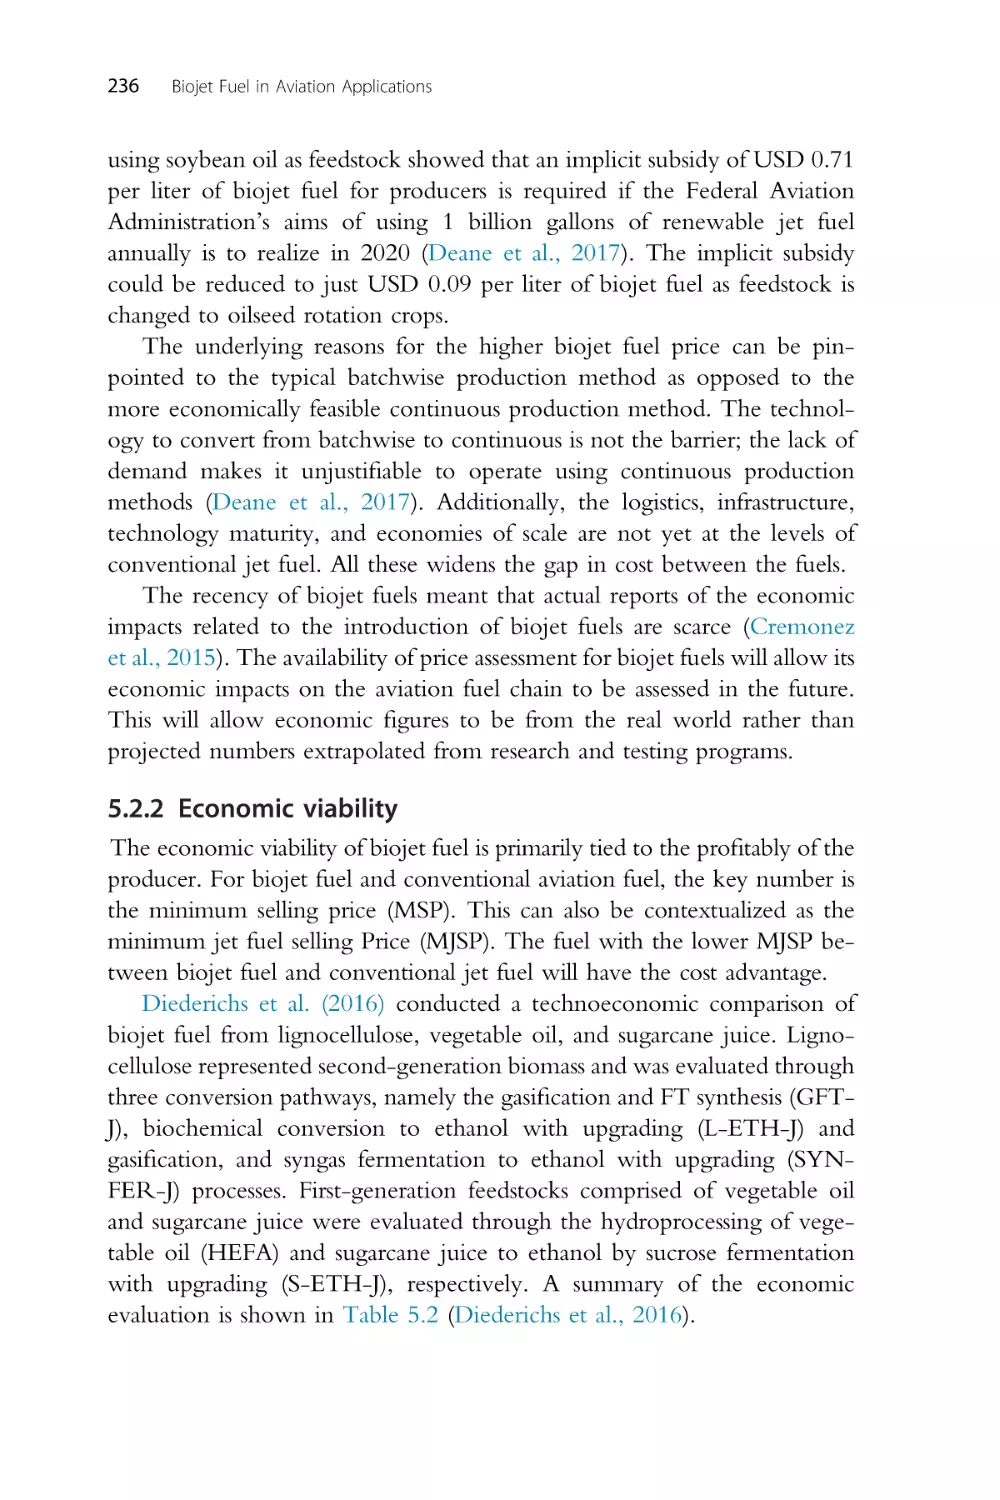
5.2 Biojet fuel prices
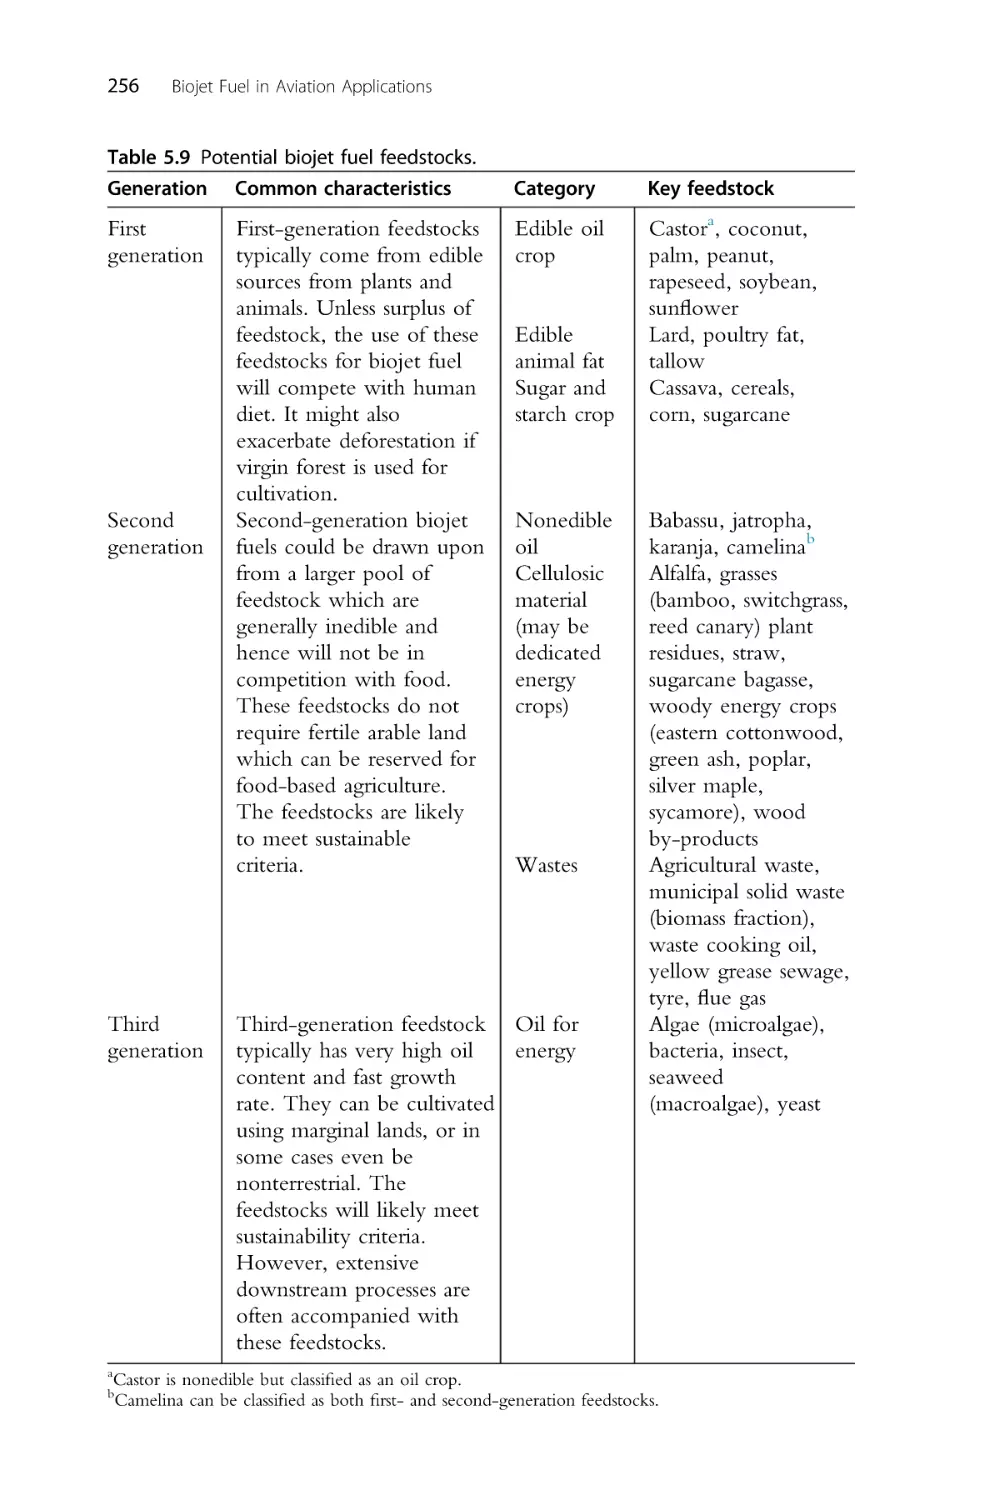
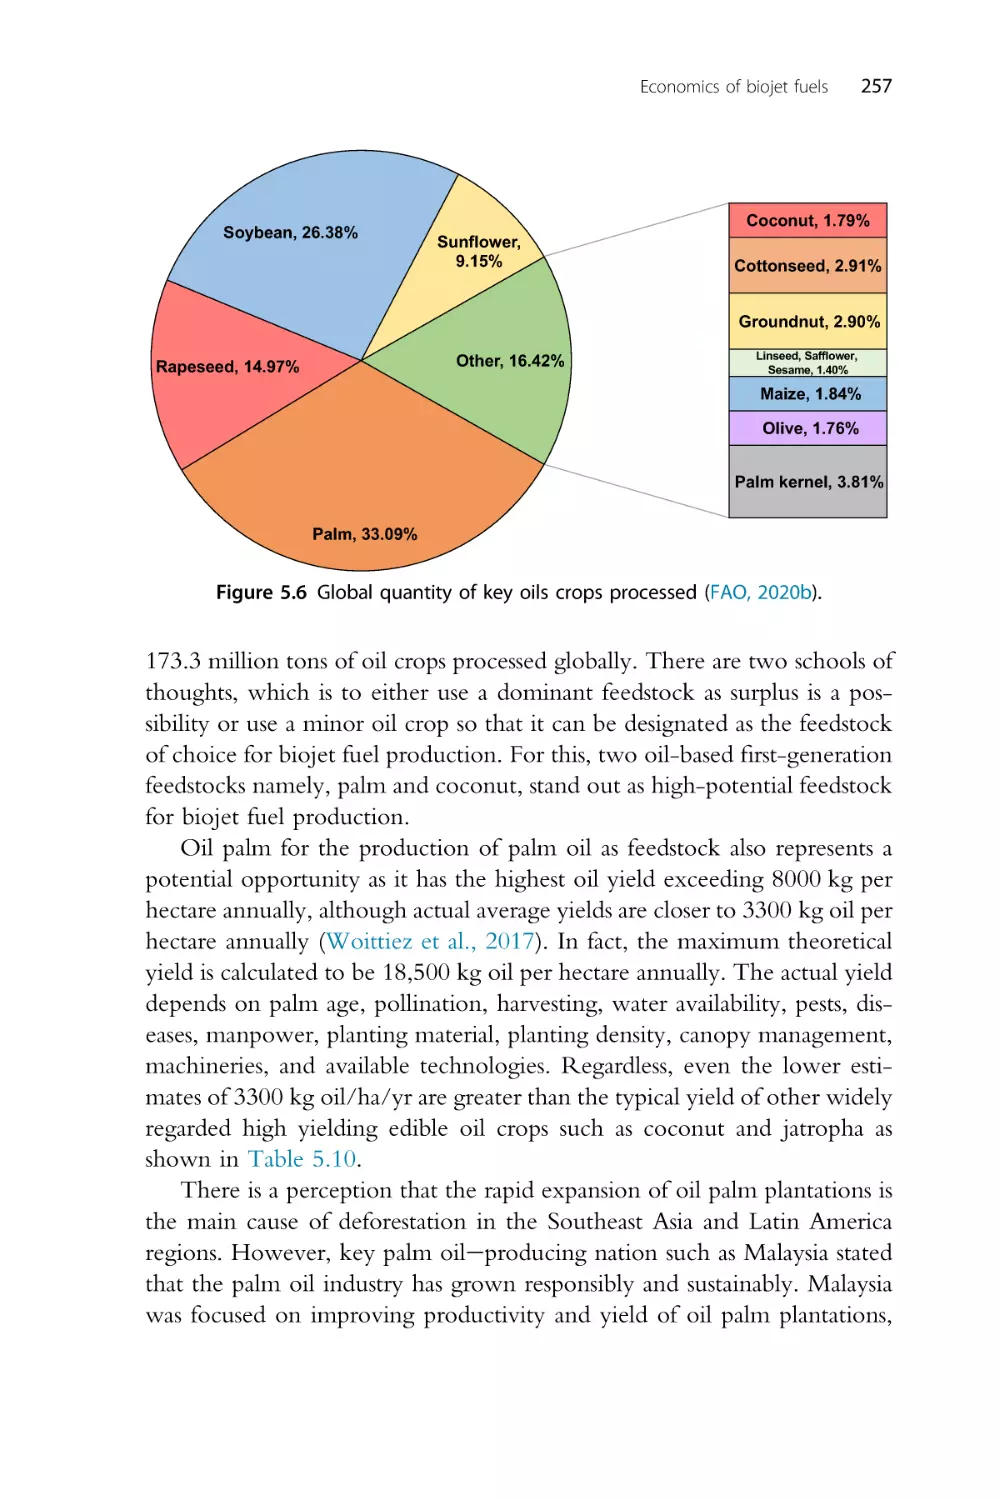
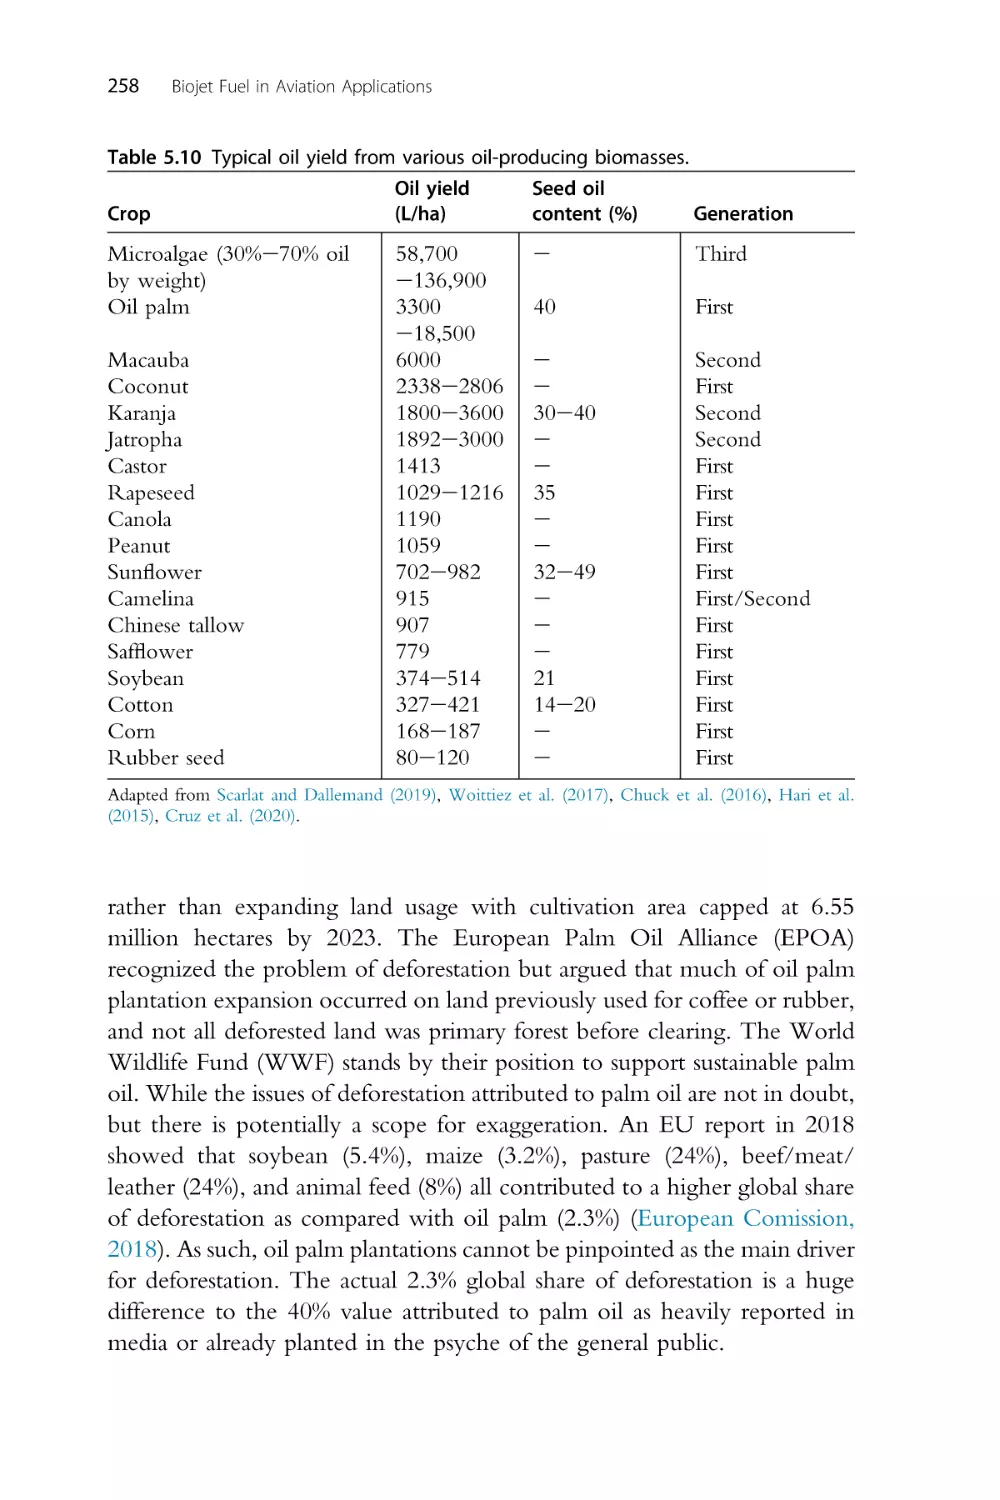
5.3 Potential feedstock
5.4 Global biojet fuel production
5.5 Barriers to commercialization
5.6 Summary
References
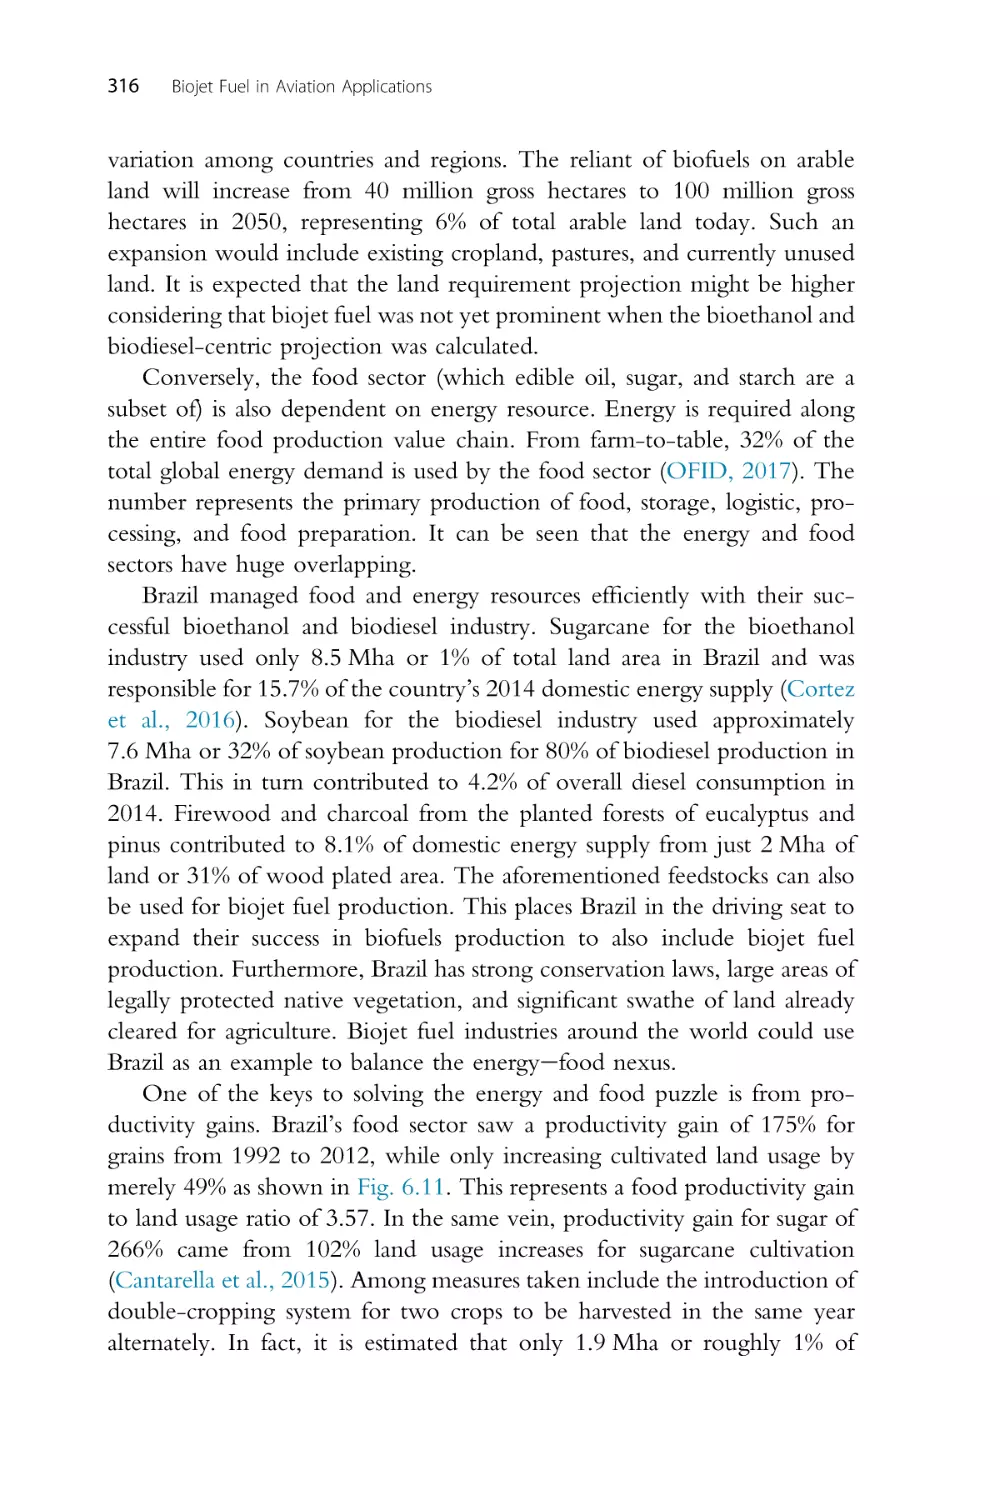
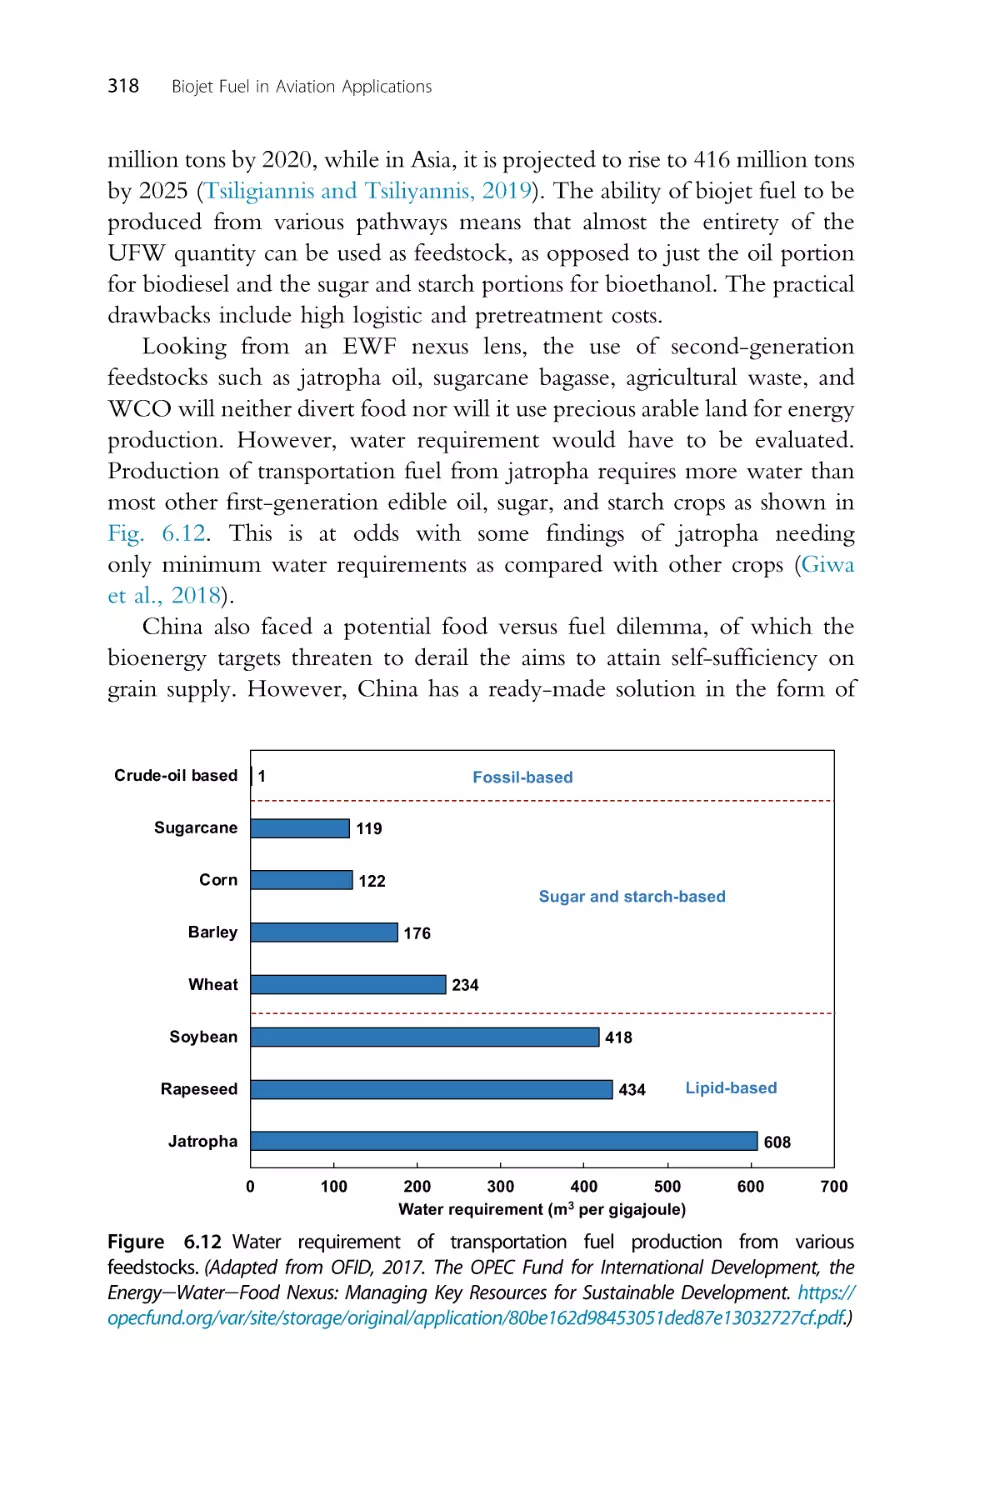
6. Sustainability of aviation biofuels
6.1
6.2
6.3
6.4
Introduction
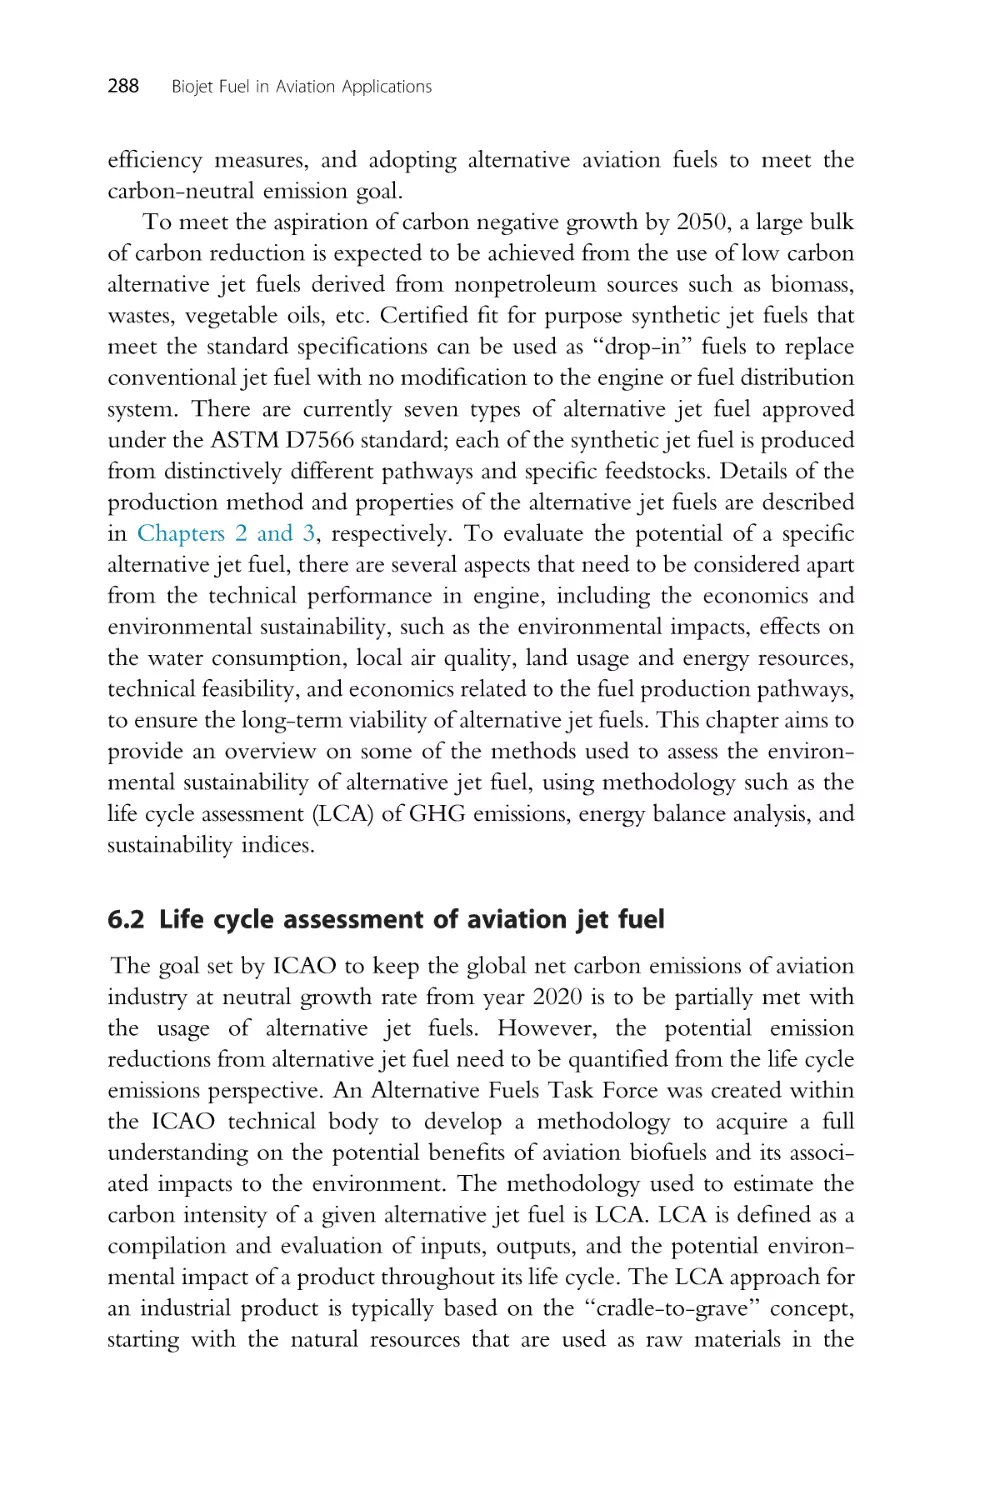
Life cycle assessment of aviation jet fuel
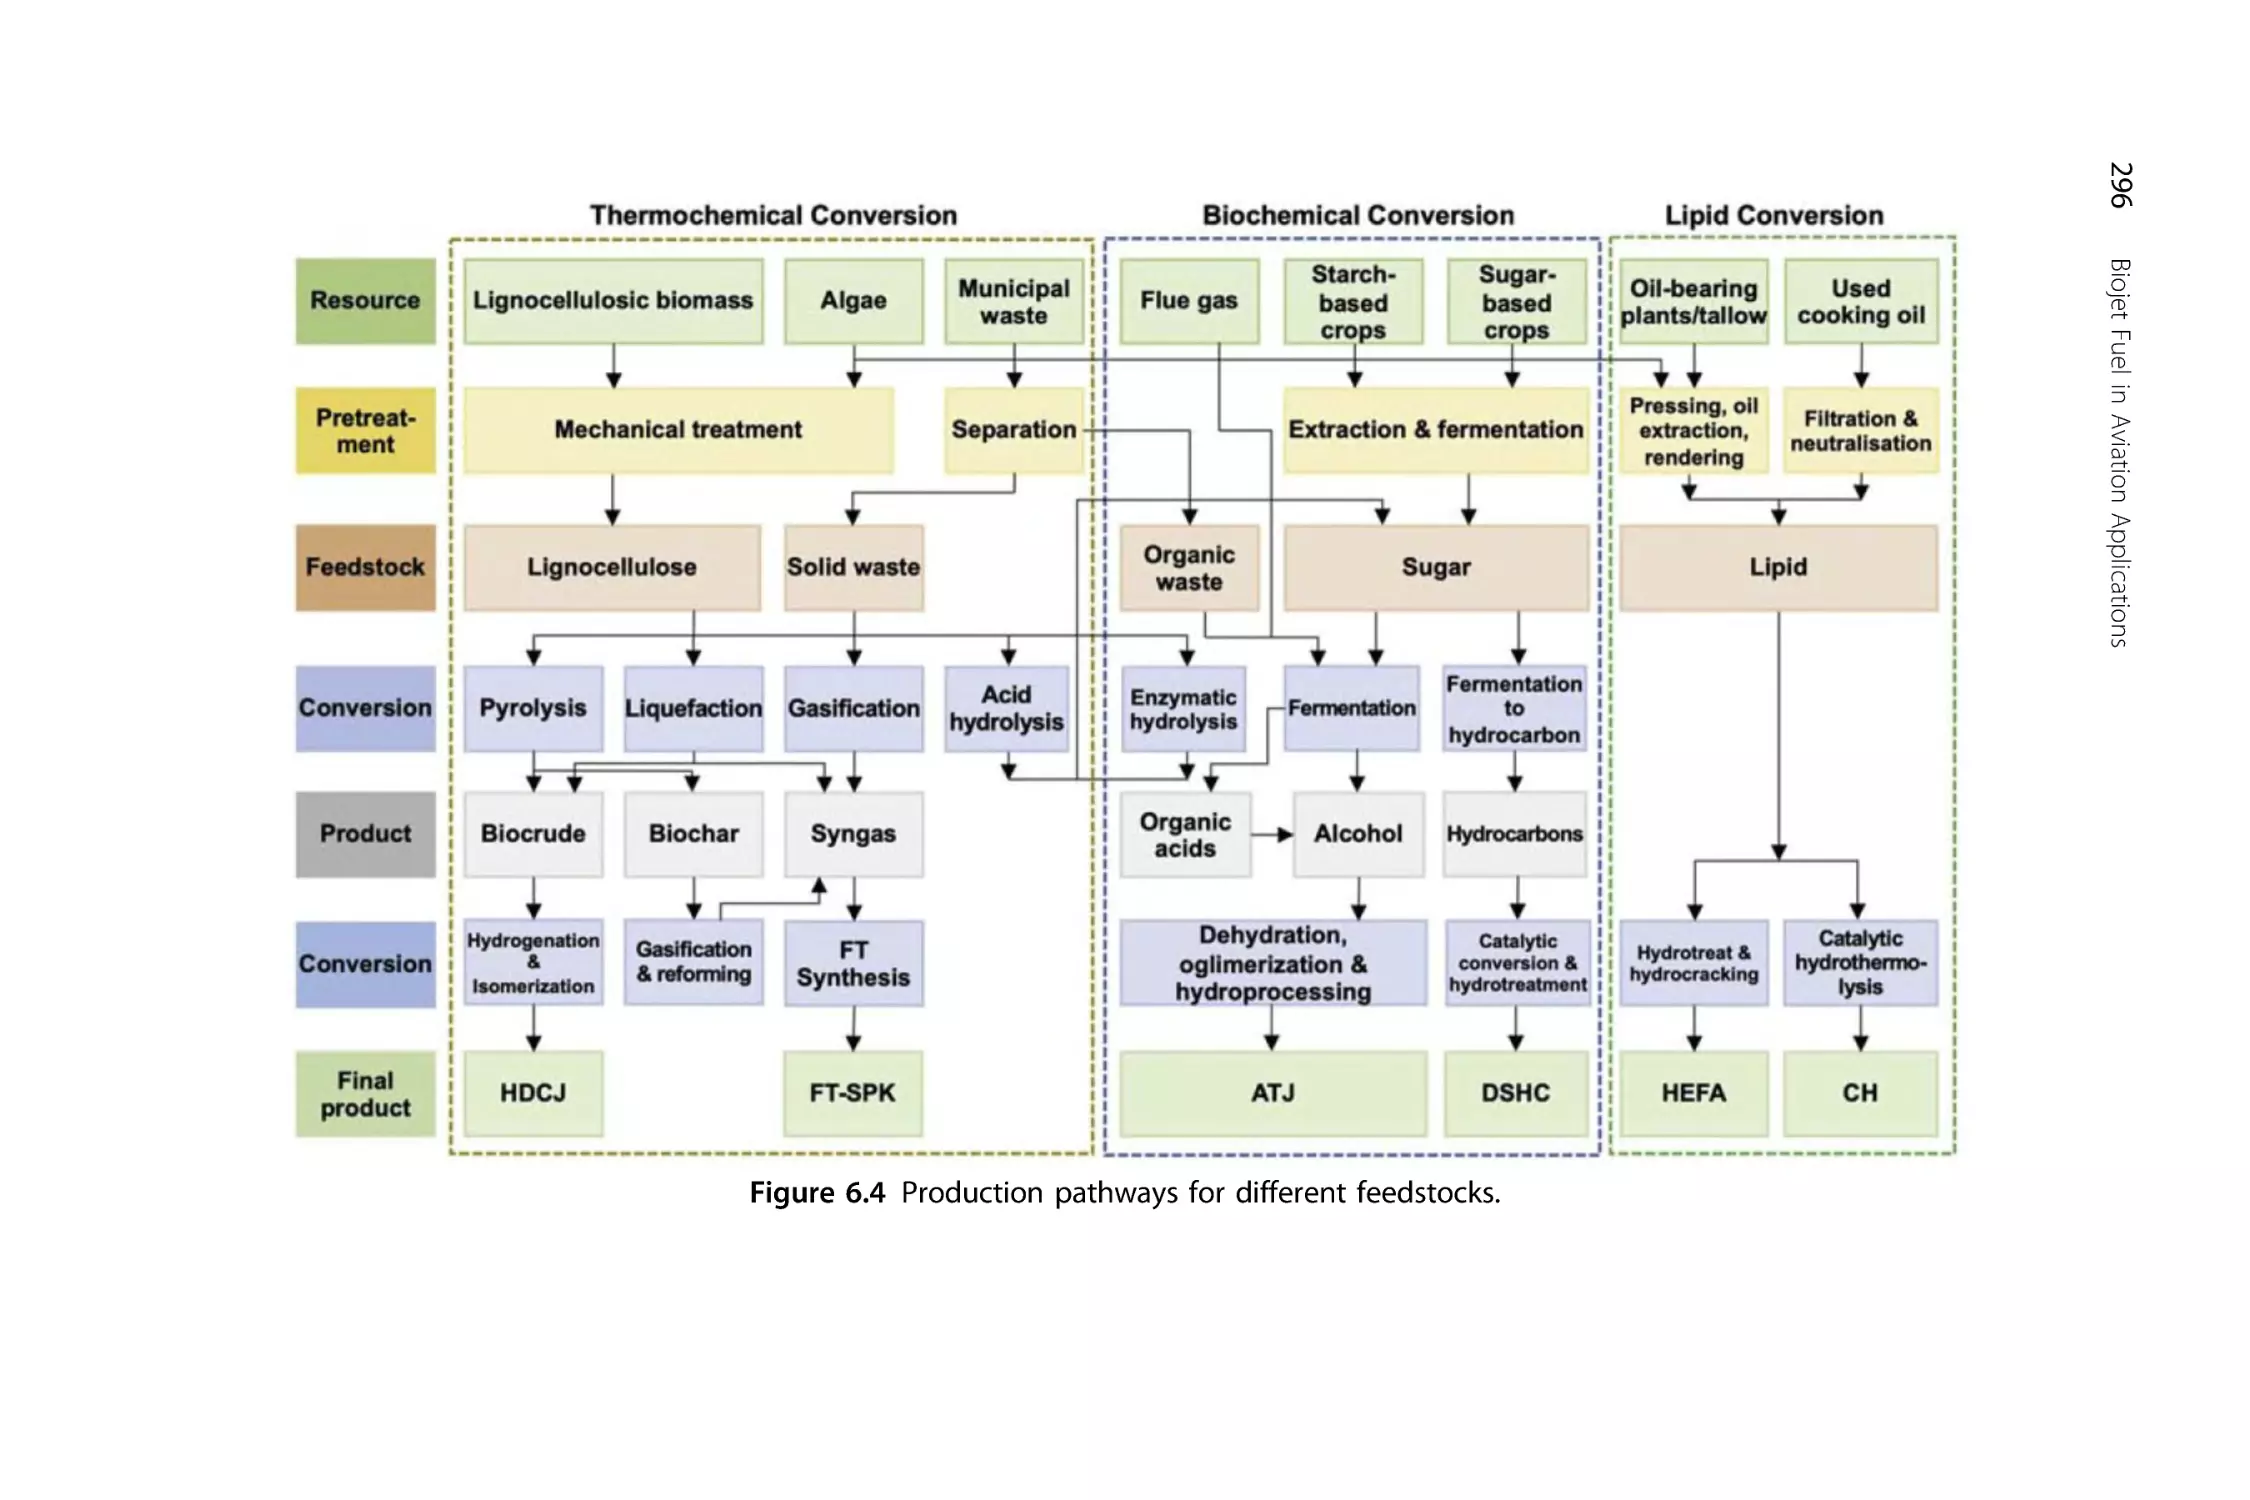
Alternative jet fuel production pathway
Life cycle greenhouse gas emissions for different
production pathways
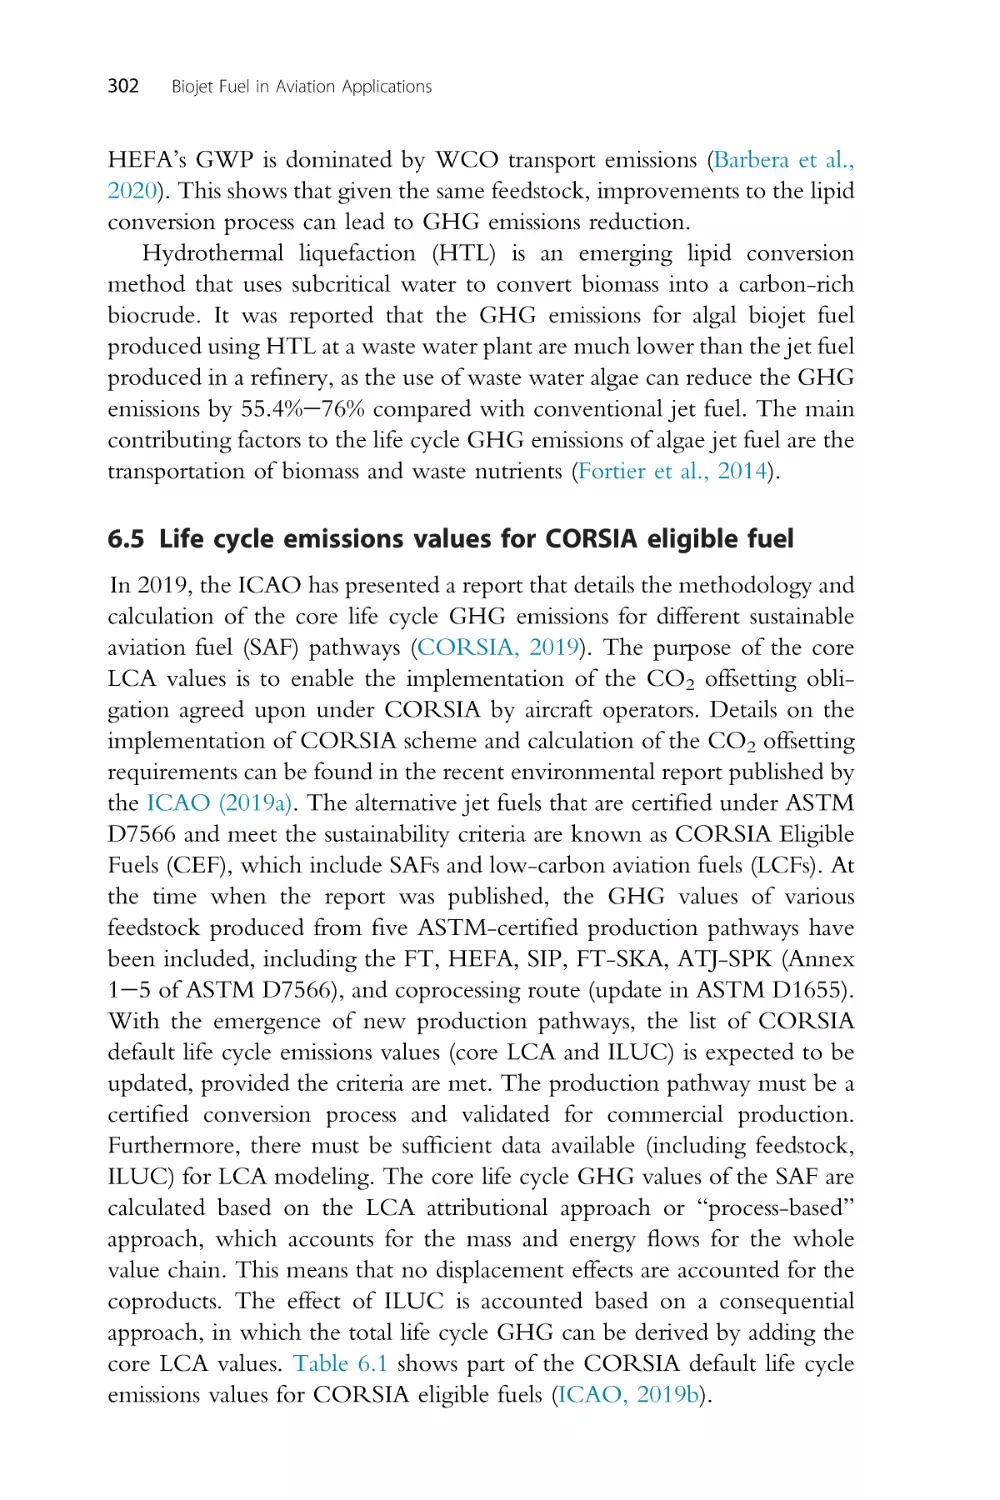
6.5 Life cycle emissions values for CORSIA eligible fuel
6.6 Comparison of greenhouse gas emission performance
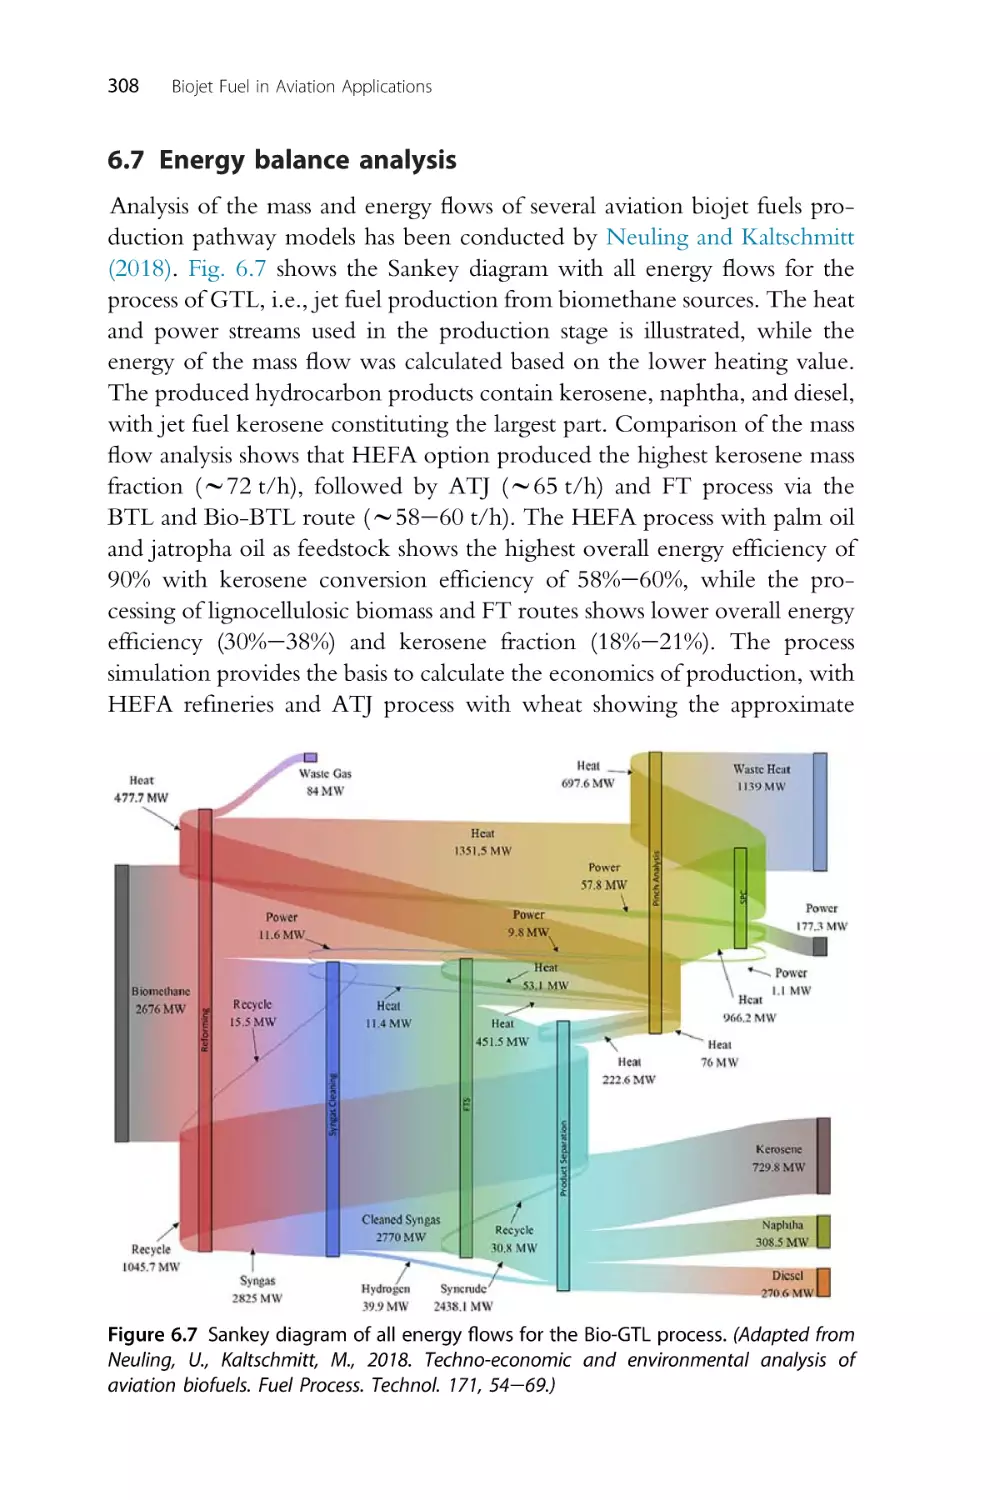
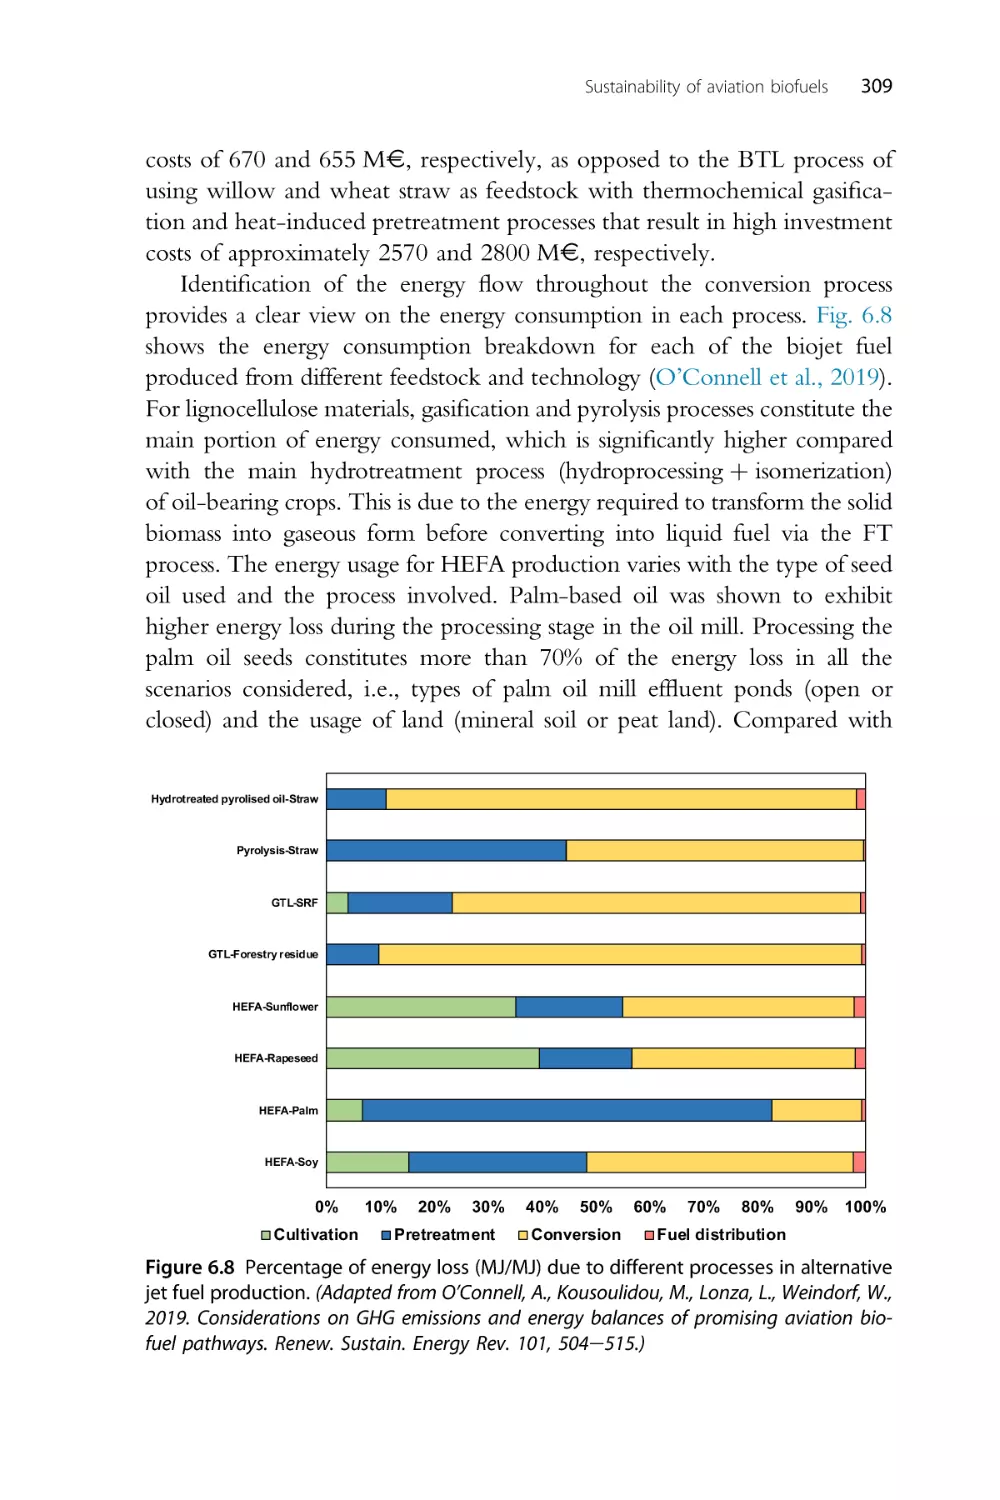
6.7 Energy balance analysis
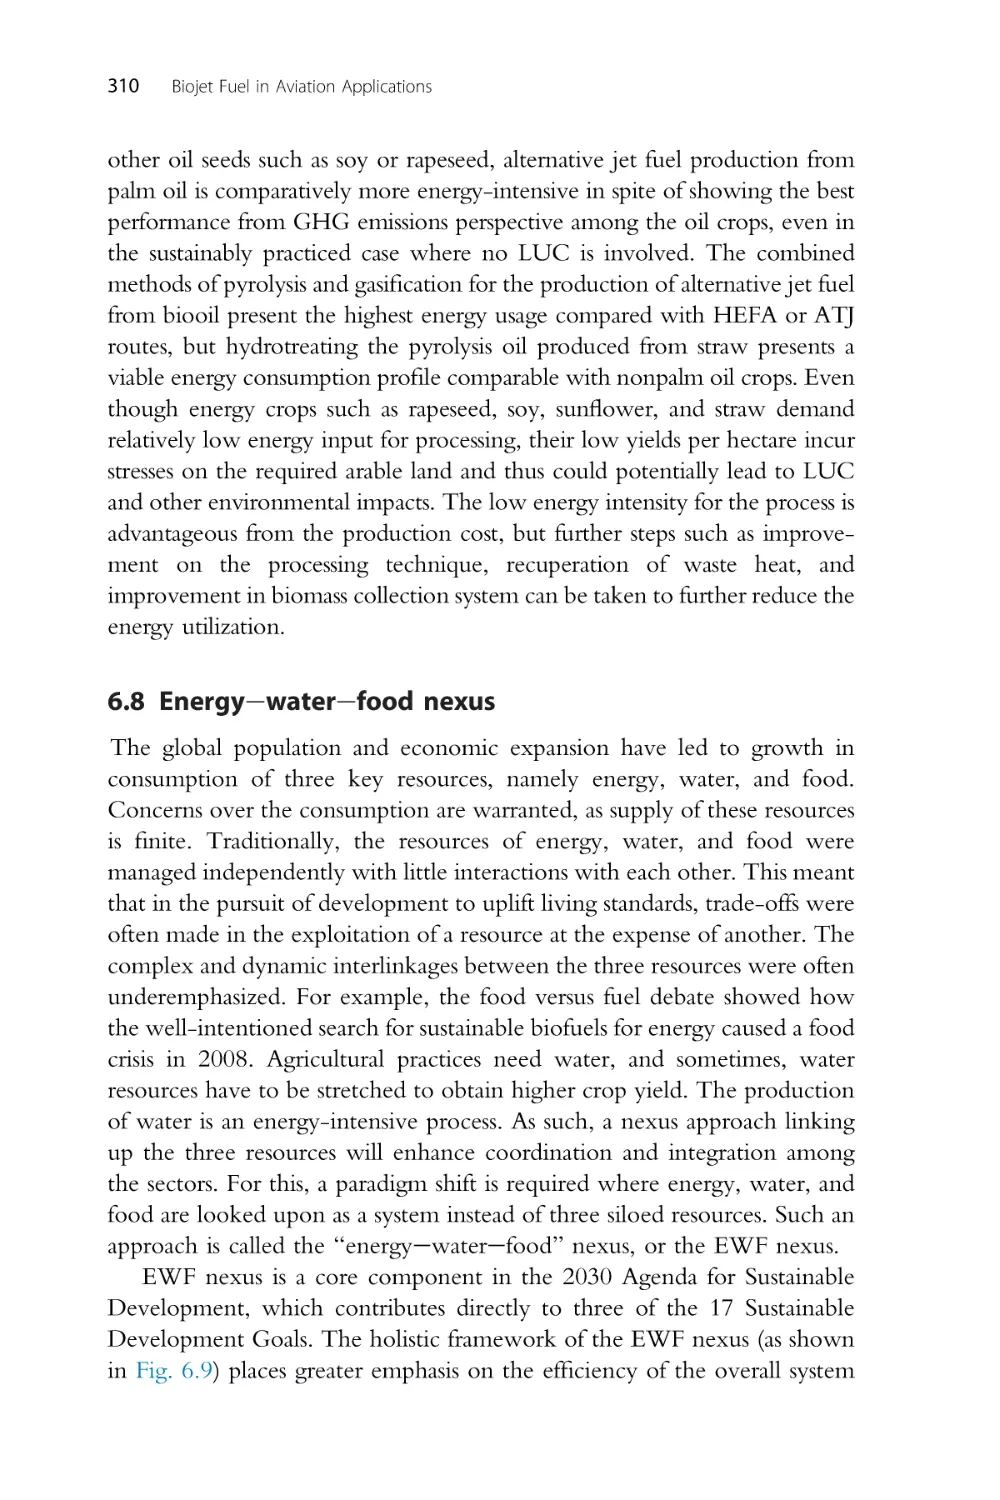
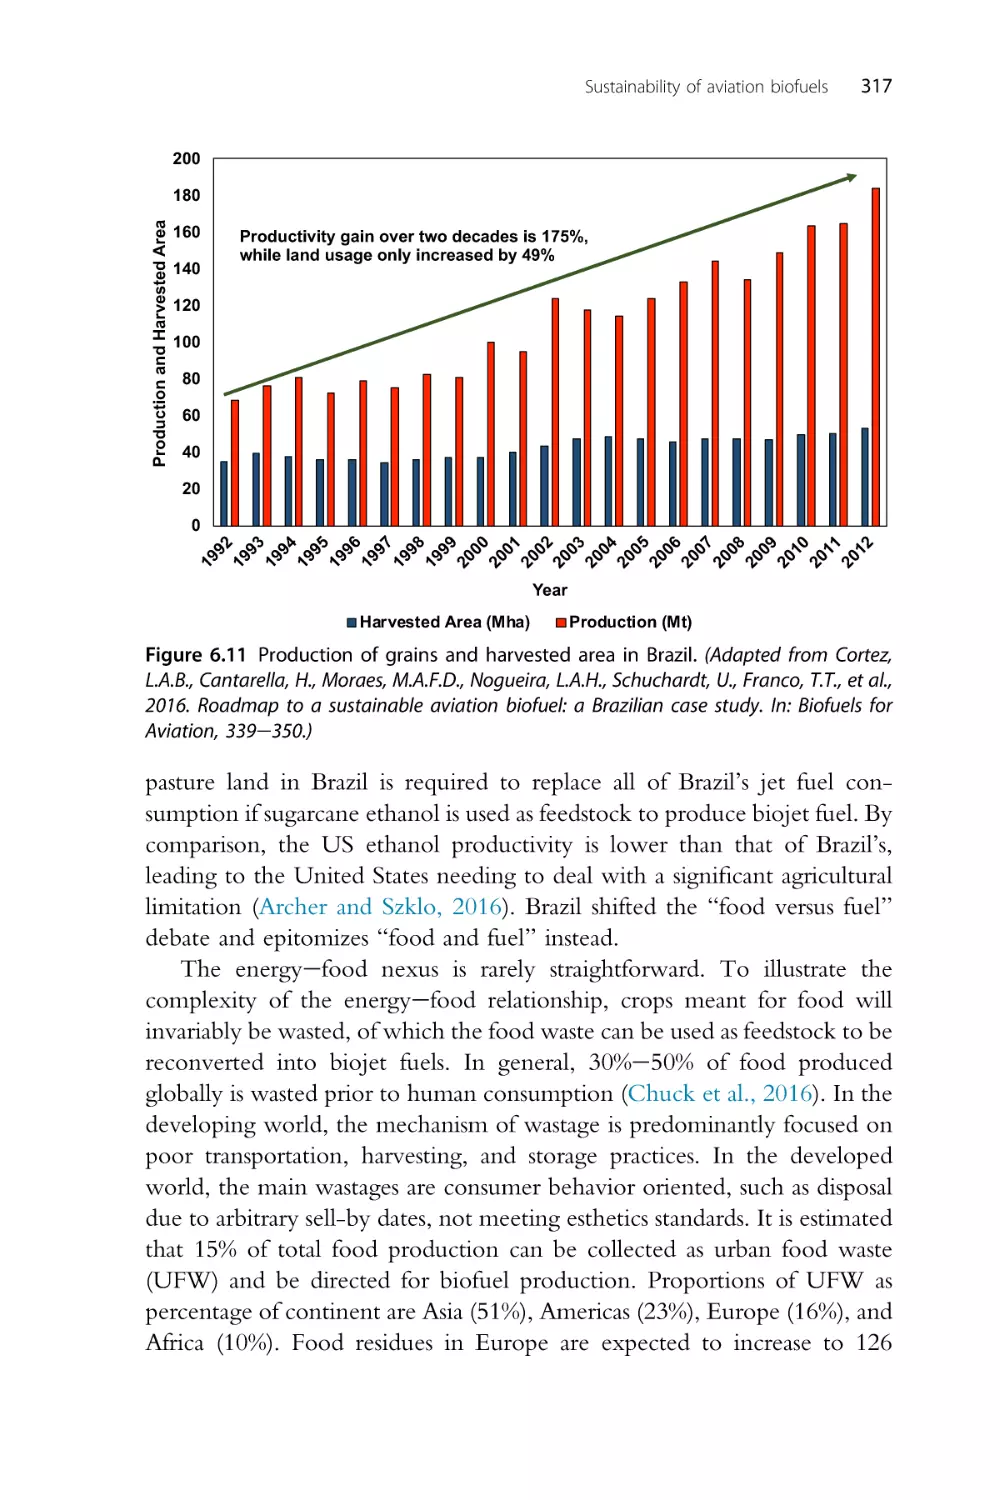
6.8 Energyewaterefood nexus
6.9 Summary
References
Index
158
164
168
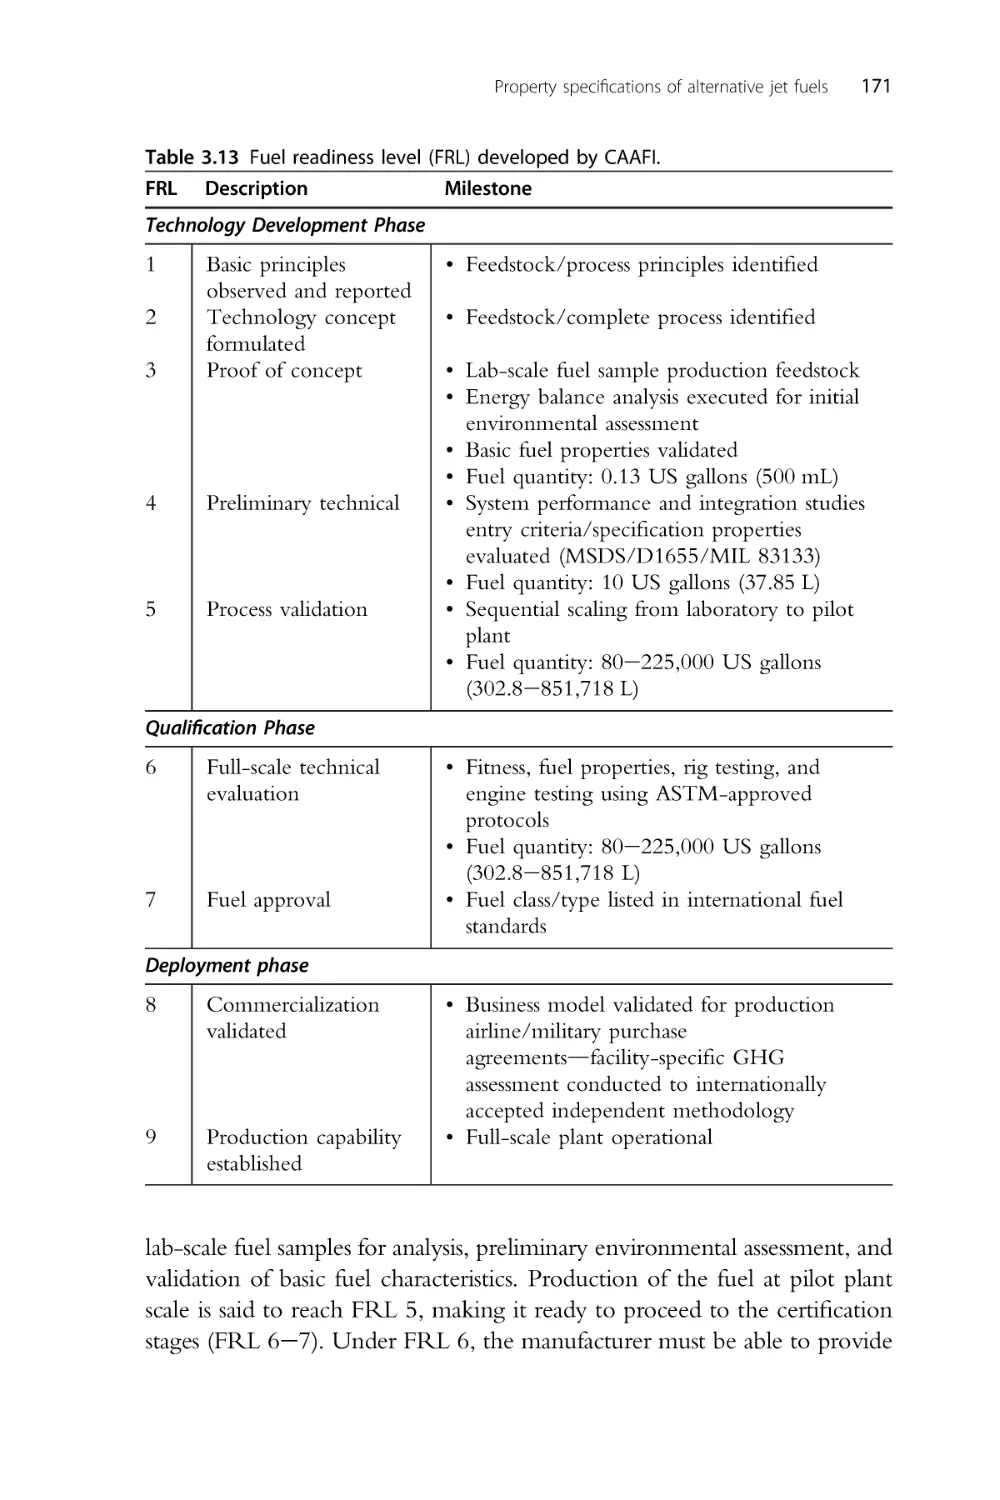
172
173
175
175
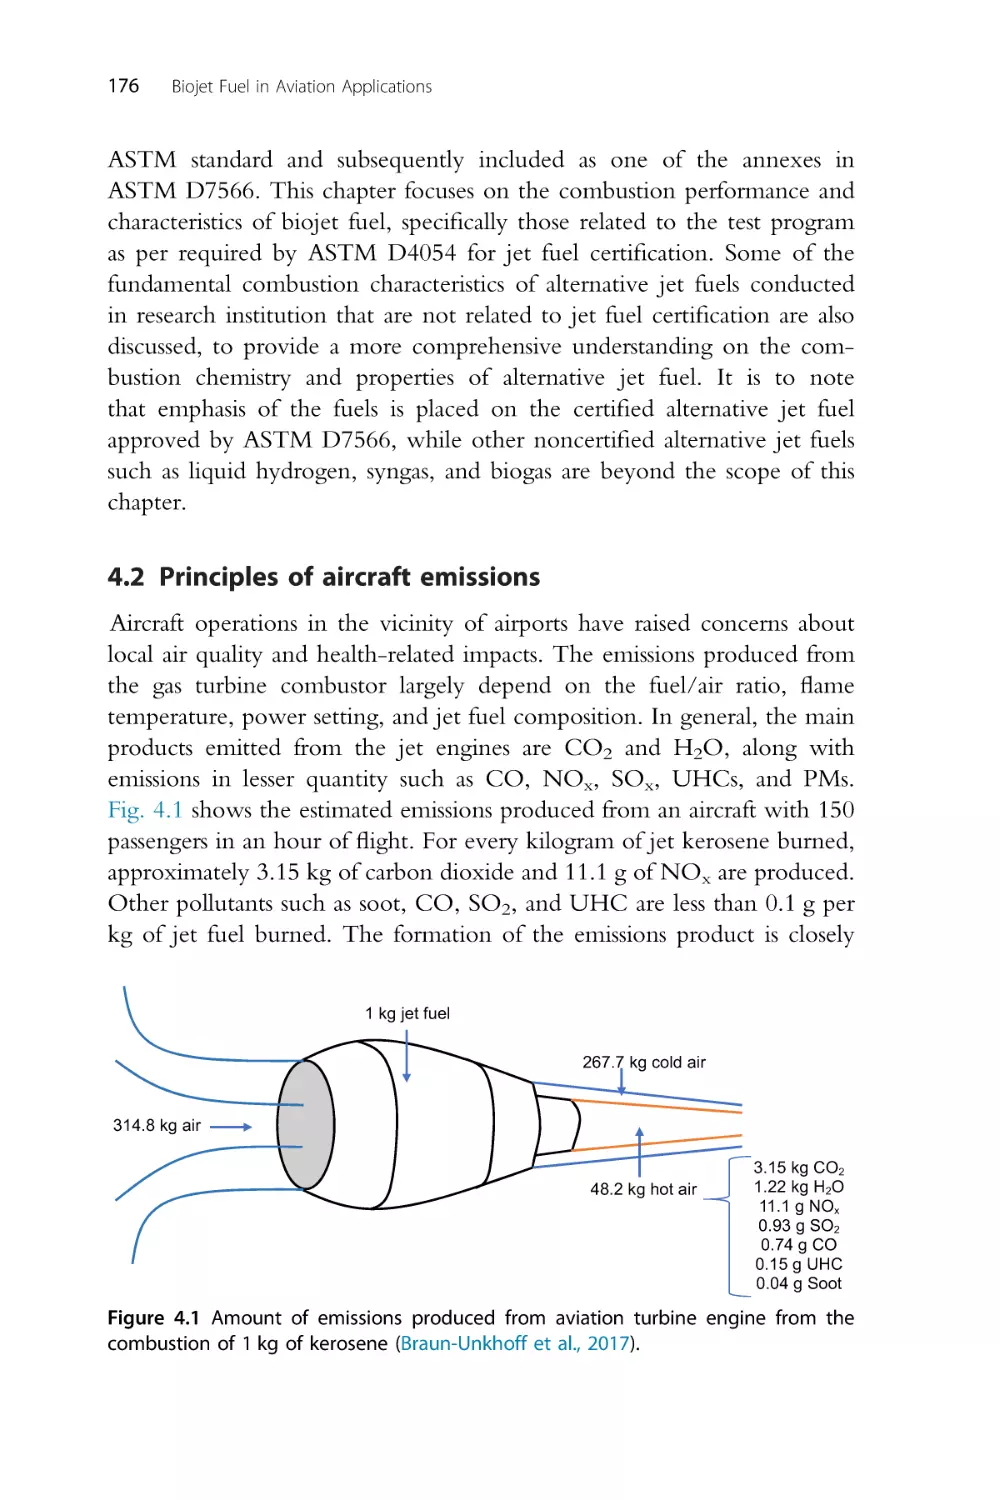
176
180
200
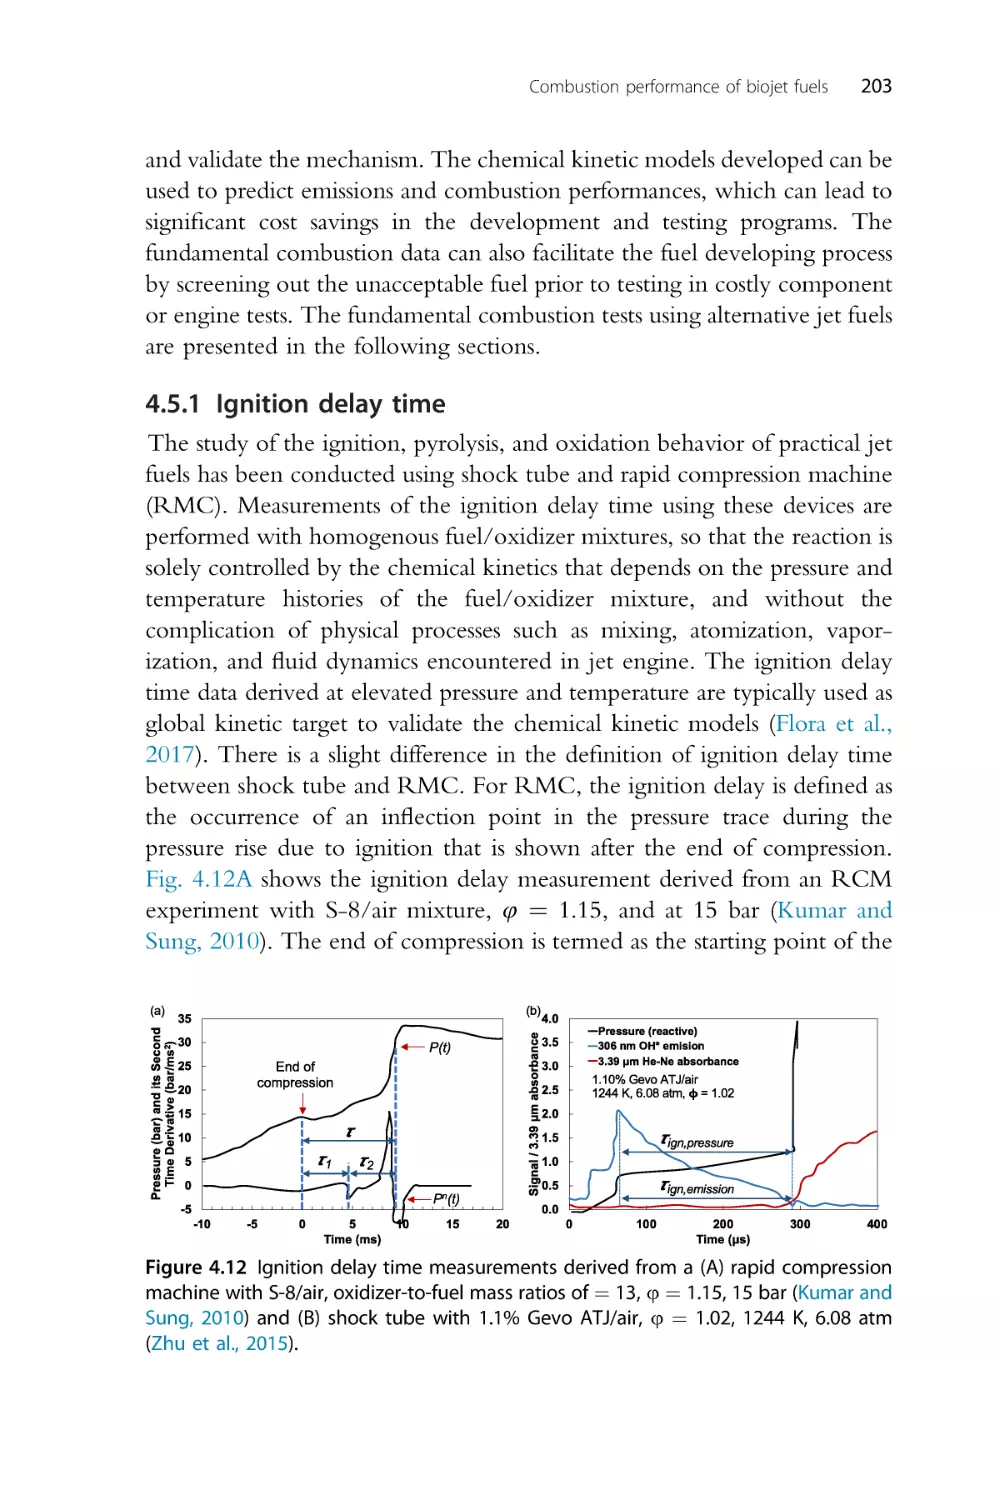
202
222
223
231
231
231
255
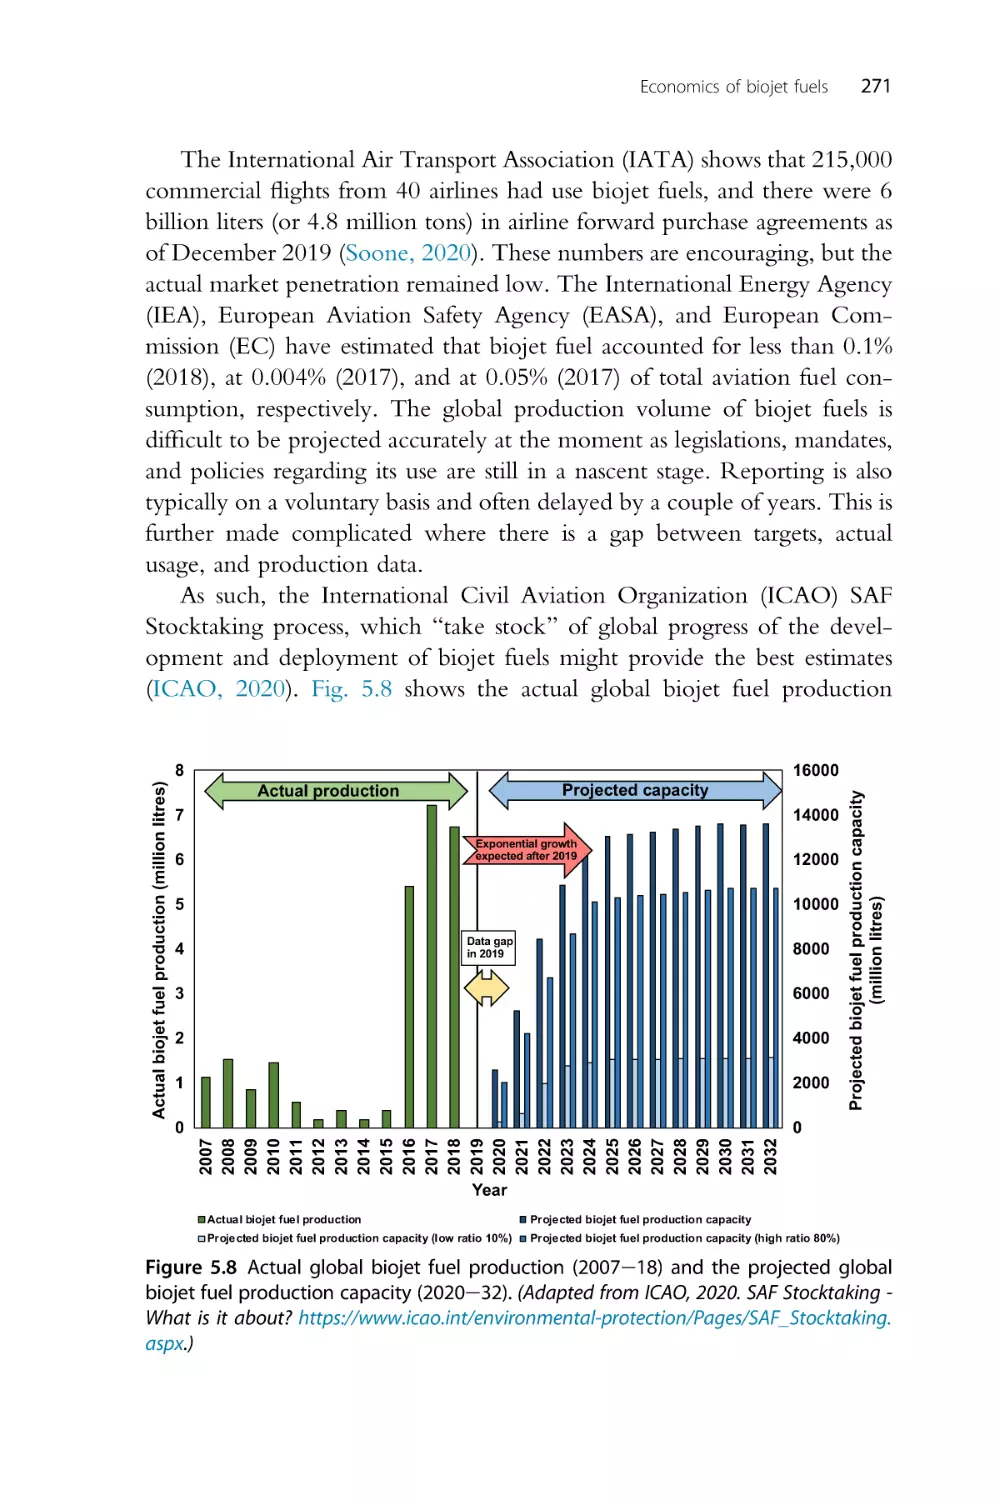
270
272
282
283
287
287
288
294
297
302
303
308
310
331
332
337
Preface
Biojet fuel is an emerging renewable energy for aviation applications that
will soon become an essential part of the aeronautical sector. This paradigm
shift meant that the study of biojet fuel is increasingly becoming part of
mainstream elective courses for undergraduate students pursuing degrees in
chemical engineering, mechanical engineering, and sustainable energy
engineering. This book is intended for use by the aforementioned undergraduate students, with emphasis placed to give students a holistic view in
terms of the technical, economical, political, and social aspects of biojet fuel.
The text is also intended as a gateway for postgraduate degree studies or as
supplementary text for introductory courses into alternative fuels.
The philosophy behind this book is for it to be the definitive “first”
book for readers wanting to know about the basic fundamental and practical issues on biojet fuels. This supports the authors’ main goals in writing
the book, which is to provide a comprehensive book for use in classrooms
and also for self-study. Thus, the book is written in an accessible manner to
encourage readers to develop deep understanding on the subject matter, by
linking up scientific knowledge, established facts, latest real-world data, and
viewpoints on biojet fuels.
In addition to students and researchers, the authors are expecting this
book, Biojet Fuel in Aviation Applications: Production, Usage and Impact
of Biofuels, will also appeal academics preparing for new courses to usher in
the age of sustainable fuels, government officials in charge of energy and
environmental policies, industrial players desiring the keep-up with the key
knowledge about the future of aviation fuels, and general public with an
inquisitive mind.
Book organization by chapter
The authors arranged the chapters in a logical manner to bring readers
through a journey of understanding the rationale behind the rise of biojet
fuel around the world, followed by the bulk technoeconomical concerns,
and culminating in its sustainability impacts on planet Earth. The following
paragraphs provide insights on the ensuing chapters:
Chapter 1 addresses the biojet fuel policies, legislations, initiatives, and
roadmaps for global aviation. In this chapter, readers will learn about the
vii
viii
Preface
simultaneous efforts by individual governments around the world to
decarbonise their domestic aviation sector and how they combined their
efforts for international flights through the Carbon Offset and Reduction
Scheme for International Aviation (CORSIA). The market-based measures,
mandates, fuel standards, initiatives, reporting tools, and legally binding
commitments all synergistically help to support the top-down development
of the biojet fuel industry.
The primary goal of Chapter 2 is to provide readers firm grasp on the
production methods, primarily categorized as oil-to-jet, alcohol-to-jet, gasto-jet, and sugar-to-jet methods. Each of the broader categories contains
production pathways, many of which pertaining to the ASTM D7566
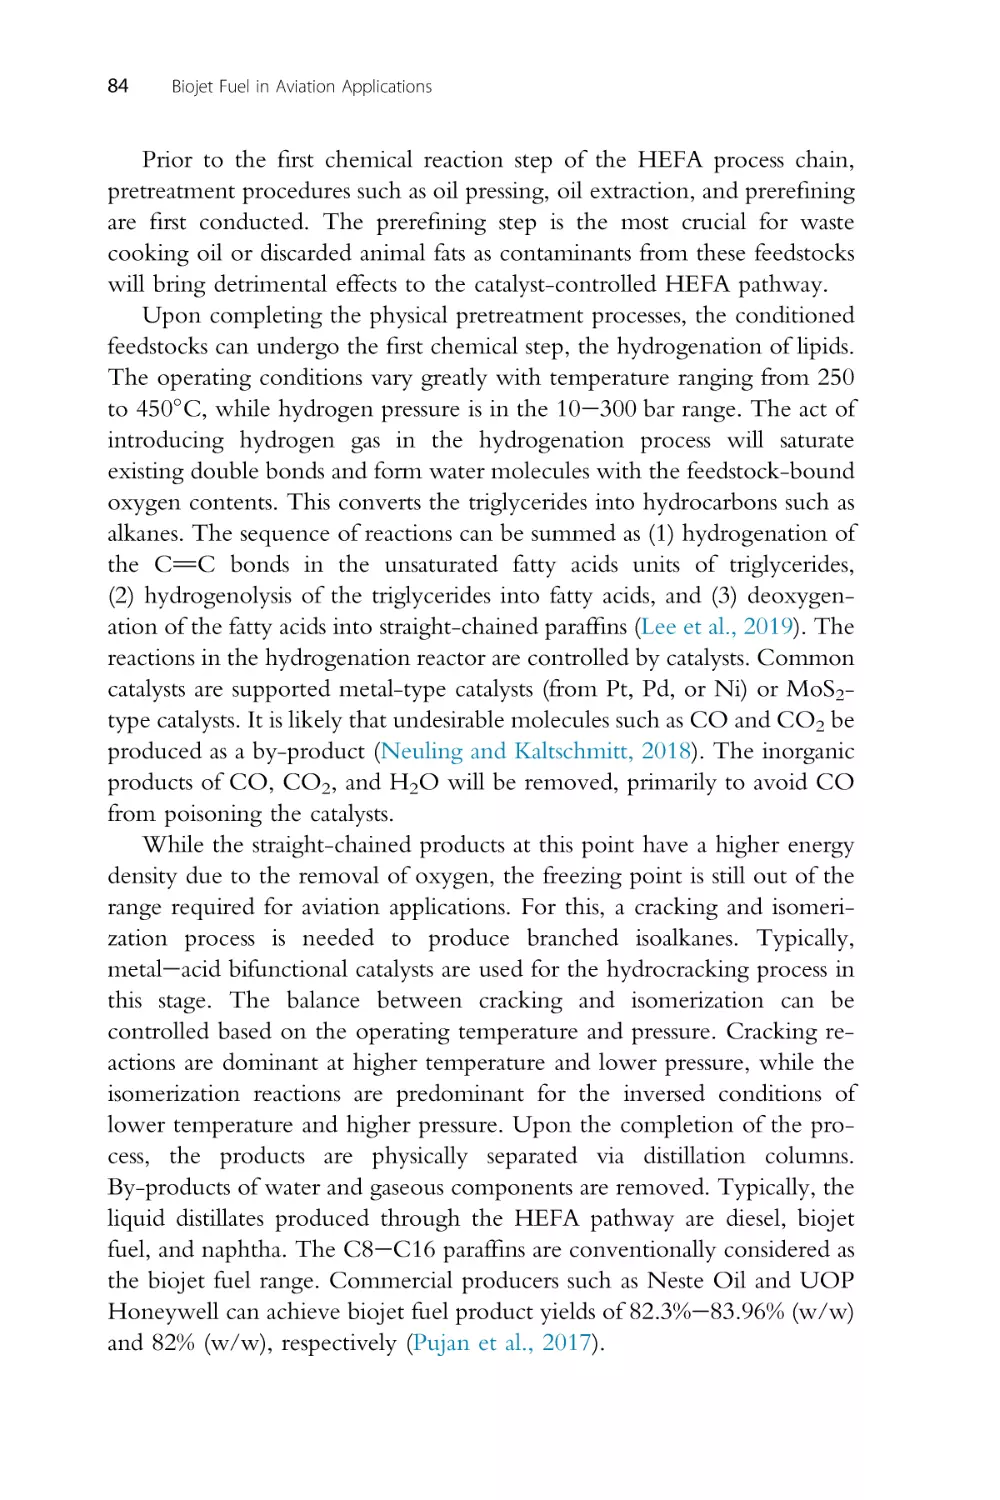
approved pathways. The chapter also discusses how the current biojet
production processes have developed to improve their yields and where
they are in the technology maturity curve.
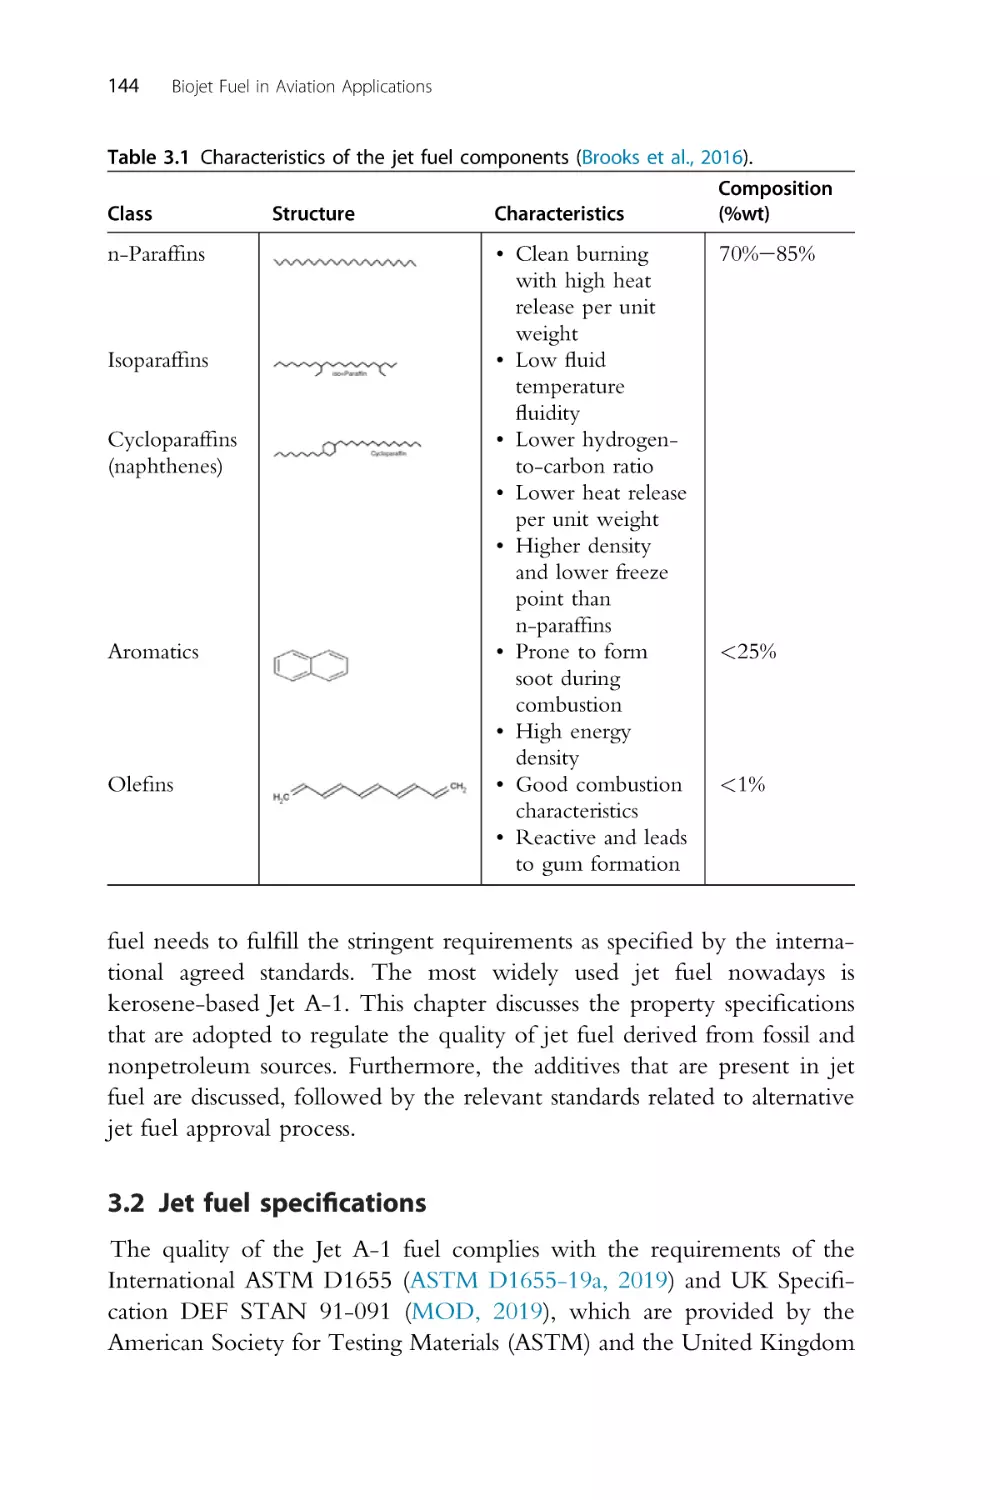
Chapter 3 highlights the characteristics of biojet fuel that distinguish it
from conventional jet aviation fuel. This covers the typical chemical
composition, physicochemical properties, and their compatibility with
present-day aviation sector infrastructure and usage in jet engines. Readers
will understand the significance of the “drop-in” requirement of biojet fuel
in blends with fossil jet fuel.
This ties in with Chapter 4 where the neat and blended biojet fuel
performances under combustion are the key focuses. The mechanisms of
biojet fuel spray, combustion, and emissions formation are fundamentally
discussed and validated by research data. This is complemented by the
myriad of flight tests conducted around the world using the various biojet
fuels.
Chapter 5 emphasizes on the economics of biojet fuel and identifies the
practical factors affecting the supplyedemand scenario such as crude oil
prices, biojet fuel production costs, feedstock prices, taxation, and subsidies.
In addition to economic concerns, the availability of feedstocks and barriers
to commercialization are also highlighted. The chapter also placed
importance on the postpandemic cost issues and the recent development of
price discovery for biojet fuel.
The final chapter, Chapter 6, provides an overview of pertinent issues
pertaining sustainability and energy balance via a life cycle assessment (LCA)
methodology. This is augmented with a holistic view using an energye
waterefood (EWF) nexus approach to resource management. The true
impacts of biojet fuel are fully elucidated in this chapter.
Preface
ix
Consistent chapter organization
While the book is intended to be read in the arranged order, the authors
purposefully wrote each chapter in a self-contained manner. This allows
readers to approach the chapters in any order and will still gain the same
insights as those faithfully following the chapters as intended. Within each
chapters, the structure order starts with a general introduction, followed by
the main contents which cover the most salient information, and ending
with a chapter summary to provide readers with the take-home messages.
Each chapter uses numerous tables and figures interspersed with text to
provide data for comparison, reveal trends, summarize concepts, illustrate
concepts, and support conclusions.
This page intentionally left blank
Acknowledgments
The authors would like to thank and acknowledge the contributions of
Elsevier and its staff for the professional support provided in the preparation
of this book. In particular, we would want due recognition to be given to
Carrie Bolger, Acquisition Editor, who provided guidance during the book
proposal stage leading to the project being approved; Aleksandra Packowska, Editorial Project Manager, who provided top-notch professional
support and encouragement throughout the writing process; Rajaganapathy
Essaki Pandyan, Payee Information Manager, and Kavitha Balasundram,
Copyrights Coordinator, for shedding light on publishing-related matters.
We would also like to express our appreciation to the book proposal
and manuscript reviewers. Their remarks and comments help us to gain
focus on the topics to write and also improve the quality of the book.
Finally, we would also want to convey heartfelt thanks to our family,
Stella, Hoe Jay and Chen Xi (Cheng Tung Chong) and Wong Minh Chjiat
Isabelle and Einstein Ng Gi Neer ( Jo-Han Ng) for their continued patience,
abundance in support, and unconditional love throughout this project.
xi
This page intentionally left blank
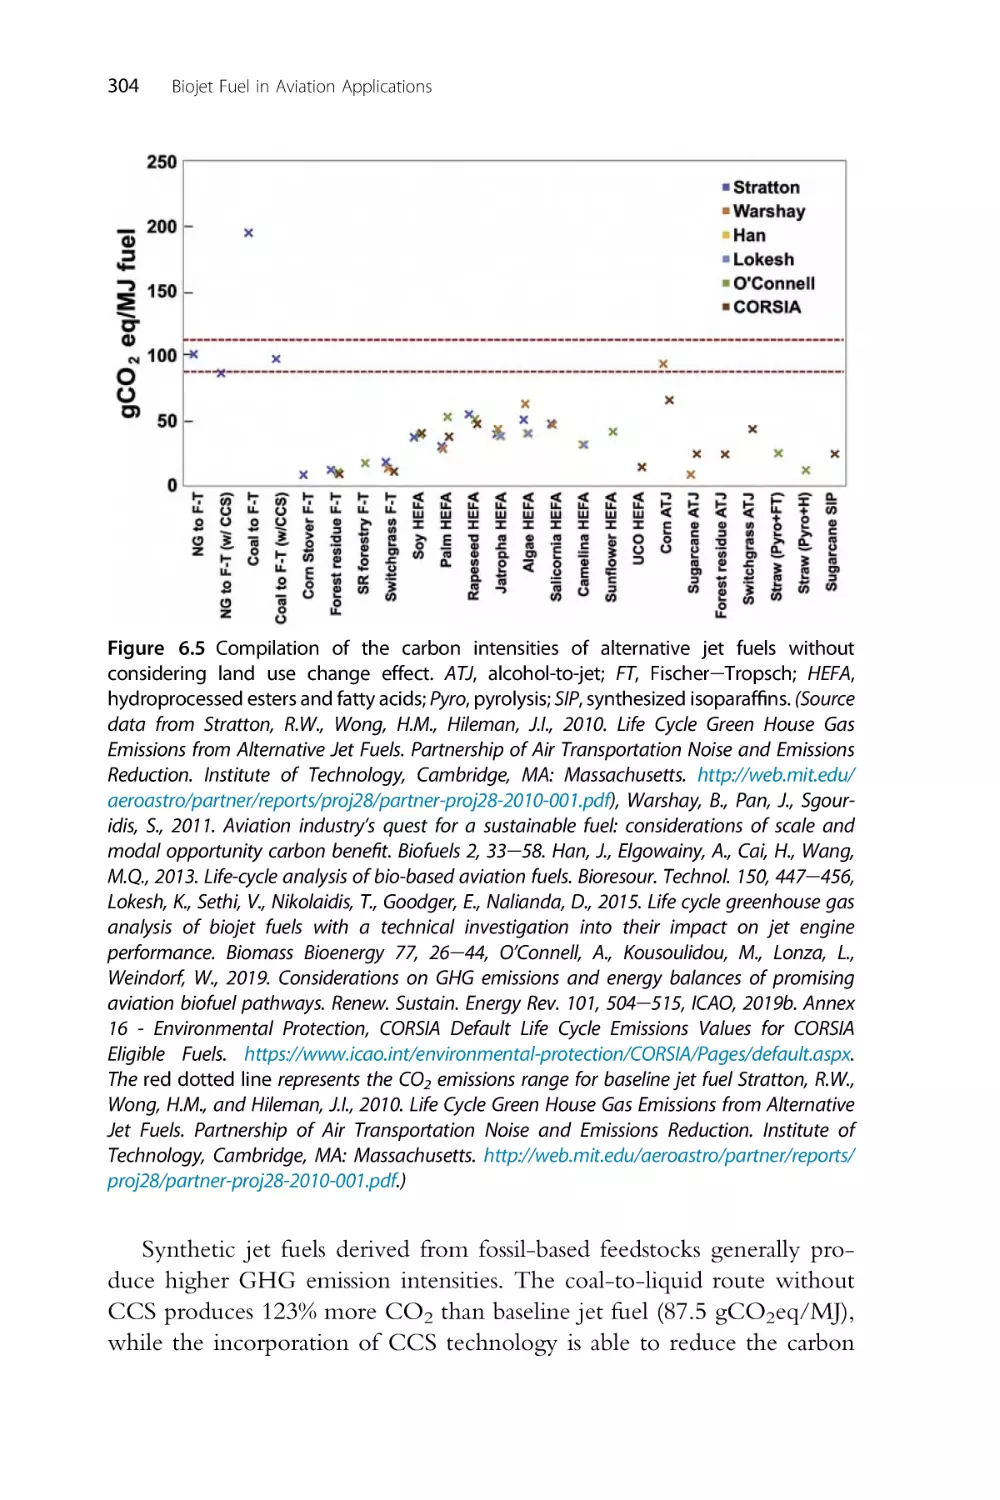
CHAPTER 1
Global Aviation and Biojet Fuel
Policies, Legislations, Initiatives,
and Roadmaps
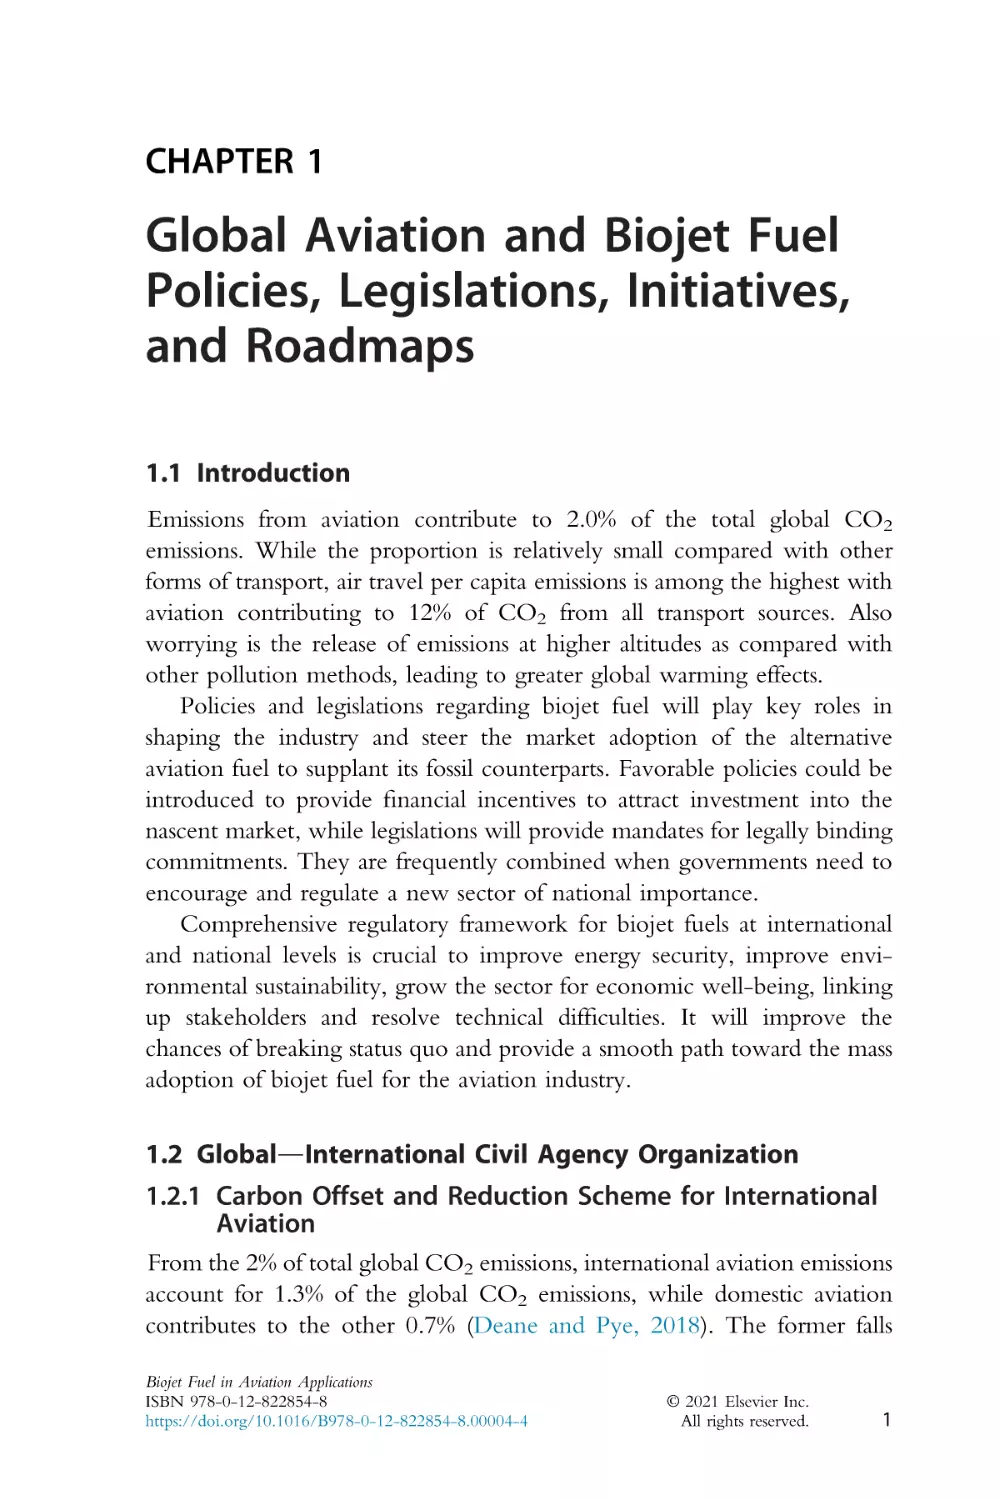
1.1 Introduction
Emissions from aviation contribute to 2.0% of the total global CO2
emissions. While the proportion is relatively small compared with other
forms of transport, air travel per capita emissions is among the highest with
aviation contributing to 12% of CO2 from all transport sources. Also
worrying is the release of emissions at higher altitudes as compared with
other pollution methods, leading to greater global warming effects.
Policies and legislations regarding biojet fuel will play key roles in
shaping the industry and steer the market adoption of the alternative
aviation fuel to supplant its fossil counterparts. Favorable policies could be
introduced to provide financial incentives to attract investment into the
nascent market, while legislations will provide mandates for legally binding
commitments. They are frequently combined when governments need to
encourage and regulate a new sector of national importance.
Comprehensive regulatory framework for biojet fuels at international
and national levels is crucial to improve energy security, improve environmental sustainability, grow the sector for economic well-being, linking
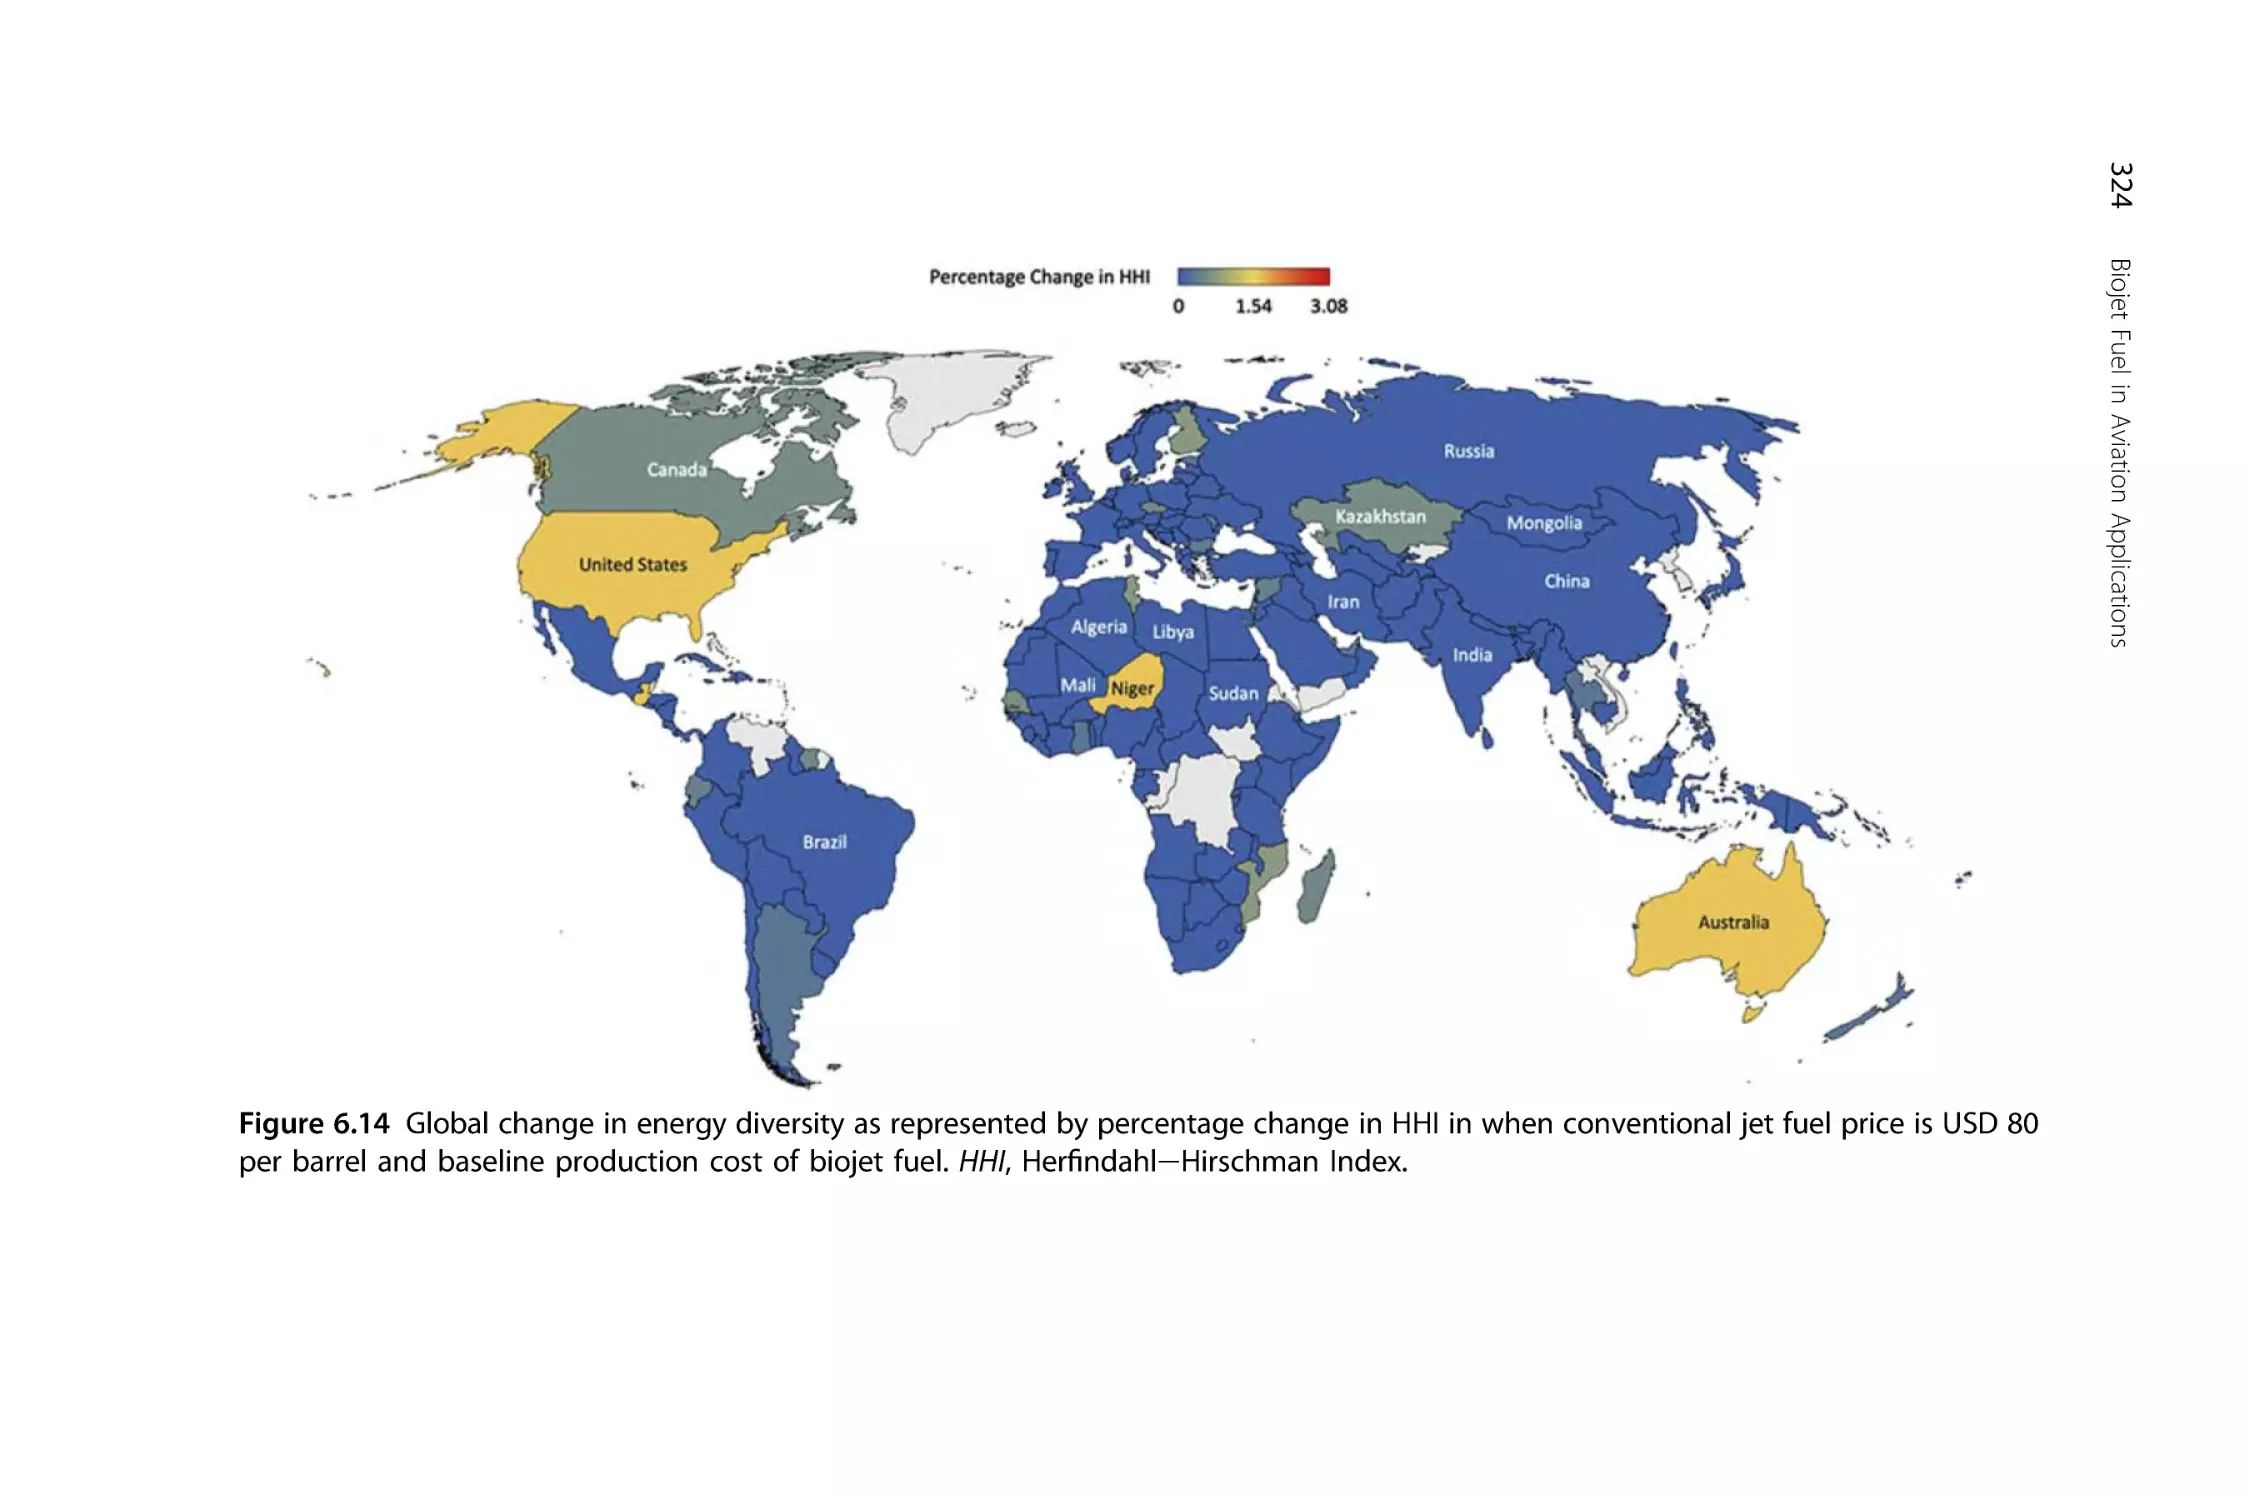
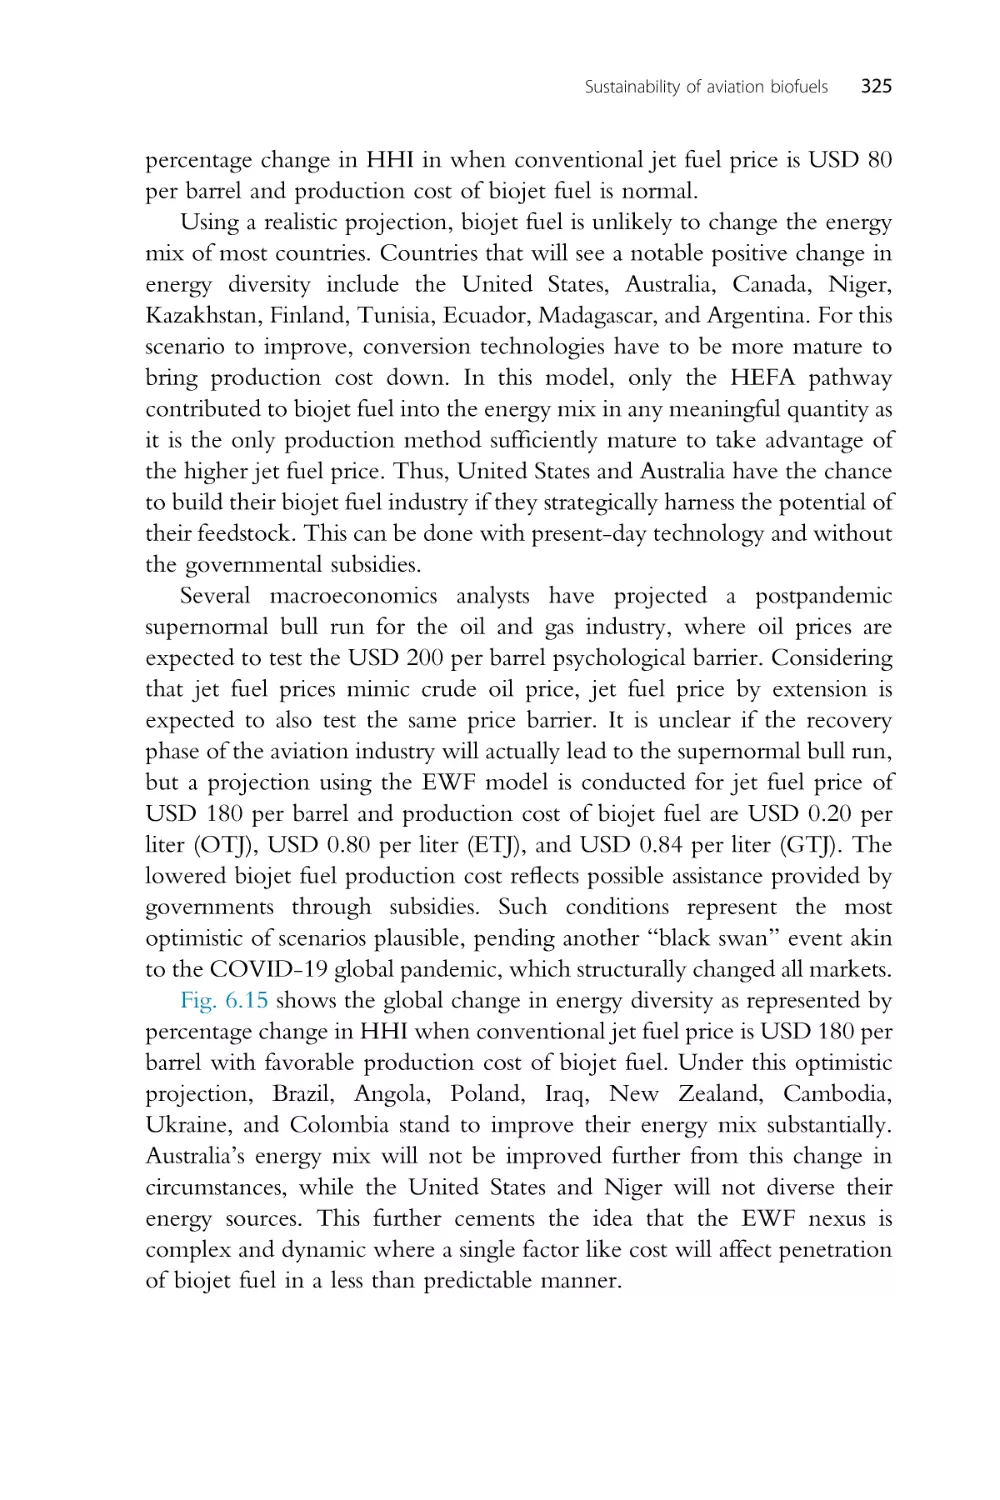
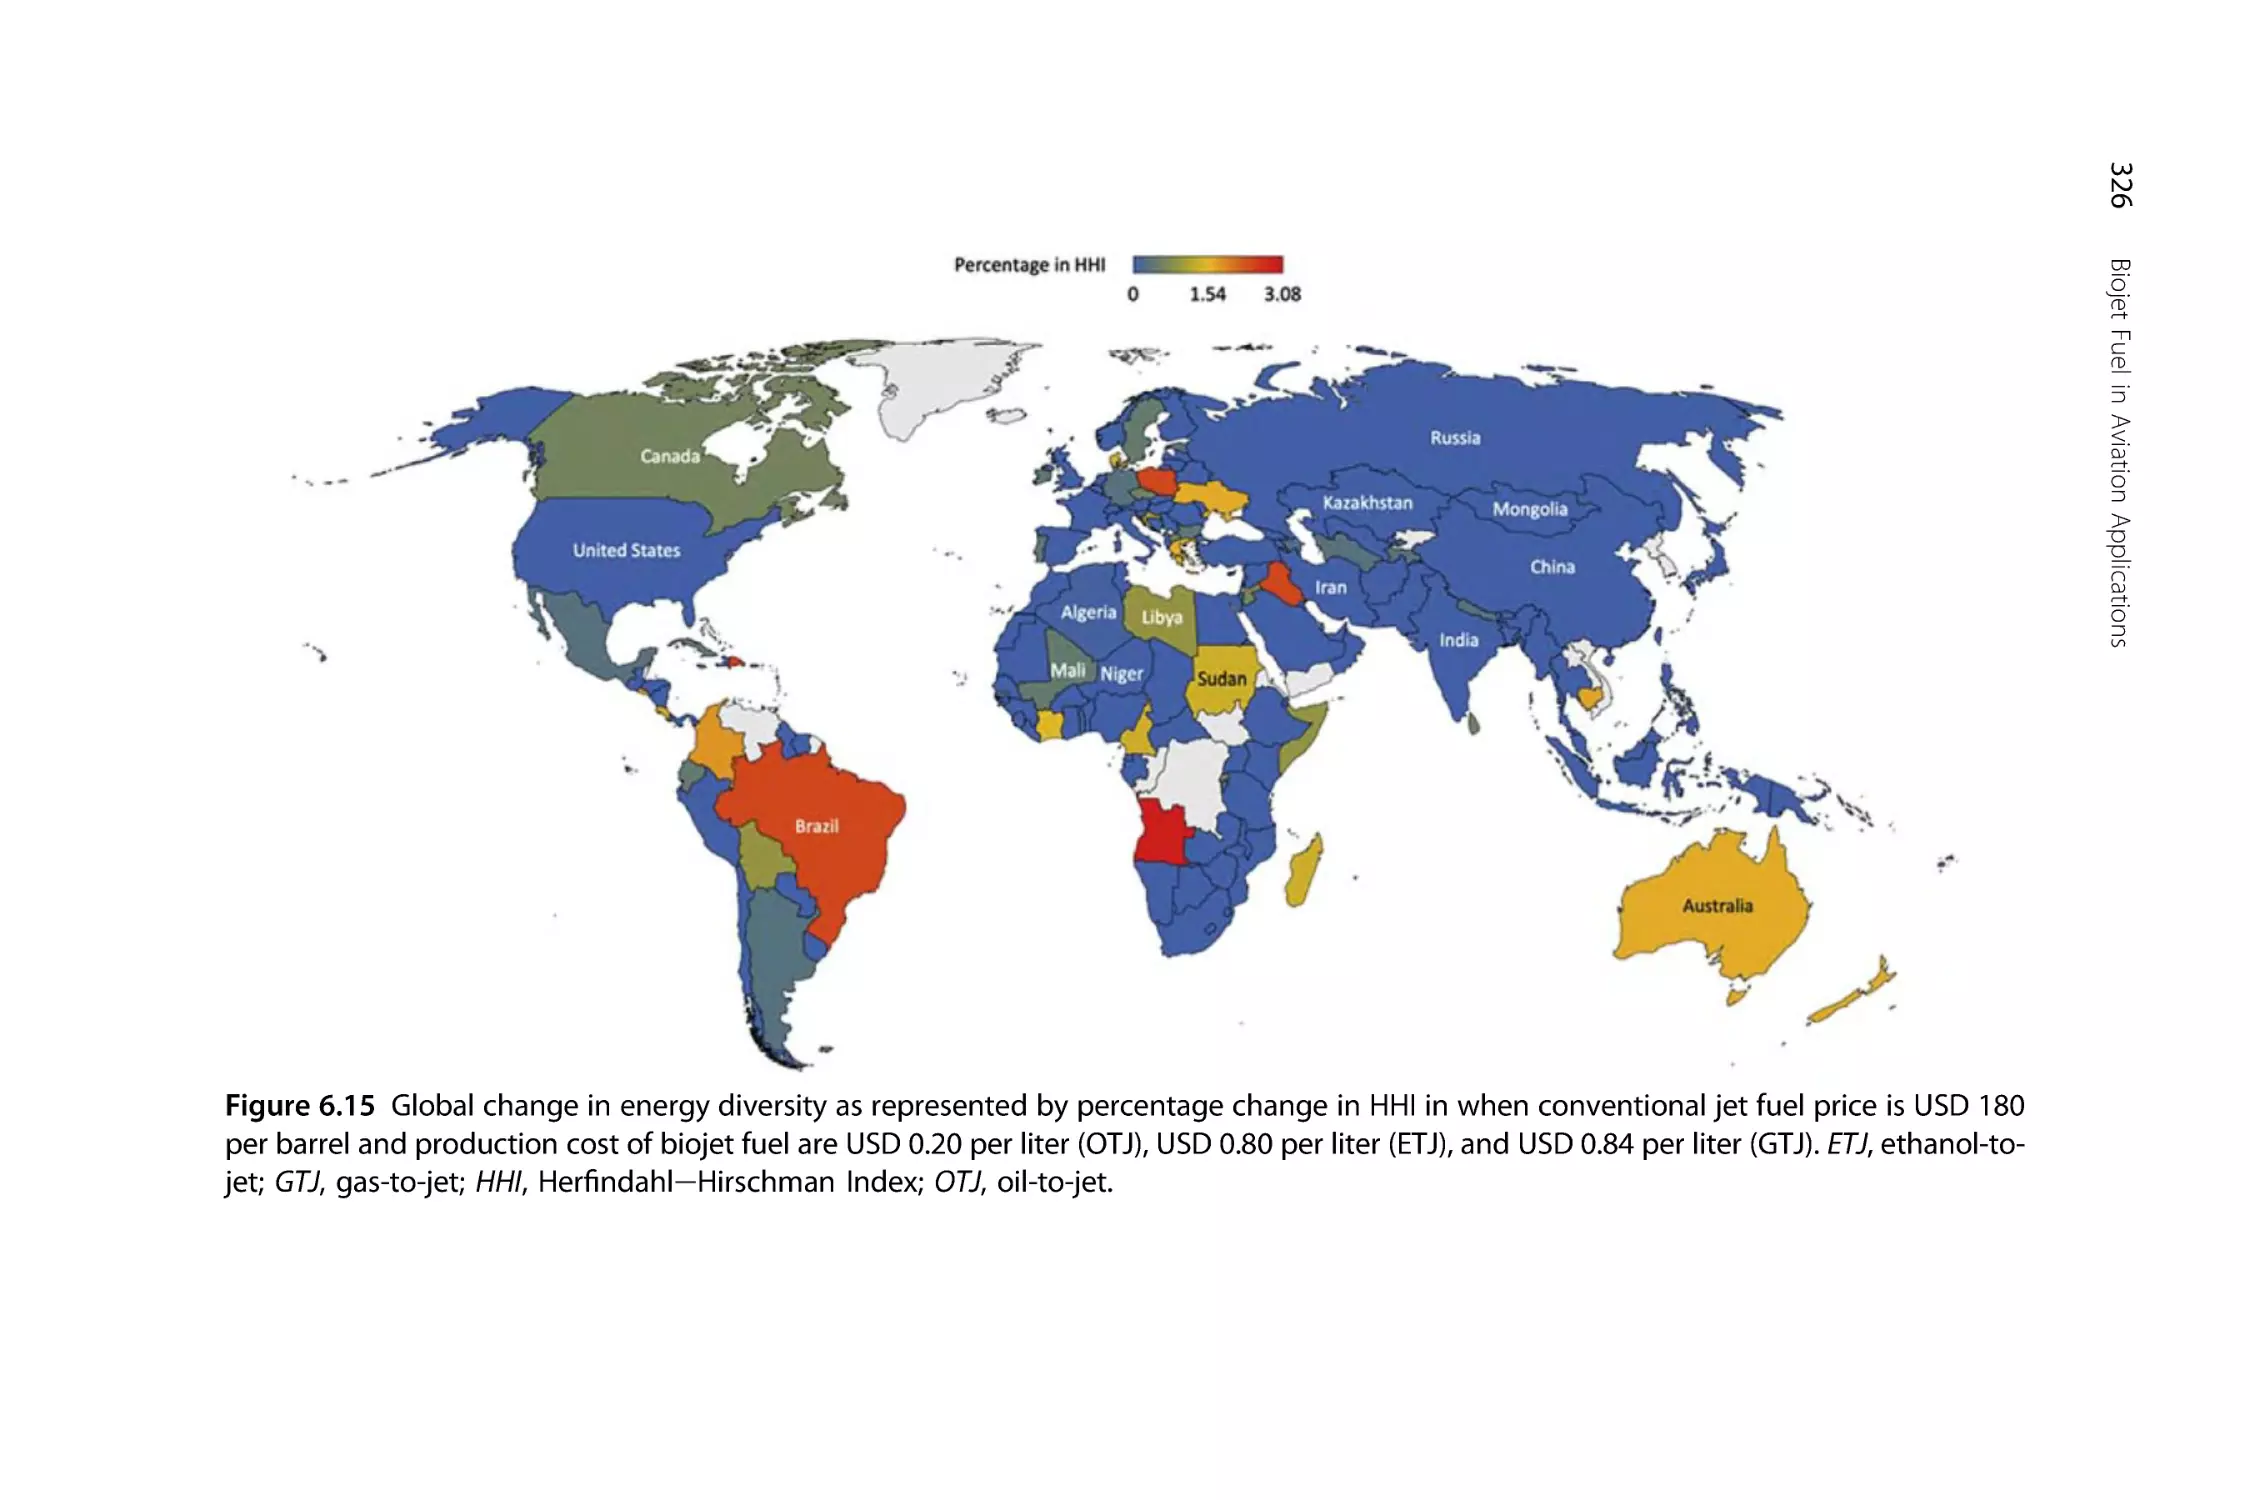
up stakeholders and resolve technical difficulties. It will improve the
chances of breaking status quo and provide a smooth path toward the mass
adoption of biojet fuel for the aviation industry.
1.2 GlobaldInternational Civil Agency Organization
1.2.1 Carbon Offset and Reduction Scheme for International
Aviation
From the 2% of total global CO2 emissions, international aviation emissions
account for 1.3% of the global CO2 emissions, while domestic aviation
contributes to the other 0.7% (Deane and Pye, 2018). The former falls
Biojet Fuel in Aviation Applications
ISBN 978-0-12-822854-8
https://doi.org/10.1016/B978-0-12-822854-8.00004-4
© 2021 Elsevier Inc.
All rights reserved.
1
2
Biojet Fuel in Aviation Applications
under the responsibility of the International Civil Agency Organization
(ICAO) as flights cross international boundaries, while the latter is reported
under the United Nations Framework Convention on Climate Change
(UNFCCC) with the responsibilities held by the countries covered under
the framework. As such, emissions produced from the international aviation
category are not included under the Paris Agreement’s Nationally Determined Contributions (NDCs).
ICAO is influential on the global stage since its inception in 1944 under
the Chicago Convention, it has grown to have 193 contracting states
agreeing to multilateral conventions. In the 1970s, ICAO tackled aviationrelated environmental issues through the Committee on Aircraft Noise
(CAN) and Committee on Aircraft Engine Emissions (CAEE), which were
formed in 1970 and 1977, respectively (ICAO, 2019f). These technical
committees of the ICAO council then developed Standards and Recommended Practices (SARPs) to deal with aircraft noise and control of aircraft
engine emissions, which were parked under SARPs Annex 16. In 1983,
the Committee on Aviation Environmental Protection (CAEP) was formed
to merge and supersede both CAN and CAEE. The CAEP focuses on
both the original aims of CAN (for aircraft noise) and CAEE (for aircraft
emissions), which are then combined for a more general coverage of aviation
environmental impacts.
Fuel requirements are specified in the SARPs Annex 6, of which the
various sovereign national aviation authorities or regulating authorities could
adjust to better match the needs and characteristics of their airspace. States are
expected to undertake measures to comply to the standard portion of the
SARPs or immediately file a difference if they implement any deviation,
while being recommended on the best practices for the Recommended
Practice of the SARPs. The focus of the SARPs with respect to fuel covers
primarily on matters such as sufficiency to complete flights, fuel contingency
requirements, in-flight fuel checks, and fuel emergency situation. The
SARPs do not specify biojet fuels per se. Ultimately, the SARPs only
concern themselves with flight operating-related State Safety Programmes
(SSP) and Safety Management Systems (SMS) by service providers.
However, to address the annual increase in total global CO2 emissions,
ICAO adopted a global carbon-offset scheme in October 2016 for
nondomestic aviation under the Carbon Offset and Reduction Scheme for
International Aviation (CORSIA). CORSIA is formed under Working
Group 4 (WG4) of CAEP. Under the scheme, aircraft operators operating
within signee countries are encouraged to offset their emissions against the
Global Aviation and Biojet Fuel Policies, Legislations, Initiatives, and Roadmaps
3
average level of international aviation CO2 emissions for the years 2019 and
2020. Aircraft operators are required to monitor emissions on all international flight routes and offset emissions by purchasing eligible emissions
units. The eligible emissions units need to be generated by emissions
reduction projects in other sectors such as the renewable energy sector. This
meant that biojet aviation fuel could generate eligible emissions units used
for carbon offsetting.
This represents the basis for carbon neutral growth from 2020 onward,
where the baseline is set for comparison against future years (ICAO, 2020a).
The difference between the international aviation CO2 emissions as
covered by the scheme and the average baseline emissions of years 2019 and
2020 will represent the required sector offset in any year from 2021 onward. The carbon offsets can be obtained from either emissions trading
scheme or the Clean Development Mechanism (CDM) as defined in
Article 12 of the Kyoto Protocol.
Sixty-nine states (as of May 24, 2017) have stated their intention to
voluntarily participate in the scheme from the outset. While they represent
more than 87% of international aviation activities (Deane and Pye, 2018),
notable countries such as India and Russia are not covered under CORSIA.
This pilot phase will apply from 2021 through 2023. The subsequent first
phase and second phase will apply from 2024 through 2026 and from 2027
through 2035, respectively. Alongside states volunteering in the pilot phase,
additional states may also opt in to participate in the first phase. All
European Union (EU) countries will join the scheme from the onset. The
second phase is made mandatory for states having an individual share of
international aviation activities on the basis of revenue ton-kilometers
(RTK) above 0.5% of total RTKs in 2018 or is listed under the cumulative share (from highest to lowest) of RTK up to 90% of total RTK.
Exceptions are given to least developed countries (LDCs), small island
developing states (SIDSs), and landlocked developing countries (LLDCs),
although they are allowed to voluntarily participate in the second phase.
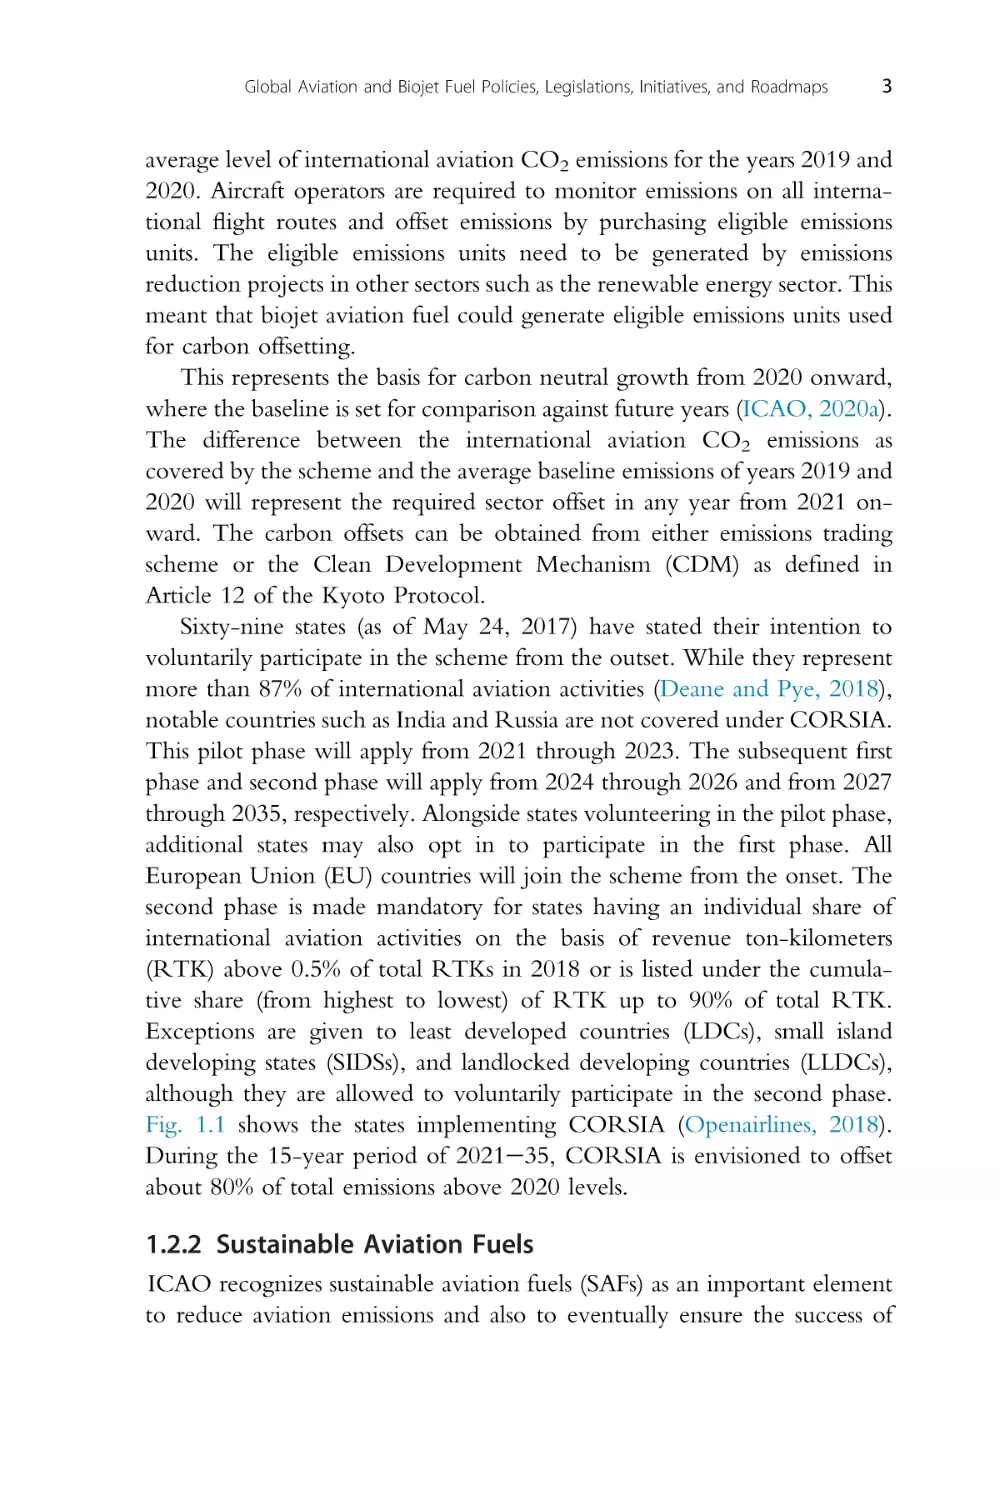
Fig. 1.1 shows the states implementing CORSIA (Openairlines, 2018).
During the 15-year period of 2021e35, CORSIA is envisioned to offset
about 80% of total emissions above 2020 levels.
1.2.2 Sustainable Aviation Fuels
ICAO recognizes sustainable aviation fuels (SAFs) as an important element
to reduce aviation emissions and also to eventually ensure the success of
4
Biojet Fuel in Aviation Applications
Voluntary states (from 2021)
Integration of CORSIA (in 2027)
Potentially exempt states
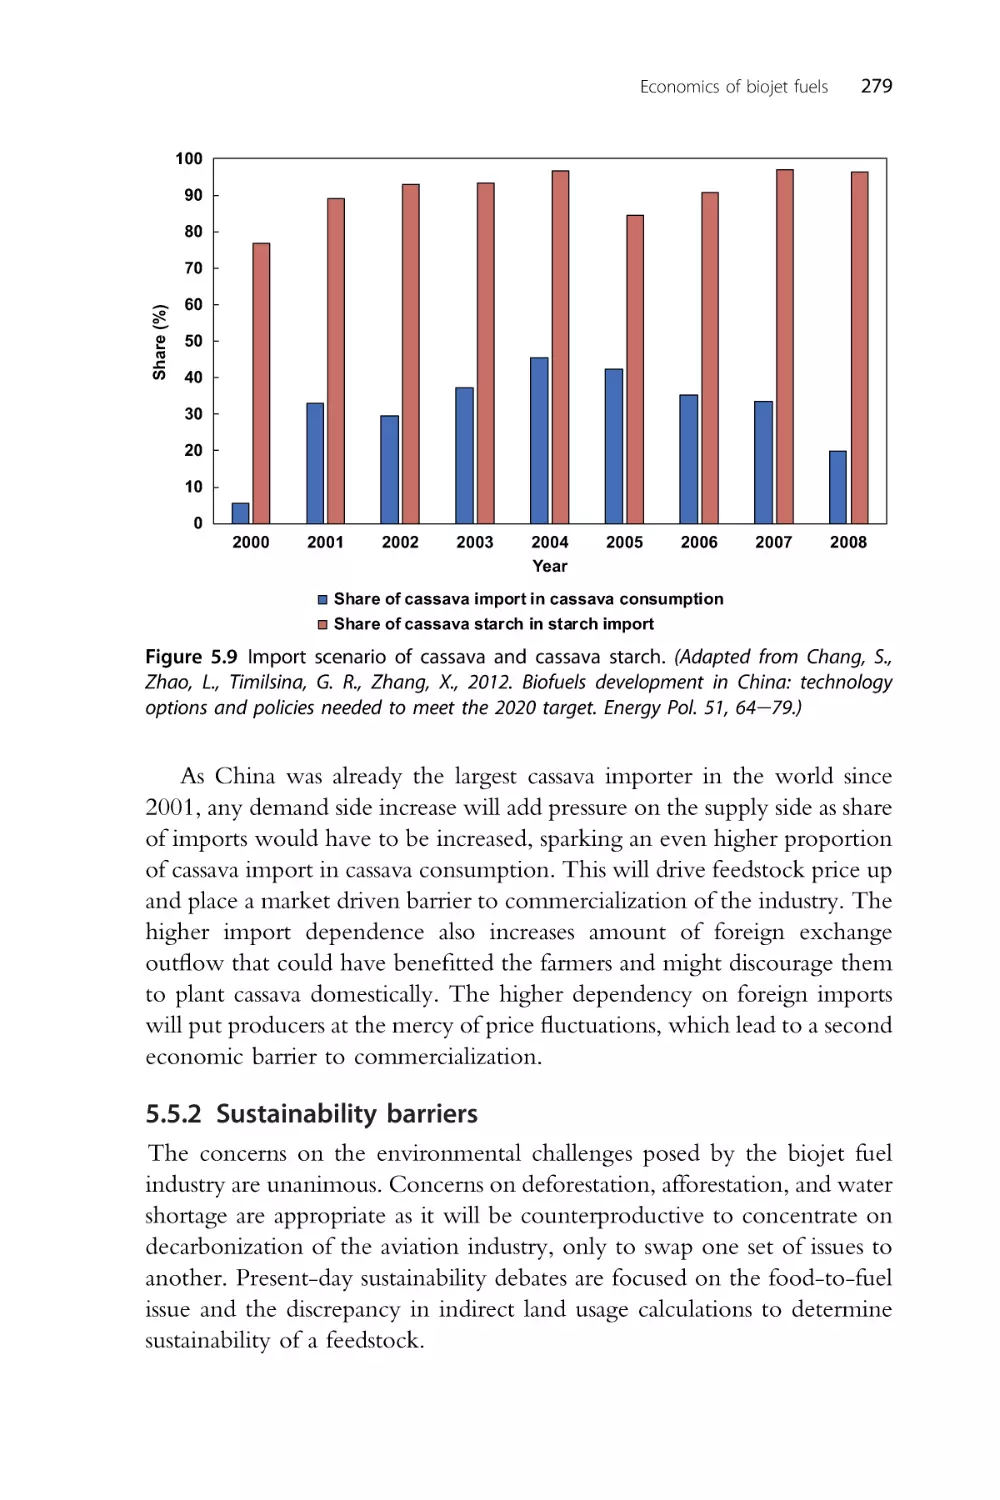
Figure 1.1 States implementing CORSIA. CORSIA, Carbon Offset and Reduction
Scheme for International Aviation. (Adapted from Openairlines, 2018. CORSIA: Who
Needs to Be Participating in the Scheme?. https://blog.openairlines.com/corsia-who-needsto-be-participating.)
CORSIA. This includes appreciating the importance of biojet fuel (under
the general umbrella of alternative fuels) and urges member states to take
due account of ICAO policies and guidance on emissions related to
environmental protection and climate change under ICAO Resolution
A38-18 (ICAO, 2013). A further resolution by ICAO under Resolution
A40-18 by the ICAO Assembly also acknowledges the need to develop
SAF in an economically, socially, and environmentally sustainable manner.
States are requested by ICAO to assess the sustainability of all alternative
fuels for use in aviation, where they should achieve net greenhouse gas
(GHG) emissions reduction on a life cycle basis and work together through
ICAO and other relevant international bodies to exchange information and
best practices on the sustainability of alternative fuels for aviation. ICAO
also pursues three key programs with regard to SAF, namely the ICAO
Global Framework for Aviation Alternative Fuels (GFAAF), the 2050
ICAO Vision, and the ICAO Stocktaking Process (ICAO, 2020b).
The ICAO GFAAF was formulated as the then tangible product of the
2009 ICAO Conference on Aviation Alternative Fuels. The GFAAF is an
online database containing information, projects, and news announcements
of aviation fuels dating back to 2005. While states and stakeholders can share
Global Aviation and Biojet Fuel Policies, Legislations, Initiatives, and Roadmaps
5
relevant information with ICAO through this portal, it also serves a secondary function of being able to keep tabs of the progress of alternative fuels
in aviation through State’s action plans and work with financial institutions
to facilitate financing of alternative fuel projects to overcome initial market
hurdles. A live feed of the ongoing alternative fuel purchase agreements
inclusive of batch delivery and ongoing deliveries through offtake agreement
is shown on the GFAAF portal, although it does not necessarily equate to the
quantity of alternative fuel used on flights. This is due to the gap in information regarding the airports’ fuel blending procedures. Nonetheless, it is a
good proxy of the SAF activities for airlines and airports.
ICAO also initiated the 2050 ICAO Vision for Sustainable Aviation
Fuel during the 2017 edition of the ICAO Conference on Aviation and
Alternative Fuels (CAAF/2) in Mexico (ICAO, 2018). The vision is to have
stakeholders within the international aviation sector to operate flights using
a significant proportion of SAF by 2050. The uptake of SAF is established
to be a key contributor to meet ICAO’s climate objectives and also allow
the aviation sector to contribute in 13 out of the 17 United Nations Sustainable Development Goals (SDGs). As a corollary to the increase in SAF
usage, international civil aviation should also reduce carbon emissions
significantly. The vision also ties in with the GFAAF where stakeholders are
expected under the vision to continuously update the portal. The 2050
ICAO Vision also identifies key steps to meet the vision which include the
• role of ICAO as a facilitator to support states to develop and deploy
SAF;
• development of guidance materials describing the drop-in nature of
SAFs;
• support from states to approve new conversion processes;
• support from states to develop and implement stable policies to facilitate
deployment of SAF;
• evaluation of policy effectiveness through qualitative metrics by states;
• evaluation and facilitation of funding sources to implement SAFs; and
• collaborative initiatives among states alongside industries to reduce the
price gap between SAF and conventional aviation fuels.
It should, however, be noted that the 2050 ICAO Vision will not set a
precedent or prejudge the periodic review of CORSIA as stated under
paragraph 18 of Assembly Resolution A39-3.
The third major initiative on SAF is the ICAO Stocktaking Process which
stemmed from a decision made during CAAF/2. The stocktaking exercise has
the objective of assessing the SAF development and deployment progress.
6
Biojet Fuel in Aviation Applications
During the first ICAO Stocktaking Process held from April 30, 2019 to May 1,
2019 in Canada, the stocktaking process was conducted through the means of a
simple questionnaire, which requires information on conducted projects,
project partners, project duration, feedstock used, feedstock origin, amount of
aviation fuel produced, and if the SAF has been certified by any Sustainable
Certification Scheme (SCS).
The self-reported stocktaking data will complement environmental
trends analysis to provide an overall picture of the impacts of SAF on the
aviation industry and also environment at large. In addition to assessing the
progress of SAF development and deployment, the aggregated data can also
be used to steer political updates for member states, provide confidence for
financial institutions to support SAF projects, match providers and
requestors of assistance, and compile the data for outreach purposes to dispel
the notion of SAF competition with food and water.
1.2.3 CORSIA Eligible Fuels
The CAEP through Fuels Task Group (FTG), which is one of the 11
groups with CAEP membership, is tasked to develop the processes and
methodologies to define what qualifies as SAF under CORSIA, or more
precisely CORSIA eligible fuel (CEF). This is requested under ICAO
Assembly Resolution A39-3 and defined in the context of CORSIA,
Annex 16, Volume IV. Both renewable and fossil-based aviation fuels have
the potential to be a CEF. The CORSIA sustainable aviation fuel refers to a
renewable or waste-derived aviation fuel that meets the CORSIA Sustainability Criteria, while the CORSIA lower carbon aviation fuel is the
counterpart for fossil-based aviation fuels (ICAO Secretariat, 2019). The
focus is on sustainability criteria and life cycle methodologies.
To ensure that the CEF meets the CORSIA Sustainability Criteria,
Sustainability Certification Schemes (SCSs) are developed by ICAO to
conduct the sustainability certification process. The current CORSIA Sustainability Criteria specifying the sustainability criteria required to be certified
as a CEF is valid through the end of the CORSIA pilot phase in 2023. Once
a fuel is deemed to be a CEF, its life cycle emissions value (LSf) is evaluated,
and their default values are listed in the “CORSIA Default Life Cycle
Emissions Values for CORSIA Eligible Fuels” document.
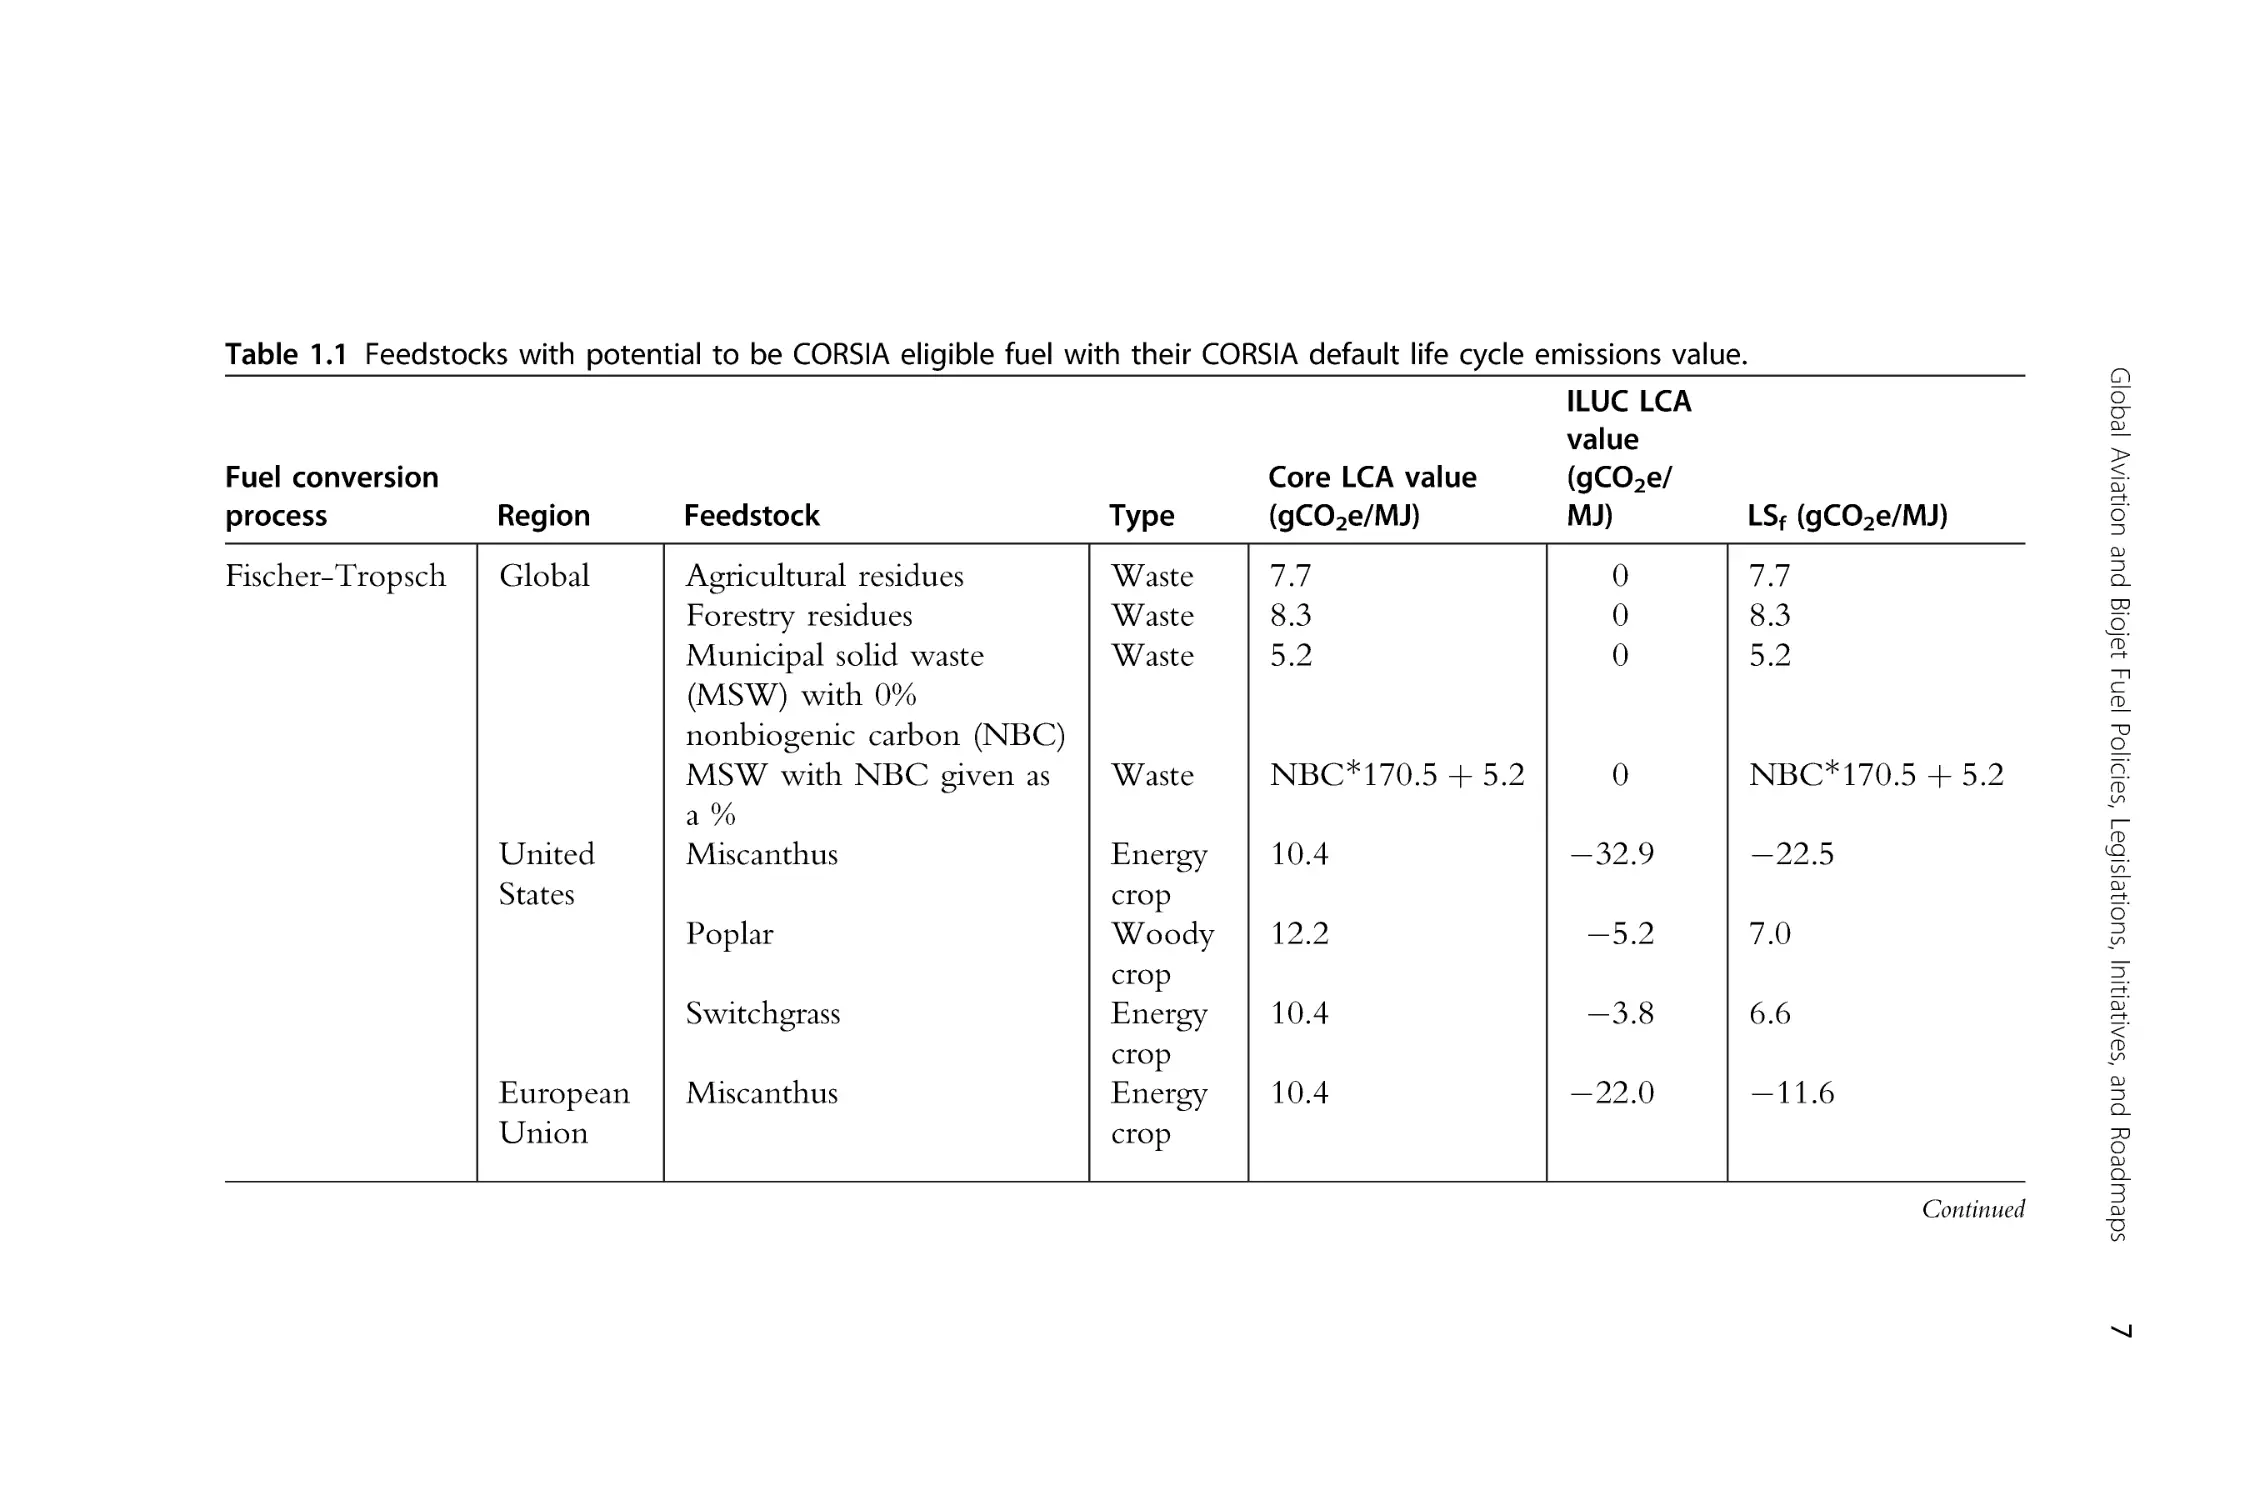
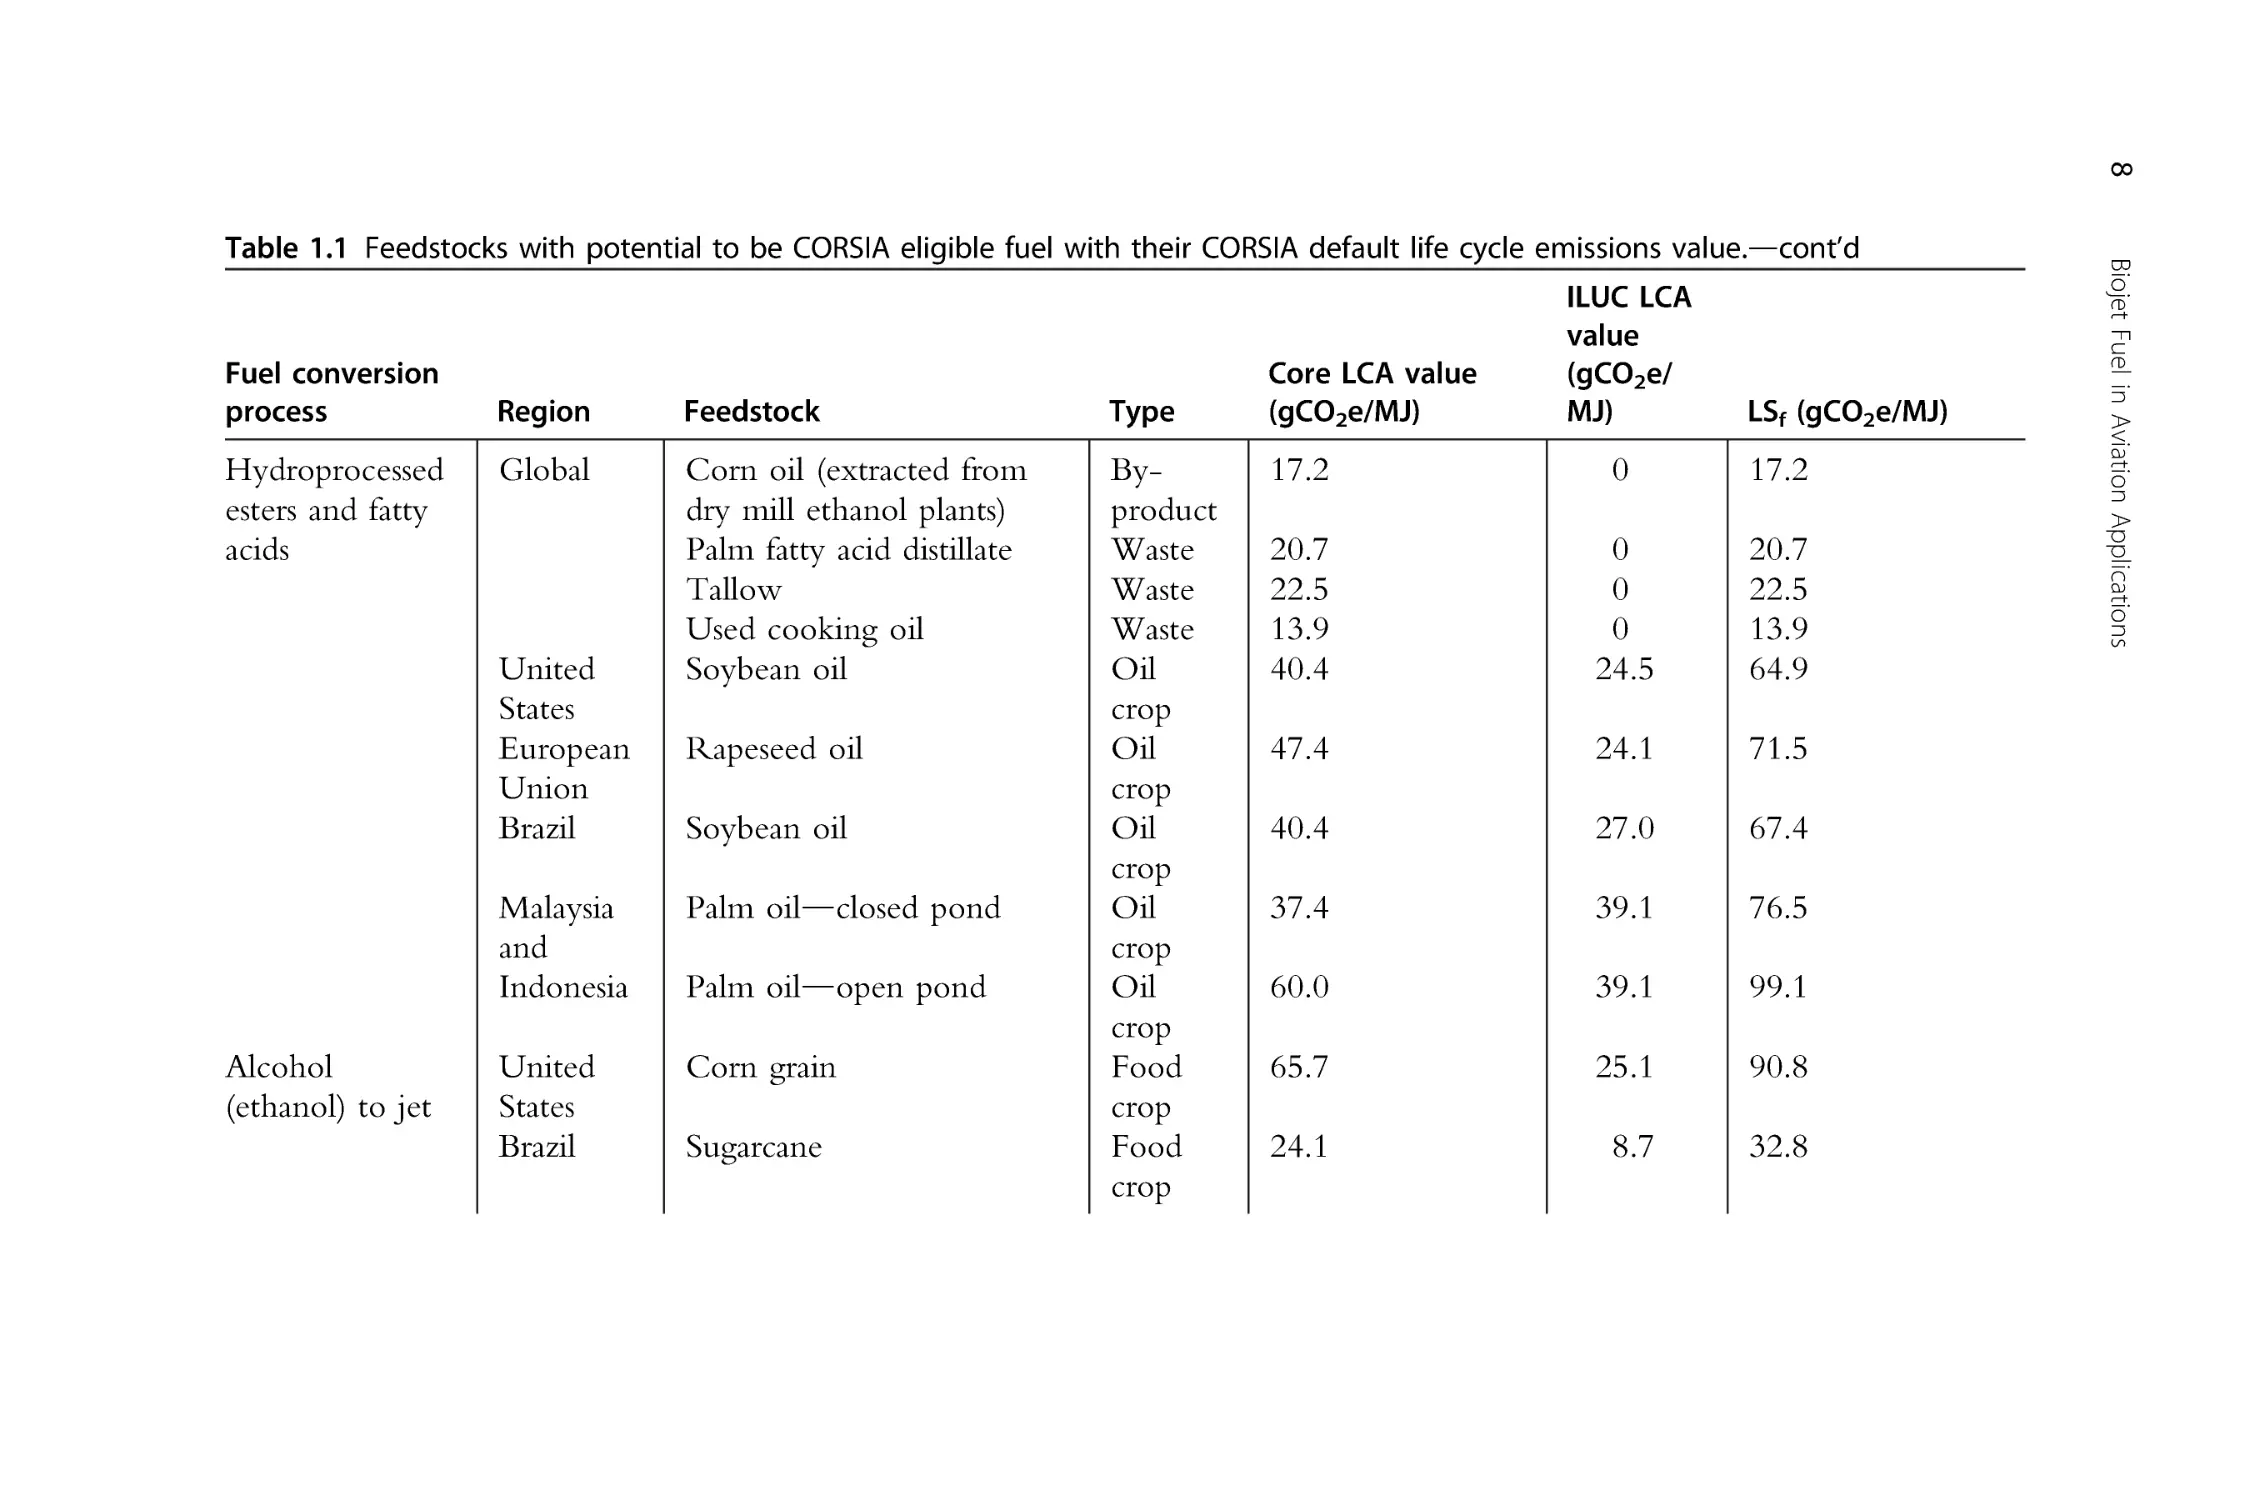
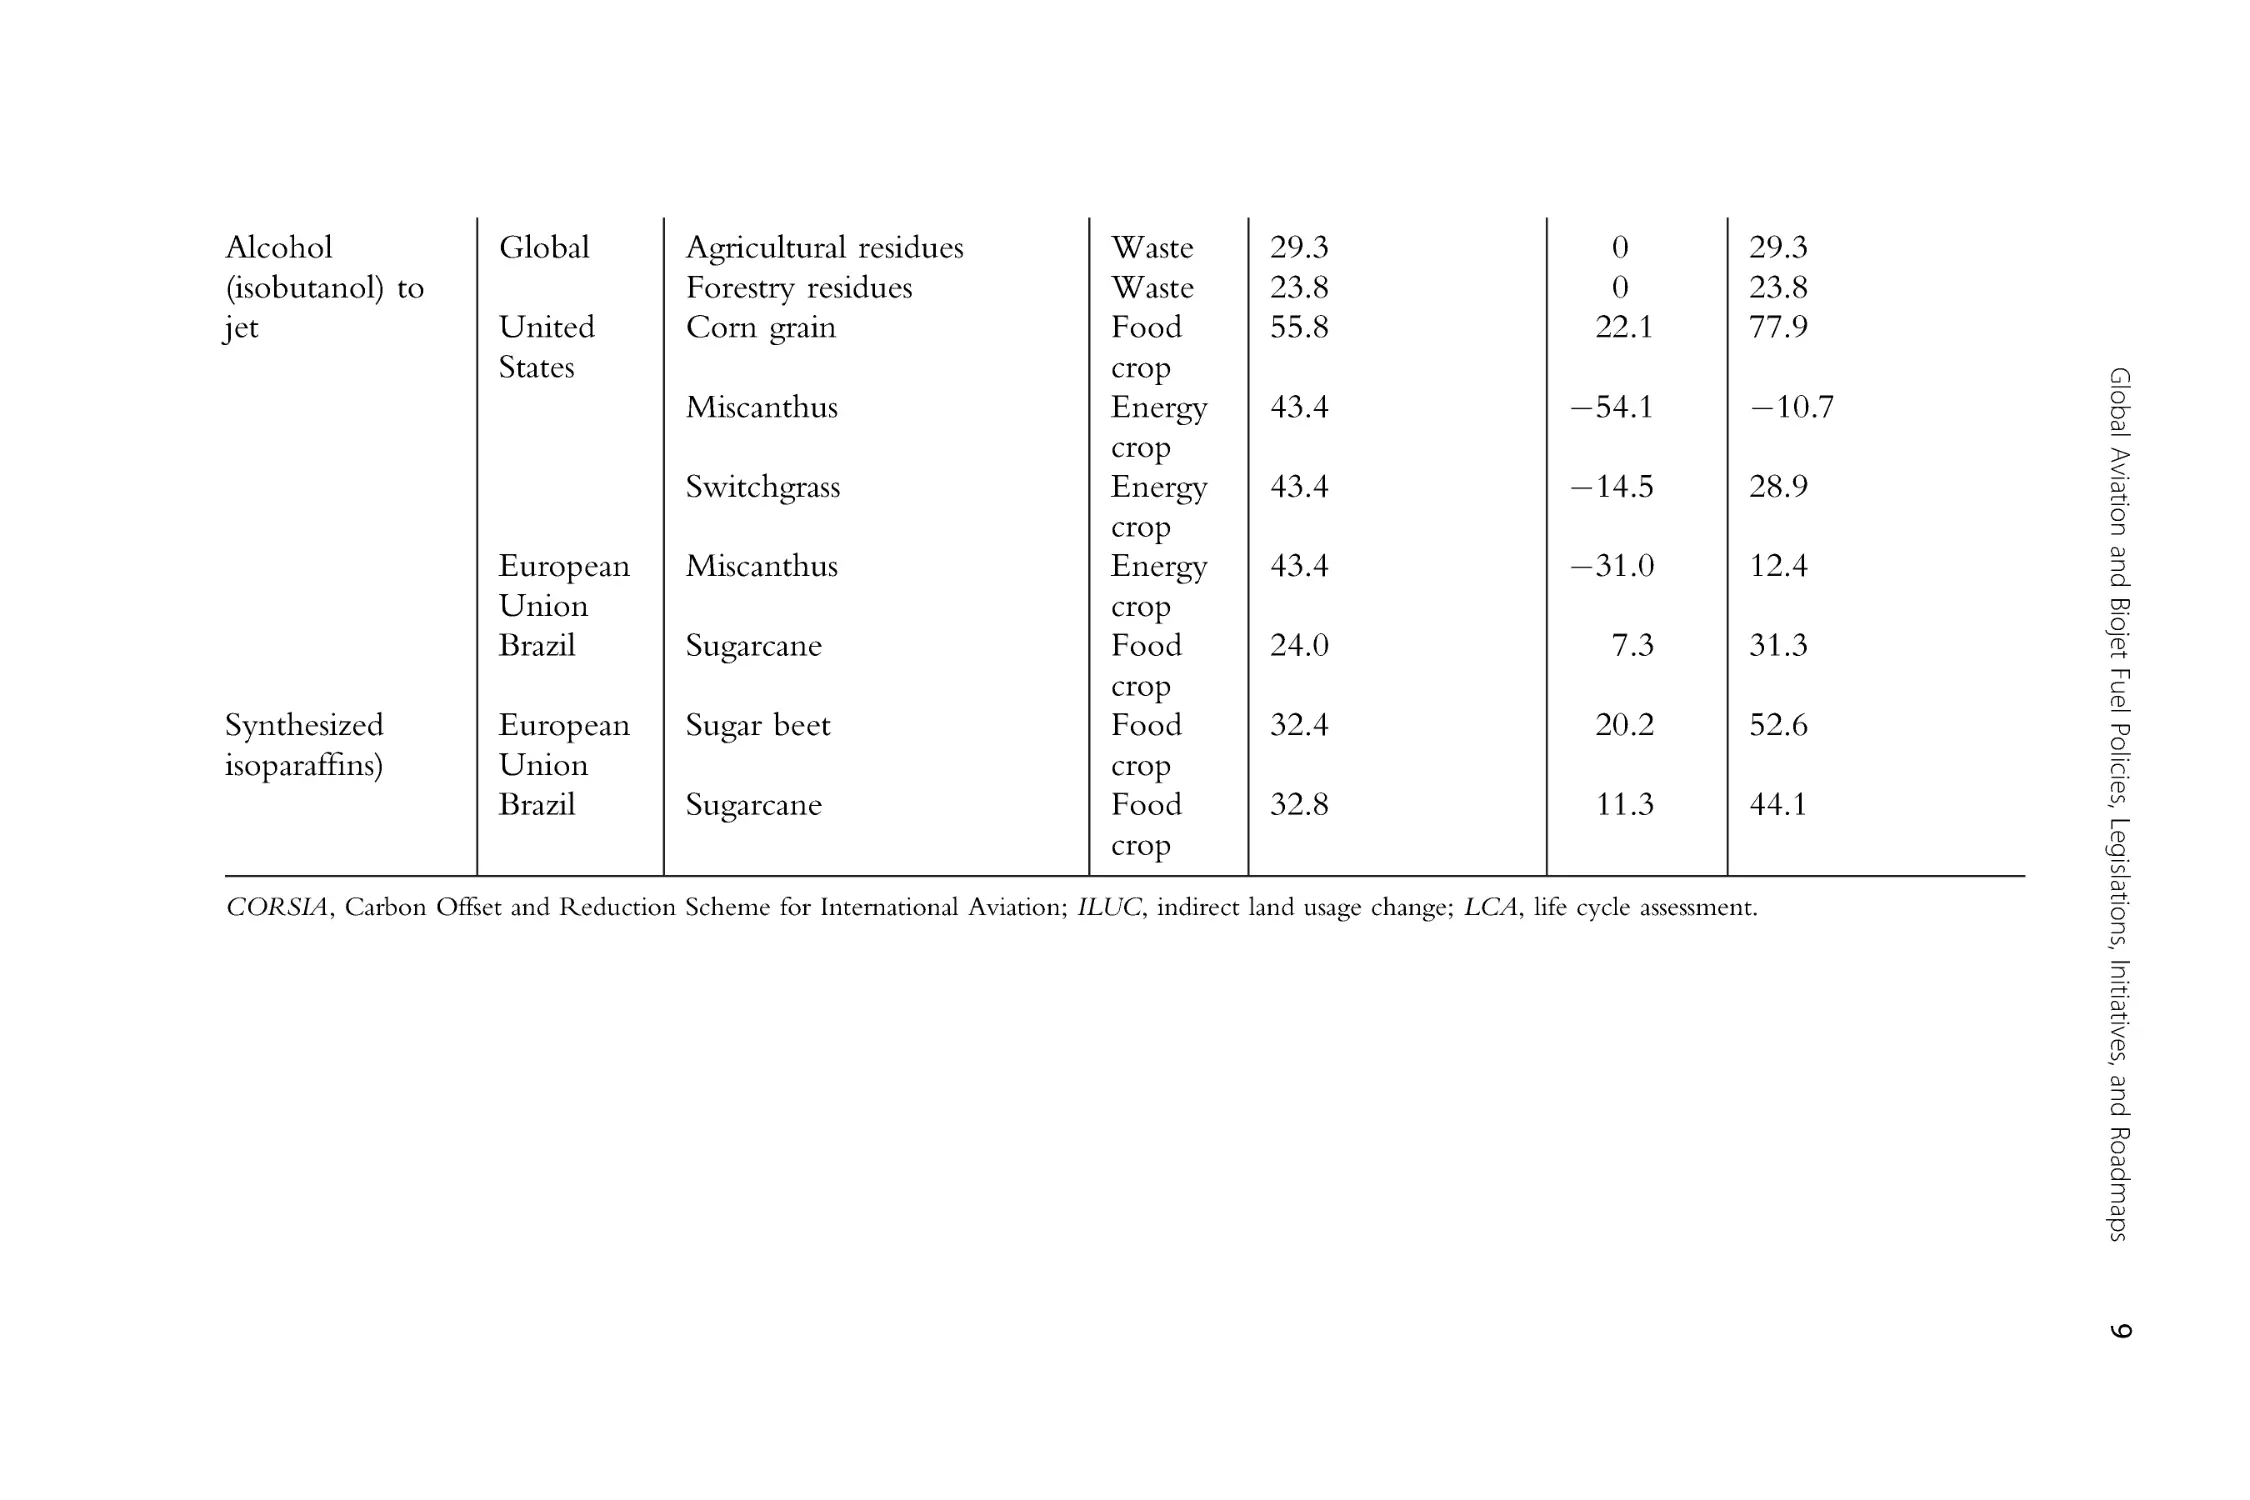
Table 1.1 shows the assigned CORSIA default life cycle emissions values
for the 16 feedstocks evaluated to have the potential to be a CEF (ICAO,
2019c). The LSf indicates the expected CO2-equivalent reduction from the
ILUC LCA
value
(gCO2e/
MJ)
Fuel conversion
process
Region
Feedstock
Type
Core LCA value
(gCO2e/MJ)
Fischer-Tropsch
Global
Agricultural residues
Forestry residues
Municipal solid waste
(MSW) with 0%
nonbiogenic carbon (NBC)
MSW with NBC given as
a%
Miscanthus
Waste
Waste
Waste
7.7
8.3
5.2
0
0
0
7.7
8.3
5.2
Waste
NBC*170.5 þ 5.2
0
NBC*170.5 þ 5.2
Energy
crop
Woody
crop
Energy
crop
Energy
crop
10.4
32.9
12.2
5.2
7.0
10.4
3.8
6.6
10.4
22.0
United
States
Poplar
Switchgrass
European
Union
Miscanthus
LSf (gCO2e/MJ)
22.5
11.6
Continued
Global Aviation and Biojet Fuel Policies, Legislations, Initiatives, and Roadmaps
Table 1.1 Feedstocks with potential to be CORSIA eligible fuel with their CORSIA default life cycle emissions value.
7
8
Fuel conversion
process
Hydroprocessed
esters and fatty
acids
Region
Feedstock
Type
Global
Corn oil (extracted from
dry mill ethanol plants)
Palm fatty acid distillate
Tallow
Used cooking oil
Soybean oil
Byproduct
Waste
Waste
Waste
Oil
crop
Oil
crop
Oil
crop
Oil
crop
Oil
crop
Food
crop
Food
crop
United
States
European
Union
Brazil
Alcohol
(ethanol) to jet
Rapeseed oil
Soybean oil
Malaysia
and
Indonesia
Palm oildclosed pond
United
States
Brazil
Corn grain
Palm oildopen pond
Sugarcane
Core LCA value
(gCO2e/MJ)
ILUC LCA
value
(gCO2e/
MJ)
LSf (gCO2e/MJ)
17.2
0
17.2
20.7
22.5
13.9
40.4
0
0
0
24.5
20.7
22.5
13.9
64.9
47.4
24.1
71.5
40.4
27.0
67.4
37.4
39.1
76.5
60.0
39.1
99.1
65.7
25.1
90.8
24.1
8.7
32.8
Biojet Fuel in Aviation Applications
Table 1.1 Feedstocks with potential to be CORSIA eligible fuel with their CORSIA default life cycle emissions value.dcont’d
Alcohol
(isobutanol) to
jet
Global
Miscanthus
Switchgrass
European
Union
Brazil
Synthesized
isoparaffins)
European
Union
Brazil
Miscanthus
Sugarcane
Sugar beet
Sugarcane
Waste
Waste
Food
crop
Energy
crop
Energy
crop
Energy
crop
Food
crop
Food
crop
Food
crop
29.3
23.8
55.8
0
0
22.1
29.3
23.8
77.9
43.4
54.1
10.7
43.4
14.5
28.9
43.4
31.0
12.4
24.0
7.3
31.3
32.4
20.2
52.6
32.8
11.3
44.1
CORSIA, Carbon Offset and Reduction Scheme for International Aviation; ILUC, indirect land usage change; LCA, life cycle assessment.
Global Aviation and Biojet Fuel Policies, Legislations, Initiatives, and Roadmaps
United
States
Agricultural residues
Forestry residues
Corn grain
9
10
Biojet Fuel in Aviation Applications
use of a CEF due to the sustainable fuel conversion pathway, production
region, feedstock type, land size usage, and the type of land used. The
general guiding principle is for waste, residue, or by-product to only consider
the core life cycle assessment (LCA) value as the LSf, whereas the other cases
will require the additional indirect land usage change (ILUC) to be factored
in the LSf value.
Some of the ILUC values are negative, which means that additional
carbon sequestration will be larger overall than the associated carbon
emissions from land use changes. The use of negative ILUC values is a point
of contention as it is said to introduce possible optimism bias. This is
compounded by the CAEP’s decision to base ILUC values using the lower
value of the competing models of GTAP-BIO and GLOBIOM models
favored by the US and EU delegations, respectively. It should be noted that
the final values used are obtained through the process of model reconciliation instead of taking any particular model as the base. It is still an open
point of debate if the values used by CAEP for CORSIA are due to
modeling improvement or the stance to adopt a more biojet fuel-positive
approach. Using this point of contention as the backdrop, a review will
be conducted at the end of the pilot phase to determine if negative ILUC
values should be allowed.
It should also be noted that the default LSf values can be challenged by
fuel producers by using the calculation methodologies stated under the
“CORSIA Methodology for Calculating Actual Life Cycle Emissions
Values” document approved in November 2019 (ICAO, 2019d). Using the
specified methodology and proof of technical information, fuel producers
are allowed the liberty to define a lower LSf values than that of the default
value. This is also particularly useful for fuel producers if their fuel production pathway does not yet have a default core life cycle value.
As per the methodology set by the CORSIA policy, fuel producers
need to determine the CEF emissions reductions (ERy) using Eq. (1.1)
(ICAO, 2019b):
"
#
X
LSf
ERy ¼ FCF
MSf ;y 1
(1.1)
LC
f
where the subscript y denotes the year, subscript f refers to the fuel type,
FCF is the fixed value fuel conversion factor, MS denotes the mass of
CEF claimed, and LC refers to the fixed value baseline life cycle emissions.
Global Aviation and Biojet Fuel Policies, Legislations, Initiatives, and Roadmaps
11
The fixed values for FCF are 3.16 kg CO2/kg fuel for Jet-A/Jet-A1 and
3.10 kg CO2/kg fuel for AvGas/Jet-B. The LCs for jet fuel and AvGas are
89 and 95 gCO2e/MJ, respectively.
1.2.4 CORSIA Central Registry
The CORSIA Central Registry (CCR) keeps three key sets of information
nested under the “CORSIA Central Registry: Information and Data for the
Implementation of CORSIA.” As stated from the title, the documents
serve to provide important information to support the implementation of
CORSIA. The first among the three documents is the “CORSIA 2020
Emissions” where the total CO2 emissions arising from international
aviation in 2020 will be published. This is relevant to biojet fuel as its efficacy in reducing CO2 equivalent emissions under the CORSIA program
can be gauged. However, it will be interesting to see by how much the
CO2 emissions will decrease as the global COVID-19 pandemic, which has
its first wave peaked in 2020. The pandemic has all but decimated the
passenger subsector of the aviation industry. The expected low CO2
emissions in 2020 will skew the data for future comparison. It will be
prudent to chalk off emissions reduction from 2020 as a one-off outlier
rather than being part of the underlying trend. As CORSIA will only start
its pilot phase in 2021, there is no report to be made available until the
second half of 2021.
The second key document is the “CORSIA Aeroplane Operator to State
Attributions.” This is not directly linked to biojet fuels as it only states the
airplane operator name, the attribution method, and the identifier for each
carrier. The current third edition of the document published in December
2019 provides information on 690 airplane operators from 122 states.
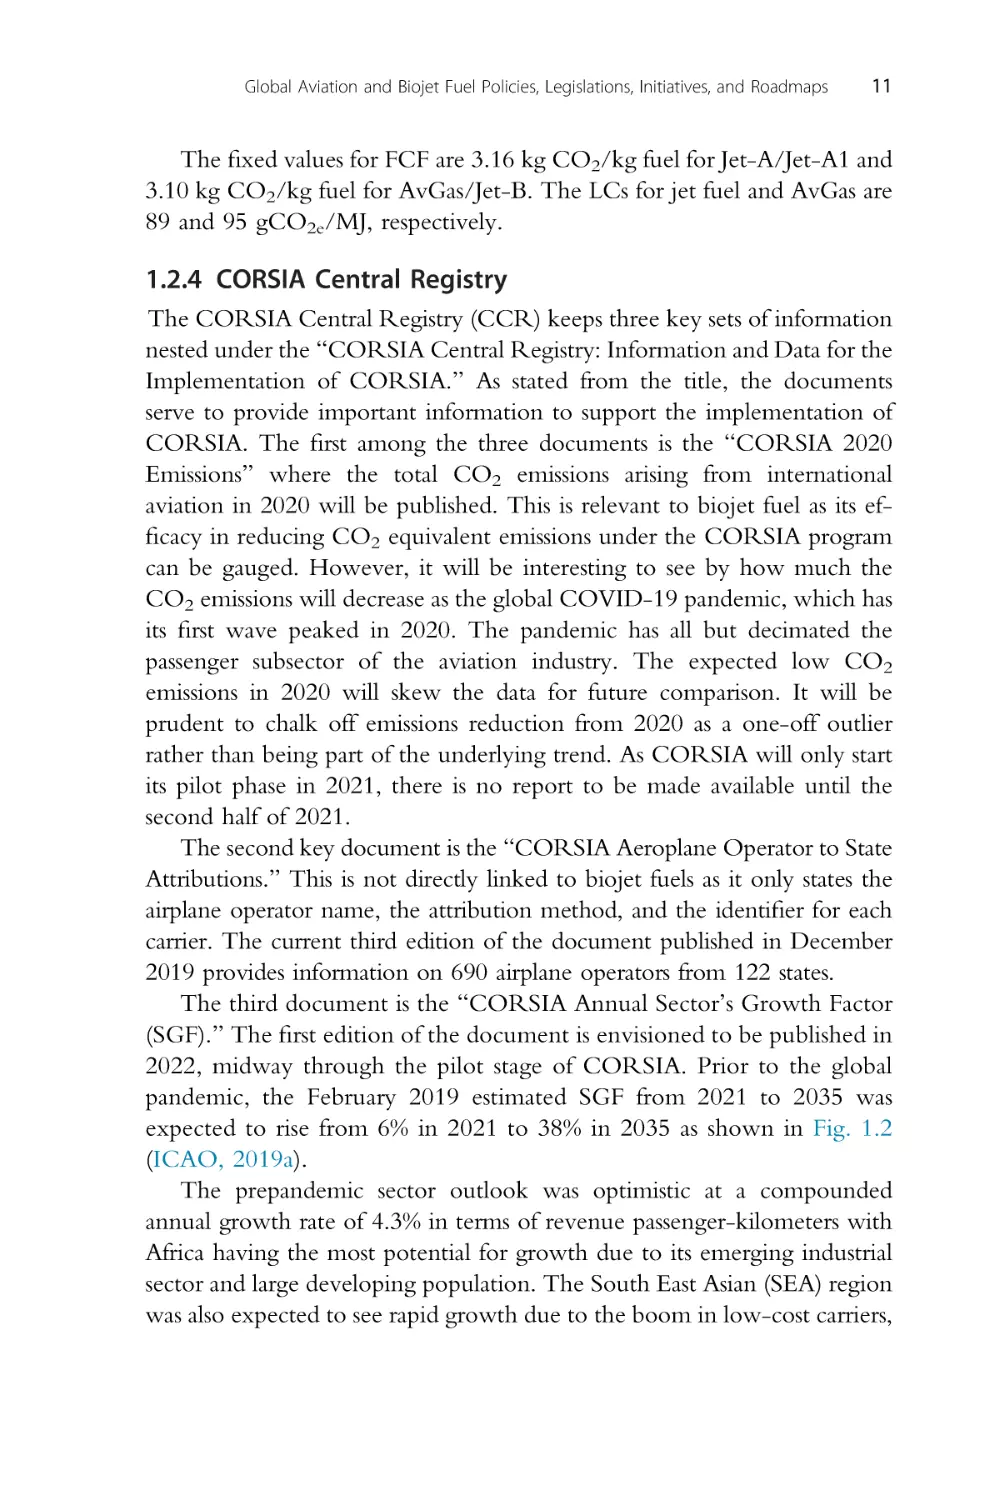
The third document is the “CORSIA Annual Sector’s Growth Factor
(SGF).” The first edition of the document is envisioned to be published in
2022, midway through the pilot stage of CORSIA. Prior to the global
pandemic, the February 2019 estimated SGF from 2021 to 2035 was
expected to rise from 6% in 2021 to 38% in 2035 as shown in Fig. 1.2
(ICAO, 2019a).
The prepandemic sector outlook was optimistic at a compounded
annual growth rate of 4.3% in terms of revenue passenger-kilometers with
Africa having the most potential for growth due to its emerging industrial
sector and large developing population. The South East Asian (SEA) region
was also expected to see rapid growth due to the boom in low-cost carriers,
12
Biojet Fuel in Aviation Applications
40
37
38
35
35
33
31
29
Sector Growth Factor (%)
30
27
25
25
23
21
20
18
16
15
13
10
10
6
5
0
0
2020 2021 2022 2023 2024 2025 2026 2027 2028 2029 2030 2031 2032 2033 2034 2035
Pilot Phase
First Phase
Second Phase
Compliance Cycle 1
Compliance Cycle 2
Compliance Cycle 3
Figure 1.2 Estimated sector growth factor (SGF) from 2021 to 2035. (Adapted from
ICAO, 2019a. Committee on Aviation Environmental Protection (CAEP). https://www.icao.
int/environmental-protection/CORSIA/Documents/CAEP_Analysis%20on%20the%20estimation%20of%20CO2%20emissions%20reductions%20and%20costs%20from%20
CORSIA.pdf.)
growing middle class, and efforts to liberalize air traffic regulations. It is also
in the SEA region where biojet fuel could potentially take a stronghold as
these countries such as Malaysia and Indonesia are rich with palm oil as
feedstock and the Philippines with coconut oil as potential feedstock. The
sudden and rapid contraction of the aviation industry will impact growth of
the overall sector and also the biojet fuel industry.
ICAO also frequently updates the “CORSIA Central Registry (CCR):
Information and Data for Transparency” listing of verification bodies
accredited in member states. In the latest April 2020 sixth edition, 40 verification bodies from 17 states are accredited and listed. The United States and
China lead the list with eight and six verification bodies, respectively. These
verification bodies can conduct verifications for carbon offsetting and GHG
inventory reports under the CORSIA scheme. The number of verification
bodies is expected to grow substantially as not all voluntary member states of
CORSIA have accredited verification bodies. In fact, in the first edition of
Global Aviation and Biojet Fuel Policies, Legislations, Initiatives, and Roadmaps
13
the document in May 2019, there were only 22 accredited verification
bodies from seven member states. The addition of accredited verification
bodies will make it more efficient for stakeholders of CORSIA to submit
verified reports and for ICAO to determine if the biojet fuels entering
the aviation industry actually help to achieve carbon neutral growth. A
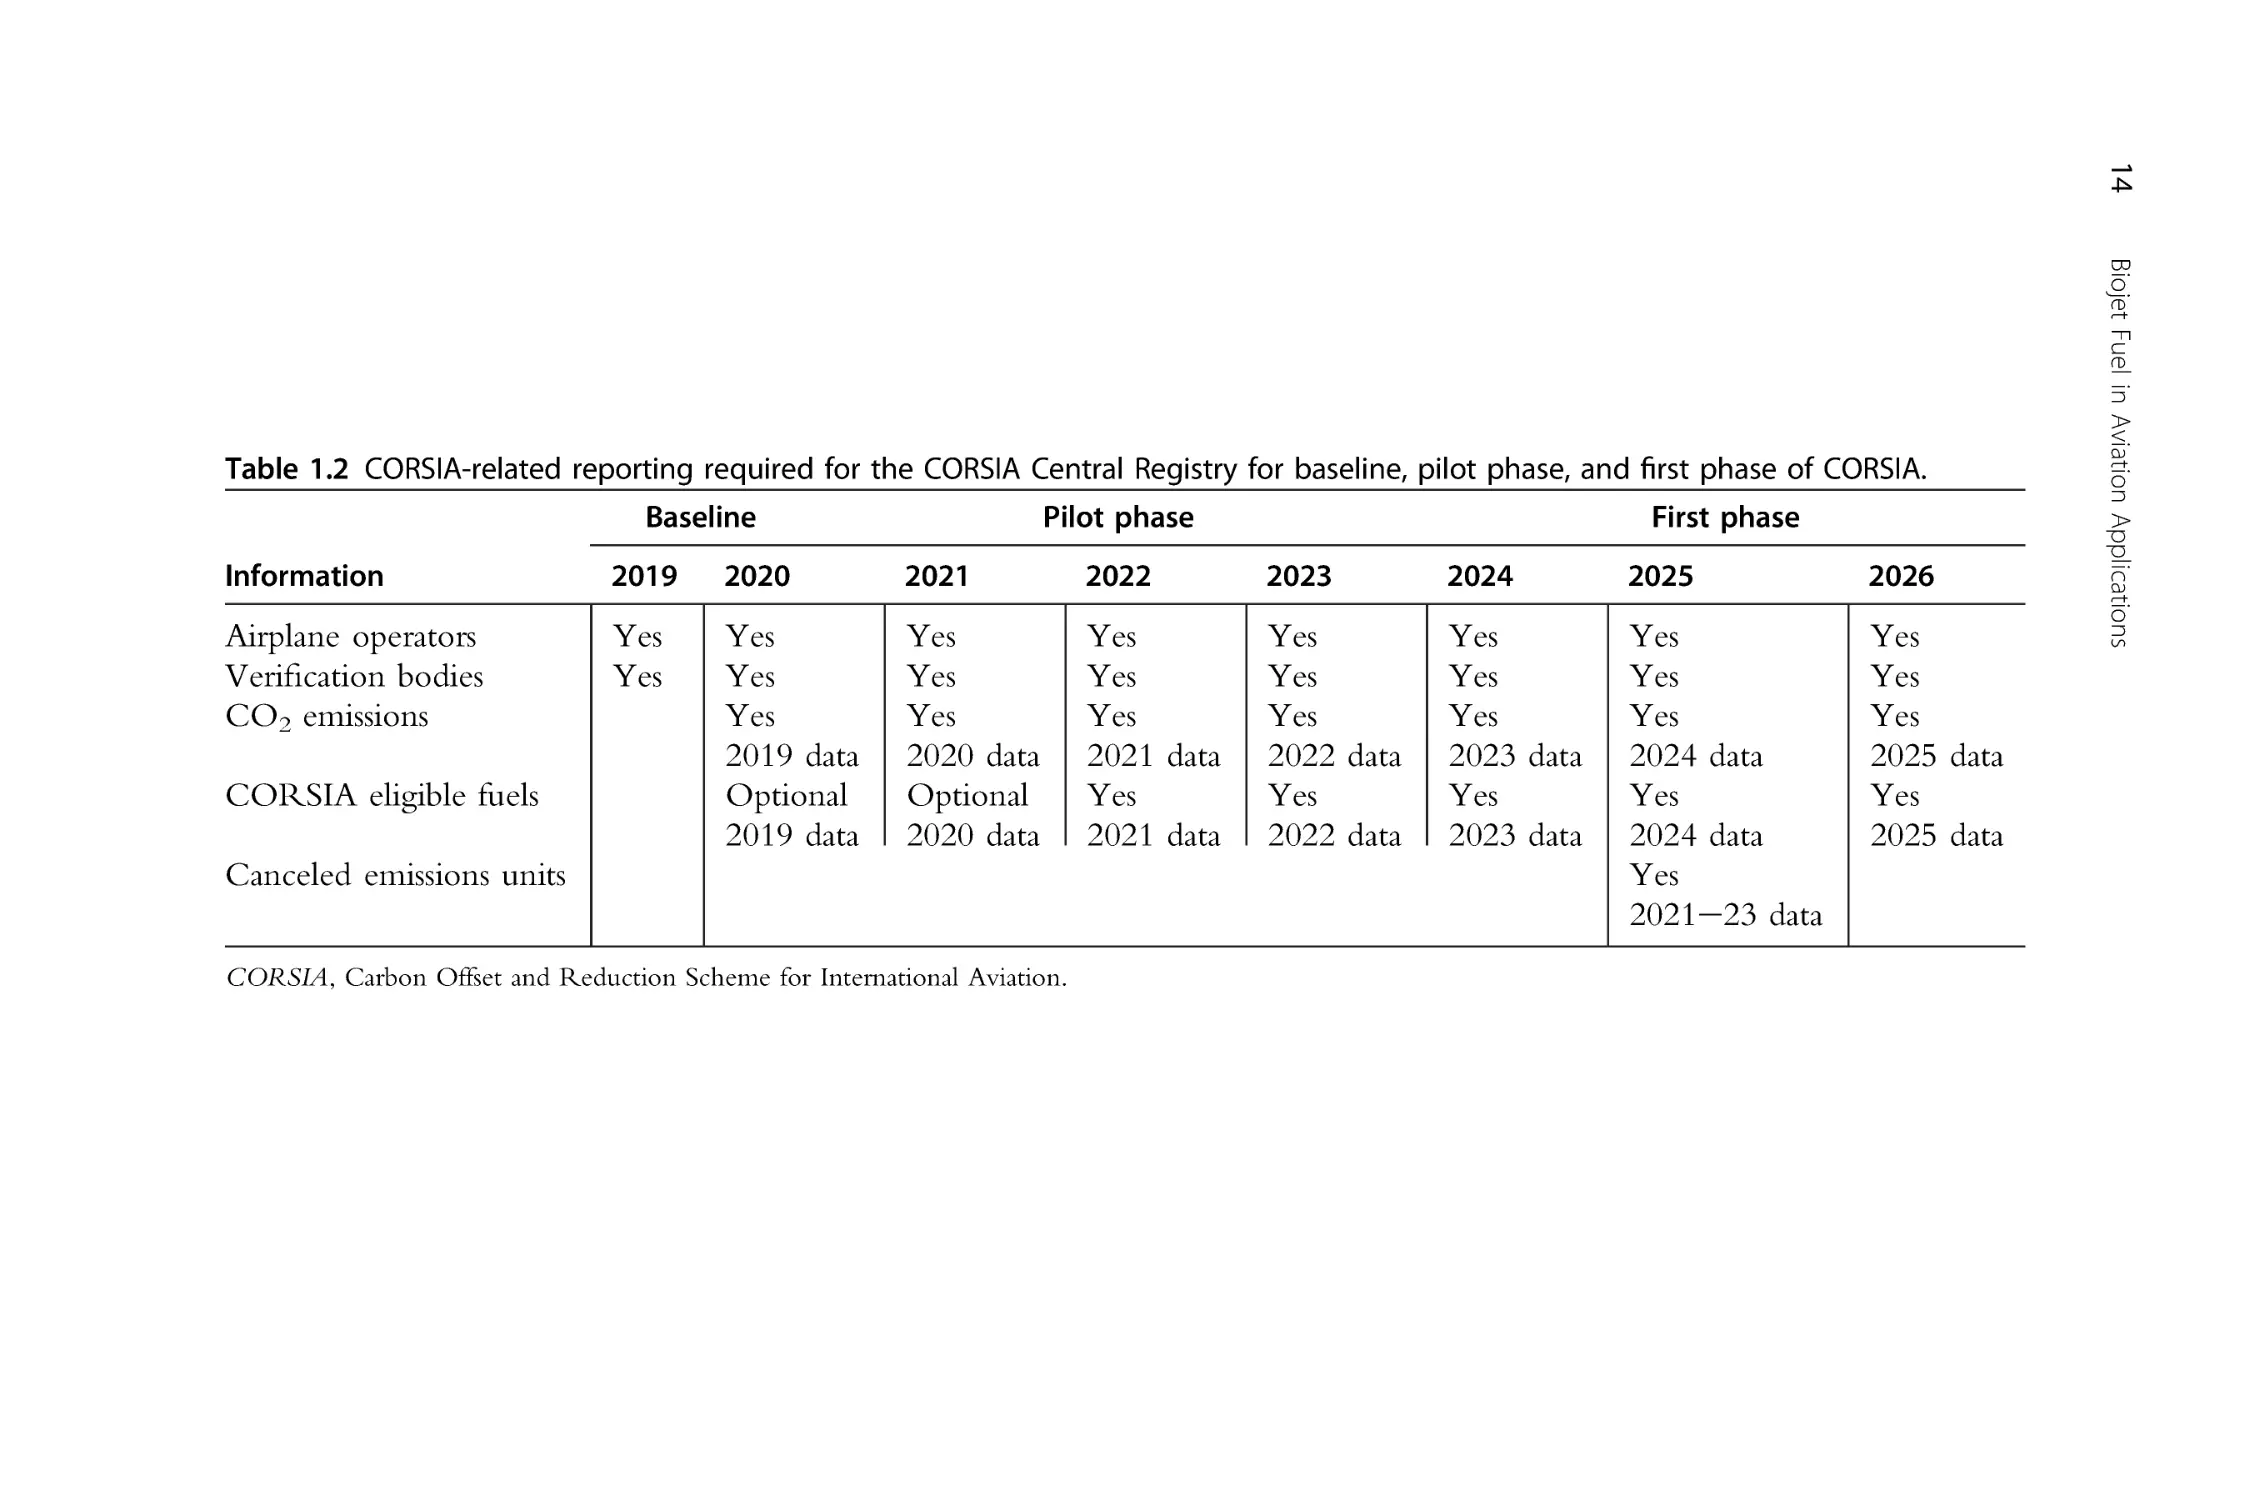
summary of CORSIA-related reporting required for the CCR can be found
in Table 1.2. CO2 emissions and CEF will be reported.
1.2.5 CORSIA CO2 Estimation and Reporting Tool
Under CORSIA, airplane operators within voluntary member states are
required to report the CO2 emissions or estimated CO2 generated. The
CORSIA CO2 Estimation and Reporting Tool (CERT) exists to help
airplane operators to generate a summary assessment for airline operators
with relatively “lower” levels of activities. This is for aircraft operators to
fulfill the monitoring and reporting requirements in accordance with ICAO
Annex 16, Volume IV, Part II, Chapter 2, 2.2.1 and Appendix 3.
CERT contains a set of equations for the estimation of CO2 emissions
based on the Great Circle Distance or Block Time for a given aircraft type
(ICAO, 2019e). CERT uses its standardized emissions monitoring plan and
emissions report to assess eligibility to utilise the fuel use monitoring
methods, assess the scope applicability of monitoring, reporting, and verification (MRV) requirements, and help to fill in any CO2 emissions data
gaps. The last of the three is the most pertinent as data are often difficult to
come by and to estimate. CERT itself refers to ICAO’s aircraft database,
location indicators, aircraft type designators, and fuel formula. It also refers
to the European Union Aviation Safety Agency (EASA)eapproved noise
level by maximum take-off mass (MTOM).
There is no specific category for biojet fuels under CERT, but biojet
fuels that meet the standards (for example, Jet-A1) can be included as
equivalent fuel. The undifferentiated categorization of biojet fuel possibly
stemmed from the present drop-in fuel mechanism where biojet fuel
meeting the standards cannot be differentiated postblending with fossilbased aviation fuel. Since they have the same or similar properties, the
emissions arising from the combustion of either fuel will also be comparable. Furthermore, the categorization of biojet fuel as equivalent fuel is
practical as the CERT is meant to be a simplified tool to easily estimate
CO2 emissions levels.
14
Baseline
Pilot phase
First phase
Information
2019
2020
2021
2022
2023
2024
2025
2026
Airplane operators
Verification bodies
CO2 emissions
Yes
Yes
Yes
Yes
Yes
2019 data
Optional
2019 data
Yes
Yes
Yes
2020 data
Optional
2020 data
Yes
Yes
Yes
2021 data
Yes
2021 data
Yes
Yes
Yes
2022 data
Yes
2022 data
Yes
Yes
Yes
2023 data
Yes
2023 data
Yes
Yes
Yes
2024 data
Yes
2024 data
Yes
2021e23 data
Yes
Yes
Yes
2025 data
Yes
2025 data
CORSIA eligible fuels
Canceled emissions units
CORSIA, Carbon Offset and Reduction Scheme for International Aviation.
Biojet Fuel in Aviation Applications
Table 1.2 CORSIA-related reporting required for the CORSIA Central Registry for baseline, pilot phase, and first phase of CORSIA.
Global Aviation and Biojet Fuel Policies, Legislations, Initiatives, and Roadmaps
15
1.2.6 Impact of COVID-19 on CORSIA
The COVID-19 pandemic has caused unprecedented disruption to the
aviation sector, especially international air travel. Air travel has greatly
reduced in 2020 with airlines around the world still assessing the impact. An
ICAO report on the state of the industry in September 2020 stated a 50%
reduction in passenger seats offered by airlines. This will invariably reduce
the CO2 emissions in 2020 and beyond, with great level of uncertainty. In
fact, it represents a reversal of expectations where the International Air
Transport Association (IATA)’s 2019 end-year report estimated a 2.3%
increase in CO2 emissions over the 2019 levels (IATA, 2019).
As such, it greatly impacts the implementation of CORSIA as the
baseline is set upon a 2-year emissions average for 2019 and 2020. This
decreases the CORSIA’s sectoral baseline sharply when compared with a
non-COVID-19 projection. The greatly reduced baseline will unfairly
burden the airline industry groups as that will mean greater offsetting costs.
ICAO reacted by invoking ICAO Assembly Resolution A40-19 to
provide a safeguard by adjusting CORSIA, as allowed in the unforeseen
circumstances where the sustainability of the scheme is affected. The
extraordinary disruption in the form of COVID-19 has led to ICAO
agreeing to use only the 2019 emissions level to determine the baseline
levels. This means that airlines will be allowed to discharge 30% more
emissions as compared with 2019’s level, which amounts to 81 million
metric tons during CORSIA’s pilot phase.
Future implications beyond the pilot phase (2021e23) cannot be known
as it is unclear if the industry will undergo a “V” (full and fast recovery), “U”
(slow recovery with dampened long-term growth), or “L” (emissions fall
then level off) shaped recovery. As such, ICAO’s move to shift the baseline
determination rules amid the uncertainty is welcomed by airline operators.
Airline operators will now get reprieve from an economic standpoint.
However, critics are of the opinion that the change in CORSIA baseline
for the pilot phase will all but practically eliminate offset requirements. It is
expected that this adjustment will also delay the implementation of aviation
carbon offset by up to 5 years. Furthermore, it has the potential to dampen
the green energy market as the rules are inconsistent. This shines a negative
light on CORSIA’s credibility and long-term stability.
The first review of CORSIA is not due until 2022, with offsetting
targets for the first phase (2024e26) not being finalized until the end of
2023. It will be prudent to adopt a practical route of observing the rebound
level of air travel before making any further adjustments.
16
Biojet Fuel in Aviation Applications
1.3 European Union
1.3.1 European Union Emissions Trading Scheme
The European Union has a head start in policies regarding to aviation
emissions. In fact, in year 2012, the EU preceded ICAO’s initiatives by
effecting aviation market-based measures (MBMs) through the inclusion of
the sector under the European Union Emissions Trading System (EU ETS)
(Deane and Pye, 2018).
In this scheme, the onus is on the airlines to reduce aviation-related
emissions. Airlines operating in the European Union irrespective of being
European or non-European are required to monitor, report, and verify their
emissions level. From it, tradable allowances can be received depending on
the flight emissions level per year.
The scheme in its original form had the ambition of covering all of
European Union’s aviation emission, although it was contested by the industry. Geographically, the legislation was also initially designed to apply to
emissions from flights from, to, and within the European Economic Area
(EEA). EEA covers all of the EU member states plus three other countries,
namely, Iceland, Liechtenstein, and Norway (European Commission, 2020).
However, in 2013, the European Union decided to limit the reach of
EU ETS to just internal flights within the confines of EEA until 2016.
This “stop the clock” measure on the implementation of international
aviation law was taken to support the efforts of ICAO in developing a
global system to combat aviation emissions, which eventually came in the
form of CORSIA in 2016. “Stopping the clock” was widely regarded as
being the crucial component in the provision of political negotiation space
to ICAO for the formation of an international framework in tackling
aviation carbon emissions.
With the introduction of CORSIA, the European Union retained the
geographic scope of EU ETS from year 2017 with a view to review the EU
ETS for aviation subjected to the codevelopment of CORSIA. It should be
noted that the EU ETS would relapse to its original scope covering extraEEA flights from 2024.
1.3.2 Renewable Energy Directives
The European Commission (EC) recognizes the need to set out the path to
climate neutrality by 2050. This can be achieved through the decarbonization of economic activities in all sectors and reduce GHG emissions. As
the energy sector contributes over three quarters of European Union’s GHG
emissions, tackling the emissions arising from the energy sector will be a
keystone in achieving climate neutrality (European Commission, 2018).
Global Aviation and Biojet Fuel Policies, Legislations, Initiatives, and Roadmaps
17
The European Union has had various directives and indicative targets
related to renewables in the past, namely the 1997 indicative EU target of
12% renewables by 2010, the 2001 directive on electricity production from
renewables, and the 2003 directive on biofuels and renewable fuels for
transport. In 2009, the EC started to set nationally binding targets of 20%
renewables by 2020 through the original Renewable Energy Directive
(2009/28/EC). The Directive allocates individual national targets to
member states, ranging from the lowest at 10% for Malta to 49% for
Sweden (Deane et al., 2017). Member states must also have 10% transport
fuels originating from renewable sources by 2020 under the 10% RES-T
target. In principle, as long as the biofuel meets the specific sustainability
criteria, it can be included as meeting the quota. However, for RED (2009/
28/EC), biojet fuel contributed to a negligible amount to this target as road
transport biofuels such as bioethanol and biodiesel remained as the lower
hanging fruits for member states to meet their quota. Also, road transport
accounts for the bulk of the total EU-28 transport emission in 2012 at 72%.
Revisions to RED were made to also specify aviation sector-specific aspects. In fact, the renewables for the aviation sector (alongside the maritime
sector) were given a boost where they are weighted 20% more.
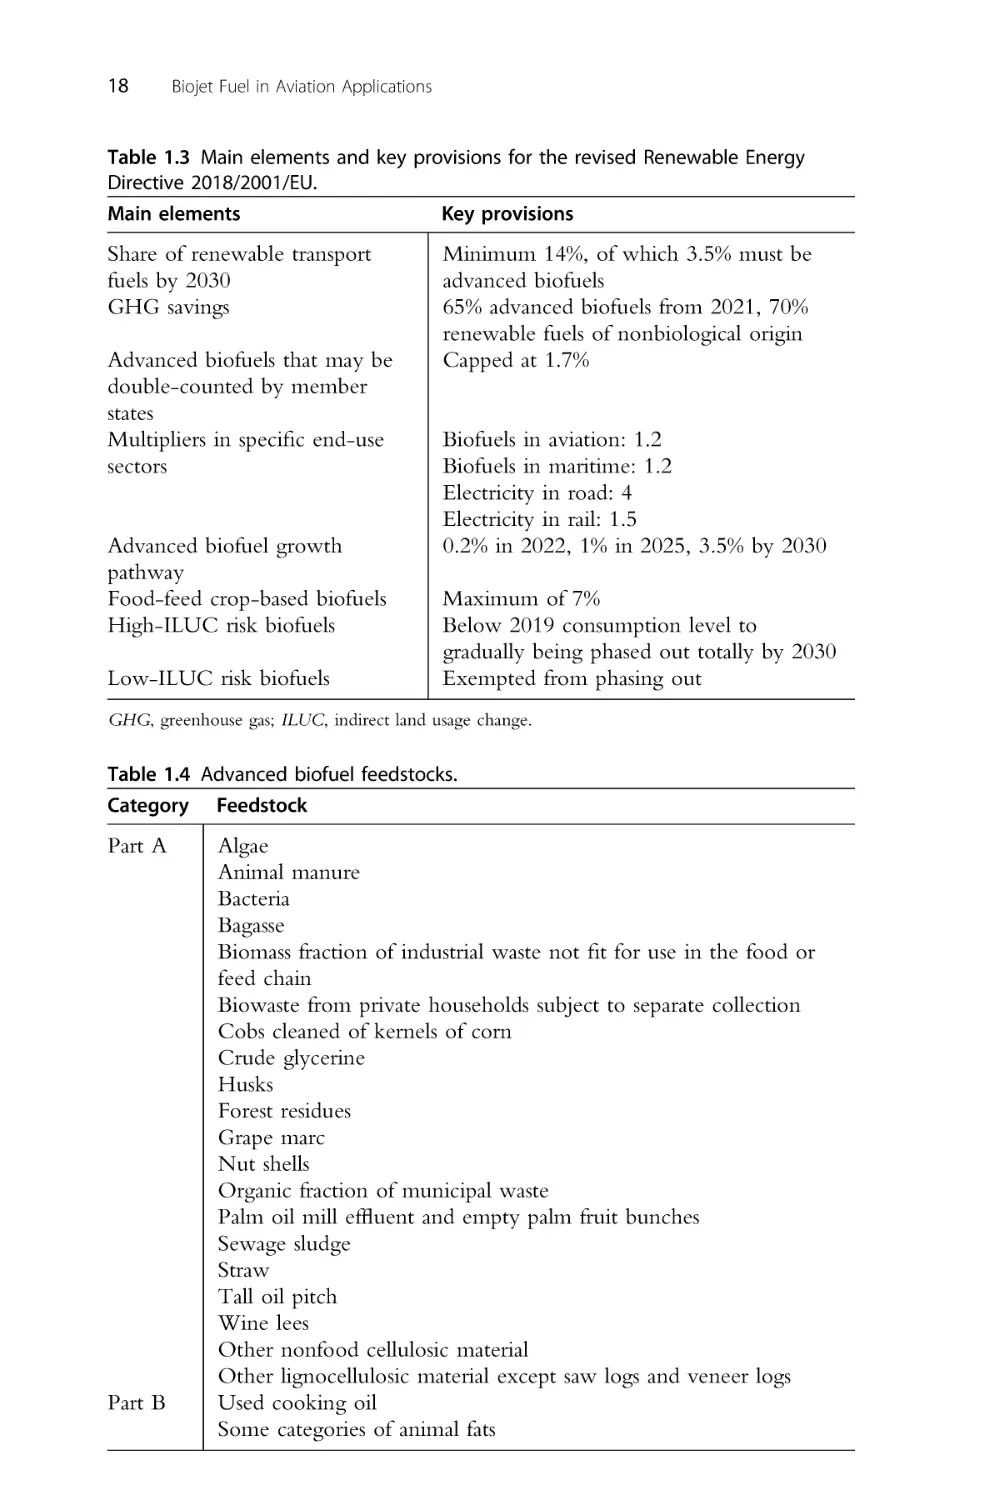
RED was revised in 2018 as Renewable Energy Directive 2018/2001/
EU with a more ambitious binding target of at least 32% for 2030. The
revised RED is also widely known as RED II. The revision was made by the
EC to keep the EU at the front of the pack for renewables, while also
bringing the EU one step closer to meeting its Paris Agreement commitments. In terms of the transport sector, the share of renewable fuel target was
increased to 14% by 2030. The criteria for bioenergy sustainability were also
specified and strengthened. The main elements and key provisions of the
revised RED are summarized in Table 1.3 (Chiaramonti and Goumas, 2019).
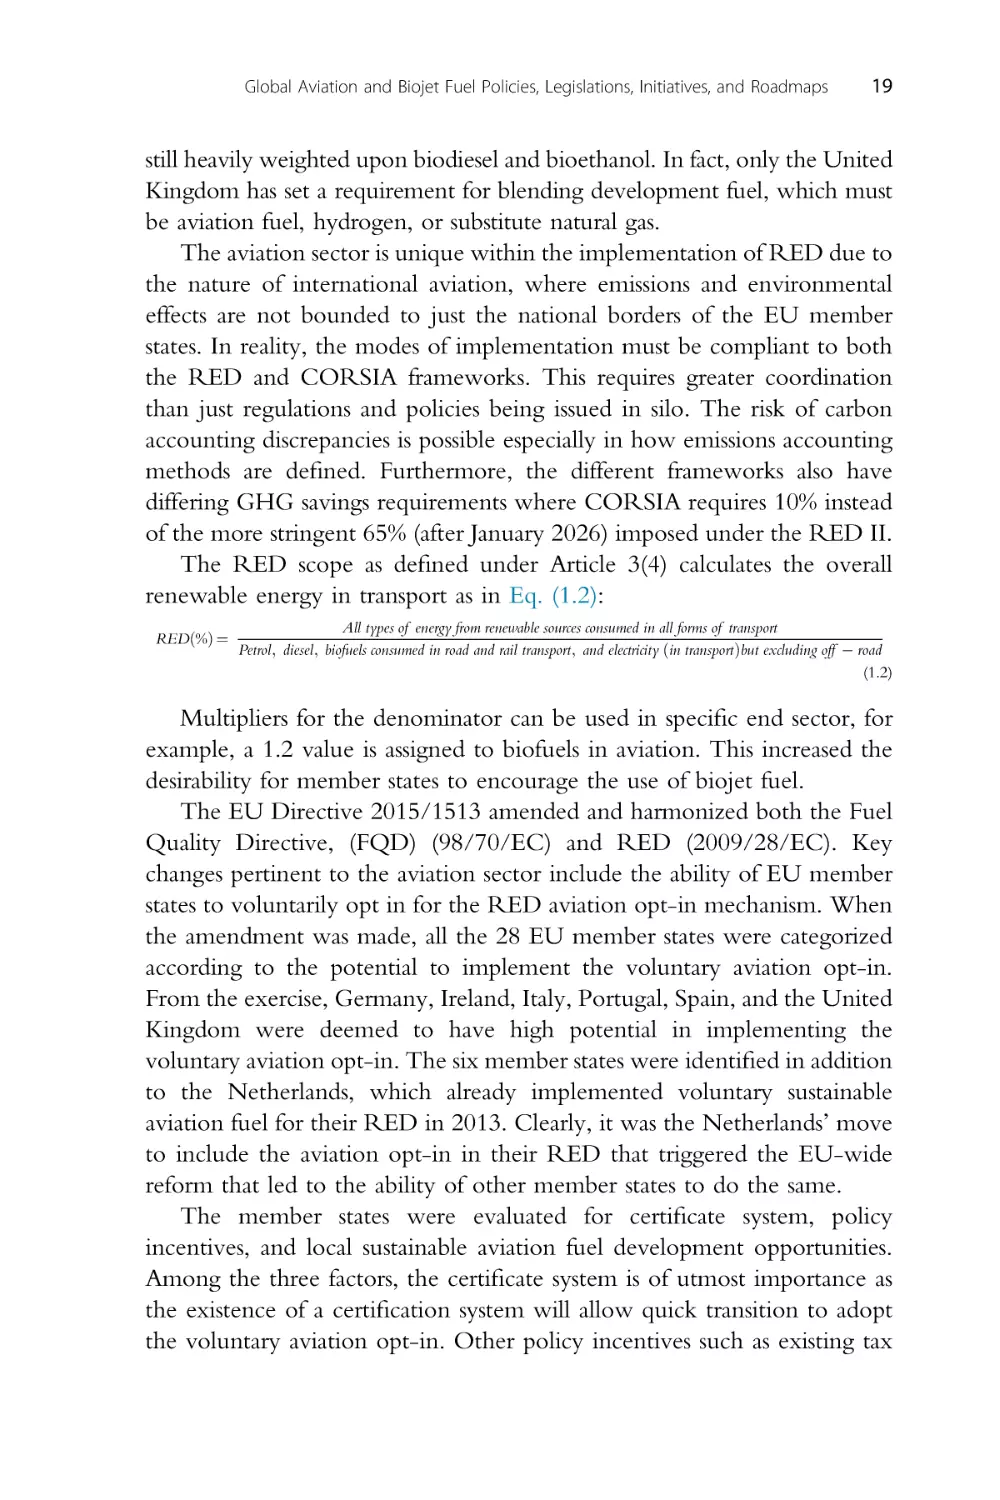
Advanced biofuel sources are also explicitly defined into two separate
groups. The groupings are tabulated in Table 1.4 (USDA GAIN Report,
2019). Feedstocks as listed in part A must form 0.2%, 1.0%, and at least 3.5%
of transport energy in 2022, 2025, and 2030, respectively. The feedstocks
consist of only nonfood sources with algae, municipal waste, agricultural
waste, glycerine, and forestry residue forming the bulk of the list. On the
other hand, part B consists of used cooking oil and some categories of animal
fat. Part B sources will be capped at 1.7% in 2030. Due to advanced biofuels
category being a subset of the overall RTF, it can be double-counted by
member states toward both the RTF (14%) and advanced biofuel (3.5%)
shares. It should be noted that the mandates by member states as of 2019 are
18
Biojet Fuel in Aviation Applications
Table 1.3 Main elements and key provisions for the revised Renewable Energy
Directive 2018/2001/EU.
Main elements
Key provisions
Share of renewable transport
fuels by 2030
GHG savings
Advanced biofuels that may be
double-counted by member
states
Multipliers in specific end-use
sectors
Advanced biofuel growth
pathway
Food-feed crop-based biofuels
High-ILUC risk biofuels
Low-ILUC risk biofuels
Minimum 14%, of which 3.5% must be
advanced biofuels
65% advanced biofuels from 2021, 70%
renewable fuels of nonbiological origin
Capped at 1.7%
Biofuels in aviation: 1.2
Biofuels in maritime: 1.2
Electricity in road: 4
Electricity in rail: 1.5
0.2% in 2022, 1% in 2025, 3.5% by 2030
Maximum of 7%
Below 2019 consumption level to
gradually being phased out totally by 2030
Exempted from phasing out
GHG, greenhouse gas; ILUC, indirect land usage change.
Table 1.4 Advanced biofuel feedstocks.
Category
Feedstock
Part A
Algae
Animal manure
Bacteria
Bagasse
Biomass fraction of industrial waste not fit for use in the food or
feed chain
Biowaste from private households subject to separate collection
Cobs cleaned of kernels of corn
Crude glycerine
Husks
Forest residues
Grape marc
Nut shells
Organic fraction of municipal waste
Palm oil mill effluent and empty palm fruit bunches
Sewage sludge
Straw
Tall oil pitch
Wine lees
Other nonfood cellulosic material
Other lignocellulosic material except saw logs and veneer logs
Used cooking oil
Some categories of animal fats
Part B
Global Aviation and Biojet Fuel Policies, Legislations, Initiatives, and Roadmaps
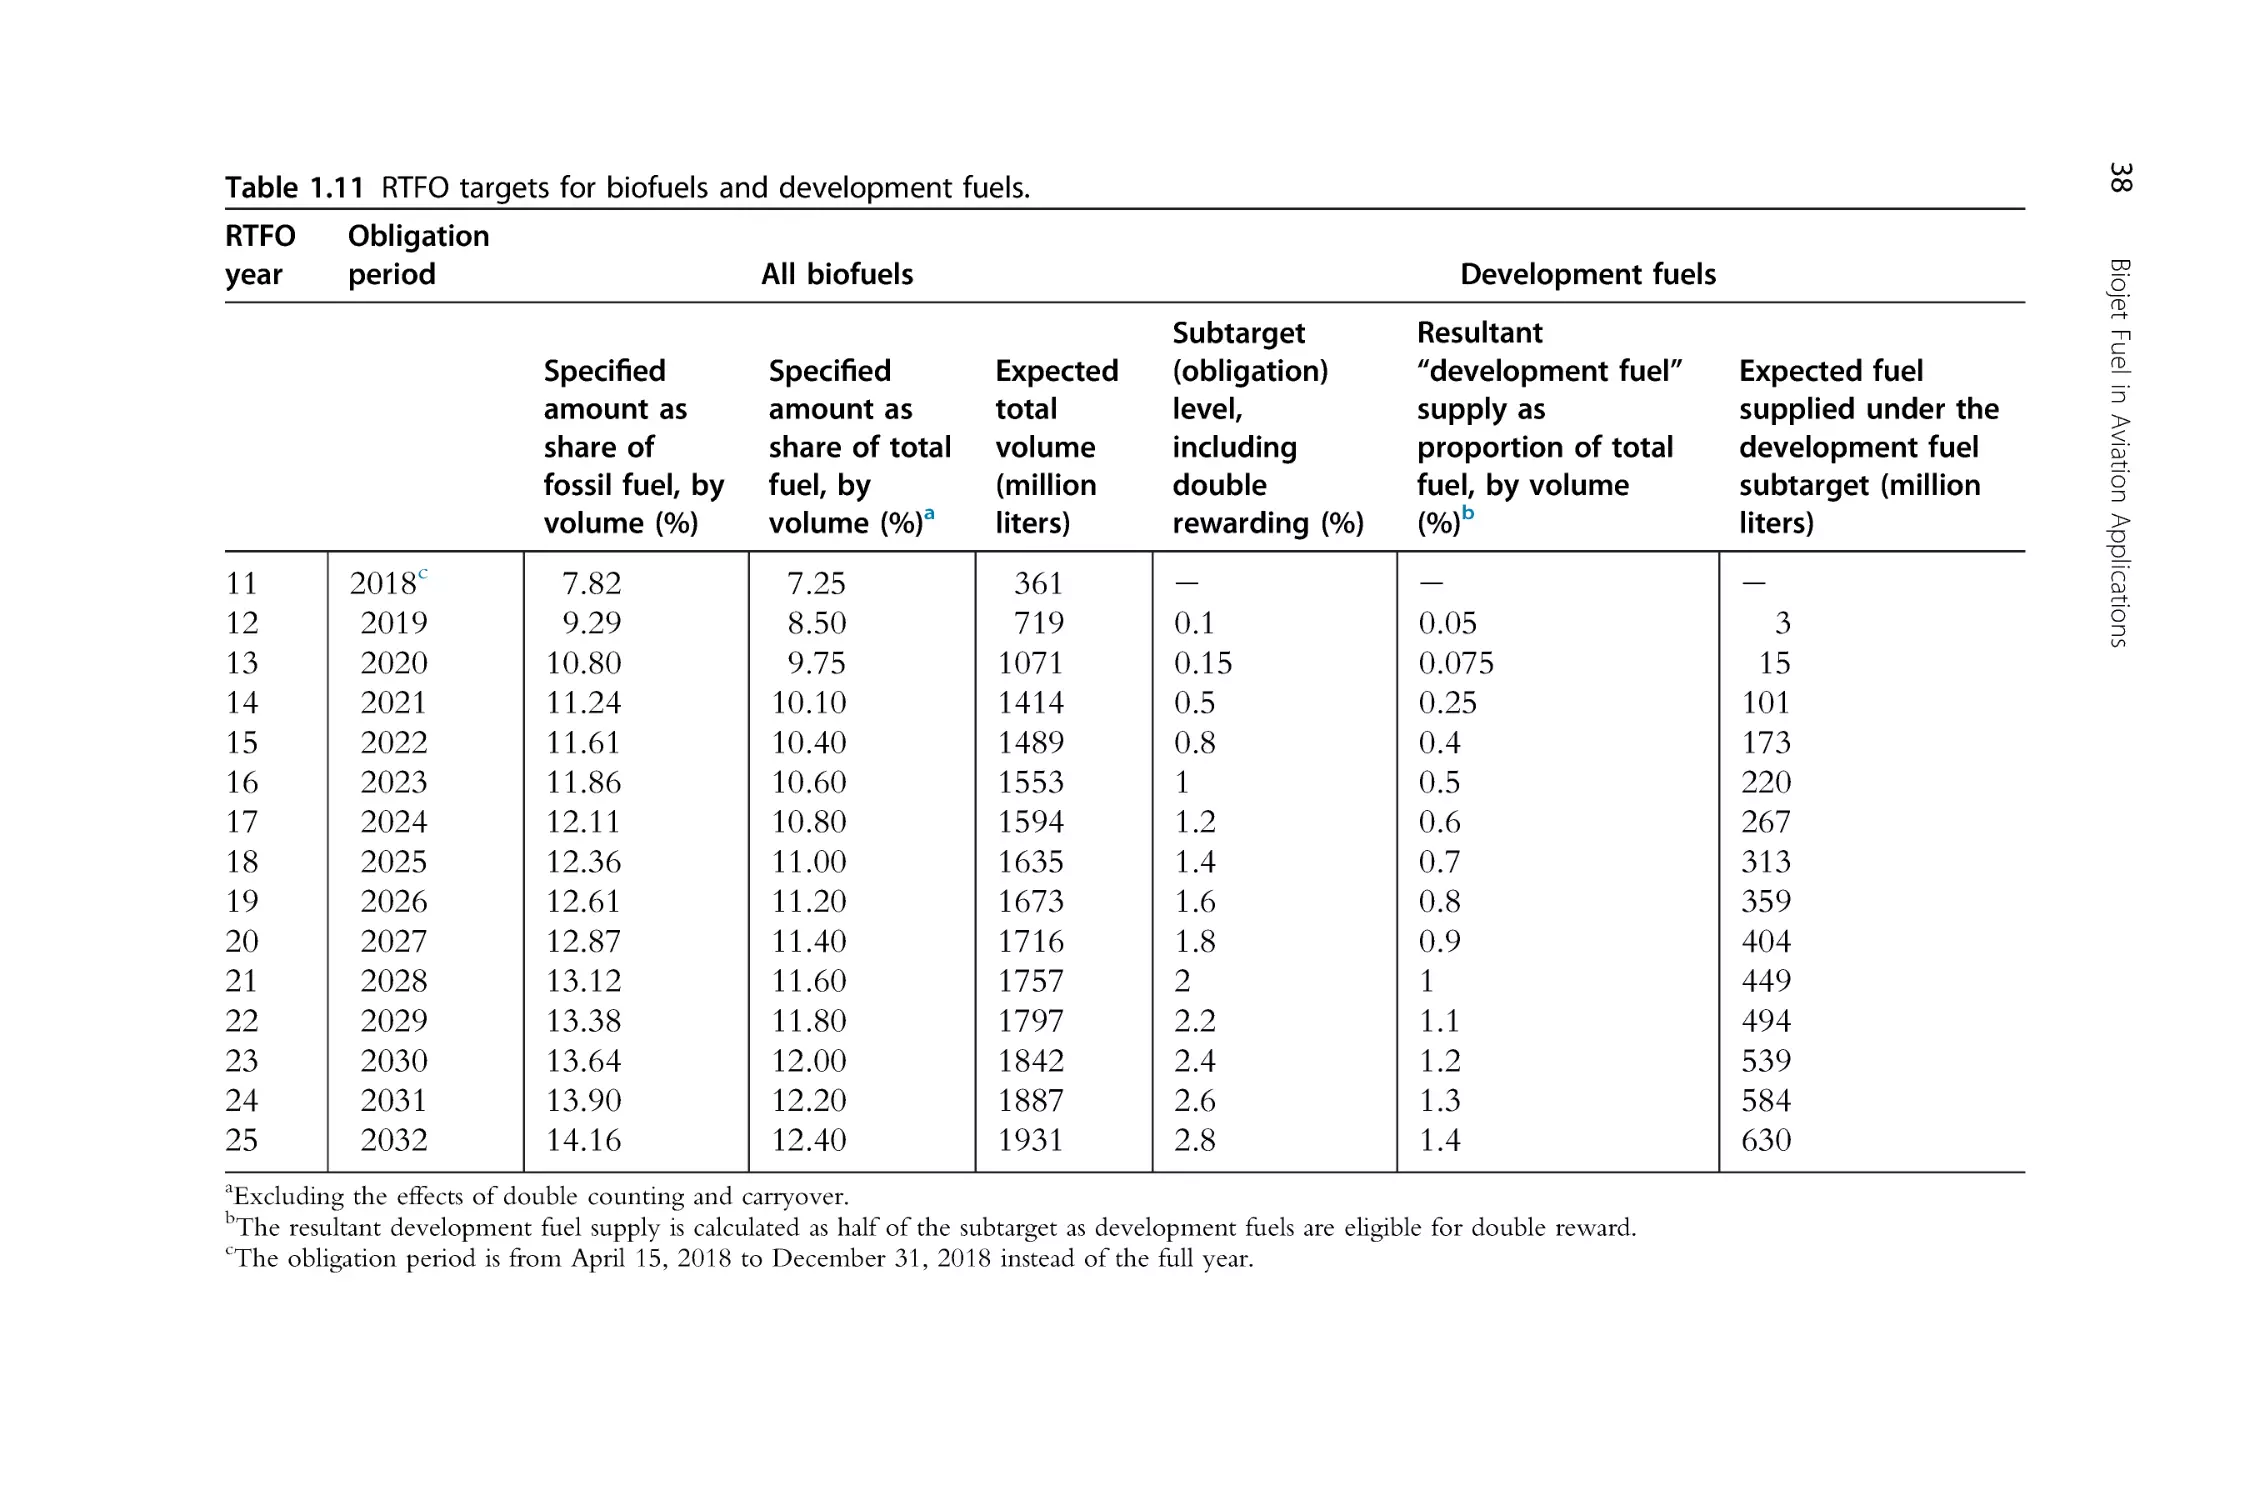
19
still heavily weighted upon biodiesel and bioethanol. In fact, only the United
Kingdom has set a requirement for blending development fuel, which must
be aviation fuel, hydrogen, or substitute natural gas.
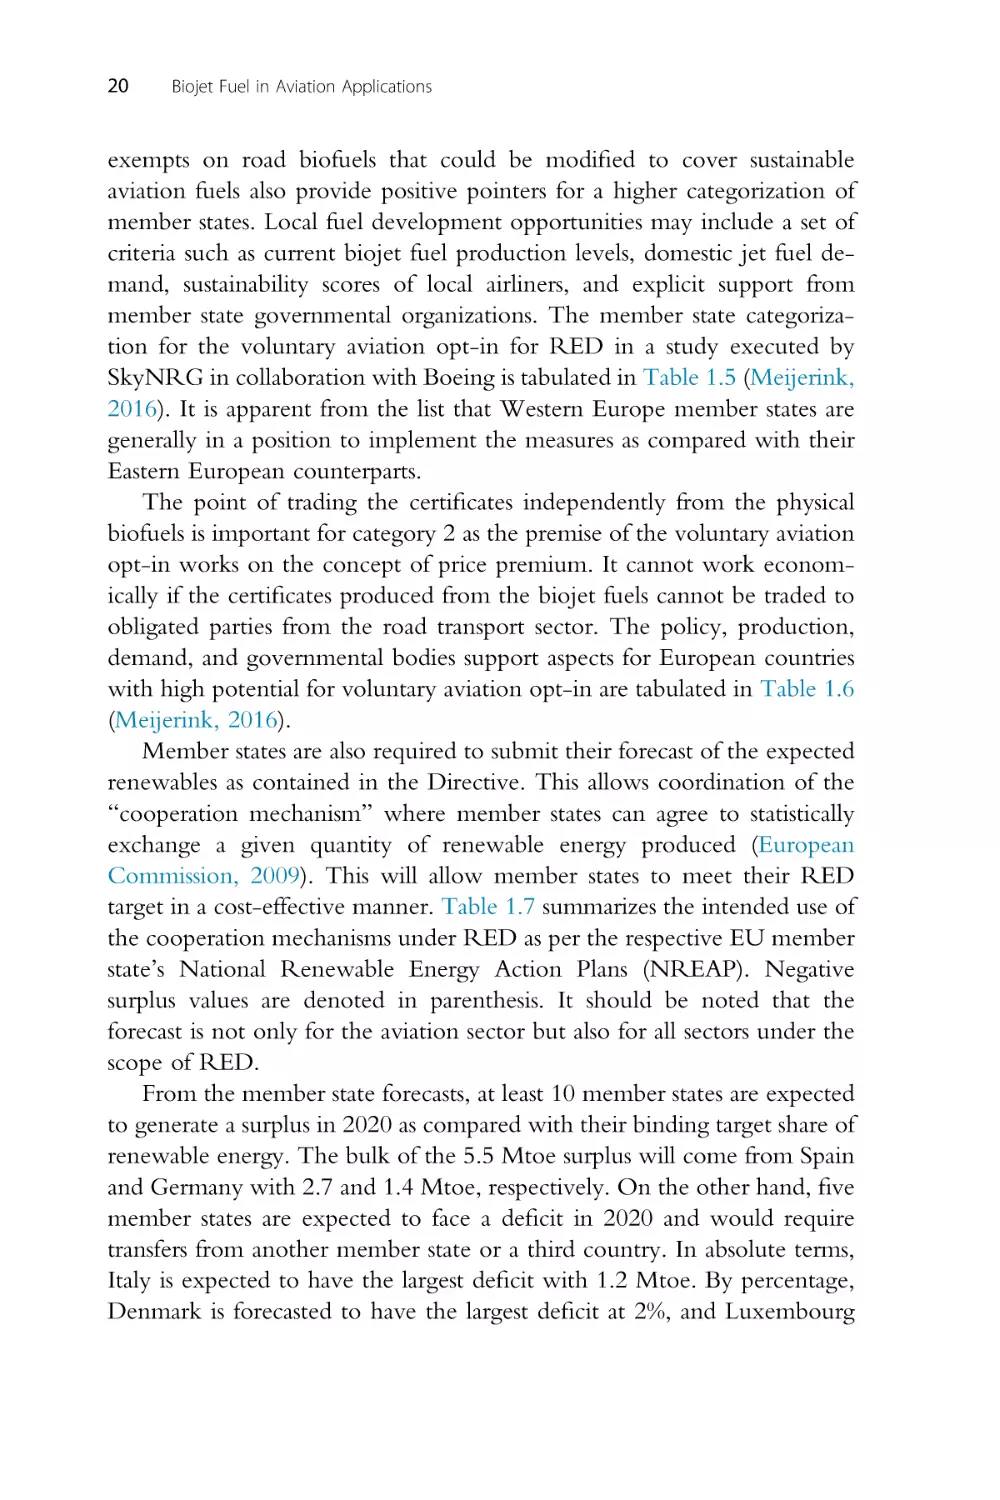
The aviation sector is unique within the implementation of RED due to
the nature of international aviation, where emissions and environmental
effects are not bounded to just the national borders of the EU member
states. In reality, the modes of implementation must be compliant to both
the RED and CORSIA frameworks. This requires greater coordination
than just regulations and policies being issued in silo. The risk of carbon
accounting discrepancies is possible especially in how emissions accounting
methods are defined. Furthermore, the different frameworks also have
differing GHG savings requirements where CORSIA requires 10% instead
of the more stringent 65% (after January 2026) imposed under the RED II.
The RED scope as defined under Article 3(4) calculates the overall
renewable energy in transport as in Eq. (1.2):
REDð%Þ ¼
All types of energy from renewable sources consumed in all forms of transport
Petrol; diesel; biofuels consumed in road and rail transport; and electricity ðin transportÞbut excluding off road
(1.2)
Multipliers for the denominator can be used in specific end sector, for
example, a 1.2 value is assigned to biofuels in aviation. This increased the
desirability for member states to encourage the use of biojet fuel.
The EU Directive 2015/1513 amended and harmonized both the Fuel
Quality Directive, (FQD) (98/70/EC) and RED (2009/28/EC). Key
changes pertinent to the aviation sector include the ability of EU member
states to voluntarily opt in for the RED aviation opt-in mechanism. When
the amendment was made, all the 28 EU member states were categorized
according to the potential to implement the voluntary aviation opt-in.
From the exercise, Germany, Ireland, Italy, Portugal, Spain, and the United
Kingdom were deemed to have high potential in implementing the
voluntary aviation opt-in. The six member states were identified in addition
to the Netherlands, which already implemented voluntary sustainable
aviation fuel for their RED in 2013. Clearly, it was the Netherlands’ move
to include the aviation opt-in in their RED that triggered the EU-wide
reform that led to the ability of other member states to do the same.
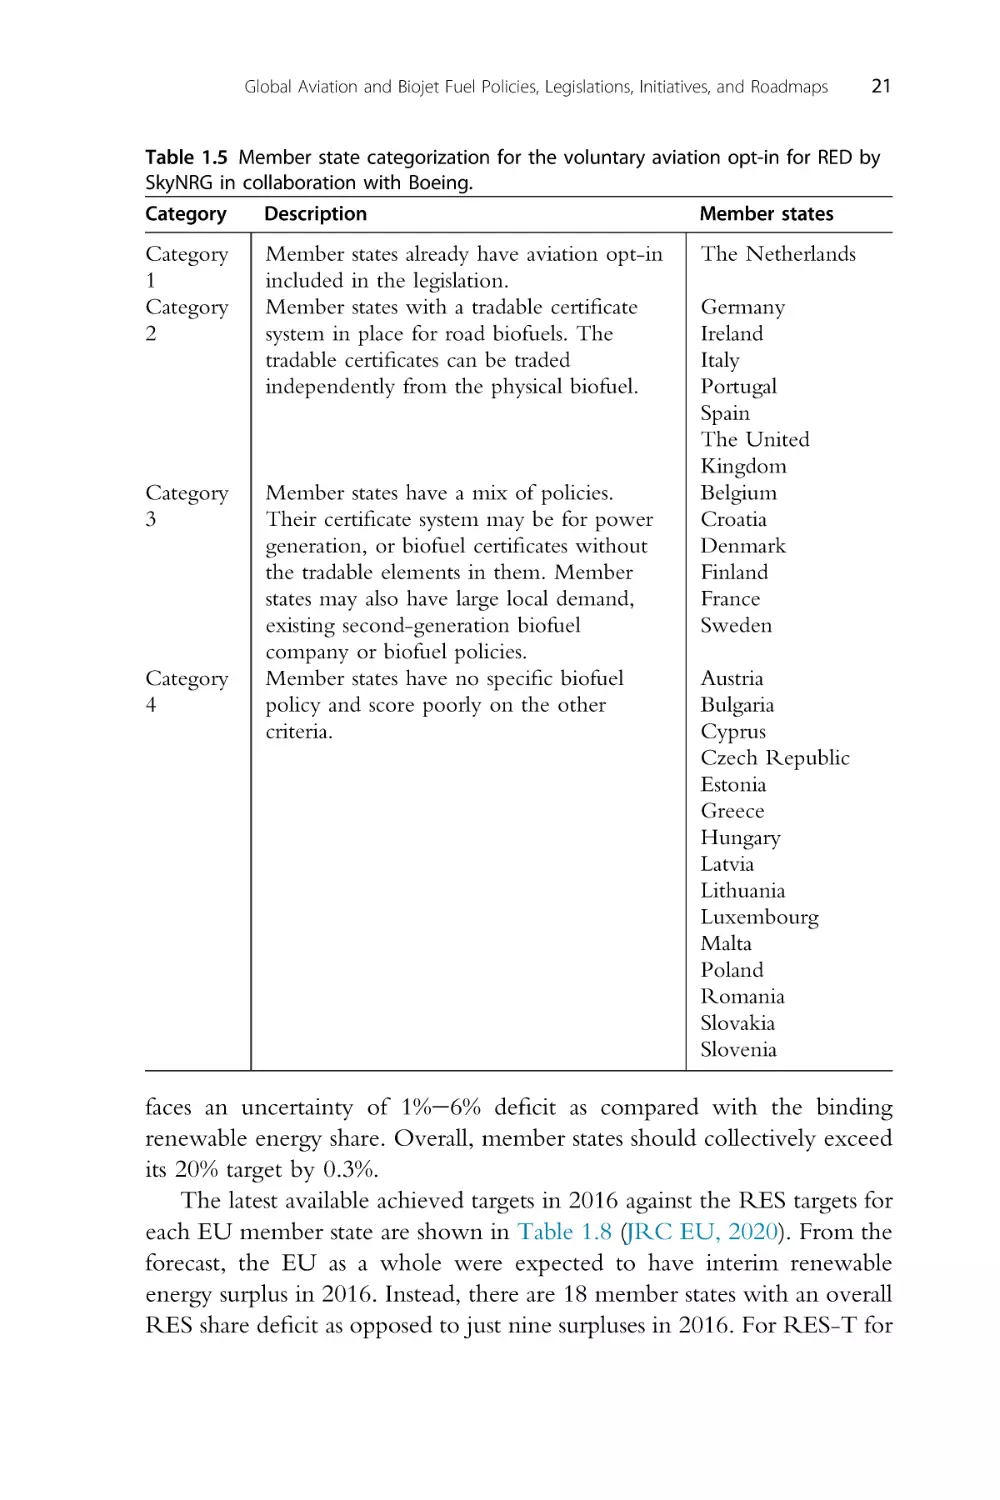
The member states were evaluated for certificate system, policy
incentives, and local sustainable aviation fuel development opportunities.
Among the three factors, the certificate system is of utmost importance as
the existence of a certification system will allow quick transition to adopt
the voluntary aviation opt-in. Other policy incentives such as existing tax
20
Biojet Fuel in Aviation Applications
exempts on road biofuels that could be modified to cover sustainable
aviation fuels also provide positive pointers for a higher categorization of
member states. Local fuel development opportunities may include a set of
criteria such as current biojet fuel production levels, domestic jet fuel demand, sustainability scores of local airliners, and explicit support from
member state governmental organizations. The member state categorization for the voluntary aviation opt-in for RED in a study executed by
SkyNRG in collaboration with Boeing is tabulated in Table 1.5 (Meijerink,
2016). It is apparent from the list that Western Europe member states are
generally in a position to implement the measures as compared with their
Eastern European counterparts.
The point of trading the certificates independently from the physical
biofuels is important for category 2 as the premise of the voluntary aviation
opt-in works on the concept of price premium. It cannot work economically if the certificates produced from the biojet fuels cannot be traded to
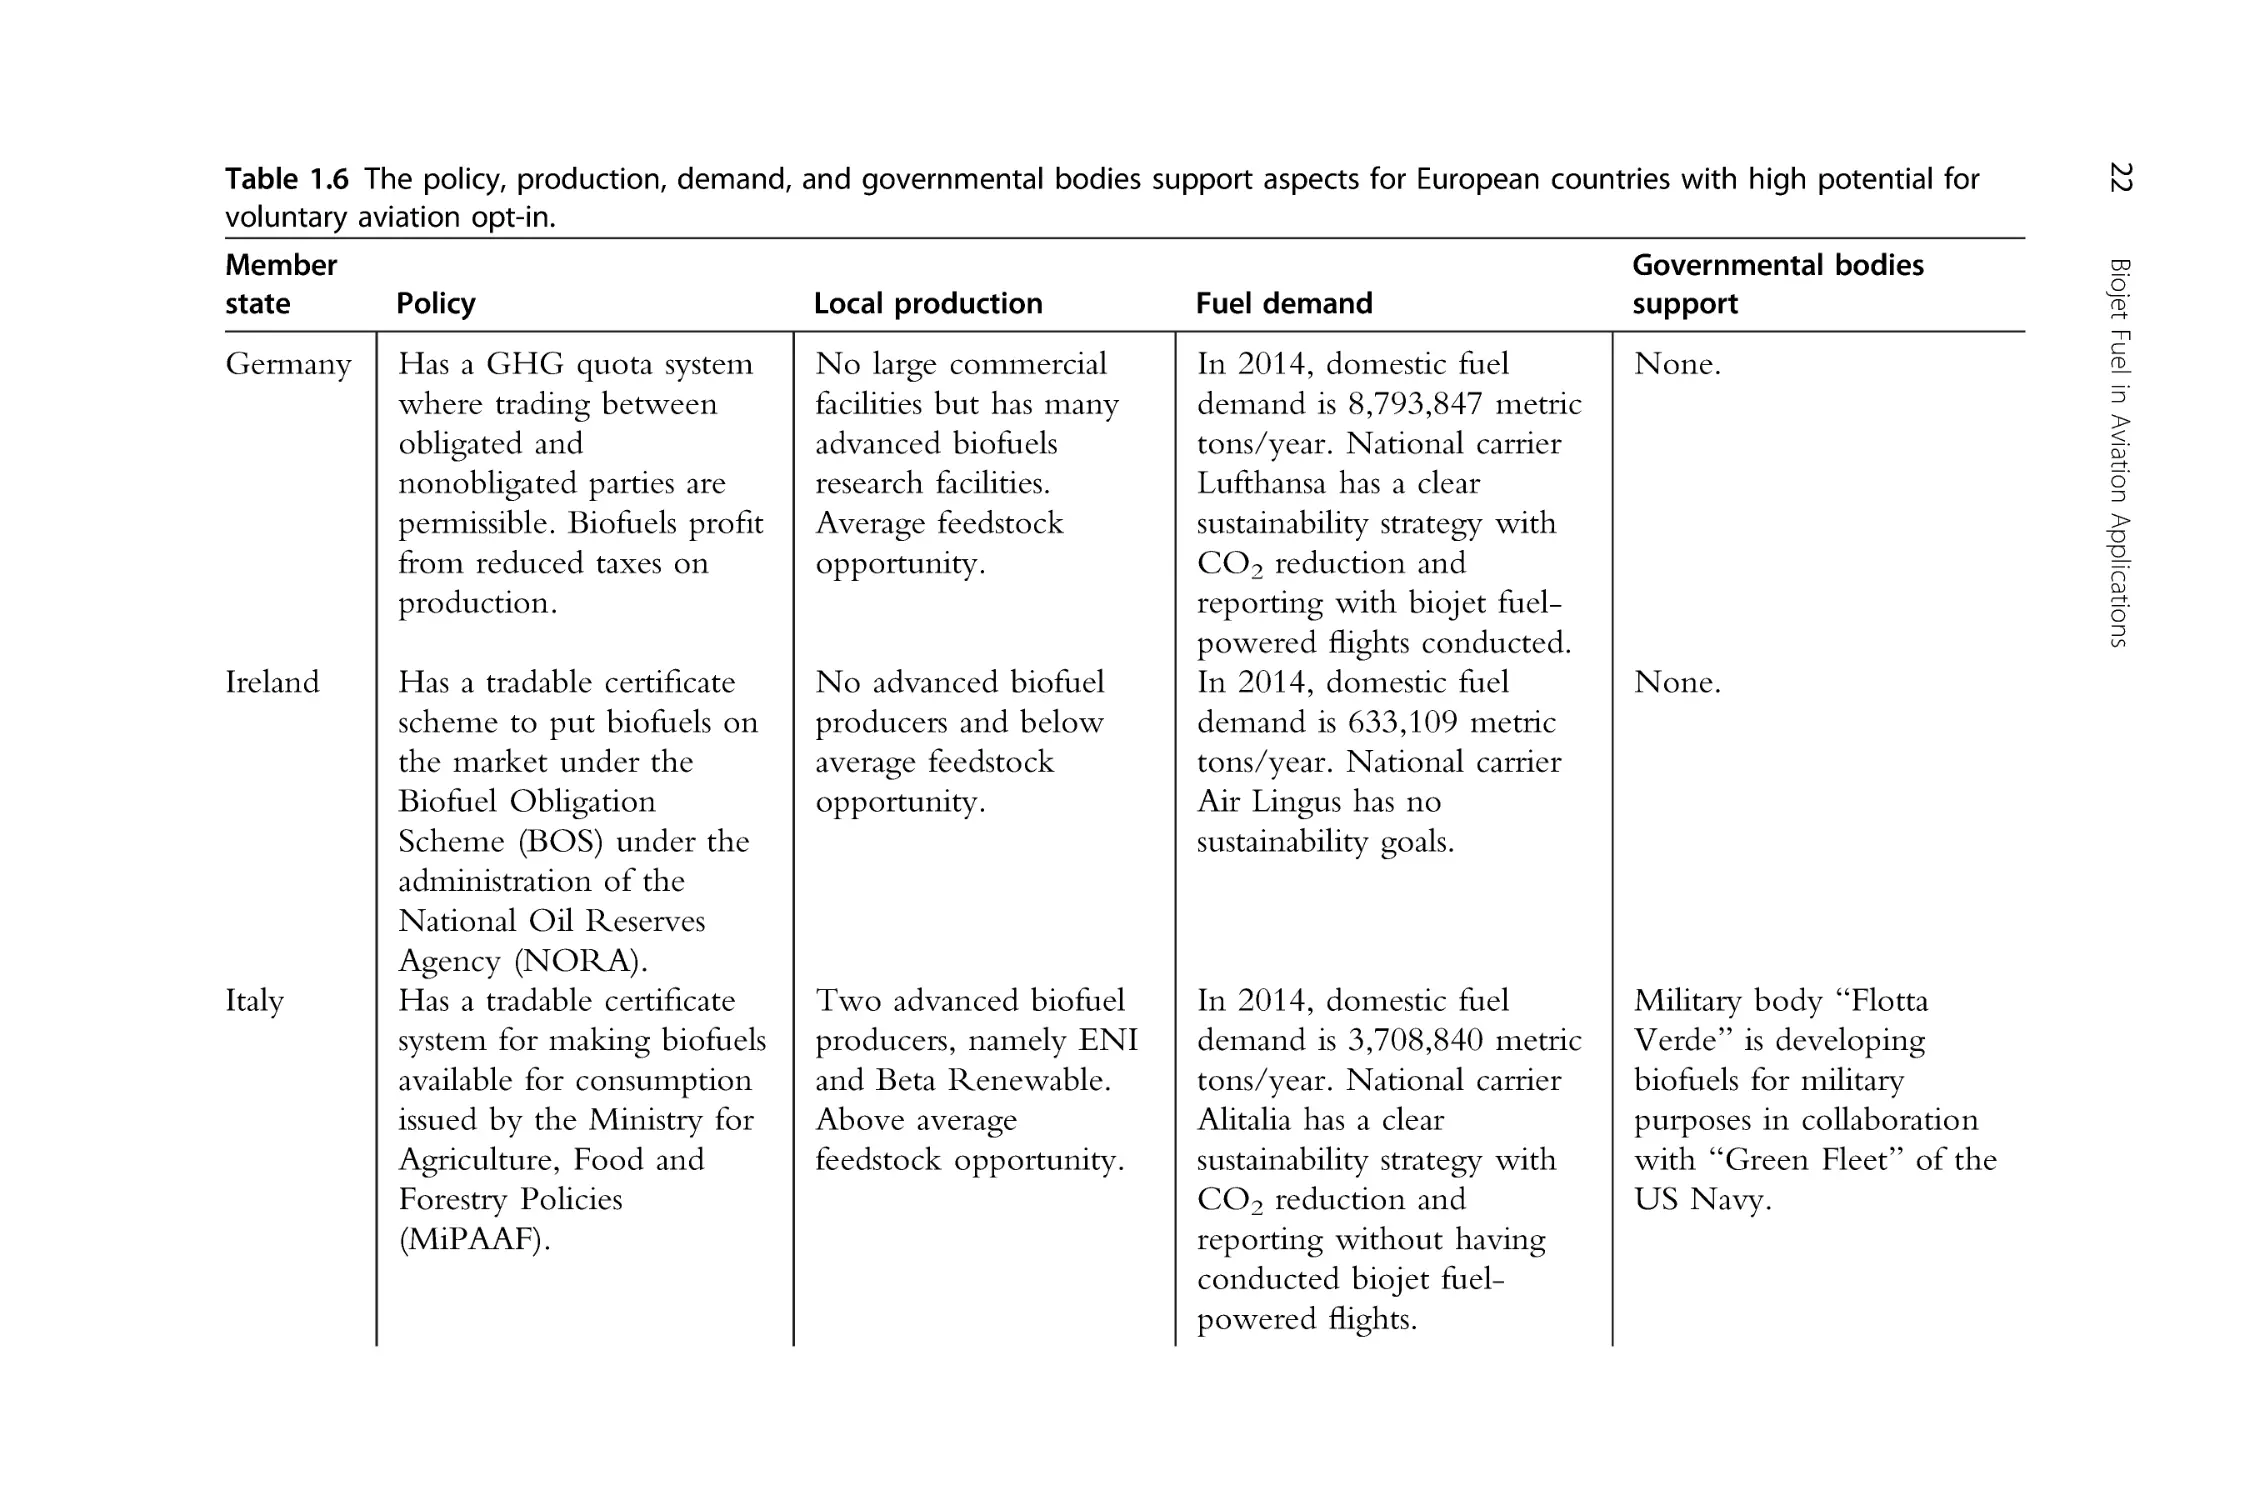
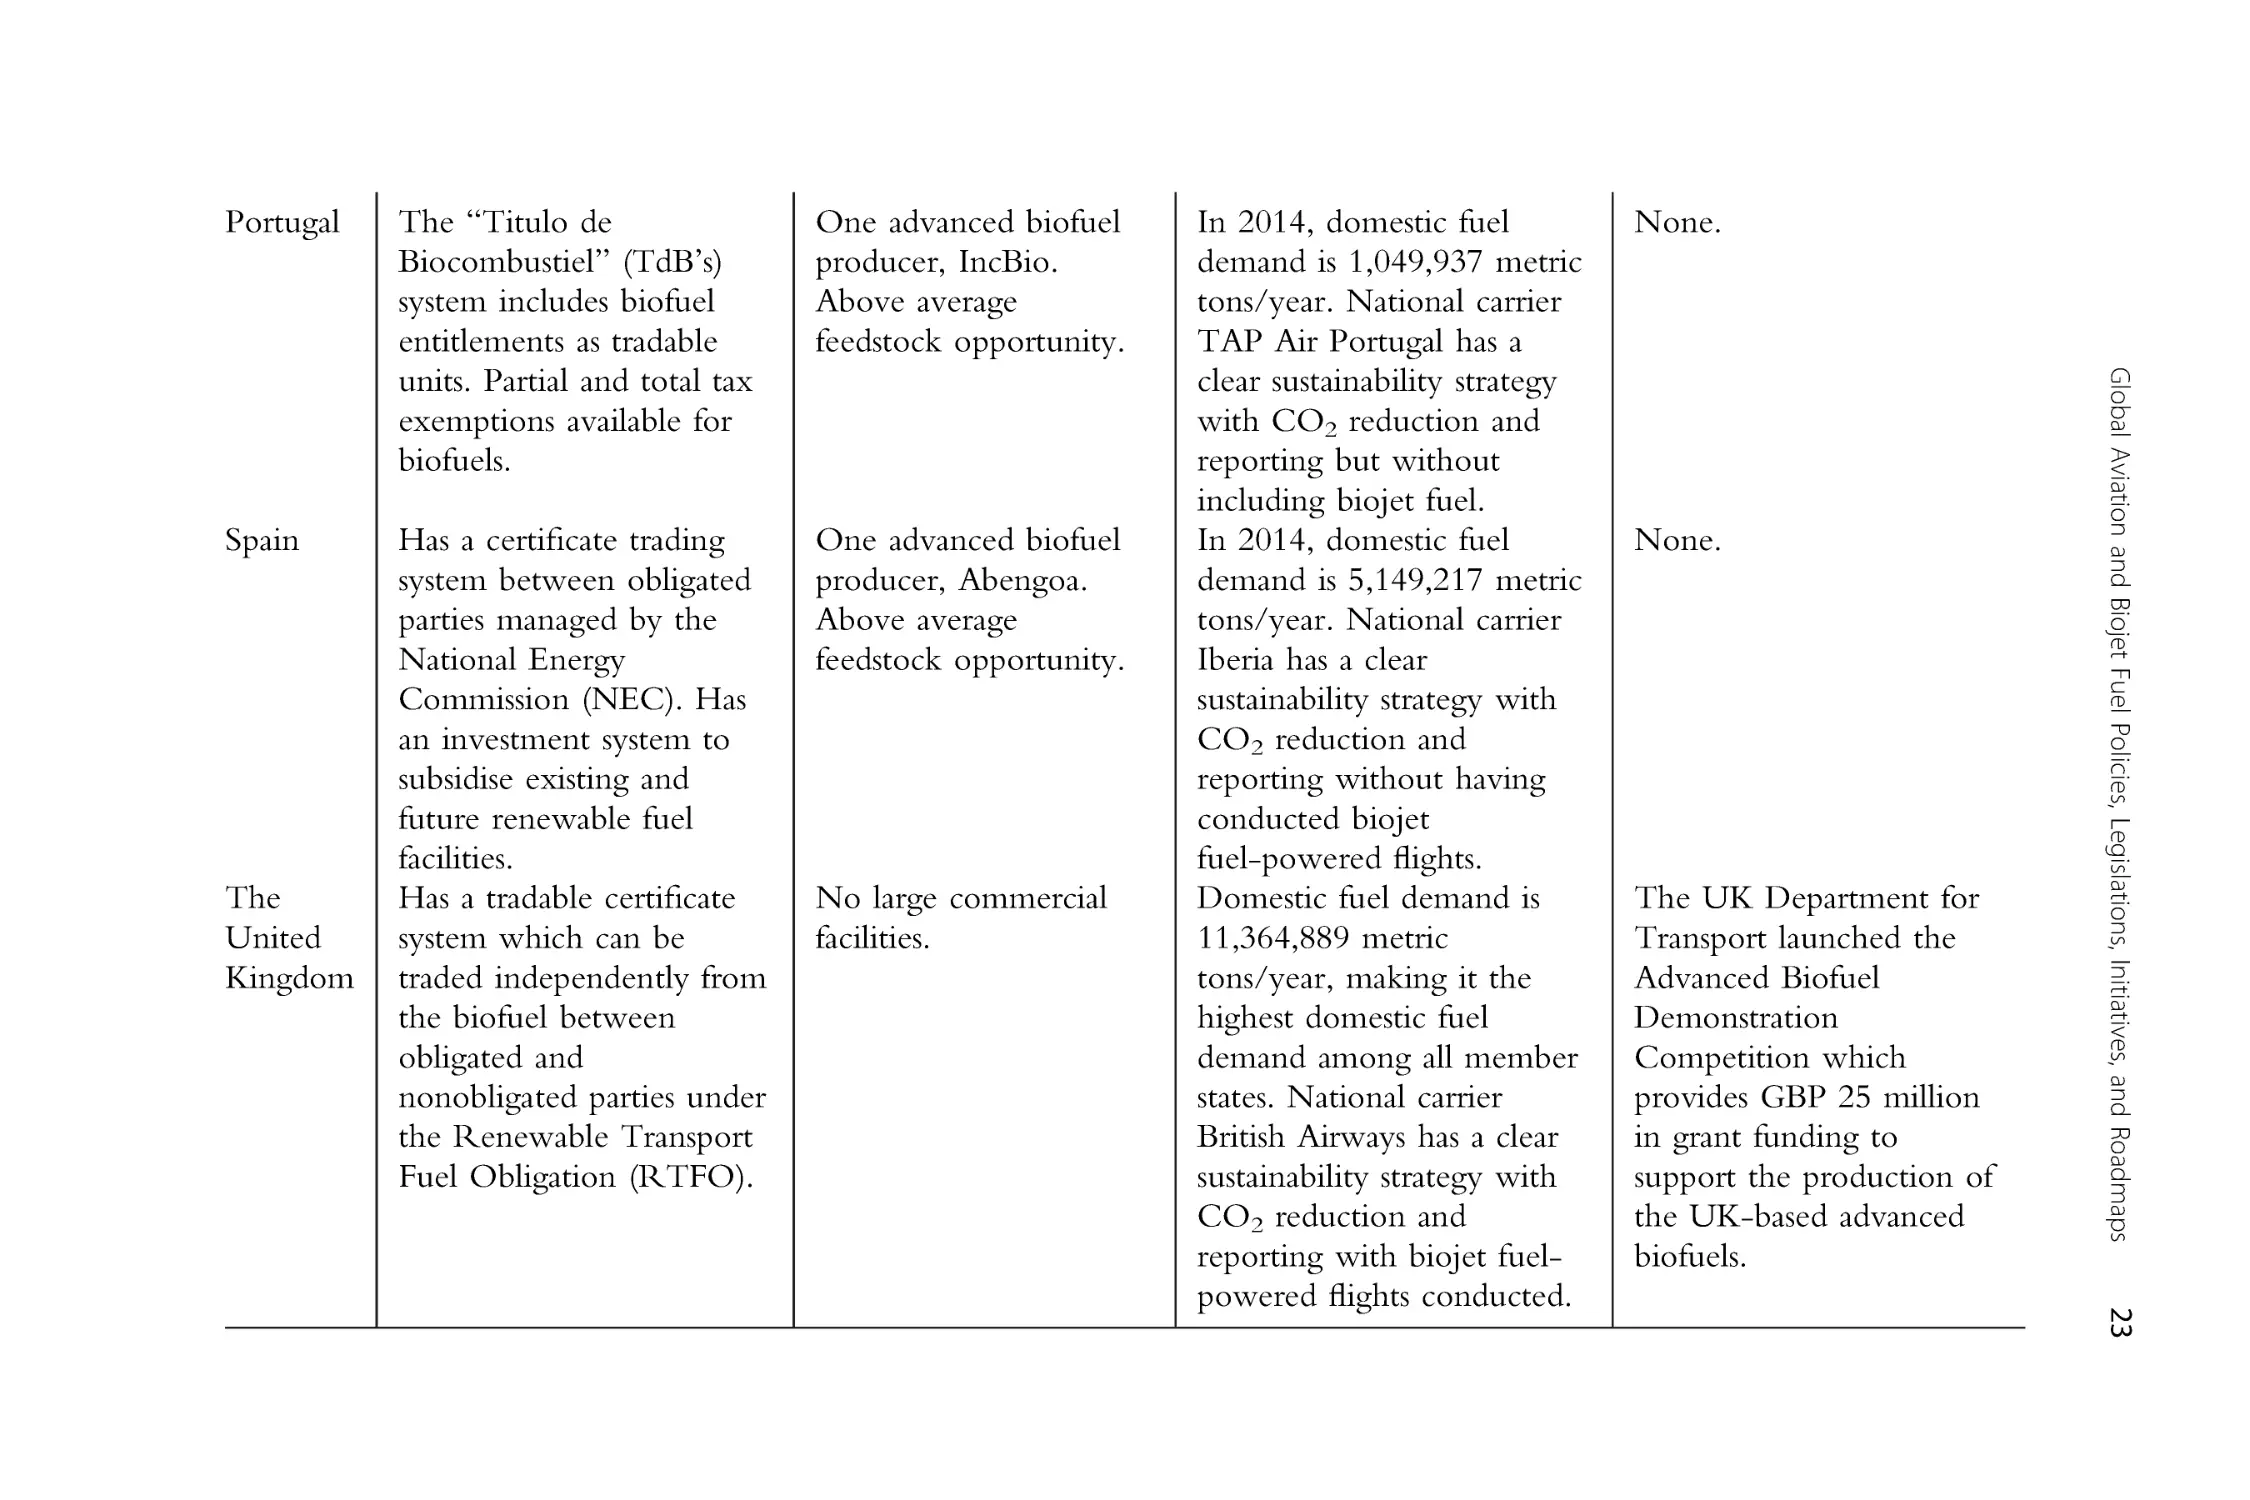
obligated parties from the road transport sector. The policy, production,
demand, and governmental bodies support aspects for European countries
with high potential for voluntary aviation opt-in are tabulated in Table 1.6
(Meijerink, 2016).
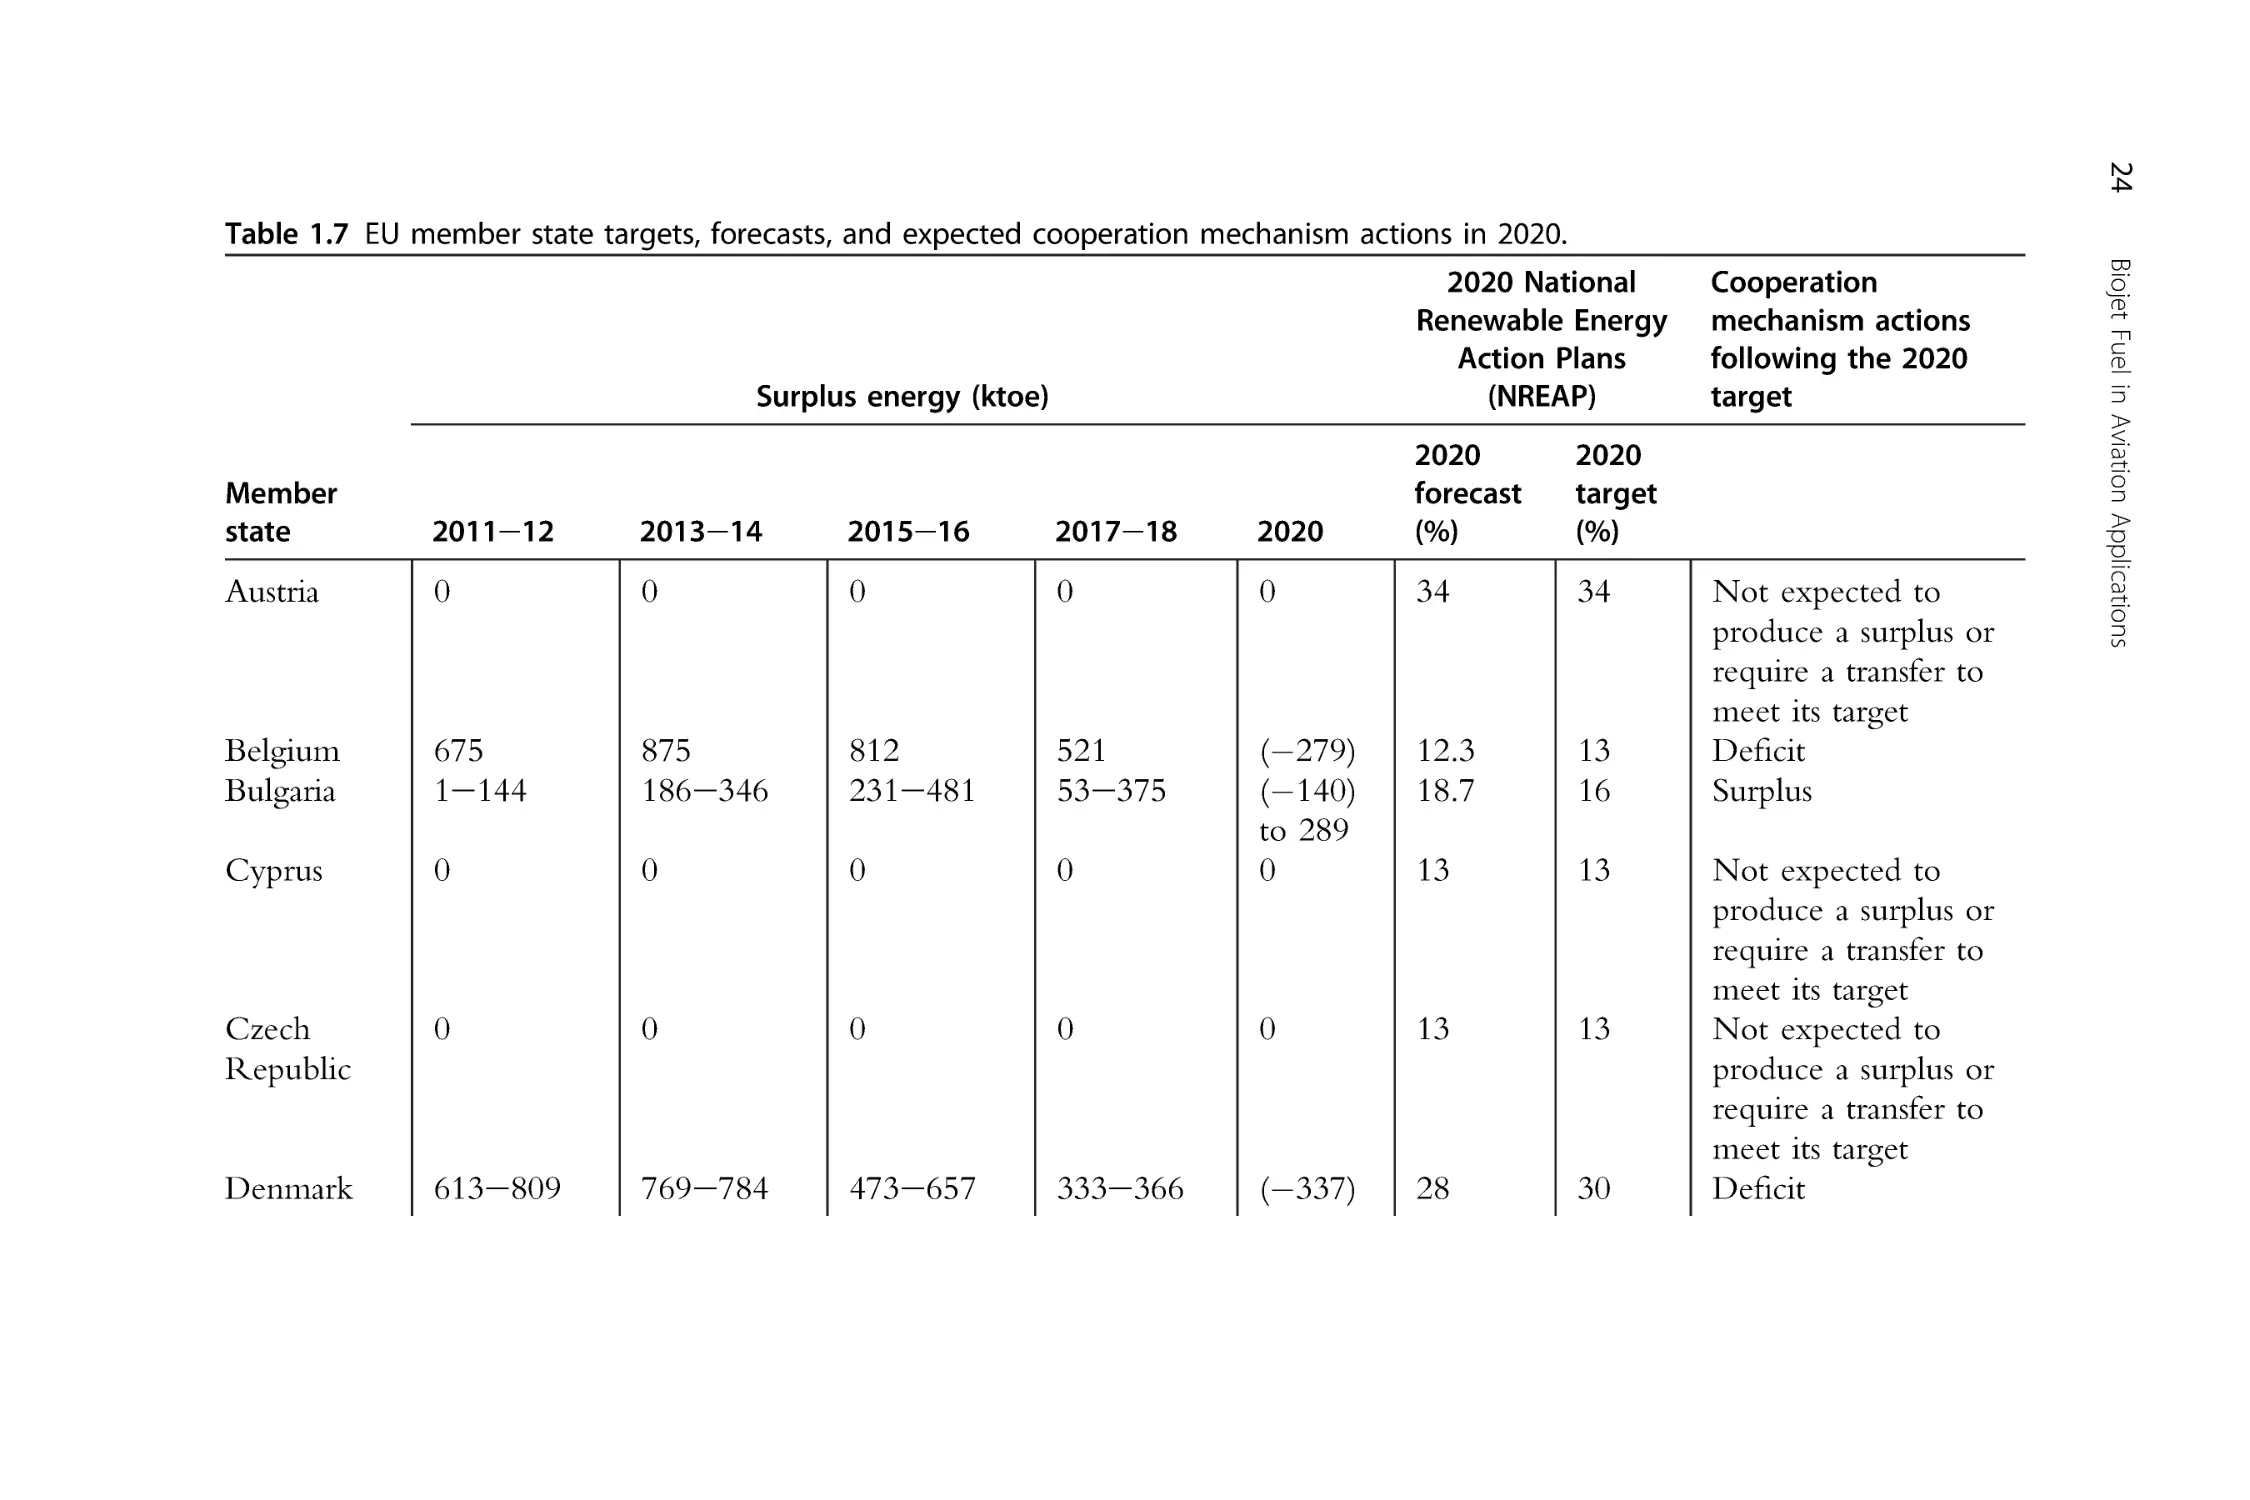
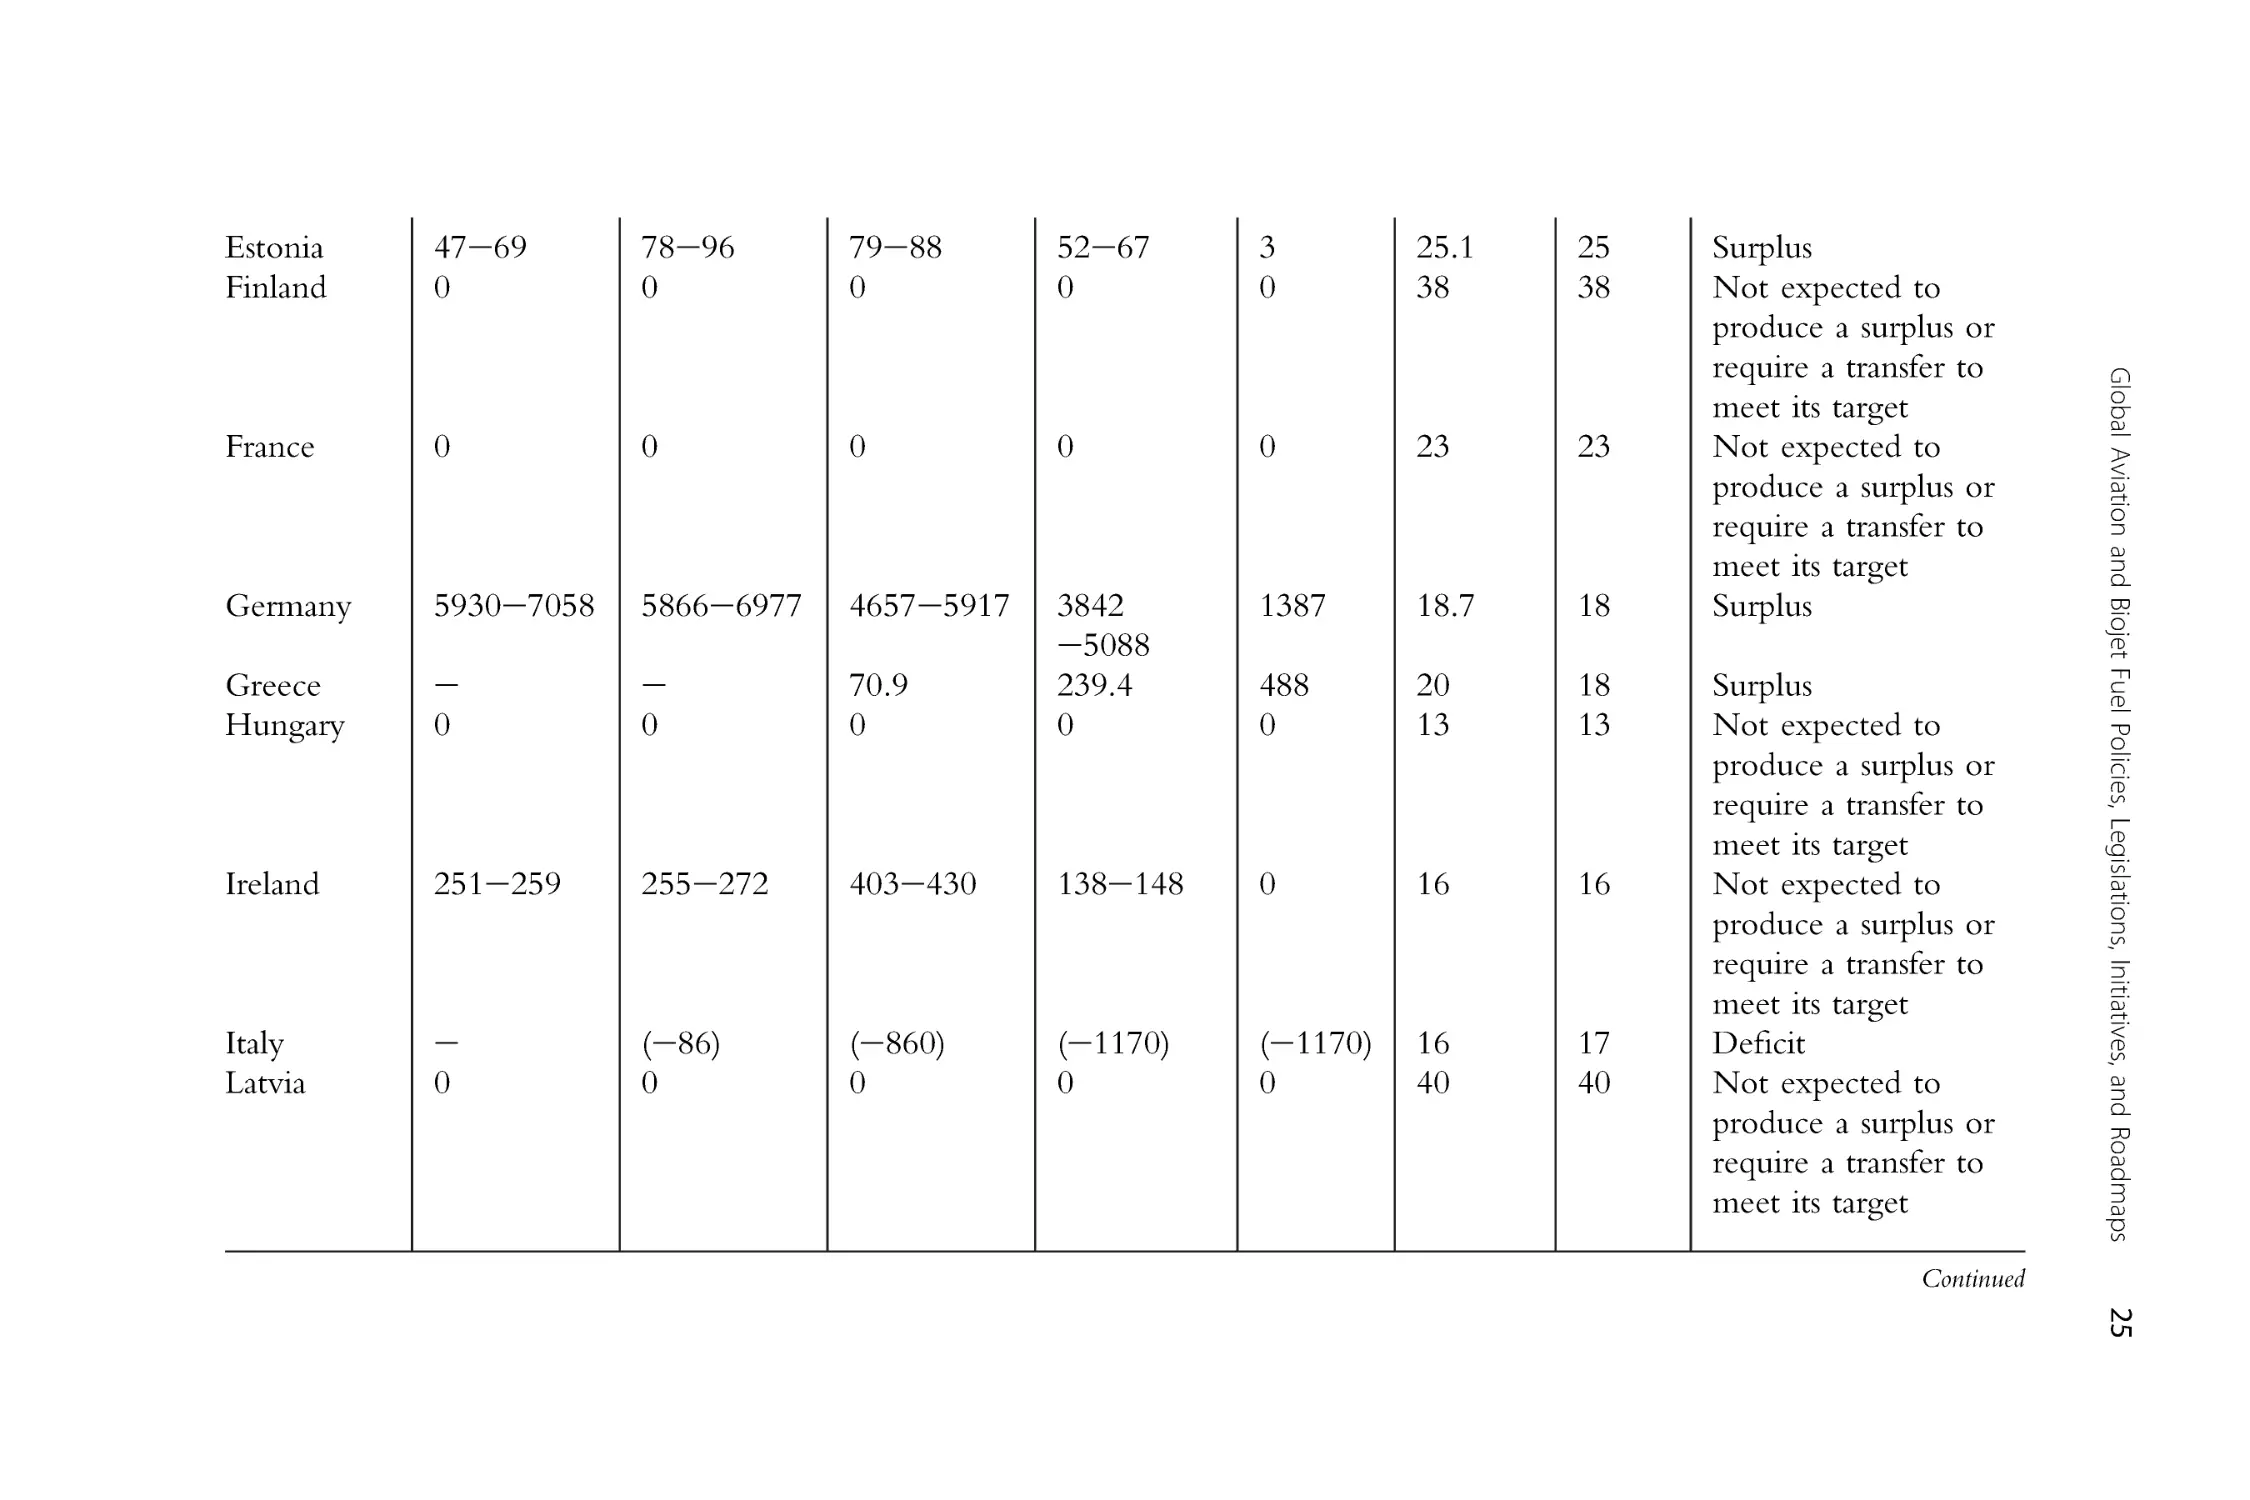
Member states are also required to submit their forecast of the expected
renewables as contained in the Directive. This allows coordination of the
“cooperation mechanism” where member states can agree to statistically
exchange a given quantity of renewable energy produced (European
Commission, 2009). This will allow member states to meet their RED
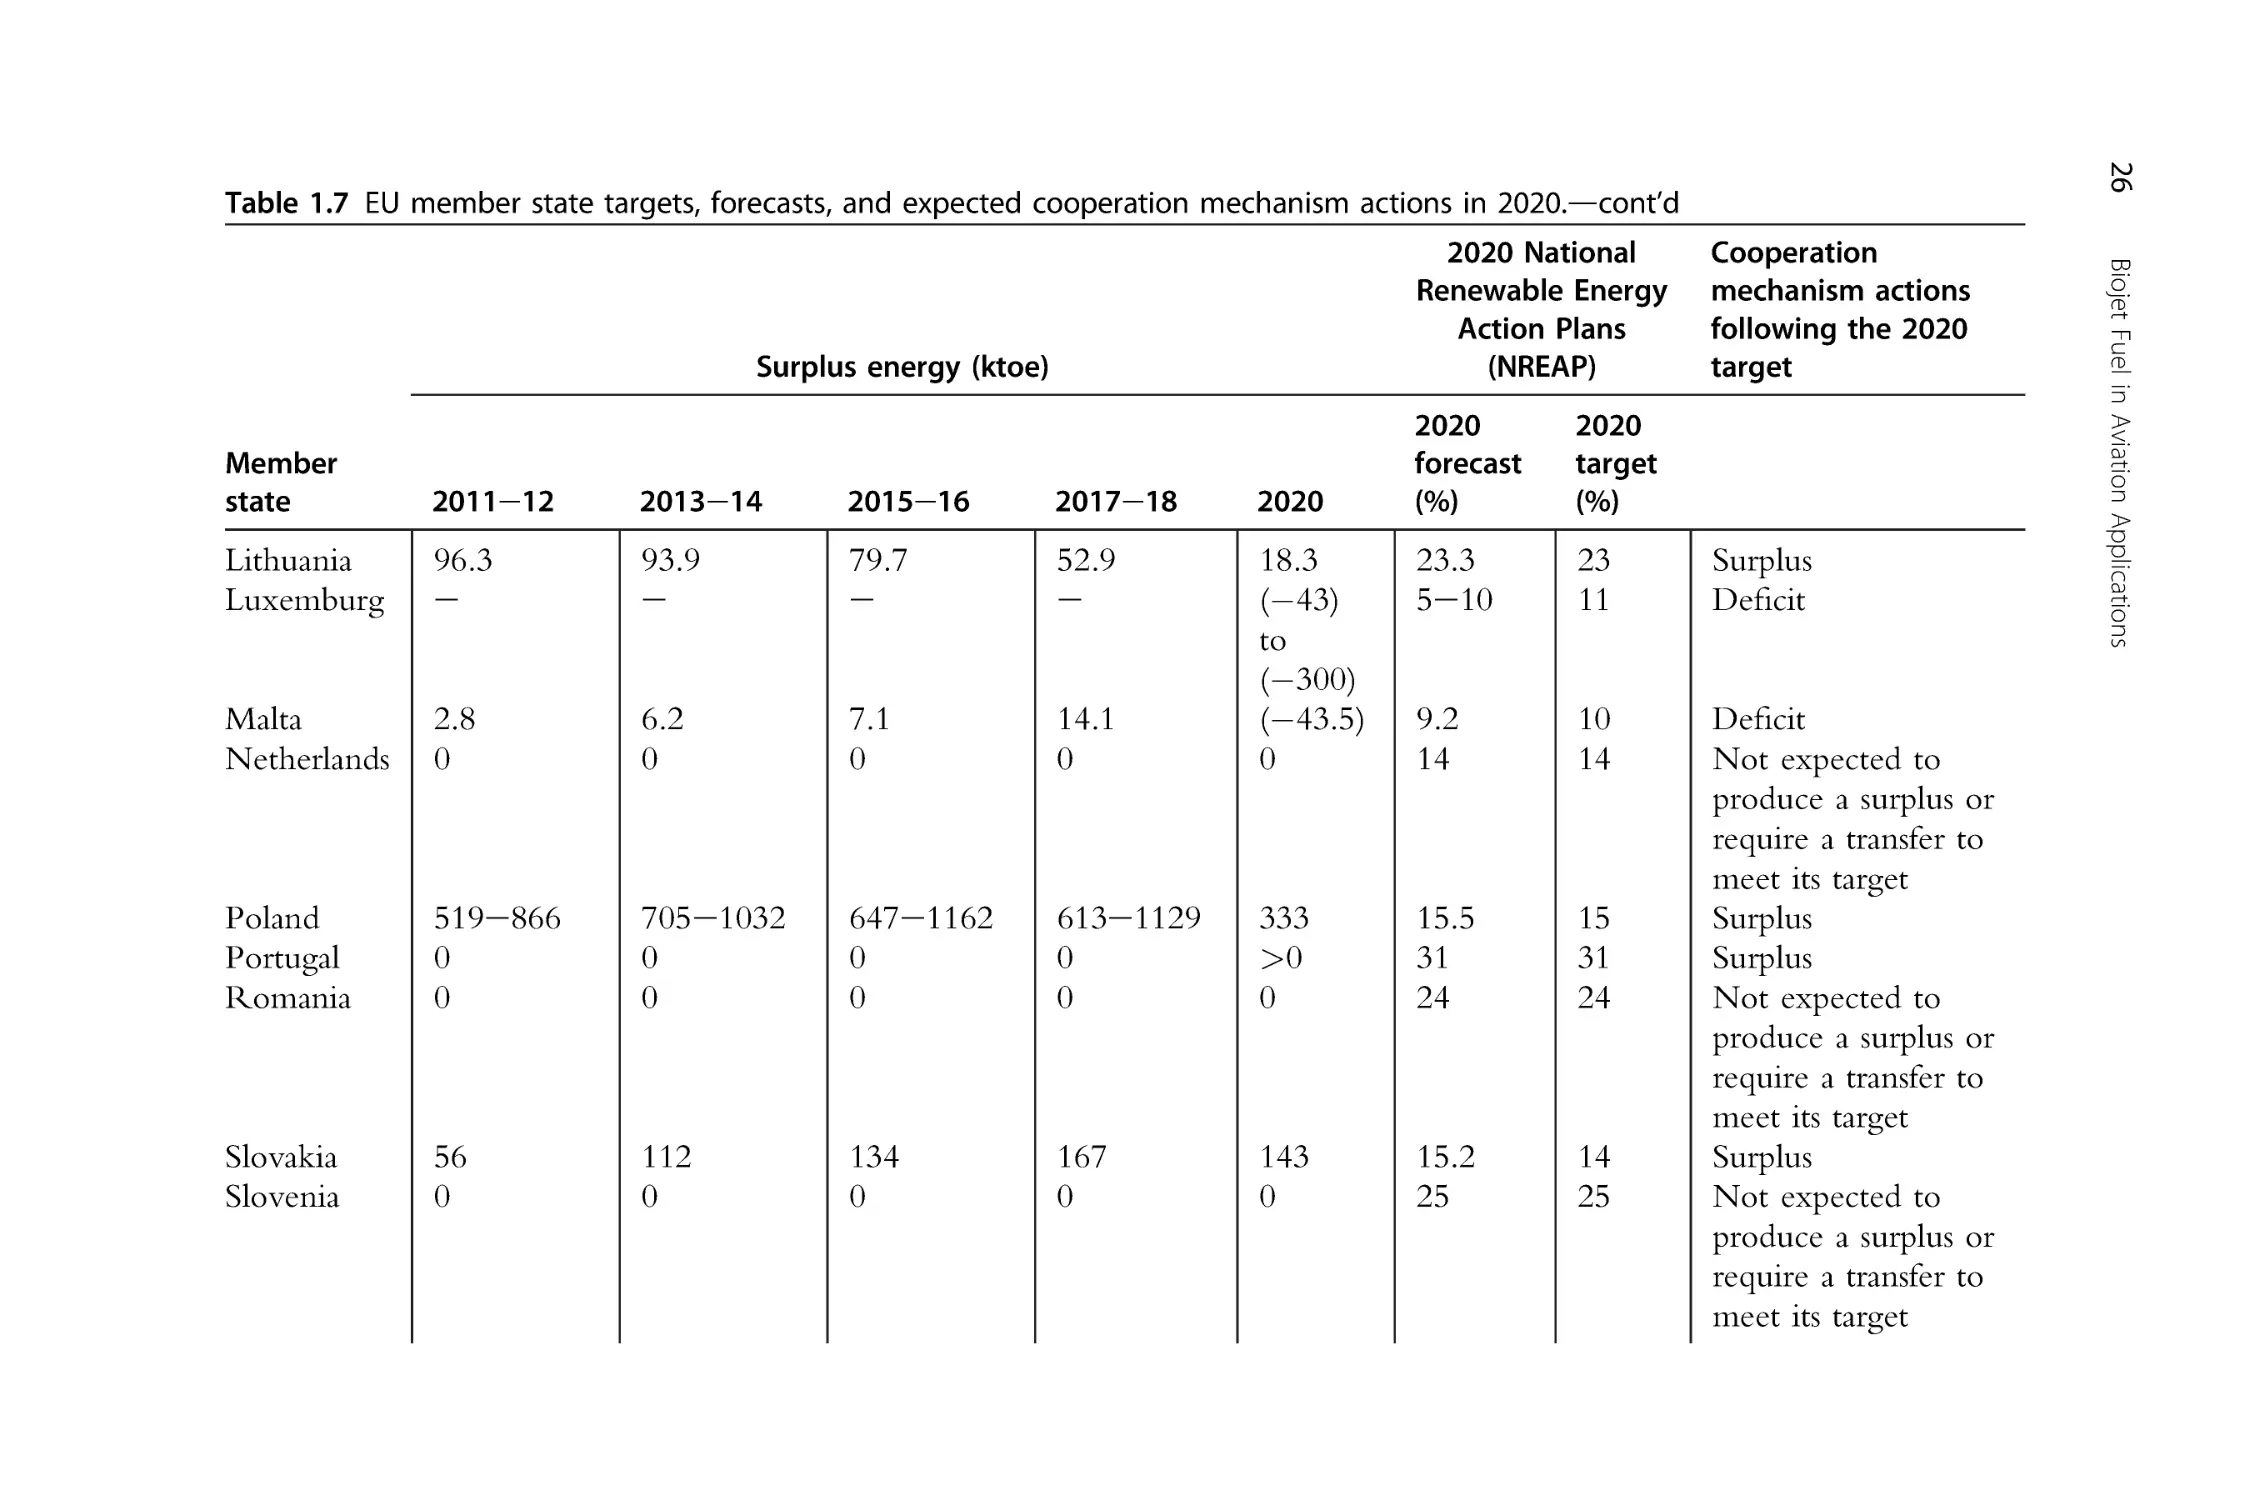
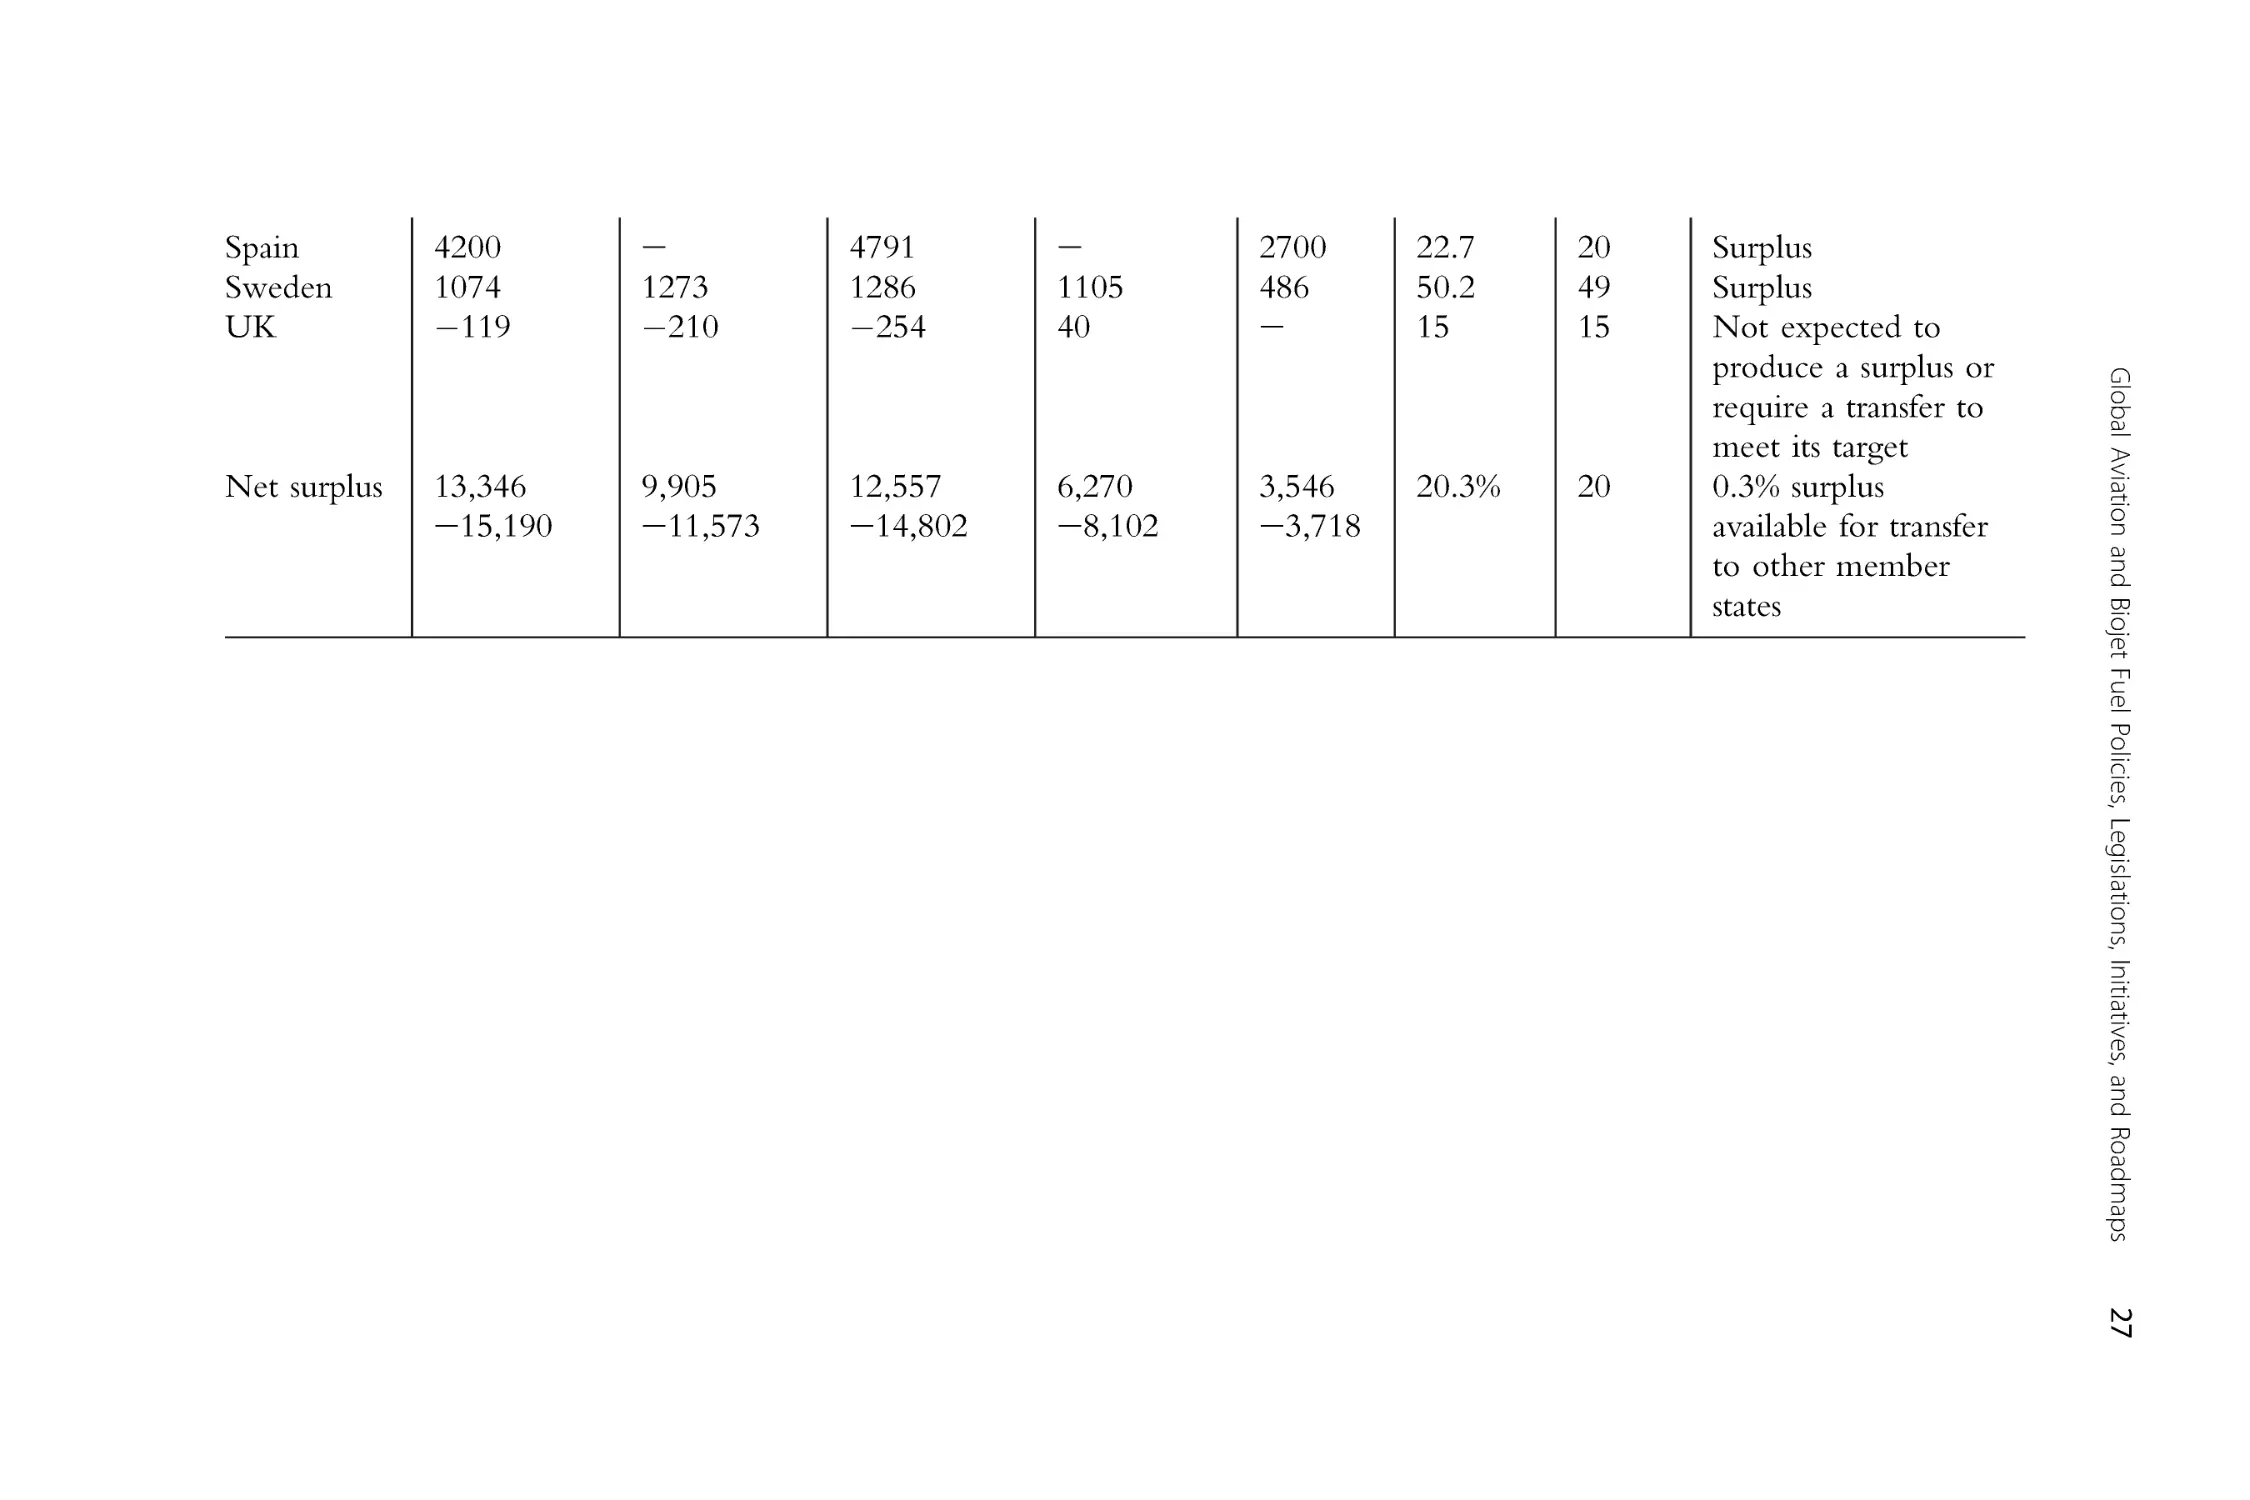
target in a cost-effective manner. Table 1.7 summarizes the intended use of
the cooperation mechanisms under RED as per the respective EU member
state’s National Renewable Energy Action Plans (NREAP). Negative
surplus values are denoted in parenthesis. It should be noted that the
forecast is not only for the aviation sector but also for all sectors under the
scope of RED.
From the member state forecasts, at least 10 member states are expected
to generate a surplus in 2020 as compared with their binding target share of
renewable energy. The bulk of the 5.5 Mtoe surplus will come from Spain
and Germany with 2.7 and 1.4 Mtoe, respectively. On the other hand, five
member states are expected to face a deficit in 2020 and would require
transfers from another member state or a third country. In absolute terms,
Italy is expected to have the largest deficit with 1.2 Mtoe. By percentage,
Denmark is forecasted to have the largest deficit at 2%, and Luxembourg
Global Aviation and Biojet Fuel Policies, Legislations, Initiatives, and Roadmaps
21
Table 1.5 Member state categorization for the voluntary aviation opt-in for RED by
SkyNRG in collaboration with Boeing.
Category
Description
Member states
Category
1
Category
2
Member states already have aviation opt-in
included in the legislation.
Member states with a tradable certificate
system in place for road biofuels. The
tradable certificates can be traded
independently from the physical biofuel.
Category
3
Member states have a mix of policies.
Their certificate system may be for power
generation, or biofuel certificates without
the tradable elements in them. Member
states may also have large local demand,
existing second-generation biofuel
company or biofuel policies.
Member states have no specific biofuel
policy and score poorly on the other
criteria.
Category
4
The Netherlands
Germany
Ireland
Italy
Portugal
Spain
The United
Kingdom
Belgium
Croatia
Denmark
Finland
France
Sweden
Austria
Bulgaria
Cyprus
Czech Republic
Estonia
Greece
Hungary
Latvia
Lithuania
Luxembourg
Malta
Poland
Romania
Slovakia
Slovenia
faces an uncertainty of 1%e6% deficit as compared with the binding
renewable energy share. Overall, member states should collectively exceed
its 20% target by 0.3%.
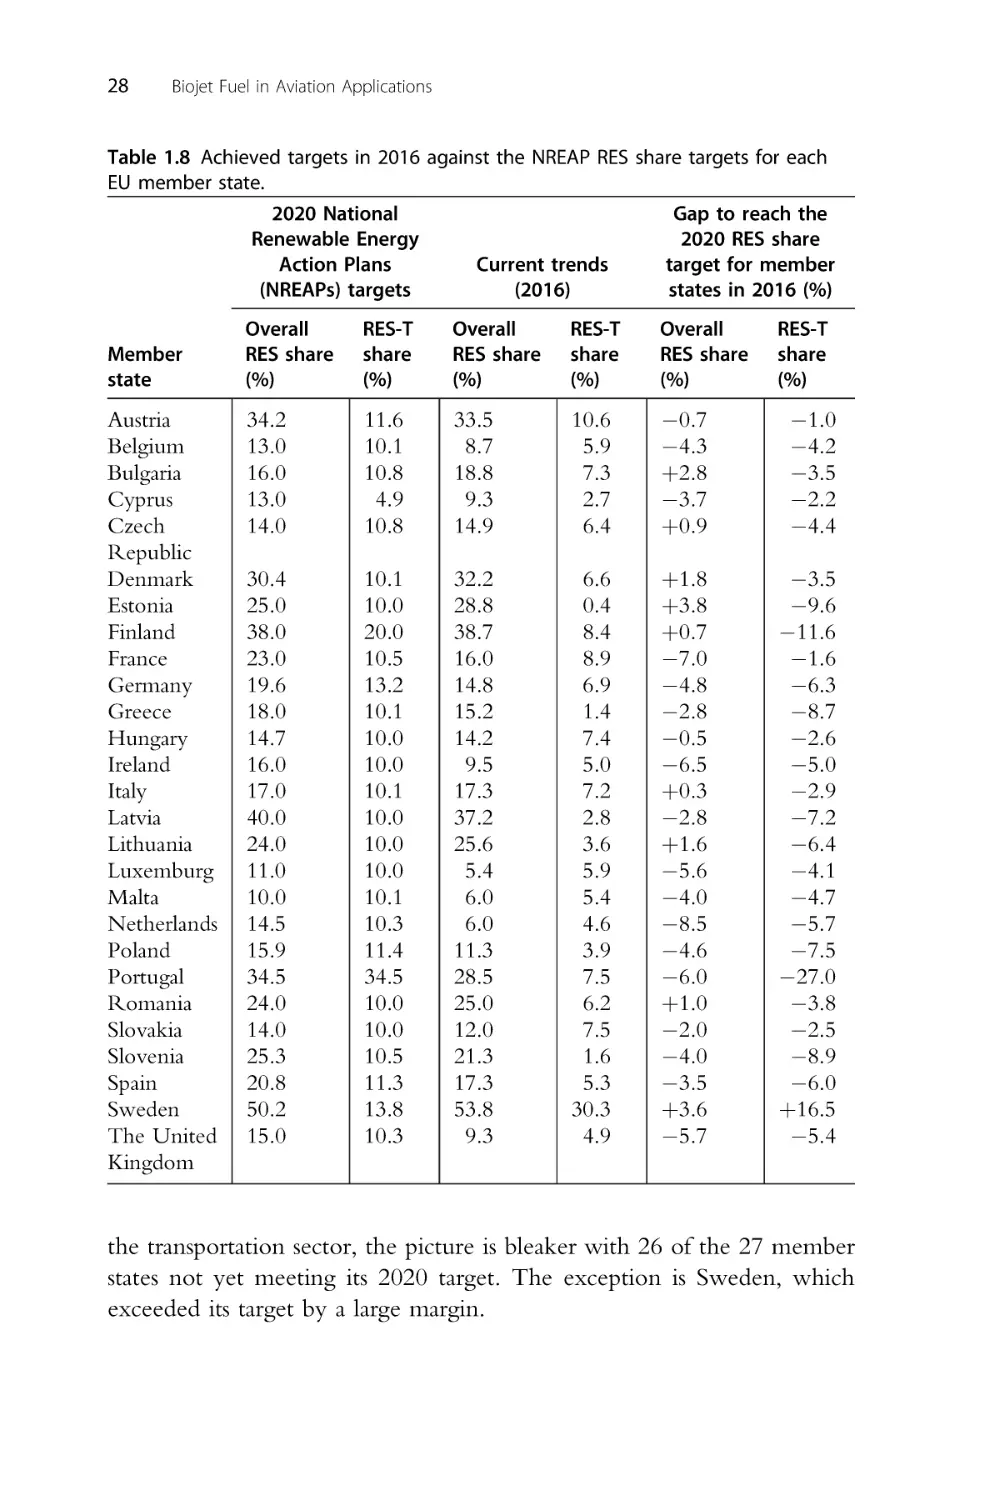
The latest available achieved targets in 2016 against the RES targets for
each EU member state are shown in Table 1.8 (JRC EU, 2020). From the
forecast, the EU as a whole were expected to have interim renewable
energy surplus in 2016. Instead, there are 18 member states with an overall
RES share deficit as opposed to just nine surpluses in 2016. For RES-T for
Table 1.6 The policy, production, demand, and governmental bodies support aspects for European countries with high potential for
voluntary aviation opt-in.
22
Member
state
Biojet Fuel in Aviation Applications
Governmental bodies
support
Policy
Local production
Fuel demand
Germany
Has a GHG quota system
where trading between
obligated and
nonobligated parties are
permissible. Biofuels profit
from reduced taxes on
production.
No large commercial
facilities but has many
advanced biofuels
research facilities.
Average feedstock
opportunity.
None.
Ireland
Has a tradable certificate
scheme to put biofuels on
the market under the
Biofuel Obligation
Scheme (BOS) under the
administration of the
National Oil Reserves
Agency (NORA).
Has a tradable certificate
system for making biofuels
available for consumption
issued by the Ministry for
Agriculture, Food and
Forestry Policies
(MiPAAF).
No advanced biofuel
producers and below
average feedstock
opportunity.
In 2014, domestic fuel
demand is 8,793,847 metric
tons/year. National carrier
Lufthansa has a clear
sustainability strategy with
CO2 reduction and
reporting with biojet fuelpowered flights conducted.
In 2014, domestic fuel
demand is 633,109 metric
tons/year. National carrier
Air Lingus has no
sustainability goals.
In 2014, domestic fuel
demand is 3,708,840 metric
tons/year. National carrier
Alitalia has a clear
sustainability strategy with
CO2 reduction and
reporting without having
conducted biojet fuelpowered flights.
Military body “Flotta
Verde” is developing
biofuels for military
purposes in collaboration
with “Green Fleet” of the
US Navy.
Italy
Two advanced biofuel
producers, namely ENI
and Beta Renewable.
Above average
feedstock opportunity.
None.
The “Titulo de
Biocombustiel” (TdB’s)
system includes biofuel
entitlements as tradable
units. Partial and total tax
exemptions available for
biofuels.
One advanced biofuel
producer, IncBio.
Above average
feedstock opportunity.
Spain
Has a certificate trading
system between obligated
parties managed by the
National Energy
Commission (NEC). Has
an investment system to
subsidise existing and
future renewable fuel
facilities.
Has a tradable certificate
system which can be
traded independently from
the biofuel between
obligated and
nonobligated parties under
the Renewable Transport
Fuel Obligation (RTFO).
One advanced biofuel
producer, Abengoa.
Above average
feedstock opportunity.
The
United
Kingdom
No large commercial
facilities.
None.
None.
The UK Department for
Transport launched the
Advanced Biofuel
Demonstration
Competition which
provides GBP 25 million
in grant funding to
support the production of
the UK-based advanced
biofuels.
23
In 2014, domestic fuel
demand is 1,049,937 metric
tons/year. National carrier
TAP Air Portugal has a
clear sustainability strategy
with CO2 reduction and
reporting but without
including biojet fuel.
In 2014, domestic fuel
demand is 5,149,217 metric
tons/year. National carrier
Iberia has a clear
sustainability strategy with
CO2 reduction and
reporting without having
conducted biojet
fuel-powered flights.
Domestic fuel demand is
11,364,889 metric
tons/year, making it the
highest domestic fuel
demand among all member
states. National carrier
British Airways has a clear
sustainability strategy with
CO2 reduction and
reporting with biojet fuelpowered flights conducted.
Global Aviation and Biojet Fuel Policies, Legislations, Initiatives, and Roadmaps
Portugal
24
Table 1.7 EU member state targets, forecasts, and expected cooperation mechanism actions in 2020.
Surplus energy (ktoe)
2020
2020
forecast
(%)
2020
target
(%)
0
0
34
34
812
231e481
521
53e375
12.3
18.7
13
16
0
0
0
(279)
(140)
to 289
0
13
13
0
0
0
0
0
13
13
613e809
769e784
473e657
333e366
(337)
28
30
Member
state
2011e12
2013e14
2015e16
2017e18
Austria
0
0
0
Belgium
Bulgaria
675
1e144
875
186e346
Cyprus
0
Czech
Republic
Denmark
Cooperation
mechanism actions
following the 2020
target
Not expected to
produce a surplus or
require a transfer to
meet its target
Deficit
Surplus
Not expected to
produce a surplus or
require a transfer to
meet its target
Not expected to
produce a surplus or
require a transfer to
meet its target
Deficit
Biojet Fuel in Aviation Applications
2020 National
Renewable Energy
Action Plans
(NREAP)
47e69
0
78e96
0
79e88
0
52e67
0
3
0
25.1
38
25
38
France
0
0
0
0
0
23
23
Germany
5930e7058
5866e6977
4657e5917
1387
18.7
18
Greece
Hungary
e
0
e
0
70.9
0
3842
e5088
239.4
0
488
0
20
13
18
13
Ireland
251e259
255e272
403e430
138e148
0
16
16
Italy
Latvia
e
0
(e86)
0
(e860)
0
(e1170)
0
(e1170)
0
16
40
17
40
Surplus
Not expected to
produce a surplus or
require a transfer to
meet its target
Not expected to
produce a surplus or
require a transfer to
meet its target
Surplus
Surplus
Not expected to
produce a surplus or
require a transfer to
meet its target
Not expected to
produce a surplus or
require a transfer to
meet its target
Deficit
Not expected to
produce a surplus or
require a transfer to
meet its target
Global Aviation and Biojet Fuel Policies, Legislations, Initiatives, and Roadmaps
Estonia
Finland
Continued
25
26
Table 1.7 EU member state targets, forecasts, and expected cooperation mechanism actions in 2020.dcont’d
Surplus energy (ktoe)
Cooperation
mechanism actions
following the 2020
target
2020
forecast
(%)
2020
target
(%)
23.3
5e10
23
11
Surplus
Deficit
14.1
0
18.3
(43)
to
(300)
(43.5)
0
9.2
14
10
14
647e1162
0
0
613e1129
0
0
333
>0
0
15.5
31
24
15
31
24
134
0
167
0
143
0
15.2
25
14
25
Deficit
Not expected to
produce a surplus or
require a transfer to
meet its target
Surplus
Surplus
Not expected to
produce a surplus or
require a transfer to
meet its target
Surplus
Not expected to
produce a surplus or
require a transfer to
meet its target
Member
state
2011e12
2013e14
2015e16
2017e18
2020
Lithuania
Luxemburg
96.3
e
93.9
e
79.7
e
52.9
e
Malta
Netherlands
2.8
0
6.2
0
7.1
0
Poland
Portugal
Romania
519e866
0
0
705e1032
0
0
Slovakia
Slovenia
56
0
112
0
Biojet Fuel in Aviation Applications
2020 National
Renewable Energy
Action Plans
(NREAP)
4200
1074
119
e
1273
210
4791
1286
254
e
1105
40
2700
486
e
22.7
50.2
15
20
49
15
Net surplus
13,346
e15,190
9,905
e11,573
12,557
e14,802
6,270
e8,102
3,546
e3,718
20.3%
20
Surplus
Surplus
Not expected to
produce a surplus or
require a transfer to
meet its target
0.3% surplus
available for transfer
to other member
states
Global Aviation and Biojet Fuel Policies, Legislations, Initiatives, and Roadmaps
Spain
Sweden
UK
27
28
Biojet Fuel in Aviation Applications
Table 1.8 Achieved targets in 2016 against the NREAP RES share targets for each
EU member state.
Gap to reach the
2020 National
2020 RES share
Renewable Energy
target for member
Action Plans
Current trends
states in 2016 (%)
(NREAPs) targets
(2016)
Member
state
Austria
Belgium
Bulgaria
Cyprus
Czech
Republic
Denmark
Estonia
Finland
France
Germany
Greece
Hungary
Ireland
Italy
Latvia
Lithuania
Luxemburg
Malta
Netherlands
Poland
Portugal
Romania
Slovakia
Slovenia
Spain
Sweden
The United
Kingdom
Overall
RES share
(%)
RES-T
share
(%)
Overall
RES share
(%)
RES-T
share
(%)
Overall
RES share
(%)
RES-T
share
(%)
34.2
13.0
16.0
13.0
14.0
11.6
10.1
10.8
4.9
10.8
33.5
8.7
18.8
9.3
14.9
10.6
5.9
7.3
2.7
6.4
0.7
4.3
þ2.8
3.7
þ0.9
1.0
4.2
3.5
2.2
4.4
30.4
25.0
38.0
23.0
19.6
18.0
14.7
16.0
17.0
40.0
24.0
11.0
10.0
14.5
15.9
34.5
24.0
14.0
25.3
20.8
50.2
15.0
10.1
10.0
20.0
10.5
13.2
10.1
10.0
10.0
10.1
10.0
10.0
10.0
10.1
10.3
11.4
34.5
10.0
10.0
10.5
11.3
13.8
10.3
32.2
28.8
38.7
16.0
14.8
15.2
14.2
9.5
17.3
37.2
25.6
5.4
6.0
6.0
11.3
28.5
25.0
12.0
21.3
17.3
53.8
9.3
6.6
0.4
8.4
8.9
6.9
1.4
7.4
5.0
7.2
2.8
3.6
5.9
5.4
4.6
3.9
7.5
6.2
7.5
1.6
5.3
30.3
4.9
þ1.8
þ3.8
þ0.7
7.0
4.8
2.8
0.5
6.5
þ0.3
2.8
þ1.6
5.6
4.0
8.5
4.6
6.0
þ1.0
2.0
4.0
3.5
þ3.6
5.7
3.5
9.6
11.6
1.6
6.3
8.7
2.6
5.0
2.9
7.2
6.4
4.1
4.7
5.7
7.5
27.0
3.8
2.5
8.9
6.0
þ16.5
5.4
the transportation sector, the picture is bleaker with 26 of the 27 member
states not yet meeting its 2020 target. The exception is Sweden, which
exceeded its target by a large margin.
Global Aviation and Biojet Fuel Policies, Legislations, Initiatives, and Roadmaps
29
It is clear that meeting the targets in its original form looks bleak. The
RED II recasting of energy policy will provide EU member states with
another chance to meet the new overall targets of 32% and 14% for RES
and RES-T, respectively. This time the European policymakers have
decided that for the transport target, member states are no longer obliged to
use crop-based biofuels. Also, there is a push toward advanced biofuels.
This can only benefit the biojet fuel industry in its attempt to gain a market
share for renewables in transport, which is currently dominated by biodiesel
and bioethanol.
1.3.3 European Advanced Biofuels FlightPath
In June 2011, the European Advanced Biofuels FlightPath initiative was
launched by the EC (DG Energy). This was done in close coordination
with stakeholders including leading European airlines such as Lufthansa, Air
France, KLM, and British Airways; major European biofuel producers such
as Neste Oils, Biomass Technology Group, UPM, Chemtex Italia, and
UOP; and aircraft maker Airbus (ICAO, 2011a). The initiative is introduced with the objectives to define a roadmap with defined milestones to
achieve an ambitious target of 2 million tons (Mt) of sustainable biofuels in
European civil sector aviation by 2020 and get sustainably produced biofuels to the market through the construction of advanced biofuels production plants in Europe. The aim is to get the two sets of plants to be
operational by 2015 or 2016 and by 2020. This will speed up the
commercialization of Sustainable Aviation Fuels (SAF) in Europe. The
target of 2 Mt represents approximately 1% of the total world jet fuel
consumption or 4% of EU jet fuel consumption projected for the year 2020
(Deane et al., 2017). The trends are certainly close to the cited values but
will no longer be valid for the year 2020 since the COVID-19 pandemic
has disrupted the global aviation sector greatly.
The volunteering members have a shared commitment to support and
promote the production, storage, and distribution of sustainably produced
drop-in aviation biofuels. Drop-in fuel refers to interchangeable substitute
for conventionally derived petroleum fuel, which does not require adaptation of the engines, fuel systems, or fuel distribution network. To achieve
the targets, the FlightPath needs to host workshop with financial institutions to find funding and facilitates the signing of purchase agreements
between the stakeholders.
30
Biojet Fuel in Aviation Applications
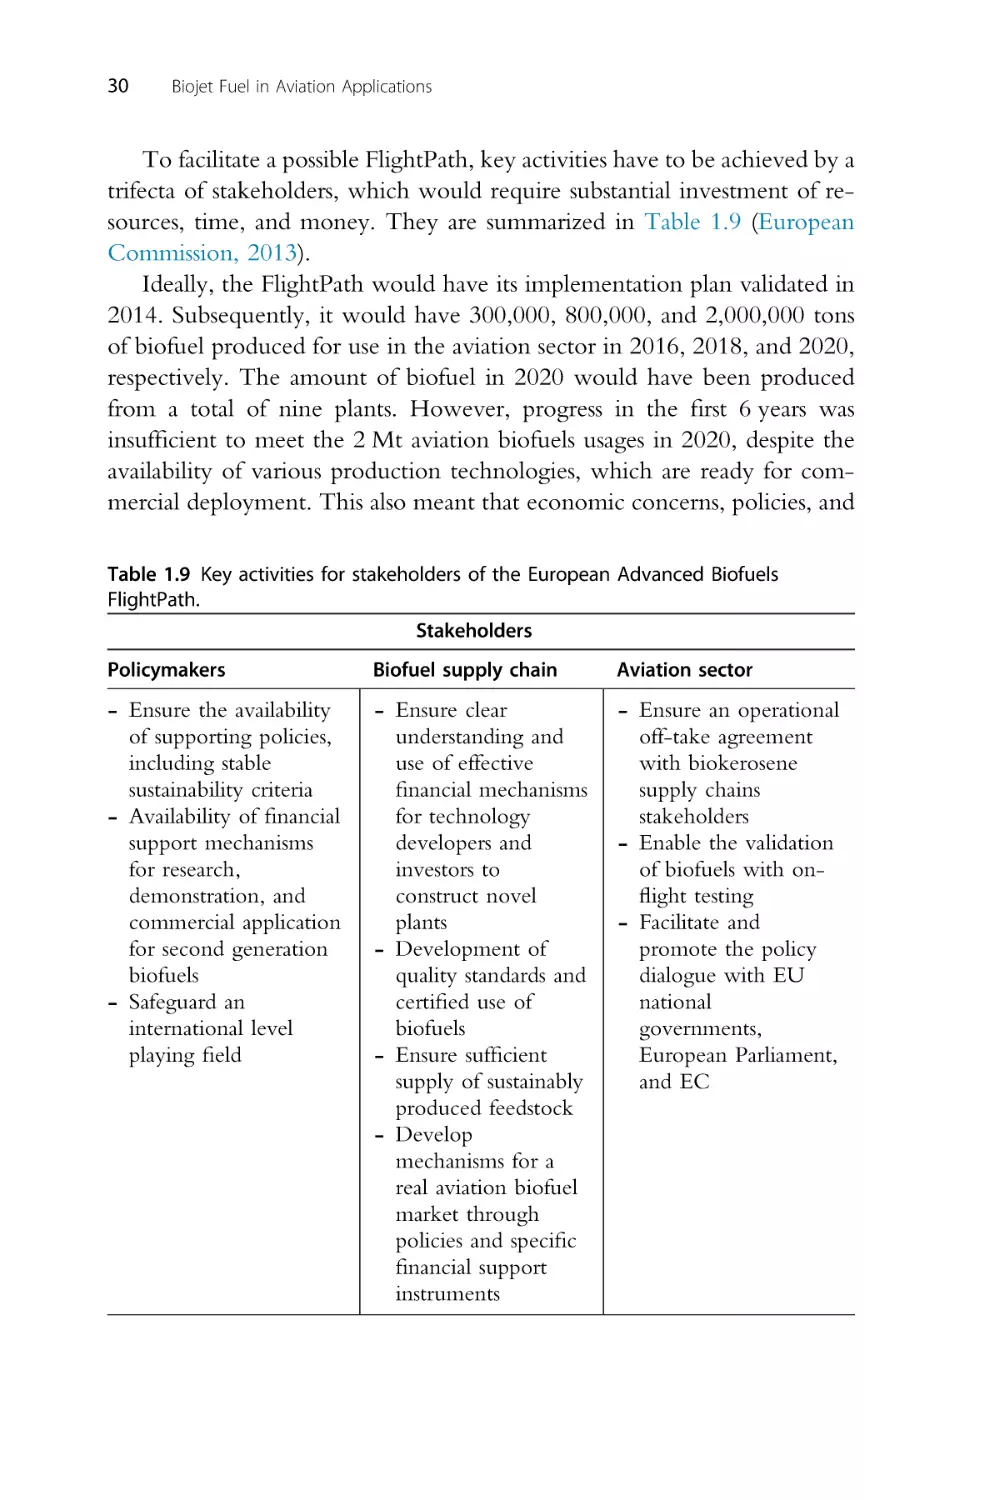
To facilitate a possible FlightPath, key activities have to be achieved by a
trifecta of stakeholders, which would require substantial investment of resources, time, and money. They are summarized in Table 1.9 (European
Commission, 2013).
Ideally, the FlightPath would have its implementation plan validated in
2014. Subsequently, it would have 300,000, 800,000, and 2,000,000 tons
of biofuel produced for use in the aviation sector in 2016, 2018, and 2020,
respectively. The amount of biofuel in 2020 would have been produced
from a total of nine plants. However, progress in the first 6 years was
insufficient to meet the 2 Mt aviation biofuels usages in 2020, despite the
availability of various production technologies, which are ready for commercial deployment. This also meant that economic concerns, policies, and
Table 1.9 Key activities for stakeholders of the European Advanced Biofuels
FlightPath.
Stakeholders
Policymakers
Biofuel supply chain
Aviation sector
- Ensure the availability
of supporting policies,
including stable
sustainability criteria
- Availability of financial
support mechanisms
for research,
demonstration, and
commercial application
for second generation
biofuels
- Safeguard an
international level
playing field
- Ensure clear
understanding and
use of effective
financial mechanisms
for technology
developers and
investors to
construct novel
plants
- Development of
quality standards and
certified use of
biofuels
- Ensure sufficient
supply of sustainably
produced feedstock
- Develop
mechanisms for a
real aviation biofuel
market through
policies and specific
financial support
instruments
- Ensure an operational
off-take agreement
with biokerosene
supply chains
stakeholders
- Enable the validation
of biofuels with onflight testing
- Facilitate and
promote the policy
dialogue with EU
national
governments,
European Parliament,
and EC
Global Aviation and Biojet Fuel Policies, Legislations, Initiatives, and Roadmaps
31
market uptake are the barriers instead of technical constraints. The
FlightPath initiative has not solved the issues of financial investment into
the sector and regulatory landscape sufficiently. Additionally, biofuels are
embroiled in a perception battle on sustainability such as the food versus
fuel debate and effects of ILUC. As such, fresh impulses are needed by the
FlightPath beyond just the addition of new aviation sector members such as
BiojetMap, IAG, IATA, and SkyNRG, alongside biofuel producers such as
Honeywell-UOP, Mossi Ghisolfi, Swedish Biofuels, and Total.
In November 2019, a conference was organized by the EC, SENASA,
FlightPath, ARTFuels, and Airport Regions Conference. Focus was given
to the development of local production capabilities for feedstock and
aviation biofuels conversion through the creation of regional bioports in
Europe to support the FlightPath.
Another initiative to meet the objectives set by the FlightPath is the
Initiative Towards Sustainable Kerosene for Aviation (ITAKA), which exists
to develop a full value chain in Europe for the production of sustainable
Synthetic Paraffinic Kerosene (SPK) (ICAO, 2016). The EC-funded
research project (EU contribution is Euro 9,378,083.40 out of total
budget of Euro 15,955,672.35) sets the ambitions of producing sufficient
SPK at a scale capable of testing the existing European logistic infrastructure
and normal flight operations. ITAKA homes in on camelina oil and used
cooking oil (UCO) due to their availability in Europe. The lipid will then be
converted into biojet fuels through the HEFA pathway. Key achievements
of the 4 year project, which ended on October 31, 2016, include large-scale
Roundtable of Sustainable Biomaterials (RSB)ecertified camelina plantations implemented, UCO-based biojet fuel flights on A330-200 and
Embraer E190, and EU RED-compliant HEFA biojet fuel produced from
camelina oil in Europe.
1.3.4 FlightPath 2050
FlightPath 2050 refers to the European Union’s vision for aviation in which
global leadership in sustainable aviation products and services is maintained
and society’s needs are served. The vision, which is set in 2011, has highly
ambitious goals divided into five categories (European Commission, 2011a),
namely:
(1) Meeting societal and market needs (5 goals)
(2) Maintaining and extending industrial leadership (3 goals)
(3) Protecting the environment and the energy supply (5 goals)
32
Biojet Fuel in Aviation Applications
(4) Ensuring safety and security (6 goals)
(5) Prioritizing research, testing capabilities, and education (4 goals)
Particular to biojet fuels will be goal no. 3 under “Protecting the environment and the energy supply” which states “Europe is established as a
center of excellence on sustainable alternative fuels.” Here, the idea would
be to reduce dependency on the more polluting crude oil through substitution with drop-in liquid fuels from renewable sources at a competitive cost.
Furthermore, the technologies (inclusive of the developed biojet fuel) and
procedures in 2050 will allow a 75% and 90% reduction in CO2 and NOx
emissions per passenger kilometer.
There is a push to move toward fuel cells, electrification, and batteries
in the aviation sector, but they are limited to ground operations. At best,
they could only be used to power ancillary systems. Liquid-based biojet
fuel is the only viable alternative for aircrafts in the foreseeable future due
to the energy density of the fuel. As such, fuel innovation research will be
pursued aggressively and be funded through revenues from the Emissions
Trading Scheme (ETS).
For Vision 2050 of the FlightPath to be realized, the EU aviation industry
will need to be underpinned by simple and effective policy and regulatory
framework. The policy and regulatory framework must also resolve the allimportant funding and financing issues. This is because an estimated EUR
100 billion is required for research funding to meet this vision. Pertaining to
biojet fuels, the FlightPath also specified that the success of alternative fuel
research requires the governance, funding, and financing framework to
coordinated oversight of a comprehensive research program.
1.3.5 EU Fuel Quality Directive 98/70/EC
The EU Fuel Quality Directive 98/70/EC of October 13, 1998, was first
launched with the objectives of ensuring the quality of petrol and diesel fuels.
The strict quality requirements are imposed within the European Union for
petrol and diesel fuels used in cars, trucks, and other vehicles to protect
human health and the environment. Among the key pushes of the 1998
FQD was to rule out the marketing of leaded petrol for all member states and
for diesel fuels complying to key environmental specifications such as cetane
number, density, distillation, polycyclic aromatic hydrocarbons (PAHs), and
sulfur content. In this iteration, aviation jet fuel was not part of its considerations. In terms of biofuels, only low blends of biofuels below 30% biofuel
content are within the scope of FQD. From Article 7a of the FQD, the
Global Aviation and Biojet Fuel Policies, Legislations, Initiatives, and Roadmaps
33
original iteration calculated the overall GHG emissions reduction in transport, aviation, and electricity used in rails, where Eq. (1.3) is
FQDð %Þ ¼
Fossil transport fuel GHG intensity 2010 All transport fuels GHG intensity 2020
Fossil transport fuels GHG intensity in 2010
(1.3)
The FQD contributed to the reduction of pollutants from the transportation sector (European Commission, 2017). Over the 1995e2013
period, sulfur oxides (SOx), lead, nitrogen oxides (NOx), PM10, and PAHs
reduced by 98%, 95%, 51%, 42%, and 62%, respectively. While it is widely
agreed that the transport fuel covered by FQD contributed to the largest
share of the reduction, other forms of transport such as international
aviation, shipping, and railways could have also contributed. The inability
to separate the effects of the non-FQD transport fuel shows the weaknesses
of this directive. The FQD also represented a possible loss of opportunity in
greening the aviation sector as compliance for petrol fuel samples range
from 74% to 100% with a median value of 99%, while the range for diesel is
89%e100% with a median compliance value of 100%. Had FQD been
extended to jet aviation fuels perhaps through the introduction of low-level
biojet fuel blends, the contribution of the aviation sector to reduce emissions could have been greater.
The FQD has always had strong interactions with the RED. In fact, a
new EU Directive 2015/1513 amended and harmonized both the FQD
(98/70/EC) and RED (2009/28/EC) in terms of sustainability criteria and
ILUC emissions requirements (Scarlat and Dallemand, 2019). The
harmonization of the RED and FQD made sense as they focused on the
renewable energy replacement and GHG emissions savings, respectively.
The two key aims need to be harmonized to prevent having dual narratives
which are conflicting.
The amendment also involves the permissions by member states to
suppliers of aviation biofuel in becoming contributors to the reduction of
obligations provided that those biofuels comply with the sustainability
criteria. This amendment meant that all member states will have the same
opportunity in adopting the voluntary aviation biojet fuel opt-in, as
compared with the preamendment rulings where the ability to opt in is
dependent on the implementation of the related directives. The voluntary
aviation opt-in will allow biojet fuels to play a part in meeting the overall
FQD aims of protecting human health and the environment through strict
fuel requirements for the transport sector.
34
Biojet Fuel in Aviation Applications
1.3.6 White Paper on Transport
While not a policy or a regulation, the EC adopted a White Paper on
Transport in 2011 (European Commission, 2011b). The strategies established
within the White Paper defined 10 challenging goals to guide policy actions
and accountably measure progress. The 10 goals as outlined by roadmap in
the White Paper will create a competitive and resource-efficient transport
system to reduce 60% in CO2 emissions and comparable reduction in petroleum dependency by 2050. Goal No. 2 which is particular to low-carbon
sustainable fuels in aviation refers to an ambitious goal to increase the share of
SAF to 40% by 2050. The other goals related to the biojet fuel within the
aviation sector are Goals No. 5, No. 7, and No. 10, which mention a fully
functional EU-wide multimodal Trans-European Transport Networks
(TEN-T) “core network” by 2030, about the modernization of air traffic
management infrastructure (SESAR) and adoption of a “user pays and
polluter pays” principle, respectively.
The White Paper is also underpinned by 40 initiatives to be developed
over the decade. Key initiatives unique or relevant to the aviation sector are
tabulated in Table 1.10 (European Commission, 2011b).
1.4 United Kingdom
1.4.1 Renewable Transport Fuel Obligation
The Renewable Transport Fuel Obligation (RTFO) was introduced in
November 2005 and came into effect in April 2008 to mandate that 5% of
all road vehicle fuel must be sourced from renewables by 2010. The
obligation made possible under the Energy Act 2004 was initially expected
to meet the target through bioethanol, biomethanol, and biodiesel.
The RTFO ties in well with the EU biofuels directives which required
all EU member states to meet the 2% and 5.75% targets of biofuel blends by
the end of 2005 and 2010, respectively. The sustainability criteria of RED
have also been implemented in RTFO through the December 2011
RTFO amendment. In 2013, RTFO was again amended to transpose the
requirements of EU FQD 2009/30/EC.
The amendment to RTFO in September 2017 brought biojet fuel into
the market trading mechanism (MTM) of RTFO for the first time (DfT,
2017). The emphasis on biojet fuel came from the realization that
domestic transport is the largest GHG emitting sector, and liquid fuel
cannot be decoupled from the aviation industry even in the longer term.
Table 1.10 Key initiatives of the white paper on transport related to the aviation sector.
Wider strategy
Narrow strategy
No Initiative
Directly related to biojet fuel
An efficient and
integrated mobility
system
A single European
transport area
Acting on transport
safety: saving thousands
of lives
Completion of the
single European sky
No
3
Capacity and quality
of airports
A socially responsible
aviation sector
Cargo security
High levels of
passenger security with
minimum hassle
“End-to-end” security
A European strategy
for civil aviation safety
No
10
12
13
15
17
20
Innovating for the
future: technology
and behavior
A European transport
research and innovation
policy
24
25
26
Promoting more
sustainable behavior
29
No
No
No
No
No
No
An innovation and
deployment strategy
A regulatory
framework for
innovative transport
Carbon footprint
calculators
Yes, to include measure for promoting the
replacement rate of inefficient and polluting vehicles
Yes, to include appropriate standards for CO2
emissions, guidelines for refueling infrastructures and
better implementation of existing rules and standards
Yes, to estimate carbon footprint of each passengers
to allow easier marketing of cleaner transport
solutions
Yes, to include a sustainable alternative fuels strategy
with appropriate infrastructure
Continued
35
Transport of
dangerous goods
A technology
roadmap
Global Aviation and Biojet Fuel Policies, Legislations, Initiatives, and Roadmaps
Promoting quality jobs
and working conditions
Secure transport
2
Table 1.10 Key initiatives of the white paper on transport related to the aviation sector.dcont’d
No
Initiative
Directly related to biojet fuel
Modern
infrastructure and
smart funding
Transport infrastructure:
territorial cohesion and
economic growth
35
No
Getting prices right and
avoiding distortions
The external dimension
39
Multimodal freight
corridors for
sustainable transport
networks
Smart pricing and
taxation
Transport in the
world: the external
dimension
40
No
Yes, to build established research and innovation
partnerships to find common answers for sustainable
low-carbon fuels
Biojet Fuel in Aviation Applications
Narrow strategy
36
Wider strategy
Global Aviation and Biojet Fuel Policies, Legislations, Initiatives, and Roadmaps
37
The amendment was made to accelerate the delivery of biojet fuel,
allowing the United Kingdom to lead in the development and deployment of the fuel. This benefits the United Kingdom in terms of decarbonization of air travel, meeting the climate change commitments and
industrial opportunities.
Aviation fuel can now be eligible for the Renewable Transport Fuel
Certificates (RTFCs) as long as they are made from an eligible feedstock.
One certificate can be claimed for every liter of renewable fuels produced,
although renewable fuels from nonbiological origins (RFNBOs) and dedicated energy crops are incentivized with double the RTFC amounts. The
MDM nature of RTFCs meant that it can be traded openly in the market.
The RTFO also defines “development fuels,” which can be a renewable aviation fuel that must be made from waste and residues. Development
fuels now form the subtarget in addition to the overall biofuel targets. The
target levels are summarized in Table 1.11 (DfT, 2017; DfT, 2018). The
RTFO policy is expected to reduce a total of 52 MtCO2e for the 2018e32
period additional to the baseline. The maximum allowable share of cropderived fuels by volume will also be reduced from 4% in 2018 to 2% in
2032. The rationale to cap crop-derived fuels is to reduce the additional
carbon emissions from ILUC through the planting of crop-based biofuels.
RTFO’s contributions to RED including fuels that are double-rewarded
are 3.24%, 4.12%, and 4.01% in 2012/13, 2013/14, and 2014/15, respectively. It should be noted that RTFO only requires that UK fuel suppliers
provide 4.75% by volume of road transport from renewables. The present
renewable fuel supply under RTFO is 3.3% by volume, increasing to 4.75%
when double rewarding is taken into consideration. Similarly, it is 2.6% by
energy, rising to 4.0% when double-rewarding is factored in. This is substantially lower than the carbon budgets and RED’s transport subtarget,
which mandates 10% of road transport fuel by energy to come from
renewable sources in 2020. The inclusion of biojet fuel from the 2017
amendment will not substantially bring RTFO closer to meeting RED’s
subtarget for transport fuel.
It is still not entirely clear on how the Brexit invoked through Article 50
of the Treaty of the European Union will affect the United Kingdom’s
current EU requirements. Regardless, leaving the European Union means
that the United Kingdom will get another opportunity to look at how the
carbon budget reductions of the transport sector (inclusive of the aviation
sector) can be met. On this front, the Brexit is unlikely to have a material
effect on the direction of the RTFO policy.
38
Table 1.11 RTFO targets for biofuels and development fuels.
11
12
13
14
15
16
17
18
19
20
21
22
23
24
25
a
Obligation
period
2018c
2019
2020
2021
2022
2023
2024
2025
2026
2027
2028
2029
2030
2031
2032
All biofuels
Development fuels
Specified
amount as
share of
fossil fuel, by
volume (%)
Specified
amount as
share of total
fuel, by
volume (%)a
Expected
total
volume
(million
liters)
Subtarget
(obligation)
level,
including
double
rewarding (%)
Resultant
“development fuel”
supply as
proportion of total
fuel, by volume
(%)b
7.82
9.29
10.80
11.24
11.61
11.86
12.11
12.36
12.61
12.87
13.12
13.38
13.64
13.90
14.16
7.25
8.50
9.75
10.10
10.40
10.60
10.80
11.00
11.20
11.40
11.60
11.80
12.00
12.20
12.40
361
719
1071
1414
1489
1553
1594
1635
1673
1716
1757
1797
1842
1887
1931
e
0.1
0.15
0.5
0.8
1
1.2
1.4
1.6
1.8
2
2.2
2.4
2.6
2.8
e
0.05
0.075
0.25
0.4
0.5
0.6
0.7
0.8
0.9
1
1.1
1.2
1.3
1.4
Excluding the effects of double counting and carryover.
The resultant development fuel supply is calculated as half of the subtarget as development fuels are eligible for double reward.
c
The obligation period is from April 15, 2018 to December 31, 2018 instead of the full year.
b
Expected fuel
supplied under the
development fuel
subtarget (million
liters)
e
3
15
101
173
220
267
313
359
404
449
494
539
584
630
Biojet Fuel in Aviation Applications
RTFO
year
Global Aviation and Biojet Fuel Policies, Legislations, Initiatives, and Roadmaps
39
1.4.2 Fuels for Flight and Freight Competition (F4C)
The UK Department for Transport (DfT) launched the Advanced Biofuels
Demonstration Competition (ABDC) in December 2014 to support the
development of a domestic advanced biofuel industry. The need for this
governmental initiative is supported by an independent feasibility study,
which pinpointed potential financial gains from converting low-value waste
into high-value transport fuels. The competition targets all biofuels and not
particular to biojet fuels. Two projects have received funds for new biofuel
plants, namely from Nova Pangaea Technologies with its production of
bioethanol from wood waste, which is then blended with petrol and
Advanced Biofuels Solutions with biomethane from municipal solid waste
(MSW) and forestry waste. The competition supported the RTFO policy
of that time, as the focus was still very much on the road transport sector.
The UK DfT then launched the Future Fuels for Flight and Freight
Competition (F4C) in April 2017 to promote the development of advanced
low carbon fuels to tackle the emissions problem from the hard-to-decarbonized aviation and heavy goods vehicle (HGV) sectors. Like ABDC,
F4C is not a policy per se, but it is conceptualized to support the addition of
aviation and HGV sectors in the RTFO amendment in 2017, which in turn
will contribute to the UK’s RED II target for the transport sector. The F4C
organized jointly by DfT, Ricardo, and E4tech will provide capital grant
funding to improve the supplier capabilities and skills in relevant technologies, while also maximizing the outcome for taxpayers.
The F4C covers two stages, namely stage 1 (project development) and
stage 2 (capital funding) (RICARDO, 2017). The former was from June to
November 2018 where GBP 2 million was awarded for the development of
proposals. In the latter, F4C shortlisted four projects and are expected to
grant GBP 20 million over a 3-year period of 2019e21 for the major
demonstration projects.
The standout project for potential biojet fuel in the future is from Kew
Projects Limited with the “Integrated ATC & F-T Demonstration Plant.”
The project was initially awarded GBP 312,300 in funding to produce the
diesel substitute in stage 1 and was awarded another GBP 1.5 million in
stage 2. Other two projects are currently in the shortlist, and they are
related directly to biojet fuels. They include Altalto Immingham Ltd’s
“Altalto (Velocys Waste to Jet Fuel Project)” and LanzaJet UK Limited’s
“Sustainable Aviation Fuel from Waste-Based Ethanol.” The Altalto
project received GBP 434,000 in stage 1 to develop a proposal for kerosene
40
Biojet Fuel in Aviation Applications
and petrol substitutes and is being supported financially and technically by
Shell and British Airways. The Lanza project obtained GBP 410,000 for
stage 1 to develop a proposal for kerosene and diesel substitutes through a
large-scale alcohol-to-jet (ATJ) facility. The proposal has partners from
various sectors such as aviation, steel mills, research, and sustainability.
The competition is expected to deliver meaningful technical, route-tomarket, and/or supply chain innovation. It is also expected to have projects
to produce quality “development fuel” for testing or sale, while having a
distinct commercial potential and plan, which is of value to the United
Kingdom. The produced fuel also needs to show significant GHG reduction against their baseline fossil counterparts and be held to the highest of
sustainability standards. The outcome of the competition might produce a
localized solution, which will benefit the local biojet fuel industry and
reduce imports of renewable fuels.
1.5 Scandinavia
1.5.1 Nordic Initiative for Sustainable Aviation
The Nordic Initiative for Sustainable Aviation (NISA) is neither a policy
nor regulation. Instead, it is an initiative consisting of stakeholders through
the entire value-chain steps including airlines, authorities, airports, and
manufacturers in Denmark, Finland, Norway, and Sweden (ICAO, 2014b).
The initiative aims to facilitate and strengthen the conditions for a
conducive sustainable aviation industry. It is aligned to the EU FlightPath
initiative. The Scandinavian regionefocused NISA also bears the ambition
of deploying new sustainable aviation fuels, spurring new green jobs, and
attracting investments in the sector, which will combine to allow the
Nordic bloc to be a global leader in green development.
1.5.2 Legislations in Nordic Countries
Within the Nordic region, Norway and Iceland are not official EU
member states. However, they are both part of the European Civil Aviation
Conference (ECAC), which is fully committed to combat climate change.
As such, the Norwegian Ministry of Climate and Environment decreed in
2018 that airlines operating in Norway will need to have 0.5% biojet fuel
blend in aviation jet fuel by 2020. The target will be increased to 30% of
sustainable aviation jet fuel a decade later in 2030.
Global Aviation and Biojet Fuel Policies, Legislations, Initiatives, and Roadmaps
41
Iceland also has a Climate Action Plan for a 5-year period of 2018e23
to phase out transport sector’s petroleum-based fuels. The plan includes the
aviation sector as the industry is a large economic driving force, contributing to about 6.6% of GDP and employs around 9200 people (ICAO,
2012). Iceland shares the view that the reduction of aviation emissions is
necessary. To achieve this, Iceland will use a two-pronged approach with
greater fuel efficiencies from flights and less dependency on fossil fuels.
EU members such as Denmark, Finland, and Sweden also have their
own legislations and priorities. Denmark has an ambitious target of making
the transport sector free of fossil fuel by 2050. Airline industry players have
taken up the task to plan for meeting the national targets. Denmark also
takes an encouragement approach instead of a punitive approach by proposing for a climate fund instead of carbon tax. This is expected to boost the
development and production of biojet fuel in the country. Finland targets
30% sustainable biofuels by blend for aviation by 2030 (NER, 2020).
Sweden recognizes the possible contribution of biojet fuel to meet its
2035 and 2050 climate goals. The 2017 aviation strategy includes support
from the government for research to reduce costs for biofuel production. A
sum of Euro 9.5 million was awarded to the Swedish Energy Agency to
support initiatives that will lead to profitable biofuels. This is a smart
strategy as the largest barrier to the success of biojet fuels is really the cost as
opposed to the price of its fossil counterpart in the market. A more punitive
obligation was proposed by the Swedish authorities, where penalty is
applied to airlines not meeting the GHG intensity reduction targets.
1.6 United States of America
1.6.1 Renewable Fuel Standard
In the United States, the Renewable Fuel Standard (RFS) was established
in 2005 through the Energy Policy Act of 2005. This federal program by
the Congress mandated that renewable fuels must consist of a minimum
volumetric amount for transportation fuel sold within the country. The US
Environmental Protection Agency (EPA) administers the RFS. Annual
target of 4 billion gallons of biofuels in used were set for year 2006, with it
rising by 87.5% of the original target in 2012.
The scope and ambitions of RFS were further expanded with the
amended form through RFS2 in 2007. The new RFS was passed through
42
Biojet Fuel in Aviation Applications
the Energy Independence and Security Act of 2007, which renewed the
biofuels usage targets. Under RFS2, 9 billion gallons of biofuels should be
in use for the year 2008, with the annual target facing a scheduled rise to 36
billion gallons in 2022. In both iterations of RFS, the defined renewable
fuel must emit lower levels of GHGs as compared with the fossil-based fuels
that it displaces. To improve the sustainable measures of biofuel sources,
corn starch ethanol and cellulosic biofuels have a quota of not more than 15
billion gallons and not less than 16 billion gallons from cellulosic biofuels,
respectively. This practically and symbolically shows the transition to the
new generation biofuels.
Although the initial RFS is very ethanol and biodiesel-centric, sustainable
fuels for the aviation sector have also entered the picture as biojet fuels from
camelina oil, sugar cane, napier grass, distillers corn oil, distillers sorghum oil,
and cellulosic components have since completed the pathway assessments as
specified by the RFS Regulations at Title 40, Chapter 1, Subchapter C, Part
80, Subpart M (US EPA, 2020a). There are currently 20 generally applicable
pathways under RFS, of which five of them are applicable for biojet fuels.
The remaining pathways are for ethanol and biodiesel.
Fuel types meeting the pathway requirements will be allowed to
generate Renewable Identification Numbers (RINs). Biojet fuels with
RIN demonstrate compliance under the RFS program. The RIN credits
are used by EPA to track and ensure compliance toward meeting the
mandates from the RFS. The generated RINs (which will be attached to
the renewable fuel) by the renewable fuel producers or importers can be
traded with an obligated party in the form of a refiner or importer of fuel.
Once the transaction is completed, the RIN is separated from the
renewable fuel and may be independently traded until it is retired to meet
the volume obligation. This provides an open market approach with the
prices and transactions tracked under the EPA Moderated Transaction
System (EMTS).
The fuels will also be assigned a RIN D-code depending on the types of
renewable fuel produced. The classification for the D-code is summarized
under Table 1.12. Qualified fuel pathways may be assigned more than one
D-code as long as they meet the qualifying standards (Celignis Analytical,
2020). The more advanced renewable fuels count against compliance for
the less advanced counterparts.
Global Aviation and Biojet Fuel Policies, Legislations, Initiatives, and Roadmaps
43
Table 1.12 RIN D-codes and the specific fuel pathway requirements.
Category of
renewable
Specific fuel pathway
RIN
requirements
Compliance
D-Codes fuel
3
Cellulosic
biofuel
4
Biomassbased diesel
5
Advanced
biofuel
6
Renewable
fuel
7
Cellulosic
biofuel
(cellulosic
diesel)
Produced from cellulose,
hemicellulose, or lignin. Must
reduce life cycle GHG
emissions by at least 60% as
compared with the petroleum
baseline.
Must reduce lifecycle GHG
emissions by at least 50% as
compared with the diesel
baseline. Examples include
biodiesel and renewable diesel.
Produced from any type of
renewable biomass except corn
starch ethanol. Must reduce
life cycle GHG emissions by at
least 50% as compared with
the petroleum baseline.
Fuel produced (in facilities or
extended capacity after
December 19, 2007) must
reduce life cycle GHG
emissions by at least 20% as
compared with the average
2005 petroleum baseline.
Examples include corn starchderived ethanol or any other
qualifying renewable fuel.
Same as RIN D-code 3 with
the additional condition that
fuel must be cellulosic diesel.
Also counts
against
compliance for
D5 and D6
Also counts
against
compliance for
D5 and D6
Also counts
against
compliance for
D5
Same as D3
GHG, greenhouse gas; RIN, Renewable Identification Number.
The RIN codes follow the format of KYYYYCCCCFFFFBBBB
RRDSSSSSSSSEEEEEEEE (Celignis Analytical, 2020), where
• K: Identifies if the RIN is attached to gallon
• YYYY: Year of production
• CCCC: Company ID
44
•
•
•
•
•
•
Biojet Fuel in Aviation Applications
FFFF: Plant facility ID
BBBB: Batch number
RR: Biofuels equivalence value
D: Renewable fuel category
SSSSSSSS: Start number for the biofuel batch
EEEEEEEE: End number for the biofuel batch
For the biofuels equivalence value, RR, it is determined from the
energy and renewable content of the RFS-compliant fuel when compared
with denatured ethanol. In this case, ethanol will have an equivalence value
(EV) of 1. The EV of a typical biojet drop-in fuel is 1.6. As decimal value is
assigned to the EV, the RR code multiplies the EV by a factor of 10. Thus,
the RR for a typical biojet fuel is 16. This also has the implication where
1.6 credits are generated for every gallon of biojet fuel produced, leading to
10 gallons of biojet fuel being able to replace 16 gallons of ethanol under
the RFS program.
Companies producing biojet fuels or finished fuels with potential
aviation sector application passing the completed pathway assessments are
compiled in Table 1.13 (US EPA, 2020b). This excludes ethanol as an
additional chemical process is still required to convert ethanol to ethanolderived jet fuel. In contrast with the 12 completed pathway assessments
for potential aviation usage, ethanol has 105 with the earliest since January
2013. The first alternative jet fuel which completed the pathway assessment
is from Sustainable Oils in March 2013 using camelina oil.
In the event that feedstocks are mixed during the renewable biofuel
conversion process, EPA evaluates the life cycle GHGs separately as per the
individual component’s weightage. The life cycle is evaluated for all of the
process energy and materials used during the fuel production process until
the point where it is a finished fuel. A fuel type is deemed to be a finished
fuel if no further chemical alteration is required prior to its usage. Fuel
blending is not considered under the life cycle calculations as it is a physical
process.
The price of RIN has been tracked since 2010 when the transition from
RFS to RFS2 was made. The weekly prices of RIN D3-D6 fuel types for
the past decade until October 2020 is shown in Fig. 1.3 (US EPA, 2020c).
The trading prices of D3 have always been the highest, followed by D4,
D5, and D6, although the gap between D4 and D5 has closed since 2013.
The price convergence of D4 and D5 is because obligated parties wanting
to fulfill its D5 volume obligations can either purchase D3, D4, or D5
RINs. While D3 could serve the purpose of D4 or D5, the cellulosic
Global Aviation and Biojet Fuel Policies, Legislations, Initiatives, and Roadmaps
45
Table 1.13 Biojet fuels or finished fuels with potential aviation sector application
passing the completed pathway assessment.
Organization Fuel
Feedstock
D-code Date
East Kansas
Agri-Energy
Naphtha
REG
Geismar
Naphtha, LPG
TexmarkNeste
National
Sorghum
Producers
Renewable jet fuel
Butamax
Advanced
Biofuels
REG
Geismar
REG
Geismar
ENVIA
energy,
LLC
Diamond
Green
Diesel, LLC
Chemtex
Group
BP Biofuels
North
America,
LLC
Sustainable
Oils
Distillers corn
oil, distillers
sorghum oil
Commingled
distillers corn oil
and sorghum oil
Renewable
diesel
Distillers
sorghum oil
5
December
19, 2019
5
December
19, 2019
4
September
23, 2019
August 2,
2018
Distillers corn oil
4
August 2,
2018
Biogenic waste
oils/fats/greases
Nonfood grade
corn oil
Landfill biogas
5
February
23, 2018
April 13,
2017
May 8,
2015
Naphtha, LPG
Nonfood grade
corn oil
5
October
28, 2013
Cellulosic biofuel
Giant reed
(Arundo donax)
Energy cane,
napier grass
3 or 7
July 11,
2013
March 5,
2013
Camelina sativa
oil
4 or 5
Biodiesel,
renewable diesel,
jet fuel, and
heating oil
Biodiesel,
renewable diesel,
jet fuel, and
heating oil
Naphtha. LPG
Naphtha, LPG
Diesel, naphtha
Ethanol, cellulosic
diesel, jet fuel, and
heating oil;
naphtha
Biodiesel,
renewable diesel,
jet fuel, heating
oil, naphtha, LPG
4/5
5
3 or 7
3 or 7
March 5,
2013
biofuel criteria for D3 also provide cellulosic waiver credit (CWC), which is
valuable on its own. Thus, the price of D3 should logically be the price of
D4 or D5 summed with the price of a CWC. The CWC price ranges from
USD 0.49 to USD 2.00, where the lowest price occurred in 2013 while the
46
Biojet Fuel in Aviation Applications
RIN Prices (USD)
3.00
D3
D4
D5
D6
2.00
1.00
0
2011 2012 2013 2014 2015 2016 2017 2018 2019 2020
Year
Figure 1.3 Weekly RINs prices for D3, D4, D5, and D6 from January 2010 to October
2020. RINs, Renewable Identification Numbers. (Adapted from US EPA, 2020c. RIN Trades
and Price Information, https://www.epa.gov/fuels-registration-reporting-and-compliancehelp/rin-trades-and-price-information.)
peak was attained in 2017. The peak number of CWC traded was in 2016
where 33,155,196 CWCs changed hands. The number of CWCs traded
has since fallen to 1,474,354 in 2019 although price remained above the
2-year average at USD 1.77. The price of a CWC is set at USD 3 minus the
12-month average of the wholesale gasoline price, with a minimum price
fixed as USD 0.25. The price mechanism and interchangeable usage (or
nesting) of the RINs add to the flexibility of the RFS program. This makes
cellulosic-based biojet fuel, which will carry the D7 code potentially
lucrative for biojet fuel producers.
The total available RINs generated, retired, and available as of October
29, 2020, are tabulated in Table 1.14. Currently, cellulosic diesel RINs
have not been generated despite three D7 codes awarded, with the first in
2013. It is also not a surprise for D6 to dominate at 71.2% of the RINs
generated as it is the usual code used for sustainable ethanol.
Great progress is made for renewable jet fuel with the absolute amount
and proportion of biojet fuel as a share of total renewable fuels increasing
throughout the decade. This is illustrated in Fig. 1.4 where the RINs
generated, volume of biojet fuels, and their proportions against that of all
sustainable fuels from 2010 to present day are shown. As of October 2020,
US domestic producers generated 6,459,392 RINs for a total of 4,037,120
gallons of biojet fuel. This is still miniscule in terms of overall proportions
with just 0.0483% and 0.0333% of RINs generated and volume, respectively.
Total available (unlocked)
3
3
4
4
5
5
6
6
7
7
324,501
312,942,232
304,261,316
2,482,720,601
5,359,877
198,500,407
611,216,914
8,208,104,129
0
0
Assigned
Separated
Assigned
Separated
Assigned
Separated
Assigned
Separated
Assigned
Separated
322,219,110
0
3,310,192,342
0
218,011,830
0
9,521,195,664
0
0
0
RINs, Renewable Identification Numbers.
218,820
2,268,078
70,987,329
437,464,737
0
14,151,546
105,814,644
179,529,639
0
0
0
6,465,479
1,173,877
13,584,482
0
0
128,311
416,402,027
0
0
Global Aviation and Biojet Fuel Policies, Legislations, Initiatives, and Roadmaps
Table 1.14 Total available RINs generated, retired, and available as of October 29, 2020 (US EPA, 2020d).
D-code
Assignments
Total generated
Total retired
Total available (locked)
47
Biojet Fuel in Aviation Applications
RINs Generated and Volume of Biojet Fuel
7,000,000
0.06
6,000,000
0.05
5,000,000
0.04
4,000,000
0.03
3,000,000
0.02
2,000,000
0.01
1,000,000
0
0
2010 2011 2012 2013 2014 2015 2016 2017 2018 2019 2020
Year
RINs Generated
Volume of Biojet Fuel
% of Total RINs Generated
% of Total Volume of Sustainable Fuel
Total RINs Generated and Volume of Sustainable
Fuels (%)
48
Figure 1.4 RINs generated, volume of biojet fuels, and their proportions against that
of all sustainable fuels from 2010 to October 2020. RINs, Renewable Identification
Numbers.
Nonetheless, compared with the all-time proportion for a decade since 2010,
the proportions are 0.0102% and 0.0071% of total RINs generated and
volume of fuel, respectively.
Small refineries may be exempted from RFS, provided petitions submitted to EPA on an annual basis to be relieved from their renewable
volume obligations (RVOs). Exemptions are given on the basis of
demonstrated disproportionate economic hardship. Compared with the
overall sustainable fuel volume, the exemptions given are just a blip with
only less than 50 petitions submitted in any given year. The COVID-19
pandemic might have greatly affected the production as the number of
petitions fell from 31 in 2019 to just 4 in October 2020. To date, no exemptions were given for biojet fuels.
While the RFS is an ambitious program to ensure the sustainability of
the transport sector and also to emphasize that biofuels remain an important
piece of the overall US strategy to address climate change and enhance
energy security, its efficacy is up for debates. Table 1.15 shows the end-ofyear compliance deficit for the RFS from 2010 to 2019. Compliance deficit
refers to the amount accumulated when obligated party or exporter does
not meet the annual RVO target through the retirement of RINs.
Global Aviation and Biojet Fuel Policies, Legislations, Initiatives, and Roadmaps
49
Table 1.15 The end-of-year compliance deficit for the RFS from 2010 to 2019.
Cellulosic
biofuel (D3 or
Biomass-based Advanced
Renewable
Compliance
D7)
diesel (D4)
biofuel (D5)
fuel (D6)
year
2010
2011
2012
2013
2014
2015
2016
2017
2018
2019
31,543
0
0
31
7615
22,823
4,454,758
19,976,793
2,962,896
7,986,724
227,120,812
45,802,515
28,773,252
23,535,850
20,276,804
5,555,088
40,944,372
75,247,335
19,737,837
105,622,268
229,693,190
37,394,607
19,690,744
26,605,634
21,654,525
4,897,514
66,462,857
137,768,294
28,957,783
169,887,781
163,353,609
68,763,484
75,521,355
68,855,617
141,478,021
10,419,624
390,514,451
681,328,963
129,279,042
458,886,372
RFS, Renewable Fuel Standard.
Compliance deficits are carried over to the next compliance year, hence
possibly creating a scenario where the deficit could be higher than any
particular annual RVO target.
Since the commencement of the program, there has been compliance
deficit year-on-year. The zero deficits for cellulosic biofuel in 2011 and 2012
were due to their removal arising from a successful legal challenge mounted
to remove them. Despite the deficit, the May 2020 data show that the
deficits are relatively low compared with the total RVO (which includes
present year reported RVO and reported prior year deficit). The 2019
compliance deficit volumes of D3 (7,986,724 gallons), D4 (105,622,268
gallons), D5 (169,887,781 gallons), and D6 (458,886,372 gallons) came
against the target of 2018s total RVO of 421,498,816 gallons, 3,526,218,417
gallons, 4,960,402,759 gallons, and 20,413,716,106 gallons, respectively.
They represent deficits of 1.89% (D3 or D7), 3.00% (D4), 3.42% (D5), and
2.25% (D6). Biojet fuel could typically contribute to the D3, D4, D5, and
D7 categories to bridge the deficit gap.
1.6.2 Farm to Fly
The Farm to Fly initiative was launched by the US Department of Agriculture (USDA), Airlines for America (A4A), and the Boeing Company in
July 2010. The initiative aims to accelerate the availability of a commercially
viable and sustainable aviation biofuel industry in the United States, increase
domestic energy security, establish regional supply chains, and support rural
development.
50
Biojet Fuel in Aviation Applications
The Farm to Fly initiative was launched on the back of the Biofuels
Interagency Working Group’s “Growing America’s Fuel” report that
portrayed strategies to meet the Energy Independence and Security Act
(EISA) target during the Obama Administration (US USDA, 2012). The
EISA target of 36 billion gallons of US biofuels per year by 2020 can be
achieved through the development of first-, second-, and third-generation
biofuels, inclusive of biojet fuels.
The initiative attempted to make biojet fuel, the favored choice over
fossil-based aviation jet fuel from the economic and environmental point of
views. As per the initiative’s namesake, it will incentivize American farmers
who produce energy crops for sustainable aviation biofuels. This merges rural
development with clean energy innovation. It also tried to pull demand for
biojet fuels from the aviation-fuel user community, instead of imposing
supply sideedriven biojet fuel usage. Coupled with compatible policies, the
US aviation industry will be a willing buyer of competitively priced biojet
fuels. The USDA and other federal agencies have a range of programs that
supported the Farm to Fly initiative as tabulated in Table 1.16.
The Future of Aviation Advisory Committee (FAAC) also supported
the deployment of sustainable alternative aviation fuels in December 2010.
Subsequently, the USDA, the Department of Energy (DOE), and the
Department of the Navy in August 2011 jointly developed and supported
production facilities for both biojet fuels and marine biofuels.
The ongoing initiative was extended in April 2013 and relabeled as
Farm to Fly 2.0 (ICAO, 2010a). The revised initiative targets an annual 1
billion gallons of drop-in aviation fuel by 2018. From it, CAAFI continued
to push the publiceprivate partnership efforts to develop supply chains for
biojet fuels in Vermont, Maryland/Delaware, and Florida.
1.6.3 Sustainable Aviation Fuels Northwest
The Sustainable Aviation Fuels Northwest (SAFN) launched in July 2010
brought together a set of over 40 stakeholders from aviation, agriculture,
forestry, biofuel producers, nonprofit advocacy, federal and state agencies,
and academia. SAFN has a stated goal of mapping a flight path for a safe,
sustainable, and economically viable biojet fuel industry in the Northwest
region of the United States. This program is the first regional assessment in
the United States on possible feedstock pathways in the four Northwest
states of Washington, Oregon, Montana, and Idaho.
Global Aviation and Biojet Fuel Policies, Legislations, Initiatives, and Roadmaps
51
Table 1.16 Programs and projects supporting the Farm to Fly initiative.
Specific
programs and
Key contributions
projects
Description
Agency
for biojet fuel
USDA Rural
Development
Provides funding
opportunities in
the form of
payments, rents,
and loan
guarantees for the
development and
commercialization
of biojet fuel.
Biorefinery
Assistance
Program
(Section 9003)
Rural Energy
for America
Program
Business and
Industry
Guaranteed
Loans
USDA
Research and
Development
Programs
Focuses on
improving biomass
varieties and
production
systems of biojet
fuels.
USDA
Biomass
Research
Centers
Agricultural
Research
Service
Provides loan
guarantees to
commercial-scale
facilities for advanced
biofuels from
renewable biomass.
Provides grants and
loan guarantees to
agricultural producers
to install renewable
energy systems.
Improves the
economic and
environmental
climate in rural
communities through
financing and
bolstering of existing
private credit
structure.
Establishes five
Biomass Research
Centers to enable
rural areas to
participate in the
biofuel supply chain
and benefit
economically.
Invests in
fundamental and
applied biological
science and
technology.
Coordinates
bioenergy research
programmes with
focus on feedstock
development,
sustainable feedstock
production systems
and biorefining and
coproducts.
Continued
52
Biojet Fuel in Aviation Applications
Table 1.16 Programs and projects supporting the Farm to Fly initiative.dcont’d
Agency
Key contributions
for biojet fuel
Specific
programs and
projects
US Forest
Service (FS)
Provides science
and technology to
sustainably
produce highvalue products
such as biojet fuel.
Biobased
Products and
Bioenergy
Research
Program
National
Institute of
Food and
Agriculture
Funds competitive
and peer-reviewed
research efforts.
Biomass
Research and
Development
Initiatives
Agriculture
and Food
Research
Initiative
Plant
Feedstock
Genomics for
Bioenergy
Economic
Research
Service
Provides primary
source of
economic
information and
research in USDA.
Economic
Research
Service
Description
Provides science and
technology to
sustainably produce,
manage, harvest, and
convert woody
biomass into liquid
transportation fuel,
inclusive of biojet
fuel.
Makes funds available
for advanced research
on feedstock
development and
biofuels.
Offers sustainable
energy grants to
reduce dependence
on foreign oil; have
net positive social,
environmental, and
rural economic
impacts.
Funds research
projects to utilize
advanced genomics
to breed energy crops
on marginal lands
with improved yield
and quality.
Informs public and
private stakeholders
on economic and
policy issues
involving food,
farming, natural
resources, and rural
development.
Global Aviation and Biojet Fuel Policies, Legislations, Initiatives, and Roadmaps
53
Table 1.16 Programs and projects supporting the Farm to Fly initiative.dcont’d
Agency
USDA Farm
Service
Agency
USDA Risk
Management
Agency
Key contributions
for biojet fuel
Provides financial
assistance to
owners and
operators of
agricultural and
nonindustrial
private forest land
for biomass
feedstocks.
Develops new
insurance products
for producers of
renewable, clean
energy crops in
the United States.
Specific
programs and
projects
Description
Biomass Crop
Assistance
Programs
Provides matching
and “establishment
and annual”
payments for eligible
biomass crops.
USDA Risk
Management
Agency
Energy Crop
Feasibility
Study
Researches on
biofuels produced
from energy cane,
switchgrass, and
camelina.
The four feedstocks in focus were oilseed crops, forest residues, algae,
and MSW, while hydroprocessing of oil and woody biomass conversion
were the two primary conversion technologies analyzed (SAFN, 2011).
Oilseed crops for the Pacific Northwest region include camelina, canola,
rapeseed, white or yellow mustard, brown or oriental mustard, black
mustard, crambe, cuphea, meadowfoam, safflower, and sunflower.
The combination of forest residues and woody biomass conversion
technologies plays into the strength of the US Pacific Northwest region as
compared with other regions as there is a low demand for wood chip and
pellet exports to the European Union. This reduces the cost of feedstock to
domestic biojet fuel producers. These set of circumstances increase the
chances of SAFN to meet its ultimate aim of generating as much biojet fuel
regionally. This has a twofold benefit in boosting the regional economy and
also reducing the overall carbon emissions.
SAFN also recommended six priority action steps as their policy
framework. One of those action steps is to ensure support for aviation fuels
and promising feedstocks under the RFS2 program. SAFN recommended
early support and investment from the government without advocating for
permanent subsidies. In addition to the substantial public investment, SAFN
identified policy support as a key element to create a biojet fuel industry in
the Northwest.
54
Biojet Fuel in Aviation Applications
The feasibility study concluded in May 2011 and resulted in the Aviation
Biofuels Production bill (HB 2422) being adopted by the Washington state
legislature. The bill mandates stakeholders within the jurisdiction to form an
“Aviation Biofuels Work Group” for the development of biojet fuel in
Washington.
1.6.4 Midwest Aviation Sustainable Biofuels Initiative
The Midwest governments and policymakers recognized the importance of
the biojet fuel industry in their region. As such, the Midwest Aviation
Sustainable Biofuels Initiative (MASBI) was initiated in May 2012 to link
up a diverse set of stakeholders from the entire biojet fuel value chain. The
initiative focused on the evaluation of the 12-state Midwest region’s biojet
fuel industry potential. An actionable roadmap was developed that covers
feedstock, commercialization, logistic, infrastructure, and regional policies
(MASBI, 2013).
MASBI categorized their 14 recommendations to advance biojet fuel
development into five key areas, with four recommendations under the
“Policy and Economic Development.” Among the policy recommendation
includes creation of long-term policies that enable investment and production, level playing field with fossil fuel, fund the Defense Production
Act Title III for biojet fuels, and build regional demonstration facilities
supported by municipal and state policies. MASBI opines that biofuel
policy measures are often short term and does not tackle the disadvantage of
biofuels over fossil fuels.
1.6.5 California Low Carbon Fuel Standard
The California Low Carbon Fuel Standard (LCFS) is a market-based measures (MBM), which uses economic incentive to reduce GHG intensity of
transport fuels to meet its designated obligations. The Executive Order S-107 in compliance with California Assembly Bill AB 32 was enacted by the
Californian governor in January 2007 to ensure that oil refineries and distributors within the Californian market meet the declining targets for GHG
emissions intensity. LCFS compliance began in January 2011.
Under the policy that originated from the Global Warming Act of 2006,
conventional fuels under the scope will generate LCFS deficits if its life
cycle carbon intensity is above the LCFS annual target. On the other hand,
alternative fuels with life cycle carbon intensity below the target will
generate LCFS credits. While the LCFS covers transport, aviation fuels do
55
Global Aviation and Biojet Fuel Policies, Legislations, Initiatives, and Roadmaps
not generate deficits. This could potentially change where deficits could
exist if the California Air Resources Board (CARB) exerts its authority to
regulate fuels for intrastate flights.
The biggest change to LCFS came in September 2018, where the 10%
reduction in the carbon intensity of California’s transportation fuels by 2020
is now increased to 20% by 2030. The amendment taking effect on January
1, 2019, represents the most stringent requirement in the whole country.
To meet this target, the aviation sector is also included as part of the
amendment. Sustainable aviation fuel producers could still opt in to
generate credit if they can prove that the life cycle carbon intensity is below
the 89.37 g CO2e/MJ of baseline jet aviation fuel using the CA-GREET
model (Davis, 2020). This was taken up by producers who obtained
LCFS credits for 1.4 million gallons of biojet fuels consumed in California
from registered pathways in 2019. World Energy contributed to the bulk of
the SAF derived from locally sourced waste cooking oil for use in the Los
Angeles International Airport.
The LCFS reporting schedule is done on a quarterly basis, and no credits
can be generated for an activity from the previous quarter. Additionally,
regulated entities must also submit an annual compliance report. The
CARB Cap-and-Trade program has a verification program based on ISO
14064-3 and 14065 to standardize the calculation of carbon pricing
mechanisms internationally.
It should be noted that currently the regulation climate will slightly
favor renewable diesel as it is easier to generate higher credit due to the
carbon intensity benchmark to beat being 94.17 g CO2e/MJ in 2019. This
gap of 4.8 g CO2e/MJ makes it more economically viable to produce
alternative diesel over alternative aviation fuels. In fact, the sustainable
aviation fuel carbon intensity target of 89.37 g CO2e/MJ in 2019 is comparable to gasoline’s 89.50 g CO2e/MJ in 2022 and diesel’s 89.15 g CO2e/
MJ in 2023. However, the declining target for alternative aviation fuel is
more gradual, as shown in Table 1.17 (California Air Resources Board,
2020). Parity will roughly be achieved in 2022.
Emissions reduction under “Fuel pathway crediting” for the LCFS
policy can be calculated by Eq. (1.4):
Credits ðtCO2 Þ ¼ ðCI of benchmark CI of fuelÞ*Energy economy ratio
*Conversion factor
(1.4)
56
Biojet Fuel in Aviation Applications
Table 1.17 California’s LCFS life cycle carbon intensity benchmarks for transport
fuels and their substitutes.
Carbon intensity benchmarks for transport fuels and their
substitutes
Year
2019
2020
2021
2022
2023
2024
2025
2026
2027
2028
2029
2030
onward
Jet fuel average
(gCO2e/MJ)
Gasoline average
(gCO2e/MJ)
Diesel average
(gCO2e/MJ)
89.37
89.37
89.37
89.37
89.15
87.89
86.64
85.38
84.13
82.87
81.62
80.36
93.23
91.98
90.74
89.50
88.25
87.01
85.77
84.52
83.28
82.04
80.80
79.55
94.17
92.92
91.66
90.41
89.15
87.89
86.64
85.38
84.13
82.87
81.62
80.36
The biojet fuel industry is given a boost when CARB approved a
temporary fuel pathway for alternative jet fuels. This augments existing
fuelefeedstock combination stated under Section 95488.9(b) (4) of the
LCFS regulation. The temporary fuel pathway is only applicable to fuels
produced through the hydrotreating process (California Air Resources
Board, 2019). The carbon intensity values vary between feedstock with
fats/oils/grease and plant oil (excluding palm oil and palm derivatives)
assigned values of 50 and 70 g CO2e/MJ, respectively. Other feedstock
adheres to the 2010 baseline CI value for USLD. LCFS credits can be
generated for fuels through this method effective from Q2 of 2019 onward.
The California LCFS as MBM is an unqualified success with credit
prices soaring to near record high at the end of 2019. However, CARB has
imposed a price cap on the secondary market for the LCFS credit clearance
market at USD 213/t, as calculated from USD 200/t in 2016. As the
renewable fuel projects remained profitable and carbon credits not hitting
the cap, there are reasons to believe that the conditions are favorable
economically to maintain the growth of the biojet fuel industry.
The outcome of LCFS is mixed with inroads into the formation of a
biojet fuel industry being made, but also creating problems leading to
lawsuits. A District Court’s judge applied an injunction on California to
Global Aviation and Biojet Fuel Policies, Legislations, Initiatives, and Roadmaps
57
prevent further enforcement of LCFS as it was deemed to discriminate
against ethanol sources from other US states due to the counting of the
transport carbon emissions of transport to California and protection of
Californian farmers. However, the Ninth Circuit Court of Appeals reversed
the opinion ruling that the GHG accounting system has the intention to
accurately assess the carbon intensity instead of unconstitutionally breaching
the “Commerce Clause” to unfairly benefit California’s farmers. There is
also an additional controversy arising because of the uncertainty in determining the magnitude of ILUC where feedstocks are practically classified as
good and bad feedstocks. Palm oil and palm derivatives are often excluded
as feedstocks that qualify for LCFS credits generation.
The LCFS credits could potentially be stacked with the relatively lowkey “Tax Credit for Carbon Sequestration (Section 45Q)” tax credit. The
latter that is also widely known as the 45Q tax credit enacted in February
2018 has started to lure corn ethanol producers into the industry as the fuel
producers could earn up to USD 50/tCO2 stored permanently or USD 35/
tCO2 if the CO2 is put to use. The combination of the LCFS credits and
45Q tax credits could potentially bring the incentives to about USD 230/
tCO2, which makes for a very lucrative business. As biomass-based biojet
fuel could also potentially use carbon dioxide capture and storage (CCS) in
the fuel production process, biojet fuel producers might find it easier to be
profitable. Biojet fuel producers that want to qualify for the 45Q scheme
will need to start their CCS facilities by 2025 and will have 12 years to
claim the tax credits. This might prove to be the boost that biojet fuel
producers need.
1.7 Canada
The government-supported BioFuelNet Canada (BFN) is a network that
connects the Canadian biofuels research community of 230 academic researchers and 152 organizations to deal with the challenges in growing the
Canadian advanced biofuel industry. The network sits under the Networks
of Centres of Excellence of Canada (NCE), with a funding of $25 million
over a 5-year period of 2012e17. BFN wanted to harness the natural
strength of Canada by focusing on using lignocellulosic feedstocks as the
central piece of the puzzle in the Canadian biofuels industry.
BFN created the Aviation Task Force as one of the six task forces initiated
within the second phase of BFN, namely the BFN II (BioFuelNet, 2020).
The task force participant consists of Transport Canada, Environment Canada,
58
Biojet Fuel in Aviation Applications
National Research Council, Air Canada, Airbus, International Air Transport
Association, CAAFI, ASCENT (FAA Centre of Excellence), and University of
Toronto.
The task force aims to resolve biojet fuel issues on deployment, production costs, feedstock costs, rigorous specification standards, and policy
considerations. From a policy perspective, the BFN views that the relatively
weak Canadian renewable fuel mandates and incentives when compared
with other developed nations, and poor governmental coordination leading
to redundancy-led wasted resources, as the main barriers to a successful
biojet fuel industry. BFN aims to improve the mandate issue by developing
and presenting the Canadian government with science-based evidence and
economic analysis to push for stronger and more targeted mandates.
Assuming success, BFN funding could be renewed past 2022 although it
will be disbursed through the New Frontiers in Research Fund (NFRF).
The Canada’s Biojet Supply Chain Initiative (CBSCI) is an initiative
steered by Air Canada, BFN, IATA, Transport Canada, Queen’s University,
SkyNRG, and Waterfall. It receives funding primarily from Green Aviation
Research and Development Network (GARDN), with additional project
funding from BFN, IATA, and Air Canada (in-kind). CBSCI wants to
enable a low carbon future for Canadian aviation through the objectives of
demonstrating the operational feasibility of biojet fuels in the domestic jet
fuel supply system, catalyze the development of the domestic biojet fuel
sector, validate the Canadian biojet fuel supply chain elements, and generate
hands-on experience with biojet handling and integration (CBSCI, 2020).
The last of the objectives is practically attained through a 3-year project
involving 14 stakeholders to introduce 400,000 L of blended biojet fuel into
a shared fuel system at the Montréal-Trudeau Airport.
Canada has twin commitments of Carbon Neutral Growth (CNG) from
2020 onward through emissions capping and Deep Carbon Reduction
arising from 50% GHG emissions reduction by 2050 as compared with 2005
levels. This two-step commitment will allow an easier quick win of CNG
prior to the deeper emissions reduction required in the 2035e50 timeframe.
For the Canadian aviation industry to achieve these targets, it must first
produce an annual biojet fuel volume of 54 ML in 2020, increasing to
923 ML by 2035 (CBSCI, 2019).
To affirm Canada’s dominant biomass for biojet fuel production, a
GARDN’s project led by NORAM and the University of British Columbia
assessed the feasibility of forest residue as feedstock. The consortium of the
ATM Project: Jet Biofuels from Forest Residuals consists of leading North
Global Aviation and Biojet Fuel Policies, Legislations, Initiatives, and Roadmaps
59
American and European groups on advanced biojet fuel. They include the
Canadian Canmet ENERGY laboratories, the US Pacific National Northwest Laboratory (PNNL), (S&T)2 Consultants, SkyNRG. Boeing,
Bombardier, Air Canada, and WestJet Airlines also supported the program
which is part of the broader CBSCI initiative. The use of forest residues in
the context of producing sustainable biojet fuel is apt as Canada is the world
leader in sustainably certified forest.
Jet fuel demand, jet fuel growth, and biojet fuel required for CNG projections from 2020 to 2035 are shown in Table 1.18 (CBSCI, 2015). The
projection assumes an 81% GHG reduction from biojet fuel and biojet fuels
contributing to 40% in CNG emissions reduction. It should, however, be
noted that the projection was done nearly 5 years before the global COVID-19
pandemic, which is expected to reduce jet fuel demand until 2024.
While Canada lags behind major biojet fuel players such as the European Union, the United States, and Brazil in terms of biojet fuel production
policies and fiscal programs, the development of a viable biojet fuel industry
in Canada is still promising, as Canada has existing renewable fuels sectors
Table 1.18 Jet fuel demand, jet fuel growth, and biojet fuel required for CNG
projections from 2020 to 2035.
Biojet fuel
Biojet fuel required
Jet fuel
Jet fuel
amount as a
for Carbon Neutral
growth
demand
total of total
Growth (billion
(billion
(billion
demand (%)
liters)
liters)
liters)
Year
2020
2021
2022
2023
2024
2025
2026
2027
2028
2029
2030
2031
2032
2033
2034
2035
7.55
7.67
7.78
7.90
8.02
8.14
8.24
8.35
8.47
8.58
8.69
8.80
8.93
9.05
9.18
9.30
0.11
0.23
0.35
0.46
0.58
0.70
0.80
0.91
1.03
1.14
1.25
1.37
1.49
1.61
1.74
1.87
0.05
0.11
0.17
0.23
0.29
0.35
0.40
0.45
0.51
0.56
0.62
0.68
0.74
0.80
0.86
0.92
0.7
1.5
2.2
2.9
3.6
4.3
4.8
5.4
6.0
6.6
7.1
7.7
8.2
8.8
9.4
9.4
60
Biojet Fuel in Aviation Applications
for bioethanol, biodiesel, and advanced biofuels. Many of these measures
can be adopted to set up a strong biojet fuel policy structure. The key
market-based instruments and examples from road transport sector that can
be adopted are summarized in Table 1.19 (CBSCI, 2015). The reworking
of existing renewable fuels policies, carbon policies, and fiscal programs is
less of a know-how but rather a question of political will.
1.8 Mexico
The “Flight Plan Towards Sustainable Aviation Biofuel in Mexico”
initiative launched in Mexico was to identify and analyze the existing and
missing supply chain elements of biojet fuel, with special emphasis being
placed on the HEFA pathway. The flight plan study started in July 2010
until March 2011 with the Aeropuertos Y Servicios Auxiliares (ASA)
(ICAO, 2011b), or Airports and Auxiliary Services in English leading it.
Partners include the National Council for Science and Technology
(CONACYT) as sponsor; strategic partners such as the Roundtable on
Sustainable Biofuels (RSB), Boeing, Honeywell-UOP; and a myriad of 60
experts and over 200 stakeholders.
The Flight Plan has the ambition of leading the national efforts to
develop and produce biojet fuels for the aviation industry; analyze the legal
framework, feedstock availability, refining infrastructure, and economic
viability of biojet fuels; and bringing together the talents of all participating
sectors. Through this Flight Plan, the Mexican target is set for biojet fuels to
be 1% of the national demand in 2015, raising to 15% in 2020. It was
envisioned that four biojet fuel refineries will be in operation by 2020 with
a throughput of 800 ML per year. It is not yet clear if the COVID-19
pandemic has caused a setback to the refineries being brought online.
The Flight Plan also recognized the shortcomings of Mexico in the form
of having a feedstock quantities bottleneck, lack of biorefining infrastructure, and the need to develop appropriate legislation to support the industry. Among key successes of the flight plan includes integration of biojet
fuel production in the supply chain and the pilot biojet fuel-powered flight
in Mexico.
1.9 Brazil
The collection of legislations regulating the oil, natural gas, and biofuel
industries in Brazil can be identified from the Brazilian National Agency of
Global Aviation and Biojet Fuel Policies, Legislations, Initiatives, and Roadmaps
61
Table 1.19 Key market-based instruments and examples from road transport sector
which can be adapted for the biojet fuel industry.
Category Instrument type
Description
Examples
Market
access
Fiscal
measures
Low carbon fuel
standard
Policy to reduce
carbon intensity of
a fuel type.
Renewable fuel
standard
Policy to set
obligations for the
inclusion of
renewable content
in a fuel sector.
Nested mandates
Mandates for
specific fuel types
that exist within
renewable fuel
standards.
Incentives to reduce
capital cost, reduce
payback risk and
enhance return
profile. Can
incentivise private
capital investment
in new sectors or
novel technologies.
Incentive to
stimulate market use
by reducing cost to
end user by
reducing price of
low carbon fuel.
Capital incentives
(grants, loans,
guarantees, green
bonds)
Consumption
incentive (fuel/carbon
tax relief, blending
incentives, credit
allowance, guaranteed
contract
- British
Columbia
RLCFRR
- California
LCFS
- EU FQD
- Canadian
federal RFS
- Canadian
provincial RFS
- EU RED
- US RFS
- US RFS with
mandates for
advanced
biofuels
- Brazilian
BNDES
Program
- EU NER 300
Program
- US Title 3
DOE, DOD,
ISDA
- Allowance
creation under
“cap and trade”
system
- Carbon tax
exemption
- Excise tax
reduction
- Volumetric
Ethanol Excise
Tax
Continued
62
Biojet Fuel in Aviation Applications
Table 1.19 Key market-based instruments and examples from road transport
sector which can be adapted for the biojet fuel industry.dcont’d
Category
Instrument type
Description
Examples
Investment incentive
(capital formation)
Incentive may
include income tax
relief, property tax
relief, contingent
taxes or royalties
(after payback),
investment tax
credits and taxexempt bond
structures. Specific
investment
structures to balance
project risk and
reward. Can
improve project
cash flow in the
early and payback
periods.
Public investment
funds to advance a
strategic sector by
stimulating
innovation research,
reduce R&D cost,
leverage private
sector investment
and knowledge, and
continuous
improvement of
production assets.
- Accelerated
depreciation
- Flow-through
shares
- Master limited
partnerships
Innovation
(technology grants,
financial incentives for
R&D, network of
enabling institutions
to participate in
industry-directed
research)
- BioFuelNet
Canada
- Climate
Change
Emissions
Management
Corporation
- Scientific
Research and
Experimental
Development
Tax Incentive
Program
- Sustainable
Development
Technology
Canada
Oil, Natural Gas and Biofuels (ANP) (de Souza et al., 2018). This also
means that biojet fuels fall under this regulatory agency with the fuel being
defined as aviation kerosene (or querosene de aviaç ão alternativo in portugese). Biojet fuel falls under ANP Resolution No. 63 of 2014 (or RANP
Global Aviation and Biojet Fuel Policies, Legislations, Initiatives, and Roadmaps
63
Table 1.20 Regulatory acts relating to the Brazilian biojet fuel market.
Regulatory acts
Year
Description
Brazilian Law No.
9478
1997
ANP Resolution No.
17
ANP Resolution No.
37
Brazilian Law No.
12,490
Brazilian Bill No. 506
2006
ANP Resolution
No.63
Brazilian Law No.
13,576
2014
2009
2011
2013
2017
Relates to national energy policy and
activities related to the petroleum industry.
Also establishes the ANP.
Regulates the distribution and supply of
aviation fuels.
Specification for fossil jet fuel to be used
pure or as blend with biojet fuel.
Includes biofuels in the Brazilian Law No.
9478.
Creation of the National Biojet Program to
encourage research and achieve sustainability
of the Brazilian aviation fuels.
Specification for biojet and its blend with
fossil jet fuel.
Creation of the National Biofuels Policy
(RenovaBio) to stimulate production and use
of biofuels based on sustainability,
competitiveness, and safety.
63d2014dLegislaçao ANP). Within it, biojet fuel is defined as a fuel
produced from alternative sources such as biomass, coal, and natural gas for
use in aircraft jet turbine engines with compliant production processes.
Brazil adopts the ASTM D4054 specification from ASTM International.
The adoption of the internationally recognized specification has its
advantage as the approved fuel must have drop-in characteristics where it
could be blended or substituted directly without requiring modification to
the engine and supporting infrastructures. The key regulatory acts related to
the Brazilian biojet aviation fuel market are shown in Table 1.20 (de Souza
et al., 2018).
The Brazilian Law No. 9478 led to the formation of the Brazilian
National Agency of Petroleum, Natural Gas and Biofuels (ANP), where
ANP is a federal government agency associated with the Ministry of Mines
and Energy (or Ministério de Minas e Energia, MME). From there, the
most prominent regulatory act for biojet fuels is the ANP Resolution No.
63 of 2014. The resolution presents the specification for the approved
alternative fuels to kerosene for the aviation market. To date, alternative
fuels approved by ASTM are eventually included in the resolution. The
alternative fuels will have their own table of specification akin to that of the
counterpart ASTM D7566.
64
Biojet Fuel in Aviation Applications
The allowable blend levels of the approved alternative biojet fuels and
petroleum-based jet fuel are also defined in the resolution. The blend is
called BX Aviation Kerosene ( Jet-BX) (de Souza et al., 2018) or Querosenes
de Aviação Alternativos e do Querosene de Aviação B-X (QAV B-X) in
Portugese. The blend follows the formula of mixing petroleum-based jet fuel
with a single type of approved alternative aviation fuel, where the X refers to
the volumetric amount of the alternative fuel component in the blend.
Postmixing, the Jet-BX blend must still meet the Jet-A1 (QAV-1) fuel requirements as specified in the earlier ANP Resolution No. 37 of 2009. In
addition to meeting the basic Jet-A1 requirements, other operational-related
parameters such as aromatics, distillation for 10%, 50%, and 90% recovered
volume, lubricity and viscosity also need to be met.
The tight requirement is due to the “drop-in” criteria where once the
alternative and fossil-based fuels are mixed, they can no longer be separated
or differentiated. Thus, it is only prudent to set up stringent criteria prior to
the mixing and treat them as the conventional Jet-A1 postmixing. This very
fact also makes the ANP Resolution No.17 of 2006 to be hard to police as
the regulation attempts to cover the distribution of aviation fuels. In Brazil,
fuel is mixed (for Jet-BX blends) prior to reaching the end customers, and
the producers and distributors are allowed to import the biojet fuels. Due to
the difficulty in determining the blend levels, Jet-BX cannot be exported
out of Brazil. The other key Brazilian laws and bills relate to the Brazilian
government attempts to promote the biojet fuel industry, increase energy
security, and also reduce GHGs, in particular the RenovaBio national
biofuels policy which will be discussed in detail in the next section.
1.9.1 Brazilian national biofuels policy (RenovaBio)
The then President of Brazil, Michel Temer approved the legislation creating
the Brazilian National Biofuels Policy (RenovaBio), which was a new national
biofuels policy. The law was officially gazetted by the Brazilian Senate in
December 2017 by Law No. 13,576/2017 with the aims to increase the use of
all biofuels. Additional regulations were also issued by Brazil’s MME through
Decree No. 9888/2019 and Ordinance No. 419 of November 20, 2019
(B3, 2019). While all biofuels inclusive of biojet fuels are part of the policy, it
remained dominated by bioethanol and to a certain extent biodiesel. The
clearly defined targets will bring greater degree of certainty for investment
planning within the sector. The biofuels policy is also timely as Brazil is already a
titan on the global stage being the world’s second largest consumer and
producer of biofuels (although its share of biojet fuel remain small), where biobased energy contributes to 18% of the nation’s energy mix.
Global Aviation and Biojet Fuel Policies, Legislations, Initiatives, and Roadmaps
65
As the RenovaBio is partially set up to meet the NDCs of Brazil’s
commitment to the Paris Agreement. For this purpose, MME, which is the
ministry in charge, sets a target of 18% reduction in GHG emissions for the
fuel matrix by 2030. Fuel distributors will have to meet the annual targets in
accordance with their market share. To quantify the targets and account for
the exact contribution of each biofuel producers, a certification system is
drawn out with the formation of the Biocarbon Decarbonation Credit
(CBIO). Although the target is annual, CBIO will not expire and can only
be withdrawn from circulation when it is officially retired by proving that
decarbonization is fulfilled.
Energyeenvironmental efficiency rating will also be given to biofuels
producers through a certification program by inspection accredited by the
ANP. This way the decarbonization credit that merges the elements of
emissions reduction, and life cycle assessment for the producers can be
ascertained. The credit also meant that tradable financial assets are introduced into the market for a more efficient “commodity-like” efficiency of
meeting the target through financial imperatives. The main features of
RenovaBio are shown in Fig. 1.5 (Denny, 2020). From the figure, it can
also be seen that the replacement of fossil jet fuel with biojet fuel is part of
the RenovaBio push.
CMBC/CNPE
stabilises the CIR
mandate
Certification
process
CBIO
market
Biofuel
producer
Econometric
model to define
RenovaBio-CIR
mandate
Fuel distributor
(blender)
Investors
Biofuels
Jet fuel
Gasoline
Jet fuel
Others
Diesel
Gasoline A
Diesel A
Hydrated
ethanol
Other fossil
Profit
Cost
Figure 1.5 Main features of RenovaBio. (Adapted from Denny, D.M.T., 2020. Competitive
renewables as the key to energy transitiondRenovaBio: the Brazilian biofuel regulation. In:
The Regulation and Policy of Latin American Energy Transitions, pp. 223e242.)
66
Biojet Fuel in Aviation Applications
The CBIO has repercussion beyond just the renewable energy sector as it
has wider implications across the wider economy. Fuel distributors can now
buy CBIOs to offset the emissions produced from the sales of petroleumbased fuels. It should be noted that any parties interested to offset their
carbon could purchase CBIO. In fact, CBIOs can now be freely traded in the
Brazilian stock exchange, the B3dBrazil Stock Exchange, and Over-theCounter Market (or Brasil, Bolsa, Balcão) in Sao Paulo. One CBIO is set to
offset 1 ton of CO2. It is estimated that on average, one CBIO is equivalent
to 800 and 500L of bioethanol and biodiesel, respectively.
The new Brazilian carbon credit had its first trade at Real 50 per CBIO
on June 12, 2020 (S&P Global Platts, 2020). In this symbolic trade, ethanol
producer Adecoagro sold the first 100 units to Datagro Conference to offset
carbon emissions generated during Datagro events for the year 2020. It is
expected that beyond this symbolic first trade, purchasers of the credit will
mainly be the mandated parties such as fuel distributors. Petrobras is
mandated to purchase the largest share of the CBIO at 27.1% of total
CBIO. Brazilian biojet fuel producers will remain a minor player in the
CBIO market for a foreseeable time despite the standing of Brazilian biofuel
industry, as none of the 189 fuel producers certified for the generation of
CBIO are biojet fuel producers. The breakdown is 89.4%, 10.1%, and 0.5%
for bioethanol, biodiesel, and biogas producers, respectively. The second
trade on June 29, 2020, tumbled to just Real 15 per CBIO, which is below
the estimated price of around Real 55 per CBIO (Argus, 2020). The CBIO
trading volume remained low as players within the industry are awaiting the
proposal by Brazil’s MME to reduce RenovaBio’s mandatory goals. The
new proposal will close to halve the CBIO target from 28.7 million CBIO
to 14.53 million CBIO. This is in view of the concerns by MME that
existing biofuel producers might not produce and sell sufficient biofuels to
generate the CBIOs.
1.10 Argentina
The Administración Nacional de Aviación Civil (ANAC) together with the
National Institute of Industrial Technology (INTI) embarked on aviation
biojet fuel production research in 2011 (ANAC, 2014). Concurrently, the
Aerolineas Argentinas (ARSA) and the Argentine Chamber of Biofuels
(CARBIO) also evaluated the feasibility of supplying its fleet with biojet
fuel produced in Argentina.
Global Aviation and Biojet Fuel Policies, Legislations, Initiatives, and Roadmaps
67
The two groups formed a multidisciplinary group to combine their
efforts and worked on the national production of biojet fuels, which will
meet international quality standards. The standard adopted is ASTM D7566.
The development of biojet fuel is supervised by the Under Secretariat of
Air Transportation (or “Subsecretaria de Transporte Aerocomercial de la
Secretaria de Transporte [SSTA y ST]” in Spanish). Additional members such
as Yacimientos Petroliferos Fiscales (YPF) and the National Institute of
Agricultural Technology (INTA) also joined the working group.
While the Argentinian biodiesel industry is well developed with supporting policies and mandates, its biojet fuel industry does not currently
enjoy the same support in terms of policies and legislations. Despite that,
Argentina can claim to have produced the feedstock for the first flight by an
airplane powered 100% by algal biojet fuel through the Biocombustibles del
Chubut S.A. plant in Puerto Madryn.
1.11 China
The Civil Aviation Administration of China (CAAC) formulated the
energy conservation and emissions reduction plan as part of their mandate
to promote air travel in a sustainable manner (CACC, 2008). This regulatory support from CAAC was issued through two documents in 2008,
namely the “Civil Aviation Industry Energy Conservation and Emissions
Reduction Plan (2005e15)” and “Circular on the Full-scale Implementation of Energy Conservation and Emissions Reductions throughout
Civil Aviation Industry.”
This is followed up in 2011 when CAAC released the “Guidelines to
Speed Up the Promotion of Energy Conservation and Emissions
Reduction Regime in Civil Aviation Industry,” dovetailing with the 12th
Five-Year Plan of the Civil Aviation Industry. Under the guideline, target
emissions reduction is materialized as fuel consumption reduction on a
2005 RTK basis. The fuel consumption
reduction targets are 11%, 15%,
́
and 22%
for
Phase
I
(2011e12),
Phase
II (2013e15), and Phase III
́
(2016e20), respectively.
́
The Chinese plan involves a three-phase stepping up of improving the
foundation in Phase I, scaling up in Phase II, and trickling up innovation
and optimization in Phase III. These targets from China are autonomous,
and CAAC is given the powers to exert itself to achieve the benchmarks
through joint efforts within the industry.
68
Biojet Fuel in Aviation Applications
CAAC has several energy efficiency programs and actions. Pertinent to
biojet fuel is the optimization of airspace and routes, implementation of
Reduced Vertical Separation Minimum (RVSM) and gate power unit
(GPU) to replace auxiliary power unit (APU). While these actions might
not directly impact biojet fuel implementation, it serves to reduce the
amount of aviation fuel used. In fact, an estimated 38,000 tons of jet fuel
and 121,000 tons of CO2 emissions have been saved through nonflight
measures such as replacing APU by GPU. This makes it easier to increase
the proportion of biojet fuel in the aviation energy mix.
China also approved the commercial use of a bio-based aviation jet fuel
in February 2014. The CAAC announced that Sinopec, a leading energy and
chemical company in China, was granted the first certificate of airworthiness
for biojet fuel. For this, the biojet fuel needed to comply with the CTSO2C701 standard, which applies to civilian aviation jet fuels containing synthesized hydrocarbons. Within CTSO-2C701, the synthesized component
of SPK needed to conform to the ASTM D7566-11a standard.
1.11.1 Civil Aviation Development Fund
The CAAC started a Civil Aviation Development Fund (CADF) in April
2012 which is collected with the intention to develop airport facilities.
The amount collected varies based on flight routes and aircraft types. The
CADF is established for the development of airport facilities, typically for
local airport constructions. Funds in the CADF have also been diverted for
energy-saving innovative technologies and the development of biojet
fuels. Companies can be granted subsidies through the CADF scheme in
the 30%e60% range of total investment for emissions reduction efforts
(China.org.cn, 2012).
A joint venture between the Commercial Aircraft Corp of China and
Boeing has launched an aviation energy conservation and emissions
reduction technology center in Beijing to convert “gutter oil” into biojet
fuel. Gutter oil is the colloquial name for leftover cooking oil which is
reused in the practice of restaurants. The use of gutter oil as feedstock
resolves the twin issues of using recycled oil which is no longer safe for
human consumption and also to reduce wastes. CAAC estimated that
China may use up to 12 million tons of biojet fuel by 2020, or 30% of
China’s total consumption of jet aviation fuels.
The aforementioned technology center and the planned biojet fuelpowered international flight between Air China and Boeing encapsulate
Global Aviation and Biojet Fuel Policies, Legislations, Initiatives, and Roadmaps
69
the increasing cooperation between China and the United States. The
US Trade and Development Agency (USTDA) and China’s National
Energy Administration (NEA) also have announced a renewable energy
agreement.
The amount collected from CADF reached an all-time high of RMB
47.672 billion in 2018, from the RMB 23.609 billion in 2012. Chinese
airlines were estimated to have contributed around RMB 12 billion for the
2018 figure, although that has been reduced substantially since July 2019.
Nonetheless, the amount is still substantial, and this augurs well for the
development of the biojet fuel industry in China. Due to the COVID-19induced aviation sector losses, the CAAC issued a set of relief measures in
March 2020 to exempt mandatory contribution to CADF. This reduction
in CADF income might have an impact on the long-term development of
biojet fuels.
1.11.2 China Five-Year plans
The push for biofuels has started in 2001 through the 10th Five-Year Plan
(2001e05) to mass-produce ethanol and formulate national standards for
fuel ethanol and pilot projects for E10 blends (IEA Bioenergy, 2016).
Further legislative pieces were passed, namely the “Renewable Energy
Promotion Law” and “New Ethanol Policy” in 2005 and 2006, respectively. The former signals China’s big move into renewable energy, while
the latter attempts to diffuse the food versus fuel issue by mandating ethanol
feedstock to not compete with grains. The ethanol industry gained a boost
with ethanol subsidies of USD 0.19 per liter being put in place. The ethanol
subsidy would eventually be slashed to USD 0.06 per liter in 2013,
although the reduced subsidy support is still arguably better than the lack of
direct biojet fuel usage subsidy.
In 2010, the national standards for B5 biodiesel fuel blend were
formulated with the government also eliminating biodiesel consumption
tax of 5%. Trial programs for biodiesels have also been rolled out to two
counties. The 12th Five-Year Plan (2011e15) saw a new ethanol target of
4 million tons by 2015. In September 2017, several ministries issued a joint
directive on the “Expansion of Ethanol Production and Promotion of
Transportation Fuel” to mandate a nationwide E10 blend by 2020. In
contrast, there is no biodiesel or biojet fuel mandate at national level.
China announced the 14th Five-Year Plan (2021e25) in October 2020
with aggressive goals for China to have CO2 emissions to peak in 2030 and
70
Biojet Fuel in Aviation Applications
achieve carbon neutrality by 2060. This continues China’s increased efforts
in pollution prevention and control, as witnessed during the previous 13th
Five-Year Plan period (2016e20). The biojet fuel industry is expected to
be one of the favored industries as it supports Part 10 of the 60-point
proposal to “accelerate green, low-carbon, and sustainable development”
for the National Economic and Social Development and the Long-Range
Objectives through the year 2035.
The danger for biojet fuel industry, as faced by the biodiesel industry
with low penetration rate in China, is from the lack of available feedstock,
subsidies, and clear policy support. However, China has a good track record
in its Five-Year Plans in which China transformed from not producing any
biofuels into the fourth largest biofuel producer in the world (USDA GAIN
Report, 2018).
1.12 Malaysia
The National Biomass Strategy 2020 (AIM, 2013) was initiated in
November 2011 by the National Innovation Agency (AIM). It is set up
initially to assess how Malaysia could increase revenue from its palm oil
industry through the broadening use of the associated biomass. This has
since been expanded in 2013 to also include biomass from the forestry
sector and dedicated crops on marginal land (AIM, 2013). The push for
palm oilederived biojet fuel in Malaysia will tie in well with the strategy,
which in turn will benefit the industry as incentives will be provided by the
government that is aligned with the strategy.
In April 2019, the Malaysian Palm Oil Council signed a memorandum
of understanding in Beijing with the China Chamber of Commerce of
Foodstuffs and Native Produce that would see China invests at least RM 2
billion in a Malaysian biojet fuel plant. The biojet fuel industry in Malaysia
was further given a boost when budget was allocated in the Malaysian 2020
Budget to study the use of palm oilebased biojet fuel. The government
allocated RM30 million for R&D matching grants for collaboration with
industry and academia to develop higher value-added downstream uses of
palm oil, which includes biojet fuel (Bank Negara Malaysia (BNM),
Malaysia 2020 budget, 2019). The Malaysian Palm Oil Board (MPOB) will
play the lead to set up a biojet production plant in Malaysia. For this,
MPOB requested around RM 5e6 million for the initial biojet fuel
project, which is 0.90%e1.08% of the budget allocation for R&D in
Malaysia. This is reminiscence of the push in 1982 where MPOB came up
Global Aviation and Biojet Fuel Policies, Legislations, Initiatives, and Roadmaps
71
with the first palm biodiesel pilot plant within 3 years, which subsequently
led to Malaysia being a global player in the biodiesel industry through
commercialization of plant technology, product innovation with the winter
grade palm biodiesel, and production of value-added products such as palm
phytonutrients.
The Malaysian National Aviation Policy was first proposed in October
2011, and the Ministry of Transport was tasked with drafting the policy.
The policy was supposed to define all the key aspects of aviation, direction,
objectives, and long-term strategies. The independent regulatory body
Malaysian Aviation Commission (MAVCOM) proposed an Economic
Master Plan for the Malaysian civil aviation sector to the Ministry of
Transport in March 2016, outlining the need for a National Aviation Policy
(MAVCOM, 2016). The proposed plan has the sectoral coverage of airlines, air traffic control, airport, and ground handling. It does not cover the
upstream subsectors such as aircraft design, leasing companies, and “maintenance, repair, and overhaul” (MRO). It also does not cover the type of
fuel and sustainability. Granted that the proposed plan only indirectly
addresses environmental issues and highlights the interlinkage between
environmental and economic matters, the proposal could have provided
more explicit links to show how sustainable biojet fuels fit into the bigger
picture and their connection to synergize with other policies. Despite the
proposal, a National Aviation Policy has yet to materialize as of 2020.
1.13 Japan
The Initiatives for Next-generation Aviation Fuels (INAF) inaugurated in
May 2014 is a Japanese deployment initiative to establish a supply chain
for the next-generation aviation fuels in the country. INAF was set up by
All Nippon Airways (ANA), Japan Airlines (JAL), Nippon Cargo Airlines
(NCA), Boeing Japan, Narita Airport, Japan Petroleum Exploration, and
University of Tokyo. In all, INAF comprised 46 organizations from the
government, industry, and academia collaborating to roll out biojet fuel
by 2020.
For the Japanese situation, INAF suggested the adoption of six raw
materials such as municipal waste, microalgae, natural oil, waste cooking
oil, nonedible biomass, and woody biomass. It is upon the development of
supply chain involving these feedstocks will Japan be ready to start producing biojet fuel by financial year 2020. A summary of the feedstockcentric roadmap is shown in Table 1.21.
72
Biojet Fuel in Aviation Applications
Table 1.21 Feedstocks and stages of development for the production of biojet fuels
as identified by INAF.
Fiscal year
Stages
2015
2016
Formulate
business plan
MW
MA
NO
WCO
NEB
WB
MA
WCO
WB
Design,
construction,
and trial
operation of
demonstration
plant for
production of
biojet fuel
Produce nextgeneration
aviation fuel
(biojet fuel)
through
demonstration
projects
Expand scale
of production
(commercial
project)
MW
NO
NEB
2017
2018
2019
MW
MA
NO
WCO
NEB
WB
MW
MA
NO
WCO
NEB
WB
MA
WCO
WB
MW
NEB
MW
NO
MW
MA
WCO
WB
MW
NEB
MW
NO
NEB
MW
MA
NO
NEB
MW
NEB
2020
2021
MW
MA
NEB
WB
MA, microalgae; MW, municipal waste; NEB, nonedible biomass; NO, natural oil; WB, woody
biomass; WCO, waste cooking oil.
INAF acknowledges that it will be extremely difficult to produce
economically viable alternative aviation fuel below 2015’s crude oil price of
around USD 65 per barrel. Given that the crude oil price postpandemic in
2020 traded around the USD 35e50 per barrel band, it is likely that the
business cost for Japanese biojet fuel producers will exceed the conventional
aviation fuel prices. Supportive policies will have to be drafted to provide
subsidies, specially recognized depreciation of capital investment, reduction
of aircraft fuel tax, and “petroleum and coal” taxes when using biojet
fuel. INAF also conceded that fuel prices are cyclical and fluctuates, which
makes it difficult for the nascent biojet fuel supply chain to be viable.
Global Aviation and Biojet Fuel Policies, Legislations, Initiatives, and Roadmaps
73
However, INAF is of the opinion that the long lead time is required for
stable supply to be achieved, so demonstration projects are the key to
provide confidence to businesses for the long-haul regardless of the prevailing aviation fuel supplyedemand levels. Continuing technological
development and securing a margin of investment are seen as crucial moves
to ensure the long-term success of the biojet fuel industry in Japan.
The INAF committee met on a biannual basis from July 2015 until
April 2018. However, meeting was suspended until members have good
prospect of a concrete plan to introduce biojet fuel during the 2020 Tokyo
Olympic and Paralympic Games.
1.14 Indonesia
The Indonesian government established the Indonesian Aviation Biofuels
and Renewable Energy Task Force (ABRETF) to reduce aviation GHG
emissions and increase the use of biojet fuel in the blend mix. The task force
was set up in August 2014 under DG Decree No. 517 K/73/DJE/2014 and
KP. 429 Year 2014. The ABREFT jointly sits under the Ministry of
Transportation’s Directorate General of Civil Aviation (DGCA) and the
Ministry of Energy and Mineral Resources’s Directorate General of
Renewable Energy and Energy Conservation (EBTKE). The initiative
covers the full value-chain focusing on HEFA initially, with stakeholders
covering the government, the massive feedstock producers, oil companies,
airlines, airports, aviation associations, and universities. It should be noted
that the inclusion of feedstock producers is crucial as Indonesia is the largest
palm oil producer in the world and the feedstock is earmarked as one of the
possible feedstocks through the HEFA pathway.
This ties in well with the mandate from the Indonesian Ministry of
Energy and Mineral Resources under Decree No. 25 Year 2013 to use 2%
of biojet fuel in aviation fuel blends nationally in 2016. The mandate also
specified an increase to 3% and 5% by 2020 and 2025 (Wei et al., 2019),
respectively. Although the 5% amount looks low at first glance, the ambitions of the Indonesian government are comparable with other major
initiatives from the European Union and China to have drop-in biofuel
quantity of 4% and 3% in 2020, respectively. Also, to provide additional
context, air transport consumed 4% of fuel consumption for transport, or
1.9% of total national fuel in 2015. The sustainable aviation fuel from
vegetable oil, primarily palm oil used in Indonesia, is labeled as Bioavtur.
74
Biojet Fuel in Aviation Applications
ABREFT has conceded that the 2016 goal of 2% biojet fuel in aviation
fuel blends will not be achieved due to national circumstances. However,
oil producers in Indonesia have since reiterated their commitment to have a
production capacity of 257,000 kL/year (ICAO, 2014a).
1.15 Australia
The Australian Initiative for Sustainable Aviation Fuels (AISAF) was formed
in 2012. Key publiceprivate partners include the Australian government;
airliners such as Qantas Airways, Virgin Australia, Air New Zealand; aircraft
supply chain such as Airbus, Boeing, GE; academia and research entities such
as CSIRO, the US Studies Centre at the University of Sydney; aviation
groups such as Queensland Sustainable Aviation Fuels Initiative and CAAFI;
and others such as Baker McKenzie. AISAF sets a long-term target of 50%
sustainable biojet fuel by 2050. This target is not legally binding and does not
have any obligated parties.
A year later, AISAF joined forces with Aviation/Aerospace Australia (A/
AA) to contribute to the long-term sustainability of the country’s aviation
and aerospace sector. There are four working groups within AISAF, namely
“Research, Development and Demonstrationdfeedstocks and conversion
technologies,” “Fuel Certification and Qualification,” “Environmental
Impacts,” and “Commercialization.” The groups were tasked to identify
research gap for the production and commercialization of SAF, improve
integration of activities leading to the development of SAF, and implement
the AustraliaeUS Memorandum of Understanding on Sustainable Aviation
Fuels. The program in this format ended in 2015 when it was absorbed into
the University of Sydney-based US Studies Centre’s Alternative Transport
Fuel Initiative.
Simultaneously, there were also a few other projects running in tandem
with the AISAF. One of those is the “Qantas and Shell Aviation Biofuel
Feasibility Study” in 2013 to identify environmental and economic challenges of the development of a commercially viable SAF industry in
Australia. The study stated that a commercially viable SAF industry can be
formed if access to substantial and ratable volume of feedstock can be
obtained at submarket prices, ramping up emerging and nonfood domestic
feedstock production, and policy that incentivizes the production of any
renewable transport fuel (including biojet fuel). The modeling work predicted that between 5% and 35% of Qantas’ domestic flights could be flown
using a 50% biojet fuel blends from FT or HEFA pathway.
Global Aviation and Biojet Fuel Policies, Legislations, Initiatives, and Roadmaps
75
In 2014, the Sustainable Mallee Jet Fuel project commissioned by
Airbus evaluated the possibility of using mallee, which is a dominant
vegetation in the semiarid areas of Australia. The use of mallee will avoid
the food versus fuel debate altogether as arable lands and food feedstock
need not be used. In this study, a value chain was proposed according to the
Roundtable for Sustainable Biomass (RSB). It includes the production of
biojet fuels and sustainability certification. The results are promising, with
the pyrolysis of the lignocellulosic-based mallee reducing emissions by 40%
as compared with conventional aviation fuel. However, it narrowly missed
the 50% emissions reduction threshold of the RSB standard. Additionally,
mallee-derived biojet fuels were not price-competitive against that of its
fossil counterpart; it was projected that mallee biomass could be competitive
by 2021. The plunging demand for air transport since the COVID-19
pandemic might affect this estimation.
The development of biojet fuel is important to Australia as it currently
imports about 93% of its commercial aviation fuel. The high import level,
closure of refineries, and low stockpile of jet fuel at 23 days represent an
energy security concern. Notably, the share of aviation fuel in the transport
fuel mix increased the most in recent decades as compared with petrol and
diesel fuel. With this in mind, the Australian government should set
mandatory biojet fuel blends and reignite the fervor of the early 2010s
when multiple biojet fuel initiatives were introduced.
1.16 Summary
As commercial biojet fuels assume greater significance in the global aviation
industry, it is crucial that policies and legislations are passed to support biojet
fuel initiatives to meet the roadmap goals. Presently, governments around
the world are increasingly implementing decarbonization targets concerning the aviation sector and introducing mandates for mandatory blending.
Also, more countries are voluntarily signing up to international carbon
reduction schemes such as CORSIA. The need for both intranational and
international measures is apparent as the major polluting flights often cross
national borders, starting the flight in a country and ending in another. The
biojet fuel industry is currently developing technological maturity and
attempting to swing the pendulum toward profitability. The industry can
follow the footsteps of the successful biodiesel and bioethanol industries.
Among steps include supportive public policies to protect and nurture the
industry, encourage academia to collaborate with industry to develop the
76
Biojet Fuel in Aviation Applications
technology, and have long-term targets and transparent mandates to
improve supply chain for better risk management and financial projections.
The public will also need convincing on the safety aspects. This can be
conveyed explicitly by requiring biojet fuels to meet the standards prior to
usage. It is encouraging that biojet fuel-related policies are steering actions,
mandates are ensuring biojet fuel usage, legislations set the boundaries of
law, and roadmaps are showing the end goals. Early government-steered
initiatives in collaboration with industrial stakeholders are also gaining
momentum. The present public policy measures are top-down heavy,
relying on vertical integration with industrial players and academia.
Nonetheless, for biojet fuel to be the de facto aviation fuel and supplanting
conventional jet fuel in the long term, citizen involvement in public policymaking will increase the motivation to adopt biojet fuel for the common
good and foster accountability.
References
AIM, 2013. National Biomass Strategy 2020: New Wealth Creation for Malaysia’s Biomass
Industry.
ANAC, 2014. Administración Nacional de Aviación Civil, Argentina’s Action Plan on CO2
emissions reduction. https://www.icao.int/environmental-protection/Lists/ActionPlan/Attachments/53/Argentina_Action%20Plan%202014.pdf.
Argus, 2020. Brazil Carbon Credits Miss Price Expectations. https://www.argusmedia.com/
en/news/2118789-brazil-carbon-credits-miss-price-expectations.
B3, 2019. Decarbonization Credit. http://www.b3.com.br/en_us/products-and-services/
additional-services/informational-service/decarbonization-credit-cbio/.
Bank Negara Malaysia (BNM), Malaysia 2020 budget, 2019. https://bnmold.bnm.gov.my/
documents/budget/bs2020.pdf.
BioFuelNet, 2020. Task Forces. http://www.biofuelnet.ca/nce/phase-ii/phase-ii-task-forces/.
CACC, 2008. China’s Action Plan to Limit and Reduce CO2 Emissions from International
Aviation. https://www.icao.int/environmental-protection/Lists/ActionPlan/Attachments/5/China_en.pdf.
California Air Resources Board, 2019. Low Carbon Fuel Standard Proposed New Temporary
Fuel Pathway. https://ww2.arb.ca.gov/sites/default/files/classic//fuels/lcfs/fuelpathways/
comments/ajf_temp.pdf?utm_medium¼email&utm_source¼govdelivery.
California Air Resources Board, 2020. Low Carbon Fuel Standard. https://ww2.arb.ca.gov/
sites/default/files/2020-09/basics-notes.pdf.
CBSCI, 2015. Feasibility Study of Canadian Biojet Fuel Supply Chain Phase 2: Creating a
Biojet Market. https://cbsci.ca/wp-content/uploads/Aviation_CTI_Biojet_Phase_2.pdf.
CBSCI, 2019. Feasibility Study of Canadian Biojet Fuel Supply Chain Executive Summary.
https://cbsci.ca/wp-content/uploads/CTI_Biojet_Combined_Executive_Summary.pdf.
CBSCI, 2020. Canada’s Biojet Supply Chain Initiative. https://cbsci.ca/about/.
Celignis Analytical, 2020. Renewable Identification Numbers (RINs) Credit. https://www.
celignis.com/RINs-credits.php.
Global Aviation and Biojet Fuel Policies, Legislations, Initiatives, and Roadmaps
77
Chiaramonti, D., Goumas, T., 2019. Impacts on industrial-scale market deployment of
advanced biofuels and recycled carbon fuels from the EU renewable energy directive II.
Appl. Energy 251, 113351.
China.org.cn, 2012. Subsidies for Going Green in Aviation. http://www.china.org.cn/
business/2012-08/22/content_26302422.htm.
Davis, U.C., 2020. Sustainable Aviation Fuels under a Low Carbon Fuel Standard. https://
policyinstitute.ucdavis.edu/wp-content/uploads/Murphy-ITF-LCFS-and-SAF-Today.pdf.
de Souza, L.M., Mendes, P.A.S., Aranda, D.A.G., 2018. Assessing the current scenario of the
Brazilian biojet market. Renew. Sustain. Energy Rev. 98, 426e438.
Deane, J.P., Pye, S., 2018. Europe’s ambition for biofuels in aviation - a strategic review of
challenges and opportunities. Energy Strategy Rev. 20, 1e5.
Deane, P., Gallachóir, B.Ó., Shea, R.O., R. O., 2017. Biofuels for aviation. In: Europe’s
Energy Transition - Insights for Policy Making, pp. 79e88.
Denny, D.M.T., 2020. Competitive renewables as the key to energy transitiond
RenovaBio: the Brazilian biofuel regulation. In: The Regulation and Policy of Latin
American Energy Transitions, pp. 223e242.
DfT, U., 2017. The Renewable Transport Fuel Obligations Order. https://assets.publishing.
service.gov.uk/government/uploads/system/uploads/attachment_data/file/644843/
renewable-transport-fuel-obligations-order-government-response-to-consultations-onamendments.pdf.
DfT, U., 2018. Renewable Transport Fuel Obligation Statistics. https://assets.publishing.
service.gov.uk/government/uploads/system/uploads/attachment_data/file/752990/no
tes-and-definitions.pdf.
European Commission, 2009. Summary of the Member State Forecast Documents. https://
ec.europa.eu/energy/sites/ener/files/dir_2009_0028_article_4_3_forecast_by_ms_sym
mary.pdf.
European Commission, 2011a. Flightpath 2050 - Europe’s Vision for Aviation (Report of
the High-Level Group on Aviation Research) Luxembourg. Publications Office of the
European Union 2011, p. 25. https://doi.org/10.2777/50266.
European Commission, 2011b. White Paper on Transport. https://ec.europa.eu/transport/
sites/transport/files/themes/strategies/doc/2011_white_paper/white-paper-illustratedbrochure_en.pdf.
European Commission, 2013. 2 Million Tons Per Year: A Performing Biofuels Supply
Chain for EU Aviation. https://ec.europa.eu/energy/sites/ener/files/20130911_a_
performing_biofuels_supply_chain.pdf.
European Commission, 2017. Evaluation of Directive 98/70/EC of the European Parliament and of the Council Relating to the Quality of Petrol and Diesel Fuels (‘Fuel
Quality Directive’). https://ec.europa.eu/transport/sites/transport/files/swd20170178fuelqualitydirective.pdf.
European Commission, 2018. Renewable Energy Directive. https://ec.europa.eu/energy/
topics/renewable-energy/renewable-energy-directive/overview_en.
European Commission, 2020. Reducing Emissions from Aviation. https://ec.europa.eu/
clima/policies/transport/aviation_en.
IATA, 2019. Economic Per Formance of the Airline Industry. https://www.iata.org/en/iatarepository/publications/economic-reports/airline-industry-economic-performance—
december-2019—report/.
ICAO, 2010a. Farm-to-Fly. https://www.icao.int/environmental-protection/GFAAF/
Pages/InitiativesAndProjectsDetails.aspx?ProjectID¼32.
ICAO, 2011a. European Advanced Biofuels Flight Path. https://www.icao.int/environmentalprotection/GFAAF/Pages/Project.aspx?ProjectID¼9.
78
Biojet Fuel in Aviation Applications
ICAO, 2011b. Flight Plan Towards Sustainable Aviation Biofuel in Mexico. https://www.
icao.int/environmental-protection/GFAAF/Pages/InitiativesAndProjectsDetails.aspx?Pro
jectID¼23.
ICAO, 2012. Action Plan of Iceland. https://www.icao.int/environmental-protection/Documents/ActionPlan/Iceland_en.pdf.
ICAO, 2013. Assembly Resolutions in Force. https://www.icao.int/meetings/glads-2015/
documents/a38-18.pdf.
ICAO, 2014a. Indonesian Aviation Biofuels and Renewable Energy Task Force
(ABRETF). https://www.icao.int/environmental-protection/GFAAF/Pages/Project.aspx?ProjectID¼40.
ICAO, 2014b. Nordic Initiative for Sustainable Aviation (NISA). https://www.icao.int/
environmental-protection/GFAAF/Pages/Project.aspx?ProjectID¼25.
ICAO, 2016. Initiative Towards Sustainable Kerosene for Aviation (ITAKA). https://www.
icao.int/environmental-protection/GFAAF/Pages/Project.aspx?ProjectID¼19.
ICAO, 2018. ICAO Vision. https://www.icao.int/environmental-protection/GFAAF/
pages/ICAO-Vision.aspx.
ICAO, 2019a. Committee on Aviation Environmental Protection (CAEP). https://www.
icao.int/environmental-protection/CORSIA/Documents/CAEP_Analysis%20on%20the%20estimation%20of%20CO2%20emissions%20reductions%20and%20costs%20from%20CORSIA.pdf.
ICAO, 2019b. CORSIA at a Glance Series. https://www.icao.int/environmental-protection/
CORSIA/Documents/CORSIA%20Leaflets/CorsiaLeaflet-EN-9-WEB.pdf.
ICAO, 2019c. CORSIA Default Life Cycle Emissions Values for CORSIA Eligible Fuels.
https://www.icao.int/environmental-protection/CORSIA/Documents/ICAO%20docu
ment%2006%20-%20Default%20Life%20Cycle%20Emissions.pdf.
ICAO, 2019d. CORSIA Methodology for Calculating Actual Life Cycle Emissions Values.
https://www.icao.int/environmental-protection/CORSIA/Documents/ICAO%20docu
ment%2007%20-%20Methodology%20for%20Actual%20Life%20Cycle%20Emissions.pdf.
ICAO, 2019e. ICAO CORSIA CO2 Estimation and Reporting Tool (CERT). www.icao.int/
environmental-protection/CORSIA/CERTTool/ICAO%20CORSIA%20CERT%20version%202019%20-%20Design,%20Development%20and%20Validation.pdf.
ICAO, 2019f. ICAO Strategy to Deal with Aviation Emissions. https://www.icao.int/
EURNAT/Other%20Meetings%20Seminars%20and%20Workshops/ICAO%20EUR
%20Environment%20Task%20Force%20Meetings/Second%20ICAO%20EUR%20En
vironment%20Task%20Force%20Meeting/1.1.presentationICAO.2019.pdf.
ICAO, 2020a. Climate Change: Adaptation. https://www.icao.int/environmental-protection/
pages/adaptation.aspx.
ICAO, 2020b. Sustainable Aviation Fuels (SAF). https://www.icao.int/environmentalprotection/pages/SAF.aspx.
ICAO Secretariat, 2019. Environemental Report, an Overview of CORSIA Eligible Fuels
(CEF).
https://www.icao.int/environmental-protection/Documents/Environmental
Reports/2019/ENVReport2019_pg228-231.pdf.
IEA Bioenergy, 2016. The Potential of Biofuels in China. https://www.ieabioenergy.com/
wp-content/uploads/2017/01/The-Potential-of-biofuels-in-China-IEA-BioenergyTask-39-September-2016.pdf.
JRC, E.U., 2020. RES Target for EU Member State. https://visualise.jrc.ec.europa.eu/t/
NREAPs/views/RESsharetrajectory/RES_shares_trajectories?:
isGuestRedirectFromVizportal¼y&:embed¼y. (Accessed 14 November 2020).
MASBI, 2013. Fueling a Sustainable Future for Aviation. http://www.masbi.org/content/
assets/MASBI_Report.pdf.
MAVCOM, 2016. Malaysian Aviation Commission. https://www.mavcom.my/wpcontent/uploads/2020/02/Executive-Summary.pdf.
Global Aviation and Biojet Fuel Policies, Legislations, Initiatives, and Roadmaps
79
Meijerink, O., 2016. Report, the Voluntary RED Opt-In for Aviation Biofuels. https://
skynrg.com/wp-content/uploads/2019/03/Publications-The-voluntary-RED-opt-infor-aviation-biofuels.pdf.
NER, 2020. Nordic Energy Research, Sustainable Jet Fuel for Aviation. https://www.
nordicenergy.org/wp-content/uploads/2020/01/Sustainable-Jet-Fuel-Update-FinalNER.pdf.
Openairlines, 2018. CORSIA: Who Needs to Be Participating in the Scheme? https://blog.
openairlines.com/corsia-who-needs-to-be-participating.
RICARDO, 2017. Future Fuels for Flight and Freight Competition (F4C). https://ee.
ricardo.com/transport/case-studies/f4c.
S&P Global Platts, 2020. Brazilian Carbon Credit First Trade at Near $10/CBIO. https://
www.spglobal.com/platts/en/market-insights/latest-news/oil/061220-brazilian-carboncredit-first-trade-at-near-10cbio.
SAFN, 2011. Sustainable Aviation Fuels Northwest: Powering the Next Generation of Flight.
https://www.climatesolutions.org/sites/default/files/uploads/safn_2011report.pdf.
Scarlat, N., Dallemand, J.-F., 2019. Future role of bioenergy. In: The Role of Bioenergy in
the Bioeconomy, pp. 435e547.
US USDA, 2012. U.S. Department of Agriculture, Agriculture and Aviation: Partners
in Prosperity. https://www.usda.gov/sites/default/files/documents/usda-farm-to-fly-re
port-jan-2012.pdf.
US EPA, 2020a. Environmental Protection Agency, Approved Pathways for Renewable
Fuel. https://www.epa.gov/renewable-fuel-standard-program/approved-pathways-re
newable-fuel.
US EPA, 2020b. Environmental Protection Agency, what Is a Fuel Pathway? https://www.
epa.gov/renewable-fuel-standard-program/what-fuel-pathway.
US EPA, 2020c. RIN Trades and Price Information. https://www.epa.gov/fuels-registrationreporting-and-compliance-help/rin-trades-and-price-information.
US EPA, 2020d. Total Available RINs to Date Report. https://www.epa.gov/fuelsregistration-reporting-and-compliance-help/available-rins.
USDA GAIN Report, 2018. China Biofuels Annual 2018. https://apps.fas.usda.gov/
newgainapi/api/report/downloadreportbyfilename?filename¼Biofuels%20Annual_Beij
ing_China%20-%20Peoples%20Republic%20of_7-25-2018.pdf.
USDA GAIN Report, 2019. Global Agricultural Information Network, Biofuel Mandates
in the EU by Member State in 2019. https://apps.fas.usda.gov/newgainapi/api/report/
downloadreportbyfilename?filename¼Biofuel%20Mandates%20in%20the%20EU%20by
%20Member%20State%20in%202019_Berlin_EU-28_6-27-2019.pdf.
Wei, H., Liu, W., Chen, X., Yang, Q., Li, J., Chen, H., 2019. Renewable bio-jet fuel
production for aviation: a review. Fuel 254, 115599.
This page intentionally left blank
CHAPTER 2
Biojet fuel production pathways
2.1 Introduction
Biojet fuel production is the process of producing renewable liquid fuel for
aviation applications. The renewable fuel can be produced from various
biomass from plants, animals, wastes, and residues. Presently, the dominant
method of production is via the hydroprocessed ester and fatty acid (HEFA)
pathway using first-generation feedstocks, primarily from edible oils.
Unlike the more mature biofuel like biodiesel where the transesterification
process is the de facto production method, the best pathway for biojet fuel
production is still up for debates. Alongside HEFA, there are eight other
pathways, which might still prove to be viable when the technologies
mature.
Biojet fuel production pathways can be categorized into four main
types: (1) oil-to-jet (OTJ) that uses lipids and biooils, (2) gas-to-jet (GTJ)
that utilizes syngases, (3) alcohol-to-jet (ATJ) that consumes small carbonchain alcohols, and (4) sugar-to-jet (STJ) that uses sugars and starches. The
categories are denoted by the raw materials used in the key processes of the
pathways. Fig. 2.1 illustrates the broad categories of the various biojet fuel
production pathways.
The different production pathways have different feedstock requirements,
convert to different intermediates, yield different product compositions, and
operate on different sets of conditions and time scales.
2.2 Oil-to-jet
The common oil-to-jet (OTJ) conversion pathways are HEFA, catalytic
hydrothermolysis (CH), and hydroprocessed depolymerized cellolusic jet
(HDJC). The typical feedstocks used for HEFA, CH, and hydrogenated
pyrolysis are fatty acid and esters, triglycerides-rich oil, and wastes/lignocelluloses, respectively (Casas-Godoy et al., 2020). For a pathway to be
Biojet Fuel in Aviation Applications
ISBN 978-0-12-822854-8
https://doi.org/10.1016/B978-0-12-822854-8.00003-2
© 2021 Elsevier Inc.
All rights reserved.
81
82
Biojet Fuel in Aviation Applications
Oil-to-Jet (OTJ)
Lipids
Cracking / Isomerisation
Hydrotreatment
Hydroprocessed esters and fatty acids (HEFA)
Catalytic hydrothermolysis (CH)
Hydroprocessed depolymerized cellulosic jet (HDJC),
Alcohol-to-Jet (ATJ)
Dehydration
Oligomerisation
Hydrogenation
Ethanol-to-Jet (ETJ)
Butyl alcohol-to-jet
Gas-to-Jet (GTJ)
Syngas
Catalytic fuel synthesis
Cracking / Isomerisation
Fractionation
Feedstock
Alcohol
Fischer-Tropsch (FT)
Biomass-to-Fuel
Sugar-to-Jet (STJ)
Sugar
Sugar conversion
Hydrotreatment
Direct sugar-to-hydrocarbon (DSHC)
Aqueous phase reforming (APR)
Figure 2.1 Biojet fuel conversion pathways by category.
considered as OTJ, the starting feedstock need not necessarily be lipidbased, instead the main conversion process will convert oil into biojet fuel.
2.2.1 Hydroprocessed esters and fatty acids
HEFA is also commonly known by its other names such as hydrotreated
vegetable oil (HVO) or hydrotreated renewable jet (HRJ) (Dayton and
Foust, 2020). HEFA biojet fuels are straight-chain paraffinic hydrocarbons
produced from the hydroprocessing of lipids such as oils and fats. As such,
HEFA fuels have high cetane numbers and do not generally contain
oxygen, sulfur, and aromatics. They are also microbial growth-resistant and
are stable for storage. HEFA biojet fuels are unique in the sense that they
can be used for aviation in jet engines, road in diesel cars, and marine in
ships.
The hydrotreating process for the HEFA conversion pathway as
developed by UOP Honeywell in 2009 is illustrated in Fig. 2.2. The basic
HEFA pathway involves three main processes of deoxygenation, cracking/
isomerization, and distillation. Even in the early days, the quantum of biojet
fuel produced was in thousands of gallons, from feedstocks covering multiple generations such as palm, soybean, camelina, jatropha, and algae oils
(Gutiérrez-Antonio et al., 2015). This led to demonstration flights being
Biojet fuel production pathways
83
Figure 2.2 Hydrotreating process for production of HEFA biojet fuel. HEFA, hydroprocessed ester and fatty acid.
Performance
conducted to prove that the biojet fuel achieved parity in performance with
conventional jet fuel, culminating in the approval of HEFA biojet fuel for
commercial flights by ASTM International in July 2011. HEFA fuels
meeting the ASTM D7566 specifications can be blended with conventional
jet aviation fuel up to a volumetric blend ratio of 50% (Yilmaz and Atmanli,
2017). This followed the approval of FischereTropsch (FT)esynthesized
paraffinic kerosene (FT-SPK) as a conventional aviation fuel in 2009. Despite
FT-SPK gaining approval ahead of HEFA, HEFA has the highest technology
readiness level (TRL) among the ASTM-certified pathways at TRL 9. This
level of TRL denotes advanced commercialization level of technology
maturity. Fig. 2.3 shows the technology maturity versus performance curve
of various biojet fuel conversion pathways (Vásquez et al., 2017).
Embryonic
Emergent
Development
Mature
Exploratory
development
Laboratory /
Concept Demonstration
Pilot plant /
Demonstration
Industrial
Hydroprocessed esters
and fatty acid (HEFA)
Alcohol-to-Jet (ATJ)
Fischer-Tropsch (FT)
Catalytic
hydrothermolysis (CH)
Aqueous phase
reforming (APR)
Direct sugar-tohydrocarbon (DSHC)
Hydroprocessed depolymerized
cellulosic jet (HDCJ)
Technology maturity
Figure 2.3 Technology maturity versus performance curve of various biojet fuel
conversion pathways. (Adapted from Vásquez, M.C., Silva, E.E., Castillo, E.F., 2017.
Hydrotreatment of vegetable oils: a review of the technologies and its developments for
jet biofuel production. Biomass Bioenergy 105, 197e206.)
84
Biojet Fuel in Aviation Applications
Prior to the first chemical reaction step of the HEFA process chain,
pretreatment procedures such as oil pressing, oil extraction, and prerefining
are first conducted. The prerefining step is the most crucial for waste
cooking oil or discarded animal fats as contaminants from these feedstocks
will bring detrimental effects to the catalyst-controlled HEFA pathway.
Upon completing the physical pretreatment processes, the conditioned
feedstocks can undergo the first chemical step, the hydrogenation of lipids.
The operating conditions vary greatly with temperature ranging from 250
to 450 C, while hydrogen pressure is in the 10e300 bar range. The act of
introducing hydrogen gas in the hydrogenation process will saturate
existing double bonds and form water molecules with the feedstock-bound
oxygen contents. This converts the triglycerides into hydrocarbons such as
alkanes. The sequence of reactions can be summed as (1) hydrogenation of
the C]C bonds in the unsaturated fatty acids units of triglycerides,
(2) hydrogenolysis of the triglycerides into fatty acids, and (3) deoxygenation of the fatty acids into straight-chained paraffins (Lee et al., 2019). The
reactions in the hydrogenation reactor are controlled by catalysts. Common
catalysts are supported metal-type catalysts (from Pt, Pd, or Ni) or MoS2type catalysts. It is likely that undesirable molecules such as CO and CO2 be
produced as a by-product (Neuling and Kaltschmitt, 2018). The inorganic
products of CO, CO2, and H2O will be removed, primarily to avoid CO
from poisoning the catalysts.
While the straight-chained products at this point have a higher energy
density due to the removal of oxygen, the freezing point is still out of the
range required for aviation applications. For this, a cracking and isomerization process is needed to produce branched isoalkanes. Typically,
metaleacid bifunctional catalysts are used for the hydrocracking process in
this stage. The balance between cracking and isomerization can be
controlled based on the operating temperature and pressure. Cracking reactions are dominant at higher temperature and lower pressure, while the
isomerization reactions are predominant for the inversed conditions of
lower temperature and higher pressure. Upon the completion of the process, the products are physically separated via distillation columns.
By-products of water and gaseous components are removed. Typically, the
liquid distillates produced through the HEFA pathway are diesel, biojet
fuel, and naphtha. The C8eC16 paraffins are conventionally considered as
the biojet fuel range. Commercial producers such as Neste Oil and UOP
Honeywell can achieve biojet fuel product yields of 82.3%e83.96% (w/w)
and 82% (w/w), respectively (Pujan et al., 2017).
Biojet fuel production pathways
85
Table 2.1 compares the physicochemical properties of HEFA biojet
fuels, FT biojet fuels, and conventional JP-8 fuels. The biojet fuels are all
from commercial entities such as Syntroleum Corporation, UoP, Shell,
Sasol, and Rentech. The Syntroleum Corporation’s R-8 uses waste fats and
greases as feedstocks with the compositions of poultry fat (46%), yellow
grease (18%), brown grease (18%), floatation grease (9%), and prepared food
(9%). In general, both the HEFA and FT biojet fuels meet all criteria of the
standards with the notable exception of specific gravity. It will not be an
issue if blended, but if used in neat form the relatively low specific gravity
might impact aircraft range. The impacts are dependent on the limitations,
be it weight or volume limited. HEFA biojet fuels showed better performance than JP-8 for total acid number, freezing point, smoke point, and
heat of combustion. This shows that the HEFA production pathway
independent of feedstock is able to provide paraffinic fuels for use as dropin fuels in compliance with ASTM 7566.
Table 2.2 tabulates the aromatic species analysis, hydrocarbon type
analysis, and proportion of n-paraffins of HEFA biojet fuels, FT biojet fuels,
and conventional JP-8 fuel. The low concentration of longer-chain
n-paraffins for HEFA from tallow and camelina led to improved low
temperature properties as compared with that of JP-8. This is proven where
the R-8 HEFA biojet fuel has identical freeze point of 49 C with JP-8
and both have higher concentration of C14eC19 n-paraffins.
HEFA fuels also have low to negligible amount of aromatics as
compared with JP-8. This will affect the swelling of O-rings used in aircraft
fuel systems, as O-ring seals will shrink, harden, and fail to function without
aromatics exposure. It was found that the volume swell of extracted nitrile
rubber is in the range of 7.0%e9.1% for HEFA biojet fuels as compared
with 16.6% for JP-8 aviation fuel. Lighter fuels swell more than heavier
fuels, and linear molecules are more mobile than branched molecules. From
this, it can be concluded that HEFA biojet fuels will not shrink O-ring seals,
although it does not have the same ability as JP-8 fuel to impart volume
swell.
Direct conversion of oil into biojet fuel is difficult due to the production
of catalyst-poisoning CO during the deoxygenation reaction of the
hydrogenation process. This will rapidly deactivate the metaleacid
bifunctional catalyst and cause undesired overcracking. Lee et al. (2019)
resolved this by using a novel CO-tolerant catalyst by supporting the
bimetallic PtRe on ultrastable Y (USY) zeolite as acidic support. The
PtRe/USY showed tolerance to CO as it has weakened interactions with
86
Table 2.1 Physicochemical properties of HEFA biojet fuels, FT biojet fuels, and conventional JP-8 fuel (Corporan et al., 2011).
Total acid number, mg KOH/
g (D3242)
Aromatics, % vol (D1319)
Total sulfur, % wt (D4294 or
D2622)
Distillation, initial boiling
point (IBP), C (D86)
10% recovered, C (D86)
20% recovered, C (D86)
50% recovered, C (D86)
90% recovered, C (D86)
Final boiling point, C (D86)
Distillation residue, % vol
(D86)
Loss, % vol (D86)
Freeze point, C (D5972)
Existent gum, mg/100 mL
(D381)
Viscosity @ 20 C, cSt
(D445)
JP-8
UOP
tallow
HEFA
UOP
camelina
HEFA
Shell
FT
Sasol
FT
Rentech
FT
Max 0.015
0.005
0.002
0.002
0.002
0.002
0.002
0.004
Max 25.0
Max 0.30
17.2
0.064
0.0
<0.001
0.4
<0.0003
0.0
0.0018
0.0
<0.001
0.4
<0.001
1.7
<0.001
Report
152
158
165
151
146
149
152
Max 205
Report
Report
Report
Max 300
Max 1.5
173
179
198
239
260
1.1
175
185
215
260
274
0.8
179
185
210
243
255
1.2
161
166
182
237
259
1.1
162
162
169
184
198
1.0
166
170
180
208
228
1.4
168
179
216
263
275
1.0
Max 1.5
Max 47
Max 7.0
0.2
49
0.4
0.2
49
<1
0.8
62
<1
0.9
<77
<1
0.4
55
1.6
0.5
<77
1.4
0.8
50
<1
Max 8.0
4.1
5.5
5.3
3.3
2.6
3.8
5.1
Biojet Fuel in Aviation Applications
ASTM tests
SC R-8
HEFA
Standards
requirement
Report
0.54
0.92
0.76
0.76
0.75
0.87
0.82
0.775e0.840
Min 19.0
Min 38
Min 42.8
0.799
25
48
43
0.762
>40
48
44.1
0.758
>40
55
44.1
0.751
50
43
44.1
0.737
40.0
44
44.1
0.762
>40
44
44.2
0.763
>40
44
44.2
13.4
13.9
15.3
15.3
15.4
15.6
15.1
15.2
Biojet fuel production pathways
Lubricity test (BOCLE)
(D5001) wear scar mm
Specific gravity (D4052)
Smoke point, mm (D1322)
Flash point C (D93)
Heat of combustion, MJ/kg
(D3338)
Hydrogen content, % mass
(D3343)
87
88
Category
Subcategory
JP-8
SC R-8
HEFA
UOP tallow
HEFA
UOP camelina
HEFA
Shell
FT
Sasol
FT
Rentech
FT
Aromatics (vol %)
Monoaromatics
Diaromatics
Total aromatics
Total saturates
Paraffins
(normal þ iso)
Cyclo-paraffins
Alkylbenzenes
Indans and
tetralins
Indenes and
CnH2n10
Naphthalene
Naphthalenes
Acenaphthenes
Acenaphthylenes
Tricyclic
aromatics
15.1
1.6
16.7
83.3
50
0.3
<0.1
0.3
99.7
92
<0.2
<0.1
<0.2
>99.8
98
<0.2
<0.1
<0.2
>99.8
90
<0.2
<0.1
<0.2
>99.8
>99
0.4
<0.1
0.4
99.6
88
1.5
<0.1
1.5
98.5
92
34
12
3
8a
<0.3
<0.3
2
<0.3
<0.3
10
<0.3
<0.3
<1
<0.3
<0.3
12a
0.4
<0.3
7a
1.3
<0.3
0.4
<0.3
<0.3
<0.3
<0.3
<0.3
<0.3
<0.3
1.4
<0.3
<0.3
<0.3
<0.3
<0.3
<0.3
<0.3
<0.3
<0.3
<0.3
<0.3
<0.3
<0.3
<0.3
<0.3
<0.3
<0.3
<0.3
<0.3
<0.3
<0.3
<0.3
<0.3
<0.3
<0.3
<0.3
<0.3
<0.3
<0.3
<0.3
<0.3
<0.3
<0.3
Hydrocarbon type
(vol %)
Biojet Fuel in Aviation Applications
Table 2.2 Aromatic species analysis, hydrocarbon type analysis, and proportion of n-paraffins of HEFA biojet fuels, FT biojet fuels, and
conventional JP-8 fuel (Corporan et al., 2011).
n-Paraffins (wt %)
0.10
0.34
1.21
3.48
4.24
3.71
2.84
1.79
0.87
0.27
0.089
0.024
0.008
19.0
1.7
14.3
2.9
0.12
0.13
0.80
2.28
2.47
2.10
1.64
1.23
0.92
0.80
0.60
0.052
0.026
<0.001
13.1
3.2
7.4
2.3
0.079
<0.001
0.12
2.01
1.88
1.52
1.25
0.82
0.86
0.35
0.004
<0.001
<0.001
<0.001
8.8
4.0
2.9
0.35
<0.001
The ASTM D2425 test method may overpredict cycloparaffins for highly branched SPKs.
0.017
0.71
3.20
2.80
1.20
0.87
0.60
0.41
0.37
0.061
0.015
0.006
0.001
10.2
6.7
4.9
0.45
0.022
0.012
1.63
22.4
25.1
3.78
0.29
0.003
0.001
<0.001
<0.001
<0.001
<0.001
<0.001
53.3
24.1
29.2
<0.003
<0.003
<0.001
<0.01
<0.05
<0.03
<0.02
<0.01
<0.01
<0.01
<0.005
<0.003
<0.001
<0.001
<0.001
<0.2
<0.06
<0.1
<0.02
<0.003
0.007
1.88
2.75
2.22
1.81
1.52
1.40
1.05
0.90
0.64
0.071
0.002
<0.001
14.3
4.6
7.0
2.6
0.07
Biojet fuel production pathways
a
n-Heptane
n-Octane
n-Nonane
n-Decane
n-Undecane
n-Dodecane
n-Tridecane
n-Tetradecane
n-Pentadecane
n-Hexadecane
n-Heptadecane
n-Octadecane
n-Nonadecane
Total n-paraffins
C7eC9
C10eC13
C14eC16
C17eC19
89
90
Biojet Fuel in Aviation Applications
CO. Rather than removing CO, the chemisorbed CO could be converted
into CH4 and H2O through the methanation process. Using the novel
catalyst, 41 wt% of biojet fuel could be obtained from palm oil through
direct hydroconversion. The properties of the biojet fuel met all
requirements of the standard.
Similarly, Verma et al. (2011) successfully produced biojet fuels via a
single-step route using hierarchical mesoporous zeolites from algae and
jatropha oils. Key operating conditions are reaction temperature of
330e430 C, pressure from 10 to 80 bar, and liquid hourly space velocity of
1.0e1.1/h. Using jatropha oil as feedstock and NieW catalyst supported
on an acidic zeolitic ZSM-5 support, biojet fuel yield in the range of
40%e45% with high isomerization selectivity of isomer/n-alkane around
2e6 was achieved. Yield was further increased to 40%e50% with an even
greater isomerization selectivity ratio of w3e13 for the NieMo catalyst.
The catalysts have intracrystalline mesoporosity with hierarchical structure.
The greatest yield of 77% was achieved when algal oil and sulfided NieMo
catalyst supported on semicrystalline ZSM-5 were used, although isomerization selectivity is reduced to 2.5. The biojet fuel products from this
single-step route met all of the basic requirements including freezing point,
density, flash point, heat of combustion, and viscosity. The used catalysts
could also be regenerated and reused without noticeable degradation in
performance after resulfidation.
Eller et al. (2016) improved the technical grade coconut oil HEFA
conversion pathway with special hydrocracking, utilising lower chemical
and energy costs by maintaining the sulfide state of the catalyst. The choice
of coconut oil as feedstock reduced H2 consumed due to the high proportion of saturated fatty acids with carbon number in the jet fuel range. In
this study, presulfided NiMo/Al2O3 was used as the catalyst at operating
pressure of 30 bar, temperature range of 280e380 C, H2/feedstock volume
ratio of 600 Nm3/m3, and liquid hourly space velocity of 1.0e3.0/h. The
two methods employed to maintain sulfide state of catalyst are through the
use of sulfidation agent such as dimethyl-disulfide (DMDS) and H2S
containing H2 gas. Table 2.3 shows the main properties and yields of the
biojet fuel products from special hydrocracking and after isomerization
using the two sulfidation agents.
The product yields for the H2S in H2 gas sulfidation method are higher
by 0.5%e2.0% than those of DMDS. This can be attributed to the lower
sulfur content, which poisons the active sites of the catalyst to a smaller
Biojet fuel production pathways
91
Table 2.3 Main properties and yields of the biojet fuel products from special
hydrocracking and after isomerization using the two sulfidation agents (Eller et al.,
2016).
Sulfidation agent
Process
Properties and yields
From special
hydrocracking
Target product yield (%)
Approaching of the
theoretical yield (%)
Density (kg/m3)
Sulfur content (mg/kg)
Aromatic content (%)
Freezing point ( C)
Smoke point (mm)
Liquid product yield (%)
Isoparaffin content of
product (%)
Sulfur content of
feedstock (mg/kg)
Aromatic content (%)
Freezing point ( C)
Freezing point after cold
flow improver additive
( C)
Cold flow improver
additive (mg/kg)
After
isomerization
Dimethyl-disulfide
(DMDS) in liquid
feedstock
H2S
containing
H2 gas
57.85
85.49
58.75
86.82
0.7646
8
<0.1
8
34
91.6
72.3
0.7601
2
<0.1
11
36
91.5
77.6
8
1.5
<0.1
41
48
<0.1
45
49
20
15
extent. While both sulfidation agents obtained yields above 85% of the
theoretical yields and have products with excellent oxidation stability, the
biojet fuel fractions after the isomerization process failed to meet the
required freezing point. This was remedied through the use of cold flow
improvers, where the freezing points for the DMDS and H2S in H2 gas
cases improved to 48 and 49 C, respectively. The results proved that
H2S in H2 gas can be used as a sulfidation agent to maintain the sulfide state
of catalysts. Such a solution is also attractive as H2S will no longer be
required to be removed from the gas stream.
The typical biojet fuel fractions from the HEFA conversion pathway
do not contain aromatics. Aromatics are crucial in aviation fuels to maintain
the fuel system elastomers. Rabaev et al. (2015) resolved this by converting
92
Biojet Fuel in Aviation Applications
Table 2.4 Organic liquid yields, aromatic contents of the organic liquid product,
and fatty acid contents of the different vegetable oils (Rabaev et al., 2015).
Polyunsaturated fatty acids
Organic
liquid
product
DiTriweight
Aromatics
(linoleic
(linolenic
Total
Vegetable
yield (%) (wt%)
acid)
acid)
polyunsaturated
oils
Sunflower
Soybean
Camelina
Castor
Palm
Tallow
84.6
83.8
83.2
78.2
81.9
85.0
15.5
15.0
14.8
2.0
1.7
1.0
63.8
51.7
19.5
5.0
11.7
3.0
0.1
5.9
37.0
<0.1
0.5
1.0
63.9
57.6
56.5
5.0
12.2
4.0
six different vegetable oils using a novel Pt/Al2O3/SAPO-11 catalyst to
diesel and jet fuels, which contain aromatics. Table 2.4 tabulates the organic
liquid yields, aromatic contents of the organic liquid product, and fatty acid
contents of the different vegetable oils. It was found that the formation of
aromatic during the hydrotreating process is dependent on total polyunsaturated proportion of the fatty acid. Ratios between di-(linoleic acid)
and tri-(linolenic acid) were determined to be a nonfactor. From this study,
it was found that biojet fuels produced from sunflower, soybean, and
camelina oil have the potential to be drop-in fuels as they meet the minimum 8 wt% aromatic contents.
Gutiérrez-Antonio et al. (2015) intensified the HEFA conversion
pathway by using thermally coupled distillation for the purification stage.
Table 2.5 summarizes the optimum heat duties of conventional and thermally coupled distillation column for the process. The optimized heat duty
values are modeled using a multiobjective genetic algorithm method based
on the criteria of lowest heat duty and optimum number of stages for the
distillation columns. As compared with conventional distillation methods,
the thermally coupled methods have lower energy requirements by an
average of 21%. The direct thermally coupled (DTC) distillation column
only requires 18,358.08 W with a total 129 stages, while the indirect
thermally coupled (ITC) method requires 10.5% more energy with 130
stages. The use of Petlyuk sequence (PS) and dividing wall column (DWC)
distillation columns is not recommended for the separation stage due to the
substantially greater energy requirement. The use of DTC will improve the
sustainability of the HEFA production process while also reducing cost due
to lower energy usage.
Table 2.5 Heat duties of conventional and thermally coupled distillation columns for HEFA conversion pathway (Gutiérrez-Antonio
et al., 2015).
Conventional
IntensifieddThermally coupled
Heat duty
Indirect
conventional
Direct thermally
coupled
Indirect thermally
coupled
Petlyuk
sequence
Dividing wall
column
21,972
23,494
23,208
23,213
18,355
18,358
20,295
20,295
29,154
31,176
269,300
270,265
29,747
26,015
19,295
22,322
53,304
293,601
Biojet fuel production pathways
Minor heat duty (W)
Similar number of total
stages (W)
Minor number of stages
(W)
Direct
conventional
93
94
Biojet Fuel in Aviation Applications
The HEFA conversion pathway should be pursued as the main conversion pathway at present, due to the possibility of leveraging the lower
technology complexity of the process, level of consolidation of this technology around the world, and availability of potential feedstock to
immediately scale-up production. Thus, more investment should be made
in the direction to develop this production route (de Souza et al., 2018).
2.2.2 Catalytic hydrothermolysis
Catalytic hydrothermolysis (CH) is also commonly known as hydrothermal
liquefaction (HTL). The process utilizes subcritical water to convert wet
biomass to carbon-rich biocrude (Capaz and Seabra, 2016). The biocrude is
also often referred as biooil. Unlike fast pyrolysis that relies on dry biomass,
CH could use wet biomass like algae or oil seeds. This allows the CH
process to avoid the energy-intensive feedstock drying process. With
respect to biojet fuel, the CH pathway is mainly developed for algae as
feedstock, as the method is robust to allow the use of species with lower
lipid content as lipid content can increase 5%e30% (Cremonez et al.,
2015). Fig. 2.4 illustrates the CH biojet fuel conversion pathway.
In general, the CH biojet fuel conversion pathway consists of the
pretreatment, CH conversion, and postrefining steps (Wei et al., 2019). At
first, wet biomass is fed to the process as slurry (Gírio, 2019). The pretreatment step consists of the cleaning of the slurry, followed by conjugation, cyclization, and cross-linking. The molecular structures of the
feedstock are improved through the pretreatment steps. After pretreatment,
the CH step comprising initially of the cracking and hydrolysis reactions
occurs at a mild temperature range of 250e380 C and operating pressure of
5e30 MPa in the presence of water assisted by catalysts. The aforemention
steps involving CH can also take place without catalyst [71]. In general, CH
can use organic materials such as lipids, proteins, and carbohydrates. Lignin
and cellulose cannot be used as feedstock for the CH pathway. Assuming
algal biomass is used as feedstock, then the free sugars, amino acids, and
residual polysaccharides will be hydrolyzed (Yoo et al., 2015). The free fatty
acids, derivative of steroids and pigments mixed with asphaltenes, will form
Figure 2.4 Catalytic hydrothermolysis (CH) biojet fuel conversion pathway.
Biojet fuel production pathways
95
the hydrophobic biooil. The two reactions are followed by catalytic
decarboxylation and dehydration reactions. Finally, postrefining hydrotreating and fractionation reactions will produce alkanes through the
conversion of straight-chain, branched, and cycloolefins.
Tzanetis et al. (2017) simulated biojet fuel production through the CH
conversion pathway by varying catalysts, catalyst-to-biomass ratio, and
operating temperature. Catalysts choice includes water (or no catalyst),
Na2Co3(aq), and Fe(aq), with catalyst loading as high as 33%. Operating
temperature ranges from 280 to 340 C. The best case obtained was for the
10% loading of Fe(aq) catalyst at 340 C. Table 2.6 compares the best CH
biojet fuel cases, with and without catalyst. While the Fe(aq) catalyst case
Table 2.6 Comparison of catalytic hydrothermolysis and biooil upgrading with
Fe(aq) as catalyst and water as catalyst (Tzanetis et al., 2017).
CH pathway stage
Categories
Properties
FE340
W300
Catalytic
hydrothermolysis (to
obtain biooil)
Operating
conditions
Yields
Properties
Catalyst
Catalytic loading
(kgcatalyst/kgbiomass
in %)
Thermochemical
conversion
temperature ( C)
Biocrude oil (%)
Solid residue (%)
Dissolved
organics (%)
Water (%)
Gas (%)
Overall biooil
yield from
biomass (%)
Biooil HHV
(MJ/kg)
Biooil LHV
(MJ/kg)
Biooil oxygen
content (wt%)
Biooil water
content (wt%)
Fe(aq)
10
Water
e
340
300
36
10
15
27
20
16
21
18
37.5
26
11
28.6
35.2
35.2
33.1
33.1
16.6
16.7
1.2
1.2
Continued
96
Biojet Fuel in Aviation Applications
Table 2.6 Comparison of catalytic hydrothermolysis and biooil upgrading with
Fe(aq) as catalyst and water as catalyst (Tzanetis et al., 2017).dcont'd
CH pathway stage
Categories
Properties
FE340
W300
Biooil upgrading (to
obtain biojet fuel and
other coproducts in the
product mix)
Operating
conditions
Biooil upgrading
temperature ( C)
Biooil upgrading
pressure (MPa)
Renewable jet
fuel yield from
biomass (%)
Upgraded oil
yield from
biomass (%)
Renewable jet
fuel yield from
biooil (%)
Upgraded oil
yield from biooil
(%)
Product mix
HHV (MJ/kg)
Product mix
LHV (MJ/kg)
Product mix
oxygen content
(wt%)
Product mix
water content
(wt%)
Product mix
density at
15 C (kg/L)
400
400
0.85
0.85
10.4
8.1
26.6
20.3
28.4
28.3
70.9
70.9
49.3
49.3
46.2
46.2
0.1
0.1
0.2
0.2
0.77
0.77
Yields
Properties
showed greater yield of 10.4% biojet fuel from biomass, as compared with
8.1% for the water case, the water case without catalytic loading is
compelling as it resolves two big issues of a typical chemical process, which
are high energy usage and specialized catalyst requirement.
While it is apparent that the CH pathway is best used for algae, the
pathway remains to be more suitable for microalgae than macroalgae as the
biooil yields are generally higher as tabulated in Table 2.7. Catalytic
hydrothermolysis of Dunaliella tertiolecta with 78.4% moisture content as
feedstock under the operating temperature of 300 C and pressure of
Table 2.7 Effects of catalytic hydrothermolysis on microalgae and macroalgae for biooil production (Kumar et al., 2016).
Higher
Bio-oil
heating
Dry biomassyield
Temperature
to-water ratio value
(%
Water
(MJ/kg)
(8C)
Catalysts
(w/v)
w/w)
Algae
Species
type
Microalgae
Freshwater
31
Scenedesmus
Freshwater
45.4
LEA of
Scenedesmus
Dunaliella
tertiolecta
Desmodesmus
Nannochloropsis
sp.
Freshwater
36
Marine
37
Freshwater
Marine
Botryococcus
braunii
Freshwater
35e37
300
e
35.5
300
e
35.3
300
e
36
340
With and without
49
57
Moisture
78.4% (w/w)
Moisture
78.4% (w/w)
Moisture
78.4% (w/w)
Moisture
78.4% (w/w)
w1:13
1:18
22e36
38
375
350
64
3:2
w50
300
With and without
Pd/C, Pt/C, Ru/C, Ni/
SiO2eAl2O3, CoMo/gAl2O3 (sulfided), and
zeolite
Na2CO3
Continued
Biojet fuel production pathways
Spirulina
97
98
Algae
Species
Macroalgae
Laminaria
saccharina
L. saccharina
Enteromorpha
prolifera
Oedogonium
Cladophora
Cladophora
Derbesia
Ulva
Water
type
Bio-oil
yield
(%
w/w)
Dry biomassto-water ratio
(w/v)
Higher
heating
value
(MJ/kg)
Temperature
(8C)
Catalysts
Marine
79
1:10
35.97
350
e
Marine
Marine
19.3
23
1:10
2:15
36.5
28e30
350
220e320
KOH
Na2CO3
Freshwater
Freshwater
Marine
Marine
Marine
26.2
19.7
13.5
19.7
18.7
1:14
1:14
1:14
1:14
1:14
33.7
33.5
33.3
33.2
33.8
330e340
330e340
330e340
330e340
330e340
e
e
e
e
e
Biojet Fuel in Aviation Applications
Table 2.7 Effects of catalytic hydrothermolysis on microalgae and macroalgae for biooil production (Kumar et al., 2016).dcont'd
Biojet fuel production pathways
99
10 MPa resulted in 37% biooil yield (Kumar et al., 2016). Attempts were
made to increase biooil yield through catalysts, but the presence or type of
catalysts did not make significant differences.
Presently, actual data from large-scale pilot or commercial endeavors are
not available as the technology maturity is just after “emergent” and at the
early stage of pilot studies.
2.2.3 Hydroprocessed depolymerized cellulosic jet
Hydroprocessed depolymerized cellulosic jet (HDJC) is an oil upgrading
process to convert biooils produced from the pyrolysis of lignocellulosic
feedstocks into biojet fuels. It is also called hydrogenated pyrolysis oil (HPO
kerosene) or pyrolysis-to-jet (PTJ). Fig. 2.5 shows the HDJC process.
Through this process, biooils from the pyrolysis process will shed their undesirable physicochemical properties such as high oxygen content, low energy density, high corrosivity, and poor thermal instability (Wei et al., 2019).
Factoring in only the postpyrolysis process, or the actual biooil
upgrading process, the HDJC pathway is a two-step hydrotreating process.
The first step is a catalyst-assisted hydrotreating process under mild conditions for hydrodeoxygenation of biooil. It is followed by a more conventional high-temperature hydrogenation catalyst-controlled process to
obtain hydrocarbon fuels. For HDJC, the ZSM-5 and Raney nickel catalysts are typically used for the fast pyrolysis and hydrotreating processes of
the pathway, respectively.
A cooperative research and development work among UOP, the National Renewable Energy Laboratory (NREL) and the Pacific Northwest
National Laboratory (PNNL), resulted in a pilot-scale biorefinery to upgrade biooil (Gutiérrez-Antonio et al., 2017). The biorefinery has a capacity
of one ton of dry biomass per day. The facility combined fast pyrolysis and
hydrotreating to produce biojet fuel alongside other coproducts of diesel
and green gasoline. The fast pyrolysis section of the biorefinery operates at a
high temperature of 450e600 C for a yield range of 65e75 wt% of biooil
from dried woody biomass as feedstock. The biooil is then upgraded using
Figure 2.5 Hydroprocessed depolymerized cellulosic jet (HDJC) biojet fuel conversion
pathway.
100
Biojet Fuel in Aviation Applications
the UOP Ecofining technology to produce biojet fuel. Although classified
under oil-to-jet pathway, this method allows the use of low-cost lignocellulose feedstocks instead of the more expensive edible oil.
Table 2.8 tabulates studies related to the HDJC conversion pathways. It
was found that high product yield is obtained when there is a positive
synergy for the aromatics in the catalytic microwave copyrolysis and performance of the Raney nickel catalyst. It should be noted that biojet fuels
produced through the HDJC conversion pathway will contain some aromatic compounds, which are required to avoid sealing problems in jet
engines. This is in contrast with the more common HEFA or FT method
where aromatics are produced in negligible quantities (Kousoulidou and
Lonza, 2016). As such, HDJC biojet fuels has the potential to be used in
neat form or drop-in fuel as long as other key physicochemical properties
meet the requirement from the standards.
2.2.4 Commercial flights from oil-based feedstocks
The intergovernmental coordinated push to decarbonize global economy
has in recent years included the aviation industry. As compared with road
transport, the aviation industry is severely lagging in displacing conventional
jet fuel. The lag is not from the lack of interests; instead it is waiting for the
biojet fuel production technologies to mature to the point of profitability.
The interests from airline companies are triggered by legislation, economics,
and “environmental, social, and corporate governance” (ESG) concerns.
Governments in meeting legally binding international targets like COP 21
have set national mandates to blend biojet fuels with conventional jet fuels.
Airlines anxious of impending carbon tax are looking for low-carbon
alternative power sources. Simultaneously, ESG issues are taking center
stage in the aviation sector, which sparks the “flight shaming” movement,
pressured by institutional funds to only invest in airliners with good ESG
scores. All these led to airliners with foresight to set up trial flights using
biojet fuels as early as 2007. Table 2.9 shows key demonstration flights
powered with biojet fuel from oil-based feedstocks.
These demonstration flights have shown progressive ambitions and increase in scale. Since the first flight involving biojet fuel in 2007 by
GreenFlight International, over a quarter million flights have involved the
use of biojet fuel, and more than 40 airlines have experience dealing with
biojet fuels. Companies such as Neste Oil Company, SkyNRG, UOP
Honeywell, ENI, Galp Energia, Hawai’i Bio Energy, Alt Air, and Byogy
Table 2.8 Studies involving the hydroprocessed depolymerized cellulosic jet (HDJC) conversion pathway to produce biojet fuels
(Gutiérrez-Antonio et al., 2017).
Feedstock (at
Operating temperature
Catalyst for fast
Catalyst for
pyrolysis stage) (8C)
pyrolysis
hydrotreating
Yield (wt%)
Remarks
375
ZSM-5
5e10 wt%
Raney nickel
12.63
Lignocellulosic
biomass
500 (fast pyrolysis)
200 (hydrotreating)
ZSM-5
10e20 wt%
Raney nickel
24.68
Biomass-toplastic ratio of
0.75
375 (fast pyrolysis)
ZSM-5
Home-made
Raney nickel
34.20
Process under mild
conditions
operation
Up to 84.59%
selectivity of jet
fuel range
cycloalkanes from
intact biomass
under very mild
conditions
Process under mild
conditions
operation
Biojet fuel production pathways
Douglas fir
pellets
101
102
Biojet Fuel in Aviation Applications
Table 2.9 Key demonstration flights powered with biojet fuel from oil-based
feedstocks (Zhao et al., 2019).
Airline
Date
company
Aircraft
Feedstock
Remark
October
2007
GreenFlight
International
Aero,
L-29
Delfin
Waste
vegetable
oil
February
2008
Virgin
Atlantic
Boeing
747
Coconut
and
babassu
January
2009
Continental
Airlines
Boeing
737
Algae and
jatropha
April 2010
US Navy
F/A-18
(the
“Green
Hornet”)
Camelina
June 2011
Boeing
Boeing
747-8F
Camelina
August
2011
US Navy
T-45
Camelina
September
2011
US Navy
AV-88
Camelina
The very first flight of
an aircraft powered
entirely by neat biojet
fuel.
Biofuel test flight
between London and
Amsterdam using a
20% volumetric blend
of biojet fuels in one
of its engines.
First flight of an algaefueled jet. The pilots
conducted a series of
tests at 12,000 m (or
38,000 feet), inclusive
of a midflight engine
shutdown.
Results indicated that
the aircraft performed
as expected through
its full flight envelope
with no degradation
of capability.
The company flew
the new 747-8F
model to the Paris Air
Show with all four
engines burning a 15%
mix of camelina biojet
fuel.
Training aircraft
successfully flew using
a camelina biojet fuel
blend with
petroleum-based JP-5
at 50:50 volumetric
blend levels.
First biojet fuel flight
test in an AV-8B
Harrier from Air Test
and Evaluation
Squadron 31.
Biojet fuel production pathways
103
Table 2.9 Key demonstration flights powered with biojet fuel from oil-based
feedstocks (Zhao et al., 2019).dcont'd
Date
Airline
company
Aircraft
Feedstock
Remark
China’s first flight
using biojet fuel.
Biojet fuel was
produced from
Chinese grown
jatropha from
PetroChina. The 2-h
flight above Beijing
used 50% biojet fuel
in one engine.
SkyNRG supplied the
biojet fuel for the 75min flight JQ 705
from Melbourne to
Hobart.
Weekly flight
between John F.
Kennedy Airport in
New York and
Schiphol Airport in
Amsterdam using
biojet fuel supplied by
SkyNRG.
A 4% blend of biojet
fuel flight, Gol Flight
2152 from Rio Santos
Dumont Airport
toward Brasilia.
China’s first
commercial flight
carrying 156
passengers from
Shanghai to Beijing.
The Sinopec-supplied
biojet fuel was
blended at 50% level
with conventional
petroleum jet fuel.
October
2011
Air China
Boeing
747-400
Jatropha
April 2012
Jetstar
Airways
Airbus
A320
Refined
cooking
oil
March
2013
KLM
Boeing
777206 ER
Waste
vegetable
oil
August
2014
Gol
Transportes
Aéreos
Boeing
737-700
March
2015
Hainan
Airlines
Boeing
737-800
Inedible
corn oil
and waste
vegetable
oil
Waste
vegetable
oil
Continued
104
Biojet Fuel in Aviation Applications
Table 2.9 Key demonstration flights powered with biojet fuel from oil-based
feedstocks (Zhao et al., 2019).dcont'd
Date
Airline
company
Aircraft
Feedstock
Remark
SkyNRG supplied the
biojet fuel made from
used cooking oil by
AltAir Fuels in Los
Angeles.
The airline begun a
series of biojet fuelpowered flights using
an A350-900 aircraft
on nonstop transPacific flights between
Singapore and San
Francisco.
September
2016
KLM
Boeing
737-400
Waste
vegetable
oil
May 2017
Singapore
Airlines
Airbus
A350900
Used
cooking
oil
have either established or have plans to construct hydrotreating plants for
biojet fuel worldwide. These show not only the commitment by the
aviation sector to implement biojet fuels as an alternative to conventional
jet fuels but also a testament to the performance and safety of flight achieved
by biojet fuel-powered flights around the world.
2.3 Alcohol-to-jet
Synthesis of jet fuel from alcohols can be performed by several conversion
pathways, including sugar fermentation with yeast or microbes, starch
hydrolyzationefermentation, hydrolyzationefermentation of lignocellulosic feedstock or thermochemical conversion, and fermentation via catalytic hydrogenation. Conversion of lignocellulosic biomass into alcohol
typically requires hydrolysis, followed by fermentation or thermochemical
conversion process. Another possible production route is via gasification,
followed by fermentation to produce alcohol (Wei et al., 2019). Different
types of alcohol such as methanol, ethanol, or higher alcohols can be used
to produce biofuels through a series of reaction: dehydration, oligomerization, hydrogenation, and fractionation (Yang et al., 2019), as illustrated in
Fig. 2.6. The sugars are fermented to produce isobutanol or ethanol, which
Biojet fuel production pathways
105
Figure 2.6 Process of converting cellulose and starch biomass into biojet fuel via the
alcohol-to-jet (ATJ) pathway.
will be catalytically dehydrated into isobutylene or ethylene. The oligomerization process creates a carbon chain length suitable for fractionation
into fuel components after hydrogenation (Geleynse et al., 2020). Although
various alcohols or different intermediate pathways are feasible for production of jet fuels, the most commonly utilized ATJ production pathways
are via ethanol or butanol. The following sections discuss the progress in the
ATJ conversion technology.
2.3.1 Ethanol-to-jet
The conversion of alcohol to SPK jet fuel can be performed by using a
variety of alcohols and oxygenated intermediates. Ethanol emerges as a
readily available feedstock due to the established technology of bioethanol
produced from biomass, which is primarily used as transportation fuel to
replace gasoline. Ethanol is first dehydrated to produce ethylene, which is a
versatile component used prevalently in industrial and consumer products,
e.g., plastic manufacturing, polyethylene production and surfactant fabrication (Cheng et al., 2020). Dehydration of ethanol can occur in two ways:
direct dehydration into ethylene or formation of diethyl ether followed by
cracking into ethylene. At low temperatures (<300 C), diethyl ether is
formed and cracked into ethylene and water when facilitated by strong
acidity (Bokade and Yadav, 2011). The catalytic dehydration of ethanol can
be achieved by using various catalysts such as transition metals (TiO2,
Fe2O3, Mn2O3, Cr2O3), heteropoly acids (H3PW12O40, montmorillonite
K10 (mont K10) impregnated with dodecatungstophosphoric acid [DTP]),
gamma alumina (g-Al2O3), and zeolites (microporous HZSM-5), with the
latter two commonly being used in industrial ethanol dehydration (Cheng
et al., 2020; Zhang et al., 2010b; de Reviere et al., 2020). The dehydration
of ethanol is strongly dependent on the acid sites in the chosen catalyst.
Brønsted’s strong acidity can facilitate both ethanol dehydration and diethyl
ether (DEE) cracking. Table 2.10 shows the various catalysts utilized for
ethanol dehydration. Phung et al. (2015) compared the ethanol
106
Biojet Fuel in Aviation Applications
Table 2.10 Various catalysts utilized for ethanol dehydration.
Ethylene
selectivity
(%)
Catalyst
Reaction conditions
Fabricated gamma
alumina sheet
(g-Al2O3)
Mesoporous SBA-15
Alumina-silica
composite 60AlSSP (60 mol% of Al
mixed with 1TEOS:
0.3CTAB: 11NH3:
58Ethanol: 144H2O)
0.06 g catalyst with
ethanol pumping at the
rate of 2 mL/min for
30 min at 350 C
0.3 g catalyst with initial
ethanol concentration of
50 wt% and LHSV
(liquid hourly space
velocity) of 16 mL/g$h
for 5 h at 400 C
0.05 g of catalyst fed
with vaporized pure
ethanol (99.98%) from
1 h up to 10 h at 400 C
References
99.4
Chen
et al.
(2018)
84.7
Cheng
et al.
(2020)
99
Krutpijit
et al.
(2020)
dehydration efficiency using zeolites, alumina, and silica alumina as catalyst.
H zeolites were found to be more active than silica alumina and alumina on
catalyst weight base to convert ethanol into DEE and ethylene. This is due
to the presence of Brønsted acidic bridging hydroxyl groups only in the
zeolite cavities. The highest ethylene yield of 99.9% was obtained by using
H-FER and faujasite at 573K.
The ethylene dehydrated from ethanol can be converted into jet fuel via
oligomerization process. The use of nickel-exchanged silicaealumina catalysts showed that 41% of C10þ products can be obtained from oligomerization of ethylene at relatively low temperature of 100e120 C and
pressure of 35 bar (Heveling et al., 1998). Production of higher oligomers is
possible, but the downsides are long duration needed and low conversion
yield. Thus, a two-step approach can be adopted, first by converting the
ethylene into intermediate olefins, e.g., butene or hexene, followed by the
subsequent oligomerization process into jet fuel-length olefins. For shortchain olefins production, homogenous catalyst system based on titanium
tetrabutoxide Ti(OC4H9)4/triethylaluminum (TEA)/tetrahydrofuran
(THF)/EDC has been shown to produce high selectivity of butene (80%)
and hexene (w15%e20%) with conversion efficiency of >94%
Biojet fuel production pathways
107
(Mahdaviani et al., 2010). Much interests have been focused on transition
metal such as nickel- and zeolite-based materials for catalytic oligomerization of ethylene into high stability and selectivity to liquid oligomers. The
use of heterogenous nickel-exchanged mesostructured materials with
MCM-41 catalysts was shown to have high selectivity toward C4, C6, C8,
and C10 olefins at 150 C and 3.5 MPa, with n-heptane as solvent (Lallemand et al., 2007). Ethylene oligomerization using nano-sized HZSM-5
zeolites with different Si/Al ratio was performed in a fixed-bed reactor at
275e300 C and 3 MPa. Result showed that Si/Al ratio of 80 produced
64.3% C4þ olefins and 13.3% a-olefins. Brønsted acid sites were reported
to promote secondary reactions such as cracking, isomerization, hydrogen
transfer, and condensation reactions, but the excess of Brønsted acid will
lead to deactivation of the catalyst (Zhang et al., 2020).
Ni loaded on nanocrystalline zeolite H-Beta was reported to effectively
convert ethylene into C10þ oligomers up to 40 wt% at 87.2% ethylene
conversion (Martínez et al., 2013). The SiO2eAl2O3-supported nickel
phosphide (Ni2P) catalyst was reported to be capable of transforming
ethylene into higher olefins (Shin et al., 2020). Ni2P/SiO2 had a higher
ratio of Brønsted to Lewis acid sites (B/L ratio), which leads to higher
catalytic activity due to the POeH groups generated on the catalyst surface,
where the acidity induced the isomerization of terminal olefins and cationic
oligomerization. The effect of the catalyst particle size is also pronounced,
where smaller particles tend to increase the interaction between Ni and P
with the support, leading to higher oligomerization efficiency (Shin et al.,
2020). Lee et al. (2018) examined the performance of nickel supported by
amorphous silicaealumina (SIRAL-30) with high Brønsted acid site density. A 4 wt% loading on the SIRAL-30 was found to achieve optimal
ethylene conversion with C10þ selectivity of 18% at 200 C and 10 bar.
The heterogenous catalyst can be recycled by reheating at 550 C and was
able to produce 16% of C10þ olefins.
The butene produced can subsequently be oligomerized into jet fuel
range oligomers. N-butene can be trimerized into C12 hydrocarbon via
Ni-doped HZSM-5 catalysts at 148 h, 420 C, weight hour space velocity
(WHSV) ¼ 2/h, and 1.0 MPa. About 77.5 wt.% conversion of n-butene
and 50.5 wt.% selectivity of C12 trimers were obtained using the
1NiHZSM-5(320) catalyst (Zhang et al., 2009). Zirconium-based catalyst
was shown to effectively convert 1-butene into jet fuel range oligomers
dominated by C8 and C12 oligomers, followed by hydrotreatment process
to produce hydrocarbons with good cold flow property and heating value
108
Biojet Fuel in Aviation Applications
similar to jet fuel (Wright et al., 2008). Kim et al. (2015) found that the C8
olefin selectivity was maximized at temperature below 473K when using
H-ferrierite as catalyst to oligomerize 1-butene. Cofeeding hexane as
cosolvent to 1-butene can shift the product selectivity from heavier to
lighter species. The obtained heavy hydrocarbons (>C12) are mostly highly
branched. Díaz et al. (2020) also utilized HZSM-5 zeolite to oligomerize 1butene. Result showed that C5-11 and C12-20 produced at the optimum
condition of 250e275 oC and 30 bar were >40% and >20%, respectively.
High conversion level of >60% with 50% C8-11 and >30% C12þ can be
achieved at 20e30 bar. The heavy oligomers can be converted into
branched alkanes via hydrotreating and isomerization process, followed by
distillation process to obtain jet fuel.
2.3.2 Butyl alcohols-to-jet
Another pathway of ATJ production apart from ethanol is through butyl
alcohol. The chemical synthesis technology of isobutanol (carbonylation
and aldol condensation) has been flourishing since 1950s and is currently
the main production method of isobutyl alcohol in the world (Guo et al.,
2020). Companies such as UOP, Gevo, and Cobalt/US Navy have
developed methods to produce alternative jet fuel based on butanol. In
general, dehydration of butyl alcohol can be divided into n-butanol and
isobutanol. Dehydration of iso-butanol produces olefins, which include 1butene, cis-2-butene, trans-2-butene, and iso-butene (Wei et al., 2019).
Isobutanol is mostly dehydrated over mildly acidic a-Al2O3 catalysts, but
other catalysts such as inorganic acids, metal oxides, zeolites, and acidic
resins, among others, have reported to be feasible. For n-butanol, dehydration can occur at lower temperatures over acid catalyst to produce
butene, but higher temperatures are required for the skeletal isomerization
of n-butanol to occur (Gunst et al., 2017). Fig. 2.7 illustrates the differences
in intermediate products produced by using different alcohols but ultimately can lead to the production of jet fuel.
Recent progress in the ATJ production pathway has focused on the
development of new catalyst for converting isobutanol into jet fuel. Zhang
et al. (2010a) compared the performance of three zeolite catalysts (Theta-1,
ferrierite, and ZSM-23) for a one-step dehydration and isomerization of nbutanol to isobutene and found that ferrierite can lead to the highest yield
of isobutene (33.8 wt%) but showed poor catalytic performance over time
as the presence of water lowers the acidity of the catalyst and causes
Biojet fuel production pathways
109
Figure 2.7 Difference of ATJ pathways from isobutanol, n-butanol, and ethanol (VelaGarcía et al., 2020). ATJ, alcohol-to-jet.
dealumination. On the other hand, ZSM-23 was found to produce low
yields of isobutene (28.2 wt%) due to its two-dimensional channel
network, which provides intersections for the formation of bulky intermediates, but high isomerization activity due to the zeolite’s high acidity.
One study investigated the oligomerization of isobutyl alcohol to jet fuels
using various dealuminated methods of zeolite beta and found that zeolite
beta (treated by HCl twice) exhibited the highest conversion of 98% and
highest C8-16 selectivity of 59% (Xu et al., 2020). Another study investigated the production of tri-isobutane as an ATJ fuel from isobutanol. The
dehydration of isobutanol (325 C, 0.62 MPa, and WHSV of 5/h) achieved
110
Biojet Fuel in Aviation Applications
a 99.1% isobutene yield, whereas the subsequent oligomerization (100 C,
0.20 MPa, spaceetime s0 of 5.5 g h/L) produced 90% tri-isobutene, and
further subjected to hydrogenation to finally produce the tri-isobutane
(Vela-García et al., 2020). The production of tri-isobutane also exhibited
an estimated 28% lesser greenhouse gas emission than Jet-A1 production.
2.3.3 Challenges and prospects
Currently, ATJ fuels must adhere to the standard specifications of ASTM
D7566 Annex 5 as the minimum property requirements for aviation turbine fuel that contain synthesized hydrocarbons. Conversion of jet fuel by
companies such UOP, Gevo, and Cobalt/US Navy is based on butanol,
which involves the basic process of dehydration, oligomerization, and
hydrogenation. Isobutene is another producer material that has been
approved for the production of jet fuel (ASTM D7566-19b, 2019), such as
those used by Gevo (Chemicals Technology, 2010). LanzaTech and Byogy
are companies that focus on the production of alternative jet fuel using the
ethanol-to-jet (ETJ) approach. LanzaTech and PNNL have developed an
ATJ pathway that converts ethanol to synthetic paraffinic jet fuel by using
the waste gas from steel mill as feedstock (PNNL, 2018). The waste gas is
first fermented into ethanol via a biological conversion process to produce
alcohol. The advantage of the process is its ability to use different ethanol
feedstock for jet fuel production, including those produced from municipal
solid waste and waste gases. Fig. 2.8 shows the LanzaTech ATJ process,
which selectively builds up jet fuel hydrocarbons from smaller compounds.
The physicochemical properties of the LanzaTech’s jet fuels are shown in
Table 2.11. To date, LanzaTech’s first commercial plant in China has
produced over 10 M gallons of ethanol from the waste gas of recycled steel
mills (Lanzatech, 2019). The ATJ fuel blends have been tested by both the
US Airforce and US Navy (Zhang et al., 2016). LanzaTech has partnered
with Japan New Energy and Industrial Technology Development Organization (NEDO) to conduct a feasibility study on scaling the LanzaTech
ATJ platform in Japan (Lanzatech, 2019). Lanzajet is a company that will
start producing sustainable aviation fuel from 2022 at the integrated biorefinery at LanzaTech’s Freedom Pines site in Soperton, Georgia (LanzaTech, 2020).
The high production cost is a major issue that makes ethanol-derived
ATJ fuel market-uncompetitive compared with fossil jet fuel (Silva Braz
and Pinto Mariano, 2018). The advantage of the ATJ method is that
Biojet fuel production pathways
111
Figure 2.8 Production of synthetic jet fuel via the ATJ pathway by LanzaTech (Green
Car Congress, 2018). ATJ, alcohol-to-jet.
available infrastructure for ethanol production can be utilized to drive down
investment cost. Vertimass LLC received $1.4 million from the Bioenergy
Technologies Office within the US Department of Energy’s Office of
Energy Efficiency and Renewable Energy to optimize jet fuel production
from ethanol with emphasis on single step conversion of ethanol into
hydrocarbon blend. The aim is to conduct the process without hydrogen
addition at a relatively low temperature and atmospheric pressure, while
producing minimal amounts of light gases. The technology is expected
to expand upon the current liquid biofuels market beyond the constraints
(Biomass Magazine, 2019). Presently, the US ethanol production plants
have the capacity to produce approximately 16 billion gallons per
year, which is at its limits if 10% of blends is used with gasoline. The
112
Biojet Fuel in Aviation Applications
Table 2.11 Physico-chemical properties of the ATJ jet fuel produced by LanzaTech.
ASTM test
ASTM
ATJ-SPK (July
Property
method
D7566
2015)
Hydrogen content, mass %
Freeze point, C
Flash point, C
Density at 15 C, kg/L
Viscosity at 20 C, cSt
at 40 C, cSt
Heat of combustion, MJ/kg
Thermal stability (325 C)
Distillation
10%
Final boiling point
T90-T10, C
Hydrocarbon type analysis
Aromatics, vol %
Paraffins, mass%
D7171
D5972
D93
D4052
D4809
D3241
D86
D6379
D2425
n/a
40
38
0.751
e0.770
<8
<12
42.8
2/25
15.4
<75
44
0.763
205
300
>22
170
263
68
0.5
Report
<0.01
97.45
4.42
9.30
43.89
1/0 (pass)
ATJ, alcohol-to-jet.
incorporation of existing ethanol dehydration studies with potential
hydroprocessing catalysts to produce ATJ fuel range hydrocarbons is expected to further lower the production cost as the technology becomes
matured.
2.4 Gas-to-jet
2.4.1 FischereTropsch
FT process is the process of converting a mixture of carbon monoxide and
hydrogen (synthesis gas) into transportation fuels and other liquid products
of higher molecular weight hydrocarbons. The process was developed by
German researchers Franz Fischer and Hans Tropsch in 1922 as a method
for making liquid fuels from coal with alkalized iron chips at 400 C and
pressures above 100 bar (Liu et al., 2013). The industrial use of natural gas as
FT feedstock is also economically attractive especially in the context of
stranded natural gas and shale gas (Eschemann and de Jong, 2015), with
minimal contaminants being produced (Luque et al., 2012). Biomass has
received considerable attention as potential feedstock for gasification to
Biojet fuel production pathways
113
produce synthesis gas via the FT process to produce hydrocarbon fuels, as
shown in the process flow in Fig. 2.9. The FT process can be thought of as a
catalytic polymerization of carbon monoxide accompanied by reaction with
hydrogen to make the methylene (CH2) units of paraffins, which comprises
two general reactions (Santos and Alencar, 2020),
Alkane formation: nCO þ ð2n þ 1Þ H2 4Cn H2nþ2 þ nH2 O
(3.1)
Alkene formation: nCO þ 2n H2 4Cn H2n þ nH2 O
(3.2)
The product composition from the FT process varies depending on the
hydrocarbon to carbon monoxide ratio, catalyst, and process conditions.
The FT synthesis generally requires H2 and CO at a ratio near 2.1:1,
depending on the selectivity, and operates at pressure ranging from 20 to
40 bar and 180e250 C. The selectivity of the FT product is also influenced
by the catalyst, types of catalyst support, and reactor used (Tijmensen et al.,
2002). Additional processing of the raw product of FT synthesis is usually
needed to further process into acceptable fuel. Such processes include the
cracking the long chains into smaller units before rearranging some of the
atoms via isomerization to obtain the desired fuel properties. The upgrading
process typically produces liquid hydrocarbon product with a wide boiling
range that consists of naphtha, kerosene, and diesel, which are subsequently
distilled to obtain the final products. The European aviation industry
predicts that approximately 140 kilotons of FT fuel could be produced
annually based on the pilot plants planned (Kousoulidou and Lonza, 2016).
The products derived from FT process are usually free from sulfur or
nitrogen compounds, which is advantageous from the combustion
perspective as no contaminants such as sulfur dioxide or sulfuric acids are
produced. FT fuels have been shown to emit 2.4% less CO2, 50%e90% less
PM, and no sulfur compared with fossil jet fuels (Zhang et al., 2016).
Besides, the lack of aromatic results in cleaner burning with low level of
soot produced. FT fuels were reported to display decreased contrail
Figure 2.9 Process flow of converting lignocellulosic biomass into biojet fuel through
gasification and FischereTropsch synthesis.
114
Biojet Fuel in Aviation Applications
formation and lesser soot emissions, which decreases the potential of the
fuel to act as a cloud condensation nuclei (Jürgens et al., 2019). However,
FT fuels with low aromatic content have caused fuel leakage problems in
the engine due to shrinkage of elastomer and have lower energy efficiency
(Kandaramath Hari et al., 2015; Wei et al., 2019). These issues can be
solved by blending the FT fuel with conventional jet fuel to maintain a
certain level of aromatics in the jet fuel. The ASTM D7566 standard has
specified that a minimum of 8% aromatics have to be maintained in aviation
turbine fuel, regardless of any type of synthetic jet fuel used as blend
(ASTM D7566-19b, 2019). Other significant drawbacks of the FT process
include the high gasification costs and relative higher CO2 emissions
compared with crude oil refining (Marsh, 2008). The chain growth
mechanism also produces approximately 25e45 wt% of FT wax, which has
a boiling point above 360 C and reduces the cost-effectiveness of the
process (Tomasek et al., 2020).
The advantage of the FT process is the versatility of the feedstock that
can be used, including coal, natural gas, and biomass. Commercial-scale
application of FT products has been shown feasible by Sasol and Shell
(Tijmensen et al., 2002). Sasol has produced three types of SPK fuels,
namely the Sasol IPK derived from coal, while Sasol GTL-1 and GTL 2 are
derived from natural gas. The Sasol GTL-1 is a distillate cut from the GTL
fuel produced at the Oryx plant in Qatar, while the Sasol GTL-2 is an
upgrade from GTL-1 with reduced paraffinic fraction with wider boiling
range. Shell GTL is produced from natural gas in Bintulu, Malaysia, and is
used by the US Air Force. The S-8 FT fuel produced by Syntroleum is
derived from natural gas and is used by the US Air Force for test flights by
blending with JP-8. Comparison of the compositional analysis of the synthetic paraffinic fuels is shown in Table 2.12. The FT SPKs consists primarily of isoparaffins and normal paraffins with a small fraction of
cycloparaffins. The S-8 has slightly higher mass fraction of cycloparaffins
compared with other SPKs. There is virtually no aromatics in the FT fuels.
In spite of the similar carbon-to-hydrogen ratio for all the FT fuels, the
distribution of hydrocarbon by carbon number can be quite different, as
shown in Fig. 2.10.
Variation in the hydrocarbon chain length and the ratio of normal
paraffins to isoparaffins can be attributed to the processing differences. Sasol
IPK has a narrow range of hydrocarbon chain between C8 and C15
consisting of isoparaffins with practically no normal paraffins. Although the
Sasol GTL-1 contains similar carbon numbers as Sasol IPK, the majority of
Biojet fuel production pathways
115
Table 2.12 Comparison of the compositional analysis of different FT-SPK (Moses,
2008).
Limit
(ASTM
Sasol
Shell
Sasol
Sasol
Test
IPK
S-8
GTL
GTL-1 GTL-2
Property
method D7566)
Hydrocarbon composition, mass %
Aromatics
Cycloparaffins
Iso þ nparaffins
D2425
D2425
D2425
0.5
15
Report
0
2.6
97.4
0
9.0
91.0
0
4.0
96.0
0
2.6
97.4
0.3
7.7
92.0
84.33
15.38
83.99
15.58
85.00
15.71
84.45
15.40
84.69
15.50
Carbon and hydrogen content, mass %
Hydrogen
Carbon
35
D5291
D5291
e
e
Sasol IPK
Mass (%)
30
25
20
S-8
15
10
5
0
C9 C10 C11 C12 C13 C14 C15 C7 C8 C9 C10 C11 C12 C13 C14 C15 C16 C17 C18 C19
35
Mass (%)
30
25
Shell GTL
Sasol GTL-1
20
Sasol GTL-2
15
10
5
0
C8 C9 C10 C11 C12 C13
C8 C9 C10 C11 C12 C13 C14
C8 C9 C10 C11 C12 C13 C14 C15 C16 C17 C18
Hydrocarbon number
Iso-paraffins
Normal paraffins
Cyclo-paraffins
Figure 2.10 Distribution of hydrocarbons for different SPK fuels (Moses, 2008). SPK,
synthesized paraffinic kerosene.
the composition is normal paraffins and a small fraction of isoparaffins. The
Sasol IPK has about 7e13% of cycloparaffins, but other FT fuels have less
than 1% cycloparaffins. The S-8 and Sasol GTL-2 contain a wider range of
8e9 carbon numbers dominated by isoparaffins, but the Sasol GTL-2
contains normal paraffins with longer hydrocarbon chain. The difference
in the hydrocarbon groups and chain length leads to the slight variation in
116
Biojet Fuel in Aviation Applications
Table 2.13 Properties of different FT fuels (Moses, 2008).
Limits
ASTM
Sasol
Shell
D7566
IPK
S-8
GTL
Property
Total acid number
(mg KOH/g)
Initial boiling
point ( C)
Final boiling
point ( C)
Freezing
point ( C)
Existent gum
(mg/100 mL)
Viscosity
at 20 C (cSt)
Density @
15 C, kg/m3
Smoke
point (mm)
Flash
point ( C)
Heat of
combustion
(MJ/kg)
Water, mg/kg
Sulfur, mg/kg
Sasol
GTL-1
Sasol
GTL-2
0.015
0.004
0.004
0.003
0.002
0.003
Report
174
144
154.1
144
179
300
232
275
195.2
208
266
40
<65
51
53.8
52.5
62
7
0.6
0.6
4.2
0.9
0.6
8
3.23
4.9
2.49
2.43
6.09
730e770
765
756
736
735
762
25
42
42
>50
29
28
38
53
45
43
48
70
42.8
44.0
43.9
44.2
44.3
44.2
75
15
25
0.7
22
0.6
28
0.6
40
0.6
32
0.6
FT, FischereTropsch.
physicochemical properties as shown in Table 2.13. The boiling point
distribution curve is noticeably different among the fuels. Shell GTL has
narrower range of boiling point. The S-8 and Sasol GTL-2 fuels are distilled
to have boiling point slopes that are typical of conventional jet fuel, while
the rest are relatively flat. The relatively high final boiling point and
viscosity for Sasol-2 imply its less volatile characteristic; thus the flash point
can be seen to be higher. All the FT fuels have excellent freeze point
characteristics and conform to the batch requirement of ASTM D7566.
The heat of combustion for all FT fuels are almost similar, but the sooting
Biojet fuel production pathways
117
tendencies are considerably higher for Sasol 1 and Sasol 2. Corporan et al.
(2011) reported that the FT-SPK fuels produced by Sasol, Shell, and
Rentech possess superior thermal stability and produced less pollutant
emissions when fueled in a T63 engine.
2.4.2 Biomass-to-fuel
Crop-based biomass to liquid fuel has gained popularity as CO2 emitted
during the combustion of fuel is offset by the CO2 absorbed during the
crop growing process (Marsh, 2008). The biomass FT process can be split
into six different steps, which include the pretreatment, gasification, gas
conditioning, acid gas removal, FT processing, and syncrude refining
(Wei et al., 2019). Fig. 2.11 shows the general FT pathways using biomass,
Figure 2.11 Production of hydrocarbon fuels from biomass, coal, and natural gas via
the FischereTropsch synthesis.
118
Biojet Fuel in Aviation Applications
coal, and natural gas as feedstocks. Initially, the biomass is pretreated, dried,
and ground before being converted into synthesis gas in a gasifier with the
addition of oxygen (Hillestad et al., 2018). The syngas produced by the
gasification process contains different kinds of contaminants such as particulates, condensable tars, alkali compounds, H2S, HCl, NH3, and HCN,
which may reduce FT synthesis efficiency (Tijmensen et al., 2002). The gas
is subjected to quenching, while components such as COS, CS2, and HCN
are hydrolyzed to form H2S, NH3, and CO2. Tar and ash are moved
followed by acid gas treatment to remove the CO2 (can be used to improve
the kinetics and economics of the downstream process), H2S (avoids catalyst
poisoning), and sulfide (Wei et al., 2019). To remove the contaminants, the
syngas is subjected to a cleaning process, typically via the “wet low temperature cleaning” as shown in Fig. 2.12. Ash particulates are removed by
the cyclone separator and bag filters, while several stages of scrubbing are
used to remove different contaminants. Scrubber with H2SO4 or Sulfinol D
solvent is used to HCN and NH3. The sulfuric compounds such as H2S or
carbonyl sulfide (COS) are removed through scrubber with Sulfinol D,
COS hydrolysation unit, and ZnO guard bed. The Cl compound such as
hydrogen chloride (HCl) can either be absorbed by dolomite in the tar
cracker, reacts with particulates in the bag filter, or removed by scrubber
with NaOH solvent. Alkalis and tars will condense on particulates or vessel
when syngas is cooled below 500 C (Tijmensen et al., 2002).
Another option to clean the syngas is via the advanced “dry hot gas
cleaning” method (Mitchell, 1998). The process consists of several filters
and separation units without cooling the syngas, which could lead to
increased efficiency and lower operational costs as the hot syngas fed to the
shift reactor or a reformer requires high inlet temperature. However, this
method is still not commercially viable due to the challenge of removing
contaminants at high temperature (Tijmensen et al., 2002). Finally, the
remaining syngas is fed into the FT synthesis reactor to be converted into
hydrocarbons. Conventional refinery processes, such as hydrocracking,
Figure 2.12 Schematic view of “wet” low temperature cleaning (Tijmensen et al.,
2002).
Biojet fuel production pathways
119
isomerization, hydrogenation, and fractionation, are then applied to upgrade the FT synthesis product to high-quality biojet fuel range hydrocarbons (Wang and Tao, 2016).
Biomass gasification has been reported to be rather different than coal
and natural gas gasification. Syngas produced from biomass gasification
often has low H2/CO ratios (less than one) (Ostadi et al., 2019). The
inconsistent moisture level, density, energy content, complex lignocellulosic structure, and size of biomass make it difficult for uniform feed rates,
and the relatively high oxygen and moisture content of the feedstock result
in a fuel with high methane content, low heating value fuel, and low
hydrogen content (Luque et al., 2012). Conversion of syngas from biomass
is often only 50%e60% effective, with tail gas consisting of lighter hydrocarbons and unconverted syngas (Hillestad et al., 2018). Besides, the
feedstock composition influences the production composition, and a large
amount of carbon is often lost as CO2 (Ostadi et al., 2019). Nevertheless,
the FT process is still an attractive option for biomass utilization as the
gasification product (syngas) and solid by-product (biochar) are valuable for
various applications. Table 2.14 shows the installation and production capacity of different biomass FT plants.
2.4.3 Advances in FischereTropsch technology
2.4.3.1 Biomass gasification technology
Different gasification technologies have been developed to accommodate
different feedstocks. Samiran et al. (2016) presented a comprehensive review on the types of gasifier used to gasify biomass, such as the fixed bed,
fluidized bed, entrained flow, and transport reactor gasifiers. Each type of
gasifier has its own technoeconomic merits and drawbacks, depending on
the operational need and application. The fixed bedetype gasifier uses
either updraft (Gunarathne et al., 2014) or downdraft (Olgun et al., 2011)
gasification air introduced from below or above a constant depth of feedstock bed, as shown in Fig. 2.13. The solid fuel is supplied from the top of
the gasifier, while the reaction zone is supported by a grate. The updraft
method is known to produce higher level of tar compared with the
downdraft configuration (Samiran et al., 2016). The fixed-bed gasifier is
generally cost-effective, but the syngas produced needs to be cleaned
separately owing to the high tar content.
The fluidized-bed gasifier employs blowing air through a bed of solid
particles to maintain the particles in suspension state and to mix and react
with the feedstock at elevated temperature. The bubbling-type fluidized
120
Biojet Fuel in Aviation Applications
Table 2.14 Installations of different of biomass FT plants (Ail and Dasappa, 2016;
Green Car Congress, 2009; Shahabuddin et al., 2020).
Reactor
Organisation
Feedstock
Year
Gasifier
details
Solena Fuels,
Green Sky
(Essex, United
Kingdom)
Municipal and
commercial
waste
2015
Solena plasma
gasification
Red Rock
Biofuels (Oregon,
United States)
Forest and saw
mill waste
(460 t/d
biomass feed)
Municipal solid
waste
2017
TRI steam
reformer
2016
TRI steam
reformer
Municipal solid
waste
2018
e
SYNDIESE, CEA
(Nevada, USA)
Forest and
agriculture
waste
2015
Velocys (Gussing,
Austria)
150 t/d dry
biomass
(pilot scale)
Forest and
agriculture
waste
2010
Entrained
flow, O2
blown, high
pressure
gasifier
Dual
fluidized bed
gasifier
Gasification
provided by
CHOREN
Sierra
Biofuels, Fulkrum
Bioenergy (Nevada,
United States)
Centerpoint
Biofuels (Indiana,
United States)
French CEA
(Nancy, France)
2009
• 1157
barrel per
day (bpd)
jet fuel
• Cocatalyst
• 1100 bpd
jet fuel
• Cocatalyst
• 657 bpd
jet fuel
• Cocatalyst
• 700,000
tons of
waste
from
Chicago
• 33 million
gallons
fuel/year
• 205 t/
d biomass
feed
• 530 bpd
liquid fuel
• 5000 bpd
jet fuel
• Cocatalyst
• 75,000 t/
year of
feedstock
• 23,000 t/
year of
biofuel
Biojet fuel production pathways
121
Figure 2.13 Schematics of the (A) fixed-bed updraft and (B) downdraft, (C) fluidized
bubbling (D) recirculating, (E) entrained, and (F) transport-type gasifier (Richards and
Casleton, 2010; Samiran et al., 2016; Breault, 2010).
bed introduces air of low velocity (<5 m/s) through the gate at the bottom
to the bed material. The bed is heated externally to provide energy for the
endothermic steam reforming reaction process. A strong vortex of gase
solid flow is introduced to intensify the fluid motion in the reactor to
promote homogenous temperature for biomass reaction (Udomsirichakorn
et al., 2013). Another variation is the circulating fluidized-bed gasifier,
where a circulation process of the bed materials with products takes place
between the reaction vessel and a cyclone reactor as shown in Fig. 2.13D.
The bed material and char are recirculated back to the combustion zone,
while the ash is removed through cyclone reactor. Fluidized bed is more
commonly opted in the industry due to medium operating cost and lower
tar content. Finland’s Valmet has developed a circulating fluidized-bed
gasification unit to gasify a variety of biomass. The combustion temperature (850e900 C) is below the melting point of ash, thus minimizing
fouling and slagging of heat surface. The solids recirculation provides a long
residence time and enables high combustion efficiency (Valmet, 2017).
Another merit of the fluidized-bed gasifier is the reduced formation of tar in
122
Biojet Fuel in Aviation Applications
the syngas (Matsuoka et al., 2013). The entrained gasifier operates at high
temperature of 700e1500 C to oxidize fine biomass particles in a short
residence time of 1e5 s. For the transport reactor gasifier, feedstock enters
with the oxidizer stream into an upward flow to react and fluidize the bed
of feedstock. The gasifier reactor needs to operate at high velocity (15 m/s)
to transport all bed materials up the reactor. The feedstock is first devolatilized in the fluidized-bed mixer, followed by char combustion in the
combustor riser (Breault, 2010; Samiran et al., 2016). The transport and
entrained gasifiers have the potential to produce higher-quality syngas but
demand stricter requirement on the feedstock size and operating conditions.
Other emerging gasification technologies such as plasma gasification,
microwave gasification, and supercritical water gasification can be utilized
to gasify biomass to produce syngas (Shahabuddin et al., 2020). Plasma
gasifier operates at a much higher temperature regime compared with the
conventional fixed bed or fluidized bed. Plasma torches are used to melt the
biomass at w1600 C, which is high enough to melt any inorganic material
in waste. Furthermore, the high temperature syngas (950 C) can gasify the
tar and convert them into smaller molecules such as CO2, CH4, CO, and
H2. Zhang et al. (2012) gasified municipal solid waste under plasma gasification condition in an updraft moving gasifier at a temperature up to
6000 C. An increase in the plasma power resulted in the increase of H2/
CO ratio from 1.5 to 2.0 owing to the increased cracking of tar. The
advantage of plasma gasification is its flexibility in handling hazardous waste
and feedstocks with high moisture content up to 40% (Mountouris et al.,
2006), but the energy intensive process is cost-prohibitive for commercial
production. Fig. 2.14A shows the schematic of a plasma gasifier.
Figure 2.14 (A) Plasma and (B) microwave-assisted dual-fluidized-bed gasifier (Shahabuddin et al., 2020; Xie et al., 2014).
Biojet fuel production pathways
123
The use of microwave as a heating source was shown to be effective in
gasifying corn stover for syngas production with Ni/Al2O3 as catalyst (Xie
et al., 2014). Extreme high temperature (>1200 C) can be obtained by
transforming the electromagnetic energy in microwave into thermal energy
at molecular level with the aid of microwave absorbents, thus enabling
rapid, efficient heating for syngas production which consumes lesser energy
compared with conventional fluidized-bed gasifier. The study showed the
potential of incorporating microwave heating with dual-fluidized-bed
gasifier for industrial-scale biomass gasification, as shown in Fig. 2.14B.
Improvement on the syngas quality can be achieved by adding steam to the
microwave gasification unit. Xie et al. (2014) reported an increase in syngas
yield up to 83.91% and a reduction of tar content to 5.11% with steam
addition. Warsita et al. (2017) examined the cracking of tar with steam in a
microwave heating system using naphthalene and toluene as model tar.
Naphthalene and toluene are the main constituents in tar, although other
compounds such as phenol and pyrene are also found in biomass tar. The
effect of steam on tar removal was found to be pronounced, with >95% tar
removal efficiency achieved at temperature of >1000 C at water to tar ratio
of 0.3. The tar steam reforming reactions are
C7 H8 þ 7H2 O47CO þ 11H2
C10 H8 þ 10H2 O410CO þ 14H2
DH393K ¼ þ881:7 kJ=mol
DH393K ¼ þ1177:8 kJ=mol
(3.3)
(3.4)
The steam reforming reaction of tar led to the production of CO and
H2, which explains the increase in yield of syngas when steam was added
(Xie et al., 2014). Zhou et al. (2020) demonstrated the production of syngas
produced from biomass using a microwave-assisted pyrolysis system. About
67% volume of high-quality syngas (18 MJ/Nm3) was produced at the
temperature of 800 C. Lesser tar (2.7 wt%) was produced compared with
conventional pyrolysis process operating at 900e1000 C (3.0e6.9 wt%
tar).
Supercritical water gasification is achieved by heating water to a temperature above its critical temperature (647K) and pressure (22.1 MPa)
(Matsumura and Minowa, 2003). It is a form of hydrothermal gasification
that has good raw material adaptability including biomass with high
moisture content. The use of high volume of water for the production of
combustible gases at supercritical condition avoids the energy-intensive
drying process (Chen et al., 2020). The main reactions that occur for
biomass in supercritical water are (Osada et al., 2006)
124
Biojet Fuel in Aviation Applications
C þ H2 O/CO þ H2
CO þ H2 O/CO2 þ H2
water gas reaction
watergas shift reaction
CO þ 3H2 /CH4 þ H2 O methanation reaction
(3.5)
(3.6)
(3.7)
The reactions in supercritical water gasifier lead to the production of
hydrogen and carbon dioxide as major products, while methane and carbon
monoxide are present as minor products (Osada et al., 2006; Guo and Jin,
2013). Varying the operating parameters including the temperature,
biomass/water ratio, and catalyst can change the output. Osada et al. (2006)
showed that gasification at high temperature region (773e973K) can
effectively inhibit the formation of char, while the use of alkali catalyst can
promote wateregas shift reaction, thereby increasing the yield of H2 and
lowering the CO yield (Kruse, 2008). Kruse and Dahmen (2015) reported
that higher temperature favors the production of hydrogen, while lower
temperature results in more CH4 production. Application of this gasification method for production of synthetic jet fuel requires reforming of the
CH4 into synthesis gas for FT reactions.
The use of renewable energy such as solar power to produce synthesis
gas is a promising route for zero-carbon fuel. An EU-funded project known
as SOLAR-JET has synthesized the first “solar” kerosene from water and
CO2 via a high-temperature solar reactor to produce H2 and CO, leaving
O2 as the purge as at the outlet (SOLAR-JET, 2015). The schematic of the
solar reactor is shown in Fig. 2.15. The two-step solar thermochemical
cycle based on ceria redox reactions to produce synthesis gas, which are the
inputs needed for FT synthesis to produce jet fuel. The project was led by
ETH-Zurich in cooperation with DLR, Shell, and Bauhaus Luftfahrt. The
project was later succeeded by a project known as SUN-to-LIQUID in
2016 aiming to scale up the production of solar-derived jet fuel. High-flux
solar concentrating system consisting of heliostat array was used to focus the
sunlight onto a reactor core made of cerium oxide to produce syngas
(SUN-to-LIQUID, 2016). The advantage of the solar-derived jet fuel is its
carbon neutrality, and no changes are needed for the current infrastructure
including storing, transporting, and distribution systems. However, the high
cost of production (w$9/gallon) meant that it is still not marketcompetitive for commercial usage (Swain, 2020).
Biojet fuel production pathways
125
Figure 2.15 Schematic of the solar reactor configuration for the two-step solar-driven
thermochemical production of fuels (SUN-to-LIQUID, 2016).
2.4.3.2 FischereTropsch reactor
The types of reactors commonly used for FT process include fluidized-bed
reactor, fixed-bed reactor, and the slurry-phase reactor. Fixed-bed reactor
typically requires periodical catalyst replacement, thus incurring maintenance cost and long downtime. Conversion efficiency up to 80% with
>90% selectivity of C5þ is possible, although pressure drop can be as high
as 3e7 bar. Nonetheless, this technology is proven, and production can be
scaled up easily. The slurry-type reactor requires lesser catalyst and can
achieve high conversion efficiency with <1 bar of pressure drop. The main
disadvantage of the slurry reactor is the need for catalyst and wax separation
(Tijmensen et al., 2002). Fig. 2.16A and B show the schematics of the
tubular fixed-bed and slurry-bed FT reactor. According to Sasol, the wax
selectivity from a fixed-bed reactor using an iron catalyst is approximately
50%e55%, while that for a slurry reactor using a similar catalyst is
w55%e60% in low temperature condition. The slurry reactor was shown
126
Biojet Fuel in Aviation Applications
Figure 2.16 (A) Tubular fixed bed, (B) slurry bed, and (C) SAS reactor (Geerlings and
Wilson, 1999; Steynberg et al., 1999).
to produce 50% higher amount of olefins with selectivity in the range of
C5eC18 compared with the fixed-bed reactor (Espinoza et al., 1999).
They later deployed a fluidized bedetype reactor or Sasol Advanced
Synthol (SAS) reactor that operates at pressure of 20e40 bar and at high
temperature of 340 C with iron as catalyst. Compared with the Synthol
CFB reactor, the SAS reactor has improved production rate due to higher
catalyst/gas ratio, which increases throughput, consumes lesser catalysts, and
is more energy efficient (Steynberg et al., 1999). The schematic of the SAS
reactor is shown in Fig. 2.16C. The increase of the partial pressure of H2
and CO tends to lead to higher selectivity of C5þ, whereas the presence of
inert gas will lower the selectivity of C5þ (Tijmensen et al., 2002). To
obtain jet fuel-quality fuel, the produced FT-liquid requires catalytic hydrocracking. Hydrogen is added to remove the double bond, and the
desired final product can be obtained by altering the hydrocracking
conditions.
2.4.4 Scientific advances
As a technique to improve the H2/CO ratios of the syngas, external hydrogen
or steam is often added into the process. The introduction of steam improves
thermal reforming of the hydrocarbons and wateregas shift of carbon
monoxide, thus increasing the hydrogen content in the gaseous product
(Hillestad et al., 2018). According to Hillestad et al. (2018), carbon efficiency
of the process can be improved from 38% to more than 90% with the use of
hydrogen sourced from renewable energy. Adding hydrogen results in higher
carbon efficiency and hydrocarbon production rate (Ostadi et al., 2019).
Chiodini et al. (2017) investigated the gasification of two different biomasses
(forest residue and Triticale crop) for direct FT application. It was found that
using a bed material constituted of active material such as magnesium oxide
Biojet fuel production pathways
127
can produce syngas with H2/CO ratio of 2 at 1020K. The produced syngas
does not require any wateregas shift section within the process and hence
would save up to 10% of production cost.
Reaction parameters that affect the range of hydrocarbons produced
include pressure, temperature, and catalyst used. Given the highly
exothermic nature of the FT process, the reaction temperature should be
monitored to avoid the formation of hot spots and the runaway phenomenon generation, which would be detrimental to both the catalyst and
reactor (Méndez and Ancheyta, 2020). Furthermore, low temperatures
during the FT process also result in increased production of methane. High
pressures also increase the conversion rate and favor the formation of longchain alkanes (Luque et al., 2012). A good catalyst should have strong
catalytic activity, selectivity, high spaceetime yield, good carbon chain
growth ability, cheap, and long catalytic life (Wei et al., 2019). Common
catalysts used for the FT process include Ni, Ru, Co, and Fe and have been
extensively reviewed by various researchers (Wei et al., 2019; Xu et al.,
2020; Abbaslou et al., 2009). Ni is often avoided because it is prone to
methane formation and cracking of higher hydrocarbon, while Ru is
expensive and rare. Both Co and Fe have high productivity and stability,
but the latter is often used for its cheap price and ability to be deployed in
environment with temperature above 300 C (Benedetti et al., 2020). Sasol
produced the FT liquid fuels by utilizing iron as catalyst at the operating
temperature of 340 C (Steynberg et al., 1999). Kumabe et al. (2010) utilized Fe-based catalyst to synthesis FT fuels using a fixed-bed reactor under
the temperature of 533e573K and a pressure of 3.0 MPa. The selectivity of
CO to the C11eC14 hydrocarbons equivalent to jet fuel kerosene was
found to be the second highest. The highest yield of kerosene was obtained
at the feeding gas H2:CO:N2 with a ratio of 2:1:3 and at the reaction
temperature of 553K with neat Fe as catalyst.
Folkedahl et al. (2011) demonstrated a pilot-scale FT reactor system that
is capable of processing up to 9 kg/h of coal and biomass to produce
synthesis gas using a fluidized-bed gasifier. Fe-based catalyst was used to
produce wax and liquid products, which were collected and subsequently
processed into synthetic isoparaffinic kerosene. The FT products were
catalytically hydrodeoxygenated to remove the alcohols and oxygenated
compounds, followed by isomerization and distillation processes. The SPK
produced is close to the specification of military-grade jet fuel. Hanaoka
et al. (2015) investigated the hydrocracking behaviors of the FT products
derived from biomass (n-C28H58 and n-C36H74), using Pt-loaded b-type
128
Biojet Fuel in Aviation Applications
zeolite catalysts with constant Pt content, acid amount, and pore parameters. The experiments were conducted at temperature 250 C, initial H2
pressure 1 MPa, and reaction time 1 h. Pt-loaded b-type zeolite catalysts
with Pt particle sizes of 2.3e13.1 nm and higher acid amounts led to high
jet fuel yields. The maximum jet fuel yield of 29.1 C-mol% was obtained
with Pt particle size 7.6 nm.
2.5 Sugar-to-jet
The common sugar-to-jet (STJ) conversion pathways are biological-type
direct sugar-to-hydrocarbon (DSHC) and catalytic conversion aqueous
phase reforming (APR). Feedstocks containing sugar and starches can all be
used for the STJ conversion pathways. For a pathway to be considered as
STJ, the starting feedstock should be sugar and typically does not require a
dedicated stage to convert alcohol into the final biojet fuel product.
2.5.1 Direct sugar-to-hydrocarbon
The DSHC method shares a few similarities with the ATJ pathway, where
typically biochemical fermentation or catalytic conversion of sugar to hydrocarbon fuels occurs (Hari et al., 2015). The feedstock for DSCH can be
directly from sugar sources such as sugarcane, beets and maize, or lignocellulosic biomass (Wei et al., 2019). The key difference is that DSHC
process does not require an alcohol intermediate. The technology is
developed due to advances in genetic engineering and screening technologies, enhancing how microbes metabolize sugar. A more specific route of
DSHC involves the production of farnesane from sugar, called hydroprocessed fermented sugars to synthetic iosparaffins (HFSeSIP), and has
been approved by ASTM in 2015. However, the terms HFSeSIP and
DSHC are typically used in an interchangeable way in literature.
Fig. 2.17 illustrates the DSHC biojet fuel conversion pathway. In the
following description, emphasis is placed on the HFSeSIP specific pathway
as it is the ASTM approved pathway. In general, the DSHC pathway
Figure 2.17 Direct sugar-to-hydrocarbon (DSHC) biojet fuel conversion pathway.
Biojet fuel production pathways
129
involves six main steps and one postprocessing fractionation step. It starts
with the conditioning of the raw material to improve feedstock quality
prior to the enzymatic hydrolysis step. Enzyme mixtures or catalytic proteins work together to break down cellulose fibers into cellobiose and
soluble glucooligomers, then into glucose monomers (Davis et al., 2013).
The solubilized C5 and C6 sugars are separated and concentrated (CORSIA, 2019). This process usually lasts 3.5 days, at slightly elevated temperature of 48 C and a cellulase loading of 10 mg protein/g cellulose.
Conversion efficiency values of glucan to glucose oligomer, cellobiose, and
glucose are 4.0%, 1.2%, and 90.0%, respectively. The conversion of
cellobiose to glucose is 100%. The enzymatic hydrolysis reactions are
ðGlucanÞn /nGlucose oligomer
(3.8)
ðGlucanÞn /1=2 nCellobiose
(3.9)
ðGlucanÞn nH2 O/nGlucose
(3.10)
Cellobiose þ H2 O/2 Glucose
(3.11)
The hydrolysate or hydrolysis product undergoes clarification for unwanted particle removal and removing turbidity. This step differentiates the
pathway from ETJ pathways where sugars are converted into ethanol by
temperature reduction and fermentation initiation, without any intermediate conditioning. Using vacuum belt filters for the hydrolysate separation,
99% of soluble sugar can be recovered. Wash ratio for such a system is 2.5:1
(L water: L liquor in filter cake).
The clarified hydrolysate then goes through biological conversion of its
sugar and through fermentation by microorganisms to produce farnesene.
The fermentation process takes typically up to 69 h, with a vessel turnaround
time of 79 h. The purified fermentation products are reacted with hydrogen
through hydrotreating in a catalytic bed. This serves to convert the farnesene
into a saturated alkane, namely farnesane (2,6,10-trimethyldodecane), which
is distilled to produce aviation grade biojet fuel (Zschocke et al., 2012).
Ideally, only farnesane is produced as the final product, but the main
contaminant hexahydrofarsenol (3,7,11-trimethyl-do-decan-1-ol), or simply HHF, is also produced (Buffon and Stradiotto, 2019). Degradation of
the fuel system occurs in the presence of HHF as the contaminant will form
polymeric chains and sediment within the system components. According
to the ASTM D7566 standards for HFSeSIP, HHF amount must not
130
Biojet Fuel in Aviation Applications
exceed 1.5% (m:m). In practical terms, there will also be trace amounts of
farnesene and olefins (partially hydrogenated farnesene). The produced
long-chained farnesane (C15) biojet fuel has relatively high viscosity and
poorer combustion performance in aviation turbine engines, as compared
with biojet fuels from other methods (Yang et al., 2019).
For the bioconversion or fermentation of sugar, farnesene is not the best
product pathway class. In fact, it is the worst among all possible product
pathway classes as shown in Table 2.15. This shows the difficulty faced by
DSHC to achieve parity as compared with other product pathway classes. It
is important to understand that the DSHC pathway is still in nascent stages
of development relative to ethanol and other product pathway classes;
hence, improvements can still be made for the fermentation process to
allow DSHC be a viable process.
Key companies working on DSHC biojet fuel pathway include Amyris,
Total, Solazyme, and LS9. The American company, Amyris, engineered
Saccharomyces cerevisiae, a species of yeast, for industrial production of isoprenoid artemisinic acid for antimalarial treatment. It was then reengineered
for large amount production of isoprenoid beta-farnesene, which has the
potential to be used for biojet fuel through the DSHC/HFSeSIP pathway
(Gírio, 2019). Amyris also developed a DSHC fermentation pathway where
sugars are aerobically fermented into a farnesene intermediate using the
mevalonate pathway in yeasts. The Amyris process obtained a maximum
farnesene yield of 16.8 g farnesene/100 g sugar at a productivity level of 16.9
g/L/d. The process has a carbon efficiency of 60%. The 300 L capacity
Table 2.15 Theoretical metabolic yields for various product pathway classes
through bioconversion of sugar (Davis et al., 2013).
Energy
Mass
yielddHHV basis
yield
Carbon
(%)
(%)
yield (%)
Product pathway classes
Farnesene (mevalonic acid
pathway)
Farnesene (1-deoxy-D-xylulose 5phosphate pathway)
Pentadecane
Fatty alcohol (hexadecanol)
FAEE (ethyl palmitate)
Fatty acid (palmitic acid)
Ethanol
25
56
74
29
64
85
29
34
35
36
51
62
67
67
67
67
88
93
90
89
98
Biojet fuel production pathways
131
demonstration project could convert both C5 and C6 sugars from corn stover
and have a farnesane recovery of 95% and purity of 97% (Wang et al., 2016).
LS9 also made huge progress to commercialize the DSHC pathway
using biological conversion (Wang et al., 2016). The process uses Escherichia
coli for fatty acids production through the anaerobic-based fatty acid
biosynthesis pathway. In addition to producing fatty acids, other coproducts
such as fatty alcohols, fatty esters, and alkanes can be produced. The alkanes
can then be further processed to produce biojet fuel. LS9 has also been
researching on the direct conversion of sugar to alkanes without the
additional step of hydrogenation. This will make it similar to the farnesane
production pathway. The purified fatty acids at the end point of the
fermentation will be hydrotreated and hydroisomerized for the production
of biojet fuel.
While DSHC is a technically viable method to produce biojet fuel, the
complexity, long residence time, and cost of production make it more
suitable to be used for the production of high-value chemicals rather than
sustainable aviation fuel. Another strike against DSCH biojet fuels is that
the official HFSeSIP fuel can only be blended with fossil jet fuel up to 10%
by volume as compared with 50% volumetrically for the HEFA and FT
pathways.
2.5.2 Aqueous phase reforming
The aqueous phase reforming (APR) pathway uses a technology to convert
soluble plant sugars to biojet fuel range hydrocarbons (Wei et al., 2019).
Before obtaining the final biojet fuel products, plant sugars will be converted first into chemical intermediates such as acids, alcohols, aldehydes,
furans, ketones, and other oxygenated hydrocarbons. Fig. 2.18 shows the
APR biojet fuel conversion pathway.
The APR conversion pathway consists of five main steps. Pretreatment
of feedstock is required to disrupt the matrix of polymeric compounds that
are bonded within the lignocellulosic wall structures. They include hemicellulose, lignin, and cellulose microfibrils (Davis et al., 2015). The enzymatic hydrolysis process will break down cellulose fibers into cellobiose and
Figure 2.18 Aqueous phase reforming (APR) biojet fuel conversion pathway.
132
Biojet Fuel in Aviation Applications
soluble glucooligomers and finally into glucose monomers. The resulting
glucose and other sugars hydrolyzed during pretreatment are purified
through microfiltration and ion exchange.
At this point, the process is still identical to that of DSHC. The catalytic
conversion stage is where APR diverges with DSHC. This step removes
oxygen to remove the functions of carbohydrates to convert into diesel
range hydrocarbons. The catalytic process has a set of two reforming reactors for hydrogenation and APR steps, followed by condensation and
oligomerization, and ending with hydrotreating. The reactors typically have
operating temperature of 350 C and pressure of 7.24 MPa. In the
condensation stage, intermediates from the previous stage go through the
CeC bond forming reactions to form longer continuous carbon chains. In
the condensation reactor, the reaction temperature is 262 and 300 C at the
inlet and outlet, respectively, while retaining pressure at 6.21 MPa. Here,
average carbon chain length increases from <C6 to the C8eC24 range. The
range matches those of biojet fuel and diesel fuel.
Table 2.16 shows the overall product carbon yields from the APR
pathway. Unlike the DSHC pathway that favors ethanol production, the
APR pathway favors the biojet fuel range or the C8eC14 range. The APR
pathway is equally adept at producing diesel range fuels.
Key companies developing the APR pathway for biojet fuel production
include Virent, Shell, and Virdia. Nonetheless, the APR pathway is still a
new and novel approach to biojet fuel production. Understanding of the
technology, in particular the catalytic conversion process is still rudimentary
with minimal literature available in the research and public domain as
compared with the other more mature pathways such as HEFA and FT.
More research have to be conducted to bring it past the emergent technology stage and into pilot plant stage.
Table 2.16 Overall product carbon yields from the APR pathway (Davis et al., 2015).
Proportion of feed C to hydrogenation/APR (%)
Products by carbon
number
Patent from Virent
Inc
Model results from
NREL
C1eC7
C8eC14
C15eC24
C24þ
23
50
23
1
22
50
23
1
APR, aqueous phase reforming.
Table 2.17 Summary of the various biojet fuel conversion pathways.
Conversion
category
Oil-to-jet
Intermediates
Economic
costs
Hydroprocessed
esters and fatty
acids
Vegetable oil,
animal fats,
waste cooking
oil, algal oil
Biooil
Low
production
cost but
feedstock
sensitive
Catalytic
hydrothermolysis
Algae, oil seeds
Biooil
Hydroprocessed
depolymerized
cellulosic jet
Ethanol-to-jet
Lignocellulosic
biomass
Biooil or
pyrolysis oil
Sugar and
starch crops,
municipal
waste
Butyl alcohol
Ethanol
Potentially
low
production
cost
Moderate
production
cost
High
production
cost
Butyl ATJ
Isobutanol or
n-butanol
High
production
cost
Major companies
Agrisoma Biosciences,
AltAir Fuels, ASA, Neste
Oil, PetroChina,
Sapphire Energy, SG
Biofuels, Syntroleum,
Tyson Food, UOP
Aemetis, Applied
Research Assoc.,
Chevron Lummus Global
Technology
readiness
level
8e9
5e6
Dynamotive, Envergent,
GTI, Hunt Refining,
Kior, Petrotech
Coskata, LanzaTech,
MixAlco, Swedish
Biofuels, Terrabon
6
Albemarie, Byogy,
Cobalt, Gevo, Solazyme
w6
Biojet fuel production pathways
Alcoholto-jet
(ATJ)
Pathways
Main
feedstocks
6e7
Continued
133
Pathways
Gas-to-jet
FischereTropsch
Intermediates
Economic
costs
Major companies
Technology
readiness
level
Syngas
High
production
cost
Rentech, Shell, Solena,
SynFuels, Syntroleum
7e8
Syngas
Moderate
production
cost
Coskata, INEOS Bio,
LanzaTech, Swedish
Biofuels
w6
Direct sugar-tohydrocarbon
Lignocellulosic
biomass,
municipal
waste
Lignocellulosic
biomass,
municipal
waste
Sugar and
starch crops
Farnesene
and fatty
acids
Amyris, LS9, Solazyme,
Total
6
Aqueous phase
reforming
Sugar and
starch crops
Hydrocarbons
Not suitable
for biojet
fuel as higher
value
chemicals can
be produced
Moderate
production
cost
Shell, Virdia, Virent
4e5
Biomass-to-fuel
Sugar-tojet
Main
feedstocks
Biojet Fuel in Aviation Applications
Conversion
category
134
Table 2.17 Summary of the various biojet fuel conversion pathways.dcont'd
Biojet fuel production pathways
135
2.6 Summary
The production methods of biojet fuels are varied with many competing
pathways as shown in Table 2.17. This is in contrast with biodiesel production where the transesterification method is the most dominant pathway
by far. Among all, the HEFA pathway has the most mature technology and
lowest average cost at present. The HEFA pathway has one distinct
disadvantage in being the most cost-sensitive to feedstocks. The dominance
of HEFA might not last long as other conversion pathways are developing
fast and going up the technology readiness level. FT pathway has the
potential to join HEFA as a commercially mature production method.
References
Abbaslou, R.M.M., Tavassoli, A., Soltan, J., Dalai, A.K., 2009. Iron catalysts supported on
carbon nanotubes for FischereTropsch synthesis: effect of catalytic site position. Appl.
Catal. A Gen. 367 1, 47e52.
Ail, S.S., Dasappa, S., 2016. Biomass to liquid transportation fuel via Fischer Tropsch
synthesis e technology review and current scenario. Renew. Sustain. Energy Rev. 58,
267e286.
ASTM D7566-19b, 2019. ASTM International, Standard Specification for Aviation Turbine Fuel Containing Synthesized Hydrocarbons.
Benedetti, V., Ail, S.S., Patuzzi, F., Cristofori, D., Rauch, R., Baratieri, M., 2020. Investigating the feasibility of valorizing residual char from biomass gasification as catalyst
support in Fischer-Tropsch synthesis. Renew. Energy 147, 884e894.
Biomass Magazine, 2019. Vertimass Wins $1.4 Million for Ethanol to Jet Fuel Process. In:
http://www.biomassmagazine.com/articles/16582/vertimass-wins-1-4-million-forethanol-to-jet-fuel-process.
Bokade, V.V., Yadav, G.D., 2011. Heteropolyacid supported on montmorillonite catalyst
for dehydration of dilute bio-ethanol. Appl. Clay Sci. 53 2, 263e271.
Breault, R.W., 2010. Gasification processes old and new: a basic review of the major
technologies. Energies 3, 216e240.
Buffon, E., Stradiotto, N.R., 2019. Electrochemical sensor based on molecularly imprinted
poly(ortho-phenylenediamine) for determination of hexahydrofarnesol in aviation
biokerosene. Sensor. Actuator. B Chem. 287, 371e379.
Capaz, R.S., Seabra, J.E.A., 2016. Life cycle assessment of biojet fuels. In: Biofuels for
Aviation, pp. 279e294.
Casas-Godoy, L., Barrera-Martínez, I., Ayala-Mendivil, N., Aguilar-Juárez, O., ArellanoGarcía, L., Reyes, A.L., et al., 2020. Chapter 4 - Biofuels in Biobased Products and
Industries, pp. 125e170.
Chemicals Technology, 2010. Lanxess Invests in Isobutene Production. https://www.
chemicals-technology.com/uncategorised/news86770-html/.
Chen, S., Chen, J., Qu, T., Xiang, K., Zhang, Y., Hao, P., et al., 2018. Crown ether
induced assembly to g-Al2O3 nanosheets with rich pentacoordinate Al3þ sites and high
ethanol dehydration activity. Appl. Surf. Sci. 457, 626e632.
Chen, J., Liang, J., Xu, Z., E, J., 2020. Assessment of supercritical water gasification process
for combustible gas production from thermodynamic, environmental and technoeconomic perspectives: a review. Energy Convers. Manag. 226, 113497.
136
Biojet Fuel in Aviation Applications
Cheng, Y.W., Chong, C.C., Cheng, C.K., Ng, K.H., Witoon, T., Juan, J.C., 2020.
Ethylene production from ethanol dehydration over mesoporous SBA-15 catalyst
derived from palm oil clinker waste. J. Clean. Prod. 249, 119323.
Chiodini, A., Bua, L., Carnelli, L., Zwart, R., Vreugdenhil, B., Vocciante, M., 2017.
Enhancements in Biomass-to-Liquid processes: gasification aiming at high hydrogen/
carbon monoxide ratios for direct Fischer-Tropsch synthesis applications. Biomass
Bioenergy 106, 104e114.
Corporan, E., Edwards, T., Shafer, L., DeWitt, M.J., Kingshirn, C., Zanarnick, S., et al.,
2011. Chemical, thermal stability, seal swell, and emissions studies of alternative jet fuels.
Energy Fuels 25, 955e966.
CORSIA, 2019. CORSIA Supporting Document - Life Cycle Assessment Methodology.
https://www.icao.int/environmental-protection/CORSIA/Pages/default.aspx.
Cremonez, P.A., Feroldi, M., Araújo, A.V., Borges, M.N., Meier, T.W., Feiden, A.,
Teleken, J.G., 2015. Biofuels in Brazilian aviation: current scenario and prospects.
Renew. Sustain. Energy Rev. 43, 1063e1072.
Davis, R., Tao, L., Tan, E.C.D., Biddy, M.J., Beckham, G.T., Scarlata, C., 2013. Process
Design and Economics for the Conversion of Lignocellulosic Biomass to Hydrocarbons:
Dilute-Acid and Enzymatic Deconstruction of Biomass to Sugars and Biological
Conversion of Sugars to Hydrocarbons. NREL Technical Report NREL/TP-510060223. https://www.nrel.gov/docs/fy14osti/60223.pdf.
Davis, R., Tao, L., Scarlata, C., Tan, E.C.D., Ross, J., Lukas, J., Sexton, D., 2015. Process
Design and Economics for the Conversion of Lignocellulosic Biomass to Hydrocarbons:
Dilute-Acid and Enzymatic Deconstruction of Biomass to Sugars and Catalytic Conversion of Sugars to Hydrocarbons. Technical Report NREL/TP-5100-62498. https://
www.nrel.gov/docs/fy15osti/62498.pdf.
Dayton, D.C., Foust, T.D., 2020. Alternative jet fuels. In: Analytical Methods for Biomass
Characterization and Conversion, pp. 147e165.
de Reviere, A., Gunst, D., Sabbe, M., Verberckmoes, A., 2020. Sustainable short-chain
olefin production through simultaneous dehydration of mixtures of 1-butanol and
ethanol over HZSM-5 and g-Al2O3. J. Ind. Eng. Chem. 89, 257e272. https://doi.
org/10.1016/j.jiec.2020.05.022.
de Souza, L.M., Mendes, P.A.S., Aranda, D.A.G., 2018. Assessing the current scenario of the
Brazilian biojet market. Renew. Sustain. Energy Rev. 98, 426e438.
Díaz, M., Epelde, E., Tabernilla, Z., Ateka, A., Aguayo, A.T., Bilbao, J., 2020. Operating
Conditions to Maximize Clean Liquid Fuels Yield by Oligomerization of 1-butene on
HZSM-5 Zeolite Catalysts. Energy, p. 118317.
Eller, Z., Varga, Z., Hancsók, J., 2016. Advanced production process of jet fuel components
from technical grade coconut oil with special hydrocracking. Fuel 182, 713e720.
Eschemann, T.O., de Jong, K.P., 2015. Deactivation behavior of Co/TiO2 catalysts during
FischereTropsch synthesis. ACS Catal. 5 6, 3181e3188.
Espinoza, R.L., Steynberg, A.P., Jager, B., Vosloo, A.C., 1999. Low temperature
FischereTropsch synthesis from a Sasol perspective. Appl. Catal. A Gen. 186, 13e26.
Folkedahl, B.C., Snyder, A.C., Strege, J.R., Bjorgaard, S.J., 2011. Process development and
demonstration of coal and biomass indirect liquefaction to synthetic iso-paraffinic
kerosene. Fuel Process. Technol. 92 (10), 1939e1945.
Geerlings, J.J.C., Wilson, J.H., 1999. Fischer-Tropsch technology-from active site to
commercial process. Appl. Catal. A Gen. 186, 27e40.
Geleynse, S., Jiang, Z., Brandt, K., Garcia-Perez, M., Wolcott, M., Zhang, X., 2020. Pulp
mill integration with alcohol-to-jet conversion technology. Fuel Process. Technol. 201,
106338.
Gírio, F., 2019. Innovation on Bioenergy. In: The Role of Bioenergy in the Bioeconomy,
pp. 405e433.
Biojet fuel production pathways
137
Green Car Congress, 2009. French CEA Launches Biomass-to-Liquids Project; Hydrogen
Used to Optimize Mass Yield. https://www.greencarcongress.com/2009/12/buresaudron-20091225.html.
Green Car Congress, 2018. ASTM Greenlights Ethanol as Feedstock for Alcohol-to-Jet
Synthetic Fuel; Blend Level up to 50%. https://www.greencarcongress.com/2018/04/
20180416-atj.html.
Gunarathne, D.S., Mueller, A., Fleck, S., Kolb, T., Chmielewski, J.K., Yang, W.,
Blasiak, W., 2014. Gasification characteristics of steam exploded biomass in an updraft
pilot scale gasifier. Energy 71, 496e506.
Gunst, D., Alexopoulos, K., Van Der Borght, K., John, M., Galvita, V., Reyniers, M.-F.,
Verberckmoes, A., 2017. Study of butanol conversion to butenes over H-ZSM-5: effect
of chemical structure on activity, selectivity and reaction pathways. Appl. Catal. A Gen.
539, 1e12.
Guo, L., Jin, H., 2013. Boiling coal in water: hydrogen production and power generation
system with zero net CO2 emission based on coal and supercritical water gasification.
Int. J. Hydrogen Energy 38, 12953e12967.
Guo, X., Guo, L., Zeng, Y., Kosol, R., Gao, X., Yoneyama, Y., et al., 2020. Catalytic
oligomerization of isobutyl alcohol to jet fuels over dealuminated zeolite Beta. Catal.
Today. https://doi.org/10.1016/j.cattod.2020.04.047.
Gutiérrez-Antonio, C., Gómez-Castro, F.I., Hernández, S., Briones-Ramírez, A., 2015.
Intensification of a hydrotreating process to produce biojet fuel using thermally coupled
distillation. Chem. Eng. Process Process Intensif. 88, 29e36.
Gutiérrez-Antonio, C., Gómez-Castro, F.I., de Lira-Flores, J.A., Hernández, S., 2017.
A review on the production processes of renewable jet fuel. Renew. Sustain. Energy
Rev. 79, 709e729.
Hanaoka, T., Miyazawa, T., Shimura, K., Hirata, S., 2015. Jet fuel synthesis in hydrocracking of FischereTropsch product over Pt-loaded zeolite catalysts prepared using
microemulsions. Fuel Process. Technol. 129, 139e146.
Hari, K., Yaakob, T.Z., Binitha, N.N., 2015. Aviation biofuel from renewable resources:
routes, opportunities and challenges. Renew. Sustain. Energy Rev. 42, 1234e1244.
Heveling, J., Nicolaides, C.P., Scurrell, M.S., 1998. Catalysts and conditions for the highly
efficient, selective and stable heterogeneous oligomerisation of ethylene. Appl. Catal. A
Gen. 173, 1e9.
Hillestad, M., Ostadi, M., Alamo Serrano, G.d., Rytter, E., Austbø, B., Pharoah, J.G.,
Burheim, O.S., 2018. Improving carbon efficiency and profitability of the biomass to
liquid process with hydrogen from renewable power. Fuel 234, 1431e1451.
Jürgens, S., Oßwald, P., Selinsek, M., Piermartini, P., Schwab, J., Pfeifer, P., et al., 2019.
Assessment of combustion properties of non-hydroprocessed Fischer-Tropsch fuels for
aviation. Fuel Process. Technol. 193, 232e243.
Kandaramath Hari, T., Yaakob, Z., Binitha, N.N., 2015. Aviation biofuel from renewable
resources: routes, opportunities and challenges. Renew. Sustain. Energy Rev. 42,
1234e1244.
Kim, Y.T., Chada, J.P., Xu, Z., Pagan-Torres, Y.J., Rosenfeld, D.C., Winniford, W.L.,
et al., 2015. Low-temperature oligomerization of 1-butene with H-ferrierite. J. Catal.
323, 33e44.
Kousoulidou, M., Lonza, L., 2016. Biofuels in aviation: fuel demand and CO2 emissions
evolution in Europe toward 2030. Transport. Res. D Transport Environ. 46, 166e181.
Kruse, A., 2008. Supercritical water gasification. Biofuels Bioprod. Biorefining 2, 415e437.
Kruse, A., Dahmen, N., 2015. Water-A magic solvent for biomass conversion. J. Supercrit.
Fluids 96, 36e45.
138
Biojet Fuel in Aviation Applications
Krutpijit, C., Tochaeng, P., Jongsomjit, B., 2020. Temperature and ethanol concentration
effects on catalytic ethanol dehydration behaviors over alumina-spherical silica particle
composite catalysts. Catal. Commun. 145, 106102.
Kumabe, K., Sato, T., Matsumoto, K., Ishida, Y., Hasegawa, T., 2010. Production of
hydrocarbons in FischereTropsch synthesis with Fe-based catalyst: investigations of
primary kerosene yield and carbon mass balance. Fuel 89, 2088e2095.
Kumar, K., Ghosh, S., Angelidaki, I., Holdt, S.L., Karakashev, D.B., Alvarado
Morales, M.A., Das, D., 2016. Recent developments on biofuels production from
microalgae and macroalgae. Renew. Sustain. Energy Rev. 65, 235e249.
Lallemand, M., Finiels, A., Fajula, F., Hulea, V., 2007. Ethylene oligomerization over Nicontaining mesostructured catalysts with MCM-41, MCM-48 and SBA-15 topologies.
Stud. Surf. Sci. Catal. 170, 1863e1869.
Lanzatech, 2019. LanzaTech Moves Forward on Sustainable Aviation Scale up in the USA
and Japan. https://www.lanzatech.com/2019/11/22/lanzatech-moves-forward-onsustainable-aviation-scale-up-in-the-usa-and-japan/.
LanzaTech, 2020. LanzaJet Takes off!. https://www.lanzatech.com/2020/06/02/lanzajettakes-off/.
Lee, M., Yoon, J.W., Kim, Y., Yoon, J.S., Chae, H.-J., Han, Y.-H., 2018. Ni/SIRAL-30 as
a heterogeneous catalyst for ethylene oligomerization. Appl. Catal. A Gen. 2018,
87e93.
Lee, K., Lee, M.-E., Kim, J.-K., Shin, B., Choi, M., 2019. Single-step hydroconversion of
triglycerides into biojet fuel using CO-tolerant PtRe catalyst supported on USY.
J. Catal. 379, 180e190.
Liu, G., Yan, B., Chen, G., 2013. Technical review on jet fuel production. Renew. Sustain.
Energy Rev. 25, 59e70.
Luque, R., de la Osa, A.R., Campelo, J.M., Romero, A.A., Valverde, J.L., Sanchez, P.,
2012. Design and development of catalysts for Biomass-To-Liquid-FischereTropsch
(BTL-FT) processes for biofuels production. Energy Environ. Sci. 5 1, 5186e5202.
Mahdaviani, S.H., Soudbar, D., Parvari, M., 2010. Selective ethylene dimerization toward
1-butene by a new highly efficient catalyst system and determination of its optimum
operating conditions in a buchi reactor. Int. J. Chem. Eng. Appl. 1, 276e281.
Marsh, G., 2008. Biofuels: aviation alternative? Renew. Energy Focus 9 4, 48e51.
Martínez, A., Arribas, M.A., Concepción, P., Moussa, S., 2013. New bifunctional NieHBeta catalysts for the heterogeneous oligomerization of ethylene. Appl. Catal. A Gen.
467, 509e518.
Matsumura, Y., Minowa, T., 2003. Fundamental design of a continuous biomass gasification
process using a supercritical water fluidized bed. Int. J. Hydrogen Energy 29, 701e707.
Matsuoka, K., Hosokai, S., Kuramoto, K., Suzuki, Y., 2013. Enhancement of coal char
gasification using a pyrolyzeregasifier isolated circulating fluidized bed gasification
system. Fuel Process. Technol. 109, 43e48.
Méndez, C.I., Ancheyta, J., 2020. Modeling and control of a Fischer-Tropsch synthesis
fixed-bed reactor with a novel mechanistic kinetic approach. Chem. Eng. J. 390,
124489.
Mitchell, S.C., 1998. Hot Gas Cleanup of Sulphur, Nitrogen, Minor and Trace Elements.
IEA Coal Research, London, UK.
Moses, C.A., 2008. Comparative Evaluation of Semi-Synthetic Jet Fuels Crc Project No.
AV-2-04A.
Mountouris, A., Voutsas, E., Tassios, D., 2006. Solid waste plasma gasification: equilibrium
model development and exergy analysis. Energy Convers. Manag. 47, 1723e1737.
Neuling, U., Kaltschmitt, M., 2018. Techno-economic and environmental analysis of
aviation biofuels. Fuel Process. Technol. 171, 54e69.
Biojet fuel production pathways
139
Olgun, H., Ozdogan, S., Yinesor, G., 2011. Results with a bench scale downdraft biomass
gasifier for agricultural and forestry residues. Biomass Bioenergy 35 1, 572e580.
Osada, M., Sato, T., Watanabe, M., Shirai, M., Arai, K., 2006. Catalytic gasification of
wood biomass in subcritical and supercritical water. Combust. Sci. Technol. 178, 1e3.
Ostadi, M., Rytter, E., Hillestad, M., 2019. Boosting carbon efficiency of the biomass to
liquid process with hydrogen from power: the effect of H2/CO ratio to the FischerTropsch reactors on the production and power consumption. Biomass Bioenergy
127, 105282.
Phung, T.K., Hernández, L.P., Lagazzo, A., Busca, G., 2015. Dehydration of ethanol over
zeolites, silica alumina and alumina: Lewis acidity, Brønsted acidity and confinement
effects. Appl. Catal. A Gen. 49, 77e89.
PNNL, 2018. PNNL and LanzaTech Team to Make New Jet Fuel. https://www.pnnl.gov/
news/release.aspx?id¼4527.
Pujan, R., Hauschild, S., Gröngröft, A., 2017. Process simulation of a fluidized-bed catalytic
cracking process for the conversion of algae oil to biokerosene. Fuel Process. Technol.
167, 582e607.
Rabaev, M., Landau, M.V., Vidruk-Nehemya, R., Koukouliev, V., Zarchin, R.,
Herskowitz, M., 2015. Conversion of vegetable oils on Pt/Al2O3/SAPO-11 to diesel
and jet fuels containing aromatics. Fuel 161, 287e294.
Richards, G.A., Casleton, K.H., 2010. Gasification technology to produce synthesis gas. In:
Synthesis Gas Combustion Fundamentals and Applications. Taylor & Francis Group.
Samiran, N.F., Mohd Jaafar, M.N., Ng, J.-H., Lam, S.S., Chong, C.T., 2016. Progress in
biomass gasification technique e with focus on Malaysian palm biomass for syngas
production. Renew. Sustain. Energy Rev. 62, 1047e1062.
Santos, R.G.d., Alencar, A.C., 2020. Biomass-derived syngas production via gasification
process and its catalytic conversion into fuels by Fischer Tropsch synthesis: a review. Int.
J. Hydrogen Energy 45 (36), 18114e18132.
Shahabuddin, M., Alam, M.T., Krishna, B.B., Bhaskar, T., Perkins, G., 2020. A review on
the production of renewable aviation fuels from the gasification of biomass and residual
wastes. Bioresour. Technol. 312, 123596.
Shin, M., Jeong, H., Park, M.-J., Suh, Y.-W., 2020. Benefits of the SiO2-supported nickel
phosphide catalyst on ethylene oligomerization. Appl. Catal. A Gen. 591, 117376.
Silva Braz, D., Pinto Mariano, A., 2018. Jet fuel production in eucalyptus pulp mills:
economics and carbon footprint of ethanol vs. butanol pathway. Bioresour. Technol.
268, 9e19.
SOLAR-JET, 2015. http://www.solar-jet.eu/. (Accessed 20 October 2020).
Steynberg, A.P., Espinoza, R.L., Jager, B., Vosloo, A.C., 1999. High temperature
FischereTropsch synthesis in commercial practice. Appl. Catal. A Gen. 186, 41e54.
SUN-to-LIQUID, 2016. https://www.sun-to-liquid.eu/. (Accessed 20 October 2020).
Swain, F., 2020. The Other Solar Power: How Scientists Are Making Fuel from Sunlight
and Air. Discover Magazine. https://www.discovermagazine.com/environment/theother-solar-power-how-scientists-are-making-fuel-from-sunlight-and-air. (Accessed
20 October 2020).
Tijmensen, M.J.A., Faaij, A.P.C., Hamelinck, C.N., van Hardeveld, M.R.M., 2002.
Exploration of the possibilities for production of Fischer Tropsch liquids and power via
biomass gasification. Biomass Bioenergy 23 2, 129e152.
Tomasek, S., Lónyi, F., Valyon, J., Hancsók, J., 2020. Fuel purpose hydrocracking of
biomass based Fischer-Tropsch paraffin mixtures on bifunctional catalysts. Energy
Convers. Manag. 213, 112775.
140
Biojet Fuel in Aviation Applications
Tzanetis, K.F., Posada, J.A., Ramirez, A., 2017. Analysis of biomass hydrothermal liquefaction and biocrude-oil upgrading for renewable jet fuel production: the impact of
reaction conditions on production costs and GHG emissions performance. Renew.
Energy 113, 1388e1398.
Udomsirichakorn, J., Basu, P., Salam, P.A., Acharya, B., 2013. Effect of CaO on tar
reforming to hydrogen-enriched gas with in-process CO2 capture in a bubbling fluidized bed biomass steam gasifier. Int. J. Hydrogen Energy 38 34, 14495e14504.
Valmet, 2017. CFB’s evolution from coal-only boiler to biomass-or anything in between.
In: Valmet Technical Paper Series. https://www.valmet.com/globalassets/media/
downloads/white-papers/power-and-recovery/cfb_evolution_coal_to_biomass_whitepaper.pdf.
Vásquez, M.C., Silva, E.E., Castillo, E.F., 2017. Hydrotreatment of vegetable oils: a review
of the technologies and its developments for jet biofuel production. Biomass Bioenergy
105, 197e206.
Vela-García, N., Bolonio, D., Mosquera, A.M., Ortega, M.F., García-Martínez, M.-J.,
Canoira, L., 2020. Techno-economic and life cycle assessment of triisobutane production and its suitability as biojet fuel. Appl. Energy 268, 114897.
Verma, D., Kumar, R., Rana, B.S., Sinha, A.K., 2011. Aviation fuel production from lipids
by a single-step route using hierarchical mesoporous zeolites. Energy Environ. Sci. 4,
1667e1671.
Wang, W.-C., Tao, L., 2016. Bio-jet fuel conversion technologies. Renew. Sustain. Energy
Rev. 53, 801e822.
Wang, W.C., Tao, L., Markham, J., Zhang, Y., Tan, E., Batan, L., et al., 2016. National
Renewable Energy Laboratory, Review of Biojet Fuel Conversion Technologies,
NREL/TP-5100-66291. http://www.nrel.gov/docs/fy16osti/66291.pdf.
Warsita, A., Al-attab, K.A., Zainal, Z.A., 2017. Effect of water addition in a microwave
assisted thermal cracking of biomass tar models. Appl. Therm. Eng. 113, 722e730.
Wei, H., Liu, W., Chen, X., Yang, Q., Li, J., Chen, H., 2019. Renewable bio-jet fuel
production for aviation: a review. Fuel 254, 115599.
Wright, M.E., Harvey, B.G., Quintana, R.L., 2008. Highly efficient zirconium-catalyzed
batch conversion of 1-butene: a new route to jet fuels. Energy Fuels 22, 3299e3302.
Xie, Q., Borges, F.C., Cheng, Y., Wan, Y., Li, Y., Lin, X., et al., 2014. Fast microwaveassisted catalytic gasification of biomass for syngas production and tar removal. Bioresour. Technol. 156, 291e296.
Xu, R., Hou, C., Xia, G., Sun, X., Li, M., Nie, H., Li, D., 2020. Effects of Ag promotion
for Co/Al2O3 catalyst in Fischer-Tropsch synthesis. Catal. Today 342, 111e114.
Yang, J., Xin, Z., He, Q., Corscadden, K., Niu, H., 2019. An overview on performance
characteristics of bio-jet fuels. Fuel 237, 916e936.
Yilmaz, N., Atmanli, A., 2017. Sustainable alternative fuels in aviation. Energy 140,
1378e1386.
Yoo, G., Park, M.S., Yang, J.-W., 2015. Chemical pretreatment of algal biomass. In:
Pretreatment of Biomass, pp. 227e258.
Zhang, X., Zhong, J., Wang, J., Zhang, L., Gao, J., Liu, A., 2009. Catalytic performance
and characterization of Ni-doped HZSM-5 catalysts for selective trimerization of nbutene. Fuel Process. Technol. 90, 863e870.
Zhang, D., Al-Hajri, R., Barri, S.A.I., Chadwick, D., 2010a. One-step dehydration and
isomerisation of n-butanol to iso-butene over zeolite catalysts. Chem. Commun. 46 23,
4088e4090.
Zhang, L., Jin, Q., Shan, L., Liu, Y., Wang, X., Huang, J., 2010b. H3PW12O40 immobilized
on silylated palygorskite and catalytic activity in esterification reactions. Appl. Clay Sci.
47 (3), 229e234.
Biojet fuel production pathways
141
Zhang, Q., Dor, L., Fenigshtein, D., Yang, W., Blasiak, W., 2012. Gasification of municipal
solid waste in the Plasma Gasification Melting process. Appl. Energy 90, 106e112.
Zhang, C., Hui, X., Lin, Y., Sung, C.-J., 2016. Recent development in studies of alternative
jet fuel combustion: progress, challenges, and opportunities. Renew. Sustain. Energy
Rev. 54, 120e138.
Zhang, J., Tang, R., Shen, Z., Liang, S., Zhong, H., 2020. Catalytic Oligomerization of
ethylene over nano-sized HZSM-5. J. Energy Inst. https://doi.org/10.1016/
j.joei.2020.09.002.
Zhao, X., Sun, X., Cui, X., Liu, D., 2019. Production of biojet fuels from biomass. In:
Sustainable Bioenergy, pp. 127e165.
Zhou, N., Zhou, J., Dai, L., Guo, F., Wang, Y., Li, H., et al., 2020. Syngas production from
biomass pyrolysis in a continuous microwave assisted pyrolysis system. Bioresour.
Technol. 314, 123756.
Zschocke, A., Scheuermann, S., Ortner, J., 2012. High Biofuel Blends in Aviation (HBBA),
ENER/C2/2012/420-1 Final Report. https://ec.europa.eu/energy/sites/ener/files/
documents/final_report_for_publication.pdf.
This page intentionally left blank
CHAPTER 3
Property specifications of
alternative jet fuels
3.1 Introduction
Aviation jet fuel is a complex mixture of hydrocarbons designed to provide
high performance for application in aircraft. The composition of the fuel
varies depending on crude source and manufacturing process. Jet fuel is
typically extracted from conventional crude oil in the middle distillate
fractions, accounting for approximately 10% of the crude oil. The conventional hydrocarbon sources used for jet fuel production include crude
oil, natural gas, liquid condensates, heavy oil, shale oil, and oil sands.
Conventional jet fuel consists of a large variety of different species
belonging primarily to four chemical families: long-chained unbranched
alkanes (n-alkanes), long-chained, branched alkanes (iso-alkanes), cyclic
alkanes (naphthenes), and aromatics. Table 3.1 shows the typical hydrocarbon components found in jet fuel and their corresponding characteristics. Jet fuel mainly consists of w70%e85% paraffins (iso, normal and
cyclic), of which the dominant straight-chain paraffin ensures high heat
release and clean burning features. The cyclic isoparaffin has the characteristic of low temperature fluidity, which is essential to keep the jet fuel
fluidic while operating at high altitude. Similarly, cycloparaffin contributes
to the cold flow property owing to the nature of low freezing point, but the
heat release rate is lower than n-paraffins due to lower hydrogen-to-carbon
ratio. The aromatics content is approximately w25%, with the main
function of providing high heat release. There are some impurities in the jet
fuel, such as less than 1% olefins and some trace amount of S, N, and O.
The olefins are reactive and can lead to gum formation; hence, they are
treated as contaminants. In addition, a small quantity of additives is usually
added to improve the fuel properties. The jet fuel typically contains a
carbon number distribution between 8 and 16 that falls in the gasoline
(C4eC12) and diesel fuel (C8eC23) ranges. The supply of commercial jet
Biojet Fuel in Aviation Applications
ISBN 978-0-12-822854-8
https://doi.org/10.1016/B978-0-12-822854-8.00007-X
© 2021 Elsevier Inc.
All rights reserved.
143
144
Biojet Fuel in Aviation Applications
Table 3.1 Characteristics of the jet fuel components (Brooks et al., 2016).
Composition
Class
Structure
Characteristics
(%wt)
n-Paraffins
Isoparaffins
Cycloparaffins
(naphthenes)
Aromatics
Olefins
• Clean burning
with high heat
release per unit
weight
• Low fluid
temperature
fluidity
• Lower hydrogento-carbon ratio
• Lower heat release
per unit weight
• Higher density
and lower freeze
point than
n-paraffins
• Prone to form
soot during
combustion
• High energy
density
• Good combustion
characteristics
• Reactive and leads
to gum formation
70%e85%
<25%
<1%
fuel needs to fulfill the stringent requirements as specified by the international agreed standards. The most widely used jet fuel nowadays is
kerosene-based Jet A-1. This chapter discusses the property specifications
that are adopted to regulate the quality of jet fuel derived from fossil and
nonpetroleum sources. Furthermore, the additives that are present in jet
fuel are discussed, followed by the relevant standards related to alternative
jet fuel approval process.
3.2 Jet fuel specifications
The quality of the Jet A-1 fuel complies with the requirements of the
International ASTM D1655 (ASTM D1655-19a, 2019) and UK Specification DEF STAN 91-091 (MOD, 2019), which are provided by the
American Society for Testing Materials (ASTM) and the United Kingdom
Property specifications of alternative jet fuels
145
Ministry of Defence, respectively. The ASTM D1655 specifies the
standard specification requirements of conventional aviation turbine fuels
from refinery to the aircraft. It also defines the minimum property
requirements for Jet A and Jet A-1 aviation turbine fuels and lists
acceptable additives for use in civil operated engines and aircrafts. Some
of the main property requirements of jet fuel complying with ASTM
D1655 are presented in Table 3.2. The Jet A-1 standard as specified in
DEF STAN 91-091 is similar to the ASTM D1655, with DEF STAN 91091 being more stringent in a small number of areas. Jet A is the standard
jet fuel used widely in the United States for domestic flights and international flights originating from the United States. The Jet A is produced
in accordance with the specifications of ASTM D1655 but with slight
differences as compared with Jet A-1. The former is specified to a minimum flash point of 38 C and a freezing point of no greater than 40 C.
The Jet A-1 typically contains more additives than Jet A, such as static
dissipator, icing inhibitor, and antioxidant. The Jet A-1 has a lower
maximum freezing point of 47 C, hence allowing the Jet A-1 to be
used for long-haul international flight, especially on polar routes during
the winter.
Due to the complex jet fuel supply arrangement and the need of storing
different jet fuel products, the major jet fuel suppliers have jointly produced
a document known as the Aviation Fuel Quality Requirements for Jointly
Operated Systems (AFQRJOS-Issue 31) Check List to standardize the
quality of the supplied Jet A-1 fuel (Joint Inspection Group, 2019). The
Check List embodies the most stringent requirements of the DEF STAN
91-091 and ASTM D1655 for Jet A-1. The Check List is recognized by
major aviation fuel suppliers including Agip, BP, Chevron Texaco, Equinor, ExxonMobil, Kuwait Petroleum, Shell, and Total. Under this
approach, the supplied Jet A-1 is ensured to meet the specifications as
required by the different standards, while allowing operators to utilize the
same fuel distribution system and storage facility to handle the jet fuel. Jet
fuel that meets the requirements of this Check List is referred as “Jet A-1 to
Check List.” The approach simplifies the jet fuel supply arrangement and
reduces the cost of handling and storage.
JP fuels refer to jet fuel generally used for military aircraft with specific
additives added to achieve the performance required by military aircraft
engines. JP-8 jet fuel has similar properties as Jet A-1 fuel, but with the
addition of more additives such as static dissipater additive, corrosion
inhibitor/lubricity improver, antioxidant, metal deactivator, and fuel system
146
Biojet Fuel in Aviation Applications
Table 3.2 Some Jet A/Jet A-1 requirements specified by ASTM D1655.
Jet A/Jet A-1
Test method
Fuel property
(ASTM D1655)
(ASTM)
Composition
Acidity, total mg KOH/g
Total aromatics, vol %
Sulfur, total mass%
0.10
26.5
0.3
D3242
D6379
D1266, D2622,
D4294, D5453
Volatility
Distillation range, C
10% recovery temperature
50% recovery temperature
90% recovery temperature
Final boiling point, C
Distillation residue, vol %
Distillation loss, vol %
Flash point, C
Density, 15 C kg/m3
D86, D2887
205
Report
Report
300
1.5
1.5
38
775e840
D56, D3828
D1298, D4052
e40 (Jet A),
e47 (Jet A-1)
8
D5972, D7153,
D7154, D2386
D445, D7042
Net heat of combustion, MJ/kg
42.8
(1) Smoke point, mm or
(2) Smoke point, mm, and
Napthalenes, % vol
Copper strip corrosion, 2 h, 100 C
25
18
3
No. 1
D4529, D3338,
D4809
D1322
D1322
D1840
D130
25
D3241
7
D381, D3948
Mobility
Freezing point, C
Kinematic viscosity at
e20 C, mm2/s
Combustion
Thermal stability
Thermal stability filter pressure
drop at 260 C, mm Hg
Cleanliness
Existent gum, mg/100 mL
Additive
Antioxidant additive, mg/L
Icing inhibitor additive range, vol%
24
0.07e0.15
Property specifications of alternative jet fuels
147
icing inhibitor (Brooks et al., 2016). JP-8 is produced in accordance with
the requirements of the US Military Specification MIL-T-83188D, British
military jet fuel specification DEF STAN 91-87 AVTUR/FSII, and
NATO Code F-34 (CSG Network, 2013). It is also the dominant military
jet fuel grade for the NATO-associated air fleet. JP-8 is specified to a
maximum freezing point of 47 C and a flash point of 38 C. Jet B fuel is a
distillate covering the naphtha and kerosene fractions, with a typical
mixture of w30% kerosene and w70% gasoline. The ASTM D6615
specification defines the Jet B wide-cut aviation turbine fuel intended for
use in aircraft that are certified to use such fuel (ASTM D6615-15a, 2019).
Jet B is a relatively wide boiling range volatile distillate produced from
blends of refined hydrocarbons derived from crude petroleum, natural
gasoline, heavy oil, shale oil, or blends with synthetic hydrocarbons. The
fuel contains a larger concentration of light hydrocarbons and naphthas than
Jet A and hence weighs lesser. According to the standard specifications of
ASTM D6615, the density range of Jet B is 751e802 kg/m3 at 15 C. The
vapor pressure of the fuel at 37.8 C is around 14e21 kPa, which is more
volatile than Jet A and is more dangerous to handle. The total aromatics
content in Jet B is limited to a maximum of 25 vol%, while the net heat of
combustion needs to maintain above 42.8 MJ/kg; hence, the fuel combustion performance is similar to that of Jet A. Jet B fuel has the advantage
for operations in very low temperature environments due to its enhanced
cold weather capabilities, with a maximum freezing point of 50 C.
The main jet fuel grade used in Russia and the Commonwealth of
Independent States is TS-1. It is a type of jet fuel specified by the Russia’s
latest industry standard edition (GOST 10227-2013), which is considered
on par with the western Jet A-1 grade fuel. The TS-1 jet fuel is slightly
more volatile with a minimum flash point of 28 C and has a lower freeze
point (<e50 C) when compared with Jet A-1. The Russian standards
emphasize on lower freezing point due to the colder climate in which the
aircrafts are expected to operate. In Russia, the typical grade designation for
jet fuel in Russia is T-1 to T-8, TS-1, or RT, governed by the State
Standard (GOST) Number or a Technical Condition (TU) number. The
TS-1 grade jet fuel also meets the specification specified by the Customs
Union Technical Regulations (TR CU 013/2011, 2011). The RT-type
fuel refers to the superior grade jet fuel that is not widely used.
The Chinese jet fuel specification covers five types of jet fuel. Previously, each grade was numbered with a prefix RP, but now has been
renamed as No. 1 Jet Fuel, No. 2 Jet Fuel, and so on. Presently, the most
148
Biojet Fuel in Aviation Applications
widely used civilian jet fuel grade in China is No. 3 Jet Fuel (previously
RP-3), of which the specification is comparable with the Jet A-1, in
compliance with the local standard GB 6537 (GB 6537-2018). Table 3.3
shows the property specifications of No. 3 Jet Fuel as specified in the GB
6537-2018 standard. The No. 3 Jet Fuel contains low flash point (28 C
minimum), similar to TS-1 jet fuel. The No. 1 and No. 2 Jet Fuels have
lower freezing point of 60 and 50 C, respectively. The No. 4 Jet Fuel
refers to wide-cut-type fuel similar to Jet B, whereas the No. 5 Jet Fuel is a
high flash point kerosene.
3.3 Jet fuel from nonconventional sources
3.3.1 SASOL coal-based synthetic fuel
There are two synthetic jet fuels derived from nonconventional petroleum
source that have been recognized as meeting the requirements of ASTM
D1655 and DEF STAN 91-091. The approved coal-based synthetic fuels
are (1) Sasol semisynthetic jet fuel and (2) Sasol fully synthetic jet fuel. The
original Sasol approvals granted are detailed in the Annex B3 of DEF
STAN 91-091 issue 11 (MOD, 2019). The Sasol semisynthetic Aviation
Turbine Fuel manufactured from the FischereTropsch (FT) process is
defined as synthetic isoparaffinic kerosene (IPK). The synthetic component
is derived from the FT process that has been polymerized and subsequently
hydrogenated. The maximum allowable aromatic content for the Sasol
semisynthetic jet fuels is 26.5%, while the minimum limit is 8.4% when
measured using method IP436. The blending of IPK with conventional
kerosene has been approved up to 50%. Sasol heavy naphtha #1 (HN1)
produced from the FT process by fractionation and hydrogenation can be
combined with IPK. Table 3.4 shows the specification requirements for
HN1/IPK Blend as specified in DEF STAN 91-091 (Annex B3). The final
synthetic blend shall contain at least 25% IPK by volume.
The Sasol fully synthetic kerosene is defined as the fuel blended from
light distillate, heavy naphtha, and isoparaffinic kerosene streams. The batch
certificate for the fuel shall state the fuel contains 100% synthetic components. The maximum flash point permitted is 50 C. The boiling point
distribution shall have a minimum slope defined by T50eT10 10 C and
T90eT10 40 C. The aromatic content requirement for Sasol fully
synthetic fuel is similar to those as specified for Sasol semisynthetic jet fuels,
Property specifications of alternative jet fuels
149
Table 3.3 Comparison of the No. 3 Jet Fuel requirements specified by GB 65372018.
No. 3 Jet Fuel
Jet A-1
Test method
Fuel property
(GB 6537)
(ASTM D1655)
for GB 6537
Composition
Acidity, total mg
KOH/g
Total aromatics, vol %
0.015
0.10
20.0
26.5
Olefin, vol%
Sulfur, total mass%
5.0
0.2
e
0.3
205
205
232
Report
Report
Report
GB/T
12574
GB/T
11132
GB/T 1132
GB/T 380,
GB/T
11140
Volatility
Distillation range, C
10% recovery
temperature
50% recovery
temperature
90% recovery
temperature
Final boiling point, C
Distillation residue, %
Amount of loss, %
(v/v)
Flash point, C
300
1.5
1.5
300
1.5
1.5
38
38
Density, 20 C kg/m3
775e830
775e840
e47
1.25
e47
e
8
8
42.8
42.8
25
25 or 18
and napthalenes
3 %vol
GB/T 6536
GB/T
21789, GB/
T 261
GB/T 1884
Mobility
Freezing point, C
Viscosity at
20 C, mm2/s
20 C, mm2/s
GB/T 2430
GB/T
30515
Combustion
Net heat of
combustion, MJ/kg
Smoke point, mm
GB/T 2429,
GB/T 384
GB/T 382
Continued
150
Biojet Fuel in Aviation Applications
Table 3.3 Comparison of the No. 3 Jet Fuel requirements specified by GB 65372018.dcont’d
Fuel property
No. 3 Jet Fuel
(GB 6537)
Jet A-1
(ASTM D1655)
Test method
for GB 6537
3.3 kPa
25 mm Hg
GB/T 9169
7
7
GB/T 8019
Thermal stability
Filter pressure drop
(260 C, 2.5 h)
Cleanliness
Existent gum, mg/
100 mL
i.e., minimum 8.4% and maximum 26.5%. Due to the near identical
composition of Sasol synthetic fuels with conventional jet fuel, the performance in aircraft jet engine is expected to be similar.
3.3.2 Synthetic jet fuel from biofeedstocks
The call for a sustainable and clean alternative jet fuel over the past decade
has led to considerable progress in the development of bio-based jet fuels.
Bio-based aviation fuels obtained from sources other than fossil-based fuels,
such as lignocellolusic biomass, hydrogenated fats, oils and waste fats have
low carbon intensity. They could play an important role in mitigating the
environment impact of the aviation industry. In order for the bio-based
fuels to be used in aircraft jet engine, the fuels must undergo extensive
tests to meet the stringent jet fuel requirements. The new fuel should have
“drop-in” characteristic where no adaptation to the fuel distribution
network or equipment engine fuel system is required. The fuel should
ideally be used “as is” and can be blended with conventional jet fuel. At
present, major international jet fuel standard has recognized the development of bio-based aviation fuel. The ASTM Specification D7566 (ASTM
D7566-19b, 2019) was developed to provide quality control for fuels of
novel compositions that include synthesized hydrocarbons from new
sources. The ASTM D7566 was first issued in 2009 to provide supply
control of synthesized paraffinic kerosene (SPK) derived from coal/natural
gas through the FT process. The standard was revised in 2011 with approval
of an annex covering SPK synthesized from esters and fatty acid in
Property specifications of alternative jet fuels
151
Table 3.4 Batch requirements for HN1/IPK Blend as specified in DEF STAN 91-091
(Annex B3).
Property
Limits
Method
Thermal stability
Jet fuel thermal
oxidation test
Test temperature, C
Tube rating visual
Pressure
differential, mm Hg
IP 323/ASTM D3241
325
Less than 3. No Peacock
(P) or Abnormal deposit
(A)
Use visual
Tube rater within
120 min of completion
of the test
Maximum 25
Fluidity
Freezing point, C
-40.0
IP 16/ASTM D2386
42.80
ASTM D3338
ASTM D4809
7.0
7.4
IP156/ASTM D1319
IP436/ASTM D6379
Combustion
Specific energy,
MJ/kg
Composition
Aromatics, % v/v
Or total aromatics, %
v/v
biofeedstock. Since then, four other types of bio-derived synthetic jet fuels
have been certified for blending with conventional jet fuel under ASTM
D7566, which are assigned by a specific annex as shown in Table 3.5.
Recently, the Commercial Aviation Alternative Fuels Initiative (CAAFI)
under International Civil Aviation Organization (ICAO) has announced
the newly approved alternative jet fuel production pathway from algaederived lipid, which is set to be included in the revised ASTM D7566
under Annex 7. The new pathway, termed as HH-SPK or HC-HEFA,
describes the hydroprocessed hydrocarbons synthesized from the oils (fatty
acids) yielded from the Botryococcus braunii algae. It is expected that 10%
blending level is permitted for this synthetic jet fuel with conventional fossil
jet fuel (CAAFI, 2020b). The DEF STAN 91-091 standard does not list out
the approved synthetic jet fuel components from nonconventional sources.
Annex B of DEF STAN 91-091 states the approval of synthetic jet fuel
based on the specifications listed in ASTM D7566. This is to avoid
152
Biojet Fuel in Aviation Applications
Table 3.5 Approved bio-based jet fuel production pathway under ASTM D7566.
Blending
limits
Approval
(vol %)
Annex Bio-based blendstock production pathway
date
A1
A4
FischereTropsch synthetic paraffinic
kerosene
SPK from hydroprocessed fatty acid esters
and free fatty acid
Hydroprocessing of fermented
sugarsdsynthetic isoparaffinic kerosene
Synthesized kerosene with aromatics
A5
A6
Alcohol-to-jet synthetic paraffinic kerosene
Catalytic hydrothermolysis jet
*A7
Hydroprocessed fatty acid from algae
A2
A3
Sep 2009
50
Jul 2011
50
Jun 2014
10
Nov
2015
Apr 2016
Dec
2019
May
2020
50
30
50
10
*, Recently approved, yet to be included in the ASTM D7566.
duplication and ensure harmonization between the two standards. At
present, each of the synthetic jet fuel as approved in the ASTM D7566 is
considered as a “batch” product that needs to be blended with ASTM
D1655-approved jet fuel. Each synthetic jet fuel needs to fulfill the batch
specification requirements as stated in the annexes of ASTM D7566,
depending on the production pathway.
There are other emerging production pathways that are in the process
of certification, such as the catalytic conversion of sugars by aqueous phase
reforming, pyrolysis (hydrotreated depolymerized cellulosic jet), catalytic
upgrading of alcohol intermediates, catalytic upgrading of ethanol, or
direct use of a wider cut of HEFA with renewable diesel (US Dept of
Energy, 2017). To be included in the ASTM standard as a certified
alternative jet fuel, the fuel candidate has to undergo a rigorous certification process, which includes several test programs and reviews by
manufacturers and flight authorities, which will be discussed in Section
3.7. At present, there are ongoing research focusing on developing
potential feedstocks and technologies to produce jet fuel compatible
blends, for example, using waste sludge or CO2-rich waste gas stream
from the industry to capitalize on the low-cost feedstocks, and catalytically
converting different alcohol intermediates such as isobutanol or higher
Property specifications of alternative jet fuels
153
alcohol into jet fuel. Other new production methods such as using catalytic pyrolysis, syngas fermentation, and hydrotreating biooil derived from
fast pyrolysis are currently being explored. Although still at early phase,
these methods could eventually lead to fuel certification and commercial
production as the technologies become mature.
3.4 Properties of synthetic jet fuel
3.4.1 FischereTropsch hydroprocessed synthesized
paraffinic kerosene
Fischer-Tropsh synthesized paraffinic kerosene (FT-SPK) is the first
approved synthetic jet fuel production pathway from bioresource under
ASTM D7566 in 2009. FT-SPK refers to synthetic paraffinic kerosene
produced from biomass via the FT process. In this process, biomass is first
gasified to produce synthesis gas, which is used to produce paraffins and
olefins via the use of iron or cobalt catalysts. Subsequently, the hydrocarbon
products undergo hydrotreating, hydrocracking, or hydroisomerization to
be converted into jet fuel quality. Conventional refinery processes such as
polymerization, isomerization, and fractionation may be included as part of
the process. The jet fuel produced is expected to have similar properties as
conventional jet fuel as defined by ASTM D1655. Table 3.6 shows the
comparison of some of the batch property requirements for FT-SPK with
Jet A-1. The FT-SPK can be produced with a freezing point of 40 or
47 C to meet the requirement of Jet A or Jet A-1, depending on the
agreement between purchaser and producer. Other properties such as the
flash point are expected to be similar as conventional jet fuel. The density of
the FT-SPK is required to be in the range of 730e770 kg/m3, which is
slightly lower compared with the specifications of jet fuel (ASTM D1655).
The lower density of the fuel is due to the limited aromatics content, which
is capped at maximum 0.5 wt% mass.
3.4.2 Synthesized kerosene with aromatics derived by
alkylation of light aromatics from nonpetroleum
sources
The synthezised paraffinic kerosene plus aromatics (FT-SPK/A) approved
in 2015 is an extension to the FT-SPK. It is produced using the same FT
process, but the aromatics content is increased by alkylation of nonpetroleum derived light aromatics such as benzene with FT-derived olefins.
The property specifications for FT-SPK/A are similar to FT-SPK, except
154
Biojet Fuel in Aviation Applications
Table 3.6 Comparison of some of the batch property requirements for FT-SPK and
FT-SPK/A (ASTM D7566) with Jet A-1 (ASTM D1655).
Jet A-1
(ASTM
ASTM
D1655)
FT-SPK
FT-SPK/A
Test Methods
Property
Flash point, C
Density at 15 C,
kg/m3
Freezing point, C
38
775e830
38
730e770
38
755e800
D56, D3828
D1298, D4052
e47
e40
e40
D5972, D7153,
D7154, D2386
Thermal stability (2.5 h at control temperature)
Temperature, C
Filter pressure
drop, mm Hg
Hydrocarbon
composition
Cycloparaffin, mass %
Aromatics, mass %
Aromatics, vol %
260
25
325
25
325
25
D3241
e
e
8.4e26.5
15
0.5
e
15
20
e
D2425
D2425
D6379
for the aromatics content and density. Even though the aromatics content
in FT-SPK/A is increased to a maximum of 20 wt%, it still needs to be
blended with conventional jet fuel to meet the required aromatics content
as specified in ASTM D1655. It is expected that the batch property
FT-SPK/A meets the requirements as stated in ASTM D7566, which is
similar to Jet A-1 as shown in Table 3.6. The blending limit for FT-SPK
and FT-SPK/A with jet fuel is 50% vol. The properties of SPK and jet fuel
blend need to fulfill the extended requirements as specified in the ASTM
D7566, as shown in Table 3.7.
3.4.3 Synthesized paraffinic kerosene from hydroprocessed
esters and fatty acids
The SPK derived from hydroprocessed esters and fatty acids (HEFA)
is another synthetic jet fuel that gained approval in July 2011 and included in ASTM D7566 under Annex 2. Lipid-based feedstocks, such as
vegetable oils, used cooking oils, and tallow which contain mono-, di-, and
triglycerides, free fatty acids, and fatty acid esters, have to undergo deoxygenation and hydrogenation processes to produce SPK. Annex 2 in ASTM
D7566 specifies that carbon and hydrogen content needs to be at least
Property specifications of alternative jet fuels
155
Table 3.7 Extended requirements applied to each batch of fuel containing a
synthetic blending component.
ASTM
Property
Limits
Test Methods
Composition
Aromatics, vol% or
Aromatics, vol %
8
8.4
D1319
D6379
Volatility
Distillation
T50eT10, C
T90eT10, C
15
40
D2887, D86, D7344, D7345
Lubricity
Wear scar diameter, mm
0.85
D5001
12
D7945
Fluidity
Viscosity 40 C, mm2/s
99.5% by mass. It is well known that oxygen content in the fuel will
reduce the heating value and affects the thermal stability of the fuel. The
HEFA batch requirement specifies the limit of the cycloparaffin which is
capped to maximum 15 wt%, while the aromatics content allowed is
0.5 wt%, as shown in Table 3.8. HEFA on its own does not fulfill the final
jet fuel requirements of ASTM D1655 and hence will need to be blended
with conventional jet fuel. The maximum blending limit allowed with jet
fuel is 50% by volume. The synthetic jet blend containing HEFA-SPK is
required to fulfill the additional jet fuel requirements related to fluidity
under the ASTM D7566 standard, that is, the maximum viscosity allowed
at 40 C is 12 mm2/s.
3.4.4 Alcohol-to-jet synthetic paraffinic kerosene
The alcohol-to-jet synthetic paraffinic kerosene (ATJ-SPK) is defined as a
type of synthetic jet fuel derived from ethanol and isobutanol. The SPK
produced from alcohol undergoes the processes of dehydration, oligomerization, hydrogenation, and fractionation. The ATJ-SPK is the fifth
synthetic jet fuel approved under ASTM D7566 in 2016, with property
specifications listed in Annex 5 of ASTM D7566. The batch property
156
Biojet Fuel in Aviation Applications
Table 3.8 Comparison of some of the batch property requirements for HEFA-SPK,
ATJ-SPK and CHJ (ASTM D7566) with Jet A-1 (ASTM D1655).
HEFAASTM
Property
ATJ-SPK
SPK
CHJ
Test Methods
Flash point, C
Density at 15 C,
kg/m3
Freezing point, C
38
730e770
38
730e772
38
775e840
D56, D3828
D1298, D4052
e40
e40
e40
D5972, D7153,
D7154, D2386
Thermal stability (2.5 h at control temperature)
Temperature, C
Filter pressure
drop, mm Hg
Hydrocarbon
composition
Cycloparaffin,
mass %
Aromatics, mass %
325
25
325
25
325
25
D3241
15
15
Report
D2425
0.5
0.5
8.4e21.2
D2425
requirements are almost identical to FT-SPK and HEFA-SPK. Some of the
batch property requirements for ATJ are shown in Table 3.8. For the
hydrocarbon composition requirements, the cycloparaffins and aromatics
are limited to a maximum of 15% and 0.5% by mass, respectively. Curiously, in spite of the similarity of batch fuel properties, the maximum
blending limit with conventional jet fuel is only 30% by volume. It is
envisaged that ATJ-SPK production will permit the use of all C2 to C5
alcohols as feedstocks, subject to the approval of the committee when data
is available.
3.4.5 Synthesized kerosene from hydrothermal conversion
of fatty acid esters and fatty acids
The sixth approved synthetic jet fuel production pathway is the catalytic
hydrothermolysis jet (CHJ) as specified in Annex A6 under ASTM D7566.
The process consists of hydrothermal conversion and hydrotreating
operations that convert fatty acid esters and fatty acids such as waste fats,
oils, and greases into jet fuel. The CHJ is a synthetic blending component
that is comprised essentially of normal paraffin, cycloparaffin, isoparaffin,
and aromatic compounds. Unlike HEFA-SPK which lacks aromatics
compounds, it is required that a batch of CHJ fuel produced must contain a
Property specifications of alternative jet fuels
157
minimum of 8.4 wt% and a maximum of 21.2 wt% of aromatics, as shown
in Table 3.8. The CHJ fuel needs to fulfill the density requirement of
775e840 kg/m3, which is slightly denser as compared with HEFA-SPK
due to the presence of aromatics. The blending limit for CHJ with conventional jet fuel is 50 vol%.
3.4.6 Synthesized isoparaffins from hydroprocessed
fermented sugars
The permissible blending limits for synthetic fuels of FT-SPK, HEFA-SPK,
SPK/A, and CHJ are 50 vol% with conventional jet fuel. The synthesized
iso-paraffin (SIP) was approved by ASTM in 2014, but the blending limit is
capped to 10% by volume. The synthetic blend component is composed of
isoparaffins derived from farnesene (C15H24) produced from fermentable
sugars. Farnesene is a type of branched alkene of C15 hydrocarbon
molecule produced from fermentation process, where the biochemical
conversion process utilizes modified yeast to convert sugar into hydrocarbon. The farnesene then undergoes the process of hydroprocessing where
the farnesene is reacted with hydrogen, followed by the fractionation
operation to separate gas and liquid to produce isoparaffin known as farnesane (C15H32). Table 3.9 shows some of the batch requirements for SIP
as specified under ASTM D7566. The production pathway requires the
produced hydrocarbons to have a minimum saturation level of 98 %wt, of
which 97 %wt is farnesane. The permissible oxygenated compound of
hexahydrofarnesol (C15H32O) in the blend is capped to 1.5 %wt. The
olefins and aromatic compounds are limited to within 300 mgBr2/100 g
and 0.5 %wt, respectively. It is noted that the minimum flash point
Table 3.9 Some batch requirements for SIP (ASTM D7566).
Property
SIP
Test method
Flash point, C
Density at 15 C, kg/m3
Freezing point, C
100
765e780
e60
D3828
D1298, D4052
D5972, D7153, D7154, D2386
D7974
D7974
D7974
D2710
D2425
Hydrocarbon composition
Saturated hydrocarbons, mass %
Farnesane, mass %
Hexahydrofarnesol, mass %
Olefins, mgBr2/100 g
Aromatics, mass %
98
97
1.5
300
0.5
158
Biojet Fuel in Aviation Applications
requirement is 100 C, which is significantly higher than those of other
synthetic jet fuels. The density requirement of the fuel is 765e780 kg/m3,
while the freezing point is extended to a maximum of 60 C.
3.4.7 Coprocessing of biocrude
Another biojet fuel production pathway known as coprocessing has been
approved. The coprocessing of mono-, di-, and triglycerides, free fatty
acids, and fatty acid esters producing cohydroprocessed hydrocarbon synthetic kerosene is recognized as being acceptable for jet fuel manufacture.
This means that vegetable oils, waste oils, and fats can be coprocessed along
with conventional crude oil feedstocks in existing refining complexes, albeit
in a small percentage of 5% by volume. There is no separate annex in
ASTM D7566 for coprocessing, but rather, it is included in the amendment
made to ASTM D1655. The DEF STAN 91-091 lists the coprocessing
specifications in Annex B4. Similar to the ASTM counterpart, the
permitted bio-feedstock used in coprocessing refinery unit is 5% by volume. The processes involved in coprocessing the lipid feedstocks are hydrocracking or hydrotreating and fractionation.
3.5 Performance characteristics of aviation turbine fuels
To ensure a safe and economic operation of aviation turbine, the fuel used
needs to be essentially free from contamination and meets the specifications
as stated in the ASTM D1655 standard. The following section discusses the
key characteristics of jet fuel and their effects on the performance of aircraft
engine systems.
3.5.1 Thermal stability
Thermal stability refers to the measurement of the amount of deposit
formed in the engine fuel system by heating the fuel. Any jet fuel used in
aviation engine needs to be thermally stable against oxidation and polymerization at a wide operating temperature range during flight. The
oxidative thermal stability of jet fuel is determined via the D3241/IP 323
test method, in which a simple test run with tube temperature controlled at
260 C is conducted to ensure the minimum requirement is met. Two or
more runs at different tube temperatures can be conducted to obtain the
breakpoint, which is the highest tube temperature at which the fuel still
passes the specification requirements of tube deposit color and pressure
Property specifications of alternative jet fuels
159
differential. The thermal stability test for the synthetic fuels is specified at
the control temperature of 325 C, except for SIP from Annex 3 of ASTM
D7566 where the control temperature is specified at 355 C to ensure the
blend components are free of reactive species.
3.5.2 Combustion
The liquid jet fuel supplied to the combustion chamber is first atomized
into tiny droplets before burning continuously with the stream of hot air.
The fuel and air are mixed and burned at near stoichiometric conditions in
the primary zone, where the heat is released. The burnt gases are diluted
with the excess air, supplied via the dilution hole in the secondary zone of
combustion chamber to lower the gas temperature to a safe level acceptable
by the turbine. The effectiveness of the fuel combustion process and the
level of soot emissions are strongly related to the fuel composition. Paraffins
are straight-chain hydrocarbon, which offer the cleanest combustion
characteristics. Olefins have good combustion characteristics, but their poor
gum stability limits their use in aircraft turbine fuel to about 1% or less.
Aromatics tend to produce soot that leads to undesirable thermal radiation
in spite of their higher energy content. Within the aromatics group,
naphthalene (a bicyclic aromatic) produces more soot than monocyclic
aromatics and hence is the least desirable hydrocarbon class for aircraft fuel.
In spite of the drawback, the study has shown that a minimal level of aromatics is needed to be present in the fuel to prevent the shrinkage of aged
elastomer seals and fuel leakage (Chen and Liu, 2013). Therefore, the
ASTM D7566 standard requires that the final blend for synthetic jet fuel
with Jet A contains a minimum of 8 vol% of aromatics. To test the sooting
tendency of the fuel, the smoke point test method (ASTM D1322) requires
that a minimum smoke point of 25 mm to be met under the aviation jet
fuel specification (ASTM D1655). Alternatively, a lower smoke point level
of 18 mm is allowed provided that the total naphthalene is capped to a
maximum of 3 vol%. Jet fuel with low smoke point tends to produce
smoky flame, indicating high aromatic content.
3.5.3 Fuel metering and aircraft range
The density of jet fuel is an important fluid property needed for practical
purposes, such as metering flow, and to determine the massevolume
relationship for commercial flights. A fuel with low density indicates low
160
Biojet Fuel in Aviation Applications
heating value per unit volume and would indicate reduced flight range for a
given volume of fuel. The minimum requirement for density of jet fuel is
775 kg/m3, as specified in ASTM D1655. The chemical energy in the jet
fuel is converted into heat and mechanical energy. The aircraft flight range
depends on the amount of fuel available and the energy obtainable from
useful work. Therefore, an accurate determination of the net heat of
combustion is vital so that the availability of a certain predetermined
minimum amount of energy as heat is known for the flight operation. In
the jet fuel specification, a minimum net heat of combustion requirement is
specified to ensure the proper operation of the aircraft engine. The heat of
combustion of jet fuel can be determined via the use of an aniline point and
density relationship, as specified in the Test Method D4529. An alternative
Test Method D3338, which is based on the correlations of aromatics
content, gravity, volatility, and sulfur content, can be used to determine the
net heat of combustion, thus avoiding the need to obtain the aniline points.
In cases of dispute, the direct measurement method of Test Method D4809
or IP 12 can be used as the referee method.
3.5.4 Fuel atomization
Effective fuel atomization is important to maintain a consistent nozzle spray
pattern and to ensure the breakup of spray into fine droplets for vaporization. The fuel physical properties are strongly related to the fuel volatility. For jet fuel, the 10% distilled temperature is limited to <205 C to
ensure easy ignition. The final boiling point limit excludes heavier fractions
that would be difficult to vaporize. Due to the extreme operating temperature range during flight, the fuel pumpability needs to be maintained to
ensure a consistent nozzle spray pattern for continuous combustion. As
such, the viscosity of aviation turbine fuel at 20 C is specified to exceed
5.5 mm2/s for Jet A (40 C freeze point) or 4.5 mm2/s for Jet A-1 (47 C
freeze point). Another critical property that the jet fuel must possess is low
freezing point. The temperature of fuel in an aircraft tank decreases as the
outside temperature decreases with increasing altitude. A sufficiently low
freezing point for the jet fuel is needed to ensure the fuel can flow through
the filter screen to engine at extreme low temperature. The manual sampling method to determine freezing point, Test Method D2386/IP 16, is
designated as the referee method.
Property specifications of alternative jet fuels
161
3.5.5 Compatibility with elastomer and the metals in the
fuel system and turbine
The jet fuel must not consist of elements that are reactive to any parts in the
engine to ensure the durability and safe operation of the components, i.e.,
the elastomer and metals in the fuel system and turbine. The ASTM D1655
standard has specified the limits of some reactive components. The
mercaptan gases are known to be reactive with certain elastomers. A limitation in the mercaptan content is specified to prevent such reactions and
to minimize the unpleasant mercaptan odor. Another concern with the
elastomer is the shrinkage of aged elastomer seals. A minimum level of
aromatics is needed to keep the elastomer seals swollen to prevent fuel
leakage (Chen and Liu, 2013). Synthetic fuels that contain little or no aromatics in batch form do not fulfill such requirement; hence, the final blend
with conventional jet fuel needs to fulfill the minimum aromatics content
requirement as stated in ASTM D1655. A maximum limit is imposed to
prevent the formation of soot, which is considered as harmful pollutants.
Any deposition along the fuel delivery line must be avoided due to the
inevitable contact between jet fuel and metal parts. The jet fuel has to
undergo copper strip test to ensure the fuel does not contain any chemical
species that is corrosive to the copper or copper-based alloys in various parts
of the fuel system. Any impurities in the jet fuel, residual mineral acid, or
caustic left as a result of the refining process need to be removed to avoid
deposition in the fuel line. An acidity test is conducted to measure the
presence of organic acids based on the Test Method D3242. The total
acidity must be less than 0.1 mg KOH/g, as specified in the ASTM D1655
jet fuel standard. The sulfur content in the fuel needs to be kept minimum
as the sulfur oxides formed during combustion are corrosive to the turbine
metal parts. The maximum level of sulfur permitted in the ASTM D1655
jet fuel standard is 0.3% by mass.
3.5.6 Fuel storage stability and handling
The standardization of the jet fuel quality is integral to provide a guideline
in handling and storage stability of jet fuel and to avoid contamination. The
joint agreement developed by major jet fuel suppliers, i.e., Aviation Fuel
Quality Requirements for Jointly Operated Systems (AFQRJOS) ( Joint
Inspection Group, 2019) allows the operators to use the same fuel distribution system and storage facility to handle jet fuel. Some of the properties
162
Biojet Fuel in Aviation Applications
requirements as per specified in the ASTM D1655 standard are related to the
handling and storage of fuel. The flash point is an indication of the maximum
temperature for fuel handling and storage without fire risk. For Jet A-1 fuel,
the minimum flash point required is 38 C, which is the lowest temperature
at which vapors above a volatile combustible substance will ignite in air
when expose to flame. Thus, the surrounding temperature needs to be
below 38 C to ensure safe handling of the fuel. Static electricity caused by
the imbalance of charges can pose a significant fire and explosion risk during
the handling of aviation fuel. This problem can be solved by adding electrical
conductivity additives to dissipate the charges rapidly. The presence of
nonvolatile residue (gum) after evaporation is indicative of jet fuel degradation or contamination by higher boiling oils or particulate matter, which
could be attributed to long-term storage or poor handling practices. Constant
monitoring of the gum level is needed to avoid problems with aircraft fuel
system. The jet fuel specification requires the gum content to not exceed
7 mg/100 mL, measured based on the Test Method D381.
3.5.7 Fuel cleanliness and contamination
The cleanliness of aviation turbine fuel is important to ensure optimum
performance. Contamination of jet fuel will result in the failure of filtration
components in the engine system and put the flight operation at risk. Fuel
cleanliness requires the relative absence of free water, solid particulates, and
dirt. Undissolved (free) water in aviation fuel can lead to the growth of
microorganism, corrosion of aircraft fuel tank, and icing to the filters in the
fuel system. The presence of solid contaminants can potentially result in
problems such as wear and plugging of filters in the engine system. The
visual inspection of Test Method D4176 provides a qualitative method to
determine suspended free water and contaminants in distillate fuel. The
Procedure 1 provides a rapid pass/fail method for contamination, whereas
the Procedure 2 provides a gross numerical rating of haze appearance.
Quantitative testing to determine the presence of undissolved or free water
in aviation turbine fuel can be performed via Test Method D3240 without
exposing the sample fuel to the atmosphere. The test reading usually ranges
from 1 to 60 ppm of free water, but dissolved waters in the fuel are undetectable. The control of free water in the fuel is exercised in ground
fueling equipment by use of filter coalescers and water separators.
The presence of solid particulate contaminants such as dirt and rust may
be detected by filtration of the jet fuel through membrane filters as
Property specifications of alternative jet fuels
163
prescribed by conditions under Test Method D2276. The test provides a
gravimetric measurement of the particulate matter present in the sample of
aviation turbine fuel by line sampling. The same standard also provides a
qualitative assessment of particulate contaminants in fuel by filtering the fuel
through a membrane. The color rating appearing on the membrane is
compared against a standard color scale to indicate the level of contamination at a particular location. Apart from water and solid contaminants,
microbial contamination in jet fuel is of concern as it can lead to fuel
deterioration, leading to a variety of problems including corrosion, odor,
filter plugging, and decreased fuel stability. The uncontrolled growth of
microbes can even lead to the corrosion of aviation fuel storage and distribution network, thereby affecting the operation of the aircraft. There are
two biocide additives approved by the airframe and engine manufacturers,
namely Biobor JF and KATHON FP1.5, which are used in accordance
with local regulations and agreement between the fuel supplier and end
users. The ASTM D6469 lists the symptoms, occurrence, and consequences
of chronic microbial contamination caused by microbes, as well as the guide
on detection and control of microbes in fuels and fuel systems (ASTM
D6469-20, 2020).
To prevent fuel contamination, the presence of surface-active substance
known as “surfactants” has to be minimized. The presence of surfactants in
the fuel affects the ability of filter separator to separate free water from the
fuel, as the surfactants can disperse dirt and water, making them easier to
pass through filters. Surfactants that are adsorbed on the surface of filters can
interfere with the water droplet or particles and in some cases the solid level
can be increased due to the lifting of rusts from piping surface. Test Method
D3948 is used to detect the presence of surfactants in aviation turbine fuel.
It is a common practice in the industry to conduct the test at the point of
production and point of usage, in order to detect carryover traces of refinery treating residues and surface-active substances picked up by the fuel
during transportation. A high rating indicates the fuel is free of surfactants,
whereas a low rating indicates the presence of surfactants.
3.5.8 Fuel lubricity
Jet fuel plays an important side role of lubricating the sliding parts of engine
fuel system components and fuel control units. However, jet fuel is also
known to exhibit poor lubricity at high temperature and high load conditions. Lubricity improver additives can be added to improve the lubricity
164
Biojet Fuel in Aviation Applications
of fuel, but such additives could have adverse effects on fuel filtration
systems and on fuel water separation characteristics due to the polar nature
of the additives. Another concern is the depletion of the additives due to
adsorption on tank and pipe surfaces. The Test Method D5001 is used for
assessing fuel lubricity by evaluating the wear scar generated in the ball-oncylinder lubricity evaluator (BOCLE). Low lubricity fuel will give a larger
wear scar diameter. Synthesized hydrocarbons in batch form typically
consist of pure hydrocarbons with low lubricity. The final blend of synthetic jet fuel with conventional jet fuel should meet the lubricity
requirement of wear scar diameter up to 0.85 mm as specified for aviation
turbine fuel under ASTM D1655.
3.6 Additives for alternative jet fuels
Any jet fuel produced must satisfy the stringent standards governing the
physicochemical properties to ensure the fuel is fit for purpose (FFP) and
does not impact the engine operation. The function of jet fuel is not only to
provide the energy source for the engine, but also it plays an important role
as hydraulic fluid and coolant for aircraft system. Therefore, the physical
properties such as stability, lubricity, fluidity, volatility, noncorrosivity, and
cleanliness are important to ensure the proper functioning of the system. In
this context, fuel additives are used to maintain the desired properties in the
base fuel to provide specific performance properties. Only additives approved
by the aviation industry (including the aircraft certifying authority) are
permitted to be added to the fuel. The approval process for additives is
outlined in ASTM D4054 (ASTM D4054-20b, 2014). Some of the key
considerations for jet fuel additives include being effective at below 1% (v/v),
chemically stable, not having negative effects on the engine and fuel system
components, having the required solubility in fuel, minimum environmental
impact and cost-effective. For cases where the use of optional additives is
desired, the supplier and purchaser must come to agreement on the types of
additive to be used.
The additives approved in ASTM D1655 for fuel performance
enhancing and their concentration limits are shown in Table 3.10. The
typical additives used to ensure the optimum performance of jet fuel are
antioxidant, metal deactivator and fuel system icing inhibitor. Oxidation of
jet fuel is known to occur due to the oxidative degradation of hydrocarbonbased fuels during storage. The oxygen molecule reacts with hydrocarbon
to form peroxides and hydroperoxides. Antioxidants are additives that are
Property specifications of alternative jet fuels
165
Table 3.10 Fuel performance enhancing additives for aviation turbine fuels
(ASTM D1655).
Additive
Category
Approved concentration
2,6-Ditertiary-butyl phenol
2,6-Ditertiary-butyl-4-methyl
phenol
2,4-Dimethyl-6-tertiary-butylphenol
75% minimum, 2,6-Ditertiarybutyl phenol plus 25% maximum
mixed tertiary and tritertiary butylphenols
55% minimum 2,4-Dimethyl-6tertiary-butyl phenol plus 15%
minimum 2,6-Ditertiary-butyl-4methyl phenol, remainder as
monomethyl and dimethyl tertiarybutyl phenols
72% minimum 2,4-Dimethyl-6tertiary-butyl phenol plus 28%
maximum monomethyl and
dimethyl-tertiary-butyl-phenols
N,N’-Disalicylidene-1,2-propane
diamine
Antioxidant
Antioxidant
24.0 mg/L
24.0 mg/L
Antioxidant
24.0 mg/L
Antioxidant
24.0 mg/L
Antioxidant
24.0 mg/L
Antioxidant
24.0 mg/L
Metal
deactivator
Diethylene glycol monomethyl
ether
Fuel system
icing
inhibitor
2.0 mg/L (initial
doping)
5.7 mg/L (cumulative
concentration after field
redoping)
0.07%e0.15% by vol
added to improve fuel storage stability and inhibit the formation of peroxides, soluble gums or insoluble particulates produced from oxidation
reaction. For synthetic fuels such as FT fuel and HEFA that are heavily
hydroprocessed (including hydrotreatment, hydrofine, and hydrocracking),
the lubricity of the fuel is typically low as the natural oxidants are removed.
To prevent oxidation to the fuel, antioxidants in trace amount can
be added. The list of approved phenol-based antioxidants is shown in
Table 3.10, limited to maximum 24 mg/L in jet fuel.
Metal ions in jet fuel are considered as contaminants. Transition metals
such as iron, nickel, manganese, cobalt, and copper are commonly found in
the storage tanks or barrels, which can diffuse to the jet fuel in the distribution and transporting channels. The problem of metal contamination
166
Biojet Fuel in Aviation Applications
applies to both conventional and alternative jet fuels. The metal ions
promote catalysis of oxidation reaction that subsequently lead to poor fuel
thermal stability. Furthermore, these metals can react with organic substrates present in fuel such as naphthenates and stearates to form fuel-soluble
organometallic complexes that are homogeneous oxidation catalysts. As
such, metal deactivators are additives added as chelating agents to form
stable water-soluble complexes with ions to prevent fuel degradation. At
present, the approved metal deactivator additive for aviation fuel is N,N’Disalicylidene-1,2-propane diamine. The concentration of the active
material during initial doping of the fuel should not exceed 2.0 mg/L,
while the cumulative addition of the additive is limited to a maximum of
5.7 mg/L when redoping the fuel.
The additives that are approved under ASTM D1655 with the aim to
improve fuel handling and maintenance are shown in Table 3.11. They are
mainly comprising the categories of lubricity improver, static dissipator,
biocids, and electrical conductivity improver. Due to the need to store and
distribute jet fuel, the exposure to the storage tank and pipelines subject the
fuel to the risk of contamination. Corrosion inhibitors are added to the fuel
to prevent contamination resulting from rust and corrosion caused by water
and oxygen. It was later discovered that the corrosion inhibitor additives
have the side benefit of improving fuel lubricity. Jet fuel needs to maintain a
Table 3.11 Additives approved for fuel handling and maintenance under ASTM
D1655.
Approved
Additives
Category
concentration
AvGuard SDA
Stadis 450
Tracer A (LDTA-A)
HiTEC 580
Innospec DCI-4A
Nalco 5403
Biobor JF
Kathon FP1.5
Electrical conductivity improver
Electrical conductivity improver
Leak detection
Corrosion inhibitor/lubricity
improver
Corrosion inhibitor/lubricity
improver
Corrosion inhibitor/lubricity
improver
Biocide
Biocide
*, Refer to manufacturer’s Aircraft Maintenance Manuals.
3e5 mg/L
3e5 mg/L
1 mg/kg
23 mg/L
23 mg/L
23 mg/L
AMM*
AMM*
Property specifications of alternative jet fuels
167
certain level of lubricity as some components in the fuel system, such as
pumps, rely on the fuel to lubricate moving parts. The current approved
additives that function as corrosion inhibitor and lubricity improver are
HiTEC 580, Innospec DCI-4A, and Nalco 5403 with a maximum
permitted limit of 23 mg/L. An overdose in the treat rate could adversely
impact the fuel filtration system and fuel water separation characteristics,
owing to their polar nature and adsorption onto the metal surface. The
military Qualified Products List (QPL-25017) states that a minimum
effective concentration (MEC) must be maintained for the use of such
additives, where HiTEC 580, Octel DCI-4A, and Nalco 5403 are required
to have an MEC of 15, 9, and 12 g/m3, respectively. Hydroprocessing of
fuels removes trace components that provide the fuel with natural lubricating properties; hence, lubricity improvers need to be added. It has been
pointed out that lubricity improvers are typically long-chain alkylphenol
ethoxylates, carboxylic acids, or esters, such as linoleic acid derivatives (i.e.,
dilinoleic acid) (Black and Hardy, 1989).
Some fuel-handling procedures such as high-speed pumping and
microfiltration can create charge separation at interfaces, which is capable of
producing high voltage gradients inside fuel storage areas and increasing the
risk of fire and explosion. Thus, static dissipator additive is widely used in jet
fuel to eliminate the risk. Static dissipators are added to improve the
naturally poor conductivity of jet fuel. Jet fuel has very low natural electrical
conductivity of less than 5 pS/m, but the requirement in ASTM D1655 for
the electric conductivity in jet fuel is 50e600 pS/m. As of now, Stadis 450
is the only static dissipator additive (SDA) approved for aviation turbine jet
fuel. The concentration on first doping of the fuel is 3.0 mg/L, with a
maximum concentration of 5.0 mg/L permitted.
Jet fuel produced in the refinery is sterilized due to high temperature,
yet microorganisms such as bacteria and fungi can enter the fuel as soon as
the fuel is in contact with air and water. Aviation jet fuel contains hydrocarbons, nitrogen, sulfur, phosphorous, oxygenated organic compounds,
organometallic species, and other metal salts, which provides the essential
nutrients for microbes to grow. The presence of microbes will accelerate
fuel degradation and clog fuel filters. Biocides are additives that can be
added to prevent the growth of microorganisms. Another effective method
of retarding microbial activities is by controlling the water content in the
fuel, since the lack of water will prohibit the growth of microorganisms.
168
Biojet Fuel in Aviation Applications
3.7 Jet fuel certification process
Development of new alternative jet fuel must be certified to ensure the
compatibility of the synthetic fuel with conventional jet fuel for safety
reasons. The ASTM International Aviation Fuel Subcommittee (subcommittee J) was established to facilitate the development and deployment of
alternative jet fuels. Two standards related to the specification criteria of
alternative jet fuels have been issued by the subcommittee, which are
ASTM D7566dStandard Specification for Aviation Turbine Fuel Containing
Synthesized Hydrocarbons, and ASTM D4054dStandard Practice for Qualification and Approval of New Aviation Turbine Fuels and Fuel Additives. An
alternative aviation fuel meeting the property and composition standards of
ASTM D7566 can be considered as a “drop-in” replacement for the D1655
jet fuel, which can be integrated into the existing infrastructure designed
to support the conventional jet fuel. The ASTM D4054 was developed to
provide the guidance regarding testing and property targets necessary to
evaluate a candidate alternative jet fuel.
Fig. 3.1 shows the process flow for testing fuel and additive as per
ASTM D4054 (ASTM D4054-20b, 2014). The test program comprises
specification properties (Tier 1), FFP properties (Tier 2), component or rig
test (Tier 3), and engine test (Tier 4). Within each tier, there are several
elements to be considered, as detailed in Table 3.12. Fuel producers will
need to produce the Phase 1 research report based on the outcome of Tier
1 and 2 test programs. Next, the original engine manufacturer (OEM) will
Figure 3.1 Overview of the testing protocols with four-tier programs for new aviation
turbine fuel and additives as specified under ASTM D4054, Standard Practice for
Evaluation of New Aviation Turbine Fuels and Fuel Additives. The Fast Track Annex for
qualification and approval of new aviation fuel is highlighted in the box.
Property specifications of alternative jet fuels
169
Table 3.12 Detail tests involved in each subtest program.
Tier 1: Fuel specification properties
• Relating to engine safety, performance, and durability
Tier 2: Fit for purpose properties
• Chemistry
- Hydrocarbon chemistry (carbon number, type and distribution)
- Trace materials
• Bulk physical and performance properties
- boiling point distribution, vapor pressure, thermal stability breakpoint
- Lubricity, response to lubricity improver, viscosity
- Specific heat, thermal conductivity
- Density, surface tension, bulk modulus
- Water solubility, air solubility (O2/N2)
• Electrical properties
- Dielectric constant, electrical conductivity and response to static dissipator
• Ground handling/safety
- Effect on clay filtration, filtration (coalescers and monitors)
- Storage stability (peroxides, potential gum), toxicity
- Flammability limits, autoignition temperature, hot surface ignition
temperature
• Compatibility
- With other approved additives and fuels
- With engine and airframe seals, coatings and metallics
Tier 3: Component tests
• Turbine hot section
- Oxidative or corrosive attack on turbine blade metallurgy and coating
• Fuel system
- APU cold filter, fuel control, fuel pump, fuel nozzle
• Combustor rig tests
- Cold ignition (sea level to 10,000 feet)
- Lean blowout
- Aerial restarting
- Turbine inlet-temperature distribution
- Combustor efficiency
- Flow path carboning/plating
- Emissions
- Auxiliary power unit altitude starting
Tier 4: Engine endurance test
• Sea level endurance/durability
• Sea level performance and operability
• Altitude performance and operability
• Emissions
170
Biojet Fuel in Aviation Applications
review the report and propose the requirements for Tier 3 and Tier 4 test
programs. It is unlikely that all tests are to be performed. Hence, the OEM
will provide the guidance on the type of tests to be run. Based on the test
results, the fuel producer will revise the Phase 2 research report. The test
results from the test program are then submitted to the OEM and flight
authority for considerations. At this stage, additional information or tests
may be requested. Even after a new fuel or additive passes the approval
stage, a control test known as Controlled Service Introduction (CSI) is
required to evaluate its long-term impact on the maintenance of the engine.
The fuel or additive that passes the assessment will be included in the OEM
specification or service bulletin. For the candidate fuel/additive to be
included in the ASTM standards, the changes proposed by the OEM will
need to be reviewed through the ASTM balloting process, which is a
rigorous process that may require several iterations. Up until the time of
writing, seven synthetic jet fuels have been approved in ASTM D7566 as
shown in Table 3.5, while other production pathways are under evaluation
to be included in the ASTM D7566 standard (DOE, 2020).
The ASTM D4054 was updated with a Fast Track Annex in early 2020
to expedite the approval of new jet fuel by reducing the set of property
and compositional tests for evaluating new alternative jet fuels. The Fast
Track Annex is limited to sustainable aviation fuel with conventional
hydrocarbon fuel. Candidate fuel that meets the compositional and performance requirements of conventional jet fuel is allowed to blend up to
10% with Jet A or Jet A-1. The distillation point distribution of the blend
must be similar to the slope of typical jet fuel, while the cycloparaffin and
aromatic compositions must be less than 30 and 20 wt%, respectively. The
Fast Track Annex for approving new aviation fuel with a limit of 10%
blend is shown in Fig. 3.1.
Among the many local projects and initiatives to develop sustainable
aviation fuel (ICAO, 2020), CAAFI is a coalition of stakeholders that seek to
explore and facilitate the development and deployment of drop-in sustainable aviation fuel (CAAFI, 2020a). They have proposed a tool, known as the
fuel readiness level (FRL) (CAAFI, 2016), which can be used to classify and
track the progress on research, certification, and demonstration activities at
difference milestones, as shown in Table 3.13. The tool provides a nine-level
roadmap for fuel technology and certification. The FRL level of 1e5
indicates the progress of jet fuel development is at R&D stage. FRL 1 and
FRL 2 focus on the fundamentals of the feedstock and process. At the proofof-concept stage (FRL 3), the manufacturer needs to provide 500 mL of
Property specifications of alternative jet fuels
171
Table 3.13 Fuel readiness level (FRL) developed by CAAFI.
FRL Description
Milestone
Technology Development Phase
1
3
Basic principles
observed and reported
Technology concept
formulated
Proof of concept
4
Preliminary technical
5
Process validation
2
• Feedstock/process principles identified
• Feedstock/complete process identified
• Lab-scale fuel sample production feedstock
• Energy balance analysis executed for initial
environmental assessment
• Basic fuel properties validated
• Fuel quantity: 0.13 US gallons (500 mL)
• System performance and integration studies
entry criteria/specification properties
evaluated (MSDS/D1655/MIL 83133)
• Fuel quantity: 10 US gallons (37.85 L)
• Sequential scaling from laboratory to pilot
plant
• Fuel quantity: 80e225,000 US gallons
(302.8e851,718 L)
Qualification Phase
6
Full-scale technical
evaluation
7
Fuel approval
• Fitness, fuel properties, rig testing, and
engine testing using ASTM-approved
protocols
• Fuel quantity: 80e225,000 US gallons
(302.8e851,718 L)
• Fuel class/type listed in international fuel
standards
Deployment phase
8
Commercialization
validated
9
Production capability
established
• Business model validated for production
airline/military purchase
agreementsdfacility-specific GHG
assessment conducted to internationally
accepted independent methodology
• Full-scale plant operational
lab-scale fuel samples for analysis, preliminary environmental assessment, and
validation of basic fuel characteristics. Production of the fuel at pilot plant
scale is said to reach FRL 5, making it ready to proceed to the certification
stages (FRL 6e7). Under FRL 6, the manufacturer must be able to provide
172
Biojet Fuel in Aviation Applications
80 to 225,000 US gallons of fuel for a full technical evaluation involving rig
and engine tests. The alternative fuel that has been listed in the international
standards is deemed to reach FRL7. Fuel production at Business and
Economics levels are FRL 8e9, of which the fuel is said to reach FRL9 once
full production capacity has been established. Preliminary assessments of
environmental impacts are nested under FRL 3 and FRL 8.
Apart from the FRL, the feedstock readiness level (FSRL) tool is
developed to track the development and availability of feedstock needed for
the production of alternative jet fuels, which covers a broader aspect of
production, market, program support, and regulatory compliance. These
tools are designed to be used in conjunction with the FRL tool to assess the
ready states of the fuel conversion and processing technology, fuel testing,
and certification. The guides for commercialization of alternative jet fuel
and environmental progression are also provided.
3.8 Summary
Commercial aviation jet fuel has to fulfill the stringent requirements as
specified by the internationally agreed standard to ensure the safety of flight
operation. Newly developed synthetic jet fuel needs to undergo stringent
certification process to ensure the physicochemical properties of the fuel are
met. Current practice employs the blending concept without modifying the
engine; hence the developed synthetic jet fuel must be fit for purpose and
does not impact the engine operation. At present, the ASTM D7566 is the
widely referred standard for nonconventional jet fuel derived from new
sources. The standard currently lists the property specifications of the
approved alternative jet fuels in the Annexes of ASTM D7566, along with
the limits allowed for blending with conventional jet fuel. In spite of the
variation of batch properties of alternative jet fuel due to the use of different
feedstocks and processing pathways, the jet fuel standard requires the final
properties of the blended fuel to meet the requirements of conventional jet
fuel. Fuel additives can be added to enhance the fuel performance of the
blended fuel, such as to increase the oxidation resistance, inhibit the tendency for ice to form in the fuel system, deactivate the metal content in the
fuel, and improve the electrical conductivity, among others. The process of
certification for alternative jet fuel is discussed, based on the guidelines as
specified in the ASTM D4054 standard. The test programs that an alternative jet fuel candidate needs to pass include the specification properties,
FFP properties, component or rig test and engine test. The test reports are
Property specifications of alternative jet fuels
173
reviewed by the original equipment manufacturer and flight authority,
before proceeding to the ASTM balloting process to be included in the
ASTM standard. The Fast Track Annex was recently introduced in ASTM
D4054 to expedite the qualification and approval of new alternative jet fuel
with 10% blend limit. At present, there are seven approved alternative jet
fuels from nonconventional sources as listed in the ASTM D7566 standard.
More emerging synthetic jet fuels derived from different feedstocks and
production pathways are expected to be certified in the future.
References
ASTM D1655-19a, 2019. ASTM International, Standard Specification for Aviation Turbine
Fuels.
ASTM D4054-20b, 2020. ASTM International, Standard Practice for Qualification and
Approval of New Aviation Turbine Fuels and Fuel Additives.
ASTM D6469-20, 2020. ASTM International, Standard Guide for Microbial Contamination in Fuels and Fuel Systems.
ASTM D6615-15a, 2019. Standard Specification for Jet B Wide-Cut Aviation Turbine
Fuel. ASTM International.
ASTM D7566-19b, 2019. ASTM International, Standard Specification for Aviation
Turbine Fuel Containing Synthesized Hydrocarbons.
Black, B.H., Hardy, D.R., 1989. The Lubricity Properties of Jet Fuel as a Function of
Composition. Part 2. Application of Analysis Method.
Brooks, K.P., Snowden-Swan, L.J., Jones, S.B., Butcher, M.G., Lee, G.-S.J.,
Anderson, D.M., et al., 2016. Biofuels for Aviation: Chapter 6: Low-Carbon Aviation
Fuel through the Alcohol to Jet Pathway. Elsevier.
CAAFI, 2016. Fuel Readiness Level. CAAFI. http://caafi.org/information/pdf/FRL_
CAAFI_Jan_2010_V16.pdf.
CAAFI, 2020a. Commercial Aviation Alternative Fuels Initiative (CAAFI). http://www.
caafi.org/.
CAAFI, 2020b. Two New Alternative Jet Fuel Production Pathways Approved. www.caafi.
org/news/NewsItem.aspx?id¼10502.
Chen, K., Liu, H., 2013. The impacts of aromatic contents in aviation jet fuel on the
volume swell of the aircraft fuel tank sealants. SAE Int. J. Aerospace 6, 350e354
(2013-01-9001).
CSG Network, 2013. Aviation Turbine Fuel ( Jet Fuel). CSG Network. www.csgnetwork.
com/jetfuel.html.
DOE, 2020. Sustainable Aviation Fuel e Review of Technical Pathways. U.S. Department
of Energy.
GB 6537-2018, 2018. No.3 Jet Fuel, State Administration for Industry and Commerce,
People’s Republic of China.
ICAO, 2020. Committee on Aviation Environmental Protection (CAEP). https://www.
icao.int/ENVIRONMENTAL-PROTECTION/Pages/CAEP.aspx.
Joint Inspection Group, 2019. Bulletin 125, Aviation Fuel Quality Requirements for Jointly
Operated Systems (AFQRJOS): Issue 31, November 2019, p. 1e9. Joint Inspection
Group. Accessed at. www.jigonline.com.
174
Biojet Fuel in Aviation Applications
MOD, 2019. Ministry of Defense, Defense Standard 91-091 Issue 11, Turbine Fuel,
Kerosene Type, Jet A-1; Nato Code: F-35; Joint Service Designation. AVTUR.
TR CU 013/2011, 2011. Technical Regulations of the Customs Union, TR CU 013/
2011, on Requirements to Automobile and Aviation Gasoline, Diesel and Marine Fuel,
Jet Fuel and Heating Oil. Global Expert Group. http://globexpert.ru/en/.
US Dept of Energy, 2017. Alternative Aviation Fuels: Overview of Challenges, Opportunities, and Next Steps Alternative Aviation Fuels: Overview of Challenges, Opportunities,
and Next Steps.
CHAPTER 4
Combustion performance of
biojet fuels
4.1 Introduction
The growing demand for air traveling inevitably leads to more emissions as
greater amount of jet fuels will be consumed. In the aviation turbine
engine, the burning of conventional jet fuels typically produces carbon
monoxide (CO), carbon dioxide (CO2), water vapor, nitrogen oxides
(NOX), sulfur oxides (SOX), unburned hydrocarbons (UHCs), and particulate matters (PMs), similar to those of ground transportations. These
emissions are considered to be local air quality pollutants and greenhouse
gases when emitted near the ground or at high altitude. Even though the
aviation industry contributes to only 2%e3% of the global total greenhouse
gases and 3% of the total NOx, it is projected that the emissions will be
significant in the near future, given the rapid growth of the industry (EASA,
2019). To achieve the goal negative carbon growth set by the International
Civil Aviation Organization (ICAO), alternative jet fuels derived from
nonconventional sources have been identified as one of the main strategies
to achieve a sustainable and green aviation (ICAO, 2018). At present, only
certified biojet fuel are allowed to be used in civilian aircraft. The ASTM
D7566 standard established in 2009 specifies the property specifications of
alternative jet fuels produced from nonconventional sources, placing
emphasis on the “drop-in” characteristic so that the fuel is interchangeable
with conventional jet fuel; hence, no modification to the engine or fuel
distribution system is required. The certification process for alternative jet
fuel, as described in the ASTM D4054 standard, requires a series of rigorous
test programs and detailed reviews for fuel property certification, combustion, and flight tests. The whole process involves the participation of
various stakeholders, including the fuel producer, original equipment
manufacturers (OEMs), flight authority, and experts from the aviation
community, in order for the developed alternative jet fuel to be accepted by
Biojet Fuel in Aviation Applications
ISBN 978-0-12-822854-8
https://doi.org/10.1016/B978-0-12-822854-8.00002-0
© 2021 Elsevier Inc.
All rights reserved.
175
176
Biojet Fuel in Aviation Applications
ASTM standard and subsequently included as one of the annexes in
ASTM D7566. This chapter focuses on the combustion performance and
characteristics of biojet fuel, specifically those related to the test program
as per required by ASTM D4054 for jet fuel certification. Some of the
fundamental combustion characteristics of alternative jet fuels conducted
in research institution that are not related to jet fuel certification are also
discussed, to provide a more comprehensive understanding on the combustion chemistry and properties of alternative jet fuel. It is to note
that emphasis of the fuels is placed on the certified alternative jet fuel
approved by ASTM D7566, while other noncertified alternative jet fuels
such as liquid hydrogen, syngas, and biogas are beyond the scope of this
chapter.
4.2 Principles of aircraft emissions
Aircraft operations in the vicinity of airports have raised concerns about
local air quality and health-related impacts. The emissions produced from
the gas turbine combustor largely depend on the fuel/air ratio, flame
temperature, power setting, and jet fuel composition. In general, the main
products emitted from the jet engines are CO2 and H2O, along with
emissions in lesser quantity such as CO, NOx, SOx, UHCs, and PMs.
Fig. 4.1 shows the estimated emissions produced from an aircraft with 150
passengers in an hour of flight. For every kilogram of jet kerosene burned,
approximately 3.15 kg of carbon dioxide and 11.1 g of NOx are produced.
Other pollutants such as soot, CO, SO2, and UHC are less than 0.1 g per
kg of jet fuel burned. The formation of the emissions product is closely
1 kg jet fuel
267.7 kg cold air
314.8 kg air
48.2 kg hot air
3.15 kg CO2
1.22 kg H2O
11.1 g NOx
0.93 g SO2
0.74 g CO
0.15 g UHC
0.04 g Soot
Figure 4.1 Amount of emissions produced from aviation turbine engine from the
combustion of 1 kg of kerosene (Braun-Unkhoff et al., 2017).
Combustion performance of biojet fuels
177
related to the way the fuel is combusted. The generation of UHC, NOx,
and CO is strongly dependent on the combustion parameters in the
combustor, such as temperature, pressure, turbulence level, and residence
time. The generation of CO2 and H2O is proportional to the fuel
combusted. Higher H/C ratio in the jet fuel will produce more H2O.
Some studies have shown that the water vapor produced will impact the
formation of contrail, which can have greater impact as a heat trapping
agent than the CO2. Sulfur dioxide emission is proportional to the amount
of sulfur in the fuel but is considered to be low due to the regulated amount
as specified in the jet fuel standard.
The complete combustion of any hydrocarbon fuel will produce stable
end products of carbon dioxide and water vapor. Such ideal fuel/air
mixture with sufficient oxygen for complete combustion is known as a
stoichiometric mixture. Thus, a stoichiometric fuel/air ratio in gas turbine
term refers to the portion of fuel and air required for complete combustion.
However, the use of stoichiometric mixture for operation is rarely adopted
in actual gas turbine engine, as the flame temperature for a stoichiometric
mixture is too high and will result in high portion of NOx emissions. Very
often, gas turbine operates based on lean combustion principle, in which
more air is available than stoichiometric quantity. Such fuel-lean burning
condition results in lower flame temperature and thus lowers NOx.
Furthermore, lean burning operation provides the conditions to oxidize
unburned hydrocarbons as well as CO. For the aviation gas turbine, air
entering the engine is partly used for combustion, while the excess air is
used to cool the combustion products to within the turbine material’s
metallurgical limits. Additional air is introduced into the exhaust to tailor
the temperature profile and to reduce the overall temperature of the
exhaust gases entering the turbine.
Apart from the combustion aspect, the emissions are also strongly
dependent on the flight operation, i.e., power settings, as shown in Fig. 4.2.
The power settings used during the LTO cycle (landing-take off ), taxi,
approach, climb, and takeoff correspond to 7%, 30%, 85%, and 100%
thrust, respectively. During aircraft idling and taxiing, the CO and UHC
emissions tend to be high. Increasing the thrust during takeoff and climbing
will elevate the flame temperature, thereby increasing the formation of
NOx and particulate matter, while the increase in combustion efficiency
will reduce the emissions of CO and UHC. The emissions of NOx, CO,
UHC, and smoke produced during LTO cycle from aircraft engines are
regulated by the ICAO.
Biojet Fuel in Aviation Applications
CO
Soot
NOx
UHC
0
Take off power, %
Smoke number
Emissions, g/kg fuel
178
100
Figure 4.2 Emissions characteristics in an aircraft engine as a function of engine
thrust.
4.2.1 Mechanism of aircraft pollutant formations
The oxides of nitrogen produced from the combustion in aviation turbine
engine can lead to the formation of PMs, smog, and acid rain, which are
detrimental to the environment and human health. The main routes
responsible for the formation of NO have been identified as thermal NO,
prompt NO, fuel NO, and nitrous oxide route. Thermal NO refers to the
formation of NO driven by the high flame temperature, via the main
reactions as prescribed in the Zel’dovich mechanism (Zel’dovich, 1946):
O þ N2 5 NO þ N, N þ O2 5 NO þ O, and N þ OH 5 NO þ H.
Thermal NO is found to be strongly dependent on the combustion
temperature. At temperature around or above 1800K, which is the typical
temperature for lean and stoichiometric burning in gas turbine combustor,
thermal NO formation can be dominant. The prompt NO mechanism is
typically referred as the Fenimore mechanism (Fenimore, 1971), which
describes the formation of NO involving a rapid reaction of hydrocarbon
radicals such as CH, CH2, C2 or C2H with nitrogen that leads to the
formation of hydrocyanic acid (HCN) and a nitrogen atom. The single
nitrogen atom then reacts with the NO and O2 to form NO, via the
reactions in the Zel’dovich thermal NO mechanism. Bachmaier et al.
(1973) showed that maximum prompt NO is attained at the fuel-rich
region.
The fuel NO refers to the formation of NO due to the inherent
presence of nitrogen compound in the fuel. The fuel NO production
depends weakly on the local temperature as the reactions involved require
low activation energy. The nitrogen compounds in the fuel provide the
precursors necessary for the formation of fuel NO, such as HN3, NH2, NH,
Combustion performance of biojet fuels
179
HCN, and CN. It has been shown that the aromatic rings in fuel could
contribute to the formation of fuel NO during the combustion process
(Levy, 1982).
The formation of NO via the nitrous oxide mechanism requires the
formation of N2O species via the reaction N2 þ O þ M 5 N2O þ M,
after which the N2O produced reacts with O atoms to form NO, via the
reaction N2O þ O 5 NO þ NO. These reactions become dominant
under fuel-lean condition, during which the temperature is around 1500K.
Such low temperature prohibits the formation of thermal NO and prompt
NO due to the lack of CH radicals needed for the initiation of reaction
(Kuo, 2005). In aviation turbine engine, thermal NO is expected to be the
main NO formation route. The increase of the engine thrust results in the
increase of flame temperature; therefore, the NOx emission is increased.
The formation of CO is inversely related to the NO in gas turbine
combustor. The CO emissions are seen to peak at low aircraft engine thrust,
while the NO emissions are correspondingly low. The formation of CO at
high temperature oxidation involves the formation of HCO via the
oxidation of methyl radical, where CH3 þ O2 5 HCO þ H2O. The
HCO produced contributes to the formation of CO via the reactions
HCO þ OH 5 CO þ H2O and HCO þ M 5 H þ CO þ M. The
emissions of CO become less important during cruising as the emissions of
CO become insignificant under high engine thrust.
4.2.2 Emission index calculation
Aircraft emissions are typically expressed in the form of emission index,
which is a method of normalizing the emission species mass flow with fuel
mass flow to have a better comparability of the emissions for different power
settings and fuel mass flow. The unit for emission index is in g/kg fuel (Riebl
et al., 2017). For flight emission measurement, the emission index of
nitrogen oxides (NOx) can be calculated from the emission index of carbon
dioxide (CO2) and the carbon content in the fuel. Eq. (4.1) shows an
example of an emission index calculated from measurement results.
EIn ¼
En
Mn
EICO2
ECO2 MCO2
(4.1)
Aircraft engine certification values are in mass of pollutant per unit mass
of thrust, which is the pure emission index referenced on the ICAO thrust
levels. The ICAO published the boundary values in Annex 16 Volume II
180
Biojet Fuel in Aviation Applications
which limits the emissions of NOx, CO, and hydrocarbons. The limits
imposed are dependent on the maximum rated thrust of the engine at
sea-level static conditions without water injection, engine age, and engine
pressure ratio (ICAO, 2017). The ICAO Aircraft Engine Emissions Databank contains information on exhaust emissions of production aircraft
engines, submitted by engine manufacturers to the certification authority as
part of the certification process.
4.3 Component or rig test for alternative jet fuel
The approval of alternative jet fuel for application in aircraft requires the
alternative jet fuel to meet the fuel specification properties. The fuel needs
to be proven as “fit for purpose” by meeting the specified properties and
characteristics including the bulk thermodynamic and transport properties,
compatibility with existing fuels, additives, handling and storage, and
combustion process. The ASTM D4054 defines the approval process for
alternative fuels as commercial fuels (refer to Chapter 3 for detailed
description). Within the ASTM D4054, the test program of Tier 3, also
known as “Component or Rig Test,” requires the fuel candidate to
undergo a series of tests in different combustor components to assess the fuel
performance and the impact on other components. The combustor rig
testing is defined in terms of the desired engine performance to be evaluated, such as cold ignition at sea level and high altitude (10,000 ft), flame
extinction, lean blowout (LBO), aerial restarting after a flame-out event,
turbine inlet temperature distribution, combustor efficiency, emissions, and
auxiliary power unit altitude starting. The ASTM D4054 does not specify
any standardized criteria for the test rigs and testing conditions, but rather,
the list of tests provided is merely a guide. Not all tests will be conducted,
but the OEM will provide advice on the tests to be conducted, depending
on the availability of testing components and facilities as appropriate.
The combustion performance of alternative jet fuels that are considered
most important from the standpoint of fuel effects on safety and operability
includes cold ignition limits, LBO limits, and altitude relight limits. These
combustion performance issues have been termed as figures of merit
(FOMs).The secondary FOMs include temperature field (including flame
structure, pattern and profile factors, radiation), combustion efficiency and
emissions (including CO, HC, NOx, and smoke), and combustor coking
(Edwards et al., 2010). The following sections discuss some of the
component tests and results of alternative jet fuels conducted at research
institutions or OEM facilities.
Combustion performance of biojet fuels
181
4.3.1 Spray atomization
Fuel atomization is the process that occurs before evaporation and mixing
takes place. It is directly related to the fuel combustion efficiency and
emissions performance. An effective liquid fuel combustion in a combustor
requires a consistent nozzle spray pattern and fine jet fuel breakup. The
spray quality of alternative jet fuel needs to be thoroughly investigated to
ensure the breakup of fuel into fine droplets, so that effective droplet
vaporization can take place to ensure a good mixing with air and effective
combustion. The atomization process is known to strongly relate to the fuel
physical properties, such as fuel viscosity, density, volatility, and surface
tension. Poor atomization can lead to detrimental effect to the ignition and
altitude relight, LBO, and emissions performance. Hence, the atomization
tests at pressure are part of the test program to provide accurate data for the
combustion models, as current fundamental models for atomization are not
adequate (Edwards et al., 2010). Table 4.1 shows the type of alternative jet
fuels that have been tested in different test spray facilities.
In the test program conducted by OEM to evaluate the spray characteristics and combustion performance of 50/50 blend of alcohol-to-jet
(ATJ) fuel, FAA, (2016) a pilot injector was used to test the spray quality at
ambient temperature with ambient and cold fuels (40 C) using laser
diagnostic methods. The test results show that the ATJ fuel blend has
similar mean droplet sizes as baseline JP-8 fuel at four different injection
pressures vary between 100 and 400 psi. Measurement of the spray cone
angle, radial, and circumferential droplet flow distribution via patternation
test indicates the similarity of cone angles between the tested fuels. The
data generated formed part of the research report submitted to the
American Society for Testing and Materials (ASTM) for the evaluation
and approval process of the ATJ-SKA fuel. Another ATJ fuel spray
characteristics test was conducted by Bokhart et al. (2017) as part of the
National Jet Fuel Combustion Program (NJFCP). The spray measurement
was conducted using a pressure swirl nozzle with the pressure differentials
of 172e517 kPa across the nozzle, while maintaining the ambient condition of the pressure vessel at 204 kPa and 394K. The droplet Sauter
mean diameter (SMD) distribution shows that ATJ fuel droplets are
smaller at the locations that shift radially outward from the center of the
spray, and the spray cone angle was also found to vary slightly between
ATJ and Jet A-1. The difference could be due to the variation in fuel
physical properties, as the ATJ fuel has lower surface tension and density
182
Biojet Fuel in Aviation Applications
Table 4.1 Types of alternative jet fuels tested in nonreacting spray facilities.
Year
Tested fuel
Spray injector conditions
References
2012
Coal-derived FT fuel
2014
Gas-derived FT fuel
2015
Camelina HEFA
(UOP)
20/80 and 70/30
Jatropha HEFA/Jet
A-1
FT fuel (Yitai
Petrochemical)
2016
2017
2016
ATJ (Swedish
Biofuel)
2020
GTL FT fuel
2017
ATJ (Gevo)
• Pressure-swirl injector
• Pinj ¼ 0.1e0.9 MPa,
Tfuel ¼ 10 C
• Pressure swirl injector
• Pinj ¼ 0.3e0.9 MPa
• Simplex swirl injector
• Pinj ¼ up to 160 psi
• Hollow cone pressure
swirl injector
• Pinj ¼ 100e300 kPa
• Pressure swirl injector
• Pinj ¼ 0.05e0.85 MPa,
Tfuel ¼ 25 C
• Pilot pressure injector
• Tfuel ¼ 25 and 40 C,
Pinj ¼ 100e400 psi
• Pressure swirl injector
• Pinj ¼ 300 kPa,
Tfuel ¼ 288K
• Pamb ¼ 100e1300 kPa,
Tamb ¼ 300e375K
• Pressure swirl injector
• Pinj ¼ 1.7e5.2 bar,
Tfuel ¼ 322K
• Tamb ¼ 394K
Lin et al. (2012)
Kannaiyan and
Sadr (2014a,b)
Sivakumar et al.
(2015)
Sivakumar et al.
(2016)
Zhao et al.
(2017)
FAA (2016)
Kannaiyan and
Sadr (2020)
Bokhart et al.
(2017)
Pamb, ambient gas pressure; Pinj, injection pressure; Tamb, ambient gas temperature; Tfuel, fuel
temperature.
compared with Jet A-1. The droplet diameter is also sensitive to the
pressure differential across the injector swirler, as an increase in the
pressure drop will result in the decrease in droplet diameter.
There have been a number of spray studies conducted using FT-based
fuels. Lin et al. (2012) evaluated the spray characteristics of FT-based jet
fuel derived from coal. The test was conducted using a pressure swirl
atomizer under atmospheric condition and at the operating temperature of
10 C. The injection pressure of the fuel was varied between 0.1 and
0.9 MPa. The generated spray for FT fuel at different tested pressure
shows uniform and similar droplet size distribution as conventional jet fuel
(RP-3), except at low pressure of 0.1 MPa where FT fuel droplets are
slightly smaller. In another separate atomization test using FT fuel at
Combustion performance of biojet fuels
183
ambient temperature of 25 C, the SMD of the synthetic jet fuel was found
to be consistently smaller and more uniform in size than those of RP-3 jet
fuel for injection pressures below 0.8 MPa. The spray cone angle for the
FT fuel was also found to be larger, indicating a better spray quality was
achieved for the FT fuels. The lower SMD for FT fuel was attributed to
the lower surface tension of the fuel. Fig. 4.3 shows the effect of injection
pressure on the spray cone angle for FT fuels and conventional RP-3 jet
fuels (Zhao et al., 2017).
Kannaiyan and Sadr (2014a,b) compared the spray characteristics of
GTL synthetic jet fuels using a pilot-scale pressure swirl nozzle. The GTL
and Jet A-1 fuels were shown to have similar global spray parameters, such
as the effective spray cone angle and global SMD, while the differences in
local SMD for radial profiles were minor at atmospheric condition. The
difference was more prominent at high injection pressure due to the
influence of inertial force and surface tension of the fuels. The lower
kinematic viscosity and surface tension of the GTL fuel resulted in faster
disintegration and dispersion of the droplets in the core region of the spray
as compared with the Jet A-1 fuel (Kannaiyan and Sadr, 2014b). At elevated
ambient conditions, the liquid sheet breakup for GTL was slightly longer
than Jet A-1 (Kannaiyan and Sadr, 2020). Such discrepancy is attributed to
the differences in fuel evaporation characteristics, which is more pronounced at elevated ambient conditions compared with atmospheric
Figure 4.3 Effects of oil supply pressure on spray cone angles (Zhao et al., 2017).
184
Biojet Fuel in Aviation Applications
Figure 4.4 Images of hollow cone fuel sprays discharging from a simplex swirl atomizer
at 300 kPa for (left) 70/30 Jatropha HRJ/Jet A-1 and (right) Jet A-1 (Sivakumar et al., 2016).
condition. It was also reported that the effect of ambient gas pressure on
the spray characteristics is more significant when compared with that of
ambient gas temperature.
There have been some studies on the spray characteristics of hydrogenated fatty acid-based biojet fuels. Sivakumar et al. (2015) studied the
atomization characteristics of camelina biojet fuel using a simplex swirl
atomizer. The measured breakup length of biojet fuel sheet and wavelength
discharged from the atomizer agrees well with the prediction using film
breakup model. The measured SMD for biojet fuel concurs with the
empirical correlations derived from conventional hydrocarbon fuel sprays.
They extended the experiments to compare the spray characteristic of
jatropha-derived jet fuel with Jet A-1. Only minor differences were
recorded in the spray characteristics, for instance, a marginal decrease in
SMD along the spray axis was observed for jatropha biojet fuel compared
with Jet A-1 owing to the lower boiling point for the former that facilitates
rapid evaporation (Sivakumar et al., 2016). Fig. 4.4 shows the comparison
of the hollow cone fuel sprays discharged from a simplex swirl atomizer for
biojet fuel blend and Jet A-1.
4.3.2 Ignition
The ignition characteristic of jet fuel is important as it relates to the cold
starting and high altitude relighting. The ignitibility of a mixture depends
strongly upon the equivalence ratio in the vicinity of the igniter. Other
factors that govern the ignition characteristics are fuel volatility, droplet size
Combustion performance of biojet fuels
185
and distribution, mixing of the fuel and oxidizer, ignition energy, fuel-air
temperature, air velocity, and various other parameters (Mosbach et al.,
2011). It is to note that the volatility and the droplet size are dependent on
the physical properties of the fuel. Although the final blend of the alternative
jet fuel with conventional jet fuel has to meet the ASTM D1655 standard
specification, the varied chemical properties for alternative jet fuel mean that
the combustion chemistry may differ; thus, investigation of the combustion
properties including ignition needs to be conducted. Table 4.2 shows the
ignition and extinction performances of alternative jet fuels conducted by
different groups. Hermann et al. (2005) compared the ignition characteristics
of FT-SPK developed from syngas with Jet A-1 fuel. The FT-SPK was
found to ignite at slightly fuel-rich conditions than Jet A-1, due to
the slightly higher flash point and viscosity for the FT-SPK than Jet A-1.
The latter produces finer droplets, which enable faster evaporation and
subsequently facilitate ignition. The extinction point was found to be similar
for both fuels. The ignition and high altitude relight performance of GTL
FT fuels was investigated at simulated high altitude conditions of
25,000e30,000 ft using a subatmospheric sectorial rig (Fyffe et al., 2011).
The combustor inlet pressures were set at 6 and 8 psi with the inlet air
temperatures of 265 and 278K. The FT fuels tested showed similar ignition
performance as the regular Jet A-1. Lower iso-to-normal paraffin ratio fuels
were found to exhibit better ignition performance.
From the comparative study of ignition performance using two combustors, it was found that the FT GTL fuel exhibited similar ignition
behavior as Jet A-1 fuel in the can-annular combustor equipped with an
airblast-type atomizer (Rye and Wilson, 2012). However, the annular
combustor fitted with two lean airblast atomizers showed a consistent
improved ignition probability for FT fuel compared with Jet A-1, attributable to the sufficient presence of light hydrocarbons in the vicinity of
spark kernel to vaporize, thus enabling ignition at leaner condition in the
primary zone. Lin et al. (2012) showed that the ignition performance for FT
fuel is slightly better than those of RP-3, in particular at low liner pressure
drop conditions, which is attributable to the lower viscosity of the fuel and
finer atomized droplets that improve droplet vaporization. Burger et al.
(2014) compared the ignition and extinction characteristics of FT fuels with
Jet A-1. The tests were conducted in a rich-burn, quick-mix, lean-burn
(RQL) combustor equipped with an airblast atomizer, under a fixed
combustor inlet pressure of 41.4 kPa and 265K. The tests showed that FT
fuels have similar ignition characteristic as Jet A-1 fuel, but the lean
186
Biojet Fuel in Aviation Applications
Table 4.2 Ignition and extinction performances of alternative jet fuels.
Test component
Year
(OEM)
Fuel
Test conditions
References
2005
Single can-type
combustor
(Volvo Aero)
FT-SPK
2011
Subatmospheric
relight sector rig
(Rolls Royce)
GTL
FT-SPK
2011
Twin-sector
combustors
FT-SPK
2012
Single-cup
rectangular
combustor
CTL
FT-SPK
2012
Annular and
can-annular
combustor
GTL FT
2014
RQL combustor
SPK
2016
APU combustor
rig (Pratt &
Whitney
AeroPower)
ATJ
• Equipped with
air-assisted nozzle
• Atmospheric, ambient
temperature 20 C
• Airflow rates were varied
from 10 g/s up until
ignition was not possible
• Coaxially staging lean
burn fuel injector
• Simulated altitude
ignition at combustor
inlet pressure 6e8 psi,
air temperature
265e278K, fuel
temperature 288K
• Air pressure 5.9e7.9
psia, air temperature
265e278K
• Fuel temperature
288e290K
• Fuel/air ratio of 0.08
and 0.055
• Pressure swirl atomizer
and counter-rotating
swirl cup
• Atmospheric inlet
pressure
(0.1e0.11 MPa) and
inlet air temperatures
of 275e278K
• Inlet air temperature
w310K, fuel inlet
temperature 290K,
inlet air flow rate
(0e0.47 kg/s)
• Lean airblast atomizer
and airblast atomizer
• Air supplied at
41.4 kPa and 265K,
fuel temperature 288K
• Fuel supplied at
ambient and 40 C
• Simulate altitude of sea
leveld41,000 ft
Hermann
et al.
(2005)
Fyffe
et al.
(2011)
Mosbach
et al.
(2011)
Lin et al.
(2012)
Rye and
Wilson
(2012)
Burger
et al.
(2014)
FAA
(2016)
Combustion performance of biojet fuels
187
extinction behaviors show higher variability with no significant trend
observed for low air flow rate. Mosbach et al. (2011) studied the temporal
behavior of flame ignition process at high altitude with FT fuel in a twinsector combustor. It was reported that the temporal radiation emitted after
the spark ignition and failed ignition events for FT fuel and Jet A-1 were
similar. To ensure a high probability of high altitude relight, a fuel-rich, low
velocity region between the ignitor and fuel injector is desirable to ensure
the initiation of flame kernel and subsequent flame propagation.
Ignition tests were conducted in an APU combustor rig at three simulated altitudes using 50/50 ATJ-SKA/JP-8 fuel blend supplied at both
ambient and cold temperatures (40 C) (FAA, 2016). During the test,
combustor inlet airflow was set to simulate low-speed engine airflow
condition. The ignition boundary that separates light off and no-light
data was determined. It was reported that the ignition boundary of 50/50
ATJ-SKA/JP-8 blend fuel is comparable with the baseline fuel of JP-8 and
Jet A, implying similar ignition capabilities among the fuels tested.
4.3.3 Lean blowout
Alternative fuel developed for aviation purpose must be operationally fit
and compatible with existing engine, apart from meeting the fit for purpose
requirements. The lean blowout behavior of the fuel is one of the
important characteristics that needs to be assessed to ensure the safe flight
operation. In a liquid fuel spray flame system, the process governing
blowoff can be rather complex, as a number of processes can affect blowoff,
including kinetics, atomization, vaporization, mixing, and heat transfer. As
part of the alternative jet fuel approval process, LBO test has been included
as part of the component test. Burger et al. (2012) investigated the LBO
behavior of 26 types of liquid fuels, including Sasol fully synthetic jet fuel,
SPK, Jet A-1, and other fuel blends in a heterogenous combustor. The
flame stability limits were determined over a range of air flow rates that
correspond with liner pressure drops ranging from 1% to 6%, while
maintaining the inlet air condition of 310K and 1 bar. The LBO limit was
determined by reducing the fuel flow rate while keeping the air flow rate
constant until the flame went off. It has been found that density and
viscosity exhibited a positive correlation with blowout equivalence ratio. A
decrease in the density and viscosity resulted in lower LBO and led to the
increase of stability limit of the flames. The fuel physical property is related
to the atomization of the fuel, as blowout in rich primary zone combustor is
188
Biojet Fuel in Aviation Applications
governed by evaporation and mixing. Reaction rates were shown to have a
lesser influence on the stability limits. Lin et al. (2012) showed that CTL FT
fuel possesses better LBO performance than RP-3 at low liner pressure drop
conditions, which could be due to finer droplets for the former that
facilitates vaporization and hence extends the flame stability limit. However, the LBO result needs to be interpreted with care, as the result is
geometry specific and highly dependent on the operating conditions. Rock
et al. (2017) examined the blowoff phenomena of 10 different liquid fuels at
two air inlet temperatures, i.e., 450 and 300K. It was concluded that
blowoff event is limited by fuel vaporization temperature at 300K, where
fuels with higher volatility tend to resist blowoff, but the physics that
govern blowoff at higher inlet temperature of 450K remained unclear.
Given that a flight operation involves a wide range of conditions, rig
component tests should cover the possible range of flight including extreme
operating conditions.
4.3.4 Emissions of alternative jet fuels
4.3.4.1 Gaseous emissions
Different test setups have been utilized to assess the emission performance
of alternative jet fuels at flight conditions, such as lab-scaled gas turbine
combustor, APU unit, sectorial combustor, and full engine test, as shown in
Table 4.3. These emission tests are typically designed based on the flight
operation including ground idle, landing and takeoff, and cruising conditions, while the emissions of interest include the gaseous emissions and
particulate matters. This section discusses the gaseous pollutants emitted
from the tests of alternative jet fuel, followed by the emissions of particulate
matters in the subsequent section. Earlier jet engine study on the emissions
of alternative jet fuel can be traced back to 2007 conducted by Corporan
et al. (2007). The FT fuel was tested in a T63 turboshaft engine and swirlstabilized research combustor at idle and cruise conditions. Analysis of the
gaseous emissions of FT fuel and blends shows only minor effects on the
CO, CO2, and NOx species. Water vapor was shown to increase with FT
blend fraction due to the higher H/C ratio. The sulfur-free FT fuel results
in a linear decrease in SO2 with increasing FT concentration in the blend.
Lobo et al. (2012) evaluated the emissions of FT synthetic jet fuel in an
APU unit at idle and full power conditions. The report showed 5% and
5%e10% reductions in NOx and CO emissions for the alternative fuels and
blend tested, respectively. The UHC was shown to increase by 7% at idle
condition for CTL FT relative to Jet A-1.
Table 4.3 Emissions of alternative jet fuels produced from different engine conditions.
Year
Aircraft engine/combustor
Fuel
Operating conditions
References
2007
T63 turboshaft engine,
swirl-stabilized research
combustor
FT
Corporan
et al. (2007)
2011
Combustion chamber
sector rig
80/20 Jet A-1/FAME, 50/50
Jet
A-1/GTL FT, GTL FT
2012
Artouste
Mk113 APU
T63-A-700 Allison
turbine engine
CTL FT, GTL FT, 50/50
GTL/Jet A-1
Camelina HRJ, 50/50 (by vol)
HRJ/JP-8, tallow-derived
HRJ, 16% trimethylbenzene/
Tallow HRJ
GTL FT, 50/50 Jet A-1/FT,
Algae HRJ, 50/50 Jet
A-1/camelina blend
• Engine was operated at idle and
cruise power
• Injector is a generic swirl-cup liquidfuel nozzle fitted with a pressure
swirl atomizer
• Mass airflow 0.465 kg/s, inlet
temperature 315K
• Inlet pressure 16 kPa, equivalence
ratio 0.23
• Idle and full power
2013
Combustion chamber
sector rig
2013
GE CFM-56-2C1 engine
aboard of a DC-8 aircraft
HRJ, FT, 50/50 HRJ/JP-8
• Idle and cruise conditions, 150 h
duration test
• Air mass flow 0.465 kg/s, inlet
temperature 315K
• Pressure drop across the inlet 16 kPa,
equivalence ratio of 0.23
• Engine set to six different power
settings between 4% and 100% of
max rated thrust
Lobo et al.
(2012)
Klingshirn
et al. (2012)
Purcher
et al. (2013)
Huang and
Vander Wal
(2013)
Combustion performance of biojet fuels
2012
Pucher et al.
(2011b)
Continued
189
Table 4.3 Emissions of alternative jet fuels produced from different engine conditions.dcont’d
2014
Aircraft engine/combustor
Fuel
GTL, 50/50 HEFA/Jet A-1,
75/25 HEFA/Jet A-1
UCOHEFA
GE CF-700-2D-2 engine
core
Rolls-Royce Tay gas
turbine combustor
CH-SKA, FT-SPK,
50/50 HEFA-SPK/Jet A-1
GTJ, ATJ, HEFA, SPK
2018
Turbojet engine (GTM
140 series)
48% camelina HEFA blended
with Jet A-1
2019
CFM 56-7B26 turbofan
engine
32% HEFA/Jet A-1
2019
CFM56-5C4 jet engine
2019
Single-can combustor
ATJ-SPK (Gevo), HEFA-SKA
(Readijet)
SPK (UOP), jatropha HEFA,
2020
J-85 engine
2015
2016
2018
30% and 70% camelina
HEFA/Jet A-1
• Idle: EGT 445 C, AFR 80
• Full power: EGT 460 C, AFR 76
• No load, environmental control
systems, main engine start
• Ground idle, 80%, and 95% of rated
power 20 kN
• Air mass flow rate 200 g/s,
• Fuel flow rate 1.8 g/s for stable
burning and 0.5 g/s for lean burning
conditions
• 33,000e120,000 rpm, maximum
thrust is 140 N
• Ground idle (34% engine thrust) and
• Climb-out engine thrust (w85%
engine thrust)
• Idle to takeoff conditions (20%e96%
of rated power)
• Inlet pressure 3.66e4.46 bar, inlet
temperature 375 and 500K
• Combustor pressure loss 1.3e1.4,
fueleair ratio 0.0115e0.0132
• Idle to full power
References
Altaher et al.
(2014)
Lobo et al.
(2015a)
Chan et al.
(2016)
Zheng et al.
(2018)
Gawron and
Bialecki
(2018)
Liati et al.
(2019)
Schripp et al.
(2019)
Sundararaj
et al. (2019)
Kumal et al.
(2020)
Biojet Fuel in Aviation Applications
Artouste MK113 APU
gas turbine engine
GTCP85 aircraft APU
Operating conditions
190
Year
Combustion performance of biojet fuels
191
In the turbine engine emissions test using HEFA conducted by Klingshirn
et al. (2012), a reduction of CO emissions by w20% was shown by neat
HEFAs compared with JP-8 in Fig. 4.5A, which could be attributed to the
lower overall carbon content in the renewable fuels. No significant difference was observed in NOx emissions for the operating conditions
tested, indicating the similar combustion temperatures for the fuels tested.
Fig. 4.5B shows alternative fuels emitted lower UHC at idle engine
condition due to the low aromatics contents. Likewise, the emissions of
benzene, toluene, ethylbenzene, and xylene (BTEX) were also shown to
reduce due to similar reason. No UHC was detected during cruise engine
condition as the combustion efficiency is high. The negligible amount of
sulfur in the HEFA is the reason for the low sulfur oxide emissions
detected in the alternative fuels.
(a) 1.2
CO Idle
CO Cruise
Normalised to JP-8
1
0.8
0.6
0.4
0.2
(b)
0
1.2
UHC
Normalised to JP-8
1
0.8
0.6
0.4
0.2
0
Camelina
50% Camelina / JP8
Tallow
50% Tallow / JP-8
16%
Trimethylbenzene /
Tallow
Figure 4.5 Comparison of emissions of (A) carbon monoxide and (B) unburned hydrocarbons relative to JP-8 at different engine conditions (Klingshirn et al., 2012).
192
Biojet Fuel in Aviation Applications
Altaher et al. (2014) investigated the emissions of unburned nonmethane
hydrocarbons (NMHCs) and oxygenated VOCs (carbonyl compounds) in
the exhaust gas from an APU gas turbine engine using renewable fuels such
as GTL and HEFA blends. The emissions of NMHC were most significant at
idle condition, which was about four to nine times higher compared with
full power condition. The content of aromatics in the fuel is the most
pronounced factor that affects the emissions of NMHC. Fuels with low
aromatics lead to reduced aromatics hydrocarbon emissions including
benzene and toluene. GTL fuel showed a significant reduction in aldehyde
emissions, but HEFA blends and Jet A-1 showed similar carbonyls emissions
level. The CO2 emitted from Jet A-1 is highest, followed by the 100%
CH-SKA, 50% HEFA-SPK, and then 100% FT-SPK. NOx emissions are
strongly related to the flame temperature; hence, higher engine load leads to
higher NOx emissions. The FT-SPK and 50% HEFA-SPK showed lower
NOx emissions than Jet A-1 at high engine load conditions, whereas the
CH-SKA showed comparable NOx emissions level as the latter (Chan et al.,
2016). The emission performance of HEFA/Jet A-1 blend has been tested in
a miniature turbojet engine (Gawron and Bialecki, 2018). The HEFA blend
showed a reduced thrust and thrust specific fuel consumption compared with
the baseline Jet A-1. Unsurprisingly, the measured turbine inlet temperature
for HEFA blend is also lower across all engine rotational speeds tested. The
lower flame temperature could explain the lower NOx emissions measured
for HEFA blend. The CO2 and CO emissions were found to be slightly
lower by approximately 1% and 4%, respectively, at certain conditions.
Sundararaj et al. (2019) reported that increasing blend ratio of camelinabased biojet fuel showed an increase in NOx emissions, but drops in CO,
UHC, and soot were observed. Increase in flame temperature is the primary
reason for higher NOx and reduced CO and UHC emissions, but the lack
of aromatic content in biojet fuel is the main reason for reduced soot.
Jatropha-based biojet fuel has lower viscosity, which affects the spray quality
at low power setting, thus affecting the emissions, as observed with higher
CO and UHC due to incomplete mixing. Schripp et al. (2019) showed that
the emission indices of CO and NOx per fuel burned for ATJ and CHJ
fuels were not significantly different, as shown in Fig. 4.6. The obtained
emission indices show a good correlation to the values recorded in the
ICAO database for CFM56-5C4 engine. However, Wang et al. (2020)
demonstrated that the emissions of NO and CO for HEFA-SPK and blends
can be reduced by using distributed combustion conditions, which was
Combustion performance of biojet fuels
(a) 100
1
50
40
EI NO x (g/kg)
EI CO (g/kg)
10
(b)
DB ICAO 2018
ARA Readijet
GEVO ATJ
193
DB ICAO 2018
ARA Readijet
GEVO ATJ
30
20
10
0.1
0
0 10 20 30 40 50 60 70 80 90 100
Thrust (%)
0 10 20 30 40 50 60 70 80 90 100
Thrust (%)
Figure 4.6 Emission indices of (A) carbon monoxide and (B) nitrogen oxides for
different alternative jet fuels at different fuel flow settings and fuels. Reference values
for the CFM56-5C4 engine (blue) were derived from the ICAO database 2018 (Schripp
et al., 2019).
achieved by reducing the oxygen concentration in the oxidizer through
adding diluent gases of N2 and CO2, thereby simulating the internal
entrainment of hot reactive gases into the combustor.
4.3.4.2 Particulate matters
Solid particulate matter (PM) comprises mainly soot and, to a small extent,
ash (metal particles). Soot generated from combustion is known to have
adverse effects on human health. Soot particles generated from the aviation
gas turbine engine depend on the fuel types and engine operating conditions. At present, the aircraft emissions of PM during landing and takeoff are
regulated under the CAEP/10 standard introduced by ICAO ( Jacob and
Rindlisbacher, 2019). The regulatory limit concentration of nonvolatile
particulate matters (nvPM) applies to all in production engine types with
rated thrust of greater than 26.7 kN or after January 1, 2020, based on the
equation nvPMmass ¼ 10(3 þ 2.9Foo 0.274), where Foo refers to the
rated thrust ( Jacob and Rindlisbacher, 2019). The PM emissions standard
proposed under the CAEP/11 are expectedly more stringent, prompting
future engine development to consider the full interdependencies between
pollutant formation and fuel burn.
The interest in decarbonizing the aviation industry via the use of
alternative jet fuels has prompted the detailed investigation of the combustion characteristics and emissions performance of the substitute fuels. In
earlier studies, the effects of the fuel properties of a natural gasederived
194
Biojet Fuel in Aviation Applications
synthetic jet fuel on the PM and gaseous emissions produced from a T63
engine and a swirl-stabilized research combustor were examined. FT fuel
without aromatics showed a reduction of 90% and 80% in particle number
and smoke number, respectively, compared with JP-8. The absence of
sulfur and high hydrogen-to-carbon ratio of the FT fuel resulted in
the reduction in sulfur oxide and increased in water vapor, respectively
(Corporan et al., 2007). In a CFM56-7B engine test simulating the LTO
cycle, Lobo et al. (2011) showed a reduction of 62% of PM emissions was
achieved for the neat FT fuel compared with Jet A-1 fuel. The reduction of
PM emissions was attributed to the absence of aromatics content in FT fuel,
as opposed to the 18.5 vol% of aromatics in the Jet A-1. Similar conclusion
was reached by Lobo et al. (2012), in which the reduction of PM emissions
were found to be pronounced for FT fuels due to the lack of aromatics,
with up to 90%, 72%, and 65% of reduction by mass recorded for GTL,
50:50 GTL: Jet A-1, and CTL at idle and full power conditions. Although
lower aromatics content in synthetic fuel blend results in lower soot, other
problem such as insufficient swelling of the engine seal was reported (Link
et al., 2008; Jürgens et al., 2019). Hence, it has been specified in the ASTM
D7566 standard that a minimum of 8.4 vol% aromatics content for
synthetic jet fuel blend needs to be retained.
Klingshirn et al. (2012) evaluated the PM emissions of two types of
HEFA derived from camelina and tallow in a T63 turbine engine. The lack
of aromatics in the neat HEFA fuel showed the least soot with 90%e98%
reduction in particle number. The tallow-HEFA blended with 16% trimethylbenzene (aromatics) shows the highest soot emissions among all
alternative fuels tested, but a reduction of w30% in smoke number was
achieved in cruising condition compared to jet fuel. For the duration test of
150 h using 50/50 HRJ/JP-8 fuel, it was reported that similar heating and
sooting patterns were achieved compared with JP-8 fuels. Huang and
Vander Wal (2013) studied the characteristics of particulate matters emitted
from a CFM56-2C1 engine on a DC-9 aircraft operating with FT fuel and
50/50 HRJ/JP-8 in the power range of 4%e100%, covering ground-idle,
intermediate, cruise, and takeoff levels. Measurements showed that the soot
particle size varies as a function of engine power, albeit in a different trend
depending on the type of fuel. The primary soot particle size for the
renewable fuels decreases with increasing power, but the conventional JP-8
shows a reverse trend, as shown in Fig. 4.7. The reduced soot particle size
Combustion performance of biojet fuels
195
35
Primary particle size (nm)
JP-8
HRJ
FT
30
25
20
15
0
20
40
60
80
100
Engine power level (%)
Figure 4.7 Primary particle distributions of JP-8-, HRJ-, and FT-derived soot across
engine power levels from 4% to 100% (Huang and Vander Wal, 2013).
for renewable fuels indicates less time and low concentration of growth
species, as higher temperature with higher power setting accelerates fuel
pyrolysis reactions, increases fueleair mixing, and lowers local equivalence
ratio. Conversely, the high aromatic content in JP-8 directly contributes to
the inception of soot growth. Furthermore, the paraffinic and cycloparaffinic compounds pyrolyzed at high power could have contributed
aromatics for soot growth. It is to note that the blended HRJ fuel and FT
fuel contain 9.8 and 1.7 vol% of aromatics, respectively, as opposed to JP-8
which contains 21.8 vol% of aromatics. The soot nanostructure for
renewable fuels and baseline jet fuel are different, suggesting that the soot
formation path is dependent on the chemical composition of the fuel and
burning conditions in the combustor.
Purcher et al. (2013) evaluated the emissions and deposits of several
synthetic jet fuels, including 100% GTL FT, 50/50 FT/Jet A-1, 100%
HEFA and 50/50 HEFA/Jet A-1 blends. Overall, the smoke emission and
deposit levels for all synthetic jet fuels were substantially lower than Jet A-1.
The camelina/Jet A-1 blend showed a reduction of 70% in smoke relative
to neat Jet A-1, despite the presence of 50% conventional jet fuel in the
blend. A significant reduction of mass deposit of 72% was reported for the
camelinaeHEFA blend relative to Jet A-1 over the course of testing
conducted on the rig. The 100% algae-based HEFA showed a remarkable
196
Biojet Fuel in Aviation Applications
Figure 4.8 High pressure optical chamber axial view at pressure of 1 bar and equivalence ratio of 0.9 for blended fuels of (A) neat Jet A-1 (B) Jet A-1:HEFA at 80/20% vol
(C) Jet A-1/HEFA at 50/50% vol and (D) neat HEFA (Buffi et al., 2017).
96% reduction in smoke number compared with Jet A-1. Significant
amount of deposits builtup on the surfaces of the combustor can be
observed for Jet A-1. FT synthetic fuel was shown to be exhibit clean
burning characteristics, with no clear carbon deposited on the injector and
combustor wall based on visual inspection (Pucher et al., 2011a). They
further reported 20% fatty acid methyl esters (FAME) blend with Jet A-1
resulted in lower soot emission, although FAME is not an ASTM-certified
biojet fuel. Buffi et al. (2017) further reinforced this in an emissions
characterisation test for comparing various blends of the conventional Jet A-1
fuel with HEFA. Fig. 4.8 shows the presence of soot in the blended fuel
flames using a pressurised swirl combustor in a high pressure optical chamber.
It is clear that the HEFA component in the blend has a higher oxygen
consumption rate, hence producing a higher temperature flame which goes
through a more complete combustion reaction.
The particulate matters emitted from used cooking oil (UCO)ebased
HEFA biojet fuel in different blends were investigated using an aircraft
APU. The reductions of PM were shown to increase with increasing HEFA
Combustion performance of biojet fuels
197
content, owing to the increase of hydrogen content. The PM size distributions were found to narrow and shift to smaller sizes as the UCOHEFA
component of the fuel blend increased (Lobo et al., 2015a). The
ASTM-approved 50:50 blend of UCO-HEFA and Jet A-1 showed a
reduction of 60% by mass compared with baseline Jet A-1 (Lobo et al.,
2015a). Chan et al. (2016) evaluated the gaseous emissions and PM emitted
from a GE CF-700-2D-2 turbofan engine (20 kN) for three alternative
fuels. The fuels tested were neat CH-SPK, derived from Brassica carinata
plant oil via catalytic hydrothermolysis process, 50% camelina HEFA-SPK
blended with Jet A-1, and neat FT-SPK fuels. The particle number
emissions for CH-SKA showed a reduction of 7%e25% over the range of
engine load conditions, in spite of the similar aromatics level between CHSKA and Jet A-1. The HEFA-SPK and FT-SPK showed a significant
reduction of 40%e60% and 70%e95%, respectively, mainly due to the
reduced level of aromatics compared to Jet A-1.
Zheng et al. (2018) systematically evaluated the sooting tendency of
16 different types of jet fuels including ATJ, HEFA, GTL, and others.
They concluded that aromatics content is the main determinant for
soot formation; in particular, di- and cycloaromatics are more prone to
produce soot than alkylbenzenes. In addition, fuels with higher density,
cycloparaffin content, and surface tension were also found to have
higher soot formation tendency. In the engine test study of the soot
reactivity conducted by Liati et al. (2019), it was reported that 32%
HEFA/Jet A-1 blend showed reduced soot reactivity during ground
idle conditions as compared with Jet A-1, an important improvement
to local air quality in airport area during ground-idle condition. The
HEFA blend shows higher soot reactivity during climb-out conditions,
but the overall lower soot emitted by HEFA blend could result in net
positive effects.
Schripp et al. (2019) evaluated the performance of catalytic hydrothermolysis jet fuel (ReadiJet) and an unblended ATJ fuel in a CFM565C4 engine. Measurements of the gaseous emissions and particulate
matters were performed at idle and takeoff conditions, which translated to
roughly 20% and 96% of the total engine thrusts. Measurements of the
PM emissions were conducted at 25 m behind the engine exit plane
rather than in-plane of the engine exhaust as prescribed in AIR 6241
(AIR6241, 2013). The tested ATJ-SPK fuel consists of a few different
198
Biojet Fuel in Aviation Applications
Figure 4.9 (A) Total particle number and (B) particle mass emission index for different
alternative jet fuels and thrust settings. (Schripp et al., 2019).
branched aliphatic compounds (primarily iso-C12H26 and iso-C16H34),
while the CHJ-SPK (ReadiJet) contains high level of aromatics and
cycloparaffins that are preserved during the production process. As expected, the higher content of aromatics (20.9 vol%) in CHJ-SPK led to
higher emissions of particulate matters, whereas the unblended neat AJTSPK with <1% aromatics content produced lower soot than the baseline
Jet A-1, as shown in PM emission index presented in Fig. 4.9. Calculation
of the emission index (EI) for particulate emissions and combustion gases
follows the proposed method in Chapter 7 of AIR 6241 (AIR6241,
2013).
EI #=kg ¼ PN #=cm3 106
EI mg=kg ¼ PM mg=m3
0:082 TðKÞ
i
h
þ a MH g=
½ðCO2 Þ ðCO2 ÞBG
pðatmÞ Mc g=
mol
mol
(4.2)
0:082 TðKÞ
h
i
PðatmÞ MC g=mol þ a MH g=mol ½ðCO2 Þ ðCO2 ÞBG
(4.3)
where PN is the particle number concentration or PM particle mass concentration, CO2 is the measured concentration of carbon dioxide in air,
(CO2)BG is the background carbon dioxide concentration, P is the atmospheric pressure, a is the molar ratio of hydrogen to carbon in the fuel,
and the MC and MH are the molar masses of carbon and hydrogen, respectively (Schripp et al., 2019).
Combustion performance of biojet fuels
199
In the MERMOSE project (Smith et al., 2017) that focuses on the
characterization of particulate matters emissions of aircraft engine, measurement at downstream of the exhaust plane of a turbofan engine at
ground level revealed that the size of PM increases with engine thrust,
concurring with the findings shown in other engines (Lobo et al., 2015b).
In spite of the differences in particle sizes, the soot morphology within the
primary particles does not vary across the test regimes. The organic content
of the emitted particles was found to significantly decrease at 30% and 70%
engine thrust levels (Smith et al., 2017). Lobo et al. (2015b) compared the
PM sampled from different in-service engines. It was concluded that the
PM emissions indices vary with engine size, type, and technology, with
older technology engines showing higher PM emissions in mass. The
particulate matters emitted from aircraft turbine engines are composed of
branched-chain fractal aggregates of multiple primary particles (Saffaripour
et al., 2019). The primary diameter, aggregate size, and density strongly
depend on the engine power setting and fuel type. Kumal et al. (2020)
studied the morphology and aggregate size of the particulate matters
emitted from 30% to 70% camelina-based biofuel/Jet A-1 blends under
various engine thrust conditions. The camelina-based biofuel consists
primarily of n-paraffins and isoparaffins, produced via the catalytic hydroprocessing pathway. It was reported that the size of the PM increases with
engine power (Fig. 4.10). The increase in paraffinic and hydrogen contents
with increasing biofuel fraction results in the significant reduction in PM
size. The low tendency of soot formation for biojet fuel is attributable to
the reduced aromatics required for soot nucleation, as well as limited by the
Aggregate size (nm)
50
Jet A
45
30% Camelina Blend
40
70% Camelina Blend
35
30
25
20
15
0
20
40
60
Engine thrust (%)
80
100
Figure 4.10 Variation of aggregate size as a function of engine thrust for Jet A and
camelina/Jet A blend fuels (Kumal et al., 2020).
200
Biojet Fuel in Aviation Applications
kinetic delay in biojet fuel fraction. In addition, the highly turbulent
environment in the combustor dilutes the fuel-rich pockets, thus lowering
the local equivalence ratio in the soot-forming region.
4.4 Flight test
The successful application of aviation biofuels in commercial airline was
first demonstrated by Virgin Atlantic in a B747 flight using the blend of Jet
A-1 with 20% biofuels derived from coconut and babassu oil (Greenair,
2008). Since then, the frequency of flight trials with alternative fuels has
been increasing over the years. The alternative jet fuels used have largely
focused on the use of drop-in sustainable aviation fuel (SAF), which is
defined by the IATA to be (1) jet fuel production from alternative feedstock in an alternative manner, (2) proven sustainable in the context
consistent with economic, social, and environment, and (3) jet fuel that
meets the technical and certification requirements for use in commercial
aircraft (IATA, 2020). Fig. 4.11 shows the timeline of the flight demonstrations using SAF by different airlines, aircraft OEMs, and fuel manufacturers. Air New Zealand demonstrated the flight test with blend of 50%
SAF derived from Jatropha in a B747-400 fitted with Rolls Royce engines,
marking the first flight test using nonedible feedstock (Express, 2008). The
SAF used by Continental Airlines in 2009 was derived from algae and
United Airlines
Etihad Airway
Continental Airline
Hainan Airline
Air China
Azul Airlines
Virgin Atlantic
Boeing
Qatar Airway
Saab
Alaska Airline
China Eastern
Airlines
Etihad Airway
SpiceJet
Year
2008
09
12
11
10
KLM
13
15
14
16
17
18
19
2020
Boeing
Honeywell
US Navy
Qantas
Air Canada
Japan Airline
Interjet
Air New Zealand
TAM Airlines
All Nippon
Airways
Babassu & coconut
Camelina,
algae
jatropha
&
Used cooking oil
Used cooking oil + palm
Jatropha
GTL
Sugarcane
Used cooking oil + animal fat
Algae & jatropha
Camelina
Brassica carinata
Woody biomass
Salicornia
Rapeseed
Figure 4.11 Alternative fuel-powered flights between 2008 and 2020 by various airlines (IATA, 2015).
Combustion performance of biojet fuels
201
jatropha, implying a blend of drop-in SAF is feasible regardless of the
feedstock type (GE Aviation, 2009). Qatar Airways first demonstrated the
use synthetic jet fuel derived from natural gas in aircraft engine in 2009.
The gas-to-liquid synthetic fuel was blended with jet fuel and used in an
Airbus A340-600 flight (Greenair, 2009). In the following year, Sasol, the
South Africa fuel manufacturer demonstrated the world’s first passenger
aircraft flight using 100% synthetic jet fuel (Sasol, 2010).
After HEFA’s approval in 2011, various airlines and fuel producers have
demonstrated flight trials using blends of SAF with regular jet fuel to
demonstrate their environmental commitment and market interest. Air
China tested a Boeing 747-400 flight powered by Pratt & Whitney engines
using blends of 50% HEFA derived from jatropha with conventional jet
fuel. The SAF was the first biojet fuel produced in China by China
National Petroleum Corp (China Daily, 2011). Interjet and Airbus jointly
completed a flight trial in 2011 using biojet fuel blend. The flight test was
conducted using an Airbus A320 fueled with 27% HEFA-SPK produced by
Honeywell’s UOP with jatropha seeds (Biofuels Digest, 2011). Honeywell,
being an SAF producer, further conducted flight test in 2011 with 50%
HEFA-SPK derived from camelina in a Gulfsream G450 powered with
Rolls Royce engines (Marketwatch, 2011). In 2012, Etihad Airways
completed a 14-hour flight with a Boeing 777-300 ER aircraft from Seattle
to Abu Dhabi using waste cooking oil biojet fuel supplied by SkyNRG
(Airportwatch, 2012). The same fuel was fueled in a Boeing 787 by All
Nippon Airways to complete a transpacific flight in the same year (ANA,
2012). In fact, KLM has already started using waste cooking oil biojet fuel
in their regular commercial flight since 2011 (WIRED, 2011).
In Brazil, Azul Airlines demonstrated the use of sugarcane-based biojet
fuel, produced by Amyris, in the Embraer 195 aircraft powered by GE’s
CF34-10E engines (Digest, 2012). The first flight test using 100% biojet
fuel was conducted by Air Canada in 2012. The biojet fuel (ReadiJet),
produced from Brassica Carinata oil seeds, was developed by Applied
Research Associates and Chevron Lumnus Global (Newatlas, 2012). In
2013, China’s locally produced biojet fuel (CBF-1) by Sinopec from used
cooking oil and palm oil was tested in an Airbus A320 by China Eastern
Airline (China Daily, 2013), paving way for the biojet fuel certification
process by Civil Aviation of Administration of China for commercial use in
the following year. This later enabled Hainan Airlines to complete the
first commercial flight operating with 50% biojet fuel made from waste
cooking oil on a Boeing 737 flight (Breaking Travel News, 2015). In 2014,
202
Biojet Fuel in Aviation Applications
The ecoDemonstrator program by Boeing demonstrated the feasibility of
flying with 15% biofuels derived from fatty acids of different sources in a
B787 aircraft. The program later showed a successful flight with a Boeing
777 freighter fueled with 100% HEFA biofuels produced from animal fat
and beef tallow waste (Greenaironline, 2014). In 2018, India’s first biofuel
test flight was conducted by Spicejet with a Bombardier Q400 aircraft
fueled with 25% jatropha biojet fuel (Indiatimes, 2018). In 2019, Etihad
Airways conducted a flight trial with a Boeing 787 operated with biojet fuel
derived from Salicornia plant, which is a type of seed plant grown in desert
with seawater (Gulfnews, 2019). To cater for the demand of SAF,
Norway’s Oslo airport became the first airport in the world to regularly
offer SAF to all departures in 2016, followed by Los Angeles, Stockholm
and Bergen, Norway (Boeing, 2019). As test flights are part of the rigorous
process in achieving biojet fuel certification, it is expected that more flight
tests will be conducted in the near future given that different alternative jet
fuel methods are under development. At the same time, the commitment
shown by commercial airlines in using SAF indicates the growing
acceptance of biofuels, which is important in the long run to achieve
decarbonization goal in the aviation section.
4.5 Fundamental combustion properties
Since the fuel composition in alternative fuel may vary significantly
compared with conventional jet fuel, understanding the fundamental
combustion properties is important to gain insights into the impact of the
fuel properties on the combustion performance. Significant effort has been
devoted to investigate the chemistry of alternative jet fuels under reacting
conditions. The fundamental combustion properties of interest include
ignition characteristics, flame speed, flame blowout and extinction characteristics, and chemical reaction pathway, which are closely linked to the
fuel composition and molecular structure. The fuel chemistry forms the
building blocks of flames that has direct impact to the combustion
performance in engine such as cold startup, high altitude relight, combustion efficiency, and emissions. Furthermore, the understanding of the
combustion properties plays an important role in facilitating the development of fuel and engine technology. For example, the development of the
detailed reaction mechanism requires the identification of suitable surrogate
fuels and valid kinetic targets (such as ignition delay time, laminar flame
speed, and temporal combustion speciation, among others) to test, refine,
Combustion performance of biojet fuels
203
and validate the mechanism. The chemical kinetic models developed can be
used to predict emissions and combustion performances, which can lead to
significant cost savings in the development and testing programs. The
fundamental combustion data can also facilitate the fuel developing process
by screening out the unacceptable fuel prior to testing in costly component
or engine tests. The fundamental combustion tests using alternative jet fuels
are presented in the following sections.
4.5.1 Ignition delay time
The study of the ignition, pyrolysis, and oxidation behavior of practical jet
fuels has been conducted using shock tube and rapid compression machine
(RMC). Measurements of the ignition delay time using these devices are
performed with homogenous fuel/oxidizer mixtures, so that the reaction is
solely controlled by the chemical kinetics that depends on the pressure and
temperature histories of the fuel/oxidizer mixture, and without the
complication of physical processes such as mixing, atomization, vaporization, and fluid dynamics encountered in jet engine. The ignition delay
time data derived at elevated pressure and temperature are typically used as
global kinetic target to validate the chemical kinetic models (Flora et al.,
2017). There is a slight difference in the definition of ignition delay time
between shock tube and RMC. For RMC, the ignition delay is defined as
the occurrence of an inflection point in the pressure trace during the
pressure rise due to ignition that is shown after the end of compression.
Fig. 4.12A shows the ignition delay measurement derived from an RCM
experiment with S-8/air mixture, 4 ¼ 1.15, and at 15 bar (Kumar and
Sung, 2010). The end of compression is termed as the starting point of the
Figure 4.12 Ignition delay time measurements derived from a (A) rapid compression
machine with S-8/air, oxidizer-to-fuel mass ratios of ¼ 13, 4 ¼ 1.15, 15 bar (Kumar and
Sung, 2010) and (B) shock tube with 1.1% Gevo ATJ/air, 4 ¼ 1.02, 1244 K, 6.08 atm
(Zhu et al., 2015).
204
Biojet Fuel in Aviation Applications
ignition. The first stage of ignition delay (s1) corresponds to the time interval between the end of compression and the onset of the first-stage
ignition, while the duration of the second-stage ignition is termed as s2.
The sum of the two intervals s ¼ s1 þ s2 is the overall ignition delay. For
shock tube, the pressure traces derived from the ignition experiment of a
shock tube conducted with 1.1% ATJ/air at 4 ¼ 1.02, 1244 K and 6.08 atm
are shown in Fig. 4.12B (Zhu et al., 2015). They used laser absorption
method to trace the OH* emissions in conjunction with the pressure traces
for reacting mixture. The ignition delay time is defined as the time interval
between the arrival of the reflected shock and the onset of ignition. The
point of ignition can be determined by extrapolating the maximum slope of
the pressure or OH* signal back to the baseline. The operating range between shock tube and RCM differs quite significantly. Shock tube has been
used to determine the short ignition delay measurements in the high
temperature range, while RCM is generally used in the low-to-intermediate temperature range for relatively longer ignition delay measurements.
In practice, measurement data from shock tube and RCM can overlap,
although discrepancies in data have been observed. Therefore, the ignition
delay results obtained from different facilities have to be interpreted with
care (Zhang et al., 2016).
Comparison on the autoignition delay times for conventional and
alternative jet fuels has been performed by several groups, as shown in
Table 4.4. Kahandawala et al. (2008) measured the ignition delay time
of FT fuel and JP-8 behind the reflected shock wave under the conditions
of f ¼ 0.5, pressure of 21 atm, and the preignition temperature of
1100e1600K. The FT fuel and JP-8 fuel show similar ignition delays for
the range of temperature tested, although the FT fuel contains two times
more cycloparaffin than JP-8 with no aromatics. Kumar and Sung (2010)
extended the study of autoignition delay time of FT fuel by using a
rapid compression machine at lower and intermediate temperature of
615e933K, covering an extended pressure range of 7e30 bar and equivalence ratio of 0.43e2.29. The FT fuel was found to have the shortest
overall ignition delay time, followed by Jet A-1 and JP-8, as shown in
Fig. 4.13. The mixture’s equivalence ratio is reported to have a strong
influence on the ignition propensity. Gokulakrishnan et al. (2008) utilized a
pressure flow reactor to measure the ignition delay time of FT fuel at
900e1200K, f ¼ 0.5e1.5, and atmospheric condition. Result showed that
the FT fuel has lower ignition time compared with JP-8, which is attributable to the lower aromatic content and higher activation energy.
Combustion performance of biojet fuels
Table 4.4 Ignition delay measured for alternative jet fuels.
Year
Fuel
Operating condition
2008
FT (Syntroleum)
2008
FT (S8)
2010
FT (Syntroleum)
2012
GTL FT fuel
(S-8, Shell), CTL
FT, Sasol IPK
2,6,10-trimethyl
dodecane (farnesane)
FT (Sasol, Shell),
HRJ (tallow,
camelina), ATJ
(Gevo), Swedish
BioJet, hydrorefined algal oil
2014
2015
2015
ATJ (Gevo), sugarto-hydrocarbon
(Amyris Farnesane)
2017
GTL, GTL surrogate
of 32% isooctane,
25% n-decane, and
43% n-dodecane
2017
CTL FT (Sasol),
DSHC (Amyris),
ATJ (Gevo), HEFA
based biojet (corn,
canola and soy)
2018
50/50 BTL FT/Jet
A-1 blend
Shock tube, f ¼ 0.5,
pressure of 21 atm and the
pre-ignition temperature of
1100e1600K
Atmospheric pressure flow
reactor, 900 and 1200K,
f ¼ 0.5e1.5
Rapid compression
machine, initial pressure of
7, 15, and 30 bar,
temperature 615e933K,
f ¼ 0.43e2.29
Shock tube, 8e39 atm,
651e1381K,
f ¼ 0.25e1.5
Initial pressure 20 atm
Initial temperature
1047e1520K, and
f ¼ 0.25e2.2, in two
pressure and mixture
regimes: for fuel/air
mixtures at 2.07e8.27 atm,
and for fuel/4% O2/Ar
mixtures at 15.9e44.0 atm
Rapid compression
machine, compressed
pressure 20 bar, initial
temperature between
600e700K, f ¼ 1.0, 0.5,
0.25
Spherical chamber,
f ¼ 0.8e1.2, initial
pressure 8.6, 10, and
12 atm at initial
temperature of 450K.
Shock tube, preignition
temperature range of
980e1800K at a pressure
of 16 0.8 atm, f ¼ 0.5
and argon as the diluent
(93% by vol)
700e1200K at 20 atm,
f ¼ 1.0
205
References
Kahandawala
et al. (2008)
Gokulakrishnan
et al. (2008)
Kumar and
Sung (2010)
Wang and
Oehlschlaeger
(2012)
Won et al.
(2014)
Zhu et al.
(2015)
Min et al.
(2015)
Askari et al.
(2017)
Flora et al.
(2017)
Han et al.
(2018)
206
Biojet Fuel in Aviation Applications
Autoignition Delay Time (ms)
100
SASOL IPK
Shell GTL
S-8
Jet A
JP8-RCM
CHRJ
10
1
0.1
0.01
0.7
0.8
0.9
1
1.1 1.2 1.3
1000/T (1/K)
1.4
1.5
1.6
1.7
Figure 4.13 Autoignition delay times for different alternative jet fuels measured at
stoichiometric and pressure of 20 atm using shock tubes and rapid compression
machine (Zhang et al., 2016; Vasu et al., 2008).
Wang and Oehlschlaeger (2012) measured the ignition delay times of
four FT fuels using a shock tube at the condition of 8e39 atm,
651e1381K, and f ¼ 0.25e1.5. Comparison of ignition delay for FT fuels
and Jet A-1 showed no discernible difference in reactivity at T > 1000K.
However, the negative temperature coefficient (NTC) and low temperature region showed an inverse correlation between the fuel’s derived cetane
number and ignition time. The compositional variation between the FT
fuels influenced the reactivity of the fuel. For example, Shell GTL exhibits
slightly shorter ignition delay times in the NTC regime than S-8 due to its
larger n-alkane fraction, while the 90% isoalkanes and 10% cycloalkanes
have relatively low reactivity. A comparison of the ignition delay time data
obtained with shock tube (Wang and Oehlschlaeger, 2012) is compared
with those derived with RMC (Allen et al., 2012). Both set of data show
similar trends, albeit the temperature range for shock tube is significantly
extended compared to RMC. Han et al. (2018) measured the ignition delay
of 50/50 BTL FT/Jet A-1 blend in a shock tube at the preignition temperature range of 700e1200K and pressure of 20 atm. The ignition delay of
biojet fuel blend is similar to Jet A-1, except at the condition below 1000K
where the former shows a reduced ignition delay time by w50%, which
could be due to the higher derived cetane number contributed by the biojet
fuel component.
Won et al. (2014) compared the reflected shock ignition delay characteristic of 2,6,10-trimethyl dodecane (farnesane) with FT (S-8) surrogate
Combustion performance of biojet fuels
207
fuel (n-dodecane/isooctane, 51.9/48.1 mol%) at 20 atm. The farnesane
exhibited a notable difference in ignition delay at temperature lower than
870K when compared with S-8 surrogate fuel. The latter shows a faster
ignition delay time by a factor of 2 at the low temperature kinetic regime.
Min et al. (2015) examined the ignition delay characteristics of ATJ
(GEVO) and direct sugar to hydrocarbon fuel (Amyris Farnesane) in a rapid
compression machine. The ATJ fuel has a low derived cetane number
(DCN) of 15 and shows the longest ignition delay time and prominent
multistage ignition behavior. The farnesane fuel contains the highest DCN
among the tested fuels, with the shortest ignition delay time except for
f ¼ 0.25. The ATJ fuel does not ignite at f ¼ 0.25 due to low reactivity
and was observed to enter the NTC region faster than Jet A-1 fuel.
Measurement of the ignition delay of alternative jet fuels of ATJ fuel
(GEVO), direct sugar to hydrocarbon (farnesane), and CTL-FT fuel via a
single-pulse shock tube was performed under lean, high pressure conditions
(Flora et al., 2017). The tests were conducted at 980e1800K, at a pressure
of 16 atm and an equivalence ratio of 0.5 in the presence of 93 vol%
dilution with argon. ATJ fuel showed slightly longer ignition delay time at
higher temperature. Kinetic modeling results show that predominant
reactions are oxidation of C1eC4 fuel fragments; hence the chain
branching of large n-paraffins hardly has any impact on the ignition delay
(Flora et al., 2017). The ignition delay characteristics of nine neat alternative
fuels and six blends were investigated using a high-pressure shock tube
under the preignition temperatures of 1047e1520K, compressed pressures
of 2.07e8.27 atm, and equivalence ratios of 0.42e2.19 (Zhu et al., 2015).
It was shown that the fuels tested showed similar orders of magnitude of
ignition delay data, with all isoparaffin fuels and conventional jet fuels
showing similar ignition delay times. However, the ATJ fuels display lower
reactivity than JP-8 at 3 atm, as shown in Fig. 4.14A. The GEVO ATJ is
less reactive than Swedish BioJet fuel at higher temperature. At elevated
pressure of 6 atm, the differences in reactivity among the alternative fuels
and JP-8 are less pronounced, as shown in Fig. 4.14B.
4.5.2 Derived cetane number
The indicator used to describe the ignition characteristics of diesel fuel in
compression ignition engine is known as cetane number (CN). Higher
value of CN indicates higher reactivity and autoignition tendency under
diesel-relevant conditions, which implies better combustion performance.
208
Biojet Fuel in Aviation Applications
Figure 4.14 Comparison of ignition delay time for alternative fuels in air at (A) 3 atm
and (B) 6 atm and f ¼ 1.0 (Zhu et al., 2015).
The DCN is another method that has been developed to characterize the
autoignition reactivity of liquid fuel based on pressure trace. At present,
there are three ASTM-approved devices and procedures to derive the
DCN values, which are the fuel ignition tester (FIT), ignition quality tester
(IQT), and cetane ignition delay (CID) based on the respective approved
ASTM standard of D7170 (ASTM, 2016b), D6890 (ASTM, 2016a) and
D7668 (ASTM, 2017). These methods employ a constant volume combustion chamber to measure the ignition delay time of the fuel injected at
designated standard conditions of pressure (2.4 MPa for FIT, 2.137 MPa for
IQT) and temperature (545K for IQT, 510K for FIT). The ignition delay
time measured is defined as the time interval from injection of the fuel to
the start of ignition, taking into account the process of spray injection,
vaporization, mixing with oxidizer, and reaction. The DCN value is then
calculated based on an empirical correlation using the ignition delay time
(IDT), via the equation DCN ¼ 4.460 þ 186.6/IDT (ASTM, 2016a). The
DCN is inversely proportional to ignition delay time. Similar to CN,
higher DCN value implies shorter ignition delay time and better autoignition propensity.
Table 4.5 shows the DCN values of conventional jet fuel and alternative
jet fuels measured using different standards. It can be seen that the measured
DCN shows a wide spectrum of ignition reactivity for the fuels. Fossilbased jet fuel (Jet A) shows minor difference in the DCN values (47e49)
measured using different methods. One should note that the DCN values
Combustion performance of biojet fuels
209
Table 4.5 Derived cetane number for jet fuel and alternative jet fuels.
FIT, ASTM
IQT, ASTM
CID, ASTM
Fuel
D7170
D6890
D7668
Jet A
Syntroleum S-8s
Shell GTLs
Shell SPKs
Sasol IPKs
Camelina HRJ
Tallow HRJ
Gevo ATJ
Farnesane (2,6,10-trimethyl
dodecane)
49.35
66.50
64.69
e
33.46
60.70
65.85
e
e
47.1
58.7
59.1
58.4
31.28
53.94
58.1
15.5, 18
59.1
47.01
e
e
62.43
31.71
59.77
e
18.24
e
Data are compiled from Hui et al. (2012), Dooley et al. (2012a), Bessee et al. (2011), Won et al. (2013,
2014), Zhu et al. (2015), Dickerson et al. (2015), Kang et al. (2019b).
vary according to the method used. FT fuels generally show higher DCN
value than conventional jet fuels except for Sasol IPK. The FT fuels of S-8,
Shell GTL, and Shell SPK exhibit a DCN value between 58 and 67, but the
Sasol IPK shows a significantly lower DCN value of 31e33 compared with
Jet A due to the presence of branched alkanes, which are less reactive. In
spite of the lower DCN value, the measured ignition delay time is comparable to conventional jet fuel (Zhu et al., 2015). Farnesane (2,6,10trimethyl dodecane) shows a comparable DCN value (59.1) as those of
FT-SPK fuels (Won et al., 2014). Interestingly, HEFA-based synthetic jet
fuels show similar DCN values as FT fuels, which is within the range of
58e67, but the ATJ-SPK developed by GEVO showed a significantly
lower DCN value of 15e19. One might expect the ignition delay characteristic to be impacted due to the stark difference in DCN, but experimental measurements have shown that GEVO ATJ-SPK exhibited similar
ignition delay trend as regular jet fuel (Flora et al., 2017; Zhu et al., 2015).
The similar ignition delay characteristics of GEVO ATJ and Sasol IPK with
conventional jet fuel despite having lower DCN values indicates that DCN
value alone is insufficient to characterize the reactivity of the fuels. The
DCN value for alternative jet fuel blends can be estimated based on the
percentage of blend fraction of synthetic jet fuel, as previous studies have
shown a fairly linear relationship between the DCN values and synthetic jet
fuel volume fraction in the binary fuel blend (Zhu et al., 2015).
210
Biojet Fuel in Aviation Applications
4.5.3 Laminar flame speed
Laminar flame speed is defined as the propagation rate of the normal flame
front relative to the unburned mixture. It is an important property for a
premixed flame as it embodies the fundamental information of diffusivity,
reactivity, and exothermicity of the combustible hydrocarbon mixture.
Laminar flame speeds are also practical building blocks for understanding
fuel behavior in devices that operate via mixture deflagration. On a practical
level, laminar flame speed is related to the burning rate in the combustor,
which can affect the combustion efficiency and exhaust emissions. Values
for laminar flame speeds can be used directly in turbulent combustion
models, or indirectly as validation targets for chemical kinetic models.
Measurement of the laminar flame speeds of FT fuel (S-8) and conventional Jet A has been performed by Kumar et al. (2011) via the use of a
counterflow twin-flame configuration at elevated preheated temperatures
of 400e470K and f ¼ 0.7e1.4. From the plot of stretched laminar flame
speed as a function of stretch rate, they applied a linear extrapolation
technique to derive the unstretched laminar flame speed. Results indicate
that the Jet A and FT fuel exhibit similar flame speeds across the equivalence ratios tested. The same group later extended the study to investigate
the laminar flame speeds at elevated pressure of 1e3 atm, with result
showing that S-8 has the same laminar flame speed characteristics as Jet A
across fuel-lean and fuel-rich regions (Hui and Sung, 2013). Mze-Ahmed
et al. (2012) measured the laminar flame speeds of CTL-FT fuel and Jet A-1
using the cone angle method. The measurements were performed at 473K
and pressures of 1 and 3 atm at the equivalence ratios of 0.95e1.30. The
measured flame speeds for CTL-FT fuel are close to Jet A-1 at atmospheric
pressure.
Wang et al. (2018) studied the laminar flame speed of GTL-FT fuel/air/
diluent in a spherical vessel over a wide range of temperatures of
490e610K, pressures of 0.5e3.2 atm, f ¼ 0.7e1.2, and two different
diluent concentrations of 5% and 10%. A mixture of 32% isooctane, 25%
n-decane, and 43% n-dodecane by volume was used as a surrogate to
represent GTL fuel. The laminar flame speed decreases with the increase of
pressure but increases with increasing preheated temperatures. Hwang et al.
(2020) measured the laminar flame speeds of two types of alternative jet fuel
using the Bunsen flame method at elevated temperature of 550K and
atmospheric pressure. The tested synthetic jet fuels were synthesized
cyclohydrocarbons derived via chemical reactions from crude oilederived
Combustion performance of biojet fuels
211
chemicals. It is noted that the fuels tested were not conforming to the
ASTM D7566 standards, as the properties (e.g., density) deviate from the
batch property specification as required by the synthetic jet fuel. The
measured peak laminar burning velocities for the alternative jet fuels are
higher than Jet A-1, but the flame speeds at fuel-lean region are comparatively lower.
Vukadinovic et al. (2012) measured the laminar burning velocity of
GTL-FT fuel using a spherical bomb method. By imaging the spherical
expanding flame in a constant volume chamber, information of the
propagation rate of the flame kernel with different stretch rate can be
obtained. The unstretched burning velocity can be obtained by extrapolating back to zero stretch rate. Result shows that the laminar flame speed of
GTL and GTL blend with aromatics have similar values as Jet A-1. Kick
et al. (2012) utilized the cone-angle method of Bunsen flame to derive the
laminar flame speed of FT-SPK, CTL-FT, and blends. Fig. 4.15A shows
the example of premixed conical flame established using GTL fuel at
f ¼ 1.2. The flame speed is derived from the cone angle and the velocity of
the unburned gas based on the nozzle diameter and volumetric flow rate,
Su ¼ Vu sin a, as illustrated in Fig. 4.15B. Among the fuels tested, no
discernible difference in flame speed was observed, but the comparison with
Jet A-1 shows some deviation at f < 1.1, where the synthetic jet fuel
velocities are lower than Jet A-1.
Munzar et al. (2014) showed the laminar flame speed is sensitive to the
blend ratio of HEFA with Jet A-1. In their study, they utilized a jet stagnation flame method to derive the flame speed for HEFA/Jet fuel blends of
Figure 4.15 (A) Premixed conical flame used to obtain the laminar flame speed of
GTL/air established at f ¼ 1.2. (B) Cone angle method used to derive the flame speed
(Kick et al., 2012).
212
Biojet Fuel in Aviation Applications
Laminar Flame Speed (cm/s)
different ratios at preheat temperature of 400K and atmospheric pressure.
The 20% camelinaeHEFA blend with Jet A-1 showed similar flame speed
trend as Jet A-1, but 50% camelinaeHEFA blend showed slightly higher
reactivity across all equivalence ratios. Similar blend fractions of 20% and
50% of Jatropha HEFA with Jet A-1 showed lower flame speed at fuel-lean
and fuel-rich regions, but the stoichiometric flame speed for the blends is
slightly higher. Hui et al. (2012) compared the laminar flame speeds of FT
fuels and HEFA with Jet A derived at 400 and 470K as a function of
equivalence ratios. The flame speeds of alternative jet fuels are quite similar
to Jet A, regardless of the preheating temperatures and equivalence ratios
tested owing to the similar heat of combustion. The increase in preheat
temperature results in the increase of laminar flame speeds by about 30% for
all fuels.
Fig. 4.16 shows the comparison of atmospheric laminar flame speeds of
several alternative jet fuels derived at the preheat temperature of 470e473K
with conventional jet fuel. The laminar flame speeds for Jet A-1 are found
to be quite different, which can be attributed to the differences in experimental techniques and the associated uncertainties in measurements and
extrapolation methods used by different research group. Larger discrepancies in flame speed can be observed on the fuel-rich side for Jet A-1, but
most alternative jet fuels are measured within the jet fuel band. Within each
100
95
90
85
80
75
70
65
60
55
50
45
40
Jet A - 470K (Hui et al.)
IPK - 470K (Hui et al.)
HRJ - 470K (Hui et al.)
GTL - 473K (Kick et al.)
CTL - 473K (Kick et al.)
Jet A-1 - 473K (Kick et al.)
Jet A-1 - 473K (Vukadinovic et al.)
GTL - 473K (Vukadinovic et al.)
GTL+Aromatics - 473K (Vukadinovic et al.)
0.6
0.7
0.8
0.9
1
1.1
1.2
1.3
1.4
1.5
Equivalence Ratio (Φ)
Figure 4.16 Laminar flame speeds of conventional and alternative jet fuels derived at
elevated temperature w470-473K as a function of equivalence ratios (Hui et al., 2012;
Kick et al., 2012; Vukadinovic et al., 2012).
Combustion performance of biojet fuels
213
group of synthetic jet fuel, the measured values are similar and close to
conventional jet fuel, which implies similar reactivity. Laminar flame speed
is known to be strongly dependent on adiabatic flame temperature rather
than fuel composition; thus, the Arrhenius kinetics and heat of combustion
are important factors that influence flame speed. This explains the general
similarity in laminar flame speed characteristic for different alternative jet
fuels due to similar heat of combustion. The peaking flame speed at near
stoichiometric condition for all fuels indicates that heat release is highest at
this condition.
4.5.4 Extinction strain rate
Another combustion property of interest is the flame extinction limit, a
phenomenon that is induced by the incomplete reaction in the flame, or
the nonequidiffusivity of heat and mass in conjunction with the flame
stretch effect manifested by the flow nonuniformity, flame curvature, and
flow-flame unsteadiness. A typical flame configuration used to measure the
flame extinction limit is counterflow twin-flame configuration. Under this
setup, a flat flame is established between two nozzles under a stretched
condition. The extinction of the flame is induced by gradually increasing
the flow rates through the burner nozzles until the flame blows off abruptly.
The maximum axial velocity gradient of the flame just before the flame
blows out is defined as the extinction strain rate, which characterizes the
interaction between characteristic flame/flow time and chemical reaction
time. This parameter is used to describe flame stability and blowout event
under engine operating conditions. There have been some studies conducted on measuring the extinction strain rates of alternative jet fuels.
Hui et al. (2012) compared the extinction characteristics of FT S-8,
Sasol IPK, and camelina HRJ with Jet A. The fuels were first vaporized and
established as flat flame using a twin-flame counterflow burner. Fig. 4.17
shows the result of the extinction stretch rate for the fuels at different
equivalence ratios. It can be seen that the extinction characteristics are
comparable at fuel-lean condition, but some deviation can be noticed at
fuel-rich regions where the HEFA exhibits a higher stretched extinction
than Sasol IPK and S-8, while Jet A shows the least resistant to extinction
with the lowest extinction stretch values. Ji et al. (2011) also showed that
synthetic jet fuels of S-8, Shell GTL, and R-8 are more resistant to
extinction compared with JP-8 for nonpremixed flames established under
opposed flame at 403K and atmospheric pressure. No distinct difference is
214
Biojet Fuel in Aviation Applications
Extinction Stretch Rate (l/s)
450
400
350
300
250
Camelina
IPK
Jet A
S-8
200
150
100
50
0.9
1
1.1
1.2
1.3
1.4
Equivalence Ratio (Φ)
1.5
1.6
Figure 4.17 Extinction stretch rates of Jet A, S-8, IPK, and camelinaeHEFA at 400K as a
function of equivalence ratios (Hui et al., 2012).
shown in the extinction strain rates for S-8, Shell GTL, and R-8 fuel under
nonpremixed flame condition. The same study also showed that premixed
flames for synthetic jet fuels are more resistant to flame extinction than
conventional jet fuel. In general, the lower resistance to flame extinction is
attributable to the presence of aromatics, as the disintegration of the aromatic ring results in lower reactivity compared with aliphatics (Hui et al.,
2012). Higher amount of aromatics will lead to lower extinction strain rate.
4.5.5 Sooting propensity
Evaluation of the sooting tendency of jet fuels can be performed via the
smoke point (SP) measurement, which is a standard specification for
aviation fuels as stated in ASTM D7566. Differing from the PM exhausted
from the engines, the SP measurement represents the fundamental sooting
tendency of a fuel indicative of the balance between soot formation and
oxidation in a nonpremixed flame without the complexity in combustor.
The SP of a fuel is defined as the maximum flame height in milimeters at
which the fuel burns without smoking, which can be measured via a wickfed lamp in accordance with the ASTM D1322 method (ASTM, 2019). In
general, sooting tendency is inversely proportional to SP, where low SP
indicates high sooting tendency and vice versa. The current ASTM D7566
specifies the minimum SP required for the final blend is 25 or 18 mm with
a maximum 3 vol% of naphthalenes, although there is no batch requirement for synthetic jet fuel in neat form. Still, the SP values of alternative jet
Combustion performance of biojet fuels
215
fuels or blends are of practical and scientific interests. Won et al. (2016)
compared the derived smoke point with those of conventional jet fuels, as
shown in Table 4.6. Since the alternative jet fuels contain little or no
aromatic components, the H/C ratio and measured smoke point are
considerably higher than those petroleum-derived jet fuels. Llamas et al.
(2012) showed that the measured smoke point values for biokerosene/Jet
A-1 blends are linearly related with biokerosene fuel fraction up to 20 vol%.
Another method that is commonly used to assess the sooting tendency
of alternative jet fuel is via the use of threshold sooting index (TSI), which is
related to smoke point and molecular structure as defined by Calcote and
Manos (1983) via Eq. (4.4):
MW
TSI ¼ a
þb
(4.4)
SP
where a (mol mm/g) and b (dimensionless) are experimentally determined
constants based on the fuel tested. Larger smoke point indicates lower sooting propensity, which is reflected in lower TSI due to their inverse relationship, thus making the latter a useful parameter to predict the sooting
tendency of alternative jet fuel in practical combustor. The TSI of alternative jet fuels has been determined by some research groups, as shown in
Table 4.6. It can be seen that the TSI may differ greatly for the same
fuel, as the TSI depends upon an accurate determination of the molecular
weight of the fuels, while the coefficients of a and b used are experiment
specific. As expected, conventional jet fuels exhibit highest TSI values,
while the alternative jet fuels show significantly lower TSI values. The
discrepancy in TSI is largely due to the presence of aromatic content in
Table 4.6 Hydrogen/carbon ratio, smoke point and threshold sooting index for
conventional and alternative jet fuels (Won et al., 2013,2016; Dooley et al., 2012a).
Fuel
H/C ratio
Smoke point
TSI
JP-8
Jet A
S-8
SPK
IPK
ATJ
Camelina HRJ
Tallow HRJ
2.02
1.96
2.14
2.24
2.19
2.17
2.20
2.18
24.4
22.1
79.2
84.4
42.5
35.2
59.2
62.1
19.3
21.4
e
9.11
17.3
e
12.0
11.6
216
Biojet Fuel in Aviation Applications
the fuel. Synthetic jet fuel with low aromatic content generally exhibits low
sooting tendency compared with jet fuel (Saffaripour et al., 2011). Han
et al. (2018) investigated sooting propensity of 50% FT-derived biojet
fuel blend via smoke point measurement. The soot emissions were reportedly reduced by half compared with conventional jet fuel. Among the
alternative jet fuels, Sasol IPK has the highest TSI value due to its heavily
branched alkane composition.
The IPK and ATJ show relatively higher sooting tendencies due to the
presence of isoalkane and higher aromatic contents compared with straightchain alkanes such as S8, Shell SPK, and HRJ8 (Kang et al., 2019b). The
soot propensities for different hydrocarbon classes can generally be ranked
as aromatics > cyclic alkanes > branched alkanes > linear alkanes (Calcote
and Manos, 1983). Due to the limitation of smoke point to <45 mm, Won
et al. (2013) utilized a “virtual” smoke point to derive the TSI values of
alternative jet fuels, by extracting the smoke point values that vary in the
blending ratio between a fuel and another fixed chemical component. Xue
et al. (2017) investigated the soot volume fraction of biojet fuel including
FT-SPK, camelinaeHEFA, and ATJ fuels in the nonpremixed flame
configuration at atmospheric condition using laser-induced incandescence
technique. The TSI shows an approximate linear correlation with the
maximum soot volume fraction for all the fuel blends. The sooting propensity of the jet fuels is ranked largely in accordance to the aromatic
contents, where conventional jet fuel > ATJ > FT-SPK > HEFA (Xue
et al., 2019), except ATJ which has lower aromatic content than FT-SPK.
The ATJ fuel has higher sooting propensity due to the presence of heavier
hydrocarbons.
4.5.6 Formulation of surrogates for alternative jet fuels
Practical liquid fuels for use in transportation engines consist of hundreds of
hydrocarbons of different molecular classes. Such complexity and variation
in the fuel composition makes it almost impossible to simulate the fuel
performance using the exact fuel composition, as the computational power
required would be extremely high, not to mention the formidable challenge in developing the exact fuel chemical kinetic mechanism. In view of
the extensive use of computational engine modeling by engine manufacturers to aid in design and test of new engine component from system level
prior to prototype fabrication stage, the ability to predict the engine’s
efficiency and combustion emissions with high level of confidence becomes
Combustion performance of biojet fuels
217
highly critical, as it is directly related to the cost and time of production.
The ability to predict the fuel performance relies largely on the accuracy of
the fuel models, which should be of high fidelity so that the fuel properties
and behaviors can be accurately reflected in different engine operating
conditions. In the case of a newly developed alternative jet fuel, the
combustion performance and emissions must be predicted with high reliability when applied in aviation turbine engine. To overcome the difficulty
of overcomplex fuel components, a surrogate fuel model approach can be
adopted to mimic the behaviors of the target fuel. A surrogate typically
consists of a limited number of hydrocarbons, which are formulated to
emulate the real practical fuel’s thermophysical and chemical properties. A
single component surrogate may not be sufficient to reproduce the reactive
characteristics and is certainly insufficient to represent the varied molecular
classes and carbon distribution of real fuels. Thus, fuel modelers adopt
the multicomponent surrogate approach to capture a broad range of
characteristics, be it under engine operating conditions or fundamental
combustion aspects for a wide range of application. Such approach simplifies the components required and reduces the reactions to manageable
size, so that the computational time frame required for simulation can be
reasonably achievable.
There have been ongoing efforts to design and optimize the surrogates
for conventional jet fuel, as they play an important role in aero engine
development. The ability to predict the engine’s performance and combustion characteristics accurately can significantly cut down the cost and
production time. This can be extended to the development of alternative
jet fuel, where surrogates can provide a screening process by reducing the
number of large-scale rig or engine tests required for testing and certifying a
candidate jet fuel. Much effort has been devoted to study the surrogates for
alternative jet fuels since the introduction of drop-in alternative jet fuels.
Some of the recent developments of surrogates for alternative jet fuels are
shown in Table 4.7. It can be seen that the surrogates developed varied in
terms of composition and validation targets, even for the same target fuel.
This is due to the different strategies adopted to develop fuel surrogates,
including the use of distillation curve analysis, chemical structure-based
modeling method, and the physical and combustion properties matching
method. Although the primary aim of jet fuel surrogate is to simulate the
fuel oxidation chemistry to reflect the combustion kinetics, the ability of
218
Biojet Fuel in Aviation Applications
Table 4.7 List of surrogates developed for alternative jet fuels.
Target
Validation
fuel
Surrogate fuels
targets
S-8
S-8
S-8
S-8
Shell
GTL
S-8
n-Nonane/2,6dimethyloctane/
3-methyldecane/n-tridecane/
n-tetradecane/
n-pentadecane/n-hexadecane
0.03/0.28/0.34/0.13/0.20/
0.015/0.005 (by mol)
n-Decane/i-octane 0.6/0.4
(by vol)
Isooctane/n-decane 80/20
(by vol)
4-Methyloctane/
2,5-dimethylnonane/
2,3,5-trimethyldecane/
n-tridecane/n-pentadecane
0.105/0.281/0.164/0.227/
0.223 (by mol)
Isooctane/n-decane/
n-dodecane 28/61/11
(by mol)
Isooctane/n-decane/
n-dodecane 32/25/43
(by mol)
S-8
n-Dodecane/isooctane
51.9/48.1 (by mol)
GTL
FT
n-Decane/isooctane/
n-propylcyclohexane
0.58/0.33/0.09 (by mol)
CTL
FT
n-Decane/n-dodecane/
n-tetradecane/isooctane/
methylcyclohexane 0.026/
0.603/0.229/0.117/0.025
(by mol)
References
Distillation
curve
Huber et al.
(2008)
Autoignition
delay time and
species profile
Ignition delay
time
Distillation
curve
Mawid (2007)
Autoignition
temperature,
laminar flame
speed,
extinction strain
rate, NOx
emissions
Species profiles,
ignition delay
time, extinction
limit of
diffusion flame
Species profiles,
ignition delay
time, laminar
flame speed
Droplet SMD,
CO, and NOx
emissions
Gokulakrishnan
et al. (2008)
Huber et al.
(2011)
Naik et al.
(2011)
Dooley et al.
(2012b)
Dagaut et al.
(2014)
Xu et al. (2017)
Combustion performance of biojet fuels
Table 4.7 List of surrogates developed for alternative jet fuels.dcont’d
Target
fuel
IPK
S-8
CHCJ
IPK
IPK
S-8
Surrogate fuels
n-Dodecane/isocetane/
isooctane/decalin
0.1416/0.3141/0.4016/
0.1427 (by vol)
n-Dodecane/n-decane/
isocetane/isooctane
0.3073/0.4234/0.2309/
0.0384 (by vol)
n-Butylcyclohexane
n-Butylbenzene/n-dodecane
0.64/0.36 (by mol)
n-Butylcyclohexane/nbutylbenzene/n-dodecane
0.104/0.582/0.314 (by mol),
0.246/0.508/0.246 (by mol),
0.453/0.396/0.151 (by mol)
n-Dodecane/isocetane/
isooctane/decalin/2,2,4,6,6pentamethylheptane 16.91/
7.38/23.2/10.89/41.63 (by
vol)
n-Dodecane/isooctane/
decalin/2,2,4,6,6pentamethylheptane 18.03/
19.77/11.71/50.49 (by vol)
n-Dodecane/isocetane/
isooctane/decalin
0.1416/0.3141/0.4016/
0.1427 (by vol)
n-Dodecane/n-decane/
isocetane/isooctane 0.3073/
0.4234/0.2309/0.0384
(by vol)
Validation
targets
References
Ignition delay
time
Kim et al.
(2017)
Burn duration
in crank angle
degrees, crank
angle degree
location where
50% of the fuel
has burned,
maximum rate
of heat release,
engine thermal
efficiency,
ignition delay
Density,
distillation
curve, ignition
delay time
Prak et al.,
2017
CO emissions,
heat release rate,
ignition delay,
threshold
sooting index
Kim and Violi
(2018)
Kang et al.
(2019a)
219
220
Biojet Fuel in Aviation Applications
the surrogate to reflect the physical properties is also important as it is
related to the spray atomization process in the aviation turbine engine
(Slavinskaya et al., 2010).
The synthetic jet fuel of derived from natural gas (S-8) is the most
investigated target fuel for surrogate fuel formulation. Huber et al. (2008)
developed a seven-component surrogate to represent the thermophysical
properties of natural gasederived synthetic jet fuel, S-8. The surrogate is
able to match the experimental data to within 1%. The overall shape of the
distillation curve is primarily governed by the four major components, i.e.,
2,6-dimethyloctane, 3-methyldecane, n-tridecane, and n-tetradecane,
while the presence of n-nonane and n-hexadecane in small amount reflects
the initial boiling behavior and the tail of the distillation curve. They later
demonstrated the concept of dynamic data evaluation within the NIST
ThermoData Engine to generate equations of state (EOS) on demand to
develop a surrogate for synthetic fuel derived from biomass (Huber et al.,
2011). A five-component S-8 surrogate was shown to provide a good
match with the distillation curve of S-8 to within 0.1% accuracy. Gokulakrishnan et al. (2008) developed a surrogate for S8 that consists of 80% vol
isooctane and 20% n-decane to represent the content of isoparaffins and nparaffins, respectively. The surrogate model was able to predict the ignition
characteristic of the fuel reasonably well, partly due to the simplicity of the
component in the synthetic fuel that could be sufficiently represented with
a two-component surrogate. The result also showed that the NTC region
between 700 and 900K is sensitive to the presence of isoparaffins to within
two orders of magnitude. From the ignition characteristic evaluation, the
two-component surrogate for S-8 (n-decane and isooctane) developed by
Mawid (2007) was shown to have higher reactivity compared with the
surrogates of JP-8. Naik et al. (2011) developed a high-temperature
(>1000K) reaction mechanism for the surrogates of Shell GTL and S-8
using three basic components of isooctane/n-decane/n-dodecane of
different ratios. The surrogates were intended to emulate not only the
combustion and emissions characteristics for high-temperature chemical
kinetics relevant to jet engine combustion but also the physical and
chemical properties of the target fuels. The method used to construct the
mechanism was done in steps, where the single mechanism containing the
surrogate components was first assembled using a surrogate blend optimizer
software, followed by the addition of NOx and PAH submechanisms.
Finally, the accuracy of the mechanism was optimized by applying the rate
rules. Validation of the mechanism of surrogates against fundamental
Combustion performance of biojet fuels
221
properties including laminar flame speeds and extinction rates with good
agreement was achieved. Furthermore, the mechanisms were validated
against premixed stretched flames and was used to predict the NOx emissions, but the sooting characteristics have not been validated.
Dooley et al. (2012b) proposed a surrogate for S-8 that consists of
n-dodecane and isooctane. The surrogate fuel matches the target fuel of S-8
from the aspects of H/C ratio and DCN, but the mixture averaged
molecular weight number is slightly mismatched due to the heavier
n-dodecane. The surrogate fuel is validated via the measurements of flow
reactor oxidation, shock tube ignition delay, and diffusion flame strained
extinction with good agreement, indicating the reactivity of the S-8 is
sufficiently emulated. Dagaut et al. (2014) proposed a three-component
surrogate for GTL-FT that consists of n-decane, isooctane (2,2,4trimethyl pentane), and n-propylcyclohexane. The surrogate was formulated in accordance with the chemical composition of the fuel determined
quantitatively and was used to simulate the oxidation kinetics, laminar
flame speed, and autoignition delay time. Comparison against the experimental data shows that the surrogate is able to predict the species profiles
and laminar flame speed accurately, but the calculated ignition delay time is
slightly larger than the measurements. The measured ignition delay time for
GTL-surrogate showed similar trend as those of GTL fuel. Kim et al. (2017)
used the surrogate optimizing method to derive the surrogate fuels for FT
fuels of Sasol IPK and S-8. The method uses models and correlations to
estimate the various chemical and physical properties of the HC mixtures to
determine the surrogate compositions that best fit the target fuel properties.
The cycloalkane contents in IPK and S-8 are emulated using their
respective surrogates. Apart from emulating the chemical and physical
properties critical to spray and ignition behavior, the DCN of the surrogates
matched the values determined experimentally. The surrogates were able
to capture the trends shown experimentally, especially in the hightemperature regime. Kim and Violi (2018) utilized the surrogate optimizer model to identify the suitable components for IPK synthetic fuel.
Two surrogates (four- and five-component) with substantial amount of
branched alkane (2,2,4,6,6-pentamethylheptane) was shown to provide
a good match with the densities and distillation curves. The ignition
characteristics were also better represented, especially in the low temperature region.
222
Biojet Fuel in Aviation Applications
Xu et al. (2017) utilized hybrid mixing model based on explicit equations and artificial neural network (ANN) to develop a surrogate jet fuel for
CTL-FT fuel. The ANN model is used to predict the physical properties of
the surrogate mixtures, while the thermo and chemical properties are
estimated using three linear equations. The formulated five-component
surrogate was able to match the target physicochemical properties to
within 4.6%. Measurements of the spray droplet size show that the surrogate fuel was able to reflect the droplet SMD of FT fuel. The emissions of
CO between the surrogate and FT fuel are quite similar, but the NOx
emissions for surrogate are slightly higher. Prak et al., 2017 formulated
five different surrogates with one to three components to represent the
properties of catalytic hydrothermal conversion jet (CHCJ) fuel. The
formulation was done by matching the physical properties with CHCJ,
including the density, kinematic viscosity, speed of sound, bulk modulus,
surface tension, flash point, and derived cetane number. They validated
the surrogates using data obtained from engine operating conditions. It is
clear that validation of the surrogates requires extensive validations, from
fuel’s physicochemical properties, fundamental combustion properties to
system-level engine data. To develop reliable surrogates for alternative jet
fuels, more experimental efforts are needed to provide data for target
validations.
4.6 Summary
The rigorous jet fuel certification process consists of fuel tests of physicochemical properties, rig and component tests, engine tests, and flight tests.
This chapter reviews some of the combustion tests of alternative jet fuels
needed to fulfill the requirements for certification. Due to regulatory
requirement, the produced alternative jet fuel must be “drop-in” in nature,
so that it can be blended in certain limits with conventional fuel and used as
operating fuel without compromising flight safety. Since the establishment
of ASTM D7566, more emerging technologies have shown the capability
to produce alternative jet fuels with different compositions. Substitution of
the jet fuel with alternative jet fuels requires comprehensive knowledge of
the physicochemical properties and combustion characteristics of alternative
jet fuel. This leads to the interest in continuously refining the fuel certification program to streamline the required tests as to better understand the
impact of fuel properties on combustor performance. Component and rig
tests of alterative jet fuels are usually carried out in facilities dedicated for
Combustion performance of biojet fuels
223
specific tests such as spray atomization, ignition, flame blowout, and
emissions tests, even though there are no standardized practices and procedures. The component tests can be complemented with fundamental
combustion data set to gain better understanding on the fuel chemistry
effects. Fundamental flame studies including ignition delay time, laminar
flame speeds, extinction limits, and fuel chemical kinetics study are related
to engine performance such as altitude relight, flame propagation, lean
blowout, and engine emissions. The fundamental combustion data can
serve as validation targets for surrogate fuel models. There are several surrogate fuel models developed for alternative jet fuels with reasonably well
validation achieved. The high fidelity of the surrogate fuel model is
important to ensure the accuracy of combustion modeling and development of predictive tool. Thus, further studies on alternative jet fuel combustion are required for a better understanding of fuel oxidation chemistry
and comprehensive surrogate models with a wider range of predictability.
To achieve the goal of sustainable and green aviation, development of lowcarbon alternative jet fuel requires thorough screening, characterization,
and rigorous testings, as well as the validated fuel models that can be used
for modeling and predicting the engine performance. The combination of
fundamental combustion research and rig tests is essential to facilitate the
development of alternative jet fuel and aid in the design of advanced aero
engine and related aviation infrastructure.
References
AIR6241, 2013. Procedure for the Continuous Sampling and Measurement of Nonvolatile
Particle Emissions from Aircraft Turbine Engines, SAE Aerospace Information Report
(AIR).
Airportwatch, 2012. Etihad Airways Operates First Biofuel (Recycled Cooking Oil)
Powered Delivery Flight. https://www.airportwatch.org.uk/2012/01/next-stop-forlong-haul-airlines-set-a-course-to-the-east/.
Allen, C., Toulson, E., Edwards, T., Lee, T., 2012. Application of a novel charge preparation approach to testing the autoignition characteristics of JP-8 and camelina
hydroprocessed renewable jet fuel in a rapid compression machine. Combust. Flame
159, 2780e2788.
Altaher, M.A., Li, H., Blakey, S., Chung, W., 2014. NMHC and VOC speciation of the
exhaust gas from a gas turbine engine using alternative, renewable and conventional jet
A-1 aviation fuels. In: Proceedings of ASME Turbo Expo 2014: Turbine Technical
Conference and Exposition, Düsseldorf, Germany, GT2014e25445.
ANA, 2012. The World’s First Trans-atlantic Flight Using Biofuels. https://www.ana.co.jp/
eng/aboutana/corporate/csr/stakeholders/environment/biofuel.html.
224
Biojet Fuel in Aviation Applications
Askari, O., Elia, M., Ferrari, M., Metghalchi, H., 2017. Auto-ignition characteristics study of
gas-to-liquid fuel at high pressures and low temperatures. J. Energy Resour. Technol.
139, 012204e1e6.
ASTM, 2016. ASTM D7170e16. Standard Test Method for Determination of Derived
Cetane Number (DCN) of Diesel Fuel OilsdFixed Range Injection Period, Constant
Volume Combustion Chamber Method. ASTM International.
ASTM, 2018. ASTM D6890e18. Standard Test Method for Determination of Ignition
Delay and Derived Cetane Number (DCN) of Diesel Fuel Oils by Combustion in a
Constant Volume Chamber. ASTM International.
ASTM, 2017. ASTM D7668-17. Standard Test Method for Determination of Derived
Cetane Number (DCN) of Diesel Fuel OilsdIgnition Delay and Combustion Delay
Using a Constant Volume Combustion Chamber Method. ASTM International.
ASTM, 2019. ASTM D1322e19, Standard Test Method for Smoke Point of Kerosene and
Aviation Turbine Fuel. ASTM International.
GE Aviation, 2009. Continental Airlines Flight Demonstrates Use of Sustainable Biofuels as
Energy Source for Jet Travel. https://www.geaviation.com/press-release/jv-archive/
continental-airlines-flight-demonstrates-use-sustainable-biofuels-energy.
Bachmaier, F., Eberius, K.H., Just, T., 1973. The formation of nitric oxide and the detection
of HCN in premixed hydrocarbon-air flames at 1 atmosphere. Combust. Sci. Technol.
7 (2), 77e84.
Bessee, G.B., Hutzler, S.A., Wilson, G.R., 2011. Propulsion and Power Rapid Response
Research and Development (R&D) Support. Delivery Order 0011: Analysis of Synthetic Aviation Fuels. DTIC Document.
Biofuels Digest, 2011. Interjet, Airbus Complete Jatropha Aviation Biofuels Trial in Mexico.
https://www.biofuelsdigest.com/bdigest/2011/04/04/interjet-airbus-completejatropha-aviation-biofuels-trial-in-mexico/.
Boeing, 2019. Boeing Pilots the Birth of Biofuel for Aviation’s Sustainable Growth. https://
www.boeing.com/features/innovation-quarterly/2019_q3/btj-sustainability.page.
Bokhart, A.J., Shin, D., Gejji, R., Buschhagen, T., Naik, S.V., Lucht, R.P., 2017. Spray
measurements at elevated pressures and temperatures using phase Doppler anemometry.
In: AIAA SciTech Forum, 55th AIAA Aerospace Sciences Meeting, Grapevine, Texas,
2017. https://doi.org/10.2514/6.2017-0828.
Braun-Unkhoff, M., Riedel, U., Wahl, C., 2017. About the emissions of alternative jet
fuels. CEAS Aeronaut. J. 8, 167e180.
Breaking Travel News, 2015. Hainan Airlines brings first commercial biofuel flight to
China. https://www.breakingtravelnews.com/news/article/hainan-airlines-brings-firstcommercial-biofuel-flight-to-china.
Burger, V., Yates, A., Viljoen, C., 2012. Influence of fuel physical properties and reaction
rate on threshold heterogeneous gas turbine combustion. In: Proceedings of the ASME
Turbo expo. Copenhagen, GT2012e68153.
Buffi, M., Valera-Medina, A., Marsh, R., Pugh, D., Giles, A., Runyon, J., Chiaramonti, D.,
2017. Emissions characterization tests for hydrotreated renewavle jet fuel from used
cooking oil and its blends. Appl. Energy 201, 84e93.
Burger, V., Mosbach, T., Yates, A., Gunasekaran, B., 2014. Fuel influence on targeted gas
turbine combustion properties part II: detailed results. In: Proceedings of ASME Turbo
Expo. Düsseldorf, GT2014e25105.
Calcote, H., Manos, D., 1983. Effect of molecular structure on incipient soot formation.
Combust. Flame 49, 289e304.
Chan, T.W., Chishty, W.A., Canteenwalla, P., Buote, D., Davison, C.R., 2016. Characterization of emissions from the use of alternative aviation fuels. J. Eng. Gas Turbines
Power 138, 011506e1e9.
Combustion performance of biojet fuels
225
China Daily, 2011. Air China Conducts First Biofuel Test Flight. www.chinadaily.com.cn/
china/2011-10/28/content_13998217.htm.
China Daily, 2013. China Eastern Tests Flight Using Biofuel. http://www.chinadaily.com.
cn/business/2013-04/25/content_16447065.htm.
Corporan, E., DeWitt, M.J., Belovich, V., Pawlik, R., Lynch, A.C., Gord, J.R.,
Meyer, T.R., 2007. Emissions characteristics of a turbine engine and research combustor
burning a Fischer-Tropsch jet fuel. Energy Fuels 21, 2615e2626.
Dagaut, P., Karsenty, F., Dayma, G., Diévart, P., Hadj-Ali, K., Mzé-Ahmed, A., et al.,
2014. Experimental and detailed kinetic model for the oxidation of a Gas to Liquid
(GtL) jet fuel. Combust. Flame 161, 835e847.
Dickerson, T., McDaniel, A., Williams, S., Luning-Prak, D., Hamilton, L., Bermudez, E.,
Cowart, J., 2015. Start-up and steady-state performance of a new renewable alcohol-tojet (ATJ) fuel in multiple diesel engines. In: SAE Pap. 2015, Paper No. 2015-01-0901.
Digest, B., 2012. The Airlines: Who’s Doing what in Aviation Biofuels? https://www.
biofuelsdigest.com/bdigest/2015/10/19/the-airlines-whos-doing-what-in-aviationbiofuels/4/.
Dooley, S., Won, S.H., Heyne, J., Farouk, T.I., Ju, Y., Dryer, F., et al., 2012a. The
experimental evaluation of a methodology for surrogate fuel formulation to emulate gas
phase combustion kinetic phenomena. Combust. Flame 159, 1444e1466.
Dooley, S., Won, S.H., Jahangirian, S., Ju, Y., Dryer, F., Wang, H., Oehlschlaeger, M.A.,
2012b. The combustion kinetics of a synthetic paraffinic jet aviation fuel and a
fundamentally formulated, experimentally validated surrogate fuel. Combust. Flame
159, 3014e3020.
EASA, 2019. European Aviation Environmental Report. https://www.easa.europa.eu/eaer/.
Edwards, T., Moses, C., Dryer, F., 2010. Evaluation of combustion performance of alternative aviation fuels. In: 46th AIAA/ASME/SAE/ASEE Joint Propulsion Conference &
Exhibit, Nashville, TN, 2010, AIAA 2010-7155.
Express, 2008. Air New Zealand Biofuel Flight Test. https://www.express.co.uk/news/
world/77677/Air-New-Zealand-biofuel-flight-test.
FAA, 2016. Federal Aviation Administration, Swedish Biofuel Performance Evaluation,
Report no.: DOT/FAA/AEE/2016-05, 2016.
Fenimore, C.P., 1971. Formation of nitric oxide in premixed hydrocarbon flames. Symp.
(Intl.) Combust. 13, 373e380.
Flora, G., Balagurunathan, J., Saxena, S., Cain, J.P., Kahandawala, M.S.P., DeWitt, M.J.,
et al., 2017. Chemical ignition delay of candidate drop-in replacement jet fuels under
fuel-lean conditions: a shock tube study. Fuel 209, 457e472.
Fyffe, D., Moran, J., Kannaiyan, K., Al-Sharshani, A., Sadr, R., 2011. Effect of GTL-like jet
fuel composition on gt engine altitude ignition performance: Part Idcombustor
operability. In: Proceedings of the ASME Turbo Expo. Vancouver, GT2011e45487.
Gawron, B., Bialecki, T., 2018. Impact of a Jet A-1/HEFA blend on the performance and
emission characteristics of a miniature turbojet engine. Int. J. Environ. Sci. Technol. 15,
1501e1508.
Gokulakrishnan, P., Klassen, M.S., Roby, R.J., 2008. Ignition characteristics of a fischertropsch synthetic jet fuel. In: Proceedings of ASME Turbo Expo 2008: Power for
Land, Sea and Air, Berlin, Germany, GT2008e51211, pp. 1e9.
Greenair, 2008. Biofuelled Virgin Boeing 747 Takes to the Skies on Pioneering First Flight.
https://www.greenaironline.com/news.php?viewStory¼116.
Greenair, 2009. Qatar Airways Undertakes First Commercial Passenger Flight Powered by
a Natural Gas Blended Jet Fuel. https://www.greenaironline.com/news.php?
viewStory¼624.
226
Biojet Fuel in Aviation Applications
Greenaironline, 2014. Boeing’s Latest 777F ecoDemonstrator Flight Programme Tests 100%
Biofuel Use and Turbulence Detection on GreenAir Online. https://www.greenaironline.
com/news.php?viewStory¼2462.
Gulfnews, 2019. Etihad Flies World’s First Commercial Flight Using UAE-Made Fuel from
Plants. https://gulfnews.com/business/aviation/etihad-flies-worlds-first-commercialflight-using-uae-made-fuel-from-plants-1.1547634775232.
Han, H.S., Kim, C.J., Cho, C.H., Sohn, C.H., Han, J., 2018. Ignition delay time and
sooting propensity of a kerosene aviation jet fuel and its derivative blended with a biojet fuel. Fuel 232, 724e728.
Hermann, F., Hedemalm, P., Orbay, R., Gabrielsson, R., Klingmann, J., 2005. Comparison
of combustion properties between a synthetic jet fuel and conventional Jet A-1. In:
Proceedings of ASME Turbo Expo. Nevada, GT2005e68540.
Huang, C.-S., Vander Wal, R.L., 2013. Effect of soot structure evolution from commercial
jet engine burning petroleum based JP-8 and synthetic HRJ and FT fuels. Energy Fuels
27, 4946e4958.
Huber, M.L., Smith, B.L., Ott, S., Bruno, T.J., 2008. Surrogate mixture model for the
thermophysical properties of synthetic aviation fuel S-8: explicit application of the
advanced distillation curve. Energy Fuels 22, 1104e1114.
Huber, M.L., Bruno, T.J., Chirico, R.D., Diky, V., Kazakov, A.F., Lemmon, E.W., et al.,
2011. Equations of state on demand: application for surrogate fuel development. Int. J.
Thermophys. 32, 596e613.
Hui, X., Sung, C.-J., 2013. Laminar flame speeds of transportation-relevant hydrocarbons
and jet fuels at elevated temperatures and pressures. Fuel 109, 191e200.
Hui, X., Kumar, K., Sung, C.-J., Edwards, T., Gardner, D., 2012. Experimental studies on
the combustion characteristics of alternative jet fuels. Fuel 98, 176e182.
Hwang, B.J., Kang, S., Lee, H.J., Min, S., 2020. Measurement of laminar burning velocity
of high performance alternative aviation fuels. Fuel 261, 116466.
IATA, 2015. IATA Sustainable Aviation Fuel Roadmap. IATA.
IATA, 2020. What Is SAF. IATA. https://www.iata.org/contentassets/d13875e9ed78
4f75bac90f000760e998/saf-what-is-saf.pdf.
ICAO, 2017. Local Air Quality. https://www.icao.int/environmental-protection/Pages/
local-air-quality.aspx.
ICAO, 2018. Sustainable Aviation Fuels Guide. https://www.icao.int/environmentalprotection/Documents/Sustainable%20Aviation%20Fuels%20Guide_100519.pdf.
Indiatimes, 2018. SpiceJet Operates India’s First Biofuel-Powered Flight from Dehradun to
Delhi. https://indianexpress.com/article/business/aviation/spicejet-operates-indias-firstbiofuel-powered-flight-5326913/.
Jacob, S.D., Rindlisbacher, T., 2019. The Landing and Take-Off Particulate Matter Standards
for Aircraft Gas Turbine Engines, Chapter 3, Local Air Quality. https://www.icao.int/
environmental-protection/Documents/EnvironmentalReports/2019/ENVReport2019_
pg100-105.pdf.
Ji, C., Wang, Y.L., Egolfopoulos, F.N., 2011. Flame studies of conventional and alternative
jet fuels. J. Propul. Power 27 (4), 856e863.
Jürgens, S., Oßwald, P., Selink, M., Piermartini, P., Schwab, J., Pfeifer, P., et al., 2019.
Assessment of combustion properties of non-hydroprocessed Fischer-Tropsch fuels for
aviation. Fuel Process. Technol. 193, 232e243.
Kahandawala, M.S.P., DeWitt, M.J., Corporan, E., Sidhu, S.S., 2008. Ignition and emission
characteristics of surrogate and practical jet fuels. Energy Fuels 22, 3673e3679.
Kang, D., Kim, D., Kalaskar, V., Boehman, A., Violi, A., 2019a. Experimental characterization of jet fuels under engine relevant conditions e Part 2: insights on optimization
approach for surrogate formulation. Fuel 239, 1405e1416.
Combustion performance of biojet fuels
227
Kang, D., Kim, D., Kalaskar, V., Violi, A., Boehman, A.L., 2019b. Experimental characterization of jet fuels under engine relevant conditions e Part 1: effect of chemical
composition on autoignition of conventional and alternative jet fuels. Fuel 239,
1388e1404.
Kannaiyan, K., Sadr, R., 2014a. Effect of fuel properties on spray characteristics of
alternative jet fuels using global sizing velocimetry. Atomization Sprays 24 (7),
575e597.
Kannaiyan, K., Sadr, R., 2014b. Experimental investigation of spray characteristics of
alternative aviation fuels. Energy Convers. Manag. 88, 1060e1069.
Kannaiyan, K., Sadr, R., 2020. Macroscopic spray performance of alternative and
conventional jet fuels at non-reacting, elevated ambient conditions. Fuel 266, 117023.
Kick, T., Herbst, J., Kathrotia, T., Marquetand, J., Braun-Unkhoff, M., Naumann, C.,
Riedel, U., 2012. An experimental and modeling study of burning velocities of possible
future synthetic jet fuels. Energy 43, 111e123.
Kim, D., Violi, A., 2018. Hydrocarbons for the next generation of jet fuel surrogates. Fuel
228, 438e444.
Kim, D., Martz, J., Abdul-Nour, A., Yu, X., Jansons, M., Violi, A., 2017. A six-component
surrogate for emulating the physical and chemical characteristics of conventional and
alternative jet fuels and their blends. Combust. Flame 179, 86e94.
Klingshirn, C.D., Dewitt, M., Striebich, R., Anneken, D., Shafer, L., Corporan, E., et al.,
2012. Hydroprocessed renewable jet fuel evaluation, performance, and emissions in a
T63 turbine engine. J. Eng. Gas Turbines Power 134, 051506e1e8.
Kumal, R.R., Liu, J., Gharpure, A., Wal, R.L.V., Kinsey, J.S., Giannelli, B., et al., 2020.
Impact of biofuel blends on black carbon emissions from a gas turbine engine. Energy
Fuels 34, 4958e4966.
Kumar, K., Sung, C.-J., 2010. A comparative experimental study of the autoignition
characteristics of alternative and conventional jet fuel/oxidizer mixtures. Fuel 89,
2853e2863.
Kumar, K., Sung, C.-J., Hui, X., 2011. Laminar flame speeds and extinction limits of
conventional and alternative jet fuels. Fuel 90, 1004e1011.
Kuo, K.K., 2005. Principles of Combustion. John Wiley & Sons, Inc.
Levy, A., 1982. Unresolved problems in SOx, NOx, soot control in combustion. Symp.
(Intl.) Combust. 19 (1), 1223e1242.
Liati, A., Scheriber, D., Alpert, P.A., Liao, Y., Brem, B.T., Corral, A., et al., 2019. Aircraft
soot from conventional fuels and biofuels during ground idle and climb-out conditions:
electron microscopy and X-ray micro-spectroscopy. Environ. Pollut. 247, 658e667.
Lin, Y., Zhang, C., Xu, Q., Sung, C.J., Liu, G., 2012. Evaluation of combustion performance of a coal-derived synthetic jet fuel. In: Proceedings of ASME Turbo Expo.
Copenhagen GT2012e68604.
Link, D.D., Gormley, R.J., Baltrus, J.P., Anderson, R.R., Zandhuis, P.H., 2008. Potential
additives to promote seal swell in synthetic fuels and their effect on thermal stability.
Energy Fuels 22 (2), 1115e1120.
Llamas, A., García-Martínez, M.-J., Al-Lal, A.-M., Canoira, L., Lapuerta, M., 2012.
Biokerosene from coconut and palm kernel oils: production and properties of their
blends with fossil kerosene. Fuel 102, 483e490.
Lobo, P., Hagen, D.E., Whitefield, P.D., 2011. Comparison of PM Emissions from a
commercial jet engine burning conventional, biomass, and Fischer-Tropsch fuels.
Environ. Sci. Technol. 45 (24), 10744e10749.
Lobo, P., Rye, L., Williams, R., Christie, S., Uryga-Bugajska, I., Wilson, C.W., et al., 2012.
Impact of alternative fuels on emissions characteristics of a gas turbine engine Part 1:
gaseous and particulate matter emissions. Energy Fuels 46, 10805e10811.
228
Biojet Fuel in Aviation Applications
Lobo, P., Christie, S., Khandelwal, B., Blakey, S.G., Raper, D.W., 2015a. Evaluation of
non-volatile particulate matter emission characteristics of an aircraft auxiliary power unit
with varying alternative jet fuel blend ratios. Energy Fuels 29, 7705e7711.
Lobo, P., Hagen, D.E., Whitefield, P.D., Rapper, D., 2015b. PM emissions measurements
of in-service commercial aircraft engines during the Delta-Atlanta Hartsfield Study.
Atmos. Environ. 104, 237e245.
Marketwatch, 2011. Biofuel-powered Jet Flies across the Atlantic. https://www.marketwatch.
com/story/biofuel-powered-jet-flies-across-the-atlantic-2011-06-18.
Mawid, M.A., 2007. Development of a detailed chemical kinetic mechanism for JP-8 &
Fisher-Tropsch-Derived synthetic jet fuels. In: 43rd AIAA/ASME/SAE/ASEE Joint
Propulsion Conference and Exhibit, Cincinnati, USA, AIAA 2007-5668.
Min, K., Valco, D., Oldani, A., Lee, T., 2015. An ignition delay study of category a and c
aviation fuel. In: Proceedings of the ASME 2015 International Mechanical Engineering
Congress and Exposition, Houston, Texas, 2015, IMECE2015-51713.
Mosbach, T., Gebel, G.C., Clercq, P.L., Sadr, R., Kannaiyan, K., Al-Sharshani, A., 2011.
Investigation of GTL-like jet fuel composition on GT engine altitude ignition and
combustion performance: Part IIddetailed diagnostics. In: Proceedings of ASME
Turbo Expo. Vancouver, GT2011e45510.
Munzar, J.D., Zia, A., Versailles, P., Jimenez, R., Bergthorson, J.M., Akih-Kumgeh, B.,
2014. Comparison of laminar flame speeds, extinction stretch rates and vapor pressures
of jet a-1/HRJ biojet fuel blends. In: Proceedings of ASME Turbo Expo 2014: Turbine
Technical Conference and Exposition, Düsseldorf, Germany, GT2014e25951,
pp. 1e9.
Mze-Ahmed, A., Dagaut, P., Hadj-Ali, K., Dayma, G., Kick, T., Herbst, J., et al., 2012.
Oxidation of a coal-to-liquid synthetic jet fuel: experimental and chemical kinetic
modeling study. Energy Fuels 26, 6070e6079.
Naik, C.V., Puduppakkam, K.V., Modak, A., Meeks, E., Wang, Y.L., Feng, Q.,
Tsotsis, T.T., 2011. Detailed chemical kinetic mechanism for surrogates of alternative jet
fuels. Combust. Flame 158, 434e445.
Newatlas, 2012. World’s First 100 Percent Biofuel-Powered Flight of Civil Aircraft. https://
newatlas.com/nrc-biofuel-flight/24896/.
Prak, D.J.L., Romanczyk, M., Wehde, K.E., Ye, S., Mclaughlin, M., Luning Prak, P.J.,
et al., 2017. Analysis of catalytic hydrothermal conversion jet fuel and surrogate mixture
formulation: components, properties, and combustion. Energy Fuels 31, 13802e13814.
Pucher, G., Allan, W., LaViolette, M., Poitras, P., 2011a. Emissions from a gas turbine sector
rig operated with synthetic aviation and biodiesel fuel. J. Eng. Gas Turbines Power 133,
111502e1.
Pucher, G., Poitras, P., Allan, W., LaViolette, M., 2011b. Emissions from a gas turbine
sector rig operated with synthetic aviation and biodiesel fuel. J. Eng. Gas Turbines
Power 133, 111502.
Purcher, G., Allan, W., Poitras, P., 2013. Characteristics of deposits in gas turbine combustion chambers using synthetic and conventional jet fuels. J. Eng. Gas Turbines Power
135, 071502e1e8.
Riebl, S., Braun-Unkhoff, M., Riedel, U., 2017. A study on the emissions of alternative
aviation fuels. J. Eng. Gas Turbines Power 139, 081503e1e11.
Rock, N., Chterev, I., Emerson, B., Seitzman, J., Lieuwen, T., 2017. Blowout sensitivities
in a liquid fueled combustor: fuel composition and preheat temperature effects. In:
Proceedings of ASME Turbo Expo 2017: Turbomachinery Technical Conference and
Exposition, 2017, GT2017e63305. Charlotte, NC, USA.
Rye, L., Wilson, C.W., 2012. The influence of alternative fuel composition on gas turbine
ignition performance. Fuel 96, 277e283.
́
Combustion performance of biojet fuels
229
Saffaripour, M., Thomson, K.A., Smallwood, G.J., Lobo, P., 2019. A review on the
morphological properties of non-volatile particulate matter emissions from aircraft
turbine engines. J. Aerosol Sci. https://doi.org/10.1016/j.jaerosci.2019.105467.
Sasol, 2010. Sasol Takes to the Skies with the World’s First Fully Synthetic Jet Fuel.
https://www.sasol.com/media-centre/media-releases/sasol-takes-skies-world-s-firstfully-synthetic-jet-fuel.
Saffaripour, M., Zabeti, P., Kholghy, M., Thomson, M.J., 2011. An experimental comparison of the sooting behavior of synthetic jet fuels. Energy Fuels 25, 5584e5593.
Schripp, T., Herrmann, F., Oßwald, P., Köhler, M., Zschocke, A., Weigelt, D., et al., 2019.
Particle emissions of two unblended alternative jet fuels in a full scale jet engine. Fuel
256, 115903.
Sivakumar, D., Vankeswaram, S.K., Sakthikumar, R., BN, R., 2015. Analysis on the atomization characteristics of aviation biofuel discharging from simplex swirl atomizer.
Int. J. Multiphas. Flow 72, 88e96.
Sivakumar, D., Vankeswaram, S.K., Sakthikumar, R., Raghunandan, B.N., Hu, J.T.C.,
Sinha, A.K., 2016. An experimental study on jatropha-derived alternative aviation fuel
sprays from simplex swirl atomizer. Fuel 179, 36e44.
Slavinskaya, N.A., Zizin, A., Aigner, M., 2010. On model design of a surrogate fuel
formulation. J. Eng. Gas Turbines Power 132, 111501e1e11.
Smith, P.M., Gaffney, M.J., Shi, W., Hoard, S., Armendariz, I.I., Mueller, D.W., 2017.
Drivers and barriers to the adoption and diffusion of sustainable jet fuel (SJF) in the U.S.
Pacific Northwest. J. Air Transport. Manag. 58, 113e124.
Sundararaj, R.H., Kumar, R.D., Raut, A.K., Sekar, T.C., Pandey, V., Kushari, A.,
Puri, S.K., 2019. Combustion and emission characteristics from biojet fuel blends in a
gas turbine combustor. Energy 182, 689e705.
Vasu, S.S., Davidson, D.F., Hanson, R.K., 2008. Jet fuel ignition delay times: shock tube
experiments over wide conditions and surrogate model predictions. Combust. Flame
152, 125e143.
Vukadinovic, V., Habisreuther, P., Zarzalis, N., 2012. Comparison of laminar flame speeds,
extinction stretch rates and vapor pressures of Jet A-1/HRJ biojet fuel blends. J. Eng.
Gas Turbines Power 134, 121504e1e9.
Wang, H., Oehlschlaeger, M.A., 2012. Autoignition studies of conventional and
FischereTropsch jet fuels. Fuel 98, 249e258.
Wang, Z., Bai, Z., Yelishala, S.C., Yu, G., Metghalchi, H., 2018. Effects of diluent on
laminar burning speed and flame structure of gas to liquid fuel air mixtures at high
temperatures and moderate pressures. Fuel 231, 204e214.
Wang, Z., Feser, J.S., Lei, T., Gupta, A.K., 2020. Performance and emissions of camelina oil
derived jet fuel blends under distributed combustion condition. Fuel 271, 117685.
WIRED, 2011. KLM Completes First Scheduled Service Flight Using Biofuel. https://www.
wired.com/2011/07/klm-completes-first-scheduled-service-flight-using-biofuel/.
Won, S.H., Veloo, P., Santner, J., Ju, Y., Dryer, F., 2013. Comparative evaluation of global
combustion properties of alternative jet fuels. In: 51st AIAA Aerospace Sciences
Meeting including the New Horizons Forum and Aerospace Exposition, Texas, USA,
AIAA 2013-0156, pp. 1e8.
Won, S.H., Dooley, S., Veloo, P., Wang, H., Oehlschlaeger, M.A., Dryer, F., Ju, Y., 2014.
The combustion properties of 2,6,10-trimethyl dodecane and a chemical functional
group analysis. Combust. Flame 161, 826e834.
Won, S.H., Veloo, P., Dooley, S., Santner, J., Haas, F.M., Ju, Y., Dryer, F., 2016.
Predicting the global combustion behaviors of petroleum-derived and alternative jet
fuels by simple fuel property measurements. Fuel 168, 34e46.
230
Biojet Fuel in Aviation Applications
Xu, Q., Liu, Z., Zhang, C., Hui, X., Lin, Y., 2017. Surrogate formulation for a coal-based
jet fuel using a mixing model based on explicit equations and artificial neural network.
Fuel 210, 262e271.
Xue, X., Hui, X., Singh, P., Sung, C.-J., 2017. Soot formation in non-premixed counterflow flames of conventional and alternative jet fuels. Fuel 210, 343e351.
Xue, H., Hui, X., Vannorsdall, P., Singh, P., Sung, C.-J., 2019. The blending effect on the
sooting tendencies of alternative/conventional jet fuel blends in non-premixed flames.
Fuel 237, 648e357.
Zel’dovich, J.B., 1946. Oxidation of nitrogen in combustion and explosion. Comptes
Rendus (Doklady) de l’Academiedes Sciences de l’URSS 51 (3), 217e220.
Zhang, C., Hui, X., Lin, Y., Sung, C.J., 2016. Recent development in studies of alternative
jet fuel combustion: Progress, challenges, and opportunities. Renew. Sustain. Energy
Rev. 54, 120e138.
Zhao, J., Zhao, B., Wang, X., Yang, X., 2017. Atomization performance and TG analysis of
Fischer-Tropsch fuel compared with RP-3 aviation fuel. Int. J. Hydrogen Energy 42,
18626e18632.
Zheng, L., Ling, C., Ubogu, E.A., Cronly, J., Ahmed, I., Zhang, Y., Khandelwal, B., 2018.
Effects of alternative fuel properties on particulate matter produced in a gas turbine
combustor. Energy Fuels 32, 9883e9897.
Zhu, Y., Li, S., Davidson, D.F., Hanson, R.K., 2015. Ignition delay times of conventional
and alternative fuels behind reflected shock waves. Proc. Combust. Inst. 35, 241e248.
CHAPTER 5
Economics of biojet fuels
5.1 Introduction
The single largest hurdle in any product category entering the market as a
mainstream product is in its economic feasibility. This is particularly true for
alternative fuels, which already have a long-term incumbent in the form of
petroleum. While the use of petroleum since the eras of ancient civilizations
has been well documented, “modern”-day dominance of petroleum started
in the midnineteenth century. This itself predated even the heavier-than-air
human-made flight. By the point of the first flights around the turn of 20th
century, the competing power sources were the petroleum-based gasoline,
steam power, and also compressed gas for the key designs by the Wright
brothers, Langley, and Herring, respectively. The Wright brothers’ choice
of a gasoline-powered internal combustion engine to rotate the propellers
for thrust generation proved to be the right choice. With that, the dominance of petroleum has encroached even flight. Even the advent of jet
engines only shifted the use of petroleum from the gasoline distillate to jet
fuel fraction.
Since the mid-2000s, the dominance of fossil fuel for aviation applications was challenged by biojet fuels. This is made necessary by the need to
combat climate change. Biojet fuels have all the right technical ingredients
to supplant conventional jet fuel, as it can be produced sustainably, operate
as a drop-in fuel for comparable flight performance, and help to decarbonize the sector. The only force slowing down its progress is market force
as it is presently still not price competitive.
5.2 Biojet fuel prices
The price of petroleum is driven by and drives the world’s economy,
energy security concerns, and geopolitics. It is near impossible to disassociate petroleum price to the upstream, midstream and downstream
products in the supply chain. In fact, it even dictates the price of
Biojet Fuel in Aviation Applications
ISBN 978-0-12-822854-8
https://doi.org/10.1016/B978-0-12-822854-8.00009-3
© 2021 Elsevier Inc.
All rights reserved.
231
232
Biojet Fuel in Aviation Applications
competing products. This is particularly true where crude oil price is
directly correlated to aviation jet fuel price, which in turn affects biojet
fuel price. Fig. 5.1 shows the conventional jet fuel price against crude oil
price (IATA, 2020). In general, jet fuel price commands a slight premium
over crude oil price, although the COVID-19 pandemic has caused an
aberration in March 2020 where the inverse occurred. This happened
because the demand for jet fuel plummeted due to the travel restrictions
and lockdowns in place for many countries globally. The price has since
been near identical although conventional jet fuel price is expected to
regain its premium once air travel returns to normalcy.
Policies, legislation, and standards also play a part in determining or
influencing prices. For biojet fuel, the price tie-in to conventional jet fuel is
greater as all commonly accepted standards require “drop-in” for blending.
This well-intended ruling to avoid changes to the operation of existing jet
engines and infrastructures also meant that the biojet fuel in the blend with
conventional jet fuel cannot be differentiated. Thus, both biojet fuel and
conventional jet fuel must have very similar properties and perform similarly. This makes the use of biojet fuel and conventional jet fuel a zero-sum
game in the financial sense as the market will always choose the cheaper
option if products are functionally identical.
5.2.1 Sustainable aviation fuel price assessment
Unlike conventional jet fuel for the aviation sector, the biojet fuel market
previously lacked a benchmark price. This changed amid the global
155
Price (USD/barrel)
135
Jet fuel
Crude oil
115
95
75
55
35
15
Nov
2014
Nov
2015
Nov
2016
Nov
2017
Nov
2018
Nov
2019
Nov
2020
Figure 5.1 Jet fuel price versus crude oil price (Brent) from November 2013 to
November 2020. (Adapted from IATA, 2020. Jet Fuel Price Monitor. https://www.iata.org/
en/publications/economics/fuel-monitor/. (Accessed 24 November 2020).)
Economics of biojet fuels
233
pandemic when S&P Global Platts (“Platts”) launched the first-to-market
Sustainable Aviation Fuel (SAF) price assessment in Europe (S&P Global,
2020c). It is called the “Sustainable Aviation Fuel Ex Works Northwest
Europe.” The daily price assessment started in August 17, 2020, and bears the
symbolic point of the aviation industry resetting with the green agenda in
mind. This brings biojet fuel from a niche product to be closer as a commodity and energy-like product in the open market. Biojet fuel price can
now be compared against that of conventional jet fuel and crude oil price for
price discovery, bringing about greater transparency as airlines join in the
process of decarbonization of the industry. This is particularly important as
spot market for biojet fuel is still in its infancy stages. In this respect, spot
market refers to the trading of biojet fuel for immediate delivery.
The price assessment follows a cost-based system and mirrors the cost of
SAF derived from used cooking oil on an ex-refinery basis in Northwest
Europe. It also factors in hydrogen cost and fixed refinery costs, while also
deducting for the by-product credits of propane, naphtha and diesel. In
other words, it portrays the production cost of SAFs for blending into the
petroleum-based jet fuel. The publicly published price assessment will
immediately be of use to the seven airports in Europe that accepts batch
deliveries from pilot SAF production plants. Presently, they are concentrated in the Northwestern region of Europe, or more precisely within the
subregion of Scandinavia.
Platts followed up with the launch of two US West Coast SAF price
assessments in September 21, 2020 (S&P Global, 2020b). They are the
“Sustainable Aviation Fuel with credits US West Coast” and “Sustainable
Aviation Fuel without credits US West Coast.” Like their European
counterpart, the price assessment will also be cost-based. However, the US
assessments differ in having a variation where environmental credits are
factored in and also reflecting SAF produced from tallow.
A comparison of the price assessments for biojet fuels is summarized in
Table 5.1 (S&P Global, 2020b). Presently, the price assessments are only
available for two geographical divisions. This is in contrast with conventional jet fuels, which has assessment from five major global trading, supply,
and demand centers. This allows a global index, the “Jet Index Global” to
be developed based on the weighted average of the regions. The weighting
of each region of North America (38.61%), Europe and CIS (28.47%), Asia
and Oceania (21.74%), Middle East and Africa (7.10%), and Latin America
234
Biojet Fuel in Aviation Applications
Table 5.1 Sustainable aviation fuel price assessments.
Sustainable
aviation fuel with
Sustainable aviation
credits US West
fuel ex works
Price
Coast
northwest Europe
assessment
Geographical
division
Basis of
assessment
SAF input
Europe, the Middle
East, and Africa
(EMEA)dcovering
116 countries. Focal
point is in
northwest Europe
Cost-based price
assessment (exrefinery price)
Cost of used
cooking oil and
hydrogen added to
fixed renewable
refinery costs, then
deducting the byproduct credits of
propane, naphtha,
and diesel
Environmental
credits factored
No
Units
USD per metric
ton
Frequency
Daily
Sustainable
aviation fuel
without credits
US West Coast
United States of
America. Focal
point is in
California
United States of
America. Focal
point is in
California
Cost-based price
assessment (exrefinery price)
Cost of packer
grade beef
tallow and
hydrogen
(without carbon
capture and
storage) added to
fixed renewable
aviation fuel
refinery costs,
then deducting
the by-products
of gasoline,
propane, and
diesel
Yes, credits from
renewable
identification
numbers (under
US RFS),
CARB’s low
carbon fuel
standard, and US
biodiesel tax
credit (where
applicable)
US cents per
gallon
USD per metric
ton
USD per barrel
Daily
Cost-based price
assessment (exrefinery price)
Cost of packer
grade beef
tallow and
hydrogen
(without carbon
capture and
storage) added to
fixed renewable
aviation fuel
refinery costs,
then deducting
the by-products
of gasoline,
propane, and
diesel
No
US cents per
gallon
USD per metric
ton
USD per barrel
Daily
Economics of biojet fuels
235
and Caribbean (4.08%) is allocated based on uplift data and trading volume.
As biojet fuel grows in usage, a future global index for biojet fuel would be
useful for price monitoring.
Currently, biojet fuels on their own are not price competitive against
conventional jet fuel. Since the advent of the European-based price
assessment for biojet fuel to allow fair comparisons, it is traded at around
4.3 to 5.4 of conventional jet fuel as shown in Fig. 5.2 (S&P Global,
2020a). However, the gap can be narrowed through various incentives such
as tradable carbon credits and increase in conventional jet fuel spot prices.
Tradable credits might even outright make biojet fuel profitable, as the
credits are often stackable and may even exceed the cost of production (see
Fig. 5.3) (S&P Global, 2020a). A study of the US aviation industry modeled
Figure 5.2 Price comparison of sustainable aviation fuel against conventional jet fuel
(S&P Global, 2020a).
Price (USD/gal)
4
3
2
1
0
D4 RIN
Federal blenders
tax credit
SAF
CA low carbon
fuel standard
SAF environmental
credits
Jet fuel
SAF,
California
Jet fuel,
Los Angeles
Figure 5.3 Price of sustainable aviation fuel, conventional jet fuel and stackable
environmental credits (S&P Global, 2020a).
236
Biojet Fuel in Aviation Applications
using soybean oil as feedstock showed that an implicit subsidy of USD 0.71
per liter of biojet fuel for producers is required if the Federal Aviation
Administration’s aims of using 1 billion gallons of renewable jet fuel
annually is to realize in 2020 (Deane et al., 2017). The implicit subsidy
could be reduced to just USD 0.09 per liter of biojet fuel as feedstock is
changed to oilseed rotation crops.
The underlying reasons for the higher biojet fuel price can be pinpointed to the typical batchwise production method as opposed to the
more economically feasible continuous production method. The technology to convert from batchwise to continuous is not the barrier; the lack of
demand makes it unjustifiable to operate using continuous production
methods (Deane et al., 2017). Additionally, the logistics, infrastructure,
technology maturity, and economies of scale are not yet at the levels of
conventional jet fuel. All these widens the gap in cost between the fuels.
The recency of biojet fuels meant that actual reports of the economic
impacts related to the introduction of biojet fuels are scarce (Cremonez
et al., 2015). The availability of price assessment for biojet fuels will allow its
economic impacts on the aviation fuel chain to be assessed in the future.
This will allow economic figures to be from the real world rather than
projected numbers extrapolated from research and testing programs.
5.2.2 Economic viability
The economic viability of biojet fuel is primarily tied to the profitably of the
producer. For biojet fuel and conventional aviation fuel, the key number is
the minimum selling price (MSP). This can also be contextualized as the
minimum jet fuel selling Price (MJSP). The fuel with the lower MJSP between biojet fuel and conventional jet fuel will have the cost advantage.
Diederichs et al. (2016) conducted a technoeconomic comparison of
biojet fuel from lignocellulose, vegetable oil, and sugarcane juice. Lignocellulose represented second-generation biomass and was evaluated through
three conversion pathways, namely the gasification and FT synthesis (GFTJ), biochemical conversion to ethanol with upgrading (L-ETH-J) and
gasification, and syngas fermentation to ethanol with upgrading (SYNFER-J) processes. First-generation feedstocks comprised of vegetable oil
and sugarcane juice were evaluated through the hydroprocessing of vegetable oil (HEFA) and sugarcane juice to ethanol by sucrose fermentation
with upgrading (S-ETH-J), respectively. A summary of the economic
evaluation is shown in Table 5.2 (Diederichs et al., 2016).
Table 5.2 Economic evaluation and minimum jet fuel selling price (MJSP) for first- and second-generation feedstocks (Diederichs et al.,
2016).
Process
Parameter
L-ETH-J
SYN-FER-J
GTF-J
HEFA
S-ETH-J
Generation
Feedstock
Second
Lignocellulose
Second
Lignocellulose
Second
Lignocellulose
First
Sugarcane juice
Raw material and waste disposal (million
USD/annum)
By-product credits (million USD/annum)
Fixed operating costs (million USD/
annum)
Total indirect costs (million USD)
Fixed capital investment (million USD)
Fixed capital investment/Annual jet fuel
kilogram (USD/kg)
Total capital investment (million USD)
MJSP (USD per kg jet fuel)
(1) Main feedstock
(2) Trash
(3) Enzymes
(4) Catalysts
(5) Other raw materials
(6) Waste disposal
(7) Grid electricity
120.23
69.75
62.51
First
Vegetable
oil
112.60
24.77
24.78
13.03
22.09
38.16
27.85
25.44
10.52
38.28
18.92
274.2
482.6
7.90
232.8
409.7
6.54
321.3
565.5
9.05
91.7
161.4
2.87
184.1
324.0
5.30
532.7
3.431
0.961
e
0.722
0.177
0.215
0.027
0.197
452.5
2.495
0.938
e
e
0.176
0.110
0.029
0.0
623.9
2.444
0.940
e
e
0.136
0.023
0.026
0.126
179.4
2.223
1.992
e
e
0.018
0.001
0.001
0.0
358.3
2.541
1.175
0.384
e
0.191
0.046
0.044
0.542
85.36
Economics of biojet fuels
237
Continued
Parameter
L-ETH-J
SYN-FER-J
GTF-J
HEFA
S-ETH-J
(8) Fuel by-products
(9) Fixed costs
(10) Capital depreciation
(11) Average income tax
(12) Average return on investment
Lowest MJSP from sensitivity analysis
(USD per kg jet fuel)
Highest MJSP from sensitivity analysis
(USD per kg jet fuel)
Largest influence
0.208
0.406
0.120
0.173
1.035
3.02
0.208
0.353
0.118
0.143
0.836
2.09
0.484
0.446
0.118
0.191
1.174
1.99
0.452
0.187
0.143
0.062
0.271
1.37
0.208
0.371
0.144
0.142
0.794
2.22
4.17
3.17
3.24
3.36
3.10
Enzyme cost
Feedstock
cost
Fixed capital
investment
Feedstock
cost
Fixed capital
investment
Biojet Fuel in Aviation Applications
Process
238
Table 5.2 Economic evaluation and minimum jet fuel selling price (MJSP) for first- and second-generation feedstocks (Diederichs
et al., 2016).dcont’d
Economics of biojet fuels
239
Vegetable oilederived biojet fuel from the HEFA pathway was found
to have the lowest baseline MJSP of USD 2.223 per kg jet fuel, while the
L-ETH-J pathway with lignocellulose has the highest MJSP of USD 3.431
per kg jet fuel. From the sensitivity analysis, the MJSP for the L-ETH-J
pathway could further rise to USD 4.17 per kg jet fuel if the unfavorable
enzyme cost scenario of USD 1385 per MT broth were to materialize.
Conversely, the MJSP of the HEFA pathway can be reduced to USD 1.37
per kg jet fuel if the feedstock price is reduced to USD 546 per MT oil.
Even the most optimistic projection for the HEFA pathway is still greater
than the maximum fossil-based jet fuel MJSP range of USD 0.42e1.28 per
kg jet fuel. It should also be noted that since the main feedstock price of the
HEFA pathway can be up to 89%, this represents a cause of uncertainty,
which increases the risk for producers. It essentially makes the profitability
of biojet fuel producers to be dependent on commodities price.
Hypothetically, a simultaneous reduction in feedstock cost to USD 546
per MT oil and increase in by-product price of naphtha to USD 1.52 per
liter could feasibly bring the MJSP to USD 1.22 per kg jet fuel. This will
bring the MJSP of biojet fuel to within the higher end jet fuel prices. The
further reduction in feedstock cost is plausible as palm oil futures traded at
USD 535.02 per MT as late as December 2018, although the high naphtha
price scenario is unlikely with the highest price in the past decade being
merely w USD 0.75 per liter in March 2012. The price of naphtha has
since fallen to USD 0.26 per liter in November 2020.
If first-generation biojet fuel cannot yet compete with conventional jet
fuel in cost, then second-generation biojet fuel might be at a further
disadvantage due to the substantially greater fixed capital investment
required. The fixed capital investment required for second-generation biojet
fuel can be up to 3.5 times greater than that of the first-generation counterparts. With the main feedstock cost for second-generation biojet fuels
contributing to 28.0%e38.4% of the MJSP, a favorable reduction in
lignocellulose price through technological breakthrough will reduce the gap.
Martinez-Hernandez et al. (2019) performed an uncertainty analysis
using Monte Carlo simulation to predict the MSP required for biojet fuel to
cope with the uncertainties with feedstock cost, product price, and capital
investment. To lower the risk of failure due to uncertainty, a liter of biojet
fuel needs to have an MSP of USD 1.35. This allows an internal rate of
return (IRR) projection of 10% to provide buffer for the uncertainty.
Fig. 5.4 shows the IRR and MSP variation against biojet fuel production capacity. Both IRR and MSP are sensitive to crude oil price. A low
240
(a) 20
18
16
14
(b)
0.263 USD/L oil
0.315 USD/L oil
0.342 USD/L oil
IRR(%)
12
10
8
6
4
2
0
50
100
150
200
Biojet fuel production (1000 barrels/year)
Minimum Selling Price (USD/L)
Biojet Fuel in Aviation Applications
1.5
1.4
1.3
Minimum selling
price
1.2
1.1
1.0
0.9
0.8
0 50 100 150 200 250 300 350 400
Biojet fuel production (1000 barrels/year)
Figure 5.4 Internal rate of return (IRR) and minimum selling price against biojet fuel
production capacity (Martinez-Hernandez et al., 2019).
crude oil price of USD 0.263 per liter (or USD 41.81 per barrel) will allow
a 95,000 barrel per year biojet fuel plant to have a project IRR of 10%,
although at the oil price no plants with a capacity under 58,000 barrels per
year are expected to be profitable. With just an increase of oil price to USD
0.342 per liter (or USD 54.37 per barrel), a plant annual output of 200,000
barrels is needed for an expected IRR of 5%. Thus, it is more favorable for
larger plants to absorb the price uncertainty of crude oil from sheer
economies of scale. However, there is a limitation to how large a plant
should be, as a 200,000 barrel per year plant requires around 459,000 barrels
of vegetable oil. For scale, this represents around 61% of the national
vegetable oil production capacity of Mexico.
The improvement to MSP shows a diminishing return with biojet fuel
production capacity above 150,000 barrel per year. At 150,000 barrels per
year, the predicted MSP of around USD 1.05 per liter is still more than
double the typical fossil jet fuel price of USD 0.50 per liter. As such, only a
blending mandate coupled with subsidies could make biojet fuel an
attractive proposition with high IRR at the current state of technology and
market penetration.
The study also predicted an annual cost breakdown of USD 22.7
million per year for a 75,000 barrel per year biojet fuel plant, with oil
feedstock for the HEFA process taking up 66% of the cost. The other costs
in descending order are annual capital cost (13%), waste treatment (8%),
hydrogen (7%), labor (5%), and utilities (1%). Such a plant if located in
Mexico will have an 85% chance of garnering an IRR >> 10%. The
chances would improve with larger plant size and lower feedstock cost.
Economics of biojet fuels
241
Ranganathan and Savithri (2016) conducted a discounted cash flow
analysis of the third-generation wastewater-based microalgae as a feedstock
for biofuel production. The analysis of a conceptual plant factored in the
wastewater treatment, hydrothermal liquefaction, hydroprocessing, and
hydrogen generation processes. Although the product is a mixture of gasoline, diesel, and biojet fuels, the bulk of the product with 69.6% is biojet
fuel. From the sensitivity analysis, an increase in algae yield per nitrogen
used holds the greatest process-based effects of reducing MSP, where a 10%
increase in algae yield will favorably reduce MSP by 6%. A drop of 10% in
biooil yield will adversely increase MSP by 13%. It is also shown that income tax rate from the government could also greatly swing the MSP
required at 6.18% and þ7.2% for income tax rate change of 10%
and þ10%, respectively. Unlike first generationebased biojet fuel, feedstock cost is a nonfactor.
For such an integrated facility, the likeliest MSP of the biofuel is USD 4.3
per gasoline gallon equivalent (GGE) or USD 1.01 per liter of kerosene.
Such a conceptual plant may yet to be realistic as of present, but it shows that
the use of third-generation feedstock could be comparable biojet fuel produced from first-generation feedstocks priceewise. Projections of biofuel
MSP can differ greatly, where the MSP from 10 similar work ranging from
USD 2.07e7.11 per GGE. This brings the MSP range to USD 0.49e1.67
per liter.
While there are many factors determining the MJSP, feedstock and
pathway combinations would be the predominant factors. Table 5.3 tabulates the economic characteristics of the different biojet fuel production
pathways from various feedstocks (Wei et al., 2019). The pathways of
HEFA and CH with first-generation edible oil as feedstock allow for the
lowest MJSPs as the conversion pathways are relatively mature and the
feedstocks are also among the cheapest. Using the average jet fuel price of
USD 2.07 per gallon in 2018, the use of camelina oil under the HEFA
pathway could achieve price advantage over conventional jet fuel. On the
other hand, the use of second- and third-generation feedstocks still commands a premium, notably with microalgae and HEFA having an MJSP of
USD 31.98 per gallon.
The HEFA pathway is the most cost-effective pathway, but its feasibility
is still dependent on feedstock price. In order of descending feedstock cost
using the HEFA pathway are third-generation > second-generation
nonedible oil > waste oils and animal fats > first-generation edible oil.
The catalytic hydrothermolysis (CH) and hydroprocessed depolymerized
242
Biojet Fuel in Aviation Applications
Table 5.3 Minimum jet fuel selling price of the different biojet fuel production
pathways from various feedstocks (Wei et al., 2019).
MJSP (USD
Pathway
Type
Feedstock
per gallon)
Hydrogenated
esters and fatty
acids
Catalytic
hydrothermolysis
or hydrothermal
liquefaction
Hydroprocessed
depolymerized
cellulosic jet
Fischertropsch
process
Alcohol-to-jet
Direct sugar to
hydrocarbons
Aqueous phase
reforming
a
First-generation
edible oil
Secondgeneration
nonedible oil
Third
generation
Waste oils and
animal fats
First-generation
edible oil
Second
generation
Second
generation
Camelina oila
Soybean oil
Jatropha
1.63e4.62
3.82e4.39
5.42e5.74
Microalgae
31.98
Yellow grease
Tallow
Camelina oila
3.33e4.01
3.98e4.73
2.48e3.23
Lignocellulose
3.66e5.06
Lignocellulose
5.23e7.15
Second
generation
First generation
edible crop
Second
generation
Lignocellulose
6.23e7.57
Sugarcane
Corn grain
Lignocellulose
(biochemistry)
Lignocellulose
(thermochemistry)
Sugarcane
3.65e8.08
3.84e6.63
4.32e10.91
Lignocellulosedforest
residue
Lignocellulosedwheat
straw
Lignocellulose
18.55e20.61
First-generation
edible crop
Second
generation
Second
generation
7.30e7.82
7.17
24.74e26.80
4.66e4.75
Camelina can be classified as either first- or second-generation feedstock.
cellulosic jet (HDCJ) pathways have comparable MJSP to HEFA due to the
relatively high yields and also low equipment costs.
Comparing like-to-like, FischereTropsch (FT) pathway using secondgeneration feedstock has higher MJSP as compared with HEFA’s
Economics of biojet fuels
243
equivalent, but the FT process typically produces a significant amount
valuable by-product such as gasoline and LPG. Alcohol-to-jet (ATJ) presently has greater MJSP as compared with HEFA due to the cost of enzymes.
Its large range is contributed by feedstock and capital costs. Among the
various ATJ methods, the biochemistry pathway has the greatest potential for
the lowest cost.
The direct sugar to hydrocarbon (DSCH) pathway is an interesting
proposition as it has not only the greatest cost but also the highest value
intermediates. One of the intermediates isoprenoids, namely farnesene that
has applications in the lucrative pharmaceutical industry, is priced at USD
22.53 per gallon. The intermediates could serve to recoup a portion of the
cost if the process could be tweaked to have higher selectivity for biojet fuel
and farnesene. Industrious producers might even prioritize the production
of farnesene and treat biojet fuel as the by-product to offset the costs.
However, the process shares the same risk as the transesterification process
to produce biodiesel, where the previously high-valued by-product of
glycerine became close to worthless. This happened as there was a glut of
glycerine flooding the pharmaceutical market due to the success of the
biodiesel industry.
Pereira, MacLean, and Saville (Pereira et al., 2017) conducted a Monte
Carlo analysis utilizing a discounted cash flow approach to evaluate the
financial viability of different biojet fuel pathways. The analysis factored in
internal uncertainty such as scaling up and external concerns such as crude
oil price. Table 5.4 shows the financial analysis scenarios for the biojet fuel
pathways (Pereira et al., 2017).
All of the evaluated pathways have positive IRRs with the exception of
ATJ. The HEFA pathway leads with IRR range of 28.2%e29.0%. For the
purpose of biojet fuel production, the use of camelina oil as feedstock has an
advantage over soybean oil due to its higher biojet fuel yield of 16.77%.
The CH pathway using first-generation edible oil has also shown high IRR
of 17.9%e18.9%. The use of nonoil edible crop feedstock for the pyrolysisto-jet and FT pathways produces less desirable IRR (8.7%e12.4%). ATJ
pathways show negative IRR of up to 8.0%. Presuming that the minimum
attractive rate of return (MARR) is fixed at 15%, then only HEFA and CH
pathways would be attractive to investors.
Based on scenario projections of highelow oil price and optimistice
pessimistic technology development, there is a 100% probability (90%
confidence interval) that the HEFA pathway will meet the MARR for high
oil price scenarios. The CH pathway is also promising as a low risk option
244
Pathway
Feedstock
HEFA
Camelina
Soybean
Camelina
Soybean
Corn
stover
Sugarcane
bagasse
Corn
stover
Sugarcane
bagasse
Corn
Sugarcane
CH
Pyrolysisto-jet
FT
ATJ
Capital
investment
(USD million)
Annual
operating cost
(USD million)
Return on
investment
(USD million)
Annual
revenues
(USD
million)
Biojet fuel
(kg/metric
ton of
biomass)
Net present
value (USD
million)
IRR (%)
375
385
486
497
472
303
605
303
605
148
44
45
57
58
55
468
792
417
741
204
167.7
91.0
78.4
42.6
178.5
637
691
292
345
8
28.2
29.0
17.9
18.9
10.5
472
136
55
204
178.5
76
12.4
470
100
55
144
115.5
42
8.7
470
88
55
144
115.5
22
10.9
311
428
140
93
36
50
142
95
163.6
38.5
214
270
8.0
5.0
Biojet Fuel in Aviation Applications
Table 5.4 Financial analysis scenarios for the biojet fuel pathways (Pereira et al., 2017).
Economics of biojet fuels
245
where a high oil price economic climate will lead to a 99% and 85% chance
of meeting the MARR for optimistic and pessimistic technology scenarios,
respectively. However, the CH pathway is predicted to only meet MARR
50% of the time if oil price tumbles.
This analysis also highlights the fact that biojet fuel is often a minor
product in the production process and the calculation of MJSP is sensitive
to the yields and prices of coproducts. Even at its peak, biojet fuel as a
product is only 17.85% of total biomass used as feedstock. In fact, biojet fuel
only contributes to roughly 16% and 14% of revenue for HEFA and CH
plants, respectively. Both pathways would rely on revenues obtained from
protein meal produced to the tune of 72% for HEFA (soybean) and 60% for
CH (camelina). This is expected as even for oil crops such as soybean and
camelina, protein meal outweighs oil by mass.
5.2.3 Process cost and investment cost
While it is clear that the MJSP of biojet fuel will determine the economic
viability of the renewable energy, the estimation of the current biojet fuel
production costs remained unclear. Production cost estimates have a large
degree of uncertainty as most values are only obtained from economic
models, pilot studies, or lab-scale extrapolations, instead of actual
commercial-scale values (Chiaramonti et al., 2014). Thus, this section
attempts to use process cost from available literature to construct a more
generalized process cost breakdown.
In the broadest sense, production costs can be attributed to capital
expenditure (CAPEX), operational expenditure (OPEX), and biomass
feedstock cost. By-product credits can be used to offset the production
costs. The biomass feedstock cost is deliberately separated from OPEX as it
could be the single most costly item in some pathways. Table 5.5 shows the
process costs for various pathwayefeedstock combinations by major categories. The values are calculated through a normalization process from
(Pereira et al., 2017; Atsonios et al., 2015). It should be noted that the
values are skewed toward a producer entering the industry in its formation
years. Such an approach was adopted as the largest barrier to enter a
potentially profitable industry or an industry supported through subsidies is
the CAPEX requirement. While the size of the plant is important, it would
be impossible to project for a variety of plant sizes. Also, working capitals
are not considered as part of the analysis as they infer financial liquidity
instead of the cost associated to the process. Governmental interventions
such as subsidies and grants are not considered to provide an estimation
resembling the free market.
Alcohol-to-jet (ATJ)
ATJ
ATJ (with modFT)
ATJ (with
modMeOH)
Direct fermentationto-jet (DFJ)
DFJ
Hydroprocessed ester
and fatty acid (HEFA)
HEFA
Catalytic
hydrothermolysis
(CH)
CH
Pyrolysis-to-jet (PTJ)
PTJ
FischereTropsch (FT)
Gasification with
FischereTropsch
(GFT)
GFT
a
Biomass
feedstock
Biomass
feedstock
costs (%)
Capital
expenditure
(%)
Operational
expenditure
(%)
Byproduct
credits
(%)
Normalized
MJSP ()
Jet fuel yield
(kg/metric ton
of biomass)
Sugarcane
Corn
Wood chip
Wood chip
13.9%
22.9%
25.0%
24.5%
78.1%
65.1%
45.9%
44.8%
8.0%
12.0%
29.1%
30.8%
19.1%
32.8%
13.4%
10.5%
1.88
1.36
2.24
1.93
38.5
163.6
112
138
Sugarcane
12.2%
80.1%
7.8%
14.6%
2.26
36.8
Corn
Soybean
18.8%
56.2%
69.8%
34.8%
11.4%
9.0%
23.7%
78.7%
1.88
1.00a
156.2
91
Camelina
Soybean
38.2%
51.5%
49.3%
41.2%
12.6%
7.4%
67.6%
67.5%
1.05
1.67
167.7
42.6
Camelina
Sugarcane
bagasse
Corn stover
Wood chip
Sugarcane
bagasse
33.7%
7.1%
56.4%
72.5%
9.8%
20.4%
53.3%
34.5%
1.71
1.81
78.4
178.5
9.0%
28.7%
7.8%
71.4%
43.1%
79.2%
19.6%
28.2%
13.0%
33.9%
28.7%
26.7%
1.86
1.87
1.85
178.5
97
115.5
9.9%
77.9%
12.2%
26.3%
1.89
115.5
Corn stover
MJSP is normalized against biojet fuel produced from soybean through the HEFA pathway.
Biojet Fuel in Aviation Applications
Conversion pathway
246
Table 5.5 Biojet fuel process costs by major categories for various pathwayefeedstock combinations.
247
Economics of biojet fuels
In general, the use of first-generation feedstocks and lipid-based pathways such as HEFA and CH will lead to biomass feedstock cost being
dominant, even up to more than half of the cost. However, a switch to
second-generation feedstock like camelina will substantially lead to capital
expenditure being the major costs. In both cases, the lipid-based pathways
will lead to great amount of saleable meal which can offset costs. In fact,
meals are expected to provide nearly 5 times and 10 times the revenue of
biojet fuels for HEFA and CH, respectively. The HEFAeedible oil combination will require the lowest MJSP among all with the CH methods
generally be w60% greater.
The nonlipid pathways of DFJ, PTJ, ATJ, and FT are CAPEX intensive
with expenditure in the category exceeding 60% of total costs in all of
them. None of the methods are expected to rival the lipid-based pathways
in the near term. The methods of DFJ, PTJ, ATJ, and FT are greater than
the HEFAeedible oil combinations by at least 88%, 81%, 36%, and 85%,
respectively. The use of corn for ATJ is promising with the gap against
HEFA being only 36% due to the lower installed equipment cost required,
the high jet fuel yield, and higher offset due to by-product credits.
If we were to consider the best combination of cost and sustainability,
the use of second-generation camelina oil as feedstock under the HEFA
pathway is among the best. Its relative MJSP is only about 5% greater than
the best case but would not bear the baggage of first-generation feedstocks.
A detailed technoeconomical study by Li et al. looks at the production of
biojet fuel from camelina at commercial scale using the HEFA process (Li
et al., 2018). The economic analysis is broken down into total capital costs,
operating costs, and costs related to scale and profitability.
The total capital costs are associated to the investment amount, which
covers all upstream and downstream sections of the process. The total plant
direct cost (TPDC), total plant indirect cost (TPIC), direct fixed capital
(DFC), and total investment (TI) are calculated through Eqs. (5.1)e(5.4).
The coefficients associated to the equations are summarized in Table 5.6.
Eq. (5.1) calculates TPDC using
TPDC ¼ Total equipment purchase cost þ Process ping þ Instrumentation
þ Insulation þ Electrical þ Buildings þ Yard improvement
þ Auxiliary facilities þ Installation
(5.1)
248
Biojet Fuel in Aviation Applications
Table 5.6 Coefficients use for the HEFA plant economic analysis calculations.
Cost category
Coefficients
Total equipment purchase cost (PC)
Process ping
Instrumentation
Insulation
Electrical
Buildings
Yard improvement
Auxiliary facilities
Installation
Engineering
Construction
Contractor’s fee
Contingency
Start-up and validation cost
Labor basic rate
Benefits factor
Supplies factor
Supervision factor
Administration factor
Laboratory and quality control cost
1.20 listed equipment purchase costa
0.20 PC
0.35 PC
0.40 PC
0.10 PC
0.45 PC
0.15 PC
0.40 PC
0.50 PC
0.25 TPDC
0.35 TPDC
0.05 (TPDC þ TPIC)
0.10 (TPDC þ TPIC)
0.05 DFC
USD 30 per hour
0.40
0.10
0.15
0.60
0.15 LC
a
PC factors in unlisted equipment purchase cost which is assumed to be 20% of listed equipment
purchase cost.
Adapted from Li, X., Mupondwa, E., Tabil, L., 2018. Technoeconomic analysis of biojet fuel production from camelina at commercial scale: case of Canadian Prairies. Bioresour. Technol. 249,
196e205.
Eq. (5.2) calculates TPIC through
TPIC ¼ Engineering þ Construction
(5.2)
Eq. (5.3) calculates DFC from
DFC ¼ TPDC þ Engineering þ Construction þ Contractor’s Fee
þ Contingency
(5.3)
Eq. (5.4) calculates TI using:
TI ¼ DFC þ Start-up and validation cost
(5.4)
The plant operating cost factors in labor, material, utility and coproducts cost used in the process. Eq. (5.5) calculated the labor cost (LC)
where
Economics of biojet fuels
249
LC ¼ ½Labour basic rate3
ð1 þ Benefits þ Supplies þ Supervision þ AdministrationÞ
(5.5)
3ðLabour = hoursÞ3ð1 þ Laboratory and quality control costÞ
The key material costs consist of camelina oil (USD 0.80/L), hydrogen
(USD 2.90/kg), catalyst (USD 330/kg), and hexane (USD 2.00/kg). Costs
of water required are for cooling tower water, chilled water, cooling water,
steam, and high-pressure steam at USD 0.04/MT, USD 0.40/MT, USD
0.05/MT, USD 12.00/MT, and USD 20.00/MT, respectively. Water has
to be disposed at a price of USD 0.85 per m3, while power can be bought at
USD 0.08/kWh. Cost can be recouped through the sales of coproducts.
The key saleable coproducts are propane (USD 0.19e0.73/L), LPG (USD
0.19e0.76/L), naphtha (USD 0.22e1.08/L), and neat biodiesel (USD
0.80e1.24/L).
Economies of scale refer to the cost advantage obtained through
increasing output level. However, there is a limit to how large an operation should scale before it reached the point of diminishing returns. For
HEFA-based plants, a minimum scale of 340e570 million L per year is
recommended by the Transportation Research Board. For each plant, the
optimum point is arrived at when the marginal cost (MC) and average cost
(AC) for the biojet fuel production plant intersect. MC refers to the
incremental costs of the last unit of biojet fuel produced, while AC is the
total cost divided by the quantity of biojet fuel produced. Thus, their
intersection will imply the minimum of the average cost curve.
The profitability of the biojet fuel production plant can be determined
using the common net present value (NPV), which is calculated as the
difference between present values of cash inflows from sales of biojet fuel
and cash outflows due to production of biojet fuel. Underpinning this
relationship is the MJSP required as a financial breakeven point. The model
again reiterated that competitiveness of biojet fuel is heavily dependent on
feedstock costs and prevailing conventional het fuel price.
Neuling and Kaltschmitt (2018) modeled the investment costs required
for four different conversion pathways, each with two feedstocks. The
pathways modeled include HEFA, biomass-to-liquid (BtL), biogas-toliquid (BioGtL), and ATJ. Fig. 5.5 shows the annualized costs for four
different biojet fuel conversion pathways. The plants are assumed to have a
life span of 20 years.
250
Biojet Fuel in Aviation Applications
HEFA - palm oil
HEFA - jatropha oil
BtL - willow
BtL - straw
BioGtL - biomethane (manure)
BioGtL - biomethane (grid)
ATJ - wheat grain
ATJ - straw
-1000
-500
0
500
1000
1500
2000
€ (Million/year)
Total investment costs
Other costs
Revenue electricity
Operation-linked costs
Revenue butane/naphtha
Consumption-linked costs
Revenue diesel
Figure 5.5 Annualized costs for four different biojet fuel conversion
pathways. (Adapted from Neuling, U., Kaltschmitt, M., 2018. Techno-economic and
environmental analysis of aviation biofuels. Fuel Process. Technol. 171, 54e69.)
For pathways at deployment phase, the HEFAepalm oil or HEFAe
edible oil combination again proved to be very competitive pricewise as
investment costs are low, bringing down the nett cost. The dominant cost
associated to HEFA is the consumption-linked costs. As the secondgeneration feedstock of jatropha oil cost is still high as compared with
first-generation feedstocks, the HEFAejatropha oil combination is not
attractive. On the other hand, the usually uncompetitive ATJ pathway has
the lowest nett cost among all methods for the ATJewheat grain combination. This can be single-handedly pinpointed to the extremely low
investment cost, which is in the same range as HEFA’s investment costs.
Putting things into perspective, the production costs for HEFAepalm oil,
HEFAejatropha oil, and ATJewheat grain are 890 V/t, 2000 V/t, and
827 V/t, respectively. The cost competitiveness of ATJ against HEFA is
surprising as ATJ has a technology readiness level of 8 and HEFA is at 9.
For the qualification phase pathways, biogas-to-liquid methods are
generally expensive due to the use of biomethane as feedstock. Despite the
added revenue from electricity generation leading to the highest byproduct credits to offset production costs, the BioGtL methods are the
most expensive. The production costs for biomethane from manure and
Economics of biojet fuels
251
grid are 2178 and 2854 V/t, respectively. The BtLewillow combination is
also promising due to the low feedstock cost. If not for the high total investment costs, this method that has a production cost of 1054 V/t could
have been competitive with ATJewheat grain and HEFAepalm oil.
Moving away from the more mature technologies, Yang et al. (2018)
analyzed the capital costs for biojet fuel production through the microwaveassisted catalytic pyrolysis pathway. The 47,882.74 gallon biojet fuel/day
modeled plant is integrated with mild hydrogenation that investigated four
scenarios varying for solvent selection, availability of heat integration, and
selling of coproducts for extra credits. The capital cost comparison is tabulated in Table 5.7. Despite having the second highest capital investment of
USD 285.51 million and total operating cost of USD 52.5 million, scenario 2
has the lowest production cost. This can be attributed primarily to the sales of
extra H2 and secondarily to the superior solvent/product separation from the
use of hexane. The risk to such operation is the uncertainty of H2 prices in
the open market, where the higher capital investment for H2 production
requires a high H2 price.
5.2.4 Impacts of subsidies and taxes
Renewable energies such as wind, solar, biodiesel, and bioethanol are
now success stories in their own rights, but all of them started with suitable
subsidies. The subsidies were useful as consumers understood the
ecological benefits of using renewables but were unwilling to be the early
adopters that will pay for the premium associated with new renewables. In
a scenario where consumers are unwilling or unable to pay for the premium, then public policy in the form of subsidies can be pushed forward
for the greater good.
Reimer and Zheng (2017) modeled the effects of subsidies on aviation
bioenergy supply chain from 21 sectors based on oilseed camelina for the
Pacific Northwest region of the United States. In the study, subsidy for
biojet fuel and taxation on conventional jet fuel were considered.
Table 5.8 shows the price gap between biojet fuel price and conventional
jet fuel price for various subsidy and tax scenarios. From the projected scenarios, a 17.2% subsidy for biojet fuel on one end or 22.6% taxation on
conventional jet fuel would allow biojet fuel to be worked without needing
consumers to pay for a huge premium. The prices will be brought to close to
parity. The subsidy scenario will bring down both fuel prices, while the tax
252
Scenario 1:
Hexane as
solvent, with
heat integration
and selling of
biochar and
extra H2
Scenario 2:
Hexane as
solvent, with
heat integration
and selling of
biochar and
extra syngas
Scenario 3:
Hexane as
solvent, no heat
integration and
selling of
biochar
Scenario 4:
Heptane as
solvent, with
heat integration
and selling of
biochar and
extra H2
Production process
TPEC
TIC
TPEC
TIC
TPEC
TIC
TPEC
TIC
Biomass preheating
Microwave-assisted catalytic pyrolysis
Biooil collection
Hydrogen production via steam reforming
Biojet fuel production via hydroprocessing
Separation process in distillation columns
Cooling water system
Auxiliary utilities
Wastewater treatment and recycling
Total cost
Total capital investment
0.11
5.48
4.88
2.55
1.85
35.52
0.95
0.66
3.32
55.32
285.51
0.22
13.16
5.98
4.51
3.95
69.15
1.90
1.37
7.97
108.21
0.11
4.93
4.86
2.60
1.81
14.61
0.95
0.66
3.32
33.85
183.07
0.22
13.76
5.92
5.35
3.97
28.55
1.90
1.37
7.97
69.01
0.11
4.92
4.63
2.32
1.62
14.50
0.95
0.66
3.32
33.03
174.93
0.22
13.73
5.89
4.51
3.31
28.21
1.90
1.37
7.97
67.11
0.11
4.93
4.90
2.54
2.13
36.65
0.96
0.66
3.32
56.19
291.50
0.22
13.79
6.00
4.62
4.69
70.20
1.91
1.37
7.97
110.77
Biojet Fuel in Aviation Applications
Table 5.7 Capital cost (in USD million) comparisons considering the total purchased equipment cost (TPEC) and total installed
equipment costs (TIC) for microwave-assisted catalytic pyrolysis for biojet fuel production (Yang et al., 2018).
Table 5.8 Price gap between biojet fuel price and conventional jet fuel price for various subsidy and tax scenarios.
Demand
Biojet fuel
Conventional jet
Biojet fuel price
Conventional jet fuel
Price gap (USD
Scenario change
subsidy (%)
fuel tax (%)
(USD per gallon)
(USD per gallon)
per gallon)
Baseline
1
2
3
4
5
No
Yes
Yes
Yes
Yes
Yes
e
Reference
17.2
0
0
9.0
e
Reference
0
19.5
22.6
9.0
3.69
3.71
3.06
3.79
3.80
3.36
3.06
3.05
3.05
3.66
3.75
3.33
0.63
0.66
0.01
0.13
0.05
0.03
Economics of biojet fuels
Adapted from Reimer, J.J., Zheng, X., 2017. Economic analysis of an aviation bioenergy supply chain. Renew. Sustain. Energy Rev. 77, 945e954.
253
254
Biojet Fuel in Aviation Applications
conditions will keep the prices for fuel high. The former will artificially
support the biojet fuel industry while reducing revenue to a country, while
the latter might unfairly punish the oil and gas (O&G) industry.
A combined 9% biojet fuel subsidy and 9% conventional jet fuel tax
would be a more favorable scenario as this mitigates the gap without overly
distorting either industries. This method will not reduce motivation from
the biojet fuel industry to seek free market profitability, nor will it be seen
to overly penalize the existing O&G industry. While short-term subsidies
and taxation can kickstart a new industry, governments need to avoid
making it a long-term answer as it will result in competitive distortions.
Both the subsidies and taxation could also be made indirect using marketbased measures (MBMs) such as carbon offsetting mechanism.
5.2.5 Impacts of biojet fuel on travel costs
The Energy Information Administration (EIA) projected the conventional
jet fuel price in 2020 to be 0.54 V/L, while the IEA predicted the
dominant biojet fuels produced to be in the range of 0.96e1.45 V/L
(Deane et al., 2017). This meant a price delta of 0.42e0.91 V/L that
translates to a 1.20e4.30 V/passenger cost increase for a 1000-km flight.
They are modeled under the presumption that costs are spread across all
domestic and intra-EU-28 flights in 2020, with biojet fuel contributing to
4% of jet fuel volume demand.
In 2020, the world was hit by a global pandemic which all but decimated air travel and skewed all projections. From a recalculation by the
authors using mid-September 2020 prices, the expected cost increase for a
1000-km flight has risen to 7.02 V/passenger as compared with conventionally fueled flights. This rise is due to the plunge in global crude oil price
and the lower demands of both biojet fuels. Unlike typical supply and
demand scenario, the fall in demand for biojet fuel does not reduce price as
cost rises due to smaller batch being produced. However, if adjusted for the
previously predicted values, the gap reduces to 5.82 V/passenger cost increase for a 1000-km flight.
The increase in gap does not augur well for the biojet fuel industry from
a free market sense, as the lower cost increase would implicitly mean that
biojet fuels has achieved greater economies of scale. It is not entirely clear if
the increase in relative cost for biojet fuel is due to the renewable fuel not
making inroads into the market or the pandemic setting back the industry.
The recovery of the biojet fuel industry is dependent on the recovery
Economics of biojet fuels
255
trajectory that the aviation sector follows. A V-shape recovery will be
preferable to a U-shape recovery. Regardless, stronger legislations in the
form of blending mandates and emissions limits; and greater incentives in
the form of subsidies, pioneering statuses, and environmental credits might
be required in the near term for the industry to regain its footing.
5.3 Potential feedstock
Biojet fuel can be derived from various biomass such as edible vegetable oil,
animal fat, waste cooking oil (WCO), cellulose, and algae. Unlike the more
established biofuels of bioethanol and biodiesel, the methods available to
produce biojet fuel are more diverse. From a technical point of view, the
choice of feedstock is primarily determined by the conversion pathway.
However, conversion pathway is itself secondary when more localized
circumstances such as availability of feedstock, supply chain maturity, local
cost of production, political decisions, trade restrictions, and availability of
crude oil will be the more practical determinant. In other words, the most
optimum method will not be the same for all producers.
Potential feedstock for biojet fuel can be classified by their main groups
as shown in Table 5.9. The first-generation feedstock is taken from food
source, and usage for biojet fuel will cause competition to feed mouths.
This sparks the “food versus fuel” debate. These feedstocks are in the
position where the accompanying technological pathways such as HEFA
are relatively mature. Also, the boom-and-bust cyclical nature of these
feedstocks meant that most of them have at some point in time been touted
as economically viable options for biojet fuel production. For firstgeneration feedstocks, the availability, land usage concerns, and moral
dilemma are the factors plaguing their use as biojet fuel feedstocks.
5.3.1 First-generation feedstock
First-generation feedstocks are dominated by edible oil, animal fats, and
sugar/starch crops. The global quantity of key oils crops processed as
published by the Food and Agriculture Organization of the United Nations
(FAO) is shown in Fig. 5.6. From it, palm dominates with one-third of
global oil crop processed, followed by soybean (slightly above a quarter),
rapeseed (15%), and sunflower (9%) to round off the top four. The big four
feedstocks contribute to an extremely high 83.6%, which is further
increased to 87.4% if palm kernel is factored in due to palm oil and palm
kernel oil coming from the same source. This is out of a total of roughly
256
Biojet Fuel in Aviation Applications
Table 5.9 Potential biojet fuel feedstocks.
Generation Common characteristics
Category
Key feedstock
First
generation
Edible oil
crop
Castora, coconut,
palm, peanut,
rapeseed, soybean,
sunflower
Lard, poultry fat,
tallow
Cassava, cereals,
corn, sugarcane
Second
generation
Third
generation
a
First-generation feedstocks
typically come from edible
sources from plants and
animals. Unless surplus of
feedstock, the use of these
feedstocks for biojet fuel
will compete with human
diet. It might also
exacerbate deforestation if
virgin forest is used for
cultivation.
Second-generation biojet
fuels could be drawn upon
from a larger pool of
feedstock which are
generally inedible and
hence will not be in
competition with food.
These feedstocks do not
require fertile arable land
which can be reserved for
food-based agriculture.
The feedstocks are likely
to meet sustainable
criteria.
Edible
animal fat
Sugar and
starch crop
Nonedible
oil
Cellulosic
material
(may be
dedicated
energy
crops)
Wastes
Third-generation feedstock Oil for
typically has very high oil
energy
content and fast growth
rate. They can be cultivated
using marginal lands, or in
some cases even be
nonterrestrial. The
feedstocks will likely meet
sustainability criteria.
However, extensive
downstream processes are
often accompanied with
these feedstocks.
Babassu, jatropha,
karanja, camelinab
Alfalfa, grasses
(bamboo, switchgrass,
reed canary) plant
residues, straw,
sugarcane bagasse,
woody energy crops
(eastern cottonwood,
green ash, poplar,
silver maple,
sycamore), wood
by-products
Agricultural waste,
municipal solid waste
(biomass fraction),
waste cooking oil,
yellow grease sewage,
tyre, flue gas
Algae (microalgae),
bacteria, insect,
seaweed
(macroalgae), yeast
Castor is nonedible but classified as an oil crop.
Camelina can be classified as both first- and second-generation feedstocks.
b
Economics of biojet fuels
Soybean, 26.38%
257
Coconut, 1.79%
Sunflower,
9.15%
Cottonseed, 2.91%
Groundnut, 2.90%
Other, 16.42%
Rapeseed, 14.97%
Linseed, Safflower,
Sesame, 1.40%
Maize, 1.84%
Olive, 1.76%
Palm kernel, 3.81%
Palm, 33.09%
Figure 5.6 Global quantity of key oils crops processed (FAO, 2020b).
173.3 million tons of oil crops processed globally. There are two schools of
thoughts, which is to either use a dominant feedstock as surplus is a possibility or use a minor oil crop so that it can be designated as the feedstock
of choice for biojet fuel production. For this, two oil-based first-generation
feedstocks namely, palm and coconut, stand out as high-potential feedstock
for biojet fuel production.
Oil palm for the production of palm oil as feedstock also represents a
potential opportunity as it has the highest oil yield exceeding 8000 kg per
hectare annually, although actual average yields are closer to 3300 kg oil per
hectare annually (Woittiez et al., 2017). In fact, the maximum theoretical
yield is calculated to be 18,500 kg oil per hectare annually. The actual yield
depends on palm age, pollination, harvesting, water availability, pests, diseases, manpower, planting material, planting density, canopy management,
machineries, and available technologies. Regardless, even the lower estimates of 3300 kg oil/ha/yr are greater than the typical yield of other widely
regarded high yielding edible oil crops such as coconut and jatropha as
shown in Table 5.10.
There is a perception that the rapid expansion of oil palm plantations is
the main cause of deforestation in the Southeast Asia and Latin America
regions. However, key palm oileproducing nation such as Malaysia stated
that the palm oil industry has grown responsibly and sustainably. Malaysia
was focused on improving productivity and yield of oil palm plantations,
258
Biojet Fuel in Aviation Applications
Table 5.10 Typical oil yield from various oil-producing biomasses.
Oil yield
Seed oil
Crop
(L/ha)
content (%)
Generation
Microalgae (30%e70% oil
by weight)
Oil palm
Macauba
Coconut
Karanja
Jatropha
Castor
Rapeseed
Canola
Peanut
Sunflower
Camelina
Chinese tallow
Safflower
Soybean
Cotton
Corn
Rubber seed
58,700
e136,900
3300
e18,500
6000
2338e2806
1800e3600
1892e3000
1413
1029e1216
1190
1059
702e982
915
907
779
374e514
327e421
168e187
80e120
e
Third
40
First
e
e
30e40
e
e
35
e
e
32e49
e
e
e
21
14e20
e
e
Second
First
Second
Second
First
First
First
First
First
First/Second
First
First
First
First
First
First
Adapted from Scarlat and Dallemand (2019), Woittiez et al. (2017), Chuck et al. (2016), Hari et al.
(2015), Cruz et al. (2020).
rather than expanding land usage with cultivation area capped at 6.55
million hectares by 2023. The European Palm Oil Alliance (EPOA)
recognized the problem of deforestation but argued that much of oil palm
plantation expansion occurred on land previously used for coffee or rubber,
and not all deforested land was primary forest before clearing. The World
Wildlife Fund (WWF) stands by their position to support sustainable palm
oil. While the issues of deforestation attributed to palm oil are not in doubt,
but there is potentially a scope for exaggeration. An EU report in 2018
showed that soybean (5.4%), maize (3.2%), pasture (24%), beef/meat/
leather (24%), and animal feed (8%) all contributed to a higher global share
of deforestation as compared with oil palm (2.3%) (European Comission,
2018). As such, oil palm plantations cannot be pinpointed as the main driver
for deforestation. The actual 2.3% global share of deforestation is a huge
difference to the 40% value attributed to palm oil as heavily reported in
media or already planted in the psyche of the general public.
Economics of biojet fuels
259
Coconut oil has unique properties as feedstock for biojet fuel production. The oil is primarily saturated, with the shortest average carbon chain
length among all major oil crops. As the dominant fatty acids for coconut
oil are caprylic acid (C8:0), capric acid (C10:0), lauric acid (C12:0), myristic
acid (C14:0), and palmitic acid (C16:0) which are in the C8eC16 range,
they also overlap well with the typical biojet fuel carbon chain length of
C8eC16 range. This meant that coconut oilederived biojet fuel will
potentially have higher yield and maybe even skip the cracking step of the
HEFA process as required for longer carbon chain length feedstocks. Coconut has high oil yield but without the perception that it is unsustainable as
a crop. The only drawbacks are the present low production quantity at less
than 2% of global vegetable oil and relative high price compared with other
major vegetable oils. The prices of various oils are shown in Table 5.11.
Coconut oil can be a candidate to be cultivated for the purpose of biojet
fuel production, just like how jatropha was planted in some regions for the
sole purpose of producing biodiesel. When produced in larger quantities,
price will invariably fall due to economies of scale. This will benefit coconut planters as it will be converted from an expensive niche product to a
more moderately priced large-volume commodity.
Animal fats are typically produced at one-sixth to one-seventh of the
fats and oils produced. A substantial proportion of the animal fats produced
are not fit for human consumption, which severely limits their market
appeal as compared with vegetable oil. Thus, they are usually utilized in the
Table 5.11 Vegetable oil prices.
Proportion of
oil crop
Global
processed
rank in
quantity globally (%)
Vegetable oil
Quantity of oil
crop processed
globally (million
tons)
Price
(USD/MT) in
2018
Palm oil
Sunflower oil
Soybean oil
Rapeseed oil
Coconut oil
Palm kernel oil
Groundnut oil
57.329
15.848
45.705
25.945
3.106
6.602
5.031
535e709
703e806
728e871
793e854
787e871
708e1265
1433e1477
1
4
2
3
9
5
7
33.1
9.2
26.4
15.0
1.8
3.8
2.9
260
Biojet Fuel in Aviation Applications
animal feed, pet food, and soap-making industries. As feedstock for these
industries, the price that animal fats command is low. Animal fats may
contain contaminants such as phospholipids (gums) and polyethylene.
Animal fats also have high sulfur contents, which is undesirable as the
combustion of biojet fuels containing sulfur will form SO2. Proper filtering
of the contaminants and vacuum distillation to remove sulfur will be
required to put it on par with vegetable oil as a feedstock from a technical
standpoint. The greatest obstacle to animal fat as a major feedstock for
biojet fuel production is the fact that it is merely the by-product of the meat
supply chain. It will not be feasible to raise animals for the production of
animal fats, so supply cannot meet potential spike in demand.
While the use of edible oil and animal fat as feedstock can be controversial, the conscientious use of these feedstock will be acceptable. The
world has a hunger problem with 10.8% of the population considered to be
undernourished and 9.8% facing severe food insecurity (FAO, 2017).
However, it is not from the lack of food production. Instead the problem
comes from the poor distribution of food and urban food wastage. Globally,
the average dietary energy supply adequacy has increased every decade with
115%, 116%, and 122% in 1997, 2007, and 2017, respectively. The growth
of vegetable oil production of 1.45% from 2019 to 2028 is expected to
outpace growth in its requirement as food on a weight per capita basis of
0.81% for the same 10-year period (OECD-FAO, 2019).
For sugar and starch crops, sugarcane is front-runner as a biojet fuel
feedstock. The direct use of sugar or the derived ethanol from sugarcane
can serve as a feedstock for biojet fuel production. It is photosynthetically
efficient and is one of the most grown crops globally. It is already widely
used for bioethanol, with three quarters being used in the food
manufacturing sector and the rest for biofuels production. As a sugar crop,
sugarcane has the upper hand as compared with sorghum and sugar beet in
terms of total production and yield as shown in Table 5.12 (FAO, 2019).
Both the Americas and Asia produced more sugarcane than the rest of the
world combined for sorghum and sugar beet. In particular, Brazil, India,
China, and Thailand are powerhouses for sugarcane production. These
countries are also located in the correct climate and hence have the largest
yield in the range of 731,441e734,768 hg/ha. The major drawback of
using sugarcane as a feedstock is the relative immaturity of the conversion
pathways as opposed to the more advanced stage of development for oil-tojet pathways. The success of biojet fuel will see the gradual shift of
Economics of biojet fuels
261
Table 5.12 Area harvested, production, and yield for sugar crops (FAO, 2019).
Sugar
Area harvested
Production
Yield (hg/
crop
Region
(ha)
(tonnes)
ha)
Sugarcane
Sorghum
Sugar
beet
Africa
Americas
Asia
Europe
Oceania
World
Africa
Americas
Asia
Europe
Oceania
World
Africa
Americas
Asia
Europe
Oceania
World
1,547,616
13,919,856
10,279,738
37,739
484,869
26,269,819
29,710,774
5,300,555
6,432,088
236,174
463,554
42,143,146
275,038
475,234
743,392
3,315,825
e
4,809,490
94,925,364
1,022,785,798
751,902,468
2,280,152
35,130,948
1,907,024,730
29,782,406
19,244,420
7,973,788
1,079,149
1,262,340
59,342,103
15,021,745
33,007,156
41,743,674
185,113,732
e
274,886,306
613,365
734,768
731,441
604,188
724,545
725,938
10,024
36,306
12,397
45,693
27,232
14,081
546,169
694,545
561,530
558,274
e
571,550
sugarcane from a source of sucrose to a source of energy. This will pose a
unique problem of sugarcane being in a three-way usage competition for
the sugar, bioethanol, and biojet fuel industries.
5.3.2 Second-generation feedstock
Second-generation feedstocks will not compete with the food market and
can theoretically be cheaper as a feedstock in the long term. However,
prices are still high due to the inability to grow nonedible oil on marginal
land and collection of wastes in large quantities. Most operations are still at
small scale as compared with the vast collective operations of the oil crop
and O&G industries. Second-generation feedstock also has the advantage of
democratizing the availability of feedstocks as cellulosic materials and wastes
are found in significant quantities for nearly all countries. The use of these
feedstocks will be dominant once cost parity with first-generation feedstock
is achieved.
Among second-generation feedstocks, jatropha oil, camelina, and
WCO are the current oil-based feedstock candidates. Jatropha gained its
reputation as a wonder crop for biofuel during the biodiesel industry boom
262
Biojet Fuel in Aviation Applications
due to its high oil content (>30%), high yield (w3000 kg oil/ha.yr), and
ability to be grown in marginal land without irrigation. The plant is also
potentially drought and pest resistant (Hari et al., 2015). These factors
allowed jatropha to enter the biofuel industry as a viable feedstock without
being embroiled in the food versus fuel debate. Fast forwarding a couple of
decades, the results of jatropha as feedstock for biofuels is mixed as efforts to
plant jatropha in marginal lands regularly failed in areas without sufficient
land moisture, like in Ethiopia (Wendimu, 2016). The Indian efforts on
jatropha as feedstock for biofuels, inclusive of biojet fuels, are more successful. This is reflected in the area of jatropha plantation from 2006 to 2012
where Asia, Africa, and Latin America contributed to 85%, 13%, and 2%,
respectively (van Eijck et al., 2014).
Camelina, which is traditionally used as edible oil and lamp oil, has
second generationelike characteristics of being able to be cultivated at
marginal land. This ability will reduce precious arable land usage, freeing up
more arable land for food production. While not unique to camelina, the
oil crop can serve as a rotational crop with wheat for soil preservation.
WCO has the base properties of edible cooking oil used as feedstock in
the HEFA process but does not incur additional direct land change usage.
The use of WCO solves the trifecta problems of diverting edible oil for fuel
production, reducing oil waste, and minimizing the incentive to reuse WCO
for food. The last of which is the “gutter oil” practice where restaurants reuse
WCO collected from restaurants, grease traps, and slaughterhouse wastes.
WCO has high variability in quality and composition due to the locality,
collection method, and period of the year when different vegetable oil is
consumed (Chiaramonti et al., 2014). The biggest issue facing WCO is the
contaminant. This represents the largest technical challenges to be dealt with
before the catalytic hydrotreatment process.
There is a large quantity of WCO produced annually as shown for the
selected countries in Table 5.13. The selected countries alone have the
Table 5.13 Quantity of waste edible oil for selected countries (Kalam et al., 2011).
Country
Quantity of waste edible oil (million tons/year)
United States
China
Europe
Malaysia
Japan
Canada
10.0
4.5
0.7e1.0
0.5
0.45e0.57
0.12
Economics of biojet fuels
263
capacity to provide 16.5 million tons of WCO per annum, which easily
places WCO among the top four feedstocks if it were an edible vegetable oil.
Technical concerns aside, WCO is more likely to be curtailed by logistic
concerns. The collection of WCO will represent a challenge as the supply
system, collection methods, and processing capacity require augmentation
into the existing waste management supply chain.
For dedicated energy crops, lignocellulose-type feedstock can be
cultivated for biojet fuel production. Table 5.14 tabulates some key energy
crops and the suitable geographic locations. Using the lower bounds for
productivity, it is apparent that productivity of energy crop is greater as the
suitable climate transits from temperature to subtropical or tropical. It makes
sense to suggest that countries with temperate climate should not prioritize
lignocellulosic energy crops as feedstocks for biojet fuel unless the conditions are favorable for crops such as miscanthus, switchgrass, and poplar to
reach the upper bounds.
Agricultural wastes are great sources of lignocellulosic materials as a
result of various agricultural operations. They are usually the leftover
biomass after the edible portions of the plants are harvested. It is inaccurate
to classify the wastes as unwanted as they are often returned to the land in
Table 5.14 Productivity and suitable climate for energy crop (Chuck et al., 2016).
Productivity
(tonne/ha/year)
Suitable geographic
location
Energy cane (Saccharum sp.)
Elephant grass (Pennisetum
purpureum)
Sorghum (fiber)
33e400
22e31
Giant reed (Arundo donax)
10e30
Eucalyptus
10e21
Miscanthus (Miscanthus sp.)
Switchgrass (Panicum virgatum)
Willow
Poplar
Canary grass (Phalaris
arundinacea)
Alfalfa
5e43
5e35
5e11
2e34
2e10
Subtropical, tropical
Temperate, subtropical,
tropical
Warm climates
worldwide
Temperate, subtropical,
tropical
Temperate, subtropical,
tropical
Temperate
Temperate
Temperate
Temperate
Temperate
1e17
Temperate
Crop
16e43
264
Biojet Fuel in Aviation Applications
various waste-to-wealth initiatives. Depending on the types of wastes, they
can be used to improve fertility of soil, as animal feed and direct use for
low-grade fuel. Despite the utility, they are often not fully consumed and
also represent a loss in opportunity costs as they could be converted into the
high value biojet fuel. The amount of agricultural wastes globally is estimated to be in the range of 1.47e3.84 billion tons per year as shown in
Table 5.15.
Staple foods such as rice and wheat, which already provide food for
more than 90% of the global population, could further contribute to the
large proportion of the agricultural residues. Rice residues are dominant in
the tropic regions of Asia, while wheat residues from Europe are prominent
in temperature regions due to its domestication as a winter crop. Next
down the list are C4 plants such as maize and sugarcane. C4 plants, which
use the C4 or Hatch-Slack pathway, thrive in tropical climates; hence, the
residuals from the aforementioned plants are mostly from Americas and
Asia. On the other hand, barley, oats, oil palm, rye, and sunflower have
high residue to crop ratio, which renders the collection of agricultural waste
to be potentially worthwhile. All nine crops mentioned here are good
candidates as feedstock as the cost will be low with relatively high quantities
for collection.
5.3.3 Third-generation feedstock
Third-generation feedstocks can be classified as any feedstock with the
capability to accumulate lipids. They are usually fast growing and require
little additional natural resources to cultivate. The leading lights of this
generation are from microorganisms such as microalgae and yeast. Microalgae can be harvested all-year long, located at marginal lands, and use saline
or wastewater streams (Noh et al., 2016). Microalgae has high lipid contents
as shown in Table 5.16 (Giwa et al., 2018). Presently, the microalgal market
is led by Chlorella, Spirulina, and Dunaliella. There are other microalgae with
theoretically higher oil content, but optimum growth is dependent on
many factors.
Although research at lab scale has shown promising results such as
having lipid to land usage ratio that dwarves even that of oil palm, this has
not yet translated to any large-scale microalgae or yeast farms. At the upper
bounds of oil yields, microalgae’s oil yield of 136,900 L/ha/yr is 7.4 times
greater than that of oil palm yield of 18,833 L/ha/yr. Also, the production
of biojet fuel from microalgae grown in the Netherlands is currently
Table 5.15 Agricultural waste estimations for various crops (Chuck et al., 2016).
Estimate of annual residue production in 2010 (billion tons)
Global
production
Residue
of edible
to crop
portion
ratio
Africa
Americas
Asia
Europe
Oceania World
(billion tons)
Crop
2.25
0.088
0.419
1.5
2.0
e
2.5
2.6
0.25
e
1.5
2.25
1.5
1.07
0.85
e
0.3
10
e
e
e
0e64
23
0.2
e
5
e
21e35
0.1
e
32
e
3
11e22
24
e
e
e
149e445
0.4
5
e
10
e
37e56
4
e
34
e
8
88e241
30
e
e
e
34e246
24
1
e
38
e
668e949
3
e
15
e
9
75e156
111
e
e
e
29e85
0.5
12
e
27
e
3.9e6.5
35
e
1
e
38
0
11
e
e
e
0.2e0.5
0.06
1
e
0.4
e
1.7
0.8
e
2
e
0
6e8
186
e
e
e
203e840
48
20
e
8
e
731e1045
39
e
84
e
58
181e428
16.9
18.4
18.1e18.6
12.4e16.3
12.4e16.8
e
17.4
9.8e17.9
17.4
16.5
12.6e16.3
17.4
15.9
13.9
16.3
e
15.8e18.1
44.8
713.2
6602
5.0
1.5
e
e
5.3e33
e
e
63e169
e
e
145e439
e
e
133e306
e
e
8e34
e
e
354e981
1470e3836
18.6
15.9
e
265
144.8
276.7
62.0
44.5
e
1016.7
29.9
55.8
368.1
72.5
745.7
16.7
4.8
61.4
276.4
250.2
1877.1
Economics of biojet fuels
Barley
Cassava
Coconut
Cotton
Maize
Millet
Oats
Oil palm
Potatoes
Rapeseed
Rice
Rye
Sesame
Sorghum
Soybean
Sugar beet
Sugarcane
bagasse
Sunflower
Wheat
Total
Calorific
value
(GJ/ton)
266
Biojet Fuel in Aviation Applications
Table 5.16 Lipid contents of microalgae (Giwa et al., 2018).
Microalgae species
Oil content (% dry wt)
Botryococcus braunii
Chlorella sp.
Crypthecodinium cohnii
Cylindrotheca sp.
Dunaliella primolecta
Isochrysis sp.
Monallanthus salina
Nannochloris sp.
Nannochloropsis sp.
Neochloris oleoabundans
Nitzschia sp.
Phaeodactylum tricornutum
Schizochytrium sp.
Tetraselmis suecica
25e75
28e32
20
16e37
23
25e33
>20
20e35
31e68
35e54
45e47
20e30
50e77
15e23
approximated to be 60 times greater than that of conventional jet fuel
(Deane et al., 2017). Without scaling up, the cost of using third-generation
feedstock remains high, and such projects will have a longer-term horizon
rather than immediate industrial application. While it makes sense to
accelerate the progress of third-generation feedstock for the supernormal
gains, it is more prudent to focus on improving the more immediately
achievable price parity of second-generation feedstocks.
While microalgae comes to the public’s mind for third-generation
feedstocks, macroalgae (seaweed) also have huge potential as feedstock
for biojet fuel production. Seaweed has the resource advantage over
terrestrial crops and microalgae, as it does not require fertiliser and freshwater, while also forming stable ecosystems if cultivated responsibly (Chuck
et al., 2016). As compared with terrestrial crops, seaweed has at least four
times the solar efficiency, exceeding 8%. Presently, only 16 million tons per
year of seaweed biomass is cultivated globally. This represents a large unrealized potential as conservative estimates show that offshore farms, coastal
farms, and open sea colonies have the potential to generate 110 EJ, 35 EJ,
and 6000 EJ, respectively. Among the macroalgae classes, the green variant
has the best potential for the HEFA conversion pathway. The key properties of macroalgae are shown in Table 5.17. The high ash contents for all
macroalgal classes meant that thermal conversion and fermentation pathways will be less efficient.
Economics of biojet fuels
267
Table 5.17 Key properties of macroalgae (Chuck et al., 2016).
Macroalgal class
Description
Green
Red
Brown
Key species
Ulva
lactuca,
Ulva
pertusa
25e65
Gelidium amansii
Laminaria japonica,
Sargassum fulvellum
30e85
40e60
Starch,
cellulose
Floridian starch,
galactans, agar,
carrageenan, cellulose
<1.1
Laminarin, mannitol,
alginate, fucoidan,
cellulose
<2
8e14
3e9
Up to 57%
12e19
Up to 46%
Up to 37%
Glucose, galactose
Glucose, mannitol
Carbohydrate
content (%)
Carbohydrate
type
Lipids content
(%)
Protein (%)
Ash (%)
Sugar released
on hydrolysis
Main sugar
type
<6
7e20
18e25
Up to
60%
Glucose
Yeast, more particularly oleaginous yeast can be a possible rival to
microalgae. It has almost all of the advantages of microalgae such as short
life cycle, high growth, and high oil yield but without the need for light
source. In fact, yeasts even have higher cell densities while having shorter
doubling time. The fermentation of yeasts may also produce other saleable
coproducts, which can be used to offset production costs. For the purpose
of biojet fuel production, the Saccharomyces cerevisiae yeast is currently
favored although it is nowhere near to being sufficient for industrial usage.
The oleaginous yeast Yarrowia lipolytica is widely researched for biofuels as it
can produce a high amount of lipids. Like S. cerevisiae, the Y. lipolytica yeast
would need major optimization before it can make the step-up for
economically viable usage in the industry. Primarily, improvements have to
be made on mass of lipids produced per unit of sugar consumed, which is
the most important parameter for biojet fuels derived from single cell oils.
The term “fourth-generation feedstock” has also been coined, with the
general idea of them being genetically engineered feedstocks. Feedstock
metabolism could be altered to improve yield, while composition could be
optimized for biojet fuel production. The ability to capture and store
carbon could also be enhanced in which more carbon could be captured at
268
Biojet Fuel in Aviation Applications
cultivation stage and less carbon released postcombustion. For example,
strains of microalgae, which have the most desirable existing properties,
could be a candidate for gene alteration to improve cellular metabolism.
This will further accelerate growth and increase oil yield. Conversely, the
microalgae’s composition could also be tweaked to prioritize either sugar,
starch, or oil production depending on the desired conversion pathways to
be used. Other example includes the altering of sugarcane (which is not
usually associated as an oil crop) to produce triglycerides using metabolic
engineering and plant genetics techniques. Oil content could increase by
200 times to oil crop levels for the bioengineered sugarcanes as compared
with their wild-type plant counterparts.
Pennycress (Thlaspi arvense L.) from the Brassicaceae family is another
highly regarded feedstock for biofuels produced from oil-based conversion
pathways (Claver et al., 2016). It has no specific water requirement, requires
no pesticide, does not need fertilizer, and can be planted in rotation
(pennycress-soybean rotation). Pennycress could be planted in nonagricultural lands, hence not competing with food crops for land usage. It also has
the added benefit of being a winter annual, making it the equivalent of the
tropic regionecentric jatropha for the temperate climates of North America
and Europe. The use of biotechnology techniques to control the gene expressions of TaFAE1, TaSGAT1, and TaWRI1 will maximize the production of fatty acids for biojet fuel production. The relatively high oil content
will make it a possible candidate for sustainable biojet fuel production.
The term “fourth generation” has not gained general consensus as some
researchers consider it as an extension of third-generation feedstocks.
Regardless, this method holds great promises as the potential upside is huge,
justifying the risk-reward evaluation to support the high initial R&D costs.
Interestingly enough, the success of biojet fuel is hinged upon the
trajectory of biodiesel and bioethanol industry as they all share the
biomass-based feedstock. The increased use of first-generation feedstock
will serve to raise the price of feedstock for all three industries as currently
the dominant conversion pathways are still pivoted toward edible oil,
sugar, and starch crops. This leads to a four-way competition between the
three industries and the food market. On the other hand, any gravitation
toward second-generation feedstock will improve the feedstock cultivation and collection supply chain, which will diversify the availability of
feedstock, leading to lower feedstock costs for both first- and secondgeneration feedstocks.
269
Economics of biojet fuels
It should be noted that the categorization differs as some feedstock
arguably matched multiple categories, and the classification of generation
is also a point of contention. As such, the term “advanced biofuels” is
gaining wider acceptance and generally refers to biofuels with superior
carbon footprint.
5.3.4 Feedstock cost implications
180
1300
160
1200
140
1100
120
1000
100
900
80
800
60
700
600
40
500
20
400
0
20
FAO Index (Vegetable Oil) - 2014-2016 = 100
1400
04
/
20 05
05
/
20 0 6
06
/
20 0 7
07
/
20 0 8
08
/
2 0 09
09
/
20 1 0
10
/
2 0 11
11
/
20 12
12
/
20 1 3
13
/
20 1 4
14
/
20 15
15
/
2 0 16
16
/
20 17
17
/
2 0 18
18
/
20 1 9
19
/2
0
International Price (USD per tonne)
While there is not yet widespread production of biojet fuel in the scale of
bioethanol and biodiesel, the effects can best be predicted from the biodiesel industry. This is because the leading biojet fuel production pathway
of HEFA bears similarity to the biodiesel transesterification process, in
which they both rely on lipids as feedstocks. Fig. 5.7 shows the international
prices for oil crop products and price index from FAO as of October 2020.
From 2002 to 2008, crude oil price went on a bull run due to the 2003
Iraq war (wUSD30/barrel), 2005 Hurricane Katrina (wUSD50/barrel),
2006 North Korean missile launch incident (wUSD79/barrel), 2007
Turkish tension (wUSD90/barrel), 2008 Nigerian militant attack
(wUSD117/barrel), and reducing US dollar strength. These catalysts
brought crude oil price to an impossibly high peak price of USD 145.85
per barrel on July 3, 2008. This made them expensive to produce, while
Period (October/Sept)
Soybean Oil (USD per tonne)
Palm oil (USD per tonne)
Vegetable oil (FAO index)
Figure 5.7 International prices for oil crop products and FAO vegetable oil price index
(FAO, 2020a).
270
Biojet Fuel in Aviation Applications
making biodiesel to be very profitable. Many biodiesel projects were
declared to capitalize on the high crude oil price. As biodiesel projects
relied only on edible vegetable oil at that time, price spiked due to demand as biodiesel feedstock. It is more profitable to use the feedstock for
fuel than to feed mouths. This is on top of the natural mirroring of
vegetable oil and crude oil prices since 2003. Year 2008 saw the highest
food inflation since the early 1990s.
Thus, it is not inconceivable to believe that if biojet fuels become
profitable due to extremely high petroleum price, the price of vegetable oil
will face a sudden spike before it renormalizes. Two opposing economic
forces in the supplyedemand play might skew the outcome. First, a greater
spike in vegetable oil price is expected as both biodiesel and biojet fuel will
use the same feedstocks, increasing demand in vegetable oil. Second, demand
will not rise as much as expected as the dominant biojet fuel conversion
pathway might gravitate away from HEFA and use other feedstocks instead.
Irrespective of the spike, market will renormalize by either increasing supplyside vegetable oil or having lower demand as higher feedstock cost will make
biojet fuel production less desirable. Fears of hyper food inflation should not
happen in the more efficient modern market era. The post-COVID-19
period is still an unknown quantity, but early signs are showing that vegetable oil price and crude oil price might be decoupling.
5.4 Global biojet fuel production
The US Department of Energy (US DOE) stated that the global demand
for aviation jet fuel is 106 billion gallons in 2019 and expected to grow to
230 billion gallons in 2050 (US DOE, 2020). This translated to an actual
2019 and predicted 2030 global demand of 401 billion liters and 871 billion
liters, respectively. Aviation industry is reliant on crude oil as the primary
power source, as it can neither rely on electricity unlike road transport nor
can it rely on solar and wind which favor stationary usage. When it comes
to power generation for propulsion, liquid fuel is still the only choice that
provides sufficient energy density volumetrically. This has led to the use of
6.5% of all oil refined worldwide for jet fuels. For biojet fuel to supplant or
complement conventional jet fuel to meet the broad-based 2020 and 2050
aviation industry goals, large quantities of feedstock will be required. The
present target for biojet fuel production is around 2e3 million tons by
2020, with longer-term targets rising exponentially to at least 58 million
tons by 2050.
Economics of biojet fuels
271
8
7
14000
Exponential growth
expected after 2019
6
5
12000
10000
Data gap
in 2019
4
8000
3
6000
2
4000
1
2000
0
0
Projected biojet fuel production capacity
(million litres)
16000
Projected capacity
Actual production
2007
2008
2009
2010
2011
2012
2013
2014
2015
2016
2017
2018
2019
2020
2021
2022
2023
2024
2025
2026
2027
2028
2029
2030
2031
2032
Actual biojet fuel production (million litres)
The International Air Transport Association (IATA) shows that 215,000
commercial flights from 40 airlines had use biojet fuels, and there were 6
billion liters (or 4.8 million tons) in airline forward purchase agreements as
of December 2019 (Soone, 2020). These numbers are encouraging, but the
actual market penetration remained low. The International Energy Agency
(IEA), European Aviation Safety Agency (EASA), and European Commission (EC) have estimated that biojet fuel accounted for less than 0.1%
(2018), at 0.004% (2017), and at 0.05% (2017) of total aviation fuel consumption, respectively. The global production volume of biojet fuels is
difficult to be projected accurately at the moment as legislations, mandates,
and policies regarding its use are still in a nascent stage. Reporting is also
typically on a voluntary basis and often delayed by a couple of years. This is
further made complicated where there is a gap between targets, actual
usage, and production data.
As such, the International Civil Aviation Organization (ICAO) SAF
Stocktaking process, which “take stock” of global progress of the development and deployment of biojet fuels might provide the best estimates
(ICAO, 2020). Fig. 5.8 shows the actual global biojet fuel production
Year
Actual biojet fuel production
Projected biojet fuel production capacity
Projected biojet fuel production capacity (low ratio 10%)
Projected biojet fuel production capacity (high ratio 80%)
Figure 5.8 Actual global biojet fuel production (2007e18) and the projected global
biojet fuel production capacity (2020e32). (Adapted from ICAO, 2020. SAF Stocktaking What is it about? https://www.icao.int/environmental-protection/Pages/SAF_Stocktaking.
aspx.)
272
Biojet Fuel in Aviation Applications
(2007e18) and the projected global biojet fuel production capacity
(2020e32). The stocktaking result as of July 2020 shows that the 3-year
average 6.45 million liters per year for the 2016e18 period. This represented 22.2 times increase from the 2013e15 timeframe, which were the
nadir for the biojet fuel industry. The industry is also projected to have an
extended period of exponential growth until 2024, followed by a plateauing period where global biojet fuel production capacity is expected to
be 13.6 billion liters.
The projected global biojet fuel production capacity for 2020 is about
2.6 billion liters, which could potentially contribute to 0.65% of total
aviation fuel demand. However, having the capacity and actual production
is not the same. It is still unclear on how the postpandemic biojet fuel
industry will respond. It is also equally uncertain if the doubling of production capacity would achieve the 5.23 billion liters projection for 2021.
Assuming a low ratio of 10% capacity being utilized, biojet fuel is expected
to only fulfill 0.64 billion liters or roughly 0.07% of global jet fuel demand.
An optimistic high ratio of 80% will lead to about 1.05% of global need
fulfilled by biojet fuel.
A summary of the planned biojet fuel production capacity is shown in
Table 5.18. Major projects include those from Marathon, World Energy,
Diamond Green, Lanzatech, Hollyfrontier, Gevo, and Fulcrum in the
United States; Total, Neste, Preem, and UPM in Europe; Neste in Asia;
and ECB in Latin America.
5.5 Barriers to commercialization
The sustainability credentials of biojet fuel are undisputed; likewise is the
business opportunity offered by biojet fuel. Scientific and technical solutions are sprouting to move biojet fuel production toward commercialization and mass-scale adoption. Nonetheless, there are still barriers to
commercialization. Table 5.19 summarizes the main challenges of the biojet
fuel market as compiled from experts globally, concentrated in “Europe and
North America” and in Brazil.
5.5.1 Economic barriers
The aviation industry is a very price-sensitive industry without abilities of
airlines to absorb any increase in fuel price (Hudson et al., 2016). As fuel
costs can account for 30%e50% of operating costs, the concern of high cost
or lack of price parity between biojet fuel and conventional jet fuel is of
Economics of biojet fuels
273
Table 5.18 Planned biojet fuel production projects around the world (ICAO, 2020).
Full production
capacity
(Mgal/year)
Producer
Location
Production year
REG
Neste
RedRock
Total
Lanzatech
Marathon
World
Energy
ARA
licensee 1
ARA
licensee 2
ARA
licensee 3
Diamond
Green
ECB
Neste
Lanzatech
ST1 Oy
Hollyfrontier
Hollyfrontier
Neste
Refuel YYZ
Caphenia
PREEM
Geismar,
United States
Porvoo,
Finland
Oregon,
United States
La Mède,
France
Port Talbot,
Wales
Dickinson,
United States
Los Angeles,
United States
e
In operation
75
2019
31
2020
15.1
2020
165
2021 onwards
26.4
2021
184
2021 (already in operation
with 38 MGPY)
2022
306
e
2022
46
e
2022
81.25
Louisiana,
United States
2022 (already in operation
with 275 MGPY stated
production capacity)
2022
2022
2022 (existing 10 MGPY)
675
252.95
317
100
2022
66
2022
2022 (full capacity in
2023)
2023
90
125
2024 (starting in 2023
with 4.76 MGPY)
2024
2024
9.51
Paraguay
Singapore
Georgia,
United States
Gothemburg,
Sweden
United States
New Mexico,
United States
Rotterdam,
netherlands
Toronto,
Canada
Germany
Gothemburg,
Sweden
40.62
145.3
0.08
264
Continued
274
Biojet Fuel in Aviation Applications
Table 5.18 Planned biojet fuel production projects around the world (ICAO,
2020).dcont’d
Producer
Location
Production year
Full production
capacity
(Mgal/year)
UPM
Flexjet
project
Kotka, Finland
BadenWürttemberg,
Germany
Montreal,
Canada
Immingham,
United
Kingdom
Minnesota and
Texas, United
States
Nevada,
United States
Mississippi,
United States
Piteå, Sweden
2024
2025
165
5.3
2025
7.9
2025
13.2
2029 (starting with 50
kGPY in 2020)
100
e (starting with 10.5
MGPY, 2020)
e
300
e
e
SAF plus
consortium
Velocys
Gevo
Fulcrum
Velocys
LTU
Greenfuels
20
utmost importance. In short, biojet fuel must be price-competitive over the
long term, although it could rely on carbon offsets in the short term.
Despite the numerous economic and financial projections showing the
potential profitability of biojet fuels, the stark reality remains where the
feedstock cost of biojet fuel often eclipses the price of conventional jet fuel.
The discrepancy is primarily due to projections done at full scale, while
the present phase of the biojet fuel industry is the “ramping-up” phase.
Before scaling up is completed, such price disparity may exist. Many projections are also done with favorable macroeconomics conditions in place,
including scenarios where demands of biojet fuel are high, leading to
globalized economies of scale effects. Such optimism is placing a burden on
early adopters to be profitable. For the industry to flourish, the early
adopters must be profitable. However, for the early adopters to be profitable, the industry must flourish to form a strong supply chain.
Presently, there are two groups of biojet fuel producers, the large
corporations attempting to diversify from their core businesses and the
smaller start-ups entering the market. Any increase in biojet fuel producers
Economics of biojet fuels
Table 5.19 Biojet fuel industry challenges to commercialization.
Europe and
North
Global
America
(Hari
(Gegg et al.,
et al.,
Description of
2014)
2015)
Challenges
challenges
Environmental
challenges
Environmental
controls
Production
issues
Social and
environmental
impacts inclusive
of deforestation,
afforestation,
biodiversity, soil
destruction,
water issues, and
land usage
Overly strict
environmental
hurdles and
tendency to
overlook slightly
less
environmentally
beneficial
technologies in
favor of “holy
grail”etype
technologies
Cost-effectiveness
of the process,
feedstock
flexibility,
suitability of
catalyst,
consistency of
production
process, and
immature
technology of
biojet fuel
production routes
X
X
275
Brazil
(de Souza
et al.,
2018)
X
X
X
X
Continued
276
Biojet Fuel in Aviation Applications
Table 5.19 Biojet fuel industry challenges to commercialization.dcont’d
Challenges
Distribution
problems
Investment
High costs
Feedstock
availability and
sustainability
Description of
challenges
Fuel
infrastructure,
by-product
marketing
regulations, and
coordination of
investors and
biomass suppliers
Investment for
aviation biofuel
technologies and
government
investment,
difficulty in
obtaining credit
due to global
economic
downturn
Uncompetitive
cost of biojet fuel
leading to large
gap to price
parity with
conventional jet
fuel
Feedstock yield,
water intake,
fertilizer
requirements,
food-to-fuel
issues, availability
of biomass
feedstock, supply
feedstock supply
chain, feedstock
research, and
unclear
sustainability
criteria
Global
(Hari
et al.,
2015)
Europe and
North
America
(Gegg et al.,
2014)
X
Brazil
(de Souza
et al.,
2018)
X
X
X
X
X
X
X
X
X
Economics of biojet fuels
277
Table 5.19 Biojet fuel industry challenges to commercialization.dcont’d
Challenges
Compatibility
with
conventional
fuel
Certification
Legislation
Description of
challenges
Fuel properties
(such as sulfur
and aromatics
contents, freezing
point,
autoignition
temperature,
thermal stability
and impurities
contents),
performance,
safety, and
storage stability
Complications in
certification,
quality testing,
and certification
done abroad
Legislation,
imbalance
playing field
between road
and aviation
biofuels,
mandates, tax
breaks, subsidies,
and poor
knowledge flow
between
legislators and
aviation biofuel
community
Global
(Hari
et al.,
2015)
Europe and
North
America
(Gegg et al.,
2014)
X
X
X
Brazil
(de Souza
et al.,
2018)
X
X
that has a sustainable business model will help the industry to flourish. The
issue for entry to the market faced by larger and smaller producers alike is
the reduced availability of cheap credits. Industrial experts in Europe, North
America, and Brazil have identified the lack of eager investors as a barrier to
278
Biojet Fuel in Aviation Applications
commercialization. The lack of enthusiasm stemmed from the present
sentiments of being risk averse, requiring quick returns and the lack of
conviction from producers to overcome the payback hurdles. Investors
want regulators to derisk their investments. Improving the coordination
between investors and would-be producers is imperative to grow the biojet
fuel industry.
Feedstock cost is the main operating culprit as it is the costliest
component in biojet fuel production. This is especially true presently where
the oil-based HEFA pathway is the dominant commercially available
pathway for biojet fuel production. The soybean oil, palm oil, rapeseed oil,
sunflower oil, and coconut oil monthly prices in November 2020 are USD
973.88, USD 917.81, USD 1047.78, USD 890.00, and USD 1368.95 per
metric ton, respectively. The average crude oil spot price of Brent, Dubai,
and West Texas Intermediate for the same period is USD 42.30 per barrel.
Comparing like-to-like, the prices of soybean oil, palm oil, rapeseed oil,
sunflower oil, and coconut oil per barrel are approximately USD 141.98,
USD 134.89, USD 152.42, USD 130.00, and USD 196.53, respectively.
This shows that the selected oil-based feedstock costs for biojet fuels are
3.07e4.64 times the feedstock cost for conventional jet fuel.
While high feedstock cost is a problem of its own, the uncertainties
associated with fluctuating feedstock price are an equally large concern as
producers will find it difficult to tame the bullwhip effect. Producers and
feedstock sellers will have to participate in the practice of hedging,
rationing, and gaming, which causes distortion to the market. There is also
the issue of demand forecasting as the nascent biojet fuel industry does not
yet have a centralized body where members could update demand forecasts
to predict end-customer demand.
From a macroeconomic point of view, shift in trends due to the
emergence of biojet fuel industry will affect the supply and demand
equilibrium. As biojet fuel production is still at low quantity, there is no
direct example of this happening at large scale. A parallel example relates to
the biofuel development in China to meet the Medium and Long-Term
Development Plan for Renewable Energy in 2007 (Chang et al., 2012).
This economic supply of feedstock barrier shows that since biofuel feedstocks of cassava follow market price, then production cost will fluctuate
based on the current market and future demand of the crop. Fig. 5.9 shows
the import scenario of cassava and cassava starch for China for years
2000e08.
Economics of biojet fuels
279
100
90
80
Share (%)
70
60
50
40
30
20
10
0
2000
2001
2002
2003
2004
Year
2005
2006
2007
2008
Share of cassava import in cassava consumption
Share of cassava starch in starch import
Figure 5.9 Import scenario of cassava and cassava starch. (Adapted from Chang, S.,
Zhao, L., Timilsina, G. R., Zhang, X., 2012. Biofuels development in China: technology
options and policies needed to meet the 2020 target. Energy Pol. 51, 64e79.)
As China was already the largest cassava importer in the world since
2001, any demand side increase will add pressure on the supply side as share
of imports would have to be increased, sparking an even higher proportion
of cassava import in cassava consumption. This will drive feedstock price up
and place a market driven barrier to commercialization of the industry. The
higher import dependence also increases amount of foreign exchange
outflow that could have benefitted the farmers and might discourage them
to plant cassava domestically. The higher dependency on foreign imports
will put producers at the mercy of price fluctuations, which lead to a second
economic barrier to commercialization.
5.5.2 Sustainability barriers
The concerns on the environmental challenges posed by the biojet fuel
industry are unanimous. Concerns on deforestation, afforestation, and water
shortage are appropriate as it will be counterproductive to concentrate on
decarbonization of the aviation industry, only to swap one set of issues to
another. Present-day sustainability debates are focused on the food-to-fuel
issue and the discrepancy in indirect land usage calculations to determine
sustainability of a feedstock.
280
Biojet Fuel in Aviation Applications
The food-to-fuel debate has cooled down in recent years due to the
vegetable oil surplus and growing unused stockpile, for example, palm oil in
Malaysia and Indonesia. It is increasingly seen as a food distribution and
affordability issue than outright availability problem. Instead, the sustainability issues have come to the forefront with respect to feedstocks.
Scientists could not attain consensus on how sustainability parameters are
calculated. Meanwhile advocates and lobbyists from various regions are
pushing for the adoption of calculation methods which portrays their own
region’s dominant feedstock in a better light. As such, some feedstocks are
given poor sustainability ratings due to deforestation concerns despite the
science being disputed. This has led to the blanket ban of palm oil in the
European Union, be it sustainable or unsustainable palm oil. While it is
understandable to ban unsustainable palm oil plantation practices, but the
boycott calls that affect also sustainable palm oil will deprive the biojet fuel
industry of a possibly sustainable feedstock.
In addition to deforestation, other sustainability concerns include soil
pollution, decreased land service expectancy, habitat interruptions, eutrophication, overstretched water usage, waterway damage, and uncertainty in
carbon footprint generated. The sustainability criteria, in particular the
assigned coefficients and formula used, need to be improved and evidence
based. It has to be purely viewed from a scientific viewpoint without
prejudice or vested economic interests. Protectionism would have to take a
step back so that potentially sustainable feedstock for biojet fuel production
could flourish. Another solution is the identification of a purposely grown
oil crops as feedstock for biojet fuel production, which meets all sustainability criteria.
If not for the global pandemic, the wildfires of western United States,
Australia, and Siberia would have dominated news headlines. While the
availability of biomass in forests on its own does not contribute to forest
fires, the use of such biomass will reduce the burning of organic matter
from forest floors. A robust supply chain could be developed to utilize forest
biomass, which helps to improve sustainability and also abate the exacerbating wildfire problems. The barrier to this is the lack of supportive forest
regulations explicitly prioritizing biomass usage for as biojet fuel feedstock.
5.5.3 Operational barriers
One of the main concerns from regulators and the general public in a
transition occurring within the transport sector is safety. This is extremely
Economics of biojet fuels
281
crucial for the aviation industry as planes cannot risk stalling at high altitude
as compared with cars stalling on road. For biojet fuel to be accepted, it has
to be proved that it will not jeopardize the safety of flights. None of the
215,000 commercial flights involving biojet fuels ended in tragedy.
However, some stakeholders in the aviation fuel supply chain remained
concerned with biojet fuel safety (Smith et al., 2017). More laboratory
experiments and actual flight tests have to be conducted to assuage the
safety concerns, especially if neat biojet fuels are used and their properties be
allowed by regulators to deviate from the existing standards.
The quality perception facing biojet fuel is unwarranted. Many considers biojet fuel to be different from conventional jet fuel. This is true for
their origins but is no longer distinguishable at use point. Biojet fuel must
meet the prevailing standards such as the ASTM D7566’s Jet A or Jet A-1
standards prior to blending. The properties of biojet fuels conforming to the
standards are less of a concern than the lack of certification agencies in some
countries to certify the fuel. Some countries do not have the resources to
regulate and monitor the development of biojet fuels to ensure that aircraft
and engine manufacturer standards are met.
Logistics is a real concern to commercialization. It is often stated that
biojet fuel could directly use the infrastructure of conventional jet fuel due
to their compatibility and interchangeability inside jet engines. However,
this is not entirely true as logistics goes beyond the end user. Conventional
jet fuels are often delivered to airports through pipelines, and producers are
located strategically. Biojet fuel producers do not have the means or scale to
set up pipelines and often required to deliver biojet fuel via ships, rail, and
road transports. The distance traveled is often far as biojet fuel producers are
often located closer to feedstock source than airports. Logistically, this is
undesirable. One mitigation would be to tap into the existing pipelines for
fuel delivery. However, there are whole other issues of biojet fuel being
viewed as a contaminant, which may invalidate warranties. Furthermore,
the vested interests between traditional oil companies and biojet fuel producers may not yet be aligned.
5.5.4 Societal barriers
If the promises of third-generation feedstocks like microalgae or yeast can
be fulfilled, the quantum leap in gains will be phenomenal. At present,
larger-scale algal farms have not been able to replicate the microalgal
proliferation rates obtained in laboratories. Algae were often found to be
282
Biojet Fuel in Aviation Applications
vulnerable to infections and predators. Efforts need to be concentrated to
reidentify algal strains, which are resistant to local infectors. Another
method is to culture the microalgae to their original habitat with sufficient
inoculum (Saad et al., 2019). Genetic engineering of microalgae may
enhance its survivability, growth rate, and compatibility for use as biojet
fuel feedstock. However, the increase use of a single strain, be it genetically
modified or not, increases the risk of a new infection destroying an entire
microalgae farm. Furthermore, societal barrier exists in the form of public
rejection of genetically modified organisms. Safety concerns about genetically engineered microalgae are part of the public psyche.
The positive findings on biojet fuel may not yet come into public mindset. The general public view renewable energy favorably but often have poor
understanding of biofuels and may be fixated on renewables such as solar
power and wind energy. The fact that biojet fuel is premixed with conventional jet fuel also made it nonvisible as compared with solar panels on the
roof and large wind turbines dotting the rural landscapes. Some also question
the need for biojet fuels in the aviation sector as opposed to electrifying
airplanes like in road transport. The general public need to be receiving
information that electrifying airplanes poses a greater challenge than land
vehicles as aircrafts are more sensitive in coping with extra weight from the
electrical propulsion system and electricity storage. Due to the requirement
of airborne transport to be lighter-than-air, energy use in aircrafts is directly
proportional to its weight unlike the less stringent power-to-weight ratio
required for land-based vehicles. Outreach efforts could be increased to
better inform the public on the benefits of biojet fuel, and the public may
reciprocate in kind to support it in combating climate change.
5.6 Summary
The biojet fuel industry is still currently in a nascent stage, lagging behind
the more illustrious road transport sector biofuels such as biodiesel and
bioethanol. Unlike bioethanol and biodiesel for road transports, which are
facing strong competition from electric vehicles, biojet fuels do not face any
direct renewable energy competitors due to the need for long haul travel
and high density fuels. This means that the main hurdles for the industry are
purely to make it profitable through the use of cheaper feedstocks, develop
mature technologies, and increase output for improved economies of scale.
While the ability for nations to produce biojet fuel is more democratized as
compared with other forms of renewable energies due to availability of
Economics of biojet fuels
283
natural feedstocks, there is still a resource-technology conundrum. Countries with cheaper feedstocks often lag behind in the development of
production technologies and also availability of skilled engineers for setting
up the facilities. The current trajectory points toward a subsidy-supported
industry to allow eventual organic growth for the industry. Such organic
growth will eventually bring down cost of production and make biojet fuel
profitable globally. In addition to economic barrier, the industry also faces
challenges in the form of sustainability and operational and societal barriers.
Biojet fuel as a green energy is no longer just a “corporate social responsibility.” It has the capability to transform the economies of countries
while also decarbonizing the aviation sector and improving energy securities. Although the climate change planetary crisis sparks the need for biojet
fuels, it will ultimately be economic factors that will decide if the biojet fuel
industry is a long-standing success.
References
Atsonios, K., Kougioumtzis, M.-A., Panopoulos, K.D., Kakarasa, E., 2015. Alternative
thermochemical routes for aviation biofuels via alcohols synthesis: process modeling,
techno-economic assessment and comparison. Appl. Energy 138, 346e366.
Chang, S., Zhao, L., Timilsina, G.R., Zhang, X., 2012. Biofuels development in China:
technology options and policies needed to meet the 2020 target. Energy Pol. 51,
64e79.
Chiaramonti, D., Prussi, M., Buffi, M., Tacconi, D., 2014. Sustainable bio kerosene: process
routes and industrial demonstration activities in aviation biofuels. Appl. Energy 136,
767e774.
Chuck, C.J., McManus, M., Allen, M.J., Singh, S., 2016. Feedstocks for Aviation Biofuels,
in Biofuels for Aviation, pp. 17e34.
Claver, A., Rey, R., Lopez, M.V., Picorela, R., Alfonso, M., 2016. Identification of target
genes and processes involved in erucic acid accumulation during seed development in
the biodiesel feedstock Pennycress (Thlaspi arvense L.). J. Plant Psychol. 208, 7e16.
Cremonez, P.A., Feroldi, M., Oliveira, C.D.J., Teleken, J.G., Alves, H.J., Sampaio, S.C.,
2015. Environmental, economic and social impact of aviation biofuel production in
Brazil. N. Biotech. 32 (2), 263e271.
Cruz, G., Silva, A.V.S., Da Silva, J.B.S., Caldeiras, R.d.N., de Souza, M.E.P., 2020. Biofuels
from oilseed fruits using different thermochemical processes: opportunities and challenges. Biofuels Bioprod. Biorefining 14 (3), 696e719.
de Souza, L.M., Mendes, P.A.S., Aranda, D.A.G., 2018. Assessing the current scenario of the
Brazilian biojet market. Renew. Sustain. Energy Rev. 98, 426e438.
Deane, P., Gallachóir, B.Ó., Shea, R.O., 2017. Biofuels for aviation. In: Europe’s Energy
Transition - Insights for Policy Making, pp. 79e88.
Diederichs, G.W., Mandegari, M.A., Farzad, S., Görgens, J.F., 2016. Techno-economic
comparison of biojet fuel production from lignocellulose, vegetable oil and sugar
cane juice. Bioresour. Technol. 216, 331e339.
284
Biojet Fuel in Aviation Applications
European Comission, 2018. Feasibility Study on Options to Step up EU Action against
Deforestation. https://ec.europa.eu/environment/forests/pdf/KH0418199ENN2.pdf.
FAO, 2017. Food and Agriculture Data. http://faostat.fao.org/static/syb/syb_5000.pdf.
FAO, 2019. Foof and Agriculture Organisation of the United Nations. FAOSTAT. http://
www.fao.org/faostat/en/#data/QC.
FAO, 2020a. Food and Agriculture Organization of the United Nations. Food Outlook.
http://www.fao.org/3/cb1993en/cb1993en_oilcrops.pdf.
FAO, 2020b. Food and Agriculture Organization. Crops Processed. http://www.fao.org/
faostat/en/#data/QD.
Gegg, P., Budd, L., Ison, S., 2014. The market development of aviation biofuel: drivers and
constraints. J. Air Transport. Manag. 39, 34e40.
Giwa, A., Adeyemi, I., Dindi, A., García-Baños Lopez, C.G.-B., Lopresto, C.G., Curcio, S.,
Chakraborty, S., 2018. Techno-economic assessment of the sustainability of an integrated biorefinery from microalgae and Jatropha: a review and case study. Renew.
Sustain. Energy Rev. 88, 239e257.
Hari, K., Yaakob, T.Z., Binitha, N.N., 2015. Aviation biofuel from renewable resources:
routes, opportunities and challenges. Renew. Sustain. Energy Rev. 42, 1234e1244.
Hudson, L., Jefferson, A., Bauen, A., Nattrass, L., 2016. Sustainable Aviation: A uk
Roadmap for Sustainable Aviation Fuels, in Biofuels for Aviation, pp. 315e337.
IATA, 2020. Jet Fuel Price Monitor. https://www.iata.org/en/publications/economics/
fuel-monitor/.
ICAO, 2020. SAF Stocktaking - What is it about? https://www.icao.int/environmentalprotection/Pages/SAF_Stocktaking.aspx.
Kalam, M.A., Masjuki, H.H., Jayed, M.H., Liaquat, A.M., 2011. Emission and performance
characteristics of an indirect ignition diesel engine fuelled with waste cooking oil.
Energy 36 (1), 397e402.
Li, X., Mupondwa, E., Tabil, L., 2018. Technoeconomic analysis of biojet fuel production
from camelina at commercial scale: case of Canadian Prairies. Bioresour. Technol. 249,
196e205.
Martinez-Hernandez, E., Ramírez-Verduzco, L.F., Amezcua-Allieri, M.A., Aburto, J.,
2019. Process simulation and techno-economic analysis of bio-jet fuel and green diesel
production d minimum selling prices. Chem. Eng. Res. Des. 146, 60e70.
Neuling, U., Kaltschmitt, M., 2018. Techno-economic and environmental analysis of
aviation biofuels. Fuel Process. Technol. 171, 54e69.
Noh, H.M., Benito, A., Alonso, G., 2016. Study of the current incentive rules and
mechanisms to promote biofuel use in the EU and their possible application to the civil
aviation sector. Transport. Res. Transport Environ. 46, 298e316.
OECD-FAO, 2019. OECD-FAO Agricultural Outlook, Oilseeds and Oilseed Products.
http://www.agri-outlook.org/commodities/Oilseeds.pdf.
Pereira, L.G., MacLean, H.L., Saville, B.A., 2017. Financial analyses of potential biojet fuel
production technologies. Biofuels Bioprod. Biorefining 11 (4), 665e681.
Ranganathan, P., Savithri, S., 2016. Techno-economic analysis of microalgae-based liquid
fuels production from wastewater via hydrothermal liquefaction and hydroprocessing.
Bioresour. Technol. 284, 256e265.
Reimer, J.J., Zheng, X., 2017. Economic analysis of an aviation bioenergy supply chain.
Renew. Sustain. Energy Rev. 77, 945e954.
S&P Global, 2020a. As Jet Fuel Market Craters, Sustainable Aviation Fuel Prepares for
Takeoff.
https://www.spglobal.com/platts/en/market-insights/blogs/agriculture/
092320-as-jet-fuel-market-craters-sustainable-aviation-fuel-prepares-for-takeoff.
S&P Global, 2020b. Platts Sustainable Aviation Fuel (SAF) and HVO Assessments. https://
www.spglobal.com/platts/PlattsContent/_assets/_files/en/our-methodology/methodolo
gy-specifications/platts-saf-and-hvo-faq.pdf.
Economics of biojet fuels
285
S&P Global, 2020c. S&P Global Platts Launches First Sustainable Aviation Fuel Price
Assessments in Europe. https://www.spglobal.com/platts/en/about-platts/mediacenter/press-releases/2020/081720-platts-launches-first-sustainable-aviation-fuel-priceassessments-europe.
Saad, M.G., Dosoky, N.S., Zoromba, M.S., Shafik, H.M., 2019. Algal biofuels: current
status and key challenges. Energies 12 (10), 1920.
Scarlat, N., Dallemand, J.-F., 2019. Future role of bioenergy. In: The Role of Bioenergy in
the Bioeconomy, pp. 435e547.
Smith, P.M., Gaffney, M.J., Shi, W., Hoard, S., Armendariz, I.I., Mueller, D.W., 2017.
Drivers and barriers to the adoption and diffusion of sustainable jet fuel (SJF) in the U.S.
Pacific northwest. J. Air Transport. Manag. 58, 113e124.
Soone, J., 2020. European Parliamentary Research Service, Sustainable Aviation Fuels. https://
www.europarl.europa.eu/RegData/etudes/BRIE/2020/659361/EPRS_BRI(2020)6593
61_EN.pdf.
US DOE, 2020. Sustainable Aviation Fuel-Review of Technical Pathways. https://www.
energy.gov/sites/prod/files/2020/09/f78/beto-sust-aviation-fuel-sep-2020.pdf.
van Eijck, J., Romijn, H., Balkema, A., Faaij, A., 2014. Global experience with jatropha
cultivation for bioenergy: an assessment of socio-economic and environmental aspects.
Renew. Sustain. Energy Rev. 32, 869e889.
Wei, H., Liu, W., Chen, X., Yang, Q., Li, J., Chen, H., 2019. Renewable bio-jet fuel
production for aviation: a review. Fuel 254, 115599.
Wendimu, M.A., 2016. Jatropha potential on marginal land in Ethiopia: reality or myth?
Energy Sustain. Dev. 30, 14e20.
Woittiez, L.S., van Wijk, M.T., Slingerland, M., van Noordwijk, M., Giller, K.E., 2017.
Yield gaps in oil palm: a quantitative review of contributing factors. Eur. J. Agron. 83,
57e77.
Yang, Z., Qian, K., Zhang, X., Lei, H., Xin, C., Zhang, Y., et al., 2018. Process design and
economics for the conversion of lignocellulosic biomass into jet fuel range cycloalkanes.
Energy 154, 289e297.
This page intentionally left blank
CHAPTER 6
Sustainability of aviation biofuels
6.1 Introduction
From the perspective of greenhouse gas (GHG) emissions, the aviation
industry contributes to a mere 2% of the global anthropogenic carbon
dioxide (CO2) emissions, but the rapid expansion in the airline industry is
expected to lead to an increase of emissions. Unlike ground transportation,
the difficulty for aircraft to follow the path of electrification means that the
reliance on hydrocarbon fuels will continue in the foreseeable future. It has
been projected that the jet fuel consumption within the transportation
sector would increase from 11% to 14% in the next 20 years, with international aviation accounting for approximately 65% of global aviation fuel
consumption. The growth in the aviation sector is expected to contribute
1.1e1.5 billion tons of CO2 by 2035 (ICAO, 2016). Under the United
Nations Framework Convention on Climate Change (UNFCCC), the
tabled Kyoto Protocol specifies that strong cooperation between countries
is needed to limit and reduce the GHG emissions. Although GHG
emissions from international aviation are not included in national GHG
inventories or targets, the Kyoto Protocol specifies that industrialized
countries shall pursue limitations or reductions of GHG emissions from
aviation through the International Civil Aviation Organization (ICAO)
(UNFCCC, 1998).
The ICAO is a United Nation agency that spearheads the role of
addressing the issue of GHG emissions for the aviation sector by working
with 191 member states and industry groups to develop policies, standards,
and recommended practices for the civil aviation sector. To facilitate
carbon-neutral growth for international civil aviation after 2020, the ICAO
introduced the Carbon Offsetting and Reduction Scheme for International
Aviation (CORSIA), which is a global market-based measure system to
offset international aviation emissions growth, along with other proposed
GHG mitigation strategies such as improving operational and technology
Biojet Fuel in Aviation Applications
ISBN 978-0-12-822854-8
https://doi.org/10.1016/B978-0-12-822854-8.00005-6
© 2021 Elsevier Inc.
All rights reserved.
287
288
Biojet Fuel in Aviation Applications
efficiency measures, and adopting alternative aviation fuels to meet the
carbon-neutral emission goal.
To meet the aspiration of carbon negative growth by 2050, a large bulk
of carbon reduction is expected to be achieved from the use of low carbon
alternative jet fuels derived from nonpetroleum sources such as biomass,
wastes, vegetable oils, etc. Certified fit for purpose synthetic jet fuels that
meet the standard specifications can be used as “drop-in” fuels to replace
conventional jet fuel with no modification to the engine or fuel distribution
system. There are currently seven types of alternative jet fuel approved
under the ASTM D7566 standard; each of the synthetic jet fuel is produced
from distinctively different pathways and specific feedstocks. Details of the
production method and properties of the alternative jet fuels are described
in Chapters 2 and 3, respectively. To evaluate the potential of a specific
alternative jet fuel, there are several aspects that need to be considered apart
from the technical performance in engine, including the economics and
environmental sustainability, such as the environmental impacts, effects on
the water consumption, local air quality, land usage and energy resources,
technical feasibility, and economics related to the fuel production pathways,
to ensure the long-term viability of alternative jet fuels. This chapter aims to
provide an overview on some of the methods used to assess the environmental sustainability of alternative jet fuel, using methodology such as the
life cycle assessment (LCA) of GHG emissions, energy balance analysis, and
sustainability indices.
6.2 Life cycle assessment of aviation jet fuel
The goal set by ICAO to keep the global net carbon emissions of aviation
industry at neutral growth rate from year 2020 is to be partially met with
the usage of alternative jet fuels. However, the potential emission
reductions from alternative jet fuel need to be quantified from the life cycle
emissions perspective. An Alternative Fuels Task Force was created within
the ICAO technical body to develop a methodology to acquire a full
understanding on the potential benefits of aviation biofuels and its associated impacts to the environment. The methodology used to estimate the
carbon intensity of a given alternative jet fuel is LCA. LCA is defined as a
compilation and evaluation of inputs, outputs, and the potential environmental impact of a product throughout its life cycle. The LCA approach for
an industrial product is typically based on the “cradle-to-grave” concept,
starting with the natural resources that are used as raw materials in the
Sustainability of aviation biofuels
289
processing and ending with the residues generated by the consumption of
the products that return to nature.
The International Organization for Standardization (ISO) specifies the
LCA methodology and framework in ISO 14040:2006, which broadly
consists of four phases (ISO 14040, 2006). The goal and scope definition
phase defines the system boundary and level of detail. The system boundary
defines the unit processes to be included in the system and the inputs and
outputs through the boundaries. For aviation jet fuel, the system boundary
typically covers the well-to-wake (WTWa) cycle, where the boundary
defines the raw material acquisition stage up until the end-use stage. The
functional unit is defined at this stage to provide a reference to which
the inputs and outputs are related. All subsequent analyses are based on the
functional unit to ensure comparability of the LCA results.
The inventory analysis phase that is related to the inventory analysis
phase involves the evaluation of the data collected and calculation to
quantify relevant inputs (e.g., resources) and outputs (e.g., emissions) of a
product system, based on the defined boundary systems and the functional
unit. The calculation procedures include the validation of the data of each
unit process and reference flow of the functional unit. For an industrial
process that involves multiple end products and recycling streams, a proper
allocation procedure is needed to ensure a realistic distribution of the
impact assessed.
The significance of the potential environmental impacts of the product
is assessed via the impact assessment phase of LCA by using the results
calculated from the life cycle inventory (LCI) analysis. The impacts of the
life cycle can be assessed by associating the inventory data with specific
environmental impact categories and indicators, such as global warming and
water resources depletion, among others. The most assessed impact category for alternative jet fuel is perhaps the global warming potential (GWP),
as it directly concerns with the GHG emissions, although the assessment of
other impact categories related to environment and human health is also
found in many studies. The inventory and impact assessment phases provide
the information necessary for the interpretation phase, where recommendations and decisions are made in accordance with the goal and scope
defined. The interpretation of the result is based on the relative approach,
where they indicate potential environmental effects instead of predicting
the actual impacts on category endpoints. The relationship between the
phases is illustrated in Fig. 6.1. It should be noted that LCA studies differ
from one another and that the limitations and recommendations of the
290
Biojet Fuel in Aviation Applications
Goal and scope
definition
•
•
•
Boundaries
Allocation
method
Functional unit
Inventory analysis
•
•
Data collection
Calculation
procedure
Impact assessment
•
•
Classification
Characterization
Interpretation
Figure 6.1 Life cycle assessment framework according to ISO 14040 (2006).
study should be clearly stated in the report. The LCA method is useful to
identify opportunities to improve the environmental performance of
products at various points in their life cycle.
The life cycle of jet fuel constitutes of multiple steps, covering feedstock
extraction, production, and the final use in engine. At each of these steps,
GHG emissions are likely to be produced; hence the LCA approach can be
adopted to ascertain the total carbon footprint of the fuel emitted from each
of these steps. The carbon intensity of a given fuel is estimated using LCA
methodology and is typically expressed in gCO2 equivalent per MJ of fuel
(i.e., its carbon intensity). The life cycle of fossil-based jet fuels begins at the
moment it is extracted from the well to the production facility, undergoing
processing and refining into practical fuels, transportation and distribution
of the fuels to the aircraft tank, and finally combusted in the engine. The
net total impact of all of these life cycle phases is commonly referred to as
the WTWa, which consists of the fuel production and distribution,
“well-to-tank,” and fuel combustion, “tank-to-wake.” The life cycle of the
fossil jet fuel is illustrated in Fig. 6.2.
For biomass-derived jet fuel, the life cycle differs from that of fossil jet
fuel, as the emissions are now associated with the cultivation, harvesting,
transport, and conversion of feedstock. Although the emissions of the
Figure 6.2 Life cycle of fossil-based jet fuel (Stratton et al., 2010).
Sustainability of aviation biofuels
291
Figure 6.3 Life cycle of biomass-derived fuels (Stratton et al., 2010).
biofuels are produced as a result of combustion in engine, it is considered as
“neutral,” based on the assumption where the CO2 emissions from the
combustion are absorbed by the biomass during their growth phase
(Hileman and Stratton, 2014). Such sequestration of the CO2 by the
biomass offsets the CO2 in the life cycle assessment; thus, biofuels have
“biomass credit.” The biomass credit is the primary difference between
biomass and fossil fuels in terms of their GHG emissions. Therefore, the life
cycle of the biofuel produced from biomass is considered based on
the “field-to-tank” approach, as illustrated in Fig. 6.3. Depending on the
feedstock type and agricultural practices, the cultivation part can represent a
significant portion of the GHG emissions. The GHG emissions reduction
potential of the alternative jet fuel is ascertained by subtracting the carbon
intensity of the alternative jet fuel from the baseline carbon intensity of
petroleum-derived jet fuel. A lower GHG emission for the full life cycle of
alternative jet fuel has positive impact on the environment and can be
considered as a potential fuel to meet the ICAO’s carbon reduction goal.
6.2.1 Product allocation
The production of biojet fuel typically results in the creation of coproducts
in addition to the primary fuel product. Product allocation is implemented
to partition the environmental impacts from the process based on product
flows. For example, during the extraction and pretreatment processes, the
biomass coproducts generated could be used as solid fuel or processed into
fertilizer. Liquid fuel coproducts derived during the jet fuel production
stage such as hydrocarbons with shorter or higher chain length can be used
as fuels for different purposes. These coproducts have values, which can be
quantified based on physical metrics, and displace some of the values of the
intended products. This is important considering the net GHG reduction
for the whole life cycle is needed to achieve the carbon reduction target as
per required by local policy. For instance, under the EU Renewable
Energy Directive 2018/2001/EUdRecast to 2030 (REDII), the alternative jet fuels produced must achieve a 50% reduction of GHG emissions for
292
Biojet Fuel in Aviation Applications
production facilities before October 2015, while a mandatory 50%
reduction is required for production facilities after the date. For sustainable
jet fuel produced in facilities that begin operations after January 2021, a 65%
of carbon reduction must be achieved (EU, 2018). Therefore, proper
accounting of the carbon intensity and energy input that takes into account
coproduct allocation is essential to meet the regulatory set targets.
Nonetheless, allocation is not a straightforward division of environmental impacts between products and coproducts. A set of protocol set
forth by ISO 14044:2006 provides the basis for the allocation (ISO 14044,
2006). There are four methods that can be used to assign the life cycle
GHG emissions between the primary fuel products and coproducts, which
are (1) mass allocation, (2) energy allocation, (3) market-value allocation,
and (4) displacement (system expansion) methods. Each of the methods
differs in allocation methodologies that can invariably lead to different
results, in particular for biofuel pathways with significant quantities of
coproducts. LCA practitioners can choose the method that best fits their
scenarios to achieve the goal of the study. The absence of a fixed methodology is one of the reasons that makes comparison among LCA studies
difficult. It is important to clarify the allocation approach adopted in any
LCA work.
The ISO 14044:2006 (E) specifies that processes shared with other
product systems shall be identified and dealt with by preferentially using
process disaggregation, system expansion, allocation by an underlying
physical relationship, and economic value, in this order. Inventories are
based on material balances between input and output; therefore, allocation
procedures should attempt to approximate such fundamental input/output
relationships and characteristics (ISO 14044, 2006). The mass and energy
allocation approaches distribute the life cycle GHG emissions based on
respective mass or energy content of the coproducts of the fuel. The work
by Stratton et al. (2010) utilized the energy allocation method to allocate
the energy and emissions between products of FischereTropsch (FT)
process and hydroprocessed renewable jet fuels. The basis of this choice is
due to the same functionality of coproduct (liquid fuel) compared with the
primary jet fuel product.
Allocation of the coproducts based on the market value approach is
subjected to the sensitivity of the market forces, and the values can change
over time. Contrary to the mass or energy allocation approaches, which are
fixed in values, the market value of coproducts fluctuate depending on their
utilization. For example, the market value method will allocate more of the
Sustainability of aviation biofuels
293
emissions to the main fuel produced if the coproducts displace some
existing product. Such method has been used to allocate the emissions based
on market valuation between coproducts of the hydroprocessed esters and
fatty acids (HEFA) production pathways (Stratton et al., 2010). The
displacement method can be deployed if the coproducts displace the
production of a substitute product, e.g., counterpart of the fossil coproduct,
so that the emissions credit from the displaced product is aggregated onto
the primary product. Li and Mupondwa (2014) used this method in their
LCA of GHG emissions of camelina oil in Canadian Prairies for biojet fuel
production. The displacement method may give negative emission
intensities if the emission credits exceed the total system emissions, contrary
to energy allocation which strictly yields positive emissions intensities
except when carbon capture and storage is adopted (de Jong et al., 2017). A
significant difference has been reported in the GHG emission intensity
between energy allocation and the hybrid method using the displacement
method, especially when high amount of nonfuel coproducts was produced
that effectively displace carbon-intensive products. This effect was evident
for conversion pathways such as FT, jatropha-based HEFA, or corn-based
ATJ. Nevertheless, the advantage of the displacement method is its
reflection of the potential GHG emissions mitigation effects of producing
coproducts, as stated by the ISO (de Jong et al., 2017). However, the
challenge of this method is the requirement to determine the displacement
ratio and life cycle of the GHG emissions of the displaced product; thus, the
level of uncertainty is greater. For example, the allocation of the land
use change (LUC) emissions to the biofuel complicates the application of
the displacement method.
6.2.2 Effect of land use change on emissions
The use of biomass feedstocks for alternative jet fuel products can cause
direct and indirect emissions due to LUC. The emissions and sequestration
of CO2 are closely related to changes in the biomass, soil, and organic waste
contained within the land, which can significantly impact the GHG
emissions. Direct LUC occurs when land is converted to grow feedstock for
bioenergy. An example is the clearing of forest for feedstock growing,
which causes a shift in that land’s carbon stocks due to changes in land
management practices. The indirect land use change (ILUC) refers to the
indirect conversion of arable land to land catered for the demand of energy
crops, most often driven by the indirect effect of biofuel policies. ILUC
considers the change in emissions from land conversion that is used for the
294
Biojet Fuel in Aviation Applications
growth of energy crops and is usually quantified through LCA modelling. In
such analysis, it is commonly assumed that the biomass supplied to the global
food market is satisfied; hence, the subsequent LUC for energy crops is used
to fulfill the demand of biofuels. Emissions from ILUC is due to existing
cropland being used to farm energy crops to meet the biofuel demand,
thereby resulting in the displacement of other agricultural products with high
carbon stocks or other ecosystem services. The determining factors that are
critical in the modeling of emissions caused by ILUC include the elasticity of
food demand for price, elasticity of yield to price, choice of crops, utilization
of coproducts, elasticity of area to price, and carbon stock of new land. These
factors need to be taken into account to reflect the realistic scenario of ILUC
emissions (Malins et al., 2014). Valin et al. (2015) utilized the Global
Biosphere Management Model (GLOBIOM) to assess the biofuel-induced
LUC and its impact on GHG emission. The model accounts for 12 sources of GHG emissions covering crop cultivation, livestock, LUC, and soil
organic carbon based on advanced accounting framework. The study
included various emissions sources and sinks related to biomass and soil
carbon stocks, but the emissions related to feedstock cultivation and
processing, biofuel production, transport, and distribution are not considered.
Since the study was set in the EU context, the emissions values that are
factored in LUC effect may differ significantly if the scenario is set in a
different region. The type of land used for conversion into cropland was
shown to have a significant effect on the emissions. For example, peatland is
known to be efficient carbon sinks and long-term repositories of terrestrial
organic carbon formed by dead organic matter and concentrated biomass in
oxygen-low water environment that have been accumulated over centuries.
Conversion of peat land into agricultural farm land can induce significant
amount of CO2 released into the atmosphere, with approximately 105 tons
of CO2 equivalent per hectare per year when averaged over 20 years (Page
et al., 2011). The change in agricultural practice by rotating the plantation of
woody biomass and perennial plants can induce negative LUC emissions,
owing to the increase of carbon stock on the land (Valin et al., 2015).
Contrary to the jet fuel produced from biomass, the effect of LUC for fossil
fuel extraction and fuel processing is considered to be negligible due to the
high throughput of fuel volume and mass created per unit land converted
(Stratton et al., 2010).
6.3 Alternative jet fuel production pathway
The establishment of the system boundary for alternative jet fuel requires
the unit processes to be defined, as well as the input and output flows into
Sustainability of aviation biofuels
295
the system. Identification of the unit processes for each of the production
pathway assists in the establishment of list of inventories. Fig. 6.4 depicts
some of the typical feedstocks and their possible conversion pathways.
Although details on the production pathways for biojet fuels have been
discussed in depth in Chapter 2, the major production routes are briefly
presented here to assist in defining the system boundaries for the LCA. In
general, the production pathways for biojet fuel can broadly be categorized
into three main groups, i.e., lipid conversion, thermochemical conversion,
and biochemical conversion methods. The lipid conversion pathway converts the fatty acids and esters extracted from oil-bearing crops such as
vegetable oils, animal fat, waste cooking oil (WCO), or algae into synthetic
jet fuel via hydroprocessing, where the oxygen molecules in the oil are
removed and the double bonds in the fuels are saturated via hydrogenation.
The produced oil is isomerized and cracked into jet fuel and other hydrocarbon products. This production method is the most technologically
matured pathway and is currently at commercial stage. Another method of
lipid conversion is via the hydrothermolysis treatment, which involves
hydrothermal conversion and hydrotreating operations to produce biojet
fuel that contains aromatics.
The production of jet fuel via thermochemical conversion route can be
performed via gasification and pyrolysis techniques. Biomass in solid form
can be gasified at elevated temperature to produce synthesis gas (syngas),
consisting of CO and H2, which are then purified and used as precursor
gases to synthesize jet fuel via the Fisher-Tropsch (FT) process. The FT
hydroprocessing method is a certified production route for biojet fuel under
the ASTM D7566 (ASTM D7566-19b, 2019). Although biooil derived
from pyrolysis process can further be upgraded via hydrotreatment processes
to derive jet fuel quality hydrocarbons, this method is still at development
phase and has yet to be certified as fit for purpose jet fuel.
The biochemical conversion route for production of biojet fuel is via
the fermentation of sugar or starch derived from organic resources such as
lignocellulosic biomass. The alcohol produced from the fermentation is
dehydrated, oligomerized, and hydroprocessed into jet fuel. The production of jet fuel via the direct sugar to hydrocarbon conversion (DSHC)
method has been shown to be feasible via the use of modified yeast,
producing farnesene (C15 hydrocarbon molecule) that can be further
processed into jet fuel via hydroprocessing and fractionation. This
processing method demonstrated by the pilot plant of Amyris (US) was
shown to be able to achieve GHG emissions reduction up to 80%
(US DOE, 2012). The ATJ and DSHC production methods are both
296
Biojet Fuel in Aviation Applications
Figure 6.4 Production pathways for different feedstocks.
Sustainability of aviation biofuels
297
ASTM-certified production pathways (ASTM D7566-19b, 2019). Details
of the production pathway are important in developing the life cycle
inventory, but the pre- and postproduction processes, including the cultivation, transportation, and distribution, among others, are also needed to
complete the system boundary in LCA.
6.4 Life cycle greenhouse gas emissions for different
production pathways
The life cycle GHG emissions of alternative jet fuel depend on the production pathways. Each of the conversion routes is discussed, followed by a
comparison of the GHG emissions across different feedstocks and
production pathways. It should be noted that different methodologies were
used in these studies, such as the different approaches used in the product
allocation; hence, comparison of the LCA values across different studies
should be done with care. It is important for the practitioners of LCA to
clearly indicate the assumptions and allocation methods used in their
studies. This also reflects the need for the harmonization of LCA to better
represent the GHG impacts from the fuels (Takriti et al., 2017).
6.4.1 Biochemical conversion
Conversion of lignocellulosic biomass into biojet fuel via biochemical route
has shown promising GHG emissions reduction potentials. Alternative jet
fuel produced from sugarcane ethanol in Brazil can lead to GHG reductions
of 70%e90%, or relevant GHG mitigation in comparison to fossil kerosene,
depending on the methodological approach (Capaz et al., 2018). Lignocellulosic biomass used for the biojet fuel production generally refers to a
wide range of materials such as woody biomass, eucalyptus, wheat straw, or
sugarcane bagasse, depending on the local availability. The feedstock is
usually pretreated to derive the sugars before undergoing enzymatic hydrolysis and saccharification to produce fermentable sugars. Subsequently,
the sugars are converted into isoparaffinic kerosene using fermentation and
oligomerization process. This process is commonly known as the alcoholto-jet (ATJ) production route. Ganguly et al. (2018) assessed the environmental implications of alternative jet fuel produced from residual woody
biomass by conducting an LCA study. It was shown that the potential
GWP can be reduced by 78% compared with fossil-based jet fuel. The main
portion of the GWP is attributable to the recovery and processing of woody
biomass. For mallee eucalypt-based jet fuel, the carbon emissions were found
298
Biojet Fuel in Aviation Applications
to be 85%e93% lower than fossil jet fuel (Crossin, 2017). Transporting
distance can occupy up to 35% of the carbon emissions, while the impact of
sheep farming and supply of hydrogen can account for over 50% of the
mallee jet fuel GHG impacts. Wheat straw was shown to have high GHG
emissions reduction potential with only 30.4 gCO2eq/MJ kerosene, but the
energy efficiency is relatively poor due to high losses during the conversion
process (Neuling and Kaltschmitt, 2018). On the other hand, wheatgrass
showed relatively higher GHG emissions of 70.3 gCO2eq/MJ kerosene
with moderate energy efficiency.
Triisobutane produced from cellulosic isobutanol has been identified as
a potential jet fuel blend component. It is an isoalkane with similar boiling
specific range and molecular weight as Jet A-1, which can be produced via
thermochemical upgradation process. The conversion process from
isobutanol to triisobutane contributes to 6.60 gCO2eq/MJ; thus the final
net GHG emissions for the production of triisobutane from cellolusic
biomass via the ATJ route are 64.54 gCO2eq/MJ, which is w28% lower
compared with Jet A-1 fuel (89 gCO2eq/MJ) (Vela-García et al., 2020).
The processes that emit the most CO2 are the cultivation, harvesting,
pretreatment of raw material, and the conversion of cellulose into simple
sugars via strong acids, ionic liquids, or enzymatic reaction. Development of
catalysts is needed to increase the efficiency of the conversion process. Jet
fuel produced from waste gas was shown to reduce GHG emissions by 67%
owing to the utilization of carbon contained in the gas (Handler et al.,
2016). The large carbon credit gained is attributable to net gas absorption
during the ethanol production phase. The carbon-containing waste gas can
be sourced from steel mill or gasified biomass. Unlike other biomass such as
corn stover, switchgrass, and forest residue, there are no GHG emissions
due to waste gas procurement. Budsberg et al. (2016) reported the GHG
emissions of jet fuel produced from poplar biomass via the biochemical
conversion route to be ranging between 32 and 73 gCO2eq/MJ jet
fuel, which is lower compared with those of conventional jet fuel
(93 gCO2eq/MJ). The values were derived under different scenarios, such
as using natural gas steam reforming and lignin gasification to produce the
hydrogen needed for hydroprocessing. The usage of hog fuel to provide
heat and steam further lowers the GHG emissions.
6.4.2 Thermochemical conversion
Thermochemical conversion of biomass into biojet fuel can be performed
via the FT processing route, where the biomass is gasified to produce
Sustainability of aviation biofuels
299
synthesis gas and subsequently used as precursor gas for biojet fuel production. Negative GHG values have been reported for FT fuel produced
from switchgrass owing to the carbon sequestration effect due to the
changes in soil (Stratton et al., 2010). The potential for offsetting CO2
emissions via soil carbon changes depends on the rate of carbon addition,
the capacity of soil for carbon storage, and the stability of sequestered
soil carbon over time. In a study that compares the LCA GHG emissions
of different production routes, the FT production pathway was shown
to produce lower GHG than the HEFA route for biojet fuel production
using integrated biorefineries with ethanol distillers in Brazil (Klein
et al., 2018). Two scenarios of FT were studied. The first was using
lignocellulosic materials of sugarcane bagasse and straw, while the second
scenario uses eucalyptus and sugarcane bagasse. The use of biomass does
not incur additional impact to the agricultural phase, while eucalyptus
crops require fewer inputs such as fertilizer than sugarcane. Both scenarios
show the GWP to be 9.4 and 9.3 gCO2eq/MJ jet fuel. The potential of
FT route is also reflected in another LCA study conducted by Carter
et al. (2011), in which switchgrass-based FT biomass-to-liquid (BTL) was
found to emit 12e26.1 gCO2eq/MJ jet fuel. The carbon footprint is even
lower than camelina HEFA with 19.9e34.1 gCO2eq/MJ, as compared
with the baseline conventional jet fuel of 87.5 gCO2eq/MJ. These studies
indicate that FT process with switchgrass as feedstock has the potential to
achieve lowest GHG emissions among all feedstocks and production
methods.
Han et al. (2013) compared the FT and pyrolysis conversion processes of
corn stover into biojet fuel. Both methods showed a potential GHG
emissions reduction of 89% and 68%e76%, respectively, but the coproduct
allocation selection can affect the result significantly. Although FT shows
the most promising GHG reductions among all processing routes, the
capital costs for biomass-to-liquid (BTL) facilities can be significantly higher
compared with other production methods (Carter et al., 2011).
6.4.3 Lipid conversion
The technology for lipid conversion into biojet fuel through HEFA processing pathway is presently the most mature and commercial-ready among
all methods. From the life cycle GHG emissions perspective, several studies
have shown positive impacts toward to environment, albeit with a large
variation depending on the type of feedstock used. Han et al. (2013)
300
Biojet Fuel in Aviation Applications
showed that the life cycle GHG emissions can be reduced by 41%e63% for
HEFA-SPK derived from different oil seeds including soybean, palm,
rapeseed, jatropha, and camelina. Among all, palm shows the highest GHG
emission reduction potential of 63%. Another study shows that the carbon
emission intensities for HEFA derived from camelina, jatropha, and
microalgae are 71%, 64%, and 57.5% lower compared with Jet A, respectively (Lokesh et al., 2015). The study was conducted using mass-based
allocation method, and the emissions related to coproducts were accounted. The high biomass output of microalgae results in lower GHG emissions
owing to higher allocation to the coproduct. Other microalgae-based jet
fuels have also shown a wide variation of carbon intensities due to different
cultivation conditions and assessment methodologies used (Takriti et al.,
2017). Several studies have compared several feedstocks for the HEFA
production. The GHG emissions intensity was found to be sensitive to the
yield of the feedstock. Among the feedstock compared, palm-based HEFA
has been reported to emit the lowest GHG emissions of 52.0 gCO2eq/MJ
fuel due its high yield while assuming no LUC effect. The matured HEFA
technology and high yield of palm enable the production cost to be
competitive, which is estimated to be 890 V/t compared with the
nonedible jatropha-based HEFA of 2000 V/t (Neuling and Kaltschmitt,
2018). However, when compared with the production cost of conventional
jet fuel (w340 V/t) (IATA, 2020), even the best performing HEFA crop
case is still not market-competitive. The oil yield from the cultivation of
energy crops simply cannot match the high throughput from oil drilling.
Further, there are other costs associated to the cultivation stage that
contributes to the carbon cost. The GHG emissions for energy crops are
sensitive to the use of fertilizer and pesticides during the cultivation stage.
For example, soy oilebased jet fuel was shown to produce three times
higher GHG emissions than that of palm oil (Vasquez et al., 2019); thus the
cost of biojet fuel production is also correspondingly increased.
In an LCA study of camelina biojet fuel using system expansion method
(Li and Mupondwa, 2014), camelina oil from the Canadian Prairies region
could significantly reduce GWP by 65%e97% compared with fossil-based
jet fuel (88 gCO2eq/MJ). The main contributors to GWP have been
identified as yield of oil, natural gas, and electricity consumption. Among
them, the GHG emissions are particularly sensitive to oil yield. Higher seed
yield in camelina could reduce GHG emissions by 77% and 96% compared
with low yield scenario. In another study that uses jatropha curcas as jet fuel
Sustainability of aviation biofuels
301
feedstock, an efficient plantation management and displacement of high
emission product such as recycling of jatropha oil cake were shown to
be essential to ensure a positive impact to the environment (Liu and
Qiu, 2019).
The HEFA production pathway requires hydrogen for the hydrotreatment process. A study by de Jong et al. (2017) assumed that the hydrogen
used in their LCA study was supplied through steam methane reforming of
natural gas, which is the main industrial practice for hydrogen production.
The GHG emissions of the waste cooking oil (WCO)-based HEFA jet fuel
were shown to be lower than conventional jet fuel by 68%. It is expected
that the use of renewable hydrogen can further lower the GHG emissions.
Study has shown that renewable hydrogen produced from palm biomass
gasification and subsequent syngas reforming can reduce the carbon
footprint of palm biojet fuel from 14.2 gCO2eq/MJ to 4.8 gCO2eq/MJ,
whereas using hydrogen from water electrolysis can reduce the carbon
footprint of soy biojet from 40.1 to 33.9 gCO2eq/MJ compared with
basedline jet fuel, which amounts to 95% and 63% emissions reduction,
respectively (Vasquez et al., 2019). The electrolysis method requires high
energy input to break the molecular bond in water to produce hydrogen,
which in turn contributes a significant amount of GHG emissions. However,
as the biomass utilized is considered as carbon neutral, the overall net GHG
emissions is still considerably lower than conventional jet fuel, implying that
renewable hydrogen is an attractive option to be included in the biojet fuel
production process.
The conversion of fatty acid in WCO via the HEFA route is another
promising feedstock for biojet fuel production. Although there is no
cultivation of feedstock required, the collection of WCO from various
locations in urban areas poses a logistical challenge, which could incur
significant costs and GHG emissions. Nonetheless, WCO biojet fuel
showed a potential reduction of GHG by 68% (de Jong et al., 2017). The
production method can invariably affect the GHG emissions. A study was
conducted to compare two different production methods of WCO biojet
fuel. A technique known as the catalytic transfer of hydrogenation (CTH),
which utilizes isopropanol as hydrogen donor, was compared with the
HEFA pathway. The GWP for CTH method is lower than HEFA-WCO
by 8%, under the scenario with no CO2 sequestration through coproduct
offsets. The higher GWP potential for HEFA-WCO is attributable to the
higher heat input and electricity consumption compared with CTH. The
dominant factor for GWP in CTH is the low-pressure flash, while the
302
Biojet Fuel in Aviation Applications
HEFA’s GWP is dominated by WCO transport emissions (Barbera et al.,
2020). This shows that given the same feedstock, improvements to the lipid
conversion process can lead to GHG emissions reduction.
Hydrothermal liquefaction (HTL) is an emerging lipid conversion
method that uses subcritical water to convert biomass into a carbon-rich
biocrude. It was reported that the GHG emissions for algal biojet fuel
produced using HTL at a waste water plant are much lower than the jet fuel
produced in a refinery, as the use of waste water algae can reduce the GHG
emissions by 55.4%e76% compared with conventional jet fuel. The main
contributing factors to the life cycle GHG emissions of algae jet fuel are the
transportation of biomass and waste nutrients (Fortier et al., 2014).
6.5 Life cycle emissions values for CORSIA eligible fuel
In 2019, the ICAO has presented a report that details the methodology and
calculation of the core life cycle GHG emissions for different sustainable
aviation fuel (SAF) pathways (CORSIA, 2019). The purpose of the core
LCA values is to enable the implementation of the CO2 offsetting obligation agreed upon under CORSIA by aircraft operators. Details on the
implementation of CORSIA scheme and calculation of the CO2 offsetting
requirements can be found in the recent environmental report published by
the ICAO (2019a). The alternative jet fuels that are certified under ASTM
D7566 and meet the sustainability criteria are known as CORSIA Eligible
Fuels (CEF), which include SAFs and low-carbon aviation fuels (LCFs). At
the time when the report was published, the GHG values of various
feedstock produced from five ASTM-certified production pathways have
been included, including the FT, HEFA, SIP, FT-SKA, ATJ-SPK (Annex
1e5 of ASTM D7566), and coprocessing route (update in ASTM D1655).
With the emergence of new production pathways, the list of CORSIA
default life cycle emissions values (core LCA and ILUC) is expected to be
updated, provided the criteria are met. The production pathway must be a
certified conversion process and validated for commercial production.
Furthermore, there must be sufficient data available (including feedstock,
ILUC) for LCA modeling. The core life cycle GHG values of the SAF are
calculated based on the LCA attributional approach or “process-based”
approach, which accounts for the mass and energy flows for the whole
value chain. This means that no displacement effects are accounted for the
coproducts. The effect of ILUC is accounted based on a consequential
approach, in which the total life cycle GHG can be derived by adding the
core LCA values. Table 6.1 shows part of the CORSIA default life cycle
emissions values for CORSIA eligible fuels (ICAO, 2019b).
Sustainability of aviation biofuels
Table 6.1 CORSIA life cycle emissions values for CORSIA
Core
LCA
Fuel production
value
pathway
Fuel feedstock
FischereTropsch
Hydroprocessed
esters and fatty
acids
Alcohol
(isobutanol)-to-jet
Alcohol (ethanol)to-jet
Synthesized
isoparaffins
a
Agricultural residues
Miscanthus
(herbaceous energy
crops)
Switchgrass
(herbaceous energy
crops)
Used cooking oil
Tallow
Soybean oil
Rapeseed oil
Palm oildclosed
pond
Agricultural residues
Switchgrass
(herbaceous energy
crops)
Sugarcane
Corn grain
Sugarcane
303
eligible fuels (ICAO, 2019b).
ILUC
LCA
value
LSf(gCO2e/MJ)a
7.7
10.4
0
22.0
7.7
11.6
10.4
3.8
6.6
13.9
22.5
40.4
47.4
37.4
0
0
24.5
24.1
39.1
13.9
22.5
64.9
71.5
76.5
29.3
43.4
0
14.5
29.3
28.9
24.1
65.7
32.8
8.7
25.1
11.3
32.8
90.8
44.1
Total life cycle GHG value (LSf) ¼ core LCA value þ ILUC LCA value.
6.6 Comparison of greenhouse gas emission performance
Fig. 6.5 shows the compilation of the GHG emissions values taken from
several literature sources, classified according to their feedstock-production
technology combinations and compared with the LCA values of CORSIA
eligible fuels. The GHG emissions for baseline jet fuel derived from the
WTWa cycle is represented by the dashed lines with reported values of 80.7
and 109.3 gCO2eq/MJ, proposed by the working group in MIT under the
initiative of Partnership for Air Transportation Noise and Emissions
Reduction (PARTNER). Four alternative jet fuels derived from either coal
or natural gas via the FT routes are included for comparison, with two FT
fuels derived under the carbon capture and sequestration (CCS) scenario.
For biomass-based jet fuels, the GHG emission values reported are derived
from the field-to-wake cycle without considering the effect of LUC.
304
Biojet Fuel in Aviation Applications
Figure 6.5 Compilation of the carbon intensities of alternative jet fuels without
considering land use change effect. ATJ, alcohol-to-jet; FT, FischereTropsch; HEFA,
hydroprocessed esters and fatty acids; Pyro, pyrolysis; SIP, synthesized isoparaffins. (Source
data from Stratton, R.W., Wong, H.M., Hileman, J.I., 2010. Life Cycle Green House Gas
Emissions from Alternative Jet Fuels. Partnership of Air Transportation Noise and Emissions
Reduction. Institute of Technology, Cambridge, MA: Massachusetts. http://web.mit.edu/
aeroastro/partner/reports/proj28/partner-proj28-2010-001.pdf), Warshay, B., Pan, J., Sgouridis, S., 2011. Aviation industry’s quest for a sustainable fuel: considerations of scale and
modal opportunity carbon benefit. Biofuels 2, 33e58. Han, J., Elgowainy, A., Cai, H., Wang,
M.Q., 2013. Life-cycle analysis of bio-based aviation fuels. Bioresour. Technol. 150, 447e456,
Lokesh, K., Sethi, V., Nikolaidis, T., Goodger, E., Nalianda, D., 2015. Life cycle greenhouse gas
analysis of biojet fuels with a technical investigation into their impact on jet engine
performance. Biomass Bioenergy 77, 26e44, O’Connell, A., Kousoulidou, M., Lonza, L.,
Weindorf, W., 2019. Considerations on GHG emissions and energy balances of promising
aviation biofuel pathways. Renew. Sustain. Energy Rev. 101, 504e515, ICAO, 2019b. Annex
16 - Environmental Protection, CORSIA Default Life Cycle Emissions Values for CORSIA
Eligible Fuels. https://www.icao.int/environmental-protection/CORSIA/Pages/default.aspx.
The red dotted line represents the CO2 emissions range for baseline jet fuel Stratton, R.W.,
Wong, H.M., and Hileman, J.I., 2010. Life Cycle Green House Gas Emissions from Alternative
Jet Fuels. Partnership of Air Transportation Noise and Emissions Reduction. Institute of
Technology, Cambridge, MA: Massachusetts. http://web.mit.edu/aeroastro/partner/reports/
proj28/partner-proj28-2010-001.pdf.)
Synthetic jet fuels derived from fossil-based feedstocks generally produce higher GHG emission intensities. The coal-to-liquid route without
CCS produces 123% more CO2 than baseline jet fuel (87.5 gCO2eq/MJ),
while the incorporation of CCS technology is able to reduce the carbon
Sustainability of aviation biofuels
305
footprint significantly, but the net carbon emission intensity is still 11.1%
higher than baseline. Using natural gas as feedstock to produce FT fuel via
the GTL route results in 15.4% more CO2 emissions than baseline jet fuel,
which is lower than Coal-to-liquid (CTL) route owing to the absence of
feedstock gasification process. The incorporation of CCS technology with
natural gas FT process would reduce the CO2 emissions to the level
comparable with baseline jet fuel, with no positive impact to the
environment. However, gasifying lignocellulosic biomass such as corn
stover, forest residue, and switchgrass could subsequently lead to jet fuel
production via the FT pathway, which resulted in significant GHG emissions savings. The FT pathway has lower emission than the lipid conversion
route via hydrotreament as the former does not require hydrogen input.
The heat required for gasification can be obtained from waste heat while
the coproduction of electricity can further reduce GHG emissions. The
pyrolysis pathway is another emerging technology that can be utilised to
produce biojet fuel from lignocellulosic materials with promising carbon
reduction potential. Pyrolyzing straw, for example, can produce synthesis
gas, which can be processed into jet fuel via the FT route. The combined
pyrolysis and hydroprocessing pathway used to process straw into jet fuel is
considered to produce low GHG emissions comparable with those of ATJ
pathways owing to the nature of self-sufficiency (O’Connell et al., 2019).
The need for hydrogen during hydrotreatment can be resolved by
producing hydrogen during the pyrolysis process, while the heat and
electricity needed for the process are generated within the plant. In
addition, the production of coproducts such as biochar and biogas enables
product allocation, which further lowers the net GHG emissions.
The conversion of lignocellulosic biomass such as forest residues and
switchgrass into jet fuel via the ATJ route produces lower emission
intensities compared with conventional jet fuel, even if LUC effect is taken
into account (ICAO, 2019b). Direct conversion of sugar into hydrocarbon
via the synthesized isoparaffins (SIP) route is less carbon intensive, especially
when sugarcane is utilized as feedstock for the biochemical conversion
process (ICAO, 2019b). Converting the sugar from sugarcane and lignocellulosic feedstock, i.e., forest residues and switchgrass, via the ATJ route,
shows promising low carbon intensities of <50 gCO2eq/MJ fuel, but the
use of starch from corn grain tends to yield higher carbon footprint. The
CEF states that ATJ conversion with corn grain produces 65.7 gCO2eg/MJ
fuel without considering LUC. Warshay et al. (2011) reported the GHG
value of corn-based ATJ is comparable with the baseline jet fuel.
306
Biojet Fuel in Aviation Applications
A significant variation of GHG emission intensity can be observed for
the hydroprocessing of lipid into jet fuel pathway. For oil-bearing crops
such as camelina, jatropha, palm, rapeseed, sunflower, and soybean, the life
cycle GHG emissions are less carbon intensive compared with conventional
jet fuel when LUC effect is not considered. Sunflower HEFA has a carbon
footprint of about 41.4 gCO2eq/MJ, which is 52.6% lower compared with
baseline jet fuel GHG emissions (O’Connell et al., 2019). Other oil crops
such as palm, soybean, rapeseed, and camelina generally show lower carbon
intensities than fossil jet fuel in the case with no LUC, although the values
might differ depending on the LCA conducted. Palm can produce 23e
41 gCO2eq/MJ of GHG emissions under the scenario with no LUC. If
LUC is factored in, the GHG emission can increase quite significantly,
depending on the type of land conversion. Clearing of tropical rainforest or
peatland can release significant GHG emissions into the atmosphere. It has
been estimated that about 600 gCO2eq/MJ of GHGs will be emitted from
clearing the forest for palm cultivation (Stratton et al., 2010), whereas the
cultivation of palm oil on mineral soils without LUC yields meaningful
carbon reduction effect, with only 50 and 30 gCO2eq/MJ of emissions if
methane is captured from the mill effluent pond (O’Connell et al., 2019).
Nevertheless, if the demand for biojet fuel continues to soar, it can be
expected that LUC will occur to give way to energy crop cultivation to
meet the production capacity. This will inadvertantly result in negative
implication to the environment with significant rise in GHG emissions.
The degree of saturation of the fatty acids in the crop oil was found to
have an effect on the yield and hydrogen input requirements. Highly
unsaturated fatty acids require more hydrogen during the hydrotreatment
process; thus the carbon emission intensities for rapeseed, sunflower, and
soybean oil (7.8e8.3 gCO2eq/MJ) are higher than those of oil palm
(6 gCO2eq/MJ). The use of urban waste such as WCO can potentially
reduce the carbon intensity by 73.8% compared with baseline jet fuel. Lipid
conversion from microalgae via the HEFA route shows a large variability in
GHG emissions. Although no LUC effect is considered, the requirement of
nutrient inputs for the cultivation of algae could increase the GHG emission
level (Capaz et al., 2018).
Fig. 6.6 compares the breakdown of GHG emissions for several production route of biojet fuels (O’Connell et al., 2019). For HEFA process, the
cultivation stage for oil seed crops produces the largest part of GHG, whereas
the conversion stage of hydroprocessing accounts for 15% of the total GHG
emissions. As compared with the FT and pyrolysis process using forest residue
and straws, the advantage is that no cultivation is involved; hence, the GHG
Sustainability of aviation biofuels
(a)
Isomerization
7%
Fuel
distribution
1%
(b)
307
Fuel
distribution
3%
Hydroprocessing
15%
Feedstock
transport
1%
Isomerization
36%
Oil mill
6%
Drying and
storage
3%
Cultivation
67%
Fuel
distribution
1%
(c)
Transport
pyro oil/coke
slurry
7%
Isomerization
14%
Straw
balling
10%
Feedstock
transport
3%
Feedstock
transport
25%
Gasification
and FT
synthesis
6%
(d)
Chipping
30%
Fuel
distribution
3%
Straw
balling
10%
Feedstock
transport
3%
Isomerization
30%
Pyrolysis
65%
Transport
pyro oil/coke
slurry
54%
Figure 6.6 Breakdown of the GHG emissions for production of (A) rapeseed HEFA,
(B) forest residueeFT fuel, (C) straw pyrolysis þ FT, (D) hydrotreated pyrolysis oil from
straw. FT, FischereTropsch; GHG, greenhouse gas; HEFA, hydroprocessed esters and
fatty acids. (Adapted from O’Connell, A., Kousoulidou, M., Lonza, L., Weindorf, W., 2019.
Considerations on GHG emissions and energy balances of promising aviation biofuel
pathways. Renew. Sustain. Energy Rev. 101, 504e515.)
emissions are mainly attributed to the mechanical processing and thermochemical conversion process. For the FT production route by gasifying forest
residue, about 55% of the GHG emissions are attributed to chipping and
transportation. Although gasification and the FT process emits only 15% of
the GHG, the subsequent isomerization process used to produce the biojet
fuel is a carbon-intensive process that takes up 36% of the total GHG
emissions. The process of isomerization is to convert the small fuel molecules
into jet fuel-like molecules, i.e., similar chain length and physicochemical
properties as Jet A-1. This process tends to emit a significant part of GHG for
the pyrolysis and the hydrotreated pyrolysis oil routes. The heating required
for pyrolyzing straw results in 65% of the GHG emissions, whereas the
transporting of pyro oil or coke slurry dominates with 54% of the total GHG
emissions. The distribution of GHG emissions can vary quite significantly
depending on the process involved.
308
Biojet Fuel in Aviation Applications
6.7 Energy balance analysis
Analysis of the mass and energy flows of several aviation biojet fuels production pathway models has been conducted by Neuling and Kaltschmitt
(2018). Fig. 6.7 shows the Sankey diagram with all energy flows for the
process of GTL, i.e., jet fuel production from biomethane sources. The heat
and power streams used in the production stage is illustrated, while the
energy of the mass flow was calculated based on the lower heating value.
The produced hydrocarbon products contain kerosene, naphtha, and diesel,
with jet fuel kerosene constituting the largest part. Comparison of the mass
flow analysis shows that HEFA option produced the highest kerosene mass
fraction (w72 t/h), followed by ATJ (w65 t/h) and FT process via the
BTL and Bio-BTL route (w58e60 t/h). The HEFA process with palm oil
and jatropha oil as feedstock shows the highest overall energy efficiency of
90% with kerosene conversion efficiency of 58%e60%, while the processing of lignocellulosic biomass and FT routes shows lower overall energy
efficiency (30%e38%) and kerosene fraction (18%e21%). The process
simulation provides the basis to calculate the economics of production, with
HEFA refineries and ATJ process with wheat showing the approximate
Figure 6.7 Sankey diagram of all energy flows for the Bio-GTL process. (Adapted from
Neuling, U., Kaltschmitt, M., 2018. Techno-economic and environmental analysis of
aviation biofuels. Fuel Process. Technol. 171, 54e69.)
Sustainability of aviation biofuels
309
costs of 670 and 655 MV, respectively, as opposed to the BTL process of
using willow and wheat straw as feedstock with thermochemical gasification and heat-induced pretreatment processes that result in high investment
costs of approximately 2570 and 2800 MV, respectively.
Identification of the energy flow throughout the conversion process
provides a clear view on the energy consumption in each process. Fig. 6.8
shows the energy consumption breakdown for each of the biojet fuel
produced from different feedstock and technology (O’Connell et al., 2019).
For lignocellulose materials, gasification and pyrolysis processes constitute the
main portion of energy consumed, which is significantly higher compared
with the main hydrotreatment process (hydroprocessing þ isomerization)
of oil-bearing crops. This is due to the energy required to transform the solid
biomass into gaseous form before converting into liquid fuel via the FT
process. The energy usage for HEFA production varies with the type of seed
oil used and the process involved. Palm-based oil was shown to exhibit
higher energy loss during the processing stage in the oil mill. Processing the
palm oil seeds constitutes more than 70% of the energy loss in all the
scenarios considered, i.e., types of palm oil mill effluent ponds (open or
closed) and the usage of land (mineral soil or peat land). Compared with
Hydrotreated pyrolised oil-Straw
Pyrolysis-Straw
GTL-SRF
GTL-Forestry residue
HEFA-Sunflower
HEFA-Rapeseed
HEFA-Palm
HEFA-Soy
0%
Cultivation
10%
20%
30%
Pretreatment
40%
50%
Conversion
60%
70%
80%
90% 100%
Fuel distribution
Figure 6.8 Percentage of energy loss (MJ/MJ) due to different processes in alternative
jet fuel production. (Adapted from O’Connell, A., Kousoulidou, M., Lonza, L., Weindorf, W.,
2019. Considerations on GHG emissions and energy balances of promising aviation biofuel pathways. Renew. Sustain. Energy Rev. 101, 504e515.)
310
Biojet Fuel in Aviation Applications
other oil seeds such as soy or rapeseed, alternative jet fuel production from
palm oil is comparatively more energy-intensive in spite of showing the best
performance from GHG emissions perspective among the oil crops, even in
the sustainably practiced case where no LUC is involved. The combined
methods of pyrolysis and gasification for the production of alternative jet fuel
from biooil present the highest energy usage compared with HEFA or ATJ
routes, but hydrotreating the pyrolysis oil produced from straw presents a
viable energy consumption profile comparable with nonpalm oil crops. Even
though energy crops such as rapeseed, soy, sunflower, and straw demand
relatively low energy input for processing, their low yields per hectare incur
stresses on the required arable land and thus could potentially lead to LUC
and other environmental impacts. The low energy intensity for the process is
advantageous from the production cost, but further steps such as improvement on the processing technique, recuperation of waste heat, and
improvement in biomass collection system can be taken to further reduce the
energy utilization.
6.8 Energyewaterefood nexus
The global population and economic expansion have led to growth in
consumption of three key resources, namely energy, water, and food.
Concerns over the consumption are warranted, as supply of these resources
is finite. Traditionally, the resources of energy, water, and food were
managed independently with little interactions with each other. This meant
that in the pursuit of development to uplift living standards, trade-offs were
often made in the exploitation of a resource at the expense of another. The
complex and dynamic interlinkages between the three resources were often
underemphasized. For example, the food versus fuel debate showed how
the well-intentioned search for sustainable biofuels for energy caused a food
crisis in 2008. Agricultural practices need water, and sometimes, water
resources have to be stretched to obtain higher crop yield. The production
of water is an energy-intensive process. As such, a nexus approach linking
up the three resources will enhance coordination and integration among
the sectors. For this, a paradigm shift is required where energy, water, and
food are looked upon as a system instead of three siloed resources. Such an
approach is called the “energyewaterefood” nexus, or the EWF nexus.
EWF nexus is a core component in the 2030 Agenda for Sustainable
Development, which contributes directly to three of the 17 Sustainable
Development Goals. The holistic framework of the EWF nexus (as shown
in Fig. 6.9) places greater emphasis on the efficiency of the overall system
Sustainability of aviation biofuels
311
E
En
W
Water
o
dt
i re
qu
r e ood
f
is
e
o
c
gy
u
dt
d
er
se el
En pro
e u t fu
n b je
ca bio
od ce
Fo odu
pr
erg
y
su is r
pp e q
u
ly
Wa
wa ired
te r t o
pr t e r i
od s r
uc eq
e b ui r
ioj ed
et
fue to
l
Energy
EWF
Nexus
Sustainable Resource
Usage and Management
for Biojet Fuel
F
Food
Figure 6.9 EWF nexus holistic framework. EWF, energyewaterefood.
rather than any individual component. Trade-offs are part and parcel of the
nexus but will lead to an improved allocation of resources, reduced adverse
environmental impacts, and improved economic efficiency, while still
developing in a sustainable manner.
EWF nexus as a concept has gained traction but policy design mostly
remained sectoral-based, with mandates focused on individual sectors of
energy, water, and agriculture (Chiaramonti and Goumas, 2019). Crosssectoral effects are accounted in the more recent policies although
primarily in nonformalized statements of intent. The most common nexus
considered is between the agricultural and water policies. Cross-sectoral
thinking has also led to radical but promising ideas such as introducing a
diet change among EU citizens by reducing meat intake. For example, by
halving meat intake from 200 g/day per person to 100 g/day per person,
resources will be made available to multiply biofuel production by a
7.7-fold. This will have the social impacts of healthier citizens and triple
environmental benefits of reducing agricultural GHG by 24%, decreasing
GHG from EU transport by 14% and displacing 16.1% of EU fossil fuel for
the transport sector.
6.8.1 Energyewater nexus in biojet fuel production
Water footprint of a crop can be evaluated by dividing further into green,
blue, and gray water footprints. Green water footprint denotes rainwater
consumed, blue water footprint refers to the surface and groundwater
consumed, and gray water footprint quantifies the volume of freshwater
312
Biojet Fuel in Aviation Applications
Table 6.2 Global average water footprint of primary crop products and derived
crop products for potential biojet fuel feedstocks (Mekonnen and Hoekstra, 2011).
Global average water footprint
(m3 per ton)
Primary crop products and
Green
Blue
Gray Total
Category
derived crop products
Edible oil
Edible sugar
and starch
Castor oil
Coconut oil, refined
Cottonseed oil, refined
Groundnut oil, refined
Maize oil
Olive oil, refined
Olive oil, virgin
Palm oil, refined
Palm kernel oil, refined
Rapeseed oil, refined
Sesame oil
Soybean oil, refined
Sunflower seed oil, refined
Cassava, starch
Maize, starch
Potato starch
Rice, husked (brown)
Rye flour
Sorghum
Sugarbeet
Sugarcane, molasses
Wheat, starch
21,058
4,461
2,242
6,681
1,996
12,067
11,826
4,787
5,202
3,226
19,674
3,980
6,088
2,200
1,295
1,005
1,488
1,774
2,857
82
350
1,004
2,938
3
1,283
405
171
2,437
2,388
1
1
438
1,183
137
299
1
111
173
443
32
103
26
144
269
744
27
432
442
409
221
217
182
198
636
936
73
405
53
265
333
242
124
87
25
33
163
24,740
4,490
3,957
7,529
2,575
14,726
14,431
4,971
5,401
4,301
21,793
4,190
6,792
2,254
1,671
1,512
2,172
1,930
3,048
132
527
1,436
required to assimilate pollutant load as per the existing ambient water
quality standards (Mekonnen and Hoekstra, 2011). These measures of water
footprints provide indicators of the direct and indirect uses of freshwater
resources.
Globally, the average water footprint of crop production was 7404 Gm3
per year for the 1996e2005 period, with a breakdown of green water
(78%), blue water (12%), and gray water (10%). For key biojet fuel feedstocks, the total water footprint proportions globally are wheat (15%),
maize (10%), soybean (5%), sugarcane (4%), oil palm (2%), coconut (2%),
cassava (1%), and rapeseed (1%). Table 6.2 summarizes the global average
water footprint of primary crop products and derived crop products for
potential biojet fuel feedstocks. Derived crop products rather than primary
crop products are selected as the components often have different water
footprint compositions from the primary crop products.
Sustainability of aviation biofuels
313
Large variation was found for vegetable oil in terms of water footprint.
Total water footprint ranges from 2575 m3 per ton for maize oil to
24,740 m3 per ton for castor oil. Edible sugar and starch feedstocks have a
smaller absolute water footprint range from 132 m3 per ton for sugarbeet to
3048 m3 per ton for sorghum. From a water footprint point of view for the
energyewater or even the foodewater nexuses, the use of edible oil as
feedstock will pile stronger pressure on water resource than edible sugar and
starch. However, note that these values are just average, and they vary
between regions. The general rule of thumb points to the average water
footprint in Asia being lower than that of the Americas due to the greater
yield.
Among plausible oil-based biojet fuel feedstock, maize and cottonseed
will do well as biojet fuels when looking at water usage. In regions with
heavy rainfall, coconut oil, palm oil, and palm kernel oil will be the choice
to reduce water footprint as the plant relies almost exclusively on green
water or rainwater. Castor oil, olive oil, and sesame oil are poor choices as
feedstocks for biojet fuel production as they require huge water footprints.
For edible sugars and starch, sugarcane, sugarbeet, and wheat may be
suitable biojet fuel feedstocks for water conservation. In regions with high
rainfall, cassava will be a good choice as the plant taps primarily green water
and uses almost no surface- and groundwater.
The water withdrawal and consumption issues for biofuels, although
inclusive of bioethanol and biodiesel, are expected to grow as shown in
Fig. 6.10 (IEA, 2020). Water withdrawal as an indicator helps to evaluate
demands from agricultural, domestic, and industrial users by quantifying the
total amount of water withdrawn from blue water source. Water consumption refers to the amount of withdrawn water permanently lost from
its source. The water is lost due to consumption by human and livestock,
transpired by plants or evaporated. Water stress evaluation must incorporate
both indicators.
Presently, water withdrawal from the energy sector is dominated by coal
(150.3 bcm) and nuclear energy (99.9 bcm) in the power generation energy
sector. Water withdrawal due to biofuels (31.3 bcm) stands in third place
and is comparable with the much larger fossil fuel energy sector (21.1 bcm)
and gas (26.1 bcm). The water withdrawal for the energy sector under
the Sustainable Development Scenario projected for 2030 in a report by the
International Energy Agency (IEA) showed that biofuels will withdraw the
most water with 107.6 bcm, representing a 244% increase from 2016.
Biofuels will also command a share of 39.5% of total water withdrawal for
Biojet Fuel in Aviation Applications
160
140
Primary energy
Power generation
120
100
80
60
40
Biomass
Nuclear
Oil
Water withdrawal (2030)
Water consumption (2030)
Other renewables
Water withdrawal (2016)
Water consumption (2016)
Gas
Coal
0
Biofuels
20
Fossil fuels
Global water withdrawal and consumption
(billion cubic metre)
314
Figure 6.10 Global water withdrawal in the energy sector by fuel type in the Sustainable Development Scenario, 2016e30. (Adapted from IEA, 2020. International Energy
Agency, if the Energy Sector Is to Tackle Climate Change, it Must Also Think about Water.
https://www.iea.org/commentaries/if-the-energy-sector-is-to-tackle-climate-change-it-mustalso-think-about-water.)
the energy sector in 2030 as compared with only 9.3% in 2016. Together
with biomass, biofuels are the only fuel type with an expected increase in
water withdrawal.
Similar trends were found for water consumption, where water consumption for biofuel is ranked second at 14.5 bcm behind fossil fuel at
18.0 bcm. This represents 30.8% global water consumption for the energy
sector. Water consumption for biofuels is expected to increase by
34e48.5 bcm in 2030. This leads to biofuels (64.8%) consuming more
water than the other fuels types in the entire energy sector. This also means
that a drought will adversely affect biojet fuel production.
When conversion pathways are factored in, the oil-based feedstocks are
comparable with the edible sugar and starch-based feedstocks in water
consumption. This reverses the impression obtained when evaluating water
footprint at crop planting level. Table 6.3 shows the water consumption for
the different biojet fuel production pathways. A good way forward is to
combine the use of feedstock with low water footprint at cultivation level
and low water usage at process stage.
The cultivation of microalgae for energy has the potential to treat
wastewater. Microalgae are efficient at removing nutrients from municipal
Sustainability of aviation biofuels
315
Table 6.3 Water consumption for the different biojet fuel production pathways
(Wei et al., 2019).
Pathway
Feedstock
Water use (m3/GJ)
Hydrogenated esters and fatty acids
Direct sugar-to-hydrocarbon
Pongamia oil
Microalgae oil
Rapeseed oil
Jatropha
Soybean
Sugarcane
Switchgrass
Corn grain
5.50e11.80
6.40e13.90
57.91e143.00
66.45e75.03
63.65e106.79
15.60e147.00
92.39e104.74
76.46e85.81
wastes. Municipal wastewater can provide the appropriate quantities of
micronutrients, macronutrients, and dissolved salts. The relative proportions
of carbohydrate, lipid, and protein can be altered through nutrient change
(Dickinson et al., 2013). In fact, the effectiveness of microalgae in removing
N and P will abate the effects of eutrophication and improving water
quality. As such, the coupling of bioremediation and biojet fuel production
using algae will be a possible winewin solution to satisfy the energyewater
nexus. This also shows that the cultivation of microalgae could shift away
from using clean water mixed with nutrients.
If energy production from biofuels is reliant on water as a resource, then
water also relies on energy in its entire supply chain. The global water
sector consumed 120 Mt of oil equivalent (mtoe) in 2014 (Popp et al.,
2014). The majority of this quantity is used in the form of electricity,
leading to a 4% electricity consumption globally. The major uses of
electricity in the water sector are water extraction (40%), wastewater
treatment (25%), and water distribution (20%). The interreliance of the
energyewater nexus is shown when we factor in the 15% of global
freshwater withdrawal in production of energy worldwide.
6.8.2 Energyefood nexus in biojet fuel production
First-generation biojet fuel feedstocks utilize edible oil, sugar, and starch.
This meant that potential food is diverted to the energy sector. As the
limiting factor for food production manifests itself in the form of cropland,
the diversion of food to the energy sector should be calculated in terms of
cropland area. The proportion of global cropland utilized for biofuels stands
at about 2.5% or 40 million gross hectares (Popp et al., 2014). The net
land requirement can be reduced to 1.5% globally by considering the
by-products substituted for grains and oilseeds. The usage has a large
316
Biojet Fuel in Aviation Applications
variation among countries and regions. The reliant of biofuels on arable
land will increase from 40 million gross hectares to 100 million gross
hectares in 2050, representing 6% of total arable land today. Such an
expansion would include existing cropland, pastures, and currently unused
land. It is expected that the land requirement projection might be higher
considering that biojet fuel was not yet prominent when the bioethanol and
biodiesel-centric projection was calculated.
Conversely, the food sector (which edible oil, sugar, and starch are a
subset of) is also dependent on energy resource. Energy is required along
the entire food production value chain. From farm-to-table, 32% of the
total global energy demand is used by the food sector (OFID, 2017). The
number represents the primary production of food, storage, logistic, processing, and food preparation. It can be seen that the energy and food
sectors have huge overlapping.
Brazil managed food and energy resources efficiently with their successful bioethanol and biodiesel industry. Sugarcane for the bioethanol
industry used only 8.5 Mha or 1% of total land area in Brazil and was
responsible for 15.7% of the country’s 2014 domestic energy supply (Cortez
et al., 2016). Soybean for the biodiesel industry used approximately
7.6 Mha or 32% of soybean production for 80% of biodiesel production in
Brazil. This in turn contributed to 4.2% of overall diesel consumption in
2014. Firewood and charcoal from the planted forests of eucalyptus and
pinus contributed to 8.1% of domestic energy supply from just 2 Mha of
land or 31% of wood plated area. The aforementioned feedstocks can also
be used for biojet fuel production. This places Brazil in the driving seat to
expand their success in biofuels production to also include biojet fuel
production. Furthermore, Brazil has strong conservation laws, large areas of
legally protected native vegetation, and significant swathe of land already
cleared for agriculture. Biojet fuel industries around the world could use
Brazil as an example to balance the energyefood nexus.
One of the keys to solving the energy and food puzzle is from productivity gains. Brazil’s food sector saw a productivity gain of 175% for
grains from 1992 to 2012, while only increasing cultivated land usage by
merely 49% as shown in Fig. 6.11. This represents a food productivity gain
to land usage ratio of 3.57. In the same vein, productivity gain for sugar of
266% came from 102% land usage increases for sugarcane cultivation
(Cantarella et al., 2015). Among measures taken include the introduction of
double-cropping system for two crops to be harvested in the same year
alternately. In fact, it is estimated that only 1.9 Mha or roughly 1% of
317
Sustainability of aviation biofuels
200
Production and Harvested Area
180
160
Productivity gain over two decades is 175%,
while land usage only increased by 49%
140
120
100
80
60
40
20
12
20
10
11
20
20
08
09
20
07
20
06
20
20
04
05
20
20
02
03
20
01
20
20
99
00
20
19
97
98
19
96
19
95
19
19
93
94
19
19
19
92
0
Year
Harvested Area (Mha)
Production (Mt)
Figure 6.11 Production of grains and harvested area in Brazil. (Adapted from Cortez,
L.A.B., Cantarella, H., Moraes, M.A.F.D., Nogueira, L.A.H., Schuchardt, U., Franco, T.T., et al.,
2016. Roadmap to a sustainable aviation biofuel: a Brazilian case study. In: Biofuels for
Aviation, 339e350.)
pasture land in Brazil is required to replace all of Brazil’s jet fuel consumption if sugarcane ethanol is used as feedstock to produce biojet fuel. By
comparison, the US ethanol productivity is lower than that of Brazil’s,
leading to the United States needing to deal with a significant agricultural
limitation (Archer and Szklo, 2016). Brazil shifted the “food versus fuel”
debate and epitomizes “food and fuel” instead.
The energyefood nexus is rarely straightforward. To illustrate the
complexity of the energyefood relationship, crops meant for food will
invariably be wasted, of which the food waste can be used as feedstock to be
reconverted into biojet fuels. In general, 30%e50% of food produced
globally is wasted prior to human consumption (Chuck et al., 2016). In the
developing world, the mechanism of wastage is predominantly focused on
poor transportation, harvesting, and storage practices. In the developed
world, the main wastages are consumer behavior oriented, such as disposal
due to arbitrary sell-by dates, not meeting esthetics standards. It is estimated
that 15% of total food production can be collected as urban food waste
(UFW) and be directed for biofuel production. Proportions of UFW as
percentage of continent are Asia (51%), Americas (23%), Europe (16%), and
Africa (10%). Food residues in Europe are expected to increase to 126
318
Biojet Fuel in Aviation Applications
million tons by 2020, while in Asia, it is projected to rise to 416 million tons
by 2025 (Tsiligiannis and Tsiliyannis, 2019). The ability of biojet fuel to be
produced from various pathways means that almost the entirety of the
UFW quantity can be used as feedstock, as opposed to just the oil portion
for biodiesel and the sugar and starch portions for bioethanol. The practical
drawbacks include high logistic and pretreatment costs.
Looking from an EWF nexus lens, the use of second-generation
feedstocks such as jatropha oil, sugarcane bagasse, agricultural waste, and
WCO will neither divert food nor will it use precious arable land for energy
production. However, water requirement would have to be evaluated.
Production of transportation fuel from jatropha requires more water than
most other first-generation edible oil, sugar, and starch crops as shown in
Fig. 6.12. This is at odds with some findings of jatropha needing
only minimum water requirements as compared with other crops (Giwa
et al., 2018).
China also faced a potential food versus fuel dilemma, of which the
bioenergy targets threaten to derail the aims to attain self-sufficiency on
grain supply. However, China has a ready-made solution in the form of
Crude-oil based
1
Fossil-based
Sugarcane
119
Corn
122
Barley
Sugar and starch-based
176
Wheat
234
Soybean
418
Rapeseed
434
Lipid-based
Jatropha
608
0
100
200
300
400
500
Water requirement (m3 per gigajoule)
600
700
Figure 6.12 Water requirement of transportation fuel production from various
feedstocks. (Adapted from OFID, 2017. The OPEC Fund for International Development, the
EnergyeWatereFood Nexus: Managing Key Resources for Sustainable Development. https://
opecfund.org/var/site/storage/original/application/80be162d98453051ded87e13032727cf.pdf.)
Sustainability of aviation biofuels
319
Table 6.4 Potential generation and collectable potential of cellulosic biomass in
China (Chang et al., 2012).
Generation
potential
Collectable potential
(Mt)
(Mt)
Residues
2010
2010
2020
(estimated)
Agriculture
650.55
540
563.79
Forest
854.56
460.79
520.55
Current utilization
Traditional burning
(35%), fodder (28%),
returning to the field
(15%), agricultural and
industry use (7%)
Fiber and paper
manufacturing (32%),
returning to the forest
(25%), traditional burning
(16%)
cellulosic feedstock, which can also be used for biojet fuel productions. The
vast quantities of agricultural and forest residues in China could unlock high
quantities of feedstock without jeopardizing food supply. The potential
generation and collectable potential of cellulosic biomass in China are
summarized in Table 6.4. Another alternative available to China that will
not cause potential food insecurity and still meet current land administration policies is the tapping into marginal land for oil-bearing trees. China’s
vast landmass meant that the combined forest barren lands, barren
mountains, barren sand areas, and unutilized land resources could provide
more than 36 Mha for oil-bearing crops. This is roughly the total landmass
size of Malaysia (32.98 Mha) or the average arable land of the G7 group
(37.12 Mha). It is posited that growing cellulosic crops on degraded lands
could sequester carbon, improve soil health, and improve habitat for
wildlife (Costello and Ayoub, 2019).
Similar to China, the moderately sized Spain in Europe also has lowcost and readily harvestable biomass from agriculture and forest.
Table 6.5 tabulates the biomass quantity and the estimated bioenergy that
can be unlocked from the biomass (Paredes-Sánchez et al., 2019). The
potential biomass and bioenergy were estimated for the Spanish Renewable
Energy Pan 2011e20. Spain alone has 0.726 EJ of bioenergy awaiting to be
unlocked. These biomasses can be used for biojet fuel production without
adversely affecting the energy-food nexus.
320
Biojet Fuel in Aviation Applications
Table 6.5 Potential biomass and bioenergy in Spain.
Biomass
Bioenergy
Source
(Mt/y)
(Mtoe/y)
Lumber industry residue
Exploitation of entire tree
Herbaceous agricultural residue
Woody agricultural residue
Herbaceous mass from agricultural
terrain
Woody mass collected from
agricultural terrain
Woody mass collected from forest
terrain
Total
Bioenergy
(PJ)
2.98
15.73
14.44
16.12
17.74
0.64
3.41
6.39
26.88
143.22
268.38
3.59
150.78
6.60
1.47
61.74
15.07
1.78
74.76
88.68
17.29
726.18
Adapted from Paredes-Sánchez, J.P., López-Ochoa, L.M., López-González, L.M., Las-Heras-Casas, J.,
Xiberta-Bernat, J., 2019. Evolution and perspectives of the bioenergy applications in Spain. J. Clean.
Prod. 213, 553e568.
More broadly in the European Union, it is estimated that biomass
production for the years 2005, 2030, and 2050 are 90, 212, and 356 Mtoe,
respectively (Benito and Alonso, 2018). The largest growth of biomass
production is expected to come from second-generation crops from none
in 2005 to 127 Mtoe in 2050. Biomass production for second-generation
crops is expected to dwarf first-generation crops by a factor of 18.1.
Biomass from waste will also increase by 248% to 87 Mtoe in 2050. The
European Union is also expected to increase waste import by 1200% over
the 2005e50 period, although in absolute terms, it amounts to 24 Mtoe.
This is close to the expected increase of agricultural residues from 17 Mtoe
to 49 Mtoe for the same period.
Seaweed or macroalgae are consumed as food, but its potential for
energy is even greater. From an EWF standpoint, seaweed has advantages
over terrestrial cultured crops and microalgae. The cultivation of seaweed
does not require freshwater. Additional production of seaweed will add to
food supply without reducing available arable land. From an energy
viewpoint, it has high solar efficiency of up to 8%, making it four times
better than any terrestrial crops (Chuck et al., 2016). Seaweed farms located
in coastal regions, offshore, and open sea colonies can produce up to 35,
110, and 6000 EJ, respectively. It could also democratize energy as seaweed
is sufficiently robust to be inhabiting every marine ecosystem, allowing it to
be cultivated in large scale by any country. In short, seaweed satisfies all of
the EWF nexus considerations. The question remains is the logistics
Sustainability of aviation biofuels
321
involved in ramping up production of seaweed to support the biojet fuel
industry. The other considerations not covered by the EWF nexus include
ecosystems and biodiversity. The danger of one feedstock dominating the
landscape is the displacement of native species, habitat fragmentation,
disruption to food chain, and possibility of reducing the resilience of an area
to natural disaster.
6.8.3 Energyewaterefood nexus and holistic considerations
for biojet fuel production
6.8.3.1 Limiting factors
An analysis was conducted to evaluate the EWF nexus in biojet fuel
production around the world. Limiting factors were determined using an
unpublished data-driven model by the authors. In addition to the EWF
nexus, economic factors were also considered. As biojet fuel itself represents
the energy dimension, the limiting factor is not in the quantity, but instead
the energy diversity afforded through the introduction of sustainable biojet
fuel. For this, the HerfindahleHirschman Index (HHI) was used to
determined energy type concentration. Countries that ended up with a
poorer HHI for energy type will have an energy diversity limiting factor.
The limiting factor of the water dimension is defined by water stress level.
Food limiting factor is defined by the inadequacy of food triggered by the
development of a biojet fuel industry in the country. Lastly, economic
factors are defined by the prevailing jet fuel price and refinery costs. Economic factors are important as there will be no biojet fuel industry without
profitability. The strongest of the limiting factors will be identified as the
limiting factor for the biojet fuel industry of a country. Fig. 6.13 shows the
global limiting factor map based on the EWF nexus and economic factors.
The model only considers exported feedstocks to avoid food versus fuel
conflict. It also uses three conversion pathways of oil-to-jet (OTJ), ethanolto-jet (ETJ), and gas-to-jet (GTJ) representing the three diverse branches of
production methods. It is apparent that the bulk of countries with biojet
fuel potentials are limited by economic factors first and foremost, rather
than EWF resource factors. Nearly all of Africa, the Middle East, the Iberian
Peninsula, and Central Asia are limited by economic factors. They are
joined prominently by Mexico in North America; Peru and Bolivia in
South America; Malaysia and Cambodia in South-East Asia; and New
Zealand. This clearly shows that before sustainability and resource concerns
are factored in, the biojet fuel industry must first resolve the profitability
aspects of producing biojet fuel.
322
Biojet Fuel in Aviation Applications
Figure 6.13 Global limiting factors of the biojet fuel industry for each countries based on economic and EWF nexus. EWF,
energyewaterefood.
Sustainability of aviation biofuels
323
There are a handful of countries, such as India, Myanmar, Thailand, the
Philippines, Ghana, Togo, and Nicaragua, which are limited by energy
diversity concerns if they introduce large-scale biojet fuel industry in their
countries. It is likely that these countries share the characteristics of already
being either heavily vested in biofuels or already have a balanced mixed of
energy type, hence not benefitting greatly from adding biojet fuel to the
mix.
Food as a limiting factor affects Canada, Russia, Kazakhstan, Australia,
Brazil, Argentina, and a host of other nations. It is striking that most of the
countries mentioned have large landmass, but not necessarily having high
proportion of arable land. Most of these countries are located in either the
upper end of the Northern Hemisphere or southern end of the Southern
Hemisphere. This makes them located away from the fertile tropical region,
so food production in these countries would not be able to withstand a
huge diversion for the purpose of producing fuel.
Water stress is a limiting factor for the United States, Indonesia, and
most of Europe. The existing thriving economic sectors in the United
States and Europe are already tapping into the finite water resources. The
addition of the biojet fuel industry for these wealthy nations will generally
improve energy diversity in general but will put too much undue pressure
on water supply. Unlike food and energy which can be imported, water is
primarily a localized issue. Large quantity transfer of water over a large
distance is a logistic impossibility.
Evaluating the limiting factors as a whole, economic factors will trump
EWF concerns in the immediate term. Following it, food diversion and
water concerns are equally pressing as limiting factors. Decreasing energy
diversity is a minor concern globally.
6.8.3.2 Energy diversity
It is not disputed that the introduction of biojet fuel will help countries to
achieve their decarbonization targets to battle climate change. However,
the process of introducing biojet fuel might represent a shift in the energy
mix. The monthly crude oil price in the entire of year 2020 hovered in the
range of USD 17.28e71.68 per barrel, with the price on an upward
trajectory and closed the year around the USD 50 per barrel range.
Considering the previous high of 2020 and upward trajectory, the EWF
nexus model projects the energy diversity change based on jet fuel price of
USD 80 per barrel and production cost of biojet fuel are USD 0.355 per
liter (OTJ), USD 1.00 per liter (ETJ), and USD 0.840 per liter (GTJ).
Fig. 6.14 shows the global change in energy diversity as represented by
324
Biojet Fuel in Aviation Applications
Figure 6.14 Global change in energy diversity as represented by percentage change in HHI in when conventional jet fuel price is USD 80
per barrel and baseline production cost of biojet fuel. HHI, HerfindahleHirschman Index.
Sustainability of aviation biofuels
325
percentage change in HHI in when conventional jet fuel price is USD 80
per barrel and production cost of biojet fuel is normal.
Using a realistic projection, biojet fuel is unlikely to change the energy
mix of most countries. Countries that will see a notable positive change in
energy diversity include the United States, Australia, Canada, Niger,
Kazakhstan, Finland, Tunisia, Ecuador, Madagascar, and Argentina. For this
scenario to improve, conversion technologies have to be more mature to
bring production cost down. In this model, only the HEFA pathway
contributed to biojet fuel into the energy mix in any meaningful quantity as
it is the only production method sufficiently mature to take advantage of
the higher jet fuel price. Thus, United States and Australia have the chance
to build their biojet fuel industry if they strategically harness the potential of
their feedstock. This can be done with present-day technology and without
the governmental subsidies.
Several macroeconomics analysts have projected a postpandemic
supernormal bull run for the oil and gas industry, where oil prices are
expected to test the USD 200 per barrel psychological barrier. Considering
that jet fuel prices mimic crude oil price, jet fuel price by extension is
expected to also test the same price barrier. It is unclear if the recovery
phase of the aviation industry will actually lead to the supernormal bull run,
but a projection using the EWF model is conducted for jet fuel price of
USD 180 per barrel and production cost of biojet fuel are USD 0.20 per
liter (OTJ), USD 0.80 per liter (ETJ), and USD 0.84 per liter (GTJ). The
lowered biojet fuel production cost reflects possible assistance provided by
governments through subsidies. Such conditions represent the most
optimistic of scenarios plausible, pending another “black swan” event akin
to the COVID-19 global pandemic, which structurally changed all markets.
Fig. 6.15 shows the global change in energy diversity as represented by
percentage change in HHI when conventional jet fuel price is USD 180 per
barrel with favorable production cost of biojet fuel. Under this optimistic
projection, Brazil, Angola, Poland, Iraq, New Zealand, Cambodia,
Ukraine, and Colombia stand to improve their energy mix substantially.
Australia’s energy mix will not be improved further from this change in
circumstances, while the United States and Niger will not diverse their
energy sources. This further cements the idea that the EWF nexus is
complex and dynamic where a single factor like cost will affect penetration
of biojet fuel in a less than predictable manner.
326
Biojet Fuel in Aviation Applications
Figure 6.15 Global change in energy diversity as represented by percentage change in HHI in when conventional jet fuel price is USD 180
per barrel and production cost of biojet fuel are USD 0.20 per liter (OTJ), USD 0.80 per liter (ETJ), and USD 0.84 per liter (GTJ). ETJ, ethanol-tojet; GTJ, gas-to-jet; HHI, HerfindahleHirschman Index; OTJ, oil-to-jet.
Sustainability of aviation biofuels
327
Figure 6.16 Aviation sector emissions scenarios for various jet fuel price (JFP) in USD
per barrel and production cost per liter, where (A) JFP ¼ 80, OTJ ¼ 0.2, ETJ ¼ 0.8,
GTJ ¼ 0.84, (B) JFP ¼ 80, OTJ ¼ 0.355, ETJ ¼ 1.0, GTJ ¼ 0.84, (C) JFP ¼ 180, OTJ ¼ 0.2,
ETJ ¼ 0.8, GTJ ¼ 0.84, (D) JFP ¼ 180, OTJ ¼ 0.355, ETJ ¼ 1.0, GTJ ¼ 0.84. ETJ, ethanolto-jet; GTJ, gas-to-jet; OTJ, oil-to-jet.
6.8.3.3 Emissions
The introduction of biojet fuel will displace conventional jet fuel and also
the associated CO2 emissions. Fig. 6.16 uses the EWF model by the authors
to predict aviation sector emissions for four scenarios of various jet fuel
prices and biojet fuel production costs. The four scenarios are as follows:
• Scenario 1 (optimistic O&G cycle with favorable production cost): Jet
fuel price of USD 80 per barrel, production costs in USD per liter
for OTJ ¼ 0.2, ETJ ¼ 0.8, and GTJ ¼ 0.84
• Scenario 2 (optimistic O&G cycle with baseline production cost): Jet
fuel price of USD 80 per barrel, production costs in USD per liter
for OTJ ¼ 0.355, ETJ ¼ 1.0, and GTJ ¼ 0.84
• Scenario 3 (supernormal O&G cycle with favourable production cost):
Jet fuel price of USD 180 per barrel, production costs in USD per liter
for OTJ ¼ 0.2, ETJ ¼ 0.8, and GTJ ¼ 0.84
• Scenario 4 (supernormal O&G cycle with baseline production cost): Jet
fuel price of USD 180 per barrel, production costs in USD per liter for
OTJ ¼ 0.355, ETJ ¼ 1.0, and GTJ ¼ 0.84
328
Biojet Fuel in Aviation Applications
In scenarios 1 and 2, the emissions for the aviation sector are generally
unchanged as biojet fuel is unlikely to have made any inroads to displace
conventional jet fuel in any considerable quantity. As such, the emissions
will be unchanged. This projection should form the lower bounds as
governments around the world would either be subsidizing the biojet fuel
industry or taxing the conventional jet fuel producers to meet the various
decarbonization targets. Nonetheless, the free market prognosis is poor until
production costs can be lowered. Two factors that are often understated
include the rate at which production price tumbles as economies of scale are
achieved, and pioneering nations figure out the best way to build the biojet
fuel industry. Good examples include the solar energy industry pioneered in
Germany and EV industries of the United States and China.
Scenarios 3 and 4 showed that biojet fuel has attained a market foothold,
hence contributing the biojet fuel emissions. This should not be confused
with LCA values. The prebiojet fuel and postbiojet fuel CO2 emissions
quantities do not vary much as biojet fuel and conventional aviation fuel
have very similar fuel properties and are used in the same jet engines.
Nonetheless, biojet fuel CO2 emissions in the Americas, Asia and Europe
are expected to be substantial but are unlikely to dominate over conventional jet fuel. It will be more prudent to expect emissions reduction from a
life cycle perspective than combustion emissions perspective.
6.8.3.4 Energyewaterefood nexus by biojet fuel generations
Table 6.6 summarizes the EWF nexus and other holistic concerns for
the biojet fuels produced from different generations. The main strength of
Table 6.6 EWF and other holistic considerations of biojet fuel production by
feedstock generations.
First-generation
Second-generation
Third-generation
Generation biojet fuel
biojet fuel
biojet fuel
Key
feedstock
Energy
dimension
Edible oil, edible
animal fat,
edible sugar,
edible starch
Low energy
sustainability,
Net energy
ratio (NER)
w0.8e1.5:1
Nonedible oil,
cellulosic materials,
wastes
Microalgae,
macroalgae, yeasts.
High energy
sustainability, NER
as high as 5.4:1
Potentially high
energy sustainable,
NER w0.2e3.0:1
Sustainability of aviation biofuels
329
Table 6.6 EWF and other holistic considerations of biojet fuel production by
feedstock generations.dcont’d
Generation
First-generation
biojet fuel
Second-generation
biojet fuel
Third-generation
biojet fuel
Water
dimension
High water
requirement
Food
dimension
Competes with
food usage
Potentially lower
water requirement,
as feedstock is byproduct of process
Does not compete
with food usage
Land
usage
High land usage
High land usage,
but can use
marginal land
Scalability
Large-scale
production
already in
existence
Emissions
Significant
pollution in CO2
and GHG
emissions
Large-scale
production is
ramping, although
yield for oil-based
crops is inconsistent
around the world.
Logistics poses a
huge barrier for
cellulosic and waste
feedstocks
Significant
reduction in CO2
and other GHG
emissions as
compared with
first-generation
feedstocks
High water
requirement for
conventional
microalgae farming
Does not compete
with food usage, and
may even be used as
food
Low land usage as
dominant feedstock
of microalgae and
macroalgae are not
terrestrial based
Large-scale
production requires
more R&D,
scalability studies and
larger-scale pilot
projects
Economic
impacts
May cause food
price increase,
but improve
livelihood of
farmers
Improve rural
economies
Potentially even
lower CO2 and
other GHG
emissions than
second-generation
feedstocks, although
real-world large-scale
project
measurements are
not yet available
Generate modern
agricultural or “hightechnology” jobs
330
Biojet Fuel in Aviation Applications
first-generation biojet fuel lies in the inherent scalability as it is directly a
function of agricultural outcomes. Scaling of agricultural activities through
crop intensification will occur with or without considering the biojet fuel
industry. As agriculture modernizes, the energy sustainability might be
improved, and water requirement could be reduced. As crop yield
increases, food production might even lead to overproduction, which
solves the food versus fuel debate. The possible food price increase from
rising demand of first-generation feedstock is a double-edge sword. On one
hand, it improves the livelihood of farmers. On the other hand, food might
be priced beyond affordability of the poor. In spite of the relatively poor
EWF nexus outlook, it will be sensible to first use the current generation
feedstock in the interest of scaling up biojet fuel production to achieve
economies of scale. This will also benefit the implementation of future
generation biojet fuels.
The key strengths of second-generation biojet fuels are the twin factors
of land usage reduction and noncompetition with food. The latter can be
solved with increased yield, but the former is especially beneficial as land is a
finite resource, which is ever dwindling. The scaling of second-generation
feedstock looks promising as supply chains to collect wastes and residues are
forming around the world, albeit still on scales which are orders of
magnitude smaller than agricultural products. This is expected to be
reversed in the next decade. Water usage is debatable as presently the
feedstocks are considered as a by-product and not counted within the
boundaries of water cycle calculations. Assuming that wastes and residues
are considered as coproducts, then water stress imparted by these feedstocks
will be factored in. This paradigm shift means that water requirement
should be shared with first-generation crops and their agricultural residues.
The EWF nexus considerations for second-generation biojet fuel are
outstanding. As marginal lands could be utilized, rural economies can be
stimulated. Thus, second-generation feedstocks should be the focus of
the industry as the associated technologies are already available; the only
requirement is the governmental will power and industry building
know-how.
The pool of third-generation feedstock consists primarily of microalgae,
macroalgae, and yeast-derived feedstocks. However, third generation is
almost synonymous with microalgae due to its dominance in the research
field. Third-generation feedstocks hold extreme promises in yield
improvement and life cycle carbon reduction. Looking at the EWF nexus
considerations, the food dimension will improve, while the water
Sustainability of aviation biofuels
331
dimension will depend on the ability to use wastewater instead of fresh
water. Energy dimension still requires more research to be conducted as the
energy balance from a life cycle perspective is still unclear. When implemented correctly, third-generation feedstocks have the best EWF nexus
balance. Unlike second-generation feedstocks where it is a matter of
“when, not if,” third-generation feedstock is a question of “if and when.”
6.9 Summary
There exist different technologies and feedstocks that can be used to
produce alternative jet fuel. Thorough assessment on the environmental
and climatic impacts from the use of these alternative fuels is important to
ensure the targets of negative carbon emissions are achieved. Life cycle
assessment has become an important tool to assess the climatic impact from
GHG emissions. The ICAO has set up a task force that assesses the LCA
GHG emissions of alternative jet fuel and establishes the sustainability
criteria of different jet fuel conversion pathways and feedstocks. From
several LCA studies, it has been shown that alternative jet fuels derived from
FT, HEFA, and ATJ pathways can lead to reduced GHG emissions up to
80% compared with conventional jet fuels. Among the conversion pathways, the carbon intensities for biojet fuels produced from lignocellulosic
feedstocks, waste gas, and sugar-based feedstock via the ATJ routes tend to
be lower. Lipid conversion technology via the HEFA pathway also shows
promising reduced carbon footprint. Oil-bearing crops such as rapeseed,
palm oil, soybean, jatropha, and camelina have shown potential GHG
emissions reduction, but the GHG values can vary significantly when LUC
effects are taken into considerations. The release of carbon into the
atmosphere as a result of land conversion will lead to the spike in GHG
emission intensity. The use of agrochemicals during the cultivation stage
and the oil yield in the feedstock are among the factors that contribute to
the GHG emissions. Gasification of biomass for production of FT fuel and
combined pyrolysis and hydrotreatment process are viable options for low
carbon jet fuel production. The use of renewable energies from solar and
wind for production of hydrogen are strategies that can be adopted to
further lower GHG emissions intensities. In addition to LCAs of carbon and
energy, resource management in the form of the interdependent EWF
nexus is equally important. Using an EWF nexus approach, the limiting
factors in resources can be determined. Water stress issue is a concern for the
United States and most of Europe, while food diversion has the potential to
332
Biojet Fuel in Aviation Applications
affect countries with large landmass such as Canada, Russia, Australia,
Brazil, and Argentina. When EWF nexus is coupled with economic factors,
sustainable development of the biojet fuel industry is curtailed by financial
viability. Energy diversity can also be improved for most countries if a
viable biojet fuel industry is successfully developed. The risks and
opportunities in carbon emissions associated with alternative jet fuel
production depend on the feedstock choice and production pathways. The
promotion of alternative jet fuels with low carbon footprint and environmentally sustainable is essential to help achieve the decarbonization targets
for the sector.
References
Archer, M., Szklo, A., 2016. Can increasing gasoline supply in the United States affect
ethanol production in Brazil? Renew. Energy 95, 586e596.
ASTM D7566-19b, 2019. ASTM International, Standard Specification for Aviation
Turbine Fuel Containing Synthesized Hydrocarbons.
Barbera, E., Naurzaliyev, R., Asiedu, A., Bertucco, A., Resurreccion, E.P., Kumar, S., 2020.
Techno-economic analysis and life-cycle assessment of jet fuels production from waste
cooking oil via in situ catalytic transfer hydrogenation. Renew. Energy 160, 428e449.
Benito, A., Alonso, G., 2018. Energy Efficiency and the Environment in Energy Efficiency
in Air Transportation, pp. 153e199.
Budsberg, E., Crawford, J.T., Morgan, H., Chin, W.S., Bura, R., Gustafson, R., 2016.
Hydrocarbon bio-jet fuel from bioconversion of poplar biomass: life cycle assessment.
Biotechnol. Biofuels 9, 170.
Cantarella, H., Nassar, A.M., Cortez, L.A.B., Baldassin, R., 2015. Potential feedstock for
renewable aviation fuel in Brazil. Environ. Develop. 15, 52e63.
Capaz, R., Posada, J., Seabra, J., Osseweijer, P., 2018. Life cycle assessment of renewable jet
fuel from ethanol: an analysis from consequential and attributional approaches. In: 26th
European Biomass Conference and Exhibition, 14e17 May 2018, Copenhagen,
Denmark.
Carter, N.A., Stratton, R.W., Bredehoeft, M.K., Hileman, J.I., 2011. Energy and environmental viability of select alternative jet fuel pathways. In: 47th AIAA/ASME/SAE/
ASEE Joint Propulsion Conference & Exhibit. AIAA, San Diego, California,
2011e5968.
Chang, S., Zhao, L., Timilsina, G.R., Zhang, X., 2012. Biofuels development in China:
technology options and policies needed to meet the 2020 target. Energy Pol. 51,
64e79.
Chiaramonti, D., Goumas, T., 2019. Impacts on industrial-scale market deployment of
advanced biofuels and recycled carbon fuels from the EU renewable energy directive II.
Appl. Energy 251, 113351.
Chuck, C.J., McManus, M., Allen, M.J., Singh, S., 2016. Feedstocks for aviation biofuels.
In: Biofuels for Aviation, pp. 17e34.
CORSIA, 2019. CORSIA Supporting Document - Life Cycle Assessment Methodology.
https://www.icao.int/environmental-protection/CORSIA/Pages/default.aspx.
Cortez, L.A.B., Cantarella, H., Moraes, M.A.F.D., Nogueira, L.A.H., Schuchardt, U.,
Franco, T.T., et al., 2016. Roadmap to a sustainable aviation biofuel: a Brazilian case
study. In: Biofuels for Aviation, pp. 339e350.
Sustainability of aviation biofuels
333
Costello, C., Ayoub, N., 2019. Exploring the potential for riparian marginal lands to
enhance ecosystem services and bioenergy production. In: Biofuels, Bioenergy and
Food Security, pp. 101e123.
Crossin, E., 2017. Life cycle assessment of a mallee eucalypt jet fuel. Biomass Bioenergy 96,
162e171.
de Jong, S., Antonissen, K., Hoefnagels, R., Lonza, L., Wang, M., Faaij, A., Junginger, M.,
2017. Life-cycle analysis of greenhouse gas emissions from renewable jet fuel production. Biotechnol. Biofuels 10, 64.
Dickinson, K.E., Whitney, C.G., McGinn, P.J., 2013. Nutrient remediation rates in
municipal wastewater and their effect on biochemical composition of the microalga
Scenedesmus sp. AMDD. Algal Res. 2 (2), 127e134.
EU, 2018. Directive (EU) 2018/2001 of the European Parliament and of the Council of 11
December 2018 on the promotion of the use of energy from renewable sources. Off. J.
Eur. Union 5, 82e209.
Fortier, M.-O.P., Roberts, G.W., Stagg-Williams, S.M., Sturm, B.S.M., 2014. Life cycle
assessment of bio-jet fuel from hydrothermal liquefaction of microalgae. Appl. Energy
122, 73e82.
Ganguly, I., Pierobon, F., Bowers, T.C., Huisenga, M., Johnston, G., Eastin, I.L., 2018.
‘Woods-to-Wake’ life cycle assessment of residual woody biomass based jet fuel using
mild bisulfite pretreatment. Biomass Bioenergy 108, 207e216.
Giwa, A., Adeyemi, I., Dindi, A., Lopez, C.G.-B., Lopresto, C.G., Curcio, S.,
Chakraborty, S., 2018. Techno-economic assessment of the sustainability of an
integrated biorefinery from microalgae and Jatropha: a review and case study. Renew.
Sustain. Energy Rev. 88, 239e257.
Han, J., Elgowainy, A., Cai, H., Wang, M.Q., 2013. Life-cycle analysis of bio-based aviation
fuels. Bioresour. Technol. 150, 447e456.
Handler, R.M., Shonnard, D.R., Griffing, E.M., Lai, A., Palou-Rivera, I., 2016. Life cycle
assessments of ethanol production via gas fermentation: anticipated greenhouse gas
emissions for cellulosic and waste gas feedstocks. Ind. Eng. Chem. Res. 55, 3253e3261.
Hileman, J.I., Stratton, R.W., 2014. Alternative jet fuel feasibility. Transport Pol. 34,
52e62.
IATA, 2020. IATA, Jet Fuel Price Monitor. Available at: https://www.iata.org/en/
publications/economics/fuel-monitor/. (Accessed 20 October 2020).
ICAO, 2016. IATA 2015 Report on Alternative Fuels, tenth ed. Retrieved from: https://
www.iata.org/publications/Documents/2015-reportalternative-fuels.pdf.
ICAO, 2019a. 2019 Environmental Report - Aviation and Environment.
ICAO, 2019b. Annex 16 - Environmental Protection, CORSIA Default Life Cycle
Emissions Values for CORSIA Eligible Fuels. https://www.icao.int/environmentalprotection/CORSIA/Pages/default.aspx.
IEA, 2020. International Energy Agency, if the Energy Sector Is to Tackle Climate Change,
it Must Also Think about Water. https://www.iea.org/commentaries/if-the-energysector-is-to-tackle-climate-change-it-must-also-think-about-water.
ISO 14040, 2006. ISO 14040:2006, Environmental Management - Life Cycle Assessment Principles and Framework.
ISO 14044, 2006. ISO 14044:2006, Environmental Management - Life Cycle Assessment Requirements and Guidelines.
Klein, B.C., Chagas, M.F., Junqueira, T.L., Rezende, M.C.A.F., Cardoso, T.d.F.,
Cavalett, O., Bonomi, A., 2018. Techno-economic and environmental assessment of
renewable jet fuel production in integrated Brazilian sugarcane biorefineries. Appl.
Energy 209, 290e305.
334
Biojet Fuel in Aviation Applications
Li, X., Mupondwa, E., 2014. Life cycle assessment of camelina oil derived biodiesel and jet
fuel in the Canadian Prairies. Sci. Total Environ. 481, 17e26.
Liu, H., Qiu, T., 2019. Life cycle assessment of Jatropha jet biodiesel production in China
conditions. In: Proceedings of the 29th European Symposium on Computer Aided
Process Engineering, June 16th to 19th, 2019, Eindhoven, The Netherlands.
Lokesh, K., Sethi, V., Nikolaidis, T., Goodger, E., Nalianda, D., 2015. Life cycle greenhouse gas analysis of biojet fuels with a technical investigation into their impact on jet
engine performance. Biomass Bioenergy 77, 26e44.
Malins, C., Searle, S., Baral, A., 2014. A Guide for the Perplexed to the Indirect Effects of
Biofuels Production. The International Council on Clean Transportation. Retrieved
from: http://www.theicct.org/guide-perplexed-indirecteffects-biofuels-production.
Mekonnen, M.M., Hoekstra, A.Y., 2011. The green, blue and grey water footprint of crops
and derived crop products. Hydrol. Earth Syst. Sci. 15, 1577e1600.
Neuling, U., Kaltschmitt, M., 2018. Techno-economic and environmental analysis of
aviation biofuels. Fuel Process. Technol. 171, 54e69.
O’Connell, A., Kousoulidou, M., Lonza, L., Weindorf, W., 2019. Considerations on GHG
emissions and energy balances of promising aviation biofuel pathways. Renew. Sustain.
Energy Rev. 101, 504e515.
OFID, 2017. The OPEC Fund for International Development, the EnergyeWatereFood
Nexus: Managing Key Resources for Sustainable Development. https://opecfund.org/
var/site/storage/original/application/80be162d98453051ded87e13032727cf.pdf.
Page, S.E., Morrison, R., Malins, C., Hooijer, A., Rieley, J.O., Jauhiainen, J., 2011. Review
of peat surface greenhouse gas emissions from oil palm plantations in southeast Asia. In:
White Paper No. 15. Indirect Effects of Biofuel Production Series. International
Council on Clean Transportation. Available online at: http://www.theicct.org/sites/
default/files/publications/ICCT_Peat-Emissions_Sept2011.pdf.
Paredes-Sánchez, J.P., López-Ochoa, L.M., López-González, L.M., Las-Heras-Casas, J.,
Xiberta-Bernat, J., 2019. Evolution and perspectives of the bioenergy applications in
Spain. J. Clean. Prod. 213, 553e568.
Popp, J., Lakner, Z., Harangi-Rákos, M., Fári, M., 2014. The effect of bioenergy expansion:
food, energy, and environment. Renew. Sustain. Energy Rev. 32, 559e578.
Stratton, R.W., Wong, H.M., Hileman, J.I., 2010. Life Cycle Green House Gas Emissions
from Alternative Jet Fuels. Partnership of Air Transportation Noise and Emissions
Reduction. Massachusetts Institute of Technology, Cambridge, MA. http://web.mit.
edu/aeroastro/partner/reports/proj28/partner-proj28-2010-001.pdf.
Takriti, S.E., Pavlenko, N., Searle, S., 2017. Mitigating International Aviation Emissions.
The International Council on Clean Transportation.
Tsiligiannis, A., Tsiliyannis, C., 2019. Renewable energy in cement manufacturing: a
quantitative assessment of energy and environmental efficiency of food residue biofuels.
Renew. Sustain. Energy Rev. 107, 568e586.
UNFCCC, 1998. Kyoto Protocol to the United Nations Framework Convention on
Climate Change. Retrieved from: http://unfccc.int/kyoto_protocol/items/2830.php.
US DOE, 2012. Amyris Integrated Biorefinery. U.S. Department of Energy. https://
www1.eere.energy.gov/bioenergy/pdfs/ibr_arra_amyris.pdf.
Valin, H., Peters, D., den Berg, M., Frank, S., Havlik, P., Forsell, N., et al., 2015. The Land
Use Change Impact of Biofuels Consumed in the EU. Quantification of Area and
Greenhouse Gas Impacts. Retrieved from: http://www.globiom-iluc.eu/iluc-studynow-available-online/. (Accessed 20 October 2020).
Sustainability of aviation biofuels
335
Vasquez, M.C., Martínez, A., Castillo, E.F., Silva, E.E., 2019. Holistic approach for
sustainability enhancing of hydrotreated aviation biofuels, through life cycle assessment:
a Brazilian case study. J. Clean. Prod. 237, 117796.
Vela-García, N., Bolonio, D., Mosquera, A.M., Ortega, M.F., García-Martínez, M.-J.,
Canoira, L., 2020. Techno-economic and life cycle assessment of triisobutane
production and its suitability as biojet fuel. Appl. Energy 268, 114897.
Warshay, B., Pan, J., Sgouridis, S., 2011. Aviation industry’s quest for a sustainable fuel:
considerations of scale and modal opportunity carbon benefit. Biofuels 2, 33e58.
Wei, H., Liu, W., Chen, X., Yang, Q., Li, J., Chen, H., 2019. Renewable bio-jet fuel
production for aviation: a review. Fuel 254, 115599.
This page intentionally left blank
Index
Note: ‘Page numbers followed by “f ” indicate figures and “t” indicate tables.’
A
Acidity test, 161
Activation energy, 178e179, 204
Additives, 143e147, 165t, 180
biocide, 162e163
deactivator, 165e166
fuel handling and maintenance, 166t
jet fuels, 164e167
lubricity, 163e164
Adiabatic flame temperature, 212e213
Aggregate size, 199e200, 199f
Agricultural waste, 17e19, 265t, 318
estimations, 265t
lignocellulosic materials, 263e264
AIR 6241, 197e198
AISAF. See Australian Initiative for
Sustainable Aviation Fuels
(AISAF)
Alcohols, 81, 242e243
aqueous phase reforming (APR), 131
fermentation, 295e297
intermediates, 152e153
Alcohol-to-jet (ATJ), 81, 110e112,
181e182, 242e243
butyl alcohols-to-jet, 108e110
cellulose and starch biomass, 105f
direct sugar to hydrocarbon conversion
(DSHC), 295e297
ethanol-to-jet, 105e108
Algal biojet fuel, 67, 302
Alkylation, 153e154
American Society for Testing Materials
(ASTM), 67, 82e83, 144e145,
146t, 148, 154e155, 161,
166e167, 175e176, 181e182,
281, 295
Anthropogenic carbon dioxide, 287
Antioxidants, 144e147, 164e165, 165t
APR. See Aqueous phase reforming
(APR)
Aqueous phase reforming (APR), 128,
152e153
conversion pathway, 131, 131f
product carbon yields, 132, 132t
Area harvested, 260e261, 261t
Aromatics, 64, 82, 91e92, 114,
145e147, 213e214
kerosine, 153e154
organic liquid product, 92t
species analysis, 88te89t
ASTM D1655, 144e145, 146t, 148,
153e154, 161e162, 165t
ASTM D4054, 60e63, 168, 170,
175e176
ASTM D6469, 162e163
ASTM D6615, 145e147
ASTM D7566, 63, 82e83, 113e114,
150e152, 152t, 281, 288
ATJ. See Alcohol-to-jet (ATJ)
Attributional approach, 302
Australian Initiative for Sustainable
Aviation Fuels (AISAF), 74
B
Benzene, 153e154, 189e191
Biochemical conversion, 157e158, 236,
297e298
Biochemical fermentation, 128
Biocide additives, 162e163. See also
Additives
Biofuel Obligation Scheme (BOS),
22te23t
Biojet fuels, 175e176, 231
aircraft emissions, 176e180
aircraft pollutant formations,
178e179
emission index calculation, 179e180
alcohol-to-jet (ATJ), 104e105, 105f,
111f, 112t
butyl alcohols-to-jet, 108e110, 109f
337
338
Index
Biojet fuels (Continued)
ethanol-to-jet, 105e108, 106t
category, 81, 82f
commercialization, 272e282
component/rig test, alternative jet fuel,
180
gaseous emissions, 188e193,
189te190t, 191f, 193f
ignition, 184e187, 186t
lean blowout, 187e188
particulate matter (PM), 193e200
spray atomization, 181e184, 182t,
183fe184f
derived cetane number (DCN),
207e209
economy, 231e232
investment cost, 245e251
process cost, 245e251
subsidies and taxes, 251e254
sustainable aviation fuel price
assessment, 232e236, 234t
travel costs, 254e255
viability, 236e245
extinction strain rate, 213e214
flight test, 200e202, 200f
gas-to-jet
biomass-to-fuel, 117e119,
117fe118f, 120t
FischereTropsch (FT), 112e117,
113f, 115f, 115te116t, 119e126
ignition delay time, 203e207
laminar flame speed, 210e213
oil-to-jet (OTJ), 81e82
catalytic hydrothermolysis (CH),
94e99, 94f, 95te98t
commercial flights, oil-based
feedstocks, 100e104, 102te104t
hydroprocessed depolymerized
cellulosic jet (HDJC), 99e100,
99f, 101t
hydroprocessed esters and fatty acids
(HEFA), 82e94, 83f, 86te89t,
91te93t
potential feedstock, 255e270, 256t
cost implications, 269e270
first-generation feedstock,
255e261
second-generation feedstock,
261e264
third-generation feedstock, 264e269
production, 270e272
sooting propensity, 214e216
sugar-to-jet (STJ), 128
aqueous phase reforming (APR),
131e132, 131f, 132t
direct sugar-to-hydrocarbon (DSHC),
128e131, 128f, 130t
surrogates, for alternative jet fuels,
216e222
Biological, 110, 129
Biomass credit, 290e291
Biomass gasification, 119e124, 301
Biomass-to-liquid (BtL), 117e118, 249,
299, 308e309
Biooils, 81, 94, 95te96t, 96e99,
152e153, 241, 295
Biorefineries, 99e100, 298e299
Bioremediation, 314e315
Biotechnology, 268
Blenders tax credit, 57
Blending limit, 152t, 153e155,
157e158
Blowoff, 187e188
Blowout equivalence ratio, 187e188
Botryococcus braunii algae, 150e152
Branched alkanes, 107e108, 143e144,
208e209
Breakeven point, 249
Brent, 231e232, 232f, 278
Bunsen flame method, 210e211
Butyl alcohol-to-jet, 108e110
C
CAAF/2, 5
CAAFI. See Commercial Aviation Alternative Fuels Initiative (CAAFI)
CAEE. See Committee on Aircraft
Engine Emissions (CAEE)
California Air Resources Board
(CARB), 54e55
California Low Carbon Fuel Standard
(LCFS), 54e57
Camelina, 82e83, 192e193, 241, 262,
292e293
Index
lipid conversion, 300e301
particulate matter (PM), 194e195
plantations, 31
Renewable Fuel Standard (RFS, 42
CAN. See Committee on Aircraft Noise
(CAN)
CAPEX. See Capital expenditure
(CAPEX)
Capital expenditure (CAPEX), 54e56
CARB. See California Air Resources
Board (CARB)
Carbon capture and sequestration, 303
Carbon footprint, 269, 280, 290, 301
Carbon intensity, 54e55, 56t, 150e152,
288e289, 291e292
Carbon monoxide (CO), 112e113,
176e177, 191f
Carbon neutral growth (CNG), 3, 58,
59t, 287e288
Carbon Offset and Reduction Scheme
for International Aviation
(CORSIA), 3. See also specific
types
Carbonyls emissions, 192
Cassava, 278, 279f, 312
Castor oil, 313
Catalyst, 58, 84, 90, 95e96, 249
alkali, 124
cobalt, 153
ethanol dehydration, 106t
heterogenous, 107
homogenous, 106e107
iron, 153
metaleacid bifunctional, 84
Catalyst-to-biomass ratio, 95e96
Catalytic conversion, 128, 132, 152e153
Catalytic hydrothermolysis (CH),
94e99, 196e197, 241e242
Catalytic transfer of hydrogenation
(CTH), 301e302
Cellulosic biofuel, 41e42, 44e46
Cellulosic isobutanol, 298
Cellulosic waiver credit (CWC), 44e46
CERT. See CORSIA CO2 Estimation
and Reporting Tool (CERT)
Certification, 6, 65, 152e153, 175e176,
200e201, 281
339
Cetane ignition delay (CID), 207e208
Civil Aviation Administration of China
(CAAC), 67, 69
Civil Aviation Development Fund
(CADF), 68e69
Clean Development Mechanism
(CDM), 3
Combustion, 13, 85, 145e147, 159,
196f, 231
aviation turbine engine, 176f
biojet fuels, 259e260
biomass-to-fuel, 117e118
efficiency, 119e122, 180, 210
FischereTropsch (FT), 113e114
nitrogen, 178
properties, 184e185
Commercial airline, 200e201
Commercial Aviation Alternative Fuels
Initiative (CAAFI), 50, 74,
150e152, 171t
Commercialization, 272, 275te277t
economic barriers, 272e279
operational barriers, 280e281
societal barriers, 281e282
sustainability barriers, 279e280
Committee on Aircraft Engine Emissions
(CAEE), 2
Committee on Aircraft Noise (CAN), 2
Condensation, 106e108, 117e118,
143e144
Conductivity, 161e162, 167, 172e173
Cone angle method, 181e182, 183f,
211
Copper strip test, 161
Co-processing, 302
biocrude, 158
Corn stover, 123, 298
Corrosion inhibitors, 166e167
CORSIA. See Carbon Offset and
Reduction Scheme for International Aviation (CORSIA)
CORSIA Central Registry (CCR),
11e13
CORSIA CO2 Estimation and Reporting Tool (CERT), 13
CORSIA Eligible Fuel, 6e11, 302
COVID-19, 11, 15, 231e232, 325
340
Index
Cracking, 82e84, 123, 259
Cradle-to-grave, 288e289
Crude oil price, 72e73, 231e232, 232f,
323e325
CTSO-2C701, 68
Cyclic alkanes, 143e144
Cycloaromatics, 197
Cycloparaffins, 114, 154e155, 194e195
D
D-code, 42, 43t
DEF STAN 91-91, 144e145, 148
Dehydration, 104e106, 155e156
Deoxygenation, 82e83, 85e90,
154e155
Department of Energy (DOE), 50
Deposits, 158e159, 161, 195e196, 196f
Derived cetane number, 206e209, 209t
Desulfurization process, 161
Detailed reaction mechanism, 202e203
Development fuels, 17e19, 38t
Diffusivity, 210
Direct sugar-to-hydrocarbon (DSHC),
128e131, 206e207, 295e297
Displacement methods, 292e293
Distillation, 32e33, 84
curve, 217e220
Dividing wall column (DWC), 92
Droplet Sauter mean diameter (SMD),
181e182, 222
Droplet size distribution, 182e183
E
Economic analysis, 58, 231e232, 247
investment cost, 245e251
process cost, 245e251
subsidies and taxes, 251e254
sustainable aviation fuel price
assessment, 232e236, 234t
travel costs, 254e255
viability, 236e245
Economic barriers, 272e279
Economic factors, 282e283, 321
Economic viability, 60, 236e245
Elastomers, 91e92
fuel system and turbine, 161
seal, 159
shrinkage, 113e114
Emission index, 179e180
Emissions trading scheme, 3
Energy allocation, 292
Energy balance analysis, 308e310
Energy diversity, 321, 323e325
Energy flow, 302, 308f
Energy-food nexus, 315e321
Energy mix, 64, 323e325
Energy security, 48e49, 231e232
Energy-water-food nexus, 310e331,
311f
Engine shutdown, 102te104t
Engine test, 168, 188
Engine thrust, 178f, 197e198, 199f
Environmental, social, and corporate
governance (ESG), 100
Enzymatic hydrolysis, 128e129,
131e132, 297e298
Enzyme, 239
catalytic proteins, 128e129
mixtures, 128e129
EPA. See US Environmental Protection
Agency (EPA)
Equivalence ratio, 184e185, 194e195,
204, 211e212
Escherichia coli, 131
ESG. See Environmental, social, and
corporate governance (ESG)
Ethanol-to-jet (ETJ), 105e108, 321
Ethylbenzene, 189e191
Eucalyptus, 297e298, 316
EU Emissions Trading System (ETS), 16
EU Fuel Quality Directive, 32e33
European Advanced Biofuels FlightPath,
29e31
European Economic Area (EEA), 16
Exothermicity, 210
Extinction, 180, 213
Extinction strain rate, 213e214
F
F4C. See Fuels for Flight and Freight
Competition (F4C)
FAAC. See Future of Aviation Advisory
Committee (FAAC)
FAEE, 130t
Index
Farm to Fly, 49e50
Farnesane, 128e131, 157e158,
206e207
Farnesene, 129e131, 157e158, 243,
295e297
Feedstock readiness level, 172
Feedstocks, 255e270, 256t
cost implications, 269e270
first-generation feedstock, 255e261
second-generation feedstock, 261e264
third-generation feedstock, 264e269
Fenimore mechanism, 178
Fermentable sugars, 157e158, 297e298
Fermentation, 297e298
biochemical, 128
catalytic hydrogenation, 104e105
direct sugar-to-hydrocarbon (DSHC),
130e131
farnesene, 129
sucrose, 236
syngas, 152e153, 236
yeasts, 267
Field-to-tank, 290e291
Figures of Merit (FOM), 180
FischereTropsch (FT), 82e83,
112e117, 117f, 242e243, 292
biomass gasification, 119e124
reactor, 125e126
synthesis, 113, 124
Fit-for purpose (FFP), 164, 180, 295
Flame curvature, 213
Flame propagation, 185e187, 222e223
Flame speed, 210e213
Flame stability, 187e188, 213
Flame structure, 180
Flash point, 90, 114e117, 144e145,
153, 184e185
Flight shaming, 100
Flight test, 200e202
Flow-flame unsteadiness, 213
Fluidity, 143e144, 154e155
Food and fuel, 279e280, 316e317
Food versus fuel, 30e31, 255, 310,
328e330
Forest residue, 53, 298, 305
Fourth generation feedstock, 267e268
FQD. See Fuel Quality Directive
(FQD)
341
Fractionation, 94e95, 104e105, 148,
155e156, 295e297
Freezing point, 84, 90, 143e147
Fuel atomization, 160, 181
Fuel chemistry, 202e203, 222e223
Fuel cleanliness, 162
Fuel ignition tester (FIT), 207e208
Fuel lubricity, 163e164
Fuel metering, 159e160
Fuel NO, 178e179
Fuel oxidation chemistry, 217e220,
222e223
Fuel Quality Directive (FQD), 19,
32e33
Fuel readiness level (FRL),
170e172, 171t
Fuels for Flight and Freight Competition
(F4C), 39e40
Fuel storage stability, 161e162
Fully synthetic jet fuel, 148
Functional unit, 289
Future of Aviation Advisory Committee
(FAAC), 50
G
Gasification, 104e105, 236, 295
biomass, 119e124
coal and natural gas, 119
FischereTropsch (FT) synthesis, 113f
syngas, 117e118
Gas-to-jet (GTJ), 81
biomass-to-fuel, 117e119
FischereTropsch (FT), 112e117
biomass gasification technology,
119e124
reactor, 125e126
scientific advances, 126e128
GB 6537, 147e148, 149te150t
Genetic engineering, 128, 281e282
Geopolitics, 231e232
GFAAF. See ICAO Global Framework
for Aviation Alternative Fuels
(GFAAF)
Global Biosphere Management Model
(GLOBIOM), 10, 293e294
Global kinetic target, 203e204
Global warming potential (GWP),
289e290, 300e302
342
Index
GLOBIOM. See Global Biosphere Management Model (GLOBIOM)
Greenhouse gas (GHG), 175e176
emissions, 3e4, 32e33, 54, 287,
292e293, 300e301, 306e307
GTAP-BIO, 10
H
Heat of combustion, 85, 90, 159e160,
211e212
HEFA. See Hydroprocessed ester and
fatty acid (HEFA)
Herfindahl-Hirschman Index (HHI),
321, 324f
Hexahydrofarnesol (HHF), 129e130,
157e158
HFS-SIP. See Hydroprocessed fermented
sugars to synthetic iosparaffins
(HFS-SIP)
HHF. See Hexahydrofarnesol (HHF)
High altitude relight, 184e185
Hollow cone, 184
HRJ. See Hydrotreated renewable jet
(HRJ)
HVO. See Hydrotreated vegetable oil
(HVO)
Hydrocracking, 84, 91t, 125e126, 153
Hydrogenation, 84, 99, 131, 148
Hydrolysate, 129
Hydrolysis, 94e95, 128e129, 297e298
Hydroprocessed, 150e152, 154e155
Hydroprocessed depolymerized cellolusic
jet (HDJC), 81e82, 99e100
Hydroprocessed ester and fatty acid
(HEFA), 60, 81e94, 154e155,
189e191, 194e195, 249
Hydroprocessed fermented sugars to
synthetic iosparaffins (HFS-SIP),
128, 157e158
Hydrothermal liquefaction (HTL), 94,
241, 302
Hydrothermolysis treatment, 294e295
Hydrotreated renewable jet (HRJ), 82,
213e214
Hydrotreated vegetable oil (HVO), 82
Hydrotreating, 56, 82e83, 83f,
107e108, 153
I
ICAO. See International Civil Agency
Organization (ICAO)
ICAO Global Framework for Aviation
Alternative Fuels (GFAAF), 3e4
2050 ICAO Vision, 3e4
Ignition, 160
characteristics, 184e185
cold, 180
extinction performance, 186t
Jet A-1 fuel, 185e187
Ignition boundary, 187
Ignition delay time (IDT), 203e208,
203f, 205t, 208f
Ignition energy, 184e185
Ignition quality tester (IQT), 207e208
INAF. See Initiatives for Next-generation Aviation Fuels (INAF)
Indirect land use change (ILUC), 6e10,
30e31, 293e294
Initiatives for Next-generation Aviation
Fuels (INAF)
Initiative Towards sustainable Kerosene
for Aviation (ITAKA), 31
Injection pressure, 181e184
Intermediates, 81, 106e107, 129,
152e153, 194e195, 243
Internal rate of return (IRR), 239, 240f,
243
International Civil Agency Organization
(ICAO), 150e152, 175e176
aircraft engine certification values,
179e180
carbon offset and reduction scheme,
1e3
CORSIA Central Registry (CCR),
11e13
CORSIA CO2 estimation and reporting
tool, 13
CORSIA Eligible Fuels, 6e11
COVID-19, 15
sustainable aviation fuels (SAFs),
3e6
Inventory analysis phase, 289
ISO 14040, 289
ISO 14044, 292
Isoalkanes, 84, 206, 298
Index
Isobutanol, 104e105, 108, 152e153,
298
Isomerization, 82e83, 153, 306e307
isoalkanes, 84
n-butanol, 108
sulfidation agents, 90, 91t
Isoparaffinic kerosene, 127e128, 148,
297e298
Isoparaffins, 114e117, 148e150,
199e200, 297e298
Isopropanol, 301e302
ITAKA. See Initiative Towards sustainable Kerosene for Aviation
(ITAKA)
J
Jet A, 11, 144e145, 210, 281, 299e300
Jet A-1, 11, 64, 108e110, 143e145,
153, 181e182, 195e196,
212e213, 281, 298
Jet A-1 Check List, 145
Jet B fuel, 145e147
Jet Fuel No. 3, 147e148
JP-8 jet fuel, 145e147
JP Fuel, 145e147
K
Kinetic modeling, 206e207
Kyoto Protocol, 3, 287
L
Land use change (LUC), 10, 292e294,
306
LCA. See Life cycle assessment (LCA)
methodology
LCFS. See California Low Carbon Fuel
Standard (LCFS)
Lean blowout (LBO), 180, 187e188
Lean-burning, 177
Life cycle assessment (LCA) methodology, 6e10, 288
aviation jet fuel, 288e294
land use change (LUC), 293e294
product allocation, 291e293
Life cycle inventory, 295e297
Lignin gasification, 298
343
Lignocellulosic biomass, 104e105, 113f,
295e297, 305
Limiting factor, 321e323
Lipid conversion, 299e302
Liquid sheet breakup, 183e184
M
Macroalgae, 96e99, 266, 320e321
Macroeconomics, 274, 278, 325
Malaysian Palm Oil Board (MPOB),
70e71
Market-value allocation, 292
MASBI. See Midwest Aviation Sustainable Biofuels Initiative (MASBI)
Mass allocation, 292
MDM, 37
Mercaptan, 161
Metal deactivators, 145e147, 165e166
Microalgae, 71, 96e99, 241, 264
Microbial contamination, 162e163
Microwave, 122e123
Microwave co-pyrolysis, 100
Midwest Aviation Sustainable Biofuels
Initiative (MASBI), 54
MIL-T-83188D, 145e147
Minimum attractive rate of return
(MARR), 243
Minimum jet fuel selling price (MJSP),
236, 239, 242t, 245
Mixing, 64, 181, 203e204
MJSP. See Minimum jet fuel selling
price (MJSP)
MPOB. See Malaysian Palm Oil Board
(MPOB)
Municipal wastewater, 314e315
N
Naphtha, 84, 145e147, 233, 308e309
Nationally Determined Contributions
(NDCs), 1e2
National Renewable Energy Action
Plans (NREAP), 20, 28t
National Renewable Energy Laboratory
(NREL), 99e100
Natural gas steam reforming, 298
Net present value (NPV), 249
344
Index
NISA. See Nordic Initiative for Sustainable Aviation (NISA)
Nitrogen oxides (NOx), 33, 176e177,
179
Noncorrosivity, 164
Nonequidiffusivity, 213
Nordic Initiative for Sustainable Aviation
(NISA), 40
Nozzle spray pattern, 160, 181
n-paraffins, 85, 88te89t
NREAP. See National Renewable
Energy Action Plans (NREAP)
NREL. See National Renewable Energy
Laboratory (NREL)
O
OH* emissions, 203e204
Oil crops, 245, 257, 269, 306
Oil-to-jet (OTJ), 81, 321
catalytic hydrothermolysis (CH), 94e99
commercial flights, oil-based feedstocks,
100e104
hydroprocessed depolymerized cellulosic
jet (HDJC), 99e100
hydroprocessed esters and fatty acids
(HEFA), 82e94
Oil yield, 257, 259, 300e301
Olefins, 106e107, 143e144
Oligomerization, 104e107, 155e156,
297e298
Olive oil, 313
Operational barriers, 280e281
Operational expenditure (OPEX), 245
OPEX. See Operational expenditure
(OPEX)
Original engine manufacturer
Oxygenated VOCs, 192
P
Pacific National Northwest Laboratory
(PNNL), 58e59, 99e100
Palm oil, 11e12, 73, 85e90, 239,
299e300
Pandemic, 11, 29, 232e233, 325.
See also COVID-19
Paraffins, 31, 84, 114e117, 153,
184e185
Particle number, 193e194
Particulate matters, 161e162, 193e200
Peatland, 293e294
Pennycress, 268
Petlyuk sequence (PS), 92
Petroleum, 34, 145e147, 214e215,
231, 290e291
Physicochemical, 85, 86te87t, 110, 164,
222, 306e307
Platts, 232e233
PNNL. See Pacific National Northwest
Laboratory (PNNL)
Pressure-swirl atomizer, 182e183
Pretreatment, 84, 117e118, 131e132,
291e292
Product allocation, 291e293
Profile factors, 180
Prompt NO, 178
Proof-of-concept stage, 170e172
Property specification, 143e144
additives, for alternative jet fuels,
164e167
aviation turbine fuels, 158e164
jet fuel, 144e148
certification process, 168e172
nonconventional sources, 148e153
synthetic jet fuel, 153e158
Pyrolysis oil, 306e307, 309e310
R
Rapid compression machine (RMC),
203e204, 203f
Reactivity, 197, 206e209, 213e214
REAP. See National Renewable Energy
Action Plans (NREAP)
Recuperation of waste heat, 309e310
RED. See Renewable Energy Directive
(RED)
RED II. See Renewable Energy
Directive II (RED II)
Renewable Energy Directive (RED),
17, 19, 33
Renewable Energy Directive II
(RED II), 17, 29, 291e292
Renewable Fuel Standard (RFS), 41e49
Renewable Identification Numbers
(RINs), 42, 44e46, 47t
Renewable Transport Fuel (RTF),
17e19
Renewable Transport Fuel Certificates
(RTFCs), 37
Renewable Transport Fuel Obligation
(RTFO), 34e37
Index
RenovaBio, 64e66
Revenue-ton-kilometres (RTK), 3
RFS. See Renewable Fuel Standard
(RFS)
Rig test, 168e170, 180e200
RIN. See Renewable Identification
Numbers (RINs)
RIN codes, 43e44
Roundtable of Sustainable Biomaterials
(RSB), 31, 60
RQL combustor, 185e187
RTF. See Renewable Transport Fuel
(RTF)
RTFO. See Renewable Transport Fuel
Obligation (RTFO)
S
Saccharification, 297e298
Sasol, 85, 114e117, 125e126, 148e150,
187e188
Seaweed, 266, 320e321
Seed oil content, 258t
Separation, 92, 118e119, 163e164, 251
Sesame oil, 313
SESAR, 34
Shock tube, 203e204, 206e207, 206f
Simplex swirl atomizer, 184
Slurry bed, 125e126
Smoke number, 193e196
Societal barriers, 281e282
Soot, 143e144, 194e195
combustion, 159
FischereTropsch (FT), 113e114
growth, 194e195
morphology, 199e200
Sooting propensity, 214e216
Sooting tendency, 114e117, 159, 197,
214e215
Soot reactivity, 197
Spark kernel, 185e187
Specification properties, 168, 172e173,
180
Spherical bomb method, 211
Spirulina, 97te98t, 264
Spray atomization, 181e184
Spray cone angle, 181e182, 183f
Static dissipators, 144e145, 167
Steam methane reforming, 301
Stoichiometric, 159, 177, 206f,
212e213
345
Stop the clock, 16
Stretch rate, 210e211
Subsidy, 69, 235e236, 251e254,
282e283
Sugarcane bagasse, 244t, 297e298, 318
Sugar-to-jet (STJ), 128
aqueous phase reforming (APR),
131e132
direct sugar-to-hydrocarbon (DSHC),
128e131
Sulfidation agent, 90e91
Sulfur dioxide, 113e114, 176e177
Sulfur oxides (SOx), 33, 161, 176e177,
193e194
Surfactants, 105e106, 163
Surrogate fuel, 202e203, 216e217, 221
Surrogate model, 220e221
Sustainability, 287e288
alternative jet fuel production pathway,
294e295, 296f
barriers, 279e280
energy balance analysis, 308e310
energyewaterefood nexus
biojet fuel production, 311e321,
328e331
emissions, 327e328
energy diversity, 323e325
limiting factors, 321e323
vs. greenhouse gas emission (GHG)
performance, 303e307
indices, 288
life cycle assessment (LCA), 289,
290fe291f
land use change (LUC), 293e294
product allocation, 291e293
life cycle emissions values CORSIA
Eligible Fuel, 302
life cycle greenhouse gas
emissions, 297
biochemical conversion, 297e298
lipid conversion, 299e302
thermochemical conversion,
298e299
Sustainable aviation fuel (SAF), 3e6,
110, 170, 200e201, 232e236,
302
Sustainable Aviation Fuels Northwest
(SAFN), 50e54
Sustainable Certification Scheme (SCS),
5e6
346
Index
Switchgrass, 263, 298, 305
Syngas, 81, 117e119, 123, 152e153,
175e176, 236
biomass gasification, 119
Synthesized paraffinic kerosene (SPK),
31, 115f, 150e152, 154e155
System boundary, 289, 294e295
System expansion, 292, 300e301
T
Tar steam, 123
Tax, 19e20, 41, 251e254
Technology readiness level (TRL),
82e83, 250
Thermal NO, 178e179
Thermal stability, 114e117, 154e155,
158e159
Thermochemical, 124, 298, 308e309
Thermochemical conversion, 104e105,
298e299
Threshold sooting index (TSI),
215e216, 215t
Toluene, 123, 189e191
Trans-European Transport Netwoek
(TEN-T), 34
Transition metal, 105e107, 165e166
Triglyceride, 81e82, 84, 154e155,
267e268
Triisobutane, 108e110, 298
TS-1 jet fuel, 147
Tubular fixed bed, 125e126, 126f
Turbine inlet temperature, 180, 192
U
Unburned hydrocarbons (UHCs),
175e177, 188, 191f, 192e193
UNFCCC. See United Nations Framework Convention on Climate
Change (UNFCCC)
United Nations Framework Convention
on Climate Change (UNFCCC),
287
Upgrading, 95te96t, 99, 152e153
Urban food waste (UFW), 317e318
USDA. See US Department of Agriculture (USDA)
US Department of Agriculture (USDA),
49
US Environmental Protection Agency
(EPA), 41, 46f
Used cooking oil (UCO), 31, 154e155,
196e197, 233
V
Viscosity, 64, 90, 181, 187e188
Vision 2050, 32
Volatility, 159e160, 181
W
Water electrolysis, 301
Water footprint, 311e314
Water stress evaluation, 313
Well-to-tank, 290
Well-to-wake (WTW), 289e290
Wheat straw, 297e298
Woody biomass, 53, 99e100, 293e294
X
Xylene, 189e191
Z
Zel’dovich mechanism, 178