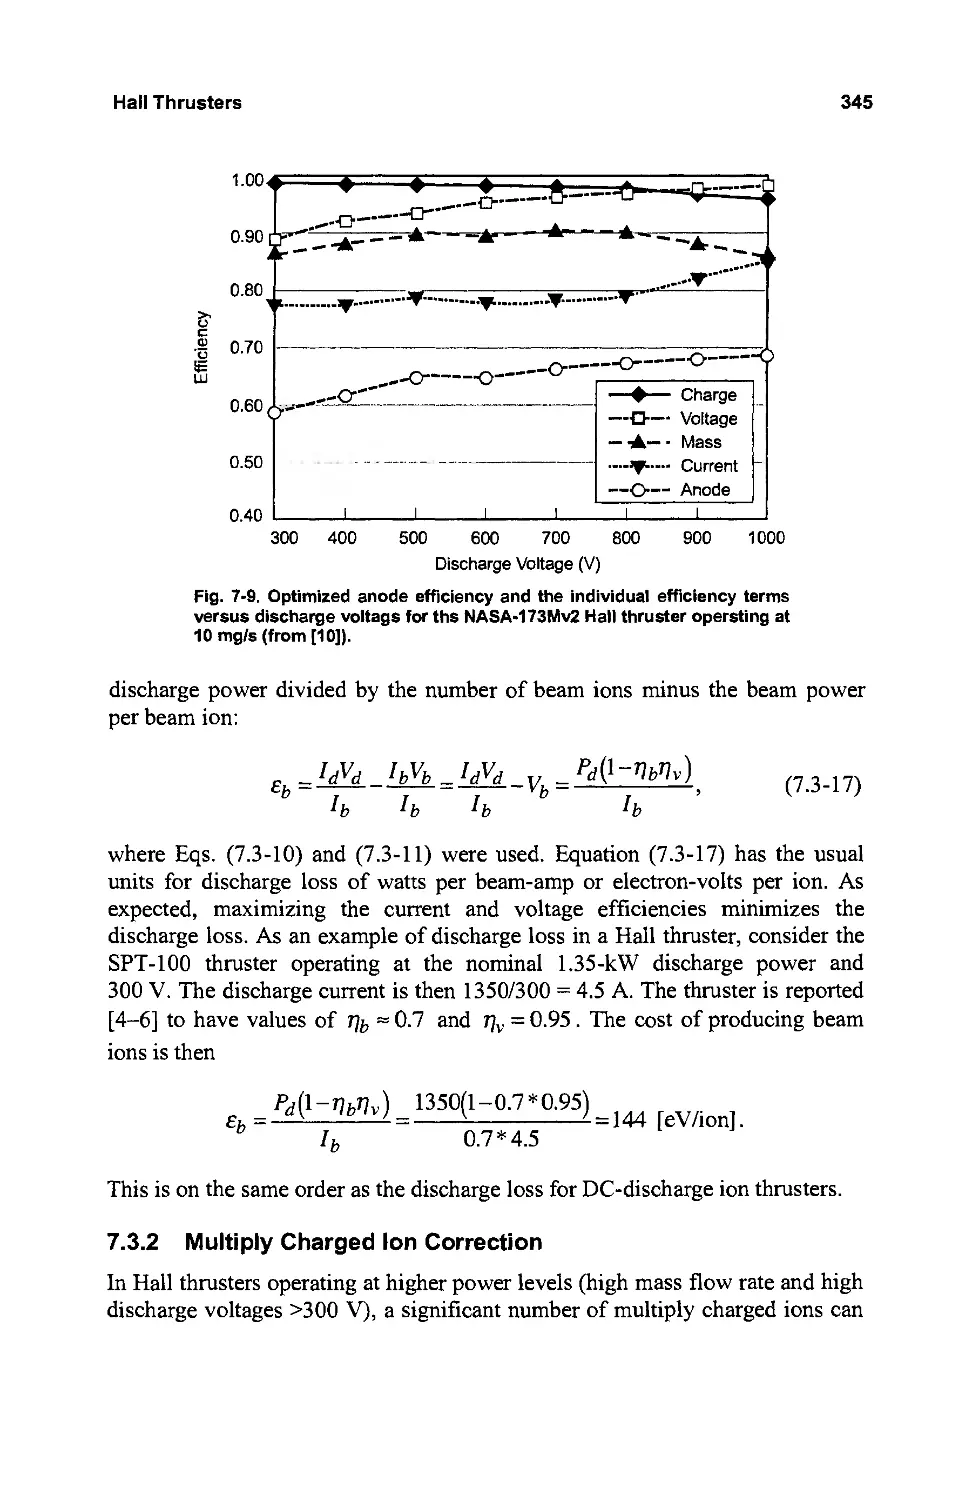
/


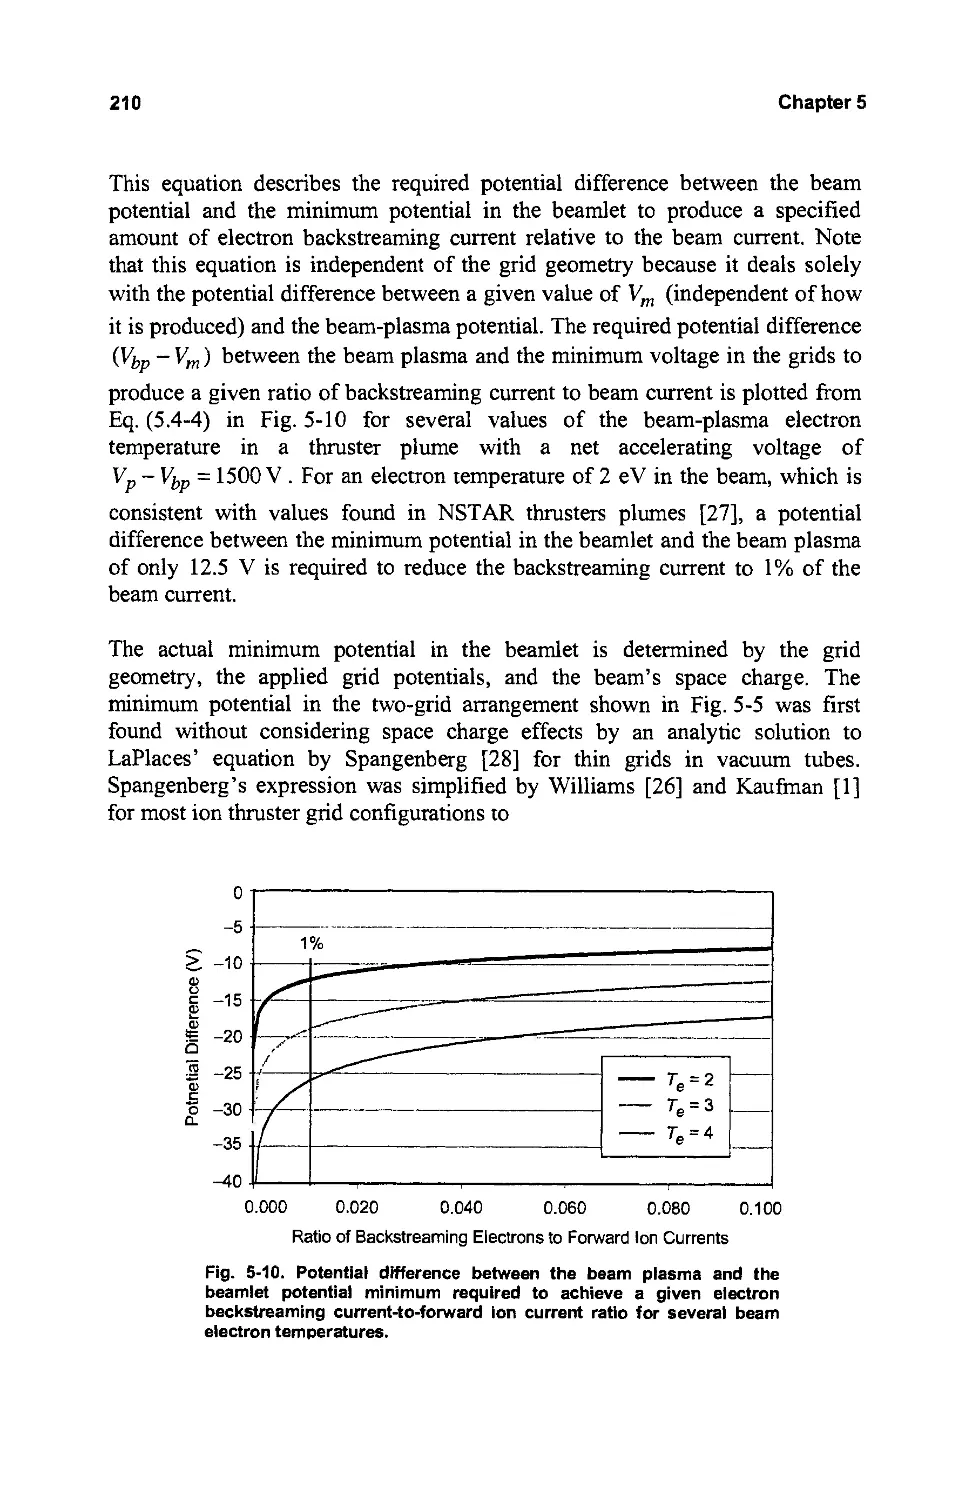


Author: Goebel Dan M. Katz Ira
Tags: electric motor rocket motors
ISBN: 978-0-470-42927-3
Year: 2008


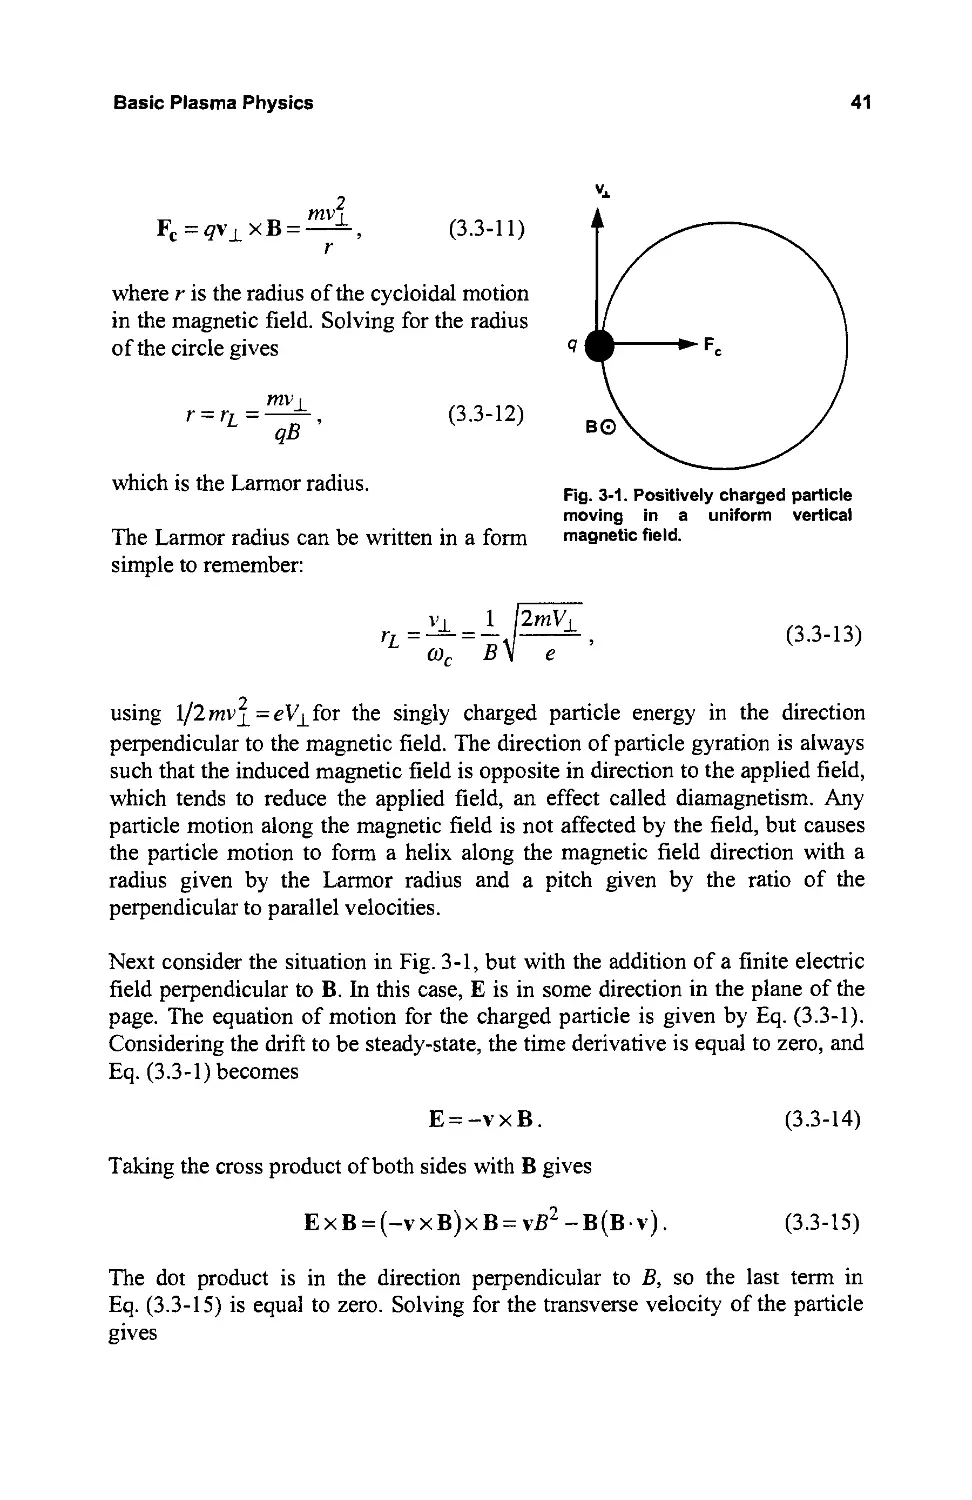
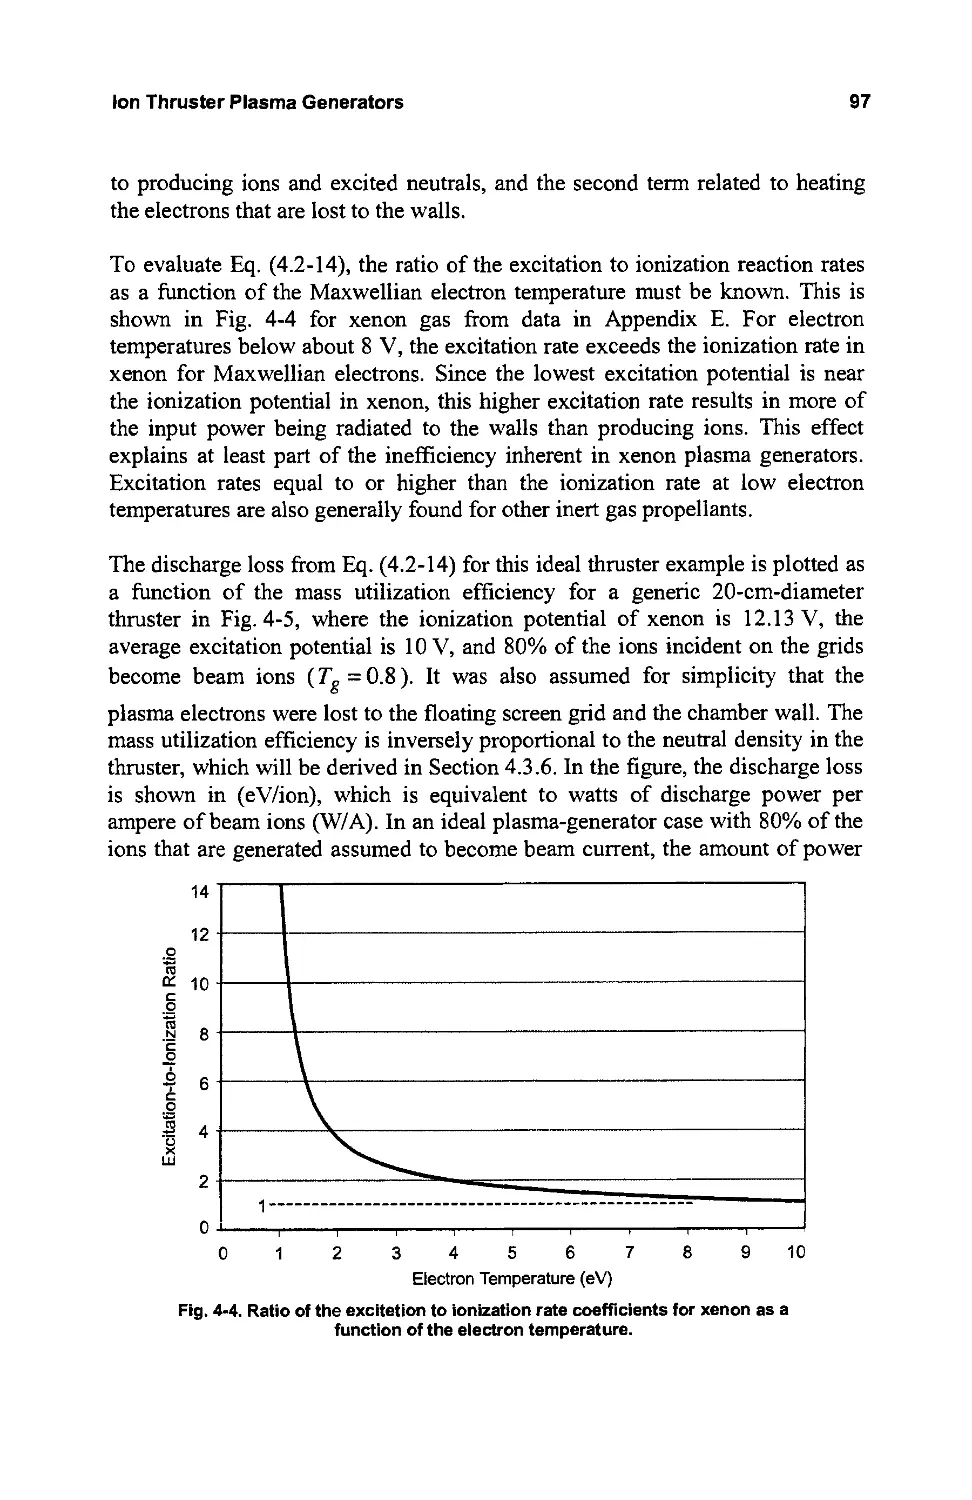
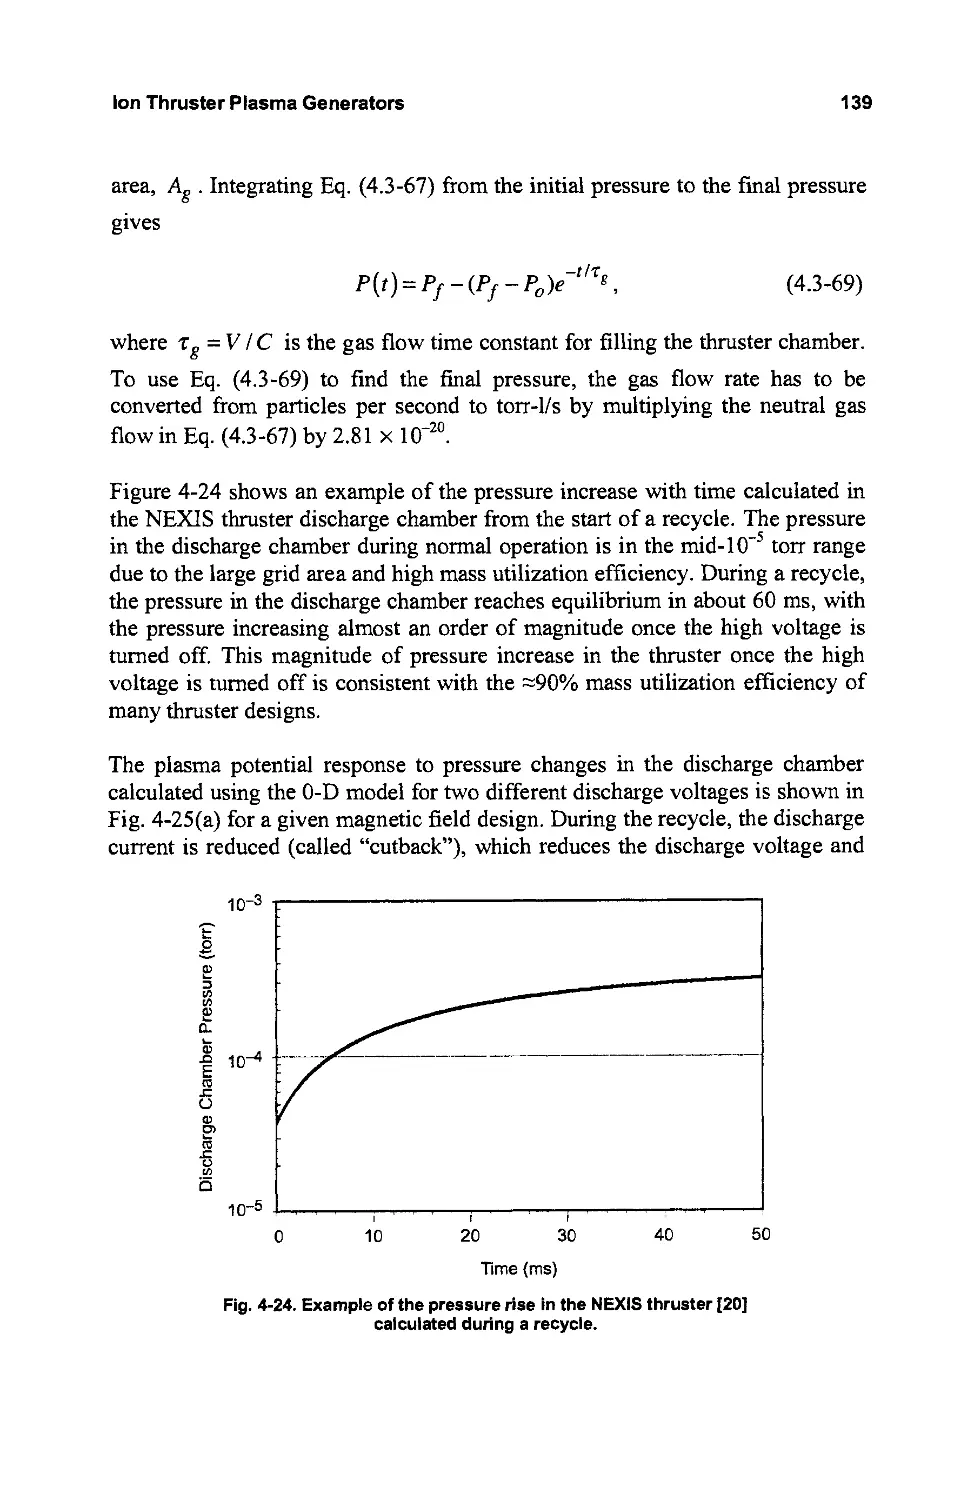
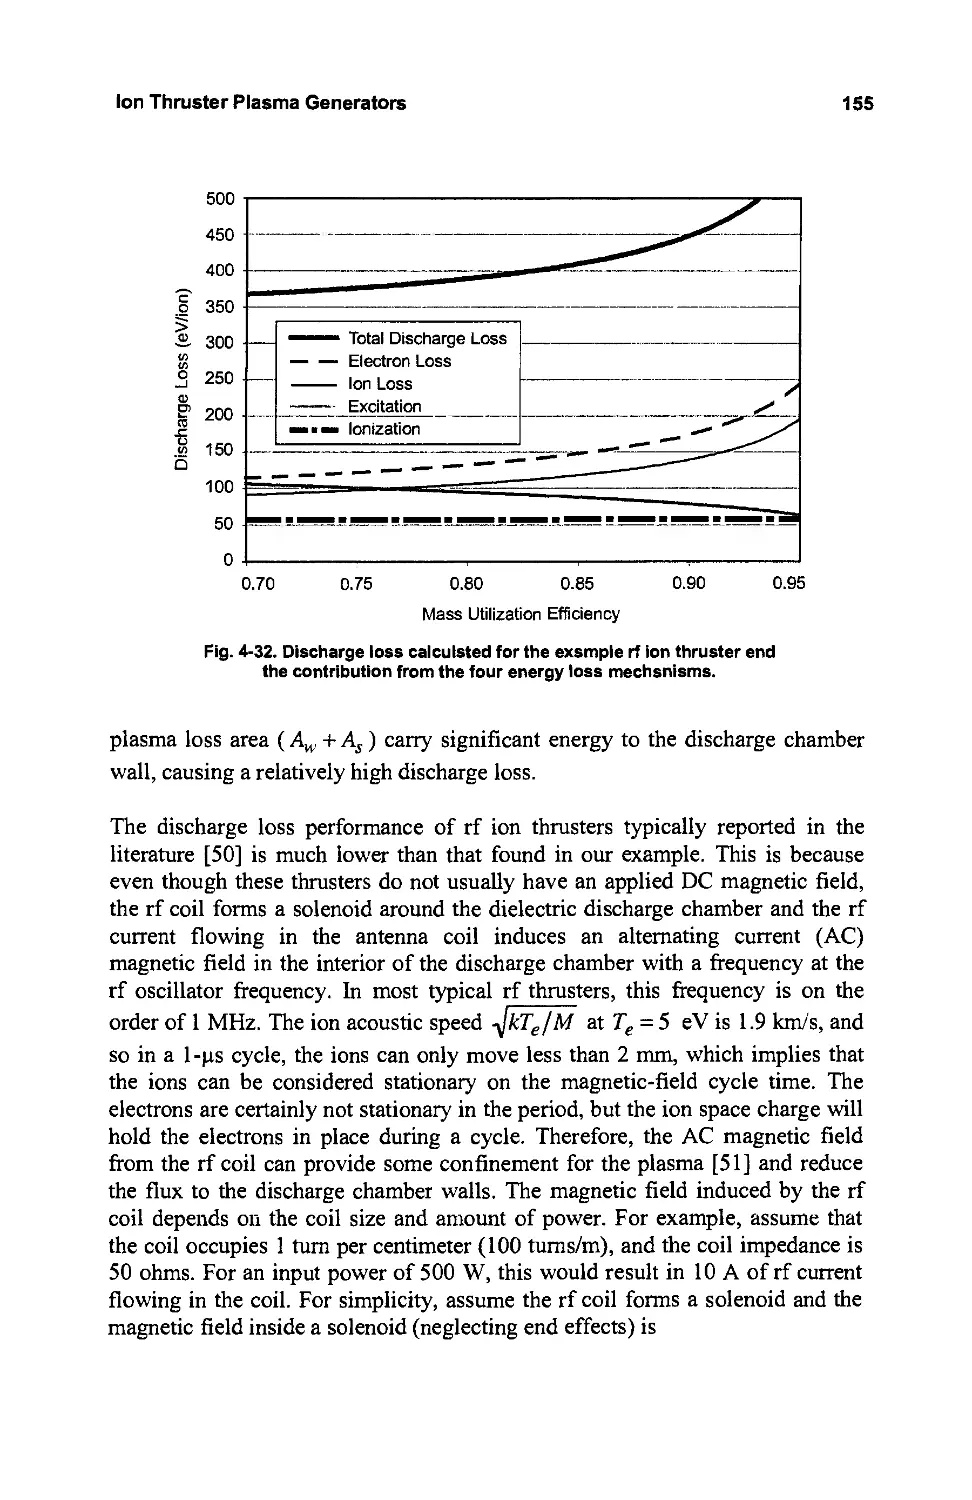
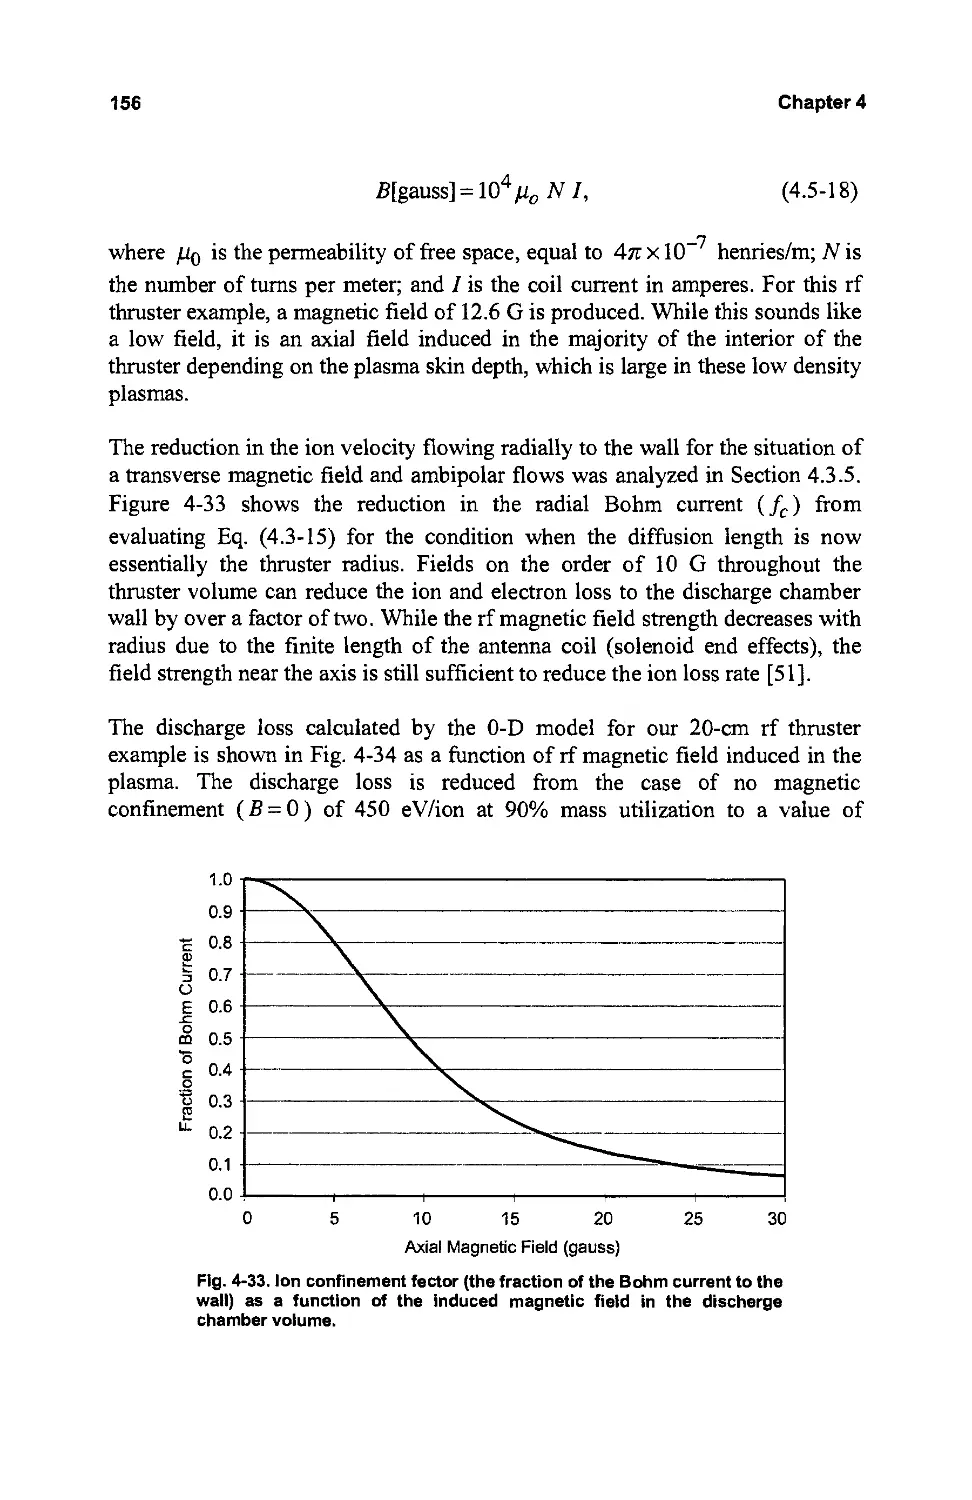
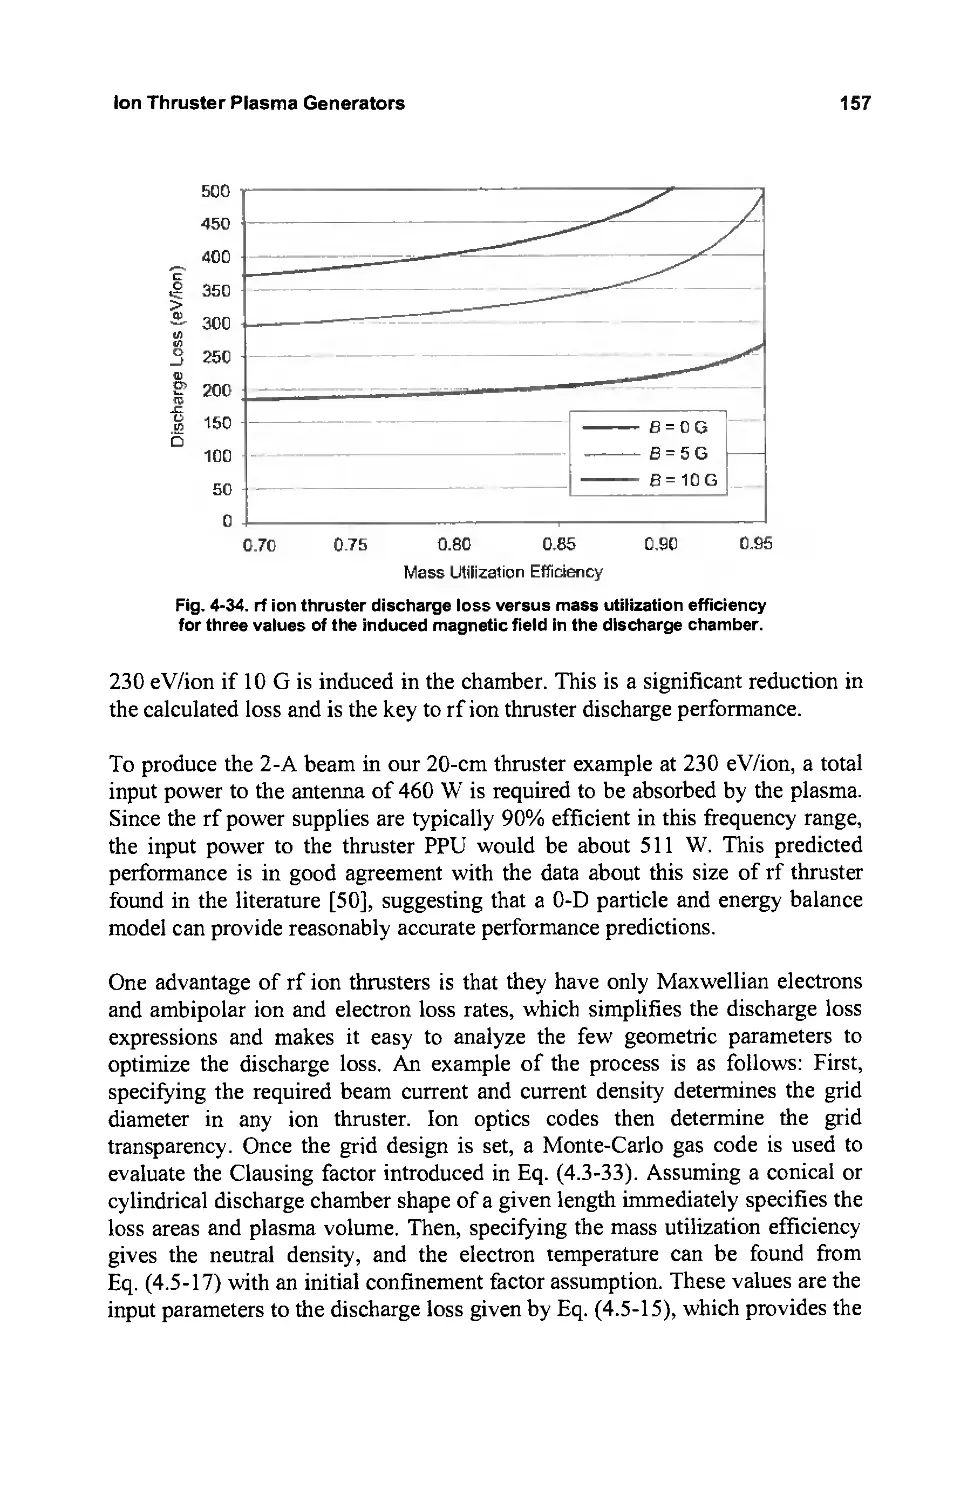
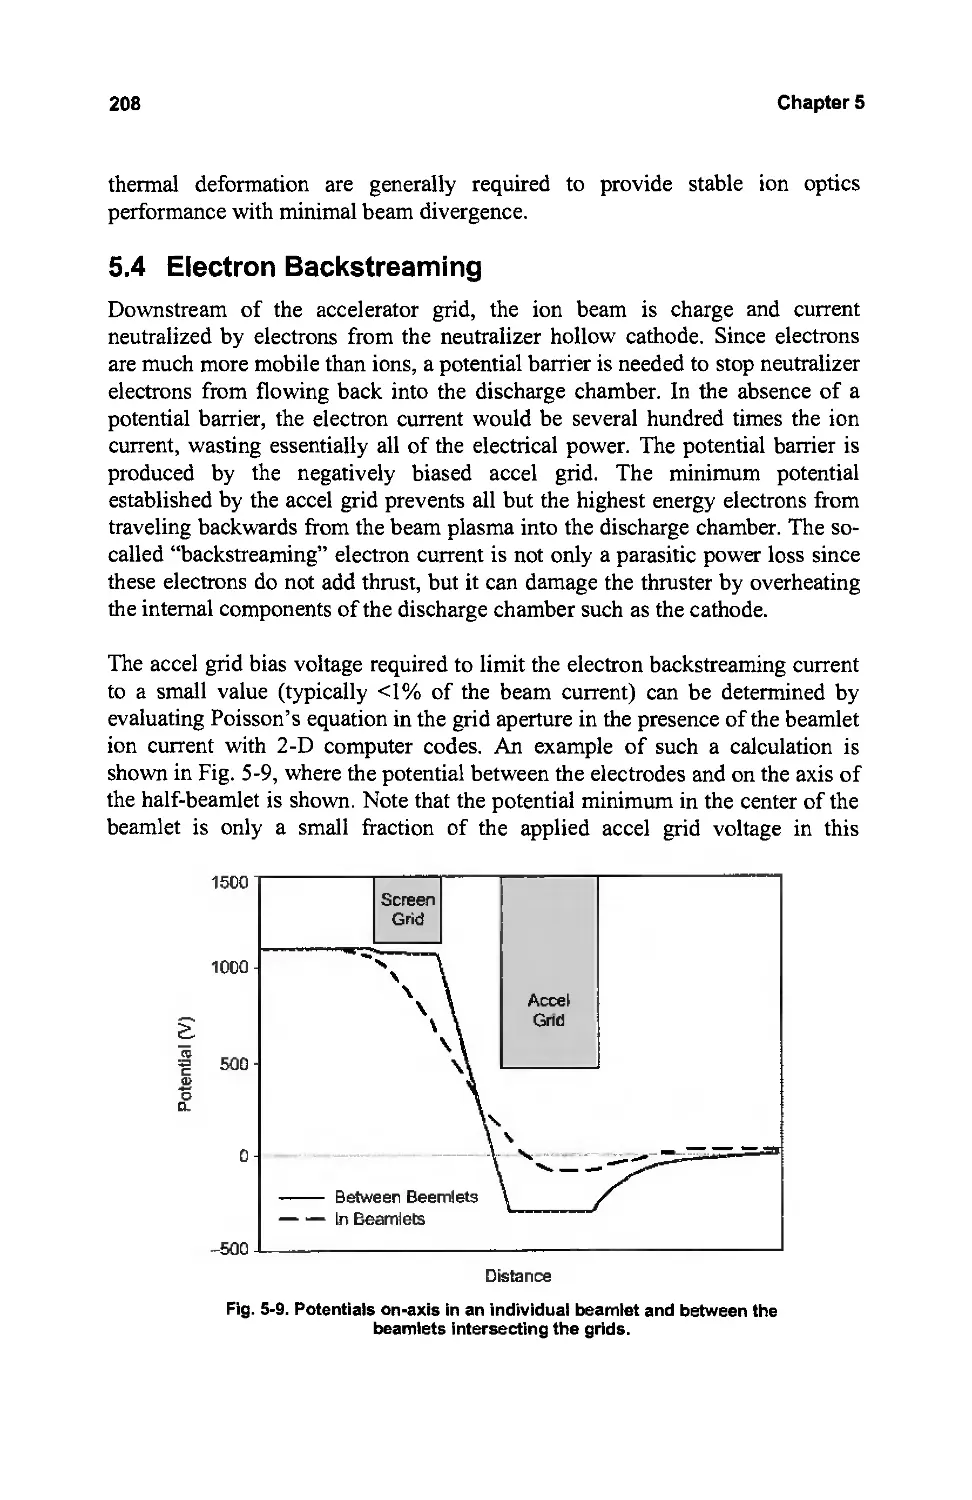
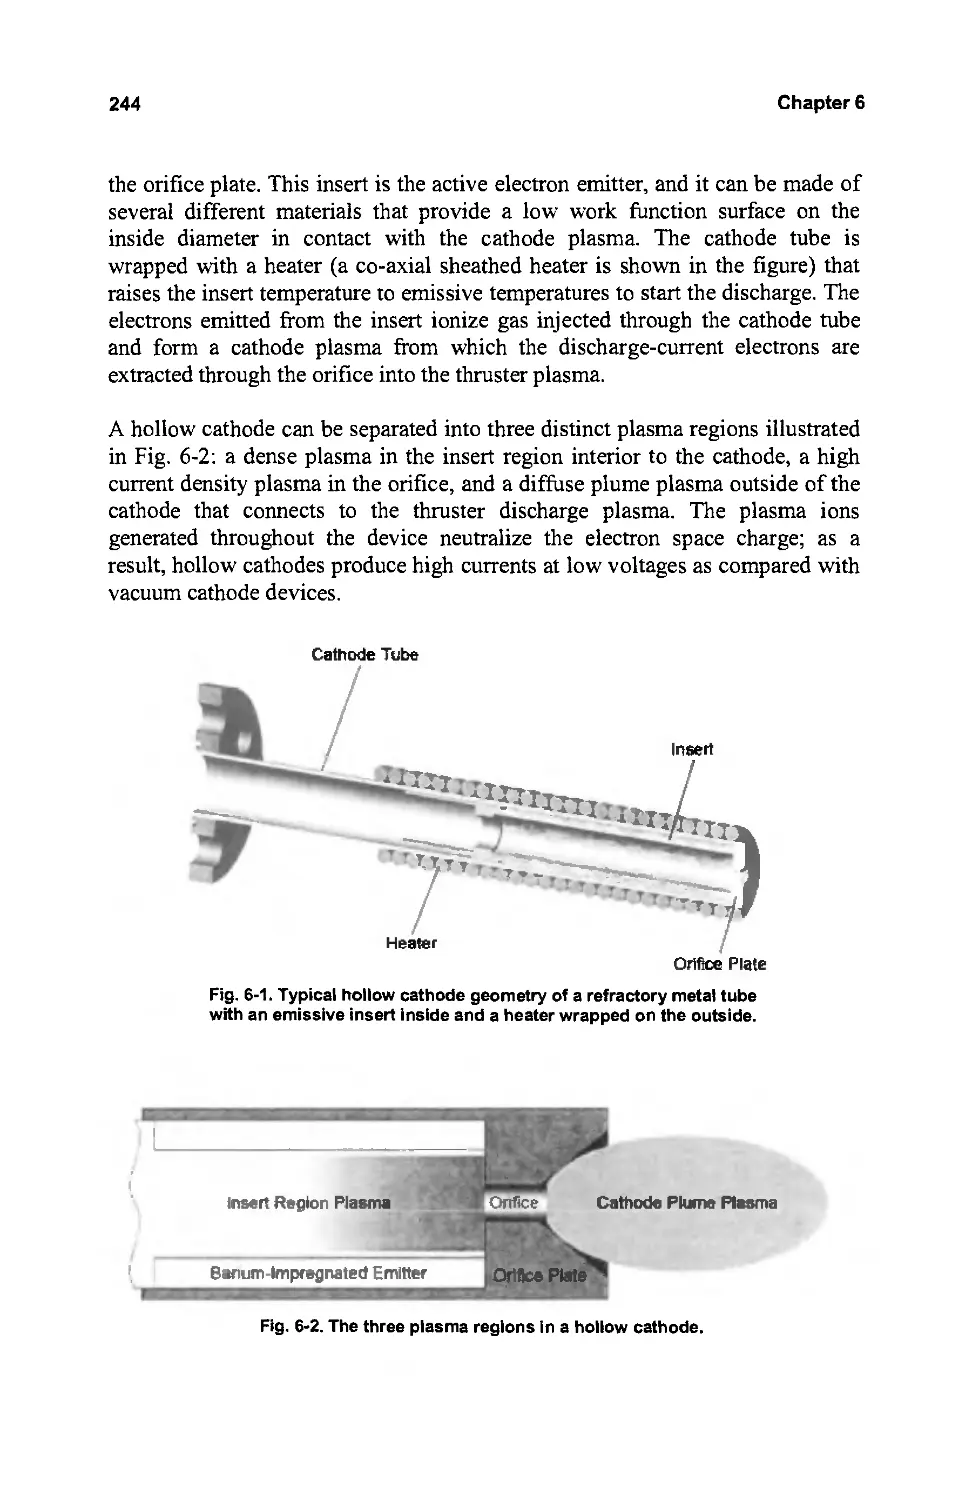
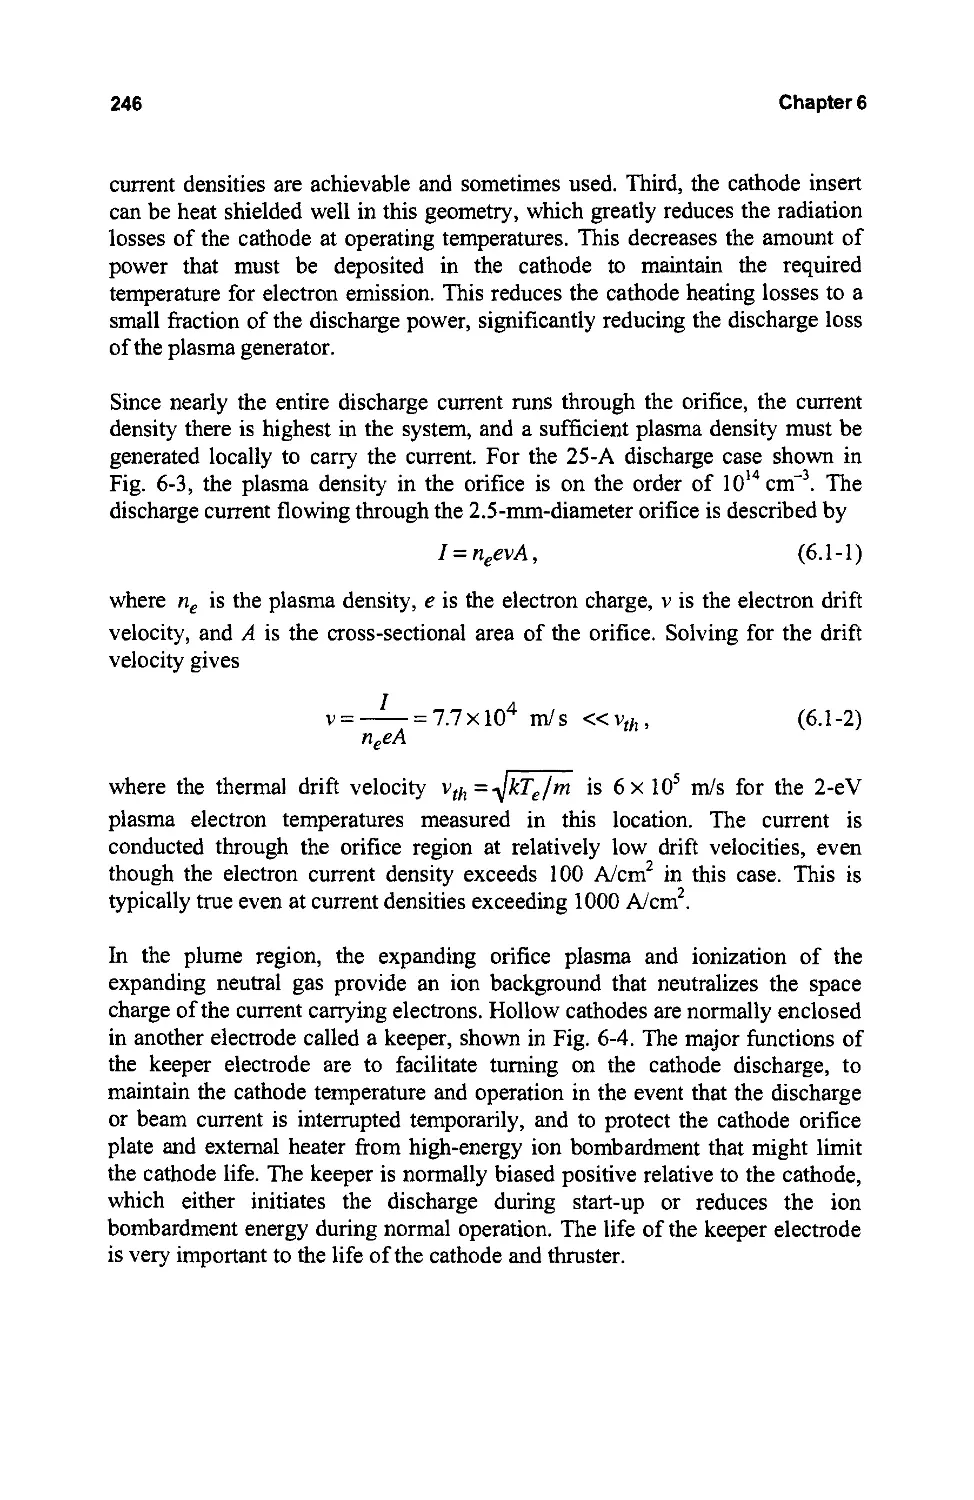
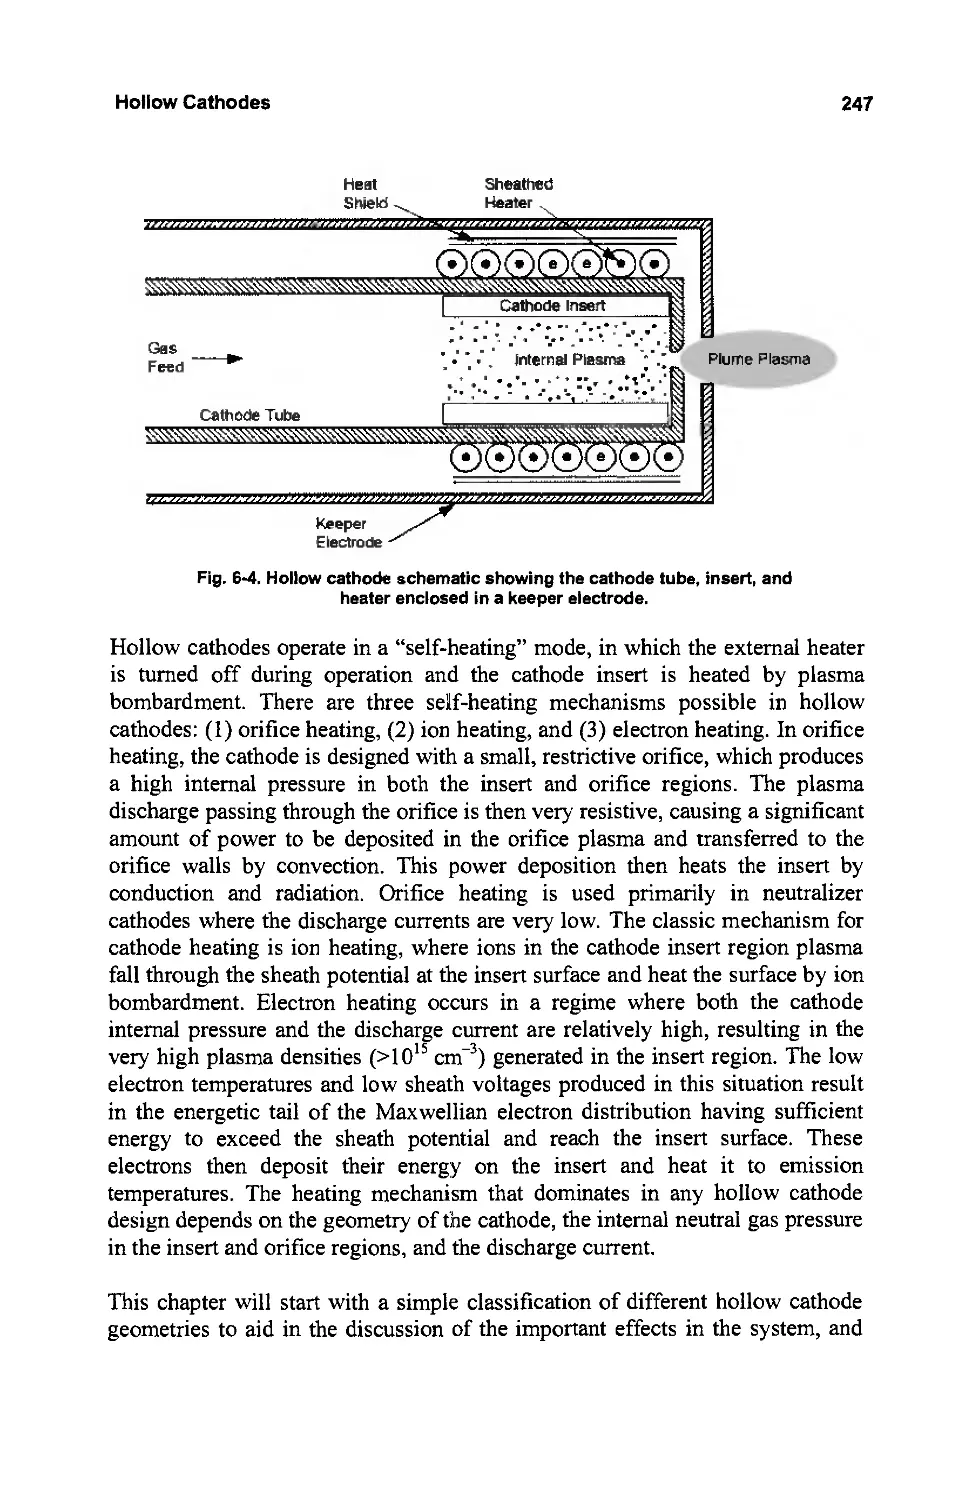
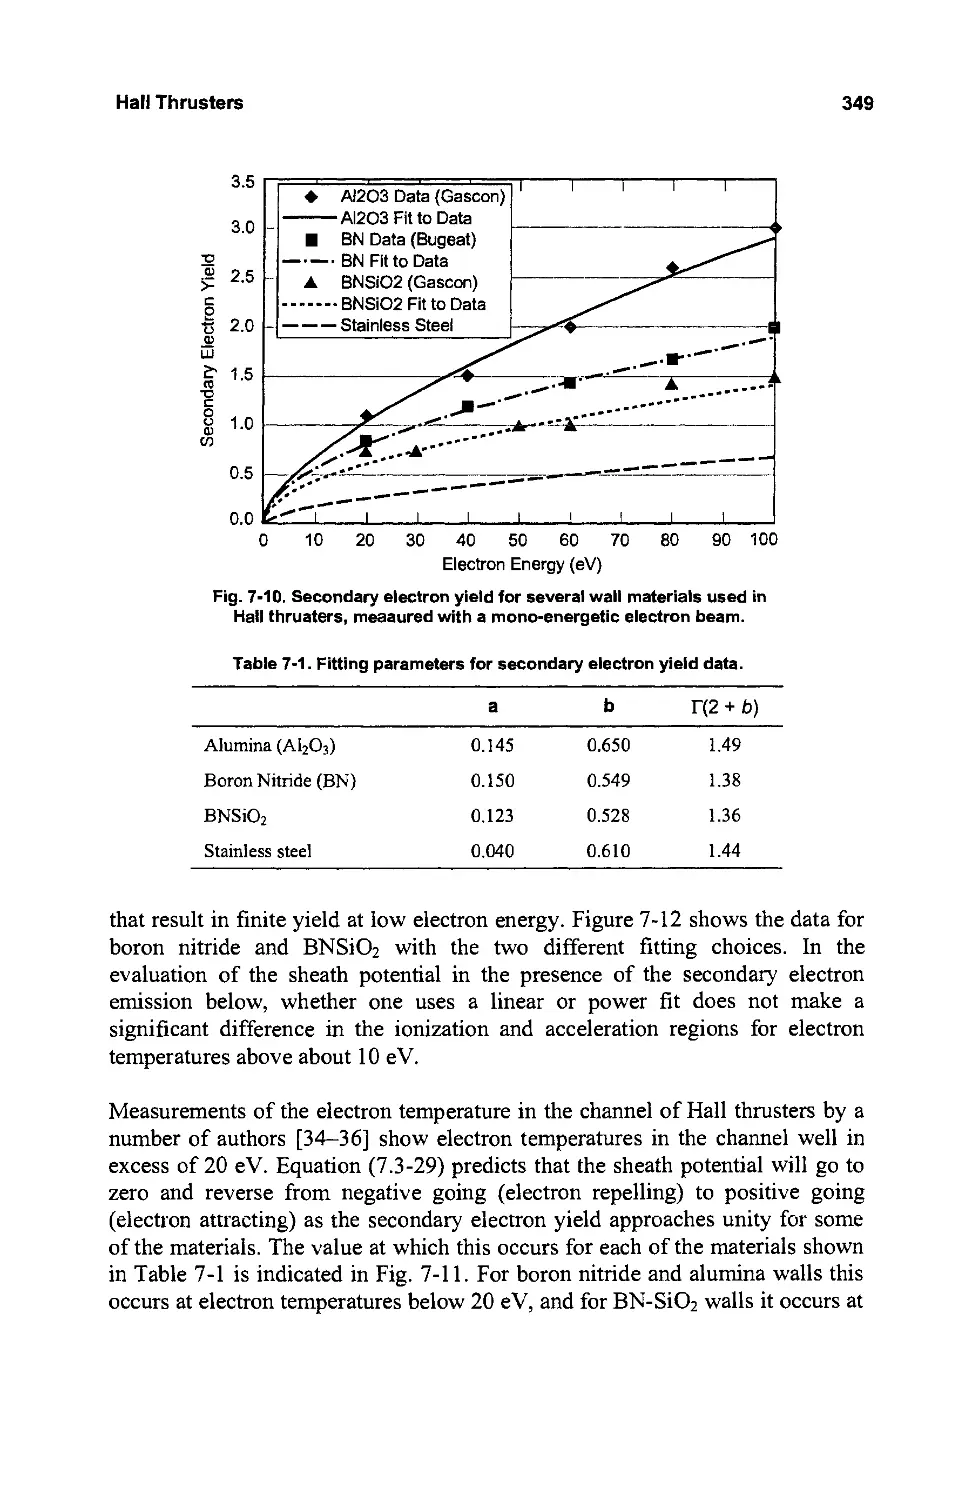
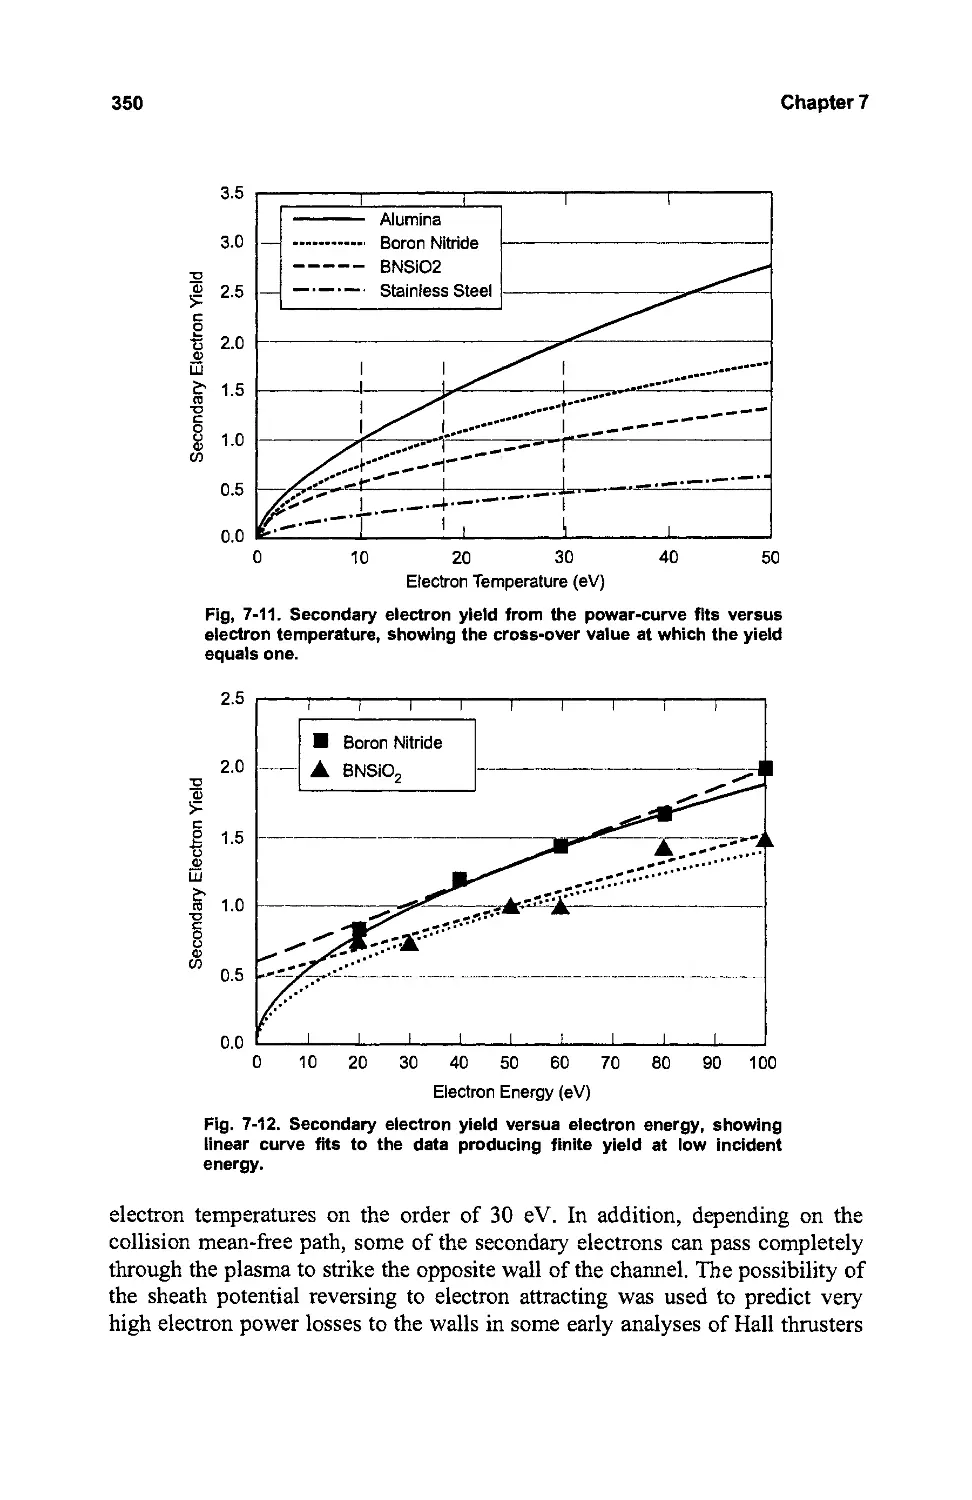
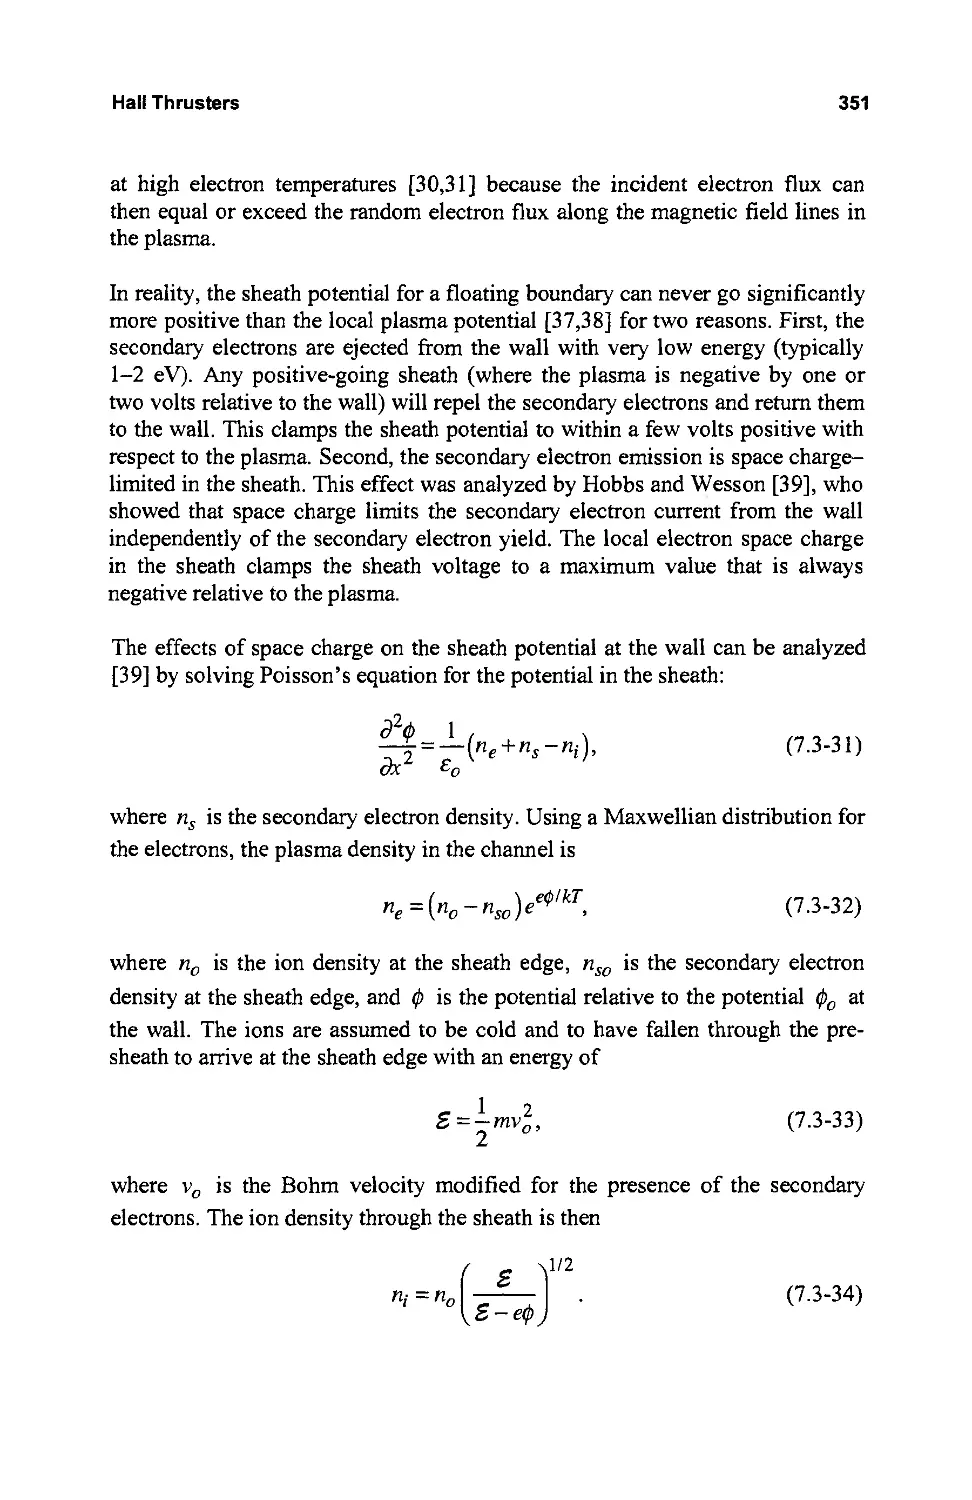
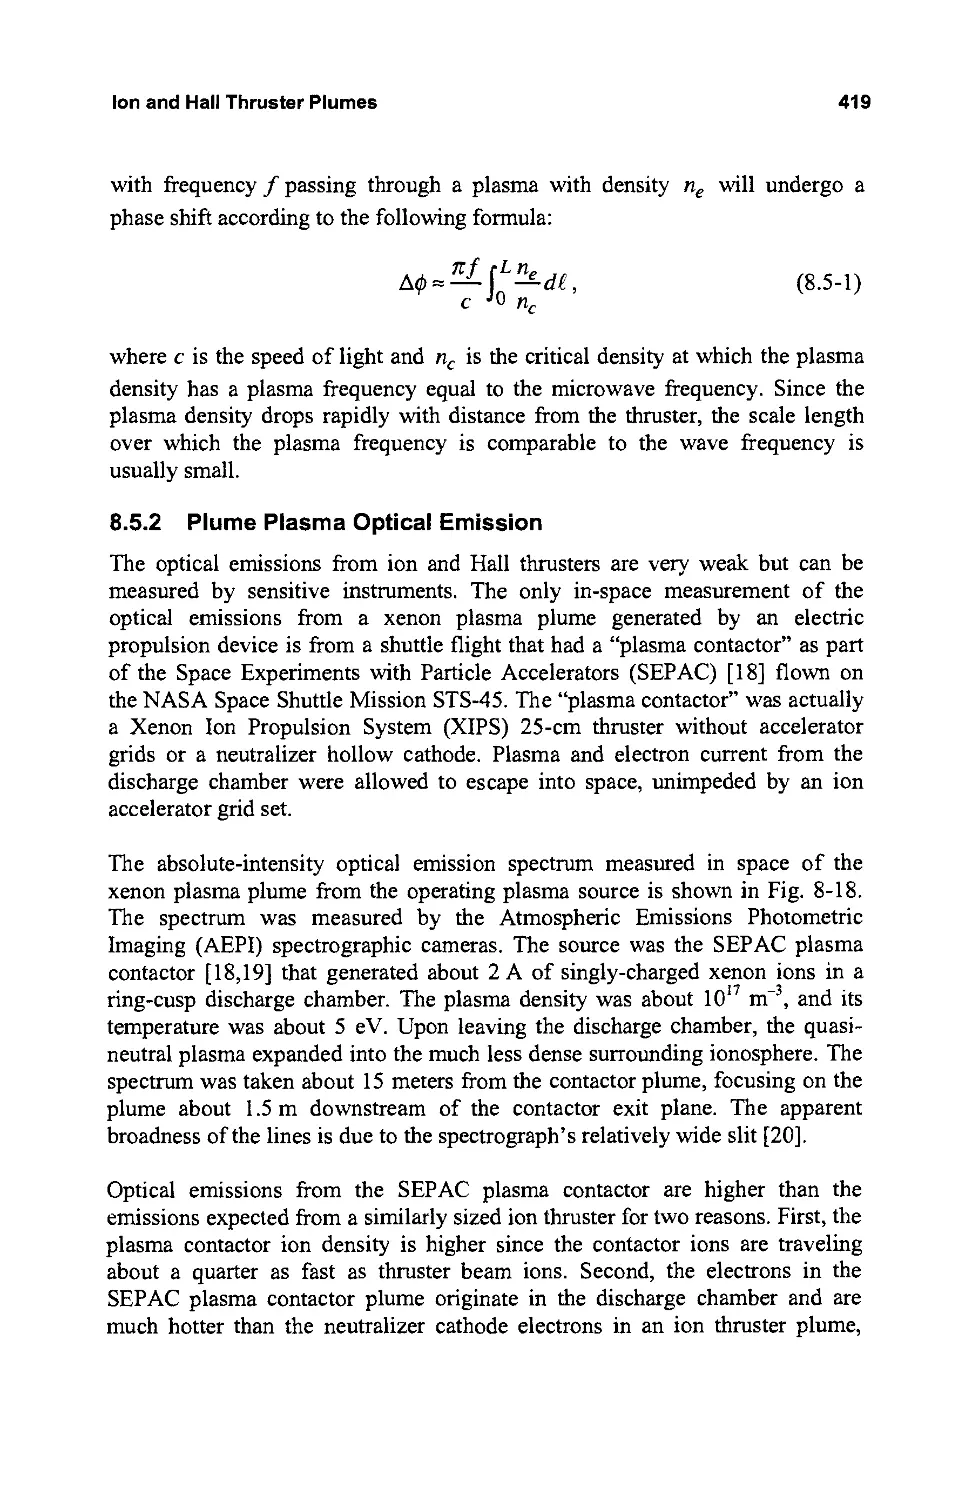
Text
\
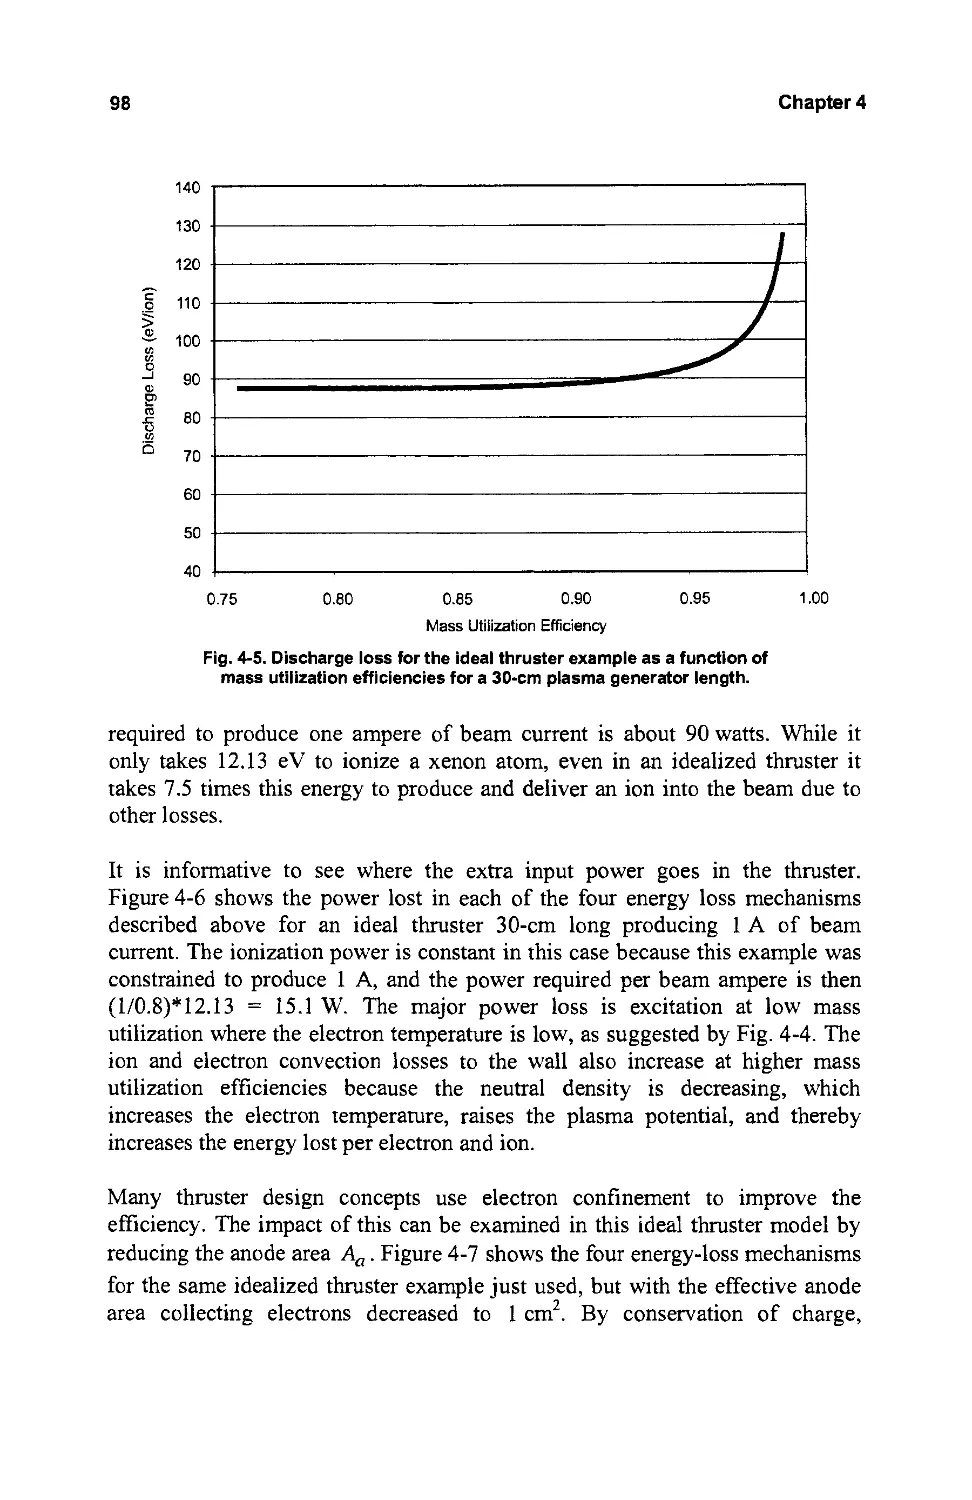
I
.
d Hall Thru
J
.
I
. . . :
Fundamentals of
Electric Propulsion
Fundamentals of
Electric Propulsion
Ion and Hall Thrusters
Dan M. Goebel
I ra Katz
Jet Propulsion Laboratory
California Institute of Technology
@
WILEY
A JOHN WILEY & SONS, INC., PUBLICATION
Copyright @ 2008 by John Wiley & Sons, Inc. All rights reserved.
Published by John Wiley & Sons, Inc., Hoboken, New Jersey.
Published simultaneously in Canada.
No part of this publication may be reproduced, stored in a retrieval system, or transmitted in any form or
by any means, electronic, mechanical, photocopying, recording, scanning, or otherwise, except as
permitted under Section 107 or 108 of the 1976 United States Copyright Act, without either the prior
written permission of the Publisher, or authorization through payment of the appropriate per-copy fee to
the Copyright Clearance Center, Inc., 222 Rosewood Drive, Danvers, MA 01923, (978) 750-8400, fax
(978) 750-4470, or on the web at www.copyright.com. Requests to the Publisher for permission should
be addressed to the Permissions Department, John Wiley & Sons, Inc., I I I River Street, Hoboken, NJ
07030, (201) 748-601 I, fax (201) 748-6008, or online at http://www.wiley.comlgo/permission.
Limit of Liabllity/Disclaimer of Warranty: While the publisher and author have used their best efforts in
preparing this book, they make no representations or warranties with respect to the accuracy or
completeness of the contents of this book and specifically disclaim any implied warranties of
merchantability or fitness for a particular purpose. No warranty may be created or extended by sales
representatives or written sales materials. The advice and strategies contained herein may not be suitable
for your situation. You should consult with a professional where appropriate. Neither the publisher nor
author shall be liable for any loss of profit or any other commercial damages, including but not limited
to special, incidental, consequential, or other damages.
For general information on our other products and services or for technical support, please contact our
Customer Care Department within the United States at (800) 762-2974, outside the United States at
(317) 572-3993 or fax (3 I 7) 572-4002.
Wiley also publishes its books in a variety of electronic formats. Some content that appears in print may
not be available in electronic format. For information about Wiley products, visit our web site at
www.wiley.com.
Library of Congress Cataloging-in-Publication Data is available.
ISBN 978-0-470-42927-3
Printed in the United States of America.
10 9 8 7 6 5 4 3 2 I
Contents
Note from the Series Editor
Foreword
Preface
Acknowledgments
IX
Xl
Xlll
XV
Chapter 1: Introduction
1.1 Electric Propulsion Background
1.2 Electric Thruster Types
1.3 Ion Thruster Geometry
1.4 Hall Thruster Geometry
1.5 Beam/Plume Characteristics
References
1
2
3
6
6
9
11
Chapter 2: Thruster Principles
2.1 The Rocket Equation
2.2 Force Transfer in Ion and Hall Thrusters
2.3 Thrust
2.4 Specific Impulse
2.5 Thruster Efficiency
2.6 Power Dissipation
2.7 Neutral Densities and Ingestion in Electric Thrusters
References
Problems
15
15
18
21
25
27
30
32
34
35
Chapter 3: Basic Plasma Physics
3.1 [ntroduction
3.2 Maxwell's Equations
3.3 Single Particle Motions
3.4 Particle Energies and Velocities
3.5 Plasma as a Fluid
3.5.1 Momentum Conservation
3.5.2 Particle Conservation
3.5.3 Energy Conservation
3.6 Diffusion in Partially Ionized Gases
3.6.1 Collisions
3.6.2 Diffusion and Mobility Without a Magnetic Field
3.6.3 Diffusion Across Magnetic Fields
37
37
38
39
43
46
46
48
51
54
55
60
66
v
vi Contents
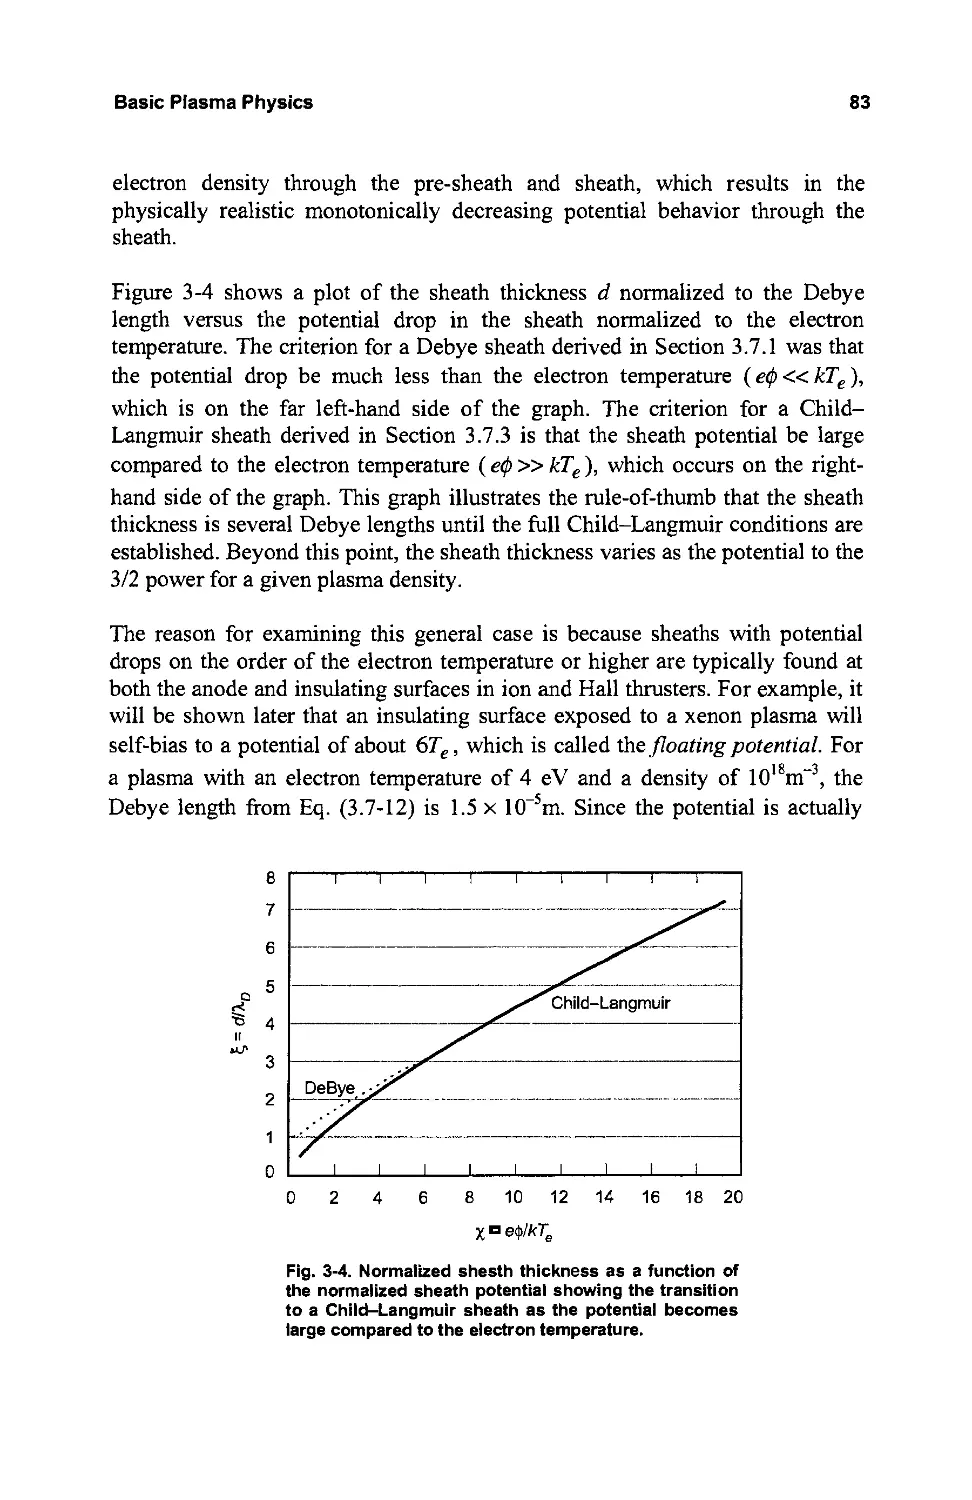
3.7 Sheaths at the Boundaries of Plasmas 71
3.7.1 Debye Sheaths 73
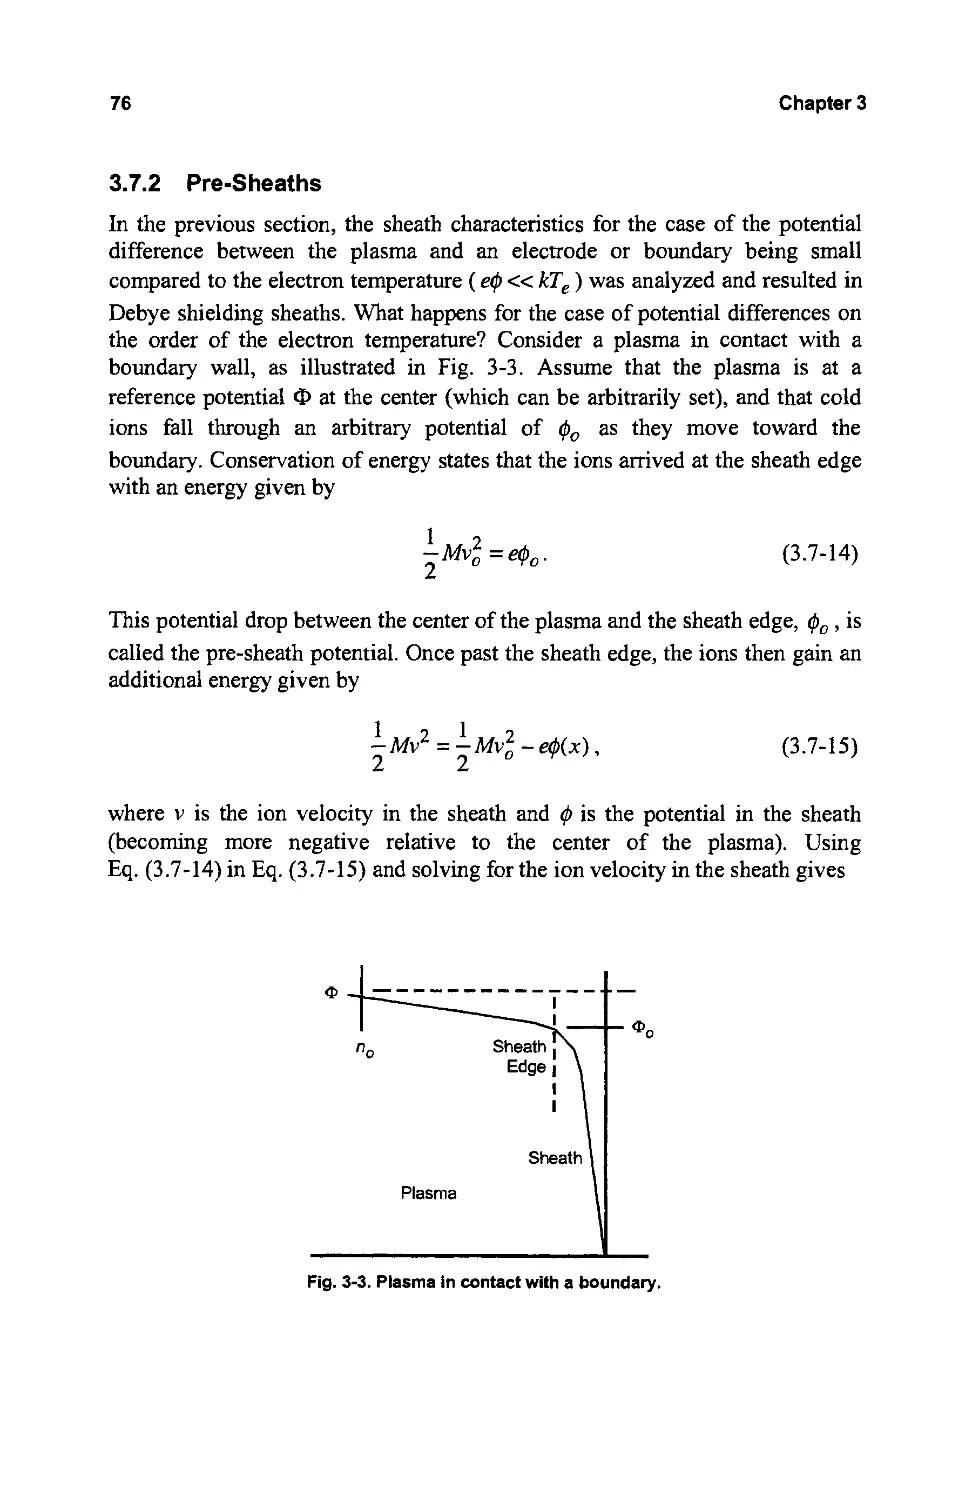
3.7.2 Pre-Sheaths 76
3.7.3 Child-Langmuir Sheaths 79
3.7.4 Generalized Sheath Solution 81
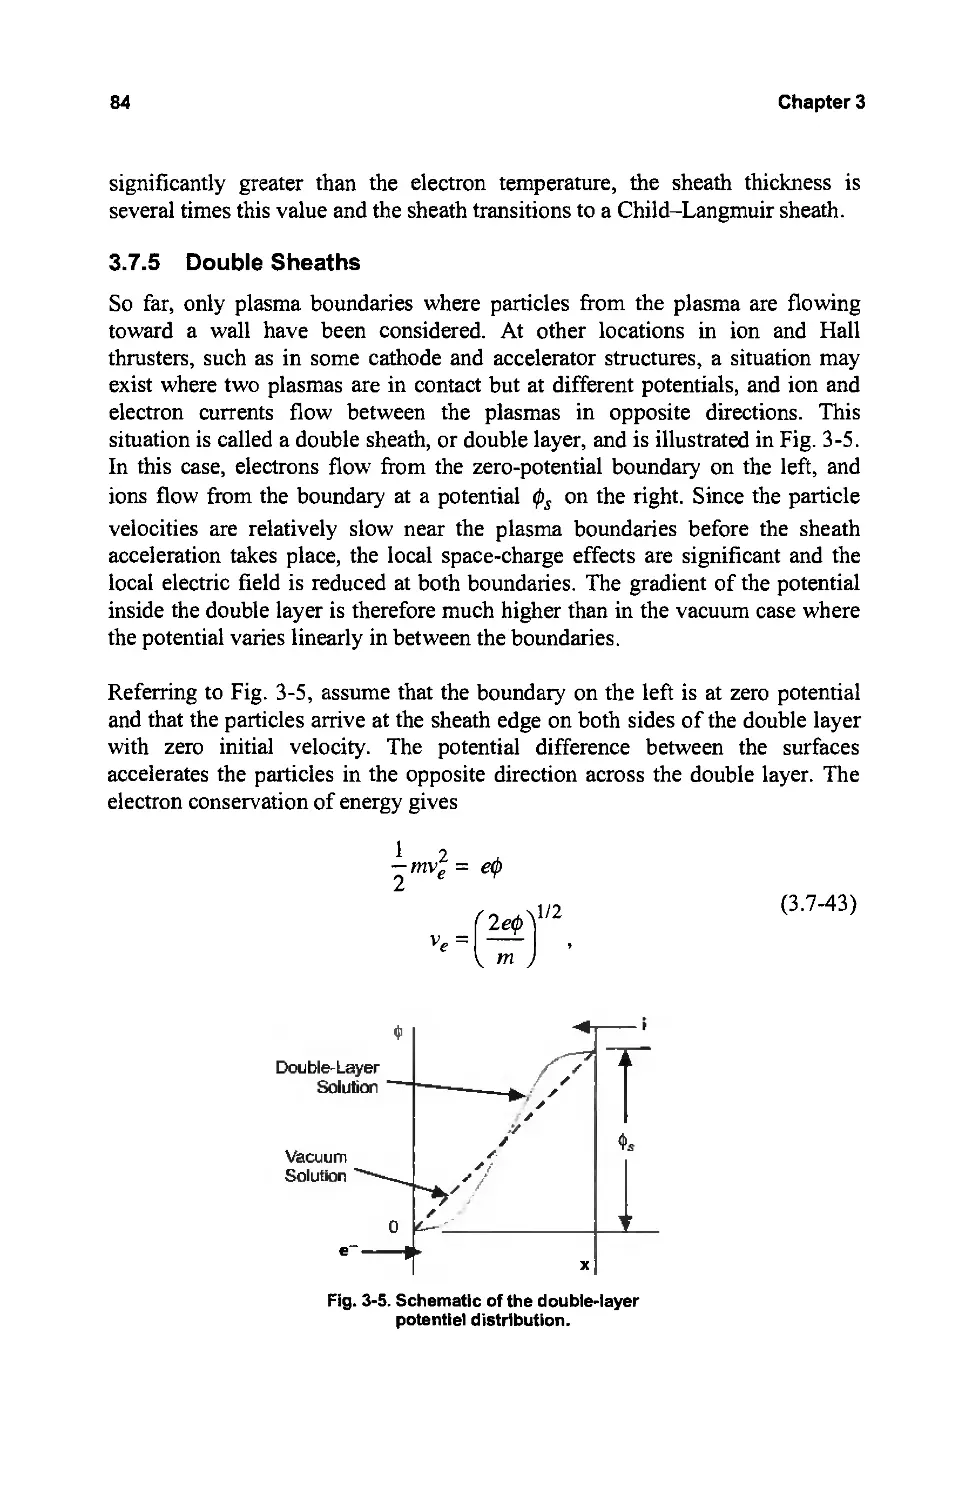
3.7.5 Double Sheaths 84
3.7.6 Summary of Sheath Effects 86
References 88
Problems 89
Chapter 4: Ion Thruster Plasma Generators 91
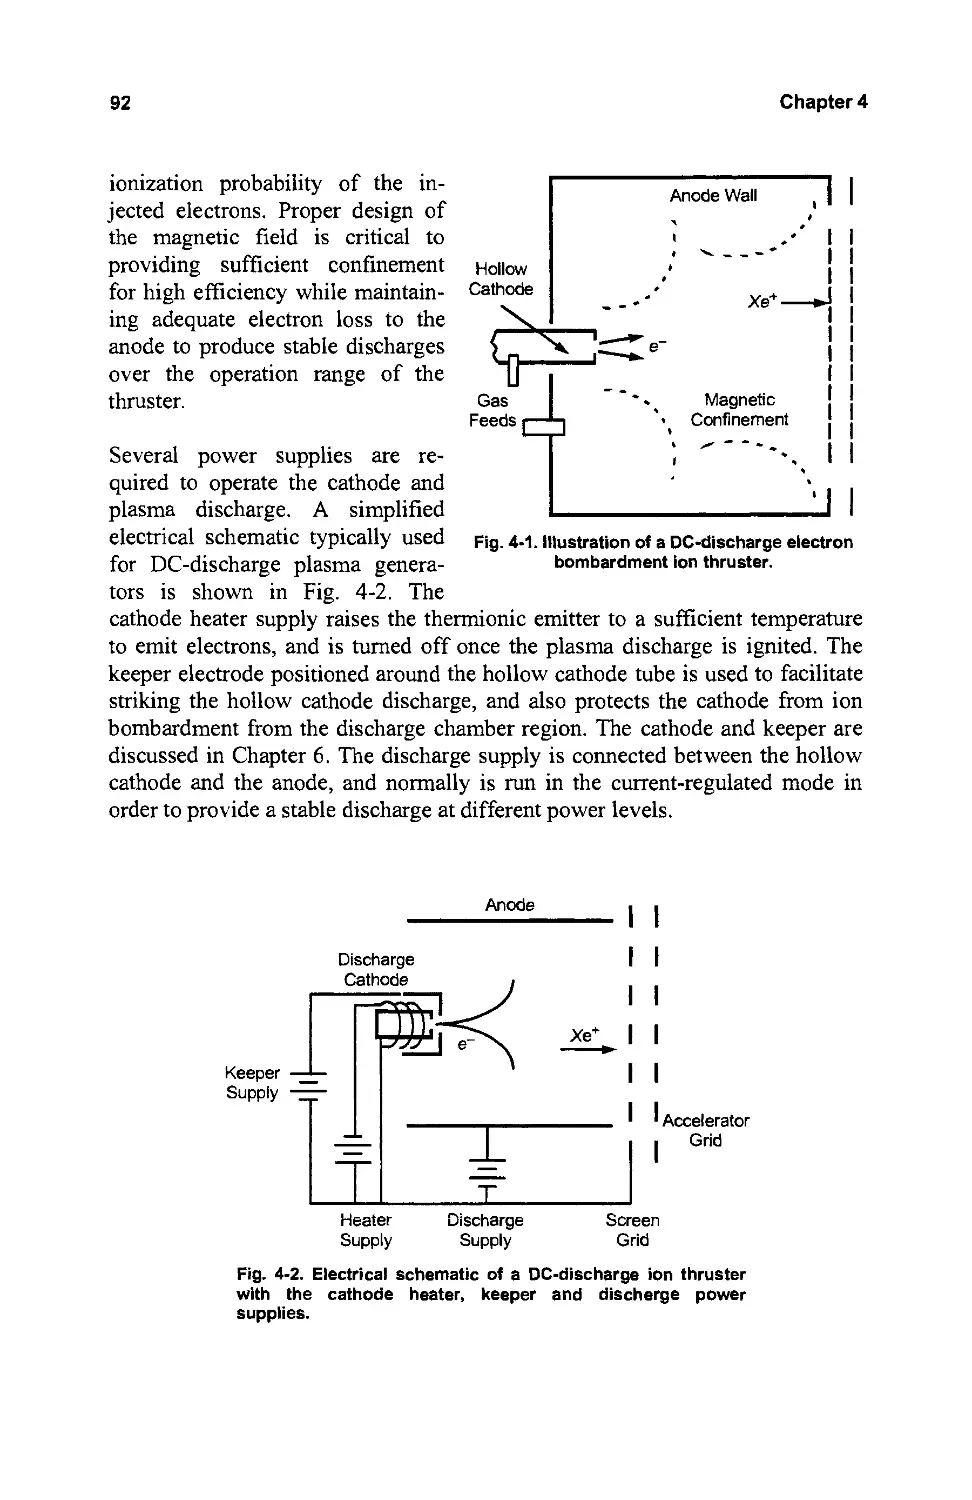
4.1 Introduction 91
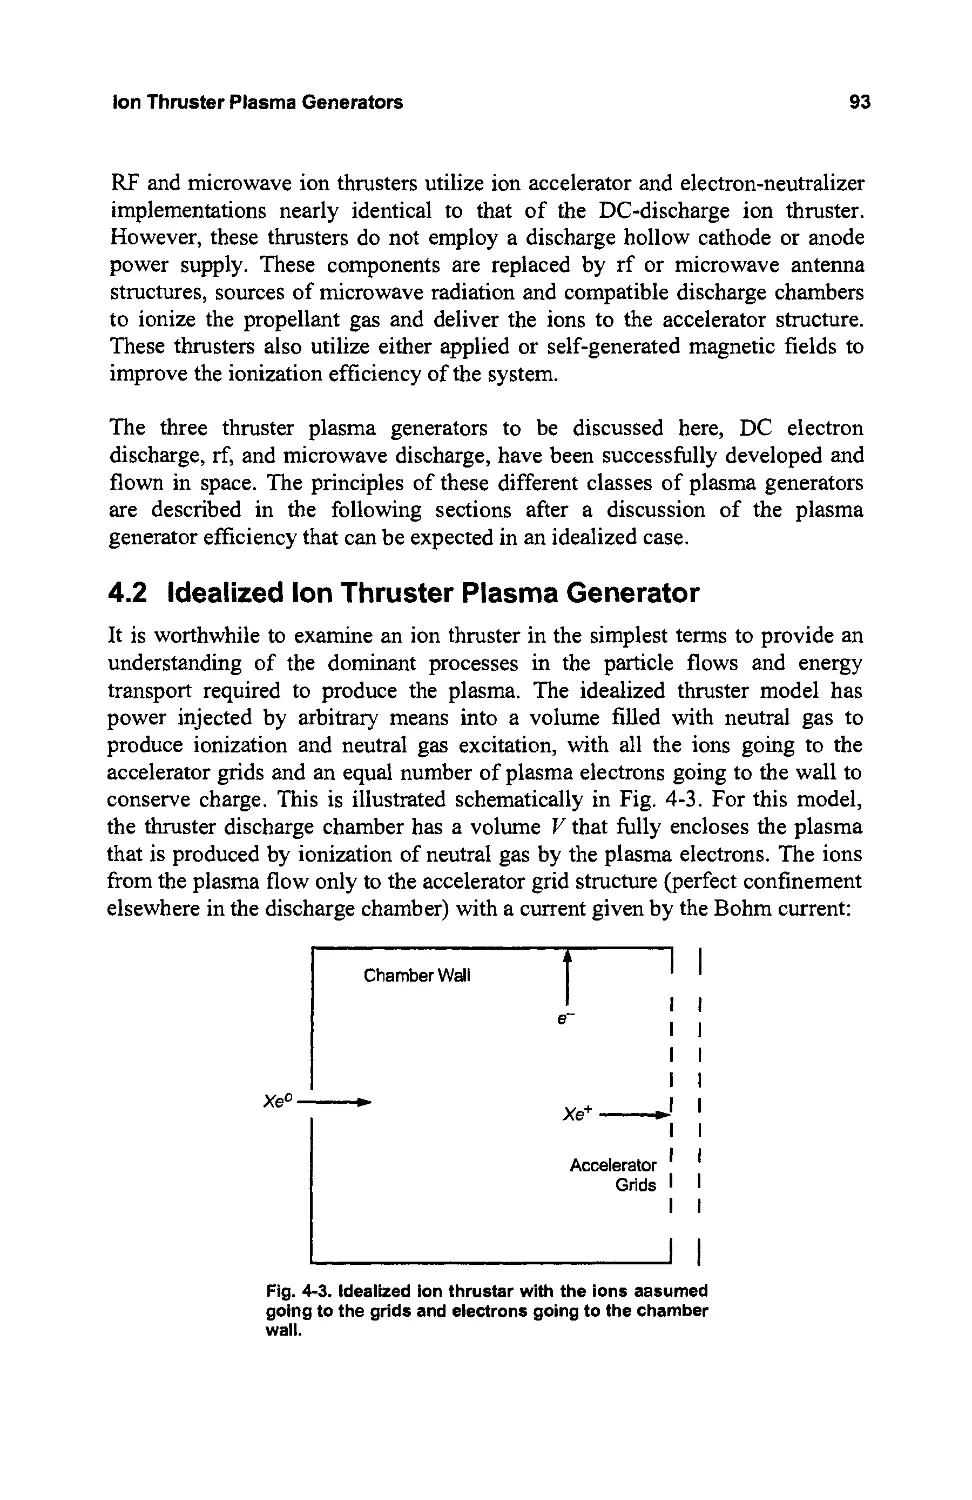
4.2 Idealized Ion Thruster Plasma Generator 93
4.3 DC Discharge Ion Thruster 100
4.3.1 Generalized O-D Ring-Cusp Ion Thruster Model 102
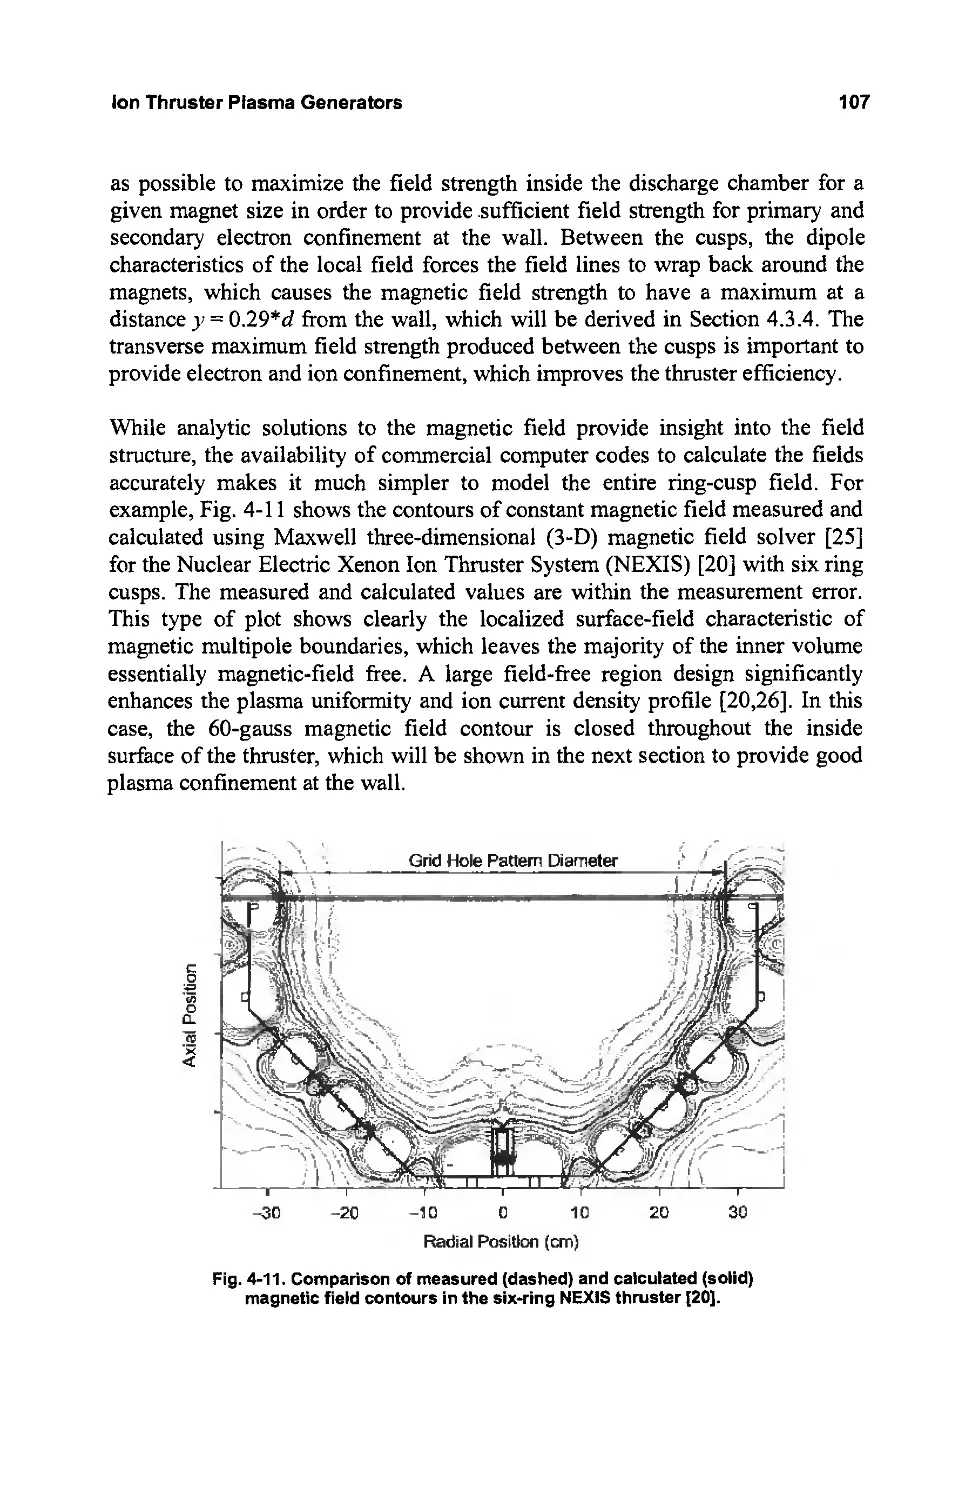
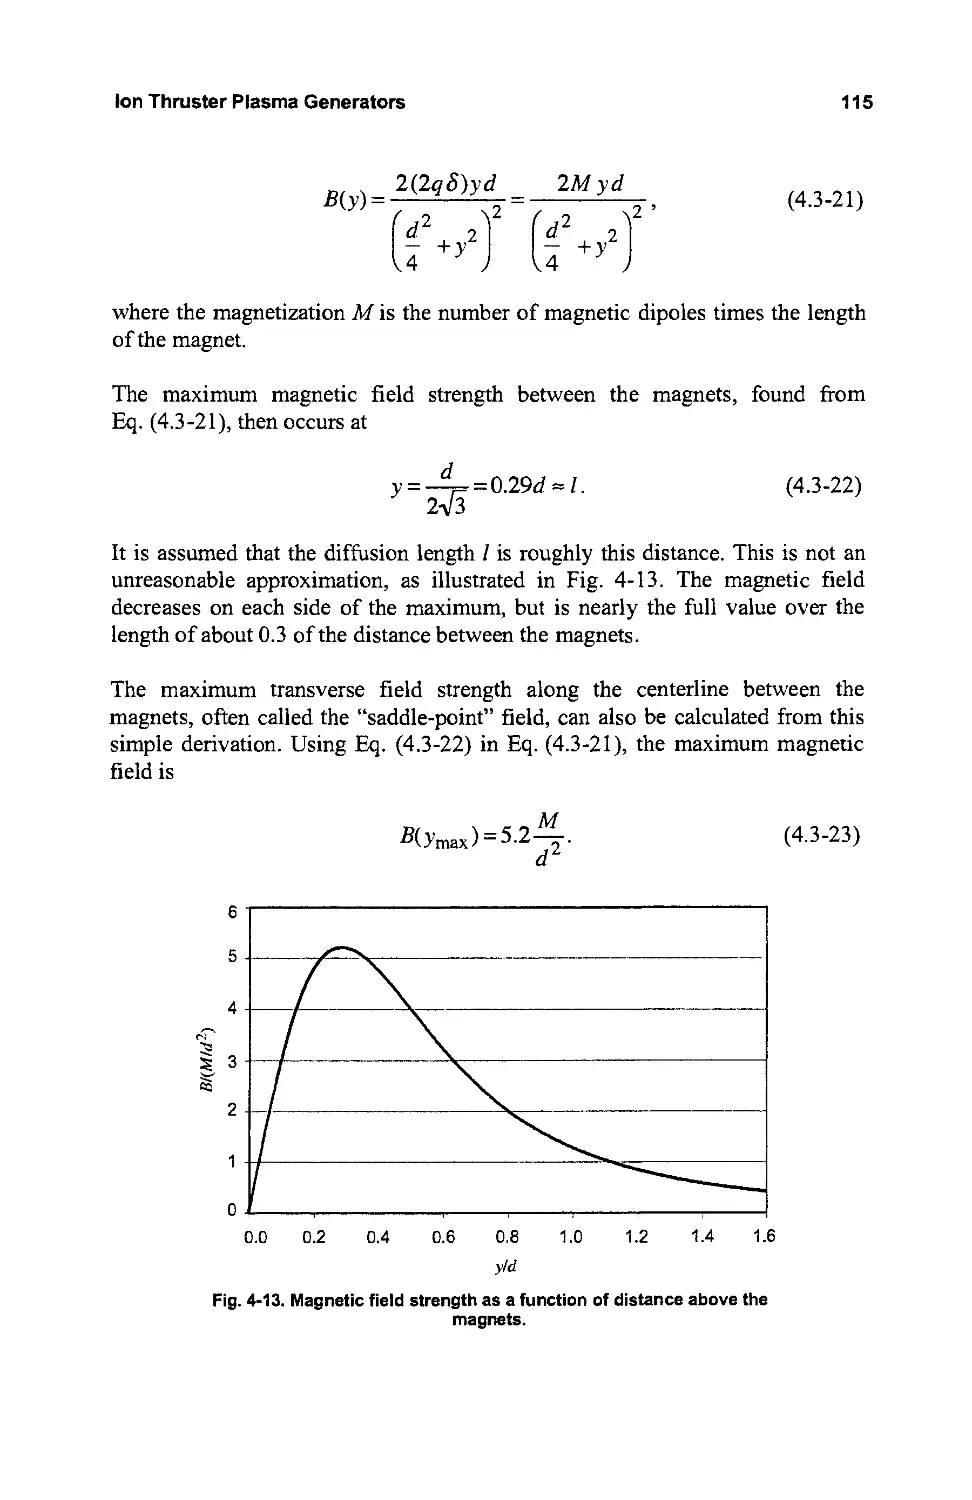
4.3.2 Magnetic Multipole Boundaries 105
4.3.3 Electron Confinement 108
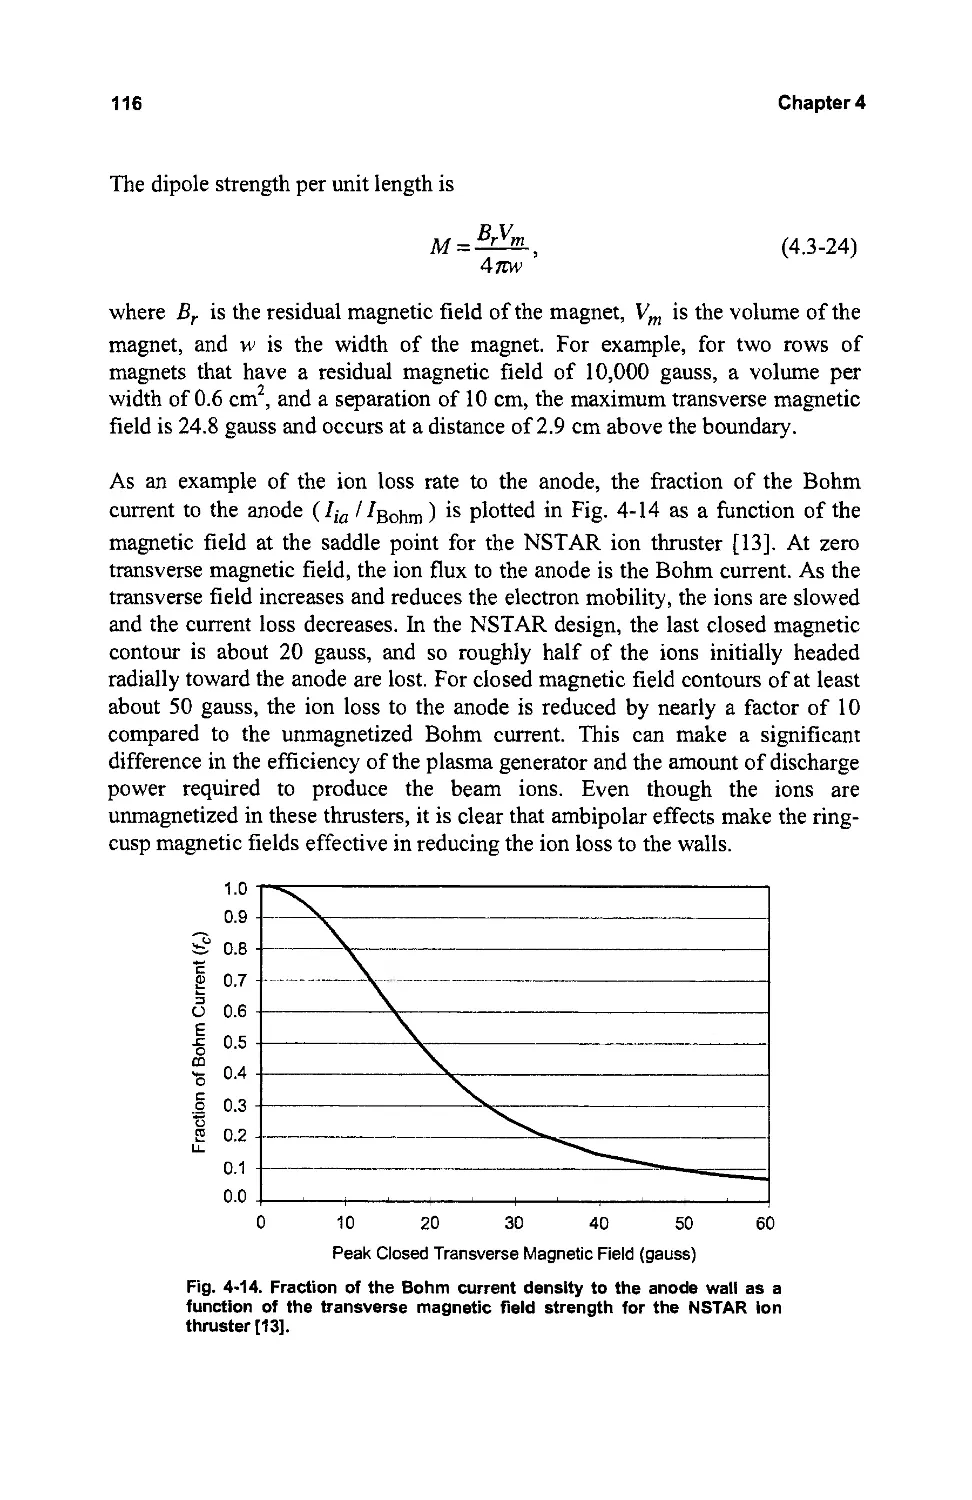
4.3.4 Ion Confinement at the Anode Wall 110
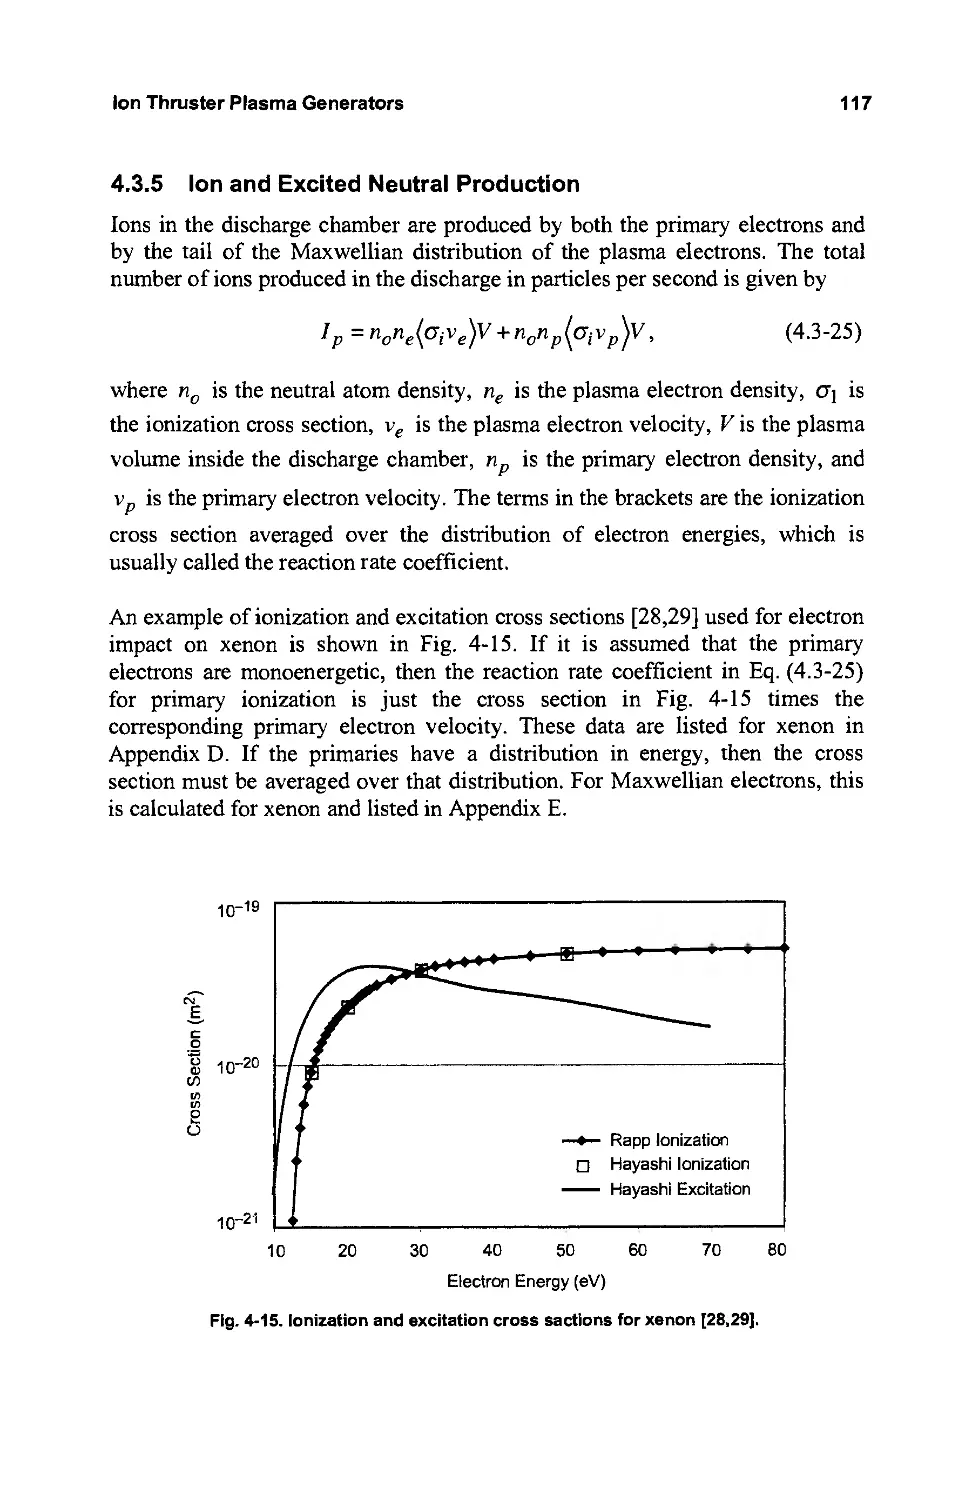
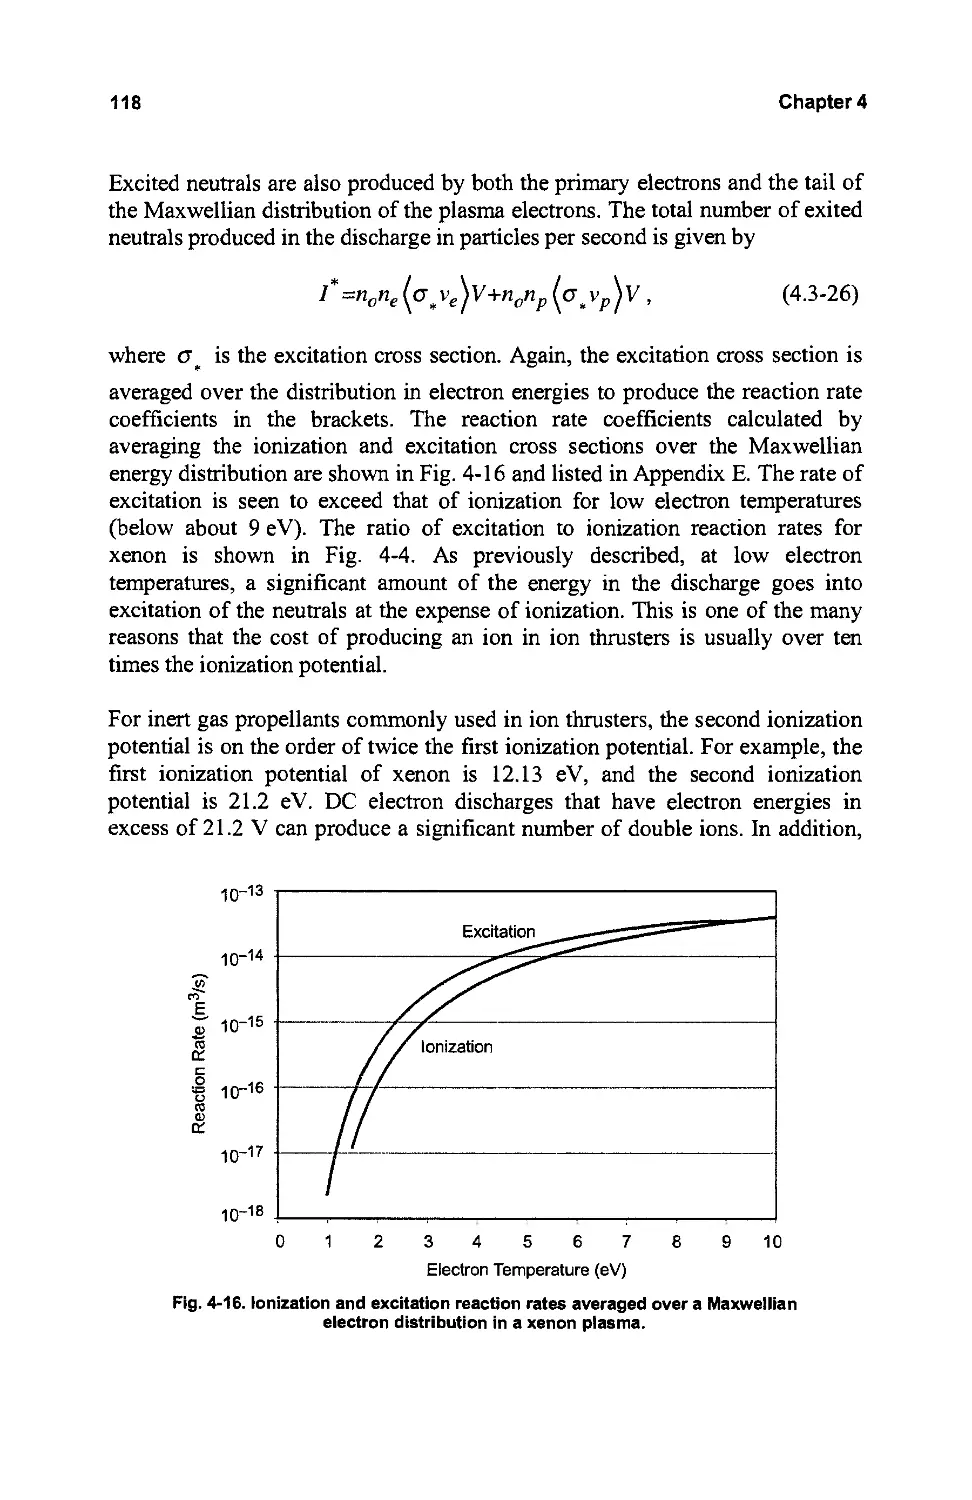
4.3.5 Ion and Excited Neutral Production 117
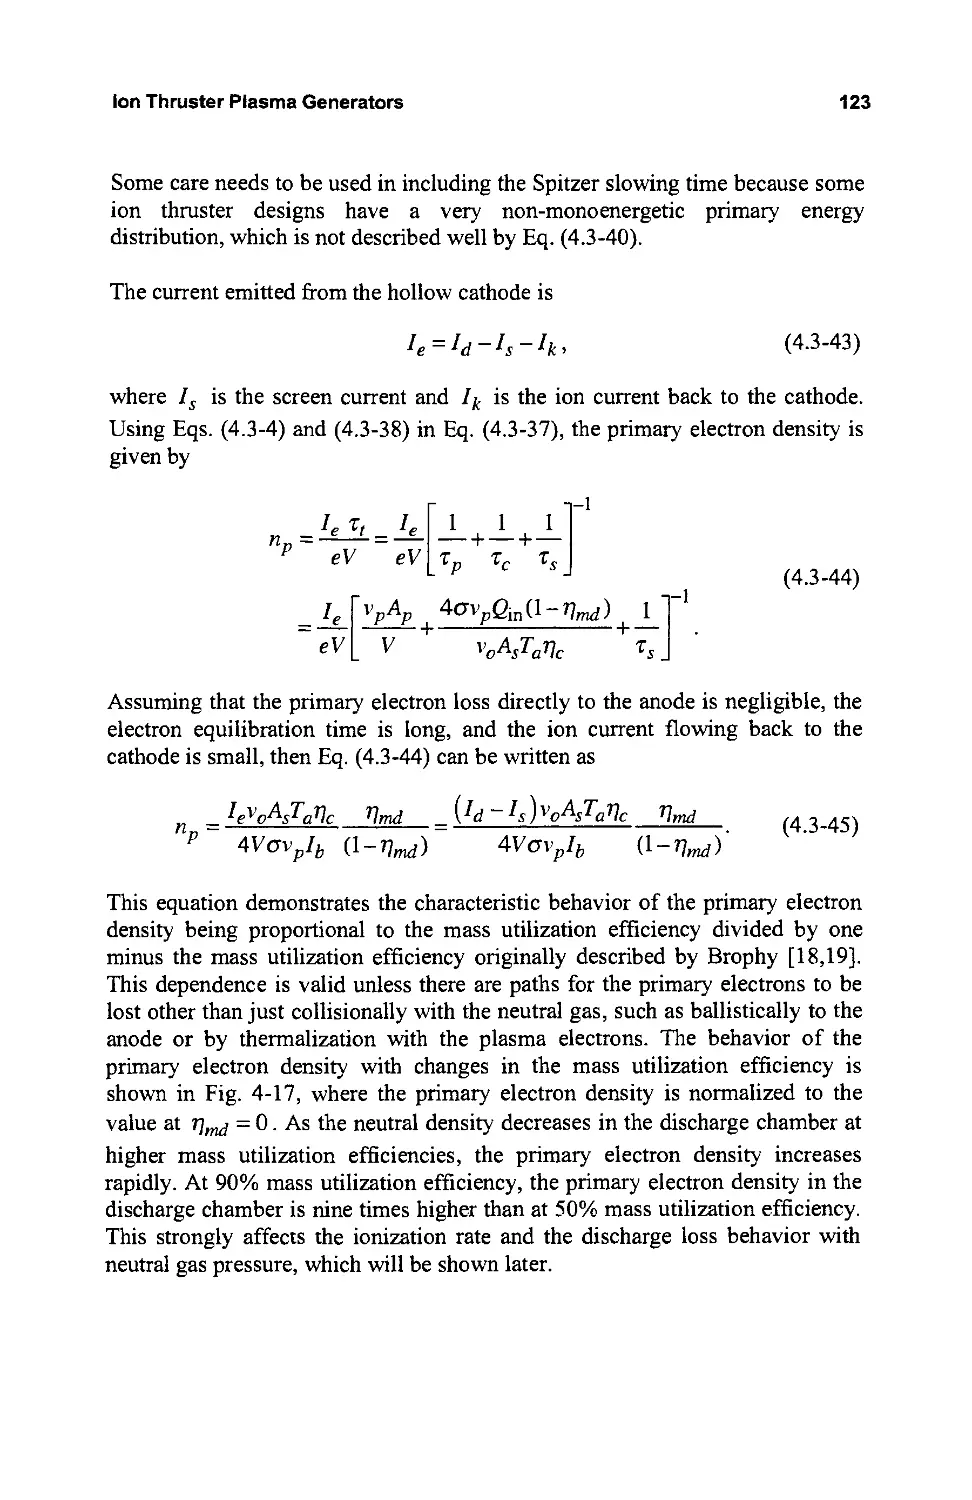
4.3.6 Neutral and Primary Densities in the Discharge Chamber 120
4.3.7 Power and Energy Balance in the Discharge Chamber 124
4.3.8 Discharge Loss 126
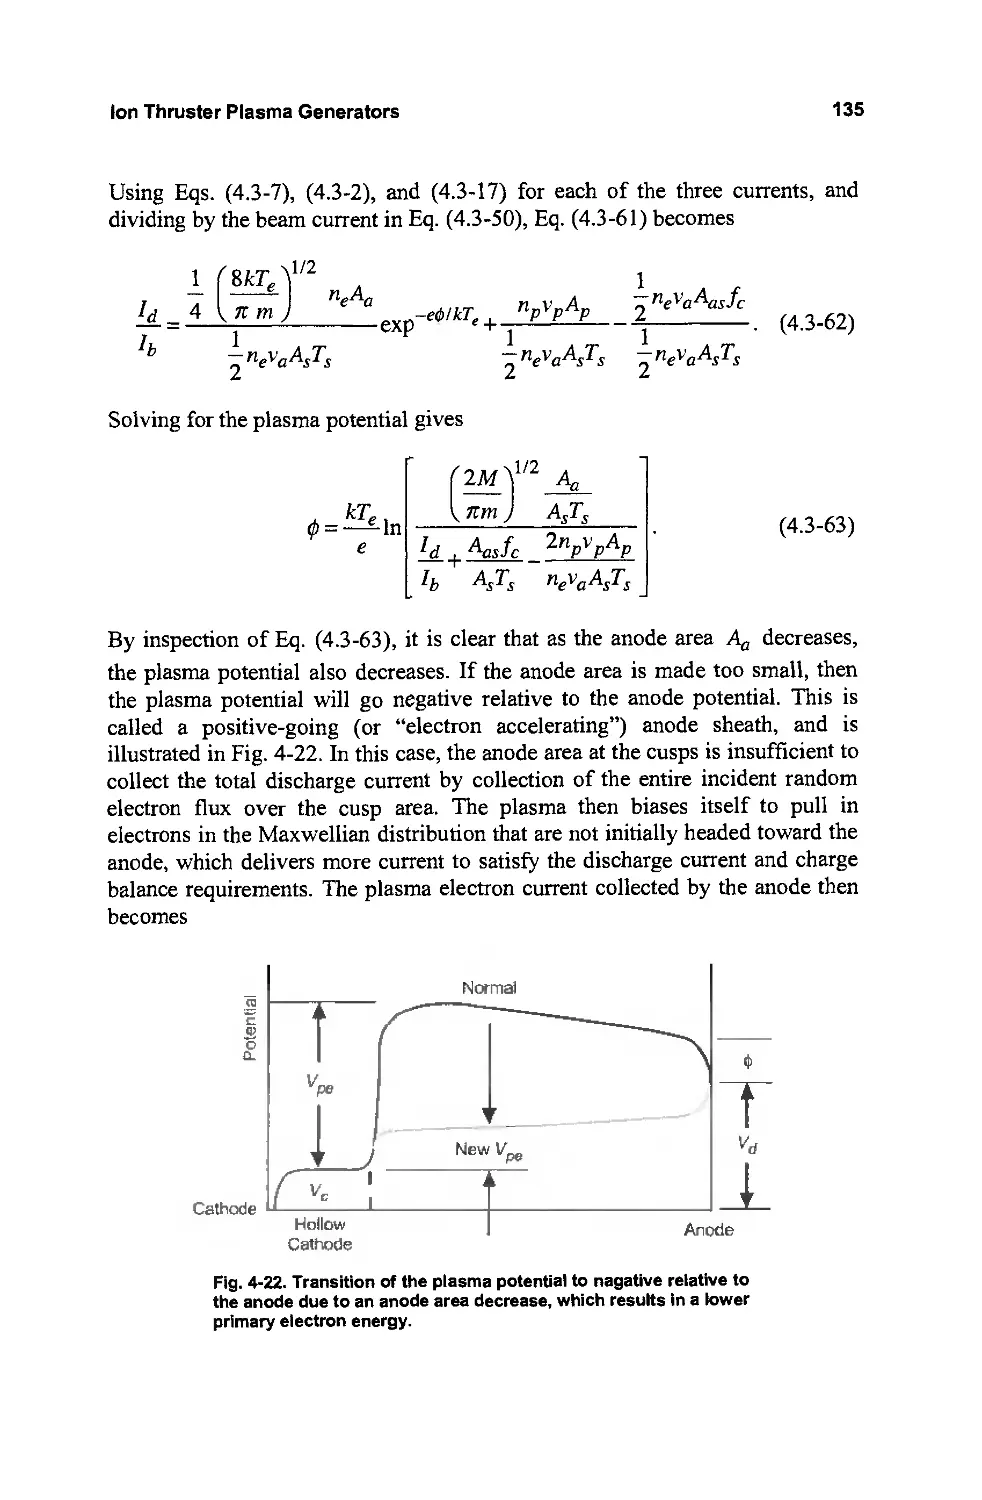
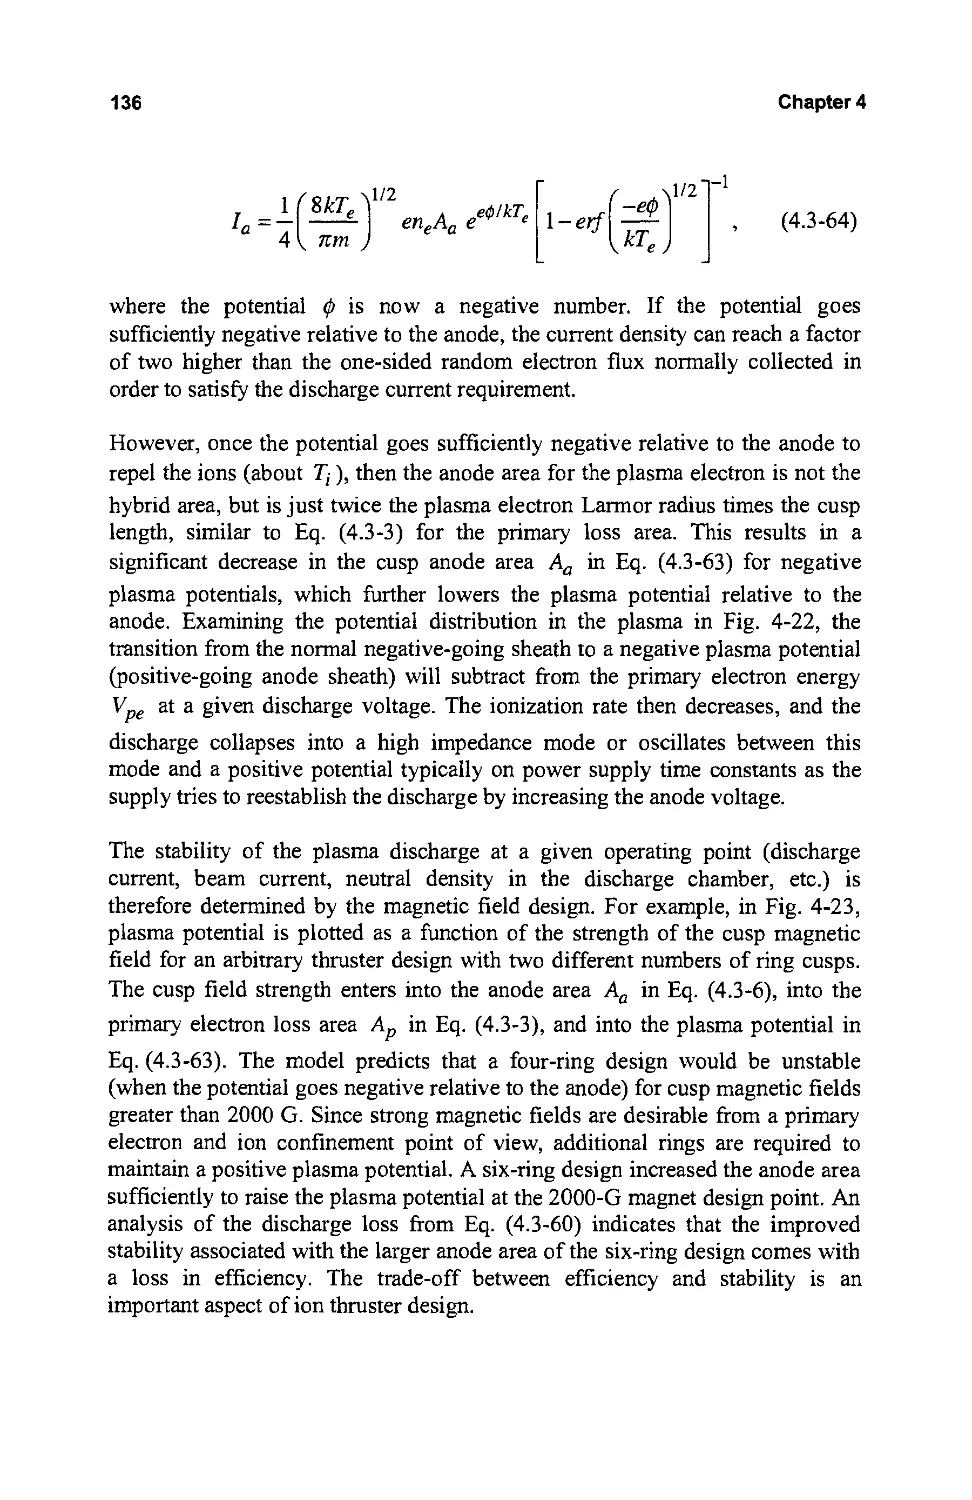
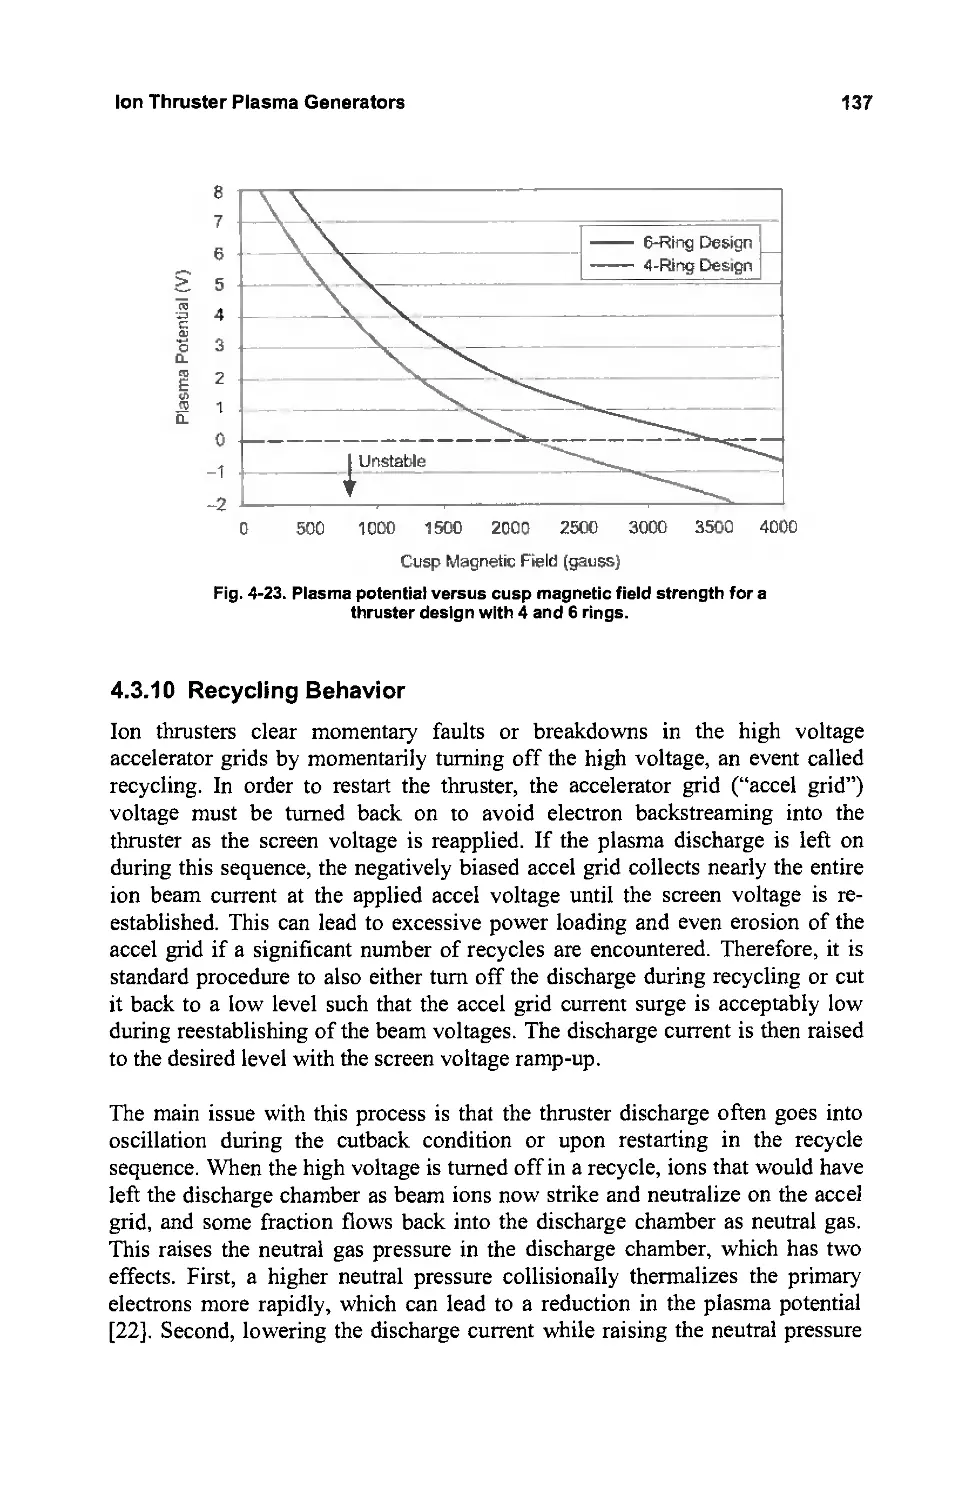
4.3.9 Discharge Stability 133
4.3.10 Recycling Behavior 137
4.3.11 Limitations of a 0- D Model 141
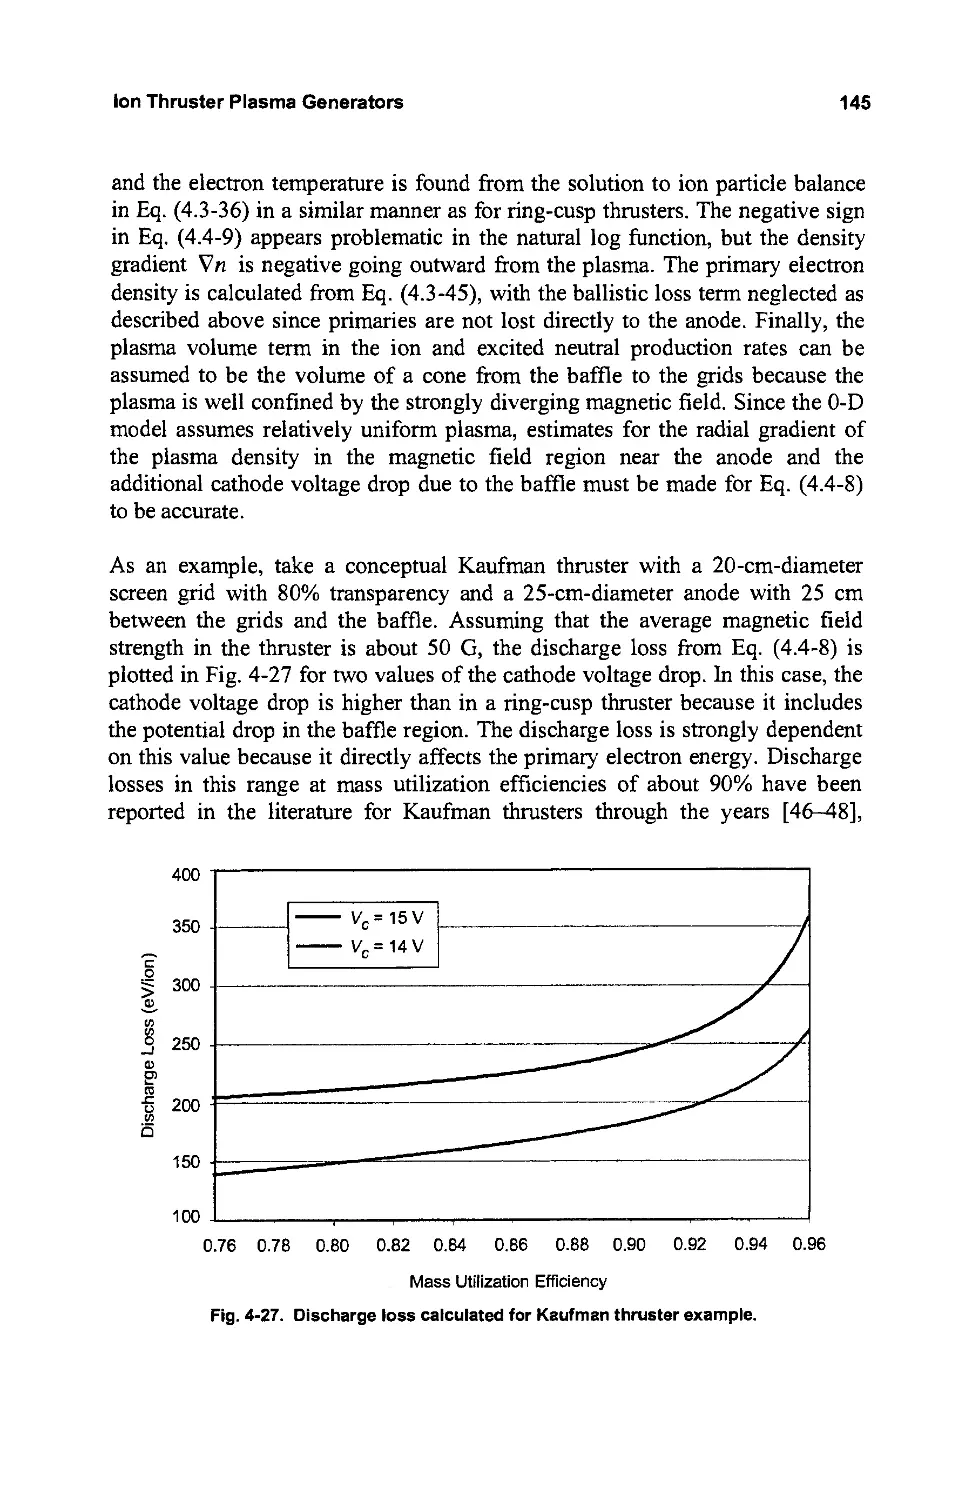
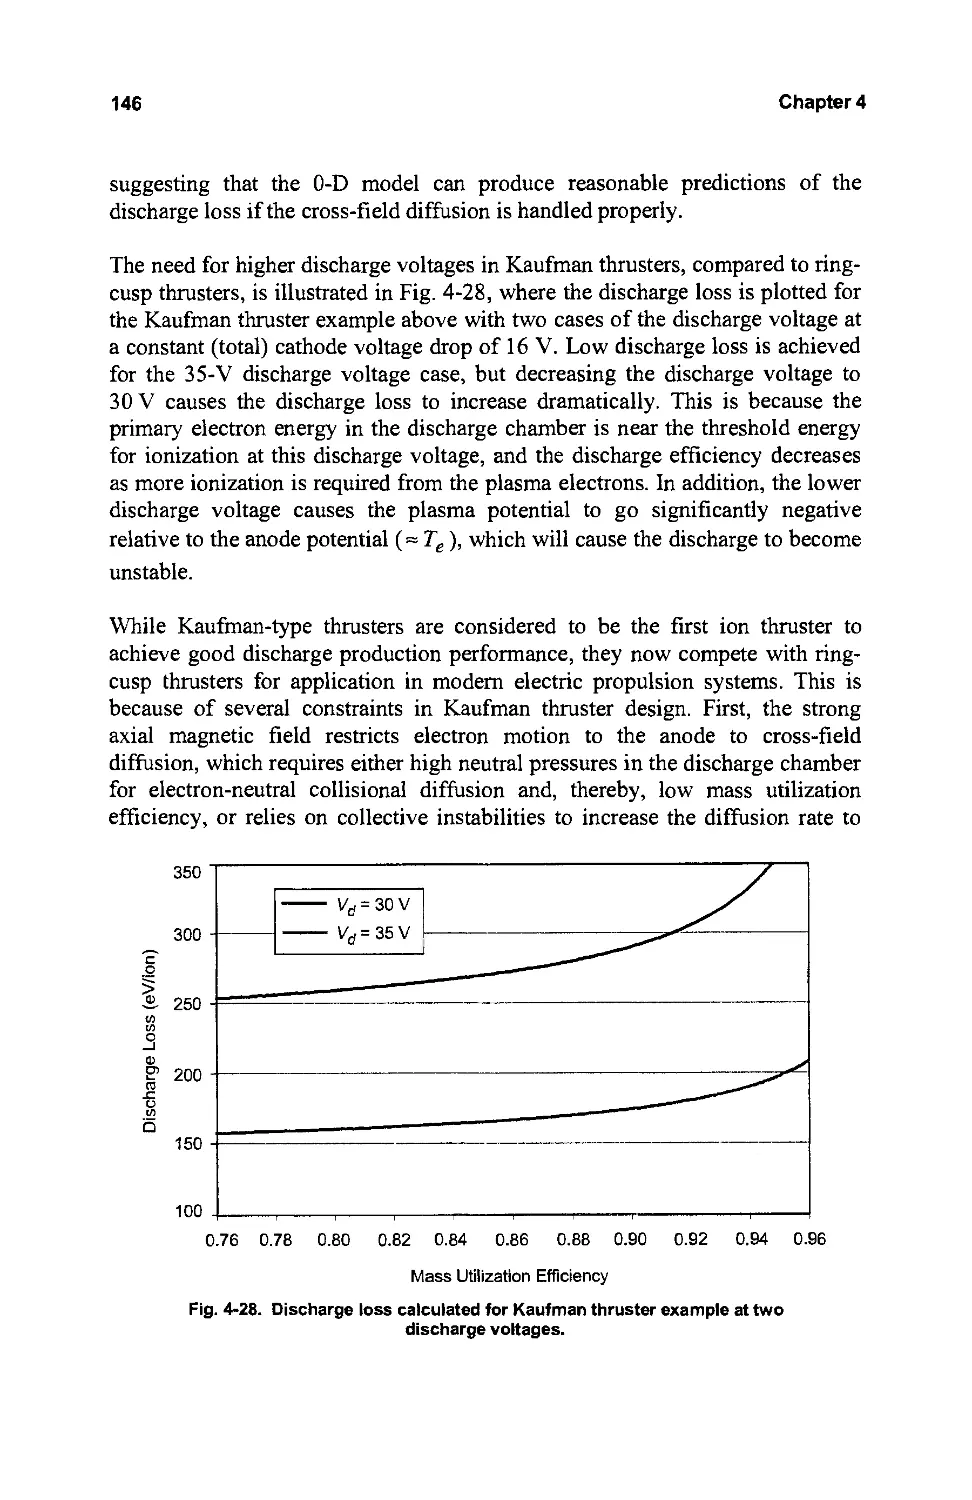
4.4 Kaufman Ion Thrusters 142
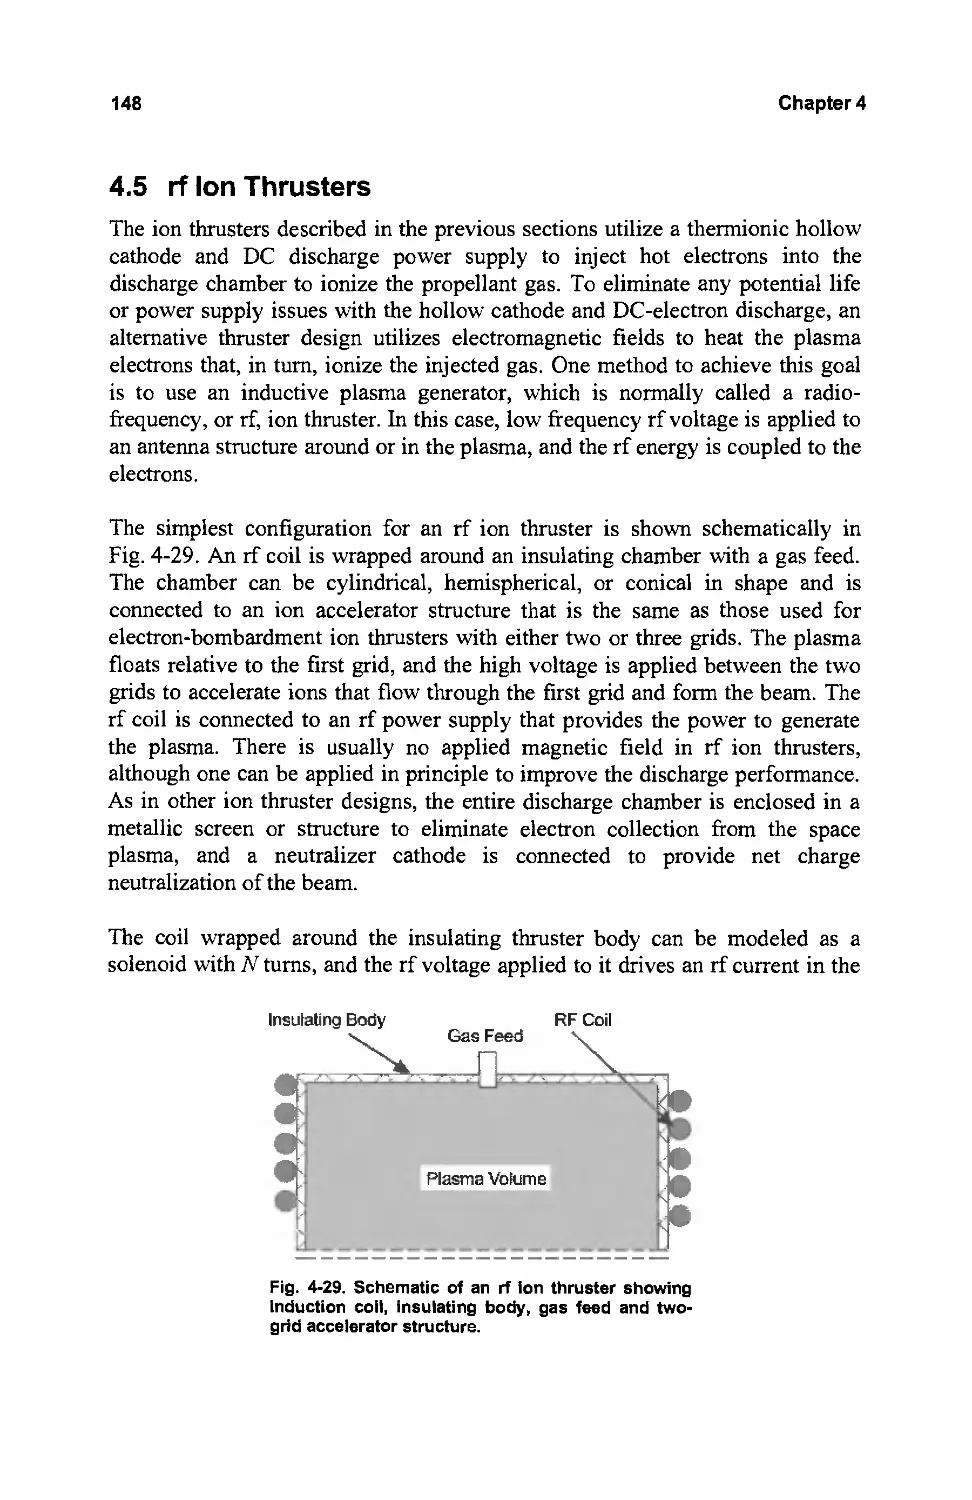
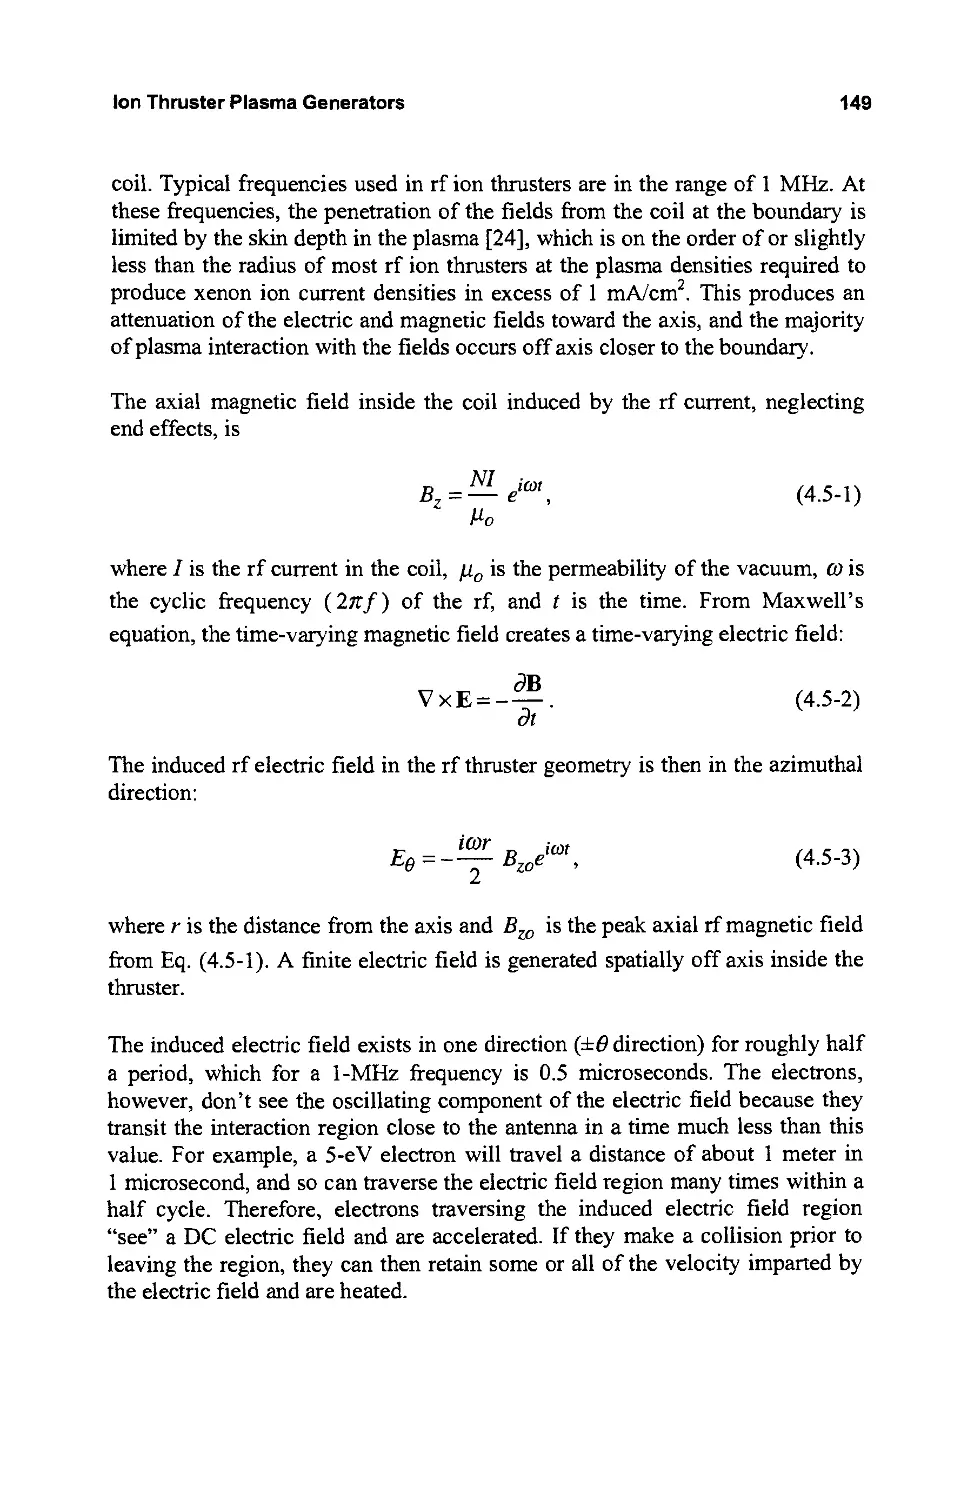
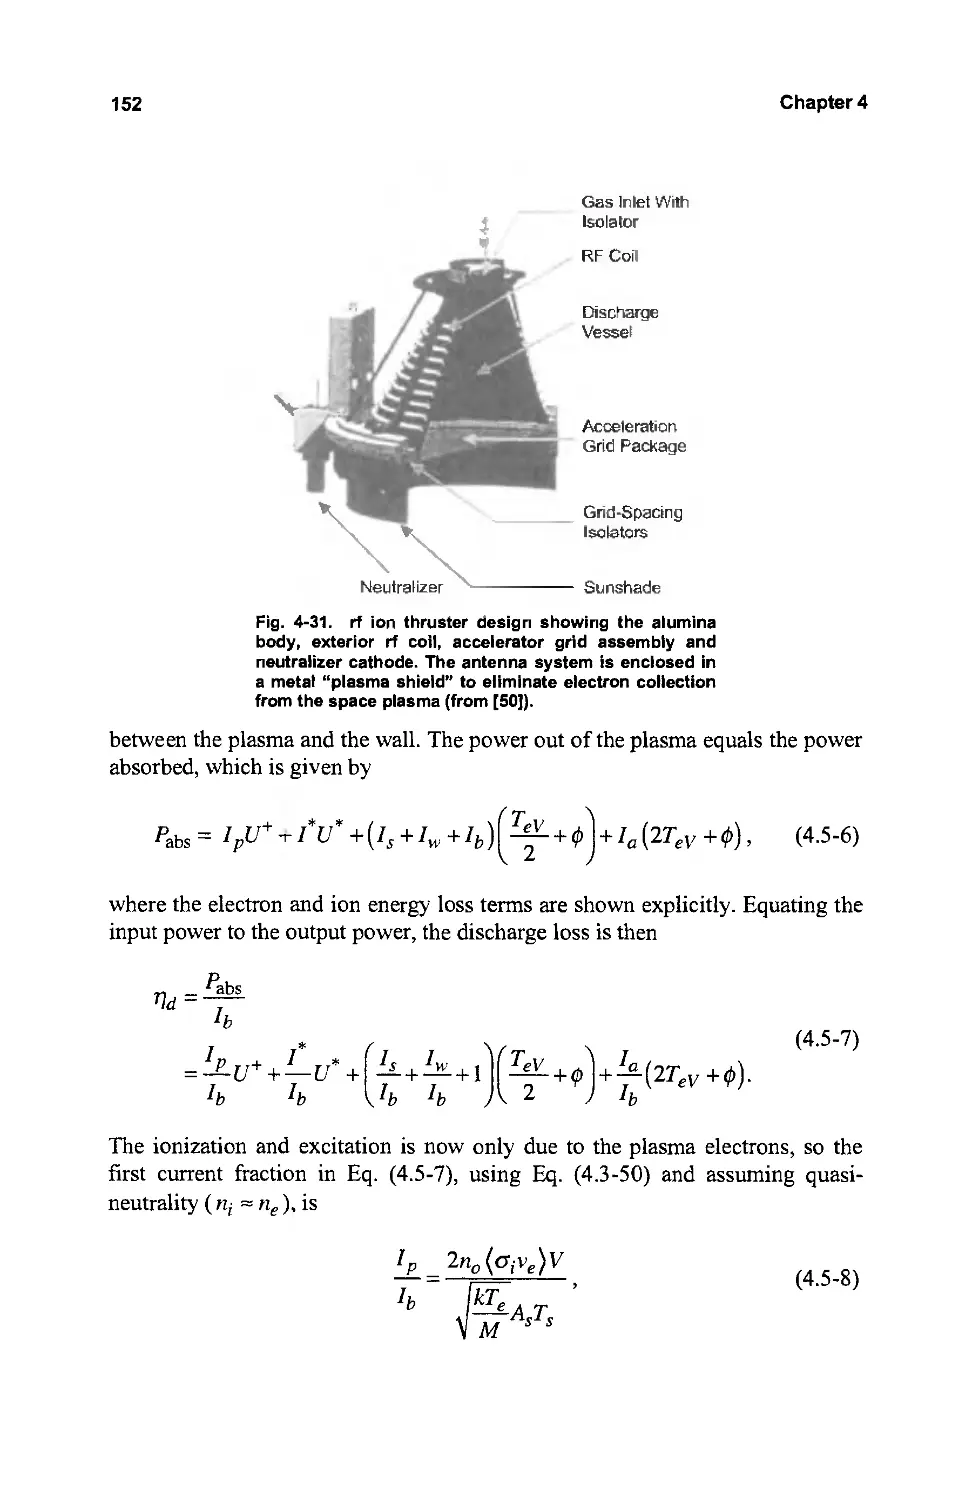
4.5 rfIon Thrusters 148
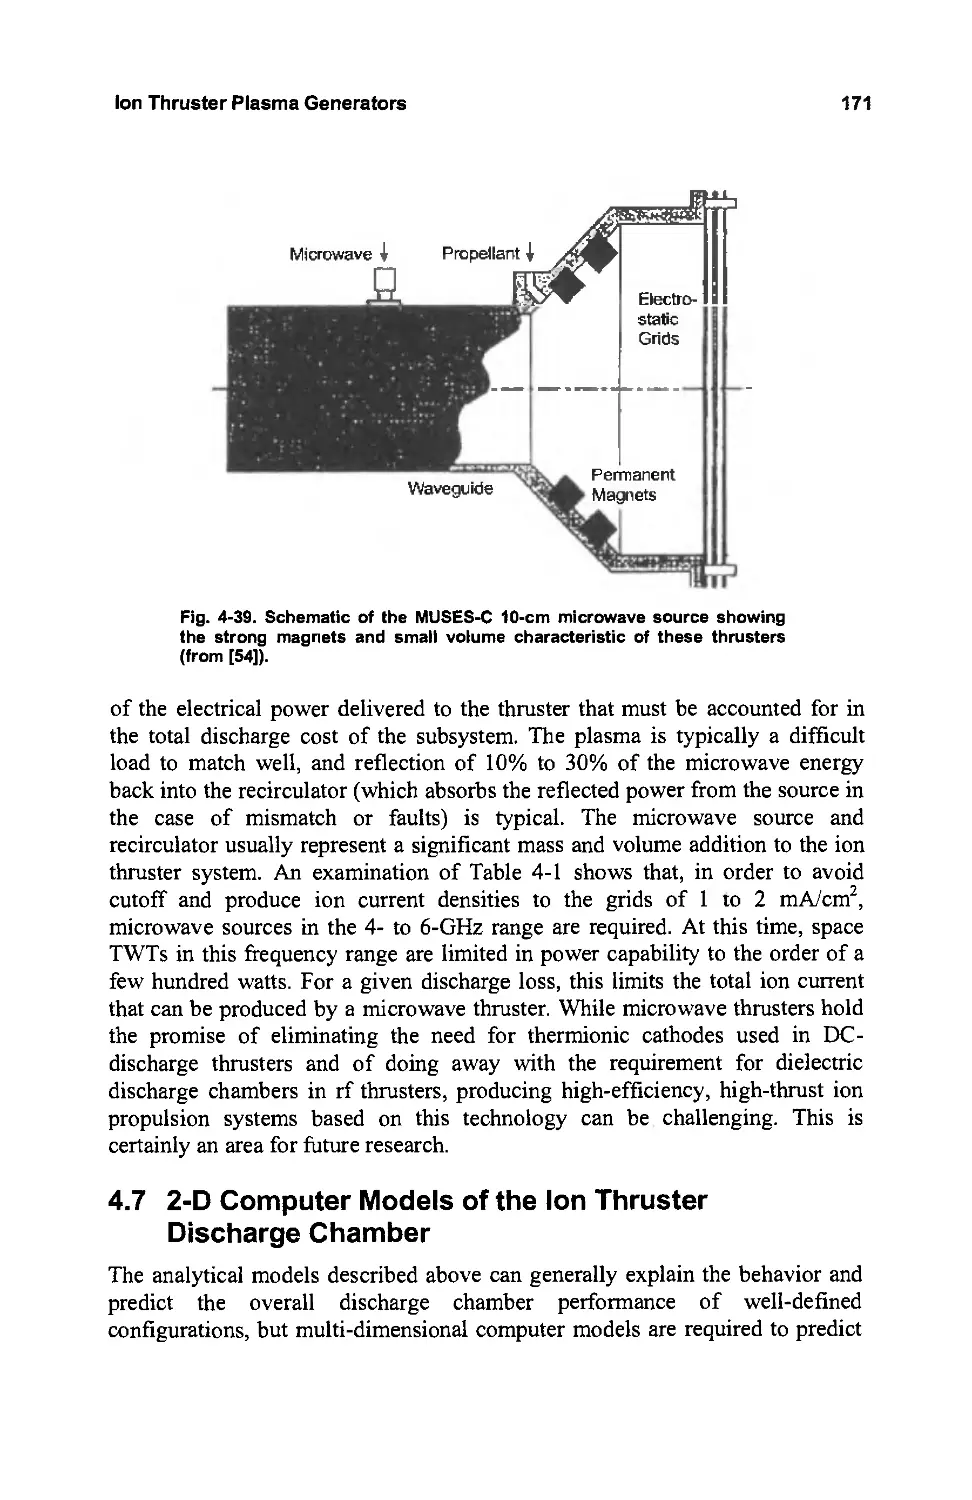
4.6 Microwave Ion Thrusters 158
4.7 2-D Computer Models of the Ion Thruster Discharge Chamber 171
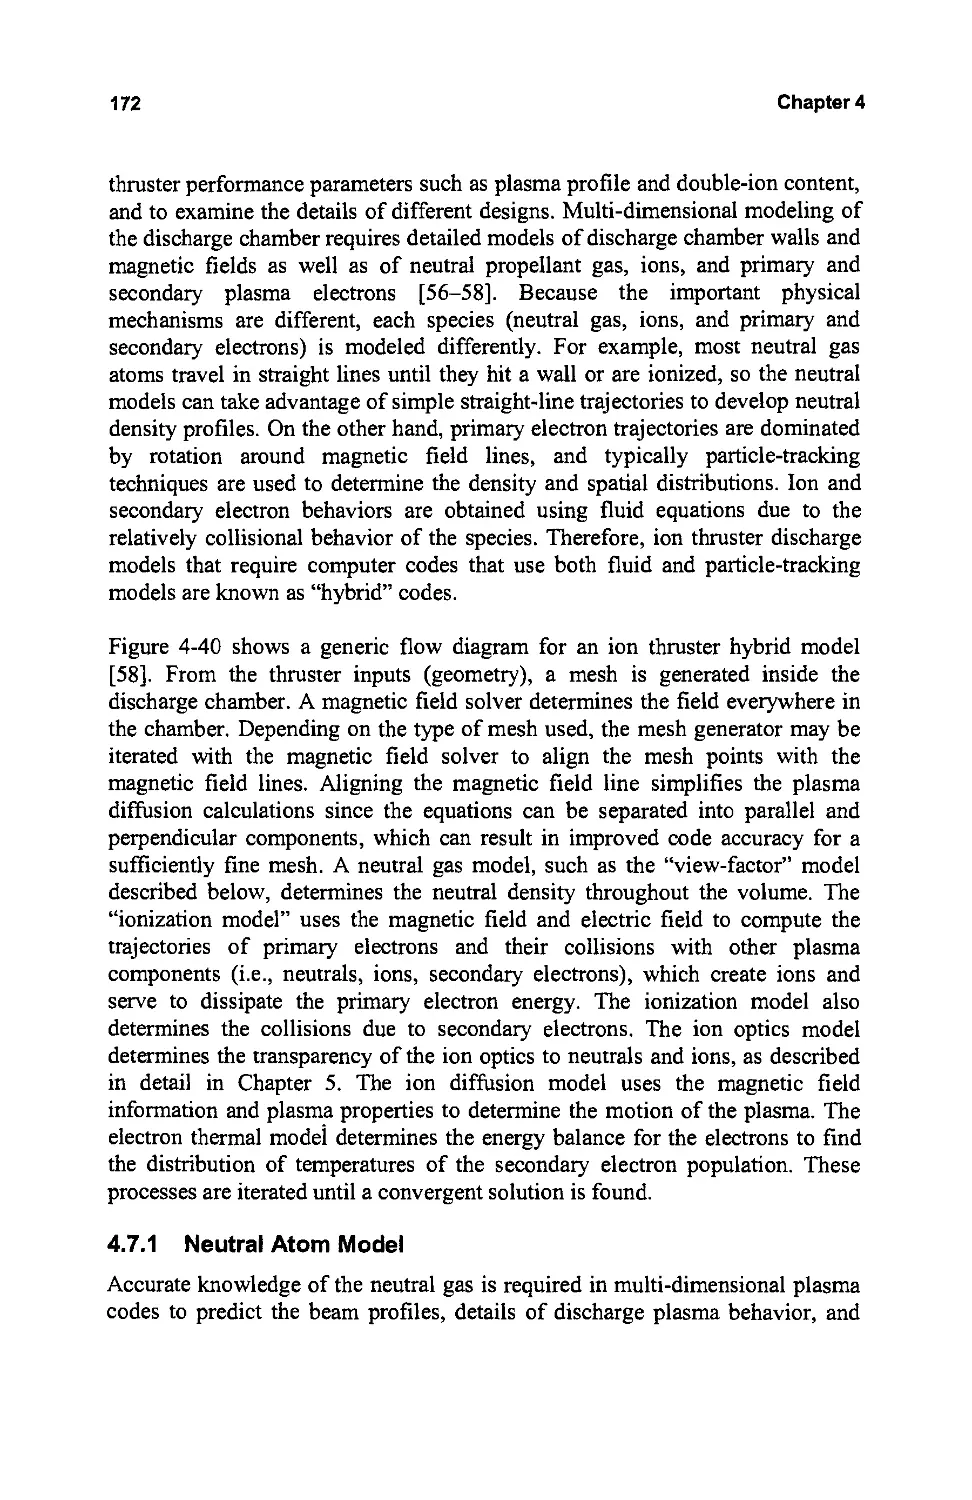
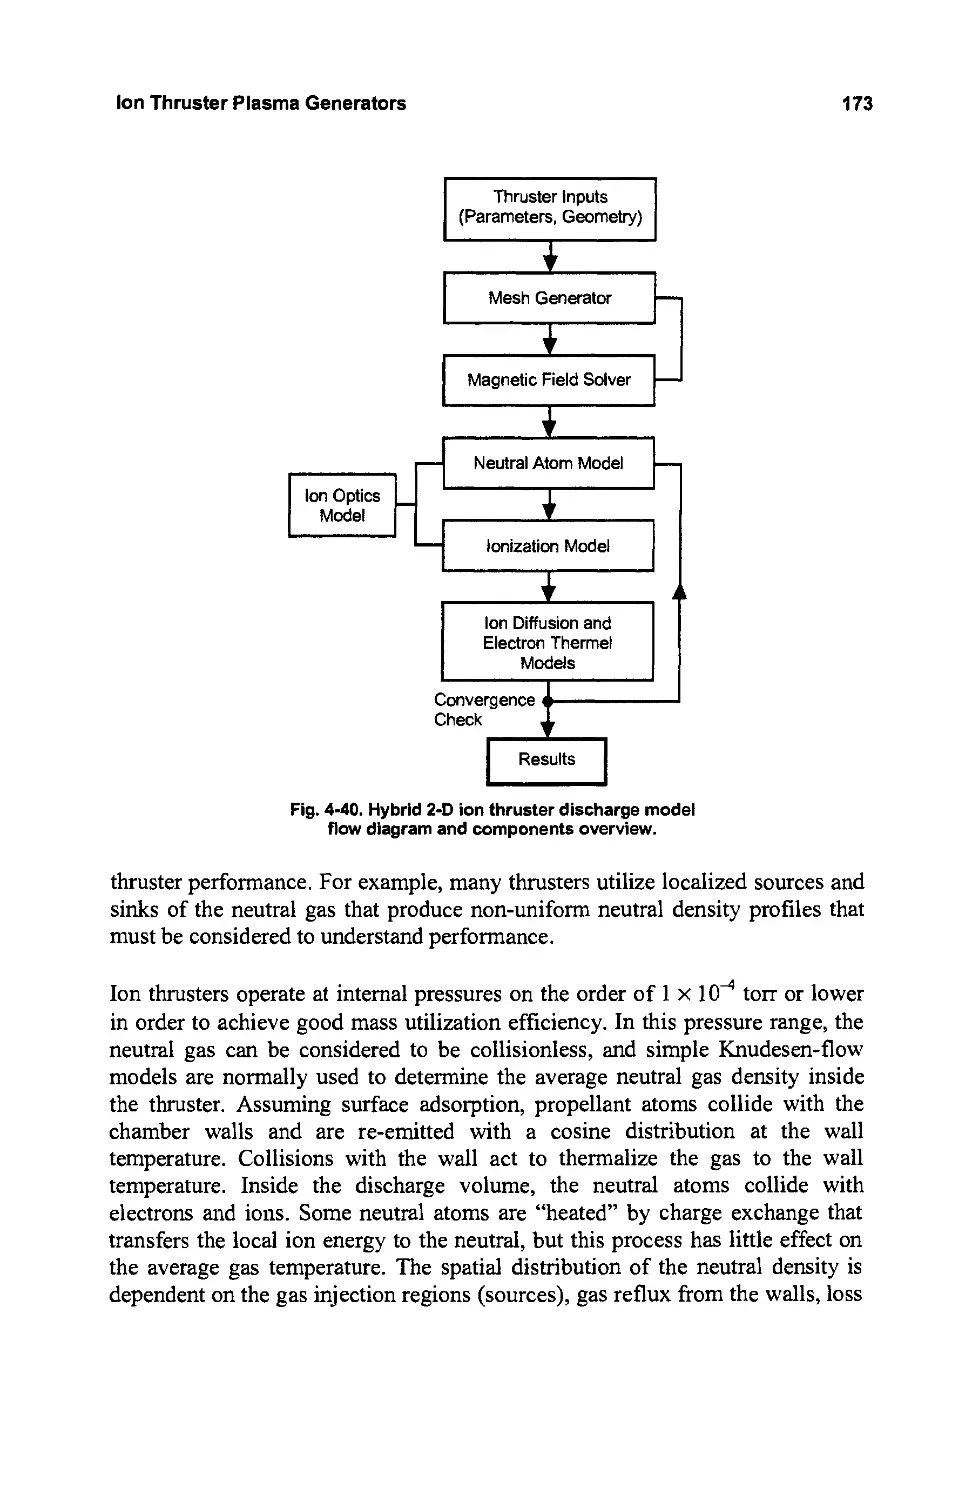
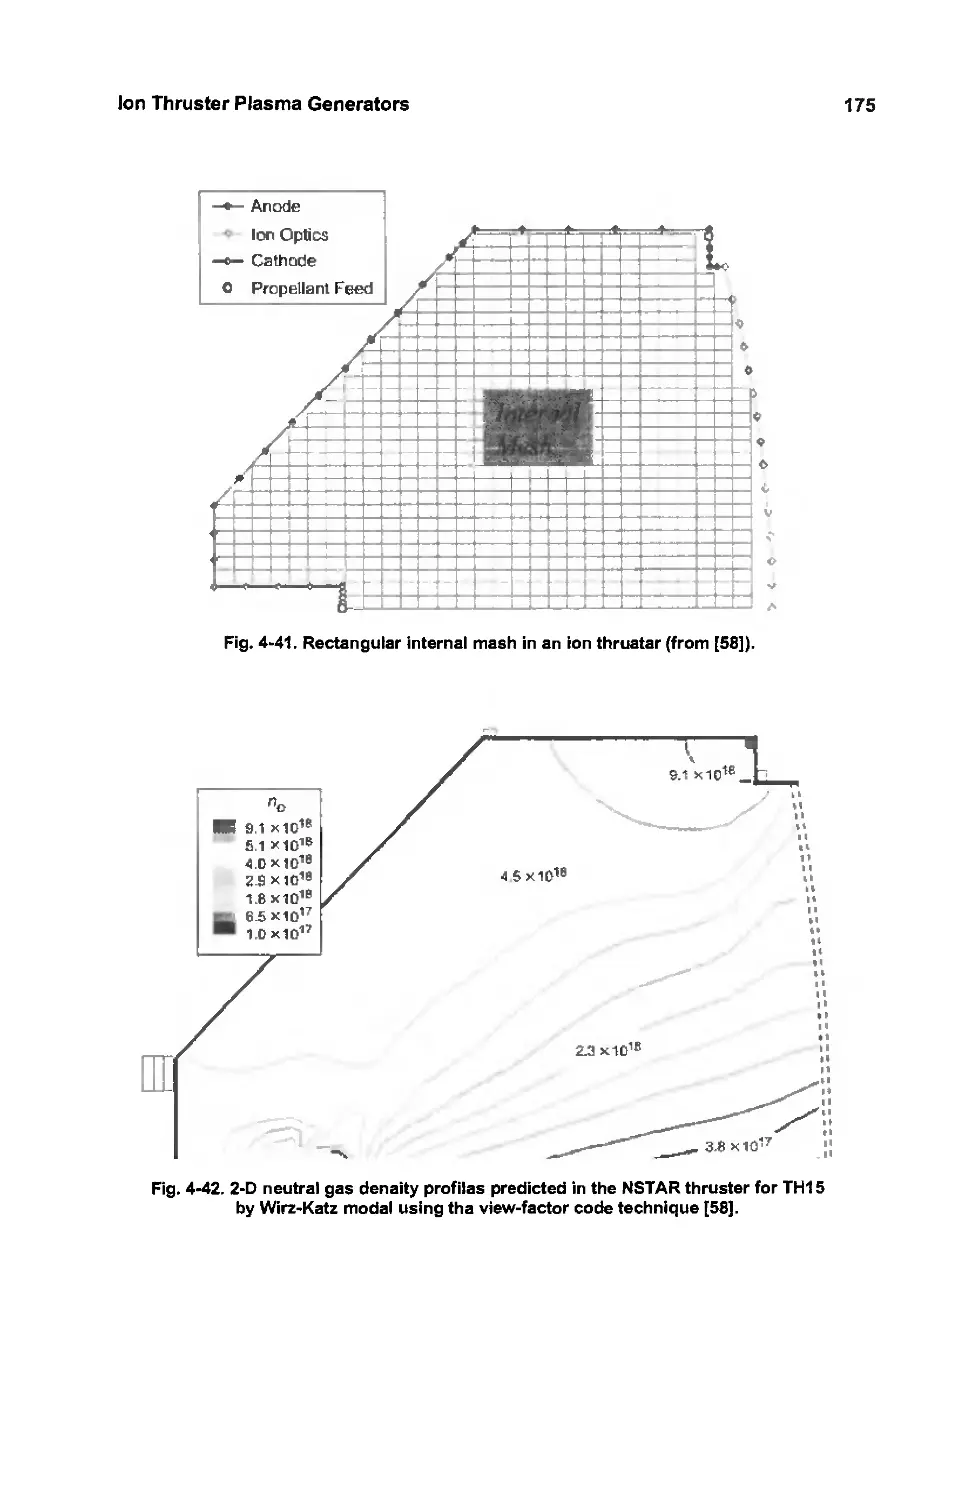
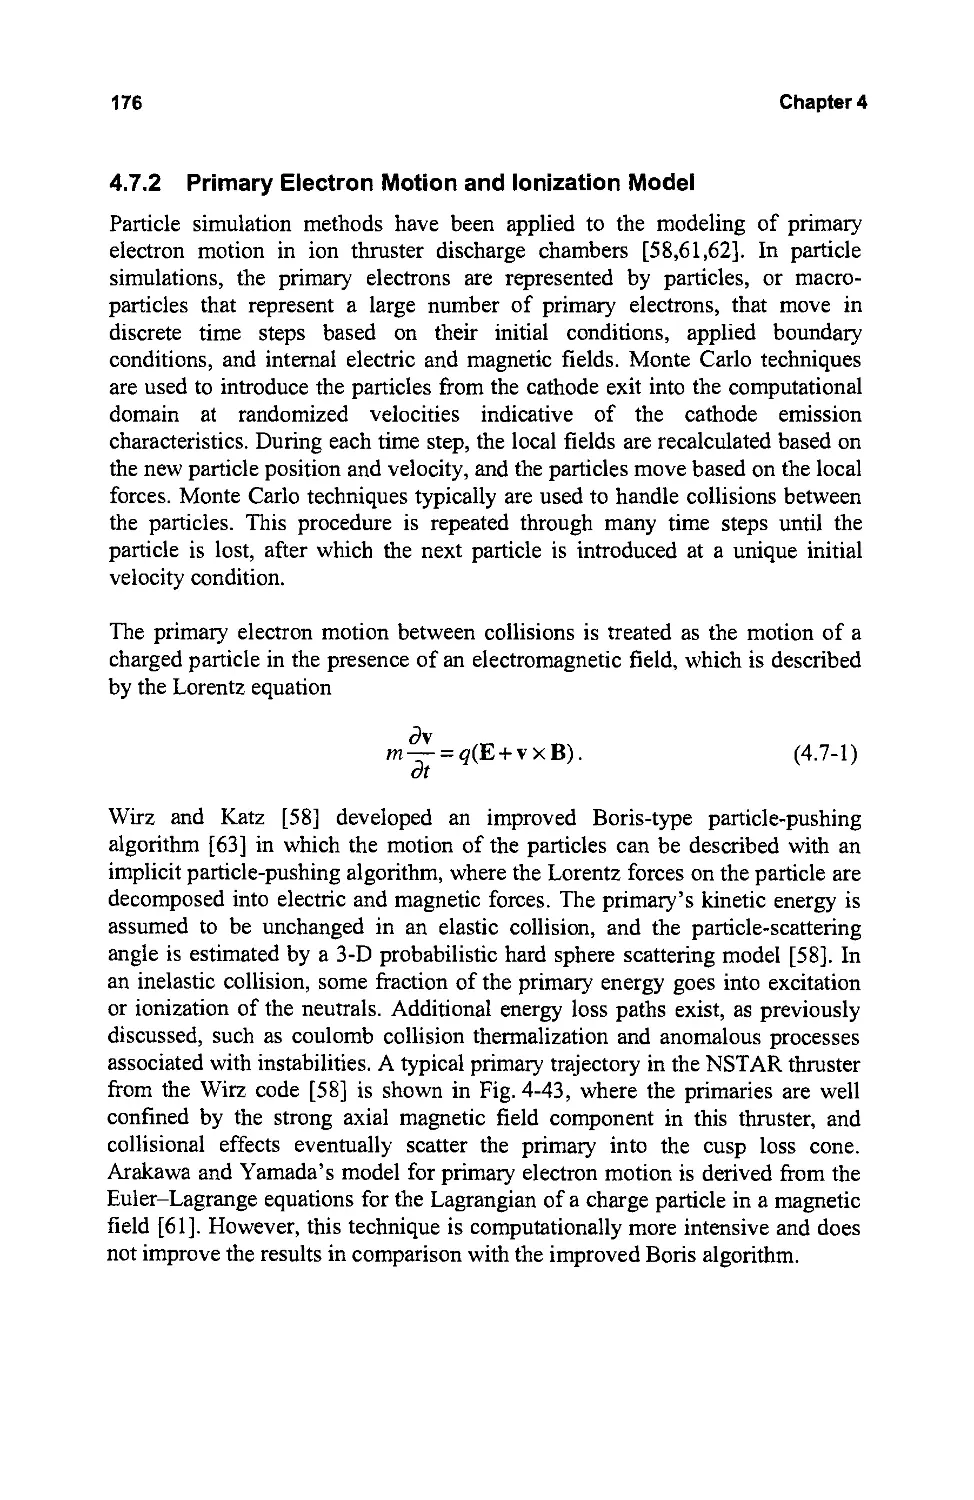
4.7.1 Neutral Atom Model 172
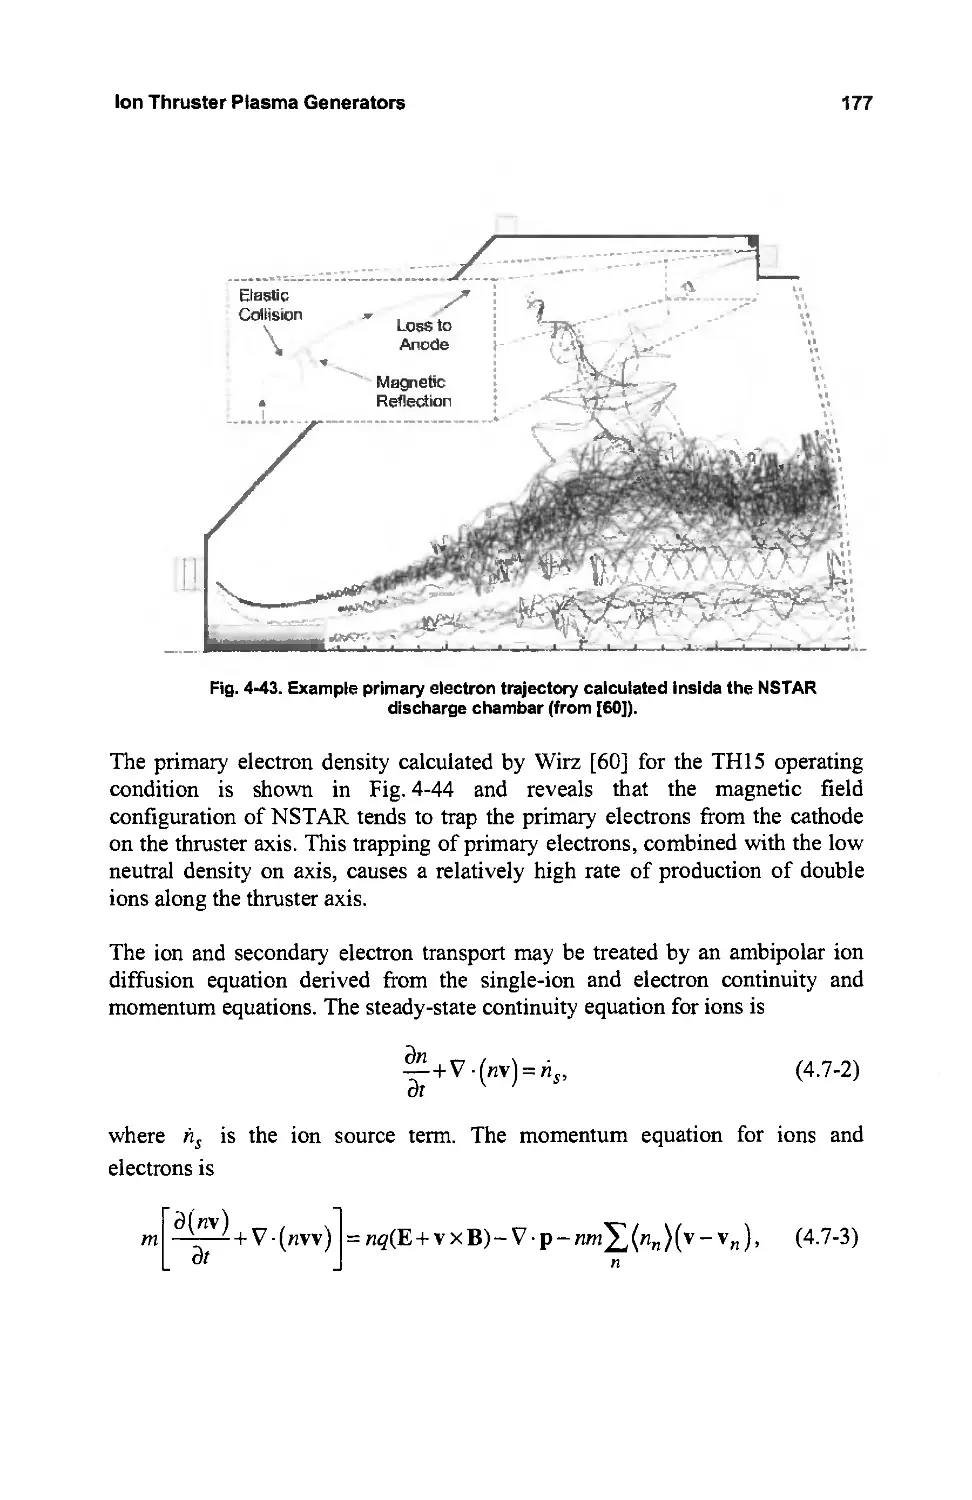
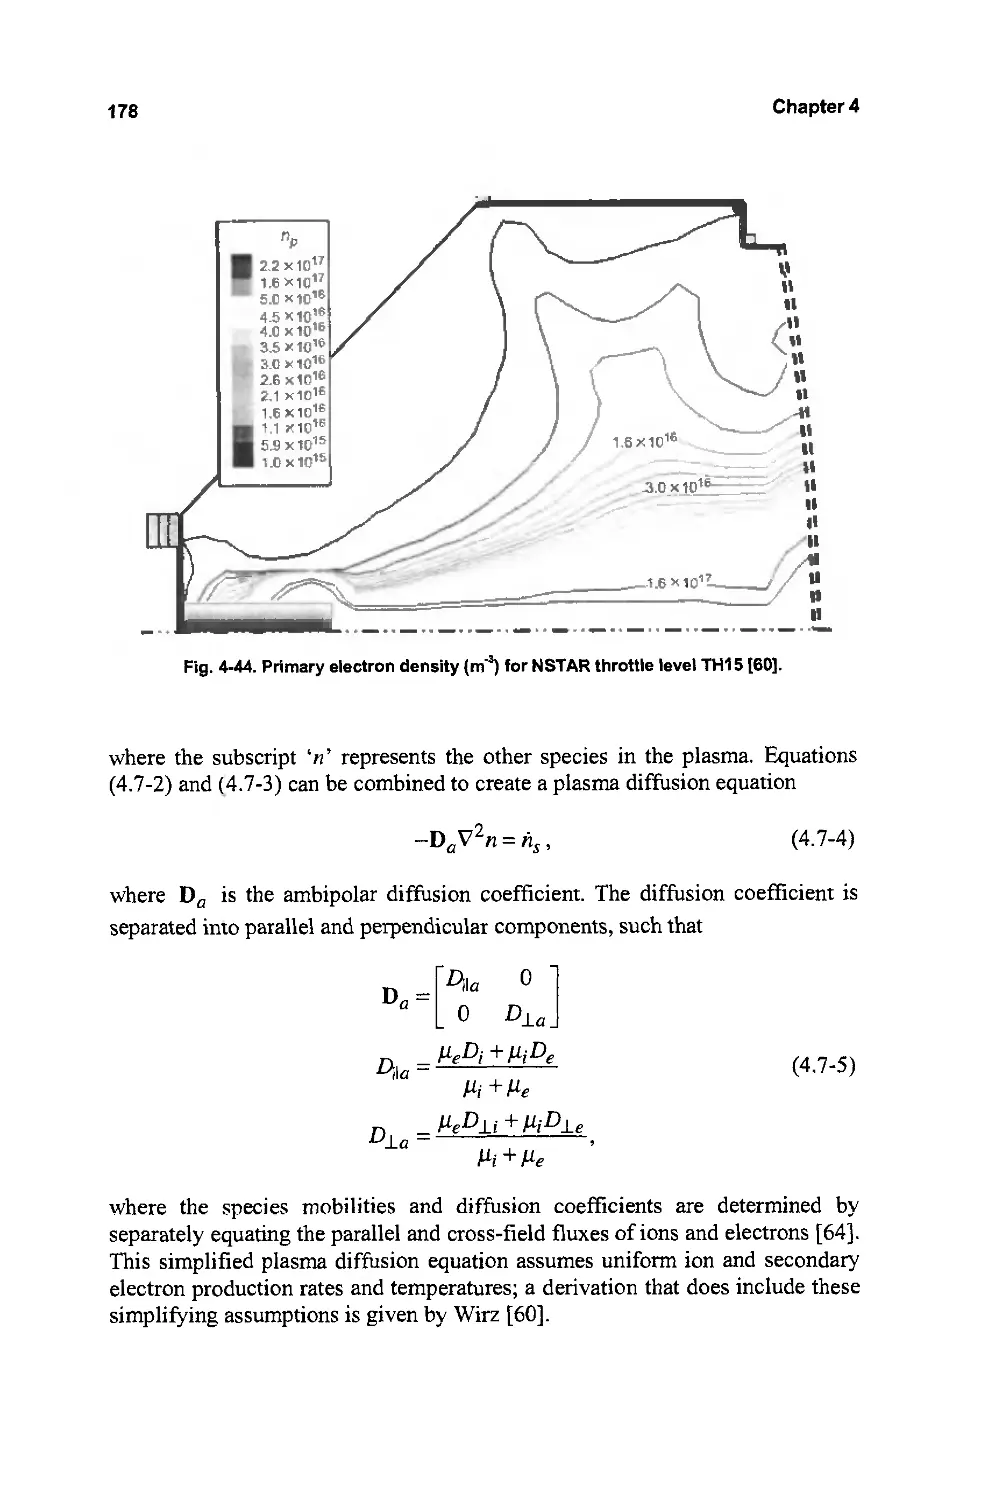
4.7.2 Primary Electron Motion and Ionization Model 176
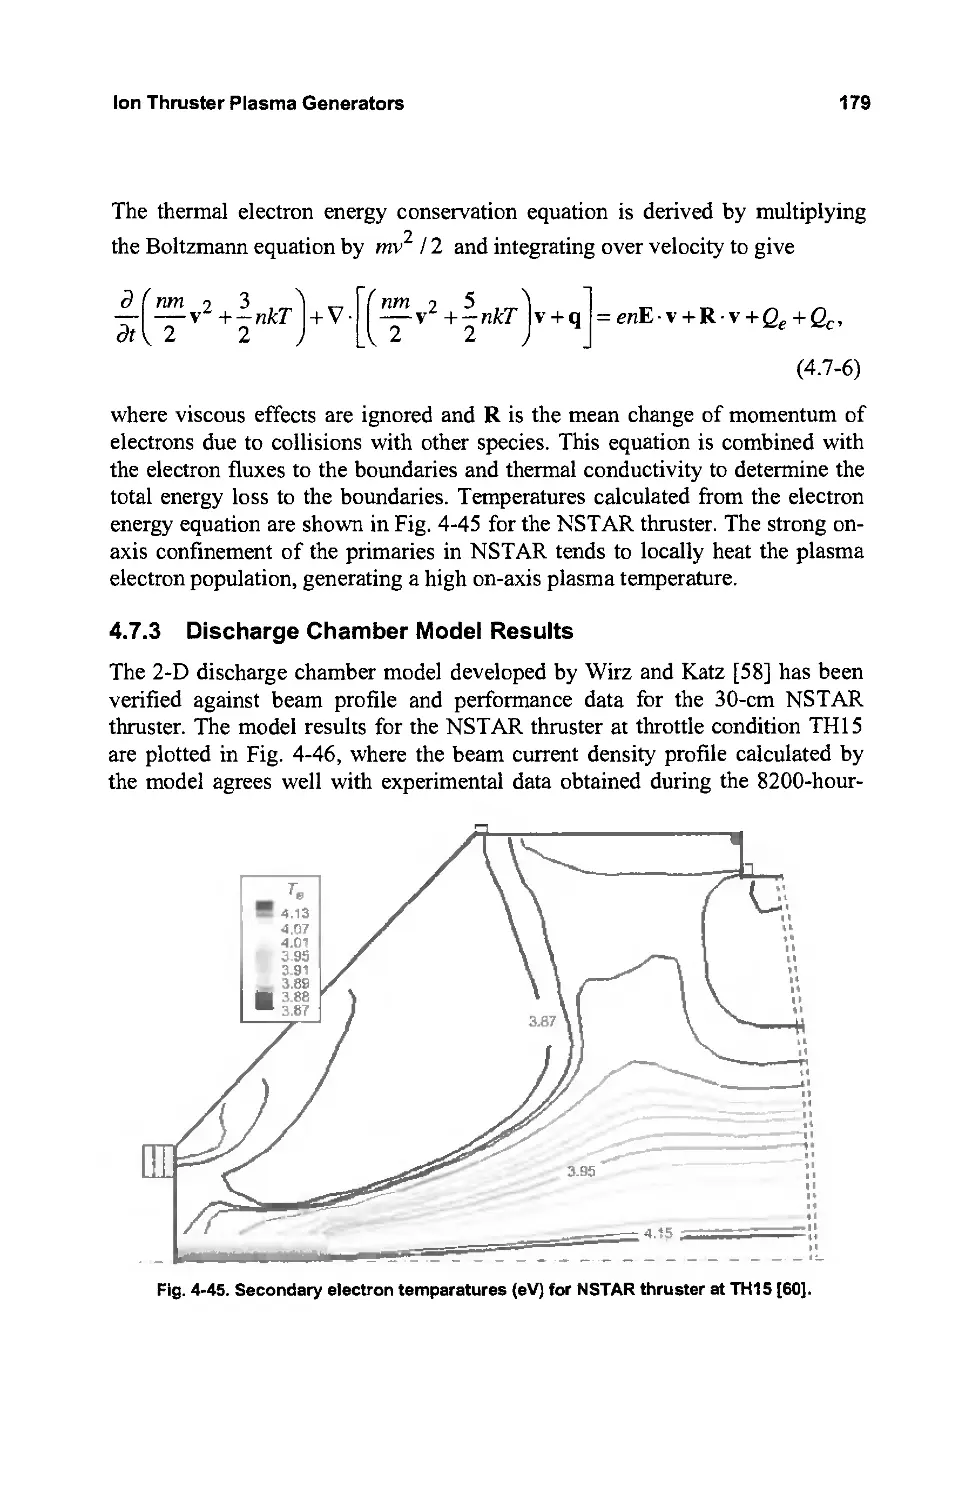
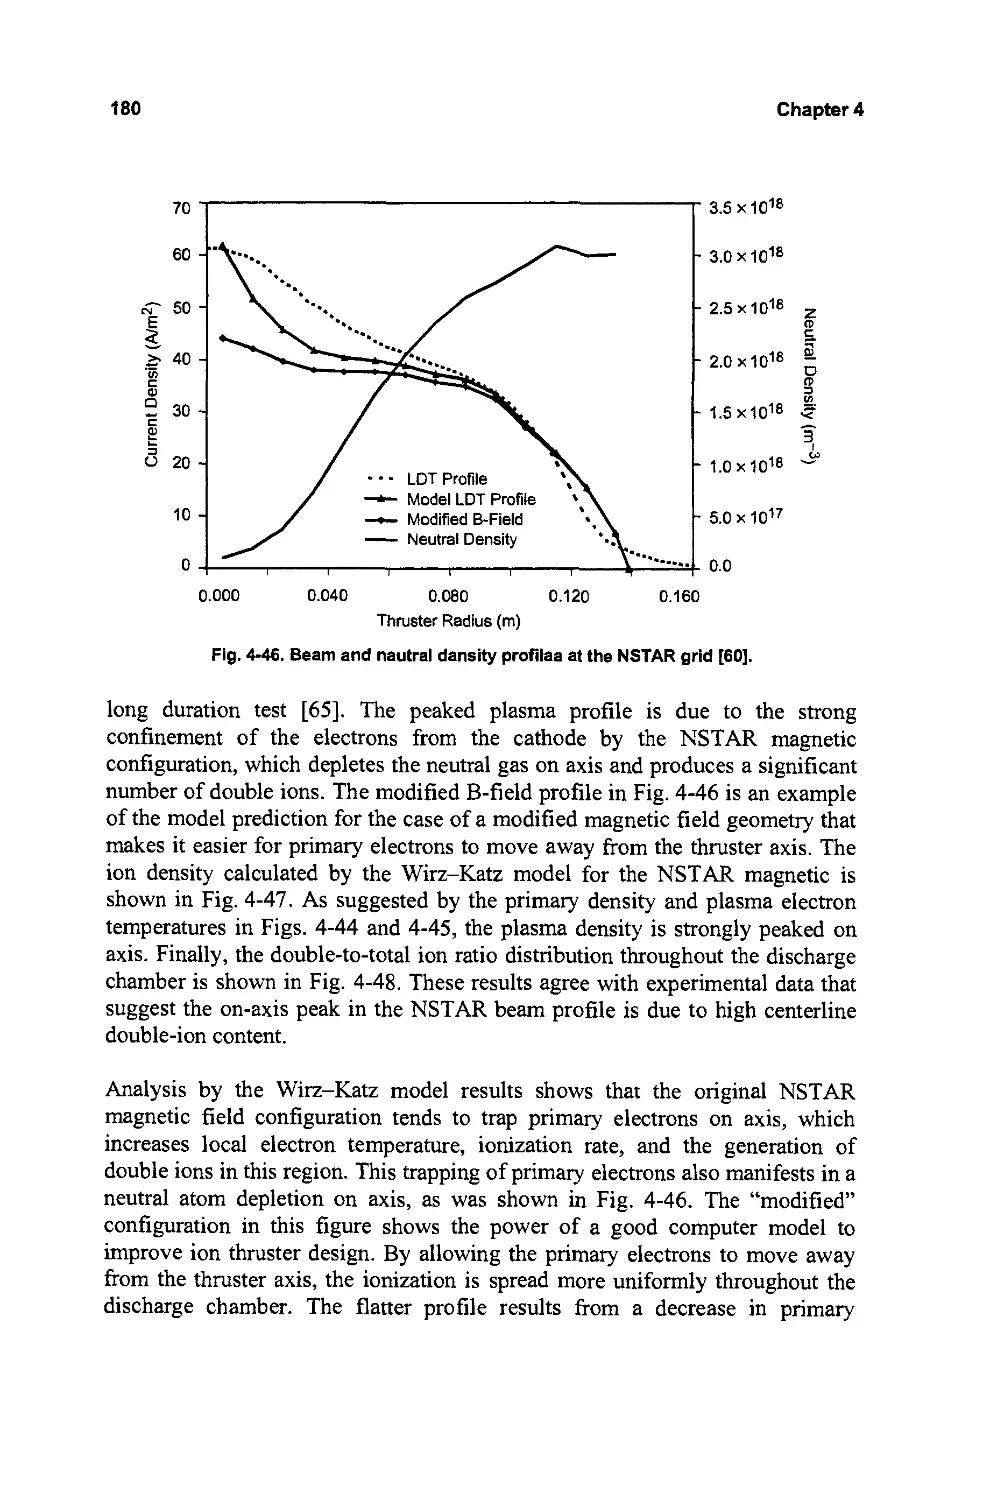
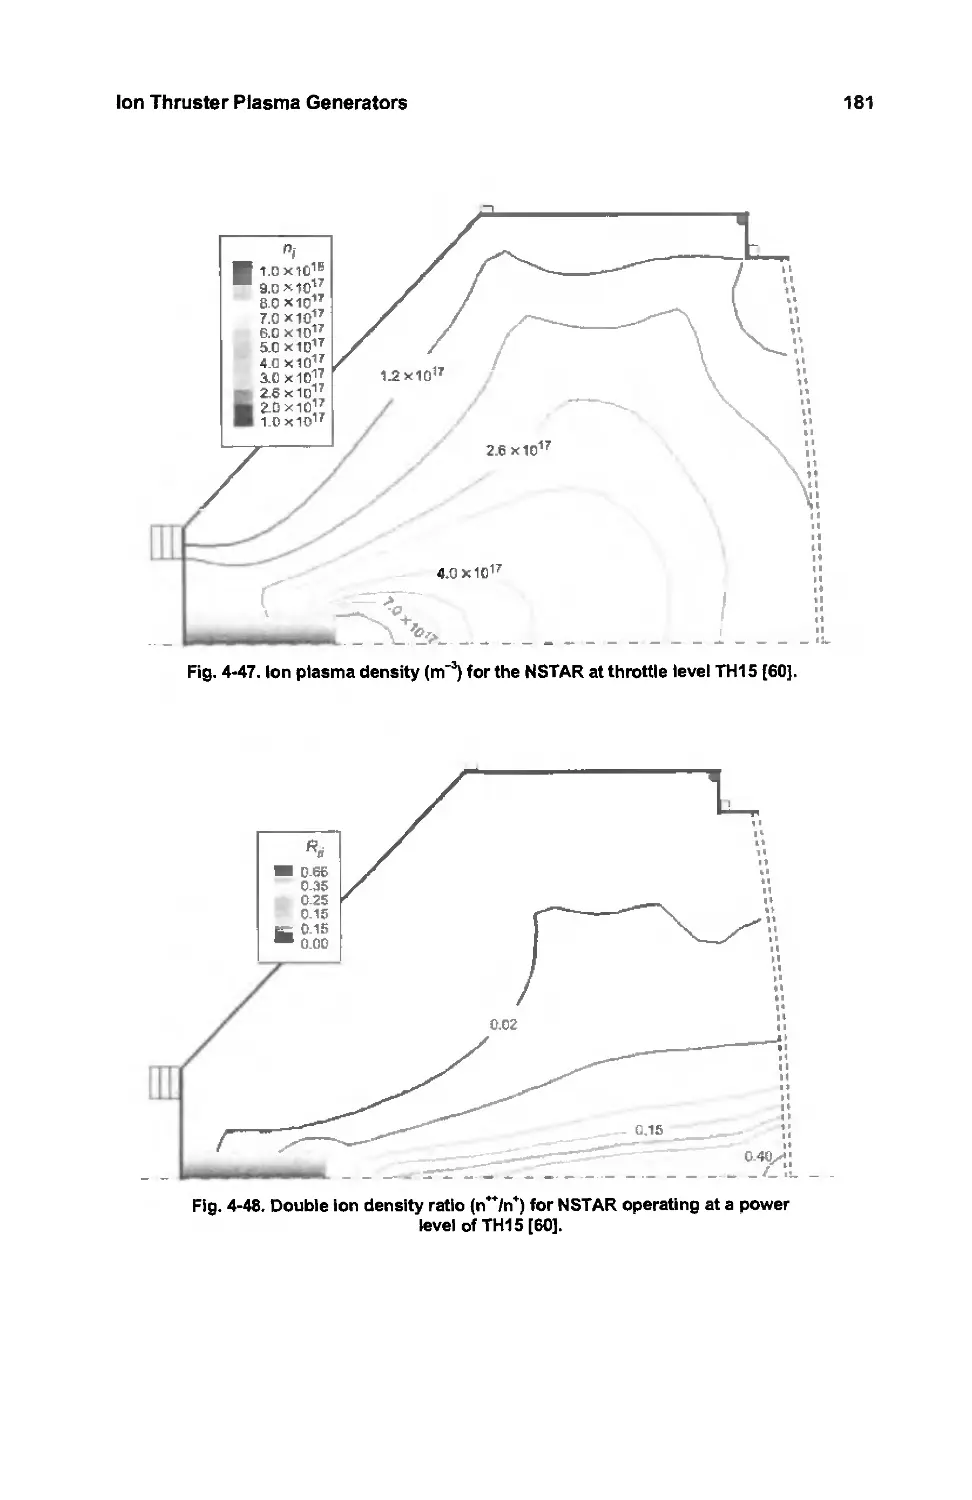
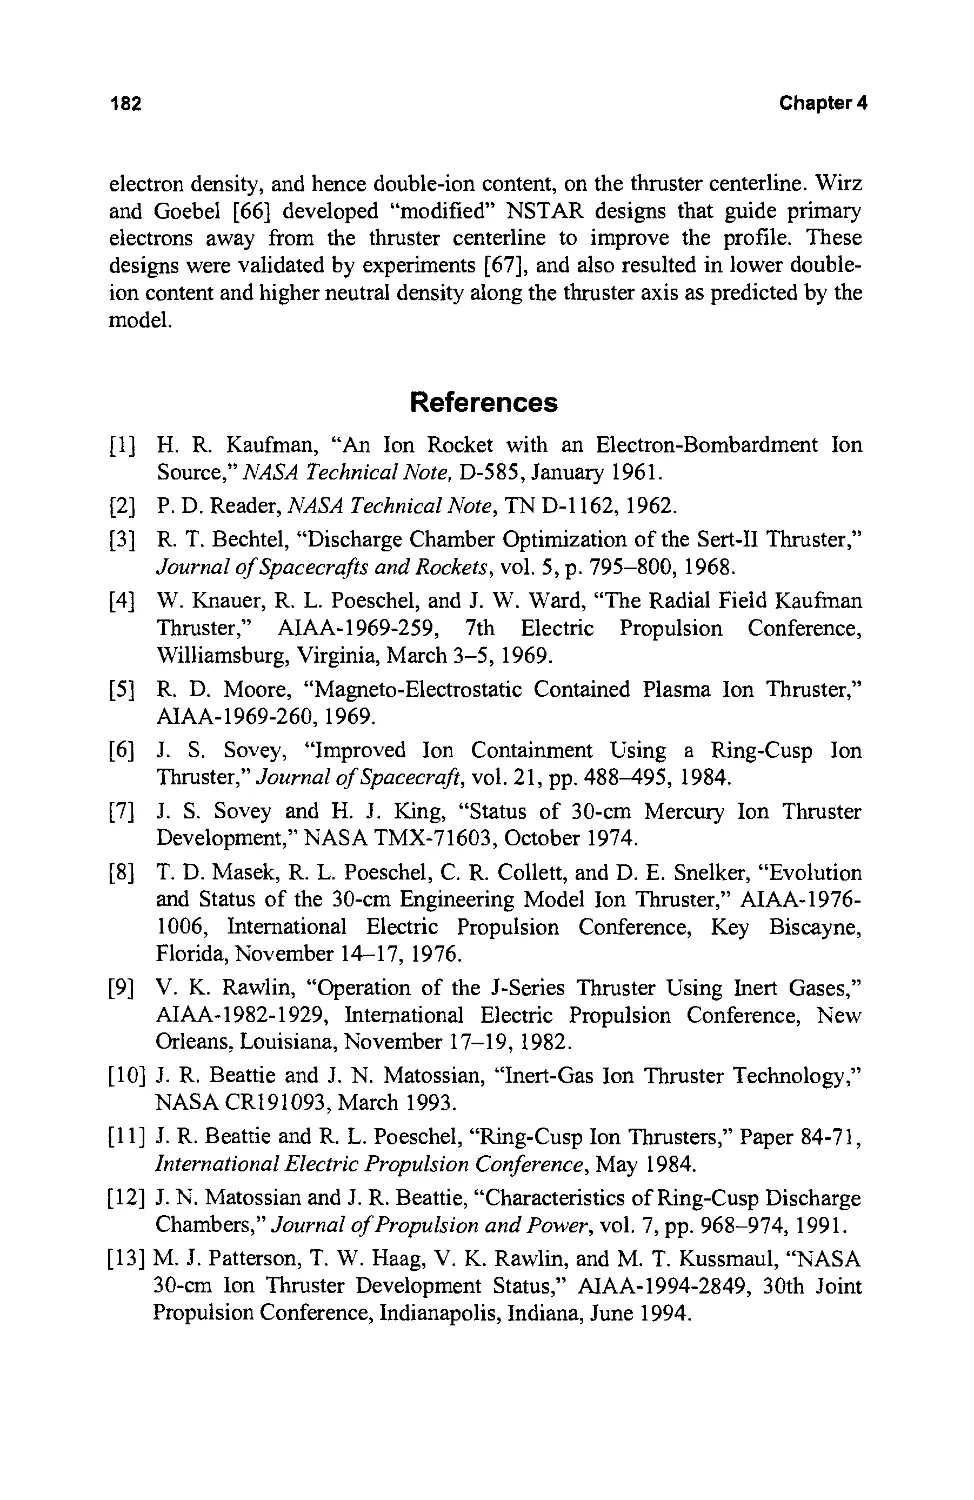
4.7.3 Discharge Chamber Model Results 179
References 182
Problems 187
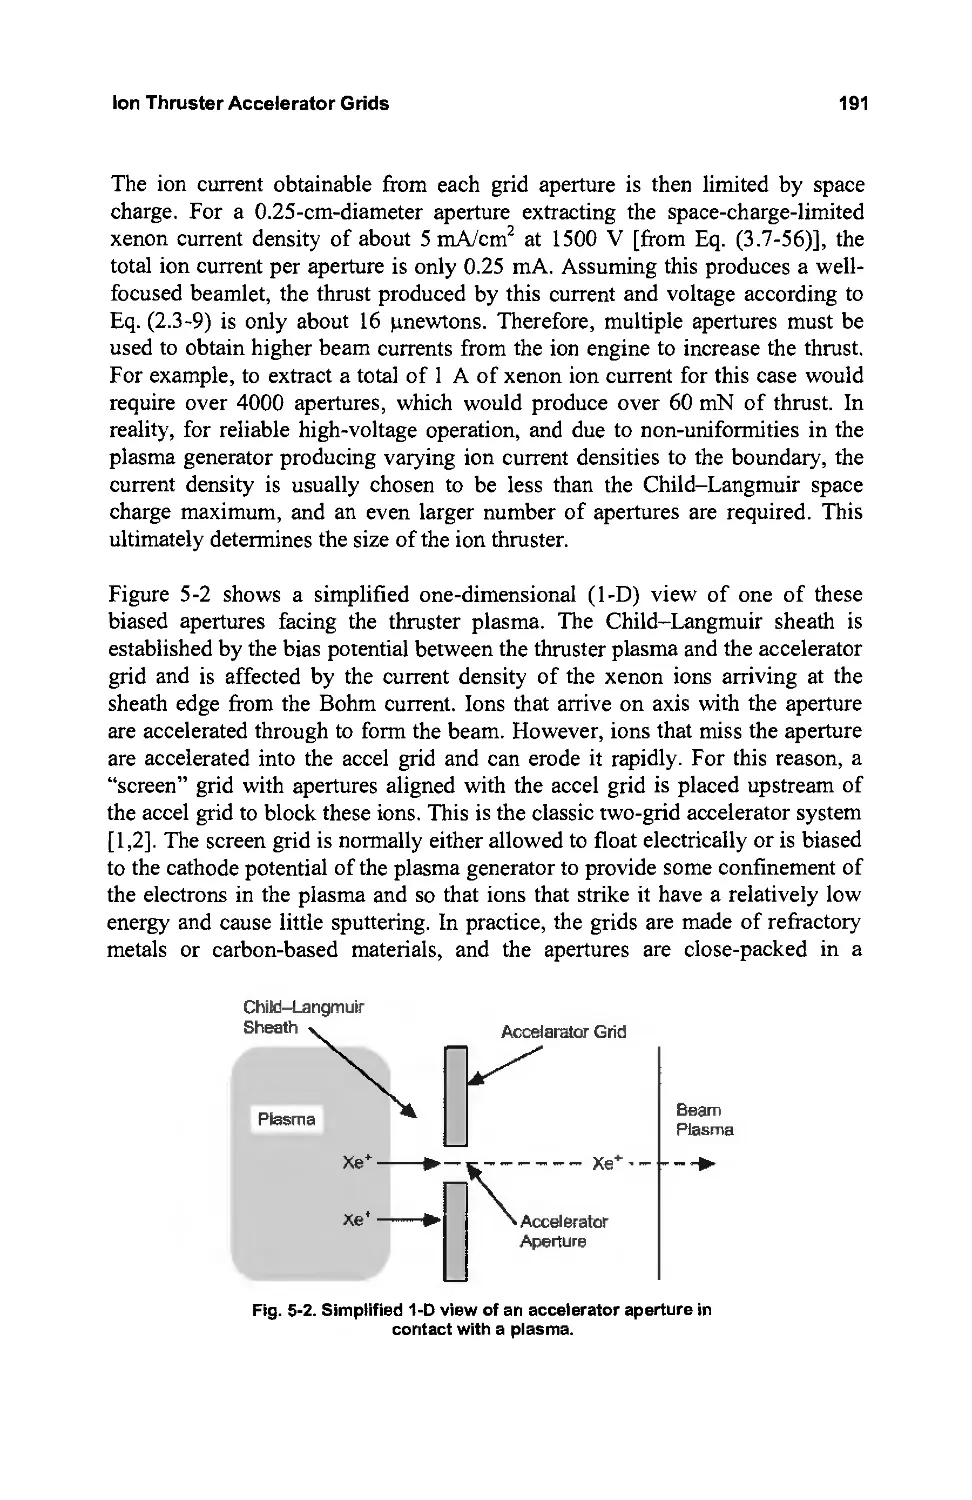
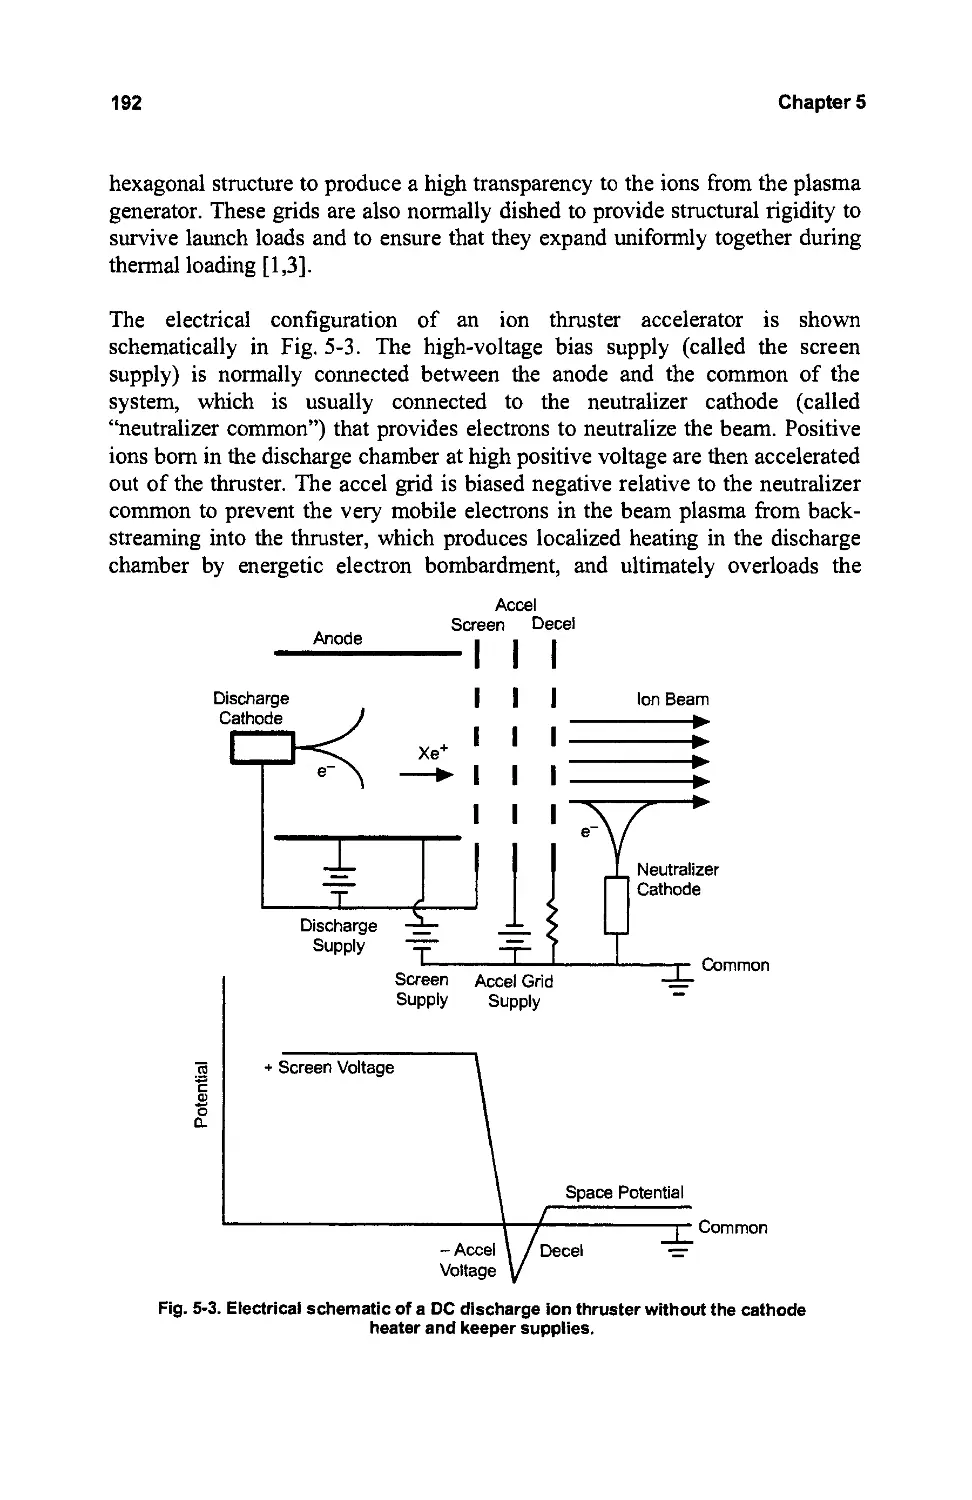
Chapter 5: Ion Thruster Accelerator Grids 189
5.1 Grid Configurations 190
5.2 Ion Accelerator Basics 196
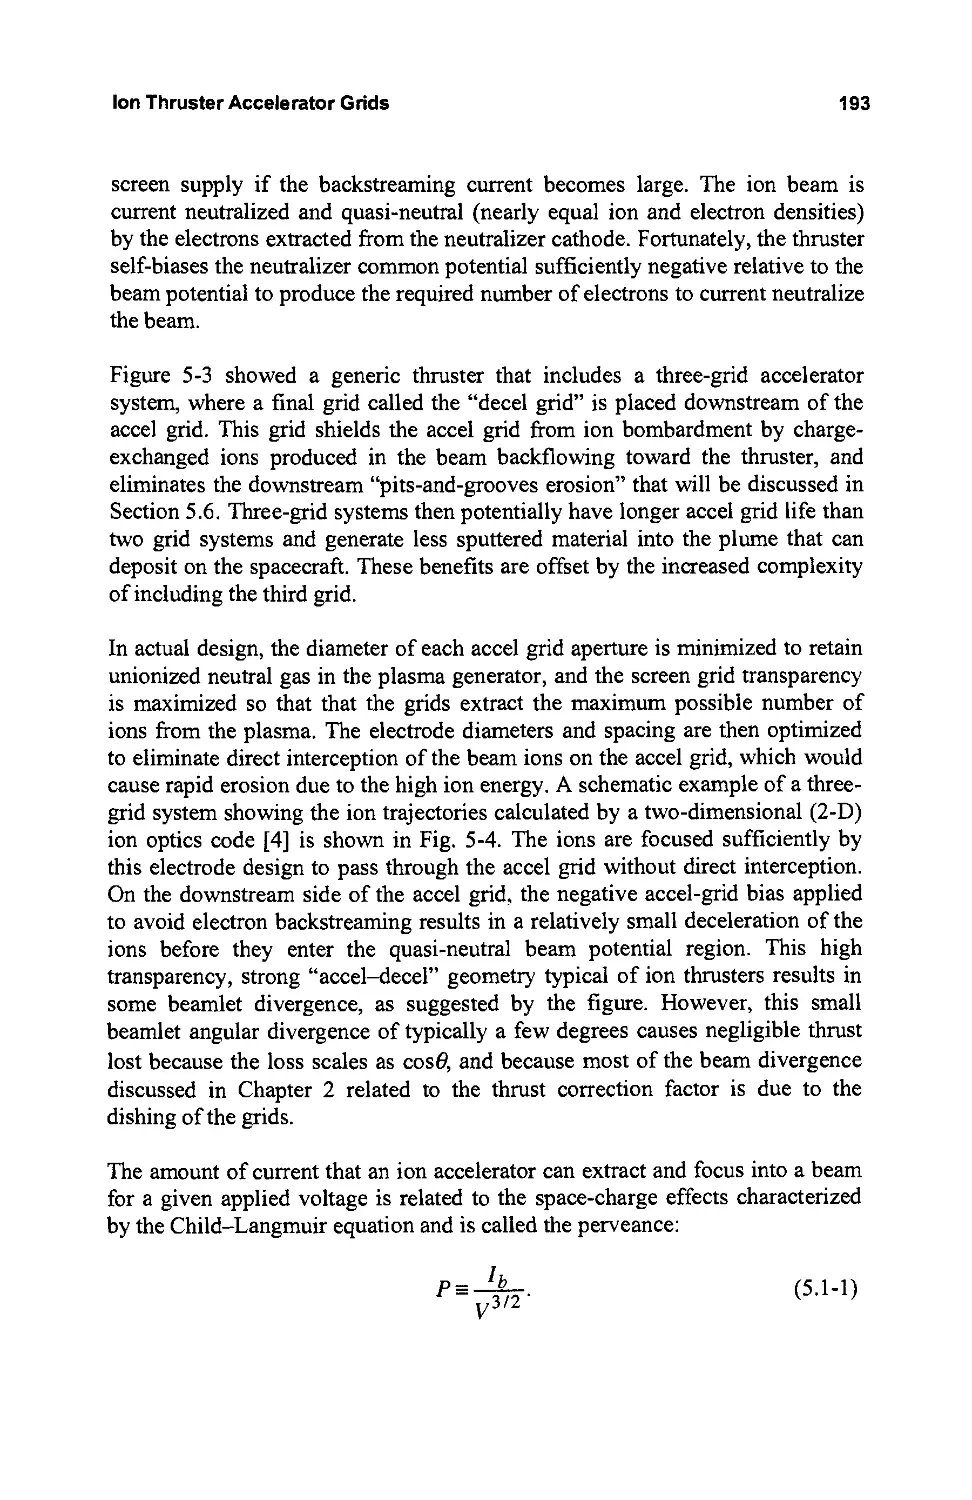
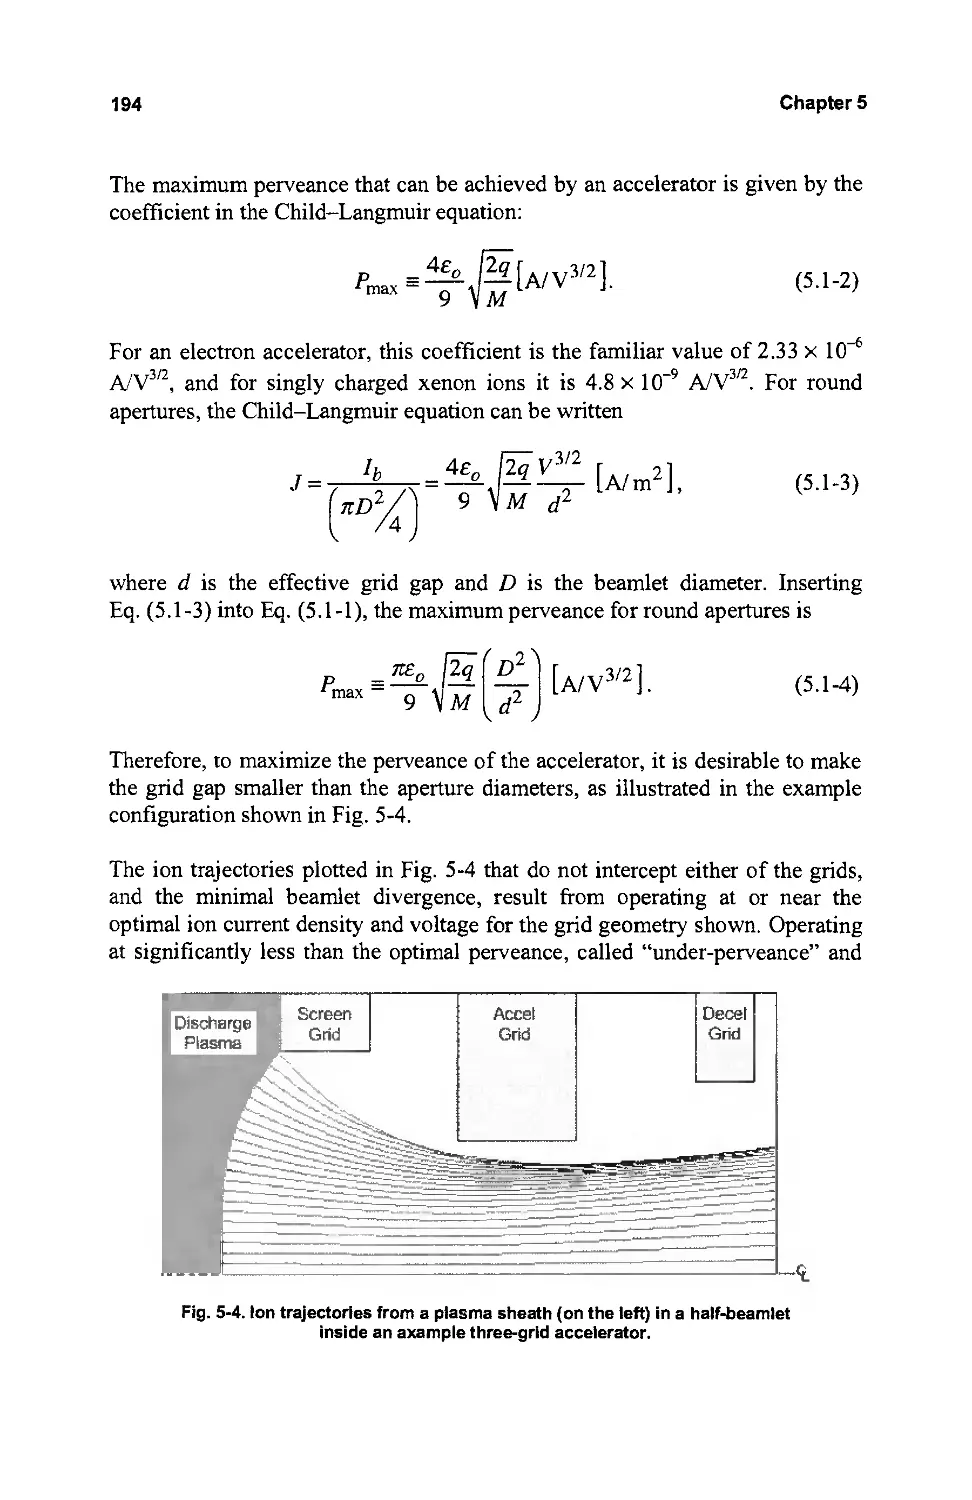
5.3 Ion Optics 200
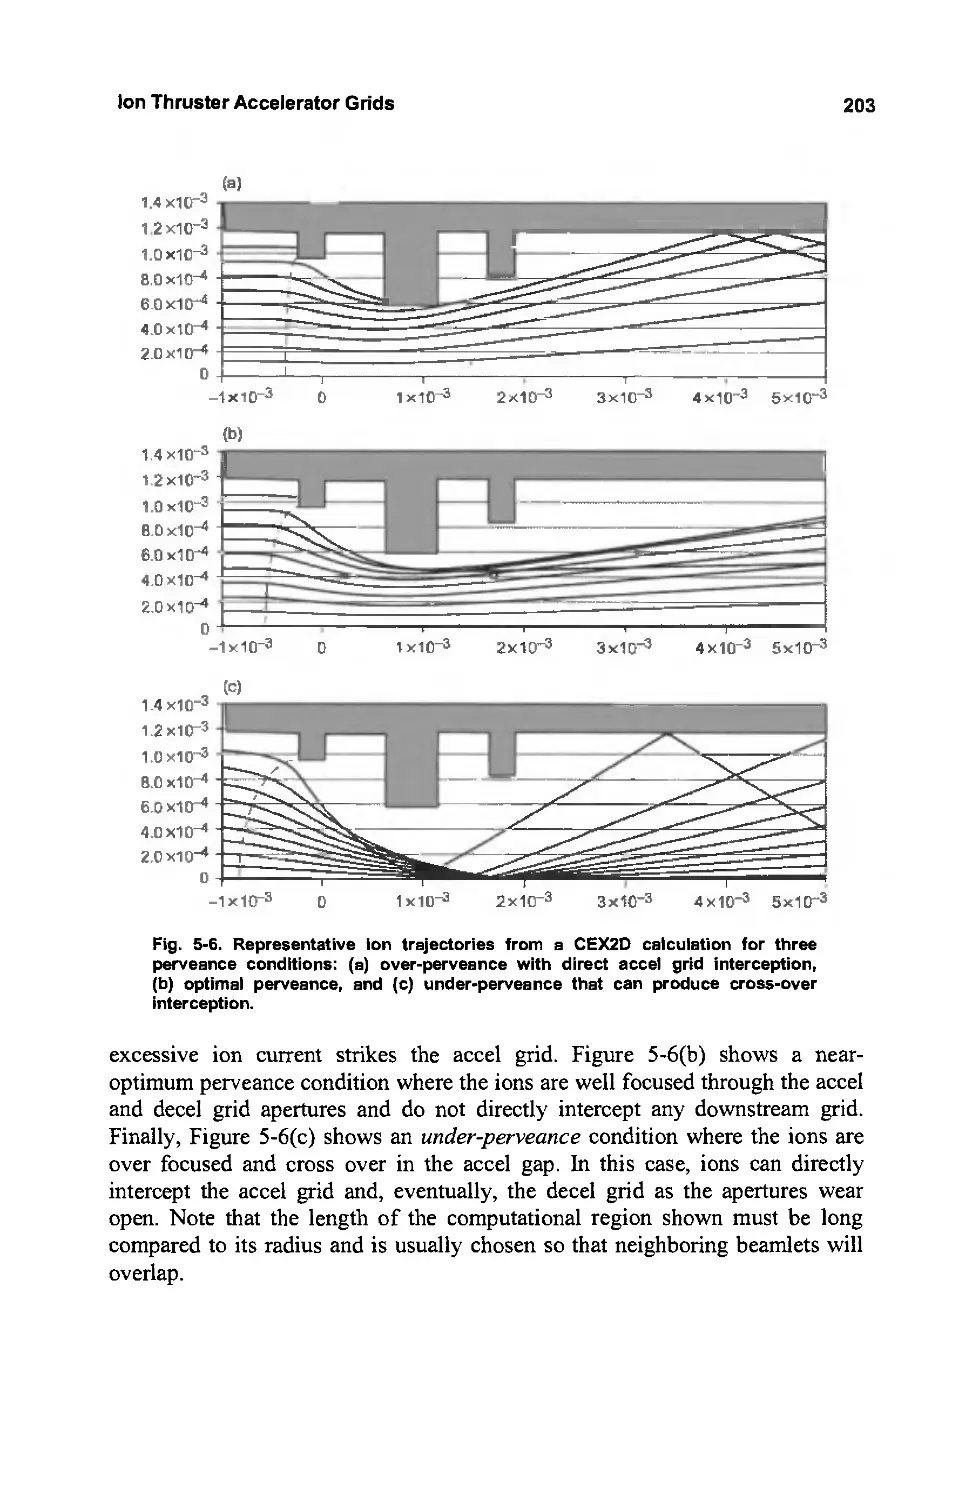
5.3.1 Ion Trajectories 200
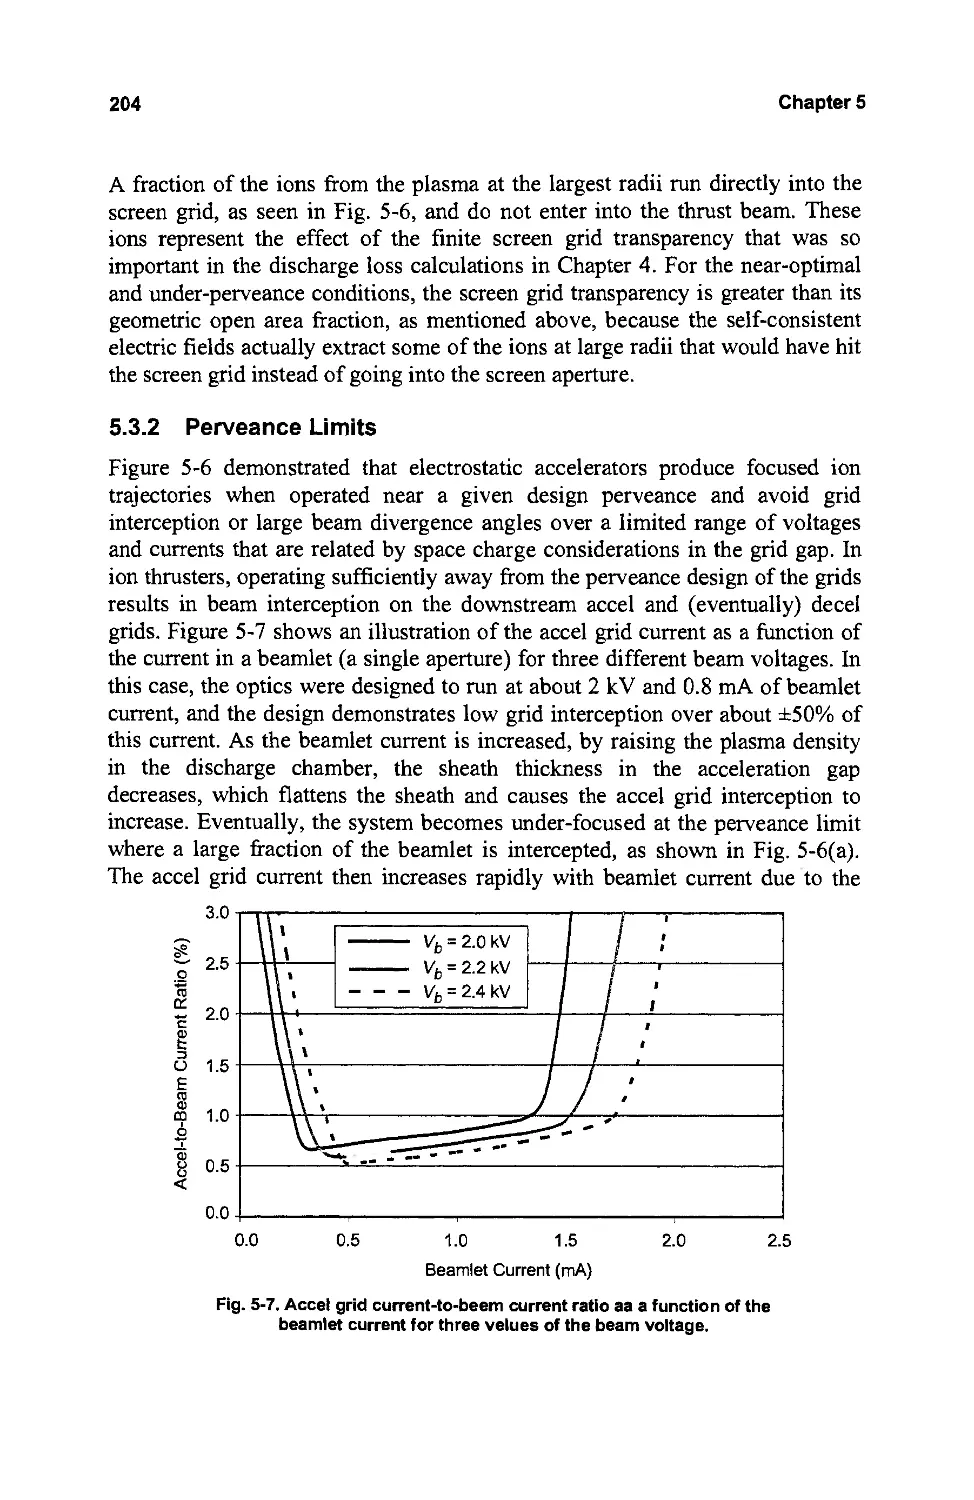
5.3.2 Perveance Limits 204
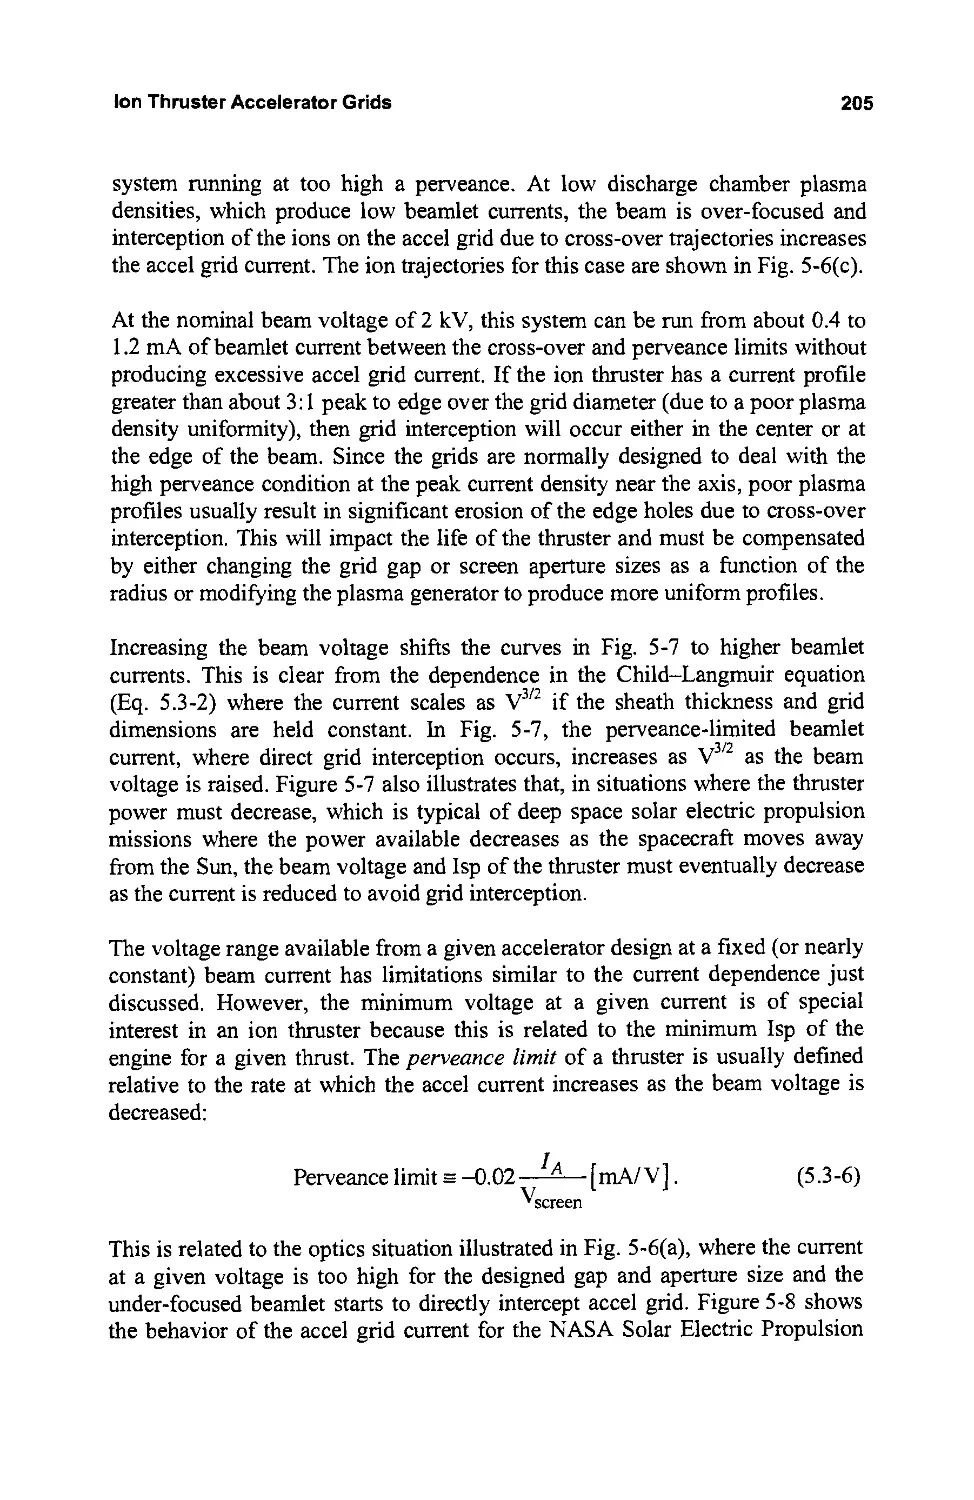
5.3.3 Grid Expansion and Alignment 206
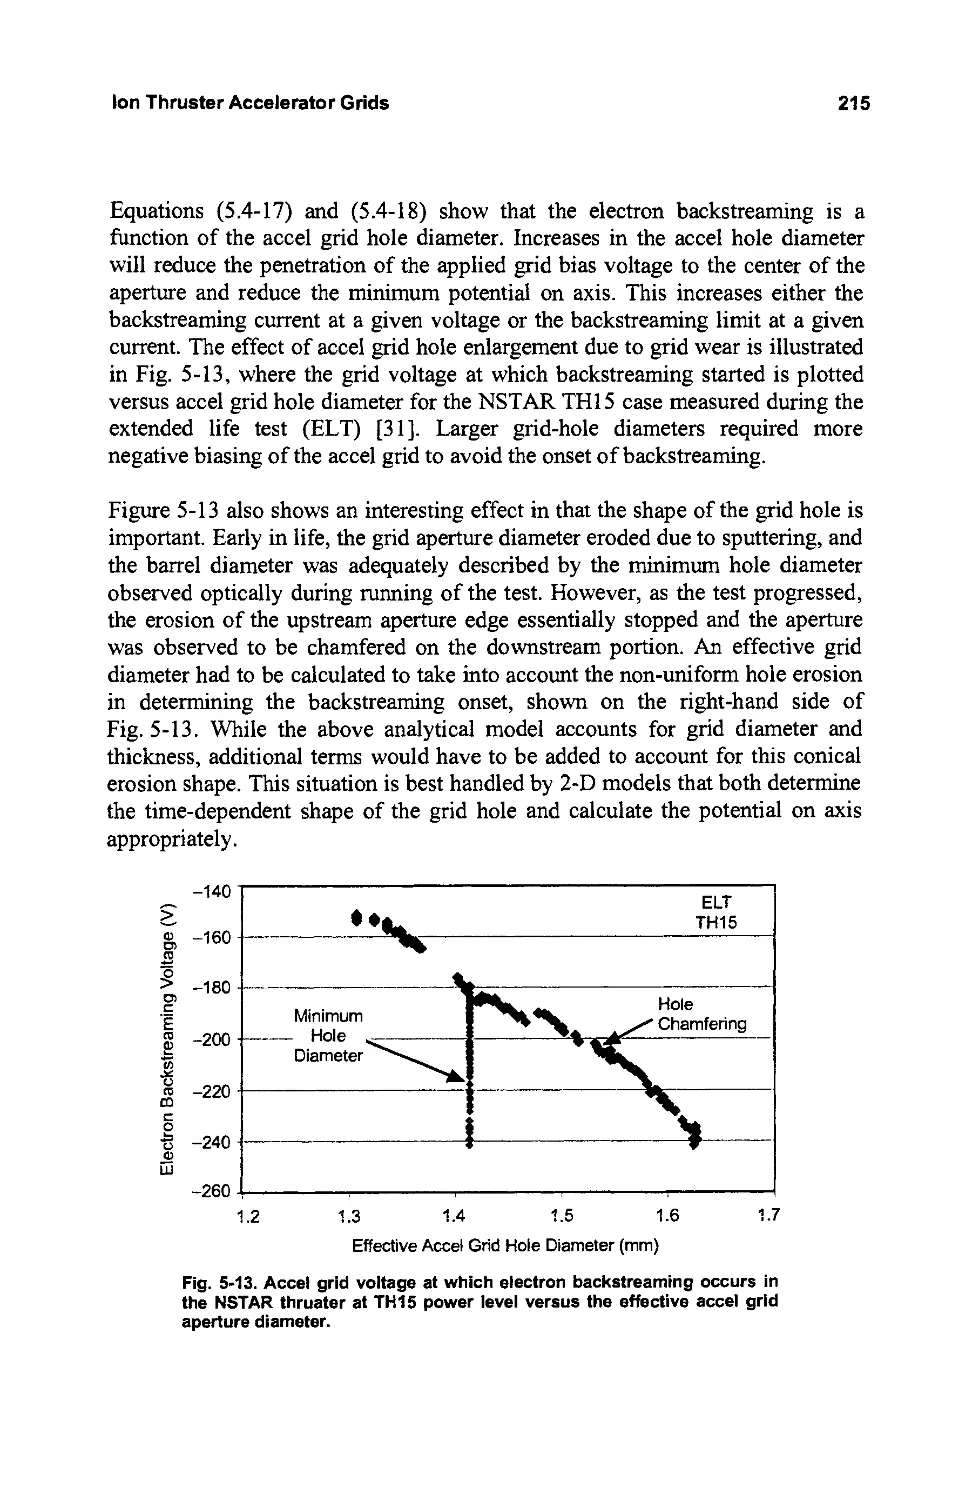
5.4 Electron Backstreaming 208
5.5 High-Voltage Considerations 216
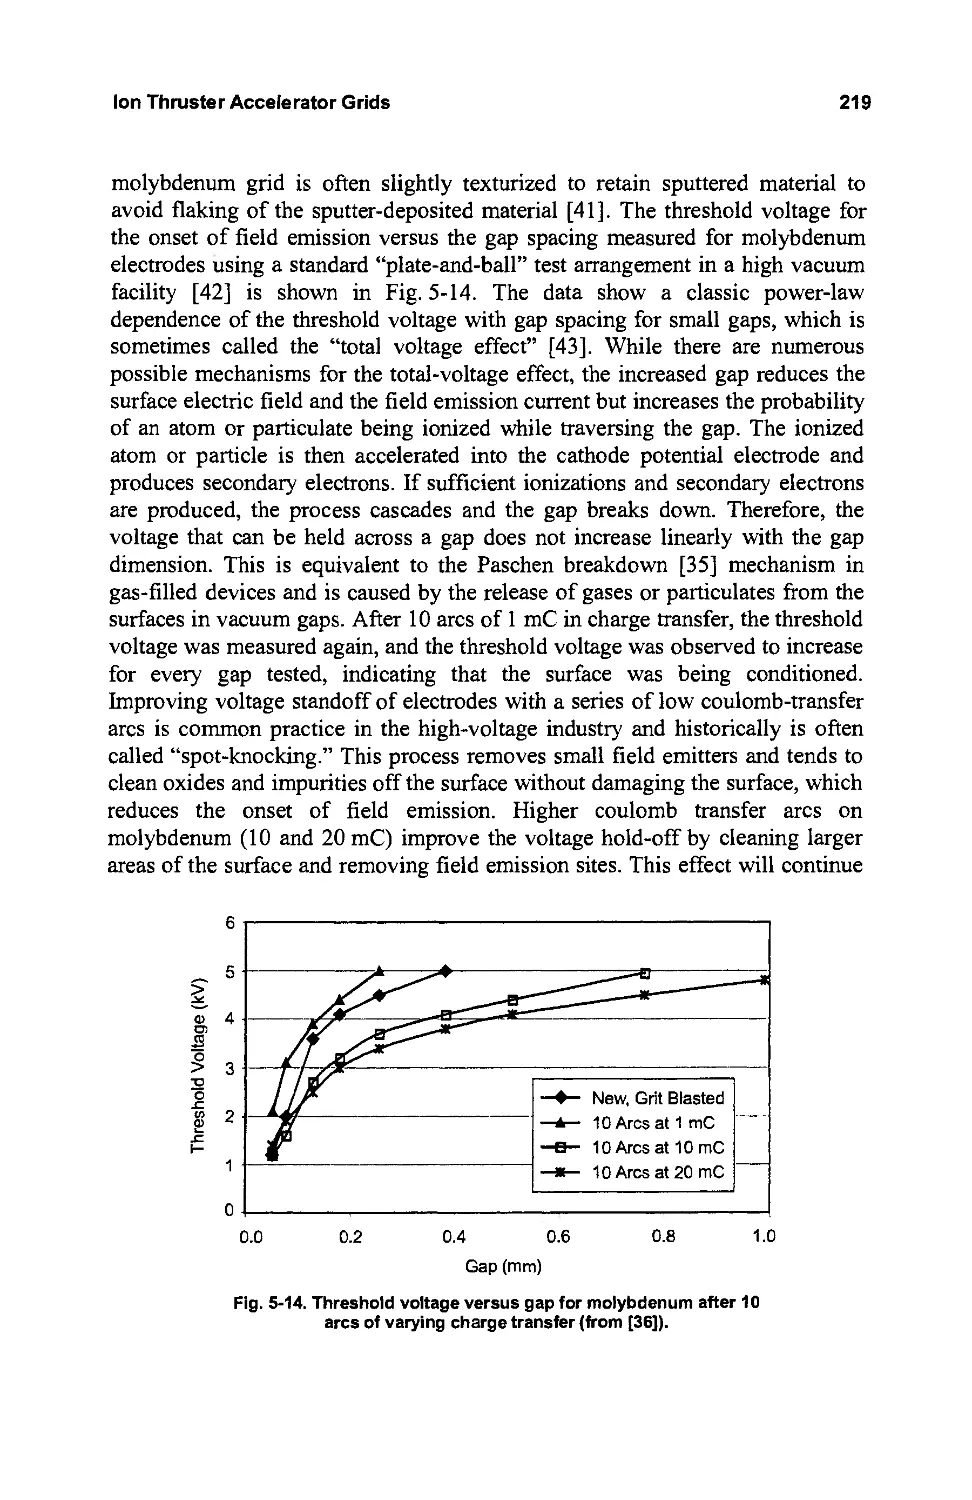
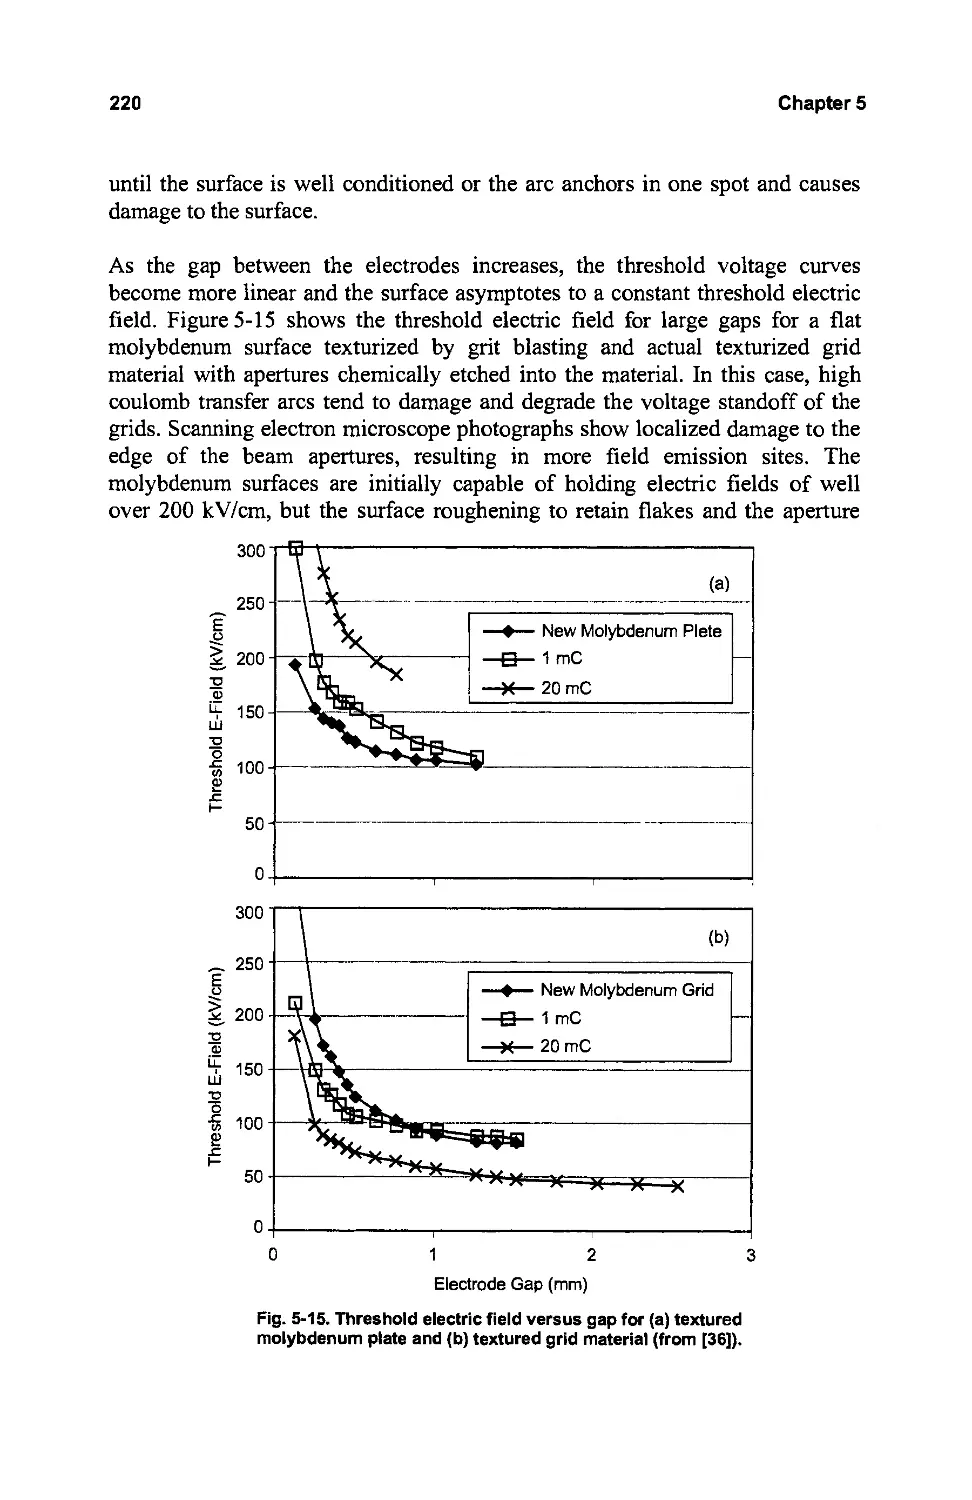
5.5.1 Electrode Breakdown 217
Contents
vii
5.5.2 Molybdenum Electrodes
5.5.3 Carbon-Carbon Composite Materials
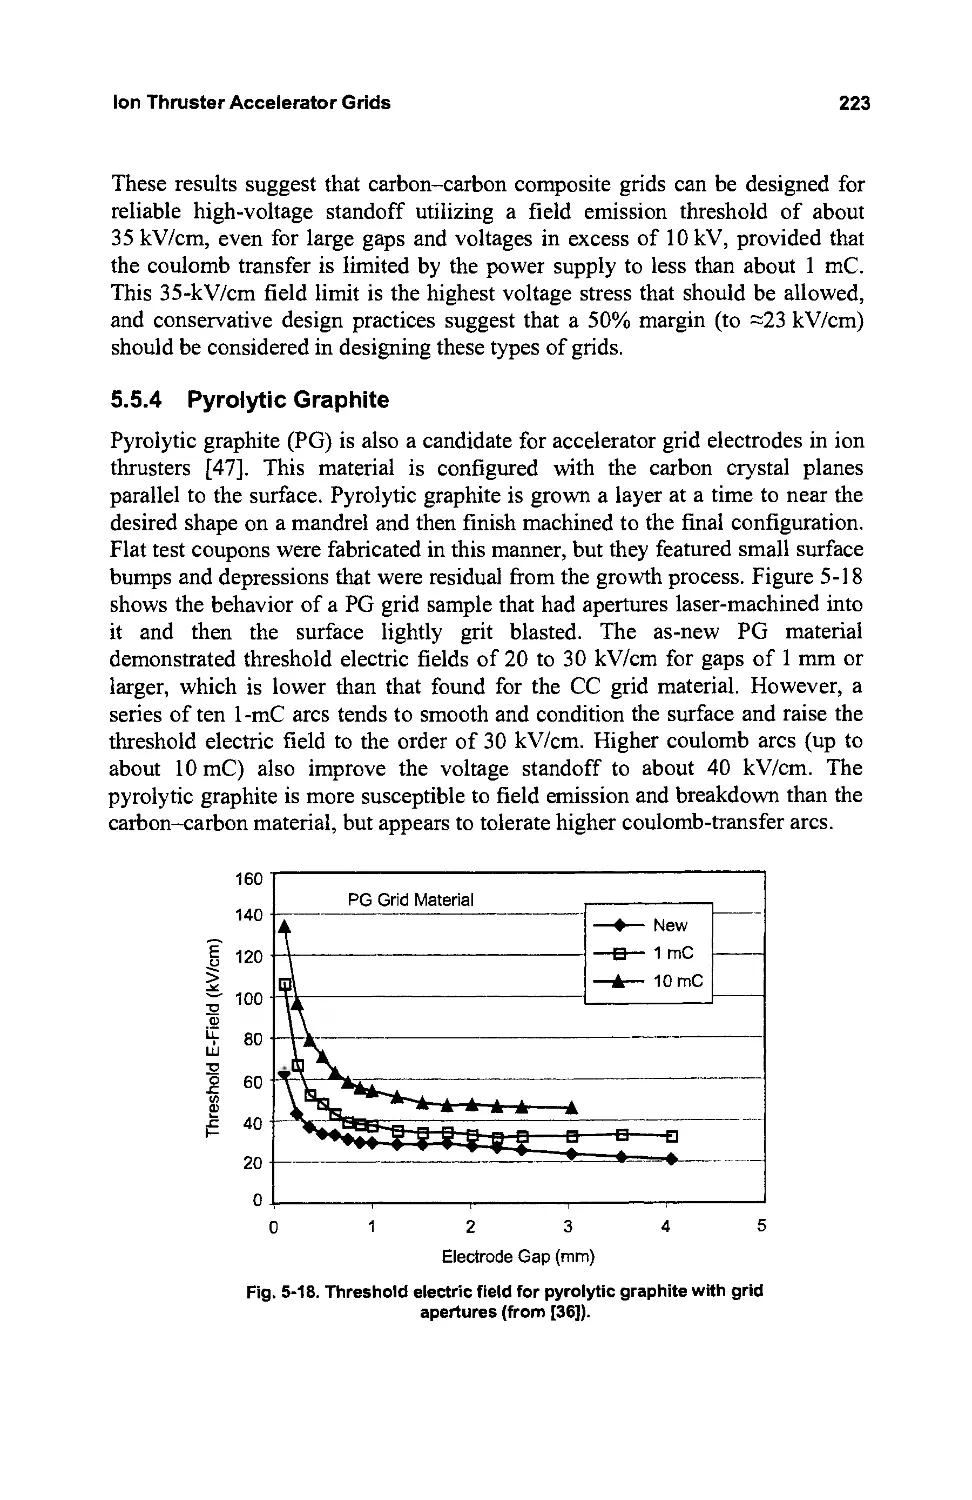
5.5.4 Pyrolytic Graphite
5.5.5 Hold-off and Conditioning in Ion Thrusters
5.6 Ion Accelerator Grid Life
5.6.1 Grid Models
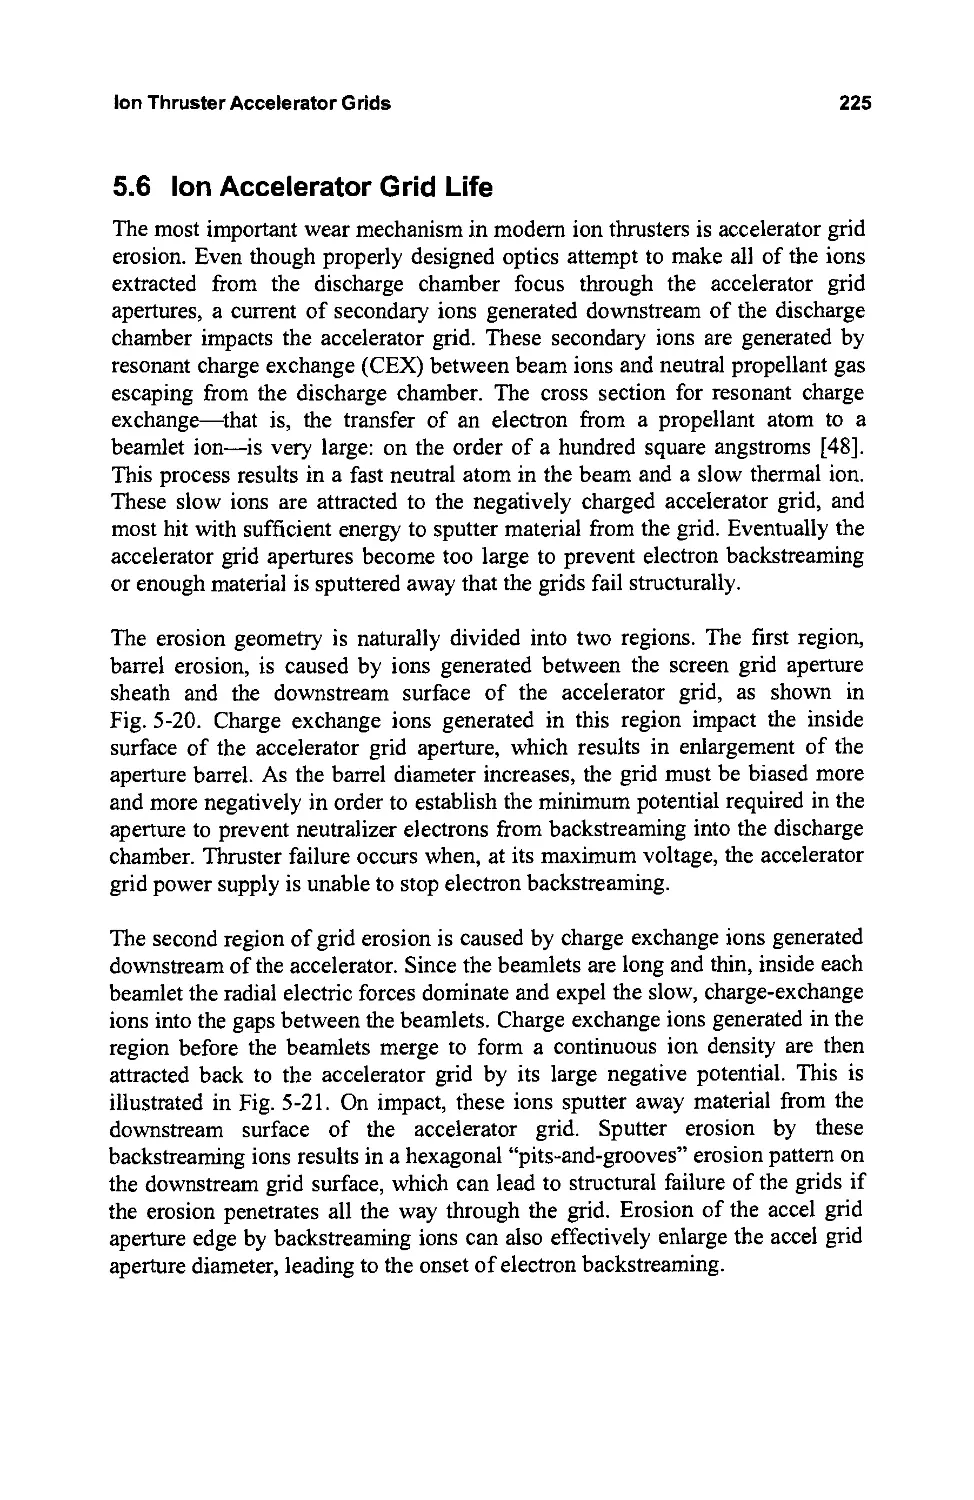
5.6.2 Barrel Erosion
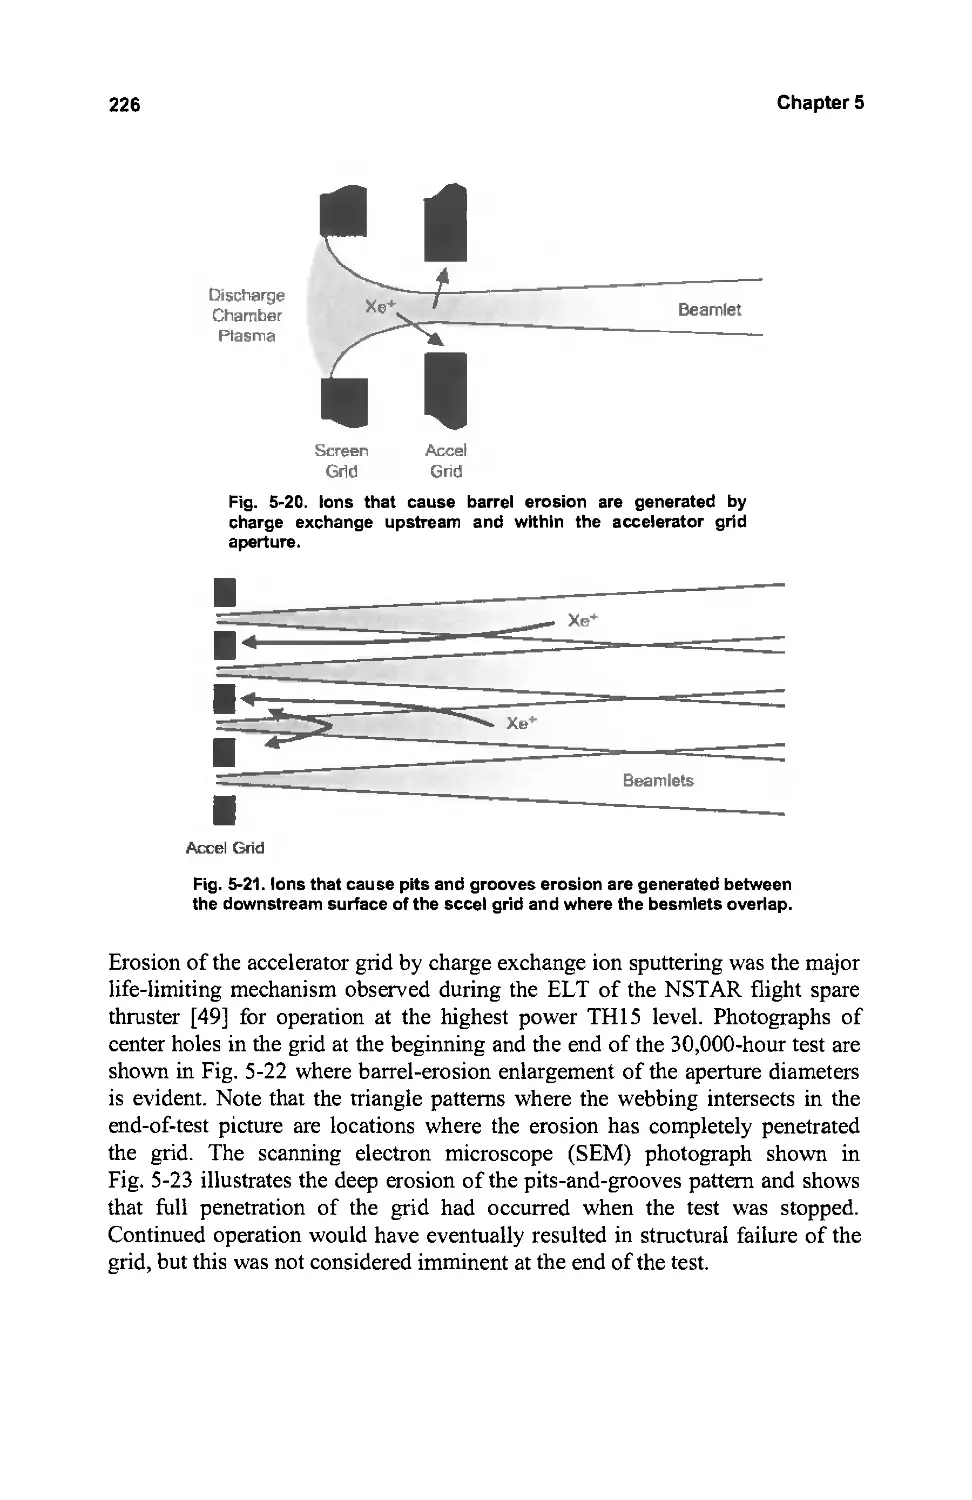
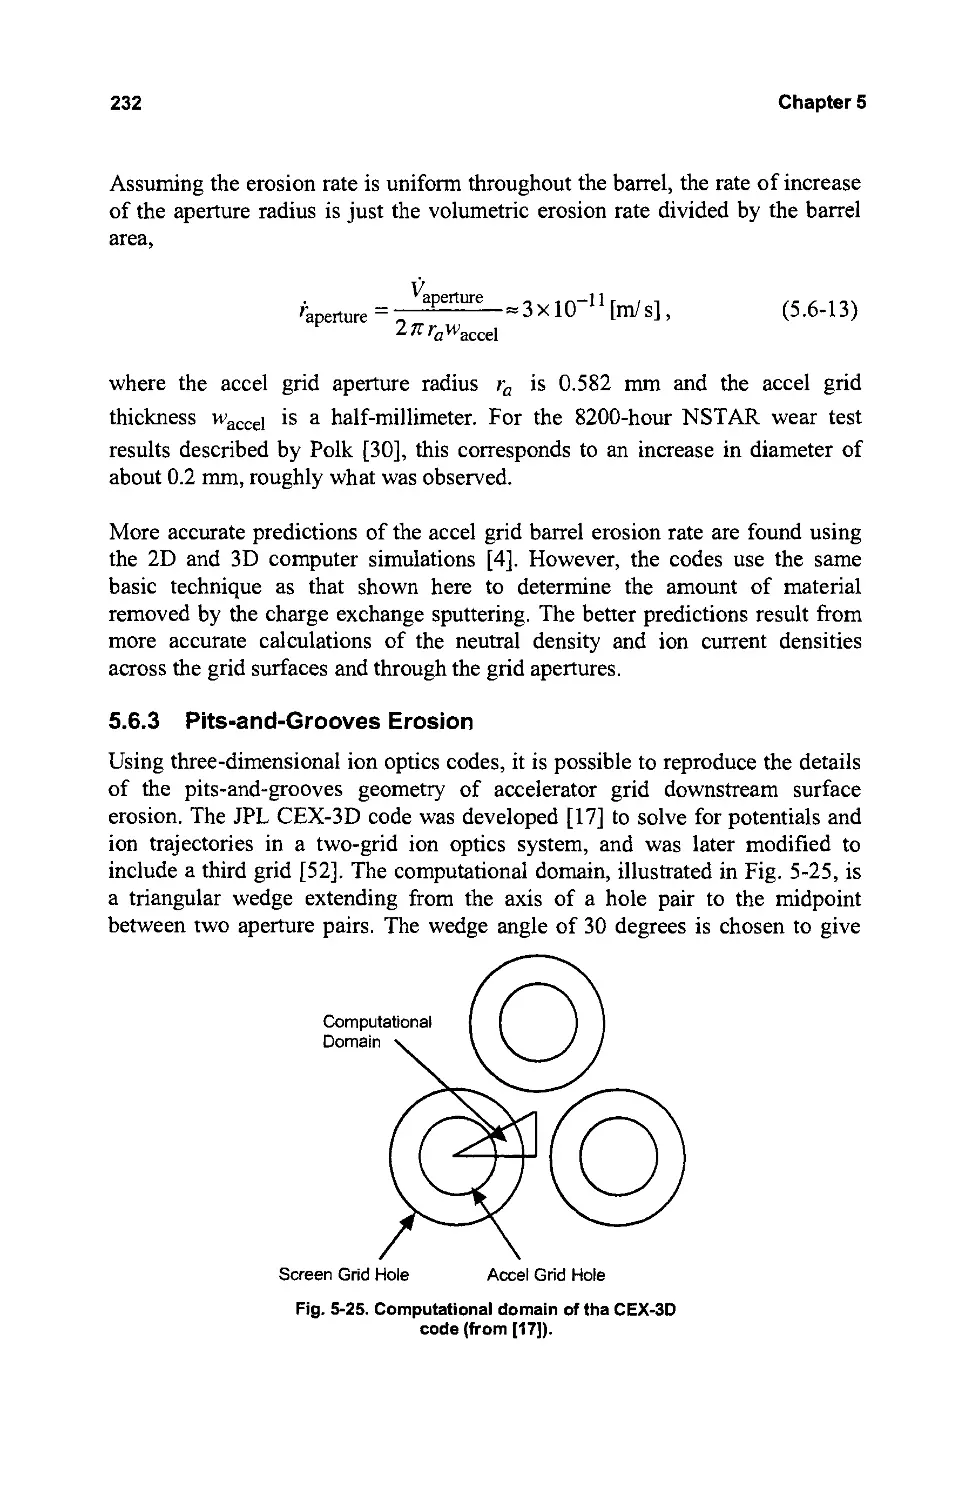
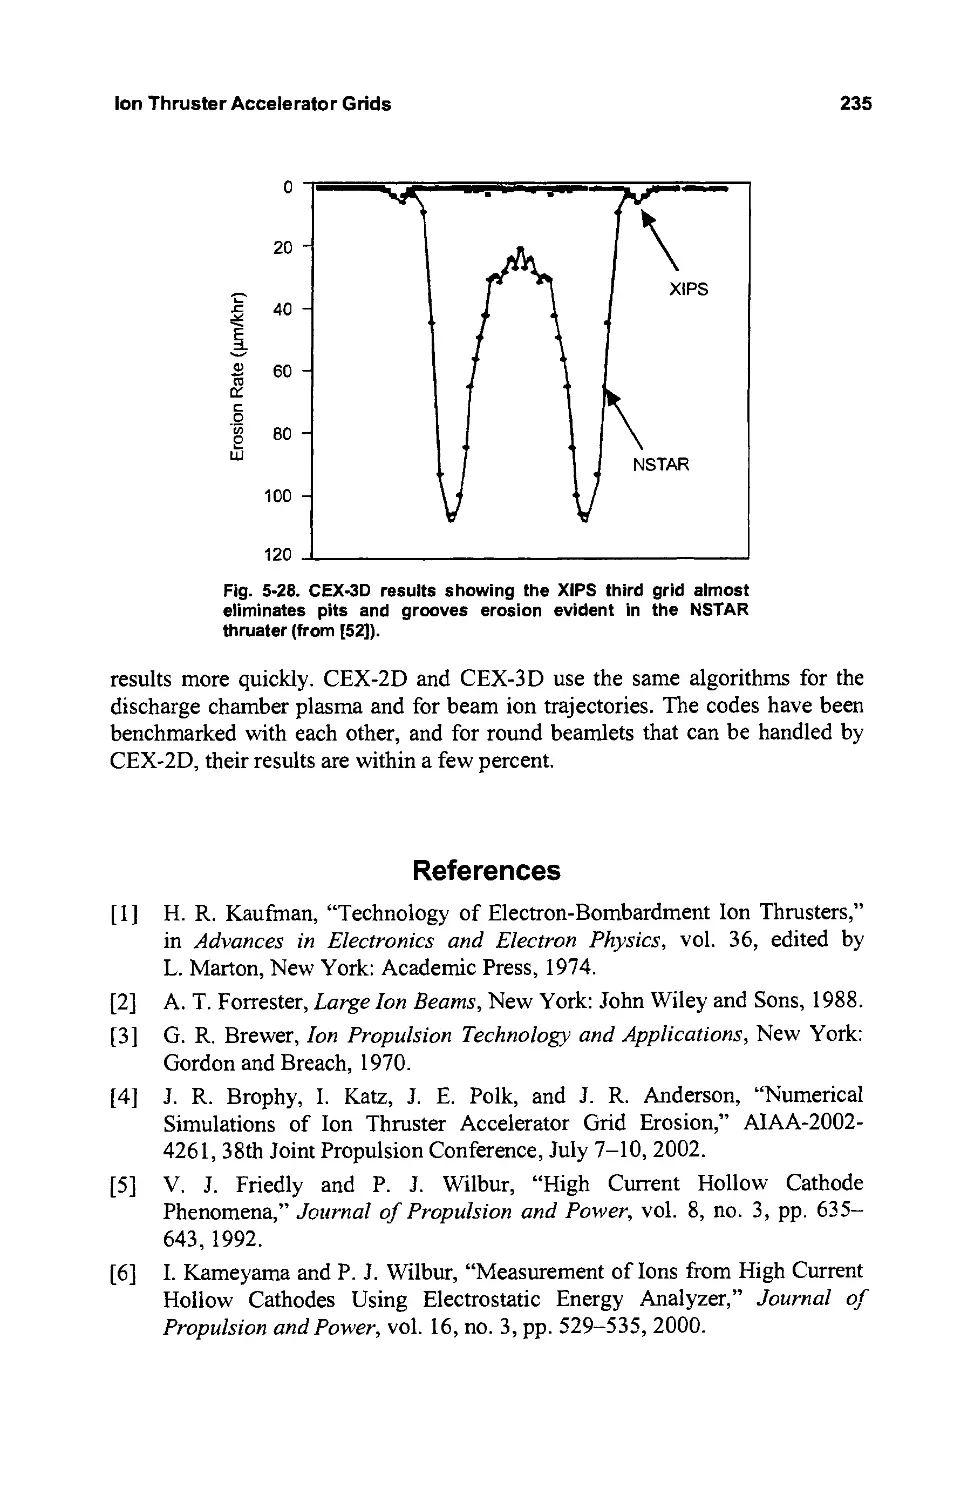
5.6.3 Pits-and-Grooves Erosion
References
Problems
218
221
223
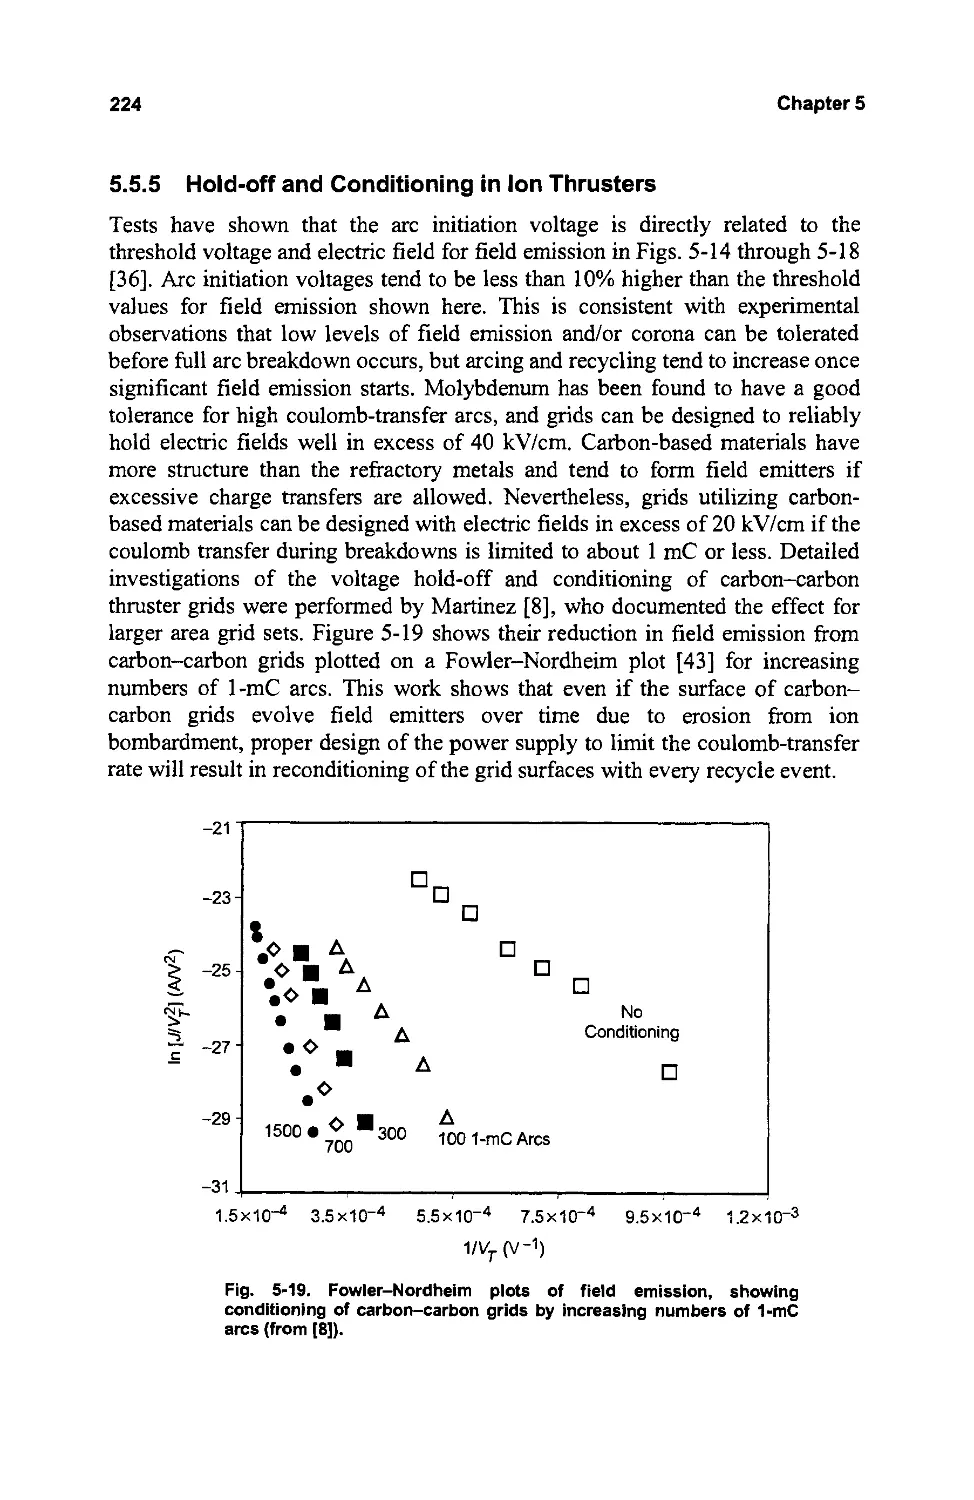
224
225
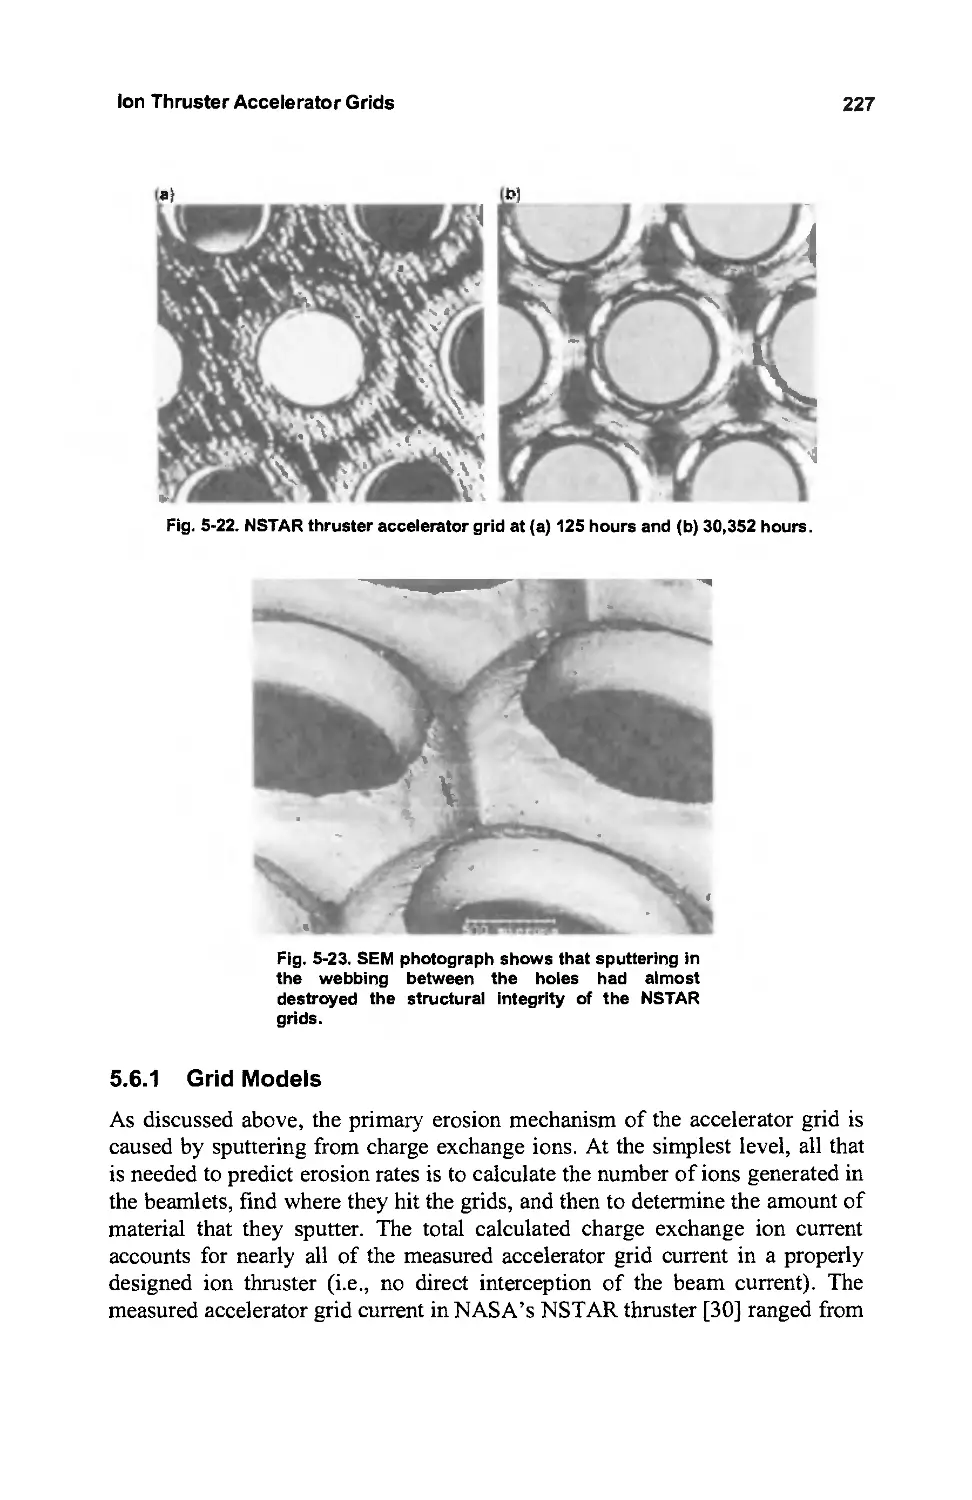
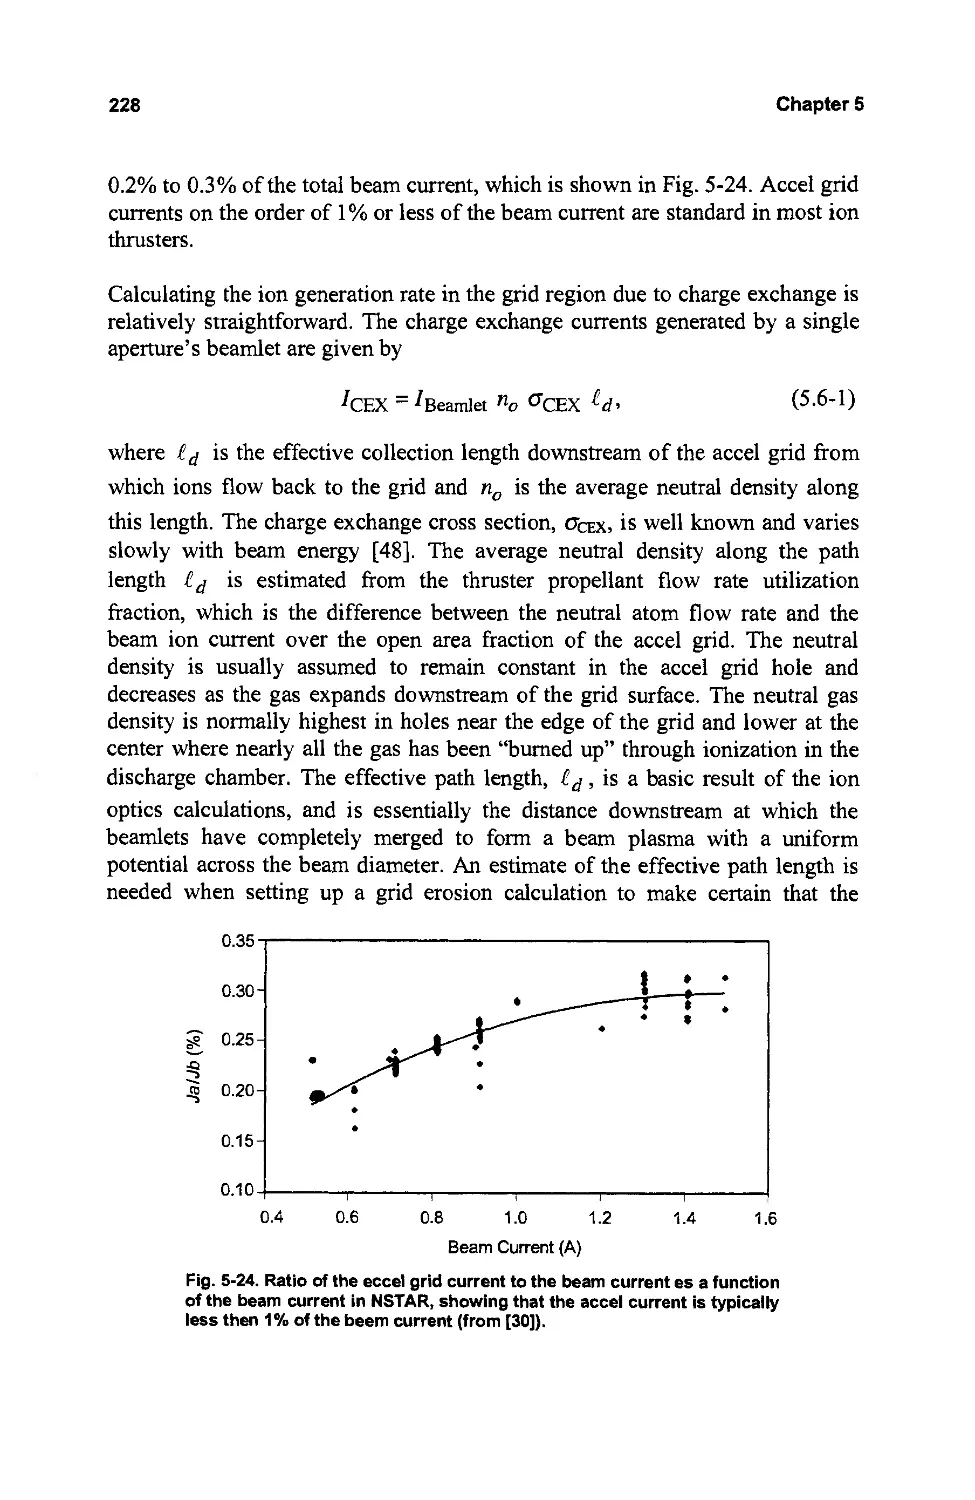
227
230
232
235
240
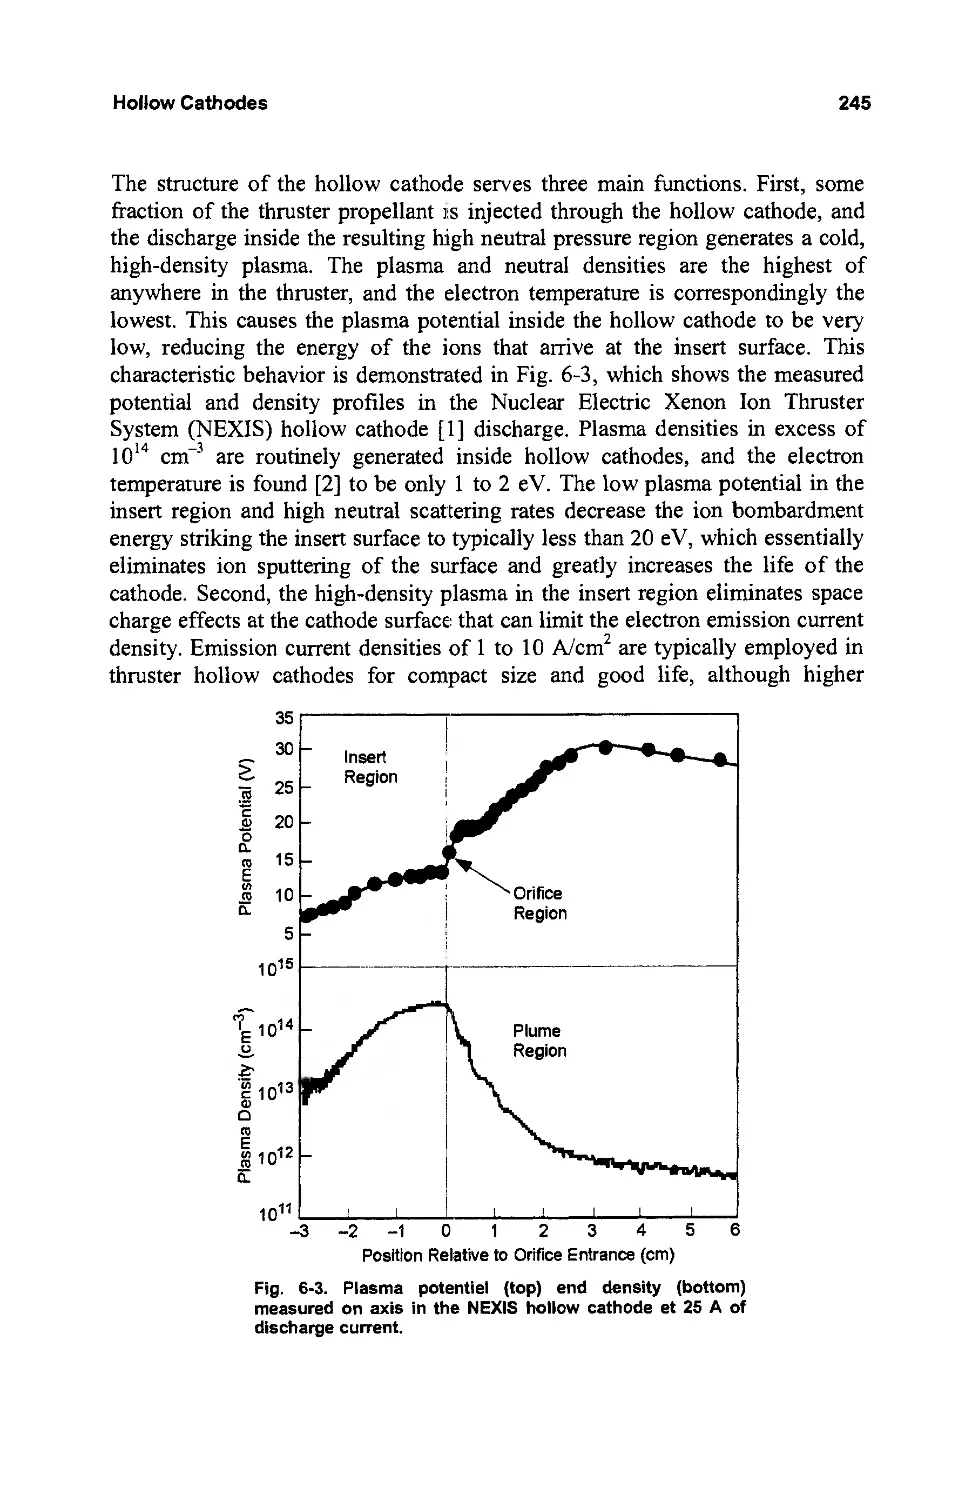
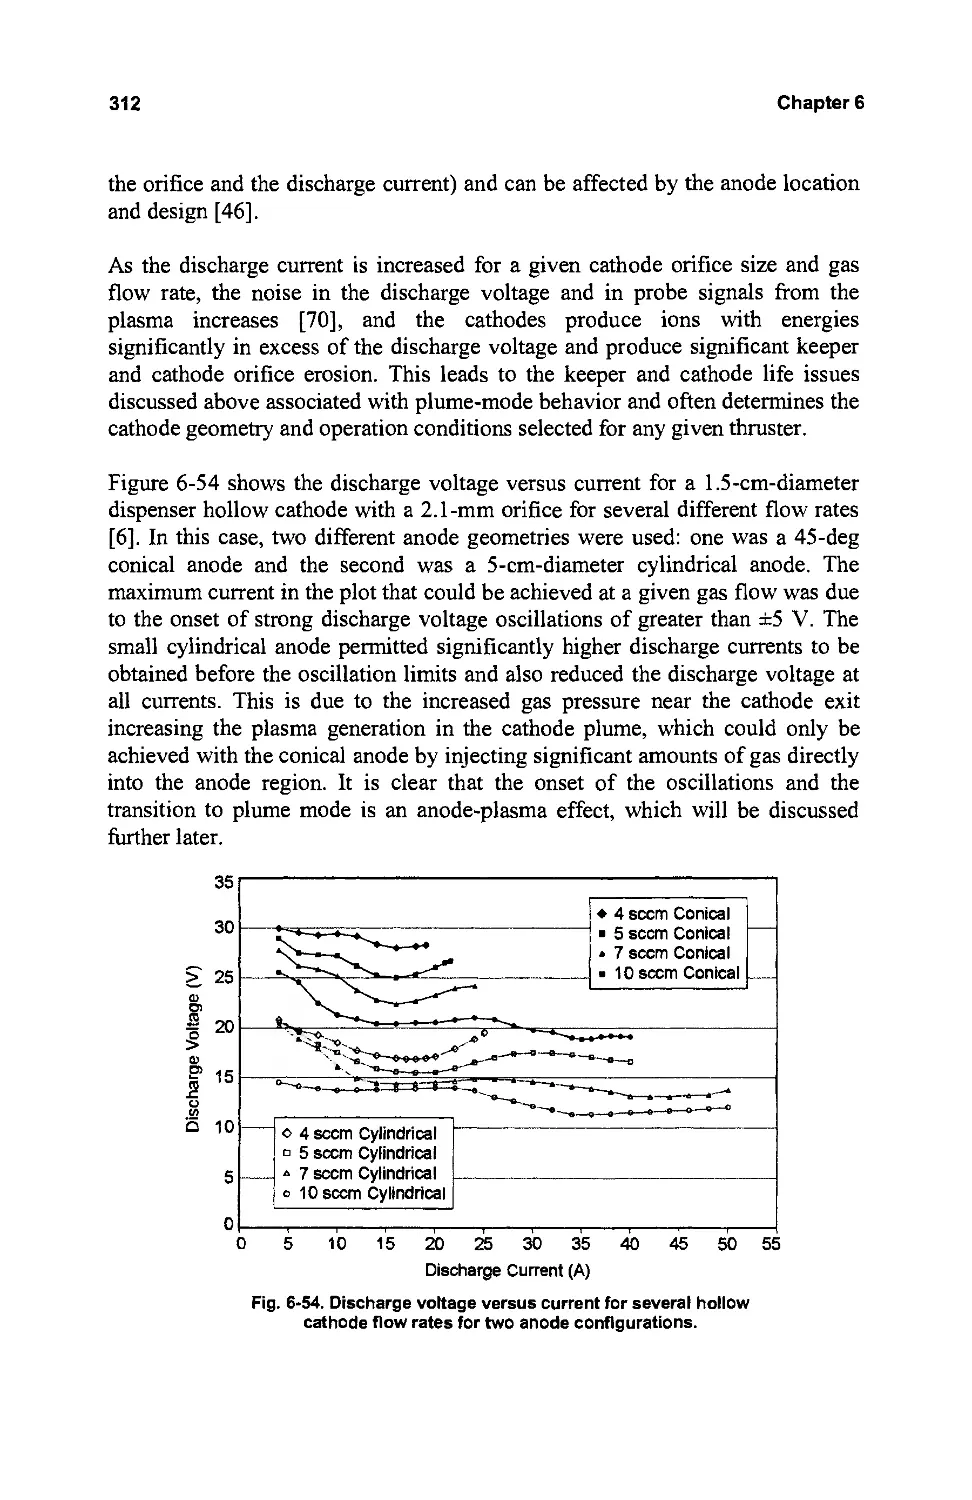
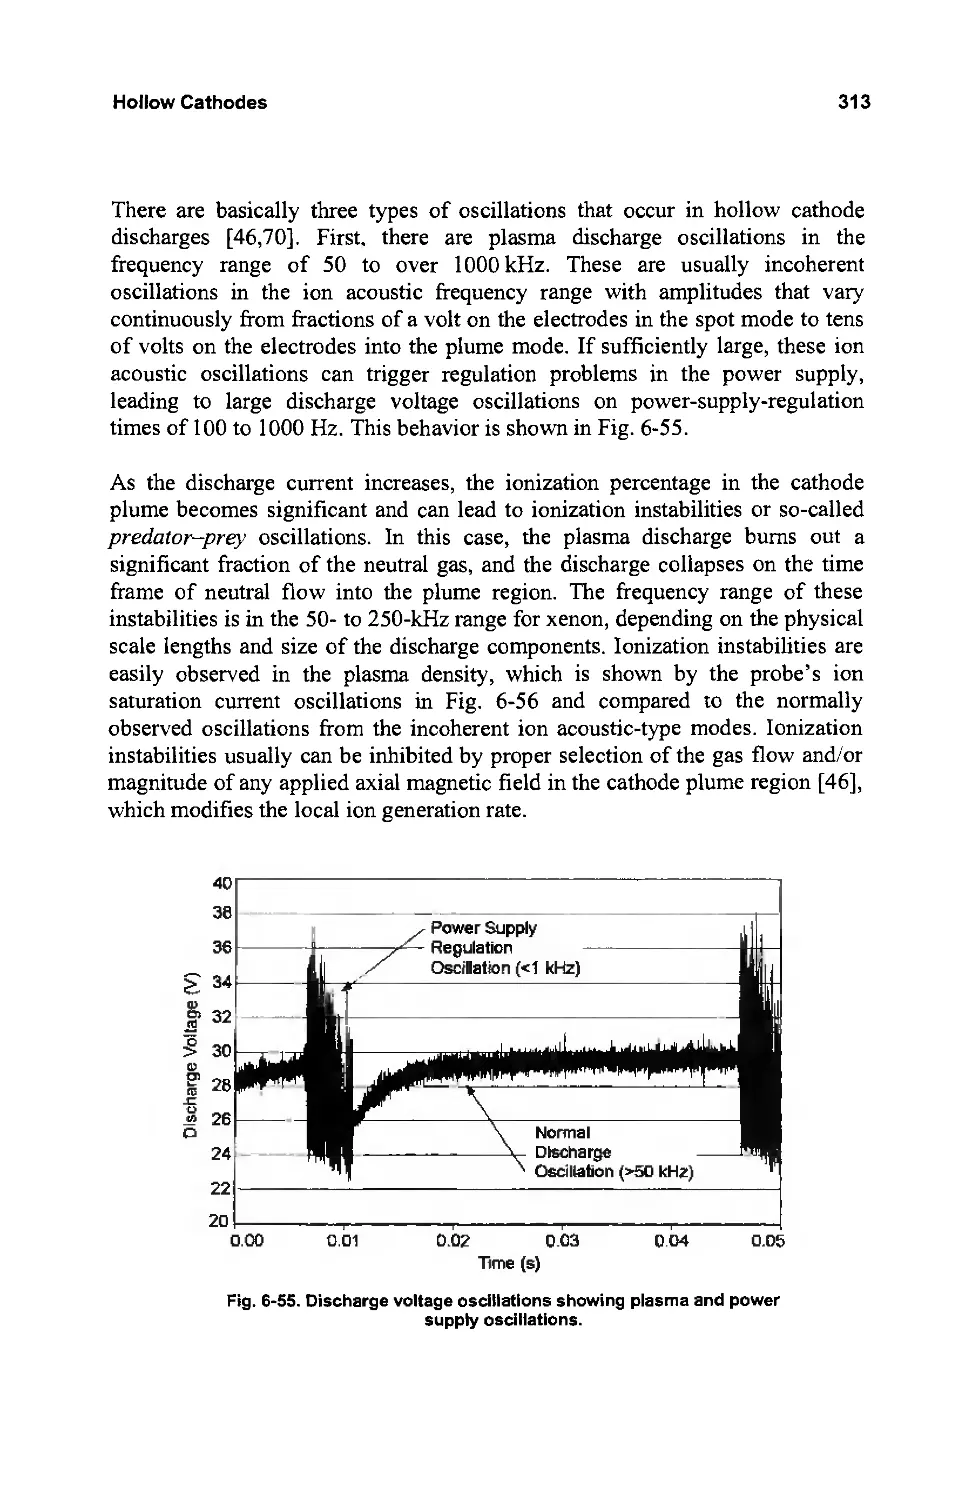
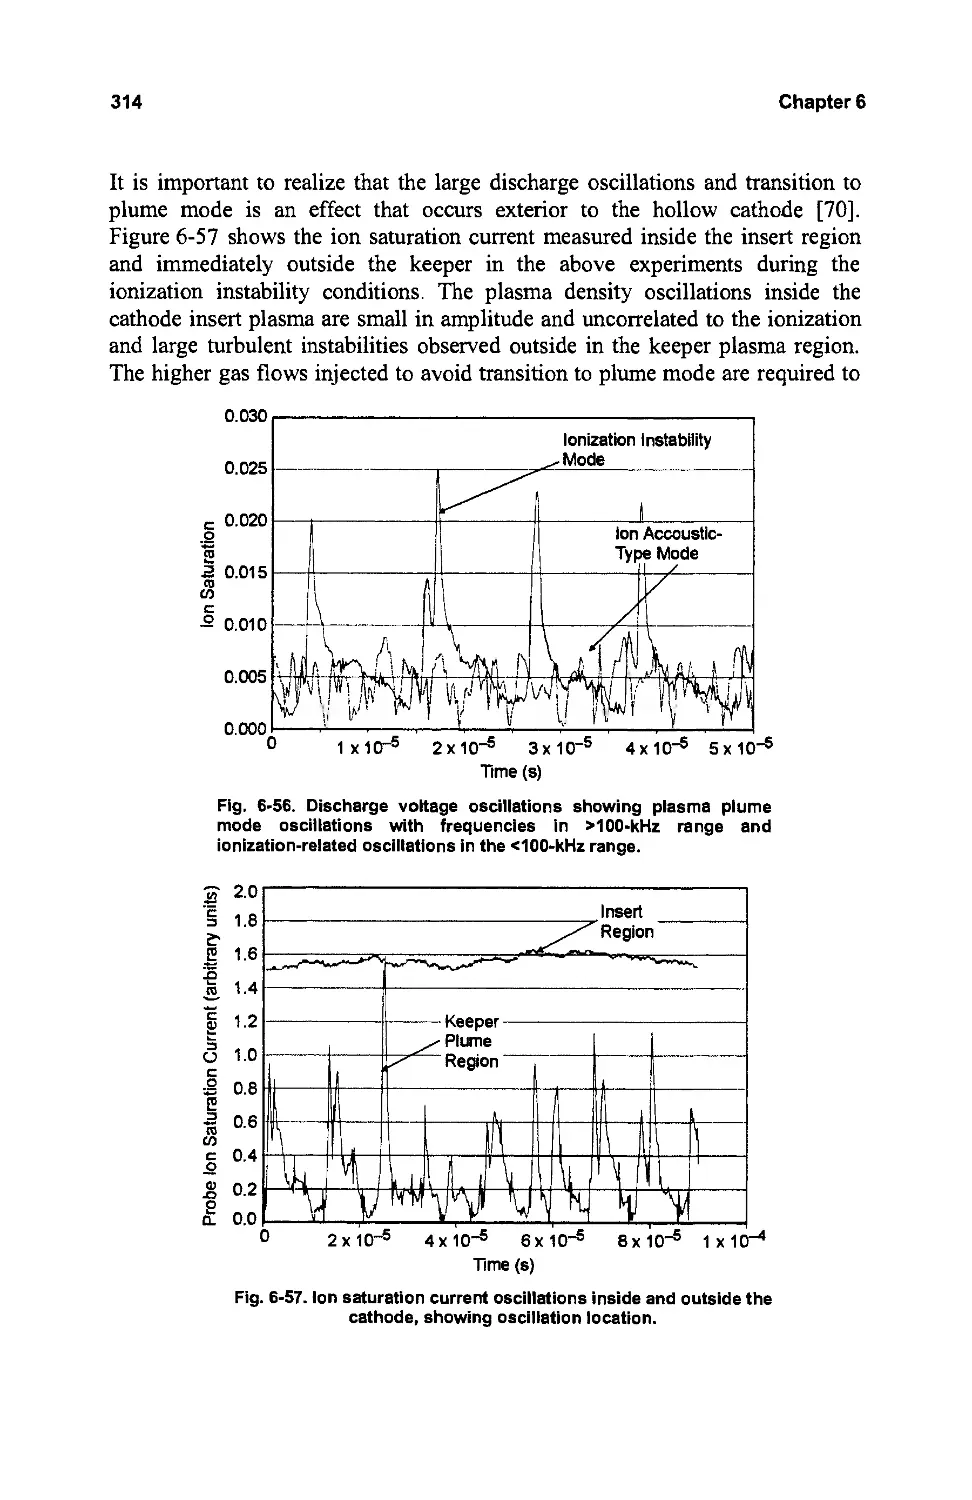
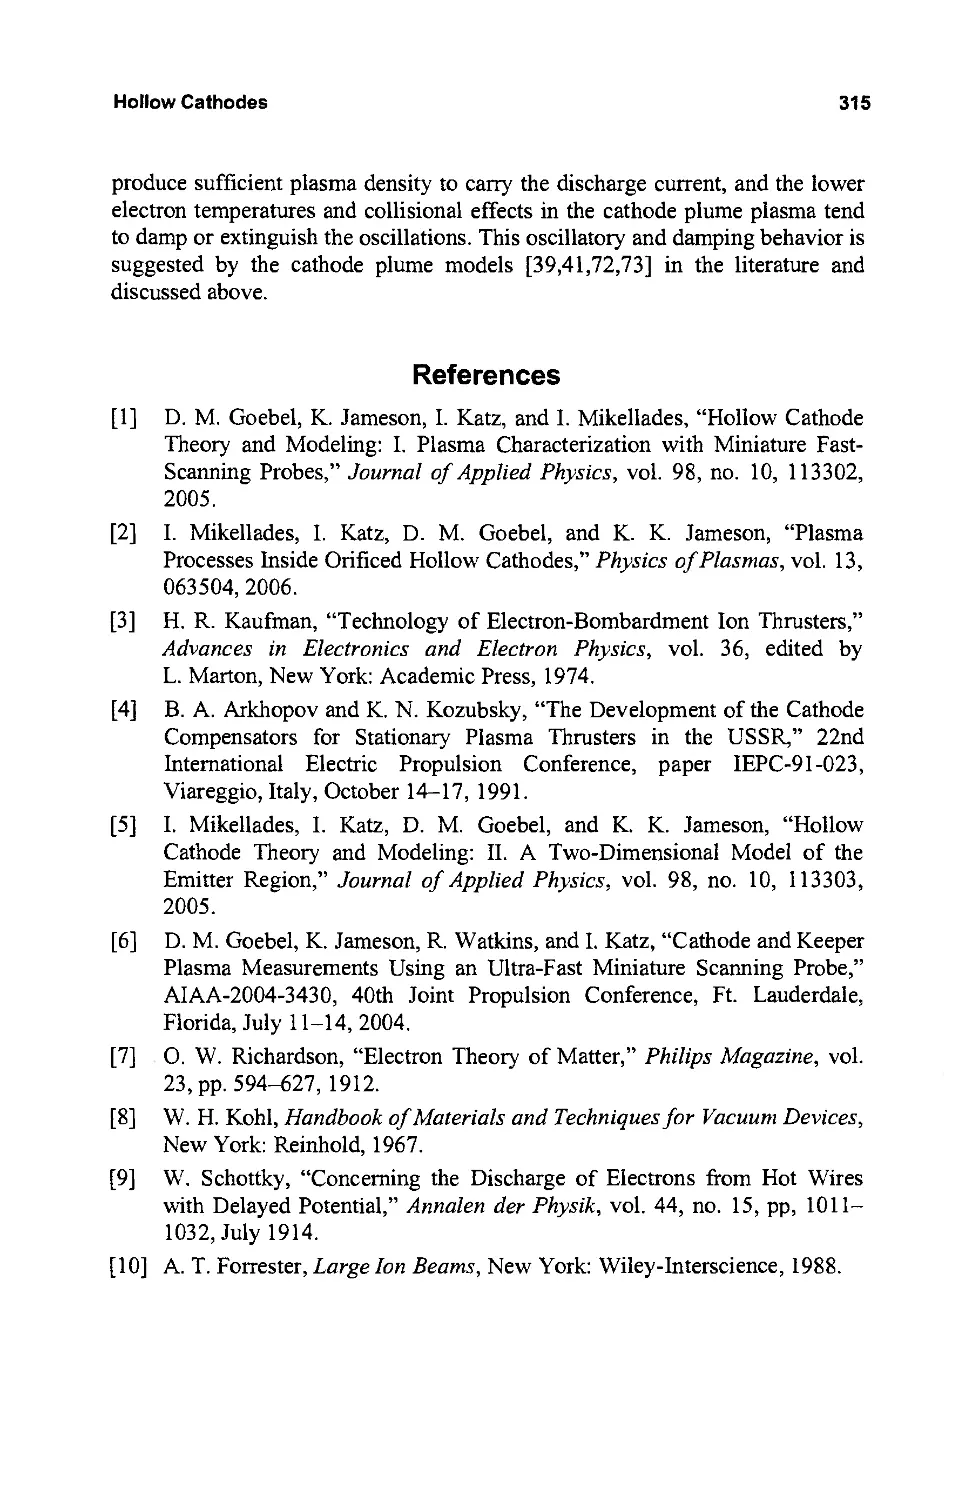
Chapter 6: Hollow Cathodes
6.1 Introduction
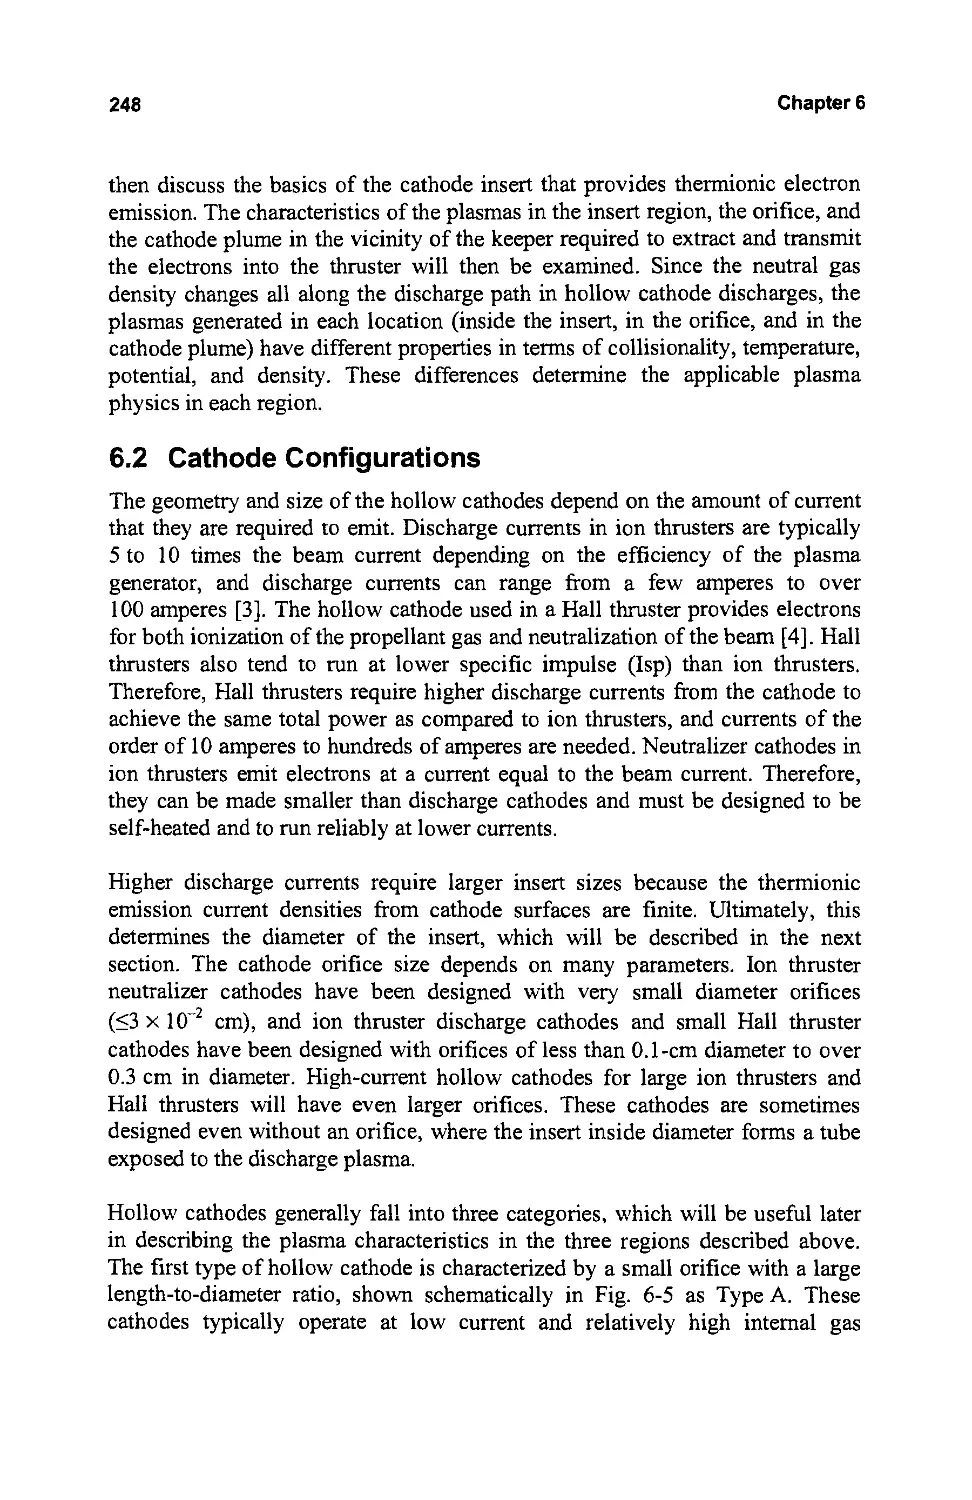
6.2 Cathode Configurations
6.3 Thermionic Electron Emitter Characteristics
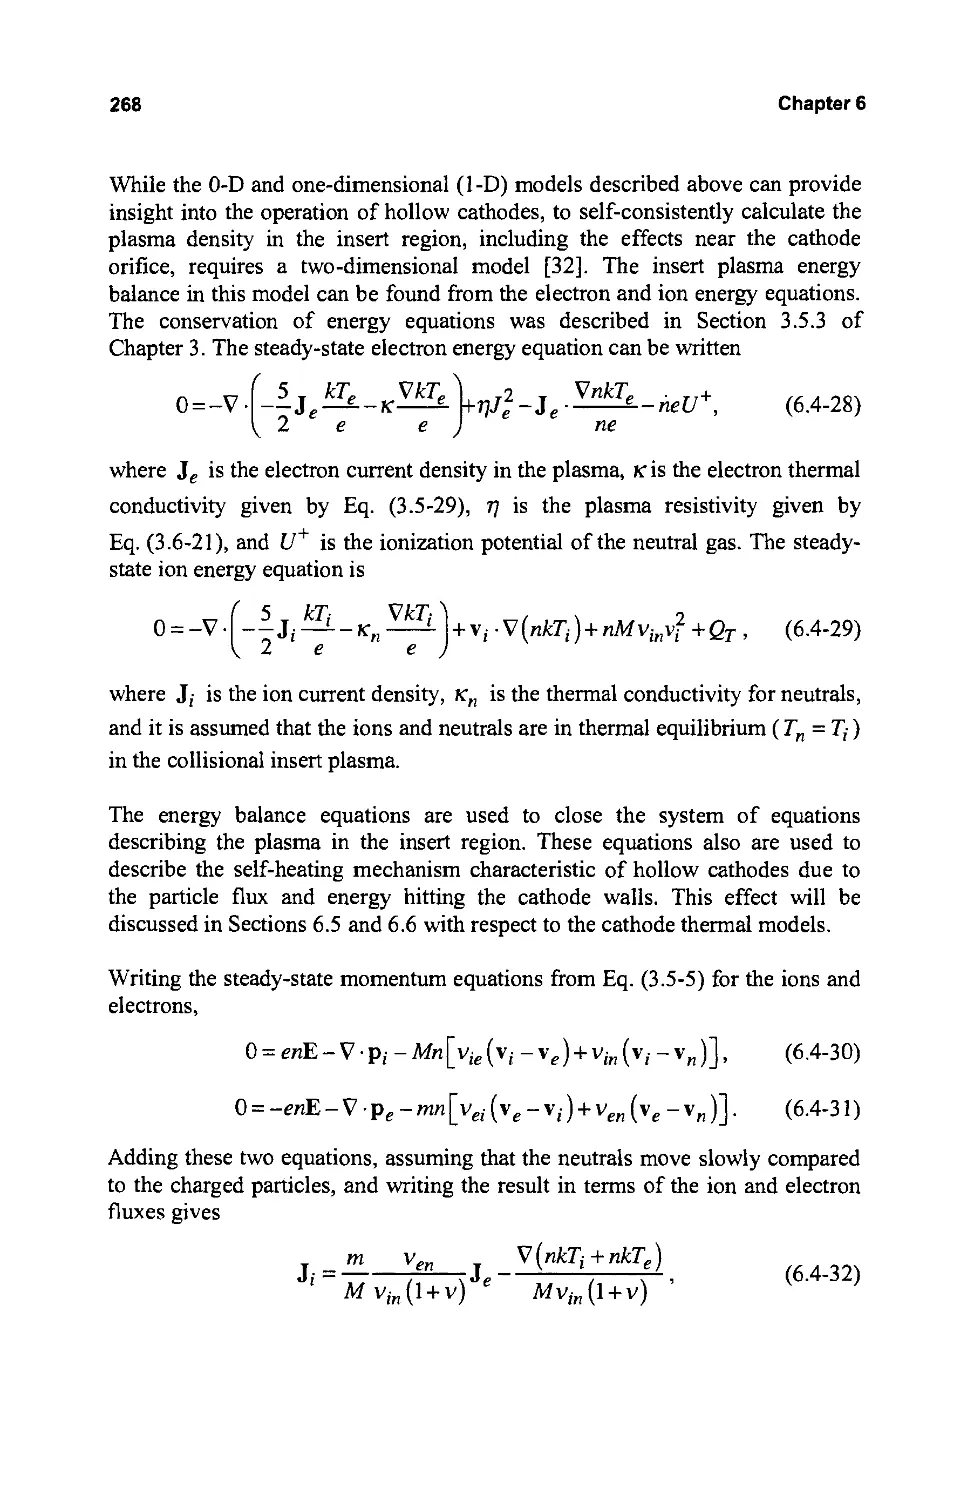
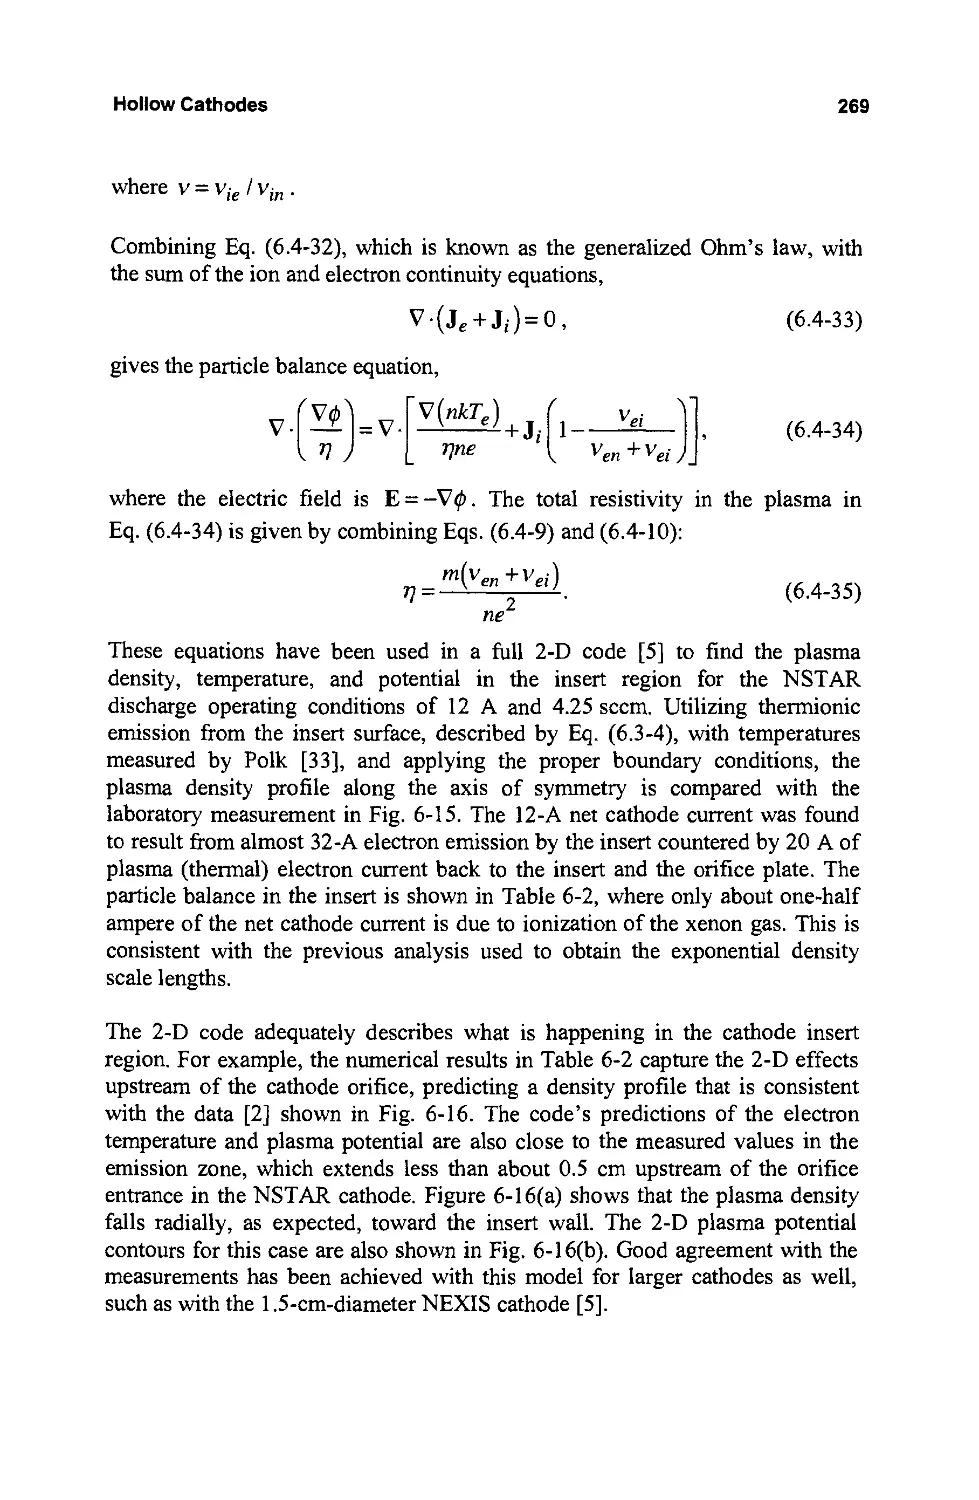
6.4 Insert Region Plasma
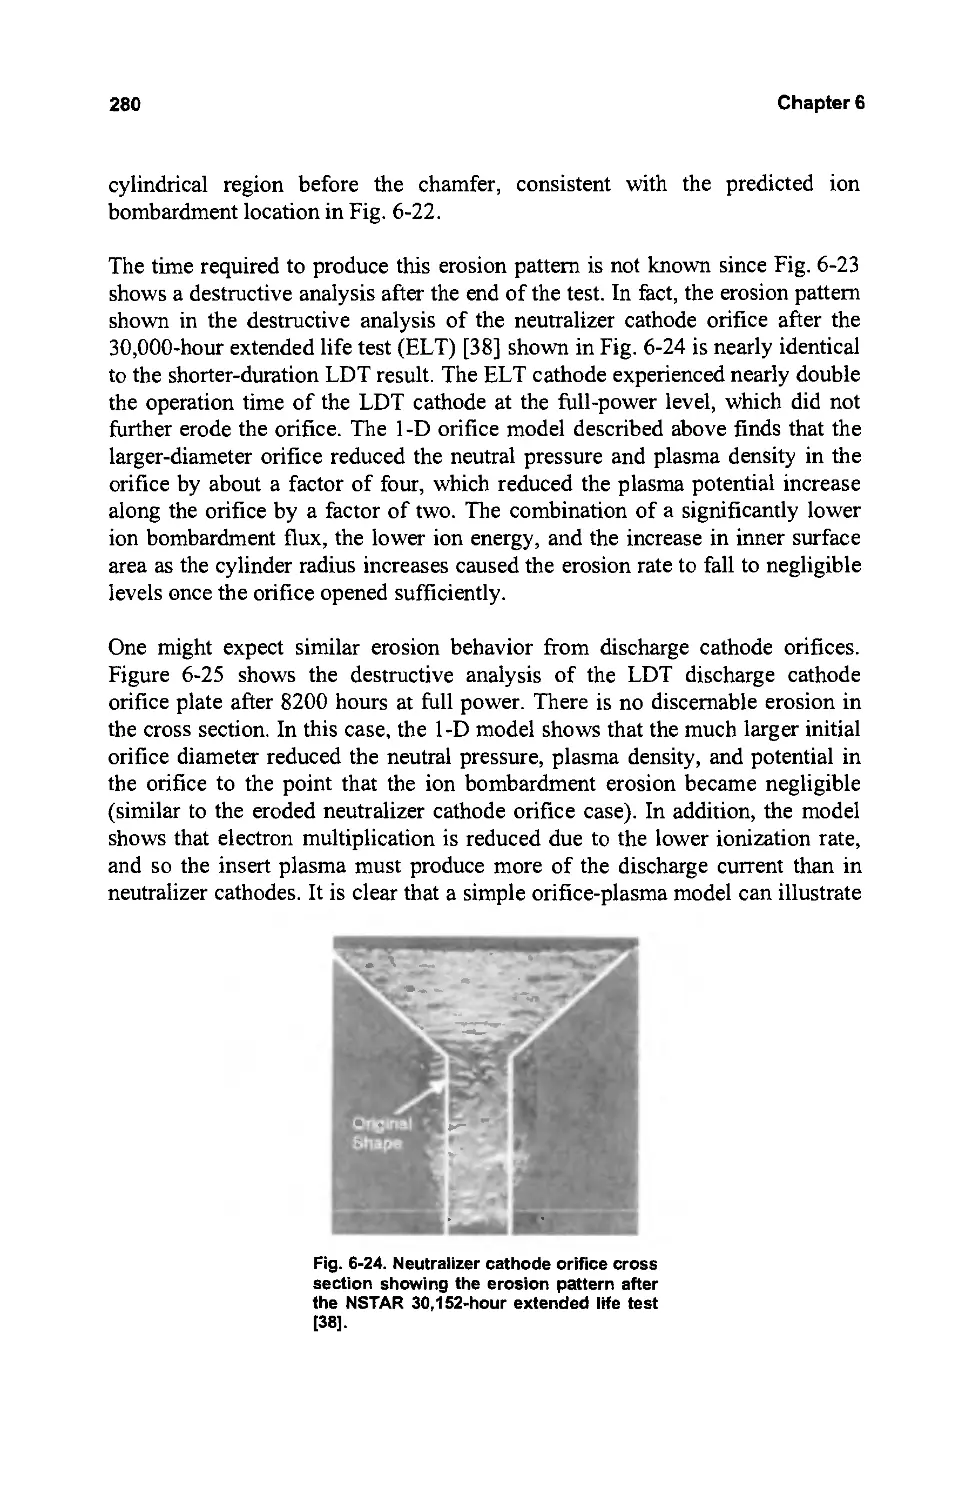
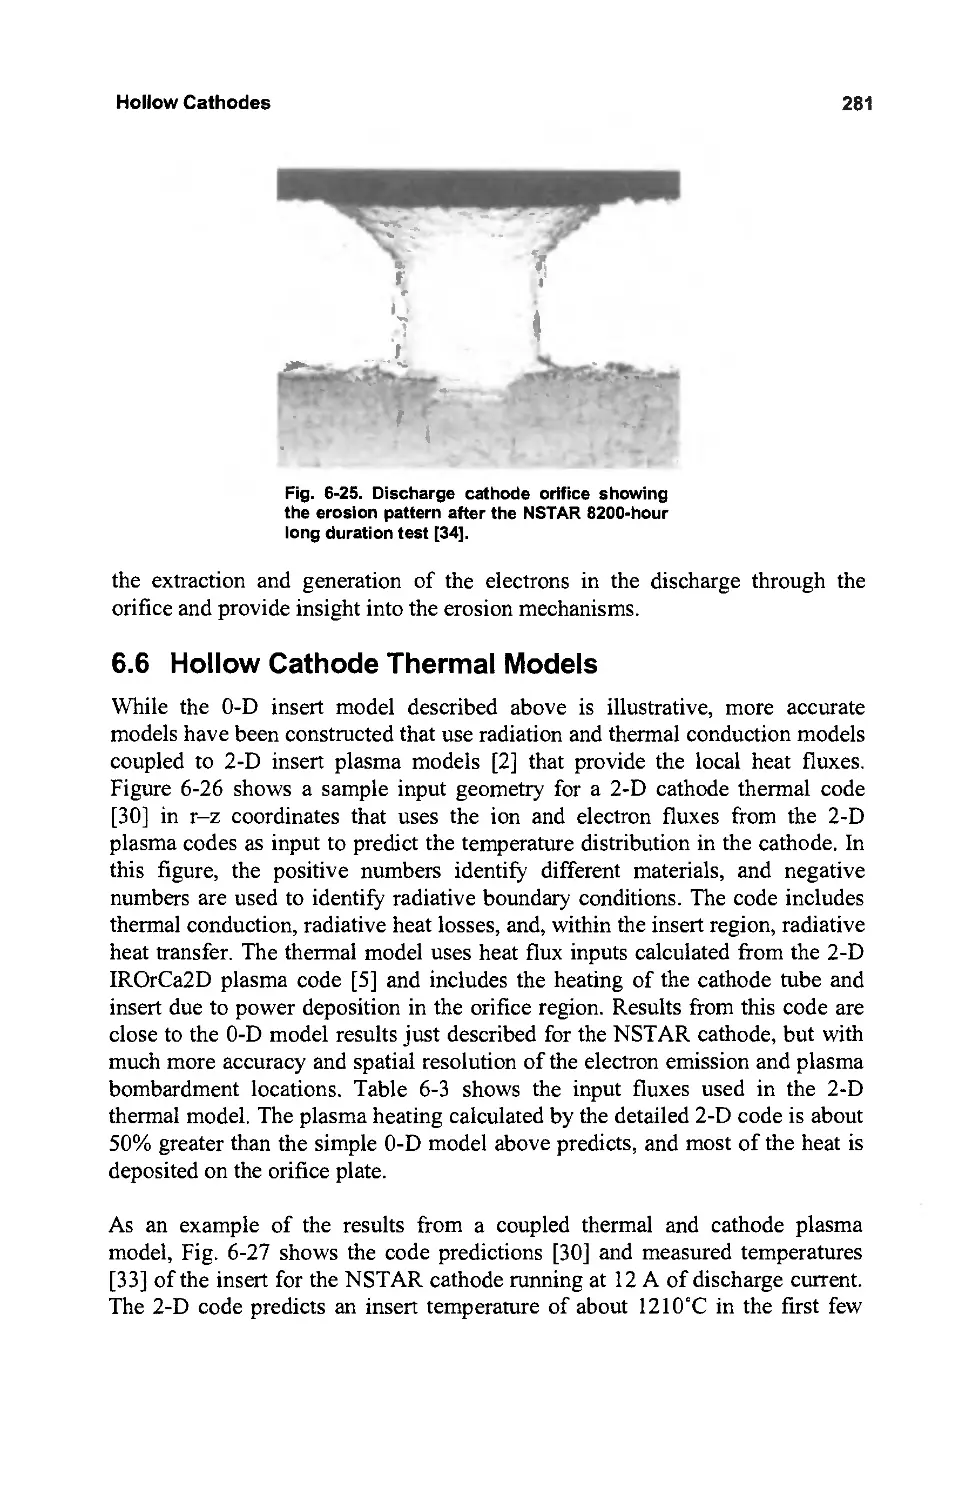
6.5 Orifice Region Plasma
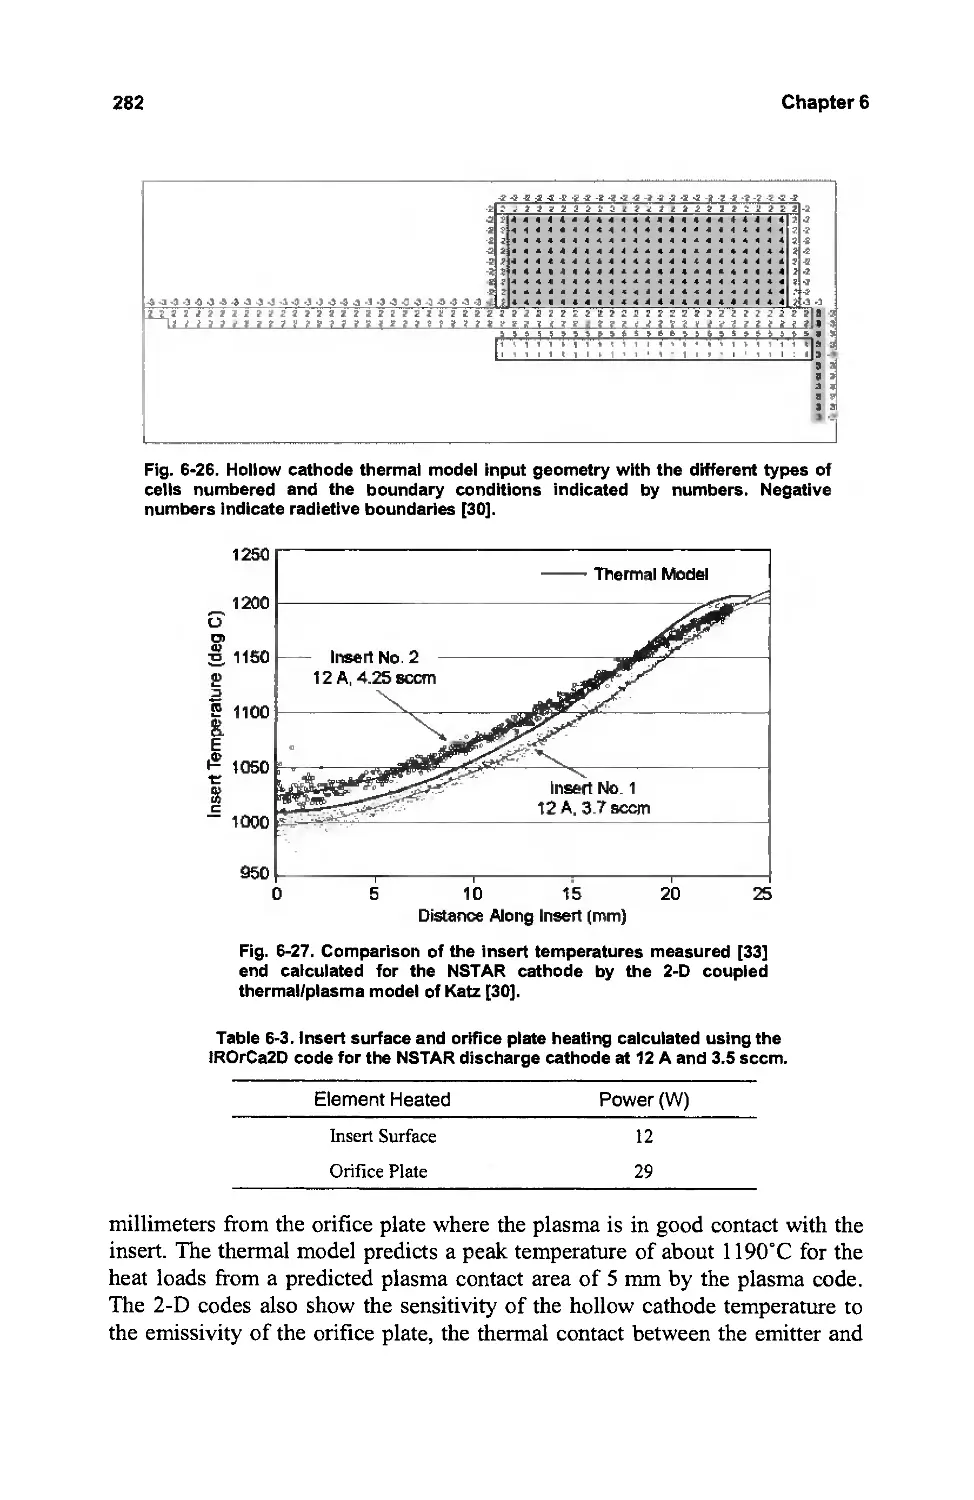
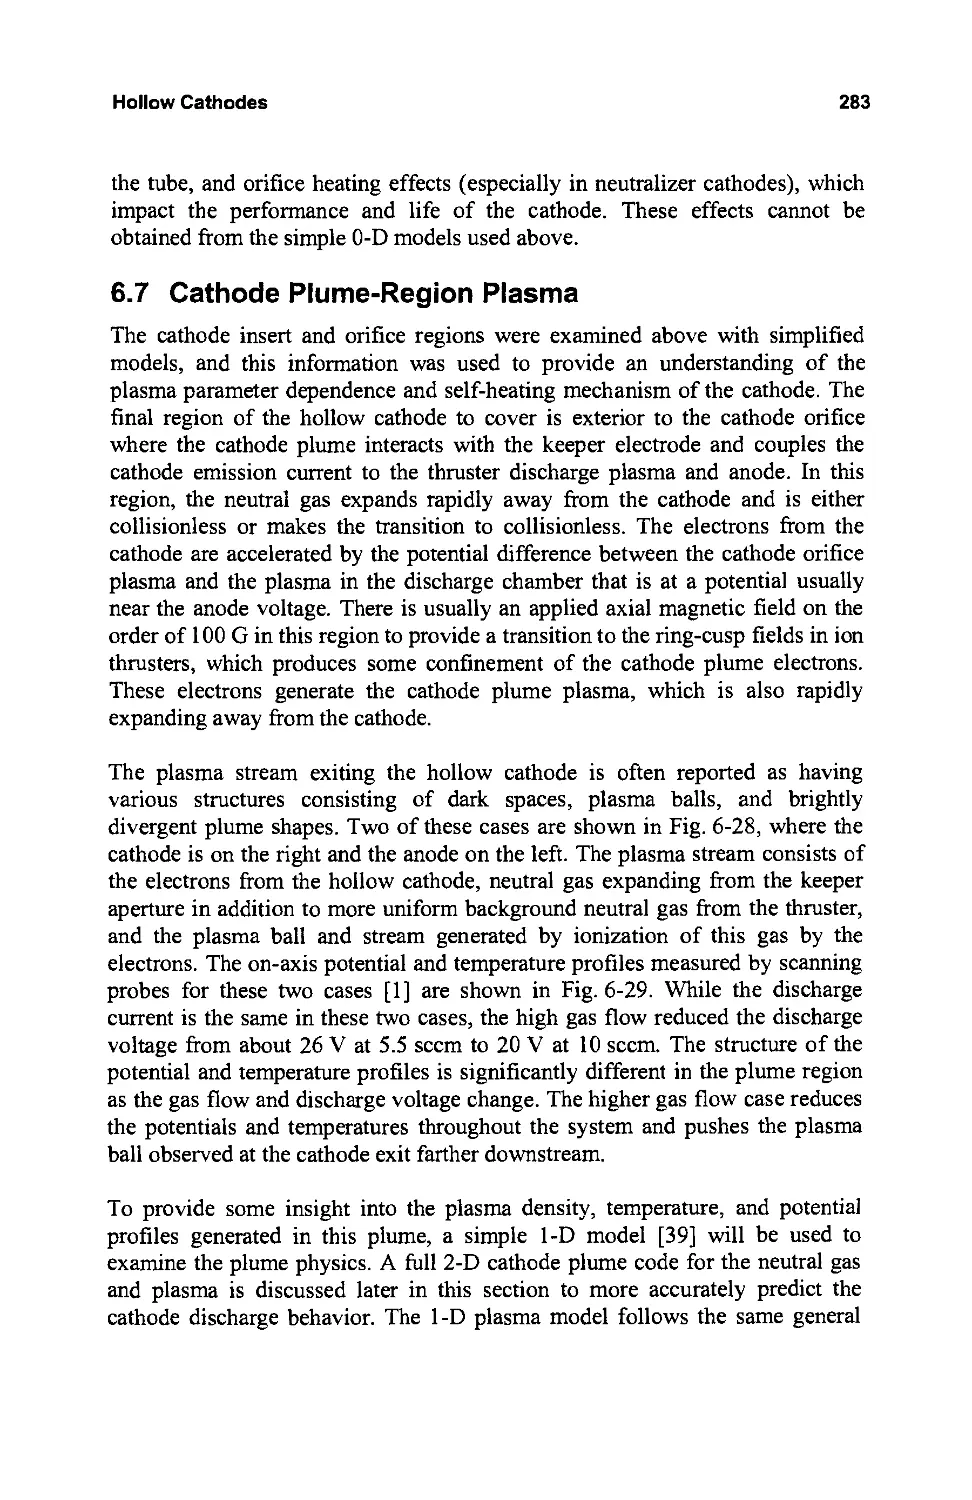
6.6 Hollow Cathode Thermal Models
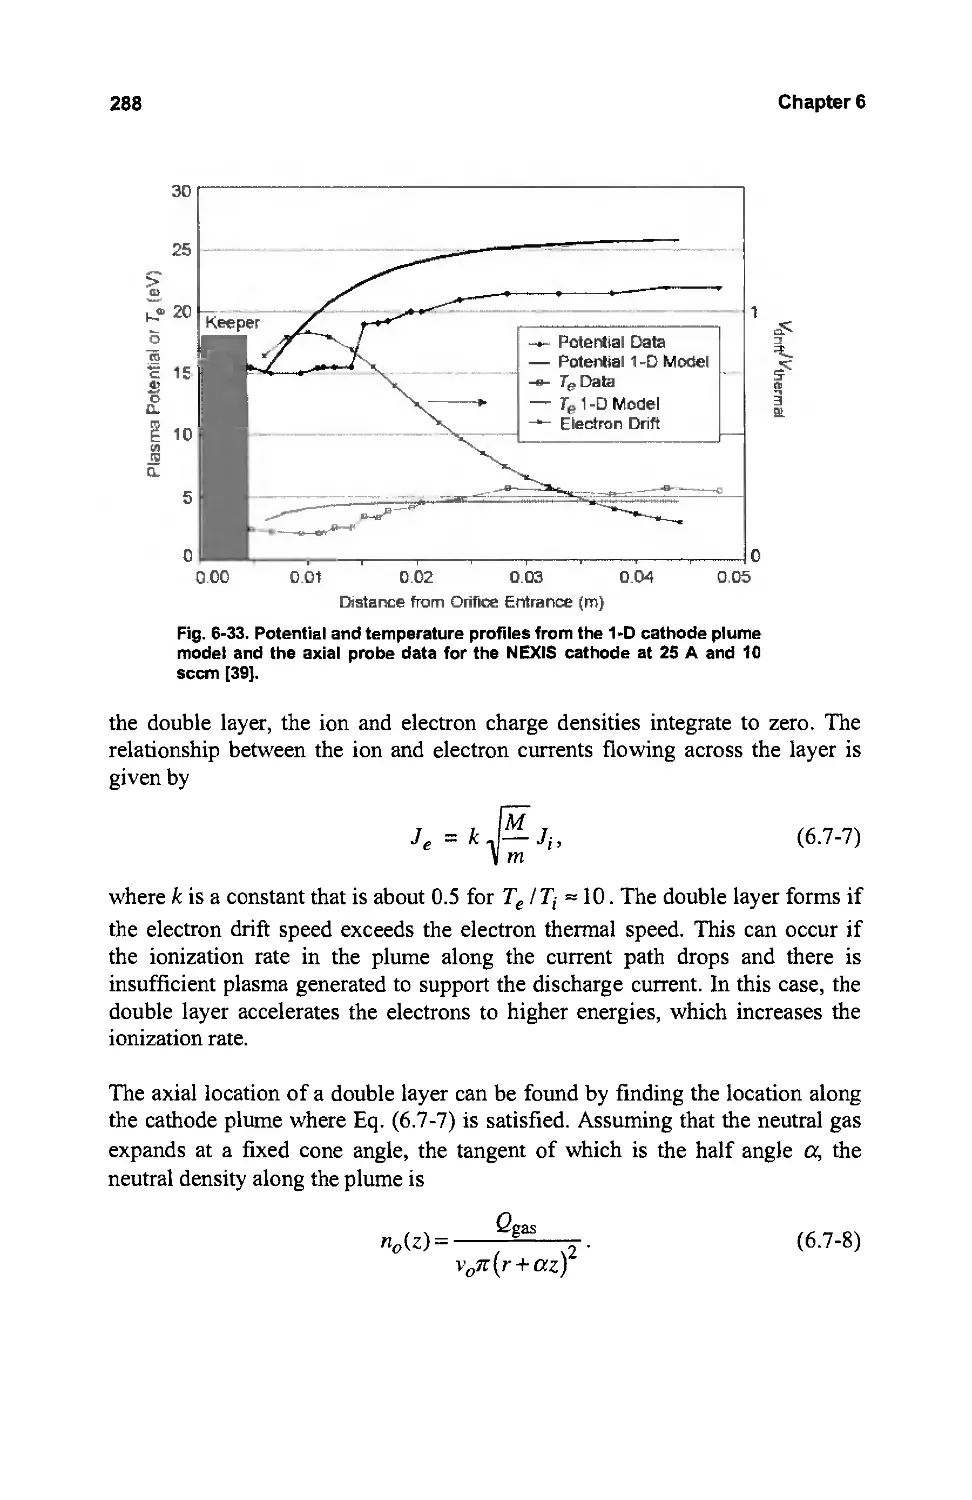
6.7 Cathode Plume-Region Plasma
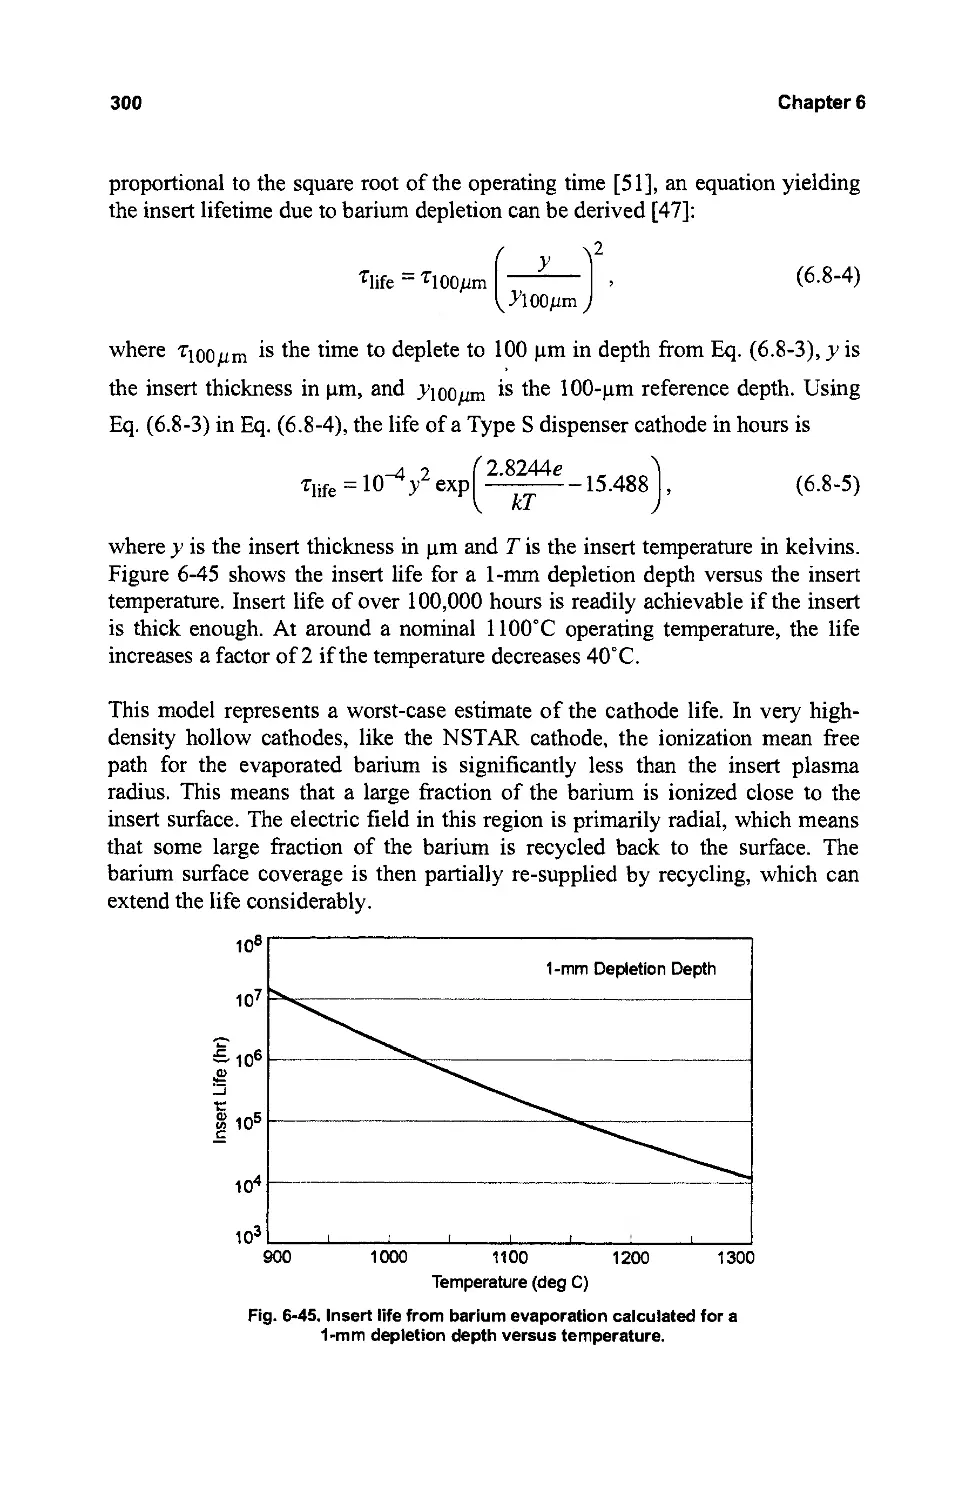
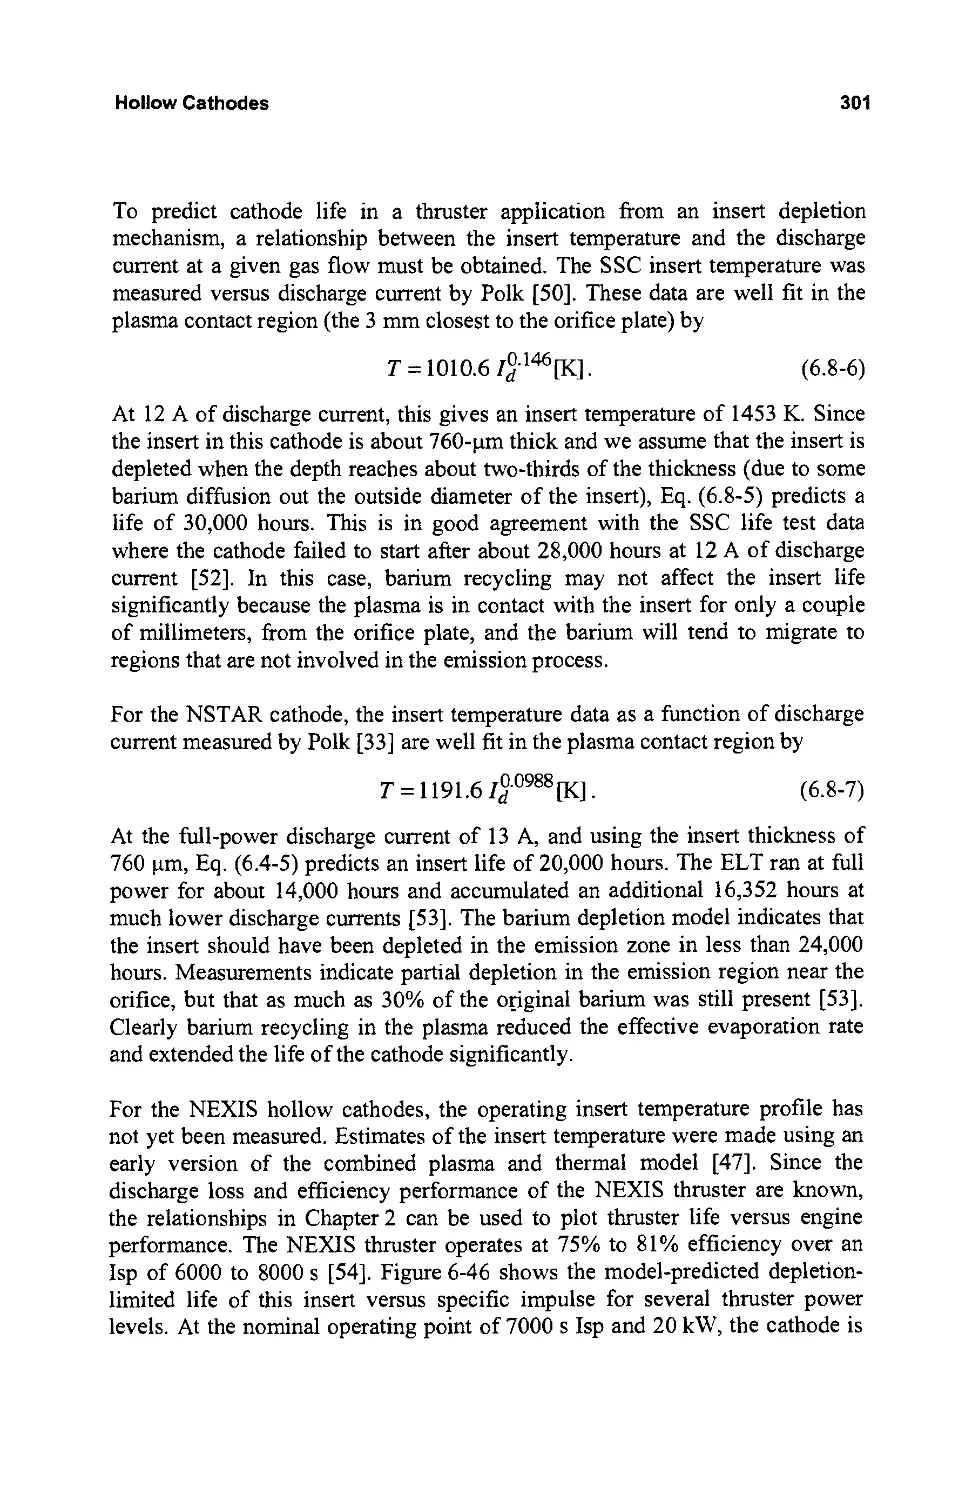
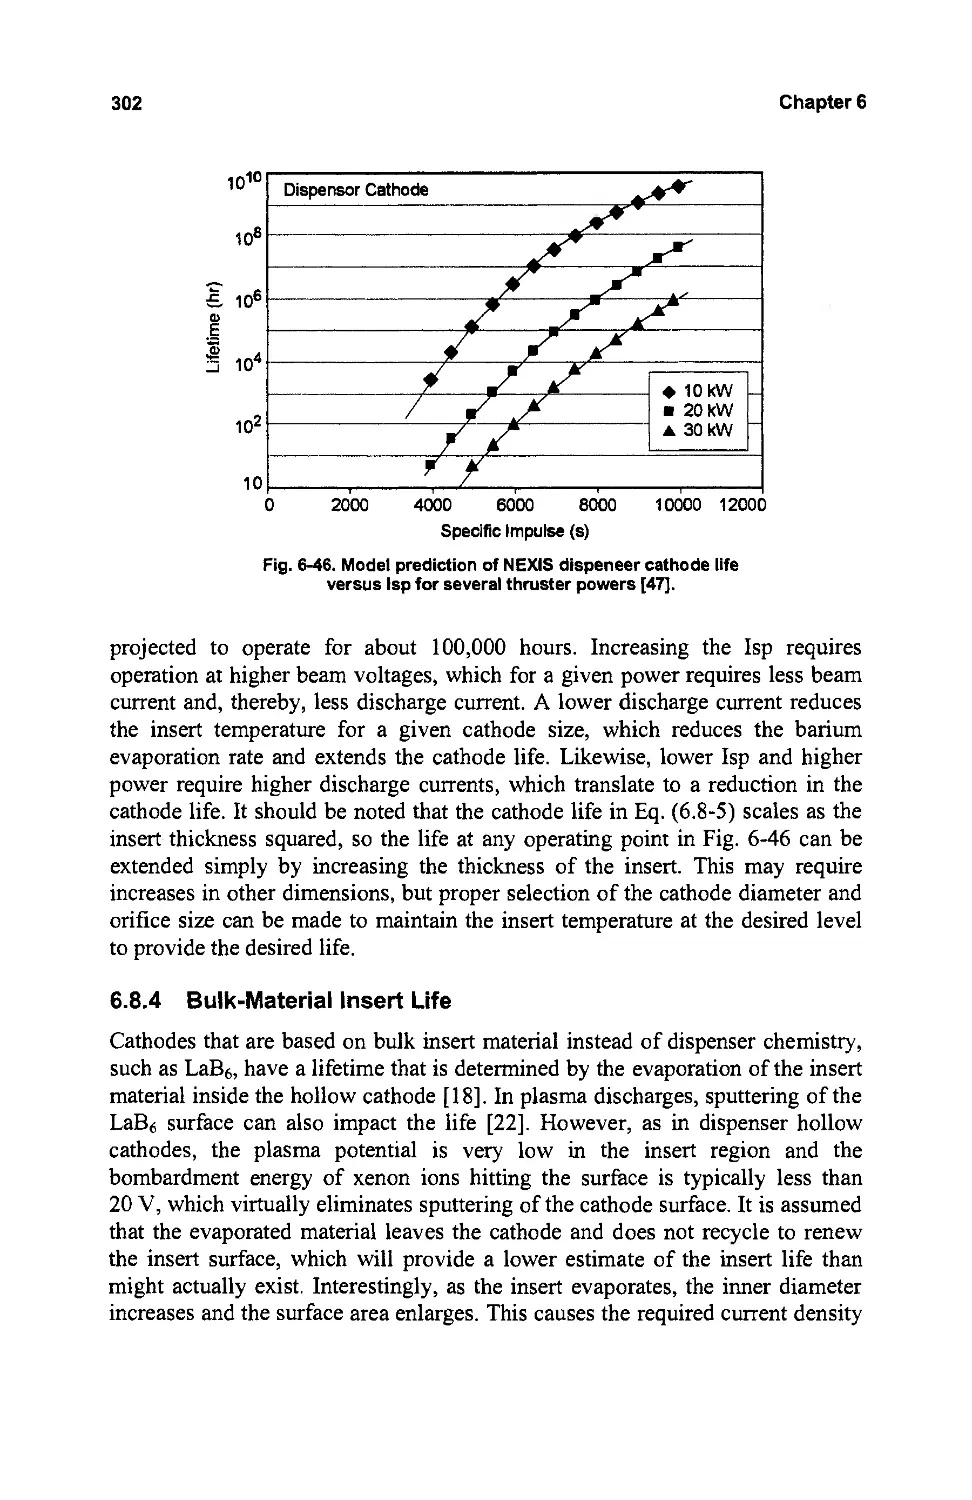
6.8 Hollow Cathode Life
6.8.1 Dispenser Cathodes in Insert Plasmas
6.8.2 Cathode Insert Temperature
6.8.3 Barium Depletion Model
6.8.4 Bulk-Material Insert Life
6.8.5 Cathode Poisoning
6.9 Keeper Wear and Life
6.10 Hollow Cathode Operation
References
Problems
243
243
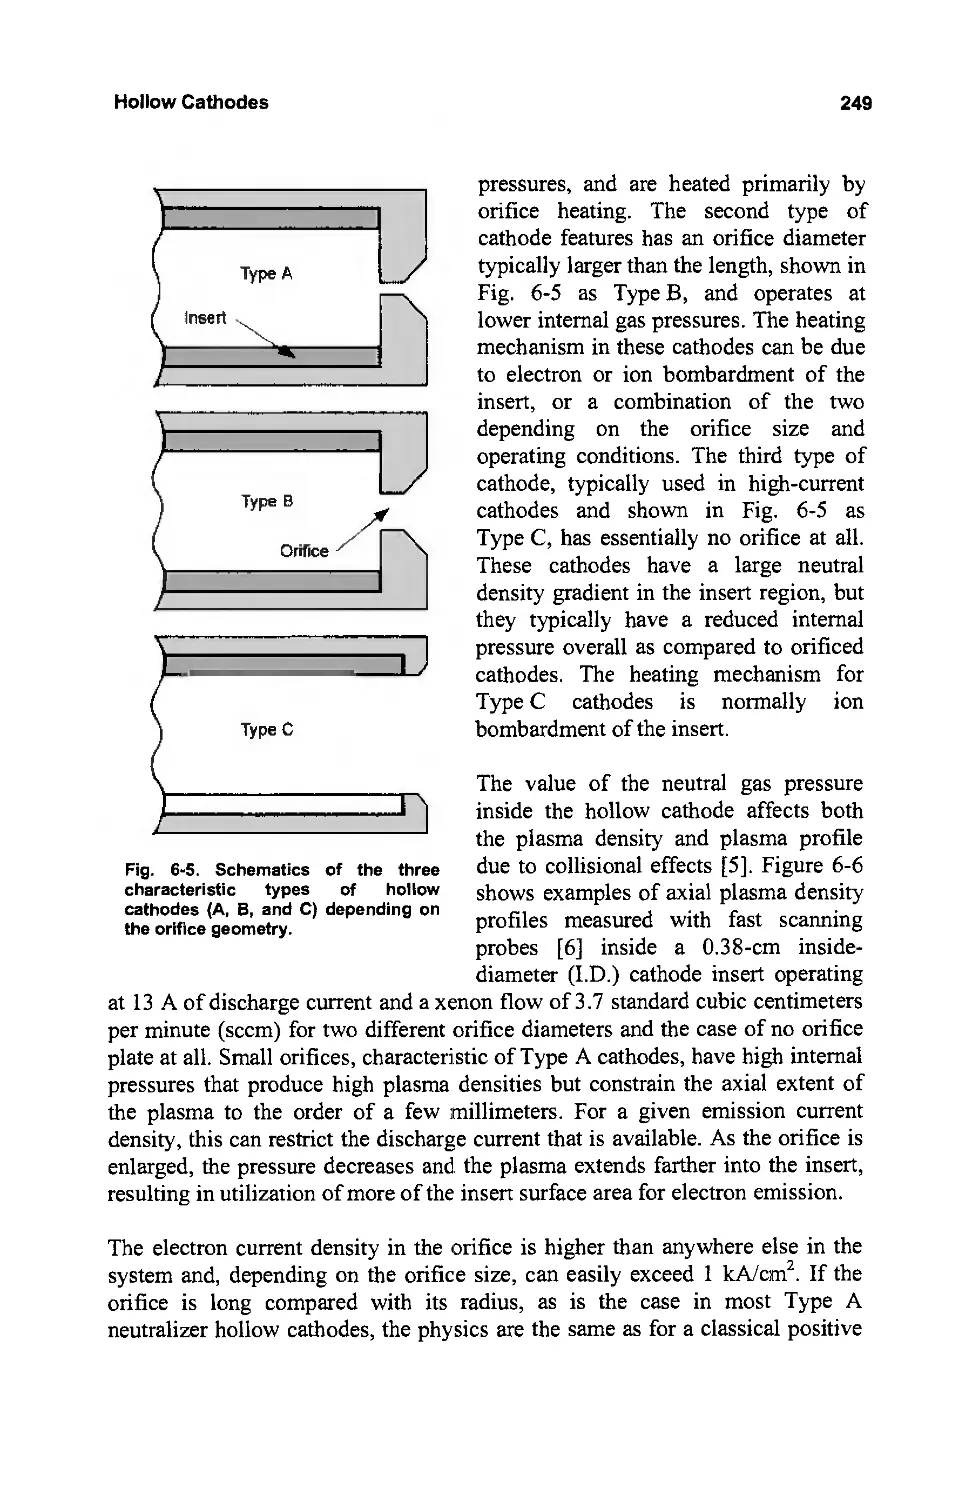
248
251
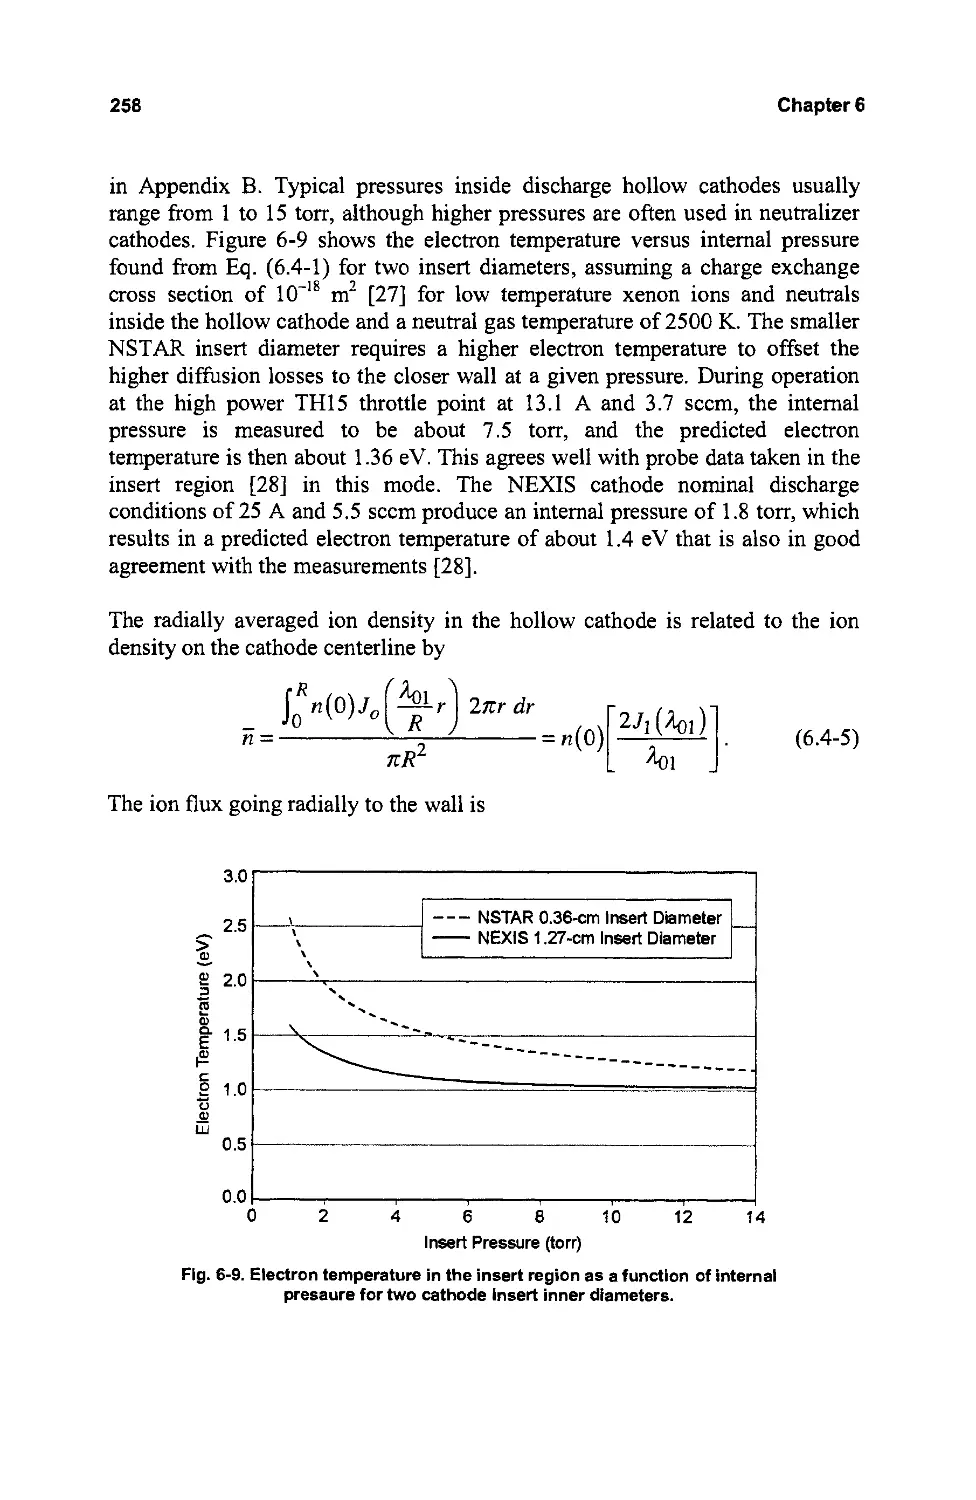
256
270
281
283
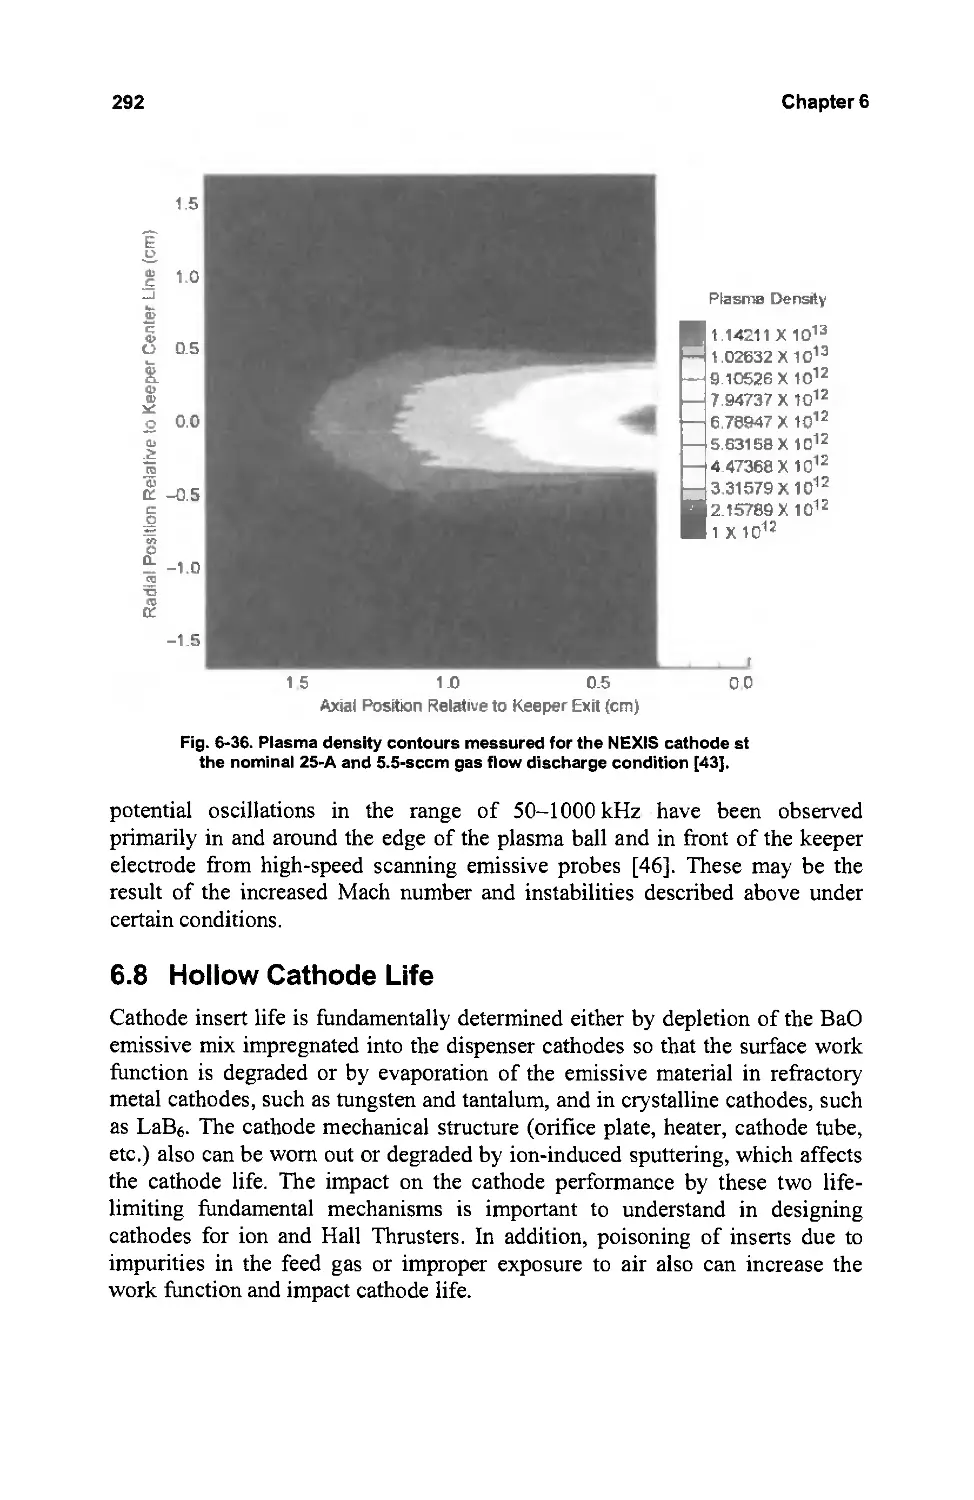
292
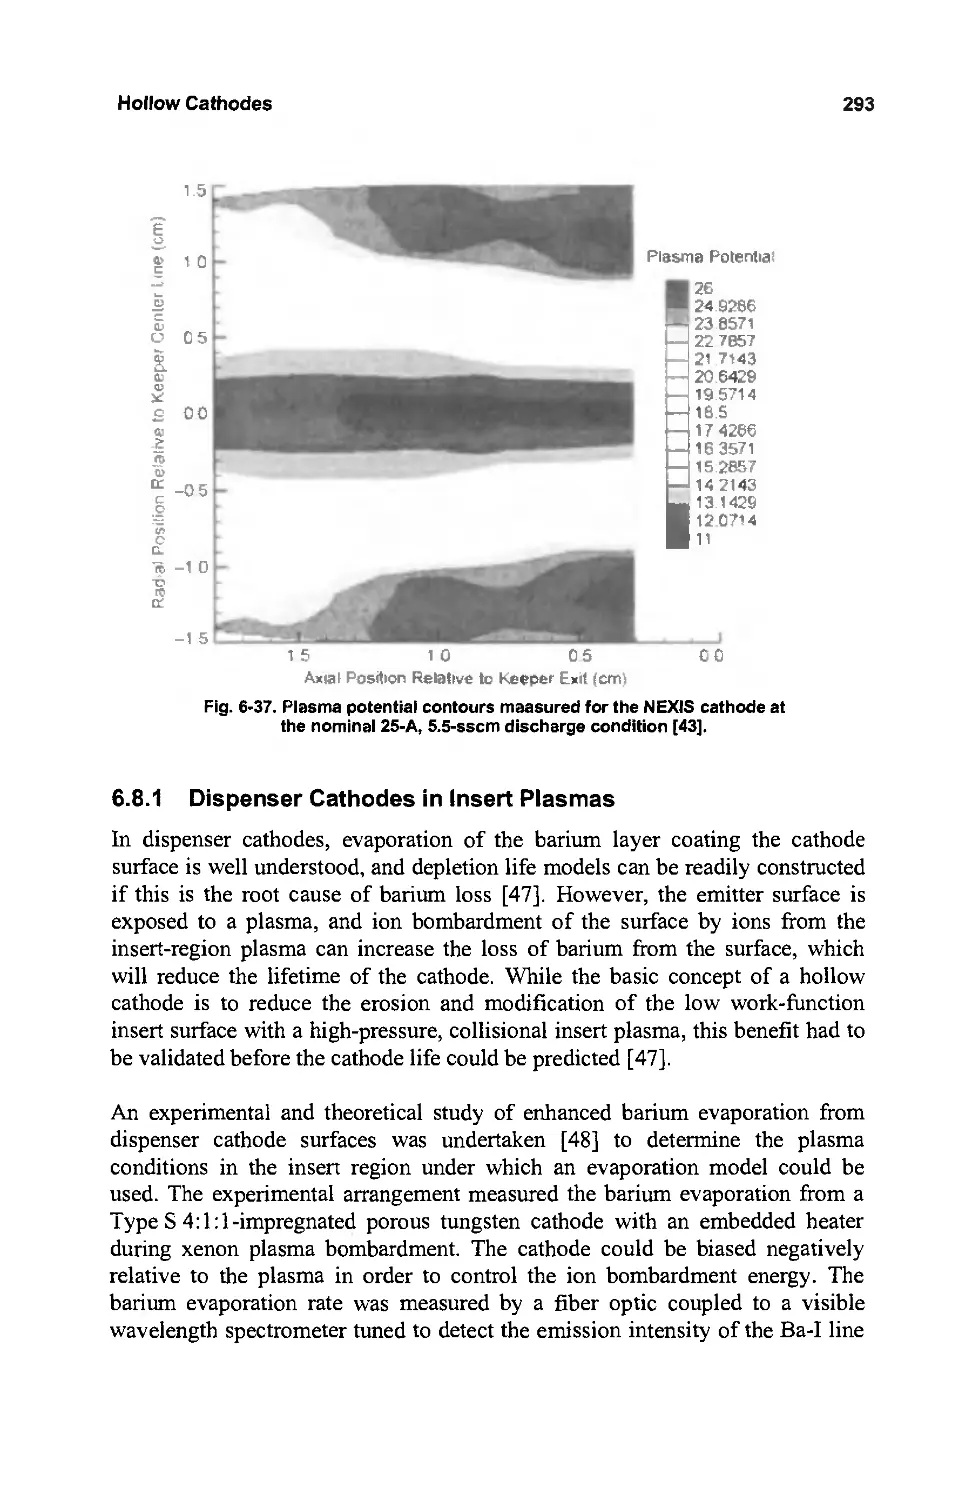
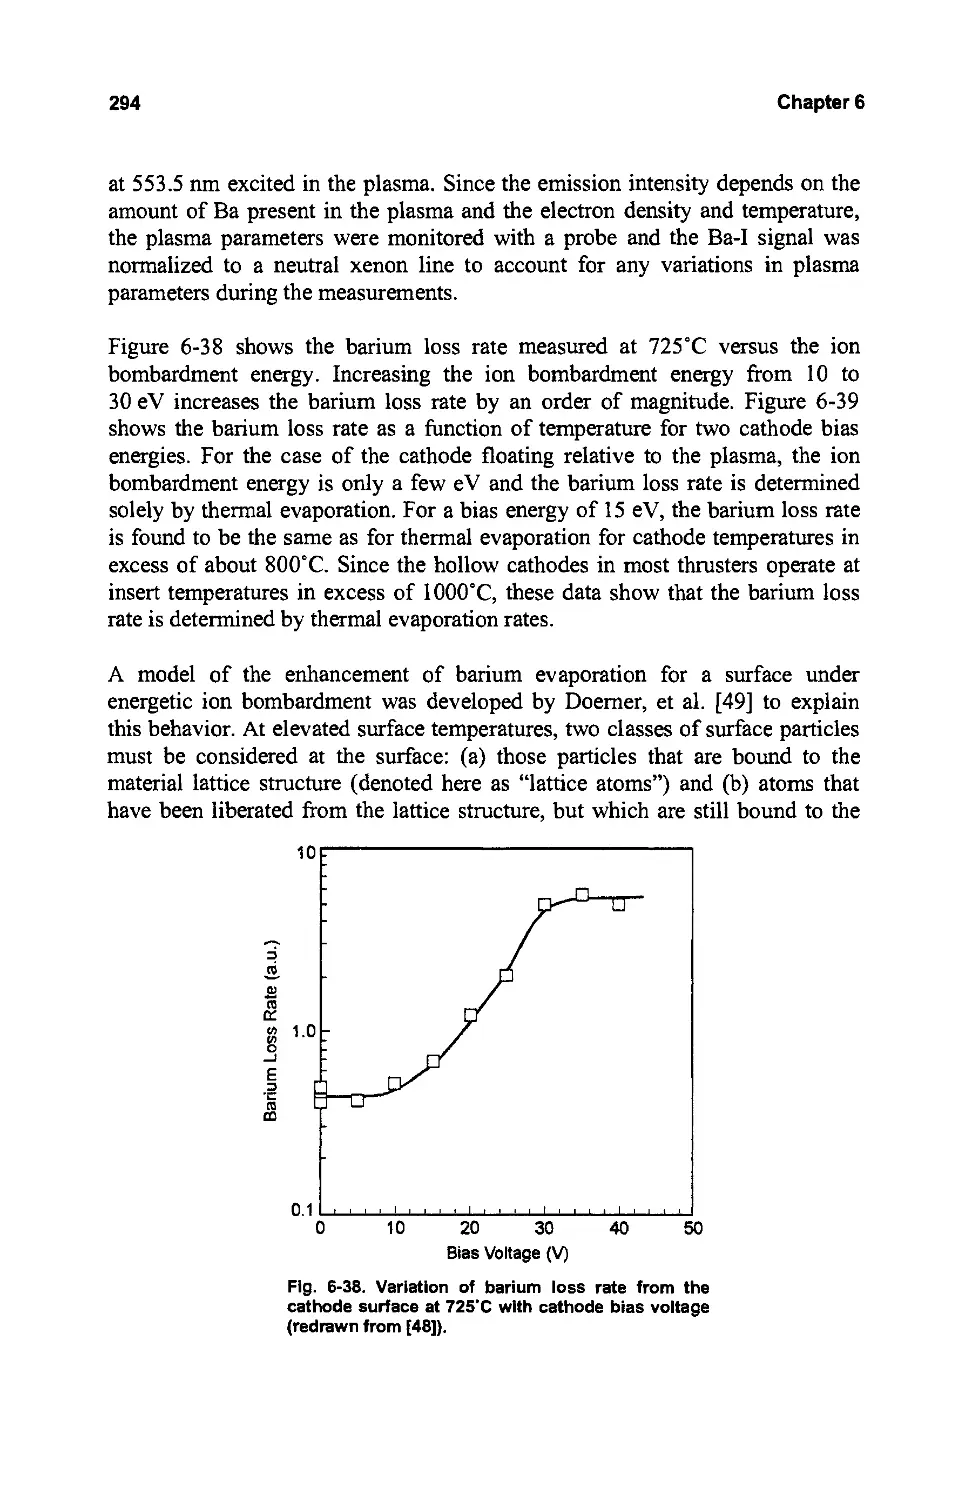
293
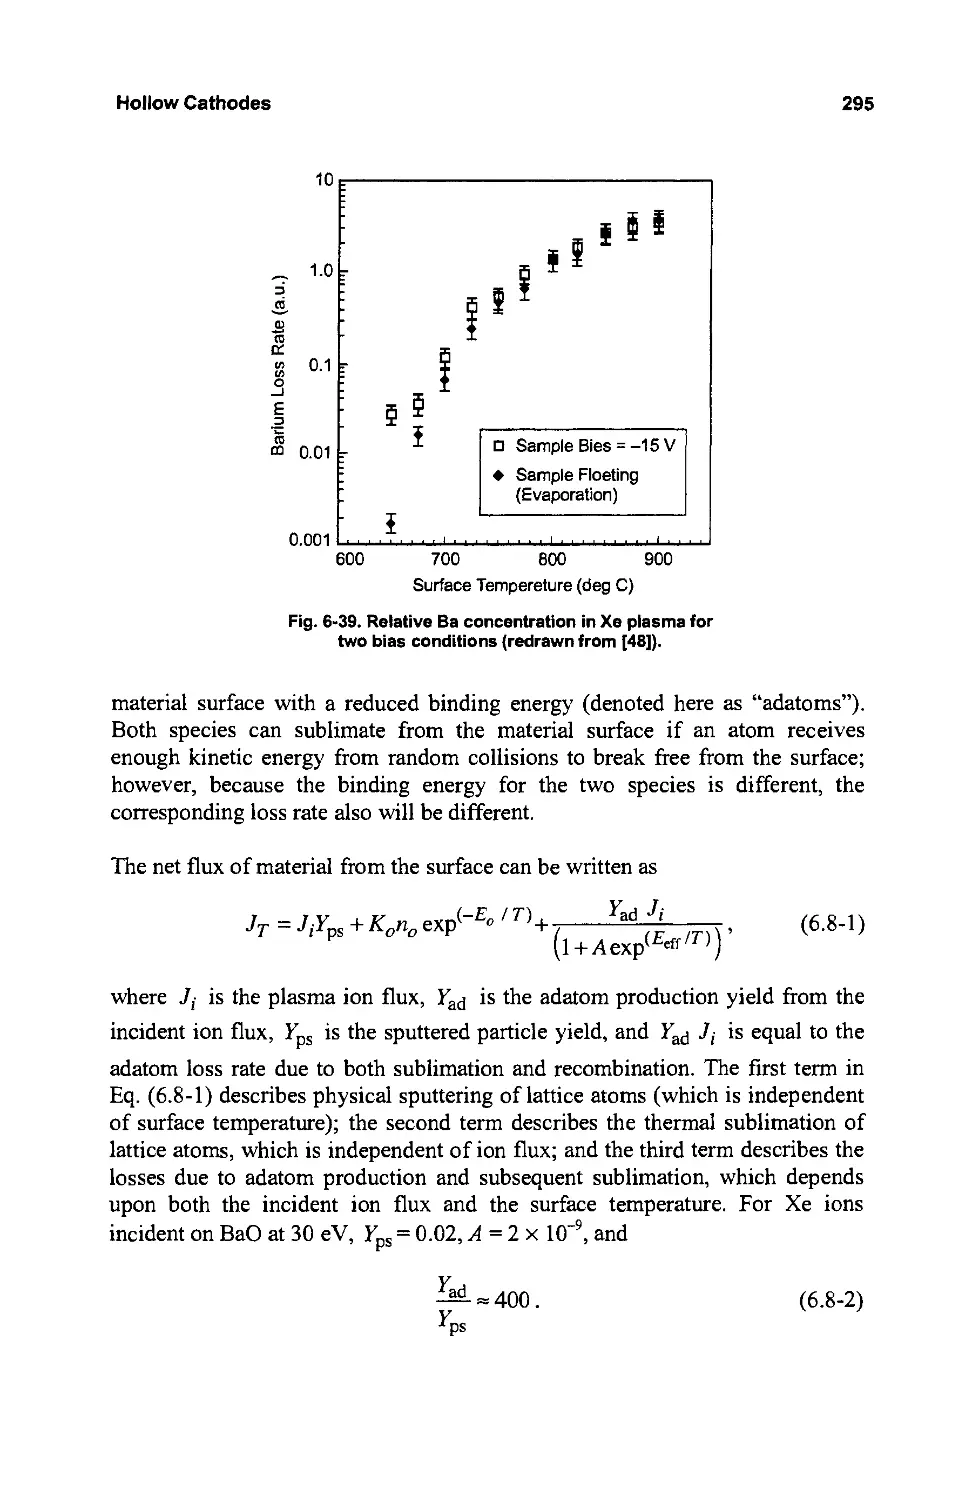
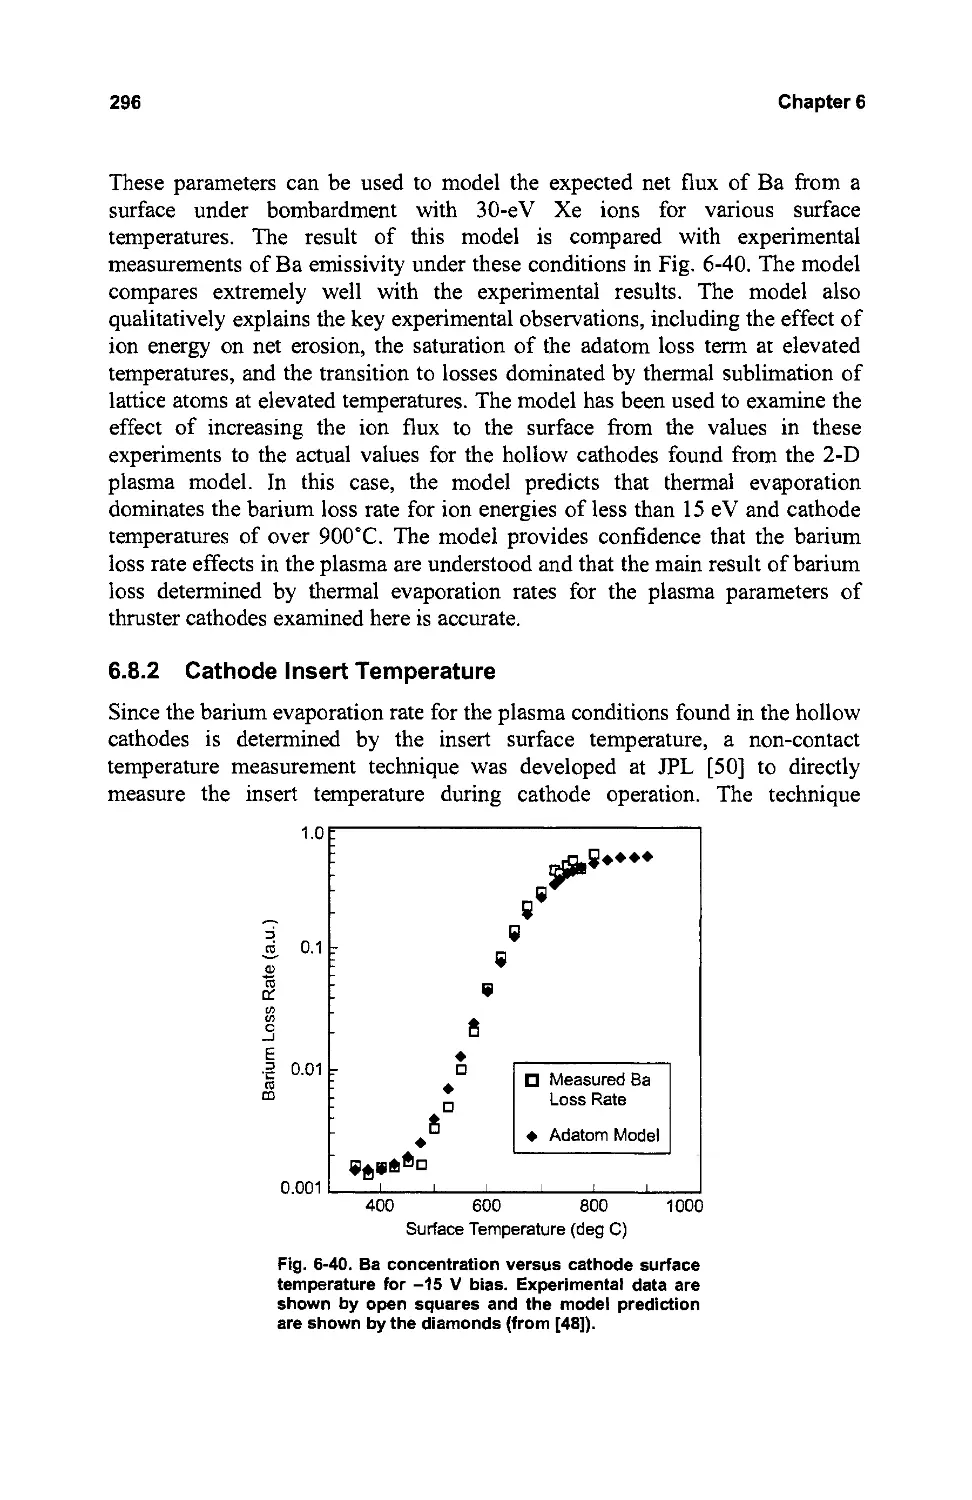
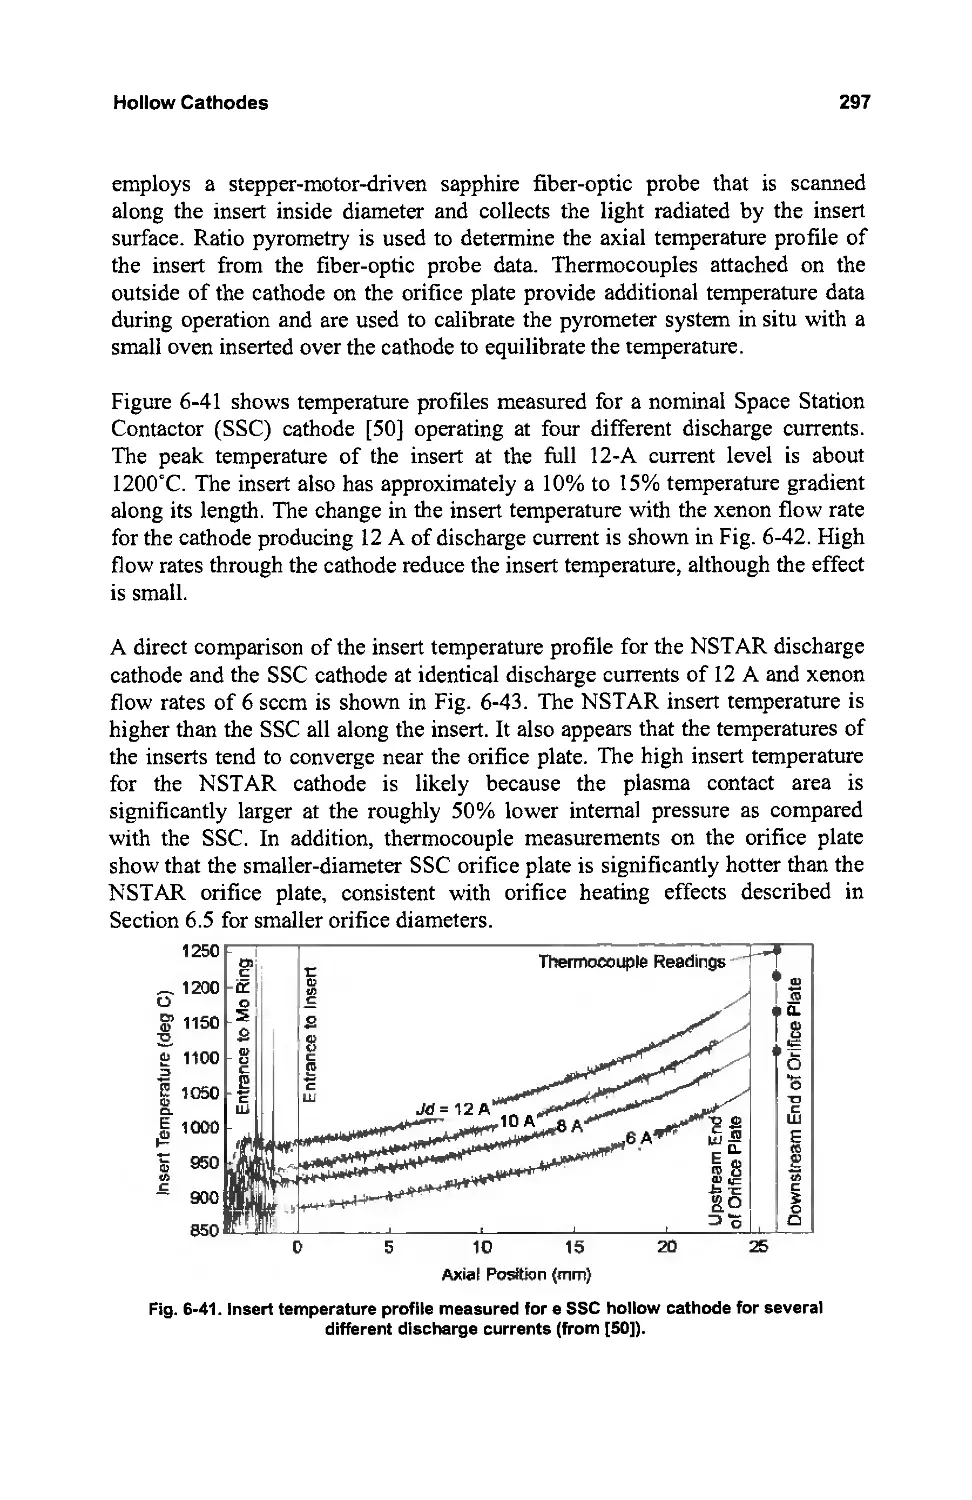
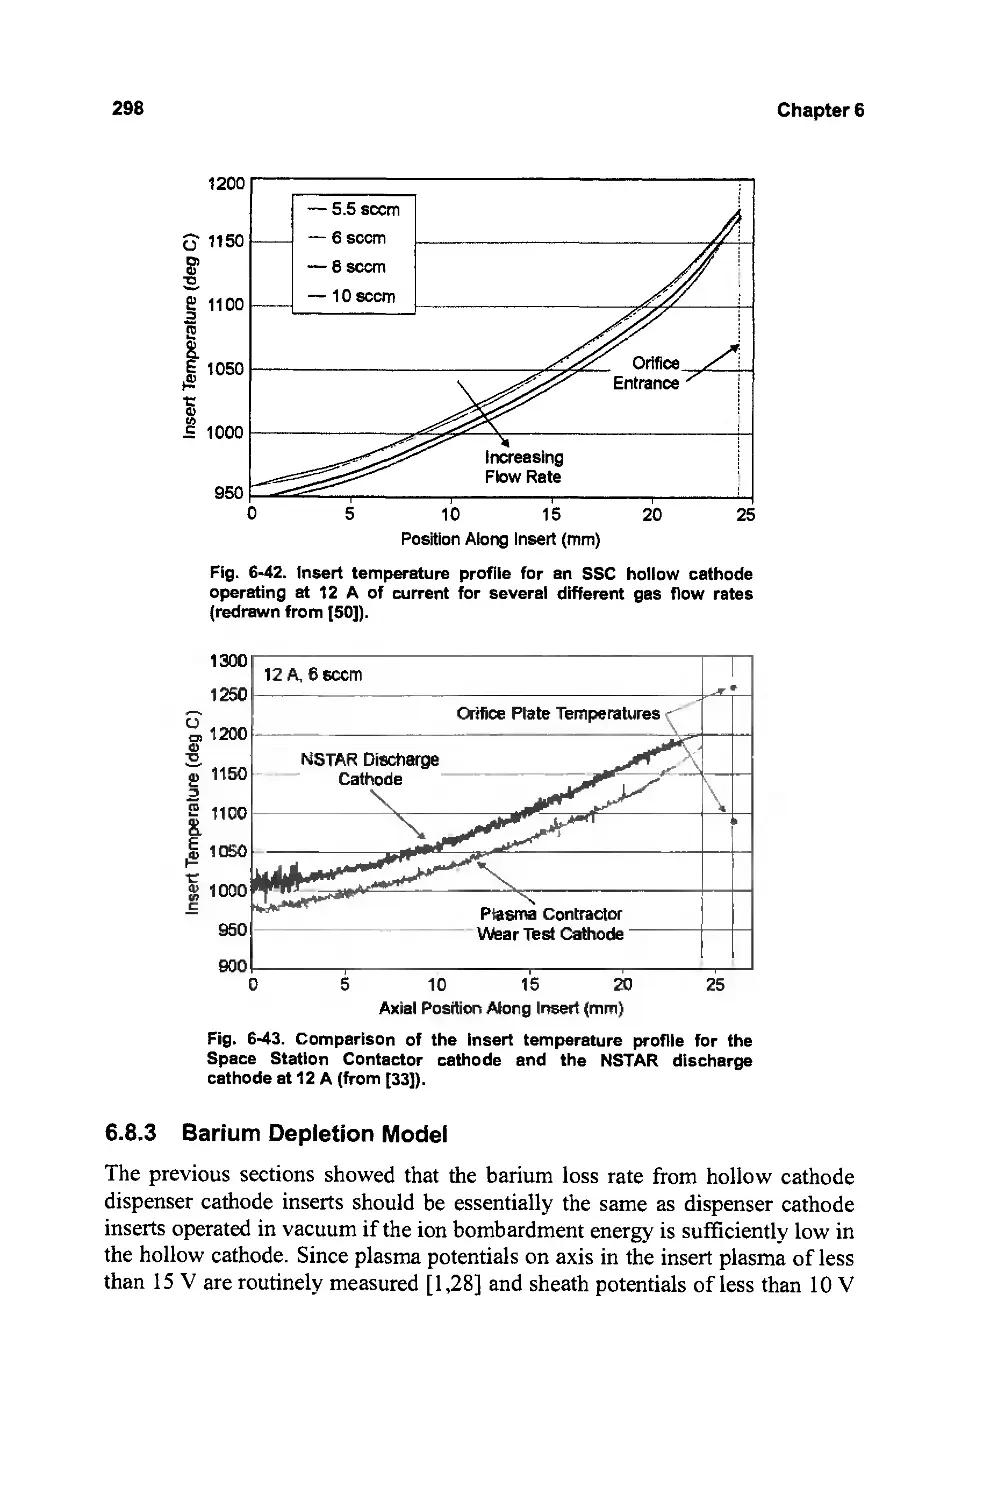
296
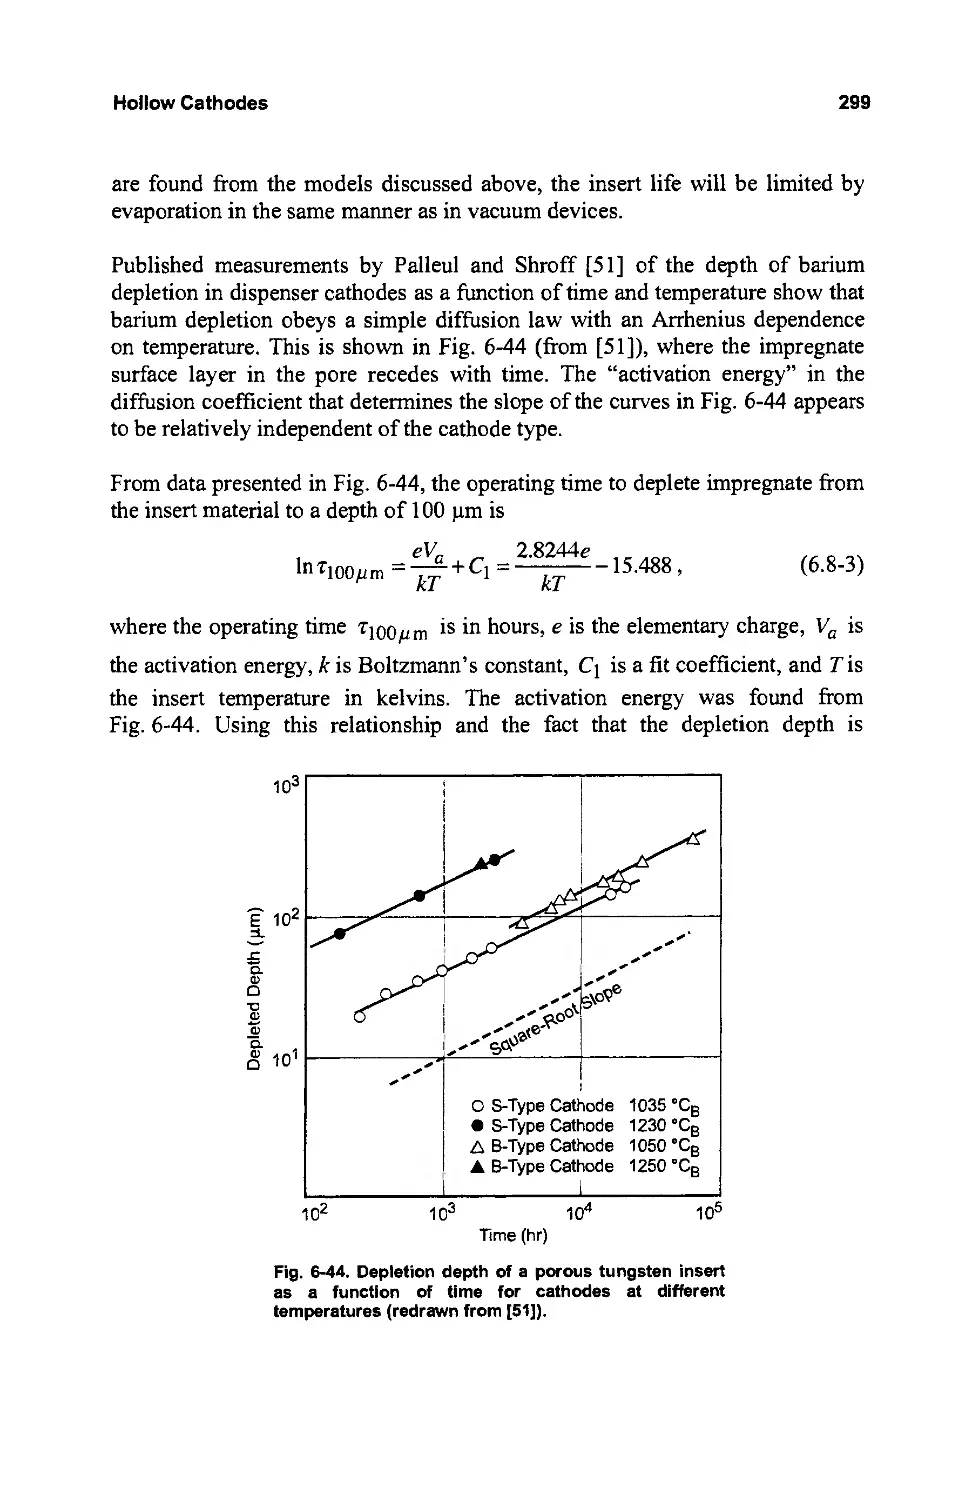
298
302
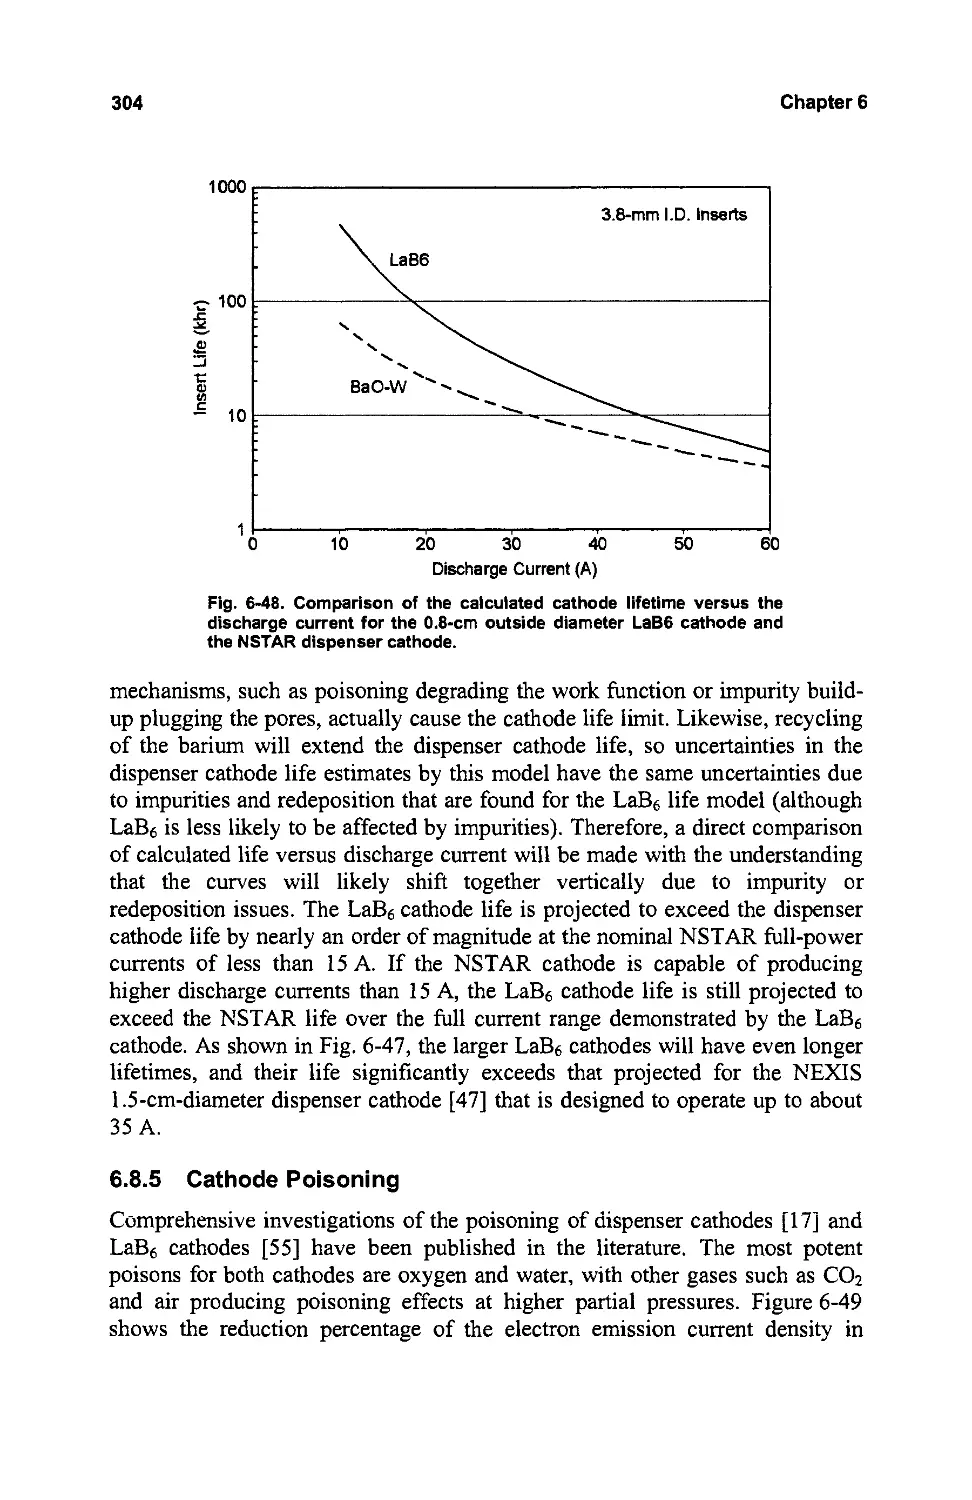
304
306
309
315
321
Chapter 7: Hall Thrusters
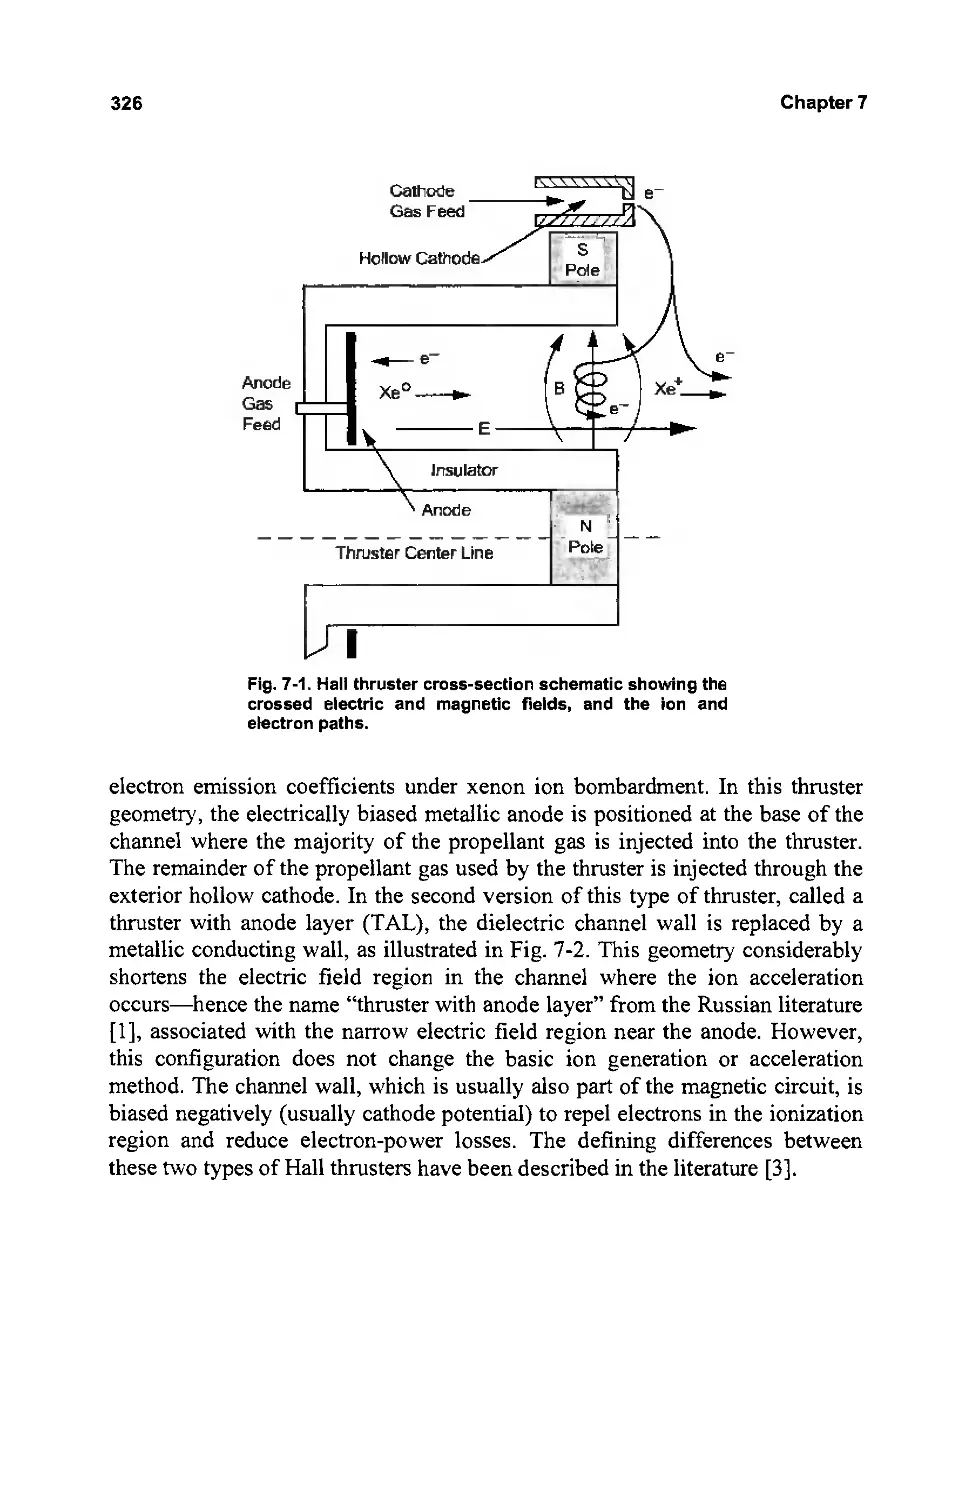
7.1 Introduction
7.2 Thruster Operating Principles and Scaling
7.2.1 Crossed-Field Structure and the Hall Current
7.2.2 Ionization Length and Scaling
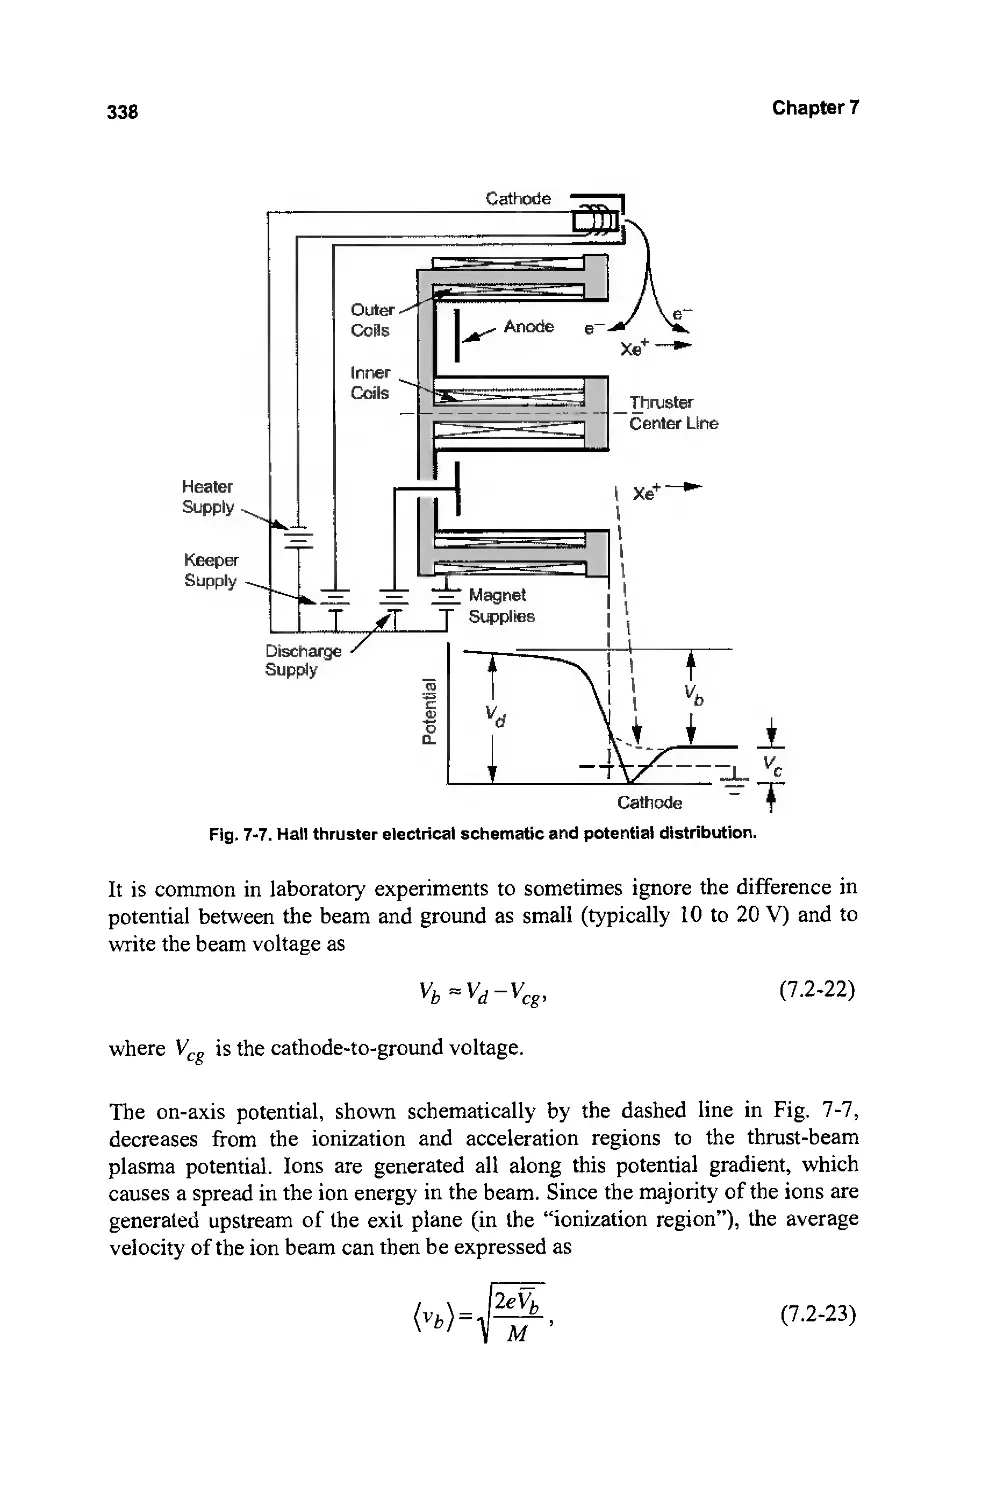
7.2.3 Potential and Current Distributions
7.3 Hall Thruster Performance Models
7.3.1 Hall Thruster Efficiency
7.3.2 Multiply Charged Ion Correction
7.3.3 Dominant Power Loss Mechanisms
7.3.4 Plasma Electron Temperature
7.3.5 Hall Thruster Efficiency (Dielectric Walls)
7.3.6 TAL Hall Thruster Efficiency (Metallic Walls)
7.3.7 Dielectric-Wall Versus Metallic-Wall Comparison
7.4 Channel Physics and Numerical Modeling
325
325
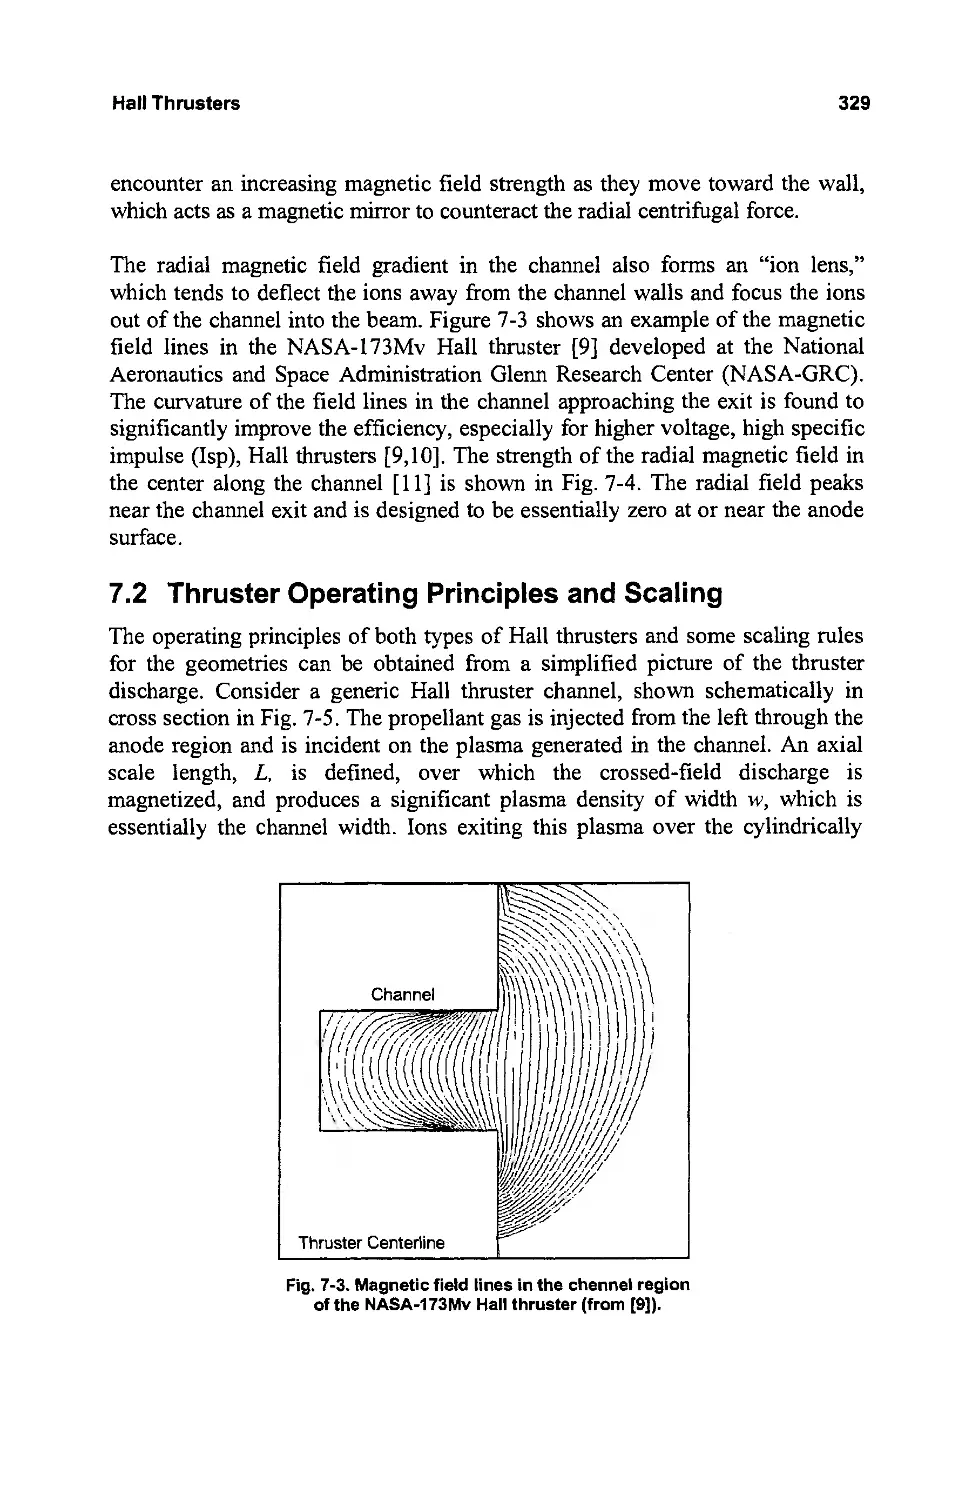
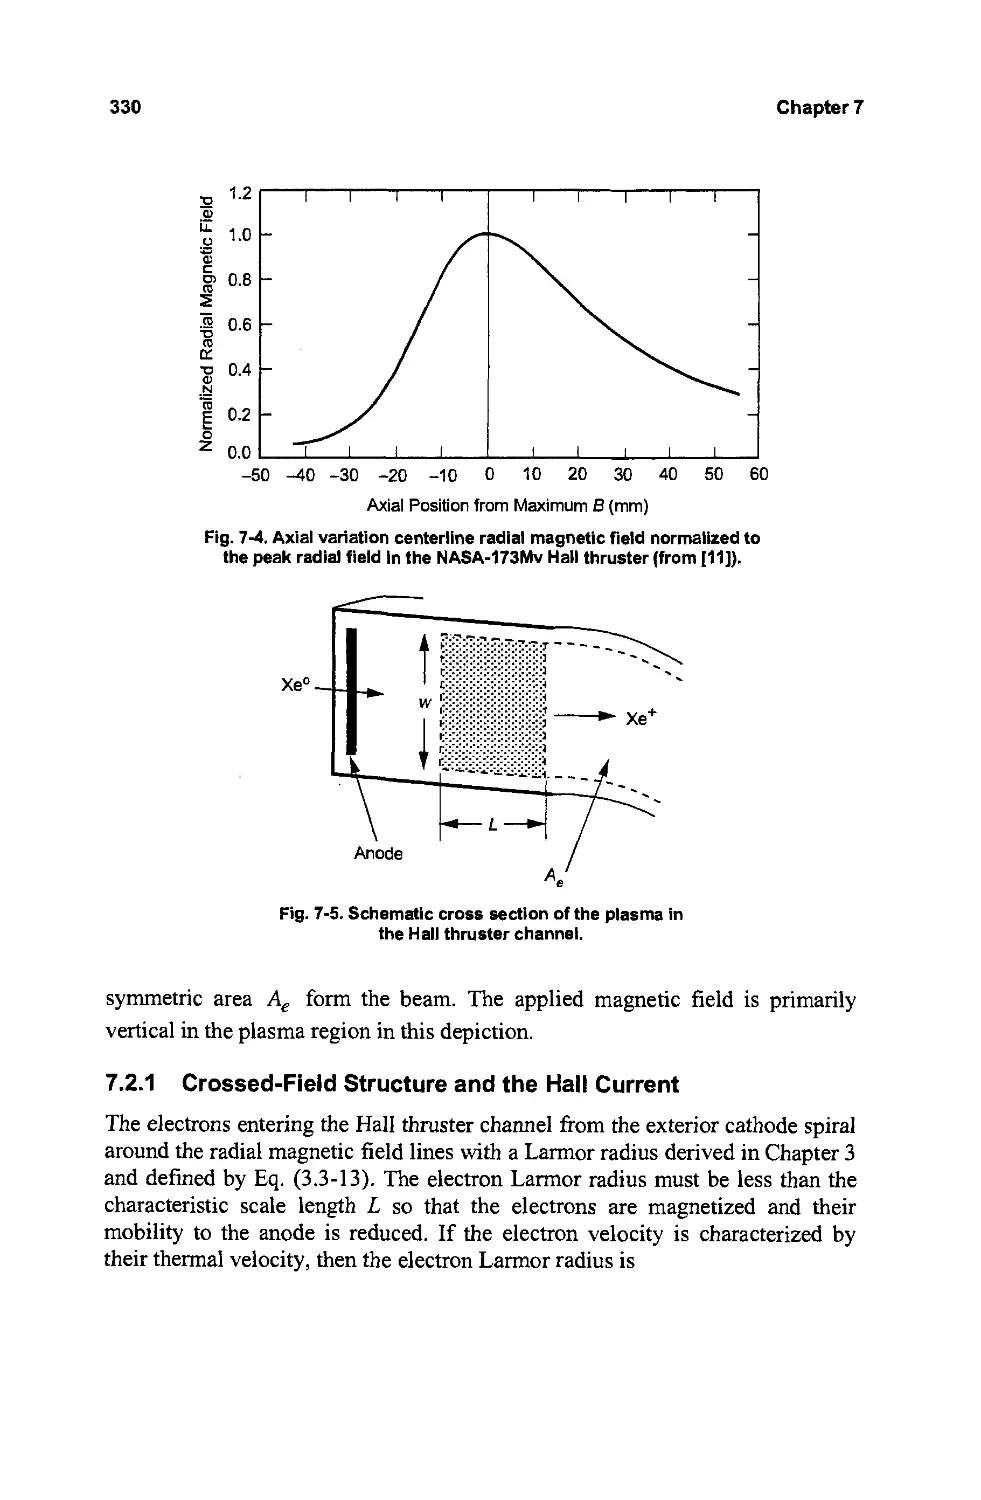
329
330
334
337
341
341
345
347
357
359
363
364
365
viii
7.4.1 Hybrid Hall Thruster Models
7.4.2 Steady-State Modeling Results
7.4.3 Oscillations in Hall Thrusters
7.5 Hall Thruster Life
References
Problems
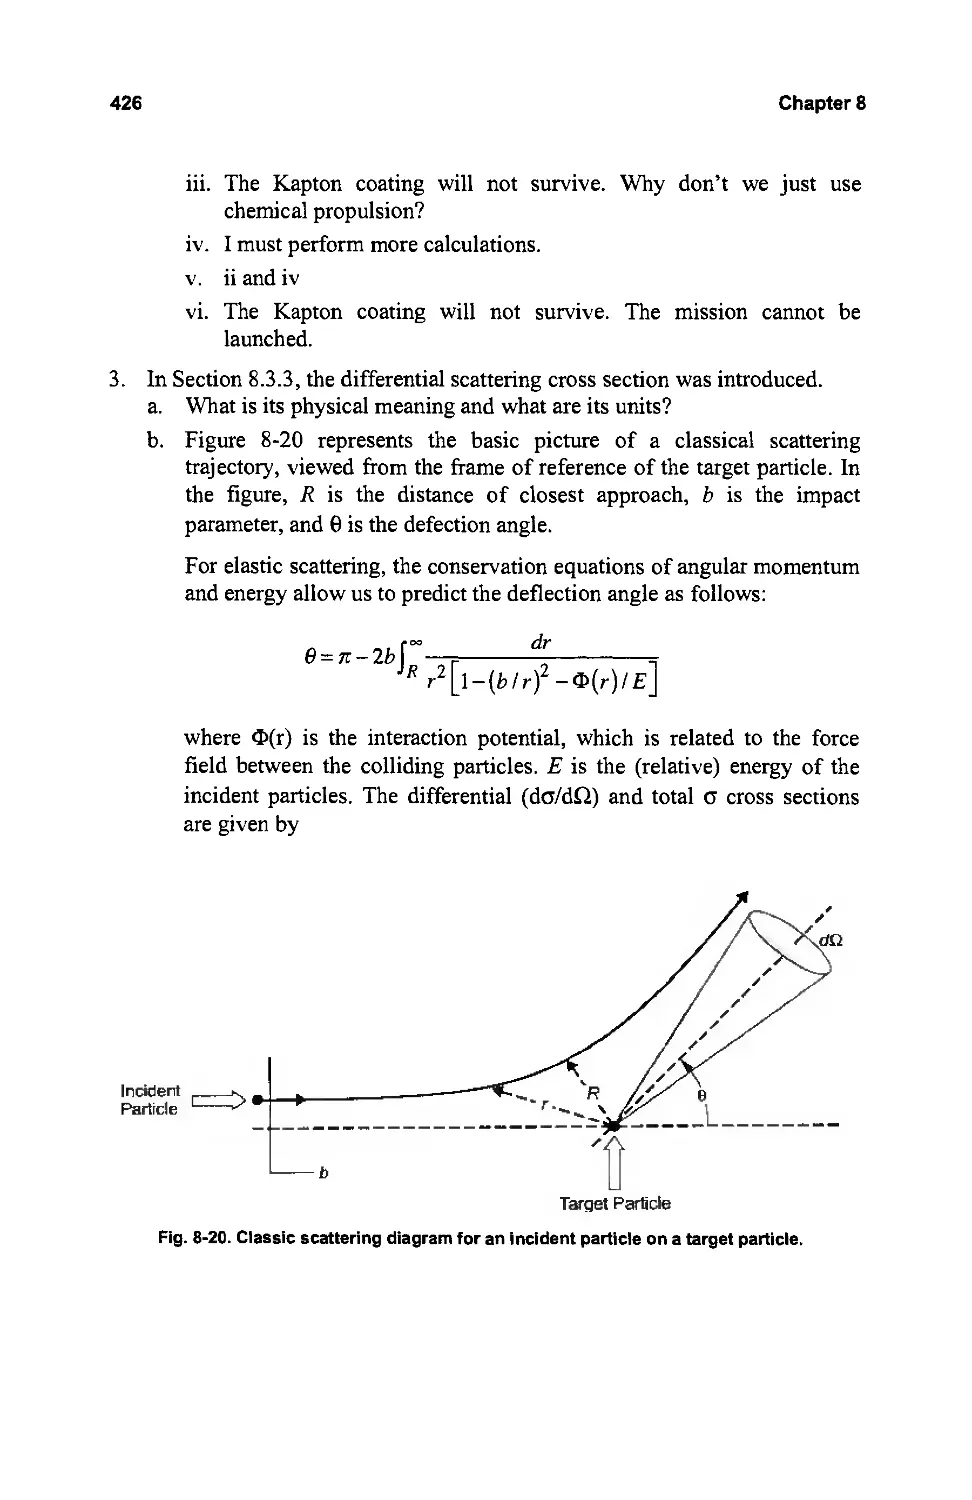
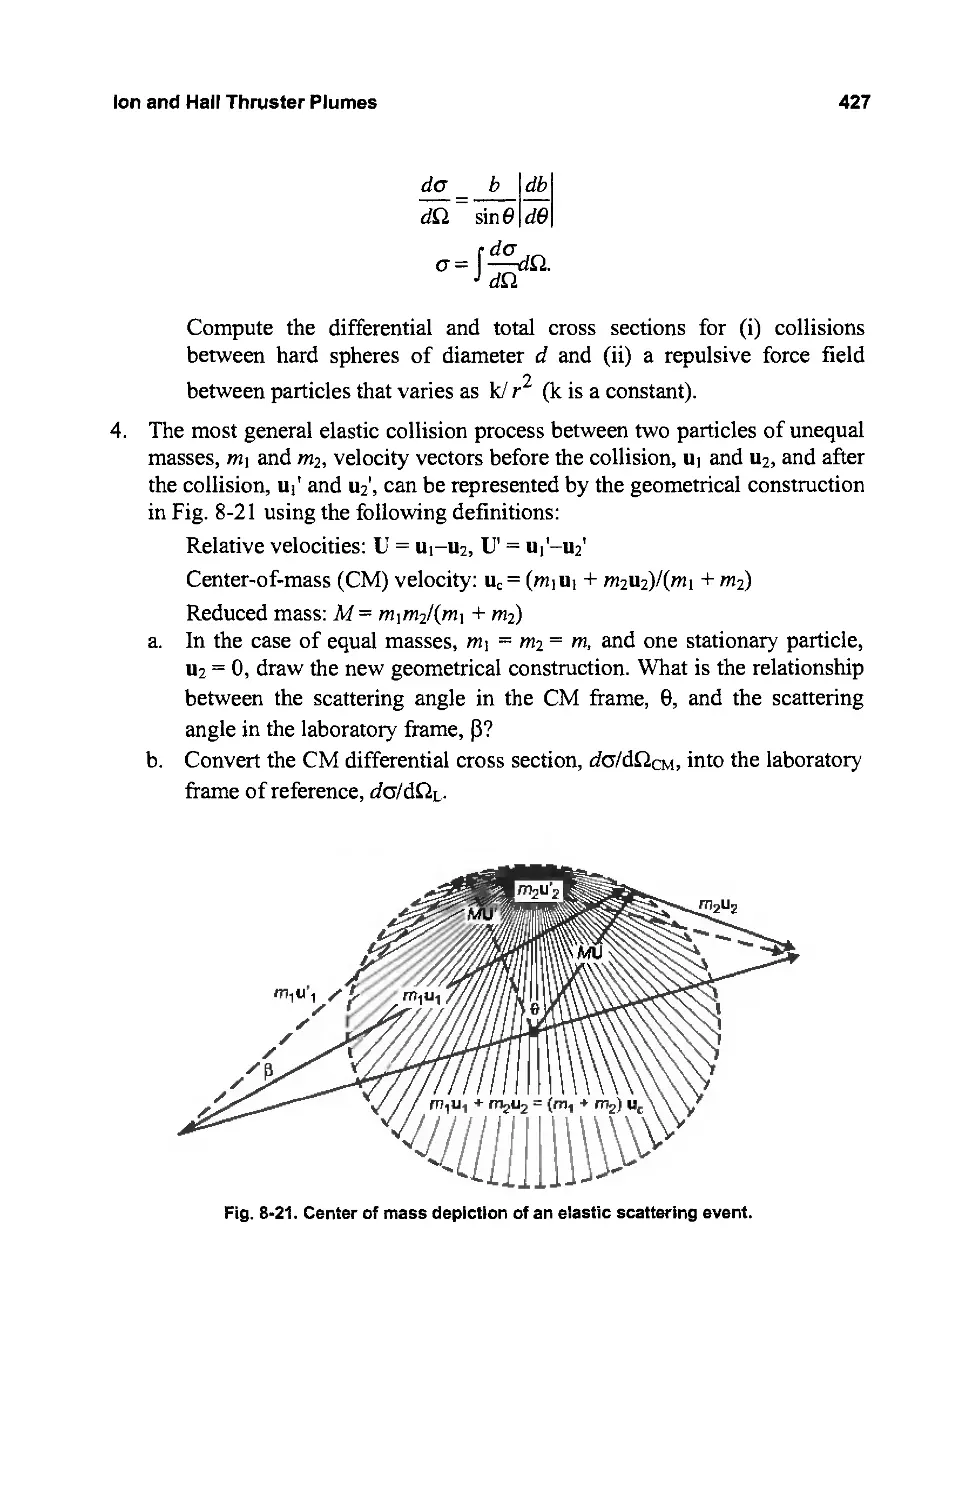
Chapter 8: Ion and Hall Thruster Plumes
8.1 Introduction
8.2 Plume Physics
8.2.1 Plume Measurements
8.2.2 Flight Data
8.2.3 Laboratory Plume Measurements
8.3 Plume Models
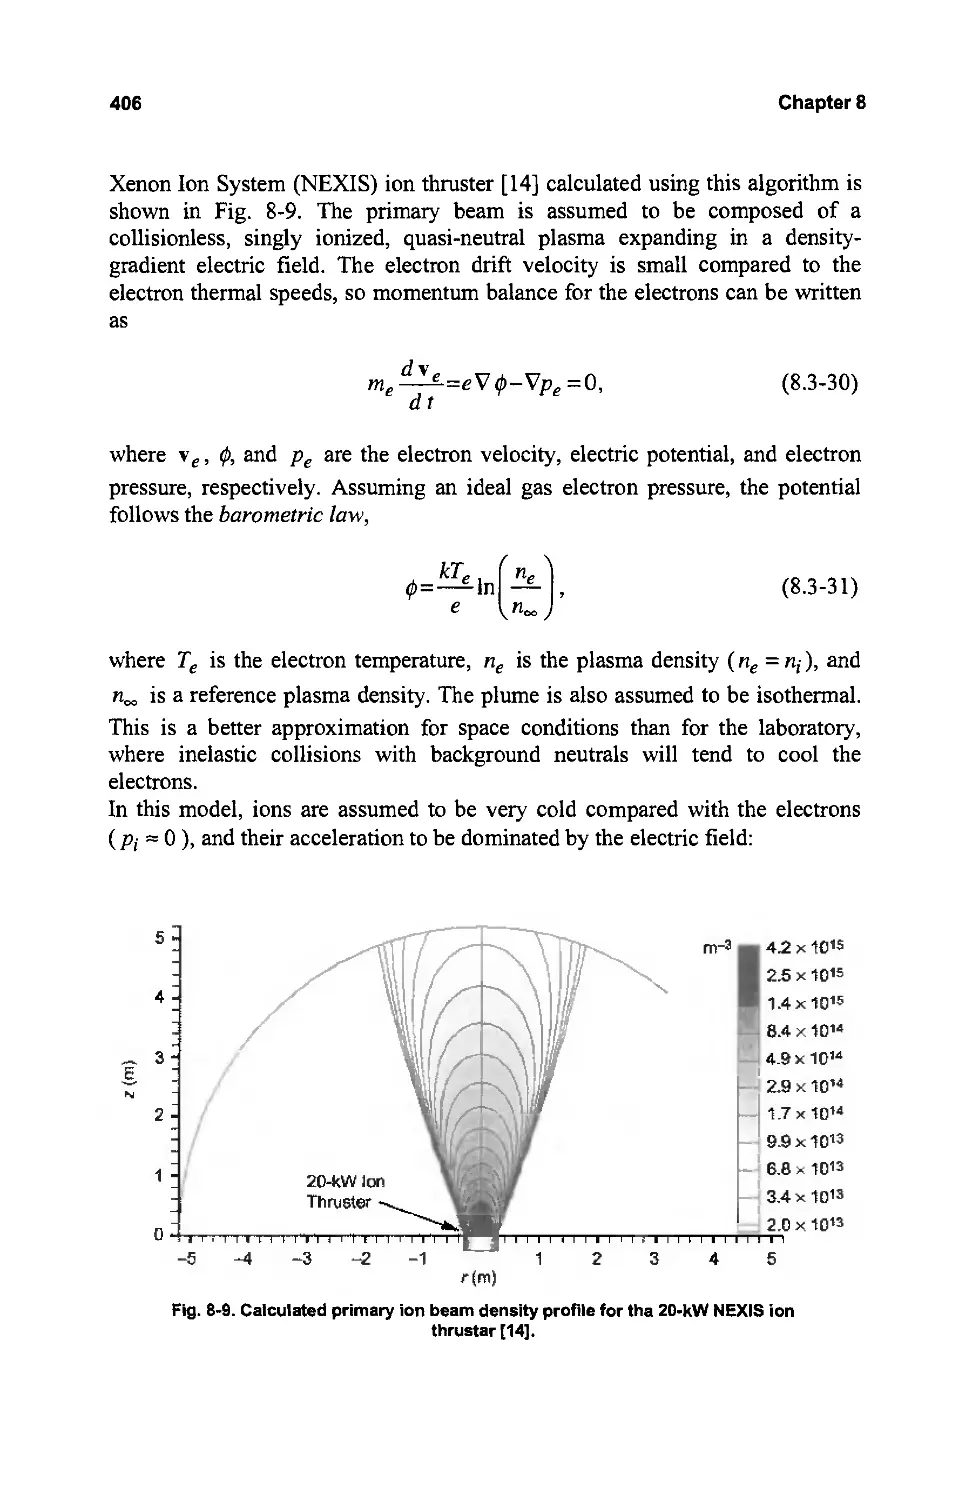
8.3.1 Primary Beam Expansion
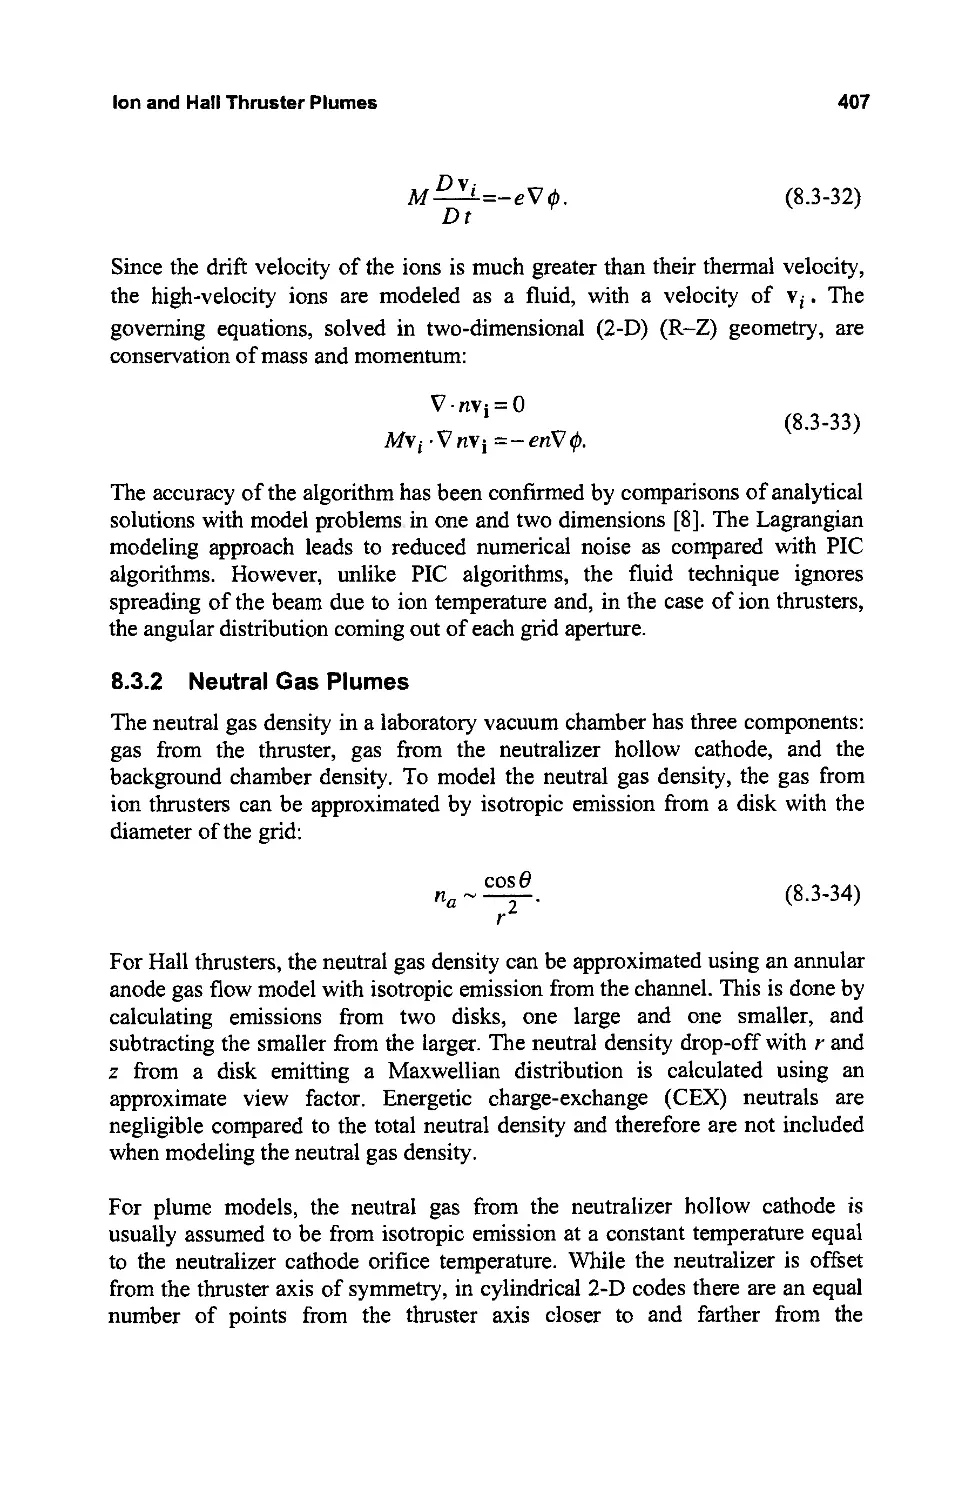
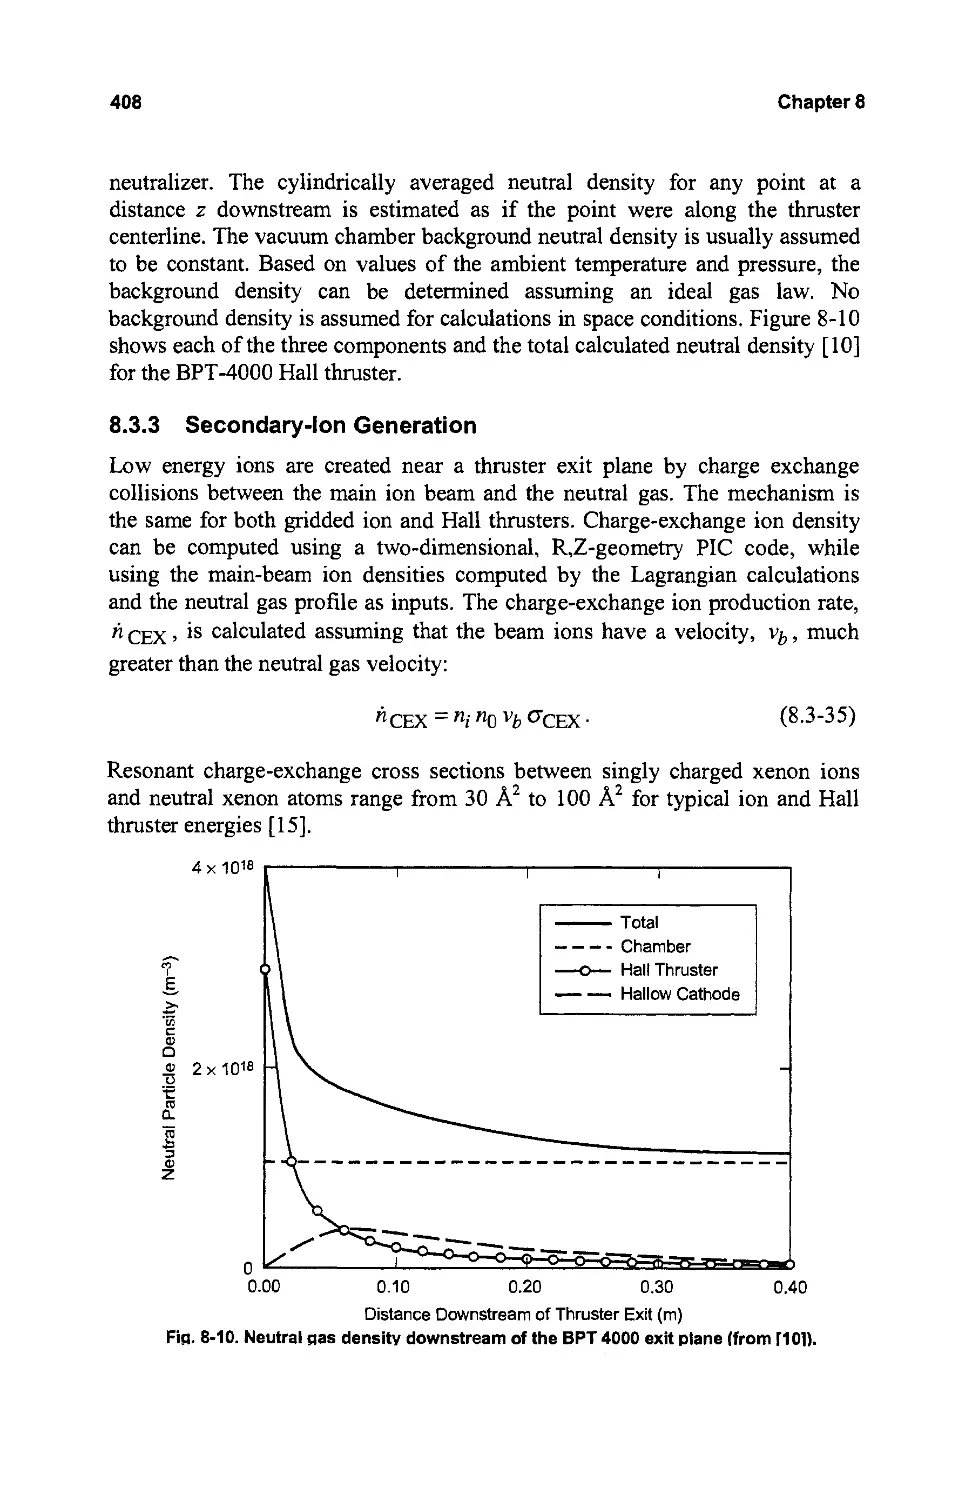
8.3.2 Neutral Gas Plumes
8.3.3 Secondary-Ion Generation
8.4 Spacecraft Interactions
8.4.1 Momentum of the Plume Particles
8.4.2 Sputtering and Contamination
8.4.3 Plasma Interactions with Solar Arrays
8.5 Interactions with Payloads
8.5.1 Microwave Phase Shift
8.5.2 Plume Plasma Optical Emission
References
Problems
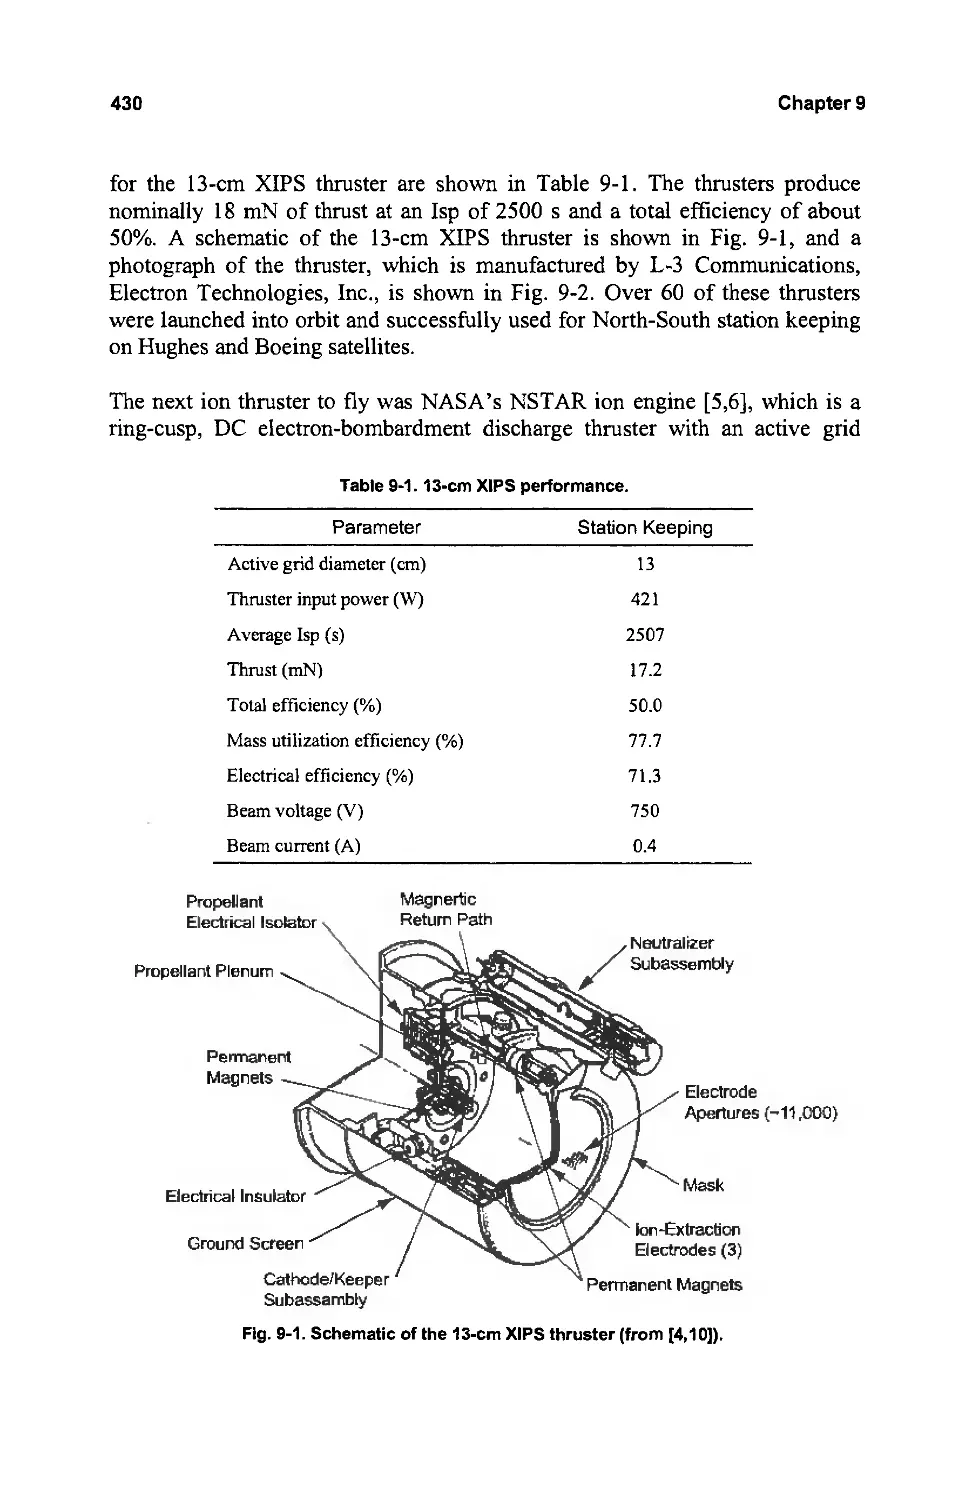
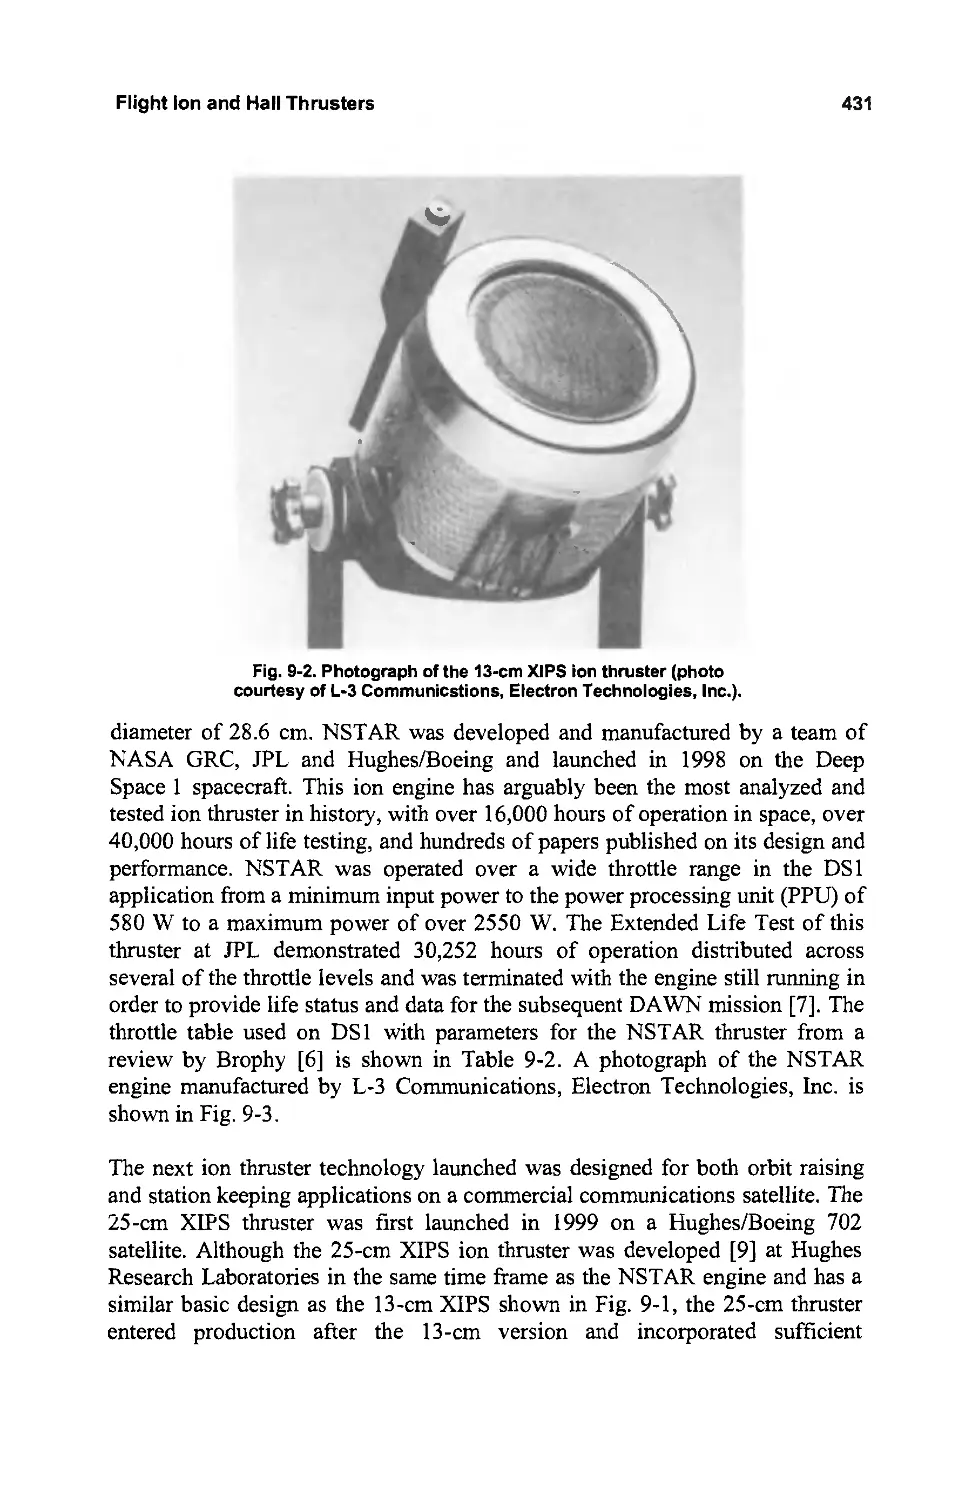
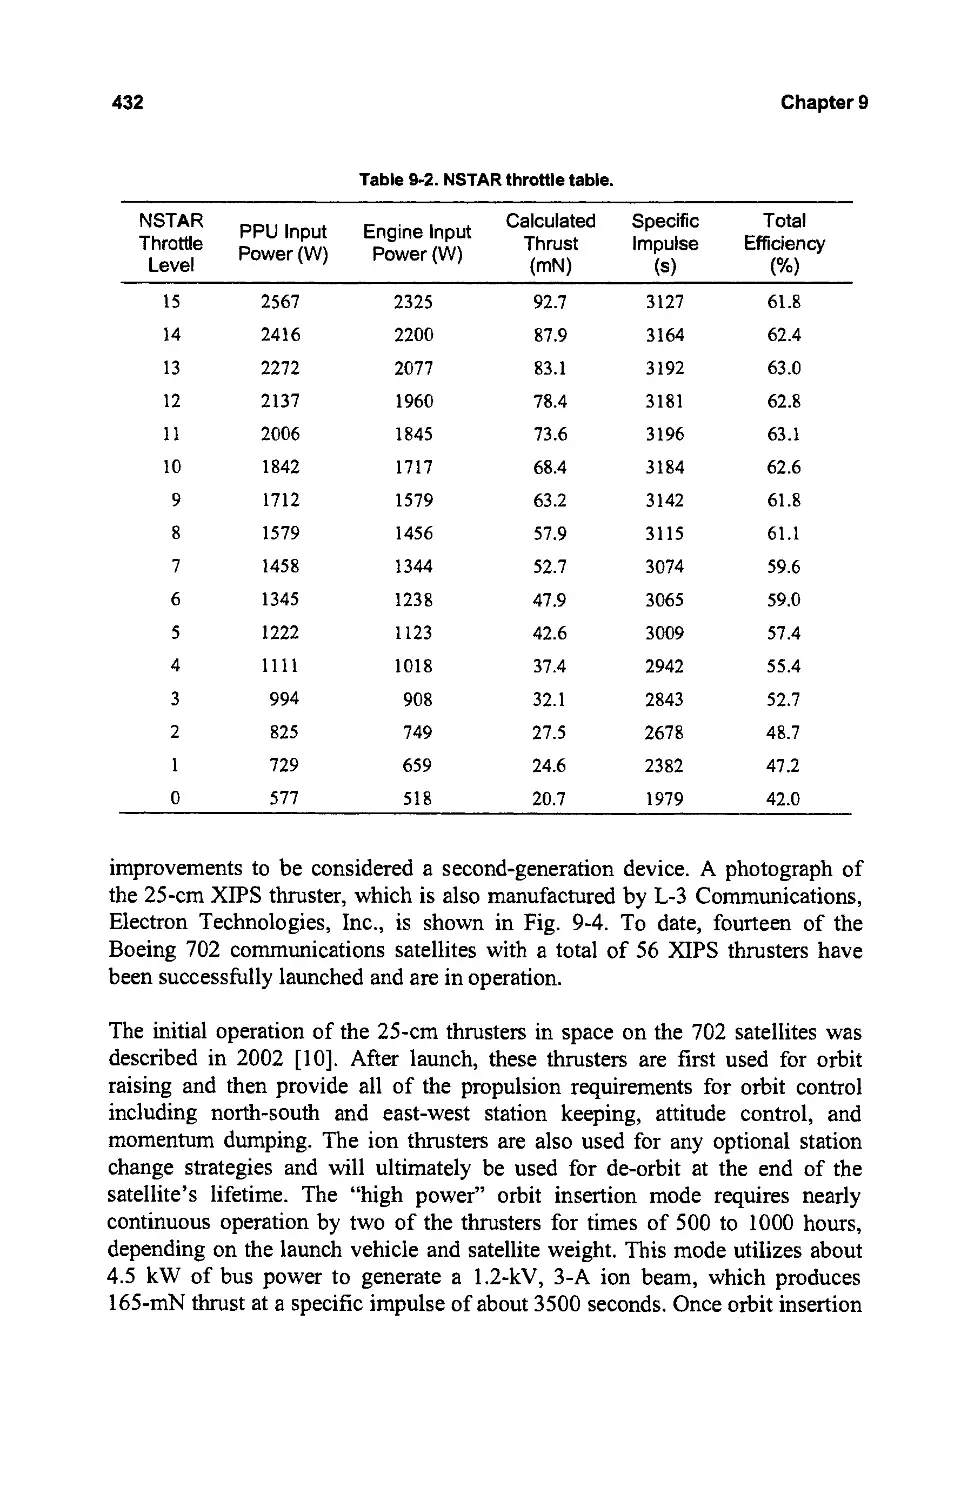
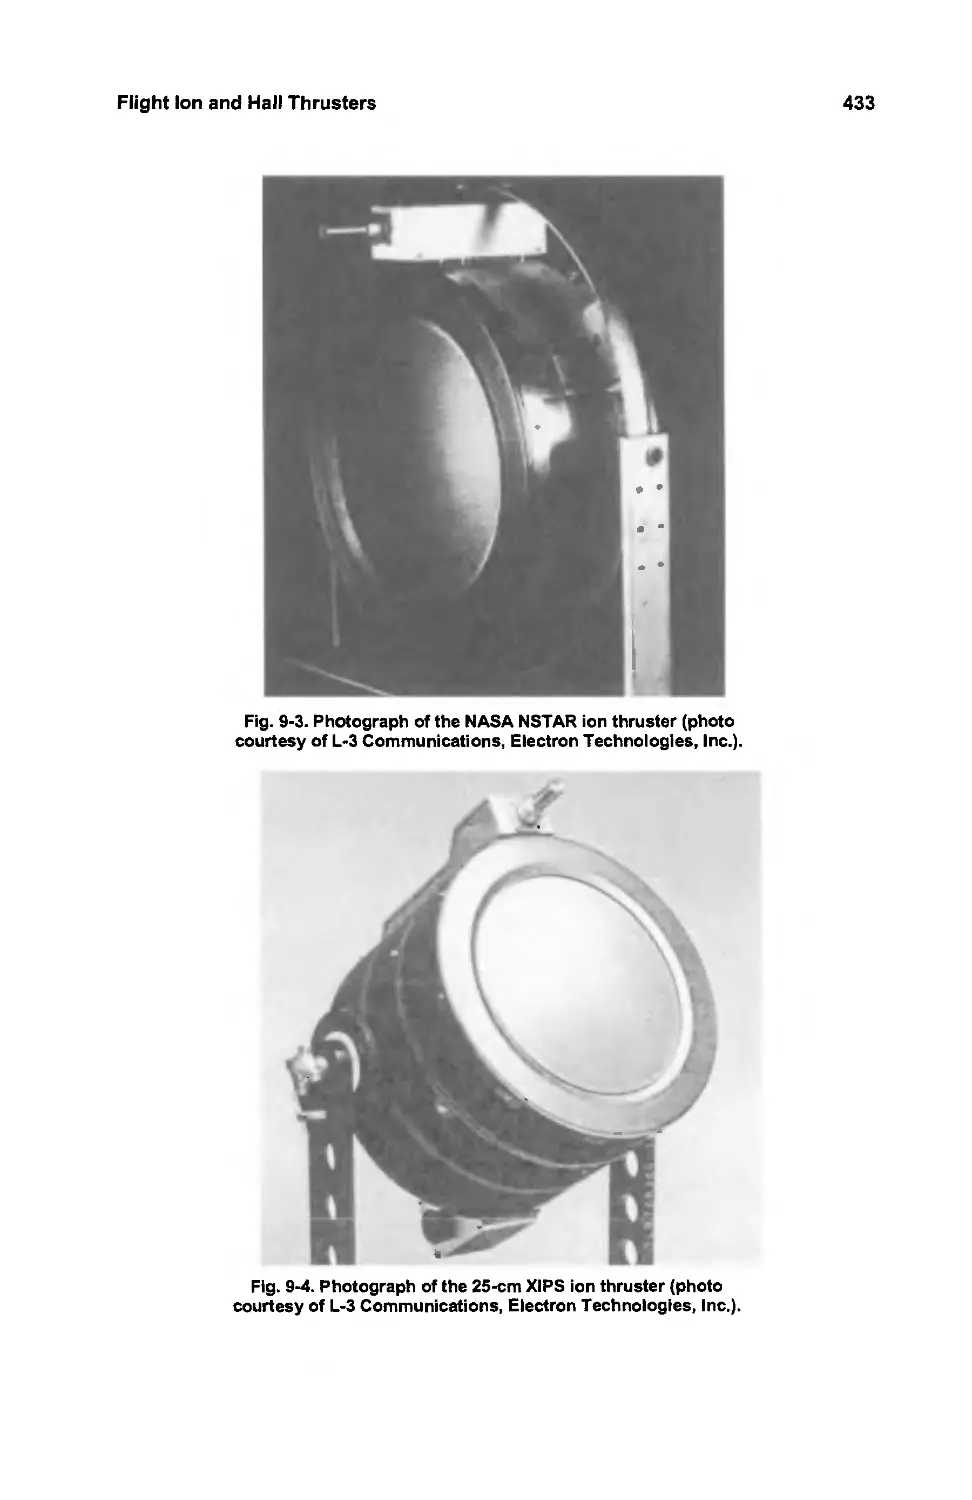
Chapter 9: Flight Ion and Hall Thrusters
9.1 Introduction
9.2 Ion Thrusters
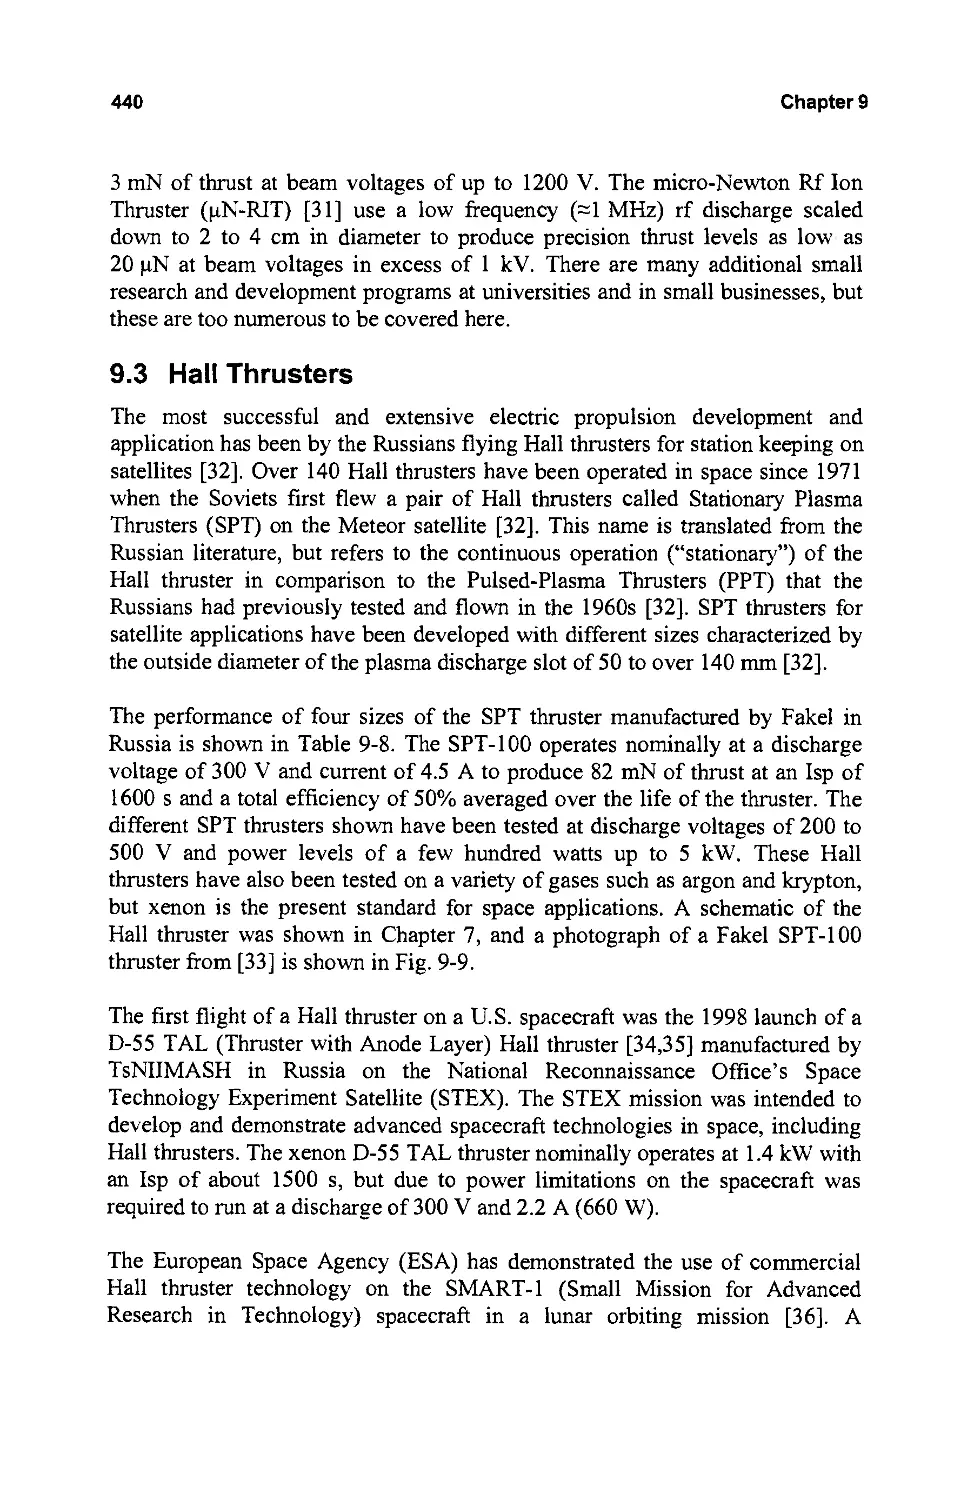
9.3 Hall Thrusters
References
Appendices
A: Nomenclature
B: Gas Flow Unit Conversions and Cathode Pressure Estimates
C: Energy Loss by Electrons
D: Ionization and Excitation Cross Sections for Xenon
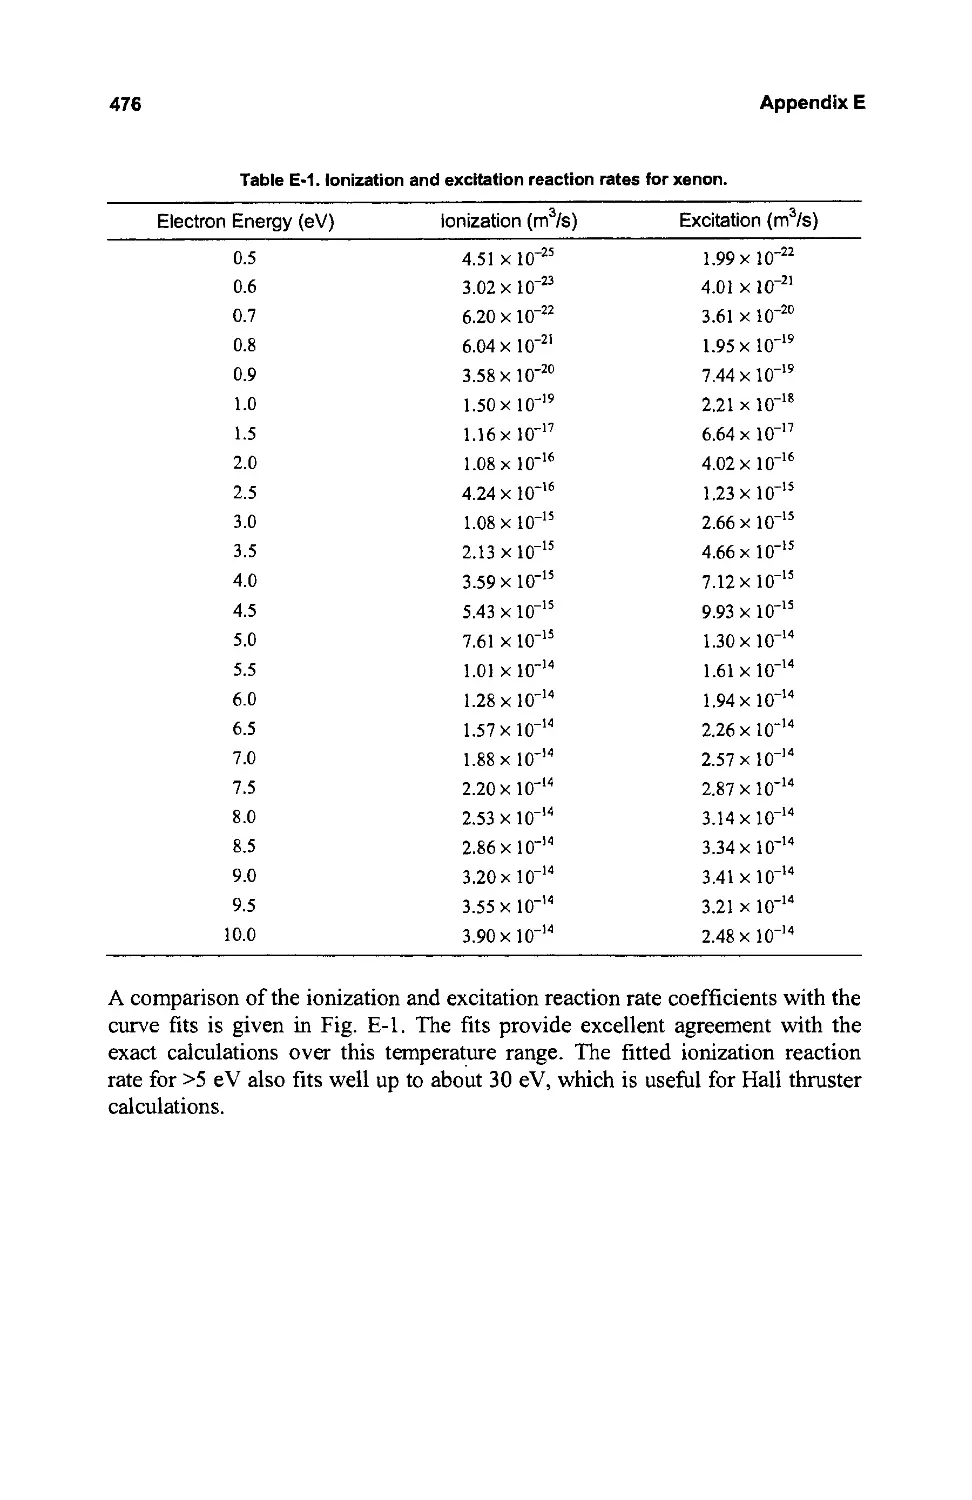
E: Ionization and Excitation Reaction Rates for Xenon in
Maxwellian Plasmas
F: Electron Relaxation and Thermalization Times
G: Clausing Factor Monte Carlo Calculation
Index
Contents
366
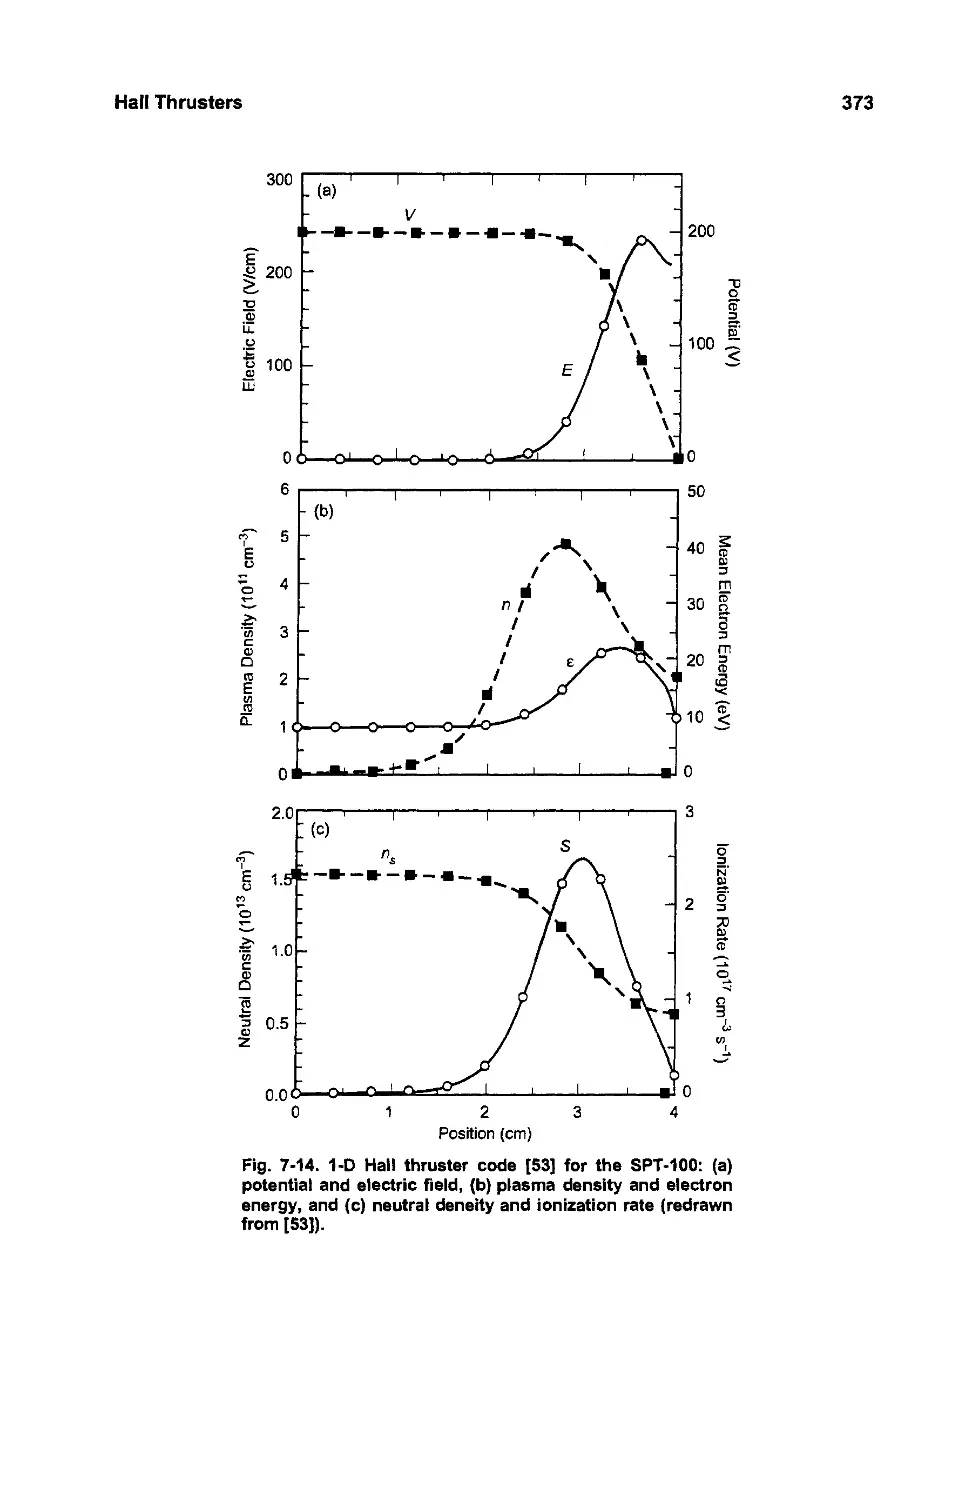
372
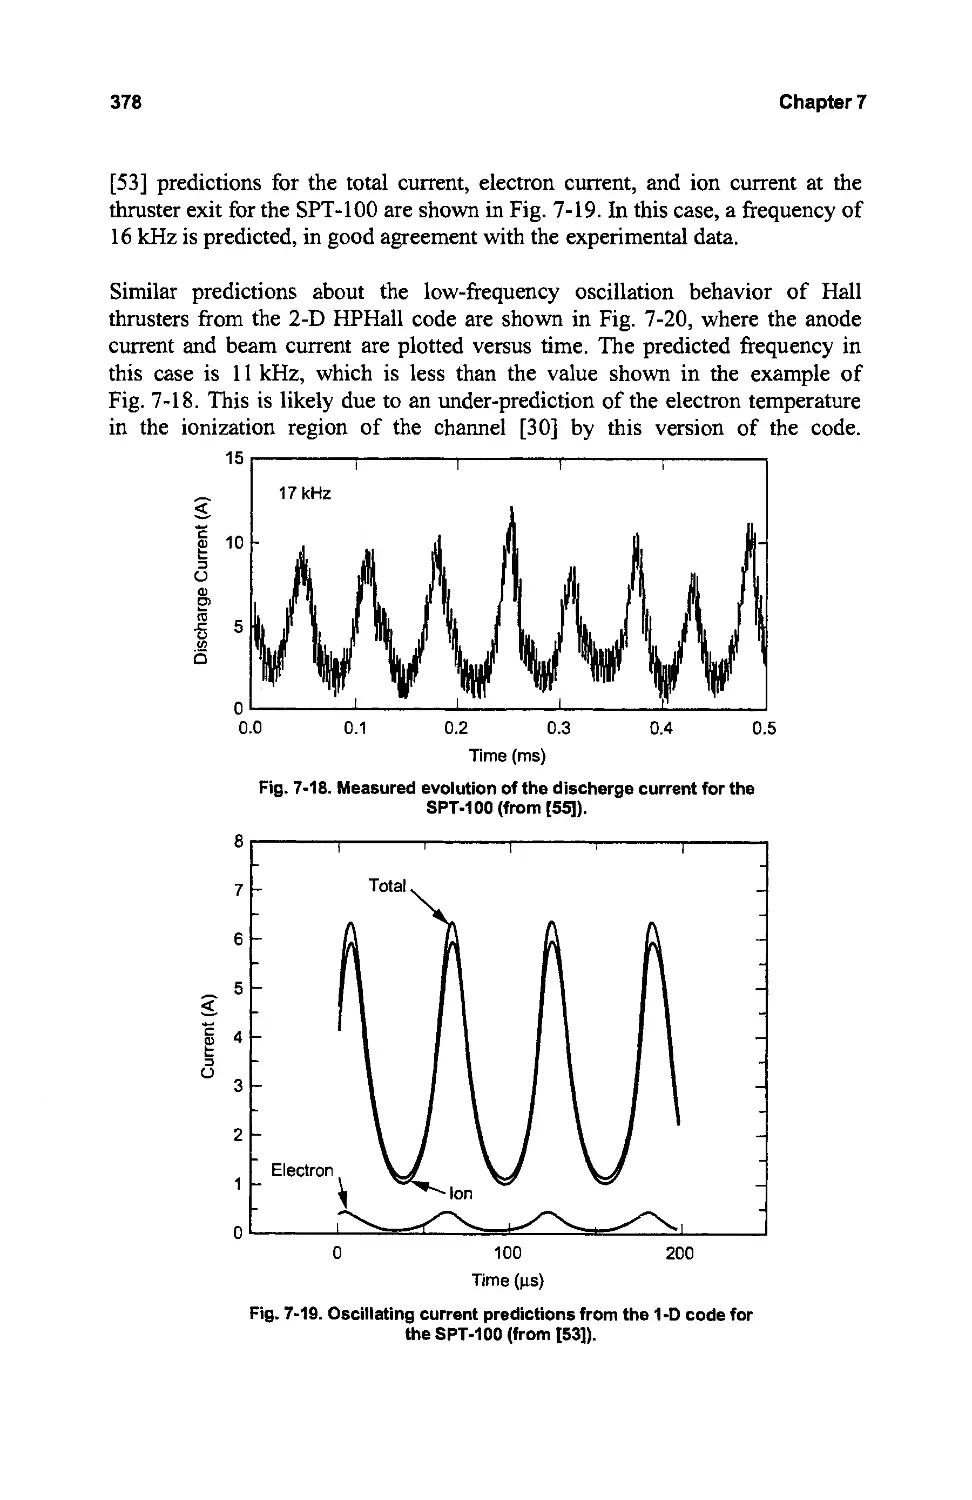
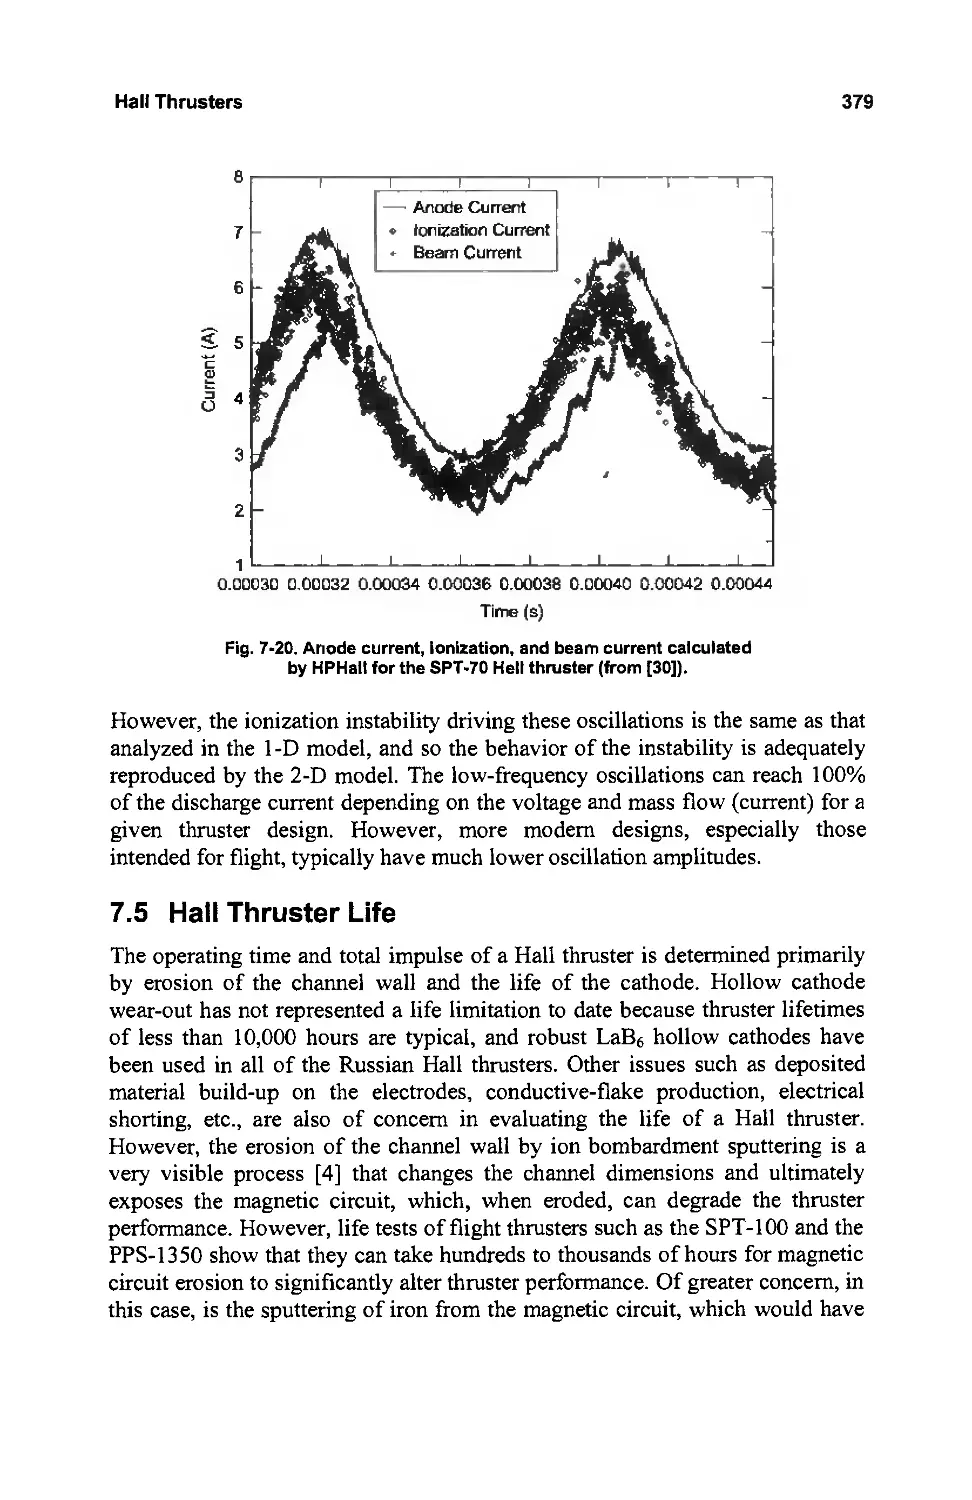
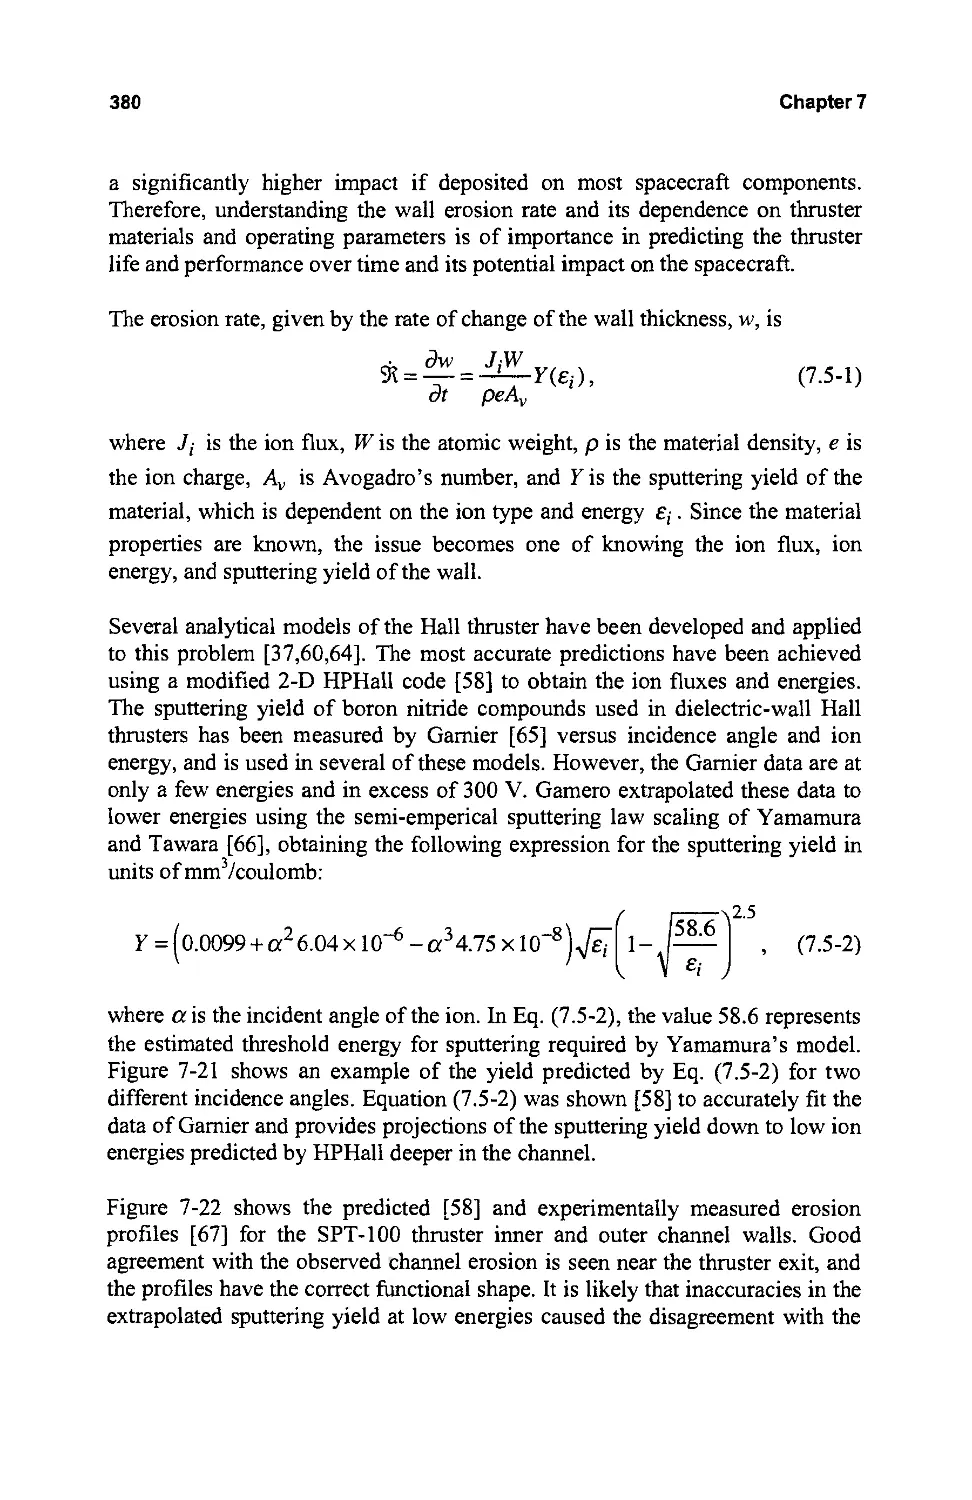
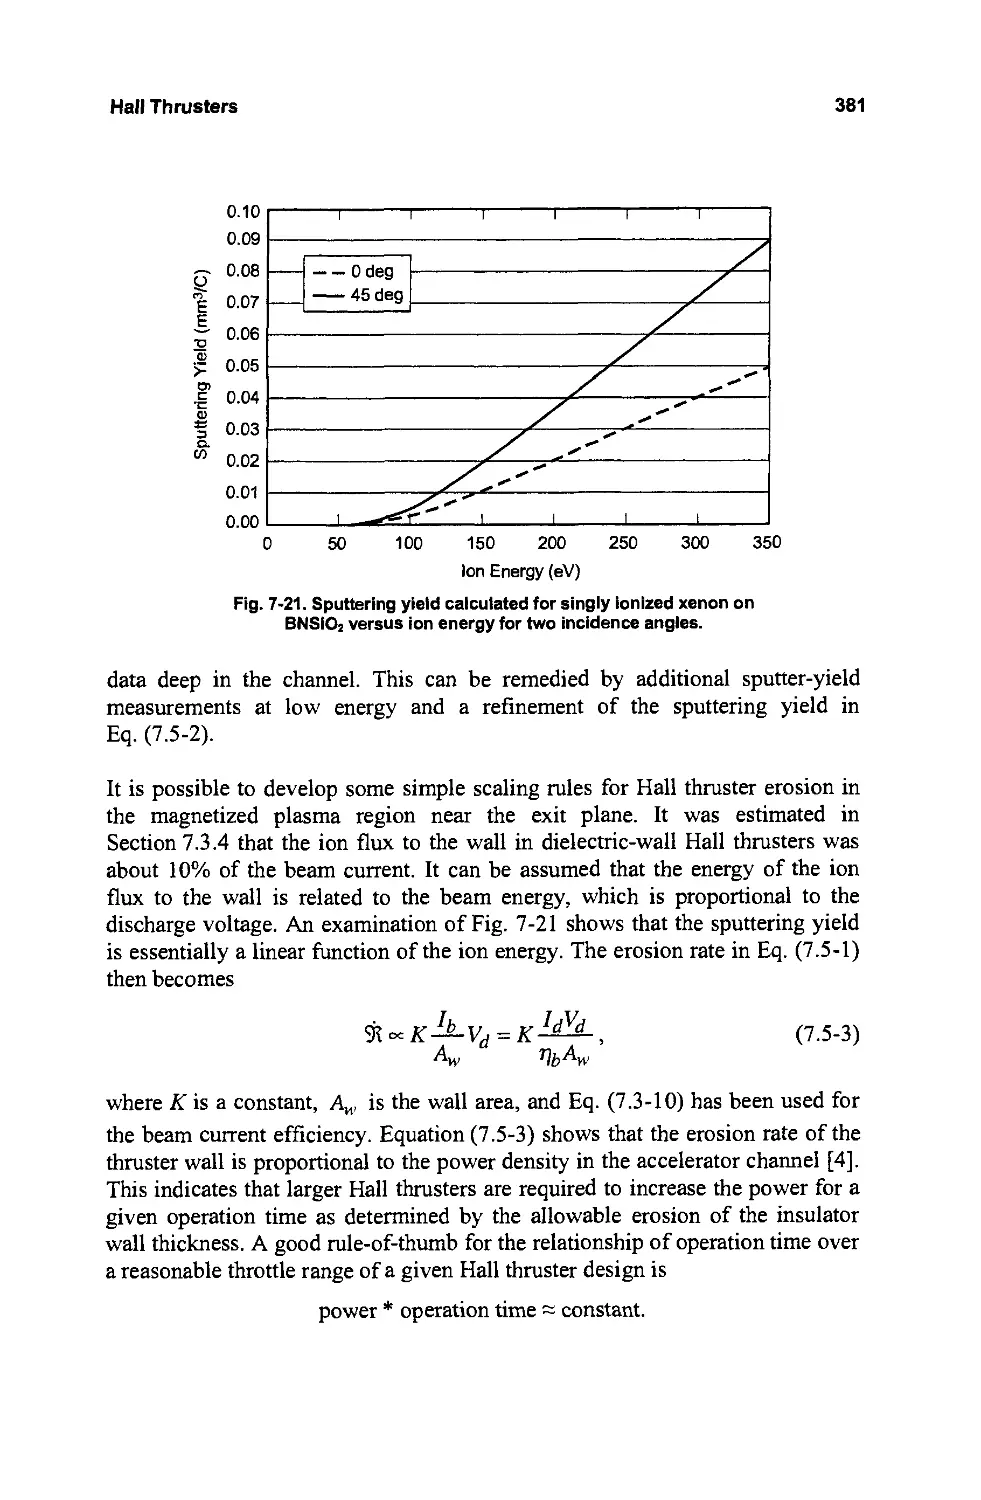
376
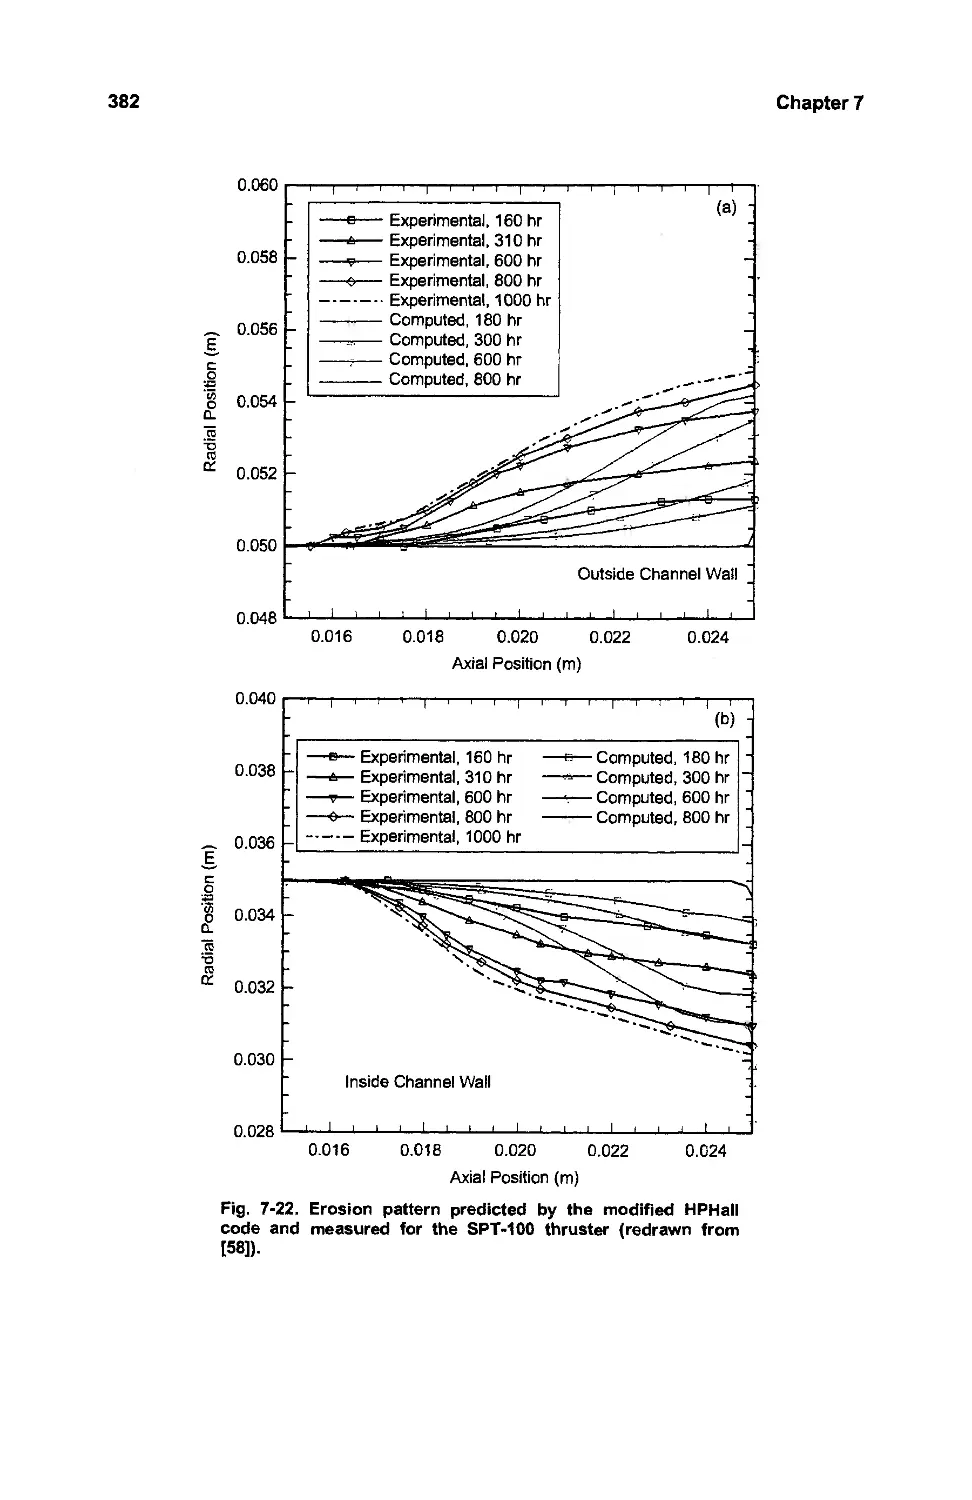
379
384
389
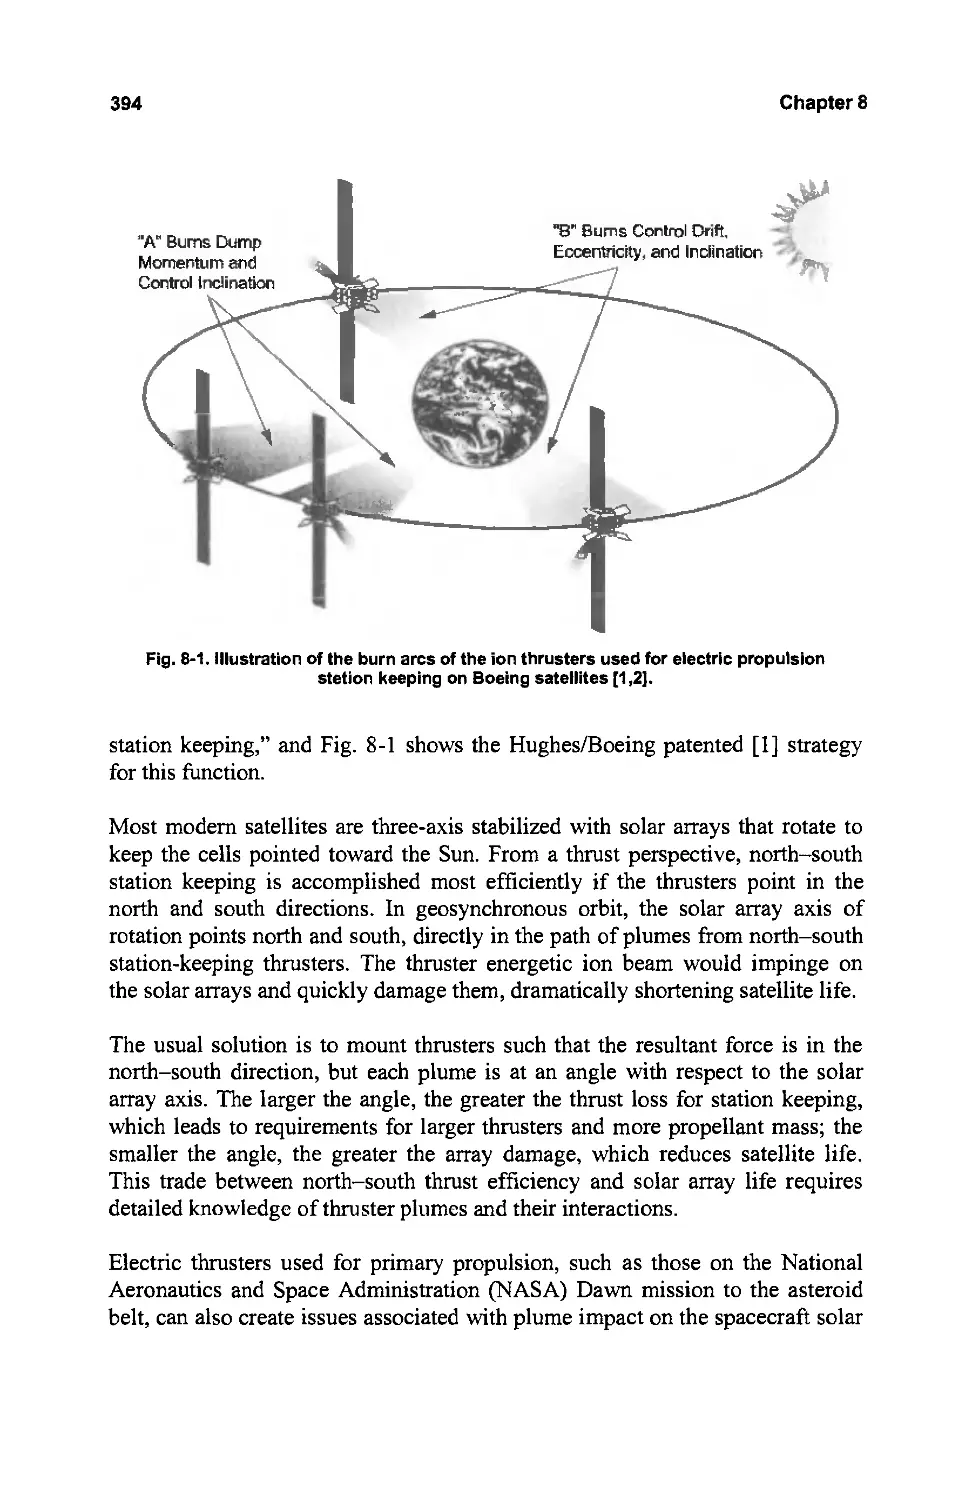
393
393
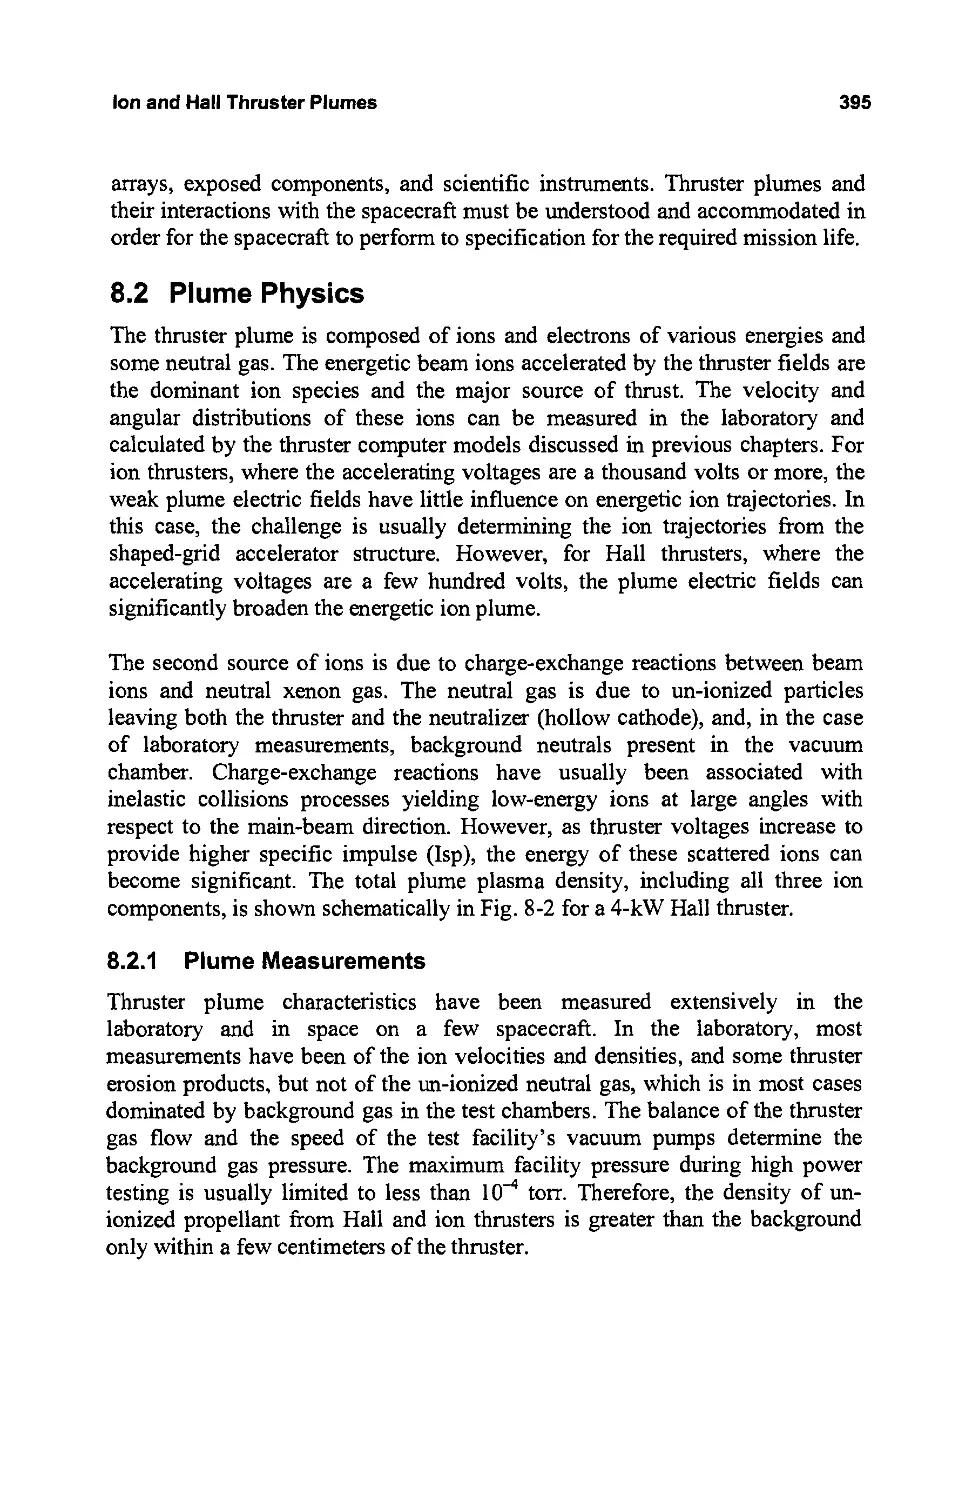
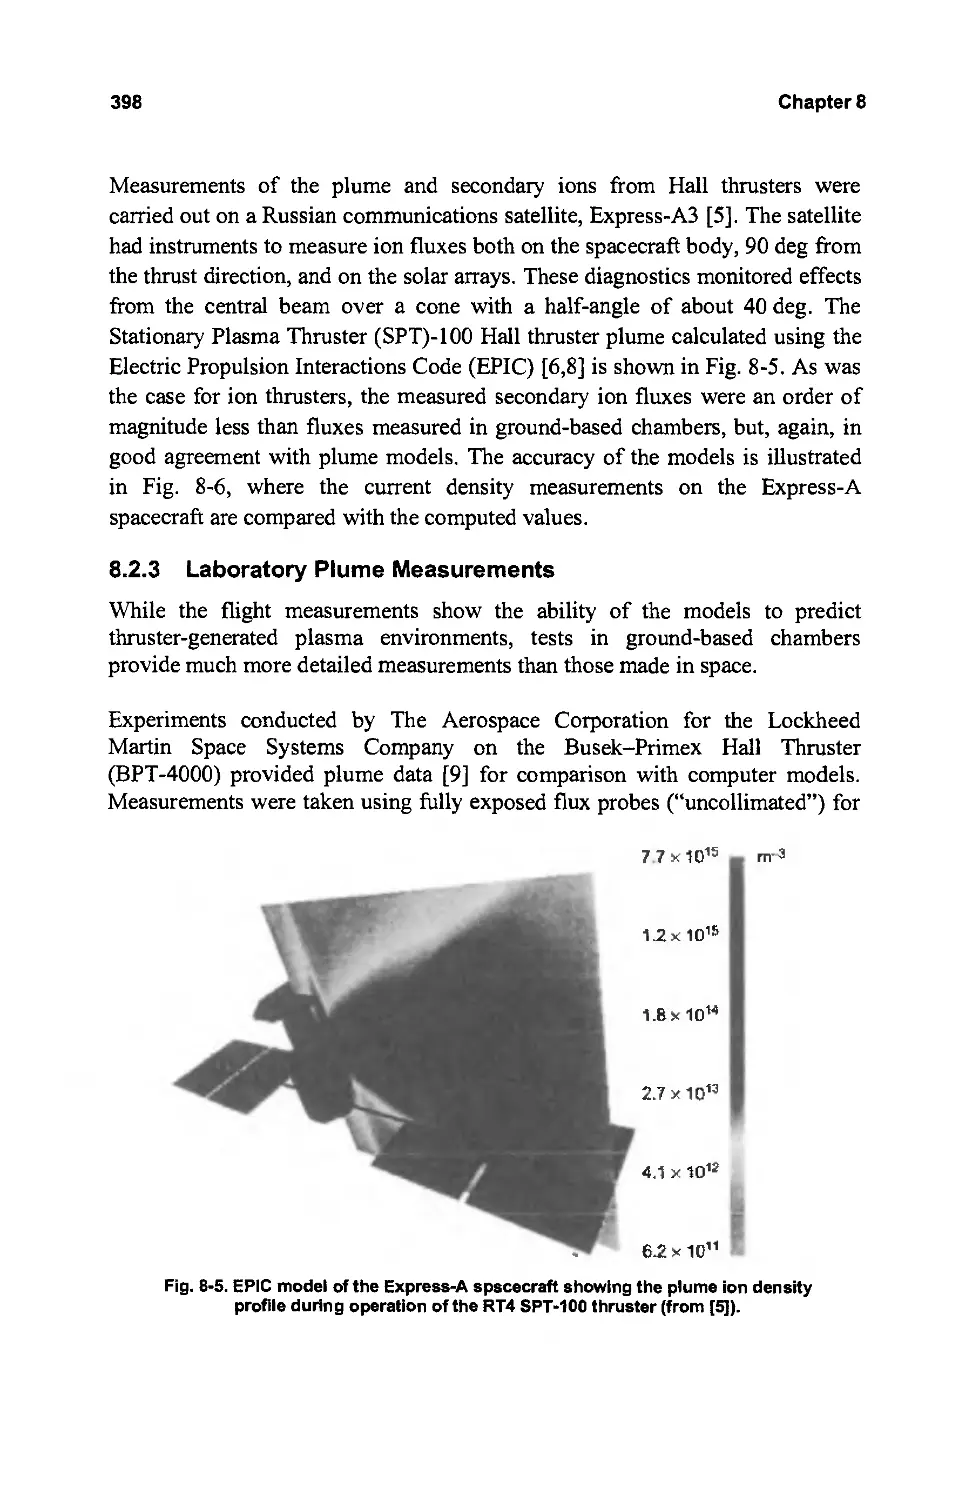
395
395
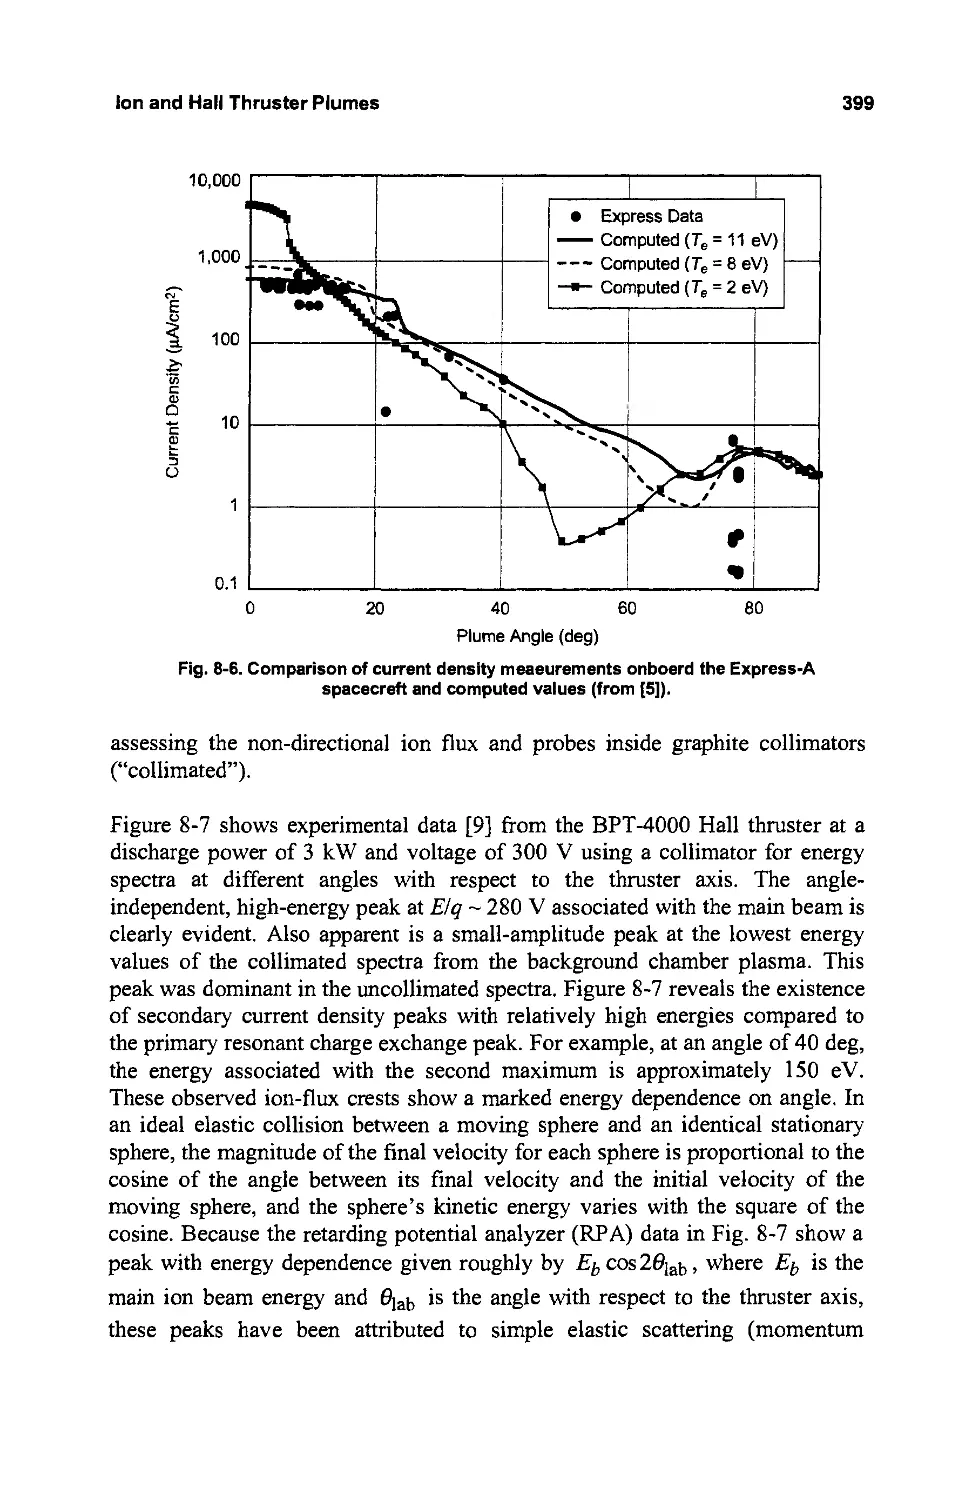
.396
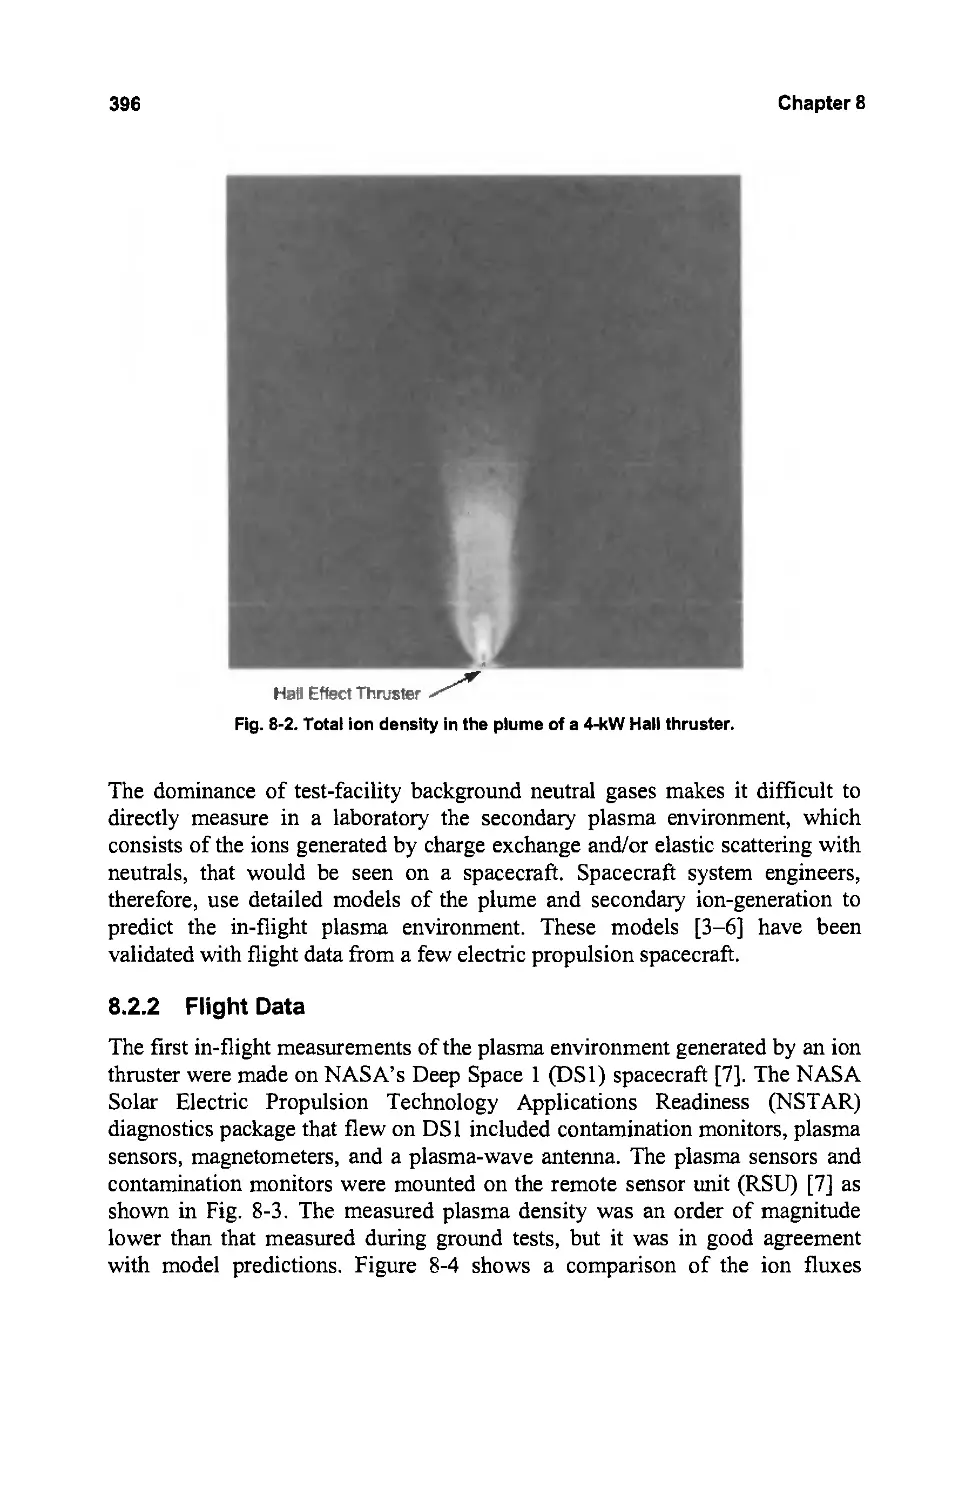
398
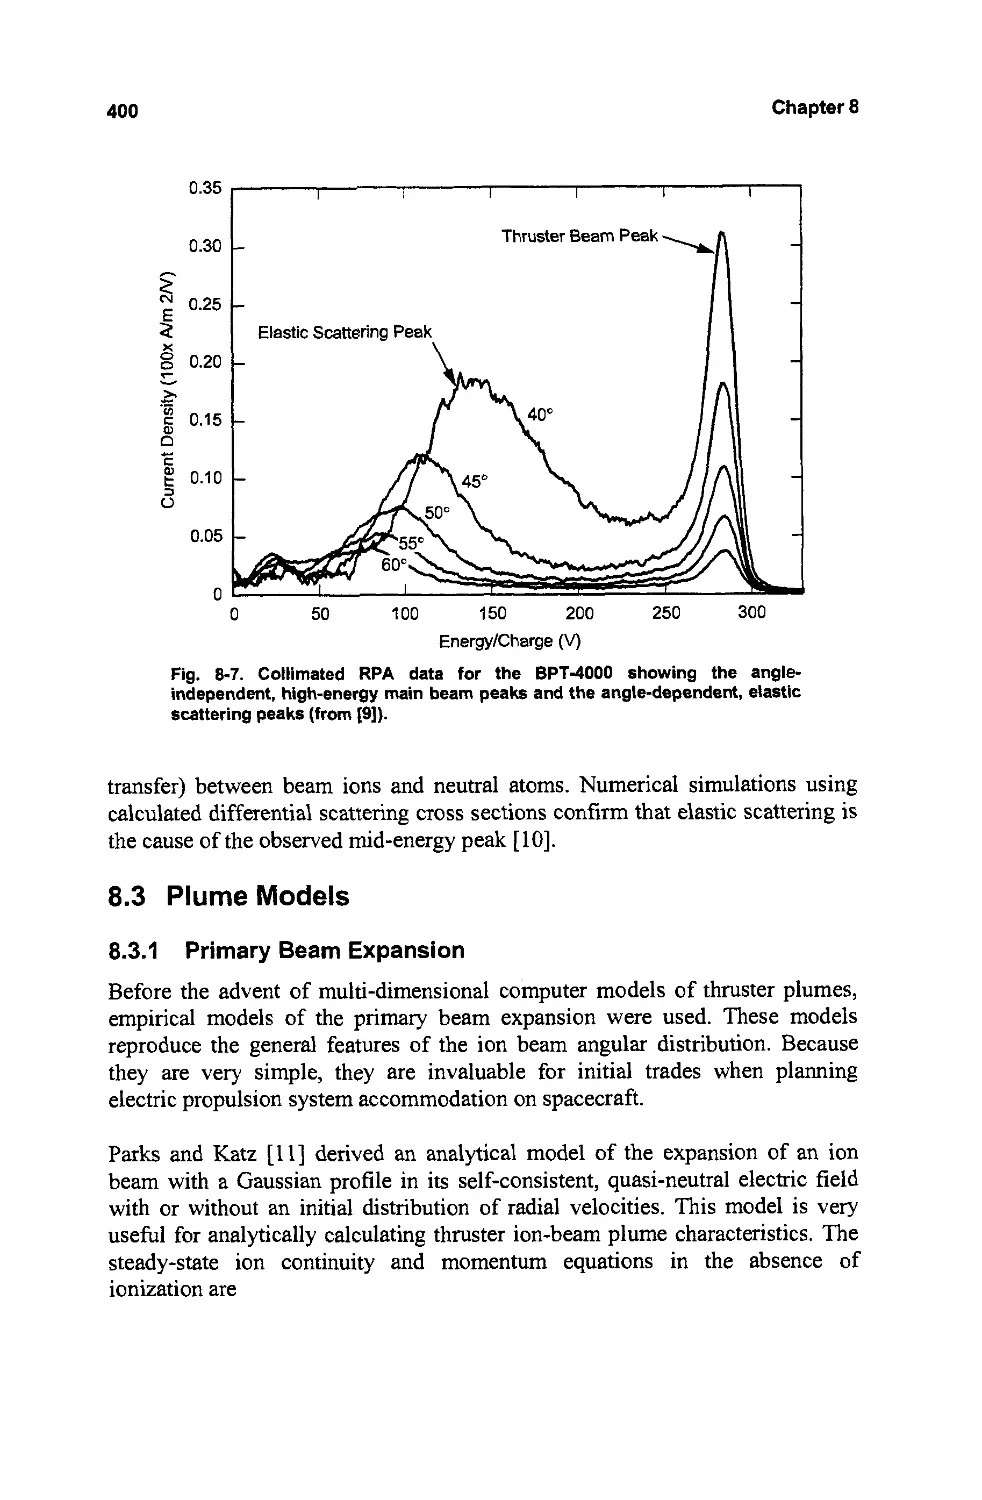
400
400
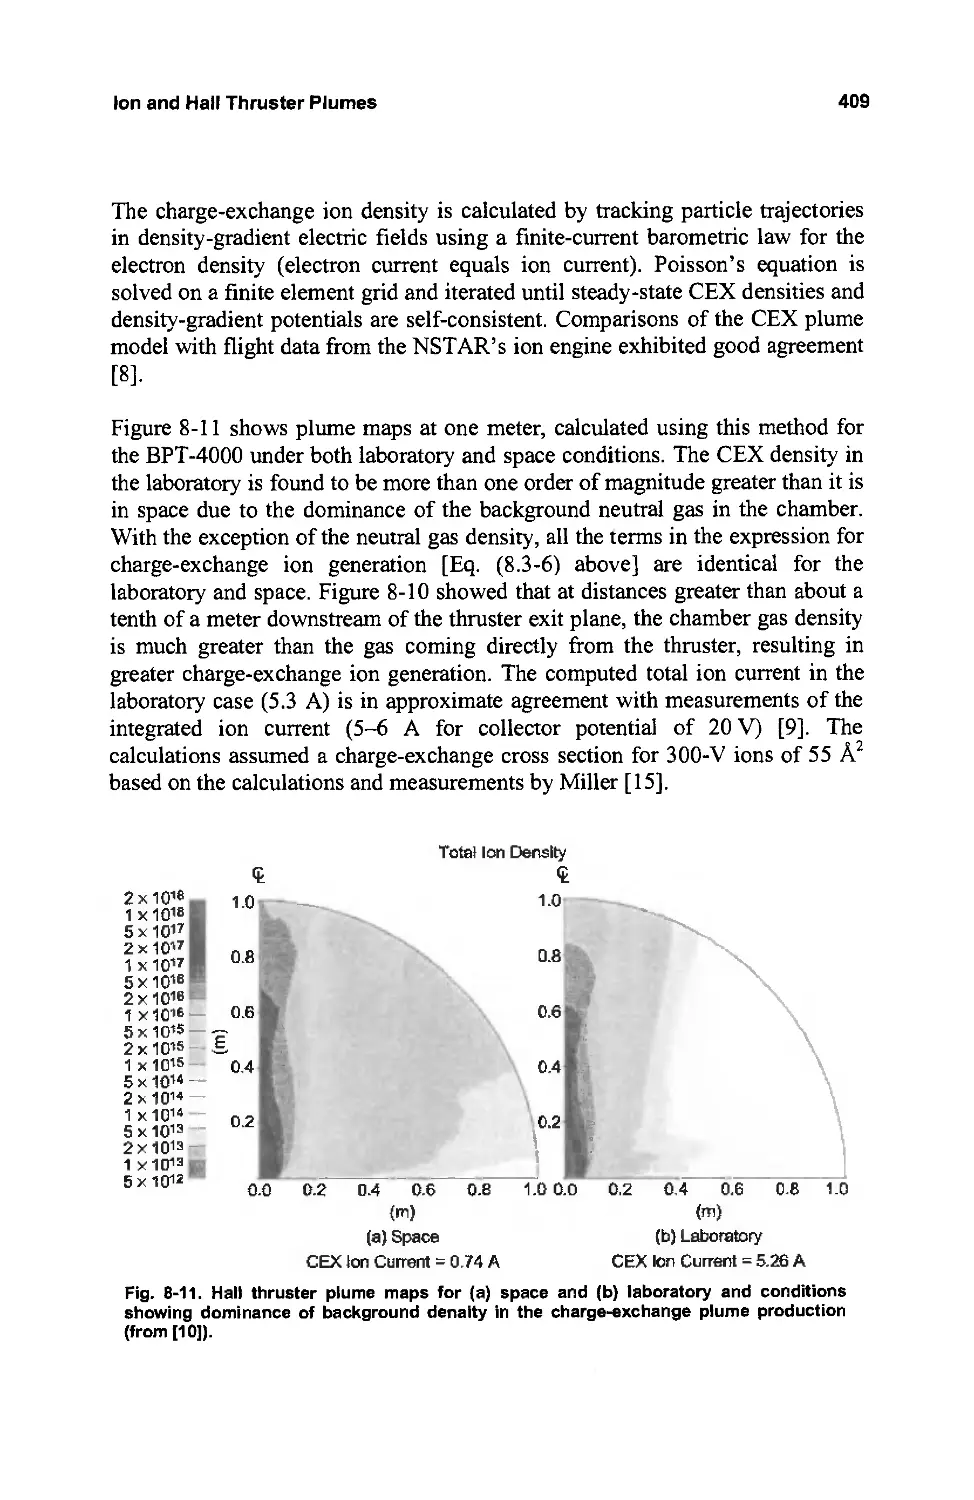
407
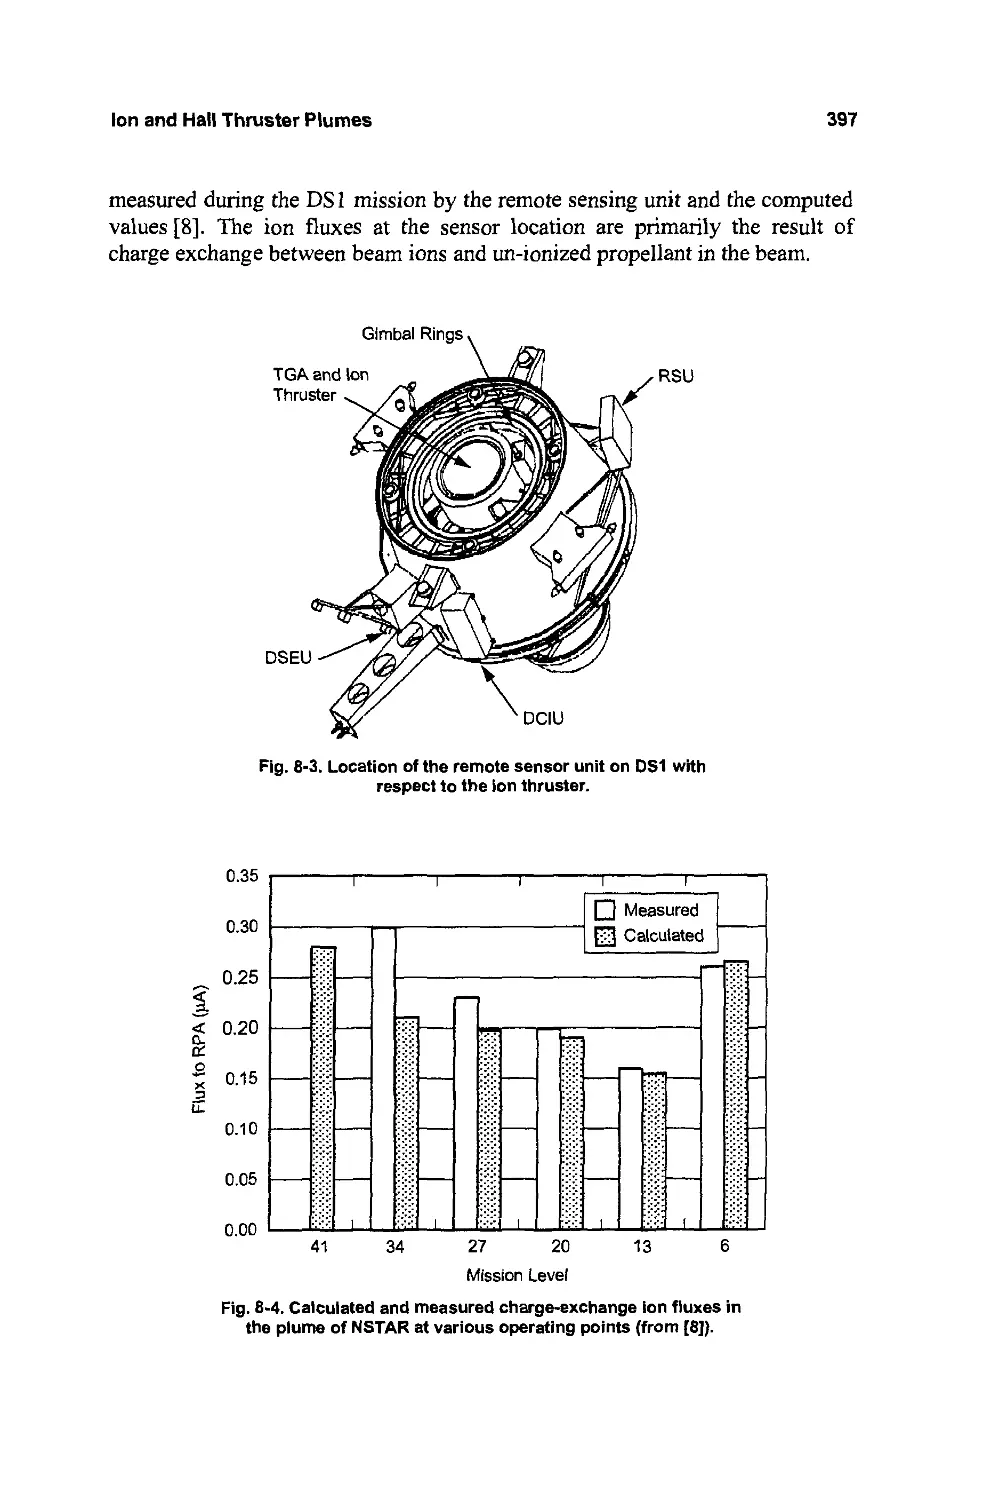
408
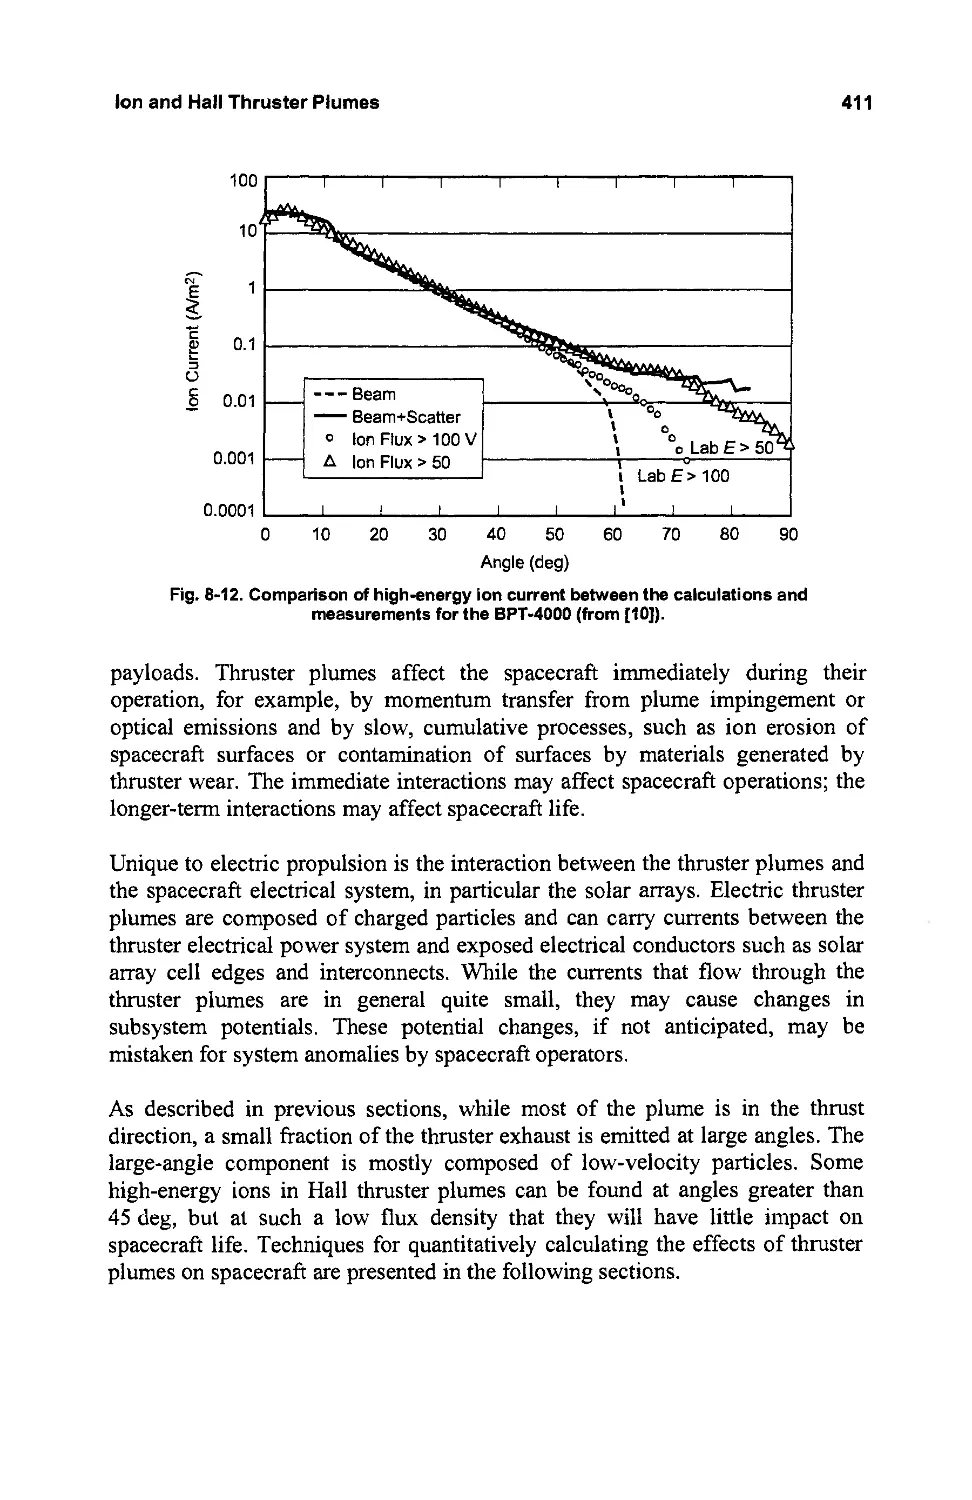
410
412
413
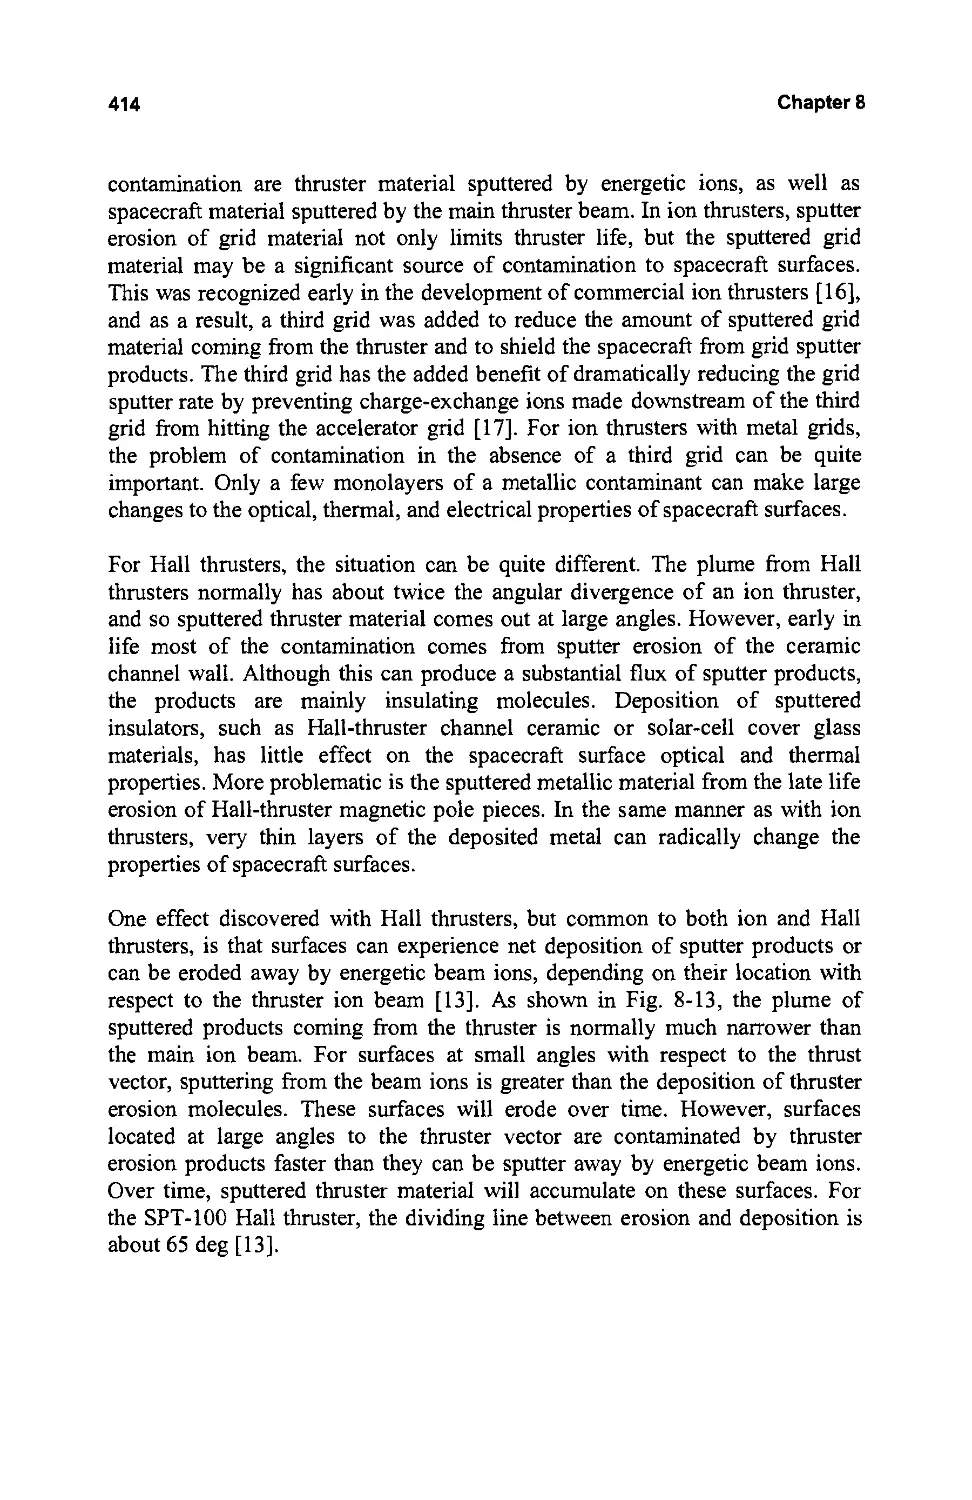
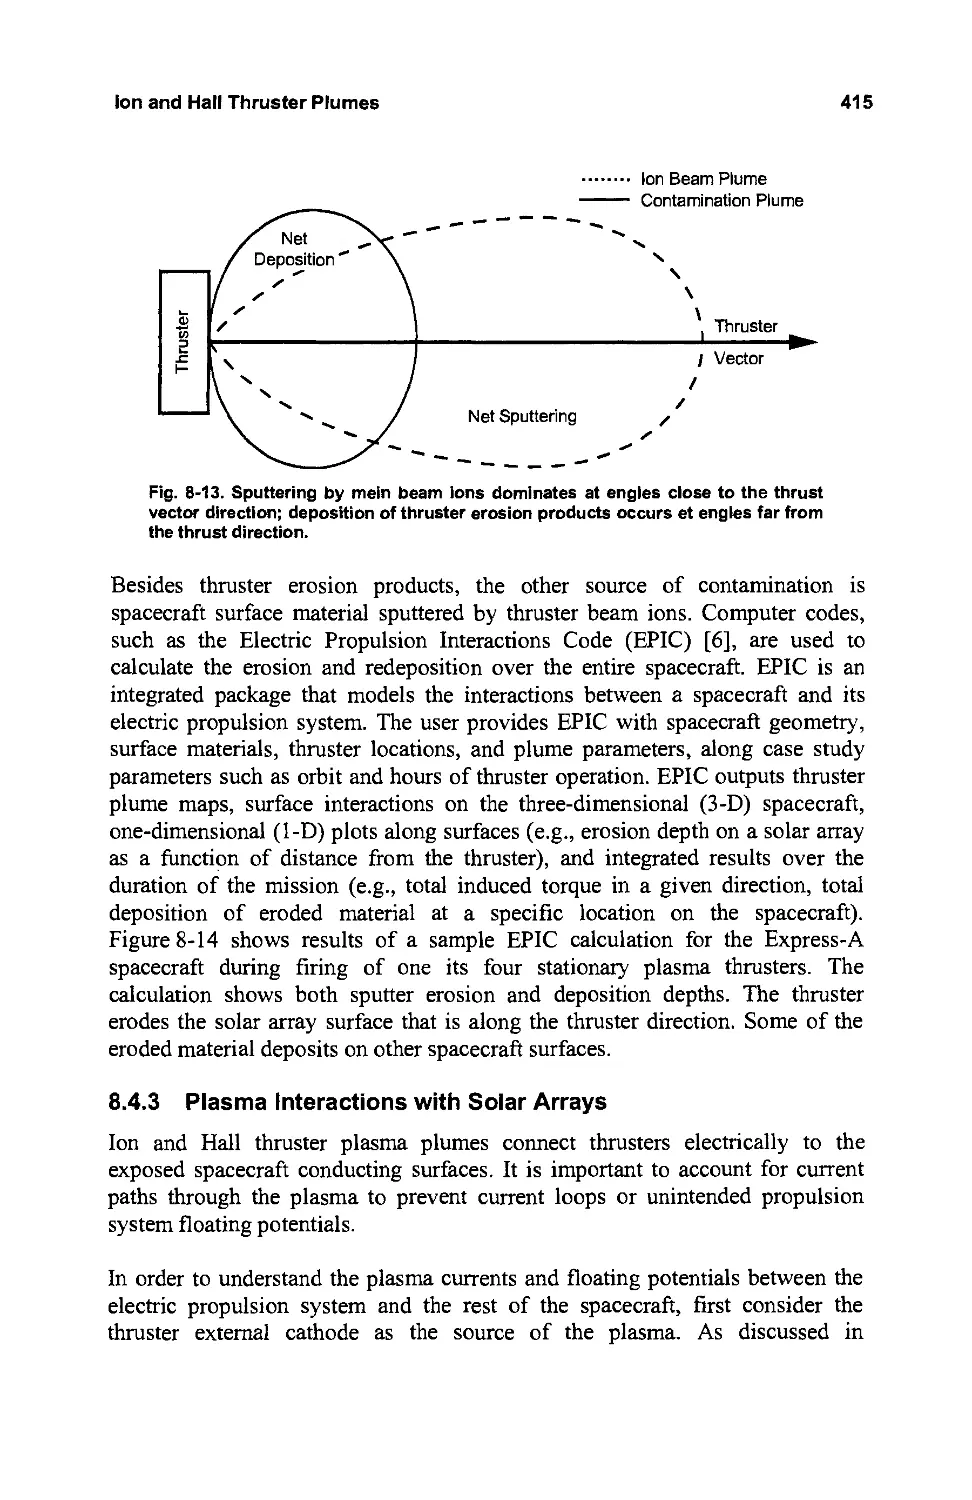
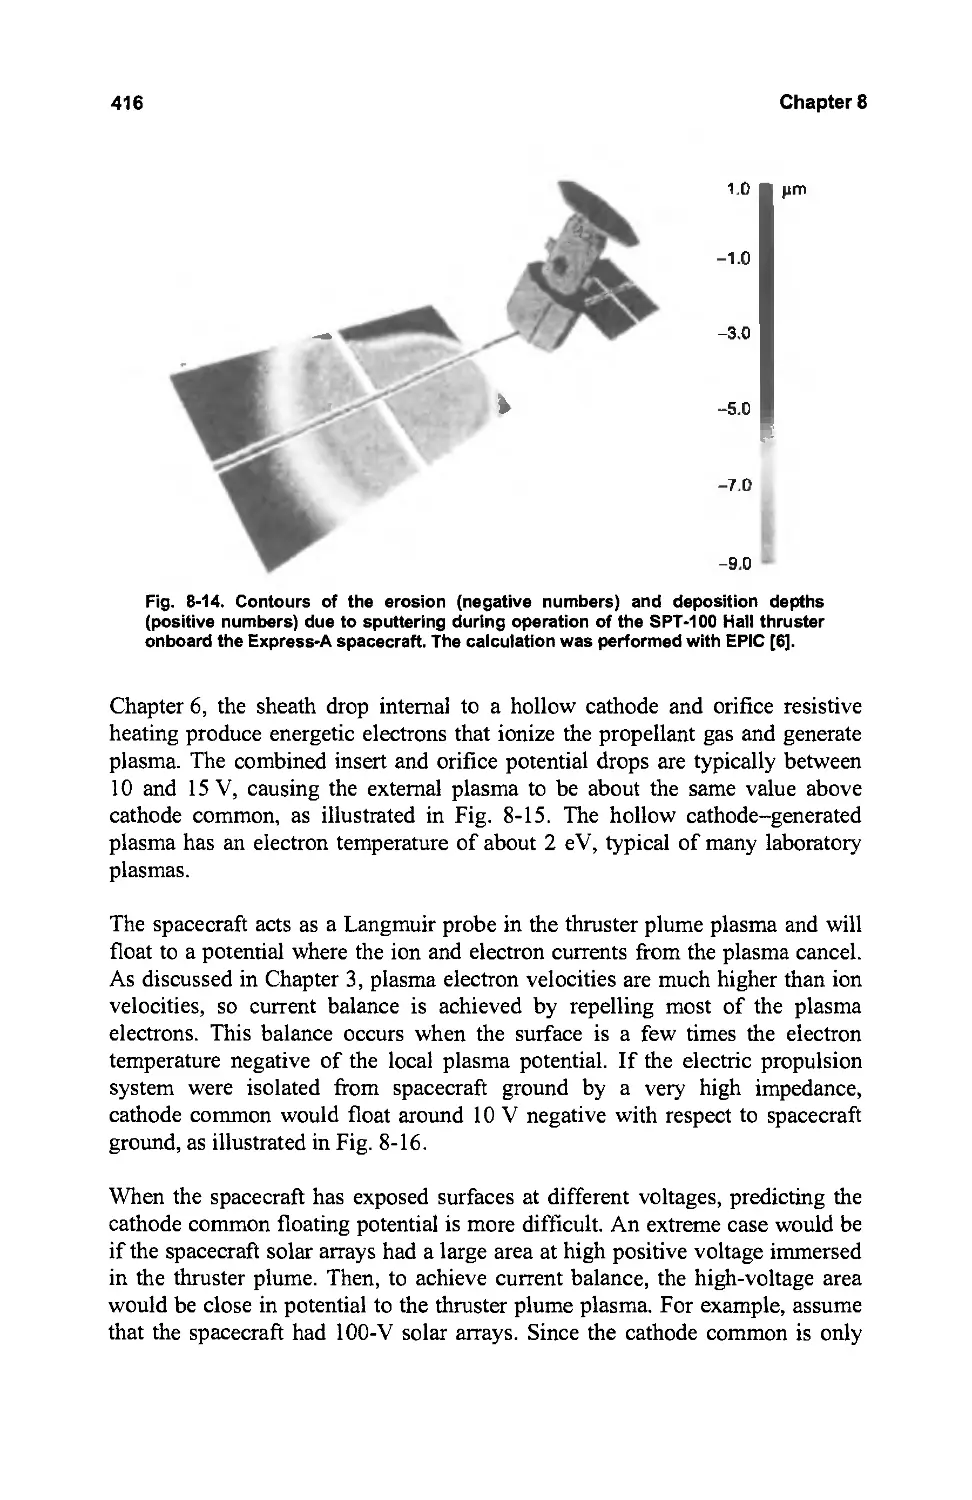
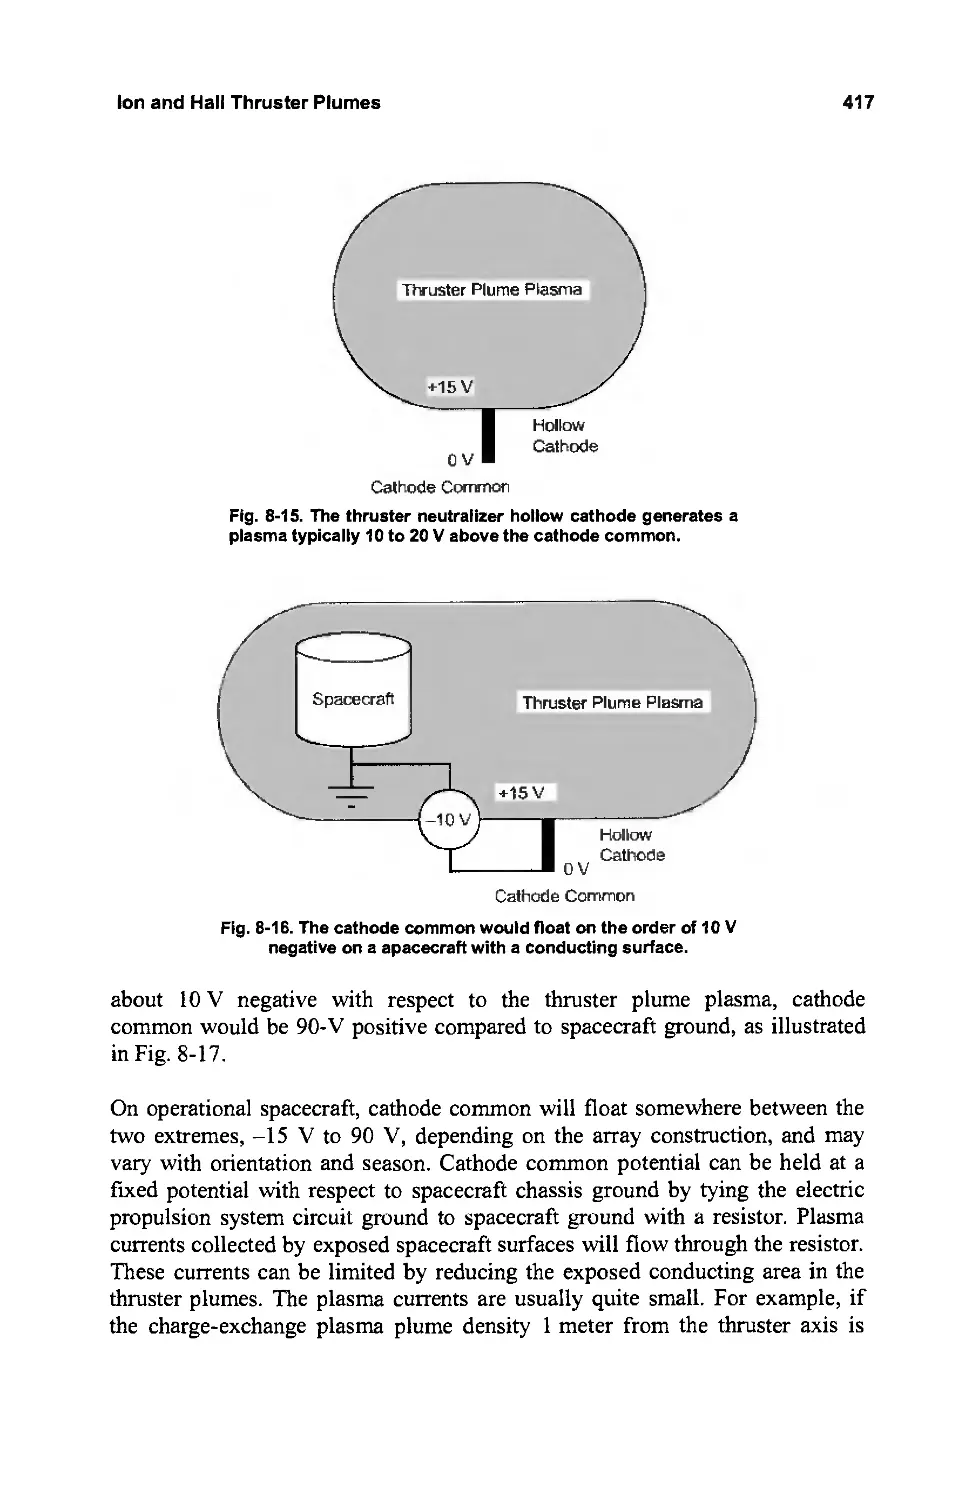
415
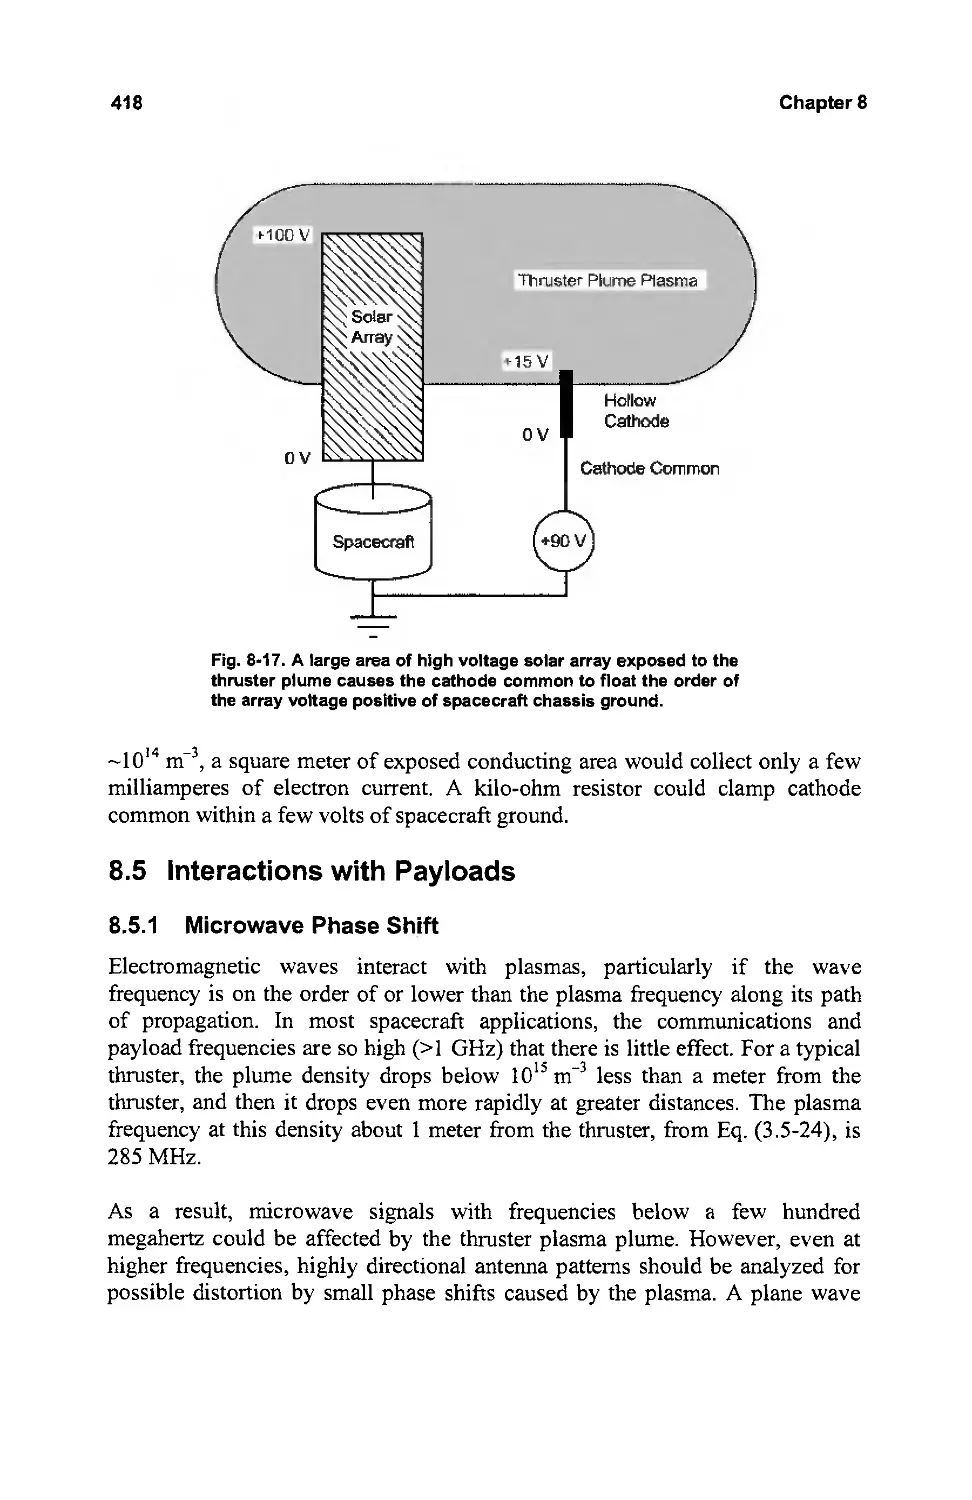
418
418
419
422
424
429
429
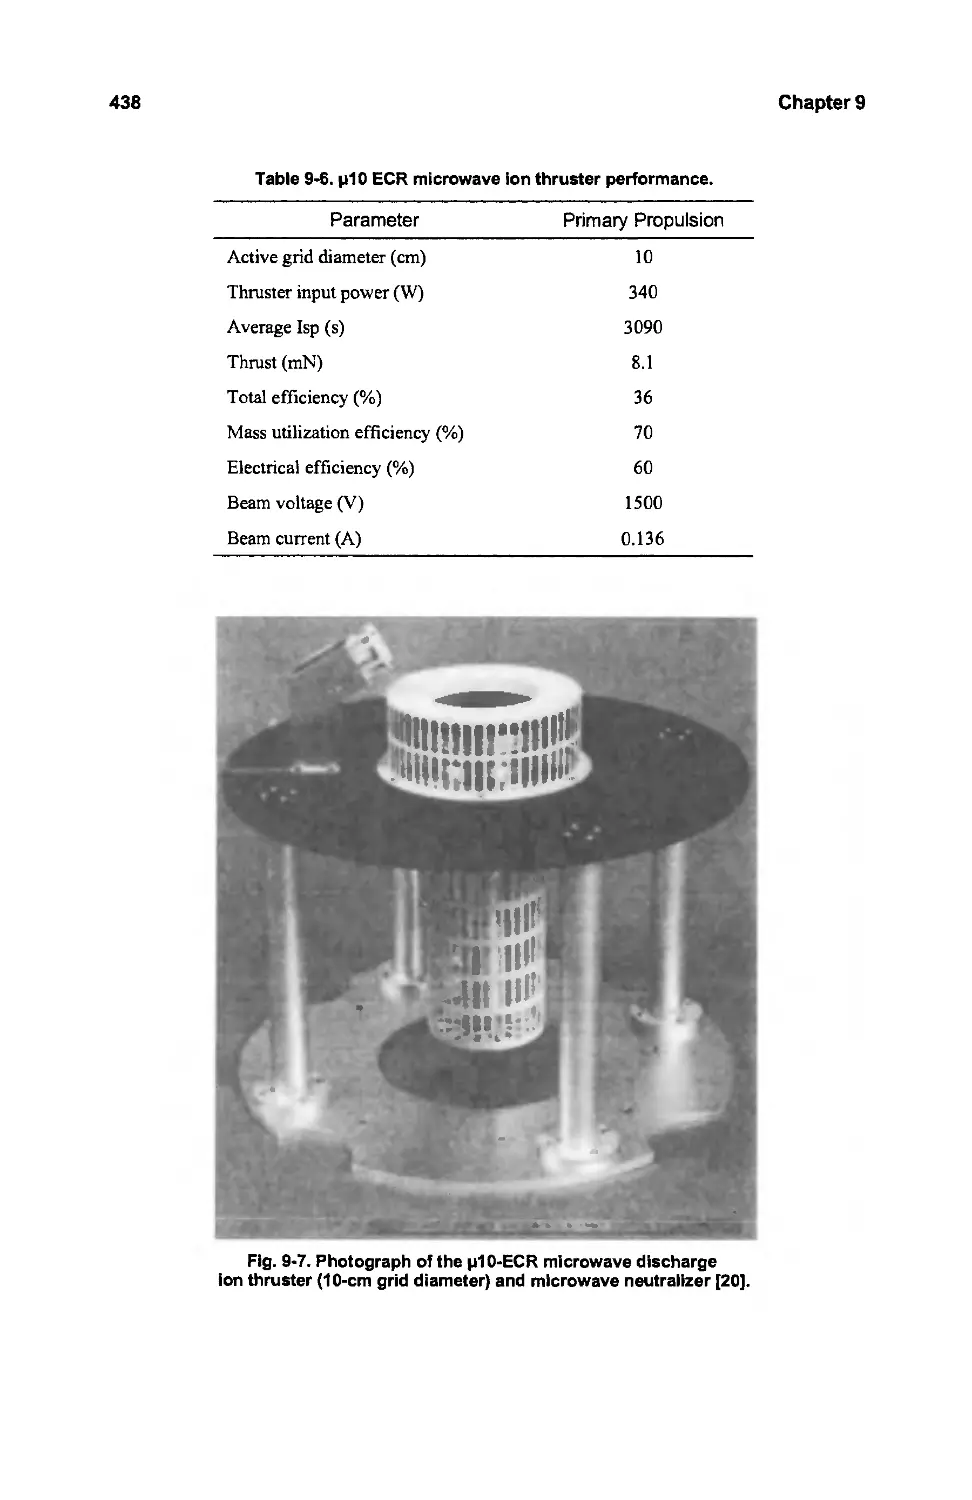
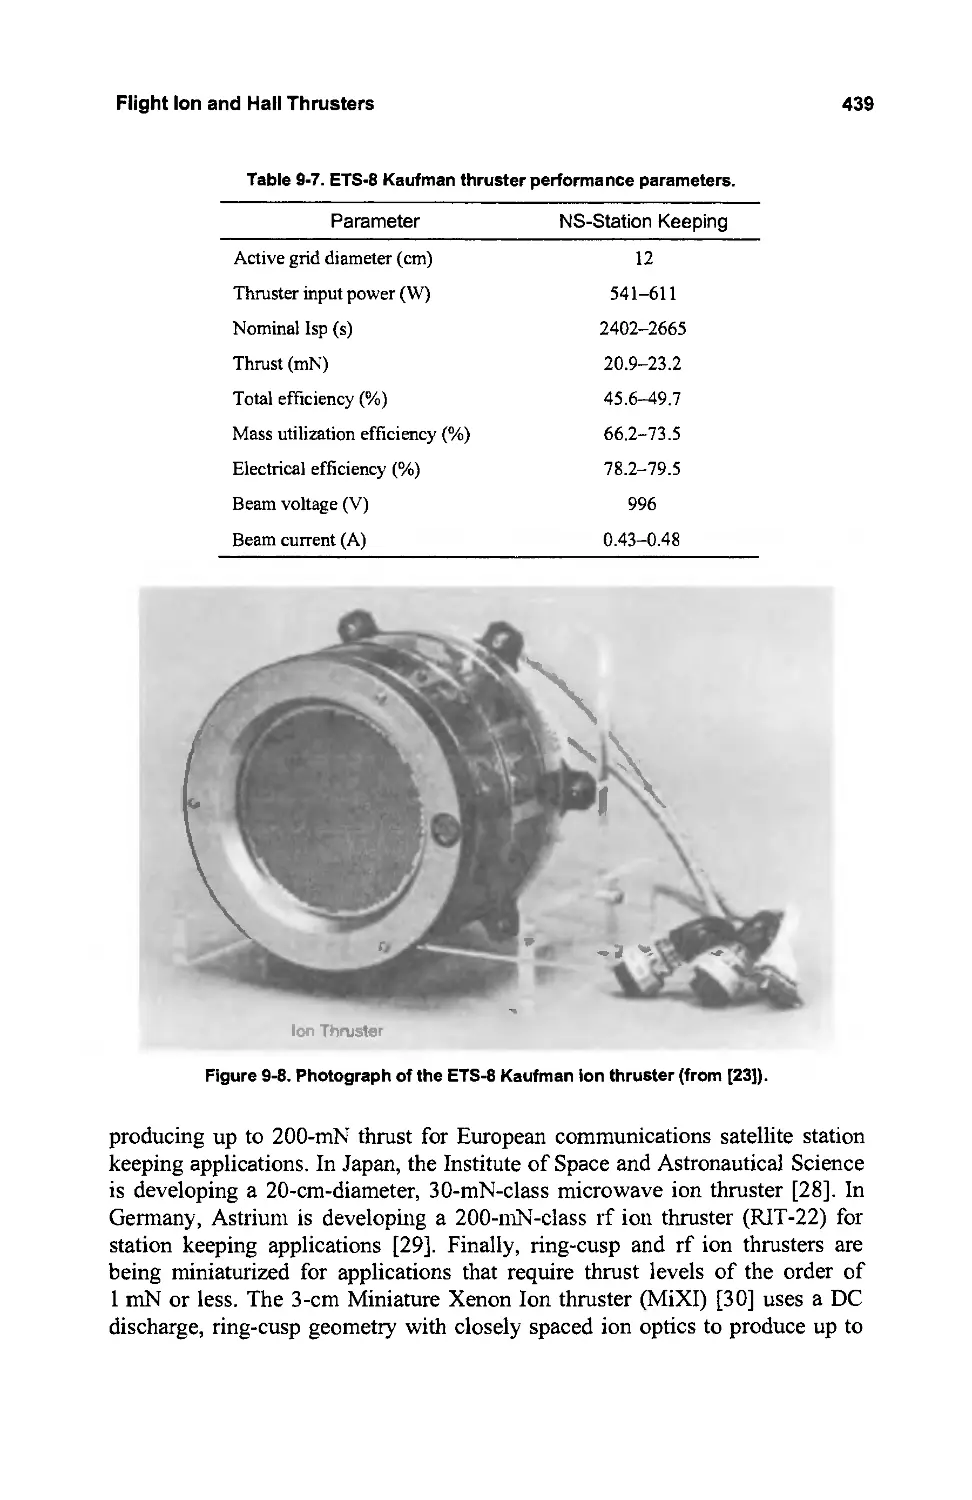
429
440
443
447
463
467
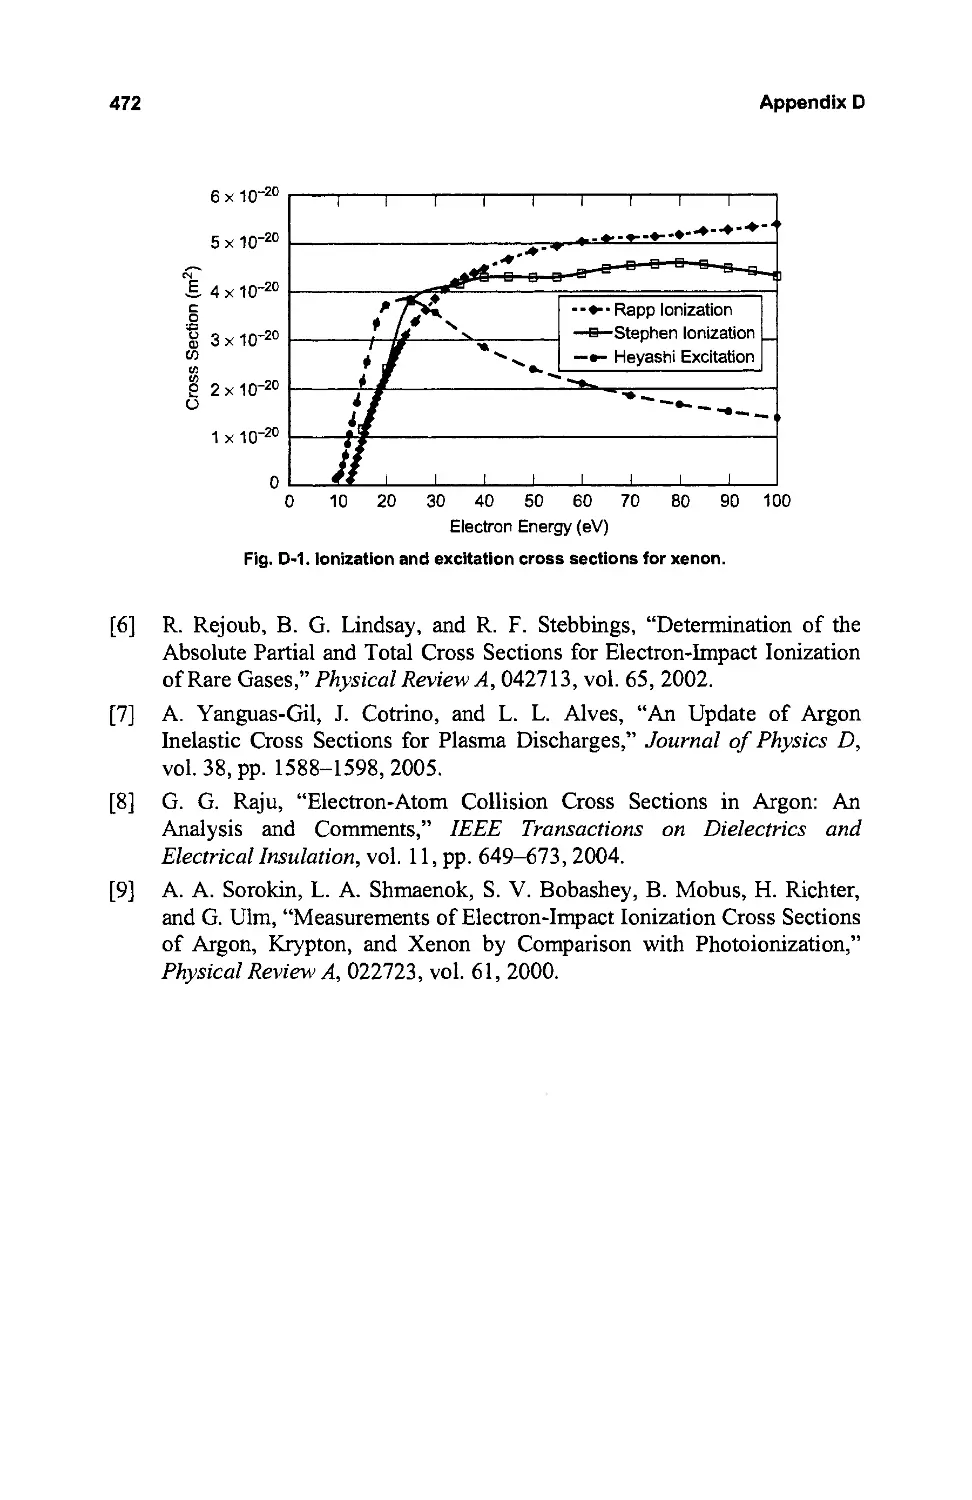
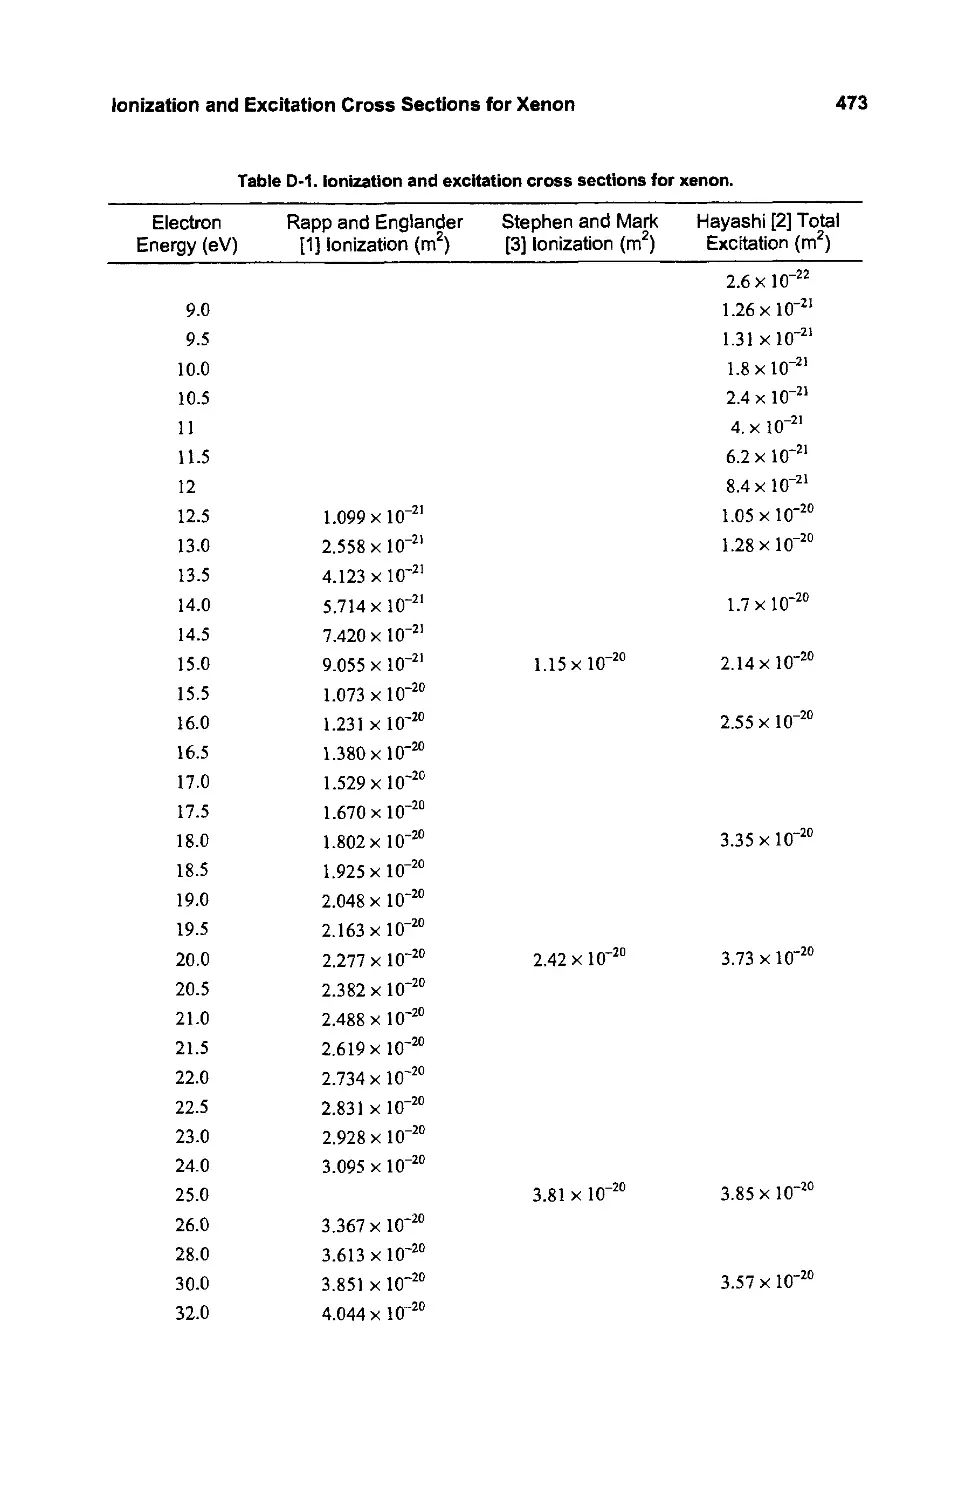
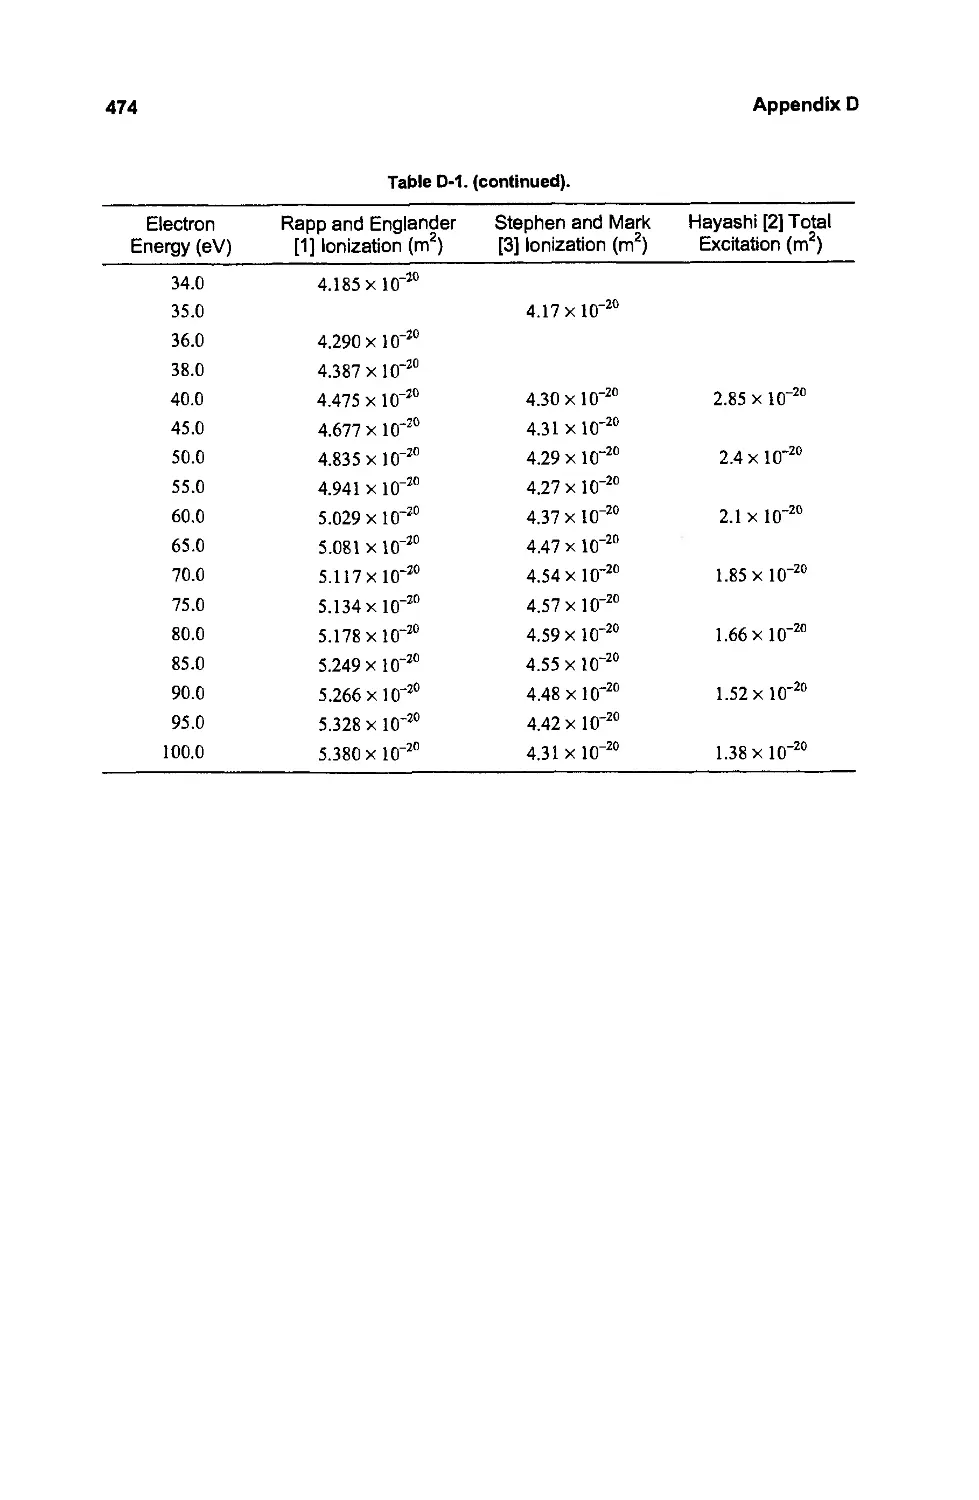
471
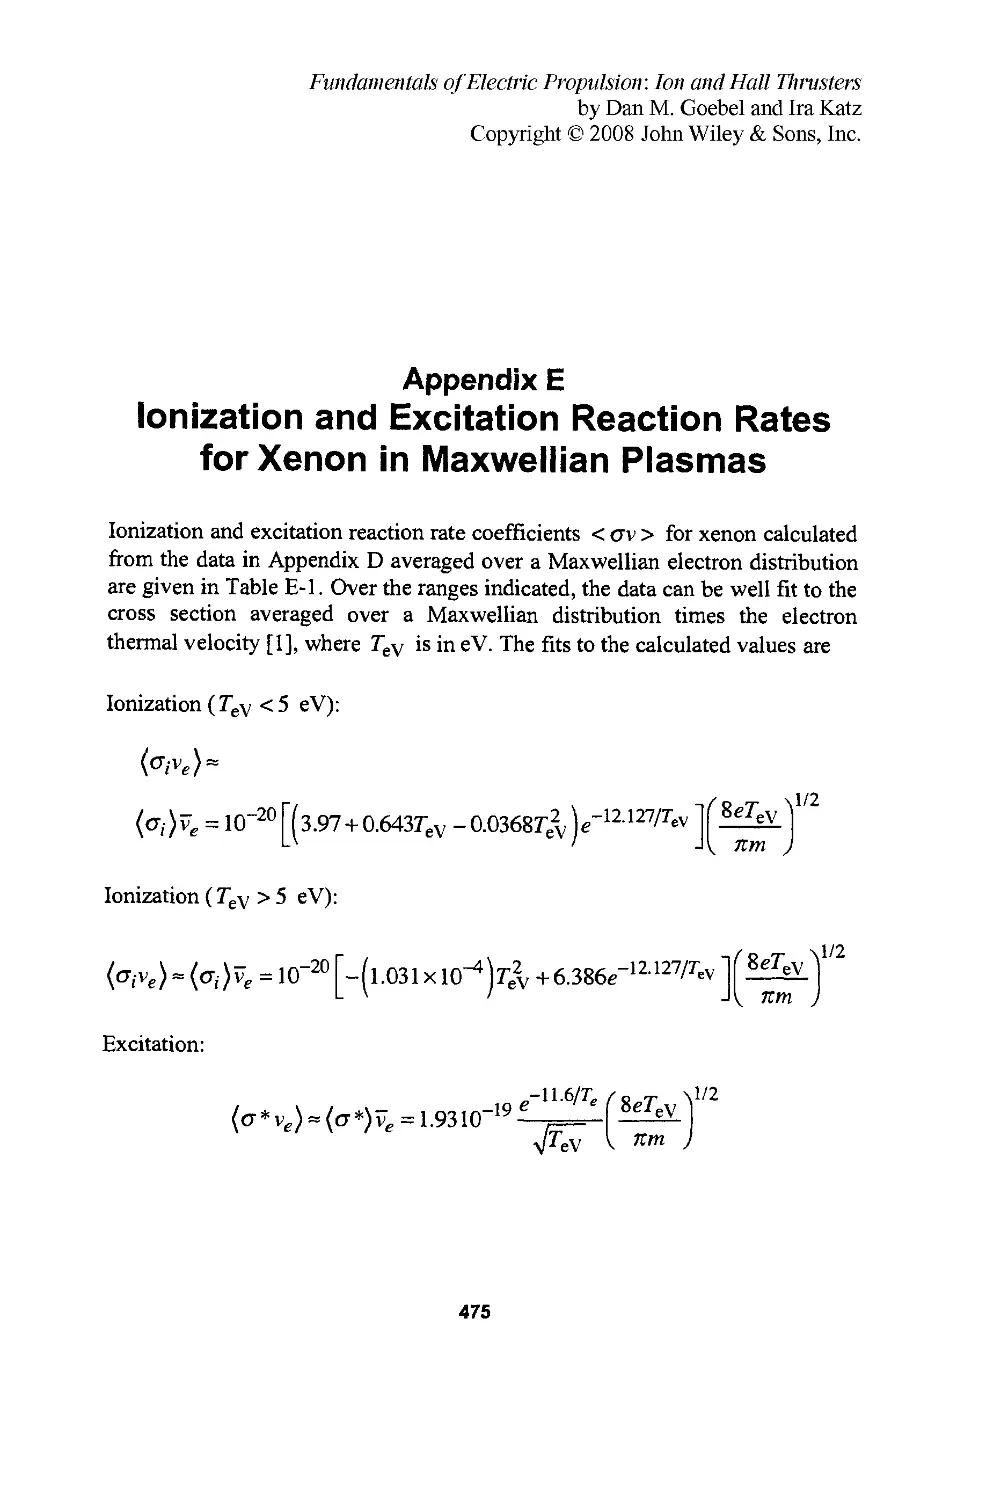
475
479
483
487
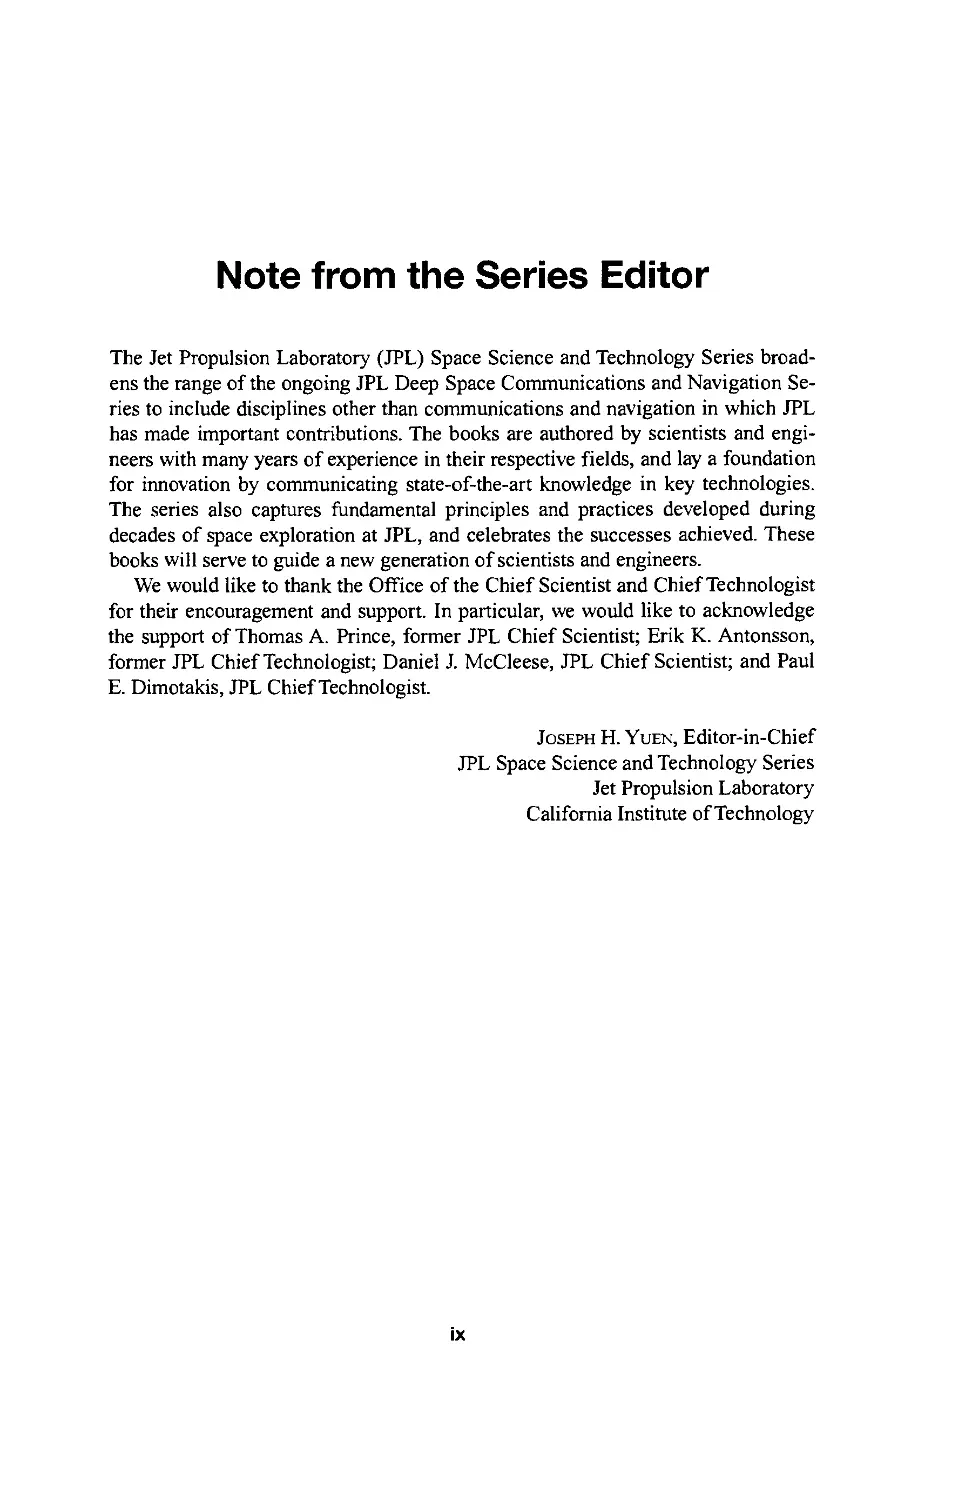
Note from the Series Editor
The Jet Propulsion Laboratory (JPL) Space Science and Technology Series broad-
ens the range of the ongoing JPL Deep Space Communications and Navigation Se-
ries to include disciplines other than communications and navigation in which JPL
has made important contributions. The books are authored by scientists and engi-
neers with many years of experience in their respective fields, and lay a foundation
for innovation by communicating state-of-the-art knowledge in key technologies.
The series also captures fundamental principles and practices developed during
decades of space exploration at JPL, and celebrates the successes achieved. These
books will serve to guide a new generation of scientists and engineers.
We would like to thank the Office ofthe Chief Scientist and Chief Technologist
for their encouragement and support. In particular, we would like to acknowledge
the support of Thomas A. Prince, former JPL Chief Scientist; Erik K. Antonsson,
former JPL Chief Technologist; Daniel J. McCleese, JPL Chief Scientist; and Paul
E. Dimotakis, JPL Chief Technologist.
JOSEPH H. YUEN, Editor-in-Chief
JPL Space Science and Technology Series
Jet Propulsion Laboratory
California Institute of Technology
ix
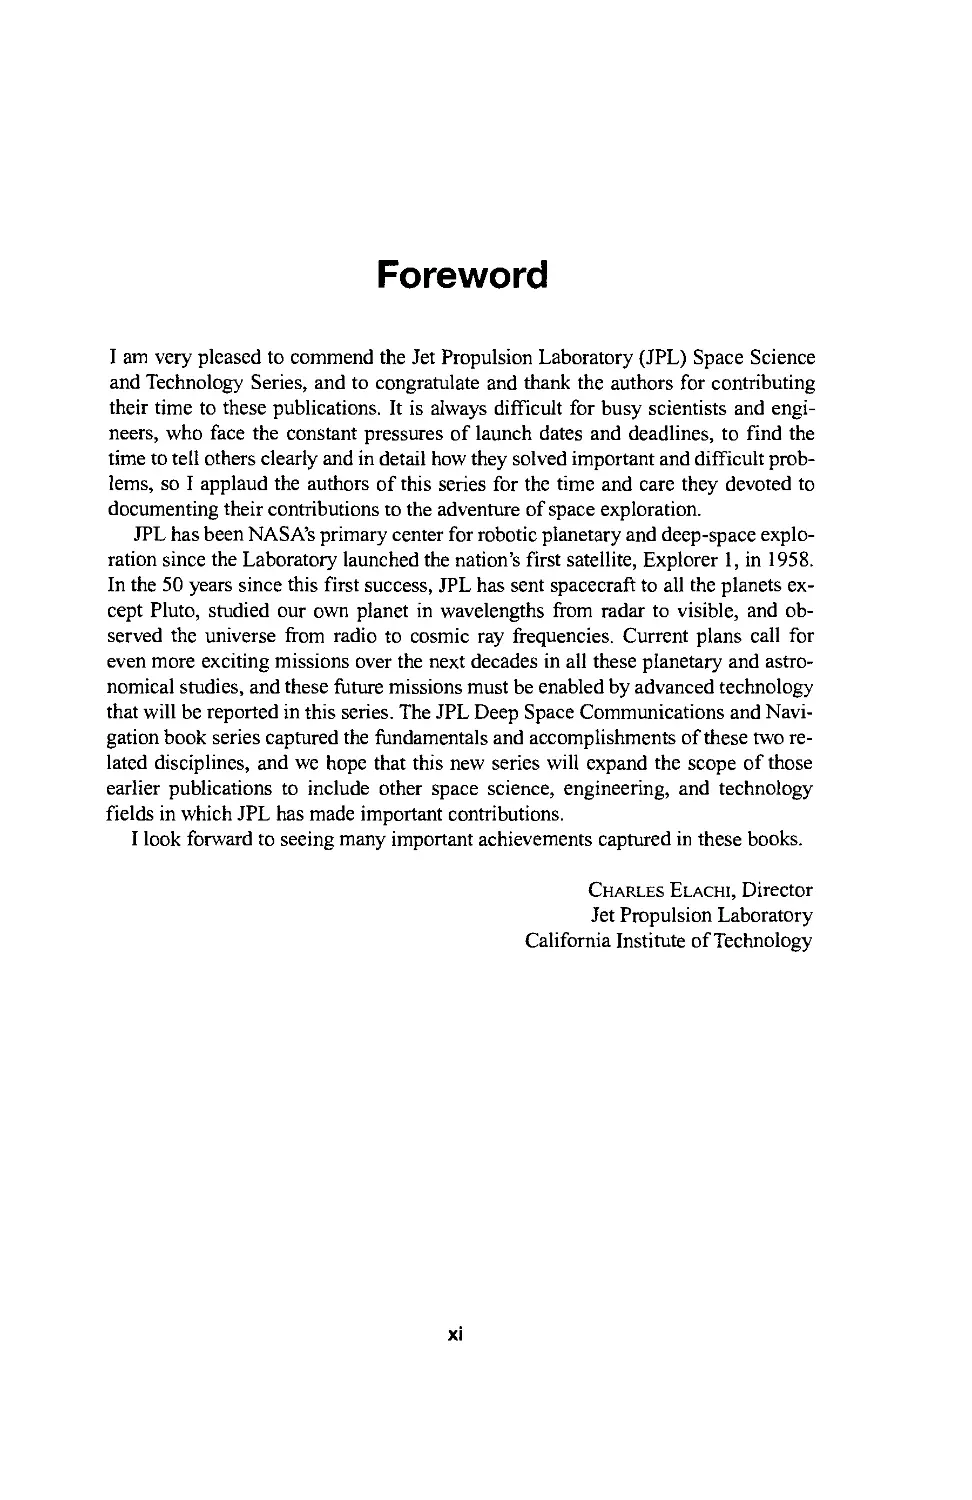
Foreword
I am very pleased to commend the Jet Propulsion Laboratory (JPL) Space Science
and Technology Series, and to congratulate and thank the authors for contributing
their time to these publications. It is always difficult for busy scientists and engi-
neers, who face the constant pressures of launch dates and deadlines, to find the
time to tell others clearly and in detail how they solved important and difficult prob-
lems, so I applaud the authors of this series for the time and care they devoted to
documenting their contributions to the adventure of space exploration.
JPL has been NASA's primary center for robotic planetary and deep-space explo-
ration since the Laboratory launched the nation's first satellite, Explorer 1, in 1958.
In the 50 years since this first success, JPL has sent spacecraft to all the planets ex-
cept Pluto, studied our own planet in wavelengths from radar to visible, and ob-
served the universe from radio to cosmic ray frequencies. Current plans call for
even more exciting missions over the next decades in all these planetary and astro-
nomical studies, and these future missions must be enabled by advanced technology
that will be reported in this series. The JPL Deep Space Communications and Navi-
gation book series captured the fundamentals and accomplishments of these two re-
lated disciplines, and we hope that this new series will expand the scope of those
earlier publications to include other space science, engineering, and technology
fields in which JPL has made important contributions.
I look forward to seeing many important achievements captured in these books.
CHARLES ELACHI, Director
Jet Propulsion Laboratory
California Institute of Technology
xi
Preface
Electric propulsion was first envisioned 100 years ago, and throughout most of the
20th century was considered the technology of the future for spacecraft propulsion.
With literally hundreds of electric thrusters now operating in orbit on communica-
tions satellites, and ion and Hall thrusters both having been successfully used for
primary propulsion in deep-space scientific missions, the future for electric propul-
sion has arrived.
The literature contains several books from the 1960s and numerous journal arti-
cles and conference papers published over the years discussing electric thruster con-
cepts, benefits, physics, and technological developments. Much of this work has
been based on empirical investigations and laboratory-based development programs
of different thruster types. As such, the fundamental understanding of how these
thrusters work has generally lagged behind the technological achievements and ap-
plications of electric thrusters in space.
The quest over the past 10 years to improve often technically mature thruster per-
formance and significantly extend thruster life for applications in deep-space
propulsion and satellite station-keeping requires a much deeper understanding of
the physics of electric thrusters. The purpose of this book is to discuss and explain
how modern ion and Hall thrusters work by describing the fundamental physics of
these devices. This is a challenging task requiring a basic knowledge of plasma
physics, ion accelerators, cathodes, electrical discharges, high voltage, gas dynam-
ics, and many other technologies. As such, we rely heavily on physics-based models
that are often greatly simplified compared to the complex two-dimensional and
three-dimensional codes required to accurately predict the plasma dynamics that
drive thruster performance, and ultimately determine their life. Work in this field is
still progressing, and we hope this book will lead to further research and advances
in our understanding of these surprisingly complex devices.
While this effort encompasses a large body of literature in the area of ion and
Hall thrusters. it is based largely on the research and development performed at the
Jet Propulsion Laboratory (JPL). Therefore, this book should not be considered an
all-inclusive treatise on the subject of electric thrusters or a review of their develop-
ment history, but rather one that delves into the basics of two of the more modern
electric engines that are finding increasingly more applications, specifically ion and
Hall thrusters, in an attempt to provide a better understanding of their principles.
DAN M. GOEBEL and IRA KATZ
March 2008
xiii
Acknowledgments
We are greatly indebted to our colleagues at the Jet Propulsion Laboratory who both
collaborated in the research and development of these thrusters and provided valu-
able comments and material for this manuscript. We gratefully acknowledge the
many contributions of John Anderson, John Brophy, Richard Hofer, Kristina Jame-
son, Ioannis Mikellides, Timothy O'Donnell, James Polk, Thomas Randolph, J.
Steven Snyder, and Richard Wirz. The research and development at JPL on ion and
Hall thrusters has been supported through the years by NASA and the Jet Propul-
sion Laboratory, California Institute of Technology. The authors would also like to
thank the developers and manufacturers of the flight thrusters described here for
performance data and photographs of their thrusters. Finally, we would like to thank
Joseph Yuen for his support in the preparation and publication of this book, and
gratefully acknowledge the extensive and skillful efforts by Patricia Ehlers, Judi
Dedmon, and Katherine Goebel in the editing and preparation of this book.
xv
Fundamentals oIElectric Propulsion: Ion and Hall T1l1'llsters
by Dan M. Goebel and Ira Katz
Copyright iQ 2008 John Wiley & Sons, Inc.
Chapter 1
Introduction
Electric propulsion is a technology aimed at achieving thrust with high exhaust
velocities, which results in a reduction in the amount of propellant required for
a given space mission or application compared to other conventional propulsion
methods. Reduced propellant mass can significantly decrease the launch mass
of a spacecraft or satellite, leading to lower costs from the use of smaller launch
vehicles to deliver a desired mass into a given orbit or to a deep-space target.
In general, electric propulsion (EP) encompasses any propulsion technology in
which electricity is used to increase the propellant exhaust velocity. There are
many figures of merit for electric thrusters, but mission and application
planners are primarily interested in thrust, specific impulse, and total efficiency
in relating the performance of the thruster to the delivered mass and change in
the spacecraft velocity during thrust periods. While thrust is self-explanatory,
specific impulse (Isp) is defined as the propellant exhaust velocity divided by
the gravitational acceleration constant g, which results in the unusual units of
seconds. The total efficiency is the jet power produced by the thrust beam
divided by the electrical power into the system. Naturally, spacecraft designers
are then concerned with providing the electrical power that the thruster requires
to produce a given thrust, as well as with dissipating the thermal power that the
thruster generates as waste heat.
In this book, the fundamentals of the ion and Hall thrusters that have emerged
as leading electric propulsion technologies in terms of performance (thrust, Isp,
and efficiency) and use in space applications will be presented. These thrusters
operate in the power range of hundreds of watts up to tens of kilowatts with an
Isp of thousands of seconds to tens of thousands of seconds, and they produce
thrust levels typically of some fraction of a newton. Ion and Hall thrusters
generally use heavy inert gases such as xenon as the propellant. Other
propellant materials, such as cesium and mercury, have been investigated in the
1
2
Chapter 1
past, but xenon is generally preferable because it is not hazardous to handle and
process, it does not condense on spacecraft components that are above
cryogenic temperatures, its large mass compared to other inert gases generates
higher thrust for a given input power, and it is easily stored at high densities
and low tank mass fractions. Therefore, the main focus will be on xenon as the
propellant in ion and Hall thrusters, although performance with other
propellants can be examined using the basic information provided here.
1.1 Electric Propulsion Background
A detailed history of electric propulsion up to the 1950s was published by
Choueiri [1], and information on developments in electric propulsion since then
can be found in reference books, e.g., [2], and on various internet sites, e.g., [3].
Briefly, electric propulsion was first conceived by Robert Goddard [4] in 1906
and independently described by Tsiolkovskiy [5] in Russia in 1911. Several
electric propulsion concepts for a variety of space applications were included in
the literature by Hermann Oberth in Germany in 1929 and by Shepherd and
Cleaver in Britain in 1949. The first systematic analysis of electric propulsion
systems was made by Ernst Stuhlinger [6] in his book Ion PropulsionJor Space
Flight, published in 1964, and the physics of electric propulsion thrusters was
first described comprehensively in a book by Robert Jahn [7] in 1968. The
technology of early ion propulsion systems that used cesium and mercury
propellants, along with the basics of low-thrust mission design and trajectory
analysis, was published by George Brewer [8] in 1970. Since that time, the
basics of electric propulsion and some thruster characteristics have been
described in several chapters of textbooks published in the United States on
spacecraft propulsion [9-12]. An extensive presentation of the principles and
working processes of several electric thrusters was published in 1989 in a book
by S. Grishin and L. Leskov [13 (in Russian)].
Significant electric propulsion research programs were established in the 1960s
at the National Aeronautics and Space Administration (NASA) Glenn Research
Center, Hughes Research Laboratories, NASA's Jet Propulsion Laboratory
(JPL), and at various institutes in Russia to develop this technology for satellite
station-keeping and deep-space prime propulsion applications. The first experi-
mental ion thrusters were launched into orbit in the early 1960s by the U.S. and
Russia using cesium and mercury propellants. Experimental test flights of ion
thrusters and Hall thrusters continued from that time into the 1980s.
The first extensive application of electric propulsion was by Russia using Hall
thrusters for station keeping on communications satellites [14]. Since 1971
when the Soviets first flew a pair of SPT-60s on the Meteor satellite, over 238
Hall thrusters have been operated on 48 spacecraft to date [15]. Japan launched
Introduction
3
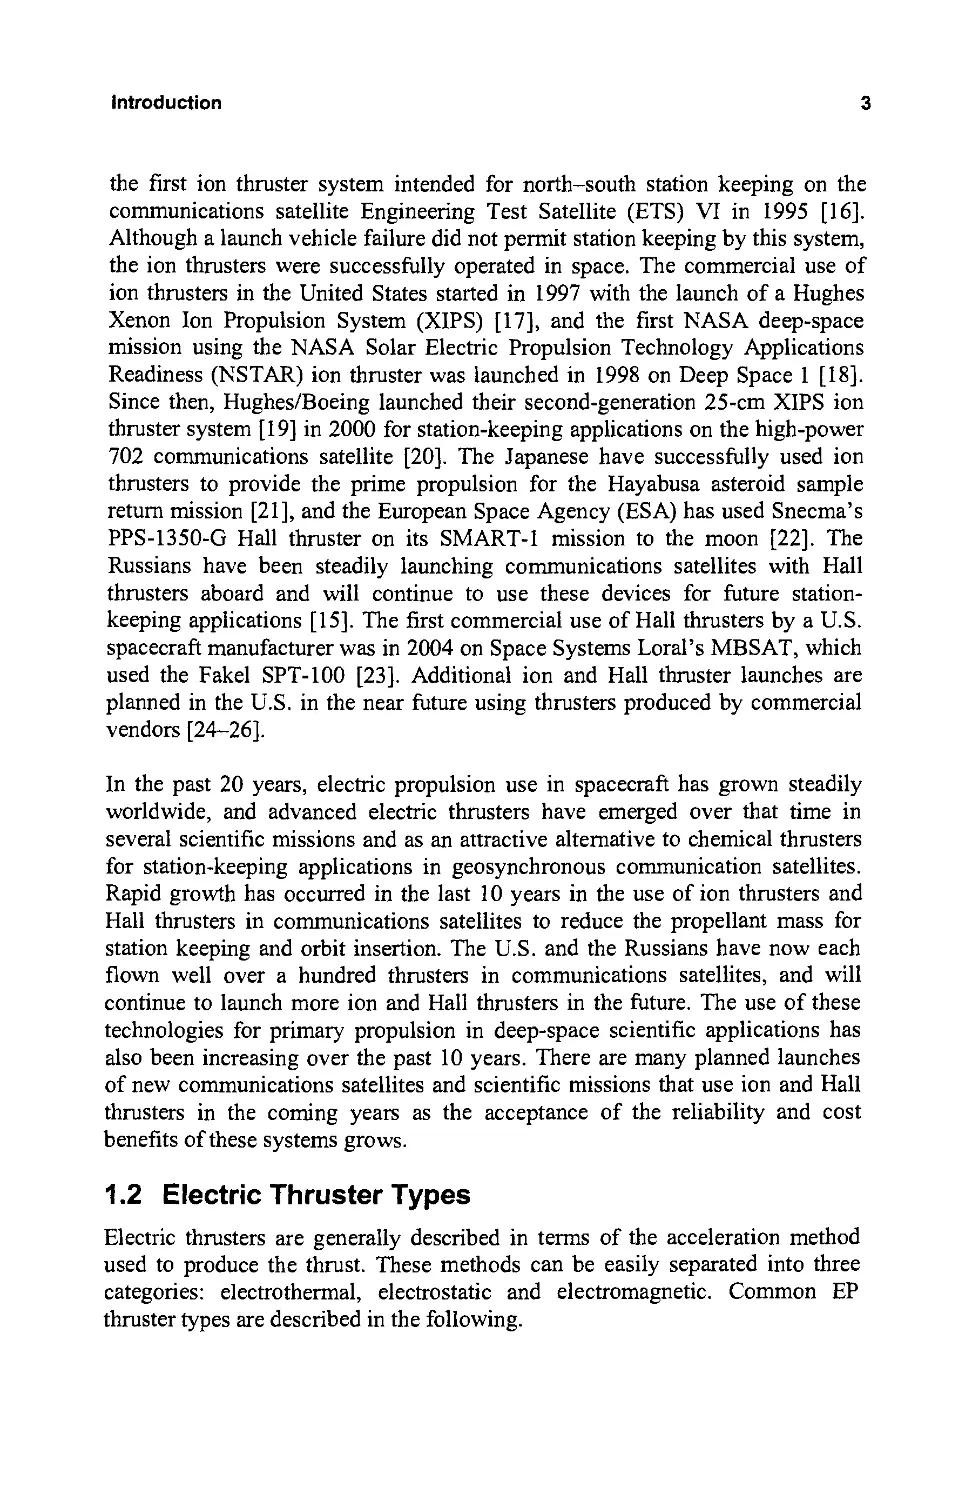
the first ion thruster system intended for north-south station keeping on the
communications satellite Engineering Test Satellite (ETS) VI in 1995 [16].
Although a launch vehicle failure did not permit station keeping by this system,
the ion thrusters were successfully operated in space. The commercial use of
ion thrusters in the United States started in 1997 with the launch of a Hughes
Xenon Ion Propulsion System (XIPS) [17], and the first NASA deep-space
mission using the NASA Solar Electric Propulsion Technology Applications
Readiness (NSTAR) ion thruster was launched in 1998 on Deep Space 1 [18].
Since then, Hughes/Boeing launched their second-generation 25-cm XIPS ion
thruster system [19] in 2000 for station-keeping applications on the high-power
702 communications satellite [20]. The Japanese have successfully used ion
thrusters to provide the prime propulsion for the Hayabusa asteroid sample
return mission [21], and the European Space Agency (ESA) has used Snecma's
PPS-1350-G Hall thruster on its SMART-1 mission to the moon [22]. The
Russians have been steadily launching communications satellites with Hall
thrusters aboard and will continue to use these devices for future station-
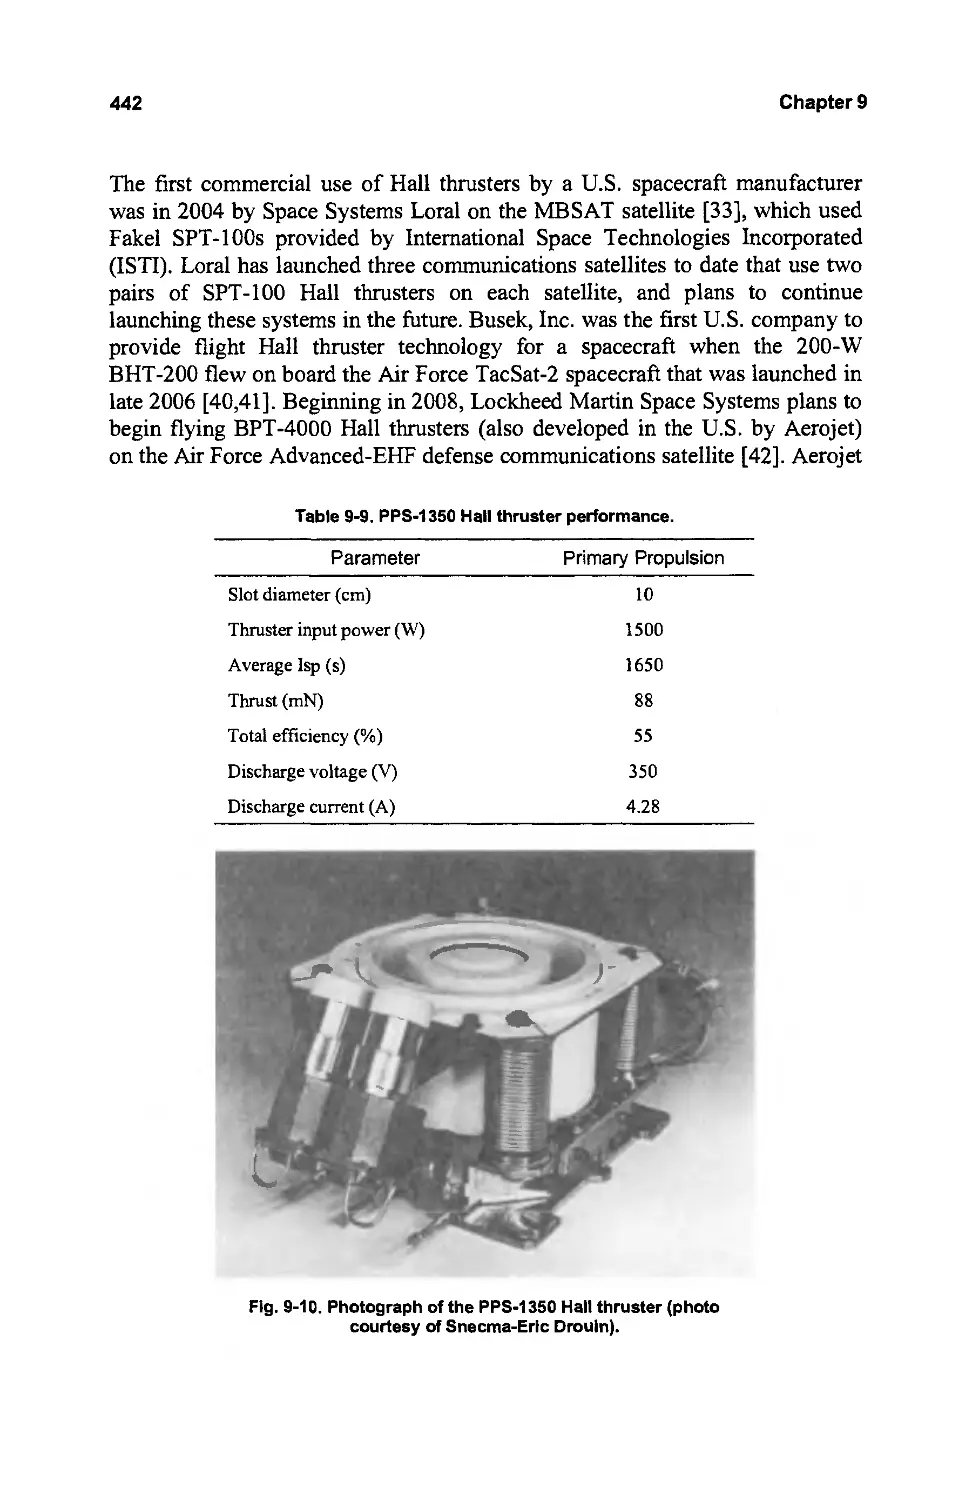
keeping applications [15]. The first commercial use of Hall thrusters by a U.S.
spacecraft manufacturer was in 2004 on Space Systems Loral's MBSAT, which
used the Fakel SPT-lOO [23]. Additional ion and Hall thruster launches are
planned in the U.S. in the near future using thrusters produced by commercial
vendors [24-26].
In the past 20 years, electric propulsion use in spacecraft has grown steadily
worldwide, and advanced electric thrusters have emerged over that time in
several scientific missions and as an attractive alternative to chemical thrusters
for station-keeping applications in geosynchronous communication satellites.
Rapid growth has occurred in the last 10 years in the use of ion thrusters and
Hall thrusters in communications satellites to reduce the propellant mass for
station keeping and orbit insertion. The U.S. and the Russians have now each
flown well over a hundred thrusters in communications satellites, and will
continue to launch more ion and Hall thrusters in the future. The use of these
technologies for primary propulsion in deep-space scientific applications has
also been increasing over the past 10 years. There are many planned launches
of new communications satellites and scientific missions that use ion and Hall
thrusters in the coming years as the acceptance of the reliability and cost
benefits of these systems grows.
1.2 Electric Thruster Types
Electric thrusters are generally described in terms of the acceleration method
used to produce the thrust. These methods can be easily separated into three
categories: electrothermal, electrostatic and electromagnetic. Common EP
thruster types are described in the following.
4
Chapter 1
Resistojet
Resistojets are electrothermal devices in which the propellant is heated by
passing through a resistively heated chamber or over a resistively heated
element before entering a downstream nozzle. The increase in exhaust velocity
is due to the thermal heating of the propellant, which limits the Isp to low levels
«500 s).
Arcjet
An arcjet is also an electrothermal thruster that heats the propellant by passing
it though a high current arc in line with the nozzle feed system. While there is
an electric discharge involved in the propellant path, plasma effects are
insignificant in the exhaust velocity because the propellant is weakly ionized.
The Isp is limited by the thermal heating to less than about 700 s for easily
stored propellants.
Ion Thruster
Ion thrusters employ a variety of plasma generation techniques to ionize a large
fraction of the propellant. These thrusters then utilize biased grids to
electrostatically extract ions from the plasma and accelerate them to high
velocity at voltages up to and exceeding 10 kY. Ion thrusters feature the highest
efficiency (from 60% to >80%) and very high specific impulse (from 2000 to
over 10,000 s) compared to other thruster types.
Hall Thruster
This type of electrostatic thruster utilizes a cross-field discharge described by
the Hall effect to generate the plasma. An electric field established
perpendicular to an applied magnetic field electrostatically accelerates ions to
high exhaust velocities, while the transverse magnetic field inhibits electron
motion that would tend to short out the electric field. Hall thruster efficiency
and specific impulse is somewhat less than that achievable in ion thrusters, but
the thrust at a given power is higher and the device is much simpler and
requires fewer power supplies to operate.
E'ectrospray/Fie'd Emission E'ectric Propulsion Thruster
These are two types of electrostatic electric propulsion devices that generate
very low thrust «1 mN). Electrospray thrusters extract ions or charged droplets
from conductive liquids fed through smali needles and accelerate them
electrostatically with biased, aligned apertures to high energy. Field emission
electric propulsion (FEEP) thrusters wick or transport liquid metals (typically
indium or cesium) along needles, extracting ions from the sharp tip by field
Introduction
5
emission processes. Due to their very low thrust, these devices will be used for
precision control of spacecraft position or attitude in space.
Pulsed Plasma Thruster
A pulsed plasma thruster (PPT) is an electromagnetic thruster that utilizes a
pulsed discharge to ionize a fraction of a solid propellant ablated into a plasma
arc, and electromagnetic effects in the pulse to accelerate the ions to high exit
velocity. The pulse repetition rate is used to determine the thrust level.
Magnetoplasmadynamic Thruster
Magnetoplasmadynamic (MPD) thrusters are electromagnetic devices that use a
very high current arc to ionize a significant fraction of the propellant, and then
electromagnetic forces (Lorentz J x B forces) in the plasma discharge to
accelerate the charged propellant. Since both the Current and the magnetic field
are usually generated by the plasma discharge, MPD thrusters tend to operate at
very high powers in order to generate sufficient force for high specific impulse
operation, and thereby also generate high thrust compared to the other
technologies described above.
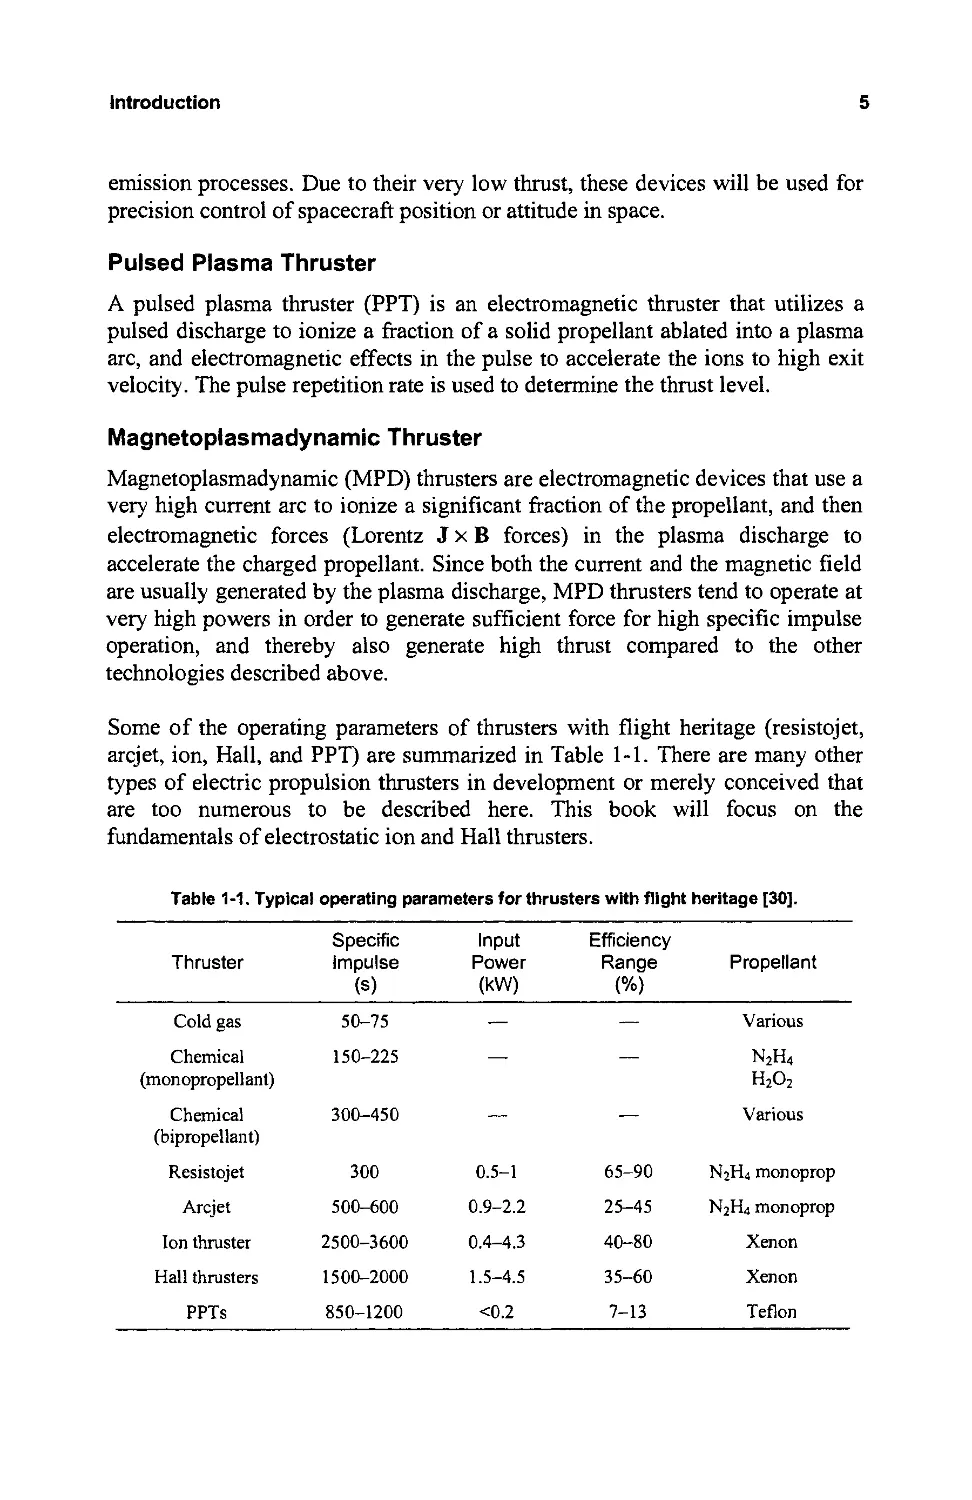
Some of the operating parameters of thrusters with flight heritage (resistojet,
arcjet, ion, Hall, and PPT) are summarized in Table 1-1. There are many other
types of electric propulsion thrusters in development or merely conceived that
are too numerous to be described here. This book will focus on the
fundamentals of electrostatic ion and Hall thrusters.
Table 1-1. Typical operating parameters for thrusters with flight heritage [30].
Specific Input Efficiency
Thruster Impulse Power Range Propellant
(s) (kW) (%)
Cold gas 50-75 Various
Chemical 150-225 N 2 H 4
(monopropellant) H 2 0 2
Chemical 300-450 Various
(bipropellant)
Resistojet 300 0.5-1 65-90 N 2 H 4 monoprop
Arcjet 500-600 0.9-2.2 25-45 N 2 H 4 monoprop
Ion thruster 2500-3600 0.4-4.3 40-80 Xenon
Hall thrusters 1500-2000 1.5-4.5 35-60 Xenon
PPTs 850-1200 <0.2 7-13 Teflon
6
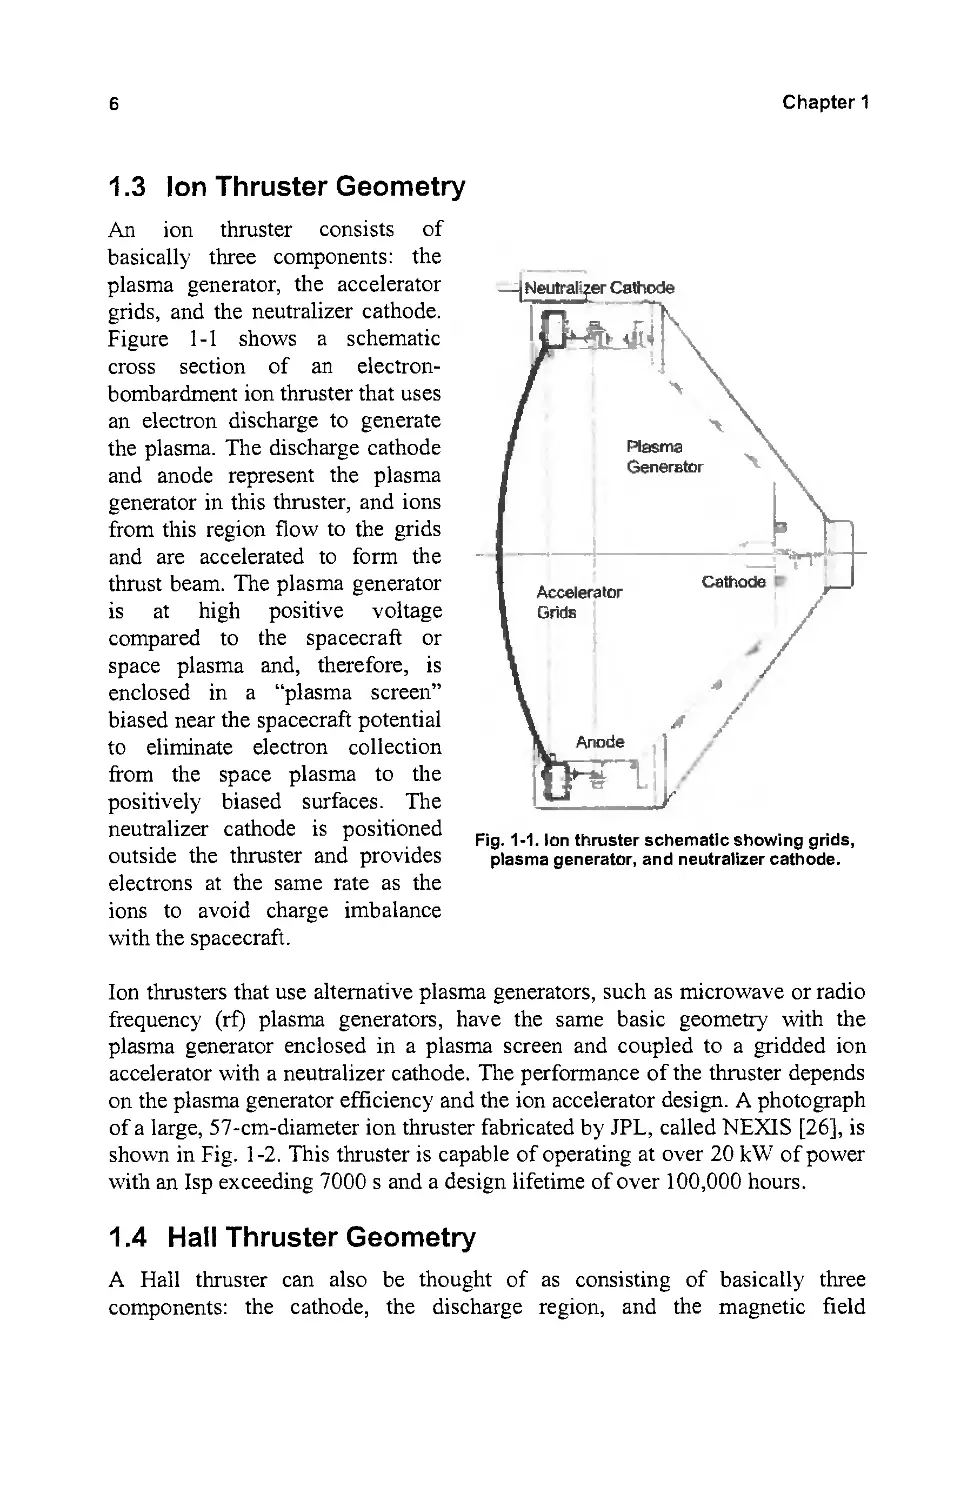
1.3 Ion Thruster Geometry
An ion thruster consists of
basically three components: the
plasma generator, the accelerator
grids, and the neutralizer cathode.
Figure 1-1 shows a schematic
cross section of an electron-
bombardment ion thruster that uses
an electron discharge to generate
the plasma. The discharge cathode
and anode represent the plasma
generator in this thruster, and ions
from this region flow to the grids
and are accelerated to form the
thrust beam. The plasma generator
is at high positive voltage
compared to the spacecraft or
space plasma and, therefore, is
enclosed in a "plasma screen"
biased near the spacecraft potential
to eliminate electron collection
from the space plasma to the
positively biased surfaces. The
neutralizer cathode is positioned
outside the thruster and provides
electrons at the same rate as the
ions to avoid charge imbalance
with the spacecraft.
Chapter 1
-i e rCathode
I -
'\-
Plasm
Generator
Acceleralor
Grids I
"""
---.: I I
=-/
"
/
Fig. 1-1. Ion thruster schematic showing grids,
plasma generator, and neutralizer cathode.
Ion thrusters that use alternative plasma generators, such as microwave or radio
frequency (rt) plasma generators, have the same basic geometry with the
plasma generator enclosed in a plasma screen and coupled to a gridded ion
accelerator with a neutralizer cathode. The performance of the thruster depends
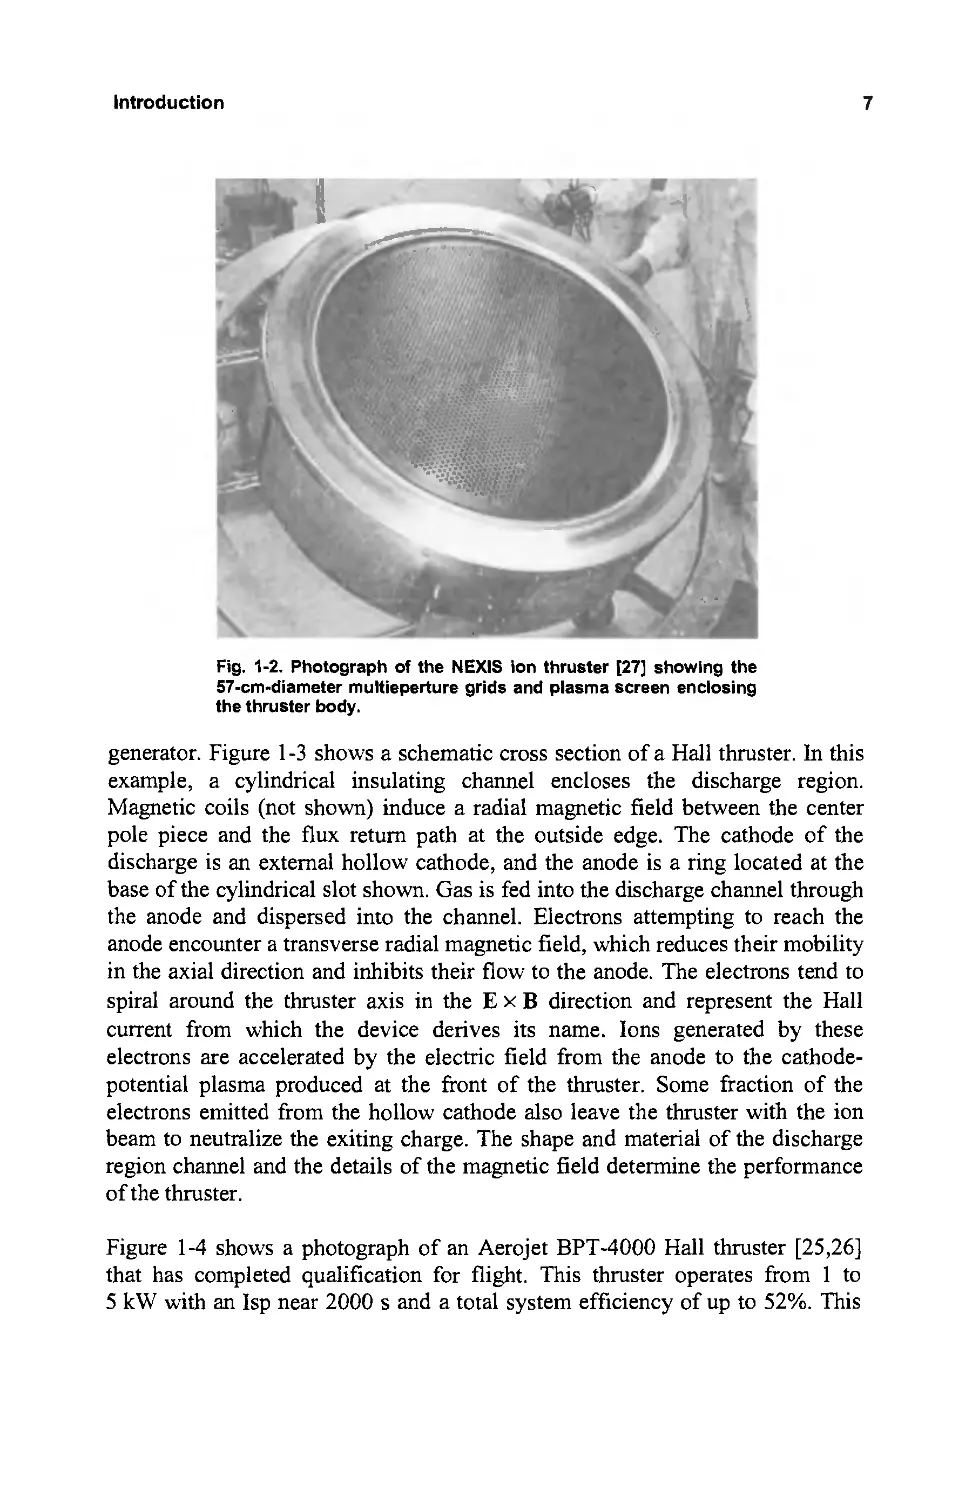
on the plasma generator efficiency and the ion accelerator design. A photograph
of a large, 57 -em-diameter ion thruster fabricated by JPL, called NEXIS [26], is
shown in Fig. 1-2. This thruster is capable of operating at over 20 kW of power
with an Isp exceeding 7000 s and a design lifetime of over 100,000 hours.
1.4 Hall Thruster Geometry
A Hall thruster can also be thought of as conslstmg of basically three
components: the cathode, the discharge region, and the magnetic field
Introduction
7
.'
t
l'
"......-, , " I I
" '
\
.
./
h //1
l/j/,,;.!!,, II
JJ f{,J..'''li "
aq. ; ,.
';':f:f ;/J;;'!iiJi.%':
. : l, :..::;.
Fig. 1-2. Photograph of the NEXIS ion thruster [27J showing the
57-cm.diameter multieperture grids and plasma screen enclosing
the thruster body.
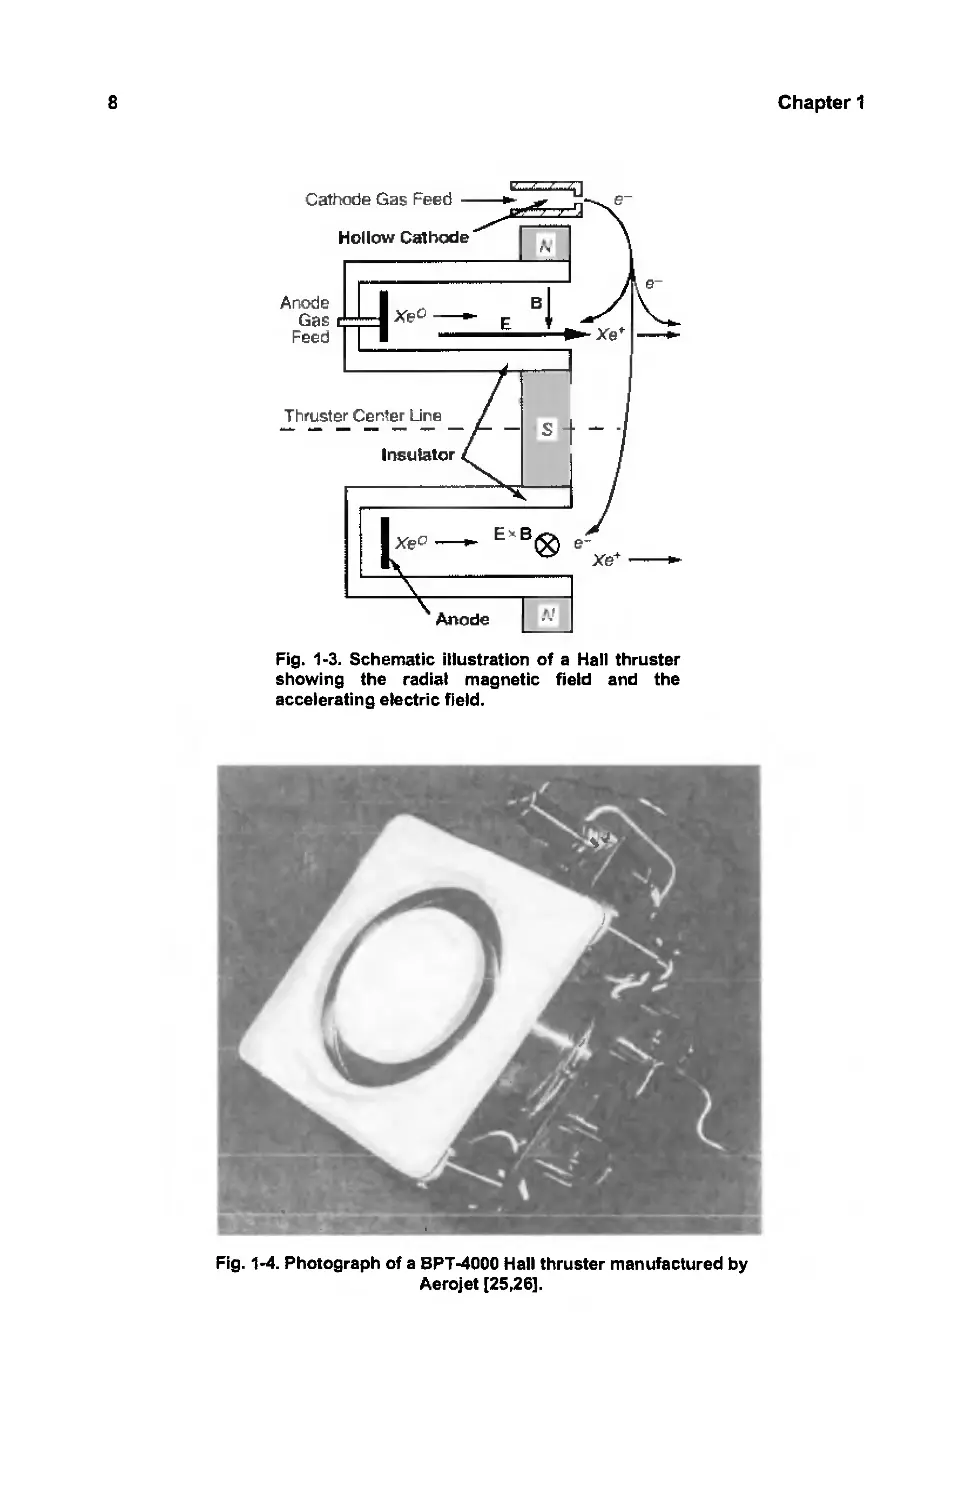
generator. Figure 1-3 shows a schematic cross section of a Hall thruster. In this
example, a cylindrical insulating channel encloses the discharge region.
Magnetic coils (not shown) induce a radial magnetic field between the center
pole piece and the flux return path at the outside edge, The cathode of the
discharge is an external hollow cathode, and the anode is a ring located at the
base of the cylindrical slot shown. Gas is fed into the discharge channel through
the anode and dispersed into the channel. Electrons attempting to reach the
anode encounter a transverse radial magnetic field, which reduces their mobility
in the axial direction and inhibits their flow to the anode. The electrons tend to
spiral around the thruster axis in the E x B direction and represent the Hall
current from which the device derives its name. Ions generated by these
electrons are accelerated by the electric field from the anode to the cathode-
potential plasma produced at the front of the thruster. Some fraction of the
electrons emitted from the hollow cathode also leave the thruster with the ion
beam to neutralize the exiting charge. The shape and material of the discharge
region channel and the details of the magnetic field detennine the performance
of the thruster.
Figure 1-4 shows a photograph of an Aerojet BPT-4000 Hall thruster [25,26]
that has completed qualification for flight. This thruster operates from 1 to
5 kW with an Isp near 2000 s and a total system efficiency of up to 52%. This
8
Anode
Gas
Feed
Thruster Center Line
e-
Xe+ --
Fig. 1-3. Schematic illustration of a Hall thruster
showing the radial magnetic field and the
accelerating electric field.
..'"
/
Fig. 1-4. Photograph of a BPT-4000 Hall thruster manufactured by
Aerojet [25,26].
Chapter 1
Introduction
9
thruster is in development for satellite station-keeping and deep-space
propulsion applications. The more familiar Russian SPT-IOO Hall thruster,
which has considerable flight heritage on Russian spacecraft [15] and is
described in Chapter 9, operates nominally [28,29] at a power of 1.35 kW and
an Isp of 1600 s. This thruster includes a redundant hollow cathode to increase
the reliability and features a lifetime in excess of 9000 hours 12. In addition, the
SPT -100 has also been flown on U. S. commercial communications satellites
[23 ].
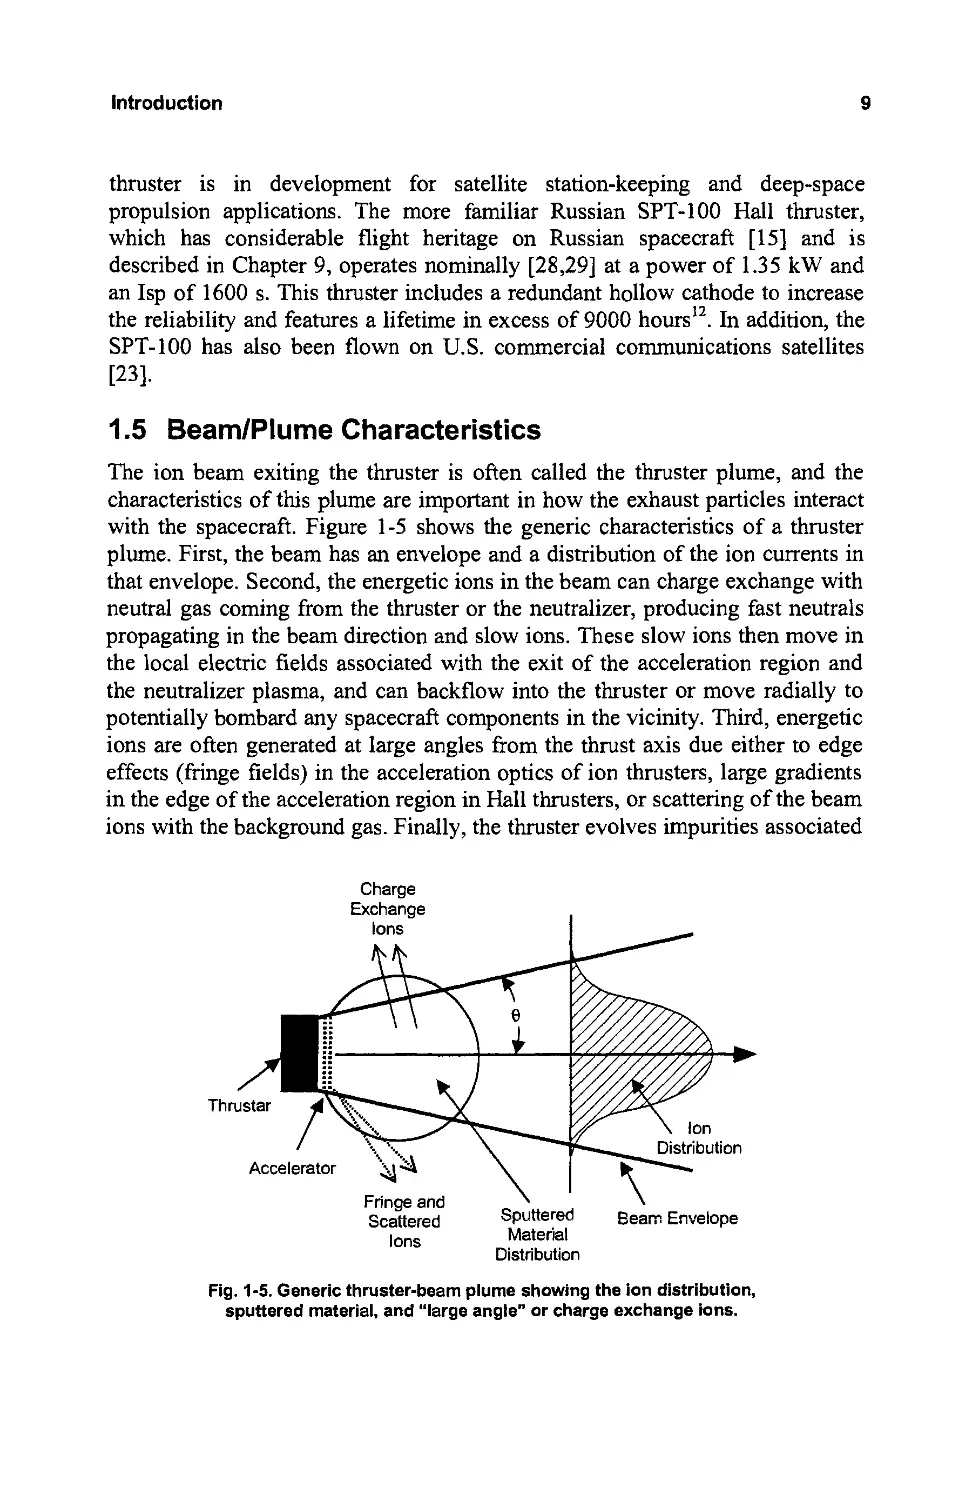
1.5 Beam/Plume Characteristics
The ion beam exiting the thruster is often called the thruster plume, and the
characteristics of this plume are important in how the exhaust particles interact
with the spacecraft. Figure 1-5 shows the generic characteristics of a thruster
plume. First, the beam has an envelope and a distribution of the ion currents in
that envelope. Second, the energetic ions in the beam can charge exchange with
neutral gas coming from the thruster or the neutralizer, producing fast neutrals
propagating in the beam direction and slow ions. These slow ions then move in
the local electric fields associated with the exit of the acceleration region and
the neutralizer plasma, and can backflow into the thruster or move radially to
potentially bombard any spacecraft components in the vicinity. Third, energetic
ions are often generated at large angles from the thrust axis due either to edge
effects (fringe fields) in the acceleration optics of ion thrusters, large gradients
in the edge of the acceleration region in Hall thrusters, or scattering of the beam
ions with the background gas. Finally, the thruster evolves impurities associated
Fringe and
Scattered
Ions
Sputtered
Material
Distribution
Beam Envelope
Fig. 1-5. Generic thruster-beam plume showing the ion distribution,
sputtered material, and "large angle" or charge exchange ions.
10
Chapter 1
with the wear of the thruster components. This can be due to the sputtering of
the grids in ion thrusters, the erosion of the ceramic channel in Hall thrusters, or
the evolution of cathode materials or sputtering of other electrodes in the
engines. This material can deposit on spacecraft surfaces, which can change
surface properties such as emissivity, transparency, etc.
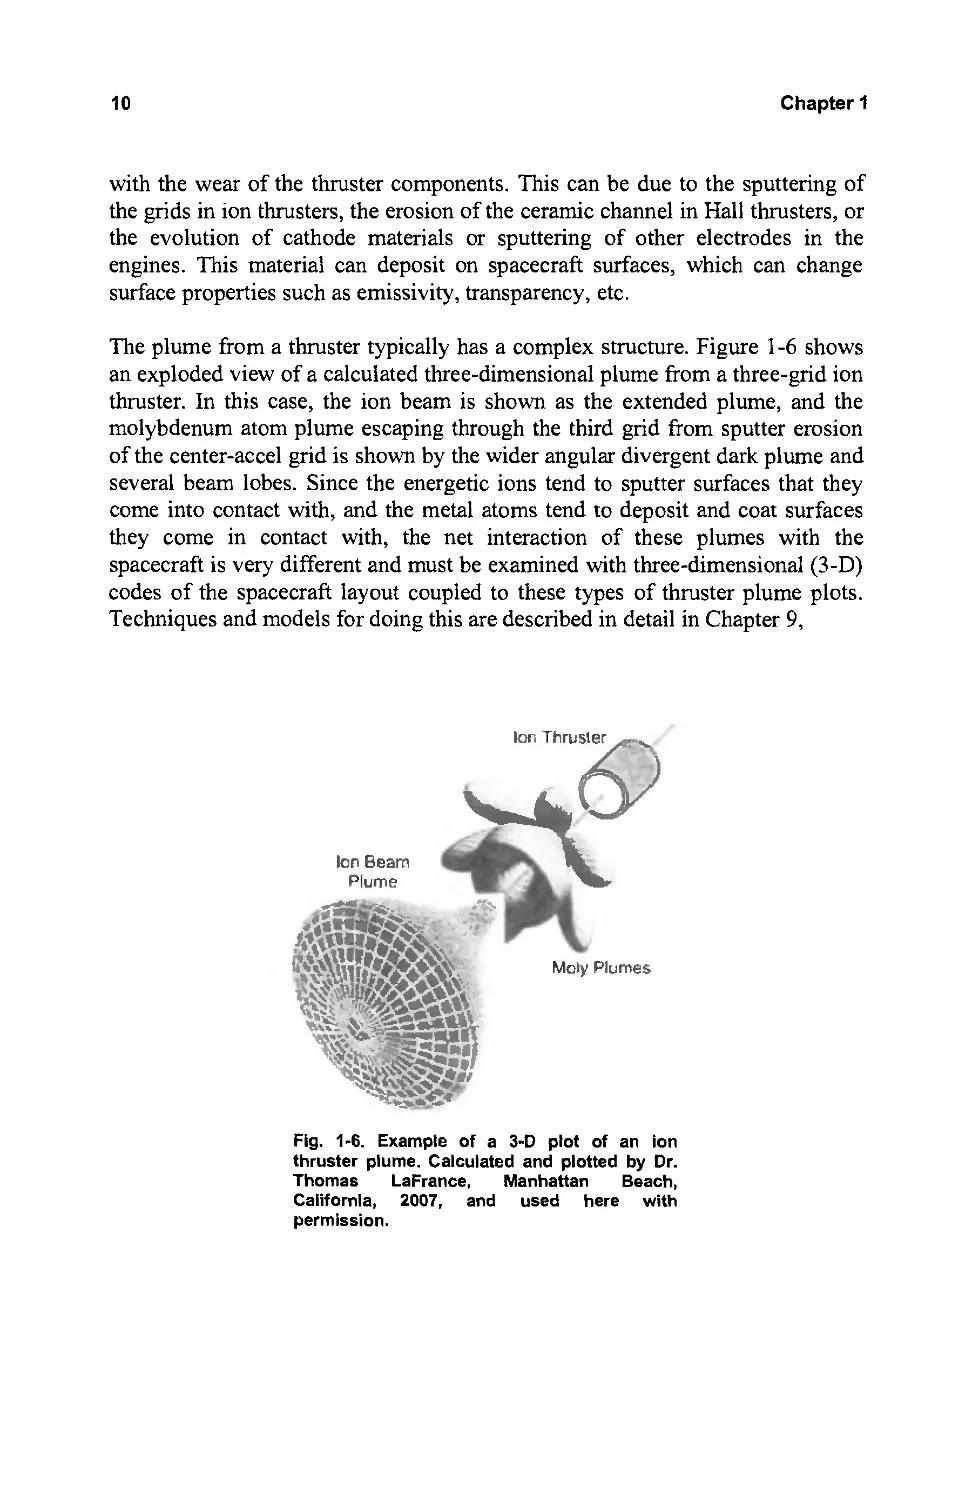
The plume from a thruster typically has a complex structure. Figure 1-6 shows
an exploded view of a calculated three-dimensional plume from a three-grid ion
thruster. In this case, the ion beam is shown as the extended plume, and the
molybdenum atom plume escaping through the third grid from sputter erosion
of the center-accel grid is shown by the wider angular divergent dark plume and
several beam lobes. Since the energetic ions tend to sputter surfaces that they
come into contact with, and the metal atoms tend to deposit and coat surfaces
they come in contact with, the net interaction of these plumes with the
spacecraft is very different and must be examined with three-dimensional (3-D)
codes of the spacecraft layout coupled to these types of thruster plume plots.
Techniques and models for doing this are described in detail in Chapter 9,
Ion Beam
Plume
"" .
,..- s-- - -.'
. ........ ....,,", '. ".0'
":t 'I ...", ---' , ,
r. ,\'J .... .:
flh\\lI"tl.. . .
m 1 J';,, .. i.'
;. .p .. .,\.
"'¥:: :4.%.
.. "-::::-..
'\ -::....';' .:!!f.'
';."'Jo -..:"'I.'
.... 'Io..... ..,
, "".
... : 4'
Thru
'-\:
Moly Plumes
Fig. 1.6. Example of a 3.D plot of an ion
thruster plume. Calculated and plotted by Dr.
Thomas LaFrance, Manhattan Beach,
California, 2007, and used here with
permission.
Introduction
11
References
[1] E. Y. Choueiri, "A Critical History of Electric Propulsion: The First 50
Years (1906-1956)," Journal of Propulsion and Power, vol. 20, pp. 193-
203, 2004.
[2] R. G. Jahn and E. Y. Choueiri, "Electric Propulsion," Encyclopedia of
Physical Science and Technology, third edition, vol. 5, New York:
Academic Press, 2002.
[3] http://en.wikipedia.org/wiki/Fie1d Emission_Electric_Propulsion
[4] R. H. Goddard, The Green Notebooks, vol. 1, The Dr. Robert H. Goddard
Collection at the Clark University Archives, Clark University,
Worchester, Massachusetts.
[5] T. M. Mel'kumov, ed., Pioneers of Rocket Technology, Selected Works,
Academy of Sciences of the USSR, Institute for the History of Natural
Science and Technology, Moscow, 1964; translated from the 1964
Russian text by NASA as NASA TT F-9285, 1965.
[6] E. Stuhlinger, Ion Propulsion for Space Flight, New York: McGraw-Hill,
1964.
[7] R. G. Jahn, Physics of Electric Propulsion, New York: McGraw-Hill,
1968.
[8] G. R. Brewer, Ion Propulsion Technology and Applications, New York:
Gordon and Breach, 1970.
[9] H. R. Kaufman, "Technology of Electron-Bombardment Ion Thrusters,"
in Advances in Electronics and Electron Physics, vol. 36, edited by
L. Marton, New York: Academic Press, 1974.
[10] P. J. Turchi, "Electric Rocket Propulsion Systems," Chapter 9 in Space
Propulsion Analysis and Design, edited by R. W. Humble, G .N. Henry,
and W. J. Larson, New York: McGraw-Hill, pp. 509-598,1995.
[11] 1. R. Wertz and W. 1. Larson, eds., Space Mission Analysis and Design,
third edition, New York: Springer Publishing Co., 1999.
[12] G. P. Sutton and O. Biblarz, Rocket Propulsion Elements, New York:
John Wiley and Sons, pp. 660-710,2001.
[13] S. D. Grishin and L. V. Leskov, Electrical Rocket Engines of Space
Vehicles, Moscow, Russia: Mashinostroyeniye Publishing House, 1989
(in Russian).
[14] A. S. Boever, V. Kiim, A. S. Koroteev, L. A. Latyshev, A. I. Morozov,
G. A. Popov, Y. P. Rylov, and V. V. Zhurin, "State of the Works of
Electrical Thrusters in the USSR," IEPC-91-003, 22nd International
Electric Propulsion Conference, Viareggio, Italy, 1991.
12 Chapter 1
[15] V. Kim, "Electric Propulsion Activity in Russia," IEPC-2001-005, 27th
International Electric Propulsion Conference, Pasadena, California,
October 14-19, 2001.
[16] S. Shimada, K. Sato, and H. Takegahara, "20-mN Class Xenon Ion
Thruster for ETS-VI," AIAA-1987-1029, 19th International Electric
Propulsion Conference, Colorado Springs, Colorado, May 11-13, 1987.
[17] J. R. Beattie, "XlPS Keeps Satellites on Track," The Industrial Physicist,
June 1998.
[18] J. R. Brophy, "NASA's Deep Space 1 Ion Engine," Review Scientific
Instruments, vol. 73, pp. 1071-1078,2002.
[19] J. R. Beattie, J. N. Matossian, and R. R. Robson, "Status of Xenon Ion
Propulsion Technology," Journal of Propulsion and Power, vol. 6, no. 2,
pp. 145-150, 1990.
[20] D. M. Goebel, M. Martinez-Lavin, T. A. Bond, and A. M. King,
"Performance of XlPS Electric Propulsion in Station Keeping of the
Boeing 702 Spacecraft," AIAA-2002-4348, 38th Joint Propulsion
Conference, Indianapolis, Indiana, July 7-10, 2002.
[21] H. Kuninaka, K. Nishiyama, I. Funakai, K. Tetsuya, Y. Shimizu, and
J. Kawaguchi, "Asteroid Rendezvous of Hayabusa Explorer Using
Microwave Discharge Ion Engines," 29th International Electric
Propulsion Conference, IEPC-2005-01O, Princeton, New Jersey, October
31-November 4,2005.
[22] C. R. Koppel and D. Estublier, "The SMART-1 Hall Effect Thruster
around the Moon: In Flight Experience," 29th International Electric
Propulsion Conference, IEPC-2005-119, Princeton, New Jersey,
October 31-November 4, 2005.
[23] D. 1. Pidgeon, R. L. Corey, B. Sauer, and M. L. Day, "Two Years On-
Orbit Performance of SPT-lOO Electric Propulsion," AIAA-2006-5353,
24th AlAA International Communications Satellite Systems Conference,
San Diego, California, June 11-14,2006.
[24] K. R. Chien, W. G. Tighe, and S. Hart, "L-3 Communications ETI
Electric Propulsion Overview," 29th International Electric Propulsion
Conference, IEPC-2005-315, Princeton, New Jersey, October 31-
November 4,2005.
[25] F. Wilson, D. King, M. Willey, R. Aadland, D. Tilley, and K. deGrys,
"Development Status of the BPT Family of Hall Current Thrusters,"
AIAA-99-2573, 35th Joint Propulsion Conference, Los Angeles,
California, June 20-24, 1999.
Introduction
13
[26J K. H. de Grys, B. Welander, J. Dimicco, S. Wenzel, and B. Kay, "4.5 kW
Hall Thruster System Qualification Status," AIAA-2005-3682, 41st Joint
Propulsion Conference, Tucson, Arizona, July 10-13,2005.
[27] J. E. Polk, D. M. Goebel, I. Katz, 1. S. Snyder, A. Schneider, L. Johnson,
and A. Sengupta, "Performance and Wear Test Results for a 20-kW Class
Ion Engine with Carbon-Carbon Grids," AIAA-2005-4393, 41st Joint
Propulsion Conference, Tucson, Arizona, July 10-13,2005.
[28] V. Kim, "Main Physical Features and Processes Determining the
Performance of Stationary Plasma Thrusters," Journal of Propulsion and
Power, vol. 14, pp. 736-743, 1998.
[29] 1. R. Brophy, 1. W. Barnett, J. M. Sankovic, and D. A. Barnhart,
"Performance of the Stationary Plasma Thruster: SPT-IOO," AIAA-92-
3155, 28th Joint Propulsion Conference, Nashville, Tennessee, June 1992.
[30] J. R. Wertz and W. J. Larson, eds., Space Mission Analysis and Design,
Torrance, California: Microcosm Press, 1999.
Fundamentals oIElectric Propulsion: Ion and Hall T1l1'llsters
by Dan M. Goebel and Ira Katz
Copyright iQ 2008 John Wiley & Sons, Inc.
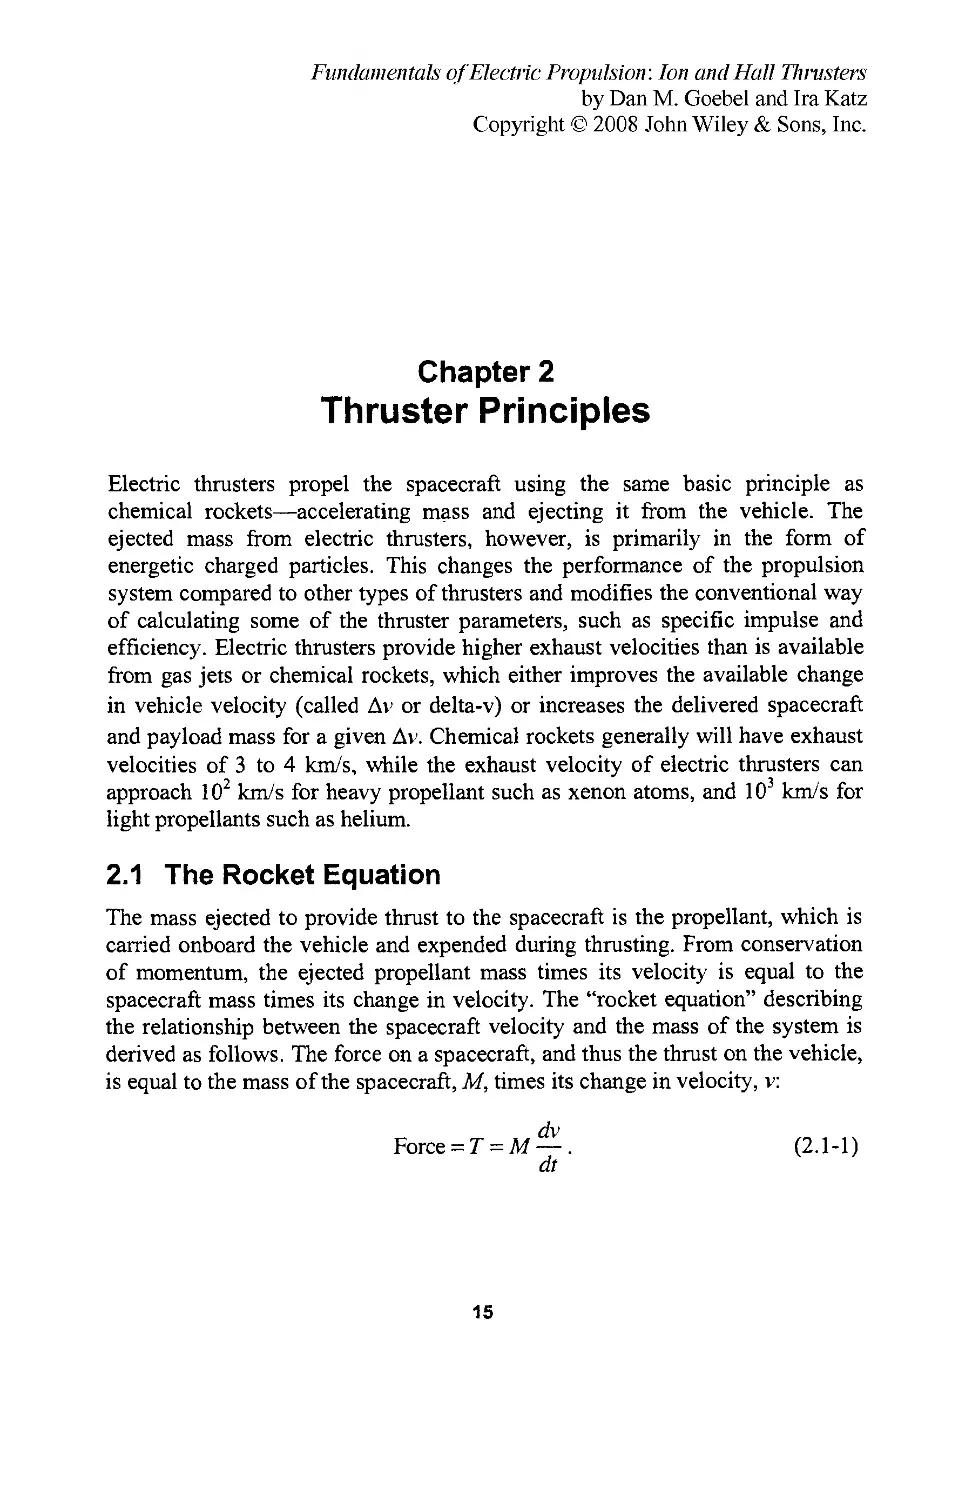
Chapter 2
Thruster Principles
Electric thrusters propel the spacecraft using the same basic principle as
chemical rockets-accelerating mass and ejecting it from the vehicle. The
ejected mass from electric thrusters, however, is primarily in the form of
energetic charged particles. This changes the performance of the propulsion
system compared to other types of thrusters and modifies the conventional way
of calculating some of the thruster parameters, such as specific impulse and
efficiency. Electric thrusters provide higher exhaust velocities than is available
from gas jets or chemical rockets, which either improves the available change
in vehicle velocity (called .:lv or delta-v) or increases the delivered spacecraft
and payload mass for a given .:lv. Chemical rockets generally will have exhaust
velocities of 3 to 4 km/s, while the exhaust velocity of electric thrusters can
approach 10 2 km/s for heavy propellant such as xenon atoms, and 10 3 km/s for
light propellants such as helium.
2.1 The Rocket Equation
The mass ejected to provide thrust to the spacecraft is the propellant, which is
carried onboard the vehicle and expended during thrusting. From conservation
of momentum, the ejected propellant mass times its velocity is equal to the
spacecraft mass times its change in velocity. The "rocket equation" describing
the relationship between the spacecraft velocity and the mass of the system is
derived as follows. The force on a spacecraft, and thus the thrust on the vehicle,
is equal to the mass of the spacecraft, M, times its change in velocity, v:
dv
Force = T = M - .
dt
(2.1-1)
15
16
Chapter 2
The thrust on the spacecraft is equal and opposite to the time rate of change of
the momentum of the propellant, which is the exhaust velocity of the propellant
times the time rate of change of the propellant mass:
T=- (mpvex)=-vex dm p ,
dt dt
(2.1-2)
where mp is the propellant mass on the spacecraft and Vex is the propellant
exhaust velocity in the spacecraft frame of reference.
The total mass of the spacecraft at any time is the delivered mass, md, plus the
propellant mass:
M(t)=md+mp'
(2.1-3)
The mass of the spacecraft changes due to consumption of the propellant, so the
time rate of change of the total mass is
dM = dm p
dt dt
(2.1-4)
Substituting Eq. (2.1-4) into Eq. (2.1-2) and equating with Eq. (2.1-1) gives
dv dM
M-=-v -
dt ex dt '
(2.1-5)
which can be written as
dM
dv = -v -
ex M
(2.1-6)
For motion in a straight line, this equation is solved by integrating from the
spacecraft initial velocity, vi, to the final velocity, vI' during which the mass
changes from its initial value, md + mp' to its final delivered mass, md:
f V! J md dM
dv=-v ex -.
Vi md+mp M
(2.1-7)
The solution to Eq. (2.1-7) is
Thruster Principles
17
Vi -VI = v= Vex In ( md ) .
md+mp
(2.1-8)
The final mass of a spacecraft delivered after a given amount of propellant has
been used to achieve the specified v is
md =(md +mp)e-llVlv ex .
(2.1-9)
The specific impulse, Isp, will be shown in Section 2.4 to be equal to the
propellant exhaust velocity, vex' divided by the gravitational acceleration g.
The change in velocity of the spacecraft is then
( md + m )
v = (Isp* g) In md p ,
(2.1-10)
whereg is the acceleration by gravity, 9.8067 mls 2 .
Equation (2.1-10) shows that for a given mission with a specified v and final
delivered mass, md, the initial spacecraft wet mass (md + m p ) can be reduced
by increasing the Isp of the propulsion system, which has implications for the
launch vehicle size and cost. High delta-v missions are often enabled by electric
propulsion because it offers much higher exhaust velocities and Isp than do
conventional chemical propulsion systems.
Equation (2.1-9) can be written in terms of the required propellant mass:
mp = md [ellV/(V ex ) -1] = md [ellV/(Isp*g) -1]. (2.1-11)
The relationship between the amount of propellant required to perform a given
mission and the propellant exhaust velocity (or the propulsion system Isp)
shows that the propellant mass increases exponentially with the delta-v
required. Thrusters that provide a large propellant exhaust velocity compared to
the mission v will have a propellant mass that is only a small fraction of the
initial spacecraft wet mass.
The exhaust velocity of chemical rockets is limited by the energy contained in
the chemical bonds of the propellant used; typical values are up to 4 km/s.
Electric thrusters, however, separate the propellant from the energy source
(which is now a power supply) and thus are not subject to the same limitations.
18
Chapter 2
Modern ion and Hall thrusters operating on xenon propellant have exhaust
velocities in the range of20-40 km/s and 10-20 km/s, respectively.
The dramatic benefits of the high exhaust velocities of electric thrusters are
clearly seen from Eq. (2.1-11). For example, consider an asteroid rendezvous
mission for which it is desired to deliver 500 kg of payload with a mission t.v
of 5 km/s. A spacecraft propelled by a chemical engine with a 3-km/s exhaust
velocity, corresponding to an Isp 0006 s, would require 2147 kg of propellant
to accomplish the mission. In contrast, an ion thruster with a 30-km/s exhaust
velocity, corresponding to an Isp of3060 s, would accomplish the same mission
using only 91 kg of propellant. High-t.v missions such as this are often enabled
by electric propulsion, allowing either a significant reduction in the amount of
required propellant that has to be launched or the ability to increase the
spacecraft dry mass for a given wet mass associated with a launch vehicle or
mission requirement.
2.2 Force Transfer in Ion and Hall Thrusters
The propellant ionized in ion and Hall thrusters is
accelerated by the application of electric fields.
However, the mechanism for transferring the thrust
from the ion motion to the thruster body, and thereby
the spacecraft, is different for ion thrusters and Hall
thrusters.
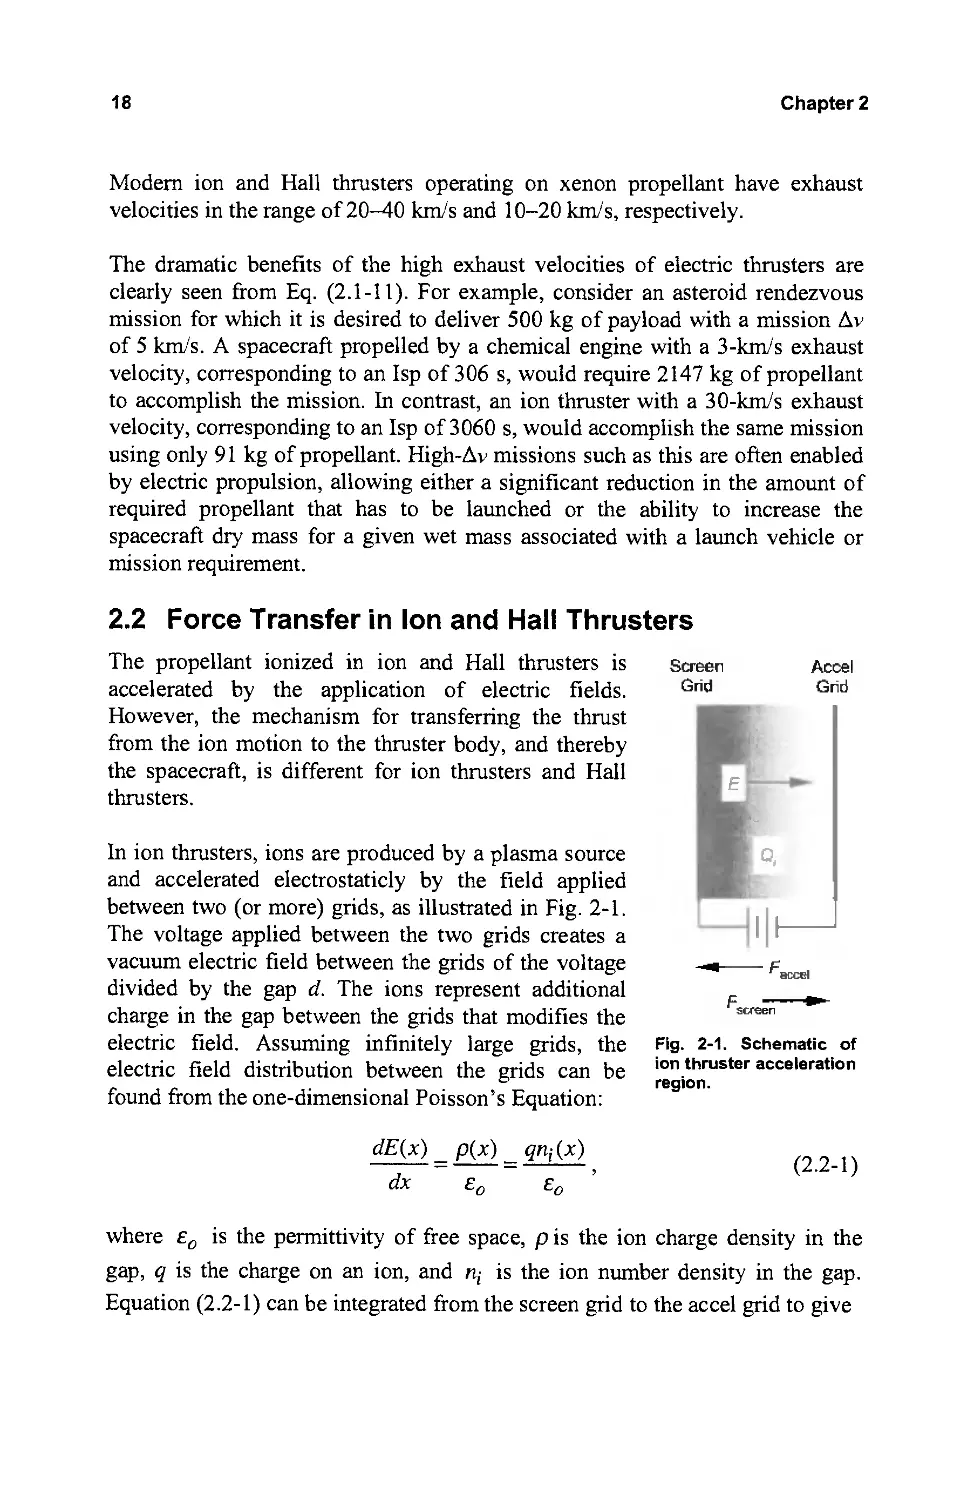
In ion thrusters, ions are produced by a plasma source
and accelerated electrostaticly by the field applied
between two (or more) grids, as illustrated in Fig. 2-1.
The voltage applied between the two grids creates a
vacuum electric field between the grids of the voltage
divided by the gap d. The ions represent additional
charge in the gap between the grids that modifies the
electric field. Assuming infinitely large grids, the
electric field distribution between the grids can be
found from the one-dimensional Poisson's Equation:
dE(x) = p(x) = qni(x)
dx Eo Eo
Screen
Grid
Acrel
Grid
. ' I
E
'"
0,
II
----- F "",,01
F---
screen
Fig. 2-1. Schematic of
ion thruster acceleration
region.
(2.2-1 )
where Eo is the permittivity of free space, p is the ion charge density in the
gap, q is the charge on an ion, and ni is the ion number density in the gap.
Equation (2.2-1) can be integrated from the screen grid to the accel grid to give
Thruster Principles
19
q I x , ,
E(x)=- ni(x )dx + Escreen,
e 0
o
(2.2-2)
where Escreen is the electric field at the screen grid. Assuming that the screen
grid is a perfect conductor, its surface charge density, a, is
a = eo Escreen .
(2.2-3)
The surface charge is an image charge and is attracted by the ion charge in the
gap. Since the field drops to zero inside the conductor, the screen grid feels a
force per unit area equal to the charge density times the average field (which is
half the field on the outside ofthe conductor):
(Esereen + 0) 1 2
Fscreen = a = - eo Esereen ,
2 2
(2.2-4)
where Fscreen is the force on the screen grid. Correspondingly, at the
accelerator grid there is an electric field, Eaccel' and a surface charge density
equal to that on the screen grid but of the opposite sign. The accel grid feels a
force is in the opposite direction:
(Eaecel +0) 1 2
Faceel = -a = - - eoEaece! .
2 2
(2.2-5)
The net thrust on the ion engine is the sum of the forces on the screen and accel
grids,
1 ( 2 2 )
T = Fscreen + Faeeel = '2 eo Esereen - Eaceel '
(2.2-6)
where T is the force in newtons. The force per unit area on the ions in the gap
between the grids can be calculated using the fact that the force on an ion
equals its charge times the local electric field, and integrating that force across
the gap:
Fion = qS: ni(x)E(x)dx.
(2.2- 7)
Eliminating the ion density ni(x) using Eq. (2.2-1), the integral can be done
directly:
20
Chapter 2
J d dE(x) J Eaccel 1 ( 2 2 )
Fion = Eo - E(x)d:x -::::: Eo E dE = - Eo Eaccel - Escreen . (2.2-8)
o d:x Escreen 2
The net force on the grids, which is the thrust, is equal and opposite to the
electric field forces on the ions between the grids:
I ( 2 2 )
T = -Fion = -"2Eo Eaccel - Escreen .
(2.2-9)
Therefore, the thrust in an ion engine is transferred by the electrostatic force
between the ions and the two grids.
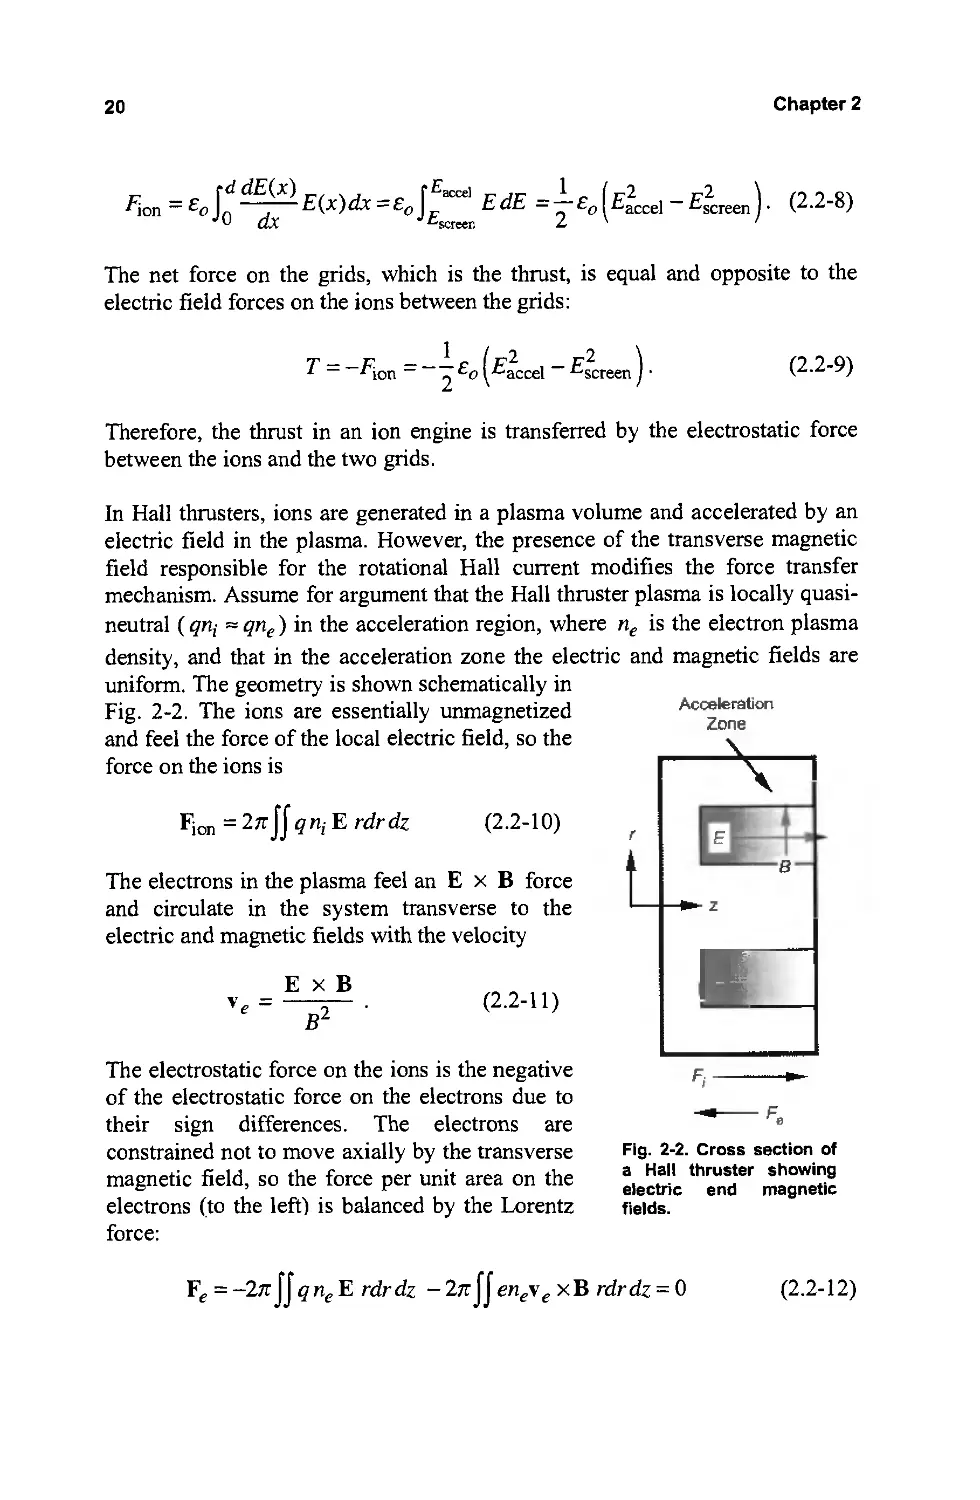
In Hall thrusters, ions are generated in a plasma volume and accelerated by an
electric field in the plasma. However, the presence of the transverse magnetic
field responsible for the rotational Hall current modifies the force transfer
mechanism. Assume for argument that the Hall thruster plasma is locally quasi-
neutral (qni "" qne) in the acceleration region, where ne is the electron plasma
density, and that in the acceleration zone the electric and magnetic fields are
uniform. The geometry is shown schematically in
Fig. 2-2. The ions are essentially unmagnetized
and feel the force of the local electric field, so the
force on the ions is
F ion = 2n Jf qni E rdrdz
(2.2-10)
The electrons in the plasma feel an E x B force
and circulate in the system transverse to the
electric and magnetic fields with the velocity
V e =
ExB
B 2
(2.2-11 )
The electrostatic force on the ions is the negative
of the electrostatic force on the electrons due to
their sign differences. The electrons are
constrained not to move axially by the transverse
magnetic field, so the force per unit area on the
electrons (to the left) is balanced by the Lorentz
force:
Acceleration
Zone
r
E
B
z
Fj ...
--Fe
Fig. 2-2. Cross section of
a Hall thruster showing
electric end magnetic
fields.
Fe = -2n Jf q ne E rdrdz - 2n fJ eneV e xB rdrdz = 0
(2.2-12)
Thruster Principles
21
Using quasi-neutrality and the definition of the Hall current density,
J Hall = -en e V e' the force on the ions is shown to be equal to Lorentz forces on
the electrons:
F i = -2n-Jf q ni E rdr dz + 2n-Jf JHall x B rdr dz = O.
(2.2-13)
Solving Eq. (2.2-13), the force on the ions is then
Fj=JHall XB
(2.2-14)
By Newton's second law, the Hall current force on the magnets is equal and
opposite to the Hall current force on the electrons and, therefore, is also equal
and opposite to the force on the ions:
T=JHall xB=-F j .
(2.2-15)
In Hall thrusters the thrust is transferred from the ions to the thruster body
through the electromagnetic Lorentz force. These thrusters are sometimes
called electromagnetic thrusters because the force is transferred through the
magnetic field. However, since the ion acceleration mechanism is by the
electrostatic field, we will choose to call them electrostatic thrusters.
2.3 Thrust
Thrust is the force supplied by the engine to the spacecraft. Since the spacecraft
mass changes with time due to the propellant consumption, the thrust is given
by the time rate of change of the momentum, which can be written as
d ( ) dmp .
T = - mpv ex = - vex = mpv ex
dt dt
(2.3-1)
where m p is the propellant mass flow rate in kg/so The propellant mass flow
rate is
rhp =QM ,
(2.3-2)
where Q is the propellant particle flow rate (in particles/s) and M is the particle
mass.
The kinetic thrust power of the beam, called the jet power, is defined as
1. 2
P jet = - m p v ex .
2
(2.3-3)
22
Chapter 2
Using Eq. (2.3-1), the jet power is then
T 2
ljet= .
2mp
(2.3-4)
This expression shows that techniques that increase the thrust without
increasing the propellant flow rate will result in an increase in the jet power.
For ion and Hall thrusters, ions are accelerated to high exhaust velocity using
an electrical power source. The velocity of the ions greatly exceeds that of any
unionized propellant that may escape from the thruster, so the thrust can be
described as
dm p .
T=-v ex "" mivi,
dt
(2.3-5)
where mi is the ion mass flow rate and vi is the ion velocity. By conservation
of energy, the ion exhaust velocity is given by
V. = 2qVb
1 M '
(2.3-6)
where Vb is the net voltage through which the ion was accelerated, q is the
charge, and M is the ion mass. The mass flow rate of ions is related to the ion
beam current, I b ' by
m. = Ib M
I
q
(2.3-7)
Substituting Eqs. (2.3-6) and (2.3-7) into Eq. (2.3-5), the thrust for a singly
charged propellant (q = e) is
T = 27 Ib .Jv;; [newtons).
(2.3-8)
The thrust is proportional to the beam current times the square root of the
acceleration voltage. In the case of Hall thrusters, there is a spread in beam
energies produced in the thruster, and Vb represents the effective or average
beam voltage. If the propellant is xenon, .J2M/e = 1.65 x 10- 3 , the thrust is
given by
Thruster Principles
23
T = 1.65I b .Jv;; [mN],
(2.3-9)
where Ib is in amperes and Vb is in volts.
Equation (2.3-9) is the basic thrust equation that applies for a unidirectional,
singly ionized, monoenergetic beam of ions. The equation must be modified to
account for the divergence of the ion beam and the presence of multiply
charged ions commonly observed in electric thrusters. The assumption of a
monoenergetic ion beam in Eq. (2.3-6) is generally valid for ion thrusters, but is
only an approximation for the beam characteristics in Hall thrusters, which will
be discussed in Chapter 7.
The correction to the thrust equation for beam divergence is straightforward for
a beam that diverges unifonnly upon exiting from the thruster. For a thruster
with a constant ion current density profile accelerated by unifonn electric
fields. the correction to the force due to the effective thrust-vector angle is
simply
F; =cos6,
(2.3-10)
where 6 is the average half-angle divergence of the beam. If the thrust half
angle is 10 deg, then cos 6 = 0.985, which represents a 1.5% loss in thrust. If
the plasma source is not unifonn and/or the accelerator system has curvature,
then the thrust correction must be integrated over the beam and grid profiles.
For cylindrical thrusters, the correction factor is then
r 2nr J(r) cos6(r) dr
F. - 0
t - Ib '
(2.3-11)
where J(r) is the ion current density which is a function of the radius. The ion
current density is usually detennined from direct measurement of the current
distribution in the plume by plasma probes. For a constant value of J(r),
Eq. (2.3-11) reduces to Eg. (2.3-10).
The second correction applied to the thrust equation for electric thrusters
accounts for the presence of multiply charged ion species. If the beam contains
both singly charged and doubly charged ions such that the total beam current is
Ib = 1+ + 1++,
(2.3-12)
24
Chapter 2
where /+ is the singly charged ion current and /++ is the doubly charged ion
current, the total thrust for the multiple species, T m' is the sum of the thrust
from each species:
Tm = /+ 2MVb + /++ MVb = /+ 2MVb ( l+....!.- /++ J .
e e e Ji /+
(2.3-13)
The thrust correction factor, a, for thrust in the presence of doubly ionized
atoms is defined by the ratio of Eqs. (2.3-13) and (2.3-8), where the beam
current in Eq. (2.3-8) is given by Eq. (2.3-12):
/ + + ....!.- / ++
Ji
a=
/+ + /++
/++
1 + 0.707-
/+
/++
1+-
/+
(2.3-14)
where /++ / /+ is the fraction of double ion current in the beam. A similar
correction factor can be easily derived for higher charged ions (see Problem 4),
although the number of these species is typically found to be relatively small in
most ion and Hall thrusters.
The total thrust correction is the product of the divergence and multiply charged
species terms:
r = aft .
(2.3-15)
The total corrected thrust is then given by
T = rmivi = r 2 /b ,JV;.
(2.3-16)
The total thrust for xenon can be simply written as
T = 1.65 r /b .JY; [mN].
(2.3-17)
For example, assuming an ion thruster with a 10-deg half-angle beam
divergence and a 10% doubles-to-singles ratio results in r = 0.958. For a
thruster producing 2 A of xenon ions at 1500 V, the thrust produced is
122.4 mN.
Thruster Principles
25
2.4 Specific Impulse
Specific impulse, tenned Isp, is a measure of thrust efficiency and is defined as
the ratio of the thrust to the rate of propellant consumption. Specific impulse for
constant thrust and propellant flow rate is
T
Isp=-
rhpg'
(2.4-1 )
where g is the acceleration of gravity, 9.807 mls 2 . For a xenon thruster, the Isp
can be expressed as
Isp = 1.037 x 10 6 T[N] = 1.02 x 10 5 T[N] ,
Q[sccm] Q[mg/ s]
(2.4-2)
where Eq. (2.3-2) and the flow conversions in Appendix B have been used.
Using Eq. (2.3-1) for the thrust in Eq. (2.4-1), the Isp for any thruster is
v
Isp = ,
g
(2.4-3)
where vex is the effective exhaust velocity.
Defining the Isp in tenns of the exhaust velocity relative to g is what gives rise
to the unusual units of seconds for Isp. In electric thrusters, the thrust is due
primarily to the ions. Using Eq. (2.3-5), the Isp is given by
v. rho
Isp=-L .
g mp
(2.4-4)
where Vi is the exhaust velocity for unidirectional, monoenergetic ion exhaust.
The thruster mass utilization efficiency, which accounts for the ionized versus
unionized propellant, is defined for singly charged ions as
rh i lb M
17m = -;-- = --;--.
mp e mp
(2.4-5)
In the event that the thruster produces a significant number of multiply charged
ions, the expression for the propellant utilization efficiency must be redefined.
26
Chapter 2
For thrusters with both singly and doubly charged ions, the corrected mass
utilization efficiency for multiple species is
Ib M
1) · = a m ---:--
m e m
p
(2.4-6)
where am is a term that accounts for the fact that a doubly charged ion in the
beam current carries two charges but only one unit of mass. In a manner similar
to the derivation of the thrust correction due to double ions, the mass utilization
correction am is given by
a m =
11++
1+--
2 1+
1++
1+-
1+
(2.4-7)
For small ratios of double-to-single ion content, am is essentially equal to one.
Substituting Eq. (2.3-16) for the thrust and Eq. (2.4-5) for the propellant
utilization efficiency into Eq. (2.4-3) yields an expression for the Isp:
Isp= Y m 2;:b ,
(2.4-8)
where the propellant utilization efficiency for singly charged ions must be used
because Eq. (2.3-16) defines the beam current that way, and again the effective
beam voltage must be used for Hall thrusters. Using the values for g and e, the
Isp for an arbitrary propellant is
Isp = 1.417 x 10 3 Y1)m JJ-
'\JMa
(2.4-9)
where Vb is the beam voltage in volts and M a is the ion mass in atomic mass
units [1 AMU = 1.6605 X 10- 27 kg]. For xenon, the atomic mass M a = 131.29 ,
and the Isp is given by
Isp= 123.6 Y1)m,JV; .
(2.4-10)
Thruster Principles
27
Using our previous example of a 10-deg half-angle beam divergence and a 10%
doubles-to-singles ratio with a 90% propellant utilization of xenon [in
Eq. (2.4-5)] at 1500 V, the lsp is 123.6*0.958*0.9* ..J1500 = 4127 s.
Specific impulse is functionally equivalent to gas mileage in a car. Cars with
high gas mileage typically don't provide much acceleration, just as thrusters
with high lsp don't provide as much thrust for a given input electrical power.
Of critical importance is the ratio of the thrust achieved to total power used,
which depends on the electrical efficiency of the thruster (to be described in the
next section).
2.5 Thruster Efficiency
The mass utilization efficiency, defined in Eq. (2.4-6), describes the fraction of
the input propellant mass that is converted into ions and accelerated in the
electric thruster. The electrical efficiency of the thruster is defined as the beam
power, P b , out of the thruster divided by the total input power, P T :
Pb Ib Vb
7] ---
e - - ,
P T IbVb + Po
(2.5-1)
where Po represents the other power input to the thruster required to create the
thrust beam. Other power will include the electrical cost of producing the ions,
cathode heater or keeper power, grid currents in ion thrusters, etc.
The cost of producing ions is described by an ion production efficiency term,
sometimes called the discharge loss:
Power to produce the ions P d
7]d = C f . od d Ib '
urrent 0 IOns pr uce
(2.5-2)
where 7]d has units of watts per ampere (WI A) or equivalently electron-volts
per ion (eV/ion). Contrary to most efficiency terms, it is desirable to have 7]d
as small as possible since this represents a power loss. For example, if an ion
thrusterrequires a 20-A, 25-V discharge to produce 2 A of ions in the beam, the
discharge loss is then 20*25/2 = 250 eV/ion.
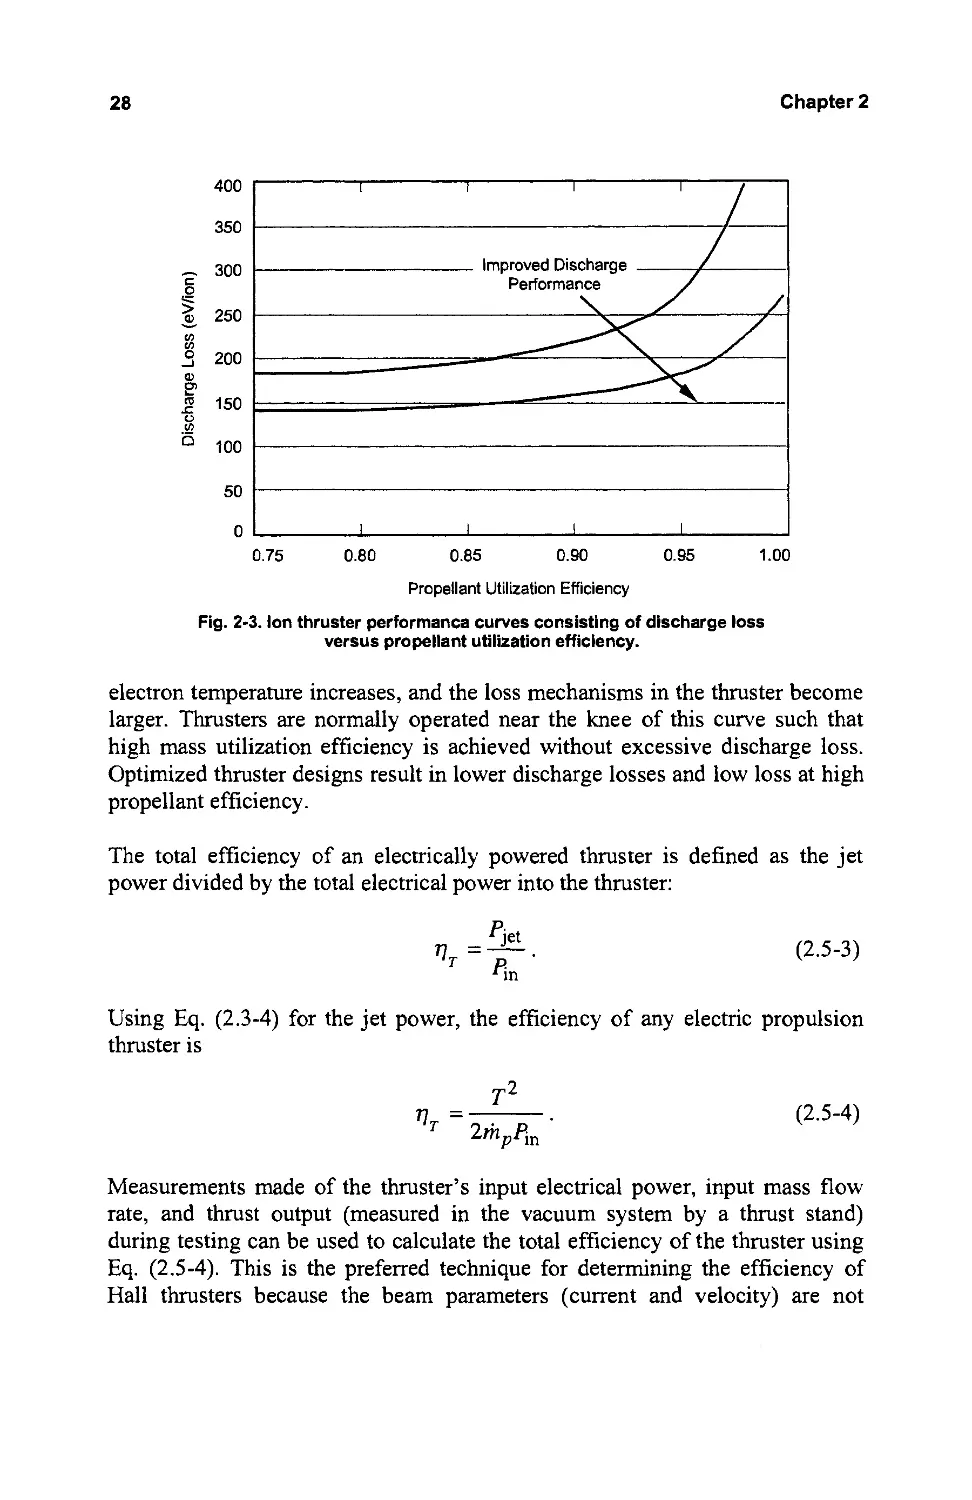
The performance of a plasma generator is usually characterized by plotting the
discharge loss versus the propellant utilization efficiency. An example of this is
shown in Fig. 2-3. At low propellant efficiencies, the neutral pressure in the
thruster is high and the performance curves are relatively flat. As the propellant
efficiency is increased, the neutral pressure in the thruster decreases, the
28
Chapter 2
400
350
'2 300
0
250
'"
'"
0 200
-'
Q)
E'
co 150
.c
u
'"
is 100
50
0
0.75 0.80 0.85 0.90
0.95
1.00
Propellant Utilization Efficiency
Fig. 2-3. Ion thruster performanca curves consisting of discharge loss
versus propellant utilization efficiency.
electron temperature increases, and the loss mechanisms in the thruster become
larger. Thrusters are normally operated near the knee of this curve such that
high mass utilization efficiency is achieved without excessive discharge loss.
Optimized thruster designs result in lower discharge losses and low loss at high
propellant efficiency.
The total efficiency of an electrically powered thruster is defined as the jet
power divided by the total electrical power into the thruster:
P jet
17 T =R
In
(2.5-3)
Using Eq. (2.3-4) for the jet power, the efficiency of any electric propulsion
thruster is
T 2
17 T = 2 . D
mpcin
(2.5-4)
Measurements made of the thruster's input electrical power, input mass flow
rate, and thrust output (measured in the vacuum system by a thrust stand)
during testing can be used to calculate the total efficiency of the thruster using
Eq. (2.5-4). This is the preferred technique for determining the efficiency of
Hall thrusters because the beam parameters (current and velocity) are not
Thruster Principles
29
known outright from measurements of electrical or gas flow parameters
external to the vacuum system.
In ion thrusters, the beam is nearly monoenergetic, the exhaust velocity can be
found from the net acceleration voltage applied to the thruster [using
Eq. (2.3-6)], and the beam current is measured by the high voltage power
supply. This allows the total efficiency to be accurately calculated from the
electrical and gas flow inputs to the thruster. Using Eq. (2.3-16) for the thrust,
Eq. (2.3-6) for the exhaust velocity, and Eq. (2.4-5) for the propellant flow rate,
the total efficiency in Eq. (2.5-4) can be written as
rTlmTVi 2 IbV b
TIT = 2 . D - r TIm --;;- .
mirin rin
(2.5-5)
The input power into the thruster, from Eq. (2.5-1), is
Q _ P b _ IbV b
rin - - ,
TIe TIe
(2.5-6)
Substituting Eq. (2.5-6) into Eq. (2.5-5) gives
2
TIT = r Tle1Jm'
(2.5-7)
Measurements of the input propellant flow rate and electrical parameters
(currents and voltages), and knowledge of the thrust correction factors from
thruster plume measurements or code predictions, pennit the total efficiency of
ion thrusters to be calculated with high accuracy using Eq. (2.5-7).
Using our previous example of an ion thruster with 10-deg half-angle
divergence, 10% double ion current, 90% mass utilization efficiency, and
250 eV/ion to produce a 2-A beam at 1500 V, the electrical efficiency is
= 2 * 1500 = 0.857
TIe 2*1500+250*2 '
and the total efficiency is
2
TlT= (0.958) (0.857) (0.9) = 0.708,
which says that the thruster converts 70.8% of the supplied electrical energy
into useful kinetic energy imparted to the spacecraft.
30
Chapter 2
Thrusters with high exhaust velocities, and thus high Isp's, are desirable to
maximize a mission payload mass. It was shown in Eq. (2.4-9) that to achieve
high Isp, it is necessary to operate at a high ion acceleration voltage and high
mass utilization efficiency. Reductions in ion mass also increase the Isp, but at
the cost of thrust at the same power level. This is seen by examining the thrust-
to-total input power ratio. The total power is just the beam power divided by
the electrical efficiency, so the thrust-to-power ratio using Eq. (2.5.1) is
!..... = T 17 e
P T P b
(2.5-8)
The beam power is the beam current times the beam voltage. Using
Eq. (2.3-16) for the thrust and Eq. (2.4-8) to put this in terms ofIsp, the thrust
per unit input power is
2
!..... = 2y lJmlJe _ lJT
P T g Isp g Isp
(2.5-9)
Equation (2.5-9) shows that for a given input power and total thruster
efficiency, increasing the Isp reduces the thrust available from the electric
engine. This trade of thrust for Isp at a constant input power can only be
improved if higher efficiency ion thrusters are employed.
2.6 Power Dissipation
The power into a thruster that does not result in thrust must be dissipated
primarily by radiating the unused power into space. If the thruster electrical
efficiency is accurately known, the dissipated power is
Pdissipated = Fin ( I-lJe ) .
(2.6-1)
If the electrical efficiency is not well known, alternative techniques can be used
to determine the dissipated power. For example, in an ion thruster, the power in
the beam is well known, and a simple difference between the total input power
and the beam power represents the dissipated power. The various input powers
can be measured externally to the thruster on the power supplies. For example,
assuming the heaters have been turned off and the hollow cathodes are self-
heating, the power into the ion thruster is given by
Fin = IbV b + IdV d + IckV ck + InkV nk
+I A1 (Vb +V a )+I A2 V a +IDElV b +I DE2 V C ,
(2.6-2)
Thruster Principles
31
where the subscript "b" represents the beam current and voltage, "d" is the
discharge current and voltage, "ck" is the cathode keeper current and voltage,
"nk" is the neutralizer keeper current and voltage, "A 1" represents beam ions
incident on the accel grid, "A2" represents charge exchange ions at the accel
grid potential Va' "IDE I " represents the decel grid (if present) current from
beam ions, and" I DE2 " represents the decel grid current from backstreaming
ions from the beam plume. In reality, the accel and decel grid power are very
small compared to the other power levels in the thruster.
The power that must be dissipated by the thruster is Eq. (2.6.2) minus the beam
power:
l'in = IdV d + IckV ck + InkV nk +I A1 (Vb + Va)
+I A2 V a +IDEIV b +I DE2 V G .
(2.6-3)
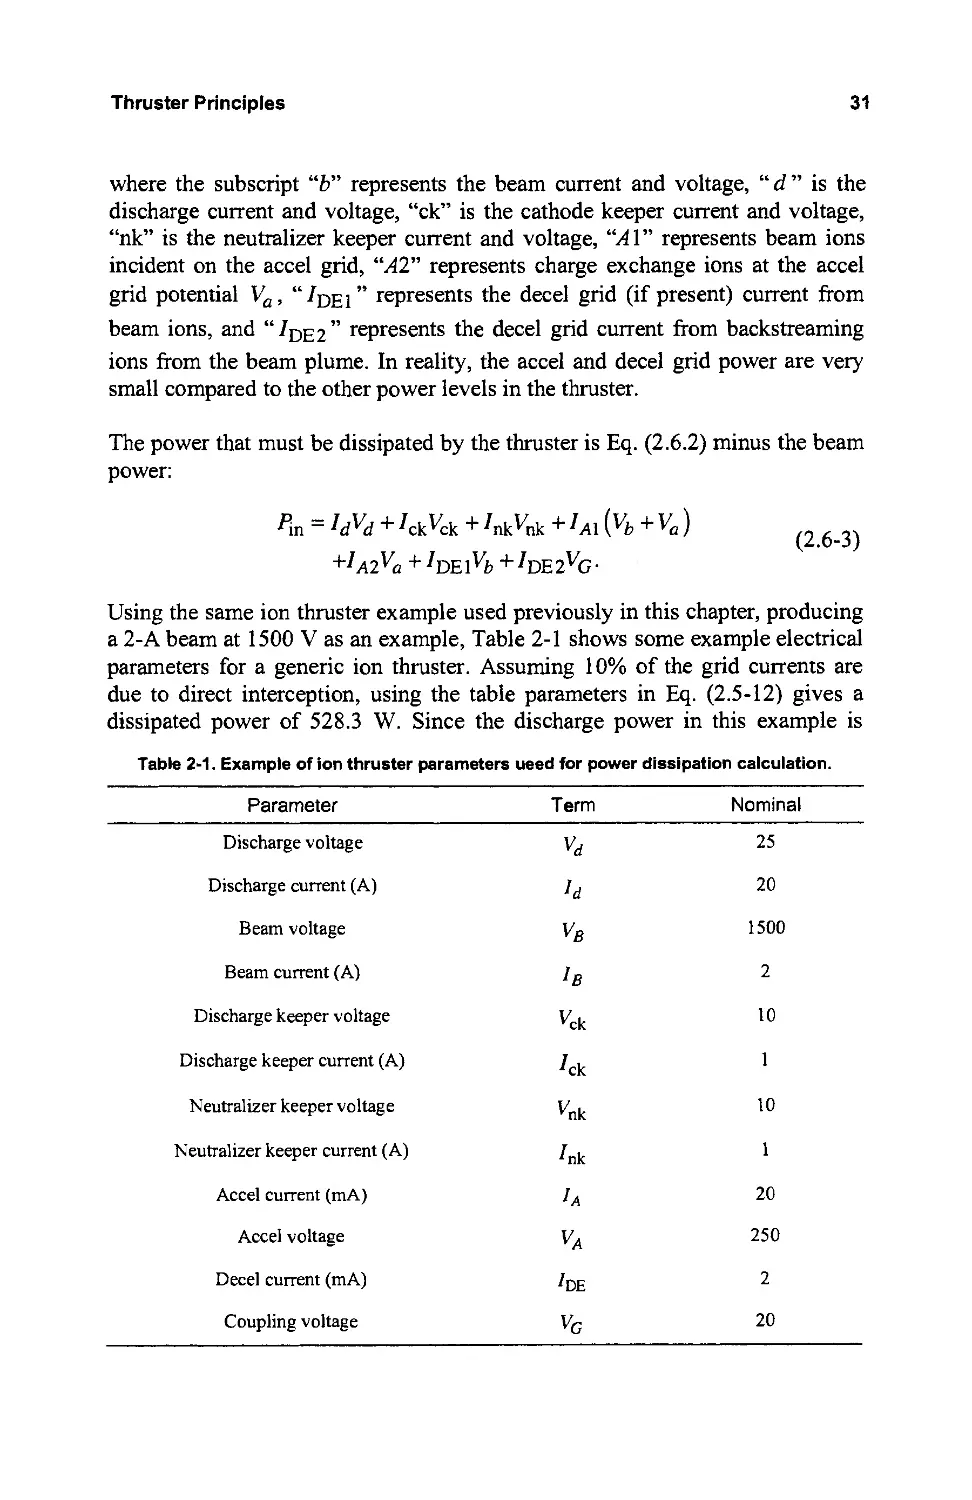
Using the same ion thruster example used previously in this chapter, producing
a 2-A beam at 1500 V as an example, Table 2-1 shows some example electrical
parameters for a generic ion thruster. Assuming 10% of the grid currents are
due to direct interception, using the table parameters in Eq. (2.5-12) gives a
dissipated power of 528.3 W. Since the discharge power in this example is
Table 2.1. Example of ion thruster parameters ueed for power dissipation calculation.
Parameter Term
Discharge voltage V d
Discharge current (A) Id
Beam voltage VB
Beam current (A) I B
Discharge keeper voltage V ck
Discharge keeper current (A) ICk
Neutralizer keeper voltage V nk
Neutralizer keeper current (A) Ink
Accel current (mA) fA
Accel voltage VA
Decel current (mA) IDE
Coupling voltage V G
Nominal
25
20
1500
2
10
10
20
250
2
20
32
Chapter 2
500 W, the other power levels are relatively insignificant. However, the thruster
will have to be of sufficient size to radiate all this power to space at a
reasonable temperature that the materials and construction are designed to
handle.
Unlike ion thrusters, power dissipation in Hall thrusters is not easily obtained
from the external power supply readings. However, two techniques can be used
to estimate the dissipated power. First, the dissipated power can be inferred
from measurements of the thruster efficiency and the beam power (ion current
and energy), which involves calculating the difference between the total beam
power and the input electrical power. Another technique is to assume that the
dissipated power is primarily the loss due to the electron current flowing from
the exterior cathode through the thruster to the high voltage anode. If the
fraction of the discharge current that becomes beam ions can be determined
from the external diagnostics, then the difference between the discharge current
and beam current times the discharge voltage is approximately the dissipated
power. This technique neglects the ionization power and energy carried by the
electrons in the beam, and so produces only a rough estimate. Hall thruster
efficiency and perfonnance useful in detennining the power dissipation are
described in detail in Chapter 7.
2.7 Neutral Densities and Ingestion in Electric Thrusters
In electric propulsion thrusters, the propellant is injected as a neutral gas into a
chamber or region where ionization takes place. Accurately knowing the flow
rate of the propellant gas is important in detennining the perfonnance and
efficiency of the thruster and allows the operator to find the impact of finite
pumping speed of test chambers on the thruster operation. The gas flow into the
thruster, which is sometimes called the throughput, is often quoted in a number
of different units. The most common units are standard cubic centimeters per
minute (sccm) for ion thrusters and mg/s for Hall thrusters. Additional flow rate
units include atoms per second, equivalent amperes, and torr-liter per second
(torr-lis). Conversion factors between these systems of flow units are derived in
Appendix B.
The neutral pressure in the thruster discharge chamber or in the vacuum system
follows standard gas law [1,2]:
PV=NkT,
(2.7-1)
where P is the pressure in pascals, V is the volume, N is the number of particles,
k is Boltzman's constant (1.38 x 10- 23 W/s/K), and T is the temperature in
kelvins. Since there are 133.32 pascals per torr, the number density of the
neutral gas is
Thruster Principles
33
n=
P T [torr] * 133.32 [pascali torr]
1.38 x 10- 23 [1/K]*T[K]
= 9.66 x 10 24 * i [ pa: les 1
(2.7-2)
where P T is the pressure in the vacuum system in torrs and T is the gas
temperature in kelvins. It should be noted that the pressure must be corrected
for the gas type in whatever measurement system is used to obtain the actual
pressure data. As an example, for a pressure of 10- 6 torr and a temperature of
290 K, the density of gas atoms is 3.3 x }OI6 per cubic meter.
The pressure in a vacuum system [3] in which a thruster is being tested is
detennined by the gas flow rate and the pumping speed
p= Q
s'
(2.7-3)
where Q is the total propellant throughput and S is the pumping speed. The
most common units for pumping speed are liters per second, so utilizing a
throughput in torr-lis directly provides the pressure in the vacuum system in
torr. The conversions of different flow units to torr-lis can be obtained from
Appendix B.
The finite pressure in the test vacuum system causes a backflow of neutral gas
into the thruster that may artificially improve the perfonnance. This ingestion
of facility gas by the thruster can be calculated if the pressure in the chamber is
known by evaluating the flux of neutral gas from the chamber into the thruster
ionization region. The equivalent flow into the thruster is then the injected
flow Q plus the equivalent ingested flow. The ingested flow (in particles per
second) is given by
Q _ nc A*
ingested -"4 1Jc'
(2.7-4)
where n is the neutral density in the chamber, c is the gas thennal velocity, A
is the total open area fraction of the thruster to the vacuum system, and 1Jc is a
correction factor related to the conductance into the thruster from the vacuum
system. The neutral gas density is given by Eq. (2.7-2), and the gas thennal
velocity is given by
c = 8kT
nM'
(2.7-5)
34
Chapter 2
where M is the atom mass in kg. The conductance correction factor is
sometimes called the Clausing factor [4] and describes the conductance
reduction due to the finite axial length of the effective entrance aperture(s) to
the thruster. This factor is generally negligible for Hall thrusters but appreciable
for the apertured grids of ion thrusters. Due to the large diameter-to-Iength ratio
of the accelerator grid apertures in ion thrusters, the Clausing factor is usually
calculated by Monte-Carlo gas flow codes. An example of a simple spreadsheet
Monte-Carlo code for calculating the Clausing factor for ion thruster grids is
given in Appendix G.
The ingested flow of gas from the finite pressure in the vacuum system is then
133.2P 8kT A*1Jc
Qingested = - 17 [sccm].
4 k T nM 4.479 x 10
(2.7-6)
This expression for the ingested flow can be rewritten as
8 P * A * 1J c
Qingested = 7.82 x 10 r;;:;-;:;- [seem],
...;T M Q
(2.7-7)
where P is the vacuum chamber pressure in torr, T is the backflowing neutral
gas temperature in K, M Q is the gas mass in AMU, and A is the open area in
m 2 . The total flow rate into the thruster is then
Qtotal = Qinjected + Qingested .
(2.7-8)
References
[1] J. M. Lafferty, Foundations of Vacuum Science and Technology, New
York: John Wiley and Sons, 1998.
[2] A. Ross, Vacuum Technology, Amsterdam, Holland: Elsevier, 1990.
[3] G. Lewin, Fundamentals of Vacuum Science and Technology, New York:
McGraw-Hill, 1965.
[4] P. Clausing, "The Flow of Highly Rarefied Gases Through Tubes of
Arbitrary Length," Journal of Vacuum Science and Technology, vol. 8,
pp. 636-646, 1971.
Thruster Principles
35
Problems
1. Assume that the ion charge density in a one-dimensional (I-D) accelerator
gap between two grids varies as P = Pox / d, and that a voltage V o is
applied to the electrodes bounding the gap.
a. Find the potential and electric field as a function of position in the
gap.
b. Find the force on each of the grids.
c. Find the total electrostatic force between the ions and the grids.
2. A mission under study desires to deliver a 800-kg payload through 8 km/s
of b.v. The spacecraft has 3 kW of electric power available for propulsion.
The mission planners want to understand the trade-offs for different
thrusters and operating conditions, and they want you to make plots of
propellant mass and trip time required versus specific impulse for the
following cases. Assume xenon is the propellant.
a. Ion thruster case: The ion thruster can run at full power from 1 kV to
2 kV. For all throttle conditions, assume the following parameters are
constant: total efficiency of 55%, propellant utilization of 85%, beam
divergence angle of 12 deg, and double-to-single ion current ratio of
10%.
b. Hall thruster case: The Hall thruster can run at full power from 300 V
to 400 V. For all throttle conditions, assume the following parameters
are constant: total efficiency of 45%, propellant utilization of 85%,
beam divergence angle of 25 deg, and double-to-single ion current
ratio of 15%.
3. Derive Eq. (2.4-7) for the mass utilization efficiency correction due to
double ions.
4. Derive the thrust correction factor and the resulting thrust equation
accounting for the presence of triply ionized atoms. Assuming 10%
doubles, what is the error in the calculated thrust if 5% actually present
triples have been neglected?
5. Mission planners have two candidate ion and Hall thrusters to place on a
spacecraft and want to understand how they compare for thrust-to-power
ratio and performance. The xenon ion thruster has a total power of 5 kW, a
1200-V, 3.75-A beam with 10% double ions, a total efficiency of 65%, and
a mass utilization efficiency of 86%. The Hall thruster has a total power of
5 kW, a 300-V discharge voltage and a 12.5-A beam with 10% double ions,
a total efficiency of 50%, and an input xenon gas flow of 19 mg/s.
36
Chapter 2
a. What is the thrust-to-power ratio (usually expressed in mN/kW) for
each thruster?
b. What is the Isp for each engine?
c. For a 1000-kg spacecraft, what is the fuel mass required to achieve a
5-k.m/s delta-v?
d. What is the trip time to expend all of the fuel for each thruster type if
the thrusters are on 90% of the time?
6. The thrust correction factor for multiply ionized species is based on the
current of charges in the beam (see Eq. (2.3-12) for singles and doubles).
a. Derive an expression for the number of atoms of each ionized species
in the beam for a given value of T""/1" and rhlT.
b. If TTIT = 10% and r"/T = 5%, what are the actual percentages of the
number of atoms of each species in the beam compared to the total
beam current?
7. An ion thruster is being tested in a vacuum chamber with a measured xenon
pressure of 1 x I 0- 5 torr at room temperature (300°C). The thruster grids
have a 25-cm grid diameter and a Clausing factor of 0.5.
a. If the thruster is producing a 3-A beam with 15% double ions with a
total of 50 sccm of xenon gas flow into the thruster, what is the mass
utilization efficiency neglecting gas ingestion?
b. What is the mass utilization efficiency including the effects of
ingestion?
Fundamentals oIElectric Propulsion: Ion and Hall T1l1'llsters
by Dan M. Goebel and Ira Katz
Copyright iQ 2008 John Wiley & Sons, Inc.
Chapter 3
Basic Plasma Physics
3.1 Introduction
Electric propulsion achieves high specific impulse by the acceleration of
charged particles to high velocity. The charged particles are produced by
ionization of a propellant gas, which creates both ions and electrons and forms
what is called a plasma. Plasma is then a collection of the various charged
particles that are free to move in response to fields they generate or fields that
are applied to the collection and, on the average, is almost electrically neutral.
This means that the ion and electron densities are nearly equal, ni "" ne' a
condition commonly termed "quasi-neutrality." This condition exists
throughout the volume of the ionized gas except close to the boundaries, and
the assumption of quasi-neutrality is valid whenever the spatial scale length of
the plasma is much larger than the characteristic length over which charges or
boundaries are electrostatically shielded, called the Debye length. The ions and
electrons have distributions in energy usually characterized by a temperature T i
for ions and Te for electrons, which are not necessarily or usually the same. In
addition, different ion and electron species can exist in the plasma with
different temperatures or different distributions in energy.
Plasmas in electric propulsion devices, even in individual parts of a thruster,
can span orders of magnitude in plasma density, temperature, and ionization
fraction. Therefore, models used to describe the plasma behavior and
characteristics in the thrusters must be formed with assumptions that are valid
in the regime being studied. Many of the plasma conditions and responses in
thrusters can be modeled by fluid equations, and kinetic effects are only
important in specific instances.
There are several textbooks that provide very comprehensive introductions to
plasma physics [1-3] and the generation of ion beams [4]. This chapter is
37
38
Chapter 3
intended to provide the basic plasma physics necessary to understand the
operation of ion and Hall thrusters. The units used throughout the book are
based on the International System (SI). However, by convention we will
occasionally revert to other metric units (such as Alcm 2 , mg/s, etc.) commonly
used in the literature describing these devices.
3.2 Maxwell's Equations
The electric and magnetic fields that exist in electric propulsion plasmas obey
Maxwell's equations fonnulated in a vacuum that contains charges and
currents. Maxwell's equations for these conditions are
P
V.E=-
Eo
(3.2-1)
aB
VxE=--
at
(3.2-2)
V.B=O
(3.2-3)
VxB= 110 ( J +Eo }
(3.2-4 )
where p is the charge density in the plasma, J is the current density in the
plasma, and Eo and 110 are the permittivity and penneability of free space,
respectively. Note that p and J comprise all the charges and currents for all the
particle species that are present in the plasma, including multiply charged ions.
The charge density is then
p= Lqsns = e(Zni -n e ),
s
(3.2-5)
where qs is the charge state of species s, Z is the charge state, ni is the ion
number density, and ne is the electron number density. Likewise, the current
density is
J = Lqsnsv s = e(Znivi -neve),
s
(3.2-6)
where V s is the velocity of the charge species, vi is the ion velocity, and V e is
the electron velocity. For static magnetic fields (aB/m = 0), the electric field
can be expressed as the gradient of the electric potential,
Basic Plasma Physics
39
E=-V' ,
(3.2-7)
where the negative sign comes from the convention that the electric field
always points in the direction of ion motion.
3.3 Single Particle Motions
The equation of motion for a charged particle with a velocity v in a magnetic
field B is given by the Lorentz force equation:
dv
F=m-=q(E+vxB).
dt
(3.3-1)
Particle motion in a magnetic field in the Z direction for the case of negligible
electric field is found by evaluating Eq. (3.3-1):
av
m-L=qBv y
at
av
m----L = - q Bv
at x
m av z =0.
at
(3.3-2)
Taking the time derivative of Eq. (3.3-2) and solving for the velocity in each
direction gives
a 2 v x = qB av y = _ ( qB ) 2 v
at 2 m at m x
a 2 v y = _ qB av x = _ ( qB ) 2 v .
at 2 m at m y
(3.3-3)
These equations describe a simple harmonic oscillator at the cyclotron
frequency:
IqlB
we = - .
m
(3.3-4)
For electrons, this is called the electron cyclotron frequency.
The size of the particle orbit for finite particle energies can be found from the
solution to the particle motion equations in the axial magnetic field. In this
case, the solution to Eq. (3.3-3) is
40
Chapter 3
v = v e iWct
x,y .1
(3.3-5)
The equation of motion in the y-direction in Eq. (3.3-2) can be rewritten as
_ m av x _ 1 av x
v ----
Y - qB at - me at
(3.3-6)
Utilizing Eq. (3.3-5), Eq. (3.3-6) becomes
1 av x . iw t ay
v, =--=lv.le c =-
) me at at
(3.3-7)
Integrating this equation gives
V I . t
y-Yo =-=-e'w c
me
(3.3-8)
Taking the real part ofEq. (3.3-8) gives
v.l
y- Yo = -cas met = rL cos met,
me
(3.3-9)
where rL = v.l / me is defined as the Larmor radius. A similar analysis of the
displacement in the .x direction gives the same Larmor radius 90 degrees out of
phase with the )' -direction displacement, which then with Eq. (3.3-9) describes
the particle motion as a circular orbit around the field line at Xo and Yo with a
radius given by rL'
The Larmor radius arises from very simple physics. Consider a charged particle
of mass, m, in a uniform magnetic field with a velocity in one direction, as
illustrated in Fig. 3-1. The charge will feel a Lorentz force
F=qv.lxB.
(3.3-10)
Since the charged particle will move under this force in circular orbits in the
v.l x B direction, it feels a corresponding centripetal force such that
Basic Plasma Physics
41
mv 2
Fe =qv1. xB= ,
,
v...
(3.3-11)
where, is the radius of the cycloidal motion
in the magnetic field. Solving for the radius
of the circle gives q
mv1.
, = 'L = qB '
(3.3-12)
which is the Lannor radius.
Fig. 3-1. Positively charged particle
moving in a uniform vertical
magnetic field.
The Lannor radius can be written in a fonn
simple to remember:
'L = v1. = 2mV1. ,
W c B e
(3.3-13)
using 1/2 mv i = e V 1. for the singly charged particle energy in the direction
perpendicular to the magnetic field. The direction of particle gyration is always
such that the induced magnetic field is opposite in direction to the applied field,
which tends to reduce the applied field, an effect called diamagnetism. Any
particle motion along the magnetic field is not affected by the field, but causes
the particle motion to fonn a helix along the magnetic field direction with a
radius given by the Lannor radius and a pitch given by the ratio of the
perpendicular to parallel velocities.
Next consider the situation in Fig. 3-1, but with the addition of a finite electric
field perpendicular to B. In this case, E is in some direction in the plane of the
page. The equation of motion for the charged particle is given by Eq. (3.3-1).
Considering the drift to be steady-state, the time derivative is equal to zero, and
Eq. (3.3-1) becomes
E=-vxB.
(3.3-14)
Taking the cross product of both sides with B gives
ExB =(-vxB)xB= vB 2 -B(B'v).
(3.3-15)
The dot product is in the direction perpendicular to B, so the last term in
Eq. (3.3-15) is equal to zero. Solving for the transverse velocity of the particle
gIves
42
Chapter 3
ExB
V= =VE'
B
(3.3-16)
which is the "E cross BOO drift velocity. In this case, the drift is in the direction
perpendicular to both E and B, and arises from the cycloidal electron motion in
the magnetic field being accelerated in the direction of -E and decelerated in
the direction of E. This elongates the orbit on one-half cycle and shrinks the
orbit on the opposite half cycle, which causes the net motion of the particle in
the Ex B direction. The units of the E x B velocity are
_ E [VIm] (mJ )
vE - s .
B [tesla]
(3.3-17)
Finally, consider the situation of a particle gyrating in a magnetic field that is
changing in magnitude along the magnetic field direction z. This is commonly
found in electric propulsion thrusters relatively close to permanent magnets or
electromagnetic poles-pieces that produce fields used to confine the electrons.
Since the divergence of B is zero, Eq. (3.2-3), the magnetic field in cylindrical
coordinates is described by
1 a aBz
-;: ar (rB r )+ dz =0.
(3.3-18)
Assuming that the axial component of the field does not vary significantly with
r and integrating yields the radial component of the magnetic field with respect
to r,
B ""_ aBz
r 2 dz
(3.3-19)
The Lorentz force on a charged particle has a component along Z given by
Fz "" -qv tpBn
(3.3-20)
where the azimuthal particle velocity averaged over a Larmor-radius (r = rL )
gyration is v tp = -v 1.. The average force on the particle is then
F.. "" _..!. mvl aBz .
<- 2 B dz
(3.3-21)
The magnetic moment of the gyrating particle is defined as
Basic Plasma Physics
43
1 mv 2
J.1. = - ---4:.. .
2 B
(3.3-22)
As the particle moves along the magnetic field lines into a stronger magnitude
field, the parallel energy of the particle is converted into rotational energy and
its Lannor radius increases. However, its magnetic moment remains invariant
because the magnetic field does no work and the total kinetic energy of the
particle is conserved. For a sufficiently large increase in the field, a situation
can arise where the parallel velocity of the particle goes to zero and the Lorentz
force reflects the particle from a "magnetic mirror." By conservation of energy,
particles will be reflected from the magnetic mirror if their parallel velocity is
less than
VII<V.l Rm-1 ,
(3.3-23)
where vII is the parallel velocity and Rm is the mlITor ratio given by
Bmax / B min . This effect is used to provide confinement of energetic electrons
in ion-thruster discharge chambers.
There are a number of other particle drifts and motions possible that depend on
gradients in the magnetic and electric fields, and also on time-dependent or
oscillating electric or magnetic fields. These are described in detail in plasma
physics texts such as Chen [1], and while they certainly might occur in the
electric propulsion devices considered here, they are typically not of critical
importance to the thruster perfonnance or behavior.
3.4 Particle Energies and Velocities
In ion and Hall thrusters, the charge particles may undergo a large number of
collisions with each other, and in some cases with the other species (ions,
electrons, and/or neutrals) in the plasma. It is therefore impractical to analyze
the motion of each particle to obtain a macroscopic picture of the plasma
processes that is useful to for assessing the performance and life of these
devices. Fortunately, in most cases it is not necessary to track individual
particles to understand the plasma dynamics. The effect of collisions is to
develop a distribution of the velocities for each species. On the average, and in
the absence of other forces, each particle will then move with a speed that is
solely a function of the macroscopic temperature and mass of that species. The
charged particles in the thruster, therefore, can usually be described by difterent
velocity distribution functions, and the random motions can be calculated by
taking the moments of those distributions.
44
Chapter 3
Most of the charged particles in electric thrusters have a Maxwellian velocity
distribution, which is the most probable distribution of velocities for a group of
particles in thermal equilibrium. In one dimension, the Maxwellian velocity
distribution function is
f(vJ=( 2:T r ex p ( - ;;; }
(3.4-1 )
where m is the mass of the particle, k is Boltzmann's constant, and the width of
the distribution is characterized by the temperature T. The average kinetic
energy of a particle in the Maxwellian distribution in one dimension is
f OO 1 2
-mv f(v) dv
-002
Eave =
f oo f(v) dv
(3.4-2)
By inserting in Eq. (3.4-1) and integrating by parts, the average energy per
particle in each dimension is
1
Eave = -kT .
2
(3.4-3)
If the distribution function is generalized into three dimensions, Eq. (3.2-8)
becomes
f(U'V'W)= ( ) 3/2 e xp [ _..!!!:.... ( u2+v2+w2 )] ,
2nkT 2kT
(3.4-4)
where u, v, and w represent the velocity components in the three coordinate
axes. The average energy in three dimensions is found by inserting Eq. (3.4-2)
in Eq. (3.4-4) and performing the triple integration to give
3
Eave = -kT .
2
(3.4-5)
The density of the particles is found from
n = Hr: nf(v) dv
( ) 3/2 ( m(u2+v2+w2) ]
= fff +oo n exp - dudvdw.
_00 2nkT 2kT
(3.4-6)
Basic Plasma Physics
45
The average speed of a particle in the Maxwellian distribution is
v = Joo V ( ) 3/2 exp [ - v: ] 4nv2dV,
o 2nkT vth
(3.4-7)
where v in Eq. (3.4-7) denotes the particle speed and vth is defined as
(2kT / m )1/2 . Integrating Eq. (3.4-7), the average speed per particle is
V=( )l!2
(3.4-B)
The flux of particles in one dimension (say in the Z direction) for a Maxwellian
distribution of particle velocities is given by n < V z >. In this case, the average
over the particle velocities is taken in the positive V z direction because the flux
is considered in only one direction. The particle flux (in one direction) is then
r z = J nv z J(v )d3v,
(3.4-9)
which can be evaluated by integrating the velocities in spherical coordinates
with the velocity volume element given by
d 3 v = v 2 dvdQ= v 2 dvsin6d6dlP,
(3.4-10)
where the dQ represents the element of the solid angle. If the incident velocity
has a cosine distribution (v z = vcos6), the one-sided flux is
r z = n ( ) 3/2 r1r dlP J1r/2 sin6 d6 Joo vcos6 e xp [ - } 2dV' (3.4-11)
2nkT 0 0 0 vth
which gives
r. = nv= n ( BkT ) 1/2
4 4 nm
(3.4-12)
Since the plasma electrons are very mobile and tend to make a large number of
coulomb collisions with each other, they can usually be characterized by a
Maxwellian temperature Te and have average energies and speeds well
described by the equations derived in this section. The random electron flux
inside the plasma is also well described by Eq. (3.4-12) if the electron
46
Chapter 3
temperature and density are known. The electrons tend to be relatively hot
(compared to the ions and atoms) in ion and Hall thrusters because they
typically are injected into the plasma or heated by external mechanisms to
provide sufficient energy to produce ionization. In the presence of electric and
magnetic fields in the plasma and at the boundaries, the electron motion will no
longer be purely random, and the flux described by Eq. (3.4-12) must be
modified as described in the remainder of this chapter.
The ions in thrusters, on the other hand, are usually relatively cold in
temperature (they may have high directed velocities after being accelerated, but
they usually have low random velocities and temperatures). This occurs
because the ions are not well confined in the plasma generators because they
must be extracted to fonn the thrust beam, and so they leave the plasma after
perhaps only a single pass. The ions are also not heated efficiently by the
various mechanisms used to ionize the gas. Therefore, the plasmas in ion and
Hall thrusters are usually characterized as having cold ions and Maxwellian
electrons with a high electron-to-ion temperature ratio (Te / T i "" 10). As a
result, the velocity of the ions in the plasma and the fluxes to the boundaries
tend to be detennined by the electric fields generated inside the plasma to
conserve charge, and to be different from the expressions derived here for the
electron velocity and fluxes. This effect will be described in more detail in
Section 3.6.
3.5 Plasma as a Fluid
The behavior of most of the plasma effects in ion and Hall thrusters can be
described by simplified models in which the plasma is treated as a fluid of
neutral particles and electrical charges with Maxwellian distribution functions,
and the interactions and motion of only the fluid elements must be considered.
Kinetic effects that consider the actual velocity distribution of each species are
important in some instances, but will not be addressed here.
3.5.1 Momentum Conservation
In constructing a fluid approach to plasmas, there are three dominant forces on
the charged particles in the plasma that transfer momentum that are considered
here. First, charged particles react to electric and magnetic field by means of the
Lorentz force, which was given by Eq. (3.3-1):
dv
F L =m-=q(E+vxB).
dt
(3.5-1 )
Next, there is a pressure gradient force,
Basic Plasma Physics
47
F =_ V.p =_ V(nkT)
P n n'
(3.5-2)
where the pressure is given by P = nkT and should be written more rigorously
as a stress tensor since it can, in general, be anisotropic. For plasmas with
temperatures that are generally spatially constant, the force due to the pressure
gradient is usually written simply as
Fp =-kT Vn .
n
(3.5-3)
Finally, collisions transfer momentum between the different charged particles,
and also between the charged particles and the neutral gas. The force due to
collisions is
Fe = -m LV ab ( V a - Vb) ,
a,b
(3.5-4)
where vab is the collision frequency between species a and b.
Using these three force terms, the fluid momentum equation for each species is
dv [ dV ]
mn-=mn -+(v.V)v =qn(E+vxB)-V.p-mnv(v-v o )'
dt dt
(3.5-5)
where the convective derivative has been written explicitly and the collision
term must be summed over all collisions.
Utilizing conservation of momentum, it is possible to evaluate how the electron
fluid behaves in the plasma. For example, in one dimension and in the absence
of magnetic fields and collisions with other species, the fluid equation of
motion for electrons can be written as
[ d ] dp
mne -+( v, V)v z = qneEz --,
dt dz
(3.5-6)
where V z is the electron velocity in the z-direction and p represents the electron
pressure term. Neglecting the convective derivative, assuming that the velocity
is spatially uniform, and using Eq. (3.5-3) gives
m dV z = -eE. _ kTe dn e .
dt ... ne dZ
(3.5- 7)
48
Chapter 3
Assuming that the electrons have essentially no inertia (their mass is small and
so they react infinitely fast to changes in potential), the left-hand side of
Eq. (3.5-7) goes to zero, and the net current in the system is also zero.
Considering only electrons at a temperature Te, and using Eq. (3.2-7) for the
electric field, gives
qEz =e Jl/J = kTe an e .
az ne az
(3.5-8)
Integrating this equation and solving for the electron density produces the
Boltzmann relationship for electrons:
- (0) (eqJI kTe )
ne - ne e ,
(3.5-9)
where l/J is the potential relative to the potential at the location of ne(O).
Equation (3.5-9) is also sometimes known as the barometric law. This
relationship simply states that the electrons will respond to electrostatic fields
(potential changes) by varying their density to preserve the pressure in the
system. This relationship is generally valid for motion along a magnetic field
and tends to hold for motion across magnetic fields if the field is weak and the
electron collisions are frequent.
3.5.2 Particle Conservation
Conservation of particles and/or charges in the plasma is described by the
continuity equation:
an
-+ V 'nv = n
at s'
(3.5-10)
where ns represents the time-dependent source or sink tenn for the species
being considered. Continuity equations are sometimes called mass-conservation
equations because they account for the sources and sinks of particles into and
out of the plasma.
Utilizing continuity equations coupled with momentum conservation and with
Maxwell's equations, it is possible to calculate the response rate and wave-like
behavior of plasmas. For example, the rate at which a plasma responds to
changes in potential is related to the plasma frequency of the electrons. Assume
that there is no magnetic field in the plasma or that the electron motion is along
the magnetic field in the z-direction. To simplify this derivation, also assume
that the ions are fixed lU1ifonnly in space on the time scales of interest here due
to their large mass, and that there is no thennal motion of the particles (T = 0).
Basic Plasma Physics
49
Since the ions are fixed in this case, only the electron equation of motion is of
interest:
ml1 e [ z +(V. V)V z ]= -eneEz,
(3.5-11)
and the electron equation of continuity is
an e + V . ( ne v) = 0 .
at
(3.5-12)
The relationship between the electric field and the charge densities is given by
Eq. (3.2-1), which for singly ionized particles can be written using Eq. (3.2-5)
as
p e
V .E=-=-(ni -ne).
Eo Eo
(3.5-13)
The wave-like behavior ofthis system is analyzed by linearization using
E = Eo + E 1 (3.5-14)
v=v o +vl (3.5-15)
n = no +nl, (3.5-16)
where Eo, v 0 , and no are the equilibrium values of the electric field, electron
velocity, and electron density, and E 1 , Bl' and jl are the perturbed values of
these quantities. Since quasi-neutral plasma has been assumed, Eo = 0 , and the
assumption of a uniform plasma with no temperature means that lIDo = v 0 = 0 .
Likewise, the time derivatives of these equilibrium quantities are zero.
Linearizing Eq. (3.5-13) gives
e
V . E 1 = - - nl .
Eo
(3.5-17)
Using Eqs. (3.5-14), (3.5-15), and (3.5-16) in Eq. (3.5-11) results in
dVl e
-=--E 1 Z,
dt m
(3.5-18)
50
Chapter 3
where the linearized convective derivative has been neglected. Linearizing the
continuity Eq. (3.5-12) gives
dnl t7 A
-=-n v 'V I Z
dt 0 ,
(3.5-19)
where the quadratic terms, such as nlvl, etc., have been neglected as small. In
the linear regime, the oscillating quantities will behave sinusoidally:
EI = £1 ei(kz-Wt) Z
(3.5-20)
VI = vI ei(kz-Wt) Z
(3.5-21 )
nl = nl ei(kz-Wt) .
(3.5-22)
This means that the time derivates in momentum and continuity equations can
be replaced by -iOJt, and the gradient in Eq. (3.5-17) can be replaced by ik in
the z direction. Combining Eqs. (3.5-17), (3.5-18), and (3.5-19), using the time
and spatial derivatives of the oscillating quantities, and solving for the
frequency of the oscillation gives
[ 2 ) 112
nee
OJ p = - ,
Eom
(3.5-23)
where OJ p is the electron plasma frequency. A useful numerical formula for the
electron plasma frequency is
OJ p r::-
ip =-=9-y n e,
21C
(3.5-24)
where the plasma density is in m- 3 . This frequency is one of the fundamental
parameters of a plasma, and the inverse of this value is approximately the
minimum time required for the plasma to react to changes in its boundaries or
in the applied potentials. For example, if the plasma density is 10 18 m- 3 , the
electron plasma frequency is 9 GHz, and the electron plasma will respond to
perturbations in less than a nanosecond.
In a similar manner, if the ion temperature is assumed to be negligible and the
gross response of the plasma is dominated by ion motions, the ion plasma
frequency can be found to be
Basic Plasma Physics
51
( 2 J lI2
Q = nee
P EM
o
(3.5-25)
This equation provides the approximate time scale in which ions move in the
plasma. For our previous example for a 10 18 m- 3 plasma density composed of
xenon ions, the ion plasma frequency is about 18 MHz, and the ions will
respond to first order in a fraction of a microsecond. However, the ions have
inertia and respond at the ion acoustic velocity given by
YikTi + kTe
va = ,
M
(3.5-26)
where Yi is the ratio of the ion specific heats and is equal to one for isothennal
ions. In the normal case for ion and Hall thrusters, where Te» T i , the ion
acoustic velocity is simply
Va = .
(3.5-27)
It should be noted that if finite-temperature electrons and ions had been
included in the derivations above, the electron-plasma and ion-plasma
oscillations would have produced waves that propagate with finite wavelengths
in the plasma. Electron-plasma waves and ion-plasma waves (sometimes called
ion acoustic waves) occur in most electric thruster plasmas with varying
amplitudes and effects on the plasma behavior. The dispersion relationships for
these waves, which describe the relationship between the frequency and the
wavelength of the wave, are derived in detail in plasma textbooks such as Chen
[1] and will not be re-derived here.
3.5.3 Energy Conservation
The general fonn of the energy equation for charged species "s," moving with
velocity v s in the presence of species "n" is given by
:t ( nsms v;2 + ps)+ V -( nsms v;2 + ps}s + V .a s
( R \
=qsns l E+-L ) .v s +Qs - '¥ s'
qsns
(3.5-28)
For simplicity, Eq. (3.5-28) neglects viscous heating of the species. The
divergence terms on the left-hand side represent the total energy flux, which
52
Chapter 3
includes the work done by the pressure, the macroscopic energy flux, and the
transport of heat by conduction as = Ksf'j.Ts . The thermal conductivity of the
species is denoted by 1I:s' which is given in SI units [5] by
2
_ 3 2 're ne TeV
1I:s - .
m
(3.5-29)
where TeV in this equation is in electron volts (eV). The right-hand side of
Eq. (3.5-28) accounts for the work done by other forces as well for the
generation/loss of heat as a result of collisions with other particles. The term
Rs represents the mean change in the momentum of particles "s" as a result of
collisions with all other particles:
Rs == L,Rsn = - L,nsmsv sn (v s -v n ).
n n
(3.5-30)
The heat-exchange terms are Qs, which is the heat generated/lost in the
particles of species "s" as a result of elastic collisions with all other species, and
'P s' the energy loss by species "s" as a result of inelastic collision processes
such as ionization and excitation.
It is often useful to eliminate the kinetic energy from Eq. (3.5-28) to obtain a
more applicable form of the energy conservation law. The left-hand side of
Eq. (3.5-28) is expanded as
2 2 :\ ( )
Dv s msv s Dns V s 3 rJPs 5
n m v .-+--+n m -V'.v +--+\7. - p v +9
s s s Dt 2 Dt s s 2 s 2 at 2 s s s
= qsnsE.v s +Rs'v s +Qs - '¥ S'
(3.5-31)
The continuity equation for the charged species is in the form
Dns = an s + v .V'n =n-nV'.v.
Dt at s s s s
(3.5-32)
Combining these two equations with the momentum equation dotted with v s
gIves
DVf; . 2
n,msv s '--"-=nsqsv s .E-v s .\7ps+v s . Rs-nmsv s .
. Dt
(3.5-33 )
The energy equation can now be written as
Basic Plasma Physics
53
3 aps t7 ( 5 9 ) t7 msv/
--+V. - p V + -v . v p = Q -'¥ -n-.
2 at 2 s s s s s s s 2
(3.5-34)
The heat-exchange terms for each species Qs consists of "frictional" (denoted
by superscriptR) and "thermal" (denoted by superscript T) contributions:
R T
Qs =Qs +Qs '
Q: =- L,Rsn 'V s .
(3.5-35)
n
Q,; =_ L,ns 2ms V sn ( kTs _ kTn ) .
n ma 2 e e
In a partially ionized gas consisting of electrons, singly charged ions, and
neutrals of the same species, the frictional and thermal terms for the electrons
take the form
Q R (R R ) ( Rei+Ren ) J
e = - ei + en . v e = . e
en e
Q; = - 3n e !!!. [ Vei (Te - 1";)+ v en (Te - Tn ) ] ,
M e e
(3.5-36)
where as usual M denotes the mass of the heavy species, and the temperature of
the ions and neutrals is denoted by T i and Tn' respectively. Using the steady-
state electron momentum equation, in the absence of electron inertia, it is
possible to write
Q: = ( Rei + Ren J .Je = ( E+ '\IPe J .Je'
en e en e
(3.5-37)
Thus Eq. (3.5-34) for the electrons becomes
ape + V" ( p v +9 ) =Q -J . V'Pe -neU
2 at 2 e e e e e en I
== E. J e -neVi'
(3.5-38)
where the inelastic term is expressed as 'P e == enV i to represent the electron
energy loss duc to ionization, with Vi (in volts) representing the first ionization
potential of the atom. In Eq. (3.5-38), the mev /2 correction term has been
neglected because usually in ion and Hall thrusters eV i » mev /2. If multiple
54
Chapter 3
ionization and/or excitation losses are significant, the inelastic tenns in
Eq. (3.5-38) must be augmented accordingly.
In ion and Hall thrusters, it is common to assume a single temperature or
distribution of temperatures for the heavy species without directly solving the
energy equation(s). In some cases, however, such as in the plume of a hollow
cathode for example, the ratio of Te / T i is important for detennining the extent
of Landau damping on possible electrostatic instabilities. The heavy species
temperature is also important for detennining the total pressure inside the
cathode. Thus, separate energy equations must be solved directly. Assuming
that the heavy species are slow moving and the inelastic loss tenns are
negligible, Eq. (3.5-34) for ions takes the fonn
3 dPin t7 ( 5 )
'2 a;- + v. '2 Pin v in + 8 in - v in . V Pin = Qin '
(3.5-39)
where the subscript "in" represents ion-neutral collisions.
Finally, the total heat generated in partially ionized plasmas as a result of the
(elastic) friction between the various species is given by
R R R R
L.,Qs =Qe +Qi +QI1
s
(3.5-40)
= -(Rei + Rel1)'v e -(R ie + R in )'Vi -(R l1e + Rl1i ),v l1 '
Since Rsa = -Ras , it is possible to write this as
Q R=_R .. ( v -v. ) -R . ( v -v ) -R . ( v.-v ) .
L.J s el e 1 en e n In 1 n
s
(3.5-41)
The energy conservation equation(s) can be used with the momentum and
continuity equations to provide a closed set of equations for analysis of plasma
dynamics within the fluid approximations.
3.6 Diffusion in Partially Ionized Gases
Diffusion is often very important in the particle transport in ion and Hall
thruster plasmas. The presence of pressure gradients and collisions between
different species of charged particles and between the charged particles and the
neutrals produces diffusion of the plasma from high density regions to low
density regions, both along and across magnetic field lines.
Basic Plasma Physics
55
To evaluate diffusion-driven particle motion in ion and Hall thruster plasmas,
the equation of motion for any species can be written as
dv )
mn-=qn(E+vxB)-V.p-mnv (v-v o '
dt
(3.6-1)
where the terms in this equation have been previously defined and v is the
collision frequency between two species in the plasma. In order to apply and
solve this equation, it is first necessary to understand the collisional processes
between the different species in the plasma that determine the applicable
collision frequency.
3.6.1 Collisions
Charged particles in a plasma interact with each other primarily by coulomb
collisions and also can collide with neutral atoms present in the plasma. These
collisions are very important when describing diffusion, mobility, and
resistivity in the plasma.
When a charged particle collides with a neutral atom, it can undergo an elastic
or an inelastic collision. The probability that such a collision will occur can be
expressed in terms of an effective cross-sectional area. Consider a thin slice of
neutral gas with an area A and a thickness dx containing essentially stationary
neutral gas atoms with a density na' Assume that the atoms are simple spheres
of cross-sectional area Cf. The number of atoms in the slice is given by naAdx.
The fraction of the slice area that is occupied by the spheres is
na ACfdx dx
- naCf .
A
(3.6-2)
If the incident flux of particles is f" 0' then the flux that emerges without
making a collision after passing through the slice is
f"(x) = f" 0 (1- naCfdx).
(3.6-3)
The change in the flux as the particles pass through the slice is
df"
- = -f"naCf .
dx
(3.6-4)
The solution to Eq. (3.6-4) is
56
Chapter 3
f= foexp(-naO' x)= foex p ( - },
(3.6-5)
where A. is defined as the mean free path for collisions and describes the
distance in which the particle flux would decrease to lie ofits initial value. The
mean free path is given by
A.=
,
naO'
(3.6-6)
which represents the mean distance that a relatively fast-moving particle, such
as an electron or ion, will travel in a stationary density of neutral particles.
The mean time between collisions for this case is given by the mean free path
divided by the charged particle velocity:
I
'l'=-.
naO'v
(3.6-7)
Averaging over all of the Maxwellian velocities of the charged particles, the
collision frequency is then
I _
v = - = naO'v .
'l'
(3.6-8)
In the event that a relatively slowly moving particle, such as a neutral atom, is
incident on a density of fast-moving electrons, the mean free path for the
neutral particle to experience a collision is given by
A= V n
ne ( O'v e) ,
(3.6-9)
where V n is the neutral particle velocity and the reaction rate coefficient in the
denominator is averaged over all the relevant collision cross sections.
Equation (3.6-9) can be used to describe the distance that a neutral gas atom
travels in a plasma before ionization occurs, which is sometimes called the
penetration distance.
Other collisions are also very important in ion and Hall thrusters. The presence
of inelastic collisions between electrons and neutrals can result in either
ionization or excitation of the neutral particle. The ion production rate per unit
volume is given by
Basic Plasma Physics
57
dn.
--L = nane((JiVe) ,
dt
(3.6-10)
where (Ji is the ionization cross section, v e is the electron velocity, and the
tenn in the brackets is the reaction rate coefficient, which is the ionization cross
section averaged over the electron velocity distribution function.
Likewise, the production rate per unit volume of excited neutrals, n * , is
dn*
-= Lnane((J*v e ).,
dt. J
J
(3.6-11)
where (J.. is the excitation cross section and the reaction rate coefficient is
averaged over the electron distribution function and summed over all possible
excited states j. A complete listing of the ionization and excitation cross
sections for xenon is given in Appendix D, and the reaction rate coefficients for
ionization and excitation averaged over a Maxwellian electron distribution are
given in Appendix E.
Charge exchange [2,6] in ion and Hall thrusters usually describes the resonant
charge transfer between like atoms and ions in which essentially no kinetic
energy is exchanged during the collision. Because this is a resonant process, it
can occur at large distances, and the charge exchange (CEX) cross section is
very large [2]. For example, the charge exchange cross section for xenon is
about 10- 18 m 2 [7], which is significantly larger than the ionization and
excitation cross sections for this atom. Since the ions in the thruster are often
energetic due to acceleration by the electric fields in the plasma or acceleration
in ion thruster grid structures, charge exchange results in the production of
energetic neutrals and relatively cold ions. Charge exchange collisions are often
a dominant factor in the heating of cathode structures, the mobility and
diffusion of ions in the thruster plasma, and the erosion of grid structures and
surfaces.
While the details of classical collision physics are interesting, they are well
described in several other textbooks [1,2,5] and are not critically important to
understanding ion and Hall thrusters. However, the various collision
frequencies and cross sections are of interest for use in modeling the thruster
discharge and perfonnance.
The frequency of collisions between electrons and neutrals is sometimes written
[8] as
58
Chapter 3
8kTe
v en = CYen(Te)n a -,
1!m
(3.6-12)
where the effective electron-neutral scattering cross section CY(T e ) for xenon
can be found from a numerical fit to the electron-neutral scattering cross
section averaged over a Maxwellian electron distribution [8]:
r -O.1 ]
G,,(T,)=6.6xlO- 19 l+ (T;;' )1.6 [m 2 ],
(3.6-13)
where TeV is in electron volts. The electron-ion collision frequency for
coulomb collisions [5] is given in 81 units by
-12 ne In A
vei =2.9xlO ,
TeV
(3.6-14)
where lnA is the coulomb logarithm given in a familiar form [5] by
1 [ lO-6n )
In A = 23 - -In 3 e .
2 TeV
(3.6-15)
The electron-electron collision frequency [5] is given by
-12 ne lnA
v ee =5 x lO ,
TeV
(3.6-16)
While the values of the electron-ion and the electron-electron collision
frequencies in Eqs. (3.6-14) and (3.6-16) are clearly comparable, the electron-
electron thermalization time is much shorter than the electron-ion
thermalization time due to the large mass difference between the electrons and
ions reducing the energy transferred in each collision. This is a major reason
that electrons thermalize rapidly into a population with Maxwellian
distribution, but do not thermalize rapidly with the ions.
In addition, the ion-ion collision frequency [5] is given by
1/2 ( T ) 3/2
V.. =Z4 ( ) J... V
II M T. ee'
I
(3.6-17)
Basic Plasma Physics
59
where Z is the ion charge number.
Collisions between like particles and between separate species tend to
equilibrate the energy and distribution functions of the particles. This effect was
analyzed in detail by Spitzer [9] in his classic book. In thrusters, there are
several equilibration time constants of interest. First, the characteristic collision
times between the different charged particles is just one over the average
collision frequencies given above. Second, equilibration times between the
species and between different populations of the same species were calculated
by Spitzer. The time for a monoenergetic electron (sometimes called a primary
electron) to equilibrate with the Maxwellian population of the plasma electrons
is called the slowing time, -rs' Finally, the time for one Maxwellian population
to equilibrate with another Maxwellian population is called the equilibration
time, -req' Expressions for these equilibration times, and a comparison of the
rates of equilibration by these two effects, are found in Appendix F.
Collisions of electrons with other species in the plasma lead to resistivity and
provide a mechanism for heating. This mechanism is often called ohmic heating
or joule heating. In steady state and neglecting electron inertia, the electron
momentum equation, taking into account electron-ion collisions and electron-
neutral collisions, is
0= -en(E+v eX B)- V. Pe - mn[ Vei (v e - Vi)+V en (v e - v o )]. (3.6-18)
The electron velocity is very large with respect to the neutral velocity, and
Eq. (3.6-18) can be written as
o=-en( E+ : e )-env e xB-mn(vei +ven)v e +mnveivi'
(3.6-19)
Since charged particle current density is given by J = qnv, Eq. (3.6-19) can be
written as
Vp-J e xB
11J e =E+ 11ei J j,
en
(3.6-20)
where J e is the electron current density, J j is the ion current density, and 11ei
is the plasma resistivity. Equation (3.6-20) is commonly known as Ohm's law
for partially ionized plasmas and is a variant of the well-known generalized
Ohm's law, which usually is expressed in terms of the total current density,
J = en( v j - v e ) , and the ion fluid velocity, vi' If there are no collisions or net
60
Chapter 3
current in the plasma, this equation reduces to Eq. (3.5-7), which was used to
derive the Boltzmann relationship for plasma electrons.
In Eq. (3.6-20), the total resistivity of a partially ionized plasma is given by
_ m(vei +v en ) _ 1
17- 2 2 '
e n £0 "C e OJ p
(3.6-21)
where the total collision time for electrons, accounting for both electron-ion
and electron-neutral collisions, is given by
"C -
e-
Vei +V en
(3.6-22)
By neglecting the electron-neutral collision terms in Eq. (3.6-19), the well-
known expression for the resistivity of a fully ionized plasma [1,9] is
recovered:
_ m vei _ 1
17ei -----z-- 2 .
e n £0 "Cei OJ p
(3.6-23)
In ion and Hall thrusters, the ion current in the plasma is typically much smaller
than the electron current due to the large mass ratio, so the ion current term in
Ohm's law, Eq. (3.6-20), is sometimes neglected.
3.6.2 Diffusion and Mobility Without a Magnetic Field
The simplest case of diffusion in a plasma is found by neglecting the magnetic
field and writing the equation of motion for any species as
dv
mn dt = qnE - V . p - mnv (v - v 0 ),
(3.6-24)
where m is the species mass and the collision frequency is taken to be a
constant. Assume that the velocity of the particle species of interest is large
compared to the slow species ( v » v 0)' the plasma is isothermal
(Vp = kTVn), and the diffusion is steady state and occurring with a sufficiently
high velocity that the convective derivative can be neglected. Equation (3.6-24)
can then be solved for the particle velocity:
Basic Plasma Physics
61
v =LE- kT V'n .
mv mv n
(3.6-25)
The coefficients of the electric field and the density gradient tenns in
Eq. (3.6-25) are called the mobility,
fJ. = M [m 2 1V-s],
mv
(3.6-26)
and the diffusion coefficient,
kT 2
D =- [m Is].
mv
(3.6-27)
These terms are related by what is called the Einstein relation:
_lqlD
fJ.--.
kT
(3.6-28)
3.6.2.1 Fick's Law and the Diffusion Equation. The flux of diffusing
particles in the simple case of Eq. (3.6-25) is
r=nv=fJ.nE-DV'n.
(3.6-29)
A special case of this is called Pick's law, in which the flux of particles for
either the electric field or the mobility tenn being zero is given by
r=-DV'n.
(3.6-30)
The continuity equation, Eq. (3.5-10), without sink or source tenns can be
written as
an
-+V'T=O,
at
(3.6-31 )
where r represents the flux of any species of interest. If the diffusion
coefficient D is constant throughout the plasma, substituting Eq. (3.6-30) into
Eq. (3.6-31) gives the well-known diffusion equation for a single species:
an '7
--DV'-n=O.
at
(3.6-32)
The solution to this equation can be obtained by separation of variables. The
simplest example of this is for a slab geometry of finite width, where the
62
Chapter 3
plasma density can be expressed as having separable spatial and temporal
dependencies:
n(x,t)= X(x)T(t).
(3.6-33)
Substituting into Eq. (3.6-32) gives
- 2
X dT =DT d X .
dt dx 2
(3.6-34)
Separating the terms gives
dT =D d 2 X =a
T dt X dx 2
(3.6-35)
where each side is independent of the other and therefore can be set equal to a
constant a. The time dependent function is then
dT T
----
dt l'
(3.6-36)
where the constant a will be written as -1/-r. The solution to Eq. (3.6-36) is
T = Toe-tiT.
(3.6-37)
Since there is no ionization source term in Eq. (3.6-32), the plasma density
decays exponentially with time from the initial state.
The right-hand side of Eq. (3.6-35) has the spatial dependence of the diffusion
and can be written as
d 2 X X
dx 2 - - D-r '
(3.6-38)
where again the constant a will be written as -ll-r. This equation has a solution
of the form
X X. X
= A cos - + B Sill - ,
L L
(3.6-39)
where A and B are constants and L is the diffusion length given by (D-r)1/2 . If it
is assumed that X is zero at the boundaries at dI2, then the lowest-order
Basic Plasma Physics
63
solution is symmetric ( B = 0 ) with the diffusion length equal to n. The solution
to Eq. (3.6-38) is then
nx
X=cos-.
d
(3.6-40)
The lowest-order complete solution to the diffusion equation for the plasma
density is then the product ofEq. (3.6-37) and Eq. (3.6-40):
n = n o e- t /1: cos nx .
d
(3.6-41)
Of course, higher-order odd solutions are possible for given initial conditions,
but the higher-order modes decay faster and the lowest-order mode typically
dominates after a sufficient time. The plasma density decays with time from the
initial value no, but the boundary condition (zero plasma density at the wall)
maintains the plasma shape described by the cosine function in Eq. (3.6-41).
While a slab geometry was chosen for this illustrative example due to its
simplicity, situations in which slab geometries are useful in modeling ion and
Hall thrusters are rare. However, solutions to the diffusion equation in other
coordinates more typically found in these thrusters are obtained in a similar
manner. For example, in cylindrical geometries found in many hollow cathodes
and in ion thruster discharge chambers, the solution to the cylindrical
differential equation follows Bessel functions radially and still decays
exponentially in time if source tenns are not considered.
Solutions to the diffusion equation with source or sink tenns on the right-hand
side are more complicated to solve. This can be seen in writing the diffusion
equation as
an n2 .
--Dv n=n
at '
(3.6-42)
where the source tenn is described by an ionization rate equation given by
n = na n{O'jv e )=:: na nO'j(Te)'v,
(3.6-43)
and where v is the average particle speed found in Eq. (3 A-R) and O'i (Te) is
the impact ionization cross section averaged over a Maxwellian distribution of
electrons at a temperature Te' Equations for the xenon ionization reaction rate
coefficients averaged over a Maxwellian distribution are found in Appendix E.
64
Chapter 3
A separation of variables solution can still be obtained for this case, but the
time-dependent behavior is no longer purely exponential as was found in
Eq. (3.6-37). In this situation, the plasma density will decay or increase to an
equilibrium value depending on the magnitude of the source and sink terms.
To find the steady-state solution to the cylindrical diffusion equation, the time
derivative in Eq. (3.6-42) is set equal to zero. Writing the diffusion equation in
cylindrical coordinates and assuming uniform radial electron temperatures and
neutral densities, Eq. (3.6-42) becomes
cPn 1 an a 2 n 2
-+--+-+C n=O
ar 2 r ar az 2 '
(3.6-44)
where the constant is given by
C 2 = naai (Te )v .
D
(3.6-45)
This equation can be solved analytically by separation of variables of the form
n = n(O,O)f(r)g(z).
(3.6-46)
Using Eq. (3.6-46), the diffusion equation becomes
I a 2 f 1 af 2 2 1 a 2 g 2
--+--+C +a =---+a =0.
f ar 2 rf ar g az 2
(3.6-47)
The solution to the radial component of Eq. (3.6-47) is the sum of the zero-
order Bessel functions of the first and second kind, which is written in a general
form as
f(r) = AIJ o (ar)+A2Yo (ar).
(3.6-48)
The Bessel function of the second kind, Yo, becomes infinite as (ar ) goes to
zero, and because the density must always be finite, the constant A 2 must equal
zero. Therefore, the solution for Eq. (3.6-47) is the product of the zero-order
Bessel function of the first kind times an exponential term in the axial direction:
n{r.z)= n(O,O)J o ( C2 +a 2 r) e- az .
(3.6-49)
Assuming that the ion density goes to zero at the wall,
Basic Plasma Physics
65
.J c 2 +a2 = A.0l
R'
(3.6-50)
where Acl is the first zero of the zero-order Bessel function and R is the internal
radius of the cylinder being considered. Setting a = 0, this eigenvalue results
in an equation that gives a direct relationship between the electron temperature,
the radius of the plasma cylinder, and the diffusion rate:
( R ) 2 kTe
- naO'j(Te) --D=O.
Acl 1Cm
(3.6-51)
The physical meaning ofEq. (3.6-51) is that particle balance in bounded plasma
discharges dominated by radial diffusion detennines the plasma electron
temperature. This occurs because the generation rate of ions, which is
detennined by the electron temperature from Eq. (3.6-43), must equal the loss
rate, which is detennined by the diffusion rate to the walls, in order to satisfy
the boundary conditions. Therefore, the solution to the steady-state cylindrical
diffusion equation specifies both the radial plasma profile and the maximum
electron temperature once the dependence of the diffusion coefficient is
specified. This result is very useful in modeling the plasma discharges in
hollow cathodes and in various types of electric thrusters.
3.6.2.2 Ambipolar Diffusion Without a Magnetic Field. In many
circumstances in thrusters, the flux of ions and electrons from a given region or
the plasma as a whole are equal. For example, in the case of microwave ion
thrusters, the ions and electrons are created in pairs during ionization by the
plasma electrons heated by the microwaves, so simple charge conservation
states that the net flux of both ions and electrons out of the plasma must be the
same. The plasma will then establish the required electric fields in the system to
slow the more mobile electrons such that the electron escape rate is the same as
the slower ion loss rate. This finite electric field affects the diffusion rate for
both species.
Since the expression for the flux in Eq. (3.6-29) was derived for any species of
particles, a diffusion coefficient for ions and electrons can be designated
(because D contains the mass) and the fluxes equated to obtain
J1inE-Di '\In=-J1enE-De '\In.
(3.6-52)
where quasi -neutrality (nj "" ne) in the plasma has been assumed. Solving for
the electric field gives
66
Chapter 3
E= D i -De Vn
f..Li+f..Le n
(3.6-53)
Substituting E into Eq. (3.6-29) for the ion flux,
r - - f..LiDe+f..LeDi D - D D
vn-- avn,
f..Li +f..Le
(3.6-54)
where Da is the ambipolar diffusion coefficient given by
D - f..LPe +f..LeDi
a-
f..Li +f..Le
(3.6-55)
Equation (3.6-54) was expressed in the fonn of Fick's law, but with a new
diffusion coefficient reflecting the impact of ambipolar flow on the particle
mobilities. Substituting Eq. (3.6-54) into the continuity equation without
sources or sinks gives the diffusion equation for ambipolar flow:
an -D V 2 n=O.
at a
(3.6-56)
Since the electron and ion mobilities depend on the mass
e e
f..Le=-»f..Li= M '
mv v
(3.6-57)
it is usually possible to neglect the ion mobility. In this case, Eq. (3.6-55)
combined with Eq. (3.6-28) gives
f..Li ( Te )
D =D.+-D =D. 1+-
a I e IT.
f..Le i
(3.6-58)
Since the electron temperature in thrusters is usually significantly higher than
the ion temperature (Te » T i ), ambipo1ar diffusion greatly enhances the ion
diffusion coefficient. Likewise, the smaller ion mobility significantly decreases
the ambipo1ar electron flux leaving the plasma.
3.6.3 Diffusion Across Magnetic Fields
Charged particle transport across magnetic fields is described by what is called
classical diffusion theory and non-classical or anomalous diffusion. Classical
diffusion, which will be presented below, includes both the case of particles of
one species moving across the field due to collisions with another species of
Basic Plasma Physics
67
particles, and the case of ambipolar diffusion across the field where the fluxes
are constrained by particle balance in the plasma. Anomalous diffusion can be
caused by a number of different effects. In ion and Hall thrusters, the
anomalous diffusion is usually described by Bohm diffusion [10].
3.6.3.1 Classical Diffusion of Particles Across B Fields. The fluid
equation of motion for isothennal electrons moving in the perpendicular
direction across a magnetic field is
dvl.
mn-=qn(E+v l..xB)-kTeVn-mnv v 1...
dt
(3.6-59)
The same fonn of this equation can be written for ions with a mass M and
temperature T i . Consider steady-state diffusion and set the time and convective
derivatives equal to zero. Separating Eq. (3.6-59) into x and y coordinates gives
an
mnv V x = qnE x + qnvyBo - kTe-
ax
(3.6-60)
and
an
mnv v y = qnEy + qnvxBo - kTe -,
ay
(3.6-61)
where B = Bo(z). The x and y velocity components are then
We
V x = IpE x +-v y
V
Dan
---
n ax
(3.6-62)
and
We D an
v y = i:.pEy +-v x ---.
V n ay
(3.6-63)
Solving Eqs. (3.6-62) and (3.6-63), the velocities in the two directions are
[ 1 + W 2 !2 J v = +11£ _ D an + W2!2 Ey _ W2!2 kTe ..!. an
e x -f"" x "'\ e B e B :J
n CJx 0 q 0 n uy
(3.6-64)
and
68
Chapter 3
[ 2 2 ] D an 2 2 E 2 2 kT 1 an
l+we'l' v =IJiE ---+we-r ---:!...-we-r --..L__,
Y Y n ay Bo qBo n ax
(3.6-65)
where -r = 1 / v is the average collision time.
The perpendicular electron mobility is defined as
Ji Ji
Jil. = =-,
l+w 2 -r 2 1+0 2
e e
(3.6-66)
where the perpendicular mobility is written in terms of the electron Hall
parameter defined as 0e = eB / mv. The perpendicular diffusion coefficient is
defined as
D
Dl.=
1 + w 2 -r 2
e
D
1+0 2 .
e
(3.6-67)
The perpendicular velocity can then be written in vector form again as
Vn vE+vD
vl. = IJil. E - Dl. - + ( 2 2 ) .
n 1 + v / we
(3.6-68)
This is a form of Fick's law with two additional terms, the azimuthal
Ex B drift,
ExB
vE= '
Bo
(3.6-69)
and the diamagnetic drift,
kT VnxB
vD=---
qB n '
(3.6-70)
both reduced by the fluid drag term (1 + v 2 / w; ). In the case of a thruster, the
perpendicular cross-field electron flux flowing toward the wall or toward the
anode is then
re=nvl. =IJil.nE-Dl.Vn,
(3.6-71 )
which has the form of Fick's law but with the mobility and diffusion
coefficients modified by the magnetic field.
Basic Plasma Physics
69
The "classical" cross-field diffusion coefficient D 1.' derived above and found
in the literature [1,2], is proportional to lIB 2 . However, in measurements in
many plasma devices, including in Kaufman ion thrusters and in Hall thrusters,
the perpendicular diffusion coefficient in some regions is found to be close to
the Bohm diffusion coefficient:
D -J.. kTe
B - 16 eB '
(3.6-72)
which scales as liB. Therefore, Bohm diffusion often progresses at orders of
magnitude higher rates than classical diffusion. It has been proposed that Bohm
diffusion results from collective instabilities in the plasma. Assume that the
perpendicular electron flux is proportional to the Ex B drift velocity,
E
r e = nv 1. oc n - .
B
(3.6-73)
Also assume that the maximum electric field that occurs in the plasma due to
Debye shielding is proportional to the electron temperature divided by the
radius of the plasma:
E - C/Jmax = kTe
max - .
r qr
(3.6-74)
The electron flux to the wall is then
n kTe kTe D D
re zC--z-C-vn=-DBvn.
r qB qB
(3.6-75)
where C is a constant less than 1. The Bohm diffusion coefficient has an
empirically determined value of C =1/16, as shown in Eq. (3.6-72), which fits
most experiments with some uncertainty. As pointed out in Chen [1], this is
why it is no surprise that Bohm diffusion scales as kTe / eB .
3.6.3.2 Ambipolar Diffusion Across B Fields. Ambipolar diffusion
acros.s magnetic fields is much more complicated than the diffusion cases just
covered because the mobility and diffusion coefficients are anisotropic in the
presence of a magnetic field. Since both quasi-neutrality and charge balance
must be satisfied, ambipolar diffusion dictates that the sum of the cross field
and parallel to the field loss rates for both the ions and electrons must be the
same. This means that the divergence of the ion and electron fluxes must be
equal. While it is a simple matter to write equations for the divergence of these
70
Chapter 3
two species and equate them, the resulting equation cannot be easily solved
because it depends on the behavior both in the plasma and at the boundaries
conditions.
A special case in which only the ambipolar diffusion toward a wall in the
presence of a transverse magnetic field is now considered. In this situation,
charge balance is conserved separately along and across the magnetic field
lines. The transverse electron equation of motion for isothermal electrons,
including electron-neutral and electron-ion collisions, can be written as
mn( a;t e +(v e ,V)v e )=-en(E+VeXB)-kTeVn
- mnven(v e -v o)-mnvei(v e - vi)'
(3.6-76)
where v 0 is the neutral particle velocity. Taking the magnetic field to be in the
z-direction, and assuming the convective derivative to be negligibly small, then
in steady-state this equation can be separated into the two transverse electron
velocity components:
e kTe an vei
v + /I E +-v B+----v. = 0
x re x y :! I
mV e mnv e oX v e
(3.6-77)
e kTe an vei
v + /I E --v B+----v. =0
y re y x :! "
mV e mnv e oy v e
(3.6-78)
where v e = v en + vei is the total collision frequency, Jle = e / mV e is the
electron mobility including both ion and neutral collisional effects, and v 0 is
neglected as being small compared to the electron velocity v e . Solving for v y
and eliminating the Ex Band diagmagnetic drift terms in the x-direction, the
transverse electron velocity is given by
( 2 2 ) ( kTe V n ) Vei
v e I+Jle B =Jl e E+-- +-Vi,
e n V e
(3.6-79)
Since ambipolar flow and quasi-neutrality are assumed everywhere in the
plasma, the transverse electron and ion transverse velocities must be equal,
which gives
(1 2 B 2 Vei ) _ (E kTe V n )
vi +Jle -- -Jle +--.
V e e n
(3.6-80)
Basic Plasma Physics
71
The transverse velocity of each species is then
Pe ( kTe V n )
Vi=V e = ( V' J E+-;--;: .
1 + P; B 2 _.....!l..
v e
(3.6-81)
In this case, the electron mobility is reduced by the magnetic field (the first
tenn on the right-hand side of this equation), and so an electric field E is
generated in the plasma to actually slow down the ion transverse velocity in
order to balance the pressure term and maintain ambipolarity. This is exactly
the opposite of the nonnal ambipolar diffusion without magnetic fields or along
the magnetic field lines covered in Section 3.6.2, where the electric field
slowed the electrons and accelerated the ions to maintain ambipolarity.
Equation (3.6-81) can be written in tenns of the transverse flux as
r 1. = ( 2 e ) (enE + kTe Vn) .
l+Pe B -vedVe
(3.6-82)
3.7 Sheaths at the Boundaries of Plasmas
While the motion of the various particles in the plasma is important in
understanding the behavior and perfonnance of ion and Hall thrusters, the
boundaries of the plasma represent the physical interface through which energy
and particles enter and leave the plasma and the thruster. Depending on the
conditions, the plasma will establish potential and density variations at the
boundaries in order to satisfy particle balance or the imposed electrical
conditions at the thruster walls. This region of potential and density change is
called the sheath, and understanding sheath fonnation and behavior is also very
important in understanding and modeling ion and Hall thruster plasmas.
Consider the generic plasma in Fig. 3-2, consisting of quasi-neutral ion and
electron densities with temperatures given by T i and Te, respectively. The ion
current density to the boundary "wall" for singly charged ions, to first order, is
given by nievi, where vi is the ion velocity. Likewise, the electron flux to the
boundary wall, to first order, is given by neev e , where v e is the electron
velocity. The ratio of the electron flux to the ion current density going to the
boundary, assuming quasi-neutrality, is
J e = neev e = v e
J i nievi vi
(3.7-1)
72
Chapter 3
n j ::: n-e
, Boundary
Fig. 3-2. Generic quesi-neutral plasma
enclosed in a boundary.
In the absence of an electric field in the plasma volume, conservation of energy
for the electrons and ions is given by
1 2 kTe
-mv =-
2 e e'
1 2 kT i
-Mv. =-
2 I e
If it is assumed that the electrons and ions have the same temperature, the ratio
of current densities to the boundary is
J e _ v e -
- - -
J i vi m
(3.7-2)
Table 3-1 shows the mass ratio M/m for several gas species. It is clear that the
electron current out of the plasma to the boundary under these conditions is
orders of magnitude higher than the ion current due to the much higher electron
mobility. This would make it impossible to maintain the assumption of quasi-
neutrality in the plasma used in Eq. (3.7-1) because the electrons would leave
the volume much faster than the ions.
If different temperatures between the ions and electrons are allowed, the ratio of
the current densities to the boundary is
J e _ v e _ M Te
- - --
J. v. m T: .
I I I
(3.7-3)
To balance the fluxes to the wall to satisfy charge continuity (an ionization
event makes one ion and one electron), the ion temperature would have to again
Basic Plasma Physics
73
Table 3-1.lon-to-electron mass ratios for several gas species.
Gas Mass ratio Mlm Square root of the
mass ratio Mlm
Protons (H+) 1836 42.8
Argon 73440 270.9
Xenon 241066.8 490.9
be orders of magnitude higher than the electron temperatures. In ion and Hall
thrusters, the opposite is true and the electron temperature is nonnally about an
order of magnitude higher than the ion temperature, which compounds the
problem of maintaining quasi-neutrality in a plasma.
In reality, if the electrons left the plasma volume faster than the ions, a charge
imbalance would result due to the large net ion charge left behind. This would
produce a positive potential in the plasma, which creates a retarding electric
field for the electrons. The electrons would then be slowed down and retained
in the plasma. Potential gradients in the plasma and at the plasma boundary are
a natural consequence of the different temperatures and mobilities of the ions
and electrons. Potential gradients will develop at the wall or next to electrodes
inserted into the plasma to maintain quasi-neutrality between the charged
species. These regions with potential gradients are called sheaths.
3.7.1 Debye Sheaths
To start an analysis of sheaths, assume that the positive and negative charges in
the plasma are fixed in space, but have any arbitrary distribution. It is then
possible to solve for the potential distribution everywhere using Maxwell's
equations. The integral form ofEq. (3.2-1) is Gauss's law:
E.ds=.!.. f pdv=SL,
S Eo V Eo
(3.7-4)
where Q is the total enclosed charge in the volume V and s is the surface
enclosing that charge. If an arbitrary sphere of radius r is drawn around the
enclosed charge, the electric field found from integrating over the sphere is
E= Q i.
47rEor2
(3.7-5)
Since the electric field is minus the gradient of the potential, the integral fonn
ofEq. (3.2-5) can be written
74
Chapter 3
f P2
cf>2 -cf>1 =- E.dl,
pI
(3.7-6)
where the integration proceeds along the path dl from point pI to point p2.
Substituting Eq. (3.7-5) into Eq. (3.7-6) and integrating gives
Q
cf>=-.
41!c o r
(3.7-7)
The potential decreases as 1/r moving away from the charge.
However, if the plasma is allowed to react to a test charge placed in the plasma,
the potential has a different behavior than predicted by Eq. (3.7-7). Utilizing
Eq. (3.2-7) for the electric field in Eq. (3.2-1) gives Poisson's equation:
V 2 lp = _2. = - (Zni - ne),
Eo Eo
(3.7-8)
where the charge density in Eq. (3.2-5) has been used. Assume that the ions are
singly charged and that the potential change around the test charge is small
(ecf>« kT e ), such that the ion density is fixed and ni "" no' Writing Poisson's
equation in spherical coordinates and using Eq. (3.5-9) to describe the
Boltzmann electron density behavior gives
( r2 acf» = - [ no -no exp ( )] = eno [ exP ( ) -I ] . (3.7-9)
r ar ar Eo kTe Eo kTe
Since ecf>« kTe was assumed, the exponent can be expanded in a Taylor
senes:
[ ( ) 2 ]
I a 2 alp en o ecf> I elp
r 2 ar (r ar )= Co kTe +'2 kTe +....
(3.7-10)
Neglecting all the higher-order terms, the solution of Eq. (3.7-10) can be
written
e l / 7 ' J EokTe ' j
cf>=-exp -r -.
41!c o r n o e 2
(3.7 -II)
By defining
Basic Plasma Physics
75
AD = EokTe
n e 2
o
(3.7-12)
as the characteristic Debye length, Eq. (3.7-12) can be written
4J = exp ( -..!- ) .
47rEor AD
(3.7-13)
This equation shows that the potential would normally fall off away from the
test charge inserted in the plasma as 1/r, as previously found, except that the
electrons in the plasma have reacted to shield the test charge and cause the
potential to decrease exponentially away from it. This behavior of the potential
in the plasma is, of course, true for any structure such as a grid or probe that is
placed in the plasma and that has a net charge on it.
The Debye length is the characteristic distance over which the potential changes
for potentials that are small compared to kTe. It is common to assume that the
sheath around an object will have a thickness of the order of a few Debye
lengths in order for the potential to fall to a negligible value away from the
object. As an example, consider a plasma with a density of 10 17 m- 3 and an
electron temperature of 1 eV. Boltzmann's constant k is 1.3807 X 10- 23 J/K and
the charge is 1.6022 x 10- 19 coulombs, so the temperature corresponding to
1 electron volt is
T = 1 ( !.. ) = 1.6022 x 10- 19 = 11604.3 K.
k 1.3807 x 10- 23
The Debye length, using the permittivity or free space as 8.85 x 10- 12 F/m is
then
r ] 112
_ (8.85 x 10- 12 )( 1.38 x 10- 23 ) 11604
AD-
10 17 (1.6 x 10- 19 t
= 2.35 x 10- 5 m = 23.5,um.
A simplifying step to note in this calculation is that kTe I e in Eq. (3.7-12) has
units of electr on vol ts. A handy formula for the Debye length
is AD (cm) "" 740 .J Tev I no , where Tev is in electron volts and no is in cm -3.
76 Chapter 3
3.7.2 Pre-Sheaths
In the previous section, the sheath characteristics for the case of the potential
difference between the plasma and an electrode or boundary being small
compared to the electron temperature ( elf> « kTe ) was analyzed and resulted in
Debye shielding sheaths. What happens for the case of potential differences on
the order of the electron temperature? Consider a plasma in contact with a
boundary wall, as illustrated in Fig. 3-3. Assume that the plasma is at a
reference potential cI> at the center (which can be arbitrarily set), and that cold
ions fall through an arbitrary potential of If>o as they move toward the
boundary. Conservation of energy states that the ions arrived at the sheath edge
with an energy given by
1 2
-Mv o =elf>o'
2
(3.7-14)
This potential drop between the center of the plasma and the sheath edge, If>o , is
called the pre-sheath potential. Once past the sheath edge, the ions then gain an
additional energy given by
1 2 1
-Mv = -Mv 2 -etl> ( x )
2 2 0 'I' '
(3.7-15)
where v is the ion velocity in the sheath and If> is the potential in the sheath
(becoming more negative relative to the center of the plasma). Using
Eq. (3.7-14) in Eq. (3.7-15) and solving for the ion velocity in the sheath gives
<1>
<1>0
Sheath
Plasma
Fig. 3-3. Plasma In contact with a boundary.
Basic Plasma Physics
77
v= II [ o _ ]1/2 .
(3.7-16)
However, from Eq. (3.7-14), V o = .J 2e o/M , so Eq. (3.7-16) can be rearranged
to give
V o = o ,
V o -
(3.7 -17)
which represents an acceleration of the ions toward the wall. The ion flux
during this acceleration is conserved:
njV = novo
v
nj = no -2...
v
(3.7-18)
Using Eq. (3.7-17) in Eq. (3.7-18), the ion density in the sheath is
nj = no : .
(3.7-19)
Examining the potential structure close to the sheath edge such that l/J is small
compared to the pre-sheath potential o' Eq. (3.7-19) can be expanded in a
Taylor series to give
nj = no ( 1 - i +..)
(3.7-20)
where the higher-order tenns in the series will be neglected.
The electron density through the sheath is given by the Boltzmann relationship
in Eq. (3.5-9). If it is also assumed that the change in potential right at the
sheath edge is small compared to the electron temperature, then the exponent in
Eq. (3.5-9) can be expanded in a Taylor series to give
ne = no exp ( !!t ) = no [ l-!!t + ... J .
kTe kTe
(3.7-21)
Using Eqs. (3.7-20) and (3.7-21) in Poisson's equation, Eq. (3.7-8), for singly
charged ions in one dimension gives
78
Chapter 3
d 2 : =- (ni-ne)=- enO [ 1_.!.!t_ 1 + eC/> ]
dx Eo Eo 2 C/>o kTe
_ enoC/> [ _ ]
- Eo 2C/>0 kTe'
(3.7-22)
In order to avoid a positive-going inflection in the potential at the sheath edge,
which would then slow or even reflect the ions going into the sheath, the right-
hand side ofEq. (3.7-22) must always be positive, which implies
1 e
->-.
2C/>0 kTe
(3.7-23)
This expression can be rewritten as
n, kTe
'1-'0>-'
2e
(3.7-24)
which is the Bohm sheath criterion [10] that states that the ions must fall
through a potential in the plasma of at least Te /2 before entering the sheath t o
produce a monotonically decreasing sheath potential. Since v o = .J 2eC/>0/ M ,
Eq. (3.7-24) can be expressed in familiar form as
> kTe
v o - .
M
(3.7-25)
This is usually called the Bohm velocity for ions entering a sheath. Equation
(3 .2-25) s tates that the ions must enter the sheath with a velocity of at least
.J kTe / M (known as the acoustic velocity for cold ions) in order to have a
stable (monotonic) sheath potential behavior. The plasma produces a potential
drop of at least Te /2 prior to the sheath (in the pre-sheath region) in order to
produce this ion velocity. While not derived here, ifthe ions have a temperature
T i , it is easy to show that the Bohm velocity will still take the form of the ion
acoustic velocity given by
YikTi + kTe
v =
o M
(3.7-26)
It is important to realize that the plasma density decreases in the pre-sheath due
to ion acceleration toward the wall. This is easily observed from the Boltzmann
behavior of the plasma density. In this case, the potential at the sheath edge has
Basic Plasma Physics
79
fallen to a value of -kTe /2e relative to the plasma potential where the density
is no (far from the edge of the plasma). The electron density at the sheath edge
is then
ne = no ex p ( : ) = no ex p [ ( k;J ( - e )]
(3.7-27)
= 0.606 no'
Therefore, the plasma density at the sheath edge is about 60% of the plasma
density in the center of the plasma.
The current density of ions entering the sheath at the edge of the plasma can be
found from the density at the sheath edge in Eq. (3.7-27) and the ion velocity at
the sheath edge in Eq. (3.7-25):
J. = 0.6 n ev. "".2. ne kTe
I 0 1 2M '
(3.7-28)
where n is the plasma density at the start of the pre-sheath, which is normally
considered to be the center of a collisionless plasma or one collision-mean-free
path from the sheath edge for collisional plasmas. It is common to write
Eq. (3.7-28) as
[. = .2.ne kTe A
! 2 M'
(3.7-29)
where A is the ion collection area at the sheath boundary. This current is called
the Bohm current. For example, consider a xenon ion thruster with a 1018m- 3
plasma density and an electron temperature of3 eV. The current density of ions
to the boundary of the ion acceleration structure is found to be 118 A/m 2 , and
the Bohm current to an area of 10- 2 m 2 is 1.18 A.
3.7.3 Child-Langmuir Sheaths
The simplest case of a sheath in a plasma is obtained when the potential across
the sheath is sufficiently large that the electrons are repelled over the majority
of the sheath thickness. This will occur if the potential is very large compared
to the electron temperature (tP » kTe ! e). This means that the electron density
goes to essentially zero relatively close to the sheath edge, and the electron
space charge does not significantly affect the sheath thickness. The ion velocity
through the sheath is given by Eq. (3.7-16). The ion current density is then
80
Chapter 3
[ ] 112
J j = njev = nje "{ii t/Jo - t/J .
(3.7-30)
Solving Eq. (3.7-30) for the ion density, Poisson's equation in one dimension
and with the electron density contribution neglected is
2 ( ) 1/2
d t/J en. J. M
dx 2 = - E; = - E 2e( t/Jo - t/J)
(3.7-31)
The first integral can be performed by multiplying both sides of this equation
by dt/J 1 dx and integrating to obtain
[( dt/J ) 2 _ ( dt/J ) 2 ] = 2Jj [ M(t/Jo _t/J) ] 1I2
2 dx dx x=o Eo 2e
(3.7-32)
Assuming that the electric field (dt/Jldx) is negligible at x=O, Eq. (3.7-32)
becomes
dlJ> = 2 ( Jj ) 1I2 [ M (lJ>0 _lJ» ] 1I4
dx Eo 2e
(3.7-33)
Integrating this equation and writing the potential across the sheath of
thickness d as the voltage V gives the familiar form of the Child-Langmuir law:
J. = 4Eo ( 2e ) 1/2 V3/2 .
1 9M d 2
(3.7-34)
This equation was originally derived by Child [11] in 1911 and independently
derived by Langmuir [12] in 1913. Equation (3.7-34) states that the current per
unit area that can pass through a planar sheath is limited by space-charge effects
and is proportional to the voltage to the 3/2 power divided by the sheath
thickness squared. In ion thrusters, the accelerator structure can be designed to
first order using the Child-Langmuir equation where d is the gap between the
accelerator electrodes. The Child-Langmuir equation can be conveniently
written as
Basic Plasma Physics
81
V 3 / 2
J e = 2.33 x 10 electrons
d
5.45 x 10⁻⁸ V 3/2
J. = singly charged ions
I .JMa d 2
3/2
- - 4.75 X 10 -9 - V 2 .
xenon Ions,
d
(3.7-35)
where M a is the ion mass in atomic mass units. For example, the space-
charge-limited xenon ion current density across a planar I-mrn grid gap with
1000 V applied is 15 mAlcm 2 .
3.7.4 Generalized Sheath Solution
To find the characteristics of any sheath without the simplifying assumptions
used in the above sections, the complete solution to Poisson's equation at a
boundary must be obtained. The ion density through a planar sheath, from
Eq. (3.7-19), can be written as
( ) -1/2
n'=n 1-1..
I 0 CPo '
(3.7-36)
and the electron density is given by Eq. (3.5-9),
ne = no exp ( .!t. ) .
kTe
(3.7-37)
Poisson's equation (3.7-8) for singly charged ions then becomes
d2 = -":""(ni -ne) = _ en o [( 1_1.. ) -112 -exp ( .!t. )] .
dx Eo Eo CPo kTe
(3.7-38)
Defining the following dimensionless variables,
82
Chapter 3
ecfJ
X = - kT '
e
ecfJo
Xo = kT '
e
x
= AD '
Poisson's equation becomes
d 2 ( ) -112
d = 1+ :0 _e- X .
(3.7-39)
This equation can be integrated once by multiplying both sides by the first
derivative of X and integrating from 1 = 0 to 1 = :
2 ( ) -1/2
r; ax a X d = f ; 1+..K. ax- f ;e- X d .
Jo a ae 1 0 Xo 0 X
(3.7-40)
where 1 is a dummy variable. The solution to Eq. (3.7-40) is
[( r -( L] 2X,[(1+ :. J'" -}e-Ll
(3.7-41)
Since the electric field (dcfJ / dx) is zero away from the sheath where = 0 ,
rearrangement ofEq. (3.7-41) yields
[ 112 ] 112
= 4Xo(1+ ) +2e- X -2(2Xo-l)
(3.7-42)
To obtain a solution for X( ), Eq. (3.7-42) must be solved numerically.
However, as was shown earlier for Eq. (3.7-22), the right-hand side must
always be positive or the potential will have an inflection at or near the sheath
edge. Expanding the right-hand side in a Taylor series and neglecting the
higher-order terms, this equation will also produce the Bohm sheath criterion
and specify that the ion velocity at the sheath edge must equal or exceed the ion
acoustic (or Bohm) velocity. An examination of Eq. (3.7.42) shows that the
Bohm sheath criterion forces the ion density to always be larger than the
Basic Plasma Physics
83
electron density through the pre-sheath and sheath, which results in the
physically realistic monotonically decreasing potential behavior through the
sheath.
Figure 3-4 shows a plot of the sheath thickness d normalized to the Debye
length versus the potential drop in the sheath normalized to the electron
temperature. The criterion for a Debye sheath derived in Section 3.7.1 was that
the potential drop be much less than the electron temperature (et/J« kTe ),
which is on the far left-hand side of the graph. The criterion for a Child-
Langmuir sheath derived in Section 3.7.3 is that the sheath potential be large
compared to the electron temperature (et/J» kTe), which occurs on the right-
hand side of the graph. This graph illustrates the rule-of-thumb that the sheath
thickness is several Debye lengths until the full Child-Langmuir conditions are
established. Beyond this point, the sheath thickness varies as the potential to the
3/2 power for a given plasma density.
The reason for examining this general case is because sheaths with potential
drops on the order of the electron temperature or higher are typically found at
both the anode and insulating surfaces in ion and Hall thrusters. For example, it
will be shown later that an insulating surface exposed to a xenon plasma will
self-bias to a potential of about 6Te, which is called the floating potential. For
a plasma with an electron temperature of 4 eV and a density of 10 18 m- 3 , the
Debye length from Eq. (3.7-12) is 1.5 x 1O- 5 m. Since the potential is actually
8
7
6
c 5
.<
'0 4
II
oJ..!'
3
2
o
024
6
8 10 12 14 16 18 20
X ICI e(plkT e
Fig. 3-4. Normalized shesth thickness as a function of
the normalized sheath potential showing the transition
to a Child-Langmuir sheath as the potential becomes
large compared to the electron temperature.
84
Chapter 3
significantly greater than the electron temperature, the sheath thickness is
several times this value and the sheath transitions to a Child-Langmuir sheath.
3.7.5 Double Sheaths
So far, only plasma boundaries where particles from the plasma are flowing
toward a wall have been considered. At other locations in ion and Hall
thrusters, such as in some cathode and accelerator structures, a situation may
exist where two plasmas are in contact but at different potentials, and ion and
electron currents flow between the plasmas in opposite directions. This
situation is called a double sheath, or double layer, and is illustrated in Fig. 3-5.
In this case, electrons flow from the zero-potential boundary on the left, and
ions flow from the boundary at a potential q>s on the right. Since the particle
velocities are relatively slow near the plasma boundaries before the sheath
acceleration takes place, the local space-charge effects are significant and the
local electric field is reduced at both boundaries. The gradient of the potential
inside the double layer is therefore much higher than in the vacuum case where
the potential varies linearly in between the boundaries.
Referring to Fig. 3-5, assume that the boundary on the left is at zero potential
and that the particles arrive at the sheath edge on both sides of the double layer
with zero initial velocity. The potential difference between the surfaces
accelerates the particles in the opposite direction across the double layer. The
electron conservation of energy gives
I 2
-mv e = eq>
2
= ( 2eq» 1/2
v e '
m
(3.7-43)
4'
Vacuum
Solution
.f',/ T
"
.,
,. 41"
'I
,'/
Double-Layer
Solution
x
Fig. 3-5. Schematic of the double-layer
potentiel distribution.
Basic Plasma Physics
85
and the ion energy conservation gives
i MV ; =e(l/Js -l/J)
[ 2e ] 112
vi= M (l/Js-l/J)
(3.7-44)
The charge density in Eq. (3.2-5) can be written
P = Pi + Pe
J i J e J i {M J e r;;
= - = Jl/Js -l/J V "2; - # V 2; .
(3.7-45)
Poisson's equation can then be written in one dimension as
dE P J i (M J e r;;
dx = Eo = Eo Jl/Js-l/J V "2; - Eo# V "2; .
(3.7-46)
Integrating once gives
i' E 2 = 2J i j¥; [l/Js -(l/Js -l/J )112]_ 2J e Jf;l/J 1I2 .
(3.7-47)
For space-charge-limited current flow, the electric field at the right-hand
boundary (the edge of the plasma) is zero and the potential is l/J = l/Js . Putting
that into Eq. (3.7-47) and solving forthe current density gives
Je= J i .
(3.7-48)
If the area of the two plasmas in contact with each other is the same, the
electron current crossing the double layer is the square root of the mass ratio
times the ion current crossing the layer. This situation is called the Langmuir
condition (1929) and describes the space-charge-limited flow of ions and
electrons between two plasmas or between a plasma and an electron emitter.
For finite initial velocities, Eq. (3.7-48) was corrected by Andrews and Allen
[13J to give
J e =/( J i ,
(3.7-49)
86
Chapter 3
where 1( is a constant that varies from 0.8 to 0.2 for Te / T i changing from 2 to
about 20. For typical thruster plasmas where Te / T i "" 10, k is about 0.5.
While the presence of free-standing double layers in the plasma volume in
thrusters is often debated, the sheath at a thermionic cathode surface certainly
satisfies the criteria of counter-streaming ion and electron currents and can be
viewed as a double layer. In this case, Eq. (3.7-49) describes the space-charge-
limited current density that a plasma can accept from an electron-emitting
cathode surface. This is useful in that the maximum current density that can be
drawn from a cathode can be evaluated if the plasma parameters at the sheath
edge in contact with the cathode are known (such that J i can be evaluated from
the Bohm current), without requiring that the actual sheath thickness be known.
Finally, there are several conditions for the formation of the classic double
layer described here. In order to achieve a potential difference between the
plasmas that is large compared to the local electron temperature, charge
separation must occur in the layer. This, of course, violates quasi-neutrality
locally. The current flow across the layer is space-charge limited, which means
that the electric field is essentially zero at both boundaries. Finally, the flow
through the layer discussed here is collisionless. Collisions cause resistive
voltage drops where current is flowing, which can easily be confused with the
potential difference across a double layer.
3.7.6 Summary of Sheath Effects
It is worthwhile to summarize here some of the important equations in this
section related to sheaths because these will be very useful later in describing
thruster performance. These equations were derived in the sections above, and
alternative derivations can be found in [1-3].
The current density of ions entering the sheath at the edge of the plasma is
given by
J. =0.6 nev. "".!.ne kTe
I 1 2M '
(3.7-50)
where n is the plasma density at the start of the pre-sheath far from the
boundary, which was considered to be the center of the plasma by Langmuir for
his coHisionless plasmas. The convention of approximating the coefficient 0.6
as 1/2 was made by Bohm in defining what is now called the "Bohm current."
Basic Plasma Physics
87
If there is no net current to the boundary, the ion and electron currents must be
equal. The Bohm current of ions through the sheath is given by the current
density in Eq. (3.7-50) times the wall area A:
I. =.!.n. e kTe A.
I 2 I M
(3.7-51)
The electron current through the sheath is the random electron flux times the
Boltzmann factor:
1 !! kTe ( ecp )
I =- - n eA ex p --
e 4 1Cm e kTe '
(3.7-52)
where the potential is by convention a positive number in this fonnulation.
Equating the total ion and electron currents (Ii = Ie), assuming quasi-neutrality
in the plasma ( ni = ne), and solving for the potential gives
cp= k e In[ l
(3.7-53)
This is the potential at which the plasma will self-bias in order to have zero net
current to the walls and thereby conserve charge and is often called the floating
potential. Note that the floating potential is negative relative to the plasma
potential.
For sheath potentials less than the electron temperature, the sheath thickness is
given by the Debye length:
AD=
(3.7-54)
For sheath potentials greater than the electron temperature (ecp > kT e ), a pre-
sheath fonns to accelerate the ions into the sheath to avoid any inflection in the
potential at the sheath edge. The collisionless pre-sheath has a potential
difference from the center of the plasma to the sheath edge of Te / 2 and a
density decrease from the center of the plasma to the sheath edge of 0.61 no .
The Te /2 potential difference accelerates the ions to the Bohm velocity:
VBohm =vB = .
(3.7-55)
88
Chapter 3
The sheath thickness at the wall depends on the plasma parameters and the
potential difference between the plasma and the wall, and is found from the
solution ofEq. (3.7-42).
For the case of sheath potentials that are large compared to the electron
temperature (eq; » kTe ), the current density through the sheath is described by
the Child-Langmuir equation:
J. = 4e o ( 2e ) 1/2 q;3/2 .
1 9M d 2
(3.7-56)
Finally, for the case of double sheaths where ion and electrons are
counterstreaming across the boundary between two plasmas, the relationship
between the two currents is
J e = /( J i .
(3.7-57)
If one boundary of the double layer is the sheath edge at a thermionic cathode,
Eq. (3.7-51) can be used for the Bohm current to the opposite boundary to give
the maximum emission current density as
J = n' e kTe "" n e kTe .
e 2 1 m 4 e m
(3.7-58)
This is the maximum electron current density that can be accepted by a plasma
due to space-charge effects at the cathode double sheath. For example, the
maximum space-charge-limited cathode emission current into a xenon plasma
with a density of 10 18 m- 3 and an electron temperature of 5 eV is about
3.8 A/cm 2 .
These summary equations are commonly seen in the literature on the design
and analysis of ion sources, plasma processing sources, and, of course, many
electric propulsion thrusters.
References
[1] F. F. Chen, lntroduction to Plasma Physics and Controlled Fusion, vol. 1,
New York: Plenum Press, 1984.
[2J M. Lieberman and A. Lichtenberg, Principles of Plasma Discharges and
Materials Processing, New York: John Wiley and Sons, 1994.
Basic Plasma Physics
89
[3] R. J. Goldston and P. H. Rutherford, Introduction to Plasma Physics,
London: Institute of Physics Publishing, 1995.
[4] A. T. Forrester, Large Ion Beams, New York: John Wiley and Sons, 1988.
[5] D. L. Book, NRL Plasma Formulary, Washington, D.C.: Naval Research
Laboratory, 1987.
[6] E. A. Mason and E. W. McDaniel, Transport Properties of Ions in Gases,
New York: John Wiley and Sons, 1988.
[7] J. S. Miller, S. H. Pullins, D. J. Levandier, Y. Chiu, and R. A. Dressler,
"Xenon Charge Exchange Cross Sections for Electrostatic Thruster
Models," Journal of Applied Physics, vol. 91, no. 3, pp. 984-991,2002.
[8] 1. Katz, J. Anderson, J. Polk and J. Brophy, "One Dimensional Hollow
Cathode Model," Journal of Propulsion and Power, vol. 19, no. 4,
pp. 595-600,2003.
[9] L. Spitzer, Jr., Physics of Fully Ionized Gases, New York: Interscience,
pp. 127-135, 1962.
[10] D. Bohm, Chapter I, The Characteristics of Electric Discharges in
Magnetic Fields, edited by A. Guthrie and R. Wakerling, New York:
McGraw-Hill, pp. 1-76, 1949.
[11] C. D. Child, "Discharge from Hot CaO," Physical Review, vol. 32, p. 492,
1911.
[12] 1. Langmuir, "The Effect of Space Charge and Residual Gases on
Thennionic Currents in High Vacuum," Physical Review, vol. 2, p. 450,
1913.
[13] J. G. Andrews and J. E. Allen, "Theory of a Double Sheath Between Two
Plasmas," Proceedings of the Royal Society of London, series A, vol. 320,
pp. 459-472,1971.
Problems
1. Show that Eq. (3.2-7) becomes E = -V cp - aAtat when B is varying with
time, where A is the "vector potential." How are A and B related?
2. Derive Eq. (3.3-21) for the force on a particle in a magnetic mirror.
3. Show that the magnetic moment is invariant and derive Eq. (3.3-23).
4. Derive the expression for ion acoustic velocity in Eq. (3.5-26).
90
Chapter 3
5. Answer the following question that might be brought up by a student
working in the lab: "In a plasma discharge set up in my vacuum chamber
the other day, I measured an increase in the plasma potential with an
electrostatic probe. How do I know if it's a double layer or just a potential
gradient within which the ionized gas is quasi-neutral?"
6. Derive Eq. (3.6-9) for the penetration distance of neutral particles in a
plasma.
7. Derive the expression for Ohm's law for partially ionized plasmas,
Eq. (3.6-20).
8. Derive Eq. (3.6-81) for the transverse ambipolar ion velocity across
magnetic field lines.
9. Derive the Bohm sheath criteria including the presence of double ions.
10. Derive an expression equivalent to the Child-Langmuir law for the
condition where the initial ion velocity entering the sheath is not neglected
(ions have an initial velocity V o at the sheath edge at z = 0).
11. A 2-mm by 2-mm square probe is immersed in a 3 e V xenon plasma.
a. If the probe collects 1 mA of ion current, what is the plasma density?
(Hint: the probe has two sides and is considered infinitely thin.)
b. What is the floating potential?
c. What is the probe current collected at the plasma potential?
12. A 2-mm-diameter cylindrical probe 5 mm long in a xenon plasma with
Te = 3 e V collects 1 mA of ion saturation current.
a. What is the average plasma density?
b. How much electron current is collected if the probe is biased to the
plasma potential?
c. Why is this electron current the same as the solution to Problem ll.c
when the plasma densities are so different?
13. An electron emitter capable of emitting up to 10 Alcm 2 is in contact with an
Xe+ plasma with an electron temperature of2 eV. Plot the emission current
density versus plasma density over the range from 10 10 to 10 13 cm- 3 . At
what density does the emission become thermally limited (the maximum
current density that the electron emitter can emit)?
Fundamentals oIElectric Propulsion: Ion and Hall T1l1'llsters
by Dan M. Goebel and Ira Katz
Copyright iQ 2008 John Wiley & Sons, Inc.
Chapter 4
Ion Thruster Plasma Generators
Ion thrusters are characterized by the electrostatic acceleration of ions extracted
from a plasma generator. Ion thruster geometries are best described in tenns of
three basic components: the ion accelerator, the plasma generator, and the
electron neutralizer. The ion accelerator, described in Chapter 5, typically uses
electrically biased multi-aperture grids to produce the ion beam. The neutralizer
cathode, which is discussed in Chapter 6, is positioned outside the thruster body
to provide electrons to neutralize the ion beam and maintain the potential of the
thruster and spacecraft relative to the space plasma potential. In this chapter,
three types of the third component of modem flight ion thrusters, namely the
plasma generator, are discussed. These plasma generators utilize direct current
(DC) electron discharges, radio frequency (rf) discharges and microwave
discharges to produce the plasma. Physics-based models will be developed and
used throughout the chapter to describe the performance and characteristics of
these different plasma-generation techniques.
4.1 Introduction
The basic geometry of an ion thruster plasma generator is illustrated well by the
classic DC electron discharge plasma generator. This version of the thruster
plasma generator utilizes an anode potential discharge chamber with a hollow
cathode electron source to generate the plasma from which ions are extracted to
fonn the thrust beam. A simplified schematic of a DC electron bombardment
ion thruster with these components coupled to a multi-grid accelerator is shown
in Fig. 4-1. Neutral propellant gas is injected into the discharge chamber, and a
small amount is also injected through the hollow cathode. Electrons extracted
from the hollow cathode enter the discharge chamber and ionize the propellant
gas. To improve the efficiency of the discharge in producing ions, some fonn of
magnetic confinement typically is employed at the anode wall. The magnetic
fields provide confinement primarily of the energetic electrons, which increases
the electron path length prior to loss to the anode wall and improves the
91
92
Chapter 4
ionization probability of the in-
jected electrons. Proper design of
the magnetic field is critical to
providing sufficient confinement
for high efficiency while maintain-
ing adequate electron loss to the
anode to produce stable discharges
over the operation range of the
thruster.
Anode Wall
.
Hollow .'
. -
Gas
Feeds
.
.
.
.
.
Magnetic
Confinement
I
.
..' I
.... - - -. I
I
Xe+-1
I
I
I
I
I
I
I I
---. II
.
,
Several power supplies are re-
quired to operate the cathode and
plasma discharge. A simplified
electrical schematic typically used Fig. 4.1.lI\ustration of a DC-discharge electron
for DC-discharge plasma genera- bombardment ion thruster.
tors is shown in Fig. 4-2. The
cathode heater supply raises the thermionic emitter to a sufficient temperature
to emit electrons, and is turned off once the plasma discharge is ignited. The
keeper electrode positioned around the hollow cathode tube is used to facilitate
striking the hollow cathode discharge, and also protects the cathode from ion
bombardment from the discharge chamber region. The cathode and keeper are
discussed in Chapter 6. The discharge supply is connected between the hollow
cathode and the anode, and normally is run in the current-regulated mode in
order to provide a stable discharge at different power levels.
Anode
I I
I I
I I
Xe+ I I
-
I I
I I Accelerator
Grid
Discharge
Cathod
rr==AO'LJ
Keeper -1 I f
Supply -=-
-1
Heater
Supply
Discharge
Supply
Screen
Grid
Fig. 4-2. Electrical schematic of a DC-discharge ion thruster
with the cathode heater, keeper and discherge power
supplies.
Ion Thruster Plasma Generators
93
RF and microwave ion thrusters utilize ion accelerator and electron-neutralizer
implementations nearly identical to that of the DC-discharge ion thruster.
However, these thrusters do not employ a discharge hollow cathode or anode
power supply. These components are replaced by rf or microwave antenna
structures, sources of microwave radiation and compatible discharge chambers
to ionize the propellant gas and deliver the ions to the accelerator structure.
These thrusters also utilize either applied or self-generated magnetic fields to
improve the ionization efficiency of the system.
The three thruster plasma generators to be discussed here, DC electron
discharge, rf, and microwave discharge, have been successfully developed and
flown in space. The principles of these different classes of plasma generators
are described in the following sections after a discussion of the plasma
generator efficiency that can be expected in an idealized case.
4.2 Idealized Ion Thruster Plasma Generator
It is worthwhile to examine an ion thruster in the simplest terms to provide an
understanding of the dominant processes in the particle flows and energy
transport required to produce the plasma. The idealized thruster model has
power injected by arbitrary means into a volume filled with neutral gas to
produce ionization and neutral gas excitation, with all the ions going to the
accelerator grids and an equal number of plasma electrons going to the wall to
conserve charge. This is illustrated schematically in Fig. 4-3. For this model,
the thruster discharge chamber has a volume V that fully encloses the plasma
that is produced by ionization of neutral gas by the plasma electrons. The ions
from the plasma flow only to the accelerator grid structure (perfect confinement
elsewhere in the discharge chamber) with a current given by the Bohm current:
Chamber Wall
e-
XeD
.
Xe+ ..'
I
Accelerator I
Grids I
I
Fig. 4-3. Idealized Ion thrustar with the Ions aasumed
going to the grids and electrons going to the chamber
wall.
94
Chapter 4
1
Ii = -nieva A ,
2
(4.2-1)
where ni is the ion density in the center of the volume; va is the ion acoustic
velocity; A is the total ion loss area, which is assumed to be only the grid area;
and the ions are assumed to be cold relative to the electrons. The ion beam
current is then the total ion current to the grids multiplied by the effective grid
transparency, Tg:
1
Ib = -nievaATg,
2
(4.2-2)
where the current lost to the accel and decel grids has been neglected as small.
Ions are assumed to be produced by ionization of neutral particles by the
plasma electrons in the discharge chamber, with a rate given by
Ip = nonee(aiV e ) V ,
(4.2-3)
where no is the neutral gas density, ne is the plasma electron density, ai is the
ionization cross section, v e is the electron velocity, and the term in the brackets
is the reaction rate coefficient which is the ionization cross section averaged
over the Maxwellian electron velocity distribution function. The formulation of
the reaction rate coefficient was described in Chapter 3, and the values for
xenon as a function of electron temperature are given in Appendix E.
Power is conserved in the system, so the power put into the plasma is equal to
the power that comes out in the form of charged particles and radiation. To first
order, the power injected into the plasma goes into ionization and excitation of
the neutral gas, heating of the electrons, and power that is carried to the walls
and the grids by the ions and electrons. The power that is put into the system is
then
+ * * ne V
Fin = I pU + I U + IiEi + - Ee '
'C
(4.2-4)
where U+ is the ionization potential of the propellant gas, U* is the excitation
potential of the gas, 'C is the average electron confinement time, Ei is the ion
energy carried to the walls, and Ee is the electron energy carried to the walls by
*
the electrons leaving the plasma. The term I is the excited neutral production
rate, given by
Ion Thruster Plasma Generators
95
l* = L nonee ( a. v e ) . V ,
. }
}
(4.2-5)
where a is the excitation cross section and the reaction rate coefficient is
.
averaged over the electron distribution function and summed over all possible
excited states j. Using Eqs. (4.2-3) and (4.2-5) in Eq. (4.2-4), the power input
can then be written as
( ) r + (a.ve)j * ] neV
Pjn = none aive V V + ( . ) V +liEi+-Ee.
a1v e r
(4.2-6)
Assuming quasi-neutrality (ni "" ne) and that the ions and electrons leave the
volume by ambipolar flow at the same rate, which is a function of the mean
confinement time r, the ion current out is given by
I nieV
Ii = -nieva A = -.
2 r
(4.2-7)
The mean confinement time for ions and electrons is then
2V
r=-.
vaA
(4.2-8)
The energy that an electron removes from the plasma as it goes to the wall is
given by
kT
Ee = 2--f.+C/J,
e
(4.2-9)
where rp is the plasma potential relative to the wall. Equation (4.2-9) is derived
in Appendix C. The ions fall first through the pre-sheath potential,
approximated by Tevl2 to produce the Bohm velocity, and then through the
sheath potential. Each ion then removes from the plasma a total energy per ion
of
Ei =.!. kTe +C/J.
2 e
(4?-1())
\. ..- ..... /
The plasma potential in these two equations is found from the electron current
leaving the plasma, which is given by Eq. (3.7-52):
96
Chapter 4
( ) 112
I 1 SkT e .d -e IkT
a = - - e ne ''a exp e ,
4 nm
(4.2-11)
where Aa is the electron loss area and m is the electron mass. Since ambipolar
ion and electron flow to the wall was assumed, equate Eqs. (4.2-1) and (4.2-11)
and use .JTe / M for the ion acoustic velocity to give the plasma potential
relative to the wall:
t/J= kTe In [ Aa 2M ] .
e A nm
(4.2-12)
Equation (4.2-12) is normally called the floating potential and applies in this
case because there are no applied potentials in our ideal thruster to draw a net
current.
The electron temperature can be found by equating the ion production and loss
rates, Eqs. (4.2-1) and (4.2-3), which gives
.JkTe/ M _ 2n o V
(aiVe) A
(4.2-13)
The reaction rate coefficient in the denominator depends on the electron
temperature, and so this equation can be solved for Te if the discharge chamber
volume, neutral pressure, and ion loss area are known.
The discharge loss is defined as the power into the plasma divided by the beam
current out of the thruster, which is a figure of merit for the efficiency of the
plasma-generation mechanism. The discharge loss for this idealized thruster,
using Eq. (4.2-2) for the beam current, is then given by
Fin 2n o {a i V e )V [ + (a.ve}j * ]
1Jd = - = U + U
Ib va A Tg (aiVe)
+ [ 2.5kTe + 2kTe In ( Aa J2M )1 .
Tge A nm _
(4.2-14)
As evident in Eq. (4.2-14), the grid transparency (Tg) directly affects the
discharge loss, and the input power is distributed between the first term related
Ion Thruster Plasma Generators
97
to producing ions and excited neutrals, and the second tenn related to heating
the electrons that are lost to the walls.
To evaluate Eq. (4.2-14), the ratio of the excitation to ionization reaction rates
as a function of the Maxwellian electron temperature must be known. This is
shown in Fig. 4-4 for xenon gas from data in Appendix E. For electron
temperatures below about 8 V, the excitation rate exceeds the ionization rate in
xenon for Maxwellian electrons. Since the lowest excitation potential is near
the ionization potential in xenon, this higher excitation rate results in more of
the input power being radiated to the walls than producing ions. This effect
explains at least part of the inefficiency inherent in xenon plasma generators.
Excitation rates equal to or higher than the ionization rate at low electron
temperatures are also generally found for other inert gas propellants.
The discharge loss from Eq. (4.2-14) for this ideal thruster example is plotted as
a function of the mass utilization efficiency for a generic 20-cm-diameter
thruster in Fig. 4-5, where the ionization potential of xenon is 12.13 V, the
average excitation potential is 10 V, and 80% of the ions incident on the grids
become beam ions (T g = 0.8). It was also assumed for simplicity that the
plasma electrons were lost to the floating screen grid and the chamber wall. The
mass utilization efficiency is inversely proportional to the neutral density in the
thruster, which will be derived in Section 4.3.6. In the figure, the discharge loss
is shown in (e Vlion), which is equivalent to watts of discharge power per
ampere of beam ions (W/A). In an ideal plasma-generator case with 80% of the
ions that are generated assumed to become beam current, the amount of power
3 4 5 6 7
Electron Temperature (eV)
Fig. 4.4. Ratio of the excitetion to ionization rate coefficients for xenon as a
function of the electron temperature.
14
12
.2
iij
c:: 10
c
.2
iij 8
N
'c
.2
6
c
.2
2 4
"ts
><
lJ.J
2
0
0
1-------------------------------------------------
2
8
10
9
98
Chapter 4
140
130
120
C 110
0
100
en
en
0
...J 90
OJ
e>
'" 80
.t::
U
en
[5 70
60
50
40
0.75 0.80
I
I
/
0.85
0.90
0.95
1.00
Mass Utilization Efficiency
Fig. 4-5. Discharge loss for the ideal thruster example as a function of
mass utilization efficiencies for a 3D-cm plasma generator length.
required to produce one ampere of beam current is about 90 watts. While it
only takes 12.13 eV to ionize a xenon atom, even in an idealized thruster it
takes 7.5 times this energy to produce and deliver an ion into the beam due to
other losses.
It is informative to see where the extra input power goes in the thruster.
Figure 4-6 shows the power lost in each of the four energy loss mechanisms
described above for an ideal thruster 30-cm long producing 1 A of beam
current. The ionization power is constant in this case because this example was
constrained to produce 1 A, and the power required per beam ampere is then
(1/0.8)* 12.13 = 15.1 W. The major power loss is excitation at low mass
utilization where the electron temperature is low, as suggested by Fig. 4-4. The
ion and electron convection losses to the wall also increase at higher mass
utilization efficiencies because the neutral density is decreasing, which
increases the electron temperature, raises the plasma potential, and thereby
increases the energy lost per electron and ion.
Many thruster design concepts use electron confinement to improve the
efficiency. The impact of this can be examined in this ideal thruster model by
reducing the anode area Aa' Figure 4-7 shows the four energy-loss mechanisms
for the same idealized thruster example just used, but with the effective anode
area collecting electrons decreased to 1 cm 2 . By conservation of charge,
Ion Thruster Plasma Generators
45
40
35
30
25
Q)
20
c..
15
45
40
35
30
25
....
Q)
20
c..
15
10
5
99
---
-
---
---
- - Excitation
- Electron Loss
- Ion Loss
- Ionization
10
5
o
0.76 0.78 0.80 0.82 0.84 0.86 0.88 0.90 0.92 0.94 0.96
Mass Utilization Efficiency
Fig. 4-6. Discharge loaa for aach of the enargy loss mechanisms for the
ideal thruster axample.
-- -
-
- -
-
- - Excitation - -
-- --
- Electron Loss
-Ion Loss ""-.....
-Ionization
-
o
0.76 0.78 0.80 0.82 0.84 0.86 0.88 0.90 0.92 0.94 0.96
Mass Utilization Efficiency
Fig. 4-7. Discharge loss for each oftha enargy lcas mechanisms for tha
idaal thruster with raduced anode area.
electrons in this discharge are lost at the same rate as ions, so electron
confinement does not change the number or rate of electrons lost. The reduced
anode area only changes the plasma potential relative to the loss area potential
in order to maintain charge balance, as seen from examining Eq. (4.2-11). This
effect is clearly seen by comparing Figs. 4-6 and 4-7, where the energy loss
rates for ionization and excitation have not changed with the better electron
100
Chapter 4
confinement, but the energy convected out of the plasma in the form of ion and
electron power to the boundaries has decreased. This is because the plasma
potential described by the last term in Eq. (4.2-14) is reduced due to the smaller
anode area, which reduces the ion and electron energy loss channels. This is the
fundamental mechanism for making efficiency improvements (reducing the
discharge loss) in plasma generators.
The idealized thruster description illustrates that the power that must be
provided to produce the plasma in a thruster is large compared to that required
for ionization. In terms ofthe total thruster efficiency, this is the majority ofthe
"other" power in Po in Eq. (2.5-1). In reality, the discharge loss is significantly
higher than that found in this idealized example due to imperfect confinement
of the ions and electrons in the thruster, and due to other loss mechanisms to be
described below.
Finally, in most ion thrusters, such as electron bombardment thrusters and
microwave-heated electron cyclotron resonance (ECR) thrusters, the electron
distribution function is non-Maxwellian. The higher energy electrons observed
in electron bombardment thrusters are often called primaries, and they have
been found to be either mono energetic or have some distribution in energies
depending on the plasma-generator design. Primary electrons have a larger ion
to excited-neutral production rate than do the plasma electrons due to their
higher energy, and so even small percentages of primaries in the plasma can
dominate the ionization rate. The inclusion of ionization by primary electrons in
particle and energy balance models such as the one just described tends to
reduce the discharge loss significantly.
4.3 DC Discharge Ion Thruster
Ion thrusters that use a DC electron-discharge plasma generator employ a
hollow cathode electron source and an anode potential discharge chamber with
magnetic multipole boundaries to generate the plasma and improve the
ionization efficiency. Electrons extracted from the hollow cathode are injected
into the discharge chamber and ionize the propellant gas introduced in the
chamber. Magnetic fields applied in the discharge chamber provide
confinement primarily of the energetic electrons, which increases the electron
path length prior to their being lost to the anode and improves the ionization
efficiency. The ions from this plasma that flow to the grids are extracted and
accelerated to form the beam.
Empirical studies over the past 50 years have investigated the optimal design of
the magnetic field to confine electrons and ions in thrusters. Figure 4-8 shows
the evolution of the discharge chamber geometry and magnetic field shape
Ion Thruster Plasma Generators
101
employed in efforts primarily aimed at improving the confinement of energetic
electrons injected into the chamber from thermionic cathodes in order to more
efficiently produce the plasma. Early thrusters pioneered by Kaufman utilized a
solenoidal [1] or mildly divergent magnetic field [2], shown in Fig.4-8(a),
which requires that electrons from the on-axis thermionic filament cathode
undergo collisions in order to diffuse to the anode and complete the discharge
circuit. A strongly divergent magnetic field thruster [3], shown in Fig. 4-8(b),
improved the primary electron unifonnity in the plasma volume and resulted in
a lower discharge loss and a more unifonn beam profile. This thruster
introduced a baffle in front of the hollow cathode electron source to further
inhibit on-axis electrons. The radial magnetic field thruster [4], shown in
Fig. 4-8( c), produced very unifonn plasmas and good efficiencies, as did a cusp
version of the "divergent magnetic field" thruster shown in Fig. 4-8(d). The use
of permanent magnet, multipole boundaries, first reported by Moore [5],
(a)
(b)
I I I
L7J
I I
(d)
(e)
F , '1 1
. I I
I: I I
I I
--, I I
----I ' : :
I I I
---
(f)
17) ,1
\,
I 'II
1)1
b:
----J \ I
D \ )\ :
1\1
,
,
r-1;---'1JI 1 1
Fig. 4-8. Magnetic field types of ion thrusters: (a) mildly divergent B-field, (b) strongly
divergent B-field, (c) radial field. (d) cusp field, (e) magnetic multipole field, and
(f) ring-cusp fields.
102
Chapter 4
created essentially a field-free region in the center of the thruster that produced
uniform plasmas. The magnets in various versions ofthis concept were oriented
in rings or in axial lines to provide plasma confinement. Moore biased the wall
and magnets at cathode potential and placed the anodes inside the cusp fields,
as shown in Fig. 4-8(e), to require that electrons diffuse across the field lines by
collisions or turbulent transport before being lost. The permanent magnet ring-
cusp thruster of Sovey [6] is shown in Fig. 4-8(f), which has become the most
widely used thruster design to date.
The divergent field Kaufman ion thruster matured in the 1970s with the
development of30-cm mercury thrusters [7,8]. Kaufman thrusters are described
in more detail in Section 4.4. Concerns with using mercury as the propellant
resulted in the development of xenon ion thrusters [9,10], which emerged at the
same time that the benefits of ring-cusp confinement geometries became
apparent [6,11,12]. The design and development of the NASA Solar Electric
Propulsion Technology AEplications Readiness (NSTAR) [13] and Xenon Ion
Propulsion System (XIPS ) [14] flight thrusters in the 1990s was based on this
early work. At this time, only two of these magnetic field geometries are still
used in DC ion thrusters: the multipole magnetic field ring-cusp thrusters and
the divergent solenoidal magnetic fields in Kaufman-type thrusters. Ring-cusp
thrusters use alternating polarity permanent magnet rings placed around the
anode-potential thruster body. Energetic electrons are injected along a weak
diverging magnetic field at the cathode and demagnetize sufficiently to bounce
from the surface magnetic fields until they either lose their energy by collisions
or find a magnetic cusp to be lost to the anode. Kaufman thrusters inject
energetic electrons along a strong diverging solenoidal magnetic field with the
pole-pieces typically at cathode potential and rely on cross-field diffusion of the
electrons to an anode electrode placed near the cylindrical wall to produce
ionization and create a stable discharge.
4.3.1 Generalized O-D Ring-Cusp Ion Thruster Model
The idealized plasma-generator model developed in Section 4.2 is useful in
describing how the discharge produces the plasma, but neglects many of the
particle flows and energy transport mechanisms found in actual thrusters. The
complete particle flows in a thruster discharge chamber are shown in Fig. 4-9.
The primary electron current emitted by the hollow cathode, I e ' generates ions
and plasma electrons. The ions flow to the accelerator structure (l s)' to the
anode wall (lia)' and back to the cathode (l k). Some fraction of the primary
electrons is lost directly to the anode at the magnetic cusp (l L). The plasma
electrons are also predominately lost to the anode at the cusp (la)' with only a
Ion Thruster Plasma Generators
103
Screen
and
Accelerator
Grids
Magnets
-1
'E t -2 Plasma Potential
Q)
'0 t $ Sheath Potential
c.. Anode
V k T
Ie V d Anode Voltage
I Cathode Orifice ..
Cathode
Hollow
Cathode
Fig. 4-9. Schematic of the thruster showing particle flows end potential distribution
in the discharge chamber.
very small fraction lost across the transverse magnetic field between the cusps
corresponding to the ambipolar current flows in this region.
The particle energies are determined by the potential distribution in the thruster.
Figure 4-9 also schematically shows the potential in the plasma chamber.
Electrons from the plasma inside the hollow cathode at a potential V c are
extracted through the orifice and into the discharge chamber where they gain
energy by passing through the potential V k = V d - V c + V p +4>. where V p is the
potential drop in the plasma and t/> is the anode sheath potential. Some of these
electrons cause ionization near the hollow cathode exit, which produces a
higher plasma density locally near the cathode exit that must be dispersed
before reaching the grid region in order to produce the desired unifonn plasma
profile across the grids. The potential drop V p in the plasma, which is assumed
to be unifonn and quasineutral, can be reasonably approximated as kTe /2e
from the pre-sheath potential in the nearly collisionless plasma. Ions leaving the
plasma then gain the energy E1 = kTe / 2e + 4> . which was given in Eq. (4.2-10).
Electrons in the tail of the Maxwellian distribution overcome the anode sheath
104
Chapter 4
and are collected by the anode at the cusps, where they remove an energy per
particle of E e =(2kT e le+f/J), which is given in Eq. (4.2-9) and derived in
Appendix C.
Analytic models of the discharge chamber performance in ion thrusters have
been described in the literature for many years [15-17]. The first
comprehensive model of the discharge chamber performance using particle and
energy balance equations in ring-cusp thrusters was developed by Brophy and
Wilbur [18,19] in 1984. In Brophy's model, volume-averaged particle and
energy balance equations including primary electrons were used to derive
expressions for the discharge loss as a function of the mass utilization
efficiency in the thruster. Brophy's model was extended by Goebel [20,21] to
include electrostatic ion confinement, primary confinement and thermalization,
the anode sheath [22], and hollow cathode effects. This model utilizes magnetic
field parameters obtained from a magnetic field solver that accurately models
the magnetic boundary. Since the model assumes a uniform plasma in the
volume inside the magnetic confinement in the discharge chamber, it is
sometimes called a O-dimensional (O-D) model.
The O-D discharge chamber model to be described here [21] self-consistently
calculates the neutral gas density, electron temperature, primary electron
density, plasma density, plasma potential, discharge current, and ion fluxes to
the boundaries of the discharge chamber. While the assumption of uniform
plasma is not particularly accurate near the cathode plume, the majority of the
plasma in the discharge chamber is relatively uniform, and the model
predictions agree well with experimental results. The O-D model solves for
discharge loss as a function of the mass utilization efficiency, which is useful in
plotting performance curves that best characterize the discharge chamber
performance.
The particle flows and potential distribution in the thruster used in the O-D
model are shown schematically in Fig. 4-9. Mono-energetic primary electrons
with a current Ie are assumed to be emitted from the hollow cathode orifice
into the discharge chamber, where they ionize the background gas to produce a
uniform plasma. Electrons produced in the ionization process and primary
electrons that have thermalized with the plasma electrons create a Maxwellian
plasma electron population that also contributes to the ionization. Due to the
relatively high magnetic field produced by the magnets near the wall, the
electron Larmor radius is much smaller than the dimensions of the discharge
chamber, and both primary and plasma electrons are considered to be reflected
from the boundary region between the magnetic cusps. The primary and plasma
electrons can be lost at the magnetic cusps because the magnetic field lines are
Ion Thruster Plasma Generators
105
essentially perpendicular to the surface. The number of electrons lost at the
cusp depends on the local sheath potential and the effective loss area at the
cusp. Ions produced in the discharge chamber can flow back to the hollow
cathode, to the anode wall, or to the plane ofthe accelerator. At the accelerator,
these ions are either intercepted and collected by the screen electrode with an
effective transparency, Tg, or are extracted from the plasma through the grids
to become beam ions. The screen grid transparency depends on the optical
transparency of the grid and the penetration of the high voltage fields from the
accelerator region into the screen apertures. While this transparency is an input
to the discharge model, it is calculated by the ion optics codes described in
Chapter 5.
In this model, the high-voltage power supply that accelerates the ions, called
the screen supply, is connected to the anode. This means that the ions fall from
the average plasma potential in the discharge chamber to form the beam. It is
also possible to connect the screen supply to the screen and cathode, which
means that the ion current in the beam must pass through the discharge supply.
This changes the algebra slightly in calculating the discharge performance, but
it does not change the results. The components of the particle and energy
balance model are described in the following sections.
4.3.2 Magnetic Multipole Boundaries
Ring-cusp ion thrusters use alternating polarity permanent magnet rings
oriented perpendicularly to the thruster axis, with the number of rings selected
and optimized for different size thrusters [20]. This configuration provides
magnetic confinement of the electrons with finite loss at the magnetic cusps,
and electrostatic confinement of the ions from the anode wall due to the quasi-
ambipolar potentials at the boundary from the transverse magnetic fields. Line-
cusp thrusters also use high field magnets, but the magnets are configured in
alternating polarity axial lines that run along the chamber wall. Asymmetries at
the ends of the line cusps cause plasma losses and difficulties in producing a
uniform symmetric field at the cathode exit, which adversely affects the
electron confinement and thruster efficiency. Ring-cusp thrusters are the most
commonly used discharge chamber design at this time due to their ability to
produce high efficiency and uniform plasmas at the ion accelerator surface if
properly designed.
A schematic representation of a section of a ring cusp magnetic multipole
boundary is shown in Fig. 4-10. In this view, a cut along the axis through a six-
ring boundary at the wall is made, leaving the ends of the alternating magnets
visible. The magnetic field lines terminate at the magnet face, resulting in a
cusp magnetic field with field lines perpendicular to the wall at the magnet.
106
Chapter 4
Electrons that are incident in this area will be either reflected by the magnetic
mirror, electrostatically repelled by the sheath potential, or lost directly to the
anode. Electrons that are incident between the cusps encounter a transverse
magnetic field and are reflected from the boundary. The contours of constant
magnetic field shown on the right in Fig. 4-10 illustrate that the total field is
essentially constant across the boundary at a distance sufficiently above the
magnets, although the component of the field is changing from purely
perpendicular at the cusp to purely parallel between the cusps.
An analysis of the magnetic field strength for various multipole boundaries was
published by Forrester [23] and discussed by Lieberman [24]. Since the
divergence of the magnetic field is zero, the field satisfies Laplace's equation,
and the solution for the lowest-order mode at a distance from the magnets
greater than the magnet separation can be expressed by a Fourier series. This
gives a magnetic field strength above the magnet array described by
B ( ) _ nwB o ( nx ) -ny / d
x Y - -cos - e
y' 2d d '
(4.3-1)
where Bo is the magnetic field at the surface of the magnet, d is the distance
between the magnet centers, w is the magnet width, and the y-direction is
perpendicular to the wall in Fig. 4-10. Due to localized magnet positions, the
field has the periodic cosine behavior along the surface of the wall illustrated in
the figure. In addition, the magnetic field decreases exponentially away from
the wall all along the boundary.
At the cusp, the field actually decreases as 1/ d 2 due to the dipole nature of the
permanent magnet. This rapid decrease in the field moving away from the
magnet illustrates the importance of placing the magnets as close to the plasma
Contours of
Constant Total B
Alternating-Polarity
Magnet Rings
Fig. 4-10. Cross section (side) view of s six-ring-cusp magnetic
multipole boundary showing the magnetic field lines and examples
of contours of constant magnetic field.
Ion Thruster Plasma Generators
107
as possible to maximize the field strength inside the discharge chamber for a
given magnet size in order to provide .sufficient field strength for primary and
secondary electron confinement at the wall. Between the cusps, the dipole
characteristics of the local field forces the field lines to wrap back around the
magnets, which causes the magnetic field strength to have a maximum at a
distance y = 0.29*d from the wall, which will be derived in Section 4.3.4. The
transverse maximum field strength produced between the cusps is important to
provide electron and ion confinement, which improves the thruster efficiency.
While analytic solutions to the magnetic field provide insight into the field
structure, the availability of commercial computer codes to calculate the fields
accurately makes it much simpler to model the entire ring-cusp field. For
example, Fig. 4-11 shows the contours of constant magnetic field measured and
calculated using Maxwell three-dimensional (3-D) magnetic field solver [25]
for the Nuclear Electric Xenon Ion Thruster System (NEXIS) [20] with six ring
cusps. The measured and calculated values are within the measurement error.
This type of plot shows clearly the localized surface-field characteristic of
magnetic multi pole boundaries, which leaves the majority of the inner volume
essentially magnetic-field free. A large field-free region design significantly
enhances the plasma unifonnity and ion current density profile [20,26]. In this
case, the 60-gauss magnetic field contour is closed throughout the inside
surface of the thruster, which will be shown in the next section to provide good
plasma confinement at the wall.
I:::
o
:;::>
'iij
o
a.
tii
'x
<!
Grid Hole Pattem Diameter ;-'
-30
-20
-10
o
10
20
30
Radial Position (em)
Fig. 4-11. Comparison of measured (dashed) and calculated (solid)
magnetic field contours in the six-ring NEXIS thruster [20].
108 Chapter 4
4.3.3 Electron Confinement
The primary electrons are injected into the discharge chamber from the hollow
cathode. The discharge chamber can be viewed as a volume with reflecting
boundaries and discrete loss areas for the electrons at the cusps where the
magnetic fields lines are nearly perpendicular to the surface. The primary
electrons then effectively bounce around in the chamber until they are either
lost directly to the anode wall by encountering the finite loss area at the cusps,
make an ionization or excitation collision, or are thennalized by coulomb
interactions with the plasma electrons. The primary current lost directly to the
anode cusps is given by
I L = npevpAp'
(4.3-2)
where np is the primary electron density, v p is the primary electron velocity,
and Ap is the loss area for the primaries.
The loss area for primary electrons at the cusp [27] is given by
2 2mvp
Ap = 2 rp Lc = - - Lc,
B e
(4.3-3)
where rp is the primary electron Lannor radius, B is the magnetic field strength
at the cusp at the anode wall, v p is the primary electron velocity, e is the
electron charge, and Lc is the total length of the magnetic cusps (sum of the
length of the cusps).
Using a simple probabilistic analysis, the mean primary electron confinement
time can be estimated by
V
T p =-'
v p Ap
(4.3-4)
where V is the volume of the discharge chamber. The mean primary electron
path length prior to finding a cusp and being lost to the wall is L = v p * T P .
Likewise, the ionization mean free path is A = 1 / noO" , where 0" represents the
total inelastic collision cross section for the primary electrons. The probability
that a primary electron will make a collision and not be directly lost to the
anode is then
Ion Thruster Plasma Generators
109
p = [1- exp -noaL ] = [1- exp( -noaV lAp) ] .
(4.3-5)
By providing strong magnetic field strengths at the cusp to minimize the
primary loss area, the probability of a primary electron being lost directly to the
anode can be made very small. Similarly, ion thrusters with large volumes
and/or operated at higher internal gas densities will cause the primary electrons
to undergo collisions and thermalization prior to being lost directly to the
anode. Minimizing the energy loss associated with primaries being lost before
making a collision in this way serves to maximize the efficiency of the thruster.
An example of the probability of a primary electron making a collision before
finding a cusp is shown in Fig. 4-12 for the case of the NEXIS thruster
designed with either 4 or 6 cusps [20]. For the design with 6 cusps, it is
necessary to have cusp-field strengths approaching 2000 G at the surface of the
anode in order to minimize primary loss. Designs with a smaller number of ring
cusps, corresponding to a smaller primary anode collection area from
Eq. (4.3-3), require less magnetic field strength to achieve the same benefit.
However, it will be shown later that the number of cusps affects efficiency and
uniformity, and that maximizing the probability of a primary making a collision
before being lost is only one of the trade-offs in designing an ion thruster.
1.20
'"
0
0.80
'0
u
'0 0.60
Li
<11
.D
e
0-
0.20
0.00
0
soo
1000
1500
2000
2500
3000
Cusp Magnetic Fjeld (gauss)
Fig. 4.12. Probability of primary electrons making a collision before
being lost to the anode as a function of the cusp magnetic field strength
for the NEXIS thruster design [20].
110
Chapter 4
Since the primary electron current lost directly to the anode is generally
minimized for best efficiency, the discharge current is carried to the anode
mainly by the plasma electrons. The plasma electrons are almost exclusively
lost at the magnetic cusps, but their motion is affected by the presence of ions
that also penetrate the cusp. Therefore, ions and electrons are lost to a hybrid
anode area [27] at the cusp given by
Aa = 4 rh Lc = 4 M Lc,
(4.3-6)
where rh is the hybrid Larmor radius, re is the electron Larmor radius, and ri
is the ion Larmor radius. The flux of plasma electrons, Ia' that overcomes the
sheath at the anode is
1 ( 8kT ) 1/2
I = - --!... en.LI e x p -etPlkT"
a 4 nm e"'a
(4.3-7)
where f/J is the local plasma potential relative to the anode (essentially the anode
sheath potential).
The plasma in the discharge chamber obeys particle conservation in that the
current injected and produced in the discharge must equal the total current that
leaves the discharge:
L.-( Iinjected + Iproduced) = L.-Iout.
(4.3-8)
The current injected into the discharge volume is the primary electron current,
and the current produced is the ion and electron pairs from each ionization
collision. The current lost to the anode is the sum of the direct primary loss, the
plasma electron loss, and a fraction of the ion loss. There is also ion current lost
to cathode potential surfaces and the accelerator structure from the balance of
the ions produced in the discharge. The plasma potential will adjust itself such
that the total electron current to the anode is equal to the total ion current out of
the discharge. It will be shown in the following sections that changing the
anode area via the magnet strength or number of magnet rings will change the
plasma potential relative to the anode (essentially the anode sheath voltage),
which affects both the energy loss though the sheath and the stability of the
discharge.
4.3.4 Ion Confinement at the Anode Wall
Ions are typically unmagnetized in ion thruster discharge chambers because the
magnetic field is relatively low throughout the bulk of the discharge chamber,
Ion Thruster Plasma Generators
111
which results in a large ion Lannor radius compared to the thruster dimensions.
For an unmagnetized plasma, the ion current flowing out the plasma volume in
any direction is given by the Bohm current:
]. = .l.n.e kTe A
I 2 1 M '
(4.3-9)
where ni is the ion density in the center of the discharge and A is the total ion
loss area. The Bohm current also describes ion flow along magnetic field lines,
which will be useful later in discussing other plasma generator types.
The electrons mayor may not be magnetized in the main discharge chamber
volume, but they are strongly affected by the magnet fields near the boundary
in ring-cusp thrusters. The magnetized electrons then influence the ion motion
near the boundaries by electrostatic effects. This causes the ion loss to the cusps
to be the Bohm current to the hybrid area, given by Eq. (4.3-6), and a reduction
in the Bohm current to the wall area between the cusps due to the ambipolar
potentials that develop there. Since the cusp area is small compared to the rest
of the anode surface area facing the plasma, the ion current to the hybrid cusp
area often can be neglected. However, between the cusps the loss area is
significant, and it is possible to analyze the electron and ion transport across the
magnetic field to calculate the reduction in the ion velocity caused by the
reduced transverse electron drift speed. This is then used to calculate the rate of
ion loss to the anode compared to the unmagnetized Bohm current to the walls.
Ring cusp thrusters are designed with various numbers of rings, distances
betweens the rings, and magnet sizes that detennine the magnetic field strength
in the discharge chamber transverse to the wall. The quasi-neutral plasma flow
across this magnetic field to the wall is described by the diffusion equation with
an ambipolar diffusion coefficient. Ambipolar diffusion across a magnetic field
was analyzed in Section 3.6.3.2. The transverse ion velocity was found to be
/le ( kTe V' n )
V; (1+II;B 2 _ ::: ) E+-;--;;.
(4.3-10)
Setting the transverse electric field E in the plasma to zero in Eq. (4.3-10) gives
the case where the ambipolar electric field exactly cancels the pre-sheath
electric field that nonnally accelerates the ions to the Bohm veloc ity. In this
case, the ion velocity is just the ion thennal velocity ("" .J kT i / M ), and the
value of Bin Eq. (4.3-10) is the minimum transverse magnetic field required to
112
Chapter 4
reduce the electron mobility sufficiently to produce this effect. Due to the
smaller ion velocity, the flux of ions passing through the transverse magnetic
field is greatly reduced compared to the Bohm current. The ion flux that does
reach the wall is finally accelerated to the Bohm velocity close to the anode
wall to satisfy the sheath criterion. Ions are conserved in this model because
ions that are inhibited from flowing to the anode wall due to the transverse
fields instead flow axially toward the grids where there is no confinement.
However, it is not necessary to limit this analysis to the case of E = O. If the
magnetic field is smaller than the critical B that causes E = 0, then the
transverse electron mobility increases and a finite electric field exists in the
magnetic diffusion length l. The ions fall through whatever potential difference
is set up by this electric field, which means that the ions are accelerated to an
energy given by
I 2
-MVi =e E.l.
2
(4.3-11)
The ambipolar flow in the transverse magnetic field changes the electric field
magnitude in the pre-sheath region and reduces the acceleration of the ions
toward the wall. In the limit of no magnetic field, the electric field must
accelerate the ions to the Bohm velocity, which results in a net electric field in
the plasma-edge region limited to
2
E = _ MVi
e 1
(4.3-12)
Note that the electric field sign must be negative for the ion flow in this region.
Using Eq. (4.3-12) in Eq. (4.3-10), the minimum magnetic field to produce an
ion velocity of Vi is
B= vem (kTe-Mvl) ( ) ,
e vimveR. l+v
(4.3-13)
where v = v en / vei, and kTe Vn / en is approximately kTe / el for 1 representing
the length the ions travel radially in the transverse magnetic field between the
cusps. The value of 1 can be estimated from calculations of the transverse
magnetic field versus the distance from the wall between the cusps, and is
usually on the order of2 to 3 cm.
Ion Thruster Plasma Generators
113
Alternatively, the modified electric field given in Eq. (4.3-12) can be inserted
into Eq. (4.3-10) to produce an expression for the transverse ion velocity:
2 el ( 2 2 Vei ) kTe
vi +- l+,ue B -- Vi--=O.
,ueM V e M
(4.3-14)
This quadratic equation can be easily solved to give
_ 1 [ eR. (1 2 B 2 Vei )] 2 4kTe
vi-- - +,ue -- +-
2 M ,ue v e M
- [ ( 1+.u;B2 _ Vei )] .
2M,ue v e
(4.3-15)
The collision frequencies (v e = v en + vei and v = v en / vei ) in these equations
for xenon plasmas were given in Chapter 3, where the electron-neutral collision
frequency is given in Eq. (3.6-12) and the electron-ion collision frequency is
given in Eq. (3.6-14). It is possible to show that in the limit that B goes to zero
and the flow is essentially collisionless, Eq. (4.3-15) reverts to the Bohm
velocity.
Defining an ion confinement factor
V.
-f _ I
Jc=-'
vBohm
(4.3-16)
and since the Bohm velocity is vBohm = .J kTe / M , it is a simple matter to
calculate the reduction in the expected flux of ions going to the anode due to
the reduction in the Bohm velocity at a given magnetic field strength B. The ion
current transverse to the magnetic field between the cusps to the anode is then
given by
1(kT;"
I ia = '2ni e M Aasfc,
(4.3-17)
where Aas is the total surface area of the anode exposed to the plasma.
There are two issues with using Eq. (4.3-17) to evaluate ion loss rate reduction
between the cusps. First, the magnetic field in the ring-cusp geometry is not
transverse to the wall everywhere. Near the cusp, the field transitions from
114
Chapter 4
parallel to perpendicular to the wall, where the analysis above does not apply.
However, the magnetic field strength in this region increases rapidly near the
magnets and some fraction of the plasma electrons is reflected from the
magnetic mirror. This serves to retard the ion flux electrostatically in a manner
similar to the ambipolar diffusion case between the cusps described above.
Ultimately, the ions are lost at the cusp with the Bohm current to the hybrid
area, and it is usually found that the transition to this unimpeded ion flow to the
wall occurs over an area that is small compared to the total area between the
cusps.
The second issue with using Eq. (4.3-17) is that the diffusion thickness I is not
known. However, this can be estimated for ring-cusp thrusters using a dipole
model for the magnets. Consider the case of two rows of opposite polarity
magnets, which is illustrated in part of Fig. 4-10. Each magnet has a dipole
strength M per unit length, and the magnets are separated in the x-direction by a
distance d. The magnetic field along the line perpendicular to the midline
between the magnets is
IB+ (y)1 = =
q
d 2
_ +(y_8)2
4
(4.3-18)
where r is the length of the line from the point on the midline to the magnet,
q is the number of magnetic dipoles, and 8 is the half height of the magnet. The
magnetic field on the centerline between the magnets has only an x-component.
The x-component of the field from one magnet (positive polarity) is given by
d d
q- q-
B;(y)=IB+(y)jcos8= = 2 2 .
r d 2
- +(y-8)
4
(4.3-19)
The field in the x-direction from both magnets is then
qd
Bx(Y) = 2
d 2
- +(y-8)
4
qd
2 '
:!. + (y + 8)2
4
(4.3-20)
and so the total field on the center line is
Ion Thruster Plasma Generators
115
B ) _ 2(2q8)yd _ 2M yd
(y - 2 2 '
( 2+1) (1 2 + 1 )
(4.3-21)
where the magnetization M is the number of magnetic dipoles times the length
of the magnet.
The maximum magnetic field strength between the magnets, found from
Eq. (4.3-21), then occurs at
d
y = 2.J3 = O.29d l.
(4.3-22)
It is assumed that the diffusion length I is roughly this distance. This is not an
unreasonable approximation, as illustrated in Fig. 4-13. The magnetic field
decreases on each side of the maximum, but is nearly the full value over the
length of about 0.3 of the distance between the magnets.
The maximum transverse field strength along the centerline between the
magnets, often called the "saddle-point" field, can also be calculated from this
simple derivation. Using Eq. (4.3-22) in Eq. (4.3-21), the maximum magnetic
field is
M
B(Ymax) =5.2 2 ,
d
(4.3-23)
6
5
4
N
3
2
o
0.0 0.2
0.4
0.6
1.0
1.2
1.4
1.6
0.8
yld
Fig. 4-13. Magnetic field strength as a function of distance above the
magnets.
116
Chapter 4
The dipole strength per unit length is
M == BrVm
4nw '
(4.3-24)
where Br is the residual magnetic field of the magnet, V m is the volume of the
magnet, and w is the width of the magnet. For example, for two rows of
magnets that have a residual magnetic field of 10,000 gauss, a volume per
width of 0.6 cm 2 , and a separation of 10 em, the maximum transverse magnetic
field is 24.8 gauss and occurs at a distance of2.9 cm above the boundary.
As an example of the ion loss rate to the anode, the fraction of the Bohm
current to the anode (I jo / I Bohm ) is plotted in Fig. 4-14 as a function of the
magnetic field at the saddle point for the NSTAR ion thruster [13]. At zero
transverse magnetic field, the ion flux to the anode is the Bohm current. As the
transverse field increases and reduces the electron mobility, the ions are slowed
and the current loss decreases. In the NSTAR design, the last closed magnetic
contour is about 20 gauss, and so roughly half of the ions initially headed
radially toward the anode are lost. For closed magnetic field contours of at least
about 50 gauss, the ion loss to the anode is reduced by nearly a factor of 10
compared to the unmagnetized Bohm current. This can make a significant
difference in the efficiency of the plasma generator and the amount of discharge
power required to produce the beam ions. Even though the ions are
unmagnetized in these thrusters, it is clear that ambipolar effects make the ring-
cusp magnetic fields effective in reducing the ion loss to the walls.
1.0
0.9
$' 0.8
'E 0.7
::> 0.6
u
E 0.5
.r;
0
CD 0.4
'0
.:: 0.3
.Q
t5
ro 0.2
u:
0.1
0.0
0
10
20
30
40
50
60
Peak Closed Transverse Magnetic Field (gauss)
Fig. 4-14. Fraction of the Bohm current density to the anode wall as a
function of the transverse magnetic field strength for the NSTAR ion
thruster [13].
Ion Thruster Plasma Generators
111
4.3.5 Ion and Excited Neutral Production
Ions in the discharge chamber are produced by both the primary electrons and
by the tail of the Maxwellian distribution of the plasma electrons. The total
number of ions produced in the discharge in particles per second is given by
I p = none(aive)V + non p(aiv p)V,
(4.3-25)
where no is the neutral atom density, ne is the plasma electron density, aI is
the ionization cross section, V e is the plasma electron velocity, V is the plasma
volume inside the discharge chamber, np is the primary electron density, and
v p is the primary electron velocity. The terms in the brackets are the ionization
cross section averaged over the distribution of electron energies, which is
usually called the reaction rate coefficient.
An example of ionization and excitation cross sections [28,29] used for electron
impact on xenon is shown in Fig. 4-15. If it is assumed that the primary
electrons are monoenergetic, then the reaction rate coefficient in Eq. (4.3-25)
for primary ionization is just the cross section in Fig. 4-15 times the
corresponding primary electron velocity. These data are listed for xenon in
Appendix D. If the primaries have a distribution in energy, then the cross
section must be averaged over that distribution. For Maxwellian electrons, this
is calculated for xenon and listed in Appendix E.
10- 19
N
.s
c
.2
10- 20
(/)
In
In
EO:
u
__ Rapp Ionization
o Hayashi Ionization
- Hayashi Excitation
10- 21
10
20
30
40
50
60
70
80
Electron Energy (eV)
Fig. 4-15. Ionization and excitation cross sactions for xenon [28,29].
118
Chapter 4
Excited neutrals are also produced by both the primary electrons and the tail of
the Maxwellian distribution of the plasma electrons. The total number of exited
neutrals produced in the discharge in particles per second is given by
]* =none ((J. v e )V+nonp ((J. vp)V ,
(4.3-26)
where (J. is the excitation cross section. Again, the excitation cross section is
averaged over the distribution in electron energies to produce the reaction rate
coefficients in the brackets. The reaction rate coefficients calculated by
averaging the ionization and excitation cross sections over the Maxwellian
energy distribution are shown in Fig. 4-16 and listed in Appendix E. The rate of
excitation is seen to exceed that of ionization for low electron temperatures
(below about 9 e V). The ratio of excitation to ionization reaction rates for
xenon is shown in Fig. 4-4. As previously described, at low electron
temperatures, a significant amount of the energy in the discharge goes into
excitation of the neutrals at the expense of ionization. This is one of the many
reasons that the cost of producing an ion in ion thrusters is usually over ten
times the ionization potential.
For inert gas propellants commonly used in ion thrusters, the second ionization
potential is on the order of twice the first ionization potential. For example, the
first ionization potential of xenon is 12.13 eV, and the second ionization
potential is 21.2 eY. DC electron discharges that have electron energies in
excess of 21.2 V can produce a significant number of double ions. In addition,
10- 13
10- 14
g 10- 15
2
(II
a::
c:
.2 10- 16
t)
(II
(1)
a::
10- 17
10- 18
0
2
3
4
5
6
7
8
9 10
Electron Temperature (eV)
Fig. 4-16. Ionization and excitation reaction rates averaged over a Maxwellian
electron distribution in a xenon plasma.
Ion Thruster Plasma Generators
119
the tail of the Maxwellian electron distribution will also contain electrons with
an energy that exceeds the second ionization potential, and significant numbers
of double ions will be produced if the electron temperature in the discharge
chamber is high.
The generation rate of double ions is determined in the same manner as single
ions, discussed above, with different ionization cross sections [30]. The density
of the double ions is determined by the continuity equation for that species,
d H
:t +V.(n H v+.J2)=nH,
(4.3-27)
where it is assumed that due to the double ions' charge, the velocity will be
increased over the singly ionized species by a square root of two. Defining the
rate of double-ion production compared to single-ion production as
++
RH=
+ '
n
(4.3-28)
the beam current density of single ions from the discharge plasma boundary
through the ion optics (again with a transparency Tg) is
+ + + + ( ++ )
J i =n evBT = nieVBT g l-R ,
(4.3-29)
where ni is the total ion density. The double-ion current density is likewise
Jt+ = n++(2e)(.J2v )Tg = .J8niev TgR++.
(4.3-30)
The total ion beam current is then the sum of the singly and doubly ionized
particle currents.
As discussed in Chapter 2, the discharge propellant efficiency is the ratio of the
propellant that becomes beam ions (of any charge) to the rate of propellant flow
into the discharge chamber. Considering the effect of double ions, the
propellant efficiency of the discharge chamber is then
( + .T + J Ag
T)md = J B +- -;-,
2 emd
(4.3-31)
120
Chapter 4
where md is the mass flow into the discharge chamber and Ag is the area of
the grids. In the event that there is a significant double-ion content in the
discharge plasma, the beam current and the discharge chamber mass utilization
efficiency must be corrected using these equations.
4.3.6 Neutral and Primary Densities in the Discharge Chamber
The ion and excited neutral production rates described by Eqs. (4.3-25) and
(4.3-26) require knowledge of the neutral gas density in the discharge chamber.
The neutral gas flow that escapes the chamber (the unionized propellant) is
simply the gas injected into the discharge chamber minus the gas particles that
are ionized and extracted to form the ion beam:
Ib
Qout =Qin --.
e
(4.3-32)
The neutral gas that leaks through the grid is the neutral flux on the grids (in
particles per second) times the grid optical transparency Ta and a conductance
reduction tenn 17e known as the Clausing factor [31]:
1
Qout = -n o v o AgTa17e,
4
(4.3-33)
where V o is the neutral gas velocity, Ag is the grid area, and 17e is the
Clausing factor. The Clausing factor represents the reduced conductance of the
grids for finite grid thicknesses and results from Clausing's original work on
gas flow restriction in short tubes. For typical grid apertures with small
thickness-to-length ratios, the Clausing factor must be calculated using Monte
Carlo techniques, an example of which is given in Appendix G. In general, ion
thruster grids will have Clausing factors on the order of 0.5.
The mass utilization efficiency of the thruster discharge chamber is defined as
Ib
17md =-.
Qin e
(4.3-34)
Equating Eqs. (4.3-32) and (4.3-33), using Eq. (4.3-34), and solving for the
neutral gas density in the discharge chamber gives
4Qin (1- 17 m d) 4 I B (1- 17md)
no = =
v o AgTa17 e V o eA g Ta17 e 17md
(4.3-35)
Ion Thruster Plasma Generators
121
Flow is usually given in standard cubic centimeters per minute (sccm) or mg/s,
and conversions from these units to number of particles per second, useful in
Eq. (4.3-35), are given in Appendix B. The neutral pressure in the discharge
chamber during operation of the thruster can also be found using this
expression and the conversion from density to pressure given in Eq. (2.7-2), if
the neutral gas temperature is known. In general, the neutral gas atoms collide
with the anode wall and grids several times before being lost, and so the neutral
gas can be assumed to have the average temperature of the thruster body in
contact with the plasma. This temperature typically ranges from 200 to
300 deg C for operating thrusters.
The electron temperature in the discharge chamber can be found using particle
balance of the ions. The total ion production rate, given by Eq. (4.3-25), must
equal the total ion loss rate. The ion loss rate is given by the Bohm current in
Eq. (4.3-9) with the area A representing the sum of all the surfaces that collect
ions (cathode, anode, and grids), with the appropriate confinement factor Ie
found in Eq. (4.3-16) multiplied by the anode surface area. Equating
Eqs. (4.3-25) and (4.3-9) and using Eq. (4.3-35) for the neutral density gives
fkT:
M _ 2n o V _ 8V Qin(l-17md)
( ) p ( ) A, v o AgA;Ta17c
G';v e V+ G';v p V .
ne
(4.3-36)
If the total flow into the discharge chamber and the mass utilization efficiency
are specified, and the primary electron density is calculated as described below,
then Eq. (4.3-36) can be solved for the electron temperature. This is because the
ionization and excitation reaction rate coefficients are functions of the electron
temperature. Alternatively, if the beam current is specified, then the right-hand
side ofEq. (4.3-35) can be used in Eq. (4.3-36) to find the electron temperature.
Typically, curve fits to the ionization and excitation cross section and reaction
rate data shown in Figs. 4-15 and 4-16 are used to evaluate the reaction-rate
coefficients in a program that iteratively solves Eq. (4.3-36) for the electron
temperature.
The primary electron density in Eq. (4.3-36) can be evaluated from the total
primary electron confinement time in the discharge chamber. The emitted
current Ie from the hollow cathode is
np e V
I =
e
It
(4.3-37)
122
Chapter 4
where 'rt is the total primary confinement time that addresses all of the primary
electron thermalization and loss mechanisms. The ballistic confinement time
for direct primary loss to the anode, 'r p , was given in Eq. (4.3-4). It is assumed
that the primary electrons have undergone an inelastic collision with the neutral
gas and have lost sufficient energy such that they are then rapidly thermalized
with the plasma electrons. The mean time for a collision between the primary
and a neutral gas atom to occur is given by
1
'rc=-,
noav p
(4.3-38)
where a is the total inelastic collision cross section. Using Eq. (4.3-35) for the
neutral density, the mean collision time for primary electrons is
v o eAgTa17c17m
'r = =
c 4 aV p I B (l-17md)
v o AgTa17c
4av pQin (l-17md )
(4.3-39)
Finally, primary electrons can also be thermalized by equilibrating with the
plasma electrons. The time for primary electrons to slow into a Maxwellian
electron population was derived by Spitzer [32] and is given by
W
'rs = 2 '
2A D l fG(l fW)
(4.3-40)
where W= 2Vpe/m, eV pe is the pnmary energy, If= .J m/2kTe is the
inverse mean velocity of the Maxwellian electrons, AD is a diffusion constant
given by
4
A _ 8ne ne InA
D - 2 '
m
(4.3-41)
and InA is the collisionality parameter [33] given in Eq. (3.6-15). The function
G(lfW) is defined in Appendix F, and a curve fit to Spitzer's tabulated values
(in CGS units) for this function is provided.
The total primary electron confinement time can be found from
1 I 1 1
-=-+-+-.
'rt 'rp 'rc 'rs
(4.3-42)
Ion Thruster Plasma Generators
123
Some care needs to be used in including the Spitzer slowing time because some
ion thruster designs have a very non-mono energetic primary energy
distribution, which is not described well by Eq. (4.3-40).
The current emitted from the hollow cathode is
Ie=Id-Is-1b
(4.3-43)
where Isis the screen current and I k is the ion current back to the cathode.
Using Eqs. (4.3-4) and (4.3-38) in Eq. (4.3-37), the primary electron density is
given by
[ ] -1
Ie 'rt lei I I
np=&= eV 'rp + 'rc + 'rs
=lL [ VpA p + 4av p Qin(l-17md) + ] -1
eV V voAsTa17c 'rs
(4.3-44)
Assuming that the primary electron loss directly to the anode is negligible, the
electron equilibration time is long, and the ion current flowing back to the
cathode is small, then Eq. (4.3-44) can be written as
Ie v o A s T a17c 17md
n =
p 4Vav p l b (l-17md)
(Id- I s)v o A sTa17c 17md
4Vav p l b (l-17md)
(4.3-45)
This equation demonstrates the characteristic behavior of the primary electron
density being proportional to the mass utilization efficiency divided by one
minus the mass utilization efficiency originally described by Brophy [18,19].
This dependence is valid unless there are paths for the primary electrons to be
lost other than just collisionally with the neutral gas, such as ballistically to the
anode or by thermalization with the plasma electrons. The behavior of the
primary electron density with changes in the mass utilization efficiency is
shown in Fig. 4-17, where the primary electron density is normalized to the
value at 17md = 0 . As the neutral density decreases in the discharge chamber at
higher mass utilization efficiencies, the primary electron density increases
rapidly. At 90% mass utilization efficiency, the primary electron density in the
discharge chamber is nine times higher than at 50% mass utilization efficiency.
This strongly affects the ionization rate and the discharge loss behavior with
neutral gas pressure, which will be shown later.
124
Chapter 4
25
20
'j;;
c:
GJ
0
15
III
E
'C:
c..
'C
GJ 10
.!::!
m
E
0
z 5
0
0.5 0.6 0.7 0.8 0.9 1.0
Mass Utilization Efficiency
Fig. 4-17. Normalized primary alactron density as a function of mass
utilization efficiency.
4.3.7 Power and Energy Balance in the Discharge Chamber
The currents and potential distributions in the ring-cusp thruster discharge were
shown in Fig. 4-9. The power into the discharge chamber is the emitted current
from the hollow cathode multiplied by the voltage the electrons gain in the
discharge chamber (V k in Fig. 4-9):
lln= IeVk = Ie(Vd-Vc+Vp+tp),
(4.3-46)
where V d is the discharge voltage, V c is the cathode voltage drop, V p is the
potential drop in the plasma, and tp is the sheath potential relative to the anode
wall. This power into the discharge is transferred from the primary electrons
from the cathode into producing ions, excited neutrals, and Maxwellian
electrons. The power leaving the discharge to the electrodes is from ions
flowing to the anode, cathode, and screen plane, and from primary and plasma
electrons flowing to the anode. The power out of the discharge is then the sum
of these terms, given by:
Pout = I pU+ + I*U* +Us + Ik )(Vd + V p +tp)
+(Ib + I ia )(V p +tp)+ IaEe + I L (Vd - V c + V p +tp),
(4.3-47)
Ion Thruster Plasma Generators
125
where I p is the total number of ions produced in the discharge, U+ is the
ionization potential of the propellant gas, (' is the number of excited ions
produced in the discharge chamber, U* is the excitation energy, Is is the
number of ions to the screen plane, I k is the number of ions flowing back to
the cathode, IBis the beam current, I a is the plasma electron current to the
anode, Te is the electron temperature, I ia is the ion current to the anode, and
I L is the primary electron fraction lost to the anode. The plasma electron
energy lost to the anode wall, Ee' is 2kTe / e + f/J, which is derived in
Appendix C. The ions fall through the pre-sheath potential from the center of
the plasma to the sheath edge, such that V p can be approximated as kTe / 2e .
The ion energy to the anode, Ei, is then kTe / 2e + f/J, which was given in
Eq. (4.2-10).
With the screen grid connected to the cathode potential, the current emitted
from the hollow cathode was given in Eq. (4.3-43) in tenns of the other currents
in the circuit. Likewise, conservation of particles flowing to the anode gives
Ia=Id+Iia-h,
(4.3-48)
where I d is the discharge current measured in the discharge power supply.
Equating the power into the discharge to the power out, using the particle
balance equations in Eqs. (4.3-43) and (4.3-48), and solving for the beam
current from the thruster gives:
( ) + * *
Id Vd-Vc+Vp-ZTev -IpU -I U
Ib =
Vp+f/J
(Is + Ik)(ZVd - V c +ZV p +Zf/J)
Vp+f/J
I ia (V p +ZTeV + Zf/J) +h (Vd - V c + V p -ZTev)
Vp+f/J
(4.3-49)
where TeV is in electron volts.
The issue in evaluating Eq. (4.3-49) for the beam current produced by a given
thruster design is that several of the current tenns in the numerator contain the
plasma density, which is not known. In addition, the beam current IBis given
126
Chapter 4
by the Bohm current averaged over the screen-grid plane times the effective
transparency Ts of the screen grid:
1 1 kTe
Ib=-nievaAsTs :::: -nee -AsTs,
22M
(4.3-50)
where 11; is the peak ion density at the screen grid, Va is the ion acoustic
velocity, As is the screen grid area, and Ts is the effective screen transparency
with high voltage applied to the accelerator grids. In this equation, quasi-
neutrality (ni :::: ne) is assumed. Equation (4.3-50) can be solved for the plasma
density using Eq. (4.3-49) for the beam current, Eq. (4.3-2) for the primary
electron loss current, and Eq. (4.3-17) for the ion loss to the anode wall:
(Id -Id(V d - V c + V p - 2T eV )
n = , (4.3-51)
e I *
LU+ + U* + (1-Ts)v a A s V' + vaAasfc (V p +2TeV +2<1»
ne ne 2 2
where V' = 2V d - V c + 2V p + 2f/J and the screen grid current, Is, is given by
(1- Ts )
Is::::: nievaAs'
2
(4.3-52)
The plasma density is proportional to the discharge current decreased by the
amount of direct primary loss to the anode (ld - It), as expected. This
relationship shows why implementing sufficient cusp magnetic field strength is
critically important to the thruster performance.
Unfortunately, the ionization and excitation terms still contain n p / ne' so
Eq. (4.3-52) must be solved iteratively for the plasma density. Once the plasma
density is known, the beam current can be calculated from Eq. (4.3-50). If the
flatness parameter, which is defined as the average current density divided by
the peak, is known, then the peak plasma density and peak beam current density
can be obtained. The flatness parameter is found by experimental measurements
of the plasma and beam profiles, or by two-dimensional (2-D) models of the
discharge that are discussed in Section 4.7.
4.3.8 Discharge Loss
The discharge loss in an ion thruster is defined as the power into the thruster
divided by the beam current. This parameter then describes the power required
to produce the beam current, which is a good figure of merit for the discharge
Ion Thruster Plasma Generators
127
chamber performance. In DC-discharge thrusters, the discharge loss for the
plasma generator is given by
IdV d + IckV ck _ IdV d
TJd = Ib Ib '
(4.3-53)
where IBis the beam current, Ick is the current to the cathode keeper electrode
(if any), and V ck is the keeper bias voltage. The keeper power is typically
negligible in these thrusters, but it is a simple matter to include this small
correction. Combining Eqs. (4.3-53) and (4.3-49), the discharge loss is
V [ I p u+ +£..u* + (Is +Id ( zv - V +ZV +ZIII )]
d Ib Ib I B d c P 'f'
TJd =
V d - V c + V p -ZTeV
Vd[(V p +4»+ i: (V p +ZTeV +Z4»]
+
V d - V c + V p -ZTeV
V d [ (V d - V c + V p - ZTeV )]
+
V d - V c + V p -ZTeV
(4.3-54)
To evaluate the first current fraction in this equation, the ions are produced by
both primary electrons and the energetic tail of the Maxwellian distribution of
the plasma electrons. The total number of ions produced in the discharge, I p , is
given in Eq. (4.3-25), and the total number of excited neutrals produced in the
discharge, 1*, is given in Eq. (4.3-26).
Using Eqs. (4.3-25) and (4.3-26) for the particle production and excitation,
Eq. (4.3-50) for the beam current, and assuming ni =:: ne' the first current
fraction in Eq. (4.3-54) is
128
Chapter 4
lp = 2nonee(O'iVe)V + 2nOnpe(O'iVp)V
Ib kTe kTe
ni e M AsTs ni e M AsTs
2n o V ( ) np ( ))
= fli (O'ive +-;- O'ivp .
kTe ATe
M s s
(4.3-55)
The second current fraction is likewise:
* ( )
I 2n o V np
-= fli (O'.Ve)+-(O'.V p ).
Ib kTe ne
-AsTs
M
(4.3-56)
Neglecting the small amount of ion current backflowing to the hollow cathode,
the third current fraction is
lL= l-Ts
lb Ts
(4.3-57)
The ion current that goes to the anode wall is, again, the Bohm current reduced
by the confinement factor Ie' given in Eq. (4.3-17). In this model, the value of
the confinement factor must be evaluated for the particular ion thruster
discharge chamber being analyzed. However, for most ion thruster designs, if
the 50 gauss contour is closed, it is possible to assume to first order that
Ie '" 0.1 and the ion loss to the anode surface area is essentially one-tenth of
the local Bohm current. For a given confinement factor Ie' the fourth current
fraction in Eq. (4.3-54) is
1 kTe A {:
I -ni e - asJe
ia 2 M
1;= n.e kTe AT
2 I M s s
Aasle
-,
AsTs
(4.3-58)
where Aas is the surface area of the anode facing the plasma in the discharge
chamber.
The primary electron current lost to the anode, h, is given by Eq. (4.3-2). The
last current fraction in Eq. (4.3-54) is then
Ion Thruster Plasma Generators
129
h
Ib
npevpAp 2n p v p Ap
=
.!.n.ev AT ne va As Ts
2 I ass
(4.3-59)
The discharge loss can then be written
[ I p + l * 1 - T ( )]
V d -U +-U +----L 2V d -V e +2V p +24J
I bIb Ts
1Jd =
V d - V e - 2T eV
V d [ (V p +4J)+ Aasfe (V p +2TeV +24J ) ]
AsTs
+
V d - V e - 2T eV
[ 2n p v p A p ( )]
V d V d - V e + V p - 2T eV
ne Va AsTs
+
V d - V e + V p - 2T eV
(4.3-60)
Equation (4.3-60) illuminates some of the design features that improve the
discharge efficiency. Since the discharge voltage V d appears in both the
numerator and denominator of Eq. (4.3-60), there is no strong dependence of
the discharge loss on voltage shown in this equation. However, increases in the
discharge voltage raise the primary energy strongly, which increases the
ionization rate and beam current. Therefore, higher discharge voltages always
result in lower discharge losses. Higher screen grid transparency Ts, smaller
ion confinement factor Ie (better ion confinement), smaller primary loss area
Ap' and smaller wall surface area Aas all reduce the discharge loss. Lowering
the plasma potential also reduces the discharge loss by reducing the energy lost
to the anode by the plasma electrons, which is accomplished by reducing the
anode loss area at the cusps.
The input data required to solve Eq. (4.3-60) are:
. Discharge voltage
. Discharge chamber surface area and volume
. Magnetic field design (magnetic field at the cusp and the closed contour
field between the cusps)
. Grid area
. Grid transparency
. Gas temperature
. Cathode voltage drop
130
Chapter 4
It is necessary to specify either the discharge current or the beam current in
order to calculate the plasma density in the discharge chamber. The grid
transparency is obtained from the grid codes (called "optics codes"). Several of
these codes, such as the Jet Propulsion Laboratory (JPL) CEX ion optics codes
[34,35] that we use, are described in Chapter 5. The cathode voltage drop is
either measured inside the hollow cathode [36] or calculated using a separate
2-D hollow cathode plasma model [37] that will be described in Chapter 6.
Discharge chamber behavior is characterized by "performance curves," which
were described in Chapter 2 and are graphs of discharge loss versus mass
utilization efficiency. These curves plot the electrical cost of producing beam
ions as a function of the propellant utilization efficiency, and they give useful
information on how well the plasma generator works. Performance curves are
normally taken at constant beam current and discharge voltage so that the
efficiency of producing and delivering ions to the beam is not masked by
changes in the discharge voltage or average plasma density at the grids.
Calculating performance curves using Eq. (4.3-60) requires iteration of the
solutions for the electron temperature, discharge current, and/or beam current in
the above equations. To measure the discharge loss versus mass utilization in
thrusters, the discharge current, total gas flow. and gas flow split between the
cathode and main discharge chamber are normally varied to produce a constant
beam current and discharge voltage as the mass utilization efficiency changes.
This means that a beam current and mass utilization operating point can be
specified, which determines the neutral gas density in the discharge chamber
from Eq. (4.3-35) and the average plasma density in the discharge chamber
from the Bohm current in Eq. (4.3-9). If an initial discharge current is then
specified, the primary electron density can be calculated from Eq. (4.3-45) and
the electron temperature obtained by finding a solution to Eq. (4.3-36). These
parameters are used to solve for the discharge loss, which is evaluated from the
given beam current, discharge voltage, and discharge loss. A program is
iterated until a discharge current is found that produces the correct discharge
loss at the specified beam current.
An example of performance curves calculated using this model and compared
to measured curves for the NEXIS ion thruster [38] are shown in Fig. 4-18. The
discharge loss was measured for three different discharge voltages during
operation at 4 A of beam current. The l80-eV/ion discharge loss at the 26.5-V
discharge voltage required that the cathode produce a discharge current of
27.8 A to generate the 4 A of ion beam current.
Ion Thruster Plasma Generators
280
260
240
;:-
0 220
3i
VJ 200
VJ
0
..J
II' 180
'"
(;;
.s;;, 160
<>
VJ
i5
140
120
131
... 25 V Data
- 25 V Model
. 26.5 V Data
- 26.5 V Model
. 27.5 V Data
- 27.5 V Model
100
0.76 0.78 0.80 0.82 0.84 0.86 0.88 0.90 0.92 0.94 0.£
Mass Utilization Efficiency
Fig. 4-18. Example ofthe discharge loss versus mass utilization
efficiency for three discharge voltages in the NEXIS thruster [38].
The discharge model also matches the discharge loss data obtained from other
thrusters. Figure 4-19 shows the discharge loss measured at JPL in a laboratory
copy of the NSTAR thruster [39] operating at the full power (2.3 kW) THIS
throttle level. The model predictions agree with the thruster data if the
measured 6.5-V cathode voltage drop in the NSTAR hollow cathode [40] is
used for Vc- The ability of a O-D model to match the NSTAR data is significant
only in that the NSTAR plasma is not very uniform (flatness parameter;::: 0.5)
and contains over 20% double ions peaked on the axis. The O-D model likely
works in this case because the ionization is still dominated by the average
volume effects, and the losses are still determined by the magnetic field
structure at the wall, which O-D models can capture sufficiently to give
reasonably accurate results.
The shape of the performance curves is also important. As the mass utilization
is increased, the neutral density in the discharge chamber decreases [see
Eq. (4.3-35)] and more of the primary energy goes into heating the plasma
electrons and energy loss directly to the anode, as was illustrated by the
simplified model for the idealized thruster case in Section 4.2. Optimal thruster
designs have flatter discharge performance curves that exhibit lower discharge
losses as the mass utilization efficiency is increased. The model suggests that
this is generally achieved in thrusters by designing for good primary and
132
Chapter 4
300
280
260
"2 240
0
220
V>
V>
0 200
...J
CL>
180
co
L:;
<)
V> 160
is
140
120
100
0.76 0.78 0.80 0.82 0.84 0.86 0.88
. TH15 Data
- TH15 Model
0.90 0.92 0.94 0.9E
Mass Utilization Efficiency
Fig. 4.19. Discharge loss versus mass utilization efficiency for the
NSTAR thruster at the high power THiS throttle point.
plasma electron confinement such that the convective losses are minimized at
low neutral density and higher electron temperatures.
A significant challenge for most discharge models is handling the primary
electrons correctly. For the case of monoenergetic primaries assumed in this
model, the primary density is determined by collisional and ballistic (direct-to-
anode) losses that change as a function of the neutral pressure, which is
inversely proportional to the mass utilization efficiency. The primary electron
density then varies strongly as the mass utilization efficiency is changed.
However, if primary electrons are neglected altogether (i.e., assumed
thermalized immediately in the cathode plume) so that the plasma in the
discharge chamber is produced only by ionization by the high-energy tail of the
Maxwellian electron population, the discharge loss is extremely high. This is
shown in Fig. 4-20, where the discharge loss in the NEXIS thruster increases to
over 240 e V lion if the primary electron ionization effects are neglected.
Likewise, if the primary electron density is independent of the neutral pressure,
then the discharge loss curve in Fig. 4-20 has a steep slope resulting from an
excessive number of primary electrons at low mass utilization (high pressure),
which produces more ionization than actually occurs. Clearly, including the
presence of primary electrons in the analysis is required for the model results to
agree with the data, which, in turn, suggests that primary or energetic electrons
and non-Maxwellian electron populations must exist in this type of thruster.
Ion Thruster Plasma Generators
133
280 j i
260 ,
!
240 I '
e ,
.g 220 ;
> i
.!. 200 :
on '
on
.9 180 .
CII
!2'> 160 :
CIS ..
i 140 ;
.- I
c 120 '
i
I
100 i
--- ,
.
,
.
. /
.
.
-
. --
-No primaries
. . . . Constant primary density
. 26.5 V data
-26.5 V Model
60 ' -----------
0.76 0.78 0.80 0.82 0.84 0.66 0.66 0.90 0.92 0.94 0.96
r
Mass Utilization Efficiency
Fig. 4-20. Discharge loss predictions for the cases of no primary
electron density and a constant primary electron density showin9 the
poor agreement with the messurements.
Having a representative model of the discharge permits environmental changes
to the thruster to also be understood. For example, the neutral gas temperature
depends on the operating time of the thruster until equilibrium is reached,
which can take hours in some cases, during which the discharge loss will vary
[41). The O-D model predictions are shown in Fig. 4-21 for three different
neutral gas temperatures. The discharge loss data points shown were measured
for the NEXIS thruster operating at 26.5 V and 92% mass utilization efficiency
at first turn on, after 1 hour, and after 10 hours. In this case, the thruster starts at
essentially room temperature, and the model predicts that the discharge heats
the thruster and neutral gas to about 470 K after about 10 hours of operation.
While thruster thermal time constants are usually on the order of 1 hour, this
long heating time was found to be related to the facility thermal time constant.
This behavior of the discharge loss with time and temperature illustrates how
characterization of the thruster must always be measured in thermal
equilibrium, because the performance of the discharge chamber is strongly
affected by the neutral gas density, which changes with the thruster temperature
for a constant input flow rate.
4.3.9 Discharge Stability
There is a strong relationship between the discharge loss and the stability of the
discharge. By inspection of Eq. (4.3-60), it is clear that the efficiency increases
(discharge loss decreases) if the anode area for primary electrons Ap is
minimized. While it is logical to assume that this is also true if the anode area
134
220
210
200
'2 190
0
""
> 180
'"
'"
0 170
....I
OJ
C) 160
ro
.r=
u
'" 150
is
140
130
120
0.76
Chapter 4
. 26.5 V Data
- 470K
- 410 K
- 290K
Turn-on
0.78 0.80 0.82 0.84 0.86 0.88 0.90 0.92 0.94 0.9E
Mass Utilization Efficiency
Fig. 4.21. Discharge loss versus mass utilization efficiency from the
model for the NEXIS thruster [20] for three neutral gas temperatures,
for plasma electrons is minimized to reduce the energy loss from the
Maxwellian-electron population, a dependence on Aa does not appear in
Eq. (4.3-60). However, since the discharge current is carried to the anode
primarily by the plasma electrons, the sheath potential at the anode wall in
Eq. (4.3-7) is found to decrease as the anode area decreases for a given plasma
electron current to the anode. A dependence on the sheath potential is seen in
the discharge loss equation, which suggests that minimizing the sheath potential
maximizes the efficiency. However, the anode area for plasma electrons cannot
go to zero because the discharge current could not be collected by the anode,
and the discharge would either interrupt or become unstable [22]. So there is
some minimum anode area and plasma potential that can be tolerated for
discharge stability.
The value of the plasma potential relative to the anode (the anode sheath
voltage drop) can be calculated using the expression for the random electron
flux to the anode given in Eq. (4.3-7). From current conservation in the
discharge, an expression for the discharge current can also be found from the
current to the anode [Eq. (4.3-48)):
fd = fa + h - f ia .
(4.3-61 )
Ion Thruster Plasma Generators
135
Using Eqs. (4.3-7), (4.3-2), and (4.3-17) for each of the three currents, and
dividing by the beam current in Eq. (4.3-50), Eq. (4.3-61) becomes
1 ( 8kTe ) 1/2 1
- - neAa A - n v A I'
Id 4 Te m _ ,plkT npv p P 2 e a asJc
_ = exp e e + - (4.3-62)
Ib 1 1 1
-nevaAsTs -nevaAsTs -nevaAsTs
2 2 2
Solving for the plasma potential gives
cp = kTe In
e
( 2M ) 1/2
Tem AsTs
ld Aasfc 2n p v p Ap
-+-
lb AsTs nevaAsTs
(4.3-63)
By inspection of Eq. (4.3-63), it is clear that as the anode area Aa decreases,
the plasma potential also decreases. If the anode area is made too small, then
the plasma potential will go negative relative to the anode potential. This is
called a positive-going (or "electron accelerating") anode sheath, and is
illustrated in Fig. 4-22. In this case, the anode area at the cusps is insufficient to
collect the total discharge current by collection of the entire incident random
electron flux over the cusp area. The plasma then biases itself to pull in
electrons in the Maxwellian distribution that are not initially headed toward the
anode, which delivers more current to satisfy the discharge current and charge
balance requirements. The plasma electron current collected by the anode then
becomes
.!E
E
.!!!
o
c..
Cathode
Hollow
Cathode
Normal
1 cj)
T
New V p6 V d
J.-
Anode
Fig. 4-22. Transition of the plasma potential to nagative relative to
the anode due to an anode area decrease, which results in a lower
primary electron energy.
136
Chapter 4
1/2 [ ( ) 1/2 ] -1
fa = ( 8::e ) eneAa ee /kTe 1- eif ;: '
(4.3-64)
where the potential l/J is now a negative number. If the potential goes
sufficiently negative relative to the anode, the current density can reach a factor
of two higher than the one-sided random electron flux nonnally collected in
order to satisfy the discharge current requirement.
However, once the potential goes sufficiently negative relative to the anode to
repel the ions (about Tj), then the anode area for the plasma electron is not the
hybrid area, but is just twice the plasma electron Lannor radius times the cusp
length, similar to Eq. (4.3-3) for the primary loss area. This results in a
significant decrease in the cusp anode area Aa in Eq. (4.3-63) for negative
plasma potentials, which further lowers the plasma potential relative to the
anode. Examining the potential distribution in the plasma in Fig. 4-22, the
transition from the nonnal negative-going sheath to a negative plasma potential
(positive-going anode sheath) will subtract from the primary electron energy
V pe at a given discharge voltage. The ionization rate then decreases, and the
discharge collapses into a high impedance mode or oscillates between this
mode and a positive potential typically on power supply time constants as the
supply tries to reestablish the discharge by increasing the anode voltage.
The stability of the plasma discharge at a given operating point (discharge
current, beam current, neutral density in the discharge chamber, etc.) is
therefore detennined by the magnetic field design. For example, in Fig. 4-23,
plasma potential is plotted as a function of the strength of the cusp magnetic
field for an arbitrary thruster design with two different numbers of ring cusps.
The cusp field strength enters into the anode area Aa in Eq. (4.3-6), into the
primary electron loss area Ap in Eq. (4.3-3), and into the plasma potential in
Eq. (4.3-63). The model predicts that a four-ring design would be unstable
(when the potential goes negative relative to the anode) for cusp magnetic fields
greater than 2000 G. Since strong magnetic fields are desirable from a primary
electron and ion confinement point of view, additional rings are required to
maintain a positive plasma potential. A six-ring design increased the anode area
sufficiently to raise the plasma potential at the 2000-G magnet design point. An
analysis of the discharge loss from Eq. (4.3-60) indicates that the improved
stability associated with the larger anode area of the six-ring design comes with
a loss in efficiency. The trade-off between efficiency and stability is an
important aspect of ion thruster design.
Ion Thruster Plasma Generators
131
8
7
6
5
0; 4
""
<::
'"
'0 3
D..
'" 2
E
'"
'"
n:
0
-1
2
a
- 6-Ring Des-ign
- 4-Ring Design
+ Unstable
500 1000 1500 2000 2500 3000 3500 4000
Cusp Magnetic Field (gauss)
Fig. 4-23. Plasma potential versus cusp magnetic field strength for a
thruster design with 4 and 6 rings.
4.3.10 Recycling Behavior
Ion thrusters clear momentary faults or breakdowns in the high voltage
accelerator grids by momentarily turning off the high voltage, an event called
recycling. In order to restart the thruster, the accelerator grid ("accel grid")
voltage must be turned back on to avoid electron backstreaming into the
thruster as the screen voltage is reapplied. If the plasma discharge is left on
during this sequence, the negatively biased accel grid collects nearly the entire
ion beam current at the applied accel voltage until the screen voltage is re-
established. This can lead to excessive power loading and even erosion of the
accel grid if a significant number of recycles are encountered. Therefore, it is
standard procedure to also either turn off the discharge during recycling or cut
it back to a low level such that the accel grid current surge is acceptably low
during reestablishing of the beam voltages. The discharge current is then raised
to the desired level with the screen voltage ramp-up.
The main issue with this process is that the thruster discharge often goes into
oscillation during the cutback condition or upon restarting in the recycle
sequence. When the high voltage is turned off in a recycle, ions that would have
left the discharge chamber as beam ions now strike and neutralize on the accel
grid, and some fraction flows back into the discharge chamber as neutral gas.
This raises the neutral gas pressure in the discharge chamber, which has two
effects. First, a higher neutral pressure collisionally thennalizes the primary
electrons more rapidly, which can lead to a reduction in the plasma potential
[22]. Second, lowering the discharge current while raising the neutral pressure
138
Chapter 4
leads to a lower impedance discharge and a -lower discharge voltage. These two
effects will be shown next to cause a reduction in the plasma potential, and
thrusters designed for low discharge loss with a minimum plasma potential at
the nominal operating point can encounter negative plasma potentials and
discharge instability during recycling.
The time-dependent behavior of the pressure in the discharge chamber from the
high-voltage-off event can be calculated using molecular dynamics, and the
subsequent time-dependent plasma potential for stability can be evaluated using
the O-D model. The time-dependent pressure [42] in the thruster is given by
dP
V-= Q . -CM
dt 1D ,
(4.3-65)
where V is the discharge chamber volume, P is the pressure in the thruster
discharge chamber, C is the conductance of the grids, and M is the pressure
drop across the grids. The initial pressure just before the start of the recycle,
when the thruster is operating normally, is found from Eq. (4.3-35) and the
conversion of neutral density to pressure in Eq. (2.7-2):
Po = 4.1 x 10- 25 ToQin (I-17m) .
v o eAgTa17c
(4.3-66)
With the high voltage off, the ions and neutrals flow to the grid region, where a
small fraction exits through the accel aperture to escape, and the majority strike
the upstream side of the grids or the grid aperture barrel wall and flow back into
the thruster. Since the grid conductance is defined as the flow divided by the
pressure drop [42], the final pressure after steady state has been achieved is
P = ( l-T ) Qin
f a C'
(4.3-67)
where C is the conductance of the grids and the downstream pressure from the
grids has been neglected as small. The conductance of the grids can be
estimated from the molecular conductance of a thin aperture [42] times the
Clausing factor for the finite thickness grids. The conductance is then
( Y/2
C = 3.64 :a ) Tu A g 17c [liters/s],
(4.3-68)
where Ma is the ion mass in atomic mass units (AMU), and the effective open
area of the grids is the optical transparency of the accel grid, Ta, times the grid
Ion Thruster Plasma Generators
139
area, Ag . Integrating Eq. (4.3-67) from the initial pressure to the final pressure
gIves
( ) -tIT
P t = Pj - (Pj - Po)e g,
(4.3-69)
where 't' g = V I C is the gas flow time constant for filling the thruster chamber.
To use Eq. (4.3-69) to find the final pressure, the gas flow rate has to be
converted from particles per second to torr-lis by multiplying the neutral gas
flow in Eq. (4.3-67) by 2.81 x 10- 2 °.
Figure 4-24 shows an example of the pressure increase with time calculated in
the NEXIS thruster discharge chamber from the start of a recycle. The pressure
in the discharge chamber during nonnal operation is in the mid-l0- s torr range
due to the large grid area and high mass utilization efficiency. During a recycle,
the pressure in the discharge chamber reaches equilibrium in about 60 ms, with
the pressure increasing almost an order of magnitude once the high voltage is
turned off. This magnitude of pressure increase in the thruster once the high
voltage is turned off is consistent with the ;:::90% mass utilization efficiency of
many thruster designs.
The plasma potential response to pressure changes in the discharge chamber
calculated using the 0- D model for two different discharge voltages is shown in
Fig. 4-25(a) for a given magnetic field design. During the recycle, the discharge
current is reduced (called "cutback"), which reduces the discharge voltage and
10- 3
g
::I
If)
If)
a..
10-4
J:J
E
!II
J::
U
(1)
C>
J::
t)
If)
5
10- 5
0 10 20 30 40 50
Time (ms)
Fig. 4-24. Example of the pressure rise in the NEXIS thruster [20]
calculated during a recycle.
140
Chapter 4
thereby the plasma potential. The model indicates that the plasma potential
reduction and subsequent unstable operation is the result of the lower discharge
voltage, and does not occur directly due to the discharge current being lower.
This analysis shows that a given thruster design that produces a stable discharge
under nonnal conditions can go unstable due to negative plasma potentials as
the pressure rises and the discharge voltage decreases.
The plasma potential calculated using Eq. (4.3-63) for two magnet designs is
shown in Fig. 4-25(b) for the 23- V NEXIS case, which illustrates the effect of
the smaller anode area reducing the plasma potential at a given pressure. In this
case, increasing the anode area pennitted the discharge current to be cutback
3
2
'E
.& 0
0
c...
ro
E -1
(/)
ro
c::
-2
-3
10- 5
3
2
'E
.&
0
c...
ro 0
E
(/)
ro
c:: -1
-2
0
(a)
-V d =25V
- V d =23V
10-4 10-3
Discharge Chamber Pressure (torr)
(b)
- Larger Anode ea
- Smaller Anode Area
10 20 30 40 50
Time After a Recycle Starts (ms)
Fig. 4-25. Plasma potential as a function of pressure for two
different discharge voltages (a), and plasma potential versus
time (b) showing instability of the smaller anode area design at a
given pressure.
Ion Thruster Plasma Generators
141
during the recycle to the desired level without oscillating, which facilitates re-
starting the high voltage. Of course, the larger anode area increased the loss in
the discharge chamber and raised the discharge loss. This trade-off is often
required to provide good performance and stable discharge operation.
4.3.11 Limitations of a O-D Model
While the O-D models described in this chapter provide useful information on
the design parameters of ion thrusters and give good insight into the plasma
production and loss mechanisms, there are several limitations to their use. First,
O-D models assume that the electron and neutral densities are uniform and
averages the ion production throughout the volume of the discharge chamber.
For ion thrusters with significantly non-uniform plasmas, this leads to
inaccuracies in the average plasma density and beam current calculated by the
O-D model that can be handled only by multi-dimensional discharge chamber
models. Second, the source of the gas in actual discharge chambers is from the
localized hollow cathode aperture and the gas manifold inside the discharge
chamber. The neutral density, therefore, is never completely uniform, and
variations in the neutral density can affect the transport, diffusion, and
ionization rates in the discharge chamber.
Third, ion thrusters with localized electron sources like hollow cathodes have
strongly varying primary electron densities within the discharge chamber. As
shown earlier, the primary electron density strongly affects the ionization rate,
and so localized sources of primaries produce non-uniform plasmas that the
O-D models cannot address. In addition, these models utilize a monoenergetic
primary energy. A distribution in the primary electron energy has been
measured in some ion thrusters [43,44], which changes the ionization and
primary electron thermalization rates compared to the monoenergetic
calculations presented here. While primary electron energy distributions can be
incorporated in O-D models, this has not been attempted to date.
Finally, the O-D model assumed that the monoenergetic primary electrons have
an energy of e(Vd - V c +l/». For typical discharge voltages of25 V and cathode
voltage drops of 5 to 10 V, this means that potentially none of the primaries has
sufficient energy to doubly ionize xenon, which has an ionization potential of
21.2 V. Double ions can then only be produced by the tail of the plasma
electron distribution. For electron temperatures of 3 to 5 e V, less than 1 % of the
electrons have sufficient energy to produce double ions. Since the double-ion
content in NST AR thrusters has been reported to exceed 20%, a mono energetic
primary electron energy results in a model that cannot accurately address
double-ion production. While including primary electrons is necessary to obtain
agreement between the O-D models and experimental results, knowledge of the
142
Chapter 4
correct energy distribution and even spatial vanatlon in the primaries is
required, and is better handled by 2-D models discussed in Section 4.7.
4.4 Kaufman Ion Thrusters
The formulation of particle and energy balance models just described applies to
any ion thruster geometry where the electron loss can be defined by a finite
anode electrode area collecting electrons at a fraction of the random electron
flux depending on the sheath voltage. One class of thrusters still in use, the
Kaufman ion thruster shown schematically in Fig. 4-26, features a strongly
diverging axial magnetic field that shields a cylindrical anode electrode located
near the wall of the discharge chamber. In this case, electron transport to the
anode is determined by cross-field diffusion.
In Section 3.6, the flux of electrons due to cross-field diffusion is given by
r e = nv.l = J.L.l nE - D.l V n.
(4.4-1)
For the case of Kaufman thrusters, the perpendicular diffusion coefficient is
likely to be close to the Bohm diffusion coefficient [45]:
Baffle
J
Fig. 4-26. Schematic of a Kaufman ion thruster showing
the hollow cathode with a baffle, and the anode
protected by magnetic fields produced by an external
aolenoid coil.
Ion Thruster Plasma Generators
143
D = J.. kTe
B 16 eB .
(4.4-2)
The electron current collected by the anode is the flux that diffuses through the
magnetic field times the Boltzman factor at the sheath:
fa = (.u.L nE - D.L Vn )eAase-et/>lkT e ,
(4.4-3)
where Aas is again the anode surface area exposed to the plasma discharge.
The actual current distributions and potential distribution in a Kaufman thruster
are the same as for the DC discharge thruster shown in Fig. 4-9. However, there
are several terms that were analyzed for ring-cusp thrusters that can be
neglected in Kaufman thrusters.
First, if the axial magnetic field in the discharge chamber is on the order of
100 G, then the Larmor radius for, say, 20-eV primaries is 1.5 mm. Since the
magnetic field lines do not intersect the anode and primaries are too energetic to
participate in the collective instabilities that drive Bohm diffusion, the primary
electrons must make collisions in order to cross the magnetic field to be lost.
That means that the fraction of the primary electron current loss directly to the
anode in ring-cusp thrusters, f L' can be neglected, which is an advantageous
feature of Kaufman thrusters.
Second, the plasma flow across the magnetic field is still governed by
ambipolar effects. As was shown in Section 4.3.4, if the transverse magnetic
field strength is in excess of about 50 G in typical ion thruster discharge
chambers, then the radial electric field in the plasma (in the magnetic field
region) is near zero and the ion loss rate is on the order of one-tenth the Bohm
current toward the wall. This means that the ion current to the anode tenn, f ia ,
can also be neglected to first order. Since the discharge current collected
through the anode leg of the discharge power supply connection was given in
Eq. (4.3-61) as the plasma electron current minus the ion current and plus the
primary current, the discharge current is now just
f f D V A -el/!l kTe
d = a = - .L ne as e .
(4.4-4)
Third, the ion current flowing back towards the hollow cathode was neglected
in our treatment of ring-cusp thrusters because the hollow cathode exit area in
contact with the plasma was so small. In Kaufman thrusters, a baffle is placed
on axis in front of the cathode to force the primary electrons off axis to flatten
the density profile. Since the magnetic field is strongly divergent, the axial
plasma density gradient is significant and the plasma density in contact with the
144
Chapter 4
baffle can be high. For these reasons, the ion current to the cathode, I k , can no
longer be neglected.
The power into the plasma is given by Eq. (4.3-46), and the power out of the
discharge is given by
Pout = I pU+ + lu" + Is (V d + t:j) + IdVd + t:d+ Ibt:j + Ijat:j + lat:e' (4.4-5)
where t:j is the ion energy leaving the plasma, which is written here from
Eq. (4.3-10) as Tev 12+cJ>, and t: e is the electron energy removed from the
plasma, which is written from Eq. (4.3-9) as 2TeV +cJ>. Equating the power in
to the power out again and solving for the discharge loss gives
V [ I p U+ + U* +m+ TeV + (Is +I k ) ( 2V -v +2m+ TeV )]
d Ib Ib 'I' 2 Ib d c 'I' 2
1Jd = (4.4-6)
V d - V c - 2TeV
The first current ratio, I pi Ib , is given by Eq. (4.3-55), and the second current
'"
ratio, I lIb, is given by Eq. (4.3-56). The current ratio, Is lIb, is given by
Eq. (4.3-57), and the last current ratio is
1 kTe A
Ik _ i nke M k _ nkAsa
Ib - !n.e kTe AT neAsTs'
2 I M s s
(4.4-7)
where nk is the plasma density at the cathode baffle. The discharge loss for
Kaufman thrusters is then
Vd [ IP U++{u*+tP+ Tev + ( l-Ts + nkAsa )( 2Vd-Vc+2tP+ Tev )]
lb lb 2 Ts neAsTs 2
1Jd =
V d - V c - 2TeV
(4.4-8)
Tne plasma potential in Eq. (4.4-8) is found from solving Eq. (4.4-4):
l/J= kTe I n [ -D.l.. VneAas ] ,
e Id
(4.4-9)
Ion Thruster Plasma Generators
145
and the electron temperature is found from the solution to ion particle balance
in Eq. (4.3-36) in a similar manner as for ring-cusp thrusters. The negative sign
in Eq. (4.4-9) appears problematic in the natural log function, but the density
gradient Vn is negative going outward from the plasma. The primary electron
density is calculated from Eq. (4.3-45), with the ballistic loss term neglected as
described above since primaries are not lost directly to the anode. Finally, the
plasma volume term in the ion and excited neutral production rates can be
assumed to be the volume of a cone from the baffle to the grids because the
plasma is well confined by the strongly diverging magnetic field. Since the O-D
model assumes relatively uniform plasma, estimates for the radial gradient of
the plasma density in the magnetic field region near the anode and the
additional cathode voltage drop due to the baffle must be made for Eq. (4.4-8)
to be accurate.
As an example, take a conceptual Kaufman thruster with a 20-cm-diameter
screen grid with 80% transparency and a 25-cm-diameter anode with 25 cm
between the grids and the baffle. Assuming that the average magnetic field
strength in the thruster is about 50 G, the discharge loss from Eq. (4.4-8) is
plotted in Fig. 4-27 for two values of the cathode voltage drop. In this case, the
cathode voltage drop is higher than in a ring-cusp thruster because it includes
the potential drop in the baffle region. The discharge loss is strongly dependent
on this value because it directly affects the primary electron energy. Discharge
losses in this range at mass utilization efficiencies of about 90% have been
reported in the literature for Kaufman thrusters through the years [46-48],
400
350
1 - v c = 15V I
- V c =14V
'2
o
300
II>
II>
.3 250
11>
E'
tI1
"5 200
II>
is
150
100
0.76 0.78 0.80 0.82 0.84 0.86 0.88 0.90 0.92 0.94 0.96
Mass Utilization Efficiency
Fig. 4-27. Discharge loss calculated for Kaufman thruster example.
146
Chapter 4
suggesting that the O-D model can produce reasonable predictions of the
discharge loss if the cross-field diffusion is handled properly.
The need for higher discharge voltages in Kaufman thrusters, compared to ring-
cusp thrusters, is illustrated in Fig. 4-28, where the discharge loss is plotted for
the Kaufman thruster example above with two cases of the discharge voltage at
a constant (total) cathode voltage drop of 16 V. Low discharge loss is achieved
for the 35- V discharge voltage case, but decreasing the discharge voltage to
30 V causes the discharge loss to increase dramatically. This is because the
primary electron energy in the discharge chamber is near the threshold energy
for ionization at this discharge voltage, and the discharge efficiency decreases
as more ionization is required from the plasma electrons. In addition, the lower
discharge voltage causes the plasma potential to go significantly negative
relative to the anode potential ( '" Te ), which will cause the discharge to become
unstable.
While Kaufman-type thrusters are considered to be the first ion thruster to
achieve good discharge production perfonnance, they now compete with ring-
cusp thrusters for application in modern electric propulsion systems. This is
because of several constraints in Kaufman thruster design. First, the strong
axial magnetic field restricts electron motion to the anode to cross-field
diffusion, which requires either high neutral pressures in the discharge chamber
for electron-neutral collisional diffusion and, thereby, low mass utilization
efficiency, or relies on collective instabilities to increase the diffusion rate to
- V d =30V
300 - V d = 35V
350
c-
o
250
'"
II)
o
...J
Q)
200
.r::;
t.)
II)
is
150
100
0.76 0.78 0.80 0.82 0.84 0.86 0.88 0.90 0.92 0.94 0.96
Mass Utilization Efficiency
Fig. 4.28. Discharge loss calculated for Kaufman thruster example at two
discharge voltages.
Ion Thruster Plasma Generators
147
obtain sufficient electron loss to support the discharge. The instabilities are
usually related to Ex B driven instabilities and Bohm diffusion [24], which
create significant noise in the discharge that can appear in the beam current.
Second, the baffle required to force the primary electrons off axis to produce a
more unifonn plasma profile is susceptible to ion bombardment sputtering and
plasma losses in the dense plasma region near the cathode. This has historically
limited the life of these types of thrusters, although alternative materials can
mitigate this problem. In addition, the primary electrons are injected purely off
axis, which means that the plasma profile, and hence the beam profile, can be
hollow or peaked depending on the cross-field diffusion and mobility
throughout the discharge chamber.
Finally, the thruster size, shape, and magnetic field strength is limited to
regimes where the magnetic field is sufficient to confine ions by electrostatic
ambipolar effects to obtain good efficiency, and yet the magnetic field is not so
high that the cross-field diffusion cannot provide adequate electron current for
the discharge to be stable. If the field is too strong or the anode area in contact
with the plasma is too small, the plasma potential goes negative relative to the
anode to pull the electrons out of the discharge. Inspection of Fig. 4-22 shows
that if the plasma potential is negative relative to the anode, then the primary
energy is decreased at a given discharge voltage, which strongly affects the
discharge efficiency [22]. Since the discharge voltage cannot be arbitrarily
increased due to ion sputtering of the baffle and screen electrodes, in addition to
excessive double-ion production, this will significantly reduce the discharge
efficiency. In the case of negative plasma potentials, the electron loss to the
anode has the form [22]
[ 1/2 ] -1
Ia=-D.lVneAaseeiPlkTe l-eif( ;: ) ,
(4.4-10)
where tjJ is a negative number in this case. The negative plasma potential
increases the current to the anode area Aas by pulling some of the electrons
from the plasma population that were headed away from the anode. While up to
a factor of two more electron current theoretically can be drawn compared to
the case for the case of positive plasma potentials, in practice drawing even the
random electron flux can strongly deplete or perturb the Maxwellian population
and affect the plasma discharge. The geometry of Kaufman thrusters for good
efficiency is limited to configurations where the plasma potential in the
discharge chamber is not allowed to go negative relative to the anode, which
constrains the design space for the electrodes and fields.
148
Chapter 4
4.5 rf Ion Thrusters
The ion thrusters described in the previous sections utilize a thennionic hollow
cathode and DC discharge power supply to inject hot electrons into the
discharge chamber to ionize the propellant gas. To eliminate any potential life
or power supply issues with the hollow cathode and DC-electron discharge, an
alternative thruster design utilizes electromagnetic fields to heat the plasma
electrons that, in turn, ionize the injected gas. One method to achieve this goal
is to use an inductive plasma generator, which is nonnally called a radio-
frequency, or rf, ion thruster. In this case, low frequency rfvoltage is applied to
an antenna structure around or in the plasma, and the rf energy is coupled to the
electrons.
The simplest configuration for an rf ion thruster is shown schematically in
Fig. 4-29. An rf coil is wrapped around an insulating chamber with a gas feed.
The chamber can be cylindrical, hemispherical, or conical in shape and is
connected to an ion accelerator structure that is the same as those used for
electron-bombardment ion thrusters with either two or three grids. The plasma
floats relative to the first grid, and the high voltage is applied between the two
grids to accelerate ions that flow through the first grid and fonn the beam. The
rf coil is connected to an rf power supply that provides the power to generate
the plasma. There is usually no applied magnetic field in rf ion thrusters,
although one can be applied in principle to improve the discharge perfonnance.
As in other ion thruster designs, the entire discharge chamber is enclosed in a
metallic screen or structure to eliminate electron collection from the space
plasma, and a neutralizer cathode is connected to provide net charge
neutralization of the beam.
The coil wrapped around the insulating thruster body can be modeled as a
solenoid with N turns, and the rf voltage applied to it drives an rf current in the
Insulating Body
RFCoil
'"
k1e
-
Plasma Volume
Fig. 4-29. Schematic of an rf ion thruster showing
induction coil, insulating body, gas feed and two-
grid accelerator structure.
Ion Thruster Plasma Generators
149
coil. Typical frequencies used in rf ion thrusters are in the range of 1 MHz. At
these frequencies, the penetration of the fields from the coil at the boundary is
limited by the skin depth in the plasma [24], which is on the order of or slightly
less than the radius of most rf ion thrusters at the plasma densities required to
produce xenon ion current densities in excess of I mAlcm 2 . This produces an
attenuation of the electric and magnetic fields toward the axis, and the majority
of plasma interaction with the fields occurs off axis closer to the boundary.
The axial magnetic field inside the coil induced by the rf current, neglecting
end effects, is
B - NI iOJt
z- e,
J-lo
(4.5-1)
where I is the rf current in the coil, J-lo is the permeability of the vacuum, OJ is
the cyclic frequency (2rcf) of the rf, and t is the time. From Maxwell's
equation, the time-varying magnetic field creates a time-varying electric field:
aB
V'xE=--.
at
(4.5-2)
The induced rf electric field in the rf thruster geometry is then in the azimuthal
direction:
E - iOJr B iOJt
e --2 zoe
(4.5-3)
where r is the distance from the axis and Bzo is the peak axial rf magnetic field
from Eq. (4.5-1). A finite electric field is generated spatially off axis inside the
thruster.
The induced electric field exists in one direction (:1:8 direction) for roughly half
a period, which for a I-MHz frequency is 0.5 microseconds. The electrons,
however, don't see the oscillating component of the electric field because they
transit the interaction region close to the antenna in a time much less than this
value. For example, a 5-eV electron will travel a distance of about 1 meter in
1 microsecond, and so can traverse the electric field region many times within a
half cycle. Therefore, electrons traversing the induced electric field region
"see" a DC electric field and are accelerated. If they make a collision prior to
leaving the region, they can then retain some or all of the velocity imparted by
the electric field and are heated.
150
Chapter 4
The criteria for the rf plasma generator to provide net heating of the electrons is
that a sufficient number of electrons make a collision within the electric field
interaction region. If the interaction region is, say, a few centimeters across, the
mean free path should be on this order. The probability of an electron making a
collision is given by
P = 1- exp-xlJ.. = 1- exp-noCT x.
(4.5-4)
Using Eq. (2.7-2) to convert from neutral density to pressure, the minimum
pressure at a temperature T in the plasma chamber of an rf thruster for
breakdown to occur is
-1.04 x 10- 25 T
Pmin[torr] = In(l-P).
ax
(4.5-5)
For example, the minimum pressure for starting the rf-generated plasma is
plotted in Fig. 4-30, where room temperature (290 K) xenon gas with a xenon
atomic radius of 1.24 A in a 5-cm-long interaction region is assumed. If 10% of
the electrons must make an electron-neutral collision within a 5-cm interaction
region to provide sufficient heating for sustaining ionization and breakdown to
proceed, then the minimum pressure in the thruster is about 1 x 10- 3 torr.
Minimum pressures in the range of 10- 3 to 10- 2 torr are commonly reported in
the literature for rf plasma sources to ignite the plasma. Once the plasma source
is ignited, the required electron collisions to provide the heating in the rf
10- 2
....
g
!!:
::s
'"
'"
!!:
c..
E
::s
E 10-4
'c
10- 5
0.0 0.1 0.2 0.3 0.4 0.5
Collision Probability
Fig. 4-30. Minimum pressure for sterting a xenon rf thruster with a 5-cm
interaction zone as a function of the probebility of en electron having e
collision.
Ion Thruster Plasma Generators
151
electric fields can be supplemented by coulomb collisions between the plasma
electrons, which reduce the operating pressure requirement and permit high
mass utilization efficiency to be achieved.
Starting an inductive plasma discharge can also be problematic because initially
there are few free electrons present to interact with the rf fields and ionize the
fill gas. Prior to the plasma ignition, there is no load on the rf circuit driving the
coil and the reactive power stored in the inductive components in the rf
matching network grows, which increases the voltage across the coil and
induces higher electric fields inside. If the minimum gas pressure is provided,
the discharge will ignite when the field is either large enough to excite the few
electrons naturally present in the chamber or causes field emission to occur.
Another method for ignition is to inject electrons from a spark generator, small
cathode, or the neutralizer cathode (with the accel voltage turned off
momentarily) into the discharge chamber to provide the seed electrons for
interaction with the rf electric fields.
If the antenna in rf thrusters is directly exposed to the plasma, ions in the
discharge can be accelerated by the rf voltage on the surfaces and sputter-erode
the antenna. This can ultimately limit the life of rf thrusters. This problem is
minimized by either encasing the antenna in an insulator [49] or by making the
thruster body an insulating material and mounting the antenna exterior to the
plasma volume [50]. In this case, the rf voltage across the coil is shielded from
the plasma, and the ions are not accelerated to high energy before striking the
insulator. Mounting rf antennas outside insulating-material walls such as quartz
or alumina is common practice in inductive plasma generators used in the
semiconductor processing industry. An example of this arrangement applied to
a radio-frequency ion thruster (RlT)-XT thruster [50] is shown in Fig. 4-31. In
this case, the body of the thruster is constructed of a conical (or hemispherical)
alumina insulator, and a high-conductivity-material (typically copper) antenna
is coiled around the insulator. As long as the alumina body is not significantly
coated by conductive layers and remains an insulator, the rf fields will couple
through the wall and generate plasma.
This type of ion thruster is readily analyzed by particle and energy balance
models because they do not have localized electron sources (hollow cathodes);
the rf fields simply heat the Maxwellian electron distribution that provides the
ionization, and the plasma in the discharge chamber is very uniform. In the
energy balance equation, it is assumed that the power absorbed by the plasma is
simply given by P abs ' Ions generated in the plasma volume drift to the interior
surfaces in the thruster, and only electrons in the tail of the Maxwellian
distribution have sufficient energy to overcome the potential difference
152
Chapter 4
.t
III
Gas Inlet With
Isolator
RFCoil
Discharge
Vessel
"
Acceleration
Grid Package
, Grid-Spacing
'" Isolators
Neutralizer Sunshade
Fig. 4-31. rf ion thruster design showing the alumina
body, exterior rf coil, accelerator grid assembly and
neutralizer cathode. The antenna system is enclosed in
a metal "plasma shield" to eliminate electron collection
from the space plasma (from [50)).
between the plasma and the wall. The power out of the plasma equals the power
absorbed, which is given by
P abs = 1 pU+ -r lu* + (Is + Iw +I b )( T;V + I/> )+ la ( 2T eV +1/»,
(4.5-6)
where the electron and ion energy loss terms are shown explicitly. Equating the
input power to the output power, the discharge loss is then
P abs
1]d =-
Ib
1 l * ( I 1 )( T ) 1
=..LU+ +-U + --L+ +l + + (2TeV +1/».
Ib Ib Ib Ib 2 Ib
(4.5-7)
The ionization and excitation is now only due to the plasma electrons, so the
first current fraction in Eq. (4.5-7), using Eq. (4.3-50) and assuming quasi-
neutrality (ni "" n e ). is
Ip
Ib
2no (aiVe)V
kTe AT'
M s s
(4.5-8)
Ion Thruster Plasma Generators
153
and the second current fraction is likewise:
l 2no ( (] . v e ) V
I b = kTe A T
M s s
(4.5-9)
The screen current-to-beam current ratio is given in Eq. (4.3-57) as (1- Ts) / Ts .
The ion current that goes to the wall is the Bohm current to the wall area Aw
reduced by radial confinement provided by any applied or induced magnetic
fields. The fourth current ratio is then
I
I -nivaAwfc
w_2
1;- I
-nivaAsTs
2
Awfc
AsTs'
(4.5-10)
where fc is again a confinement factor for the reduction in the Bohm velocity
due to ambipolar effects in the ion and electron flows to the wall. Since there
are no applied DC potentials in the discharge chamber and all the walls float,
the electron current out is the same as the ion current out:
Ia=Is+Iw+1b'
(4.5-11)
Plasma potential in the expression for the discharge loss [Eq. (4.5-7)] can be
evaluated by equating the total ion and electron currents exiting the plasma:
ni kTe (A + +A ) = ne 8kTe [ A +(1-T ) A ] ex p -el/ilkTe. ( 4.5-12 )
2 M wJc s 4 7r m w s s
Solving for the plasma potential gives
tp = kTe In [ Aw + (1- Ts)As 2M ] .
e Awfc +As 7r m
(4.5-13)
If the wall area is large compared to the screen area, or the grid transparency is
small compared to 1, this turns into the normal equation for floating potential:
tp = k: e In[ : l
(4.5-14)
154
Chapter 4
which for xenon is 5.97 * Te .
Using Eqs. (4.5-8) through (4.5-11), the discharge loss for rf ion thrusters can
then be written
2n o (O'i V e)V [ + * (O'.V e ) ]
TJd = U + U
kTe AT (O'iVe)
M s s
+ [ l- T s + Awfc +1 ] (2.5T ev +2tfJ).
Ts AsTs
(4.5-15)
where the plasma potential tfJ is given by Eq. (4.5-13) in e V.
The electron temperature is found, again, by equating the ion production and
loss terms
nonee( O'iv e) V =.!. nie kTe (Awfc + As).
2 M
(4.5-16)
The electron temperature is then found from the solution to
{kT;
VM 2n o V
(O'iVe) = Awfc +As
(4.5-17)
As an example, assume that the rf ion thruster has a 20-cm grid diameter, an
18-cm-deep conical ceramic discharge chamber, a grid transparency of 80%,
and that it produces 2 A of beam current in xenon. Figure 4-32 shows the
calculated discharge loss as a function of the mass utilization efficiency from
Eq. (4.5-15), assuming no applied or induced magnetic fields and, therefore, no
plasma confinement. A discharge loss of about 450 eV/ion is predicted at 90%
mass utilization efficiency. This is a very high discharge loss, and it can be seen
in Fig. 4-32 that the majority of the energy loss is carried out by the ions and
electrons flowing to the floating-potential walls. This is because the
Maxwellian electron temperature required to produce the ions that flow to the
entire interior surface area of the discharge chamber at 90% mass utilization
efficiency [from the solution of Eq. (4.5-17)] is 5 eV, and the plasma potential
to achieve net ambipolar flow is, therefore, nearly 30 V. The high sheath
potential required to self-confine the electrons for particle balance and the large
Ion Thruster Plasma Generators
155
500
450
400
C 350
0
:;
300
(J)
(J)
0 250
..J
(1)
E' 200
CI5
t) 150
(J)
is
100
- Total Discharge Loss
- - Electron Loss
- Ion Loss
-- Excitation
-. - Ionization
----
- -- ---
----
--
-
-
50 _!! !!. !!_!II!!!!!!!!!!! . . !!!!_ -.!! !!!!_ -
o
0.70
0.75
0.80
0.85
0.90
0.95
Mass Utilization Efficiency
Fig. 4-32. Discharge loss calculsted for the exsmple rf ion thruster end
the contribution from the four energy loss mechsnisms.
plasma loss area (Aw + As) carry significant energy to the discharge chamber
wall, causing a relatively high discharge loss.
The discharge loss performance of rf ion thrusters typically reported in the
literature [50] is much lower than that found in our example. This is because
even though these thrusters do not usually have an applied DC magnetic field,
the rf coil forms a solenoid around the dielectric discharge chamber and the rf
current flowing in the antenna coil induces an alternating current (AC)
magnetic field in the interior of the discharge chamber with a frequency at the
rf oscillator frequency. In most typical rf thrus ters, this frequency is on the
order of 1 MHz. The ion acoustic speed .J kTe / M at Te = 5 e V is 1.9 km/s, and
so in a l-J.!s cycle, the ions can only move less than 2 rom, which implies that
the ions can be considered stationary on the magnetic-field cycle time. The
electrons are certainly not stationary in the period, but the ion space charge will
hold the electrons in place during a cycle. Therefore, the AC magnetic field
from the rf coil can provide some confinement for the plasma [51] and reduce
the flux to the discharge chamber walls. The magnetic field induced by the rf
coil depends 011 the coil size and amount of power. For example, assume that
the coil occupies 1 turn per centimeter (100 turns/m), and the coil impedance is
50 ohms. For an input power of 500 W, this would result in 10 A ofrf current
flowing in the coil. For simplicity, assume the rf coil forms a solenoid and the
magnetic field inside a solenoid (neglecting end effects) is
156
Chapter 4
B[gauss] = 10 4 ,uo N I,
(4.5-18)
where ,uo is the permeability of free space, equal to 4n x 10- 7 henries/m; N is
the number of turns per meter; and I is the coil current in amperes. For this rf
thruster example, a magnetic field of 12.6 G is produced. While this sounds like
a low field, it is an axial field induced in the majority of the interior of the
thruster depending on the plasma skin depth, which is large in these low density
plasmas.
The reduction in the ion velocity flowing radially to the wall for the situation of
a transverse magnetic field and ambipolar flows was analyzed in Section 4.3.5.
Figure 4-33 shows the reduction in the radial Bohm current (Ie) from
evaluating Eq. (4.3-15) for the condition when the diffusion length is now
essentially the thruster radius. Fields on the order of 10 G throughout the
thruster volume can reduce the ion and electron loss to the discharge chamber
wall by over a factor of two. While the rfmagnetic field strength decreases with
radius due to the finite length of the antenna coil (solenoid end effects), the
field strength near the axis is still sufficient to reduce the ion loss rate [51).
The discharge loss calculated by the O-D model for our 20-cm rf thruster
example is shown in Fig. 4-34 as a function of rf magnetic field induced in the
plasma. The discharge loss is reduced from the case of no magnetic
confinement (B = 0) of 450 eV/ion at 90% mass utilization to a value of
1.0
0.9
1: 0.8
OJ 0.7
C)
E 0.6
.c
as 0.5
'0
c 0.4
.Q
U 0.3
!::
LJ.. 0.2
0.1
0.0 .
o
5
10
15
20
25
30
Axial Magnetic Field (gauss)
Fig. 4-33. Ion confinement fector (the fraction of the Bohm current to the
wall) as a function of the induced magnetic field in the discherge
chamber volume.
Ion Thruster Plasma Generators
157
500
450
400
'2
0 350
""
>
300
'"
'"
0 250
...J
'"
0> 200
<0
..r:.
'-' 150
'"
is
100 -
50
0
0.70
- B=OG
B=5G
- B=10G
0.75
0.80
0.85
0.90
0.95
Mass Utilization Efficiency
Fig. 4.34. rf ion thruster discharge loss versus mass utilization efficiency
for three values of the induced magnetic field in the discharge chamber.
230 eV/ion if 10 G is induced in the chamber. This is a significant reduction in
the calculated loss and is the key to rf ion thruster discharge performance.
To produce the 2-A beam in our 20-cm thruster example at 230 eV/ion, a total
input power to the antenna of 460 W is required to be absorbed by the plasma.
Since the rf power supplies are typically 90% efficient in this frequency range,
the input power to the thruster PPU would be about 511 W. This predicted
performance is in good agreement with the data about this size of rf thruster
found in the literature [50], suggesting that a O-D particle and energy balance
model can provide reasonably accurate performance predictions.
One advantage of rf ion thrusters is that they have only Maxwellian electrons
and ambipolar ion and electron loss rates, which simplifies the discharge loss
expressions and makes it easy to analyze the few geometric parameters to
optimize the discharge loss. An example of the process is as follows: First,
specifying the required beam current and current density detennines the grid
diameter in any ion thruster. Ion optics codes then determine the grid
transparency. Once the grid design is set, a Monte-Carlo gas code is used to
evaluate the Clausing factor introduced in Eq. (4.3-33). Assuming a conical or
cylindrical discharge chamber shape of a given length immediately specifies the
loss areas and plasma volume. Then, specifying the mass utilization efficiency
gives the neutral density, and the electron temperature can be found from
Eq. (4.5-17) with an initial confinement factor assumption. These values are the
input parameters to the discharge loss given by Eq. (4.5-15), which provides the
158
Chapter 4
required input rf power to the antenna assuming that the antenna efficiency and
coupling (reflected power) are known. The approximate induced AC magnetic
field can then be calculated from Eq. (4.5-18) and the ion confinement factor
Ie' found as in Section 4.3.4. A simple iteration then gives the final discharge
loss and rfpower.
It should be noted that as the discharge chamber length decreases, the antenna
axial extent also decreases, which reduces the electric field interaction region
and decreases the AC axial magnetic field strength due to end effects in the
solenoid coil. The ability to breakdown the neutral gas initially and then couple
the rf energy to the electrons efficiently may be compromised as the length
decreases, which would also affect the discharge loss scaling.
A disadvantage of rf ion thrusters is that the antenna must be insulated from the
plasma, and the insulator is then subject to ion bombardment and material
deposition. Dielectric discharge chambers are susceptible to mechanical
problems in fabrication, environmental testing and launch, and life issues from
coating of the insulator surface with conducting layers. The structural issue has
been addressed on some flight units by the use of a ceramic discharge chamber
with an exterior mounted antenna structure to provide the rigidity required for
launch survival. While the discharge loss in rf ion thrusters is typically higher
than that found for well-designed electron-bombardment ion thrusters such that
the total efficiency is lower, the simplified design of rf thrusters makes it easier
to analyze them and predict the performance than most other ion thruster
configurations. The rf thruster design concept eliminates any potential
discharge cathode life issues and utilizes fewer power supplies to operate the
discharge. These factors make rf ion thrusters very competitive for future
spaceflight applications.
4.6 Microwave Ion Thrusters
An alternative to producing the plasma in the thruster with electron discharges
or rf induction heating of the electron population is to generate the plasma
using electromagnetic fields at microwave frequencies. This eliminates life
issues associated with the discharge hollow cathode, and the lack of applied DC
voltages in the discharge chamber can potentially reduce the sputter erosion of
electrodes exposed to the plasma as compared with that of DC electron
discharges. However, electromagnetic waves can propagate and be absorbed in
plasmas only under certain conditions. For example, if the microwave
frequency is too high or the plasma density too low, the microwave radiation is
reflected completely from the plasma. If the conditions are such that the
microwaves do propagate in the plasma, the microwave energy is coupled to
the plasma by resonant heating of the electrons in a magnetic field in the
Ion Thruster Plasma Generators
159
presence of collisions. The required magnetic field to achieve this resonance is
significant, and the pressure required to achieve sufficient collisions to start the
discharge can be relatively high. These effects impact the plasma generator
design and performance.
The propagation of microwaves in a plasma can be understood by examining
the dispersion relationship. The behavior of microwaves in the thruster plasma
is described by Maxwell's Equations:
V'xE=- dB
dt
V'XB=po(J+e o ).
(4.6-1)
(4.6-2)
The electromagnetic behavior is analyzed by linearizing these two equations
usmg
E= Eo +E} (4.6-3)
B=Bo+B} (4.6-4)
J = jo + j} , (4.6-5)
where Eo, Bo, and jo are the equilibrium values of the electric and magnetic
fields and currents, and EJ, BI and jl are the perturbed values in the
electromagnetic fields and current. Linearizing Eqs. (4.6-1) and (4.6.2), and
realizing that the equilibrium values have no curl or time dependence and that
eopo = Ve 2 in a vacuum, gives
dB}
V'xE 1 =--
dt
(4.6-6)
e 2 V' x B} = lL + dE} .
eo dt
(4.6-7)
Taking the curl ofEq. (4.6-6) gives
( ) 2 dB}
V' x V' x El = V' V'. E} - V' E} = -V' x - ,
dt
(4.6-8)
and the time derivative ofEq. (4.6-7) gives
160
Chapter 4
c2V x aB} = J... ajl + a 2 E}
at Eo at at 2
Combining Eq. (4.6-9) with Eq. (4.6-8) results in
(4.6-9)
( ) 2 1 ajl 1 a 2 E l
V V.E l -V E}=------.
E c 2 at c 2 at 2
o
(4.6-10)
Assuming that the microwaves are plane waves that vary as
E = E ei(kx-rot)
(4.6-11)
. . i ( kx-rot )
J=} e ,
(4.6-12)
where k = 2n / A and w is the cyclic frequency 2nf, then Eq. (4.6-10) be-
comes
. 2
( ) 2 lW. W
-k k.E l +k El = Jl +2 E1 .
EoC C
(4.6-13)
The electromagnetic waves are transverse waves, so k.E l =0 and Eq. (4.6-13)
becomes
( 2 2 2 ) -iw .
W - C k El = - Jl .
Eo
(4.6-14)
Since these waves are in the microwave frequency range, the ions are too
massive to move on these fast time scales and the perturbed current j I can come
only from electron motion. The perturbed electron current density in a plasma
IS
jl = -neevel ,
(4.6-15)
where ne is the plasma density and vel is the perturbed electron velocity. If
the applied magnetic field is zero or the perturbed electric field is parallel to the
applied magnetic field (so called "O-waves"), the equation of motion for the
perturbed electron motion is
av e }
m-=-eE}.
at
(4.6-16)
Ion Thruster Plasma Generators
161
Solving for the perturbed electron velocity, assuming plane waves, and
inserting this into Eq. (4.6-15), the perturbed current is
. E o E 1
J - n e
1--e-:--'
lCOm
(4.6-17)
Inserting Eq. (4.6-17) into Eq. (4.6-14) and solving for the frequency gives the
dispersion relation for electromagnetic waves in a plasma:
n e 2
co 2 = ....L- + c 2 k 2 = co 2 + c 2 k 2
Em p'
o
(4.6-18)
where the definition of the electron plasma frequency co = nee2/Eom has been
used.
This expression can be solved for the wavelength of the microwaves in the
plasma
A = 2nc _ c
co _co 2 f; - f2 '
(4.6-19)
where f p is the real plasma frequency andfis the microwave frequency. If the
microwave frequency exceeds the plasma electron frequency, the wavelength
becomes infinitely long and the wave becomes evanescent (it will not propagate
into the plasma) and is reflected. This condition, called cutoff, determines the
maximum plasma density into which a microwave source can inject power to
produce the plasma. Table 4-1 shows the cutoff frequency for a range of plasma
densities and the ion current density from a xenon plasma at an electron
temperature of 3 e V. As an example, if the ion thruster design requires an ion
Table 4.1. Cutoff frequencies for several plasma densities, and the corresponding ion current
density from a xenon plasma at Te = 3 eV.
Plasma Density (cm-3) Cutoff Frequency (GHz) J (mAlcm 2 )
10 9 0.285 0.0118
10 10 0.900 0.118
10 !I 2.846 1.184
10 12 9.000 11.84
1013 28.460 118.4
162
Chapter 4
current density to the grids of, say, 1.2 mAlcm 2 , then a frequency in excess of
2.85 GHz must be used to produce the plasma or else some or all of the
microwave power will be reflected.
The microwave energy is coupled to the plasma by electron cyclotron
resonance heating, where the microwave frequency corresponds to the cyclic
frequency of the electrons in a magnetic field. The resonant frequency is the
electron cyclotron frequency, which was derived in Chapter 3:
\qlB
we = - .
m
(4.6-20)
The cyclic cyclotron frequency is easily calculated using a convenient formula
of we = 2.8 GHz/kG. In the plasma, the actual microwave frequency
is Ie = eB/2nm , which is given in Table 4-2 for several magnetic field values.
If it is assumed that the microwave energy is deposited into the volume of a
plasma immersed in the magnet field, the maximum plasma density (and
corresponding ion current density to the grids) to avoid cutoff is shown for each
of the magnetic field values. To produce current densities in excess of
I mNcm 2 of xenon to the accelerator grids from a 3-eV electron temperature
plasma requires magnetic fields in excess of 1000 gauss, and values closer to
2000 G are required to avoid cutoff for slightly higher ion current densities to
the grids. This is a significant magnetic field to produce in the discharge
chamber volume.
The use of microwave radiation enables direct heating of the plasma electrons,
but for the wave to add energy to the electrons, collisions must occur.
Table 4.2. Electron cyclotron frequencies for several magnetic field levels, the corresponding
maximum plasma density before cutoff, and the maximum ion current density to the grids
from a 3 eV electron temperature xenon plasma.
Magnetic Field Cyclotron Maximum Plasma Maximum Ion
Frequency Density Current Density
(G) fc (GHz) (cm- 3 ) (mNcm 2 )
100 0.28 9.68 x 10 8 0.012
500 1.40 2.42 x 10 10 0.286
1000 2.80 9.68 x 10 10 1.146
2000 5.60 3.87 x 10¹¹ 4.58
3000 8.40 8.71 x 10¹¹ 10.31
4000 11.20 1.5 5 x 10 12 18.34
Ion Thruster Plasma Generators
163
Otherwise, the energy received by an electron during acceleration on each half-
cycle of its cyclotron motion is taken back by deceleration of the electron in the
field on the next half-cycle. Therefore, there is a minimum pressure at which
sufficient collisions occur to ignite the plasma and sustain the discharge. The
probability of a collision occurring is
p = [ 1- exp -nocr x] = [ 1- exp( -xl Aen) ] ,
(4.6-21)
where x is the path length of the electron in the neutral gas with a density of
no, and Aen is the electron-neutral collision mean-free-path. An electron
entering the interaction region gyrates around the magnetic field lines due to its
perpendicular velocity and travels along the magnetic field line due to its
parallel velocity.
While the electron cyclotron heating tends to spin-up the electron motion
around the field lines, collisions tend to scatter the motion along the direction of
the field lines and thermalize the electrons into a Maxwellian distribution,
sometimes with a high-energy bump or tail driven by the resonance. The
collisionality requirements to achieve heating can be found from examining the
path length of an electron at a temperature Te spiraling along a field line. The
distance that the electron travels when gyrating around the field lines is given
by the Larmor radius, which was derived in Chapter 3:
rL = : = 1;lv = 2:V .
(4.6-22)
The time for an electron to leave the microwave interaction region of length L
IS
L
t=-
,
VII
(4.6-23)
where vII is the parallel electron velocity along the field line. The number N of
gyrations that an electron makes in the interaction region is the microwave
frequency f multiplied by the time in the resonant region. The path length of the
perpendicular gyration of the electron is then
L
Lg =21r r L N=2;r rLf-.
vII
(4.6-24)
The total path length of the helical motion of the electron is
164
Chapter 4
4 = L +L 2 = ( 21r rLfL ) 2 +L2 .
VII
(4.6-25)
Using this value for the path length x of the electron in Eq. (4.6-21) gives the
probability of a collision with the neutral gas. Figure 4-35 shows this
probability calculated for xenon gas at room temperature for electrons with a
temperature of2 eV in two different interaction lengths. To achieve the order of
10% of the electrons colliding with neutral gas atoms in a 5- to 10-cm-long
resonance region requires an internal pressure of at least 10- 3 torr. In reality the
electrons must make multiple collisions within the interaction region because
the energy gain in a single gyration is small. However, this pressure is similar
to that found for rf thrusters to achieve sufficient collisions to start or sustain a
discharge, for essentially the same reasons. Again, once the plasma is started,
coulomb collisions will aid in transferring the electron motion in the microwave
fields into heating, which reduces the pressure required to operate the plasma
generator and permits higher mass utilization efficiencies to be achieved.
As was shown in Tables 4-1 and 4-2, a high magnetic field (>1 kG) and a high
microwave frequency (>2.8 GHz) are required to produce sufficient plasma
density to deliver reasonable current densities (>lmNcm 2 in xenon) to the grids
in microwave thrusters. Due to the difficulty in producing these high magnetic
fields throughout the discharge chamber volume, the resonance region is often
localized to a small zone inside the thruster volume, and the plasma is allowed
1.0
0.9
0.8
c:
0 0.7
"0 0.6
u
'0 0.5
:c 0.4
ro
.Q
e 0.3
c..
0.2
0.1
0.0
10-4
-L= 10cm
-L=5cm
10- 3
10- 2
10- 1
Pressure (torr)
Fig. 4-35. Probability of an electron-neutral colliaion before leaving the
resonance zone length indicated as a function of neutral pressure for
2-eV electrons.
Ion Thruster Plasma Generators
165
to expand to the grids along divergent magnetic field lines. Figure 4-36 shows
an ECR plasma source where a stronger magnetic field region resonant with
2.4-GHz radiation (produced by commercial magnetron microwave sources) is
restricted to the rear of the discharge chamber. Of course, expanding the plasma
from the resonance region to the grids decreases the plasma density and current
density, so even higher magnetic fields and frequencies than just mentioned are
normally required in the interaction region to produce over 1 mAlcm 2 to the
grids.
The microwave radiation in this ECR plasma source is coupled into the rear of
the discharge chamber through a waveguide window, and a quartz liner is used
in the resonant region to ensure that the hot electrons are not lost directly to the
metal walls of the chamber. The magnetic field in this geometry is produced by
electromagnets, with a strong divergence in the field to spread the plasma over
the grid region at the exit of the discharge chamber. This is a common
geometry for industrial ion sources and plasma sources used in plasma
processing, and the performance of the plasma generator is well known.
The performance of this style of microwave ion thruster can be examined with
a O-D model. Assume that the magnetic field is sufficiently strong that radial
losses can be neglected. This assumption implies that the plasma is frozen on
the field lines such that the density decreases linearly with the area increase as
the field expands. This simplifies the model to the case of a straight cylindrical
source with no radial losses. The plasma is lost axially to both the screen area
As and the rear wall area Aw. Since there is no DC applied field, the plasma
floats relative to the internal surfaces, the electrons are lost to the axial rear wall
area and the collection area of the screen grid given by (1- Ts )As' Neglecting
Resonance
Region
(875 G)
Electromagnets
Quartz
Liner
W....0'....0'
Fig. 4-36. Schematic of microwave ion source with a volume-
resonance zone of strong magnetic field produced by
electromagnets.
166
Chapter 4
the cost of producing the microwave radiation, the power absorbed by the
plasma is equal to the power lost:
P abs = IpU++I*U* +Us+Iw + Ib)( T;V +CP)+I a (2T ev +CP), (4.6-26)
where Is is the ion current collected by the screen grid, Iw is the ion current
collected by the entire wall, and the ion energy loss is, again, Te /2 + cp. The
amount of energy lost by electrons to the wall assumes that the electrons have a
Maxwellian distribution, which may underestimate the energy lost due to the
high energy tail in the electron distribution generated by the resonant ECR
heating. The discharge loss is the power in (or out) divided by the beam
current:
'1l _ P abs
',d--
Ib
I 1* * ( I I )( T ) I
=.J:...U+ +-U + 2..+-!:!:..+1 ....!Y....+cP +-!!.(2TeV +cp).
Ib Ib Ib Ib 2 Ib
(4.6-27)
The first three current fractions in this equation are given by Eqs. (4.3-55),
(4.3-56), and (4.3-57), respectively. The fourth current fraction is given by
lw
Ib
1
- nievaAw
= 2
1
- nievaAsTs
2
_ Aw
AsTs'
(4.6-28)
where the wall area Aw is the rear wall area only. The plasma potential is
found again from charge conservation by equating the total ion and electron
current:
n.e fli T n e 8kT [ m /kT
-L ----f. (A + A ) =......L -.£.. A + ( 1 - T ) A ] ex p -e'l' e.
2 M w s 4 nm w s s
(4.6-29)
Solving for the plasma potential gives
cP = kTe In [ Aw +(l-Ts)As 2M ] ,
e Aw + As n m
(4.6-30)
which is different from that found for rf ion thrusters because there is no ion
confinement factor due to the induced magnetic fields from the antenna (the
Ion Thruster Plasma Generators
167
ions are assumed perfectly confined radially due to the strong magnetic field).
The electrons are lost to the rear wall and the screen grid, so the final current
fraction in Eq. (4.6-27) is
I 8kTe
I - -nee[Aw +(l-Ts)As]
-E.. = 4 1C m exp -e 1 kTe
Ib !n.e kTe AT
2'M s s
(4.6-31)
Using Eq. (4.6-30) for the plasma potential, this becomes
Ia = Aw+As
I b AsTs
(4.6-32)
The discharge loss is then
2n o (a;v p )v [ + * (aov e ) )
7]d = U + U
kTe AT (aiVe)
M s s
[ l-T A ]( T V ) A +A
+ ----:!:..+---!:L+I ....£.....+C/> + w s (2Tev +C/»,
Ts AsTs 2 AsTs
(4.6-33)
with the plasma potential given by Eq. (4.6-30). The electron temperature and
neutral density are solved in the same manner as previously for the other types
of thrusters. The discharge loss for a generic microwave ion thruster producing
I A of xenon ions from a 20-em-diameter grid with 80% transparency is shown
in Fig. 4-37 for several thruster lengths. Discharge losses on the order of
200 eVlion are predicted. This discharge loss is twice that of our idealized ion
thruster in Section 4.2 because both the ideal and the microwave source cases
assumed ionization by Maxwellian electrons and perfect radial confinement,
but the microwave source case includes plasma loss to the rear wall. While the
assumption of negligible radial loss is reasonable due to the strong magnetic
fields, some additional loss is expected in this direction that will degrade the
actual discharge loss somewhat. The large loss area for plasma to the beam area
and rear wall tend to drive up the plasma potential to maintain net ambipolar
flows and charge balance, which increases the discharge loss compared to well-
designed DC discharge thrusters.
Microwave ion source designers mitigate the back wall losses by imposing a
stronger magnetic field upstream of the resonance zone. This creates a magnetic
mirror, which was described in Chapter 3, that confines the plasma electrons
168 Chapter 4
400
350
300
'2
0
250
'"
'"
0 200
-1
Q)
<II 150
-E
'" -L=10cm
is
100 -L=20cm
50 - L=40cm
o
0.76 0.78 0.80 0.82 0.84 0.86 0.88 0.90 0.92 0.94 0.96
Mass Utilization Efficiency
Fig. 4.37. Discharge loss versus mass utilization efficiency for our
microweve thruster example with perfect radial confinement.
and reduces the axial losses. Because the magnetic moment (defined as
mv 2 / 2B) is invariant along the field lines, electrons with sufficient initial
perpendicular velocity are reflected from the increasing magnetic field as their
parallel energy is converted into rotational energy. The electrons that are lost
have a parallel velocity of
vn>V.l .JRm- 1 ,
(4.6-34)
where Rm is the mirror ratio given by Bmax / Bm . For example, if the mirror
ratio is 5, only electrons with a parallel velocity twice that of their
perpendicular velocity will be lost. If the electrons have a Maxwellian
distribution with a temperature Te, then the number of particles with vII > 2 v.l
is e- 2 = 13.5%, so a large majority of the population is reflected. Since the
cyclotron heating adds perpendicular energy to the electrons, mirror ratios of 4
to 6 are very efficient in confming the heated electrons that produce ionization.
The ion source shown in Fig. 4-36 utilizes electromagnets to produce the high
field over a significant volume and also to create the confining mirror ratio.
However, the power required to operate the electromagnets in this design
increases the effective discharge loss and limits the electrical efficiency of the
device in thruster applications. In addition, it is difficult to create large area
Ion Thruster Plasma Generators
169
plasmas with good unifonnity using microwave excitation due to the strong
magnetic fields that confine the plasma and influence the profile. This leads to
other magnetic configurations to produce the plasma using microwave ECR
techniques.
In a volume-ionization ECR source, like that shown in Fig. 4-36, a significant
fraction of the discharge chamber must be filled with a strong magnetic field to
satisfy the resonance condition. If this field is produced by a solenoid, the
electrical power required to achieve a sufficient field strength can represent a
significant energy cost to the thruster. Likewise, if the field is produced by
pennanent magnets, the weight of the magnetic material required to produce
this field can represent a significant weight penalty for the thruster. This
problem can be mitigated by using magnetic multipole boundaries that produce
strong magnetic fields at the discharge chamber wall using ring or line-cusp
magnet configurations. Figure 4-38 shows the field lines between two magnet
rings and the regions of strong magnetic field close to the magnet where the
resonant condition is satisfied. Injection of the microwave radiation between
the cusps, either by cutoff waveguides inserted between the rows [52], by
slotted waveguides run along the rows [53], or by antenna structures placed
between the rows, will couple the microwaves to the high magnetic field
interaction region.
While this geometry eliminates the solenoidal magnet coils and minimizes the
size of the pennanent magnets required to produce the resonant field strength,
there are several issues remaining. First, the magnetic field strength in the cusp
region decreases as one over the distance from the surface squared. This means
that very strong magnets are required to produce the resonant field at any
significant distance from the wall. Second, electrons that gain energy from the
Magnet Rows
Fig. 4-38. Magnetic field lines and electron cyclotron
resonant zone in a ring-cusp wall geometry.
170
Chapter 4
microwaves can be easily lost along the field lines to the wall due to their finite
parallel velocity. This means that optimal ECR designs using permanent
multipole magnets will have the resonance region as far from the wall as
possible and will produce a large mirror ratio approaching the wall to reflect the
electrons to avoid excessive direct loss.
Nevertheless, wall losses are a concern in this configuration because the plasma
production is a surface effect that is confined to the boundary region, as is the
loss. Electrons that are heated in the resonance zone sufficiently to ionize the
propellant gas generate plasma on the near-surface magnetic field lines.
Coupling the plasma from the resonance region or the surface magnetic layer
into the volume of the thruster is problematic due to the reduced cross-field
transport. In the other thruster designs discussed in this chapter, the ion
production was a volume effect and convective loss a surface effect, so thruster
efficiency scaled as the volume-to-surface ratio. This means that larger DC and
rf discharge thrusters can be made more efficient than smaller ones. Microwave
thrusters, on the other hand, don't scale in the same manner with size because
large amounts of plasma must be produced and transported from the surface
region to fill the volume of larger thrusters, which can impact the discharge
loss. In addition, the plasma density is limited by both cutoff and the magnitude
of the resonant field, and so high current density ion production requires very
high magnetic fields and high microwave frequencies. Therefore, microwave
thrusters have been limited to date to lower current densities and smaller sizes
than the other thrusters discussed here. However, work continues on scaling
microwave thrusters to larger sizes and higher efficiencies.
The most successful design of a microwave thruster to date is the MUSES-C
10-cm ECR thruster [53-55], which is shown schematically in Fig. 4-39 from
[54]. In this case, extremely strong samarium cobalt (SmCo) magnets are used
to close the resonance field at the operating frequency between the magnets.
This produces heating away from the wall and traps the electrons on the field
lines due to an achievable mirror ratio of 2 to 3 in this geometry. The thruster
volume is also minimized, with the plasma production region close to the grids.
This configuration produces over 1 mNcm 2 of xenon ions over the active grid
region using a 4.2-GHz microwave source with a discharge loss of about
300 eV per ion at over 85% mass utilization efficiency [53].
Finally, there are several other components intrinsic to these thrusters that
contribute to the difficulty of achieving high efficiency and compact size in a
microwave thruster subsystem. Sources of microwave frequencies in the
gigahertz range, such as traveling-wave tubes (TWT) and magnetrons, have
efficiencies in the 50% to 70% range, and the power supply to run them is
usually about 90% efficient. This represents nearly a factor of two in-line loss
Ion Thruster Plasma Generators
171
Microwave t
.Q
Electro-
static
Grids
Waveguide
Pem18nent
Magnets
Fig. 4-39. Schematic of the MUSES-C 10-cm microwave source showing
the strong magnets and small volume characteristic of these thrusters
(from [54]).
of the electrical power delivered to the thruster that must be accounted for in
the total discharge cost of the subsystem. The plasma is typically a difficult
load to match well, and reflection of 10% to 30% of the microwave energy
back into the recirculator (which absorbs the reflected power from the source in
the case of mismatch or faults) is typical. The microwave source and
recirculator usually represent a significant mass and volume addition to the ion
thruster system. An examination of Table 4-1 shows that, in order to avoid
cutoff and produce ion current densities to the grids of 1 to 2 mA/cm 2 ,
microwave sources in the 4- to 6-0Hz range are required. At this time, space
TWTs in this frequency range are limited in power capability to the order of a
few hundred watts. For a given discharge loss, this limits the total ion current
that can be produced by a microwave thruster. While microwave thrusters hold
the promise of eliminating the need for thermionic cathodes used in DC-
discharge thrusters and of doing away with the requirement for dielectric
discharge chambers in rf thrusters, producing high-efficiency, high-thrust ion
propulsion systems based on this technology can be challenging. This is
certainly an area for future research.
4.7 2-D Computer Models of the Ion Thruster
Discharge Chamber
The analytical models described above can generally explain the behavior and
predict the overall discharge chamber performance of well-defined
configurations, but multi-dimensional computer models are required to predict
172
Chapter 4
thruster performance parameters such as plasma profile and double-ion content,
and to examine the details of different designs. Multi-dimensional modeling of
the discharge chamber requires detailed models of discharge chamber walls and
magnetic fields as well as of neutral propellant gas, ions, and primary and
secondary plasma electrons [56-58]. Because the important physical
mechanisms are different, each species (neutral gas, ions, and primary and
secondary electrons) is modeled differently. For example, most neutral gas
atoms travel in straight lines until they hit a wall or are ionized, so the neutral
models can take advantage of simple straight-line trajectories to develop neutral
density profiles. On the other hand, primary electron trajectories are dominated
by rotation around magnetic field lines, and typically particle-tracking
techniques are used to detennine the density and spatial distributions. Ion and
secondary electron behaviors are obtained using fluid equations due to the
relatively collisional behavior of the species. Therefore, ion thruster discharge
models that require computer codes that use both fluid and particle-tracking
models are known as "hybrid" codes.
Figure 4-40 shows a generic flow diagram for an ion thruster hybrid model
[58]. From the thruster inputs (geometry), a mesh is generated inside the
discharge chamber. A magnetic field solver determines the field everywhere in
the chamber. Depending on the type of mesh used, the mesh generator may be
iterated with the magnetic field solver to align the mesh points with the
magnetic field lines. Aligning the magnetic field line simplifies the plasma
diffusion calculations since the equations can be separated into parallel and
perpendicular components, which can result in improved code accuracy for a
sufficiently fine mesh. A neutral gas model, such as the "view-factor" model
described below, detennines the neutral density throughout the volume. The
"ionization model" uses the magnetic field and electric field to compute the
trajectories of primary electrons and their collisions with other plasma
components (i.e., neutrals, ions, secondary electrons), which create ions and
serve to dissipate the primary electron energy. The ionization model also
determines the collisions due to secondary electrons. The ion optics model
determines the transparency of the ion optics to neutrals and ions, as described
in detail in Chapter 5. The ion diffusion model uses the magnetic field
infonnation and plasma properties to detennine the motion of the plasma. The
electron thermal modei determines the energy balance for the electrons to find
the distribution of temperatures of the secondary electron population. These
processes are iterated until a convergent solution is found.
4.7.1 Neutral Atom Model
Accurate knowledge of the neutral gas is required in multi-dimensional plasma
codes to predict the beam profiles, details of discharge plasma behavior, and
Ion Thruster Plasma Generators
173
Ion Diffusion and
Electron Thermel
Models
Convergence
Check
Fig. 4-40. Hybrid 2-D ion thruster discharge model
flow diagram and components overview.
thruster performance. For example, many thrusters utilize localized sources and
sinks of the neutral gas that produce non-uniform neutral density profiles that
must be considered to understand performance.
Ion thrusters operate at internal pressures on the order of I x 10-4 torr or lower
in order to achieve good mass utilization efficiency. In this pressure range, the
neutral gas can be considered to be collisionless, and simple Knudesen-flow
models are normally used to determine the average neutral gas density inside
the thruster. Assuming surface adsorption, propellant atoms collide with the
chamber walls and are re-emitted with a cosine distribution at the wall
temperature. Collisions with the wall act to thermalize the gas to the wall
temperature. Inside the discharge volume, the neutral atoms collide with
electrons and ions. Some neutral atoms are "heated" by charge exchange that
transfers the local ion energy to the neutral, but this process has little effect on
the average gas temperature. The spatial distribution of the neutral density is
dependent on the gas injection regions (sources), gas reflux from the walls, loss
174
Chapter 4
of gas out the ion optic apertures, and the internal "loss" of neutral particles by
ionization.
Wirz and Katz [58] developed a technique that accurately predicts the neutral
gas density profiles in ion thrusters. Their model utilizes a three-dimensional
generalization of the view factor formulation used in thermal models [59]. The
view factor approach assumes that neutral particles travel in straight lines
between surfaces, and that, after hitting a surface, they are emitted isotropically.
In this technique [60], a 3-D boundary mesh and a 2-D internal mesh in the
thruster discharge chamber are created for an axisymmetric discharge. The
steady-state neutral fluxes are determined by balancing the injection sources,
re-emission from the walls, loss through the ion optics, and loss due to
ionization. The local neutral density at each of the internal mesh points is
calculated by integrating its view factor from the source points (all the other
mesh points in the thruster), which includes the "loss" of neutrals between the
source and the mesh point due to ionization by the plasma. The ionization
losses affect the neutral gas analogous to absorption diminishing the intensity
of a light ray. The neutral gas code and the rest of the model components,
discussed below, are iterated until a stable solution for the neutral density at
each mesh point is found. One advantage of this model is that the neutral gas
temperature can be tracked after the gas interacts with the wall temperatures
specified at the boundary mesh points. Also, this technique is much faster than
a Monte Carlo code since it requires a single matrix solution, allowing the
coupling of the neutral and plasma codes to quickly determine both neutral and
plasma density profiles.
An example of the axisymmetric boundary ("wall") and internal meshes for the
NSTAR ion thruster from Wirz and Katz [58] is shown in Fig. 4-41. Gas enters
from the hollow cathode at the center rear and the propellant injection manifold
at the front corner of the discharge chamber. The neutral gas density calculated
from this code for the NSTAR thruster in its high-power THI5 mode is shown
in Fig. 4-42. The neutral density is highest near the injection sources at the
hollow cathode and the propellant injection manifold. The neutral gas is the
lowest on axis near the grids due to the NSTAR feed arrangement; however, as
discussed below, the high primary electron density found in this region of the
thruster produces significant ionization and "burns-out" the neutral gas. This
result is critically important because the production of doubly ionized atoms
increases dramatically in regions where the neutral gas is burned out and most
of the electron energy goes into secondary ionization of the ions in the
discharge chamber [58].
Ion Thruster Plasma Generators
175
-- Anode
Ion Optics I .I:J
- Cathode , t 0<;>
0 Propellant Feed f/'
r. -0
/" -0
- -0
.- -- :t. ;: il --
-0
'.
--f- I ,;;: &" -f-
,.
I
I
I -
- - - - i-
II
q
()
.:.
,
...
...
o
"
Fig. 4.41. Rectangular internal mash in an ion thruatar (from [58]).
no
. 9.1 x 10 18
5.1 x10 '8
<1.0 x 10 '8
2.9 x 10 '8
1.8 x10 ,8
I 6.5 X10 17
1.0 x 10 17
..--
..
"
"
..
"
..
..
"
"
..
..
"
"
..
..
..
"
..
"
"
"
"
"
..
"
"
"
"
"
/ :
"
"
_ 3.8 X 10 17 .::
4$x10 18
[l]J
2.3 x 10" 1
--:::::}
-..."
--
Fig. 4.42. 2-D neutral gas denaity profilas predicted in the NSTAR thruster for TH15
by Wirz-Katz modal using tha view-factor code technique [58].
176
Chapter 4
4.7.2 Primary Electron Motion and Ionization Model
Particle simulation methods have been applied to the modeling of primary
electron motion in ion thruster discharge chambers [58,61,62]. In particle
simulations, the primary electrons are represented by particles, or macro-
particles that represent a large number of primary electrons, that move in
discrete time steps based on their initial conditions, applied boundary
conditions, and internal electric and magnetic fields. Monte Carlo techniques
are used to introduce the particles from the cathode exit into the computational
domain at randomized velocities indicative of the cathode emission
characteristics. During each time step, the local fields are recalculated based on
the new particle position and velocity, and the particles move based on the local
forces. Monte Carlo techniques typically are used to handle collisions between
the particles. This procedure is repeated through many time steps until the
particle is lost, after which the next particle is introduced at a unique initial
velocity condition.
The primary electron motion between collisions is treated as the motion of a
charged particle in the presence of an electromagnetic field, which is described
by the Lorentz equation
dV
m-=q(E+vxB).
dt
(4.7-1)
Wirz and Katz [58] developed an improved Boris-type particle-pushing
algorithm [63] in which the motion of the particles can be described with an
implicit particle-pushing algorithm, where the Lorentz forces on the particle are
decomposed into electric and magnetic forces. The primary's kinetic energy is
assumed to be unchanged in an elastic collision, and the particle-scattering
angle is estimated by a 3-D probabilistic hard sphere scattering model [58]. In
an inelastic collision, some fraction of the primary energy goes into excitation
or ionization of the neutrals. Additional energy loss paths exist, as previously
discussed, such as coulomb collision thenna1ization and anomalous processes
associated with instabilities. A typical primary trajectory in the NST AR thruster
from the Wirz code [58] is shown in Fig. 4-43, where the primaries are well
confined by the strong axial magnetic field component in this thruster, and
collisional effects eventually scatter the primary into the cusp loss cone.
Arakawa and Yamada's model for primary electron motion is derived from the
Euler-Lagrange equations for the Lagrangian of a charge particle in a magnetic
field [61]. However, this technique is computationally more intensive and does
not improve the results in comparison with the improved Boris algorithm.
Ion Thruster Plasma Generators
177
_ n' n"' _O c:: ::.:.:::_u .::::- L - :: - :-::: - -.::::: - ::(--..:---:----.-- -L
E t - ' . 1\. ,.
B tl ./' : h __--."--'u no:::; .,..
CollISion "L05S to : -- -- - '. ' . --' \',
\ . _+r- , " _ t,
Allode !- - ( '. - ,r ,, -..
..(...... I .. ......
"If -............. t ..' ", p
:N: 11 . - "l ' \
___mmmm_m_nn' 't'. .,: ' \ :\ .
\. - '?t\.. \"', ..' . " "-a . ,. .
- _0. 0. L .. . . i;
t- ?
.. -.
, :. ili. --- > .-;. '
11 . . " "' - 'w- ' tJ' . '" ,.)., '.!\ '\," \, 1::
; -'.Jr rt. ---' 'J: : . 'ir;;. : "' _'_ $,:
.... ............. , . .,-. W...'t . .....1-. .u.' .... -."
- - ' _ . -"J" \, , _ ," 'r -:"" . ":
.,' -
'....-. -- .
,'.
.t'
Fig. 4.43. Example primary electron trajectory calculated insida the NSTAR
discharge chambar (from [60]).
The primary electron density calculated by Wirz [60] for the THI5 operating
condition is shown in Fig. 4-44 and reveals that the magnetic field
configuration of NSTAR tends to trap the primary electrons from the cathode
on the thruster axis. This trapping of primary electrons, combined with the low
neutral density on axis, causes a relatively high rate of production of double
ions along the thruster axis.
The ion and secondary electron transport may be treated by an ambipolar ion
diffusion equation derived from the single-ion and electron continuity and
momentum equations. The steady-state continuity equation for ions is
an +V' .(nv)=ns,
aT
(4.7-2)
where ns is the IOn source term. The momentum equation for ions and
electrons is
m [ d(nv) + V' . (nvv) ] = nq(E+ v xB)- V'. p- nmL(nn)(v - v n ).
at n
(4.7-3)
178
Chapter 4
np
2.2 x 10 11
1.6 X 10 11
5.0>< 10'6
4.5>< 10 '6
4.0>< 10 '6
3.5>< 10'6
3.0 >< 10 '6
2.6 >< 10'6
2.1 x,O,6
1.6 x 10'6
1.1 ><10'6
5.9 x 10'
1.0 >< 1O'
---
"
"
- "
.3.0 _><.10 ' . ./ II
II
,I
II
_1 .6><10' /1 :
II
.. ._.. _.. _. ._... _.. _r._.... _.. _.._.. _..._._",-
Fig. 4-44. Primary electron density (m-3) for NSTAR throttle level TH15 [60].
where the subscript 'n' represents the other species in the plasma. Equations
(4.7-2) and (4.7-3) can be combined to create a plasma diffusion equation
-Da V2n =iis,
(4.7-4)
where Dais the ambipolar diffusion coefficient. The diffusion coefficient is
separated into parallel and perpendicular components, such that
Da =[ a D:J
n. _ PeDi + p;D e
'-'jla -
Pi + Pe
D - PeD.l..i + p;D .l..e
.l..a - ,
Pi + Pe
(4.7-5)
where the species mobilities and diffusion coefficients are determined by
separately equating the parallel and cross-field fluxes of ions and electrons [64).
This simplified plasma diffusion equation assumes uniform ion and secondary
electron production rates and temperatures; a derivation that does include these
simplifying assumptions is given by Wirz [60).
Ion Thruster Plasma Generators
179
The thermal electron energy conservation equation is derived by multiplying
the Boltzmann equation by mv 2 /2 and integrating over velocity to give
( n; v2 +%nkT )+ V .[( n; v 2 +%nkT )V+ q ]= enE.v+R.v+Qe +Qc'
(4.7-6)
where viscous effects are ignored and R is the mean change of momentum of
electrons due to collisions with other species. This equation is combined with
the electron fluxes to the boundaries and thermal conductivity to determine the
total energy loss to the boundaries. Temperatures calculated from the electron
energy equation are shown in Fig. 4-45 for the NST AR thruster. The strong on-
axis confinement of the primaries in NST AR tends to locally heat the plasma
electron population, generating a high on-axis plasma temperature.
4.7.3 Discharge Chamber Model Results
The 2-D discharge chamber model developed by Wirz and Katz [58] has been
verified against beam profile and performance data for the 30-cm NSTAR
thruster. The model results for the NSTAR thruster at throttle condition THIS
are plotted in Fig. 4-46, where the beam current density profile calculated by
the model agrees well with experimental data obtained during the 8200-hour-
_.- _..- - - - - - - - _._
Fig. 4.45. Secondary electron temparatures (eV) for NSTAR thruster at TH15 [60].
180
70
60
N 50
E
40
'u;
Q)
o 30
'E
::J
(,) 20
10
. .. LOT Profile
-- Model LOT Profile
-- Modified B-Field
- Neutral Density
o
0.000
Chapter 4
3.5 x 10 18
3.0 x 10 18
2.5 x 10 18 Z
CI>
S.
2.0 x 10 18 0
CI>
::J
.
-<
1.5x10 18
'3
I
1.0x10 18 ..!;'
5.0 X 10 17
.......... 0.0
0.160
0.040 0.080 0.120
Thruster Radius (m)
Fig. 4.46. Beam and nautral dansity profilaa at the NSTAR grid [60].
long duration test [65). The peaked plasma profile is due to the strong
confinement of the electrons from the cathode by the NSTAR magnetic
configuration, which depletes the neutral gas on axis and produces a significant
number of double ions. The modified B-field profile in Fig. 4-46 is an example
of the model prediction for the case of a modified magnetic field geometry that
makes it easier for primary electrons to move away from the thruster axis. The
ion density calculated by the Wirz-Katz model for the NST AR magnetic is
shown in Fig. 4-47. As suggested by the primary density and plasma electron
temperatures in Figs. 4-44 and 4-45, the plasma density is strongly peaked on
axis. Finally, the double-to-total ion ratio distribution throughout the discharge
chamber is shown in Fig. 4-48. These results agree with experimental data that
suggest the on-axis peak in the NSTAR beam profile is due to high centerline
double-ion content.
Analysis by the Wirz-Katz model results shows that the original NSTAR
magnetic field configuration tends to trap primary electrons on axis, which
increases local electron temperature, ionization rate, and the generation of
double ions in this region. This trapping of primary electrons also manifests in a
neutral atom depletion on axis, as was shown in Fig. 4-46. The "modified"
configuration in this figure shows the power of a good computer model to
improve ion thruster design. By allowing the primary electrons to move away
from the thruster axis, the ionization is spread more uniformly throughout the
discharge chamber. The flatter profile results from a decrease in primary
Ion Thruster Plasma Generators
181
nj
.1.0x10 18
9.0 x 10 17
8.0 >< 10 17
7.0 >< 10 17
6.0>< 10 17
5.0>< 10 17
4.0>< 10 17
3.0>< 10 17
2.6>< 10 11
2.0 x 10 17
1.0 x 10 17
1.2 x 10 17
------...
l '
..
..
..
"
.,
..
"
..
I'
..
..
..
..
..
..
..
..
..
"
"
..
,
..
..
..
"
..
..
..
"
..
..
..
..
- :...
2.6 x 10 17
('
\
4.0 x 10 17
>--
'0
.. _. -- - -
Fig. 4.47. Ion plasma density (m- 3 ) for the NSTAR at throttle level TH15 [60).
R,;
_ 0.66
0.35
0.25
0.15
Ii 0.15
0.00
"
"
..
..
..
..
..
..
..
..
..
..
..
..
..
..
.,
"
..
.,
..
"
.
"
"
..
..
..
..
..
"
__ 0.15 :
= - "
- - 0.40 :
________.___..__._______L.
0.02
Fig. 4-48. Double ion density ratio (n../n.) for NSTAR operating at a power
level of TH15 [60}.
182
Chapter 4
electron density, and hence double-ion content, on the thruster centerline. Wirz
and Goebel [66] developed "modified" NSTAR designs that guide primary
electrons away from the thruster centerline to improve the profile. These
designs were validated by experiments [67], and also resulted in lower double-
ion content and higher neutral density along the thruster axis as predicted by the
model.
References
[1] H. R. Kaufman, "An Ion Rocket with an Electron-Bombardment Ion
Source," NASA Technical Note. D-585, January 1961.
[2] P. D. Reader, NASA Technical Note, TN D-1162, 1962.
[3] R. T. Bechtel, "Discharge Chamber Optimization of the Sert- II Thruster,"
Journal of Space crafts and Rockets, vol. 5, p. 795-800,1968.
[4] W. Knauer, R. L. Poeschel, and J. W. Ward, "The Radial Field Kaufman
Thruster," AIAA -1969-259, 7th Electric Propulsion Conference,
Williamsburg, Virginia, March 3-5, 1969.
[5] R. D. Moore, "Magneto-Electrostatic Contained Plasma Ion Thruster,"
AIAA-1969-260, 1969.
[6] J. S. Sovey, "Improved Ion Containment Using a Ring-Cusp Ion
Thruster," Journal of Spacecraft, vol. 21, pp. 488-495, 1984.
[7] J. S. Sovey and H. J. King, "Status of 30-cm Mercury Ion Thruster
Development," NASA TMX-71603, October 1974.
[8] T. D. Masek, R. L. Poeschel, C. R. Collett, and D. E. Snelker, "Evolution
and Status of the 30-cm Engineering Model Ion Thruster," AIAA-1976-
1006, International Electric Propulsion Conference, Key Biscayne,
Florida, November 14-17,1976.
[9] V. K. Rawlin, "Operation of the J-Series Thruster Using Inert Gases,"
AIAA-1982-1929, International Electric Propulsion Conference, New
Orleans, Louisiana, November 17-19,1982.
[10] J. R. Beattie and J. N. Matossian, "Inert-Gas Ion Thruster Technology,"
NASA CR191093, March 1993.
[11] 1. R. Beattie and R. L. Poeschel, "Ring-Cusp Ion Thrusters," Paper 84-71,
International Electric Propulsion Conference, May 1984.
[12] J. N. Matossian and J. R. Beattie, "Characteristics of Ring-Cusp Discharge
Chambers," Journal of Propulsion and Power, vol. 7, pp. 968-974, 1991.
[13] M. J. Patterson, T. W. Haag, V. K. Rawlin, and M. T. Kussmaul, "NASA
30-cm Ion Thruster Development Status," AIAA-1994-2849, 30th Joint
Propulsion Conference, Indianapolis, Indiana, June 1994.
Ion Thruster Plasma Generators
183
[14] J. R. Beattie, J. N. Matossian, and R. R. Robson, "Status of Xenon Ion
Propulsion Technology," Journal of Propulsion and Power, vol. 7,
pp. 145-150,1990.
[15] T. D. Maske, "Plasma Properties and Performance of Mercury Ion
Thrusters," AIAA Journal, vol. 9, pp. 205-212, 1971.
[16] J. Ward and T. Masek, "A Discharge Computer Model for an Electron
Bombardment Thruster," AIAA-1976-1009, AIAA International Electric
Propulsion Conference, Key Biscayne, Florida, November 14-17, 1976.
[17] J. N. Matossian and J. R. Beattie, "Model for Computing Volume
Averaged Plasma Properties in Electron-Bombardment Ion Thrusters,"
Journal of Propulsion and Power, vol. 5, pp.188-196, 1989.
[18] J. R. Brophy, Ion Thruster Performance Model, NASA CR-1748l 0, Ph.D.
Thesis, Colorado State University, Fort Collins, Colorado, December
1984.
[19] J. R. Brophy and P. J. Wilbur, "Simple Performance Model for Ring and
Line Cusp Ion Thrusters," AIAA Journal, vol. 23, no. 11, pp. 1731-1736,
1985.
[20] D. M. Goebel, J. E. Polk, and A. Sengupta, "Discharge Chamber
Performance of the NEXIS Ion Thruster," AlAA-2004-3813, 40th AIAA
Joint Propulsion Conference, Fort Lauderdale, Florida, July 11-14,2004.
[21] D. M. Goebel, R. E. Wirz, and I. Katz, "Analytical Ion Thruster Discharge
Performance Model," AlAA-2006-4486, 42nd Joint Propulsion
Conference, Sacramento, California, July 10-13,2006.
[22] D. M. Goebel, "Ion Source Discharge Performance and Stability," Physics
of Fluids, vol. 25, no. 6, pp. 1093-1102, 1982.
[23] A. T. Forrester, Large Ion Beams, New York: John Wiley and Sons, 1988.
[24] M. Lieberman and A. Lichtenberg, Principles of Plasma Discharges and
Materials Processing, New York: John Wiley and Sons, 1994.
[25] Maxwell 3-D is a product of Ansoft Corp.,
http://www.ansoft.com/products/em/max3d/overview .cfm.
[26] R. E. Wirz and D. M. Goebel, "Ion Thruster Discharge Performance per
Magnetic Field Geometry," AIAA-2006-4487, 42nd Joint Propulsion
Conference, Sacramento, California, July 10-13,2006.
[27] K. Leung, N. Hershkowitz, and K. MacKenzie, "Plasma Confinement by
Localized Cusps," Physics of Fluids, vol. 19, no. 7, pp. 1045-1053, 1976.
[28] D. Rapp and P. Englander-Golden, "Total Cross Sections for Ionization
and Attachment in Gases by Electron Impact. I. Positive Ionization," The
Journal of Chemical Physics, vol. 43, no. 5, pp. 1464-1479,1965.
184
Chapter 4
[29] M. Hayashi, "Determination of Electron-Xenon Total Excitation Cross-
Sections, from Threshold to 100-eV, from Experimental Values of
Townsend's a," Journal of Physics D: Applied Physics, vol. 16, pp. 581-
589,1983.
[30] R. R. Peters, P. J. Wilbur, and R. P. Vahrenkamp, "A Doubly Charged Ion
Model for Ion Thrusters," Journal of Spacecraft and Rockets, vol. 14,
no.8,pp.46l-468,1977.
[31] P. Clausing, "The Flow of Highly Rarefied Gases Through Tubes of
Arbitrary Length," Journal of Vacuum Science and Technology, vol. 8,
pp. 636-646, 1971.
[32] L. Spitzer, Physics of Fully Ionized Gases, New York: lnterscience
Publishers, p. 80, 1956.
[33] D. L. Book, NRL Plasma Formulary, Naval Research Laboratory,
Washington D.C., pp. 33-34, 38, 1987.
[34] 1. R. Brophy, 1. Katz, J. E. Polk, and 1. R. Anderson, "Numerical
Simulations of Ion Thruster Accelerator Grid Erosion," AIAA Paper 2002-
4261, 38th Joint Propulsion Conference, July 7-10, 2002.
[35] 1. J. Anderson, 1. Katz, and D. Goebel, "Numerical Simulation of Two-
Grid Ion Optics Using a 3D Code," AIAA-2004-3782, 40th Joint
Propulsion Conference. Ft. Lauderdale, Florida, July 2004.
[36] D. M. Goebel, K. Jameson, 1. Katz, and 1. Mikellades, "Hollow Cathode
Theory and Modeling: 1. Plasma Characterization with Miniature Fast-
Scanning Probes," Journal of Applied Physics, vol. 98, no. 10, 113302,
2005.
[37] 1. Mikellades, 1. Katz, D. M. Goebel, and J. E. Polk, "Hollow Cathode
Theory and Modeling: II. A Two-Dimensional Model of the Emitter
Region," Journal of Applied Physics, vol. 98, no. 10, 113303,2005.
[38] 1. E. Polk, D. M. Goebel, 1. Katz, J. Snyder, A. Schneider, L. Johnson, and
A. Sengupta, "Performance and Wear Test Results for a 20-kW Class Ion
Engine with Carbon-Carbon Grids," AIAA-2005-4393, 41st Joint
Propulsion Conference, Tucson, Arizona, July 10-13,2005.
[39] 1. R. Brophy, "NASA's Deep Space 1 Ion Engine," Review of Scientific
Instruments, vol. 73, pp. 1071-1078,2002.
[40] K. K Jameson, D. M. Goebel, and R. M. Watkins, "Hollow Cathode and
Keeper-Region Plasma Measurements," AIAA-2005-3667, 41st AIAA
Joint Propulsion Conference, Tucson, Arizona, July 10-13,2005.
[41] P. 1. Wilbur and J. R. Brophy, "The Effect of Discharge Chamber Wall
Temperature on Ion Thruster Performance," AlAA Journal, vol. 24, no. 2,
pp. 278-283, 1986.
Ion Thruster Plasma Generators
185
[42] J. M. Lafferty, Foundations of Vacuum Science and Technology, New
York: John Wiley and Sons, 1998.
[43] Y. Hayakawa, K. Miyazaki, and S. Kitamura, "Measurements of Electron
Energy Distributions in a 14-cm Diameter Ring Cusp Ion Thruster,"
Journal of Propulsion and Power, vol. 8, pp. 118-126, 1992.
[44] D. Hennan, "Discharge Cathode Electron Energy Distribution Functions in
a 40-cm NEXT-type Ion Engine," AIAA-2005-4252, 41st AIAA Joint
Propulsion Conference, Tucson, Arizona, July 10-13,2005.
[45] D. Bohm, Chapter 1, The Characteristics of Electric Discharges in
Magnetic Fields, edited by A. Guthrie and R. Wakerling, New York:
McGraw-Hill, pp. 1-76, 1949.
[46] N. L. Milder, "A Survey and Evaluation of Research on the Discharge
Chamber Plasma of a Kaufman Thruster," AIAA-69-494, 5th
Propulsion Joint Specialist Conference, U.S. Air Force Academy,
Colorado Springs, Colorado, June 9-13, 1969.
[47] H. R. Kaufman, "Performance of Large Inert-Gas Thrusters," AIAA-
81-0720, 15th International Electric Propulsion Conference, Las
Vegas, Nevada, April 21-23, 1981.
[48] T. Ozaki, E. Nishida, Y. Gotoh, A. Tsujihata, and K. Kajiwara,
"Development Status of a 20 mN Xenon Ion Thruster," AIAA-2000-3277,
36th Joint Propulsion Conference, Huntsville, Alabama, July 16-19,2000.
[49] W. F. Divergilio, H. Goede, and V. V. Fosnight, "High Frequency Plasma
Generators for Ion Thrusters," NASA #CR-167957, November 1981.
[50] H. J. Leiter, R. Killinger, H. Bassner, J. Miller, R. Kulies, and T. Frohlich,
"Evaluation of the Perfonnance of the Advanced 200 mN Radio
Frequency Ion Thruster RIT_XT," AIAA-2002-3836, 38th Joint
Propulsion Conference, Indianapolis, Indiana, July 7-10, 2002.
[51] M. Tuszewski, "Inductive Electron Heating Revisited," Physics of
Plasmas, vol. 4, pp. 1922-1928,1997.
[52] H. Goede, "30-cm Electron Cyclotron Plasma Generator," Journal of
Spacecra}t,vol.24,no. 5, p. 437, 1987.
[53] H. Kuninaka and S. Satori, "Development and Demonstration of a
Cathode-less Electron Cyclotron Resonance Ion Thruster," Journal of
Propulsion and Power, vol. 14, pp. 1022-1026, 1998.
[54] H. Kuninaka, 1. Funaki, and K. Toki, "Life Test of Microwave Discharge
Ion Thrusters for MUSES-C in Engineering Model Phase," AIAA-99-
2439, 35th Joint Propulsion Conference, Los Angeles, California, June 20-
24, 1999.
186
Chapter 4
[55] H. Kuninaka, 1. Funaki, K. Nishiyama, Y. Shimizu, and K. Toki, "Results
of 18,000 Hour Endurance Test of Microwave Discharge Ion Thruster
Engineering Model," AIAA-2000-3276, 36th Joint Propulsion Conference,
Huntsville, Alabama, July 16-19,2000.
[56] Y. Arakawa and K. Ishihara, "A Numerical Code for Cusped Ion
Thrusters," IEPC-91-118, 22nd International Electric Propulsion
Conference, Viareggio, Italy, October 14-17,1991.
[57] Y. Arakawa and P. J. Wilbur, "Finite Element Analysis of Plasma Flows in
Cusped Discharge Chambers," Journal of Propulsion and Power, vol. 7,
no. l,pp. 125-128, 1991.
[58] R Wirz and 1. Katz, "Plasma Processes in DC Ion Thruster Discharge
Chambers," AIAA-2005-3690, 41st AIAA Joint Propulsion Conference,
Tucson, Arizona, July 10-13,2005.
[59] R Siegel and J. R. Howell, Thermal Radiation Heat Transfer, 4th Edition,
New York: Taylor & Francis, pp. 226-227,2002.
[60] R Wirz, "Discharge Plasma Processes of Ring-Cusp Ion Thrusters," Ph.D.
Dissertation, Aeronautics, California Institute of Technology, Pasadena,
California, 2005.
[61] Y. Arakawa and T. Yamada, "Monte Carlo Simulation of Primary Electron
Motions in Cusped Discharge Chambers," AIAA-1990-2654, 21 st
International Electric Propulsion Conference, Orlando, Florida, July 18-
20, 1990.
[62] S. Mahalingam and J. A. Menart, "Primary Electron Modeling in the
Discharge Chamber of an Ion Engine," AIAA-2002-4262, 38th Joint
Propulsion Conference, Indianapolis, Indiana, July 7-10,2002.
[63] J. P. Boris, "Relativistic Plasma Simulations-Optimization of a Hybrid
Code," Proc. 4th Conf. on Numerical Simulation of Plasmas, NRL
Washington, Washington DC, 1970.
[64] S. 1. Braginskii, "Transport Processes in Plasmas," Reviews of Plasma
Physics, vol. 1, pp. 205-311,1965.
[65] J. Polk, J. R. Anderson, J. R. Brophy, V. K. Rawlin, M. J. Patterson,
J. Sovey, and J. Hamley "An Overview of the Results from an 8200 Hour
Wear Test of the NSTAR Ion Thruster," AIAA Paper 99-2446, 35th Joint
Propulsion Conference, Los Angeles, California, 1999.
[66] R. E. Wirz and D. M. Goebel, "Ion Thruster Discharge Performance per
Magnetic Field Geometry," AIAA-2006-4487, 42nd Joint Propulsion
Conference, Sacramento, California, July 10-13,2006.
[67] A. Sengupta, "Experimental Investigation of Discharge Plasma Magnetic
Confinement in an NSTAR Ion Thruster," AIAA-2005-4069, 41st Joint
Propulsion Conference, Tucson, Arizona, July 10-13,2005.
Ion Thruster Plasma Generators
187
Problems
1. Show the conditions under which the ambipolar velocity of the ions
flowing to the wall in a transverse magnetic field reverts to the Bohm
velocity.
2. An ion thruster discharge chamber has an internal pressure of 10-4 torr, a
plasma density of 2 x 10 17 m- 3 , gas and ion temperatures of 500 K, electron
temperature of 4 eV, and a transverse magnetic field of 40 G near the wall
with a diffusion length of 2 cm. What is the average transverse ion velocity
and the ion confinement factor (ratio of vi / vBohm )?
3. In Fig. 4-16 it is shown that the reaction rate for ionization exceeds the
reaction rate for excitation if the electron temperature exceeds about 9 eV.
Why not run discharges with Te 9 eV where ionization is greater
than excitation? Give a quantitative answer for an idealized thruster
producing 1 A with 10-cm-diameter grids on a discharge chamber 10 cm in
diameter and 15 cm long with the anode being the full cylindrical and back
wall area. Assume an 80% grid transparency and a neutral density of
10 18 cm- 3 , and plot the discharge loss as a function of electron temperature
from 3 to lOeV. Explain why. (Hint: examine the various loss terms.)
4. What is the electron temperature in a xenon ion thruster that has an ion loss
area of 200 cm 2 , a plasma volume of 10 4 cm 3 , neutral gas density of
1013 cm- 3 , and a 5% primary electron density at 15 eV?
5. A thruster plasma has a volume of 10 4 cm 3 , has a neutral density of
10 12 cm- 3 , is 10% ionized with 15-V primary electrons, has a 5-eV electron
temperature, and has a primary loss area of 10 cm 2 . What are the primary
electron confinement time, the primary electron collision time (assume a
collision cross section of 2 x 10- 16 cm 2 ), and the primary electron slowing
down time? What is the total effective confinement time for a primary
electron, and which of the three contributors to the total confinement time
is the most important?
6. For a xenon ion thruster with a grid area of 500 cm 2 with a screen grid
transparency of 70%, what is the discharge current required to produce a
2.5-A ion beam? Assume a discharge voltage of 25 V, a hollow cathode
voltage drop of 10 V, a plasma potential of 5 V, a primary electron density
of 5%, and an excitation energy of 10 eV. You can neglect the ion and
primary electron loss to the anode, the ion current back to the cathode, and
any losses to the back wall of the cylindrical discharge chamber with the
same diameter as the grids.
188
Chapter 4
7. A xenon ion thruster discharge chamber produces a 5 x 10 17 m- 3 plasma
20 cm in diameter with an electron temperature of 5.5 e V. What is the beam
current and average current density if the screen grid transparency is 80%,
and what flatness parameter is required to maintain the peak current density
under 10 mAlcm 2 ?
8. A xenon ion thruster has a grid diameter of 20 cm with a transparency of
75%, an electron temperature of 3 eV in a 30-cm-diameter, 30-cm-long
cylindrical discharge chamber with an ion confinement factor of 0.1. What
does the cusp anode area have to be to maintain the plasma potential at the
sheath edge at 6 V? You can assume that the discharge current is 10 times
the beam current and neglect the back wall loss area and primary electron
effects. Assuming the ion temperature is 0.1 eV and that there are
3 magnetic rings around the cylindrical chamber, what is the magnetic field
at the wall required to produce this cusp anode area?
9. An rf xenon ion thruster has a grid diameter of 10 em, a grid transparency
of 70%, and a cylindrical discharge chamber with a diameter and length of
10 em. Assuming an electron temperature of 4 eV, an ion confinement
factor of 0.5, and a neutral density of 6 x 10 18 m- 3 , what is the plasma
potential and discharge loss? If the cylindrical discharge chamber is made
into a cone lO cm long from the grid diameter, how do the plasma potential
and discharge loss change?
10. A microwave ion thruster produces 2 A from an 80% transparent grid using
a 4-GHz microwave source. If the thruster is running at 90% of cutoff with
a flatness parameter of 0.6, what must the diameter of the grid be to
produce this beam current?
Fundamentals oIElectric Propulsion: Ion and Hall T1l1'llsters
by Dan M. Goebel and Ira Katz
Copyright iQ 2008 John Wiley & Sons, Inc.
Chapter 5
Ion Thruster Accelerator Grids
Ion thrusters are characterized by the electrostatic acceleration of ions extracted
from the plasma generator [1]. An illustration of a direct current (DC) electron
bombardment ion thruster showing the ion accelerator, the plasma generator,
and the neutralizer cathode was shown in Fig. 1-1. The ion accelerator consists
of electrically biased multi-aperture grids, and this assembly is often called the
ion optics. The design ofthe grids is critical to the ion thruster operation and is
a trade between performance, life, and size. Since ion thrusters need to operate
for years in most applications, life is often a major design driver. However,
performance and size are always important in order to satisfy the mission
requirements for thrust and specific impulse (Isp) and to provide a thruster size
and shape that fits onto the spacecraft.
There are many factors that detennine the grid design in ion thrusters. The grids
must extract the ions from the discharge plasma and focus them through the
downstream accelerator grid (acce1 grid) and decelerator grid (dece1 grid) (if
used). This focusing has to be accomplished over the range of ion densities
produced by the discharge chamber plasma profile that is in contact with the
screen grid, and also over the throttle range of different power levels that the
thruster must provide for the mission. Since the screen grid transparency was
shown in Chapter 4 to directly impact the discharge loss, the grids must
minimize ion impingement on the screen grid and extract the maximum number
of the ions that are delivered by the plasma discharge to the screen grid surface.
In addition, the grids must minimize neutral atom loss out of the discharge
chamber to maximize the mass utilization efficiency of the thruster. High ion
transparency and low neutral transparency drives the grid design toward larger
screen grid holes and smaller accel grid holes, which impacts the optical
focusing ofthe ions and the beam divergence. The beam divergence also should
be minimized to reduce thrust loss and plume impact on the spacecraft or solar
arrays, although some amount of beam divergence can usually be
189
190
Chapter 5
accommodated. Finally, grid life is of critical importance and often drives
thruster designers to compromises in performance or alternative grid materials.
In this chapter, the factors that determine grid design and the principles of the
ion accelerators used in ion thrusters will be described.
5.1 Grid Configurations
To accelerate ions, a potential difference must be established between the
plasma produced inside the thruster plasma generator and the ambient space
plasma. As shown in Chapter 3, simply biasing the anode of a DC plasma
generator or the electrodes of a radio frequency (rf) plasma generator relative to
a spacecraft or plasma in contact with the space potential does not result in ion
beam generation because the voltage will just appear in the sheath at the plasma
boundary with the walls. If the potential is small compared to the electron
temperature Te, then a Debye sheath is established, and if the potential is very
large compared to Te, then a Child-Langmuir sheath exists. Therefore, to
accelerate ions to high energy, it is necessary to reduce the dimension of an
aperture at the plasma boundary to the order of the Child-Langmuir distance to
establish a sheath that will accelerate the ions with reasonable directionality
(good focusing) and reflect the electrons from the plasma. Figure 5-1 shows the
Child-Langmuir length calculated from Eq. (3.7-34) for two singly charged ion
current densities at an acceleration voltage of 1500 V. For xenon, the
characteristic aperture dimension at this voltage is on the order of 2 to 5 mm
and will decrease if the applied voltage is reduced or the current in the aperture
is increased.
1.2
E 1.0
.£.
r.
c;, 0.6
0::
(II
...J
"- 0.6
-:;
E
C!
0:: 0.4
ro
:E 0.2
(.)
1500 V
1 - J.,=, 1 mAlcm 2 I
- J;= 10 mAlcm 2
--......----
Kr Xe -
20 40 60 80 100 120 140
Ion Mass (AMU)
Fig. 5-1. Child-Langmuir sheath length versus ion mass for two ion current
densities at 1500-V acceleration voltage.
Ion Thruster Accelerator Grids
191
The ion current obtainable from each grid aperture is then limited by space
charge. For a 0.25-cm-diameter aperture extracting the space-charge-limited
xenon current density of about 5 rnAlcm 2 at 1500 V [from Eq. (3.7-56)], the
total ion current per aperture is only 0.25 mA. Assuming this produces a well-
focused beamlet, the thrust produced by this current and voltage according to
Eq. (2.3-9) is only about 16 /lnewtons. Therefore, multiple apertures must be
used to obtain higher beam currents from the ion engine to increase the thrust.
For example, to extract a total of I A of xenon ion current for this case would
require over 4000 apertures, which would produce over 60 mN of thrust. In
reality, for reliable high-voltage operation, and due to non-unifonnities in the
plasma generator producing varying ion current densities to the boundary, the
current density is usually chosen to be less than the Child-Langmuir space
charge maximum, and an even larger number of apertures are required. This
ultimately detennines the size of the ion thruster.
Figure 5-2 shows a simplified one-dimensional (I-D) view of one of these
biased apertures facing the thruster plasma. The Child-Langmuir sheath is
established by the bias potential between the thruster plasma and the accelerator
grid and is affected by the current density of the xenon ions arriving at the
sheath edge from the Bohm current. Ions that arrive on axis with the aperture
are accelerated through to fonn the beam. However, ions that miss the aperture
are accelerated into the accel grid and can erode it rapidly. For this reason, a
"screen" grid with apertures aligned with the accel grid is placed upstream of
the accel grid to block these ions. This is the classic two-grid accelerator system
[1,2]. The screen grid is nonnally either allowed to float electrically or is biased
to the cathode potential of the plasma generator to provide some confinement of
the electrons in the plasma and so that ions that strike it have a relatively low
energy and cause little sputtering. In practice, the grids are made of refractory
metals or carbon-based materials, and the apertures are close-packed in a
Child-Langmuir
-
Plasma
Accelarator Grid
B9am
Plasma
::=n'\= :"-
U Aperture
-+
Fig. 5-2. Simplified 1-D view of an accelerator aperture in
contact with a plasma.
192
Chapter 5
hexagonal structure to produce a high transparency to the ions from the plasma
generator. These grids are also normally dished to provide structural rigidity to
survive launch loads and to ensure that they expand uniformly together during
thermal loading [1,3].
The electrical configuration of an ion thruster accelerator is shown
schematically in Fig. 5-3. The high-voltage bias supply (called the screen
supply) is normally connected between the anode and the common of the
system, which is usually connected to the neutralizer cathode (called
"neutralizer common") that provides electrons to neutralize the beam. Positive
ions born in the discharge chamber at high positive voltage are then accelerated
out of the thruster. The accel grid is biased negative relative to the neutralizer
common to prevent the very mobile electrons in the beam plasma from back-
streaming into the thruster, which produces localized heating in the discharge
chamber by energetic electron bombardment, and ultimately overloads the
Anode
Accel
Screen Decel
Xe+
--+-
Ion Beam
1
Common
12 + Screen Voltage
'E
Q)
'0
c..
Space Potential
Common
Decel
Fig. 5-3. Electrical schematic of a DC discharge Ion thruster without the cathode
heater and keeper supplies.
Ion Thruster Accelerator Grids
193
screen supply if the backstreaming current becomes large. The ion beam is
current neutralized and quasi-neutral (nearly equal ion and electron densities)
by the electrons extracted from the neutralizer cathode. Fortunately, the thruster
self-biases the neutralizer common potential sufficiently negative relative to the
beam potential to produce the required number of electrons to current neutralize
the beam.
Figure 5-3 showed a generic thruster that includes a three-grid accelerator
system, where a final grid called the "decel grid" is placed downstream of the
accel grid. This grid shields the accel grid from ion bombardment by charge-
exchanged ions produced in the beam backflowing toward the thruster, and
eliminates the downstream "pits-and-grooves erosion" that will be discussed in
Section 5.6. Three-grid systems then potentially have longer accel grid life than
two grid systems and generate less sputtered material into the plume that can
deposit on the spacecraft. These benefits are offset by the increased complexity
of including the third grid.
In actual design, the diameter of each accel grid aperture is minimized to retain
unionized neutral gas in the plasma generator, and the screen grid transparency
is maximized so that that the grids extract the maximum possible number of
ions from the plasma. The electrode diameters and spacing are then optimized
to eliminate direct interception of the beam ions on the accel grid, which would
cause rapid erosion due to the high ion energy. A schematic example of a three-
grid system showing the ion trajectories calculated by a two-dimensional (2-D)
ion optics code [4] is shown in Fig. 5-4. The ions are focused sufficiently by
this electrode design to pass through the accel grid without direct interception.
On the downstream side of the accel grid, the negative accel-grid bias applied
to avoid electron backstreaming results in a relatively small deceleration of the
ions before they enter the quasi-neutral beam potential region. This high
transparency, strong "accel-decel" geometry typical of ion thrusters results in
some beamlet divergence, as suggested by the figure. However, this small
beamlet angular divergence of typically a few degrees causes negligible thrust
lost because the loss scales as cose, and because most of the beam divergence
discussed in Chapter 2 related to the thrust correction factor is due to the
dishing of the grids.
The amount of current that an ion accelerator can extract and focus into a beam
for a given applied voltage is related to the space-charge effects characterized
by the Child-Langmuir equation and is called the perveance:
_ Ib
P = ---:sI2 .
V
(5.1-1)
194
Chapter 5
The maximum perveance that can be achieved by an accelerator is given by the
coefficient in the Child-Langmuir equation:
Pmax == 4£0 {2q [A/y3/2].
9 fii
(5.1-2)
For an electron accelerator, this coefficient is the familiar value of 2.33 x 10- 6
Ny3/2, and for singly charged xenon ions it is 4.8 X 10- 9 Ny3/2. For round
apertures, the Child-Langmuir equation can be written
{2q 3/2
J (" r 4=0 V Vd2 [Nm 2 1,
(5.1-3)
where d is the effective grid gap and D is the beamlet diameter. Inserting
Eq. (5.1-3) into Eq. (5.1-1), the maximum perveance forround apertures is
P. == n£o rzq ( D2 J [A/y3/2].
max 9 M d 2
(5.1-4)
Therefore, to maximize the perveance of the accelerator, it is desirable to make
the grid gap smaller than the aperture diameters, as illustrated in the example
configuration shown in Fig. 5-4.
The ion trajectories plotted in Fig. 5-4 that do not intercept either of the grids,
and the minimal beamlet divergence, result from operating at or near the
optimal ion current density and voltage for the grid geometry shown. Operating
at significantly less than the optimal perveance, called "under-perveance" and
Accel
Grid
Decel
Grid
. .: :..:.== -,:=' :r---
=-----------
------------
-
-
q,
Fig. 5.4. Ion trajectories from a plasma sheath (on the left) in a half-beamlet
inside an axample three-grid accelerator.
Ion Thruster Accelerator Grids
195
corresponding to higher voltages or lower beamlet currents than the optimal
combination, increases the Child-Langmuir (CL) length and pushes the sheath
to the left farther into the plasma. In the extreme case, this situation can launch
ions at a very large angle from the edge region near the screen aperture and
cause "cross-over" trajectories, which can then produce excessive erosion of the
accel grid by direct ion impingement. Likewise, operating at higher than the
optimal perveance, corresponding to higher beamlet currents or lower voltages
than optimal, reduces the Child-Langmuir sheath thickness, and the plasma
boundary pushes toward the screen aperture. This "over-perveance" condition
flattens the sheath edge and accelerates ions directly into the accel grid, again
causing excessive erosion. The optical performance and life of any grid design,
therefore, is acceptable only over a limited range in voltage and current density,
which will be discussed in Section 5.3. For this reason, the uniformity of the
plasma over the grid area is important to avoid either cross-over or direct
interception in different regions of the ion optics that strongly degrade the life
of the grids.
In the two- or three-grid configurations, the geometry of the grid apertures and
gaps is intended to eliminate or at least minimize direct impingement by beam
ions on the most negative potential electrode in the system, namely, the accel
grid. This is required to minimize sputtering of the grid by the high-energy
beam ions. The screen grid does receive ion bombardment from the discharge
plasma due to its finite transparency, but the ions arrive with only an energy of
the order of the discharge voltage in DC discharge thrusters or the floating
potential in rf or microwave thrusters. Sputter erosion of the screen grid then
becomes an issue only at high discharge voltages or due to the production of
high-energy ions in the hollow cathode region [5,6] that can bombard the
screen grid. Likewise, the decel grid is biased near the beam plasma potential
and backflowing ions produced in the'beam by charge exchange impact with
very low energy, which causes little or no sputtering. For two grid systems, the
backflowing ions bombard the accel grid with essentially the grid bias voltage.
This can cause significant sputtering of the downstream face of the accel grid
and may determine the grid life.
The decelerating field produced downstream of the accelerator grid by the accel
grid bias acts as a weak defocusing lens for the ions, but keeps electrons
emitted by the neutralizer from entering the high field region and
backstreaming at high energy into the discharge chamber. This decelerating
field is set up either by applying a potential between the accelerator grid and the
decel grid or by applying the bias between the accelerator grid and the hollow
cathode neutralizer and allowing the low energy plasma downstream of the
accelerator grid to act as a virtual anode. Unfortunately, ions generated between
the grids by either charge exchange with unionized neutral gas escaping the
196
Chapter 5
plasma generator or by ionization from the most energetic backstreaming
electrons do strike the accel grid and erode it. Charge exchange ion erosion of
the accel grid ultimately limits the grid life, which will be discussed in
Section 5.6.
5.2 Ion Accelerator Basics
The thruster ion optics assembly serves three main purposes:
1) Extract ions from the discharge chamber
2) Accelerate ions to generate thrust
3) Prevent electron backstreaming
The ideal grid assembly would extract and accelerate all the ions that approach
the grids from the plasma while blocking the neutral gas outflow, accelerate
beams with long life and with high current densities, and produce ion
trajectories that are parallel to the thruster axis with no divergence under
various thermal conditions associated with changing power levels in the
thruster. In reality, grids are non-ideal in each of these areas. Grids have finite
transparency; thus, some of the discharge chamber ions hit the upstream
"screen grid" and are not available to become part of the beam. The screen grid
transparency, Ts, is the ratio of the beam current, I b , to the total ion current,
Ii, from the discharge chamber that approaches the screen grid:
T =!.Jz..
s I.
I
(5.2-1)
This ratio is determined by comparing the ion beam current with the screen grid
current. The transparency depends on the plasma parameters in the discharge
chamber because the hemispherical sheath edge is normally pushed slightly into
the plasma by the applied voltage if the screen grid is relatively thin. The pre-
sheath fields in the plasma edge then tend to steer some ions that would have
gone to the screen grid into the beam. For this reason, the effective
transparency of the screen grid typically exceeds the optical transparency for
relatively large apertures and thin grid thicknesses. In addition, the screen grid
current must be measured with the screen grid biased negative relative to
cathode potential to reflect energetic electrons in the tail of the Maxwellian
distribution in the plasma. The goal for screen grid design is to maximize the
grid transparency to ions by minimizing the screen thickness and the webbing
between screen grid holes to that required for structural rigidity.
The maximum beam current density is limited by the ion space charge in the
gap between the screen and accelerator grids [2], which was discussed above
Ion Thruster Accelerator Grids
197
with respect to the perveance that was specified by the Child-Langmuir
equation in which the sheath was considered essentially planar. The problem is
that the sheath shape in the screen aperture is not planar, as seen in Fig. 5-4,
and the exact shape and subsequent ion trajectories have to be solved by 2-D
axi-symmetric codes. However, a modified sheath thickness can be used in the
Child-Langmuir equation to approximately account for this effect, which is
written as
3/2
J - 4£0 2e V T
max-T M 7'
e
(5.2-2)
where V T is the total voltage across the sheath between the two grids and the
sheath thickness, , f e is given by
2 d 2
€e= (€g+t s ) + .
(5.2-3)
The grid dimensions in Eq. (5.2-3) are defined in Fig. 5-5. As illustrated in the
figure, the sheath is allowed to expand essentially spherically through the
screen grid aperture. The sheath thickness fe accounts for this non-planar
condition and has been found to be useful in predicting the space-charge-
limited current in ion thruster grid configurations [1,7]. Note that the value of
f'. g is the "hot grid gap" that occurs once the grids have expanded into their
final shape during operation at a given beam current and voltage. For xenon
Ions,
r
Accel
Grid (Va)
Beam Plasma
Potential SlJnace
(Vbp)
Discl1arge
Plasma
Sheath
(VpJ
d,
1
f+-',
--.... z
Fig. 5.5. Non-planar sheath model approximation for a two-grid system.
198
Chapter 5
,,3/2
0 -9 YT
J rnax =4.75xl .
Pe
(5.2-4)
The units of the current density in the Child-Langmuir equations are amperes
divided by the dimension used for the sheath thickness, P e' squared.
The maximum thrust per unit area possible from an ion thruster can also be
found. Thrust was defined in Chapter 2 for electric thrusters as
d(mv) .
T=-=ymivi'
dt
(5.2-5)
Assuming the ions start at rest, the ion velocity leaving the accelerator is
V. = 2eVb
1 M '
(5.2-6)
where eV b is the net beam energy. Using Eq. (2.2-3) for the time rate of change
ofthe mass, the thrust per unit area of the grids becomes
T J rnax y TsMvi
-=
Ag e
(5.2-7)
where Ag is the active grid area (with extraction apertures) and Ts is the grid
transparency defined in Eq. (5.2-1). The effective electric field in the
acceleration gap is
E= VT
P ,
e
(5.2-8)
where V T is the total voltage across the accelerator gap (the sum of the screen
and accel voltages):
VT =Vs+IVal= Vb ,
R
(5.2-9)
and R is the ratio of the net beam voltage to the total voltage. Using Eq. (5.2-2)
tor the space-charge-limited current density and the electric field from
Eq. (5.2-8), the maximum achievable thrust density is
Ion Thruster Accelerator Grids
199
3/2 I¥
Tmax = EorTs M 2eV b = E r T JRE 2 .
A 9 M /)2 M 9 0S
g e e
(5.2-10)
The maximum thrust density from an ion thruster increases with the screen grid
transparency and the square of the electric field [8]. Ion thrusters with thin, high
transparency grids operating near the perveance limit and at the maximum
possible electric field in the acceleration gap will produce the most thrust for a
given grid area. A key feature of ion thrusters illustrated by Eq. (5.2-10) is that
the thrust density is independent of propellant mass.
The net-to-total voltage ratio from Eq. (5.2-9) is given by
R = Vb = Vb
V T Vs+IVal'
(5.2-11)
This equation describes the relative magnitude of the accel grid bias relative to
the screen potential. Operating with small values of R increases the total
voltage between the screen and accel grids, which, from Eq. (5.2-2), results in a
higher current density of ions accelerated from the thruster. While it appears
desirable to operate with very small values of R (large accel grid negative bias)
to increase the current capability of a grid set, this results in higher energy ion
bombardment of the accel grid and shortens grid life. Operating with small
values of R will also change the beam divergence, but this is a relatively small
effect in ion thrusters for most grid designs. For applications where thruster life
is important, the magnitude of accel grid bias voltage is usually minimized to
the value required to just avoid electron backstreaming, and the value of R
typically ranges from 0.8 to 0.9. Finally, Eq. (5.2-10) suggests that the thrust
density depends on the square root of R and would increase slowly with higher
beam-to-total voltage ratios. This is misleading because the total voltage also
appears in the electric field term (E = V T / R e), and so higher thrust densities
actually occur with more negative accel grid bias because of the higher voltage
applied across the screen-to-accel gap for a given net (beam) voltage.
Aside from mechanical tolerances, the minimum "hot-gap" grid separation, (g,
is limited by the vacuum breakdown field of the grid material:
V
E = - < Ebreakdown'
Rg
(5.2-12)
In practice, grid breakdowns initiated by arcing or small micro-discharges
between the grids cause "recycles" in which the voltages are temporarily
200
Chapter 5
removed to extinguish the arc and then reapplied. It is common to also decrease
the discharge plasma density during a recycle so that the reapplication of the
acceleration voltages corresponds with ramping up the discharge current such
that the accelerator approximately tracks the right perveance during start up.
This minimizes ion bombardment of the accel grid during a recycle. To obtain
reliable operation and avoid frequent recycles, the maximum field strength in
the ion thruster typically is set to less than half the vacuum breakdown field.
For example, if the grid spacing were a millimeter and the acceleration potential
between the grids a thousand volts, the theoretical maximum xenon ion beam
current density would be 15 mAlcm 2 . A 25-cm-diameter, uniform-profile beam
with a 75% transparent grid system would then produce about 5.5 A of beam
current. In practice, because of high voltage breakdown considerations, the
maximum beam current obtainable from grid sets is typically about half the
theoretical maximum.
The ion thruster size is determined by the perveance limit on the beam current
density and practical considerations on the grids, such as maximum grid
transparency and electric field [1]. For this reason, ion thruster beam current
densities are typically on the order of a tenth that found in Hall thrusters,
resulting in a larger thruster footprint on the spacecraft. Alternatively, the
maximum Isp that is achievable is limited by the voltage that can be applied to
the grids to extract a given current density before electrical breakdown or
electron backstreaming occurs [9]. Very high Isp thrusters (>10,000 s), with a
size that depends on the thrust requirement, have been built and successfully
tested.
5.3 Ion Optics
While the simple formulas above provide estimates of the ion accelerator optics
performance, a number of computer simulation codes have been developed
[4,10-17] to more accurately evaluate the ion trajectories produced by thruster
grids. Ion optics codes solve in two or three dimensions the combined ion
charge density and Poisson's equations for the given grid geometry and beamlet
parameters [18]. These codes have been used for the design and analysis of
two- and three-grid systems, and were extended to four-grid systems [19] to
examine "two-stage" ion optics performance [20] for very high voltage, high
Isp applications.
5.3.1 Ion Trajectories
There are a number of codes that calculate ion trajectories and grid performance
in ion thrusters, and an extensive analysis of ion optics behavior in thrusters
was recently completed by Farnell [21]. An example of a multi-dimensional
code CEX-2D, which is an ion optics code developed at lPL that calculates ion
Ion Thruster Accelerator Grids
201
trajectories and charge exchange reactions between beam ions and un-ionized
propellant gas in two [4] and three [17] dimensions. The CEX-2D code solves
Poisson's equation, given in Eq. (3.7-8) in Chapter 3, on a regular mesh in
cylindrical geometry. The code models a single set of screen and accel grid
holes and assumes cylindrical symmetry. The computational space is divided
into a grid of rectangular cells with up to 400 increments radially and 600
axially. The radial grid spacing is uniform; the axial spacing is allowed to
increase in the downstream direction. The computational region is typically a
few millimeters radially and up to 5 centimeters along the axis downstream of
the final grid. With a few exceptions, the code uses a combination of algorithms
used in earlier optics codes for ion thrusters [11-15].
Upstream of the accelerator grid, the electron density is obtained analytically
from the barometric law assuming a Maxwellian distribution:
ne(V) = ne(O) ex p ( tP ;e tPo J.
(5.3-1)
The upstream reference electron density, ne (0), is set equal to the input
discharge chamber ion density. Downstream of the accelerator grid, the electron
population is also assumed to be a Maxwellian distribution with a different
reference potential:
( tP-lJ> )
ne(V) = nee 00) exp Te 00 ,
(5.3-2)
where the downstream reference electron density, ne(oo), is set equal to the
calculated average downstream ion beam density. As a result, downstream
potentials are determined self consistently; there is no need to assume a
neutralization plane. These codes include focusing effects and the fact that the
aperture dimensions are usually significantly larger than the gap size such that
the electric fields are reduced from the ideal maximum.
The potential distributions are calculated using an optimized pre-conditioned
least-square conjugate gradient sparse matrix solver. Results for a given
upstream plasma number density, n, are found by starting from zero density and
iterating. At each iteration, i, a fraction, a, of the desired discharge chamber ion
density is blended into the code:
202
Chapter 5
nO =0
ni+l =(l-a)ni+an.
(5.3-3)
The density that the code uses asymptotically approaches the final density:
. i
n-n l =n(l-a).
(5.3-4)
If a is sufficiently small, approximate results for all upstream densities less
then n can be obtained in a single run:
n i =[I-(I-a)iJn.
(5.3-5)
By saving the intermediate results, only a single run is needed to estimate the
performance of an optics design over a wide range of discharge chamber
densities. However, since the calculation is fully converged only at the final
density, separate runs with different final densities may be necessary to obtain
accurate results over the full range of discharge chamber ion densities. A
typical CEX-2D calculation takes a few minutes on a personal computer. Ion
optic assemblies designed using the CEX-2D code have met the predicted
performance very closely [4], illustrating that grid design techniques are very
mature.
The ion density in the beamlet is obtained in the codes by tracking
representative ion trajectories and accounting for charge exchange collisions
that alter the ion energy. Ions enter the computational region from the upstream
boundary at the Bohm velocity, and their charge density is found by following
their trajectories in a stationary electric field. This is in contrast to the time-
dependent particle in cell (PIC) technique generally used in plasma physics
simulations.
An example of ion trajectories calculated by CEX-2D is shown in Fig. 5-6,
which shows the computational space with the dimensions given in meters used
for three values of beam perveance for half a beamlet in a three-grid
configuration. In this figure, ions from the discharge chamber enter from the
left and are accelerated by the electric field between the screen and accel grids.
The horizontal boundaries represent lines of symmetry such that an ion crossing
at these boundaries has another ion coming in from outside the domain. Figure
5-6(a) shows an over-perveance condition representing a beamlet current too
high for the applied voltage, or too Iowa voltage for the plasma density and ion
current provided. In this case, ions directly impinge on the upstream face of the
accel grid. This situation is considered to be the perveance limit, where
Ion Thruster Accelerator Grids 203
(a)
1.4 xur 3
1 2 x10- 3
1.0 x10- 3
8.0x10⁻⁴
6.0 x10⁻⁴
4.0x10⁻⁴
2.0 x1 0-4
0
-1>< 10- 3 0 1 X 10- 3 2 ><10---3 3x10- 3 4 x10- 3 5 x 10- 3
(b)
1.4 ><10- 3 I
1.2 x10- 3 i
1.0xlO- 3 ::::::;;!
8.0x10⁻⁴
6.0x10⁻⁴
4.0><10-4 J ---
2.0><10-4 I . . , .
0
-1 x10- 3 0 t x10- 3 2x10---3 3x10⁻³ 4 x 10- 3 5x10- 3
(e)
1.4 xlO- 3
1.2 ><10- 3
1.0 ><10- 3
8.0 ><10--4
6.0 ><10-4
4.0 )(10--4
2.0 )(10-4
0
-1 x 10- 3 0 1 X 10- 3 2x10- 3 3><10- 3 4>< 10---3 5x10- 3
Fig. 5-6. Representative Ion trajectories from a CEX2D calculation for three
perveance conditions: (a) over-perveance with direct accel grid interception.
(b) optimal perveance, and (c) under-perveance that can produce cross-over
interception.
excessive ion current strikes the accel grid. Figure 5-6(b) shows a near-
optimum perveance condition where the ions are well focused through the accel
and decel grid apertures and do not directly intercept any downstream grid.
Finally, Figure 5-6(c) shows an under-perveance condition where the ions are
over focused and cross over in the acce1 gap. In this case, ions can directly
intercept the accel grid and, eventually, the decel grid as the apertures wear
open. Note that the length of the computational region shown must be long
compared to its radius and is usually chosen so that neighboring beamlets will
overlap.
204
Chapter 5
A fraction of the ions from the plasma at the largest radii run directly into the
screen grid, as seen in Fig. 5-6, and do not enter into the thrust beam. These
ions represent the effect of the finite screen grid transparency that was so
important in the discharge loss calculations in Chapter 4. For the near-optimal
and under-perveance conditions, the screen grid transparency is greater than its
geometric open area fraction, as mentioned above, because the self-consistent
electric fields actually extract some of the ions at large radii that would have hit
the screen grid instead of going into the screen aperture.
5.3.2 Perveance Limits
Figure 5-6 demonstrated that electrostatic accelerators produce focused ion
trajectories when operated near a given design perveance and avoid grid
interception or large beam divergence angles over a limited range of voltages
and currents that are related by space charge considerations in the grid gap. In
ion thrusters, operating sufficiently away from the perveance design of the grids
results in beam interception on the downstream accel and (eventually) decel
grids. Figure 5-7 shows an illustration of the accel grid current as a function of
the current in a beamlet (a single aperture) for three different beam voltages. In
this case, the optics were designed to run at about 2 kV and 0.8 mA of beam let
current, and the design demonstrates low grid interception over about :1:50% of
this current. As the beamlet current is increased, by raising the plasma density
in the discharge chamber, the sheath thickness in the acceleration gap
decreases, which flattens the sheath and causes the accel grid interception to
increase. Eventually, the system becomes under-focused at the perveance limit
where a large fraction of the beamlet is intercepted, as shown in Fig. 5-6(a).
The accel grid current then increases rapidly with beamlet current due to the
3.0
,
\
c 2.5
.2
16
c::: 2.0
'E
::>
U 1.5
E
'"
C1> 1.0
IJJ
0.5
u
<I:
0.0
0.0 0.5
Vb = 2.0 kV
Vb = 2.2 kV
Vb = 2.4 kV
,
,
- .- ..
.- .. .-
1.0
1.5
2.0
2.5
Beamlet Current (mA)
Fig. 5-7. Accel grid current-to-beem current ratio aa a function of the
beamlet current for three velues of the beam voltage.
Ion Thruster Accelerator Grids
205
system running at too high a perveance. At low discharge chamber plasma
densities, which produce low beamlet currents, the beam is over-focused and
interception of the ions on the accel grid due to cross-over trajectories increases
the accel grid current. The ion trajectories for this case are shown in Fig. 5-6(c).
At the nominal beam voltage of 2 kY, this system can be run from about 0.4 to
1.2 mA of beam let current between the cross-over and perveance limits without
producing excessive accel grid current. If the ion thruster has a current profile
greater than about 3: 1 peak to edge over the grid diameter (due to a poor plasma
density uniformity), then grid interception will occur either in the center or at
the edge of the beam. Since the grids are normally designed to deal with the
high perveance condition at the peak current density near the axis, poor plasma
profiles usually result in significant erosion of the edge holes due to cross-over
interception. This will impact the life of the thruster and must be compensated
by either changing the grid gap or screen aperture sizes as a function of the
radius or modifying the plasma generator to produce more uniform profiles.
Increasing the beam voltage shifts the curves in Fig. 5-7 to higher beamlet
currents. This is clear from the dependence in the Child-Langmuir equation
(Eq. 5.3-2) where the current scales as y 3 / 2 if the sheath thickness and grid
dimensions are held constant. In Fig. 5-7, the perveance-limited beamlet
current, where direct grid interception occurs, increases as y 3 / 2 as the beam
voltage is raised. Figure 5-7 also illustrates that, in situations where the thruster
power must decrease, which is typical of deep space solar electric propulsion
missions where the power available decreases as the spacecraft moves away
from the Sun, the beam voltage and Isp of the thruster must eventually decrease
as the current is reduced to avoid grid interception.
The voltage range available from a given accelerator design at a fixed (or nearly
constant) beam current has limitations similar to the current dependence just
discussed. However, the minimum voltage at a given current is of special
interest in an ion thruster because this is related to the minimum Isp of the
engine for a given thrust. The perveance limit of a thruster is usually defined
relative to the rate at which the accel current increases as the beam voltage is
decreased:
Perveance limit == -o.02 [mA/V].
V screen
(5.3-6)
This is related to the optics situation illustrated in Fig. 5-6(a), where the current
at a given voltage is too high for the designed gap and aperture size and the
under-focused beamlet starts to directly intercept accel grid. Figure 5-8 shows
the behavior of the accel grid current for the NASA Solar Electric Propulsion
206
Chapter 5
12
<' 11
.s
'E 10
!!!
:;
() 9
:Q
t5 8
Q)
u
u
« 7
6
600
700 800 900 1000
Beam Power Supply Voltage (V)
Fig. 5-8. Accel grid current versus the screen supply voltage for the
NSTAR thruster at TH15 parameters, showing the perveence limit.
1100
1200
Technology Applications Readiness (NSTAR) engine operating at the full
power parameters ofTH15 but with the screen voltage decreasing. In this case,
the perveance limit is found to be at 688.8 V, compared to the nominal 1100 V
of the screen voltage at this throttle level. The perveance limit can also be
defined by a given percentage increase in the accel current. However, the
screen grid transparency usually decreases as the screen power supply voltage
is decreased, which reduces the beam current and accel current during this
measurement. The magnitude of the percentage increase in the accel current
due to direct ion impingement then needs to be defined for the ion optics
assembly.
5.3.3 Grid Expansion and Alignment
A significant issue in ion thrusters that utilize refractory metal grids is thennal
expansion of the grids during thruster operation changing the acceleration gap
dimension between the screen and accel grids. This will directly affect the ion
trajectories and the perveance of the ion optics. Since the screen grid is heated
by direct contact with the discharge plasma and is usually dished outwards and
designed with a minimum thickness to increase the effective transparency, the
screen grid expansion is usually larger than the accel grid and the gap tends to
decrease as the thruster heats up. This shift from the cold gap to the hot gap
causes the perveance of the optics to increase for convex grid curvature (grids
domed outward from the thnlster body) and changes the beamlet trajectories at
the given operating point. In addition, for grids designed to hold the applied
voltage across the cold gap, the hot gap may be so small that field emission and
high voltage breakdown become problems. For ion thrusters with refractory
metal grids designed with concave grid curvature (grids domed into the thruster
Ion Thruster Accelerator Grids
207
body), the screen grid expands away from the accel grid and the perveance
decreases as the gap gets larger. In addition, concave grids have a smaller
discharge chamber volume for a given thruster size, which adversely affects the
discharge loss.
Ideally, the ion optics design would have sufficient margin to operate at full
power over the range that the grid gap changes. This is possible for smaller
thrusters and/or lower power levels where the grid deflection is a small fraction
of cold gap. For thrusters with grid diameters greater than 15 to 20 cm
operating at power levels in excess of 1 kW, it is often necessary to design the
optics for the highest power case with the small hot gap, and to start the thruster
in the diode mode (discharge only) or at lower beam powers to pre-heat the
grids to avoid breakdown during thennal motion. This establishes the grid gap
dimension within the range the optics can tolerate for high-power operation
with minimal grid interception. It should be noted that grids fabricated from the
various fonns of carbon (graphite, carbon-carbon composite, or pyrolytic) have
smaller or negligible thennal expansion than refractory metal grids and will
have smaller grid gap changes. Ion optics sets that utilize grids made of two
different materials have to deal with this issue of different thennal expansion
coefficients and potentially larger grid gap changes.
Another significant grid issue is alignment of the grid apertures. The ion
trajectories shown in Fig. 5-6 assumed perfect alignment of the screen and
accel grid apertures, and the resultant trajectories are then axi-symmetric along
the aperture centerline. Displacement of the accel grid aperture relative to the
screen grid centerline causes an off-axis deflection of the ion trajectories,
commonly called beam steering. The affect of aperture displacement on the
beamlet steering has been investigated for many years in both ion sources and
ion thrusters [22-25]. The beamlet is steered in the direction opposite to that of
the aperture displacement due to the higher focusing electric field induced at
the accel grid aperture edge. Studies of this effect in ion thruster grid
geometries [24] show that small aperture displacements ( 10% of the screen
aperture diameter) cause a deflection in the beamlet angle of up to about 5
degrees. This phenomenon can be used to compensate for the curvature of the
grids to reduce the overall beam divergence, which is called compensation.
However, the perveance of the aperture is reduced in this case, and interception
of edge ions on the accel grid due to the non-unifonn electric fields can be an
issue. Mechanical misalignment of the grids due to manufacturing tolerances or
thermal deformation can also produce aperture displacement and unintended
beamlet steering. This problem has been identified as the cause of thrust vector
variations observed as thrusters heat up [24]. For this reason, precise alignment
of the grid apertures and grid support mechanisms that minimize non-unifonn
208
Chapter 5
thennal deformation are generally required to provide stable Ion optics
performance with minimal beam divergence.
5.4 Electron Backstreaming
Downstream of the accelerator grid, the ion beam is charge and current
neutralized by electrons from the neutralizer hollow cathode. Since electrons
are much more mobile than ions, a potential barrier is needed to stop neutralizer
electrons from flowing back into the discharge chamber. In the absence of a
potential barrier, the electron current would be several hundred times the ion
current, wasting essentially all of the electrical power. The potential barrier is
produced by the negatively biased accel grid. The minimum potential
established by the accel grid prevents all but the highest energy electrons from
traveling backwards from the beam plasma into the discharge chamber. The so-
called "backstreaming" electron current is not only a parasitic power loss since
these electrons do not add thrust, but it can damage the thruster by overheating
the internal components of the discharge chamber such as the cathode.
The accel grid bias voltage required to limit the electron backstreaming current
to a small value (typically <1% of the beam current) can be detennined by
evaluating Poisson's equation in the grid aperture in the presence of the beamlet
ion current with 2-D computer codes. An example of such a calculation is
shown in Fig. 5-9, where the potential between the electrodes and on the axis of
the half-beamlet is shown. Note that the potential minimum in the center of the
beamlet is only a small fraction of the applied accel grid voltage in this
1500
Screen
Grid
1000
soo
:;::3
<:
(II
0:
a..
0
.......
\
,
\
\
\
\
Accel
Gnd
- Between Beemlets
- - In Beamlets
-SOD
Distance
Fig. 5-9. Potentials on-axis in an individual beamlet and between the
beamlets intersecting the grids.
Ion Thruster Accelerator Grids
209
example, which is due to the beam's space charge. The actual value of this
minimum potential determines the margin to backstreaming, which should be
set well above the value at which excessive backstreaming occurs.
Examining electron backstreaming in more detail shows that the minimum
potential in the accel grid is detennined by three factors: the electrostatic
potential from the bias voltages applied to the different grids, the beamlet space
charge in the accel grid aperture, and the required potential difference between
the beam plasma and minimum voltage to reduce the backstreaming electron
current to insignificant levels. Each of these factors can be evaluated
analytically using simplifying approximations to help in understanding
backstreaming physics.
As stated above, the backstreaming electron current results from the tail of the
beam Maxwellian electron distribution overcoming the potential barrier
established in the accel grid aperture. The current of electrons backstreaming
into the thruster plasma is just the beam plasma random electron flux times the
Boltzman factor for the potential difference between the beam plasma and the
minimum potential in the accel grid region [26]:
1/2 -(Vbp-V m )
I ( 8kT e ) T
I b --ne - e e A
e - 4 TCm Q ,
(5.4-1 )
where Ieb is the electron backstreaming current, V bp is the beam plasma
potential, V m is the minimum potential in the grid aperture, and AQ is the
beamlet area in the grid aperture. The current of ions in the beamlet flowing
through the grid aperture is
Ii = nieviAQ'
(5.4-2)
and the ion velocity through the system is
2e(V p - V bp )
v. =
1 M '
(5.4-3)
where V p is the plasma generator plasma potential at the sheath edge.
Combining Eqs. (5.4-1) through (5.4-3), the minimum potential is
[ 21 b m ( Vp-V bP )]
V m = V bp + Te In ---L TC- .
Ii M Te
(5.4-4)
210
Chapter 5
This equation describes the required potential difference between the beam
potential and the minimum potential in the beamlet to produce a specified
amount of electron backstreaming current relative to the beam current. Note
that this equation is independent of the grid geometry because it deals solely
with the potential difference between a given value of V m (independent of how
it is produced) and the beam-plasma potential. The required potential difference
(V bp - V m) between the beam plasma and the minimum voltage in the grids to
produce a given ratio of backstreaming current to beam current is plotted from
Eq. (5.4-4) in Fig.5-1O for several values of the beam-plasma electron
temperature in a thruster plume with a net accelerating voltage of
V p - V bp = 1500 V . For an electron temperature of 2 eV in the beam, which is
consistent with values found in NST AR thrusters plumes [27], a potential
difference between the minimum potential in the beamlet and the beam plasma
of only 12.5 V is required to reduce the backstreaming current to 1% of the
beam current.
The actual minimum potential in the beamlet is determined by the grid
geometry, the applied grid potentials, and the beam's space charge. The
minimum potential in the two-grid arrangement shown in Fig. 5-5 was first
found without considering space charge effects by an analytic solution to
LaPlaces' equation by Spangenberg [28] for thin grids in vacuum tubes.
Spangenberg's expression was simplified by Williams [26] and Kaufman [1]
for most ion thruster grid configurations to
o
-5 ---.-------.
-10
(1)
g -15
(1)
-20
1%
-25 Te= 2
c:;
c Te = 3
(5 -30
c..
-35 Te =4
-40
0.000 0.020 0.040 0.060 0.080 0.100
Ratio of Backstreamin9 Electrons to Forward Ion Currents
Fig. 5-10. Potential difference between the beam plasma and the
beamlet potential minimum required to achieve a given electron
beckstreaming current-to-forward ion current ratio for several beam
electron temperatures.
Ion Thruster Accelerator Grids
211
v; = Va + da(Vp - Va) [ l_ 2ta tan- 1 ( da )] e-ra/da,
2nRe d a 2t a
(5.4-5)
*
where V m indicates the minimum potential with the ion space charge neglected,
Va is the applied accel grid potential, the grid dimensional terms are defined in
Fig. 5-5, and Re is given by Eq. (5.2-3). Equation (5.4-5) provides the
dependence on the geometry of the grids, but is only useful if the beam space
charge is negligible (very low current density beamlets).
The reduction in the magnitude of the minimum beam potential due to the
presence of the ion space charge in the beamlet can be estimated [26] using the
integral form of Gauss's law:
P E. dA = J... J p dV ,
S fov
(5.4-6)
where E is the electric field, dA is the differential surface area element, fo is
the permittivity of free space, and p is the ion charge density within the
Gaussian surface which has a surface area S and encloses volume V. This
equation is solved first in the beamlet and then in the charge-free space between
the beamlet and the accel aperture inside diameter. Then, adding the two
potentials together gives the total potential between the grid and the beamlet
centerline.
Assume that the beamlet has a radius db /2 inside the accel grid aperture with
a radius of d a /2. Integration of the left-hand side of Eq. (5.4-6) over a
cylindrical "Gaussian pillbox" aligned with the beamlet axis yields
J, r 21'C J r a
'fE. dA=Jo 0 Errdedz=E r 2nrz,
S
(5.4-7)
where it has been assumed that Er is constant in the axial direction over a
distance z. If it is also assumed that the ion charge density is uniform in the
volume of the pillbox, the right-hand side of Eq. (5.4-6) can also be integrated
to obtain
J... J p dV = J... J p r dr de dz = P.... n r 2 Z .
fo V fo V fo
(5.4-8)
212
Chapter 5
Equating Eqs. (5.4-7) and (5.4-8), an expression for the radial electric field in
the beamlet (E rl ) from the accel hole centerline to the outer edge of the
beamlet is obtained:
pr
Erl = -,
2 Eo
(o<r< d; ).
(5.4-9)
From the edge of the beam to the wall, Gauss's law is again used, but in this
case the entire beam charge is enclosed in the Gaussian surface. The radial
electric field in this "vacuum region" outside the beamlet (E r2 ) is then found
in a similar manner to be
2
E - pda
r2 - 8 '
Eor
( db d a )
T<r<T .
(5.4-10)
The voltage difference tJ. V from the centerline to the accel grid barrel due to the
ion space charge is obtained by integrating the electric field between these
limits. Hence,
2
tJ.V=_ J d b/ 2 E dr_ J da/2E dr=_ J db/2 pr dr_ J d a /2 pdb dr. (5.4-11)
o rl d b /2 r2 0 2E d b /2 8 E r
o 0
The total potential from the accel wall to the center of the beamlet due to ion
space charge is then
tJ.V = pit [ R.n ( d a ) +!.. ] .
8£0 db 2
(5.4-12)
The beam current density in the accel aperture is the charge density times the
beam velocity, so the ion charge density p is
4 [.
p= 2"
n db vi
(504-13)
where vi is the ion velocity evaluated at the minimum potential point:
Vi=
2e(V p - V m )
M
(504-14 )
Ion Thruster Accelerator Grids
213
Substituting Eqs. (5.4-13) and (5.4-14) into Eq. (5.4-12) gives
D.V _ Ii [ £ ( da ) 1 ]
- 2nE o v i n db +'2 .
(5.4-15)
Since scalar potentials can be added, the sum of Eqs. (5.4-15) and (5.4-5) gives
the total of the potential minimum in the accel grid aperture.
V - V A v da(Vbp - Va) [1 2ta -} ( da )] -t / d
m- a+L1 + --tan - e a a.
2 nil e d a 2t a
(5.4-16)
To calculate the backstreaming current as a function of grid voltage,
Eq. (5.4-16) must be equated to Eq. (5.4-4) and solved for the current:
I (Va+t.v +(V bp -va )C-V bp )/T.
....l2!..= e
Ii 2 m (Vp - Vbp)
n-
M Te
(5.4-17)
where the geometric tenn C is given by
C - d a [1 2ta -} ( da )] -t / d
_- --tan - e a a.
2n£e d a 2t a
(5.4-18)
In practice, the onset of backstreaming is detennined by two techniques. One
method is to monitor the increase in the screen power supply current as the
magnitude of the accel grid voltage is decreased. Increases in the measured
current are due to backstreaming electrons, and a I % increase is defmed as the
minimum accel grid voltage to avoid backstreaming: the so-called
backstreaming limit. For example, the power supply current from Eq. (5.4-17),
nonnalized to the initial beam current, is plotted in Fig. 5-11 as a function of
the accel grid voltage for the NST AR ion optics [29J for the maximum power
throttle point TH15 at the beginning of life (BOL). In this figure, the beam
potential and electron temperature were assumed to be 12 V and 2 eV,
respectively, consistent with measurements made on this thruster. The onset of
backstreaming occurs at about -150 V on the accel grid, which is consistent
with the data from tests of this engine [30,31J.
A second method for detennining the backstreaming limit is to monitor the ion
production cost, which is the discharge power required to produce the ion beam
current divided by the beam current. This is an effective method for use in
214
Chapter 5
thrusters operating in the beam-current-regulated mode where the discharge
power supply is controlled to fix the beam current. Backstreaming then appears
as a decrease in the ion production cost. This method is shown in Fig. S-12 for
the experimental data taken from the NSTAR thruster at THIS. As the
magnitude of the accel voltage is decreased, a 1 % decrease in the ion
production cost represents the defined onset of backstreaming. In this case, the
backstreaming limit was determined to be about -148 V, consistent with the
above analytical model.
1.4
NSTAR TH15 BOL
C 1.3
Q)
I:::
8 1.2
E
co
1.1
'0
Q)
.!:j
1.0
o
z
I
O 9 ---.------'-.--------------.-.--
.
Baekstraaming Limit
0.8
-140
-150 -155 -160
Aeeel Voltage (V)
Fig. 5-11. Normalized beam current versus applied accel grid voltage,
showing the onset of electron backstreaming as the voltage is
decreased.
-145
-165
-170
200
c-
o 195
13 190
u
<::
o
185
'0
!:
Q.
<:: 180
.2
Baekstreaming I
Limit = -148.1 V:
175
-180
-170
-150
-140
-160
Aeeel Grid Voltage (V)
Fig. 5-12. Ion production cost for NSTAR TH15 versus applied accel
grid voltage, showing the onset of electron backstreaming es the
voltage is decreased.
Ion Thruster Accelerator Grids
215
Equations (504-17) and (504-18) show that the electron backstreaming is a
function of the acce1 grid hole diameter. Increases in the acce1 hole diameter
will reduce the penetration of the applied grid bias voltage to the center of the
aperture and reduce the minimum potential on axis. This increases either the
backstreaming current at a given voltage or the backstreaming limit at a given
current. The effect of accel grid hole enlargement due to grid wear is illustrated
in Fig. 5-13, where the grid voltage at which backstreaming started is plotted
versus accel grid hole diameter for the NSTAR THIS case measured during the
extended life test (EL T) [31]. Larger grid-hole diameters required more
negative biasing of the accel grid to avoid the onset of back streaming.
Figure 5-13 also shows an interesting effect in that the shape of the grid hole is
important. Early in life, the grid aperture diameter eroded due to sputtering, and
the barrel diameter was adequately described by the minimum hole diameter
observed optically during running of the test. However, as the test progressed,
the erosion of the upstream aperture edge essentially stopped and the aperture
was observed to be chamfered on the downstream portion. An effective grid
diameter had to be calculated to take into account the non-uniform hole erosion
in determining the backstreaming onset, shown on the right-hand side of
Fig. 5-13. While the above analytical model accounts for grid diameter and
thickness, additional terms would have to be added to account for this conical
erosion shape. This situation is best handled by 2-D models that both determine
the time-dependent shape of the grid hole and calculate the potential on axis
appropriately.
-140 ELT
.. ..... TH15
CI> -160 '"
C>
oS
-180
C> Hole
<::
'E Minimum , s::,mferi" -
ctI -200 --- Di er
ii)
ctI -220
ro
<:: ---I , --
e -240
tS
CI>
ill
-260 ,
1.2 1.3 1.4 1.5 1.6 1.7
Effective Accel Grid Hole Diameter (mm)
Fig. 5-13. Accel grid voltage at which electron backstreaming occurs in
the NSTAR thruater at TH15 power level versus the effective accel grid
aperture diameter.
216
Chapter 5
It should be noted that while the analytical model described above illustrates
the mechanisms involved in electron backstreaming and provides reasonable
agreement with the experimental data shown, the results are very sensitive to
the dimensions and beam parameters assumed in the calculation. This is largely
because the potential minimum is the difference between two large numbers
representing the contributions of the electrostatic fields and the space charge
fields. Therefore, this backstreaming model actually provides only an estimate
of the backstreaming voltage and current levels, which can easily be off 10% to
20%. The 2-D grid codes described above that solve Poisson's equation exactly
provide more accurate calculations of the backstreaming limit.
Finally, electron backstreaming occurs first in the region of the highest beamlet
current where the ion space charge is the highest in the ion optics assembly.
Thrusters with non-unifonn beam profiles, such as NSTAR with a flatness
parameter (defined as average-to-peak current density) of about 0.5 and
therefore a 2:1 peak-to-average current density profile [30], will tend to
backstream primarily from the center beamlets. This localized backstreaming
accelerates electrons on axis and can overheat components such as the cathode
at the center-back of the thruster. Thrusters designed to have flat profiles, such
as the Nuclear Electric Xenon Ion Thruster System (NEXIS), with a better than
0.9 flatness parameter [33], will tend not to backstream easily because of a
lower peak ion current density for a given total beam current, and also, if
backstreaming starts, it will be over a larger area that minimizes the localized
heating issue in the discharge chamber.
5.5 High-Voltage Considerations
As shown in Section 5.3, the maximum thrust that can be produced by an ion
thruster' is a function of the electric field that can be sustained between the
screen and accelerator grids:
8 2
Tmax =gEoYTs Ag...;RE .
(5.5-1)
From Eq. (5.5-1), the maximum space-charge-limited (sometimes called
perveance-limited) thrust of the accelerator system is directly proportional to
the intra-grid electric field squared. To produce compact ion thrusters with the
highest possible thrust, it is necessary to maximize the electric field between
the grids. The maximum thrust in ion engines is then limited primarily by the
voltage hold-off capability of the grids.
Ion Thruster Accelerator Grids
217
The ability of the accelerator grids to hold off high voltage reliably and to
withstand occasional breakdowns without significant damage or loss of voltage
standoff capability is therefore of critical importance for ion thrusters. The
high-voltage behavior of vacuum-compatible materials has been summarized in
recent books on high-voltage engineering [34,35]. In plasma devices [36],
electric fields of up to 40 kV/cm were found useful for refractory metal
electrodes and of the order of 25 kV/cm for carbon materials. Degradation of
the voltage hold-off due to surface damage incurred during breakdowns has
been investigated for molybdenum and carbon electrodes [36] commonly used
in ion thruster applications. The surfaces of these materials can be carefully
prepared to withstand high electric fields required to produce the highest thrust
density. However, sputter erosion over time and electrical breakdowns between
grids cause some fraction of the stored energy in the power supply to be
deposited on the grid surface. The formation of an arc at the cathode electrode
(the accel grid) and the deposition of a significant amount of electron power
from discharge into the anode electrode (the screen grid) can cause both the
screen and accel grid surfaces to be modified and/or damaged. The breakdown
events usually impact the subsequent voltage hold-off capability of the grid
surfaces, which affects the long-term performance of the thruster.
5.5.1 Electrode Breakdown
The grids in ion thrusters have high voltages applied across small grid gaps,
which can lead to high-voltage breakdown and unreliable thruster operation.
High-voltage breakdown is usually described in terms of the electric field
applied to the surface that causes an arc or discharge to start. Arc initiation is
well correlated to the onset offield emission [37,38]. If sufficient field emission
occurs due to excessive voltage or a modification to the surface that enhances
field emission, the gap breaks down. Physical damage to arced surfaces during
the breakdown is attributed to localized energy deposition on the electrode that
causes melting or evaporation of the material. On the cathode surface (the accel
grid), the energy is deposited primarily by ion bombardment from the arc
plasma. On the anode surface (the screen grid), the energy is deposited from the
plasma or electron stream that crosses the gap and results in localized surface
heating and vaporization. The energy provided to the arc from the power supply
is distributed between any series resistance in the electrical circuit, the voltage
drop at the cathode surface, and the voltage drop in the plasma discharge and
anode sheath. These voltage drops can be modeled using discrete series
resistances in the energy balance of the system. Engineers often rate the
possibility of a power supply damaging the electrodes by the amount of stored
energy in the power supply. However, the amount of material removed from the
surfaces and the lifetime of high-voltage electrodes is usually characterized [36]
by the amount of current that passes through the arc. This "coulomb-transfer
218
Chapter 5
rating" is related to the energy deposition in the electrodes in a simple manner.
The power running in the arc is P = IV arc , where I is the discharge current and
V arc is the voltage drop in the arc. Assuming that most of the voltage drop is in
the cathode sheath, the energy E deposited by the arc on the cathode surface is
E = J P dt = J IV arc dt .
(5.5-2)
The voltage drop of refractory metal and graphite arcs is nearly independent of
the amount of current running in the arc up to severa) hundred amperes [39,40].
Therefore the arc voltage can be considered to be essentially a constant, and the
energy deposited by the arc on the cathode is
E = vareJ I dt =V arc Q,
(5.5-3)
where Q is the total charge transferred in the arc. The arc energy deposited on
the. cathode surface for a given electrode material is characterized by the total
charge transferred by the thruster power supplies during the arc time and not
just the stored energy in the power supply. Assuming that the arc remains lit
during the entire time required to discharge the filter capacitor in the power
supply, the total charge transferred through the arc is Q = CV, where C is the
capacitance and V is the capacitor charging voltage. If the arc current falls
below the minimum value to sustain the arc, called the "chopping current," and
is prematurely extinguished, then the total charge transferred is reduced.
It should be emphasized that the amount of energy delivered to the cathode
surface by the arc and the amount of damage to the surface incurred by material
removal are independent of any series resistance in the circuit as long as the
current is stable for the duration of the event (Le., the current is above the
chopping current). This means that simply adding a series resistor to one leg of
the high-voltage power supply circuit or the accel grid circuit will not reduce
the surface damage due to an arc unless the arc current drops to less than the
chopping current. The only mechanism that reduces surface damage if the
current is large compared to the chopping current is to limit the total charge
transfer. This requires either reducing the power supply capacitance at a given
voltage (which reduces the total stored energy) or actively shunting or opening
the circuit to reduce the arc duration.
5.5.2 Molybdenum Electrodes
Molybdenum is a standard electrode material used in ion thrusters due to its
low sputter erosion rate, ability to be chemically etched to fonn the aperture
array, and good thermal and structural properties. The surface of the
Ion Thruster Accelerator Grids
219
molybdenum grid is often slightly texturized to retain sputtered material to
avoid flaking of the sputter-deposited material [41]. The threshold voltage for
the onset of field emission versus the gap spacing measured for molybdenum
electrodes using a standard "plate-and-ball" test arrangement in a high vacuum
facility [42] is shown in Fig. 5-14. The data show a classic power-law
dependence of the threshold voltage with gap spacing for small gaps, which is
sometimes called the "total voltage effect" [43]. While there are numerous
possible mechanisms for the total-voltage effect, the increased gap reduces the
surface electric field and the field emission current but increases the probability
of an atom or particulate being ionized while traversing the gap. The ionized
atom or particle is then accelerated into the cathode potential electrode and
produces secondary electrons. If sufficient ionizations and secondary electrons
are produced, the process cascades and the gap breaks down. Therefore, the
voltage that can be held across a gap does not increase linearly with the gap
dimension. This is equivalent to the Paschen breakdown [35] mechanism in
gas-filled devices and is caused by the release of gases or particulates from the
surfaces in vacuum gaps. After 10 arcs of I mC in charge transfer, the threshold
voltage was measured again, and the threshold voltage was observed to increase
for every gap tested, indicating that the surface was being conditioned.
Improving voltage standoff of electrodes with a series of low coulomb-transfer
arcs is common practice in the high-voltage industry and historically is often
called "spot-knocking." This process removes small field emitters and tends to
clean oxides and impurities off the surface without damaging the surface, which
reduces the onset of field emission. Higher coulomb transfer arcs on
molybdenum (10 and 20 mC) improve the voltage hold-off by cleaning larger
areas of the surface and removing field emission sites. This effect will continue
6
5
Q) 4
OJ
J9
3
"0
(5 New, Grit Blasted
II) 2 10 Arcs at 1 mC
Q)
.c 10 Arcs at 10 mC
I-
--- 10 Arcs at 20 mC
0
0.0 0.2 0.4 0.6 0.8 1.0
Gap (mm)
Fig. 5-14. Threshold voltage versus gap for molybdenum after 10
arcs of varying charge transfer (from [36]).
220
Chapter 5
until the surface is well conditioned or the arc anchors in one spot and causes
damage to the surface.
As the gap between the electrodes increases, the threshold voltage curves
become more linear and the surface asymptotes to a constant threshold electric
field. Figure 5-15 shows the threshold electric field for large gaps for a flat
molybdenum surface texturized by grit blasting and actual texturized grid
material with apertures chemically etched into the material. In this case, high
coulomb transfer arcs tend to damage and degrade the voltage standoff of the
grids. Scanning electron microscope photographs show localized damage to the
edge of the beam apertures, resulting in more field emission sites. The
molybdenum surfaces are initially capable of holding electric fields of well
over 200 kV/cm, but the surface roughening to retain flakes and the aperture
300
250
E
.f2
g 200
"C
Q5
u: 150
W
"C
(5
.<: 100
'"
.<:
I-
50
0
300
250
E
u
:> 200
"C
Q5
u: 150
W
"C
(5
.<: 100
'"
.<:
I-
50
0
0
(a)
-+- New Molybdenum Plete
1mC
20mC
(b)
-+- New Molybdenum Grid
1mC
20mC
2
3
Electrode Gap (mm)
Fig. 5.15. Threshold electric field versus gap for (a) textured
molybdenum plate and (b) textured grid material (from [36]).
Ion Thruster Accelerator Grids
221
edges associated with real grids cause the voltage hold-off to decrease. For
molybdenum material with apertures, the resulting surface is susceptible to
breakdown at electric fields of 40 to 50 kV/cm, which should be considered the
maximum electric field for designing molybdenum grids.
5.5.3 Carbon-Carbon Composite Materials
Carbon is a desirable material for ion thruster grid electrodes because of its low
sputtering yield under xenon ion bombardment [44] as compared with most
refractory grid materials. However, the structural properties of graphite are
usually insufficient for thin graphite grids of any reasonable size (greater than a
5- to 10-cm diameter) to survive launch vibrations. This problem can be solved
by using carbon material with better structural properties, such as carbon-
carbon composites and pyrolytic graphite. Grids made of these materials have
demonstrated low erosion in life tests and flown successfully [45]. However,
the more complex structures of these materials leads to lower thresholds for
field emission and less voltage standoff for grids made of these materials.
Carbon-carbon composite material used for grid electrodes [46] is based on
carbon fibers woven into a matrix with the fibers oriented in one or two
dimensions. This material has enhanced strength and flexural modulus
compared to pure graphite due to the carbon-fiber properties. The carbon-fiber
weave is impregnated with a resin and built up to the desired shape by
progressive laminate layers on a mold. The resulting material is usually
densified and graphitized at high temperature, and may be further impregnated
or over-coated with a thin chemical-vapor-deposition (CVD) carbon layer after
this process to fill any voids or smooth the final surface. High-voltage
breakdown tests were conducted with and without this final surface graphite
coating.
The threshold voltage of the carbon-carbon composite samples is shown in
Fig. 5-16, where the threshold for field emission is plotted as a function of the
electrode gap for various levels of coulomb-transfer arcing. New material
(without arcing) with a fresh CVD layer has a high threshold for field emission,
and therefore holds voltage well. High coulomb-transfer arcs (> I mC) tend to
damage that surface and return it to the state of the material without the CVD
over-layer. Higher coulomb-transfer arcs also tend to damage the surface. In
fact, in this example, the 10-mC arcs resulted in damage to the opposite anode
electrode, which evaporated and redeposited material back on the cathode-
potential surface, improving its voltage hold-off capability. For this reason, the
coulomb-transfer limit for carbon-carbon (CC) grids should be set to about
I mC such that conditioning and no damage to either the screen or accel grid
occurs during any breakdowns.
222
Chapter 5
The threshold electric field for CC material with grid apertures is shown in
Fig. 5-17 for new material and after a series of arcs. After the initial charac-
terization with 10 arcs of 1 mC each, 10 arcs of 10 mC were delivered to the
surface, which degraded the voltage standoff. However, the application of
4 sets of 10 arcs of only 1 mC re-conditioned the surface. The threshold electric
field was found to asymptote to just below the same 40-kY/cm field at larger
gap sizes observed for low coulomb-transfer arcs of flat material, suggesting
that the aperture edges function in a similar manner as does material roughness.
5
> 4
C
Q)
C> 3
.£9
0 New Material + CVD
"C
"0 2 -+- No CVD Coating
.c.
'" .
f!: 2.5mC
.c.
I- 0 5.0mC
--- 10mC
0
0.0 0.2 0.4 0.6 0.6 1.0 1.2 1.4
Gap (mm)
E
t.) 140
"C 120
(j)
w:
W
"C
"0
.c.
'"
f!: 60
.c.
I-
Fig. 5-16. Threshold voltege for cerbon-carbon composite material
efter 10 ercs at verious coulomb transfers (from [36]).
200
180
160
-+- CC + CVD
_1mC
-*- 10mC
-*- 1 mC#2
--&- 1 mC#4
100
80
40
20 ------------
o
o
2 3
Electrode Gap (em)
Fig. 5-17. Threshold electric field versus electrode gap for CC grid
material with epertures (from [36]).
4
5
Ion Thruster Accelerator Grids
223
These results suggest that carbon-carbon composite grids can be designed for
reliable high-voltage standoff utilizing a field emission threshold of about
35 kV/cm, even for large gaps and voltages in excess of 10 kV, provided that
the coulomb transfer is limited by the power supply to less than about I mC.
This 35-kV/cm field limit is the highest voltage stress that should be allowed,
and conservative design practices suggest that a 50% margin (to :::::23 kV/cm)
should be considered in designing these types of grids.
5.5.4 Pyrolytic Graphite
Pyrolytic graphite (PG) is also a candidate for accelerator grid electrodes in ion
thrusters [47]. This material is configured with the carbon crystal planes
parallel to the surface. Pyrolytic graphite is grown a layer at a time to near the
desired shape on a mandrel and then finish machined to the final configuration.
Flat test coupons were fabricated in this manner, but they featured small surface
bumps and depressions that were residual from the growth process. Figure 5-18
shows the behavior of a PG grid sample that had apertures laser-machined into
it and then the surface lightly grit blasted. The as-new PG material
demonstrated threshold electric fields of 20 to 30 kV/cm for gaps of I mm or
larger, which is lower than that found for the CC grid material. However, a
series of ten l-mC arcs tends to smooth and condition the surface and raise the
threshold electric field to the order of 30 kV/cm. Higher coulomb arcs (up to
about 10 mC) also improve the voltage standoff to about 40 kV/cm. The
pyrolytic graphite is more susceptible to field emission and breakdown than the
carbon-carbon material, but appears to tolerate higher coulomb-transfer arcs.
160
PG Grid Material
140 New
E 120 -e- 1 mC
u
:> ---,\- 10 mC
::!:. 100
't:>
Q)
u: 80
W
't:>
'0 60
.s=
II>
Q)
1: 40
I-
20
0
0 2 3 4 5
Electrode Gap (mm)
Fig. 5-18. Threshold electric field for pyrolytic graphite with grid
apertures (from [36]).
224 Chapter 5
5.5.5 Hold-off and Conditioning in Ion Thrusters
Tests have shown that the arc initiation voltage is directly related to the
threshold voltage and electric field for field emission in Figs. 5-14 through 5-18
[36]. Arc initiation voltages tend to be less than 10% higher than the threshold
values for field emission shown here. This is consistent with experimental
observations that low levels of field emission and/or corona can be tolerated
before full arc breakdown occurs, but arcing and recycling tend to increase once
significant field emission starts. Molybdenum has been found to have a good
tolerance for high coulomb-transfer arcs, and grids can be designed to reliably
hold electric fields well in excess of 40 kV/cm. Carbon-based materials have
more structure than the refractory metals and tend to fonn field emitters if
excessive charge transfers are allowed. Nevertheless, grids utilizing carbon-
based materials can be designed with electric fields in excess of 20 kV/cm if the
coulomb transfer during breakdowns is limited to about 1 mC or less. Detailed
investigations of the voltage hold-off and conditioning of carbon-carbon
thruster grids were perfonned by Martinez [8], who documented the effect for
larger area grid sets. Figure 5-19 shows their reduction in field emission from
carbon-carbon grids plotted on a Fowler-Nordheim plot [43] for increasing
numbers of l-mC arcs. This work shows that even if the surface of carbon-
carbon grids evolve field emitters over time due to erosion from ion
bombardment, proper design of the power supply to limit the coulomb-transfer
rate will result in reconditioning of the grid surfaces with every recycle event.
-21
-23 DO
, 0
N .0. A- D
-25 <>. A- D
-.<>. A- D
. . A- No
:i A- Conditioning
.E -27 . <> .
. A- D
.<>
-29 1500. <> · 300 A-
700 100 1-mC Arcs
-31
1.5x10--4 3.5x10- 4 5.5x10- 4 7.5x10- 4 9.5x10- 4 1.2x10- 3
1/V r (V-1)
Fig. 5-19. Fowler-Nordheim plots of field emission, showing
conditioning of carbon-carbon grids by increasing numbers of 1-mC
arcs (from [8]).
Ion Thruster Accelerator Grids
225
5.6 Ion Accelerator Grid Life
The most important wear mechanism in modem ion thrusters is accelerator grid
erosion. Even though properly designed optics attempt to make all of the ions
extracted from the discharge chamber focus through the accelerator grid
apertures, a current of secondary ions generated downstream of the discharge
chamber impacts the accelerator grid. These secondary ions are generated by
resonant charge exchange (CEX) between beam ions and neutral propellant gas
escaping from the discharge chamber. The cross section for resonant charge
exchange-that is, the transfer of an electron from a propellant atom to a
beamlet ion-is very large: on the order of a hundred square angstroms [48].
This process results in a fast neutral atom in the beam and a slow thermal ion.
These slow ions are attracted to the negatively charged accelerator grid, and
most hit with sufficient energy to sputter material from the grid. Eventually the
accelerator grid apertures become too large to prevent electron backstreaming
or enough material is sputtered away that the grids fail structurally.
The erosion geometry is naturally divided into two regions. The first region,
barrel erosion, is caused by ions generated between the screen grid aperture
sheath and the downstream surface of the accelerator grid, as shown in
Fig. 5-20. Charge exchange ions generated in this region impact the inside
surface of the accelerator grid aperture, which results in enlargement of the
aperture barrel. As the barrel diameter increases, the grid must be biased more
and more negatively in order to establish the minimum potential required in the
aperture to prevent neutralizer electrons from backstreaming into the discharge
chamber. Thruster failure occurs when, at its maximum voltage, the accelerator
grid power supply is unable to stop electron backstreaming.
The second region of grid erosion is caused by charge exchange ions generated
downstream of the accelerator. Since the beamlets are long and thin, inside each
beamlet the radial electric forces dominate and expel the slow, charge-exchange
ions into the gaps between the beamlets. Charge exchange ions generated in the
region before the beamlets merge to form a continuous ion density are then
attracted back to the accelerator grid by its large negative potential. This is
illustrated in Fig. 5-21. On impact, these ions sputter away material from the
downstream surface of the accelerator grid. Sputter erosion by these
backstreaming ions results in a hexagonal "pits-and-grooves" erosion pattern on
the downstream grid surface, which can lead to structural failure of the grids if
the erosion penetrates all the way through the grid. Erosion of the accel grid
aperture edge by backstreaming ions can also effectively enlarge the accel grid
aperture diameter, leading to the onset of electron backstreaming.
226
Chapter 5
Discharge
Chamber
Plasma
,
CII
Beamlet
Screen AGee I
Gr1d Grid
Fig. 5-20. Ions that cause barrel erosion are generated by
charge exchange upstream and within the accelerator grid
aperture.
.
t
t
.
.
--
Xe+
--- Xe+
Beamlets
Accel Grid
Fig. 5-21. Ions that cause pits and grooves erosion are generated between
the downstream surface of the sccel grid and where the besmlets overlap.
Erosion of the accelerator grid by charge exchange ion sputtering was the major
life-limiting mechanism observed during the ELT of the NSTAR flight spare
thruster [49] for operation at the highest power THIS level. Photographs of
center holes in the grid at the beginning and the end of the 30,OOO-hour test are
shown in Fig. 5-22 where barrel-erosion enlargement of the aperture diameters
is evident. Note that the triangle patterns where the webbing intersects in the
end-of-test picture are locations where the erosion has completely penetrated
the grid. The scanning electron microscope (SEM) photograph shown in
Fig. 5-23 illustrates the deep erosion of the pits-and-grooves pattern and shows
that full penetration of the grid had occurred when the test was stopped.
Continued operation would have eventually resulted in structural failure of the
grid, but this was not considered imminent at the end of the test.
Ion Thruster Accelerator Grids
227
al
bJ
- 4
'.. ..... "
"
....
. ."
\ .'
" ...... '--
f;, .,
'X. " "4
\ . .\
'" . . \:,
...
Fig. 5.22. NSTAR thruster accelerator grid at (a) 125 hours and (b) 30,352 hours.
-
.....
"
,
,
i
"
:...
Fig. 5-23. SEM photograph shows that sputtering in
the webbing between the holes had almost
destroyed the structural integrity of the NSTAR
grids.
5.6.1 Grid Models
As discussed above, the primary erosion mechanism of the accelerator grid is
caused by sputtering from charge exchange ions. At the simplest level, all that
is needed to predict erosion rates is to calculate the number of ions generated in
the beamlets, find where they hit the grids, and then to determine the amount of
material that they sputter. The total calculated charge exchange ion current
accounts for nearly all of the measured accelerator grid current in a properly
designed ion thruster (i.e., no direct interception of the beam current). The
measured accelerator grid current in NASA's NST AR thruster [30] ranged from
228
Chapter 5
0.2% to 0.3% of the total beam current, which is shown in Fig. 5-24. Accel grid
currents on the order of 1 % or less of the beam current are standard in most ion
thrusters.
Calculating the ion generation rate in the grid region due to charge exchange is
relatively straightforward. The charge exchange currents generated by a single
aperture's beamlet are given by
I CEX = IBeamlet no CTCEX .ed,
(5.6-1)
where .e d is the effective collection length downstream of the accel grid from
which ions flow back to the grid and no is the average neutral density along
this length. The charge exchange cross section, CTCEX, is well known and varies
slowly with beam energy [48]. The average neutral density along the path
length .e d is estimated from the thruster propellant flow rate utilization
fraction, which is the difference between the neutral atom flow rate and the
beam ion current over the open area fraction of the accel grid. The neutral
density is usually assumed to remain constant in the accel grid hole and
decreases as the gas expands downstream of the grid surface. The neutral gas
density is nonnally highest in holes near the edge of the grid and lower at the
center where nearly all the gas has been "burned up" through ionization in the
discharge chamber. The effective path length, .ed, is a basic result of the ion
optics calculations, and is essentially the distance downstream at which the
beamlets have completely merged to fonn a beam plasma with a uniform
potential across the beam diameter. An estimate of the effective path length is
needed when setting up a grid erosion calculation to make certain that the
0.35
0.30
::,!< 0.25
0
=:;
0.20
0.15
0.10
0.4 0.6
I ·
.
.
.
.
.
0.8
1.0
1.2
1.4
1.6
Beam Current (A)
Fig. 5-24. Ratio of the eccel grid current to the beam current es a function
of the beam current in NSTAR, showing that the accel current is typically
less then 1 % of the beem current (from [30]).
Ion Thruster Accelerator Grids
229
computational region is long enough to include all the charge exchange ions
that can return to the grid.
Using Eq. (5.6-1) and the current ratio from Fig. 5-24, an estimate can be made
of the effective path length (R d ) for the NSTAR thruster. If the measured accel
grid current is all due to charge exchange (i.e., no direct interception), then
Eq. (5.6-1) can be rewritten as
n I accel
Cd =
IBeamO'CEX no
(5.6-2)
Assuming the effective charge exchange path length is much longer than the
gap between the screen and accelerator grids, the average neutral gas density
can be estimated from the grid diameter, the flow of neutral gas out of the
thruster, and the thruster beam current. The neutral gas density downstream of
the grids close to the thruster is then
fo
no = 2'
v 0 11: 'grid
(5.6-3)
where V o is the neutral velocity, and r 0 is the flux of unutilized propellant
escaping from the discharge chamber. Using the parameters for the NST AR at
THI5 from [29], the total neutral flow into the thruster is 28 sccm. The thruster
discharge chamber has a mass utilization efficiency of about 88%, so the
neutral gas flow escaping the thruster is about 3.4 sccm, which corresponds to
1.5 x 10 18 particles per second. Assuming the gas exits the thruster at about an
operating temperature of 250°C, the neutral velocity c /2 is about 110 mls. The
average neutral density from Eq. (5.6-3) is then about 2.3 x 10 17 m- 3 , and
neutral density varies over the grid by more than a factor of two. Using the data
in Fig. 5-24 extrapolated to the beam current of 1.76 A in THIS, and a charge
exchange cross section of 5 x 10- 19 m 2 , the average effective path length from
Eq. (5.6-2) becomes
Rd = (0.003) - 0.03 [m].
(5 x 10- 19 )(2.3 x 10 17 )
(5.6-4)
The path length is more than an order of magnitude larger than the grid gap,
consistent with our assumption. The very long path length compared with grid
hole spacing means that the computational space in ion optics codes is very
long (several centimeters), and so the computer codes must allow for the axial
zone sizes to increase downstream of the grids.
230 Chapter 5
5.6.2 Barrel Erosion
As was illustrated in Fig. 5-20, charge exchange ions generated between the
screen grid and the upstream surface of the accel grid can impact the interior
surface of the accel grid holes. These ions sputter away grid material,
increasing the barrel radius. While computer codes, such as CEX-2D [4], are
normally used to calculate the erosion rate, it is instructive to derive an
analytical estimate. The following calculation is based upon published
performance and erosion data for NASA's NSTAR thruster operating at its
highest power THI5 level [29,50].
Assume that any ions generated downstream of the discharge chamber are not
focused through the hole in the accelerator grid. For barrel erosion, the path
length is taken as the sum of the grid gap and the accelerator grid thickness,
which for NSTAR is about a millimeter. The upstream gas density is estimated
by dividing the downstream density by the grid open area fraction, fa' and the
Clausing [51] factor, 7Jc' which reduces the gas transmission due to the finite
thickness of the accel grid. The Clausing factor depends only on the aperture
length-to-radius ratio. The neutral gas density is then
ro 1
no = 2
V o n rgrid fa7Jc
(5.6-5)
The neutral gas density in the accelerator grid apertures is higher than the gas
density downstream of the accelerator grid, which was calculated using
Eq. (5.6-2), due to the effects of the open area fraction and the Clausing factor.
For an open area fraction of 0.24 and a Clausing factor of 0.6, the neutral
density in the grid gap is about 9 x }OI8 m- 3 .
The number of grid apertures is approximately the grid open area divided by
the area per aperture:
2
fa n rgrid
N aperture "" 2
n raperture
(5.6-6)
The average aperture current is the total beam current divided by the number of
apertures,
I aperture =
N aperture
lb
(5.6-7)
Ion Thruster Accelerator Grids
231
The maximum aperture current IS obtained usmg the definition of beam
flatness, which is given as
jj Average current density I aperture
bEl - .
Peak current density I ;rture
(5.6-8)
The published value of NSTAR beam flatness from Polk [30] is 0.47. Using
Eqs. (5.6-6), (5.6-7), and (5.6-8), the maximum current per aperture is
2.5 x 10⁻⁴ A. Charge exchange ions that can hit the accel grid are generated in
between the screen grid exit and the accel grid exit. The distance d between the
screen grid exit and the accel grid exit is about 1.12 mm [4]. The charge
exchange ion current to the central aperture barrel is then
I CEX = I ;rture no O'CEX d = 1.4 x 10- 6 fA].
(5.6-9)
The CEX-2D computer code simulations [4] show that charge exchange ions
hit the accelerator grid with about three-tenths of the beam potential. For
NSTAR, the beam potential is 1100 V; thus, the average charge exchange ion
energy is about 330 V. Using the curve fit in reference [4] for sputtering yield
Y, the aperture atom sputter rate is obtained:
. I CEX 12.
nsputter = - Y "" 3.5 x 10 [partlcles/s].
e
(5.6-10)
This atom sputtering rate can be used to find an initial wall erosion rate by first
calculating the volumetric erosion rate:
Ii,,,,,,,,,, = ("'",W') ,
PMo
MMo
(5.6-11)
where the density of molybdenum is PMo = 1.03 x 10 4 and the mass of
molybdenum is M Mo = 95.94 AMU = 1.6 X 10- 25 kg. The volumetric erosion
rate from Eq. (5.6-11) is then
. 12
. nsputter 3.5 x 10 -17 3
Vaperture = ( PMo ' J - ( 1.03 x 10⁴ ) - 5.5 x 10 [m Is].
mMo l1.6 x 10- 25
(5.6-]2)
232
Chapter 5
Assuming the erosion rate is unifonn throughout the barrel, the rate of increase
of the aperture radius is just the volumetric erosion rate divided by the barrel
area,
v.
. = aperture "" 3 10 -11 [m/ ]
raperture X s ,
2 n ra Waccel
(5.6-13)
where the accel grid aperture radius ra is 0.582 mm and the accel grid
thickness waccel is a half-millimeter. For the 8200-hour NSTAR wear test
results described by Polk [30], this corresponds to an increase in diameter of
about 0.2 rom, roughly what was observed.
More accurate predictions of the accel grid barrel erosion rate are found using
the 2D and 3D computer simulations [4]. However, the codes use the same
basic technique as that shown here to determine the amount of material
removed by the charge exchange sputtering. The better predictions result from
more accurate calculations of the neutral density and ion current densities
across the grid surfaces and through the grid apertures.
5.6.3 Pits-and-Grooves Erosion
Using three-dimensional ion optics codes, it is possible to reproduce the details
of the pits-and-grooves geometry of accelerator grid downstream surface
erosion. The lPL CEX-3D code was developed [17] to solve for potentials and
ion trajectories in a two-grid ion optics system, and was later modified to
include a third grid [52]. The computational domain, illustrated in Fig. 5-25, is
a triangular wedge extending from the axis of a hole pair to the midpoint
between two aperture pairs. The wedge angle of 30 degrees is chosen to give
Screen Grid Hole
Accel Grid Hole
Fig. 5-25. Computational domain of tha CEX-3D
code (from [17]).
Ion Thruster Accelerator Grids
233
the smallest area that can be used to model the ion optics in order to minimize
computational time. Similar triangles will cover each aperture pair by a
combination of reflections and rotations. The computational domain extends
from a few millimeters into the discharge chamber through the grids to a few
centimeters downstream of the final grid.
In addition to tracking the beam-ion trajectories, the code calculates charge
exchange ion production rates and charge exchange trajectories in three
dimensions. Erosion of the accel grid barrel and downstream face is caused by
these charge exchange ions. The location, kinetic energy, incidence angle, and
current of each particle are recorded and used to compute the rate at which the
grid material is removed. As shown above, charge exchange ions that strike the
downstream surface of the accelerator grid can come from several centimeters
downstream of the grid. Therefore, the computations domain is usually
extended to 5-cm downstream of the final grid.
An example of the accel-grid downstream face erosion pattern predicted by
CEX-3D is shown in Fig. 5-26. The triangular patches (the "pits"), where the
grid webbing intersects, are shown in the photograph of the NST AR EL T grid
at the end of the test [49] and are predicted by the code in Fig. 5-26(a). In
addition, the depth of the ring of erosion around the aperture ("the grooves") is
also seen in Fig. 5-26(b) from the code predictions.
Accelerator grid pits-and-grooves erosion can be almost eliminated by the use
of a third decelerator grid [44]. The Xenon Ion Propulsion System (XIPS@)
thruster [53] is an example of an ion thruster that uses a three-grid ion optics
system. As shown in Fig. 5-27, the third grid reduces from centimeters to
(a)
(b)
..----\
\ ,
(
\
\
\.
\
.
..
Fig. 5-26. CEX-3D calculation of the pits-and-grooves erosion wear patterns
that match the experimental patterns shown in (a) Fig. 5-22{a) and
(b) 5-22{b).
234
Chapter 5
Screen Grid
(1.1 kV)
Accel Grid
( 200 V)
NSTAR
,
Impact
at >200 V
(l)
e>
to
.<:
'-'
'"
is
'"
E
V>
'"
i:I
(25 V)
Source of I
Barrel Erosion
\...
/
y
Source of Pits-and-Grooves Erosion
St:reen Grid
(1.2 kV)
Accel Grid
(-300 V)
XIPS
Decel Grid
(0 V)
OJ
e>
'"
.<:
'-'
'"
o
'"
E
'"
'"
i:I
.(.
.... -.1'-
. . ':ealJ' d "'u
+ -:::: . .p.. :." .
'. '; ;. of . _) ;
I. '::" .J .'.
(25 V)
'--y-l \...
/
y
'I
Sourt:e or I
Barrel Erosion
CEX Ions from Illis Region
Recombine on Decel Grid
Fig. 5.27. Grid cross section comparing charge exchange generation in NSTAR,
a two-grid system, with XIPS, a three-grid system.
millimeters the length of the region where charge exchange ions that can hit the
accelerator grid are generated. This causes a dramatic reduction in the pits-and-
grooves erosion between the two thrusters, shown in Fig. 5-28 as calculated
using CEX-3D.
Although the three-dimensional code CEX-3D is used to predict erosion of the
accelerator grid downstream surface, the simpler, two-dimensional CEX-2D
code is typically used for accelerator grid aperture barrel erosion calculations
because the apertures are cylindrical and the CEX-2D code can produce these
Ion Thruster Accelerator Grids
235
0 -
20 \
... XIPS
.c 40
OJ 60
115
a::
r::
0
"in 80
E
UJ
100
120
Fig. 5-28. CEX-3D results showing the XIPS third grid almost
eliminates pits and grooves erosion evident in the NSTAR
thruater (from [52]).
results more quickly. CEX-2D and CEX-3D use the same algorithms for the
discharge chamber plasma and for beam ion trajectories. The codes have been
benchmarked with each other, and for round beamlets that can be handled by
CEX-2D, their results are within a few percent.
References
[1] H. R. Kaufman, "Technology of Electron-Bombardment Ion Thrusters,"
in Advances in Electronics and Electron Physics, vol. 36, edited by
L. Marton, New York: Academic Press, 1974.
[2] A. T. Forrester, Large Ion Beams, New York: John Wiley and Sons, 1988.
[3] G. R. Brewer, Ion Propulsion Technology and Applications, New York:
Gordon and Breach, 1970.
[4] J. R. Brophy, I. Katz, J. E. Polk, and J. R. Anderson, "Numerical
Simulations of Ion Thruster Accelerator Grid Erosion," AIAA-2002-
4261, 38th Joint Propulsion Conference, July 7-10, 2002.
[5] V. J. Friedly and P. J. Wilbur, "High Current Hollow Cathode
Phenomena," Journal of Propulsion and Power, vol. 8, no. 3, pp. 635-
643,1992.
[6] I. Kameyama and P. J. Wilbur, "Measurement of Ions from High Current
Hollow Cathodes Using Electrostatic Energy Analyzer," Journal of
Propulsion and Power, vol. 16, no. 3, pp. 529-535, 2000.
236 Chapter 5
[7] P. J. Wilbur, J. R. Beattie, and J. Hyman, Jr., "An Approach to the
Parametric Design of Ion Thrusters," Journal of Propulsion and Power,
vol. 6, no. 5, pp. 575-583, 1990.
[8] R. A. Martinez, J. D. Williams, and D. M. Goebel, "Electric Field
Breakdown Properties of Materials Used in Ion Optics Systems," AlAA-
2006-5004, 42nd Joint Propulsion Conference, Sacramento, California,
July 10-13,2006.
[9] P. Wilbur, "Limits on High Specific Impulse Ion Thruster Operation,"
AIAA-2004-4106, 40th Joint Propulsion Conference, Fort Lauderdale,
Florida, July 11-14,2004.
[10] J. H. Whealton, R. W. McGaffey, and P. S. Meszaros, "A Finite
Difference 3-D Poisson- Vlasov Algorithm for Ions Extracted from a
Plasma," Journal of Computational Physics, vol. 63, pp. 20-32,1986.
[11] Y. Arakawa and M. Nakano, "An Efficient Three Dimensional Optics
Code for Ion Thruster Research," AIAA-96-3198, 32nd Joint Propulsion
Conference, Lake Buena Vista, Florida, July 1-3, 1996.
[12] M. Nakano and Y. Arakawa, "Ion Thruster Lifetime Estimation and
Modeling Using Computer Simulation," IEPC-99-145, 27th International
Electric Propulsion Conference, Pasadena, California, October 15-19,
2001.
[13] Y. Nakayama and P. Wilbur, "Numerical Simulation of High Specific
Impulse Ion Thruster Optics," IEPC-01-099, 27th International Electric
Propulsion Conference, Pasadena, California, October 15-19, 2001.
[14] I. Boyd and M. Crofton, "Grid Erosion Analysis of the T5 Ion Thruster,"
AIAA-2001-3781, 37th Joint Propulsion Conference, Salt Lake City,
Utah, July 8-11, 2001.
[15] Y. Okawa, H. Takegahara, and T. Tachibana "Numerical Analysis of
Ion Beam Extraction Phenomena in an Ion Thruster," IEPC-01-097, 27th
International Electric Propulsion Conference, Pasadena, California,
October 15-19, 2001.
[16] J. Wang, J. E. Polk, J. R. Brophy, and I. Katz, "Three-Dimensional
Particle Simulations of NSTAR Ion Optics," IEPC-Ol-085, 27th
International Electric Propulsion Conference, Pasadena, California,
October 15-19,2001.
[17] J. J. Anderson, I. Katz, and D. Goebel, "Numerical Simulation of Two-
Grid Ion Optics Using a 3D Code," AIAA-2004-3782, 40th Joint
Propulsion Conference, Ft. Lauderdale, Florida, July 11-14,2004.
[18] Ian Brown, The Physics and Technology of/on Sources, New York: John
Wiley and Sons, 1989.
Ion Thruster Accelerator Grids
237
[19] Y. Nakayama and P. J. Wilbur, "Numerical Simulations of Ion Beam
Optics for Many-grid Systems," Journal of Propulsion and Power, vol.
19,no.4,pp.607-613,2003.
[20] 1. Kim, 1. H. We alton, and G. Shilling, "A Study of Two-stage Ion Beam
Optics," Journal of Applied Physics, vol. 49, no. 2, pp. 517-524, 1978.
[21] C. Farnell, "Perfonnance and Life Simulation of Ion Thruster Optics,"
Ph.D. Dissertation, Colorado State University, Fort Collins, Colorado,
2007.
[22] L. D. Stewart, J. Kim, and S. Matsuda, "Beam Focusing by Aperture
Displacement in Multiampere Ion Sources," Review of Scientific
Instruments, vol. 46, pp. 1193-1196, 1975.
[23] J. H. Whealton, "Linear Optics Theory ofIon Beamlet Steering," Review
of Scientific Instruments, vol. 48, pp. 1428-1429,1977.
[24] M. Tarz, E. Hartmann, R. Deltschew, and H. Neumann, "Effects of
Aperture Displacement in Broad-Beam Ion Extraction Systems," Review
of Scientific Instruments, vol. 73, no. 2, pp. 928-930,2002.
[25] Y. Okawa, Y. Hayakawa, and S. Kitamura, "Experiments on Ion Beam
Deflection Using Ion Optics with Slit Apertures," Japanese Journal of
Applied Physics, vol. 43, no. 3, pp. 1136-1143,2004.
[26] J. D. Williams, D. M. Goebel, and P. J. Wilbur, "Analytical Model of
Electron Backstreaming for Ion Thrusters," AIAA-2003-4560, 39th Joint
Propulsion Conference, Huntsville, Alabama, July 20-23, 2003.
[27] V. A. Davis, I. Katz, M. J. Mandell, D. E. Brinza, M. D. Henry, and D. T.
Young, "Ion Engine Generated Charge Exchange Environment:
Comparison between NSTAR Flight data and Numerical Simulations,"
AIAA-2001-0970, 39th Aerospace Sciences Meeting, Reno, Nevada,
January 8-11, 2001.
[28] K. R. Spangenberg, Vacuum Tubes, New York: McGraw-Hill, p. 348,
1948.
[29] J. R. Brophy "NASA's Deep Space 1 Ion Engine," Review of Scientific
Instruments, vol. 73 pp. 1071-1078,2002.
[30] J. Polk, J. R. Anderson, J. R. Brophy, V. K. Rawlin, M. J. Patterson,
J. Sovey, and J. Hamley "An Overview ofthe Results from an 8200 Hour
Wear Test of the NSTAR Ion Thruster," AIAA Paper 99-2446, 35th Joint
Propulsion Conference, Los Angeles, California, June 20-24, 1999.
[31] A. Sengupta, J. R. Brophy, and K. D. Goodfellow, "Status of the
Extended Life Test of the Deep Space 1 Flight Spare Ion Engine After
30,352 Hours of Operation," AIAA-2003-4558, 39th Joint Propulsion
Conference, Huntsville, Alabama, July 20-23, 2003.
238 Chapter 5
[32] A. Sengupta, "Experimental Investigation of Discharge Plasma Magnetic
Confinement in an NSTAR Ion Thruster," AlAA-2005-4069, 41st Joint
Propulsion Conference, Tucson, Arizona, July 10-13,2005.
[33] 1. E. Polk, D. M. Goebel, I. Katz, 1. S. Snyder, A. C. Schneider,
L. Johnson, and A. Sengupta, "Performance and Wear Test Results for a
20-kW Class Ion Engine with Carbon-Carbon Grids," AIAA-2005-4393,
41st Joint Propulsion Conference, Tucson, Arizona, July 10-13,2005.
[34] E. Kuffel and W. S. Zaengl, High Voltage Engineering Fundamentals,
Oxford, England: Pergamon Press, 1984.
[35] W. H. Kohl, Handbook of Materials and Techniques for Vacuum Devices,
New York: Reinhold Publishing Corporation, 1967.
[36] D. M. Goebel and A. C. Schneider, "High Voltage Breakdown and
Conditioning of Carbon and Molybdenum Electrodes," IEEE
Transactions on Plasma Science, vol. 33, issue 4, pp. 1136-1148,2005.
[37] P. A. Chatterton, "Theoretical Study of the Vacuum Breakdown Initiated
by Field Emission," Proceedings of the Physics Society, vol. 88, pp. 231-
243,1966.
[38] F. R. Schwirzke, "Vacuum Breakdown on Metal Surfaces," IEEE
Transactions on Plasma Science, vol. 19, pp. 690-696, 1991.
[39] W. D. Davis and H. C. Miller, "Analysis of the Electrode Products
Emitted by dc Arcs in a Vacuum Ambient," Journal of Applied Physics,
vol. 40, pp. 2212-2221,1969.
[40] A. Anders, B. Yotsombat, and R. Binder, "Correlation Between Cathode
Properties, Burning Voltage, and Plasma Parameters of Vacuum Arcs,"
Journal of Applied Physics, vol. 89, pp. 7764-7771,2001.
[41] J. S. Sovey, J. A. Dever, and J. L. Power, "Retention of Sputtered
Molybdenum on Ion Engine Discharge Chamber Surfaces," IEPC-01-86,
27th International Electric Propulsion Conference, Pasadena, California,
October 15-19, 2001.
[42] D. M. Goebel, "High Voltage Breakdown Limits of Molybdenum and
Carbon-based Grids for Ion Thrusters," AIAA-2005-4257, 41st Joint
Propulsion Conference, Tucson, Arizona, July 10-13,2005.
[43] M. J. Druyvesteyn and F. M. Penning, "The Mechanism of Electrical
Discharge in Gases," Reviews of Modern Physics, vol. 12, pp. 87-174,
1940.
[44] R. Doerner, D. White, and D. M. Goebel, "Sputtering Yield
Measurements during Low Energy Xenon Plasma Bombardment,"
Journal of Applied Physics, vol. 93, no. 9, pp. 5816-5823,2003.
Ion Thruster Accelerator Grids
239
[45] H. Kuninaka, 1. Funaki, K. Nishiyama, Y. Shimizu, and K. Toki, "Results
of 18,000 hour Endurance Test of Microwave Discharge Ion Thruster
Engineering Model," AIAA-2000-3276, 36th Joint Propulsion
Conference, Huntsville, Alabama, July 16-19,2000.
[46] J. S. Snyder and J. R. Brophy, "Performance Characterization and
Vibration Testing of 30-cm Carbon-Carbon Ion Optics," AIAA-2004-
3959, 40th Joint Propulsion Conference, Ft. Lauderdale, Florida, July 11-
14,2004.
[47] M. De Pano, S. Hart, A. Hanna, and A. Schneider, "Fabrication and
Vibration Results of 30-cm Pyrolytic Graphite Ion Optics," AlAA-2004-
3615, 40th Joint Propulsion Conference and Exhibit, Fort Lauderdale,
Florida, July 11-14,2004.
[48] 1. S. Miller, S. H. Pullins, D. J. Levandier, Y. Chiu, and R. A. Dressler,
"Xenon Charge Exchange Cross Sections for Electrostatic Thruster
Models," Journal of Applied Physics, vol. 91, no. 3, pp. 984-991,2002.
[49] A. Sengupta, 1. R. Brophy, J. R. Anderson, C. Gamer, K. deGroh,
T. Karniotis, and B. Banks, "An Overview of the Results from the 30,000
Hour Life Test of the Deep Space 1 Flight Spare Ion Engine," AIAA-
2004-3608, 40th Joim Propulsion Conference, Fort Lauderdale, Florida,
July 11-14,2004.
[50] 1. E. Polk, R. Y. Kakuda, J. R. Anderson, J. R. Brophy, V. K. Rawlin,
M. J. Patterson, J. Sovey, and J. Hamley, "Performance of the NSTAR
Ion Propulsion System on the Deep Space One Mission," AIAA-2001-
965, 39th Aerospace Sciences Meeting and Exhibit, Reno, Nevada,
January 8-11,2001.
[51] P. Clausing, "The Flow of Highly Rarefied Gases Through Tubes of
Arbitrary Length," Journal of Vacuum Science and Technology, vol. 8,
pp. 636-646, 1971.
[52] R. Wirz and 1. Katz, "XIPS Ion Thruster Grid Erosion Predictions for
Deep Space Missions," 30th International Electric Propulsion Conference,
Florence, Italy, September 17-20,2007.
[53] J. R. Beattie, 1. N. Matossian, and R. R. Robson, "Status of Xenon Ion
Propulsion Technology," Journal of Propulsion and Power, vol. 6, no. 2,
pp. 145-150, 1990.
240
Chapter 5
Problems
1. For an ion accelerator that is described by the Child-Langmuir law, derive
the dependence of the minimum Isp on the beam voltage for a given thrust
level.
2. A l-kV ion accelerator has a grid spacing of I nun and a screen aperture
diameter of I mm.
a. What is the space-charge-limited beamlet current density for Xe +
assuming a very thin screen grid and a planar sheath?
b. If the screen grid is 0.25 nun thick, what is the maximum beamlet
current density for a non-planar sheath? How does this compare to the
classic planar Child-Langmuir result?
3. An ion thruster with a grid diameter of 20 cm has a beam current density
that varies with the radius as kr 2 , where k is a constant.
a. If the peak current density on axis is J p and the current density at the
edge of the grid is J p / 10 , find the expression for J (r) .
b. If the peak current density is 5 mA/cm 2 , what is the total beam
current?
c. What is the flatness parameter?
d. What is the percent reduction in the beam current compared to the
case of a uniform beam current density of the peak value (the flatness
is I)?
4. An ion thruster has a beam plasma potential of 20 V and an electron
temperature in the beam of 5 e V.
a. For a plasma potential at the screen grid sheath edge of 1000 V, what
potential must be established in the accel grid aperture to keep the
electron backstreaming current to I % of the beam current?
b. Neglecting space charge in the beamlet, what voltage must be applied
to the accel grid to achieve the minimum potential in (a) for the case
of a 3-mm screen grid diameter, 0.25-mm screen grid thickness, 2-mm
accel grid diameter, and 0.5-nun accel grid thickness with a I-mm
grid gap?
c. If the beamlet current is 0.2 mA and the beamlet has a diameter in the
accel grid aperture of I nun, what must the accel grid voltage be to
maintain the 1% backstreaming current specification?
Ion Thruster Accelerator Grids
241
5. One of the first ion thrusters to fly in space was a cesium surface ionization
thruster where cesium ions were pulled from a hot surface by the electric
field that also produced the beam. Model the thruster as a diode, with
cesium ions at 7.5 mAlcm 2 coming from one surface and with the other
electrode an accel grid with 80% transparency and a grid gap "d" from the
ion source.
a. Assuming 100% mass utilization efficiency, neglecting the angular
divergence of the beam, and using a 200- V negative bias on the accel
grid, what is the voltage, current, thruster diameter, and gap size
required to produce 5 mN of thrust at an Isp of3000 s?
b. If the thruster has 95% mass utilization efficiency and a total angular
divergence of the beam of 10 deg, how does that change the results of
part (a)?
c. If it takes 100 W of power to heating the cesium ion-emitting surface
to the required surface temperature of about 1350 K, what is the total
efficiency of the thruster, using the parameters from part (b)?
Fundamentals oIElectric Propulsion: Ion and Hall T1l1'llsters
by Dan M. Goebel and Ira Katz
Copyright iQ 2008 John Wiley & Sons, Inc.
Chapter 6
Hollow Cathodes
Ion and Hall thrusters that utilize an electron discharge to ionize the propellant
gas and create the plasma in the thruster require a cathode to emit the electrons.
In addition, thrusters must neutralize the ion beam leaving the thruster by
providing electrons emitted from a cathode into the beam. The properties of the
cathode material, the physical configuration hollow cathode, and structure of
the cathode plasma determine, to a large extent, the performance and life of
both ion and Hall thrusters.
6.1 Introduction
Early electron-bombardment ion thrusters developed in the 1960s utilized
directly heated tungsten filaments as the cathode that produced electrons for the
plasma discharge. Smaller tungsten filaments were also inserted into the ion
beam to provide neutralizing electrons. Due to the high work function of
tungsten, these filaments had to be operated at temperatures of over 2600 K in
order to emit electron current densities in excess of I Ncm 2 . Operation at these
temperatures requires high heater power, often on the order of the discharge
power, which significantly reduces the efficiency of the thruster. In addition,
the life of filament cathodes is limited by rapid evaporation of the filament
material at the elevated temperatures and by sputtering of the tungsten surface
exposed to the discharge plasma or the beam by ion bombardment. Filament
cathode life was typically limited to the order of only hundreds of hours or less.
While the use of filament cathodes permitted development of ion thruster
accelerator grids and discharge chambers, they were inadequate for long-life
space applications.
These problems were solved by the development of hollow cathodes. A generic
hollow cathode is shown in Fig. 6-1, where the cathode consists of a hollow
refractory tube with an orifice plate on the downstream end. The tube has an
insert in the shape of a cylinder that is placed inside the tube and pushed against
243
244
Chapter 6
the orifice plate. This insert is the active electron emitter, and it can be made of
several different materials that provide a low work function surface on the
inside diameter in contact with the cathode plasma. The cathode tube is
wrapped with a heater (a co-axial sheathed heater is shown in the figure) that
raises the insert temperature to emissive temperatures to start the discharge. The
electrons emitted from the insert ionize gas injected through the cathode tube
and form a cathode plasma from which the discharge-current electrons are
extracted through the orifice into the thruster plasma.
A hollow cathode can be separated into three distinct plasma regions illustrated
in Fig. 6-2: a dense plasma in the insert region interior to the cathode, a high
current density plasma in the orifice, and a diffuse plume plasma outside of the
cathode that connects to the thruster discharge plasma. The plasma ions
generated throughout the device neutralize the electron space charge; as a
result, hollow cathodes produce high currents at low voltages as compared with
vacuum cathode devices.
Cathode Tube
/
Insert
- A .fT!! /
....!;1"II 11 /tr
--- I T _ hT _T -r - II )
- .----
,.T j
Heater
Orifice Plate
--... -
Fig. 6-1. Typical hollow cathode geometry of a refractory metal tube
with an emissive insert inside and a heater wrapped on the outside.
Insert Region Plallll'lll
OnflCe
Cathode Plume Plasma
Baflum-Impregnated Emitter
O.r11Ice PIlle
Fig. 6-2. The three plasma regions in a hollow cathode.
Hollow Cathodes
245
The structure of the hollow cathode serves three main functions. First, some
fraction of the thruster propellant IS injected through the hollow cathode, and
the discharge inside the resulting high neutral pressure region generates a cold,
high-density plasma. The plasma and neutral densities are the highest of
anywhere in the thruster, and the electron temperature is correspondingly the
lowest. This causes the plasma potential inside the hollow cathode to be very
low, reducing the energy of the ions that arrive at the insert surface. This
characteristic behavior is demonstrated in Fig. 6-3, which shows the measured
potential and density profiles in the Nuclear Electric Xenon Ion Thruster
System (NEXIS) hollow cathode [1] discharge. Plasma densities in excess of
10 14 cm- 3 are routinely generated inside hollow cathodes, and the electron
temperature is found [2] to be only 1 to 2 eY. The low plasma potential in the
insert region and high neutral scattering rates decrease the ion bombardment
energy striking the insert surface to typically less than 20 eV, which essentially
eliminates ion sputtering of the surface and greatly increases the life of the
cathode. Second, the high-density plasma in the insert region eliminates space
charge effects at the cathode surface: that can limit the electron emission current
density. Emission current densities of I to 10 Alcm 2 are typically employed in
thruster hollow cathodes for compact size and good life, although higher
35
30
25
]2
'E 20
(1)
'0
c..
co 15
E
<II 10
co
i5:
5
10 15
Insert
Region
1 10 14
E
. 10 13
(1)
o
co
E
10 12
i5:
Plume
Region
10 11
-3 -2 -1 0 1 2 3 4 5 6
Position Relative to Orifice Entrance (cm)
Fig. 6-3. Plasma potentiel (top) end density (bottom)
measured on axis in the NEXIS hollow cathode et 25 A of
discharge current.
246
Chapter 6
current densities are achievable and sometimes used. Third, the cathode insert
can be heat shielded well in this geometry, which greatly reduces the radiation
losses of the cathode at operating temperatures. This decreases the amount of
power that must be deposited in the cathode to maintain the required
temperature for electron emission. This reduces the cathode heating losses to a
small fraction of the discharge power, significantly reducing the discharge loss
ofthe plasma generator.
Since nearly the entire discharge current runs through the orifice, the current
density there is highest in the system, and a sufficient plasma density must be
generated locally to carry the current. For the 25-A discharge case shown in
Fig. 6-3, the plasma density in the orifice is on the order of 10 14 cm- 3 . The
discharge current flowing through the 2.5-rom-diameter orifice is described by
I=neevA,
(6.1-1)
where ne is the plasma density, e is the electron charge, v is the electron drift
velocity, and A is the cross-sectional area of the orifice. Solving for the drift
velocity gives
I 4
v=-=7.7xlO mls «vth,
neeA
(6.1-2)
where the thermal drift velocity vth = ...JkTe/m is 6 x 10 5 mls for the 2-eV
plasma electron temperatures measured in this location. The current is
conducted through the orifice region at relatively low drift velocities, even
though the electron current density exceeds 100 Alcm 2 in this case. This is
typically true even at current densities exceeding 1000 Alcm 2 .
In the plume region, the expanding orifice plasma and ionization of the
expanding neutral gas provide an ion background that neutralizes the space
charge of the current carrying electrons. Hollow cathodes are normally enclosed
in another electrode called a keeper, shown in Fig. 6-4. The major functions of
the keeper electrode are to facilitate turning on the cathode discharge, to
maintain the cathode temperature and operation in the event that the discharge
or beam current is interrupted temporarily, and to protect the cathode orifice
plate and external heater from high-energy ion bombardment that might limit
the cathode life. The keeper is nonnally biased positive relative to the cathode,
which either initiates the discharge during start-up or reduces the ion
bombardment energy during normal operation. The life of the keeper electrode
is very important to the life of the cathode and thruster.
Hollow Cathodes
247
HeElt
Shield
Plume Plasma
GElS ;: :: :....:.:.:::....:........,
F ' - <::::.i:t 7: : !.
Cathode Tube
""'''''''''''-''''''' ''''''''' '"'' .
Keeper
Electrode
Fig. 6.4. Hollow cathode schematic showing the cathode tube, insert, and
heater enclosed in a keeper electrode.
Hollow cathodes operate in a "self-heating" mode, in which the external heater
is turned off during operation and the cathode insert is heated by plasma
bombardment. There are three sdf-heating mechanisms possible in hollow
cathodes: (1) orifice heating, (2) ion heating, and (3) electron heating. In orifice
heating, the cathode is designed with a small, restrictive orifice, which produces
a high internal pressure in both the insert and orifice regions. The plasma
discharge passing through the orifice is then very resistive, causing a significant
amount of power to be deposited in the orifice plasma and transferred to the
orifice walls by convection. This power deposition then heats the insert by
conduction and radiation. Orifice heating is used primarily in neutralizer
cathodes where the discharge currents are very low. The classic mechanism for
cathode heating is ion heating, where ions in the cathode insert region plasma
fall through the sheath potential at the insert surface and heat the surface by ion
bombardment. Electron heating occurs in a regime where both the cathode
internal pressure and the discharge current are relatively high, resulting in the
very high plasma densities (> 10 15 cm -3) generated in the insert region. The low
electron temperatures and low sheath voltages produced in this situation result
in the energetic tail of the Maxwellian electron distribution having sufficient
energy to exceed the sheath potential and reach the insert surface. These
electrons then deposit their energy on the insert and heat it to emission
temperatures. The heating mechanism that dominates in any hollow cathode
design depends on the geometry of the cathode, the internal neutral gas pressure
in the insert and orifice regions, and the discharge current.
This chapter will start with a simple classification of different hollow cathode
geometries to aid in the discussion of the important effects in the system, and
248
Chapter 6
then discuss the basics of the cathode insert that provides thermionic electron
emission. The characteristics of the plasmas in the insert region, the orifice, and
the cathode plume in the vicinity of the keeper required to extract and transmit
the electrons into the thruster will then be examined. Since the neutral gas
density changes all along the discharge path in hollow cathode discharges, the
plasmas generated in each location (inside the insert, in the orifice, and in the
cathode plume) have different properties in terms of collisionality, temperature,
potential, and density. These differences determine the applicable plasma
physics in each region.
6.2 Cathode Configurations
The geometry and size of the hollow cathodes depend on the amount of current
that they are required to emit. Discharge currents in ion thrusters are typically
5 to 10 times the beam current depending on the efficiency of the plasma
generator, and discharge currents can range from a few amperes to over
100 amperes [3]. The hollow cathode used in a Hall thruster provides electrons
for both ionization of the propellant gas and neutralization of the beam [4]. Hall
thrusters also tend to run at lower specific impulse (Isp) than ion thrusters.
Therefore, Hall thrusters require higher discharge currents from the cathode to
achieve the same total power as compared to ion thrusters, and currents of the
order of 10 amperes to hundreds of amperes are needed. Neutralizer cathodes in
ion thrusters emit electrons at a current equal to the beam current. Therefore,
they can be made smaller than discharge cathodes and must be designed to be
self-heated and to run reliably at lower currents.
Higher discharge currents require larger insert sizes because the thermionic
emission current densities from cathode surfaces are finite. Ultimately, this
determines the diameter of the insert, which will be described in the next
section. The cathode orifice size depends on many parameters. Ion thruster
neutralizer cathodes have been designed with very small diameter orifices
(::;3 x 10- 2 cm), and ion thruster discharge cathodes and small Hall thruster
cathodes have been designed with orifices of less than O.l-cm diameter to over
0.3 cm in diameter. High-current hollow cathodes for large ion thrusters and
Hall thrusters will have even larger orifices. These cathodes are sometimes
designed even without an orifice, where the insert inside diameter forms a tube
exposed to the discharge plasma.
Hollow cathodes generally fall into three categories, which will be useful later
in describing the plasma characteristics in the three regions described above.
The first type of hollow cathode is characterized by a small orifice with a large
length-to-diameter ratio, shown schematically in Fig. 6-5 as Type A. These
cathodes typically operate at low current and relatively high internal gas
Hollow Cathodes
Type C
249
pressures, and are heated primarily by
orifice heating. The second type of
cathode features has an orifice diameter
typically larger than the length, shown in
Fig. 6-5 as Type B, and operates at
lower internal gas pressures. The heating
mechanism in these cathodes can be due
to electron or ion bombardment of the
insert, or a combination of the two
depending on the orifice size and
operating conditions. The third type of
cathode, typically used in high-current
cathodes and shown in Fig. 6-5 as
Type C, has essentially no orifice at all.
These cathodes have a large neutral
density gradient in the insert region, but
they typically have a reduced internal
pressure overall as compared to orificed
cathodes. The heating mechanism for
Type C cathodes is nonnally IOn
bombardment of the insert.
The value of the neutral gas pressure
inside the hollow cathode affects both
the plasma density and plasma profile
due to collisional effects [5]. Figure 6-6
shows examples of axial plasma density
profiles measured with fast scanning
probes [6] inside a O.38-cm inside-
diameter (I.D.) cathode insert operating
at 13 A of discharge current and a xenon flow of 3.7 standard cubic centimeters
per minute (sccm) for two different orifice diameters and the case of no orifice
plate at all. Small orifices, characteristic of Type A cathodes, have high internal
pressures that produce high plasma densities but constrain the axial extent of
the plasma to the order of a few millimeters. For a given emission current
density, this can restrict the discharge current that is available. As the orifice is
enlarged, the pressure decreases and. the plasma extends farther into the insert,
resulting in utilization of more of the insen surface area for electron emission.
Fig. 6-5. Schematics of the three
characteristic types of hollow
cathodes (A, 8, and C) depending on
the orifice geometry.
The electron current density in the orifice is higher than anywhere else in the
system and, depending on the orifice size, can easily exceed I kAlcm 2 . If the
orifice is long compared with its radius, as is the case in most Type A
neutralizer hollow cathodes, the physics are the same as for a classical positive
250
Chapter 6
10 16
'ii)
10 14
o
ca
E
'"
ca
a:: 10 13 .
1015 ____._____.___H_.__
'7
E
10 12
2.6 2.4 2.2 2.0 1.8 1.6 1.4 1.2 1.0 0.8 0.6 0.4 0.2 0.0 -0.2
Distance from Orifice Entrance (cm)
Fig. 6-6. Csthode plssms densIty profile examples ss the orifice dismeter
is incressed for a constsnt dlschsrge current snd flow rste.
column plasma where an axial electric field in the collisional plasma conducts
the current and plasma resistive heating is very important. A large fraction of
this ohmic power deposited in the orifice plasma goes into heating of the orifice
plate by ion bombardment, which contributes to the insert heating by
conduction and radiation. In Type B cathodes, the orifice is shaped nearly as an
aperture, and there is little local resistive heating. The plasma in the insert
region is generated by ionization of the neutral gas by the discharge current
flowing through the insert region into the orifice. At high cathode neutral-gas
flows (and subsequent high plasma density) in this type of cathode, the insert
heating is primarily by plasma electrons. At low flow rates or with large
orifices, the insert is heated predominately by the ions bombarding the emitter
surface. In Type C cathodes, there is little or no orifice, and the plasma couples
from a collisionally dominated region upstream inside the insert directly into
the nearly collisionless cathode plume region. This creates long axial density
and potential gradients and may expose some of the downstream region of the
insert to higher potentials and ion bombardment. Heating in this case is
predominately by ion bombardment through the higher cathode sheath
potential.
Naturally, there is a continuous range of cathode operation that may
demonstrate properties of all three cathode types. Indeed, a given cathode
geometry can transition from low resistive heating in the orifice at low currents
and low gas flow rates to substantial resistive heating and plasma generation at
high currents and high gas flow rates. These three types of hollow cathodes will
Hollow Cathodes
251
be discussed in detail after the actual thermionic electron emitter properties are
described.
6.3 Thermionic Electron Emitter Characteristics
Electrons are introduced into the system by thermionic emission from the insert
surface. Thermionic emission by cathodes is described by the Richardson-
Dushman equation [7J:
J = A T 2 e-et/JlkT
,
(6.3-1)
where A is, ideally, a constant with a value of 120 Alcm 2 K 2 , T is the
temperature in kelvins, e is the charge, k is Boltzmann's constant, and f/> is the
work function. Experimental investigations of the thermionic emission of
different materials reported values of A that vary considerably from the
theoretical value. The cause of thf: deviation of A from a constant has been
attributed to several different effects, such as variations in the crystal structure
of the surface, variations in the surface coverage (for dispenser cathodes),
changes in the density of states at the surface due to thermal expansion, etc.
This issue has been handled [8J for many of the thermionic electron emitters
used in hollow cathodes by introducing a temperature correction for the work
function of the form
f/>==f/>o+cxT,
(6.3-2)
where f/>o is the classically reported work function and cx is an experimentally
measured constant. This dependencf: can be inserted into Eq. (6.3-1) to give
J = Ae-ealkT2 e--et/JolkT = D T 2 e-ef/iolkT , (6.3-3)
where D IS a material-specific modification to the Richardson-Dushman
equation.
In the presence of strong electric fields at the surface of the cathode, the
potential barrier that must be overcome by the electrons in the material's
conduction band is reduced, which results effectively in a reduced work
function. This effect was first analyzed by Schottky [9J, and the so-called
Schottky effect is included in the emission equation by the addition of a term
[lOJ to describe the effect of the surface electric field on the emission current
density:
J DT2 exp( -:;o }xp[ C ) J4:J
(6.3-4)
252
Chapter 6
where E is the electric field at the cathode surface. The Schottky effect often
becomes significant inside hollow cathodes where the plasma density is very
high and the electric field in the sheath becomes significant.
The properties of the material selected for the thermionic emitter or insert
determine the required operating temperature of the cathode for a given
emission current. The work functions and values of D found in the literature for
several common cathode materials are summarized in Table 6-1. Figure 6-7
shows the emission current density calculated using Eq. (6.3-3) for several
different emitter materials. The refractory metals are seen to have work
functions in excess of 4 eV, and so they must operate at very high temperatures
to achieve significant emission current density.
The so-called "oxide" cathodes have work functions under about 2 eVand so
are capable of producing high emission current densities at temperatures under
IOOOcC. Oxide layers, such as barium oxide, were first deposited on tungsten or
nickel filaments to lower the work function and reduce the heater power
required. However, these surface layers evaporate and are easily sputtered by
ion bombardment, limiting the life in vacuum applications to thousands of
hours and in plasma discharges to tens of hours. This problem was mitigated by
the development of dispenser cathodes where a reservoir of the oxide material
is fabricated into the tungsten substrate, which continuously re-supplies the low
work function surface layer. The most commonly used dispenser cathode in
thrusters, the "Phillips Type S," uses a porous tungsten matrix that is
impregnated with an emissive mix of barium and calcium oxides and alumina
[16]. Different molar concentrations of the three constituents of the emissive
Table 6-1. Work function and Richardson coefficients for several cathode materials.
A D t/J
BaO-Scandate [11] 120 8 x 1O- 7 T 2 - 1.3 X 10 3 T+ 1.96
BaO-W 411 [12] 120 1.67 + 2.82 - 10-4 T
BaO-W 411 [10] 1.5 1.56
LaB 6 [13] 29 2.66
LaB 6 [14] 110 2.87
LaBdl5] 120 2.91
LaB6 [8] 120 2.66 + 1.23 X 10⁻⁴ T
Mo1ybdenum [8] 55 4.2
Tantalum [8] 37 4.1
Tungsten [8] 70 4.55
Hollow Cathodes
100.000
N
5 10.000
'en
c:
CI)
o
'E
:J
()
c:
o
'en
. 0.010
w
,
I
I
I
I
I
0.001 I
500
1000
253
I
I
,.
"
.'
- Scandate
---. BaO-W 411
...... LaB6
-.-. Tantalum
- Tungsten
1500 2000 2500
Temperature (deg C)
3000
Fig. 6-7. Emission current density versus temperature for
various cathode materials.
mix are used depending on the reqmred emission current density and life. In ion
thrusters, a 4: 1: 1 emissive mix typically is used, although other mixtures are
available [1]. The matrix material containing the impregnate can be directly
heated by passing a current through the material, or configured as an insert
placed inside hollow cathodes.
In dispenser cathodes, chemical reactions in the pores of the matrix or at the
surface at high temperatures reduce the emissive material and evolve a barium-
oxide dipole attached to an active site on the tungsten substrate. The 4:1:1
Type S cathode has a work function of about 2.06 eV at temperatures in excess
of about 800'C. Barium-oxide dispenser cathodes with porous matrix material
made of tungsten can provide emission current densities of 10 Alcm 2 at surface
temperatures of about 1000'C, as shown in Fig. 6-7. The work function can be
further reduced by the introduction of small amounts of other refractory
materials, such as iridium or osmium, in the tungsten matrix. These "mixed
metal matrix" cathodes can have work functions below 1.9 e V, and they
typically slow some of the chemical reactions that take place in the cathode. It
was also found that the addition of scandium to the surface of the barium-oxide
dispenser cathode reduces the work function significantly. This is reflected in
Fig. 6-7, where the reported work function [11] at l100'C is about 1.7 eV,
which is significantly less than the 2.06 eV for the BaO dispenser cathode and
results in much lower temperatures for a given emission current density. The
mechanism for this improvement is not clear to date, and the ability to fabricate
stable scandate electron emitters that maintain the low work function over time
254
Chapter 6
has been problematic. However, scandate-Ba0-W dispenser cathodes have
been successful in several different cathode structures.
Because chemistry is involved in the formation of the low work function
surface, dispenser cathodes are subject to poisoning that can significantly
increase the work function [17]. Some care must be taken in handling the
inserts and in the vacuum conditions used during operation of these cathodes to
avoid poisoning by impurities in the gas that produce unreliable emission and
shorten the lifetime. In addition, impurities in the feed gas that react with the
tungsten insert can cause migration and deposition of tungsten or tungstates
(compounds of tungsten, barium, and oxygen) on the surface, which change the
surface structure and porosity and can reduce the surface coverage of the low
work function BaO layer. One of the major drawbacks of using BaO dispenser
cathodes in electric propulsion applications is the extremely high feed gas
purity specified to avoid these poisoning and tungsten-material transport issues,
which has resulted in a special "propulsion-grade" xenon with 99.9995% purity
to be specified by some users of these cathodes for flight.
Another electron emitter material, lanthanum hexaboride [13], is a crystalline
material made by press sintering LaB 6 powder into rods or plates and then
machining the material to the desired shape. Polycrystalline LaB 6 cathodes have
a work function of about 2.67 eV, depending on the surface stoichiometry, and
will emit over 10 Ncm 2 at a temperature of 1650'C, as shown in Fig. 6-7. Since
the bulk material is emitting, there is no chemistry directly involved in
establishing the low work function surface, and LaB6 cathodes are insensitive to
impurities and air exposures that can destroy a BaO dispenser cathode [18]. An
LaB 6 cathode can withstand gas-feed impurity levels two orders of magnitude
higher than dispenser cathodes at the same emission current density. In
addition, the cathode life is determined primarily by the low evaporation rate of
the LaB 6 material at typical operating temperatures. The higher operating
temperature of bulk LaB6 and the need to support and make electrical contact
with LaB6 with materials that inhibit boron diffusion at the operating
temperatures require some careful engineering of the cathode structure.
However, LaB6 cathodes are commonly used in Russian Hall thrusters in
communications satellite applications [19].
Lanthanum hexaboride was first developed as an electron emitter by Lafferty
[13] in the 1950s. The thermionic emission of lanthanum-boron compounds for
various surface stoichiometries was extensively studied by several authors
[14,15,19]. The first flight of Russian SPT Hall thrusters [20] in 1971, and all
subsequent flights, utilized lanthanum hexaboride cathodes. The first reported
use of LaB 6 in the US in a hollow cathode was by Goebel, et al. [21] in 1978,
and the development of a high-current LaB 6 cathode for plasma sources that
Hollow Cathodes
255
dealt with supporting and making electrical contact with the material was
described by Goebel, et al. [22] in 1985. The lanthanum-boron system can
consist of combinations of stable LaB 4 , LaB6, and LaB9 compounds, with the
surface color determined [23] by the dominate compound. The evolution of
LaB4 to LaB9 compounds is caused either by preferential sputtering of the
boron or lanthanum atoms at the surface by energetic ion bombardment [14] or
by preferential chemical reactions with the surface atoms [23]. However, a
lanthanum-boride compound, when heated in excess of IOOO°C in a reasonable
vacuum, will evaporate its component atoms at rates that produce a stable
LaB 6 . 0 surface.
Dispenser cathodes and LaB 6 cathodes offer long lifetimes in thruster
applications because the evaporation rate is significantly lower than for
refractory metals. Figure 6-8 shows the evaporation rate as a function of the
emission current density for a Type S 4: 1: 1 dispenser cathode [17], LaB 6 [24],
and tungsten [8] (for comparison). The dispenser cathode and LaB 6 cathode
evaporation rates are more than one order of magnitude lower when compared
with tungsten at the same emission current density. Excessive evaporation of
barium and reduced surface coverage usually limit the current density of
dispenser cathodes to less than about 20 A/cm 2 in continuous operation. In spite
of operating at a significantly higher temperature than the barium cathode, the
LaB6 has a lower evaporation rate until the emission current exceeds about
15 A/cm 2 and can provide longer lik The life of these cathodes is discussed in
more detail in Section 6.8.
10- 5
---..--
..--..--
-.-
10- 6
'"
E
L)
E
.!:? 10- 7 I
II>
16 f
a:::
c
.S?
16
5
c.
10- 9
w
...-
.;
/
I
-"
./
n___ LaB6
- . - Tungsten
- BaO-W411
10- 10
o
10
70 80
20 30 40 50 60
Emission Current Density (A/cm 2 )
Fig. 6-8. Evaporation rate of Type-S 4:1:1-dispenser cathodes. LaSe
and tungsten.
256
Chapter 6
6.4 Insert Region Plasma
The insert region of the hollow cathode, as was illustrated in Fig. 6-4, usually
has a cylindrical geometry with electron emission from the interior surface of a
thennionic insert material. A plasma discharge is established inside the insert
region, and electrons emitted from the insert surface are accelerated through the
cathode sheath that fonns between the insert surface and the plasma. The insert
plasma must be capable of accepting the emitted electron current from the
sheath and must provide heating of the insert for the cathode to operate
properly. The maximum electron current density into the insert plasma is then
detennined by either space-charge limitations in the plasma at the sheath edge
or by characteristics of the surface (work function and temperature) that limit
the thennionic emission. As shown by the double sheath analysis in Chapter 3,
ions flowing back from the plasma through the sheath to the cathode surface
neutralize the electron space charge and increase the extracted electron current
density from the insert surface. The electrons accelerated through the sheath
quickly give up their energy to the dense collisional plasma inside the insert.
Electrons in the tail of the Maxwellian distribution in this plasma have
sufficient energy to ionize some portion of the thruster propellant injected
through the cathode, which is only a small fraction of the total propellant
injected into the thruster. Plasma electrons incident on the downstream end of
the cathode tube flow through the orifice and into the main discharge chamber.
The barium evaporated from dispenser cathode inserts is easily ionized in
plasmas with this electron temperature because its ionization potential is only
5.2 eV. A calculation of the ionization mean free path in NASA Solar Electric
Propulsion Technology Applications Readiness (NST AR)-sized hollow
cathodes [25] predicts about 4 x 10- 5 m, which is much smaller than the interior
dimensions of the cathode. The ionized barium then migrates upstream because
the potential gradient in the hollow cathode that pulls electrons out of the
cathode plasma also accelerates barium ions in the opposite direction
(upstream). This means that the barium in the insert does not leave the cathode
during discharge operation, but tends to travel upstream in the plasma and is
deposited in the cooler sections of the hollow cathode.
The pressure inside the hollow cathode is set primarily by the gas flow rate
through the cathode and the orifice size and must be sufficiently high to
produce a collisional plasma. This condition is required to slow ions
backstreaming from the orifice region and from the pcak plasma potential on
axis (primarily by charge exchange) to avoid sputtering of the insert surface by
high-energy ion bombardment. While this condition may not necessarily be
satisfied everywhere inside a Type C cathode (with no orifice), at least some
fraction of the insert is protected by the collisional processes for proper cathode
Hollow Cathodes
257
operation and life. The collisional plasma will also tend to have a low electron
temperature, which reduces the sheath voltages and further protects the low
work function insert surface from damage or modification by the plasma.
It is possible to describe [26] the insert plasma using simple particle and energy
balance models and plasma diffusion models because the plasma transport
inside the hollow cathode is dominated by collisions. In Chapter 3, the solution
to the radial diffusion equation for ions in collisionally dominated plasmas in
cylindrical geometry resulted in an eigenvalue equation with a unique
dependence on the electron temperature:
( R ) 2 g
Aol no O'j (Te )v ---;;; -D = 0,
(6.4-1)
where R is the internal radius of the insert, Aol is the first zero of the zero-order
Bessel function, no is the neutral density, O'j is the ionization cross section
averaged over a Maxwellian electron temperature, and D is the diffusion
coefficient. This means that the electron temperature is constrained to produce
sufficient ions to offset the diffusion losses to the wall.
The diffusion in the radial direction in the insert region is ambipolar, and the
ion mobility is limited by resonant charge exchange (CEX) with the xenon
neutral atoms. The average collisions frequency for the ions is then
Vi = O'CEX no V scat '
(6.4-2)
where the effective velocity for scattering of the ions in the insert region is
approximated by the ion thermal speed:
_fk1f
v scat - M .
(6.4-3)
Since the electron mobility is much higher than the ion mobility, the ambipolar
diffusion coefficient Da from Eq. (3.6-58) for this case is then
( Te ) e (TiV +Tev)
Da = Dj 1+- = ,
T i _ M O'CEX no v scat
(6.4-4)
where the ion and electron temperatures are shown in eV. As an example, take
two hollow cathodes operating in xenon with different inside diameters of the
insert. The neutral density inside the hollow cathode is described by Eq. (2.7-2)
for a given pressure, determined by the gas flow and the orifice size. A simple
analytical technique to estimate the neutral pressure in the insert region is given
258
Chapter 6
in Appendix B. Typical pressures inside discharge hollow cathodes usually
range from 1 to 15 torr, although higher pressures are often used in neutralizer
cathodes. Figure 6-9 shows the electron temperature versus internal pressure
f{)und from Eq. (6.4-1) for two insert diameters, assuming a charge exchange
cross section of 10- 18 m 2 [27] for low temperature xenon ions and neutrals
inside the hollow cathode and a neutral gas temperature of 2500 K. The smaller
NST AR insert diameter requires a higher electron temperature to offset the
higher diffusion losses to the closer wall at a given pressure. During operation
at the high power TH15 throttle point at 13.1 A and 3.7 sccm, the internal
pressure is measured to be about 7.5 torr, and the predicted electron
temperature is then about 1.36 eV. This agrees well with probe data taken in the
insert region [28] in this mode. The NEXIS cathode nominal discharge
conditions of 25 A and 5.5 sccm produce an internal pressure of 1.8 torr, which
results in a predicted electron temperature of about 1.4 eV that is also in good
agreement with the measurements [28].
The radially averaged ion density in the hollow cathode is related to the ion
density on the cathode centerline by
n ):n(O)Jo( r) 2"rdr _ n(o) [ 2J 1 (Aol) ] .
nR 2 Aol
(6.4-5)
The ion flux going radially to the wall is
3.0
\ I - - - NSTAR 0.36-cm Insert Diameter r
\ I - NEXIS 1.27-cm Insert Diameter
\
\
\
\
, ,
, "
"- '- ,
--- ----
----
------ --------
2.5
>
!!1 2.0
::I
C;;
Ii>
1.5
c::;
12 1.0
ti
Q)
W
0.5
0.0
o
2
4
6
8
10
12
14
Insert Pressure (torr)
Fig. 6-9. Electron temperature in the insert region as a function of internal
presaure for two cathode insert inner diameters.
Hollow Cathodes
259
Jj=nvr=-D a In =n(O)D a Aol JdAod=nD a (Aod 2 .
Jr R 2R
Using the ambipolar diffusion coefficient from Eq. (6.4-4), the effective radial
drift velocity at the wall is then
(6.4-6)
(2.4)2 e
v r = (TiV + Tev ) .
2RaCEX no v scat M
In the example above, the larger-diameter insert produces an electron
temperature of about 1.4 eV at 1.8-torr internal xenon pressure. The effective
ion velocity found near the wall outside the sheath is only 3.1 mls due to the
ion-neutral CEX collisions, which slows the ion velocity to significantly less
than the 500-m/s ion thermal velocity and 1200-mls xenon ion acoustic
velocity. Since the pre-sheath potential that accelerates the ions to the Bohm
velocity prior to entering the sheath extends only the order of the collision
mean free path into the plasma, ions diffusing to the plasma edge are
accelerated very close to the sheath to the Bohm velocity due to the high
collisionality in the insert plasma.
(6.4-7)
The density of the insert plasma can be estimated by a simple O-dimensional
(O-D) particle and energy balance model. These types of models assume a fairly
uniform plasma in the insert region and so provide density estimates within
factors of the order of two. In the insert plasma, heating of the plasma is
balanced by the energy loss:
Itl/Js + RI; = IjU+ + 1"evle + ( 2T ev +l/Js)I r e -rf!s/TeV ,
2
(6.4-8)
where It is the thermionic electron current, l/Js is the cathode sheath voltage,
R is the plasma resistance, Ie is the hollow cathode discharge current, Ij is the
total ion current generated in the insert region, U+ is the ionization potential,
TeV is the electron temperature (in volts), and Ir is the random electron flux at
the sheath edge. In this case, excitation and radiation losses seen in the
discharge chamber energy balance equations are ignored because the high
density plasma inside the hollow cathode is optically "thick" and the radiated
energy is reabsorbed by the plasma. The resistance, R. is the resistivity times
the average conduction length, R, divided by the cross-sectional area of the
plasma:
R
R:=7J-.
rcr 2
(6.4-9)
260
Chapter 6
The resistivity ofthe plasma is given from Eq. (3.6-21) by
1
1]= 2 '
Eo Te OJ p
(6.4-10)
where the collision time, Te, for electrons, accounting for both electron-ion and
electron-neutral collisions, is given by
T =
e
vei +v en
(6.4-11)
where vei is the electron-ion collision frequency given in Eq. (3.6-14) and
v en is the electron-neutral collision frequency given in Eq. (3.6-12) from [29].
At the insert, power balance gives
H(T)+ Itf/Ywf = Ii ( U+ +f/Ys + T;V -tPwf )+(2T ev +f/Ywf ) Ire-f/!slTev , (6.4-12)
where H(T) is the total heat lost by the insert due to radiation and conduction
and f/Y1-if is the cathode work function. Particle conservation in the discharge
dictates that
1 =1 +1. -I e-f/!s/TeV
ell r .
(6.4-13)
The random electron flux within a collision length of the sheath edge is given
by
_ ( 8kTe ) 1/2
Ir - ne e A,
4 10m
(6.4-14)
where the plasma density, n e , is evaluated at the sheath edge. The ion current is
given by the Bohm current in Eq. (3.7-29), where the ion density is again
evaluated within one collision length of the sheath edge.
Equations (6.4-8), (6.4-12), (6.4-13), and (6.4-14) can be combined to eliminate
the ion current term, which gives
RI}+Ie(@s+lT ev )
H (T) + I ef/Ywf
( 2M ) 1/2
U+ +f/Ys +2TeV;;;; e-f/!s/Tev
T ( 2M ) 1/2
U+ +f/Y + +2T - e-f/!s/Tev
s 2 eV 10m
. (6.4-15)
Hollow Cathodes
261
Since the electron temperature is given by the solution to Eq. (6.4-1) in the
insert region (as shown above), Eq. (6.4-15) can be solved for the cathode
sheath voltage as a function of the discharge current if the radiation and
conduction heat losses are known. The insert heat losses are found from
thermal models of the cathode, which will be discussed in Section 6.6. Equation
(6.4-15) can be greatly simplified by realizing that in most cases
TeV /2 «(U+ + iPs), and the right-hand side is essentially equal to one.
Equation (6.4-15) then reduces to a simple power balance equation, and the
cathode sheath voltage is
H(T) 5
iPs =-+-T eV +iPwf -Ie R .
Ie 2
Figure 6-10 shows the calculated sheath voltage from Eq. (6.4-16) for the
NSTAR cathode at a fixed 3.7-sccm xenon flow rate as a function of the
discharge current for four values of the combined radiated and conducted power
loss. From Fig. 6-9, the electron temperature is taken to be 1.36 eV for the
7.8 torr measured at 13 A of discharge current and this flow. A thermal model
of this cathode [30] indicates that the insert heat loss is about 13 W at 13 A of
discharge current, resulting in a sheath voltage from the figure of only about
3.6 V. In this case, a significant fraction of the 1.36 eV electron-temperature
plasma electrons can overcome the sheath voltage and be collected on the insert
to provide heating. The balance of the power required to heat the insert in the
NST AR cathode comes from orifice plate heating [30J, which will be discussed
in the next section.
(6.4-16)
10
9
C1> 8
C)
.!!!
g 7
.r:
16
C1>
.r: 8
en
C1>
"8 5
£;
to
()
4
3 1
5
--- 10W
-15W
-20W
-25W
--
,
6
,
7
,
8 9 10 11 12 13 14 15
Discharge Current (A)
Fig. 6-10. Insert sheath voltage versus discharge current for the
NSTAR cathode for four values of the radiated and conducted heat
loss.
262
Chapter 6
In low-pressure Type B and C cathodes, the sheath potentials are much greater
than the 3.6 V calculated for the NSTAR discharge cathode. For example, in
Fig. 6-9, the NST AR solution for the electron temperature at the far right of the
graph is in excess of 7 torr, while NEXIS and other large orifice cathodes are
closer to the left side of the graph, between 1 and 2 torr. The sheath potential
found by solving Eq. (6.4-16) for the NEXIS electron temperature is over 7 V,
and so relatively few plasma electrons return to the emitter and do little heating.
Most of the insert heating in lower pressure (on the order of 1 to 2 torr), lower
internal plasma density cathodes is from ion bombardment of the insert surface
due to the higher sheath voltage.
The insert plasma density can now be found from Eq. (6.4-8). The ion current
term is given by
Ii = noflee((jiV e ) V ,
(6.4-17)
where no is the neutral density, < (jive> is the ionization reaction rate
coefficient, V is the volume, and fle is the average plasma density over the
insert volume. Remembering that the plasma density in the random electron
flux equation is evaluated at the plasma edge, Eq. (6.4-8) can be solved using
the above equations to produce an expression for the average plasma density:
_ RI; -(%Tev -iPs )Ie
n,: [I, T,( : r eAe- oJT " +noe(av,}v(u+ + ,)]'
(6.4-18)
where in is the edge-to-average plasma density ratio. Since the electrons in the
insert plasma are Maxwellian, the value of in can be estimated from the
potential difference between the center and the edge:
in = e z e -(t/Jaxis -t/Js )/Tev ,
ne
(6.4-19)
where the potential on axis iPaxis must come from measurements or two-
dimensional (2-D) codes. The plasma density calculated from Eq. (6.4-18) for
the NSTAR discharge cathode at a constant xenon gas flow of 3.7 seem, using
the electron temperature from the radial diffusion model (Fig. 6-9), the sheath
potential from the power balance model (Fig. 6-10), and a measured on-axis
plasma potential of about 8.5 V [6], is shown in Fig. 6-11. Good agreement
with the plasma density measurements made by a miniature scanning probe in
this cathode [28] is obtained, and a nearly linear dependence on discharge
Hollow Cathodes
263
2.0 X 10 21
3.7 seem
1.5 x 10² 1
'I'
g
:&;0
'ii)
I:
CI)
o
(1j
E
U)
(1j
0::
1.0 x 10 21
/
Model
. Data
5.0 x 10 20
o
4 6 8 10 12 14 16
Discharge Current (A)
Fig. 6-11. Peak plasma density calculation for the NSTAR cathode
operating at a constant gas flow of 3.7 seem.
current is predicted by the model and shown experimentally. While the simple
O-D cathode model requires insert heat loss from a cathode thennal model and
on-axis potentials from probe measurements or 2-D code runs, it provides
reasonable agreement with the data and illustrates the dependence of the insert
plasma density and temperature on the geometry and the plasma conditions
inside the cathode.
The O-D model also illuminates the heating mechanism in the hollow cathode.
The ion heating to the insert is found in Eq. (6.4-12):
( + TeV )
Powerions = Ii U +CPs +T-CPwj ,
(6.4-20)
where the ion current is given by the Bohm current at the sheath edge. Using
the above parameters for the Type B NST AR discharge cathode shown in
Fig.6-S at the full-power THIS operating point of 13 A and 3.7 sccm
(U+ = 12.1 eV, CPs = 3.6 eV, Te = 1.36 eV, cpWl = 2.06 V, cpaxis = 8.5 V, and
ni :=:: 1.5 x 10 2 ] m- 3 ), the ion heating power from Eq. (6.4-20) is only 4.7 W.
The electron heating of the insert is also found in Eq. (6.4-12):
Powere]ectrons = ( 2TeV + CPwj ) Ire-iPs fTev ,
(6.4-21)
where the random electron flux is again evaluated at the sheath edge. For the
same parameters for the Type B NST AR cathode given in the paragraph above,
the electron heating of the insert is found to be about 45 W. This Type B
264
Chapter 6
cathode is, therefore, heated predominately by electron heating of the insert,
with a comparable amount coming from orifice heating (shown in the next
section). Similar analysis of Type B cathodes with larger orifices or lower flow
rates, and also most Type C cathodes, indicates that ion heating will become the
dominant heating mechanism due to the higher electron temperature and larger
sheath potential drop at the insert.
It is important to recognize that, as the pressure in the hollow cathode is
increased, much of plasma heating comes from resistive heating of the current
flowing through the partially ionized plasma. The higher the neutral gas
background pressure, the greater the contribution of resistive heating. In
cathodes with larger orifices that produce lower internal pressures, most of the
heating of the insert plasma comes from the emitted electrons being accelerated
across the cathode sheath potential. In lower pressure cathodes, the sheath
potential is higher and the plasma resistivity is lower, resulting in less joule
heating of the plasma but more ion bombardment heating of the insert surface.
This is illustrated in Fig. 6-12, which shows the sheath potential and the ion and
electron currents impacting the cathode as a function of the resistive joule
heating of the plasma.
The behavior shown in Fig. 6-12 can be understood by rearranging the
equations in the power balance model above. Using Eqs. (6.4-13) and (6.4-14)
in the power balance equation [Eq. (6.4-8)] and solving for the sheath potential
gIves
2 + 5 ( ) 2mi
-RIe +I i V + '2 TeVIe + 2TeV +t/>s Ii - exp(-QJs /T eV )
QJs = ( ( n me )] . (6.4-22)
Ie-Ii 1- :: exp(-QJs/T eV )
The decrease in the sheath potential observed in Fig 6-12 as the joule heating
(Rl;) becomes more significant follows directly from Eq. (6.4-22), because
the joule heating term enters with a negative sign. Equation (6.4-13) also shows
that a decrease in the sheath potential allows for more of the electron flux to
return to the emitter. Finally, if the heat loss, H(T), is fixed, Eq. (6.4-12)
shows that the increased electron return flux (second term on the right-hand
side) must be balanced by a reduced ion flux (first term on the right-hand side).
This illustrates how the design and operating conditions of the hollow cathode
(sizes, flow, and discharge current) determine which terms dominate in the
cathode self-heating.
Hollow Cathodes
265
12 24
-- Sheath Potential
10 -.. .. Ion Current
g -+- Electron Current
m
1: CD
8 16 (')
E a
:3 ::s
() ()
c !;;
.!2 6 12
;a.
CD
:m II>
1: 4 8
Q)
'0
Cl.
2 ._ ._._..._._._._._.- -.-.-...-.-.-.-. 4
-...
0 0
0 10 20 30 40 50 60 70 80
Joule Heating Power 0N!
Fig. 6-12. Sheath potential and currents to the insert as a function of
the resistive joule heating in the insert plasma.
It is also possible to estimate the axial extent of the plasma in the insert region
for Type A and some Type B cathodes with small orifices that again produce
diffusion-dominated plasmas. This is useful in understanding the plasma
"attachment" or "contact length" with the insert, which impacts where the
electron emission can take place. As was shown in Chapter 3, the solution to
the 2-D diffusion equation in cylindrical geometry is the product of a zero-order
Bessel function radially times an expone ntial term in the axial direction:
n(r,z) = n(O)J o ( C2 +ex 2 r) e- az ,
(6.4-23)
where ex is one over the e-folding distance of the plasma density from the
reference location on axis at (0,0). This length can be found by considering the
ion generation inside the insert. The ion current to the insert surface is the ion
generation rate integrated over the volume inside the insert:
Ii = 2n f: f: noneO"iverdrdz.
(6.4-24)
Taking the axial integral in Eq. (6.4-24) to be approximately the e-folding
distance (L = 1/ ex), Eq. (6.4-24) is simply
nR 2
Ii = -nOne(O"iVe).
ex
(6.4-25)
The average plasma density is found from Eq. (6.4-5):
266 Chapter 6
n= n(o,o{ 2J d ]=n(O,o{ (2; :1) ]= 0.43n(O,O). (6.4-26)
Using Eq. (6.4-26) in Eq. (6.4-25) and solving for the value of a gives
0.43nR 2
a = non(O,O)e(aiVe)' (6.4-27)
Ii
For example, the axial plasma density profile from the scanning probe inside
the NSTAR hollow cathode [31] operating at 15 A and 3.7 sccm is shown in
Fig. 6-13. Taking the peak plasma density from the figure of
n(O,O) = 1.6 x 10 21 m- 3 as the reference density at position (0,0) and using the
neutral density, calculated inside the insert from Eq. (2.7-2), of 2.5 x 10 22 m- 3 ,
Eq. (6.4-27) gives a value of a= 6.0 ifthe ion current to the insert is 0.5 A. The
fit to the exponential decrease in the plasma density upstream of the orifice
shown in Fig. 6-13 gives a= 6.1. The assumed value of 0.5 A for the ion
current actually results from a two-dimensional model of the insert plasma [5],
which will be discussed below. This simple diffusion model shows an
exponential behavior in the axial plasma density profile, predicted from
Eq. (6.4-23), which is consistent with the near-exponential profiles measured in
the NST AR cathode sufficiently far away from the orifice region.
A closer examination of Eq. (6.4-27) shows that the tenns on the right-hand
side represent the ionization rate per unit volume. If the geometry of the
2.0 x 10 15
1.8 x 10 15
1.8x10 15
'"
IE 14x1015
Co> .
1.2x10 15
'iij
5j 1.0x10 15
Q
'" 8 0 x 10 14
E .
:g 8.0 x 10 14
a::
4.0 x 10 14
2.0 x 10 14
o
1.0 0.9
0.8 0.7 0.8 0.5 0.4 0.3 0.2
Distance from Orifice Plate (em)
Fig. 6-13. Plasma density measured on axis in the insert region for an
NSTAR cathode operating at TH15.
0.1 0.0
Hollow Cathodes
267
cathode is fixed, then the number of ions flowing to the insert (Ii in the
denominator) is proportional to this ionization rate per unit volume. Therefore,
the value of alpha will be constant for varying operating conditions of a given
size of cathode. This behavior is illustrated in Fig. 6-14, where the density
profile for an NSTAR-sized cathode with two different orifice sizes operating
at the same discharge current and gas flow is shown. For the larger orifice
cathode, the internal pressure at the constant gas flow is lower, and the
penetration of the 2-D effects associated with the downstream boundary
condition and the electron current funneling into the orifice extends deeper into
the insert region. However, once the collisionality establishes a diffusion-
limited plasma flow to the insert upstream of the orifice, then Eq. (6.4-23) is
again valid and the value of alpha in the cathode is seen to be essentially
constant.
It should be noted that the e-folding distance for the plasma density measured
inside the NSTAR cathode in Fig. 6-13 is lIa= 1.7 mm. Therefore, the plasma
in the small orifice case is only in significant contact with the insert for a few
e-foldings, which is less than 1 cm. This rapid plasma density decrease away
from the orifice is the result of the very high pressure in the NST AR cathode
[5,6,] and also occurs in most neutralizer cathodes. For high-pressure cathodes
like this, utilizing inserts significantly longer than 1 to 1.5 cm in length is not
very useful because there is little plasma left beyond this distance to accept the
thermionic emission from the insert.
10 16
10 12 .
2.0 1.8
M 10 15
I
E
..!:..
. 10 14 -----------------.-
Q
m
E
II>
m
c:: 10 13
. .
1.4 1.2 1.0 0.8 0.6 0.4 0.2 0.0 -0.2
Distance from Orifice Entrance (em)
Fig. 6-14. Plasma density measured on axis in the insert region for an
NSTAR-sized cathode operating at TH15 with two different orifice sizes.
1.6
268
Chapter 6
While the O-D and one-dimensional (I-D) models described above can provide
insight into the operation of hollow cathodes, to self-consistently calculate the
plasma density in the insert region, including the effects near the cathode
orifice, requires a two-dimensional model [32]. The insert plasma energy
balance in this model can be found from the electron and ion energy equations.
The conservation of energy equations was described in Section 3.5.3 of
Chapter 3. The steady-state electron energy equation can be written
O=-V . ( - 2 Je kTe -I( VkT e L1]]; -J e' VnkT e --heU+, (6.4-28)
e erne
where J e is the electron current density in the plasma, I(is the electron thermal
conductivity given by Eq. (3.5-29), 1] is the plasma resistivity given by
Eq. (3.6-21), and U+ is the ionization potential of the neutral gas. The steady-
state ion energy equation is
( 5 kT,. V kT ) 2
0= -V. -- J . ---1..._1( --1.. +v.. V ( nkT ) +nMv. v. + Qr
2 I n I I In I '
e e
(6.4-29)
where J i is the ion current density, I(n is the thermal conductivity for neutrals,
and it is assumed that the ions and neutrals are in thermal equilibrium (Tn = T i )
in the collisional insert plasma.
The energy balance equations are used to close the system of equations
describing the plasma in the insert region. These equations also are used to
describe the self-heating mechanism characteristic of hollow cathodes due to
the particle flux and energy hitting the cathode walls. This effect will be
discussed in Sections 6.5 and 6.6 with respect to the cathode thermal models.
Writing the steady-state momentum equations from Eq. (3.5-5) for the ions and
electrons,
O=enE-V. p .-Mn [ v. ( v.-v ) +v. ( v.-v )]
I leI e Inl n'
(6.4-30)
0= -enE- V 'Pe -mn[ Vei (v e -vi )+V en (v e -v n )].
(6.4-31)
Adding these two equations, assuming that the neutrals move slowly compared
to the charged particles, and writing the result in terms of the ion and electron
fluxes gives
m V en V (nkTi +nkTe)
J i = J e - ,
M Vin(1+V) MVin(l+v)
(6.4-32)
Hollow Cathodes
269
where v = vie / Vin .
Combining Eq. (6.4-32), which is known as the generalized Ohm's law, with
the sum of the ion and electron continuity equations,
V.(Je+J;)=O,
(6.4-33)
gives the particle balance equation,
v . ( vt/J ) =v. [ V(nkTe) +Ji ( l_ vei )] ,
1] 1]ne v en + vei
(6.4-34)
where the electric field is E = -V t/J. The total resistivity in the plasma in
Eq. (6.4-34) is given by combining Eqs. (6.4-9) and (6.4-10):
_ m(v en +v e ;)
1] - 2 .
ne
(6.4-35)
These equations have been used in a full 2-D code [5] to find the plasma
density, temperature, and potential in the insert region for the NSTAR
discharge operating conditions of 12 A and 4.25 sccm. Utilizing thennionic
emission from the insert surface, described by Eq. (6.3-4), with temperatures
measured by Polk [33], and applying the proper boundary conditions, the
plasma density profile along the axis of symmetry is compared with the
laboratory measurement in Fig. 6-15. The 12-A net cathode current was found
to result from almost 32-A electron emission by the insert countered by 20 A of
plasma (thennal) electron current back to the insert and the orifice plate. The
particle balance in the insert is shown in Table 6-2, where only about one-half
ampere of the net cathode current is due to ionization of the xenon gas. This is
consistent with the previous analysis used to obtain the exponential density
scale lengths.
The 2-D code adequately describes what is happening in the cathode insert
region. For example, the numerical results in Table 6-2 capture the 2-D effects
upstream of the cathode orifice, predicting a density profile that is consistent
with the data [2] shown in Fig. 6-16. The code's predictions of the electron
temperature and plasma potential are also close to the measured values in the
emission zone, which extends less than about 0.5 cm upstream of the orifice
entrance in the NSTAR cathode. Figure 6-l6(a) shows that the plasma density
falls radially, as expected, toward the insert wall. The 2-D plasma potential
contours for this case are also shown in Fig. 6-l6(b). Good agreement with the
measurements has been achieved with this model for larger cathodes as well,
such as with the 1.5-cm-diameter NEXIS cathode [5].
270
Chapter 6
. Experiment
- Theory
Fig. 6-15. Comparison of the plasma density measured on axis in
the NSTAR-sized cathode operating at 12 A and a 4.25-sccm
xenon flow with the 2-D code predictions.
Table 6-2. Cu"ents from the 2-D cathode code
for the insert plasma of the NSTAR cathode.
Source Current (A)
Emitted Electrons 31.7
Absorbed Electrons 20.2
Absorbed Ions 0.5
Net Current 12.0
6.5 Orifice Region Plasma
Electrons are extracted from the insert plasma through the orifice into the
discharge chamber or ion beam. For cathodes with no orifice, a transition
region exists at the end of the insert and cathode tube where the neutral gas
density is sufficiently low and the flow becomes collisionless. Orificed
cathodes also have a transition region to collisionless neutral flow, which can
occur inside the orifice or slightly downstream depending on the orifice size
and the gas flow rate. Inside the orifice, the electron current density is the
highest in the entire system. In this region, classical electron scattering with the
ions and neutral gas produces resistive heating. The hot electrons then ionize a
large fraction of the xenon gas, most of which strikes the orifice wall as ions
and heats it. The amount of orifice-plasma resistance and orifice-plate heating
depends on the geometry, flow rate, and discharge current. Type A cathodes
have long, narrow orifices and high pressures, which lead to high resistivity,
Hollow Cathodes
271
IB} I I I I I I
ne/' et9(m- 3 n.OE...02 S.OE...(I2 2.SE-01 1.3E+OO 6.SE+OO 3.3E+01 1.\ E"02 \ .7E"02
0.3
0.2
0.1
....
o
-0.1
-02
-0.3
1.0 U 14 \.6 1.8 20
z(cml
(bl 0.3
EPoI(V): -3.0 -1.7 -0.5 0.8 20 3.3 4.S 5.8 7.1
-- --- --- --- 0.2
0.1
'
0]:
...(11
...(1.2
l -03
1.0 1.2 14 1.6 \.6 20
1: (em)
Fig. 6-16. Density (a) and potential (b) contours plotted for the NSTAR cathode
from the OrCa2-D code [5].
strong ion bombardment of the orifice wall, and significant local heating.
Type B cathodes tend to have smaller orifice heating unless the orifice is
relatively small and the gas flow high, both because the resistance is usually
lower than in Type A cathodes and because a larger fraction of the power
deposited in the plasma in this region convects out into the cathode plume. For
example, the l-mm-diameter orifice NST AR cathode has significant orifice
heating, but the 2.S-mm-diameter orifice NEXIS cathode has lower orifice
heating even at higher currents.
In Type A and B cathodes, the ion flow in the cylindrical region of the orifice is
diffusion limited because of the short collision mean free path for charge
exchange with the neutrals. For example, the NSTAR discharge cathode
operates at an internal pressure of about 8 torr (no"" 5 x 10 22 m -3 ) in the THIS
212
Chapter 6
mode. The mean ion mean free path for resonant CEX collisions for a cross
section of"" 10- 18 m 2 is smaller than even the orifice dimensions:
A = 1 _ 2 x 10- 5 rm] .
aCEX no
Thus, diffusion is a good approximation for the ion motion in these hollow
cathode orifices.
(6.5-1)
It is instructive to develop a O-D model of the cathode orifice plasma to show
the dependence of the plasma density, electron temperature, and voltage drop in
the orifice region. However, such a model provides only a rough estimate of
these parameters because there is a large neutral pressure gradient generated
along the orifice, whereas the model uses average parameters. It is assumed for
now that the orifice is long compared to its length so that the radial ion
diffusion equation applies. The solution to this equation for collisional plasmas
in the orifice, described above for the insert region, results in the usual
eigenvalue equation dependent on the electron temperature:
( ) 2 !!i
r 8kTe
Aol noai(T e ) nm -D=O,
(6.5-2)
where r is now the internal radius of the orifice, Aol is the first zero ofthe zero-
order Bessel function, no is the neutral density, a; is the ionization cross
section averaged over a Maxwellian electron temperature, and D is the
diffusion coefficient. The electron temperature is again constrained to produce
sufficient ions to offset the diffusion losses, as in the insert region analysis.
Equation (6.5-2) can be solved for the local electron temperature in the orifice
using the terms evaluated in Eqs. (6.4-4) through (6.4-7).
The steady-state electron energy equation [Eq. (6.4-28)] is integrated over the
cylindrical orifice, ignoring thermal conduction and radiation losses, to yield an
equation for the average plasma density in the orifice. In this case, ohmic
heating in the orifice plasma is balanced by convection of the energy deposited
in the orifice plasma electrons and ionization losses:
2 5 ( kTe kT jn ) _ ( ) + ( 2 )
Ie R ='2Ie ---;------;- +nonee aiVe U nr f ,
(6.5-3)
where f is the length of the orifice. Equation (6.5-3) can be solved for the
average plasma density in the orifice:
Hollow Cathodes
273
[2 R _:J..[ k ( T _Tin )
_ e 2 ee e e
ne = 2 .
noe(ave)U+n r R-
An evaluation of the terms in Eq. (6.5-4) for the orifice region uses the same
techniques previously described in Section 6.4 for the insert plasma region. The
resistance R is given by Eq. (6.4-9), where the conduction length is now simply
the orifice plasma length. The input electron temperature, T n, is the electron
temperature in the insert plasma that comes from the diffusion model used in
Section 6.4 or from experimental measurements.
(6.5-4)
The detailed measurements of the plasma density and temperature in the orifice
of the NST AR discharge cathode [31] will be used as a first example to
compare with the model predictions. The NST AR discharge cathode has an
orifice diameter ofO.l cm, and the case of the full-power TH15 operating point
with 13 A of discharge current at a xenon gas flow rate of 3.7 sccm will be
used. The pressure measured inside the insert region for this case is about
7.8 torr [31]. Assuming simple Poiseuille flow (see Appendix B), the pressure
in the orifice is estimated to fall to less than 3 torr by the end of the 0.75-mm-
long cylindrical section of the orifice. Assuming a gas temperature of about
2000 K in the orifice, the solution for the electron temperature in the diffusion
equation [Eq. (6.5-2)] versus pressure in the orifice is shown in Fig. 6-17. The
electron temperature predicted by this model varies by less than 1 eV along the
orifice length, and the average in the channel is about 2.3 eV. This value is
close to the experimentally measured values of 2.2 to 2.3 eV found in this
region [28].
Using this electron temperature, the density in the orifice is calculated from
Eq. (6.5-2) and plotted in Fig. 6-18 versus the discharge current for the NSTAR
cathode. The agreement with the experimental data [31] taken for two discharge
currents at the nominal 3.7-sccm cathode flow rate is also very good. The
resistance calculated from Eq. (6.4-9) for the cylindrical orifice length is
0.31 ohms, which, at 13 A, produces a voltage drop in the orifice of about 4 V.
This is the same magnitude as the voltage change observed in the experimental
data, which illustrates that the potential drop in the hollow cathode orifice is
resistive due to the very collisional plasma that exists there in these xenon
hollow cathodes. Detailed 2-D calculations, described below, indicate that
roughly half of the power deposited in this region (P = 4 V * 13 A) goes to the
orifice wall, and the remainder is convected into the discharge chamber by the
plasma.
274
Chapter 6
5.0
4.5
4.0
>
3.5
Q)
:s
3.0
Q)
2.5
t!!: 20
c: .
e
u 1.5
Q)
iIi 1.0
Orifice Cylindrical Section
Exit
Entra nce
0.5
0.0
2
456
Insert Pressure (torr)
Fig. 6-17. Orifice electron temperature calculated from the O-D model
through the orifice for the NSTAR diacharge cathode at TH15.
3
7
8
2.0 x 10 21
3.7 secm
1.5x 10 21
M
I
g
. 1 Ox 10 21
Q) .
o
ro
E
II>
ro
a:: 5.0x 10 20
o
4
8 10 12
Discharge Current (A)
Fig. 6-18. Orifice plasma density calculated from the O-D model and
measured points for the NSTAR discharge cathode at a 3.7-sccm xenon
gas flow.
6
14
16
Since the O-D orifice model with just the average parameters has been shown to
provide rough estimates of the orifice parameters, it is reasonable to use it to
examine Type A cathode orifice heating. Consider the orifice of the NST AR
neutralizer cathode [34], which has an inside diameter of 0.028 em. The
pressure measured inside the neutralizer during operation at 3.2 A, associated
Hollow Cathodes
275
with the full power TH15 case, is 145 torr. Assuming again simple Poiseuille
flow (see Appendix B) through the 3:1 aspect ratio orifice channel in this
cathode, the pressure is found to fall to less than 20 torr by the end of the
0.75-mm-long cylindrical section of the orifice. Assuming the same gas
temperature of about 2000 K in the orifice again, the solution to the radial
diffusion, Eq. (6.5-2), predicts the electron temperature to vary by only 0.5 eV
along the orifice, with an average value of about 1.4 eV. It is also assumed that
a minimal l-eV electron temperature exists in the insert region for the T;n in
Eq. (6.5-3).
The plasma density in the orifice is plotted in Fig. 6-19 versus the discharge
current. At 3.2 A, corresponding to the neutralizer cathode producing the beam
current of 1.76 A plus the keeper current of 1.5 A, the predicted plasma density
is about 6 x 10 22 m -3. The resistance calculated from Eq. (6.4-9) for the
cylindrical orifice section is 3.5 ohms, which, at 3.2 A, produces a resistive
voltage drop in the orifice of about 11 V. The power deposited in the plasma
(P = 11 V * 3.2 A = 35 W) in this case goes primarily to the orifice wall
because the convection power loss is low due to the large geometrical aspect
ratio of Type A orifices and the low electron temperature. This demonstrates
the resistivebrifice heating power characteristically found in Type A cathodes.
While O-D models are useful to illustrate the strong resistive effects in the
orifices of all Type A and some Type B cathodes, the use of average pressures
and temperatures reduces the accuracy of these models. However, it is possible
to construct a l-D model for the cathode orifice [35] to address this issue. The
1 x 10 23
9 x 10 22
8 x 10² 2 -----
'? 7x10 22
.5-
6x10 22
'u;
ffi 5x10 22
CI
4x10² 2
U>
£. 3x10 22
2 x 10 22
1 x 10 22
o
1.0 1.5
2.0 2.5 3.0
Discharge Current (A)
Fig. 6-19. Orifice plasma density calculated from the O-D model for the
NSTAR neutralizer cathode at TH15.
3.5
4.0
276
Chapter 6
orifice plate is usually chamfered on the downstream side, which must be
included in the analysis because the rapidly expanding gas plume in this region
often transitions to the collisionlesss regime in which the flow is not dominated
by diffusion.
In the orifice, continuity dictates that the ions that hit the orifice wall are re-
emitted as neutrals and re-enter the plasma. The continuity equations for the
three species (neutrals, ions, and electrons) in the cylindrically symmetric
orifice region are
2 ( an av ono )
nr --+- +2nrvwalIn=O
at az
(6.5-5)
2 ( an av;no )
nr -+- -2nrvwalIn=O
at az
nr 2 ( e an + aJ e ) = 0 ,
at az
(6.5-6)
(6.5-7)
where v is the ion or neutral velocity and vwall is the particle velocity at the
radial boundary.
The average neutral velocity is found from Poiseuille flow:
r 2 dP
v =---
° Se; dz '
(6.5-8)
where e; is the temperature-dependent neutral gas viscosity. For xenon, the
viscosity is [26]
for Tr > 1,
with units of Ns/m 2 or Pa-s and a relative temperature given by
Tr = T /289.7 K. Since a large fraction of the ions undergoes charge exchange
within the orifice, the neutral gas is heated and the viscosity is increased. This
is incorporated into the model [35] by assuming that the gas temperature varies
as
e; = 2.3 x 10- 5 TrO.965
= 2.3 x 10- 5 T 0.71 +0.29/T r )
for Tr < 1
(6.5-9)
T = Twall + [Ctvr)2 +v ].
(6.5-10)
where the fraction of the neutrals that receives the ion radial velocity via charge
exchange is given by
Hollow Cathodes
277
f = 1- ex p [ -!!... "wall ] ,
no "CEX
(6.5-11)
and "wall is the average time between collisions with the wall for a neutral
particle. This effective heating mechanism by charge exchange has been
observed in experiments where the neutral temperatures are higher than the
orifice wall temperatures.
Combining the electron and ion momentum equations [Eqs. (6.4-30) and
(6.4-31)] to eliminate the electric field term gives an expression for the particle
motion in terms of the ambipolar diffusion coefficient and the ion and electron
mobilities:
( ) an /li J e
n Vi-Vo =-D Q -+--.
az /le e
The ambipolar diffusion coefficient for this case is given by Eq. (6.4-4). In the
orifice, the radial drift velocity will often exceed the ion thermal speed due to
the radial potential gradient, so the ion scattering velocity must be
approximated by
(6.5-12)
vscat= V +(Vi-Vo)2+vr '
(6.5-13)
where v r is the radial ion velocity found from Eq. (6.4-7).
The continuity equations in the orifice [Eqs. (6.5-5) through (6.5-7)] are solved
using the electron energy equation, Eq. (6.4-28), in the cylindrical orifice,
which produces ion density and plasma potential profiles in the orifice region.
The first result from this work is that a double sheath postulated in the orifice
region [36] is not observed for xenon ion thruster cathodes. There is a potential
change through the orifice, but this results from resistive effects in the orifice
channel due to electron-ion and electron-neutral collisions.
As an example, Fig. 6-20 shows a plot of the neutral and plasma densities along
the axis of an NST AR neutralizer cathode orifice operating at the THIS power
point, producing 3.76 A of current with a xenon gas flow rate of 3.5 sccm [37].
The peak plasma density occurs in the cylindrical section of the orifice, and the
density falls though the chamfered region due to the neutral gas density
decrease. It should be noted that the peak plasma density predicted by the I-D
model in the orifice is in reasonable agreement with the O-D model results
shown above that used the average neutral density and temperature along the
length of the orifice. Reasonably accurate results can be obtained using simple
O-D models to illustrate the driving physics in this region.
218
Chapter 6
An interesting result of this analysis is that significant ionization occurs in the
orifice, which provides electrons to the discharge. Figure 6-21 shows the
electron current calculated as a function of the distance along the orifice axis.
The electron current is about 50% higher exiting the orifice as compared with
the amount extracted from the insert plasma. This is because the very high
neutral gas density in the neutralizer cathode orifice region causes significant
ionization. Discharge cathodes have much lower electron multiplication factors
in the orifice because the neutral and plasma densities are typically an order of
magnitude lower.
3 x 10 23 6 x 10 22
3 x 10 23 5 x 10 22
M "'C
I 4x10 22
.s 2 x 10 23 3
J!:- DJ
'<0 0
c 2 x 10 23 3x 10 22
OJ
0 '"
'5 1 x 10 23 2 x 10 22 3'
OJ I
Z ...!::'
5 x 10 22 1 x 10 22
o 0
-0.02 0.00 0.02 0.04 0.06 0.08 0.10 0.12 0.14
Distance Along Orifice (cm)
Fig. 6-20. Neutrel and plasma densities calculated in the NSTAR
neutralizer cathode orifice at the TH15 operation point.
3.5
3.0
2.5
C
OJ
5 2.0
(,)
e 1.5
t5
1.0
Cylindrical Region
Chamfer Region
0.5
0.0
-0.02 0.00 0.02 0.04 0.06 0.08 0.10 0.12 0.14
Distanca Along Orifice (cm)
Fig. 6-21. Electron current as a function of distance along the
axis in the NSTAR neutralizer cathode orifice at TH15.
Hollow Cathodes
279
The ion current density to the orifice wall, which naturally follows the plasma
density profile in Fig. 6-20, is shown in Fig. 6-22. The ion bombardment of the
orifice walls is seen to peak well before the chamfer region starts. Since the
plasma potential is increasing along the axis from the insert plasma to the exit
due to the plasma resistive drop, the ions in this region can have sufficient
energy to sputter the wall. This effect was observed in the cross section of the
NSTAR neutralizer after the 8200 life demonstration test (LDT) [34] and is
shown in Fig. 6-23. The orifice was observed to open up in the center
2.5x 10 6
N
E
2.0x 10 6
S 1.5x 10 6
'US
1.0 x 10 6
o
Chamfer Ragion
'E
CI>
15 5.0 x 10 5
U
c
.Q
Cylindrical Region
o
0.00 0.02
0.04 0.06 0.08 0.10
Distance Along Orifice (cm)
Fig. 6-22. Radial ion current to the orifice wall as a function of
distance along the axis in the NSTAR neutralizer cathode at TH15.
0.12 0.14
. .'
-f
.
,
.
..
Fig. 6-23. Neutralizer cathode orifice cross section
showing the erosion pattern after the NSTAR 8200-hour
test [34].
280
Chapter 6
cylindrical region before the chamfer, consistent with the predicted lOn
bombardment location in Fig. 6-22.
The time required to produce this erosion pattern is not known since Fig. 6-23
shows a destructive analysis after the end of the test. In fact, the erosion pattern
shown in the destructive analysis of the neutralizer cathode orifice after the
30,000-hour extended life test (EL T) [38] shown in Fig. 6-24 is nearly identical
to the shorter-duration LDT result. The EL T cathode experienced nearly double
the operation time of the LDT cathode at the full-power level, which did not
further erode the orifice. The I-D orifice model described above finds that the
larger-diameter orifice reduced the neutral pressure and plasma density in the
orifice by about a factor of four, which reduced the plasma potential increase
along the orifice by a factor of two. The combination of a significantly lower
ion bombardment flux, the lower ion energy, and the increase in inner surface
area as the cylinder radius increases caused the erosion rate to fall to negligible
levels 0nce the orifice opened sufficiently.
One might expect similar erosion behavior from discharge cathode orifices.
Figure 6-25 shows the destructive analysis of the LDT discharge cathode
orifice plate after 8200 hours at full power. There is no discernable erosion in
the cross section. In this case, the I-D model shows that the much larger initial
orifice diameter reduced the neutral pressure, plasma density, and potential in
the orifice to the point that the ion bombardment erosion became negligible
(similar to the eroded neutralizer cathode orifice case). In addition, the model
shows that electron multiplication is reduced due to the lower ionization rate,
and so the insert plasma must produce more of the discharge current than in
neutralizer cathodes. It is clear that a simple orifice-plasma model can illustrate
.., -
..- -
. ....
..
-"
--
--
.
......
...
Fig. 6-24. Neutralizer cathode orifice cross
section showing the erosion pattern after
the NSTAR 30,152-hour extended life test
[38].
Hollow Cathodes
281
.... - -
-
.. -
..
r "
..
I , .
...
}
,
-.
+. . .
, 0-.
Fig. 6-25. Discharge cathode orifice showing
the erosion pattern after the NSTAR 8200-hour
long duration test [34].
the extraction and generation of the electrons in the discharge through the
orifice and provide insight into the erosion mechanisms.
6.6 Hollow Cathode Thermal Models
While the O-D insert model described above is illustrative, more accurate
models have been constructed that use radiation and thennal conduction models
coupled to 2-D insert plasma models [2] that provide the local heat fluxes.
Figure 6-26 shows a sample input geometry for a 2-D cathode thennal code
[30) in r-z coordinates that uses the ion and electron fluxes from the 2-D
plasma codes as input to predict the temperature distribution in the cathode. In
this figure, the positive numbers identify different materials, and negative
numbers are used to identify radiative boundary conditions. The code includes
thennal conduction, radiative heat losses, and, within the insert region, radiative
heat transfer. The thennal model uses heat flux inputs calculated from the 2-D
IROrCa2D plasma code [5] and includes the heating of the cathode tube and
insert due to power deposition in the orifice region. Results from this code are
close to the O-D model results just described for the NSTAR cathode, but with
much more accuracy and spatial resolution of the electron emission and plasma
bombardment locations. Table 6-3 shows the input fluxes used in the 2-D
thennal model. The plasma heating calculated by the detailed 2-D code is about
50% greater than the simple O-D model above predicts, and most of the heat is
deposited on the orifice plate.
As an example of the results from a coupled thermal and cathode plasma
model, Fig. 6-27 shows the code predictions [30] and measured temperatures
[33] of the insert for the NSTAR cathode running at 12 A of discharge current.
The 2-D code predicts an insert temperature of about 121O"C in the first few
282
Chapter 6
4.Q.;i..t-2"' -2" 4-ii'.iI".:Hi-.2- . - .:2 -.l
.:i! .; 2" ... ::! ;:! ;;0- :i: ::-! .I. .J. 't l. ;It .2 :i:' :iI! -== .i/ 2 :2 ;Z -2
':! "JlIII" "'''''''4 III 4 lit..... III 44011I 4-4.t III 41.-2
.;i '" .. oil .4 oiII 4 oil 4; -4 oil .. . ill .t oil oil ... .. .. 4. .. oil .. :2-2'
-I: .il ill III 4 4 4 4 4 '" JI II 4 .. ill 4 4 oil. 4 4 " " " 4 ... 2 .Ii
-:i!;ill" &"'''Jl4 oIIIJl04"'''' "." ....11 "011I4 404
_ .. oil oil .4; .4; .4 .( " .t oil '" .4; oil .4 4 .c. .t oil .. 41 oil oil .. .Q
- ,,4....IIII...".....JI...oiI.oII4..4...oIIIlIL..II,.44
:.... 44.41 4 4 4J11" 4011.011I4 4 4.4.11I4.. 4" 4 oil :i!oJ
2"" II. ... III II .. ... .. <II 'II <III . oil III oiL '" .4 oil ... III III ... oil .
4 4 4 44 44 4 4 4 4 .4..".4"" 4J144 oIII"44J144"
412 rl:2 l.i/ i!'i!'.2:i 2'2:Z:Z 2"22i1 iP:2.z :i! il:22.i1 i!'2.i! 2 2" .2 i!:2 .i! 2 :'::22:!'2lll2l.2"i!'a.
.f 2' 2'll'l :i' t2'l .lt 1 .!'e-<!lZI "'''' ''
!!i I!o !!i 50 I
1 \ 1 , 1 , , 11 , , I . , , . , , , ... . , 1 1 t
, , , , , , , , , , ' , ' , . , , , . , ' , ., 'i'
Fig. 6-26. Hollow cathode thermal model input geometry with the different types of
cells numbered and the boundary conditions indicated by numbers. Negative
numbers indicate radietive boundaries [30].
10 15
Distance Along Insert (mm)
Fig. 6-27. Comparison of the insert temperatures measured [33]
end calculated for the NST AR cathode by the 2-D coupled
thermal/plasma model of Katz [30].
1250
1200
u
C>
1150
2!
;j
ii 1100
E
1050 .
't:
-
-= 1000".
950
o
- Thermal Model
5
20
25
Table 6-3. Insert surface and orifice plate heating calculated using the
IROrCa2D code for the NSTAR discharge cathode at 12 A and 3.5 seem.
Element Heated
Power (W)
12
29
Insert Surface
Orifice Plate
millimeters from the orifice plate where the plasma is in good contact with the
insert. The thermal model predicts a peak temperature of about 1190.C for the
heat loads from a predicted plasma contact area of 5 mm by the plasma code.
The 2-D codes also show the sensitivity of the hollow cathode temperature to
the emissivity of the orifice plate, the thermal contact between the emitter and
Hollow Cathodes
283
the tube, and orifice heating effects (especially in neutralizer cathodes), which
impact the performance and life of the cathode. These effects cannot be
obtained from the simple O-D models used above.
6.7 Cathode Plume-Region Plasma
The cathode insert and orifice regions were examined above with simplified
models, and this information was used to provide an understanding of the
plasma parameter dependence and self-heating mechanism of the cathode. The
final region of the hollow cathode to cover is exterior to the cathode orifice
where the cathode plume interacts with the keeper electrode and couples the
cathode emission current to the thruster discharge plasma and anode. In this
region, the neutral gas expands rapidly away from the cathode and is either
collisionless or makes the transition to collisionless. The electrons from the
cathode are accelerated by the potential difference between the cathode orifice
plasma and the plasma in the discharge chamber that is at a potential usually
near the anode voltage. There is usually an applied axial magnetic field on the
order of 100 G in this region to provide a transition to the ring-cusp fields in ion
thrusters, which produces some confinement of the cathode plume electrons.
These electrons generate the cathode plume plasma, which is also rapidly
expanding away from the cathode.
The plasma stream exiting the hollow cathode is often reported as having
various structures consisting of dark spaces, plasma balls, and brightly
divergent plume shapes. Two of these cases are shown in Fig. 6-28, where the
cathode is on the right and the anode on the left. The plasma stream consists of
the electrons from the hollow cathode, neutral gas expanding from the keeper
aperture in addition to more uniform background neutral gas from the thruster,
and the plasma ball and stream generated by ionization of this gas by the
electrons. The on-axis potential and temperature profiles measured by scanning
probes for these two cases [1] are shown in Fig. 6-29. While the discharge
current is the same in these two cases, the high gas flow reduced the discharge
voltage from about 26 Vat 5.5 sccm to 20 V at 10 sccm. The structure of the
potential and temperature profiles is significantly different in the plume region
as the gas flow and discharge voltage change. The higher gas flow case reduces
the potentials and temperatures throughout the system and pushes the plasma
ball observed at the cathode exit farther downstream.
To provide some insight into the plasma density, temperature, and potential
profiles generated in this plume, a simple I-D model [39] will be used to
examine the plume physics. A full 2-D cathode plume code for the neutral gas
and plasma is discussed later in this section to more accurately predict the
cathode discharge behavior. The I-D plasma model follows the same general
284
Chapter 6
Fig. 6-28. NEXIS eathode plume at 25 A with the plasma ball in (a) at 5.5 seem and a
dark spaee in (b) at high flow (10 seem) [1].
35
Anode Probe
30
e-
ll>
:; 25
iO
20
E
o 15
]3 10
'0
a.
5
3
Plasma Potential
Cathode Probe
o
-7
-5 -4 -3 -2 -1 0 1 2
Position Relative to Orifice Entrance (em)
Fig. 6-29. Plasma potential and electron temperature
profiles for the two eases in Fig. 6-27, where the elosed
symbols are the 5.5-seem, 26.5-V ease and the open
symbols are the 10-seem, 19-V ease [1].
structure as that used for the orifice region in Section 6.5, but in this case the
neutral gas is expanding and the gas and plasma flows are largely collisionless.
The steady-state continuity equation is
em
O=V.(DaVn)+-,
dt
(6.7-1)
Hollow Cathodes
285
where the diffusion is ambipolar with a diffusion coefficient given by
Eq. (6.4-4). Using the electron momentum equation, Eq. (6.4-31), the electron
current density on axis in the plume is given by
Je=*(E+ V:Te ). (6.7-2)
where the resistIvity 1] for the case of electron-neutral and electron-ion
collisions in the partially ionized gas is given by Eq. (6.4-35).
The electron energy equation is given by Eq. (6.4-28) and includes convection,
conduction, joule heating, pressure work, and ionization losses. Axial depletion
of the neutral gas by ionization can be taken into account using a simple
exponential attenuation model. The ionization rate of the neutral gas density is
d no _ ( )
---none (Jive'
dt
(6.7-3)
where no is the total neutral density in the plume. The neutral density is
composed of the flowing component, n f ' from the cathode and the background
neutral density in the chamber, nc:
no = nf(z)+n c '
(6.7-4)
The density of the flow gas decreases with distance away from the cathode
orifice:
dnfCz) _ 1 dnf _ 1 ( dn o dnc )
dz V o ----;[t - vo dt-dt '
where V o is the neutral gas velocity. Using Eq. C6.7-3), Eq. C6.7-5) can be
written as
C6.7-5)
d nfCz) _ _ 2-n ( a. v )
e Ie'
nfCz) dz V o
which has a solution of the flow density decreasing exponentially away from
the cathode. This is the same as the case analyzed in Section 3.6, in which the
ionization mean free path is found to be one over the right-hand side of
Eq. C6.7-6).
(6.7-6)
The above equations (Eqs. (6.7-1) through (6.7-6)] are solved in a simple
computational mesh shown in Fig. 6-30. The neutral gas is assumed to expand
with a full angle of 45 deg. The code has been used to solve for the NEXIS
286
Chapter 6
cathode density and potential profiles at the standard operating condition of
25-A and 5.5-sccm xenon gas flow. The density profile is shown in Fig. 6-31,
where the agreement between the I-D model and the data is reasonably close.
The plasma potential and electron temperature profiles are shown in Fig. 6-32,
where the agreement is reasonably good. Of interest is the fact that the electron
Mach number (electron drift velocity divided by the thennal velocity) is well
below 1, indicating that double layers and streaming instabilities are not
expected for this case. The visual observation of the cathode plume with a
rf 10 19
g
'"
<:
I>
o
II!
E
:.g 10 18
a::
Uniform Background of Neutrals
Cathode
Keeper
....
e-, Xe, Xe+
Z"O
z = max
Fig. 6-30. Computational region for the 1-0 cathode plume model [39].
10 20
\
"
- Data
- Model
--....-
Keeper
10 17
0.00
0.01 0.02 0.03 0.04
Distance from OrifICe Entrance (m)
Fig. 6-31. Density profile from the 1-0 model and the axial probe data for
the NEXIS cathode plume plasma density at 25 A and 5.5 seem [39].
0.05
Hollow Cathodes
287
35
30
25
1--"
20
:m
'E
.& 15
£
11;I
E
In 10
11;I
c:
5
--- Potential Data
- Potential -D Model
-"I- Te Daw
- Te 1-D Model
Electron Dr1f1
c."
.
::t..
-"
to
3
o 0
0.00 0.01 0.02 0.03 0.04 0.05
Distance from Orifice Entrance (m)
Fig. 6-32. Potential and temperature profiles from the 1-D model and the axial
probe data from the NEXIS cathode at 25 A and 5.5 seem [39].
bright, well defined "plasma ball" shown in Fig. 6-28 might suggest potential or
density discontinuities, but this is not the case. The fact that the plasma density
is falling exponentially away from the keeper, and that the neutral gas density
falls as the inverse distance from the cathode squared as well, suggests that the
boundaries of the ball are just the manifestation of a rapidly decreasing
excitation rate and the visual integration of transverse chords through this 3-D
region by the eye.
The plasma potential and electron temperature profiles for the case of the
NEXIS cathode at 25 A with a higher gas flow (10 sccm) are shown in
Fig. 6-33. In this case, close to the keeper, the potential and temperature
predicted by the model do not agree well with the data, and the photograph in
Fig. 6-28(b) suggests a dark space in this region of very low electron
temperature that is not captured by the I-D model. However, the potential
discontinuity or jump observed in the experimental data for this case at about
I cm from the keeper exit corresponds to an electron temperature increase and
higher plasma potentials. In the lower temperature region upstream of this
potential jump, the model indicates that the electron Mach number is
approaching 1, which suggests the generation of a double layer or plasma
instabilities that accelerate the electrons and heat the plasma.
Double layers can be formed in regions where the plasma potential changes
rapidly between two relative low-field regions. Double layer formation was
originally analyzed by Langmuir [40] and was described in Chapter 3. Across
288
Chapter 6
30
25
__ Potential Data
- Potential 1-D Model
........ Te Data
- Te '-D Model
Electrnn Drift
£:.
::!
't...
co
3
51!.
>
.!!!-
f-'" 20
15
m
£
o
n.
"'
a::
5
____ ......I'
--------
o
000
0.01
0.02
0.03
0.04
o
0.05
Distance from Orifice Entrance (m)
Fig. 6-33. Potential and temperature profiles from the 1-D cathode plume
model and the axial probe data for the NEXIS cathode at 25 A and 10
sccm [39].
the double layer, the ion and electron charge densities integrate to zero. The
relationship between the ion and electron currents flowing across the layer is
given by
J e = k Ji'
where k is a constant that is about 0.5 for Te / T i == 10. The double layer forms if
the electron drift speed exceeds the electron thennal speed. This can occur if
the ionization rate in the plume along the current path drops and there is
insufficient plasma generated to support the discharge current. In this case, the
double layer accelerates the electrons to higher energies, which increases the
ionization rate.
(6.7-7)
The axial location of a double layer can be found by finding the location along
the cathode plume where Eq. (6.7-7) is satisfied. Assuming that the neutral gas
expands at a fixed cone angle, the tangent of which is the half angle a, the
neutral density along the plume is
Qgas
no(z) = 2 .
v o 1t'{r+az)
(6.7-8)
Hollow Cathodes
289
If the ions are generated by the accelerated electrons within about one local
radius downstream of the double-layer flow back through the double layer, the
ion current is
f z+ro+az
Ii == Ie z aino(z)dz.
Substituting Eq. (6.7-8) into Eq. (6.7-9) and integrating, the ion current through
the sheath is
(6.7-9)
I. =1 Qgasai 1 1
I e von (ro + az) (1 + a) .
(6.7-10)
Defining the "Langmuir ratio" from Eq. (6.7-7) as
RL= e ,
a stable double layer will form in the location where R L equals one. Using
Eq. (6.7-10), the Langmuir ratio is
R L _ _ 2Qgasai 1 1
(6.7-12)
von m (ro + az) (1 + a) .
(6.7-11)
In the cathode plume, Eq. (6.7-12) indicates that the Langmuir ratio decreases
monotonically with distance from the cathode. Alternatively, the axial location
where the Langmuir condition equals 1 can be found to identify the location of
the double layer. This is shown in Fig. 6-34 where the flow rate at which
R L = 1 is plotted versus distance from the cathode orifice. At flow rates of
10 seem, Fig. 6-34 suggests that a double layer will form over I-em
downstream from the cathode, consistent with the data shown in Fig. 6-33. The
general behavior of the double-layer location moving axially downstream with
increasing gas flow has been reported [1] by both visual observations and by
probe measurements.
The cathode plume is much more complicated than this simple I-D model
suggests, and the condition of increasing electron-Mach numbers predicted
under certain situations by the I-D code may generate double layers or
instabilities in the plasma not well described by the fluid codes. The assumed
neutral gas expansion behavior and the associated electron current density in
the plume were fortuitously picked to give potential and density profiles that
came close to matching the experimental data. In reality, the neutral gas likely
expands more rapidly than the 45-deg cone assumed in the I-D model. The low
290
Chapter 6
9
8
7
6 - Keeper.
!!l
II>
li 5
4
u::
g 3
s:;
4>
X 2
1,L
o
0.0
I I
0.2 0.3 0.4 0.5 0.6 0.7
Distance from Orifice Exit (cm)
Fig. 6-34. Flow rate at which the Langmuir ratio is equal to one and double layars
can be formed as a function of the distance downstream from the NEXIS cathode
orifice [39].
0.1
0.8
0.9
1.0
electron temperature obtained from classical resistivity, with the low neutral
density in the plume, produce insufficient ionization to generate the required
plasma density to match the experimental data and carry the current to the
anode. This situation leads to the increase in the local electron Mach number
and the possible generation of double layers described above or to plasma
instabilities that increase the resistivity anomalously and heat the electrons to
produce more ionization.
A full 2-D model of the cathode plume is under development at the Jet
Propulsion Laboratory (JPL) to investigate these issues [41]. The OrCa2D code
uses a 2-D neutral gas fluid code in the insert and cylindrical orifice regions and
then transitions to a collisionless neutral gas model from the orifice chamfer
region into the plume. This provides the correct neutral gas density profile in
the cathode plume region high numerical accuracy. The 2-D plume code then
extends the system of equations used in the 2-D orifice model previously
described in Section 6.4 [Eqs. (6.4-28) through (6.4-35)] on an adaptive mesh
to provide the resolution required near the keeper and minimize the
computational time. In solving the above equations, the code also addresses the
onset of instabilities as the Mach number approaches one that produces
anomalous resistivity and electron heating. For example, Fig. 6-35 shows the
plasma density profile calculated by the code for the NEXIS cathode operating
at the nominal 25 A and 5.5 sccm for the case of classical and anomalous
resistivity in the cathode plume. The use of the classical resistivity given in
Eq. (6.4-35) results in a low electron temperature in the plume region and
insufficient ionization to match the experimental plasma density profile.
Hollow Cathodes
291
102 1
:.-- Orifice Entrance
I
M 102°
I
.s
'iij
ijj 10 19
Q
1\1
E
'"
1\1
is: 1 018
Experiment
Theory - Classical
Theory - Anomelous
----
--
10 17
3.5
6.5 7.5 8.5.
z(cm)
Fig. 6-35. Plasma density profile on axis for the NEXIS cathode showing
that an anomalous resistivity is required to provide sufficient ionization
to come close to matching the experimental data [41].
4.5
5.5
9.5
10.5 11.5
Incorporating anomalous resistivity associated with the generation of ion
acoustic instabilities in the cathode plume provides higher electron
temperatures and more ionization in the plume, which better matches the
measured profiles. Additional work is required to complete this model, but as
the model development progresses, a clearer picture of the cathode plume
physics will result.
The 2-D structure of the cathode plume as it expands from the cathode orifice
has been investigated by several authors [28,31,42). Figure 6-36 shows plasma
density contours measured [43) with a fast scanning Langmuir probe. The
density is the highest on axis and closest to the cathode orifice, which is
consistent with the visual appearance of a bright cathode ball or spot at the
cathode exit that expands both radially and axially into the discharge chamber
[28). A reduction in cathode gas flow causes the ball or spot to pull back toward
the cathode orifice and the plasma to expand into what is called a plume mode
[44,45). Plume mode operation generally results in high-frequency oscillations
in the cathode plume that propagate into the discharge chamber and keeper
region, and can couple to the power supply leads if of sufficient amplitude. The
plasma potential contours measured in this case by the probe are shown in
Fig. 6-37. The potential is actually a minimum on axis near the cathode, and
then increases radially and axially away from the cathode exit to a value several
volts in excess of the discharge voltage [28,43). This structure near the cathode
is sometimes called the trough because ions generated externally to the cathode
tend to funnel into the trough and toward the cathode. Large amplitude plasma
292
Chapter 6
1.5
E
.s
II> 1.0
<::
:::; Plasma Density
...
II>
<: 1.14211 X 10 13
II>
U 0.5 1.02632X10 13
910526 X 10 12
II> 7.94737 X 10 12
II>
Jw:: 6.76947 X 10 12
.£ 0.0
II> S.631SBX 10 12
.'" 4.4736BX 10 12
'"
"iiJ 3.31579 X 10 12
(t -Q.S 2.15789 X 10 12
I::
1 X 10 12
'"
&.
_ -1.0
'"
i5
'"
0:
-1.5
I
1 5 1.0 0.5 0 0
Axial Position Relative to Keeper Exit (em)
Fig. 6-36. Plasma density contours messured for the NEXIS cathode st
the nominal 25-A and 5.5-sccm gas flow discharge condition [43].
potential oscillations in the range of 50-1000 kHz have been observed
primarily in and around the edge of the plasma ball and in front of the keeper
electrode from high-speed scanning emissive probes [46]. These may be the
result of the increased Mach number and instabilities described above under
certain conditions.
6.8 Hollow Cathode Life
Cathode insert life is fundamentally determined either by depletion of the BaO
emissive mix impregnated into the dispenser cathodes so that the surface work
function is degraded or by evaporation of the emissive material in refractory
metal cathodes, such as tungsten and tantalum, and in crystalline cathodes, such
as LaB6. The cathode mechanical structure (orifice plate, heater, cathode tube,
etc.) also can be worn out or degraded by ion-induced sputtering, which affects
the cathode life. The impact on the cathode performance by these two life-
limiting fundamental mechanisms is important to understand in designing
cathodes for ion and Hall Thrusters. In addition, poisoning of inserts due to
impurities in the feed gas or improper exposure to air also can increase the
work function and impact cathode life.
Hollow Cathodes
293
1S
E
2-
'I> 10
'=
u 05
Plasma Polentlal
'I>
'"
)I<:
.8 00
OJ
.2:
Iii
"'
-OS
.g
.iii
o
Co.
ro -1 0
-6
0::
26
249286
238571
22 7857
21.7143
20.6429
195714
18.5
17 4286
163571
152857
142143
131429
12.0714
11
-15
15 10 OS 00
A"lal Posnlon Relallve to Keeper E"il (em)
Fig. 6.37. Plasma potential contours maasured for the NEXIS cathode at
the nominal 25.A, 5.5-sscm discharge condition [43].
6.8.1 Dispenser Cathodes in Insert Plasmas
In dispenser cathodes, evaporation of the barium layer coating the cathode
surface is well understood, and depletion life models can be readily constructed
if this is the root cause of barium loss [47]. However, the emitter surface is
exposed to a plasma, and ion bombardment of the surface by ions from the
insert-region plasma can increase the loss of barium from the surface, which
will reduce the lifetime of the cathode. While the basic concept of a hollow
cathode is to reduce the erosion and modification of the low work-function
insert surface with a high-pressure, collisional insert plasma, this benefit had to
be validated before the cathode life could be predicted [47].
An experimental and theoretical study of enhanced barium evaporation from
dispenser cathode surfaces was undertaken [48] to detennine the plasma
conditions in the insen region under which an evaporation model could be
used. The experimental arrangement measured the barium evaporation from a
Type S 4: 1: I-impregnated porous tungsten cathode with an embedded heater
during xenon plasma bombardment. The cathode could be biased negatively
relative to the plasma in order to control the ion bombardment energy. The
barium evaporation rate was measured by a fiber optic coupled to a visible
wavelength spectrometer tuned to detect the emission intensity of the Ba-I line
294
Chapter 6
at 553.5 nm excited in the plasma. Since the emission intensity depends on the
amount of Ba present in the plasma and the electron density and temperature,
the plasma parameters were monitored with a probe and the Ba-I signal was
normalized to a neutral xenon line to account for any variations in plasma
parameters during the measurements.
Figure 6-38 shows the barium loss rate measured at 725.C versus the ion
bombardment energy. Increasing the ion bombardment energy from 10 to
30 eV increases the barium loss rate by an order of magnitude. Figure 6-39
shows the barium loss rate as a function of temperature for two cathode bias
energies. For the case of the cathode floating relative to the plasma, the ion
bombardment energy is only a few e V and the barium loss rate is determined
solely by thermal evaporation. For a bias energy of 15 eV, the barium loss rate
is found to be the same as for thermal evaporation for cathode temperatures in
excess of about 800.C. Since the hollow cathodes in most thrusters operate at
insert temperatures in excess of 1000.C, these data show that the barium loss
rate is determined by thermal evaporation rates.
A model of the enhancement of barium evaporation for a surface under
energetic ion bombardment was developed by Doerner, et al. [49] to explain
this behavior. At elevated surface temperatures, two classes of surface particles
must be considered at the surface: (a) those particles that are bound to the
material lattice structure (denoted here as "lattice atoms") and (b) atoms that
have been liberated from the lattice structure, but which are still bound to the
10
::i
.!i
Q)
tiS
a:
'"
'"
o
...J
E
.2
tis
Ie
0.1
o
20 30
Bias Voltage (V)
Fig. 6-38. Variation of barium loss rate from the
cathode surface at 72S'C with cathode bias voltage
(redrawn from [48]).
10
40
50
Hollow Cathodes
295
10
! ; I
i ' i
t
2 2
! C Sample Bies = -15 V
. Sample Floeting
(Evaporation)
!
1.0
::::I
Q)
iU
c::
'" 0.1
'"
0
..J
E
::::I
.
co 0.01
0.001
600
700 800 900
Surface Tempereture (deg C)
Fig. 6.39. Relative Ba concentration in Xe plasma for
two bias conditions (redrawn from [48]).
material surface with a reduced binding energy (denoted here as "adatoms").
Both species can sublimate from the material surface if an atom receives
enough kinetic energy from random collisions to break free from the surface;
however, because the binding energy for the two species is different, the
corresponding loss rate also will be different.
The net flux of material from the surface can be written as
_ (-Eo IT) Yad J i
J T - JiY ps + Kono exp + ( ( E IT ) ) '
1 + A exp efr
(6.8-1)
where J i is the plasma ion flux, Y ad is the adatom production yield from the
incident ion flux, Y ps is the sputtered particle yield, and Y ad J i is equal to the
adatom loss rate due to both sublimation and recombination. The first term in
Eq. (6.8-1) describes physical sputtering of lattice atoms (which is independent
of surface temperature); the second term describes the thermal sublimation of
lattice atoms, which is independent of ion flux; and the third term describes the
losses due to adatom production and subsequent sublimation, which depends
upon both the incident ion flux and the surface temperature. For Xe ions
incident on BaO at 30 eV, Y ps = 0.02, A = 2 X 10- 9 , and
Y ad "" 400 .
Y ps
(6.8-2)
296
Chapter 6
These parameters can be used to model the expected net flux of Ba from a
surface under bombardment with 30-e V Xe ions for various surface
temperatures. The result of this model is compared with experimental
measurements of Ba emissivity under these conditions in Fig. 6-40. The model
compares extremely well with the experimental results. The model also
qualitatively explains the key experimental observations, including the effect of
ion energy on net erosion, the saturation of the adatom loss tenn at elevated
temperatures, and the transition to losses dominated by thennal sublimation of
lattice atoms at elevated temperatures. The model has been used to examine the
effect of increasing the ion flux to the surface from the values in these
experiments to the actual values for the hollow cathodes found from the 2-D
plasma model. In this case, the model predicts that thennal evaporation
dominates the barium loss rate for ion energies of less than 15 eV and cathode
temperatures of over 900°C. The model provides confidence that the barium
loss rate effects in the plasma are understood and that the main result of barium
loss detennined by thennal evaporation rates for the plasma parameters of
thruster cathodes examined here is accurate.
6.8.2 Cathode Insert Temperature
Since the barium evaporation rate for the plasma conditions found in the hollow
cathodes is detennined by the insert surface temperature, a non-contact
temperature measurement technique was developed at IPL [50] to directly
measure the insert temperature during cathode operation. The technique
1.0
;:j
0.1
CJ)
ro
c:::
If)
If)
0
....J
E
:J 0.01
.
CD
r?' ....
i
iii
i
ijI
.
[J [] Measured Sa
.
[J Loss Rate
. Adatom Model
.
i . [J
0.001
400 600 800 1000
Surface Temperature (deg C)
Fig. 6-40. Sa concentration versus cathode surface
temperature for -15 V bias. Experimental data are
shown by open squares and the model prediction
are shown by the diamonds (from [48]).
Hollow Cathodes
297
employs a stepper-motor-driven sapphire fiber-optic probe that is scanned
along the insert inside diameter and collects the light radiated by the insert
surface. Ratio pyrometry is used to determine the axial temperature profile of
the insert from the fiber-optic probe data. Thermocouples attached on the
outside of the cathode on the orifice plate provide additional temperature data
during operation and are used to calibrate the pyrometer system in situ with a
small oven inserted over the cathode to equilibrate the temperature.
Figure 6-41 shows temperature profiles measured for a nominal Space Station
eontactor (SSC) cathode [50) operating at four different discharge currents.
The peak temperature of the insert at the full l2-A current level is about
1200.e. The insert also has approximately a 10% to 15% temperature gradient
along its length. The change in the insert temperature with the xenon flow rate
for the cathode producing 12 A of discharge current is shown in Fig. 6-42. High
flow rates through the cathode reduce the insert temperature, although the effect
is small.
A direct comparison of the insert temperature profile for the NST AR discharge
cathode and the sse cathode at identical discharge currents of 12 A and xenon
flow rates of 6 sccm is shown in Fig. 6-43. The NSTAR insert temperature is
higher than the sse all along the insert. It also appears that the temperatures of
the inserts tend to converge near the orifice plate. The high insert temperature
for the NST AR cathode is likely because the plasma contact area is
significantly larger at the roughly 50% lower internal pressure as compared
with the SSe. In addition, thermocouple measurements on the orifice plate
show that the smaller-diameter sse orifice plate is significantly hotter than the
NST AR orifice plate, consistent with orifice heating effects described in
Section 6.5 for smaller orifice diameters.
1250 I
G' 1200 I:
g> 1150
:Eo g
2:' 1100 B
.a
1050 E
w
E 1000
Q; 950
'"
..E
900
t::
co
'"
..E
Thermocouple Readings"
g
B
c
'E
w
o
'0
"[]
c
w
E
ft!
e
'iij
c
o
Q
850
10 15
Axial Position (mm)
Fig. 6-41. Insert temperature profile measured for e SSC hollow cathode for several
different discharge currents (from [50]).
o
5
20
10 15
Position Along Insert (mm)
Fig. 6.42. Insert temperature profile for an SSC hollow cathode
operating at 12 A of current for several different gas flow rates
(redrawn from [50]).
298
1200
G 1150
1100
.2
!!?
g 1050
....
1::
CI)
II>
.E 1000
Chapter 6
- 5.5 seem
- 6 seem
- 8 seem
-10 seem
950
o
5
20
25
1250
1300
12 A, 6 seem
c;, 1200
CI)
't)
'i 1150 -
:::I
1 1100
E 1050
1::
3: 1 000
.E
900
o
5 10 15 20
Axial Position Along Insert (mm)
Fig. 6-43. Comparison of the Insert temperature profile for the
Space Station Contactor cathode and the NSTAR discharge
cathode at 12 A (from [33]).
25
6.8.3 Barium Depletion Model
The previous sections showed that the barium loss rate from hollow cathode
dispenser cathode inserts should be essentially the same as dispenser cathode
inserts operated in vacuum if the ion bombardment energy is sufficiently low in
the hollow cathode. Since plasma potentials on axis in the insert plasma of less
than 15 V are routinely measured [1,28] and sheath potentials ofless than 10 V
Hollow Cathodes
299
are found from the models discussed above, the insert life will be limited by
evaporation in the same manner as in vacuum devices.
Published measurements by Palleul and Shroff [51] of the depth of barium
depletion in dispenser cathodes as a function of time and temperature show that
barium depletion obeys a simple diffusion law with an Arrhenius dependence
on temperature. This is shown in Fig. 6-44 (from [51]), where the impregnate
surface layer in the pore recedes with time. The "activation energy" in the
diffusion coefficient that detennines the slope of the curves in Fig. 6-44 appears
to be relatively independent of the cathode type.
From data presented in Fig. 6-44, the operating time to deplete impregnate from
the insert material to a depth of 100 Jlm is
e Va 2.8244e
In'l'lOOllm =-+C j = 15.488,
,... kT kT
(6.8-3)
where the operating time 'l'IOOpm is in hours, e is the elementary charge, Va is
the activation energy, k is Boltzmann's constant, Cj is a fit coefficient, and Tis
the insert temperature in kelvins. The activation energy was found from
Fig. 6-44. Using this relationship and the fact that the depletion depth is
10 3
E 10 2
::1.
.r:
C.
Q)
o
"C
Q)
Q;
c.
10 1
......
,.,."
...... ;e
......... oo\.
...... (e
I......... so..>J
............1
I
I
I
OS-Type Cathode 1035.C e
. S- Type Cathode 1230 .C e
1). S- Type Cathode 1050 .C e
. S- Type Cathode 1250 .C e
10 2
10 3
10 4
10 5
Time (hr)
Fig. 6-44. Depletion depth of a porous tungsten insert
as a function of time for cathodes at different
temperatures (redrawn from [51]).
300
Chapter 6
proportional to the square root of the operating time [51], an equation yielding
the insert lifetime due to barium depletion can be derived [47]:
'l'life = 'l'lOO,urn ( Y ) 2 ,
Yl OO,urn
(6.8-4)
where 'l'lOO,urn is the time to deplete to 1?0 /..lm in depth from Eq. (6.8-3), Y is
the insert thickness in /..lm, and YIOO,urn is the 100-/..lm reference depth. Using
Eq. (6.8-3) in Eq. (6.8-4), the life of a Type S dispenser cathode in hours is
-4 2 ( 2. 8244e )
'l'life = 10 y exp kT 15.488, (6.8-5)
where Y is the insert thickness in /..lm and T is the insert temperature in kelvins.
Figure 6-45 shows the insert life for a l-mm depletion depth versus the insert
temperature. Insert life of over 100,000 hours is readily achievable if the insert
is thick enough. At around a nominal 1l00.C operating temperature, the life
increases a factor of2 if the temperature decreases 40.C.
This model represents a worst-case estimate of the cathode life. In very high-
density hollow cathodes, like the NST AR cathode. the ionization mean free
path for the evaporated barium is significantly less than the insert plasma
radius. This means that a large fraction of the barium is ionized close to the
insert surface. The electric field in this region is primarily radial, which means
that some large fraction of the barium is recycled back to the surface. The
barium surface coverage is then partially re-supplied by recycling, which can
extend the life considerably.
10 8
1-mm Depletion Depth
10 7
oS 10 6
.&
:,:j
t:
51 10 5
E
10 4
10 3
900
1000 1100 1200
Temperature (deg C)
Fig. 6-45. Insert life from barium evaporation calculated for a
1-mm depletion depth versus temperature.
1300
Hollow Cathodes
301
To predict cathode life in a thruster application from an insert depletion
mechanism, a relationship between the insert temperature and the discharge
current at a given gas flow must be obtained. The SSC insert temperature was
measured versus discharge current by Polk [50]. These data are well fit in the
plasma contact region (the 3 mm closest to the orifice plate) by
T = 1010.6 I .l46[K].
(6.8-6)
At 12 A of discharge current, this gives an insert temperature of 1453 K. Since
the insert in this cathode is about 760-J.tm thick and we assume that the insert is
depleted when the depth reaches about two-thirds of the thickness (due to some
barium diffusion out the outside diameter of the insert), Eq. (6.8-5) predicts a
life of 30,000 hours. This is in good agreement with the SSC life test data
where the cathode failed to start after about 28,000 hours at 12 A of discharge
current [52]. In this case, barium recycling may not affect the insert life
significantly because the plasma is in contact with the insert for only a couple
of millimeters, from the orifice plate, and the barium will tend to migrate to
regions that are not involved in the emission process.
For the NST AR cathode, the insert temperature data as a function of discharge
current measured by Polk [33] are well fit in the plasma contact region by
T = 1191.6 I .0988[K].
(6.8-7)
At the full-power discharge current of 13 A, and using the insert thickness of
760 J.tm, Eq. (6.4-5) predicts an insert life of 20,000 hours. The ELT ran at full
power for about 14,000 hours and accumulated an additional 16,352 hours at
much lower discharge currents [53]. The barium depletion model indicates that
the insert should have been depleted in the emission zone in less than 24,000
hours. Measurements indicate partial depletion in the emission region near the
orifice, but that as much as 30% of the original barium was still present [53].
Clearly barium recycling in the plasma reduced the effective evaporation rate
and extended the life of the cathode significantly.
For the NEXIS hollow cathodes, the operating insert temperature profile has
not yet been measured. Estimates of the insert temperature were made using an
early version of the combined plasma and thermal model [47]. Since the
discharge loss and efficiency performance of the NEXIS thruster are known,
the relationships in Chapter 2 can be used to piot thruster life versus engine
performance. The NEXIS thruster operates at 75% to 81% efficiency over an
Isp of 6000 to 8000 s [54]. Figure 6-46 shows the model-predicted depletion-
limited life of this insert versus specific impulse for several thruster power
levels. At the nominal operating point of 7000 s Isp and 20 kW, the cathode is
302
Chapter 6
10 10
Dispenser Cathode
. 10 kW
.20kW
... 30kW
10 8
,s 10 6
Q)
.5
i 10 4
::J
10 2
10
o
4000 6000 8000
Specific Impulse (s)
Fig. 6-46. Model prediction of NEXIS dispeneer cathode life
versus Isp for several thruster powers [47].
2000
10000 12000
projected to operate for about 100,000 hours. Increasing the Isp requires
operation at higher beam voltages, which for a given power requires less beam
current and, thereby, less discharge current. A lower discharge current reduces
the insert temperature for a given cathode size, which reduces the barium
evaporation rate and extends the cathode life. Likewise, lower Isp and higher
power require higher discharge currents, which translate to a reduction in the
cathode life. It should be noted that the cathode life in Eq. (6.8-5) scales as the
insert thickness squared, so the life at any operating point in Fig. 6-46 can be
extended simply by increasing the thickness of the insert. This may require
increases in other dimensions, but proper selection of the cathode diameter and
orifice size can be made to maintain the insert temperature at the desired level
to provide the desired life.
6.8.4 Bulk-Material Insert Life
Cathodes that are based on bulk insert material instead of dispenser chemistry,
such as LaB 6 , have a lifetime that is detennined by the evaporation of the insert
material inside the hollow cathode [18]. In plasma discharges, sputtering of the
LaB 6 surface can also impact the life [22]. However, as in dispenser hollow
cathodes, the plasma potential is very low in the insert region and the
bombardment energy of xenon ions hitting the surface is typically less than
20 V, which virtually eliminates sputtering of the cathode surface. It is assumed
that the evaporated material leaves the cathode and does not recycle to renew
the insert surface, which will provide a lower estimate of the insert life than
might actually exist. Interestingly, as the insert evaporates, the inner diameter
increases and the surface area enlarges. This causes the required current density
Hollow Cathodes
303
and temperature to decrease at a given discharge current, which reduces the
evaporation rate ofthe insert with time.
The life of the LaB6 insert for three different cathode diameters versus
discharge current was calculated based on the evaporation rate at the
temperature required to produce the discharge current in the thermally limited
regime [18]. Assuming that 90% of the insert can be evaporated, the cathode
life is shown in Fig. 6-47 as a function of the discharge current. Lifetimes of
tens of thousands of hours are possible, and the larger cathodes naturally tend to
have longer lives. While other mechanisms, such as temperature variations
along the insert, LaB 6 surface removal, or material build-up due to impurities in
the gas, can potentially reduce the life, redeposition of the evaporated LaB6
material will tend to extend the cathode life. Therefore, these life estimates for
the different cathode sizes are mostly valid relative to each other, and the actual
lifetime of the cathode can be considered to be on the order of the values shown
in Fig. 6-47.
To obtain an idea of the lifetime of a LaB 6 cathode relative to a conventional
dispenser cathode, the predictions from a dispenser cathode life model [47]
applied to the NST AR cathode are compared with the 0.8-cm LaB 6 cathode life
predictions in Fig. 6-48. These two cathodes have similar insert diameters and
lengths, and so a direct comparison is possible. The dispenser cathode
calculation assumes that barium evaporation from the insert surface causes
depletion of nearly all of the barium impregnate at the end oflife in the NST AR
dispenser cathode at the measured [33] insert temperature and temperature
gradient. This provides an upper limit to the dispenser cathode life if other
10000
1000
..
100
:::i
t
CD
<I)
.E
10
1 1
0
- - - - O.S-em Cathode
- - 1.5-em Cathode
- 2.0-em Cathode
.
.
---
-.
-.
-. -
- ..
- -
.. -
- . I
,
90 100
" I I
30 40 50 60 70
Discharge Current (A)
Fig. 6.47. Calculated lifetime in thousands of hours versus the
discharge current for three different LaBs cathode diameters.
,
10
,
80
,
20
304
Chapter 6
1000
3.8-mm 1.0. Inserts
100
.c
oS!
::;
1::
f/J
.E 10
....
....
....
.....
.....
.........
BaO-W .... _
1
o
20 30 40
Discharge Current (A)
Fig. 6-48. Comparison of the calculated cathode lifetime versus the
discharge current for the O.a-cm outside diameter LaB6 cathode and
the NSTAR dispenser cathode.
10
50
60
mechanisms, such as poisoning degrading the work function or impurity build-
up plugging the pores, actually cause the cathode life limit. Likewise, recycling
of the barium will extend the dispenser cathode life, so uncertainties in the
dispenser cathode life estimates by this model have the same uncertainties due
to impurities and redeposition that are found for the LaB 6 life model (although
LaB6 is less likely to be affected by impurities). Therefore, a direct comparison
of calculated life versus discharge current will be made with the understanding
that the curves will likely shift together vertically due to impurity or
redeposition issues. The LaB6 cathode life is projected to exceed the dispenser
cathode life by nearly an order of magnitude at the nominal NSTAR full-power
currents of less than 15 A. If the NSTAR cathode is capable of producing
higher discharge currents than 15 A, the LaB6 cathode life is still projected to
exceed the NST AR life over the full current range demonstrated by the LaB 6
cathode. As shown in Fig. 6-47, the larger LaB6 cathodes will have even longer
lifetimes, and their life significantly exceeds that projected for the NEXIS
1.5-cm-diameter dispenser cathode [47] that is designed to operate up to about
35 A.
6.8.5 Cathode Poisoning
Comprehensive investigations of the poisoning of dispenser cathodes [17] and
LaB 6 cathodes [55] have been published in the literature. The most potent
poisons for both cathodes are oxygen and water, with other gases such as CO 2
and air producing poisoning effects at higher partial pressures. Figure 6-49
shows the reduction percentage of the electron emission current density in
Hollow Cathodes
'E 1.0
e
:;
(,)
(I) 0.8
:0
'iij
a. 0.6
'0
(I)
E 0.4
<:
(I)
(J
G;
a. 0.2
305
1.2
,
"
,
,
,
,
-1000deg C
- -1100 deg C
......1010 deg C
-.-. 1110 deg C
-1440 deg C
---.1570 deg C
,
,
,
,
,
,
1
, 1
VVater
Oxygen
,
,
,
,
,
,
,
,
,
,
,
0.0
10- 7
\
\
10
1 0- 3 1 0- 2
10-5 1 cr4
Partial Pressure (torr)
Fig. 6.49. percentege of possible thermionic emiSSion versus
partial pressure of oxygen and weter, showing the sensitivity of
dispenser cathodes relative to LaBs (from [18]).
diode tests of a Type S 4: I: I dispenser cathode and a LaB6 cathode as a
function of the partial pressures of oxygen and water for two different emitter
temperatures. Oxygen partial pressures in the 10- 7 -torr range can completely
poison the dispenser cathode at temperatures of 1100'C. In a similar manner,
water vapor at partial pressures in the 10- 6 -torr range will poison dispenser
cathodes at temperatures below 111O°C. For typical pressures inside hollow
cathodes in excess of I torr, partial pressures in this range represent the best
purity level that can be achieved by the gas suppliers, resulting in the high
"propulsion-grade" purity mentioned above. This is the reason for the stringent
purity requirement levied on conventional dispenser hollow cathodes in the
U.S. to date. Recent experiments by Polk [56] showed that oxygen poisoning
observed in vacuum devices occurred only in hollow cathodes at low plasma
densities (low current) and high oxygen levels (>10 PPM), and that the plasma
environment inside hollow cathodes tended to mitigate the poisoning of oxygen
in dispenser cathodes. However, the plasma may aid in the formation of volatile
tungsten oxides and tungstates from the impurity gases that contribute to
tungsten migration and redeposition on the insert surface. This modifies the
dispenser cathode surface morphology, which may affect the emission
capabilities. It is likely that the life of dispenser cathodes can be degraded to
some extent by propellant impurities, which has yet to be fully identified and
quantified.
Lanthanum hexaboride is much less sensitive to impurities that can limit the
performance and life of the barium dispenser cathodes. Partial pressures of
306
Chapter 6
oxygen in the 10- 5 -torr range are required to degrade the emission of LaB 6 at
temperatures below l440°C, which is shown in Fig. 6-49. The curves for water
and air poisoning of LaB 6 are at much higher partial pressures off the graph to
the right. In comparison, LaB 6 at .1570°C, where the electron emission current
density is nearly the same as for the dispenser cathode at 11 OO°C, can withstand
oxygen partial pressures up to 10-4 torr without degradation in the electron
emission. This means that LaB6 can tolerate impurity levels in the feed gas two
orders of magnitude higher as compared with dispenser cathodes operating at
the same emission current density. For the case of xenon ion thrusters, LaB6
cathodes can tolerate the crudest grade of xenon available (:::::99.99% purity)
without affecting the LaB 6 electron emission or life. LaB6 cathodes also do not
require any significant conditioning or activation procedures that are required
by dispenser cathodes. The authors have used LaB6 cathodes emitting at
currents of 5 to 10 A/cm 2 to produce pure oxygen plasmas in background
pressures of 10- 3 torr of oxygen. In this case, the operating temperature of the
cathode had to be increased to just over l600°C to avoid poisoning of the
surface by the formation of lanthanum oxide, consistent with the trends in the
published poisoning results shown in Fig. 6-49. The authors have also exposed
hot, operating LaB 6 cathodes to atmospheric pressures of both air and water
vapor. In both cases, the system was then pumped out, the heater turned back
on, and the cathodes started up normally. This incredible robustness makes
handling and processing electric propulsion devices that use LaB 6 cathodes
significantly easier than thrusters that use dispenser cathodes.
6.9 Keeper Wear and Life
The keeper electrode typically encloses the hollow cathode and serves the
functions of facilitating the starting of the cathode by bring a high positive
voltage close to the orifice and protecting the cathode from ion bombardment
from the cathode plume and thruster plasmas. However, the keeper electrode is
biased during normal operation at an intermediate potential between cathode
and anode to collect a reduced number of electrons, and since it is below the
plasma potential, it is subject to ion bombardment and wear. Cathode orifice
plate and keeper electrode erosion rates measured or inferred in various
experiments [57,58] and in ion thruster life tests [34,53,59] have been found to
be much higher than anticipated. For example, Fig. 6-50 shows the NSTAR
cathode before and after the 30,352-hour extended life test [38]. The keeper
electrode was completely eroded away by the end of the test, exposing the
cathode orifice plate to the thruster discharge chamber plasma, which
significantly eroded the cathode orifice plate and the sheath-heater surfaces.
These results have been attributed to the high-energy ions bombarding and
sputtering the cathode and keeper electrodes.
Hollow Cathodes
307
.
. ......
.. . ..
.. ..
....
..
.
,
. ....-
.
o hr
30.352 hr
Fig. 6-50. NSTAR discharge cethode before end after the EL T wear test, showing
complete sputter erosion of the keeper electrode [38].
A significant effort has been expended trying to understand the mechanism for
this rapid erosion. Several organizations have measured the presence of high-
energy ions in ion thrusters and in the neighborhood of hollow cathodes using
retarding potential analyzers (RPAs) [46,60,61] and laser-induced fluorescence
(LIF) [62]. For example, Fig. 6-51 shows the ion energy distribution measured
downstream on axis and radially away from the plasma ball for the NS TAR
cathode [46]. The high-energy ions are detected in both locations, with varying
amounts depending on the position at which they are detected. The energy of
some of the ions is greatly in excess of the 26- V discharge voltage, and if these
ions were to hit the keeper or cathode orifice, they could cause significant
eroslOn.
The source and characteristics of the high-energy ions have been the subject of
much research and debate. Models of a direct current (DC) potential hill [63]
located inside or just downstream of the cathode orifice, or ion acoustic
instabilities in a double layer postulated in the orifice of the cathode [64], have
been proposed to explain the production of these ions. However, in probe
studies to date [1,6,28,42], there has been no detectable potential hill or
unstable double layer at the cathode orifice or in the cathode plume that might
explain the mechanisms responsible for the high-energy ions or the electrode
wear rates and erosion patterns. High-frequency plasma potential oscillations in
the 50- to 1000-kHz range associated with plasma instabilities have been
detected in the cathode plume and across the front of the keeper by scanning
emissive probes [46] and have been proposed as a mechanism for accelerating
ions to high energy. In this case, ions born at the peak potential gain the full
radio frequency (rt) potential energy when striking the keeper or cathode
surfaces, which can exceed 40 to 80 eV [46]. The fluctuations then produce
sufficient ion energy to explain the keeper-face erosion reported in the
literature.
308
Chapter 6
1.5 x 10⁻⁴
TH15
4.0 x 10--4
3.5 x 10--4
8 3.0 X 10--4
ts
c
::I
LI..
c
.2
'5
€
C;;
is
c
.Q
2.5 x 10⁻⁴
- Radial
-Axial
2.0 x 10⁻⁴
1.0 x 10--4
5.0 x 10⁻⁵
o
o
10 20 30 40 50 60 70 80 90 100
Discriminator Voltage (V)
Fi9. 6.51. Ion energy distribution measured on axis and radielly away
from an NSTAR hollow cathode (from [46]).
However, the fluctuations measured to date are not of sufficient amplitude to
explain the significant number of ions detected by the radially positioned RP A
with energies approaching or even exceeding 100 eV. Katz [65] has shown the
importance of charge exchange collisions on radially accelerated ions, and how
it leads to ions with higher energies than the measured plasma potentials.
Immediately downstream of the discharge cathode keeper the radial plasma
potential profile has a substantial dip on axis. Ions generated on the edges of the
potential dip are accelerated towards the centerline. The neutral gas density,
which is dominated by un-ionized gas coming out of the hollow cathode, also
peaks on axis. Near the cathode, the neutral gas density is high enough that a
substantial fraction of ions is neutralized by resonant charge exchange with gas
atoms before making it across the potential dip. Since they are now neutral, the
xenon atoms do not lose the kinetic energy they gained as ions falling into the
dip, passing through to the other side of the potential dip. However, as they
continue to drift radially some of the atoms are ionized, either by charge
exchange or collisions with electrons, and, again, are influenced by the electric
fields. By the time these ions reach the RP A, they have their original thennal
energy plus the energy they gained falling down the dip, plus the energy from
the plasma potential where they were re-ionized. This process is shown
schematically in Fig. 6-52. The measured high energies are attained because, as
a neutral particle, the xenon atom is not retarded by the potential rise, but gains
the potential energy moving through the trough.
Hollow Cathodes
309
Radial
Polential
Structure
Xe+
Potential
Energy
Gain
XeD
8
Fig. 6-52. Xenon ions gain energy falling down the potential well, ere
charge exchanged, travel past the potential rise without losing energy, and
regain their charge In a high potential region [65].
For example, a calculated spectrum is shown in Fig. 6-53. The primary, non-
charge-exchanged ion spectrum was estimated as a Maxwellian distribution
with an energy of 3.5 eV, the measured electron temperature. The high-energy
ion portion of the spectrum, while somewhat lower than the measurement,
shows the same general features. The calculated spectrum has no ions above
95 V, while the measured spectrum shows a few ions above this energy. Katz
[65] suggests that these very high-energy ions may have started out as double
ions when they entered the axial potential well and picked up twice the kinetic
energy prior to being neutralized by charge exchange. The complete
mechanisms for high-energy ion generation, the measured energies of these
ions by various techniques, and the enhanced erosion of the cathode and keeper
electrodes are still under investigation at this time. Detailed 2-D modeling [66]
and additional experimental investigations are under way to understand and
mitigate this problem.
6.10 Hollow Cathode Operation
The electron discharge from hollow cathodes can be initiated by several
mechanisms. In Type A cathodes and some Type B with small orifices, the
electrostatic (vacuum) potential from the keeper or anode electrode does not
penetrate significantly through the relatively long, thin orifice into the insert
region. In this case, electrons emitted in the insert region cannot be accelerated
to cause ionization because there is no anode potential visible inside the
cathode. However, if the cathode uses a barium dispenser insert, then barium
evaporated from the insert when heated can deposit on the upstream side of the
cathode orifice plate and inside the orifice and diffuse onto the downstream
surface of the orifice plate [67] facing the keeper electrode. The work function
subsequently decreases, and the vacuum thermionic emission from the orifice
310
4.0 x 10⁻⁴ Vd:
3.5 x 10⁻⁴
e: 3.0 x 10⁻⁴
0
:a
e: 2.5 x 10⁻⁴
:>
LI.
e:
.Q 2.0 x 10⁻⁴
'S
€ 1.5 x 10⁻⁴
u;
is
e: 1.0x 10⁻⁴
.2
5.0 x 10⁻⁵
Chapter 6
TH15
- Radial Distribution
- Calculation
- - - - Primary Ions Only
........
10 20 30 40 50 60 70 80 90 100
Discriminator Voltage (V)
Fig. 6-53. The xenon ions gain most of their kinetic energy in the
sheath and the potential well on axis (from [65]).
plate to the keeper can be sufficient to ignite a discharge once gas is introduced.
The plasma then penetrates the orifice, extending the anode potential into the
insert region and the discharge transitions directly to the insert. The orifice
plate is subject to sputter erosion by the ions in the discharge, and the barium
layer is removed and has to be reestablished if the cathode is turned off in order
to restart [68].
For cathodes with larger orifices (typically 2-mm diameter or larger), a
sufficient keeper voltage (typically 100 to 500 V) will cause the applied
positive potential to penetrate inside the insert region with levels in excess of
the ionization potential of the propellant gas. The electrons from the insert then
can be accelerated locally inside the insert and cause ionization, which ignites
the discharge through the orifice to the keeper or anode. This is the mechanism
used in most of the LaB6 cathodes developed by the authors to strike the
discharge.
For hollow cathodes with smaller orifices or inhibited orifice-plate emission
(due to surface impurities, barium depletion, etc.), an arc-initiation technique
typically is used. In this case, the applied keeper voltage is pulsed to a high
positive value (typically >500 V). The discharge starts due to either field
emission of electrons from the orifice plate ionizing the injected cathode gas or
Paschen breakdown occurring at the relatively high pressure in the cathode-to-
keeper gap generating plasma that penetrates the orifice into the insert region.
To ensure reliable thruster ignition over life, it is standard to apply both a DC
keeper voltage in the 50- to 150-V range and a pulsed keeper voltage in the
Hollow Cathodes
311
300- to 600-V range. Once the discharge is ignited, the keeper current is limited
by the power supply and the voltage falls to a low value below the discharge
voltage.
Once ignited, hollow cathodes are well known to operate in distinct discharge
"modes." In ion thrusters, the hollow cathode discharge operation has been
historically characterized as having a quiescent "spot mode" with a broadly
optimum gas flow at a given current, and a noisy "plume mode" with the gas
flow below the level at which the spot mode is obtained [44,45]. The spot
mode, seen in Fig. 6-28(a), is visually observed as manifesting a ball or "spot"
of plasma just downstream of the cathode orifice with little visual glow from
the downstream plasma at low currents and a slowly expanding plasma column
extending from the spot into the thruster discharge chamber at higher currents.
The plume mode is seen visually as a widely diverging plasma cone extending
from the cathode, often filling the vacuum chamber with diffuse plasma and
little or no spot or ball of plasma in the cathode/keeper orifice. There is a
continuous transition between these modes, which is sometime separately
identified as a transition mode [3]. A less well-known third mode, sometimes
called a "stream mode," occurs at high gas flows well above the optimum for
the spot mode. In this stream mode, shown just starting in Fig. 6-28(b), the
plasma spot is pushed well down stream of the cathode/keeper orifice, and a
dark space between the cathode or keeper electrode and the spot is usually
observed. In this case, the plasma expands and disperses faster than in the
normal spot mode. Very high cathode flow rates tend to suppress the discharge
voltage, which adversely affects the ionization rate and discharge performance
in discharge cathodes in ion thrusters. However, higher flow rates tend to
reduce the coupling voltage in both Hall and ion thruster neutralizer cathodes,
which can improve the performance.
The hollow cathode discharge modes have been examined in detail due to the
observed increases in the keeper or coupling voltages in the plume mode
[44,45,64,69,70] and increases in keeper wear [53,69]. At flow rates near the
optimum for the spot mode, thermionic hollow cathodes can produce quiescent
discharges [46,64]. In neutralizer cathodes, transition to plume mode occurs
when too Iowa gas flow rate and/or keeper current is provided for the desired
emission current. Plume mode transition is usually detected by increases in the
oscillation of the keeper voltage or in the magnitude of the coupling voltage.
For example, plume mode onset is defined in the NSTAR neutralizer when the
keeper voltage oscillation exceeds 5 V [71]. In discharge cathodes, transition to
plume mode also occurs for too low a propellant flow at a given emission
current (or too high a discharge current for a given flow), and is usually
detected by increases in the discharge voltage oscillations. Transition to plume
mode usually occurs at higher emission current densities (related to the size of
312
Chapter 6
the orifice and the discharge current) and can be affected by the anode location
and design [46].
As the discharge current is increased for a given cathode orifice size and gas
flow rate, the noise in the discharge voltage and in probe signals from the
plasma increases [70], and the cathodes produce ions with energies
significantly in excess of the discharge voltage and produce significant keeper
and cathode orifice erosion. This leads to the keeper and cathode life issues
discussed above associated with plume-mode behavior and often detennines the
cathode geometry and operation conditions selected for any given thruster.
Figure 6-54 shows the discharge voltage versus current for a 1.5-cm-diameter
dispenser hollow cathode with a 2.I-mm orifice for several different flow rates
[6]. In this case, two different anode geometries were used: one was a 45-deg
conical anode and the second was a 5-cm-diameter cylindrical anode. The
maximum current in the plot that could be achieved at a given gas flow was due
to the onset of strong discharge voltage oscillations of greater than :i:5 V. The
small cylindrical anode pennitted significantly higher discharge currents to be
obtained before the oscillation limits and a1so reduced the discharge voltage at
all currents. This is due to the increased gas pressure near the cathode exit
increasing the plasma generation in the cathode plume, which could only be
achieved with the conical anode by injecting significant amounts of gas directly
into the anode region. It is clear that the onset of the oscillations and the
transition to plume mode is an anode-plasma effect, which will be discussed
further later.
35
30
25
OJ
C>
20
OJ
C> 15
ro
.t::.
<.1
VI
C 10
5
0
0
. 4 seem Conical
. 5 seem Conical
. 7 seem Conical
. 10 seem Conical
. _.::. -.. ,..A/.J/) _
"-. .,:""S .-o..-e---o -4--.&'-&--'-0
0--0--. -. -e....... -.-...- _ -",
--"--'-9--G'-'-"'--e---G.--4--o
<> 4 seem Cylindrical
o 5 seem Cylindrical
A 7 seem Cylindrical
c 10 seem Cylindrical
5 10 15 20 25 30 35 40 45 50 55
Discharge Current (A)
Fig. 6.54. Discharge voltage versus current for several hollow
cathode flow rates for two anode conflgurations.
Hollow Cathodes
313
There are basically three types of oscillations that occur in hollow cathode
discharges [46,70]. First. there are plasma discharge oscillations in the
frequency range of 50 to over 1000 kHz. These are usually incoherent
oscillations in the ion acoustic frequency range with amplitudes that vary
continuously from fractions of a volt on the electrodes in the spot mode to tens
of volts on the electrodes into the plume mode. If sufficiently large, these ion
acoustic oscillations can trigger regulation problems in the power supply,
leading to large discharge voltage oscillations on power-supply-regulation
times of 100 to 1000 Hz. This behavior is shown in Fig. 6-55.
As the discharge current increases, the ionization percentage in the cathode
plume becomes significant and can lead to ionization instabilities or so-called
predator-prey oscillations. In this case, the plasma discharge bums out a
significant fraction of the neutral gas, and the discharge collapses on the time
frame of neutral flow into the plume region. The frequency range of these
instabilities is in the 50- to 250-kHz range for xenon, depending on the physical
scale lengths and size of the discharge components. Ionization instabilities are
easily observed in the plasma density, which is shown by the probe's ion
saturation current oscillations in Fig. 6-56 and compared to the normally
observed oscillations from the incoherent ion acoustic-type modes. Ionization
instabilities usually can be inhibited by proper selection of the gas flow and/or
magnitude of any applied axial magnetic field in the cathode plume region [46],
which modifies the local ion generation rate.
40
36
36
34
8,32-
30
CI)
E'
ft!
J::
26
i5
22
20
0.00
0.01
0.02 0.03
lime (s)
004
0.05
Fig. 6-55. Discharge voltage oscillations showing plasma and power
supply oscillations.
314
Chapter 6
It is important to realize that the large discharge oscillations and transition to
plume mode is an effect that occurs exterior to the hollow cathode [70].
Figure 6-57 shows the ion saturation current measured inside the insert region
and immediately outside the keeper in the above experiments during the
ionization instability conditions. The plasma density oscillations inside the
cathode insert plasma are small in amplitude and uncorrelated to the ionization
and large turbulent instabilities observed outside in the keeper plasma region.
The higher gas flows injected to avoid transition to plume mode are required to
0.030
0.025 ------
Ionization Instability
Mode
c: 0.020
.2
ei
.2 0.015
."
CI)
c:
.Q 0.010 ---
Fig. 6.56. Discharge voltage oscillations showing plasma plume
mode oscillations with frequencies in >100.kHz range and
ionization-related oscillations in the <100-kHz range.
$' 2.0
'2 1.8
::>
jg 1.6
:c
1.4
C 1.2 Keeper
!!!
:s Plume
(.) 1.0 Region
c:
.2 0.8
::> 0.6
ro
CI)
c: 0.4
.Q
Q) 0.2
.r>
e 0.0
a..
0 1 x 10⁻⁴
Fig. 6-57. Ion saturation current oscillations inside and outside the
cathode, showing oscillation location.
Hollow Cathodes
315
produce sufficient plasma density to carry the discharge current, and the lower
electron temperatures and collisional effects in the cathode plume plasma tend
to damp or extinguish the oscillations. This oscillatory and damping behavior is
suggested by the cathode plume models [39,41,72,73] in the literature and
discussed above.
References
[1] D. M. Goebel, K. Jameson, 1. Katz, and 1. Mikellades, "Hollow Cathode
Theory and Modeling: 1. Plasma Characterization with Miniature Fast-
Scanning Probes," Journal of Applied Physics, vol. 98, no. 10, 113302,
2005.
[2] 1. Mikellades, 1. Katz, D. M. Goebel, and K. K. Jameson, "Plasma
Processes Inside Orificed Hollow Cathodes," Physics of Plasmas, vol. 13,
063504, 2006.
[3] H. R. Kaufman, "Technology of Electron-Bombardment Ion Thrusters,"
Advances in Electronics and Electron Physics, vol. 36, edited by
L. Marton, New York: Academic Press, 1974.
[4] B. A. Arkhopov and K. N. Kozubsky, "The Development of the Cathode
Compensators for Stationary Plasma Thrusters in the USSR," 22nd
International Electric Propulsion Conference, paper IEPC-91-023,
Viareggio, Italy, October 14-17, 1991.
[5] 1. Mikellades, 1. Katz, D. M. Goebel, and K. K. Jameson, "Hollow
Cathode Theory and Modeling: II. A Two-Dimensional Model of the
Emitter Region," Journal of Applied Physics, vol. 98, no. 10, 113303,
2005.
[6] D. M. Goebel, K. Jameson, R. Watkins, and 1. Katz, "Cathode and Keeper
Plasma Measurements Using an Ultra-Fast Miniature Scanning Probe,"
AIAA-2004-3430, 40th Joint Propulsion Conference, Ft. Lauderdale,
Florida, July 11-14,2004.
[7] O. W. Richardson, "Electron Theory of Matter," Philips Magazine, vol.
23,pp. 594-627,1912.
[8] W. H. Kohl, Handbook of Materials and Techniques for Vacuum Devices,
New York: Reinhold, 1967.
[9] W. Schottky, "Concerning the Discharge of Electrons from Hot Wires
with Delayed Potential," Annalen der Physik, vol. 44, no. 15, pp, 1011-
1032, July 1914.
[10] A. T. Forrester, Large Ion Beams, New York: Wiley-Interscience, 1988.
316 Chapter 6
[11] J. W. Gibson, G. A. Haas, and R. E. Thomas, "Investigation of Scandate
Cathodes: Emission, Fabrication and Activation Processes," IEEE
Transactions on Electron Devices, vol. 36, pp. 209-214, 1989.
[12] J. L. Cronin, "Modem Dispenser Cathodes," lEE Proceedings, vol. 128,
no. 19, 1981.
[13] J. M. Lafferty, "Boride Cathodes," Journal of Applied Physics, vol. 22,
p. 299,1951.
[14] D. Jacobson and E. K. Storms, "Work Function Measurement of
Lanthanum-Boron Compounds," IEEE Transactions on Plasma Science,
vol. 6, pp. 191-199, 1978.
[15] E. Storms and B. Mueller, "A Study of Surface Stoichiometry and
Thermionic Emission using LaB6," Journal of Applied Physics, vol. 50,
pp.3691-3698,1979.
[16] R. Levi, "Improved Impregnated Cathode," Journal of Applied Physics,
vol. 26, p. 639, 1955.
[17] J. L. Cronin, "Practical Aspects of Modem Dispenser Cathodes,"
Microwave Journal, vol. 22, pp. 57-62, September 1979.
[18] D. M. Goebel, R. M. Watkins, and K. K. Jameson, "LaB6 Hollow
Cathodes for Ion and Hall Thrusters," Journal of Propulsion and Power,
vol. 23, no. 3, pp.552-558, 2007.
[19] J. Pelletier and C. Pomot, "Work Function of Sintered Lanthanum
Hexaboride," Applied Physics Letters, vol. 34, pp. 249-251,1979.
[20] V. Kim, G. Popov, B. Arkhipov, V. Murashko, O. Gorshkov,
A. Koroteyev, V. Garkusha, A. Semenkin, and S. Tverdokhlebov,
"Electric Propulsion Activity in Russia," IEPC-2001-005, 27th
International Electric Propulsion Conference, Pasadena, California,
October 14-19, 2001.
[21] D. M. Goebel, J. T. Crow, and A. T. Forrester, "Lanthanum Hexaboride
Hollow Cathode for Dense Plasma Production," Review of Scientific
Instruments, vol. 49, pp. 469-472, 1978.
[22] D. M. Goebel, Y. Hirooka, and T. Sketchley, "Large Area Lanthanum
Hexaboride Electron Emitter," Review of Scientific Instruments, vol. 56,
pp. 1717-1722, 1985.
[23] E. Storms and B. Mueller, "Phase Relationship, Vaporization and
Thermodynamic Properties of the Lanthanum-Boron System," Journal of
Chemical Physics, vol. 82. p. 51,1978.
[24] K. N. Leung, P. A. Pincosy, and K. W. Ehlers, "Directly Heated
Lanthanum Hexaboride Filaments," Review of Scientific Instruments,
vol. 55, pp. 1064-1068,1984.
Hollow Cathodes
317
[25] 1. Katz, J. Anderson, J. Polk, and D. M. Goebel, "Model of Hollow
Cathode Operation and Life Limiting Mechanisms," IEPC-2003-0243,
28th International Electric Propulsion Conference, Toulouse, France,
March 17-21,2003.
[26] 1. Katz, J. Anderson, J. Polk, and J. Brophy, "One Dimensional Hollow
Cathode Model," Journal of Propulsion and Power, vol. 19, no. 4,
pp. 595-600,2003.
[27] J. S. Miller, S. H. Pullins, D. J. Levandier, Y. Chiu, and R. A. Dressler,
"Xenon Charge Exchange Cross Sections for Electrostatic Thruster
Models," Journal of Applied Physics, vol. 91, no. 3, pp. 984-991,2002.
[28] K. Jameson, D. M. Goebel, and R. Watkins, "Hollow Cathode and
Thruster Discharge Chamber Plasma Measurements Using High-Speed
Scanning Probes," IEPC-2005-269, 29th International Electric Propulsion
Conference, Princeton University, Princeton, New Jersey, October 31-
November 4, 2005.
[29] D. L. Book, NRL Plasma Formulary, Naval Research Laboratory,
Washington, D.C., 1987.
[30] I. Katz, J. Polk, 1. Mikellides, D. M. Goebel, and S. Hornbeck,
"Combined Plasma and Thermal Hollow Cathode Insert Model," IEPC-
2005-228, 29th International Electric Propulsion Conference, Princeton
University, Princeton, New Jersey, October 31-November 4,2005.
[31] K. Jameson, D. M. Goebel, and R. Watkins, "Hollow Cathode and Keeper
Region Plasma Measurements," AIAA-2005-3667, 41st Joint Propulsion
Conference, Tucson, Arizona, July 11-14,2005.
[32] I. Mikelides, 1. Katz, D. M. Goebel, and J. Polk, "Theoretical Model of a
Hollow Cathode Plasma for the Assessment of Insert and Keeper
Lifetimes," AIAA-2005-4234, 41 st Joint Propulsion Conference, Tucson,
Arizona, July 2005.
[33] J. E. Polk, A. Grubisic, N. Taheri, D. M. Goebel, R. Downey, and
S. Hornbeck, "Emitter Temperature Distributions in the NST AR
Discharge Hollow Cathode," AIAA-2005-4398, 41st Joint Propulsion
Conference, Tucson, Arizona, July 11-14,2005.
[34] J. E. Polk, 1. R. Anderson, J. R. Brophy, V. K. Rawlin, M. J. Patterson,
J. S. Sovey, and J. 1. Hamley, "An Overview of the Results from an 8200-
Hour Wear Test of the NSTAR Ion Thruster," AIAA Paper 99-2446, 35th
Joint Propulsion Conference, Los Angeles, California, June 20-24, 1999.
[35] 1. Katz, J. Anderson, J. Polk, and J. Brophy, "A Model of Hollow Cathode
Plasma Chemistry," AIAA-2002-4241, 38th Joint Propulsion Conference,
Indianapolis, Indiana, July 7-10, 2002.
318 Chapter 6
[36] J. G. Andrews and J. E. Allen, "Theory of a Double Sheath Between Two
Plasmas," Proceedings of the Royal Society of London, Series A, vol. 320,
p. 459-472, 1971.
[37] V. Rawlins, J. S. Sovey, J. R. Anderson, and J. E. Polk, "NSTAR Flight
Thruster Qualification Testing," AIAA-98-3936, 34th Joint Propulsion
Conference, Cleveland, Ohio, July 13-15, 1998.
[38] A. Sengupta, J. R. Brophy, and K. D. Goodfellow. "Status of The
Extended Life Test of The Deep Space 1 Flight Spare Ion Engine After
30,352 Hours of Operation," AIAA Paper 2003-4558, 39th Joint
Propulsion Conference, Huntsville, Alabama, July 20-23, 2003.
[39] I. Katz, I. G. Mikellides, and D. M. Goebel, "Model of the Plasma
Potential Distribution in the Plume of a Hollow Cathode," AIAA Paper
2004-4108, 40th Joint Propulsion Conference, Ft. Lauderdale, Florida,
July 11-14,2004.
[40] I. Langmuir, "The Interaction of Electron and Positive Ion Space Charges
in Cathode Sheaths," Physical Review, vol. 33, no. 6, pp. 954-989, 1929.
[41] I. G. Mikellides, I. Katz, D. M. Goebel, and K. K. Jameson, "Towards the
Identification of the Keeper Erosion Mechanisms: 2-D Theoretical Model
of the Hollow Cathode," AIAA-2006-5l5l, 42nd Joint Propulsion
Conference, Sacramento, California, July 10-13,2006.
[42] D. A. Herman and A. D. Gallimore, "Near Discharge Cathode Assembly
Plasma Potential Measurements in a 30-cm NST AR Type Ion Engine
Amidst Beam Extraction," AIAA-2004-3958, 40th Joint Propulsion
Conference, Ft. Lauderdale, Florida, July 11-14,2004.
[43] K. K. Jameson, D. M. Goebel, I. G. Mikellides, and R. M. Watkins,
"Local Neutral Density and Plasma Parameter Measurements in a Hollow
Cathode Plume," AIAA-2006-4490, 42nd Joint Propulsion Conference,
Sacramento, California, July 10-13,2006.
[44] G. A. Csiky, "Investigation of a Hollow Cathode Discharge Plasma,"
AIAA-69-258, 7th Electric Propulsion Conference, Williamsburg,
Virginia, March 3-5, 1969.
[45] V. K. Rawlin and E. V. Pawlik, "A Mercury Plasma-Bridge Neutralizer,"
AIAA-67-670, AIAA Electric Propulsion and Plasmadynamics
Conference, Colorado Springs, Colorado, September 11-13, 1967.
[46] D. M. Goebel, K. Jameson, I. Katz, I. Mikellides, and J. Polk, "Energetic
Ion Production and Keeper Erosion in Hollow Cathode Discharges,"
IEPC-2005-266, 29th International Electric Propulsion Conference,
Princeton University, Princeton, New Jersey, October 31-November 4,
2005.
Hollow Cathodes
319
[47] D. M. Goebel, 1. Katz, Y. Mikellides, and J. Polk, "Extending Hollow
Cathode Life for Deep Space Missions," AIAA-2004-59 1 1, AIAA Space
2004 Conference, San Diego, California, September 2004.
[48] R. Doerner, G. Tynan, D. M. Goebel, and 1. Katz, "Plasma Surface
Interaction Studies for Next-Generation Ion Thrusters," AIAA-2004-
4104, 40th Joint Propulsion Conference, Ft. Lauderdale, Florida, July
2004.
[49] R. P. Doerner, S. 1. Krasheninnikov, and K. Schmidt, "Particle-Induced
Erosion of Materials at Elevated Temperature," Journal of Applied
Physics, vol. 95, no. 8, pp. 4471--4475,2004.
[50] J. E. Polk, C. Marrese, B. Thornber, L. Dang, and L. Johnson,
"Temperature Distributions in Hollow Cathode Emitters," AlAA-2004-
4116, 40th Joint Propulsion Conference, Ft. Lauderdale, Florida, July 11-
14, 2004.
[51] P. Palluel and A. M. Shroff, "Experimental Study of Impregnated-
Cathode Behavior, Emission, and Life," Journal of Applied Physics, vol.
51,no.5,pp.2894-2902,1980.
[52] T. R. Sarver-Verhey, "28,000 Hour Xenon Hollow Cathode Life Test
Results," IEPC-97-168, 25th International Electric Propulsion
Conference, Cleveland, Ohio, August 24-28, 1997.
[53] A. Sengupta, 1. R. Brophy, 1. R. Anderson, and C. Garner. "An Overview
of the Results from the 30,000 Hour Life Test of The Deep Space 1 Flight
Spare Ion Engine," AIAA Paper 2004-3608, 40th Joint Propulsion
Conference, Ft. Lauderdale, Florida, July 11-14,2004.
[54] 1. E. Polk, D. M. Goebel, 1. S. Snyder, and A. C. Schneider, "Performance
and Wear Test Results for a 20-kW Class Ion Engine with Carbon-Carbon
Grids," AIAA_2005-4393, 41st Joint Propulsion Conference, Tucson,
Arizona, July 11-14,2005.
[55] H. E. Gallagher, "Poisoning of LaB6 cathodes," Journal of Applied
Physics, vol. 40, pp. 44-51,1969.
[56] 1. E. Polk, "The Effect of Reactive Gases on Hollow Cathode Operation,"
AIAA-2006-5153, 42nd Joint Propulsion Conference, Sacramento,
California, July 9-12, 2006.
[57] R. D. Kolasinski and J. E. Polk, "Characterization of Cathode Keeper
Wear By Surface Layer Activation," AIAA Paper 2003-5144, 39th Joint
Propulsion Conference, Huntsville, Alabama, July 20-23, 2003.
[58] M. Domonkos, J. Foster, and G. Soulas, "Wear Testing and Analysis of
Ion Engine Discharge Cathode Keeper," Journal of Propulsion and
Power, vol. 21, pp. 102-110,2005.
320 Chapter 6
[59] M. J. Patterson, V. K. Rawlin, J. S. Sovey, M. J. Kussmaul, and J. Parkes,
"2.3 kW Ion Thruster Wear Test," AIAA-95-2516, 31st Joint Propulsion
Conference, San Diego, California, July 10-12, 1995.
[60] I. Kameyama and P. J. Wilbur, "Measurement ofIons from High Current
Hollow Cathodes Using Electrostatic Energy Analyzer," Journal of
Propulsion and Power, vol. 16, p. 529,2000.
[61] C. Farnell and J. Williams, "Characteristics of Energetic Ions from
Hollow Cathodes," IEPC Paper 03-072, 28th International Electric
Propulsion Conference, Toulouse, France, March 17-21, 2003.
[62] G. Williams, Jr., T. B. Smith, M. T. Domonkos, A. D. Gallimore, and R.
P. Drake, "Laser Induced Fluorescence Characterization of Ions Emitted
from Hollow Cathodes," IEEE Transactions on Plasma Science, vol. 28,
issue 5, pp. 1664-1675,2000.
[63] I. Kameyama and P. J. Wilbur, "Potential-Hill Model of High-Energy Ion
Production near High Current Hollow Cathodes," ISTS 98-a-2-17, 21 st
International Symposium on Space Technology and Science, Sonic City,
Omiya, Japan, May 1998.
[64] V. J. Friedly and P. J. Wilbur, "High Current Hollow Cathode
Phenomena," Journal of Propulsion and Power, vol. 8, no. 3, pp. 635-
643, 1992.
[65] I. Katz, I. G. Mikellides, D. M. Goebel, K. K. Jameson, and J. E. Polk,
"Production of High Energy Ions Near an Ion Thruster Discharge Hollow
Cathode," AIAA-2006-4485, 42nd Joint Propulsion Conference,
Sacramento, California, July 10-13,2006.
[66] I. G. Mikellides, I. Katz, and D. Goebel, "Partially-Ionized Gas and
Associated Wear in Electron Sources for Ion Propulsion, II: Discharge
Hollow Cathode," AIAA-2007-5192, 43rd Joint Propulsion Conference,
Cincinnati, Ohio, July 8-11, 2007.
[67] W. G. Tighe, K. Chien, D. M. Goebel, and R. T. Longo, "Hollow Cathode
Ignition and Life Model," AIAA-2005-3666, 41st Joint Propulsion
Conference, Tucson, Arizona, July 11-14,2005.
[68] W. Tighe, K. Chien, D. M. Goebel, and R. Longo, "Hollow Cathode
Ignition Studies and Model Development," IEPC-2005-314, 29th
International Electric Propulsion Conference, Princeton University,
Princeton, New Jersey, October 3 I-November 4,2005.
[69] J. R. Brophy and C. E. Gamer, "Tests of High Current Hollow Cathodes
for Ion Engines," AIAA-88-2913, 24th Joint Propulsion Conference,
Boston, Massachusetts, July 11-13, 1988.
Hollow Cathodes
321
[70] D. M. Goebel, K. Jameson, I. Katz, and I. Mikellides, "Plasma Potential
Behavior and Plume Mode Transitions in Hollow Cathode Discharge,"
IEPC-2007-027, 30th International Electric Propulsion Conference,
Florence, Italy, September 17-20,2007.
[71] 1. R. Brophy, D. E. Brinza, J. E. Polk, M. D. Henry, and A. Sengupta,
"The DSI Hyper-Extended Mission," AIAA-2002-3673, 38th Joint
Propulsion Conference, Indianapolis, Indiana, July 7-10, 2002.
[72] I. D. Boyd and M. W. Crofton, "Modeling the Plasma Plume of a Hollow
Cathode," Journal of Applied Physics, vol. 95, pp. 3285-3296,2004.
[73] I. Mikellides, I. Katz, and D. M. Goebel, "Numerical Simulation of the
Hollow Cathode Discharge Plasma Dynamics," IEPC-2005-200, 29th
International Electric Propulsion Conference, Princeton University,
Princeton, New Jersey, October 3 I-November 4,2005.
Problems
1. The power radiated from a surface is given by P = acT 4 A, where (J is the
Stephan-Boltzmann constant, e is the emissivity of the surface, T is the
surface temperature in K, and A is the radiating area.
a. Design a 0.5-mm-diameter tungsten filament electron emitter that
emits 10 A and radiates only 200 W of power. Specifically, what is
the filament length and emission current density? You can neglect
axial conduction of power to the electrical connections and assume
that the emissivity of tungsten is 0.3 at emission temperatures.
b. You decide to use a 0.25-mm-diameter and 4-cm-Iong filament to
limit the radiated power. What is the temperature of the emitter, and
how much power is actually radiated?
2. The insert in a BaO hollow cathode has a 3-mm inside diameter, is 2.5-cm
long, and is at a temperature of 11 00.c.
a. Using Cronin's expression for the work function, how much current is
emitted by the insert?
b. If the insert has a uniform plasma with ne = 10 20 m -3 density and
Te = 2 e V inside of it, how much is the electron emission enhanced
by the Schottky effect if the sheath is 10 V and 3 Debye lengths thick?
What is the total emission current?
c. Is the emission current space charge limited?
322
Chapter 6
d. Assume that the plasma density falls exponentially from the orifice
entrance to 10 18 m -3 in I em. What is the total electron current that
can be emitted into the plasma?
3. A 2.5-cm-long BaO-impregnated insert with a 2-cm inside diameter has
xenon gas injected to create an internal pressure of 2 torr at 1500 K in the
hollow cathode. Assuming the insert plasma is infinitely long, what is the
electron temperature in the insert plasma and the radial ion drift velocity at
the wall?
4. For the cathode geometry in Chapter 6, Problem 2, what is the internal
plasma density for an emission current of 30 A and a heating power of
100 W, assuming a unifonn plasma density with an electron temperature of
1.2 e V? (Hint: estimate the resistivity for the sheath voltage, find the
plasma density, then iterate.)
5. A lanthanum hexaboride hollow cathode with a 2-cm inside diameter and
2.5-cm long emits 20 A of electrons into a unifonn 2 x 10 19 m -3 plasma
with an electron temperature of 1.5 eV. For a heating power of 40 Wand an
internal xenon pressure of 1.2 torr at 1500 K, find the ion and electron
heating powers to the insert. Why is one larger than the other?
6. If a cylindrical discharge cathode orifice is 2 mm in diameter and has an
internal pressure of 3 torr at a temperature of 2000 K, what is the electron
temperature? (Neglect end losses.)
7. A neutralizer cathode produces 3 A of electron current through a 0.6-mm-
diameter orifice that is 1.5-mm long. Assuming that the electron
temperature in the orifice is 1.5 e V, the electron temperature in the insert
region is 1.2 eV, the pressure is 50 torr at 2000 K, and the sheath voltage at
the wall is 12 V, what is the plasma density, the ion heating of the orifice
plate, and the axial voltage drop in the orifice plasma?
8. A hollow cathode has an orifice diameter of 2.5 mm and a xenon gas flow
of 4 seem with an effective temperature of 2000 K. Assume that the neutral
gas density falls exponentially from the orifice exit with a characteristic
length of 0.5 mm (i.e., one e-folding for every 0.5 mm of distance from the
cathode). Assuming l5-V primary electrons in the cathode plume and that
all of the ions generated fall back through the sheath, find the location
downstream ofthe orifice exit where a double layer might occur.
Hollow Cathodes
323
9. A Hall thruster hollow cathode has a cathode orifice diameter of 3 mm and
produces 20 A of 15 e V primary electrons with a xenon gas flow of
10 sccm. Assume that the gas is at 2000 K and the neutral plume diverges
at 45 deg from the orifice.
a. Neglecting depletion of the electron current due to ionization, how
much of the cathode gas flow is ionized within 10 em of the cathode?
b. Assume that every electron that makes an ionization collision is lost
(loses most of its energy and is rapidly thennalized) and that the
neutral atom is also lost. How much of the cathode gas flow is then
ionized within 10 cm of the cathode?
c. If the primary electron energy is 20 V, how much of the cathode gas
flow is ionized within 10 cm of the orifice accounting for both
primary electron and neutral gas depletion due to ionization?
10. An ion thruster is operated at 2 A of beam current at 1500 V. The thruster
has 5% double ion content, a 10-deg beam divergent half angle, a discharge
loss of 160 eV/ion at a discharge voltage of 25 V, and uses 32 sccm of
xenon gas and 20 W of power in addition to the discharge power.
a. What insert thickness is required in an NSTAR-type cathode to
achieve 5 years of cathode life if barium loss is the life-limiting
effect?
b. What is the thruster efficiency, Isp, and thrust?
Fundamentals oIElectric Propulsion: Ion and Hall T1l1'llsters
by Dan M. Goebel and Ira Katz
Copyright iQ 2008 John Wiley & Sons, Inc.
Chapter 7
Hall Thrusters
7.1 Introduction
Hall thrusters are relatively simple devices consisting of a cylindrical channel
with an interior anode, a magnetic circuit that generates a primarily radial
magnetic field across the channel, and a cathode external to the channel.
However, Hall thrusters rely on much more complicated physics than ion
thrusters to produce thrust. The details of the channel structure and magnetic
field shape determine the performance, efficiency, and life [1-5]. The
efficiency and specific impulse of flight-model Hall thrusters are typically
lower than that achievable in ion thrusters [6,7], but the thrust-to-power ratio is
higher and the device requires fewer power supplies to operate. The life of Hall
thrusters in terms of hours of operation is usually shorter than ion thrusters (on
the order of 10,000 hours), but the throughput is usually higher than in ion
thrusters, and the total impulse capability can be comparable. Hall thrusters
were originally envisioned in the U.S. and Russia about 50 years ago, with the
first working devices reported in America in the early 1960s. Ultimately, Hall
thruster technology was developed to flight status in Russia and has only
recently been developed and flown outside of that country. Information about
flight Hall thrusters is given in Chapter 9.
There are two generic types of Hall thrusters described in the literature. Hall
thrusters, Hall-effect thrusters (HETs), stationary plasma thrusters (SPTs), and
magnetic-layer thrusters are all names for essentially the same device that is
characterized by the use of a dielectric insulating wall in the plasma channel, as
illustrated in Fig.7-1. The wall is typically manufactured from dielectric
materials such as boron nitride (BN) or borosil (BN-Si0 2 ) in flight thrusters,
and also sometimes alumina (AL 2 0 3 ) in laboratory thrusters. These dielectric
materials have a low sputtering yield and relatively low secondary
325
326
Chapter 7
Anode
Gas
Feed
Cathode
____ e-
Xe o _
E
Insulator
Anode
. 1
. N
-Pole
...,.....
. ",to...
Thruster Center Line
I
Fig. 7-1. Hall thruster cross-section schematic showing the
crossed electric and magnetic fields, and the ion and
electron paths.
electron emission coefficients under xenon ion bombardment. In this thruster
geometry, the electrically biased metallic anode is positioned at the base of the
channel where the majority of the propellant gas is injected into the thruster.
The remainder of the propellant gas used by the thruster is injected through the
exterior hollow cathode. In the second version of this type of thruster, called a
thruster with anode layer (TAL), the dielectric channel wall is replaced by a
metallic conducting wall, as illustrated in Fig. 7-2. This geometry considerably
shortens the electric field region in the channel where the ion acceleration
occurs-hence the name "thruster with anode layer" from the Russian literature
[1], associated with the narrow electric field region near the anode. However,
this configuration does not change the basic ion generation or acceleration
method. The channel wall, which is usually also part of the magnetic circuit, is
biased negatively (usually cathode potential) to repel electrons in the ionization
region and reduce electron-power losses. The defining differences between
these two types of Hall thrusters have been described in the literature [3].
Hall Thrusters
327
Cathode " , , , , , " 'i;j e-
Gas Feed , / ,
Hollow CathOde / S
Pole
E
Metallic Walls
Anode
Gas Xeo_____
Feed
Anode
Guard Rings
Thruster Center Line
N
Pole
w
III
Fig. 7.2. TAL thruster cross-section schemstic showing the
crossed electric and magnetic fields, end the ion snd
electron paths.
In the Hall thruster with dielectric walls illustrated in Fig. 7-1, an axial electric
field is established between the anode at the base of an annular channel and the
hollow-cathode plasma produced outside of the thruster channel. A transverse
(radial) magnetic field prevents electrons from this cathode plasma from
streaming directly to the anode. Instead, the electrons spiral along the magnetic
field lines (as illustrated) and in the Ex B azimuthal direction (into the page)
around the channel, and they diffuse by collisional processes and electrostatic
fluctuations to the anode and channel walls. The plasma discharge generated by
the electrons in the crossed electric and magnetic fields efficiently ionizes the
propellant injected into the channel from the anode region. Ions from this
plasma bombard and, near the channel exit, sputter erode the dielectric walls,
which ultimately determines the life of the thruster. Electrons from this plasma
also bombard the dielectric wall, depositing a significant amount of power in
this region. The reduced axial electron mobility produced by the transverse
magnetic field permits the applied discharge voltage to be distributed along the
channel axis in the quasi-neutral plasma, resulting in an axial electric field in
the channel that accelerates the ions to form the thrust beam. Therefore, Hall
thrusters are described as electrostatic devices [1] because the ions are
accelerated by the applied electric field, even though a magnetic field is critical
to the process. However, since the acceleration occurs in the plasma region near
328
Chapter 7
the channel exit, space charge is not an issue and the ion current density and the
thrust density can be considerably higher than that achievable in gridded ion
thrusters. The external hollow cathode plasma is not only the source of the
electrons for the discharge, but it also provides the electrons to neutralize the
ion beam. The single hollow cathode in Hall thrusters serves the same function
as the two cathodes in direct current (DC)-electron discharge ion thrusters that
produce the plasma and neutralize the beam.
The TAL thruster with metallic walls, illustrated in Fig. 7-2, has the same
functional features of the dielectric-wall Hall thruster-namely, an axial
electric field is established between the anode in the annular channel and the
plasma potential outside of the thruster channel. This field accelerates ions from
the ionization region near the anode out of the channel. The transverse (radial)
magnetic field again prevents electrons from streaming directly to the anode,
and the electron motion is the same as in the dielectric-wall Hall thruster.
However, the channel walls at the exit plane have metallic guard rings biased at
cathode potential to reduce the electron loss along the field lines. These rings
represent the major erosion source in the thruster because of ion bombardment
from the plasma, and guard ring material and design often determine the
thruster life. The anode typically extends close to the thruster exit and is often
funnel-shaped and curved to constrain the neutral gas and plasma to the center
of the channel (away from the guard rings) and to not intercept the magnetic
field lines, which would cause large electron losses. However, the anode is in
close proximity to the high electron-temperature region of the plasma, and
electrons collected by the anode can deposit a significant amount of power. The
channel width in TAL thrusters is typically twice the channel depth (including
the anode shaping). The external hollow cathode plasma provides the electrons
for the discharge and for neutralization of the ion beam, the same as for
dielectric-wall Hall thrusters.
The azimuthal drift of the electrons around the channel in the crossed electric
and magnetic fields in the cylindrical thruster geometry is reminiscent of the
Hall current in magnetron type devices, which has caused many authors to call
this generically a "closed-drift" thruster [1-3]. However, King [8] correctly
points out that the orientation of the fields in magnetrons (axial magnetic and
radial electric) provides a restoring force to the centrifugal force felt by the
electrons as they rotate about the axis, which produces the closed-drift electron
motion in magnetrons. There is no corresponding restoring force associated
with the different orientation of the crossed fields (radial magnetic and axial
electric required to produce axial thrust) in Hall thrusters. The closed-drift
behavior of the electron motion in Hall thrusters occurs only because of wall
sheath electric fields and the force associated with the magnetic gradient in the
radial direction in the channel. In this case, the electrons in the channel
Hall Thrusters
329
encounter an increasing magnetic field strength as they move toward the wall,
which acts as a magnetic mirror to counteract the radial centrifugal force.
The radial magnetic field gradient in the channel also forms an "ion lens,"
which tends to deflect the ions away from the channel walls and focus the ions
out of the channel into the beam. Figure 7-3 shows an example of the magnetic
field lines in the NASA-173Mv Hall thruster [9] developed at the National
Aeronautics and Space Administration Glenn Research Center (NASA-GRC).
The curvature of the field lines in the channel approaching the exit is found to
significantly improve the efficiency, especially for higher voltage, high specific
impulse (Isp), Hall thrusters [9,10]. The strength of the radial magnetic field in
the center along the channel [11] is shown in Fig. 7-4. The radial field peaks
near the channel exit and is designed to be essentially zero at or near the anode
surface.
7.2 Thruster Operating Principles and Scaling
The operating principles of both types of Hall thrusters and some scaling rules
for the geometries can be obtained from a simplified picture of the thruster
discharge. Consider a generic Hall thruster channel, shown schematically in
cross section in Fig. 7-5. The propellant gas is injected from the left through the
anode region and is incident on the plasma generated in the channel. An axial
scale length, L, is defined, over which the crossed-field discharge is
magnetized, and produces a significant plasma density of width w, which is
essentially the channel width. Ions exiting this plasma over the cylindrically
,-:-'::.
........ :..,:':",',,'._,'\.,".
,' ',"'" '.\
Ch,"",' : \\
/ , (((!;J;?f' ( / 1( II , ! i ! I I ) } \ J i l l i) )) ) I / !) ) I ' )
:.\\\\ \A \\\ \\\\l\1 I f II;;/j///
\\ \\ 1//;/ } J/(I
1\1 0 / JI' /;/.////,I;>
I "lj0. :/1 '/'1
u/w/I/;//IIJ// /1
'!tj :,/l..//'////
W/,:///I///.///
' " fii:0 ',,;;.
//
J"Y/
Thruster Centerline
Fig. 7-3. Magnetic field lines in the chennel region
of the NASA-173Mv Hall thruster (from [9]).
330
Chapter 7
'C 1.2
Cii
G: 1.0
.
aJ
c:
OJ 0.8
(II
0.6
'6
(II
c::
'C 0.4
(!)
.!:i
0.2
E
5
z 0.0
-50 -40 -30 -20 -10 0 10 20 30 40 50 60
Axial Position from Maximum B (mm)
Fig. 7-4. Axial variation centerline radial magnetic field normalized to
the peak radial field In the NASA-173Mv Hall thruster (from [11]).
XeD
t :>;..,..,.. --
...............-.,- --
j jI I [ - - - - , , , ,
i w , tr mrrIWm -+- X e+
................
...............
I':':':':':':':':':':':':':':')
...............
I:;:::::::::::::::::::::::::::
I:::::::::::::::::::::::;:::::
_...;.,...:.....:.:.::..:.;::;.:: i. _ _ _
L
Anode
Fig. 7-5. Schematic cross section of the plasma in
the Hall thruster channel.
symmetric area Ae form the beam. The applied magnetic field is primarily
vertical in the plasma region in this depiction.
7.2.1 Crossed-Field Structure and the Hall Current
The electrons entering the Hall thruster channel from the exterior cathode spiral
around the radial magnetic field lines with a Larmor radius derived in Chapter 3
and defined by Eq. (3.3-13). The electron Larmor radius must be less than the
characteristic scale length L so that the electrons are magnetized and their
mobility to the anode is reduced. If the electron velocity is characterized by
their thermal velocity, then the electron Larmor radius is
Hall Thrusters
331
re = vth = .!!!... 8kTe =J. ! m TeV «L,
roc eB 1rm B 1r e
(7.2-1)
where TeV is the electron temperature in eV and L is the magnetized plasma
depth in the channel. For example, the electron Larmor radius at a temperature
of25 eV and a typical radial magnetic field strength of 150 Gis 0.13 cm, which
is much smaller than typical channel width and plasma length in Hall thrusters.
The electrons must also be considered magnetized, meaning that they make
many orbits around a field line before a collision with a neutral or ion occurs
that results in cross-field diffusion. This is normally described by stating that
the square of electron Hall parameter must be large compared to unity:
2
£"\2 _ roc 1
U e -2» ,
v
(7.2-2)
where v is the total collision frequency. The effect of this criterion is clear in
the expression for the transverse electron mobility in Eq. (3.6-66), where a
large value for the Hall parameter significantly reduces the cross-field electron
mobility.
In a similar manner, the ion Larmor radius must be much greater than the
characteristic channel length so that the ions can be accelerated out of the
channel by the applied electric field:
'i =.:l= M 2eVb =..!. 2M Vb »L,
roc eB M B e
(7.2-3)
where the ion energy is approximated as the beam energy. The ion Larmor
radius, for example, in the l50-G radial field and at 300 eV of energy is about
180 cm, which is much larger than the channel or plasma dimensions. These
equations provide a general range for the transverse magnetic field in the
thruster channel. Even if the radial magnetic field strength doubles or ion
energy is half of the example given, the criteria in Eqs. (7.2-1) and (7.2-3) are
still easily satisfied.
As mentioned above, the magnetic and electric field profiles are important in
the thruster performance and life. The radial magnetic field typically is a
maximum near the thruster exit plane, as shoVv'Il in Fig. 7-4, and it is designed
to fall near zero at the anode in dielectric-wall Hall thrusters [12]. Electrons
from the cathode experience joule heating in the region of maximum transverse
magnetic field, providing a higher localized electron temperature and ionization
rate. The reduced electron mobility and high electron temperature in the strong
332
Chapter 7
magnetic field region causes the axial electric field also to be maximized near
the exit plane, as illustrated in Fig. 7-6. Since the neutral gas is injected from
the anode region and the mass utilization is very high (nearly every neutral is
ionized before reaching the channel exit), it is common to describe an
"ionization region" that is located upstream of the electric field peak. Of course,
the ions are accelerated directly by the electric field that peaks near the exit
plane, which is sometimes called the "acceleration region." The characteristic
scaling length L then spans these regions and is a significant fraction of the total
channel depth. The ionization and acceleration regions overlap, which leads to
dispersion in the ion velocity and some angular divergence in the resultant
beam. This is in contrast to ion thrusters, which have a distinct ionization
region in the plasma chamber and a finite acceleration region in the grids that
produces nearly monoenergetic beams with low angular divergence determined
by the optics and curvature of the grids.
In the crossed electric and magnetic field region of the channel, the electrons
move in the azimuthal direction due to the E x B force with a velocity given by
Eq. (3.3-16). The magnitude of the azimuthal electron velocity was found in
Chapter 3 to be
Ex B Er
VE=-:::- [m/sJ.
B 2 Bz
(7.2-4)
The current in the azimuthal direction, called the Hall current, is then the
integral of the electron plasma density and this velocity over the characteristic
thickness L [3,4]:
8
'c
::>
E 6
:c
4
12
10
2
o
o
10
20
30
40
50
z(mm)
Fig. 7-6. Typical Hall thruster radial magnetic field and axial
electric field along the channel length.
Hall Thrusters
333
I H = neeU: VE dZ)W = nee(J: dZ)W'
(7.2-5)
where W is the plasma width (shown in Fig. 7-5) that essentially fills the
channel. The axial electric field in the plasma channel is, approximately, the
discharge voltage divided by the plasma thickness, so the Hall current is
V d
I H "'" neew-.
B
(7.2-6)
Equation (7.2-6) shows that the Hall current increases with the applied
discharge voltage and with the channel width provided that the magnetic field is
unchanged. Hofer [10] showed that in Hall thrusters optimized for high
efficiency, the optimal magnetic field was proportional to the discharge voltage.
This implies that the Hall current is approximately constant for a given plasma
density or beam current in high-efficiency Hall thrusters.
The ion current leaving the plasma to form the beam through the area Ae is
approximately
2eVd
I. = n.ev.A "'" n.e -27CRw
I I I elM '
(7.2-7)
where R is the average radius of the plasma channel. Since the plasma is quasi-
neutral (ni "'" ne), even in the magnetized region, the Hall current can be
expressed using Eq. (7.2-7) as
I "", MVd
H 27CRB 2e.
(7.2-8)
Increasing the beam current in a fixed thruster design will increase the
circulating Hall current for a given magnetic field and discharge voltage. From
Chapter 2, the total thrust produced by a Hall thruster is
T= f(JHXB)dA=IHB""'Ii MVd .
2e
(7.2-9)
This expression for the thrust has the same form as Eq. (2.3-8) derived in
Chapter 2, where the force is coupled magnetically to the Hall thruster body
instead of electrostatically to the ion thruster grids.
334 Chapter 7
7.2.2 Ionization Length and Scaling
It is clear from the description of the Hall thruster operation above that the
electrons must be magnetized to reduce their axial mobility to the anode, but
the ions cannot be significantly magnetized so that the axial electric field can
efficiently accelerate them to form the thrust beam. In addition, a large majority
of the ions must be generated in the channel to permit acceleration by the field
in that region and to produce high mass utilization efficiency [13 J. This
provides some simple scaling rules to be established.
The neutral gas injected from the anode region will be ionized by entering the
plasma discharge in the crossed-field "ionization" region. Consider a neutral
gas atom at a velocity v n incident on plasma of a density ne' electron
temperature Te, and thickness L. The density of the neutral gas will decrease
with time due to ionization:
dn n _ ( )
---nnne aive ,
dt
(7.2-10)
where (aiv e) is the ionization reaction rate coefficient for Maxwellian
electrons, described in Appendix E. The flux of neutrals incident on the plasma
is
r n =nnvn'
(7.2-11)
and the neutral velocity is v n = dz / dt, where Z IS the axial length.
Equation (7.2-10) then becomes
dr ne ( aiVe )
---R=_ dz.
r n V n
(7.2-12)
This equation has a solution of
rn(z) =nO)e -z/A;,
(7.2-13)
where nO) is the incident flux on the ionization region and the ionization
mean free path A.i is given by
A.. = v n
I ne(aiVe)'
(7.2-14)
Hall Thrusters
335
This expression for the ionization mean free path is different from the usual
one, given in Eq. (3.6-6), that applies for the case of fast particles incident on
essentially stationary particles. This is because the neutral gas atoms are
moving slowly as they traverse the plasma thickness, and the fast electrons can
move laterally to produce an ionization collision before the neutral leaves the
region. Therefore, the ionization mean-free path depends on the neutral
velocity, which determines the time the atom spends in the plasma thickness
prior to a collision. The mean-free path also varies inversely with the electron
density because a higher number of electrons in the slab will increase the
probability of one of them encountering the neutral atom.
The percentage of the neutrals exiting the plasma of length L that are ionized is
r exit =l_e- LjA ;.
r incident
(7.2-15)
For example, in order to have 95% of the incident neutral flux on the plasma
ionized before it leaves the plasma, Eq. (7.2-15) gives
3v
L = -Ai In(1- .95) = 2. 996A i = ( n ) '
ne (Jive
(7.2-16)
or the plasma thickness must be at least three times the ionization mean-free
path. Since some of the ions generated in the plasma hit the channel side walls
and re-enter the plasma as neutrals instead of exiting as beam ions, the plasma
thickness should significantly exceed the ionization mean-free path to obtain
high mass utilization efficiency. This leads to one of the Hall thruster scaling
rules:
A-
-L = constant « 1.
L
(7.2-17)
In this example, this ratio should be less than 0.33.
The actual channel's physical depth in dielectric-wall Hall thrusters is given by
the sum of the magnetized plasma thickness (L) and the geometric length
required to demagnetize the plasma at the anode. This is illustrated
schematically in Fig. 7-6, where the channel depth is nearly twice the
magnetized plasma length. The axial magnetic field gradient has been found to
be critical for the thruster performance [12]. A decreasing radial magnetic field
strength going toward the anode, as shown in Fig. 7 -6, results in higher thruster
efficiency [4,12]. At the anode, the plasma is largely unmagnetized, and an
anode sheath fonns to maintain particle balance, similar to the DC plasma
336
Chapter 7
generator case discussed in Chapter 4. The anode sheath polarity and magnitude
depend on the local magnetic field strength and direction, which affects the
axial electron mobility, and on the presence of any insulating layers on the
anode that affects the particle balance [14-16]. Maintaining the local plasma
near the anode close to the anode potential is important in applying the
maximum amount of the discharge voltage across the plasma for the
acceleration of ions. In addition, the magnetic field profile near the thruster exit
strongly affects both the ability to achieve closed electron drifts in the
azimuthal direction [8] and the focusing of the ions in the axial direction as they
are accelerated by the electric field [9). Optimal magnetic field design in the
exit region reduces the ion bombardment of the walls and improves the ion
trajectories leaving the thruster [17].
Additional information on the thruster operation can be obtained by examining
the ionization criteria. Properly designed Hall thrusters tend to ionize
essentially all of the propellant gas incident on the plasma from the anode, so
that
nnne(aive)Ae L "" nn vnAe'
(7.2-18)
Using Eq. (7.2-6) for the Hail current, Eq. (7.2-18) becomes
L= vnVdw .
IH(aiVe)B
(7.2-19)
The length of the ionization region naturally must increase with neutral velocity
and can decrease with the ionization reaction rate coefficient, as seen in
Eq. (7.2-16). This is important in order to achieve high mass utilization when
propellants with a lower mass than xenon, such as krypton, are used to increase
the Isp ofthe thruster [18,19].
Studies of optimized Hall thrusters of different sizes [20-25] have resulted in
some scaling laws. A detailed comparison of the scaling laws in the literature,
with experimental results from the family of empirically optimized stationary
plasma thrusters (SPTs), was performed by Daren, et aI. [20). Assuming that
the thruster channel inner-to-outer diameter ratio and the ionization mean-free
path-to-plasma length ratio are constants, they found
Hall Thrusters
337
power oc thrust oc R 2
Id oc R 2
m oc R 2
w = R(1- constant)
Ae = 7r(R 2 _r 2 ),
(7.2-20)
where R is the outside radius of the channel. These scaling rules indicate that
the optimum current density is essentially constant as the thruster size changes.
The current density in Hall thrusters is typically in the range of 0.1 to
0.15 A/cm 2 . Thus, at a given discharge voltage, the power density in a Hall
thruster is also constant. Higher power densities are achieved by increasing the
voltage, which has implications for the life of the thruster.
7.2.3 Potential and Current Distributions
The electrical schematic for a Hall thruster is shown in Fig. 7-7. The power
supplies are normally all connected to the same reference, called the cathode
common. The hollow cathode requires the same power supplies as an ion
thruster, namely, a heater supply to raise the emitter to thermionic emission
temperatures and a keeper supply for ignition and to ensure stable cathode
operation at very low currents. The discharge supply is connected between the
cathode common (typically also connected to the thruster body or magnetic
circuit) and the anode located in the bottom of the channel. As in ion thrusters,
the cathode heater is turned off once the discharge supply is turned on, and the
cathode runs in a self-heating mode. The keeper is also normally used only
during start-up and is turned off once the thruster is ignited. Also shown are the
inner and outer magnetic field coils and their associated power supplies. Hall
thrusters have been built with the cathode positioned on-axis (not shown), but
this does not change the electrical schematic.
The potential distribution in a Hall thruster [26J is also illustrated in Fig. 7-7. In
the upstream region of the channel where the transverse magnetic field is low,
the plasma is weakly magnetized and the electron mobility is high. The plasma
potential is then close to the anode potential. The plasma potential decreases
toward the cathode potential near the thruster exit plane as the magnetic field
increases (shown in Fig. 7-6) and limits the electron mobility. The difference
between the cathode potential and the beam potential is the coupling voltage
V c ' which is the voltage required to extract current from the hollow cathode.
The beam voltage is then
Vb =Vd-V c
(7.2-21)
338
Chapter 7
Cathode
Outer
Coils
I Anode
Xe+ --
Inner
Coils
Thl'\Jster
Center Une
l[
-=- -=- Magnet
Supplies
Heater
Supply
0;
:;::;
<::
Q)
'0
n.
I Xe+--
I
\
I I
I I
I I
I I
1 '
I \
l"t + 1-
--r ---l V c
-=-T
t
Vb
Keeper
Supply
Cathode
Fig. 7-7. Hall thruster electrical schematic and potential distribution.
It is common in laboratory experiments to sometimes ignore the difference in
potential between the beam and ground as small (typically 10 to 20 V) and to
write the beam voltage as
Vb == V d - V cg '
(7.2-22)
where V cg is the cathode-to-ground voltage.
The on-axis potential, shown schematically by the dashed line in Fig. 7-7,
decreases from the ionization and acceleration regions to the thrust-beam
plasma potential. Ions are generated all along this potential gradient, which
causes a spread in the ion energy in the beam. Since the majority of the ions are
generated upstream of the exit plane (in the "ionization region"), the average
velocity of the ion beam can then be expressed as
( ) _ 2e
vb - M'
(7.2-23)
Hall Thrusters
339
where Vb represents, in this case, the average potential across which the ions
are accelerated. The actual spread in the beam energy can be significant [27,28]
and must be measured by plasma diagnostics.
The beam from the Hall thruster is charge neutral (equal ion and electron
currents). As in ion thrusters, the thruster floats with respect to either spacecraft
common in space or vacuum-chamber common on the ground. The common
potential normally floats between the cathode and the beam potentials and can
be controlled on a spacecraft by a resistor between the spacecraft common and
the cathode common. The actual beam energy cannot be measured directly
across the power supplies because the potential difference between the beam
and ground or spacecraft common is unknown and must be measured by probes
or energy analyzers. The coupling voltage is typically on the order of 20 V in
order to operate the cathode discharge properly, which usually ranges from 5%
to 10% of the discharge voltage for Hall thrusters with moderate Isp.
In a Hall thruster, the measured discharge current is the net current flowing
through the discharge supply. The current flowing in the connection between
the anode and the power supply in Fig. 7-7 is the electron and ion current
arriving to the anode:
Id=Iea-Ija'
(7.2-24)
The ion current is typically small due to its higher mass, and so the discharge
current is essentially the electron current collected by the anode. Likewise, the
current flowing in the cathode leg (neglecting any keeper current) is
Id=Ie+lic'
(7.2-25)
where Ie is the emitted current and I ic is the ion current flowing back to the
cathode. As with the anode, the ion current to the cathode is typically small,
and so the discharge current is essentially just the cathode electron emission
current. Therefore, the discharge current is approximately
I d "" Ie"" lea'
(7.2-26)
Figure 7-8 shows a simplified picture of the currents flowing through the
plasma, where the ion currents to the anode and cathode are neglected as small
and the ion and electron currents to the dielectric walls are equal and are not
shown. Ions are produced in the plasma by ionization events. The secondary
electrons from the ionization events, lei' go to the anode, along with the
primary electrons from the cathode, I ec. Primary electrons either ionize
neutrals or contribute energy to the plasma electrons so that the energetic
340
Chapter 7
electron distribution can produce the ionization. Since it is assumed that the
discharge current is essentially the total electron current collected by the anode
(the ion current is small), the discharge current can be written as
I d = lei + I ec-
(7.2-27)
The discharge current is also essentially the electron current emitted by the
cathode:
I d = Ie = lee + I eb .
(7.2-28)
Using the fact that one electron and one ion are made in each ionization event
such that lei = lib, Eq. (7.2-27) becomes
ld=lib+lec-
(7.2-29)
This relationship describes the net current crossing the exit plane, and so it is
commonly stated in the literature that the discharge current is the ion beam
current plus the backstreaming electron current crossing the exit plane [4,9].
Depending on the plasma conditions, it is possible for some fraction of the
secondary electrons produced near the channel exit to diffuse into the beam.
Equation (7.2-29) is still valid in this case because for every secondary electron
that diffuses into the beam, another electron from the cathode plasma must
cross the exit plane in the opposite direction to maintain the net discharge
current. The discharge current is still the net ion beam current plus the
backstreaming electron current across the exit plane. Finally, the ion beam
current is equal to the current of electrons entering the beam:
Ionization Event
'ib
lei
1\): \: \ \j \) j \ 1j 1
I ec :itm lijj t: 1
I
'eb
+
lel
Discharge Supply
Fig. 7-8. Electrical achematic for the currents
flowing through the discharge plasma and
power supply.
Hall Thrusters
341
lib =leb.
(7.2-30)
Since there is no current return path for the beam ions and electrons because the
thruster floats relative to the spacecraft or the grounded vacuum system, the
particles in Eq. (7.2-30) do not directly contribute to the discharge current
measured in the discharge power supply.
7.3 Hall Thruster Performance Models
The efficiency of a generic electric thruster was derived in Chapter 2. Since the
beam current and ion energy in Hall thrusters are not directly measured as in
ion thrusters, it is useful to develop an alternative expression for the efficiency
that incorporates characteristics of Hall thruster discharges. Total efficiency is
always defined as the jet power, which is the thrust times the exhaust velocity,
divided by the total input power:
T v
T]T =-.
lin
(7.3-1)
For any electric thruster, the exhaust velocity is given by Eq. (2.3-6), the Isp is
given by Eq. (2.4-1), and the thrust is given by Eq. (2.3-1), which can be
combined to give
Isp . g g v mi 1 T
v=-=---=--
2 2 g mp 2 mp .
(7.3-2)
The total efficiency is then
T 2
T]T = .
2mplin
(7.3-3)
7.3.1 Hall Thruster Efficiency
In Hall thrusters, the gas flow is split between the anode inside the discharge
channel and the hollow cathode:
mp =ma+me,
(7.3-4)
where ma is the anode flow rate and me is the cathode flow rate.
Since the cathode gas flow is injected exterior to the discharge channel
ionization region and is, thereby, largely lost, the "cathode efficiency" is
defined as
342
Chapter 7
. .
11 = ma = ma
'IC. . .
mp ma+mc
(7.3-5)
The total power into the thruster is
lin = P d + Pk + P mag'
(7.3-6)
where P d is the discharge power, P k is the cathode keeper power (normally
equal to zero during operation), and P mag is the power used to generate the
magnetic field. The electrical utilization efficiency for the other power used in
the Hall thruster is defined as
Pd P d
1]0 = - =
P T Pd +P k +P mag
(7.3- 7)
Using Eqs. (7.3-5) and (7.3-7) in Eq. (7.3-3) gives a useful expression for the
total efficiency of a Hall thruster:
1 T 2
7Jr= _ 2 -:-- p 7J c 7Jo'
ma d
(7.3-8)
By placing the Hall thruster On a thrust stand to directly measure the thrust,
knowing the flow rates and flow split between anode and cathode, and knowing
the total power into the discharge, keeper, and magnet, it is then possible to
accurately calculate the total efficiency.
While Eq. (7.3-8) provides a useful expression for evaluating the efficiency, it
is worthwhile to further expand this equation to examine other terms that affect
the efficiency. Thrust is given from Eq. (2.3-16):
(2M" fi7
T = Y V-;- Ib ",;V b ,
(7.3-9)
where the average or effective beam voltage is used due to the spread in ion
energies produced in the Hall thruster acceleration region. The fraction of the
discharge current that produces beam current is
Ib
7Jb =-.
Id
(7.3-10)
Likewise, the fraction of the discharge voltage that becomes beam voltage is
Hall Thrusters
343
v;
1] =-12..
v .
V d
Inserting Eqs. (7.3-9) through (7.3-11) into Eq. (7.3-8) gives
(7.3-11)
__2 M Id 2
1]T -'Y --:-1]b1]v1]c1]o'
e ma
(7.3-12)
Equation (7.3-12) shows that the Hall thruster efficiency is proportional to the
ion mass and the discharge current, because these terms dominate the thrust
production, and is inversely proportional to the anode mass flow, which
dominates the mass utilization efficiency. This equation can be further
simplified by realizing that
M 1 .
- d1]b =mi,
e
(7.3-13)
and that the total mass utilization efficiency can be expressed as
. .
m. m.
1] =--1...= I
m. . .'
mp ma+mc
(7.3-14)
The total efficiency then becomes
2
1]T = r 1]b1]v1]m1]o'
(7.3-15)
This expression contains the usual gamma-squared term associated with beam
divergence and multiply charged ion content and also the mass utilization and
electrical utilization efficiencies. However, this expression also includes the
efficiencies associated with generating beam ions and imparting the discharge
voltage to the beam voltage. This shows directly that Hall thruster designs that
maximize beam current production and beam energy and that minimize the
cathode flow produce the maximum efficiency, provided that the beam
divergence and double-ion content are not adversely affected. Expressions like
Eq. (7-3-15) appear in the Hall thruster literature [4,7] because they are useful
in illustrating how the efficiency depends on the degree to which the thruster
converts power supply inputs (such as discharge current and voltage) into the
beam current and beam voltage that impart thrust. Understanding each
efficiency term is critical to fully optimizing the Hall thruster performance.
The efficiency of a Hall thruster is sometimes expressed in terms of the anode
efficiency:
344
Chapter 7
1 T 2 17T
17 -----
a - 2 rhaPd - 17017c '
(7.3-16)
which describes the basic thruster performance without considering the effects
of the cathode flow or power used to generate the magnetic field. This is
usually done to separate out the cathode and magnet losses so that trends in the
plasma production and acceleration mechanisms can be discerned. The anode
efficiency should not be confused with the total efficiency of the thruster given
by Eq. (7.3-3).
It is useful to show an example of the relative magnitude of the efficiency terms
derived above. Figure 7-9 (from [10]) shows the anode efficiency that was
defined in Eq. (7.3 -16) and the other efficiency terms discussed above for the
laboratory-model NASA-l73Mv2 Hall thruster operating at 10 mg/s versus the
discharge voltage. In this figure, the charge utilization efficiency is the net
efficiency decrease due to multiply charged ions [10), the voltage utilization
efficiency (17v) is the conversion of voltage into axially directed ion velocity,
the current utilization efficiency (17b) is the fraction of ion current contained in
the discharge current, and mass utilization efficiency (17m) is the conversion of
neutral mass flux into ion mass flux. The anode efficiency increases with
discharge voltage, largely because the voltage efficiency and current efficiency
increase with voltage. The current utilization is always lower than the other
efficiency terms, suggesting that the ultimate efficiency of Hall thrusters is
dominated by the electron dynamics involved in producing the plasma and
neutralizing the beam. This emphasizes the importance [9, I 0) of optimizing the
magnetic field design to maximize the thruster efficiency.
The value of rin Eq. (7.3-15) that is typically found for Hall thrusters can be
evaluated using Eq. (2.3-15) and the data in the literature. For example, a 10%
double-ion content gives a thruster correction factor in Eq. (2.3-14) of
a = 0.973. The thrust loss due to the beam angular divergence of Hall thrusters
is given by Eq. (2.3-10), (F T =cos8). For both SPT-100 Hall thrusters [6) and
TAL thrusters [29), a half-angle divergence of 8 equal to about 20-deg is
observed, producing F T = 0.94. The total correction factor is then
r = aFT = 0.915 for typical Hall thruster conditions. Values for rof about 0.9
have been reported.
The equivalent discharge loss for a Hall thruster can also be calculated [4,6) to
provide information on how the thruster design impacts the cost of producing
the beam ions. The average energy cost for producing a beam ion is the
Hall Thrusters
345
1.00
{J-'-.-. -' .
ro_.-'-o-.-.-
_.-W ...
0.90 ...-. ......_ _ - .- ------... --- - ..
----
... -... ..... .....
._..._._.-......... .;........................_......... .
-..........
. .............
0.80
r::
QJ 0.70
'C::;
Ii:
UJ
0.60
0.50
_-cr---- -----CT---- ----{)----
.. ._- -()'- : __--_-._-_- -+- Charge
- -.0-- Voltage
- ....-. Mass
.-. --.--..--- --------------- -.- ............ Current
--0-- Anode
0.40
300 400
500 600 700 800
Discharge Voltage 01)
Fig. 7-9. Optimized anode efficiency and the individual efficiency terms
versus discharge voltags for ths NASA.173Mv2 Hall thruster opersting at
10 mg/s (from [10]).
900 1000
discharge power divided by the number of beam ions minus the beam power
per beam ion:
Cb = IdVd _ lbVb = IdVd _ Vb = Pd(I-1]b1]v) ,
lb lb lb lb
where Eqs. (7.3-10) and (7.3-11) were used. Equation (7.3-17) has the usual
units for discharge loss of watts per beam-amp or electron-volts per ion. As
expected, maximizing the current and voltage efficiencies minimizes the
discharge loss. As an example of discharge loss in a Hall thruster, consider the
SPT-100 thruster operating at the nominal 1.35-kW discharge power and
300 V. The discharge current is then 1350/300 = 4.5 A. The thruster is reported
[4-6] to have values of 1]b ::: 0.7 and 1]v = 0.95. The cost of producing beam
ions is then
(7.3 -17)
P d (I-1]b1]v) 1350(1-0.7*0.95) .
cb = - - 144 reV/IOn].
lb 0.7*4.5
This is on the same order as the discharge loss for DC-discharge ion thrusters.
7.3.2 Multiply Charged Ion Correction
In Hall thrusters operating at higher power levels (high mass flow rate and high
discharge voltages >300 V), a significant number of multiply charged ions can
346
Chapter 7
be generated, and their effect on the perfonnance may be noticeable. Following
the analysis by Hofer [11], the performance model from the previous section
can be modified to address the case of partially ionized thruster plasmas with an
arbitrary number of ion species.
The total ion beam current is the sum of each ion species i:
N
Ib = Ll i .
i=1
(7.3-18)
The current fraction of the ith species is
+. =!.L
Ji .
Ib
(7.3-19)
Likewise, the total plasma density in the beam is the sum of the individual
species densities,
N
nb = L ni ,
i=1
(7.3-20)
and the density fraction of the ith species is
t'. =.!!i.
I .
nb
(7.3-21)
The total beam current is then
"" ( ) "" 2eVb 3/2
Ib = £.,.niqi vi Ae = £.,.nb e -SiZi '
. . M
I I
(7.3-22)
where Zi is the charge state of each species. The mass flow rate of all the beam
ion species is
mb = IbM L Ii .
e i Zi
(7.3-23)
Using the current utilization efficiency defined In Eq. (7.3-10), the mass
utilization efficiency in Eq. (7.3-14) then becomes
Hall Thrusters
347
17m = b = 17b. 1 d M L .f; .
mp m pe i Zi
(7.3-24)
If the current utilization efficiency is the same for each species, then the mass
utilization efficiency for arbitrary species can be written as
+ "\:' .f;
17m = 17m """ Z '. '
j ,
(7.3-25)
where 17 is the usual mass utilization for a singly charged species. This is an
easily implemented correction in most models if the species fractions are
known. Likewise, the thrust obtained for multiple species can be generalized
from Eq. (2.3-16) for Hall thrusters to
"\:' 2M17bVd "\:' .f;
T m = """T j = 17b1d """ -cose.
. e. Z , '
, ,
(7.3-26)
7.3.3 Dominant Power Loss Mechanisms
In preparation for examining the terms that drive the efficiency of Hall
thrusters, it is useful to examine the dominant power-loss mechanisms in the
thruster. Globally, the power into the thruster comes from the discharge power
supply. The power out of the thruster, which is equal to the input power, is
given to first order by
P d = P b + Pw + Pa + P R + l10n ,
(7.3-27)
where P b is the beam power given by IbVb, Pwis the power to the channel
walls due to ion and electron loss, Pa is the power to the anode due to electron
collection, P R is the radiative power loss from the plasma, and l10n is the
power to produce the ions that hit the walls and become the beam. Additional
loss terms, such as the power that electrons take into the beam, the ion power to
the anode, etc., are relatively small and can usually be neglected.
In Hall thrusters with dielectric walls, the power loss due to electron and ion
currents flowing along the radial magnetic field through the sheath to the
channel walls (Pw) represents the most significant power loss. The current
deposition and power lost to the walls can be estimated from the sheath
potentials and electric fields in the plasma edge. Since the wall is insulating, the
net ion and electron currents to the surface must be equal. However, ion and
electron bombardment of common insulator materials, such as boron nitride, at
348
Chapter 7
the energies characteristic of Hall thrusters produces a significant number of
secondary electrons, which reduces the sheath potential at the wall and
increases the power loading.
The requirement of local net current equal to zero and particle balance for the
three species gives
I iw = Iew -yI ew = Iew (l-y),
(7.3-28)
where y is the secondary electron yield from electron bombardment. Using
Eq. (3.7-51) for the Bohm current of ions to the wall, Eq. (3.7-52) for the
electron current to the wall, and neglecting the secondary electron velocity,
Eq. (7.3-28) can be solved for the sheath potential l/>s' including the effect of
secondary electron emission:
l/>s = k: e In[(1-y) ].
(7.3-29)
This expression is slightly different than that found in the literature [30,31]
because we have approximated e- l12 = 0.61 :::: 0.5 for the coefficient in the
expression for the Bohm current. Nevertheless, as the secondary electron yield
increases, the sheath potential decreases from the classic floating potential
described in Chapter 3 toward the plasma potential.
Secondary electron yields reported in the literature [30,32,33] for several
materials used for the walls of Hall thrusters are shown in Fig. 7-10. In this
figure, the measurements were made using a monoenergetic electron gun.
Generalizing these data for incident Maxwellian electron temperatures is
accomplished by integrating the yield over the Maxwellian electron energy
distribution function, which results in multiplying the secondary emission
scaling by the gamma function [30]. An expression for the secondary electron
yield from electron bombardment of materials is then
b
Y = r(2 +b)aT eV '
(7.3-30)
where the electron temperature is in electron volts, r(x) is the gamma function,
and the coefficients a and b are found from fits to the data in Fig. 7-10. Values
of the coefficients in Eq. (7.3-30) can be found in Table 7-1 for these materials,
and the actual secondary electron yield for the Hall thruster walls is plotted
versus plasma electron temperature in Fig. 7-11. It should be noted that due to
reflection at the wall, the effective secondary electron yield does not go to zero
for zero electron energy. This effect is accommodated by linear fits to the data
Hall Thrusters
349
2.5 -
. AI203 Data {Gascon>
- AI203 Fit to Data
. BN Data (Bugeat)
-.-. BN Fit to Data
.... BNSi02 (Gascon>
- - ..... BNSi02 Fit to Data
Stainless Steel
3.5
3.0 -
"0
Q)
>=
c
I:?
t5
Q)
UJ
1.5
"0
c
o
1.0
UJ
2.0
0.5
---- - --=-- ---=- -
---
-----
0.0
o 10 20 30 40 50 60 70 80 90 100
Electron Energy (eV)
Fig. 7-10. Secondary electron yield for several wall materials used in
Hall thruaters, meaaured with a mono-energetic electron beam.
Table 7-1. Fitting parameters for secondary electron yield data.
a b r(2 + b)
Alumina (AI 2 0 3 > 0.145 0.650 1.49
Boron Nitride (BN) 0.150 0.549 1.38
BNSi0 2 0.123 0.528 1.36
Stainless steel 0.040 0.610 1.44
that result in finite yield at low electron energy. Figure 7-12 shows the data for
boron nitride and BNSiO z with the two different fitting choices. In the
evaluation of the sheath potential in the presence of the secondary electron
emission below, whether one uses a linear or power fit does not make a
significant difference in the ionization and acceleration regions for electron
temperatures above about 10 eV.
Measurements of the electron temperature in the channel of Hall thrusters by a
number of authors [34-36] show electron temperatures in the channel well in
excess of 20 eV. Equation (7.3-29) predicts that the sheath potential will go to
zero and reverse from negative going (electron repelling) to positive going
(electron attracting) as the secondary electron yield approaches unity for some
of the materials. The value at which this occurs for each of the materials shown
in Table 7-1 is indicated in Fig. 7-11. For boron nitride and alumina walls this
occurs at electron temperatures below 20 eV, and for BN-SiO z walls it occurs at
350 Chapter 7
3.5
3.0
'tJ
'ji; 2.5
c::
0
13 2.0
G.>
ijj
1.5
CI1
'tJ
c::
0
u 1.0
G.>
UJ
0.5
0.0
0
Alumina
...........' Boron Nitride
----- BNSi02
-. -. _. Stainless Steel
...................
--------
20 30
Electron Temperature (eV)
Fig, 7-11. Secondary electron yield from the powar.curve fits versus
electron temperature, showing the cross.over value at which the yield
equals one.
10
40
50
2.5
. Boron Nitride
'tJ 2.0 - . BNSi0 2
'ji;
c::
e
t)
G.>
ijj
1.0
'tJ
c::
o
U
G.>
UJ
1.5 -------
0.5
0.0
o 10 20 30 40 50 60 70 80 90 100
Electron Energy (eV)
Fig. 7-12. Secondary electron yield versua electron energy, showing
linear curve fits to the data producing finite yield at low incident
energy.
electron temperatures on the order of 30 eV. In addition, depending on the
collision mean-free path, some of the secondary electrons can pass completely
through the plasma to strike the opposite wall of the channel. The possibility of
the sheath potential reversing to electron attracting was used to predict very
high electron power losses to the walls in some early analyses of Hall thrusters
Hall Thrusters
351
at high electron temperatures [30,31] because the incident electron flux can
then equal or exceed the random electron flux along the magnetic field lines in
the plasma.
In reality, the sheath potential for a floating boundary can never go significantly
more positive than the local plasma potential [37,38] for two reasons. First, the
secondary electrons are ejected from the wall with very low energy (typically
1-2 eV). Any positive-going sheath (where the plasma is negative by one or
two volts relative to the wall) will repel the secondary electrons and return them
to the wall. This clamps the sheath potential to within a few volts positive with
respect to the plasma. Second, the secondary electron emission is space charge-
limited in the sheath. This effect was analyzed by Hobbs and Wesson [39], who
showed that space charge limits the secondary electron current from the wall
independently of the secondary electron yield. The local electron space charge
in the sheath clamps the sheath voltage to a maximum value that is always
negative relative to the plasma.
The effects of space charge on the sheath potential at the wall can be analyzed
[39] by solving Poisson's equation for the potential in the sheath:
J 2 tP 1
2=-(ne+ n s- n d,
ax Eo
(7.3-31)
where ns is the secondary electron density. Using a Maxwellian distribution for
the electrons, the plasma density in the channel is
_ ( ) et/JlkT
ne - no - nso e ,
(7.3-32)
where no is the ion density at the sheath edge, nso is the secondary electron
density at the sheath edge, and tP is the potential relative to the potential tP o at
the wall. The ions are assumed to be cold and to have fallen through the pre-
sheath to arrive at the sheath edge with an energy of
1 2
& = - mv
2 0'
(7.3-33)
where V o is the Bohm velocity modified for the presence of the secondary
electrons. The ion density through the sheath is then
n. = n ( J l/2
I 0 &-etP
(7.3-34)
352
Chapter 7
The secondary electrons are assumed to be emitted with an energy that is small
compared to the plasma electron temperature and are accelerated through the
sheath. The equation of continuity for current at the sheath edge gives
nsv s =Lnov o ,
l-y
(7.3-35)
where v s is the secondary electron velocity. The secondary electron density
through the sheath is then
y ( m & )
ns =n o l-y M q;-q;o .
(7.3-36)
Equations (7.3-32), (7.3-34), and (7.3-36) are inserted into Poisson's equation,
Eq. (7.3-31), and evaluated by the usual method of multiplying through by
dc/J / dx and integrating to produce
1 ( dc/J ) 2 2& [( ec/J ) 1/2 ]
2EonokTe dx = kTe 1- & - 1
+..3.L ( _ ec/Jo ) 1/2 [( 1_1- ) 1/2 -1 ] (7.3-37)
l-y M kTe kTe c/Jo
+ [ 1- -E- ( _ .£ ) 1I2 ][ exP ( ) _1 ] .
1 y M ec/Jo kTe
A monotonic sheath potential is found [39] for
& = kTe + L ( ) 1/2 ( -& ) 3/2 ( kTe _ ec/Jo ) .
2 1 - Y M ec/Jo 2
(7.3-38)
For the case of no secondary electron emission (y going to zero), the Bohm
criteria solution of & kTelZe is recovered. Due to the large electron-to-ion
mass ratio for xenon, the right-hand tenn is always small and the ion velocity at
the sheath edge for the case of finite secondary electron emission will be near
the Bohm velocity. Hobbs and Wesson evaluated this minimum ion energy at
the sheath edge for the case of space charge-limited emission of electrons at the
wall, dc/Jo / dx = 0 in Eq. (7.3-37), and they found
Hall Thrusters
353
&0 = 0.58 kTe .
e
(7.3-39)
Equation (7.3-39) indicates that the Bohm sheath criterion will still
approximately apply (within about 16%) in the presence of secondary electron
emISSIOn.
The value of the sheath potential for the space charge-limited case can be found
by setting the electric field at the wall equal to zero in Eq. (7.3-37) and
evaluating the potential using Eq. (7.3-38) and the current continuity equation:
;[l <J: ;J 2}xp( :: )( 8: r = l A )112 (73-40)
The space charge-limited sheath potential for xenon is found to be
QJo =-1.02 kTe .
e
(7.3-41 )
The secondary electron yield at which the sheath becomes space-charge limited
[39] is approximately
( } 1/2
Yo =1-8.3 : '
(7.3-42)
which for xenon is 0.983.
This analysis shows that the sheath potential for a xenon plasma decreases from
-5.97T e for walls where the secondary electron yield can be neglected to
-1.02T e for the case of space charge-limited secondary electron emission that
will occur at high plasma electron temperatures. The value of the sheath
potential below the space-charge limit can be found exactly by evaluating the
three equations, Eqs. (7.3-37), (7.3-38), and (7.3-40), for the three unknowns
(QJ, y, and &).
However, the value of the sheath potential relative to the plasma edge in the
presence of the secondary electron emission can be estimated by evaluating
Eq. (7.3-29) while accounting for each of three species [38]. Quasi-neutrality
for the three species in the plasma edge dictates that ni = ne + ns , where ns is
the secondary electron density, and the flux of secondary electrons is the
354
Chapter 7
secondary electron yield times the flux of plasma electrons. Equating the ion
flux to the net electron flux to the wall gives
I ( 8kT ) 112 ( t/J )
I iw = nieviA = Iew (1-y) = -ne (l-y)e --.£.. Aexp!....L, (7.3-43)
4 nm kTe
where the ion and electron densities are evaluated at the sheath edge. The
sheath potential q>s relative to the plasma potential is then
kTe [ ne vB ( )]
q>s =--In --- l-y ,
e 2nm ne +ns vi
(7.3-44)
where vi is the modified ion velocity at the sheath edge due to the presence of
the secondary electrons and the ion density is the sum of the plasma and
secondary electrons. This equation is useful up to the space charge-limited
potential of q>o = -1.02T eV and provides good agreement with the results for
xenon described above for nevB / nivi "" 0.5. The sheath potential predicted by
Eq. (7.3-44) is plotted in Fig. 7-13 for two wall materials. In the limit of no
secondary electron emission (r= 0), the classic value for the sheath floating
potential is obtained from Eq. (3.7-53). Once the electron temperature is
sufficiently high to produce a yield approaching and even exceeding one, then
the space charge-limited case of q>o = -1.02T e v is obtained. In between, the
sheath potential depends on the electron temperature and material of the wall.
Without the space charge-limited sheath regime predicted by Hobbs and
Wesson, the potential would have continued along the thin dashed lines for the
two cases and incorrectly resulted in very low sheath potentials and high power
loadings at the wall.
The total power to the wall of the Hall thruster is
I ( 8kT ) 112 ( kT )
Pw=; nm e enoAeel/JslkTe 2-;- +noevoA(&-q>s),
(7.3-45)
where the first term is due to electrons overcoming the repelling sheath
potential and depositing 2Te on the wall, and the second term is due to ions
that have fallen through the pre-sheath potential and then the full sheath
potential. Note that no in this equation is the plasma density at the sheath edge
and is roughly half the average plasma density in the center of the channel due
to the radial pre-sheath. The cooling of the wall by the secondary electron
Hall Thrusters
355
0
-10
-20
-30
C\i -40
OJ
'0 -50
c..
.r:: -60
16
OJ
.r:: -70
tI)
-80
-90
\.
-'\ .
\ '.
---C' ".
\ ' .
\ ,
\ "
--- ' . "
\ '...-..-,'
\
_n
\
_ _No E..!!1 _ 2 _\
(y = 0) \
\
\
Space Char g e
Limited Emission
i '
. .................
-J ... .
.
" ..........
. ........
- - -. No Emission
- AI203
----- BNSi02
-100
o
10 15 20 25 30 35 40 45 50
Electron Temperature (eV)
Fig. 7-13. Sheath potential versus electron temperature for two
materials. The sheath transitions to space-charge limited where the
dashed lines intersect the potential curves.
5
emission has been neglected. Equation (7.3-45) can be rewritten in tenns of the
total ion current to the wall as
Pw = I iw [( 2 m )1/2 ee slkTe (2 k e )+(& - S)].
(7.3-46)
For the case of space charge-limited secondary electron emission, the sheath
potential is s = o = -l.02T eV , and the ion energy is & = 0.58 TeV in order to
satisfy the Bohm condition. Equation (7.3-45) predicts the maximum heat
loading to the wall in the presence of a Maxwellian electron distribution and
secondary electron emission from the wall, which is the dominant power loss
mechanism in dielectric-wall Hall thrusters. If the electron distribution function
is non-Maxwellian, the heat load to the wall can differ from that predicted by
Eq. (7.3-45).
In the case of TAL thrusters, the channel wall is metallic and biased to the
cathode potential. This eliminates the zero-net current condition found on the
insulating walls of dielectric-channel Hall thrusters and used to determine the
local heat flux in Eq. (7.3-45). The electron flux to the cathode-biased TAL
channel wall is negligible, and the secondary yield for metals is much lower
than for insulators, so the secondary electron emission by the wall in TAL
thrusters has little effect on the thruster operation. In addition, the plasma tends
to be localized near the channel center by the anode design and gas feed
geometry. The plasma then tends to be in poor contact with the guard rings at
356
Chapter 7
the wall that also have a small exposed area to the plasma, resulting in low
radial ion currents to the wall. This is evidenced by the erosion pattern typically
observed on TAL guard rings [29], which tends to be on the downstream face
from particles outside the thruster instead of on the inside diameter from the
channel plasma. While the ion and electron currents and power deposition to
the inside diameter of the metallic guard ring are likely smaller than in the
dielectric-wall thruster case (where the power loss due to the electrons is
dominant), the erosion on the face of the guard ring indicates energetic ion
bombardment is occurring. This effect is significant in detennining the life of
the TAL.
However, TAL thrusters are characterized by having the anode in close contact
with the magnetized plasma near the channel exit, in contrast to the dielectric-
wall Hall thrusters. The magnetized plasma has a high electron temperature,
which causes a significant amount of power to be deposited from the discharge
current on the anode. It is possible to evaluate this power loss mechanism based
on the current and sheath potential at the anode.
As described above, the discharge current is essentially equal to the electron
current collected at the anode. In order for the TAL thruster to transfer a large
fraction of the discharge voltage to the ions, the potential of the plasma near the
anode must be close to the anode potential. Assuming the local plasma potential
is then equal to or slightly positive relative to the anode, the electron current to
the anode, la' deposits 2TeY in energy from the plasma (see Appendix C). The
power deposited on the anode, Pa' is then given by
Pa=2Tey1a :::: 2Tey1d'
(7.3-47)
where Eq. (7.2-26) has been used. If the plasma potential is negative relative to
the anode, the thruster efficiency will suffer due to the loss of discharge voltage
available to the ions, and the anode heating will increase due to the positive-
going sheath potential accelerating electrons into the anode. Equation (7.3-47)
then represents a reasonable, but not worst-case, heat flux to the anode.
This power loss to the anode can be related to the beam current using the
fraction of the discharge current that produces beam current, which is defined
as
Ib
T/b =-.
Id
(7.3-48)
Therefore, the power to the anode is
Hall Thrusters
357
Ib
Pa = 2T ev-'
17b
(7.3-49)
In well-designed Hall thrusters, 17b ranges typically from 0.6 to 0.8. Therefore,
the power loss to the anode is 3 to 4 times the product of the electron
temperature in the near-anode region and the beam current. This is the most
significant power loss mechanism in TAL thrusters.
7.3.4 Plasma Electron Temperature
The electron temperature in the channel must be known to evaluate the power
loss mechanisms described above. The peak electron temperature in the plasma
channel can be found using power balance, described by Eq. (7.3-27). This
method provides reasonable estimates because the power loss in the thruster
will be shown to be a strong function of the electron temperature. Even though
the plasma density and electron temperature peak in different locations along
the channel associated with the different ionization and acceleration regions, the
strong axial electron temperature profile in Hall thrusters causes the majority of
the power loss to occur in the region of the highest electron temperature. This
occurs near the channel exit where the magnetic field across the channel is the
strongest. Evaluating the plasma parameters and loss tenns in this region,
which is bounded by the channel width and magnetic axial field extent in the
channel, establishes the electron temperature that is required to satisfy the
power balance in the plasma for a given thruster current and voltage.
The individual tenns in Eq. (7.3-27) will now be evaluated. The input power to
the thruster is the discharge current times the discharge voltage (P d = IdV d ).
The power in the beam, using Eq. (7.3-48), is
P b = 17 b17 v IdV d =17Jb V d,
(7.3-50)
where the current utilization and voltage utilization efficiencies have to be
known or evaluated by some means. The difference between the beam power
and the discharge power is the power remaining in the plasma channel to
produce the plasma and offset the losses:
P p = (l-17b)I d V d = IecV d ,
(7.3-51)
where P p is the power into the plasma. The plasma is produced and heated
essentially by the collisional transport of the electrons flowing from the cathode
plasma in the near-plume region to the anode inside the thruster. The power
into channel walls, from Eq. (7.3-45), can be written as
358
Chapter 7
Pw n,eA[ ' ( :;J 2 e... IkT , + i (&- ,)l
(7.3-52)
where A is the total area of the inner and outer channel walls in contact with the
high temperature plasma region, vi is the ion velocity toward the wall, and the
sheath potential iPs is given by Eq. (7.3-44). Equation (7.3-52) shows the wall
power varies linearly with density but with the electron temperature to the 3/2
power. This is why the dominant wall losses occur in the region of the highest
electron temperature.
The power into the anode, from Eq. (7.3-47), can be written as
Pa = 2I d T ev (anode).
(7.3-53)
where the electron temperature in this case is evaluated near the anode. The
power radiated is
P R =none(a*ve)v,
(7.3-54)
where the excitation reaction rate coefficient is given in Appendix E as a
function of the electron temperature, and V is the volume of the high-
temperature plasma region in the channel, which can be taken to be the channel
cross-sectional area times the axial thickness L. Equations (7.3-52) and (7.3-54)
require knowledge of the plasma density in the high-temperature region in the
channel. This can be found to first order from the beam current
n = 1]b f d
e eVbAc eAc 21] Vd '
(7.3-55)
where Ac is the area of the channel exit. Finally, the power to produce the ions
in the thruster is the sum of the beam current and the ion current to the walls
times the ionization potential:
lion = (Ib + f iw )U+ = [1]b + few (1- y)Jfd U +,
(7.3-56)
where f iw is given by Eq. (7.3-28) and few is given by the left-hand side of
Eq. (7.3-52) divided by 2Te (because the electron energy hitting the wall is
already included in this equation).
Hall Thrusters
359
The peak electron temperature is found by equating the input power to the
plasma in Eq. (7.3-51) with the sum ofthe various loss terms described above,
and then iterating to find a solution. For example, the SPT-100 Hall thruster has
a channel outside diameter of 10 cm, a channel inside diameter of 7 cm, and
runs nominally at a discharge of 300 V at 4.5 A with a current utilization
efficiency of 0.7 and a voltage utilization efficiency of 0.95 [6]. From
Eq. (7.3-55), the plasma density at the thruster exit is about 1.6 x 10¹⁷ m -3. The
power into the plasma, from Eq. (7.3-51), is about 433 W. Taking the electron
temperature at the anode to be 5 eV and the hot-plasma thickness L to be about
1 cm, the power balance equation is satisfied if the electron temperature in the
channel plasma is about 25 eV.
It is a common rule-of-thumb in Hall thrusters to find that the electron
temperature is about one-tenth the beam voltage [35]. The result in the example
above of Te ;::: 0.08 Vd is consistent with that observation. It is also important to
note that nearly 70% of the power deposited into the plasma goes to the
dielectric channel walls in the form of electron heating, and that the radiation
losses predicted by Eq. (7.3-54) are negligible for this case because the electron
temperature is so high. Finally, the ion current to the wall for this example
from the solution to Eq. (7.3-28) is 0.52 A, which is about 12% of the discharge
current and 8% of the beam current in this thruster. This amount agrees well
with the 10% ofthe ion current going to the wall calculated by Baranov [40] in
analyzing Hall thruster channel wear.
7.3.5 Hall Thruster Efficiency (Dielectric Walls)
The efficiency of a Hall thruster with a dielectric wall can be estimated by
evaluating the terms in the thruster efficiency given by Eq. (2.5-7), which
requires evaluating the total power-loss terms in Eq. (7.3-27) to obtain a value
for the effective electrical efficiency. This also illustrates the dominant loss
mechanisms in the thruster.
The first term in Eq. (7.3-27), the beam power due to the accelerated ions, P b ,
is just lb Vb, where the effective beam voltage will be used. The power loss to
the dielectric wall will be estimated for the SPT -100 Hall thruster [4-6] using
the analysis of Hobbs and Wesson [39] described in Section 7.3.3. The heat
flux to the wall was given by Eq. (7.3-46):
Pw l;w[( r ,,,,lkT, ( k , )+(.H,J].
(7.3-57)
360
Chapter 7
where liw is the ion flux to the wall. Following Hobbs and Wesson, the
modification to the Bohm criterion is small and & "" T e /2 from the Bohm
criterion. From Eq. (7.3-44), the sheath potential for xenon and BNSi0 2 walls
in the SPT-IOO thruster, assuming an average electron temperature along the
channel wall of 25 eV, is about -54 V. Plugging these values into Eq. (7.3-57)
gives
Pw = 45.81 iw T eV +2.65I iw T eV = 48.5l iw TeV'
(7.3-58)
The first term on the right-hand side is again the electron power loss to the wall
(written in terms of the ion current to the dielectric surface), and the second
term is the ion power loss. The power loss to the channel wall due to the
electron loss term is an order of magnitude larger than the power loss due to
ions.
It is convenient in evaluating the efficiency of the thruster to relate the ion
current to the wall in Eq. (7.3-58) to the beam current. In the plasma, there is an
electric field toward the wall due to the pre-sheath of approximately
TeV /2r = Te/w. There is also the axial electric field of Vb /L producing the
beam energy. It is common in Hall thrusters to find that the electron
temperature is about one-tenth the beam voltage [35], and the channel width is
usually approximately L [4,20]. Therefore, the axial electric field is on the order
of lO times the radial electric field. On average, then, the ion current to the
channel walls will be about lO% of the beam current. This very simple
argument agrees with the SPT-lOO example results given in the previous
section and the results ofBaranov [40].
Using Eq. (7.3-58) with the above estimates for the ion current and electron
temperature, the power loss to the insulator walls is
Pw = 48.5l iw T ev = 48.5(O.lIb)(O.lVb) = 0.49I b V b .
(7.3-59)
The power loss to the anode is due to the plasma electrons overcoming the
sheath potential at the anode surface. From Eq. (7.2-24), the anode electron
current is
lea =ld +lia'
(7.3-60)
Neglecting the ion current to the anode as small (due to the mass ratio), and
realizing that each electron deposits 2kT e /e to the anode for positive plasma
potentials (from Appendix C), the power to the anode is
Hall Thrusters
361
Pa = 2TeV1d'
(7.3-61)
The electron temperature near the anode is very low, typically less than 5 eV
[34-36]. Using the thruster current utilization efficiency and assuming
1]b = 0.7 and TeV = O.OlV b near the anode, this can be written as
Pa = 21]b 1 b(0.OIV b ) =0.014I b V b'
(7.3-62)
The power required to produce the ions is given by Eq. (7.3-56). This can be
written as
llon =(Ib+1iw)U+ =(I+1]b)Id U +,
(7.3 63)
Taking the beam utilization efficiency as 0.7 and estimating that the ionization
potential is roughly 5% of the beam voltage, the power required to produce the
ions is approximately lj = 0.09 IdVb' The radiation power and other power loss
mechanisms are small and will be neglected in this simple example.
The total discharge power into the thruster is then
P d = IbVb +0.49 IbVb +0.014 IbV b +0.09 IbVb = 1.59 IbVb'
(7.3-64)
The electrical efficiency of the dielectric-wall thruster is then
1]e = Ib Vb / (1.59 Ib Vb) = 0.63.
(7.3-65)
The total thruster efficiency, assuming the same beam divergence and double-
ion content as evaluated above and a mass utilization efficiency of 95%
reported for SPT thrusters [4], is
1]T = (0.915)2 (0.63)(0.95) = 50%.
(7.3-66)
The SPT-lOO thruster is reported to run at about 50% efficiency. Since the
power loss is dominated by the electron wall losses, this analysis illustrates how
critical the wall material selection is to minimizing the secondary electron yield
and maintaining a sufficient wall sheath potential for good efficiency. For
example, if the wall had been made of alumina and the electron temperature
was about 20 V, the sheath potential would be -1.02T eV in the space charge-
limited regime. The wall power from Eq. (7.3-57) would then be about three
times higher than in the BNSi0 2 case:
Pw = 142IiwTev = 1.4I b V b.
(7.3-67)
362
Chapter 7
The electrical efficiency of the thruster, assuming the same anode loading and
energy loss to the beam, would be , TJ e =:: 0.40 and the total efficiency would be
2
TJT = (0.915) (0.40)(0.95) =:: 32%.
(7.3-68)
Recent parametric experiments in which different wall materials were used in
the SPT-lOO [33] showed that changing from BNSiO z to alumina reduced the
efficiency to the order of 30%, consistent with the increased secondary electron
yield of the different wall material.
The agreement of this simple analysis with the experimentally measured
efficiencies is somewhat fortuitous because the predictions are very sensitive to
the secondary electron yield of the wall material and the actual sheath potential.
Small errors in the yield data, changes in the wall material properties during
thruster operation, and inaccuracies in the empirical values for the electron
temperature and ion flux with respect to the beam parameters will significantly
affect the calculated results. Other effects may also be significant in
determining the thruster efficiency. The analysis of the sheath potential
assumed a Maxwellian electron distribution function. It was recognized several
years ago [37,41,42] that the electron distribution may not be Maxwellian.
Detailed kinetic modeling of the Hall thruster channel plasma [43,44] indicates
that the electron velocity distribution is depleted of the high-energy tail
electrons that rapidly leave the plasma along the magnetic field lines and
impact the wall. This is especially true near the space-charge limit where the
sheath voltage is small and a large fraction of the electron tail can be lost. The
collision frequencies and thermalization rates in the plasma may be insufficient
to re-populate the Maxwellian tail. This will effectively result in a lower
electron temperature in the direction parallel to the magnetic field toward the
walls [45], which can increase the magnitude of the sheath potential and reduce
the electron heat loss to the wall. In addition, re-collection of the secondary
electrons at the opposite wall [46,47], due to incomplete thermalization of the
emitted secondary electrons in the plasma, modifies the space-charge limits and
sheath potential, which also can change the electron heat flux to the wall.
These effects are difficult to model accurately due to the presence of several
different electron populations, several collision/thermalization processes, the
effect of magnetization on the electrons, and the presence of plasma
instabilities. Understanding what determines the electron temperature and
velocity distribution as a function of the discharge voltage and current, and
uncovering the effects that determine the wall power flux and finding
techniques to minimize them, are continuing areas of research at this time.
Hall Thrusters
363
7.3.6 TAL Hall Thruster Efficiency (Metallic Walls)
As with the 1.35-kW SPT-lOO Hall thruster example above, an estimate will be
made of the power loss terms in Eq. (7.3-27) to obtain an electrical efficiency
for the 1.4-kW D-55 TAL thruster [29]. Equation (2.5-7) will then be used to
obtain an estimate for the thruster efficiency. The beam power P b is, again, just
I b Vb' As stated in the previous section, the wall losses (Pw) are essentially
negligible in TAL thrusters, and the power to the anode is given by
Eq. (7.3-49):
lb
Pa = 2Tev - = 0. 29I b V b.
1Jb
(7.3-69)
In Eq. (7.3-69), it is again assumed 1Jb = 0.7 andT ev = O.IV b , although these
values may be somewhat different in TAL thrusters. The power to produce the
ions is again approximately 0.091 b Vb.
The total discharge power, Eq. (7.3-27), then becomes
P d = IbVb +0.29 IbV b +0.09IbVb = 1.4 IbVb'
(7.3-70)
Neglecting the power in the cathode keeper (if any) and the magnet as small
compared to the beam power, the electrical utilization efficiency from
Eq. (2.5-1) is then
P d
1J e =-=O.72.
1. 4P d
(7.3-71)
The total thruster efficiency, assuming a 10% double-ion content, a 20-deg
angular divergence [29,48], and a 90% mass utilization efficiency reported for
TAL thrusters [29,49], is then, from Eq. (2.4-7),
2
1Jr = (0.915) (0.72)(0.9) = 54% .
(7.3-72)
This result is on the same order as that reported in the literature [29,49,50] for
this power-level TAL and is essentially the same as the SPT -100 efficiency in
this simple example if the wall losses had been included. However, the power
loss to the anode is seen as the dominant mechanism in the TAL efficiency.
364 Chapter 7
7.3.7 Dielectric-Wall Versus Metallic-Wall Comparison
It is interesting to make a few direct comparisons of dielectric-wall Hall
thrusters with metallic-wall TAL thrusters. Similar discussions have appeared
in the literature [1,3,31], often with conflicting opinions. The basic plasma
physics in the channel described above applies to both the dielectric-wall Hall
thruster and the TAL. The maximum electron temperature occurs in both
thrusters near the channel exit in the region of strongest magnetic field where
the Hall current is a maximum. The different interaction of the thruster walls
with this plasma detennines many of the characteristics of the thruster,
including life. Dielectric-wall thrusters have a significant amount of their input
power deposited as loss on the dielectric channel walls due to electron
bombardment. In the above example efficiency calculation, approximately 25%
of the power going into the thruster was deposited on the channel walls. The
metallic walls in TAL thrusters collect a smaller electron current because they
are biased to cathode potential, and they also tend to have a small exposed area
in poor contact with the plasma, which limits the amount of ion and power lost
to these surfaces. However, the anode is positioned very close to the high
electron temperature region and receives a significant amount of power
deposition in collecting the discharge current. In the above example TAL
efficiency calculation, over 20% of the power going into the thruster was
deposited on the anode.
The deep channel in dielectric-wall Hall thrusters, with a low magnetic field
strength and low electron temperature near the anode, tends to minimize the
power deposition on the anode. In the above simple example, only I % of the
thruster input power was deposited on the anode. Nevertheless, the anode is
nonnally electrically isolated from the thruster body (and therefore thermally
isolated), and so anode overheating is sometimes an issue, especially at high
power density. The anode in TAL thrusters can also have heating issues
because the loading is much higher, even though the view factor for the anode
to radiate its power out of the thruster is better than the deep channel in the
insulting-wall configuration. In addition, with the anode positioned physically
close to the thruster exit in TALs, impurity deposition and material buildup
problems can occur. This has been an issue in ground testing of some TAL
thrusters [29], where carbon deposition on the anode from back sputtering from
the beam dump became significant over time. TAL thrusters with deeper
channels can be designed and operated [3]. The perfonnance of the thruster is
likely different in this configuration, and ion bombardment and sputtering of
the metallic channel walls can become significant and affect the thruster life.
Hall Thrusters
365
Dielectric-wall Hall thrusters are often described in terms of an ionization zone
upstream of the exit plane and an acceleration zone in the region of the exit
plane. TAL thrusters have a similar ionization region near the magnetic field
maximum, which is now closer to the anode because the magnetic field
gradient. is greater. The TAL acceleration zone is described as being a layer
close to the anode [1,3] that can extend outside of the thruster [48]. The higher
electron temperatures associated with TAL thrusters support higher electric
fields in the quasi-neutral plasma, which compresses these zones relative to
dielectric-wall thrusters. In addition, the metallic walls and higher electric fields
are conducive to multiple acceleration stages, which can improve thruster
performance and produce higher Isp than a conventional single-stage TAL
thruster [1,51]. Multiple-stage dielectric-wall Hall thrusters that operate at high
Isp have also been investigated (see [17] and the references cited therein).
Finally, the difference between dielectric-wall Hall thrusters and TAL thrusters
is sometimes attributed to the secondary electron coefficients of the different
wall materials. The above discussion shows that this is not the dominant
difference. Instead, the proximity of the TAL anode electrode to the high
temperature plasma region and the thruster exit plane is what changes the
electric field profile, power deposition, and sputtering characteristics as
compared to the dielectric-wall Hall thruster.
7.4 Channel Physics and Numerical Modeling
As discussed in the previous sections, the detailed physics determining Hall
thruster performance is not well understood. Specifically, the electron
distribution function in the exit region, the mechanisms responsible for electron
transport across the magnetic field, and the role of oscillations on the particle
transport and plasma conditions need to be determined. A considerable effort
has been made to develop fluid, kinetic, hybrid, and particle-in-cell (PIC)
models to predict and explain the performance and effects observed in Hall
thrusters. Hirakawa and Arakawa developed [52] a two-dimensional (2-D)
particle-in-cell model where anomalous electron diffusion was introduced by
using oscillating azimuthal electric fields. Boeuf and Garrigues developed a
one-dimensional (I-D) hybrid model [53] in which the electrons were treated as
a fluid and the ions were described by a collisionless Vlasov (kinetic) equation.
Similar fluid and hybrid models have been developed by other authors [54-56]
using various techniques to determine the ion transport, such as Monte-Carlo
simulation, Boltzman equation solutions, and "ion free-fall" (essentially a
Bohm current solution) to the boundaries. The most widely used code, HPHall,
is a 2-D, transient hybrid model originated by Fife and Martinez-Sanchez [30]
that has been recently extended with an improved sheath model [41,42,57] and
a model of channel erosion [58,59].
366 Chapter 7
7.4.1 Hybrid Hall Thruster Models
Hybrid Hall thruster models, such as HPHall [30, 57], utilize a steady-state
fluid electron momentum equation and a time-dependent electron energy
equation to solve for electron temperature and potentials in the channel and
plume. The codes also use time-dependent ion and neutral particle equations to
calculate the plasma density and ion velocities on a time scale much larger than
the electron time scale. These codes are also used to model Hall thruster transit-
time oscillations that are on the order of time scales related to neutral atom and
ion motions (:::.:1 MHz) but cannot capture the effects of electron instabilities
that have much higher frequencies.
From the steady-state electron momentum equation, an Ohm's law
representation from Eq. (3.6-20) for the electron field is
_ Vp-J e xB
l7J e -E+ l7e;J j ,
en
(7.4-1)
where the resistive term has the following form in the magnetic frame of
reference:
l7J =171. J 1. +171/J 11 +l7JA'
(7.4-2)
and the subscripts represent the directions perpendicular, parallel, and
transverse (in the E x B direction), respectively, to the local magnetic field.
Equation 7.4-1 must be separated into the two components of the J e x B motion
in a manner similar to that in Section 3.6 and solved for the electric field. From
current conservation, the electron current is taken to be the difference between
the discharge current and the ion current from the particle calculations.
Typically, the circuit current is chosen at each time step to satisfy the applied
voltage (= f E . d£) boundary conditions.
7.4.1.1 Transverse Electron Transport. Writing the perpendicular
resistivity in terms of the perpendicular electron mobility, as defined in Eq.
(3.6-66), gives
1 I +wZ-r Z 1 +w Z /v 2
17.1 =-= c m - em ,
enpe.1 enPe enP e
(7.4-3)
where the collision time -r m for momentum transfer is equal to one over the
collision frequency (11 v m)' The perpendicular electron flux from Ohm's law,
Eq. (7.4-1), can then be written as
Hall Thrusters
367
J ( E ape ) J..I.e.l. J
e1. = J..I.e1. en 1. +- -- i1.,
ax J..I.ei
(7.4-4)
and the electron mobility due only to electron-ion collisions is given by
e
J..I.ei=-'
mVei
(7.4-5)
Usually, the ion flux term in Eq. (7.4-4) is neglected and an effective electric
field is used such that the electron flux is expressed as
J e.l. = enJ..l.e.l. EJ.,
(7.4-6)
where the effective electric field is
E ' - (E I ape )
1. - 1. +-- .
en ax
(7.4- 7)
The effective perpendicular electron mobility in Eq. (7.4-4) is
e I J..I.e
J..I.e.l. = mV m I + OJ; / v - I + n '
(7.4-8)
where n; is the electron Hall parameter, and the momentum-transferring
collision frequency v m is described, as in Chapter 3, by
V m = vei + v en .
(7.4-9)
This expression for the transverse electron mobility then accounts for both
electron-ion and electron-neutral collisions in the partially ionized plasma.
Since the electrons are well magnetized in the plasma near the exit of the
channel where the magnetic field strength is the highest, the electron Hall
parameter is much greater than unity and the transverse electron mobility across
the field lines is found to be small. In fact, calculations of the electron collision
frequency based on the classical collision terms in Eq. (7.4-9) are unable to
provide sufficient cross-field transport to support the discharge current passing
through the thruster [54,57,59]. In addition, the neutral density in the plume of
the Hall thruster is low due to the high mass utilization efficiency, which
reduces the effective collision frequency in Eq. (7.4-9) and again leads to
problems in providing sufficient transport of the electrons from the external
368
Chapter 7
cathode across the transverse field lines and into the channel to support the
discharge current. Two mechanisms have been proposed in an attempt to
describe "enhanced" cross-field electron transport and explain the observed
Hall thruster operation.
Morozov [12] postulated that electron-wall interactions in the channel region
will scatter electron momentum and introduce secondary electrons, which can
increase the effective cross-field transport. This effect is introduced into the
effective collision frequency by a wall-scattering frequency v w :
V m = Vei +V en +v w '
(7.4-10)
The wall-scattering frequency is either given by a*107 per second [53], with a
an adjustable parameter used to match the experimental data, or the wall
collision frequency of electrons is calculated directly in the code [59]. While
this effect does increase the electron transport in the channel, it is sometimes
found to provide insufficient enhancement of the electron transport. In addition,
in the plume of the thruster there are no walls and the neutral density is very
low, which precludes the use of Eq. (7.4-10) to increase the cross-field
transport sufficiently to explain the experimental data.
Additional cross-field transport has been added in the codes by invoking Bohm
diffusion both inside and outside the thruster channel. As discussed in Chapter
3, Bohm diffusion likely arises from E x B driven drift instabilities, which can
naturally occur in these thrusters due to the Hall current. Using the Bohm
diffusion coefficient from Eq. (3.6-72) and the Einstein relationship of
Eq. (3.6-28), a Bohm mobility can be defined as
1 e
J1.B = f3B = f3mm c '
(7-4-11)
where f3 is an adjustable coefficient changed to make the code predictions of the
thruster parameters fit the experimental data. If full Bohm diffusion is required
by the code to match the data, such as is often the case in the plume, then
f3 = 16. The effective Bohm collision frequency is then
VB = f3 m c.
(7-4-12)
The total "anomalous" collision frequency used in the codes is
V m = vei +v en +v w +vB,
(7.4-13)
Hall Thrusters
369
where the wall collision frequency V w is neglected in the plume.
7.4.1.2 Transport Along the Magnetic Field. In the direction along the
magnetic field lines, the J x B cross product in the electron momentum
equation is zero and Eq. (7.4-1) becomes
'Vp
1]J e = E+--1]ei J i.
en
(7.4-14)
The electric field along the field line is then
E= 'Vp + 1] J _ 1] .J. =-'V 1h
e el I '/'.
en
(7.4-15)
With the standard assumptions used along magnetic fields in many plasmas of
zero net current (je "" h) and uniform electron temperature, Eq. (7.4-15) can be
solved for the potential along the field line to give
f/J = f/Jo + Te In( ).
(7.4-16)
This equation was derived in Section 3.5-1 and represents the simple Boltzman
relationship for plasmas with Maxwellian electron distribution functions. It is
often called the barometric law in ion thruster literature and the thermalized
potential in Hall thruster literature. Thus, the transport along the magnetic field
lines is usually considered to be classical.
It is commonly assumed that the density gradient along the magnetic field line
is relatively small, so the potential change along a magnetic field line from
Eq. (7.4-16) is essentially zero. Therefore, within about kTe/e, the magnetic
field lines represent equipotential lines in the plasma. The simplifying
assumptions leading to this conclusion (zero net current, Maxwellian electrons,
and small density gradient along the magnetic field lines) are often used and
may introduce significant errors in some cases. Nevertheless, the thermalized
potential has been used for many years [3] in the design of Hall thrusters to
relate the magnetic field shape to the electric field in the plasma [11].
7.4.1.3 Continuity and Energy. Continuity for the neutrals in the thruster
can be expressed as
dn o +vo'Vn o =-neno(aiv e ),
at
(7.4-17)
370
Chapter 7
where the right-hand side represents the local ionization rate. For ions and
electrons, continuity in the plasma gives
V'Je=V'Ji'
(7.4-18 )
In addition, charge balance at the insulating wall dictates that
J i =Je-J se '
(7.4-19)
where J se is the secondary electron current density, which IS equal to the
secondary electron yield r times the incident electron flux.
The electric field in the perpendicular direction (z) in the plasma can be found
from Eq. (7.4-4):
E= J e
enef..lel.
1 a( ne kT ) Pel.
- +-J i .
ene az f..lei
(7.4-20)
The potential applied across the plasma is then
v = - f E(z,t)dx,
(7.4-21)
which can be used to find the electron current or total current flowing in the
plasma.
The electron energy equation is
a ( 3 kTe } 5
- -n - V.-TJ =E.J -R-S-P.
dt 2 e e 2 e e e w'
(7.4-22)
where E. J e is the ohmic power input, R is the radiative energy loss, S is the
ionization energy loss, and Pw is the electron energy loss to the walls. The
radiative energy loss is
R = U* neno (a*v e ),
(7.4-23)
and the ionization energy loss is given by
S=U+neno(aiVe)'
(7.4-24)
Hall Thrusters
371
The ionization and excitation reaction rate coefficients in Eqs. (7.4-23) and
(7.4-24) are given in Appendix E. Finally, the electron energy density is given
by convection in the plasma as
5
E=-nekTe'
2
(7.4-25)
7.4.1.4 Ion Current. Several methods have been used to describe the ion
generation and transport in the Hall thruster models. First, the ions have been
modeled as a fluid using continuity equations [54,60], where the axial motion is
due to the electric field along the channel and the radial motion to the wall is
detennined by the ion-neutral scattering frequency. The ion current to the wall
is then
Iw = nino (ainVi)AwL ,
(7.4-26)
where Aw is the wall area, L is the plasma length, ain is the ion-neutral
collision cross section for 90-deg scattering including elastic and charge-
exchange collisions, and the velocity of the neutrals is neglected relative to the
ion velocity. In PIC numerical codes, this represents the radial flux to the cell
boundary where AwL becomes the cell volume.
Fife [30] modeled the ion motion using a 2-D PIC code that assumed the ions
and neutrals acted as discrete macro-particles in each cell. The time step in the
ion-PIC code, in this case, was adjusted (to typically three orders of magnitude
slower than the electron model time step) to handle the ion-motion time scales
without invoking excessive computational time.
Finally, the ion Vlasov equation has been used to solve for the ion generation
and motion [52,53]. This has primarily been applied for investigating low-
frequency oscillations on the order of the ion-characteristic time scales. In one
dimension, this can be written as
a.t +v x a.t +":"E a.t =ne n o(aiv e )8(v x -v o ),
dt dt M dv x
(7.4-27)
where f is the ion distribution function and 8( v x - V 0) is the Dirac delta
function evaluated for the ion velocity relative to the neutral velocity. The ion
density is then found from
ni = J f(x, vx,t)dv x .
(7.4-28)
372
Chapter 7
The plasma is always assumed to be quasi-neutral (ni "" ne)' At the sheath
boundary at the wall, the ion current nonnally is assumed to be the Bohm
current and the electron current is the one-sided random electron flux. Total
current continuity requires the ion flux and net electron flux (incident electrons
and emitted secondary electrons) to the insulating walls to be equal, which
establishes the sheath potential to produce quasineutrality and charge
conservation as described above. The hybrid-model equations described above
for detennining the ion currents are nonnally evaluated numerically in either
l-D or 2-D with greatly different time steps between the electron fluid
evolution and the ion and neutral motion evaluations.
7.4.2 Steady-State Modeling Results
The physics of the Hall thruster discharge related to the transverse electron
mobility, electron-wall interactions, and the exact nature of the electron
distribution function are not completely understood at this time. However, the
l-D and 2-D models described above are reasonably successful in predicting
plasma parameters and thruster behavior provided enhanced electron
conductivity is incorporated in the channel due to wall collisions and
turbulence, and modifications to the wall heat fluxes are made associated with
the secondary electron behavior. In addition, enhanced electron transport in the
plume region near the thruster exit is required to match the models' predictions
with the experimental results [61], which is nonnally provided by assuming
collective oscillations drive Bohm-like diffusion. In this region, other
mechanisms may also be responsible for the cross-field electron transport, and
research in this area to determine the responsible mechanism(s) is continuing.
The hybrid codes can provide very reasonable predictions of the steady-state
plasma parameters in the thrusters. For example, Fig. 7-14 shows the average
profiles (along the channel axis) predicted by a I-D model [53] for the
potential, electric field, plasma density, mean electron energy, neutral density,
and ionization rate for the 8PT-100 Hall thruster, where 4 cm corresponds to
the channel exit. The average plasma density peaks upstream of the exit, as is
also predicted by the 2-D HPHall code [30] result shown in Fig. 7-15 for the
8PT-100 Hall thruster channel. In both cases, there is a characteristic peak in
the plasma density upstream of the channel exit in the ionization region, and a
decreasing plasma density is seen moving out of the channel as the ions are
accelerated in the electric field of the acceleration region. The plasma density
prediction by the l-D code is slightly lower than the 2-D HPHall result because
of differences in the heat flux calculation to the wall and the resulting values of
Hall Thrusters
300
(a)
E
200
G.
'0
a:;
u::
.g
g 100
ill
v
-..-.-.. -.-..-..-.......
,
.
0
6
(b)
M 5 /.....
r
E
'-' I '
'0 4 n I
I \
'en 3
<:: I
'" I
£:)
ro 2 I
E
'"
ro I
CL
/
.
0 .."
2.0
(e)
ns S
'"
r -.-..-.-..-..
E 1.
'-' ........
'"
'0
1.0
'en
<::
'"
£:)
'S 0.5
'"
z
0.0
0 2 3
Position (em)
Fig. 7.14. 1-0 Hall thruster code [53] for the SPT.100: (a)
potential and electric fjeld, (b) plasma density and electron
energy. and (c) neutral deneity and ionization rate (redrawn
from [53]).
200
1:J
0
CD
a.
100 eI
S
0
50
40
CD
Q)
"
m
30 15'
Q.
a
"
m
"
CD
.a
'<
10 ro
.5
0
3
0'
"
N'
2 o'
"
;;t)
Q)
CD
-:;:
S
-./
"
3
r
'"
'"
!.
0
4
373
374
0.0600
0.0550
0.0500
0.0450
I
....
0.0400
0.0350
Chapter 7
1 0.10541 x 10 18
2 0.20515 x 10 18
3 0.30490 X 10 18
4 0.40464 X 10 18
5 0.50439 x 10 18
6 0.60414 x 10 18
7 0.70388 x 10 18
8 0.80363 x 10 18
0.0300
0.0250
0.000 0.005 0.010 0.015 0.020 0.025 0.030 0.035
z(m)
Fig. 7-15. Average plasma density computed by HPHall for the SPT-100. with the peak
plasma density at P1 = 8 X 10 17 m- 3 (from [30]).
the electron temperature. Since the distribution function of the electrons can
certainly be non-Maxwellian and anisotropic, the actual value of the density in
the Hall thruster will differ somewhat from the values calculated by these
existing codes.
The profiles shown by the I-D code results in Fig. 7-14 suggest that three
overlapping but distinct regions exist in the plasma channel of a well-designed
Hall thruster. Near the anode, the potential drop is small due to the low
magnetic field in this region, resulting in good plasma conduction to the anode
but small ionization. The ionization zone occurs upstream of the channel exit
where the neutral gas density is still high and the electrons are well confined
and have significant temperature. The acceleration zone exists near the channel
exit where the electric field is a maximum, which occurs at this location
because the magnetic field is a maximum and the transverse electron mobility is
significantly reduced as described above. Outside the channel, the electric field,
plasma density, and electron temperature drop as the magnetic field strength
decays and the Hall current decreases.
Hall Thrusters
375
The current versus voltage predictions from the I-D code [53] for different
values of the transverse magnetic field in the channel for the 8PT -100 thruster
are shown in Fig. 7-16. As the transverse magnetic field increases, the
impedance of the discharge increases significantly and higher voltages are
required to obtain the transverse electron mobility required to achieve the
desired discharge current. Increases in the mass flow rate increase the
collisional effects in the plasma region, and this results in more current at a
given voltage and magnetic field. In addition, Fig. 7-16 shows regions where
the I-D code predicts oscillatory behavior, as indicted by the solid points. This
is discussed in the next section.
The I-D hybrid code results shown in Fig. 7-16 suggest that the code captures
the trend in the discharge impedance as the magnetic field and applied voltage
are changed; i.e., the discharge current decreases as the magnetic field increases
at a given discharge voltage due to the lower electron mobility. However, the
code does not predict the correct current-versus-voltage behavior for this
thruster at low voltages. Figure 7-17 shows the current-versus-voltage data for
one condition in the 8PT-60 (a 60-mm channel outside-diameter version
described in [4]). As the discharge voltage is decreased below about 200 V, the
current initially increases until the energy ofthe electrons at very low voltage is
insufficient to produce high ionization fractions, and the plasma density and
discharge current then fall. Improvements in the electron transport physics are
200 250
Voltage (V)
Fig. 7-16. Current-versus-voltage predictions from the 1-D code of Boeuf
and Garrigues (from [53]) for the SPT-100, where the solid points indicate
regions of predicted oscillations.
7
6
5
4
'E
::::J 3
u
2
o
50
300
350
400
100
150
376
Chapter 7
4.0
SPT-60
3.0
C
!!?
(.) 2.0
OJ
ro
.J::
<.>
'"
is 1.0
0.0
0
100 200
Discharge Voltage (V)
Fig. 7-17. Current versus voltage for one operating condition in the
SPT-60 ([redrawn from [4]), showing the non-monotonic current
variations usually observed in Hall thrusters at low discharge
voltages.
300
clearly required for the hybrid code to fully predict the Hall thruster behavior.
Work continues on developing hybrid codes to better predict the thruster
parameters and performance.
7.4.3 Oscillations in Hall Thrusters
Depending on their size and operating characteristics, Hall thrusters have the
capability of generating many different waves and instabilities with frequencies
from 1 kHz to tens of MHz. A survey of the frequencies of different plasma
waves, the characteristic lengths (i.e., of sheaths, etc.) in the thruster, and wave
and particle drift velocities expected in typical Hall thrusters was compiled by
Choueiri [62]. The most commonly observed oscillations occur in the band of
frequencies from 1-30 kHz associated with ionization instabilities and
rotational oscillations in the annular discharge channel. Azimuthally
propagating waves with frequencies up to 100 kHz that are not associated with
ionization instabilities can also occur due to magnetic field gradients [11]. In
the range of 100-500 kHz, ion transit time oscillations associated with axial
motion of the ions through the ionization and acceleration regions can occur.
Above this frequency range, azimuthal drift waves [63] and ion acoustic waves
have also been predicted and observed.
The low-frequency time dependence of the ion and neutral behavior can be
analyzed with the analytical models [30] by writing the ion conservation
equation as
Hall Thrusters
377
dn' ( ) n.v.
-1..=n.n a.v _-Ll..
dt 10le L'
(7.4-29)
and the neutral particle conservation equation as
dn o ( ) novo
-=-n.n a.v +-
dt 10le L'
(7.4-30)
where v 0 is the neutral velocity and L is the axial length of the ionization zone.
The perturbed behavior of the ion and neutral densities with time is linearized
such that
n. = n. +en
I 1,0 I
,
no = no,o + eno'
(7.4-31)
where the first term on the right-hand side denotes the unperturbed state.
Combining Eqs. (7.4-29), (7.4-30), and (7.4-31) gives
::12 ,
ani ' ( ) 2
dt 2 = ni,ono,oni aive .
(7.4-32)
This equation represents an undamped harmonic oscillator with a rrequency
given by
-F I ( ) 2 vivo
Ji =- ni onoo aive "'-.
2n " 2nL
The low-frequency oscillatory behavior of Hall thrusters is related to the
velocities of the ions and neutrals relative to the scale length of the ionization
zone. This indicates that periodic depletion of the neutral gas in the ionization
region causes the ion density to oscillate, which impacts the electron
conductivity through the transverse magnetic field and thereby the discharge
current. The ionization region location can then oscillate axially in the channel
on the time scale of neutral replenishment time. The models show [53] that the
oscillation depends strongly on the magnetic field strength near the channel
exit, and that optimum operation of the thruster generally corresponds to high
mass utilization regimes where this instability occurs.
(7.4-33)
These types of oscillations, which are typically observed in the discharge
current when the thrusters are operated in a voltage-regulated mode, have been
called "breathing modes" [53] and "predator-prey modes" [30], and an example
is shown in Fig. 7-18 for the SPT-lOO Hall thruster [55]. The frequency in this
experimentally observed example is about 17 kHz. However, the frequency
depends on the thruster operating conditions and can range from 10 to 30 kHz
for different flow rates, voltages, and magnetic fields. The I-D numerical code
378
Chapter 7
[53] predictions for the total current, electron current, and ion current at the
thruster exit for the SPT -100 are shown in Fig. 7-19. In this case, a frequency of
16 kHz is predicted, in good agreement with the experimental data.
Similar predictions about the low-frequency oscillation behavior of Hall
thrusters from the 2-D HPHall code are shown in Fig. 7-20, where the anode
current and beam current are plotted versus time. The predicted frequency in
this case is 11 kHz, which is less than the value shown in the example of
Fig. 7-18. This is likely due to an under-prediction of the electron temperature
in the ionization region of the channel [30] by this version of the code.
15
17 kHz
$
1:
10
:>
u
Q)
OJ
Ii;
-E 5
V>
i:5
0.2 0.3
Time (ms)
Fig. 7-18. Measured evolution of the discherge current for the
SPT-100 (from [55]).
0.1
0.4
0.5
8
7 Total
6
5
$
1: 4
:>
U
3
2
Electron
Ion
0
0 100 200
Time (IlS)
Fig. 7-19. Oscillating current predictions from the 1-D code for
the SPT.100 (from [53]).
Hall Thrusters
379
8
3
- Anode Current
. Ionization Current
. Beam Current
7
6
g 5
C
:; 4
U
2
1
0.00030 0.00032 0.00034 0.00036 0.00038 0.00040 0.00042 0.00044
Time (s)
Fig. 7.20. Anode current, ionization, and beam current calculated
by HPHall for the SPT.70 Hell thruster (from [30]).
However, the ionization instability driving these oscillations is the same as that
analyzed in the 1- D model, and so the behavior of the instability is adequately
reproduced by the 2-D model. The low-frequency oscillations can reach 100%
of the discharge current depending on the voltage and mass flow (current) for a
given thruster design. However, more modem designs, especially those
intended for flight, typically have much lower oscillation amplitudes.
7.5 Hall Thruster Life
The operating time and total impulse of a Hall thruster is detennined primarily
by erosion of the channel waU and the life of the cathode. Hollow cathode
wear-out has not represented a life limitation to date because thruster lifetimes
of less than 10,000 hours are typical, and robust LaB6 hollow cathodes have
been used in all of the Russian Hall thrusters. Other issues such as deposited
material build-up on the electrodes, conductive-flake production, electrical
shorting, etc., are also of concern in evaluating the life of a HaU thruster.
However, the erosion of the channel wall by ion bombardment sputtering is a
very visible process [4] that changes the channel dimensions and ultimately
exposes the magnetic circuit, which, when eroded, can degrade the thruster
perfonnance. However, life tests of flight thrusters such as the SPT-100 and the
PPS-1350 show that they can take hundreds to thousands of hours for magnetic
circuit erosion to significantly alter thruster perfonnance. Of greater concern, in
this case, is the sputtering of iron from the magnetic circuit, which would have
380
Chapter 7
a significantly higher impact if deposited on most spacecraft components.
Therefore, understanding the wall erosion rate and its dependence on thruster
materials and operating parameters is of importance in predicting the thruster
life and performance over time and its potential impact on the spacecraft.
The erosion rate, given by the rate of change ofthe wall thickness, w, is
9\ = aw = JiW Y(Ei),
at peAv
(7.5-1)
where J i is the ion flux, W is the atomic weight, p is the material density, e is
the ion charge, Av is Avogadro's number, and Y is the sputtering yield of the
material, which is dependent on the ion type and energy Ei' Since the material
properties are known, the issue becomes one of knowing the ion flux, ion
energy, and sputtering yield of the wall.
Several analytical models of the Hall thruster have been developed and applied
to this problem [37,60,64]. The most accurate predictions have been achieved
using a modified 2-D HPHall code [58] to obtain the ion fluxes and energies.
The sputtering yield of boron nitride compounds used in dielectric-wall Hall
thrusters has been measured by Gamier [65] versus incidence angle and ion
energy, and is used in several of these models. However, the Gamier data are at
only a few energies and in excess of 300 V. Gamero extrapolated these data to
lower energies using the semi-emperical sputtering law scaling of Yamamura
and Tawara [66], obtaining the following expression for the sputtering yield in
units ofmm 3 /coulomb:
y (O.0099+a'6.04 x 10⁻⁶ _a 3 4.75 x 1O-8)JE,( 1- l:;6 )'"' , (7.5-2)
where a is the incident angle of the ion. In Eq. (7.5-2), the value 58.6 represents
the estimated threshold energy for sputtering required by Yamamura's model.
Figure 7-21 shows an example of the yield predicted by Eq. (7.5-2) for two
different incidence angles. Equation (7.5-2) was shown [58] to accurately fit the
data of Gamier and provides projections of the sputtering yield down to low ion
energies predicted by HPHall deeper in the channel.
Figure 7-22 shows the predicted [58] and experimentally measured erosion
profiles [67] for the SPT-lOO thruster inner and outer channel walls. Good
agreement with the observed channel erosion is seen near the thruster exit, and
the profiles have the correct functional shape. It is likely that inaccuracies in the
extrapolated sputtering yield at low energies caused the disagreement with the
Hall Thrusters
381
0.10
0.09
0.08
Q"
E 0.07
.s
"0 0.06
a;
>= 0.05
0>
t: 0.04
.
3 0.03
0.
C/) 0.02
0.01
0.00
o
50
100
300
350
150 200 250
Ion Energy (eV)
Fig. 7-21. Sputtering yield calculated for singly ionized xenon on
BNSI0 2 versus ion energy for two incidence angles.
data deep in the channel. This can be remedied by additional sputter-yield
measurements at low energy and a refinement of the sputtering yield in
Eq. (7.5-2).
It is possible to develop some simple scaling rules for Hall thruster erosion in
the magnetized plasma region near the exit plane. It was estimated in
Section 7.3.4 that the ion flux to the wall in dielectric-wall Hall thrusters was
about 10% of the beam current. It can be assumed that the energy of the ion
flux to the wall is related to the beam energy, which is proportional to the
discharge voltage. An examination of Fig. 7-21 shows that the sputtering yield
is essentially a linear function of the ion energy. The erosion rate in Eq. (7.5-1)
then becomes
9\ ex: K.!.L V d = K IdV d ,
Aw 1Jb A w
where K is a constant, Aw is the wall area, and Eq. (7.3 -10) has been used for
the beam current efficiency. Equation (7.5-3) shows that the erosion rate of the
thruster wall is proportional to the power density in the accelerator channel [4].
This indicates that larger Hall thrusters are required to increase the power for a
given operation time as determined by the allowable erosion of the insulator
wall thickness. A good rule-of-thumb for the relationship of operation time over
a reasonable throttle range of a given Hall thruster design is
(7.5-3)
power * operation time:::: constant.
382
0.058
0.056
g
<::
:8
. 0.054
Q.
10
'C
<II
0::
0.052
0.050
0.048
0.040
0.038
0.036
g
<::
:8
'(j;
o
Q.
10
'C
<II
0::
0.034
0.032
0.030
0.028
0.060
--e- Experimental, 160 hr
---- Experimental, 310 hr
__ Experimental, 600 hr
Experimental, 800 hr
-----.. Experimental, 1000 hr
- Computed, 180 hr
Computed, 300 hr
--e-- Computed, 600 hr
- Computed, 800 hr
_.-.
Outside Channel Wall
0.016
0.018 0.020 0.022
Axial Position (m)
0.024
--e- Experimental, 160 hr
--b- Experimental, 310 hr
___ Experimental, 600 hr
Experimental, 800 hr
----- Experimental, 1000 hr
---E- Computed, 180 hr
- Computed, 300 hr
--<:-- Computed, 600 hr
- Computed. 800 hr
Inside Channel Wall
0.018 0.020 0.022
Axial Position (m)
Fig. 7-22. Erosion pattern predicted by the modified HPHall
code and measured for the SPT.100 thruster (redrawn from
[58]) .
0.016
0.024
Chapter 7
(a)
(b)
Hall Thrusters
383
Over a limited range, the thrust -rrom a Hall thruster is proportional to the
discharge power, and so
thrust * operation time;:::; constant.
This suggests that the total impulse is essentially a constant for a given thruster
design. Therefore, operating at lower thrust in throttled mission profiles will
result in longer thruster operation time. However, if the throttling is too deep,
the thruster performance will degrade (requiring higher input power to produce
a given thrust) and the above relationship is no longer valid. Hall thruster
throttle ranges of over 10: I have been demonstrated with good performance,
depending on the thruster design.
Finally, the life of TAL thrusters has not been as extensively investigated as the
Russian SPT thrusters. The erosion of the channel guard rings has been
identified as the primary life-limiting mechanism [29], and alternative materials
were suggested to extend the thruster life by reducing the sputtering yield.
Since the wall/guard ring is biased at cathode potential, the incident ion energy
along the wall depends on the potential profile in the thruster channel and past
the exit plane. This certainly influenced the selection of the TAL anode
placement and the design of the anode/channel region to minimize the ion
energy (and flux) to the walls. The dielectric-wall Hall thrusters limited the ion
energy to the floating potential ("" 6Te for xenon) for wall materials with very
low secondary electron yield, and to lower energies with materials that have
secondary electron yields approaching or exceeding one at the electron
temperatures of typical operation. The sheath potential at the wall is likely on
the order of 3Te "" O.3Vd due to space charge and non-Maxwellian electron
distribution function effects. However, the lower sheath potential at the wall
increases the electron flux, which results in increased power loading at the wall.
The wall material selection, therefore, is a trade off between efficiency and life.
Dielectric walls reduce the bombarding ion energy of the wall at the expense of
higher electron fluxes and higher power loading. Metallic-wall Hall thrusters
have higher ion energies to the wall and therefore sputter-erosion life issues,
and so they have to compensate with geometry changes to obtain the desired
life. This results in higher heat fluxes to the anode, which dominates the TAL
efficiency. An increase in the power of both types of thrusters also requires
increases in the thruster size to obtain the same or longer lifetimes. Therefore,
Hall thruster design, like ion thruster design, is a trade off between performance
and life.
384
Chapter 7
References
[1] S. D. Grishin and L. V. Leskov, Electrical Rocket Engines of Space
Vehicles, Moscow, Russia: Mashinostroyeniye Publishing House
(published in Russian), 1989.
[2] H. R. Kaufman, "Technology of Closed-Drift Thrusters," AIAA Journal,
vol. 23, no. 1, pp. 78-87, 1985.
[3] V. V. Zhurin, H. R. Kaufman, and R. S. Robinson, "Physics of Closed
Drift Thrusters," Plasma Sources Science and Technology, vol. 8, no. 1,
pp. RI-R20, 1999.
[4] V. Kim, "Main Physical Features and Processes Determining the
Perfonnance of Stationary Plasma Thrusters," Journal of Propulsion and
Power, vol. 14, no. 5, pp. 736-743,1998.
[5] A. l. Morosov and V. V. Savelyev, "Fundamentals of Stationary Plasma
Thruster Theory," in Reviews of Plasma Physics, edited by B. B.
Kadomtsev and V. D. Shafranov, vol. 21, New York: Kluwer
Academic/Plenum Publishers, 2000.
[6] 1. R. Brophy, J. W. Barnett, J. M. Sankovic, and D. A. Barnhart,
"Performance of the Stationary Plasma Thruster: SPT-lOO," AIAA-92-
3155, 28th Joint Propulsion Conference, Nashville, Tennessee, July 6-8,
1992.
[7] B. A. Arhipov, L. Z. Krochak, S. S. Kudriavcev, V. M. Murashko, and
T. Randolph, "Investigation of the Stationary Plasma Thruster (SPT -100)
Characteristics and Thermal Maps at the Raised Discharge Power,"
AlAA-98-3791, 34th Joint Propulsion Conference, Cleveland, Ohio, July
13-15,1998.
[8] L. B. King, "A Re-examination of Electron Motion in Hall Thruster
Fields," IEPC-2005-258, 29th International Electric Propulsion
Conference, Princeton University, New Jersey, October 31-November 4,
2005.
[9] R. R. Hofer, R. S. Jankovsky, and A. D. Gallimore, "High-Specific
Impulse Hall Thrusters, Part 1: Influence of Current Density and
Magnetic Field," Journal of Propulsion and Power, vol. 22, no. 4,
pp. 721-731, 2006.
[10] R. R. Hofer and A. D. Gallimore, "High-Specific Impulse Hall Thrusters,
Part 2: Efficiency Analysis," Journal of Propulsion and Power, vol. 22,
no.4,pp.732-740,2006.
[11] R. R. Hofer, "Development and Characterization of High-Efficiency,
High-Specific Impulse Xenon Hall Thrusters," Ph.D. Dissertation,
Aerospace Engineering, University of Michigan, Ann Arbor, Michigan,
2004.
Hall Thrusters
385
[12] A. 1. Morozov, Y. V. Esipchuk, A. M. Kapulkin, V. A. Nevrovskii, and
V. A. Smirnov, "Effect of the Magnetic Field on a Closed-Electron-Drift
Accelerator," Soviet Physics Technical Physics, vol. 17, no. 3,1972.
[13] Y. Raitses, 1. Ashkenazy, and M. Guelman, "Propellant Utilization in Hall
Thrusters," Journal of Propulsion and Power, vol. 14, no. 2, pp. 247-253,
1998.
[14] L. A. Dorf, Y. F. Raitses, A. N. Smirnov, and N. J. Fisch, "Anode Fall
Formation in a Hall Thruster," AIAA-2004-3779, 40th Joint Propulsion
Conference, Ft. Lauderdale, Florida, July 11-14,2004.
[15] L. Dorf, Y. Raitses, and N. J. Fisch, "Experimental Studies of Anode
Sheath Phenomena in a Hall Thruster Discharge," Journal of Applied
Physics, article 103309, part 1, vol. 97, no. 10,2005.
[16] L. Dorf, Y. Raitses, and N. J. Fisch, "Effect of Magnetic Field Profile on
the Anode Fall in a Hall-Effect Thruster Discharge," Physics of Plasmas,
article 057104, vol. 13, no. 5,2006.
[17] R. R. Hofer, P. Y. Peterson, A. D. Gallimore, and R. S. Jankovsky, "A
High Specific Impulse Two-Stage Hall Thruster with Plasma Lens
Focusing," IEPC-200l-036, 27th International Electric Propulsion
Conference, Pasadena, California, October 14-19, 2001.
[18] J. A. Linnell and A. D. Galimore, "Krypton Performance Optimization in
High-Voltage Hall Thrusters," Journal of Propulsion and Power, vol. 22,
no. 4,pp. 921-925,2006.
[19] 1. A. Linnell and A. D. Galimore, "Efficiency Analysis of a Hall Thruster
Operating with Krypton and Xenon Thrusters," Journal of Propulsion and
Power, vol. 22, no. 6, pp. 1402-1412,2006.
[20] Y. Daren, D. Yongjie, and Z. Shi, "Improvement on the Scaling Theory of
the Stationary Plasma Thruster," Journal of Propulsion and Power,
vol. 21, no. 1, pp. 139-143,2005.
[21] V. Kim, G. Popov, B. Arkhipov, V. Murashko, O. Gorshkov,
A. Koroteyev, V. Garkusha, A. Semenkin, and S. Tverdokhlebov,
"Electric Propulsion Activity in Russia," IEPC-200 1-005, 27th
International Electric Propulsion Conference, Pasadena, California,
October 14-19, 2001.
[22] A. I. Bugrova, N. Maslennikov, and A. 1. Morozov, "Similarity Laws for
the Global Properties of a Hall Accelerator," Journal of Technical
Physics, vol. 61, no. 6, pp. 45-51,1991.
[23] V. Khayms and M. Martinez-Sanchez, "Design of a Miniaturized Hall
Thruster for Microsatellites," AIAA-1996-329l, 32nd Joint Propulsion
Conference, Lake Buena Vista, Florida, July 1-3,1996.
386 Chapter 7
[24] O. Gorshkov, "Russian Electric Propulsion Thruster Today," Russian
Space News, vol. 61, no. 7, pp. 5-11, 1999.
[25] A. Smirnov, Y. Raitses, and N.J. Fisch, "Parametric Investigations of
Miniaturized Cylindrical and Annular Hall Thrusters," Journal of Applied
Physics, vol. 92, no. 10, pp. 5673-5679,2002.
[26] M. Keidar, A. D. Gallimore, Y. Raitses, and 1. D. Boyd, "On the Potential
Distribution in Hall Thrusters," Applied Physics Letters, vol. 85, no.13,
pp.2481-2483,2004.
[27] L. B. King and A. D. Gallimore, "Ion Energy Diagnostics in the Plasma
Exhaust Plume of a Hall Thruster," Journal of Propulsion and Power,
vol. 16, no. 5, pp. 916-922,2000.
[28] J. E. Pollard, K. D. Diamant, V. Khayms, L. Werthman, D. Q. King, and
K. H. Degrees, "Ion Flux, Energy and Charge State Measurements for the
BPT-4000 Hall Thruster," AIAA-2001-3351, 37th Joint Propulsion
Conference, Salt Lake City, Utah, July 8-11, 2001.
[29] C. E. Gamer, J. R. Brophy, J. E. Polk, S. Semenkin, V. Garkusha,
S. Tverdokhlebov, and C. Marrese, "Experimental Evaluation of Russian
Anode Layer Thrusters," AIAA-1994-301O, 30th Joint Propulsion
Conference, Indianapolis, Indiana, June 27-29, 1994.
[30] J. M. Fife, M. Martinez-Sanchez, and J. Szabo "A Numerical Study of
Low-Frequency Discharge Oscillations in Hall Thrusters," AIAA-97-
3052, 33rd Joint Propulsion Conference, Seattle, Washington, July 6-9,
1997.
[31] E. Y. Choueiri, "Fundamental Difference Between Two Variants of Hall
Thrusters: SPT and TAL," Physics of Plasmas, vol. 8, no. 11, pp. 5025-
5033,2001.
[32] J. P. Bugeat and C. Koppel, "Development of a Second Generation of
SPT," IEPC-95-035, 24th International Electric Propulsion Conference,
Moscow, Russia, 1995.
[33] N. Gascon, M. Dudeck, and S. Barral, "Wall Material Effects in
Stationary Plasma Thrusters: 1. Parametric Studies of an SPT-100,"
Physics of Plasmas, vol. 10, pp. 4123-4136, 2003.
[34] J. M. Fife and M. Martinez-Sanchez, "Comparison of Results from a
Two-dimensional Numerical SPT Model with Experiment," AIAA-96-
3197, 32nd Joint Propulsion Conference, Lake Buena Vista, Florida, July
1-3, 1996.
[35] J. M. Haas, "Low-Perturbation Interrogation of the Internal and Near-
Field Plasma Structure of a Hall Thruster Using a High-speed Probe
Positioning System," Ph.D. Dissertation, University of Michigan, Ann
Arbor, Michigan, 2001.
Hall Thrusters
387
[36] J. A. Linnell and A. D. Gallimore, "Internal Langmuir Probe Mapping of
a Hall Thruster with Xenon and Krypton Propellant," AIAA-2006-4470,
42nd Joint Propulsion Conference, Sacramento, California, July 9-12,
2006.
[37] E. Ahedo, P. Martinez-Cerezo, and M. Martinez-Sanchez, "One-
Dimensional Model of the Plasma Flow in a Hall Thruster," Physics of
Plasmas, vol. 8,no.6,pp. 3058-3068,2001.
[38] E. Ahedo, "Presheath/Sheath Model with Secondary Electron Emission
from Two Parallel Walls," Physics of Plasmas, vol. 9, pp. 4340-4347,
2002.
[39] G. D. Hobbs and J. A. Wesson, "Heat Flow Through a Langmuir Sheath
in the Presence of Electron Emission," Plasma Physics, vol. 9, pp. 85-87,
1967.
[40] V. Baranov, Y. Nazarenko, and V. Petrosov, "The Wear of the Channel
Walls in Hall Thrusters", IEPC-2001-005, 27th International Electric
Propulsion Conference, Pasadena, California, October 14-19,2001.
[41] E. Ahedo, J. M. Gallardo, and M. Martinez-Sanchez, "Effects of the
Radial Plasma-Wall Interaction on the Hall Thruster Discharge," Physics
of Plasmas, vol. 10, no. 8,pp.3397-3409,2003.
[42] 1. M. Fife and S. Locke, "Influence of Channel Insulator Material on Hall
Thruster Discharges: A Numerical Study," AIAA-2001-1137, 39th
Aerospace Sciences Meeting, Reno, Nevada, January 8-11,2001.
[43] Y. Raitses, D. Staack, M. Keidar, and N. J. Fisch, "Electron-Wall
Interaction in Hall Thrusters," 057104, Physics of Plasmas, vol. 12,2005.
[44] 1. D. Kaganovich, Y. Raitses, D. Sydorenko, and A. Smolyakov, "Kinetic
Effects in Hall Thruster Discharge," AIAA-2006-3323, 42th Joint
Propulsion Conference, Sacramento, California, July 9-12, 2006.
[45] N. B. Meezan and M. A. Capelli, "Kinetic Study of Wall Collisions in a
Coaxial Hall Discharge," Physical Review E, 036401, vol. 66,2002.
[46] E. Ahedo and F. 1. Parra, "Partial Trapping of Secondary Electron
Emission in a Hall Thruster Plasma," Physics of Plasmas, 073503,
vol. 12, no. 7, 2005.
[47] E. Ahedo and V. DePablo, "Effects of Electron Secondary Emission and
Partial Thermalization on a Hall Thruster," AIAA-2006-4328, 42nd Joint
Propulsion Conference. Sacramento, California, July 9-12, 2006.
[48] M. T. Domonkos, A. D. Gallimore, C. M. Marrese, and J. M. Haas,
"Very-Near-Field Plume Investigation of the Anode Layer Thruster,"
Journal of Propulsion and Power, vol. 16, pp. 91-98, 2000.
388 Chapter 7
[49] A. V. Semenkin, S. O. Tverdokhlebov, V. 1. Garkusha, A. V. Kochergin,
G. O. Chislov, B. V. Shumkin, A. V. Solodukhin, and L. E.
Zakharenkov, "Operating Envelopes of Thrusters with Anode Layer,"
IEPC-2001-013, 27th International Electric Propulsion Conference,
Pasadena, California, October 14-19,2001.
[50] D. T. Jacobson, R. S. Jankovsky, and R. K. Rawlin, "High Voltage TAL
Perfonnance," AIAA-200 1-3 777, 37th Joint Propulsion Conference, Salt
Lake City, Utah, July 8-11, 2001.
[51] A. E. Solodukhin, A. V. Semenkin, S. O. Tverdohlebov, and A. V.
Kochergin, "Parameters of D-80 Anode Layer Thruster in One and Two-
Stage Operation Modes," IEPC-2001-032, 27th International Electric
Propulsion Conference, Pasadena, California, October 14-19, 2001.
[52] M. Hirakawa and Y. Arakawa, "Numerical Simulation of Plasma Particle
Behavior in a Hall Thruster," AIAA-96-3195, 32nd Joint Propulsion
Conference, Lake Buena Vista, California, July 1-3, 1996.
[53] J. P. Boeufand L. Garrigues, "Low Frequency Oscillations in a Stationary
Plasma Thruster," Journal of Applied Physics, vol. 84, pp. 3541-3554,
1998.
[54] E. Abedo, "One-Dimensional Plasma Structure in Hall Thrusters," AIAA-
98-8788, 34th Joint Propulsion Conference, Cleveland, Ohio, July 13-15,
1998.
[55] 1. Mikellides, 1. Katz, and M. Mandell, "A I-D Model of the Hall-Effect
Thruster with an Exhaust Region," AIAA-2001-3505, 37th Joint
Propulsion Conference, Salt Lake City, Utah, July 8-11, 2001.
[56] S. Barral, K. Makowski, Z. Peradzynski, N. Gascon, and M. Dudeck,
"Wall Material Effects in Stationary Plasma Thrusters. II. Near-Wall and
In-Wall Conductivity," Phys. Plasmas, vol. 10, no. 10, pp. 4137-4152,
2003.
[57] F. 1. Parra, E. Abedo, J. M. Fife, and M. Martinez-Sanchez, "A Two-
Dimensional Hybrid Model of the Hall Thruster Discharge," Journal of
Applied Physics, 023304, vol. 100,2006.
[58] M. Gamero-Castano and 1. Katz, "Estimation of Hall Thruster Erosion
Using HPHall," IEPC-2005-303, 29th International Electric Propulsion
Conference, Princeton University, New Jersey, October 31-November 4,
2005.
[59] R. R. Hofer, 1. Katz, 1. G. Mikellides, and M. Gamero-Castano, "Heavy
Particle Velocity and Electron Mobility Modeling in Hybrid-PIC Hall
Thruster Simulations," A1AA-2006-4658, 42nd Joint Propulsion
Conference, Sacramento, California, July 9-12, 2006.
Hall Thrusters
389
[60] D. Manzella, J. Vim, and 1. Boyd, "Predicting Hall Thruster Operational
Lifetime," AIAA-2004-3953, 40th Joint Propulsion Conference,
Ft. Lauderdale, Florida, July 11-14,2004.
[61] C. Boniface, L. Garrigues, G. J. M. Hagelaar, and J. P. Boeuf,
"Anomalous Cross Field Electron Transport in a Hall Effect Thruster,"
Applied Physics Letters, 161503, vol. 89,2006.
[62] E. Y. Choueiri, "Plasma Oscillations in Hall Thrusters," Phys. of Plasmas,
vol. 8, no. 4, pp. 1411-1426,2001.
[63] A. Ducrocq, J. C. Adam, A. Heron, and G. Laval, "High-Frequency
Electron Drift Instability in the Cross-field Configuration of Hall
Thrusters," Physics of Plasmas, 102111, vol. 13,2006.
[64] V. Abgaryan, H. Kaufman, V. Kim, D. Ovsyanko, 1. Shkarban,
A. Semenov, A. Sorokin, and V. Zhurin, "Calculation Analysis of the
Erosion of the Discharge Chamber Walls and Their Contamination
During Prolonged SPT Operation," AIAA-94-2859, 30th Joint Propulsion
Conference, Indianapolis, Indiana, June 27-29, 1994.
[65] Y. Garnier, V. Viel, J. F. Roussel, and J. Bernard, "Low Energy Xenon
Ion Sputtering of Ceramics Investigated for Stationary plasma Thrusters,"
Journal of Vacuum Science Technology A, vol. 17, pp. 3246-3254,1999.
[66] Y. Yamamura and H. Tawara, "Energy Dependence of lon-Induced
Sputtering from Monatomic Solids at Normal Incidence," Atomic Data
and Nuclear Data Tables, vol. 62, pp. 149-253, 1996.
[67] S. K. Absalamov, V. Andrew, T. Colberi, M. Day, V. V. Egorov, R. U.
Gnizdor, H. Kaufman, V. Kim, A. I. Korakin, K. N. Kozubsky, S. S.
Kudravzev, U. V. Lebedev, G. A. Popov, and V. V. Zhurin,
"Measurement of Plasma Parameters in the Stationary Plasma Thruster
(SPT-100) Plume and its Effect on Spacecraft Components," AIAA-1992-
3156, 28th Joint Propulsion Conference, Nashville, Tennessee, July 6-8,
1992.
Problems
1. You want to design an experimental Hall thruster to operate from 100 to
800 V and from 100 to 300 gauss. Assuming that the electron temperature
is always about 10% of the discharge voltage, what are the minimum and
maximum lengths of the magnetized region in the channel to have a factor
of 5 margin against electron and ion orbit limits? Neglect collisions.
2. Derive Eq. (7.3-42).
390
Chapter 7
3. A Hall thruster has a plasma channel with a l5-cm outer diameter and a
10-cm inner diameter. Measurements made on the thruster indicate that the
xenon plasma density in the channel is 5 x 10 17 ions per m 3 , the electron
temperature Te is 20 e V, and the radial magnetic field Br is 200 gauss
(0.02 tesla). Ifthe thruster is operated at a discharge voltage 0000 V,
a. What is the beam power?
b. What is the electron Lannour radius rL ?
c. What is the electron Hall parameter Qe ?
d. If the thrust correction factor r = 0.9 and the mass utilization
efficiency 11m = 0.8 , what is the thrust and Isp?
e. What is the Hall current?
4. A xenon Hall thruster has boron nitride walls with a linearly varying
secondary electron yield with a value of 0.5 at zero electron energy and 2
for an electron energy of 100 e V.
a. What is the equation for the secondary electron yield in tenns of the
electron energy?
b. Find the equation for the secondary electron yield for a Maxwellian
distribution of electron energies [hint: use Eq. (C-5)] in tenns of the
electron temperature Te.
c. What is the electron temperature at which the electron flow to the wall
is space-charge limited?
d. Assuming nevB / nivi = 0.5 , what is the maximum sheath potential for
non-space-charge-limited flow (Te less than the value found in part
b)?
5. Assume that all the ions in a Hall thruster are produced by the Hall current
ionizing the neutral gas in the channel.
a. Neglecting the ion current to the wall as small so that all the ions
produced become beam ions, what is the ratio of the Hall current to
the beam current if the average electron temperature is 25 eV? (Hint:
write the ion production rate in terms of the Hall current and use
Appendix E for ionization and excitation collision cross sections.)
b. For a xenon ion thruster with a mean radius of 9 cm, a radial magnetic
field of 150 G, and a discharge voltage of 300 V, what is the ratio of
the Hall current to the beam current?
Hall Thrusters
391
6. A xenon Hall thruster has a channel outside diameter of 10 cm and a
channel width of 3.5 cm with BNSiO z walls. Assume a plasma density of
2 x 10 17 m -3 and an electron temperature of 20 e V in the channel with the
majority of the plasma in contact with 1 cm of the wall axially.
a. What is the electron current to the wall?
b. What is the net electron current to the wall?
c. What is the power deposited on the wall associated with this electron
current?
d. What is the power deposited on the wall associated with ion current?
7. Assume that the thruster in Problem 6 has alumina walls and produces
3.5 A of beam current at 400 V with an electron temperature in the channel
of 15 eV. The thruster also has a beam current utilization efficiency
7Jb = 0.5 .
a. What is the power into the discharge?
b. What is the total power into the alumina walls for a contact length
L = 2 cm?
c. Assuming that the electron temperature at the anode is 5 eV, the mass
utilization efficiency is 90%, and the thrust correction factor r = 0.9,
and neglecting all other power loss channels, what is the thruster
efficiency?
d. For a beam voltage utilization efficiency of 0.9, how much thrust and
Isp is produced?
8. The electron current to the anode in a Hall thruster can be estimated from
the perpendicular electron flux diffusing through the plasma channel.
a. Neglecting the pressure gradient terms, derive an expression for the
current toward the anode in terms of the collision frequency in the
channel plasma.
b. For the thruster in Problem 7 with a transverse magnetic field of
150 G and an axial electric field of 3 x 10 4 Vim, what is the anode
current if only classic electron-ion collisions are considered?
c. The effective wall collision frequency can be estimated as the electron
current to the wall times the secondary electron yield and divided by
the total number of particles in the plasma (v w = r I ew / N . where N is
approximately the plasma density times the channel cross-sectional
area times the plasma length L). Derive an expression for the
transverse electron current due to the electron-wall collisions in terms
of the electron current to the wall.
392
Chapter 7
d. What is the total transverse electron current for this thruster example,
using L = 1 cm for the bulk of the plasma density?
e. If the walls are made of BNSiO z , what is the anode current? Why
does it depend so strongly on the wall material?
9. Calculate the power lost to the wall in a xenon TAL thruster with stainless
steel walls that has a plasma density at the sheath edge of 2 x l0 17 m- 3 and
an electron temperature of 20 eV. The channel has a 12-cm outside
diameter, an 8-cm inside diameter, and is 0.5-cm long. Which power loss
channel (ions or electrons) is larger?
lO. The life of a TAL thruster is limited primarily by the ion sputtering of the
metallic guard rings next to the thruster exit. Assume a TAL has a plasma
density near the wall of 10 17 m -3 and an electron temperature of 25 e V.
a. For stainless steel walls, what is the ion current density to the walls
(the guard rings) and the sheath potential?
b. Assuming that the stainless-steel sputtering yield is about 0.1 atoms
per incident ion at the sheath voltage found in (a), what is the life in
hours of the TAL if 2-mm thickness of the stainless-steel guard ring
material can be eroded away?
c. Assume that the wall material has been changed to graphite with a
secondary electron yield of about 0.5. What is the sheath potential at
the wall?
d. Assuming that the graphite sputtering yield is about 5 >< 10- 3 atoms per
incident ion at the sheath voltage found in (c), what is the life in hours
of the TAL if l-mm thickness of the graphite guard ring material can
be eroded away?
Fundamentals oIElectric Propulsion: Ion and Hall T1l1'llsters
by Dan M. Goebel and Ira Katz
Copyright iQ 2008 John Wiley & Sons, Inc.
Chapter 8
Ion and Hall Thruster Plumes
8.1 Introduction
Electric propulsion offers advantages for many missions and applications, but
like many spacecraft systems, integration of electric thrusters on spacecraft can
present significant systems engineering challenges. Assessing thruster plume
interactions with the spacecraft is key in determining thruster location and other
spacecraft configuration issues, often requiring trades between thrust efficiency
and the life of other subsystems, such as the solar arrays.
Electric thruster plumes consist of energetic ions, un-ionized propellant neutral
gas, low energy ions and electrons, and sputtered thruster material. Spacecraft
systems engineers must account for the interaction between each of the plume
components and other spacecraft systems. For north-south station keeping on
geosynchronous communications satellites, by far the largest application of
electric propulsion, the potential for plume impingement on solar arrays is a
significant issue.
As shown in Fig. 8-1, geosynchronous satellites are in a circular orbit coplanar
with the Earth's equator, with an orbital period of exactly one day. The satellite
appears stationary to an observer on the Earth; however, the Earth's equator is
tilted by 28 deg with respect to the Earth's orbit around the Sun. The plane of
the Earth's orbit is called the ecliptic plane. The Sun's gravity pulls on a
geosynchronous satellite to change the satellite's plane toward the ecliptic. If
the orbital plane were allowed to change, the satellite would appear from the
ground to move north and south in the sky. Optimal communication would then
require the ground-based antennas to constantly scan north and south in order to
track the satellite, defeating the big advantage of geosynchronous satellites.
Electric thrusters are used on satellites to counter the Sun's pull and prevent the
orbital plane from changing. This application is referred to as "north-south
393
394
Chapter 8
"8" Bums Conlrol Drift.
Eccentricity, and Inclination
..;;)J
"
Fig. 8-1. Illustration of the burn arcs of the ion thrusters used for electric propulsion
stetion keeping on Boeing satellites [1,2].
station keeping," and Fig. 8-1 shows the Hughes/Boeing patented [1] strategy
for this function.
Most modern satellites are three-axis stabilized with solar arrays that rotate to
keep the cells pointed toward the Sun. From a thrust perspective, north-south
station keeping is accomplished most efficiently if the thrusters point in the
north and south directions. In geosynchronous orbit, the solar array axis of
rotation points north and south, directly in the path of plumes from north-south
station-keeping thrusters. The thruster energetic ion beam would impinge on
the solar arrays and quickly damage them, dramatically shortening satellite life.
The usual solution is to mount thrusters such that the resultant force is in the
north-south direction, but each plume is at an angle with respect to the solar
array axis. The larger the angle, the greater the thrust loss for station keeping,
which leads to requirements for larger thrusters and more propellant mass; the
smaller the angle, the greater the array damage, which reduces satellite life.
This trade between north-south thrust efficiency and solar array life requires
detailed knowledge of thruster plumes and their interactions.
Electric thrusters used for primary propulsion, such as those on the National
Aeronautics and Space Administration (NASA) Dawn mission to the asteroid
belt, can also create issues associated with plume impact on the spacecraft solar
Ion and Hall Thruster Plumes
395
arrays, exposed components, and scientific instruments. Thruster plumes and
their interactions with the spacecraft must be understood and accommodated in
order for the spacecraft to perform to specification for the required mission life.
8.2 Plume Physics
The thruster plume is composed of ions and electrons of various energies and
some neutral gas. The energetic beam ions accelerated by the thruster fields are
the dominant ion species and the major source of thrust. The velocity and
angular distributions of these ions can be measured in the laboratory and
calculated by the thruster computer models discussed in previous chapters. For
ion thrusters, where the accelerating voltages are a thousand volts or more, the
weak plume electric fields have little influence on energetic ion trajectories. In
this case, the challenge is usually determining the ion trajectories from the
shaped-grid accelerator structure. However, for Hall thrusters, where the
accelerating voltages are a few hundred volts, the plume electric fields can
significantly broaden the energetic ion plume.
The second source of ions is due to charge-exchange reactions between beam
ions and neutral xenon gas. The neutral gas is due to un-ionized particles
leaving both the thruster and the neutralizer (hollow cathode), and, in the case
of laboratory measurements, background neutrals present in the vacuum
chamber. Charge-exchange reactions have usually been associated with
inelastic collisions processes yielding low-energy ions at large angles with
respect to the main-beam direction. However, as thruster voltages increase to
provide higher specific impulse (Isp), the energy of these scattered ions can
become significant. The total plume plasma density, including all three ion
components, is shown schematically in Fig. 8-2 for a 4-kW Hall thruster.
8.2.1 Plume Measurements
Thruster plume characteristics have been measured extensively in the
laboratory and in space on a few spacecraft. In the laboratory, most
measurements have been of the ion velocities and densities, and some thruster
erosion products, but not of the un-ionized neutral gas, which is in most cases
dominated by background gas in the test chambers. The balance of the thruster
gas flow and the speed of the test facility's vacuum pumps determine the
background gas pressure. The maximum facility pressure during high power
testing is usually limited to less than 10-4 torr. Therefore, the density of un-
ionized propellant from Hall and ion thrusters is greater than the background
only within a few centimeters of the thruster.
396
Chapter 8
Hall Effect Thruster /
Fig. 8-2. Total ion density in the plume of a 4-kW Hall thruster.
The dominance of test-facility background neutral gases makes it difficult to
directly measure in a laboratory the secondary plasma environment, which
consists of the ions generated by charge exchange and/or elastic scattering with
neutrals, that would be seen on a spacecraft. Spacecraft system engineers,
therefore, use detailed models of the plume and secondary ion-generation to
predict the in-flight plasma environment. These models [3-6] have been
validated with flight data from a few electric propulsion spacecraft.
8.2.2 Flight Data
The first in-flight measurements of the plasma environment generated by an ion
thruster were made on NASA's Deep Space I (DSI) spacecraft [7]. The NASA
Solar Electric Propulsion Technology Applications Readiness (NST AR)
diagnostics package that flew on DS I included contamination monitors, plasma
sensors, magnetometers, and a plasma-wave antenna. The plasma sensors and
contamination monitors were mounted on the remote sensor unit (RSU) [7] as
shown in Fig. 8-3. The measured plasma density was an order of magnitude
lower than that measured during ground tests, but it was in good agreement
with model predictions. Figure 8-4 shows a comparison of the ion fluxes
Ion and Hall Thruster Plumes
397
measured during the DS I mission by the remote sensing unit and the computed
values [8]. The ion fluxes at the sensor location are primarily the result of
charge exchange between beam ions and un-ionized propellant in the beam.
DSEU
Fig. 8-3. Location of the remote sensor unit on DS1 with
respect to the ion thruster.
0.35
0.30
......
0.25
1 ......
<! 0.20 .....
Q.. ...... ..... .....
cr: ...... .....
......
S ...... .....
0.1 5 .....
x ..... .....
::> .....
u: ..... .....
0.1 0 .....
...... .....
.....
...... .....
.....
0.05 ...... .....
..... .....
..... .....
..... .....
..... .....
......
0.00
41 34 27 20
.....
......
......
....
....
.....
......
......
. .'
13 6
Mission level
Fig. 8-4. Calculated and measured charge-exchange ion fluxes in
the plume of NSTAR at various operating points (from [8]).
398
Chapter 8
Measurements of the plume and secondary ions from Hall thrusters were
carried out on a Russian communications satellite, Express-A3 [5]. The satellite
had instruments to measure ion fluxes both on the spacecraft body, 90 deg from
the thrust direction, and on the solar arrays. These diagnostics monitored effects
from the central beam over a cone with a half-angle of about 40 deg. The
Stationary Plasma Thruster (SPT)-lOO Hall thruster plume calculated using the
Electric Propulsion Interactions Code (EPIC) [6,8] is shown in Fig. 8-5. As was
the case for ion thrusters, the measured secondary ion fluxes were an order of
magnitude less than fluxes measured in ground-based chambers, but, again, in
good agreement with plume models. The accuracy of the models is illustrated
in Fig. 8-6, where the current density measurements on the Express-A
spacecraft are compared with the computed values.
8.2.3 Laboratory Plume Measurements
While the flight measurements show the ability of the models to predict
thruster-generated plasma environments, tests in ground-based chambers
provide much more detailed measurements than those made in space.
Experiments conducted by The Aerospace Corporation for the Lockheed
Martin Space Systems Company on the Busek-Primex Hall Thruster
(BPT -4000) provided plume data [9] for comparison with computer models.
Measurements were taken using fully exposed flux probes ("uncollimated") for
7 7 X 10'5 rrr3
1.2 x 101!>
1.8x10 101
2.7)( 10'3
4.1 )( 10'2
6.2 X 10"
Fig. 8-5. EPIC model of the Express-A spscecraft showing the plume ion density
profile during operation ofthe RT4 SPT-100 thruster (from [5]).
Ion and Hall Thruster Plumes
399
10,000
1,000
. Express Data
- Computed (Te = 11 eV)
--- Computed (T e = 8 eV)
-- Computed (Te = 2 eV)
" ..
E
u
100
'(j;
c:
Q)
0 .
'E 10
:s
u
0.1
o
.
.
40 60
Plume Angle (deg)
Fig. 8-6. Comparison of current density meaeurements onboerd the Express-A
spacecraft and computed values (from [5]).
20
80
assessing the non-directional ion flux and probes inside graphite collimators
("collimated").
Figure 8-7 shows experimental data [9] from the BPT -4000 Hall thruster at a
discharge power of 3 kWand voltage of 300 V using a collimator for energy
spectra at different angles with respect to the thruster axis. The angle-
independent, high-energy peak at E/q 280 V associated with the main beam is
clearly evident. Also apparent is a small-amplitude peak at the lowest energy
values of the collimated spectra from the background chamber plasma. This
peak was dominant in the uncollimated spectra. Figure 8-7 reveals the existence
of secondary current density peaks with relatively high energies compared to
the primary resonant charge exchange peak. For example, at an angle of 40 deg,
the energy associated with the second maximum is approximately 150 eV.
These observed ion-flux crests show a marked energy dependence on angle. In
an ideal elastic collision between a moving sphere and an identical stationary
sphere, the magnitude of the final velocity for each sphere is proportional to the
cosine of the angle between its final velocity and the initial velocity of the
moving sphere, and the sphere's kinetic energy varies with the square of the
cosine. Because the retarding potential analyzer (RP A) data in Fig. 8-7 show a
peak with energy dependence given roughly by Eb cos26 1ab , where Eb is the
main ion beam energy and 6 lab is the angle with respect to the thruster axis,
these peaks have been attributed to simple elastic scattering (momentum
400
Chapter 8
0.35
0.30
N 0.25
E
< Elastic Scattering Peak
><
0 0.20
0
.?:-
'u; 0.15
c:
Q)
0
'E
0.10
:>
t.)
0.05
Thruster Beam Peak -.....-...
o
o 50 100 150 200 250 300
Energy/Charge (V)
Fig. 8-7. Collimated RPA data for the BPT-4000 showing the angle-
independent, high-energy main beam peaks and the angle-dependent, elastic
scattering peaks (from [9]).
transfer) between beam ions and neutral atoms. Numerical simulations using
calculated differential scattering cross sections confirm tbat elastic scattering is
the cause of the observed mid-energy peak [10].
8.3 Plume Models
8.3.1 Primary Beam Expansion
Before the advent of multi-dimensional computer models of thruster plumes,
empirical models of the primary beam expansion were used. These models
reproduce the general features of the ion beam angular distribution. Because
they are very simple, they are invaluable for initial trades when planning
electric propulsion system accommodation on spacecraft.
Parks and Katz [11] derived an analytical model of the expansion of an ion
beam with a Gaussian profile in its self-consistent, quasi-neutral electric field
with or without an initial distribution of radial velocities. This model is very
useful for analytically calculating thruster ion-beam plume characteristics. The
steady-state ion continuity and momentum equations in the absence of
ionization are
Ion and Hall Thruster Plumes
401
V '(Pm v) =0
(8.3-1 )
(8.3-2)
V '(Pm vv)=-Vp,
where the mass density, Pm' is the product of the ion number density and the
IOn mass.
Assuming the beam has cylindrical symmetry, the axial beam velocity remains
constant everywhere and the axial derivative of the pressure can be neglected
compared with its radial derivative. The ion continuity and momentum
equations can then be rewritten as
1 d ( ) d(Pm v z ) 0
-- rpmvr + +=
r dr dz
(8.3-3)
dV r dV r 1 dp
v -+V -=---
r dr z dZ Pm dr
(8.3-4)
The second equation was obtained from the momentum equation by using the
continuity equation to eliminate derivatives of the density. The pressure term is
assumed to be the constant temperature electron pressure
p= nkTe'
(8.3-5)
Using the assumption of constant axial velocity, the axial distance, z, can be
replaced by the product of the beam velocity, v Z ' and t, the time since the beam
left the thruster:
z = V z t .
(8.3-6)
The axial derivative can be replaced with a time derivative:
d 1 d
----
dz V z dt
(8.3-7)
Equations (8.3-3) and (8.3-4) can then be rewritten as
1 d dPm
--(rPm vr)+-=O
r dr dt
(8.3-8)
dV r dV r 1 dp
v r -+-=---.
dr dt Pm dr
(8.3-9)
402
Chapter 8
These approximations are quite good if the axial velocity is much greater than
both the initial radial velocities and the ion sound speed.
With the assumption that the ion beam profile starts out and remains a Gaussian
profile, the set of equations can be solved analytically. The beam profile is
written as
P ( r2 J
(r)= exp ,
Pm h(t)2 2R2h(t)2
(8.3-10)
where the initial ion beam mass density, Po' is
_ M1b
Po- 2 '
2nvb R
(8.3-11)
and the function h(t) describes how the beam expands radially. The
parameter R is chosen to best represent initial beam width, and the initial value
of the expansion parameter h(O) is unity. The density spreads out as the beam
moves axially, but the beam profile remains Gaussian, as shown in Fig. 8-8.
An ion that starts out at a radial position ro will move radially outward
proportionally to h(t) :
r(r o ,t) = ro h(t).
(8.3-12)
This implies that the radial velocity, v r ' is proportional to the time derivative
of h(t) :
vr(r,t) = ro h(t).
(8.3-13)
Equations (8.3-12) and (8.3-13) can be combined to obtain an expression for
the local velocity that doesn't use the initial radial position:
h(t)
vr(r,t) = r-.
h(t)
(8.3-14)
The solution obtained below is valid for a beam with no initial radial velocity,
or for an initial radial velocity distribution that is proportional to the radius:
vr(r,O)=v r.
(8.3-15)
Ion and Hall Thruster Plumes
403
h = 2.0
Fig. 8.8. The Gaussian beam deneity
profile broadens ss ions move
downstream from the thruster exit plane.
The density, defined by Eq. (8.3-10), and the radial velocity, defined in
Eq. (8.3-15), both satisfy the ion continuity equation, Eq. (8.3-8), for any
function h(t) . The first term in Eq. (8.3-8) then becomes
a(r Pm v r ) = ( r2 Pm ) = ( 2 - r2 f1 ) Pm'
r ar r ar h h R 2 h 2
(8.3-16)
and the second term in Eq. (8.3-8) becomes
aPm _ ( 2 h r2h )
-- - -+- P
at h R2h2 m'
(8.3-17)
Making the same substitutions into the momentum equation, Eq. (8.3-9), an
equation for h(t) is obtained that is independent of the radius:
aV r aV r 1 ap
v -+-----
r ar at - Pm ar
f1 a f1 a f1 e Te aPm
r--r-+-r-=---
h ar h at h M Pm ar
f12 f12 h eT r
_ e
-r h 2 + r h 2 + r h - Af Pm R2 h Pm
2
hh = kTe =:lL
Af R 2 R 2 '
(8.3-18)
404
Chapter 8
where vB is the Bohm velocity. In Eq. (8.3-18), the right-hand side is a
constant. This equation can be integrated by the usual substitution of a new
function w = dh / dt for the time derivative of h:
.. d. dw dw dh dw
h=-h =-=--=w-.
dt dt dh dt dh
(8.3-19)
Using this, Eq. (8.3-18) can be rewritten as
dw v 2
w - =-..!l.....
dh R 2 h'
(8.3-20)
Integrating once yields
. 2
f h(t) f h(t) vB
. wdw= _ 2 dh.
h(O) I R h
(8.3-21 )
Writing this expression in terms of h and its time derivative gives
2
tJi2 = Inh+t Ji2 (0).
(8.3-22)
Taking the square root and integrating again, an equation relating h to time is
obtained. For the case of no initial radial velocity, h(O) = 0, the time derivative
of h is
h = vB .J2lnh .
R
(8.3-23)
Equation (8.3-23) can be rewritten and integrated to give
= .J2i dt
..Jln h R
(8.3-24)
r = f t .,fi VB dt = .,fi VB t.
I .Jln x 0 R R
(8.3-25)
An approximate numerical solution of Eq. (8.3-25) for the expanSIOn
parameter, h, is given by
h 1.0 + 0.6524" + 0.0552,,2 - 0.0008,,3,
(8.3-26)
Ion and Hall Thruster Plumes
405
where 'l'is given by
'l' =.J2 vB t.
R
(8.3-27)
These expressions describe the beam expansion for the case of no initial radial
velocity or for an initial radial velocity distribution that is proportional to the
radius. Examples of schematic beam profiles as a function of distance from the
thruster were given in Fig. 8-8. For the case of an initial radial velocity profile,
the integral in Eq. (8.3-25) is
[ 2 ) -112
t = st 1+2 R lnx dx,
(8.3-28)
where the integral has to be calculated numerically. Park's model has been
extended by Ashkenazy and Fruchtman [12] to include thenTIal gradient and
two-dimensional effects.
The Park's fOnTIula is very similar to an empirical formula developed earlier by
Randolph for Hall thrusters [13]. Randolph's fOnTIula has two Gaussians but
does not have the curved trajectories of the Park's fOnTIula. The four
parameters, ko through k 3 , in Randolph's fOnTIula are chosen to fit plume
measurements:
. R 2 { [ (Sin6)2 ) [ 62 )}
] = 7 ko exp - kf + k2 exp - k .
(8.3-29)
While the analytical expressions above are invaluable for estimating plume
interactions, multi-dimensional computer models are nOnTIally used for detailed
calculations. There is general agreement on the physics that control the
expansion of the main ion beam from ion and Hall thrusters, but there are
differences in the numerical algorithms used to calculate the expansion. Several
researchers [3,4] employ particle-in-cell (PIC) algorithms, where the beam is
modeled as a collection of macro-particles with each particle representing a
large number of ions. The velocity and acceleration of each particle are
followed in the self-consistently calculated electric field.
Another approach, which is much less computationally intensive, is to model
the thruster beam as a drifting fluid of cold ions and warm electrons. In this
method, the expansion of the fluid-like ion beam is calculated using a
Lagrangian algorithm [5,6]. The ion beam profile for the Nuclear Electric
406
Chapter 8
Xenon Ion System (NEXIS) ion thruster [14] calculated using this algorithm is
shown in Fig. 8-9. The primary beam is assumed to be composed of a
collisionless, singly ionized, quasi-neutral plasma expanding in a density-
gradient electric field. The electron drift velocity is small compared to the
electron thermal speeds, so momentum balance for the electrons can be written
as
me dv e =eV tP-VPe =0,
dt
(8.3-30)
where v e ' tP, and Pe are the electron velocity, electric potential, and electron
pressure, respectively. Assuming an ideal gas electron pressure, the potential
follows the barometric law,
_ kTe I ( ne )
tP-- n - ,
e nee
(8.3-31)
where Te is the electron temperature, ne is the plasma density (ne = ni), and
nee is a reference plasma density. The plume is also assumed to be isothermal.
This is a better approximation for space conditions than for the laboratory,
where inelastic collisions with background neutrals will tend to cool the
electrons.
In this model, ions are assumed to be very cold compared with the electrons
(Pi"" 0 ), and their acceleration to be dominated by the electric field:
5
o
2o-kW Ion /. .
Thruster ____..? 'V
m- 2 4.2 x 10 15
2.5 x 10 15
1.4 X 10 15
8.4 X 10 14
4.9)( 10 14
I
2.9 X 10 14
1.7x10 14
9.9)( 10 12
1 6 . 8 x 10¹³
I
3.4 X 10 13
I
2.0 X 10 13
4
3
I
..
:1
-5
--4
-3
2
-1
:1
3
4
5
rIm)
Fig. 8-9. Calculated primary ion beam density profile for tha 20.kW NEXIS ion
thrustar [14].
Ion and Hall Thruster Plumes
407
M DVi =-e'V rp.
Dr
(8.3-32)
Since the drift velocity of the ions is much greater than their thermal velocity,
the high-velocity ions are modeled as a fluid, with a velocity of vi' The
governing equations, solved in two-dimensional (2-D) (R-Z) geometry, are
conservation of mass and momentum:
V' . nVj = 0
MVj' V' nVj =- enV'rp.
(8.3-33)
The accuracy of the algorithm has been confirmed by comparisons of analytical
solutions with model problems in one and two dimensions [8]. The Lagrangian
modeling approach leads to reduced numerical noise as compared with PIC
algorithms. However, unlike PIC algorithms, the fluid technique ignores
spreading of the beam due to ion temperature and, in the case of ion thrusters,
the angular distribution coming out of each grid aperture.
8.3.2 Neutral Gas Plumes
The neutral gas density in a laboratory vacuum chamber has three components:
gas from the thruster, gas from the neutralizer hollow cathode, and the
background chamber density. To model the neutral gas density, the gas from
ion thrusters can be approximated by isotropic emission from a disk with the
diameter of the grid:
cosfJ
na -Y-.
r
(8.3-34)
For Hall thrusters, the neutral gas density can be approximated using an annular
anode gas flow model with isotropic emission from the channel. This is done by
calculating emissions from two disks, one large and one smaller, and
subtracting the smaller from the larger. The neutral density drop-off with r and
z from a disk emitting a Maxwellian distribution is calculated using an
approximate view factor. Energetic charge-exchange (CEX) neutrals are
negligible compared to the total neutral density and therefore are not included
when modeling the neutral gas density.
For plume models, the neutral gas from the neutralizer hollow cathode is
usually assumed to be from isotropic emission at a constant temperature equal
to the neutralizer cathode orifice temperature. While the neutralizer is offset
from the thruster axis of symmetry, in cylindrical 2-D codes there are an equal
number of points from the thruster axis closer to and farther from the
408
Chapter 8
neutralizer. The cylindrically averaged neutral density for any point at a
distance z downstream is estimated as if the point were along the thruster
centerline. The vacuum chamber background neutral density is usually assumed
to be constant. Based on values of the ambient temperature and pressure, the
background density can be determined assuming an ideal gas law. No
background density is assumed for calculations in space conditions. Figure 8-10
shows each of the three components and the total calculated neutral density [10]
for the BPT -4000 Hall thruster.
8.3.3 Secondary-Ion Generation
Low energy ions are created near a thruster exit plane by charge exchange
collisions between the main ion beam and the neutral gas. The mechanism is
the same for both gridded ion and Hall thrusters. Charge-exchange ion density
can be computed using a two-dimensional, R,Z-geometry PIC code, while
using the main-beam ion densities computed by the Lagrangian calculations
and the neutral gas profile as inputs. The charge-exchange ion production rate,
it CEX, is calculated assuming that the beam ions have a velocity, vb, much
greater than the neutral gas velocity:
itCEX = ni no vb O'CEX'
(8.3-35)
Resonant charge-exchange cross sections between singly charged xenon ions
and neutral xenon atoms range from 30 A 2 to 100 A 2 for typical ion and Hall
thruster energies [15].
4 x 10 18
'7
.s
- Total
- - - - Chamber
-0- Hall Thruster
- - Hallow Cathode
'w
c
CI>
£:)
CI> 2x 10 18
U
'E
ro
0..
'5
CI>
z
0.10
0.20
0.30
0.40
Distance Downstream of Thruster Exit (m)
FiQ. 8-10. Neutral Qas density downstream of the BPT 4000 exit plane (from r10n.
Ion and Hall Thruster Plumes
409
The charge-exchange ion density is calculated by tracking particle trajectories
in density-gradient electric fields using a finite-current barometric law for the
electron density (electron current equals ion current). Poisson's equation is
solved on a finite element grid and iterated until steady-state CEX densities and
density-gradient potentials are self-consistent. Comparisons of the CEX plume
model with flight data from the NST AR's ion engine exhibited good agreement
[8].
Figure 8-11 shows plume maps at one meter, calculated using this method for
the BPT -4000 under both laboratory and space conditions. The CEX density in
the laboratory is found to be more than one order of magnitude greater than it is
in space due to the dominance of the background neutral gas in the chamber.
With the exception of the neutral gas density, all the terms in the expression for
charge-exchange ion generation [Eq. (8.3-6) above] are identical for the
laboratory and space. Figure 8-10 showed that at distances greater than about a
tenth of a meter downstream of the thruster exit plane, the chamber gas density
is much greater than the gas coming directly from the thruster, resulting in
greater charge-exchange ion generation. The computed total ion current in the
laboratory case (5.3 A) is in approximate agreement with measurements of the
integrated ion current (5-6 A for collector potential of 20 V) [9]. The
calculations assumed a charge-exchange cross section for 300-V ions of 55 N
based on the calculations and measurements by Miller [15].
2 x 10 16
1 x 10 16
5 x 10 17
2 x 10 u
1 x 10 17
5 x 10 16
2 x 10 16
1 X 10 16 - 0.6
5x 10 15 --
2 x 10 15 -' ..s
1 x 10 15 - 0.4
5 x 10 14 -
2 X 10 14 -
1 X 10¹⁴ -
5 x 101 - 0.2
2 x 101 -
1 X 101
5 X 10 12
I'f
1.0
Total Ion Density
I'f
1.0
--
0.8
0.8
0.6 --
0.4 __,
,0.2 ii'
I
0.0
0.2 0.4 0.6 O.B 1.0 0.0
(m)
(a} Space
CEX Ion Current'" 0.74 A
0.2 0.4 0.6 O.B
(m)
(b) Laboratory
CEX Ion Current'" 5.26 A
1.0
Fig. 8-11. Hall thruster plume maps for (a) space and (b) laboratory and conditions
showing dominance of background denaity in the charge-exchange plume production
(from [10)).
410
Chapter 8
The distinctive second peak in the energy spectra captured by the collimated
retarding potential analyzer (RP A) data shown in Fig. 8-7 is from elastic
scattering of xenon ions by neutral xenon atoms. Mikellides et al. [10] have
calculated differential cross-section data for elastic Xe + - Xe scattering in a
center-of-mass frame of reference. The calculations involve averaging over the
pertinent Xei potentials, without inclusion of charge exchange. The results are
then subsequently corrected for charge exchange.
The derived, center-of-mass differential cross sections were converted to values
in a fixed frame of reference relative to the laboratory and implemented in the
plume model. For comparisons with RP A measurements, the flux of scattered
ions lis'
I. = fx 1bno da d
IS Jo d2 dO.
_ lbnoxc da
- d 2 dO.'
(8.3-36)
was computed at a radius of I m (the RPA location). In Eq. (8.3-36), lb and
no are the main-beam ion current and neutral density, respectively. The
dimension Xc is the characteristic length of the beam column and d is the radial
distance between the thruster and the RP A. The differential contribution due to
the column element along the beam is denoted by d , and da / dO. is the
differential cross section.
The results from the complete calculation, compared with data, are shown in
Fig. 8-12. Plotted in the figure are the results of the calculations of the
expanding beam ions, and the beam and scattered ions combined. Also plotted
are the ion current probe data for four bias levels of 50 V and 100 V. The probe
bias potential prevents lower energy ions from being collected. As expected,
the beam-only values compare best with the ion probe biased to 100 V, since, at
this value, most of the scattered and charge-exchanged ions are excluded. The
calculation combining beam and elastic scattering compares well with
50 V -biased probe data since these data include most of the elastically scattered
ions.
8.4 Spacecraft Interactions
In order to design a spacecraft to accommodate electric thrusters, it is necessary
to understand how the thruster plumes interact with the spacecraft and its
Ion and Hall Thruster Plumes
411
100
10
"
E
'E 0.1
::>
U
c: 0.01
E
0.001
0.0001
0
--- Beam
- Beam+Scatter
o Ion Flux> 100 V
l:. Ion Flux> 50
'&'00
',0<>00
\
\
\
,
Lab E> 100
30 40 50 60
Angle (deg)
Fig. 8-12. Comparison of high-energy ion current between the calculations and
measurements for the BPT-4000 (from [10]).
10
20
70
80
90
payloads. Thruster plumes affect the spacecraft immediately during their
operation, for example, by momentum transfer from plume impingement or
optical emissions and by slow, cumulative processes, such as ion erosion of
spacecraft surfaces or contamination of surfaces by materials generated by
thruster wear. The immediate interactions may affect spacecraft operations; the
longer-term interactions may affect spacecraft life.
Unique to electric propulsion is the interaction between the thruster plumes and
the spacecraft electrical system, in particular the solar arrays. Electric thruster
plumes are composed of charged particles and can carry currents between the
thruster electrical power system and exposed electrical conductors such as solar
array cell edges and interconnects. While the currents that flow through the
thruster plumes are in general quite small, they may cause changes in
subsystem potentials. These potential changes, if not anticipated, may be
mistaken for system anomalies by spacecraft operators.
As described in previous sections, while most of the plume is in the thrust
direction, a small fraction of the thruster exhaust is emitted at large angles. The
large-angle component is mostly composed of low-velocity particles. Some
high-energy ions in Hall thruster plumes can be found at angles greater than
45 deg, but at such a low flux density that they will have little impact on
spacecraft life. Techniques for quantitatively calculating the effects of thruster
plumes on spacecraft are presented in the following sections.
412 Chapter 8
8.4.1 Momentum of the Plume Particles
Just as with chemical thrusters, when electric thruster plumes impact spacecraft
surfaces, they exert a force, which causes a torque on the spacecraft. The force
is easily calculated as the difference in momentum between the plume particles
that impact the surface and the momentum of particles that leave the surface.
The momentum of the plume particles is the sum of the ion and neutral atom
fluxes. Since the plume consists primarily of ions, and the velocity of the
ionized particles is much greater than the neutral atoms, the neutral component
can usually be neglected. The ion momentum is
Pi = ni M Xe Vi,
(8.4-1)
and the neutral momentum is
Po = no M Xe v 0 ,
(8.4-2)
so that the total plume momentum is
Pplume = Pi +Po "" Pi'
(8.4-3)
In one extreme, an ion that impacts a surface may scatter elastically and leave
the surface with its kinetic energy unchained, but its velocity component
nonnal to the surface is reversed:
elastic 2
Pswface . n = - Pplume' n.
(8.4-4)
In the other extreme, the incident xenon ion resides on the surface long enough
to transfer its momentum and energy to the surface, and the particle leaves the
surface with a velocity distribution corresponding to the surface temperature.
This process is called accommodation, and the fraction of particles that undergo
this process is called the accommodation coefficient.
Since spacecraft surfaces are typically less than a few hundred degrees kelvin,
the velocities of accommodated atoms are orders of magnitude less than
energetic thruster ions. For example, the speed of a xenon atom leaving a
300-K surface is
fkT
Vi(300K)=V = 137[m/s],
(8.4-5)
while the speed of a beam ion from a 300- V Hall thruster is
Ion and Hall Thruster Plumes
413
2eV
vb(300eV)= M =22,000 [m/s].
(8.4-6)
Because the thermal speeds are so small compared with the beam speeds, the
momentum of re-emitted surface-accommodated ions can be ignored when
calculating surface torques. The momentum transfer per unit area is
approximated by
F = (2 - Ac )Pplume,
(8.4-7)
where Ac is the surface accommodation coefficient, which has a range of
values from 0 to 1. Flight data from the Express-A satellite show that
accommodation coefficients for Hall thruster ions on the solar arrays were close
to unity [5].
8.4.2 Sputtering and Contamination
A major concern for implementing ion thrusters on Earth-orbiting satellites is
that energetic ions from the thruster beam will erode spacecraft surfaces. As
discussed above, north-south station keeping with body-mounted thrusters
invariably leads to high-energy ions bombarding some part of the solar arrays.
When these high-energy ions impact the solar arrays or other spacecraft
surfaces, they can cause erosion by sputtering atoms. However, with proper
placement and orientation of the thrusters, and the use of stay-out "zones"
during which the thrusters are not operated because the plume would impinge
on the array, the ion flux can be small enough to keep electric thrusters from
limiting satellite life. Whether a given surface erodes or accumulates material
depends on the relative rates of sputtering and the deposition of sputter
deposits. The deposits result from erosion products from the thruster itself, as
well as material sputtered from other spacecraft surfaces.
Sputtering affects spacecraft in two ways. First, spacecraft surfaces can erode
by sputtering or be contaminated by the buildup of sputtering products. Primary
thruster beam ions are the principal source of sputtering, and spacecraft
surfaces within a narrow cone angle of the thrust direction will erode
significantly due to ion sputtering. The cone angle where sputtering is
important depends on the specific thruster and is usually narrower for ion
thrusters than for Hall-effect thrusters. For example, the NEXIS ion thruster
primary-beam plume, shown in Fig. 8-9, has a half-angle for all particles of
only about 20 deg and 95% of the particles are within a 1 O-deg half angle.
Second, while ion and Hall thrusters typically use an inert gas propellant, both
types of thrusters can contaminate spacecraft surfaces. The sources of
414
Chapter 8
contamination are thruster material sputtered by energetic ions, as well as
spacecraft material sputtered by the main thruster beam. In ion thrusters, sputter
erosion of grid material not only limits thruster life, but the sputtered grid
material may be a significant source of contamination to spacecraft surfaces.
This was recognized early in the development of commercial ion thrusters [16],
and as a result, a third grid was added to reduce the amount of sputtered grid
material coming from the thruster and to shield the spacecraft from grid sputter
products. The third grid has the added benefit of dramatically reducing the grid
sputter rate by preventing charge-exchange ions made downstream of the third
grid from hitting the accelerator grid [17]. For ion thrusters with metal grids,
the problem of contamination in the absence of a third grid can be quite
important. Only a few mono layers of a metallic contaminant can make large
changes to the optical, thermal, and electrical properties of spacecraft surfaces.
For Hall thrusters, the situation can be quite different. The plume from Hall
thrusters normally has about twice the angular divergence of an ion thruster,
and so sputtered thruster material comes out at large angles. However, early in
life most of the contamination comes from sputter erosion of the ceramic
channel wall. Although this can produce a substantial flux of sputter products,
the products are mainly insulating molecules. Deposition of sputtered
insulators, such as Hall-thruster channel ceramic or solar-cell cover glass
materials, has little effect on the spacecraft surface optical and thermal
properties. More problematic is the sputtered metallic material from the late life
erosion of Hall-thruster magnetic pole pieces. In the same manner as with ion
thrusters, very thin layers of the deposited metal can radically change the
properties of spacecraft surfaces.
One effect discovered with Hall thrusters, but common to both ion and Hall
thrusters, is that surfaces can experience net deposition of sputter products or
can be eroded away by energetic beam ions, depending on their location with
respect to the thruster ion beam [13]. As shown in Fig. 8-13, the plume of
sputtered products coming from the thruster is normally much narrower than
the main ion beam. For surfaces at small angles with respect to the thrust
vector, sputtering from the beam ions is greater than the deposition of thruster
erosion molecules. These surfaces will erode over time. However, surfaces
located at large angles to the thruster vector are contaminated by thruster
erosion products faster than they can be sputter away by energetic beam ions.
Over time, sputtered thruster material will accumulate on these surfaces. For
the SPT-lOO Hall thruster, the dividing line between erosion and deposition is
about 65 deg [13].
Ion and Hall Thruster Plumes
415
........ Ion Beam Plume
- Contamination Plume
------
"
....
"
,
\
\
Thruster
Net Sputtering
I Vector
I
/
/
,.
,
-----
,
Fig. 8-13. Sputtering by mein beam ions dominates at engles close to the thrust
vector direction: deposition of thruster erosion products occurs et engles far from
the thrust direction.
Besides thruster erosion products, the other source of contamination is
spacecraft surface material sputtered by thruster beam ions. Computer codes,
such as the Electric Propulsion Interactions Code (EPIC) [6], are used to
calculate the erosion and redeposition over the entire spacecraft. EPIC is an
integrated package that models the interactions between a spacecraft and its
electric propulsion system. The user provides EPIC with spacecraft geometry,
surface materials, thruster locations, and plume parameters, along case study
parameters such as orbit and hours of thruster operation. EPIC outputs thruster
plume maps, surface interactions on the three-dimensional (3-D) spacecraft,
one-dimensional (I-D) plots along surfaces (e.g., erosion depth on a solar array
as a function of distance from the thruster), and integrated results over the
duration of the mission (e.g., total induced torque in a given direction, total
deposition of eroded material at a specific location on the spacecraft).
Figure 8-14 shows results of a sample EPIC calculation for the Express-A
spacecraft during firing of one its four stationary plasma thrusters. The
calculation shows both sputter erosion and deposition depths. The thruster
erodes the solar array surface that is along the thruster direction. Some of the
eroded material deposits on other spacecraft surfaces.
8.4.3 Plasma Interactions with Solar Arrays
Ion and Hall thruster plasma plumes connect thrusters electrically to the
exposed spacecraft conducting surfaces. It is important to account for current
paths through the plasma to prevent current loops or unintended propulsion
system floating potentials.
In order to understand the plasma currents and floating potentials between the
electric propulsion system and the rest of the spacecraft, first consider the
thruster external cathode as the source of the plasma. As discussed in
416 Chapter 8
1.0 Jim
--1
-1.0
- -3.0
-5.0
-7.0
-9.0
Fig. 8-14. Contours of the erosion (negative numbers) and deposition depths
(positive numbers) due to sputtering during operation of the SPT-100 Hall thruster
on board the Express-A spacecraft. The calculation was performed with EPIC [6].
Chapter 6, the sheath drop internal to a hollow cathode and orifice resistive
heating produce energetic electrons that ionize the propellant gas and generate
plasma. The combined insert and orifice potential drops are typically between
10 and 15 V, causing the external plasma to be about the same value above
cathode common, as illustrated in Fig. 8-15. The hollow cathode-generated
plasma has an electron temperature of about 2 eV, typical of many laboratory
plasmas.
The spacecraft acts as a Langmuir probe in the thruster plume plasma and will
float to a potential where the ion and electron currents from the plasma cancel.
As discussed in Chapter 3, plasma electron velocities are much higher than ion
velocities, so current balance is achieved by repelling most of the plasma
electrons. This balance occurs when the surface is a few times the electron
temperature negative of the local plasma potential. If the electric propulsion
system were isolated from spacecraft ground by a very high impedance,
cathode common would float around 10 V negative with respect to spacecraft
ground, as illustrated in Fig. 8-16.
When the spacecraft has exposed surfaces at different voltages, predicting the
cathode common floating potential is more difficult. An extreme case would be
if the spacecraft solar arrays had a large area at high positive voltage immersed
in the thruster plume. Then, to achieve current balance, the high-voltage area
would be close in potential to the thruster plume plasma. For example, assume
that the spacecraft had 100-V solar arrays. Since the cathode common is only
Ion and Hall Thruster Plumes
417
+15V
Thruster Plume Plasma
OV
Hollow
Cathode
Cathode Common
Fig. 8-15. The thruster neutralizer hollow cathode generates a
plasma typically 10 to 20 V above the cathode common.
Spacecraft
Thruster Plume Plasma
---
OV
Hollow
Cathode
Cathode Common
Fig. 8-16. The cathode common would float on the order of 10 V
negative on a apacecraft with a conducting surface.
about 10 V negative with respect to the thruster plume plasma, cathode
common would be 90- V positive compared to spacecraft ground, as illustrated
in Fig. 8-17.
On operational spacecraft, cathode common will float somewhere between the
two extremes, -15 V to 90 V, depending on the array construction, and may
vary with orientation and season. Cathode common potential can be held at a
fixed potential with respect to spacecraft chassis ground by tying the electric
propulsion system circuit ground to spacecraft ground with a resistor. Plasma
currents collected by exposed spacecraft surfaces will flow through the resistor.
These currents can be limited by reducing the exposed conducting area in the
thruster plumes. The plasma currents are usually quite small. For example, if
the charge-exchange plasma plume density I meter from the thruster axis is
418
Chapter 8
Tilruster Plume Plasma
Solar
Array
.15 V
ov
OV
Hollow
Cathode
Cathode Common
Spacecraft
Fig. 8.17. A large area of high voltage solar array exposed to the
thruster plume causes the cathode common to float the order of
the array voltage positive of spacecraft chassis ground.
_10 14 m- 3 , a square meter of exposed conducting area would collect only a few
milliamperes of electron current. A kilo-ohm resistor could clamp cathode
common within a few volts of spacecraft ground.
8.5 Interactions with Payloads
8.5.1 Microwave Phase Shift
Electromagnetic waves interact with plasmas, particularly if the wave
frequency is on the order of or lower than the plasma frequency along its path
of propagation. In most spacecraft applications, the communications and
payload frequencies are so high (> I GHz) that there is little effect. For a typical
thruster, the plume density drops below 10 15 m- 3 less than a meter from the
thruster, and then it drops even more rapidly at greater distances. The plasma
frequency at this density about 1 meter from the thruster, from Eq. (3.5-24), is
285 MHz.
As a result, microwave signals with frequencies below a few hundred
megahertz could be affected by the thruster plasma plume. However, even at
higher frequencies, highly directional antenna patterns should be analyzed for
possible distortion by small phase shifts caused by the plasma. A plane wave
Ion and Hall Thruster Plumes
419
with frequency f passing through a plasma with density ne will undergo a
phase shift according to the following formula:
D.f/J nf fL n e dR,
cOne
(8.5-1 )
where c is the speed of light and nc is the critical density at which the plasma
density has a plasma frequency equal to the microwave frequency. Since the
plasma density drops rapidly with distance from the thruster, the scale length
over which the plasma frequency is comparable to the wave frequency is
usually small.
8.5.2 Plume Plasma Optical Emission
The optical emissions from ion and Hall thrusters are very weak but can be
measured by sensitive instruments. The only in-space measurement of the
optical emissions from a xenon plasma plume generated by an electric
propulsion device is from a shuttle flight that had a "plasma contactor" as part
of the Space Experiments with Particle Accelerators (SEP AC) [18] flown on
the NASA Space Shuttle Mission STS-45. The "plasma contactor" was actually
a Xenon Ion Propulsion System (XIPS) 25-cm thruster without accelerator
grids or a neutralizer hollow cathode. Plasma and electron current from the
discharge chamber were allowed to escape into space, unimpeded by an ion
accelerator grid set.
The absolute-intensity optical emlSSlOn spectrum measured in space of the
xenon plasma plume from the operating plasma source is shown in Fig. 8-18.
The spectrum was measured by the Atmospheric Emissions Photometric
Imaging (AEPI) spectrographic cameras. The source was the SEP AC plasma
contactor (18,19] that generated about 2 A of singly-charged xenon ions in a
ring-cusp discharge chamber. The plasma density was about 10 17 m- 3 , and its
temperature was about 5 eV. Upon leaving the discharge chamber, the quasi-
neutral plasma expanded into the much less dense surrounding ionosphere. The
spectrum was taken about 15 meters from the contactor plume, focusing on the
plume about 1.5 m downstream of the contactor exit plane. The apparent
broadness of the lines is due to the spectrograph's relatively wide slit [20].
Optical emissions from the SEP AC plasma contactor are higher than the
emissions expected from a similarly sized ion thruster for two reasons. First, the
plasma contactor ion density is higher since the contactor ions are traveling
about a quarter as fast as thruster beam ions. Second, the electrons in the
SEP AC plasma contactor plume originate in the discharge chamber and are
much hotter than the neutralizer cathode electrons in an ion thruster plume,
420
Chapter 8
30
E
e
U;
C> 20
c:
.c:
C>
'Q3
>,
ro
a::
10
o
460 480 500 520 540 560 580 600
Wavelength (nm)
Fig. 8-18. Visible xenon spectra from the SEPAC plasma contactor
observed by the AEPI hand-held camera during Shuttle Mission
STS-45 (from [20)).
5 eV versus 2 eV. As a result, the absolute magnitude of the spectrum in
Fig. 8-18 is about 2 orders of magnitude more intense than one would expect
from an operating ion thruster.
The source of the strong visible lines in the xenon spectrum is interesting.
Visible emissions from states with allowed transitions to ground contribute very
little to the total observed visible spectra. Most of the visible emissions
originate from states that do not have allowed transitions to ground. The reason
for this is that an optically allowed transition to ground is typically a thousand
times more probable than a transition to another excited state. Thus, if allowed,
almost every excitation will lead to an ultraviolet (UV) photon. Indeed, most of
the radiation from xenon plasmas is in the UV, with only a small part in the
visible. Line emissions in the visible are dominated by radiative decay from
states where the radiative transitions to ground are forbidden. When an electron
collision excites one of these states, it decays though a multi-step process to
ground, since the direct radiative decay to ground is forbidden and the
collisional decay rate is orders of magnitude slower than the allowed radiative
transitions. Although the excitation cross sections from ground to these states
are smaller than those to states with optically allowed transitions, the absence
of a competing single-step decay path to ground allows these states to dominate
the visible emissions.
The total power radiated by a thruster plume, in both the visible and the UV,
can be estimated by assuming that both the ion beam and the neutral gas expand
Ion and Hall Thruster Plumes
421
with the same effective cone angle e. The radius of the beam and neutral
plumes as a function of the distance z from the thruster is then
R= Ro +ztane,
(8.5-2)
where Ro is the initial radius. Assuming a quasi-neutral beam, the ion and
electron densities are
I
n - n - b
e- i- 2'
eVi nR
(8.5-3)
The neutral density is given by
lb ( I-17 m )
no = eV n n R2 ry;;;- .
(8.5-4)
Emission from the neutral gas is proportional to the product of the electron
density, the neutral gas density, the electron velocity, and the Maxwellian-
averaged excitation cross section:
Pemission = f ne no v e (O'excite)eEemission dV
= f; ne no v e (0' excite) e Eemission 2nR 2 dz
= 2nR 2
= f neno ve(O'excite)eEemission -dR,
Ro tane
(8.5-5)
where the temperature-averaged excitation cross section, (O'excite)' IS from
[20]:
_ 19.3exp(-11.6IT ey ) -20 [ 2 J
O'excite(TeY)- xlO m.
TeY
(8.5-6)
For example, at 2 eY, the value of (O'excite) is about 0.8 x 10- 20 m 2 . Integrating
over the plume volume, assuming that Eemission is 10 eY (approximately the
energy of the lowest-lying excited state of xenon), and that the neutral
temperature is 500 deg C, the total radiated power in the NST AR thruster
plume at the full power point ( I beam 1.76 A, V beam = 1100 Y) is
422
Chapter 8
211; ( I-17m )
Pemission = R t e -;;-- v e (a excite) Eemission
eVivn n an "1m
",0.04 [W],
(8.5-7)
which is much less than a tenth of a watt. Emissions in the visible range are
usually only about one percent of the total radiated power.
References
[1] B. M. Anzel, u.s. Patent no. 5,443,231, August 22,1995.
[2] D. M. Goebel, M. Martinez-Lavin, T. A. Bond, and A. M. King,
"Performance of XIPS Electric Propulsion in Station Keeping of the
Boeing 702 Spacecraft," AIAA-2002-4348, 38th Joint Propulsion
Conference. Indianapolis, Indiana, July 7-10,2002.
[3] 1. D. Boyd and A. Ketsdever, "Interactions Between Spacecraft and
Thruster Plumes," Journal of Spacecraft and Rockets, vol. 38, no. 3,
pp. 380-380,2001.
[4] J. Wang, D. Brinza, and M. Young, "Three-Dimensional Particle
Simulations of Ion Propulsion Plasma Environment for Deep Space 1,"
Journal of Spacecraft and Rockets, vol. 38, no. 3, pp. 433 40, 2001.
[5] 1. G. Mikellides, G. A. Jongeward, I. Katz, and D. H. Manzella, "Plume
Modeling of Stationary Plasma Thrusters and Interactions with the
Express-A Spacecraft," Journal of Spacecraft and Rockets, vol. 39 no. 6,
pp. 894-903,2002.
[6] 1. G. Mikellides, M. J. Mandell, R. A. Kuharski, D. A. Davis, B. M.
Gardner, and J. Minor, "The Electric Propulsion Interactions Code
(EPIC)," AIAA 2003-4871, 39th Joint Propulsion Conference, Huntsville,
Alabama, July 20-23, 2003.
[7] D. E. Brinza, M. D. Henry, A. T. Mactutis, K. P. McCarty, J. D.
Rademacher, T. R. van Zandt, P. Narvaez, J. J. Wang, B. T. Tsurutani,
1. Katz, V. A. Davis, S. Moses, G. Musmann, F. Kuhnke, 1. Richter,
C. Othmer, and K.H. Glassmeier, "An Overview of Results from the Ion
Diagnostics Sensors Flown on DS1," AIAA-200l-0966, presented at the
39th AIAA Aerospace Sciences Meeting & Exhibit, Reno, Nevada,
January 8-11, 2001.
Ion and Hall Thruster Plumes
423
[8] V. A. Davis, I. Katz, M. 1. Mandell, D. E. Brinza, M. D. Henry, J. 1.
Wang, and D. T. Young, "Ion Engine Generated Charge Exchange
Environment-Comparison Between NST AR Flight Data and Numerical
Simulations," AIAA-2000-3529, 36th Joint Propulsion Conference,
Huntsville, Alabama, July 16-19,2000.
[9] 1. Pollard, K. D. Diamant, V. Khayms, L. Werthman, D. Q. King, and
K. H. DeGrys, "Ion Flux, Energy, Charge-State Measurements for the
BPT-4000 Hall Thruster," AIAA-2001-3351, 37th Joint Propulsion
Conference, Salt Lake City, Utah, July 8-11, 2001.
[10] I. G. Mikellides, I. Katz, R. A. Kuharski, and M. 1. Mandell, "Elastic
Scattering of Ions in Electrostatic Thruster Plumes," Journal of
Propulsion and Power, vol. 21, no. 1, pp. 111-118,2005.
[11] D. E. Parks and I. Katz, "A Preliminary Model of Ion Beam
Neutralization," Electric Propulsion and Its Applications to Space
Missions," edited by R. C. Finke, Progress in Astronautics and
Aeronautics, vol. 79,1981.
[12] 1. Ashkenazy and A. Fruchtman, "A Far-field Analysis of Hall Thruster
Plume," Division of Plasma Physics (DPP) and International Congress on
Plasma Physics Meeting (ICPP), Paper BMI-004, Quebec City, Canada,
October 2000.
[13] E. 1. Pencil, T. Randolph, and D. H. Manzella, "End-of-life Stationary
Plasma Thruster Far-field Plume Characterization," AIAA-1996-2709,
32nd Joint Propulsion Conference, Lake Buena Vista, Florida, July 1-3,
1996.
[14] 1. E. Polk, D. M. Goebel, 1. S. Snyder, and A. C. Schneider, "Performance
and Wear Test Results for a 20-kW Class Ion Engine with Carbon-Carbon
Grids," AIAA-2005-4393, 41st Joint Propulsion Conference, Tucson,
Arizona, July 11-14,2005.
[15] 1. S. Miller, S. H. Pullins, D. 1. Levandier, Y. Chiu, and R. A. Dressler,
"Xenon Charge Exchange Cross Sections for Electrostatic Thruster
Models," Journal of Applied Physics, vol. 91, no. 3, pp. 984-991,2002.
[16] J. R. Beattie and S. Kami, "Advanced Technology 30-cm Diameter
Mercury Ion Thruster," AIAA-82-1910, 16th International Electric
Propulsion Conference, New Orleans, Louisiana, November 17-19, 1982.
[17] R. Wirz and I. Katz, "XIPS Ion Thruster Grid Erosion Predictions for
Deep Space Missions," 30th International Electric Propulsion Conference,
Florence, Italy, September 17-20,2007.
424 Chapter 8
[18] J. R. Beattie, J. A. Marshall, J. L. Burch, and W. C. Gibson, "Design,
Qualification, and On-Orbit Performance of the ATLAS Plasma
Contactor," IEPC-93-0lO, International Electric Propulsion Conference,
Seattle, Washington, September 1993.
[19] J. R. Beattie, W. S. Williamson, J. N. Matossian, E. J. Vourgourakis, and
J. L. Burch, AlAA-1989-1603, "High-Current Plasma Contactor
Neutralizer System," 3rd International Conference on Tethers in Space-
Toward Flight, San Francisco, California, May 17-19, 1989.
[20] I. Katz, D. E. Parks, B. M. Gardner, S. B. Mende, H. I. Collin, D. H.
Manzella, and R. M. Myers, "Spectral Line Emission by the SEP AC
Plasma Contactor: Comparison Between Measurement & Theory,"
AlAA-95-0369, 33rd Aerospace Sciences Meeting and Exhibit, Reno,
Nevada, January 9-12,1995.
Problems
1. An ion thruster 20 cm in diameter produces a Xe + ion beam at 2000 V.
a. If there is no electron neutralization of the beam, what is the maximum
current in the beam if the beam diameter doubles in a distance of 1 m?
b. What is the effective angular divergence ofthis beam?
c. At what current density is electron neutralization required to keep the
angular divergence less than 10 deg? (Hint: find the radial acceleration
using Gauss's law for the radial electric field in the beam.)
2. You have just been hired as a propulsion engineer by a spacecraft
manufacturer who plans to launch a commercial satellite that uses a 30-cm
xenon ion engine operated for station keeping. The manufacturer plans to
perform a costly test to assess whether a I-mil-thick Kapton coating over a
critical spacecraft surface located near the engine will survive 1500 hours
of thruster operation. You immediately recall that your course work may
allow you to determine the sputtering erosion of the Kapton layer by
analysis, and thus possibly save your employer the high cost of performing
the test. The spacecraft surface in question is a flat panel located
perpendicularly to the thruster's r-z plane, as shown in Fig. 8-19. The panel
length exceeds 6 m. Assuming that the ion beam consists of singly charged
ions only,
Ion and Hall Thruster Plumes
425
Kapton-Coaled Spacecraft Surface
,
j , ':": _n __n_ __ -
--
Ion Thruster
Fig. 8-19. Flat panel positioned ovar an ion thruster plume.
a. Use the equations in your textbook to express the ion beam density, n,
as a function of spatial coordinates (r,z). Produce contour plots of the
beam density within a radius of r = 0.5 m from the center of the thruster
exit (r = 0, z = 0). Assume that the ion density no at (r = 0, z = 0) is
4 X 10 15 m- 3 and that the ion beam velocity Vo is 40 km/s. Also,
assume that uBohm / Vo = 0.03 .
b. Derive an expression for the radial component of the ion beam flux,
r r = v r ' as a function of spatial coordinates (r,z). Plot the radial ion
beam flux as a function of z for r = 0.3,0.4, and 0.5 m.
c. Perform a literature search to find the sputtering yield Y of Kapton as a
function of ion energy/ion charge, E, and incidence angle, , and then
plot Y for 300-V and 1000-V ions between 0 and 90 deg of incidence
angle. (Hint: The sputtering yield for many materials is usually
expressed as Y(E, ) = (a + bE)fl ), where fl ) is a polynomial function
and a,b are constants.)
d. Compute the erosion rate in (A/s) caused by the main ion beam along
the Kapton plate (in the r-z plane), as a function of z, for r = 0.3, 0.4,
and 0.5 m. Assume that the molecular weight of Kapton is 382 g/mol
and that its mass density is 1.42 g/cm 3 (lA = 10- 10 m).
e. If the panel was placed at r = 0.5 m from the thruster, how long would
it take for the main ion beam to erode completely the Kapton layer?
f. For partial credit, choose one answer to the following question: how
would you advise your boss based on your results?
I. The Kapton coating will be just fine. There's no need to perform a
test. Build the spacecraft as is (panel radial location = 0.5 m).
11. The Kapton coating will not survive. We must consider changing
the location of the panel relative to the thruster.
426
Chapter 8
111. The Kapton coating will not survive. Why don't we just use
chemical propulsion?
IV. I must perform more calculations.
v. ii and iv
VI. The Kapton coating will not survIVe. The mission cannot be
launched.
3. In Section 8.3.3, the differential scattering cross section was introduced.
a. What is its physical meaning and what are its units?
b. Figure 8-20 represents the basic picture of a classical scattering
trajectory, viewed from the frame of reference of the target particle. In
the figure, R is the distance of closest approach, b is the impact
parameter, and e is the defection angle.
For elastic scattering, the conservation equations of angular momentum
and energy allow us to predict the deflection angle as follows:
e=n-2bJOO dr
R r2[1-{blr)2-c1>{r)IE]
where c1>(r) is the interaction potential, which is related to the force
field between the colliding particles. E is the (relative) energy of the
incident particles. The differential (dO'/dQ) and total 0' cross sections
are given by
b
Incident c::::::::::>
Partide
Target Partide
Fig. 8-20. Classic scattering diagram for an incident particle on a target particle.
Ion and Hall Thruster Plumes
427
da b I db l
dO. = sine de
a= J Q.
dO.
Compute the differential and total cross sections for (i) collisions
between hard spheres of diameter d and (ii) a repulsive force field
between particles that varies as k/ r 2 (k is a constant).
4. The most general elastic collision process between two particles of unequal
masses, mJ and mz, velocity vectors before the collision, 0] and Oz, and after
the collision, oJ' and oz', can be represented by the geometrical construction
in Fig. 8-21 using the following definitions:
Relative velocities: U = OJ-OZ, U' = Ol'-OZ'
Center-of-mass (CM) velocity: Dc = (m] 0] + mzoz)/(mJ + mz)
Reduced mass: M = m]mz/(mJ + mz)
a. In the case of equal masses, m] = mz = m, and one stationary particle,
Oz = 0, draw the new geometrical construction. What is the relationship
between the scattering angle in the CM frame, e, and the scattering
angle in the laboratory frame, ?
b. Convert the CM differential cross section, dcr/dQcM, into the laboratory
frame ofreference, dcr/dQL.
;ZL1mlm \S
Fig. 8.21. Center of mass depiction of an elastic scattering event.
428
Chapter 8
5. Derive Eq. (8.5-1) for the phase shift of electromagnetic radiation passing
through a plasma (hint: assume the phase shift is small).
6. A spacecraft has a 32-GHz communications system that passes into the
diverging plume of an ion propulsion system 1 m from the thruster. If the
NSTAR thruster beam has an initial radius of 15 cm and produces 1.76 A
of xenon ions at 1100 V with a 10-deg half-angle divergence from the
initial area, what is the total phase shift in degrees produced when the
thruster is turned on or off?
Fundamentals oIElectric Propulsion: Ion and Hall T1l1'llsters
by Dan M. Goebel and Ira Katz
Copyright iQ 2008 John Wiley & Sons, Inc.
Chapter 9
Flight Ion and Hall Thrusters
9.1 Introduction
Ion and Hall thruster technology development programs continue to improve
the perfonnance ofthese engines. However, it is worthwhile to survey the state-
of-the-art thrusters that have been flown to date. In this brief look, we are
covering modern thrusters that have flown in the last ten to fifteen years in
satellite station-keeping and spacecraft prime-propulsion applications. These
thrusters are ion thruster and Hall thruster systems that use xenon as the
propellant. The parameters given for the thrusters include the neutralizer or
external cathode flow rates, since that is required for flight operation on
satellites and spacecraft.
9.2 Ion Thrusters
The first of the modern ion thrusters flown were intended for station-keeping
applications on geosynchronous satellites and developed by Mitsubishi Electric
Corporation (MELCO) for use on the Japanese "Engineering Test Satellite
(ETS-6)" in 1994 [1,2]. These 13-cm Kaufman thrusters produced nominally
20 mN of thrust at an Isp of about 2400 s. Despite launch vehicle problems that
caused the satellite to fail to reach its planned orbit, the thrusters were
successfully operated in orbit. The same electric propulsion subsystem was
launched on the COMETS satellite in 1996, which also failed to reach its
planned orbit. Development of Kaufman ion thrusters for communications
satellite station-keeping applications is continuing at MELCO.
The first successful use of ion thrusters in commercial station keeping
applications was the Hughe5 13-cm Xenon Ion Propulsion System (XIPS) [3,4],
which was launched into orbit in 1997 on the Hughes PAS-5 satellite. The
XIPS system utilizes two fully redundant subsystems, each consisting of two
thrusters, a power supply, and a xenon gas supply. The performance parameters
429
430
Chapter 9
for the 13-cm XIPS thruster are shown in Table 9-1. The thrusters produce
nominally 18 mN of thrust at an Isp of 2500 s and a total efficiency of about
50%. A schematic of the 13-cm XIPS thruster is shown in Fig. 9-1, and a
photograph of the thruster, which is manufactured by L-3 Communications,
Electron Technologies, Inc., is shown in Fig. 9-2. Over 60 of these thrusters
were launched into orbit and successfully used for North-South station keeping
on Hughes and Boeing satellites.
The next ion thruster to fly was NASA's NSTAR ion engine [5,6], which is a
ring-cusp, DC electron-bombardment discharge thruster with an active grid
Table 9-1. 13-cm XIPS performance.
Parameter
Station Keeping
13
421
2507
17.2
50.0
77.7
71.3
750
0.4
Active grid diameter (cm)
Thruster input power (W)
Average Isp (s)
Thrust (mN)
Total efficiency (%)
Mass utilization efficiency (%)
Electrical efficiency (%)
Beam voltage (V)
Beam current (A)
Permanent
Magnets
Electrode
Apertures (-11,000)
Propellant
Electrical Isolator
Propellant Plenum
Mask
Ground Screen
lon-Extraction
Bectrodes (3)
Cathode/Keeper
Subassambly
Fig. 9-1. Schematic of the 13-cm XIPS thruster (from [4,10)).
Permanent Magl1ets
Flight Ion and Hall Thrusters
431
\it
.. "\
Fig. 9-2. Photograph of the 13-cm XIPS ion thruster (photo
courtesy of L-3 Communicstions, Electron Technologies, Inc.).
diameter of 28.6 em. NSTAR was developed and manufactured by a team of
NASA GRC, JPL and Hughes/Boeing and launched in 1998 on the Deep
Space 1 spacecraft. This ion engine has arguably been the most analyzed and
tested ion thruster in history, with over 16,000 hours of operation in space, over
40,000 hours of life testing, and hundreds of papers published on its design and
performance. NST AR was operated over a wide throttle range in the DS 1
application from a minimum input power to the power processing unit (PPU) of
580 W to a maximum power of over 2550 W. The Extended Life Test of this
thruster at JPL demonstrated 30,252 hours of operation distributed across
several of the throttle levels and was terminated with the engine still running in
order to provide life status and data for the subsequent DAWN mission [7]. The
throttle table used on DS 1 with parameters for the NS TAR thruster from a
review by Brophy [6] is shown in Table 9-2. A photograph of the NSTAR
engine manufactured by L-3 Communications, Electron Technologies, Inc. is
shown in Fig. 9-3.
The next ion thruster technology launched was designed for both orbit raising
and station keeping applications on a commercial communications satellite. The
25-cm XIPS thruster was first launched in 1999 on a Hughes/Boeing 702
satellite. Although the 25-cm XIPS ion thruster was developed [9] at Hughes
Research Laboratories in the same time frame as the NST AR engine and has a
similar basic design as the 13-cm XIPS shown in Fig. 9-1, the 25-cm thruster
entered production after the 13-cm version and incorporated sufficient
432 Chapter 9
Table 9-2. NSTAR throttle table.
NSTAR PPU Input Engine Input Calculated Specific Total
Throttle Power (W) Power (W) Thrust Impulse Efficiency
Level (mN) (s) (%)
15 2567 2325 92.7 3127 61.8
14 2416 2200 87.9 3164 62.4
13 2272 2077 83.1 3192 63.0
12 2137 1960 78.4 3181 62.8
11 2006 1845 73.6 3196 63.1
10 1842 1717 68.4 3184 62.6
9 1712 1579 63.2 3142 61.8
8 1579 1456 57.9 3115 61.1
7 1458 1344 52.7 3074 59.6
6 1345 1238 47.9 3065 59.0
5 1222 1123 42.6 3009 57.4
4 1111 1018 37.4 2942 55.4
3 994 908 32.1 2843 52.7
2 825 749 27.5 2678 48.7
1 729 659 24.6 2382 47.2
0 577 518 20.7 1979 42.0
improvements to be considered a second-generation device. A photograph of
the 25-cm XIPS thruster, which is also manufactured by L-3 Communications,
Electron Technologies, Inc., is shown in Fig. 9-4. To date, fourteen of the
Boeing 702 communications satellites with a total of 56 XIPS thrusters have
been successfully launched and are in operation.
The initial operation of the 25-cm thrusters in space on the 702 satellites was
described in 2002 [10]. After launch, these thrusters are first used for orbit
raising and then provide all of the propulsion requirements for orbit control
including north-south and east-west station keeping, attitude control, and
momentum dumping. The ion thrusters are also used for any optional station
change strategies and will ultimately be used for de-orbit at the end of the
satellite's lifetime. The "high power" orbit insertion mode requires nearly
continuous operation by two of the thrusters for times of 500 to 1000 hours,
depending on the launch vehicle and satellite weight. This mode utilizes about
4.5 kW of bus power to generate a 1.2-kV, 3-A ion beam, which produces
1 65-mN thrust at a specific impulse of about 3500 seconds. Once orbit insertion
Flight Ion and Hall Thrusters
. .
.
Fig. 9-3. Photograph of the NASA NSTAR ion thruster (photo
courtesy of L.3 Communications, Electron Technologies, Inc.).
II
Fig. 9-4. Photograph of the 25-cm XIPS ion thruster (photo
courtesy of L-3 Communications, Electron Technologies, Inc.).
433
434
Chapter 9
is completed, each of the four thrusters is fired once daily for an average of
about 45 minutes in a "low power," 2.3-kW mode for station keeping. In this
mode, the beam voltage is kept the same, and the discharge current and gas
flow are reduced to generate a 1.2-kV, 1.5-A beam that produces nominally
79 mN of thrust at an Isp of 3400 s. The thruster perfonnance parameters are
shown in Table 9-3. Recently, tests by the manufacturer L-3 Communications
Electron Technologies Inc. have demonstrated that the XIPS engine and PPU
can be throttled from a PPU input power level of 400 W to over 5 kW. Over
this range, the performance significantly exceeds the NST AR thruster
performance [11].
The next flight of ion thrusters was on the European Space Agency Artemis
spacecraft launched in 2001. Artemis carried four ion thruster assemblies, two
EITA (Electron-bombardment Ion Thruster Assembly) systems manufactured
by Astrium UK, and two RITA (Radio-frequency Ion Thruster Assembly)
systems developed by Astrium Germany. The EITA system, also called the
UK-lO system, used copies of the T5 thruster [12,13], and the RITA system
used RlT-lO ion thrusters [14,15]. Artemis was intended to be launched into a
geosynchronous orbit, but a malfunction of the launcher's upper stage placed
the satellite into a lower orbit. The ion thrusters were used in an unplanned
orbit-raising role to rescue the spacecraft from the lower 31,000-kIn parking
orbit and raise the spacecraft to the proper geosynchronous orbit. The thrusters
then successfully perfonned standard EP station keeping activities.
The EITNUK-1O/T5 thruster is a lO-cm Kaufman thruster [13] presently
manufactured by Qinetiq in England. The performance of the T5 Kaufman
Table 9.3. 25.cm XIPS performance parameters.
Parameter Low-Power High-Power
Station Keeping Orbit Raising
Active grid diameter (cm) 25 25
Thruster input power (kW) 2 4.3
Average Isp (s) 3420 3550
Thrust (mN) 80 166
Total efficiency (%) 67 68.8
Mass utilization efficiency (%) 80 82.5
Electrical efficiency (%) 87 87.5
Beam voltage (V) 1215 1215
Beam current (A) 1.45 3.05
Flight Ion and Hall Thrusters
435
thruster in station keeping applications [13] is shown in Table 9-4. A schematic
of a generic Kaufman thruster was shown in Chapter 4, and a photograph of the
T5 thruster is shown in Fig. 9-5. The T5 thruster generates an 1100-V, 0.329-A
xenon ion beam that produces about 18 mN of thrust at a nominal Isp of 3200 s
with a total efficiency of about 55%.
The RITA system uses a RIT -10 rf ion thruster originally developed [14] at the
University of Giessen in Germany and manufactured [15] for Artemis by
Astrium in Germany. The performance of the RIT-I0 thruster in the station
keeping application [15] is shown in Table 9-5. A schematic of a generic rf
thruster was shown in Chapter 4, and a photograph of the RIT -10 rf ion thruster
from [16] is shown in Fig. 9-6. The RIT-lO thruster generates a 1500-V,
0.234-A xenon ion beam that produces 15 mN of thrust at an Isp of 3400 sand
a total efficiency in excess of 51 %.
The Institute of Space and Astronautical Science of the Japan Aerospace
Exploration Agency (JAXA) launched four of the ,.dO ECR ion thrusters on the
Hayabusa (formerly Muses-C) spacecraft [17] in 2003. These lO-cm grid-
diameter thrusters are successfully providing primary propulsion for an asteroid
sample return mission that will return to Earth in 2010. The thruster [18,19]
uses 4.2-GHz microwaves to produce the main plasma in the thruster and drive
the electron neutralizer. A schematic drawing of the thruster was shown in
Chapter 4. The performance of the 10-cm ECR thruster is shown in Table 9-6,
and a photograph of the thruster from Ref. 20 is shown in Fig. 9-7. The lO-cm
ECR ion thruster generates a 1500-V, 0.136-A xenon ion beam that produces
8.1 mN of thrust at an Isp of 3090 s and a total efficiency of 36%.
The most recent launch of a new ion thruster was by the Japan Aerospace
Exploration Agency (JAXA), who launched four 20mN-class Kaufman ion
thrusters developed by Mitsubishi Electric Corporation on the Engineering Test
Satellite VIII (ETS- VIII) [21] in 2006. The 12-cm grid-diameter Kaufman
thrusters provide north-south station keeping for this large geosynchronous
communications satellite. The performance of the 12-cm Kaufman thruster
[22] is shown in Table 9-7, and a photograph of the thruster from [23] is shown
in Figure 9-8. At its nominal operating condition, the thruster generates a
996-V, 0.432 to 0.480-A xenon ion beam that produces 20.9 to 23.2 mN of
thrust at an Isp of 2402 to 2665 sec and a total efficiency of about 46 to 50%.
There are a significant number of new ion thrusters in development world-wide
for prime propulsion and satellite station keeping applications. Since these
thrusters have not flown as of this date, they will not be covered in detail and
only mentioned here. NASA Glenn Research Center (GRC) is leading the
436
Table 9-4. T5 Kaufman thruater parformance parametars.
Parameter Station Keeping
Active grid diameter (em) 10
Thruster input power (W) 476
Nominal Isp (s) 3200
Thrust (mN) 18
Total efficiency (%) 55
Mass utilization efficiency (%) 76.5
Electrical efficiency (%) 76.6
Beam voltage (V) 1100
Beam current (A) 0.329
.
.,
Fig. 9-5. Photograph of the T5 Kaufman ion thrustar
(photo courtesy of Qinetiq, Limited).
Chapter 9
Flight Ion and Hall Thrusters
437
Table 9-5. RIT -10 rf thruster performance parameters.
Parameter
Station Keeping
10
459
3400
15
52
69.3
76.5
1500
0.234
Active grid diameter (cm)
Thruster input power (W)
Nominal Isp (s)
Thrust (mN)
Total efficiency (%)
Mass utilization efficiency (%)
Electrical efficiency (%)
Beam voltage (V)
Beam current (A)
,
-
>\
;,
'"
"
..,
..... ,0-,
.
"
...;:-
"'.
.
Fig. 9-6. Photograph of the RIT-10 rf ion thrueter (from [16]).
development of the 7-kW NASA Evolutionary Xenon Thruster (NEXT) [24].
NASA's Jet Propulsion Laboratory (JPL) led the development of the 25-kW
Nuclear Electric Xenon Ion thruster System (NEXIS) [25], which produced the
highest efficiency (>81 %) xenon ion thruster developed to date. NASA's ORC
also led the development of the 30-kW High Power Electric Propulsion
(HiPEP) thruster [26], which featured a rectangular geometry with both rf and
DC hollow cathode plasma production versions. In England, Qineteq is
developing the T-6 20-cm Kaufman thruster [27], which is capable of
438
Parameter
Table 9.6. ",10 ECR microwave ion thruster performance.
Active grid diameter (cm)
Thruster input power (W)
Average Isp (s)
Thrust (mN)
Total efficiency (%)
Mass utilization efficiency (%)
Electrical efficiency (%)
Beam voltage (V)
Beam current (A)
Primary Propulsion
10
340
3090
8.1
36
70
60
1500
0.136
..
I tJllnllJ. tllIlI.:
. '''''';11 E;i lUlU..
, nlf f
.. I II,I
....It II Jf'
.
::"'11 !-::I
.. ....L..
..
Fig. 9.7. Photograph of the ",10-ECR microwave discharge
ion thruster (10-cm grid diameter) and microwave neutralizer [20].
Chapter 9
Flight Ion and Hall Thrusters
439
Parameter
Table 9.7. ETS.8 Kaufman thruster performance parameters.
Active grid diameter (cm)
Thruster input power (W)
Nominal Isp (s)
Thrust (mN)
Total efficiency (%)
Mass utilization efficiency (%)
Electrical efficiency (%)
Beam voltage (V)
Beam current (A)
NS-Station Keeping
12
541-611
2402-2665
20.9-23.2
45.6-49.7
66.2-73.5
78.2-79.5
996
0.43-0.48
r
Ion Thf\Jster
"
",\
.
-01
-.#
Figure 9-8. Photograph of the ETS-8 Kaufman ion thruster (from [23]).
producing up to 200-mN thrust for European communications satellite station
keeping applications. In Japan, the Institute of Space and Astronautical Science
is developing a 20-cm-diameter, 30-mN-class microwave ion thruster [28]. In
Gennany, Astrium is developing a 200-mi"J'-class rf ion thruster (RIT-22) for
station keeping applications [29]. Finally, ring-cusp and rf ion thrusters are
being miniaturized for applications that require thrust levels of the order of
I mN or less. The 3-cm Miniature Xenon Ion thruster (MiXI) [30] uses a DC
discharge, ring-cusp geometry with closely spaced ion optics to produce up to
440
Chapter 9
3 mN of thrust at beam voltages of up to 1200 V. The micro-Newton Rf Ion
Thruster (!!N-RIT) [31] use a low frequency (::::1 MHz) rf discharge scaled
down to 2 to 4 em in diameter to produce precision thrust levels as low as
20 !!N at beam voltages in excess of 1 kV. There are many additional small
research and development programs at universities and in small businesses, but
these are too numerous to be covered here.
9.3 Hall Thrusters
The most successful and extensive electric propulsion development and
application has been by the Russians flying Hall thrusters for station keeping on
satellites [32]. Over 140 Hall thrusters have been operated in space since 1971
when the Soviets first flew a pair of Hall thrusters called Stationary Plasma
Thrusters (SPI) on the Meteor satellite [32]. This name is translated from the
Russian literature, but refers to the continuous operation ("stationary") of the
Hall thruster in comparison to the Pulsed-Plasma Thrusters (PPT) that the
Russians had previously tested and flown in the 1960s [32]. SPT thrusters for
satellite applications have been developed with different sizes characterized by
the outside diameter of the plasma discharge slot of 50 to over 140 mm [32].
The performance of four sizes of the SPT thruster manufactured by Fakel in
Russia is shown in Table 9-8. The SPT-100 operates nominally at a discharge
voltage of 300 V and current of 4.5 A to produce 82 mN of thrust at an Isp of
1600 s and a total efficiency of 50% averaged over the life of the thruster. The
different SPT thrusters shown have been tested at discharge voltages of 200 to
500 V and power levels of a few hundred watts up to 5 kW. These Hall
thrusters have also been tested on a variety of gases such as argon and krypton,
but xenon is the present standard for space applications. A schematic of the
Hall thruster was shown in Chapter 7, and a photograph of a Fakel SPT-100
thruster from [33] is shown in Fig. 9-9.
The first flight of a Hall thruster on a U.S. spacecraft was the 1998 launch of a
D-55 TAL (Thruster with Anode Layer) Hall thruster [34,35] manufactured by
TsNIIMASH in Russia on the National Reconnaissance Office's Space
Technology Experiment Satellite (STEX). The STEX mission was intended to
develop and demonstrate advanced spacecraft technologies in space, including
Hall thrusters. The xenon D-55 TAL thruster nominally operates at 1.4 kW with
an Isp of about 1500 s, but due to power limitations on the spacecraft was
required to run at a discharge 0000 V and 2.2 A (660 W).
The European Space Agency (ESA) has demonstrated the use of commercial
Hall thruster technology on the SMART -1 (Small Mission for Advanced
Research in Technology) spacecraft in a lunar orbiting mission [36]. A
Flight Ion and Hall Thrusters
441
Table 9.8. STP Hall thruster performance.
Parameter SPT -50 SPT-70 SPT-100 SPT-140
Slot diameter (cm) 5 7 10 14
Thruster input power (W) 350 700 1350 5000
Average Isp (s) 1100 1500 1600 1750
Thrust (mN) 20 40 80 300
Total efficiency (%) 35 45 50 >55
Status Flight Flight Flight Qualified
oJ .'
r ):
,
-.
.
Fig. 9-9. Photograph of an SPT-100 Hall thruster (from [33]).
PPS-1350-G Hall thruster [37,38] manufactured by SNECMA Moteurs in
France [39] was launched on SMART-1 in 2003 and provided primary
propulsion for this mission. This thruster is based on the SPT -100 and is similar
in size and power level. The thruster was operated over a throttleable power
range of 462 to 1190 W for this lunar mission, producing a maximum thrust of
70 mN at an Isp of 1600 s. The finite efficiency of the power processing system
required that the spacecraft supply 650 to 1420 W to the electric propulsion
system. The PPS-13 50 Hall thruster accumulated about 5000 hours of operation
in space, and processed 82 kg of xenon in a very successful mission that
featured several extensions of the mission life due to the thruster capabilities.
The nominal performance of this thruster at 1.35 kW is shown in Table 9-9.
The thruster schematic was shown in Chapter 7, and a photograph of the PPS-
1350 Hall thruster is shown in Fig. 9-10.
442
Chapter 9
The first commercial use of Hall thrusters by a U.S. spacecraft manufacturer
was in 2004 by Space Systems Loral on the MBSAT satellite [33], which used
F akel SPT -1 OOs provided by International Space Technologies Incorporated
(ISTI). Loral has launched three communications satellites to date that use two
pairs of SPT-lOO Hall thrusters on each satellite, and plans to continue
launching these systems in the future. Busek, Inc. was the first U.S. company to
provide flight Hall thruster technology for a spacecraft when the 200- W
BHT-200 flew on board the Air Force TacSat-2 spacecraft that was launched in
late 2006 [40,41]. Beginning in 2008, Lockheed Martin Space Systems plans to
begin flying BPT-4000 Hall thrusters (also developed in the U.S. by Aerojet)
on the Air Force Advanced-EHF defense communications satellite [42]. Aerojet
Table 9-9. PPS-1350 Hall thruster performance.
Parameter Primary Propulsion
Slot diameter (cm) JO
Thruster input power (W) 1500
Average Isp (s) 1650
Thrust (mN) 88
Total efficiency (%) 55
Discharge voltage (V) 350
Discharge current (A) 4.28
- -
-""\..
,-.
)-
..
l.
Fig. 9-10. Photograph of the PPS-1350 Hall thruster (photo
courtesy of Snecma-Eric Drouin).
Flight Ion and Hall Thrusters
443
and JPL have jointly investigated the applicability of the BPT-4000 to NASA
deep-space missions [43] where throttle range and efficiency are important. The
throttle ability of the BPT-4000 engine [44] from power levels I kW to 4.5 kW
was demonstrated with very high efficiency observed at low power levels for
this size thruster. Hall thruster technology will continue to be developed and
used in commercial and scientific missions due to their high performance and
relatively simple construction and operation.
References
[1] S. Shimada, K. Satho, Y. Gotoh, E. Nistida, 1. Terukina, T. Noro, H.
Takegahara, K. Nakamaru, and H. Nagano, "Development of an Ion
Engine System for ETS-6," IEPC-93-009, 23rd International Electric
Propulsion Conference, Seattle, Washington, September 1993.
[2] T. Ozaki, E. Nishida, and Y. Gotoh, "Development Status of 20mN
Xenon Ion Thruster," AIAA-2000-3277, 36th Joint Propulsion
Conference, Huntsville, Alabama, July 16-19,2000.
[3] 1. R. Beattie, "XIPS Keeps Satellites on Track," The Industrial Physicist,
June 1998.
[4] 1. R. Beattie, 1. D. Williams, and R. R. Robson, "Flight Qualification of
an 18-mN Xenon Ion Thruster," IEPC 93-1015, 23rd International
Electric Propulsion Conference, Seattle, Washington, September
1993.
[5] M. 1. Patterson, T. W. Haag, V. K. Rawlin, and M. T. Kussmaul, "NASA
30-cm Ion Thruster Development Status," AIAA-1994-2849, 30th Joint
Propulsion Conference, Indianapolis, Indiana, June 27-29, 1994.
[6] 1. R. Brophy, "NASA's Deep Space 1 Ion Engine," Review of Scientific
Instruments, vol. 73, pp. 1071-1078,2002.
[7] J. R. Brophy, M. Marcucci, G. Ganapathi, C. Garner, M. Henry, B.
Nakazono, and D. Noon, "The Ion Propulsion System for Dawn," AIAA
2003-4542, 39th Joint Propulsion Conference, Huntsville, Alabama, July
20-23,2003.
[8] http://www.l-3com.comleti/product_1ines_electric-..propulsion.htm
[9] J. R. Beattie, J. N. Matossian, and R. R. Robson, "Status of Xenon Ion
Propulsion Technology," Journal of Propulsion and Power, vol. 6,
pp. 145-150, 1990.
[10] D. M. Goebel, M. Martinez-Lavin, T. A. Bond, and A. M. King,
"Performance of XIPS Electric Propulsion in Station Keeping of the
Boeing 702 Spacecraft," AIAA-2002-5117, 38th Joint Propulsion
Conference, Indianapolis, Indiana, July 7-10, 2002.
444 Chapter 9
[11] W. Tighe, K. Chien, E. Solis, P. Robello, D. M. Goebel, and J. S. Snyder,
"Performance Evaluation of the XIPS 25-cm Thruster for Application to
NASA Missions," AIAA-2006-4999, 42nd Joint Propulsion Conference,
Sacramento, California, July 9-12, 2006.
[12] H. Gray, P. Smith, and D. G. Fern, "Design and development of the UK-
10 Ion Propulsion System," AIAA-96-3084, 32nd Joint Propulsion
Conference, Lake Buena Vista, Florida, July 1-3, 1996.
[13] http://www.qinetiq.com/home/commercial/space/space _ technology/ep/t
5 _ion _ thruster.html.
[14] K. H. Groh, O. Blum, H. Rado, and H. W. Loeb, "Inert Gas Radio-
Frequency Thruster RIT 10," IEPC-79-2l00, 14th International Electric
Propulsion Conference, October 30-November 1, 1979.
[15] R. Killinger, H. Bassner, H. Leiter, and R. Kukies, "RITA Ion Propulsion
for Artemis," AlAA-200l-3490, 37th Joint Propulsion Conference, Salt
Lake City, Utah, July 8-11, 2001.
[16] http://cs.space.eads.net/sp/SpacecraftPropulsioniRita/RIT -lO.html
[17] H. Kuninaka, K. Nishiyama, 1. Funakai, Tetsuya, and Y. Shimizu,
"Asteroid Rendezvous of Hayabusa Explorer Using Microwave
Discharge Ion Engines," IEPC Paper 2005-010, 29th International
Electric Propulsion Conference, Princeton, New Jersey, October 31-
November 4,2005.
[18] S. Tamaya, 1. Funaki, and M. Murakami, "Plasma Production Process in
an ECR Ion Thruster," AIAA-2002-2l96, 33rd AIAA Plasma Dynamics
and Lasers Conference, Maui, Hawaii, May 20-23, 2002.
[19] H. Kuninaka, 1. Funaki, K. Nishiyama, Y. Shimizu, and K. Toki, "Results
of 18,000 hour Endurance Test of Microwave Discharge Ion Thruster
Engineering Model," AlAA-2000-3276, 36th Joint Propulsion
Conference, Huntsville, Alabama, July 16-19,2000.
[20] Courtesy of Prof Kuninaka, Institute of Space and Astronautical Science,
Japan Aerospace Exploration Agency.
[21] T. Ozaki, Y. Kasai, T. Nakagawa, T. Itoh, K. Kajiwara, and M. Ikeda,
"In-Orbit Operation of 20 mN Class Xenon Ion Engine for ETS-VIII,"
28th International Electric Propulsion Conference, IEPC-2007-084,
Florence, Italy, September 17-20,2007.
[22] T. Ozaki, E. Nishida, Y. Kasai, Y. Gotoh, T. Itoh, and K. Kajiwara,
"Development Status of Xenon Ion Engine Subsystem for ETS- VIII,"
AIAA-2003-22l5, 21st International Communications Satellite Systems
Conference, Yokohama, Japan, April 15-19, 2003.
Flight Ion and Hall Thrusters
445
[23] T. Ozaki, Y. Kasai, and E. Nishida, "Improvement of 20mN Xenon Ion
thruster," 26th International Electric Propulsion Conference, IEPC-99-
153, Kitakyusyu, Japan, October 17-21, 1999.
[24] M. Patterson, J. Foster, T. Haag, V. Rawlin, and G. Soulas, "NEXT:
NASA's Evolutionary Xenon Thruster," AIAA-2002-3832, 38th Joint
Propulsion Conference, Indianapolis, Indiana, July 7-10, 2002.
[25] J. E. Polk, D. M. Goebel, 1. Katz, J. Snyder, A. Schneider, L. Johnson,
and A. Sengupta, "Performance and Wear Test Results for a 20-kW Class
Ion Engine with Carbon-Carbon Grids," AIAA-2005-4393, 41st Joint
Propulsion Conference, Tucson, Arizona, July 2005.
[26] J. Foster, T. Haag, H. Kamhawi, M. Patterson, S. Malone, and F. Elliot,
"The High Power Electric Propulsion (HiPEP) Ion Thruster," AIAA-
2004-3812, 40th Joint Propulsion Conference, Fort Lauderdale, Florida,
July 11-14,2004.
[27] N. Wallace, D. Mundy, D. Fearn, and C. Edwards, "Evaluation of the
Perfonnance of the T6 Ion Thruster," AIAA-1999-2442, 35th Joint
Propulsion Conference, Los Angeles, California, June 20-24, 1999.
[28] K. Nishiyama, H. Kuninaka, Y. Shimizu, and K. Toki, "30-mN Class
Microwave Discharge Ion Thruster," IEPC-2003-62, 28th International
Electric Propulsion Conference, Bordeau, France, October 2003.
[29] H. Leiter, R. Kukies, R. Killinger, E. Bonelli, S. Scaranzin, and F.
Scortecci, "RIT-22 Ion Engine Development - Endurance Test and Life
Prediction," AIAA-2006-4667, 42nd Joint Propulsion Conference,
Sacramento, California, July 9-12, 2006.
[30] R. Wirz, J. E. Polk, C. Marrese, and J. Mueller, "Experimental and
Computational Investigation of the Perfonnance of a Micro-Ion
Thruster," AIAA-2002-3835, 38th Joint Propulsion Conference,
Indianapolis, Indiana, July 7-10, 2002.
[31] D. Feili, H. W. Loeb, K. H. Schartner, St. Weis, D. Kirmse, B. K. Meyer,
R. Kilinger, and H. Mueller, "Testing of new JlN-RITs at Giessen
University," AIAA 2005-4263, 41st Joint Propulsion Conference, Tucson,
Arizona, July 10-13,2005.
[32] V. Kim, "Electric propulsion activity in Russia," IEPC-2001-005, 27th
International Electric Propulsion Conference, Pasadena, California,
October 14-19, 2001.
[33] D. L. Pidgeon, R. L. Corey, B. Sauer, and M. L. Day, "Two Years On-
Orbit Perfonnance of SPT-IOO Electric Propulsion," AIAA 2006-5353,
42nd Joint Propulsion Conference, Sacramento, California, July 9-12,
2006.
446 Chapter 9
[34] M. T. Domonkos, C. M. Marrese, J. M. Haas, and A. D. Gallimore, "Very
Near-Field Plume Investigation of the D55," AIAA-1997-3062, 33rd Joint
Propulsion Conference, Seattle, Washington, July 6-9, 1997.
[35] S. O. Tverdokhlebov, A. V. Semenkin, and A. E. Solodukhin, "Current
status of multi-mode TAL development and areas of potential
application," AIAA-2001-3779, 37th Joint Propulsion Conference, Salt
Lake City, Utah, July 8-11, 2001
[36] C. R. Koppel and D. Estublier, "The SMART-l Hall Effect Thruster
around the Moon: In Flight Experience," IEPC-2005-119, 29th
International Electric Propulsion Conference, Princeton, New Jersey,
October 3 I-November 4, 2005.
[37] M. Lyszyk, E. Klinger, J. Bugeat, and D. Valentian, "Development Status
of the PPS-1350 Plasma Thruster," AIAA-1998-3333, 34th Joint
Propulsion Conference, Cleveland, Ohio, July 13-15,1998
[38] C. R. Koppel and D. Estublier, "The SMART-l Electric Propulsion
Subsystem," AIAA-2003-4545, 39th Joint Propulsion Conference,
Huntsville, Alabama, July 20-23, 2003.
[39] http://www.snecma.com
[40] T. Yee, "Roadrunner, a High-Performance Responsive Space Mission,"
Proceedings of the 18th AIANUSU Conference on Small Satellites,
SSC04-I-5, Logan, Utah, August 2004.
[41] D. R. Bromaghim, J. T. Singleton, R. Gorecki, F. Dong Tan, and H.
Choy, "200 W Hall Thruster Propulsion Subsystem Development for
Microsatellite Missions," Proceedings of the 53rd JANNAF Propulsion
Meeting, Monterey, California, December 5-8,2005.
[42] K. H. de Grys, B. Welander, J. Dimicco, S. Wenzel, B. Kay, V. Khayms,
and J. Paisley, "4.5 kW Hall Thruster System Qualification Status,"
AIAA 2005-3682, 41st Joint Propulsion Conference, Tucson, Arizona,
July 10-13,2005.
[43] R. R. Hofer, T. M. Randolph, D. Y. Oh, J. S. Snyder, "Evaluation of a
4.5 kW Commercial Hall Thrusters System for NASA Science Missions,"
AIAA-2006-4469, 42nd Joint Propulsion Conference, Sacramento,
California, July 9-12, 2006.
[44] B. Welander, C. Carpenter, K. H. de Grys, R. R. Hofer, T. M. Randolph,
and D. H. Manzella, "Life and Operating Range Extension of the BPT-
4000 Qualification Model Hall Thruster," AIAA-2006-5263, 42nd Joint
Propulsion Conference, Sacramento, California, July 9-12, 2006.
Fundamentals oIElectric Propulsion: Ion and Hall T1l1'llsters
by Dan M. Goebel and Ira Katz
Copyright iQ 2008 John Wiley & Sons, Inc.
Appendix A
Nomenclature
A.1 Constants
Av Avogadro's number (atoms/mole)
AMU atomic mass unit
c velocity of light
e electron charge
g gravitational acceleration
k Boltzmann's constant
m electron mass
M proton mass
elm electron charge-to-mass ratio
M/m protron-to-electron mass ratio
M xe mass of a xenon atom
Eo pennittivity of free space
/-Lo penneability of free space
1rao 2 atomic cross section
elk temperature associated with 1 electron
volt
eV energy associated with 1 electron volt
447
6.02214179 X 10 23
1.6602176487 xlO- 27 kg
2.9979 x 10 8 mls 2
1.602176487 X 10- 19 C
9.80665 mls 2
1.3 807 x 10- 23 J/K
9.1 093822 x 10- 31 kg
1.67262164 X 10- 27 kg
1.75882 X lOll C/kg
1836.153
131.293 AMU
2.17975 x 10- 25 kg
8.8542 Xl0- 12 F/m
4n x 10- 7 Him
8.7974 x 10- 21 m 2
11604.5 K
1.602176487 X 10- 19 J
448
Appendix A
To
po
standard temperature (0 deg C)
standard pressure (760 torr = 1 atm)
Loschmidt's number (gas density at STP)
273.15 K
1.0133 x 10 5 Pa
2.6868 x 10 25 m- 3
no
A.2 Acronyms and Abbreviations
O-D O-dimensional
1-D one-dimensional
2-D two-dimensional
3-D three-dimensional
AC alternating current
accel grid accelerator grid
AEPI Atmospheric Emissions Photometric Imaging
AMU atomic mass unit
BaO barium oxide
BN boron nitride
BOL beginning of life
CC carbon-carbon
CEX charge exchange
CL Child-Langmuir
CM center of mass
CVD chemical-vapor-deposition
DC direct current (steady-state)
decel grid decelerator grid
DS1 Deep Space 1 (mission)
ECR electron cyclotron resonance (microwave)
EIT A Electron-bombardment Ion Thruster Assembly
EL T extended life test (NST AR thruster life test)
EP electric propulsion
Nomenclature
EPIC
ESA
ETS
ETS-6
eV
eV/ion
FEEP
GRC
HET
HiPEP
I.D.
ISTI
JAXA
JPL
LaB 6
LDT
LlF
MELCO
MiXI
MPD
NASA
NEXIS
NEXT
NSTAR
PG
PIC
PPT
PPU
449
Electric Propulsion Interactions Code
European Space Agency
Engineering Test Satellite
Engineering Test Satellite (Japanese ETS-6)
electron volt
electron volts per ion
field emission electric propulsion
Glen Research Center
Hall effect thruster
High Power Electric Propulsion
inside diameter
International Space Technologies Incorporated
Japanese Aerospace Exploration Agency
Jet Propulsion Laboratory
lanthanum hexaboride
life demonstration test (8200-hour NST AR thruster wear test)
laser-induced fluorescence
Mitsubishi Electric Corporation
Miniature Xenon Ion
magnetoplasmadynamic thruster
National Aeronautics and Space Administration
Nuclear Electric Xenon Ion Thruster System
NASA's Evolutionary Xenon Thruster
NASA Solar Electric Propulsion Technology Applications
Readiness
pyrolytic graphite
particle in cell
pulsed-plasma thruster
power processing unit
450
rf
RIT
RITA
RPA
RSU
sccm
SEM
SEPAC
51
SMART
SmCo
SPT
SSC
STEX
STP
TAL
torr-lIs
TWT
UV
W/A
XIPS
Appendix A
radio frequency
radio-frequency ion thruster
Radio-Frequency Ion Thruster Assembly
retarding potential analyzer
remote sensor unit
standard cubic centimeters per minute
scanning electron microscope
Space Experiments with Particle Accelerators
International System
Small Mission for Advanced Research in Technology
samarium cobalt
stationary plasma thruster (a type ofRall thruster)
Space Station contactor
Space Technology for Advanced Research in Technology
standard temperature and pressure
thruster with anode layer
torr-liter per second
traveling-wave tube
ultraviolet
watts per ampere
Xenon Ion Propulsion System (manufactured by L-3
Communications, Electron Technology, Inc.)
A.3 Defined Terms
Isp specific impulse
Ft correction to thrust force due to beam divergence
Te electron temperature in K
Tev electron temperature in electron volts
In A Coulomb logarithm
Nomenclature
Qinjested
451
gas flow recycled into thruster from vacuum system
A
A.4 Variables
cross-sectional area
Aa
Aas
Ac
Ag
Ap
As
Aw
B
Br
c
C
C 1
d
d a
db
d s
D
Da
DB
D;
DJ.
E
Eaccel
Escreen
electron loss area at anode
total surface area of anode exposed to plasma
surface accommodation coefficient
area of grid
primary electron loss area at anode
area of screen grid
discharge chamber wall area
magnetic field
radial magnetic field
neutral gas thermal velocity
constant, conductance of grids
experimental fitting coefficient in barium depletion model
gap distance (between electrodes), distance
accel grid aperture diameter
beamlet diameter
screen grid aperture diameter
diffusion coefficient, Richardson-Dushman coefficient, beamlet
diameter
ambipolar diffusion coefficient
Bohm diffusion coefficient
ion diffusion coefficient
perpendicular diffusion coefficient
electric field
electric field at the accel grid
electric field at the screen grid
452
&
E eff
f
fa
fb
!c
f,
in
J"
F
Faceel
Fe
F i
F is
Fe
F L
Fp
Fscreen
Ft
h
H(T)
Ia
I A
I
h
IE
ICk
Id
IDE
Appendix A
energy
effective atom activation energy
fraction of ions with a radial velocity
open area fraction of accel grid
beam flatness parameter
ion confinement factor for fraction of Bohm current lost
current fraction of the ith species, frequency of ion oscillations
edge to average plasma density ratio in cathode plasma
electron plasma frequency
force
force on the accel grid
force on the electrons
force on the ions
flux of scattered ions
force due to collisions causing momentum transfer
Lorentz force
pressure gradient force
force the screen grid
thrust vector correction factor
plume expansion parameter
total heat lost by hollow cathode (a function of the temperature)
electron current leaving plasma to anode
accel grid current
current
beam current
Bohm current
current to the discharge cathode keeper
discharge current
decel grid current
Nomenclature
Ie electron current, emission current from hollow cathodes
lea electron current to anode
Ieb electron backstreaming current
Iec electron current flowing backwards in a Hall thruster
Iew electron current to the wall
I H Hall current
Ii ion current
I ia ion current lost to anode
lib ion current in the beam
I ic ion current lost to cathode
I iw ion current to the wall
h ion current back to the hollow cathode
h primary electron current lost directly to anode
Ink current to the neutralizer cathode keeper
Ip ion production rate in the plasma
Ir random electron flux
Is ion current to the screen grid
It thermionic emission current
Iw current to the walls
r singly charged ion current
r+ doubly charged ion current
t excited neutral production rate in the plasma
J current density
)0 equilibrium current density
) J perturbed current density
J e electron current density
J, ion current density
J Hall Hall current density
J max maximum Child-Langmuir current density
453
454
JO,I
k
k O ,!,2,3
K
I!.
Id
Ie
Ig
L
Le
Lg
L T
m
m Q
me
md
m;
mp
ms
m,
ma
me
m.
I
mp
M
M Q
Mp
Appendix A
zero and first-order Bessel functions
wave number = In/ A.
fit parameters for Randolph's plume divergence formula
proportionality constant
length
length for radial ion diffusion between cusps
distance to merged beamlets in plume
sheath thickness length
grid gap length
primary electron path length, plasma length, microwave interaction
length, length of the plasma in Hall thrusters
total length of magnetic cusps
path length for electron gyration
total path length for helical electron motion
mass, electron mass
mass flow injected into the anode region
mass flow injected through the cathode
delivered spacecraft mass
propellant mass due to ions
propellant mass
mass of species "s"
total mass flow
Hall thruster anode mass flow rate
Hall thruster cathode mass flow rate
ion mass flow rate
total propellant mass flow rate
ion mass, total spacecraft mass, dipole strength per unit length
ion mass in AMU
propellant mass
Nomenclature
455
N total number of particles, number of magnet coil turns
n particle density
na neutral atom density
nb beam plasma density
ne electron density
nf neutral density flowing from cathode
ni ion density
no neutral density, plasma density at center of symmetry
np primary electron density
ns source or sink density tenn, secondary electron density, density of
species "s"
n + singly ionized particle density
n -+ doubly ionized particle density
P plasma pressure
pe electron pressure
Pi thruster plume ion pressure
Po thruster plume neutral pressure
P neutral pressure, probability of a collision, power, perveance
Pa power into the anode
P abs absorbed rf power
P b beam electrical power
P d discharge electrical power
Pf final neutral pressure
Pm power into the plasma discharge
P jet jet power (kinetic power in the thrust beam)
P k keeper discharge electrical power
P max maximum perveance
Po initial neutral pressure, other electrical power in the thruster
Pout power out of the plasma
456 Appendix A
P T total electrical power into thruster, pressure in Torr
P w power into the wall
q charge, number of magnetic dipoles
qs charge of species "s"
Q total charge = qn, propellant flow rate or throughput
r radius
ra aperture radius
re electron Lannor radius
rh hybrid Lannor radius
r; ion Lannor radius
rL Lannor radius
rp primary electron Lannor radius
R major radius, ratio of beam voltage to total voltage in ion thrusters
R resistance
Rm mirror ratio
Rs mean change in the momentum of particles "s" due to collisions
R+- rate of double ion production
9\ erosion rate of the walls
S ionization energy loss, pumping speed
time
t a accel grid thickness
t s screen grid thickness
T thrust, temperature [K]
Ta optical transparency of the grid
Te electron temperature [K]
Tev electron temperature [eV]
Tg grid transparency
T, ion temperature [K]
TiV ion temperature [e V]
Nomenclature
457
Tm sum of thrust from multiple species
Tn temperature of nth species
To temperature of the neutral gas
Ts effective transparency of the screen grid, temperature of secondary
electrons from wall, temperature of species "s"
Tw wall temperature
if ionization potential
U .
average excitation potential
v velocity
Va ion acoustic velocity
Vb beam velocity
VB Bohm velocity
VD diamagnetic drift velocity
V e electron velocity
VE E x B drift velocity
Vex exhaust velocity
VI final velocity
Vi ion velocity, initial velocity
V n velocity of the neutral species, velocity of the nth species
V o neutral velocity, initial ion velocity
V p primary electron velocity
Vth thennal electron drift velocity
v.1 perpendicular velocity
VII parallel velocity
V volume, voltage
Va accel grid voltage
Vb net beam voltage (screen voltage minus beam plasma potential)
V bp potential of beam plasma
V ck potential of discharge cathode keeper
458 Appendix A
V c voltage drop in hollow cathode, coupling voltage from neutralizer
common potential to beam potential
V cg cathode to ground potential
Vd discharge voltage
VI floating potential
V G coupling voltage relative to ground in ion thrusters
V k voltage of electrons (primaries) from the cathode
V m magnet volume, minimum potential in grids
V nk potential of neutralizer cathode keeper
V p voltage drop in plasma, plasma generator potential
V s screen power supply voltage
Vr total voltage across accelerator gap = V s + Va
w width
X distance, characteristic length of beam column
y insert thickness
Y sputtering yield
Yad adatom production yield on cathode surface
Y ps sputtered particle yield from cathode surface
Z atomic number
A.S Symbols
a thrust correction factor for doubly charged ions, work function
correction constant, e-folding distance for plasma density decrease,
constant in Bessel's function argument
a", mass utilization correction factor due to the multiply charge ions
f3 adjustable coefficient to Bohm collision frequency
r total thrust correction factor = aFt, secondary electron yield
Yo secondary electron yield at the space-charge limit
r flux of particles
Nomenclature
459
r 0 initial flux of particles
r(x) Gamma function
Llv change in velocity
Ll V potential modification in grids due to space charge
8 magnet half-height
e electron energy density
eb electrical cost of a beam ion
ee energy than an electron removes from the plasma
ei energy than an ion removes from the plasma
S viscosity
1] total plasma resistivity
1]a anode efficiency of a Hall thruster
1]b beam current fraction of discharge current
1]e Clausing factor (conductance reduction)
1]d discharge loss
1]e electrical efficiency
1]ei plasma resistivity due to electron-ion collisions
1]en plasma resistivity due to electron-neutral collisions
1]m mass utilization efficiency
1]m+ mass utilization efficiency for only singly ionized particles
1]md mass utilization efficiency of the discharge chamber
1]0 electrical efficiency for other power in a Hall thruster
1]T total thruster efficiency
1]. beam voltage fraction of discharge voltage
K parameter in double sheath equation;:::: 1/2, thermal conductivity
A. mean free path, wavelength
460 Appendix A
AD Debye length
.101 first zero of the Bessel function
J..1 mobility
J..1B Bohm mobility
J..1e electron mobility
J..1ei electron mobility due only to electron-ion collisions
J..1i ion mobility
v collision frequency
V ee electron-electron collision frequency
Vei electron-ion collision frequency
Yen electron-neutral collision frequency
Vii ion-ion collision frequency
V m ion-neutral collision frequency
V m total momentum transferring collision frequency
V sn collision frequency between species "s" and the nth species
Vscal scattering frequency
; nonnalized dimension = X/AD
P charge density = qn
pm ion mass density =:: Mq
po initial ion mass density
(J cross section, surface charge density
'l' collision time, mean electron or ion confinement time
'l'c time for electron-neutral collision
'l'm total collision time for momentum transferring collisions
'l'p primary electron confinement time
'l's Spitzer electron thennalization time with plasma electrons
Nomenclature
461
'ft total thennalization time
tp potential, work function
tpo potential at sheath edge
tps sheath potential
t/Jwj work function of a material or surface
J: nonnalized potential = ef/JIkT
W cyclic frequency (=27ifJ
We electron cyclotron frequency
w p electron plasma frequency
Qe electron Hall parameter
Fundamentals oIElectric Propulsion: Ion and Hall T1l1'llsters
by Dan M. Goebel and Ira Katz
Copyright iQ 2008 John Wiley & Sons, Inc.
Appendix B
Gas Flow Unit Conversions and Cathode
Pressure Estimates
Conversion between the different systems of flow units is necessary to calculate
various parameters used in evaluating thruster performance. Due to the
precision required in calculating the thruster performance, it is necessary to
carry several significant digits in the constants used to calculate the conversion
coefficients, which are obtained from the National Institute of Standards and
Technology (NIST) database that can be found on the NIST Web site.
Converting flow in standard cubic centimeters per minute (SCCM) to other
flow units for an ideal gas is achieved as follows. A mole of gas at standard
pressure and temperature is Avogadro's number (6.02214179 x 10²³) of
particles at one atmosphere and 0 deg C (273.15 K), which occupies 22.413996
liters. The conversions are
1 6.02214179 x 10 23 [atomsl mole]
seem =
22.4139% [litersl mole at STP] * 10 3 [cclliter] * 60 [sl min]
= 4.477962 x 10 17 [ at ms ]
(B-1 )
1 seem = 4.477962 x 10 17 [ at ms ]* 1.6021765 x 10- 19 [eoulombsl charge]
= 7.174486 x 10- 2 [equil valent amperes]
(B-2)
463
464
Appendix B
1 seem = 10- 3 [liters] * 760[torr] _ 0.01267 [ torr-I ]
60[s/ min] s
(B-3)
1 seem = 4.47796 x 10 17 [ at:ms ] * 1.660539 x 1O- Z7 * M a * 10 6
= 7.43583 x 10⁻⁴ Ma [ g 1
(B-4)
where M a is the propellant mass in atomic mass units (AMU).
For xenon, Ma = 131.293, and a correction must be made for its com-
pressibility at standard temperature and pressure (STP), which changes the
mass flow rate by 0.9931468. Therefore, for xenon,
1 (X ) 7.17448 x 1O- z
seem e =
0.9931468
= 0.0722399 [equilvalent amperes] (B-5)
= 0.0983009 [mgjs).
It is possible to make an estimate of the neutral gas pressure inside of a hollow
cathode insert region and in the orifice as a function of the propellant flow rate
and cathode temperature, using analytic gas flow equations. While these
equations may not be strictly valid in some locations, especially the relatively
short orifices found in discharge cathodes, they can still provide an estimate
that is usually within 10% to 20% of the actual measured pressures.
In the viscous flow regime, where the transport is due to gas atoms or
molecules primarily making collisions with each other rather than walls, the
pressure through a cylindrical tube is governed by the Poiseuille law [1,2]
modified for compressible gas [3]. The rate at which compressible gas flows
through a tube of length 1 and radius 0 (in moles per second) is given [2] from
this law by
N =3- 0 4 Pa (PI-PZ) = 0 4 p?-pl
m 8S' RoT 16S' I RoT'
(B-6)
where 0 is the tube radius, I is the tube length, Pa is the average pressure in the
tube given by ( + Pz) / 2 , S'is the viscosity, Pz is the downstream pressure at
the end of the tube, is the upstream pressure of the tube, Ro is the universal
Gas Flow Unit Conversions and Cathode Pressure Estimates
465
gas constant, and T is the temperature of the gas. The measured gas flow rate,
or the gas throughput, is given by the idea] gas law:
Q=PmV m =NmRoTm,
(B- 7)
where Pm is the pressure and V m is the volume where the flow is measured for
gas at a temperature T m ,and N m is the mole flow rate. The mole flow rate is
then N m = Pm V m / RoT m. Defining Tr = T / T m and substituting the mole flow
rate into Eq. B-1 gives the measured flow as
7r a 4 p? -if T = a 4 P?-P{
Q= 16s 1 T m 16s Tr
(B-8)
Putting this in useful units and writing it in terms of a conductance of the tube,
which is defined as the gas flow divided by the pressure drop, gives
4
Q = 1.28 d ( R2 _ p,2 )
STr 1 12,
(B-9)
where Q is the flow in sccm, 7] is the viscosity in poises, d is the orifice
diameter and 1 the orifice length in centimeters, and the pressures are in torr.
The pressure upstream of the cathode orifice is then
( 2 O.78Qs Tr 1 ) 112
1\ = P 2 + 4
d
(B-lO)
While Eq. (B-IO) requires knowledge of the downstream pressure, for this
rough estimate it is acceptable to assume P 2 «PI and neglect this term. For
xenon, the viscosity in poises is
s = 2.3 x 1O-4 T !o.7I+O.29IT r ) for Tr > 1,
(B-1 1 )
where Tr = T CK)/289.7. The viscosity in Eq. (B-ll) is different than
Eq. (6.5-9) because 1 Ns/m 2 = 10 poise. It should be noted that the temperature
of the gas in the hollow cathode can exceed the temperature of the cathode by
factors of 2 to 4 due to charge-exchange heating with the ions, which then
affects the viscosity.
As an example, take the NASA Solar Electric Propulsion Technology
Applications Readiness (NST AR) discharge cathode operating at a nominal
466
Appendix B
flow of 3.7 sccm, with an orifice diameter of 1 mm and the length of the
cylindrical section of the orifice 0.75 mm. Assuming the gas in the orifice is
4000 K due to charge-exchange heating and P 2 = 0, the upstream pressure is
found from Eq. (B-IO) to be 6.7 torr. The pressure measured upstream of the
cathode tube for this THIS case is about 8 torr [5]. Correcting for the pressure
drop in the insert region (also due to Poiseuille flow), the actual pressure
upstream of the orifice plate is about 7.2 torr. The pressure calculated from
Eq. (B-IO) is low because the downstream pressure is finite (about 2 torr where
the barrel section ends) and the bevel region at the output of the orifice has a
finite molecular conductance in the collisionless flow regime. In general, it can
be assumed that the results of Eq. (B-IO) are about 10% low due to these
effects. Similar agreement has been found for neutralizer cathodes with straight
bore orifices, suggesting that this technique provides reasonable estimates of
the pressure in the cathodes.
Finally, once the pressure inside the cathode or in the orifice region entrance is
estimated, it is straightforward to calculate the local neutral density from
Eq. (2.7-2):
no = 9.65 x 10 24 * [ p les ],
(B-I2)
where P is the pressure in torr and T is the gas temperature in kelvins.
References
[1] S. Dushman and J. Lafferty, Scientific Foundations of Vacuum
Techniques, New York: Wiley and Sons, 1962.
[2] K. F. Herzfeld and H. M. Smallwood, Taylor's Treatise on Physical
Chemistry, 2nd edition, vol. 1, New York: D. Van Nostrand Co., p. 175,
1931.
[3] A. Roth, Vacuum Technology, New York: North-Holland, 1990.
[4] R. C. Reid, The Properties of Gases and Liquids, New York: McGraw-
Hill, p. 403, 1977.
[5] K. K. Jameson, D. M. Goebel, and R. M. Watkins, "Hollow Cathode and
Keeper-Region Plasma Measurements," AIAA-2005-3667, 41st Joint
Propulsion Conference, Tucson, Arizona, July 11-13,2005.
Fundamentals oIElectric Propulsion: Ion and Hall T1l1'llsters
by Dan M. Goebel and Ira Katz
Copyright iQ 2008 John Wiley & Sons, Inc.
Appendix C
Energy Loss by Electrons
The energy lost from the plasma due to electrons being lost to an anode that is
more negative than the plasma is derived. Figure C-l shows the plasma
potential distribution in the negative-going sheath towards the anode wall. The
Maxwellian electrons are decelerated and repelled by the sheath potential. To
determine the average energy removed from the plasma by each electron,
moments of the Maxwellian distribution are taken. The electron current density
reaching the wall is given by
00 00 00 ( m ) ( -m ( vx+vy+vz )]
J e =enJ dVxJ dVyJ vz _ 3/2 exp 2 2 2 dv z
-00 -00 '\J2el/Jlm 2nkTe 2kTe
= .!en 8kTe ex p ( - elp ) . (C-I)
4 nm kTe
The electrons must overcome the sheath potential to reach the wall so the
minimum electron speed toward the wall (assumed to be in the z-direction) is
.J2ef/>/m . The plasma electrons lose kinetic energy as they traverse the sheath,
so the power flux from plasma is
[ ( 2 2 2 ) ) 3/2
f oo f oo f oo me V x +v y +v z ( m )
P =n dv dv v -
e -00 X -00 Y ,j2el/Jlm z 2 2nkTe
( m(v; +v; +v;) ]
X exp dv z
2kTe
1 8kTe ( kTe \ ( ef/> \
=-ne - 2-+lp lexp _-I,
4 nm e ) kTe)
(C-2)
467
468 Appendix C
C1> -----------1--
I
1
Sheath I
Edge 1
I
Wall
Potential
Sheath
Plesma
Fig. C-1. Schematic of plasma in contact with the
anode wall.
where l/> is expressed in electron volts (eV). The average energy that an electron
removes from the plasma (in eV) is then the ratio of the power per electron to
the flux of electrons:
Pe kTe
Eave = - = 2- + l/> = 2TeV + l/> ,
J e e
(C-3)
where TeV is in electron volts (eV). This is the energy removed from the
plasma per electron striking the wall through a negative-going sheath.
It should be noted that this energy loss from the plasma per electron is different
than the average energy that each electron has when it hits the wall. The flux of
electrons hitting the anode wall is the same as analyzed above. The plasma
electrons lose kinetic energy as they traverse the sheath; hence, a -etJ> tenn
must be included in the particle energy expression for each electron. The power
flux to the insert from plasma electrons is then
J oO J oo J oo ( me(v;+v +v;)
Pe =n dv x dv y vz
-co -co ,,2et/Jlm 2
t :T, r
[ -m( v; + v; + v;) )
xexp dv z
2kTe
=.!ne 8kTe ( 2 kTe ) exp ( _!f. ) .
4 Tem e kTe
(C-4)
Energy Loss by Electrons
469
The average energy of each electron is then the ratio of the power to the flux:
Pe kTe
Eave = - = 2- = 2Tev [energy per electron that strikes the wall] (C-5)
J e e
Fundamentals oIElectric Propulsion: Ion and Hall T1l1'llsters
by Dan M. Goebel and Ira Katz
Copyright iQ 2008 John Wiley & Sons, Inc.
Appendix D
Ionization and Excitation Cross Sections
for Xenon
Ionization and excitation cross sections for xenon are available from the
following references:
[1] D. Rapp and P. Englander, "Total Cross Sections for Ionization and
Attachment in Gases by Electron Impact. I. Positive Ionization," The
Journal of Chemical Physics, vol. 43, no. 5, pp. 1464-1479, 1965.
[2] M. Hayashi, "Determination of Electron-Xenon Total Excitation Cross-
Sections, from Threshold to 100-eV, from Experimental Values of
Townsend's ex," Journal of Physics D: Applied Physics, vol. 16, pp. 581-
589,1983.
[3] K. Stephen and T.D. Mark, "Absolute Partial Electron Impact Ionization
Cross Sections of Xe from Threshold up to 180 e V," Journal of Chemical
Physics, vol. 81, pp.3116-3117, 1984.
[4] J. A. Syage, "Electron Impact Cross Sections for Multiple Ionization of
Kr and Xe," Physical Review A, vol. 46, pp. 5666-5680, 1992.
The ionization and excitation cross sections for xenon from threshold to 100 eV
from the above references are plotted in Fig. D-l and tabulated in Table D-l.
Ionization and excitation cross sections for other gases such as argon and
krypton are available from the following references:
[5] M. Hayashi, Bibliography of Electron and Photon Cross Sections with
Atoms and Molecules Published in the 20th Century: Argon, NIFS-
DATA-n, National Institute for Fusion Science (Japan), ISSN 0915-
6364,2003.
471
472
6 X 10- 20
5 x 10- 20
1. 4 X 10- 20
I::
.2
g 3 X 10- 20
(f)
'"
e 2 x 10- 20
()
1 x 10- 20
Appendix D
- - -.......-......
..........-
.....
--... Rapp Ionization
-Stephen Ionization
-_ Heyashi Excitation
...
....
......
-
..._-...
--._-
o
o 10 20 30 40 50 60 70 80 90 100
Electron Energy (eV)
Fig. D-1. Ionization and excitation cross sections for xenon.
[6] R. Rejoub, B. G. Lindsay, and R. F. Stebbings, "Determination of the
Absolute Partial and Total Cross Sections for Electron-Impact Ionization
of Rare Gases," Physical Review A, 042713, vol. 65, 2002.
[7] A. Yanguas-Gil, J. Cotrino, and L. L. Alves, "An Update of Argon
Inelastic Cross Sections for Plasma Discharges," Journal of Physics D,
vol. 38, pp. 1588-1598,2005.
[8] G. G. Raju, "Electron-Atom Collision Cross Sections in Argon: An
Analysis and Comments," IEEE Transactions on Dielectrics and
Electrical Insulation, vol. 11, pp. 649-673,2004.
[9] A. A. Sorokin, L. A. Shmaenok, S. V. Bobashey, B. Mobus, H. Richter,
and G. Ulm, "Measurements of Electron-Impact Ionization Cross Sections
of Argon, Krypton, and Xenon by Comparison with Photoionization,"
Physical Review A, 022723, vol. 61, 2000.
Ionization and Excitation Cross Sections for Xenon 473
Table D.1. Ionization and excitation cross sections for xenon.
Electron Rapp and Englander Stephen and Mark Hayashi [2] Total
Energy (eV) [1] Ionization (m 2 ) [3] Ionization (m 2 ) Excitation (m 2 )
2.6 x 10- 22
9.0 1.26 X 10- 21
9.5 1.31 x 10- 21
10.0 1.8 X 10- 21
10.5 2.4 x 10- 21
II 4. x 10- 21
11.5 6.2 x 10- 21
12 8.4 x 10- 21
12.5 1.099 x 10- 21 1.05 X 10- 20
13.0 2.558 X 10- 21 1.28 X 10- 20
13.5 4.123 x 10- 21
14.0 5.714 x 10- 21 1.7 X 10- 20
14.5 7.420 x 10- 21
15.0 9.055 x 10- 21 1.15 X 10- 20 2.14 X 10- 20
15.5 1.073 x 10- 20
16.0 1.231 x 10- 20 2.55 X 10- 20
16.5 1.380 x 10- 20
17.0 1.529 x 10- 20
17.5 1.670 x 10- 20
18.0 1.802 x 10- 20 3.35 X 10- 20
18.5 1.925 x 10- 20
19.0 2.048 x 10- 20
19.5 2.163 x 10- 20
20.0 2.277 X 10- 20 2.42 X 10- 20 3.73 X 10- 20
20.5 2.382 x 10- 20
21.0 2.488 x 10- 20
21.5 2.619 x 10- 20
22.0 2.734 x 10- 20
22.5 2.831 x 10- 20
23.0 2.928 x 10- 20
24.0 3.095 x 10- 20
25.0 3.81 x 10- 20 3.85 X 10- 20
26.0 3.367 x 10- 20
28.0 3.613 x 10- 20
30.0 3.851 X 10- 20 3.57 X 10- 20
32.0 4.044 x 10- 20
474 Appendix D
Table 0-1. (continued).
Electron Rapp and Englander Stephen and Mark Hayashi [2] Total
Energy (eV) [1] Ionization (m 2 ) [3] Ionization (m 2 ) Excitation (m 2 )
34.0 4.185 x 10- 20
35.0 4.17 x 10- 20
36.0 4.290 x 10- 20
38.0 4.387 x 10- 20
40.0 4.475 x 10- 20 4.30 X 10- 20 2.85 X 10- 20
45.0 4.677 x 10- 20 4.31 X 10- 20
50.0 4.835 x 10- 20 4.29 X 10- 20 2.4 X 10- 20
55.0 4.941 x 10- 20 4.27 X 10- 20
60.0 5.029 x 10- 20 4.37 X 10- 20 2.1 X 10- 20
65.0 5.081 x 10- 20 4.47 X 10- 20
70.0 5.117 x 10- 20 4.54 x 10- 20 1.85 X 10- 20
75.0 5.134 x 10- 20 4.57 x 10- 20
80.0 5.178 X 10- 20 4.59 X 10- 20 1.66 X 10- 20
85.0 5.249 x 10- 20 4.55 X 10- 20
90.0 5.266 x 10- 20 4.48 X 10- 20 1.52 X 10- 20
95.0 5.328 x 10- 20 4.42 X 10- 20
100.0 5.380 X 10- 20 4.31 X 10- 20 1.38 X 10- 20
Fundamentals oIElectric Propulsion: Ion and Hall T1l1'llsters
by Dan M. Goebel and Ira Katz
Copyright iQ 2008 John Wiley & Sons, Inc.
Appendix E
Ionization and Excitation Reaction Rates
for Xenon in Maxwellian Plasmas
Ionization and excitation reaction rate coefficients < av > for xenon calculated
from the data in Appendix D averaged over a Maxwellian electron distribution
are given in Table E-1. Over the ranges indicated, the data can be well fit to the
cross section averaged over a Maxwellian distribution times the electron
thennal velocity [1], where TeV is in eV. The fits to the calculated values are
Ionization (TeV < 5 eV):
(ajV e )""
( ) 112
(aj)v e = 10- 20 [( 3.97 +0.643T eV -0.0368Te )e-12.127/Tev ] 8: v
Ionization ( Te V > 5 e V):
( 8 T ) 112
(aiVe) "" (ai )v e = 10- 20 [ -( 1.031 x 10⁻⁴ )Te + 6.386e -12. 1 27/TeV ] :;v
Excitation:
-11.6/Te ( ) 112
(a*Ve)",,(a*)Ve=1.931O-1g e,JT:; 8eTeV
TeV Tern
475
476
Appendix E
Table E-1.lonization and excitation reaction rates for xenon.
Electron Energy (eV)
0.5
0.6
0.7
0.8
0.9
1.0
1.5
2.0
2.5
3.0
3.5
4.0
4.5
5.0
5.5
6.0
6.5
7.0
7.5
8.0
8.5
9.0
9.5
10.0
Ionization (m 3 /s)
4.51 x 10- 25
3.02 X 10- 23
6.20 X 10- 22
6.04 X 10- 21
3.58 X 10- 20
1.50 X 10- 19
1.16 X 10- 17
1.08 X 10- 16
4.24 X 10- 16
1.08 X 10- 15
2.13 X 10- 15
3.59 x 10- t5
5.43 X 10- 15
7.61 X 10- 15
1.01 X 10- 14
1.28 X 10- 14
1.57 X 10- 14
1.88 X 10- 14
2.20 X 10- 14
2.53 X 10- 14
2.86 X 10- 14
3.20 X 10- 14
3.55 X 10- 14
3.90 X 10- 14
Excitation (m 3 /s)
1.99 x 10- 22
4.01 X 10- 21
3.61 X 10- 20
1.95 X 10- 19
7.44 X 10- 19
2.21 X 10- 18
6.64 X 10- 17
4.02 x 10- 16
1.23 X 10- 15
2.66 X 10- 15
4.66 x 10- 15
7.12 X 10- 15
9.93 X 10- 15
1.30 X 10- 14
1.61 X 10- 14
1.94 X 10- 14
2.26 X 10- 14
2.57 X 10- 14
2.87 X 10- 14
3.14 X 10- 14
3.34 X 10- 14
3.41 X 10- 14
3.21 X 10- 14
2.48 X 10- 14
A comparison of the ionization and excitation reaction rate coefficients with the
curve fits is given in Fig. E-l. The fits provide excellent agreement with the
exact calculations over this temperat.ure range. The fitted ionization reaction
rate for >5 eV also fits well up to about 30 eV, which is useful for Hall thruster
calculations.
Ionization and Excitation Reaction Rates for Xenon in Maxwellian Plasmas 477
3 4 5 6 7
Electron Temperature (eV)
Fig. E.1. Ionization and excitation reaction rate coefficiants from the
calculation rasults (black) and fitting equations (gray), showing
good agraament.
10- 7
'" 1 0-11
.s
'E
(!)
'(3 10-9
==
(!)
0
U
(!) 10- 10
iO
c::
c:
.2 10- 11
t5
co
(!)
c::
10- 12
0
Excitation _ _ - _._-
,...-
/' ,... Ionization
&
/' &
/,,;
..
I/'
.. !J
I"
': "
Ii
,:
!f
Jf
- Ionization Calculation
- - - - Ionization Fit
- - - - Excitation Calculation
............. Excitation Fit
2
8
10
9
Reference
[1) 1. G. Mikellides, I. Katz, and M. Mandell, "A I-D Model of the Hall-
Effect Thruster with an Exhaust Region," AIAA-2001-3505, 37th Joint
Propulsion Conference, Salt Lake City, Nevada, July 8-11, 2001.
Fundamentals oIElectric Propulsion: Ion and Hall T1l1'llsters
by Dan M. Goebel and Ira Katz
Copyright iQ 2008 John Wiley & Sons, Inc.
Appendix F
Electron Relaxation and
Thermalization Times
Spitzer [1] derived an expression for the slowing-d own ti me of test particles
(primary electrons in our case) with a velocity v = 2Vp/m, where eV p is the
test particle energy, in a population of Maxwellian electrons at a temperature
Te . Spitzer defined the inverse mean velocity of the Maxwellian electron "field
particles" in one-dimension as if = .J m/2kTe . The slowing-down time is then
given by
v
'C s = (l+%f )ADiJG{lfV)'
(F -1)
where m is the mass of the test particles, m f is the mass of the field particles,
and AD is a diffusion constant given by
87re 4 nfZ2ZJ In A
AD = 2 '
m
(F-2)
where Z is the charge and in A is the collisionality parameter [2] equal to
23 -in ( n f 1/2 / Te 3/2). The function G( i fV) is defined as
G( _ <I>(x)-x<I>'(x)
x)- 2 '
2x
(F-3)
and <I>(x) is the erf function:
479
480
Appendix F
2 rx-l
<1>(x) = 172 JI e dy.
7r 0
(FA)
Spitzer gave the values of G(x) in a table, which is plotted in Fig. F-I and
fitted. For x = 1 2 v greater than 1.8, a power function fits best with the relation
G(x) = O.463x-1. 957 .
In our case, the field particles and the test particles have the same mass, which
is the electron mass, and charge Z = e. The slowing-down time is plotted in
Fig. F-2 as a function of the primary particle energy for three representative
plasma densities found near the baffle, in the discharge chamber, and near the
grids.
For 15-eV primaries in the discharge chamber plasma with an average
temperature of 4 eV and a density approaching 10 12 cm- 3 , the slowing-down
time is about 10- 6 s. The slowing-down time is also plotted in Fig. F-3 as a
function of the plasma density for several values of the primary electron
energy, again assuming the plasma has an electron temperature of about 4 eV.
As the plasma density increases, the slowing-down time becomes very small
«10- 6 s). This will lead to rapid thermalization of the primary electrons.
0.25
0.20
S 0.15
C!i
0.10 .
0.05
0.00
0
y = 0.05409X' - 0.32513x 2 + 0.48955x - 0.00716
R2 = 0.99686 -
Polynominal Fit s 1.8 < Power Fit
y=0.46338X- 1 . 957 .
R2 = 0.9995
2
4
6
8
10
x
Fig. F-1. Spitzer's G(x) with fits.
Electron Relaxation and Thermalization Times
481
10-4
Te = 4 eV
10- 5
Q) 10
E
F
10- 7
10
5
--- -
---
---
---
----
--
- 1e11
- - 1e12
1e13
15
Primary Temperature (eV)
Fig. F-2. Spitzer's slowing-down time as a function of the primary
electron energy for three densities of electrons et 4 eV.
10
20
25
1.6x10- 5
1.4x 10- 5
1.2x 10- 5
1.0 x 10- 5
Q) 8.0 x 10
E
F
6.0 x 10
4.0 x 10
2.0 x 10
Te = 4 eV
.
.
.
. .
\
.'
\\
L '
" \...
\ ''..
, ----'.-\-'.--
\ . .
\ \ \ '.
, ....,
\ ,- -_.
\ \ .. ....
,,' " '.
,".... ..,..........
- : :::.:. : - :: .: ? : ;;, ;? ,i'-,;;."
......- Vp = 18
---- Vp= 16
-----" Vp = 14
--- Vp=12
- Vp = 10
o
5.0 x 10 10
1.5 x 10 11 2.5 x 10 11 3.5 x 10 11 4.5 x 10 11
Primary Density (cm- 3 )
Fig. F-3. Spitzer's slowing-down time as a function of the plasma density
with an electron temperature of 4 eV for several primary energies.
5.5 x 10 11
482
Appendix F
For the case of primary electrons with some spread in energy, we can examine
the time for the equilibration between that population and the plasma electrons.
Assuming that the primaries have a temperature Tl and the plasma electrons
have a temperature Tz, the time for the two populations to equilibrate is
3m llZ ( kT + kT ) 3/Z
'l' - 1 2
eq- 8(21r)1/Zne41nA
(F-5)
As an example, the slowing time for monoenergetic primaries and primaries
with a Maxwellian distribution of energies injected into a 4-eV plasma is shown
in Fig. F-4. The slowing time is significantly faster than the equilibration time.
References
[1] L. Spitzer, Jr., Physics of Fully Ionized Gases, New York, lnterscience,
pp. 127-135, 1962.
[2] D. L. Book, NRL Plasma Formulary, Naval Research Laboratory,
Washington D.C., pp. 33-34, 38, 1987.
2.5 x 10 6
ne = 10 18 m- 3
2.0 x 10 6
Q)
1.5x 10 6 _.
c
.2
ro
x
ro
a;
c::
5.0 x 10 7 -
...
...
......
...
......
--- -.=_;'.it" ...,
.......
......
.......
;T""
........
........
--
- Equilibrating
- - Slowing
o
5
10
15
20
25
Primary Tamperature (eV)
Fig. F-4. Relaxation times of monoenergetic primaries end a
Maxwellian primary population in a 4 eV, 10 18 m"" plasma.
Fundamentals oIElectric Propulsion: Ion and Hall T1l1'llsters
by Dan M. Goebel and Ira Katz
Copyright iQ 2008 John Wiley & Sons, Inc.
Appendix G
Clausing Factor Monte Carlo Calculation
Visual Basic Monte-Carlo calculation of Clausing Factor for thruster grids.
Inputs:
Clausing Factor Calculator
Inputs Radius (mm) Diameter
thick Screen 0.381
thickAccel 0.5
rScreen 0.9525 1. 905
rAccel 0.5715 1.143
gridSpace 0.5
npart 10 6
Code:
Sub Clausing()
thickScreen = Range("C4")
thickAccel = Range("C5")
rScreen = Range("C6")
rAccel = Range ( "C7" )
gridSpace = Range("C8")
npart = Range("C9")
Monte Carlo Routine that calculates Clauaing factor for
CEX
returns Clausing Factor and Downstream Correction
factor
Dim gone As Boolean
pi = 3.14159265358979
'assumes rTop = 1
483
484 Appendix G
rBottom = rScreen / rAccel
lenBottom = (thickScreen + gridS pace) / rAccel
lenTop = thickAccel / rAccel
Length = lenTop + lenBottom
iescape = 0
maxcount = 0
icount = 0
nlost = 0
vztot = 0#
vzOtot = 0#
For ipart = 1 To npart
I launch from bottom
notgone = True
rO = rBottom * Sqr(Rnd)
zO = 0#
costheta = Sqr(l# - Rnd)
If (costheta > 0.99999) Then costheta
0.99999
phi = 2 * pi * Rnd
sintheta = Sqr(l# - costheta 2)
vx = Cos(phi) * sintheta
vy = Sin (phi) * sintheta
vz = costheta
rf = rBottom
t = (vx * rO + Sqr«vx 2 + vy 2) * rf
2 - (vy * rO) 2» / (vx 2 + vy A 2)
z = zO + vz * t
vzOtot = vzOtot + vz
icount = 0
Do While notgone
icount = icount + 1
If (z < lenBottom) Then
hit wall of bottom cylinder and is re-
emitted
rO = rBottom
zO = z
costheta = Sqr(l# -
If (costheta >
Rnd)
0.99999)
Then
costheta
0.99999
phi = 2 * pi * Rnd
sintheta = Sqr(l# - costheta 2)
vz Cos(phi) * sintheta
vy Sin(phi) * sintheta
vx costheta
rf rBottom
t = (vx * rO + Sqr«vx A 2 + vy A
2) * rf A 2 - (vy * rO) A 2» / (vx 2 + vy 2)
z = zO + t * vz
End If ' bottom cylinder re-emission
Clausing Factor Monte Carlo Calculation
485
If «z >= lenBottom) And (zO < lenBottom»
Then
, emitted below but going up
, find radius at lenBottom
t (lenBottom - zO) / vz
r = Sqr«rO - vx * t) A 2 + (vy *
t) A 2)
If (r <= 1) Then
continuing upward
rf = 1#
t = (vx * rO
2) * rf A 2 - (vy * rO) A 2») / (vx A
Z = zO + vz *
Else
hit the upstream side of the accel
grid and is re-emitted downward
rO = r
zO = lenBottom
costheta = Sqr(l# - Rnd)
If (costheta > 0.99999)
+ Sqr«vx A 2 + vy A
2 + vy A 2)
t
Then
costheta
0.99999
phi = 2 * Pi * Rnd
sintheta = Sqr(l# - costheta A 2)
vx Cos(phi) * sintheta
vy = Sin(phi) * sintheta
vz = -costheta
rf = rBottom
t = (vx * rO + Sqr«vx A 2 + vy A
2) * rf A 2 - (vy * rO) A 2)) / (vx A 2 + vy A 2)
z = zO + vz * t
End If
End If ' end upward
If « z >= lenBottom) And (z <= Length))
Then
hit the upper cylinder wall and is
re-emitted
rO = 1#
zO = z
costheta = Sqr(l# -
If (costheta >
Rnd)
0.99999)
Then
costheta
0.99999
phi = 2 * pi * Rnd
sintheta = Sqr(l# - costheta A 2)
vz Cos(phi) * sintheta
vy Sin(phi) * sintheta
vx costheta
rf 1#
t = (vx * rO + Sqr«vx A 2 + vy A
2) * rf A 2 - (vy * rO) A 2» / (vx A 2 + vy A 2)
486
Appendix G
z = zO + t * vz
If (z < lenBottom) Then
find z when particle hits the
bottom cylinder
rf = rBottom
If «vx 2 + vy 2) * rf 2
- (vy * rO) 2 < 0#) Then
t = (vx * rO) / (vx 2 +
vy 2) 'if sqr arguement is less than 0 then set sqr term
to 0 12 May 2004
Else
t = (vx * rO + Sqr«vx 2
+ vy 2) * rf 2 - (vy * rO) 2)) / (vx 2 + vy 2)
End If
z = zO + vz * t
End If
End If ' end upper cylinder emission
If (z < 0#) Then
notgone = False
End If
If (z > Length) Then
iescape = iescape + 1
vztot = vztot + vz
notgone = False
End If
If (icount > 1000) Then
not gone = False
icount = 0
nlost = nlost + 1
End If
Loop 'while
If (maxcount < icount) Then maxcount = icount
Next ipart ' particles
Range ("Cll") (rBottom 2) * iescape / npart
Range("C12") = maxcount
Range("C13") = nlost
vzOav = vzOtot / npart
vzav = vztot / iescape
DenCor vzOav / vzav Downstream correction
factor
End Sub ' Clausing
Fundamentals oIElectric Propulsion: Ion and Hall T1l1'llsters
by Dan M. Goebel and Ira Katz
Copyright iQ 2008 John Wiley & Sons, Inc.
Absolute-intensity optical emission
spectrum, plume plasma optical
emission, 419-422
Acceleration region, Hall thruster operation,
332-333
Accelerator grid, ion thrusters:
basic properties, 189-190
configurations, 190----196
design principles, 196-200
electron backstreaming, 208-216
high-voltage considerations, 216-224
carbon-carbon composite materials,
221-223
electrode breakdown, 217-218
hold-off and conditioning, 224
molybdenum electrodes, 218-221
pyrolytic graphite, 223
lifespan analysis, 225-235
barrel erosion, 230-232
grid models, 227-229
pits-and-grooves erosion, 232-235
optics, 200----208
grid expansion and alignment.
206-208
ion trajectories, 200----204
perveance limits, 204-206
recycling behavior, 13 7-141
Accommodation and accommodation
coefficient, plume emissions,
spacecraft interactions, 412-413
Acronyms and abbreviations table, 448-450
Adatom production, hollow cathodes,
barium loss rates, 295-296
Alternating current CAe), radiofrequency
Crt) ion thrusters, 155-158
Index
Alumina walls, Hall thrusters, dominant
power-loss mechanisms, 349-357
Ambipolar diffusion coefficient:
hollow cathode:
insert region plasma, 257-270
orifice region plasma, 277-280
plume-region plasma, 284-292
with magnetic fields, 69-71
without magnetic fields, 65-66
primary electron motion and ionization,
178-182
radiofrequency Crt) ion thrusters,
153-158
ring-cusp ion thruster models, ion
confinement, 111-116
Anode wall:
discharge stability, 134-137
performance efficiency, 343-345
ring-cusp ion thruster, ion confinement,
110----116
Antenna design, radio frequency Crt) ion
thrusters, 151-158
Aperture design, ion thruster accelerator
grid:
alignment and expansion, 207-208
diameter calculations, 190----194
Arakawa/Yamada model, primary electron
motion and ionization, 176-182
Arc initiation:
hollow cathode operation, 310----315
ion thruster accelerator grid:
electrodes, hold-off and conditioning,
224
high-voltage parameters, 217-218
Arcjet, basic properties, 4
487
488
Arrhenius temperature dependence, hollow
cathodes, barium depletion model,
299-302
Atmospheric Emissions Photometric
Imaging (AEPI), plume plasma
optical emission, 419--422
Atomic mass units (AMU), ion mass,
447
Atom sputtering rate:
hollow cathodes, barium loss rates,
295-296
ion thruster accelerator grid, barrel
erosion, 231-232
Avogadro's number, 447
Axial electric field, Hall thrusters,
326--329
Axial magnetic field, radiofrequency (rf)
ion thrusters, 149-158
Axial plasma density, hollow cathode:
insert region plasma, 264-270
plume-region plasma, 286--292
Axial scale length, Hall thruster operation,
329-330
Azimuthal drift:
Hall thrusters, 327-328
operating principles, 332-333
oscillations, 376--379
Background density, plume emissions,
neutral gas plumes, 407--408
Backstreaming limit, ion thruster
accelerator grid, 213-216
Barium depletion model, hollow cathodes:
lifetime analysis, 298-302
operation, 309-315
Barium-oxide cathodes:
insert plasmas, evaporation analysis,
293-296
thermionic electron emission, 252-255
Barometric law:
fluid plasma, momentum conservation,
48
hybrid Hall thruster models, magnetic
field transport, 369
primary beam expansion plume models,
406--407
Barrel erosion, ion thruster accelerator grid,
lifetime analysis, 225-235
Beam current:
Index
discharge loss, 126--133
ion thruster plasma generator design,
96--100
ring-cusp ion thruster models, density
calculations, 119-120
Beam divergence:
Hall thruster efficiency, 343-345
ion thruster efficiency, 29
thrust properties, 23-24
Beam plasma potential, ion thruster
accelerator grid, electron
backstreaming, 209-216
Beam/plume characteristics, electrical
thrusters, 9-10
Beam power, thruster efficiency, 30
Beam steering, ion thruster accelerator grid
expansion and alignment, 207-208
Beam utilizatIOn efficiency, dielectric-wall
Hall thruster efficiency, 3..',3,
361-362
Bessel functions, Fick's law, 64-65
Bias voltage, accelerator grid, 208-216
Bohm current:
discharge chamber, power and energy
balance, 125-126
Hall thrusters:
dielectric-wall Hall thruster efficiency,
360-362
dominant power-loss mechanisms,
348-357
hollow cathodes, insert region plasma,
260-270
ion thruster plasma generator design,
93-100
radio frequency (rf) ion thrusters,
153-158
ring-cusp ion thruster models, ion
confinement, 111-116
Bohm diffusion:
hybrid Hall thruster models, transverse
electron transport, 368-369
Kaufman ion thrusters, 142-147
with magnetic fields, 69-71
pre-sheath potential, 78-79
Bohm sheath criterion:
plasma boundary sheaths, 82-84
pre-sheath potential, 79
summary of, 86--88
Bohm velocity:
Index
Hall thrusters, dominant power-loss
mechanisms, 351-357
ion thruster plasma generator design,
95-100
primary beam expansion plume models,
404-407
Boltzmann's constant:
Debye plasma boundary sheaths, 74-75
electrical thruster density and ingestion,
32-34
hollow cathodes, barium depletion
model,299-302
hybrid Hall thruster models, magnetic
field transport, 369
plasma boundary sheaths, 87-88
plasma physics. particle energies and
velocities, 44-46
pre-sheath potential, 77-79, 78-79
Boris-type particle-pushing algorithm,
primary electron motion and
ionization, 176--182
Boron nitride, Hall thrusters, dominant
power-loss mechanisms, 349-357
Boundary sheaths, plasma physics, 71-88
Child-Langmuir sheaths, 79-81
Debye sheaths, 73-75
double sheaths, 84-86
generalized sheath solution, 81-84
pre-sheaths, 76--79
summary of effects, 86--88
Breathing mode oscillations, Hall thrusters,
377-379
Bulk-material insert life, hollow cathodes,
302-304
Carbon-carbon composite materials, ion
thruster accelerator grid electrodes,
221-223
hold-off and conditioning, 224
Cathode common potential:
Hall thruster potential and current
distributions, 337-341
plume emissions, solar array interactions,
416--418
Cathode efficiency, Hall thruster
performance, 341-345
Cathode pressure estimates, 463--466
Centripetal force, plasma physics, single
particle motions, 40-43
489
CEX-2D optics code, ion thruster
accelerator grid trajectories,
200--204
Channel physics, hall thruster, 365-379
hybrid models, 366--372
continuity and energy, 369-371
ion current, 371-372
magnetic field transport, 369
transverse electron transport,
366--369
lifetime analysis, 379-383
oscillations, 376--379
steady-state models, 372-376
Channel plasma, dielectric-wa1l1 Hall
thruster efficiency, 362-365
Charge density, fluid plasma particle
conservation, 49-51
Charged particle collisions, partially ionized
gas diffusion, 55-60
Charge-exchange (CEX) reactions:
hollow cathodes:
insert region plasma, 257-270
orifice region plasma, 271-280
ion thruster accelerator grid:
barrel erosion, 230-232
erosion models, 227-229
lifetime analysis, 225-235
pits-and-grooves erosion, 232-235
particle collisions, 57-60
plume emissions, 395
neutral gas plumes, 407-408
secondary-ion generation, 408--410
Chemical-vapor-deposition (CYD), ion
thruster accelerator grid electrodes,
carbon-carbon composite materials,
221-223
Child-Langmuir law:
ion thruster accelerator grid, perveance
limit, 205-206
plasma boundary sheaths, 79-84, 88
Classical diffusion, with magnetic fields,
66--71
Clausing factor:
discharge chamber neutral and primary
densities, 120-124
electrical thruster density and ingestion,
34
ion thruster accelerator grid, 230-232
Monte Carlo, 483-486
490
Clausing factor (cont.)
radiofrequency (rf) ion thrusters,
157-158
Closed-drift thruster, 328-329
Cold gap, ion thruster accelerator grid
expansion and alignment, 206-208
Collisionality parameter:
discharge chamber neutral and primary
densities, 122-124
electron relaxation and thermalization
times, 479-482
hollow cathodes, insert region plasma,
256-270
microwave ion thrusters, 163-171
radio frequency (rf) ion thrusters,
150-158
Collision frequency, hybrid Hall thruster
models, transverse electron
transport, 368-369
Collisions, partially ionized gas diffusion,
55-60
Collision transfer momentum, fluid plasma,
conservation of, 47-48
COMETS satellite, ion thrusters, 429-440
Communications satellites, flight ion
thrusters, 431-440
Conductance correction factor, electrical
thruster density and ingestion,
33-34
Confinement factor, discharge loss,
128-133
Contamination, plume emissions, spacecraft
interactions, 413-415
Continuity equations:
fluid plasma:
energy conservation, 52-54
particle conservation, 48-5 I
hybrid Hall thruster models, 369-371
Convective derivative, fluid plasma,
momentum conservation, 47-48
Cosine distribution, plasma physics, particle
energies and velocities. 45-46
Coulomb collision, particle collisions,
58-60
Coulomb-transfer rating, ion thruster
accelerator grid, 217-218
molybdenum electrodes, 219-221
Coupling voltages, hollow cathode
operation, 311-315
Index
Cross-field diffusion coefficient:
Kaufman ion thrusters, 142-147
magnetic field diffusion, 69-71
primary electron motion, 178-182
Cross-field electron transport:
Hall thruster operation, 330-333
hybrid Hall thruster models, 368-369
Cross-over values, Hall thrusters, domtnant
power-loss mechanisms, 350-357
Current cutback, recycling behavior,
139-141
Current density:
Child-Langmuir sheaths, 79-81
hollow cathode geometry, 249-251
plume measurements, 398-400
Current distribution, Hall thruster operation,
337-341
Current fractions:
discharge loss, 127-133
microwave ion thrusters, 166-17 I
radio frequency (rf) ion thrusters,
152-158
Current utilization efficiency, Hall thruster,
multiply charged ion corrections,
346-347
Current-versus-voltage predictions, hybrid
ion thrusters, steady-state equations,
372-376
Cutoff frequencies, microwave ion thrusters,
161-171
Cyclotron frequency, plasma physics, single
particle motions, 39-43
Debye sheaths:
floating potential, 87-88
plasma boundary sheaths, 73-75
thickness properties, 83-84
Deep Space missions, 3
flight ion thrusters, 431-440
Density gradient:
hybrid Hall thruster models, magnetic
field transport, 369
Kaufman ion thrusters, 145-147
Depletion life models, dispenser cathods in
insert plasmas, 293-296
Diagmagnetic drift, magnetic field
diffusion, 68-71
Dielectric discharge, radiofrequency (rf) ion
thrusters, 157-158
Index
Dielectric materials, Hall thrusters, 325-329
Dielectric-wall Hall thrusters:
dominant power-loss mechanisms,
347-357
efficiency of, 359-362
ionization length and scaling, 335-337
lifetime analysis, 380--383
metallic-wall comparisons with, 364-365
operation, 331-333
Diffusion coefficient:
ambipolar diffusion, 65-66
hollow cathodes, orifice region plasma,
271-280
Diffusion-driven particle motion:
with magnetic fields, 66-71
without magnetic fields. 60----{)6
partially ionized gases, 55-71
Diffusion equation, Fick's law, 61-65
Diffusion thickness, ring-cusp ion thruster
models, 114-116
Direct-current-discharge plasma generators:
basic principles, 91-93
ion thruster, 100--107
anode wall ion confinement, 110--117
discharge chamber:
neutral and primary densities,
120--124
power and energy balance, 124-126
discharge loss, 126-133
discharge stability, 133-136
electron confinement, 108-110
excited neutral production, 117-120
generalized O-D ring-cusp model,
102-105
magnetic multipole boundaries,
105-107
recycling behavior, 137-142
Discharge chamber:
neutral and primary densities, 120--124
power and energy balance, 124-126
recycling behavior, 137-141
two-dimensional models, 171-182
neutral atom model, 172-175
performance valuation, 179-182
primary electron motion and ionization,
176-179
Discharge current:
Hall thruster:
performance efficiency, 342-345
491
potential and current distributions,
339-341
hollow cathode geometry, 246-248
barium depletion model, 301-302
bulk material insert life, 302-304
orifice region plasma, 275-280
Discharge loss:
direct-current-discharge plasma
generators, 126-133
Hall thruster performance, dominant
power-loss mechanisms, 347-357
ion thruster plasma generator design,
96-100
Kaufman ion thrusters, 144-147
microwave ion thrusters, 167-171
radio frequency (rf) ion thrusters,
154-158
Discharge stability, 133-137
Discharge voltage:
Hall thruster, efficiency, 342-345
hollow cathode operation, 3 12-315
Kaufman ion thrusters, 147
Dispenser cathodes:
barium depletion model, 298-302
insert plasmas, lifetime analysis, 293-296
poisoning of, 304-306
Dispersion relation, microwave ion
thrusters, 161-162
Dissipated power, basic principles, 30--32
Distribution function, plasma physics,
particle energies and velocities,
44-46
Divergent magnetic field thruster, direct-
current-discharge plasma generators,
101-107
Dominant power-loss mechanisms, Hall
thruster performance, 347-357
dielectric-wall Hall thruster efficiency,
359-362
Double ion generation:
Hall thruster efficiency, 343-345
ring-cusp ion thruster models, neutral
ionization/excitation, 119-120
two-dimensional discharge chamber
models, 180--182
Double sheaths:
hollow cathodes:
insert region plasma, 256-270
plume-region plasma, 287-292
492
Double sheaths (cont.)
plasma boundaries, 84--86
Double-to-single ion content, computation
of, 26--27
Downstream reference electron density, ion
thruster accelerator grid trajectories,
201-204
Drift velocity, hollow cathode geometry,
246--248
Efficiency, Hall thruster perfonnance
models, 341-345
dielectric walls, 359-362
Electrical efficiency, thruster design,
27-30
Electrical propulsion (EP):
defined, 1-2
early applications of, 2-3
electrical thruster types, 3-5
historical background, 2-3
Electrical thrusters:
beam/plume characteristics, 9-10
efficiency, 27-30
force transfer, 18-21
neutral densities and ingestion, 32-34
power dissipation, 30--32
rocket equation, 15-18
specific impulse, 25-27
thrust force, 21-24
types of, 3-4
Electric Propulsion InteractIons Code
(EPIC), plume emissions:
measurement, 398
sputtering and contamination, 415
Electric thrusters, plume emissions,
394-395
Electrode breakdown, ion thruster
accelerator grid high-voltage
parameters, 217-218
Electromagnetic thrusters, basic properties,
21
Electron backstreaming, ion thruster
accelerator grid, 208-2 I 6
Electron bombardment:
direct-current-discharge plasma
generators, 91-93
Hall thrusters, dominant power-loss
mechanisms, 347-357
Electron-bombardment Ion Thruster
Index
Assembly (EITA), flight ion
thrusters, 434-440
Electron confinement:
ion thruster plasma generator design,
98-100
0-0 ring-cusp model, 108-110
Electron cyclotron resonance heating,
microwave ion thrusters, 162- 171
Electron distribution, ion thruster plasma
generator design, 94--100
Electron-electron collision frequency,
particle collisions, 58-60
Electron energy equation:
hollow cathode, plume-region plasma,
285-292
hybrid Hall thruster models, 370--371
Electron energy loss, 467-469
Electron flux, plasma physics, particle
energies and velocities, 45-46
Electron heating, hollow cathodes, 247-248
Electron-ion collision rrequency, particle
collisions, 58-60
Electron-neutral collisions, 60
microwave ion thrusters, 164--171
Electron relaxation times, 479-482
Electron temperature:
discharge chamber neutral and primary
densities, 121-124
Hall thrusters:
dominant power-loss mechanisms,
348-357
plasma electron temperature, 357-359
hollow cathode, plume-region plasma,
286--292
hollow cathodes:
insert region plasma, 257-270
orifice region plasma, 273-280
ion thruster plasma generator design,
96-- 100
microwave ion thrusters, 167- I 71
primary beam expansion plume models,
406-407
radiofrequency (rt) ion thrusters,
154--158
Electrospraylfield emission electric
propulsion thruster, basic properties,
4--5
Electrostatic force, ion and Hall thrusters,
20--21
Index
Emitted current, discharge chamber neutral
and primary densities, 121-124
Energy balance model:
discharge chamber, 124-126
hollow cathodes, insert region plasma,
259-270
hybrid Hall thruster models, 369-371
Energy conservation, fluid plasma, 51-54
Energy-loss mechanisms, ion thruster
plasma generator design, 98-100
Engineering Test Satellite (ETS), 3
flight ion thrusters, 429--440
Erosion:
Hall thrusters, lifetime analysis, 380--383
hollow cathodes, keeper electrode wear
and life, 306---309
ion thruster accelerator grid, 225-235
plume emissions, solar array interactions,
415--418
Euler-Lagrange equations, primary electron
motion and ionization, 176---182
European Space Agency Artemis space
craft, flight ion thrusters, 434--440
European Space Agency (Small Mission for
Advanced Research in Technology),
flight ion thrusters, 440-443
Excitation cross section:
particle collisIOns, 57-60
radiofrequency (rf) ion thrusters,
152-158
ring-cusp ion thruster models, 117- I 20
xenon, 471--474
Excitation reaction rate coefficient:
Hall thrusters, plasma electron
temperature, 358-359
ion thruster plasma generator design,
97-100
xenon Maxwellian plasmas, 475--477
Excited neutral ion production, ring-cusp
ion thruster models, I 17-120
Extended life test (ELT):
hollow cathodes:
barium depletion model, 301-302
orifice region plasma, 280--28 I
ion thruster accelerator grid:
backstreaming limit calculations,
215-216
keeper erosion, 306---307
pits-and-grooves erosion, 233-235
493
Fick's law:
diffusion equation and, 61-65
magnetic field diffusion, 68-71
Field emission electric propulsion (FEEP)
thrusters, basic properties, 4-5
Flarness parameter:
discharge chamber power and energy
balance, 126
ion thruster accelerator grid:
barrel erosion, 231-232
electron backstreaming, 216
Flight data, plume emissions, 396---398
Flight thrusters:
Hall thrusters, 440-443
ion thrusters, 429--440
Floating potential, plasma boundary
sheaths, 87-88
Fluid plasma, 46---54
energy conservation, 51-54
momentum conservation, 46-48
particle conservation, 48-51
Force transfer, ion and Hall thrusters, 18-21
Fourier transform, ring-cusp ion thruster
models, magnetic multipole
boundaries, 106---107
Fowler-Nordheim plot, ion thruster
accelerator grid electrodes, hold-off
and conditioning, 224
Frictional contributions, fluid plasma
energy conservation, 53-54
Gap dimensions, ion thruster accelerator
grid expansion and alignment,
206---208
Gas flow rate:
Hall thruster efficiency, 341-345
hollow cathodes:
insert region plasma, 256---270
orifice region plasma, 276---280
unit conversions, 463--466
Gaussian beam density, primary beam
expansion plume models, 402--407
Gauss's law, ion thruster accelerator grid,
electron backstreaming, 211-216
Geometric configuration, hollow cathodes,
248-251
insert region plasma, 256---270
Geosynchronous satellites, plume
emissions, 393-394
494
Grid models, ion thruster accelerator
erosion, 227-229
Hall current, Hall thrusters:
basic properties, 328-329
operation, 330-333
Hall-effect thrusters (HETs), classification,
325
Hall thruster:
basic properties, 4, 325-329
channel physics and numerical modeling,
365-379
hybrid models, 366-372
continuity and energy, 369-371
ion current, 371-372
magnetic field transport, 369
transverse electron transport,
366-369
lifetime analysis, 379-383
oscillations, 376-379
steady-state models, 372-376
efficIency measurements, 28-30
flight thrusters, 440-443
force transfer, 18-21
geometry, 6-9
lanthanum hexaboride cathodes, 254-255
lifetime analysis, 379-383
operating principles and scaling, 329-341
crossed-field structure and current,
330-333
ionization length, 334-337
potential and current distributions,
337-341
performance models, 341-365
dielectric wall efficiency, 359-362
dielectric wall vs. metallic wall
comparison, 364-365
dominant power loss mechanisms,
347-357
efficiency, 341-345
metallic wall TAL efficiency, 363
multiply charged ion correction,
345-347
plasma electron temperature, 357-359
plumes:
basic properties, 393-395
flight data, 396-398
laboratory measurements, 398--400
measurements, 395-396
Index
natural gas plumes, 407--408
payload interactions, 418--422
microwave phase shift, 418--419
physical properties, 395--400
plasma optical emission, 419--422
primary beam expansion, 400-407
secondary-ion generation, 408--410
spacecraft interactions, 410-418
particle momentum, 412--413
solar arrays, 415--418
sputtering and contamination,
413--415
power dissipation, 32
thrust properties, 22-24
Heat-exchange terms, fluid plasma energy
conservation, 52-54
Helical electron motion, microwave ion
thrusters, 163-171
High-frequency oscillations:
hollow cathode, plume-region plasma,
291-292
hollow cathodes, keeper electrode wear
and life, 307-309
"High power" orbit insertion mode, flight
ion thrusters, 432--440
High-temperature regions, Hall thrusters,
plasma electron temperature,
358-359
High-voltage parameters, ion thruster
accelerator grid, 216-224
carbon-carbon composites, 221-223
electrode breakdown, 217-218
hold-off and conditioning, 224
molybdenum electrodes, 218-221
pyrolytic graphite, 223
Hold-offbehavior, ion thruster accelerator
grid electrodes, 224
Hollow cathodes:
configurations, 248-25 I
geometric properties, 244-245
historical overview, 243-248
insert region plasma, 256-270
keeper electrode wear and life, 306-309
lifespan testing, 292-306
barium depletion model, 298-302
bulk-material inserts, 302-304
inert plasma, dispenser cathodes,
293-296
poisoning, 304-306
Index
temperature characteristics, 296--298
operating principles, 309-315
orifice region plasma, 270-281
plume-region plasma, 283-292
thennal models, 281-283
thennionic electron emitter, 251-255
Hot gap, ion thruster accelerator grid
expansion and alignment, 206--208
Hybrid two-dimensional ion thruster
models, flow diagram, 172-173
Idealized design, ion thruster plasma
generator, 93-100
Incident flux, Hall thruster ionization length
and scaling, 334-337
Inductive plasma discharge, radiofrequency
(rf) ion thrusters, 151-158
Inert gas propellants, ring-cusp ion thruster
models, neutral
ionization/excitation, 118-120
In-flight measurements, plume emissions,
396--398
Ingestion, electrical thrusters, 32-34
Input power calculations, Hall thrusters,
plasma electron temperature,
357-359
Insert region plasma, hollow cathodes,
256--270
Insert temperatures, hollow cathode
lifetimes, 296--298
Ion acoustic velocity:
discharge chamber power and energy
balance, 126
fluid plasma particle conservation, 51
Hall thrusters, plasma electron
temperature, 357-359
hollow cathodes, insert region plasma,
258-270
radiofrequency (rf) ion thrusters,
156--158
Ion beam current:
ion thruster plasma generator design, 94
plume plasma optical emission,
420-422
Ion bombardment:
Hall thrusters:
dominant power-loss mechamsms,
347-357
lifetime analysis, 379-383
495
hollow cathodes:
barium depletion model, 298-302
keeper electrode wear and life,
306--309
orifice region plasma, 279-280
Ion charge number:
ion thruster accelerator grid, electron
backstreaming, 2 I 2-216
particle collisions, 58-60
Ion confinement:
microwave ion thrusters, 168-171
radiofrequency (rf) ion thrusters,
156--158
ring-cusp ion thruster models, 110-116
Ion conservation equation, Hall thruster
oscillations, 376--379
Ion continuity equations, primary beam
expansion plume models, 401-407
Ion current:
hollow cathodes, insert region plasma,
261-270
hybrid Hall thruster models, 371-372
Ion density:
Hall thrusters, dominant power-loss
mechanisms, 351-357
hollow cathodes, insert region plasma,
258-270
ion thruster accelerator grid trajectories,
201-204
Ion distribution function, hybrid Hall
thruster, ion current, 371-372
Ion energy distribution, hollow cathodes,
keeper electrode wear and life,
307-309
Ion exhaust velocity, thrust properties,
22-24
Ion flux:
Hall thrusters:
dominant power-loss mechanisms,
354-357
lifetime analysis, 38(}-383
hybrid Hall thruster models, transverse
electron transport, 367-369
plume emissions, 396--398
Ion generation rate, ion thruster accelerator
erosion, 228-229
Ion heating, hollow cathodes, 247-248
Ion-ion collision frequency, particle
collisions, 58 0
496
Ionization cross sections, 471-474
Ionization energy loss, hybrid Hall thruster
models, 370-371
Ionization potential, discharge chamber
power and energy balance, 125-126
Ionization reaction rates, xenon Maxwellian
plasmas, 475-477
Ionization region:
discharge chamber model, 172-182
two-dimensional models, 176-182
Hall thruster operation, 334-337
hollow cathodes:
orifice region plasma, 272-280
plume-region plasma, 285-292
ion thruster plasma generator design,
93- 100
Kaufinan ion thrusters, 146-147
radiofrequency (rf) ion thrusters,
152-158
Ion Larmor radius, Hall thruster operation,
331-333
Ion plasma density, two-dimensional
discharge chamber models,
180-182
Ion production cost, ion thruster accelerator
grid, backstreaming limit
calculations, 213-216
Ion source term, primary electron motion
and ionization, 177-182
Ion thrusters:
accelerator grid:
accelerator basics, 196-200
basic properties, 189-190
configurations, 190-196
electron backstreaming, 208-216
high-voltage considerations, 216-224
carbon-carbon composite materials,
221-223
electrode breakdown, 217-218
hold-off and conditioning, 224
molybdenum electrodes, 2 I 8-221
pyrolytic graphite, 223
lifespan, 225-235
barrel erosion, 230-232
grid models, 227-229
pits-and-grooves erosion, 232-235
optics, 200-208
grid expansion and alignment,
206-208
Index
ion trajectories, 200-204
perveance limits, 204-206
flight thrusters, 429-440
plasma generators:
basic properties, 4, 91-93
DC electron-discharge system,
100- 102
discharge chamber:
neutral and primary densities,
120-124
power and energy balance, 124-126
two-dimensional computer models,
171-182
discharge loss, 126-133
discharge stability, 133-\37
electron confinement, 108- I 10
excited neutral production, I 17-120
force transfer, 18-21
geometry, 6-7
idealized design, 93-100
ion confinement, 110-1 16
Kaufman ion thrusters, 142-147
magnetic multipole boundaries,
105- 107
microwave ion thrusters, 158-171
particle collisions, 56-60
performance efficiency, 27-30
power dissipation, 30-32
radiofrequency ion thursters, 148-158
recycling behavior, 137-142
O-D ring-cusp model, 102-105
limitations, 141-142
plumes:
basic properties, 393-395
flight data, 396-398
laboratory measurements, 398-400
measurements, 395-396
neutral gas plumes, 407-408
payload interactions, 418-422
microwave phase shift, 418-419
physical properties, 395-400
plasma optical emission, 419-422
primary beam expansion, 400-407
secondary-ion generation, 408-410
spacecraft interactions, 410-418
particle momentum, 412-413
solar arrays, 415-4 I 8
sputtering and contamination,
4\3-415
Index
Japan Aerospace Exploration Agency
(JAXA), flight ion thrusters,
435-440
Jet power, thrust properties, 21-24
Kaufman ion thruster:
basic properties, 142-147
direct-current-discharge plasma
generators, 102
flight ion thrusters, 434-440
Keeper electrodes:
bias voltage, discharge loss, 127-133
Hall thruster performance efficiency,
342-345
hollow cathodes:
geometry, 246-248
operating principles, 309-315
lifetime analysis, 306-309
Knudsen-flow models, discharge chambers,
173-175
Laboratory plume measurements, 398-400
Lagrangian algorithm, primary beam
expansion plume models, 405-407
Landau damping, fluid plasma energy
conservation, 54
Langmuir condition:
hollow cathode, plume-region plasma,
287-292
plasma double sheaths, 85-86
Langmuir probe, plume emissions, solar
array interactions, 416----418
Lanthanum hexaboride:
Hall thrusters,lifetime analysis, 379-383
hollow cathodes:
bulk material insert life, 302-304
poisoning of, 305-306
thermionic electron emission,
254-255
Larmor radius:
Hall thruster operation, crossed-field
structure and the Hall current,
330-333
Kaufman ion thrusters, 143-147
microwave ion thrusters, 163-171
plasma physics, single particle motions,
40-43
O-D ring-cusp model, electron
confinement, 108-110
497
Lattice atoms, hollow cathodes, barium loss
rates, 294-296
Life demonstration test (LDT), hollow
cathodes:
barium depletion model, 298-302
bulk-material inserts, 302-304
inert plasma, dispenser cathodes,
293-296
insert life analysis, 292-306
orifice region plasma, 279-281
poisoning, 304-306
temperature characteristics, 296-298
Lifetime analysis:
extended life test:
hollow cathodes:
barium depletion model, 301-302
orifice region plasma, 280-281
ion thruster accelerator grid:
backstreaming limit calculations,
215-216
pits-and-grooves erosion, 233-235
Hall thrusters, 379-383
hollow cathodes:
barium depletion model, 298-302
bulk material inserts, 304-306
keeper electrodes, 306-309
thermionic electron emission, 255
inert plasmas, dispenser cathodes,
293-296
ion thruster accelerator grid, 225-235
barrel erosion, 230-232
grid models, 227-229
pits-and-grooves erosion, 232-235
Linearization, fluid plasma particle
conservation, 49-51
Lorentz equation, two-dimensional
discharge chamber model, primary
electron motion and ionization,
176-182
Lorentz force:
fluid plasma, momentum conservation,
46----48
ion and Hall thrusters, 20-2 I
plasma physics, single particle motIOns,
39-43
Loss rates, barium cathodes, lifetime
analysis, 293-296
Low-frequency oscillation, Hall thruster,
377-379
498
Mach number, hollow cathode. plume-
region plasma, 286-292
Magnetic field electron transport, hybrid
Hall thruster models, 369
Magnetic-layer thrusters, classification,
325
Magnetic mirror, plasma physics, single
particle motions, 43
Magnetic multipole boundaries, ion thruster
plasma generators, O-D ring-cusp
model, 105-107
Magnetized electrons, Hall thruster
operation, 331-333
Magnetoplasmadynamic (MPD) thruster,
basic properties, 5
Mass-conservation equations, fluid plasma
particle conservation. 48-51
Mass ratio, plasma boundary sheaths, 72-73
Mass utilization efficiencies:
dielectric-wall Hall thrusters, 361-362
discharge chamber neutral and primary
densities, 120----124
discharge loss, 131-134
Hall thruster:
ionization length and scaling, 336-337
performance models, 343-345
Hall thruster operation, 334-337
ion thruster plasma generator design,
98-100
microwave ion thrusters. 167-171
radiofrequency (rt) ion thrusters,
156-158
recycling behavior, 139-141
Maximum magnetic field strength, ring-
cusp ion thruster models, ion
confinement, 114-] 16
Maxwellian distribution:
discharge loss, 127-133
discharge stability, 134-137
Hall thrusters, dominant power-loss
mechanisms, 348-357
hollow cathodes:
insert region plasma, 256-270
keeper electrode wear and life, 309
ionization/excitation reactions, 475-477
ion thruster accelerator grid trajectories,
201-204
electron backstreaming, 209-216
microwave ion thrusters and, 166-171
Index
radiofrequency (rt) ion thrusters,
15]-158
ring-cusp ion thruster models, 117-120
Maxwellian electron "field particles,"
479-482
Maxwell's equations:
Debye plasma boundary sheaths, 73-75
fluid plasma particle conservation, 48-51
ion thruster plasma generator design,
electron velocity distribution
function, 94-100
microwave ion thrusters, 159-160
plasma physics, 38-39
particle energies and velocities, 44-46
Maxwell three-dimensional magnetic field
solver, ring-cusp ion thruster
models, 107
Mean collision time, discharge chamber
neutral and primary densities,
122-124
Mean confinement time:
electron confinement, 108-110
ion thruster plasma generator design,
95-100
Mean free path calculations:
Hall thrusters, ionization length and
scaling, 335-337
hollow cathode:
barium depletion model, 300----302
plume-region plasma, 285-292
particle collisions, 56-60
Mean ion free path, hollow cathodes, orifice
region plasma, 272-280
Metallic-wall Hall thrusters:
dielectrIc-wail Hall thruster comparison
with, 364-365
lifetime analysis, 383
thruster with anode layer (TAL), 363
Microwave ion thrusters, 158-171
Microwave phase shift, plume-payload
interactions, 4]8-419
Miniature Xenon Ion Thruster (MiX]),
439-440
MIrror ratio, microwave ion thrusters,
168--171
Mobility, non-magnetic field diffusion,
60----66
Molybdenum electrodes, ion thruster
accelerator grid, 2 I 8-221
Index
barrel erosion, 231-232
hold-off and conditionmg, 224
Momentum conservation, fluid plasma,
46--48
Momentum equation:
plume emissions:
primary beam expansion models,
400-407
spacecraft interactions, 412-413
primary electron motion and ionization,
177-182
Momentum-transferring collision
frequency, hybrid Hall thruster
models, transverse electron
transport, 367-369
Mono-energetic primary electrons, ion
thruster plasma generators, O-D
ring-cusp model, 104-105
Monte-Carlo calculations:
Clausing factor, 483-486
discharge chamber models, 174-182
radiofrequency (rf) ion thrusters,
157-158
two-dimensional discharge chamber
model, primary electron motion and
ionization, 176-.182
Multi-dimensional modeling, discharge
chamber, 171-182
Multiply charged ion correction, Hall
thruster perfonnance, 345-347
MUSES-C ECR thruster, 170-171
NASA Evolutionary Xenon Thruster
(NEXT), flight ion thrusters,
437-440
NASA Glenn Research Center (GRC),
flight ion thrusters, 435-440
NASA-173Mv Hall thruster:
basic properties, 329
performance efficiency, 344-345
NASA Solar Electric Propulsion
Technology Applications Readiness
(NSTAR):
direct-current-discharge plasma
generators, 102
discharge chamber models, 174-182
discharge loss, 131-133
electron backstreaming, 210-216
flight ion thruster. 430-440
499
hollow cathodes:
barium depletion model, 301-302
insert region plasma, 256--270
keeper electrode wear and life,
307-309
orifice region plasma, 271-280
thermal models, 281-283
lifetime analysis, 226--235
barrel erosion, 230-232
insert temperatures. 297-298
perveance limit, 205-206
plume emissions flight data, 396--398
primary electron motion and ionization,
176--182
ring-cusp ion thruster models, ion
confinement. 116
throttle table, 432
two-dimensional discharge chamber
model,179-182
Net flux calculations:
Hall thrusters, dominant power-loss
mechanisms. 354-357
hollow cathodes, barium loss rates.
295-296
Neutral atom model, discharge chamber,
172-175
Neutral gas density:
discharge chambers, 120-124
two-dimensional models. 174-.182
electrical thrusters. 32-34
Hall thruster operation, 334-337
hollow cathode, 249-251
insert region plasma, 263-270
orifice region plasma, 276--280
plume-region plasma. 283-292,
285-292
ion thruster accelerator grid, erosion
models, 227-229
ion thruster plasma generator design, 94
microwave ion thrusters, 167-171
plume emissions, 407-408
plume plasma optical emission,
420-422
radiofrequency (rf) ion thrusters,
149-158
recycling behavior, 137-141
view-factor model, 172-182
Neutral gas excitation, ion thruster plasma
generator design, 93-100
500
Neutral gas temperatures, discharge
stability,133-137
Neutral IOn production:
hybrid Hall thruster models, continuity
and energy, 369-371
ring-cusp ion thruster models, 117-120
Neutral particle conservation equation, Hall
thruster oscillations, 376-379
Neutral particle velocity:
Hall thruster:
ionization length and scaling, 334-337
oscillations, 377-379
hollow cathode, orifice region plasma,
276-280
Newton's second law, ion and Hall current
force, 20-21
Nomenclature table, 447-448
Non-contact temperature measurement,
hollow cathode lifetimes, 296-298
Non-magnetic diffusion and mobility,
partially ionized gases, 60-66
ambipolar diffusion, 65-66
Fick's law, 61-65
Non-Maxwellian distribution function:
discharge loss, 132-133
hybrid ion thrusters, steady-state
equations, 374-376
ion thruster plasma generator design, 100
Non-unifonTI plasmas, O-D ring-cusp
model, 141-142
North-south station keeping, plume
emissions, 393-394
Nuclear Electric Xenon Ion Thruster
System (NEXIS):
discharge loss, 130-134
flight ion thrusters, 437-440
hollow cathode geometry, 245-248
barium depletion model, 301-302
plume-region plasma, 283-292
hollow cathodes, insert region plasma,
262-270
ion thruster accelerator grid, electron
backstreaming, 216
plume emissions, sputtering and
contamination, 413-415
primary beam expansion plume models,
405-407
recycling behavior, 139-141
ring-cusp ion thruster models, 107
Index
electron confinement, 109-110
Numerical modeling, Hall thruster, 365-379
hybrid models, 366-372
continuity and energy, 369-371
ion current, 371-372
magnetIc field transport, 369
transverse electron transport, 366-369
lifetime analysis, 379-383
oscillations, 376-379
steady-state models, 372-376
Ohmic heating, particle collisions, 59-60
Ohm's law:
hollow cathode, insert region plasma,
269-270
hybrid Hall thruster models, 366-372
transverse electron transport, 366-369
particle collisions, 59-60
On-axis potentials:
electron backstreaming, ion thruster
accelerator grid, 208-216
Hall thruster potential and current
distributions, 338-341
One-dimensional models:
Hall thrusters, 365-366
hollow cathodes, plume-region plasma,
283-292
hybrid Hall thrusters, steady-state
equations, 372-376
Optics codes, ion thruster accelerator grid,
200-208
barrel erosion, 230-232
grid expansion and alignment, 206-208
ion trajectories, 200-204
perveance limits, 204-206
pits-and-grooves erosion, 232-235
Orifice dimensions, hollow cathode
geometry, 248-251
orifice region plasma, 271-280
Orifice heating, hollow cathodes, 247-248
Oscillations:
fluid plasma particle conservation,
50-51
Hall thrusters, 376-379
hollow cathode operation, 313-315
Over-perveance, ion thruster accelerator
grid trajectories, 202-204
O-waves, microwave ion thrusters,
160-161
Index
Oxide cathodes, thermionic electron
emission, 252-255
Parallel electron velocity, microwave ion
thruslers, 163-171
Park's fonnula, primary beam expansion
plume models, 405-407
Partially ionized gas diffusion, plasma
physics, 54-71
collisions, 55----(j0
diffusion and mobility, 60-66
ambipolar diffusion, 65----(j6
Fick's law, 61----(j5
with magnetic field diffusion, 66-7 I
ambipolar B particle diffusion, 69-71
Particle conservation, fluid plasma, 48-51
Particle energies and velocities:
ion thruster plasma generators, O-D ring-
cusp model, 103-105
Kaufman ion thrusters, 142-147
plasma physics, 43-46
Particle gyration, plasma physics, 41-43
Particle-in-cell (PIC) model:
Hall thruster, 365-366
ion current, 371-372
ion thruster accelerator grid trajectories,
202-204
plume emissions:
primary beam expansion models,
405-407
secondary-ion generation, 408-410
Particle-pushing algorithm, primary
electron motion and ionization,
176-182
Particle simulation, two-dimensional
discharge chamber model, 176-182
Paschen breakdown mechanism,
molybdenum electrodes, ion thruster
accelerator grid, 219-221
Path length calculations:
hollow cathodes:
insert region plasma, 256-270
orifice region plasma, 272-280
ion thruster accelerator gnd, erosion
models, 229
Payload interactions, plume emissions,
418-422
microwave phase shift, 418-419
plasma optical emissions, 419-422
501
Peak electron temperature, Hall thrusters,
358-359
Penetration distance, particle collisions,
56-60
Performance models:
discharge loss, 130-133
Hall thruster, 341-365
dielectric wall efficiency, 359-362
dielectric wall vs. metallic wall
comparison, 364-365
dominant power loss mechanisms,
347-357
efficiency, 341-345
metallic wall TAL efficiency, 363
multiply charged ion correction,
345-347
plasma electron temperature, 357-359
ion thruster discharge chamber, two-
dimensional models, 179-182
ion thruster plasma generator efficiency,
27-30
Perpendicular electron mobility:
hybrid Hall thruster models:
continuity and energy, 369-371
transverse electron transport, 367-369
magnetic field diffusion, 67-71
Perturbed electron current density,
microwave ion thrusters, 160-161
Perveance limit, ion thruster accelerator
grid, 204-206
Phillips type S thruster, hollow cathodes,
thermionic electron emission,
252-255
Pits and grooves erosion, ion thruster
accelerator grid, lifetime analysis,
225-235
Plasma ball definition, hollow cathode,
plume-region plasma, 287-292
Plasma contactors, plume emissions,
419-422
Plasma currents, plume emissions, solar
array interactions, 415-418
Plasma density:
discharge chamber power and energy
balance, 126
Fick's law, 62----(j5
Hall thruster operation, 333
hollow cathodes:
geometry, 245-251
502
Plasma density (com.)
insert region plasma, 262-270
orifice region plasma, 273-280
oscillation patterns, 313-315
hybrid ion thrusters, steady-state
equations, 374-376
ion thruster plasma generator design,
94-100
Kaufman ion thrusters, 144-147
microwave ion thrusters, 162-171,
165-171
plume emissions, 396-398
Plasma electron temperature, Hall thrusters,
357-359
Plasma frequency, fluid plasma particle
conservation, 48-51
Plasma generators, thruster efficiency,
27-30
Plasma ion flux, hollow cathodes, barium
loss rates, 295-296
Plasma optical emission, plume-payload
interactions, 419-422
Plasma physics:
boundary sheaths, 71-88
Child-Langmuir sheaths, 79-81
Debye sheaths, 73-75
double sheaths, 84-86
generalized sheath solution, 8 1-84
pre-sheaths, 76-79
summary of effects. 86-88
fluid plasma, 46-54
energy conservation, 51-54
momentum conservation, 46-48
particle conservation, 48-51
hollow cathodes:
insert region plasma, 256-270
orifice region plasma, 270-281
overview, 37-38
partially ionized gas diffusion, 54-71
collisions, 55-60
diffusion and mobility, 60----66
ambipolar diffusion, 65-66
Fick's law, 61-65
with magnetic field diffusion, 66-71
ambipolar B particle diffusion,
69-71
particle energies and velocities, 43-46
single particle motions, 39-43
Plasma potential:
Index
discharge stability, 134-137
Hall thrusters, dominant power-loss
mechanisms, 354-357
hollow cathodes:
barium depletion model, 298-302
bulk-material insert life, 302-304
geometry, 245-248
keeper electrode wear and life,
307-309
ion thruster accelerator grid, electron
back streaming, 209-216
Kaufman ion thrusters, 144-147
microwave ion thrusters, 165- 171
radiofrequency (rf) ion thrusters,
153-158
recycling behavior, 139-141
Plasma regions, hollow cathode geometry,
243-248
Plate-and-ball testing, molybdenum
electrodes, ion thruster accelerator
grid, 219-221
Plume emissions:
hollow cathode operation, 311-315
ion and Hall thrusters:
basic properties, 393-395
flight data, 396-398
laboratory measurements, 398-400
measurements, 395-396
natural gas plumes, 407-408
payload interactions, 418-422
microwave phase shift, 418-419
physical properties. 395-400
plasma optical emission, 419-422
primary beam expansion, 400--407
secondary-ion generatIOn, 408-410
spacecraft interactions, 410--418
particle momentum, 412-413
solar arrays, 415-418
sputtering and contamination,
413-415
Plume-region plasma, hollow cathodes,
283-292
Poiseuille flow rate, hollow cathodes,
orifice region plasma, 273-280
Poisoning, hollow cathodes:
lifetime analysis, 304-306
thermionic electron emission,
254-255
Poisson's equation:
Index
Debye plasma boundary sheaths, 74--75
electron backstreaming, ion thruster
accelerator grid, 208-216
force transfer, 18-2 I
plume emissions, secondary-ion
generation, 409-410
Positive-going anode sheath:
discharge stability, 135-137
Hall thrusters, dominant power-loss
mechanisms, 351-357
Potential distribution, Hall thruster
operation, 337-341
Potential drop, ion thruster plasma
generators, O-D ring-cusp model,
103-105
Power balance model:
Hall thrusters, plasma electron
temperature, 357-359
hollow cathode, insert region plasma,
264--270
Power dissipation:
basic principles, 30-32
discharge chamber energy balance,
124--126
Power processing unit (PPU), flight ion
thrusters, 431-440
Power supplies:
direct-current-discharge plasma
generators, 92-93
Hall thruster potential and current
distributions, 340-341
ion thruster plasma generators:
electrode breakdown, 217-218
O-D ring-cusp model, 105
Predator-prey oscillations:
Hall thrusters, 377-379
hollow cathode operation, 313-315
Pre-sheath potential, plasma boundary
sheaths, 76--79
Pressure gradient force:
fluid plasma, momentum conservation,
46--48
hollow cathodes, insert region plasma,
257-270
Pressure increase, recycling behavior,
139-141
Primary beam expansion, plume models,
400-407
Primary electron densities:
503
discharge chambers, 120-124
two-dimensional models, 176--182
discharge loss, 132-133
discharge stability, 133-137
Hall thruster potential and current
distributions, 339-341
ion thruster plasma generator design,
100
Kaufman ion thrusters, 145-147
O-D ring-cusp model, 108-110
Propellant flow rate:
ring-cusp ion thruster models, neutral
ionization/excitation, 119-120
thruster efficiency, 28-30
Propellant mass:
rocket equation, 17-18
thrust properties, 21-24
Pulsed plasma thruster (PPT), 440-443
basic properties, 5
Purity standards, hollow cathode poisoning
and, 254--255
Pyrolytic graphite, ion thruster accelerator
grid electrodes, 223
Quasi-neutral plasma:
boundary sheaths, 71-73
discharge chamber power and energy
balance, 126
Hall thrusters, dominant power-loss
mechanisms, 353-357
ion thruster plasma generator design,
95-100
radio frequency (rf) ion thrusters,
152-158
Radial confinement, microwave ion
thrusters, 168-171
Radial magnetic field thruster:
basic properties, 329
dlrect-current-discharge plasma
generators, 10 I-I 07
ionization length and scaling, 335-337
Radial plasma potential profile, hollow
cathodes, keeper electrode wear and
life, 308-309
Radial velocity, primary beam expansion
plume models, 402-407
Radiation emissions, microwave ion
thrusters, 165-171
504
Radio-frequency Ion Thruster Assembly
(RITA), flight ion thrusters,
434-440
Radiofrequency (rt) ion thrusters (RIT):
basic properties, 148-158
flight ion thrusters, 437-440
Randolph's formula, primary beam
expansion plume models, 405-407
Reaction rate coefficient:
Hall thruster ionization length and
scaling, 334-337
ion thruster plasma generator design,
96-100
particle collisions, 57-60
ring-cusp ion thruster models, neutral
ionization/excitation, I 18-120
Recycling behavior, ion thruster design,
137-141
Refractory metals, hollow cathodes,
thermionic electron emission,
25]-255
Remote sensor unit (RSU), plume
emissions, 396-398
Resistivity, hollow cathode:
insert region plasma, 259-270
plume-region plasma, 290-292
Resistojets, basic properties, 4
Retarding potential analyzer (RPA) data,
plume emissions. 399-400
secondary-ion generation, 410
Richardson coefficients, thermionic
electron emission, hollow cathodes,
252-255
Richardson-Dushman equation, thermionic
electron emission, hollow cathodes,
251-255
Ring-cusp thrusters, discharge chamber
stability, 136-] 37
Rocket equation, electric thrusters, 15-18
Saddle-point magnetic field, ring-cusp ion
thruster models. ion confinement,
115-116
Samarium cobalt (SmCo) magnets,
microwave ion thrusters. 170-171
Sapphire fiber optic probes, hollow cathode
lifetime measurements, 297-298
Scaling parameters, Hall thruster operation,
334-337
Index
Schottky effect, thermionic electron
emission, hollow cathodes, 251-255
Screen current-to-beam current ratio,
perveance limit, 205-206
Screen supply, ion thruster plasma
generators, O-D ring-cusp model,
105
Secondary electron temperature, two-
dimensional discharge chamber
model, 179-182
Secondary electron yield:
dielectric-walll Hall thruster efficiency,
362-365
Hall thrusters, dominant power-loss
mechanisms, 348-357
Secondary ion measurements, plume
emissions, 398, 408-410
Self-heating mechanisms, hollow cathodes,
247-248
plume-region plasma, 283-292
Sheath potentials, Hall thruster
performance, dominant power-loss
mechanisms, 347-357
Sheath voltage, hollow cathodes:
barium depletion mode], 298-302
insert region plasma, 260-270
Single particle motions, plasma physics,
39-43
Slab geometry, Fick's law, 63-65
SMART-I mission, 3
Solar arrays, plume emissions:
plasma ineractions with, 415-418
spacecraft interactions, 411-418
Solenoidal thrusters:
direct-current-discharge plasma
generators, 10 I -107
radiofrequency (rf) ion thrusters,
155-158
Space-charge-limited current flow, plasma
double sheaths, 85-86
Space charge-limited electron emission,
Hall thrusters, dominant power-loss
mechanisms, 352-357
Spacecraft, rocket equation, 15- 18
Spacecraft interactions, plume emissions,
410-418
particle momentum, 412-413
solar arrays, 415-418
sputtering and contamination, 413-415
Index
Space Experiments with Particle
Accelerators (SEPAC), plume
plasma optical emission, 419-422
Space Station Contactor (SSC) cathode:
banum depletion model, 301-302
lifetime measurements, 297-298
Space Technology Experiment Satellite
(STEX), flight thrusters, 440---443
Specific impulse (Isp):
basic principles, 25-27
Spot-knocking, ion thruster accelerator grid,
molybdenum electrodes, 2 I 9-221
Spot mode, hollow cathode operation,
311-315
Sputtering yield:
Hall thrusters, lifetime analysis, 380-383
plume emissions, spacecraft interactions,
413-415
Standard gas law, electrical thruster density
and ingestion, 32-34
Stationary plasma thrusters (SPTs):
classification, 325
dielectric-wall efficiency, 361-362
flight thrusters, 440---443
ionization length and scaling, 336-337
lifetime analysis, 380-383
performance efficiency, 344-345
plume emissions, sputtering and
contamination, 414-415
plume emissions measurement, 398
steady-state equations, 372-376
Stay-out zones, plume emissions, sputtering
and contamination, 413-415
Steady-state equations:
Fick's law and, 64-65
hollow cathode:
insert regIon plasma, 268-270
orifice region plasma, 272-280
plume-region plasma, 284-292
hybrid Hall thruster models, 372-376
ion current, 366-372
plume models, primary beam expansion
models, 400---407
Surface-accommodated ions, plume
emissions, spacecraft interactions,
413
Surface particle analysis, hollow cathodes,
barium evaporation, 294-296
Symbols table, 458-461
505
Taylor series, pre-sheath potential, 77-79
Temperature effects:
barium depletion model, 298-302
hollow cathodes:
bulk material insert life, 302-304
thermionic electron emission, 252-255
Term definitions, 450---451
Thermal conductivity, fluid plasma energy
conservation, 52-54
Thermal contributions, fluid plasma energy
conservation, 53-54
Thermal expansion, ion thruster accelerator
grid, 206-208
Thermalization, discharge chamber neutral
and primary densities, 122-124
Thermalization times, 479-482
Thermalized potential, hybrid Hall thruster
models, magnetic field transport,
369
Thermal models, hollow cathodes, 281-283
Thermionic electron emission, hollow
cathodes, 251-255
poisoning effects, 304-306
Three-dimensional models:
discharge chambers, I 74-182
primary electron motion and ionization,
176-182
Threshold voltage vs. gap measurements,
ion thruster accelerator grid
electrodes:
carbon-carbon electrodes, 222-223
molybdenum electrodes, 219-221
pyrolytic graphite, 223
Thrust, basic properties of, 21-24
Thrust-beam plasma potential, Hall thruster
potential and current distributions,
338-341
Thrust correction factor, 24
Thruster mass utilization efficiency:
basic principles, 27-30
specific impulse, 25-27
Thruster with anode layer (TAL):
basic properties, 326-329
dielectric-wall Hall thruster comparison
with, 364-365
dominant power-loss mechanisms,
355-357
flight thrusters, 440---443
lifetime analysis, 3833
506
Thruster with anode layer (TAL) (cont.)
metallic-wall efficiency, 363
Time dependent function:
Fick's law, 62-65
recycling behavior, 138-141
Total collision frequency, Hall thruster
operation, 331-333
Total discharge power, dielectric-wall Hall
thruster efficiency, 361-362
Total energy flux, fluid plasma energy
conservation, 51-54
Total ion beam current:
Hall thruster, multiply charged ion
corrections, 346-347
ring-cusp ion thruster models, density
calculations, 119-120
Total ion density, plume emissions,
395-396
Total plasma density, Hall thruster, multiply
charged ion corrections, 346-347
Total voltage effect, molybdenum
electrodes, ion thruster accelerator
grid, 2 I 9-221
Trajectories, ion thruster accelerator grid,
optics codes, 200-204
Transverse electron transport, hybrid Hall
thruster models, 366-369
Transverse velocity:
plasma physics, single particle motions,
4]-43
ring-cusp ion thruster models, ion
confinement, 111-116, 113-116
Traveling-wave tubes (TWT), microwave
ion thrusters, 170-171
Trough contours, hollow cathode, plume-
region plasma, 291-292
Tungsten matrix, hollow cathodes,
thermionic electron emission,
252-255
Two-dimensional models:
Hall thrusters, 365-366
hollow cathode:
insert region plasma, 268-270
plume-region plasma, 283-292
thermal models, 281-283
hybrid Hall thrusters, steady-state
equations, 372-376
ion thruster accelerator grid, electron
backstreaming, 215-216
Index
ion thruster discharge chamber, 17]-182
neutral atom model, 172- I 75
performance evaluation, 179-182
primary electron motion and
ionization, 176-179
Ultraviolet photon, plume plasma optical
emission, 420-422
Under-perveance, ion thruster accelerator
grid trajectories, 202-204
Uniform plasma, ion thruster plasma
generators, O-D ring-cusp model,
104-105
Uniform vertical magnetic field, plasma
physics, single particle motions,
4]-43
Upstream reference electron density, ion
thruster accelerator grid trajectories,
201-204
Vacuum applications, hollow cathodes,
thermionic electron emission,
252-255
Vacuum potentia], hollow cathode
operation, 309-315
Vacuum region, ion thruster accelerator
grid, electron backstreaming,
212-2]6
Variables table, 451-458
Velocity volume element, plasma physics,
45-46
View-factor model, discharge density,
172-182
Vlasov equation, hybrid Hall thruster, ion
current, 371-372
Wall-scattering frequency, hybrid Hall
thruster models, transverse electron
transport, 368-369
Wirz-Katz model, discharge chambers,
180-182
Work function, thermionic electron
emission, hollow cathodes, 251-255
Xenon ionization cross-sections, 471-474
Xenon Ion Propulsion System (X]PS), 3
direct-current-discharge plasma
generators, 102
ion thrusters, 429-440
Index
plume plasma optical emission, 419-422
Xenon ion thrusters, direct-current-
discharge plasma generators, 102
Xenon thrusters, specific impulse, 25-27
O-D ring-cusp model:
discharge loss, 133
discharge stability, 134-13 7
507
electron confinement, 108-110
ion thruster plasma generators, 102-105
limitations, 141-142
magnetic multipole boundaries, 105-107
microwave ion thrusters, 165-171
radiofrequency (rf) ion thrusters,
156-158
Fundamentals oIElectric Propulsion: Ion and Hall T1l1'llsters
by Dan M. Goebel and Ira Katz
Copyright iQ 2008 John Wiley & Sons, Inc.
JPL SPACE SCIENCE AND TECHNOLOGY SERIES
Joseph H. Vuen, Editor-in-Chief
Published Titles in this Series
1. Fundamentals of Electric Propulsion: Ion and Hall Thrusters
Dan M. Goebel and Ira Katz