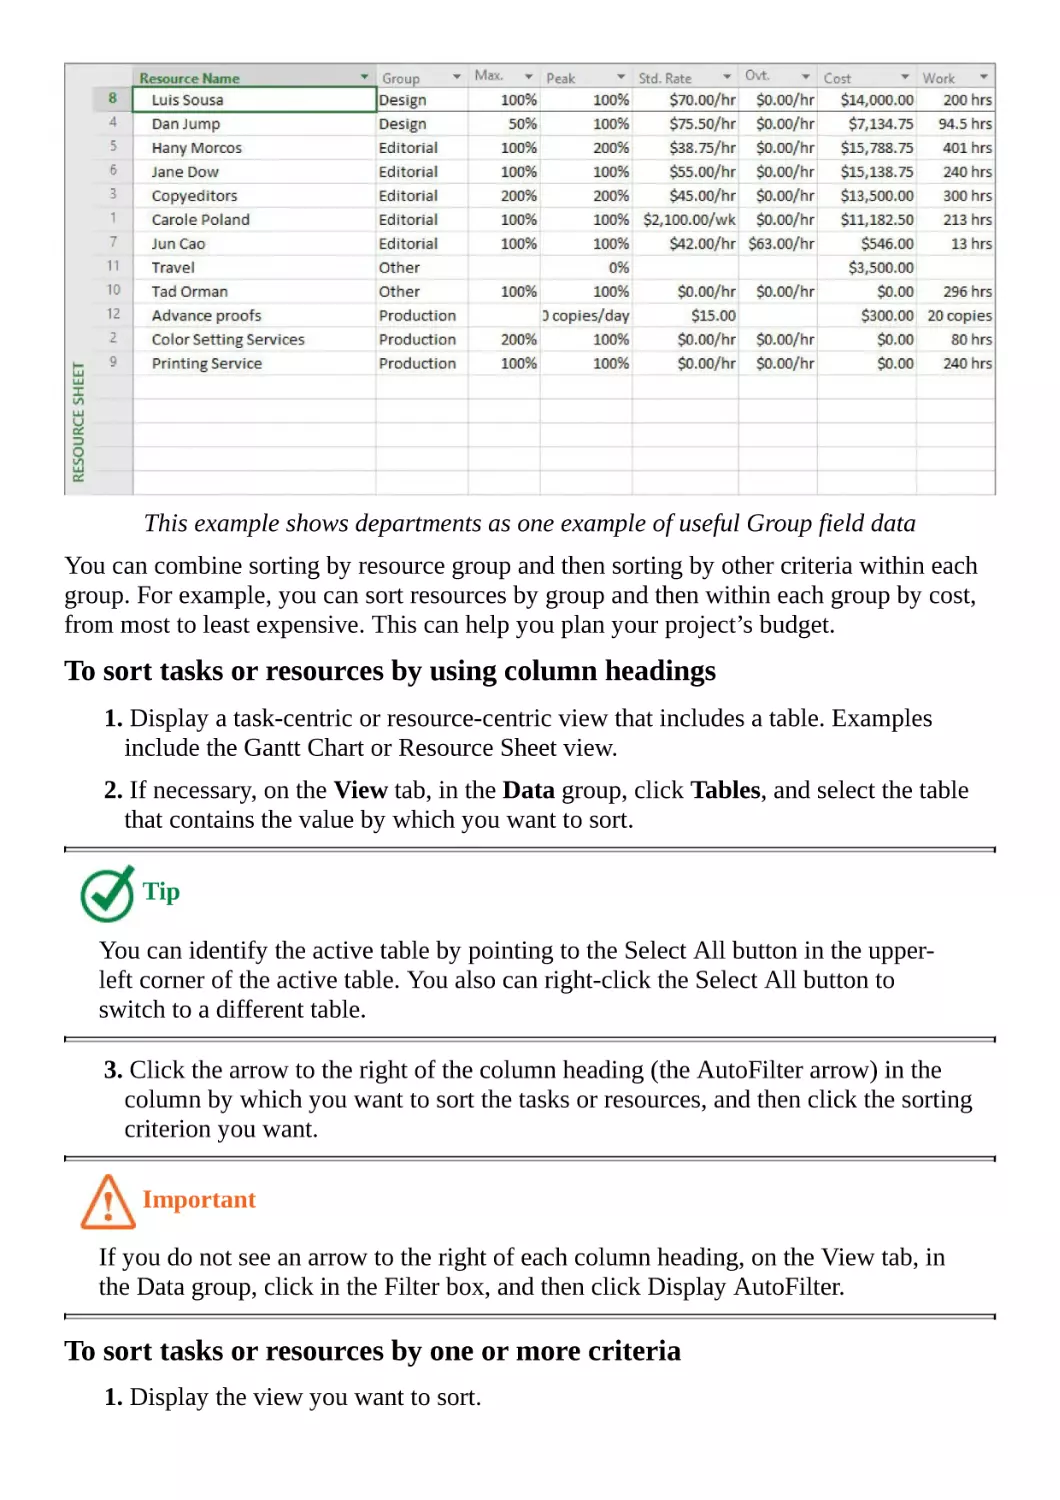
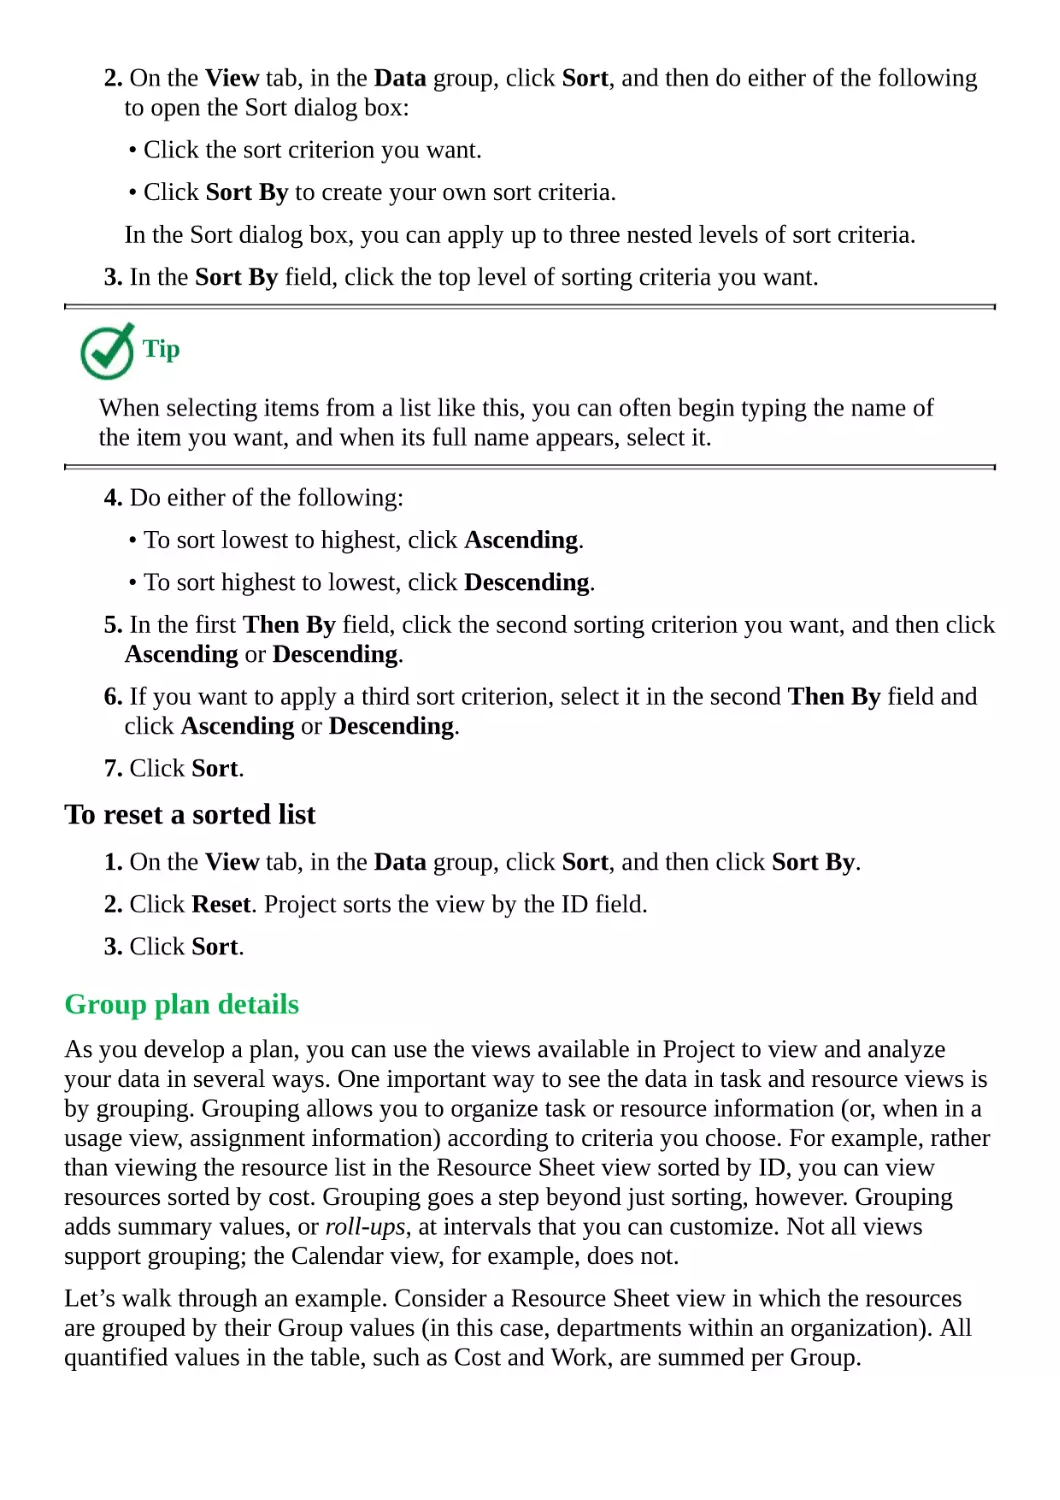
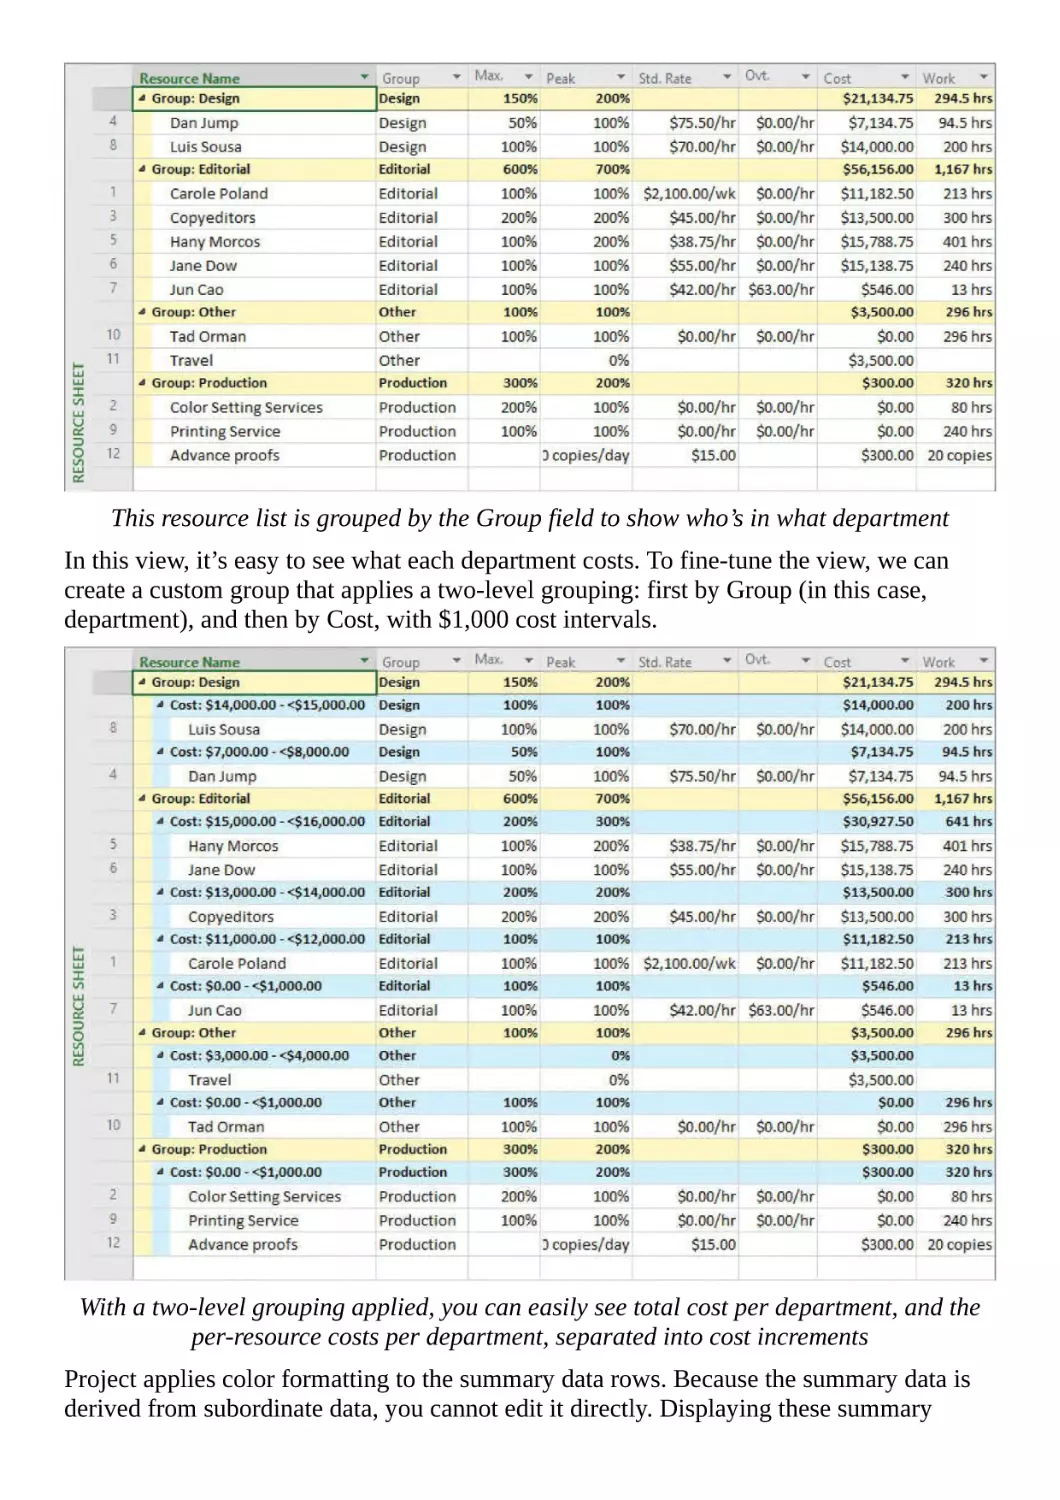
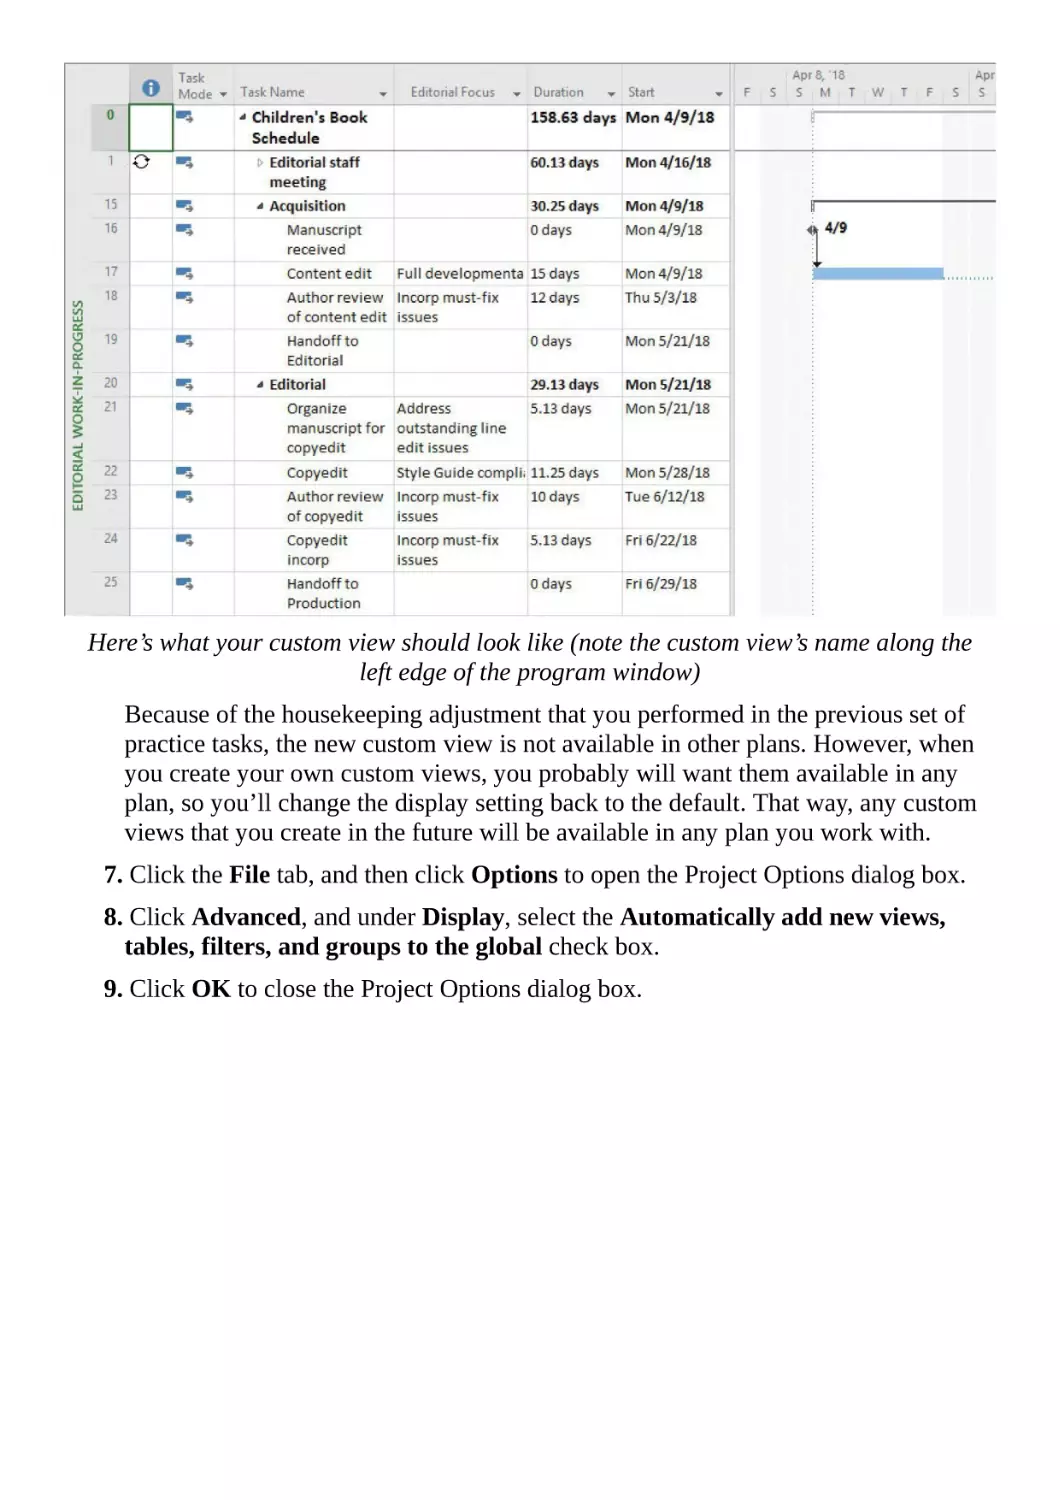
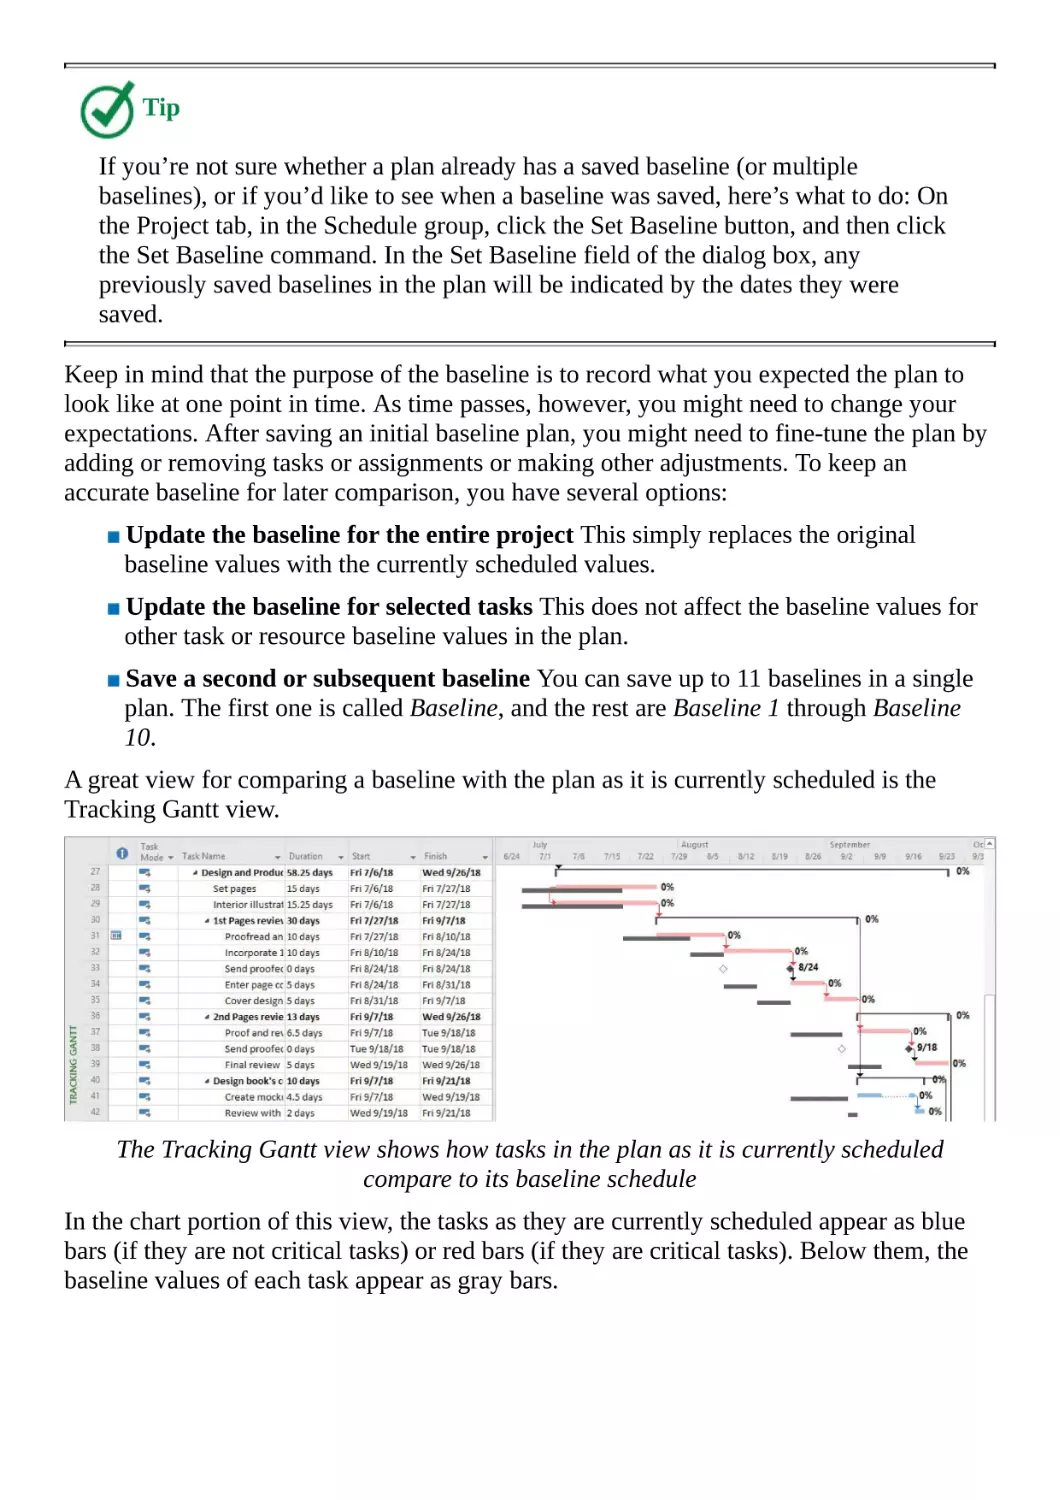
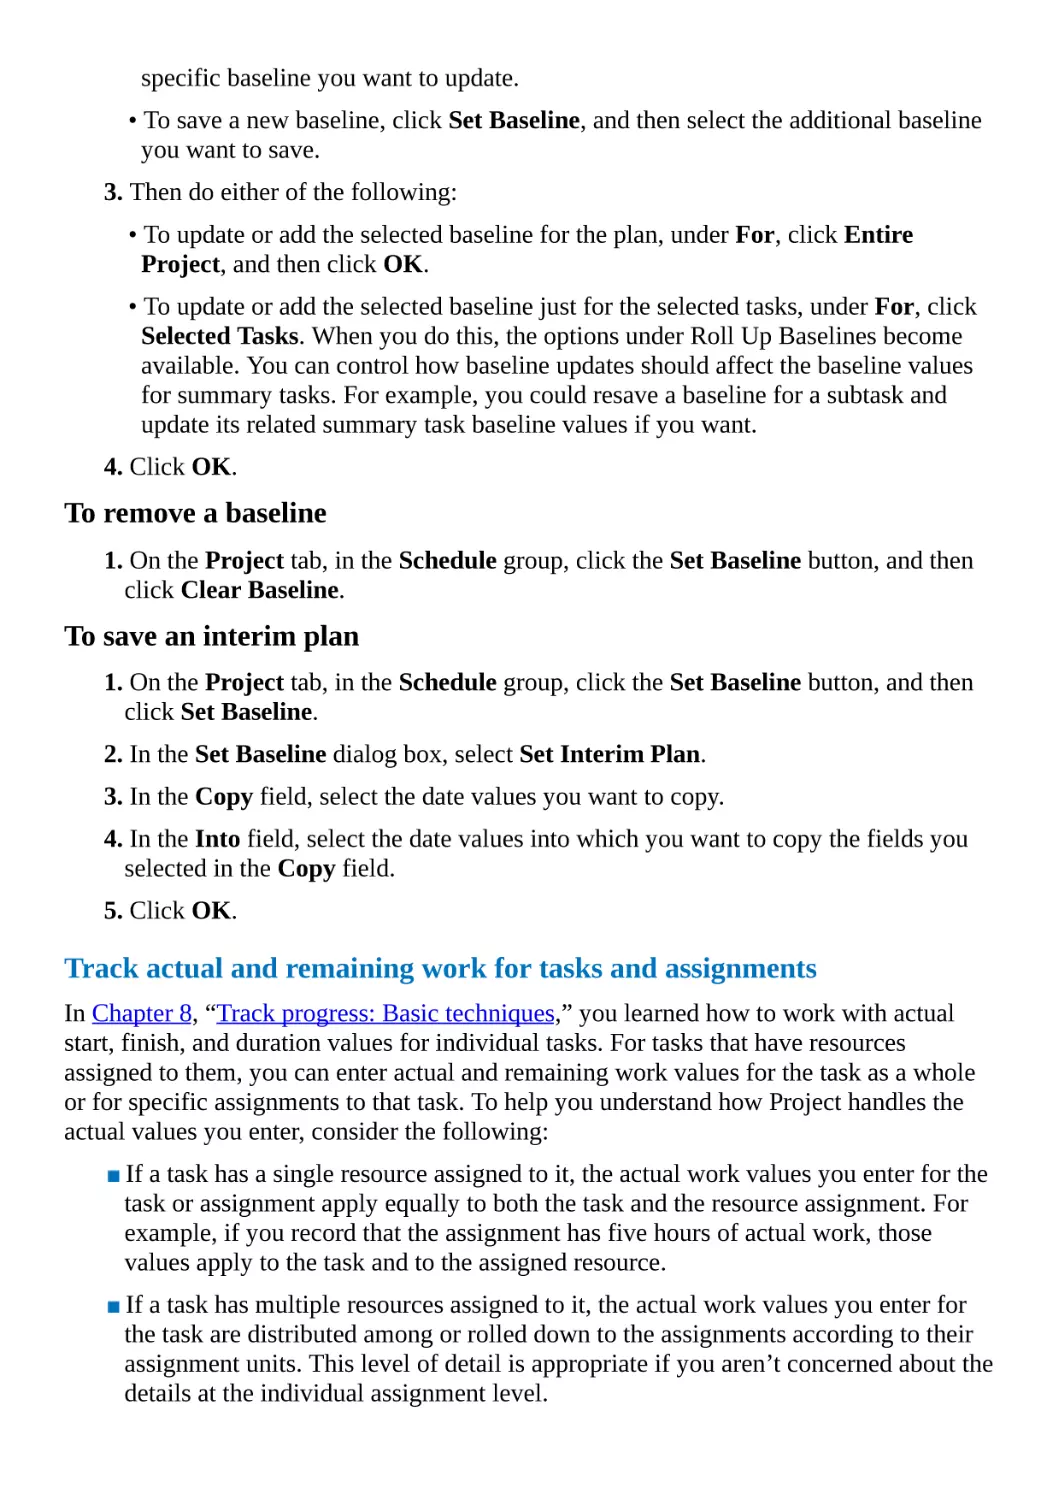
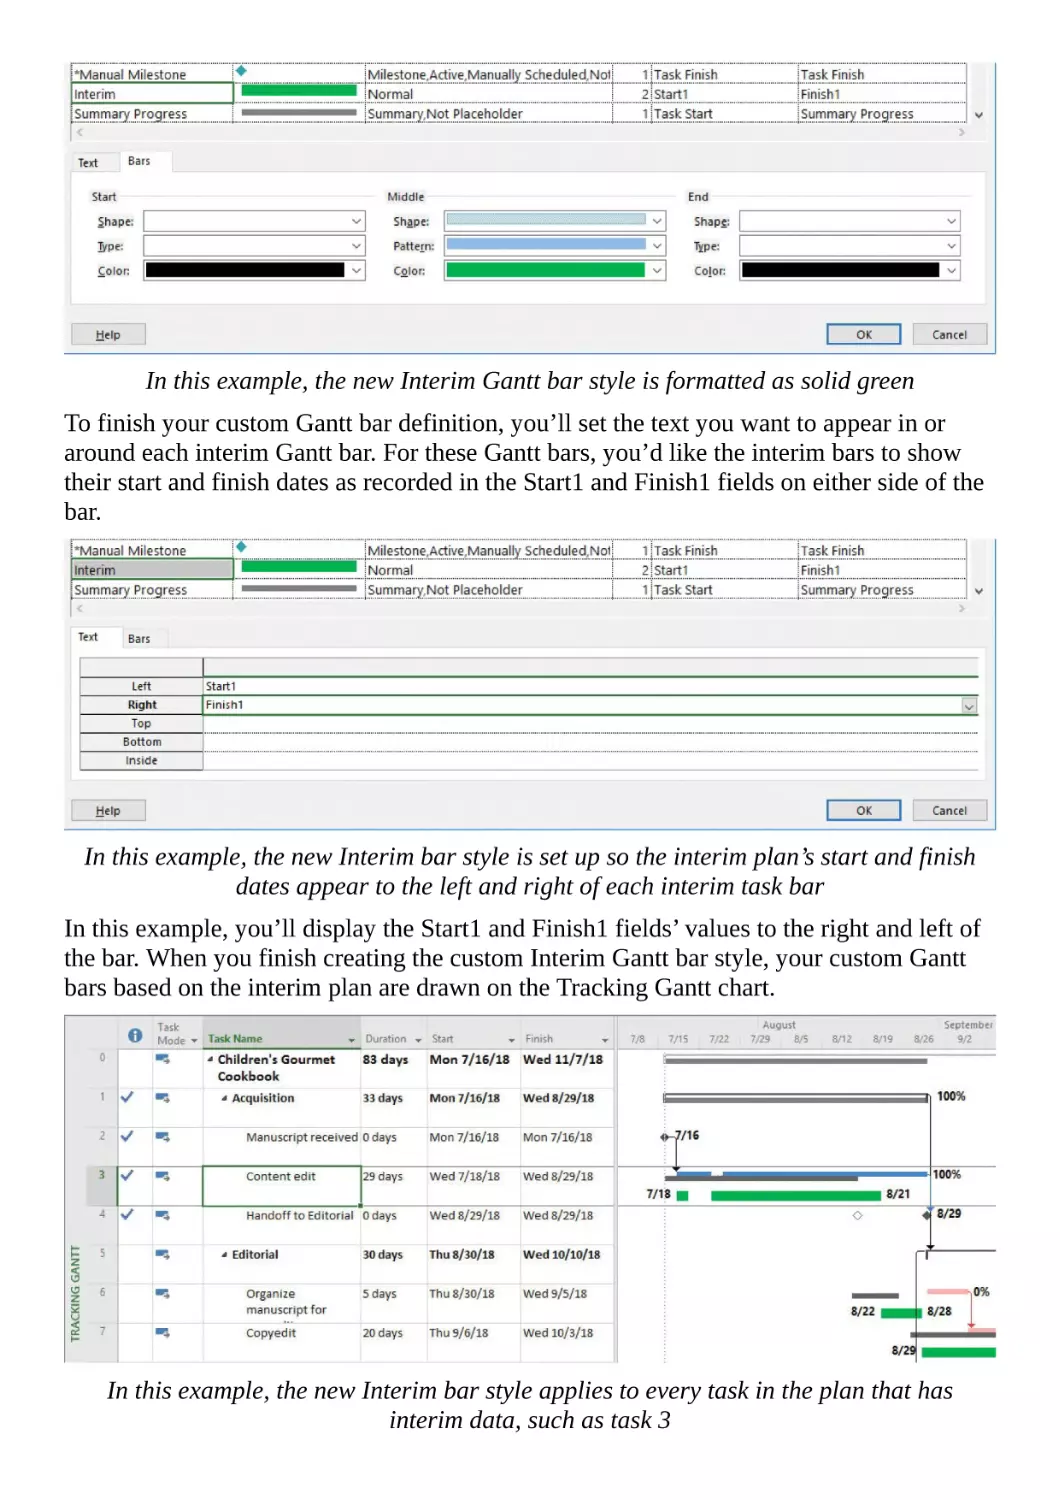
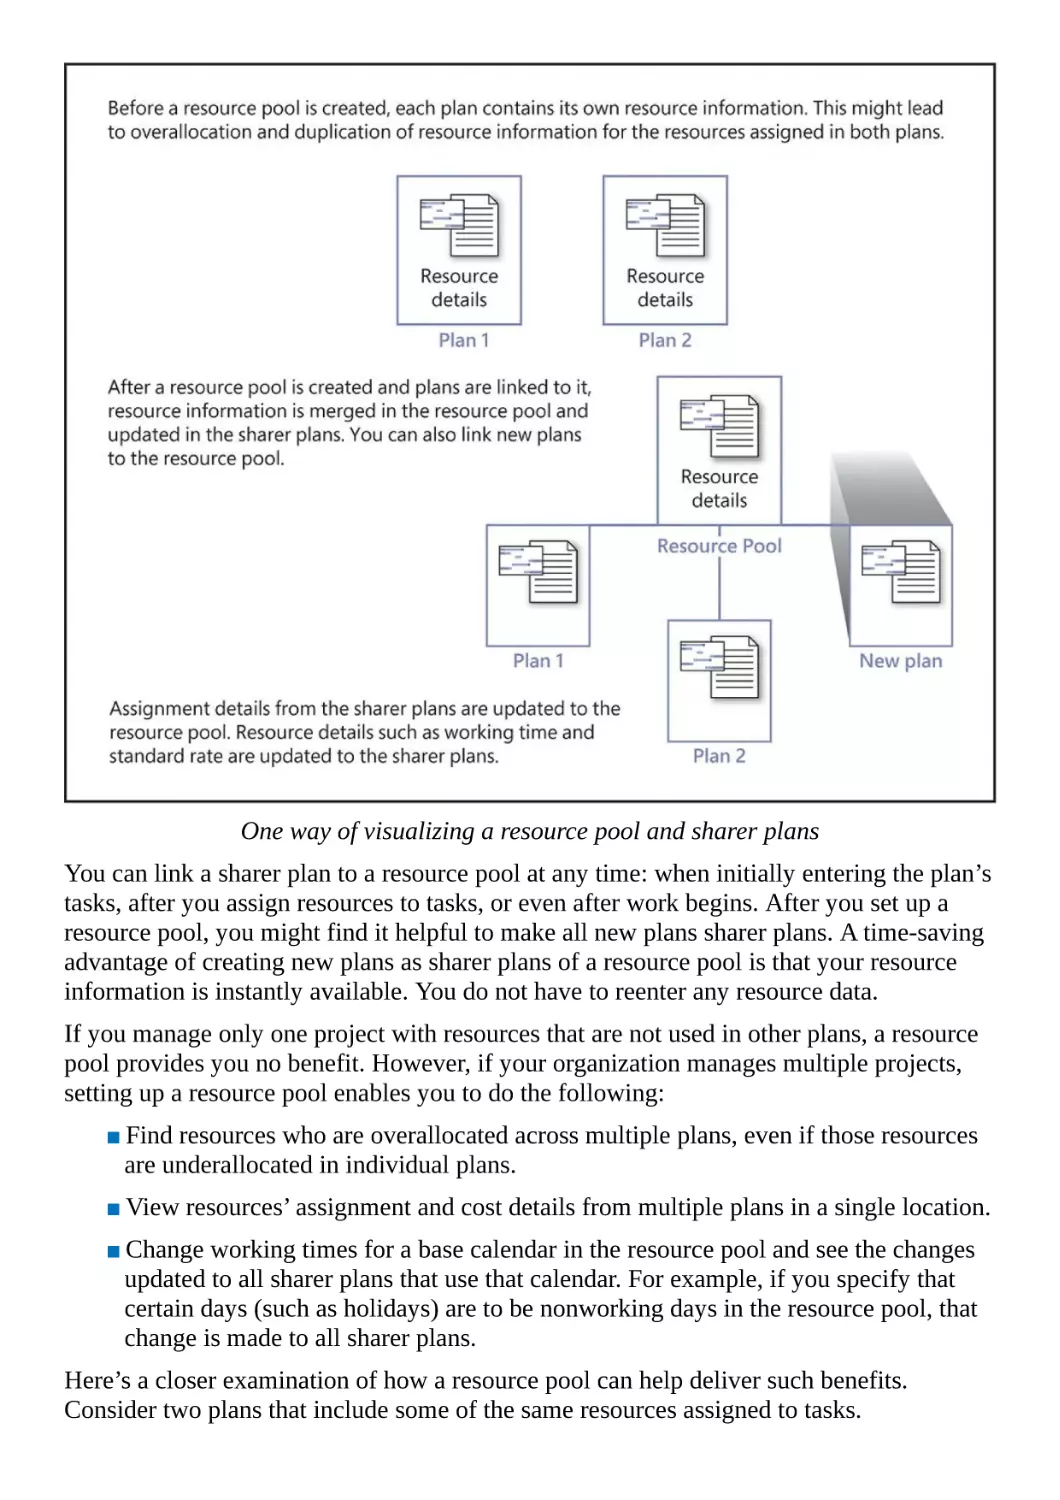
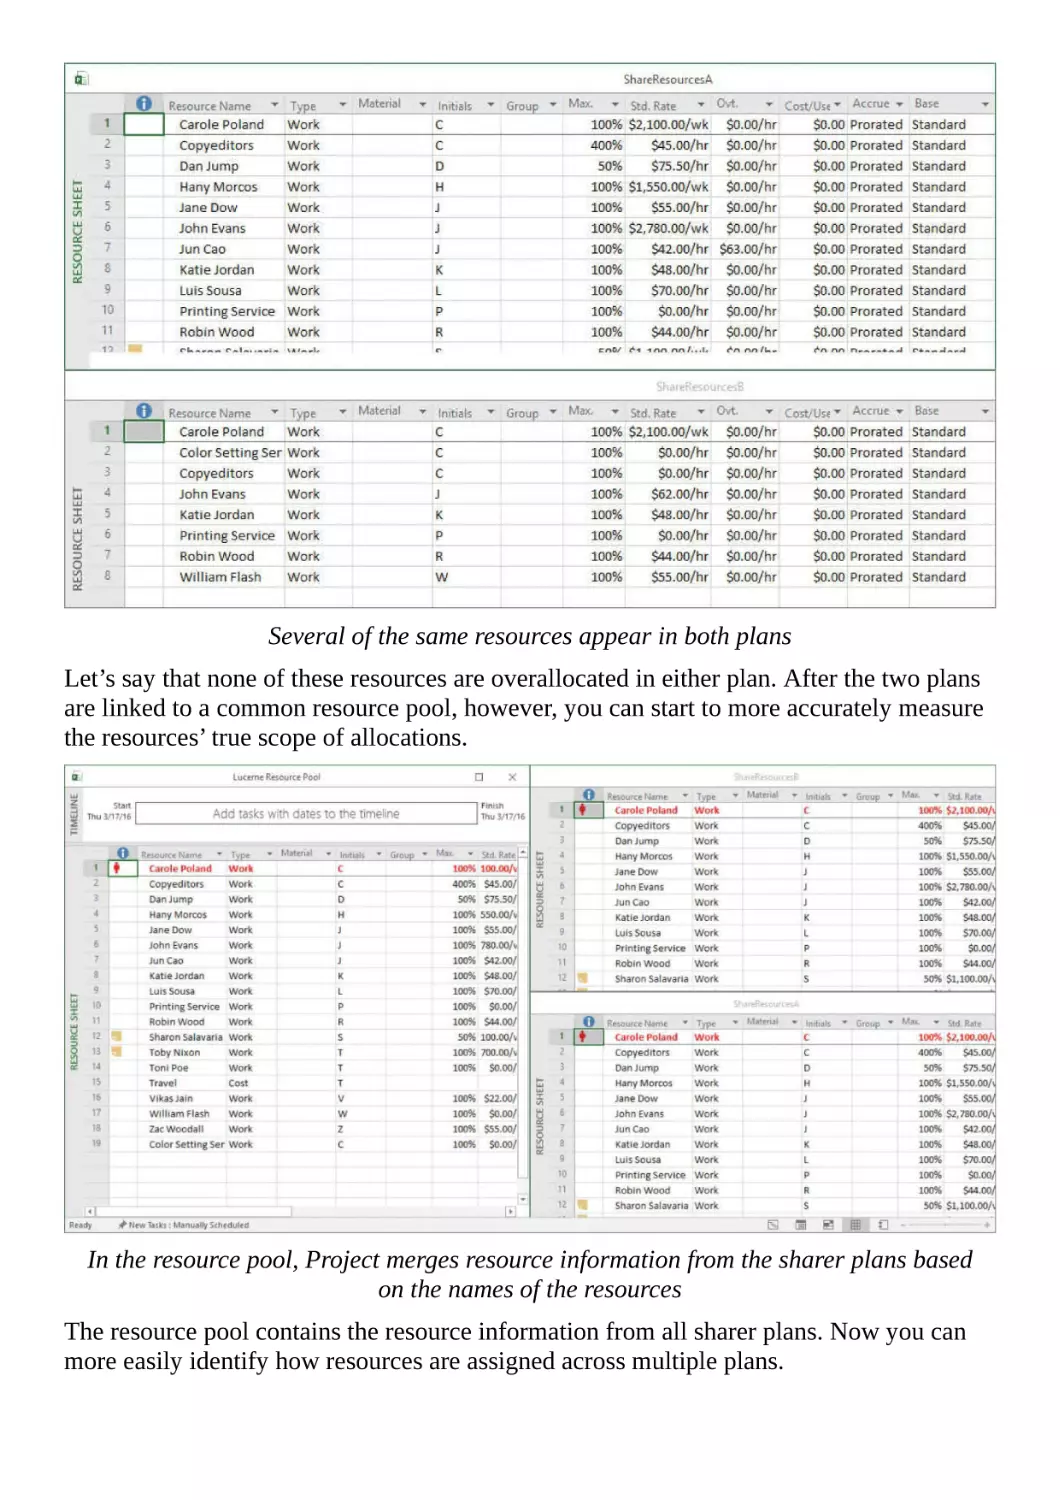
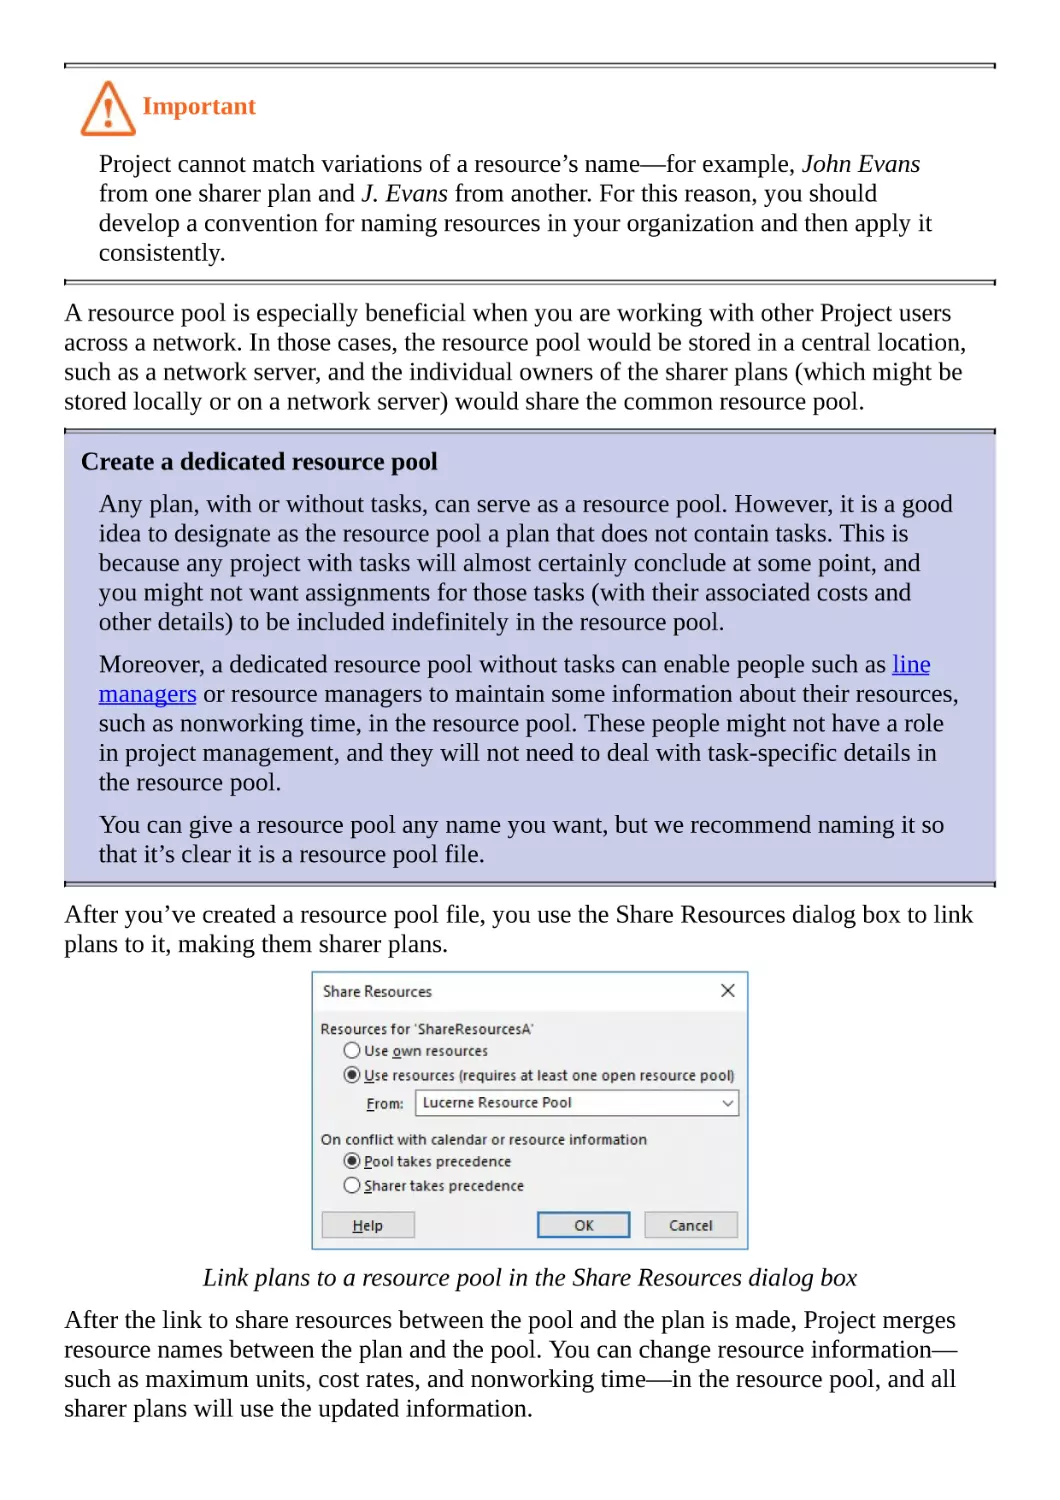
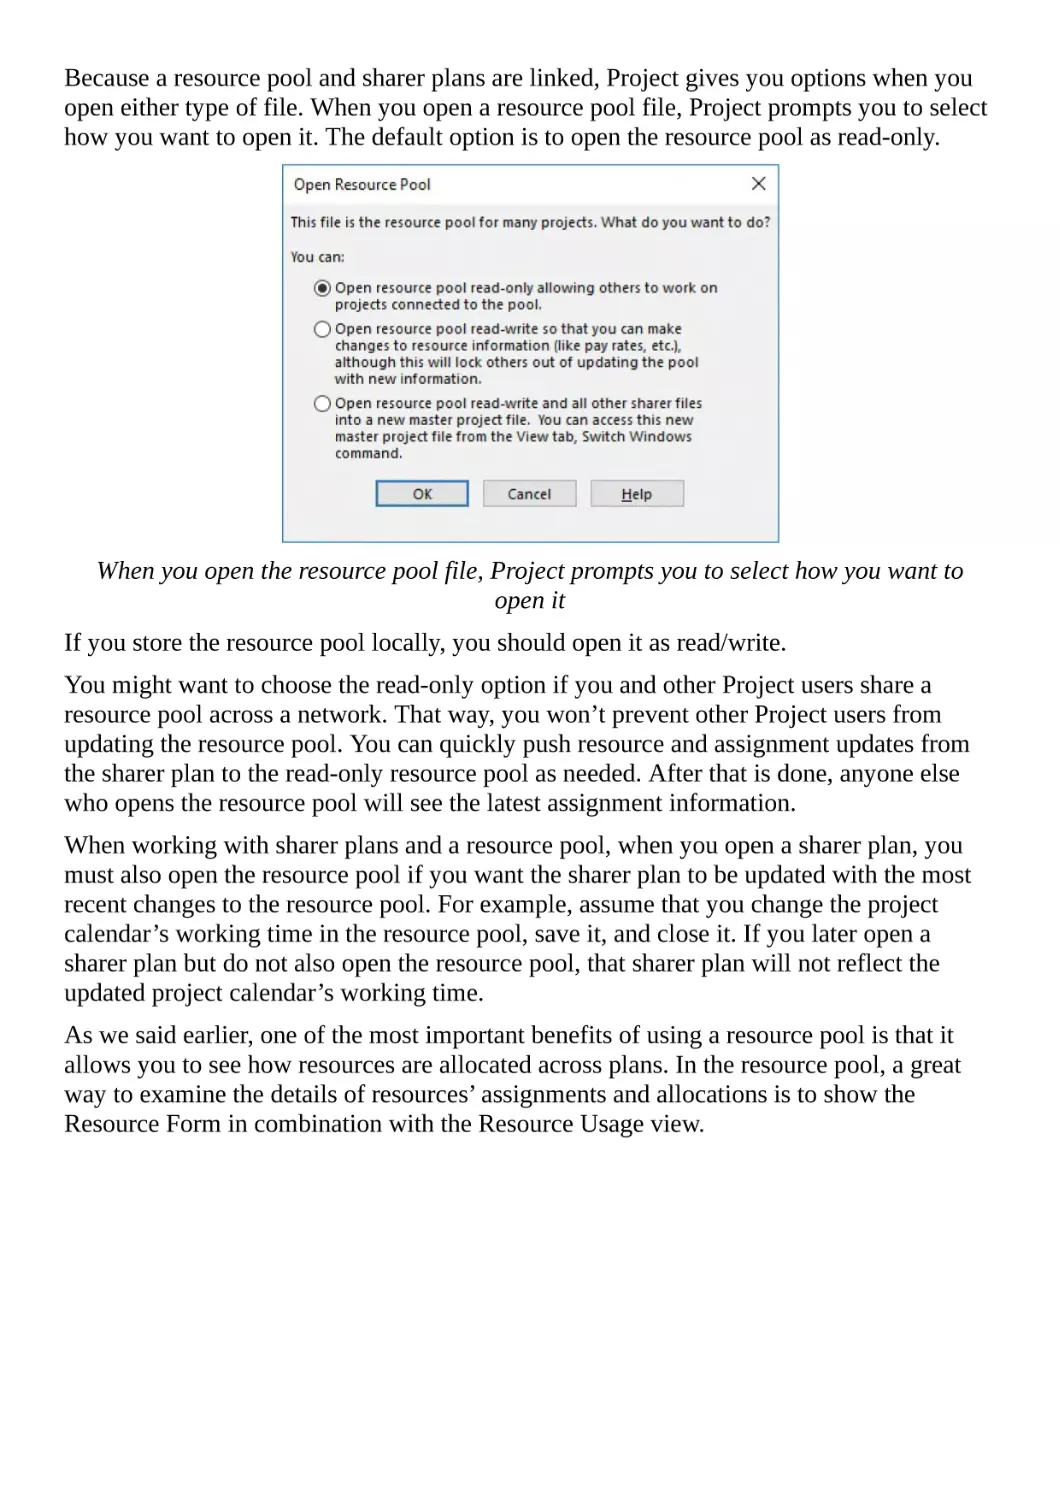
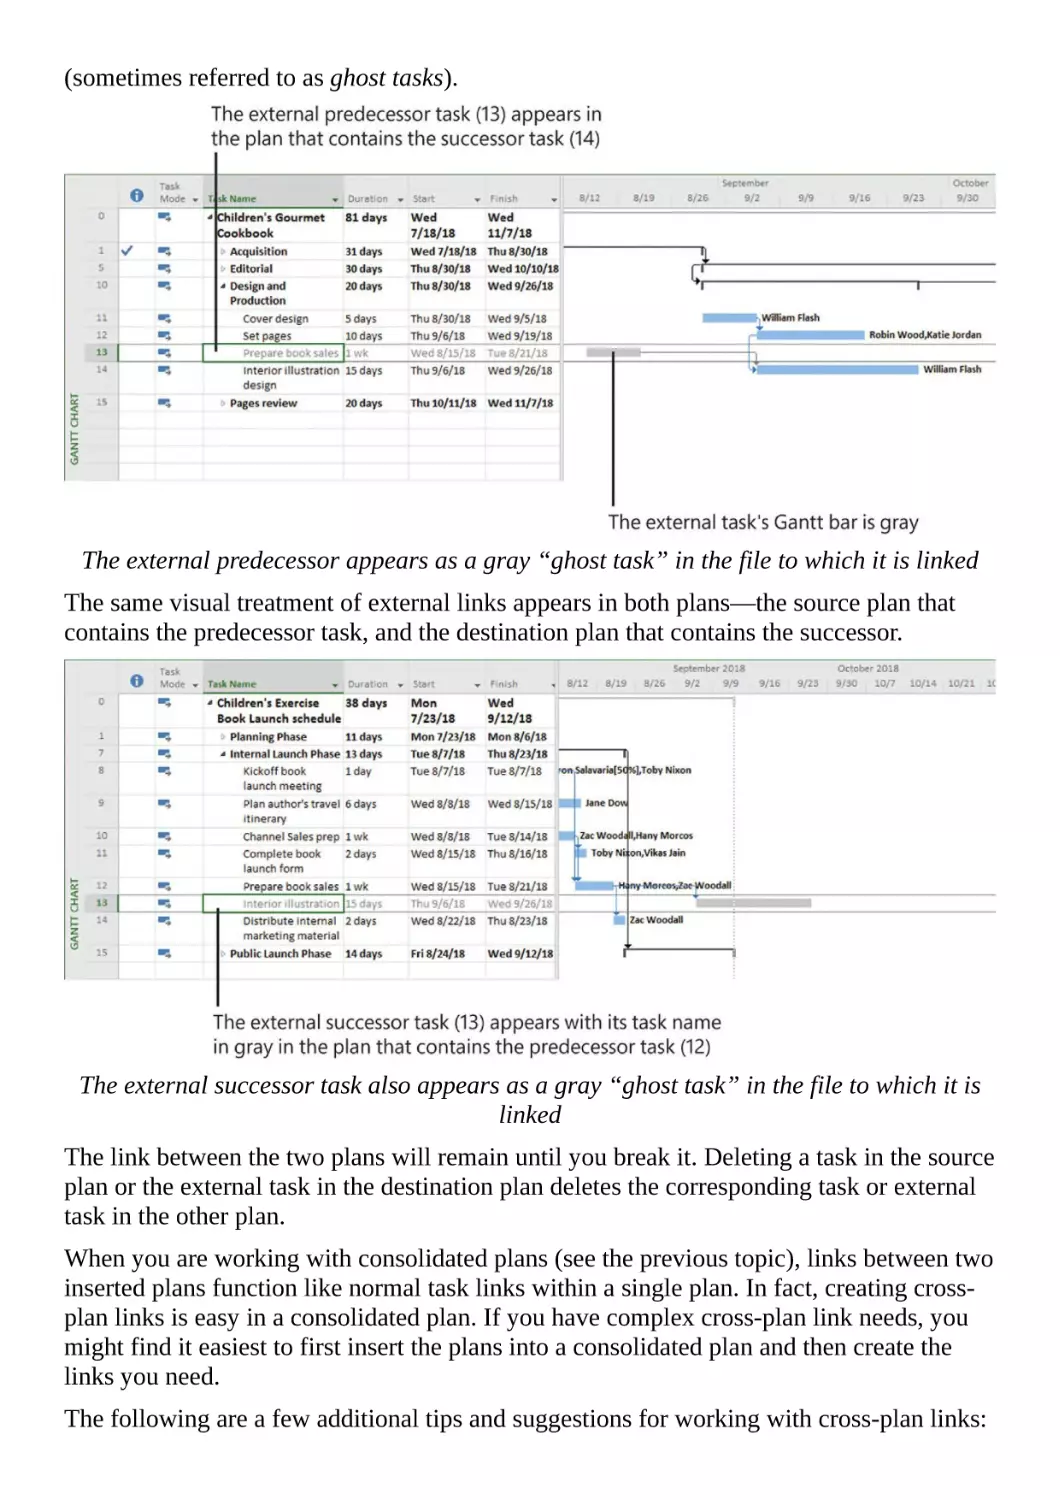
/


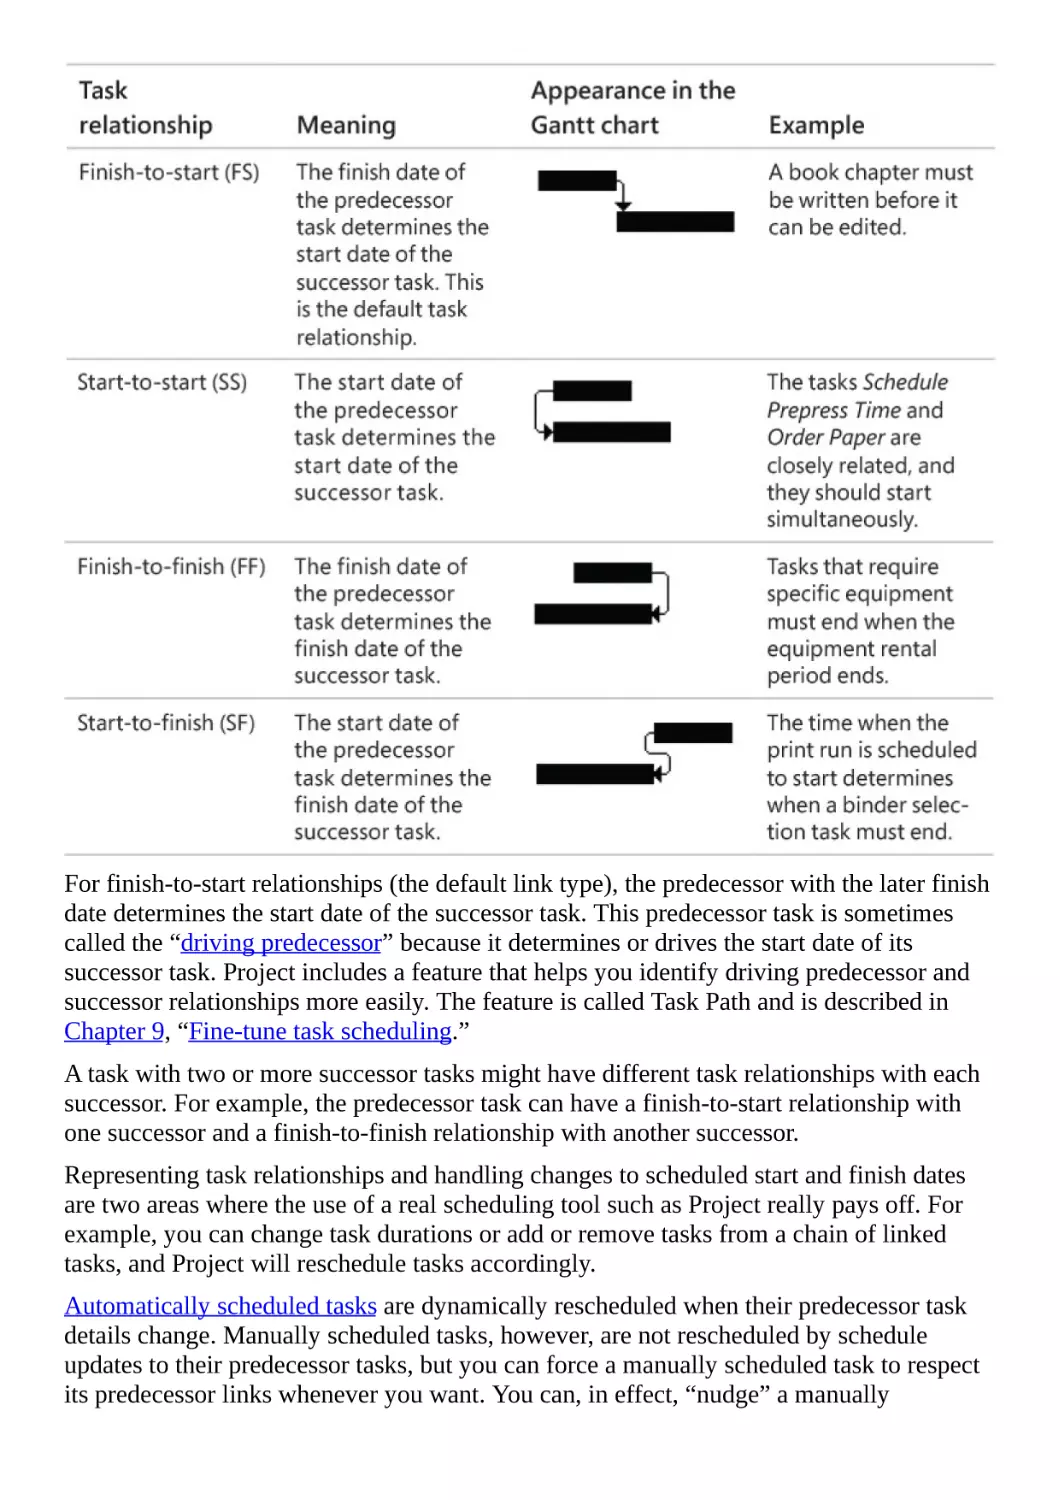
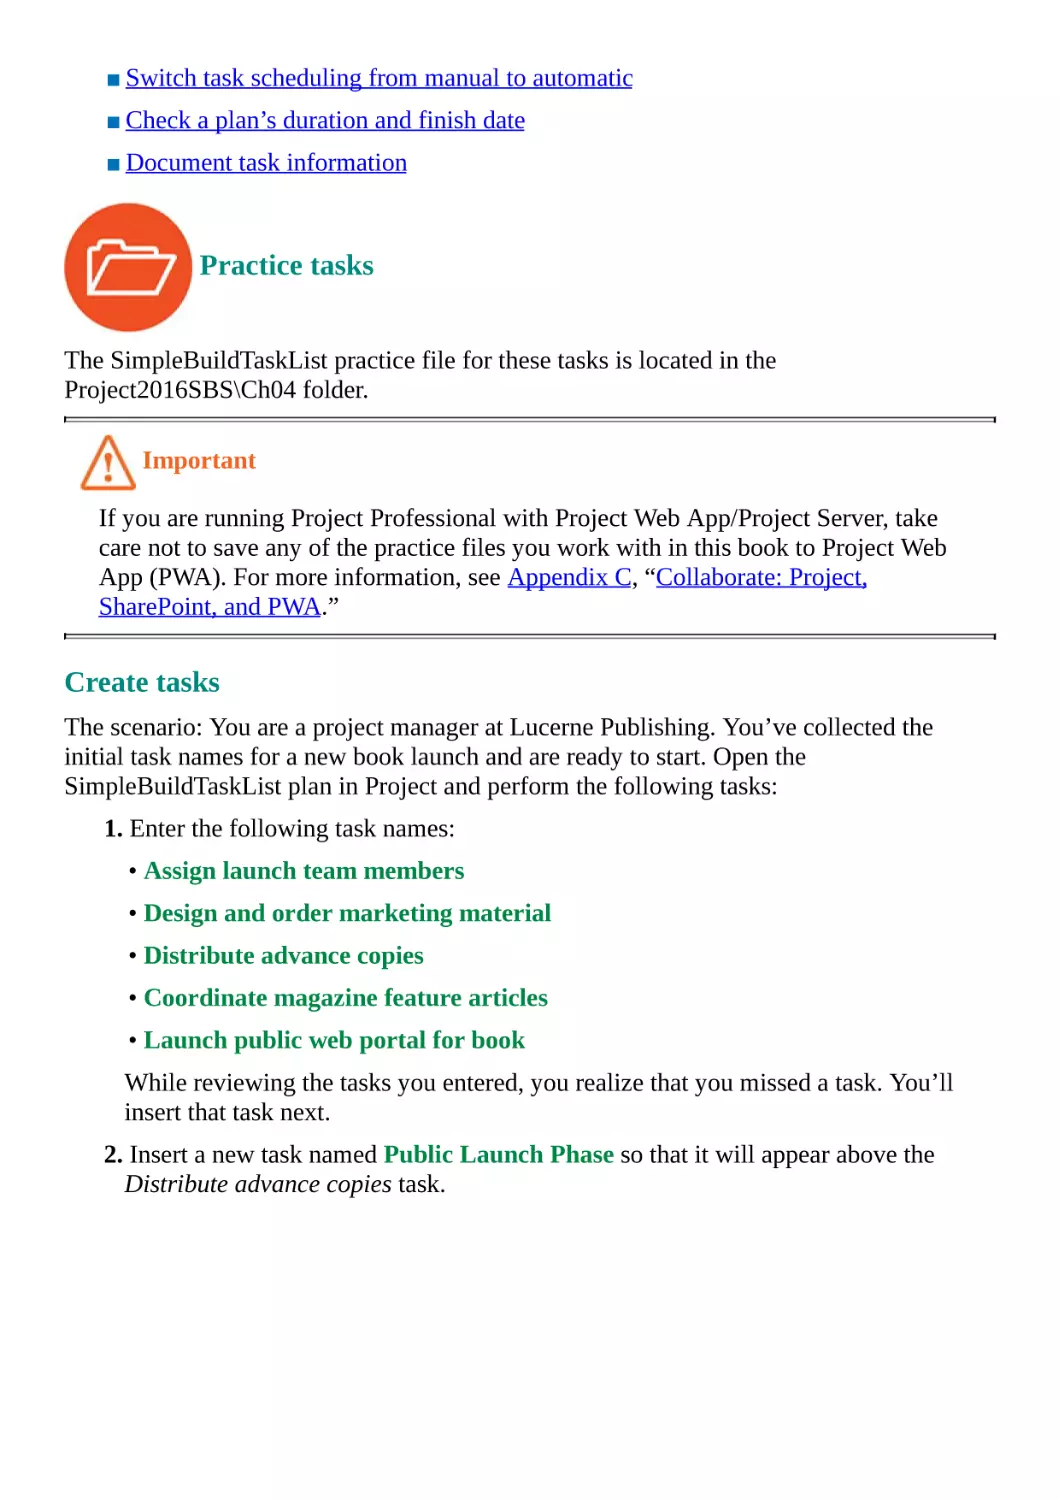
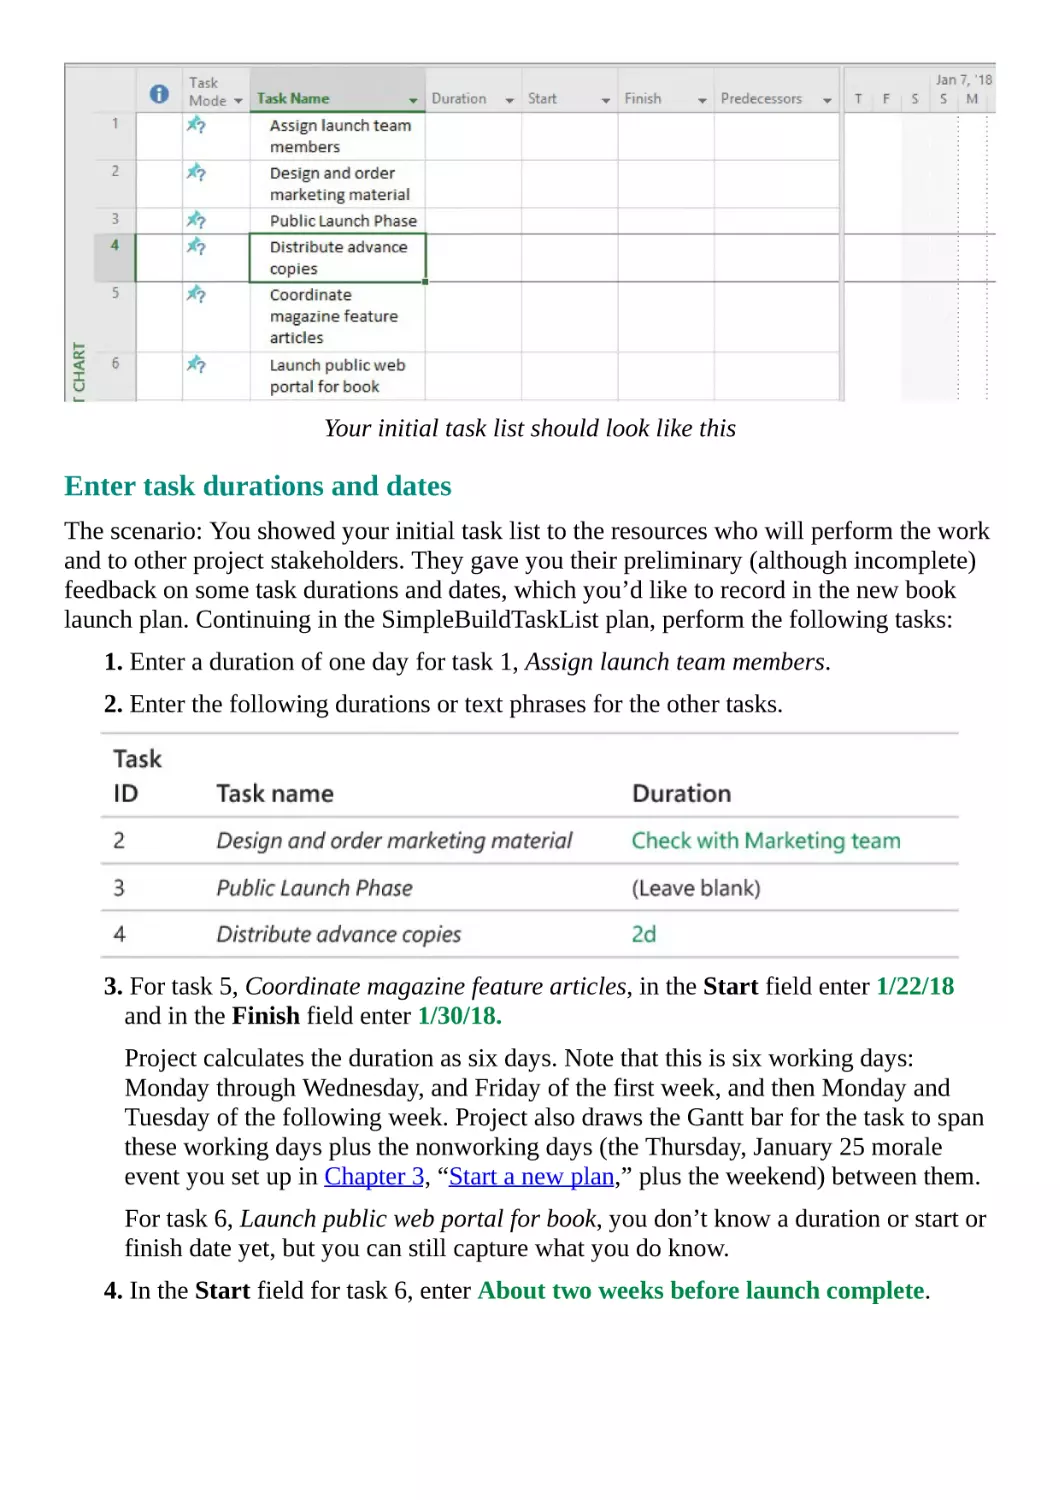
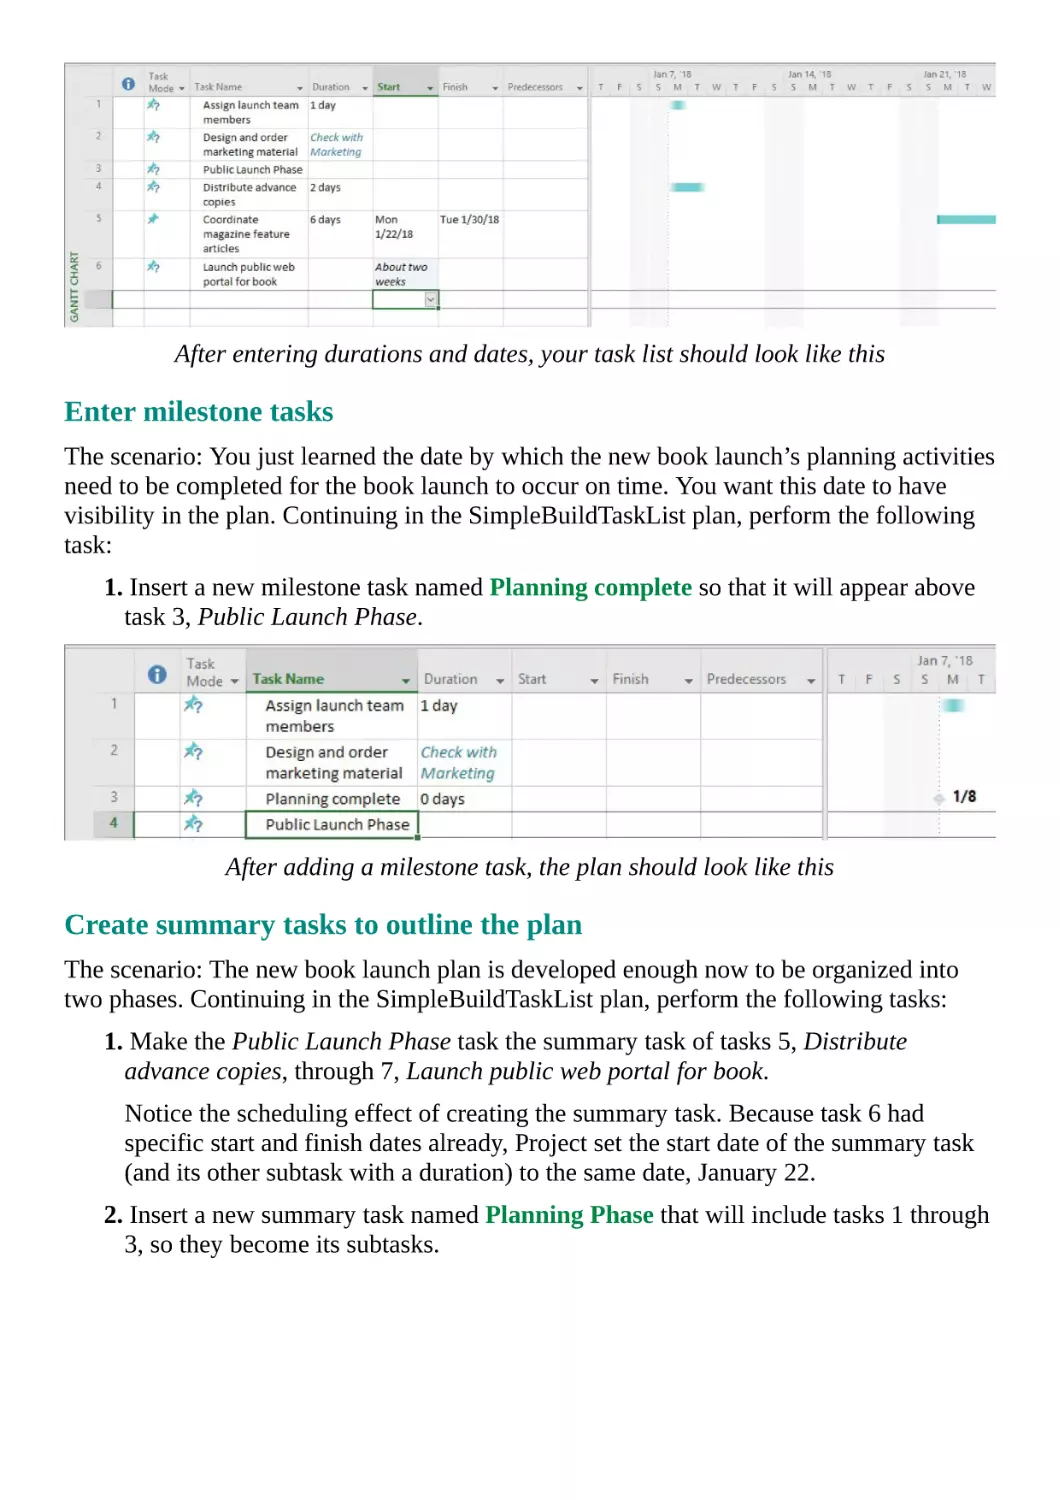
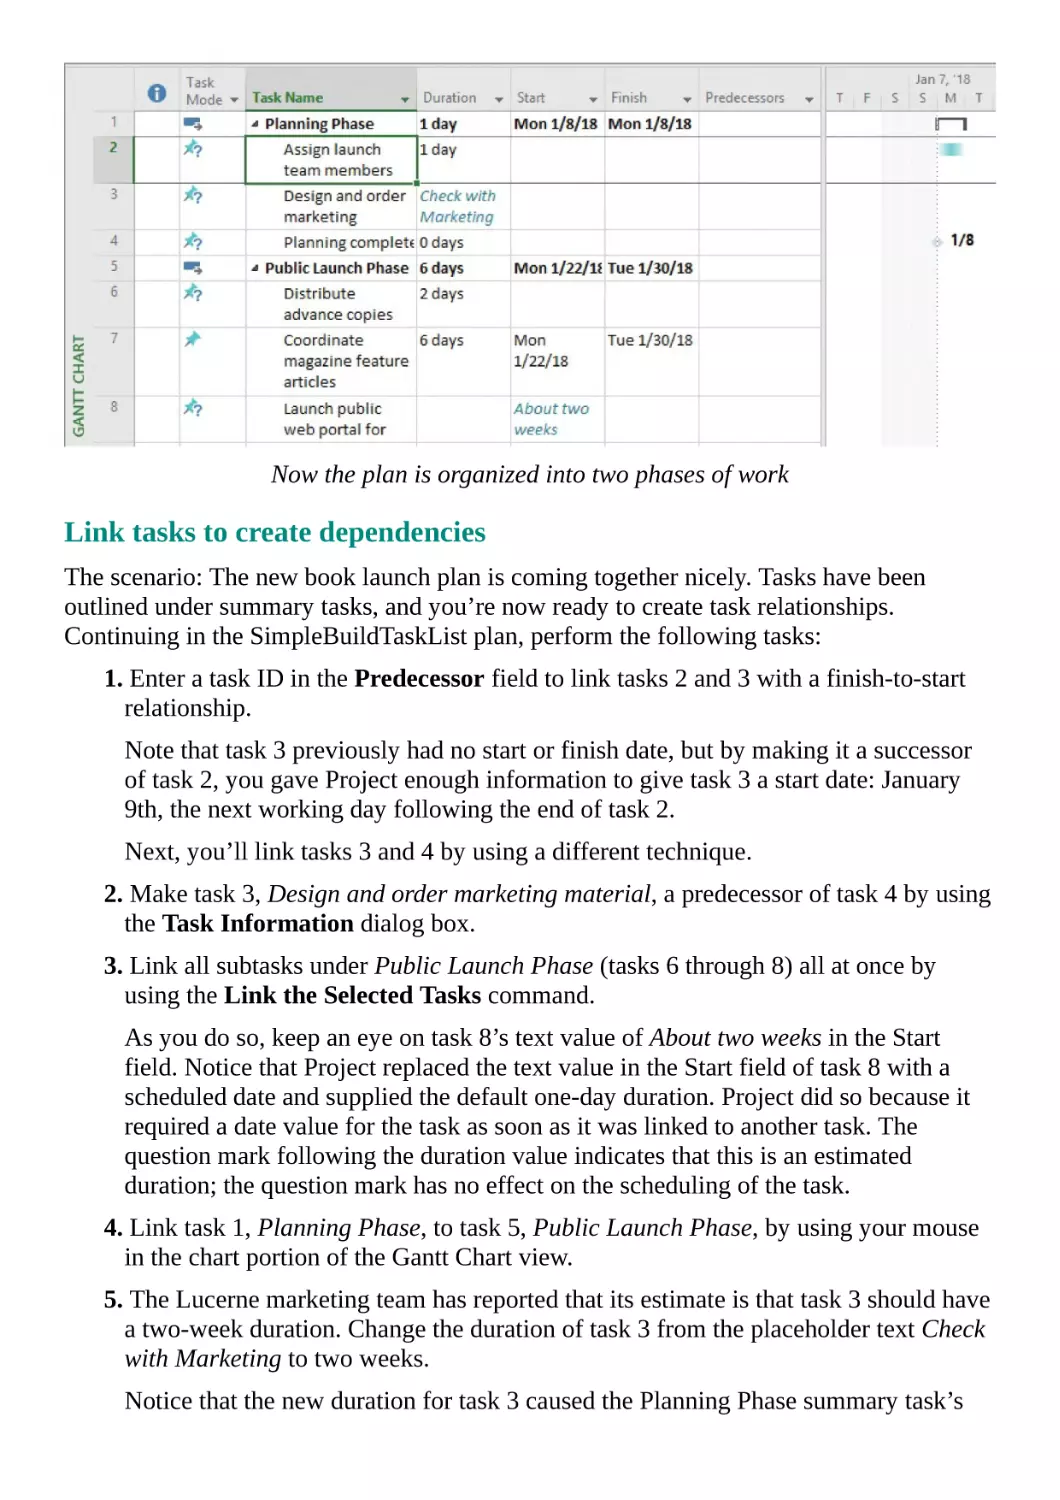

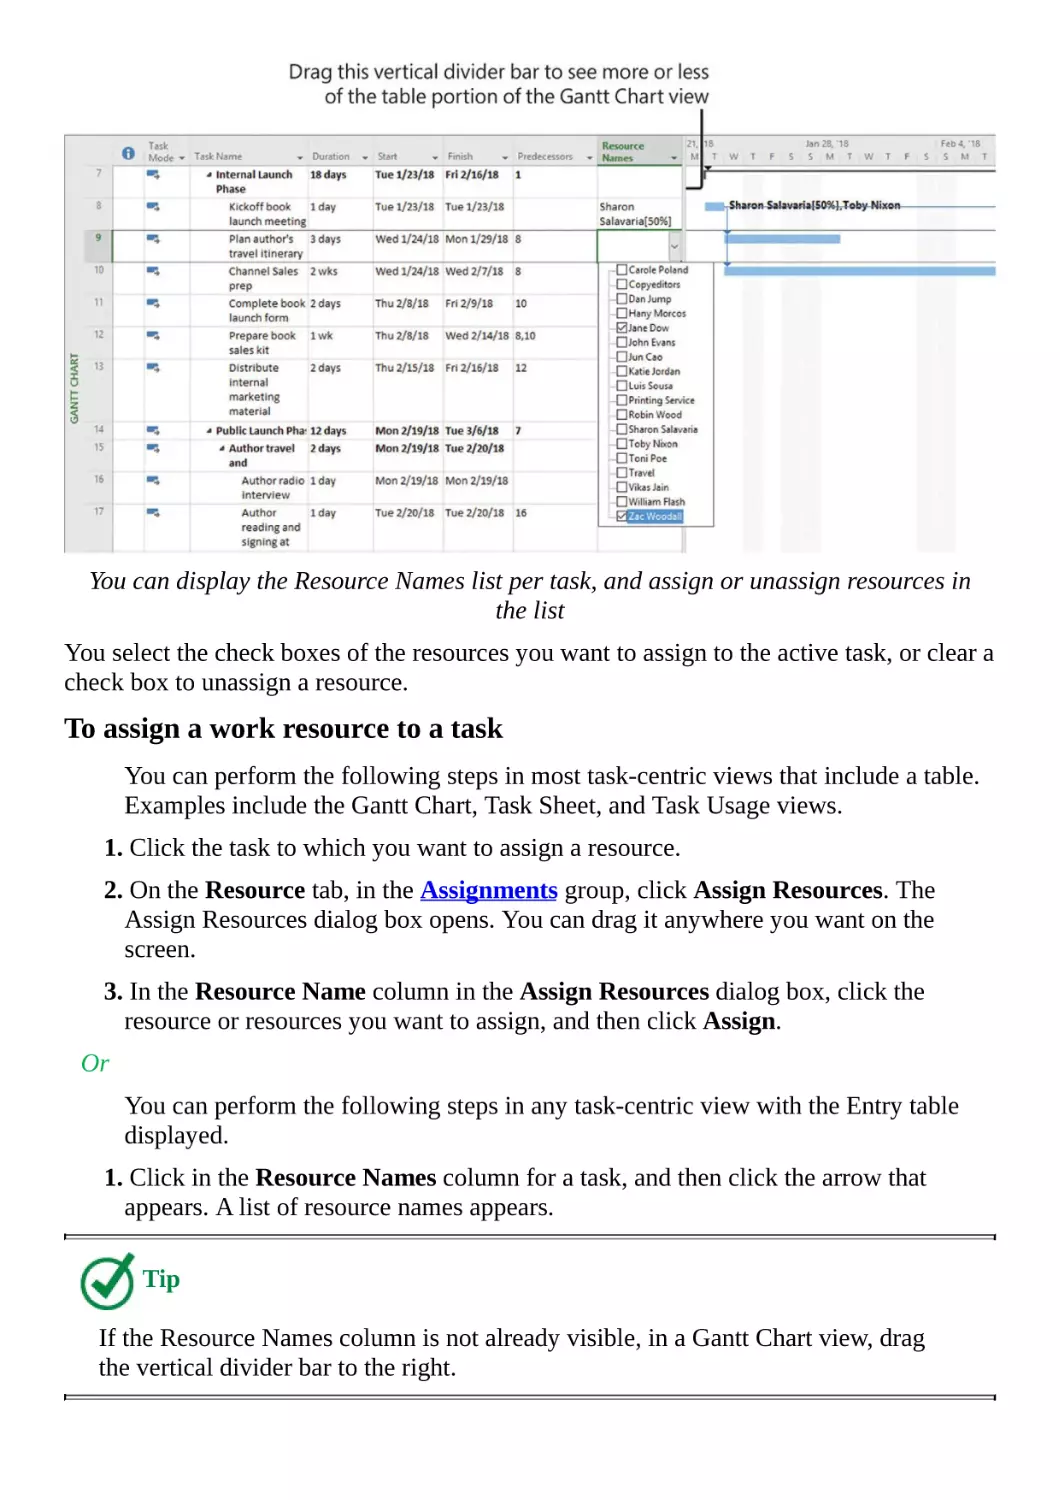
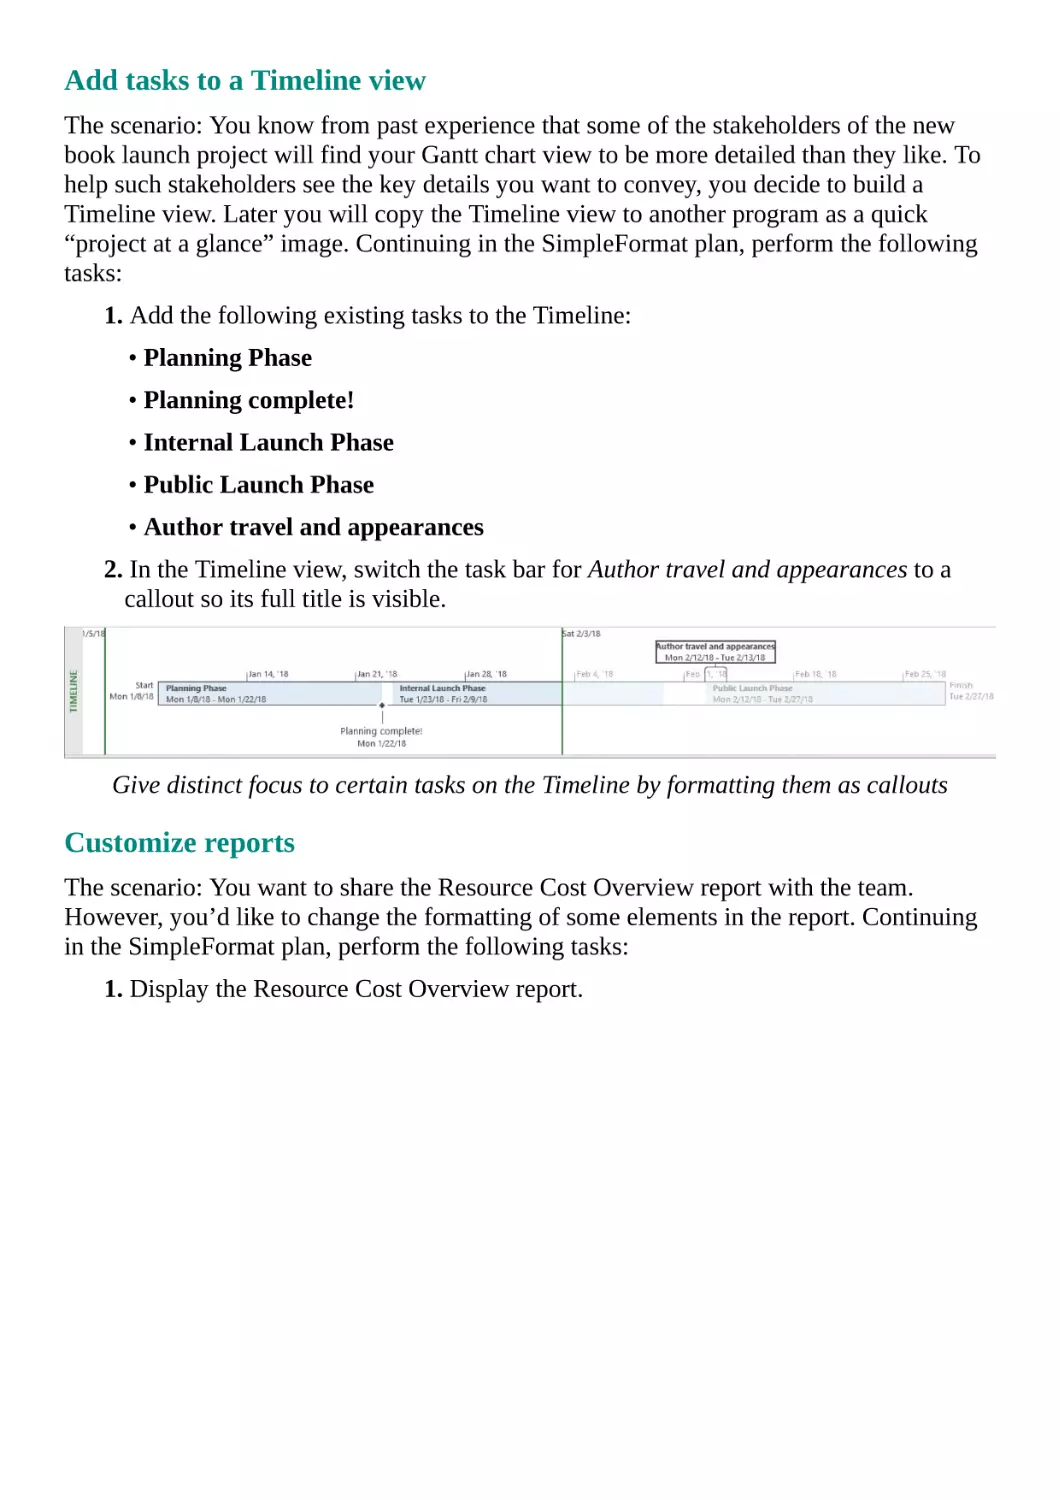

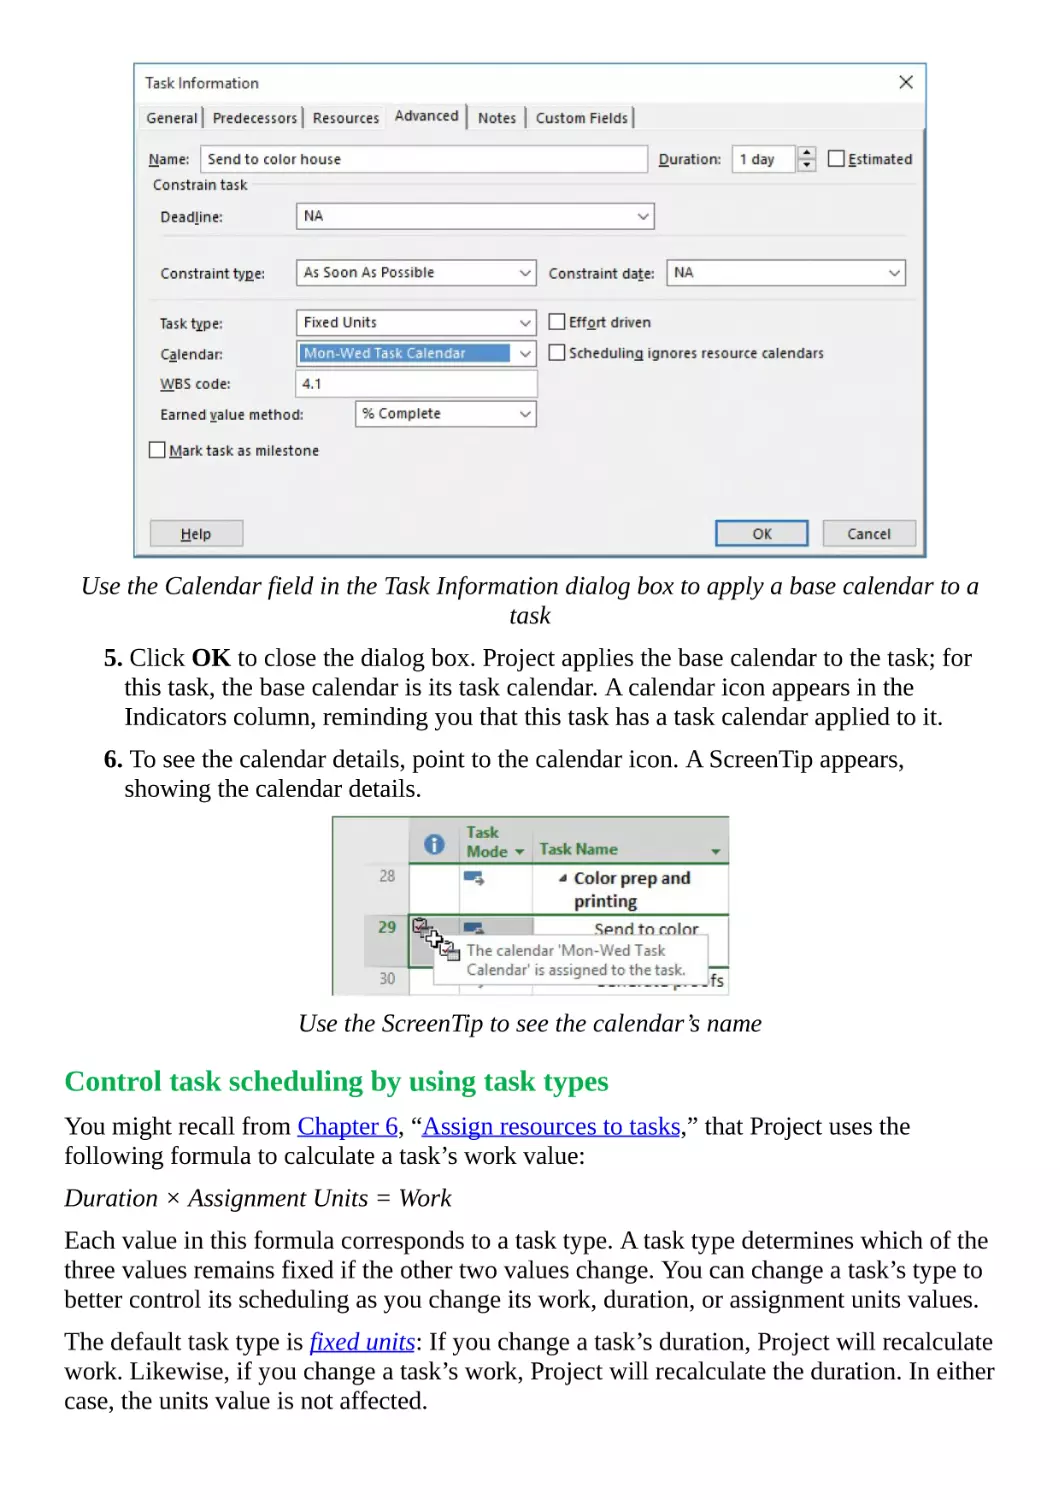
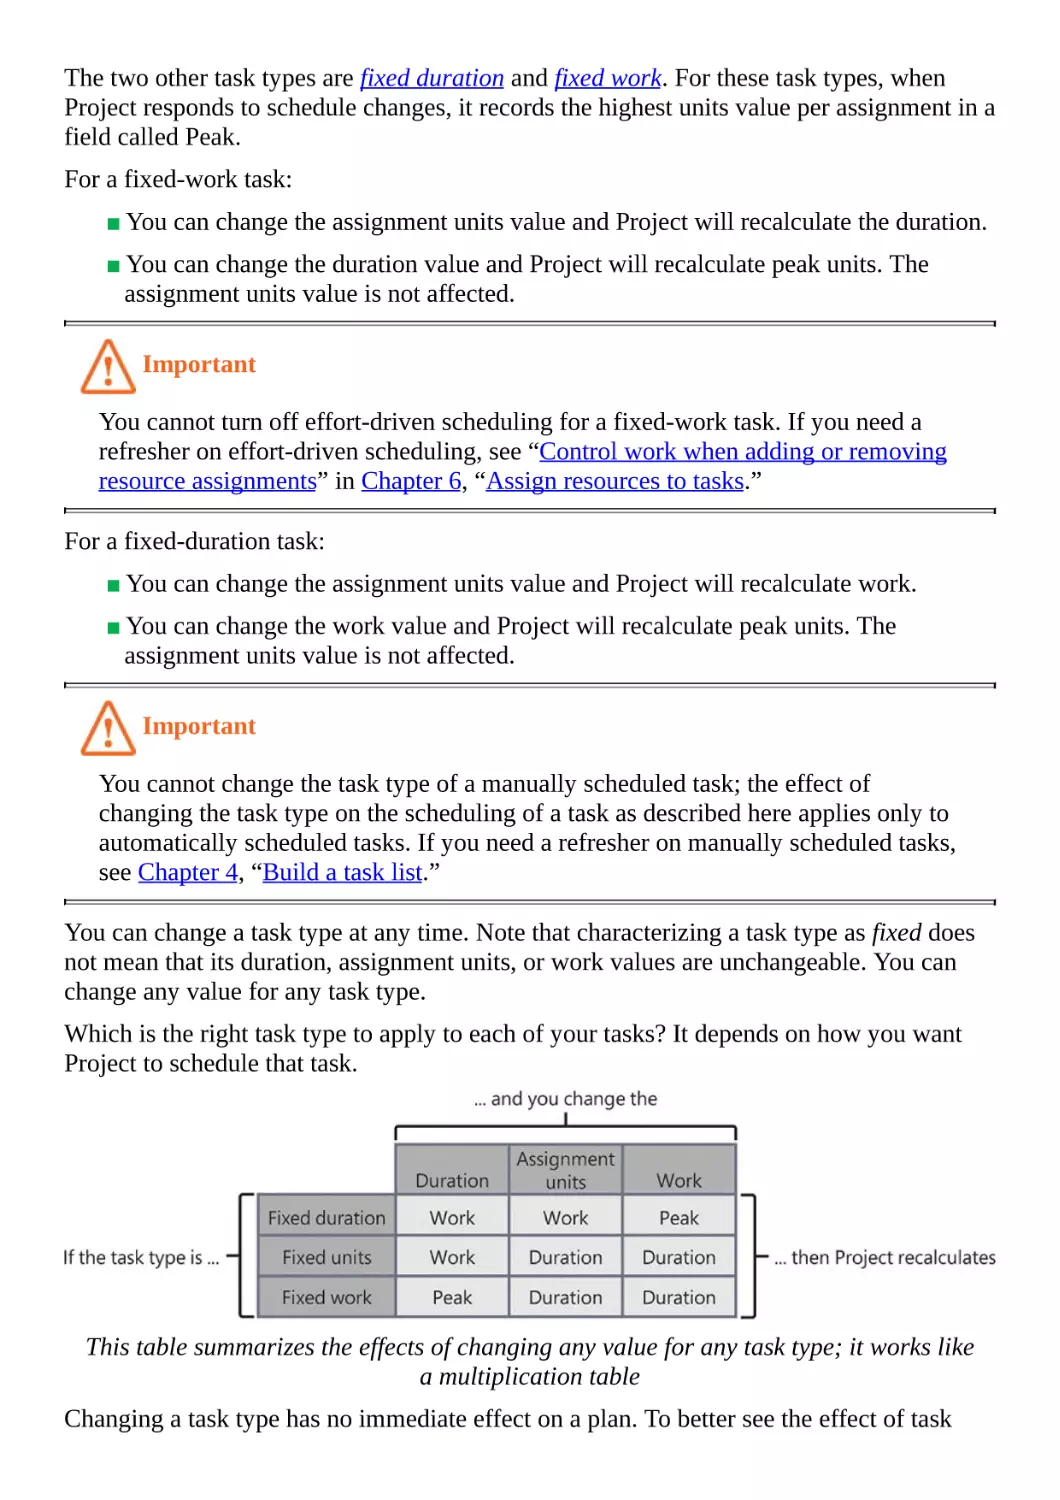
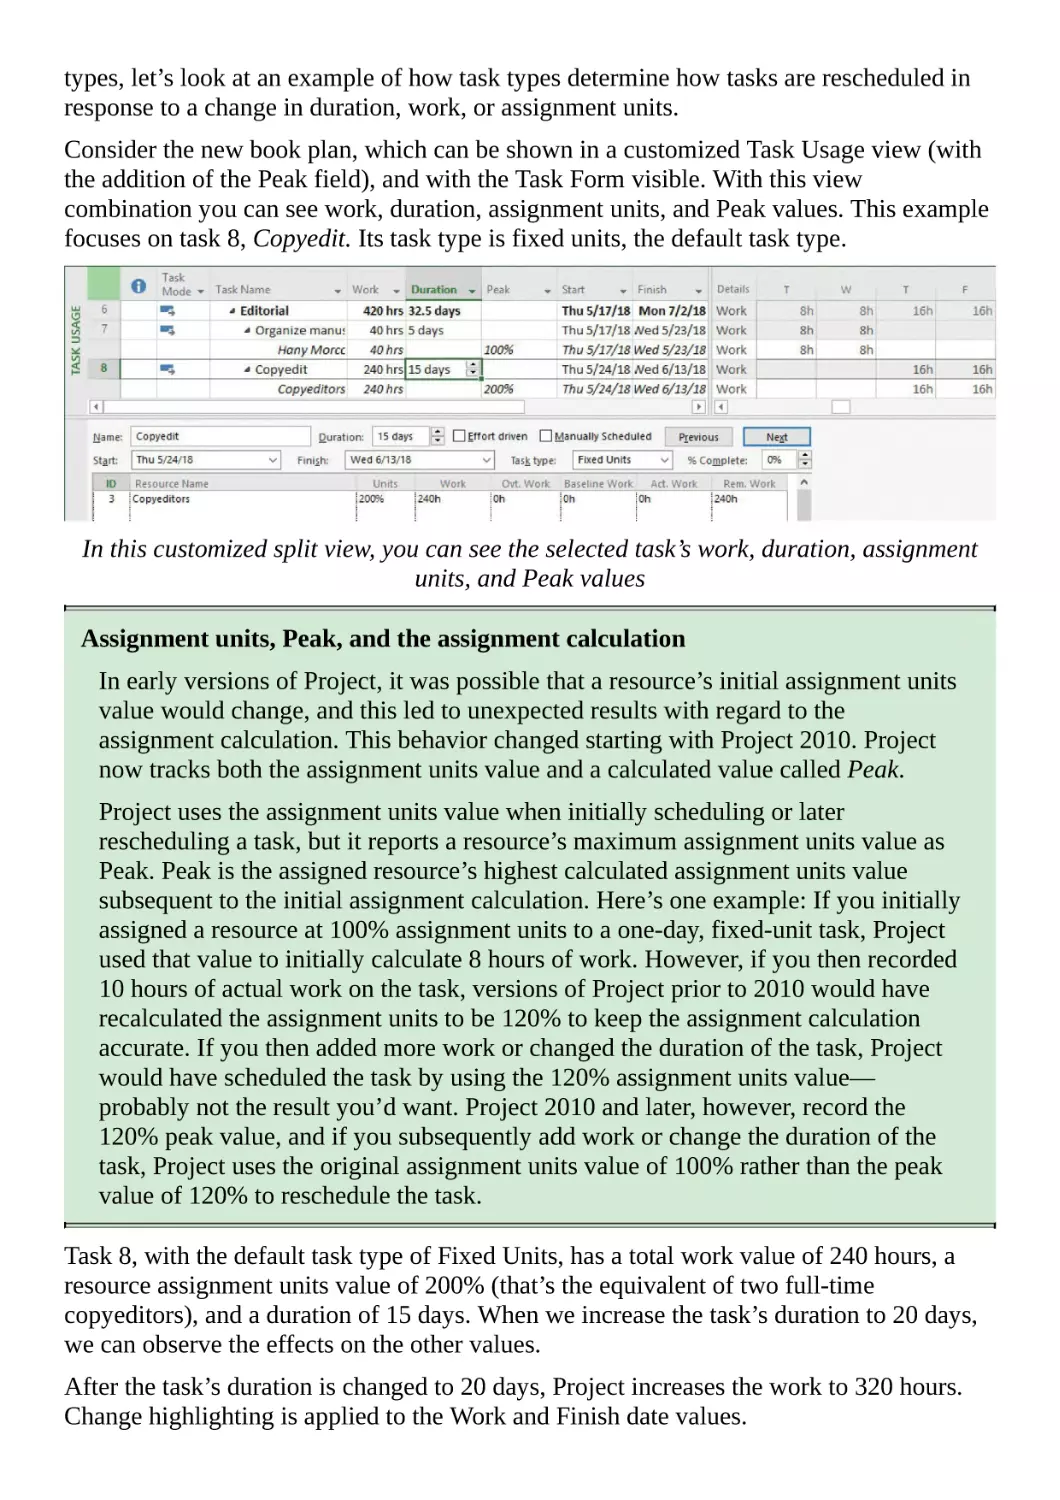
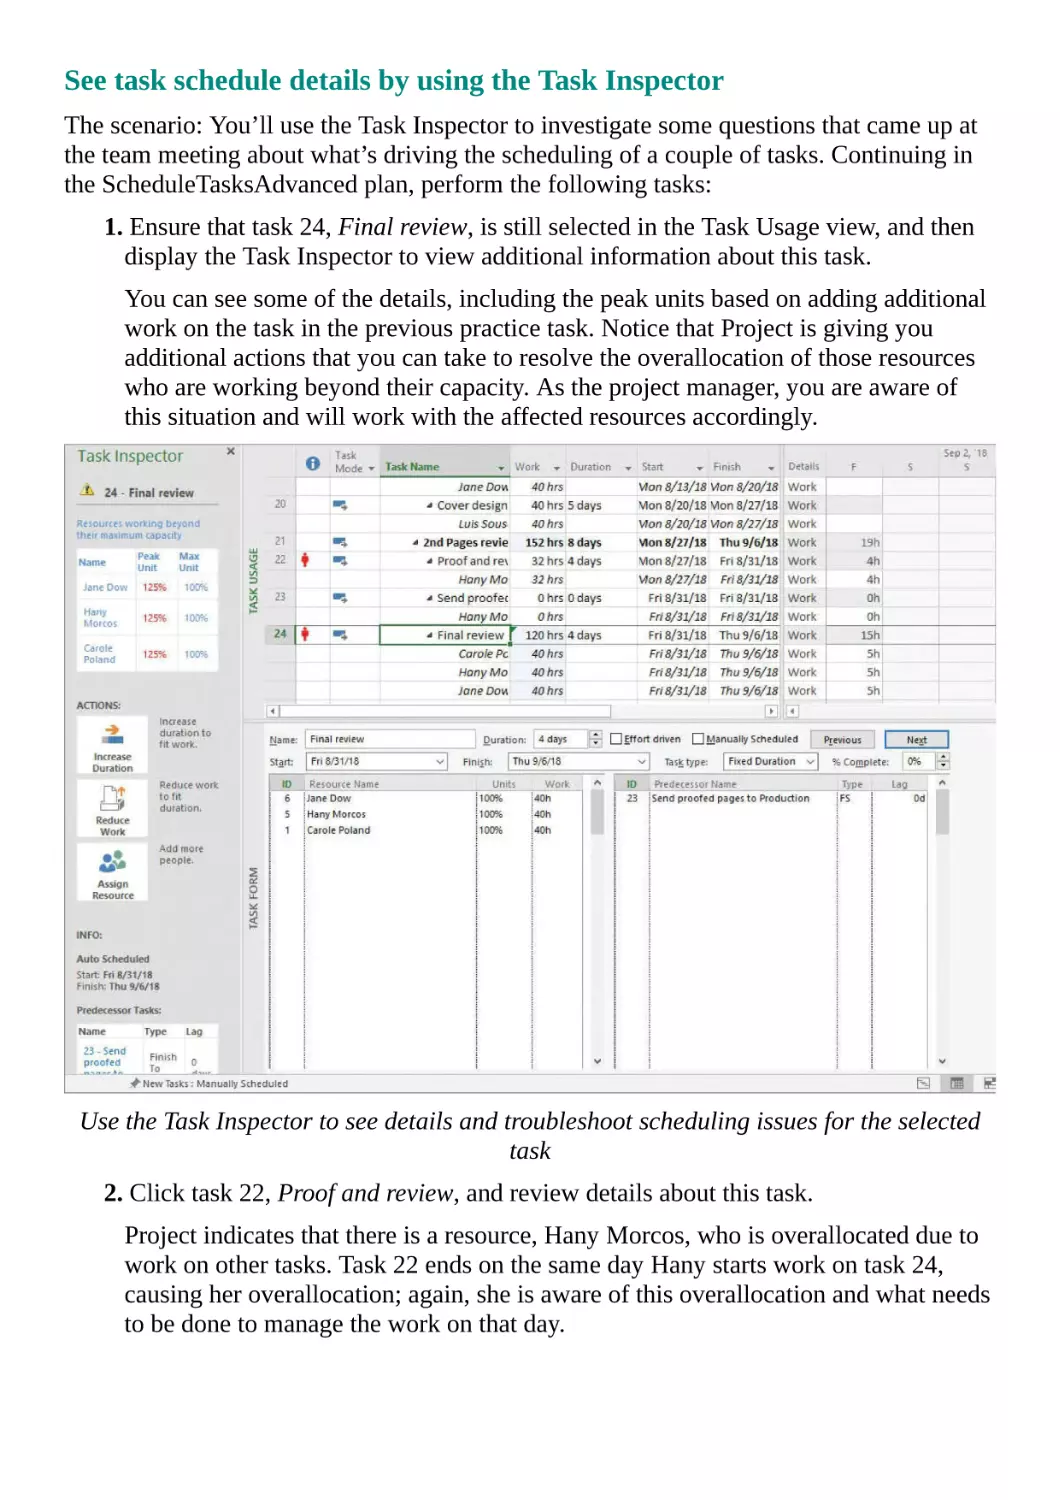

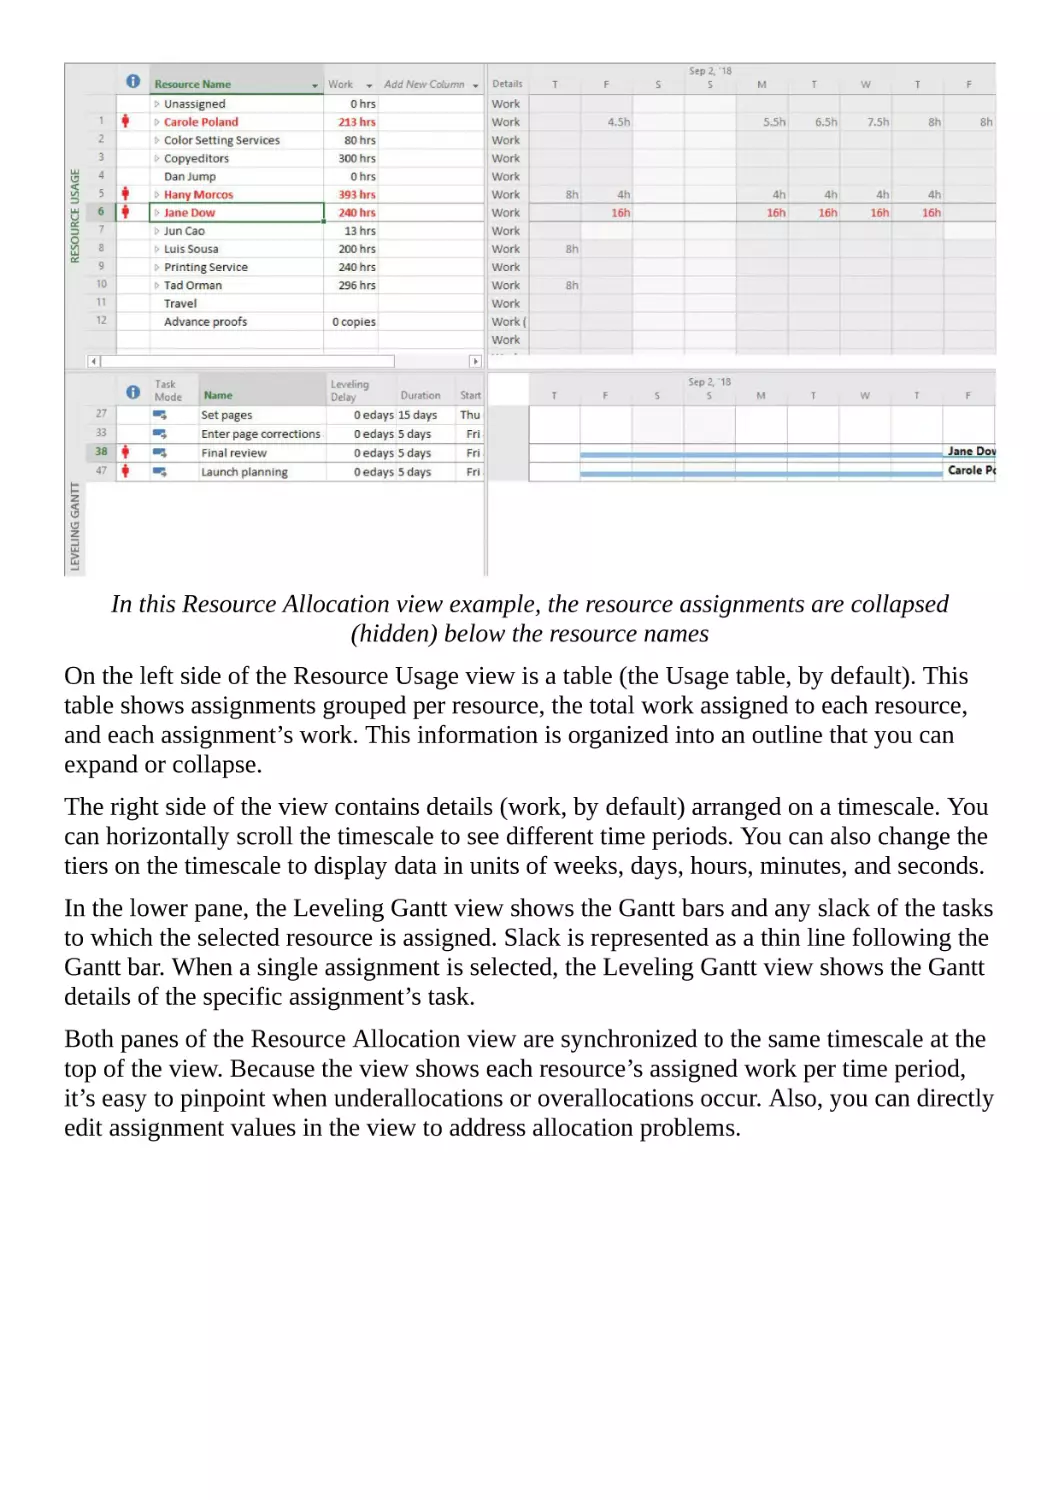
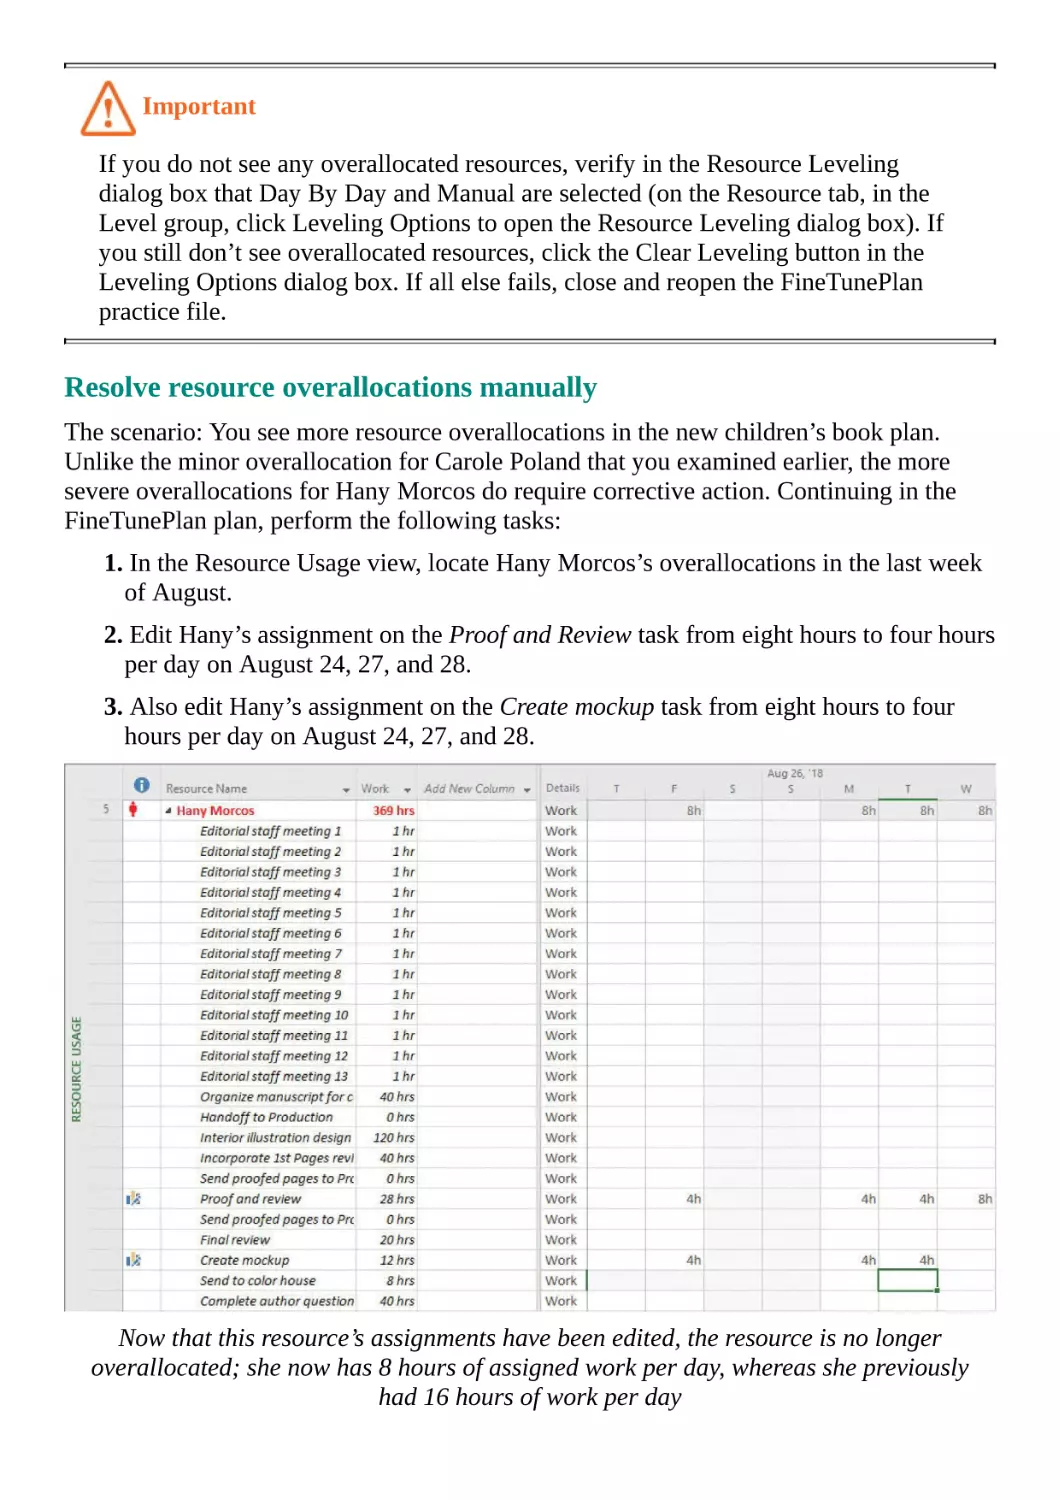
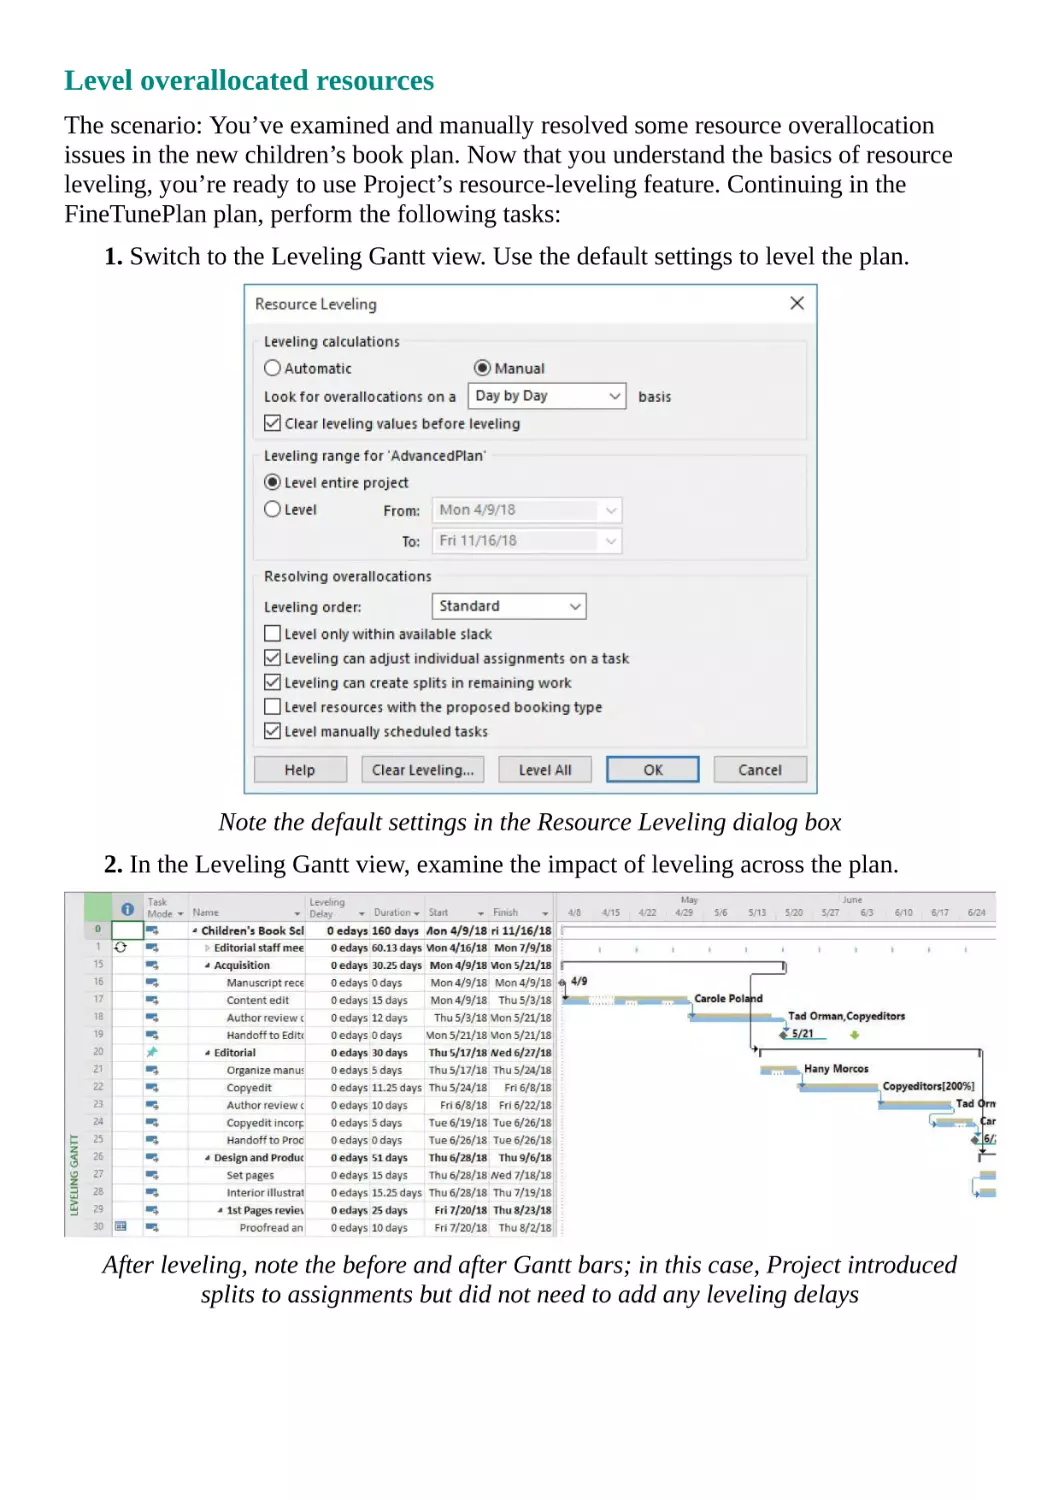
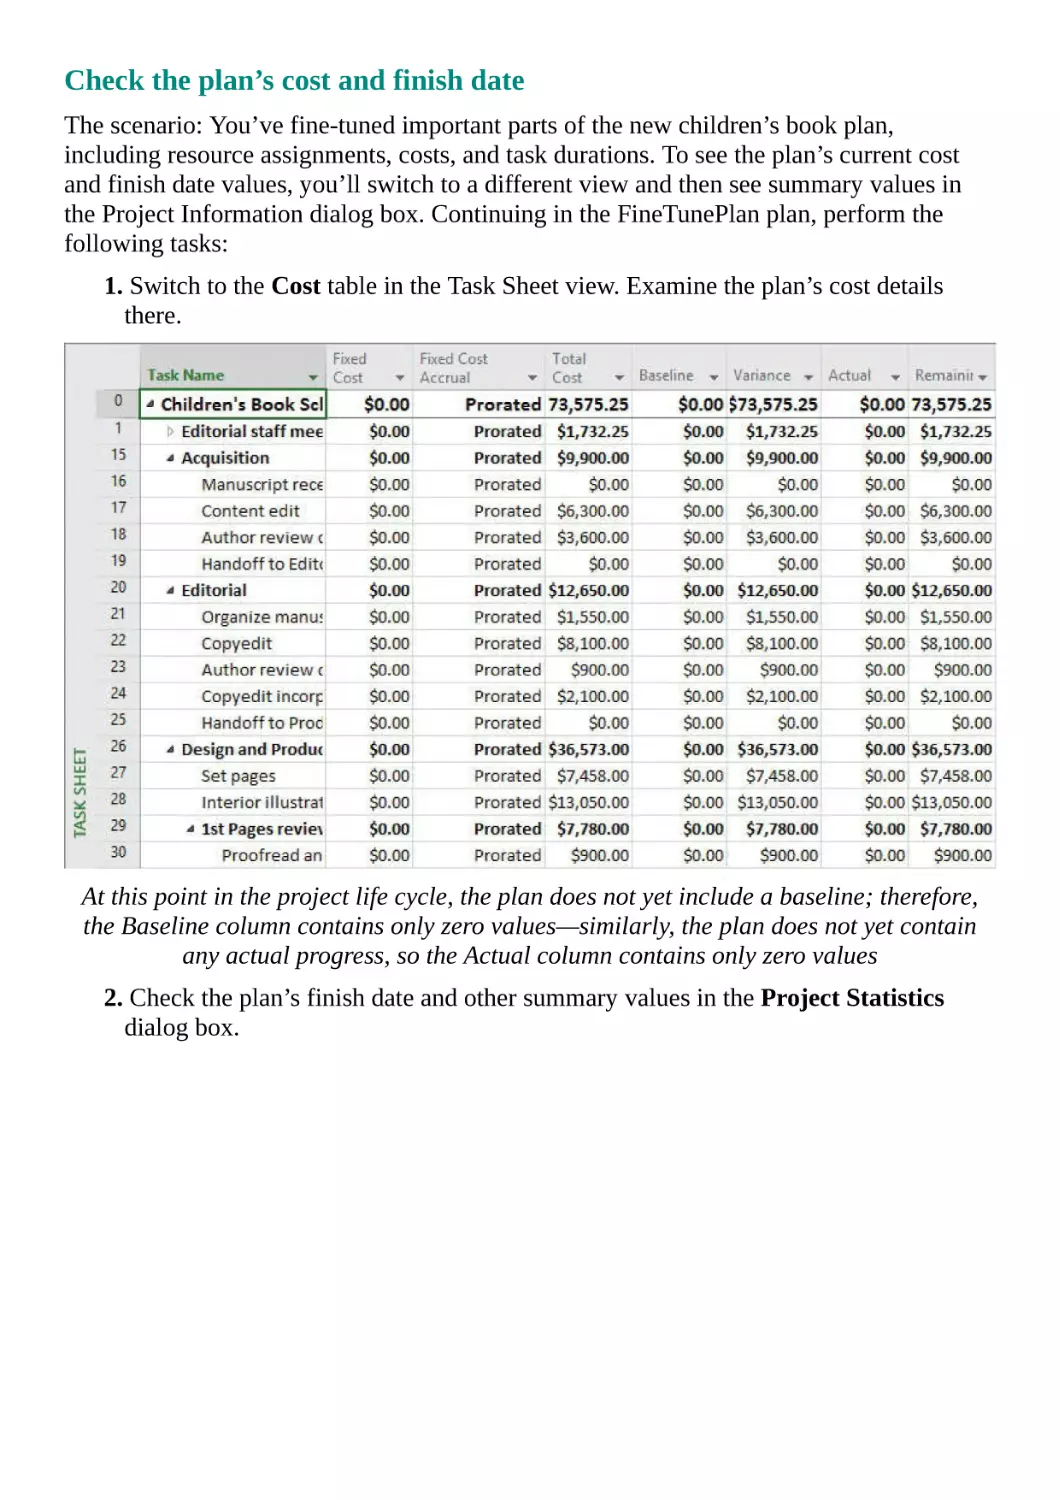
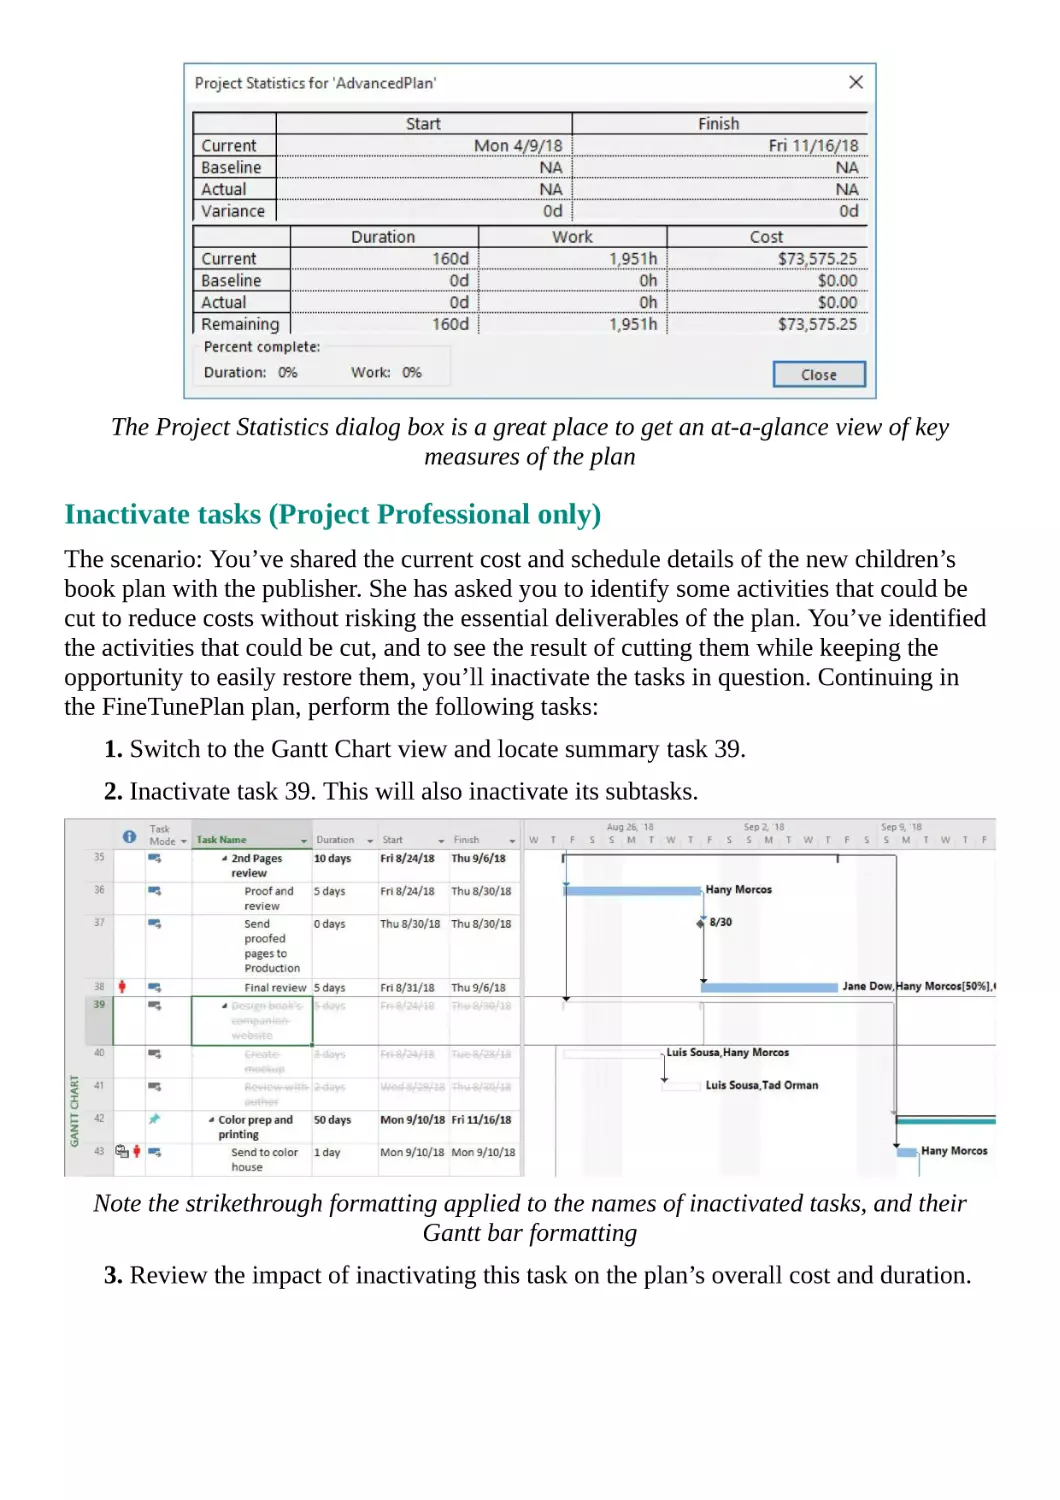


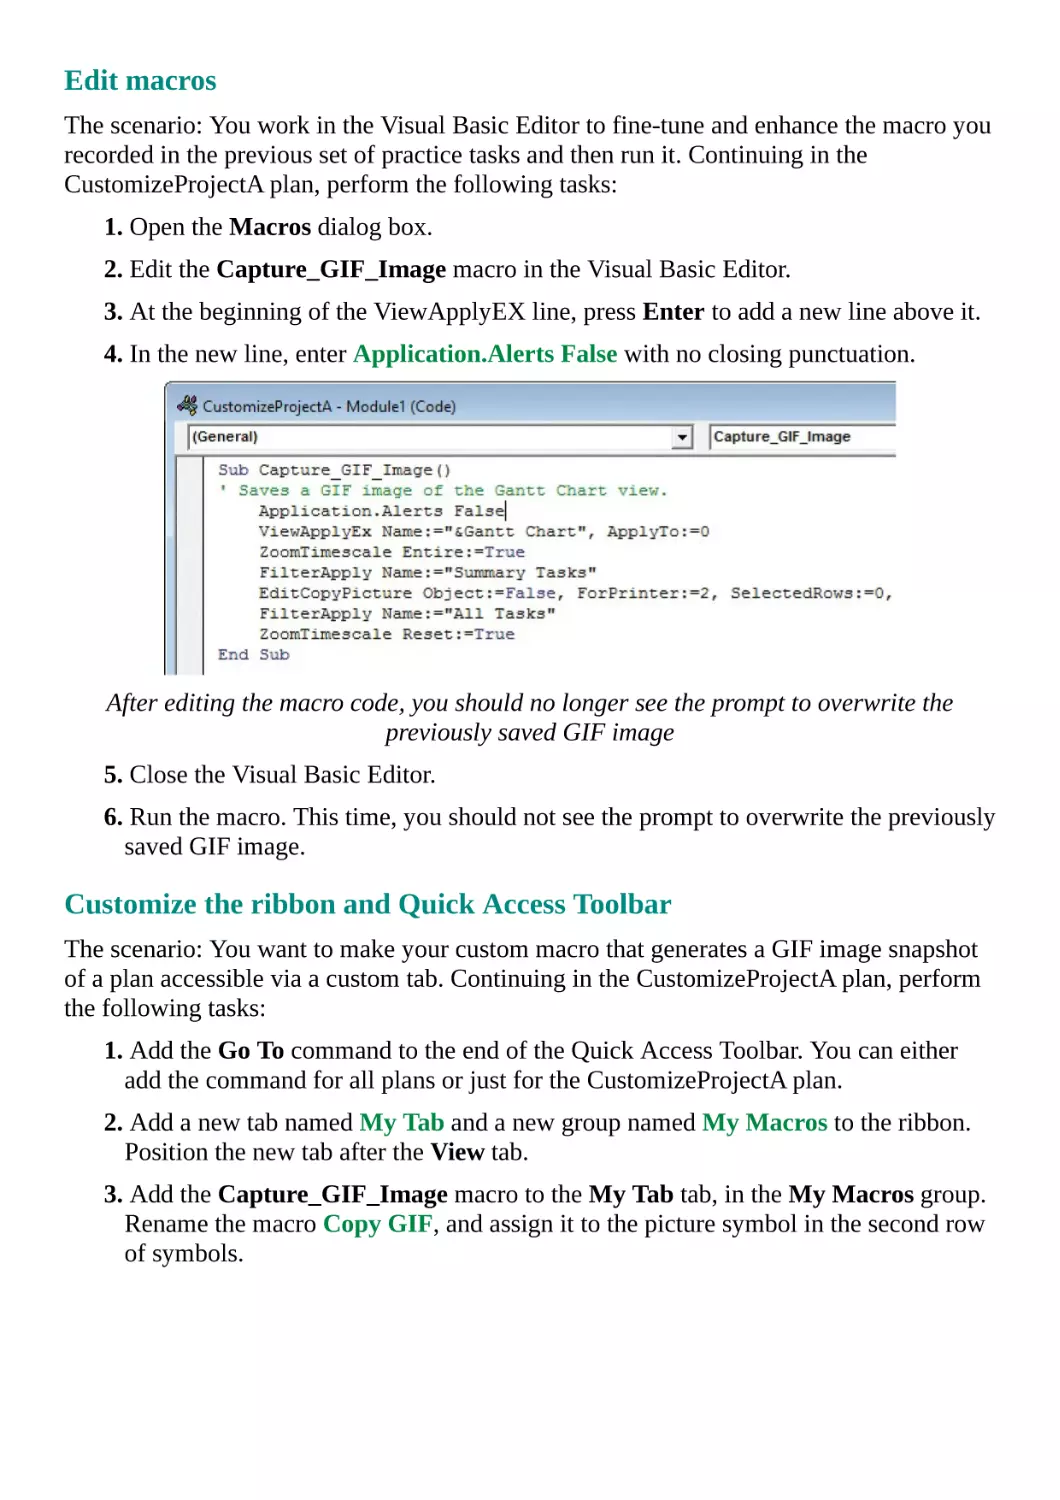


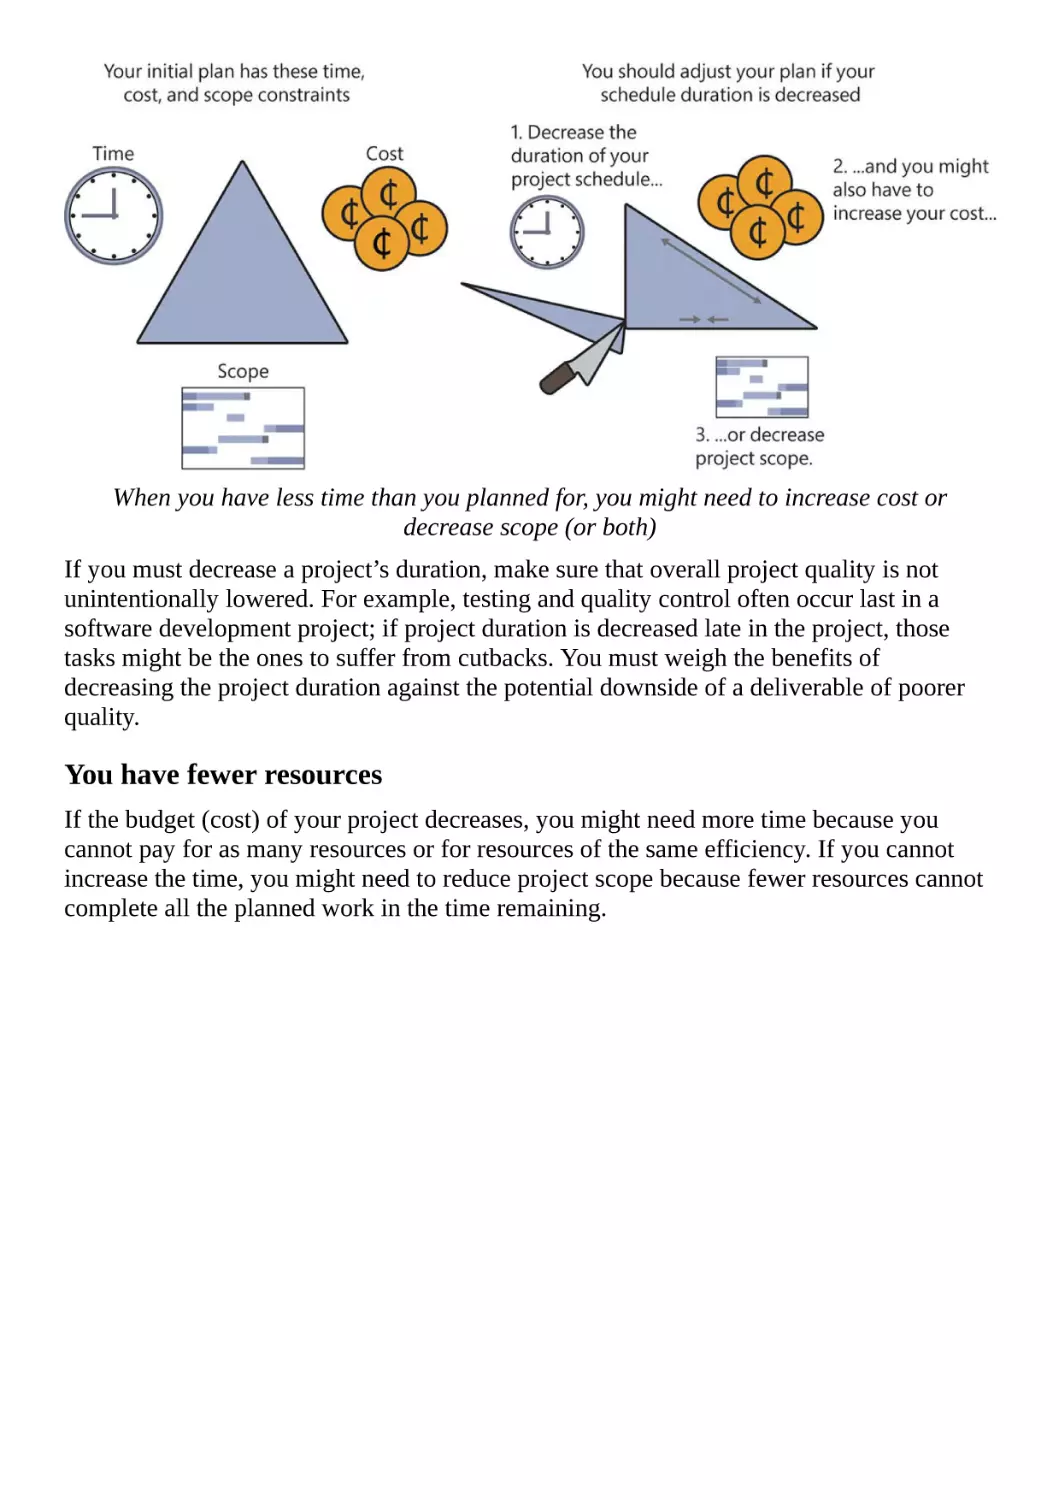
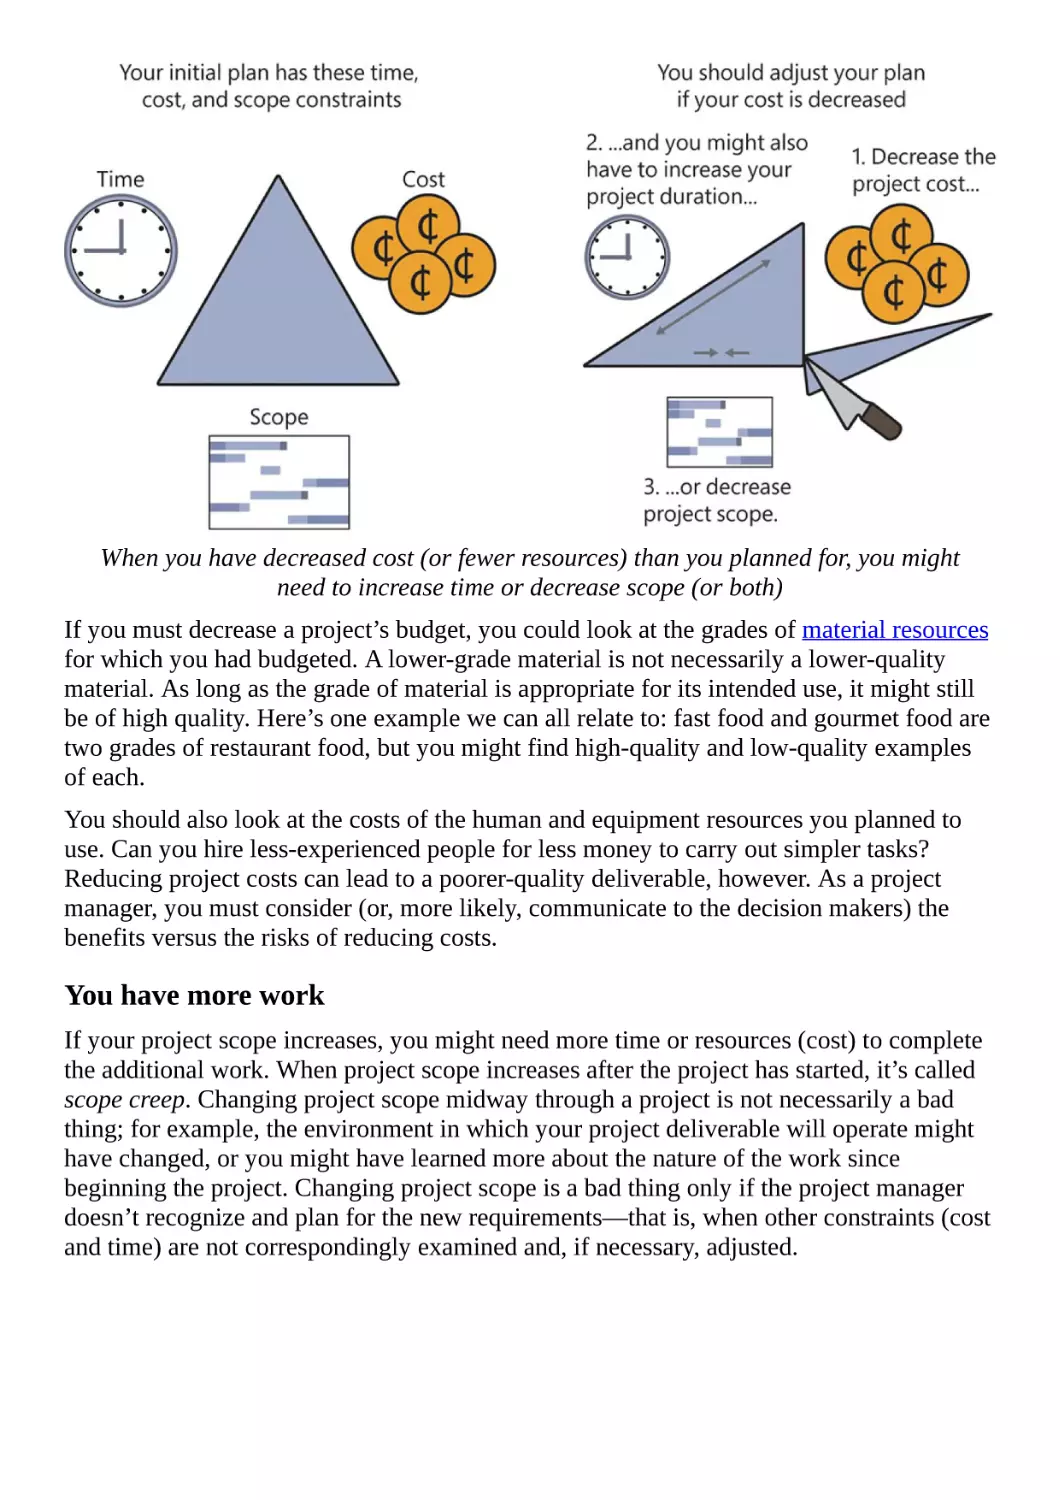
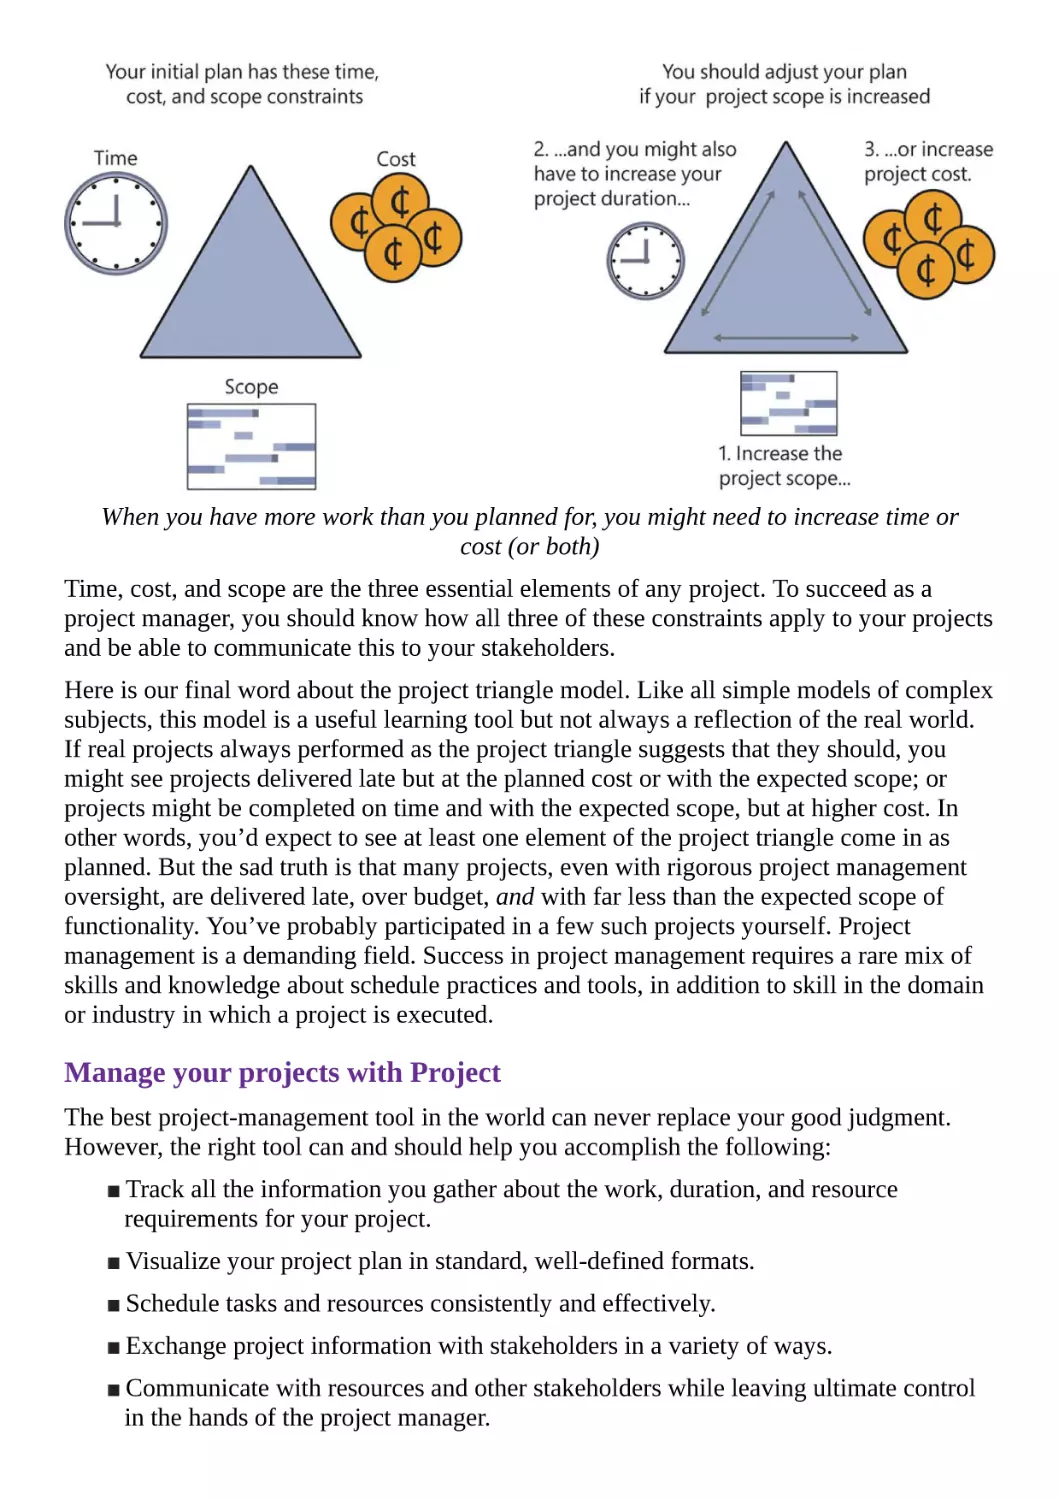


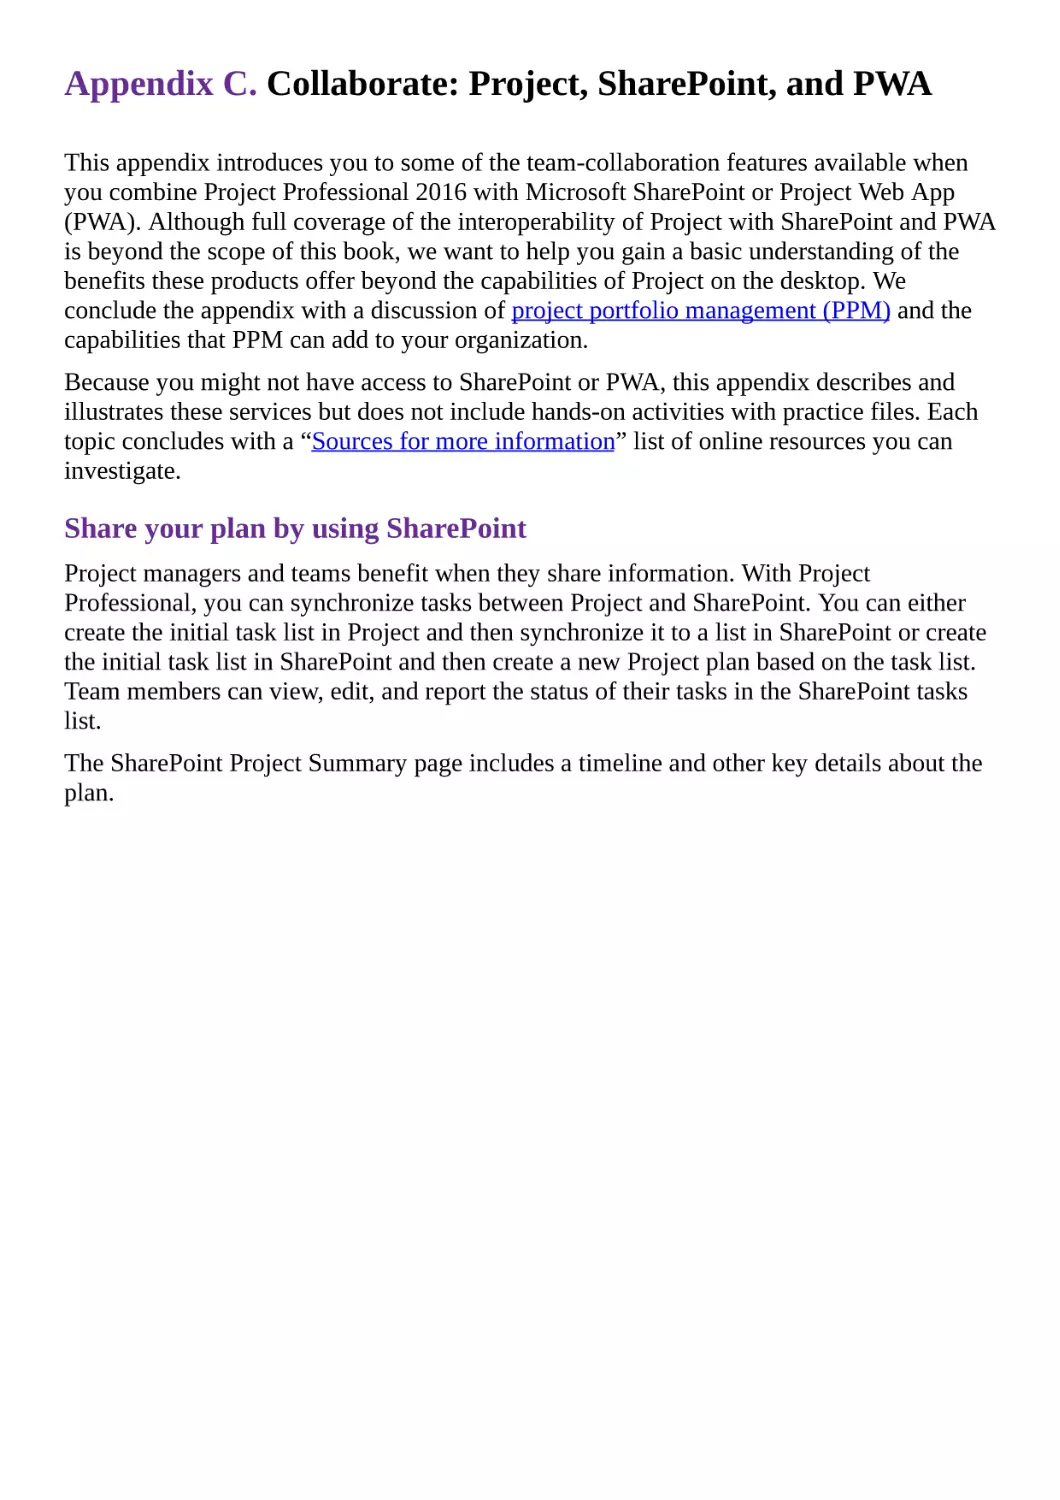


Text
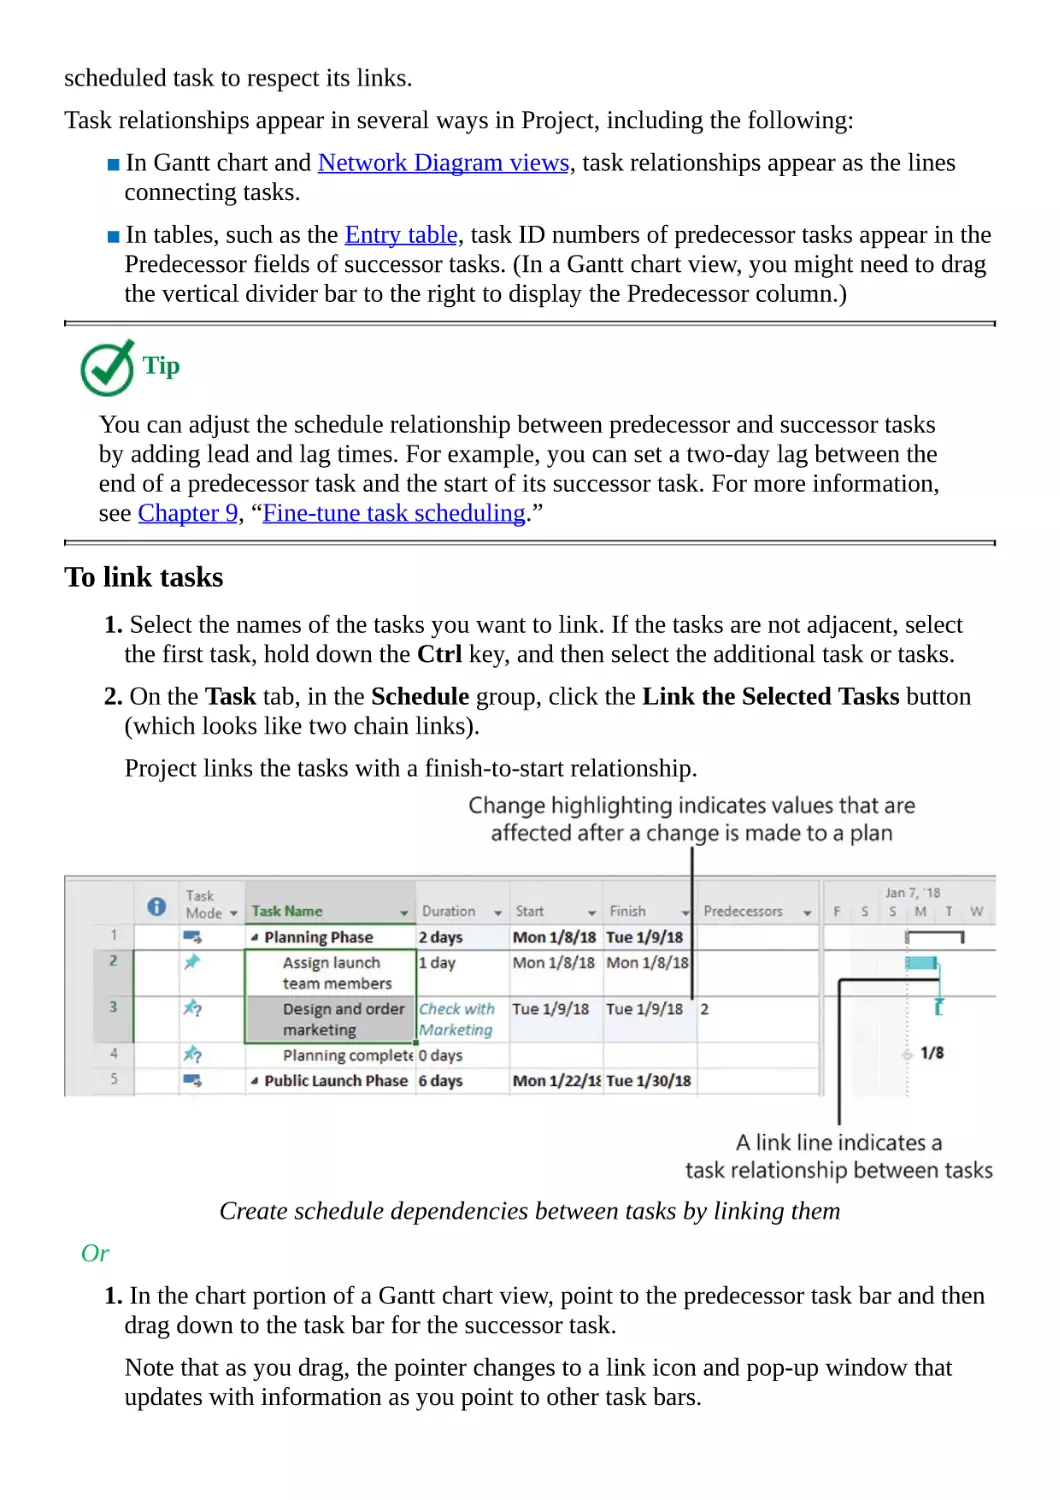
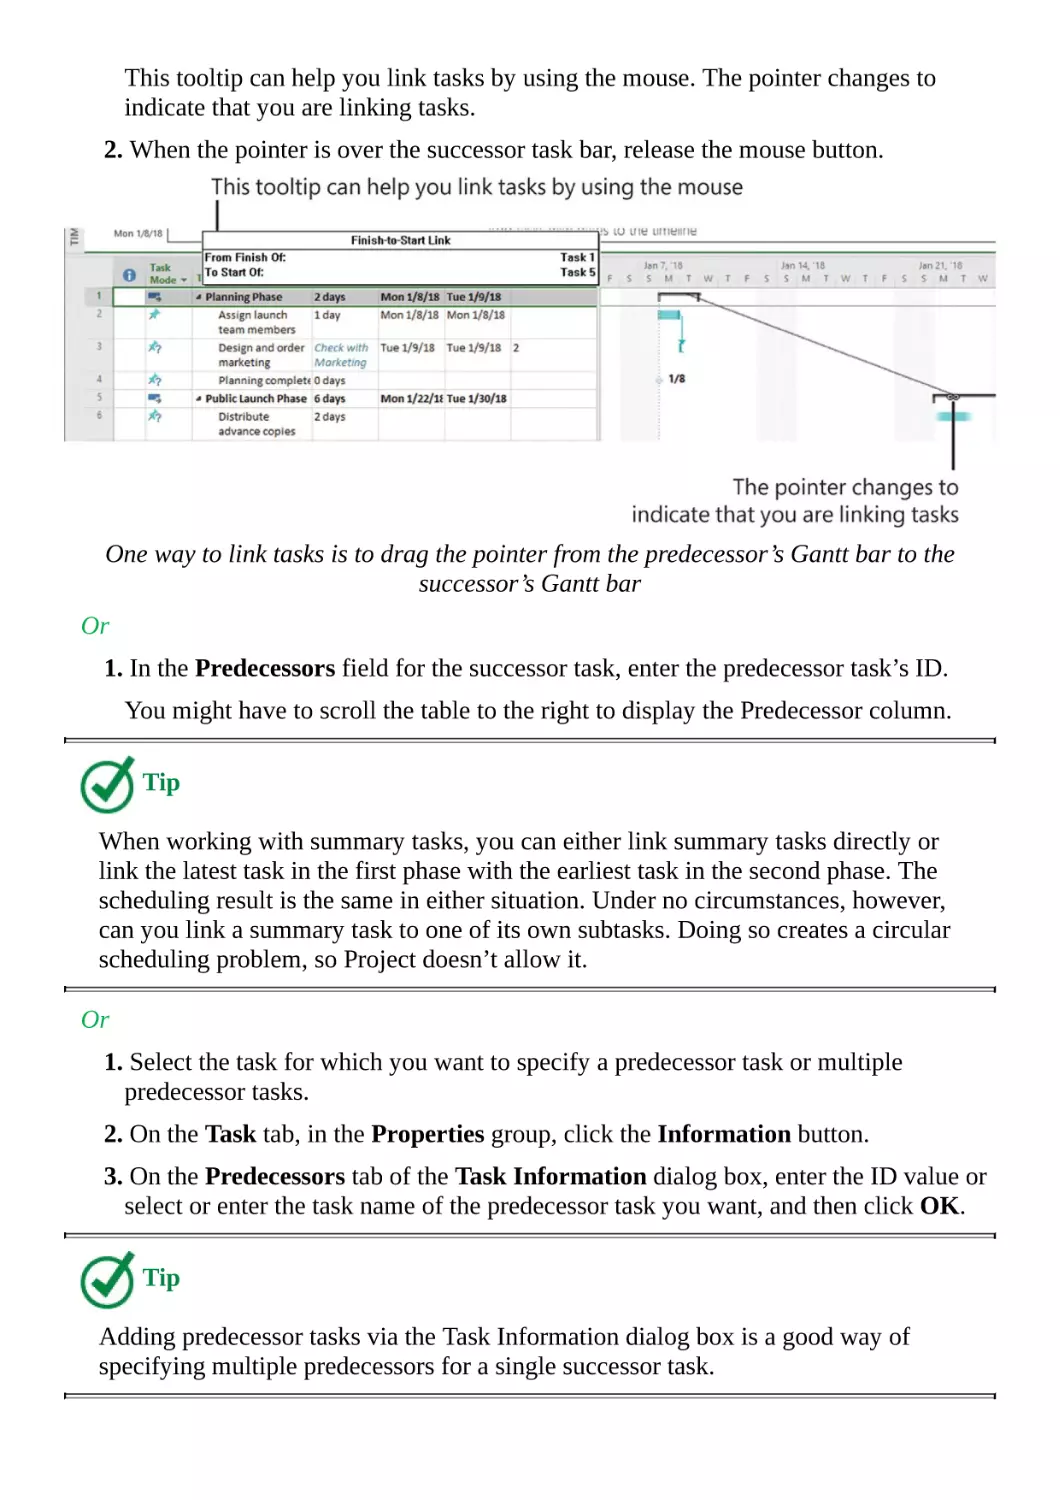
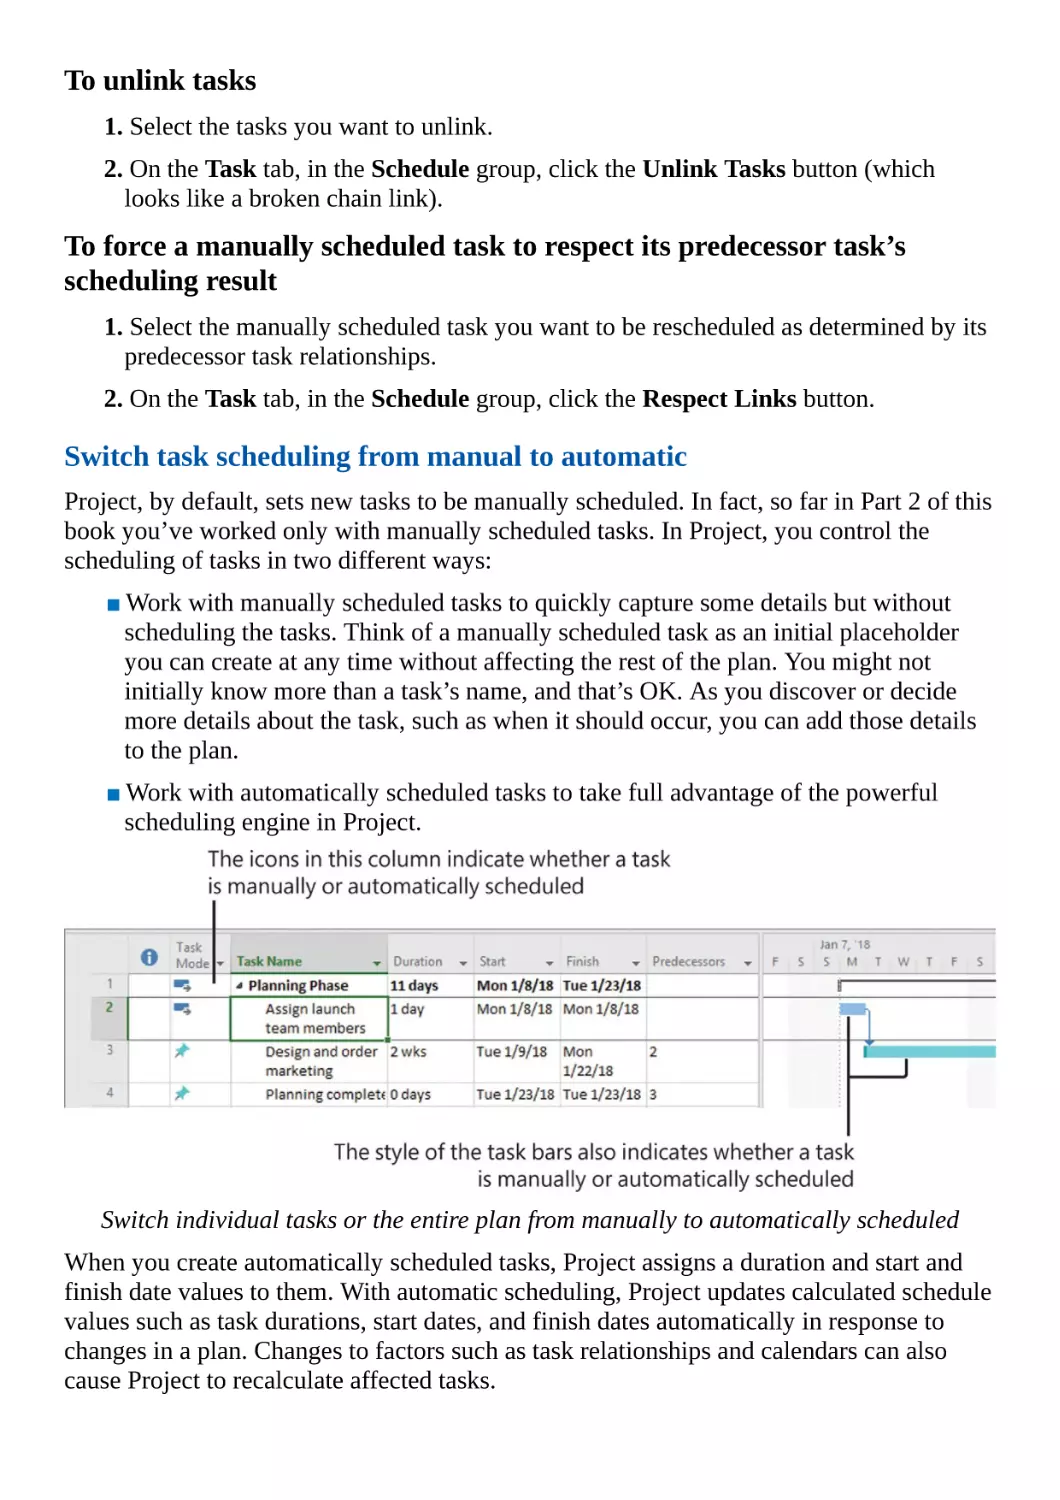
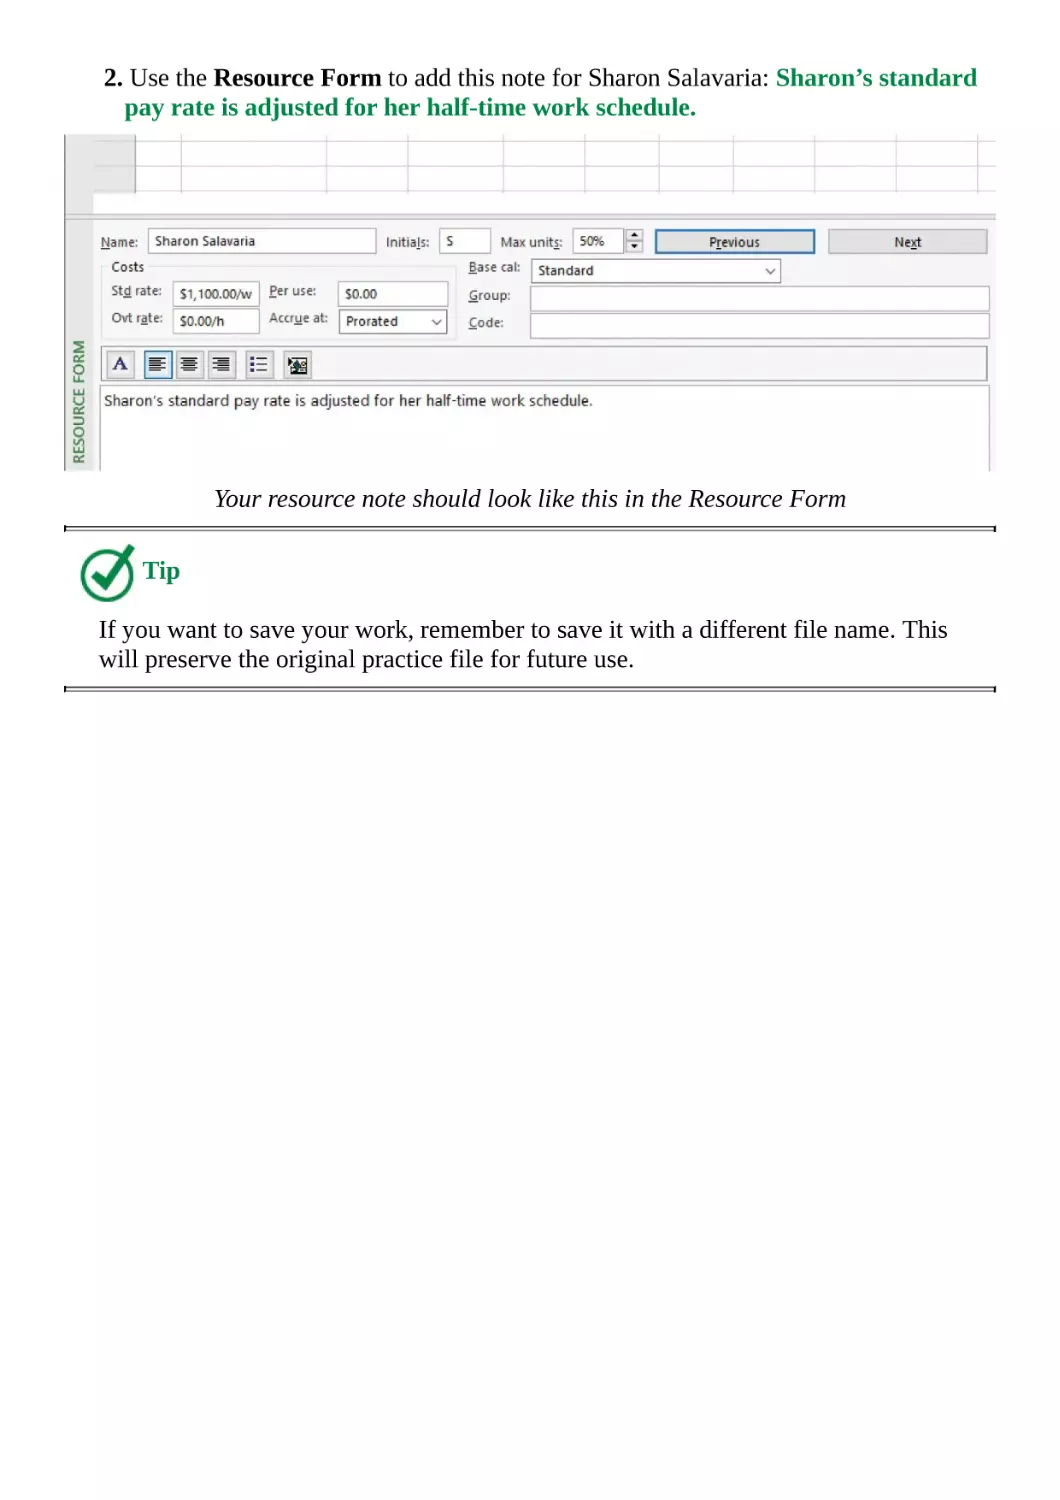
Microsoft Project 2016 Step by Step
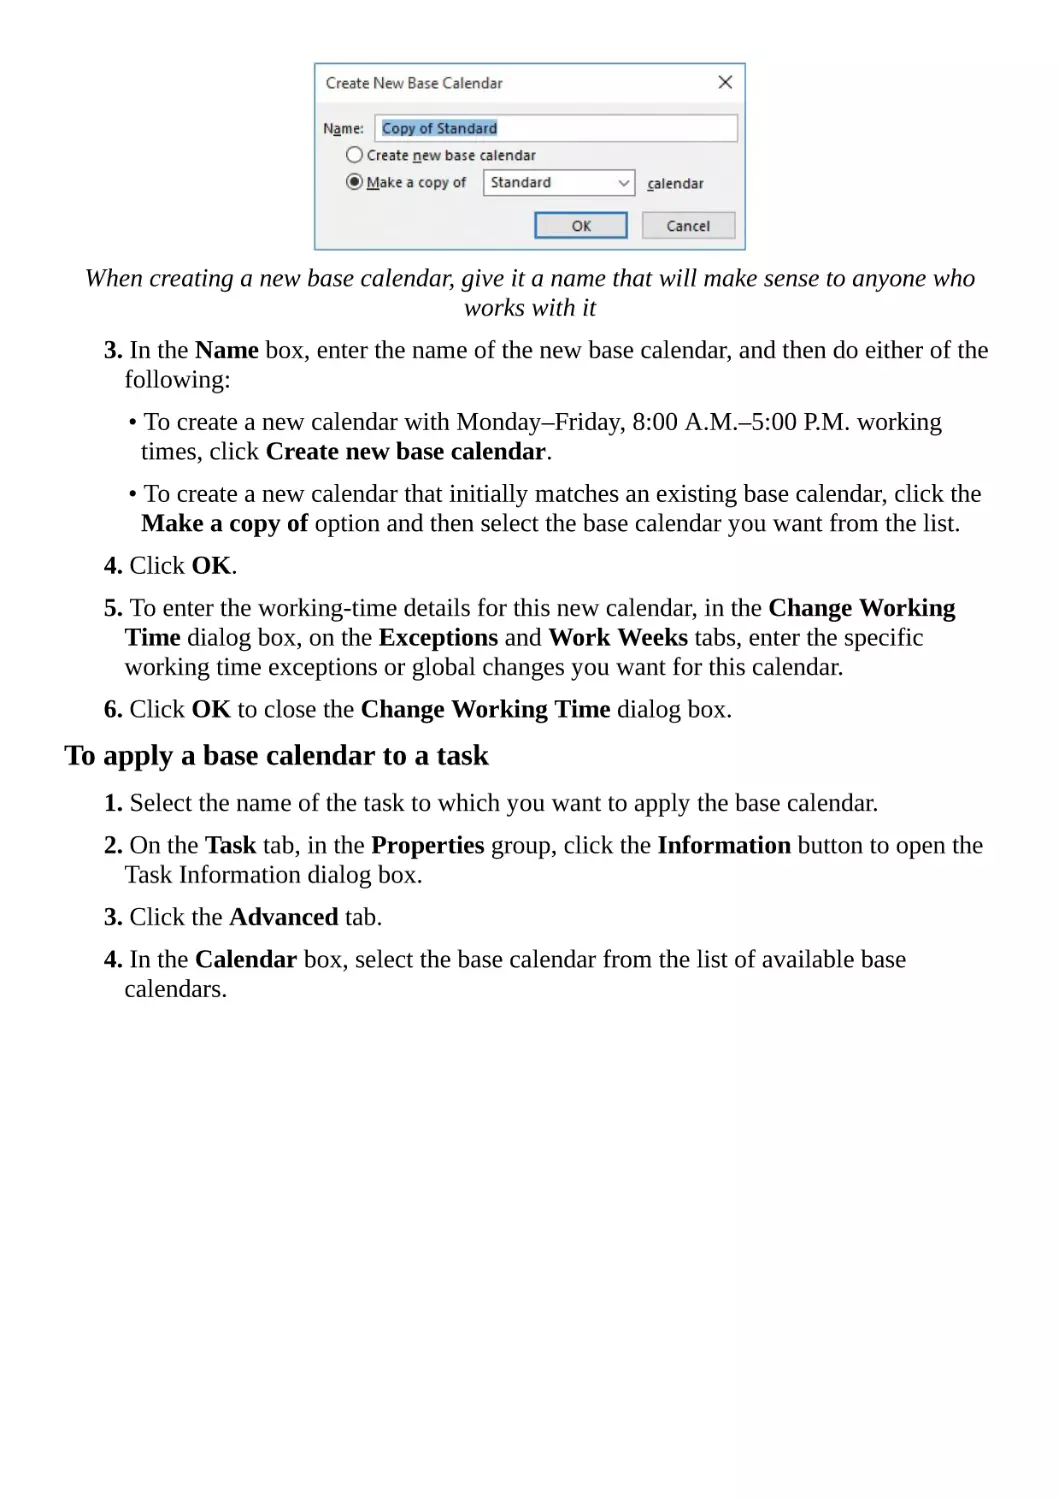
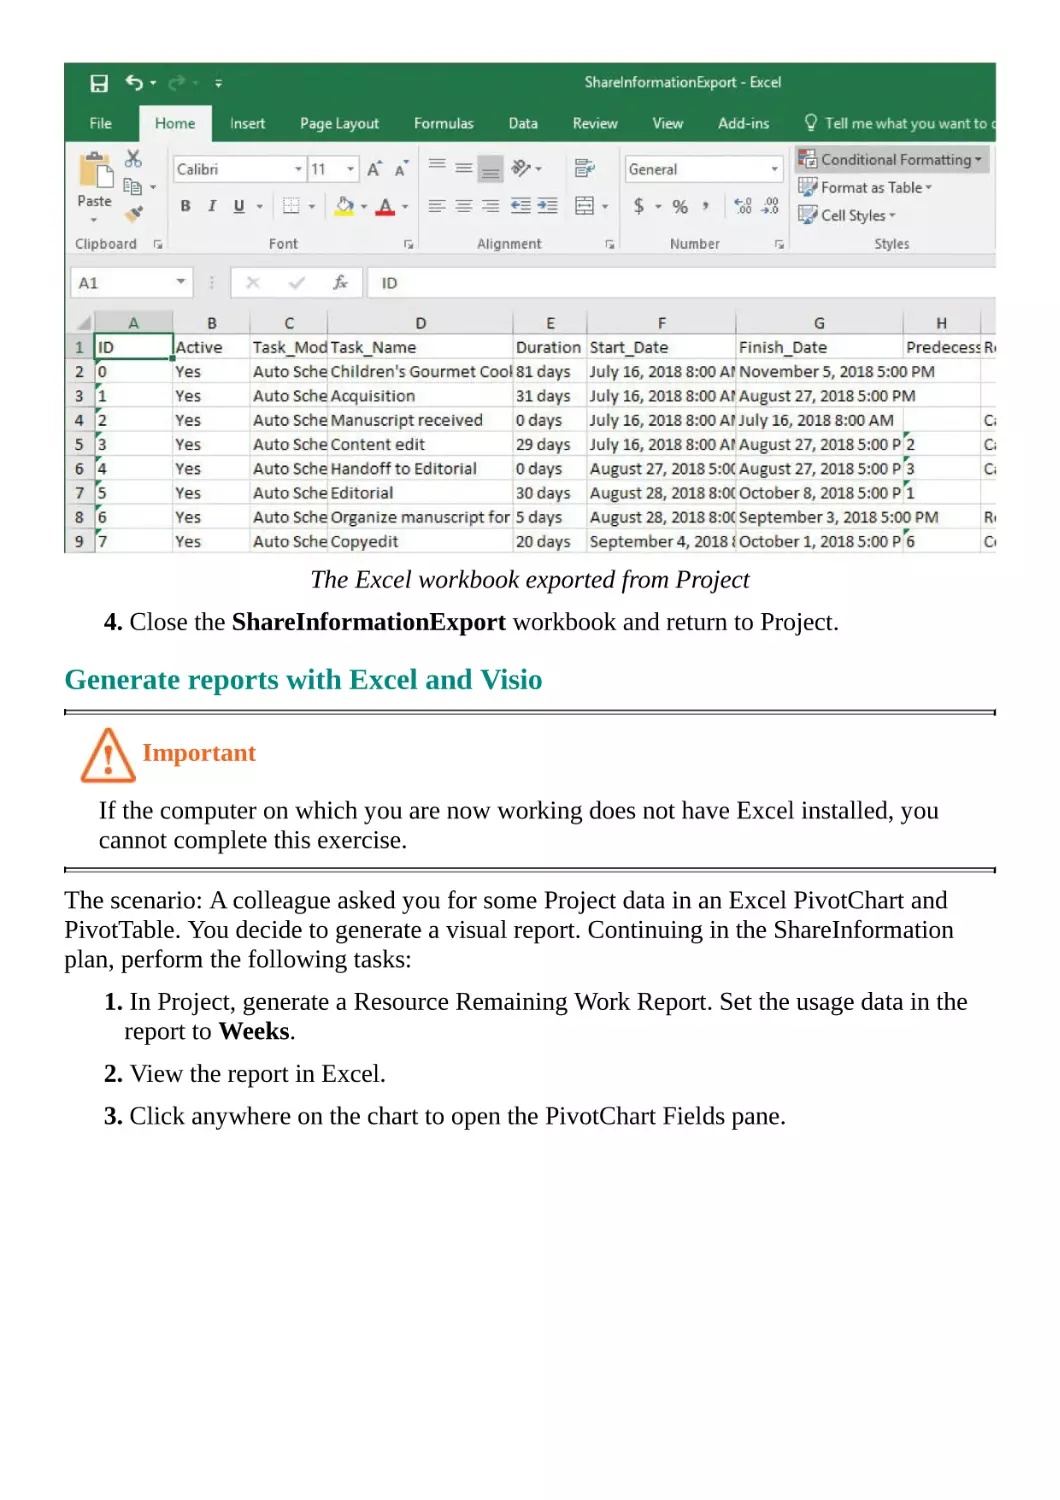
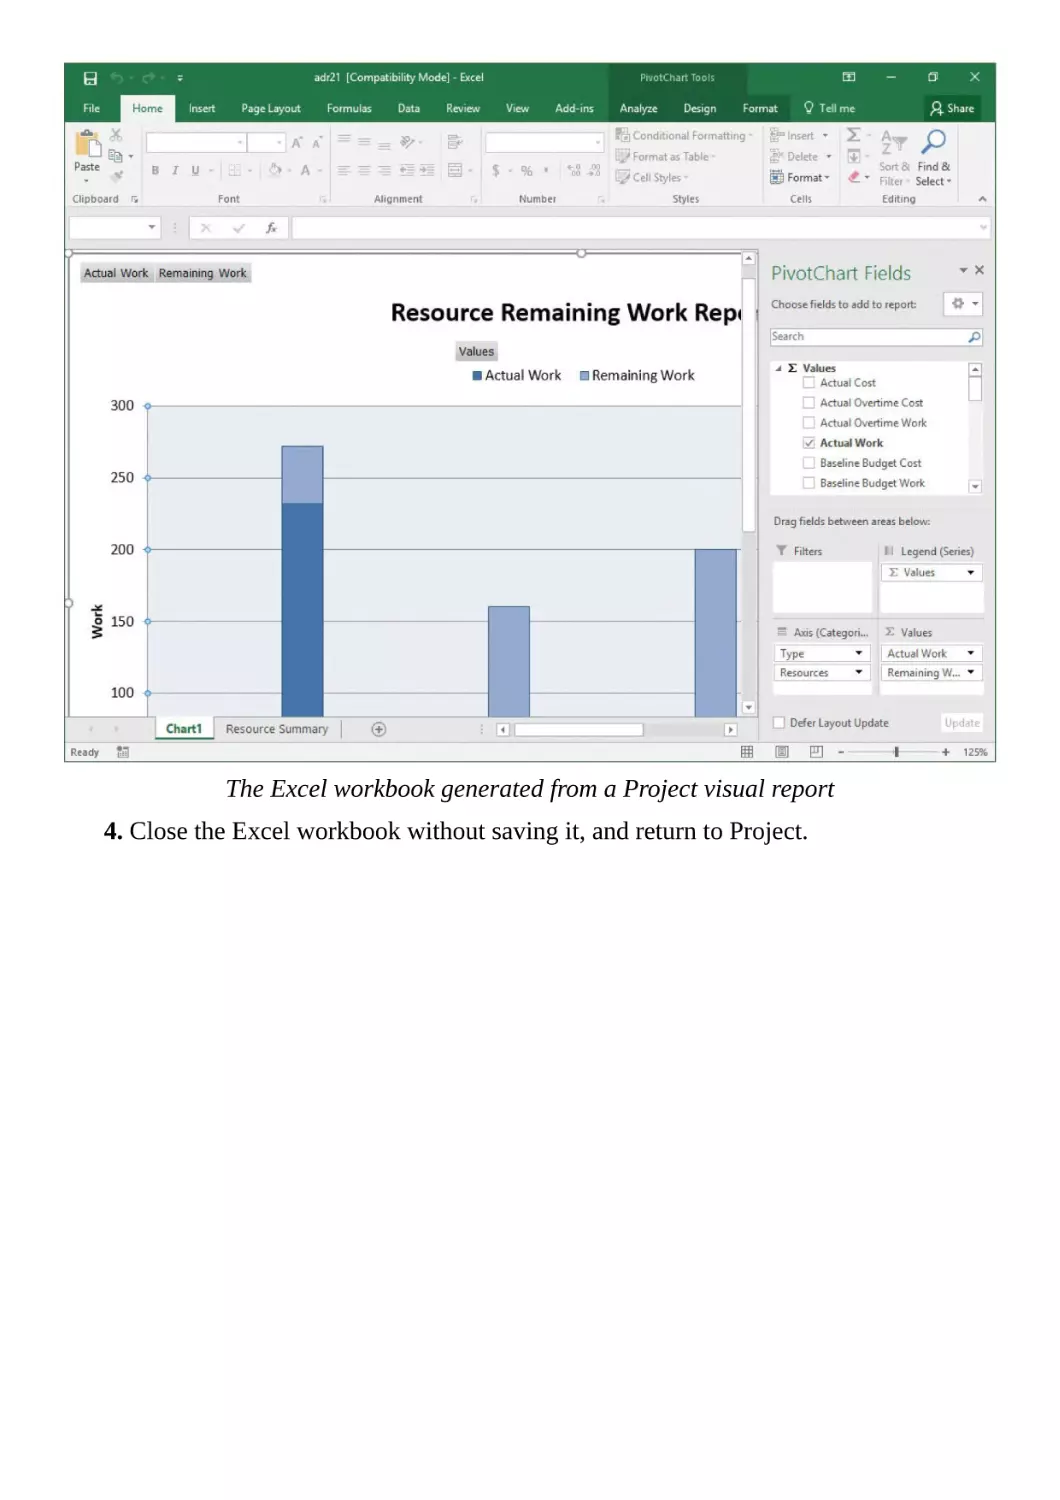
Carl Chatfield
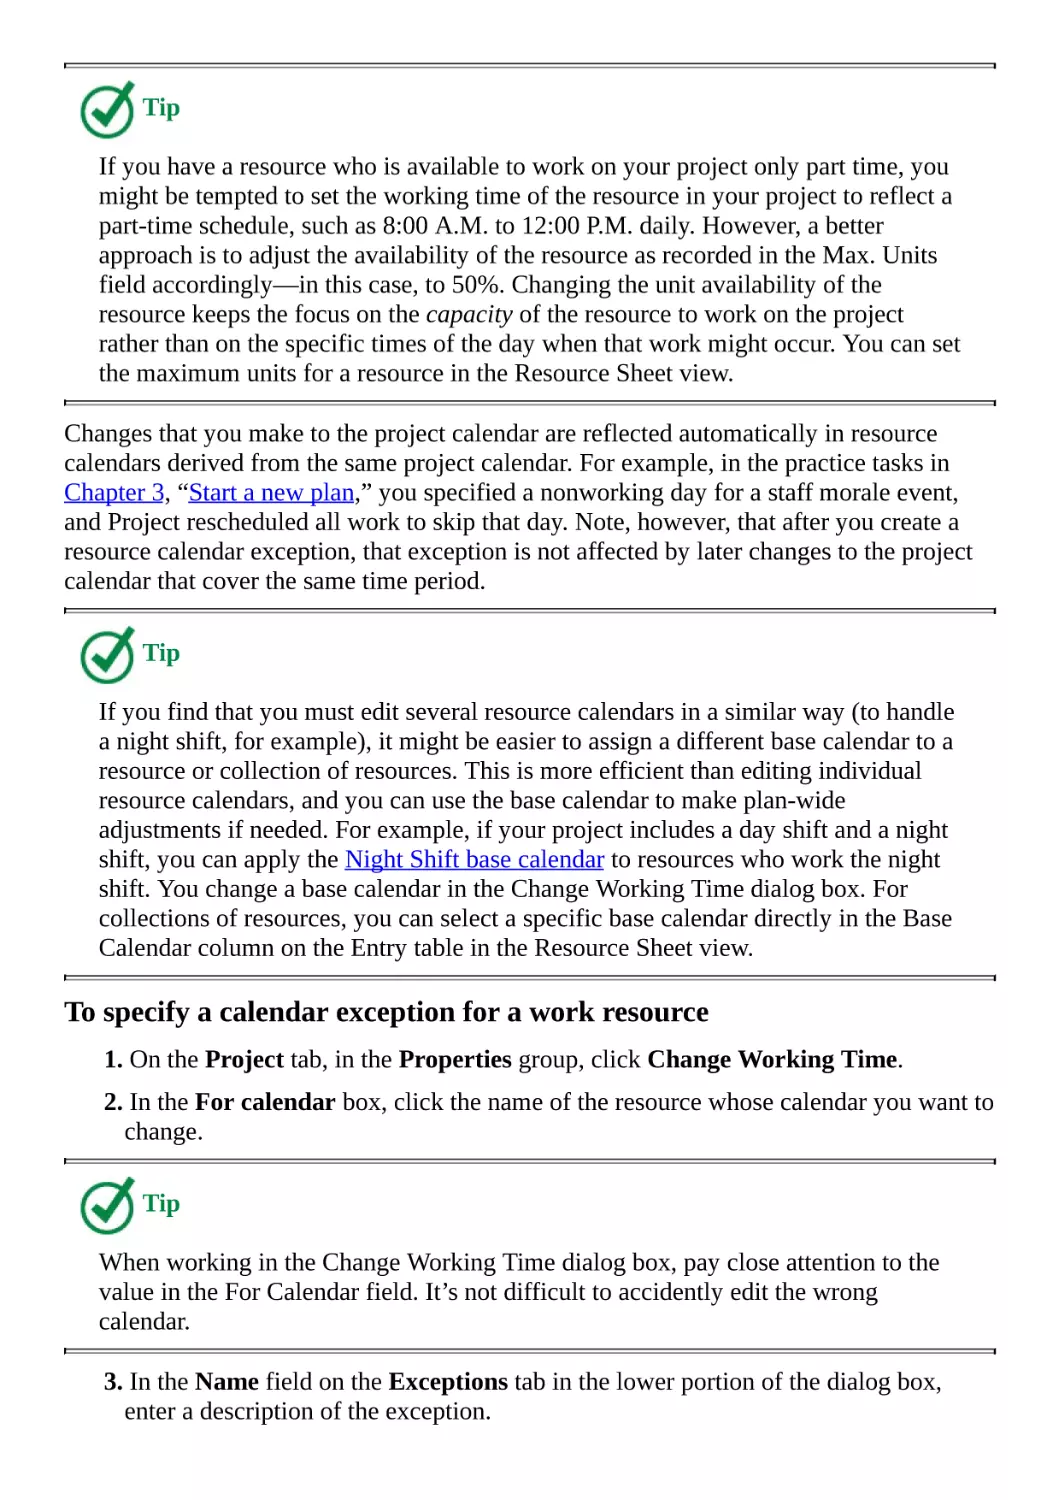
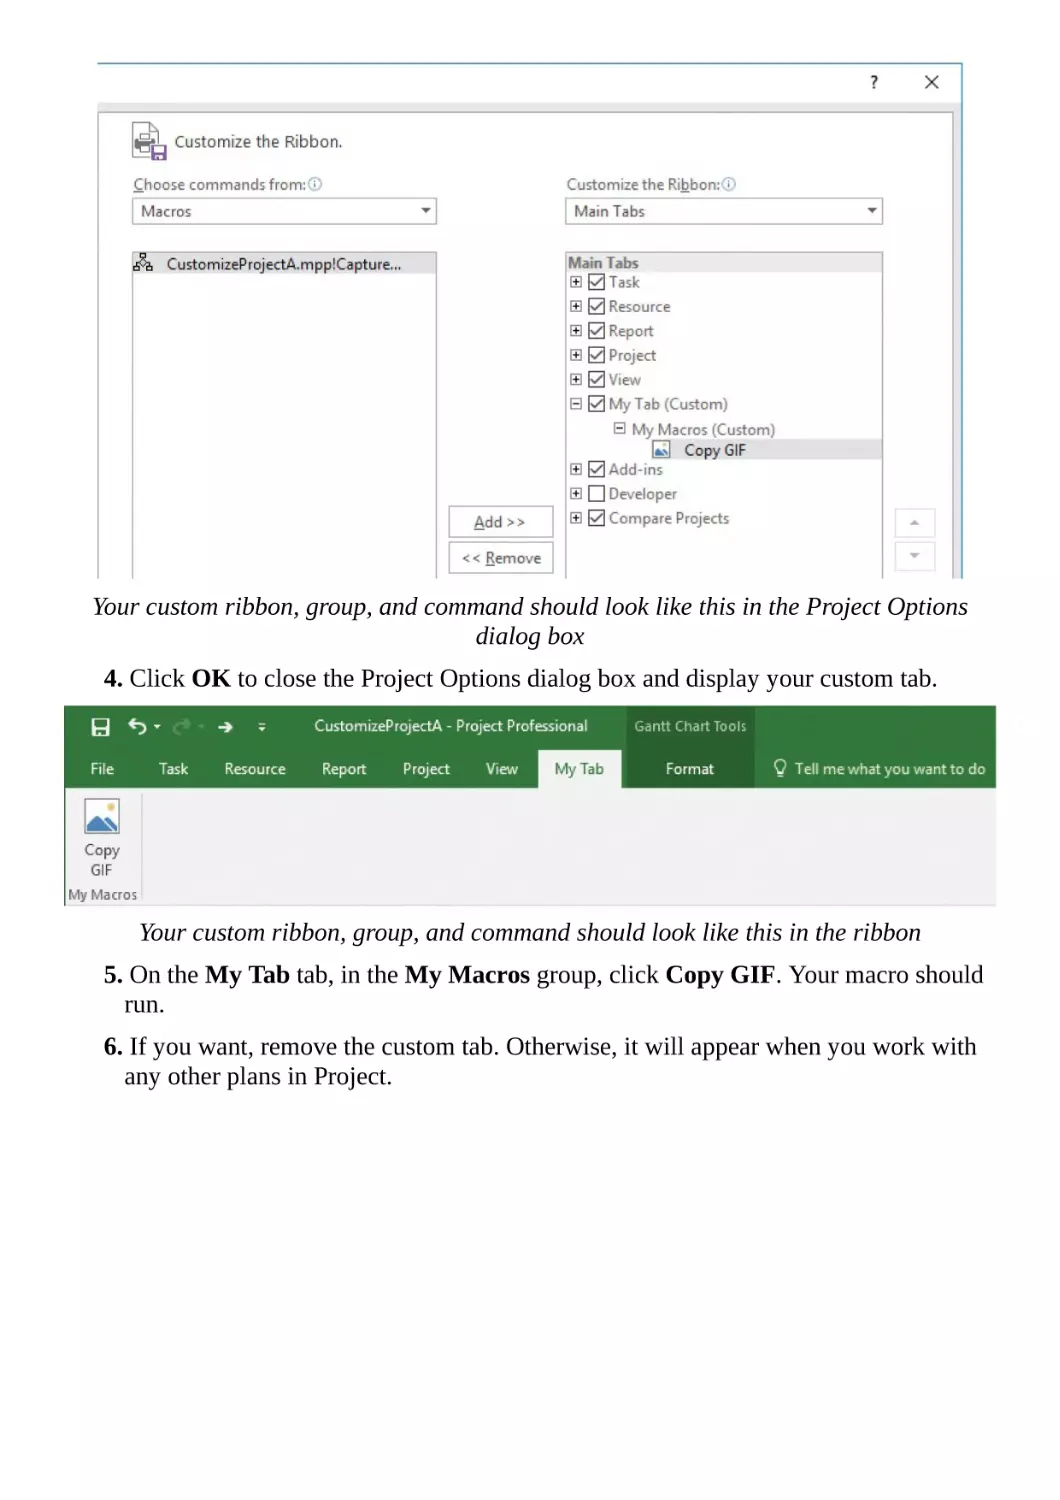
Timothy Johnson
PUBLISHED BY
Microsoft Press
A division of Microsoft Corporation
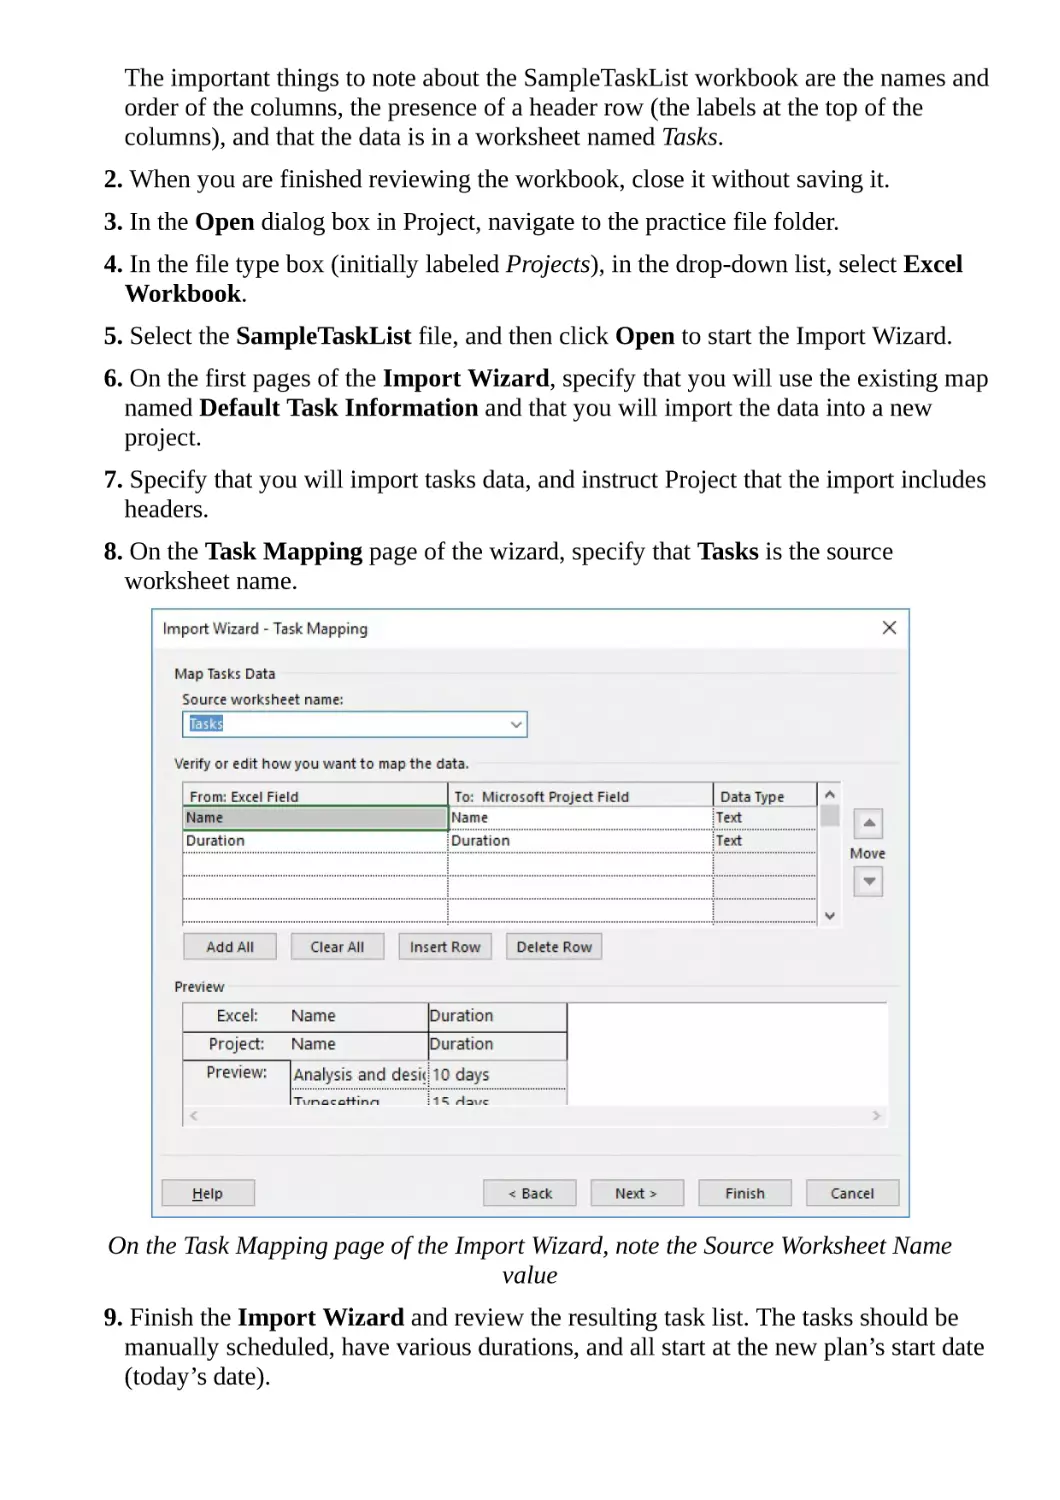
One Microsoft Way
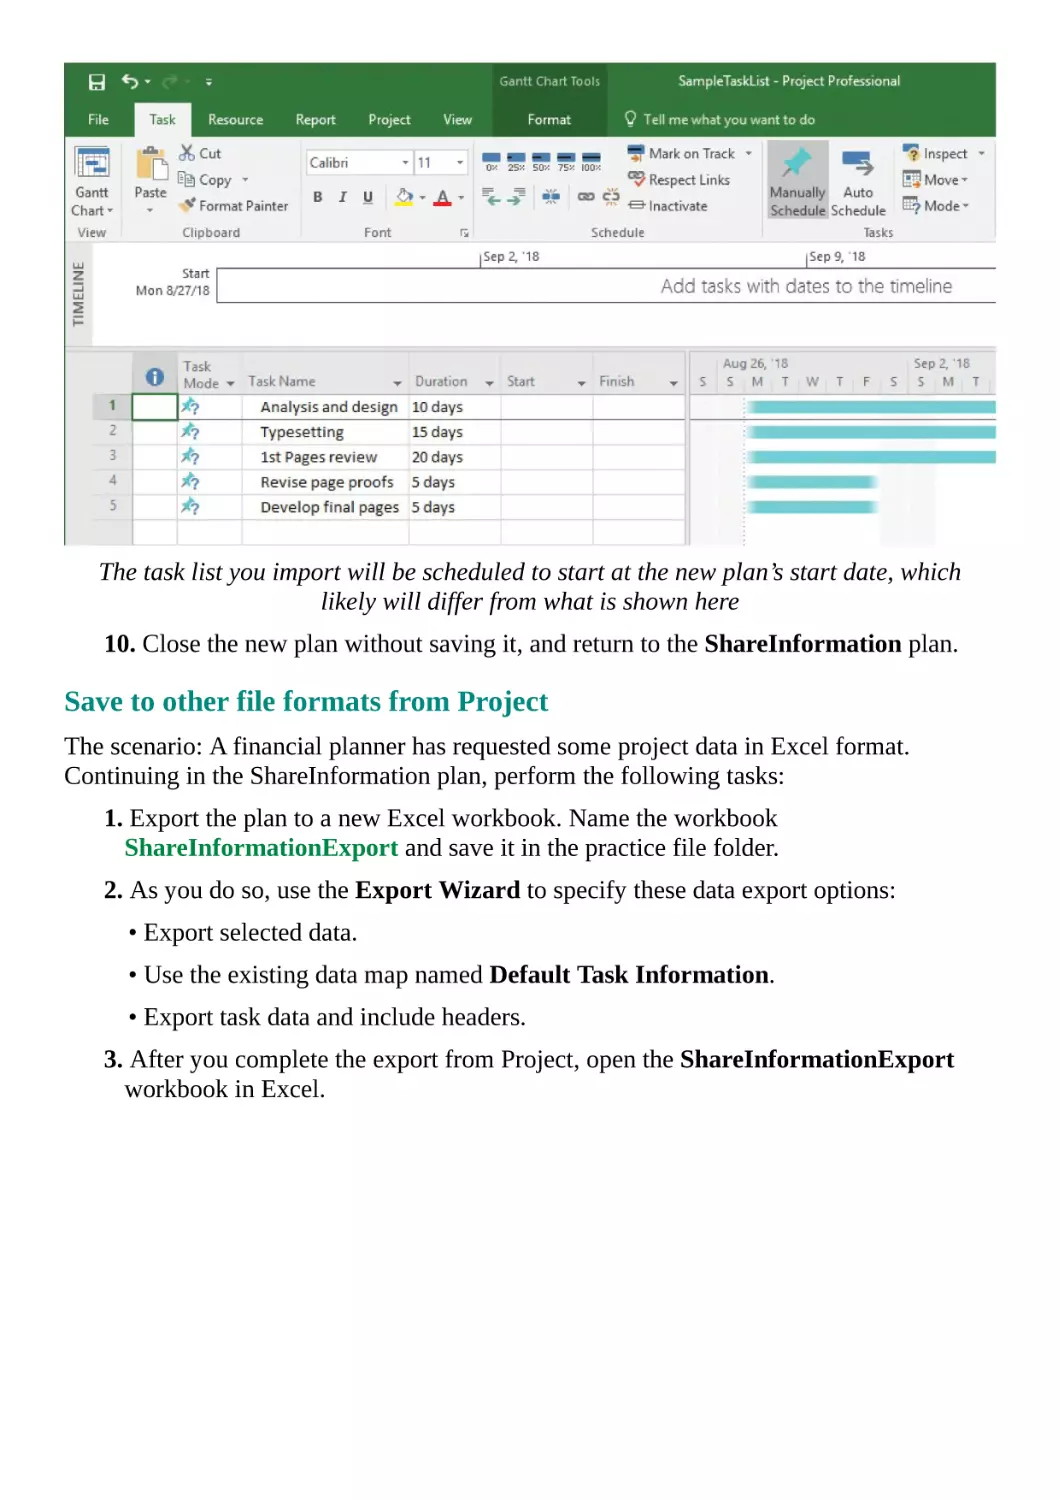
Redmond, Washington 98052-6399
Copyright © 2016 by Carl Chatfield and Timothy Johnson
All rights reserved. No part of the contents of this book may be reproduced or transmitted
in any form or by any means without the written permission of the publisher.
Library of Congress Control Number: 2015935268
ISBN: 978-0-7356-9874-1
Printed and bound in the United States of America.
First Printing
Microsoft Press books are available through booksellers and distributors worldwide. If
you need support related to this book, email Microsoft Press Support at
mspinput@microsoft.com. Please tell us what you think of this book at
http://aka.ms/tellpress.
This book is provided “as-is” and expresses the author’s views and opinions. The views,
opinions, and information expressed in this book, including URL and other Internet
website references, may change without notice.
Some examples depicted herein are provided for illustration only and are fictitious. No
real association or connection is intended or should be inferred.
Microsoft and the trademarks listed at www.microsoft.com on the “Trademarks” webpage
are trademarks of the Microsoft group of companies. All other marks are property of their
respective owners.
Acquisitions and Developmental Editor: Rosemary Caperton
Editorial Production: Online Training Solutions, Inc. (OTSI)
Technical Reviewer: Kate Simpson
Copyeditor: Kathy Krause (OTSI)
Indexers: Susie Carr and Joan Lambert (OTSI)
Cover: Twist Creative • Seattle
Contents
Introduction
Who this book is for
The Step by Step approach
Download the practice files
Ebook edition
Sidebar: Adapt procedure steps
Get support and give feedback
Errata and support
We want to hear from you
Stay in touch
Part 1: Get started with Microsoft Project
1 Project, project management, and you
Meet the Project program
Meet the Project family
See the new features in Project 2016
What was new in Project 2013
What was new in Project 2010
Take a project manager’s perspective
Let’s get started!
2 Take a guided tour
Explore the Project user interface
Manage files and set options in the Backstage view
Sidebar: Templates: Avoid reinventing the wheel
Work with schedule details in views
Use reports to check a plan’s status
Skills review
Practice tasks
Part 2: Simple scheduling basics
3 Start a new plan
Create a new plan and set its start date
Set nonworking days in the project calendar
Enter the plan title and other properties
Sidebar: Project management focus: Project is part of a larger picture
Skills review
Practice tasks
4 Build a task list
Create tasks
Sidebar: Project management focus: Defining the right tasks for the deliverable
Enter task durations and dates
Sidebar: Project management focus: How do you come up with accurate task
durations?
Enter milestone tasks
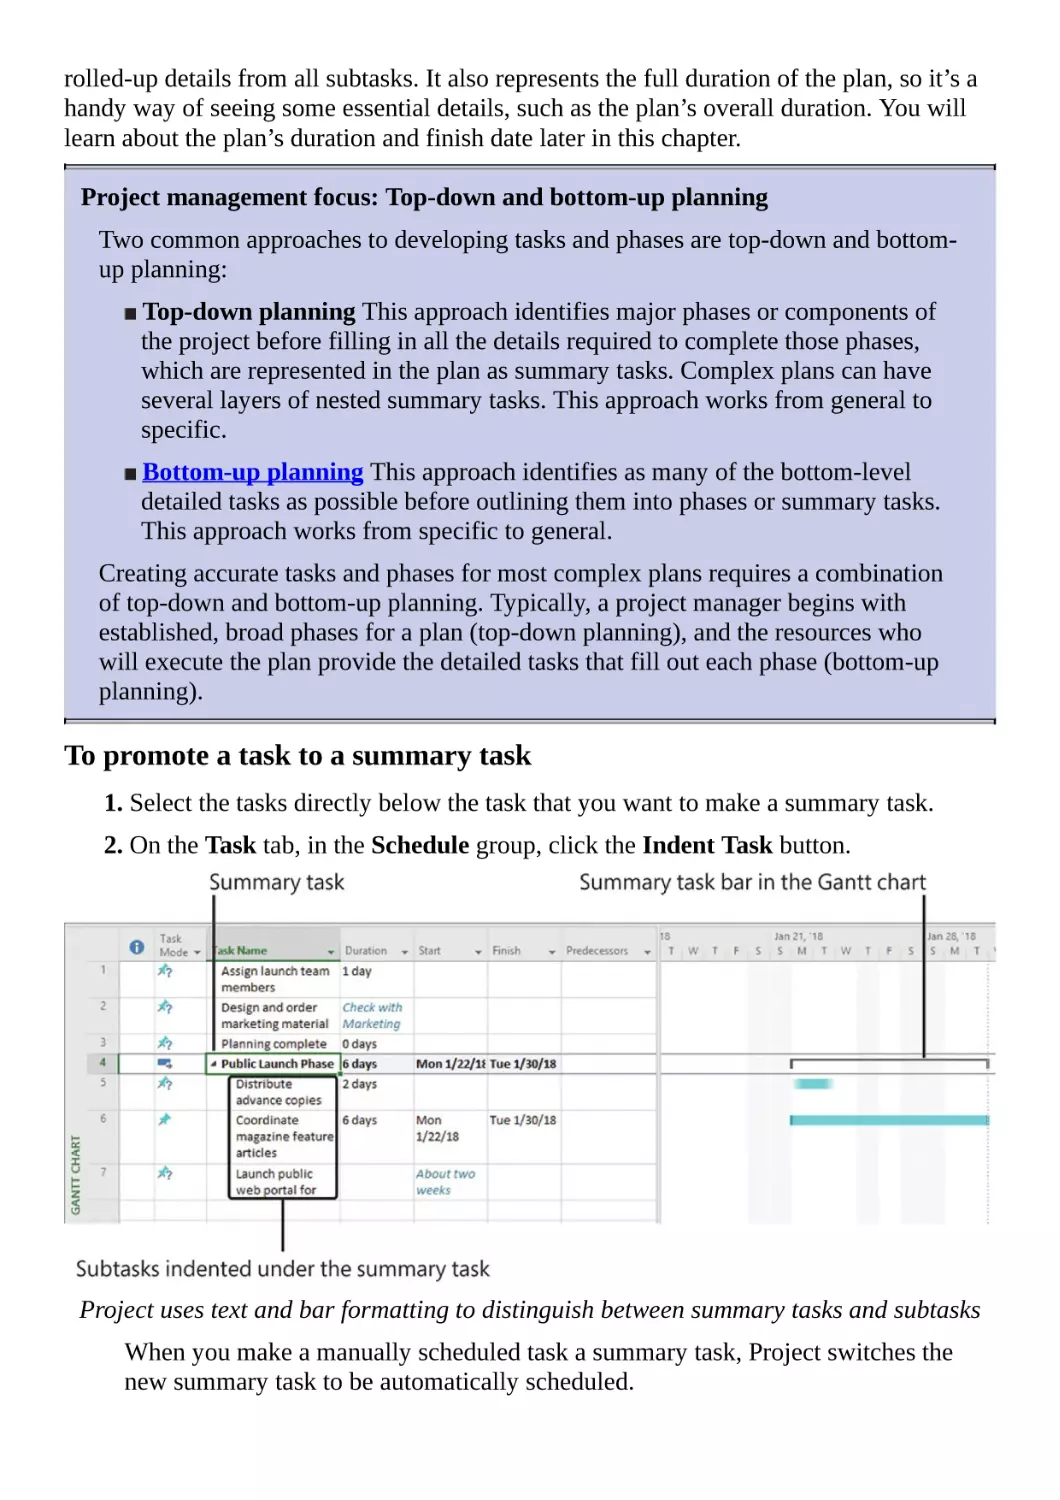
Create summary tasks to outline the plan
Sidebar: Project management focus: Top-down and bottom-up planning
Link tasks to create dependencies
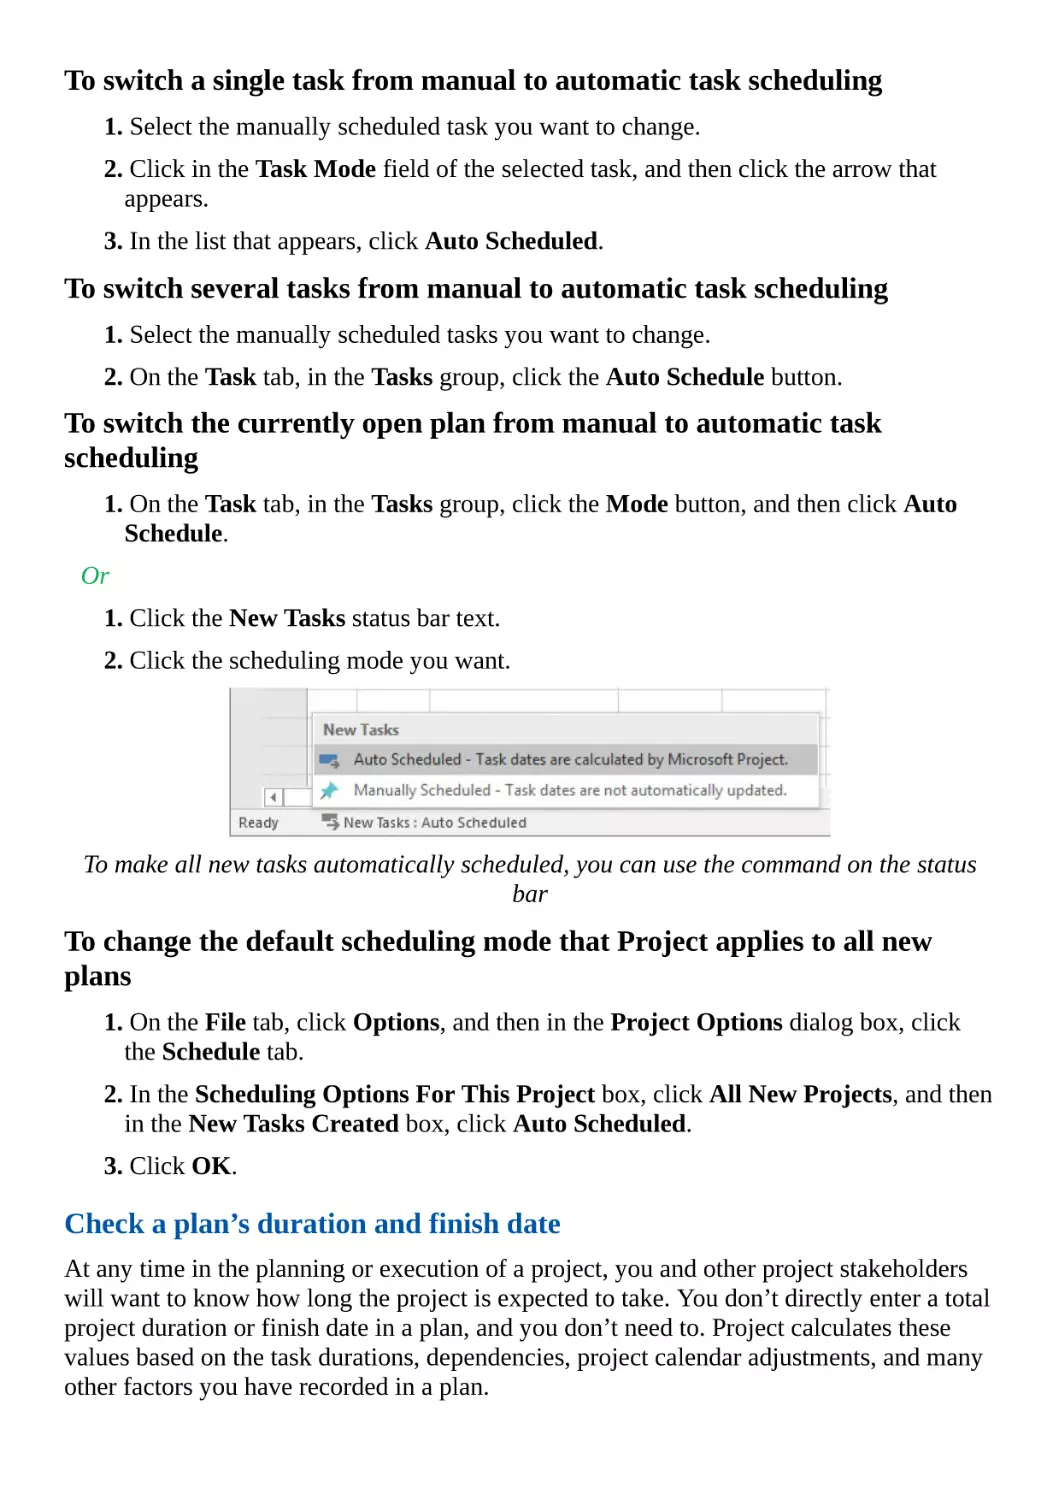
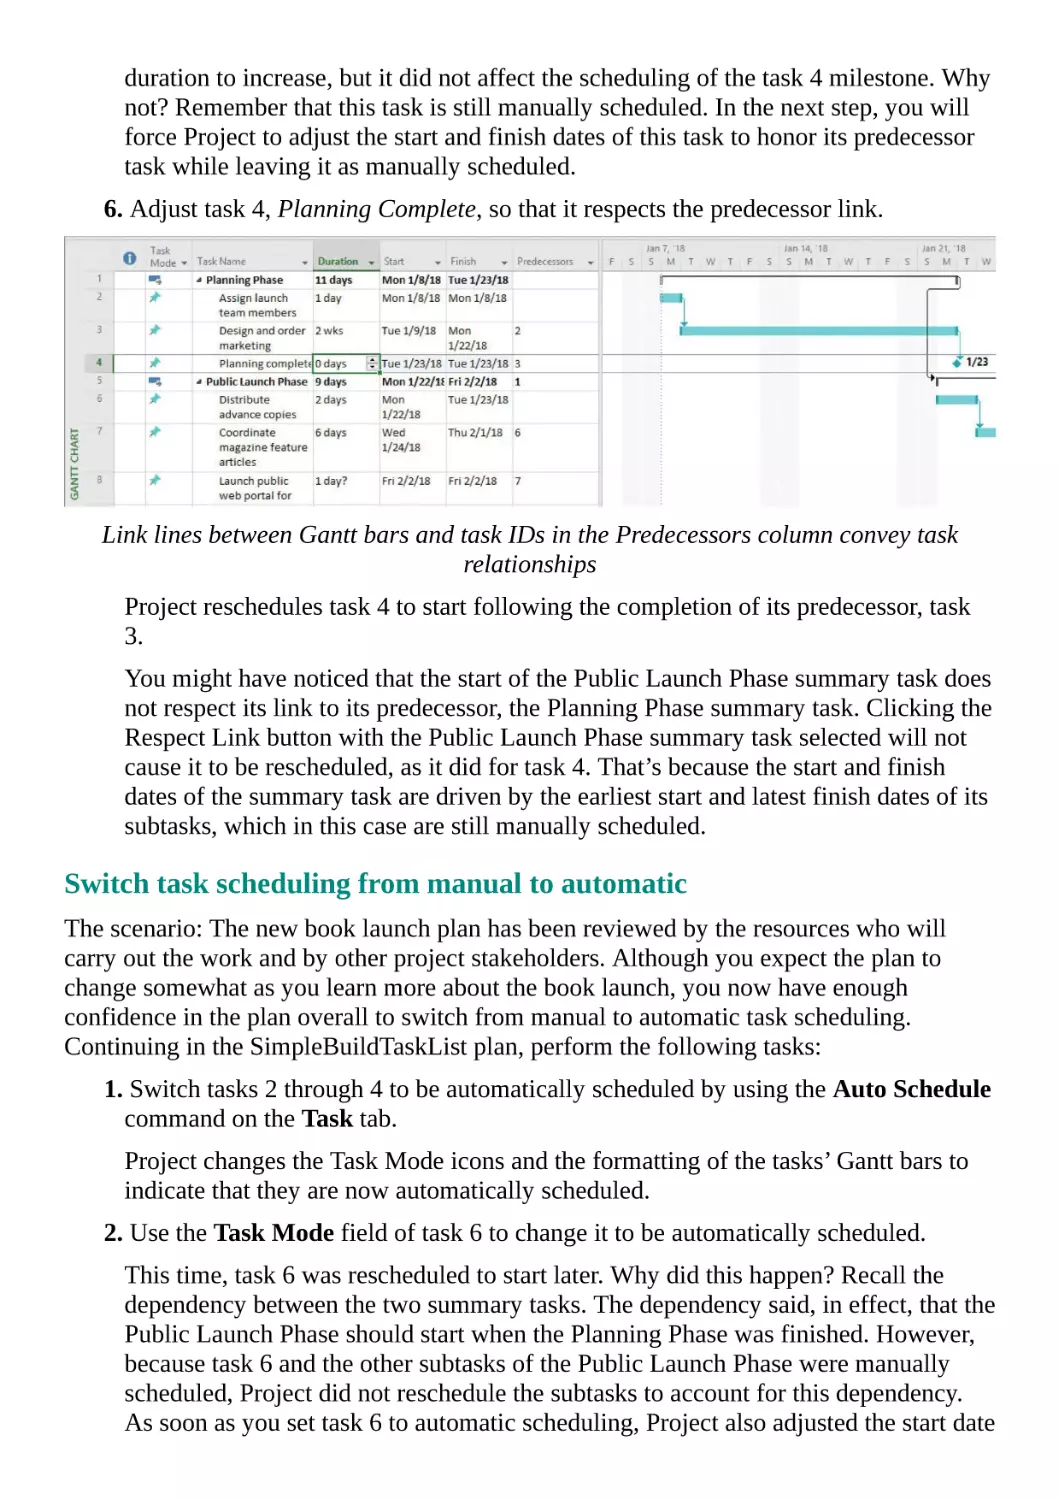
Switch task scheduling from manual to automatic
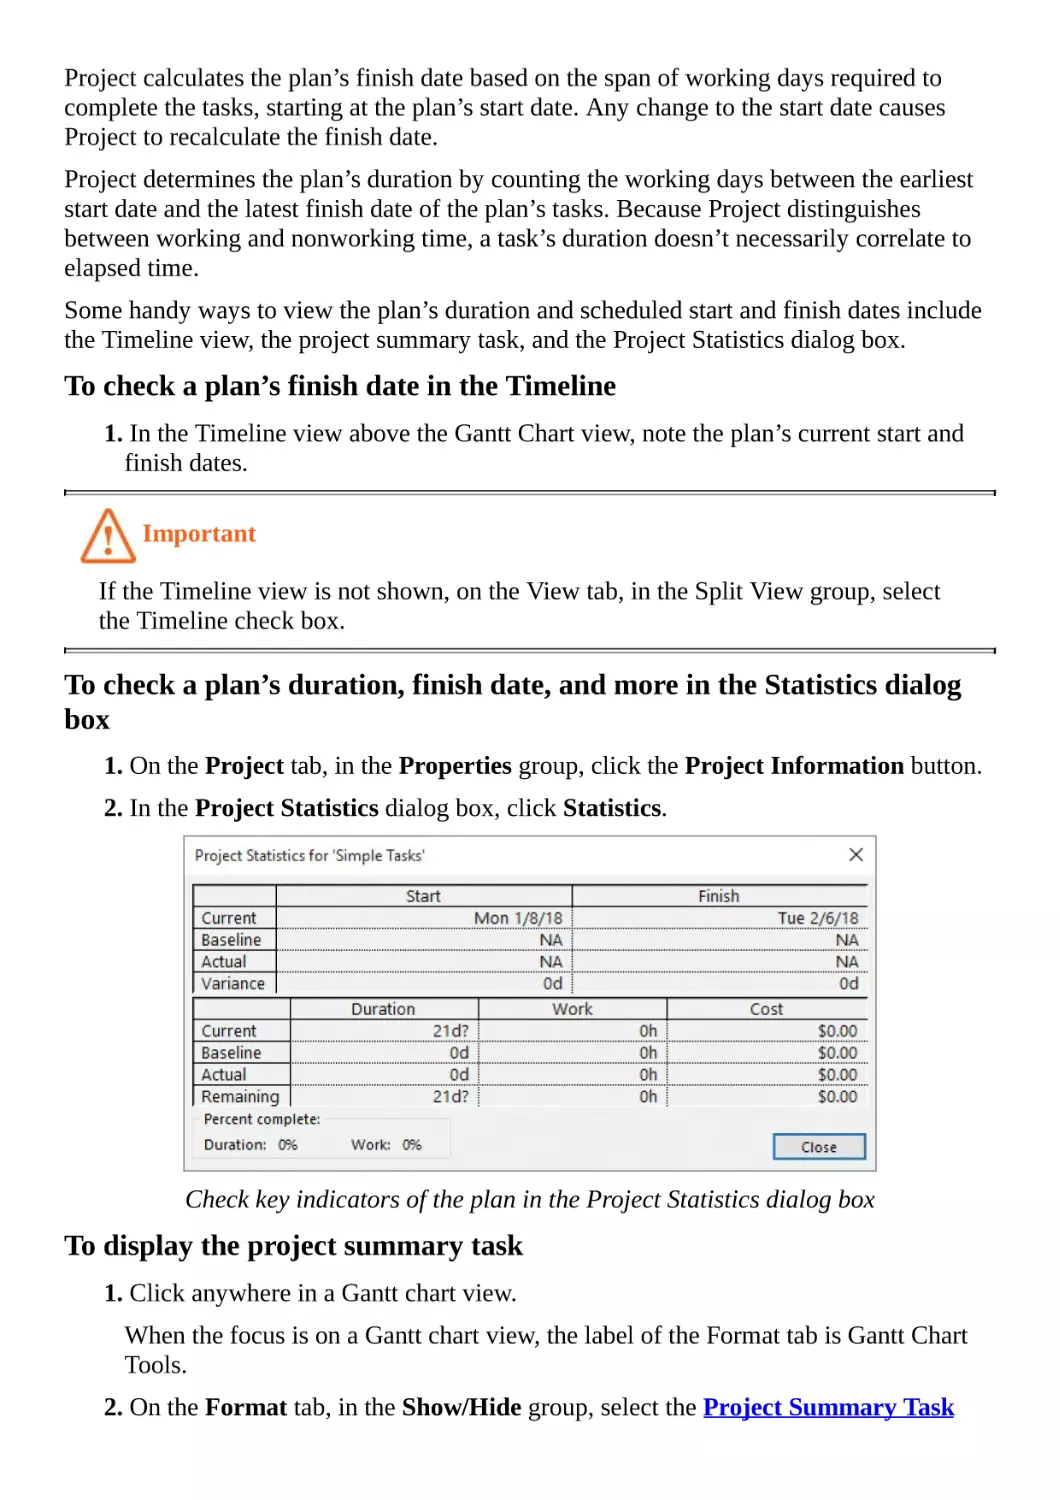
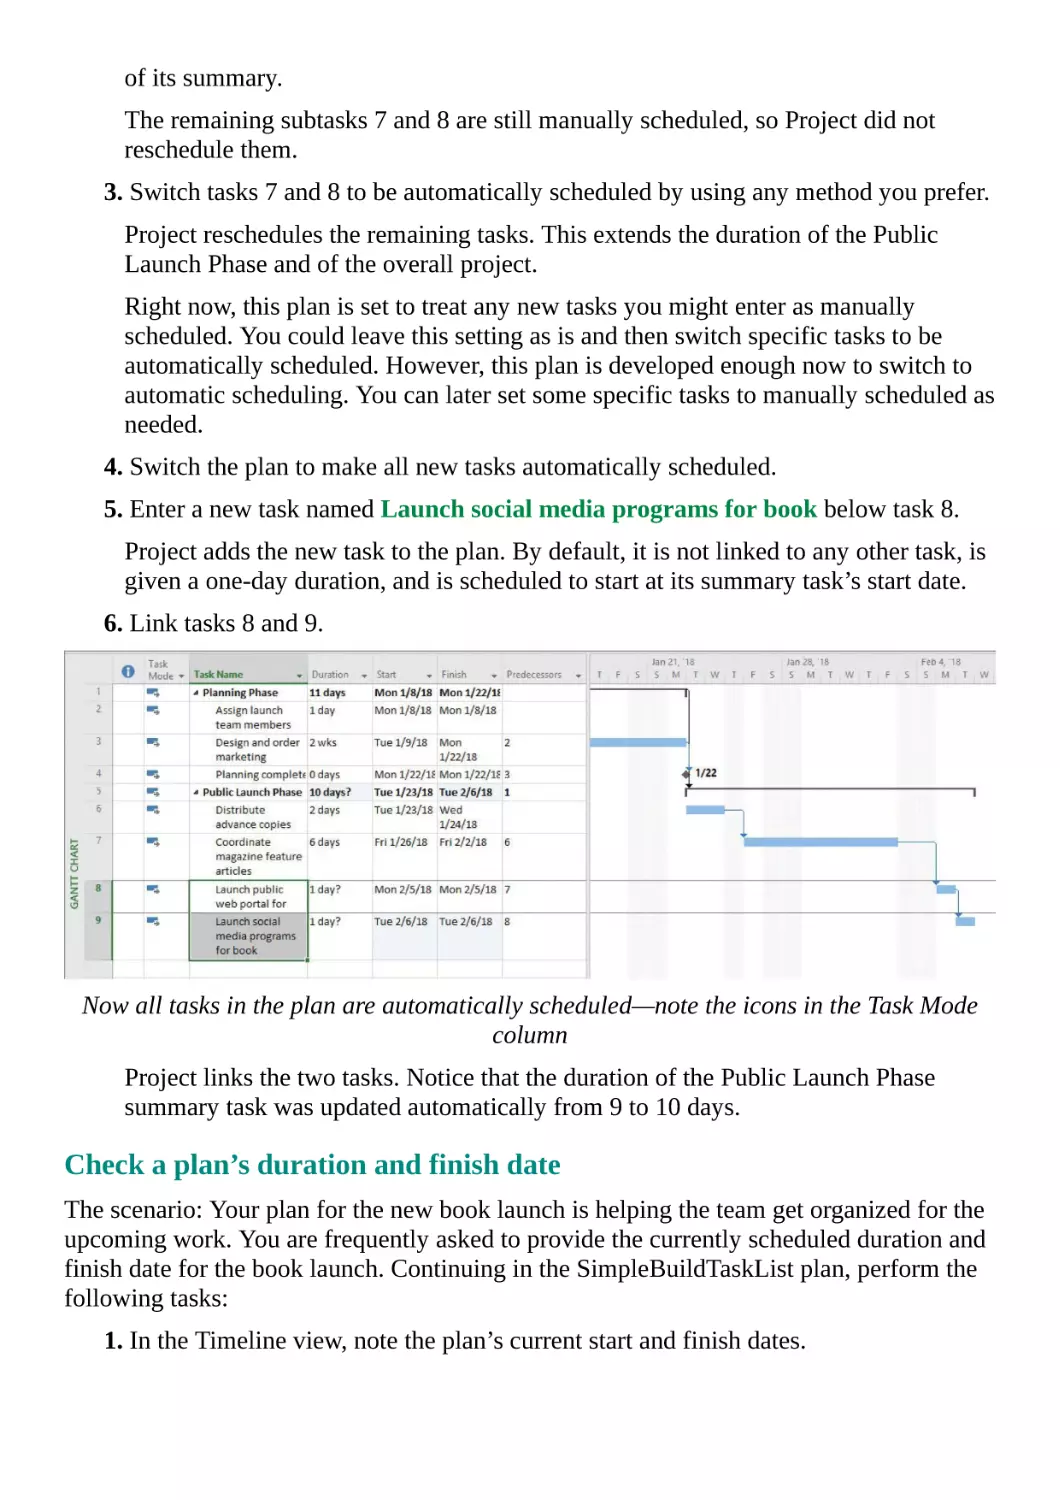
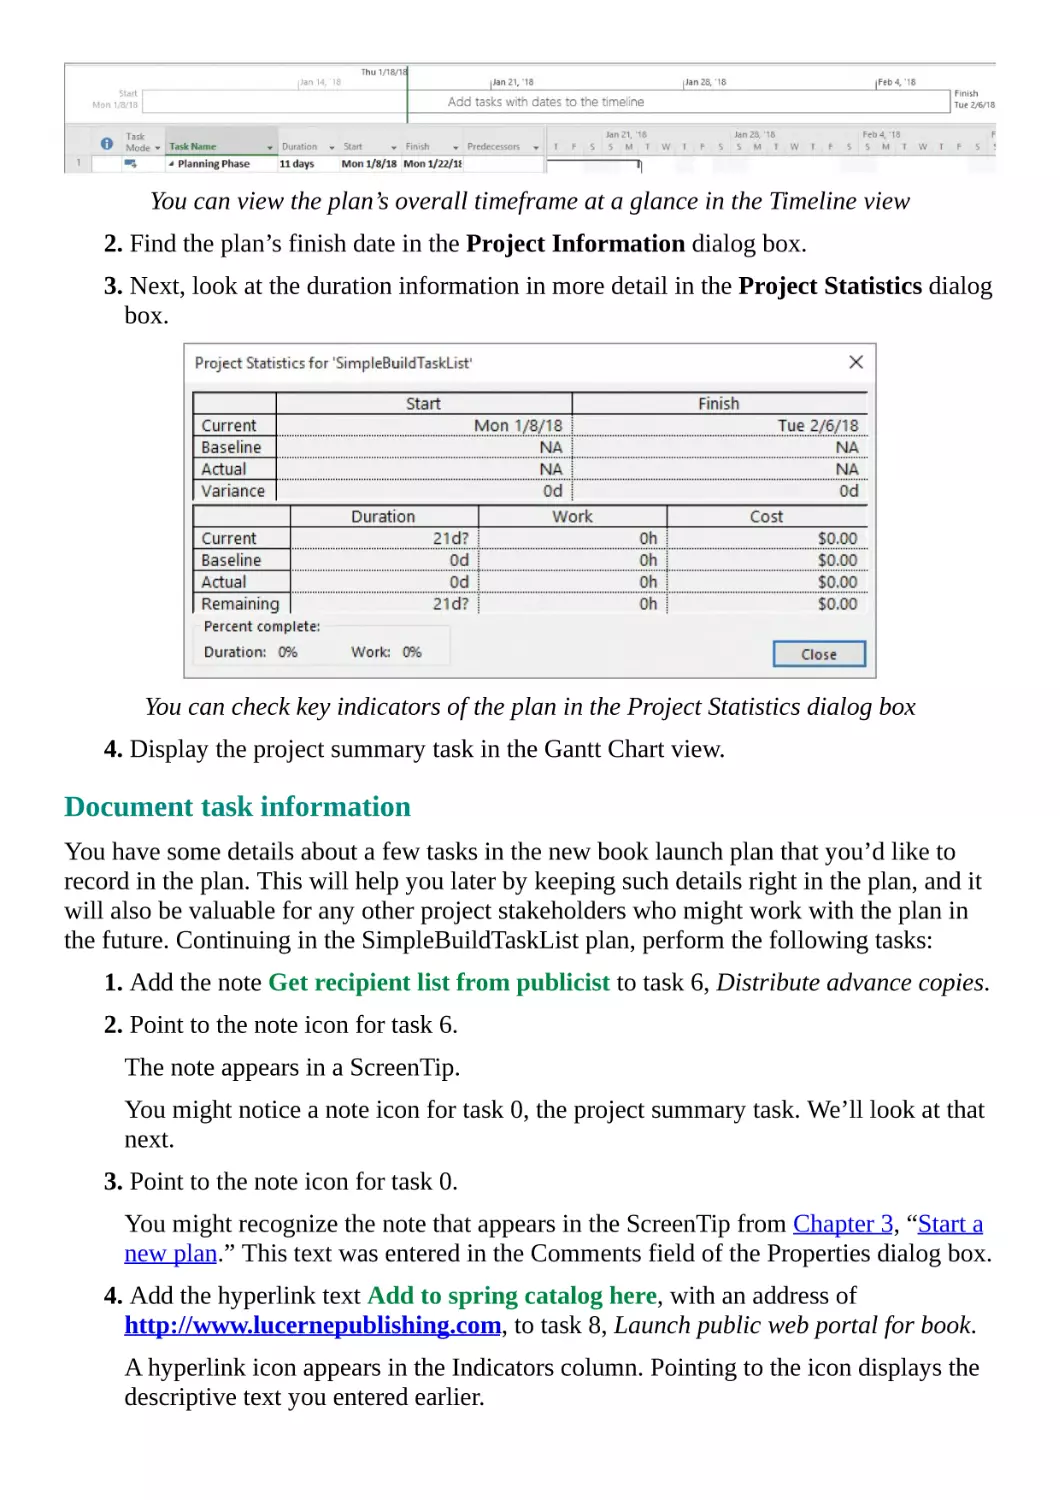
Check a plan’s duration and finish date
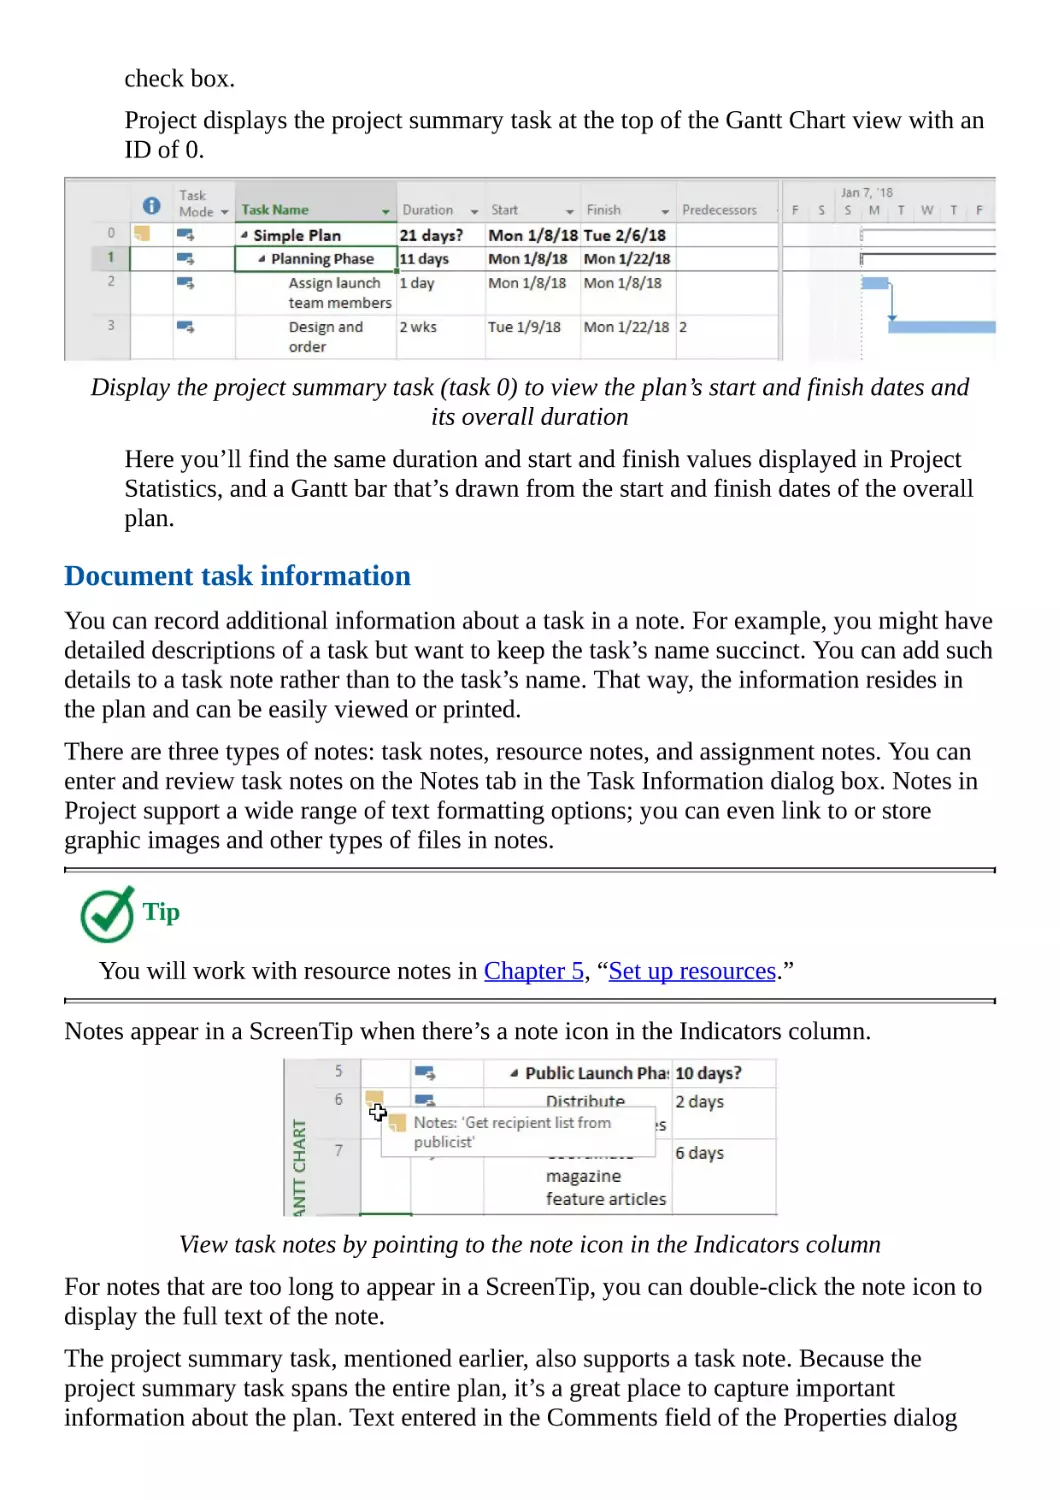
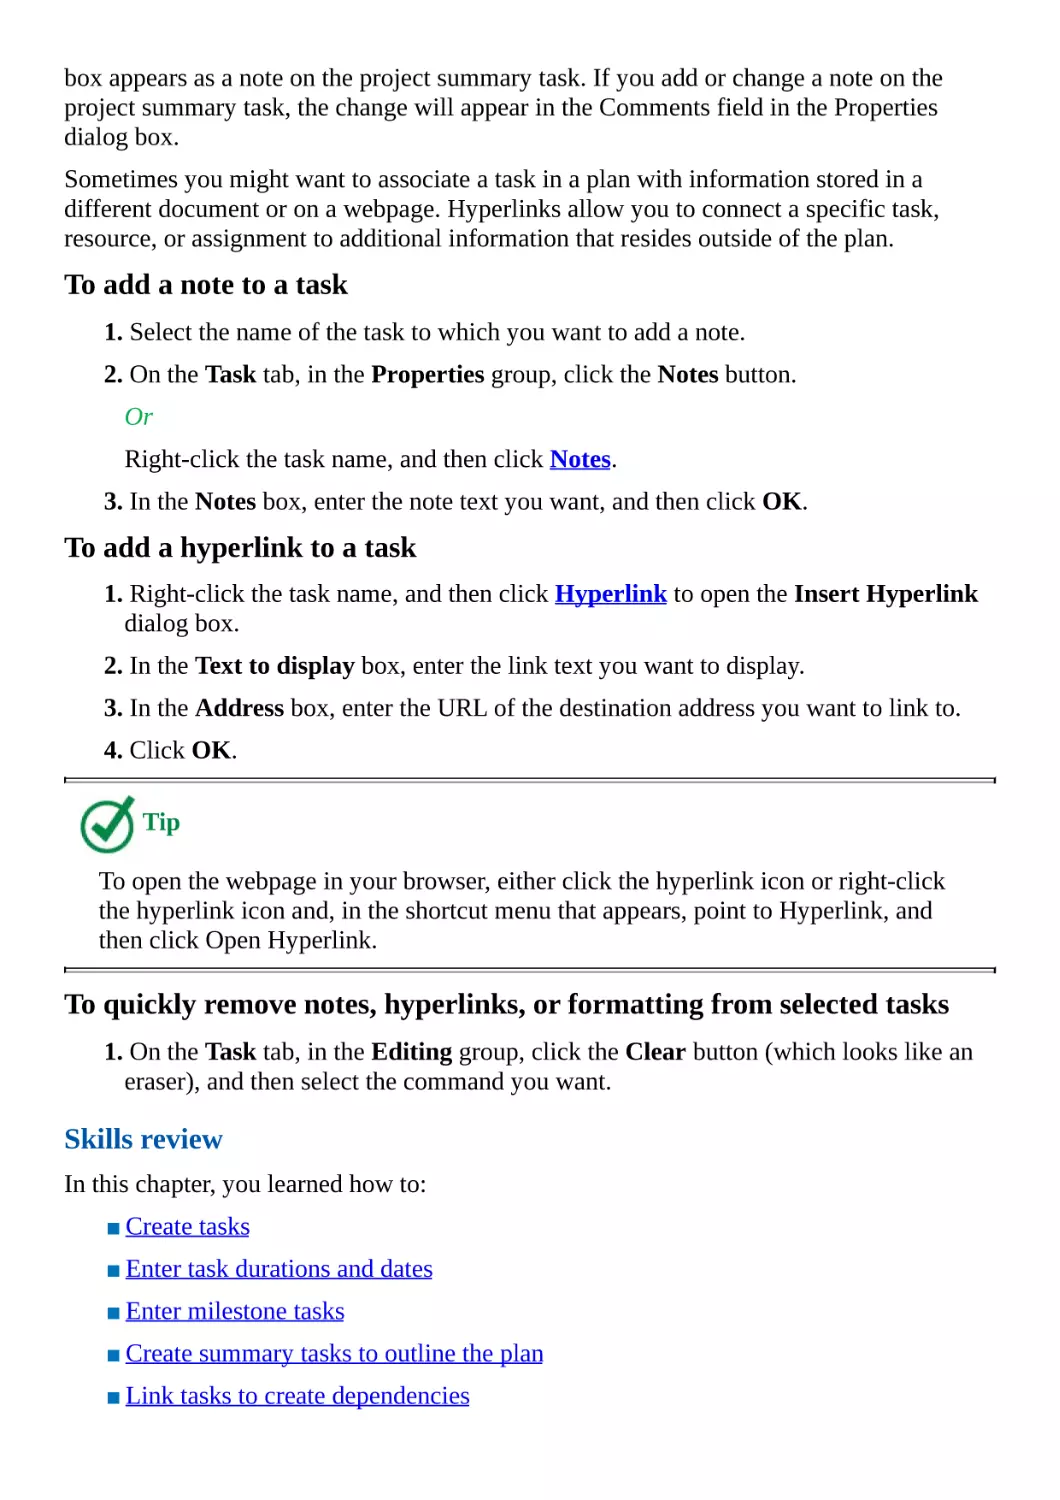
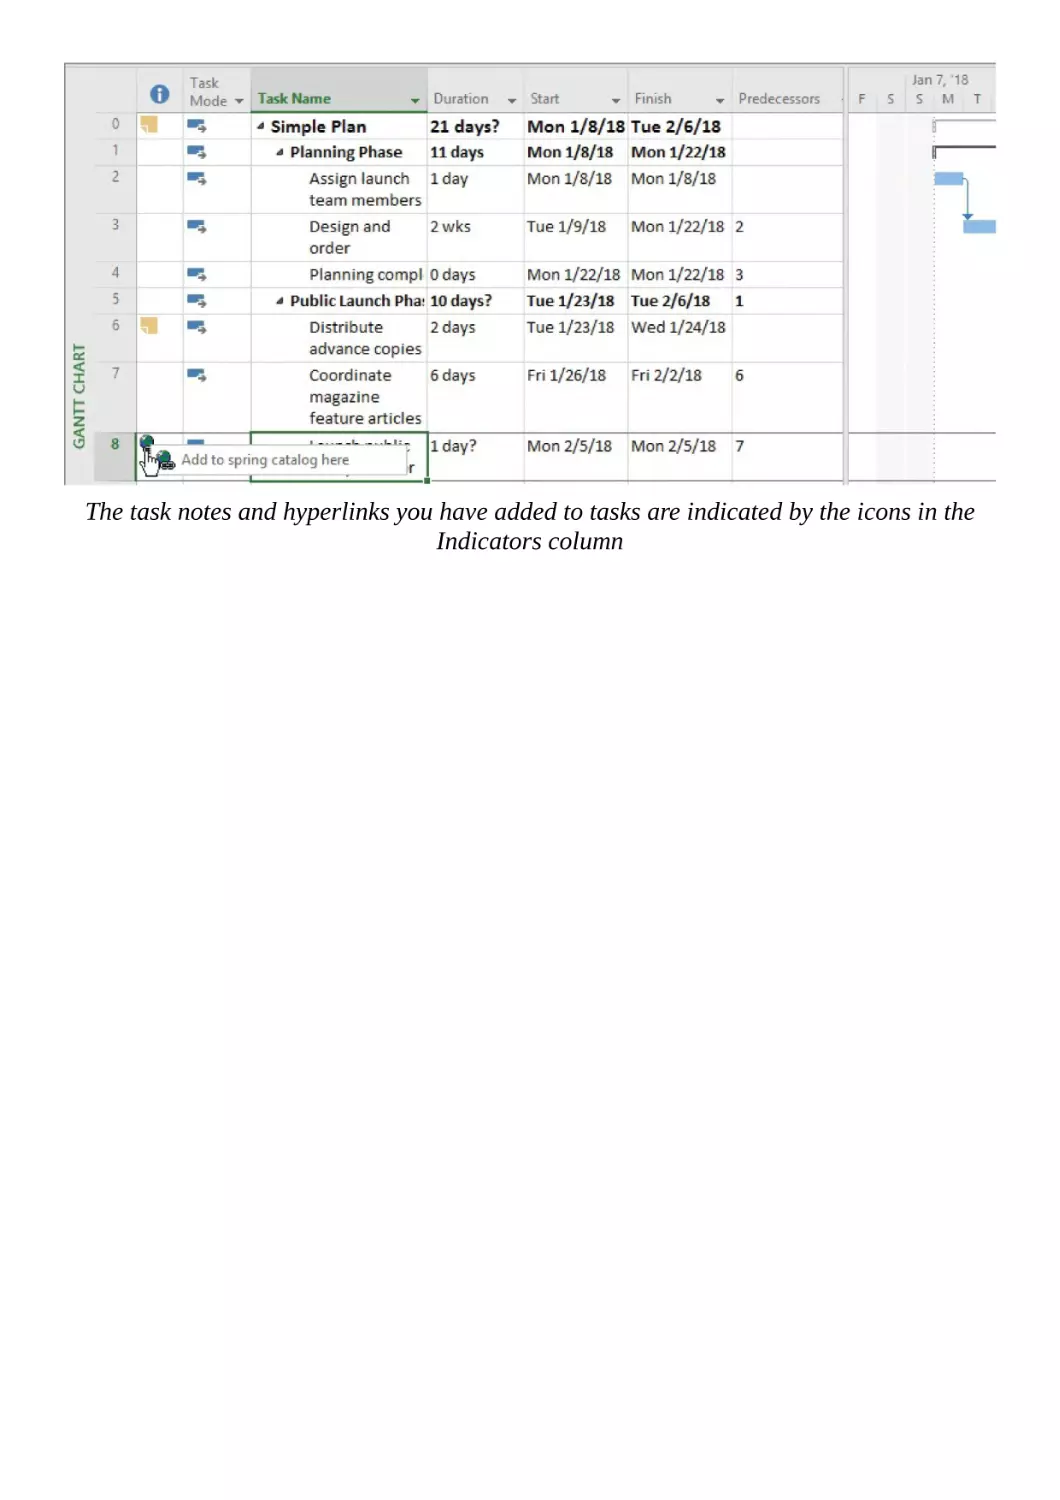
Document task information
Skills review
Practice tasks
5 Set up resources
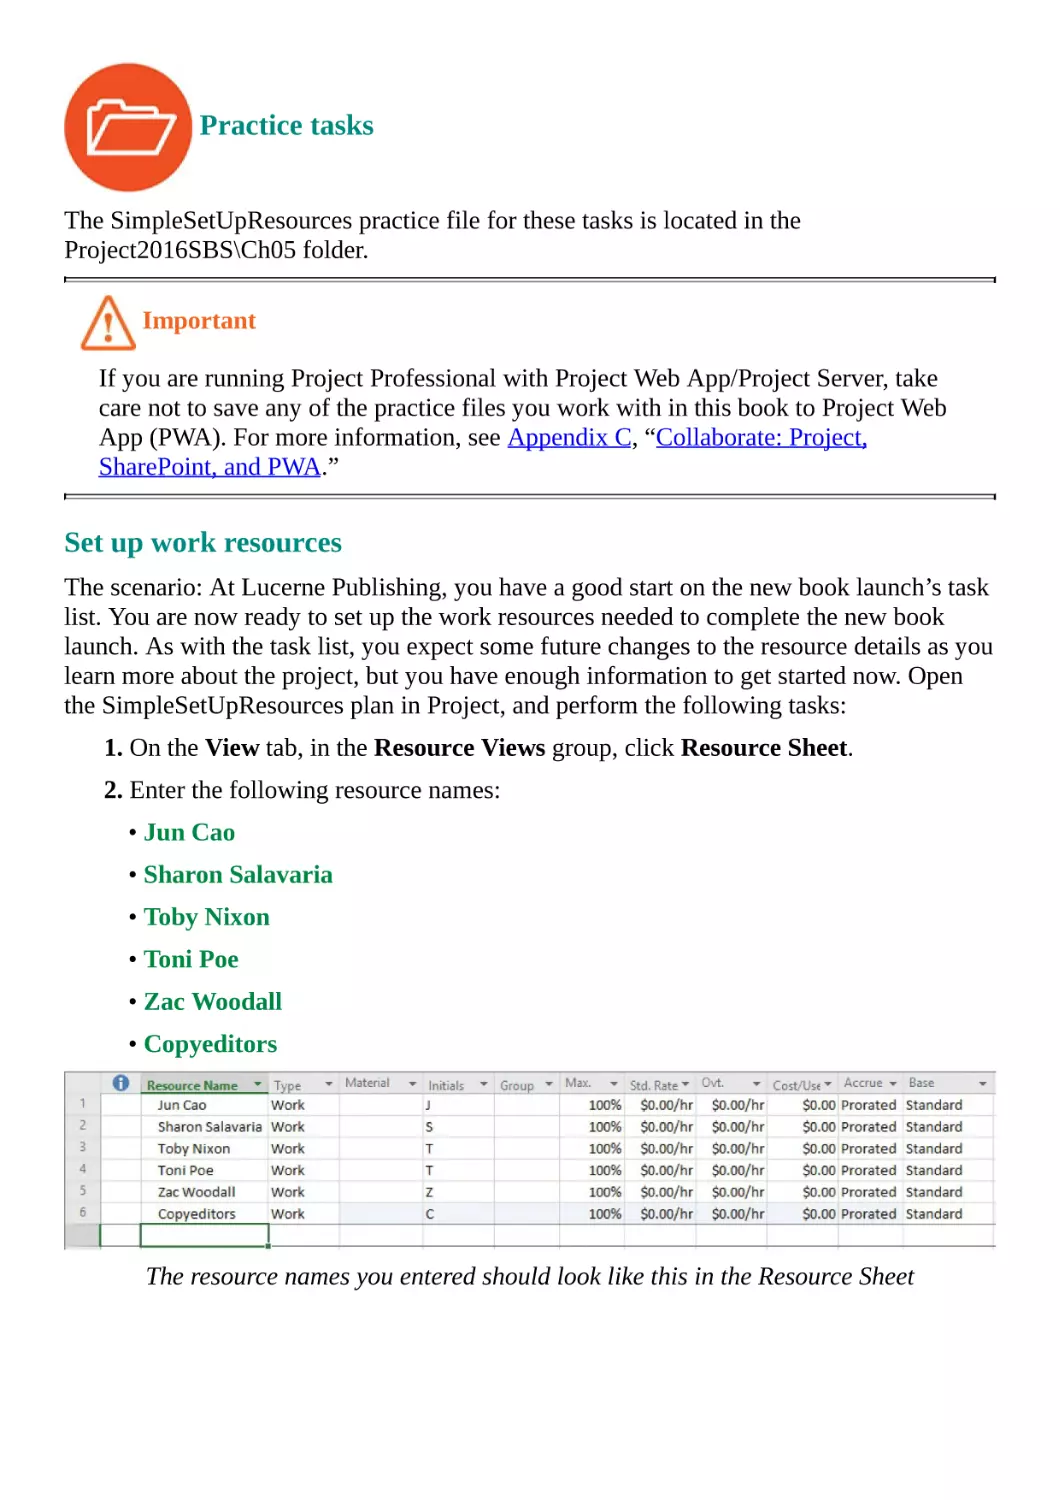
Set up work resources
Sidebar: Equipment resource considerations
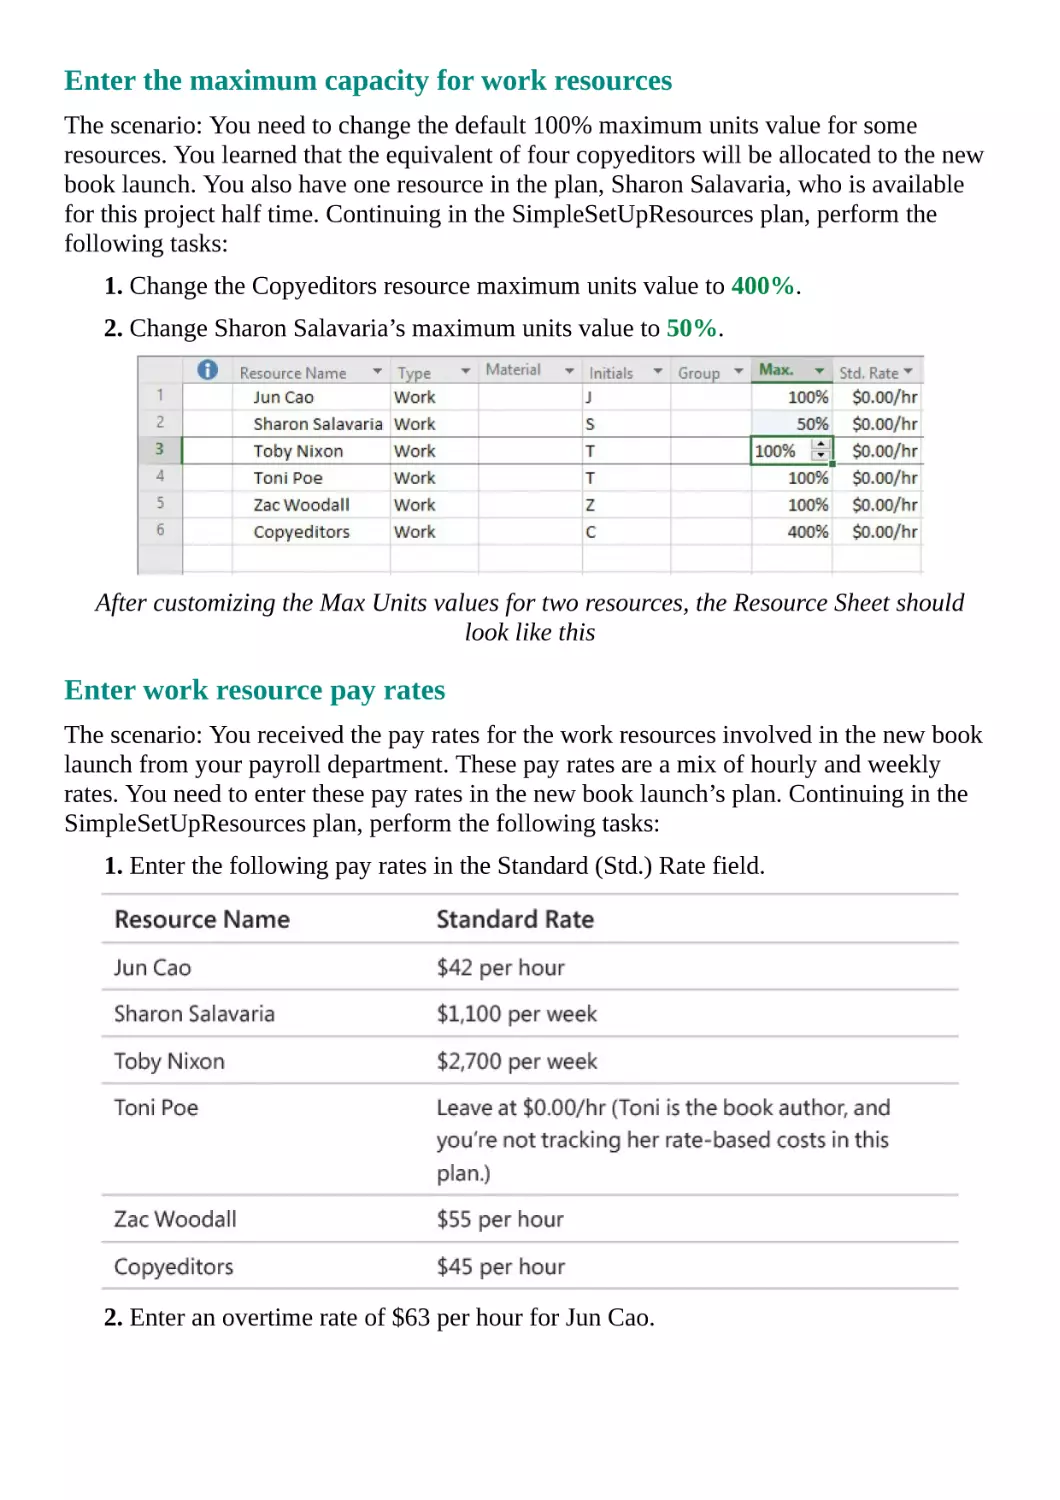
Enter the maximum capacity for work resources
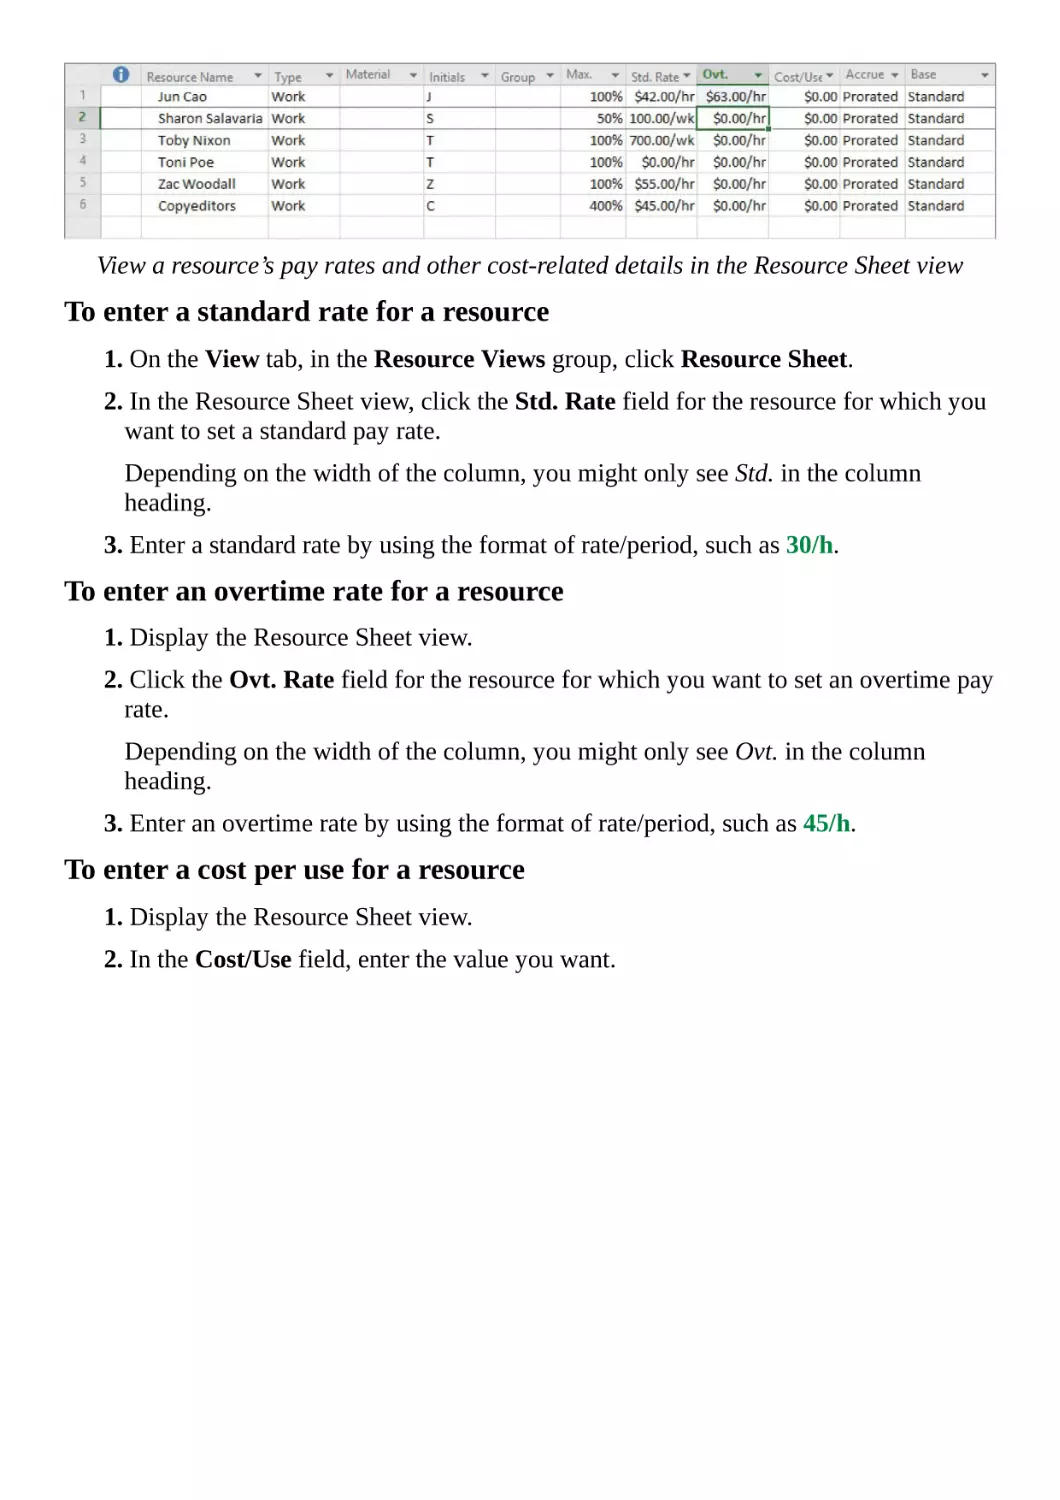
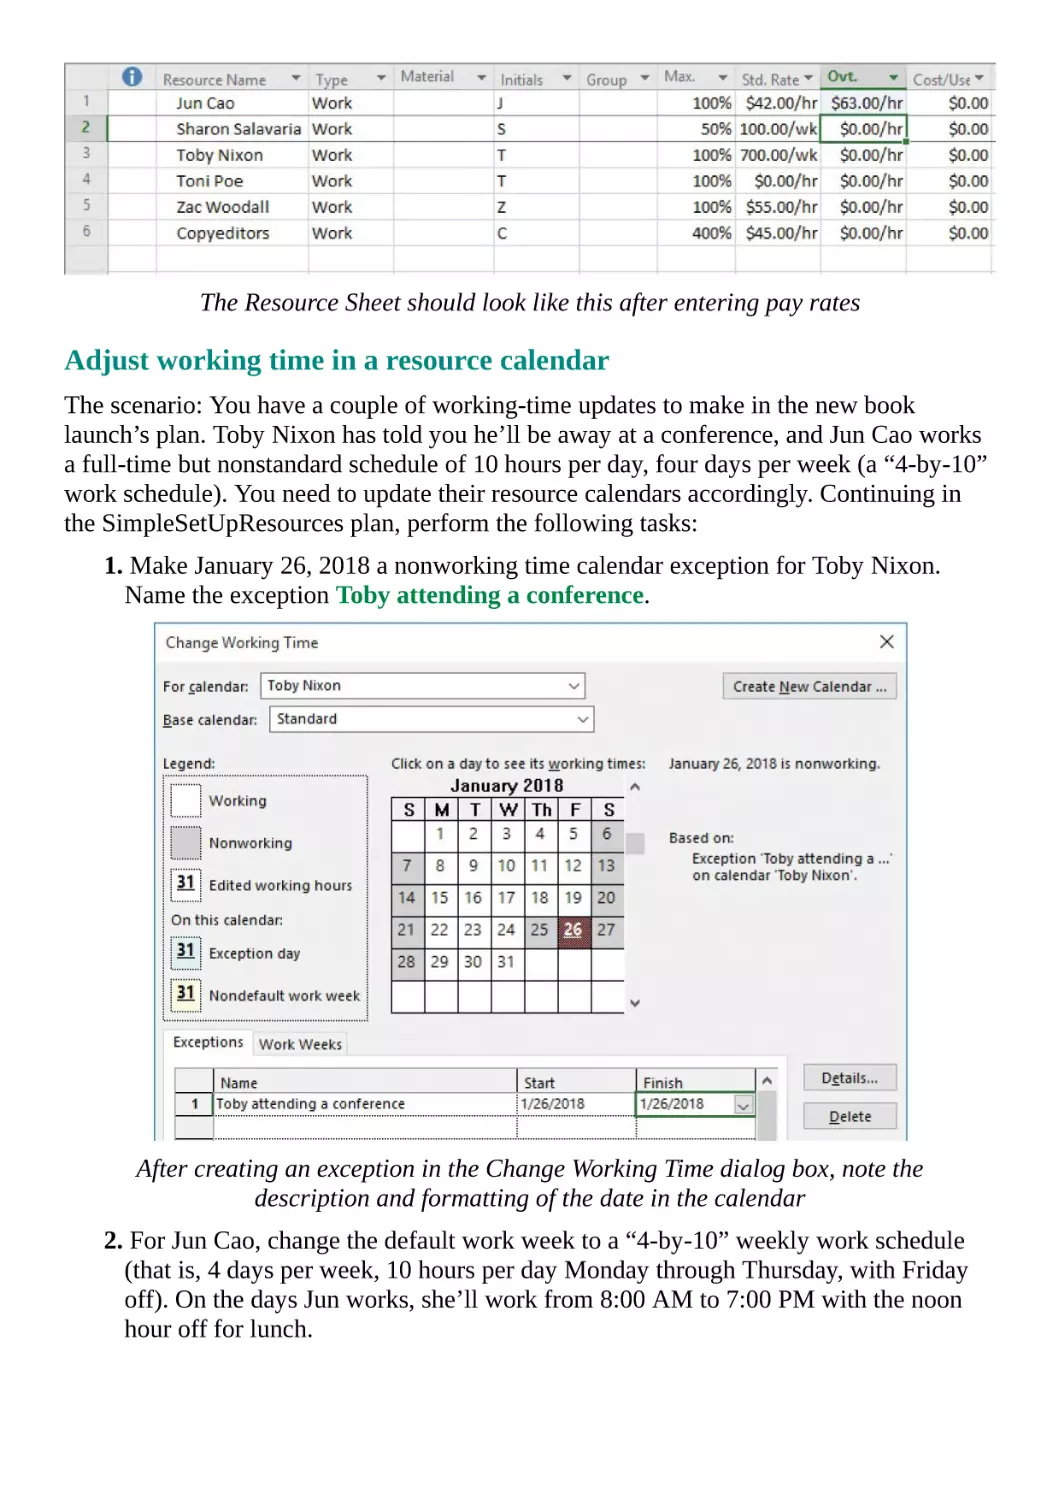
Enter work resource pay rates
Sidebar: Project management focus: Getting resource cost information
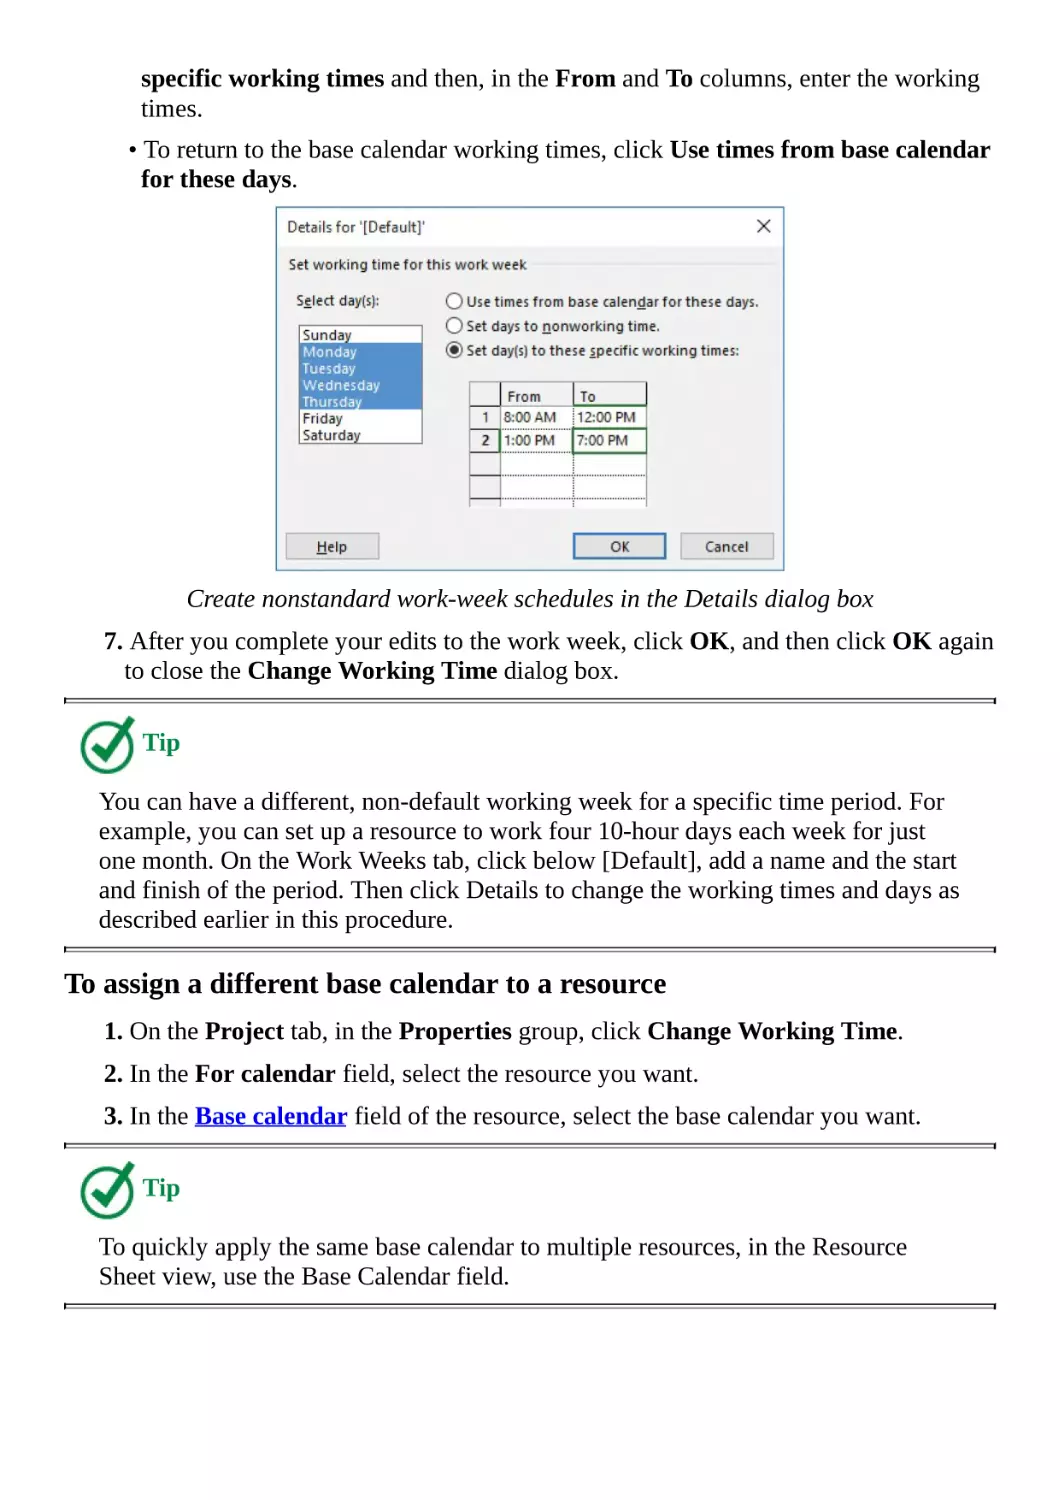
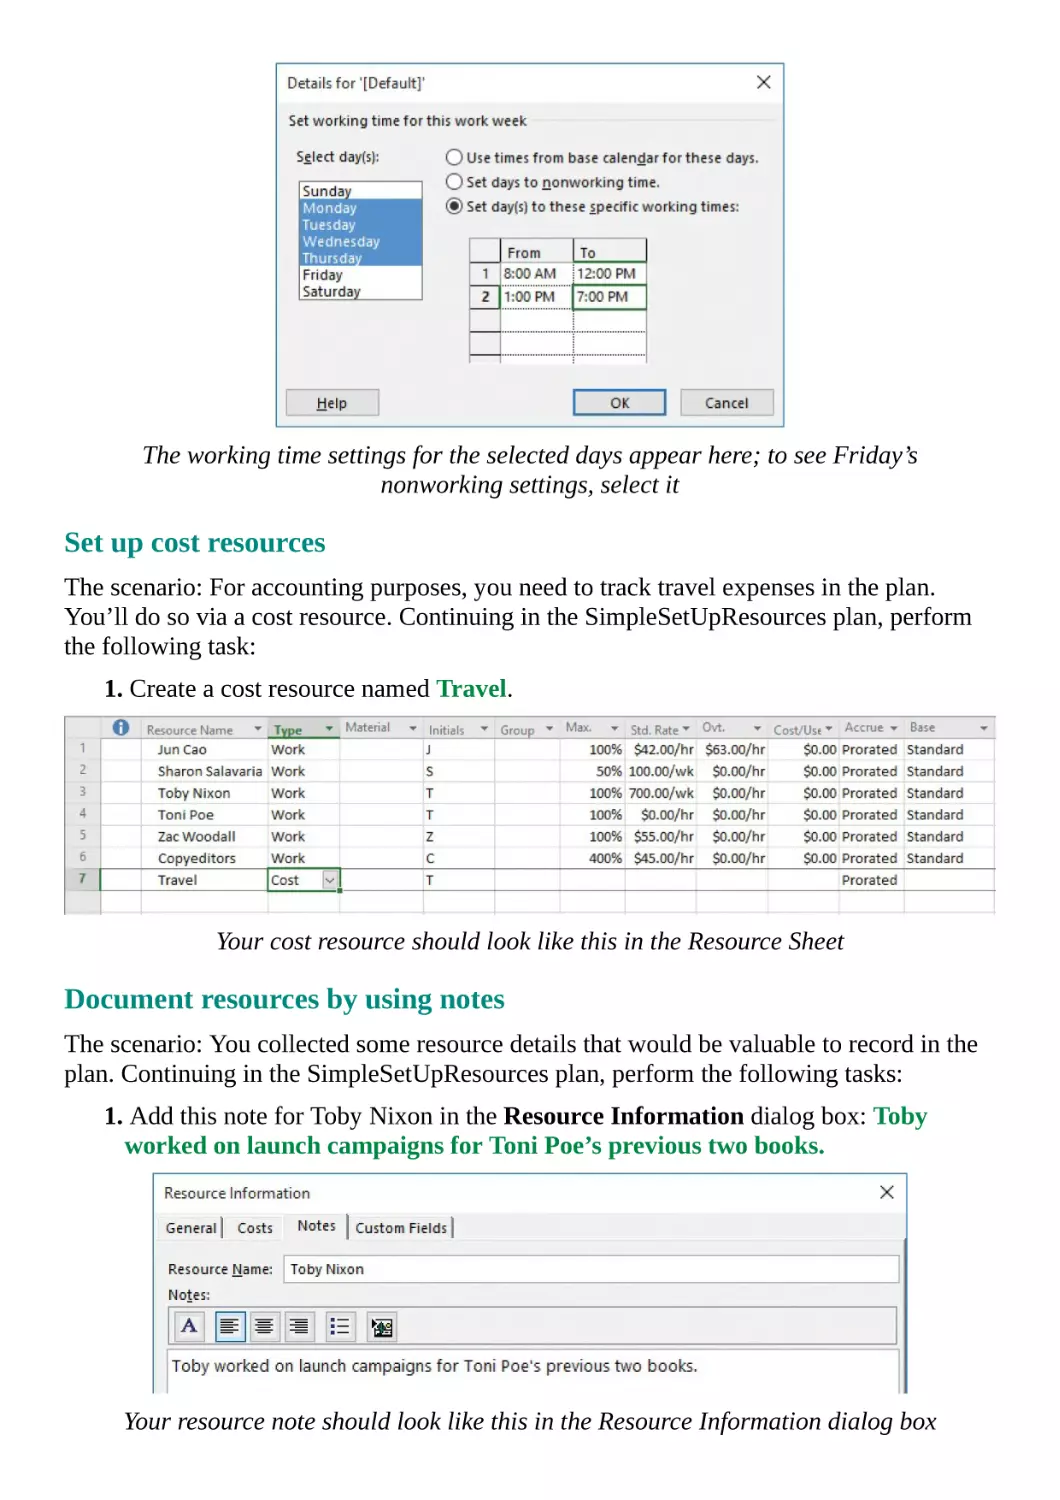
Adjust working time in a resource calendar
Set up cost resources
Document resources by using notes
Skills review
Practice tasks
6 Assign resources to tasks
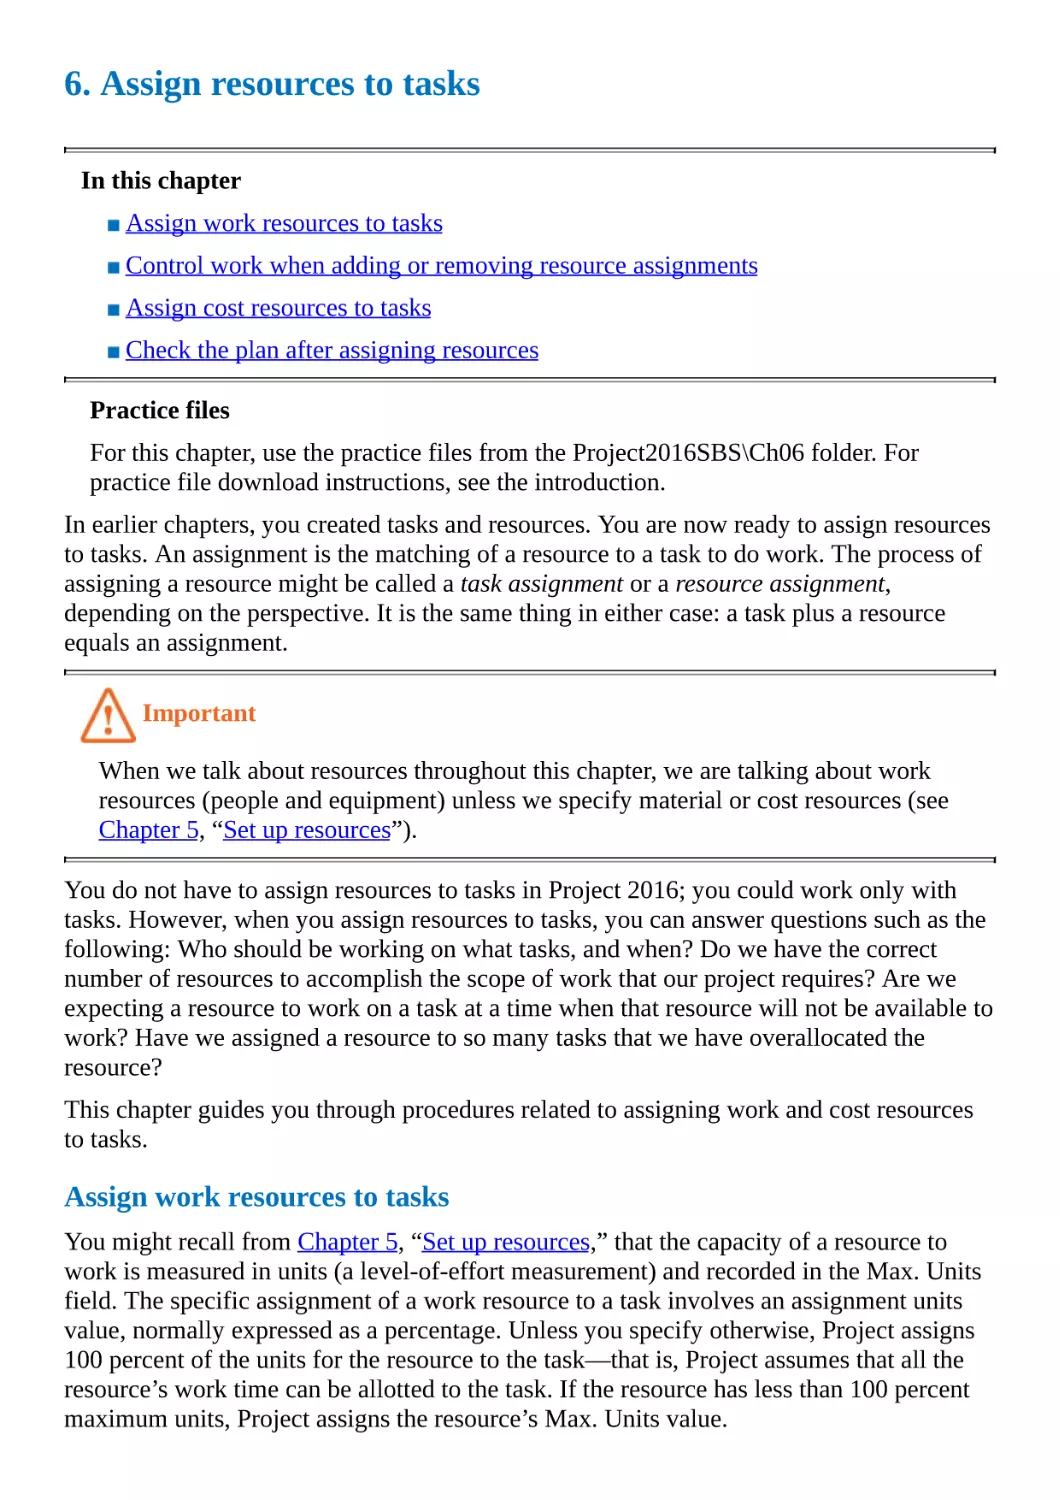
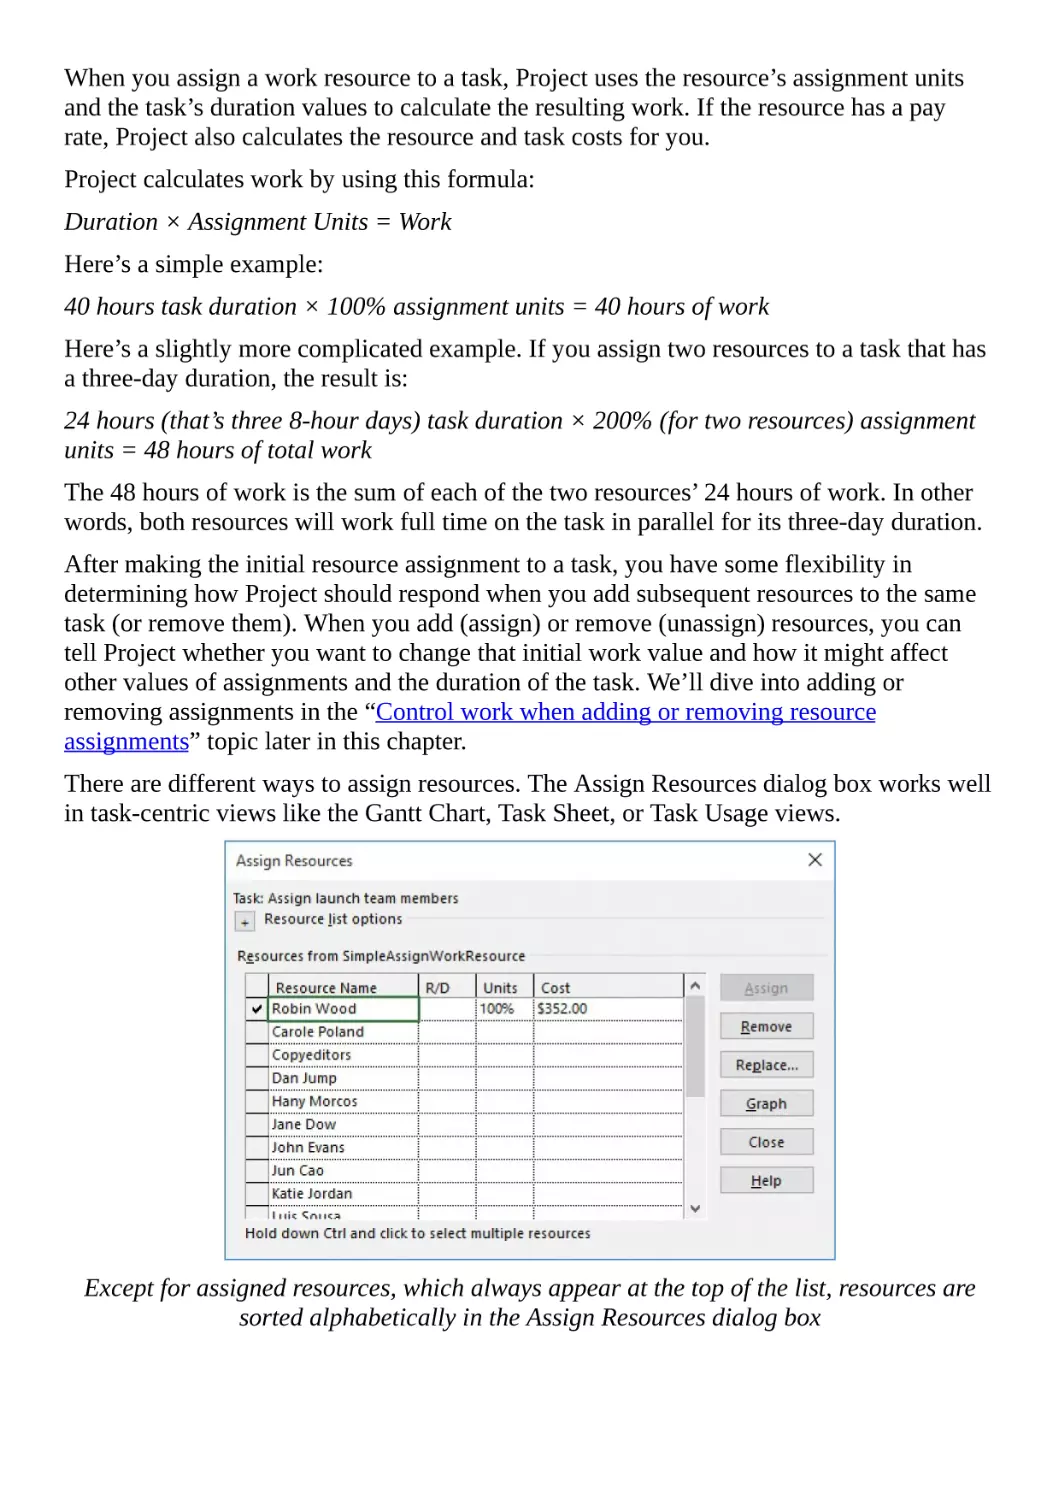
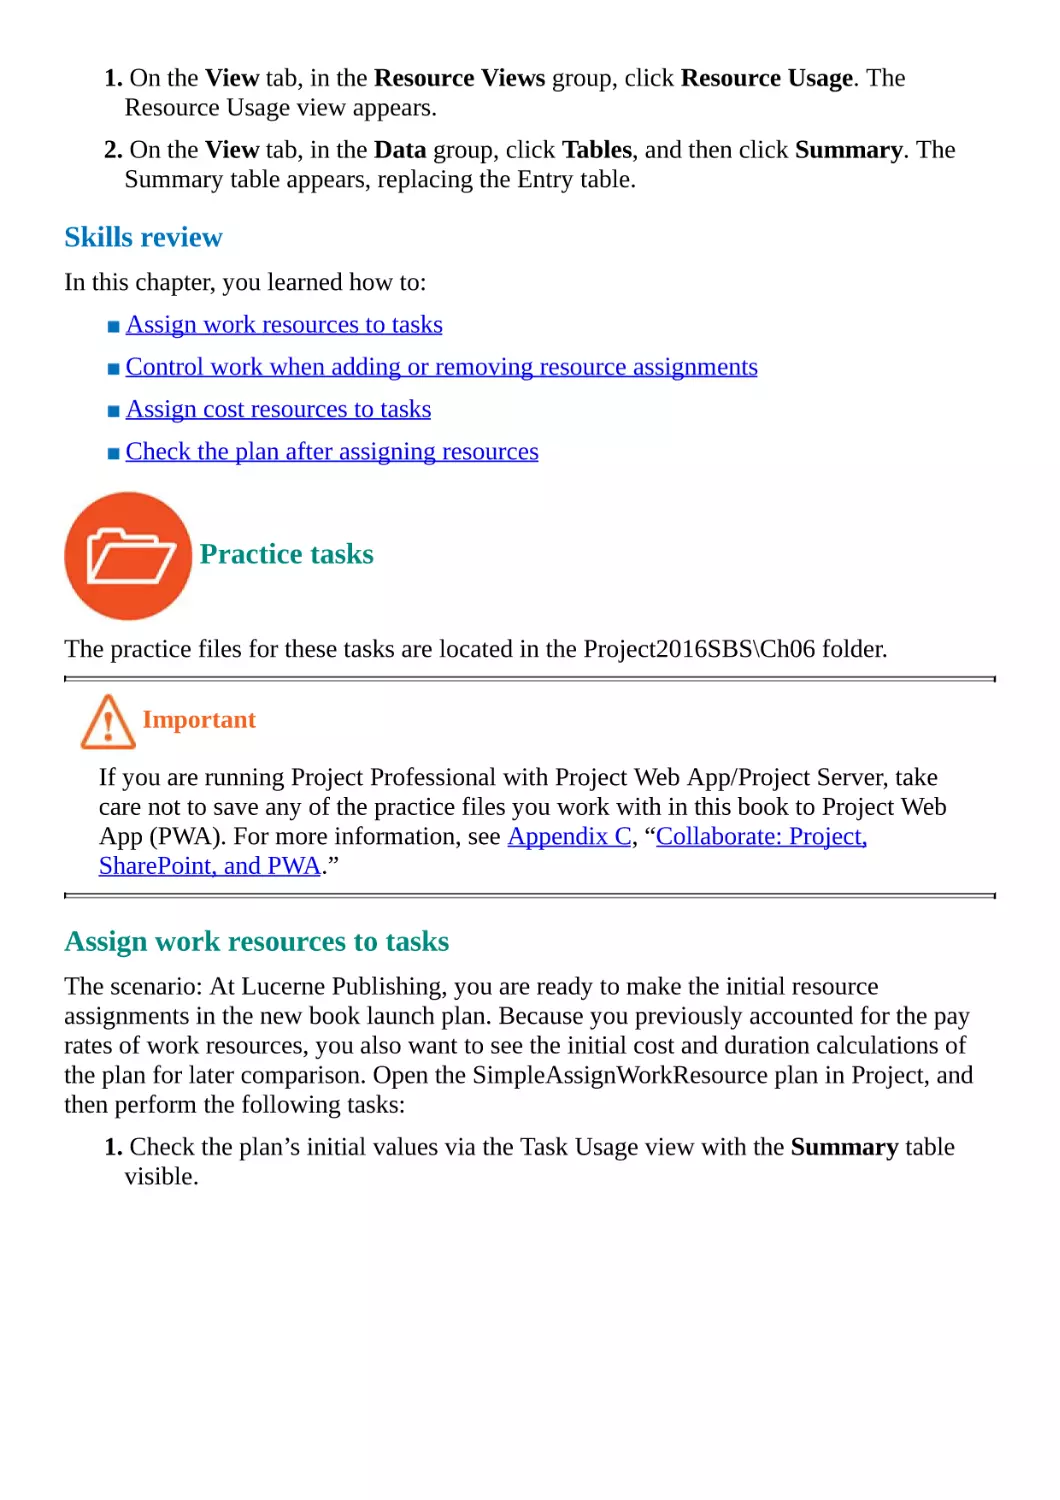
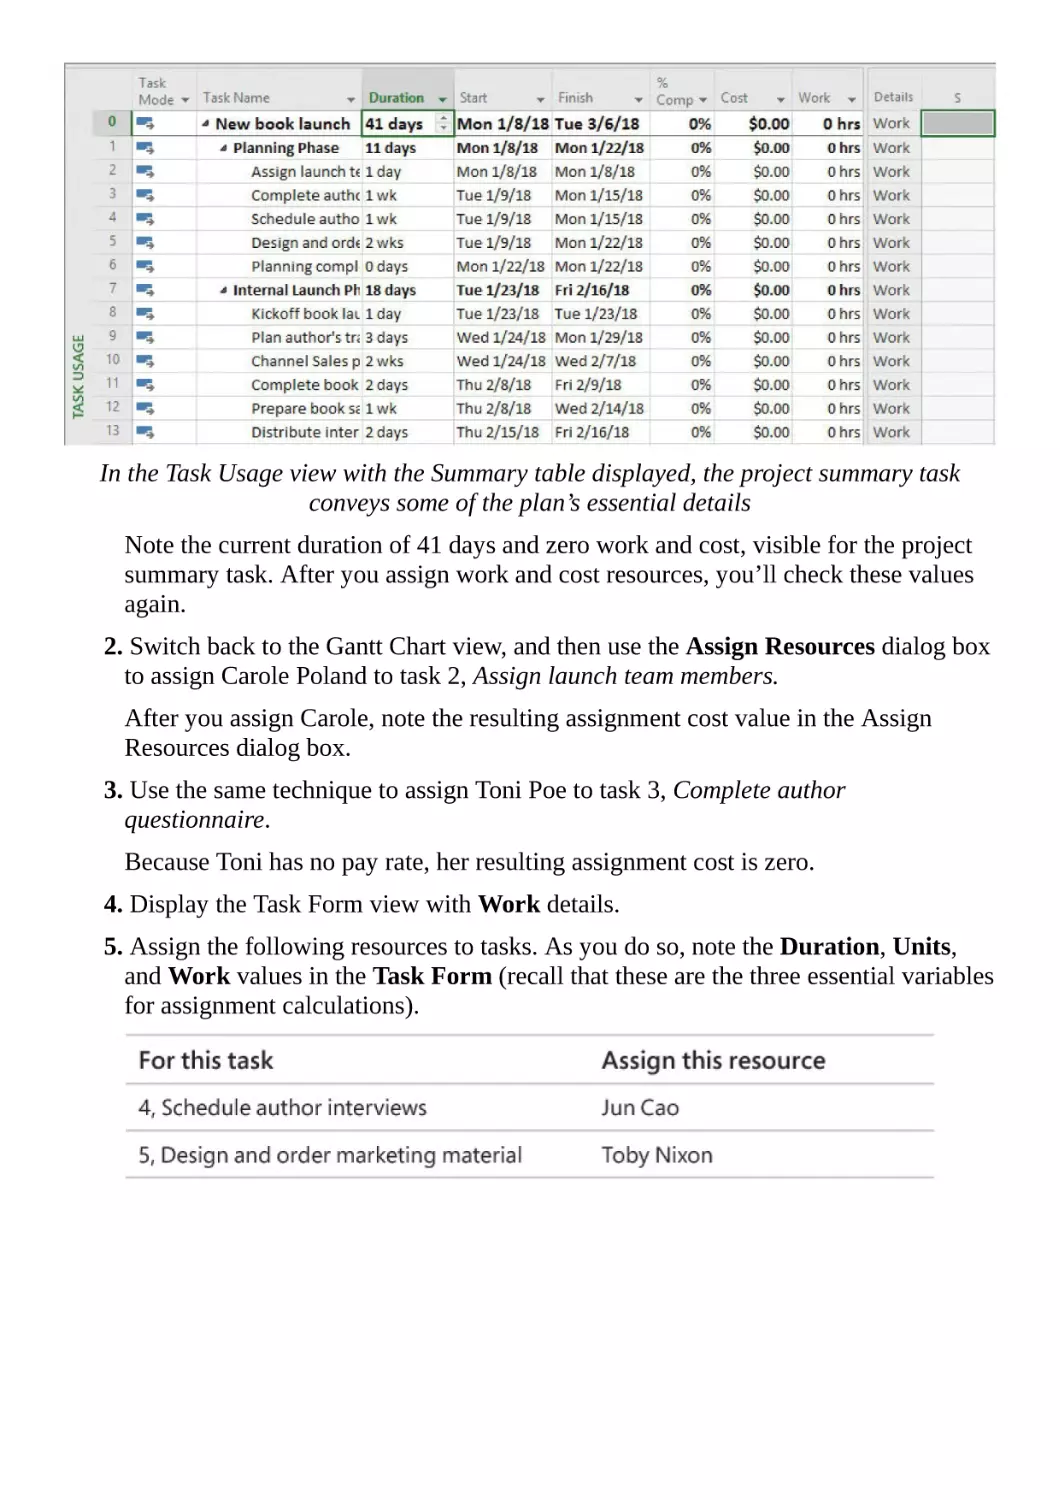
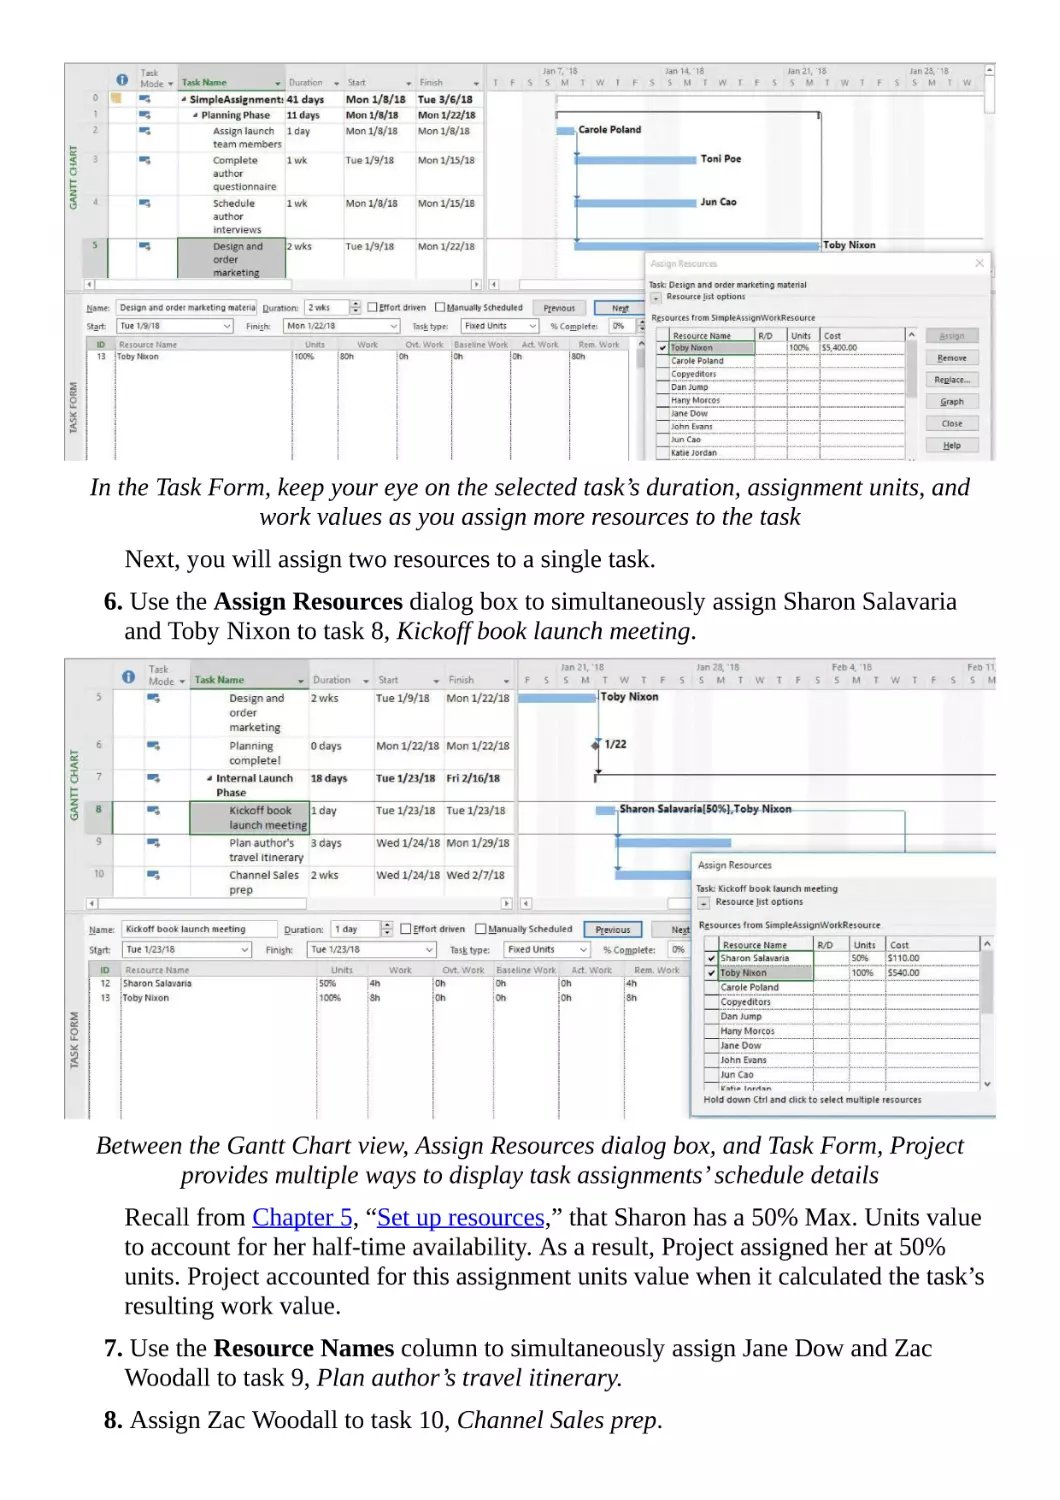
Assign work resources to tasks
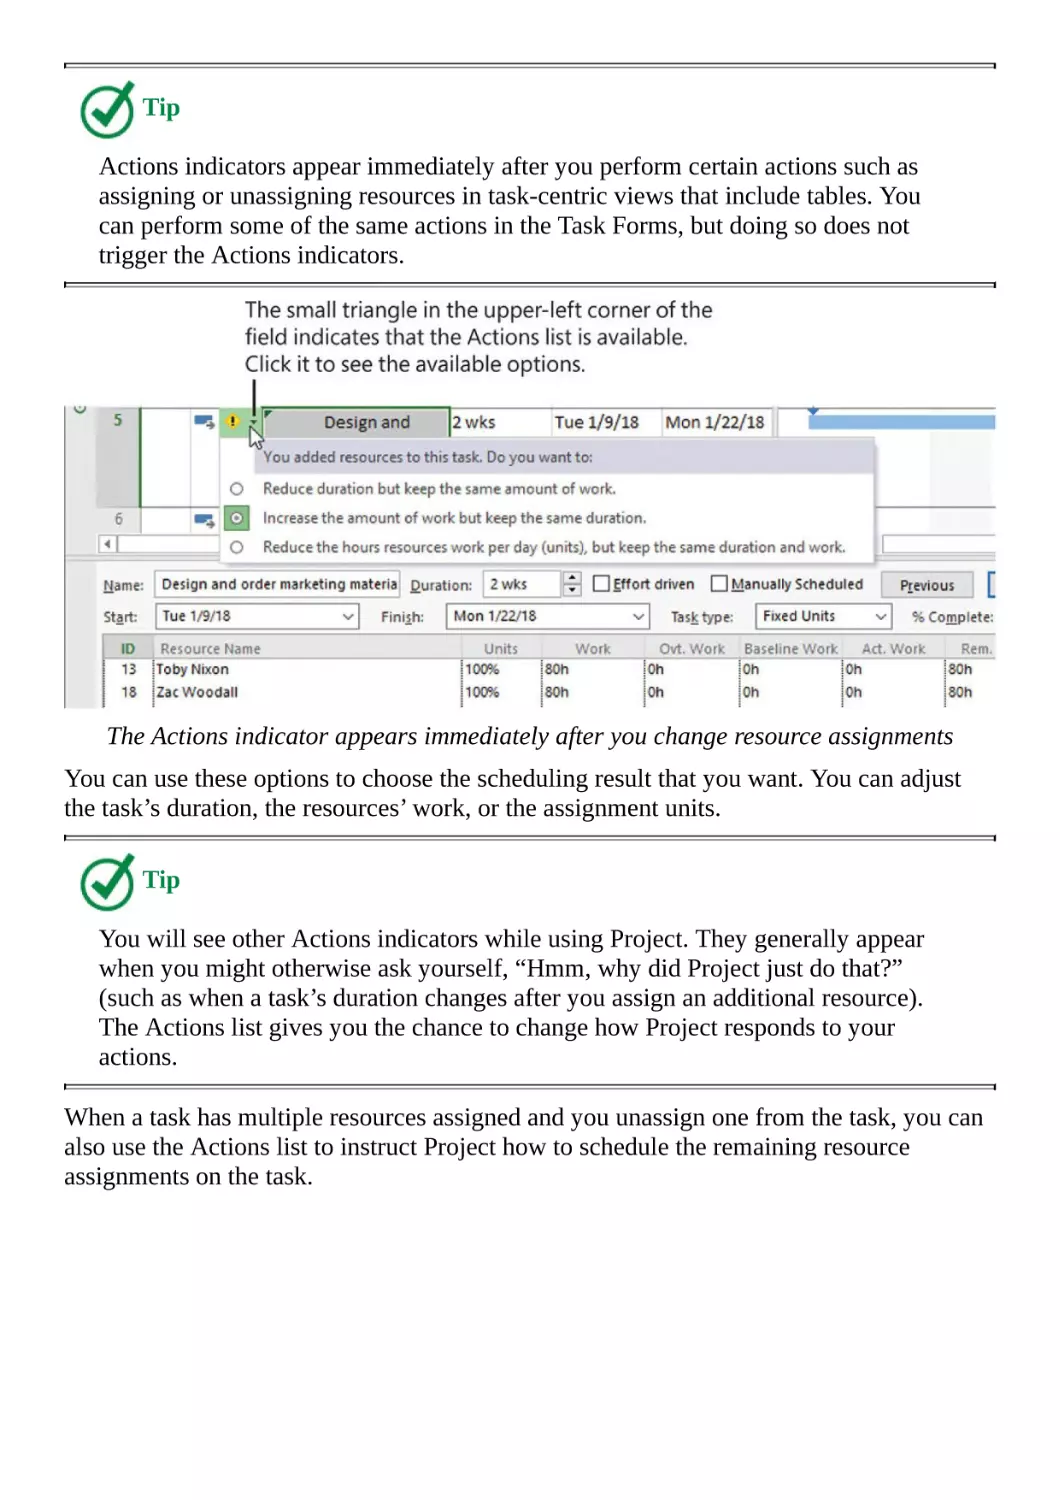
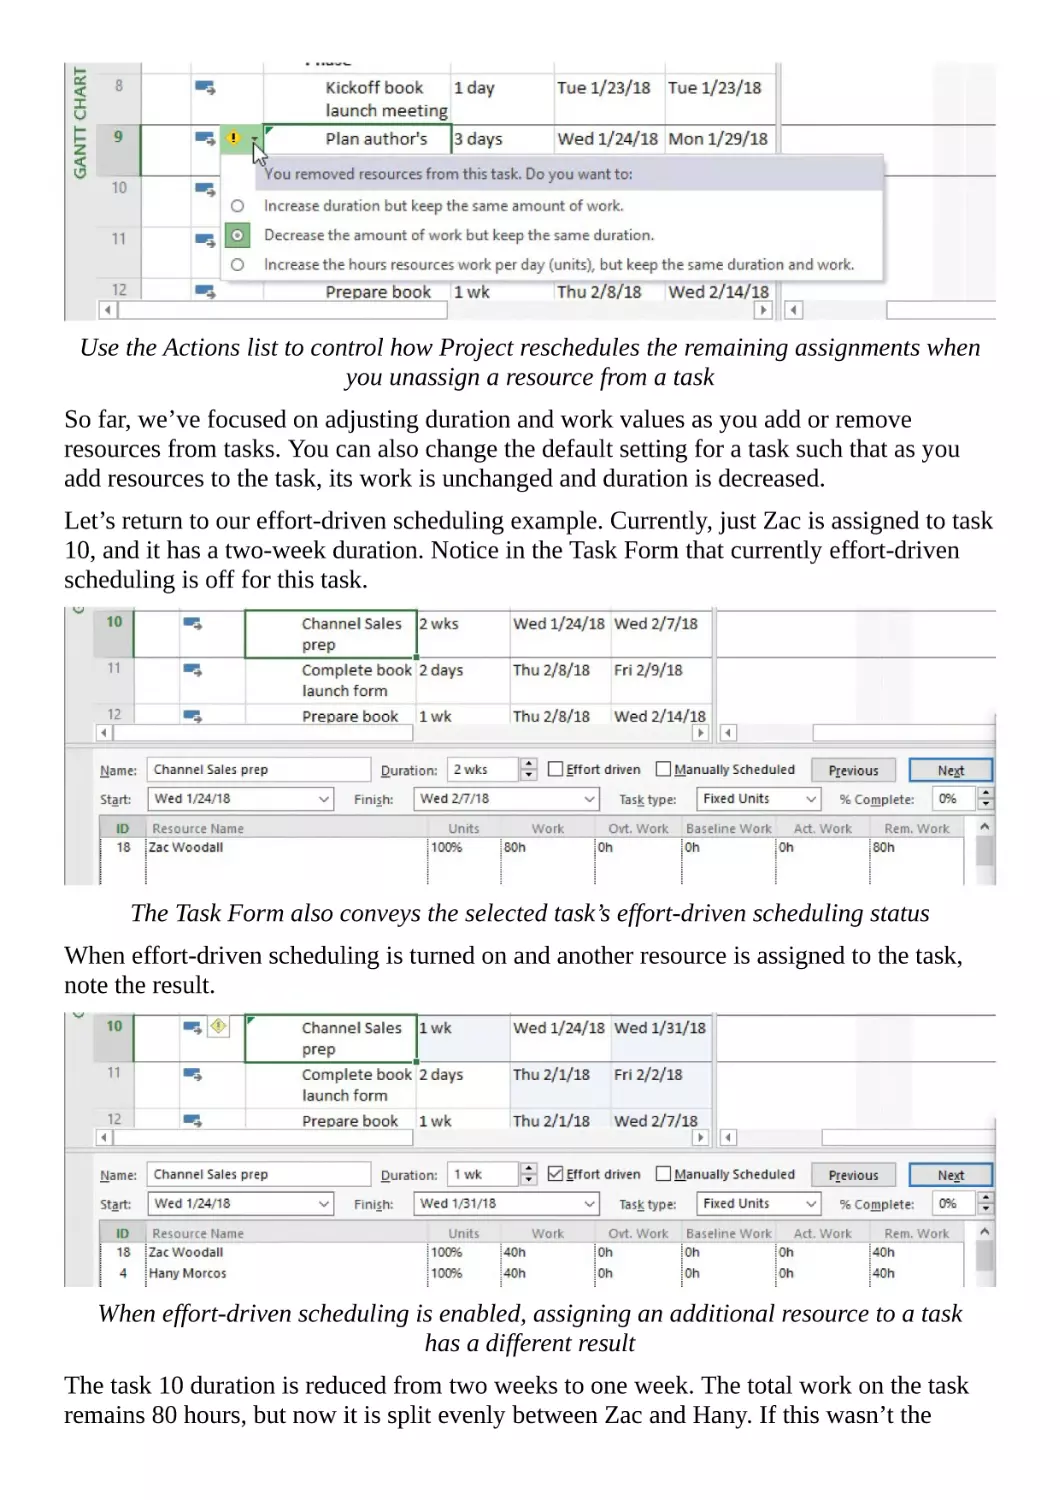
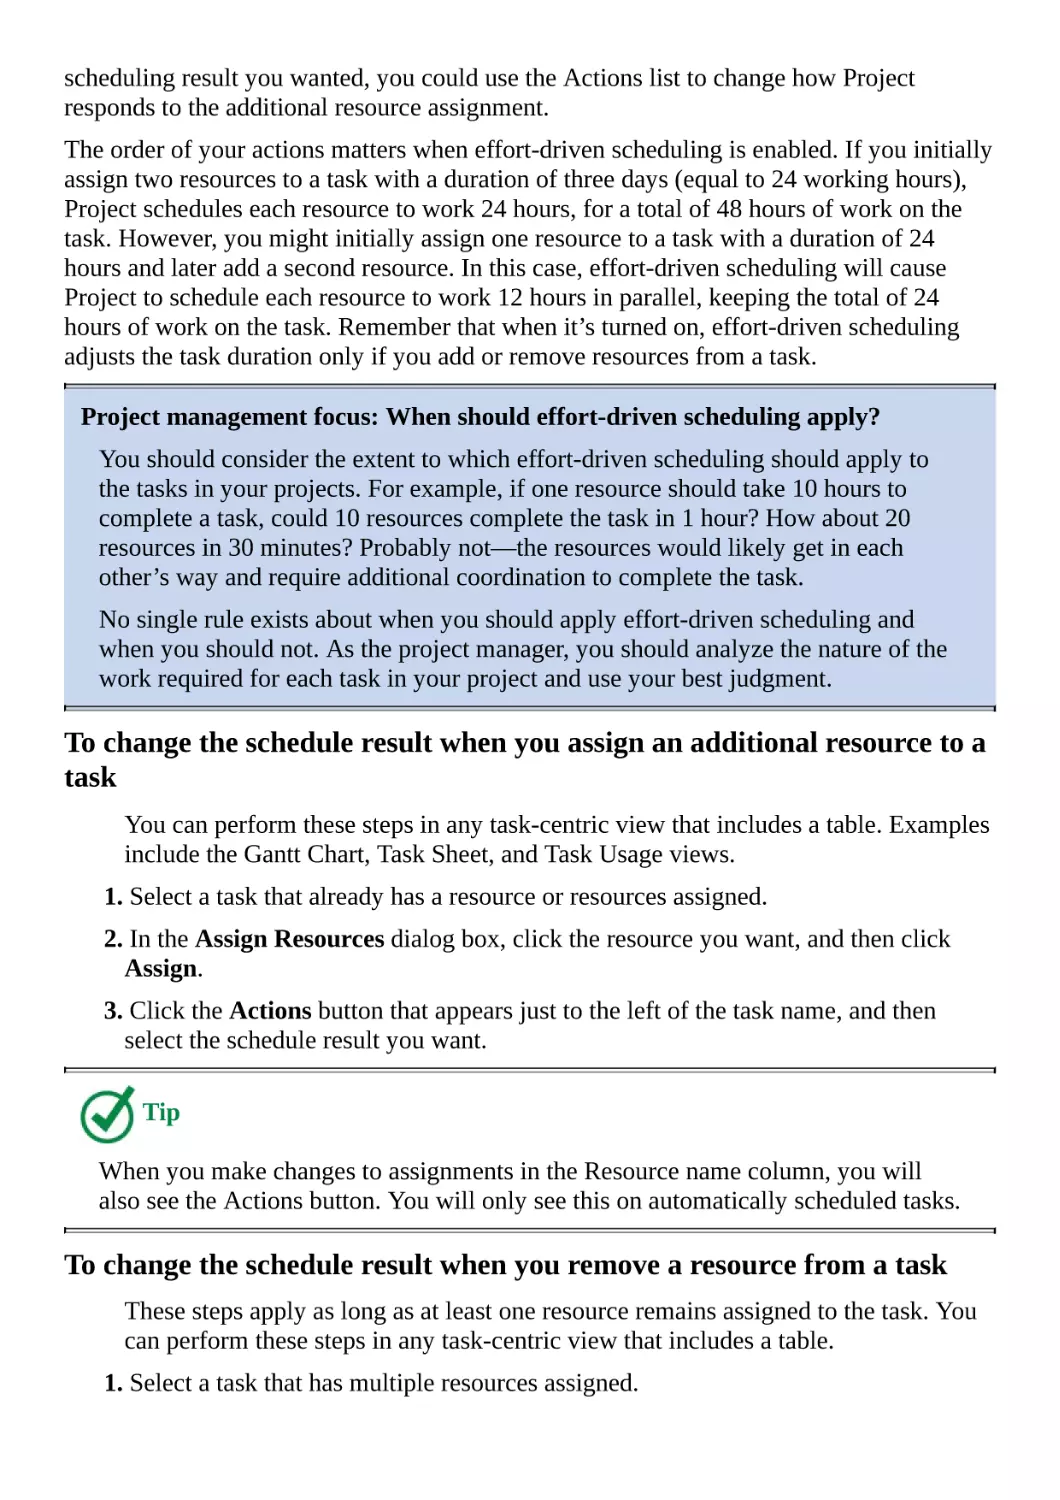
Control work when adding or removing resource assignments
Sidebar: Project management focus: When should effort-driven scheduling apply?
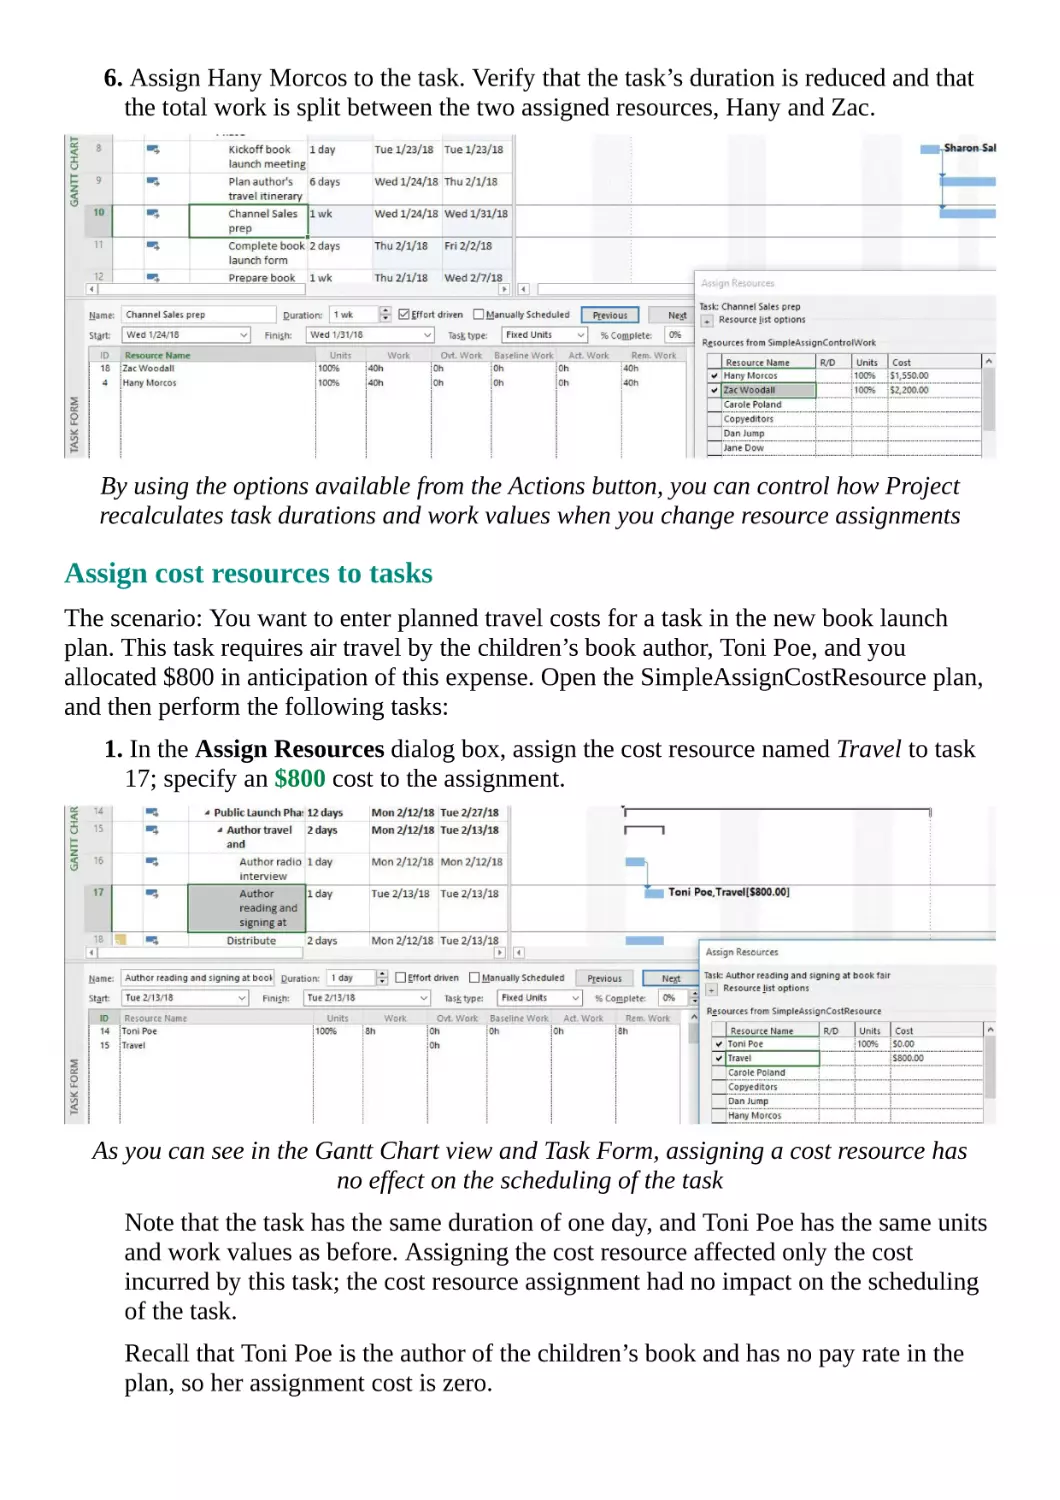
Assign cost resources to tasks
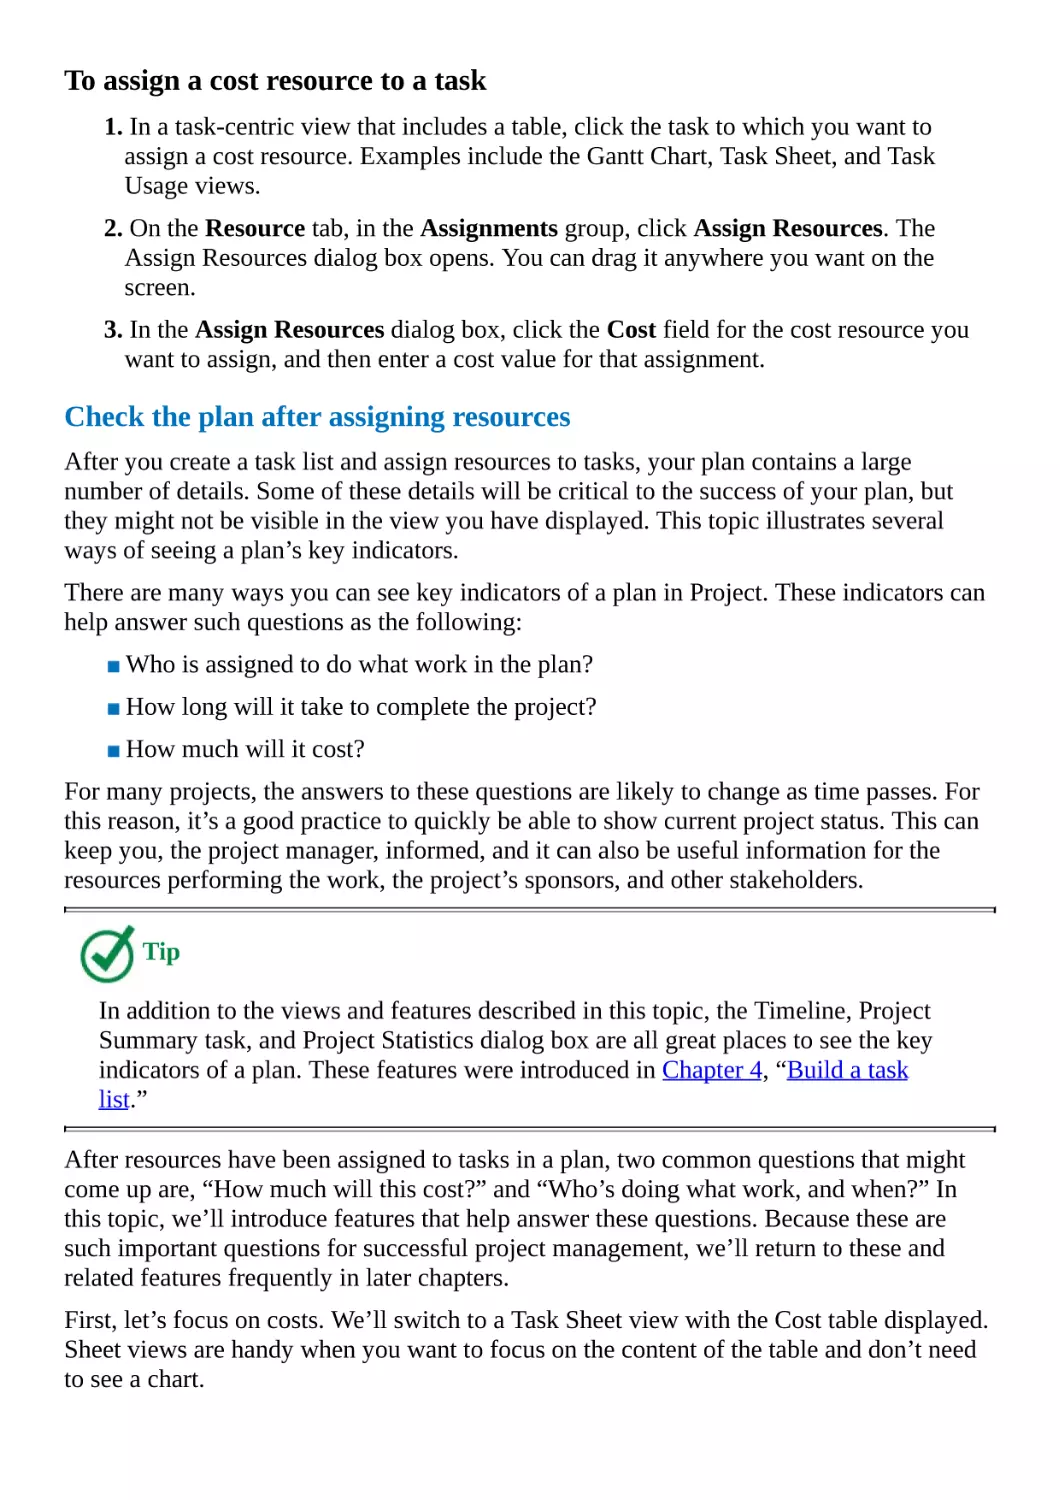
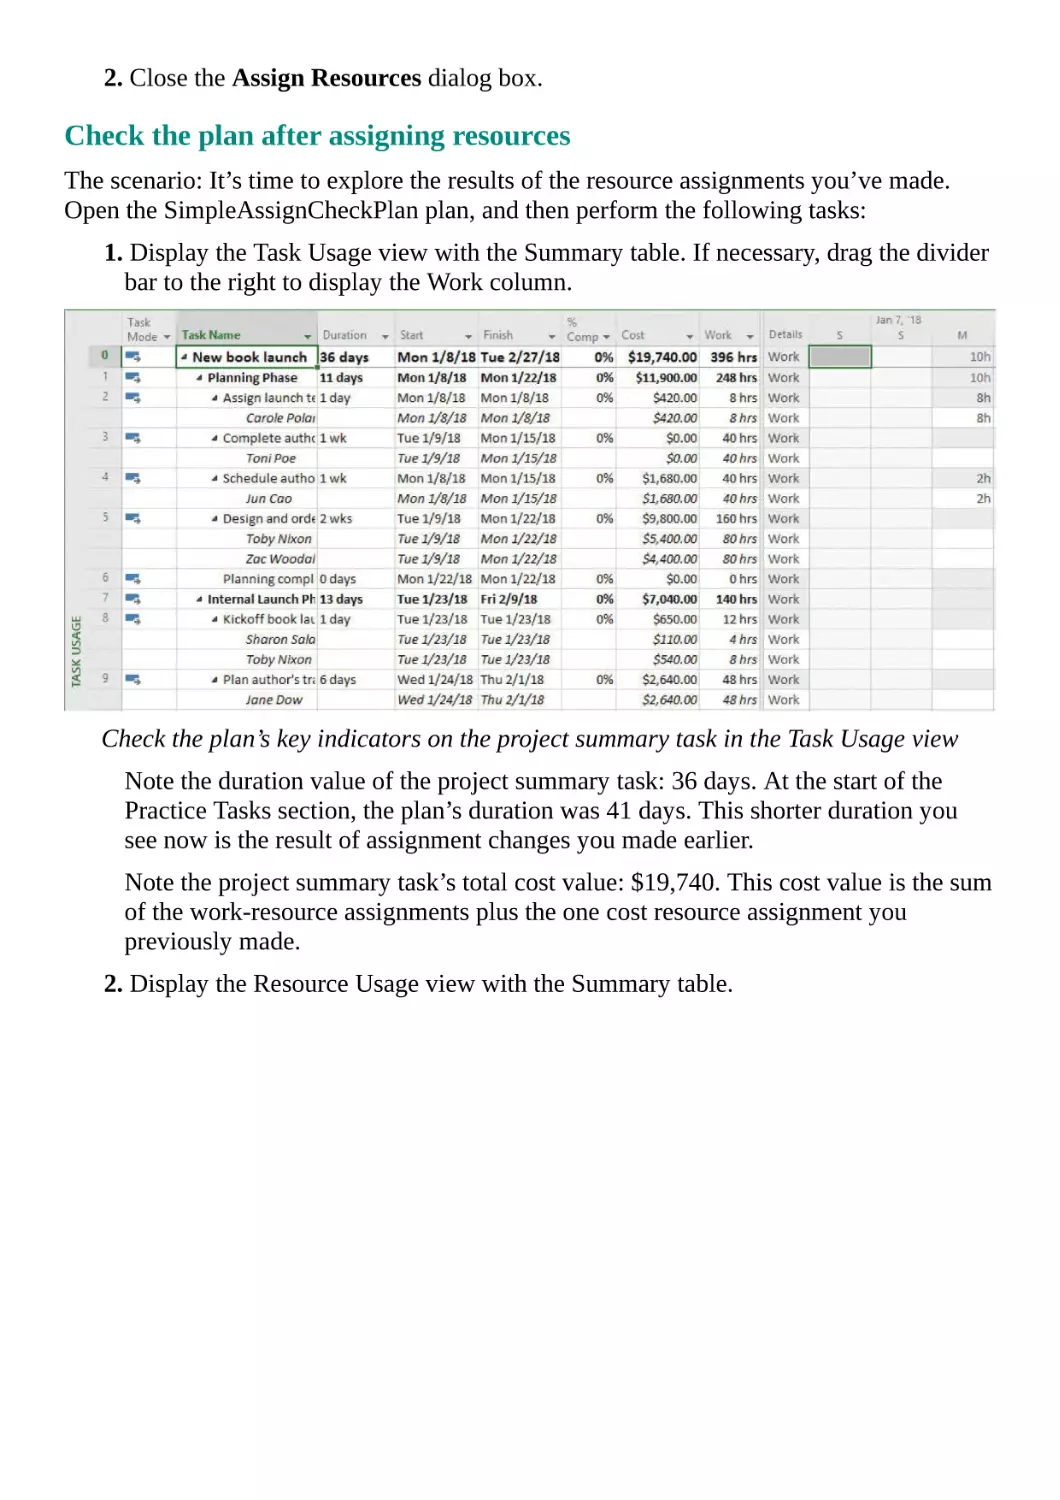
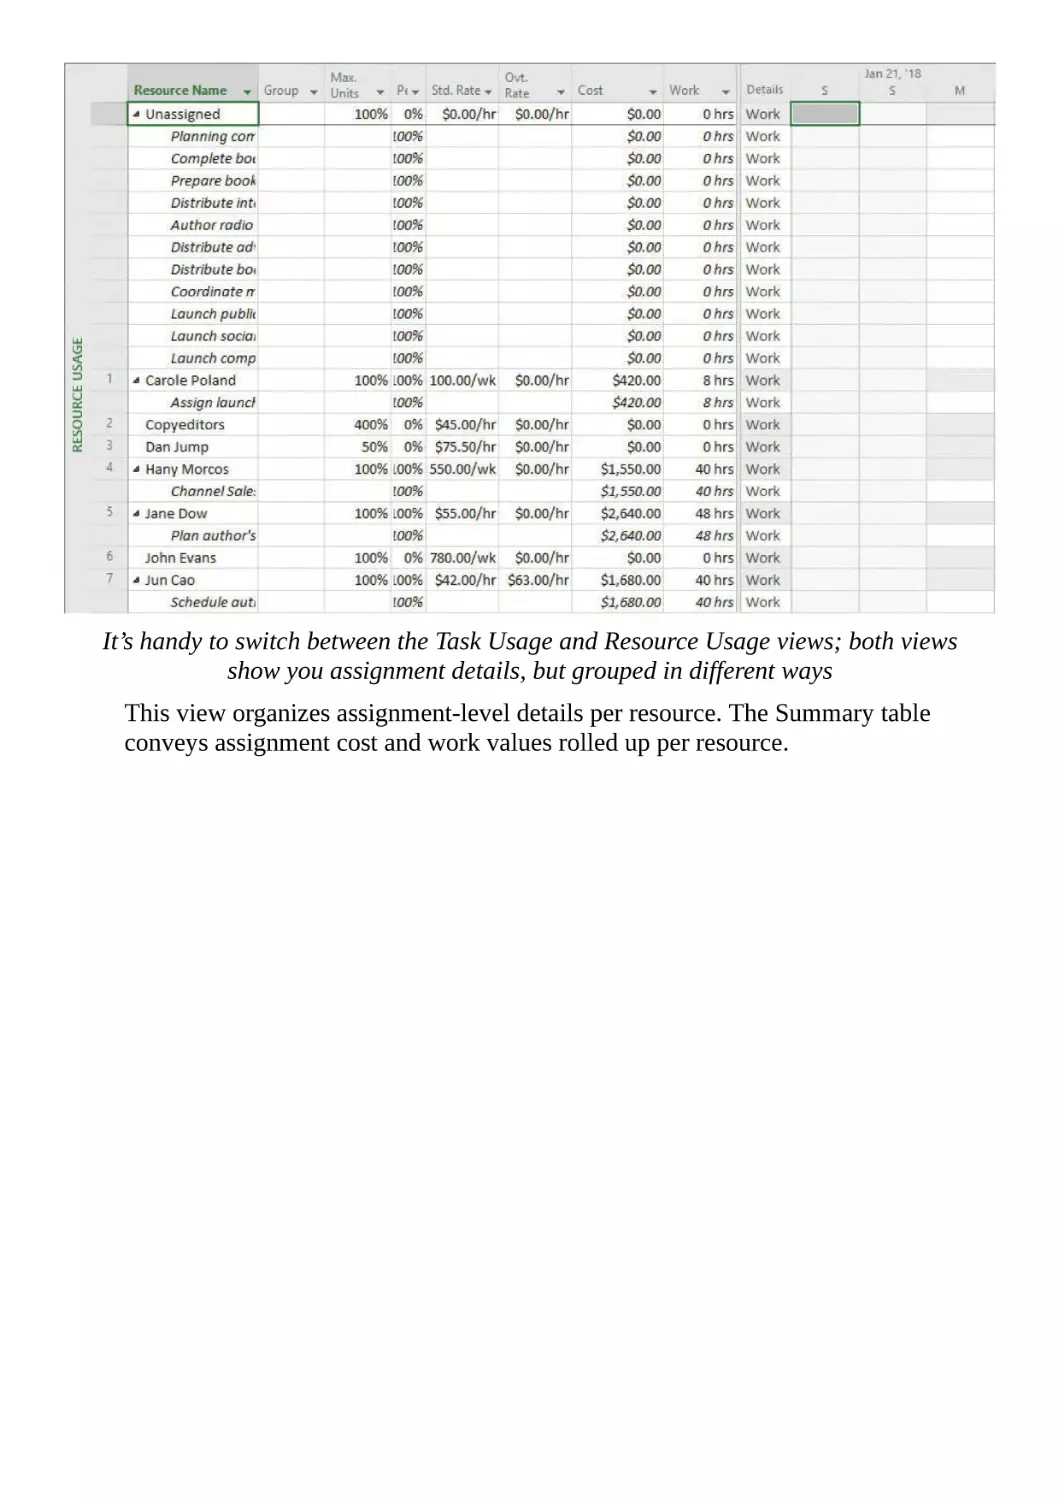
Check the plan after assigning resources
Skills review
Practice tasks
7 Format and share your plan
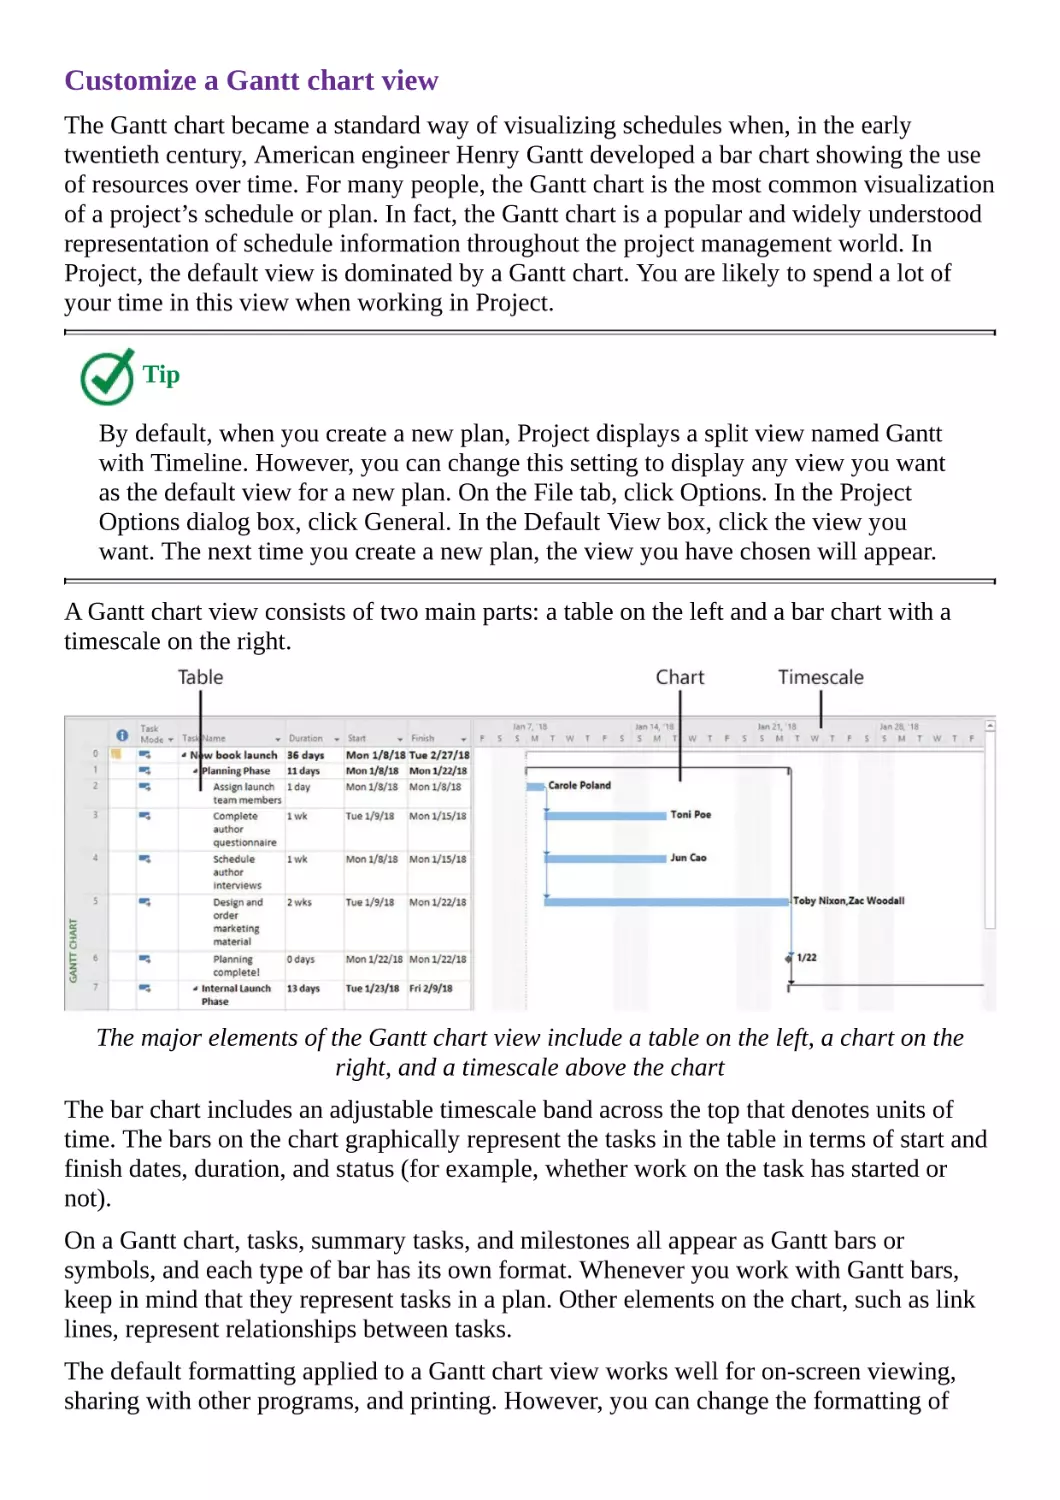
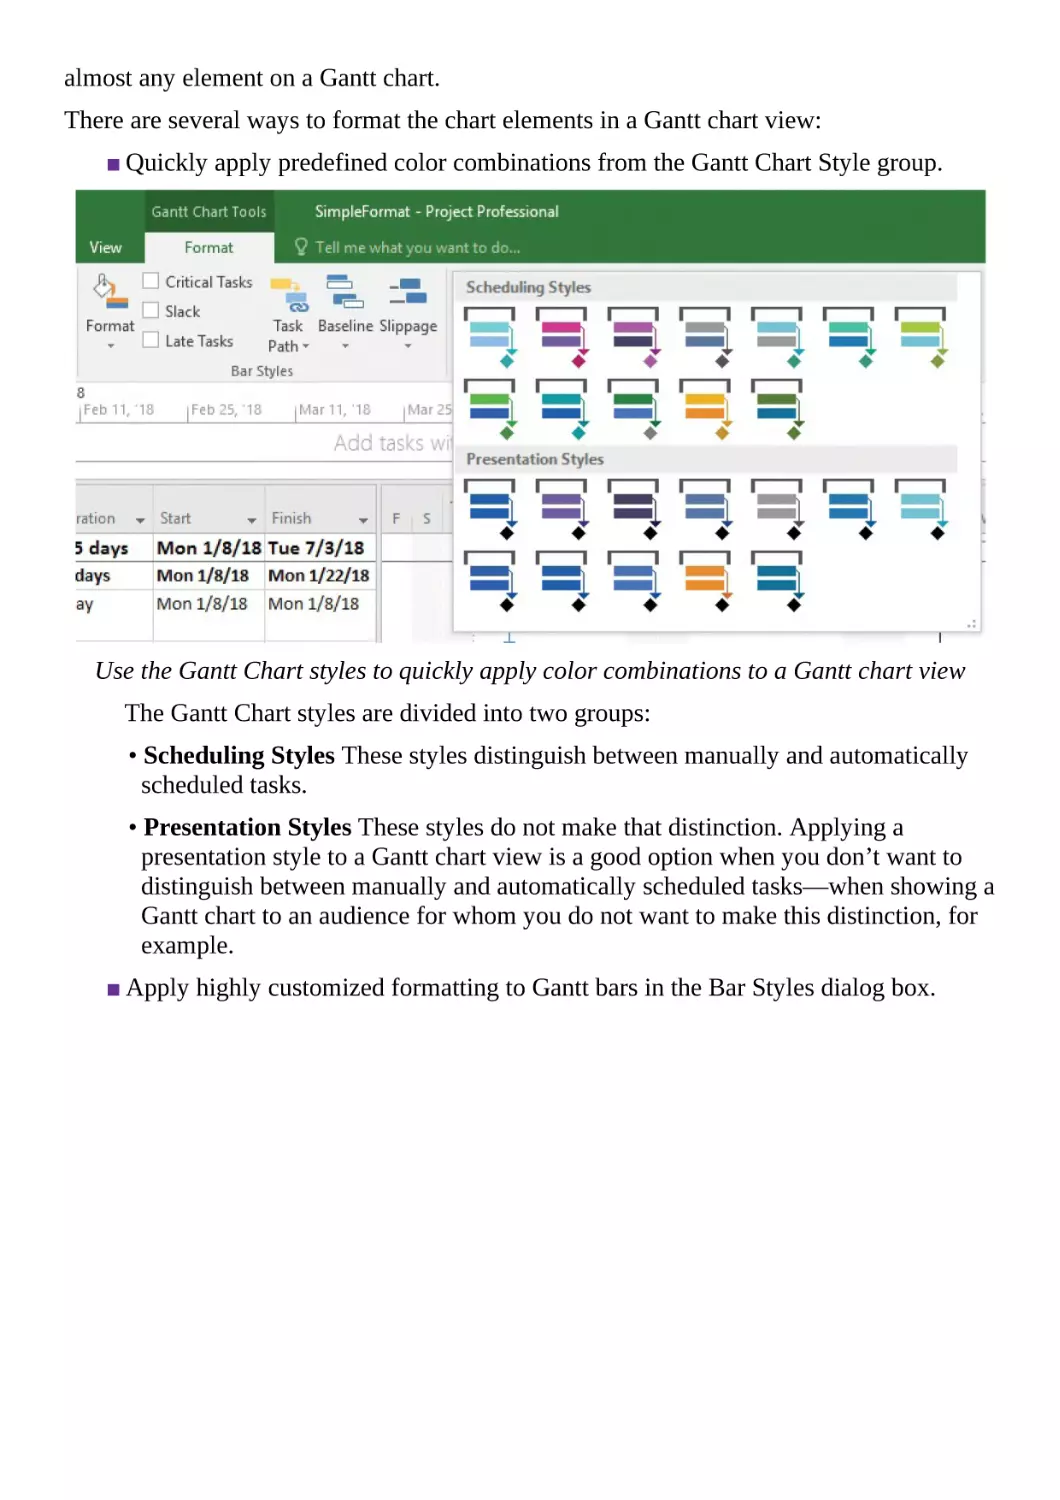
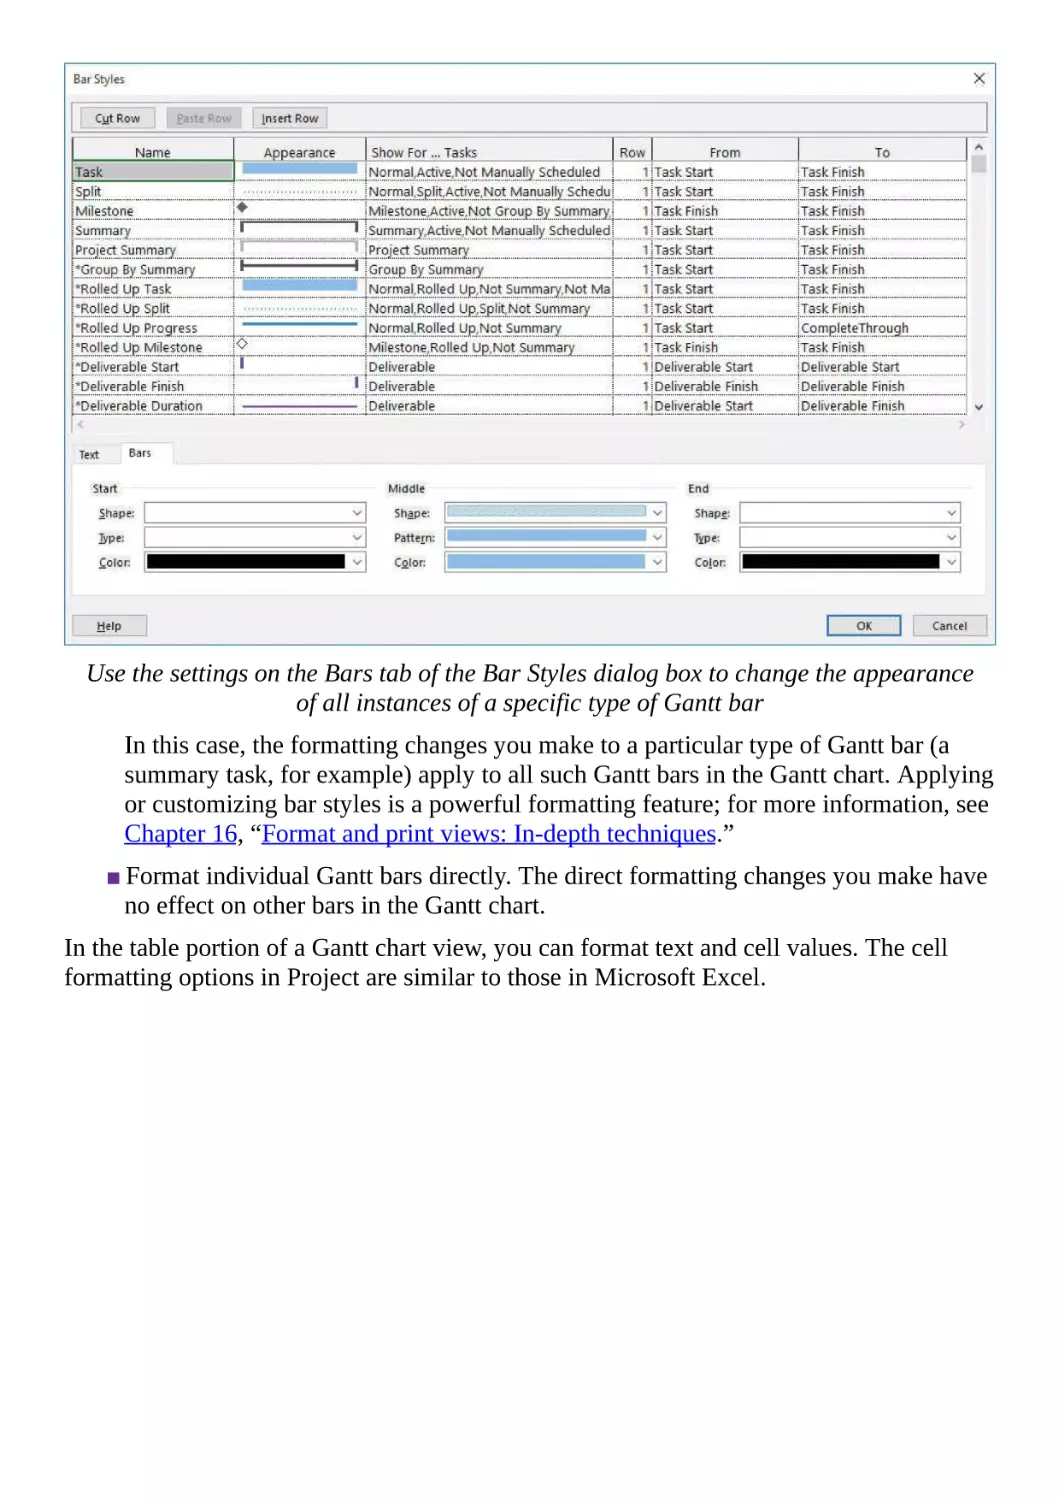
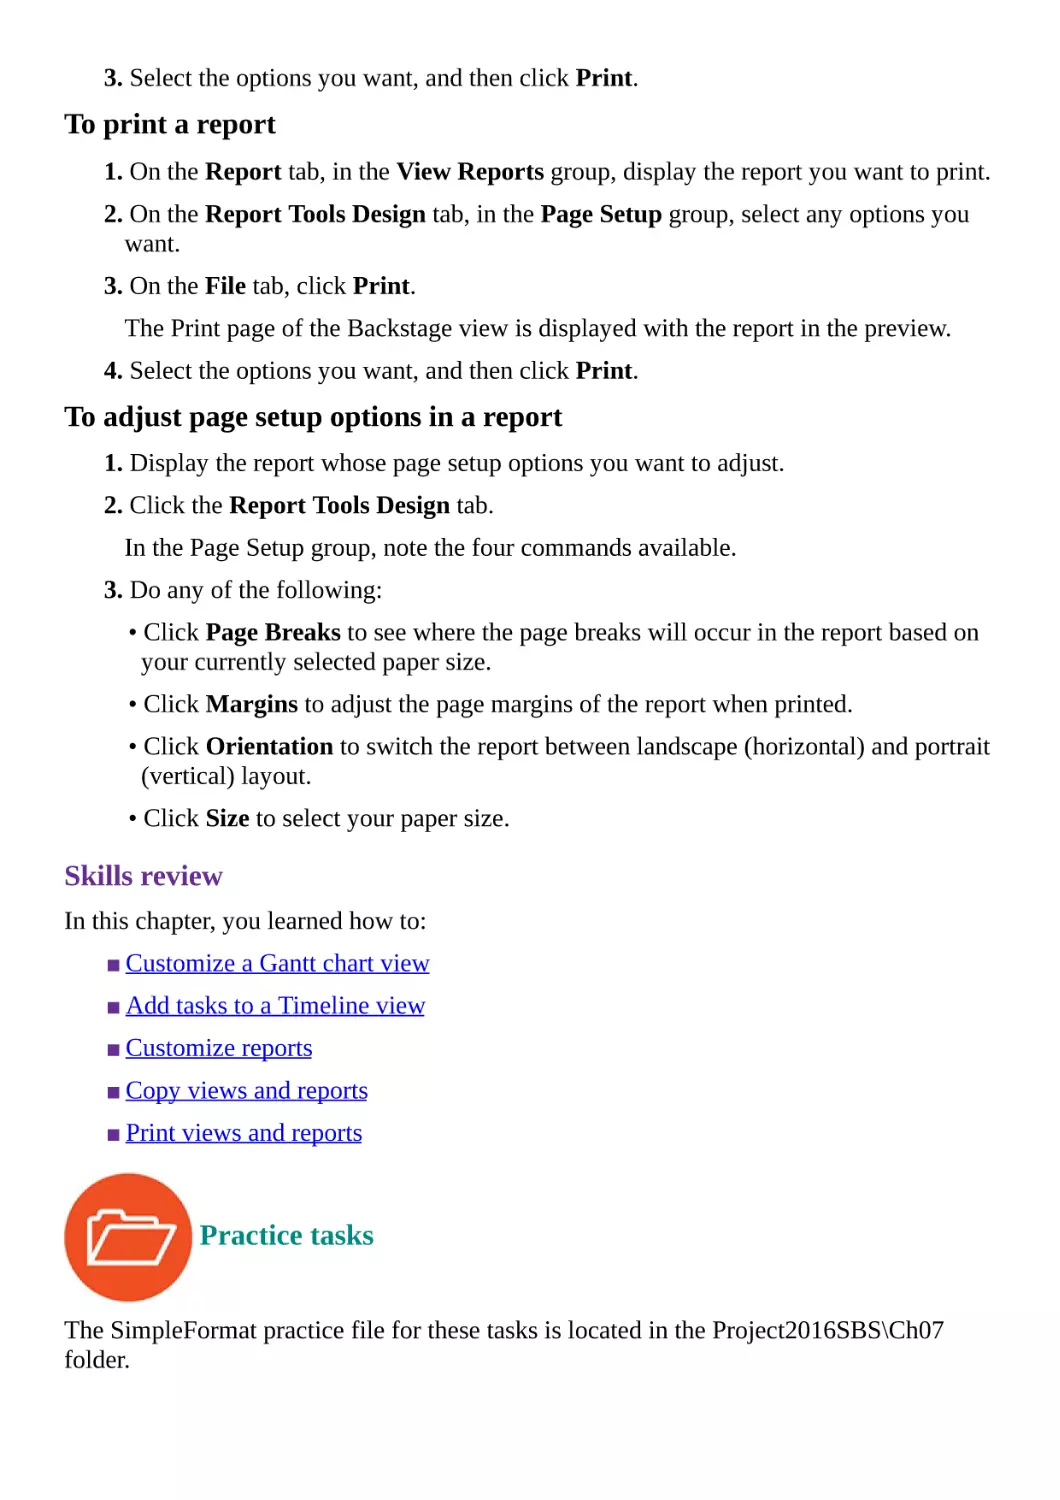
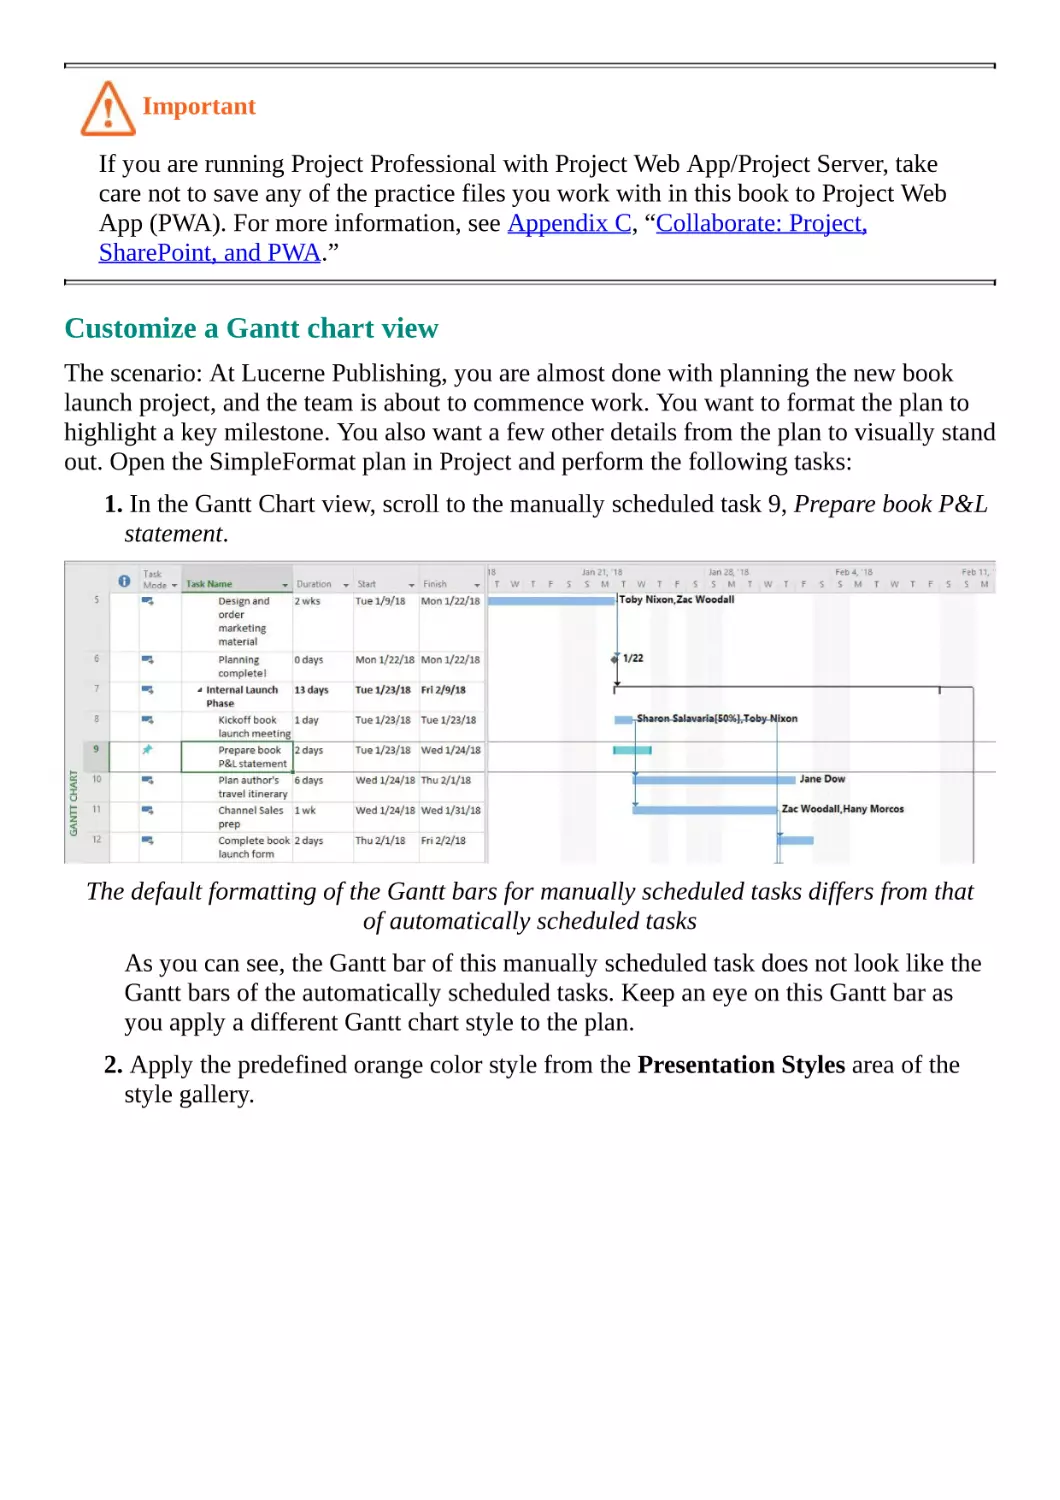
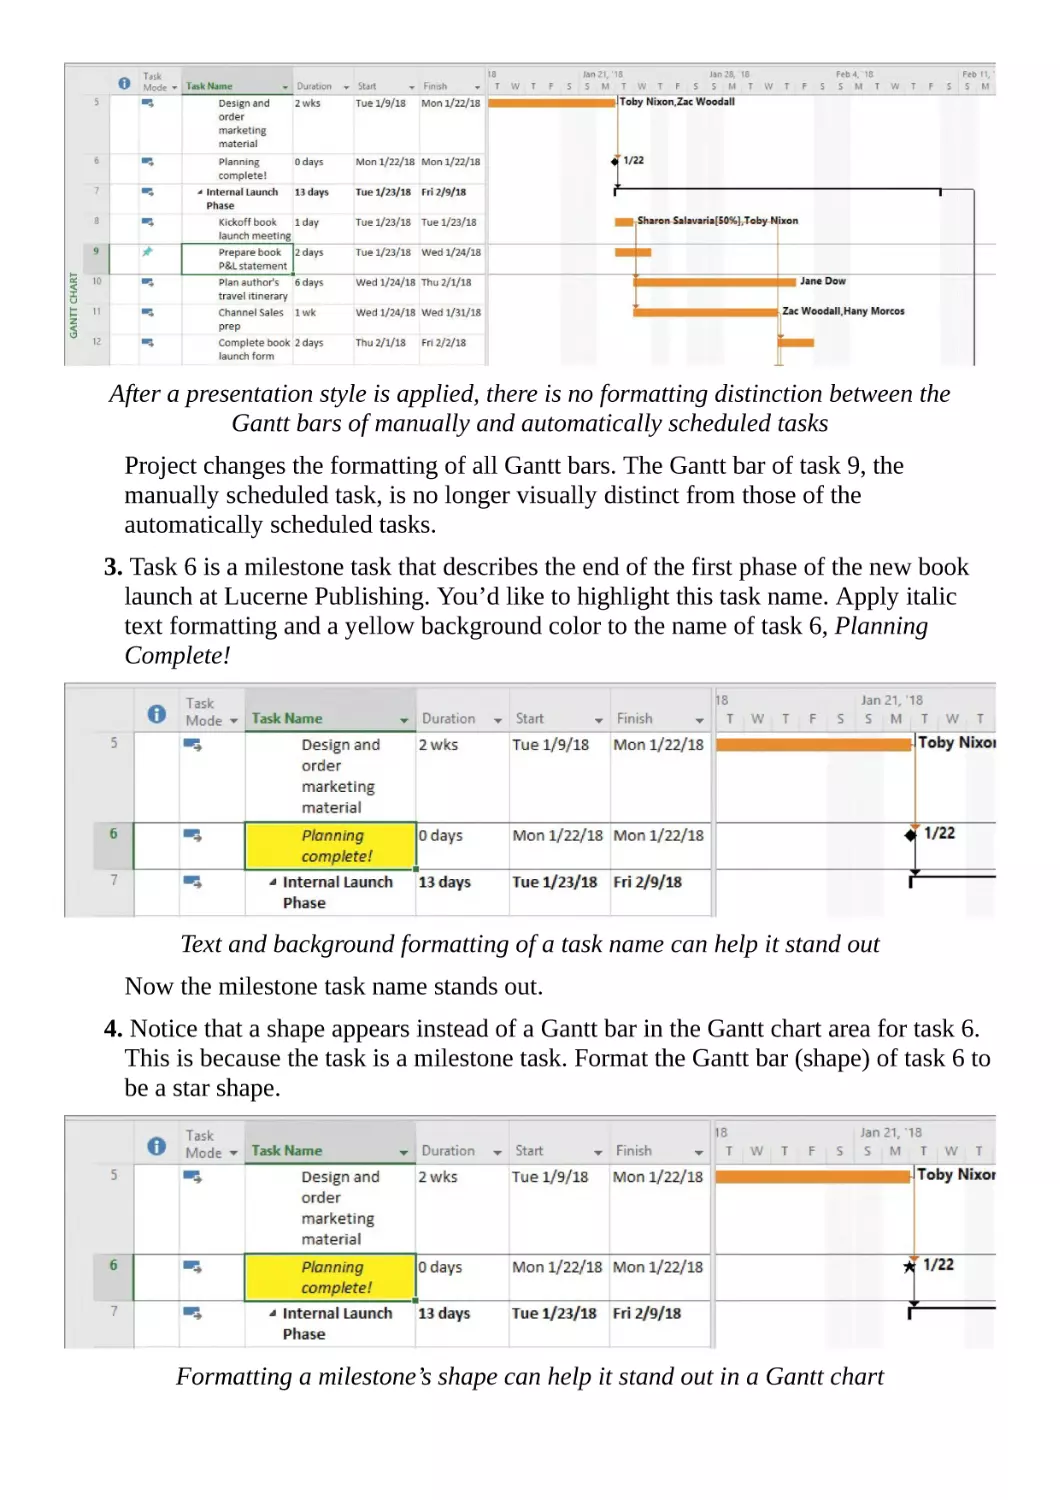
Customize a Gantt chart view
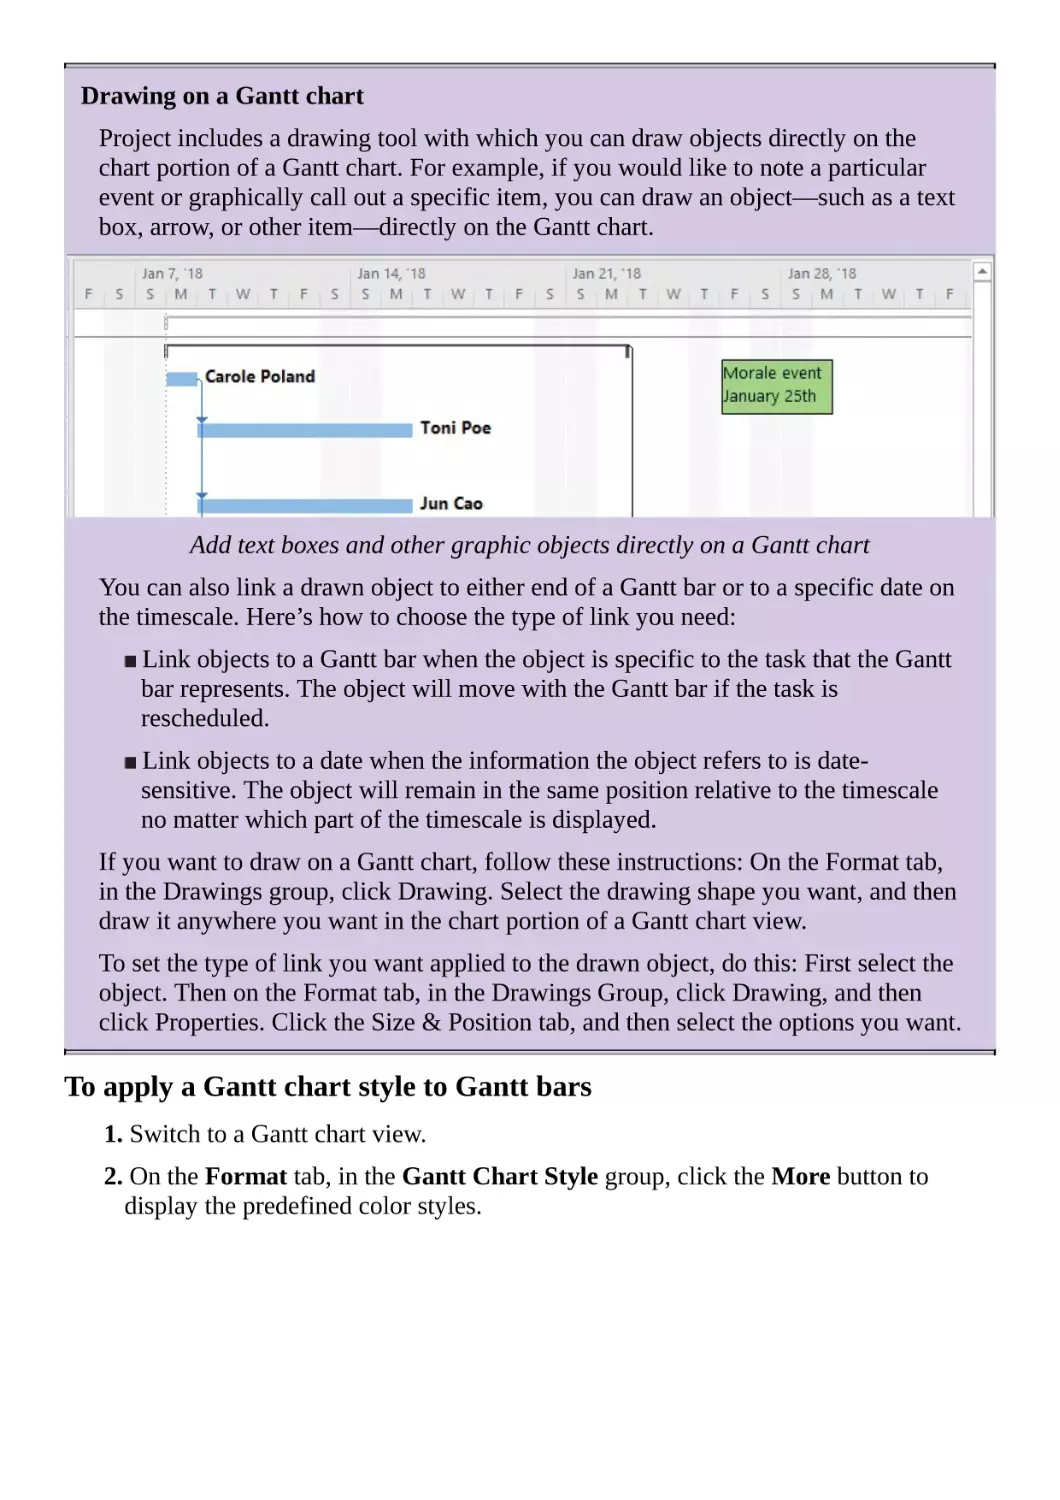
Sidebar: Drawing on a Gantt chart
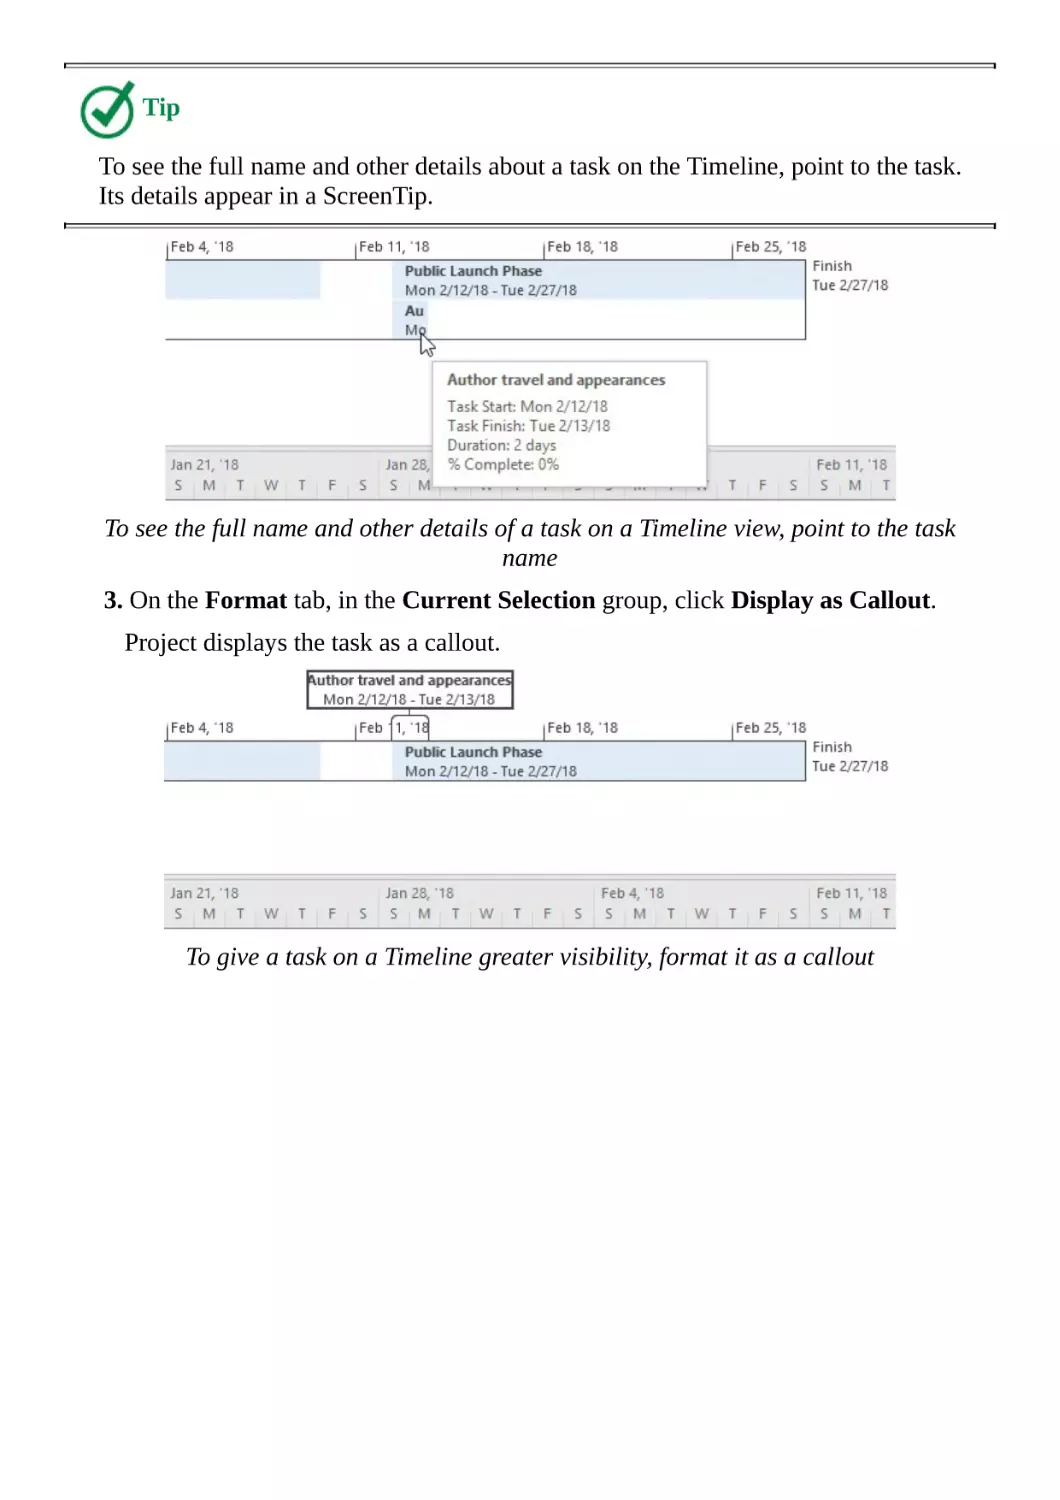
Add tasks to a Timeline view
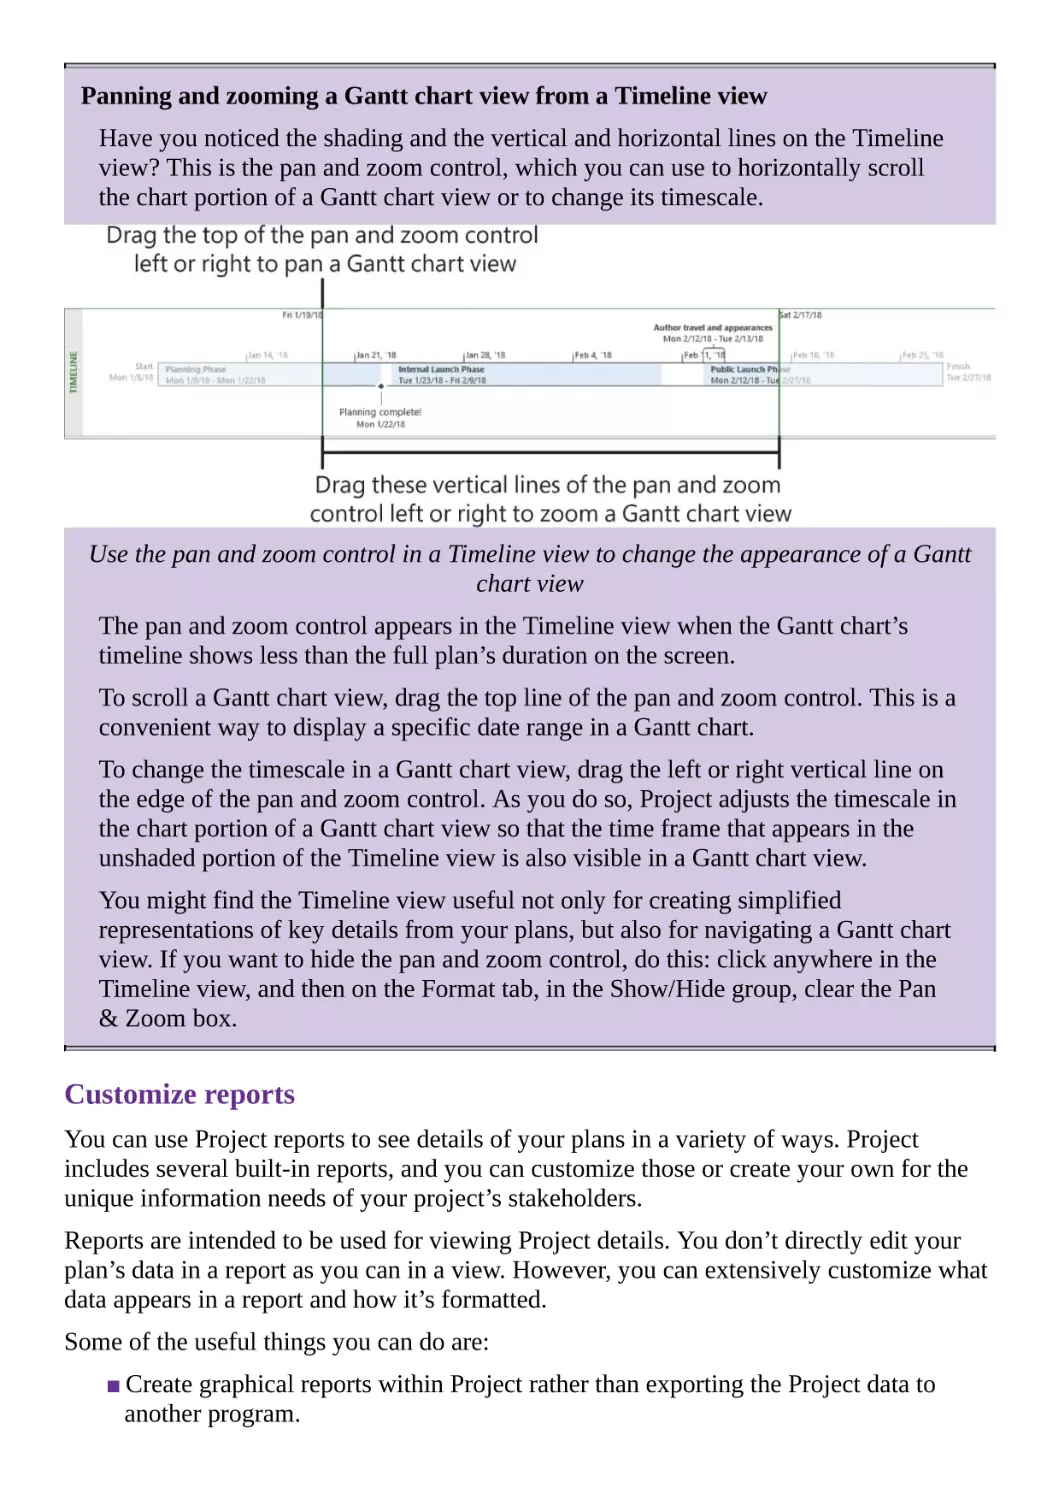
Sidebar: Panning and zooming a Gantt chart view from a Timeline view
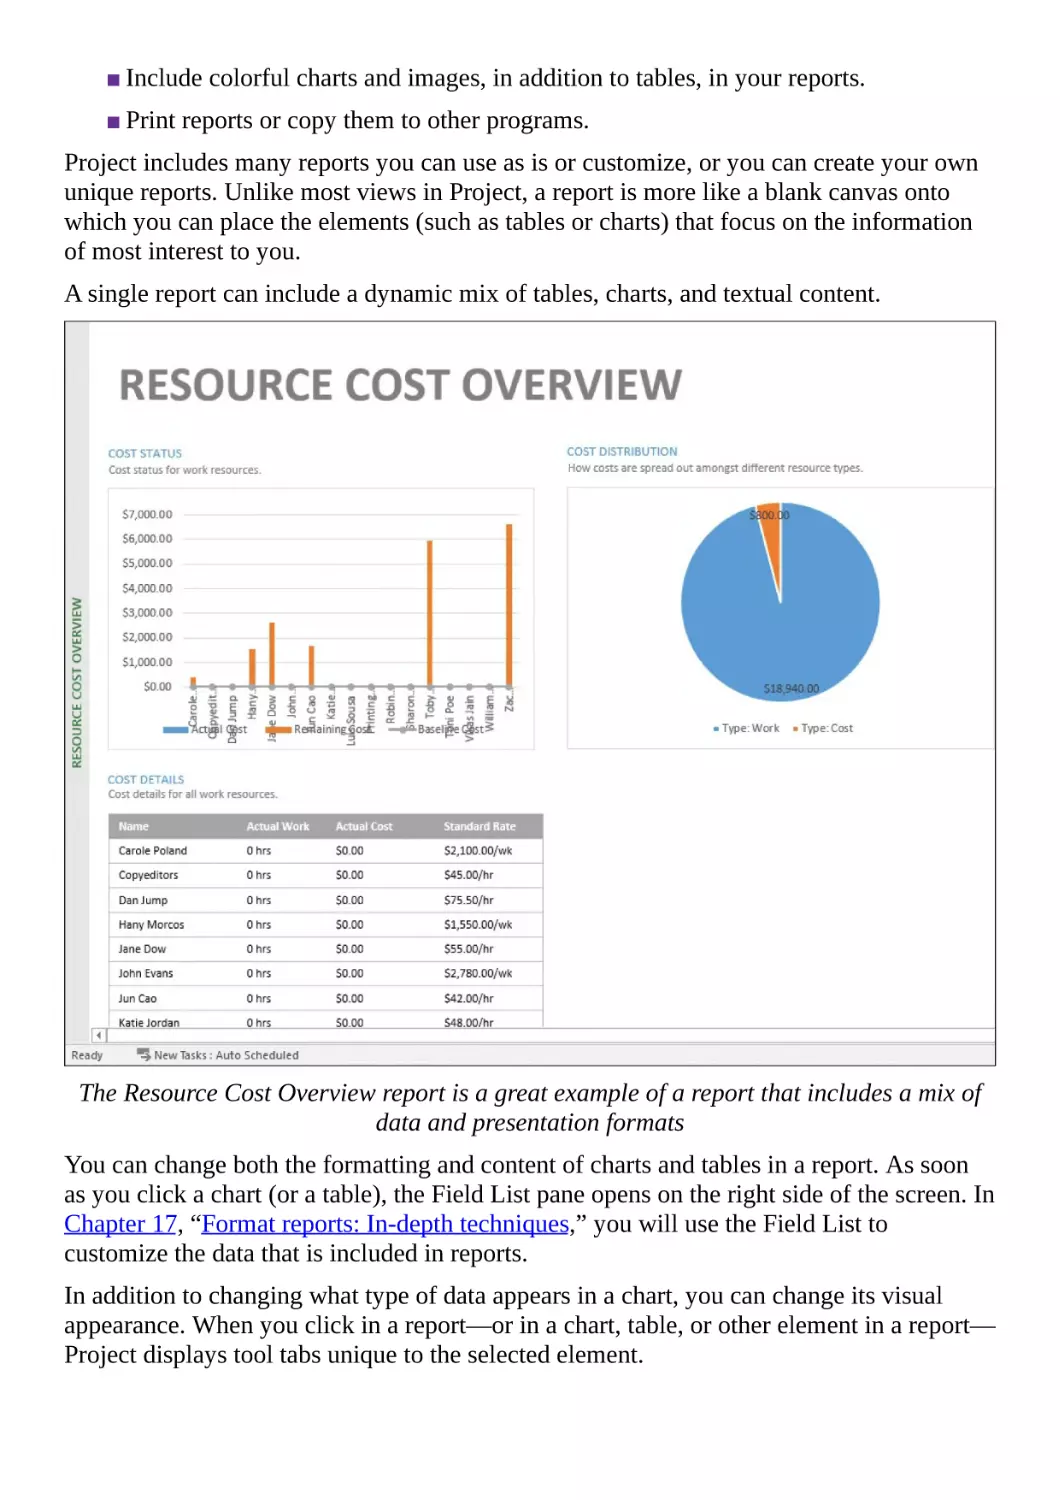
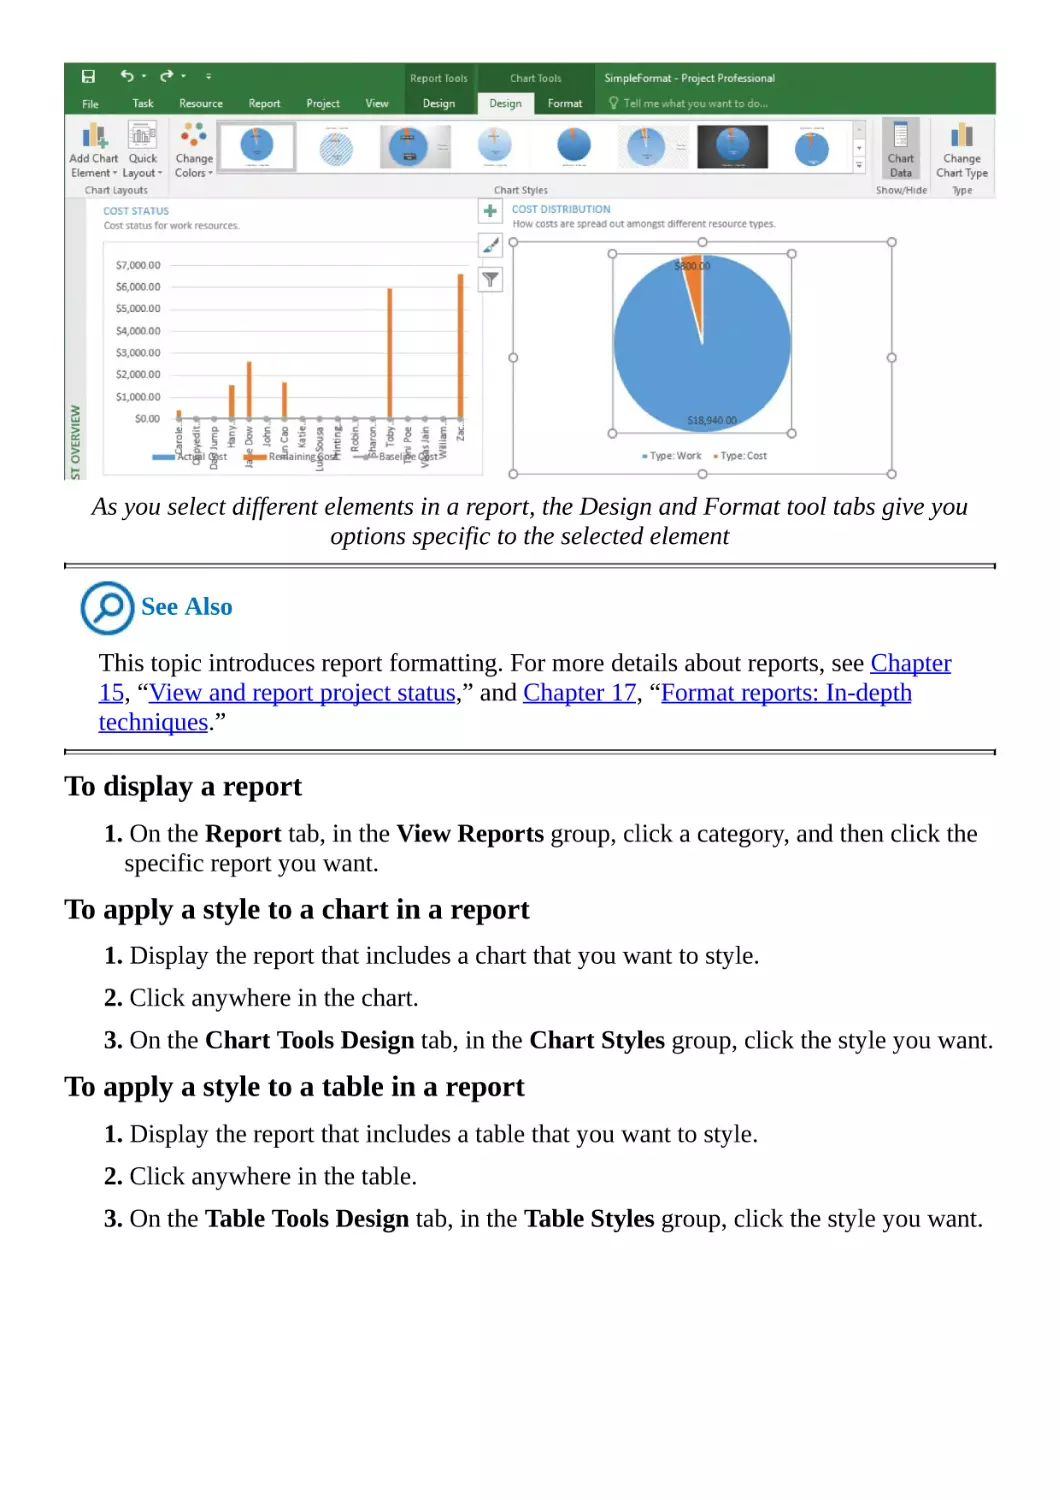
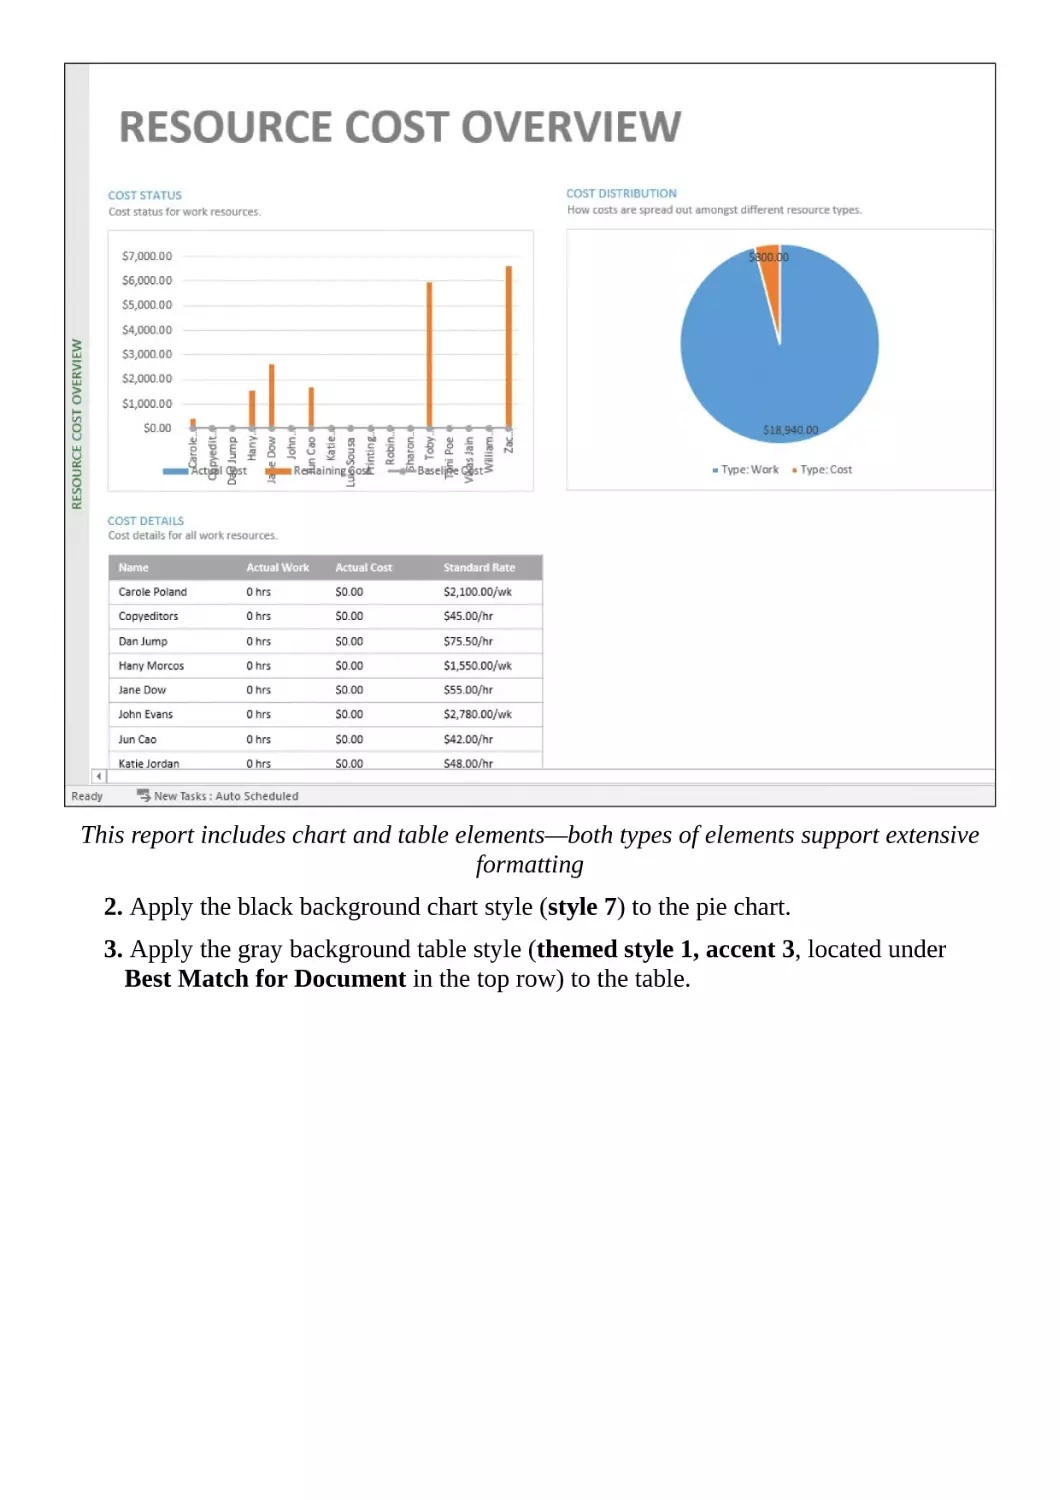
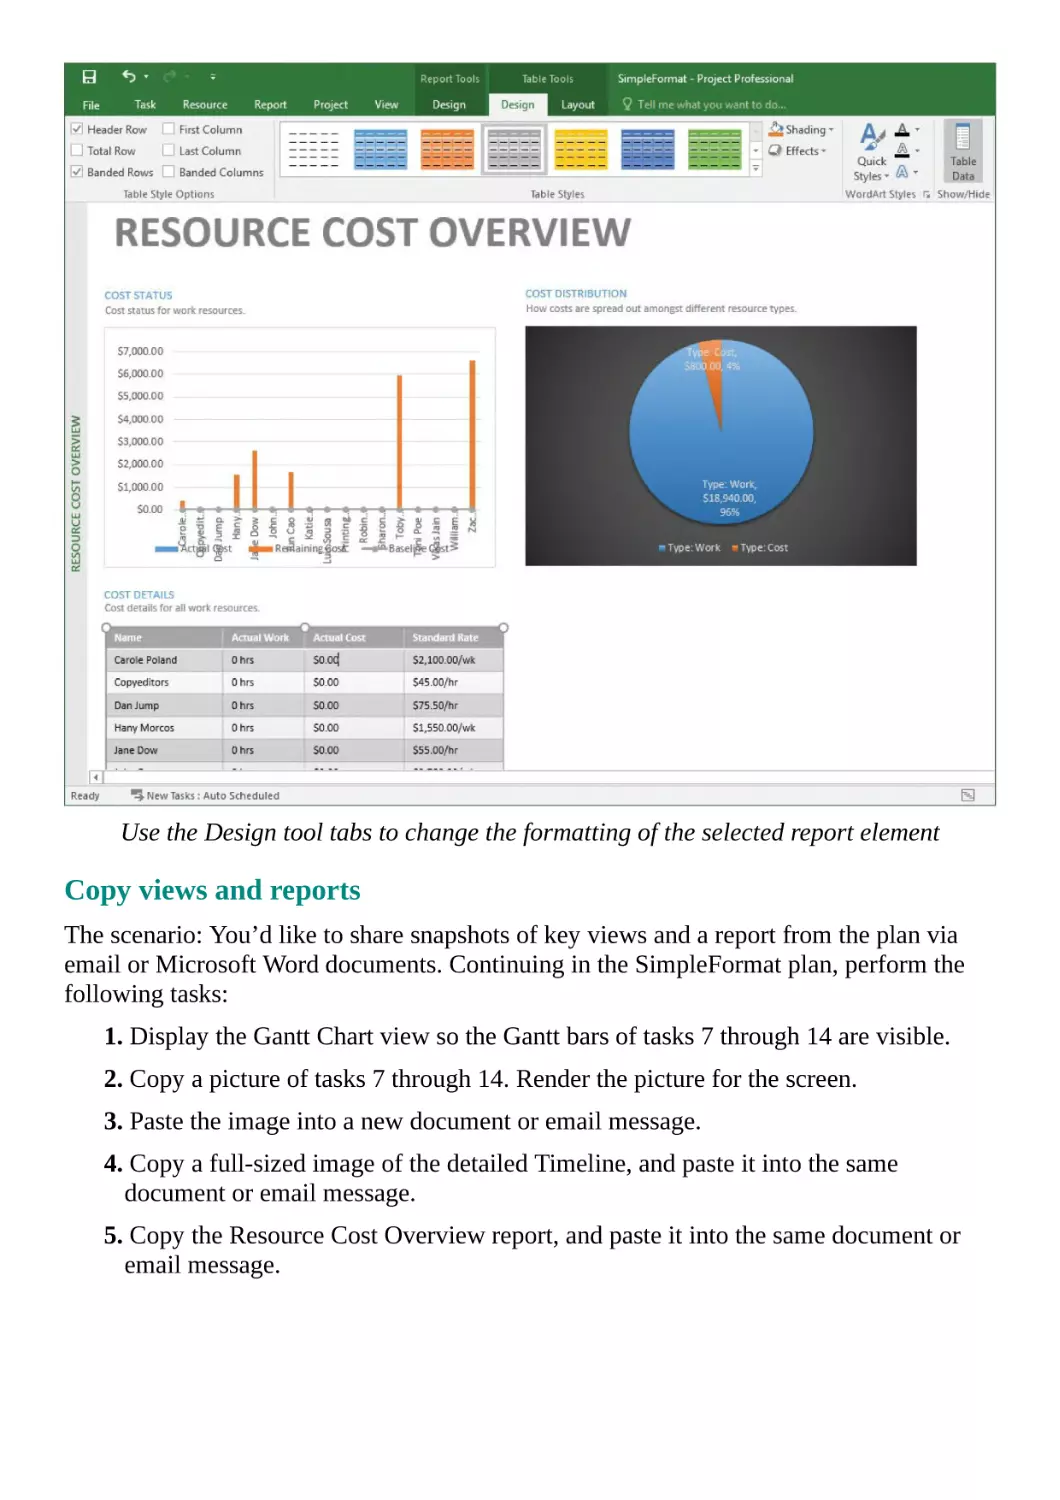
Customize reports
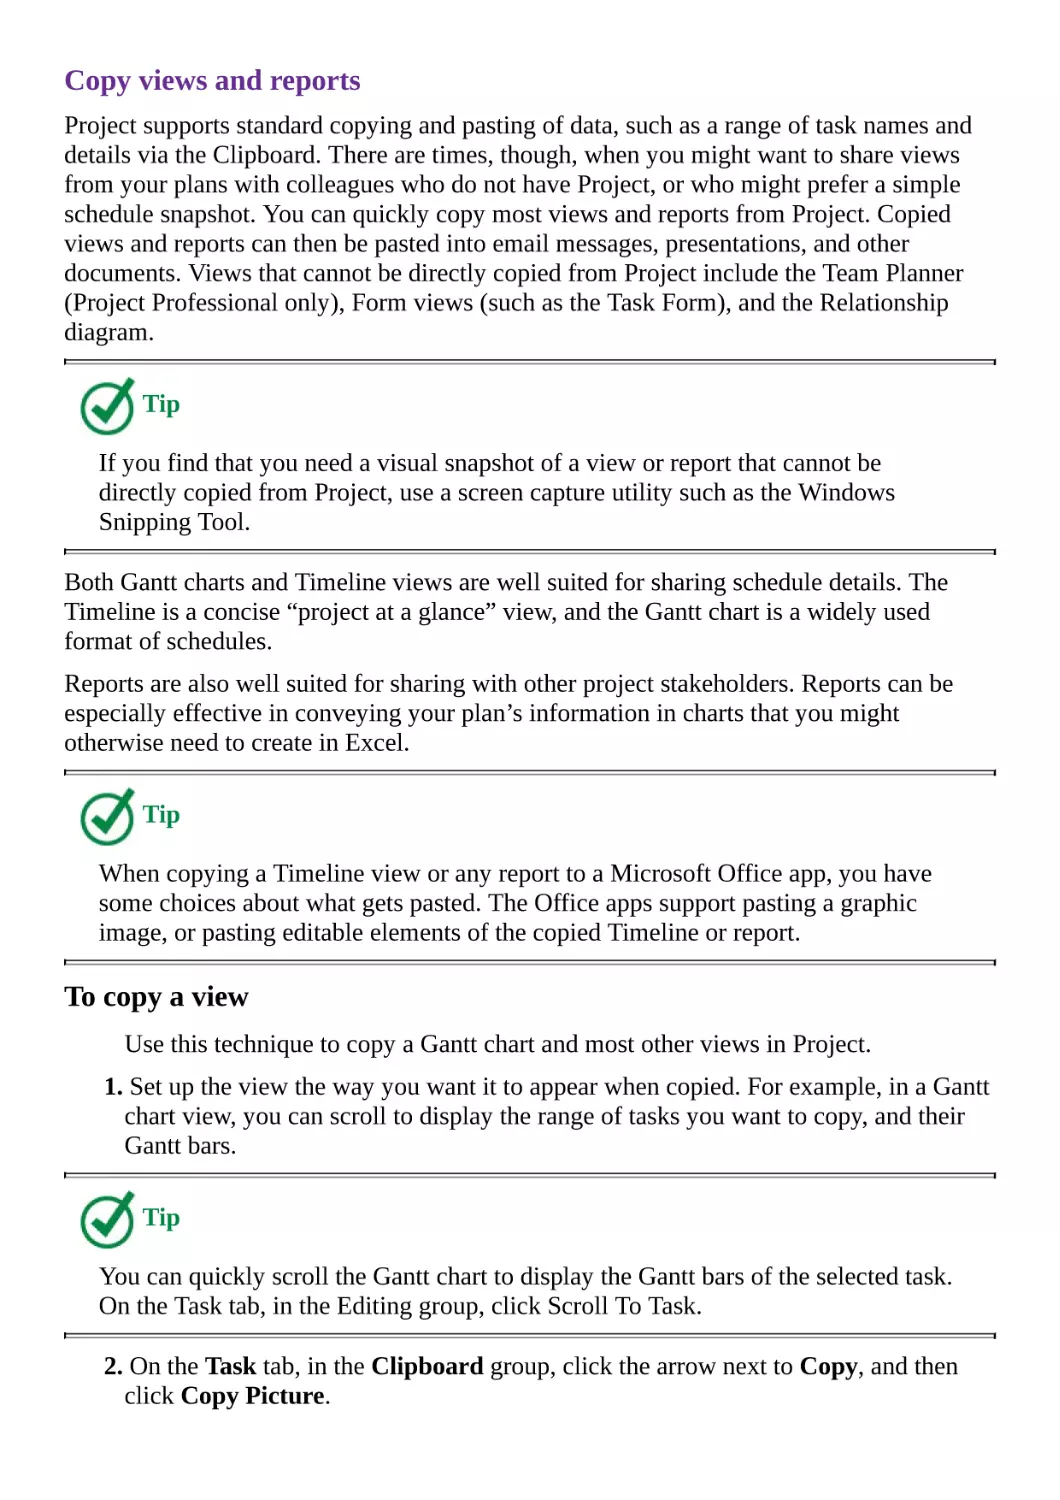
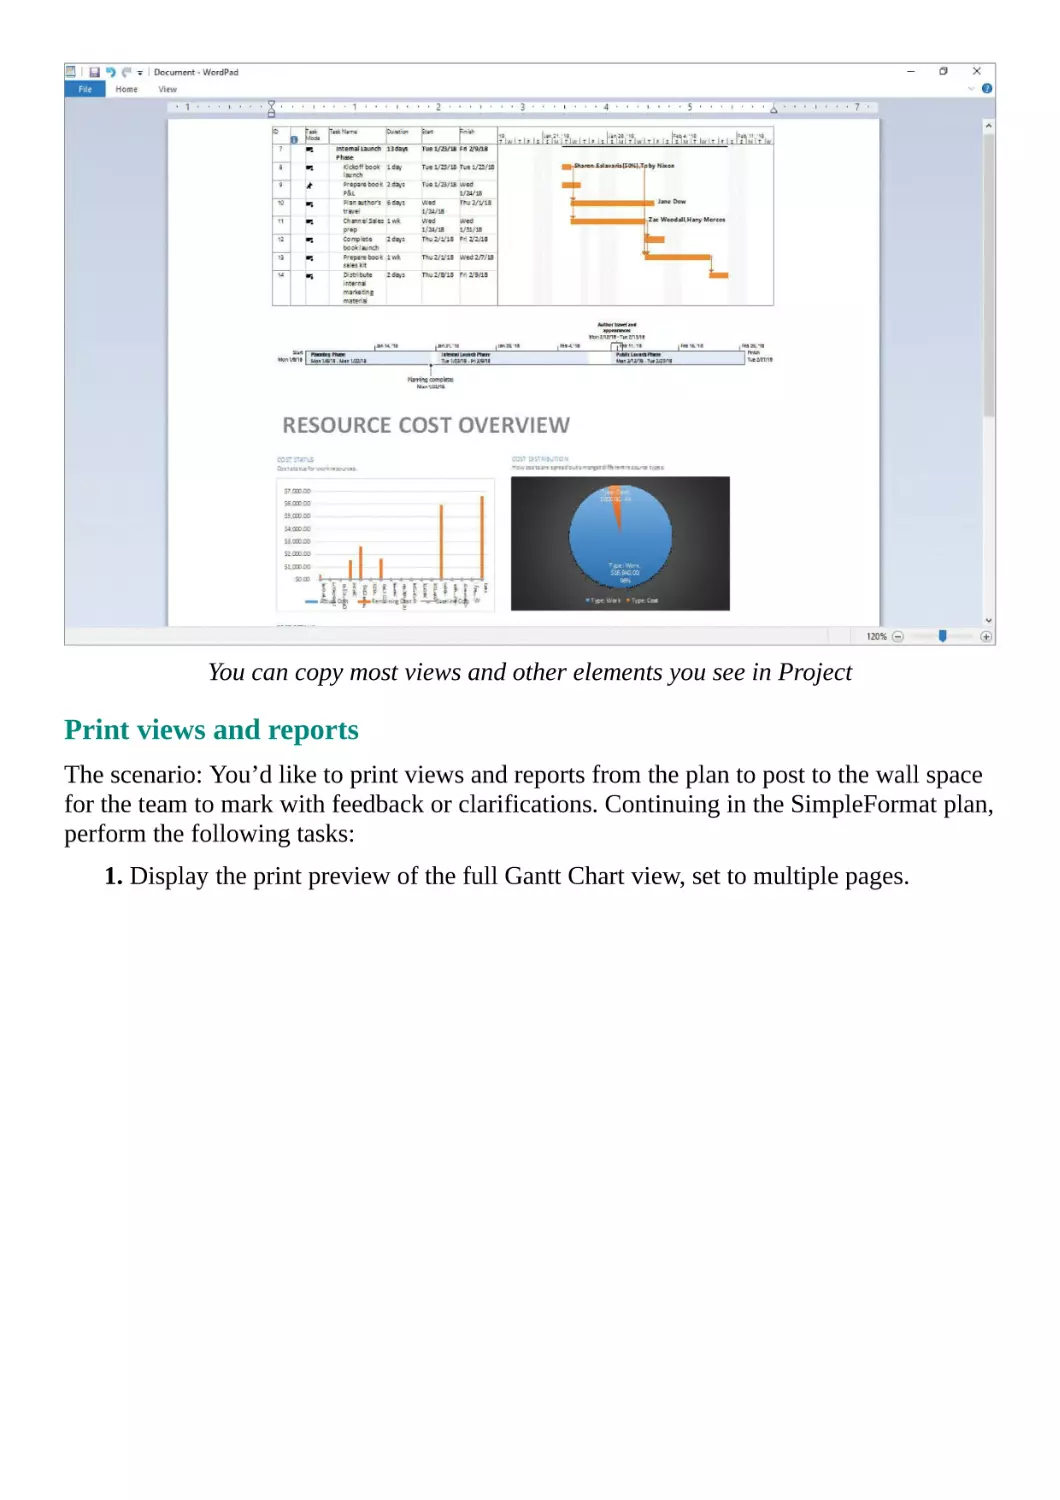
Copy views and reports
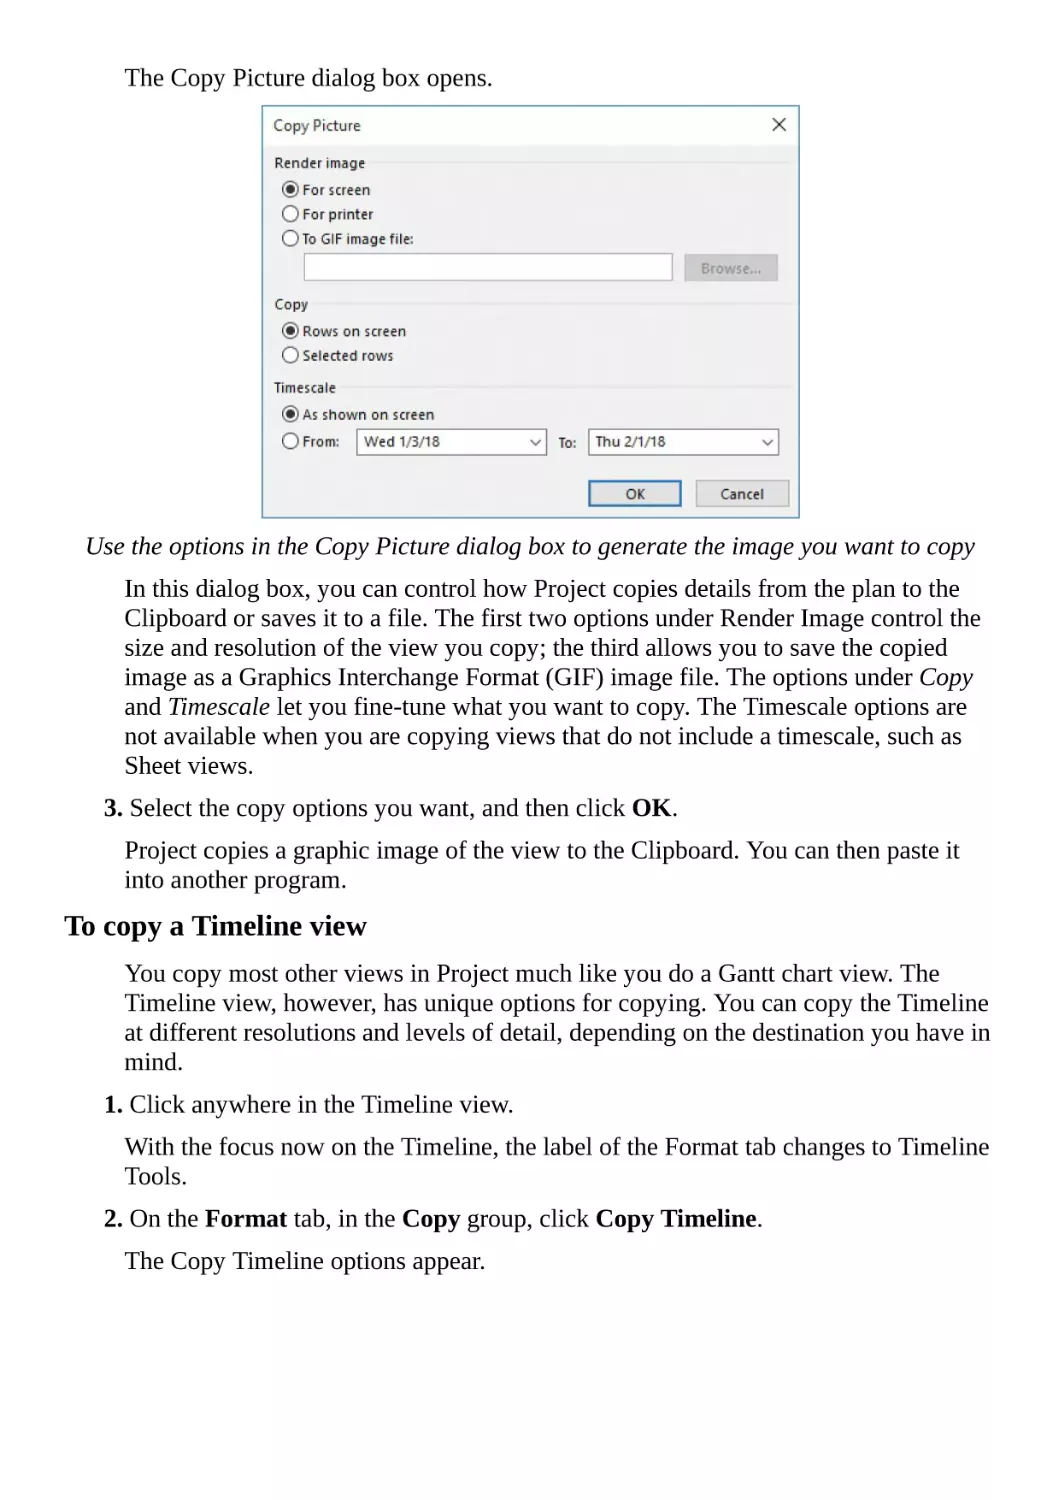
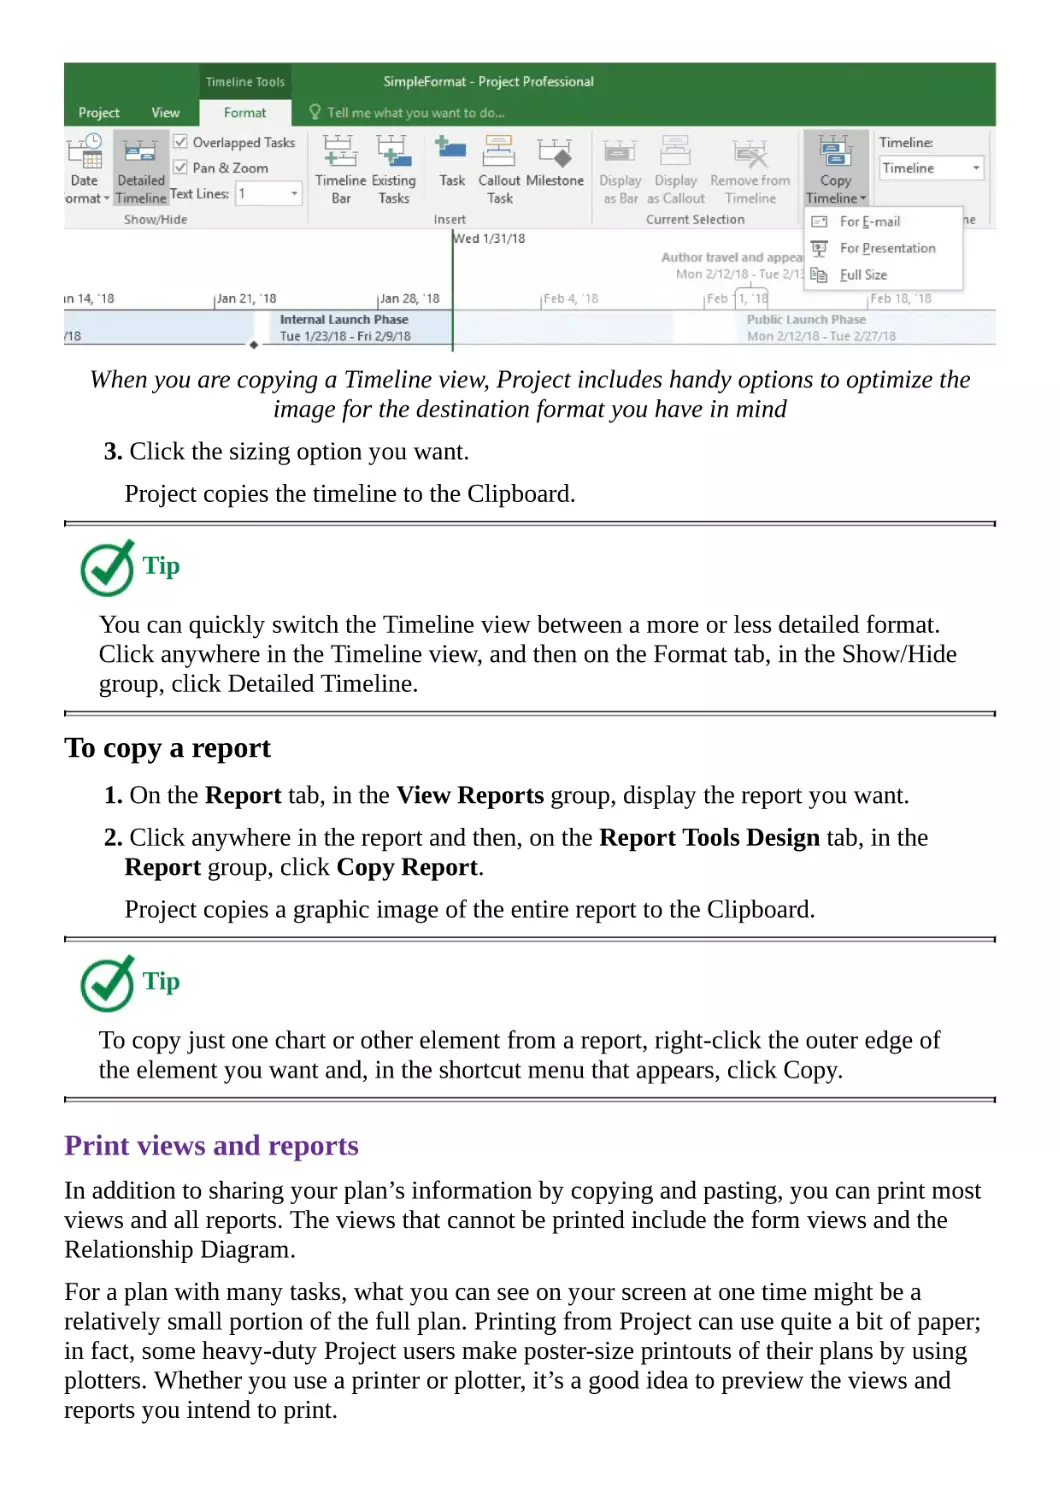
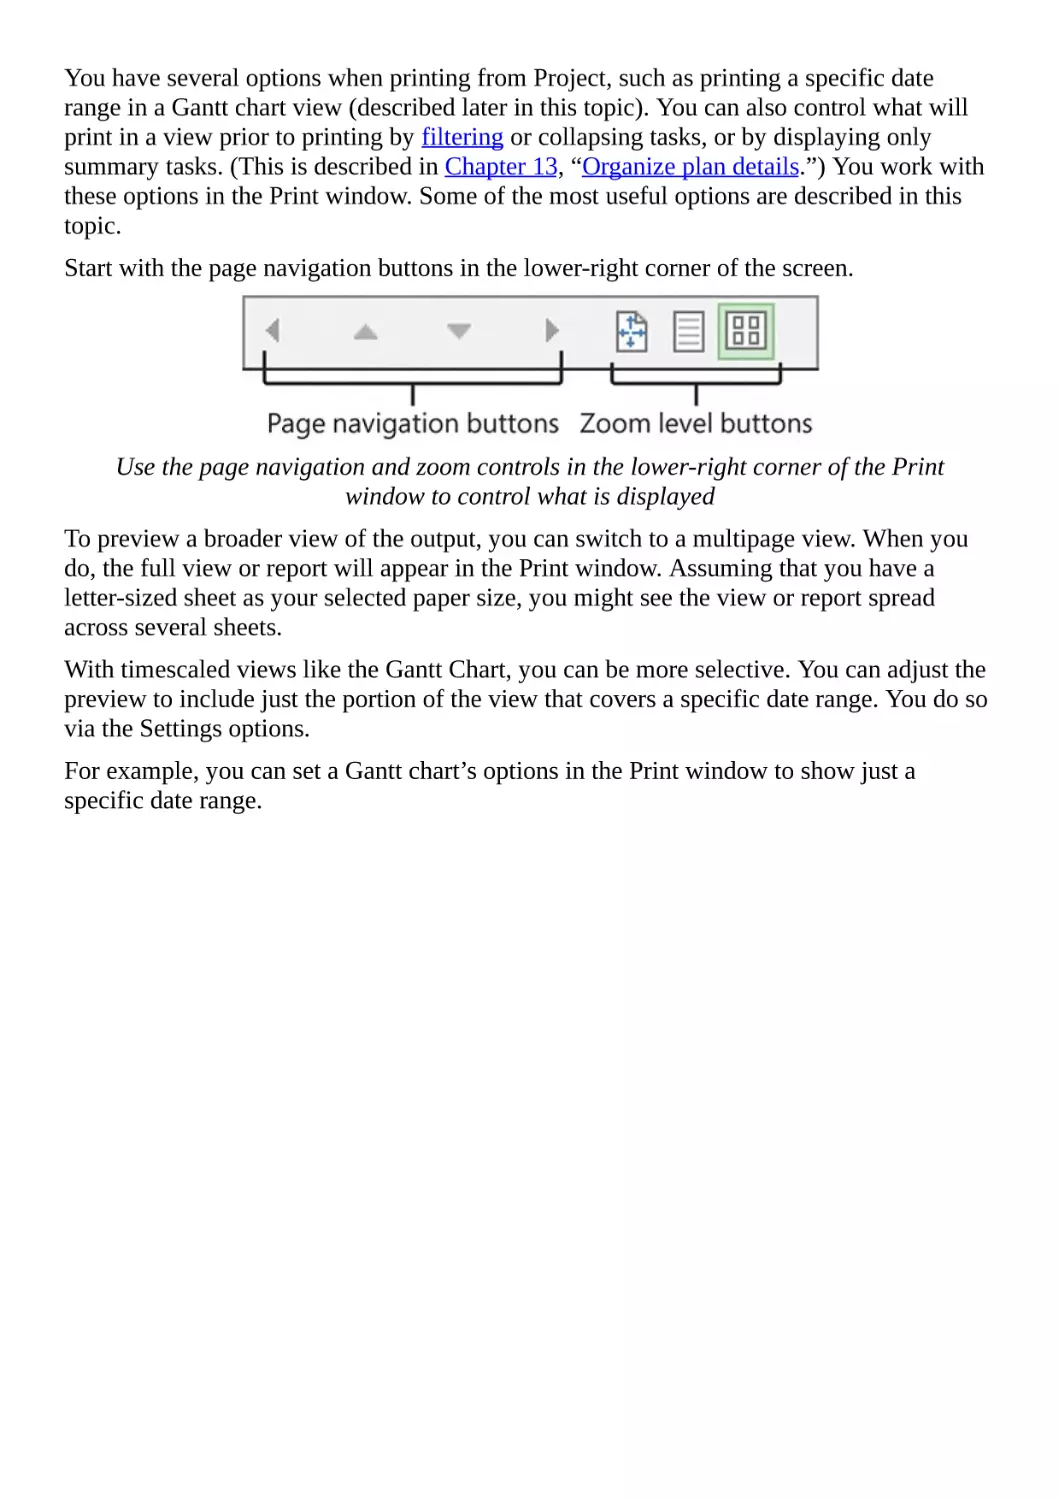
Print views and reports
Skills review
Practice tasks
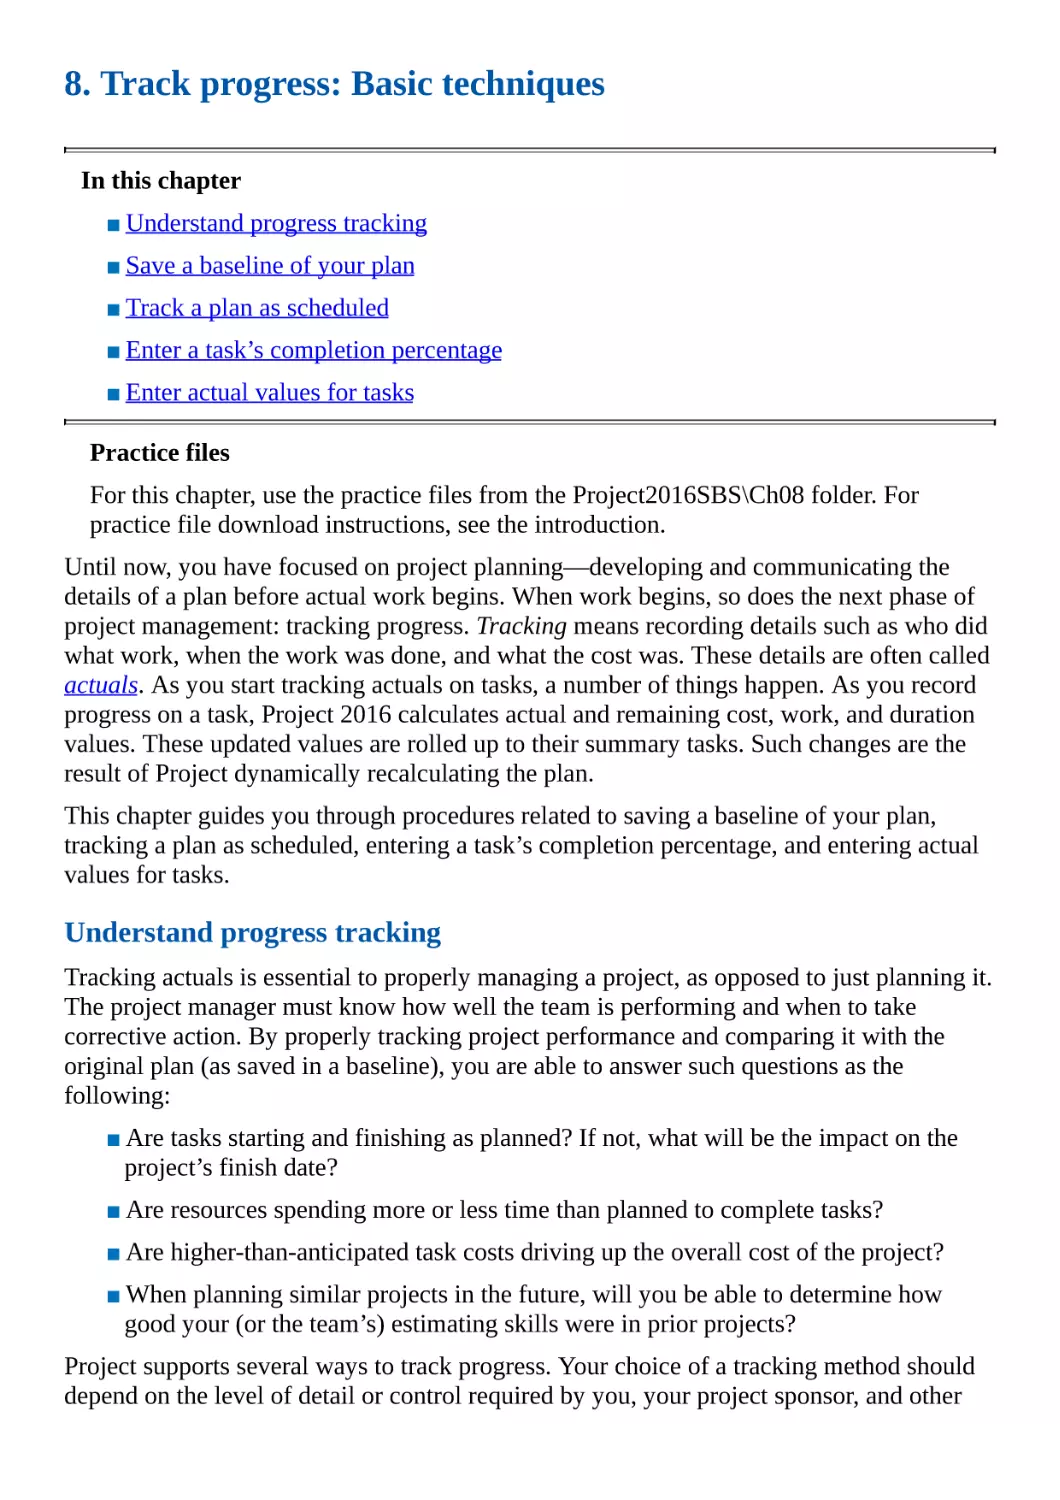
8 Track progress: Basic techniques
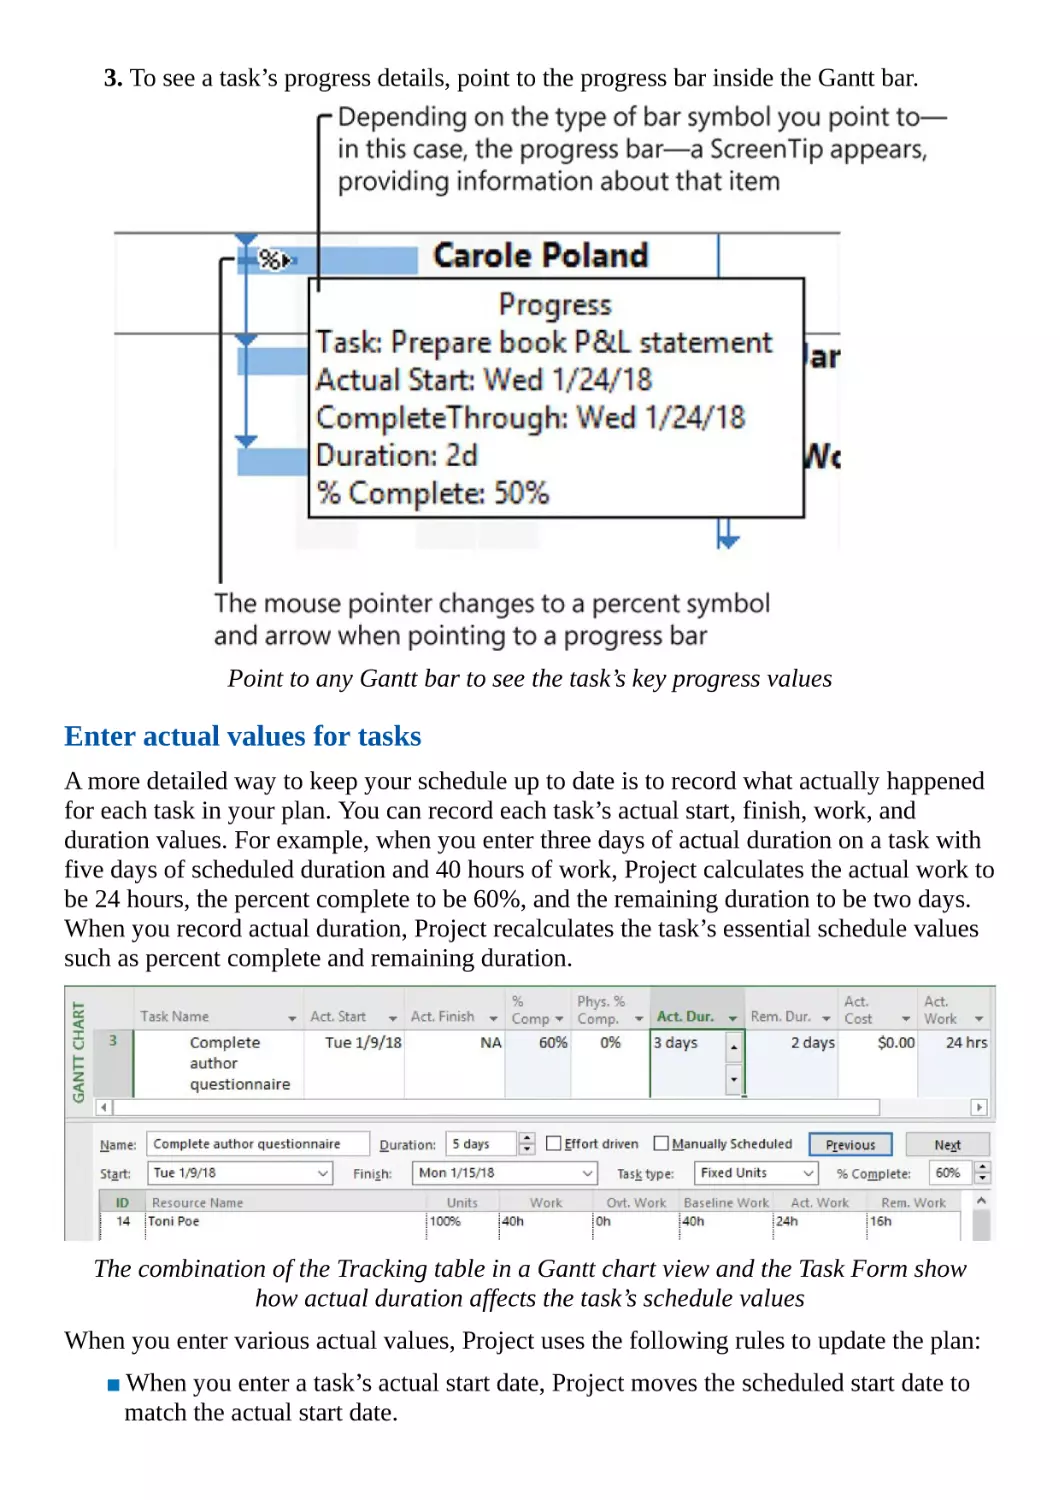
Understand progress tracking
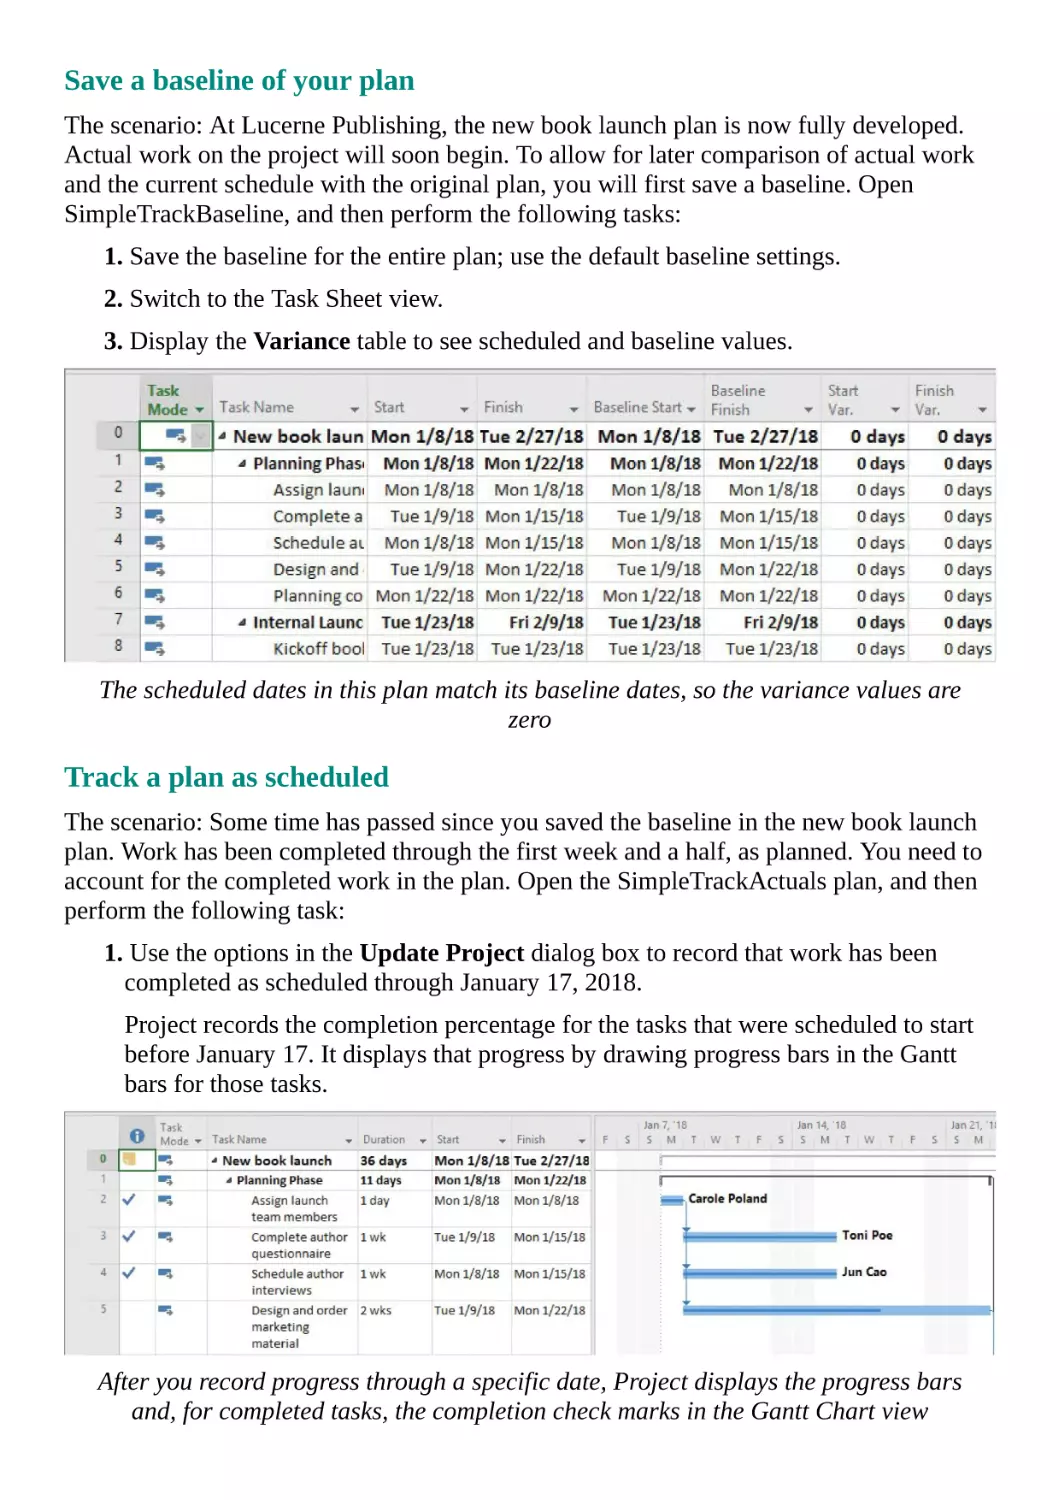
Save a baseline of your plan
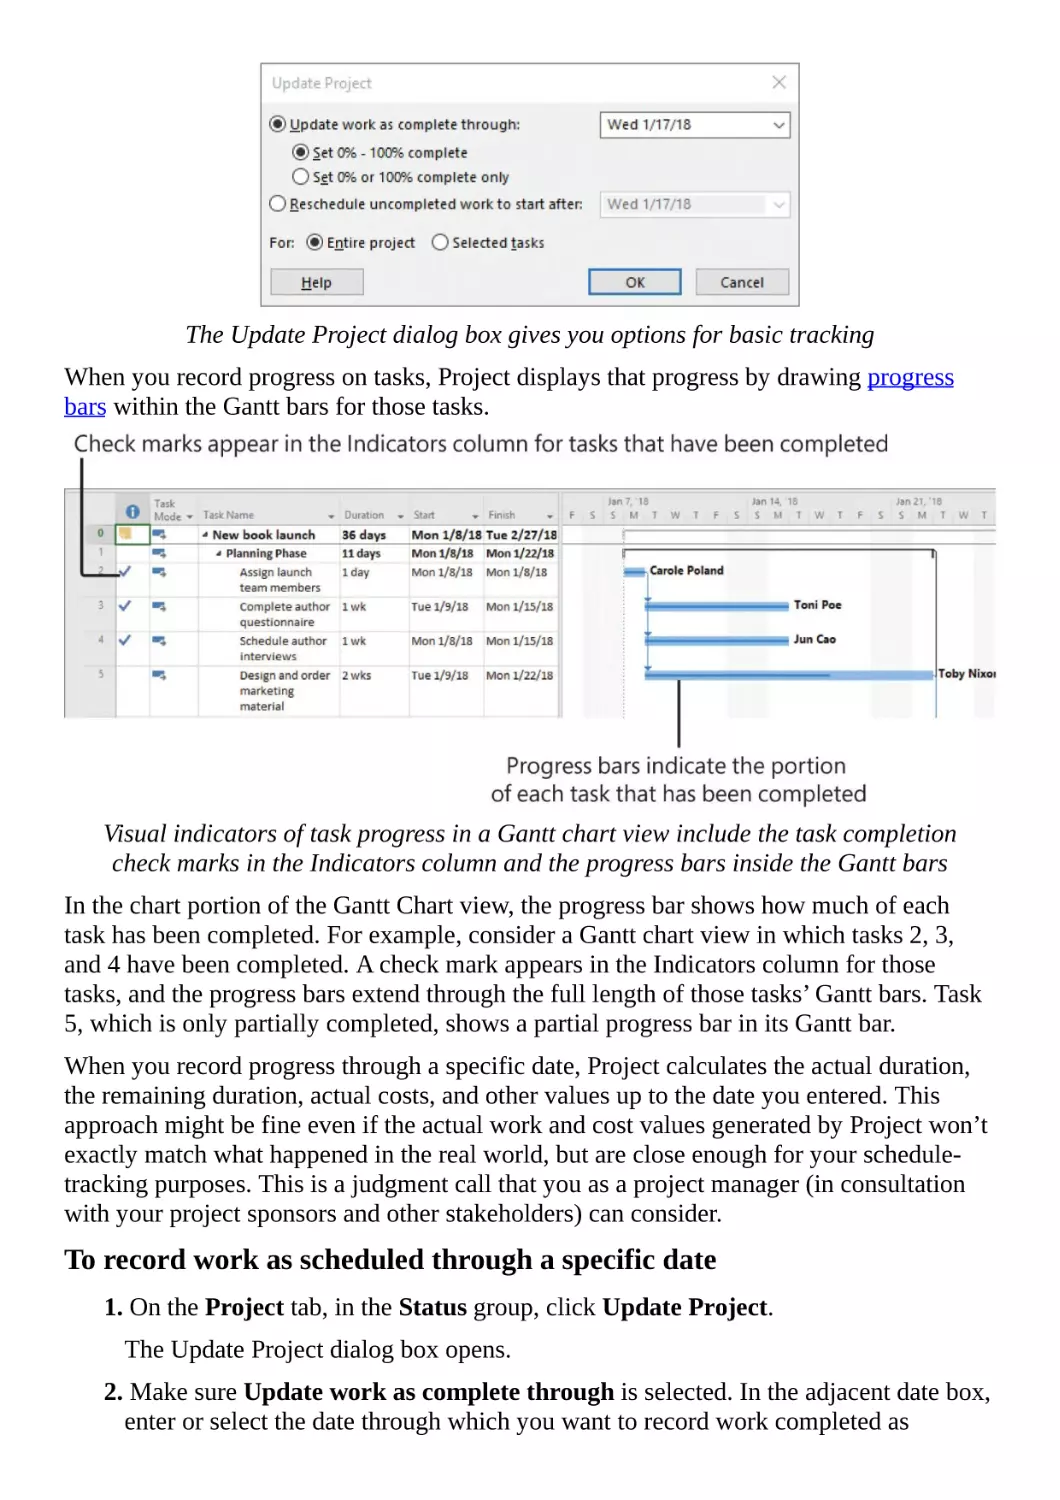
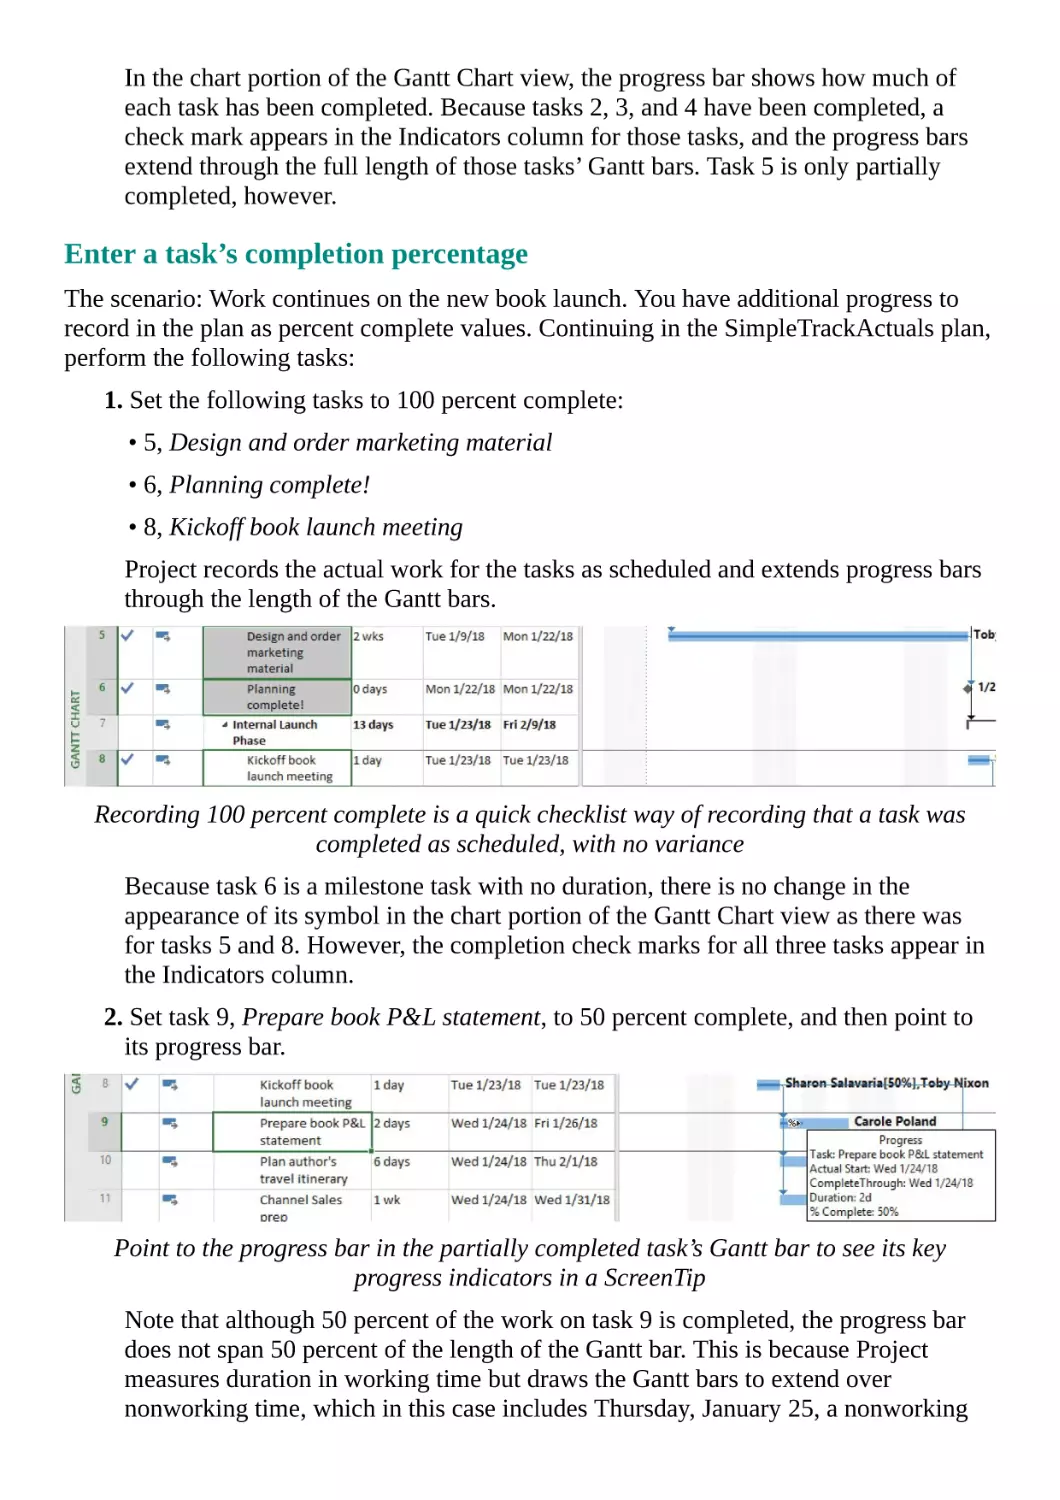
Track a plan as scheduled
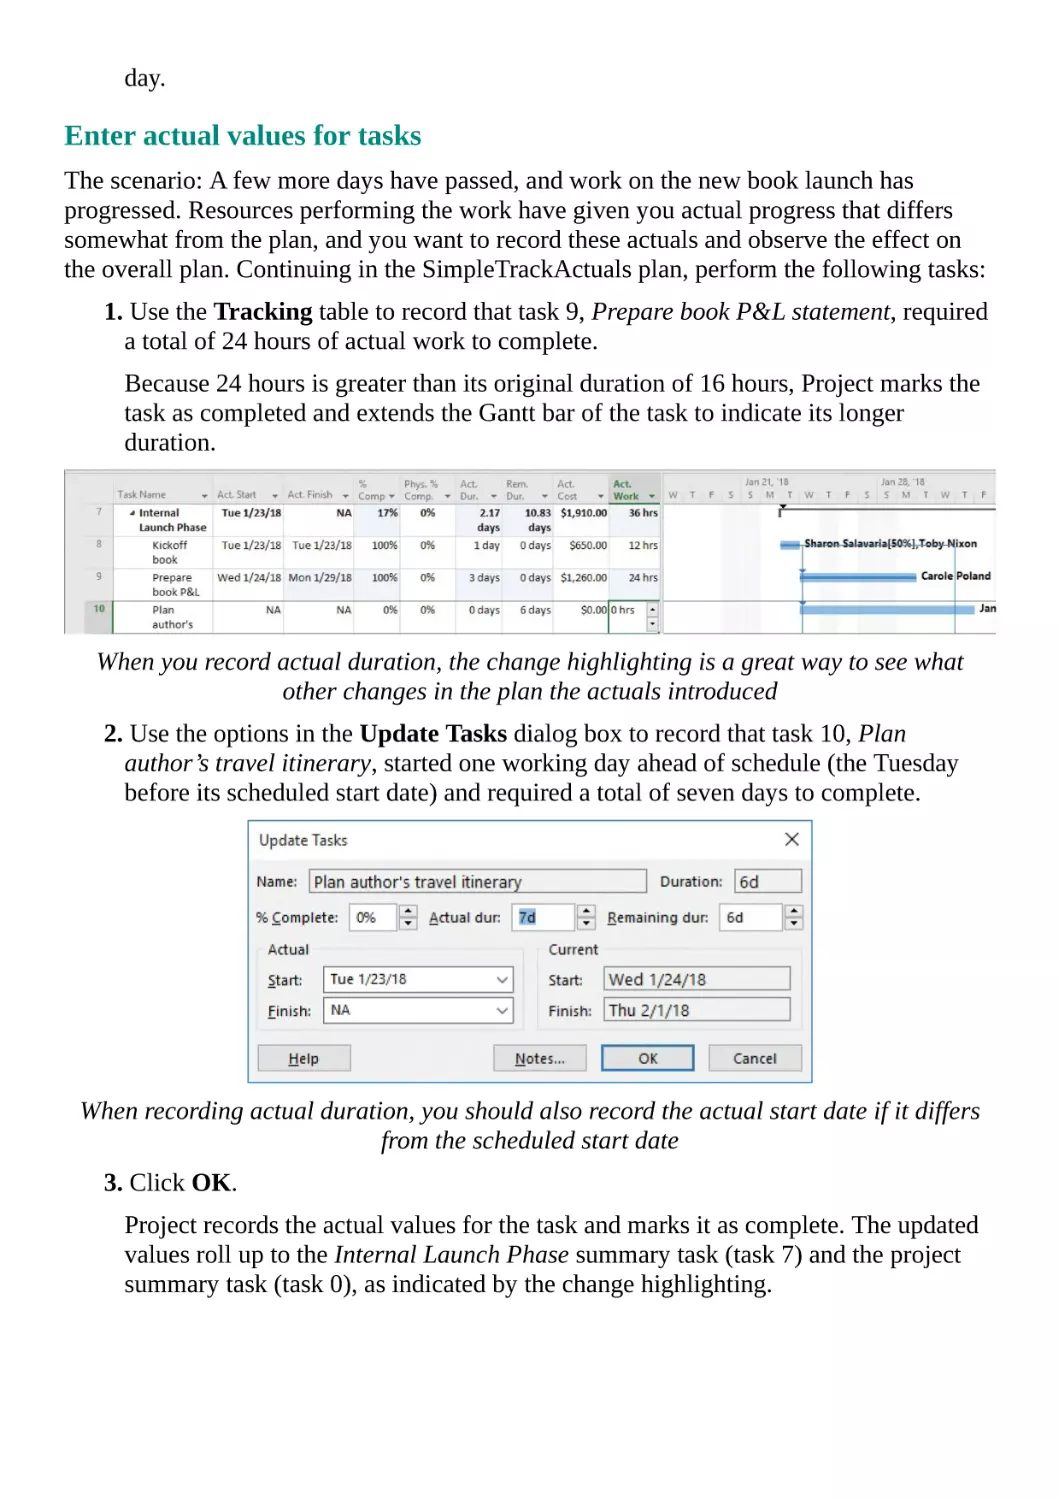
Enter a task’s completion percentage
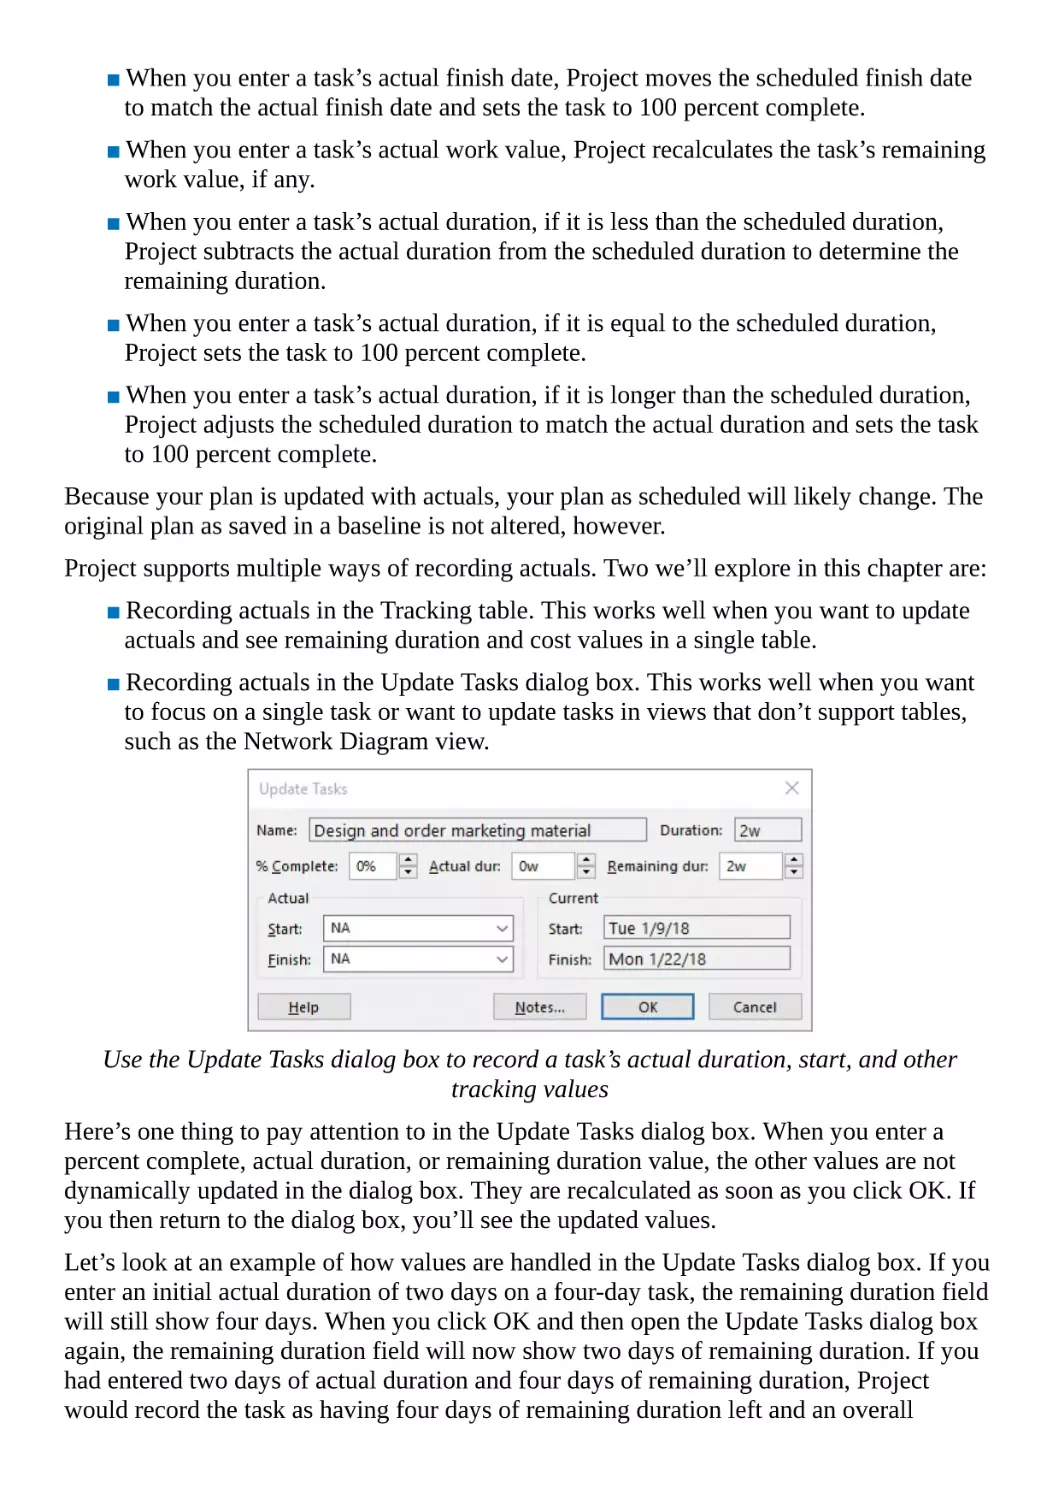
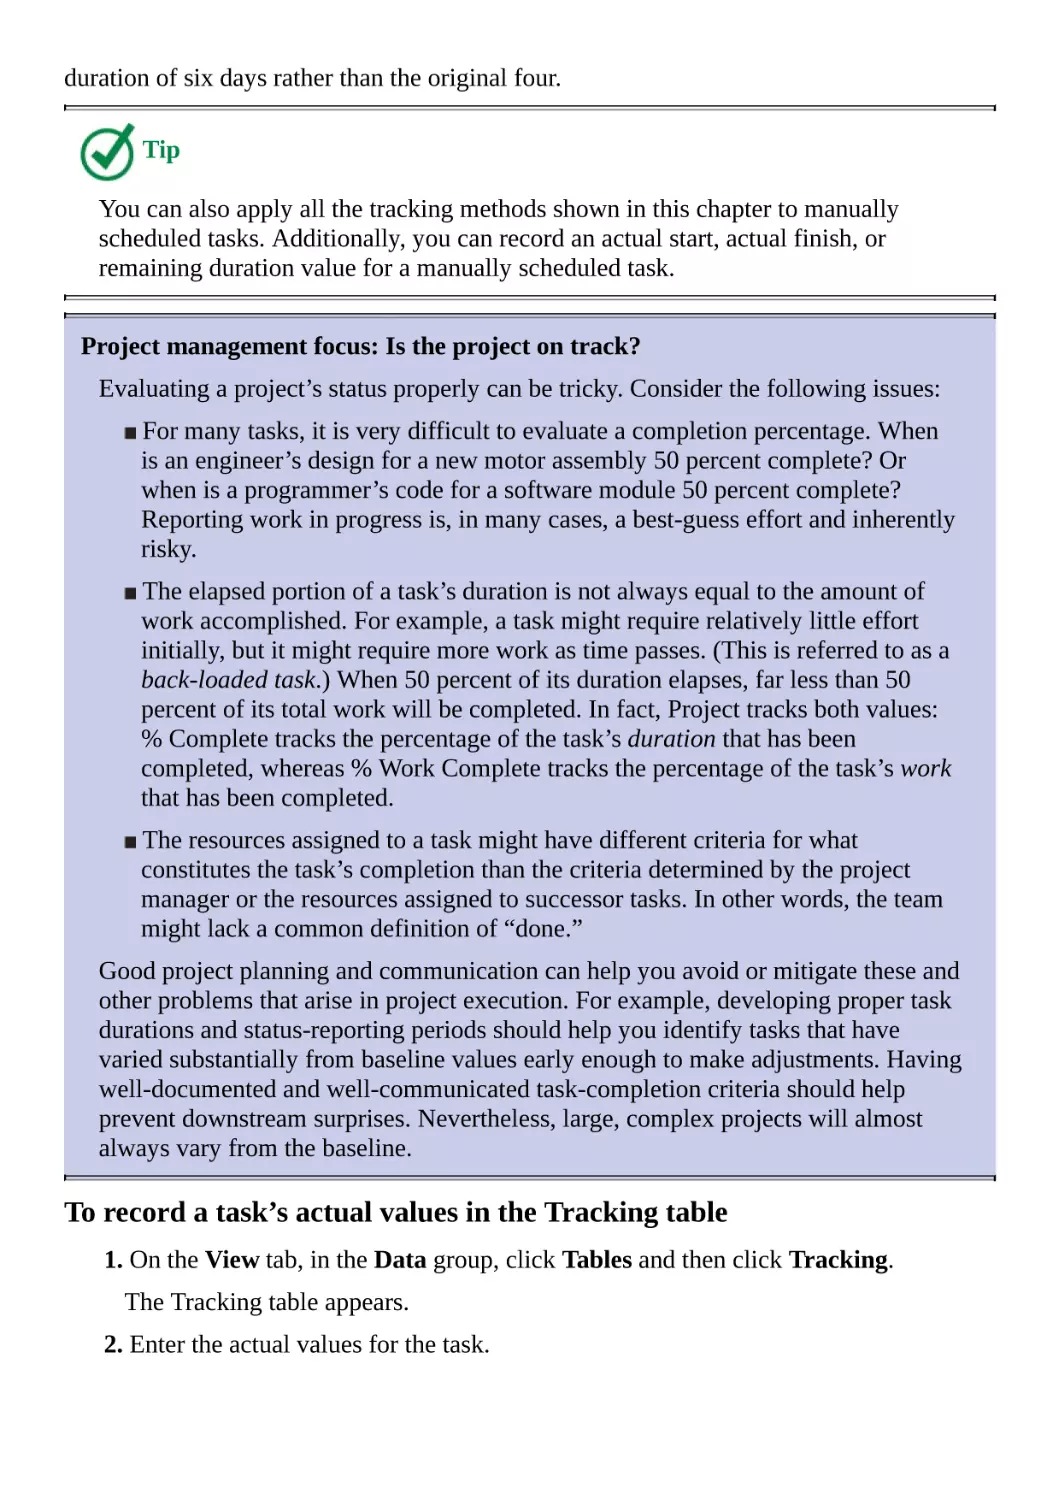
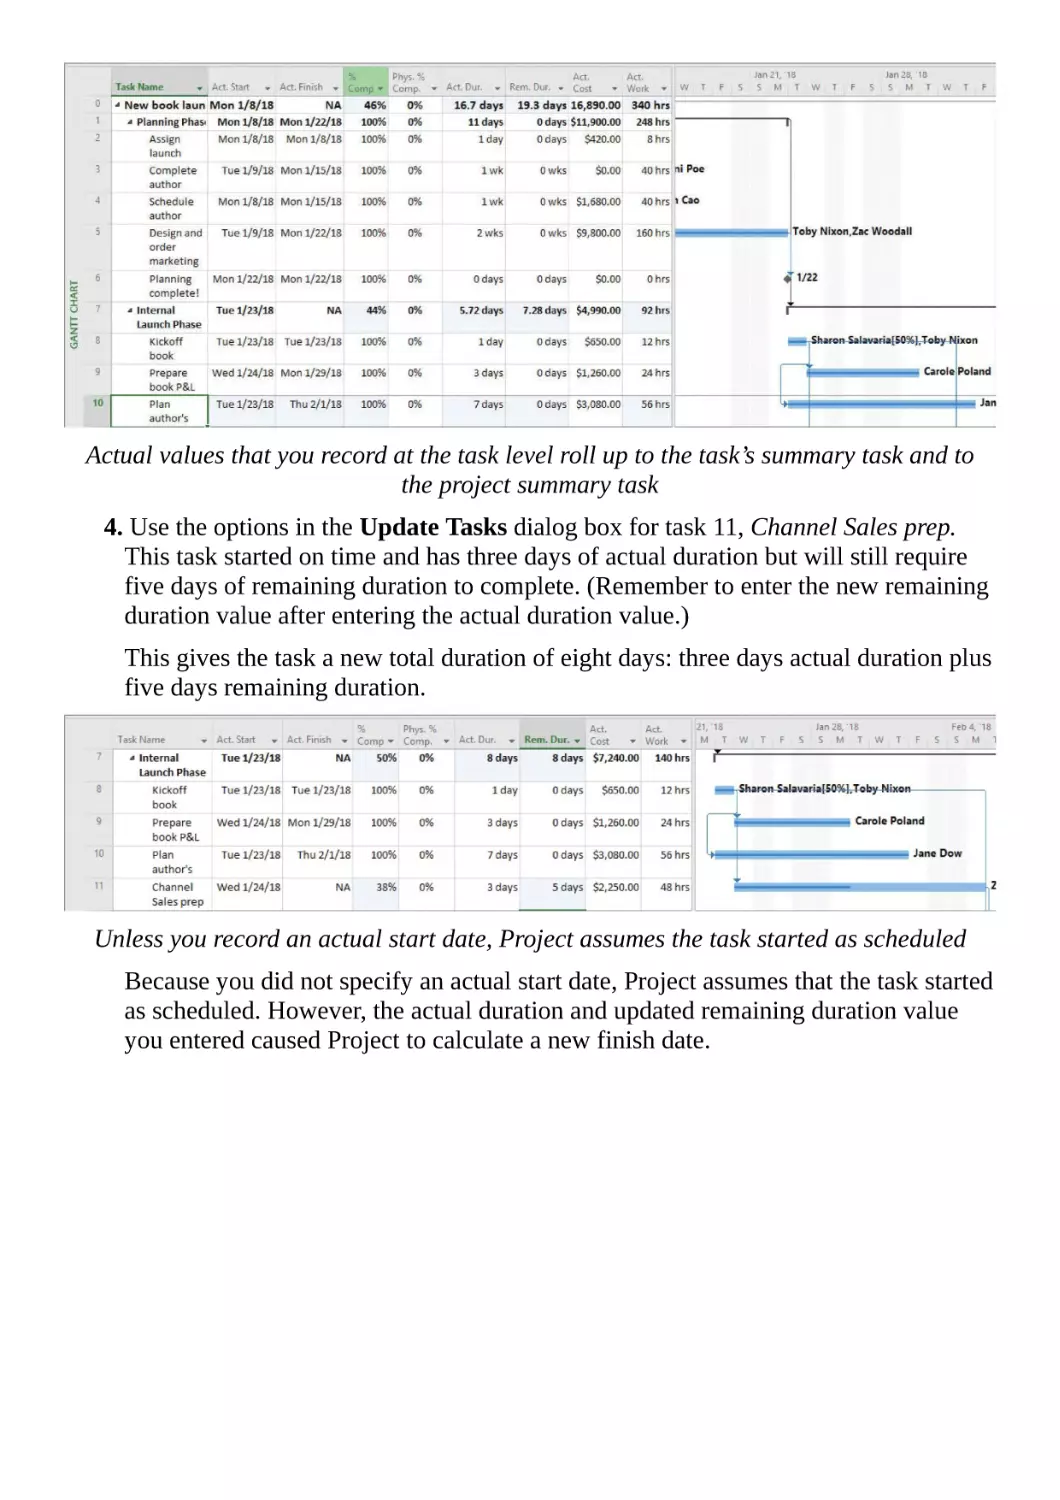
Enter actual values for tasks
Sidebar: Project management focus: Is the project on track?
Skills review
Practice tasks
Part 3: Advanced scheduling techniques
9 Fine-tune task scheduling
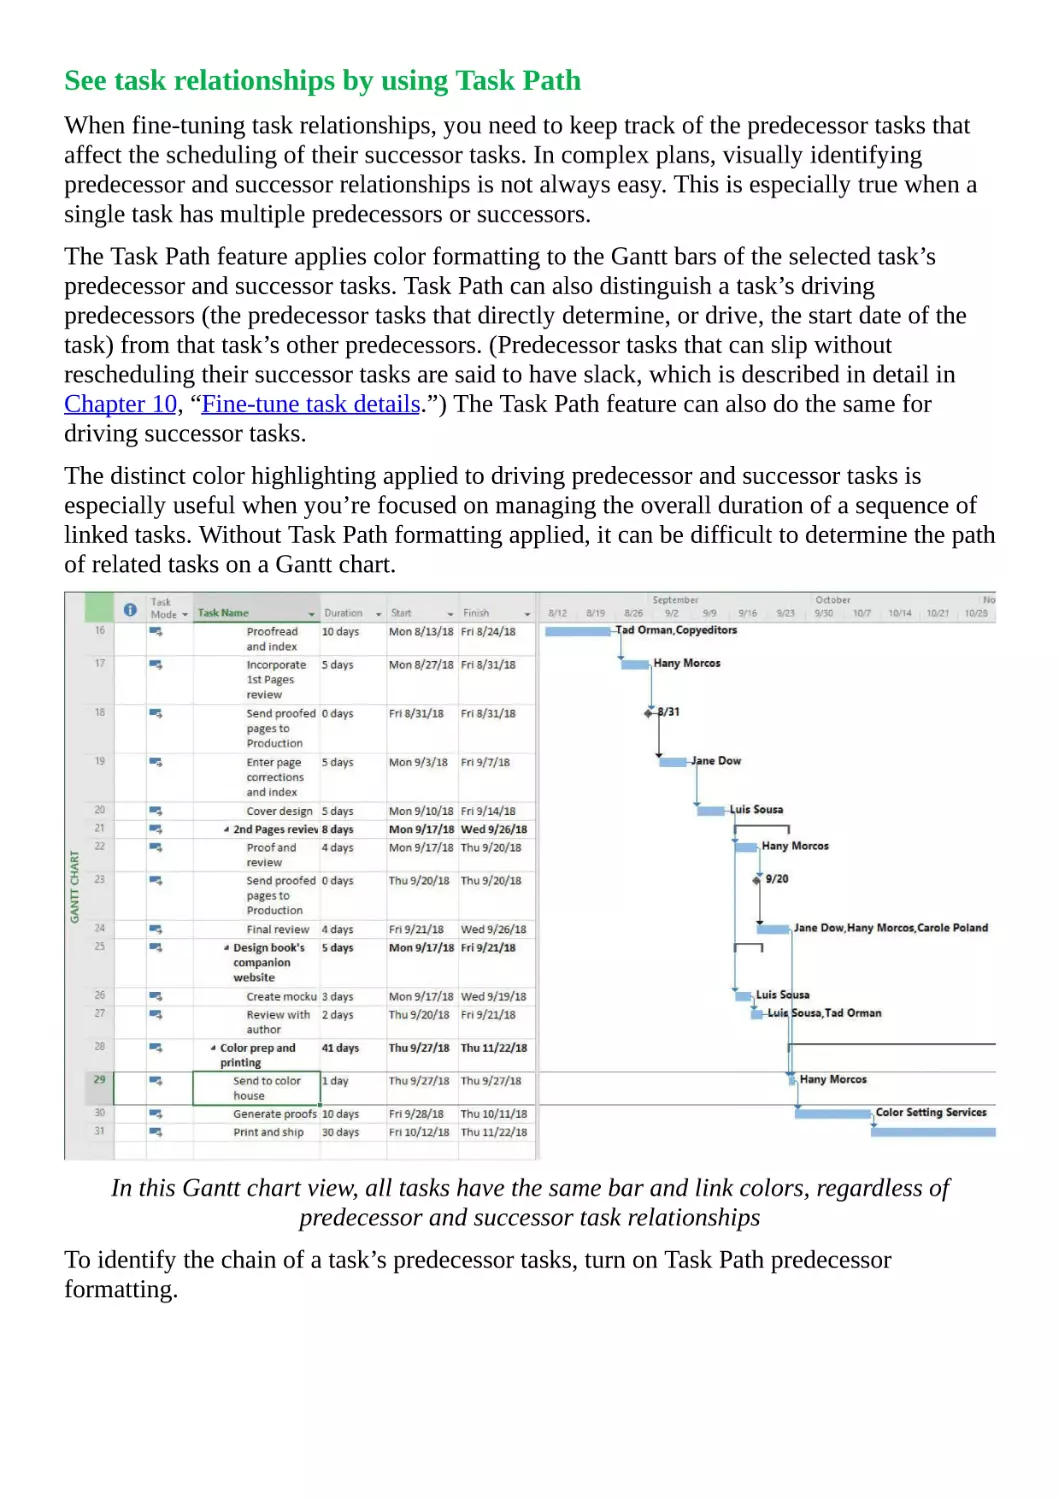
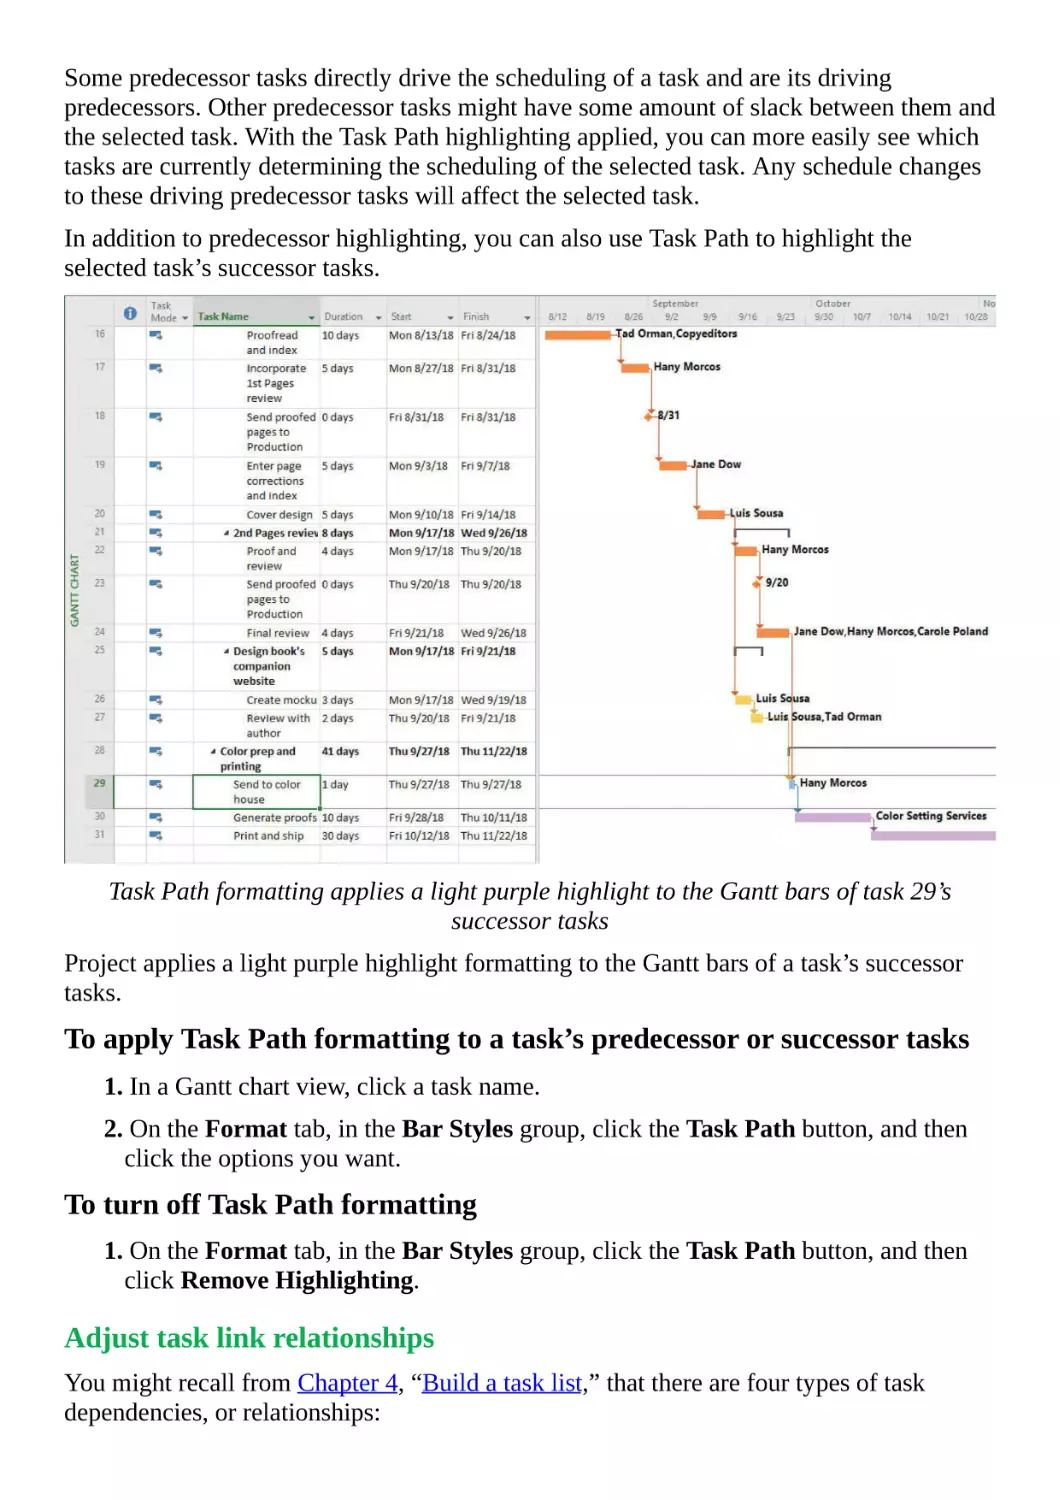
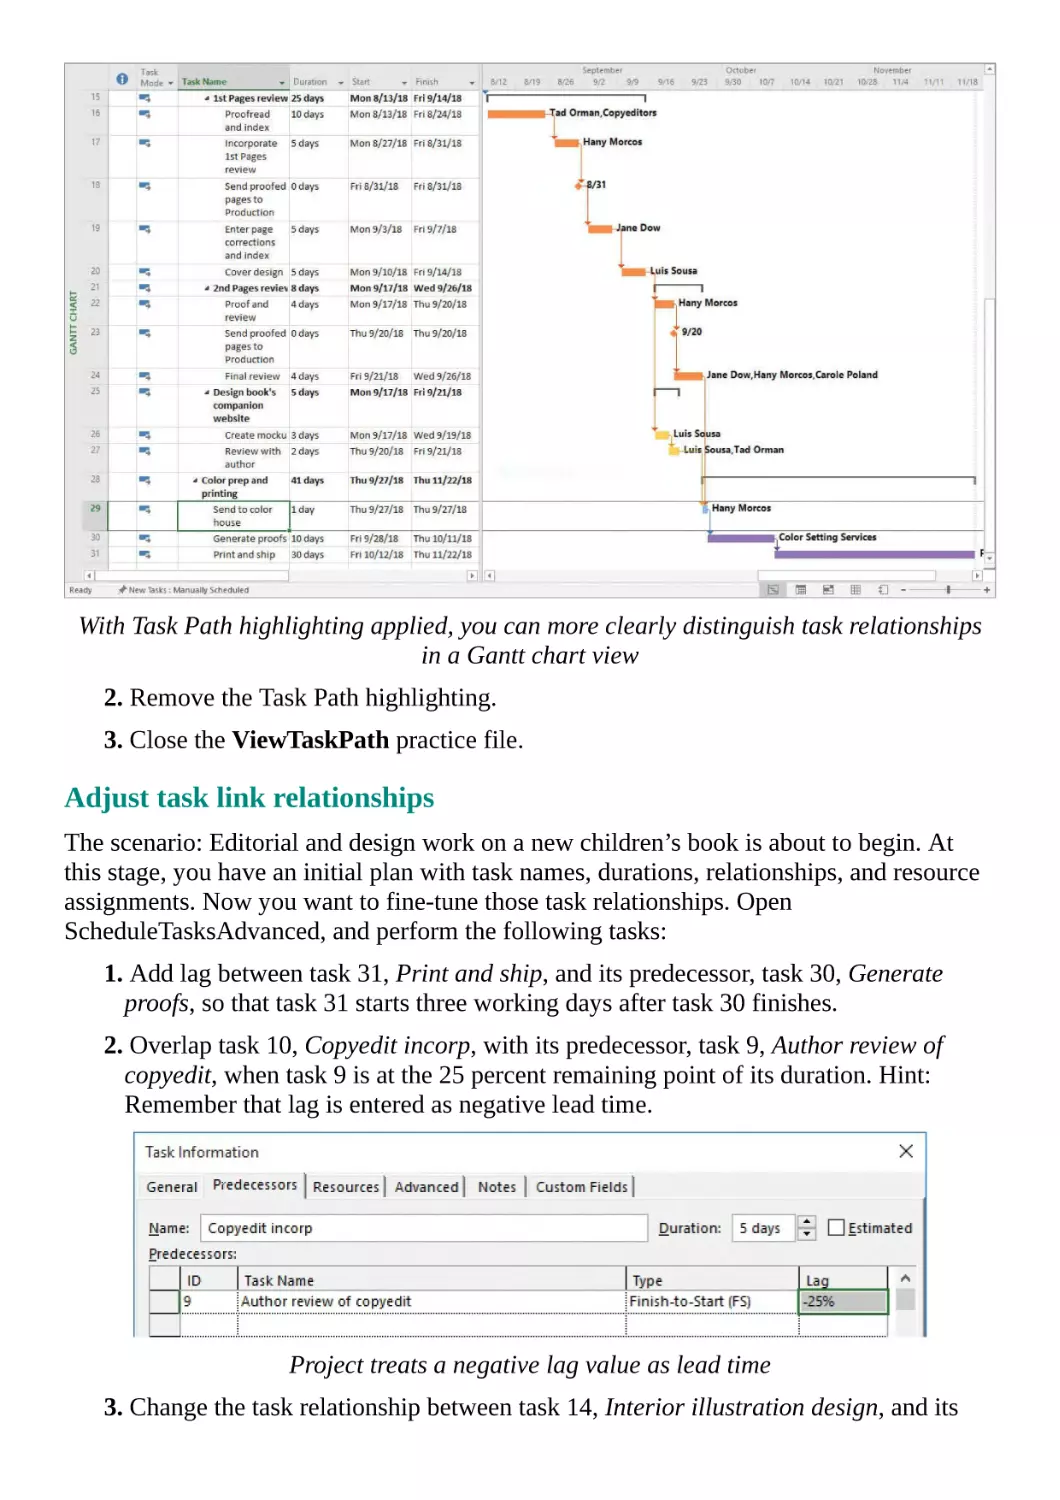
See task relationships by using Task Path
Adjust task link relationships
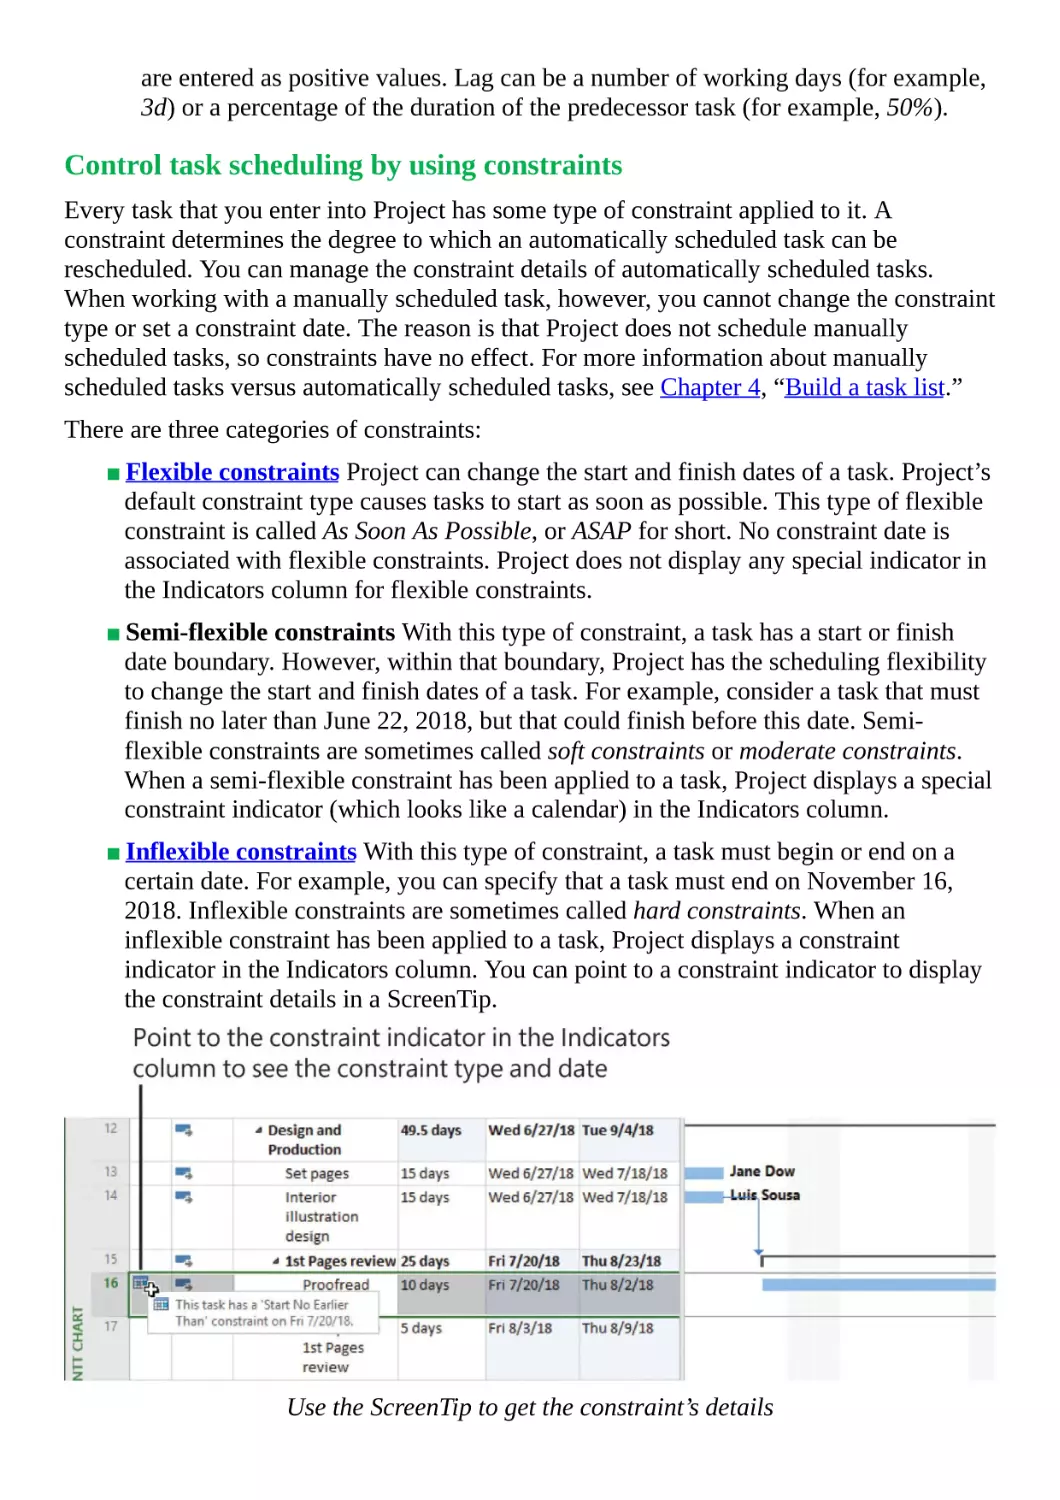
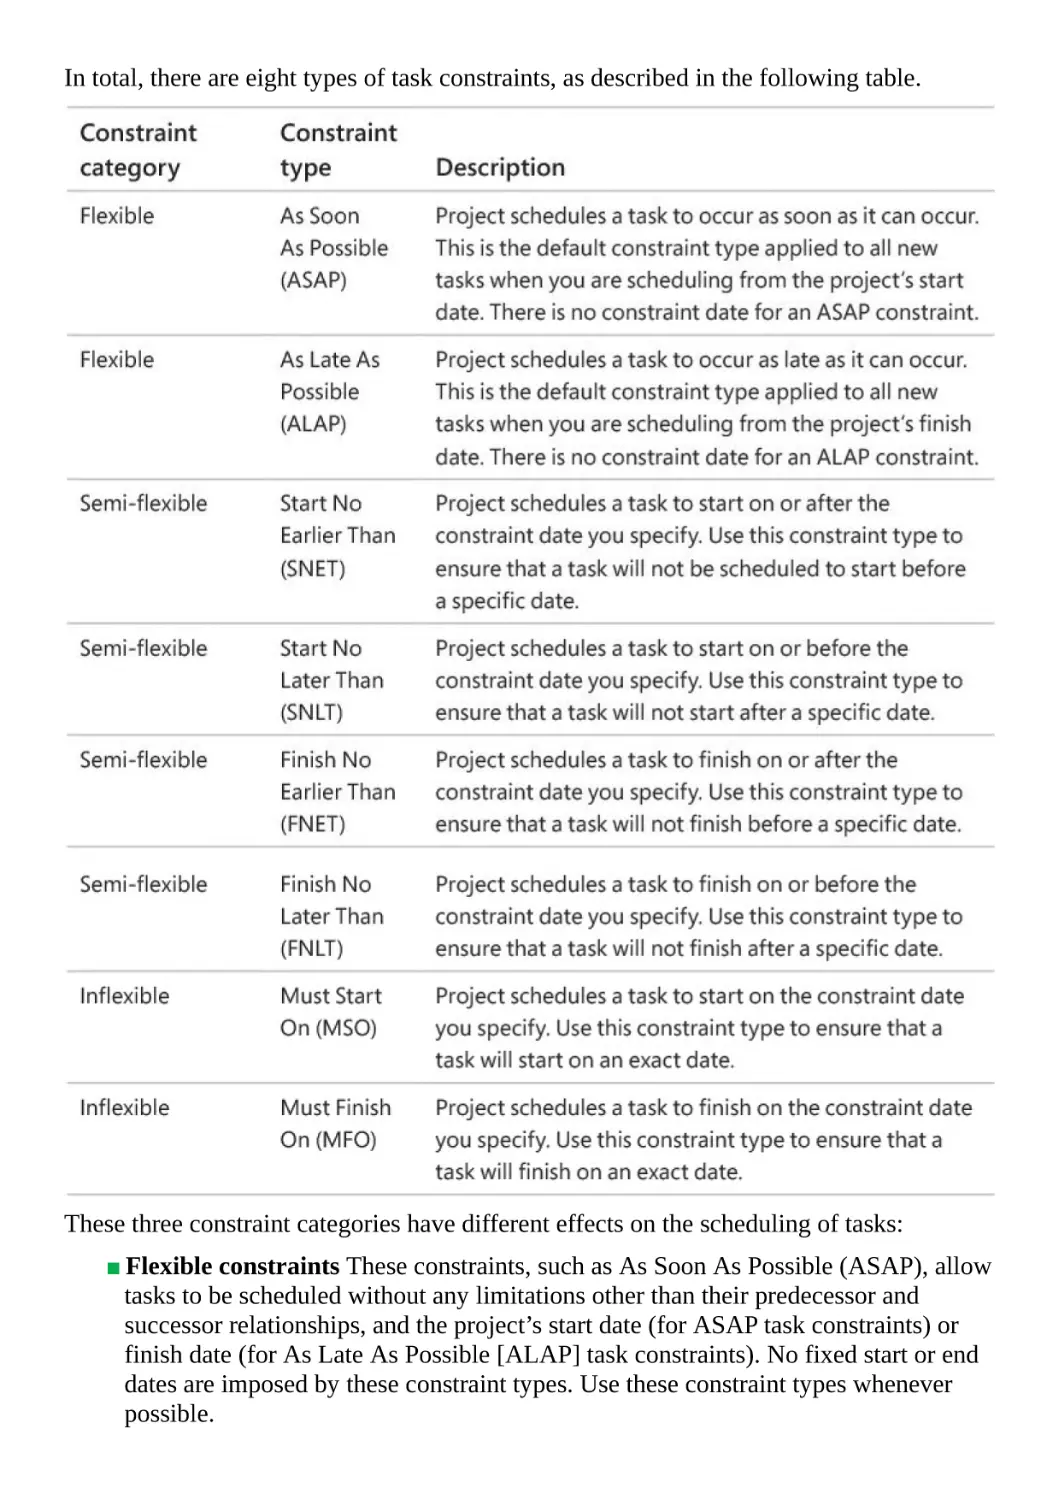
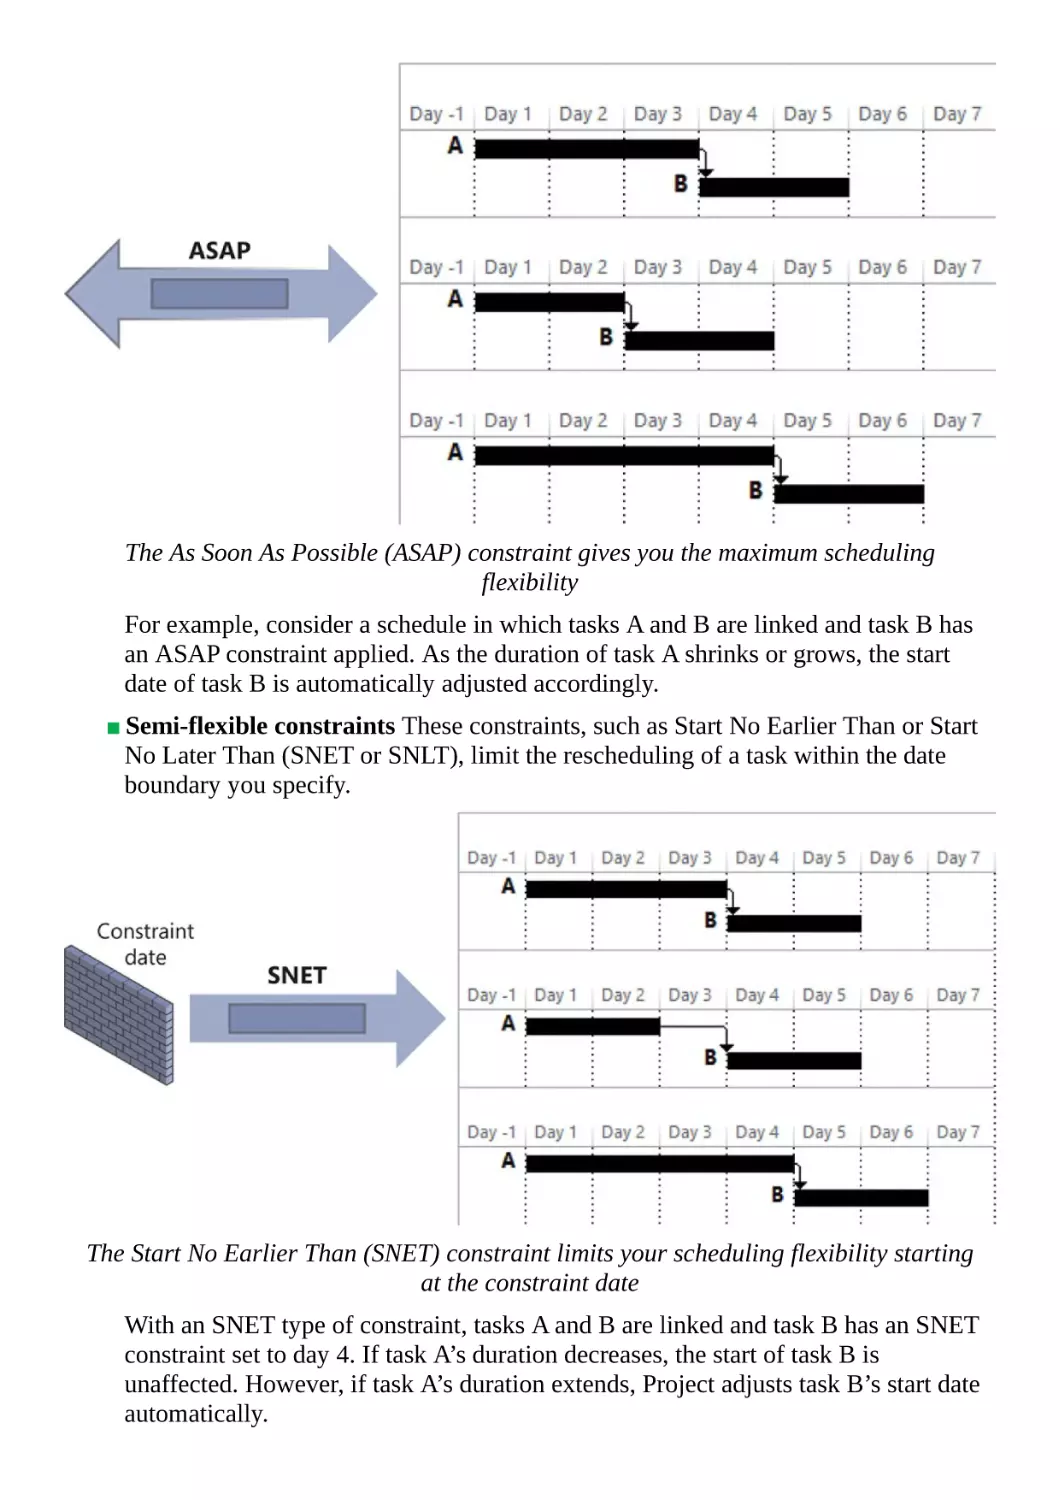
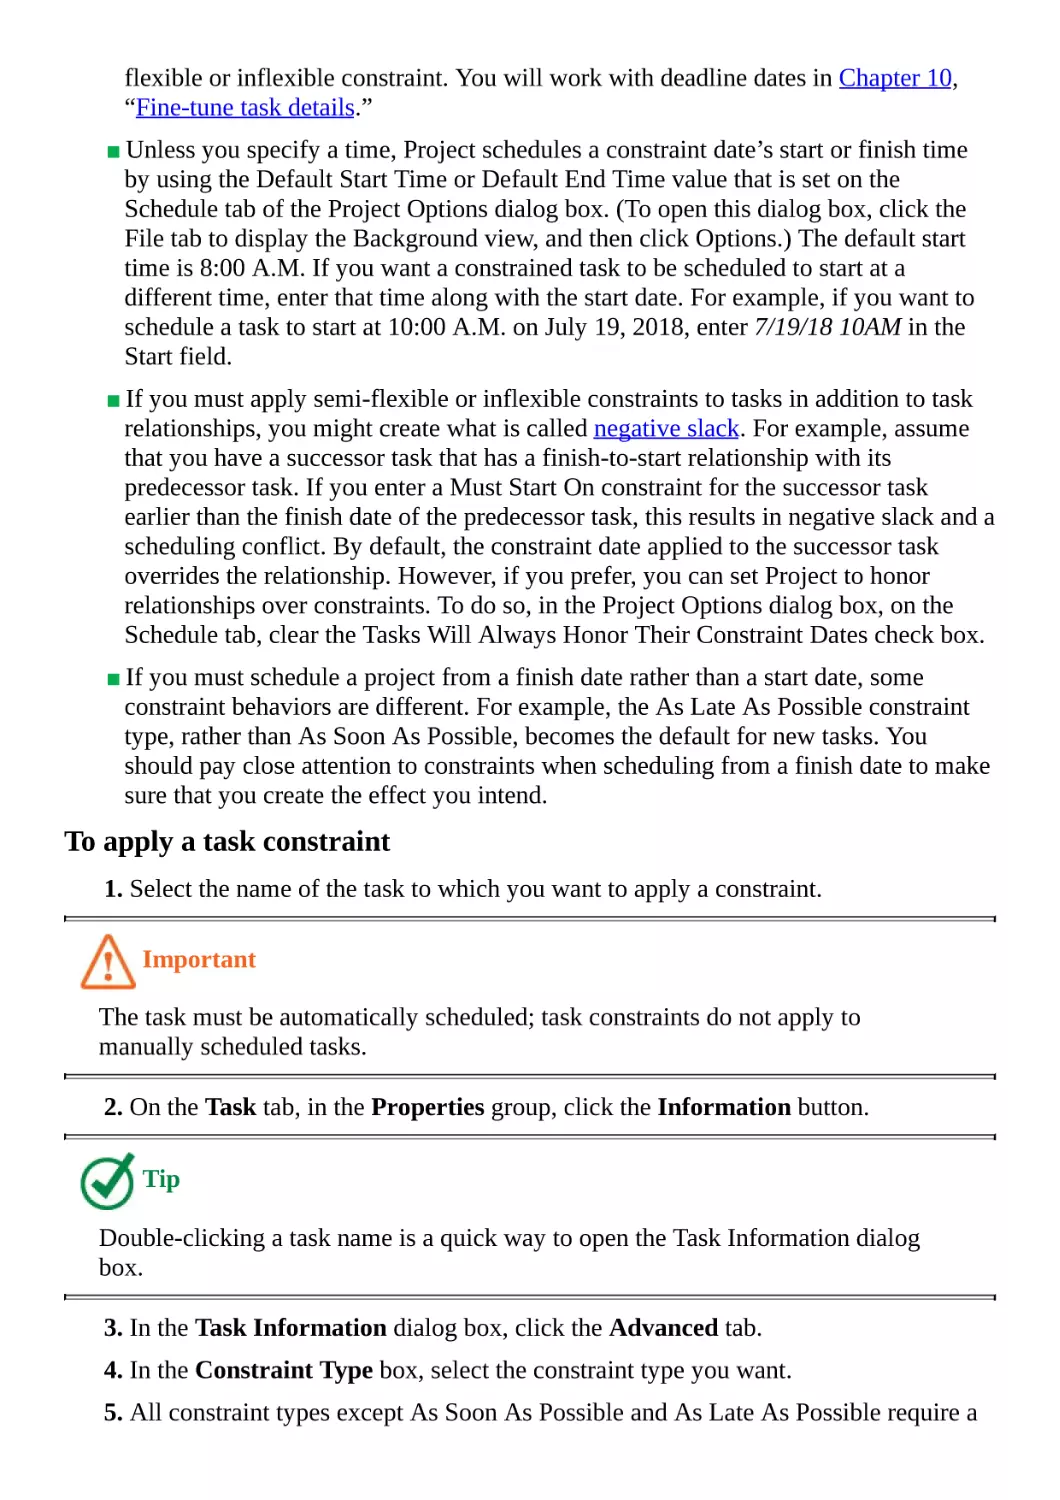
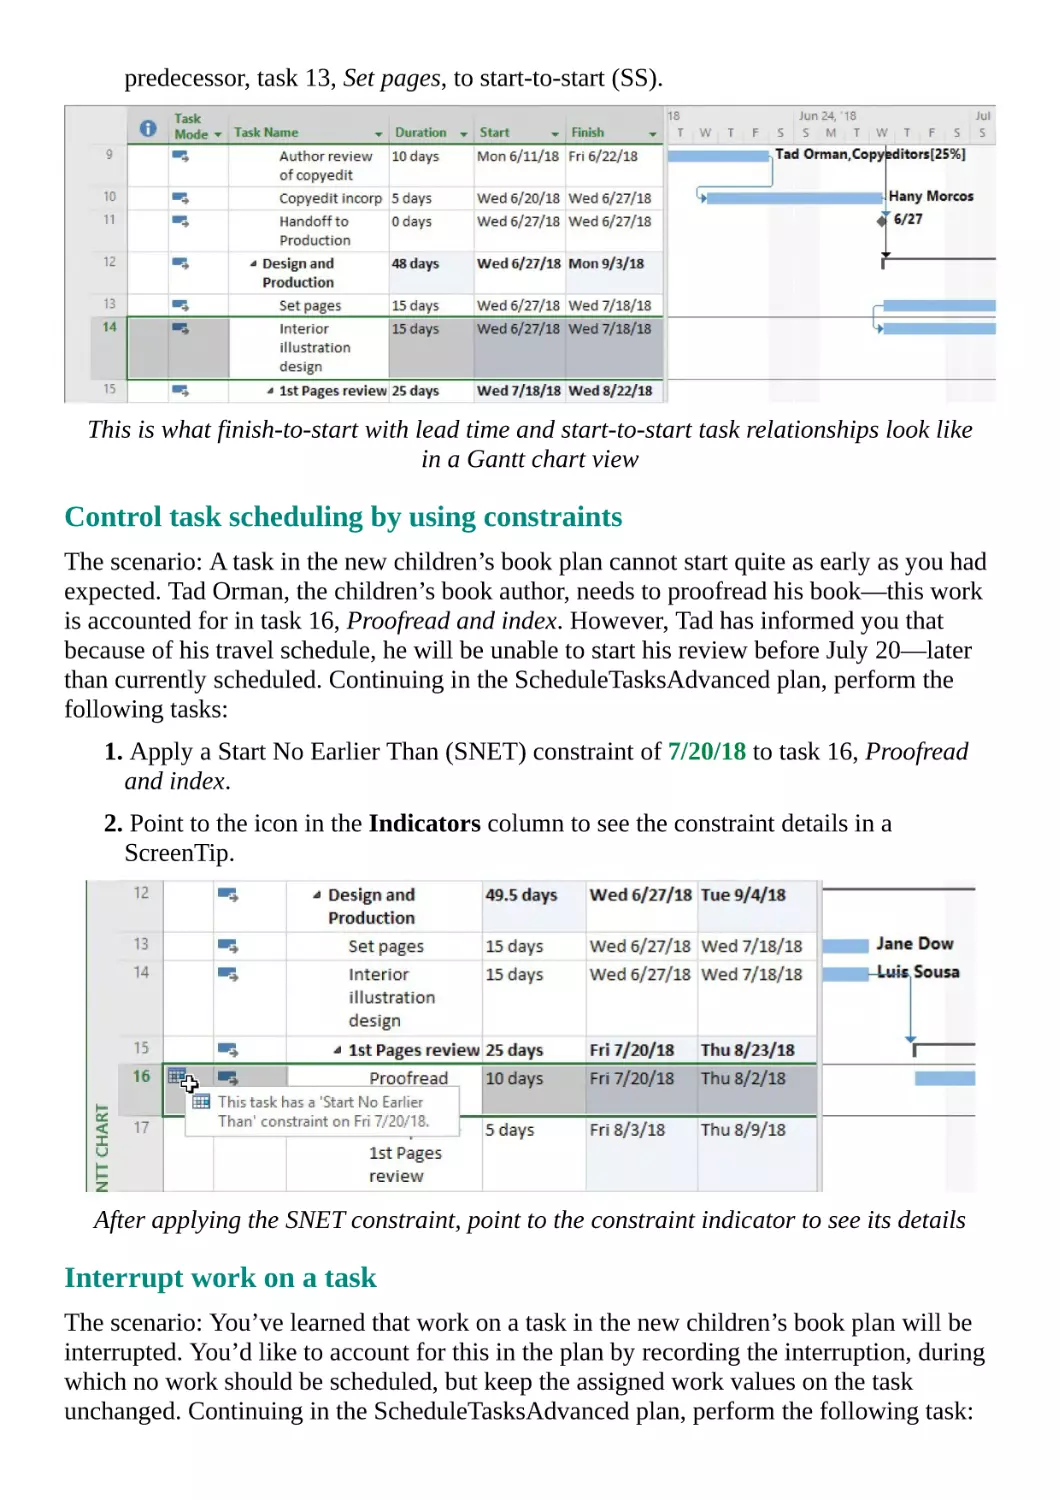
Control task scheduling by using constraints
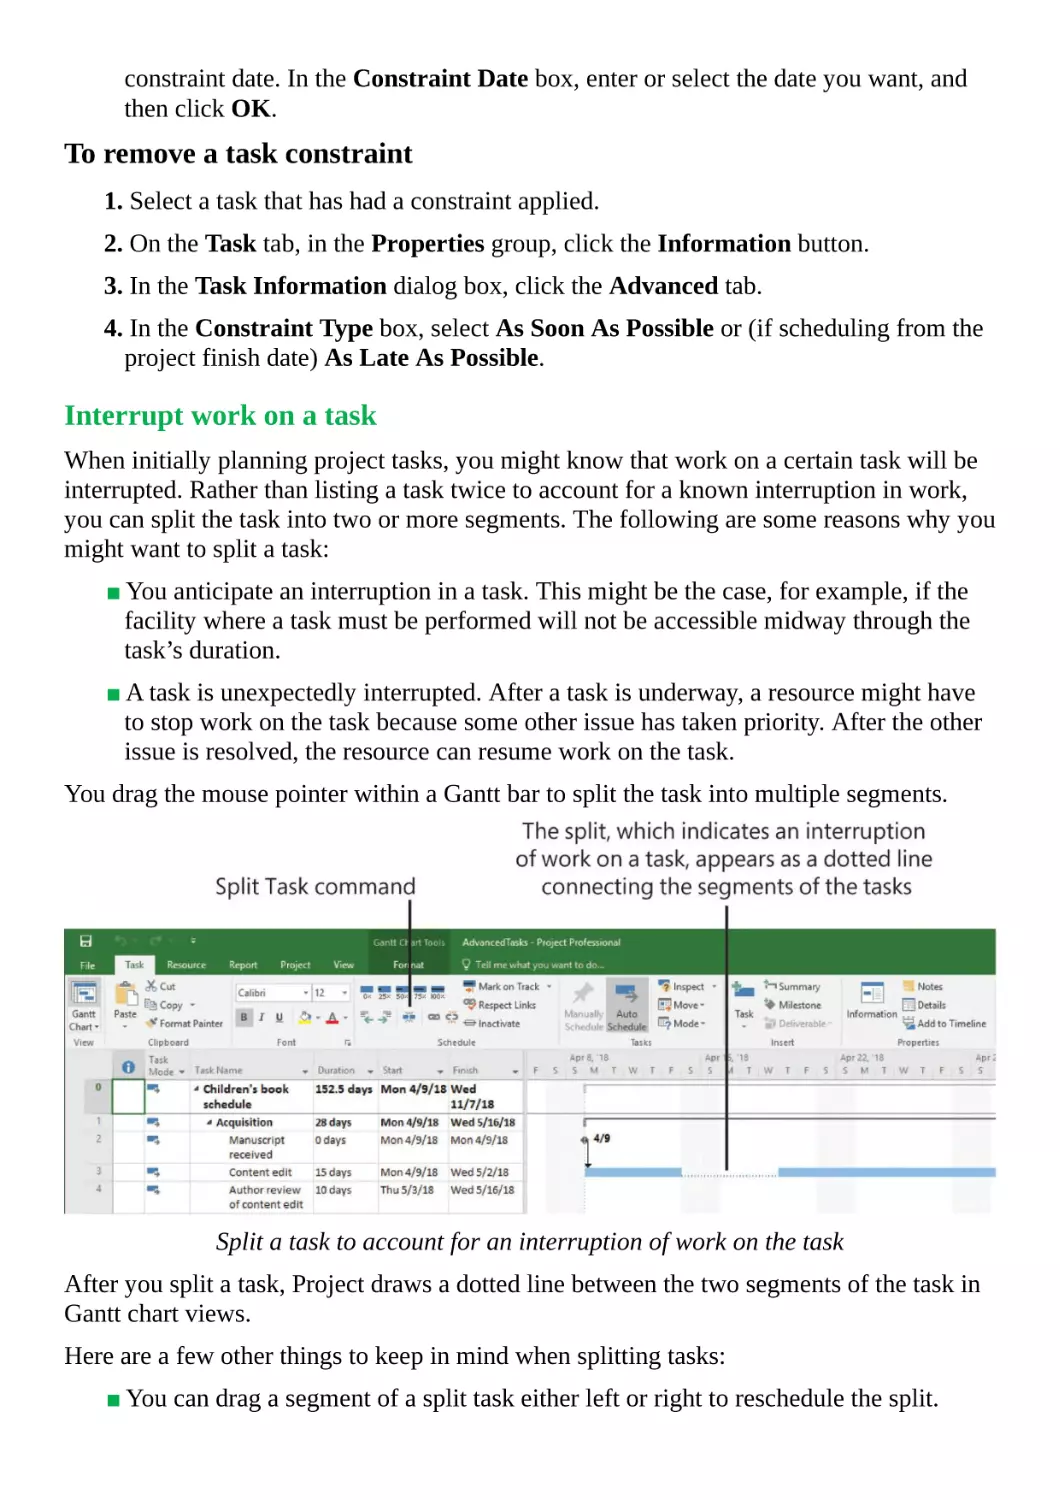
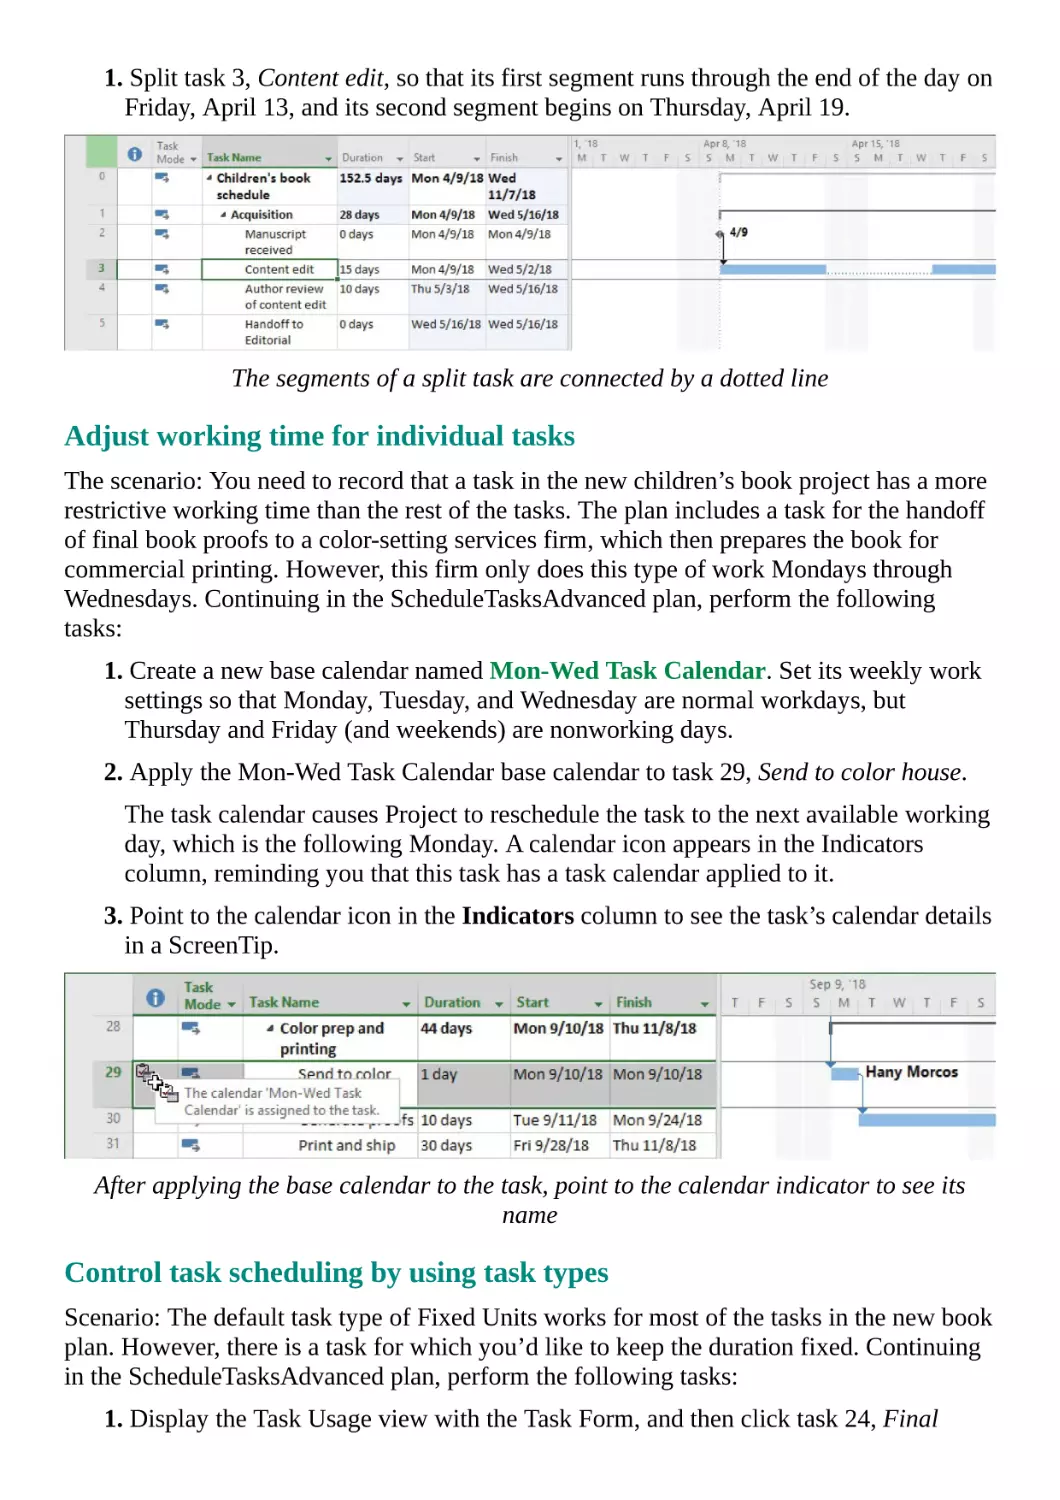
Interrupt work on a task
Adjust working time for individual tasks
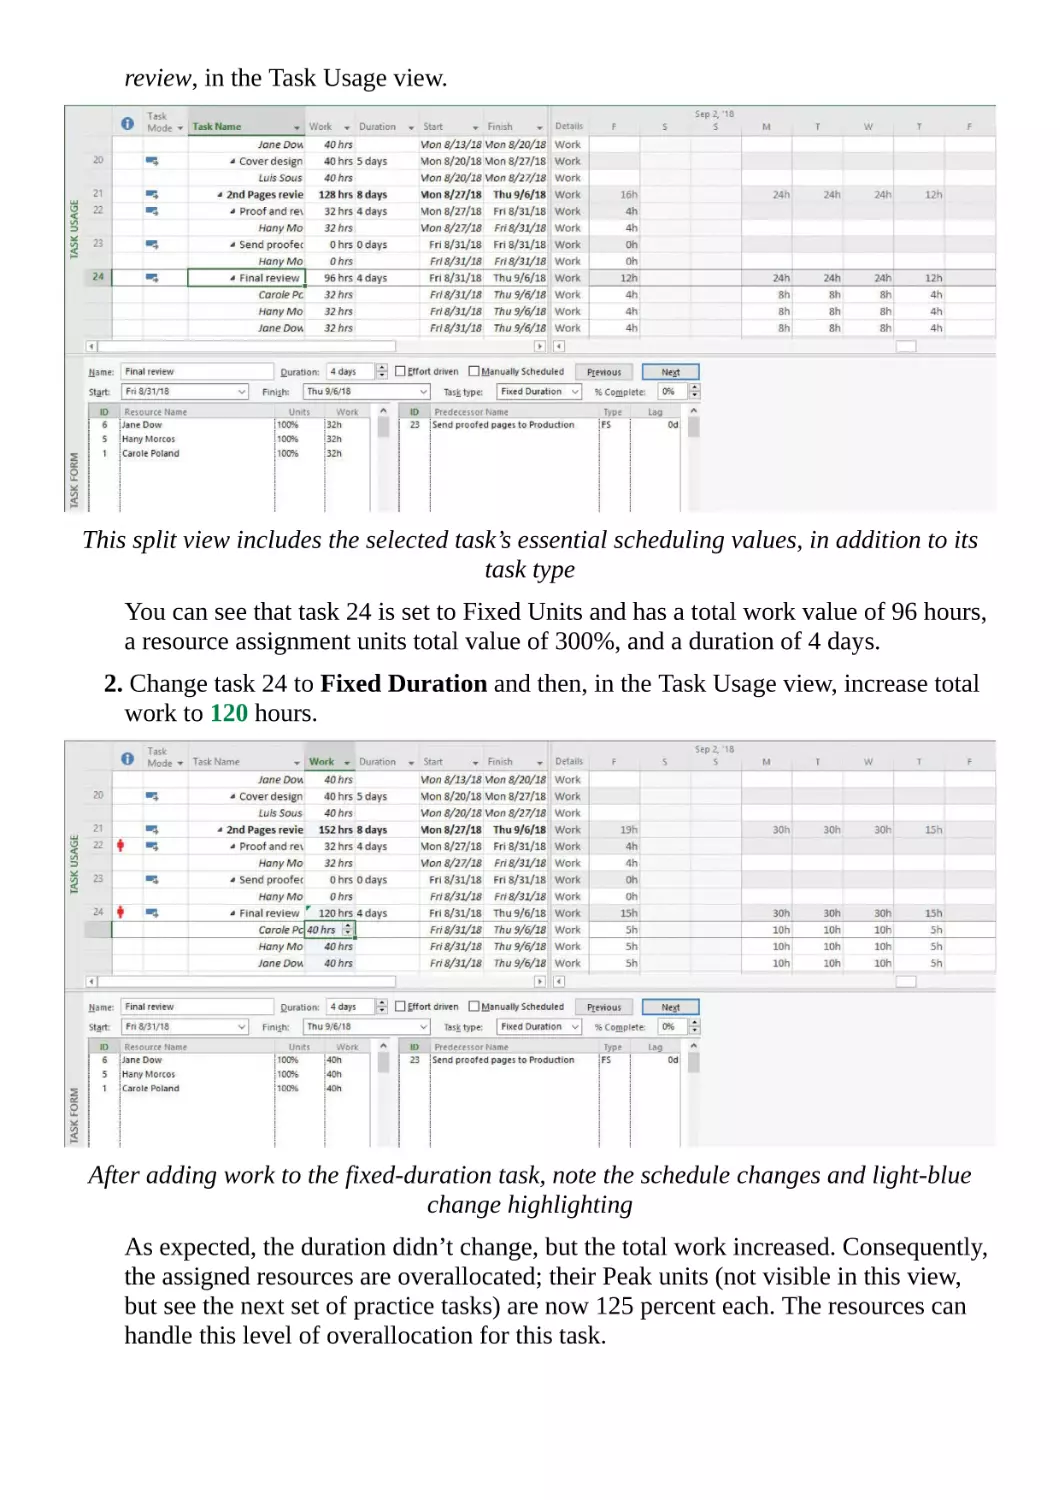
Control task scheduling by using task types
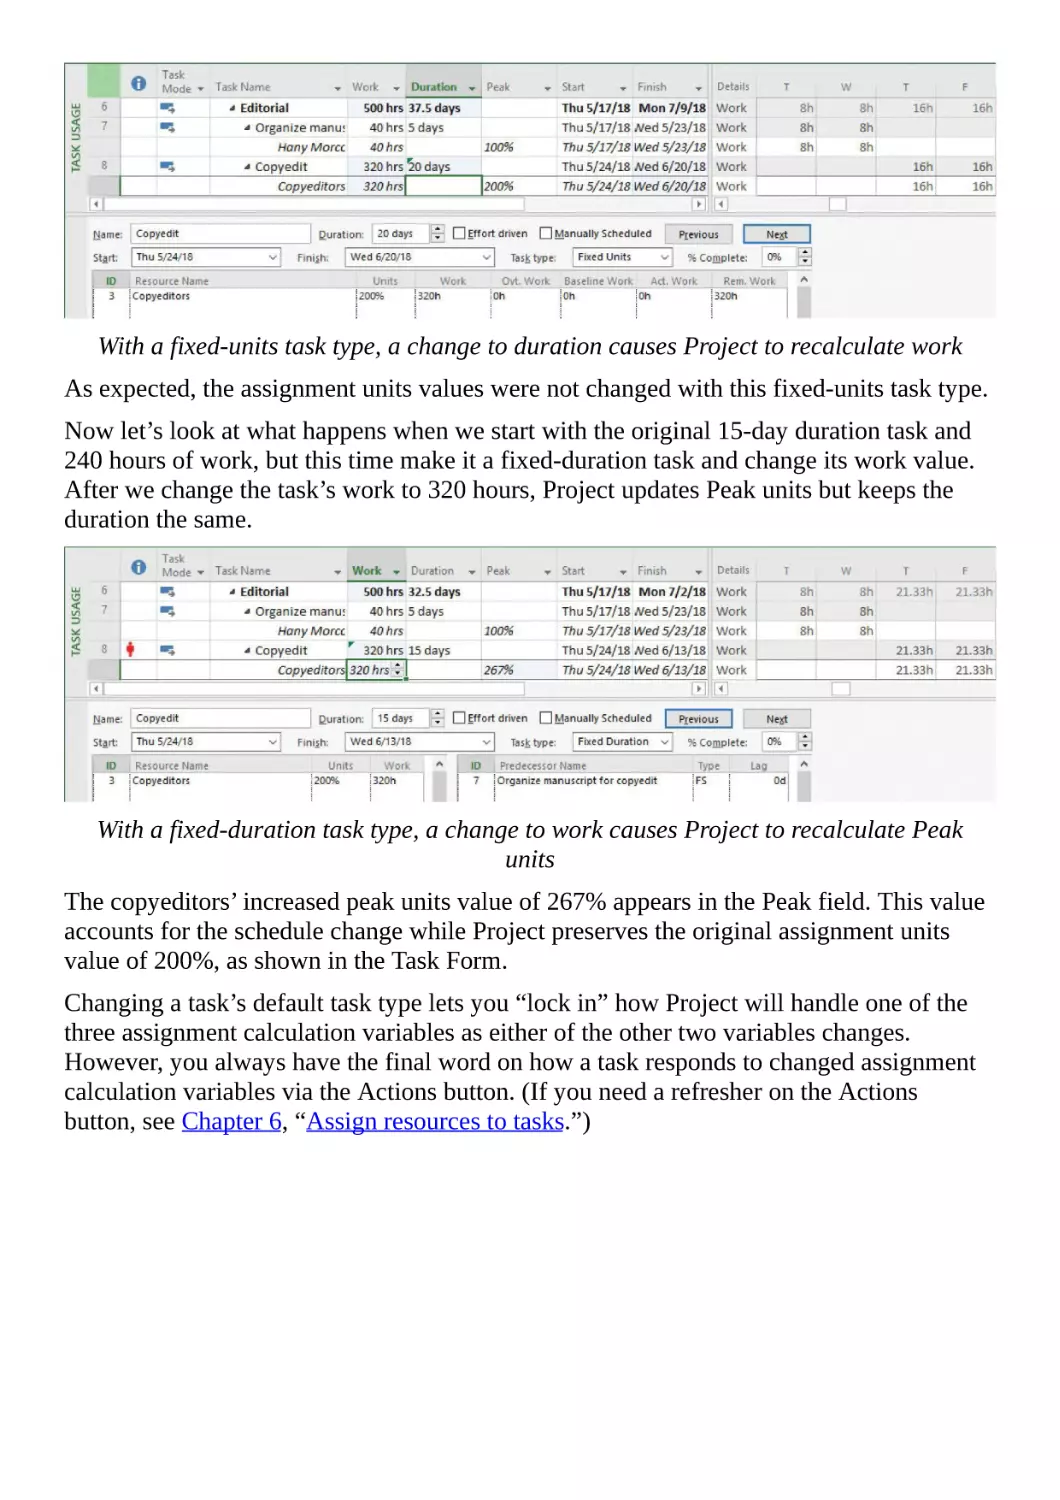
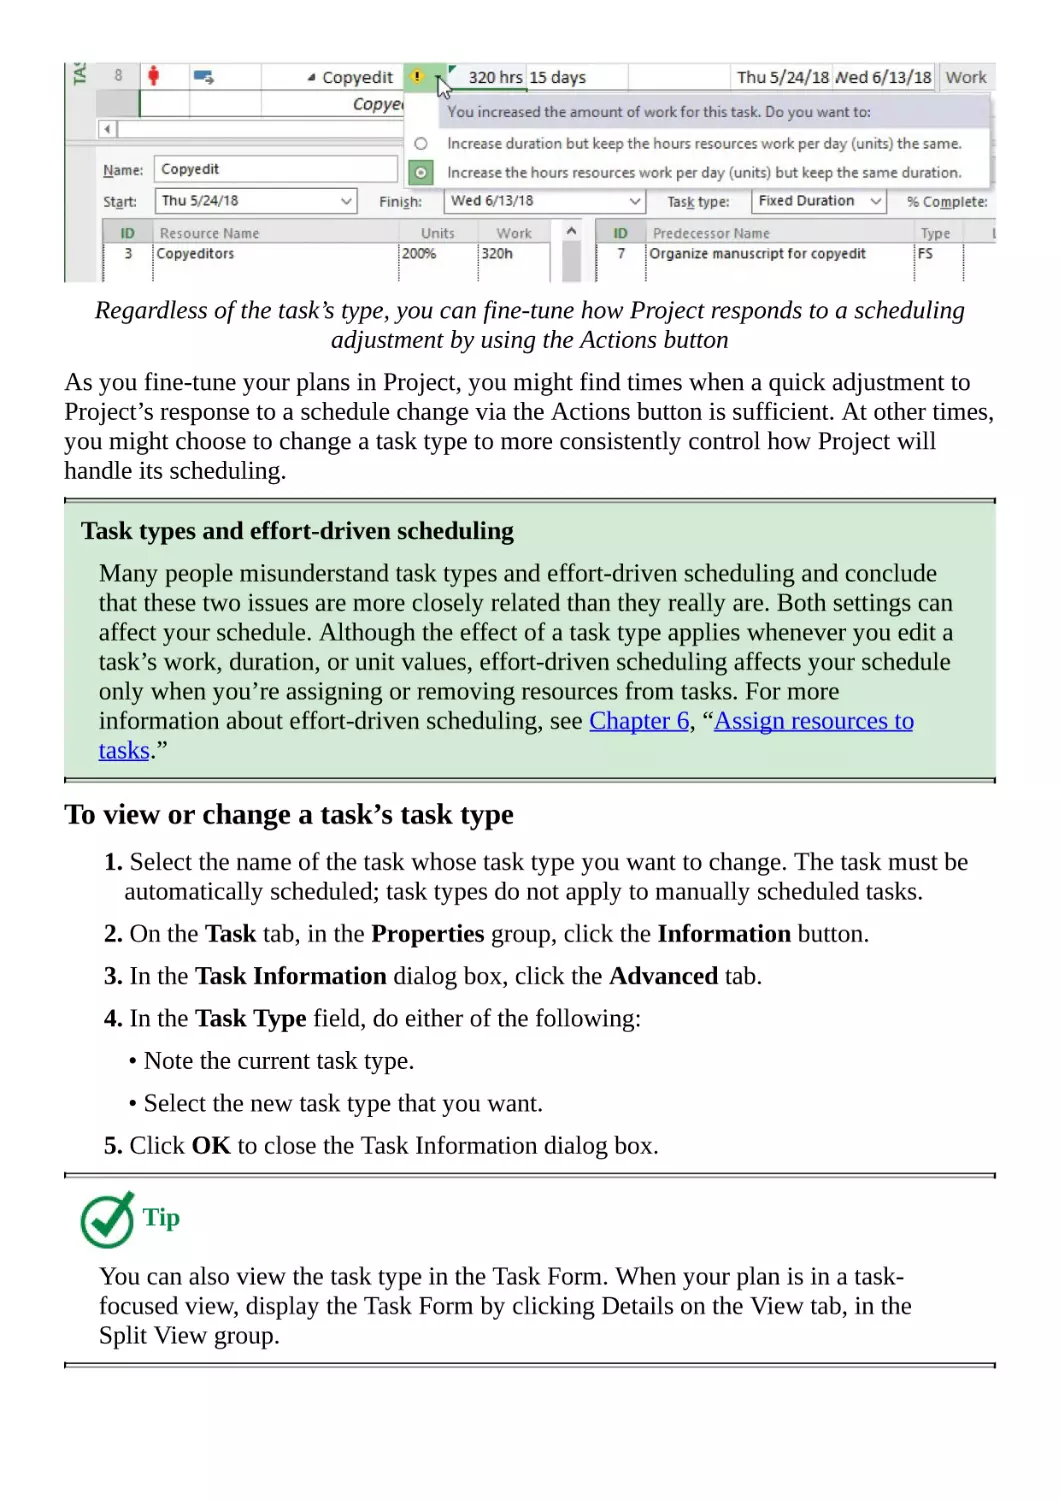
Sidebar: Assignment units, Peak, and the assignment calculation
Sidebar: Task types and effort-driven scheduling
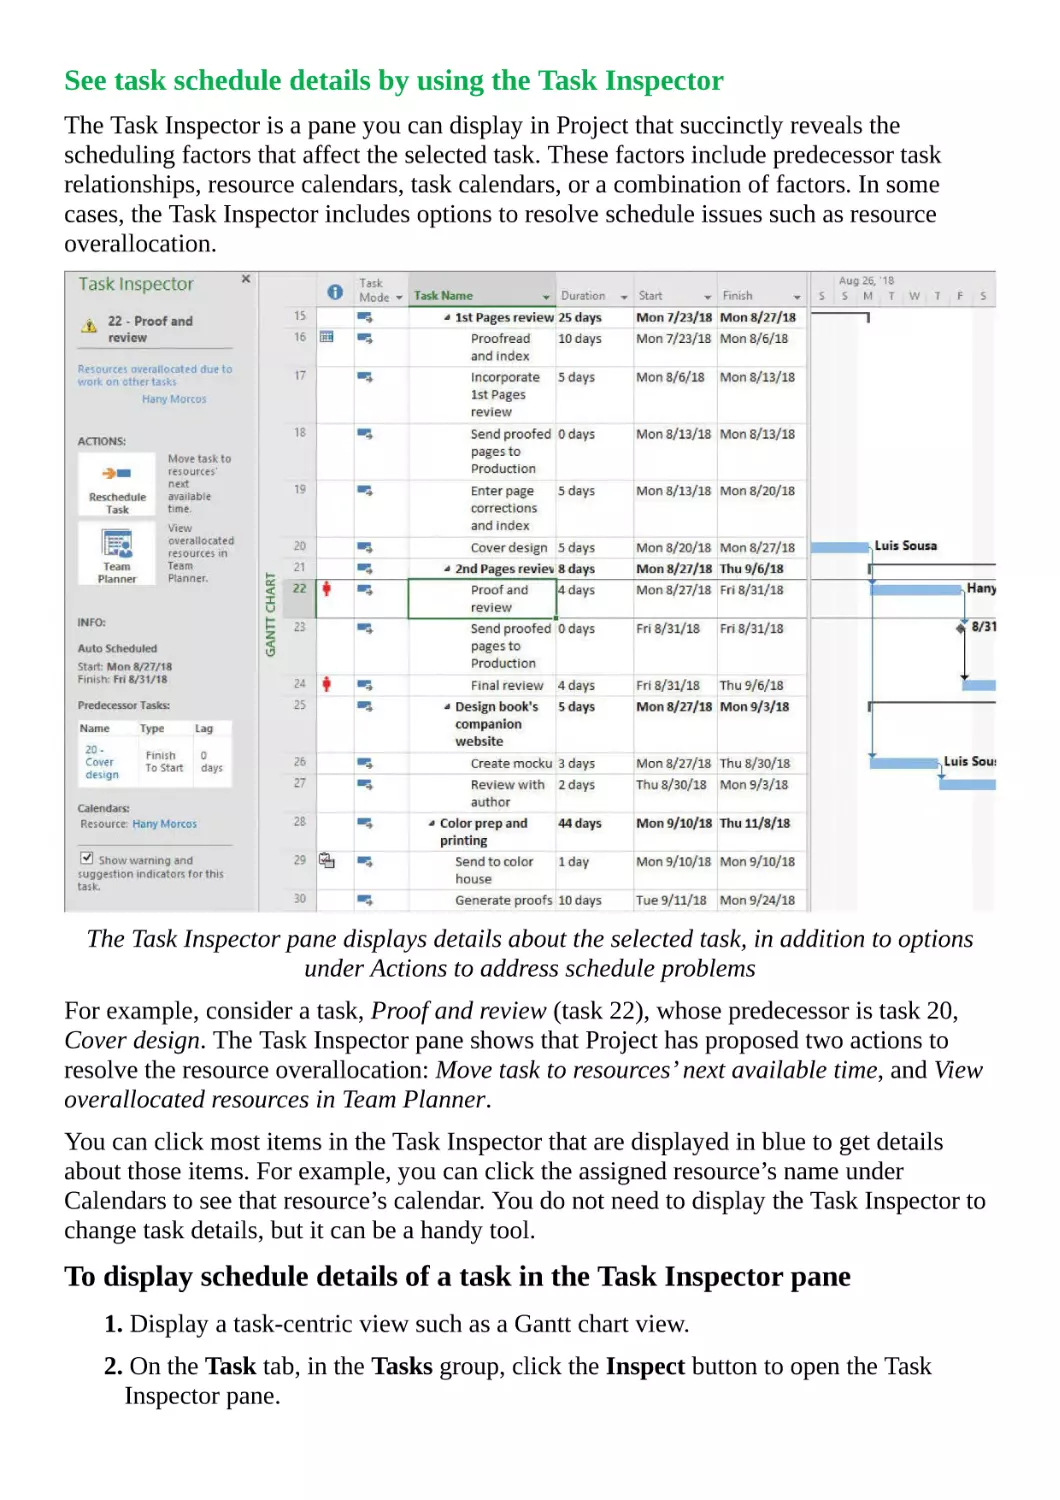
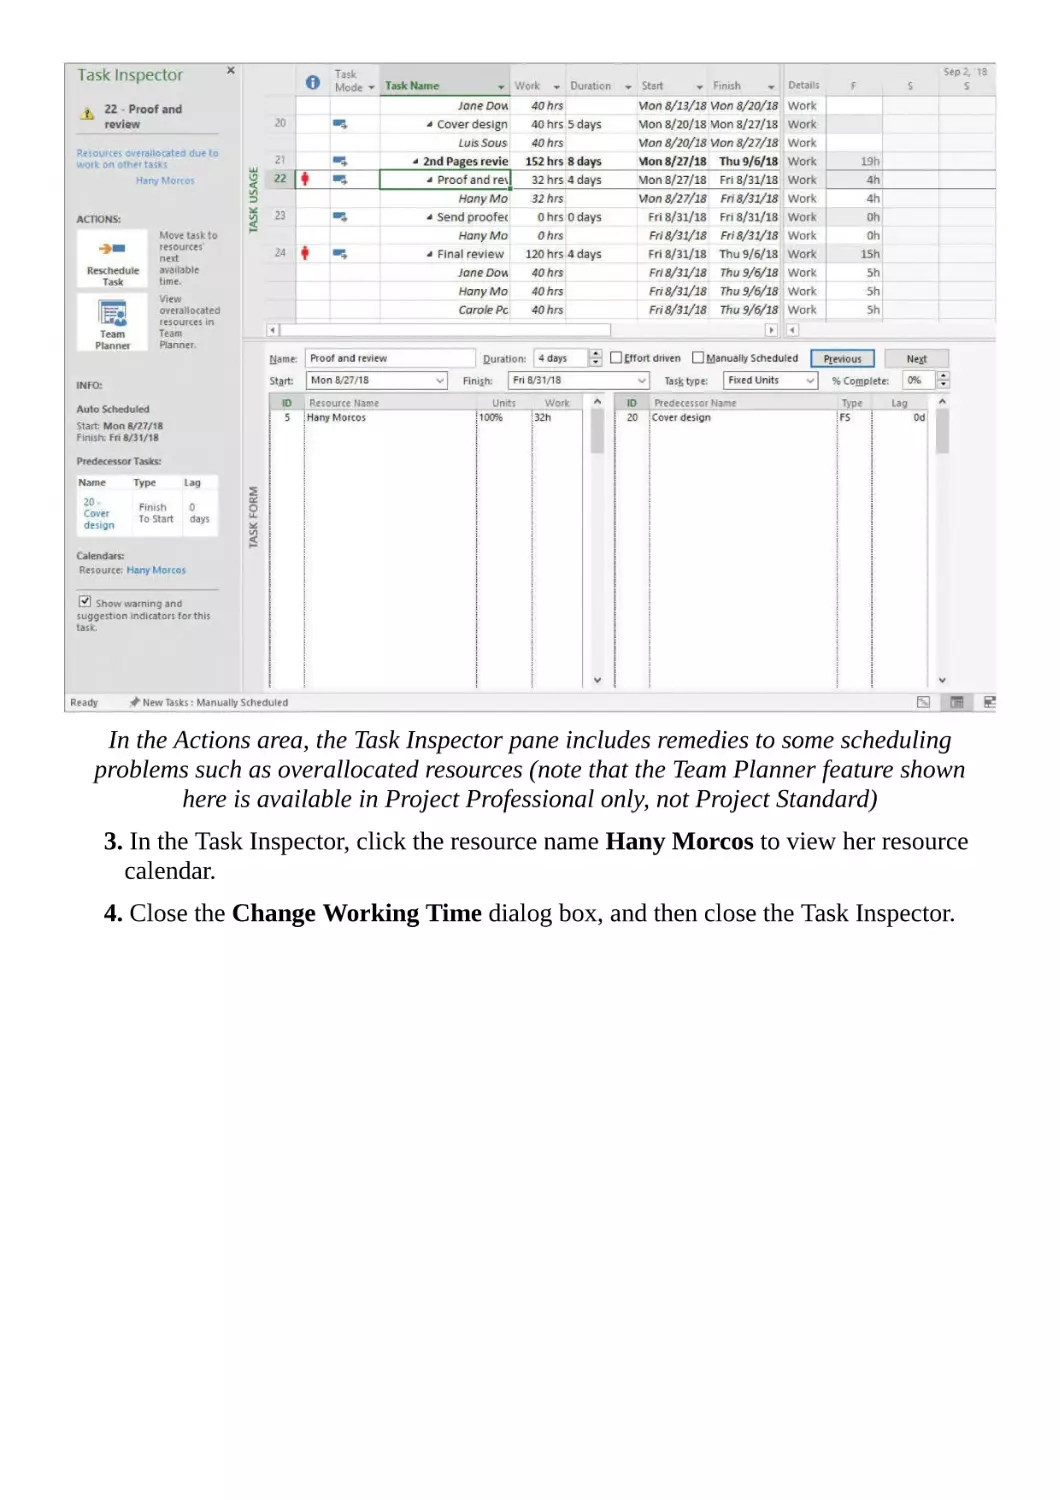
See task schedule details by using the Task Inspector
Skills review
Practice tasks
10 Fine-tune task details
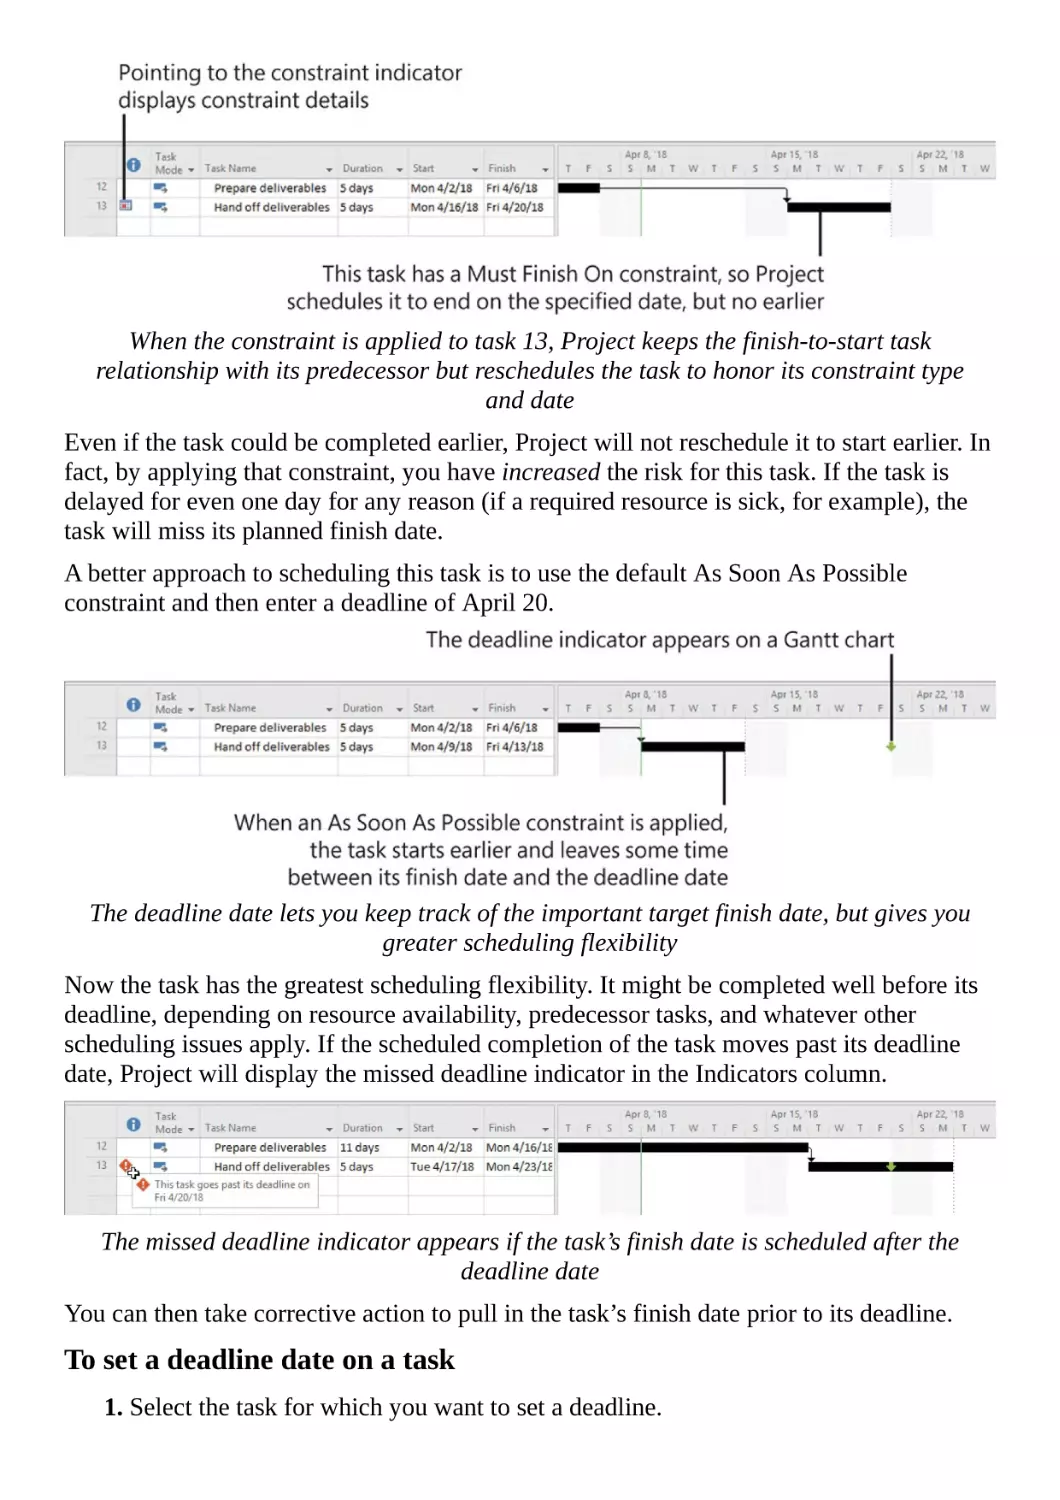
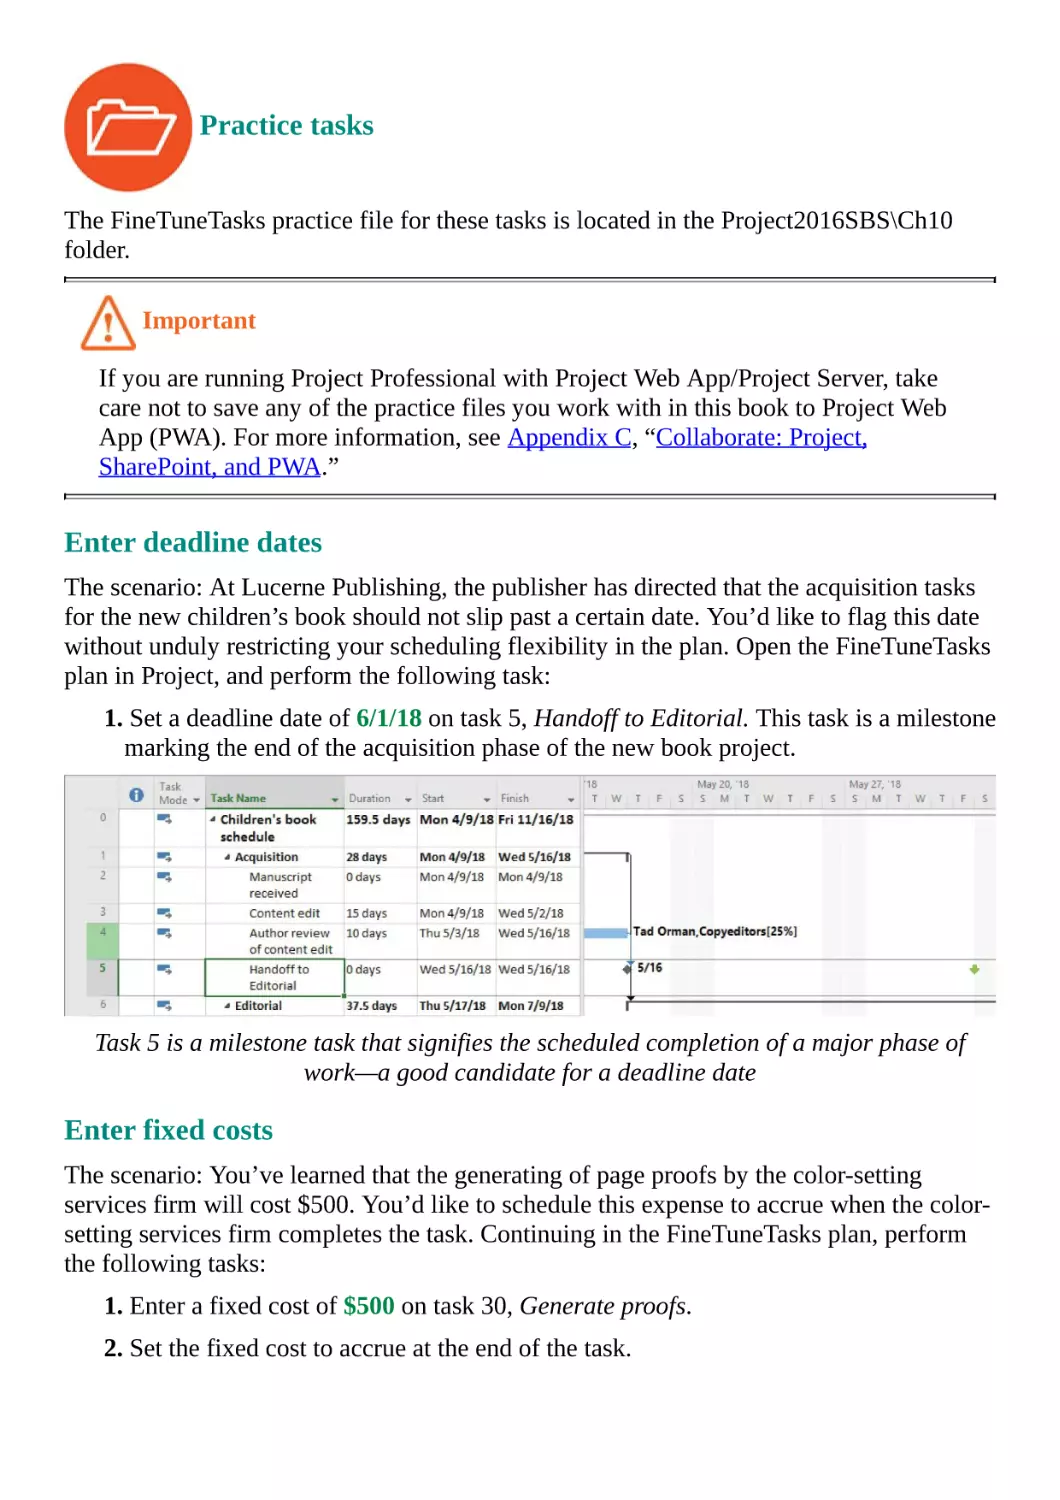
Enter deadline dates
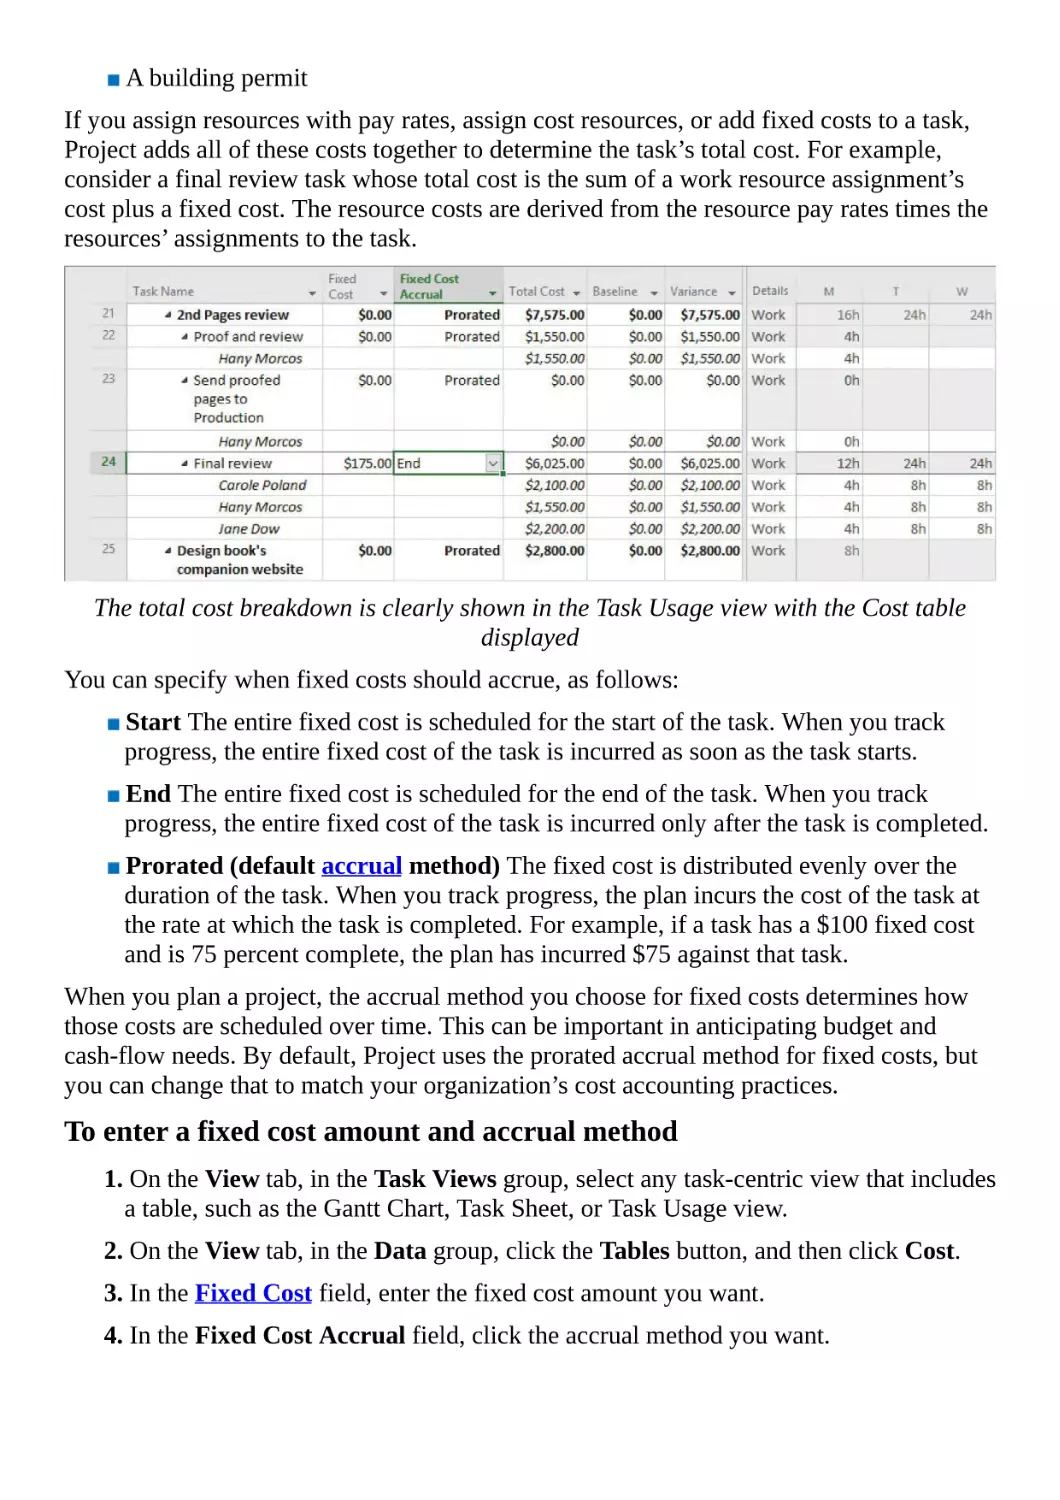
Enter fixed costs
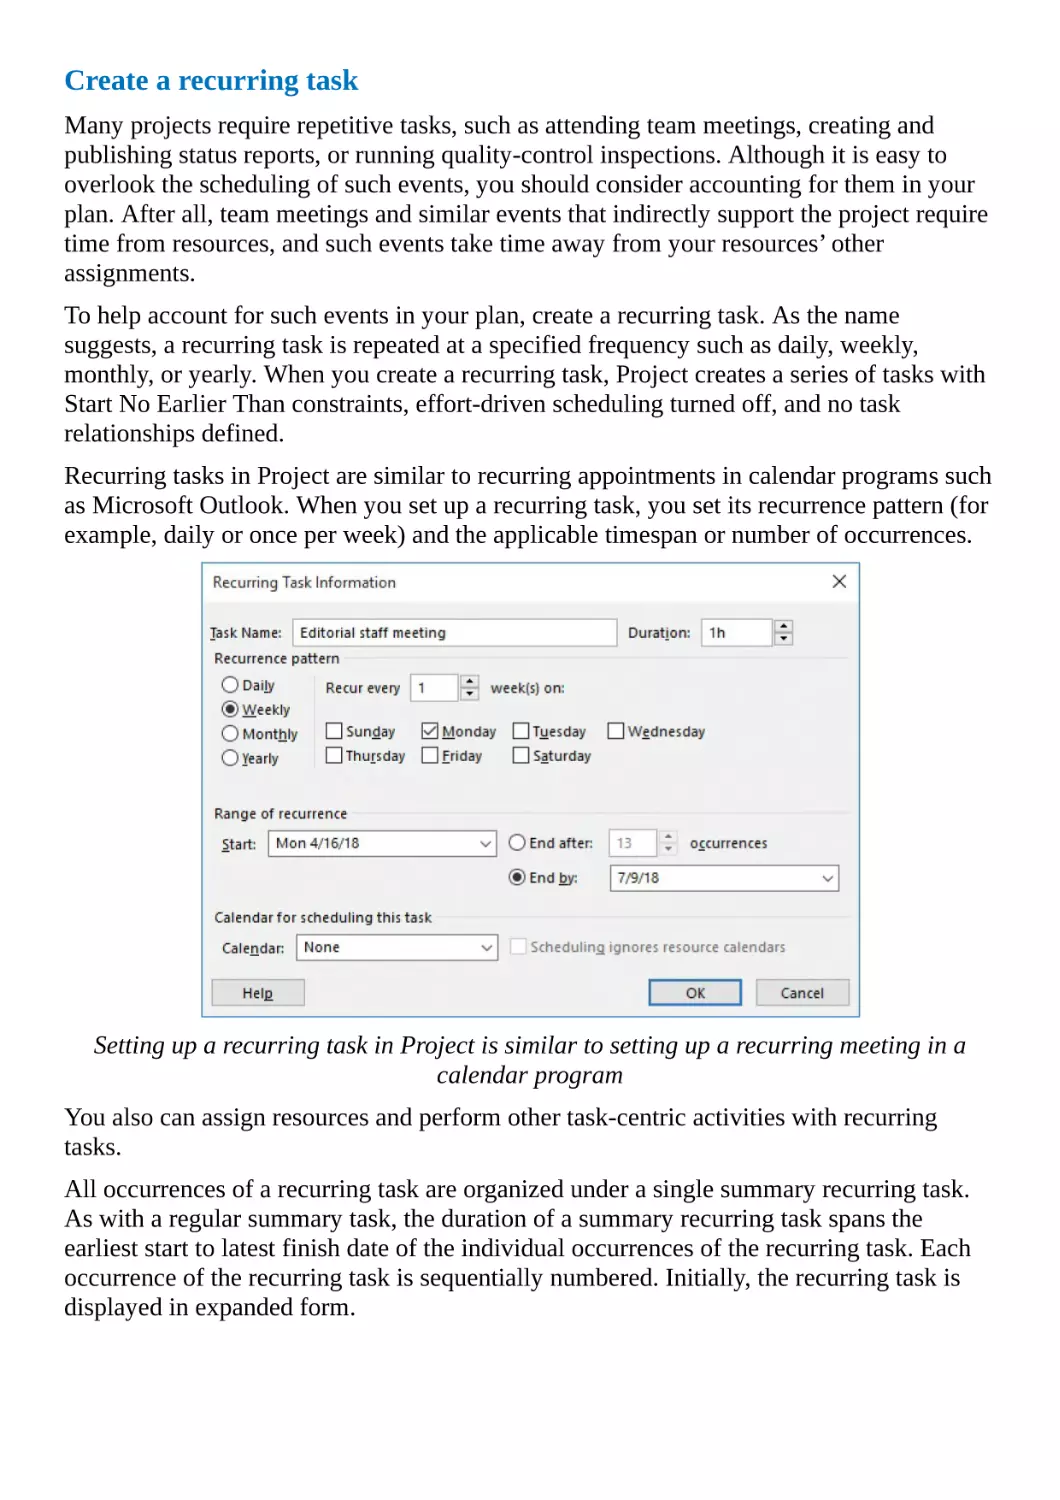
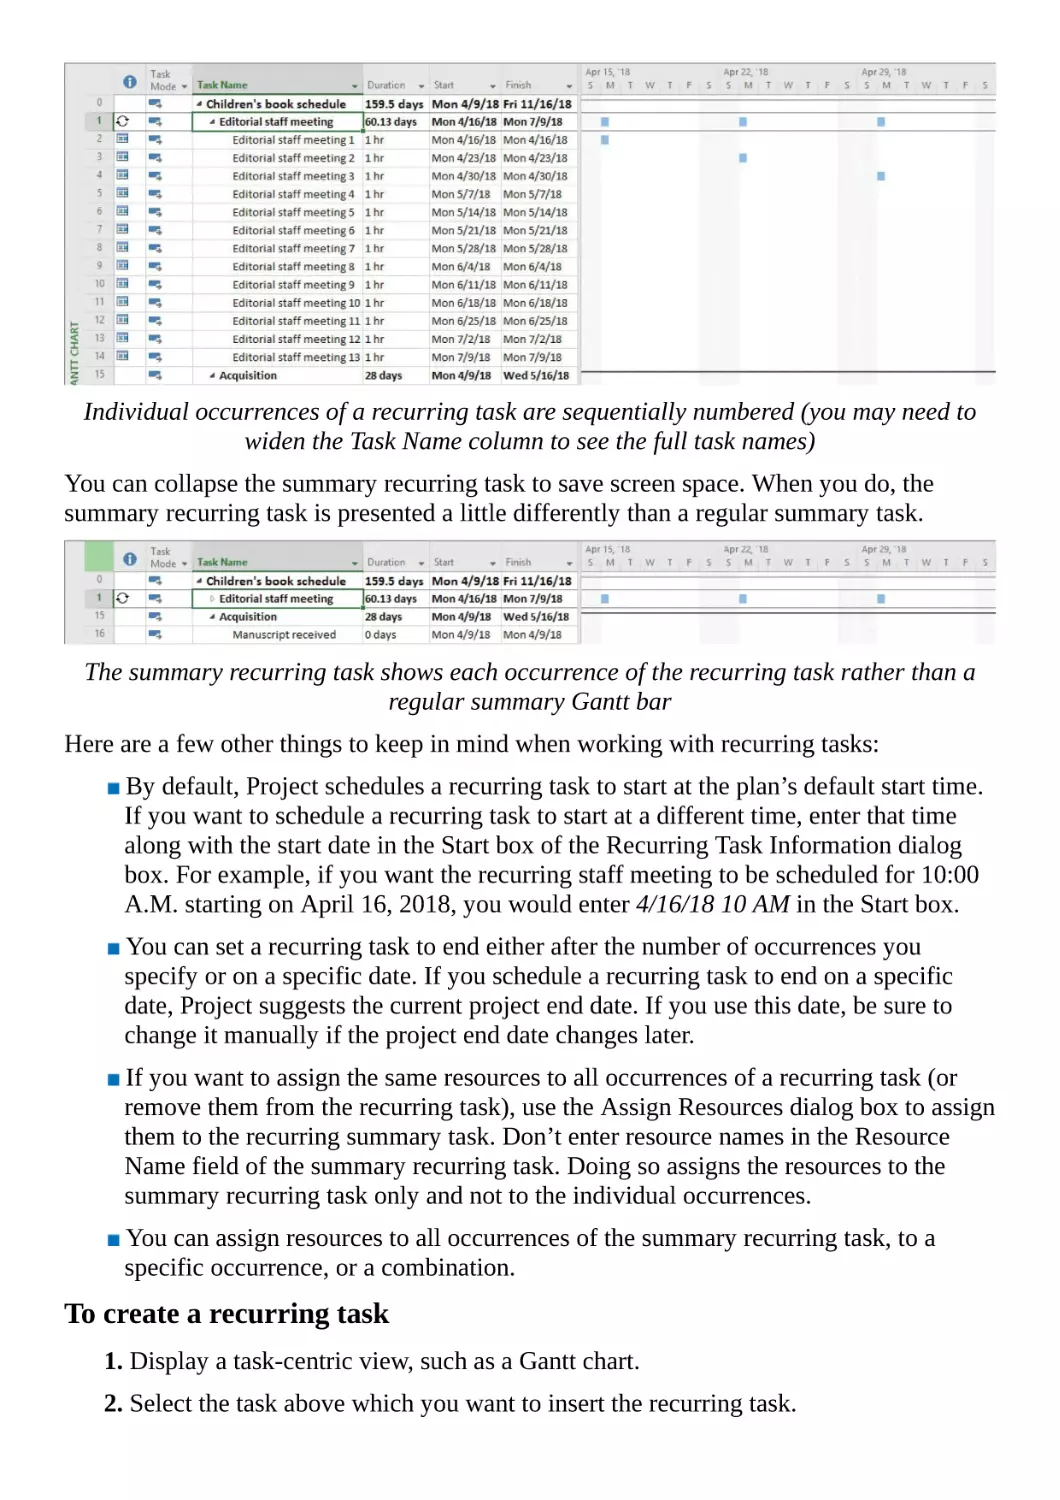
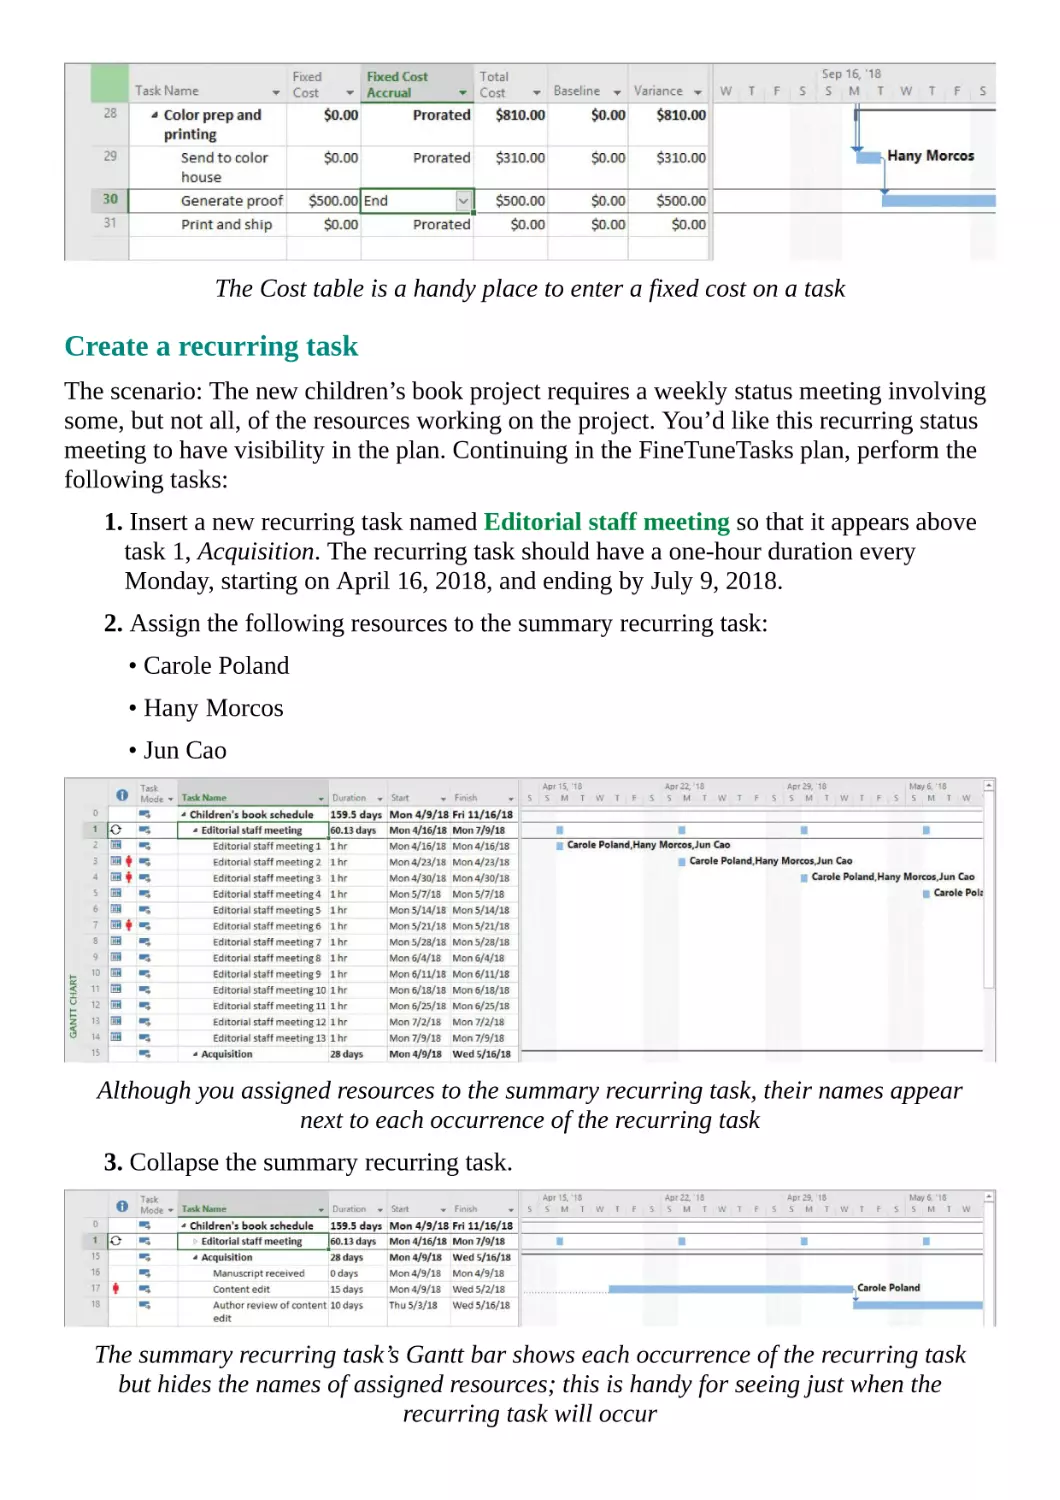
Create a recurring task
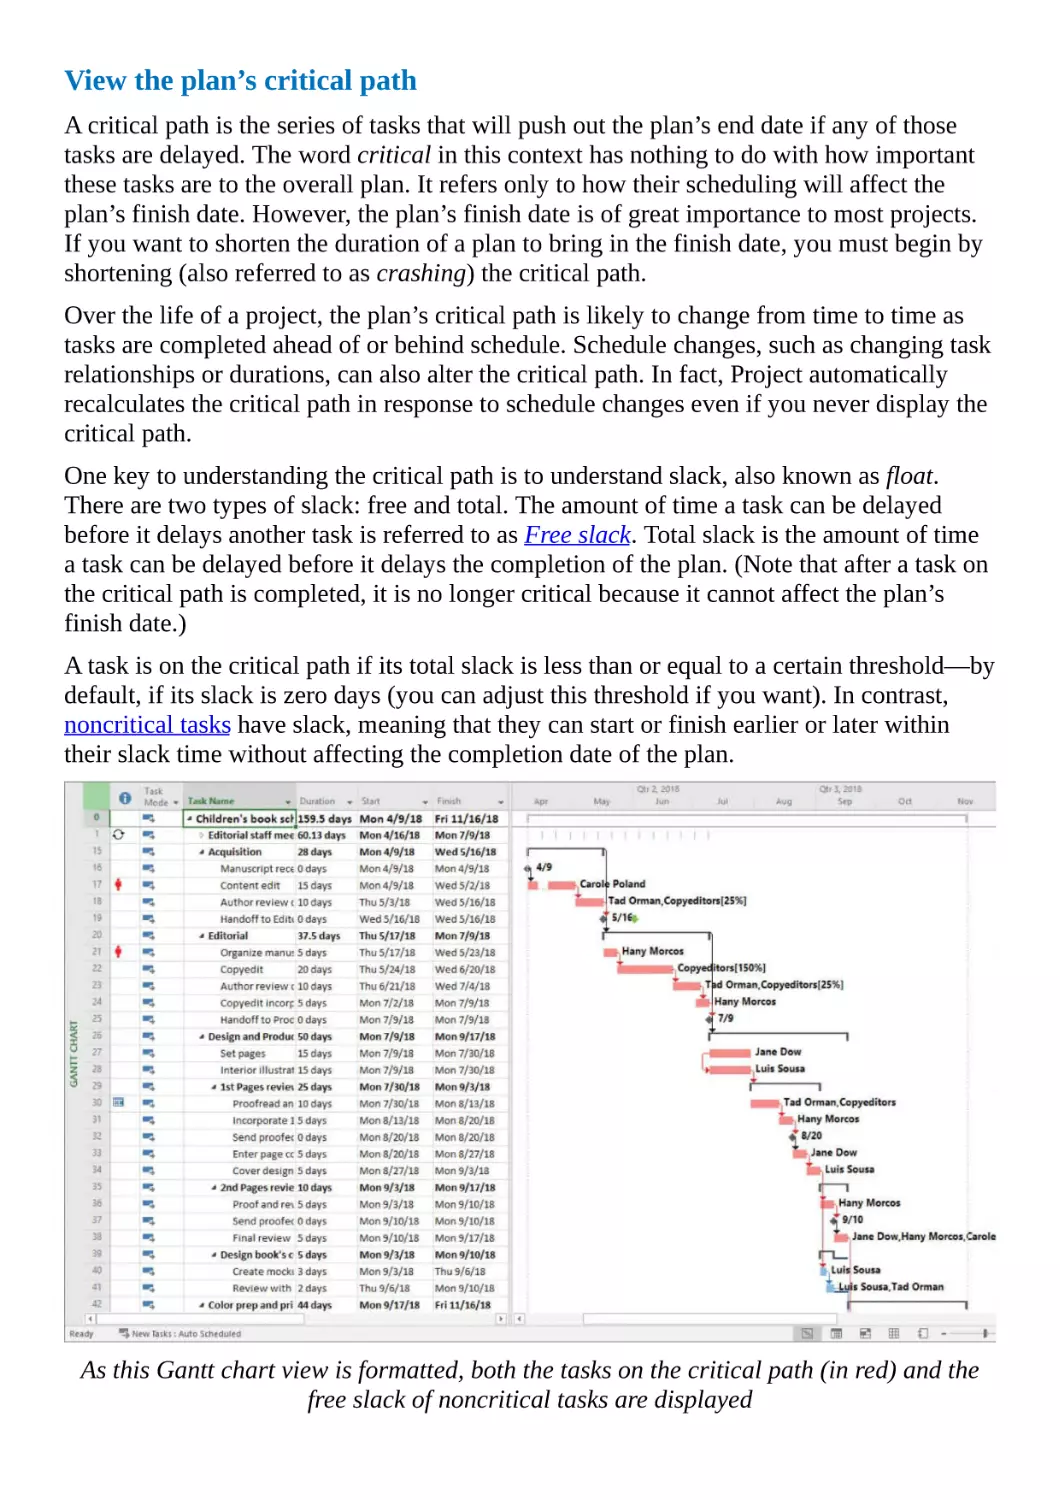
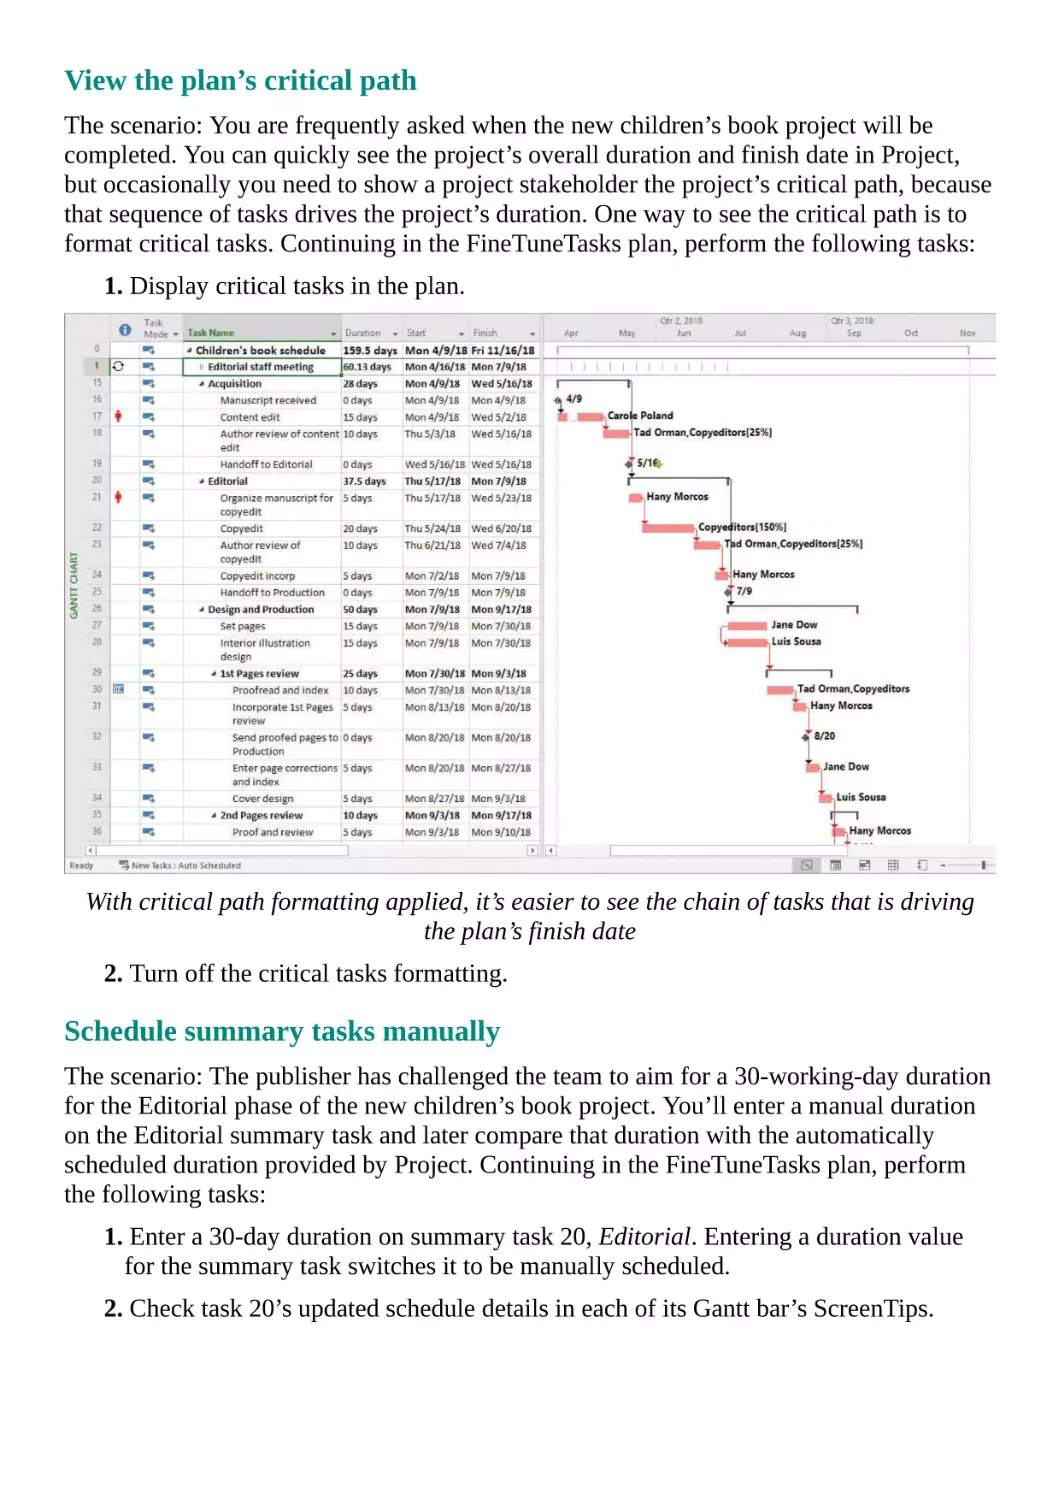
View the plan’s critical path
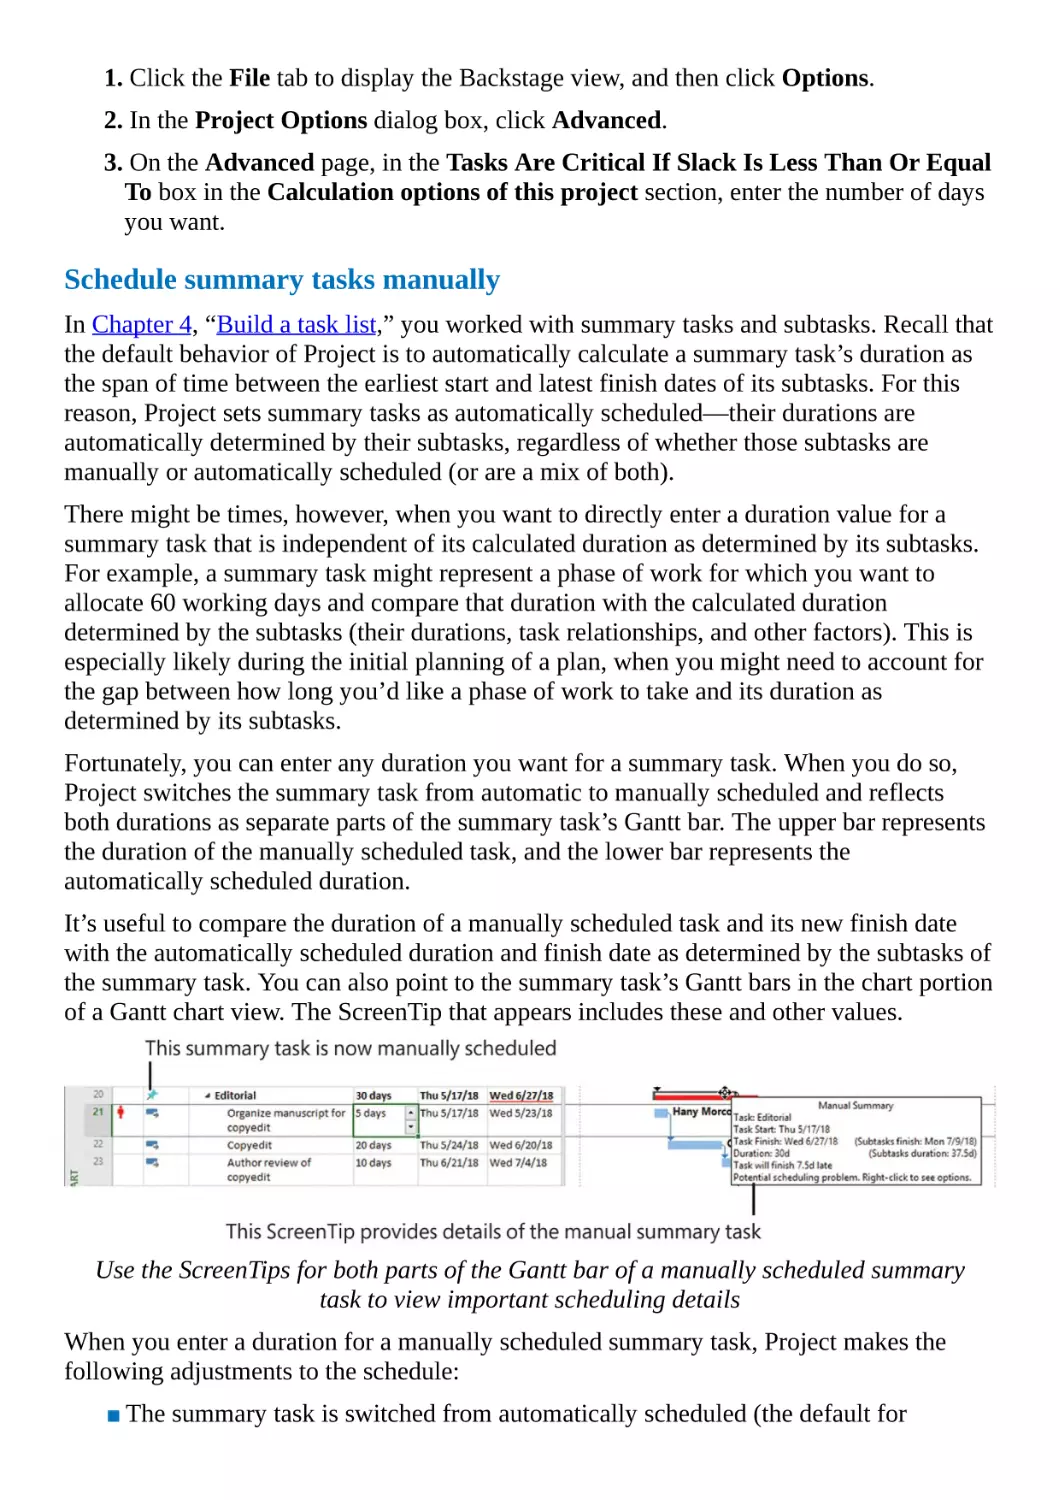
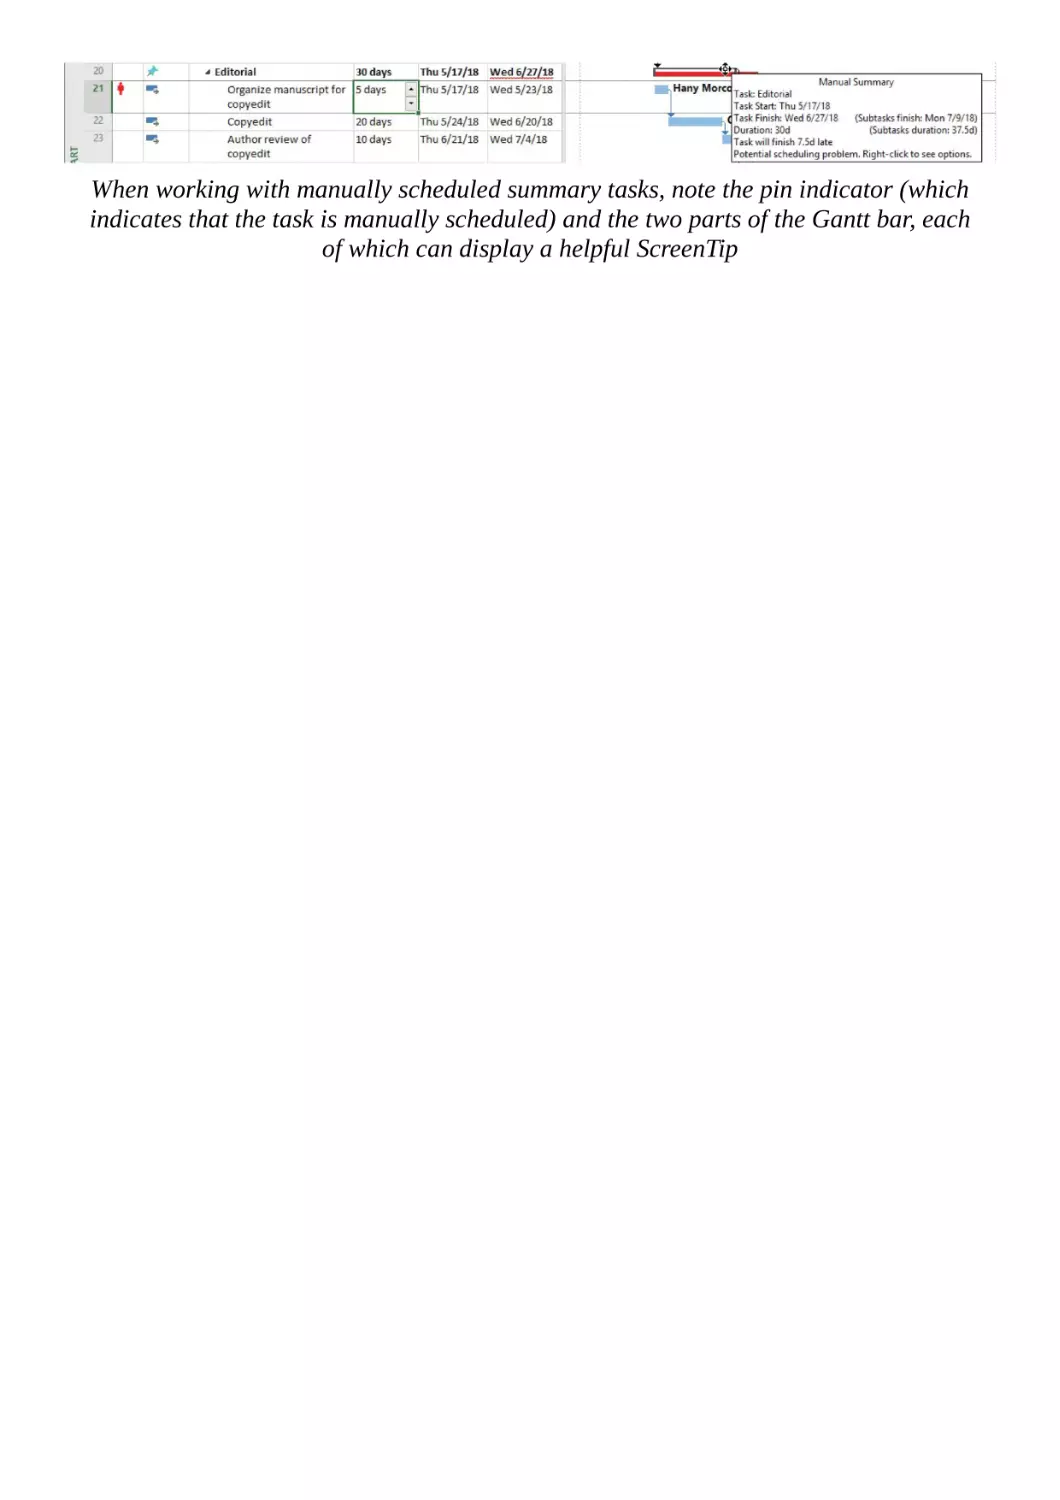
Schedule summary tasks manually
Skills review
Practice tasks
11 Fine-tune resource and assignment details
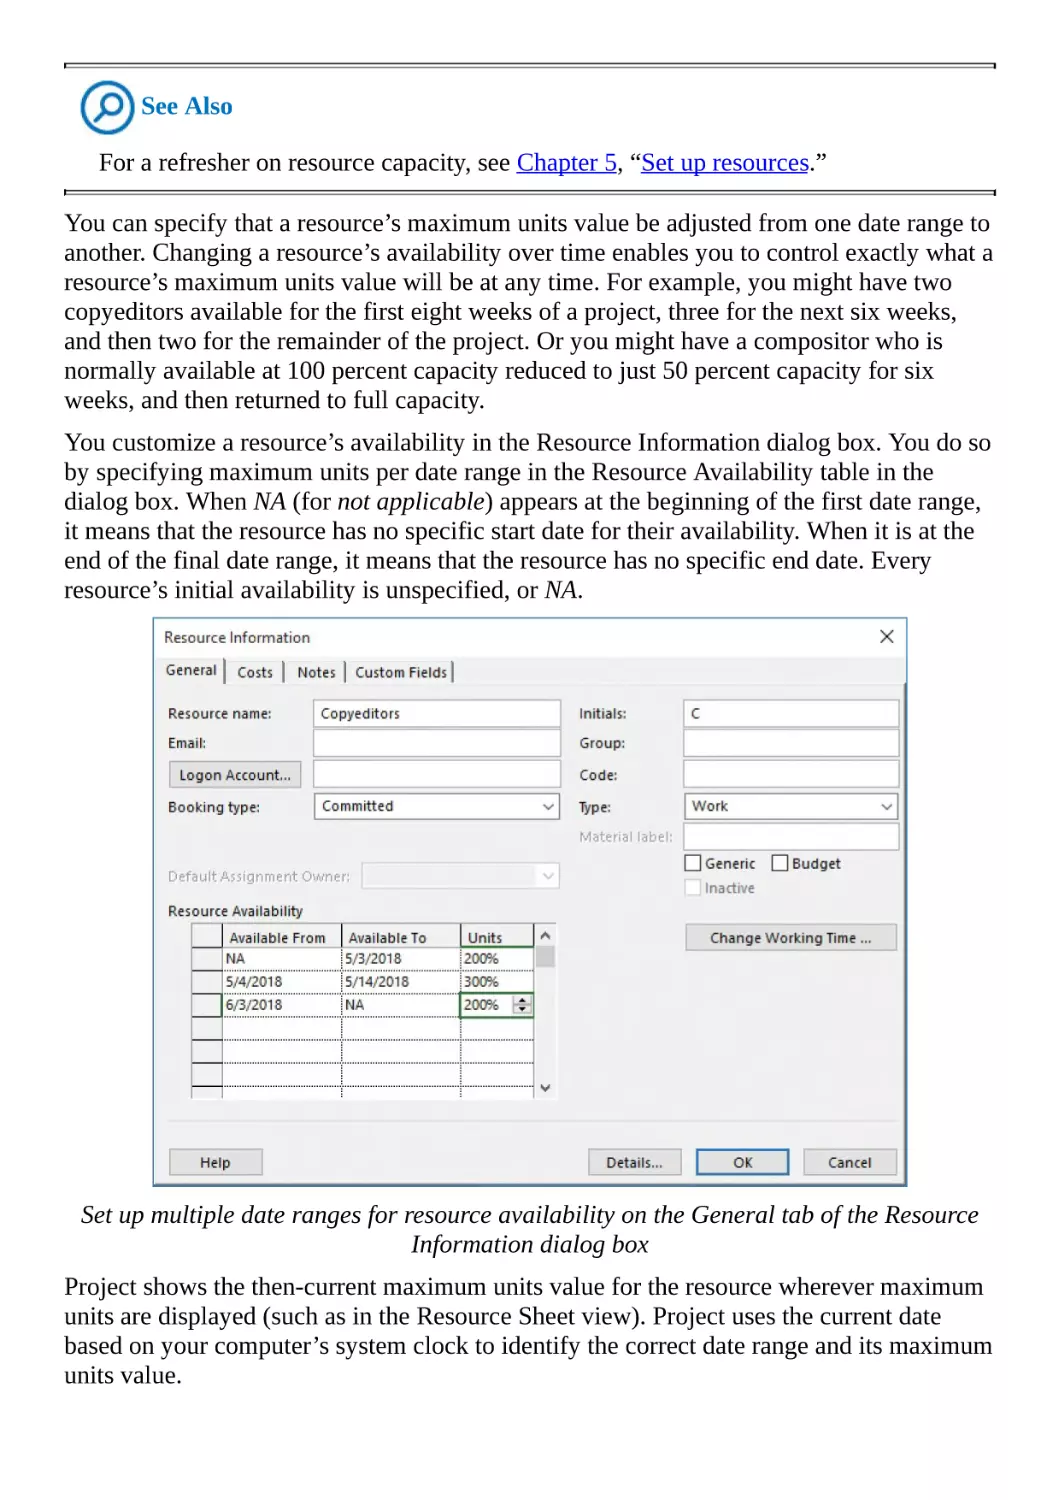
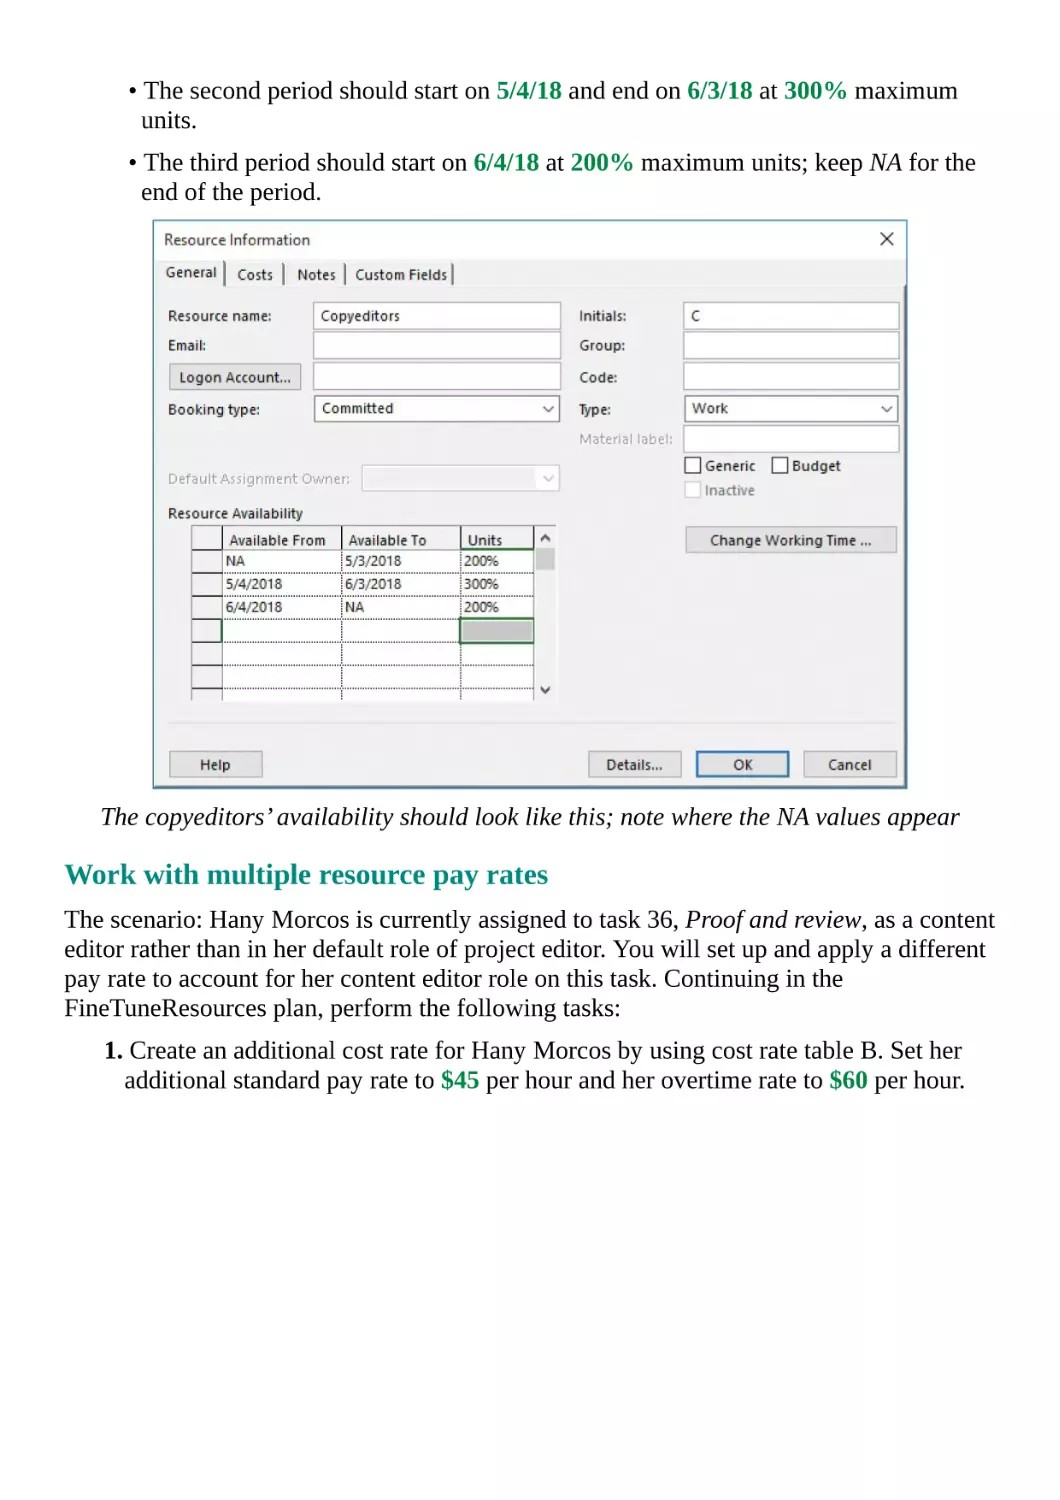
Change resource availability over multiple date ranges
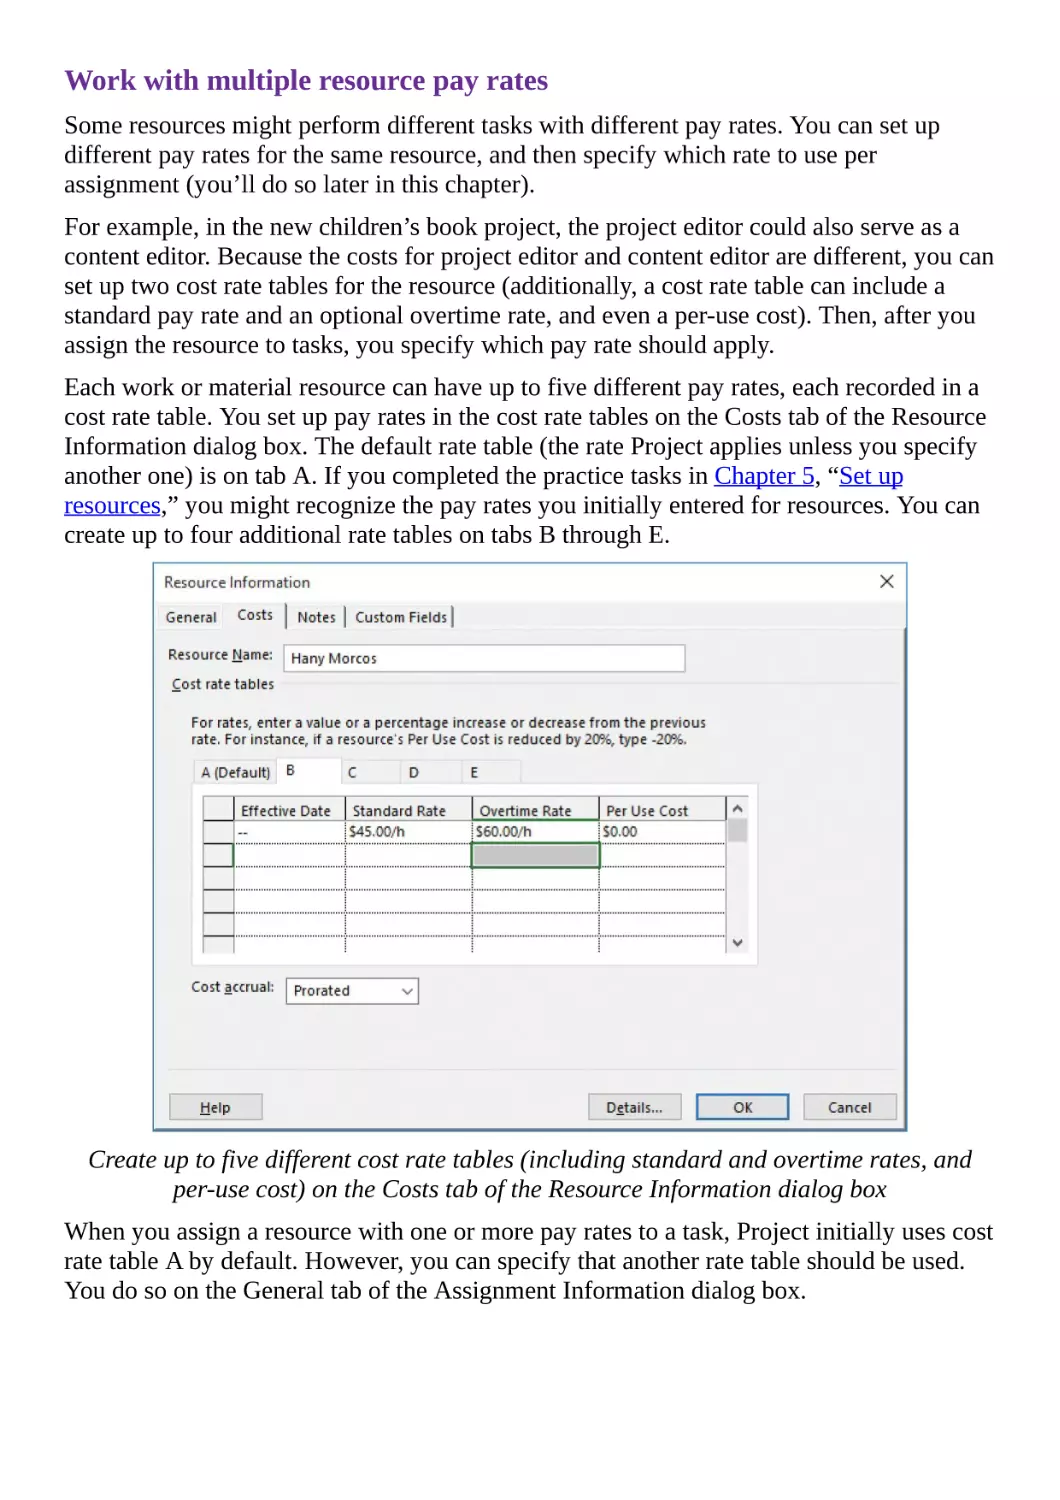
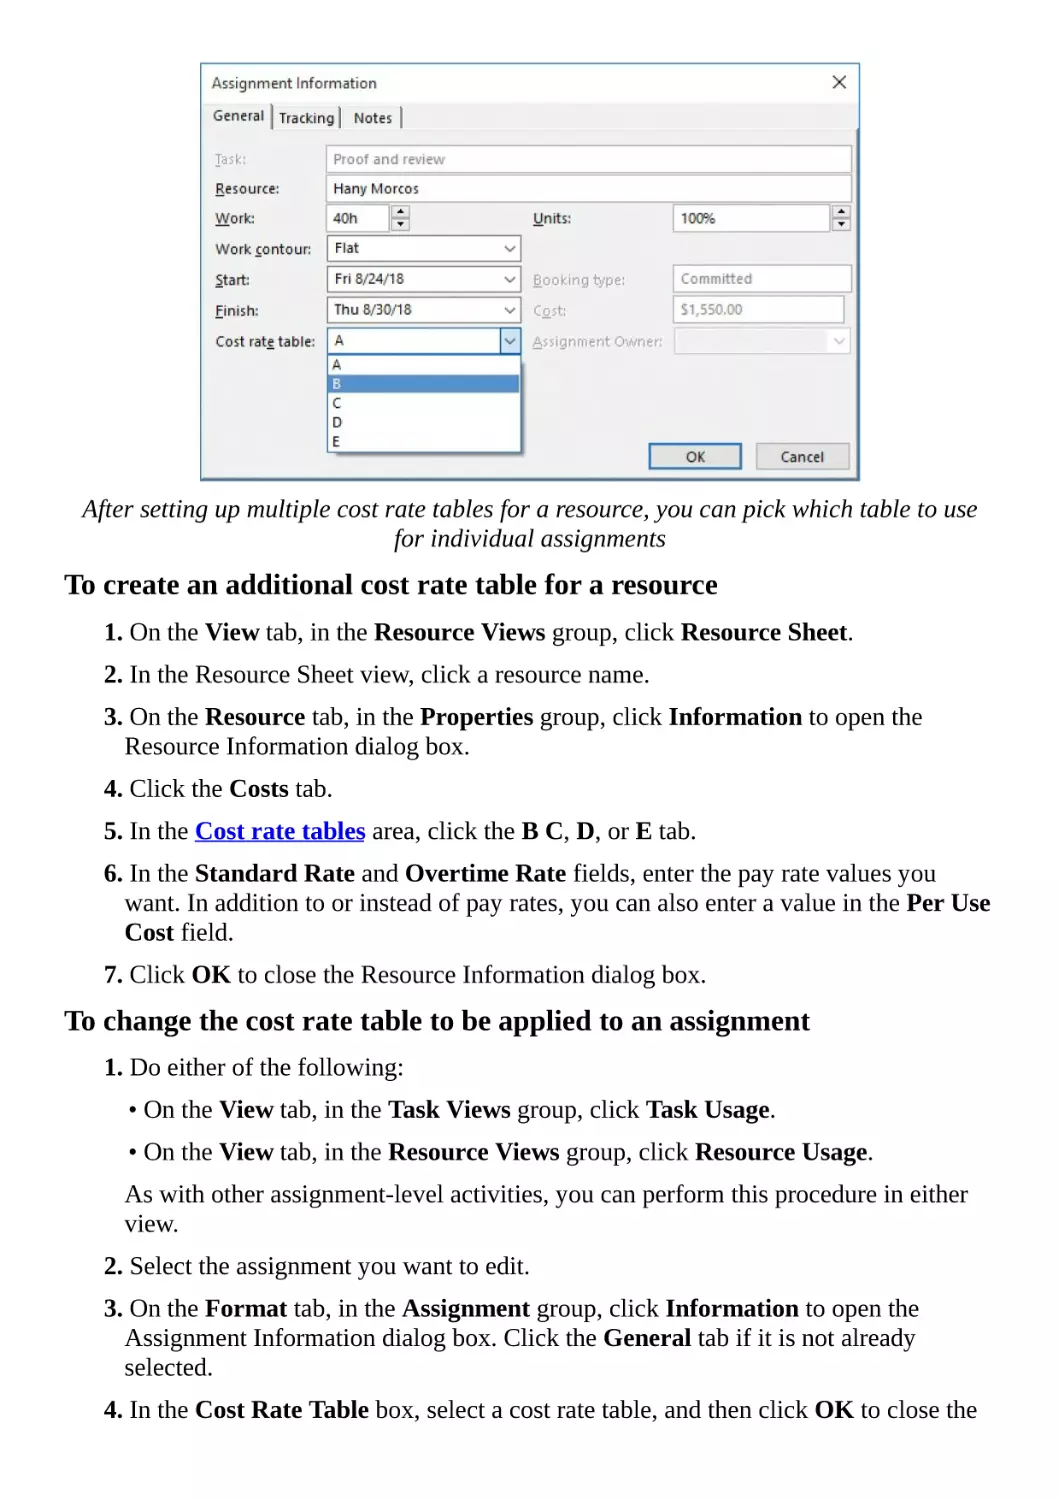
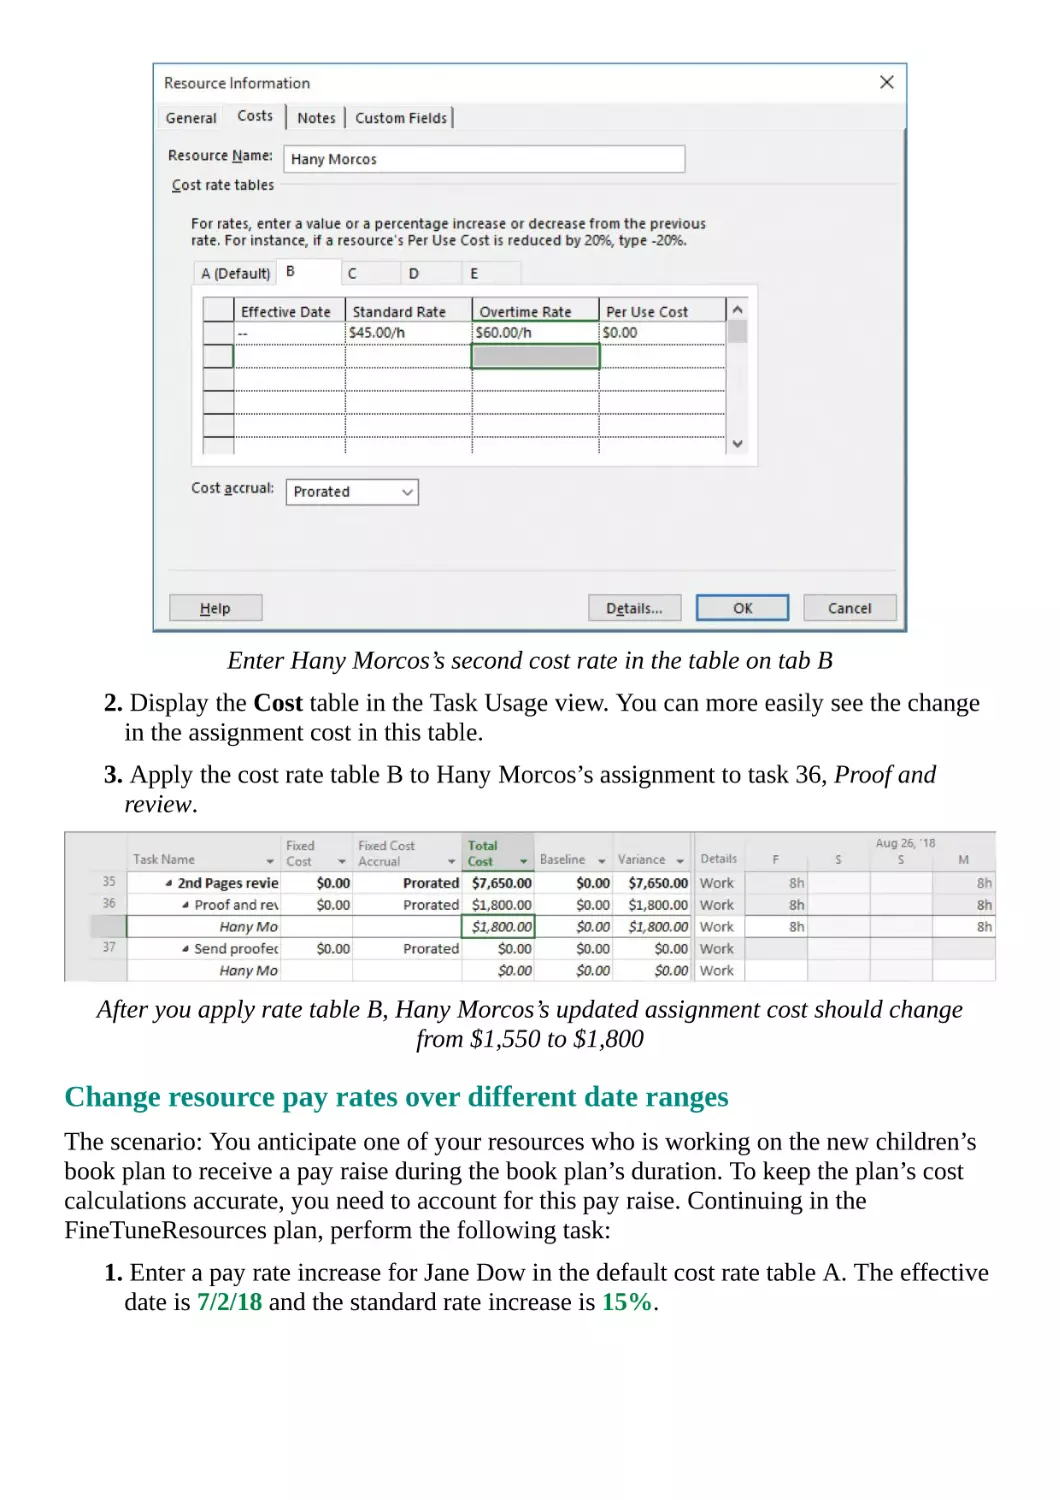
Work with multiple resource pay rates
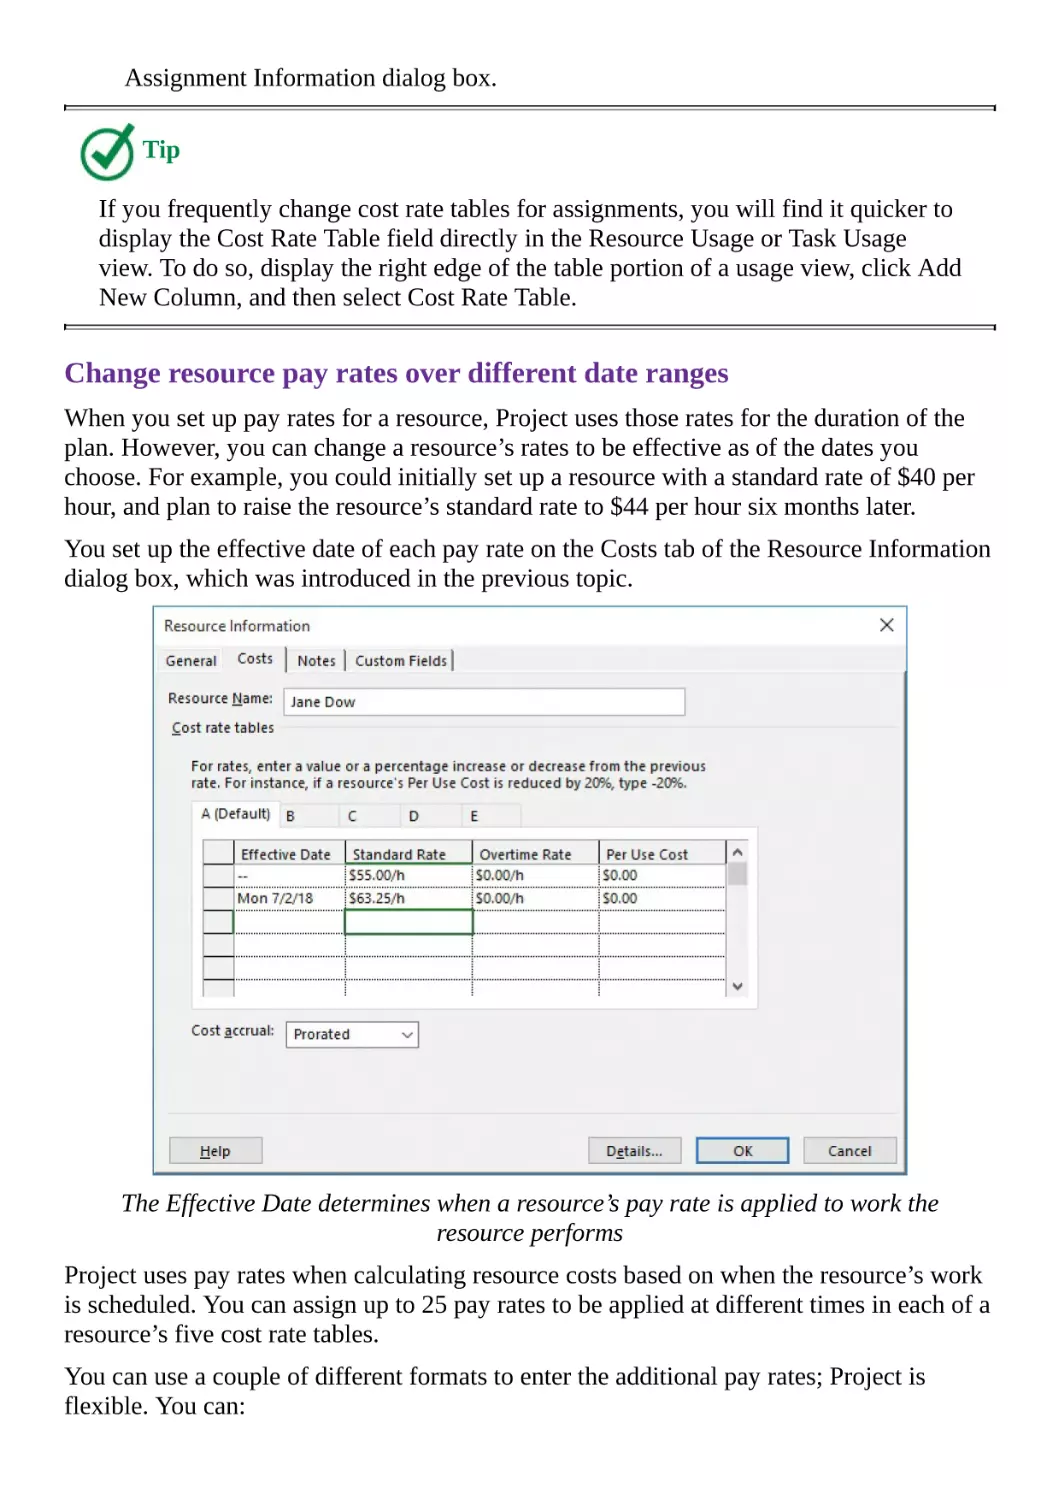
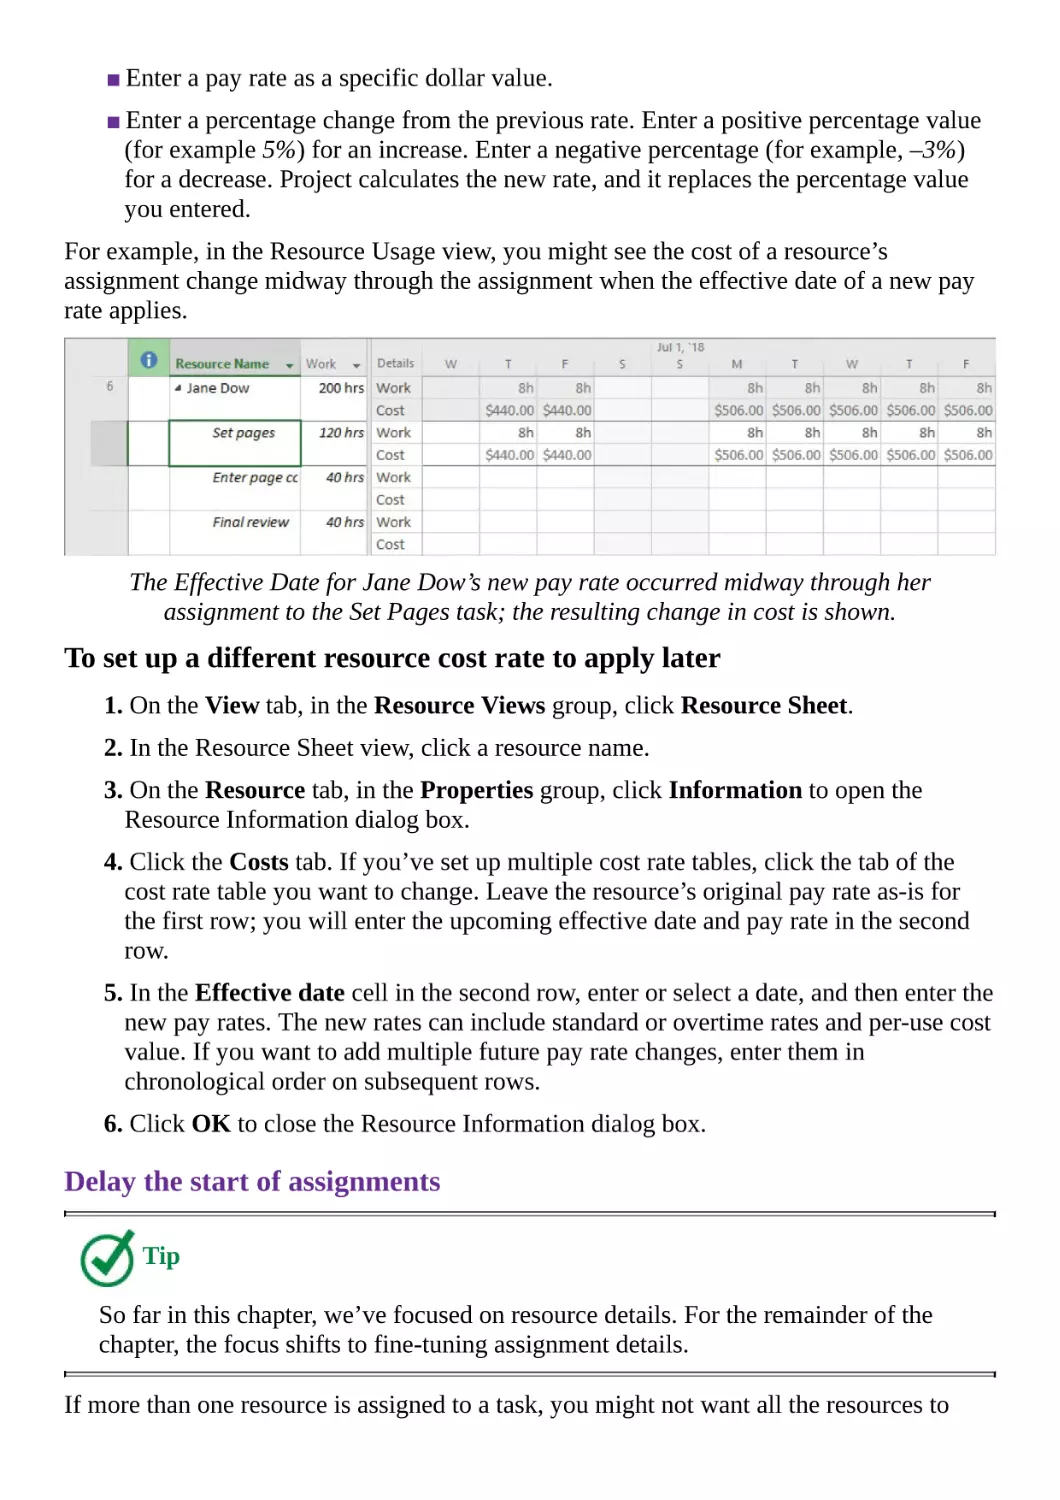
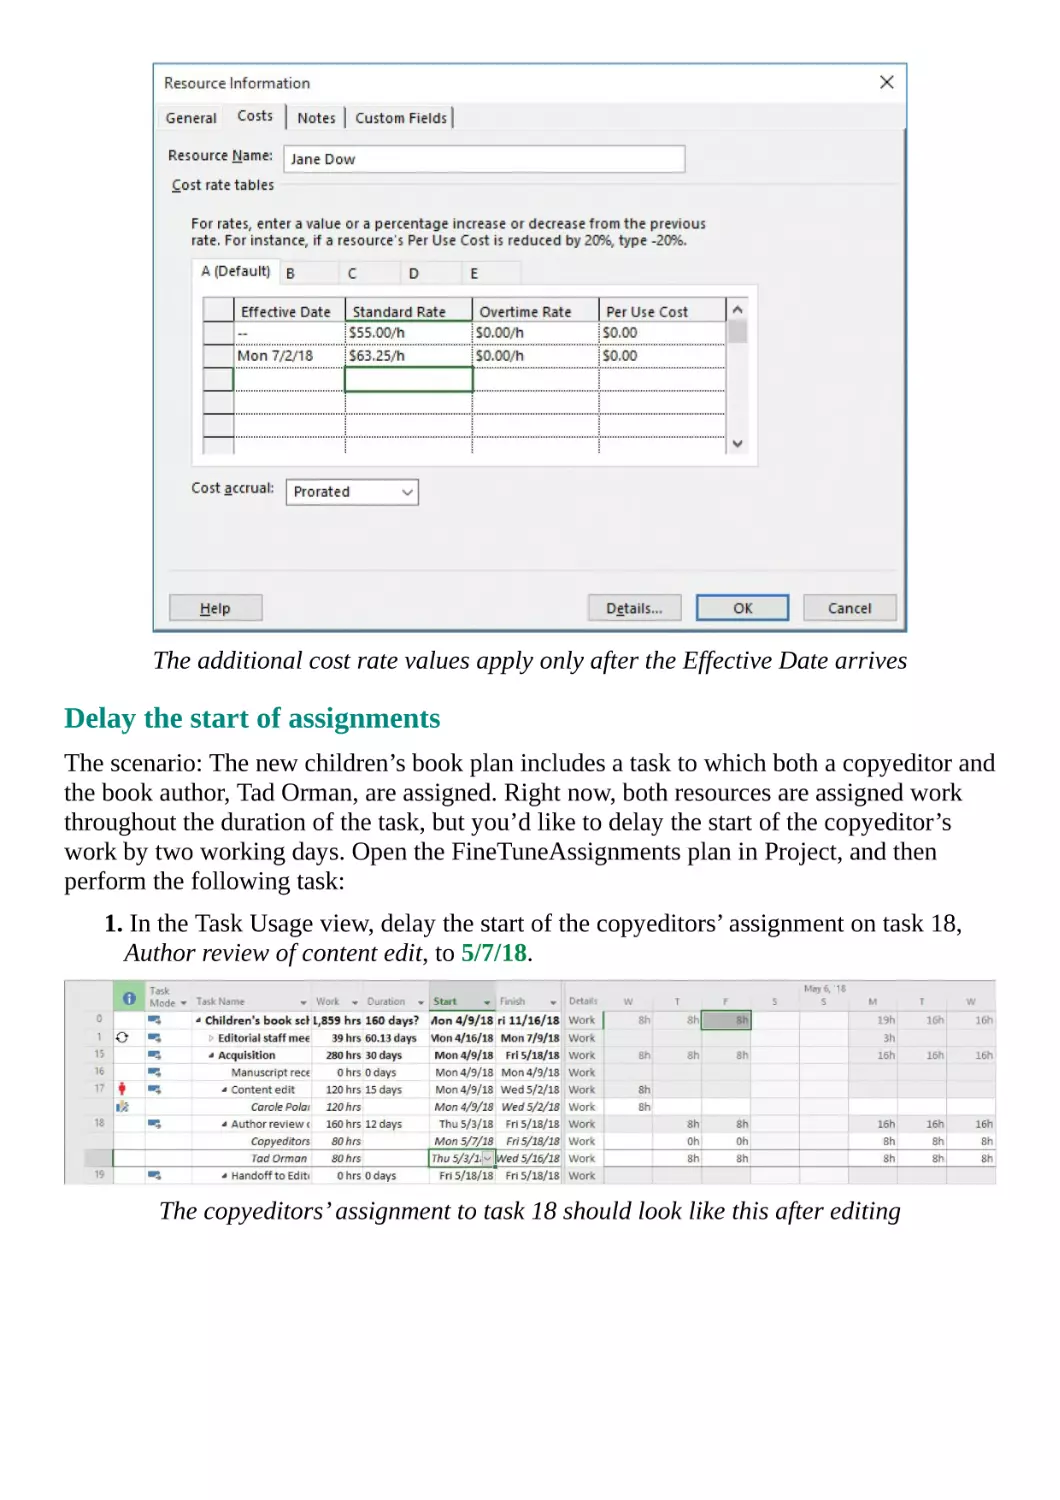
Change resource pay rates over different date ranges
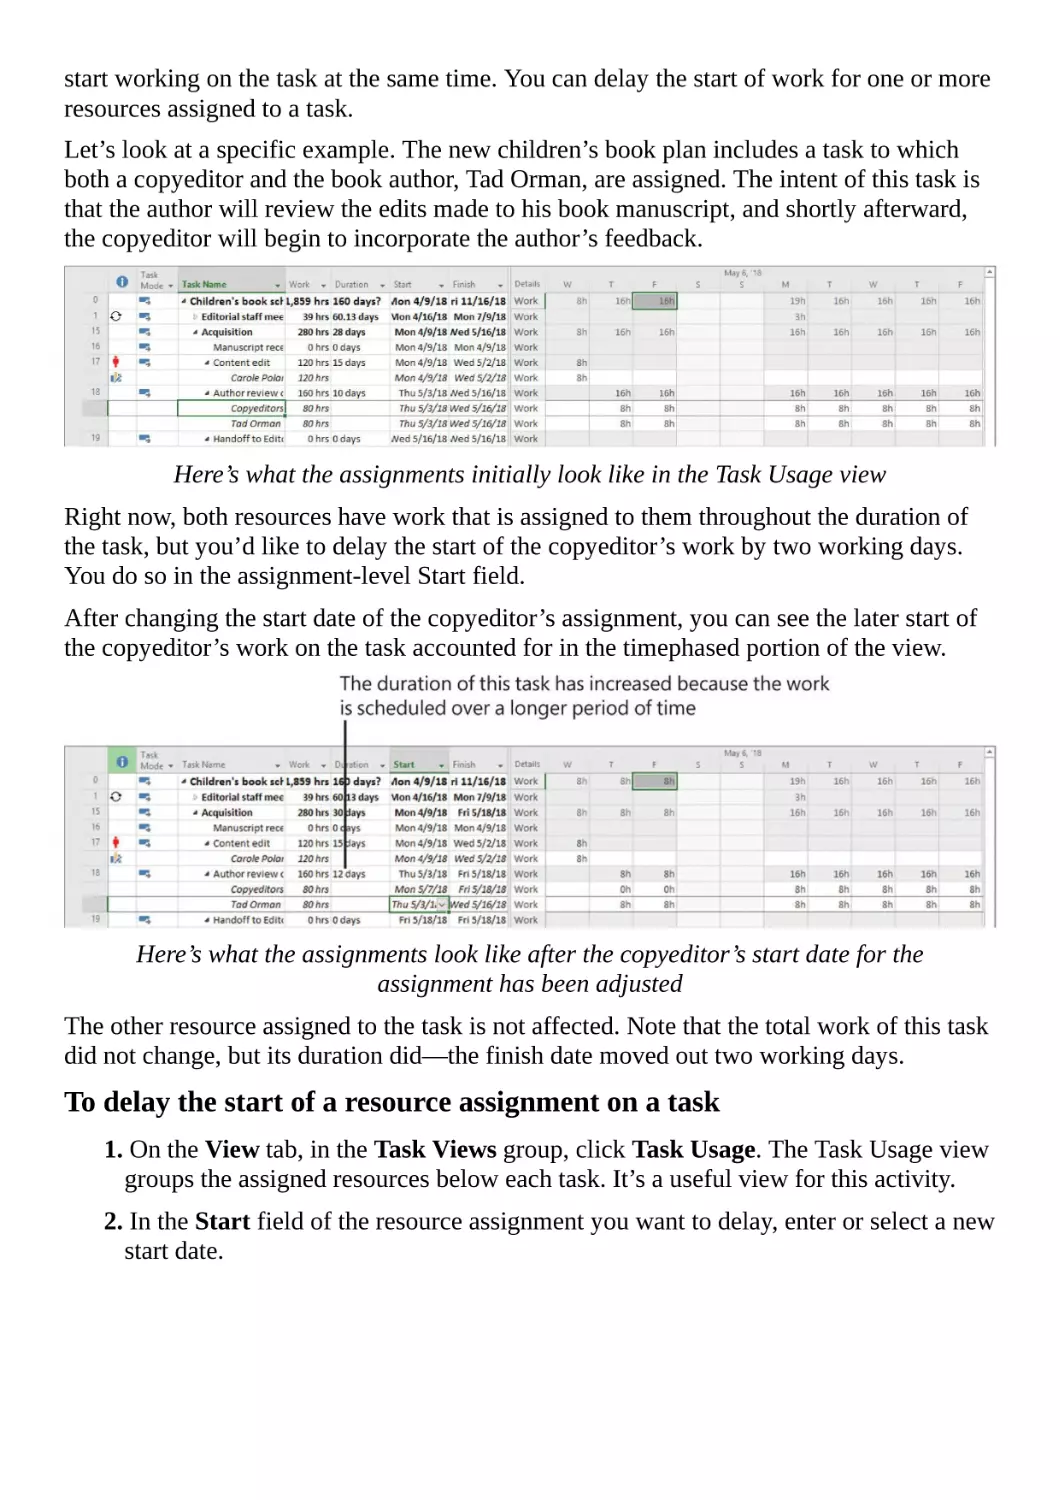
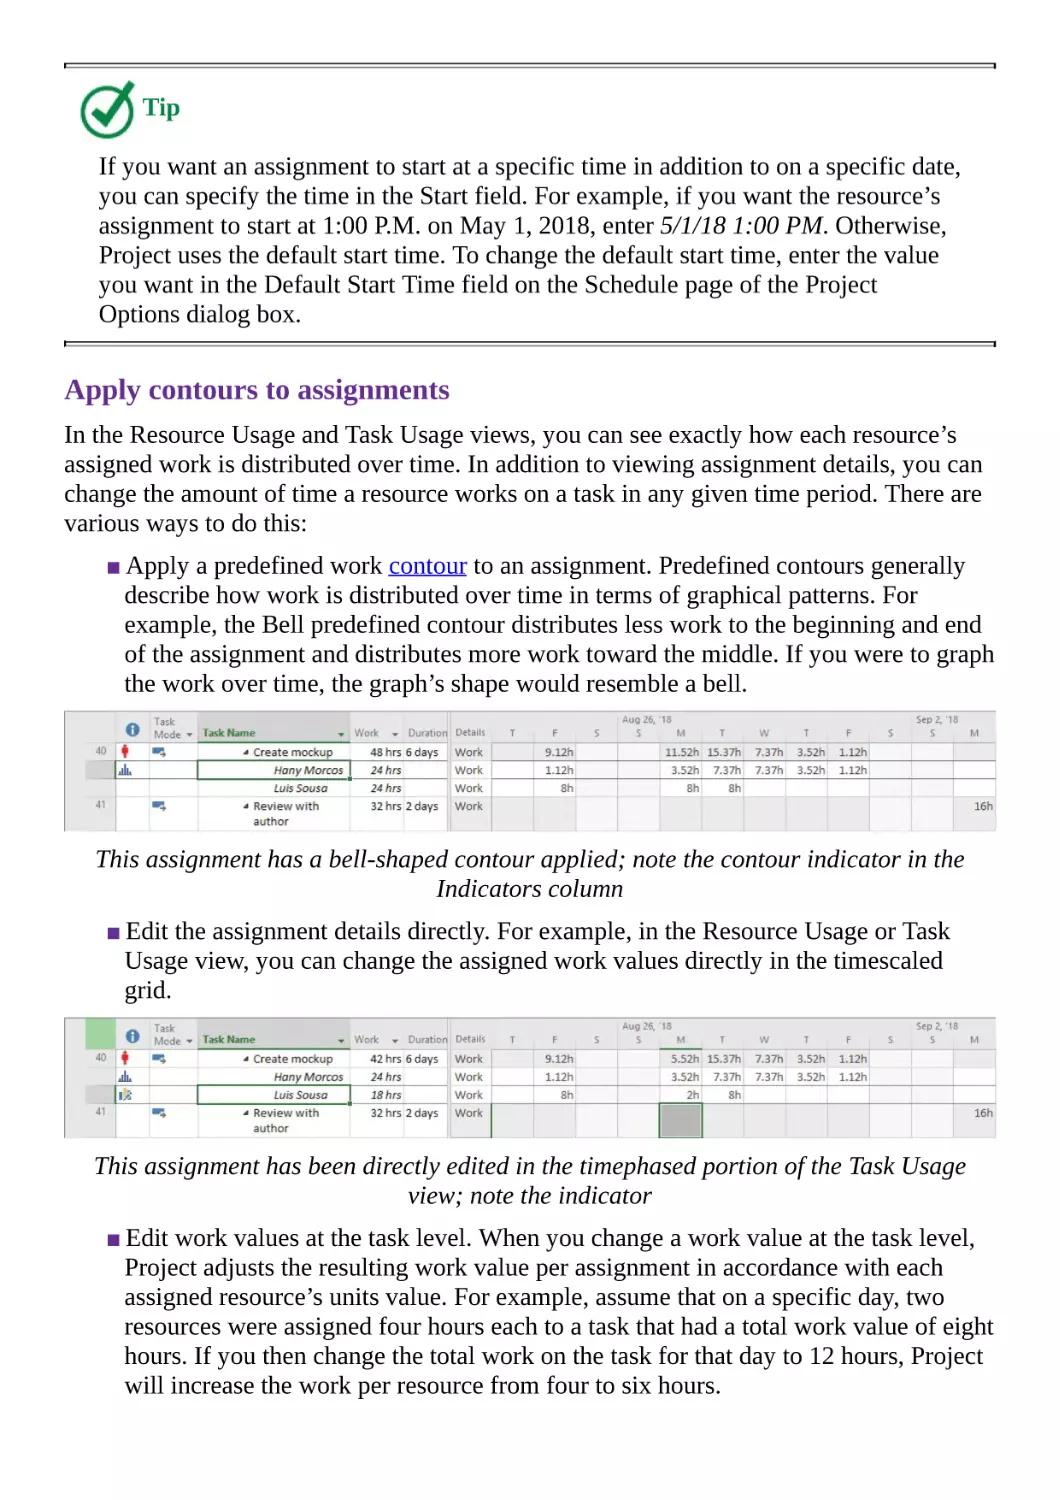
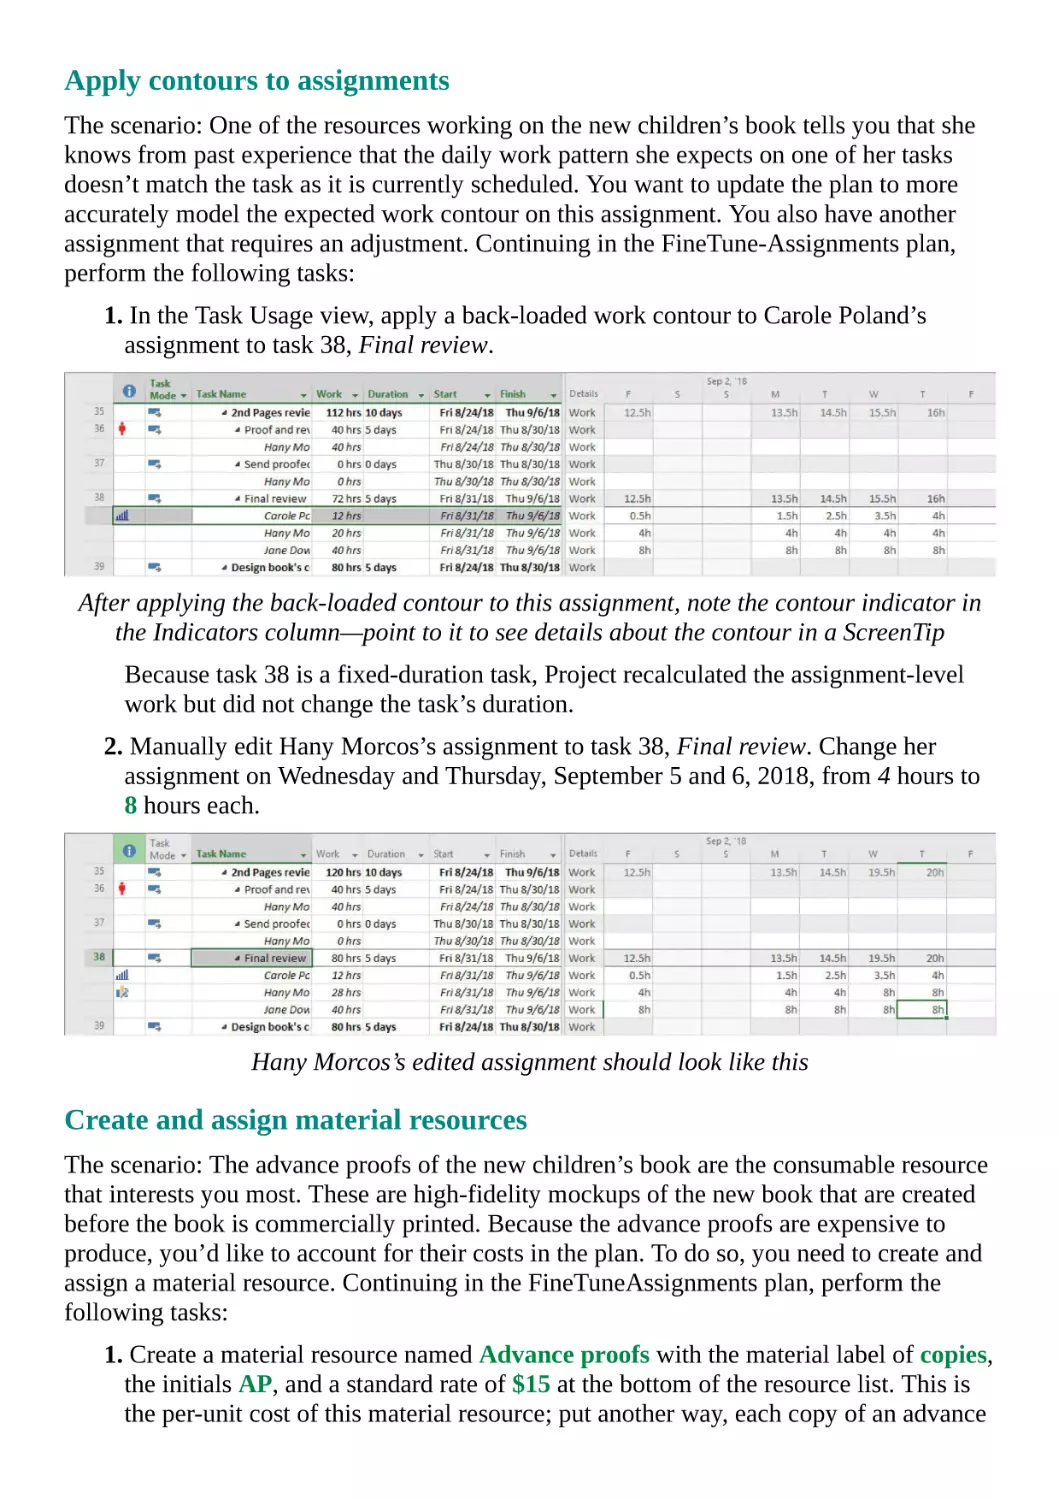
Delay the start of assignments
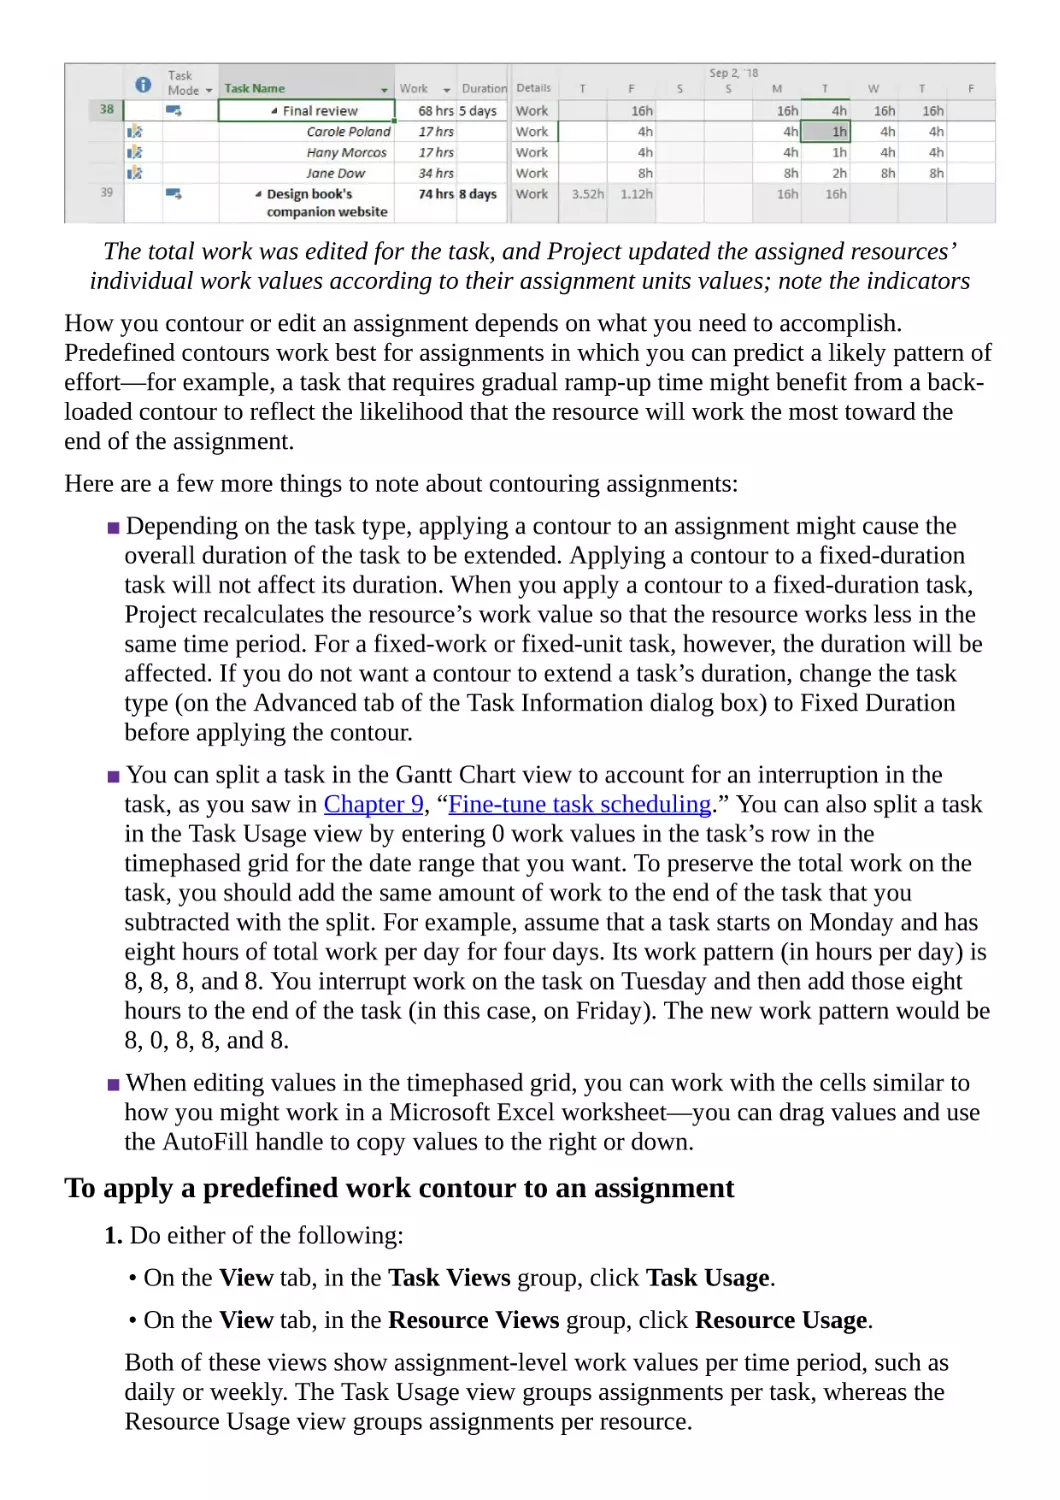
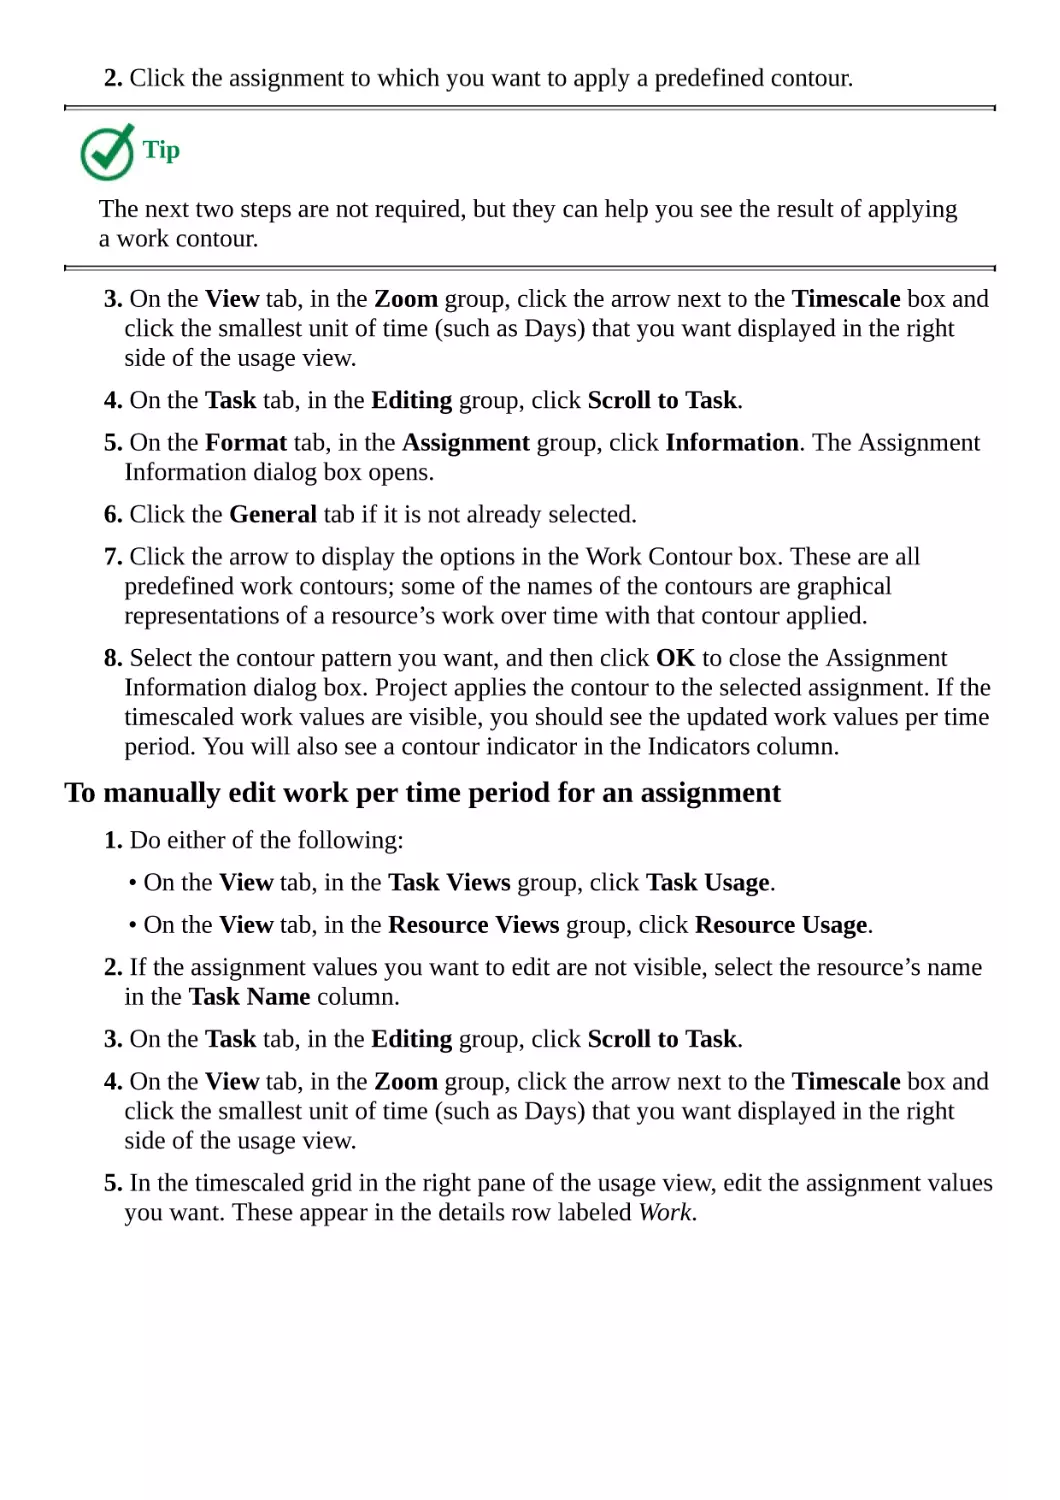
Apply contours to assignments
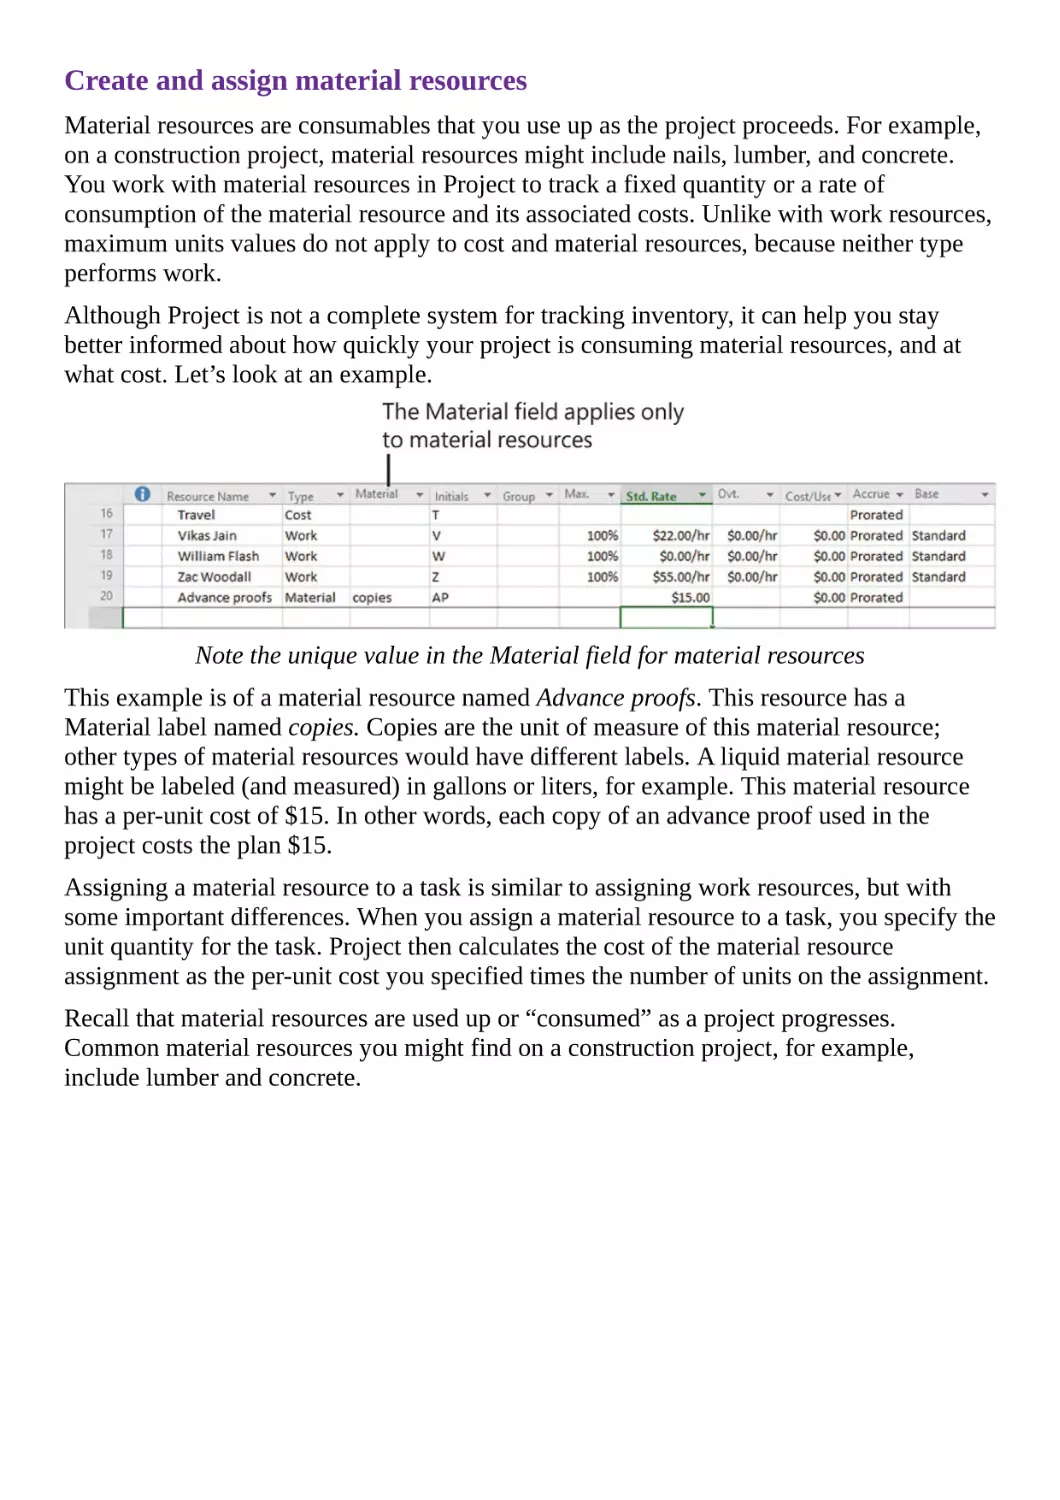
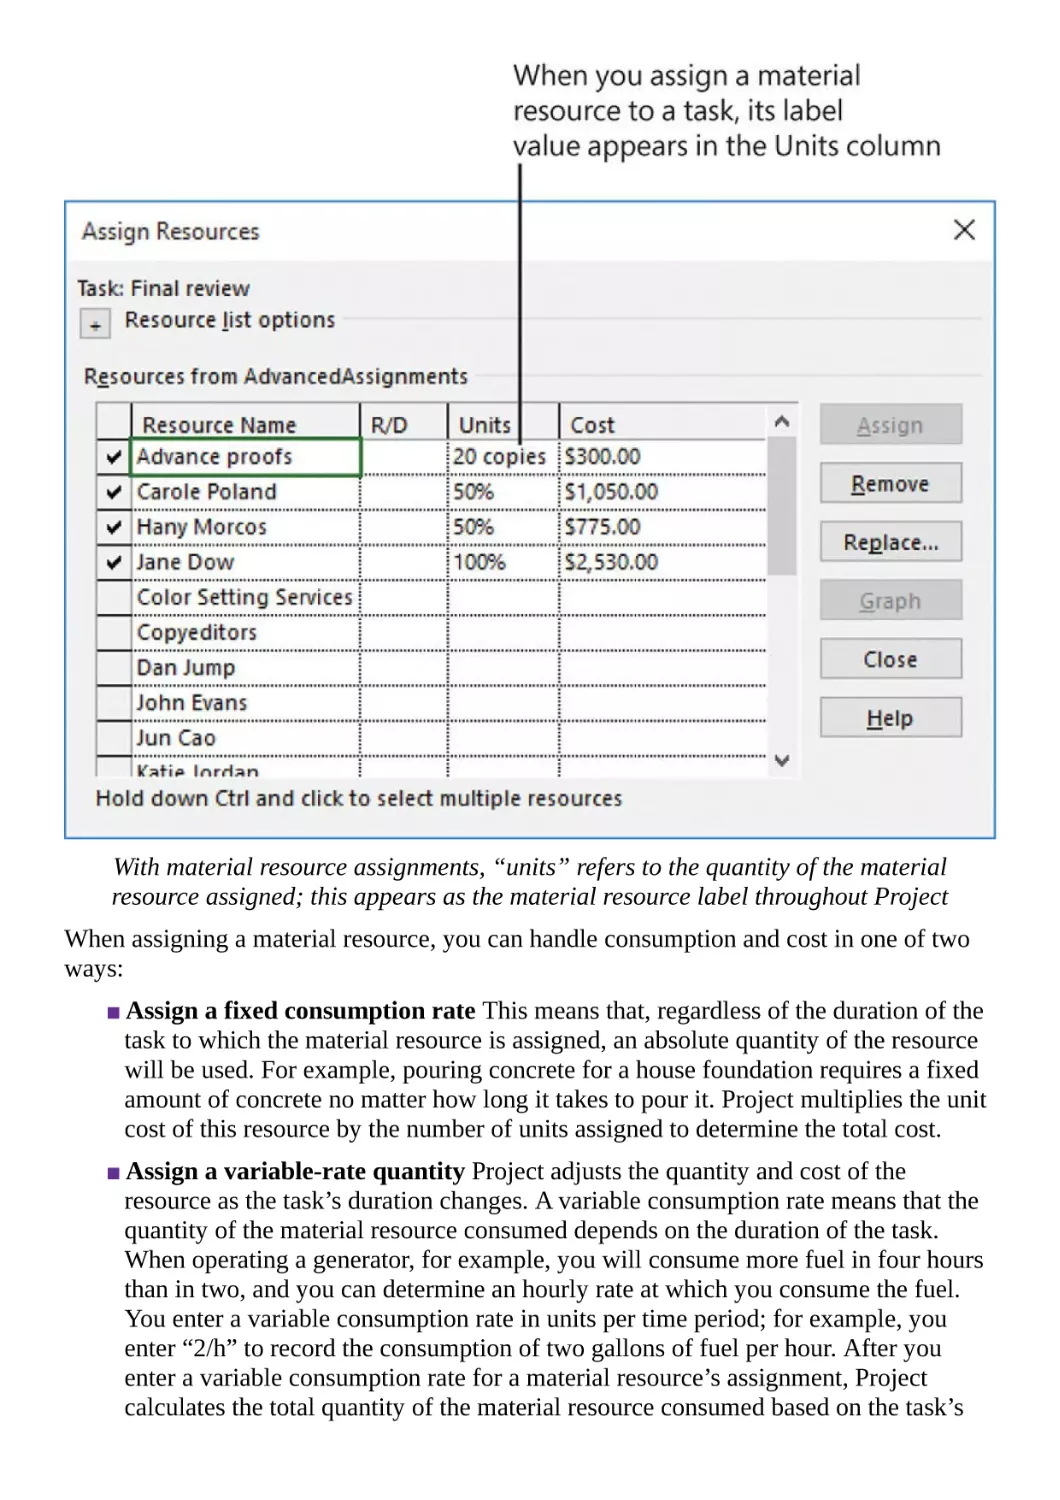
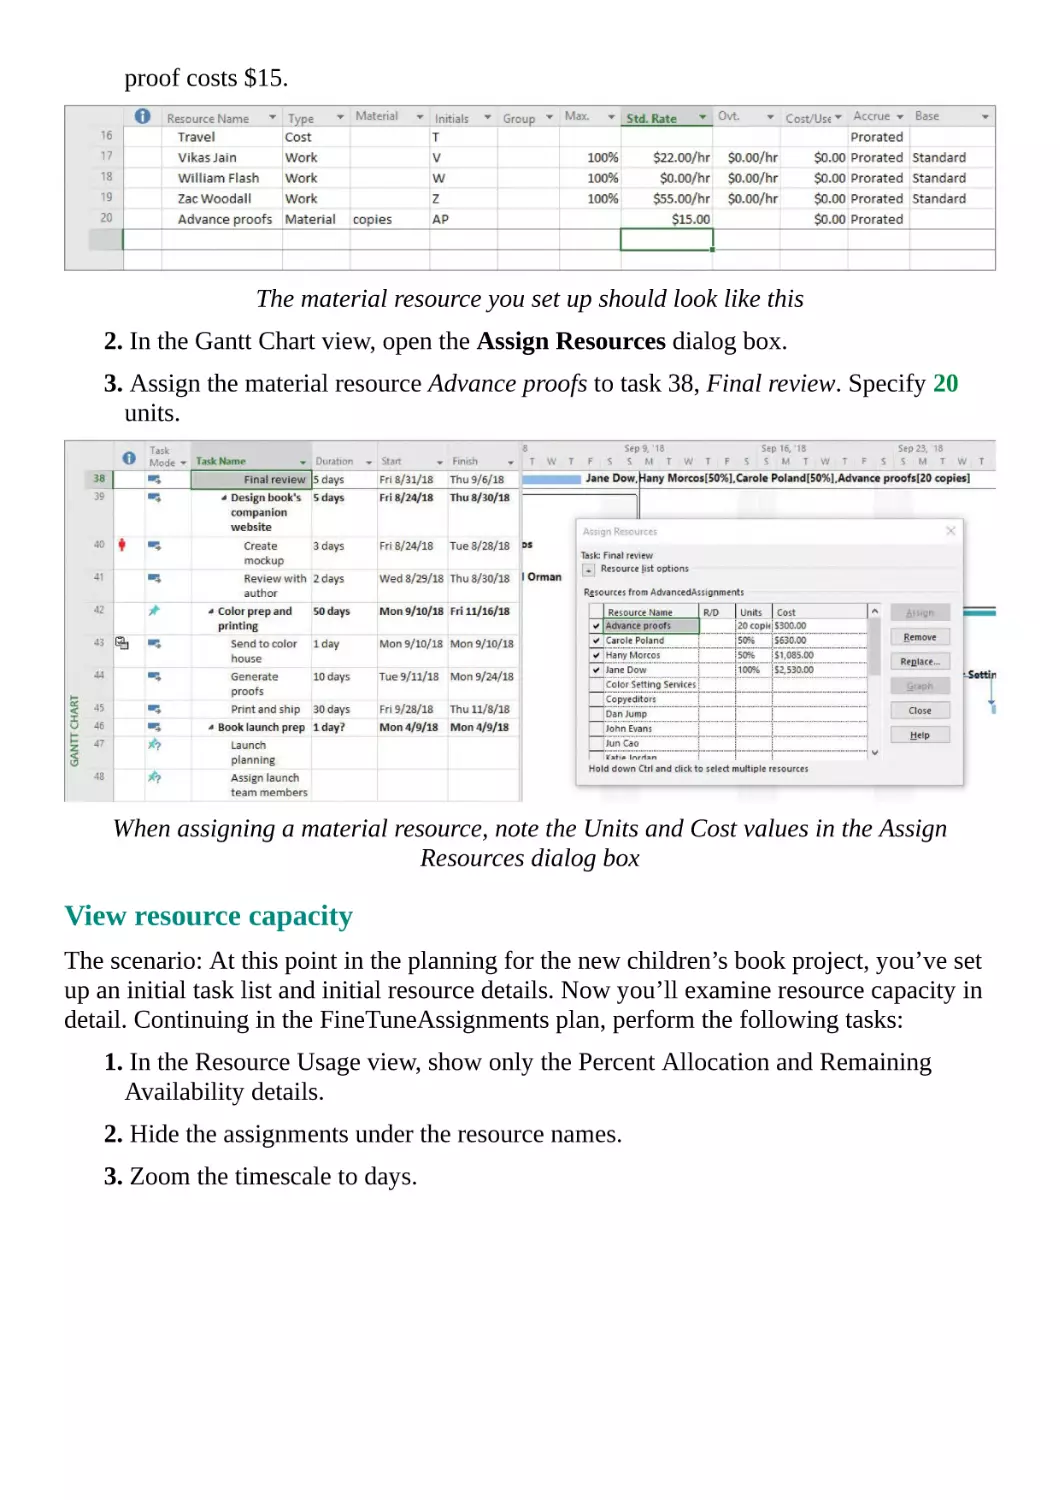
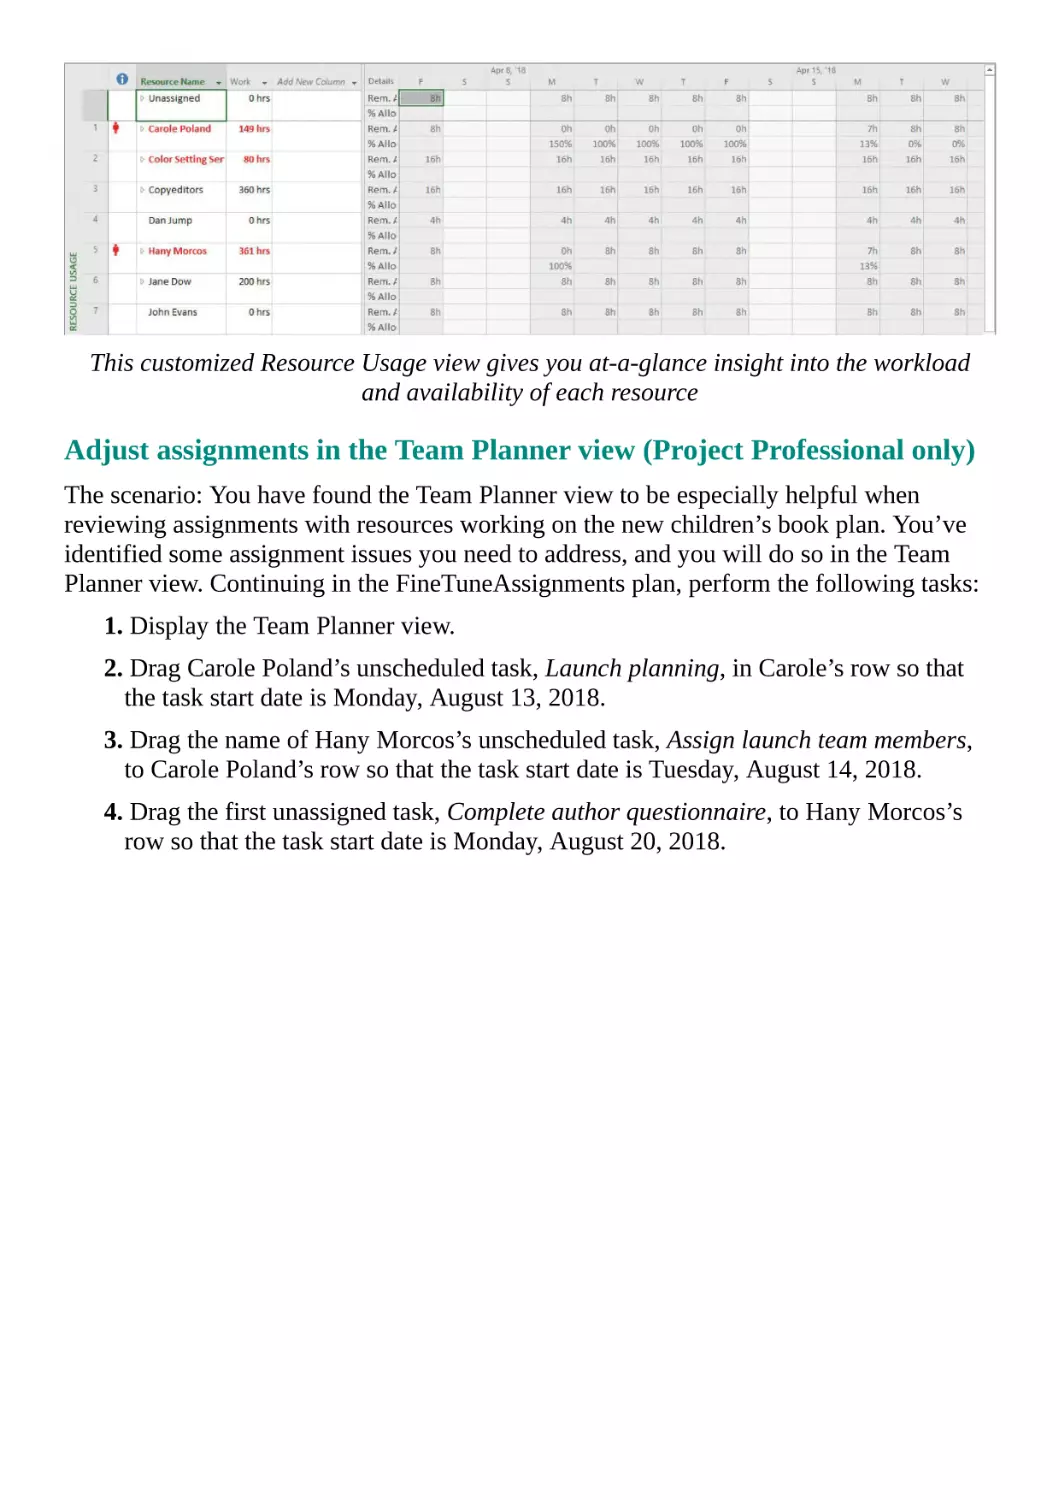
Create and assign material resources
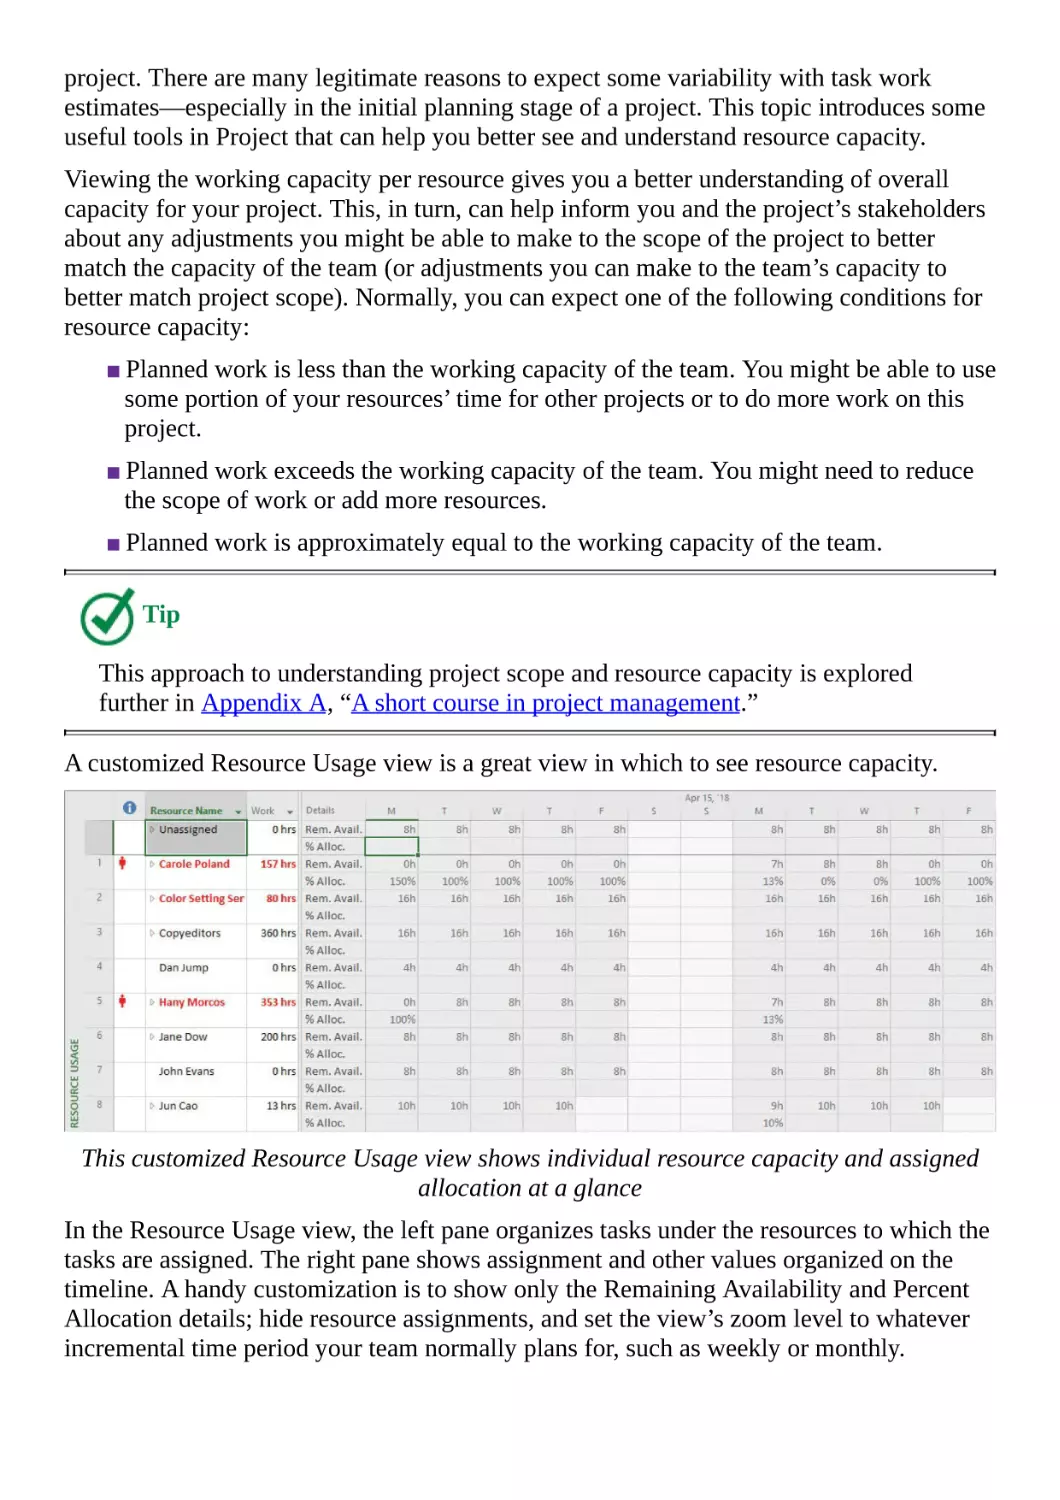
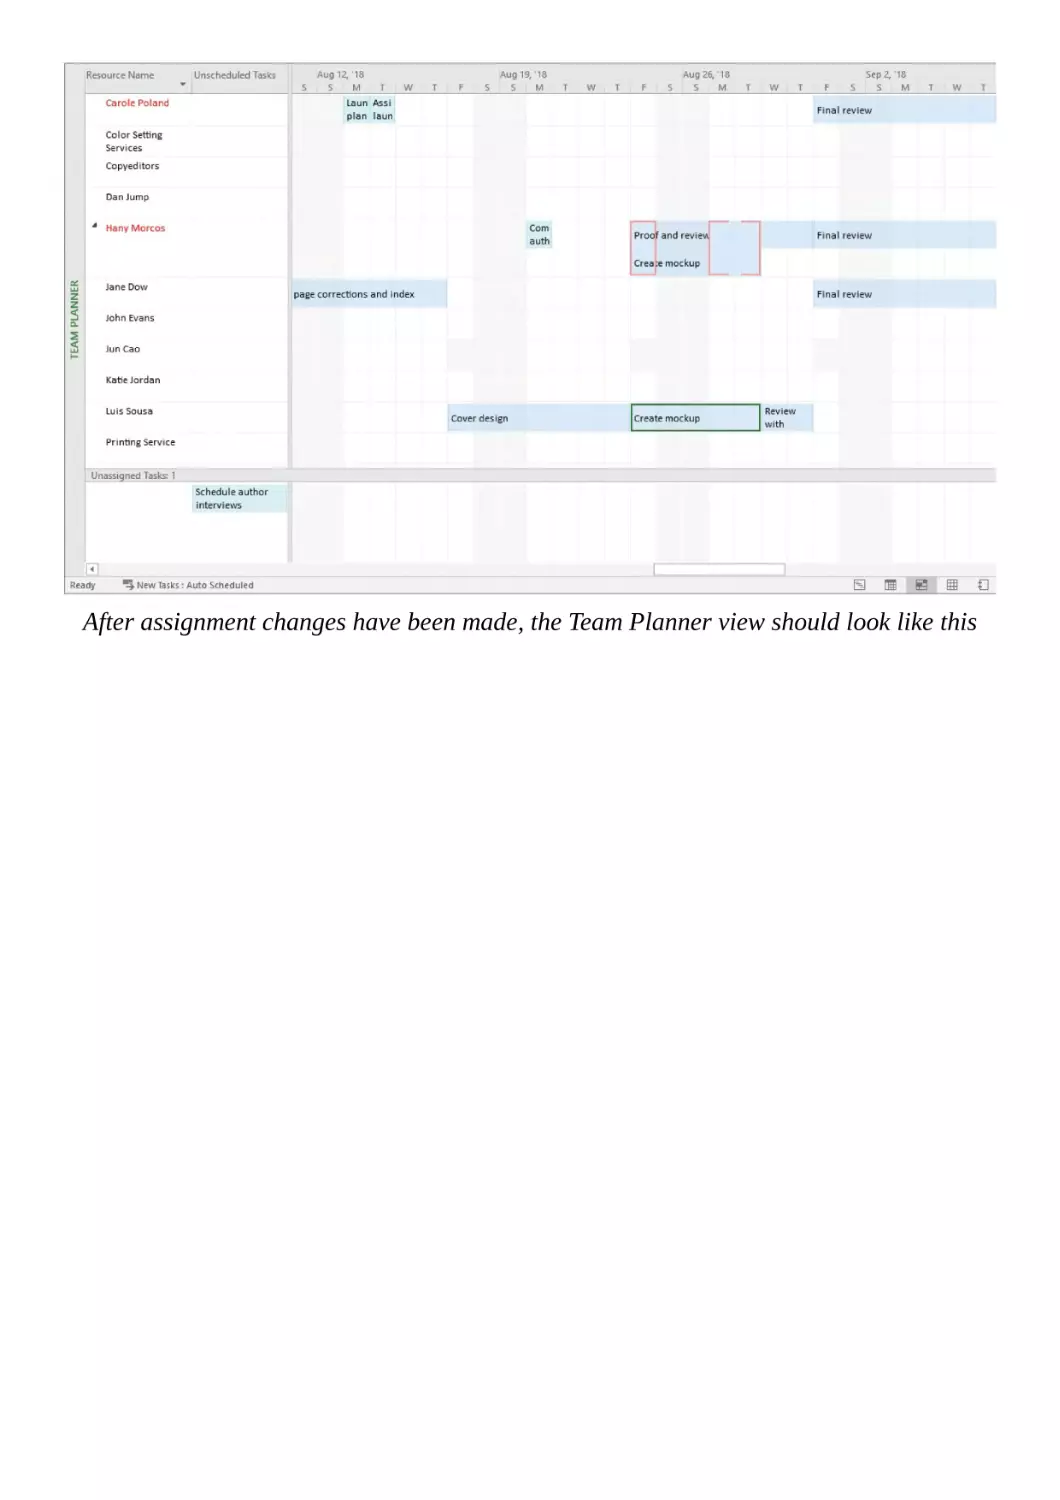
View resource capacity
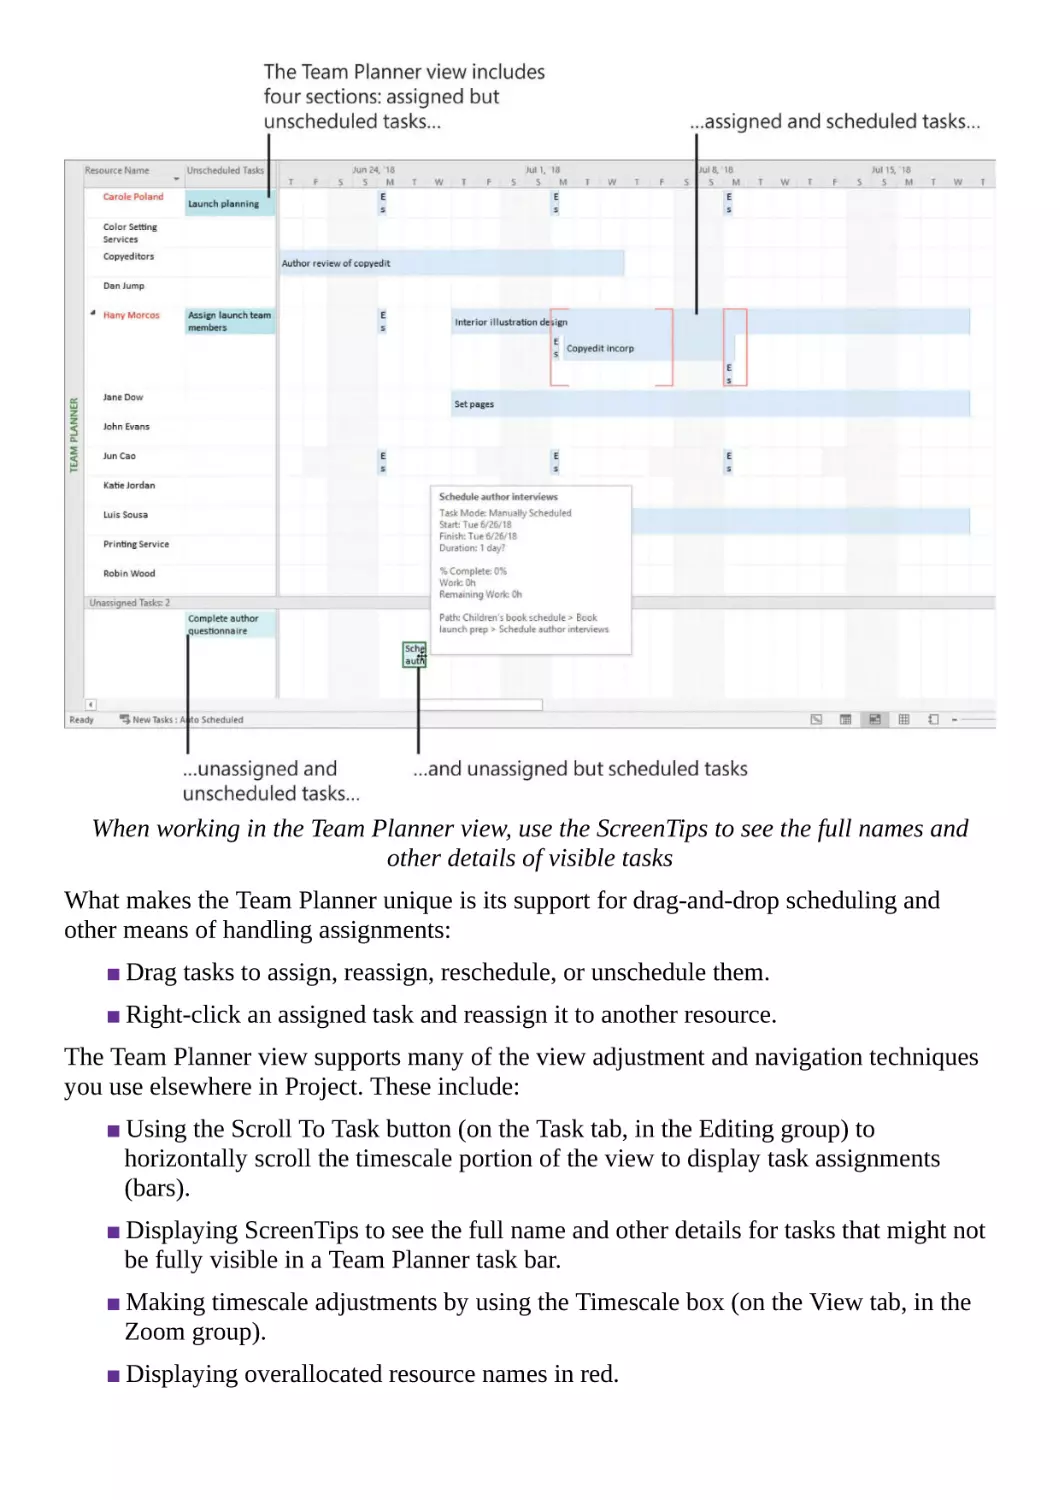
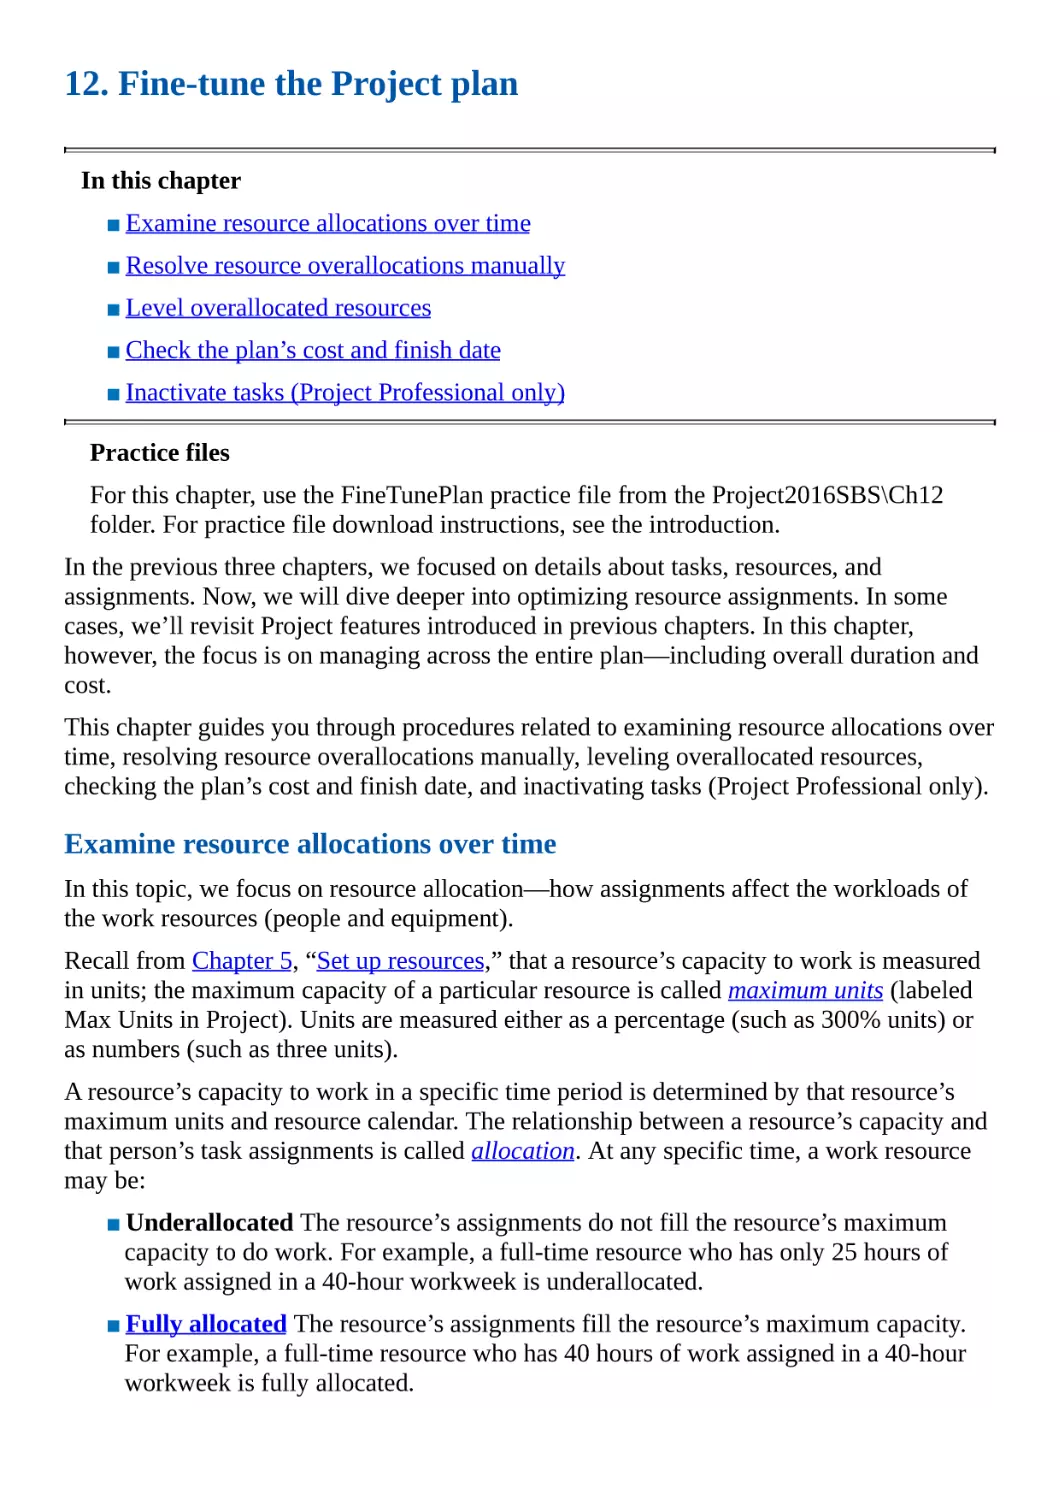
Adjust assignments in the Team Planner view (Project Professional only)
Skills review
Practice tasks
12 Fine-tune the Project plan
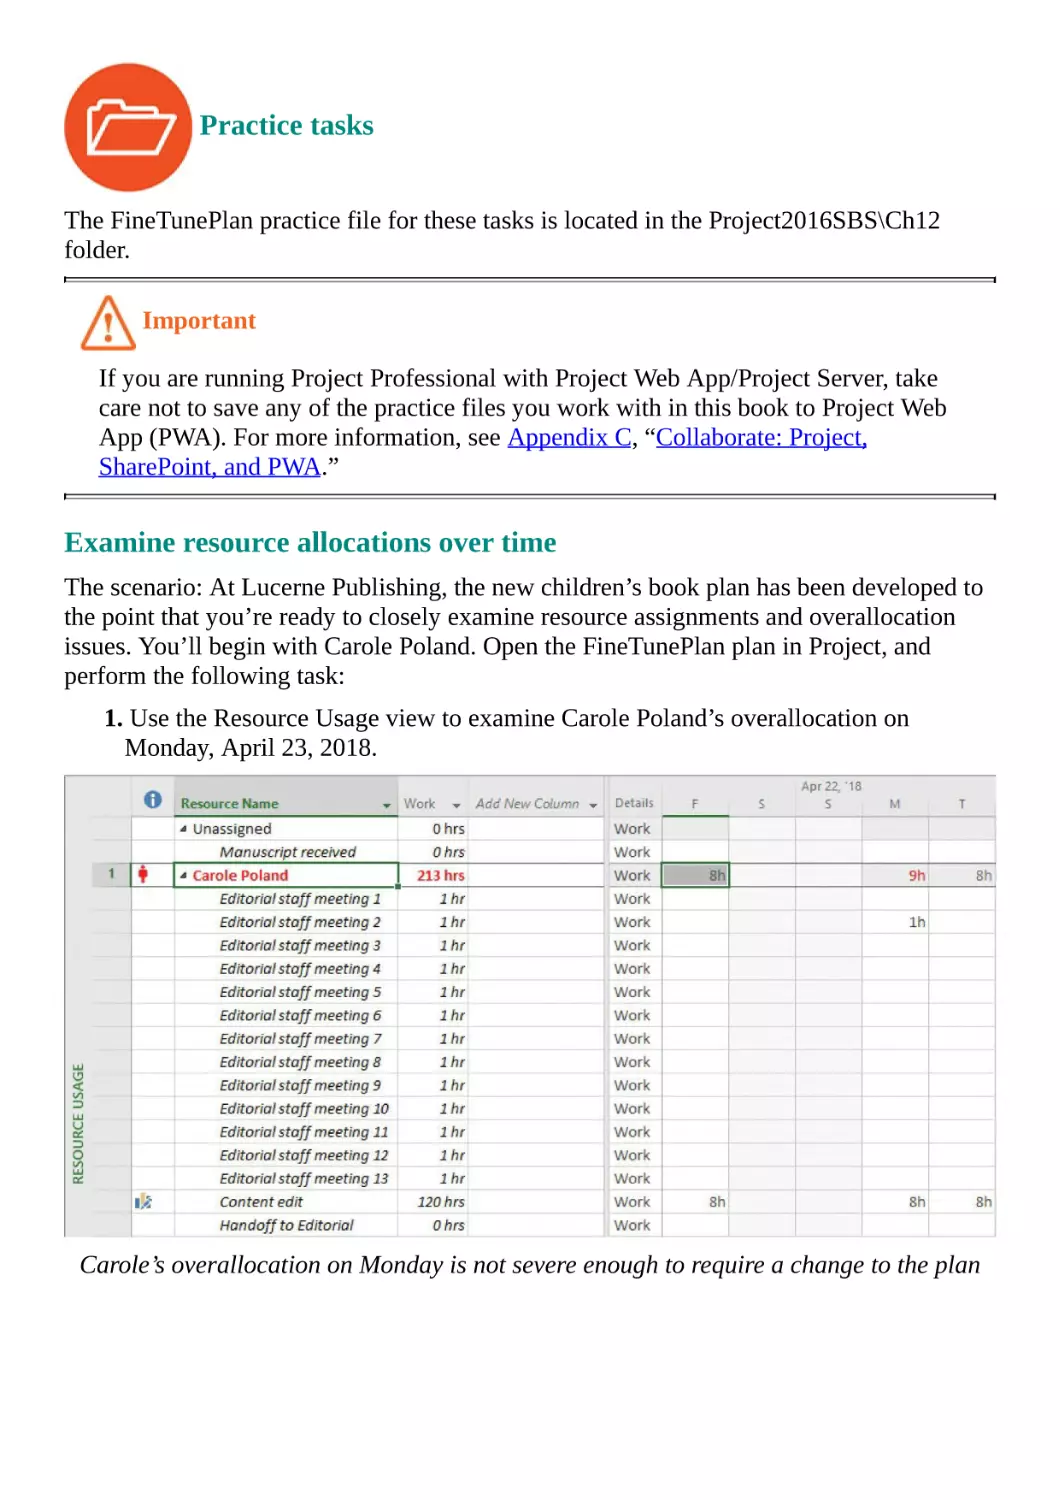
Examine resource allocations over time
Sidebar: Project management focus: Evaluate resource allocation
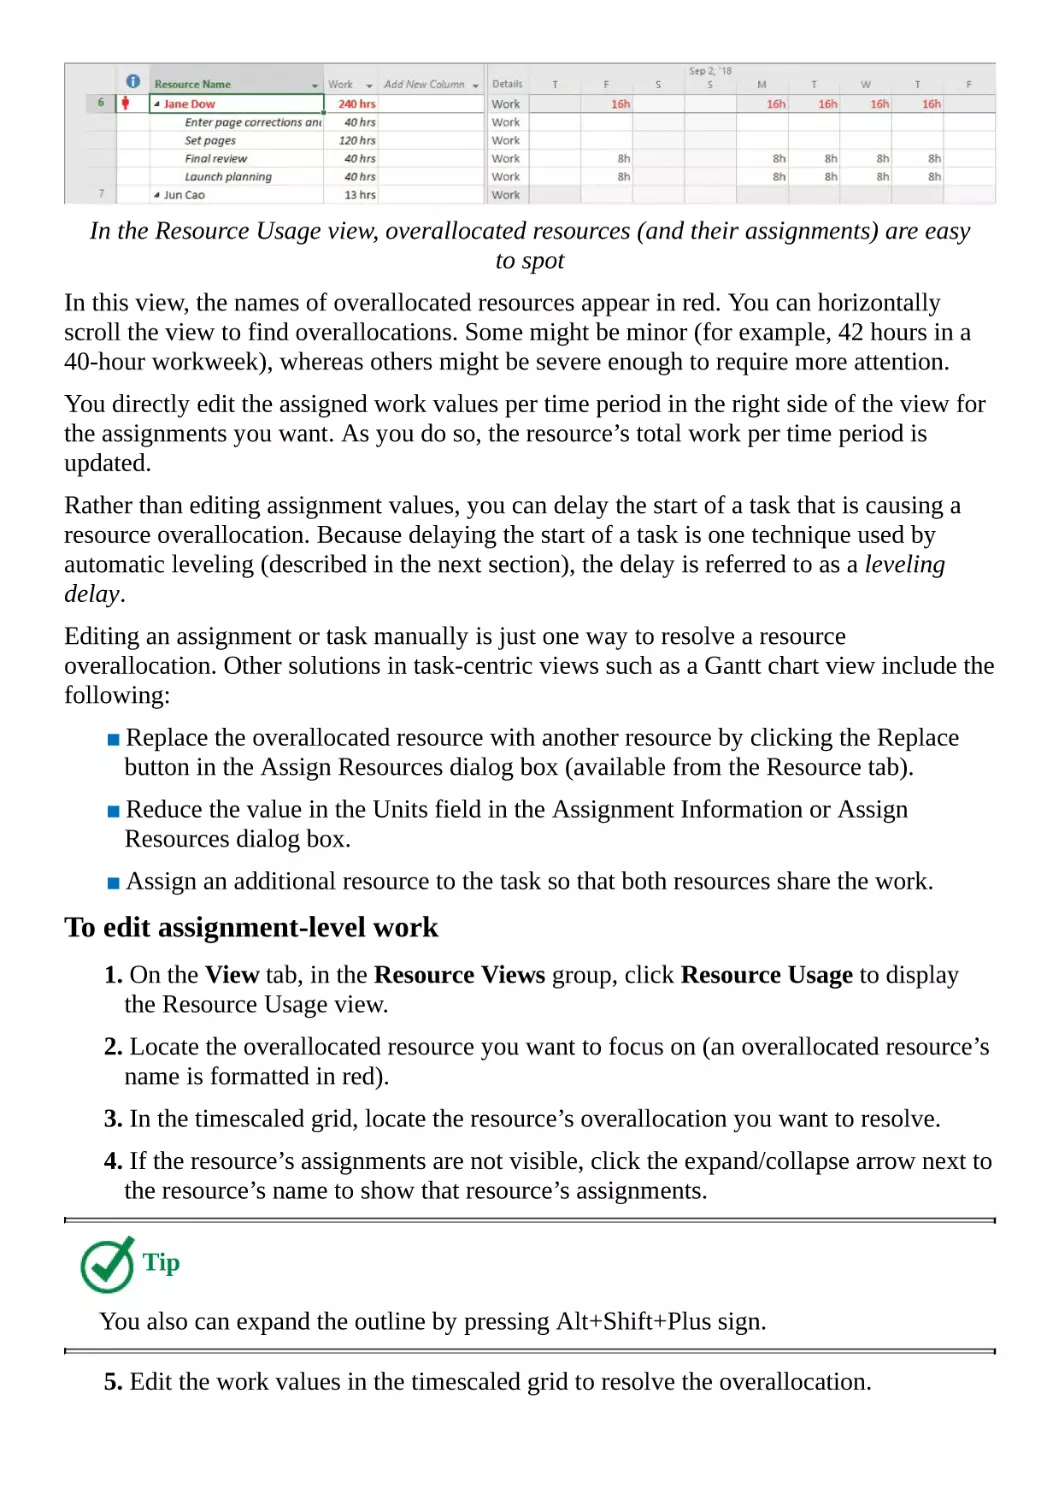
Resolve resource overallocations manually
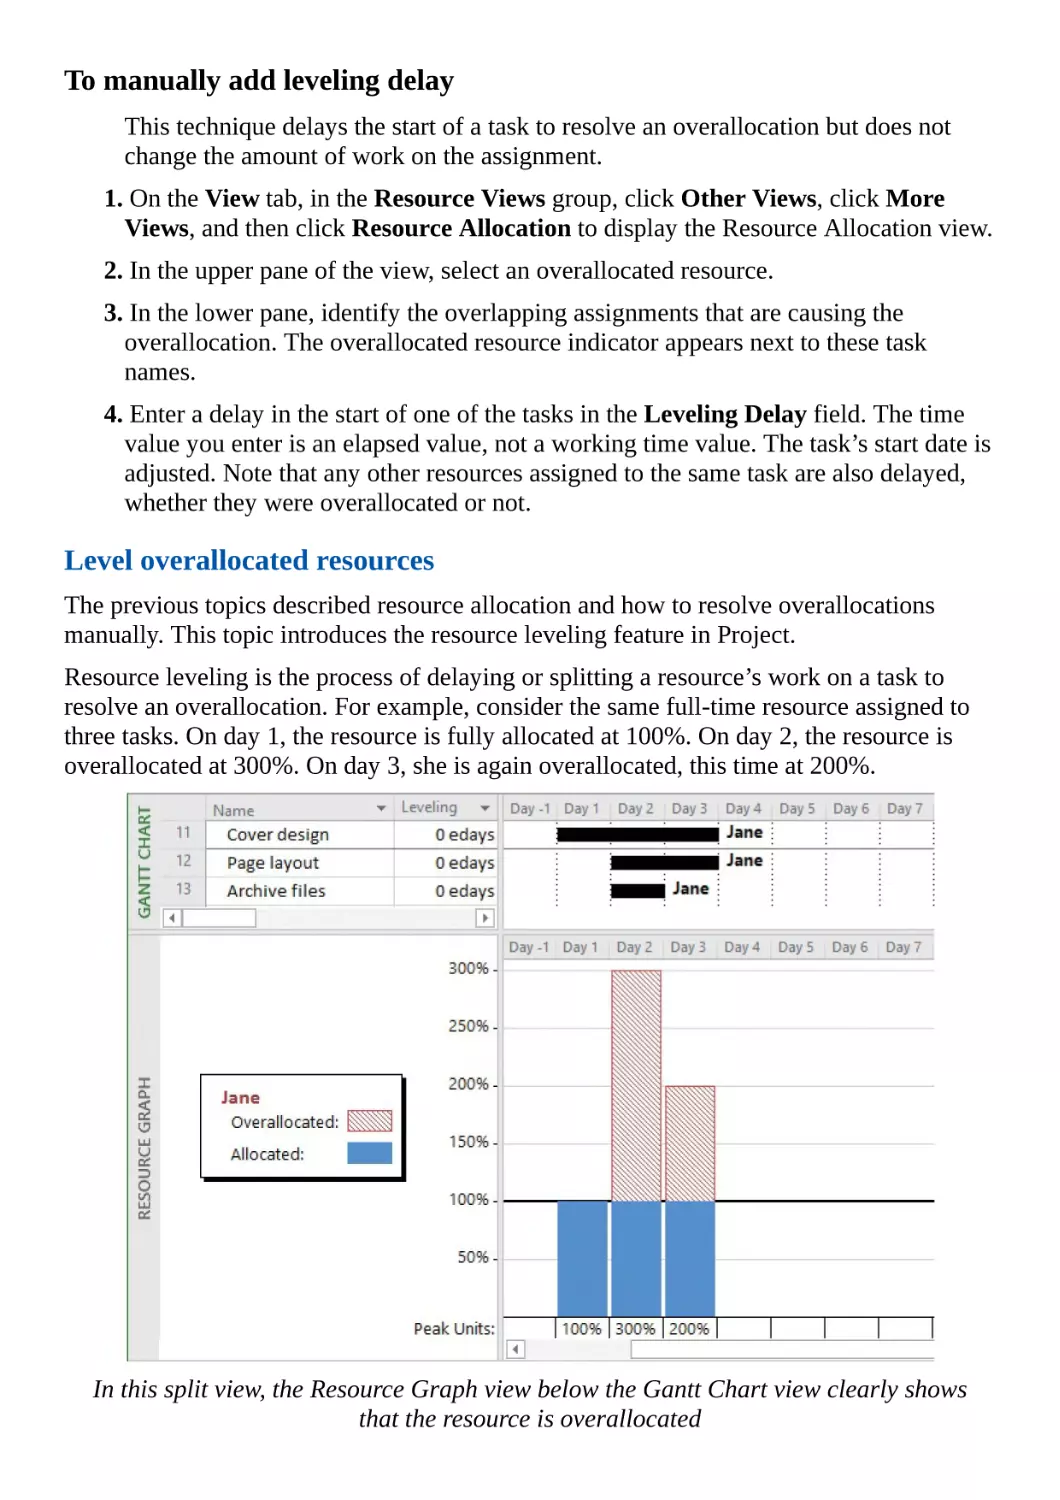
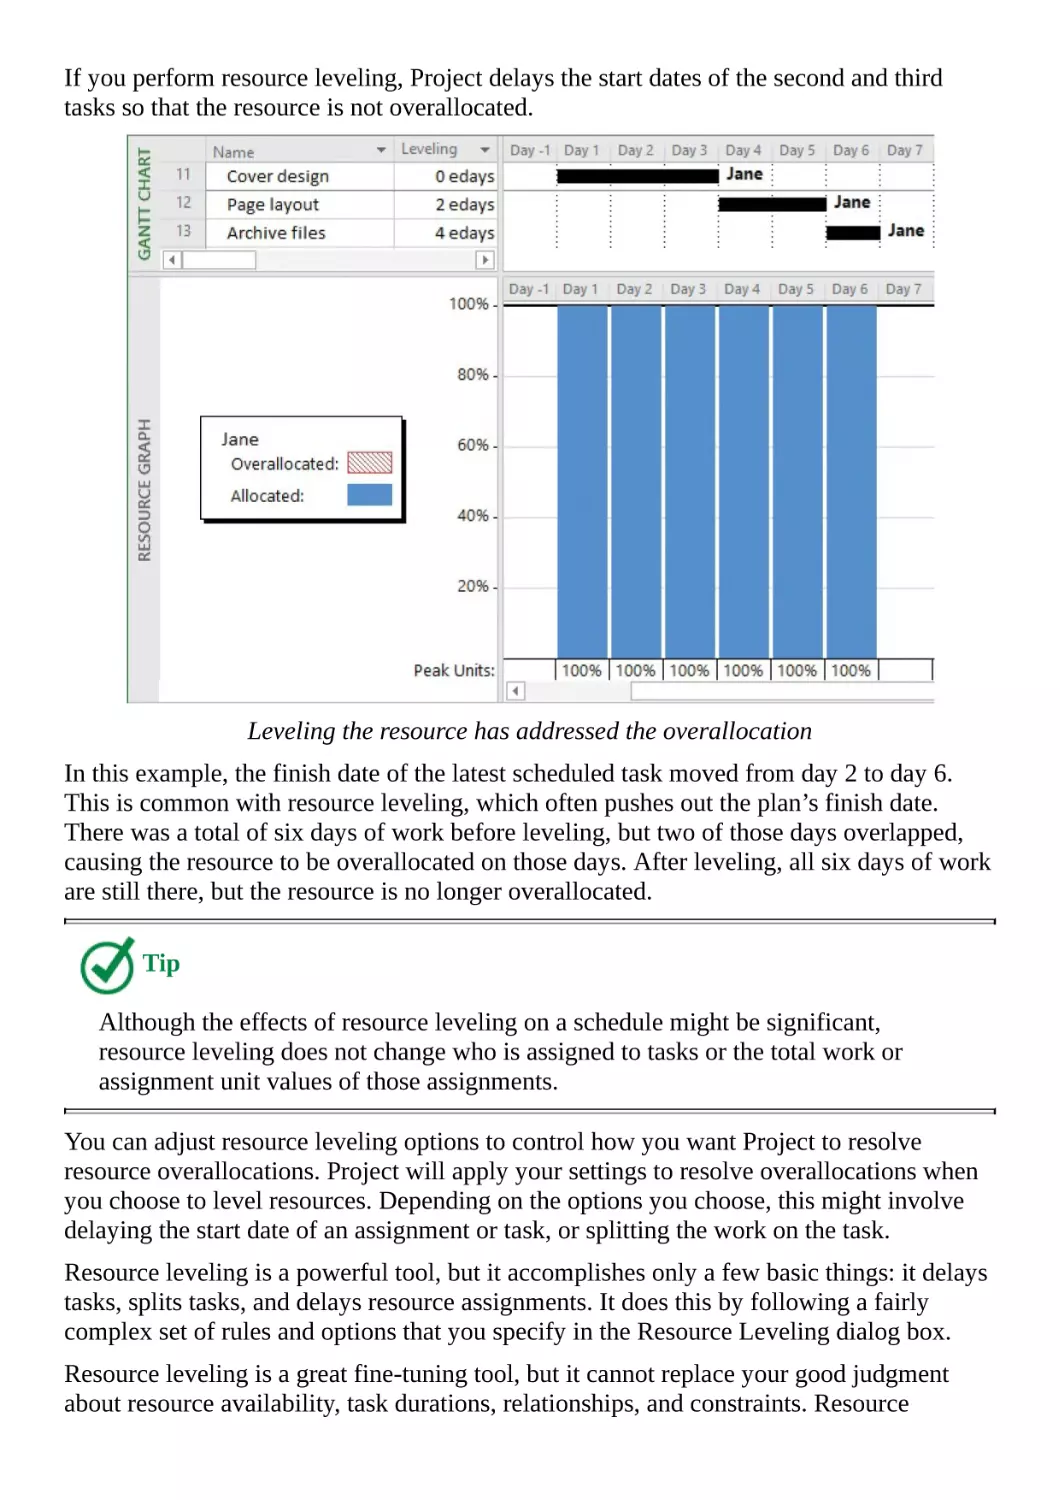
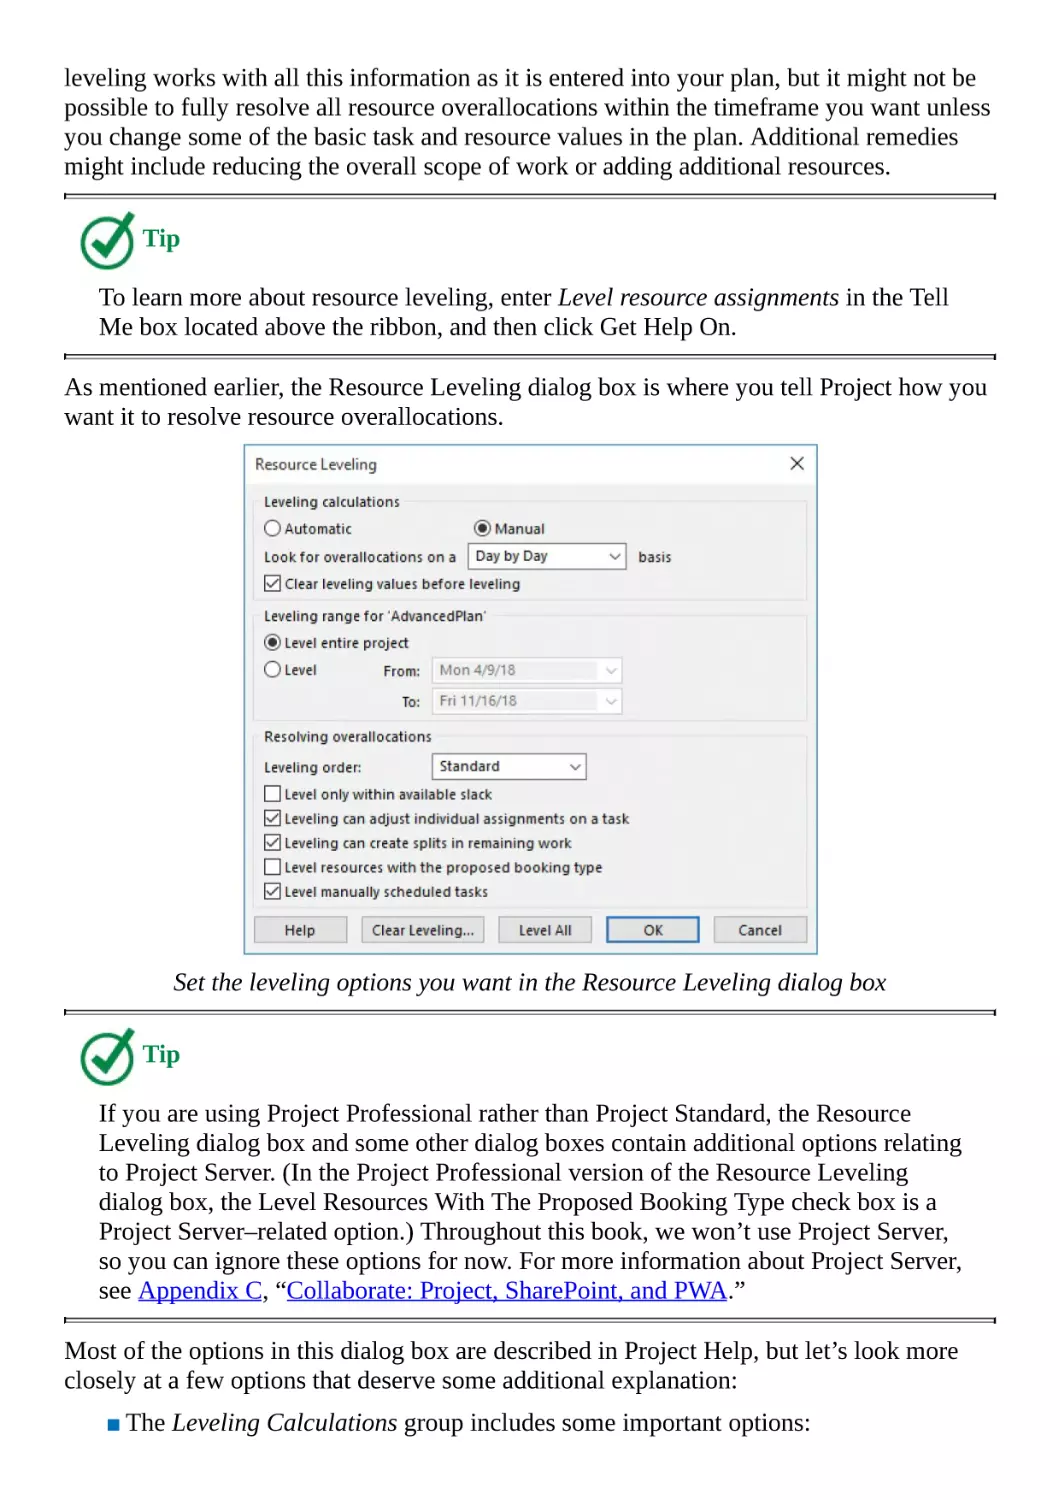
Level overallocated resources
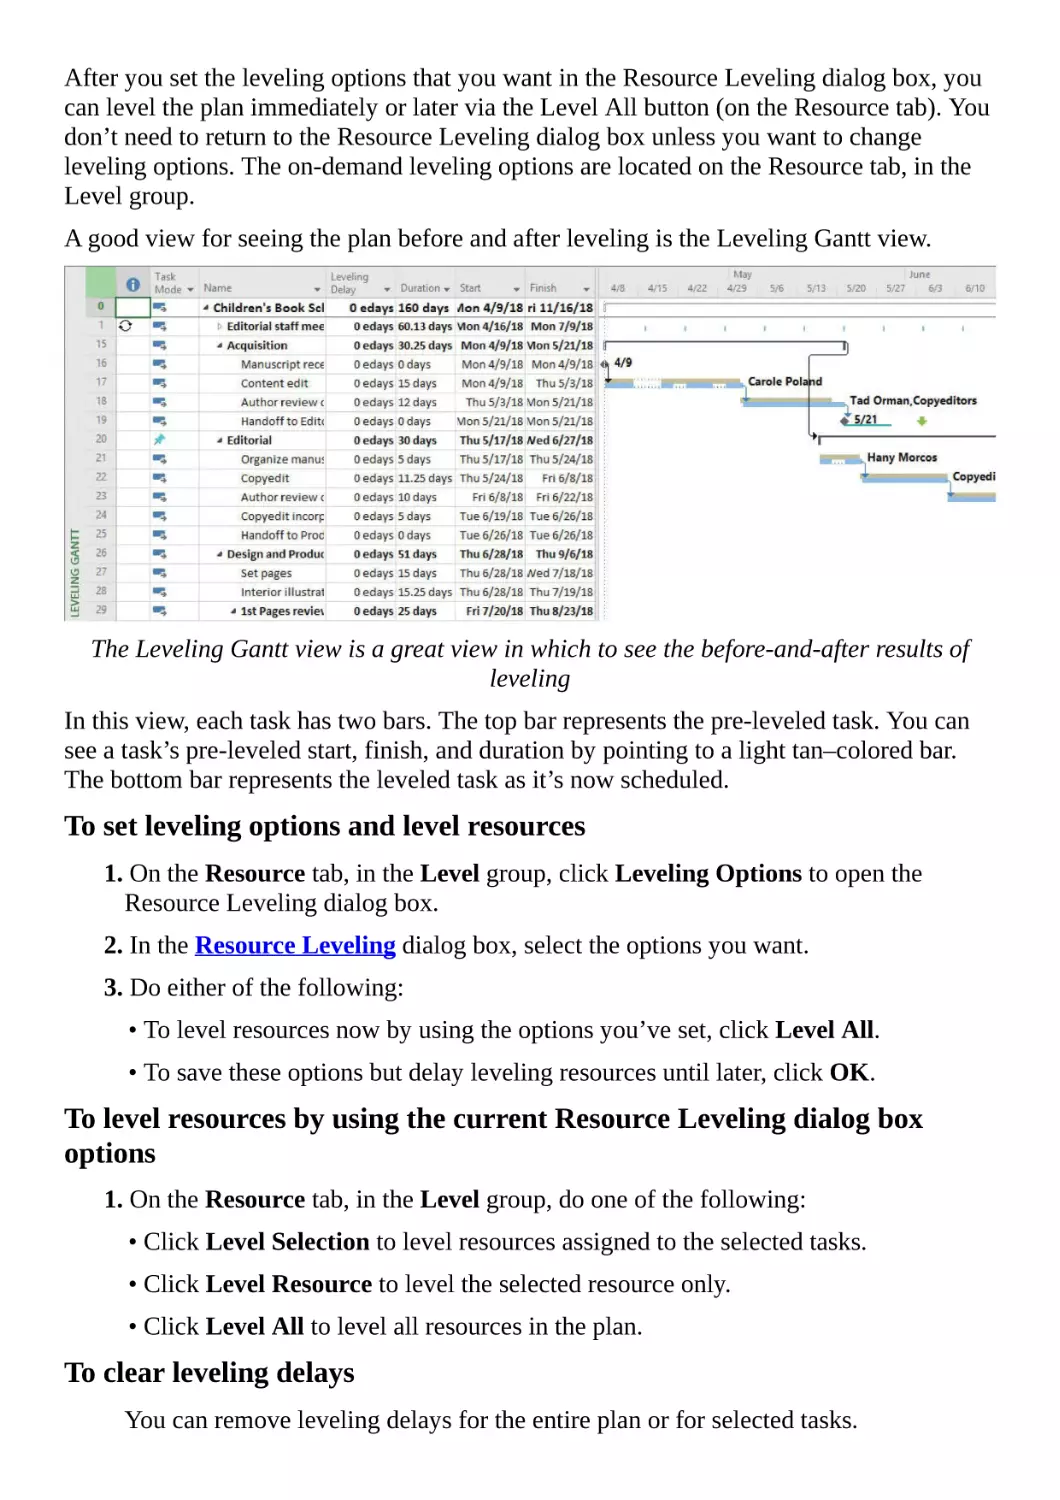
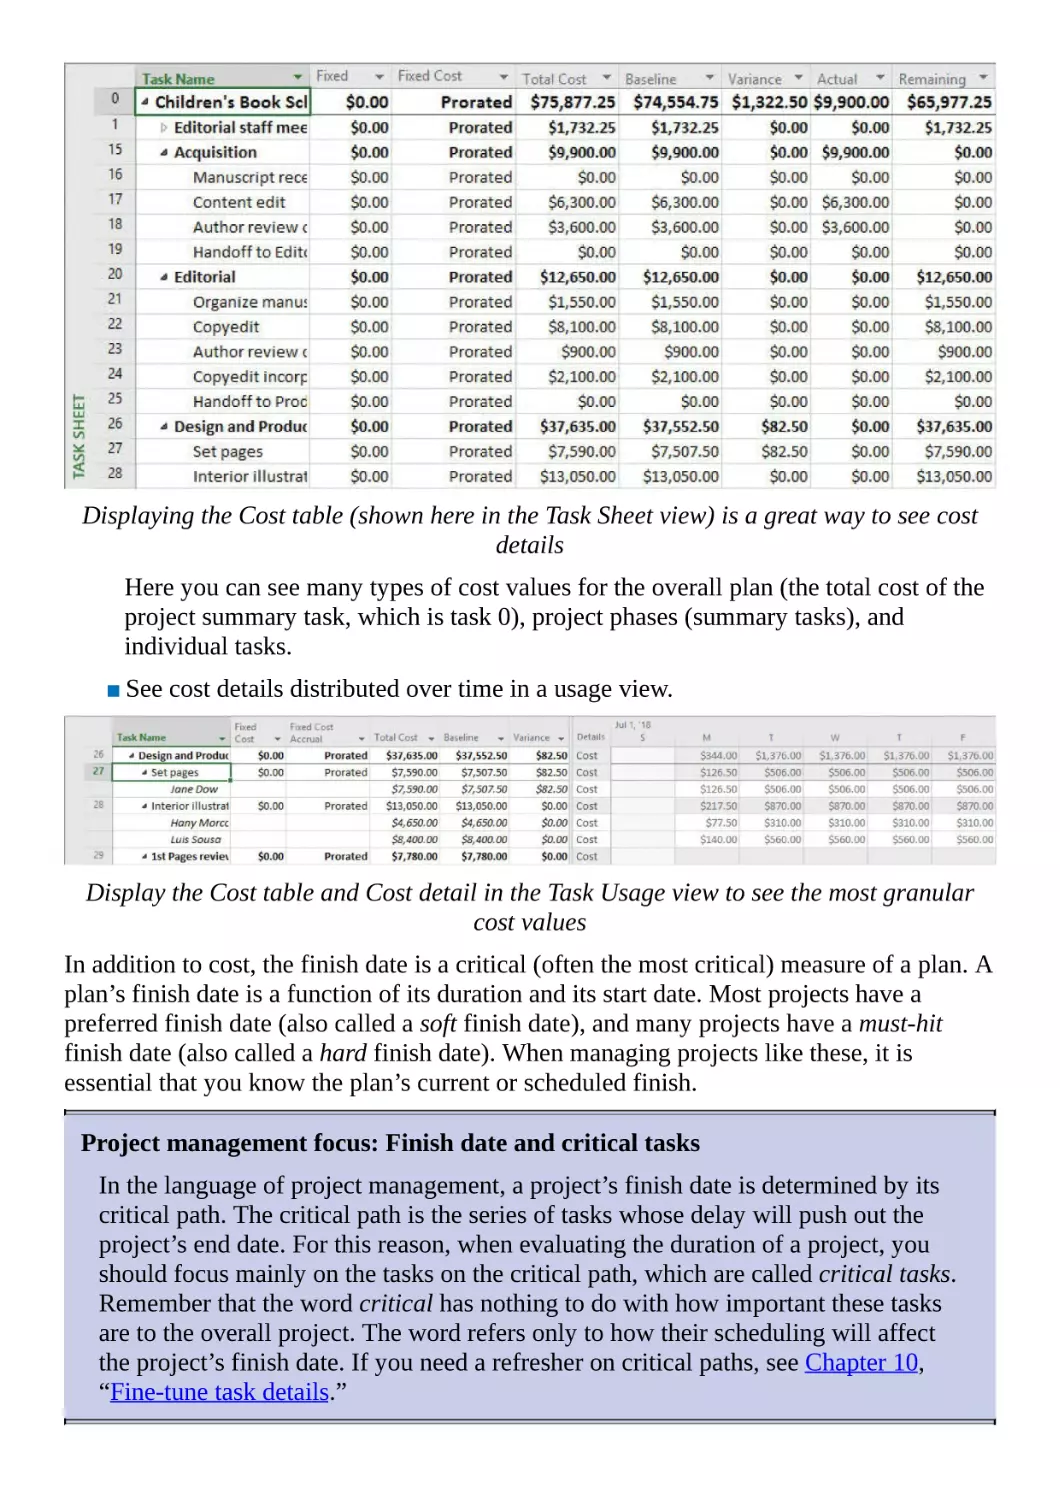
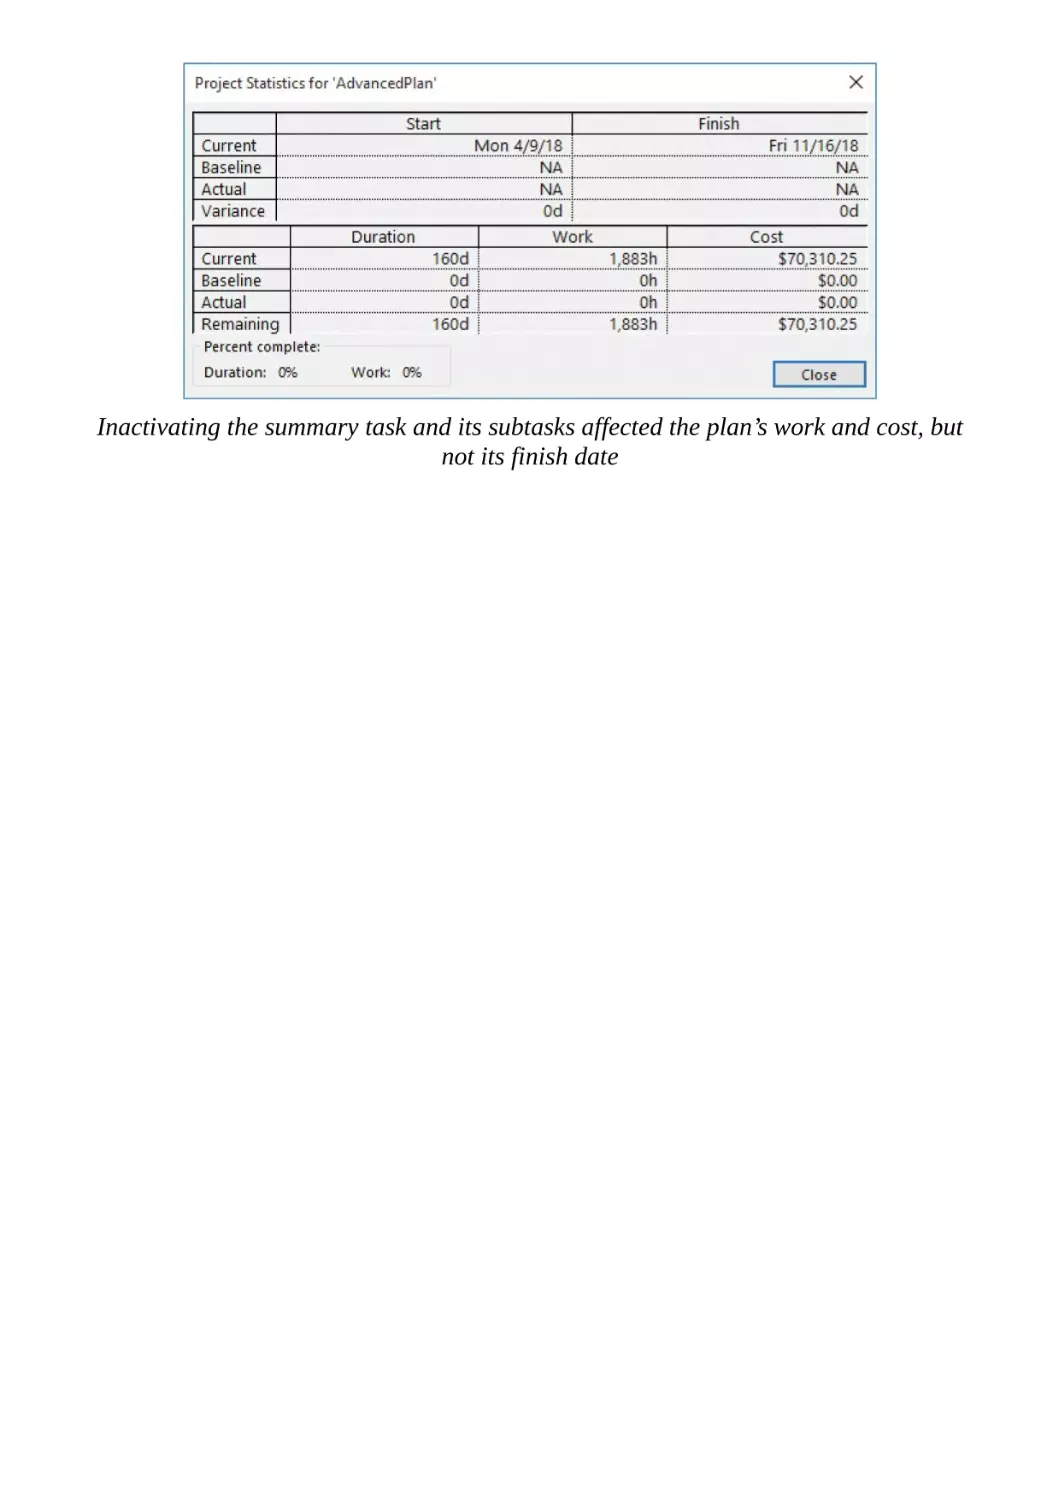
Check the plan’s cost and finish date
Sidebar: Project management focus: Finish date and critical tasks
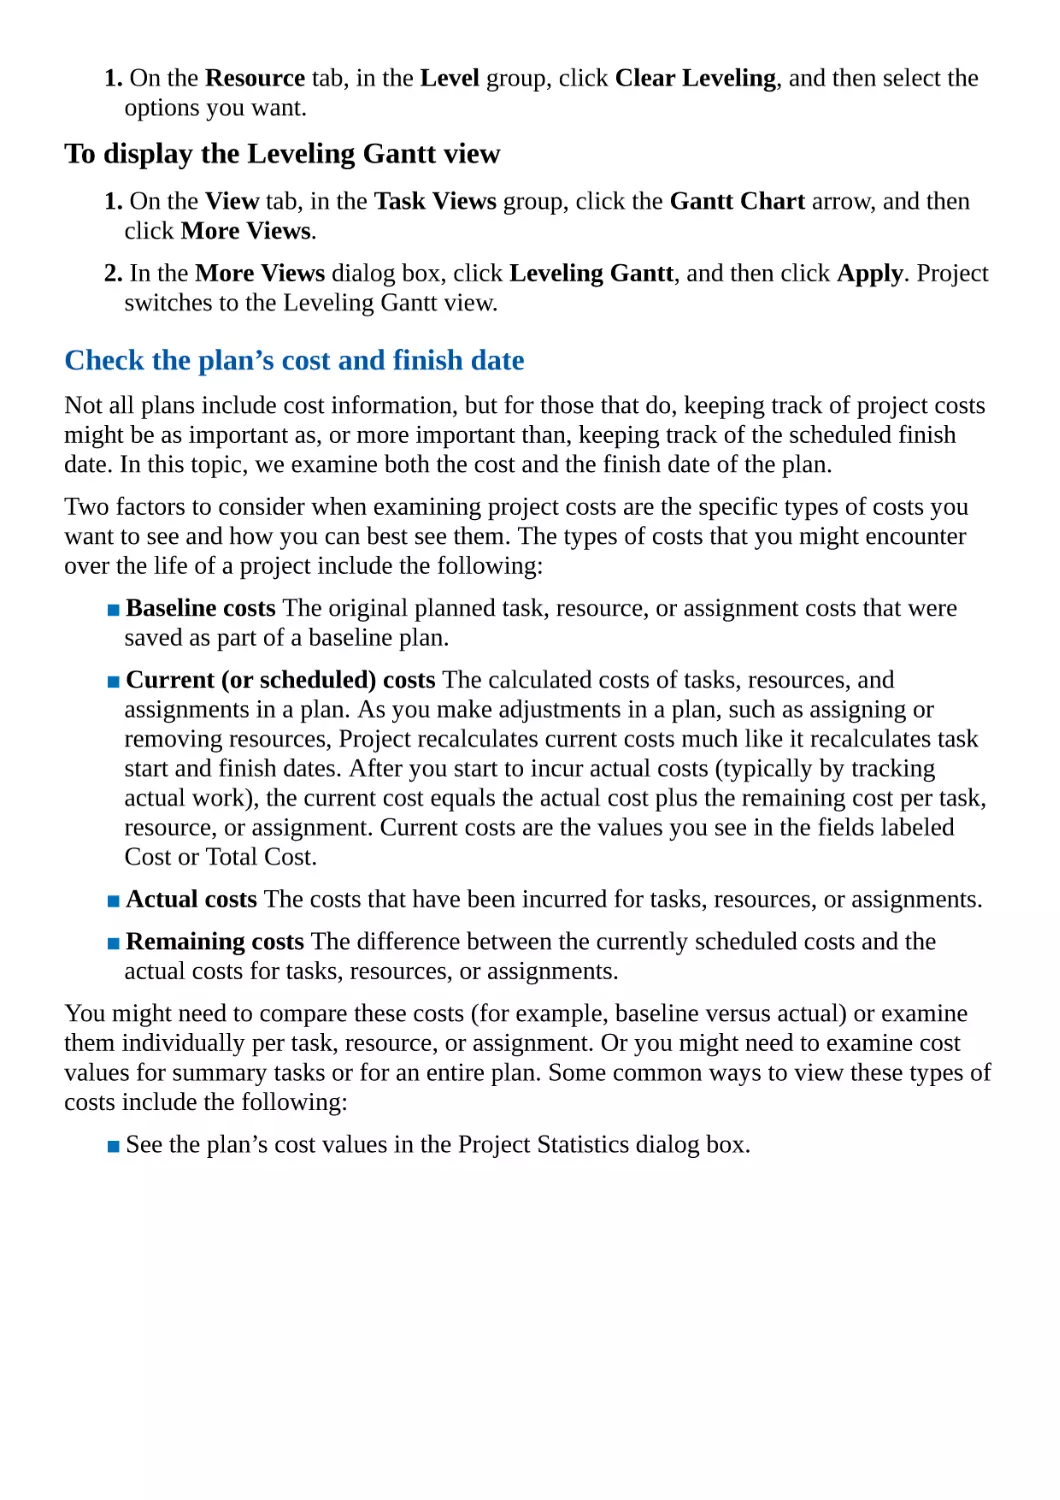
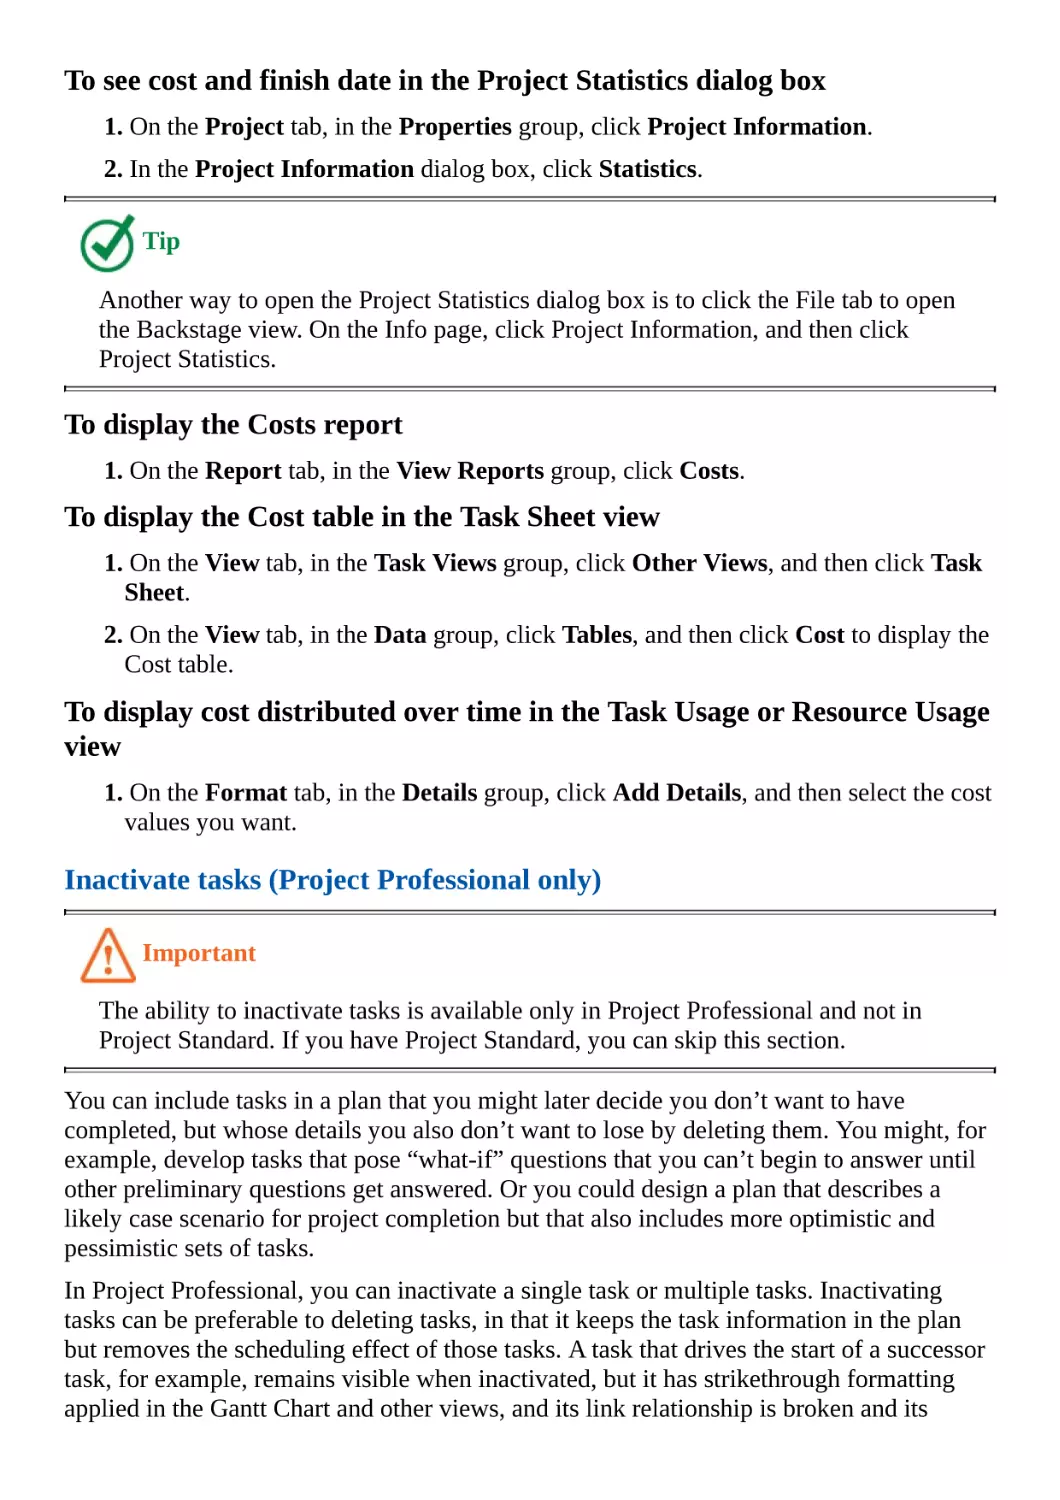
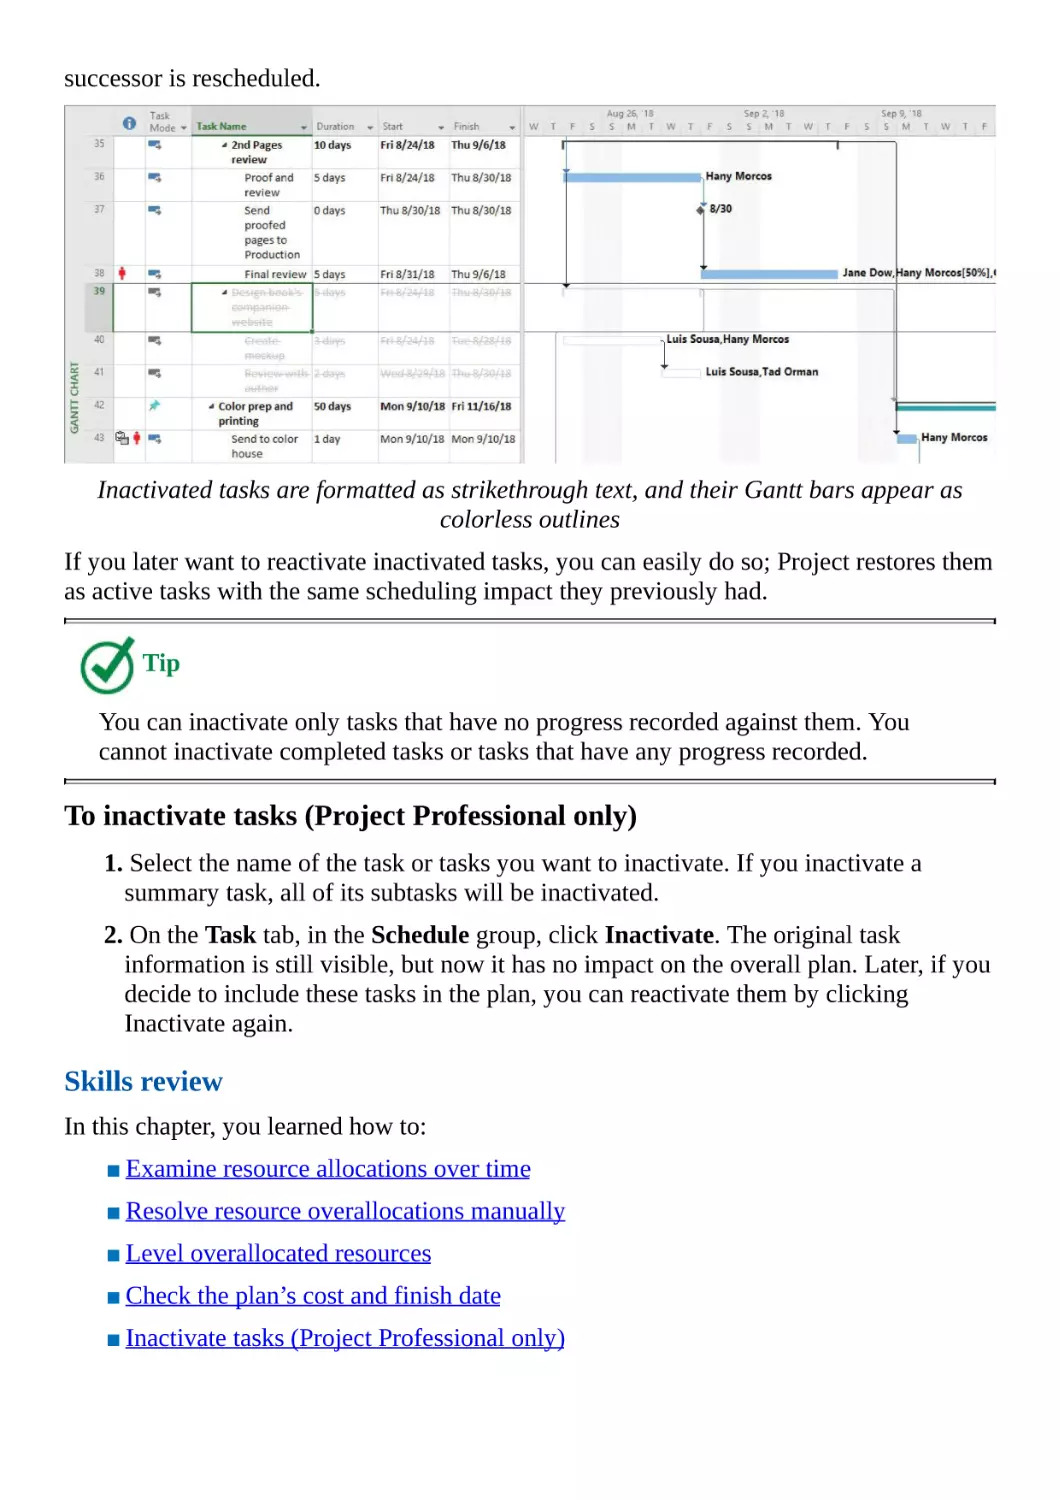
Inactivate tasks (Project Professional only)
Skills review
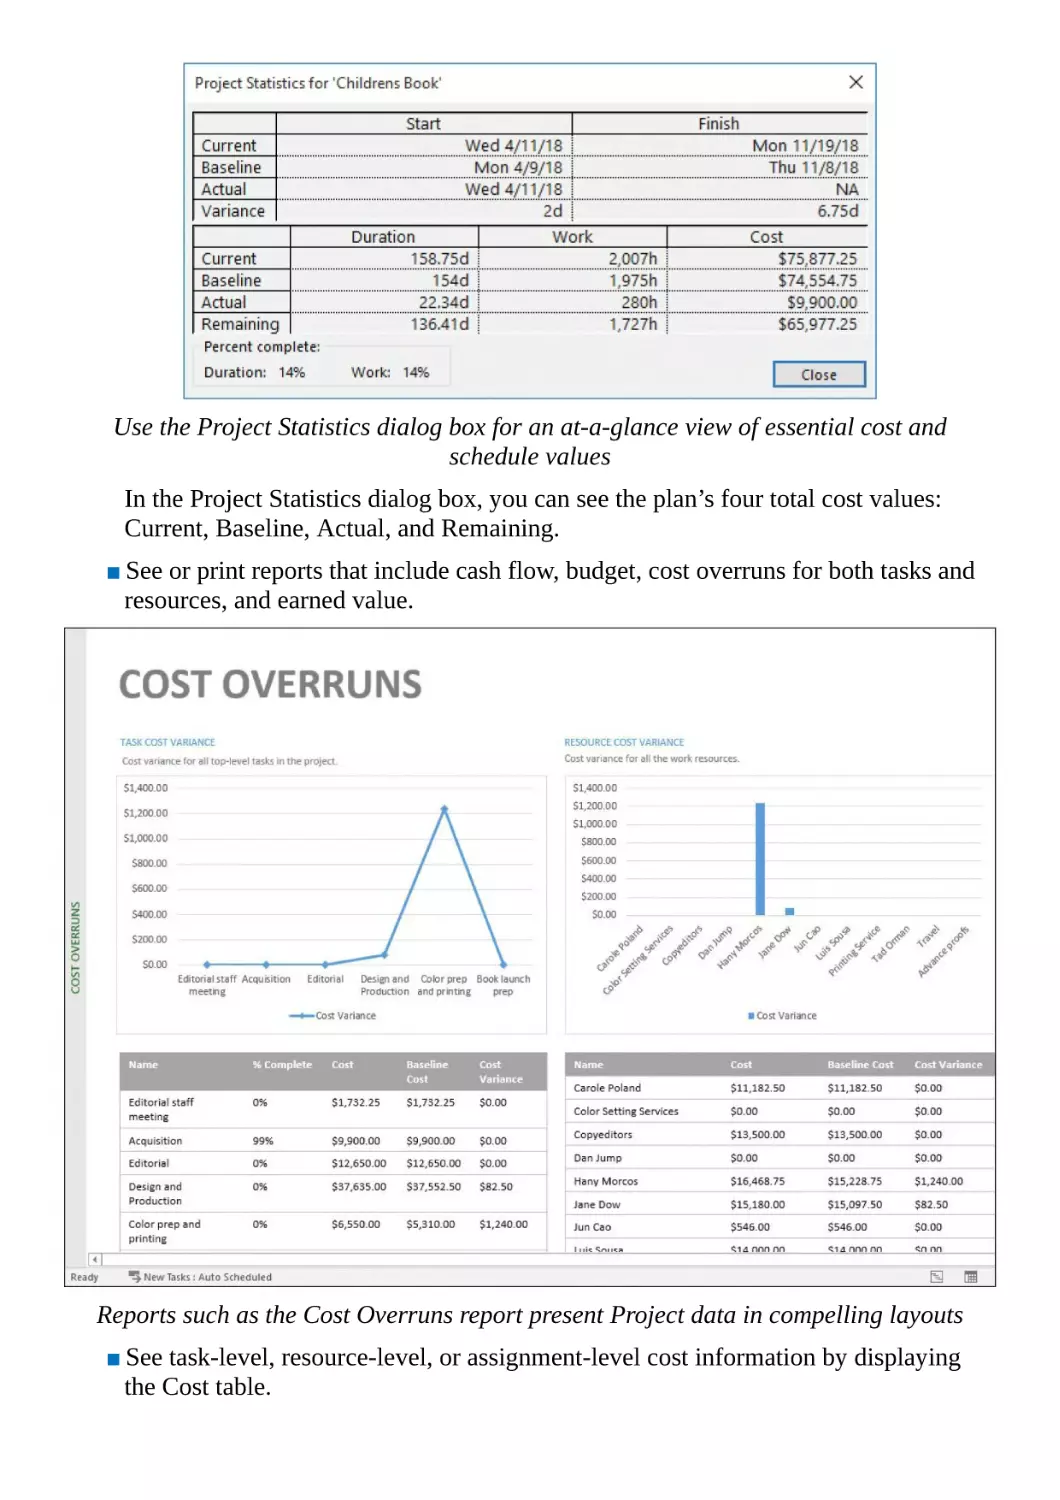
Practice tasks
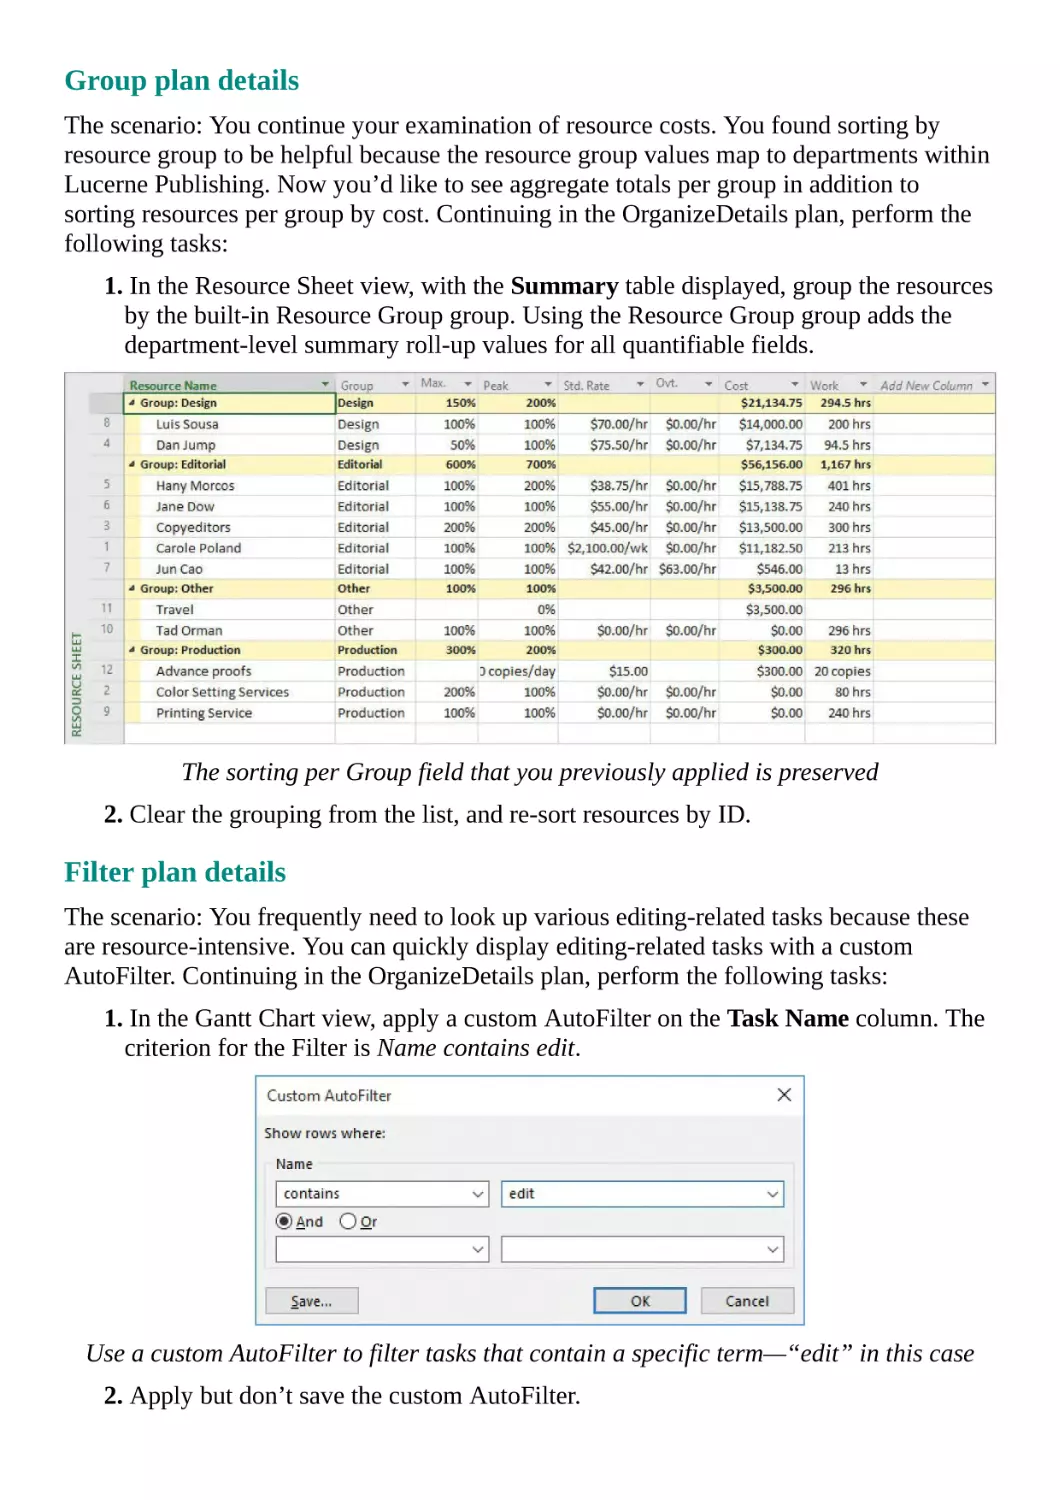
13 Organize plan details
Sort plan details
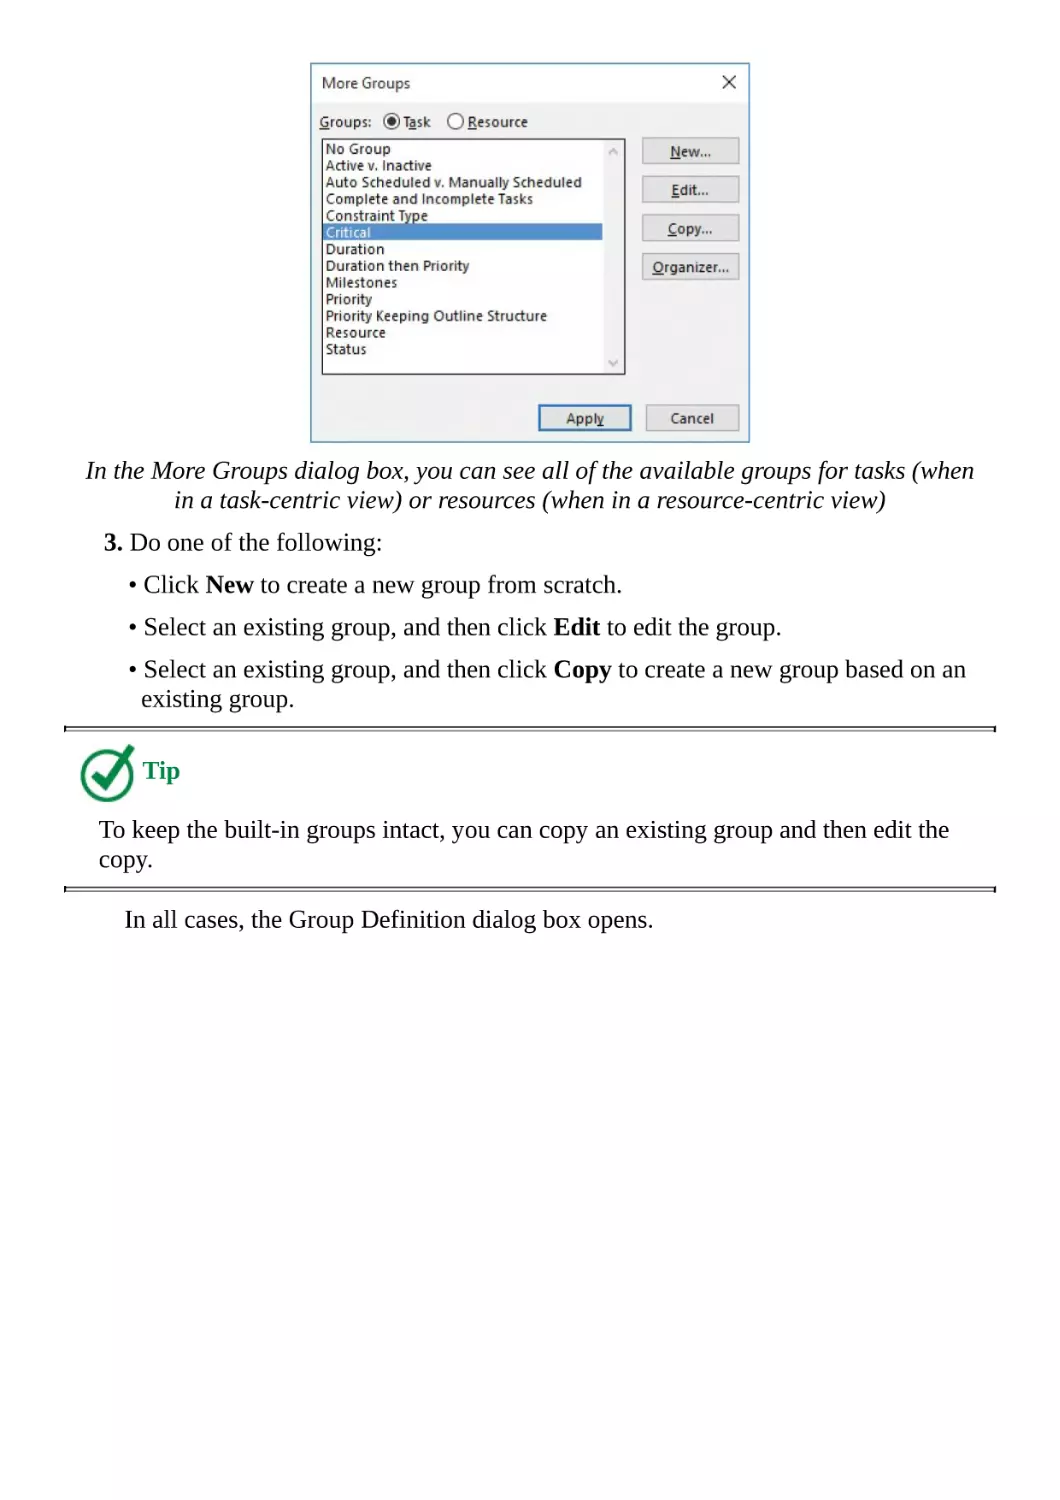
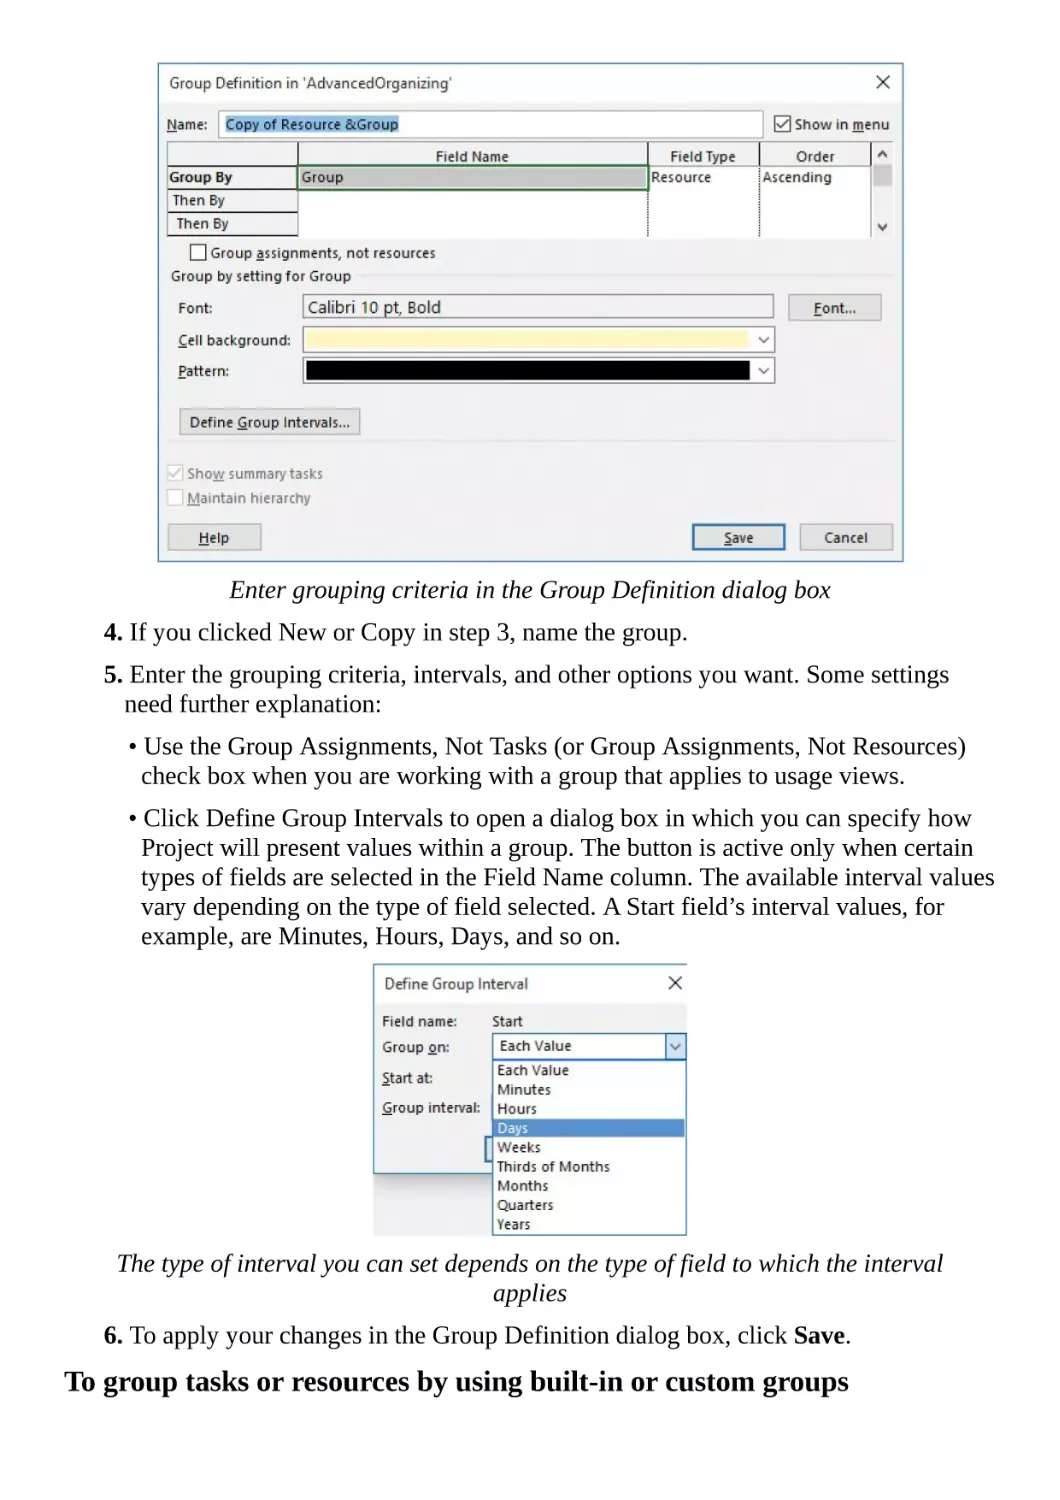
Group plan details
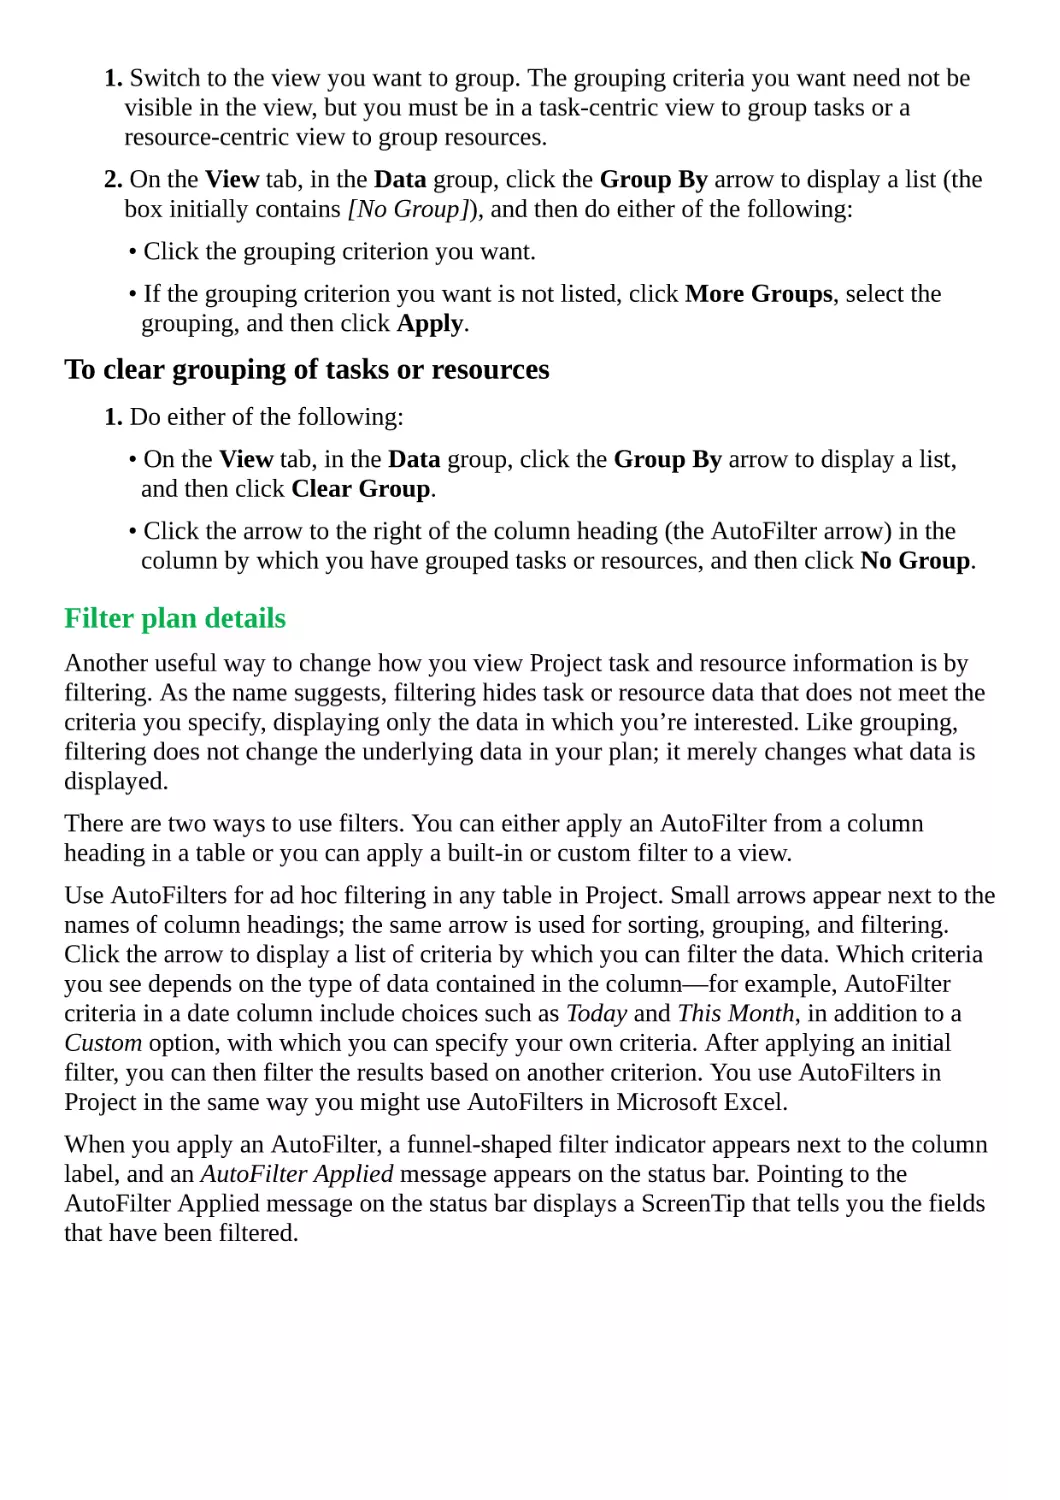
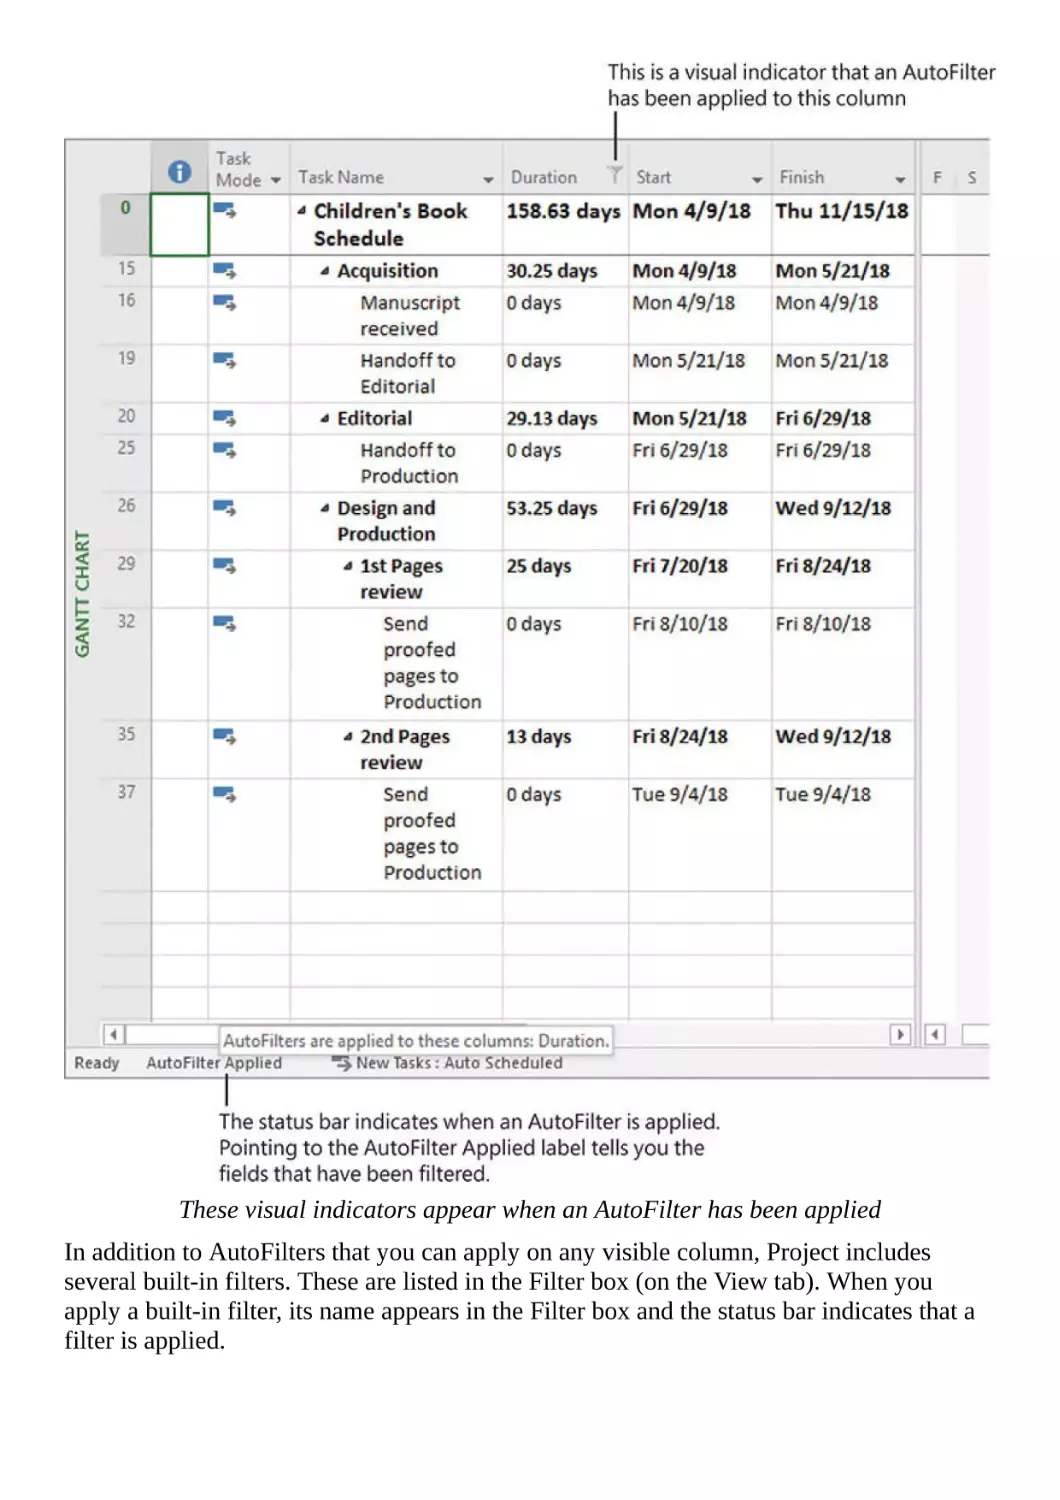
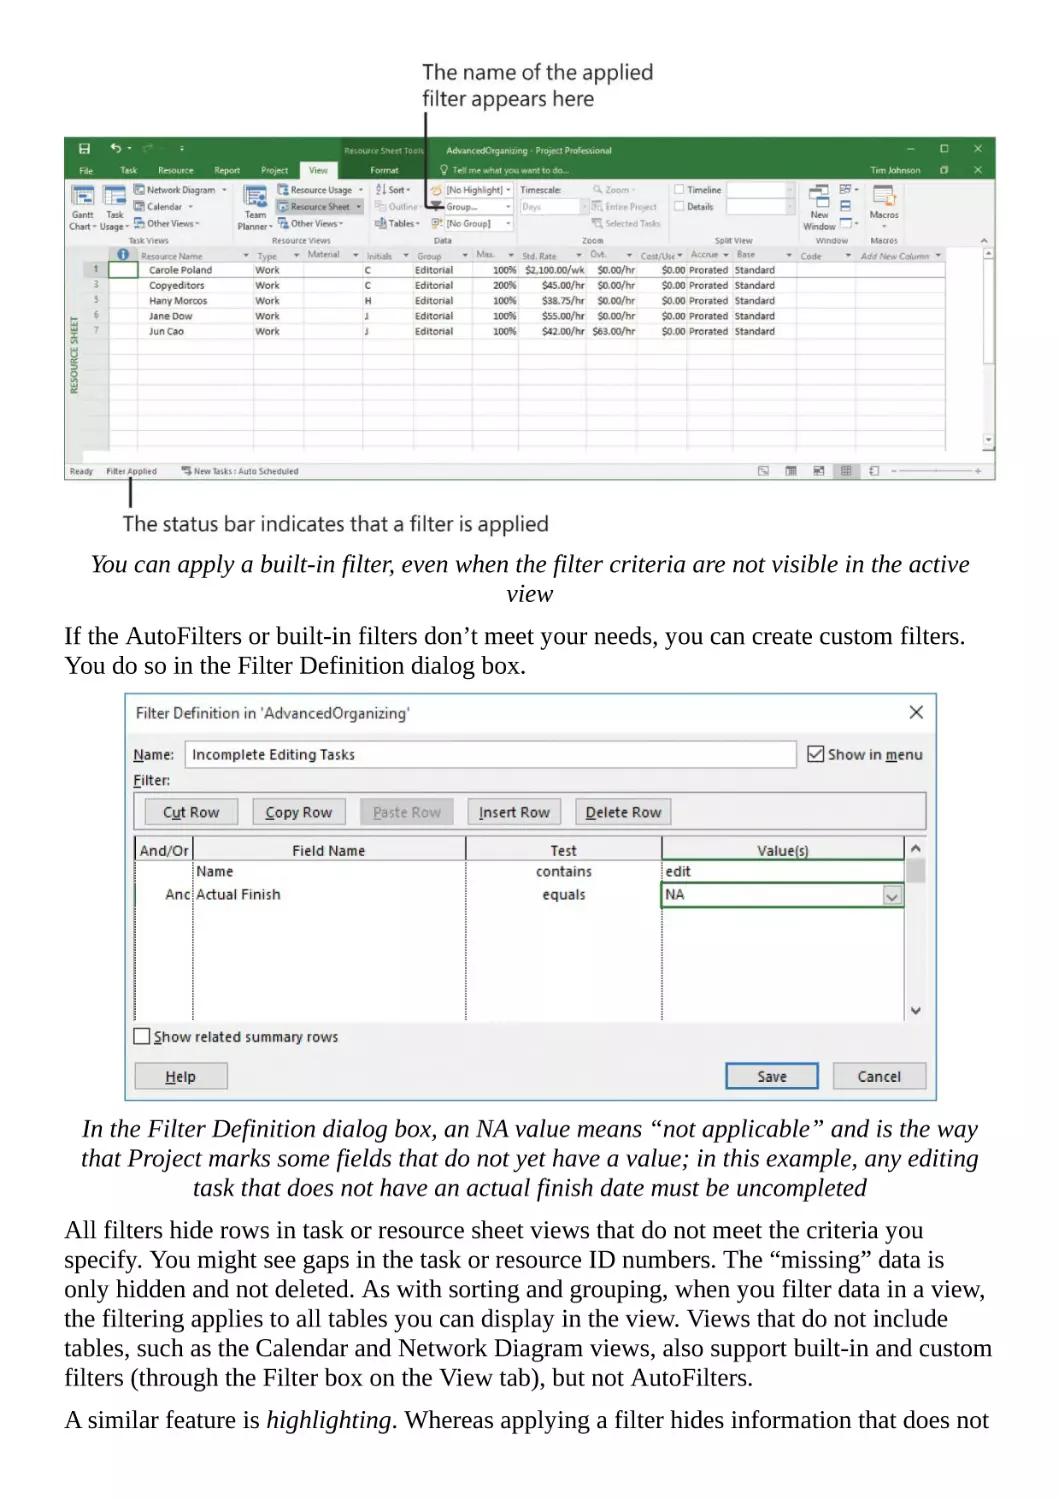
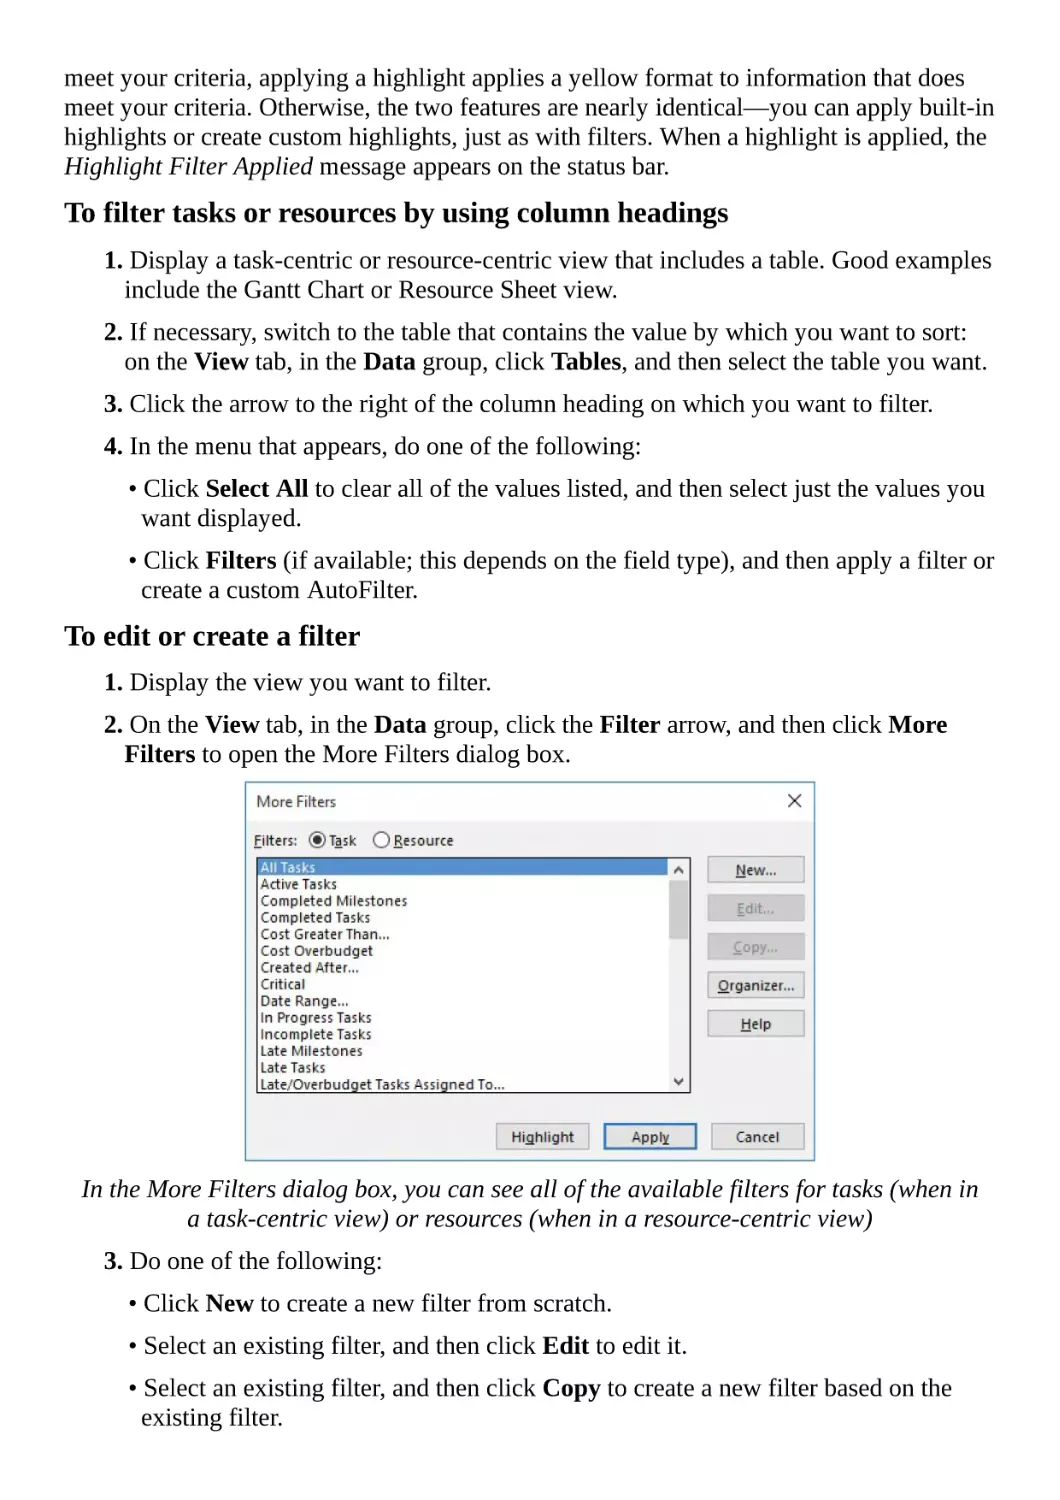
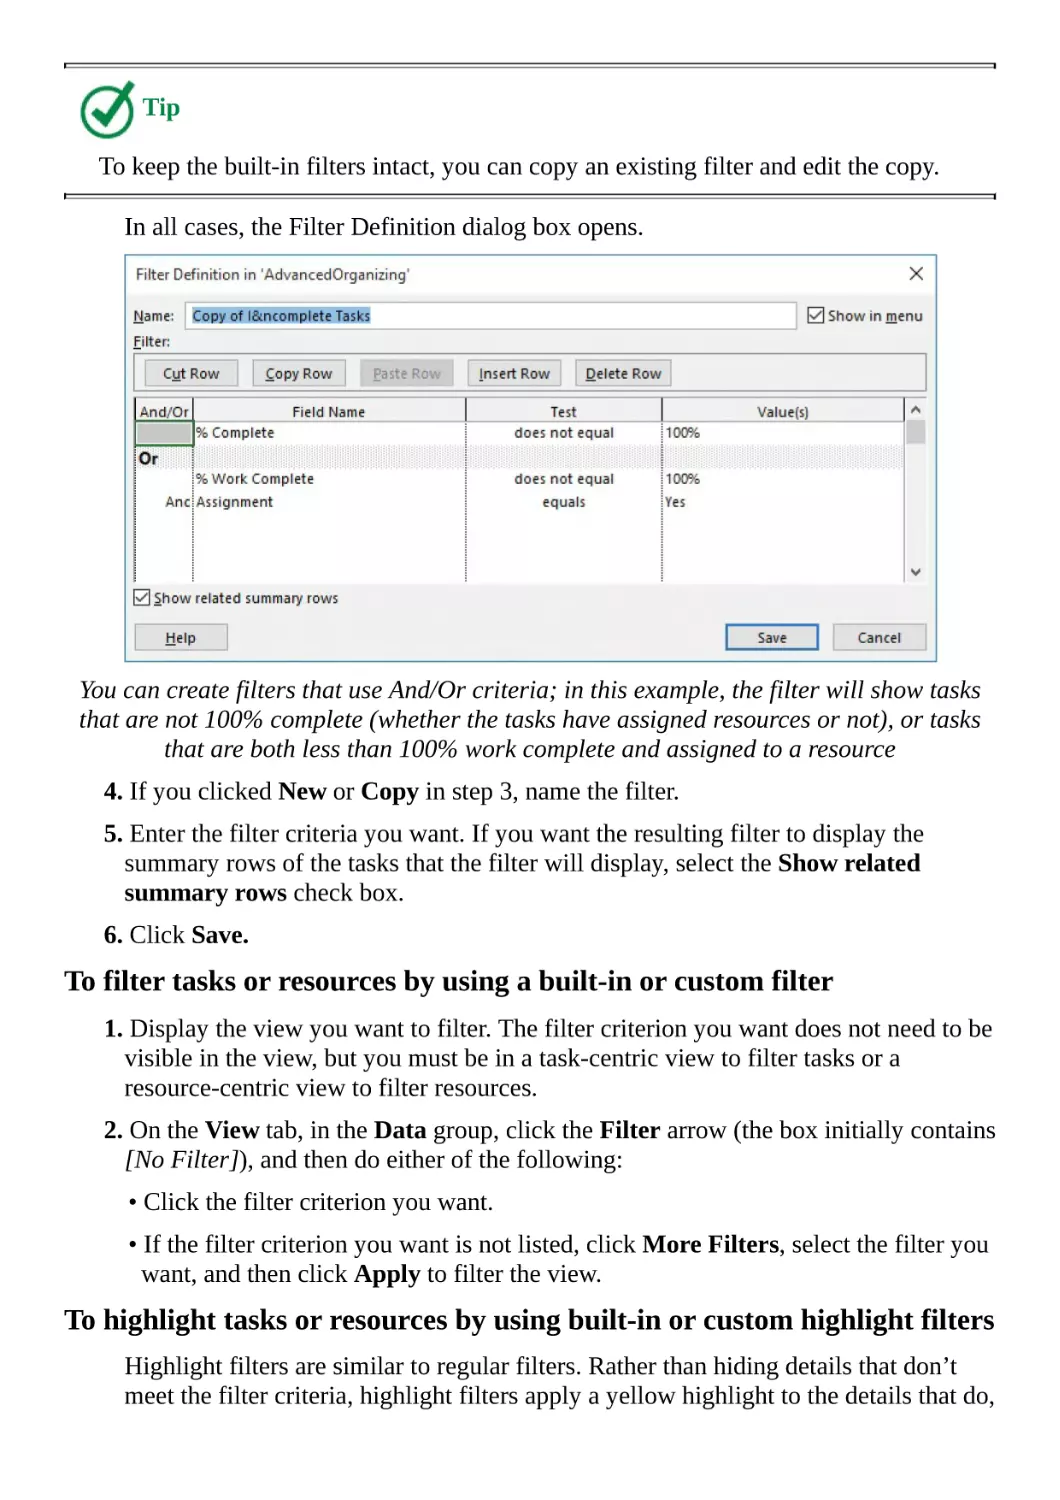
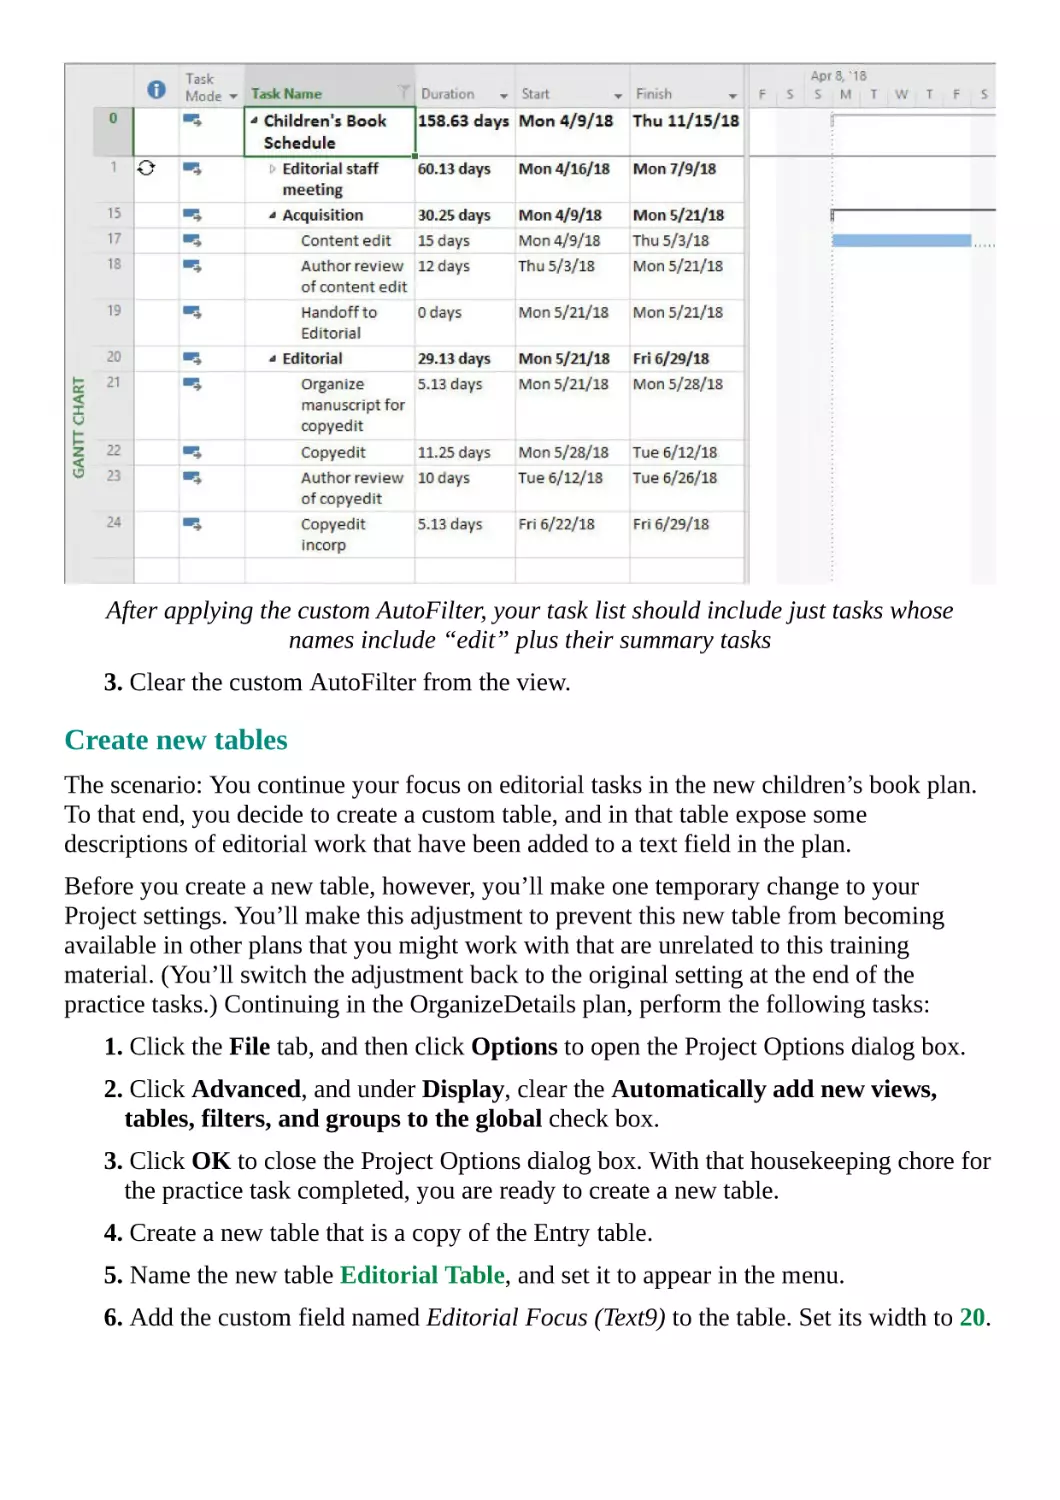
Filter plan details
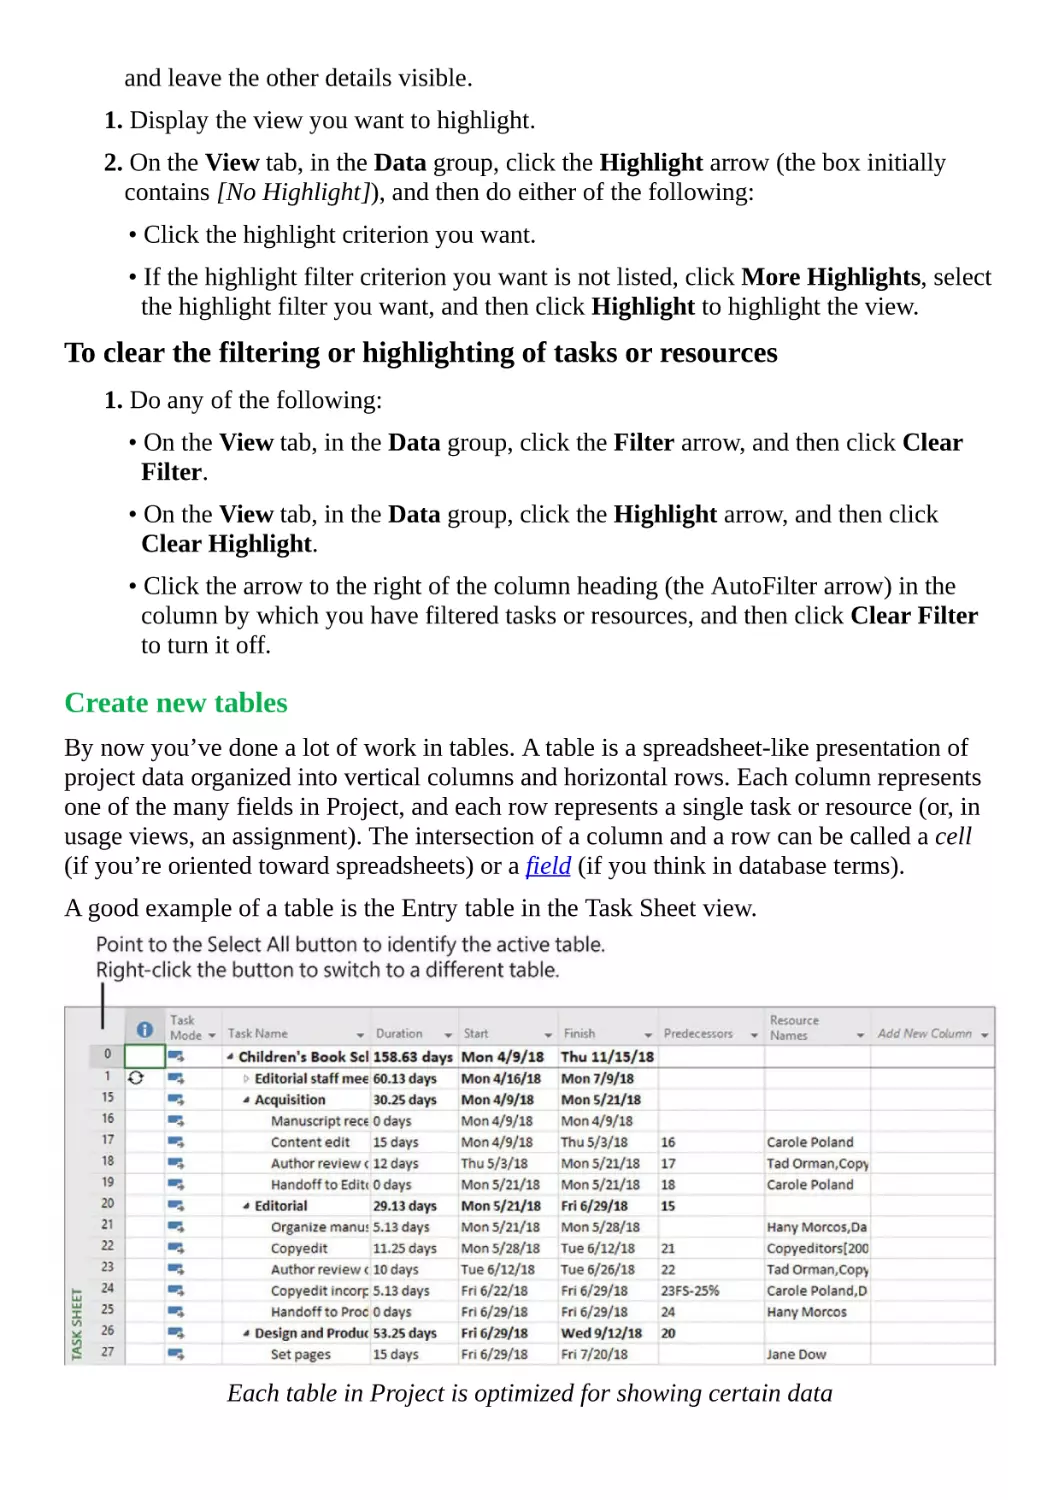
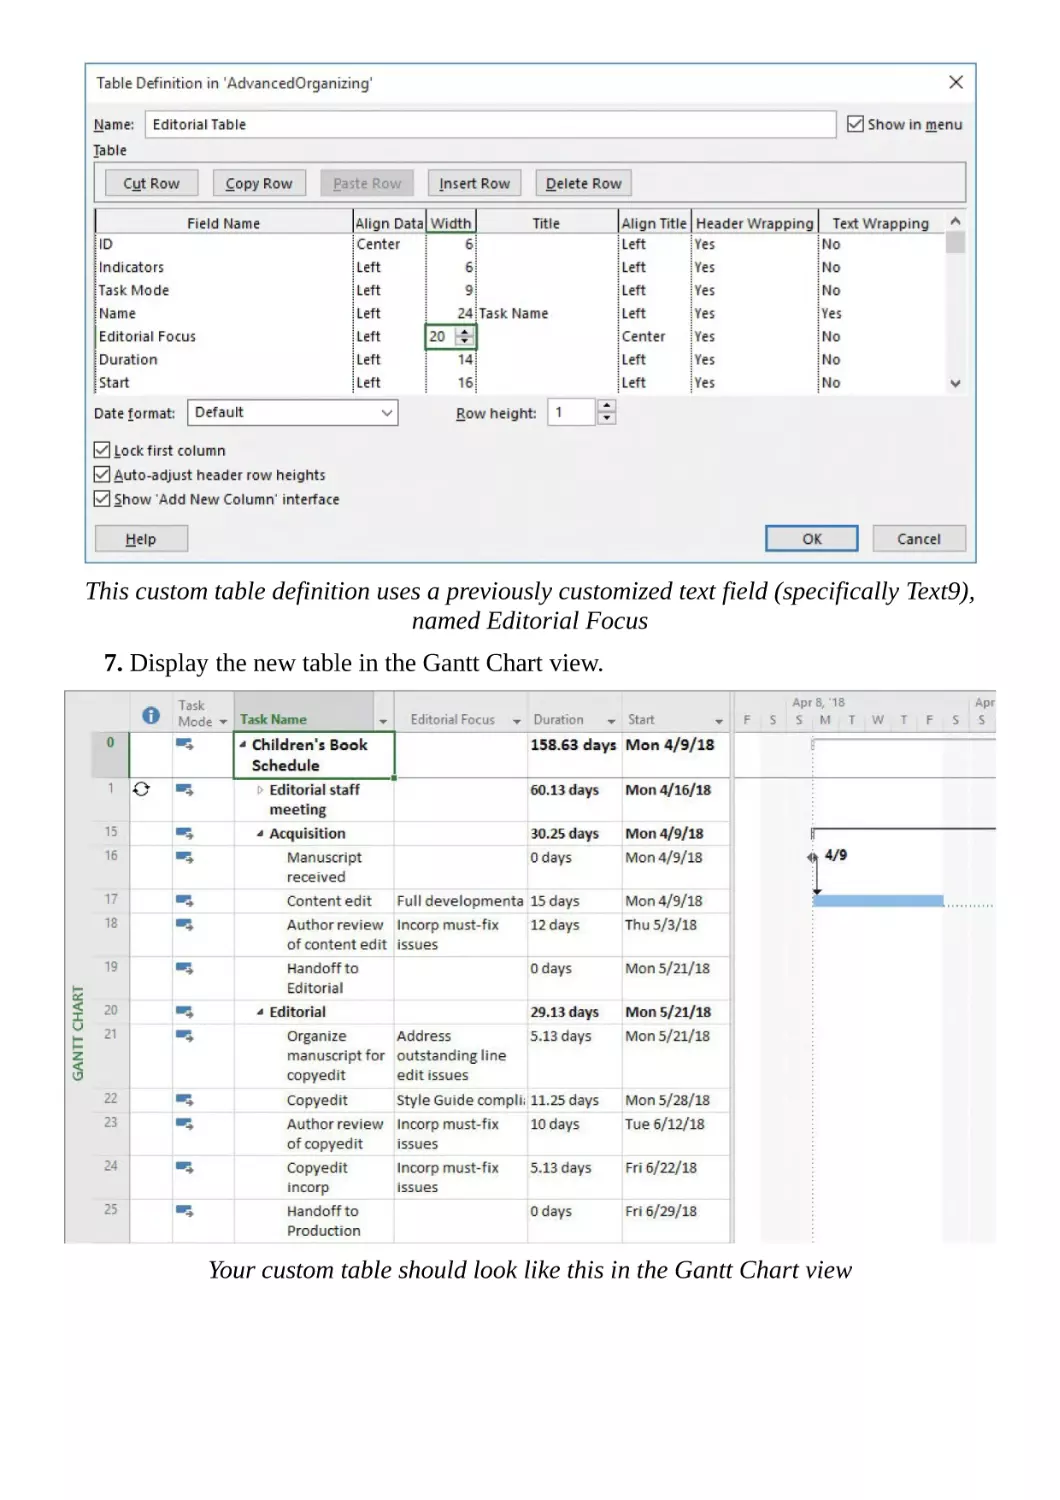
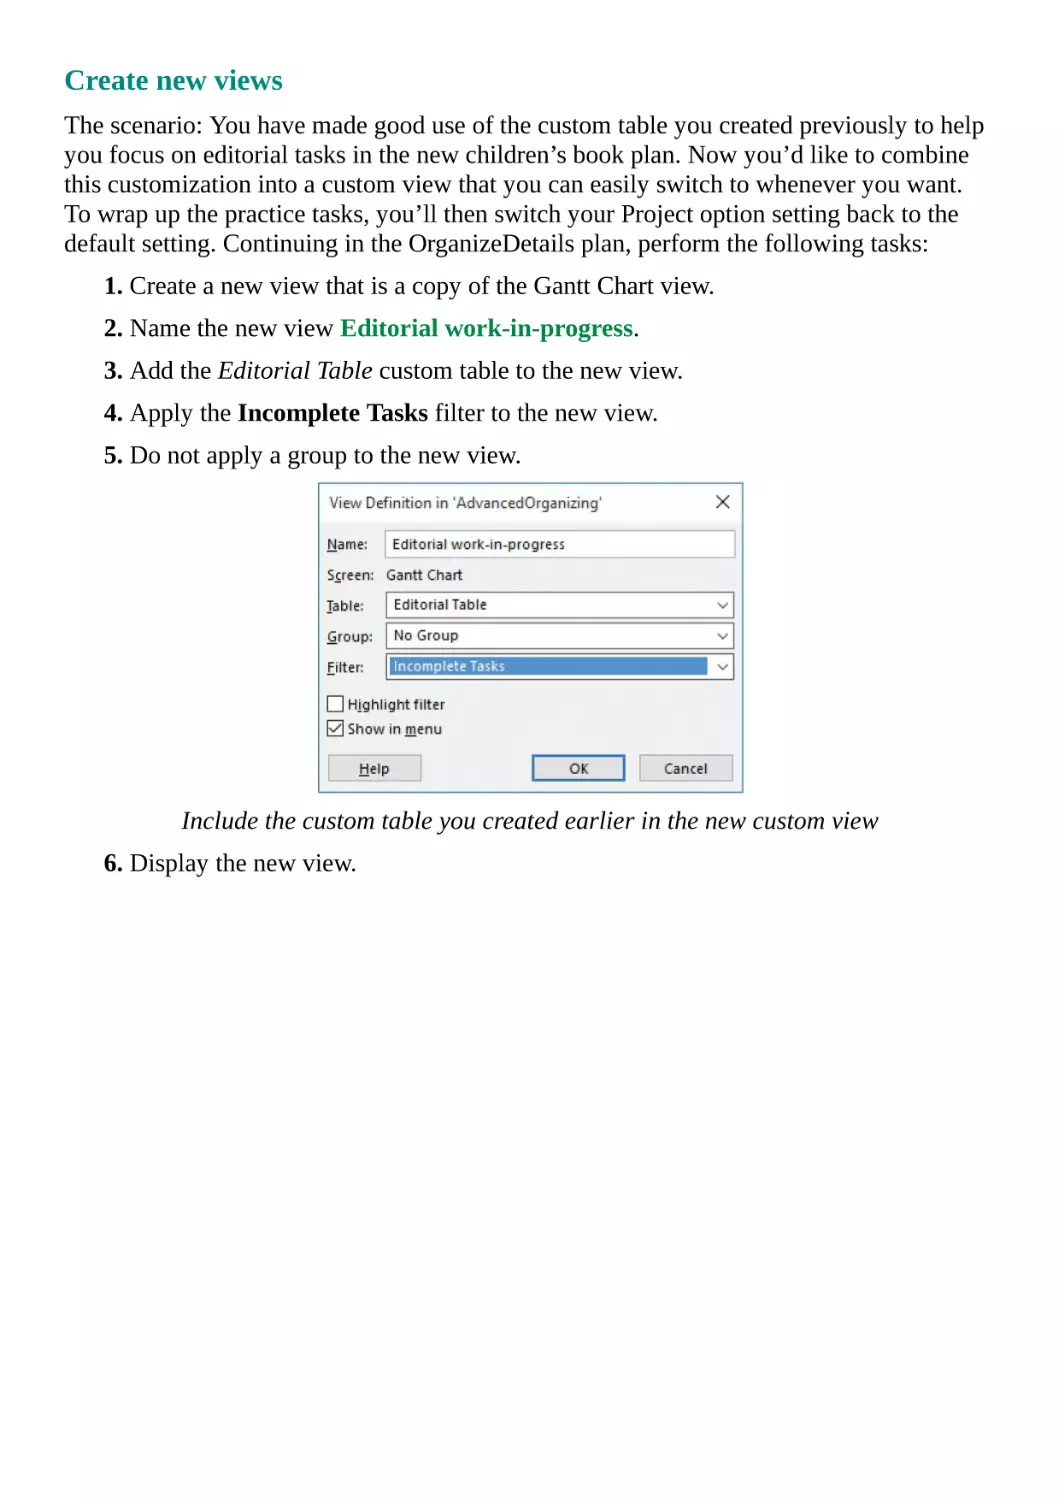
Create new tables
Sidebar: Create custom fields quickly
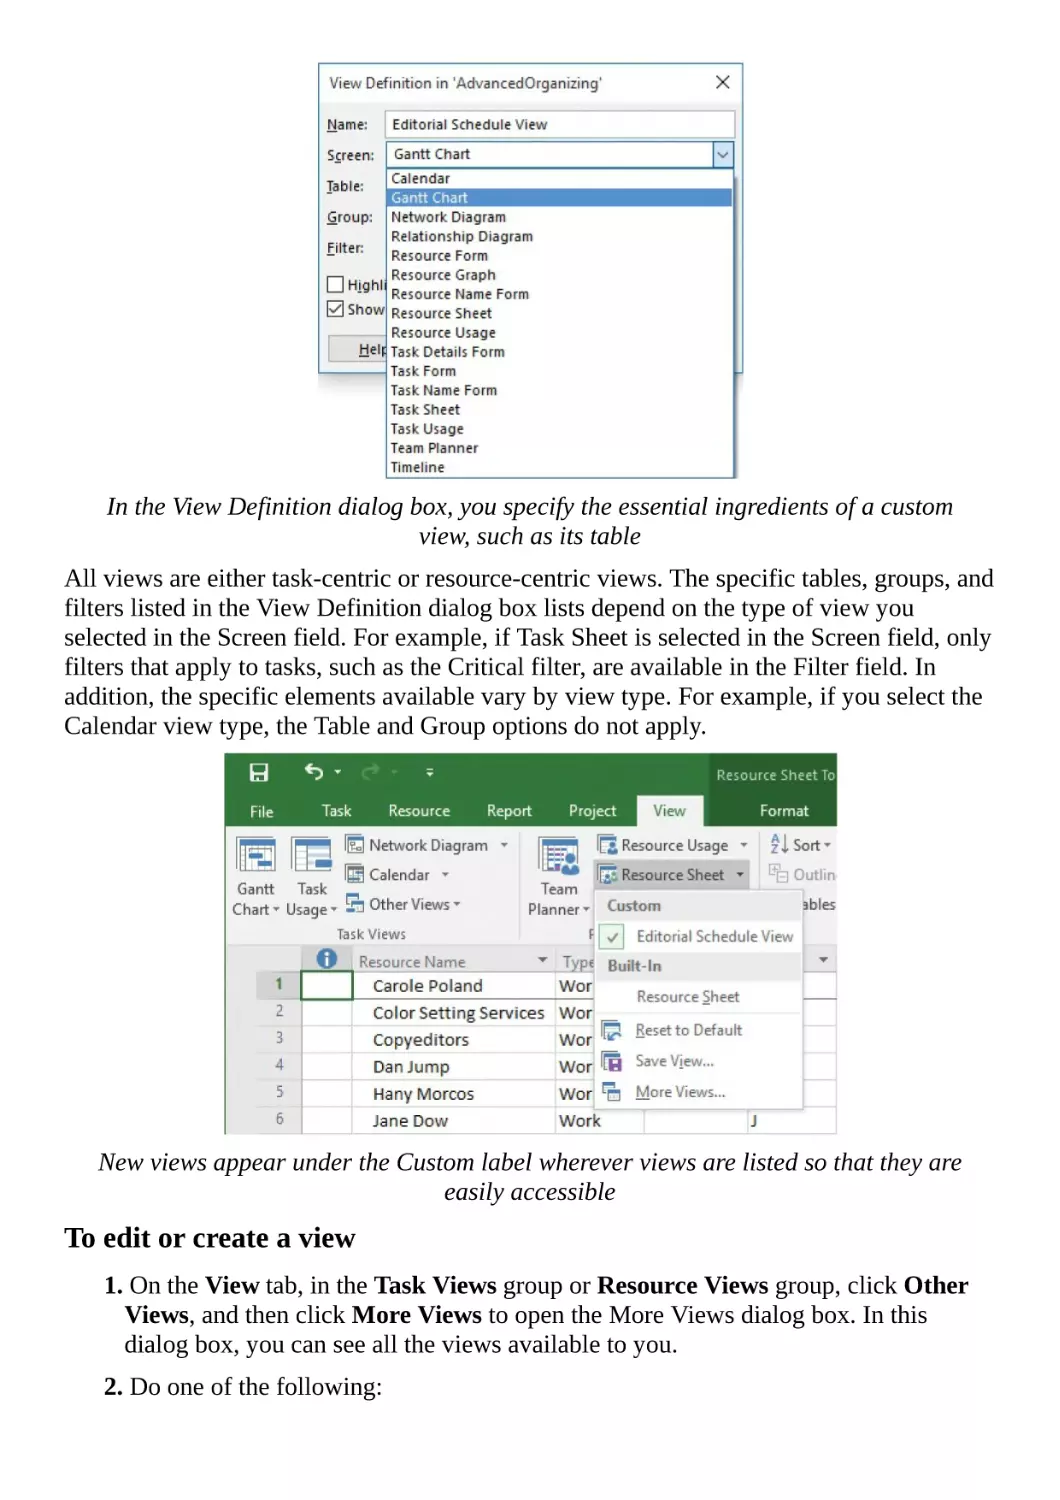
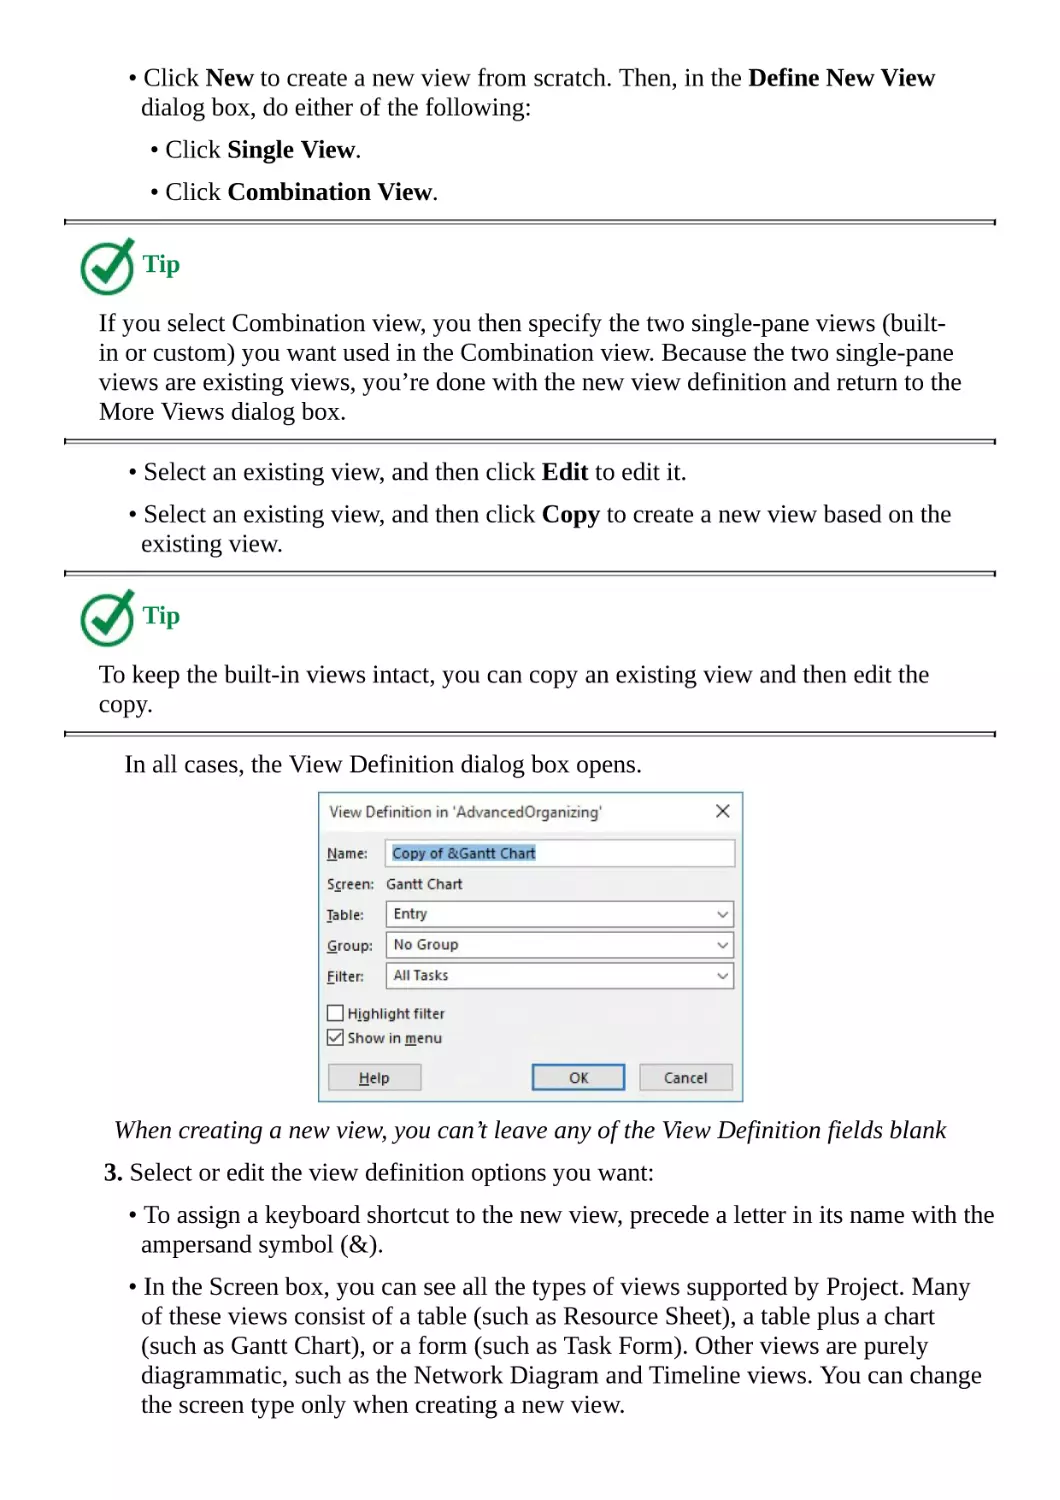
Create new views
Skills review
Practice tasks
14 Track progress: Detailed techniques
Update a baseline
Sidebar: Save interim plans
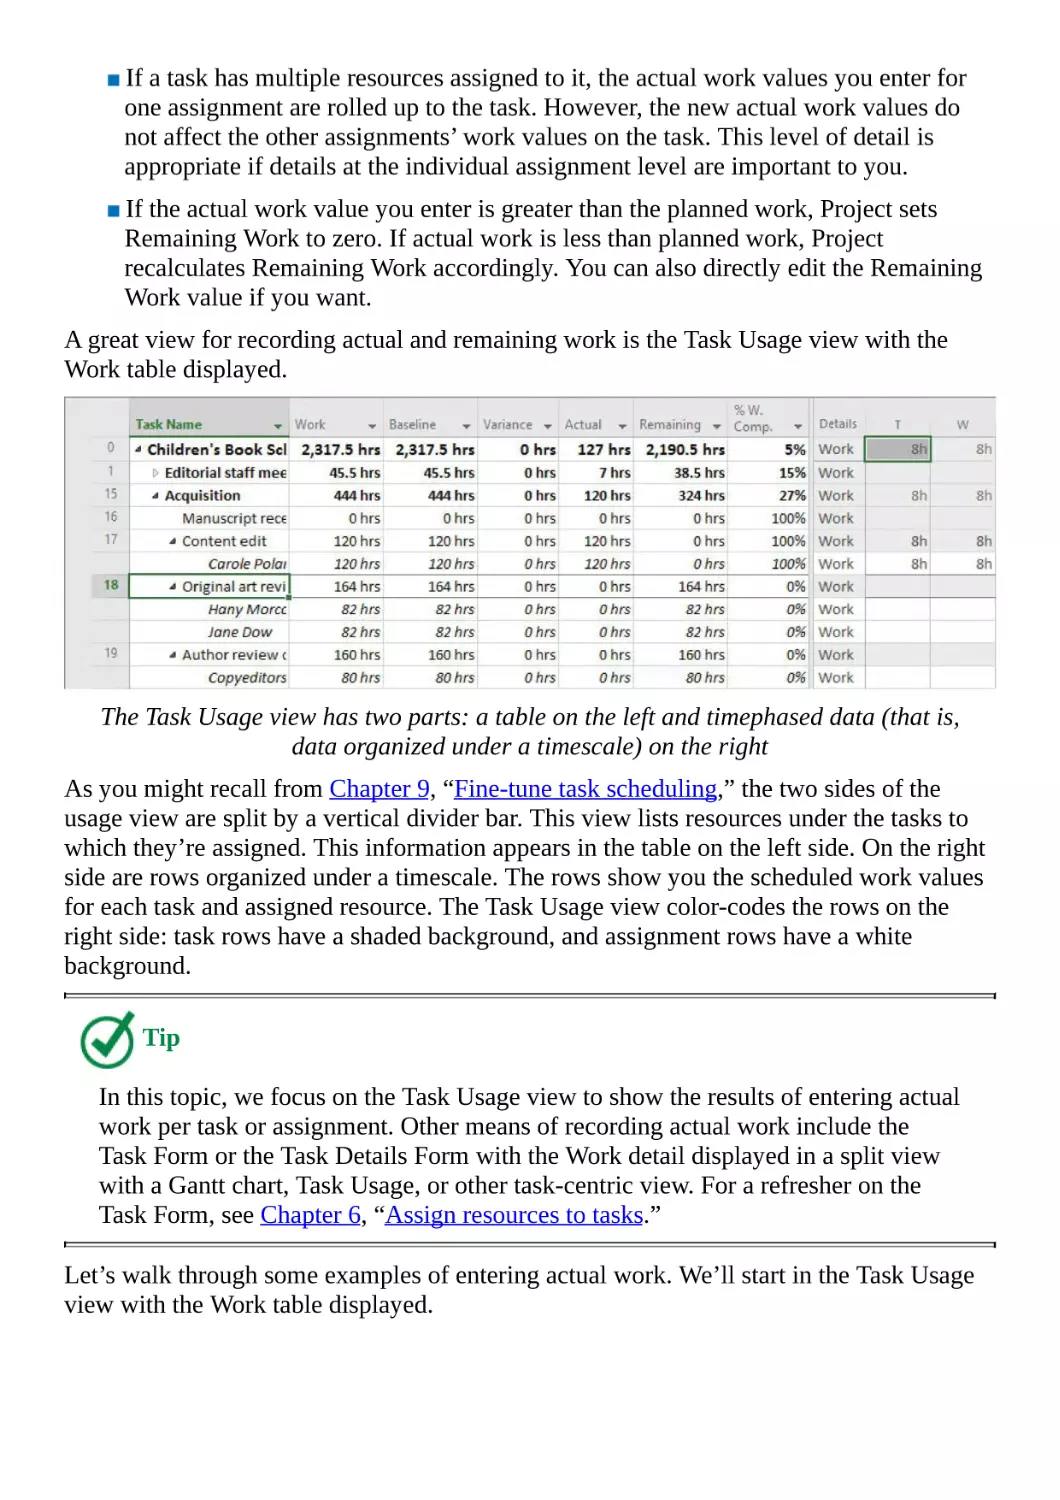
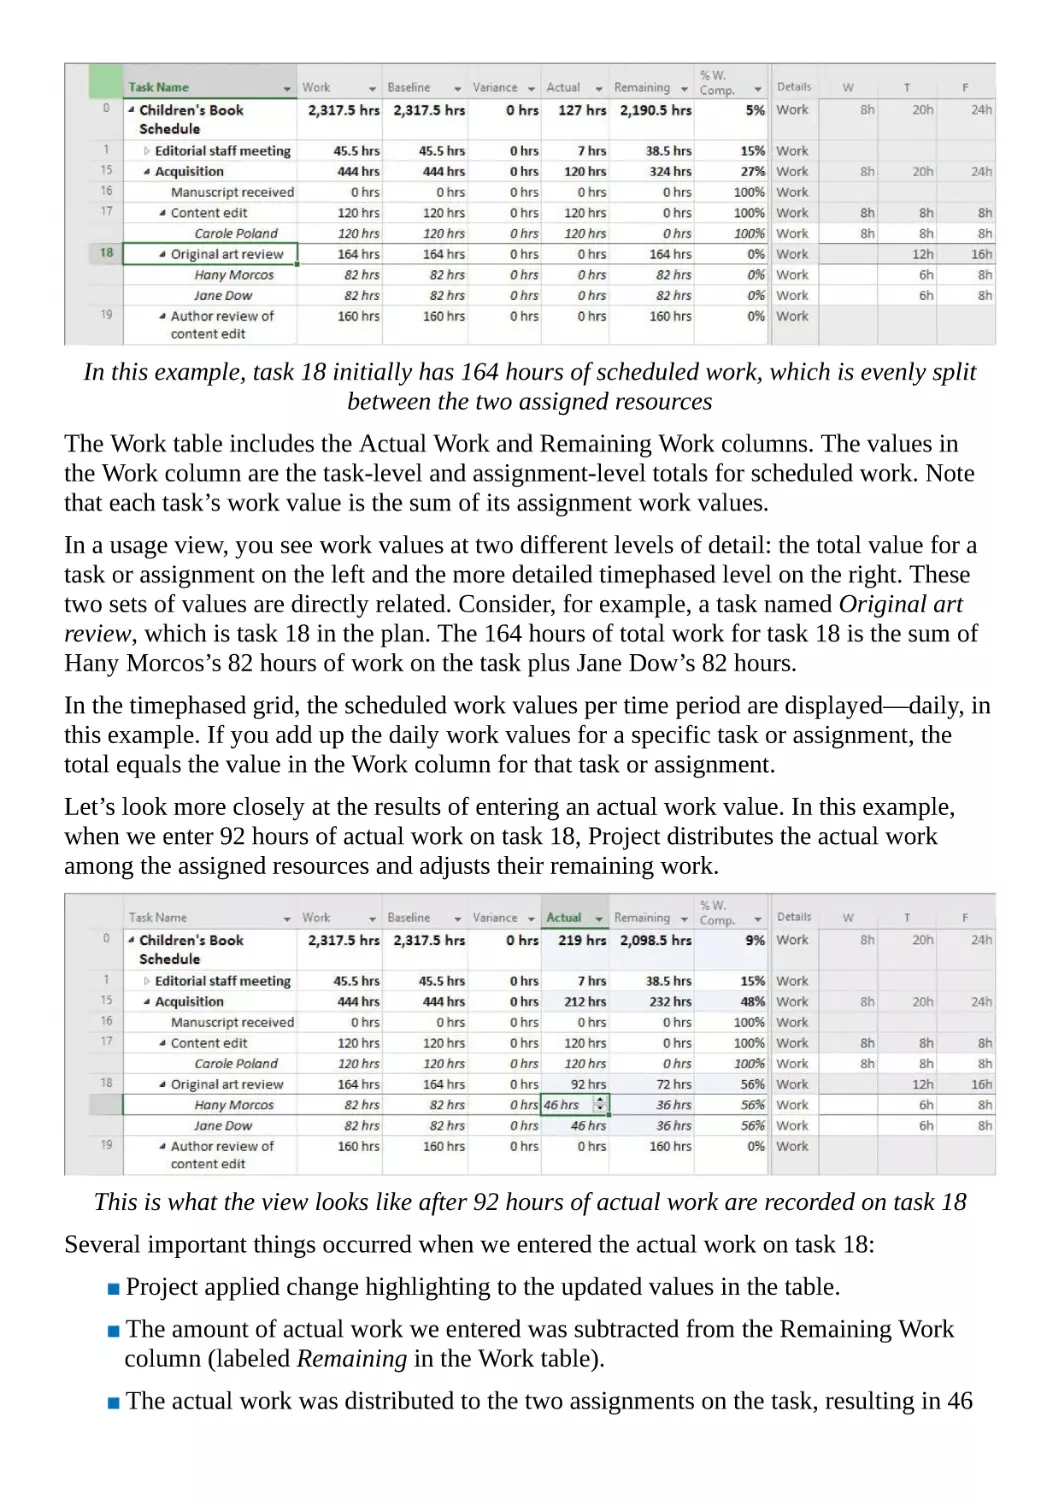
Track actual and remaining work for tasks and assignments
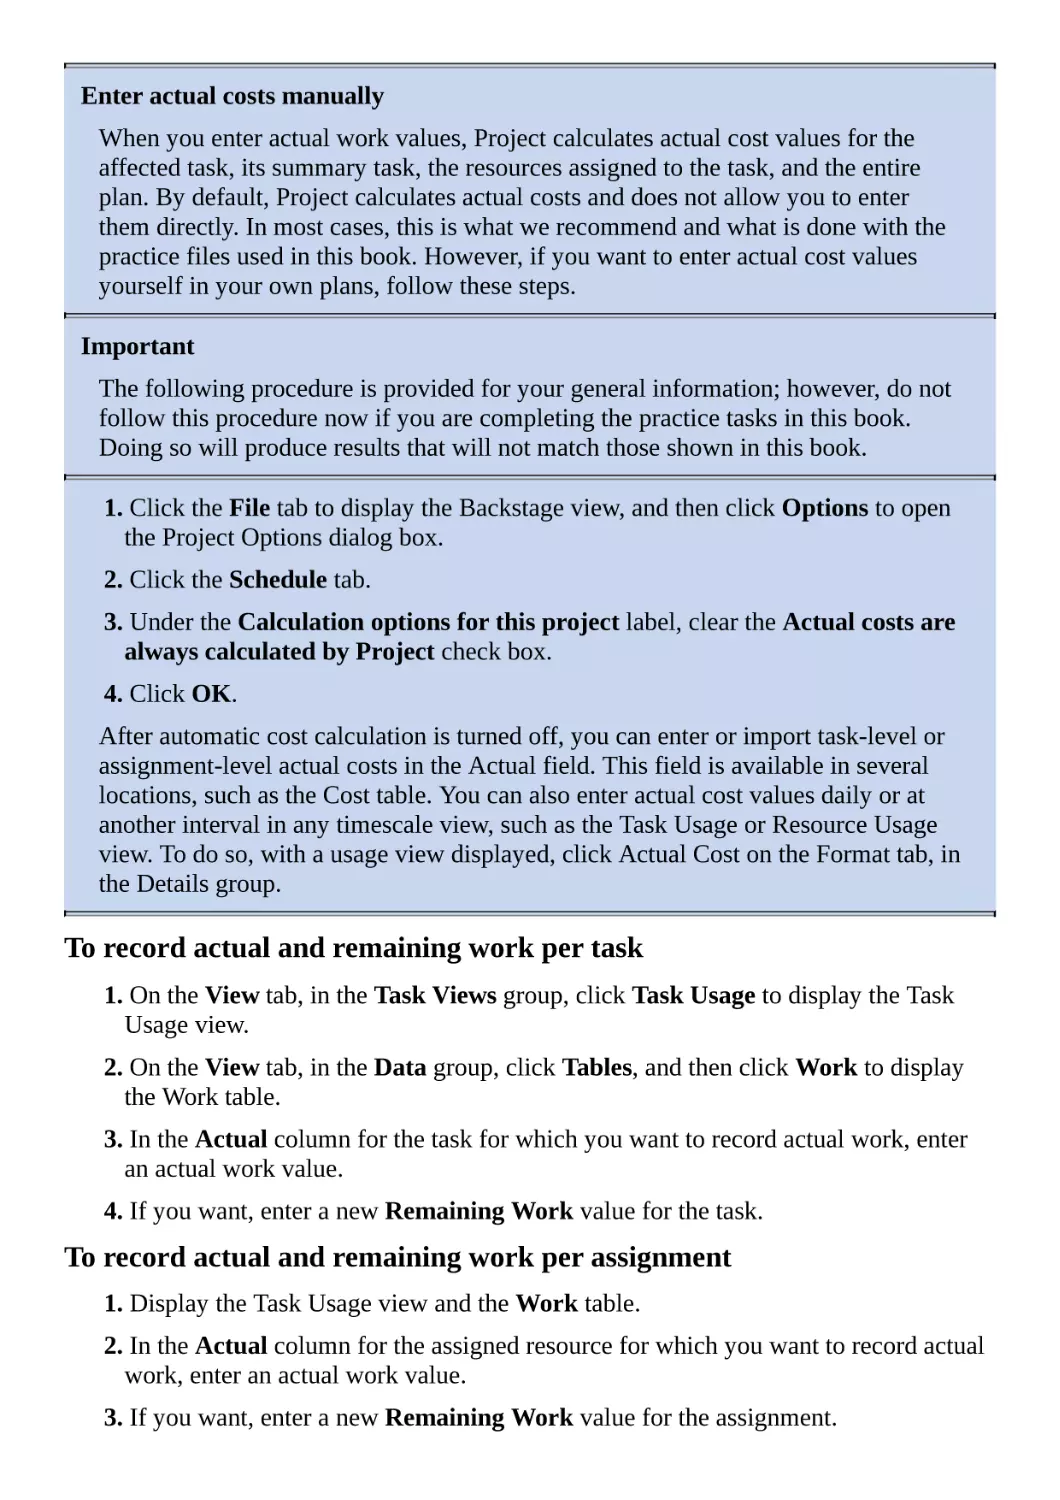
Sidebar: Enter actual costs manually
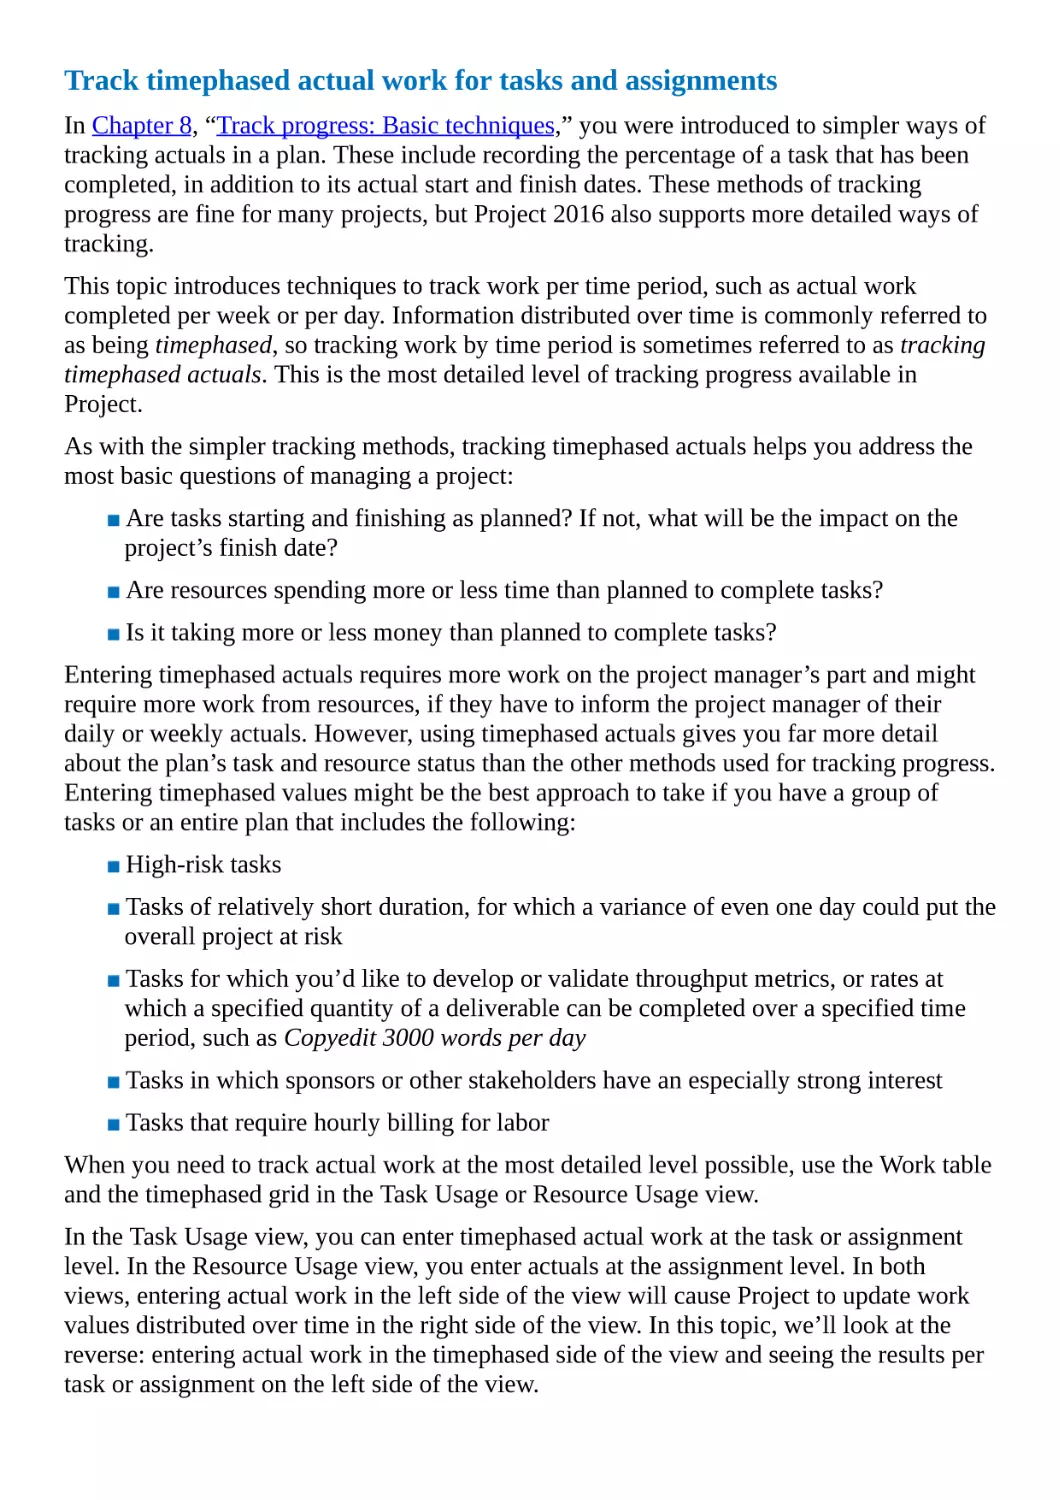
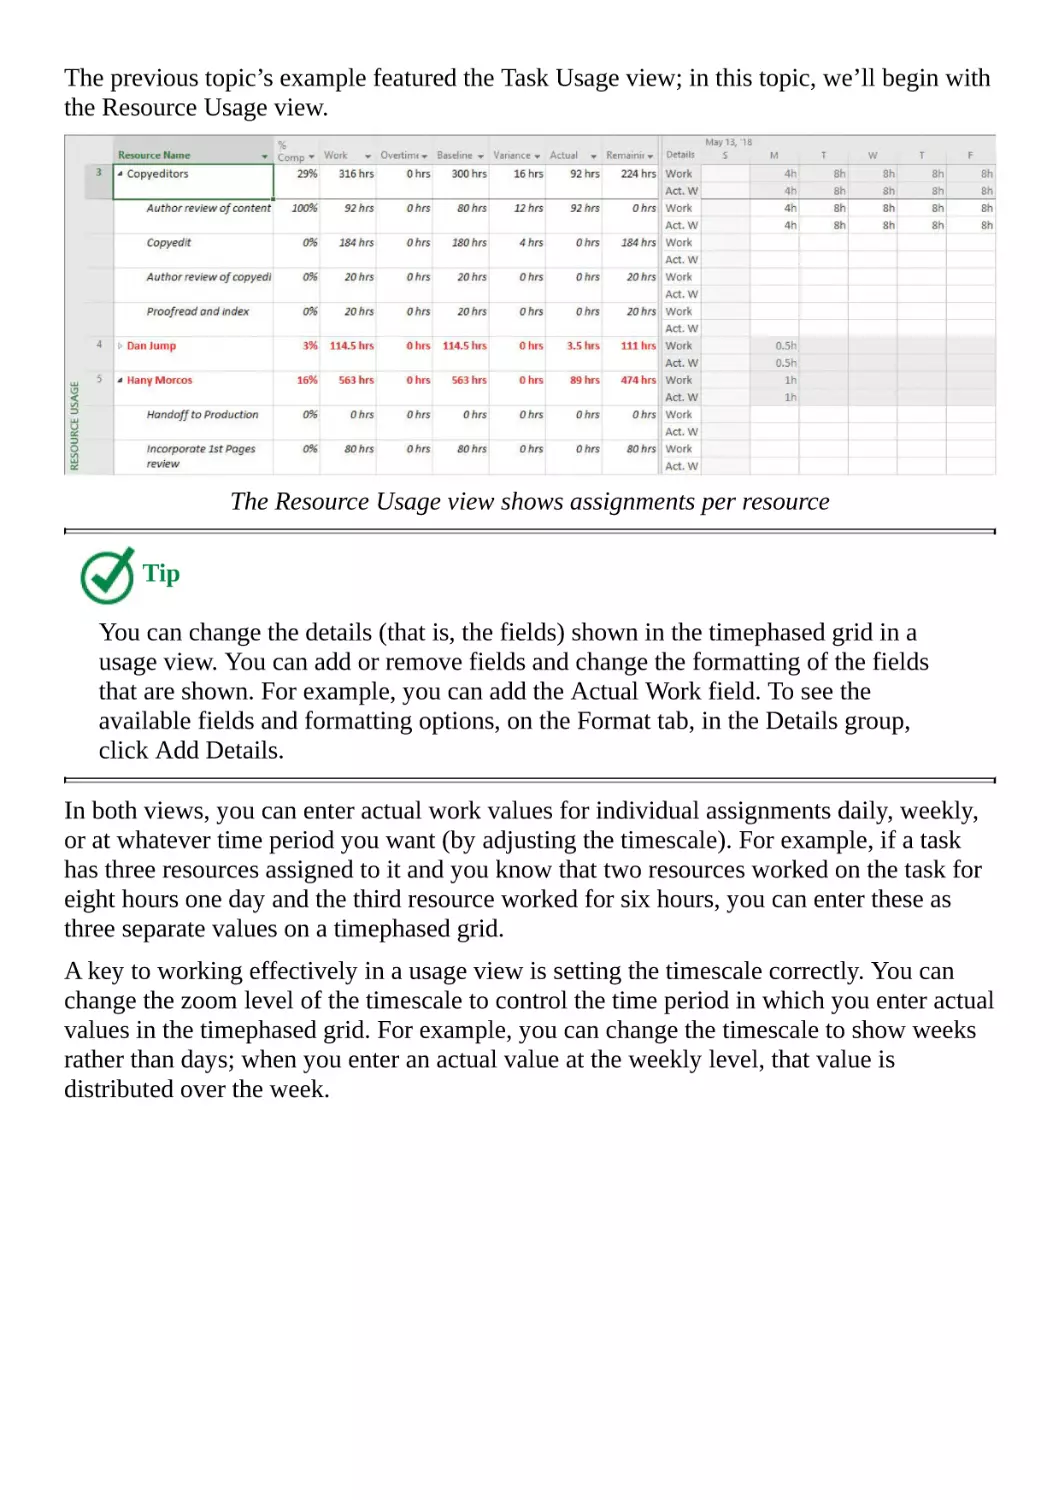
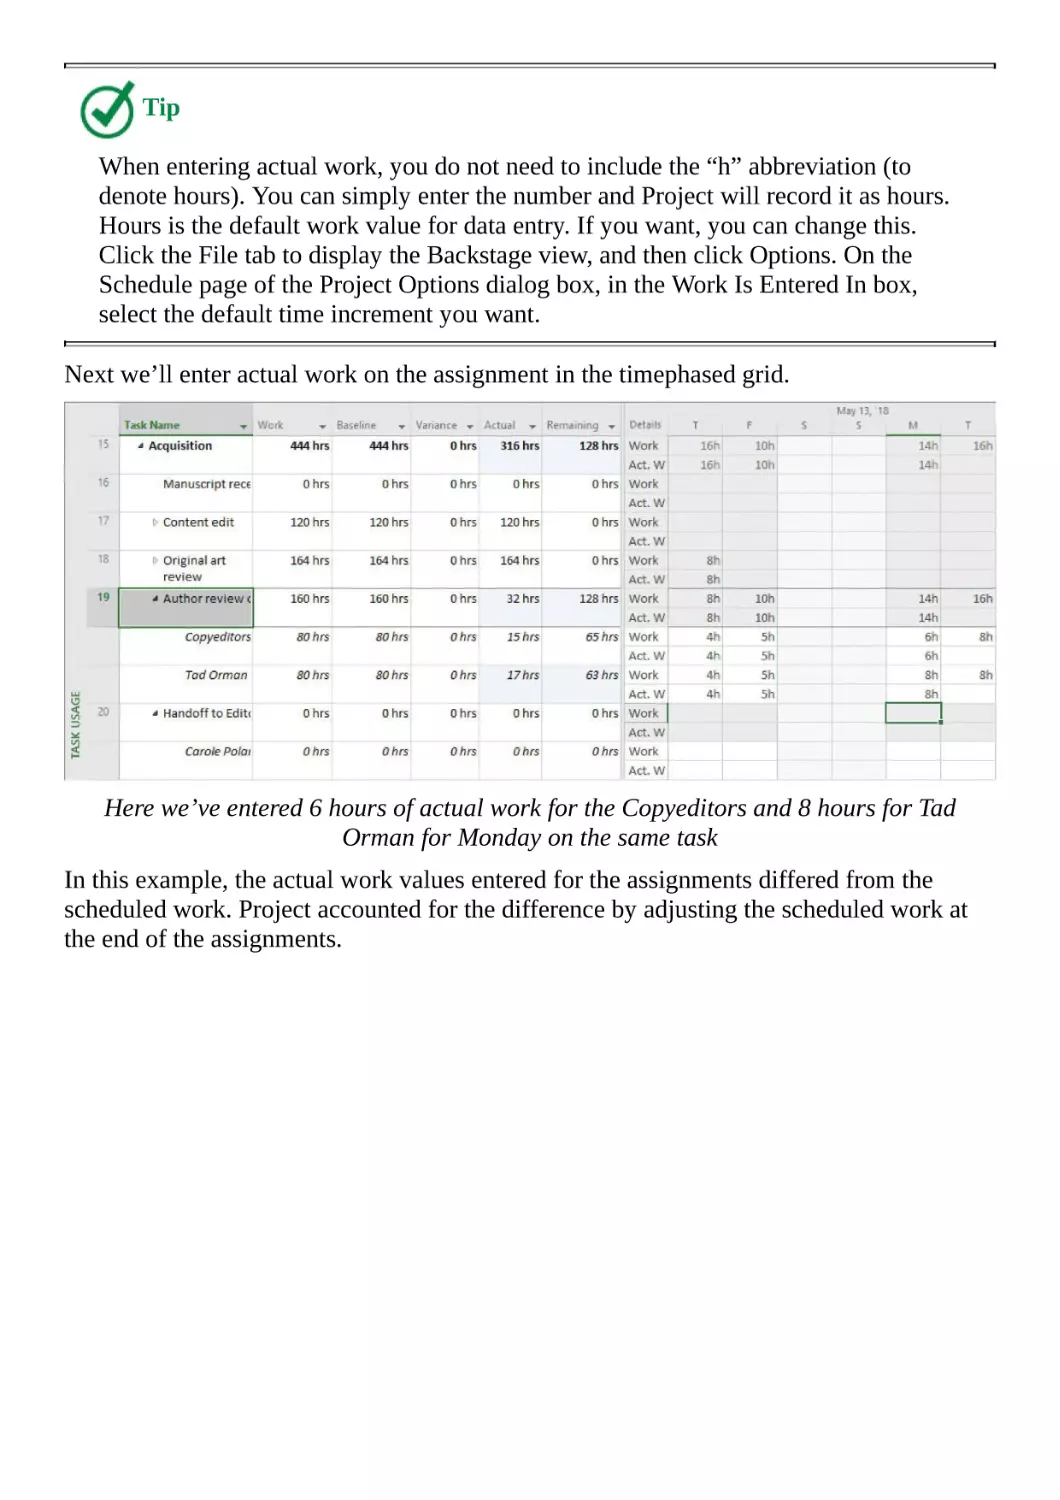
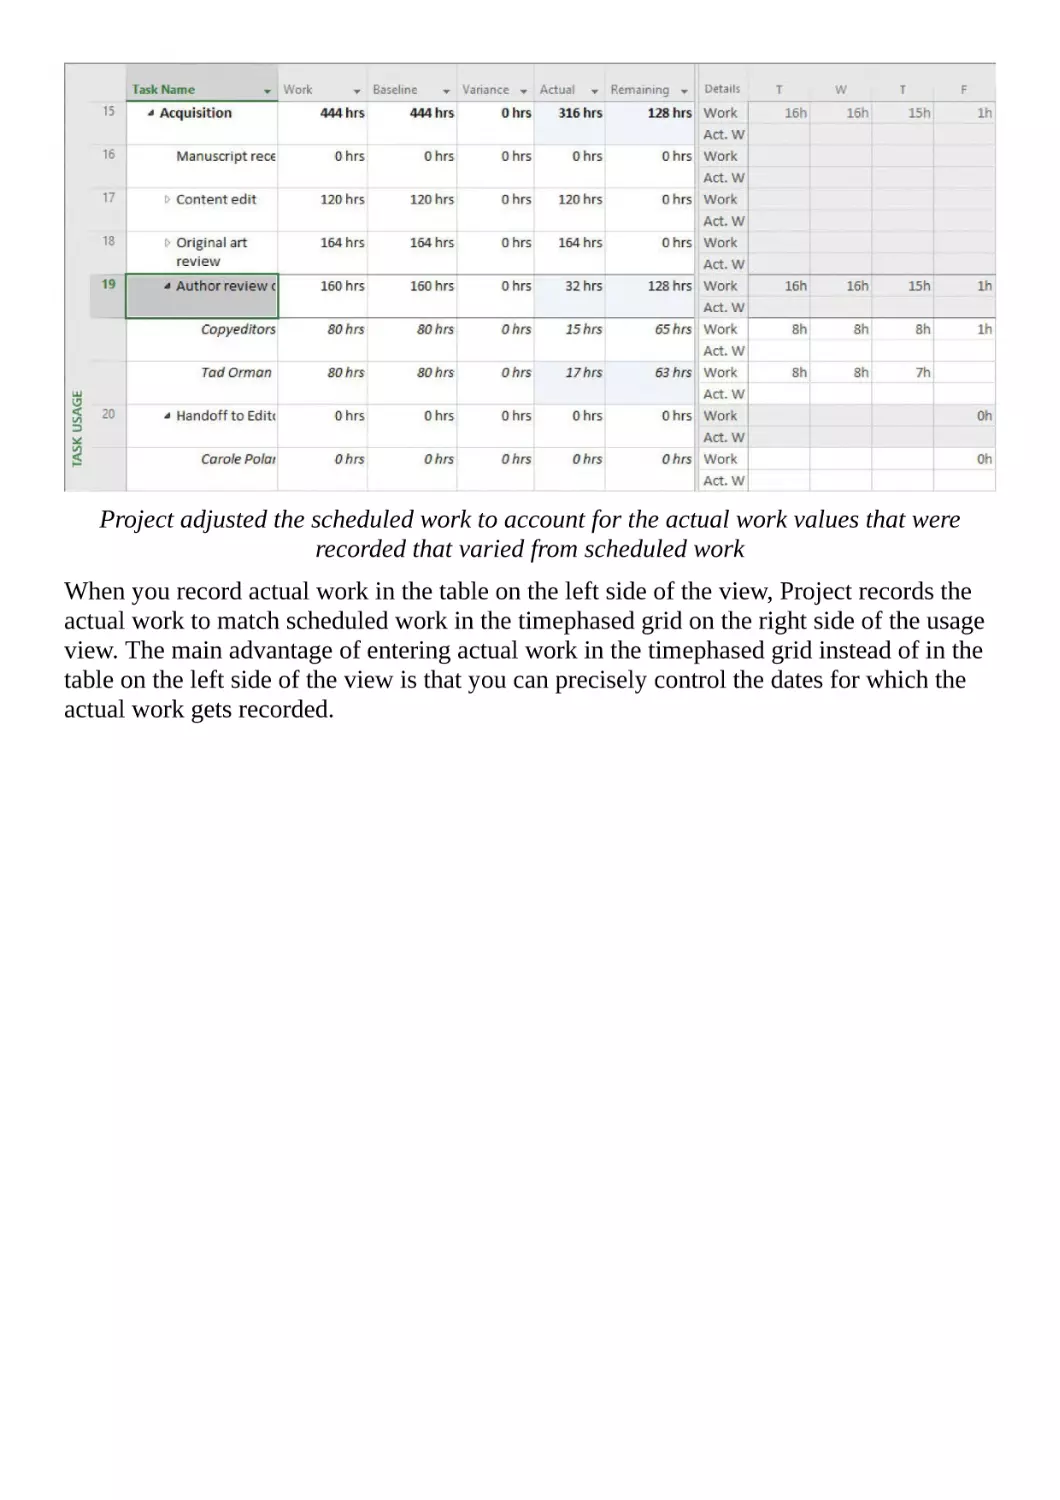
Track timephased actual work for tasks and assignments
Sidebar: Project management focus: Collect actuals from resources
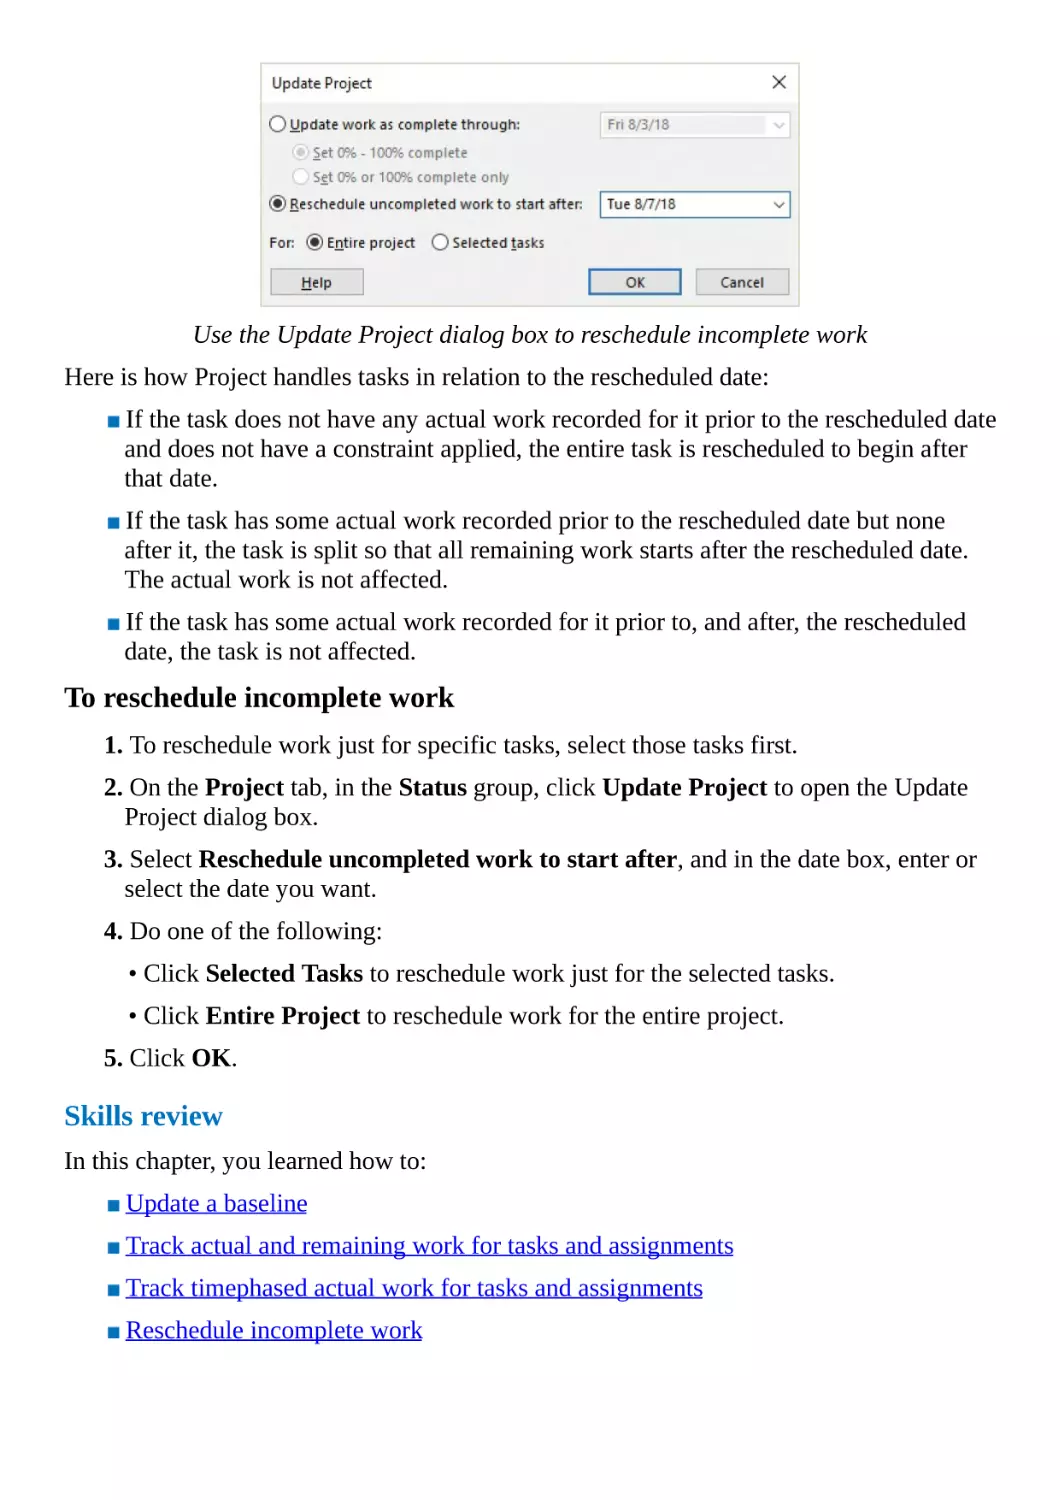
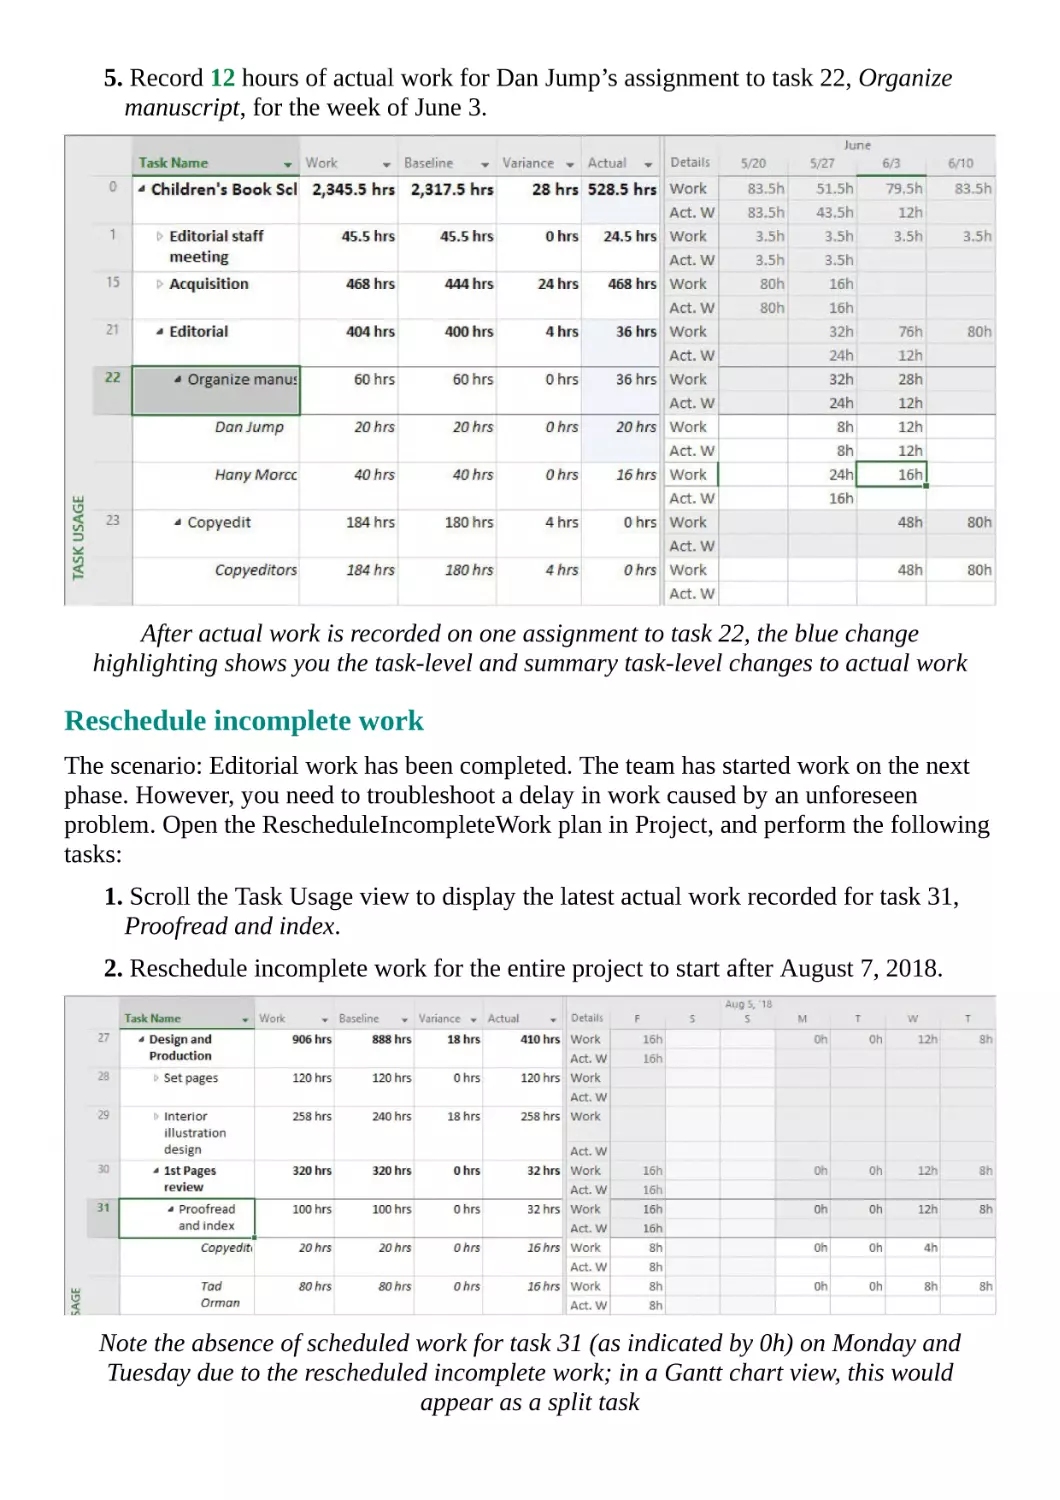
Reschedule incomplete work
Skills review
Practice tasks
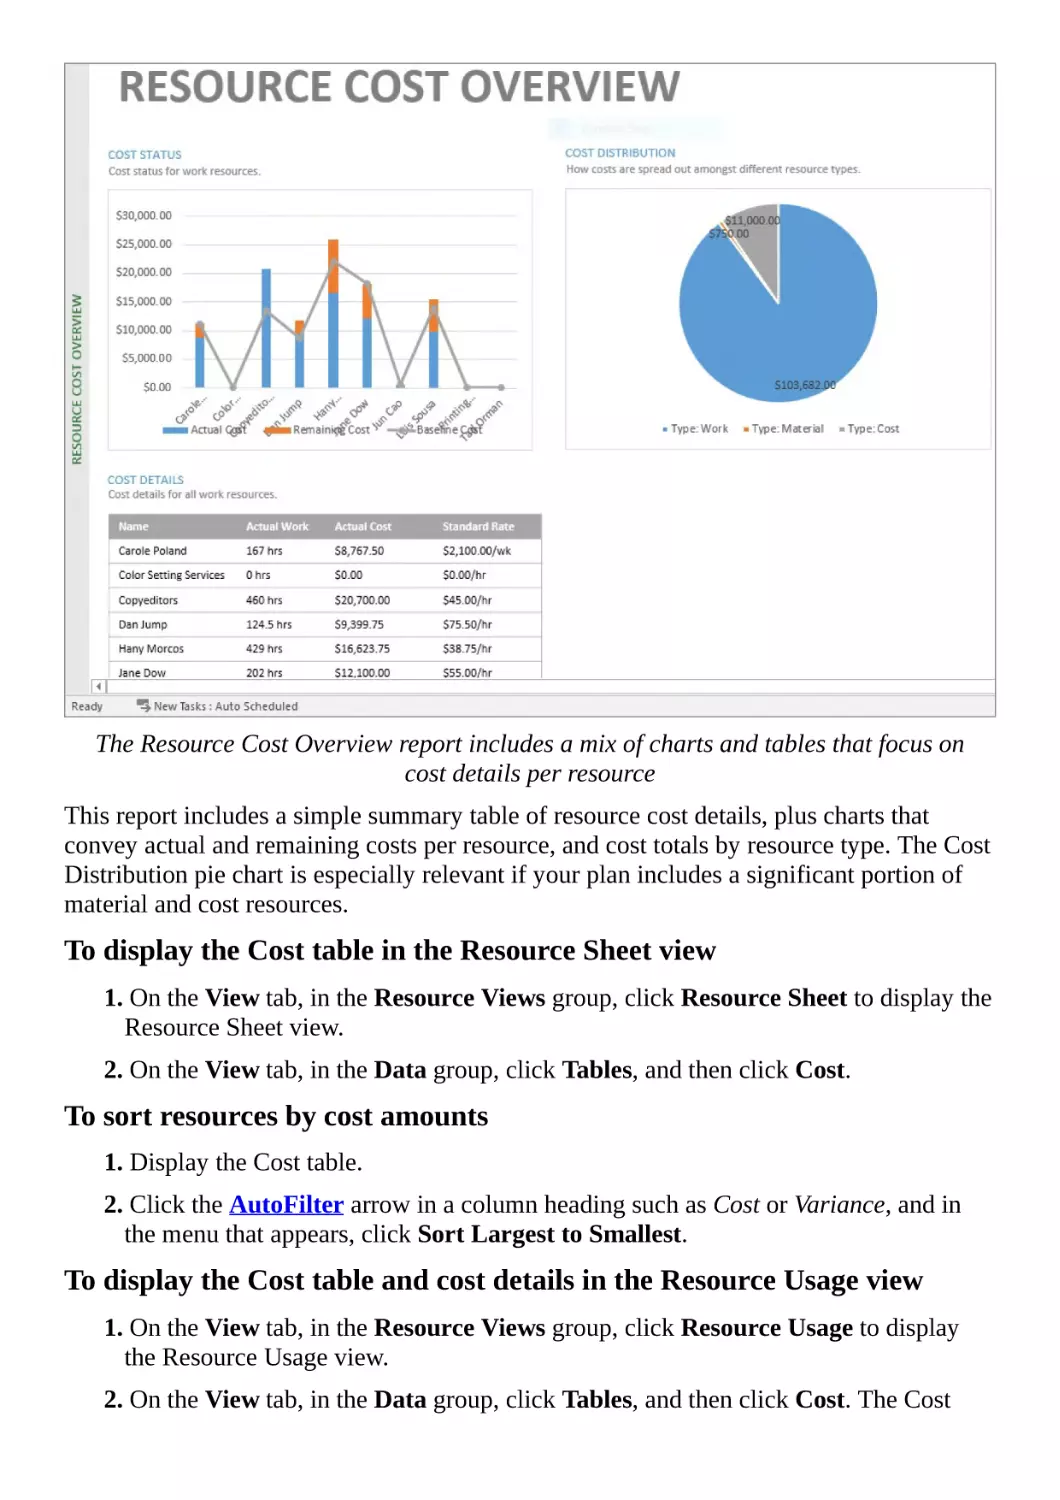
15 View and report project status
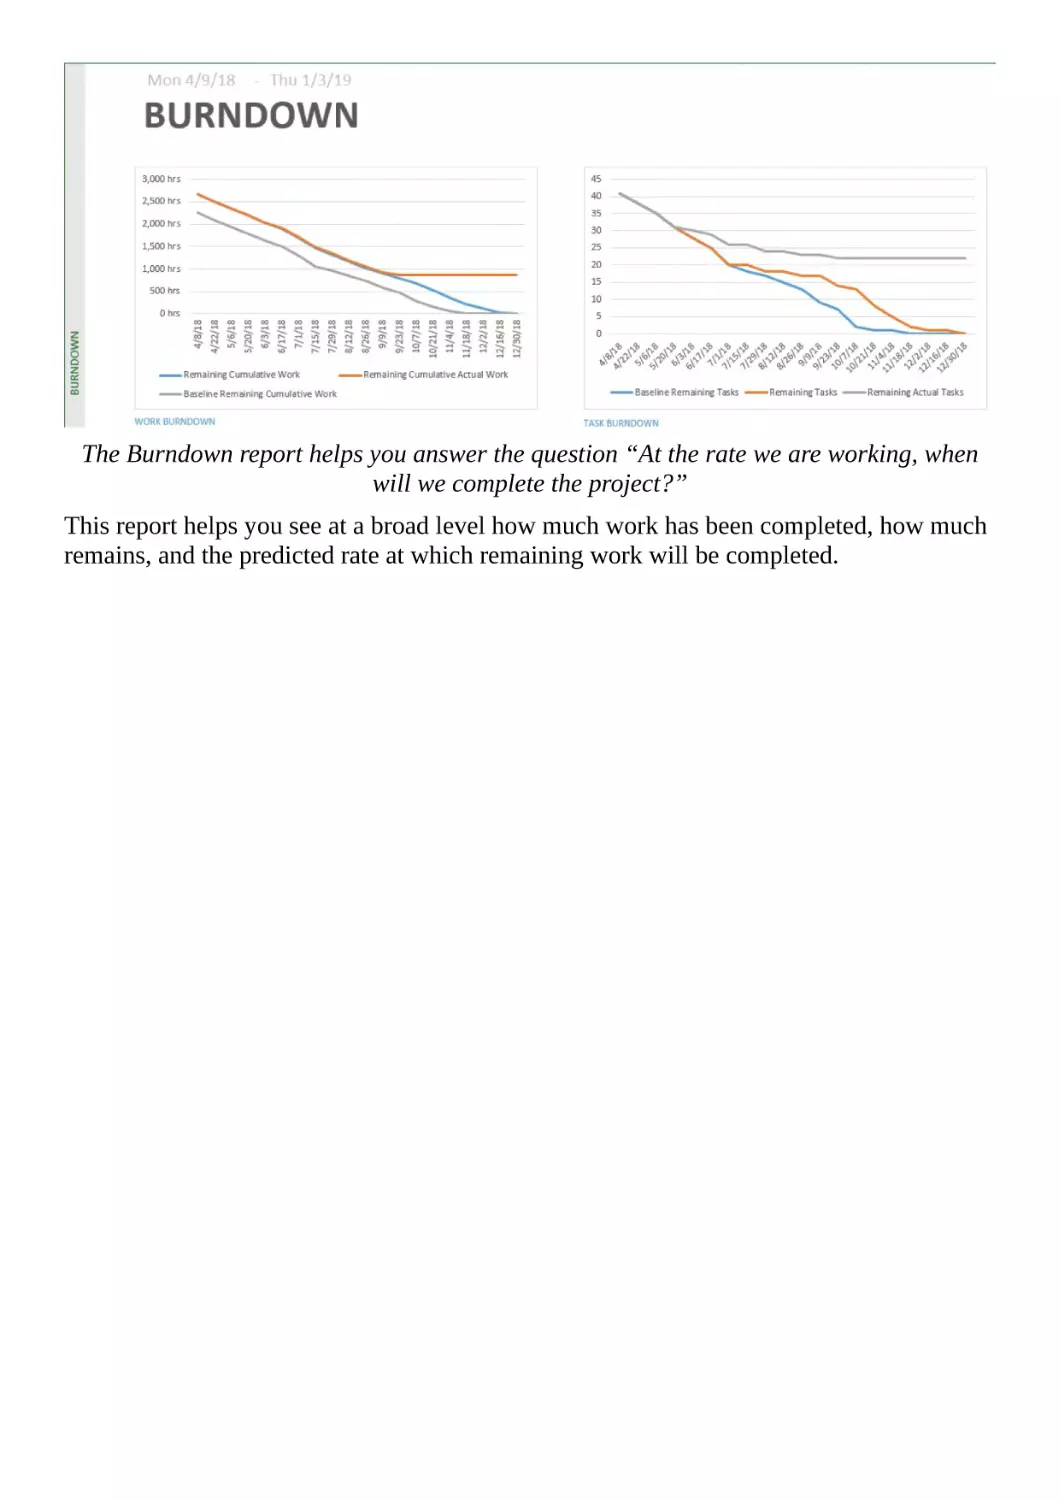
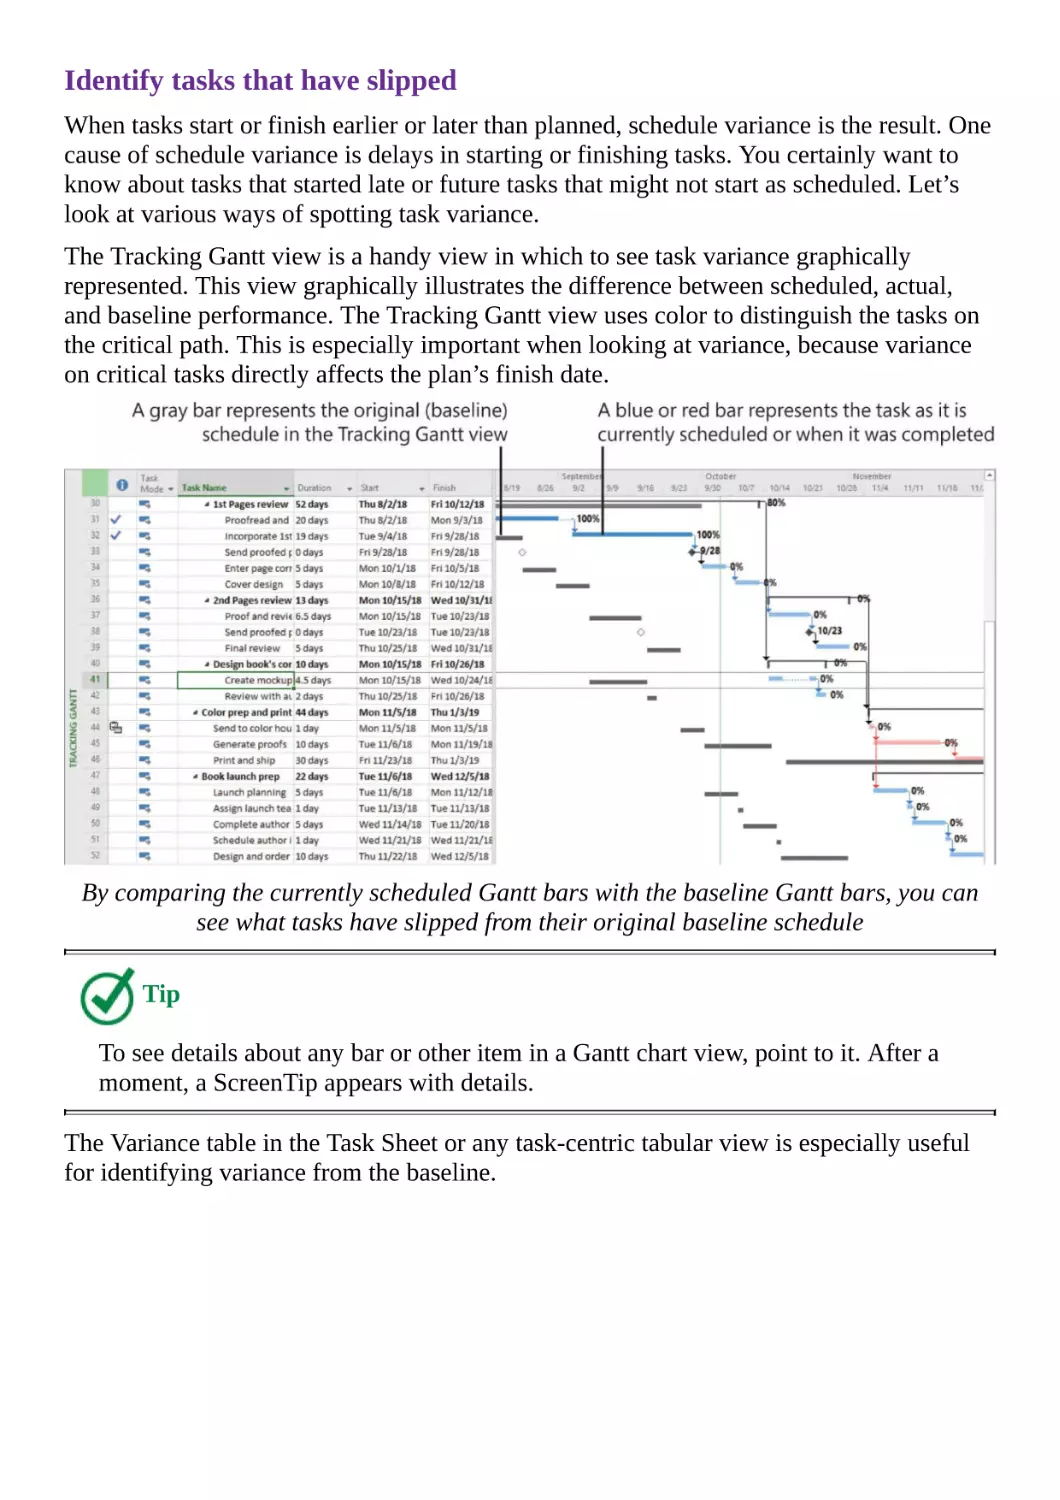
Examine a plan’s variance
Sidebar: Project management focus: Get the word out
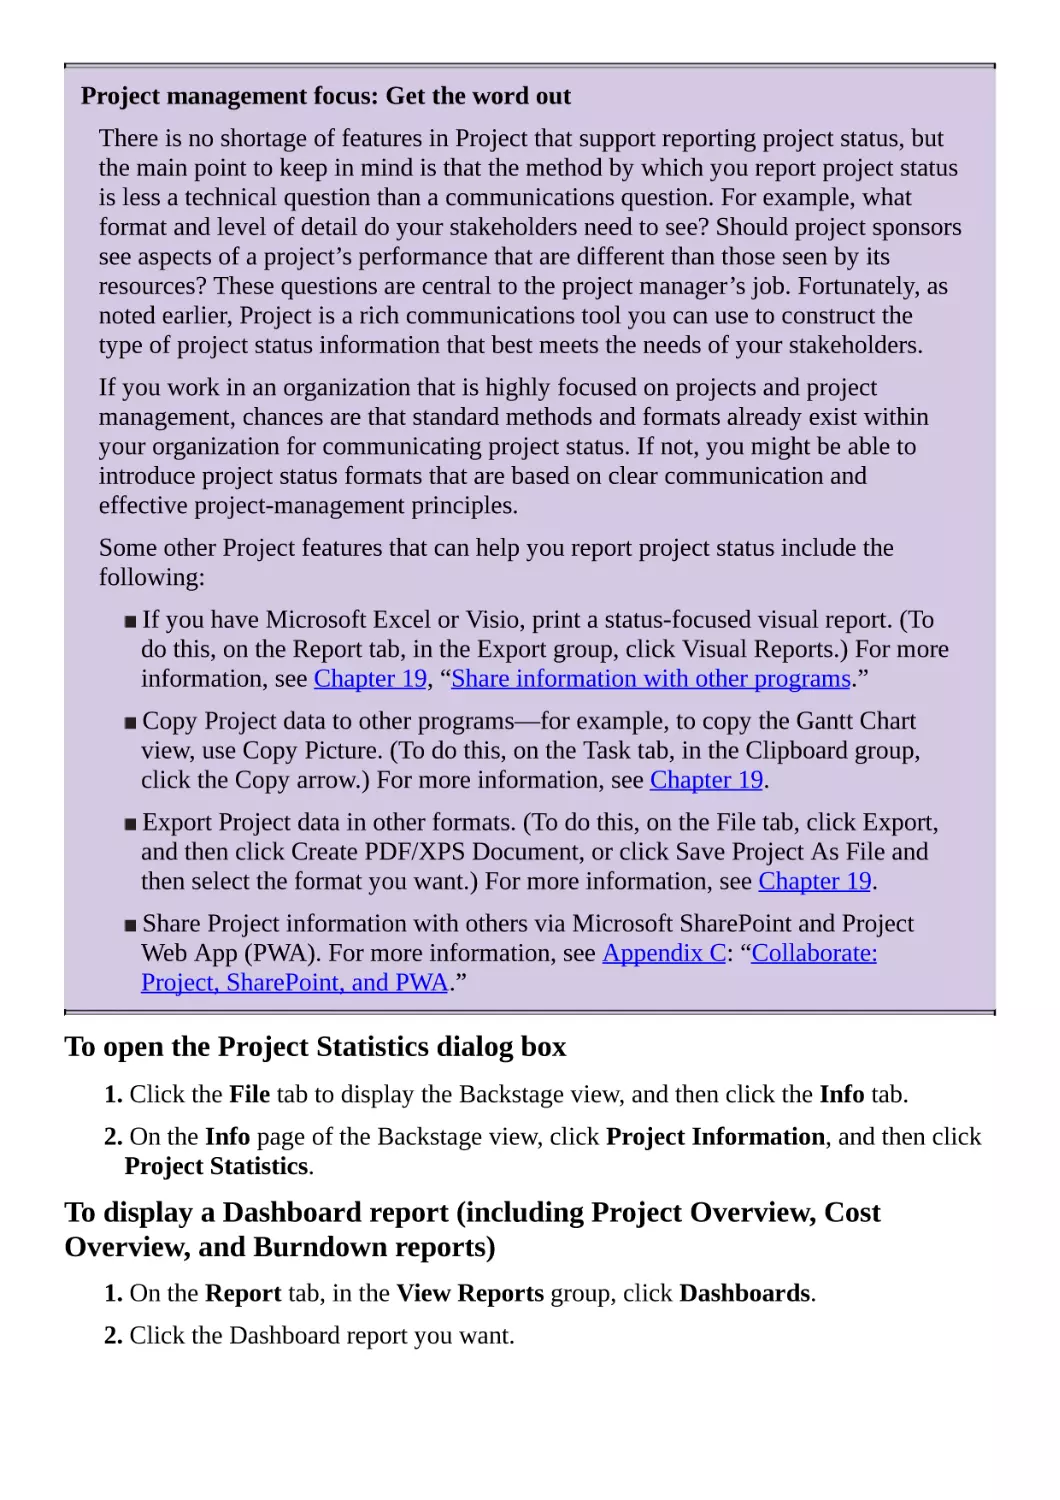
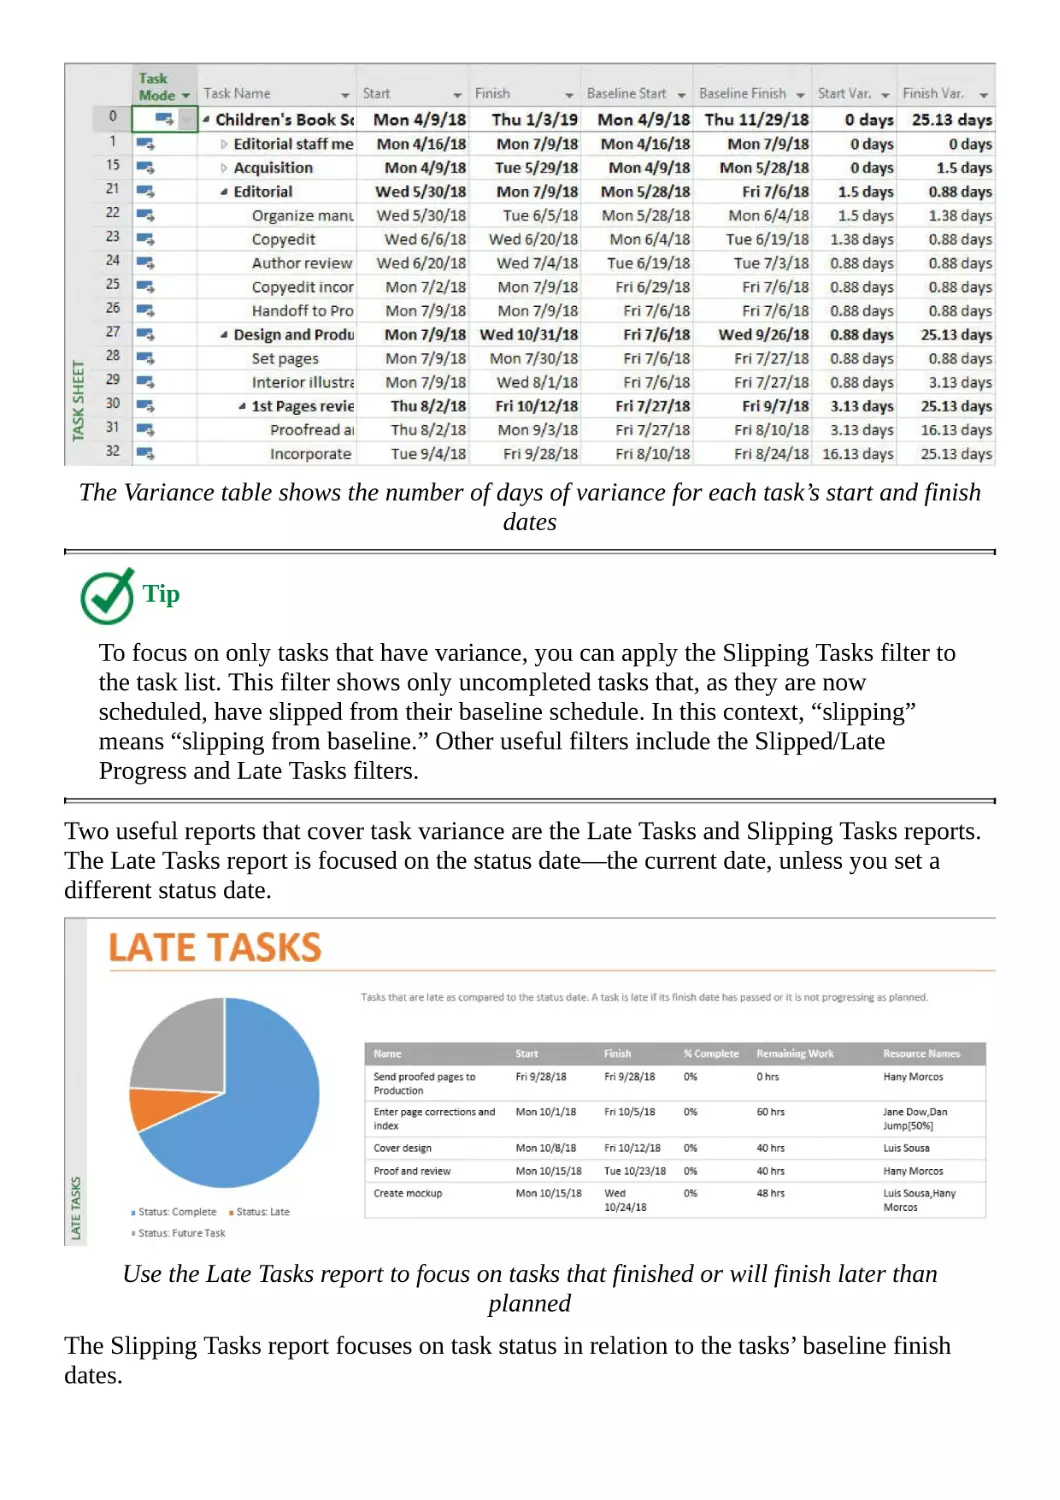
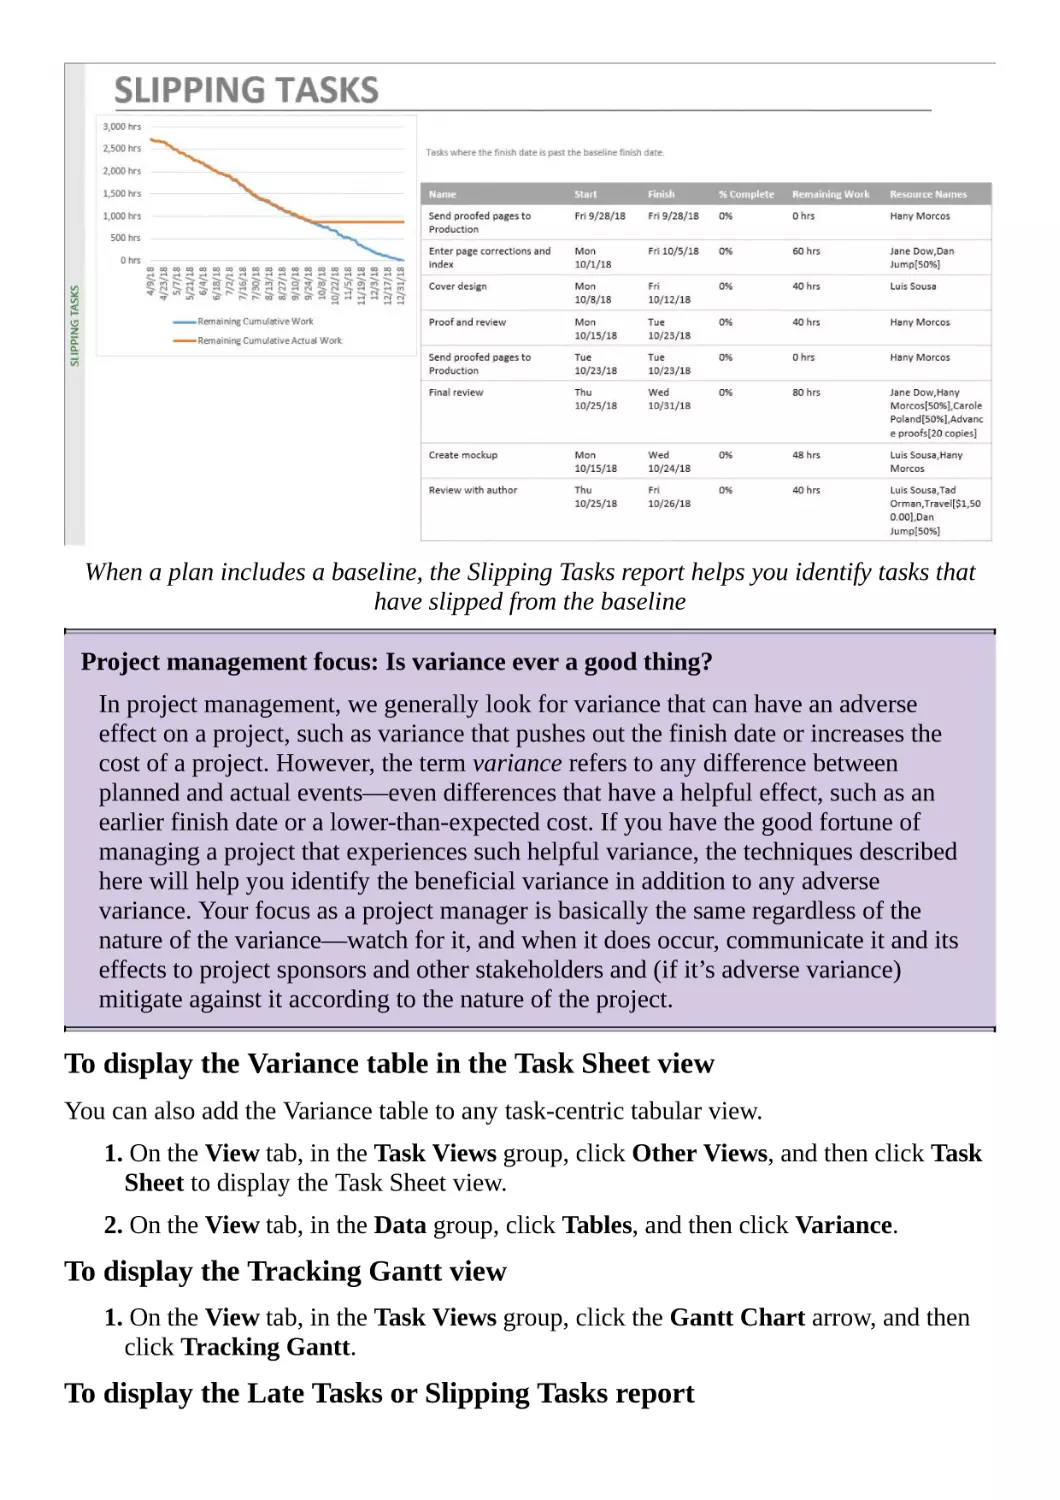
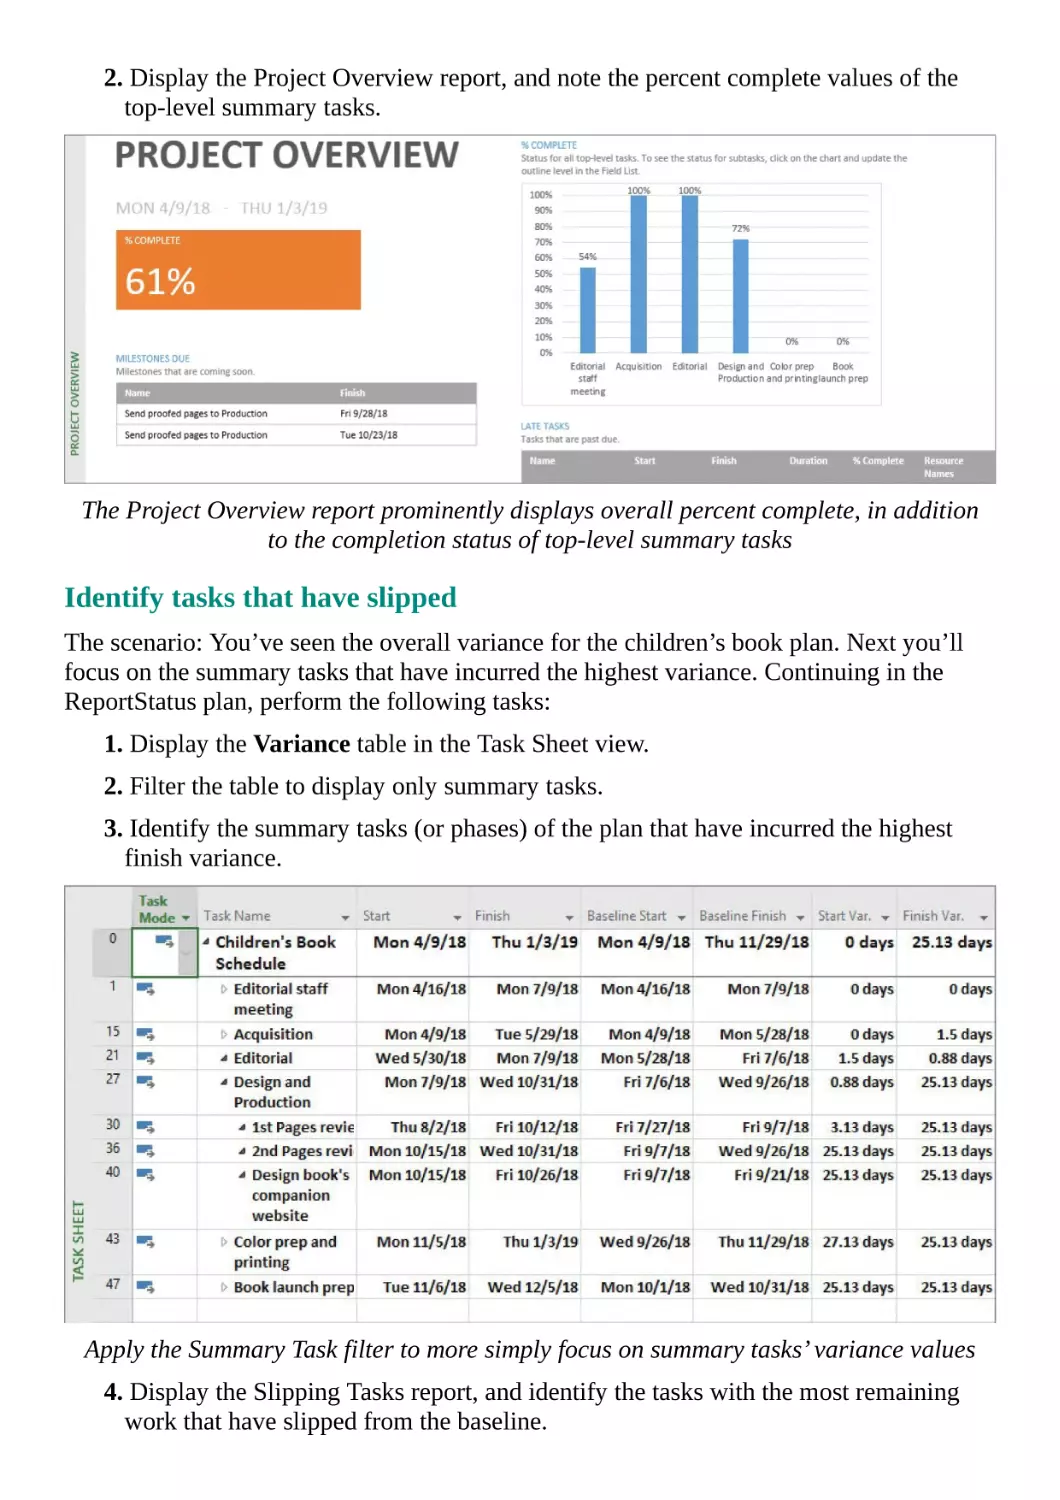
Identify tasks that have slipped
Sidebar: Project management focus: Is variance ever a good thing?
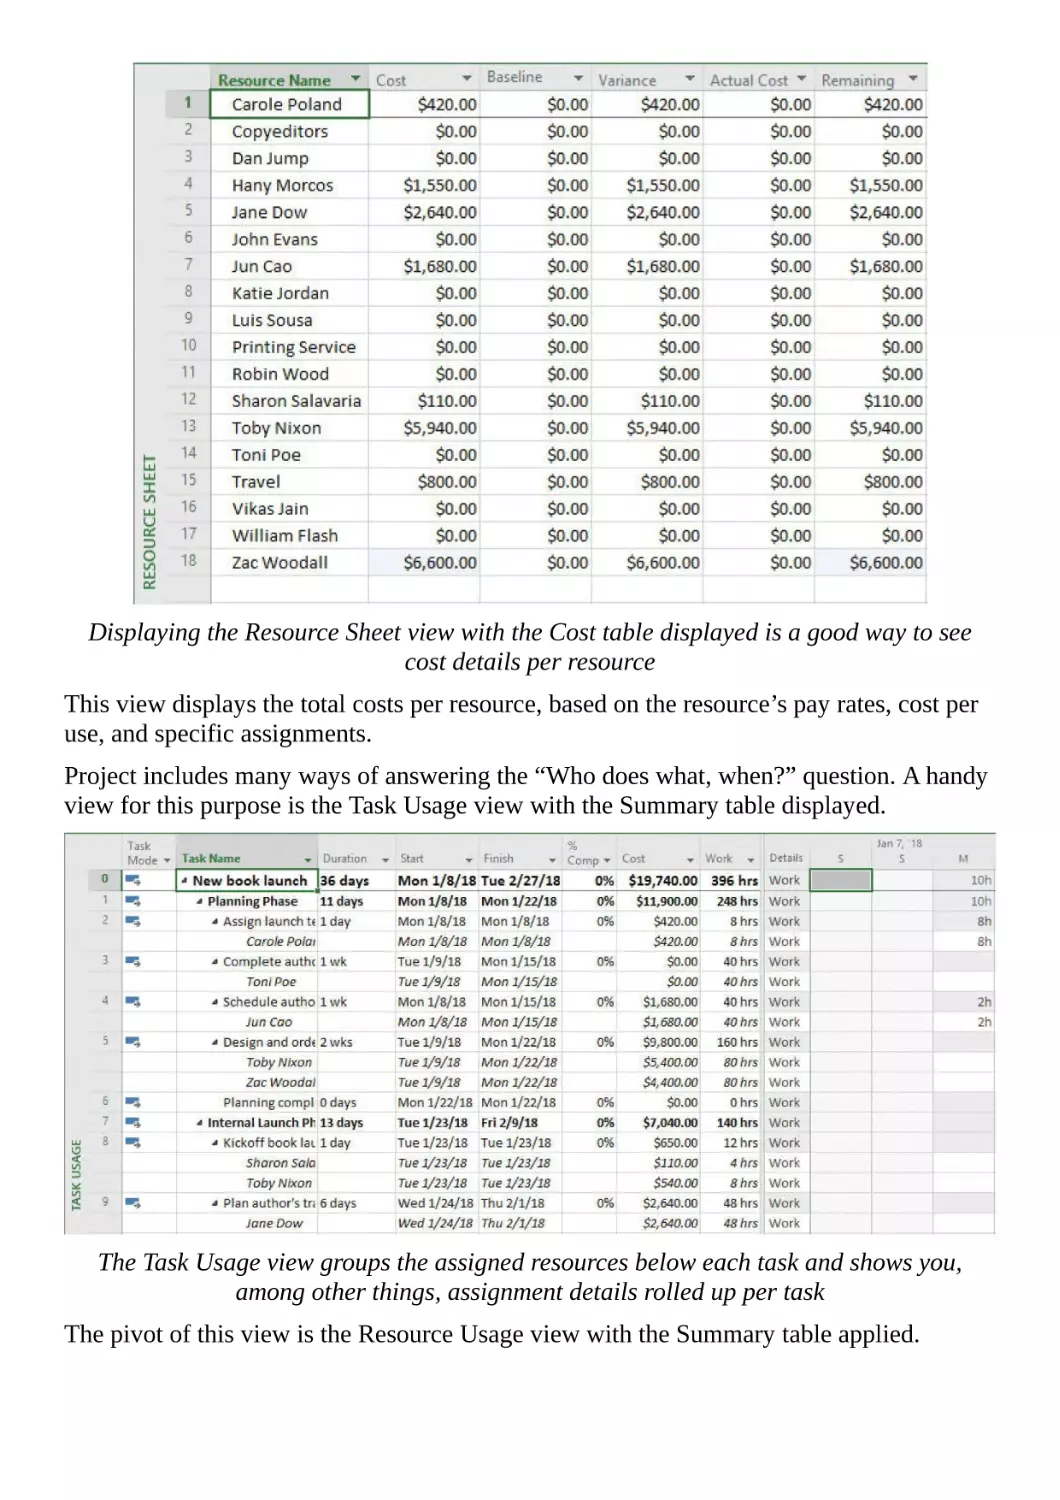
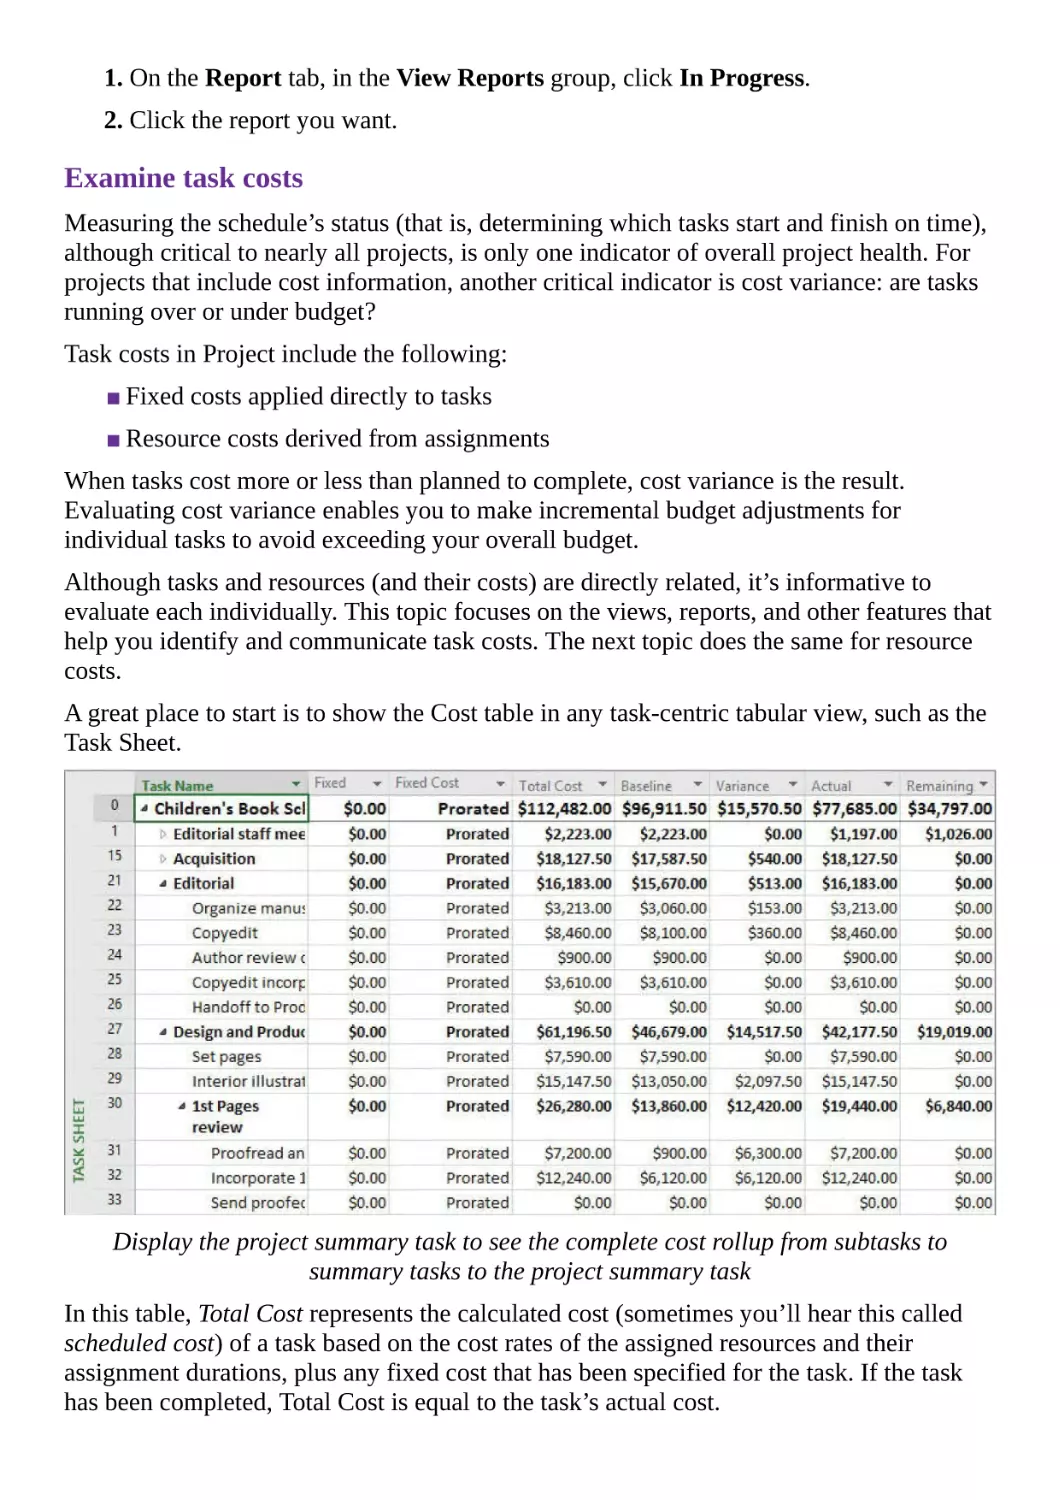
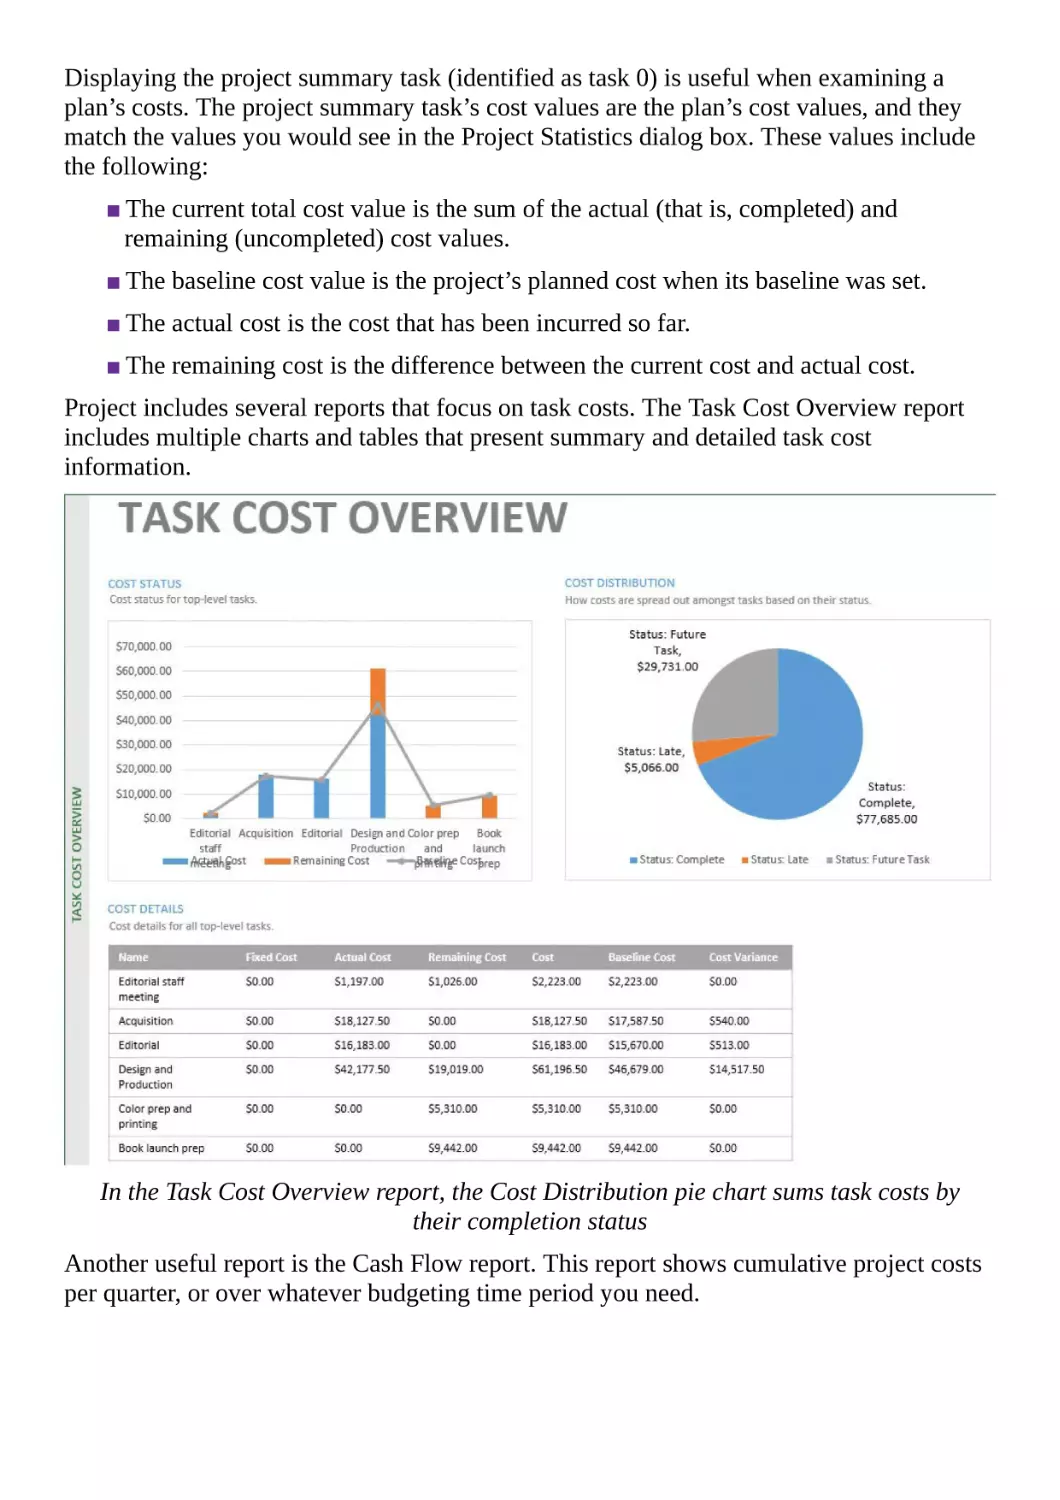
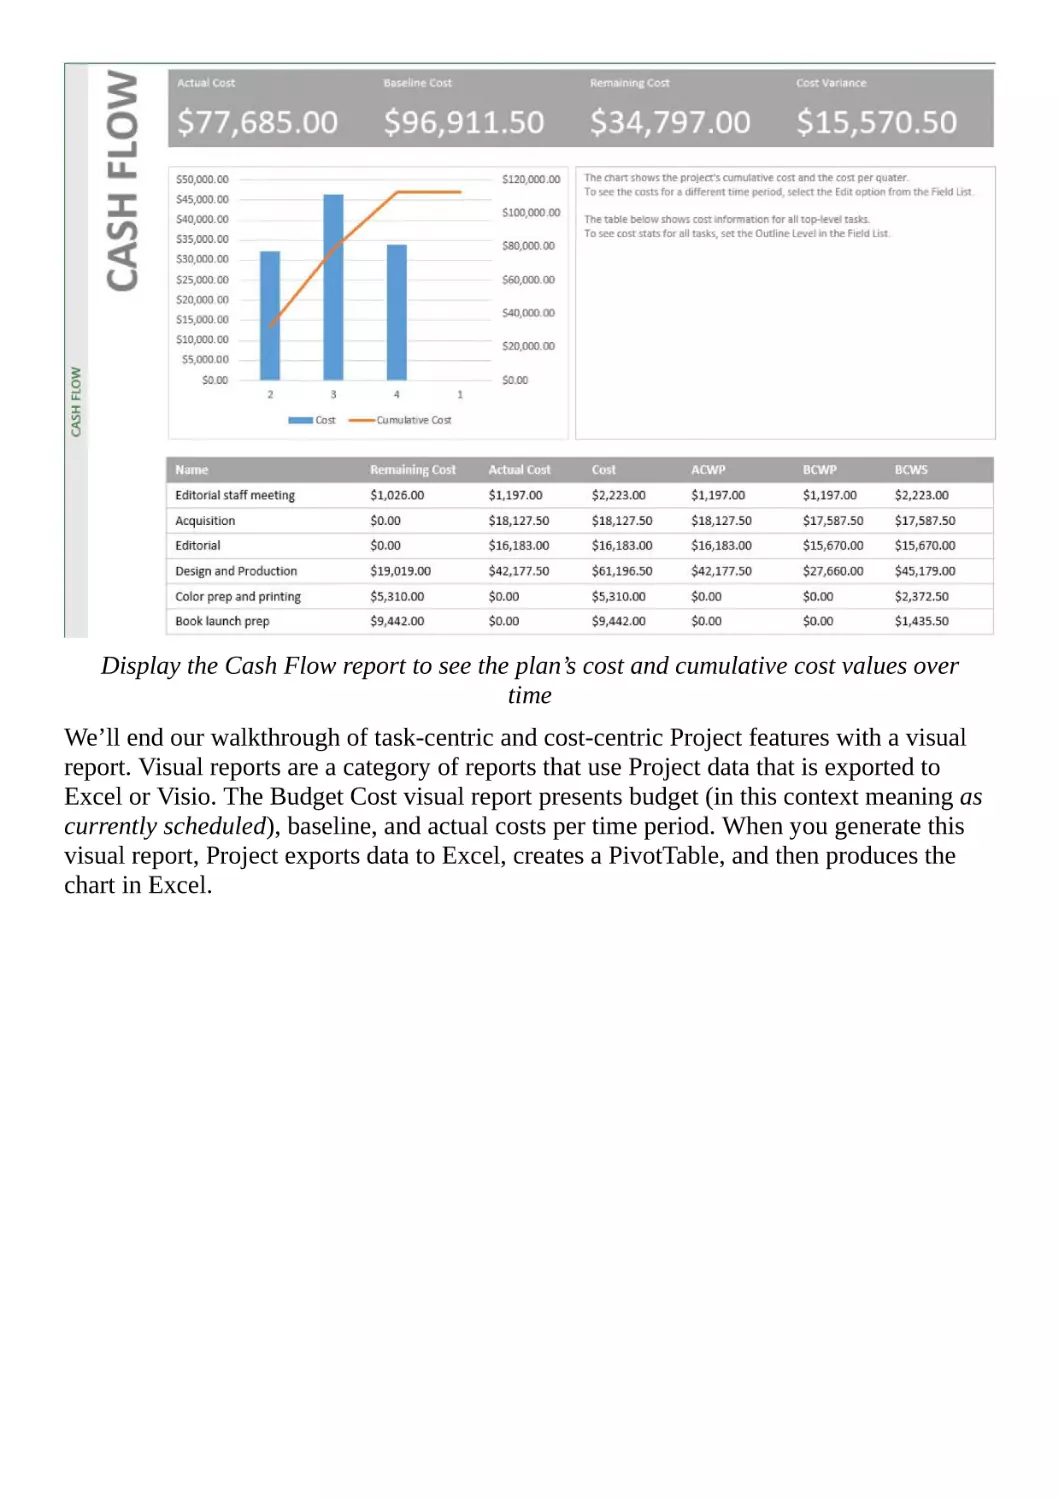
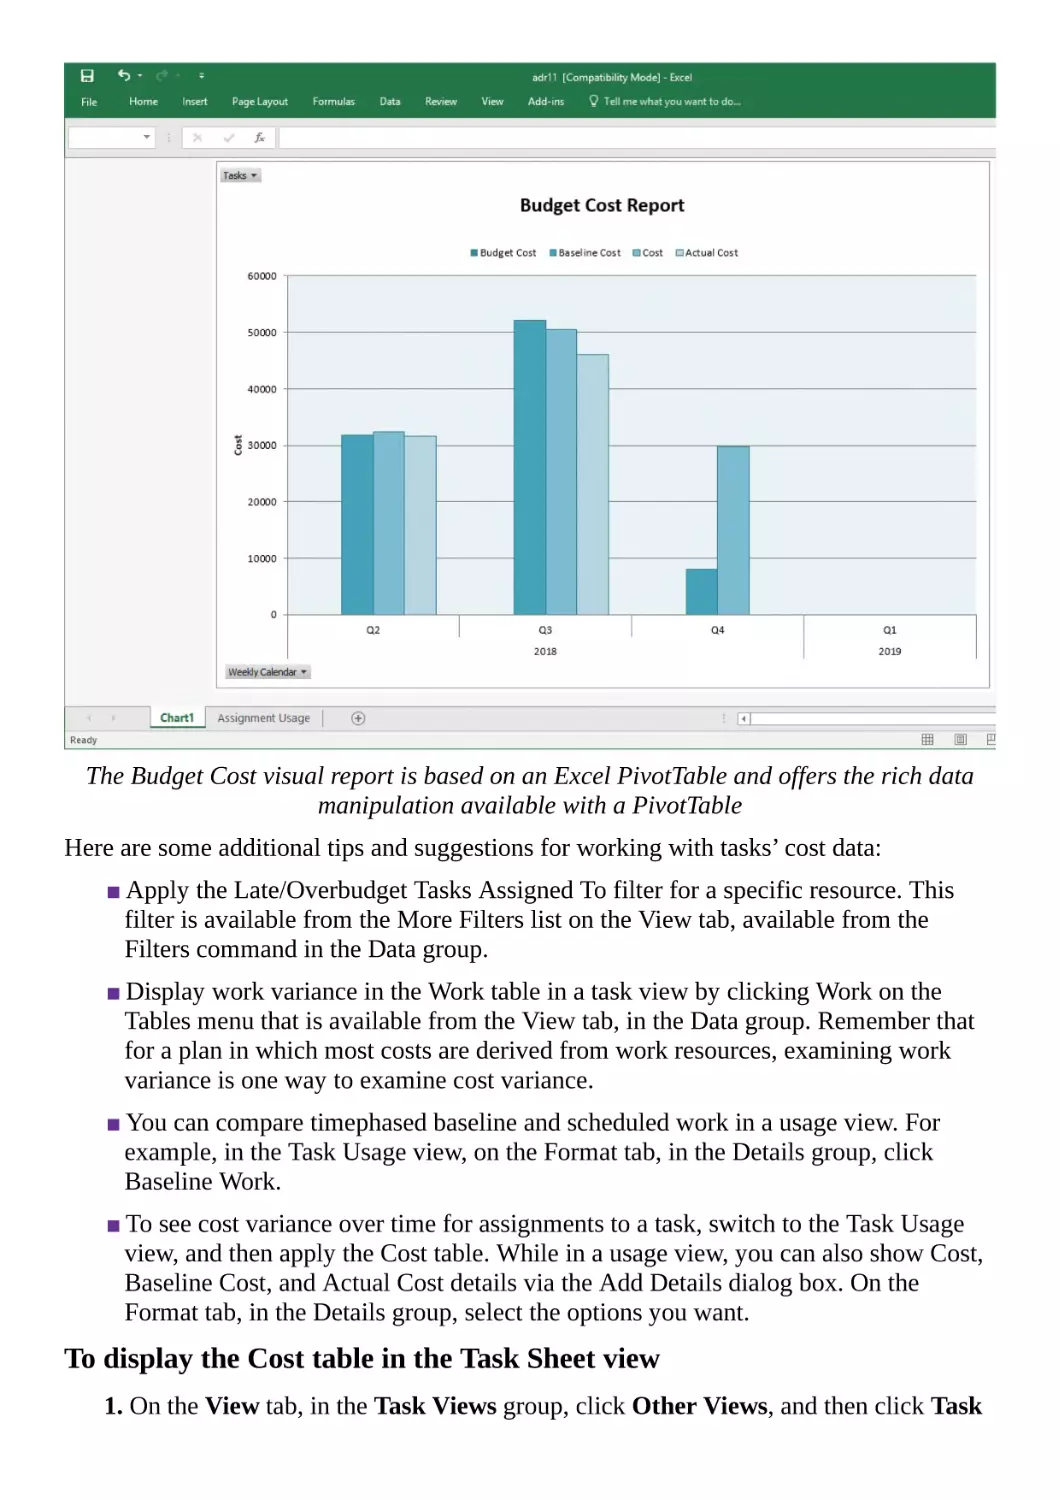
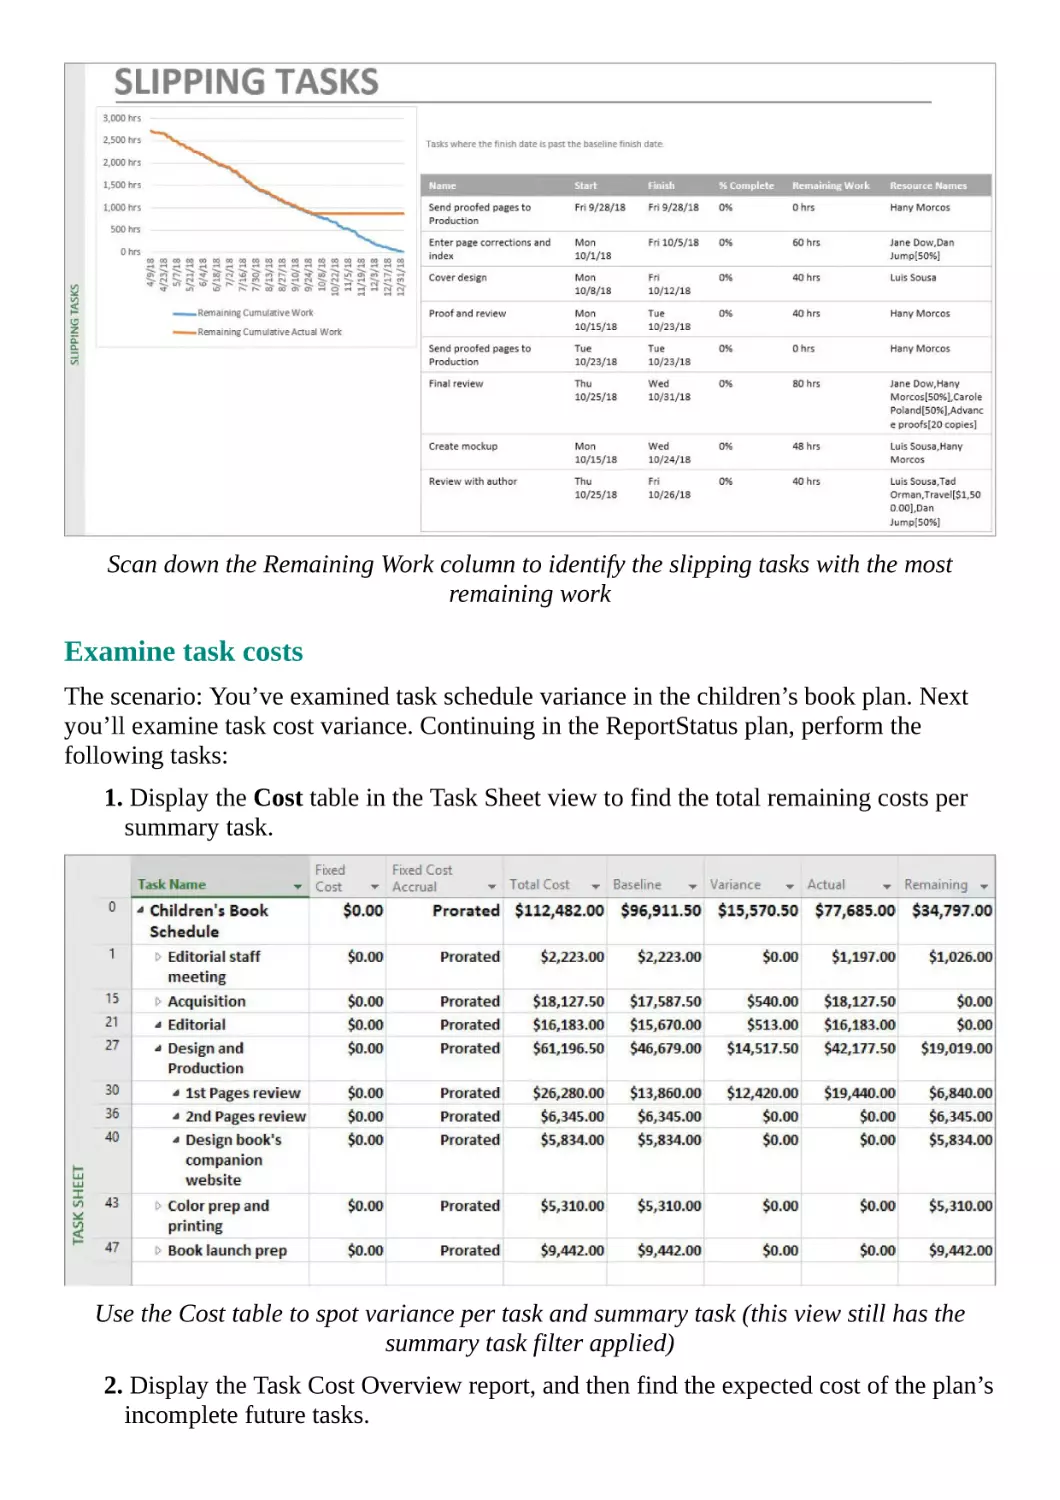
Examine task costs
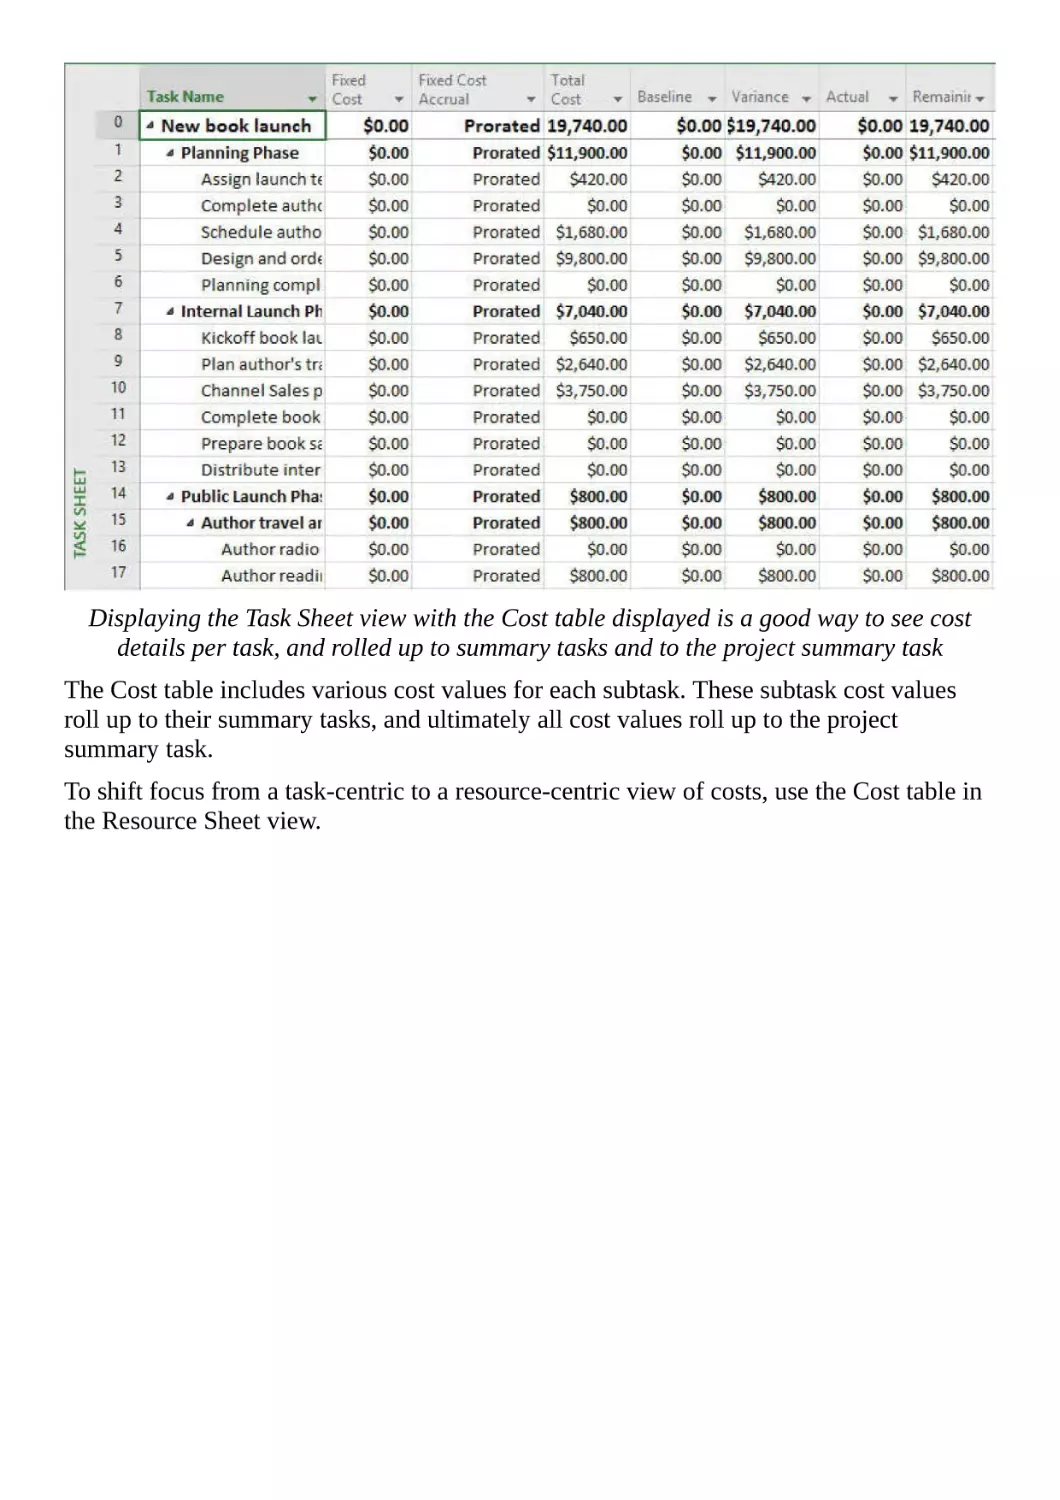
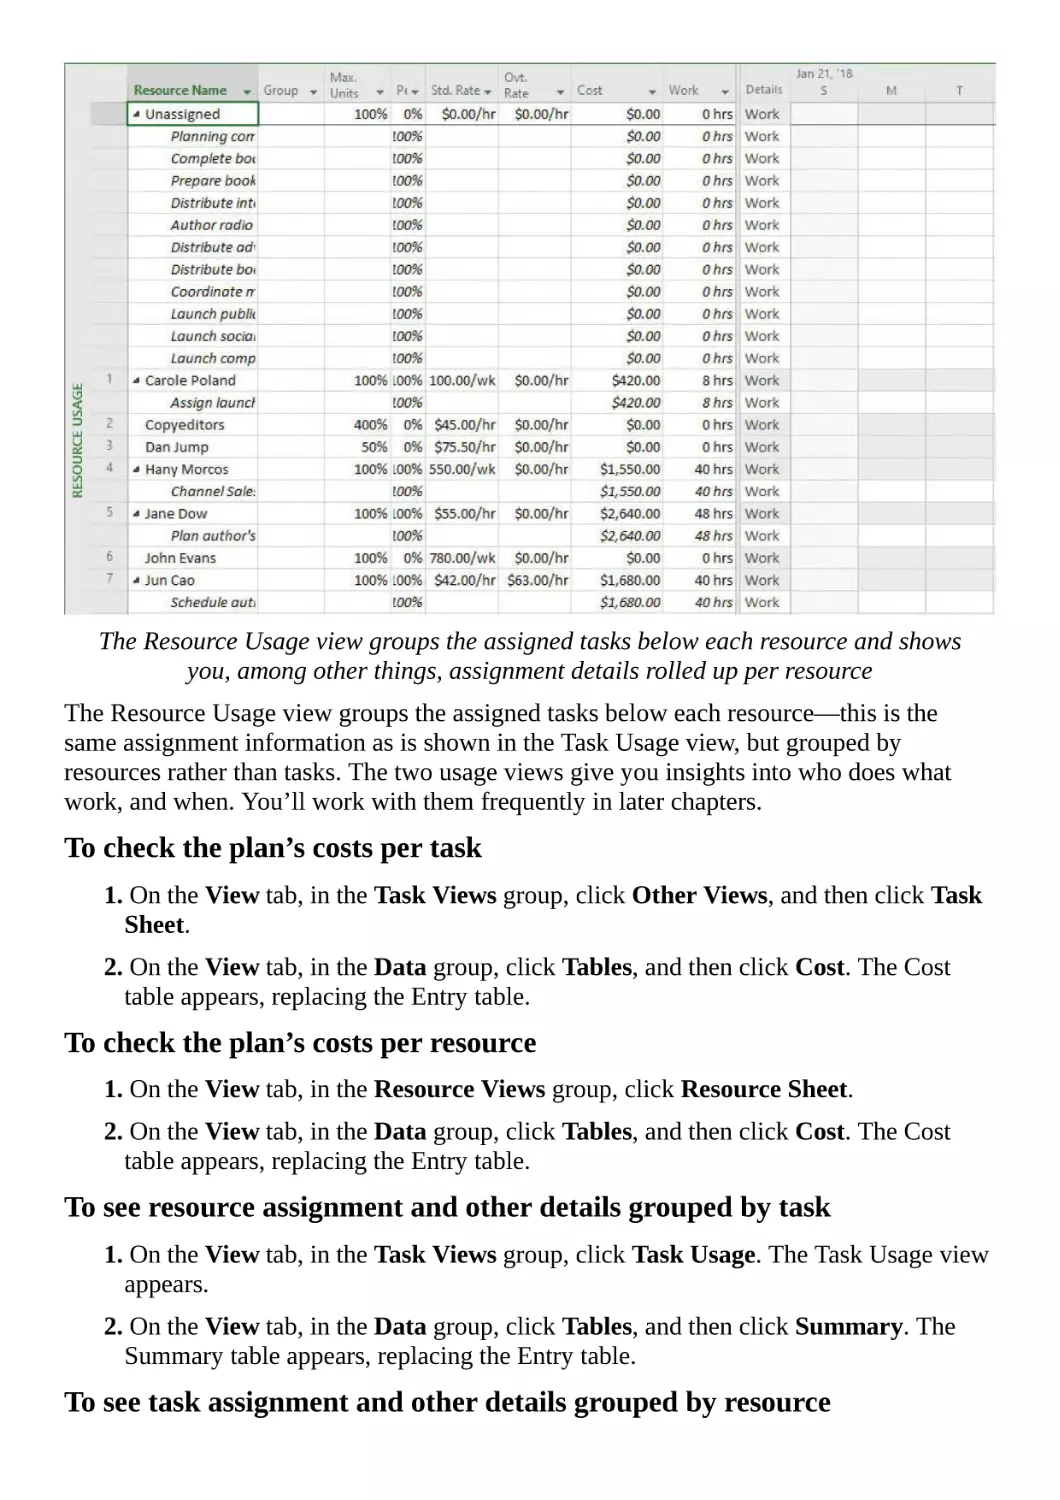
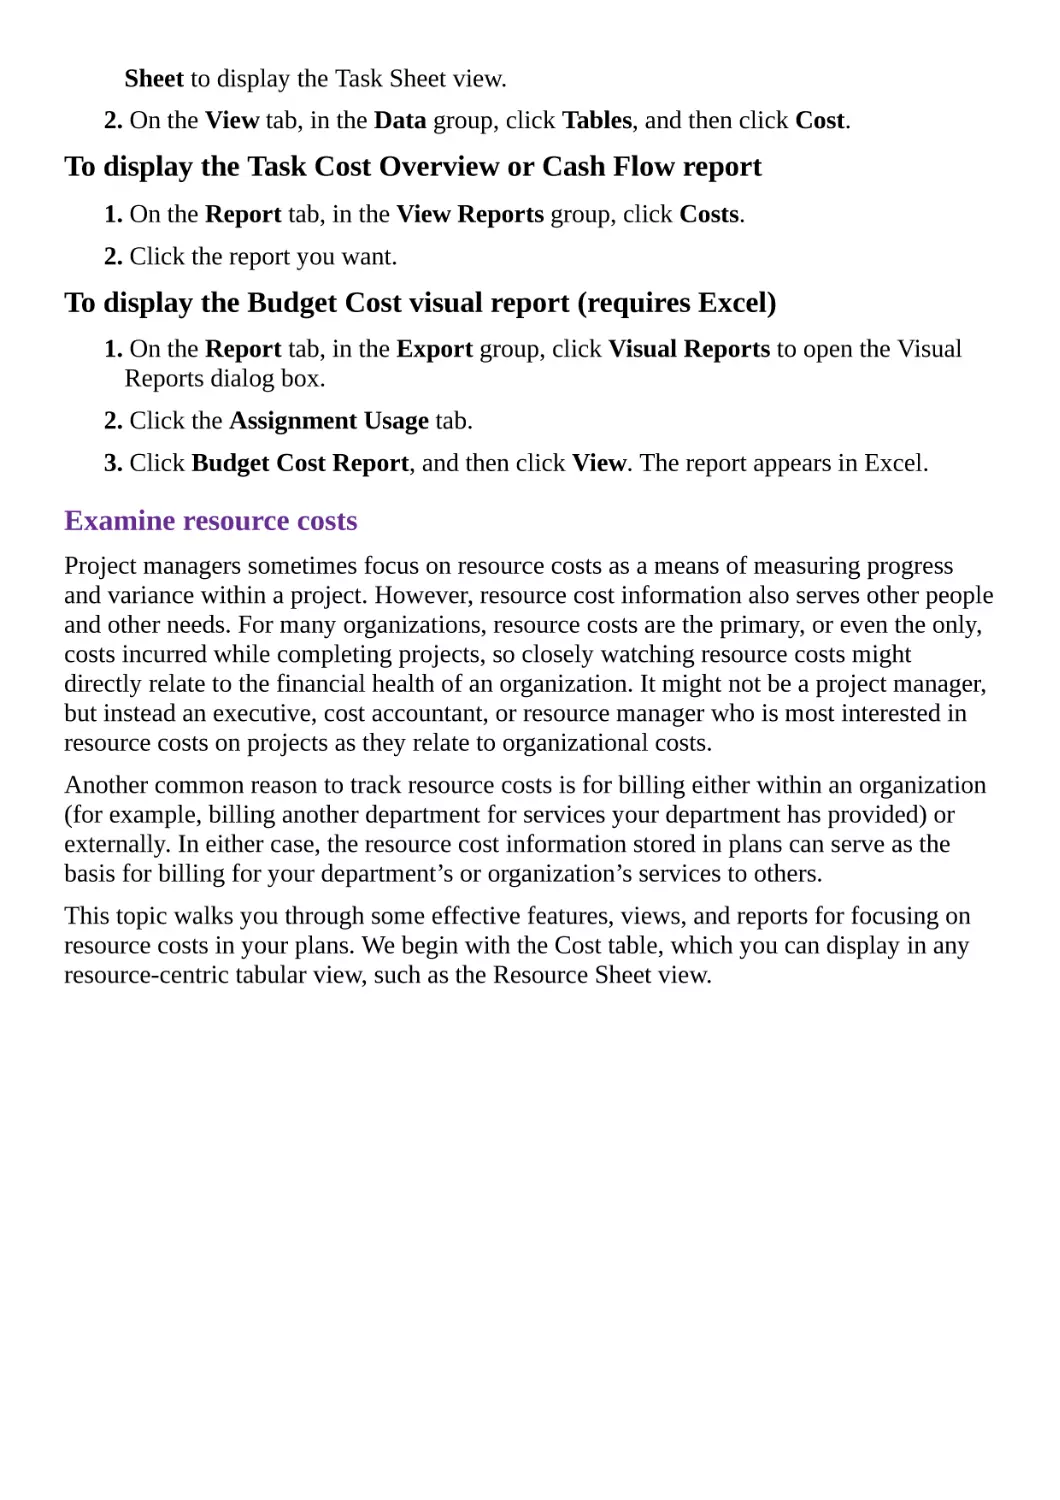
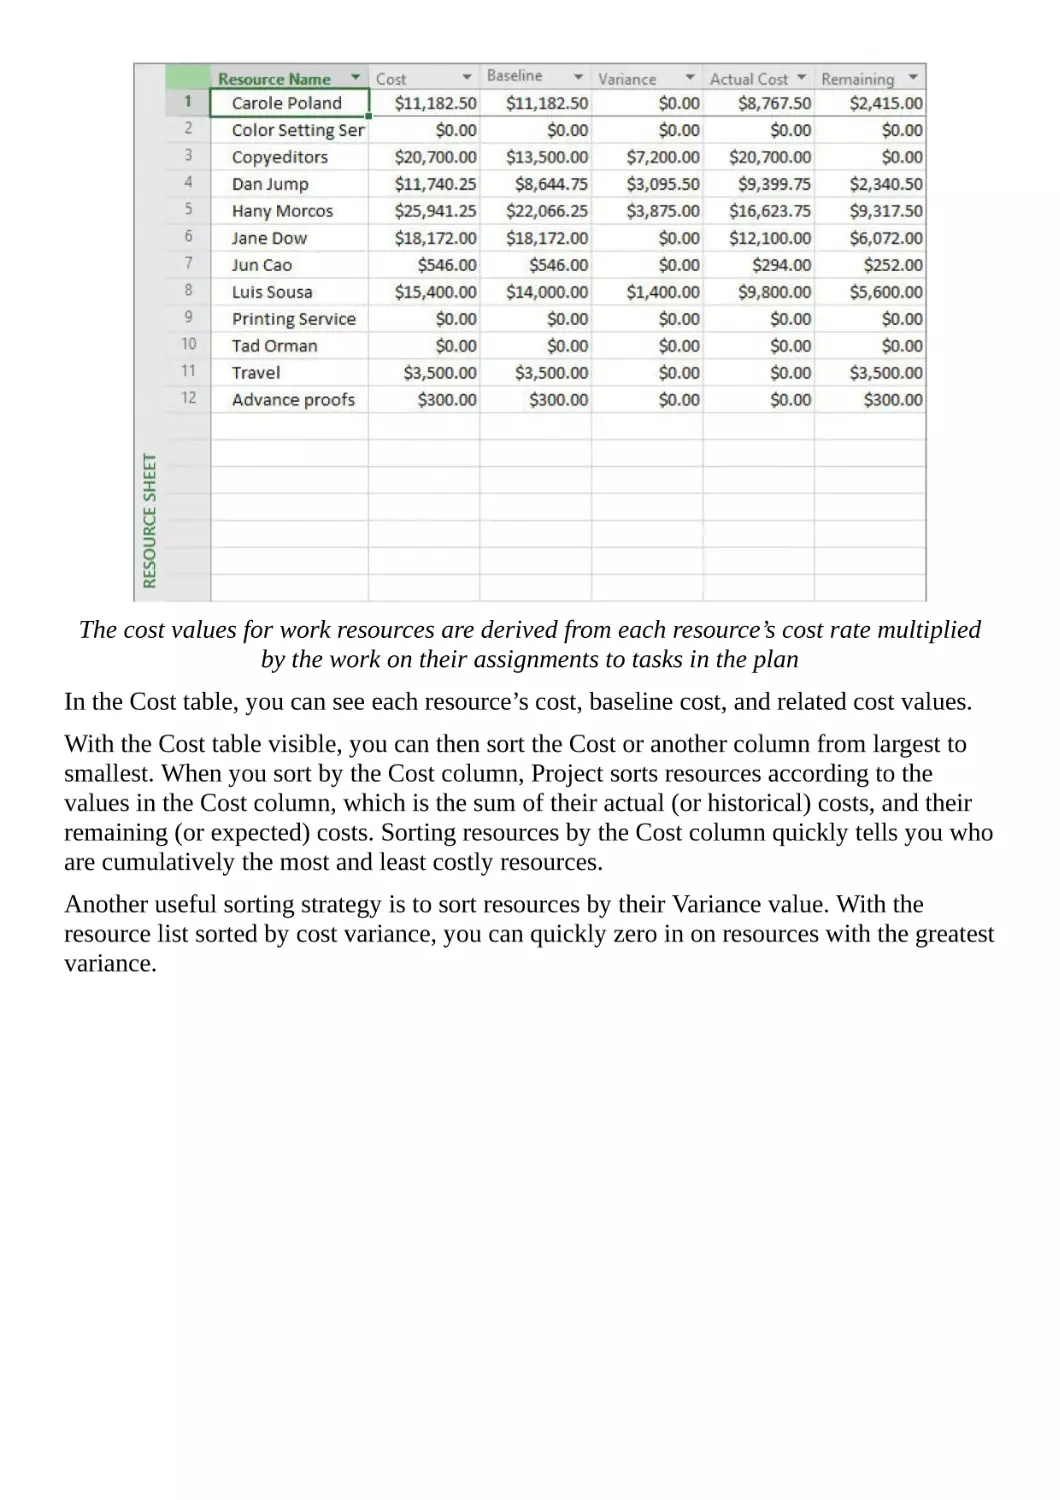
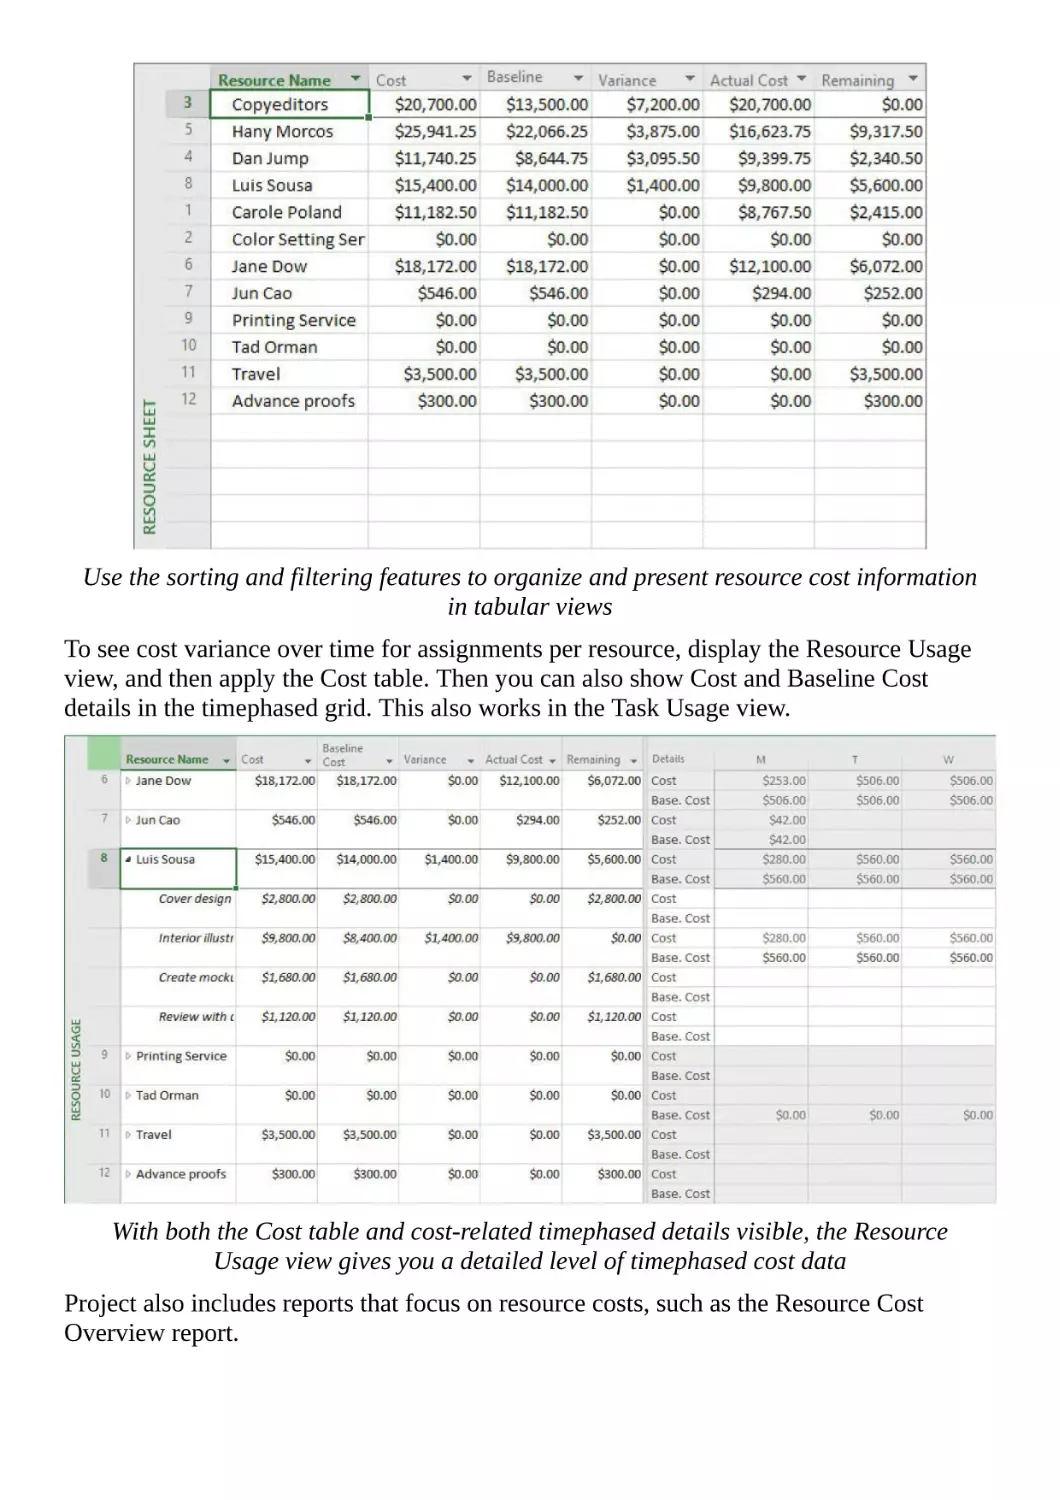
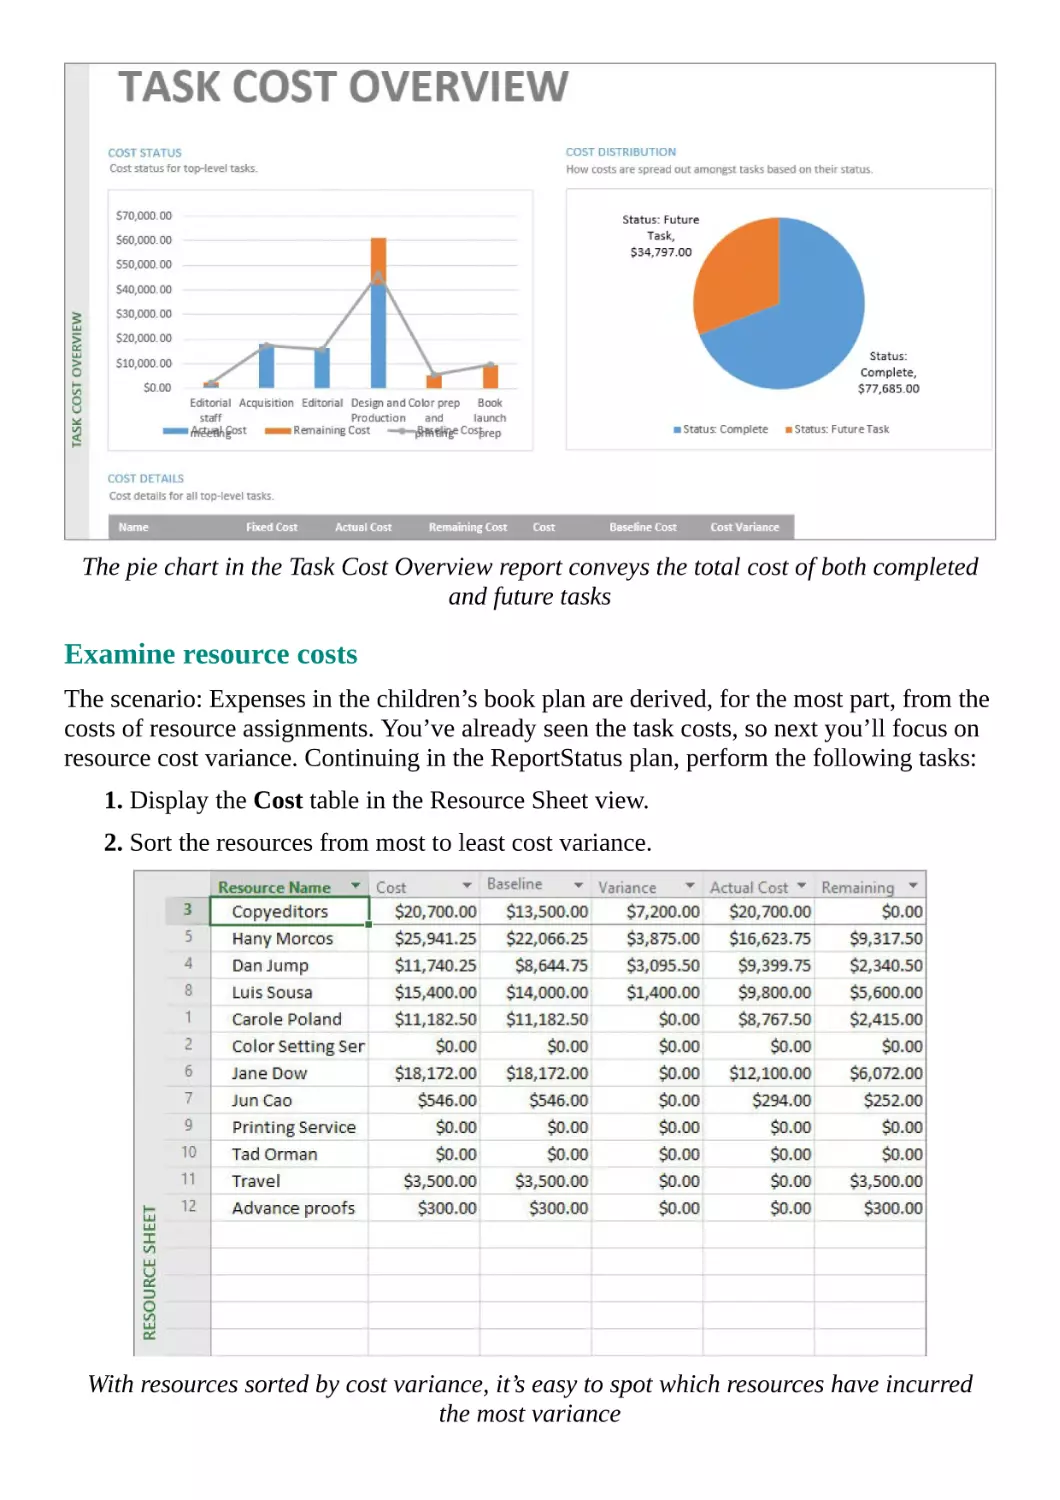
Examine resource costs
Skills review
Practice tasks
Part 4: In-depth and special subjects
16 Format and print views: In-depth techniques
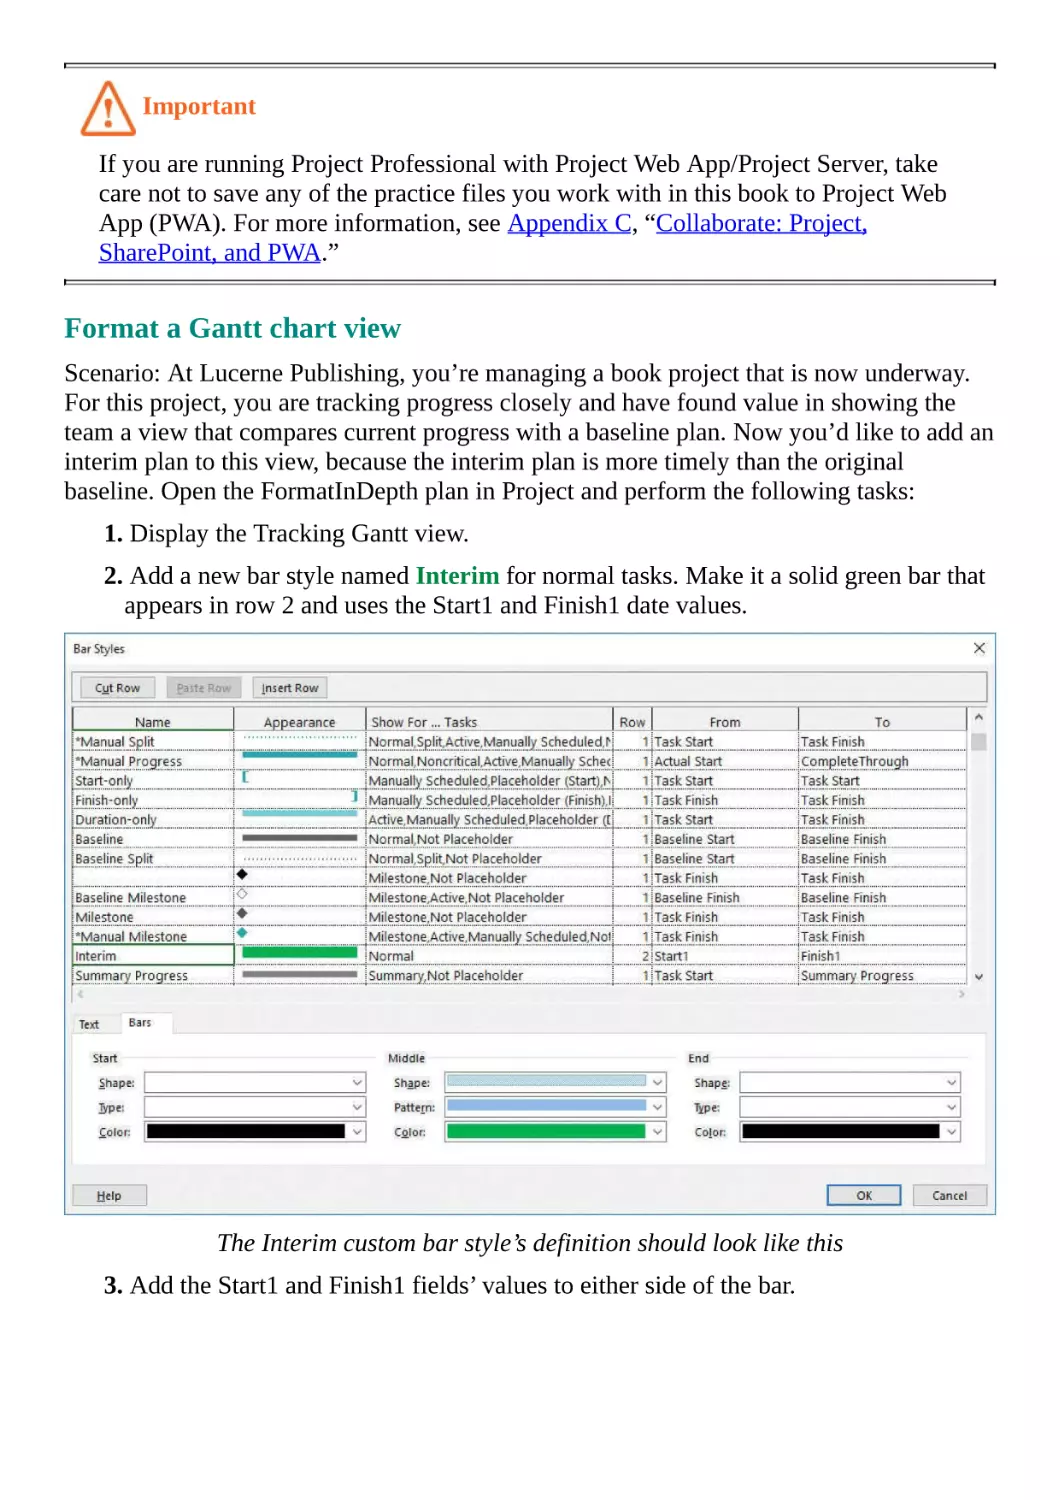
Format a Gantt chart view
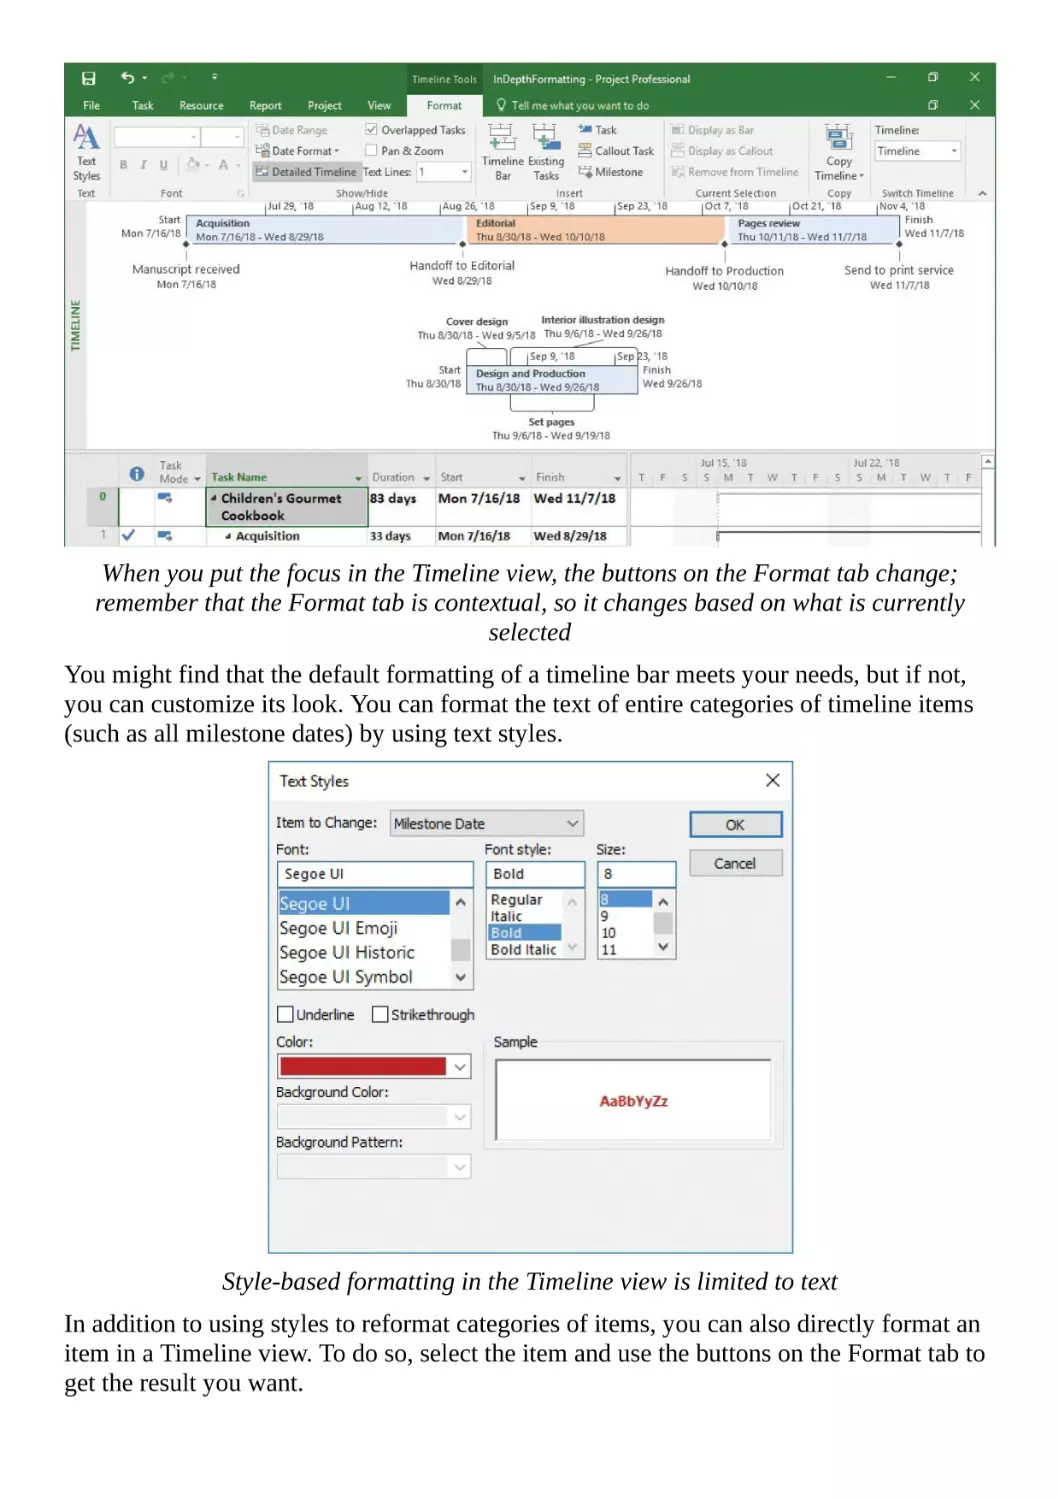
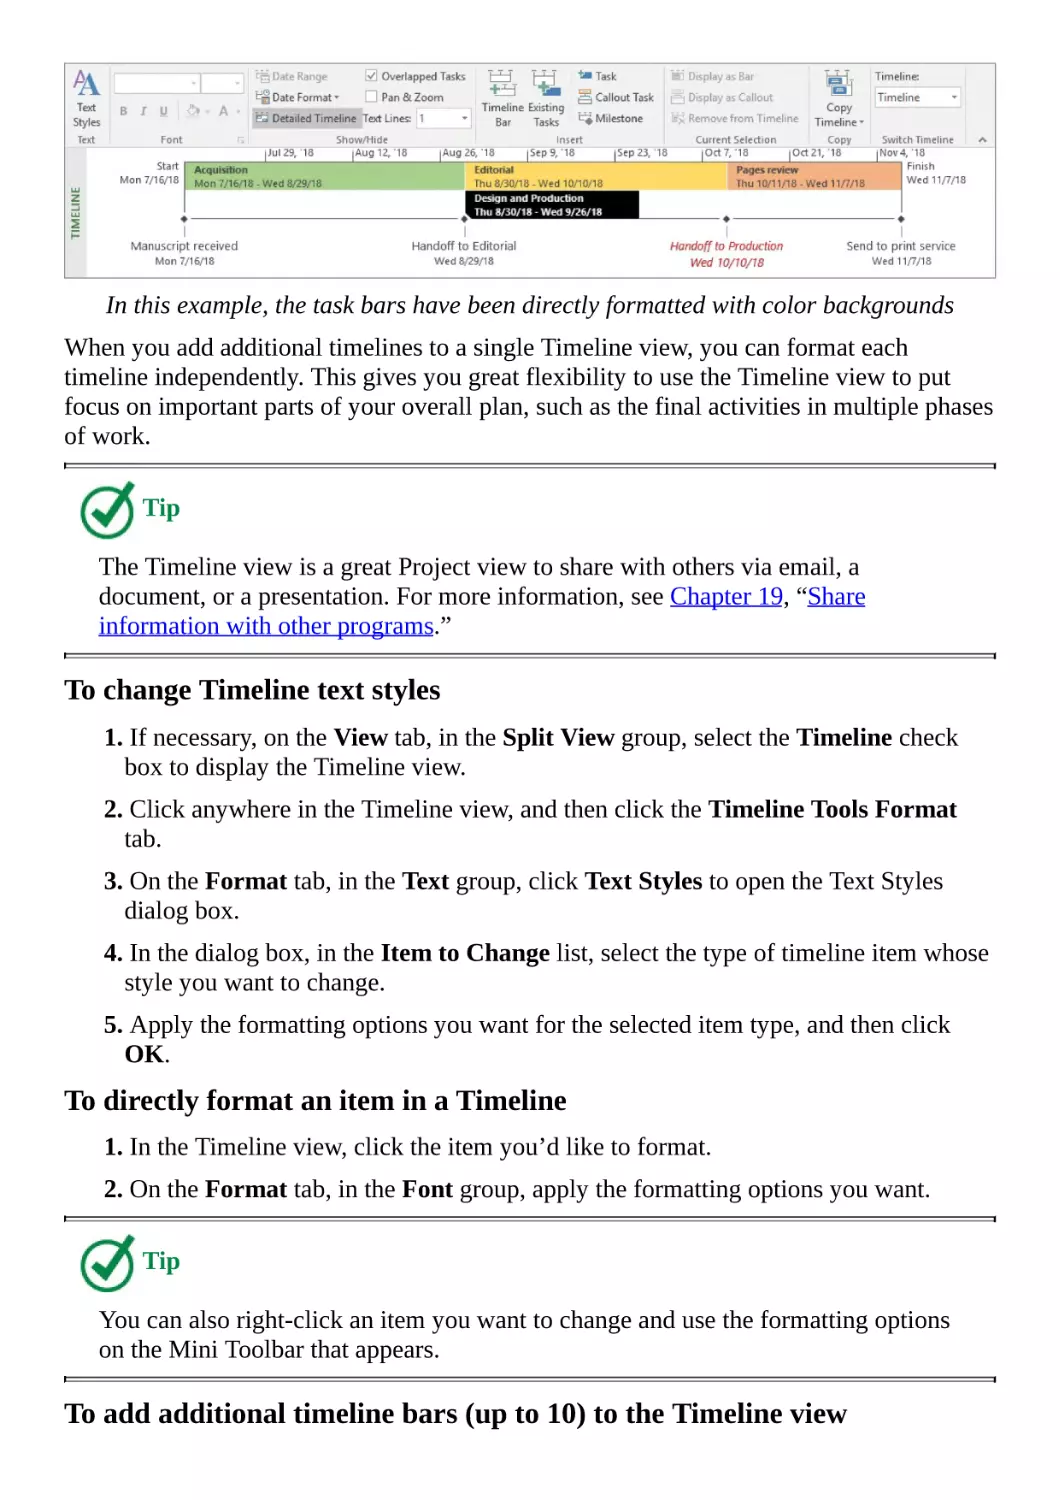
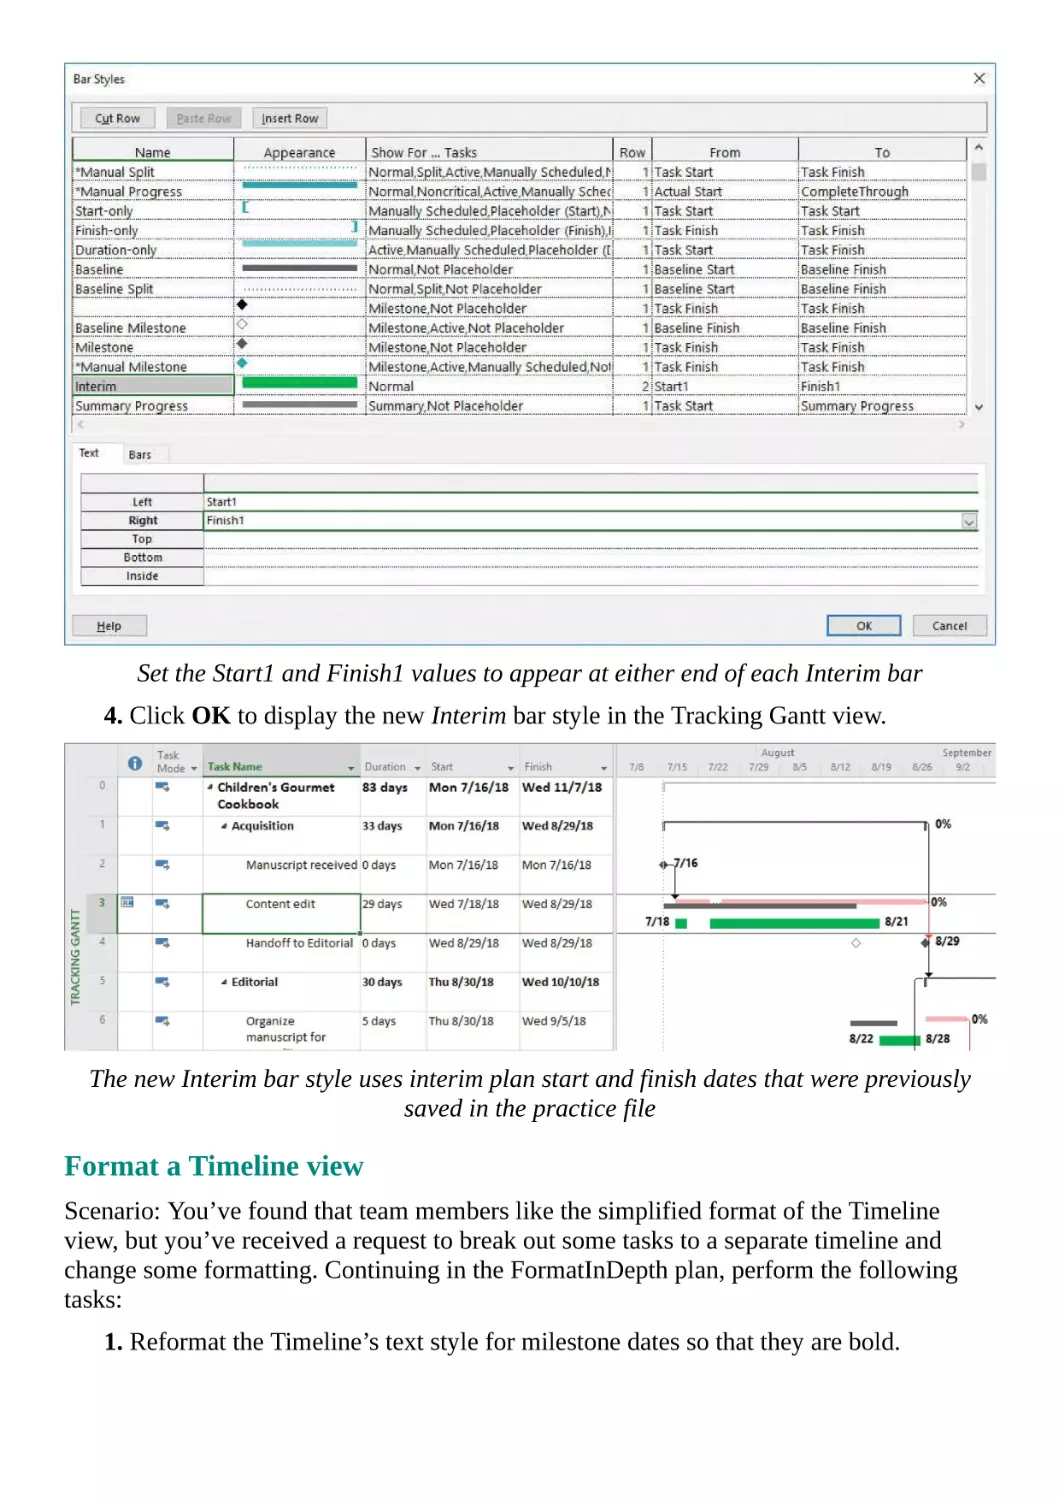
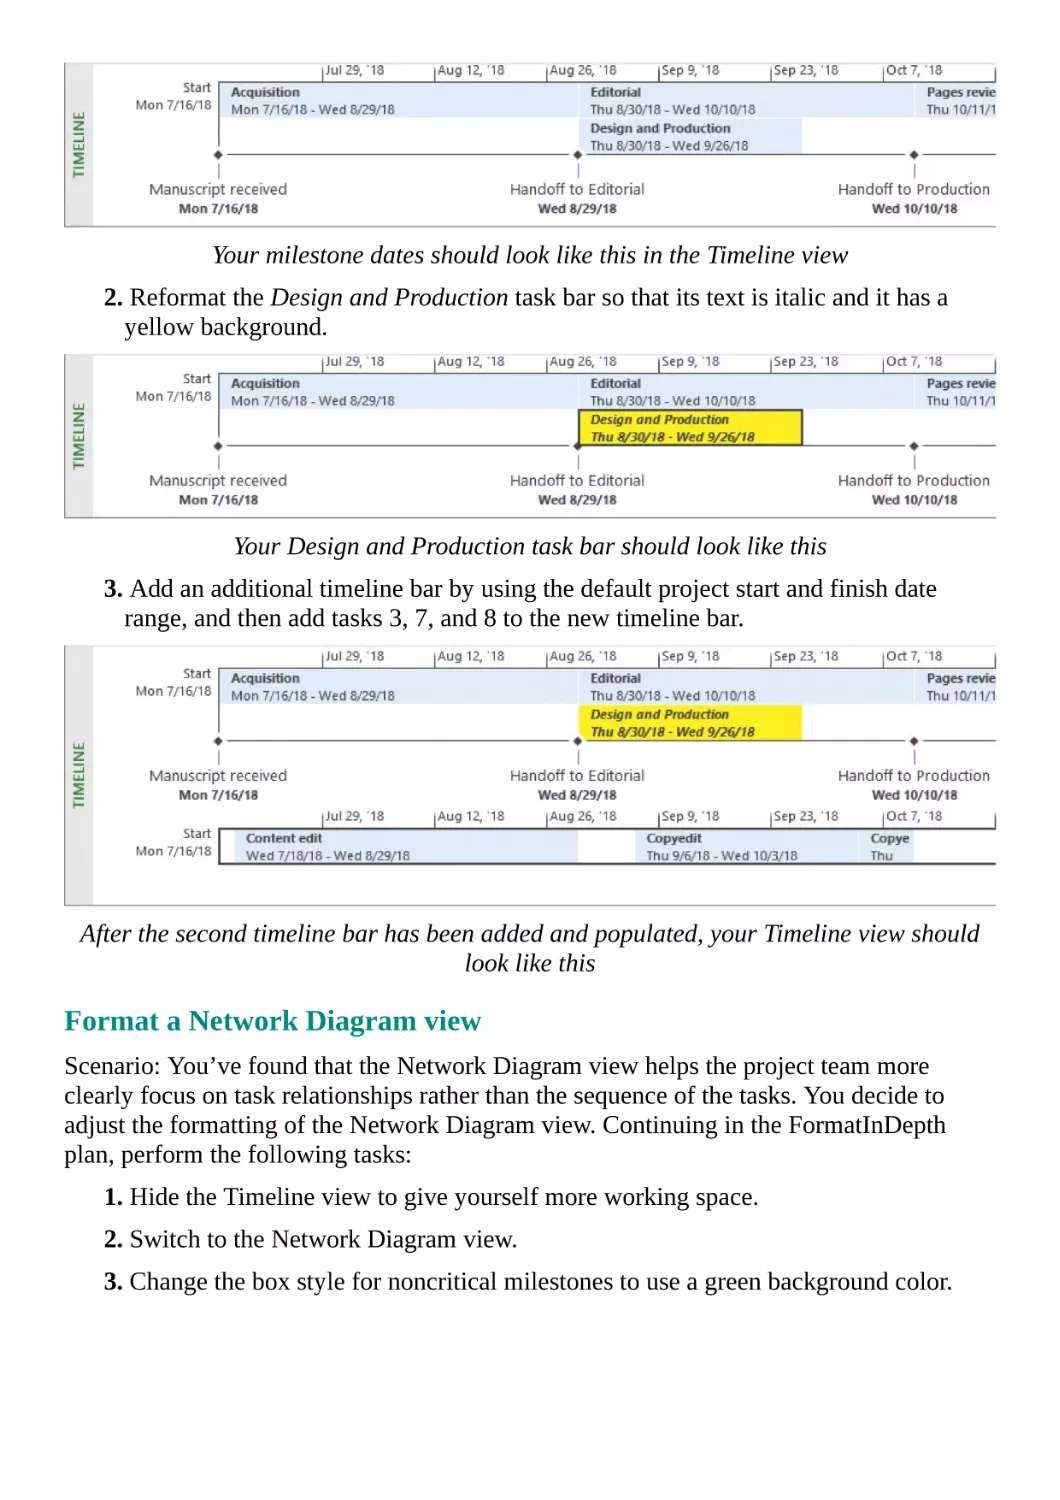
Format a Timeline view
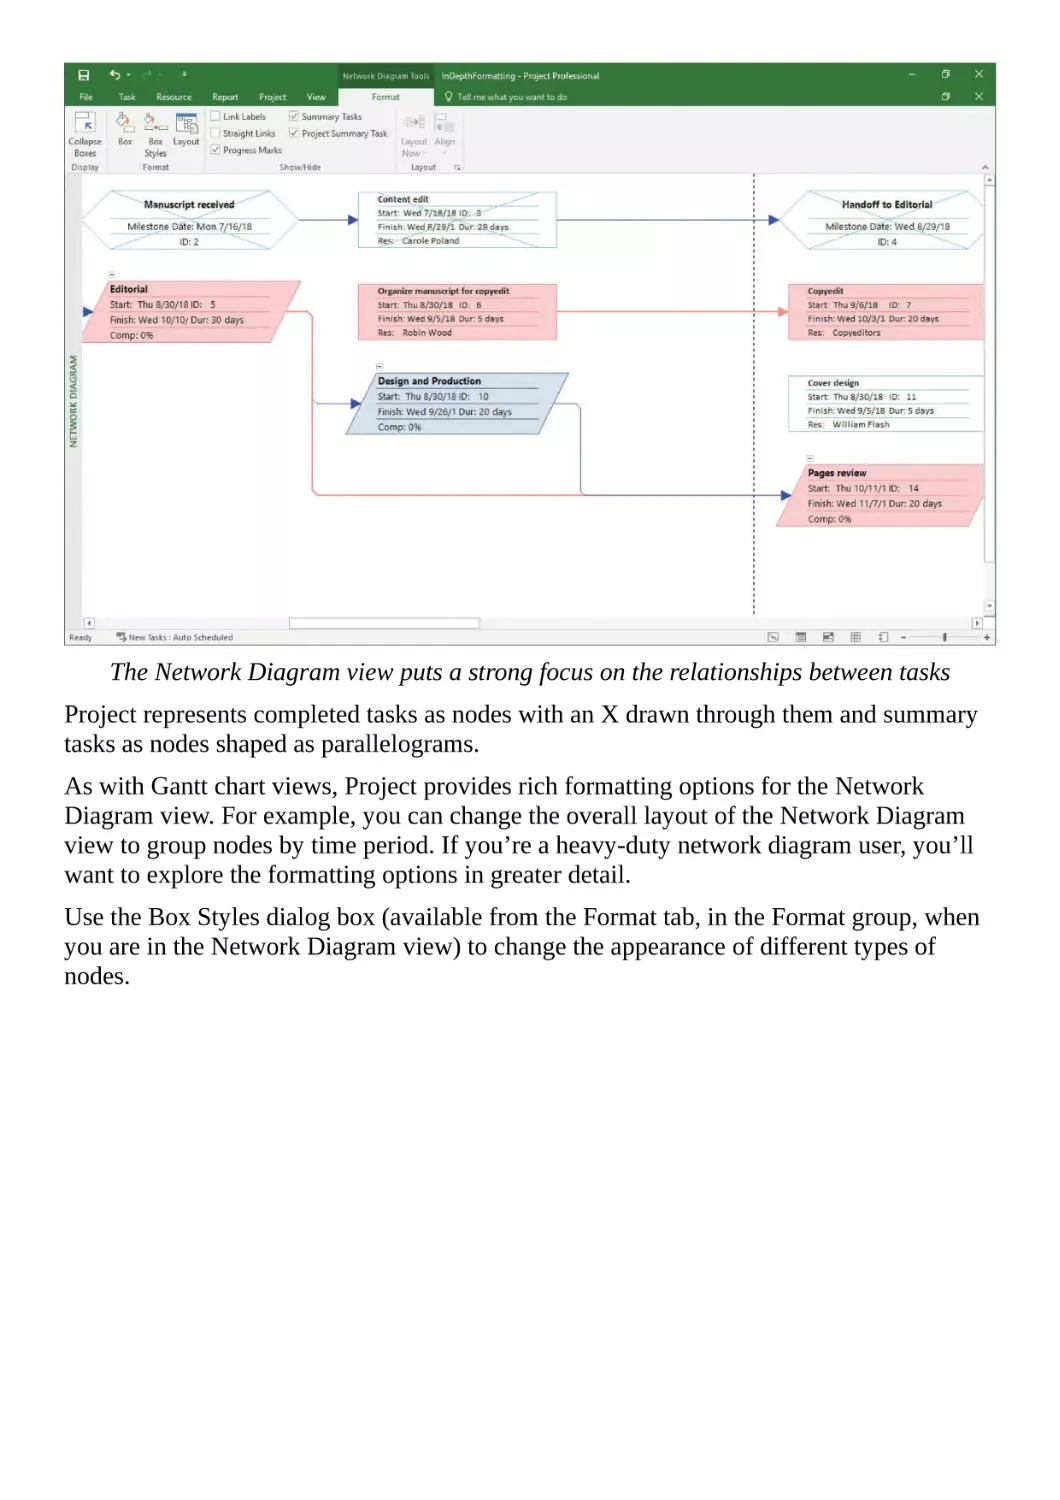
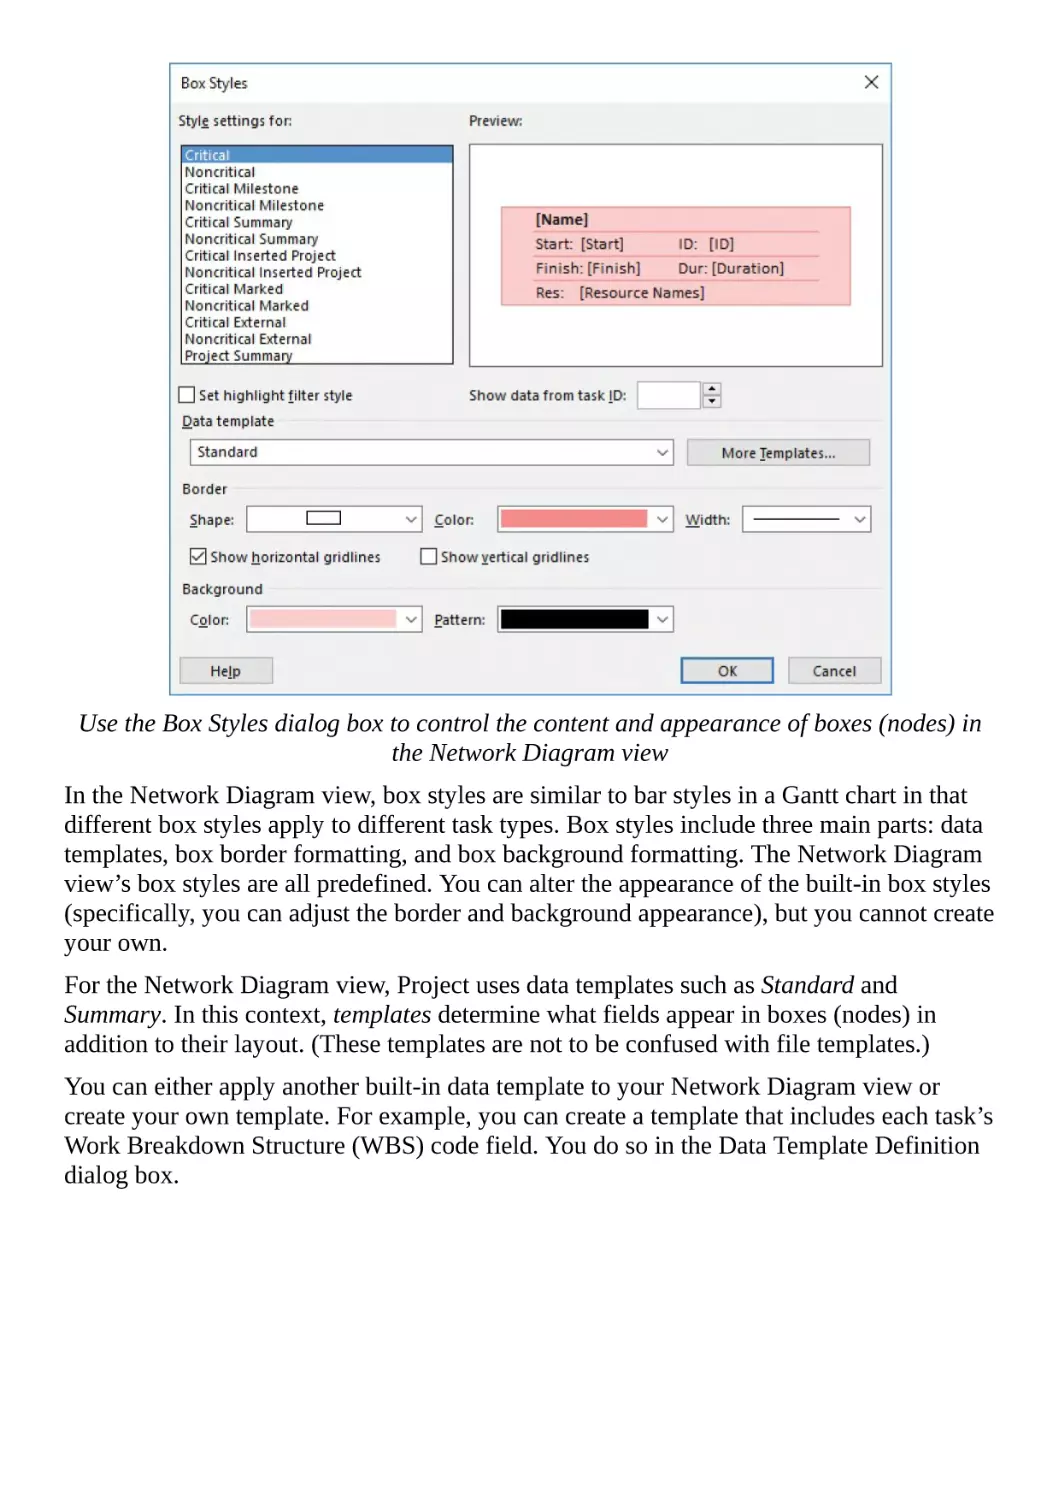
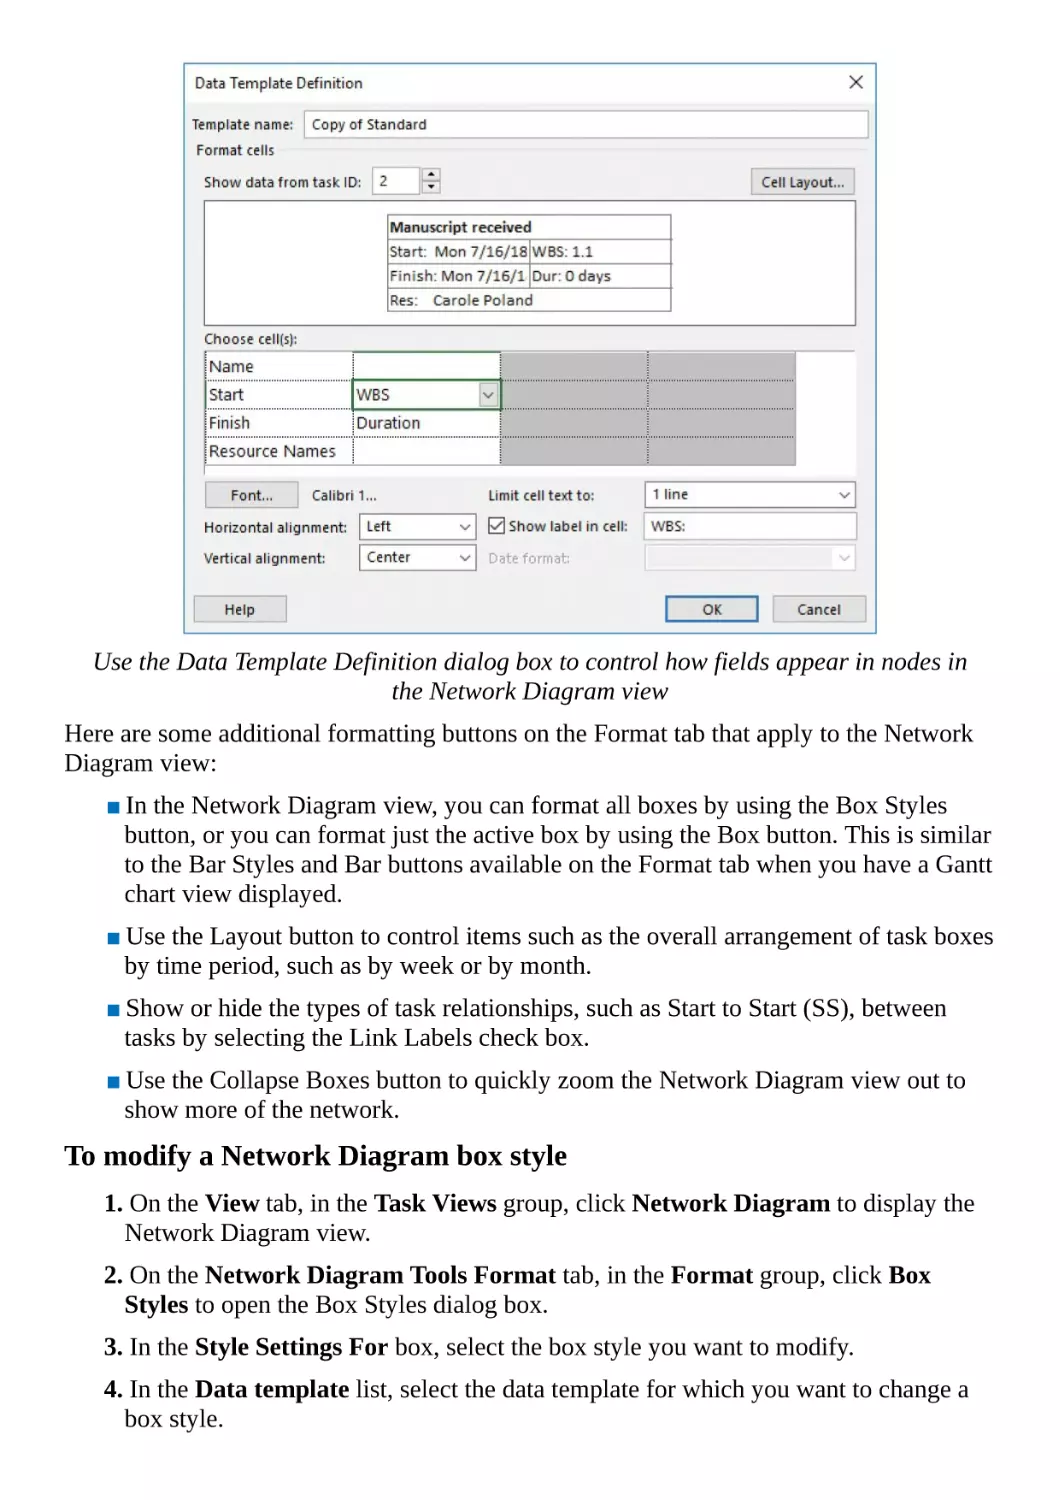
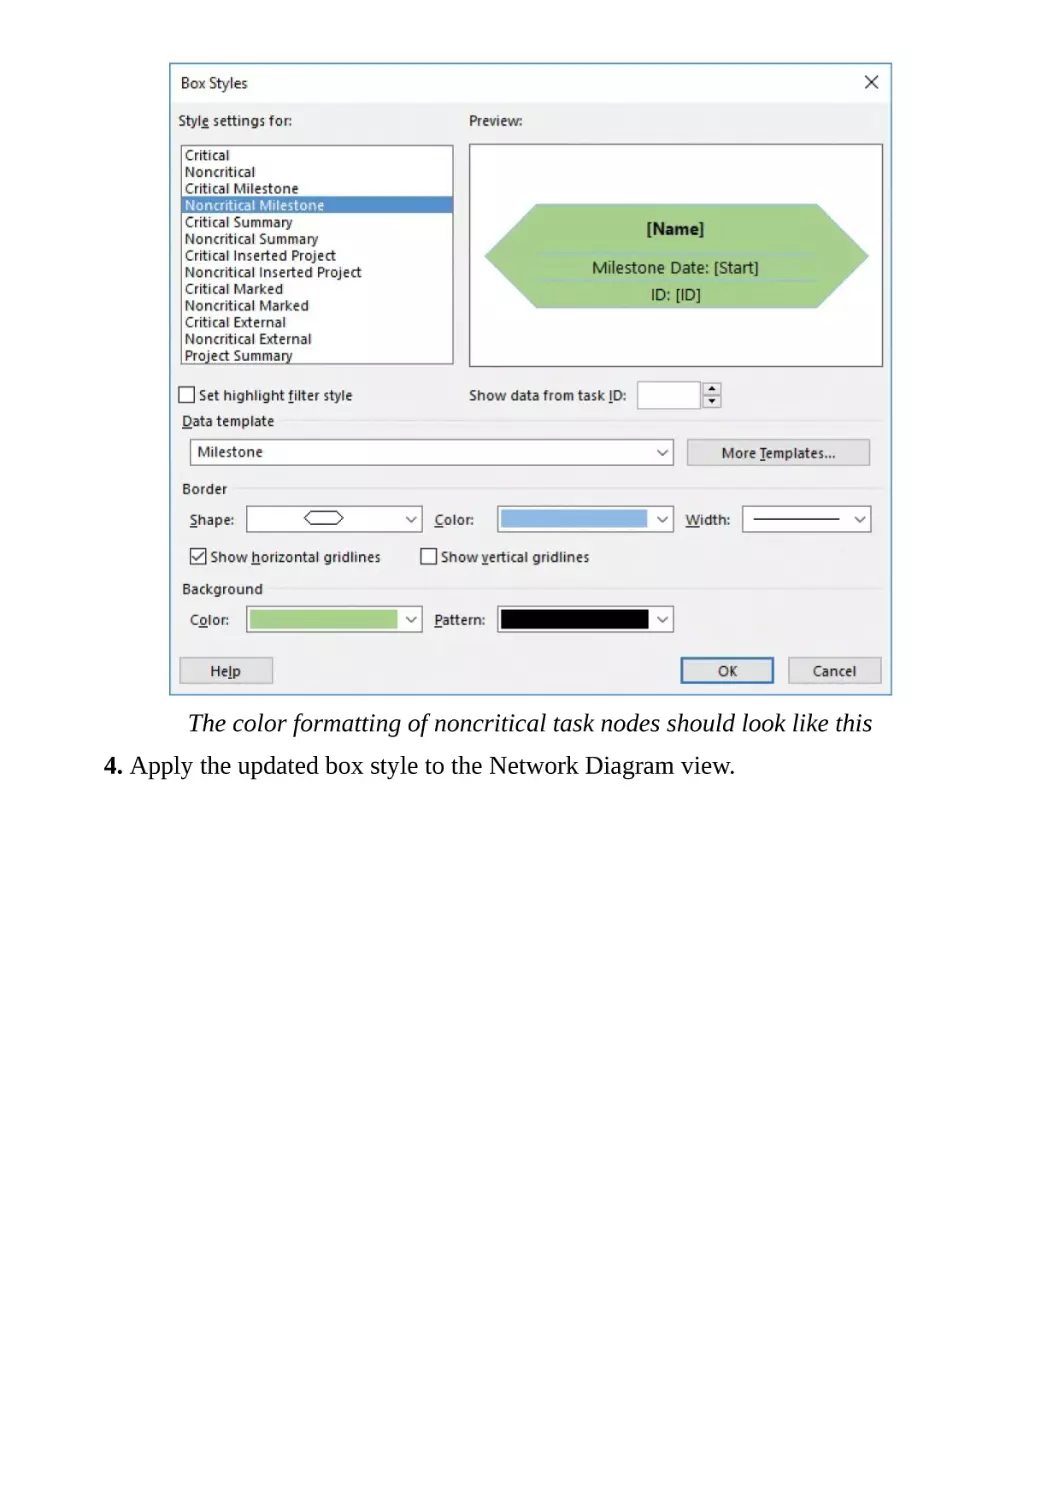
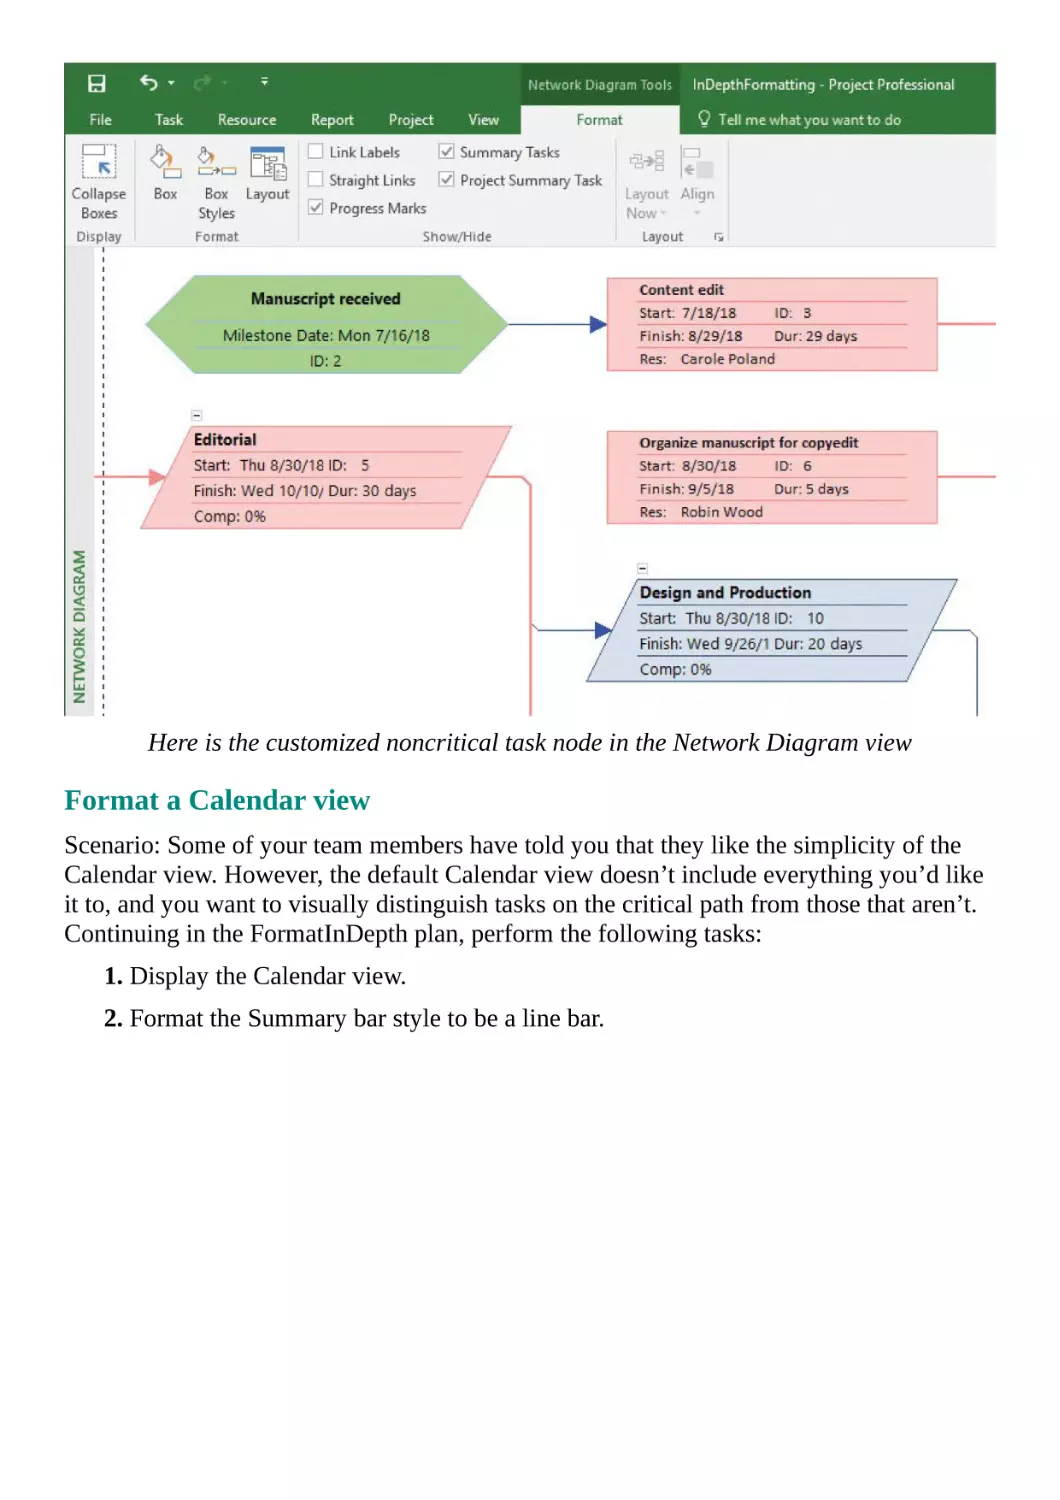
Format a Network Diagram view
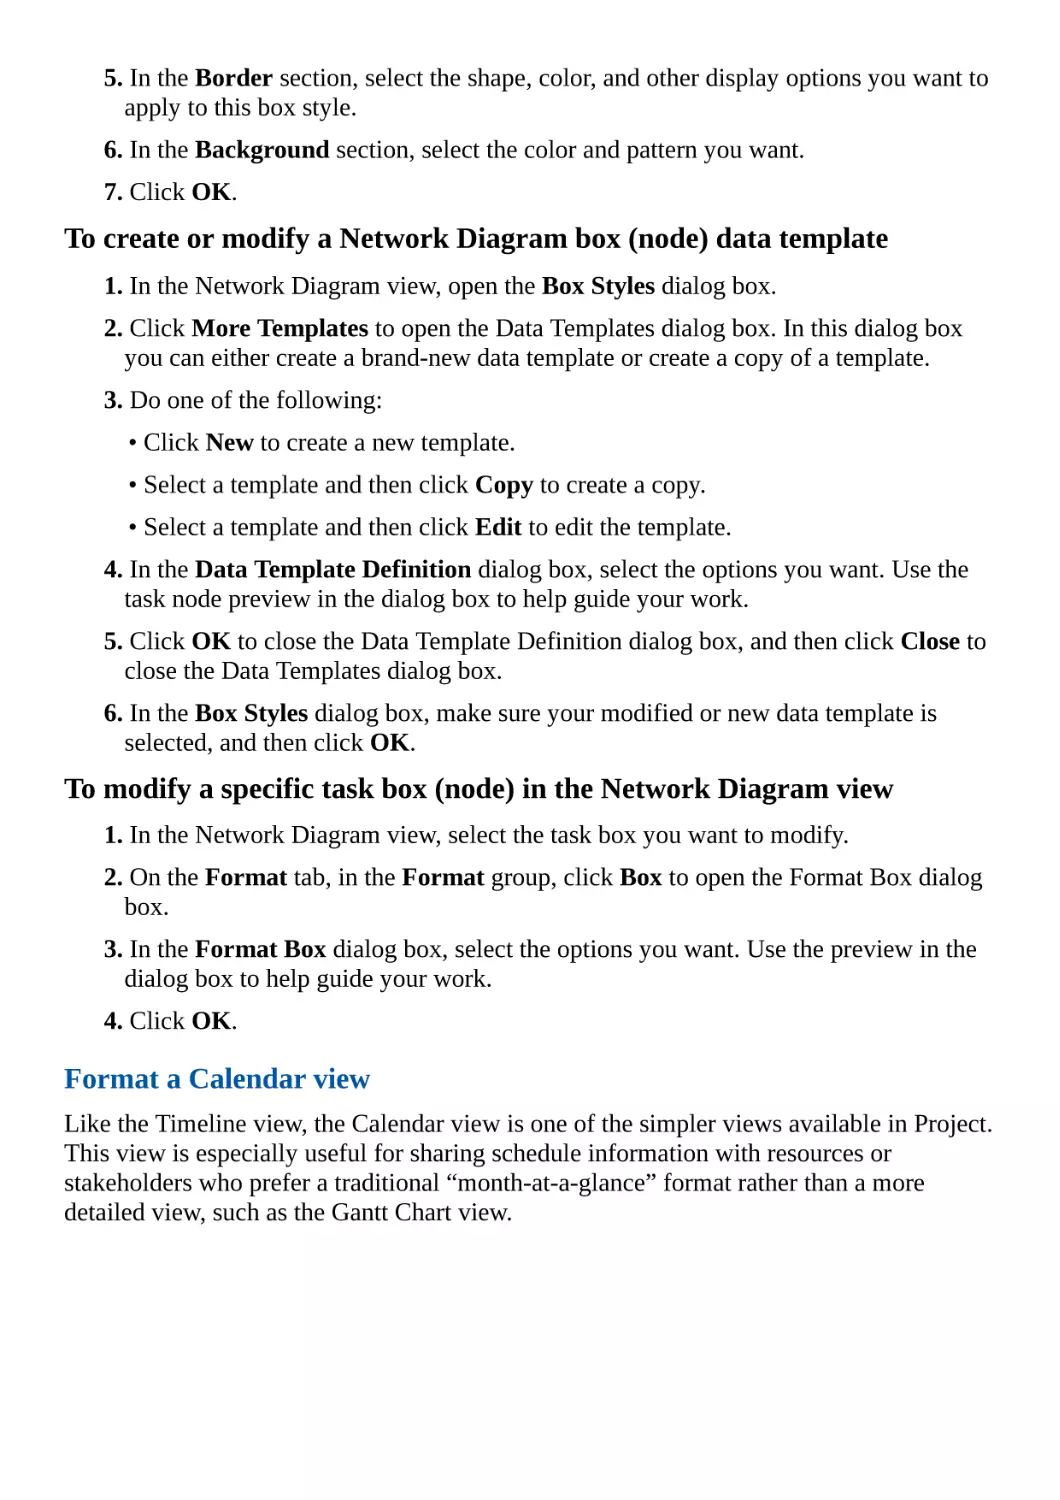
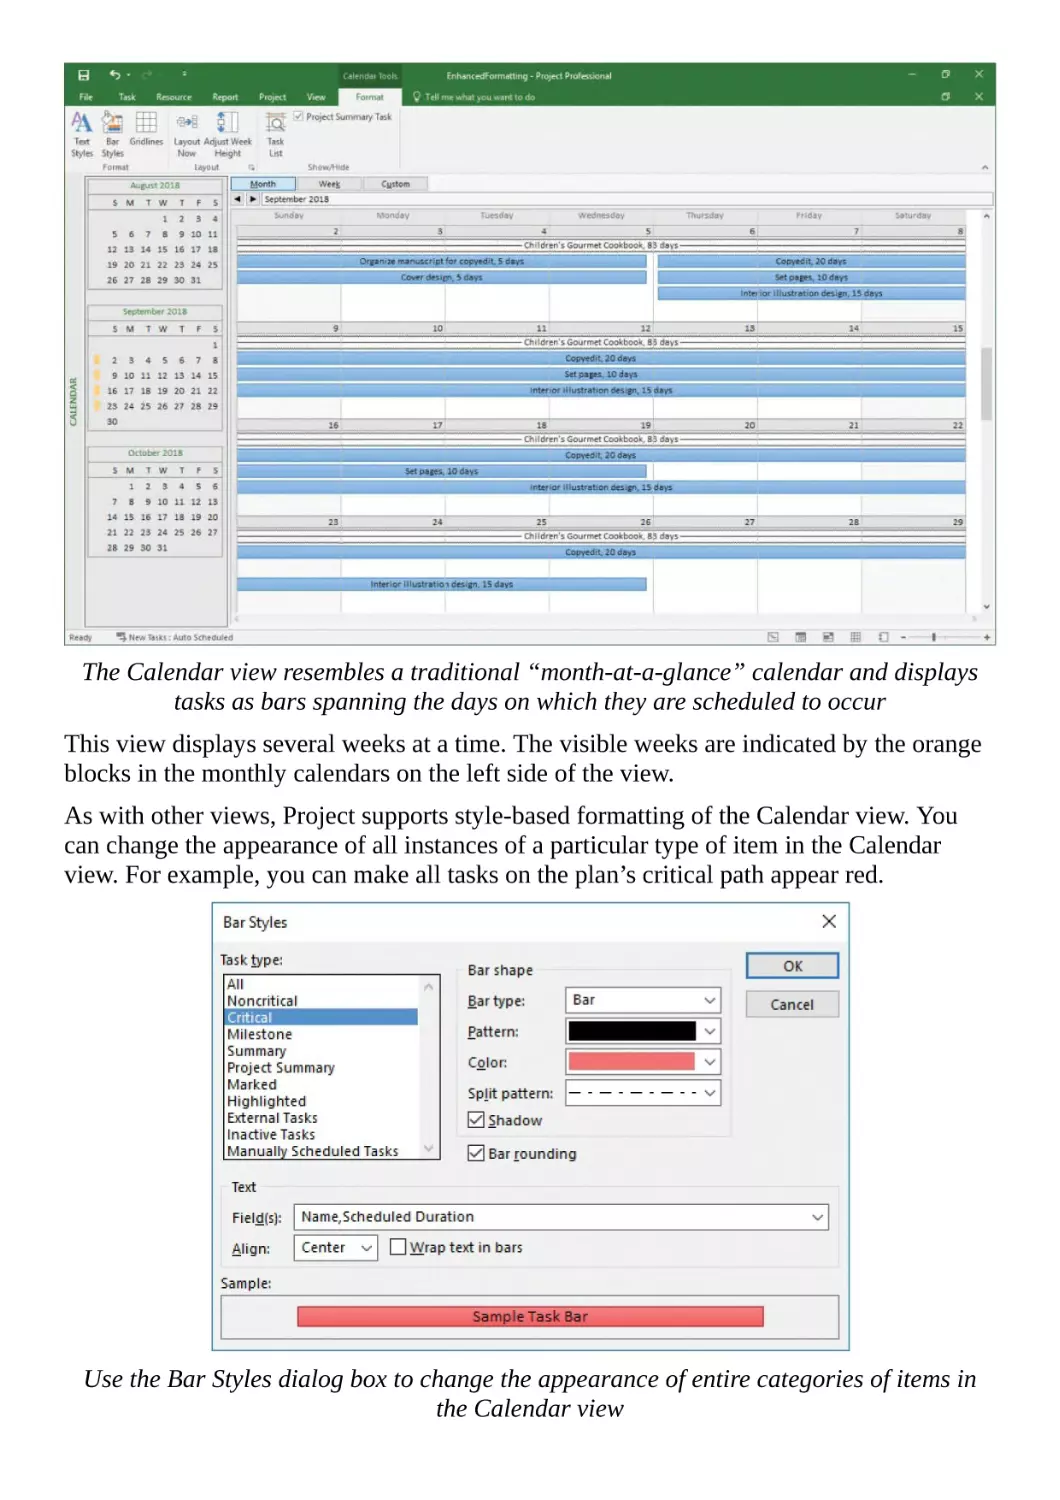
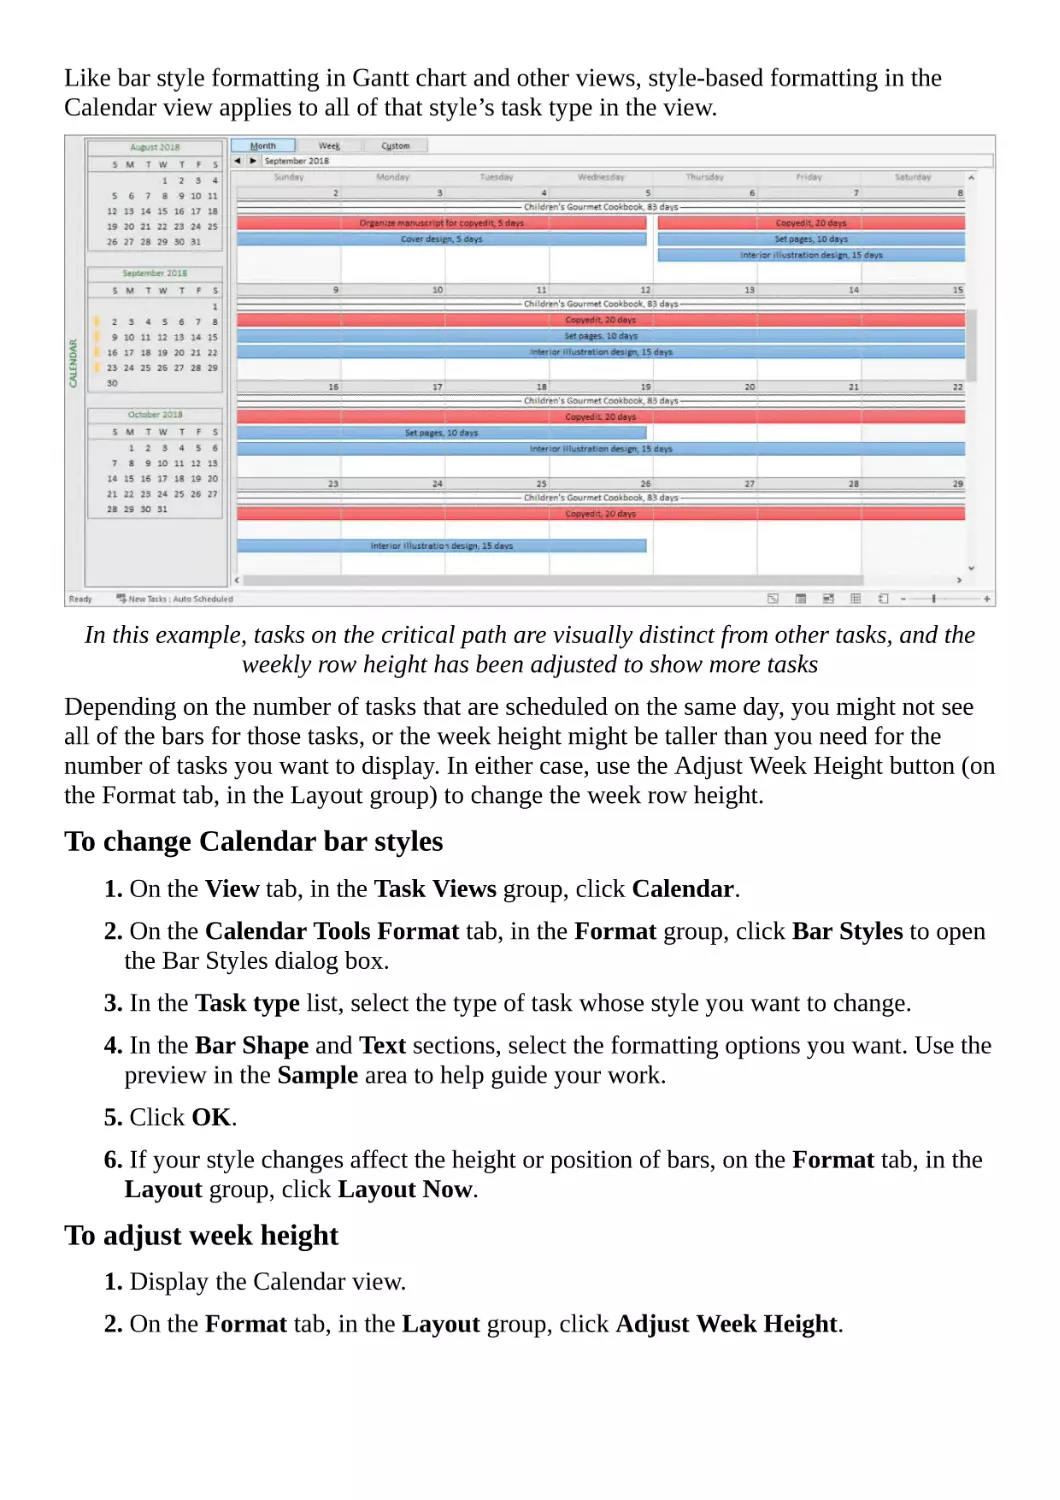
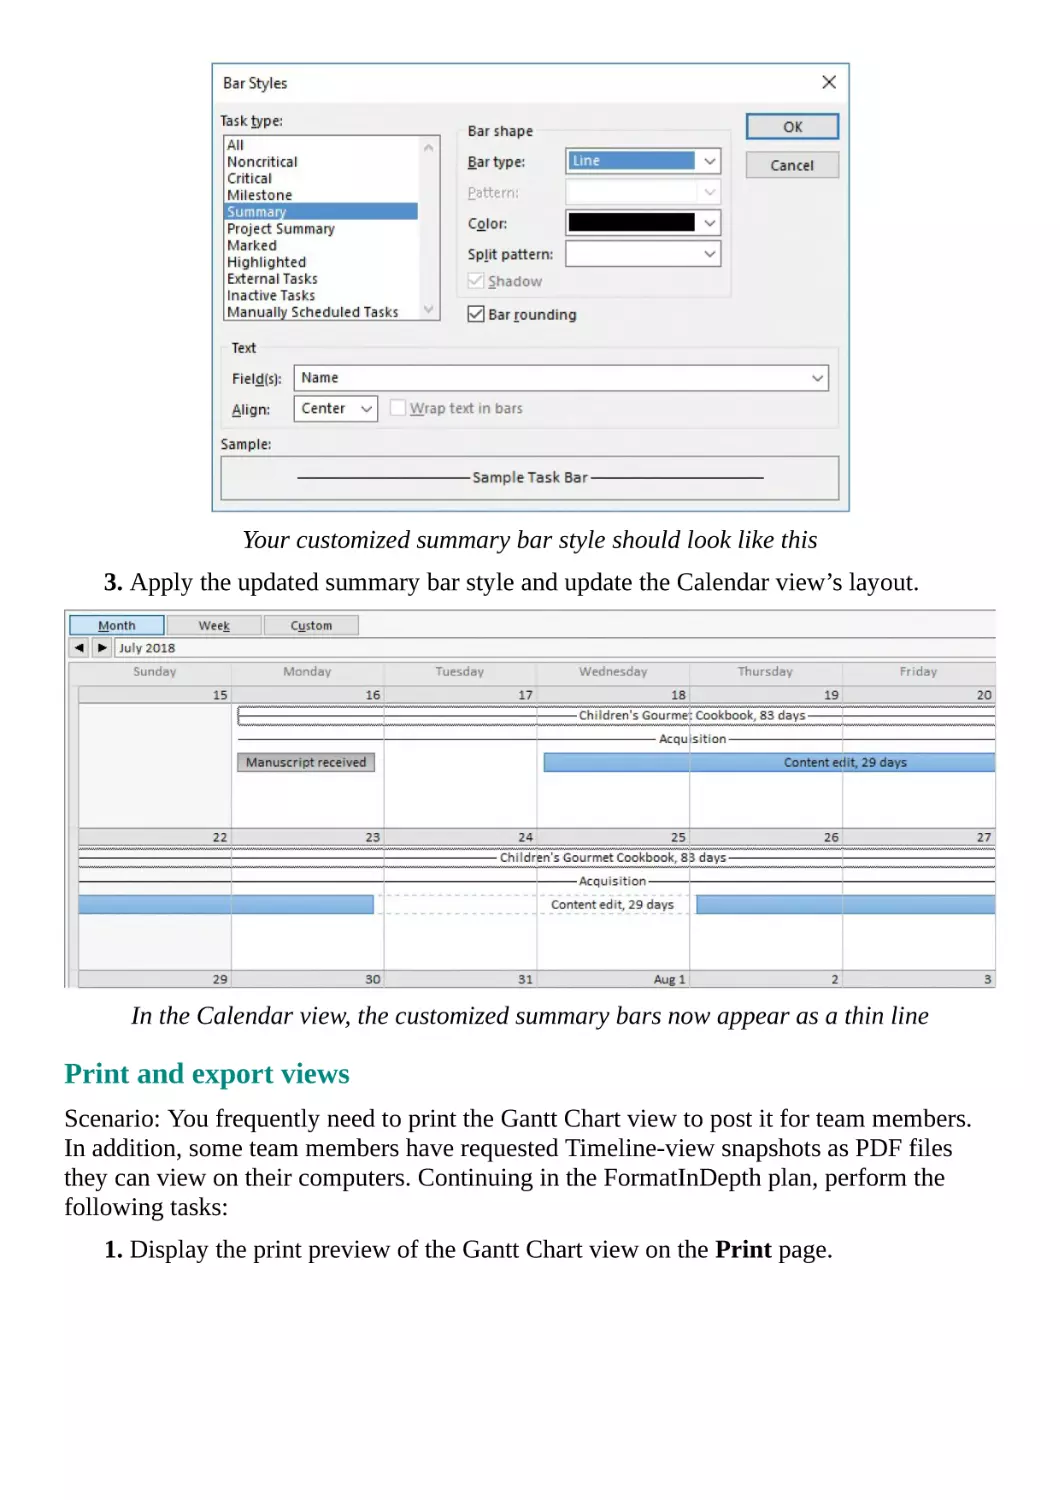
Format a Calendar view
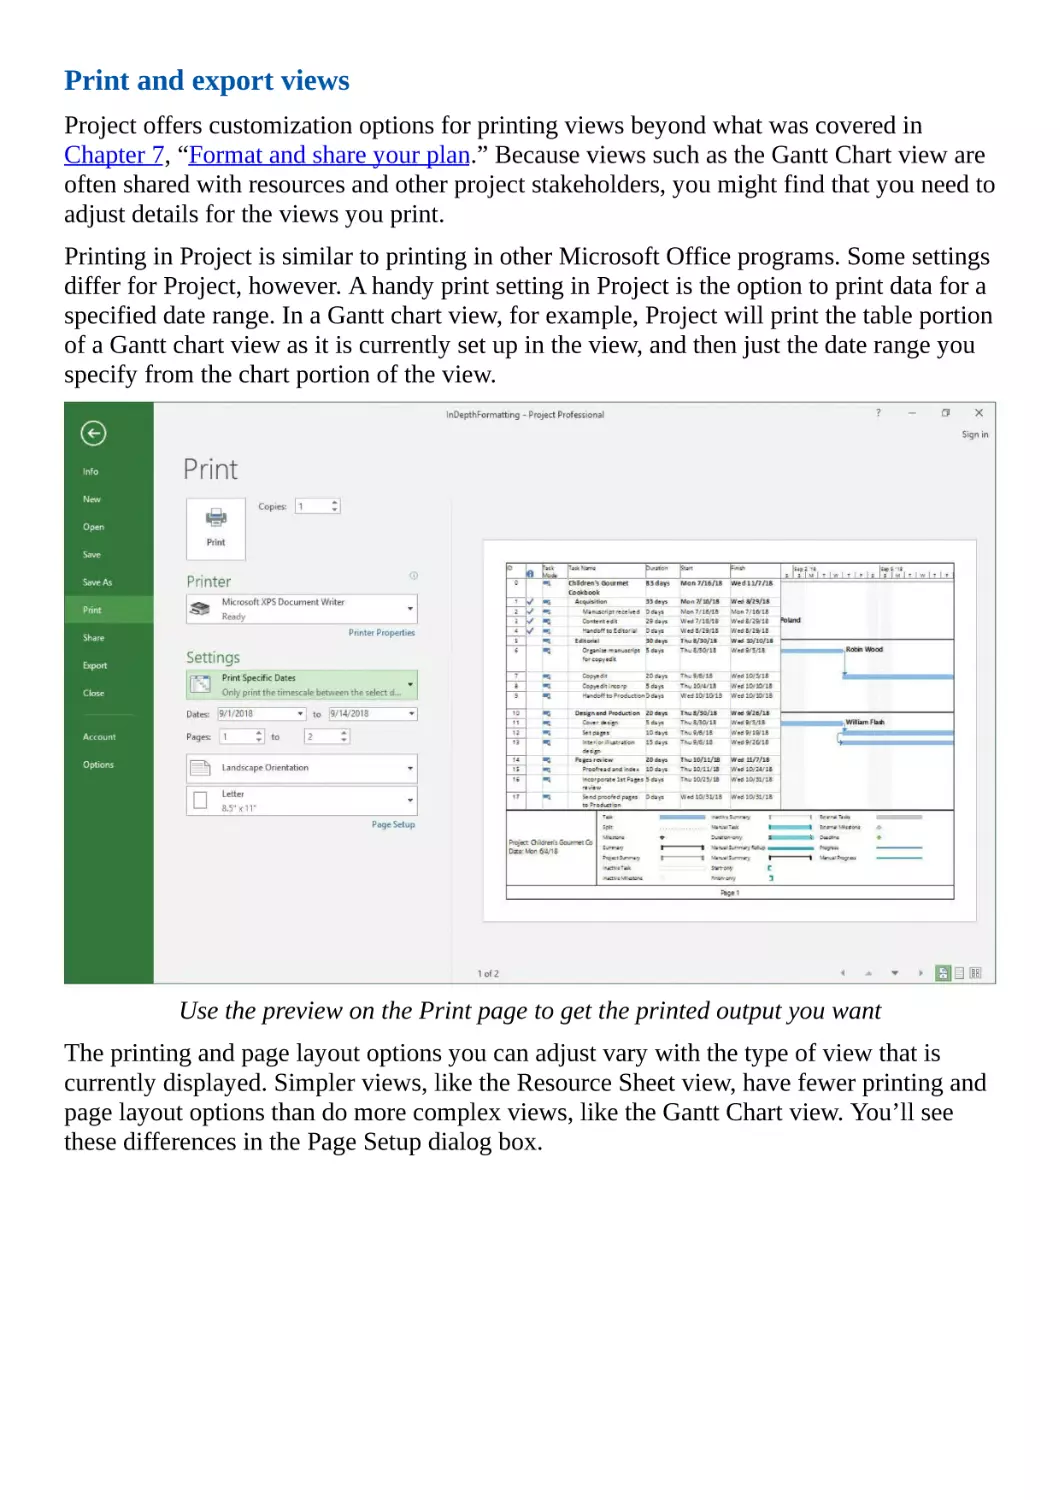
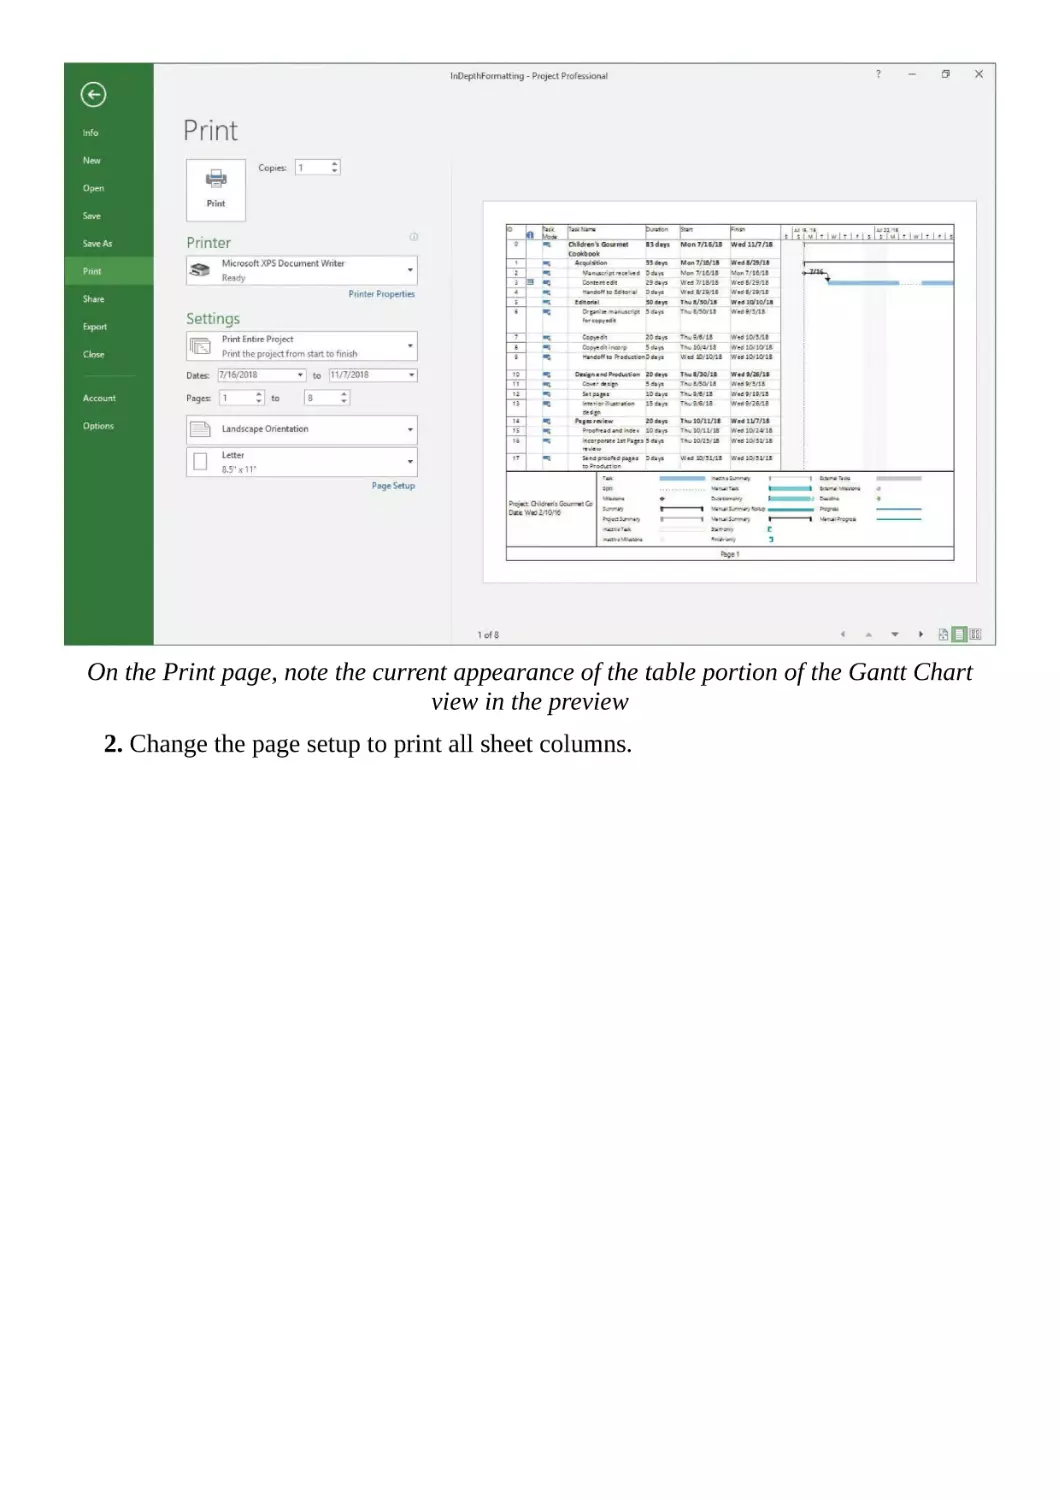
Print and export views
Skills review
Practice tasks
17 Format reports: In-depth techniques
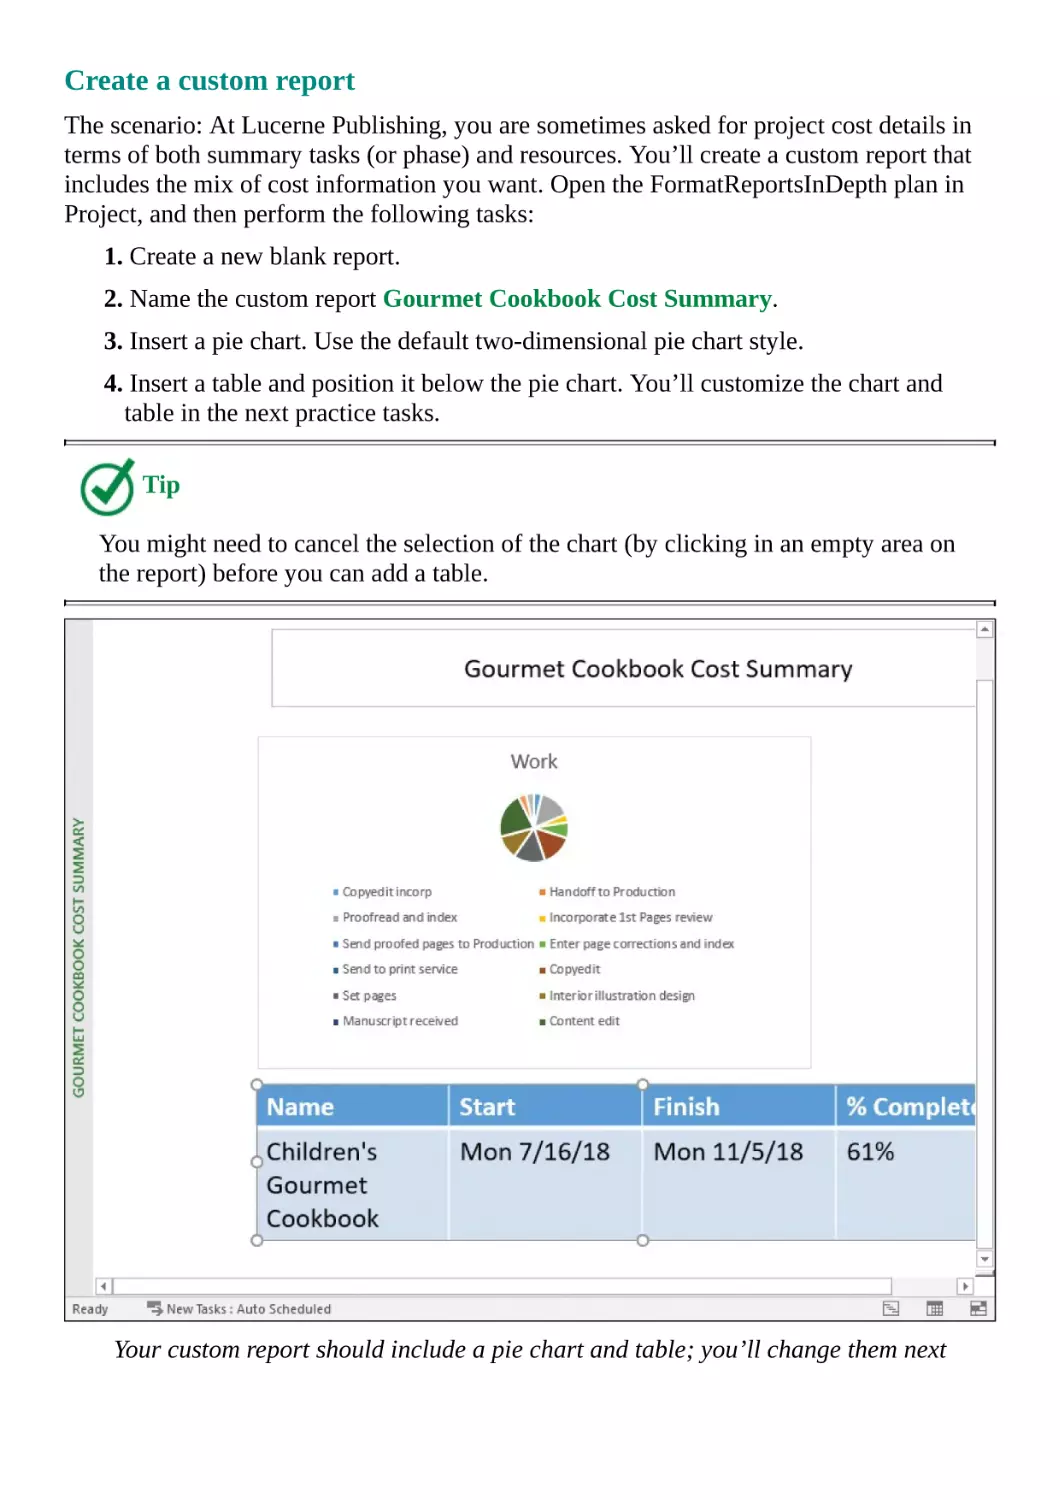
Create a custom report
Sidebar: How reports compare to views
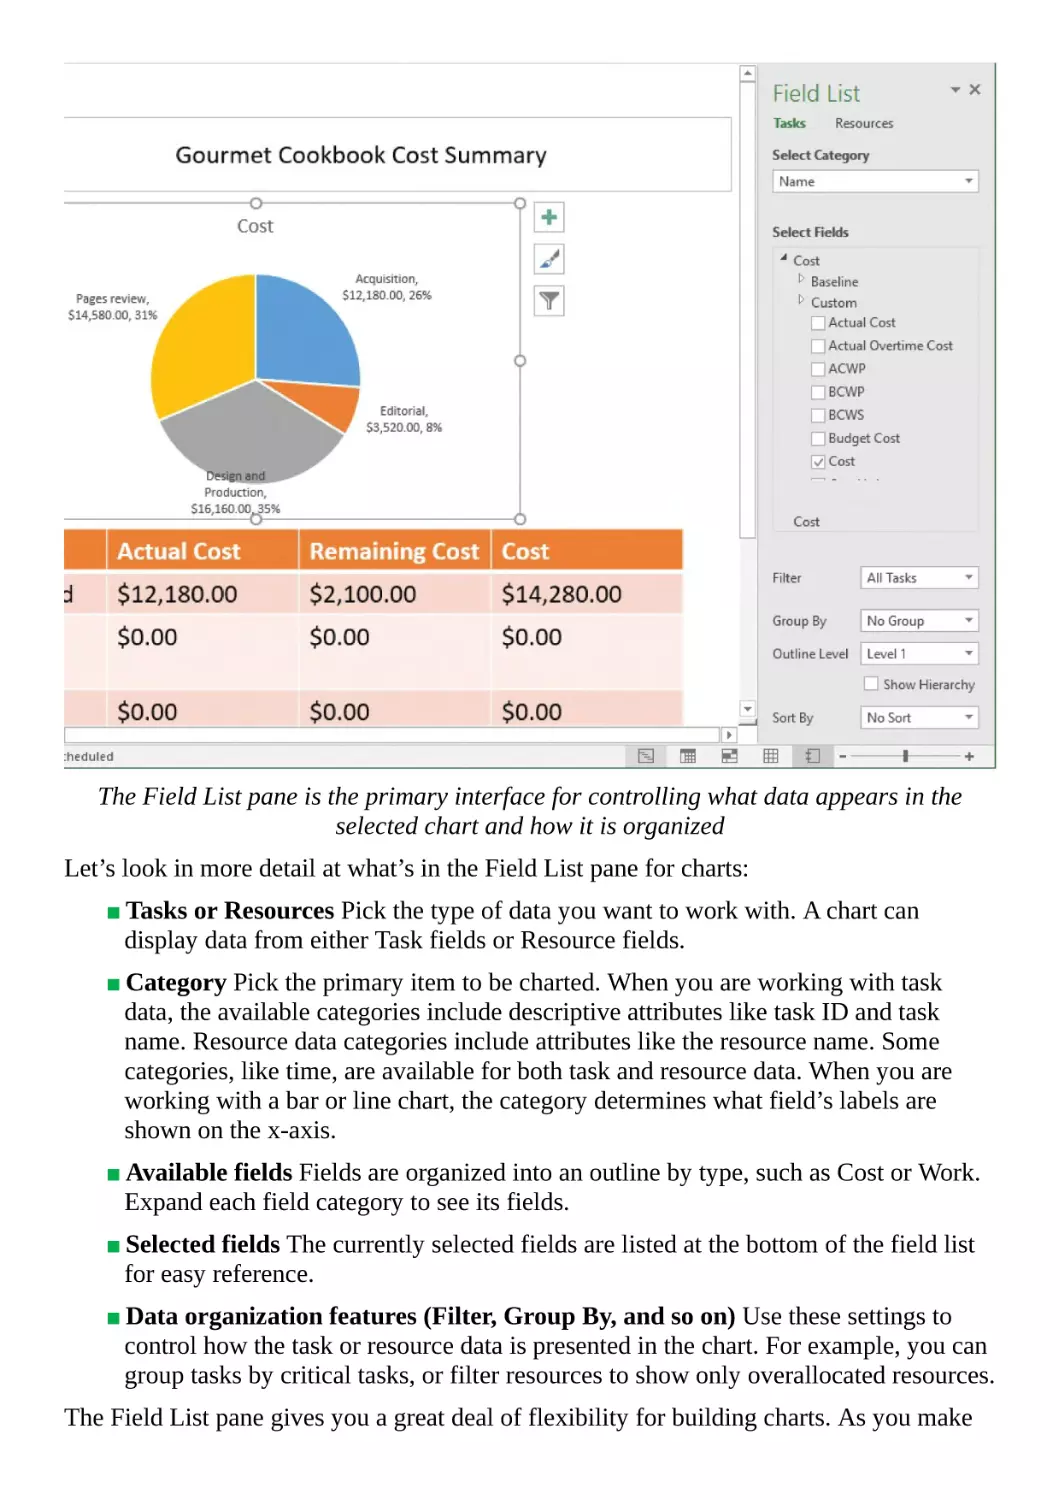
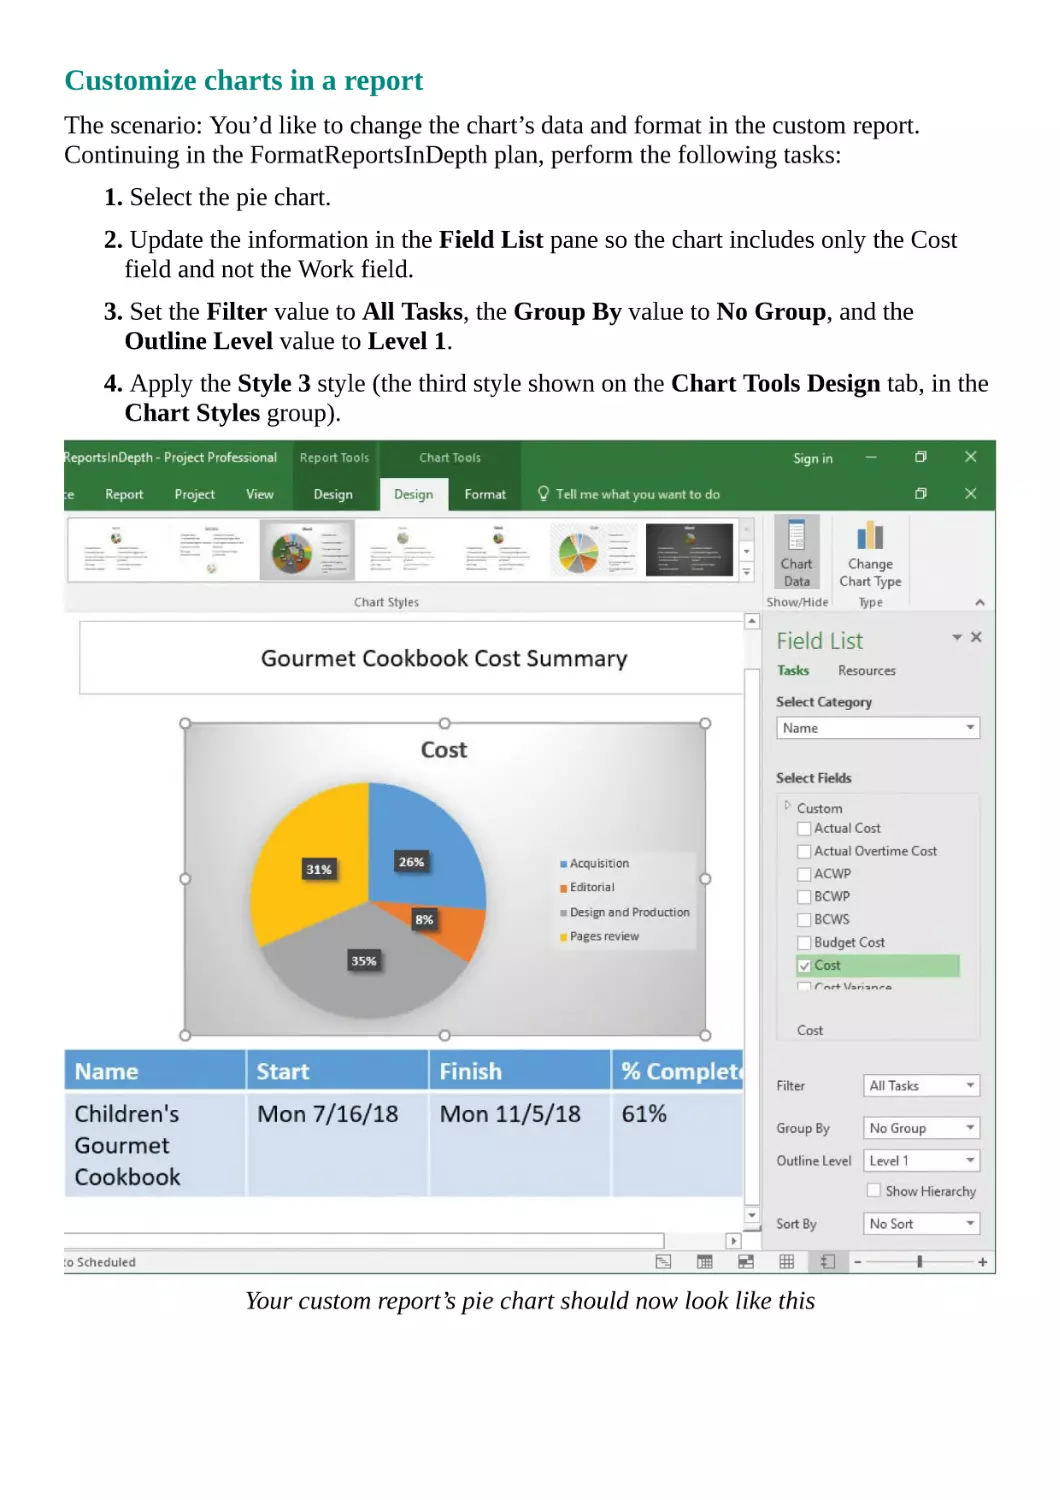
Customize charts in a report
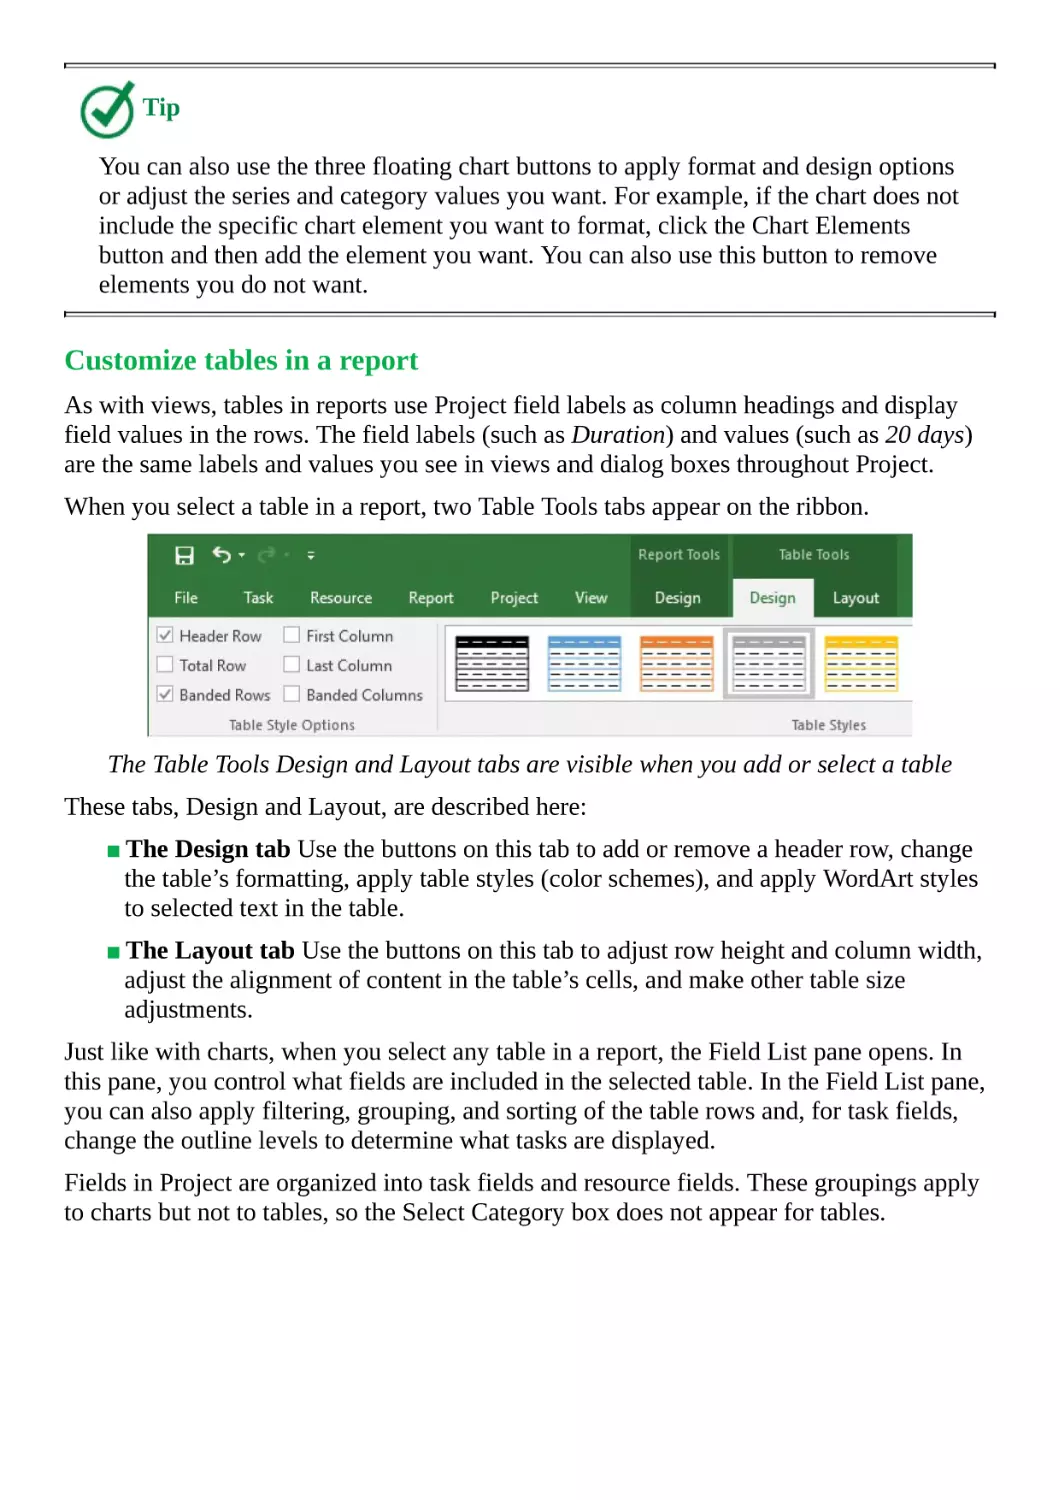
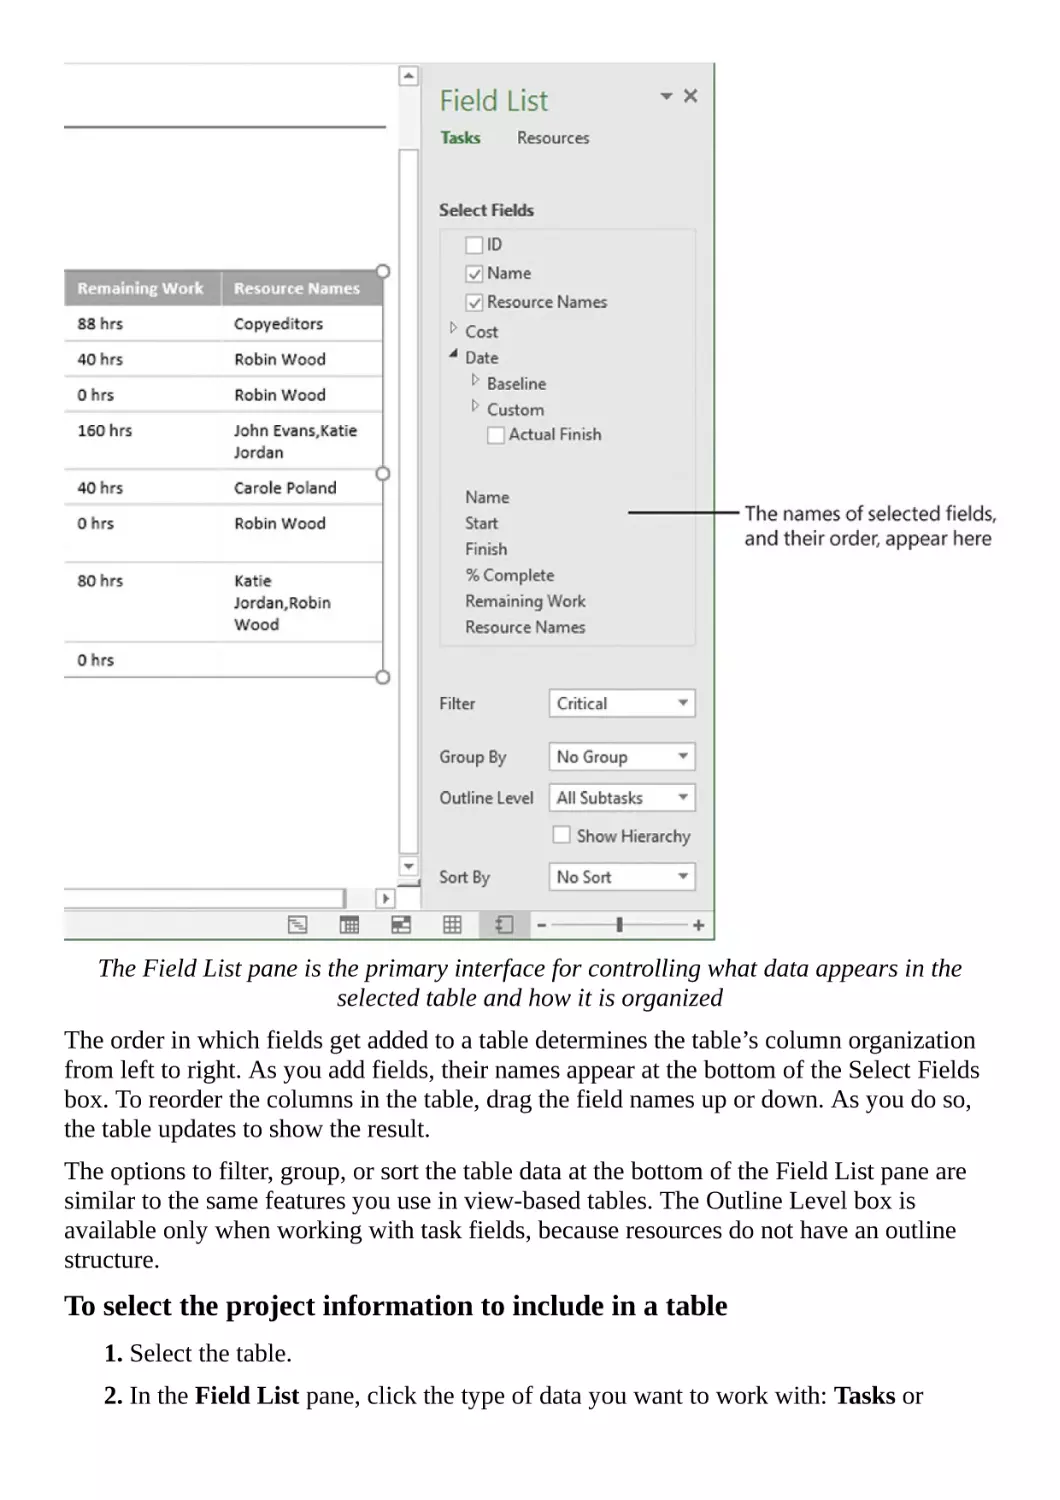
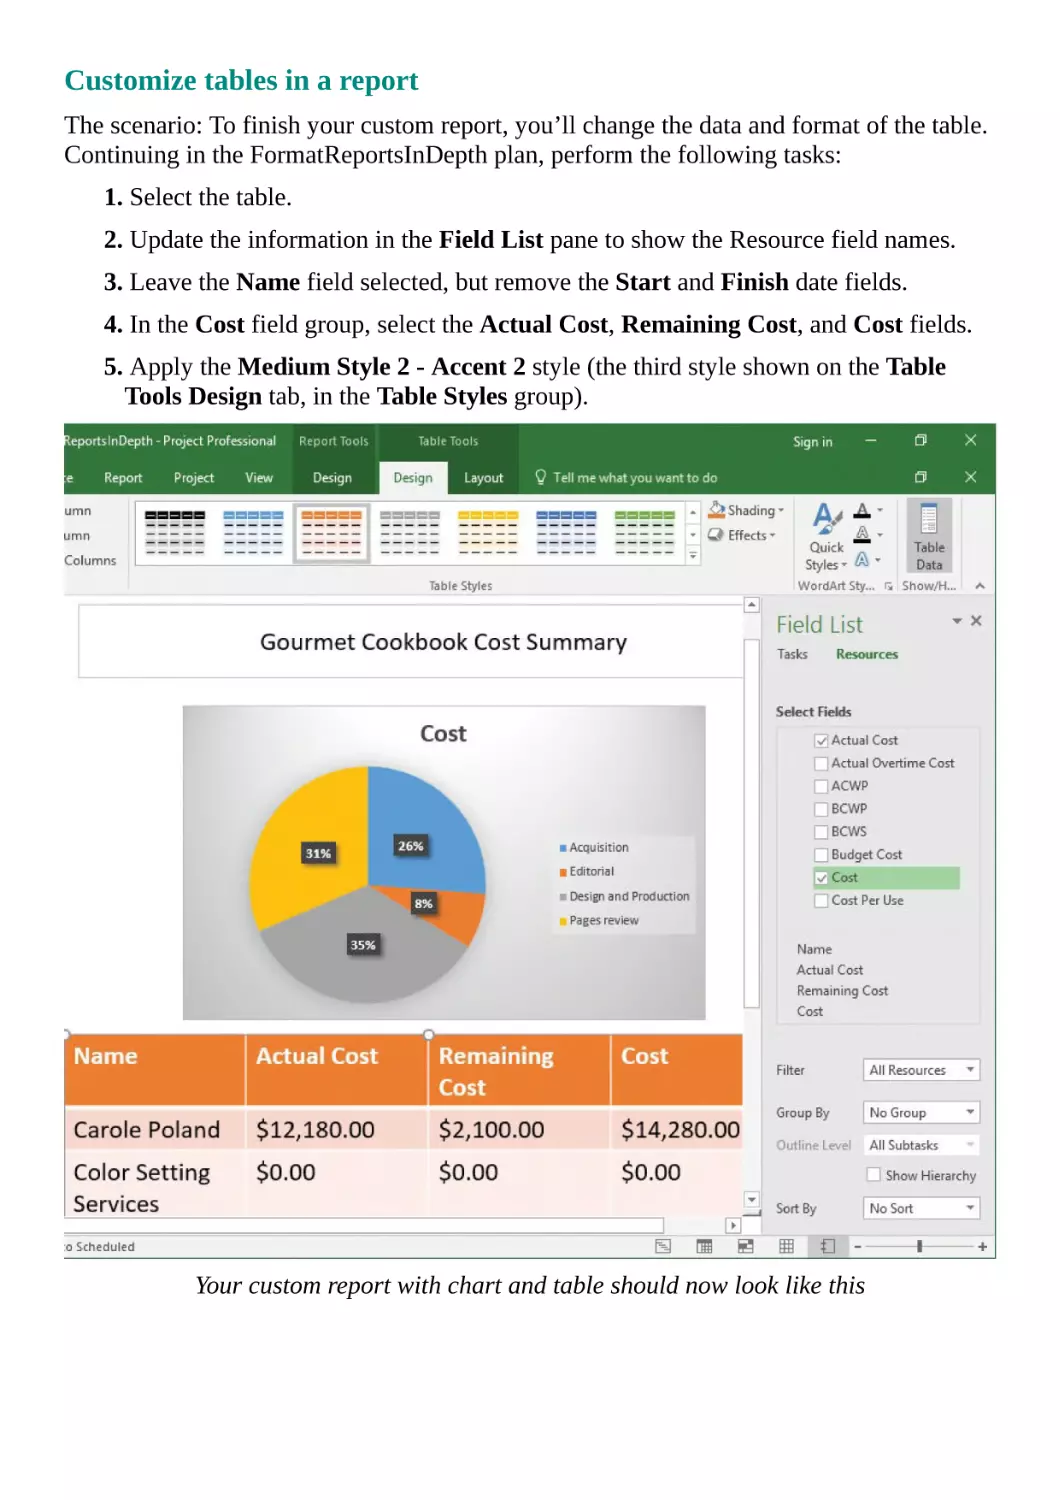
Customize tables in a report
Skills review
Practice tasks
18 Customize Project
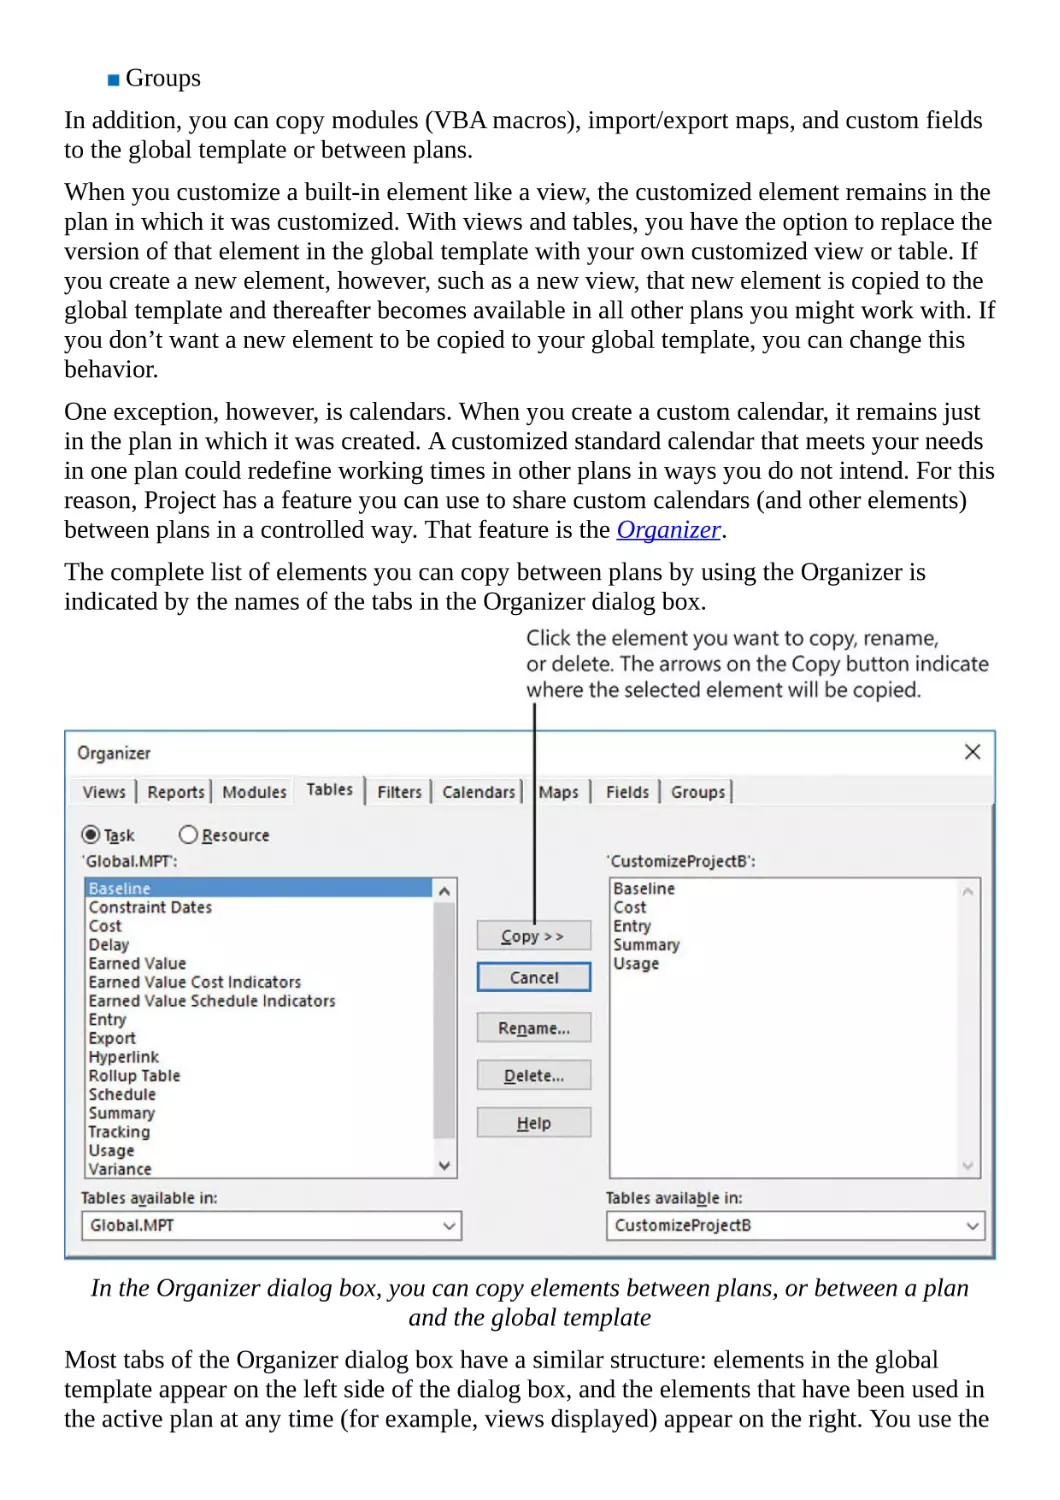
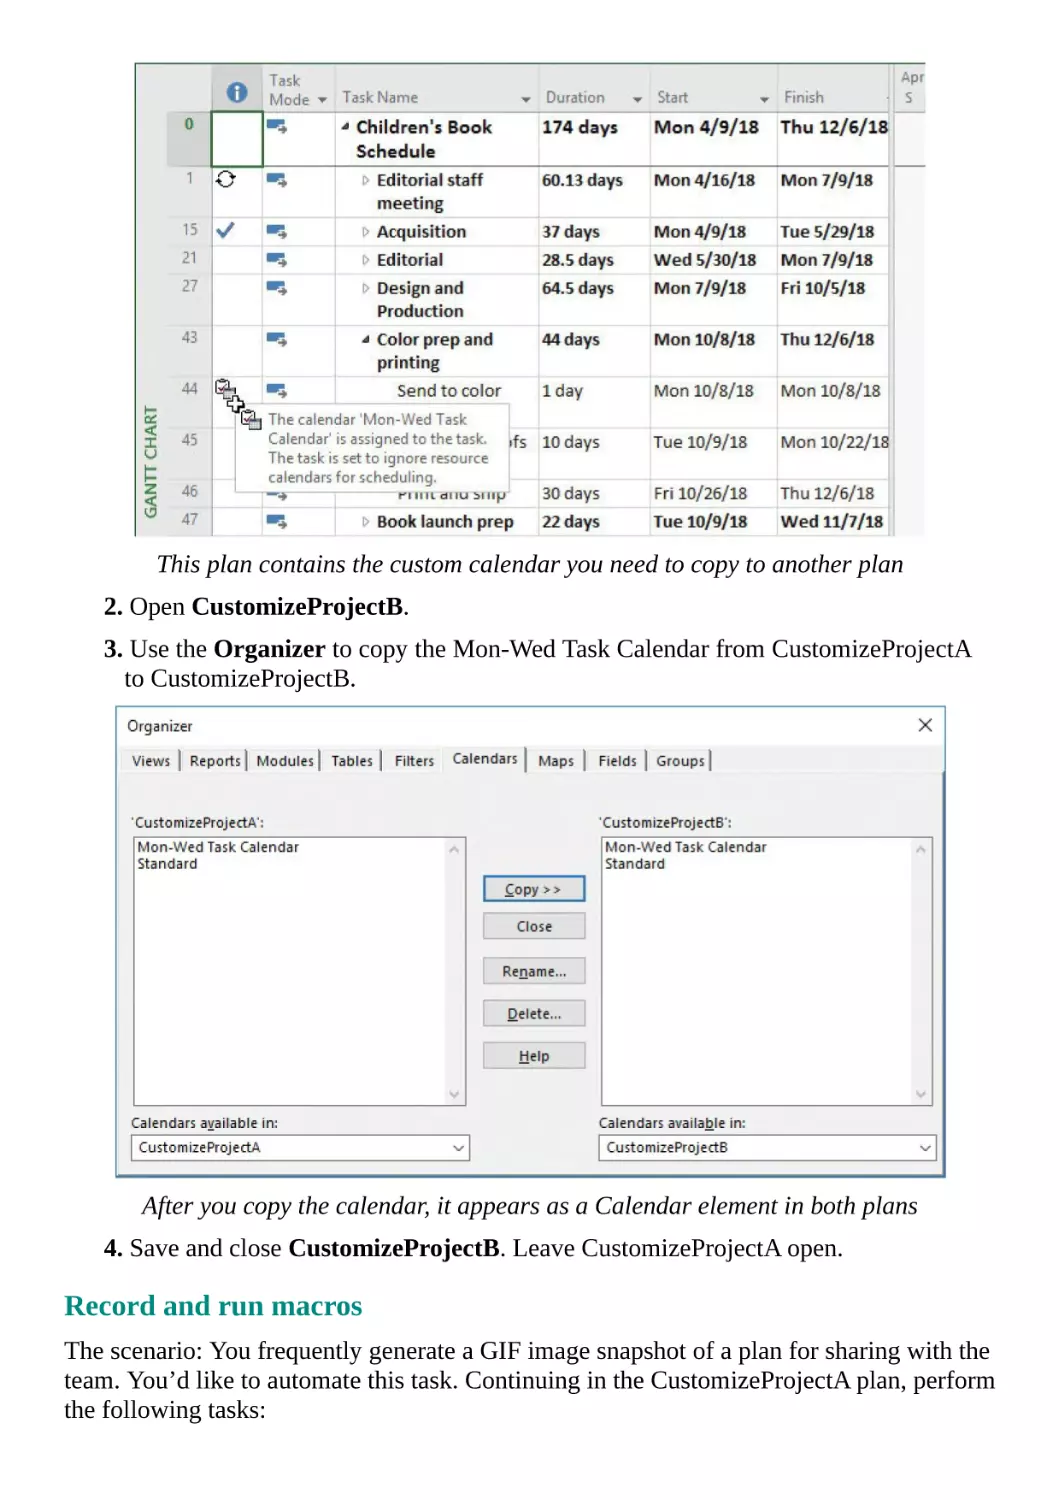
Share custom elements between plans
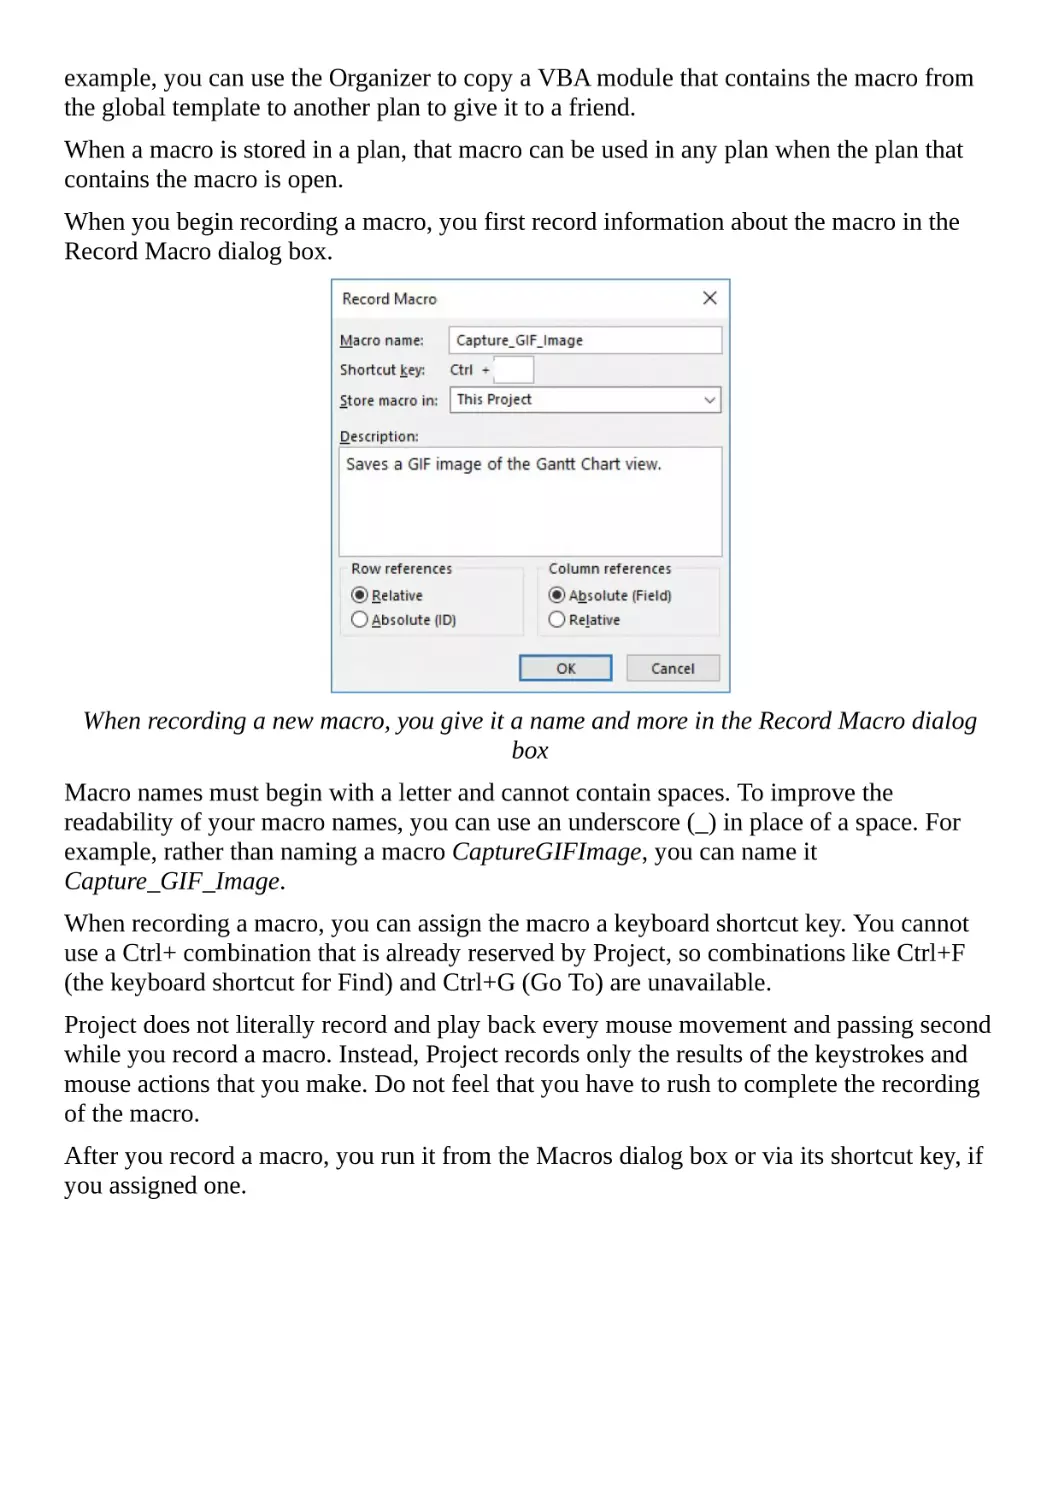
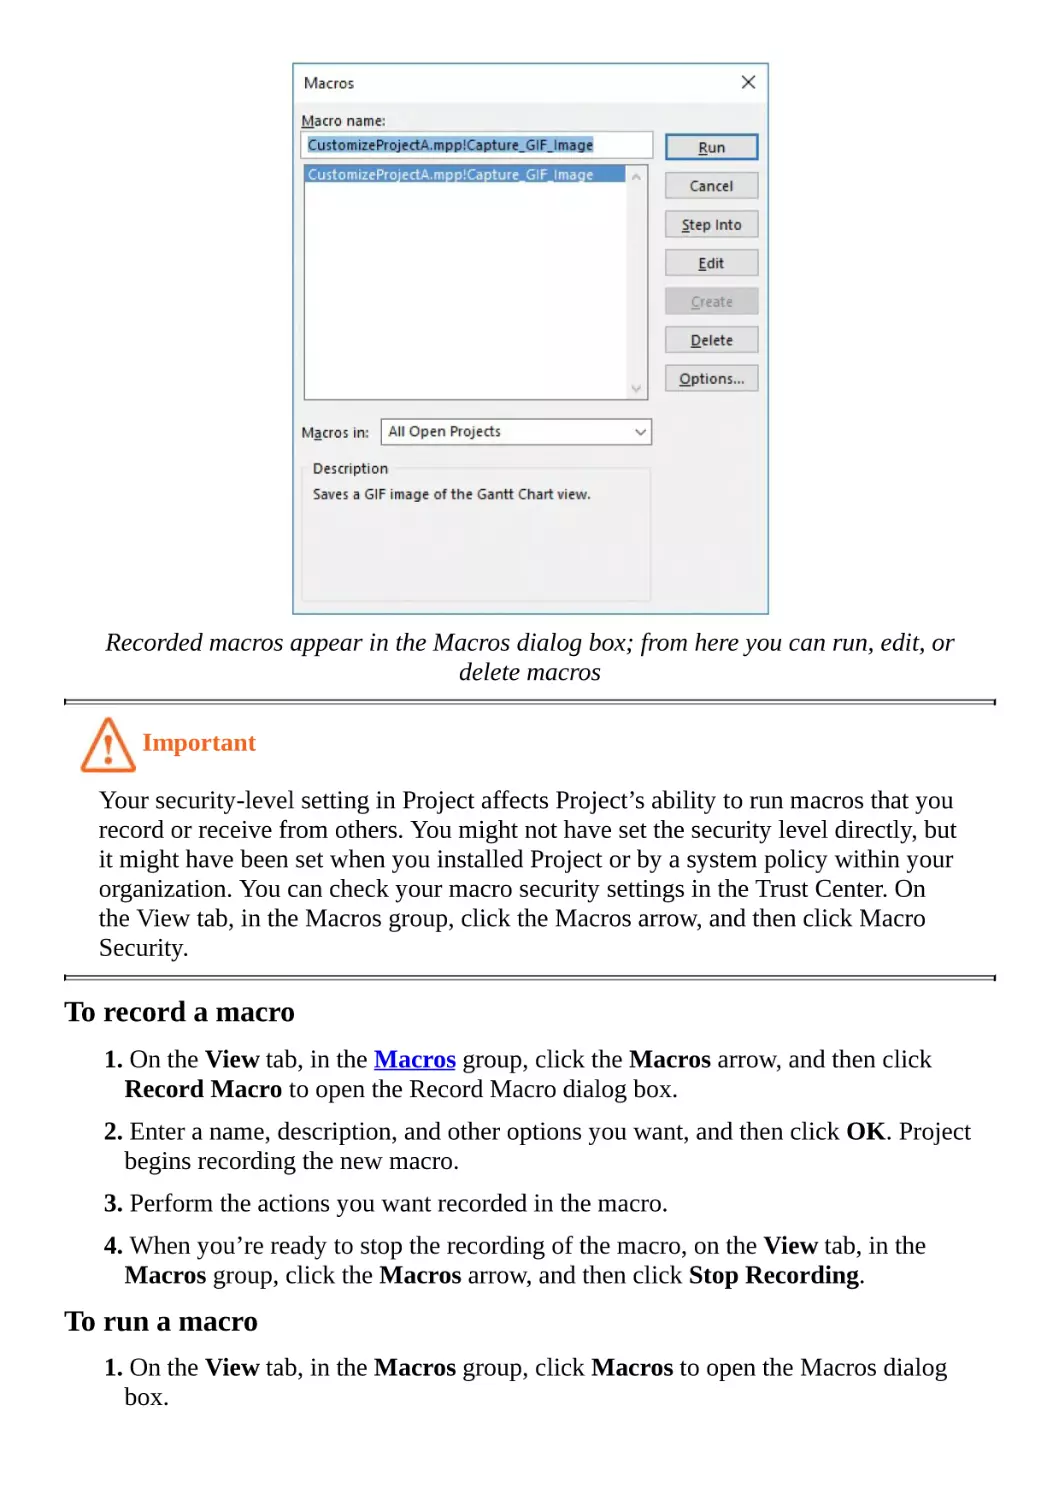
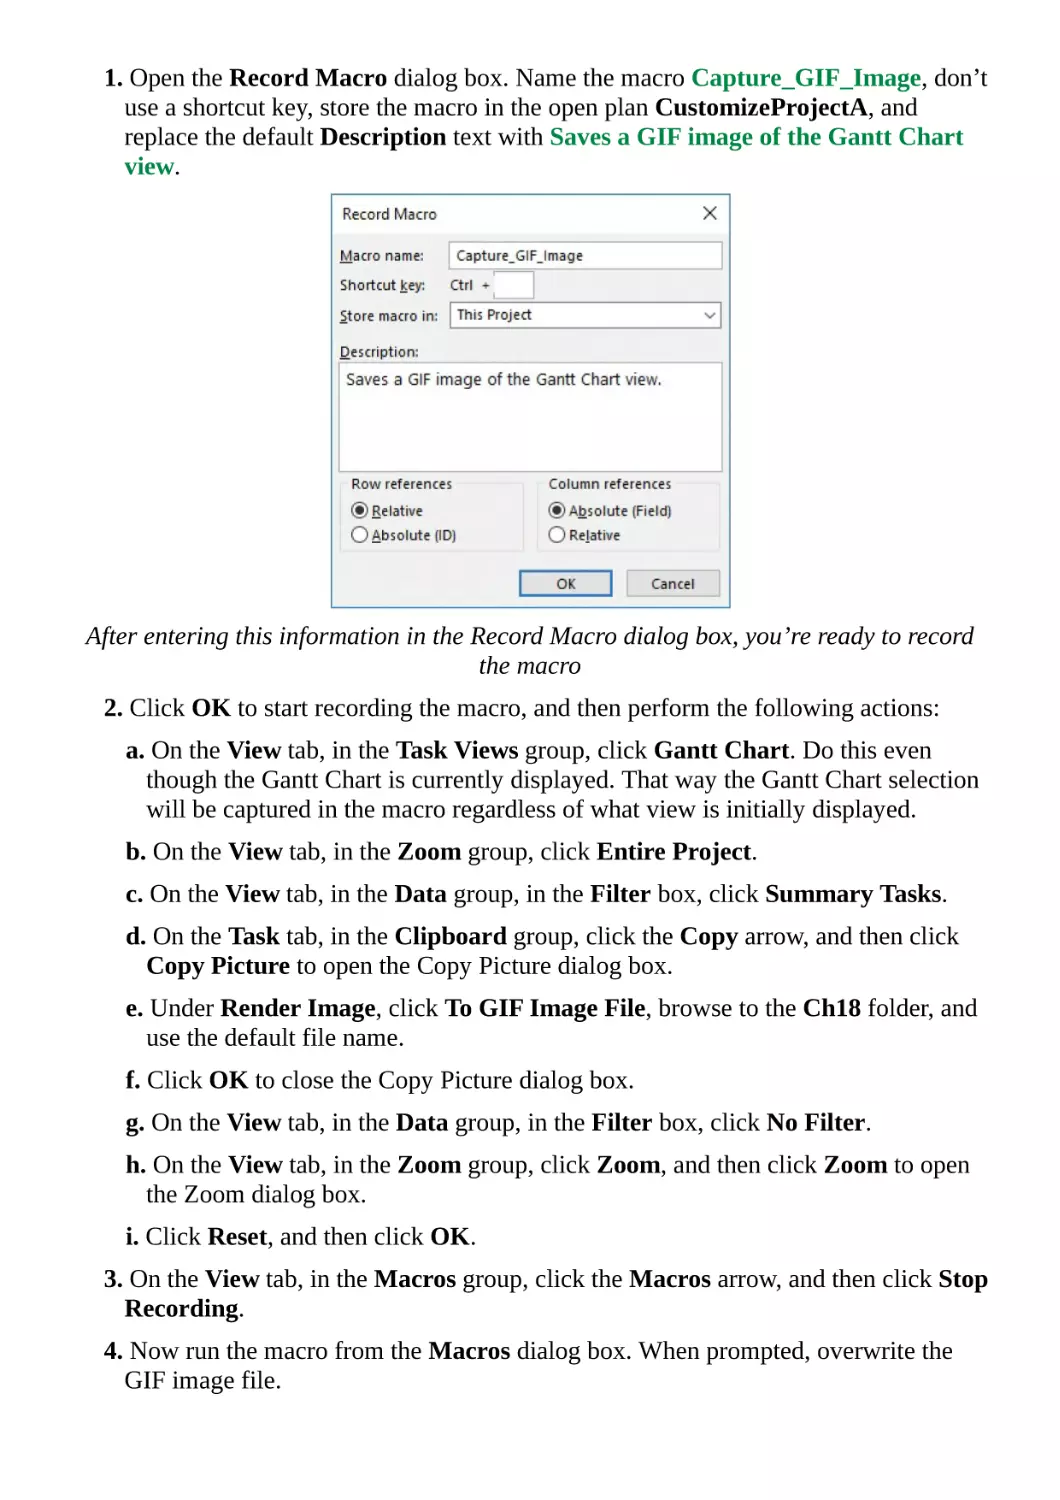
Record and run macros
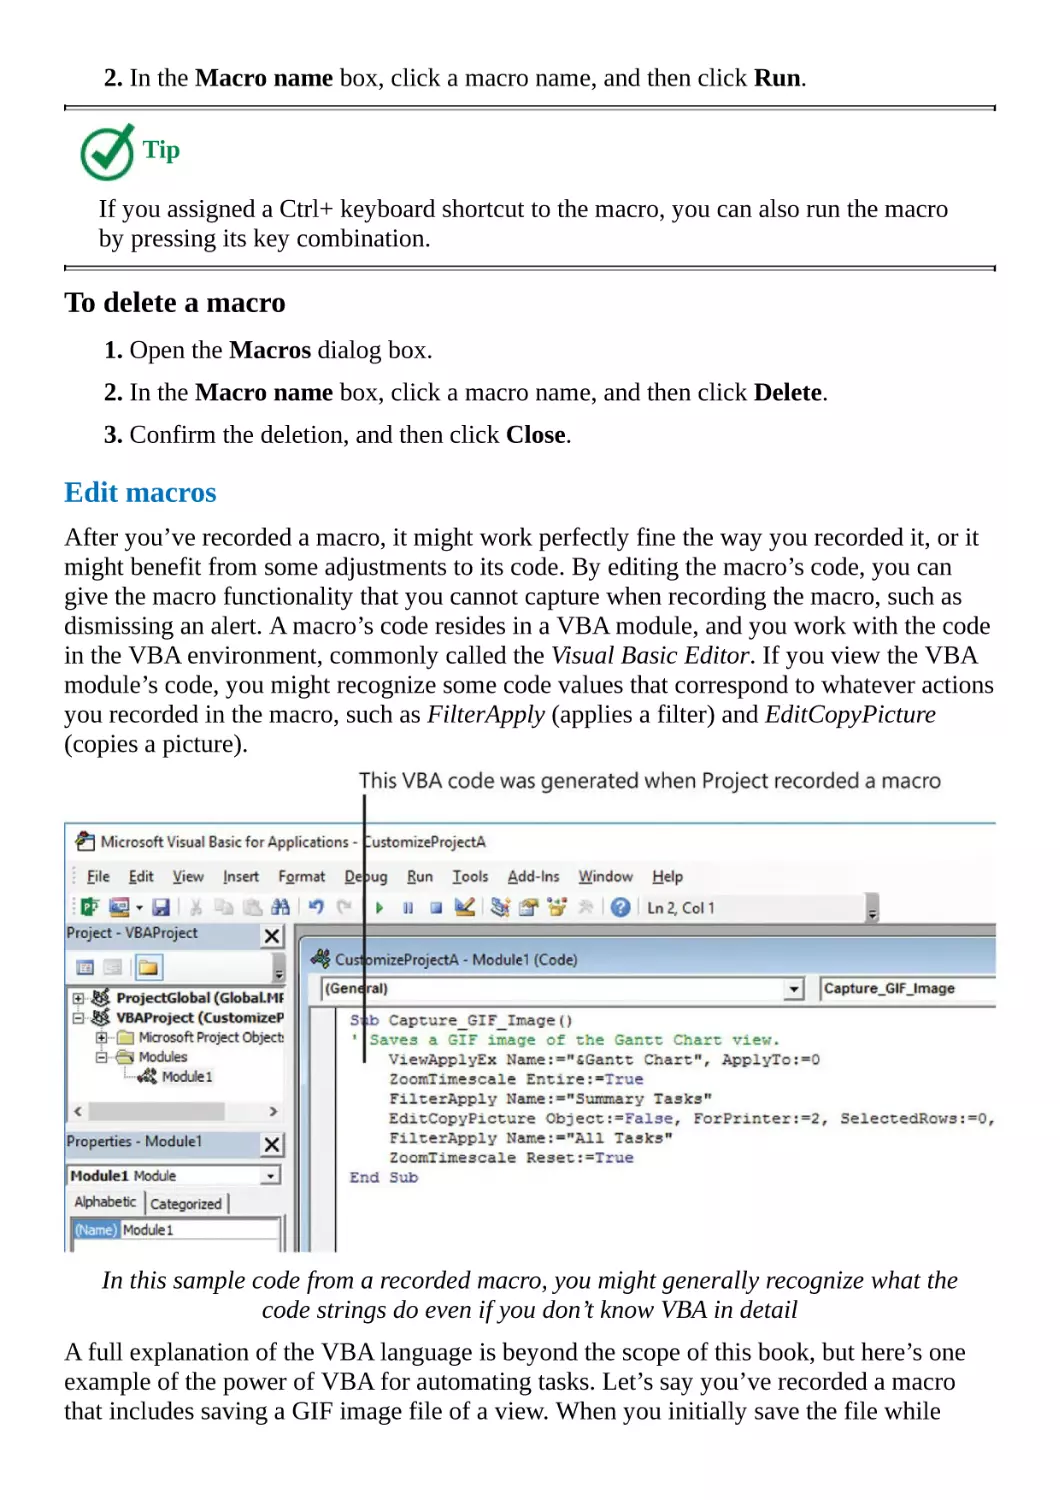
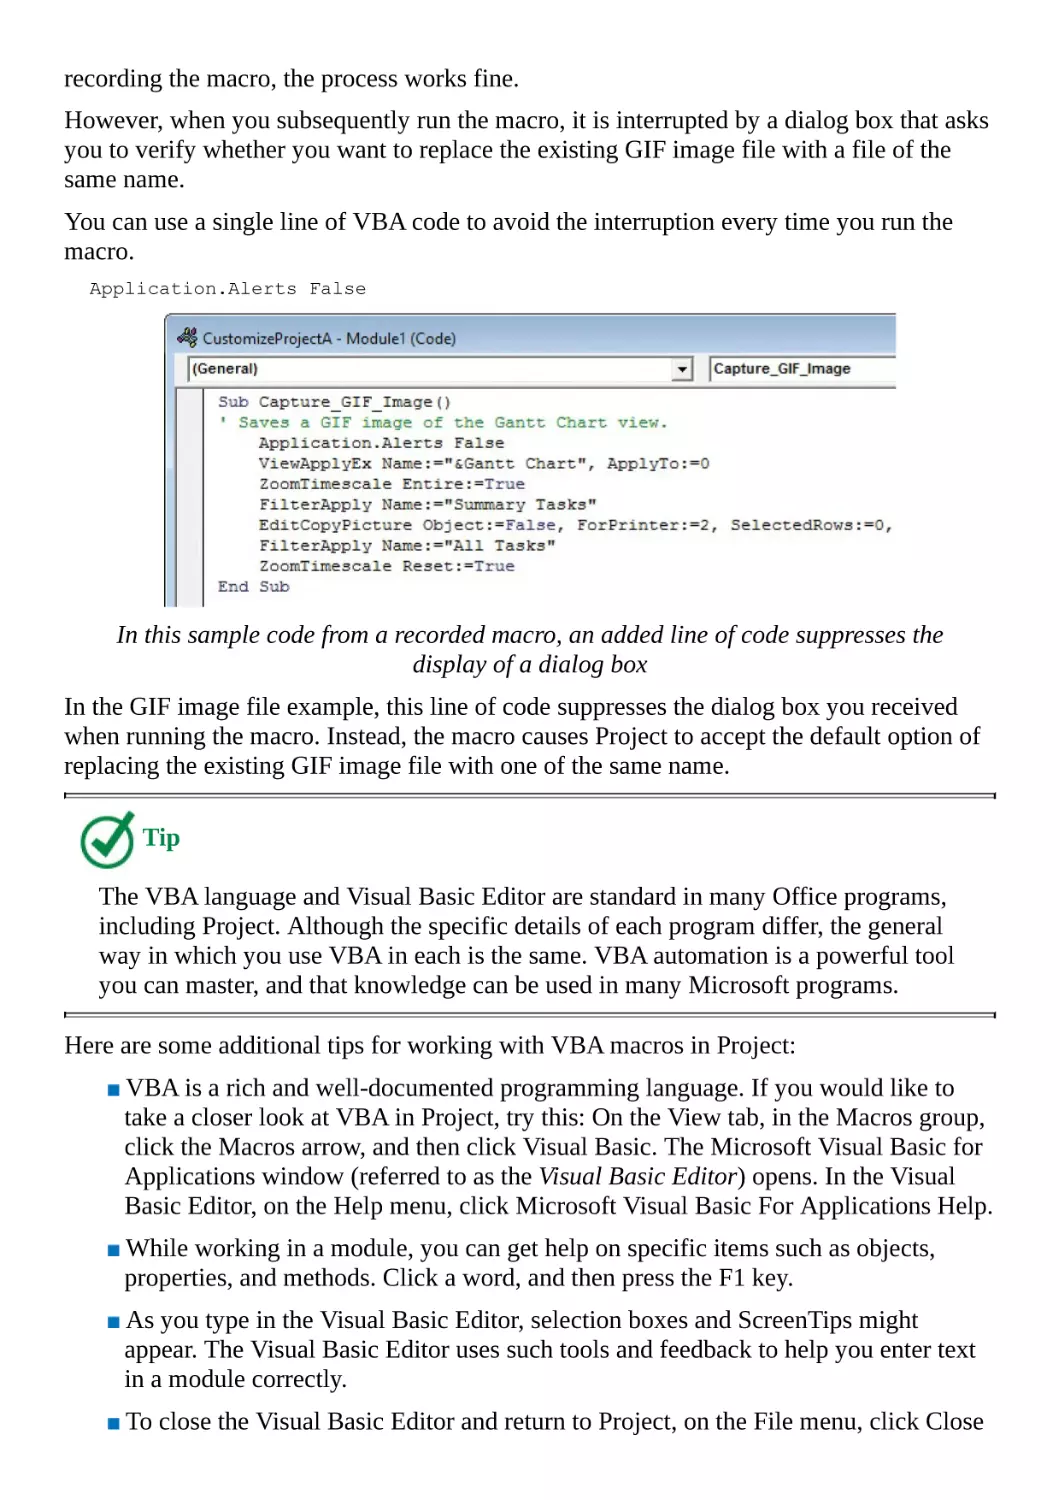
Edit macros
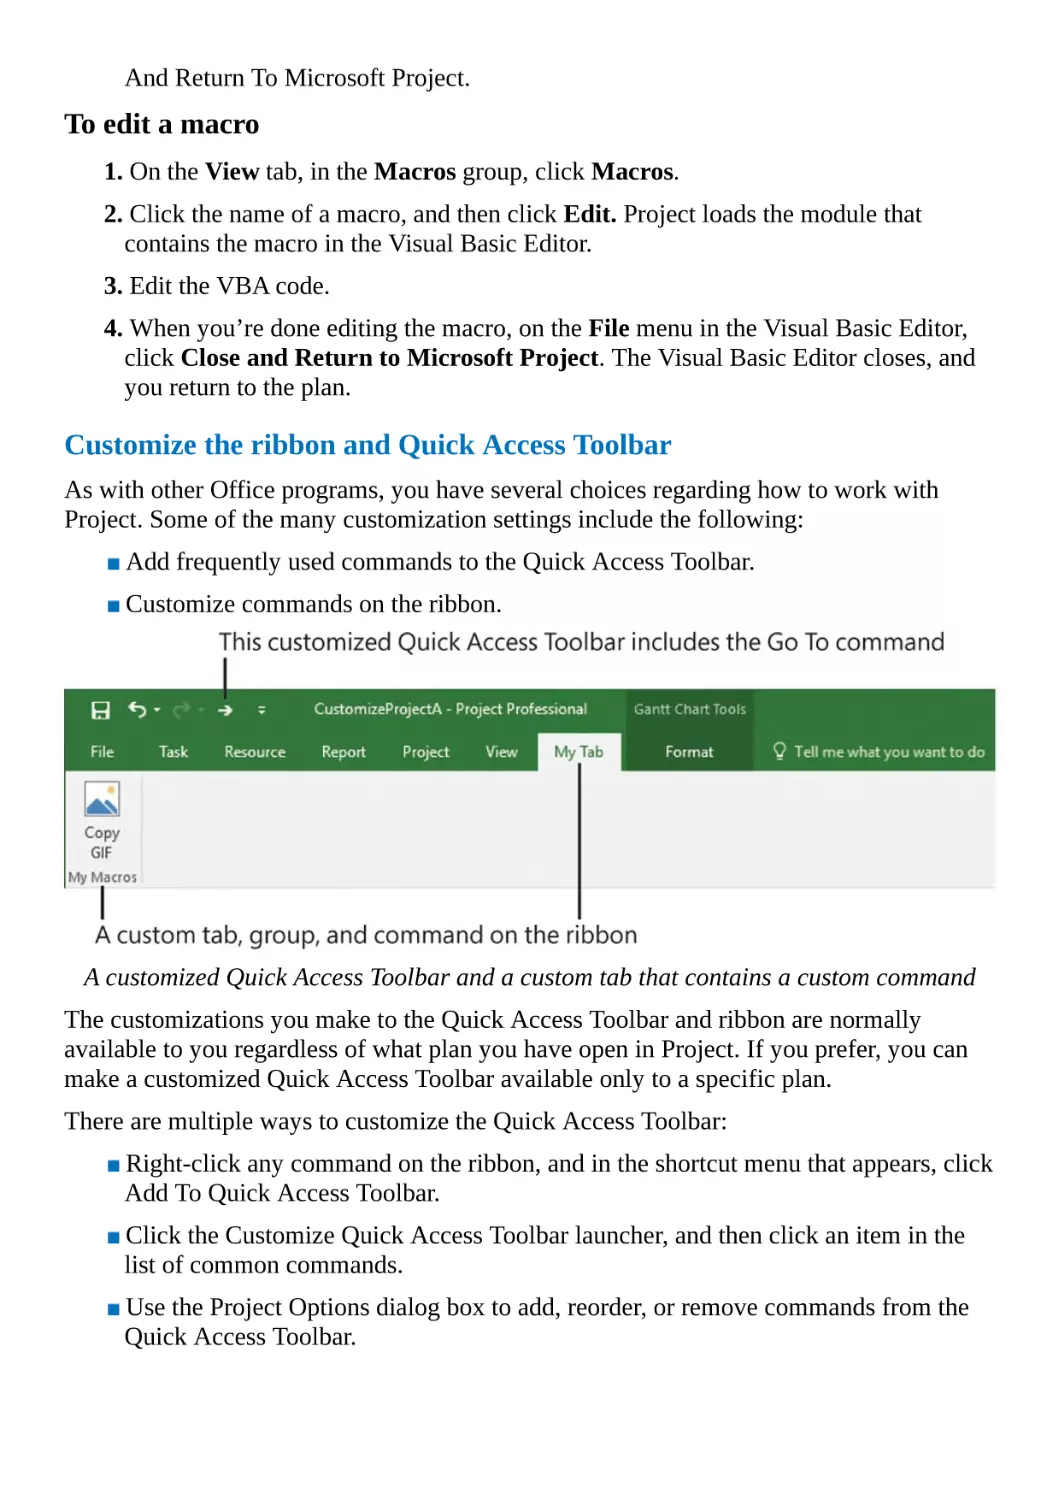
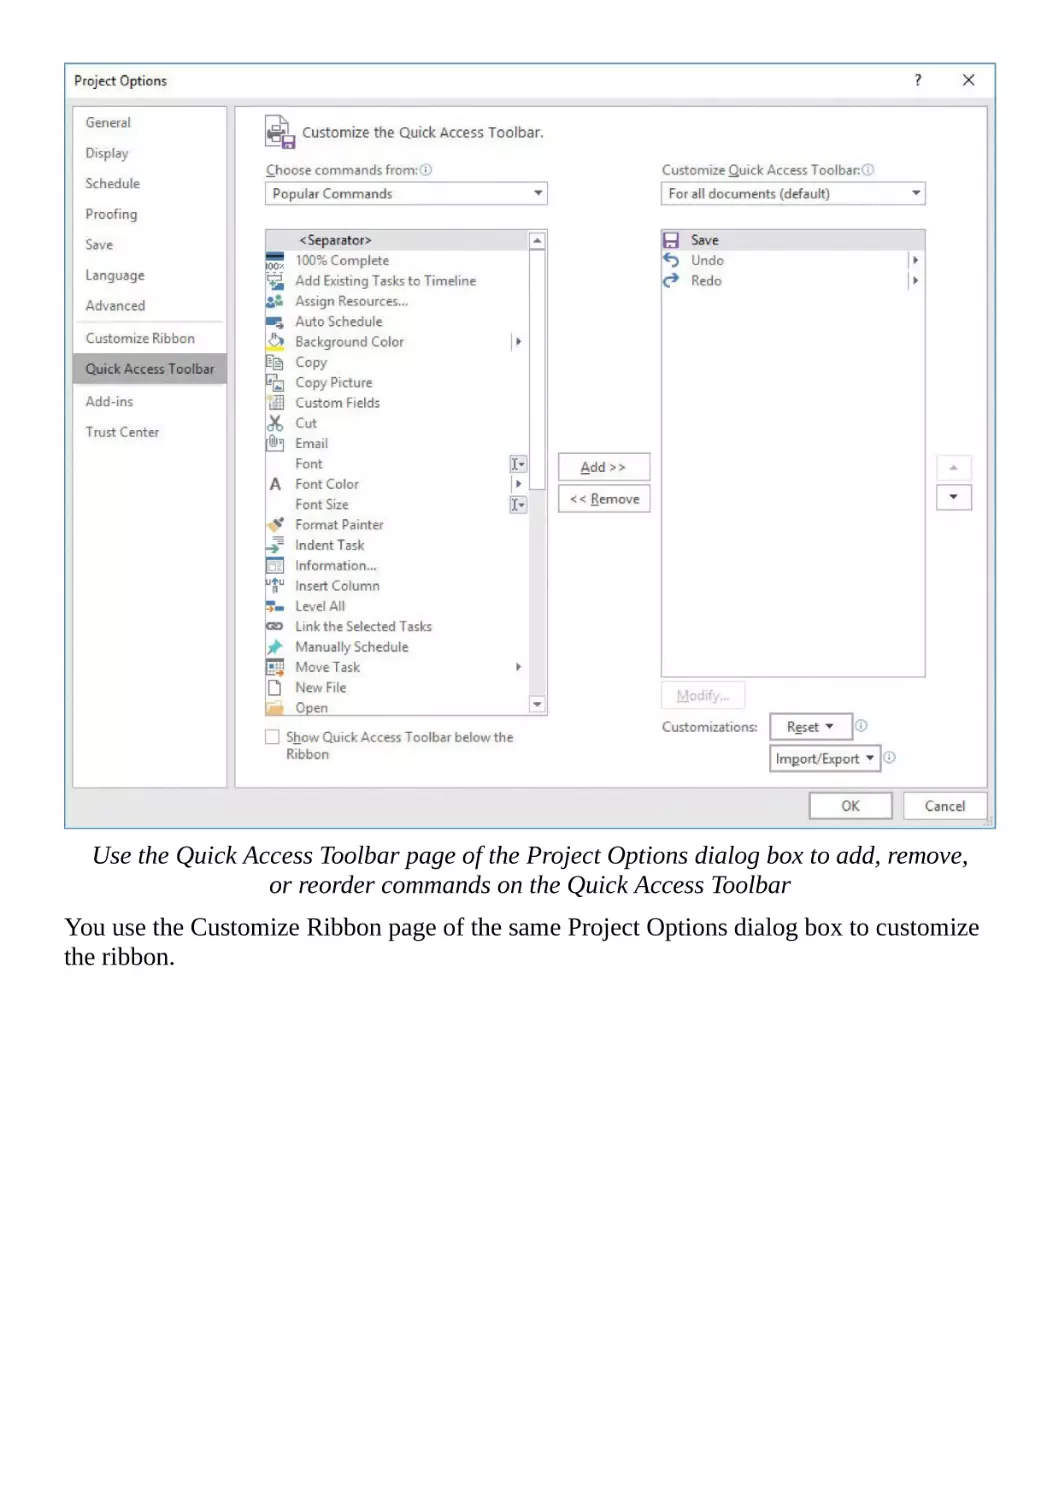
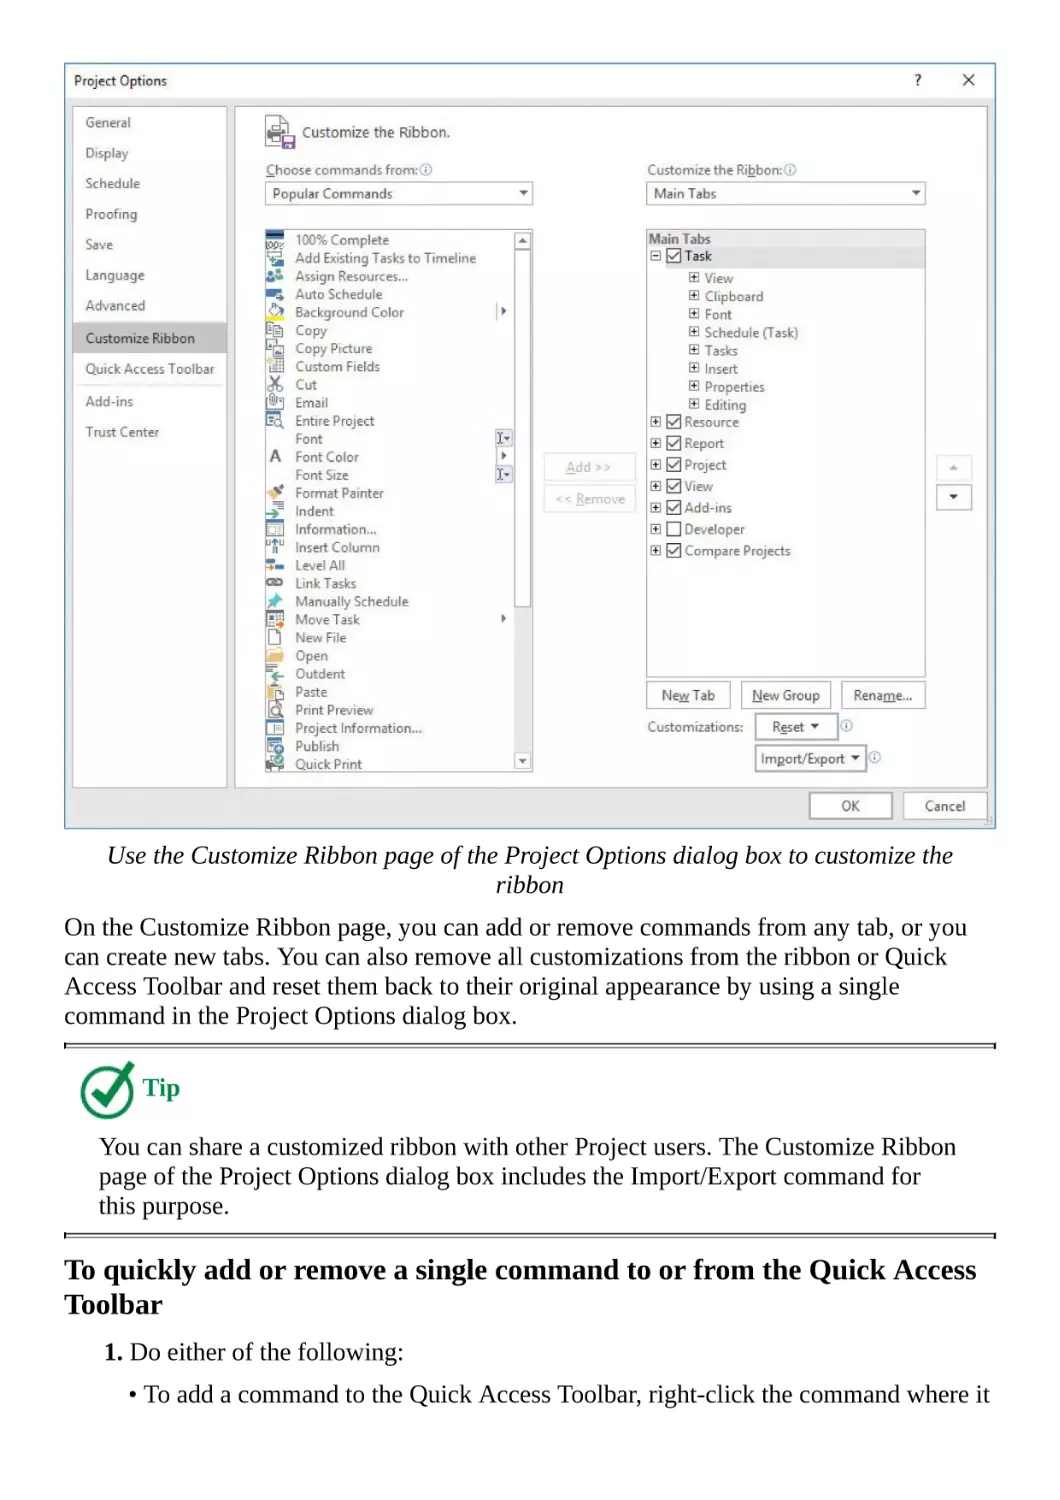
Customize the ribbon and Quick Access Toolbar
Skills review
Practice tasks
19 Share information with other programs
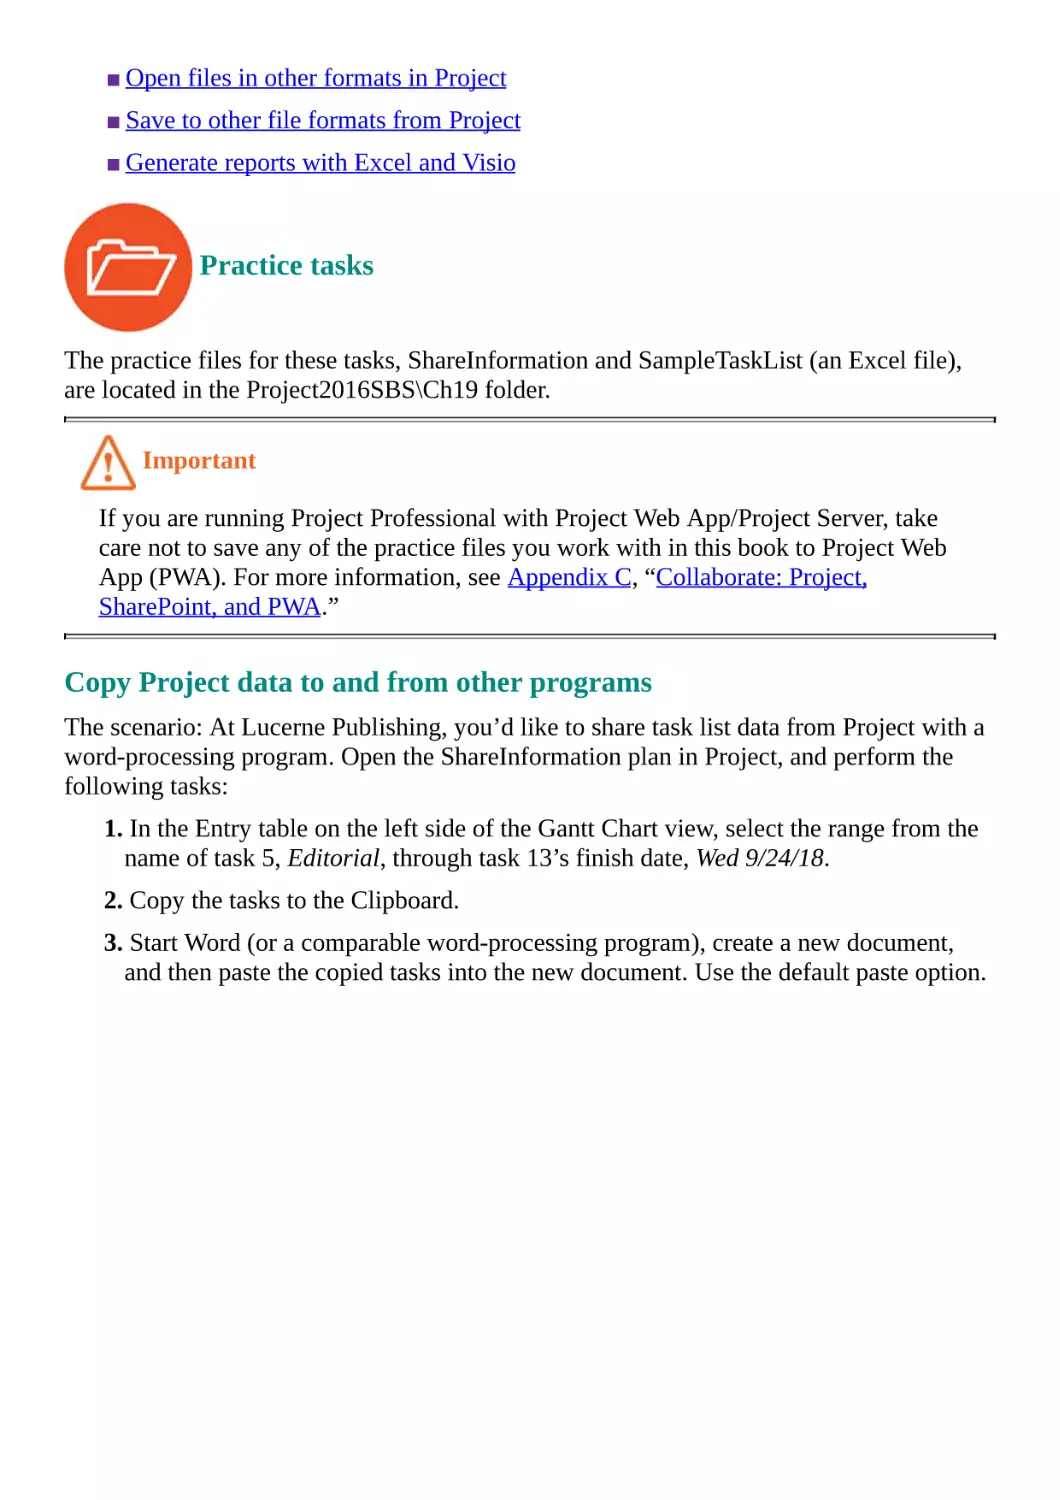
Copy Project data to and from other programs
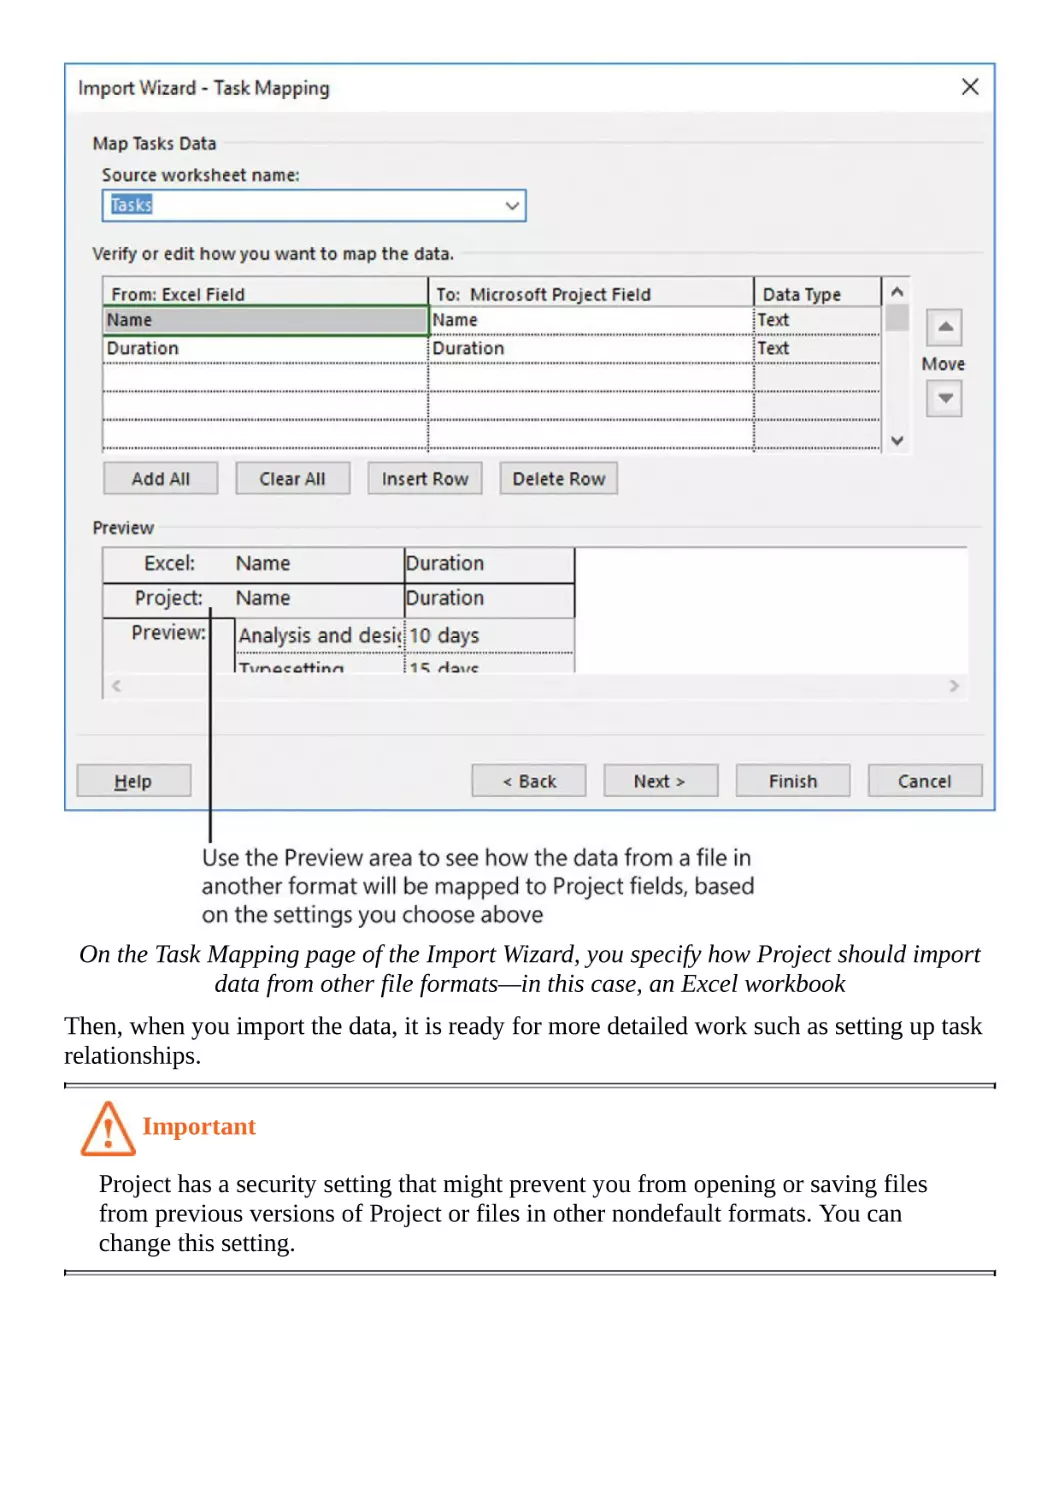
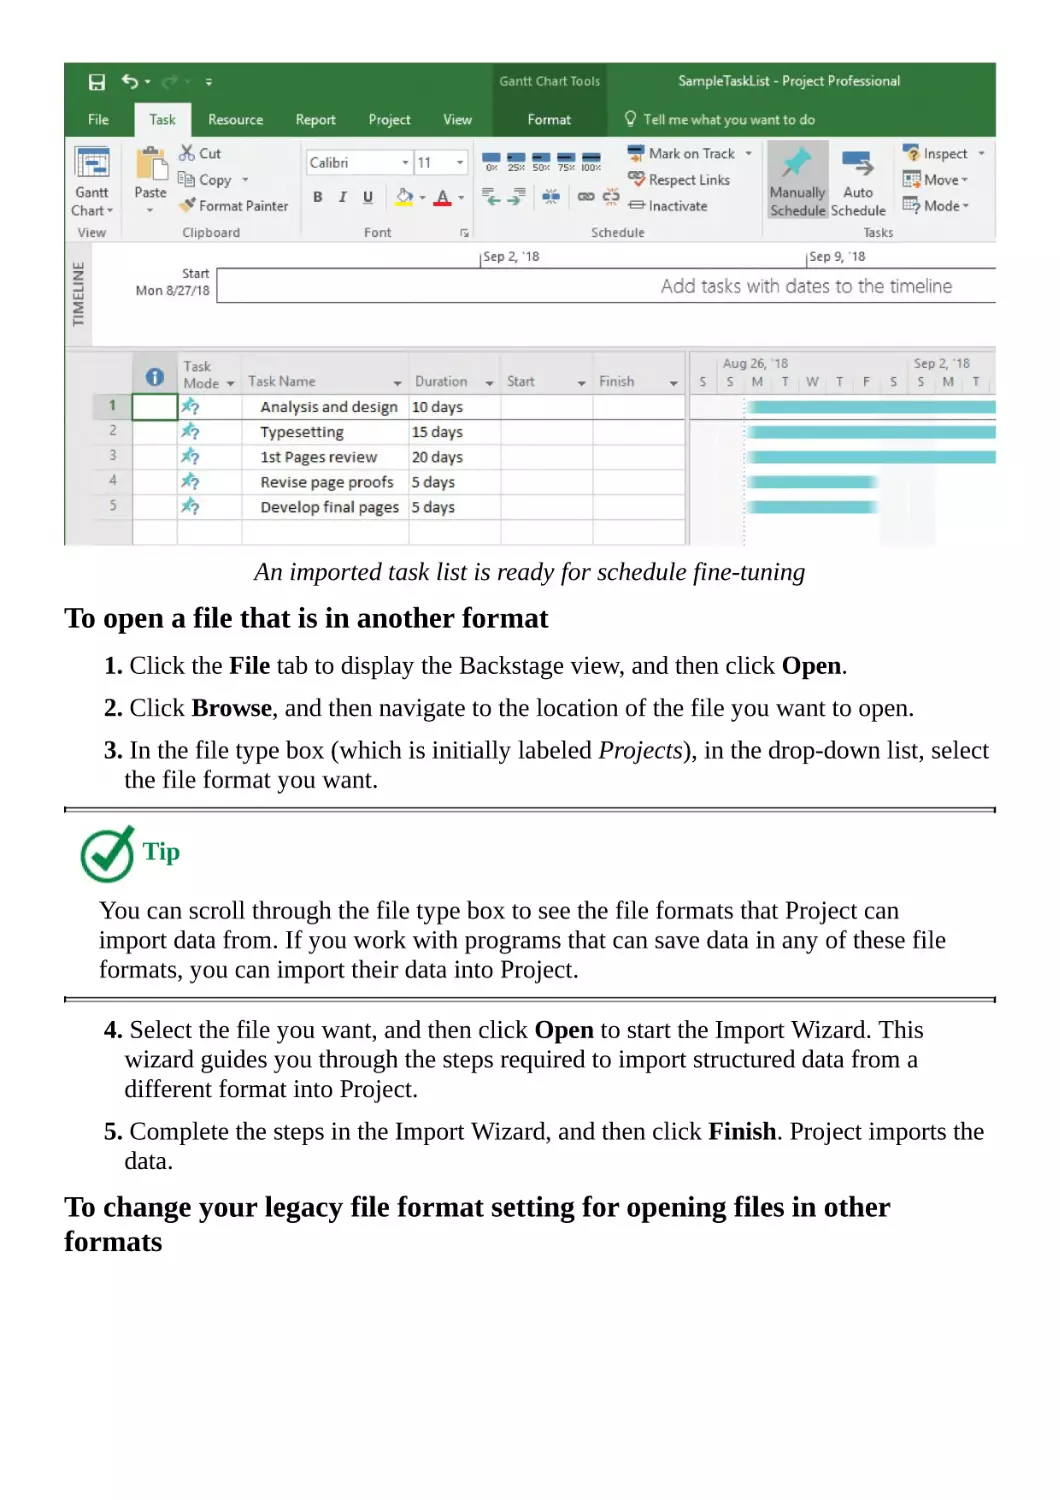
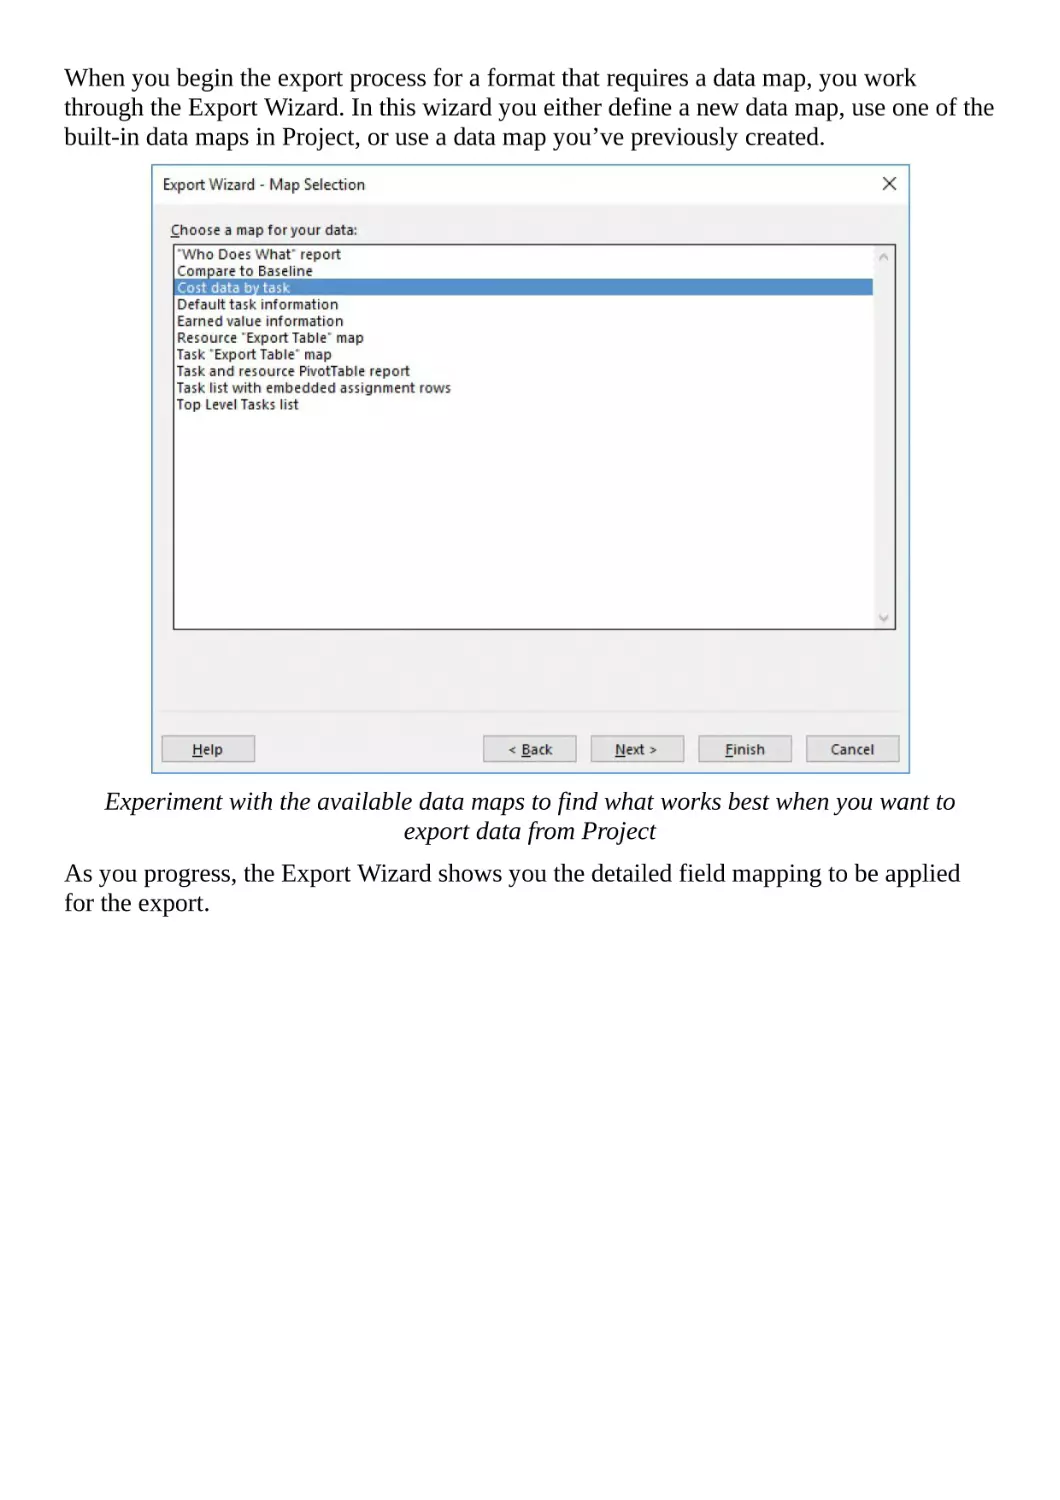
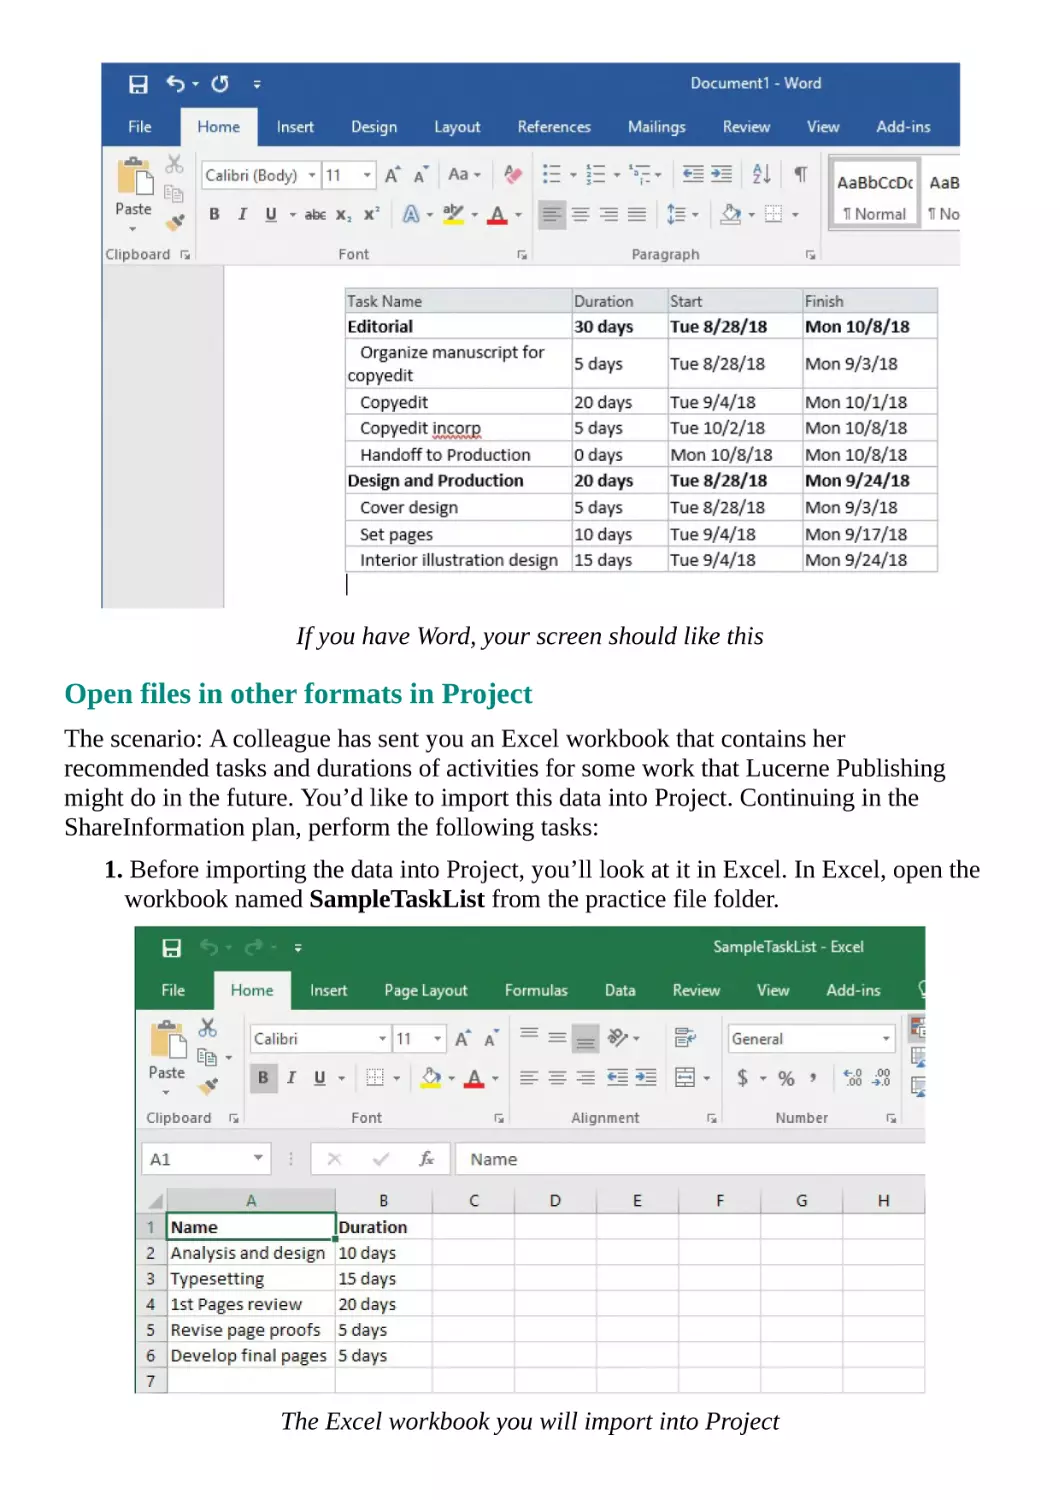
Open files in other formats in Project
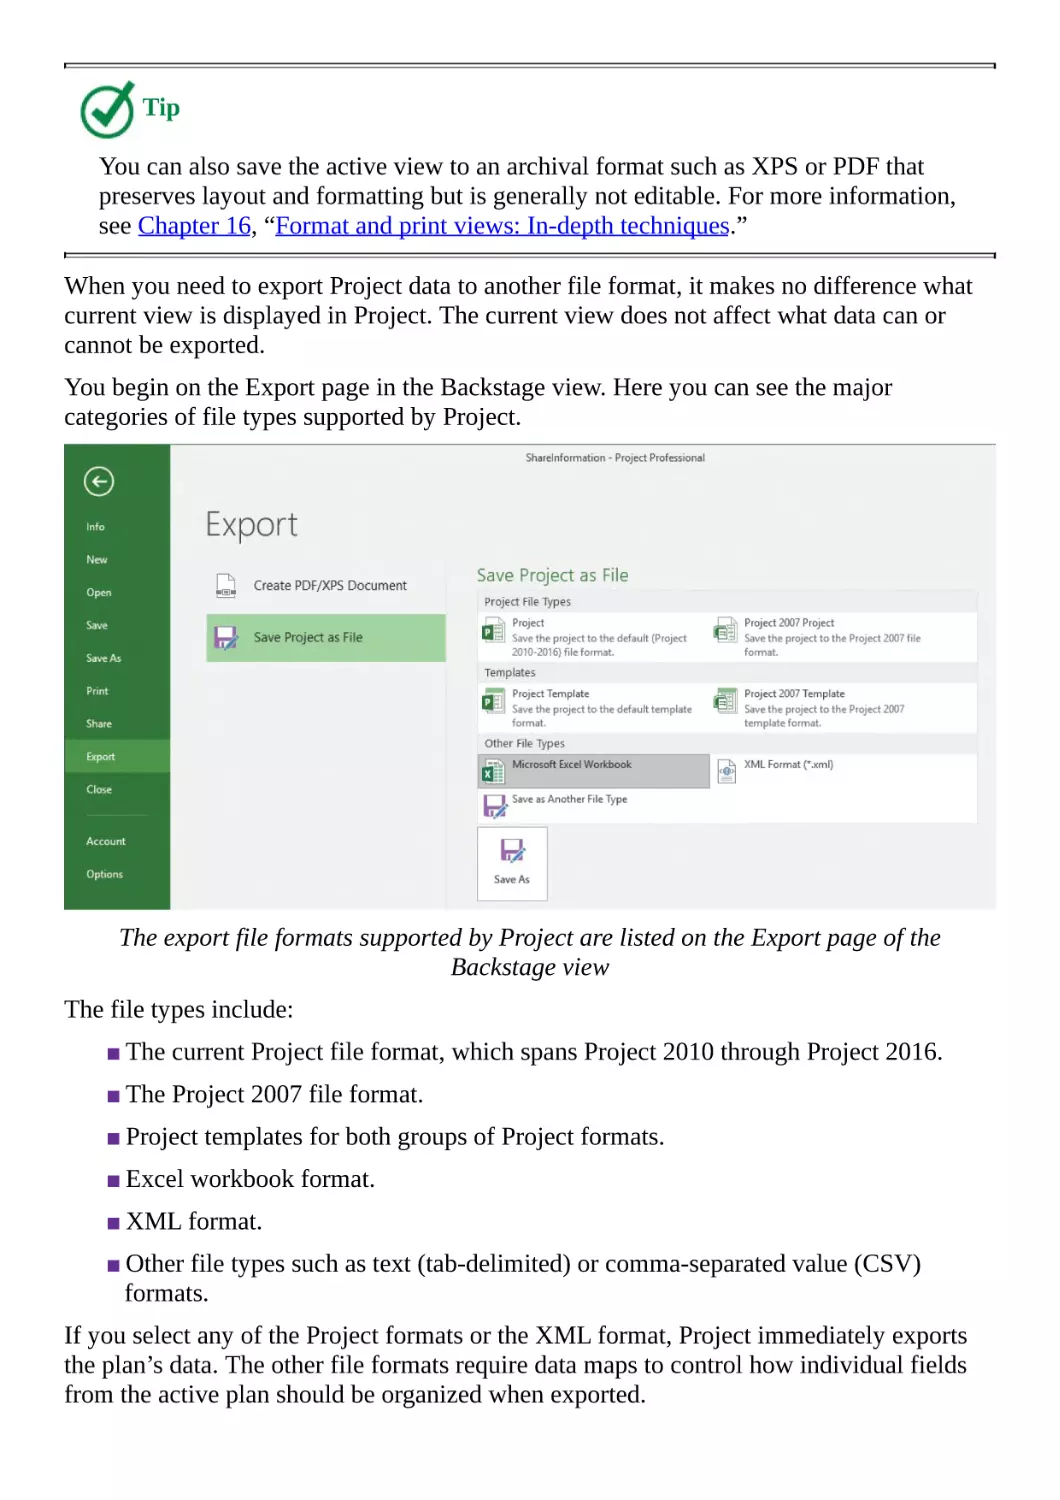
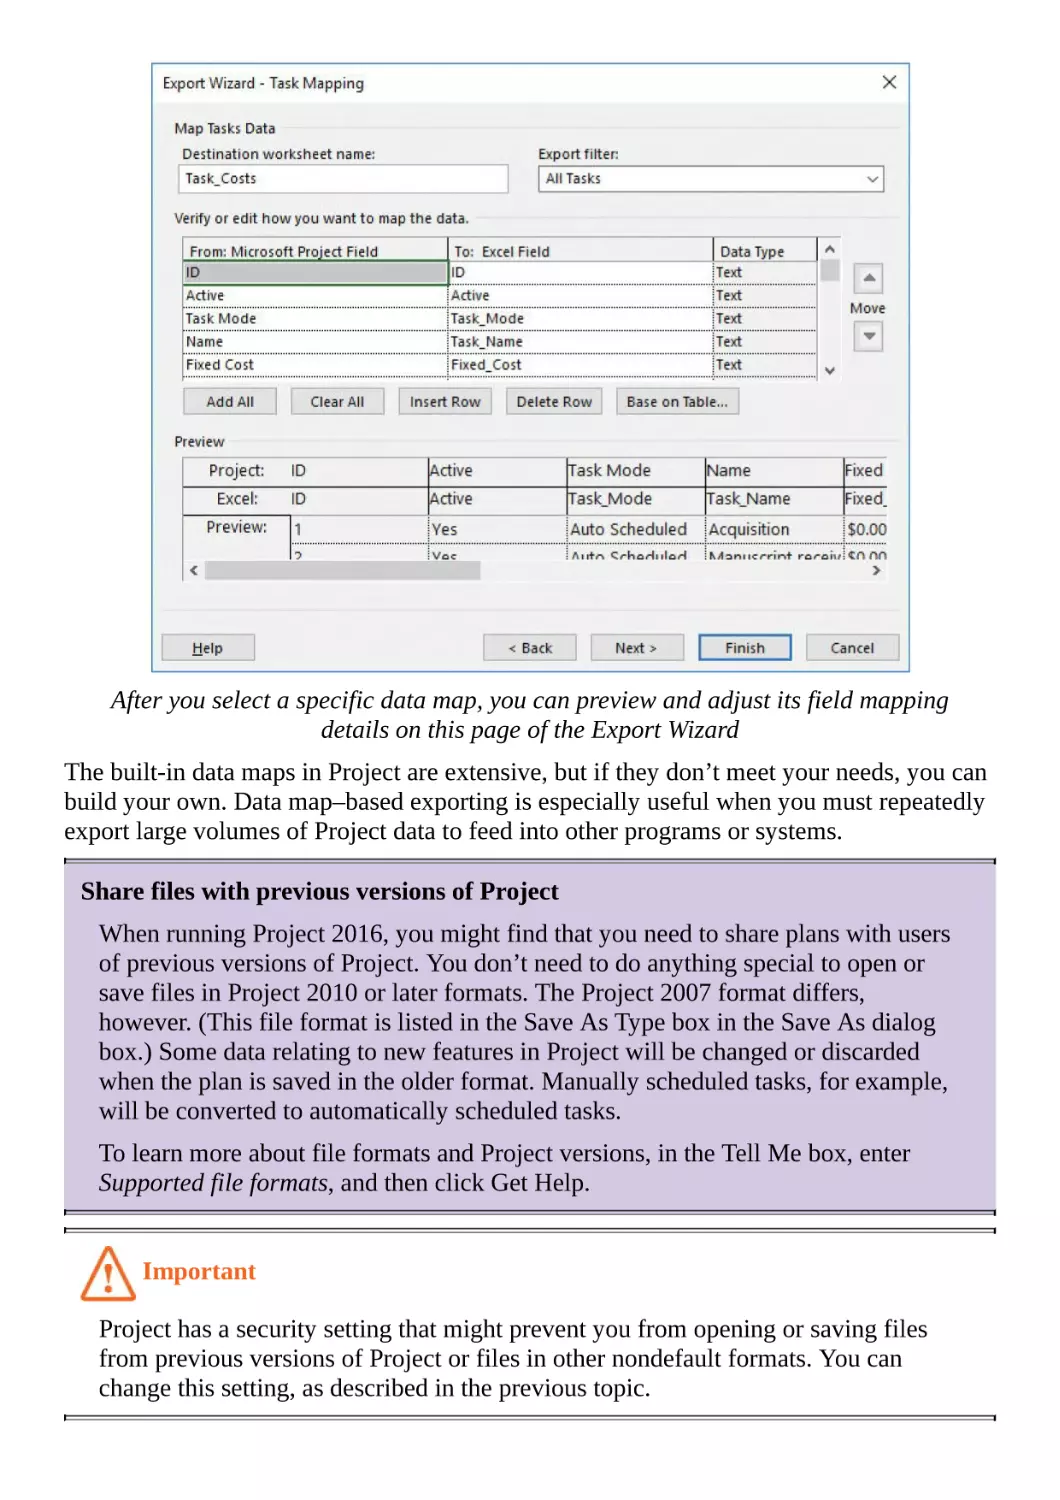
Save to other file formats from Project
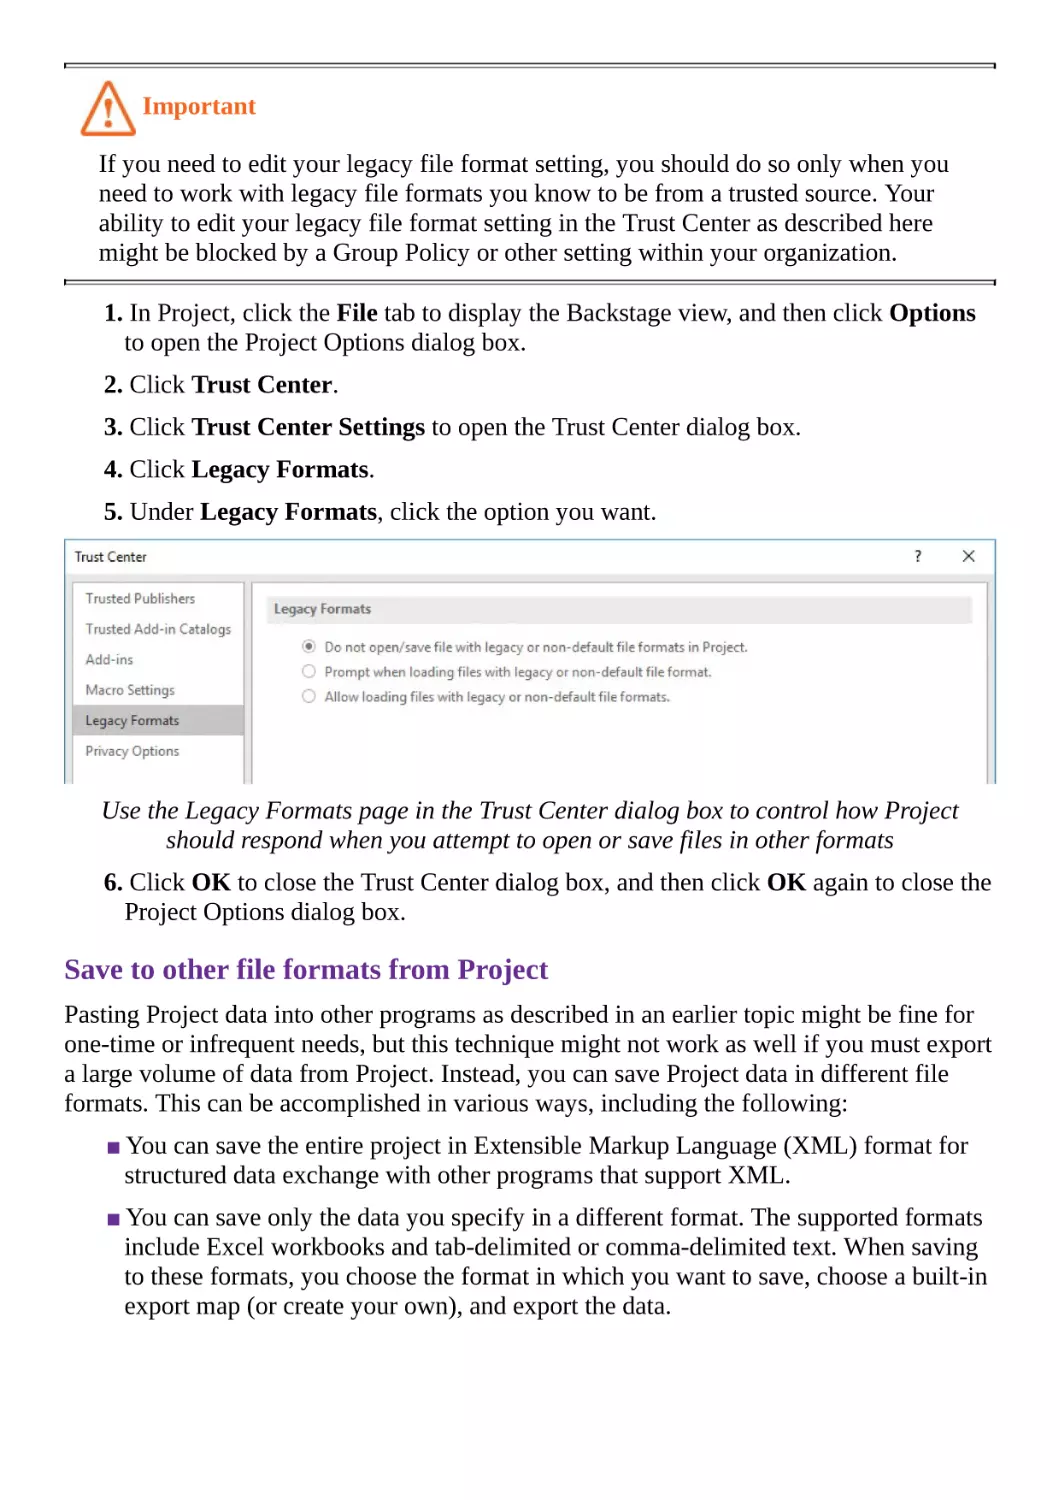
Sidebar: Share files with previous versions of Project
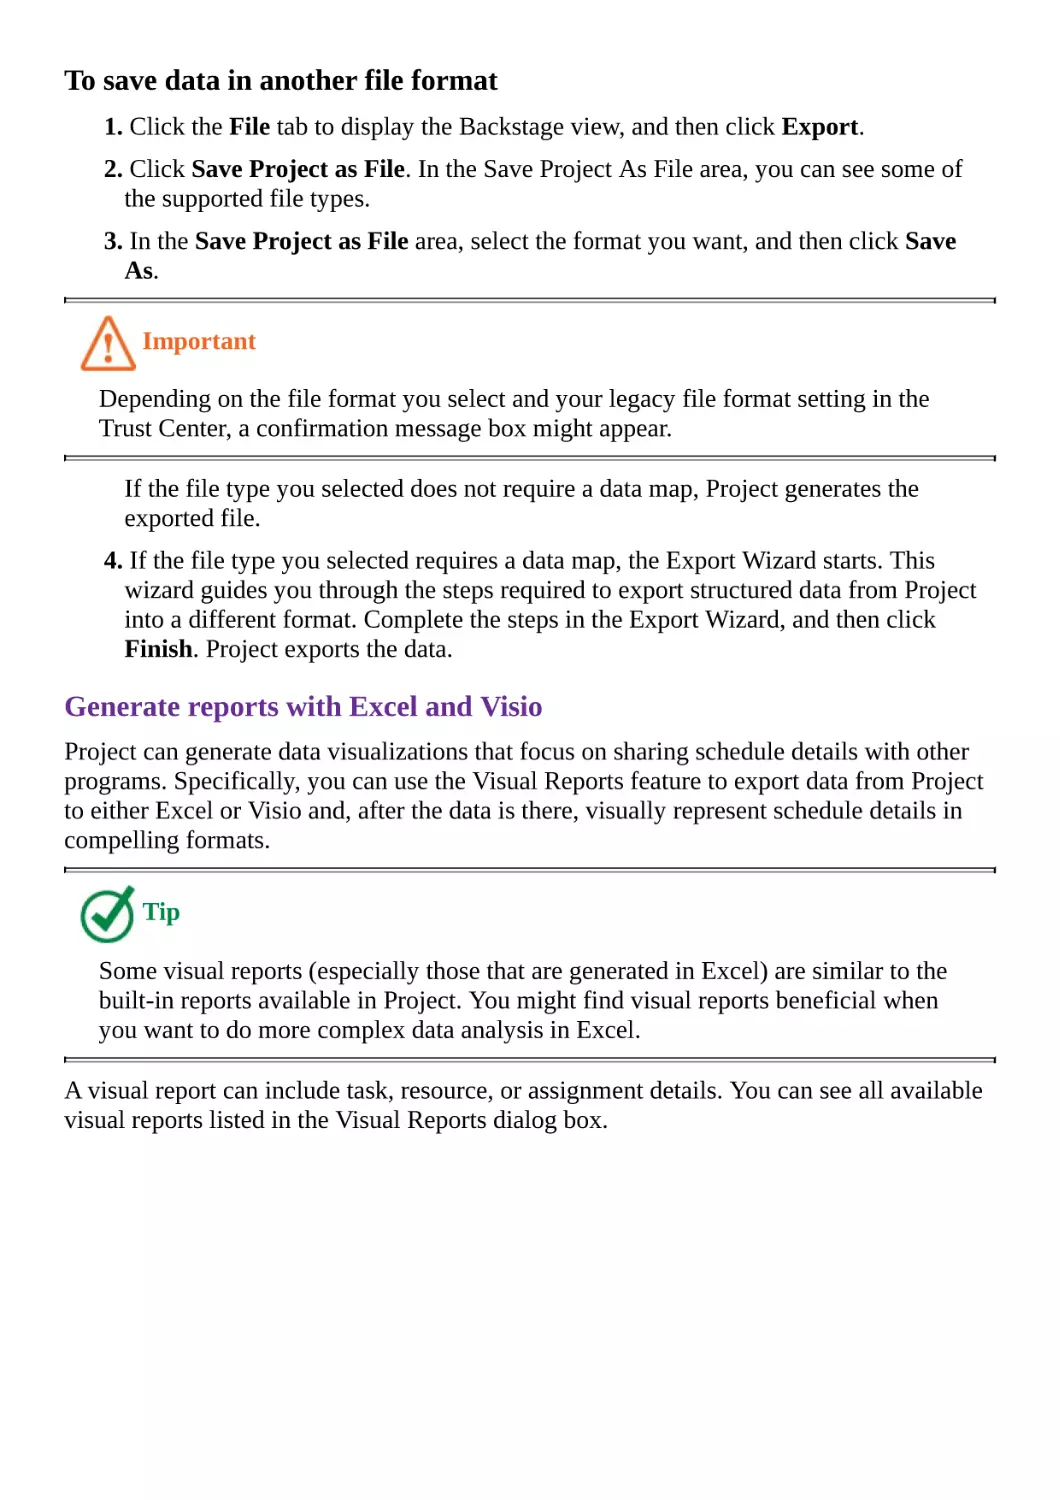
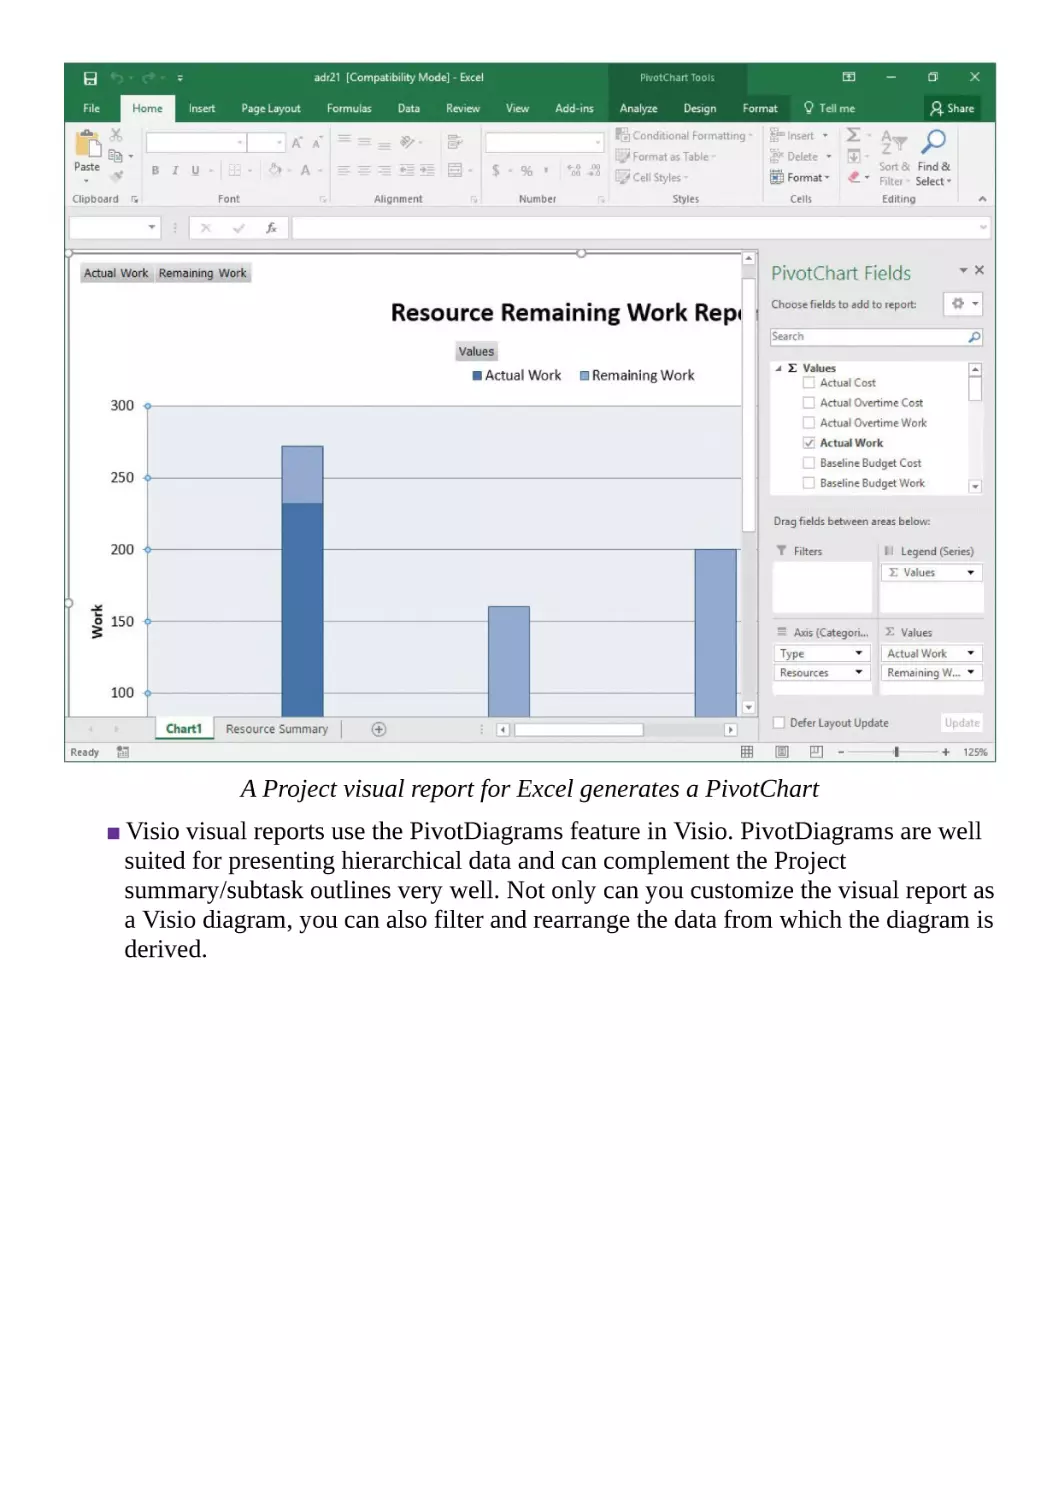
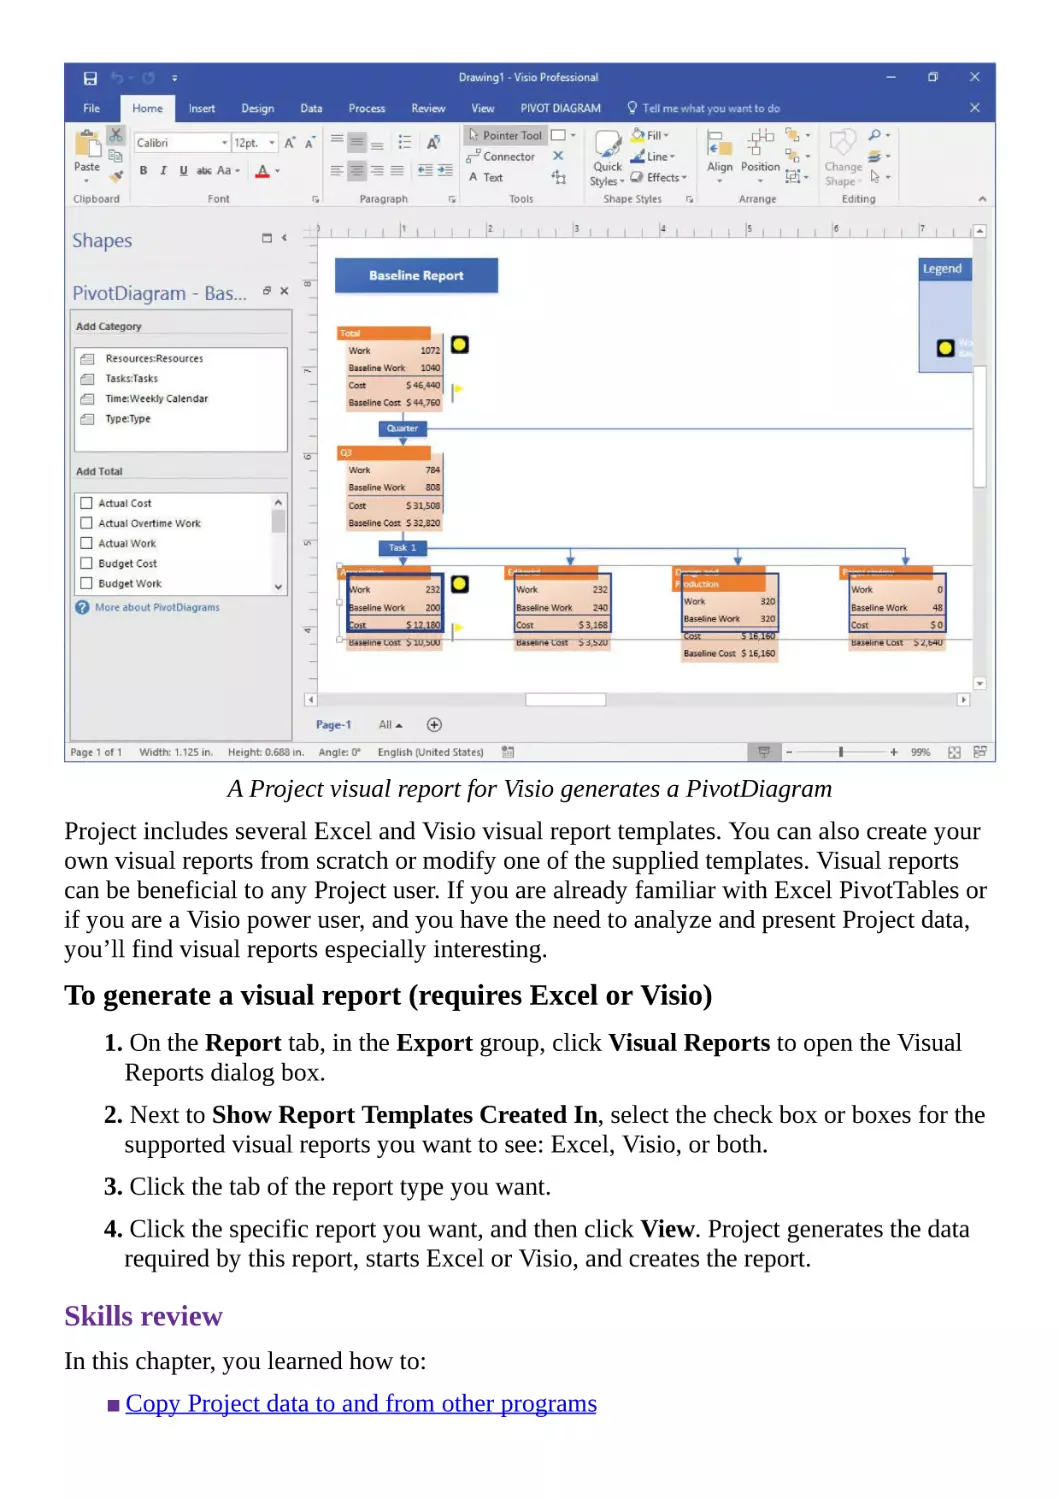
Generate reports with Excel and Visio
Skills review
Practice tasks
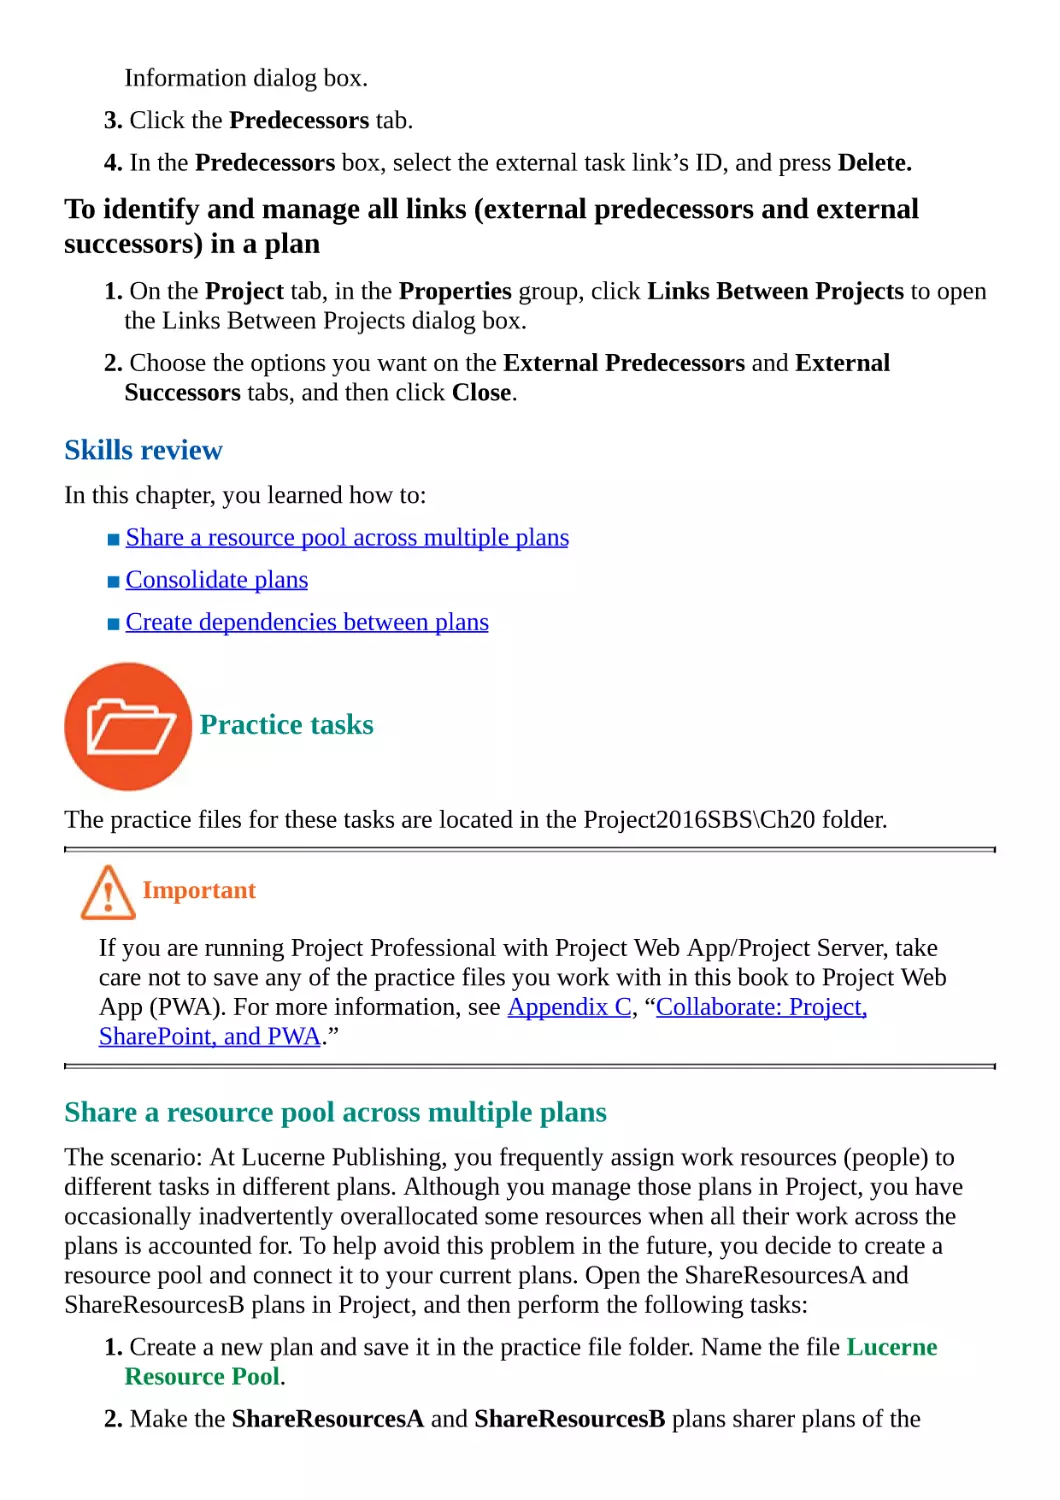
20 Consolidate projects and resources
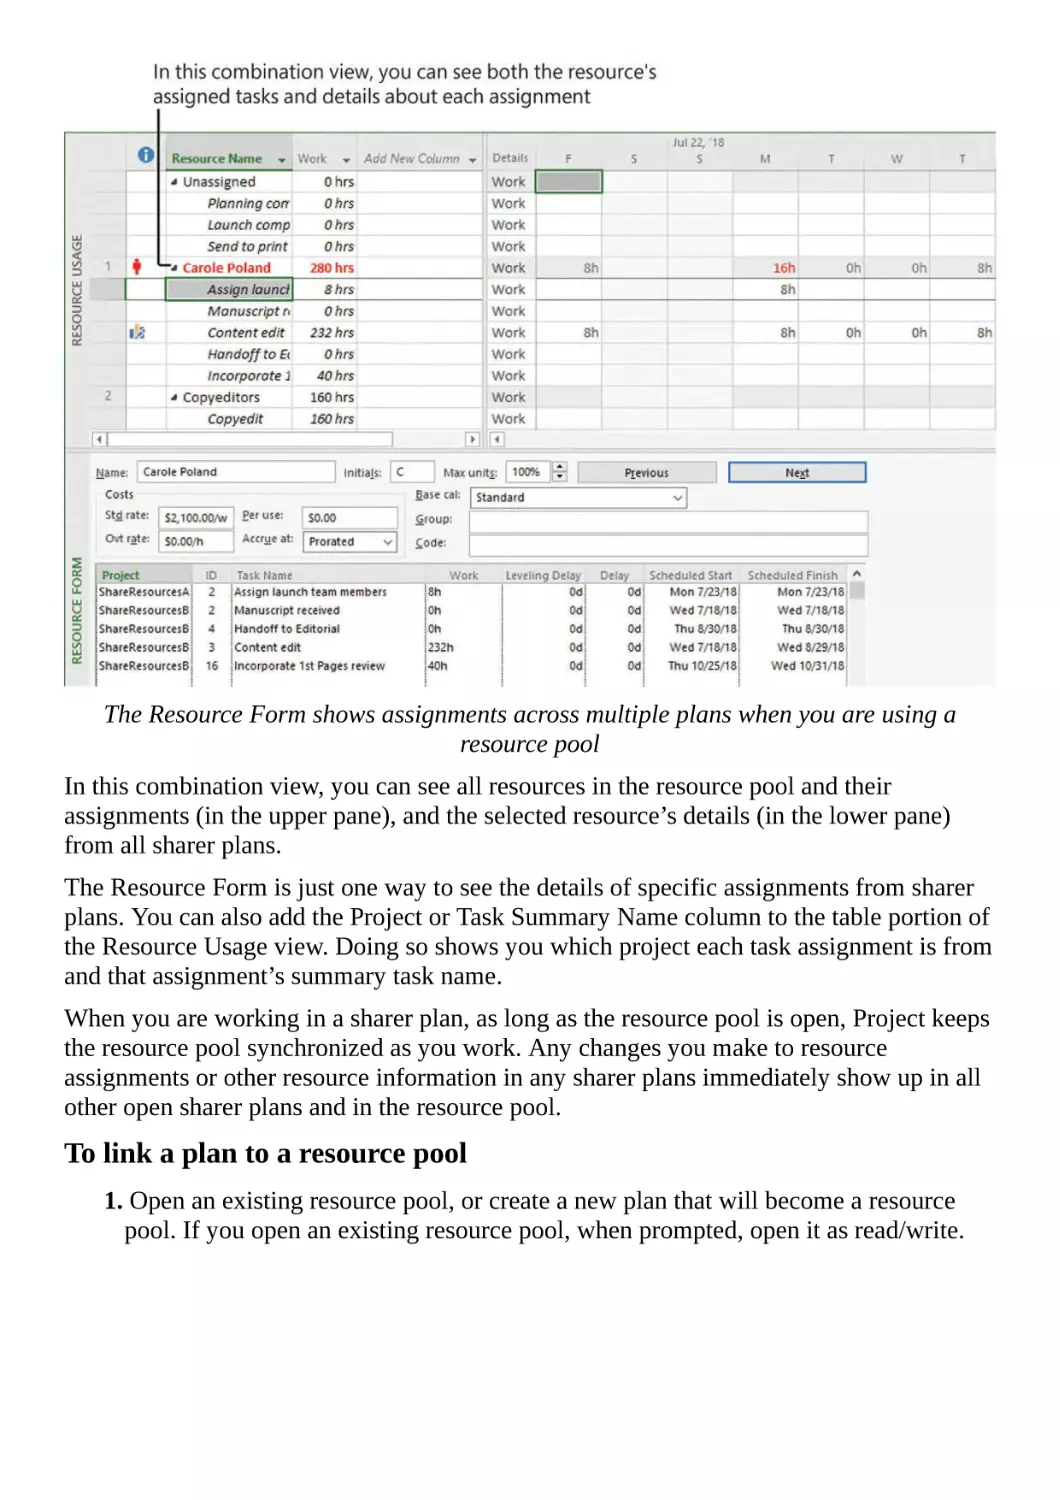
Share a resource pool across multiple plans
Sidebar: Create a dedicated resource pool
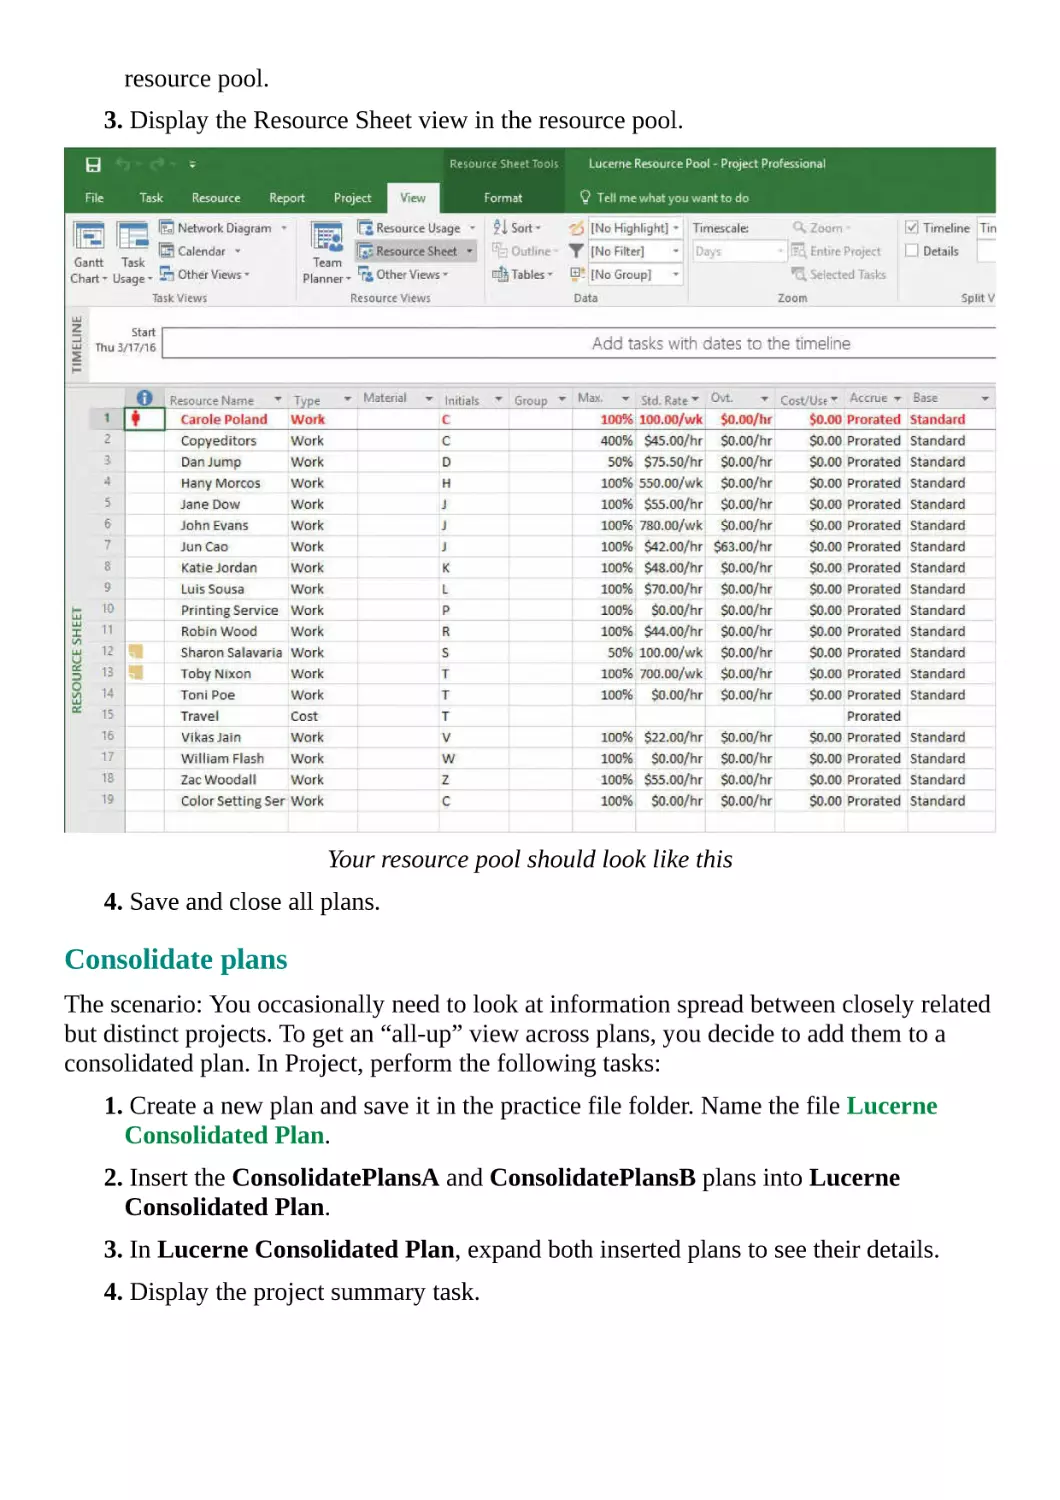
Consolidate plans
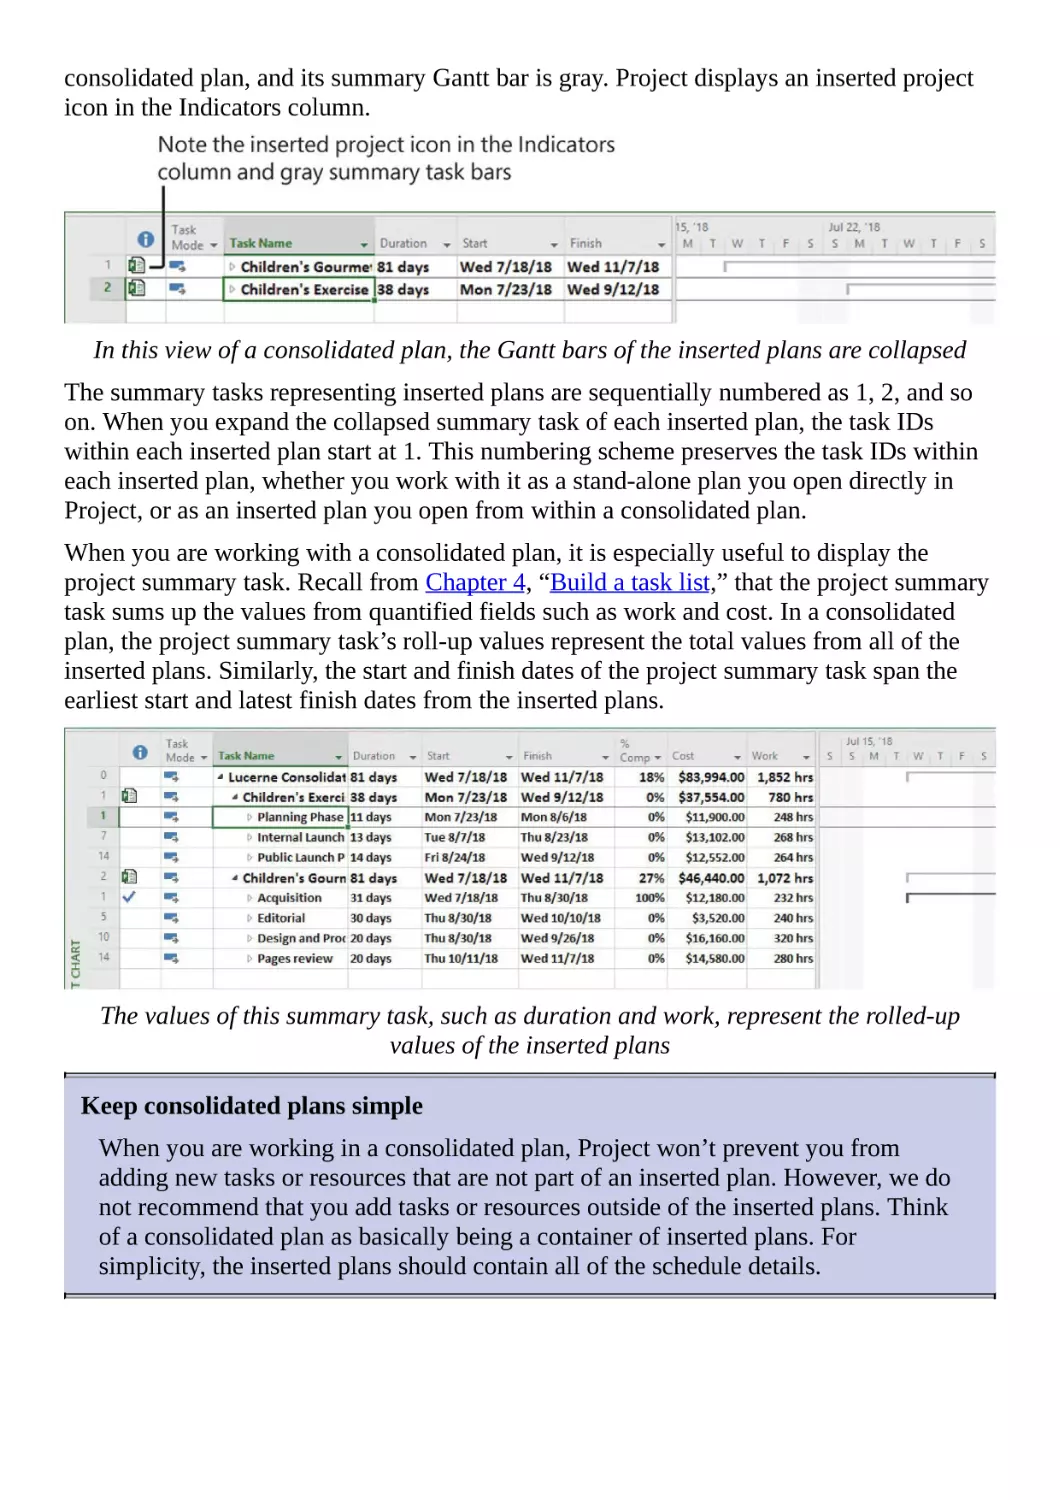
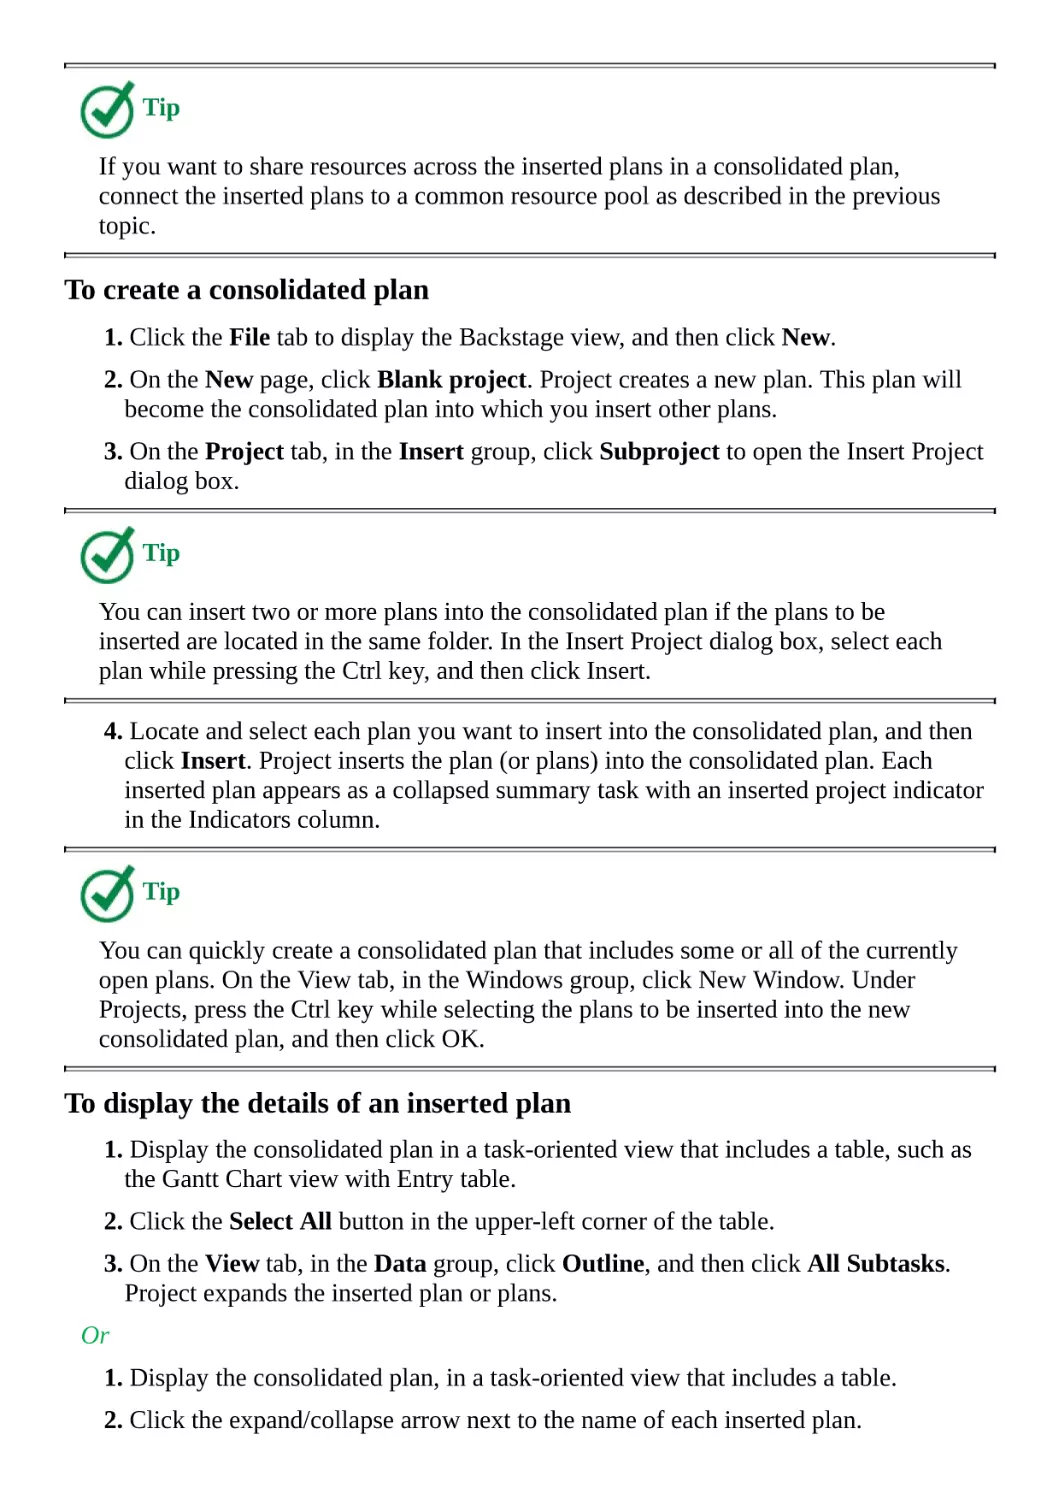
Sidebar: Keep consolidated plans simple
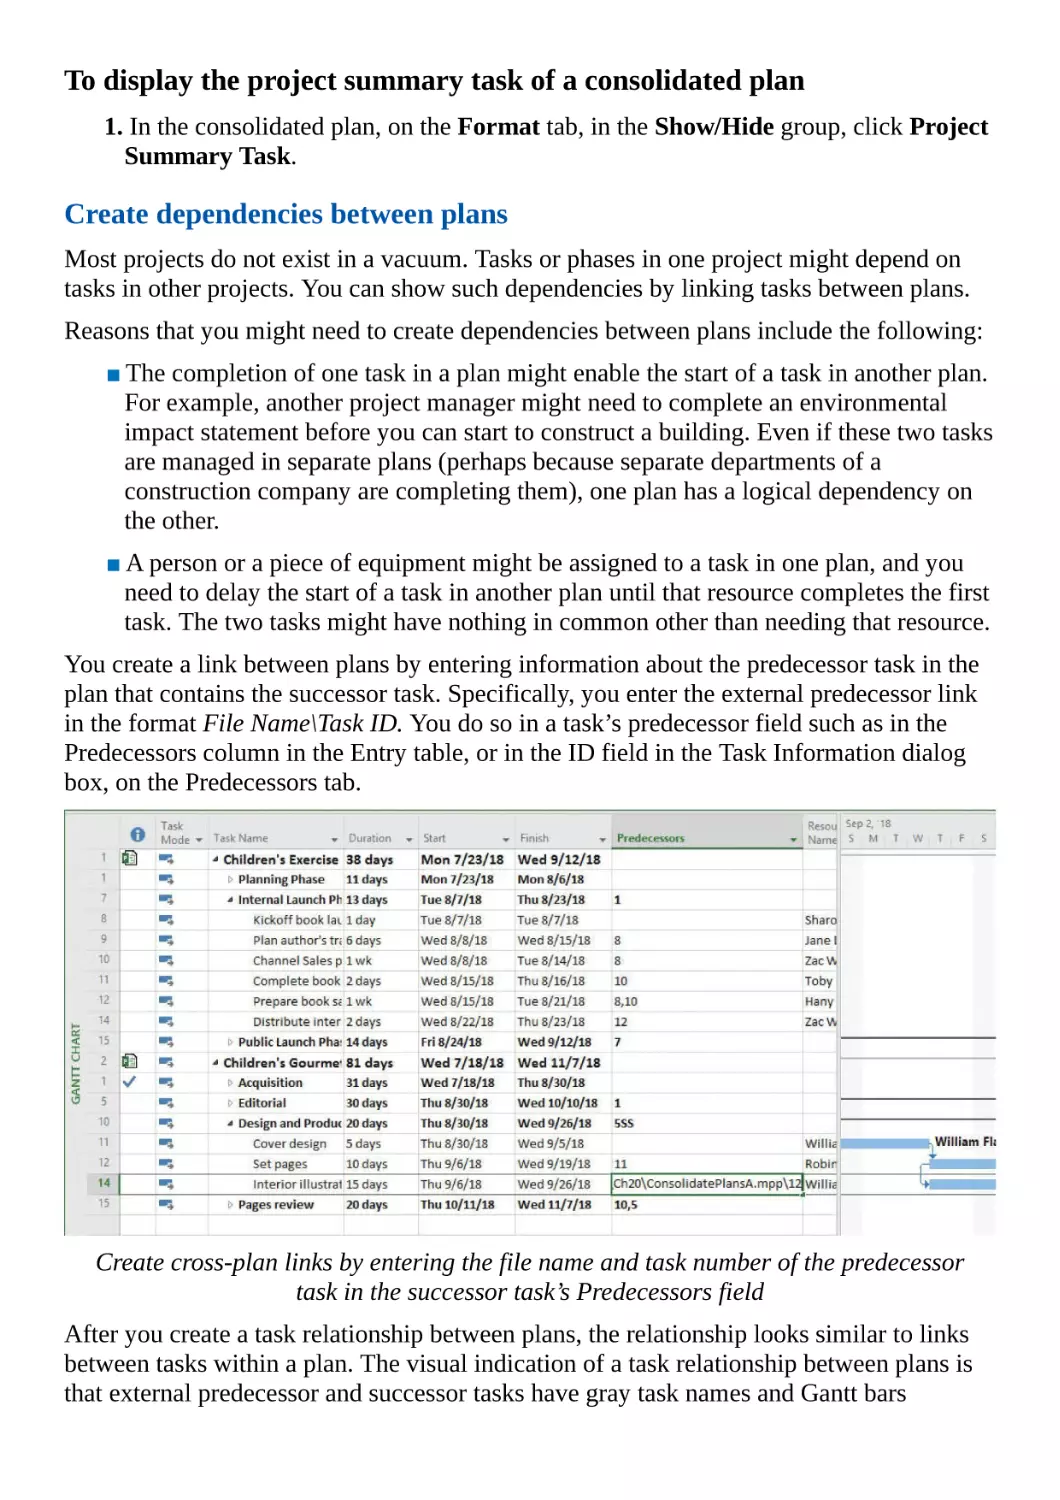
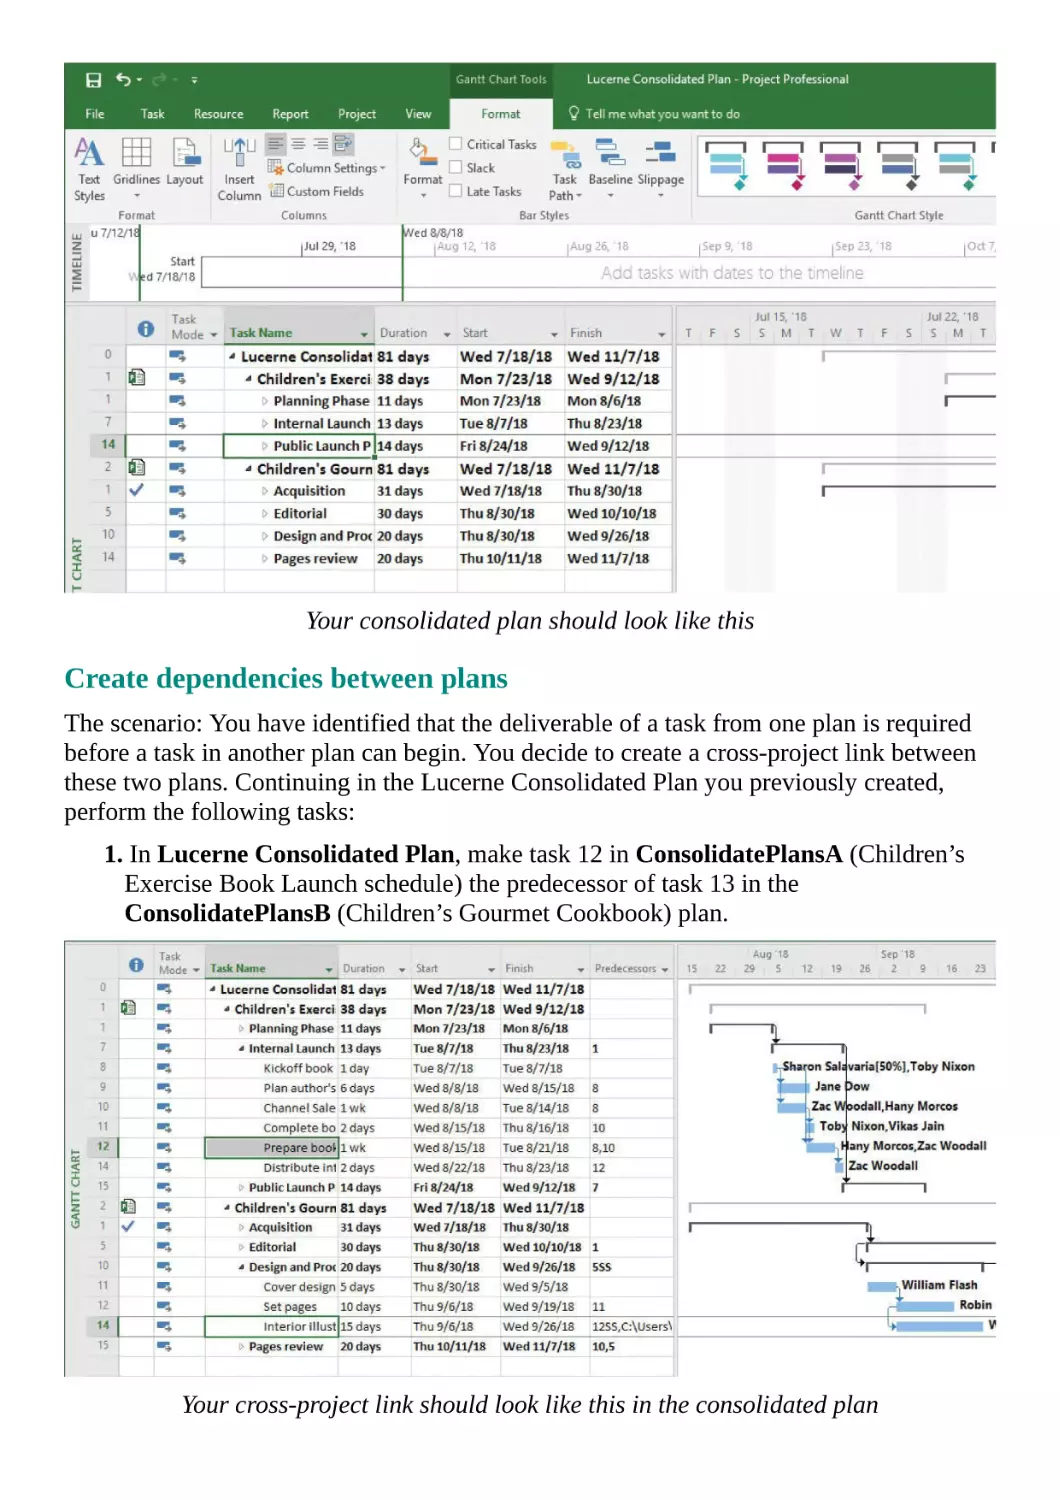
Create dependencies between plans
Skills review
Practice tasks
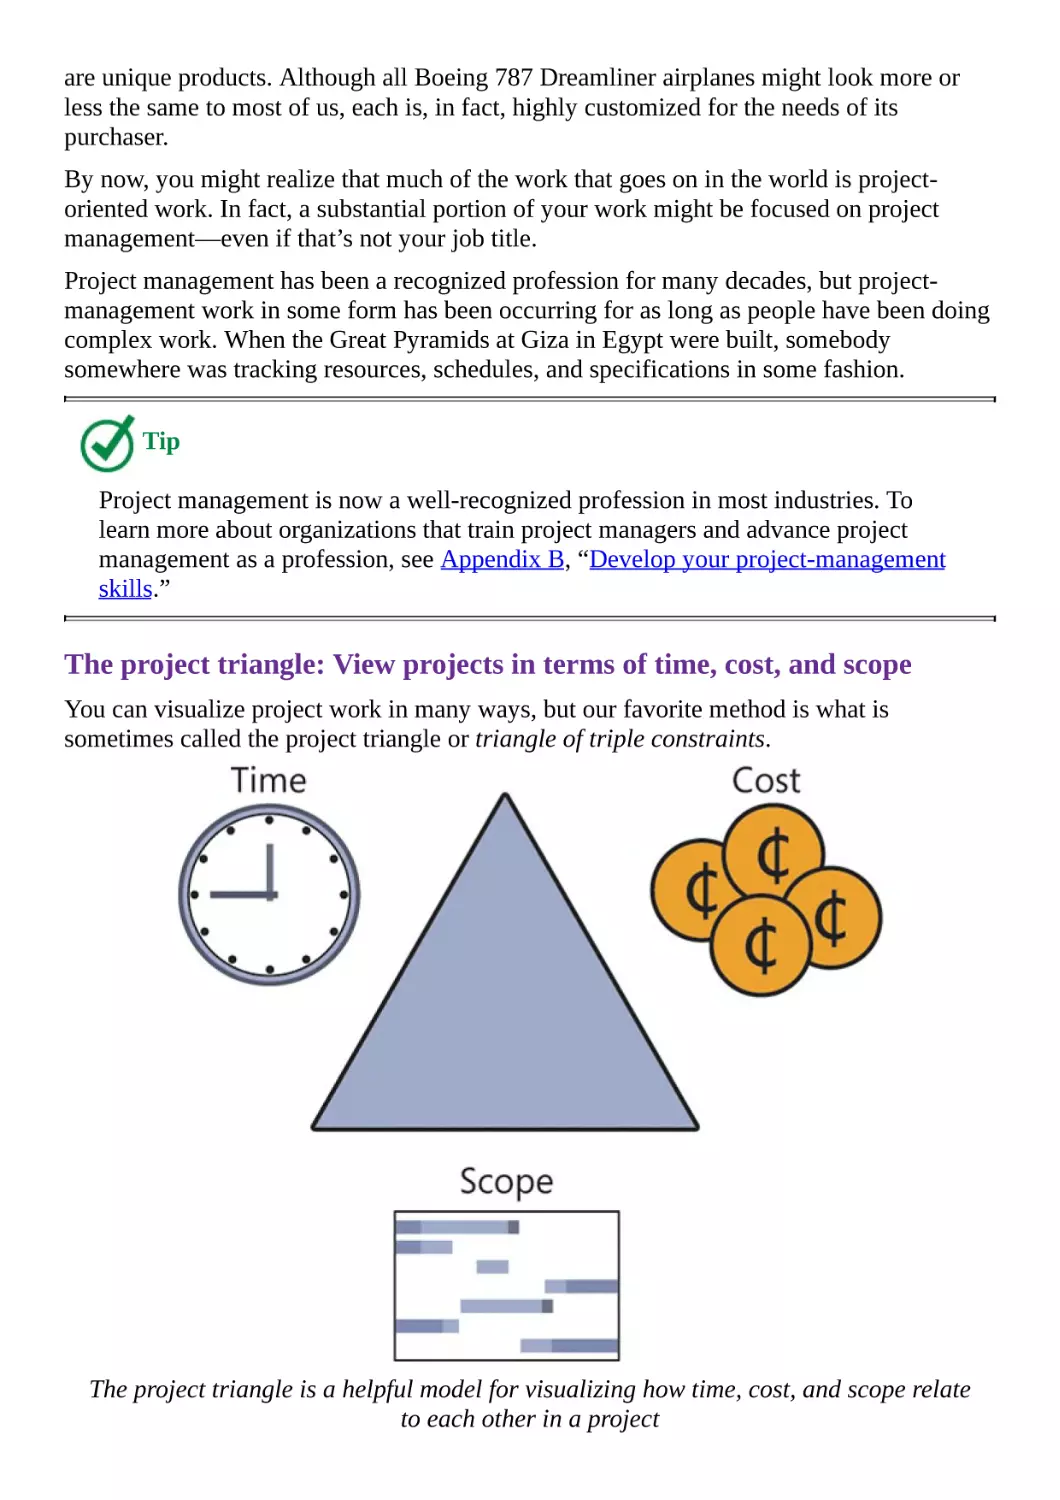
Appendix A: A short course in project management
Appendix B: Develop your project-management skills
Appendix C: Collaborate: Project, SharePoint, and PWA
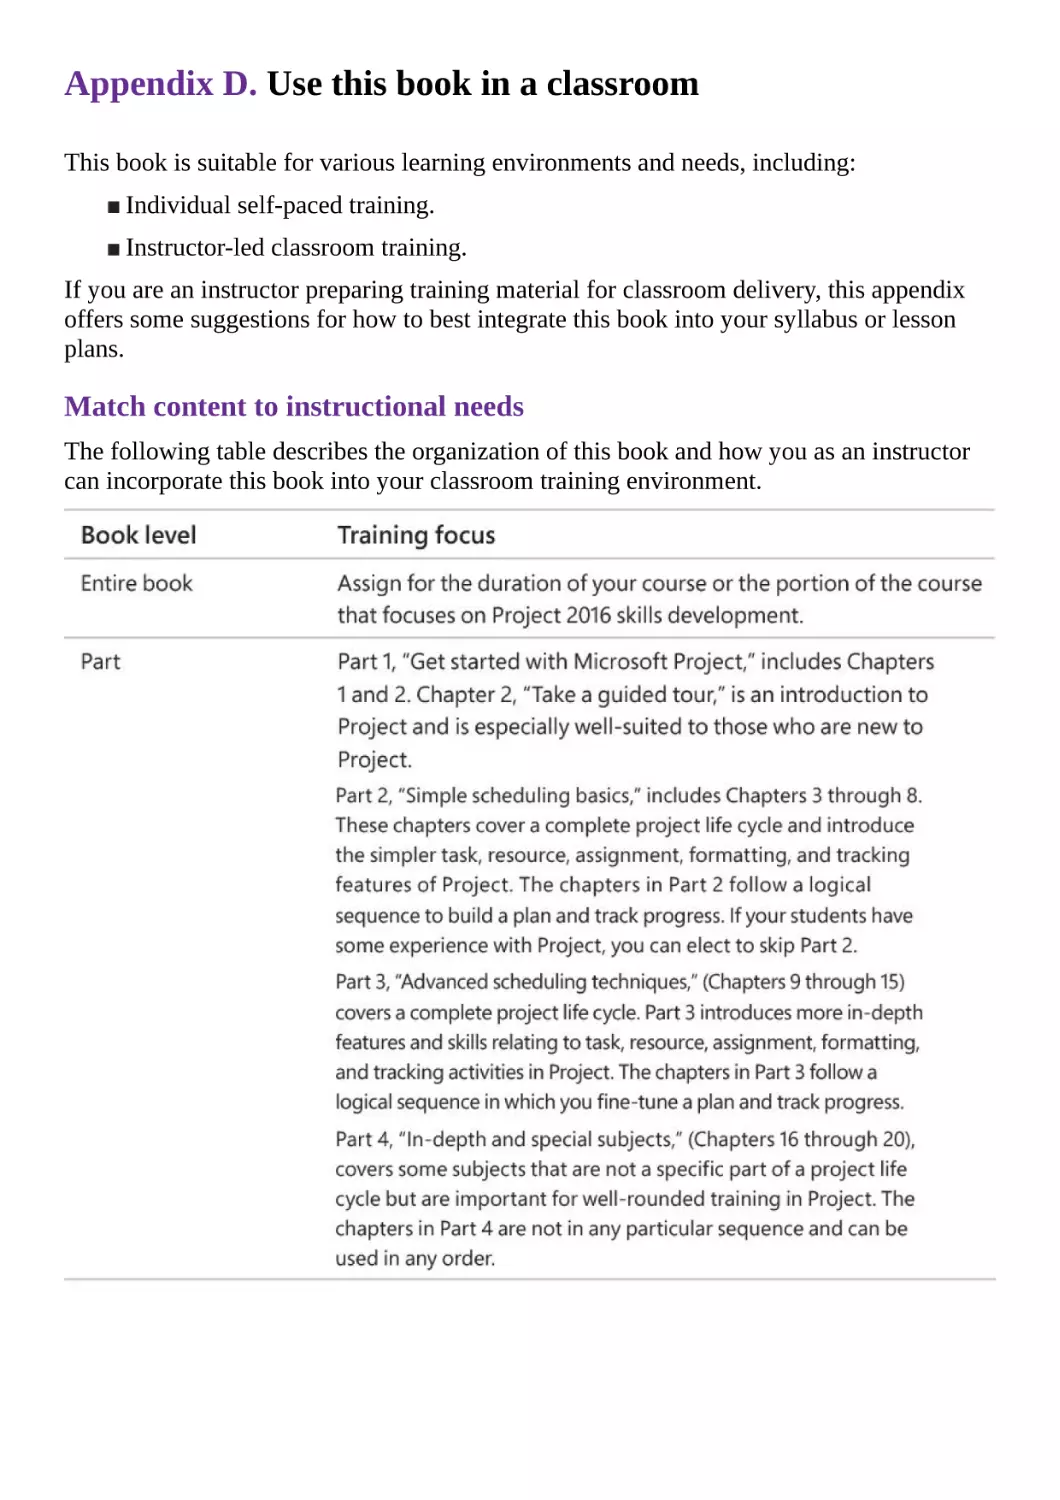
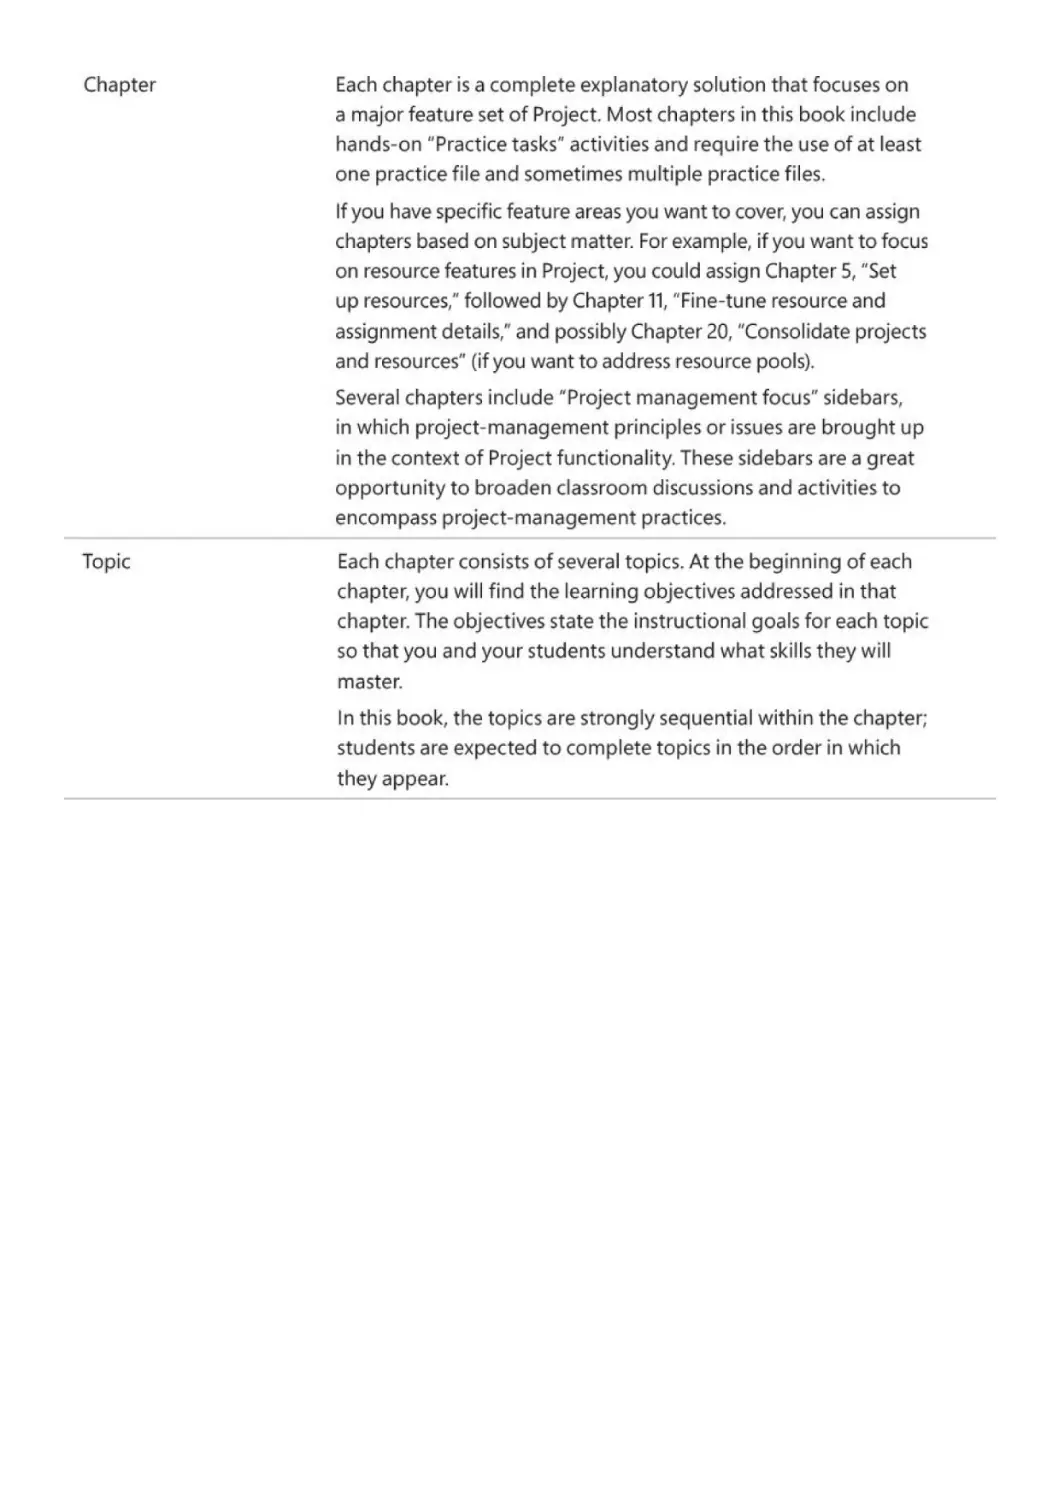
Appendix D: Use this book in a classroom
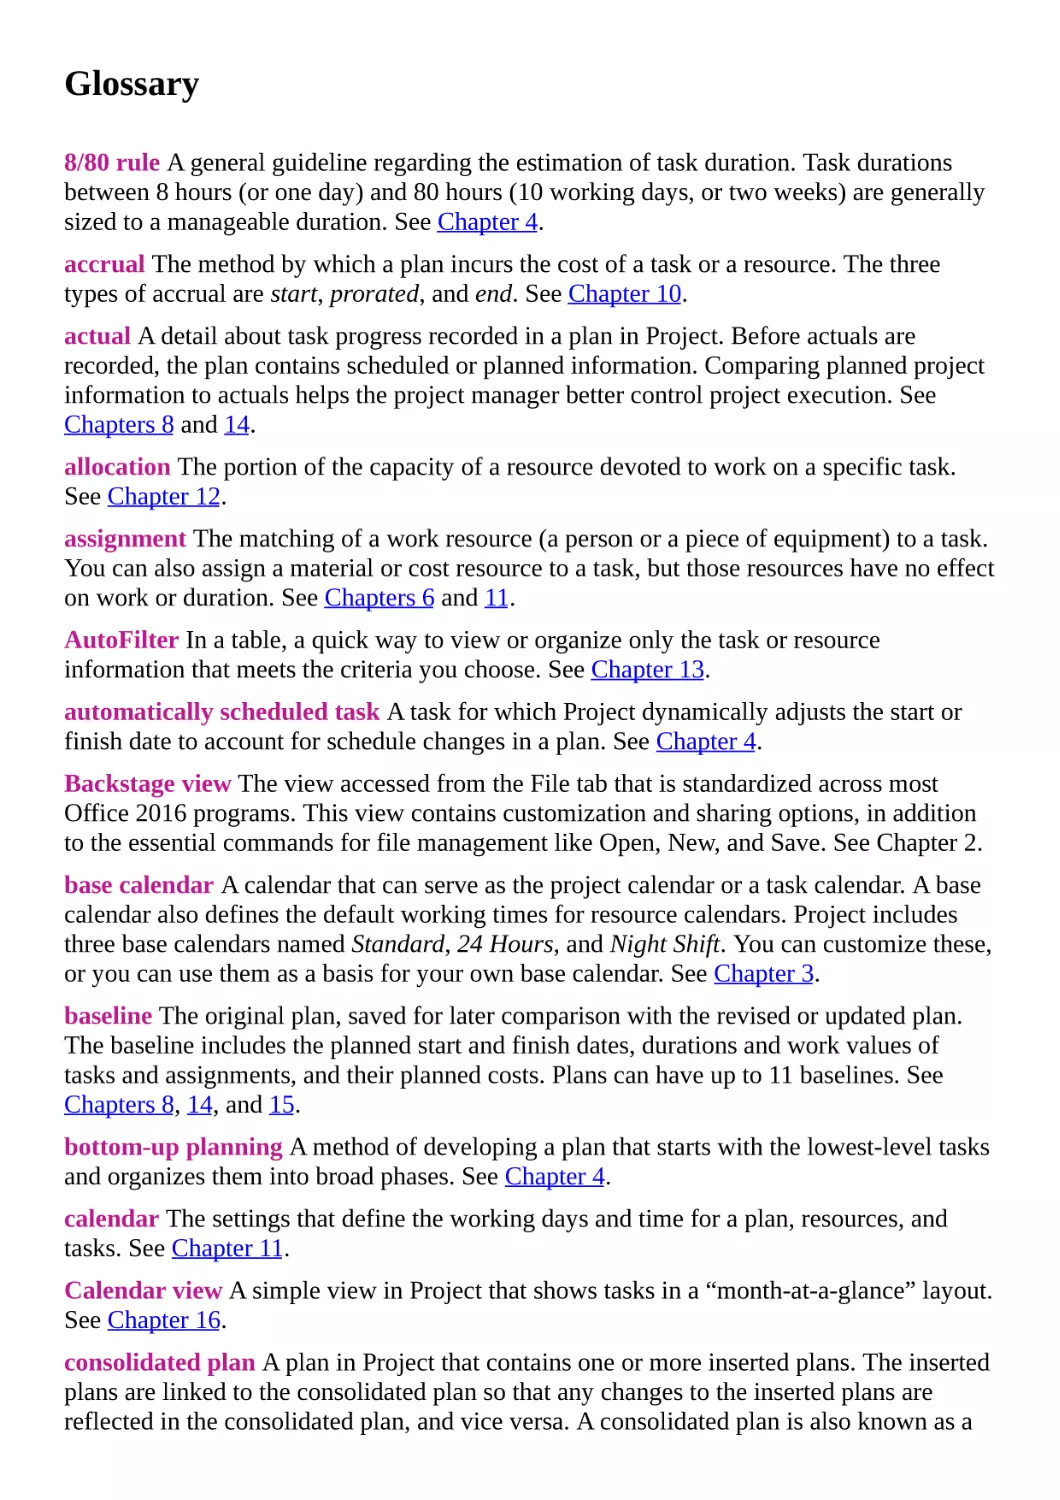
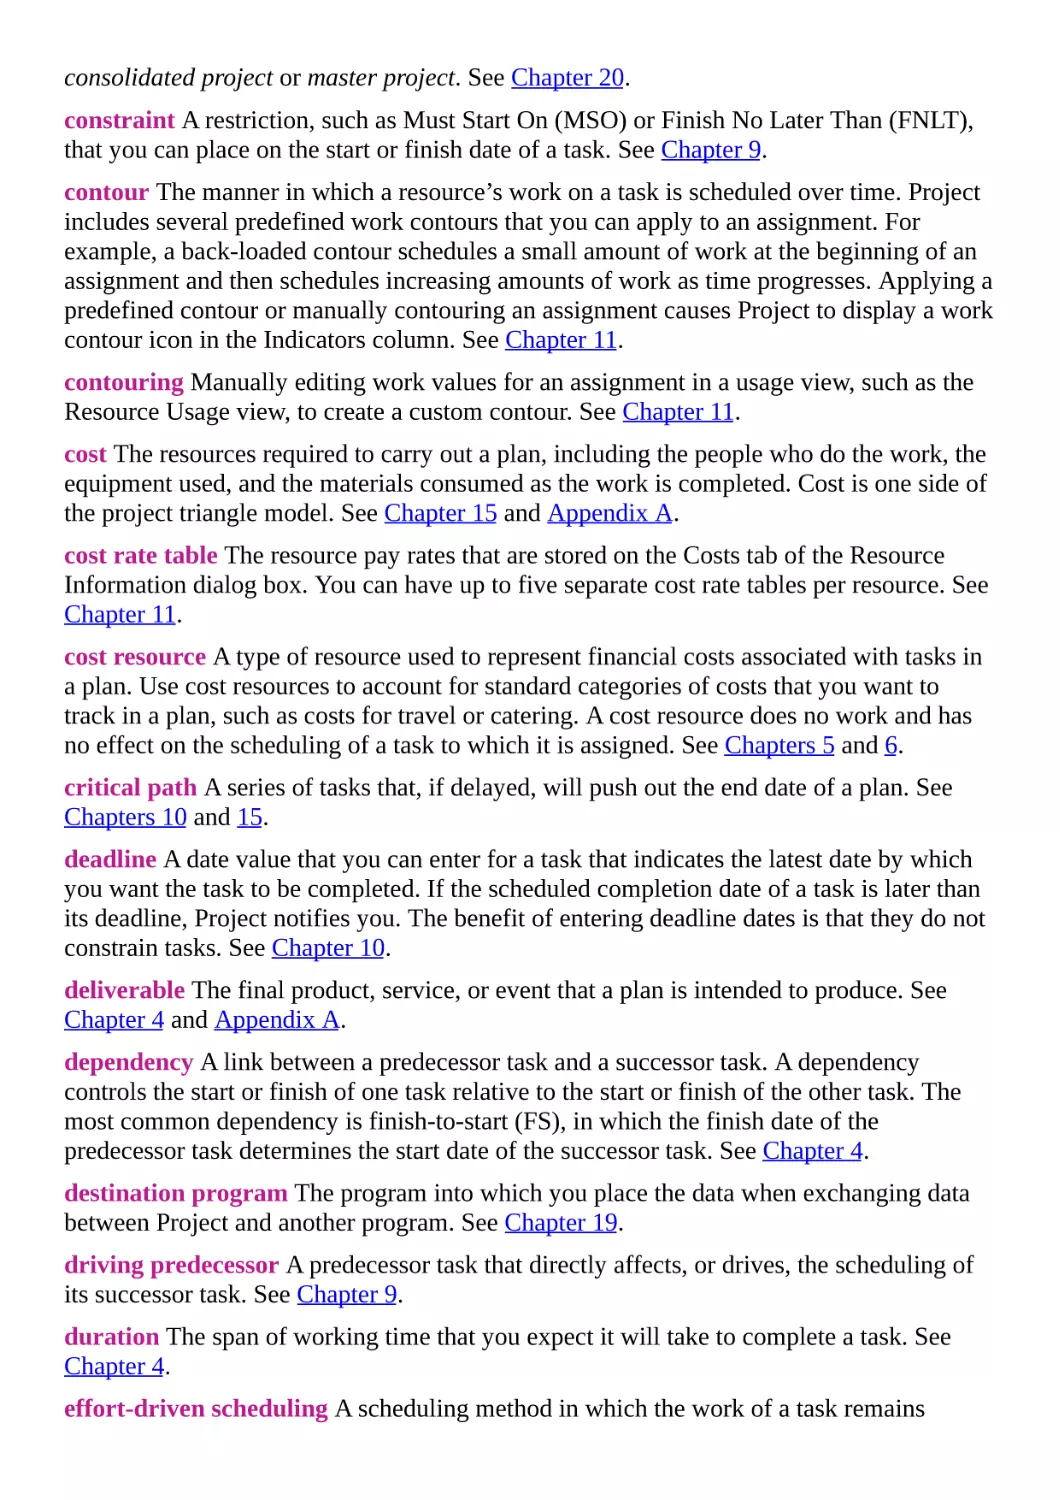
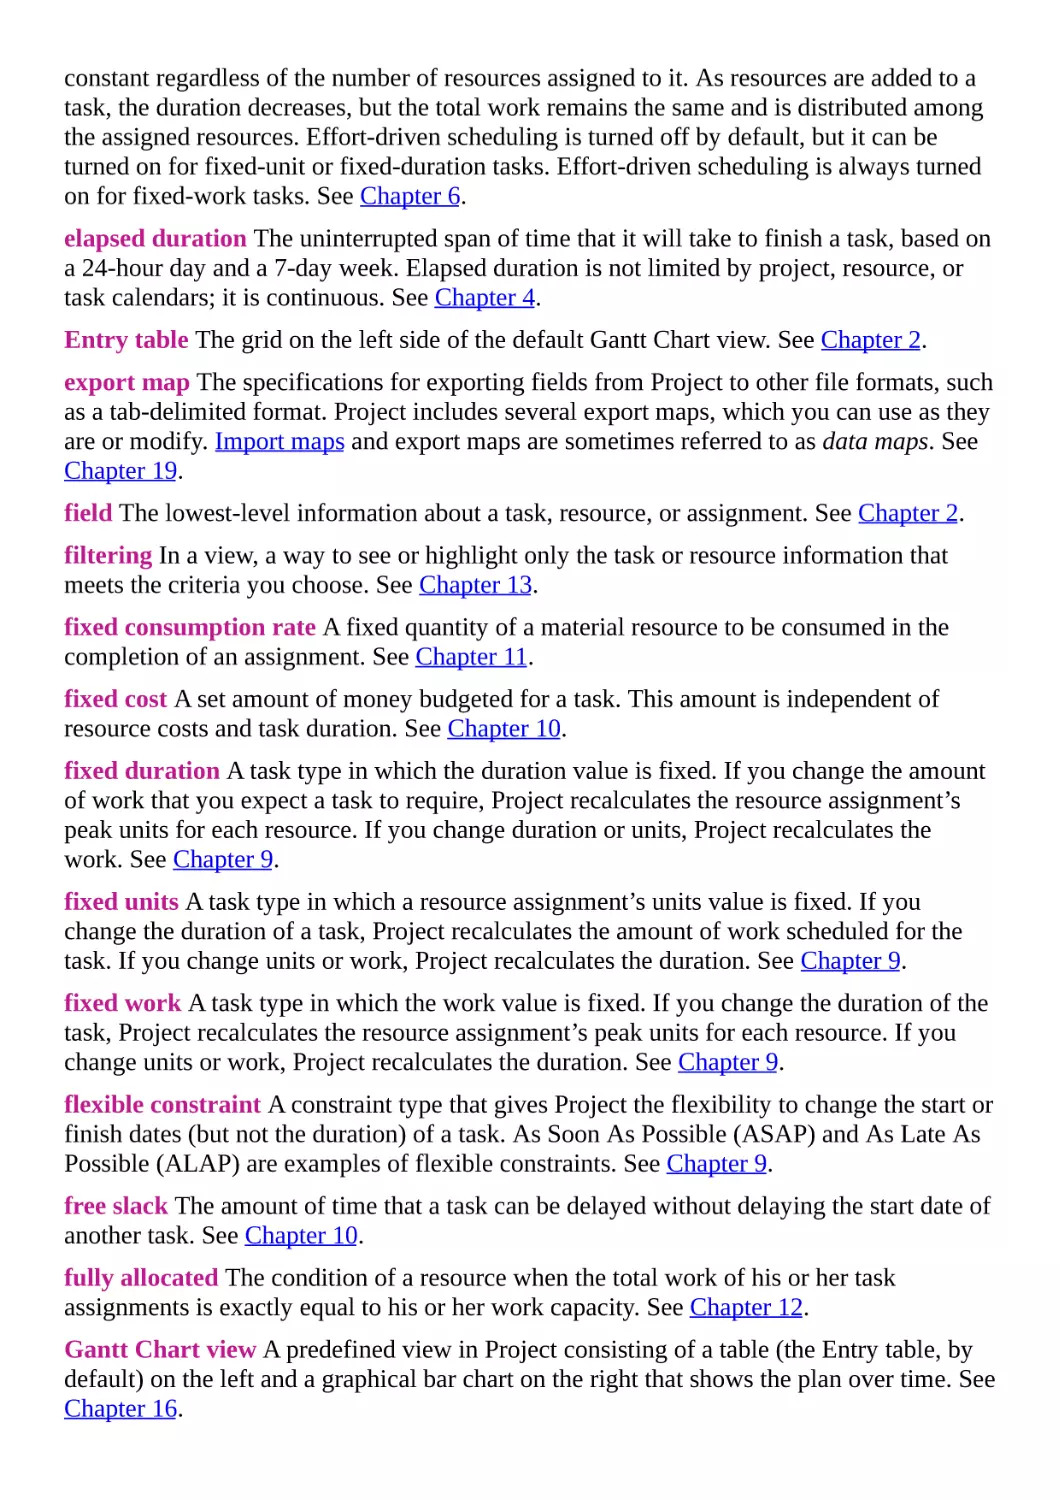
Glossary
Index
About the authors
Give us feedback
Tell us what you think of this book and help Microsoft improve our products for
you. Thank you! http://aka.ms/tellpress
Introduction
Welcome! This Step by Step book has been designed so you can read it from the beginning
to learn about Microsoft Project 2016 and then build your skills as you learn to perform
increasingly specialized procedures. Or, if you prefer, you can jump in wherever you need
ready guidance for performing tasks. The how-to steps are delivered crisply and concisely
—just the facts. You’ll also find informative, full-color graphics that support the
instructional content.
Who this book is for
Microsoft Project 2016 Step by Step is designed for use as a learning and reference
resource by home and business users of Microsoft Office programs who want to use
Project to create and manage projects more efficiently. The content of the book is designed
to be useful for people who have previously used earlier versions of Project and for people
who are discovering Project for the first time.
The Step by Step approach
The book’s coverage is divided into chapters representing general Project skill sets. Each
part is divided into chapters representing skill set areas, and each chapter is divided into
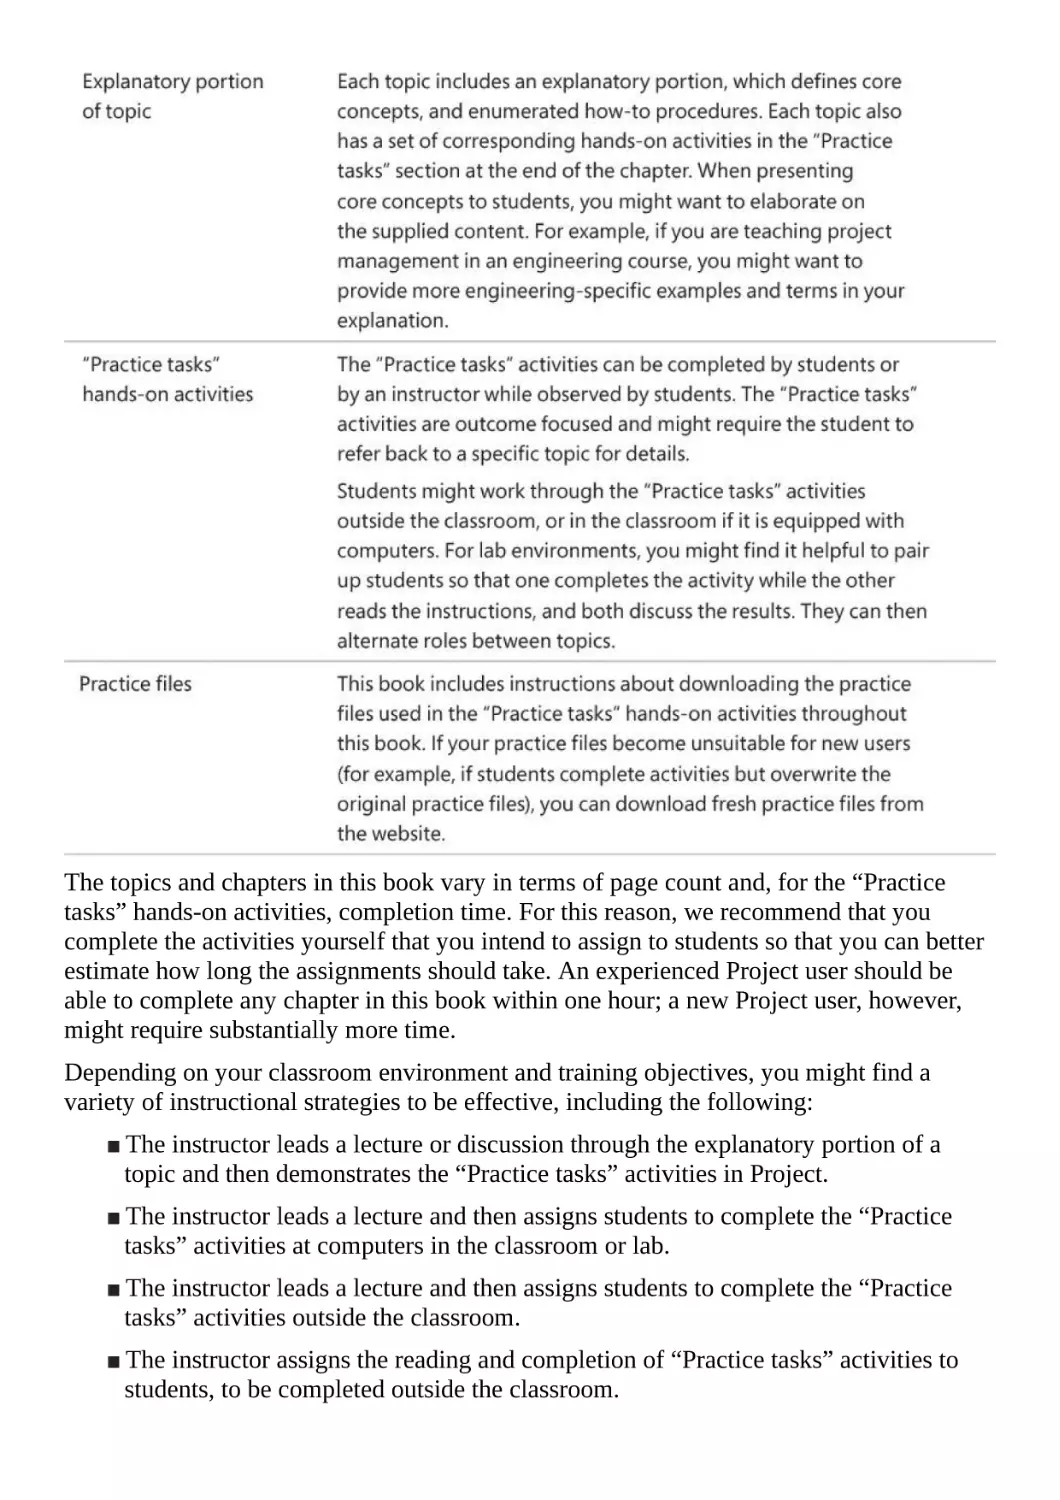
topics that group related skills. Each topic includes expository information followed by
generic procedures. At the end of the chapter, you’ll find a series of practice tasks you can
complete on your own by using the skills taught in the chapter. You can use the practice
files that are available from this book’s website to work through the practice tasks, or you
can use your own files.
Download the practice files
Before you can complete the practice tasks in this book, you need to download the book’s
practice files to your computer from http://aka.ms/project2016sbs/downloads. Follow the
instructions on the Downloads tab.
Important
Project 2016 is not available from the book’s website. You should install that
program before working through the procedures and practice tasks in this book.
You can open the files that are supplied for the practice tasks and save the finished
versions of each file. If you later want to repeat practice tasks, you can download the
original practice files again.
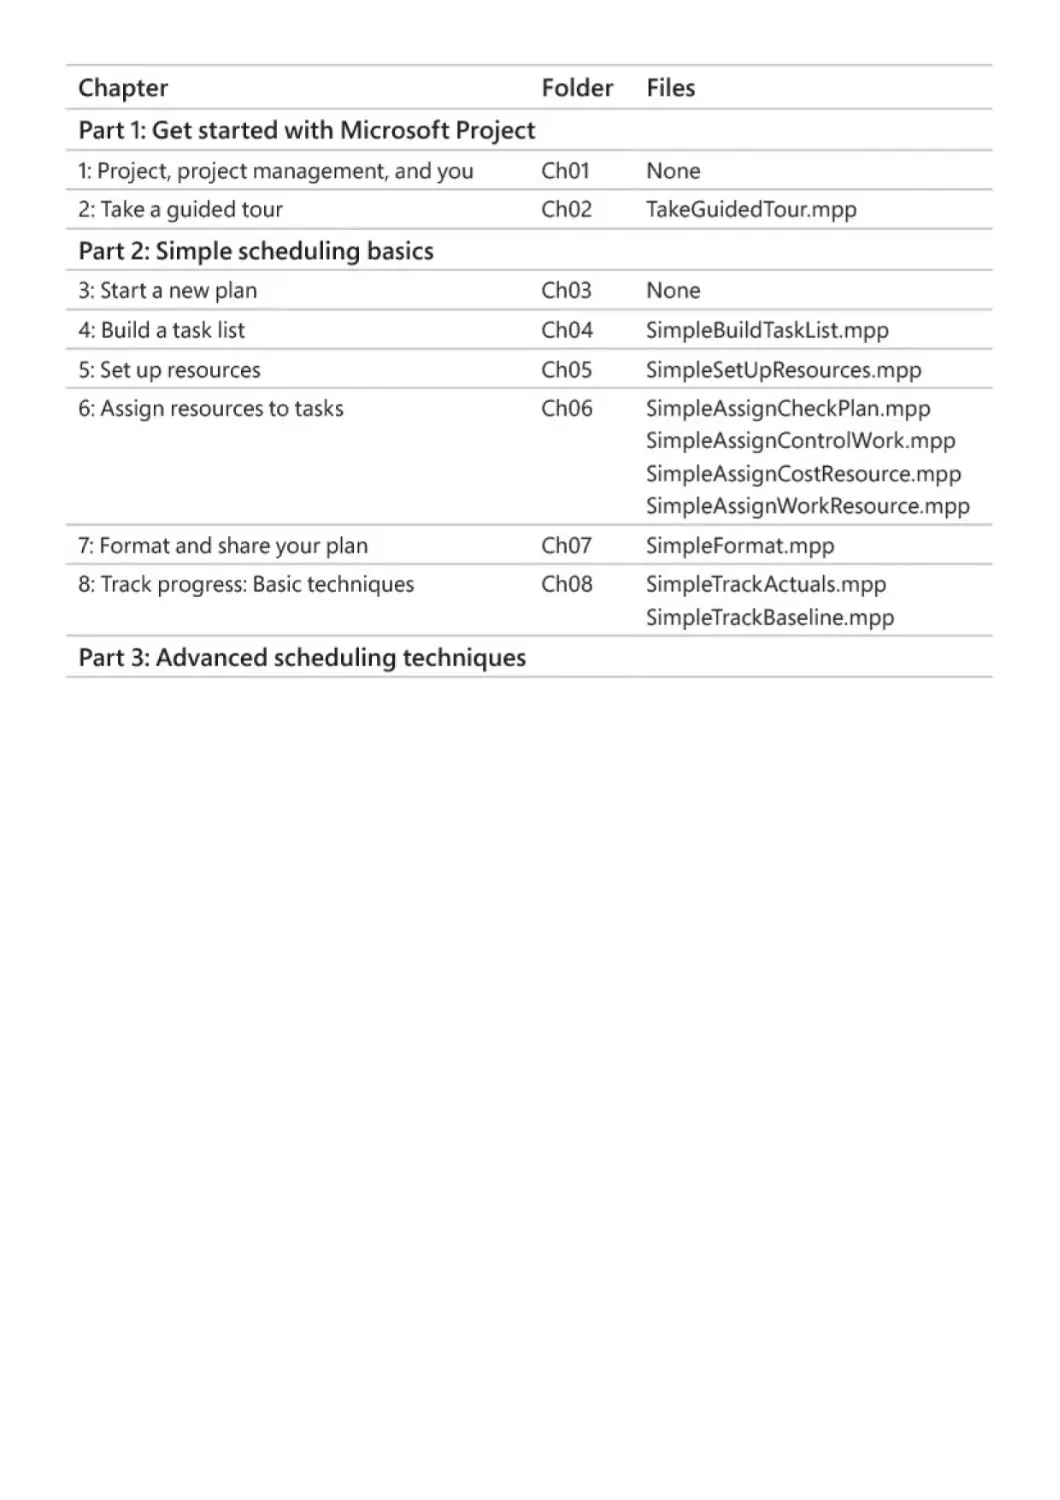
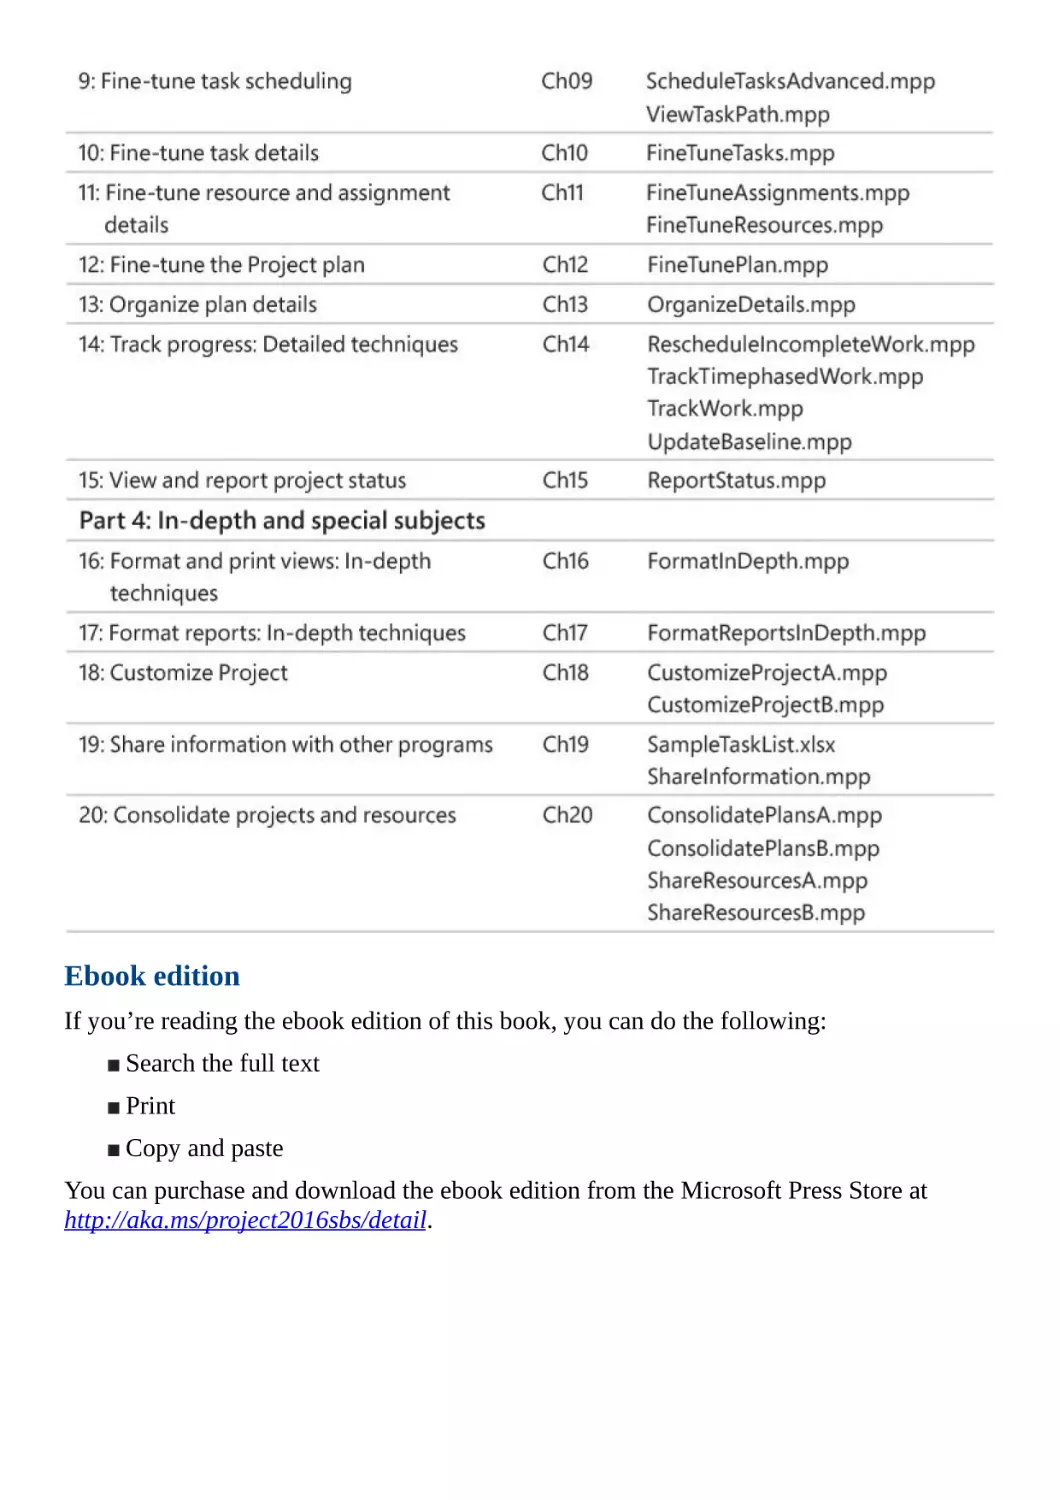
The following table lists the practice files for this book.
Ebook edition
If you’re reading the ebook edition of this book, you can do the following:
Search the full text
Print
Copy and paste
You can purchase and download the ebook edition from the Microsoft Press Store at
http://aka.ms/project2016sbs/detail.
Adapt procedure steps
This book contains many images of the Project user interface elements (such as the
ribbon and the program window) that you’ll work with while performing tasks in
Project on a Windows computer. Depending on your screen resolution or window
width, the Project ribbon on your screen might look different from that shown in
this book.(If you turn on Touch mode, the ribbon might display some commands in
a different layout.) As a result, procedural instructions that involve the ribbon might
require a little adaptation.
Simple procedural instructions use this format:
1. On the Task tab, in the View group, click the Gantt Chart button.
If the command is in a list, our instructions use this format:
1. On the View tab, in the Data group, click the Filter arrow and then, in the Filter
list, click Summary Tasks.
If differences between your display settings and ours cause a button to appear
differently on your screen than it does in this book, you can easily adapt the steps to
locate the command. First click the specified tab, and then locate the specified
group. If a group has been collapsed into a group list or under a group button, click
the list or button to display the group’s commands. If you can’t immediately
identify the button you want, point to likely candidates to display their names in
ScreenTips.
Multistep procedural instructions use this format:
1. On the View tab, in the Resource Views group, click the Resource Sheet button
to display the Resource Sheet view.
2. On the View tab, in the Data group, click the Tables button, and then click Cost.
The instructions in this book assume that you’re interacting with on-screen
elements on your computer by clicking (with a mouse, touchpad, or other hardware
device). If you’re using a different method—for example, if your computer has a
touchscreen interface and you’re tapping the screen (with your finger or a stylus)—
substitute the applicable tapping action when you interact with a user interface
element.
Instructions in this book refer to Project user interface elements that you click or tap
on the screen as buttons, and to physical buttons that you press on a keyboard as
keys, to conform to the standard terminology used in documentation for these
products.
When the instructions tell you to enter information, you can do so by typing on a
connected external keyboard, tapping an on-screen keyboard, or even speaking
aloud, depending on your computer setup and your personal preferences.
Get support and give feedback
This topic provides information about getting help with this book and contacting us to
provide feedback or report errors.
Errata and support
We’ve made every effort to ensure the accuracy of this book and its companion content. If
you discover an error, please submit it to us at http://aka.ms/project2016sbs/errata.
If you need to contact the Microsoft Press Support team, please send an email message to
mspinput@microsoft.com.
For help with Microsoft software and hardware, go to http://support.microsoft.com.
We want to hear from you
At Microsoft Press, your satisfaction is our top priority, and your feedback our most
valuable asset. Please tell us what you think of this book at http://aka.ms/tellpress.
The survey is short, and we read every one of your comments and ideas. Thanks in
advance for your input!
Stay in touch
Let’s keep the conversation going! We’re on Twitter at http://twitter.com/MicrosoftPress.
Part 1: Get started with Microsoft Project
CHAPTER 1 Project, project management, and you
CHAPTER 2 Take a guided tour
1. Project, project management, and you
In this chapter
Meet the Project program
Meet the Project family
See the new features in Project 2016
Take a project manager’s perspective
Practice files
There are no practice tasks in this chapter.
Thank you for adding this book to your Microsoft Project 2016 skills development plan.
This book is designed as a learning and reference resource. Most of the chapters that
follow include hands-on activities in Project.
This chapter does not involve hands-on work in Project. Instead, read it to better
understand how Project and project management fit with your personal skills development
goals. This chapter introduces you to Project and the field of project management.
Meet the Project program
Project can be the go-to tool in your project-management toolbox. This book explains how
to use Project to build schedules (which we’ll generally call plans), complete with tasks
and resources.
Project is a powerful program that you can use to plan and manage a wide range of
projects. From meeting crucial deadlines and budgets to selecting the right resources, you
can be more productive and realize better results by using the set of features Project offers.
You can use Project to do the following:
Create plans at the level of detail that’s right for your project. Work with summary
data initially, and then shift to a more detailed approach when needed.
Control what tasks Project can schedule automatically and which ones you’ll
schedule manually.
Manage tasks, resources, work, and costs at whatever level of detail is appropriate
for your project’s needs.
Work with your plan’s data in a variety of views and reports.
Track and manage your plan throughout the life of the project.
Collaborate and share data with others in your organization.
Use resource pools, consolidated projects, and cross-project links to extend your
project-management focus across multiple projects.
Project 2016 builds on previous versions to provide powerful project-management tools.
See “See the new features in Project 2016“ later in this chapter for a list of the major new
features from the last several releases of Project, and for cross-references to the related
topics in this book.
Meet the Project family
The Project desktop program is available in two different editions:
Project Standard This edition is the entry-level desktop program with which you
can create, modify, and track plans.
Project Professional This edition includes all the functionality of Project Standard
plus a few additional features, such as the Team Planner view. Project Professional
can also work with Project Online and Project Server. (When Project Professional is
obtained via a Microsoft Office 365 subscription, you might see it referred to as
Project Pro.)
In addition to installing the Project desktop programs on your computer, you have other
options for accessing Project and related services:
Project Online Delivered through Office 365, Project Online is the Microsoft
Project and Portfolio Management (PPM) solution. (Note that Project Online is not a
web-based version of the Project program.)
Project Server This is the Microsoft on-premises PPM solution.
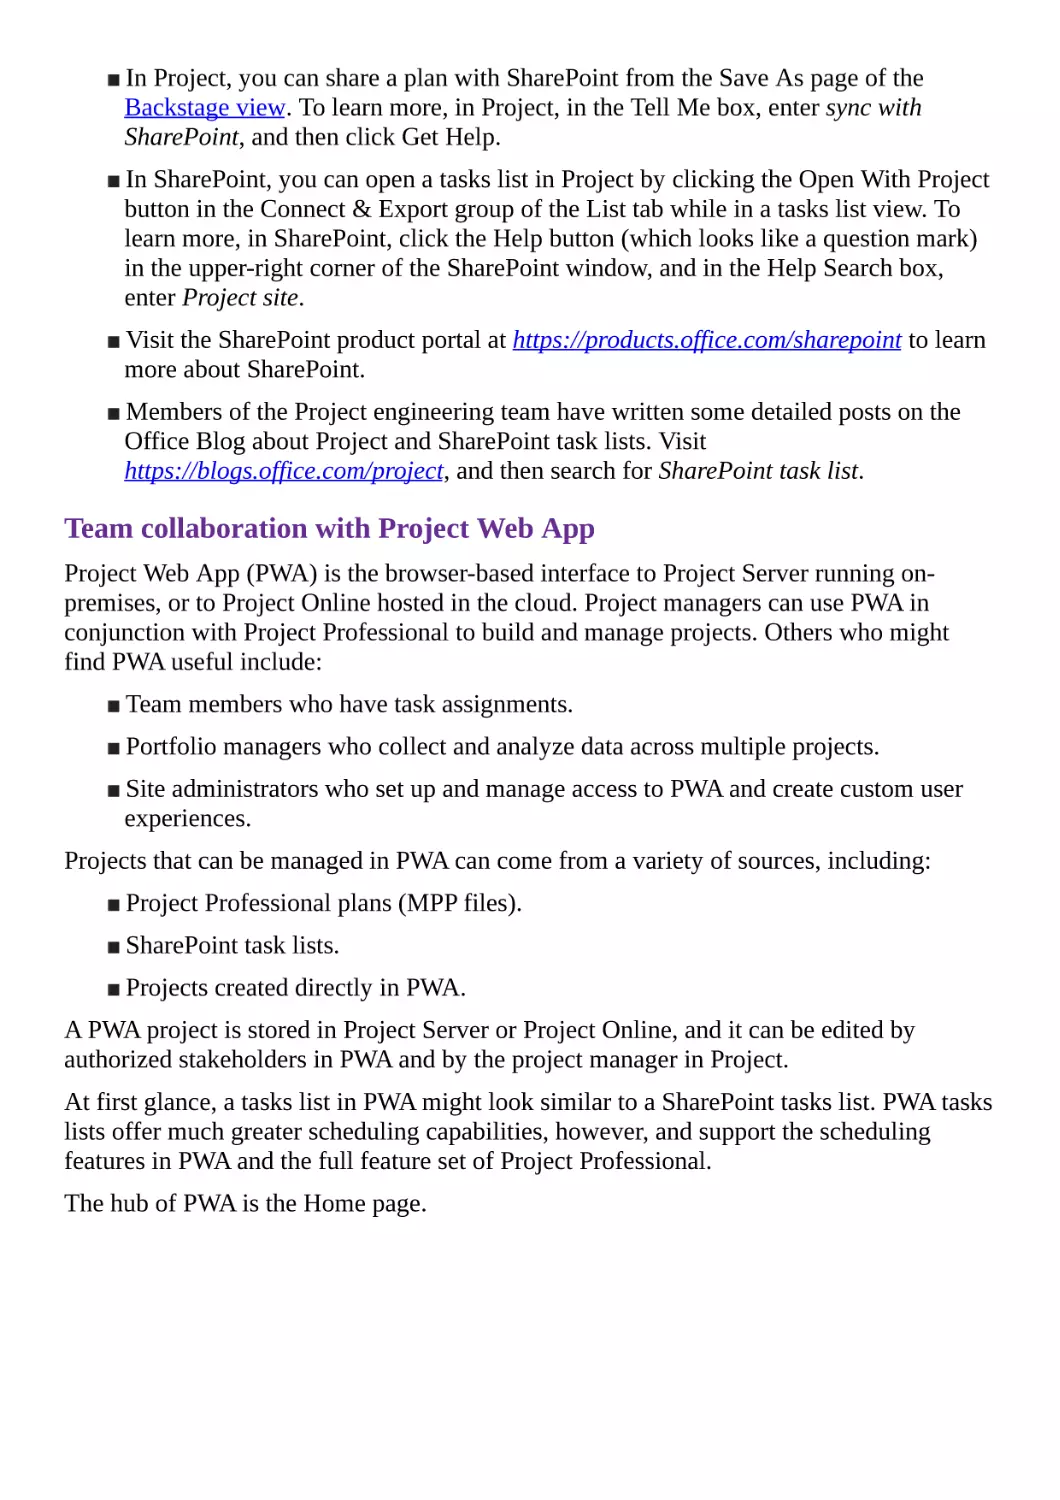
Project Web App (PWA) This is the browser-based interface for the PPM solution.
Tip
For more information about using Project with the Microsoft SharePoint and PPM
solutions, see Appendix C, “Collaborate: Project, SharePoint, and PWA.“ To learn
more about Project Online and Office 365 subscription offerings, go to
https://products.office.com/Project.
This book focuses on the features in the Project Standard and Project Professional desktop
programs. When a feature that is unique to Project Professional appears, you’ll see
instructions for users of both Project Standard and Project Professional.
See the new features in Project 2016
The 2016 version of Project includes some new and improved features, such as the
following:
Timeline view updates Display multiple timeline bars with custom date ranges. For
more information, see “Format a timeline view” in Chapter 16, “Format and print
views: In-depth techniques.“
Tell Me This is a help and feature search text box on the ribbon. Use it to quickly
find a Project feature (or help content about that feature). For more information, see
Chapter 2, “Take a guided tour.“
New themes Change the visual style of Project by applying one of the new Office
themes. You do so on the General page of the Project Options dialog box (available
via the File tab).
If you’re upgrading to Project 2016 from a previous version, you’re probably most
interested in the differences between the old and new versions and how they will affect
you. The following sections list new features that were introduced in Project 2013 and
Project 2010. These features are also present in Project 2016 and, depending on the
version of Project from which you are upgrading, might be new to you.
What was new in Project 2013
The 2013 version included several new features and some improved ones, such as the
following:
Reports Project 2013 replaced the previous tabular reports feature with an entirely
new way of visualizing your Project data. The reports feature includes a dynamic
mix of tables, charts, and textual content, and it’s highly customizable. For more
information, see, “Customize reports” in Chapter 7, “Format and share your plan,“
and Chapter 17, “Format reports: In-depth techniques.“
Task Path Use this feature to quickly identify the Gantt bars of the selected task’s
predecessors and successors. For more information, see “See task relationships by
using Task Path” in Chapter 9, “Fine-tune task scheduling.“
Redesigned Backstage and OneDrive integration As with other Office programs,
quick access to Microsoft OneDrive storage is integrated into the Project Backstage
view. For more information, see “Manage files and set options in the Backstage
view” in Chapter 2, “Take a guided tour.“
A much later project finish date The latest possible date Project can work with
was moved from December 31, 2049 to December 31, 2149.
Support for touch input As in other Office programs, you can optimize the Project
interface (primarily the commands on the ribbon) for either touch or mouse input.
Skype integration (Project Professional only) In Project, you can start a Skype for
Business chat or create an email message to a resource directly from Project. To do
so, point to the resource name and start an instant messaging session or video chat.
Support for apps for Office Project supports third-party add-ins and apps available
from the Office Store, located at store.office.com.
What was new in Project 2010
The 2010 version included the following:
The ribbon interface The ribbon interface organized all the commands that most
people use in a new way, making them quickly accessible from tabs at the top of the
program window. For more information, see “Explore the Project user interface” in
Chapter 2, “Take a guided tour.“
The Backstage view All the tools you need to work with your files are accessible
from one location. For more information, see “Manage files and set options in the
Backstage view” in Chapter 2, “Take a guided tour.“
Manually scheduled tasks Begin creating tasks with whatever information you
might have, and don’t worry about automatic scheduling of tasks until you’re ready.
Manually scheduled tasks are not affected by changes in duration, start or finish
dates, dependencies, or other items that otherwise would cause Project to reschedule
a task. You can then switch individual tasks or an entire plan from manual to
automatic scheduling. For more information, see “Create tasks“ and “Switch task
scheduling from manual to automatic“ in Chapter 4, “Build a task list.“
Timeline view Create a “project at a glance” view that includes just the summary
tasks, tasks, and milestones that you choose. Easily copy the Timeline view as a
graphic image to paste into other programs. For more information, see “Add tasks to
a Timeline view” in Chapter 7, “Format and share your plan.“
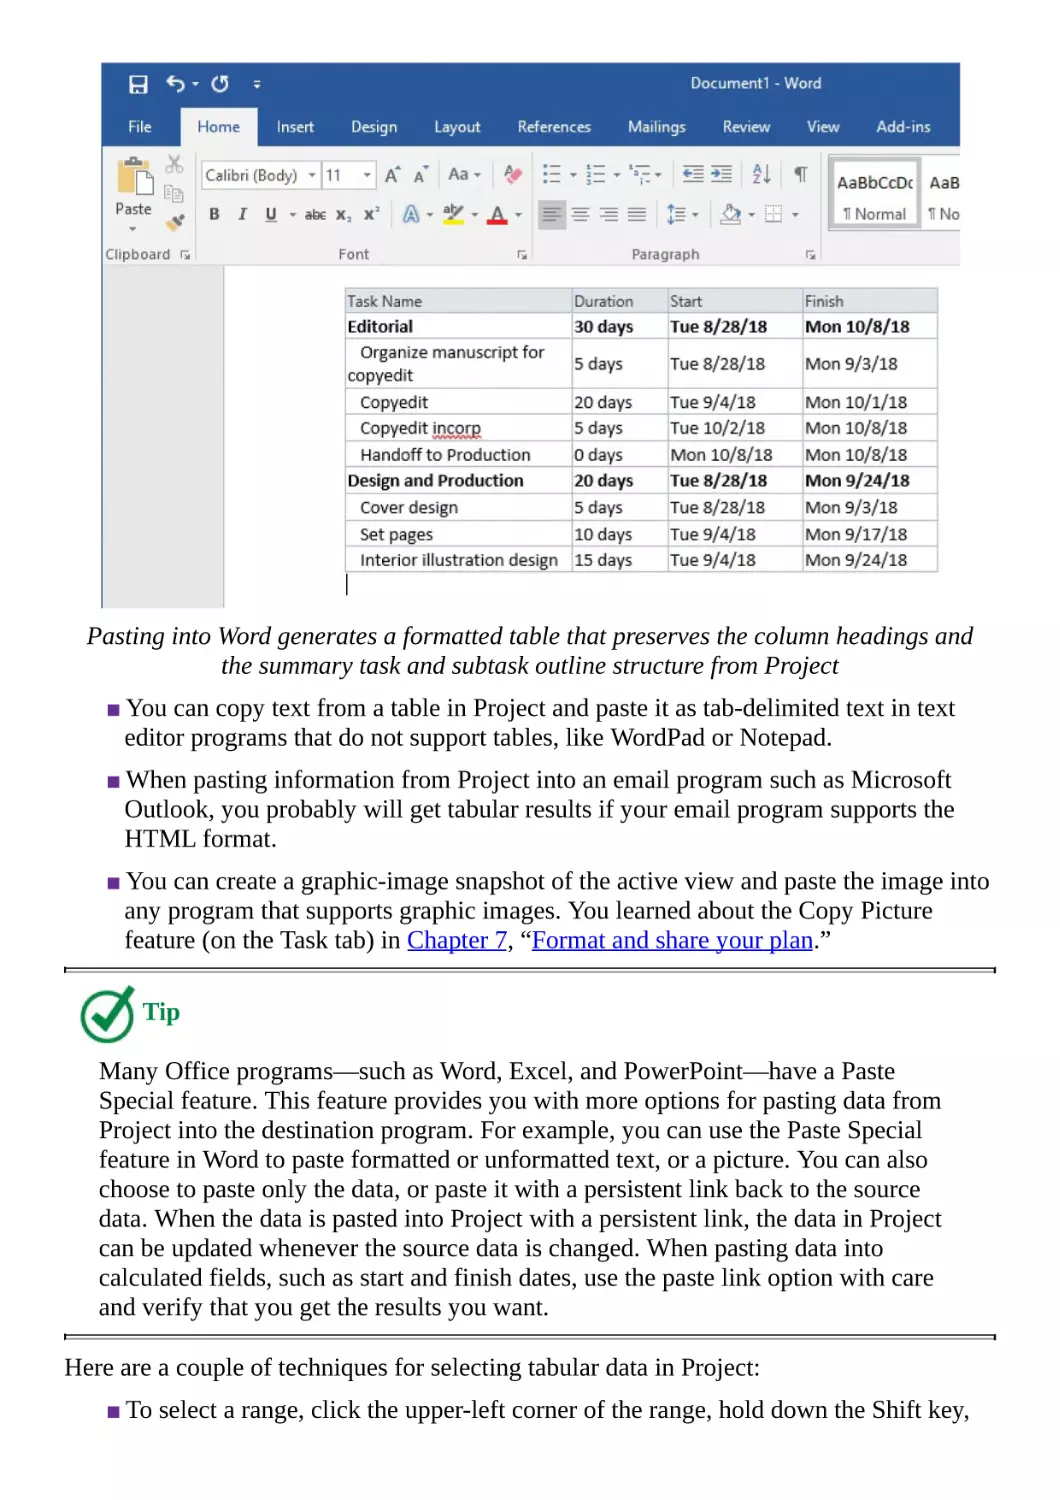
Improved pasting to Excel and Word Paste Project data into Microsoft Excel or
Word and preserve the column headings and outline structure of your Project data.
For more information, see “Copy Project data to and from other programs” in
Chapter 19, “Share information with other programs.”
Customizable ribbon Create your own tabs and groups to suit the way you work.
For more information, see “Customize the ribbon and Quick Access Toolbar” in
Chapter 18, “Customize Project.“
Custom fields Just start typing a numeric value, date value, or text string into the
rightmost column in a table, and Project will identify the right data type. For more
information, see “Create new tables” in Chapter 13, “Organize plan details.“
AutoFilter improvements Use Excel-like column filtering, in addition to sorting
and grouping, directly from AutoFilter arrows on column headings. For more
information, see “Filter plan details” in Chapter 13, “Organize plan details.“
Save as PDF or XPS Create PDF or XPS-format documents directly from Project.
For more information, see “Print and export views” in Chapter 16, “Format and print
views: In-depth techniques.“
Team Planner view (Project Professional only) Perform actions like reassigning a
task from one resource to another with simple drag-and-drop actions in the Team
Planner view. For more information, see “Adjust assignments in the Team Planner
view” in Chapter 11, “Fine-tune resource and assignment details.“
Inactivate tasks (Project Professional only) Disable (but don’t delete) tasks from a
plan so that they have no effect on the overall schedule but can be reactivated later if
you need them. For more information, see “Inactivate tasks” in Chapter 12,“ Finetune the Project plan.“
SharePoint Task List integration (Project Professional only) Publish and
synchronize tasks between Project and a SharePoint list. For more information, see
Appendix C, “Collaborate: Project, SharePoint, and PWA.“
Take a project manager’s perspective
Project management is a broadly practiced art and science. If you’re reading this book,
chances are that you’re either seriously involved in project management or you want to be.
Project is unique among the Office programs in that Project is a specialized tool designed
for the specific domain of project management. You might be invested in your
professional identity as a project manager, or you might not identify yourself with project
management at all. Either way, your success as a user of Project, to a large degree, will be
related to your success as a project manager. Let’s take a moment to explore this subject.
At its heart, project management is a combination of skills and tools that help you predict
and control the outcomes of endeavors undertaken by your organization. Your
organization might be involved in other work apart from projects. Projects (such as
developing a new product) are distinct from ongoing operations (such as running payroll
services). Projects are defined as temporary endeavors undertaken to create some unique
deliverable or result. With a good project-management system in place, you should be
able to answer such questions as the following:
What tasks must be performed, and in what order, to produce the deliverable of the
project?
When should each task be performed, and what is the final deadline?
Who will complete these tasks?
How much will it cost?
What if some tasks are not completed as scheduled?
What’s the best way to communicate project details to those who have an interest or
stake in the project?
Good project management does not guarantee the success of every project, but poor
project management often leads to failure.
A core principle of this book’s instructional strategy is that success with Project is built on
success with basic project-management practice. Although Project is a feature-rich
program, mastery of its features alone is no guarantee of success in project management.
For this reason, you will find material about project-management best practices
throughout this book. See, for example, the following:
The many “Project management focus” sidebars throughout the chapters
Appendix A, “A short course in project management“
Appendix B, “Develop your project-management skills“
Let’s get started!
In the Practice tasks hands-on activities in this book, you will play the role of a project
manager at a fictitious children’s book publishing company, Lucerne Publishing. Each
new book (even this one) constitutes its own project; in fact, some are complex projects
involving costly resources and aggressive deadlines. We think you’ll be able to recognize
many of the scheduling needs that the project managers at Lucerne Publishing encounter,
and transfer their strategies and solutions to your own scheduling needs.
We’ve been working with Project since it debuted for Windows, and each version has
offered something that made project planning and management a little easier. Project 2016
continues that tradition for desktop project management, and we look forward to showing
you around.
2. Take a guided tour
In this chapter
Explore the Project user interface
Manage files and set options in the Backstage view
Work with schedule details in views
Use reports to check a plan’s status
Practice files
For this chapter, use the TakeGuidedTour practice file from the
Project2016SBS\Ch02 folder. For practice file download instructions, see the
introduction.
This chapter leads you on a quick tour of Project 2016. You’ll see the essential features
that make it such a powerful program. In this chapter, you’ll be introduced to many of the
Project features and conventions that you’ll work with throughout this book.
This chapter guides you through procedures related to managing files and setting options
in the Backstage view, working with schedule details in views, and using reports to check
a plan’s status.
Explore the Project user interface
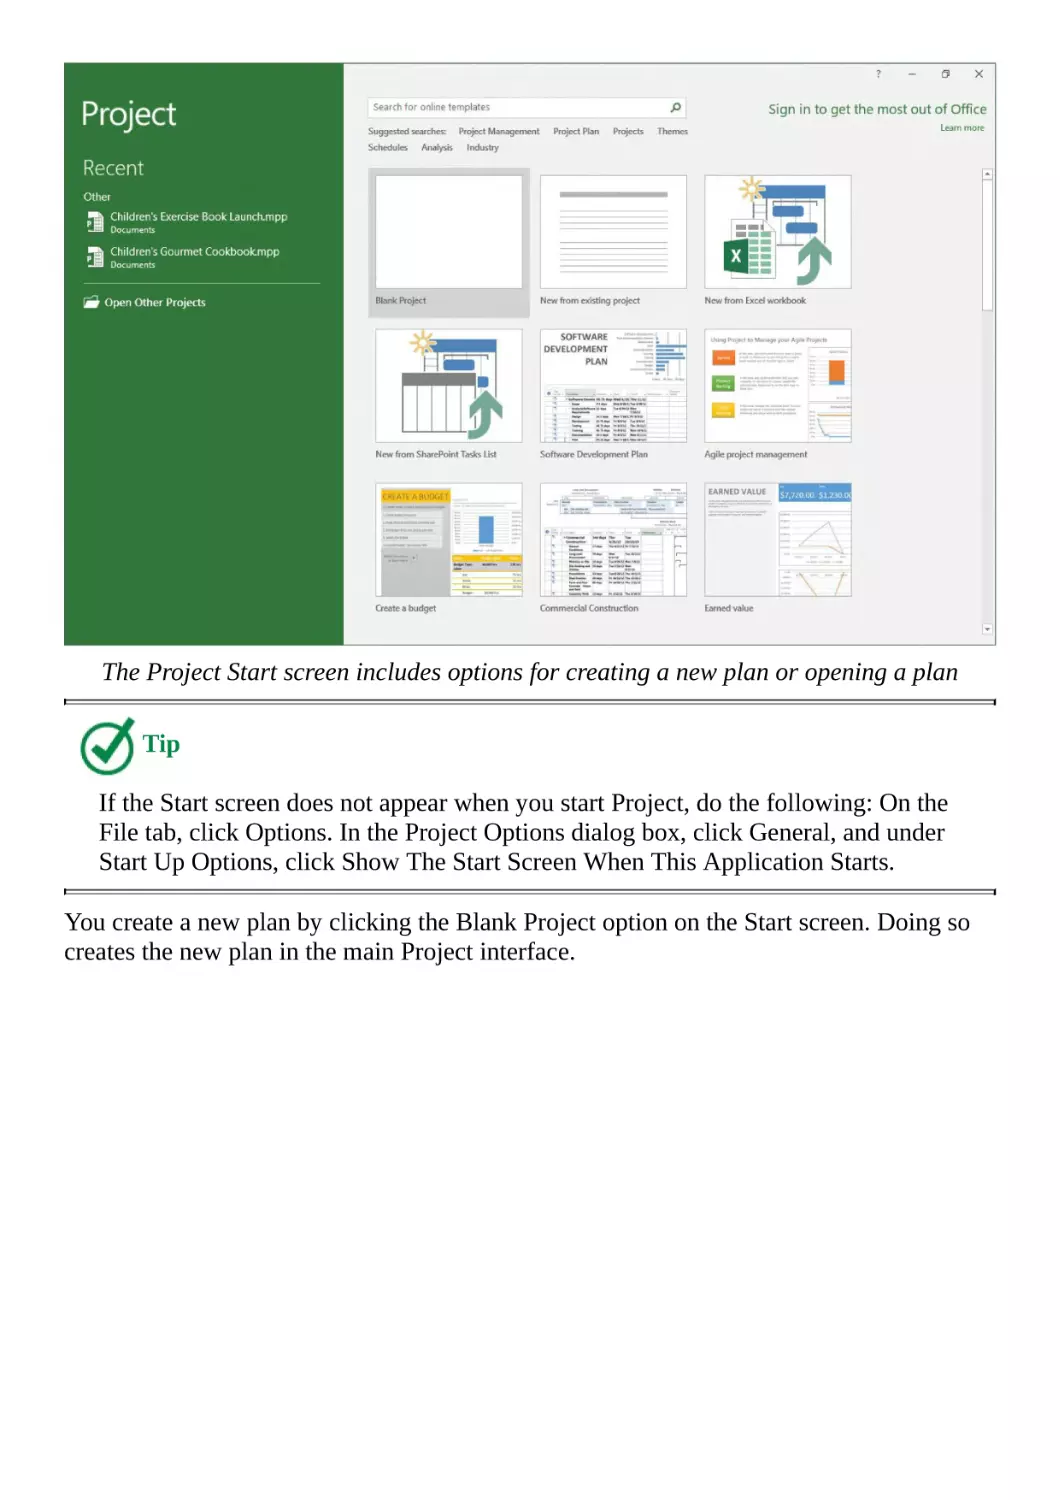
When you start Project, its Start screen appears. Here you can quickly open a plan that
was recently opened, open another plan, or create a new plan. The new plan can be empty
or it can be based on a template or on another plan.
The Project Start screen includes options for creating a new plan or opening a plan
Tip
If the Start screen does not appear when you start Project, do the following: On the
File tab, click Options. In the Project Options dialog box, click General, and under
Start Up Options, click Show The Start Screen When This Application Starts.
You create a new plan by clicking the Blank Project option on the Start screen. Doing so
creates the new plan in the main Project interface.
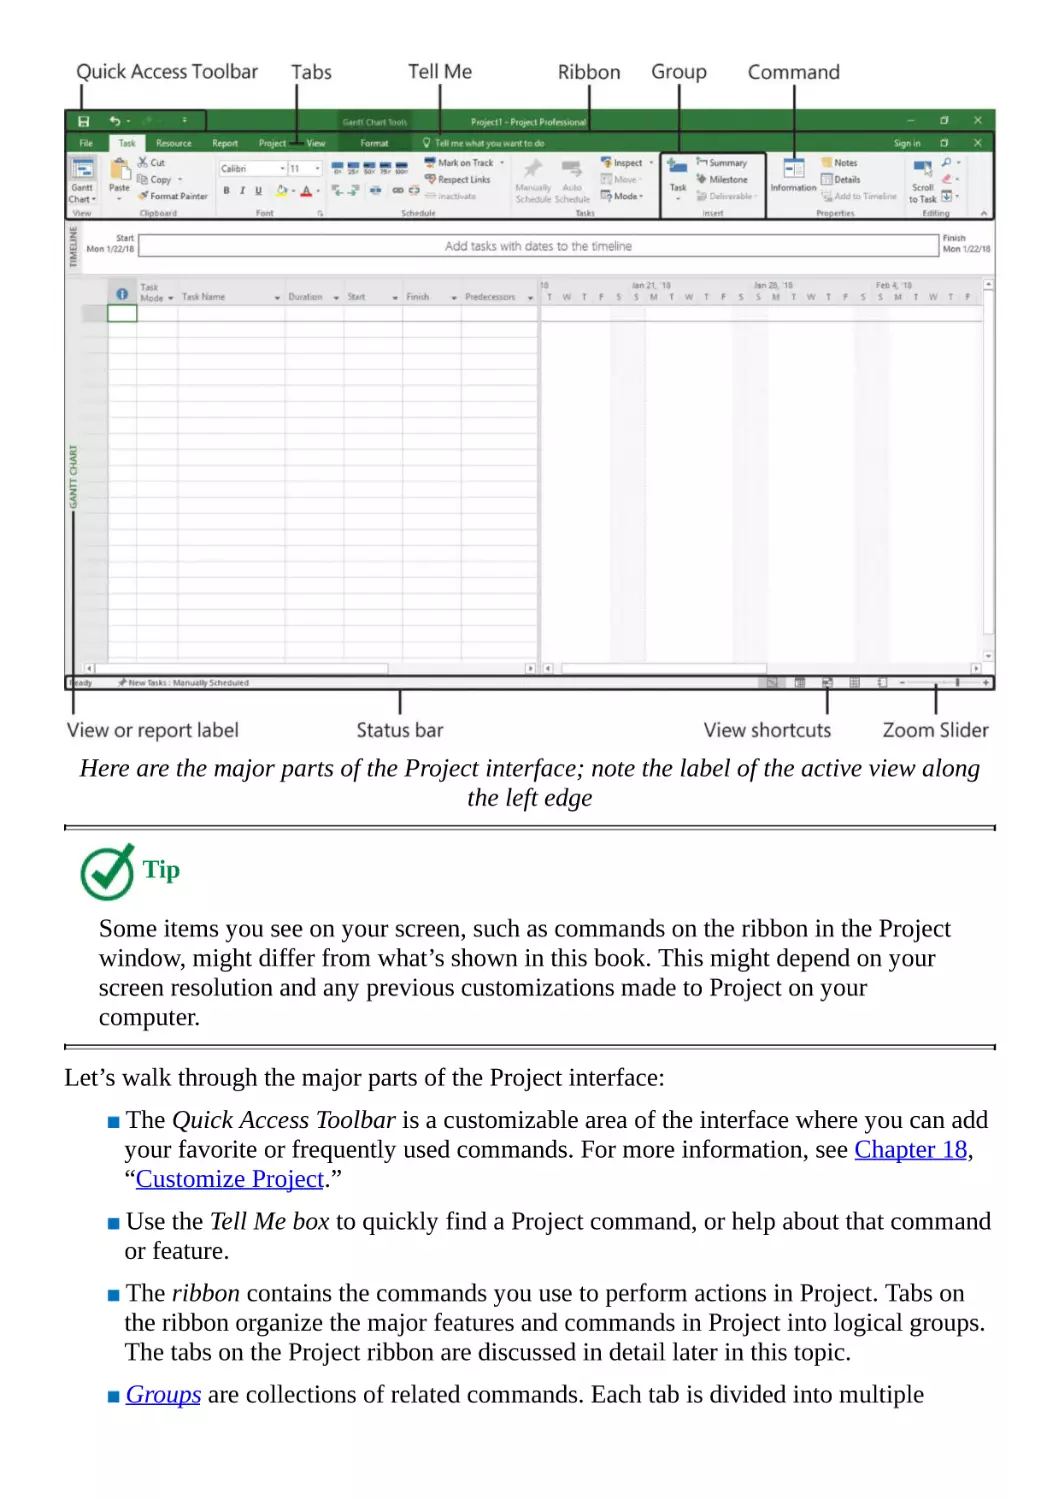
Here are the major parts of the Project interface; note the label of the active view along
the left edge
Tip
Some items you see on your screen, such as commands on the ribbon in the Project
window, might differ from what’s shown in this book. This might depend on your
screen resolution and any previous customizations made to Project on your
computer.
Let’s walk through the major parts of the Project interface:
The Quick Access Toolbar is a customizable area of the interface where you can add
your favorite or frequently used commands. For more information, see Chapter 18,
“Customize Project.”
Use the Tell Me box to quickly find a Project command, or help about that command
or feature.
The ribbon contains the commands you use to perform actions in Project. Tabs on
the ribbon organize the major features and commands in Project into logical groups.
The tabs on the Project ribbon are discussed in detail later in this topic.
Groups are collections of related commands. Each tab is divided into multiple
groups.
Commands are the specific features you use to perform actions in Project. Each tab
contains several commands. Some commands, like Cut on the Task tab, perform an
immediate action. Other commands, like Change Working Time on the Project tab,
open a dialog box or prompt you to take further action in some other way. Some
commands are available only when you’re in a particular type of view or report.
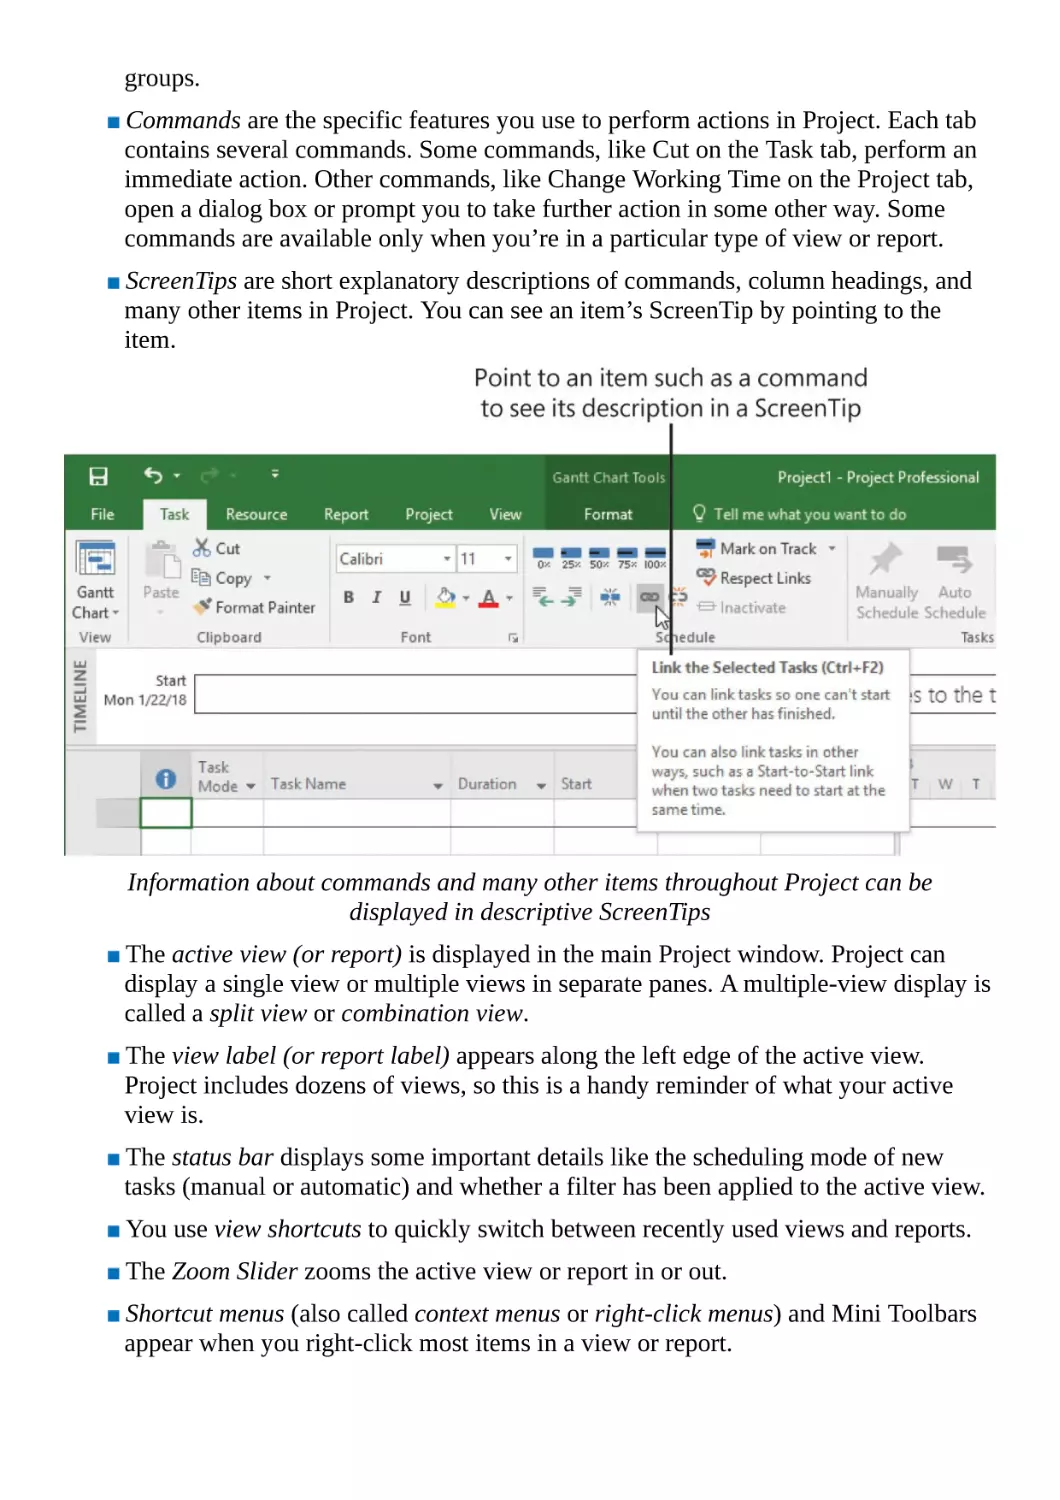
ScreenTips are short explanatory descriptions of commands, column headings, and
many other items in Project. You can see an item’s ScreenTip by pointing to the
item.
Information about commands and many other items throughout Project can be
displayed in descriptive ScreenTips
The active view (or report) is displayed in the main Project window. Project can
display a single view or multiple views in separate panes. A multiple-view display is
called a split view or combination view.
The view label (or report label) appears along the left edge of the active view.
Project includes dozens of views, so this is a handy reminder of what your active
view is.
The status bar displays some important details like the scheduling mode of new
tasks (manual or automatic) and whether a filter has been applied to the active view.
You use view shortcuts to quickly switch between recently used views and reports.
The Zoom Slider zooms the active view or report in or out.
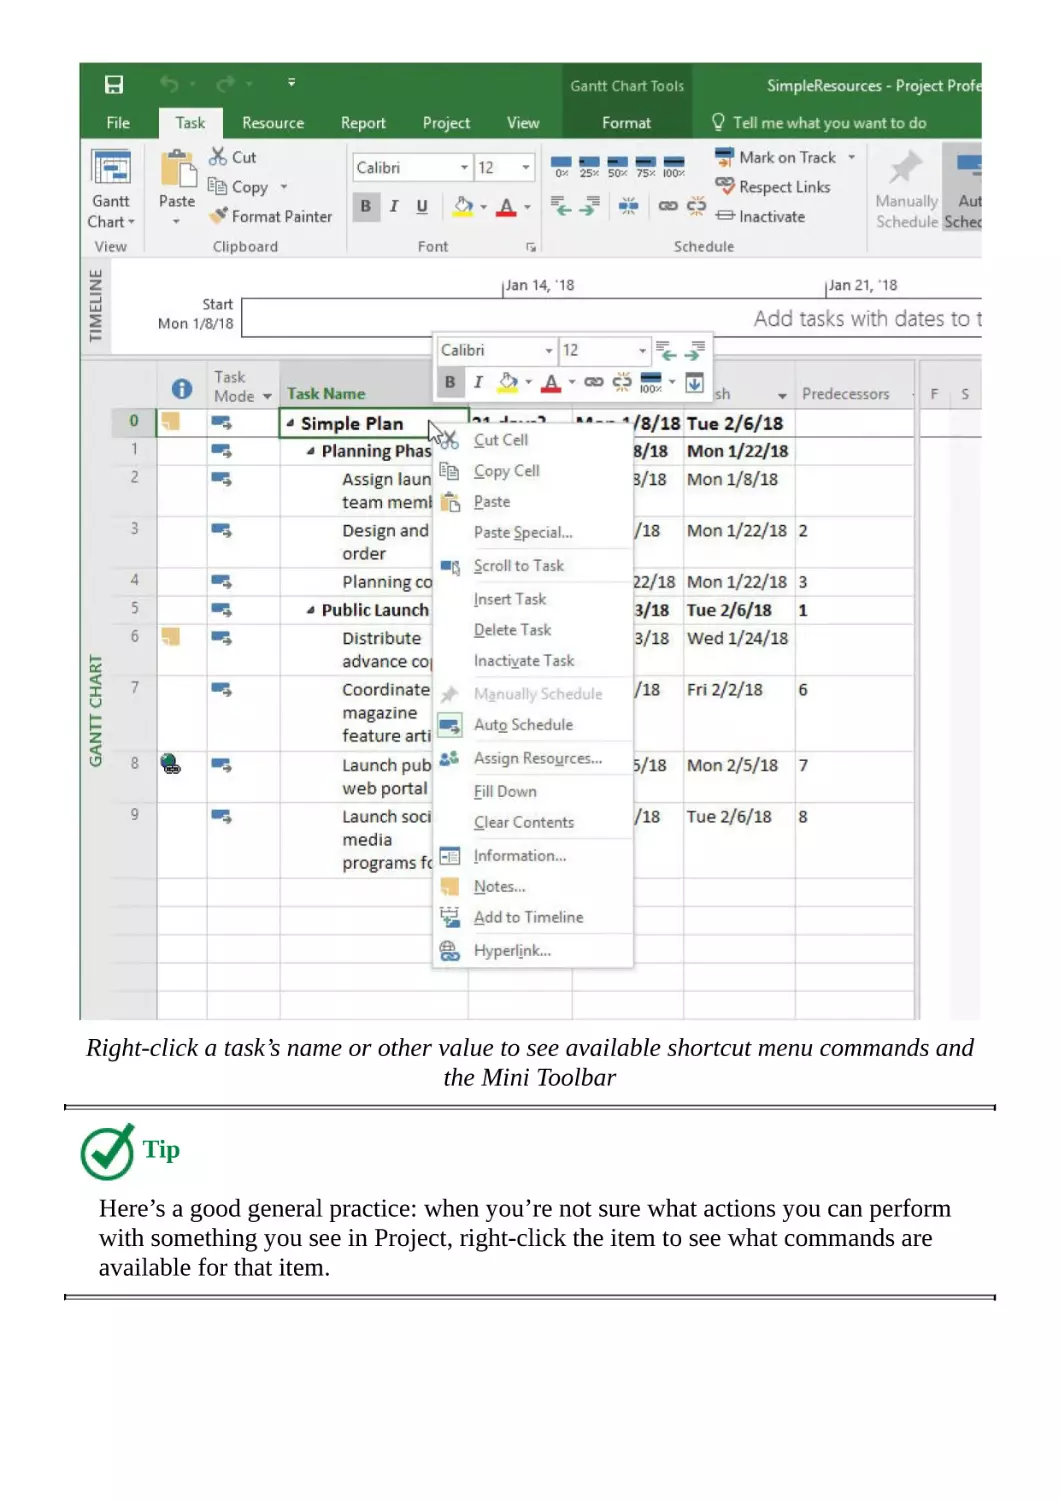
Shortcut menus (also called context menus or right-click menus) and Mini Toolbars
appear when you right-click most items in a view or report.
Right-click a task’s name or other value to see available shortcut menu commands and
the Mini Toolbar
Tip
Here’s a good general practice: when you’re not sure what actions you can perform
with something you see in Project, right-click the item to see what commands are
available for that item.
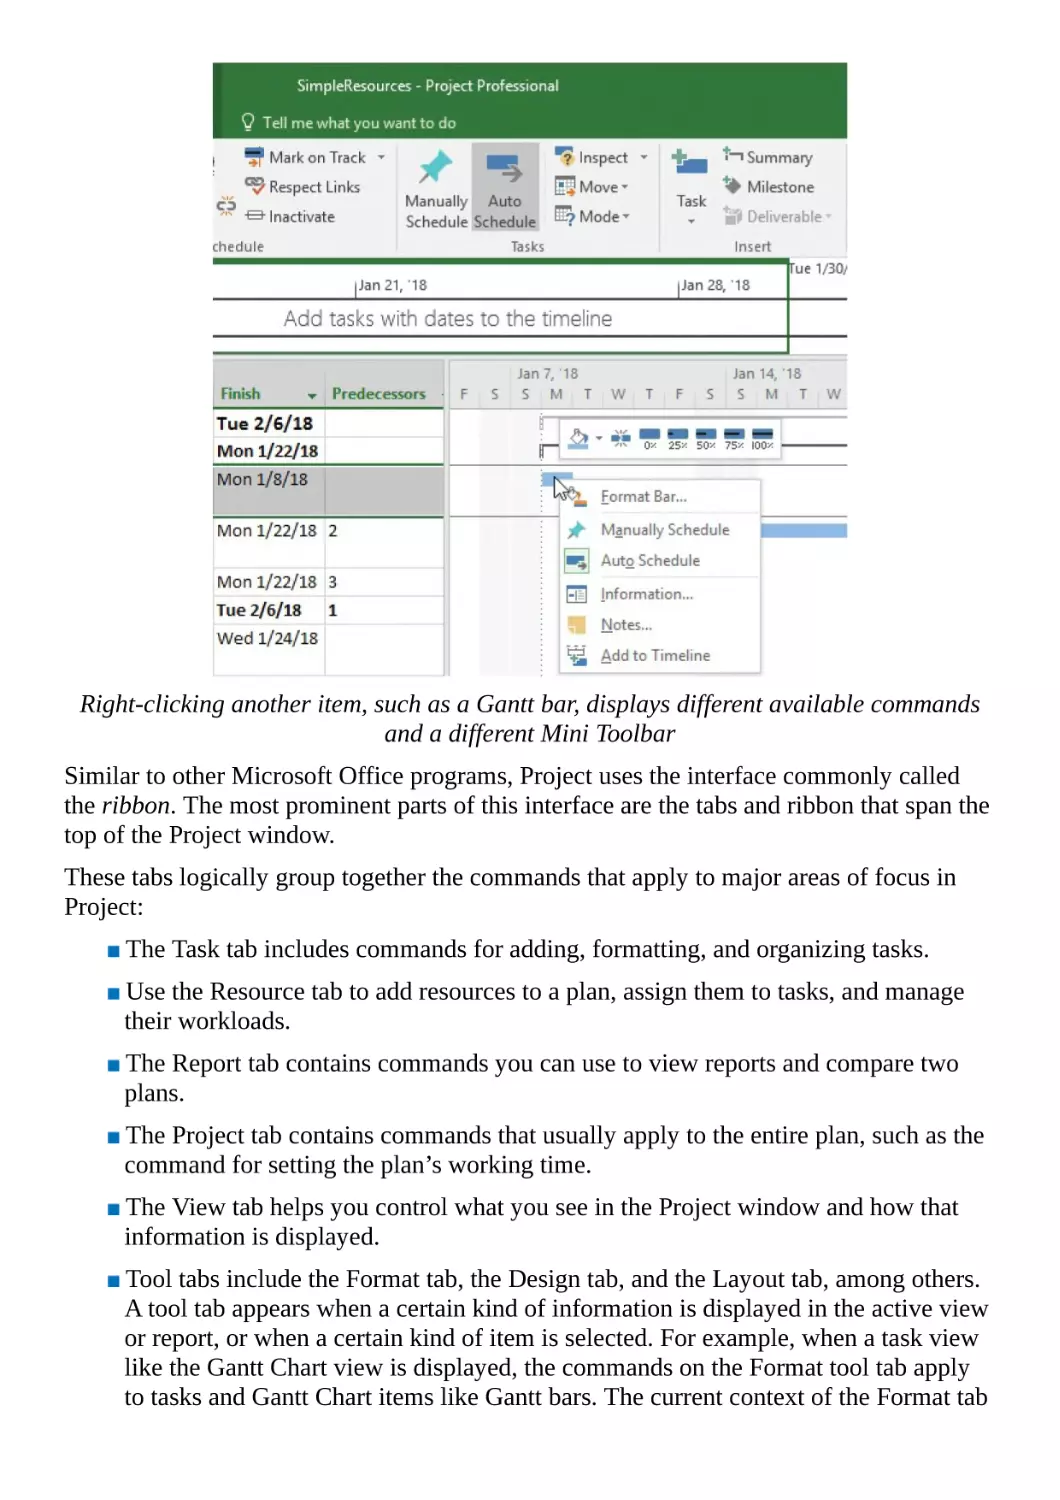
Right-clicking another item, such as a Gantt bar, displays different available commands
and a different Mini Toolbar
Similar to other Microsoft Office programs, Project uses the interface commonly called
the ribbon. The most prominent parts of this interface are the tabs and ribbon that span the
top of the Project window.
These tabs logically group together the commands that apply to major areas of focus in
Project:
The Task tab includes commands for adding, formatting, and organizing tasks.
Use the Resource tab to add resources to a plan, assign them to tasks, and manage
their workloads.
The Report tab contains commands you can use to view reports and compare two
plans.
The Project tab contains commands that usually apply to the entire plan, such as the
command for setting the plan’s working time.
The View tab helps you control what you see in the Project window and how that
information is displayed.
Tool tabs include the Format tab, the Design tab, and the Layout tab, among others.
A tool tab appears when a certain kind of information is displayed in the active view
or report, or when a certain kind of item is selected. For example, when a task view
like the Gantt Chart view is displayed, the commands on the Format tool tab apply
to tasks and Gantt Chart items like Gantt bars. The current context of the Format tab
is shown above the tab label—Gantt Chart Tools, for example.
Tip
You can double-click a tab label to collapse or expand the ribbon. You can also
view a collapsed tab by clicking the tab label and then selecting the command you
want.
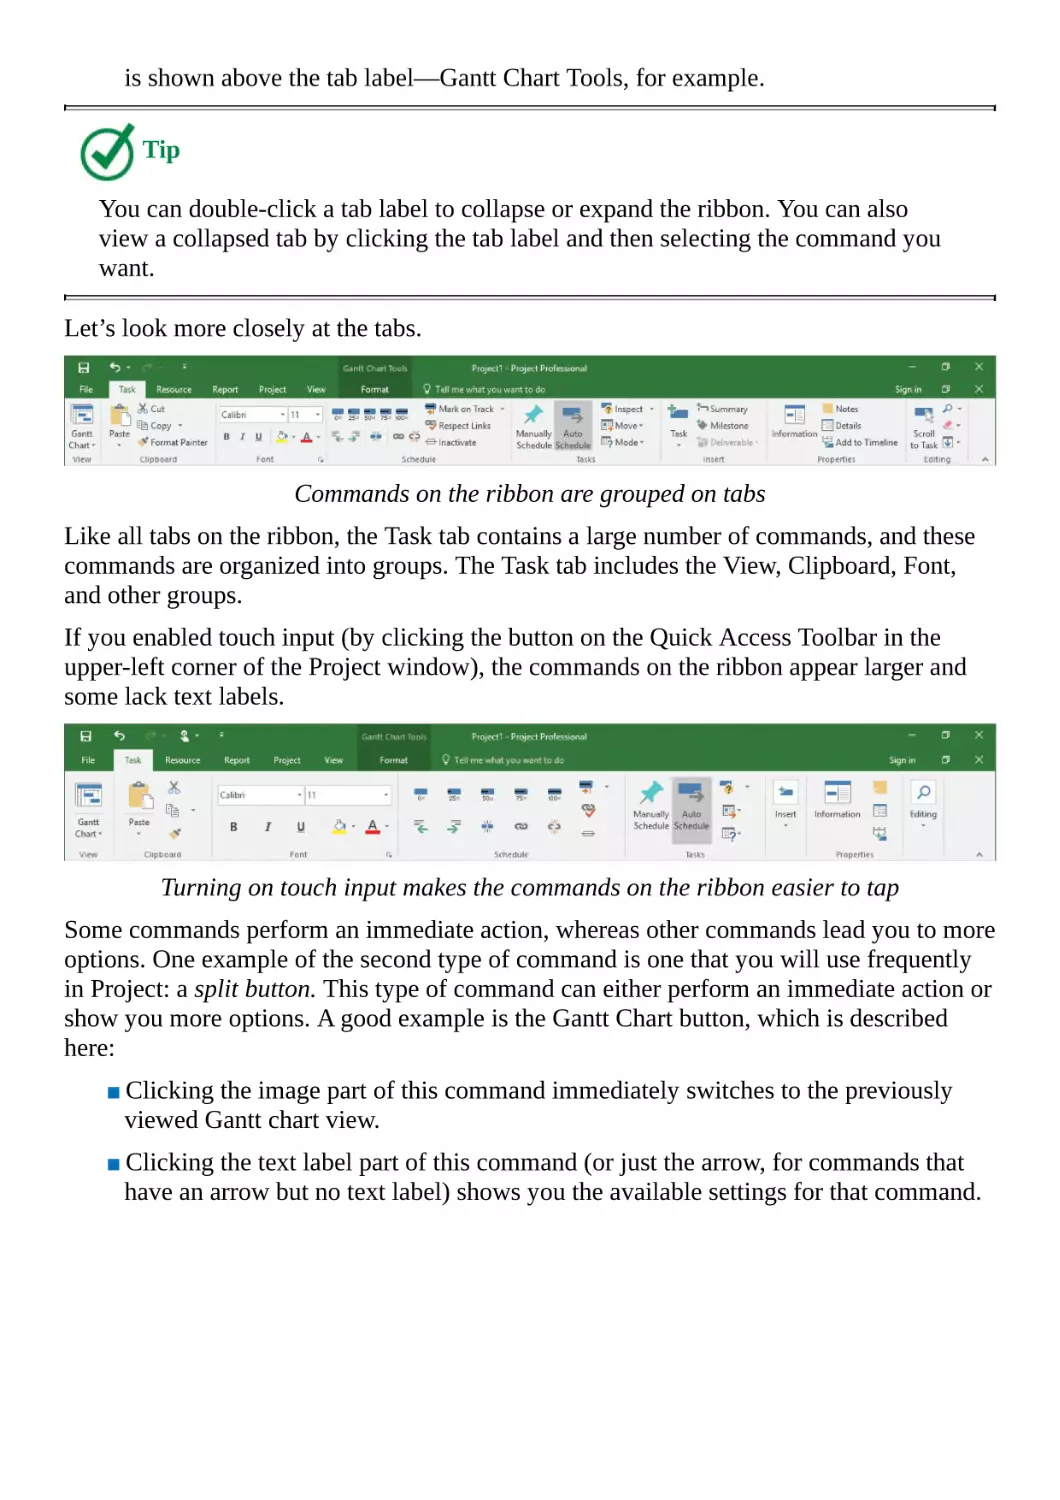
Let’s look more closely at the tabs.
Commands on the ribbon are grouped on tabs
Like all tabs on the ribbon, the Task tab contains a large number of commands, and these
commands are organized into groups. The Task tab includes the View, Clipboard, Font,
and other groups.
If you enabled touch input (by clicking the button on the Quick Access Toolbar in the
upper-left corner of the Project window), the commands on the ribbon appear larger and
some lack text labels.
Turning on touch input makes the commands on the ribbon easier to tap
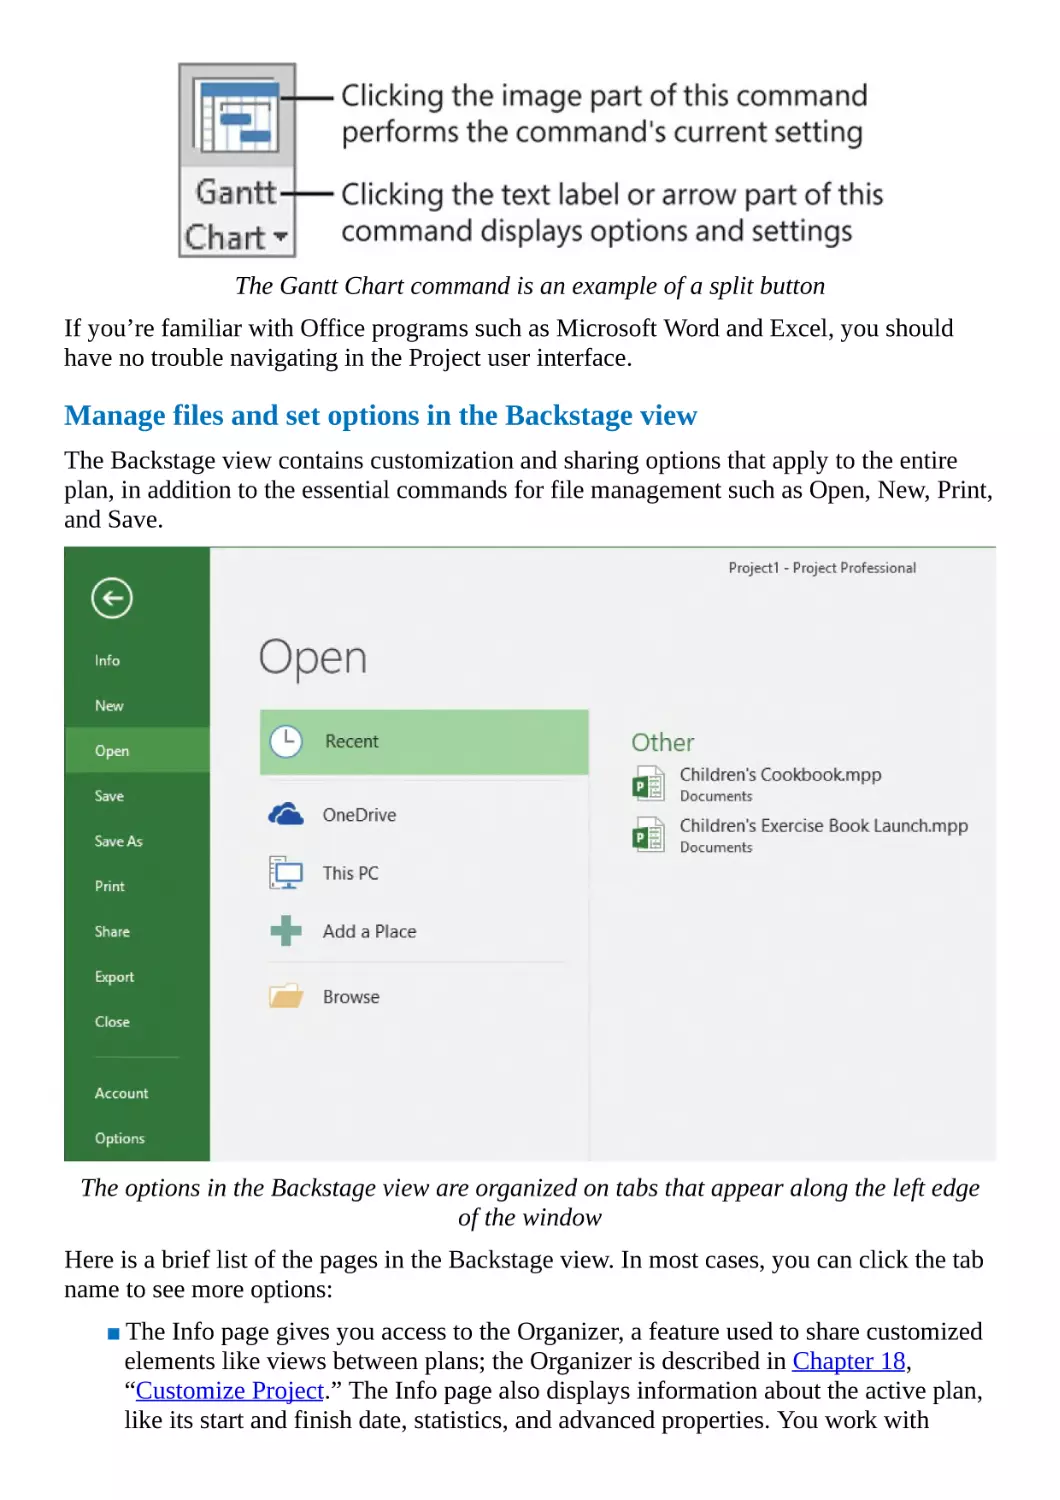
Some commands perform an immediate action, whereas other commands lead you to more
options. One example of the second type of command is one that you will use frequently
in Project: a split button. This type of command can either perform an immediate action or
show you more options. A good example is the Gantt Chart button, which is described
here:
Clicking the image part of this command immediately switches to the previously
viewed Gantt chart view.
Clicking the text label part of this command (or just the arrow, for commands that
have an arrow but no text label) shows you the available settings for that command.
The Gantt Chart command is an example of a split button
If you’re familiar with Office programs such as Microsoft Word and Excel, you should
have no trouble navigating in the Project user interface.
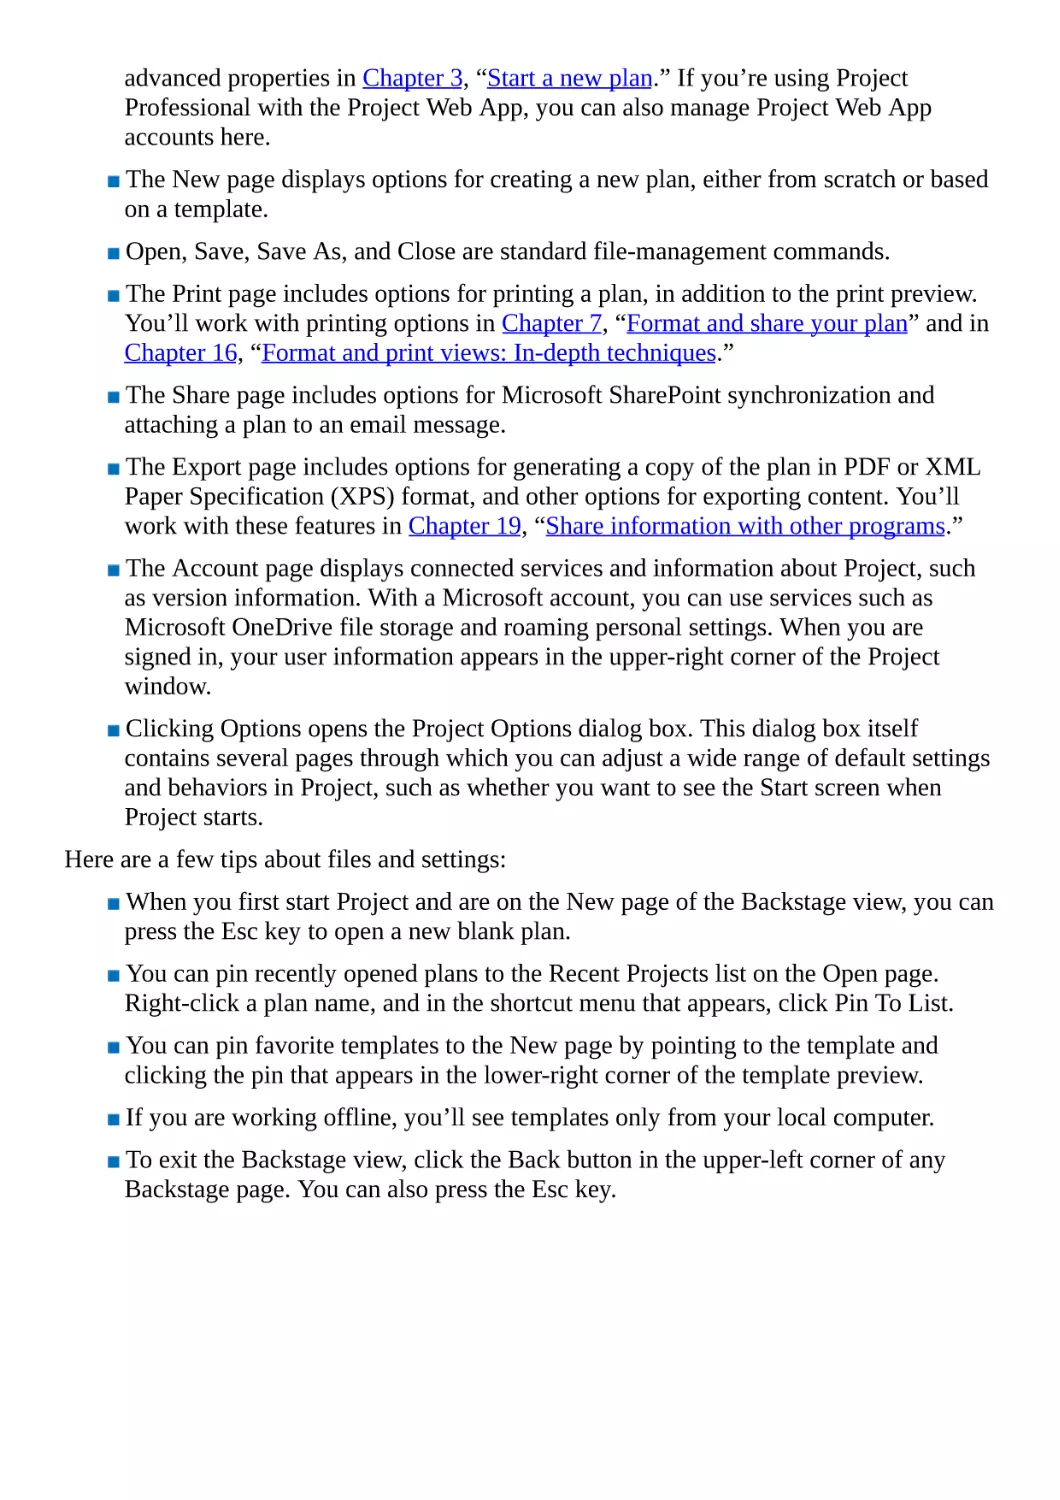
Manage files and set options in the Backstage view
The Backstage view contains customization and sharing options that apply to the entire
plan, in addition to the essential commands for file management such as Open, New, Print,
and Save.
The options in the Backstage view are organized on tabs that appear along the left edge
of the window
Here is a brief list of the pages in the Backstage view. In most cases, you can click the tab
name to see more options:
The Info page gives you access to the Organizer, a feature used to share customized
elements like views between plans; the Organizer is described in Chapter 18,
“Customize Project.” The Info page also displays information about the active plan,
like its start and finish date, statistics, and advanced properties. You work with
advanced properties in Chapter 3, “Start a new plan.” If you’re using Project
Professional with the Project Web App, you can also manage Project Web App
accounts here.
The New page displays options for creating a new plan, either from scratch or based
on a template.
Open, Save, Save As, and Close are standard file-management commands.
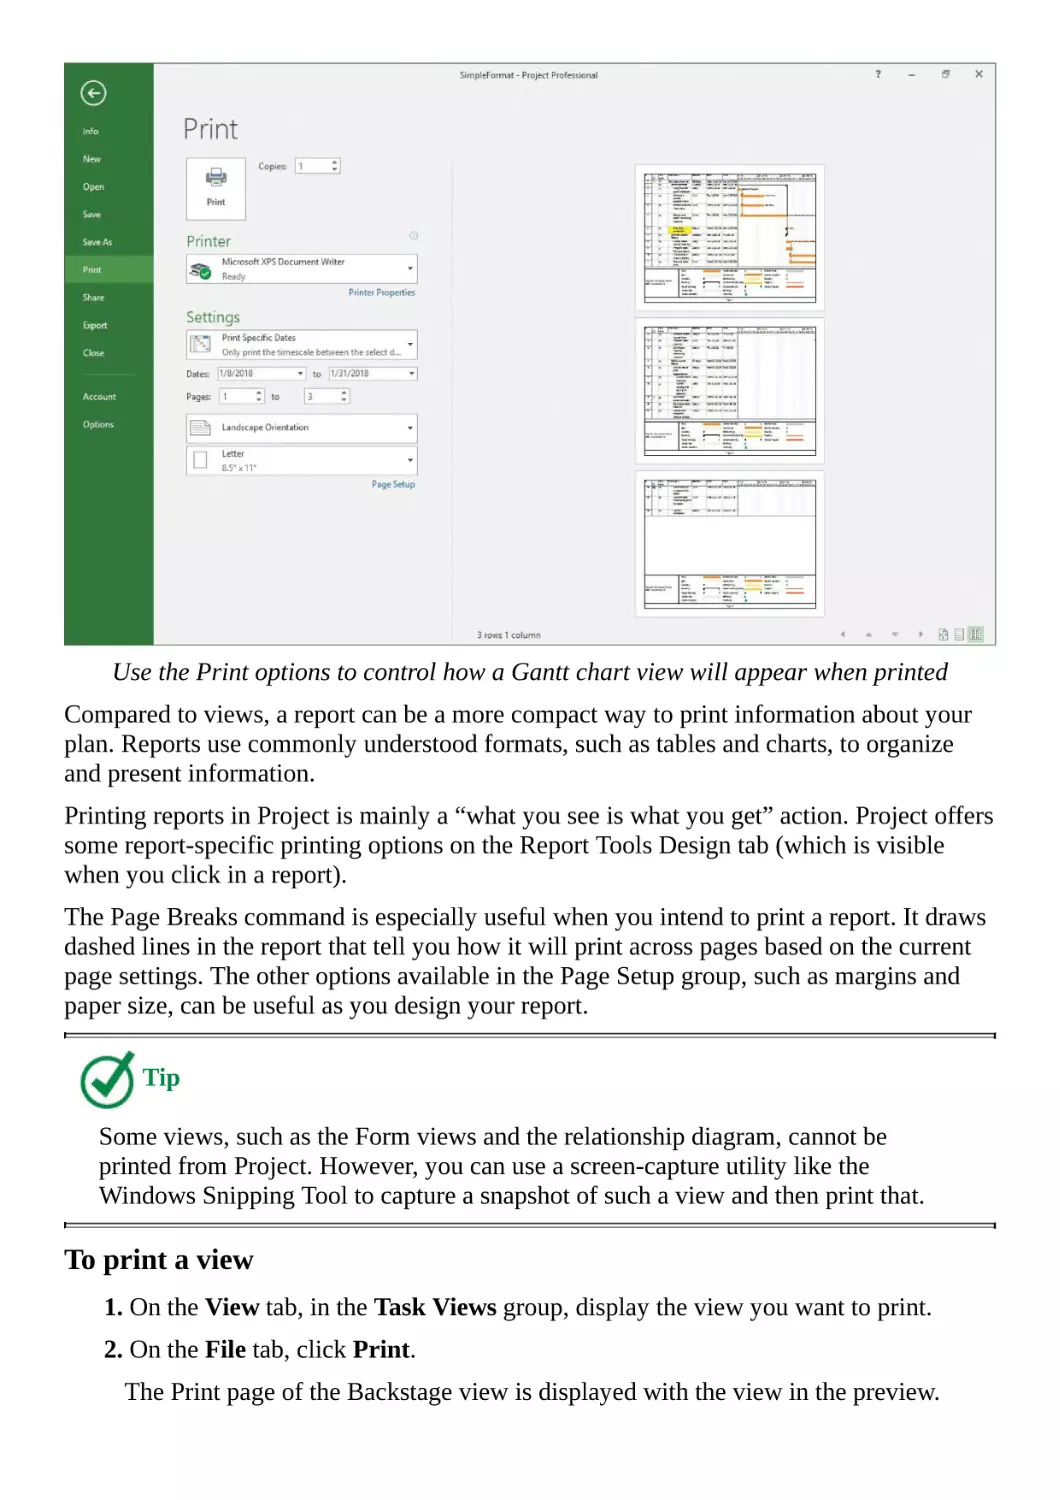
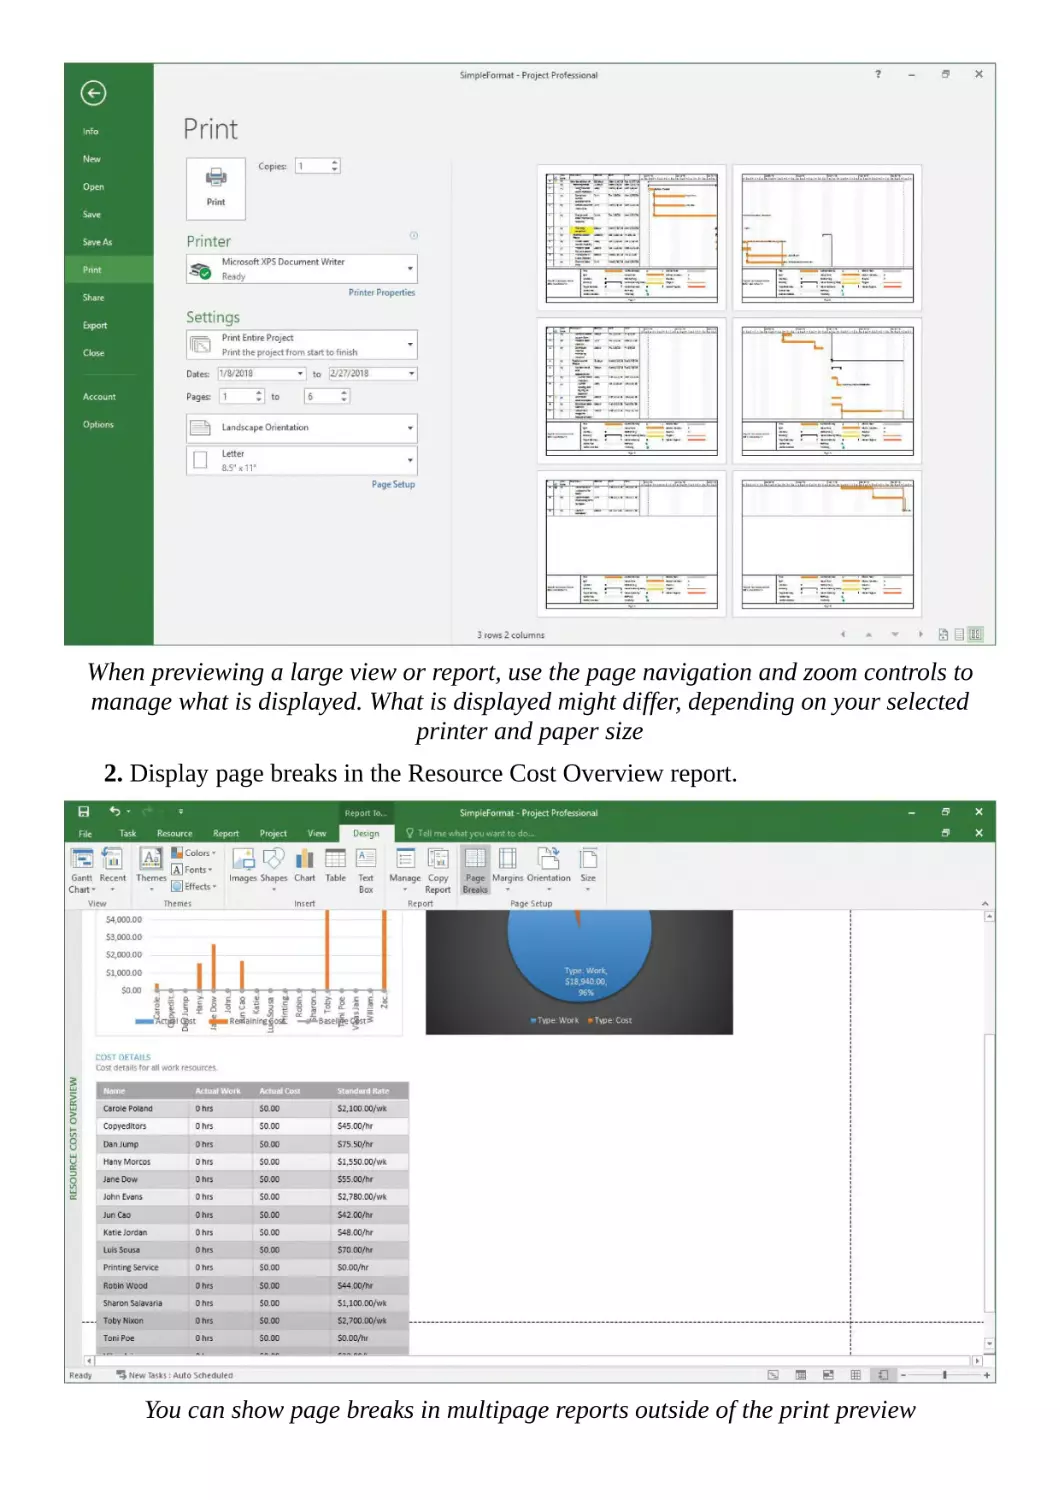
The Print page includes options for printing a plan, in addition to the print preview.
You’ll work with printing options in Chapter 7, “Format and share your plan” and in
Chapter 16, “Format and print views: In-depth techniques.”
The Share page includes options for Microsoft SharePoint synchronization and
attaching a plan to an email message.
The Export page includes options for generating a copy of the plan in PDF or XML
Paper Specification (XPS) format, and other options for exporting content. You’ll
work with these features in Chapter 19, “Share information with other programs.”
The Account page displays connected services and information about Project, such
as version information. With a Microsoft account, you can use services such as
Microsoft OneDrive file storage and roaming personal settings. When you are
signed in, your user information appears in the upper-right corner of the Project
window.
Clicking Options opens the Project Options dialog box. This dialog box itself
contains several pages through which you can adjust a wide range of default settings
and behaviors in Project, such as whether you want to see the Start screen when
Project starts.
Here are a few tips about files and settings:
When you first start Project and are on the New page of the Backstage view, you can
press the Esc key to open a new blank plan.
You can pin recently opened plans to the Recent Projects list on the Open page.
Right-click a plan name, and in the shortcut menu that appears, click Pin To List.
You can pin favorite templates to the New page by pointing to the template and
clicking the pin that appears in the lower-right corner of the template preview.
If you are working offline, you’ll see templates only from your local computer.
To exit the Backstage view, click the Back button in the upper-left corner of any
Backstage page. You can also press the Esc key.
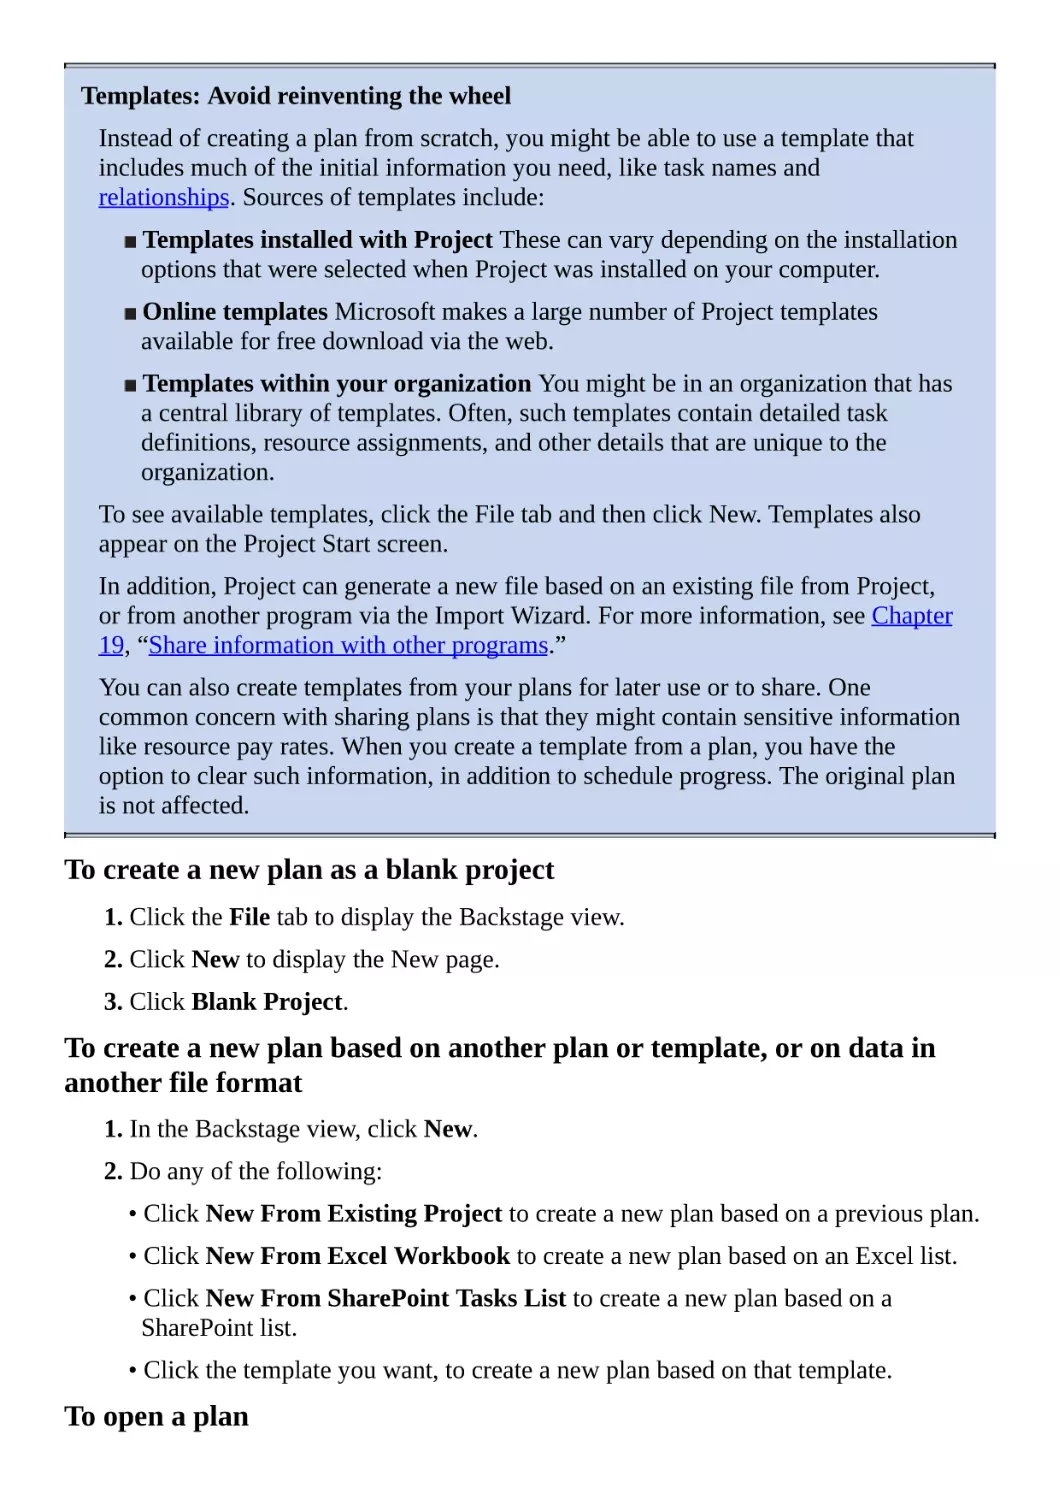
Templates: Avoid reinventing the wheel
Instead of creating a plan from scratch, you might be able to use a template that
includes much of the initial information you need, like task names and
relationships. Sources of templates include:
Templates installed with Project These can vary depending on the installation
options that were selected when Project was installed on your computer.
Online templates Microsoft makes a large number of Project templates
available for free download via the web.
Templates within your organization You might be in an organization that has
a central library of templates. Often, such templates contain detailed task
definitions, resource assignments, and other details that are unique to the
organization.
To see available templates, click the File tab and then click New. Templates also
appear on the Project Start screen.
In addition, Project can generate a new file based on an existing file from Project,
or from another program via the Import Wizard. For more information, see Chapter
19, “Share information with other programs.”
You can also create templates from your plans for later use or to share. One
common concern with sharing plans is that they might contain sensitive information
like resource pay rates. When you create a template from a plan, you have the
option to clear such information, in addition to schedule progress. The original plan
is not affected.
To create a new plan as a blank project
1. Click the File tab to display the Backstage view.
2. Click New to display the New page.
3. Click Blank Project.
To create a new plan based on another plan or template, or on data in
another file format
1. In the Backstage view, click New.
2. Do any of the following:
• Click New From Existing Project to create a new plan based on a previous plan.
• Click New From Excel Workbook to create a new plan based on an Excel list.
• Click New From SharePoint Tasks List to create a new plan based on a
SharePoint list.
• Click the template you want, to create a new plan based on that template.
To open a plan
1. In the Backstage view, click Open. Project displays options for opening plans, in
addition to a list of recently opened plans.
2. Select the location and plan you want to open.
To save a plan
1. In the Backstage view, click Save As.
2. Select the location and folder where you want to save the plan.
3. In the Save As dialog box, enter a file name, and then click Save.
To create a template from an existing plan
1. In the Backstage view, click Export.
2. Click Save Project As File.
3. Under Save Project As File, click Project Template.
4. Click Save As.
5. Navigate to the folder where you want to create the new template.
6. In the File Name box, enter the template file name that you want, and then click
Save.
7. When the Save As Template dialog box opens, select the types of information, such
as resource pay rates, that you want removed from the template.
8. Click Save.
Work with schedule details in views
You create and work with your plan’s data in views. Project includes many types of views.
Examples of views include tables with graphics, tables with timescales, tables alone,
charts and diagrams, and forms. In some views, you can filter, sort, or group data, and
specify what types of data are displayed. You can use and customize the views that come
with Project in addition to creating your own.
Project contains dozens of views, but most people usually work with one view (or
sometimes two in a split view, also known as a combination view) at a time. You use views
to enter, edit, analyze, and display your project information. The default view—the one
you see when you create a new plan—is called the Gantt With Timeline view.
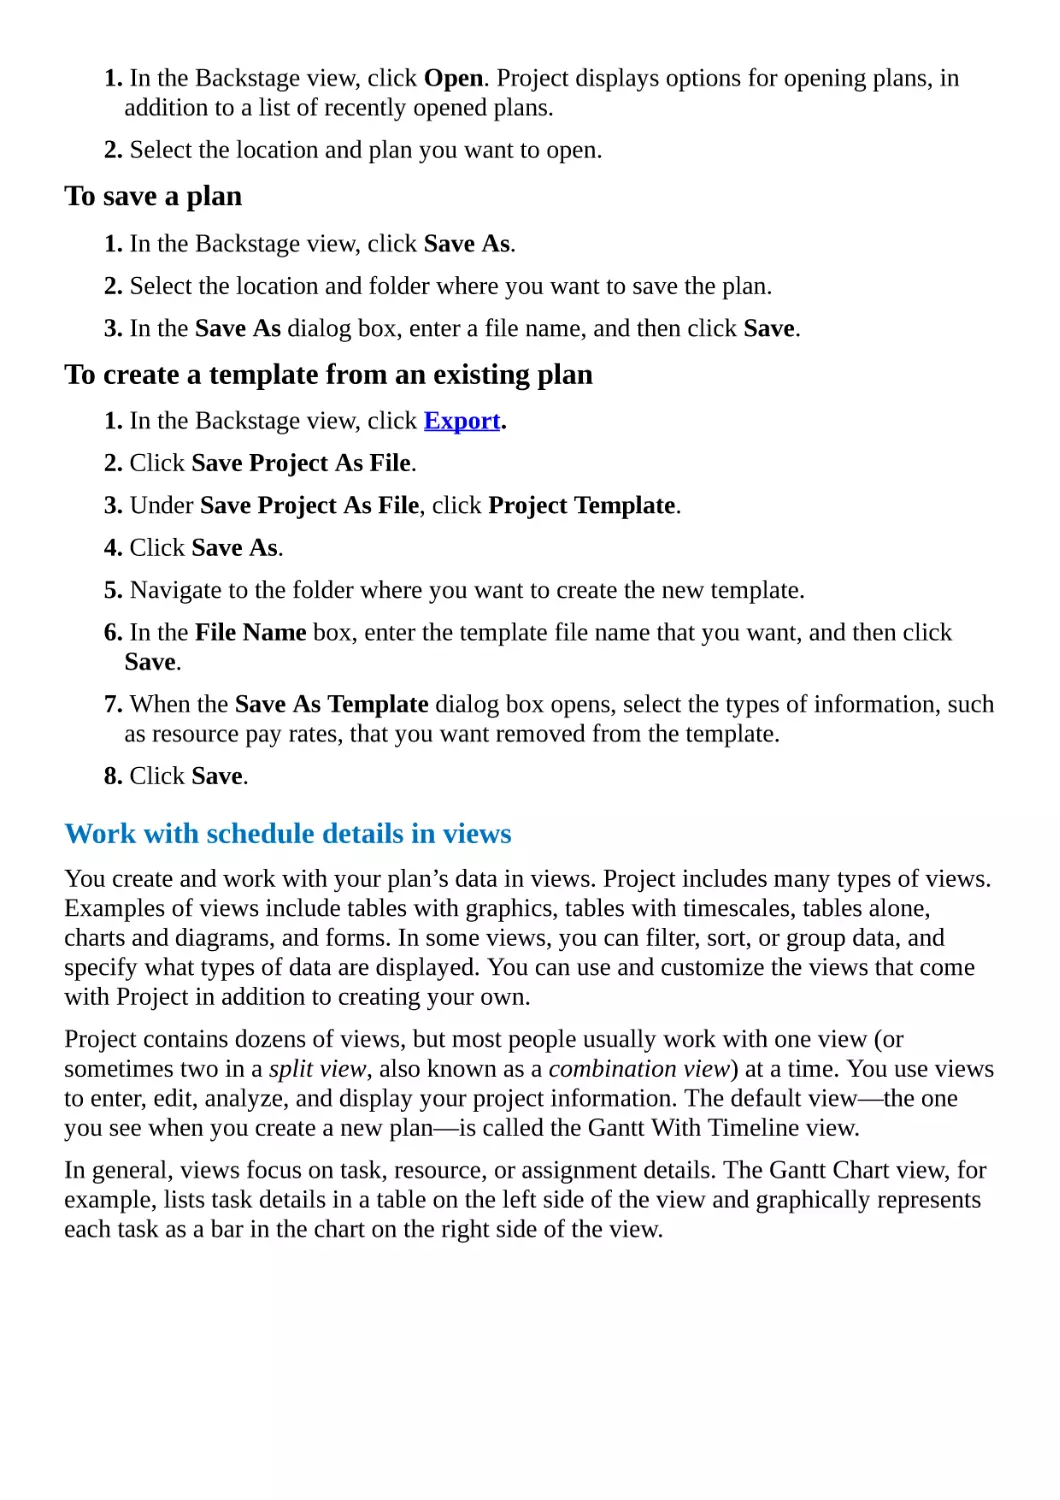
In general, views focus on task, resource, or assignment details. The Gantt Chart view, for
example, lists task details in a table on the left side of the view and graphically represents
each task as a bar in the chart on the right side of the view.
The Gantt With Timeline view is a split view with the Timeline view in the top pane and
the Gantt Chart view below it
The Gantt Chart view is a common way to represent a schedule. This type of view is also
useful for entering and fine-tuning task details and for analyzing your plan. You can adjust
the timescale in the Gantt Chart view in several ways to see more or less of the plan.
The Timeline view is a handy way of seeing the “big picture” of the plan.
You can set up multiple timeline bars in the Timeline view
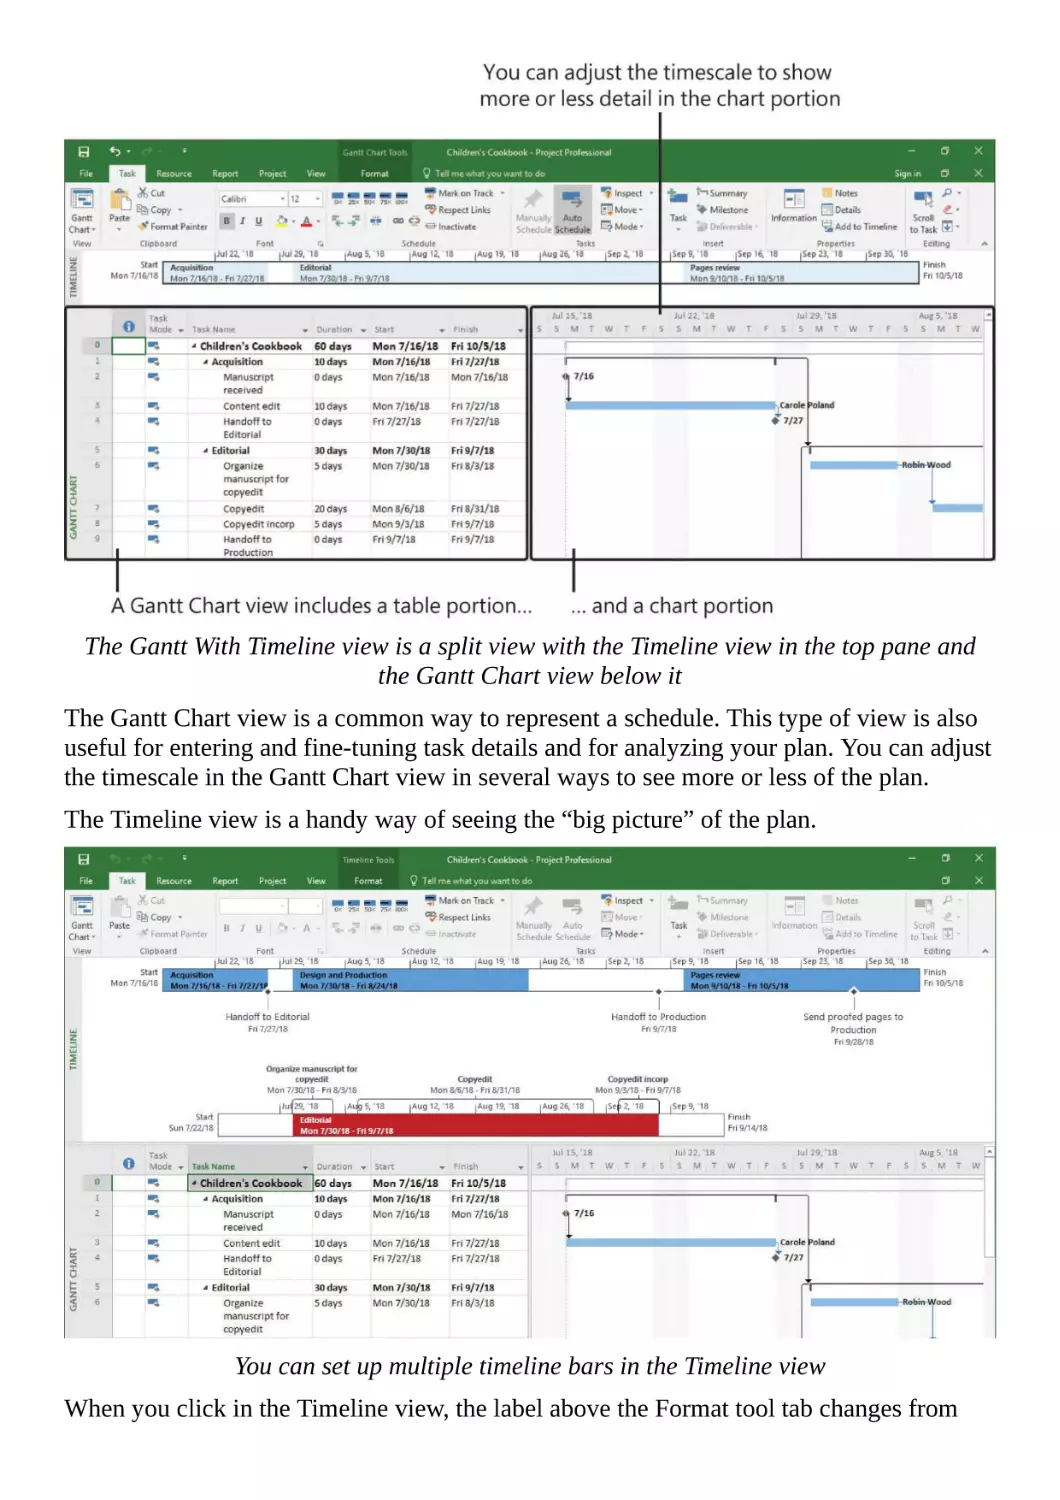
When you click in the Timeline view, the label above the Format tool tab changes from
Gantt Chart Tools to Timeline Tools.
When the Timeline view is selected, its formatting commands are available on the
Timeline Tools Format tab
In this case, the commands displayed on the Format tab are specific to the Timeline view.
As you display or select different views, reports, or specific items in Project, note when
the label above the Format tab changes accordingly.
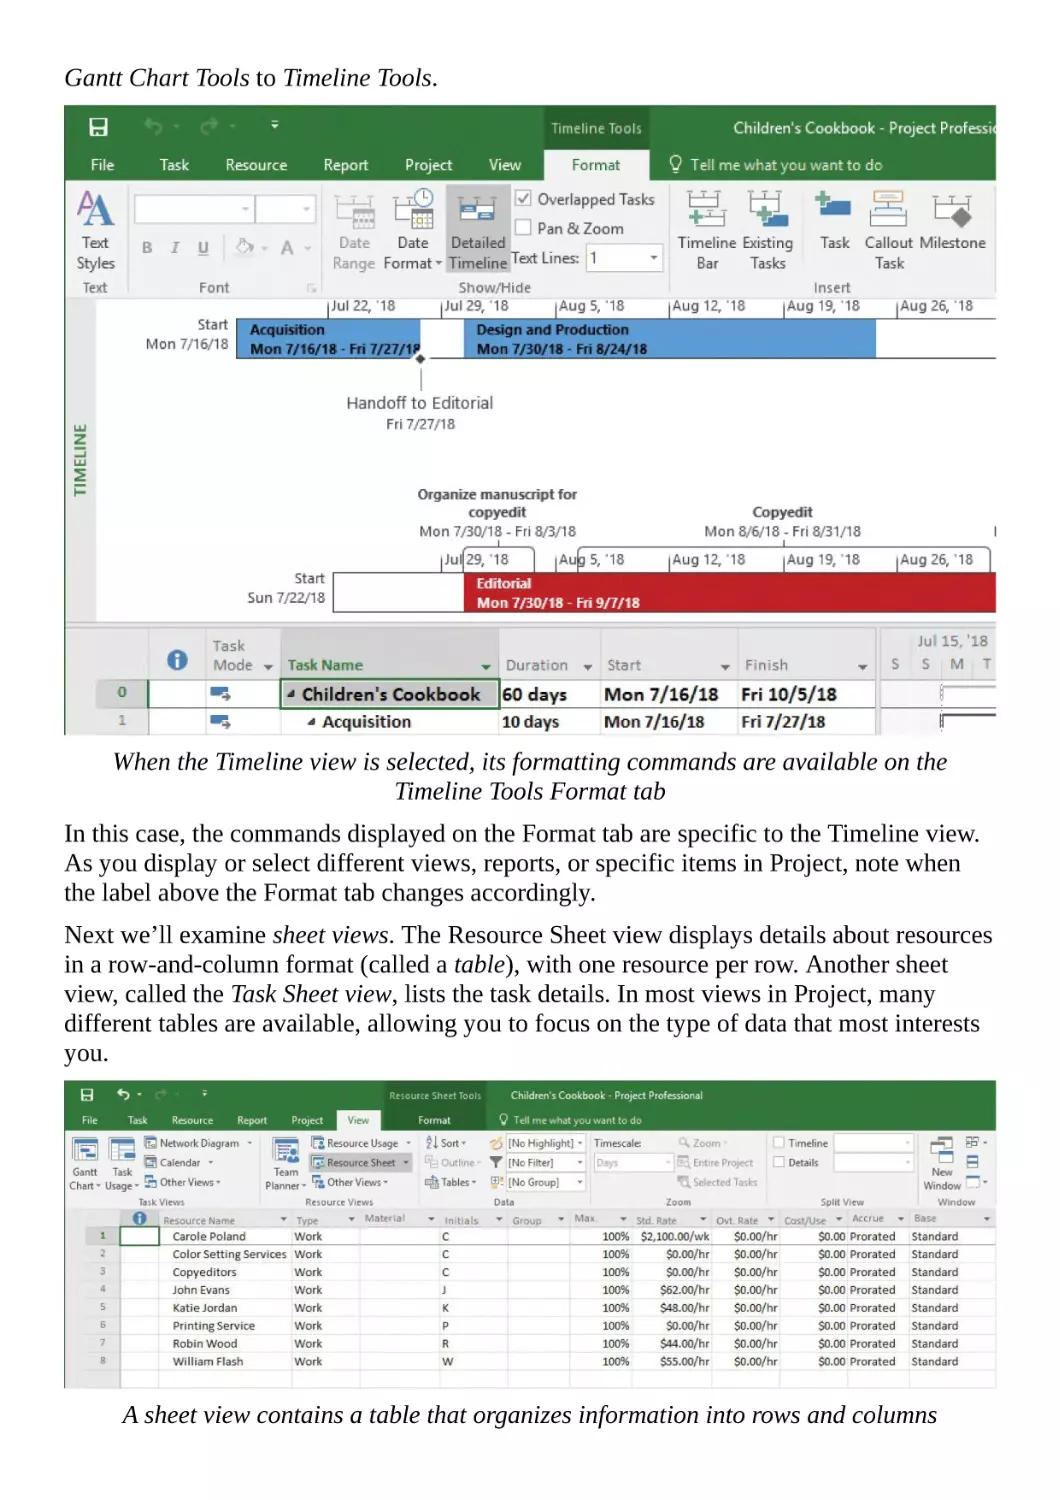
Next we’ll examine sheet views. The Resource Sheet view displays details about resources
in a row-and-column format (called a table), with one resource per row. Another sheet
view, called the Task Sheet view, lists the task details. In most views in Project, many
different tables are available, allowing you to focus on the type of data that most interests
you.
A sheet view contains a table that organizes information into rows and columns
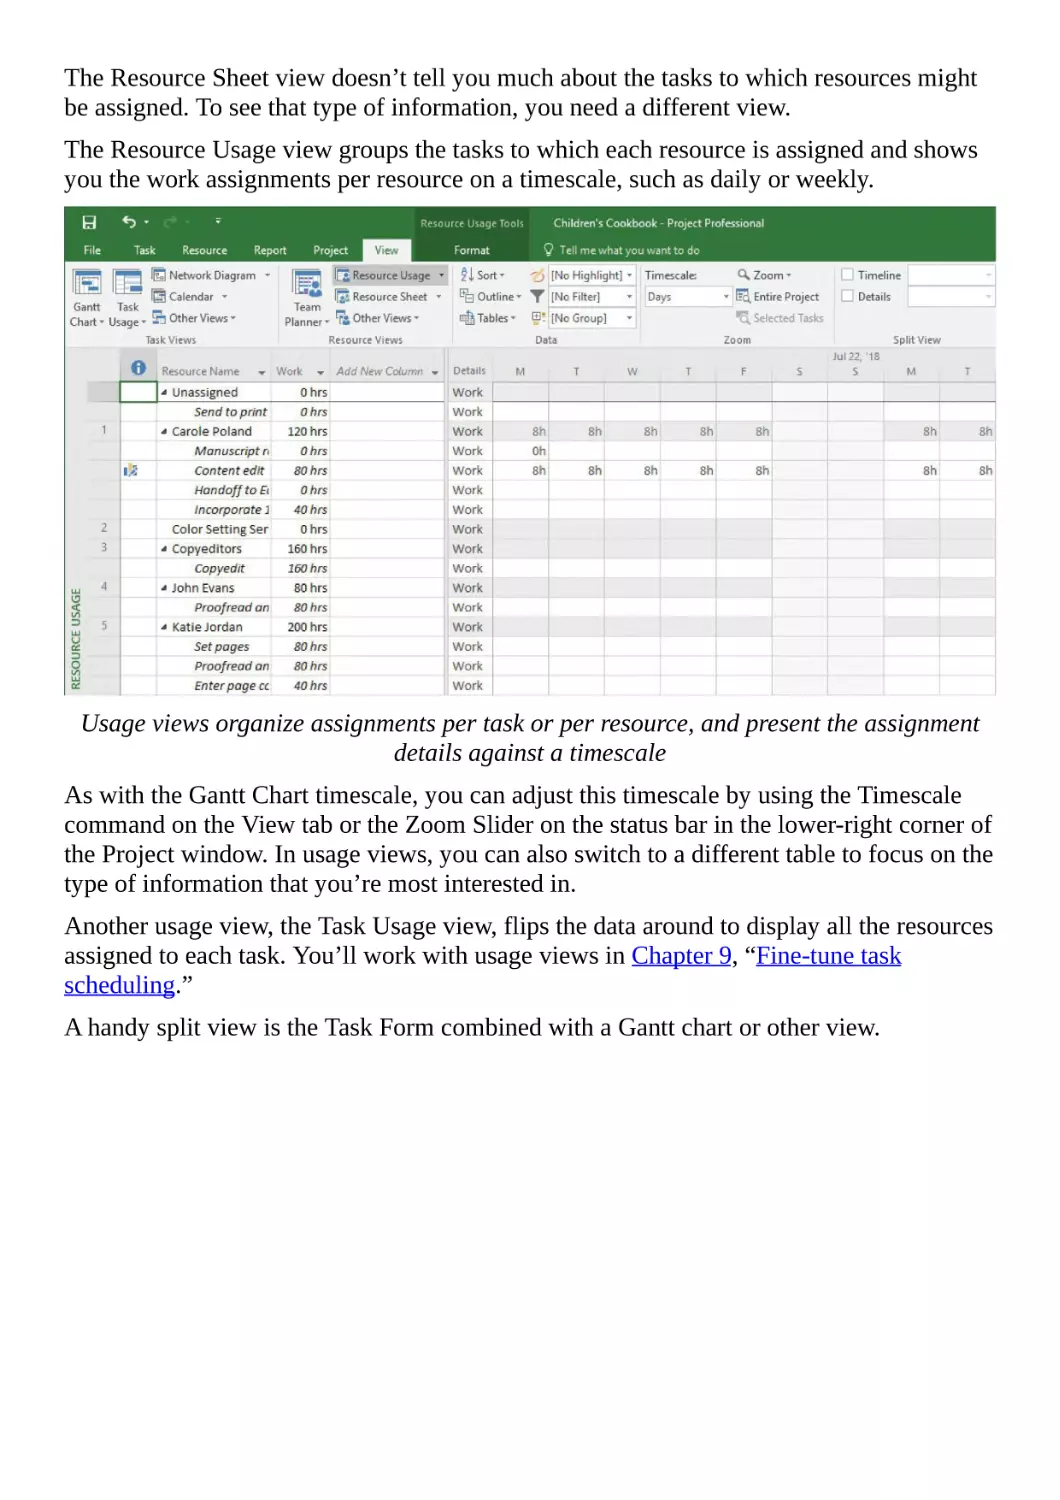
The Resource Sheet view doesn’t tell you much about the tasks to which resources might
be assigned. To see that type of information, you need a different view.
The Resource Usage view groups the tasks to which each resource is assigned and shows
you the work assignments per resource on a timescale, such as daily or weekly.
Usage views organize assignments per task or per resource, and present the assignment
details against a timescale
As with the Gantt Chart timescale, you can adjust this timescale by using the Timescale
command on the View tab or the Zoom Slider on the status bar in the lower-right corner of
the Project window. In usage views, you can also switch to a different table to focus on the
type of information that you’re most interested in.
Another usage view, the Task Usage view, flips the data around to display all the resources
assigned to each task. You’ll work with usage views in Chapter 9, “Fine-tune task
scheduling.”
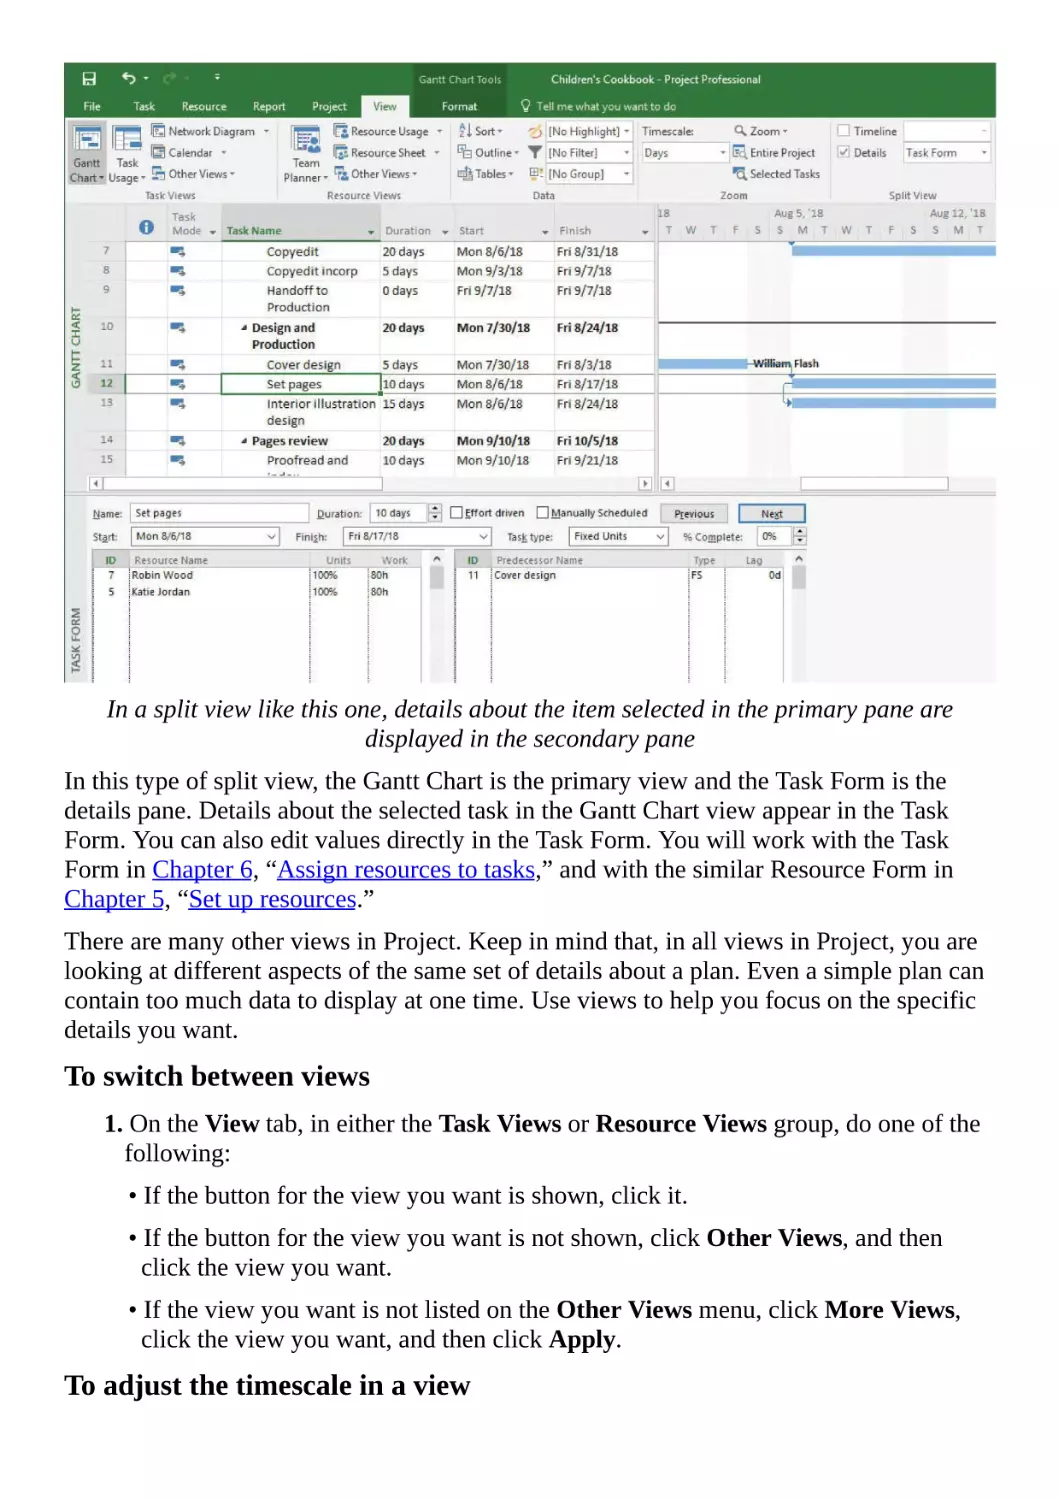
A handy split view is the Task Form combined with a Gantt chart or other view.
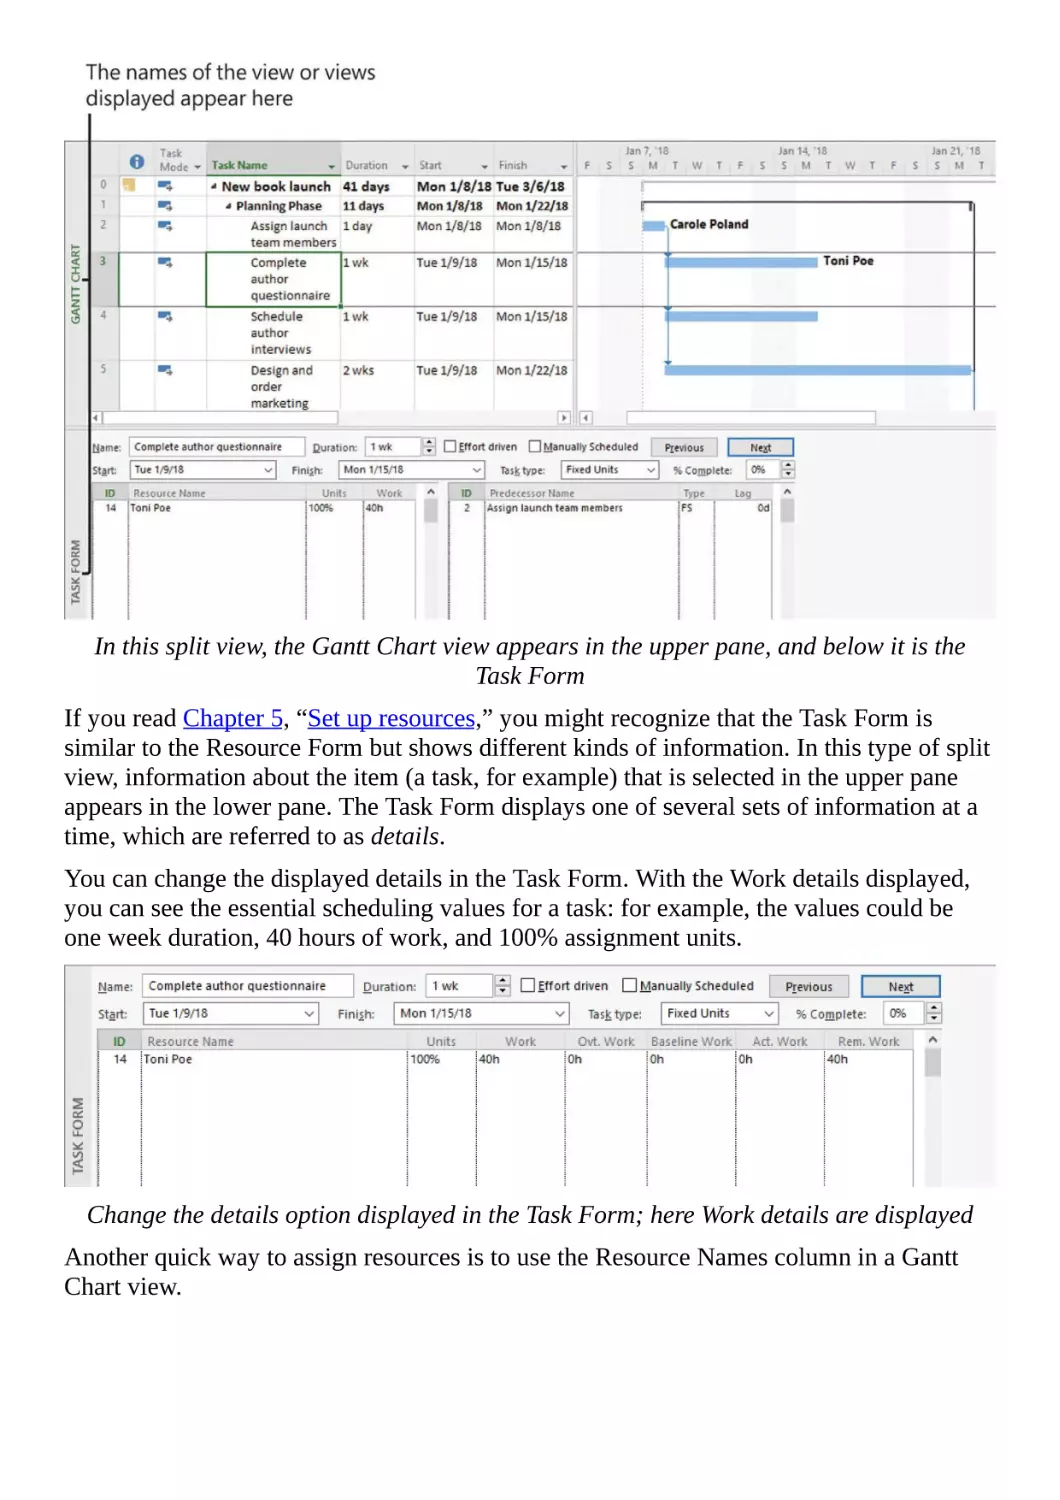
In a split view like this one, details about the item selected in the primary pane are
displayed in the secondary pane
In this type of split view, the Gantt Chart is the primary view and the Task Form is the
details pane. Details about the selected task in the Gantt Chart view appear in the Task
Form. You can also edit values directly in the Task Form. You will work with the Task
Form in Chapter 6, “Assign resources to tasks,” and with the similar Resource Form in
Chapter 5, “Set up resources.”
There are many other views in Project. Keep in mind that, in all views in Project, you are
looking at different aspects of the same set of details about a plan. Even a simple plan can
contain too much data to display at one time. Use views to help you focus on the specific
details you want.
To switch between views
1. On the View tab, in either the Task Views or Resource Views group, do one of the
following:
• If the button for the view you want is shown, click it.
• If the button for the view you want is not shown, click Other Views, and then
click the view you want.
• If the view you want is not listed on the Other Views menu, click More Views,
click the view you want, and then click Apply.
To adjust the timescale in a view
In views with a timescale, such as the Gantt chart, this action adjusts the timescale.
In other views, it changes how much detail is displayed.
1. Do either of the following:
• On the View tab, in the Zoom group, click the Zoom command, and then click the
zoom level you want.
• In the lower-right corner of the status bar, on the Zoom Slider bar, click Zoom
Out or Zoom In.
To switch to another table in a view
This action applies only to views that include tables (such as the Gantt chart), not to
views that lack tables (such as the Calendar view).
1. On the View tab, in the Data group, click Tables.
2. Do either of the following:
• If the table you want is listed, click the table.
• If the table you want is not listed, click More Tables, click the table you want, and
then click Apply.
To display a split (combination) view
1. On the View tab, in the Split View group, click Details.
2. In the Details box, click the view you want to load into the bottom pane of the split
view.
To display or hide the timeline view
1. On the View tab, in the Split View group, select or clear the Timeline check box.
Use reports to check a plan’s status
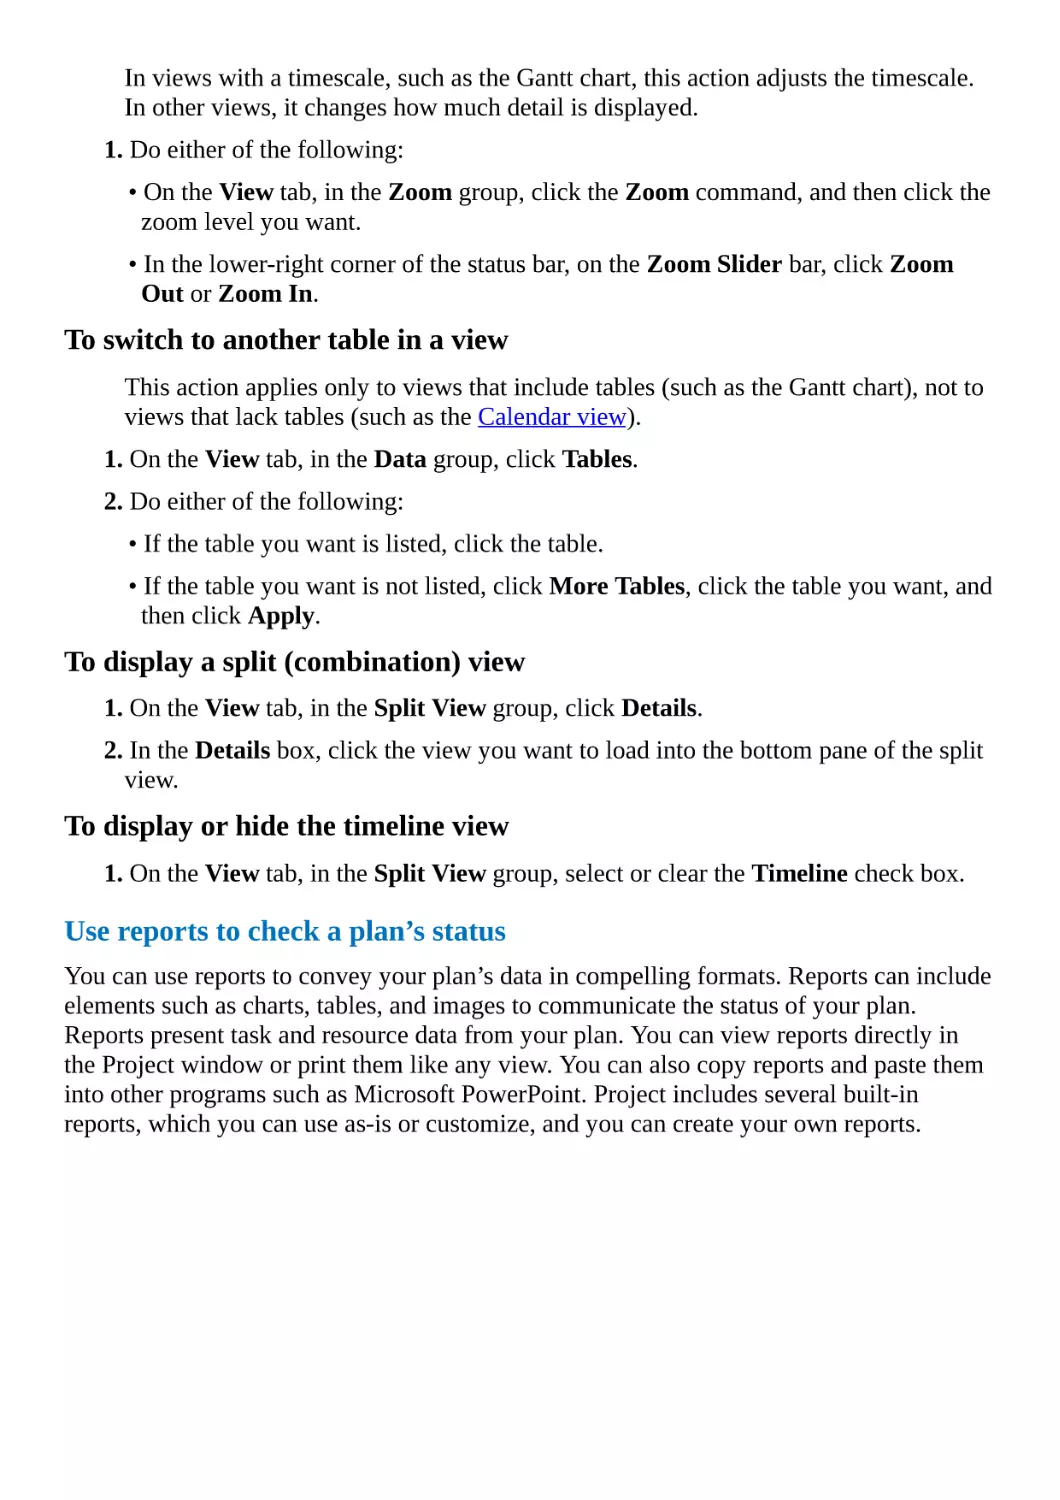
You can use reports to convey your plan’s data in compelling formats. Reports can include
elements such as charts, tables, and images to communicate the status of your plan.
Reports present task and resource data from your plan. You can view reports directly in
the Project window or print them like any view. You can also copy reports and paste them
into other programs such as Microsoft PowerPoint. Project includes several built-in
reports, which you can use as-is or customize, and you can create your own reports.
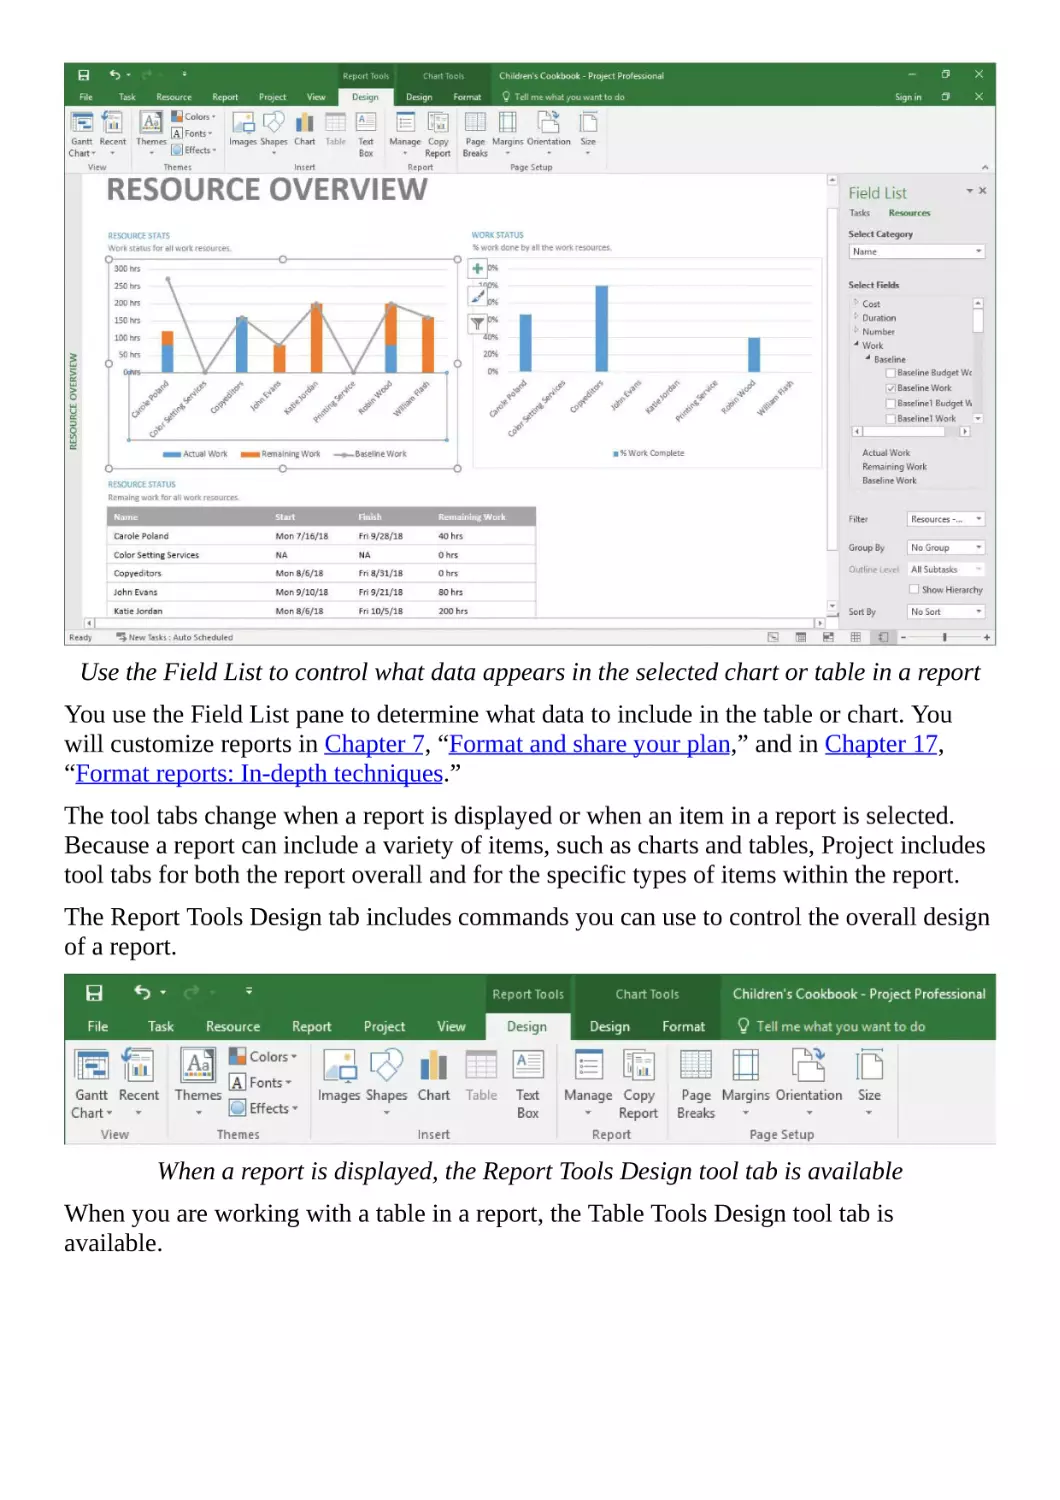
Reports can contain a mix of charts, tables, and images
When you click a table or chart in a report, the Field List pane appears on the right side of
the window.
Use the Field List to control what data appears in the selected chart or table in a report
You use the Field List pane to determine what data to include in the table or chart. You
will customize reports in Chapter 7, “Format and share your plan,” and in Chapter 17,
“Format reports: In-depth techniques.”
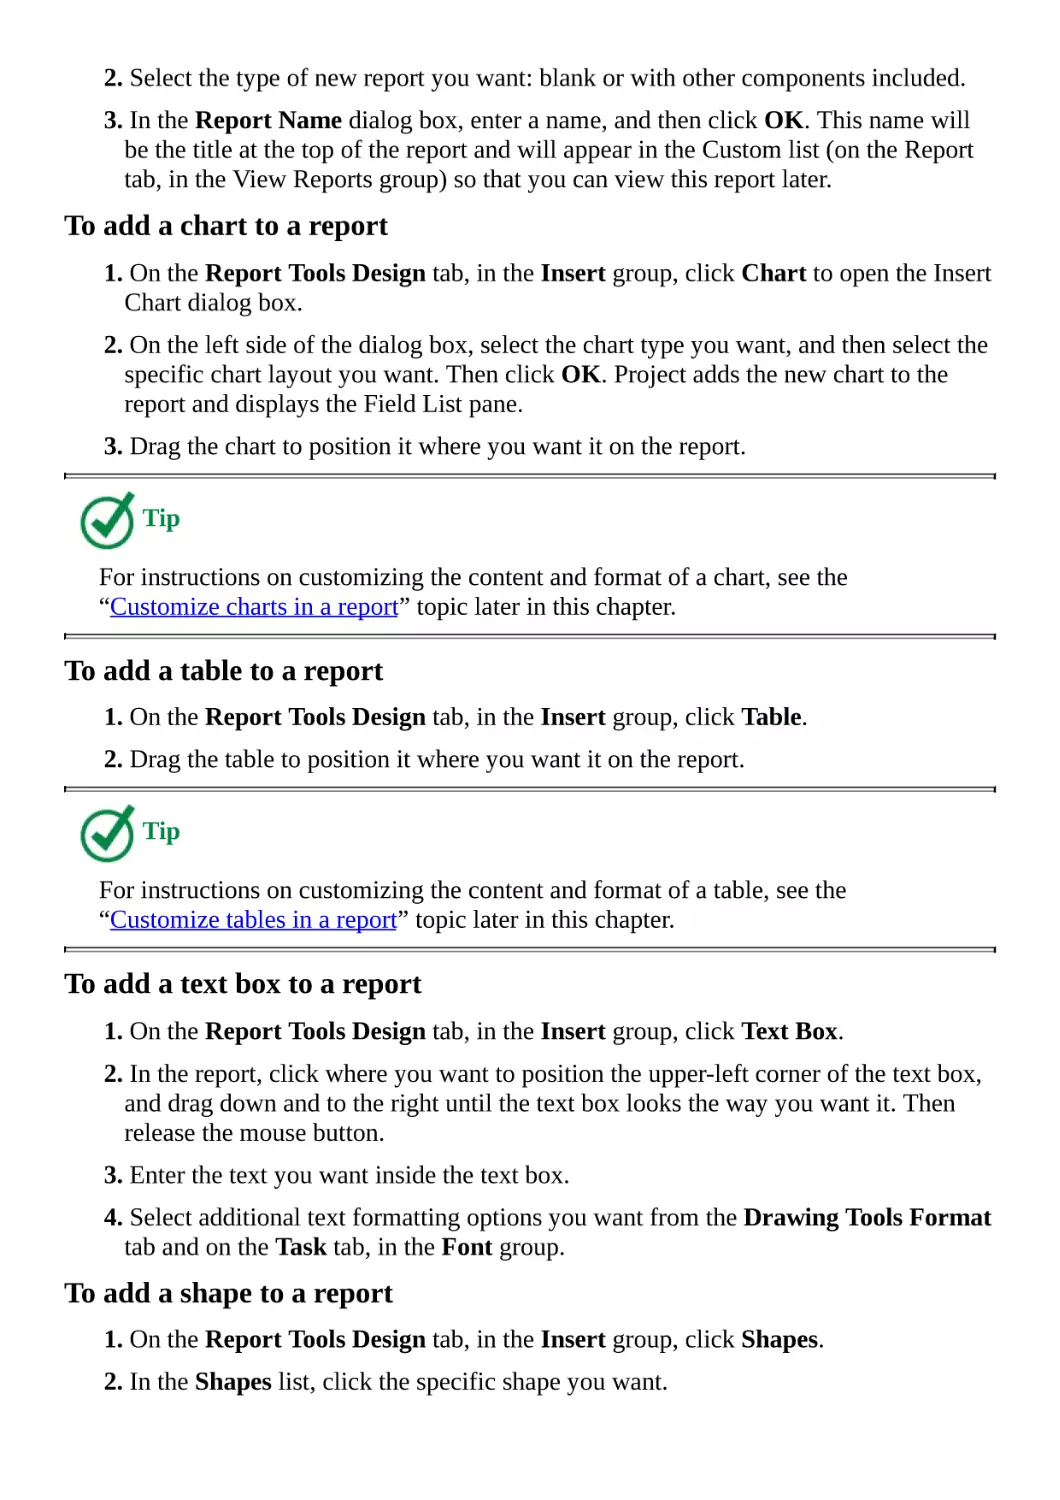
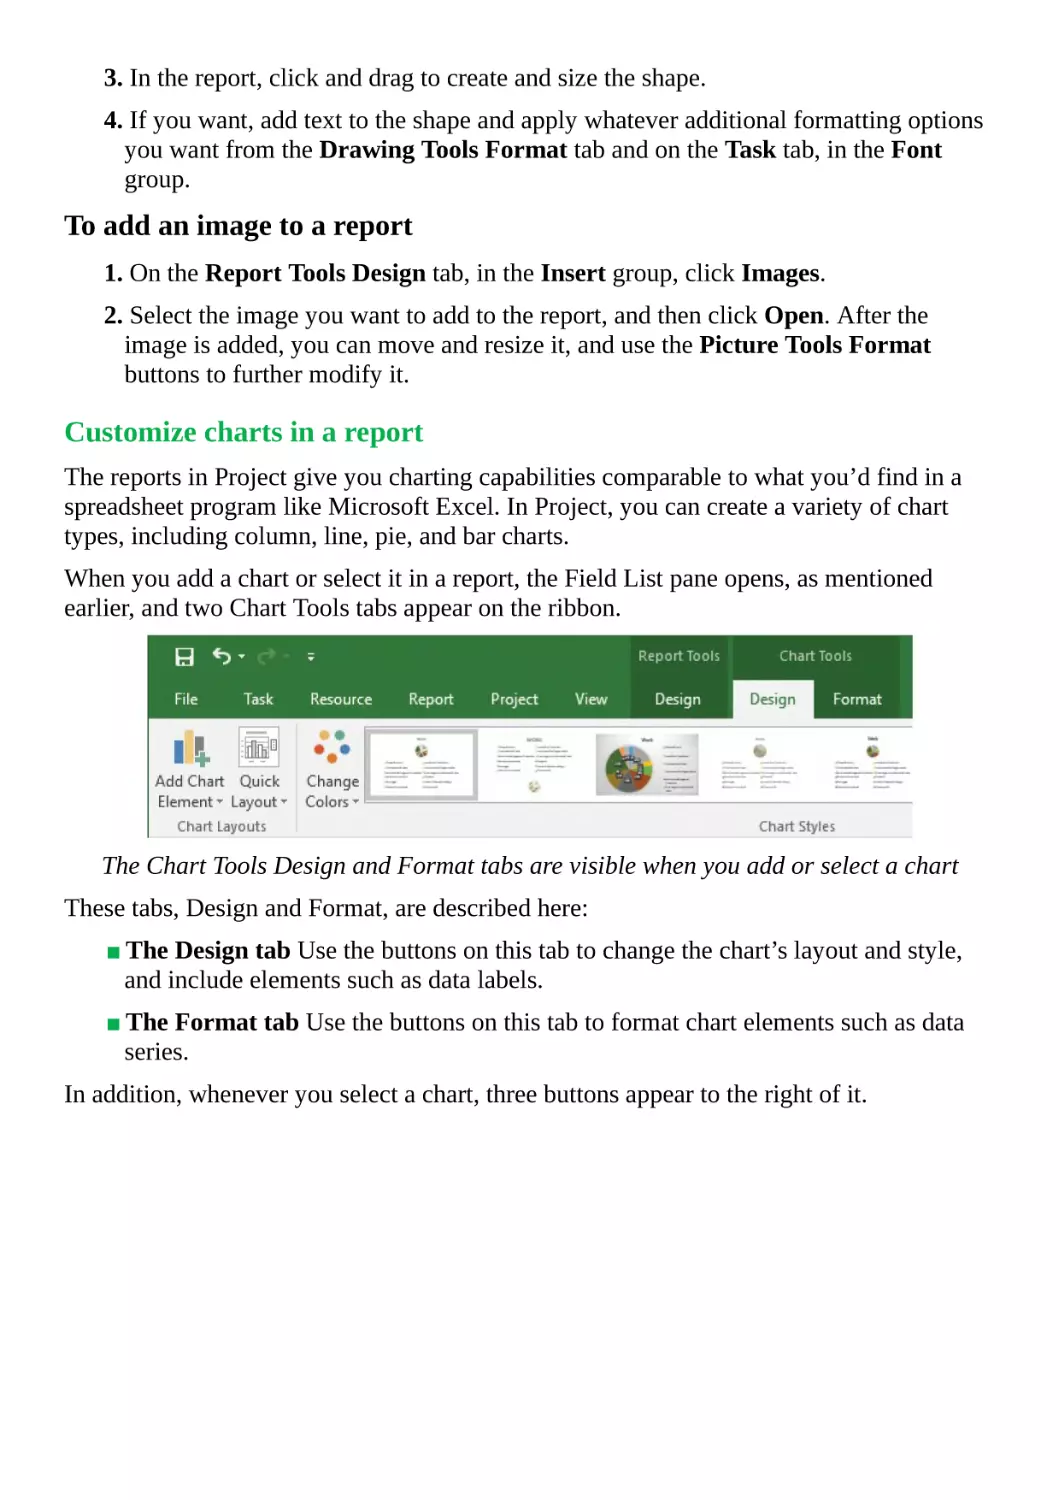
The tool tabs change when a report is displayed or when an item in a report is selected.
Because a report can include a variety of items, such as charts and tables, Project includes
tool tabs for both the report overall and for the specific types of items within the report.
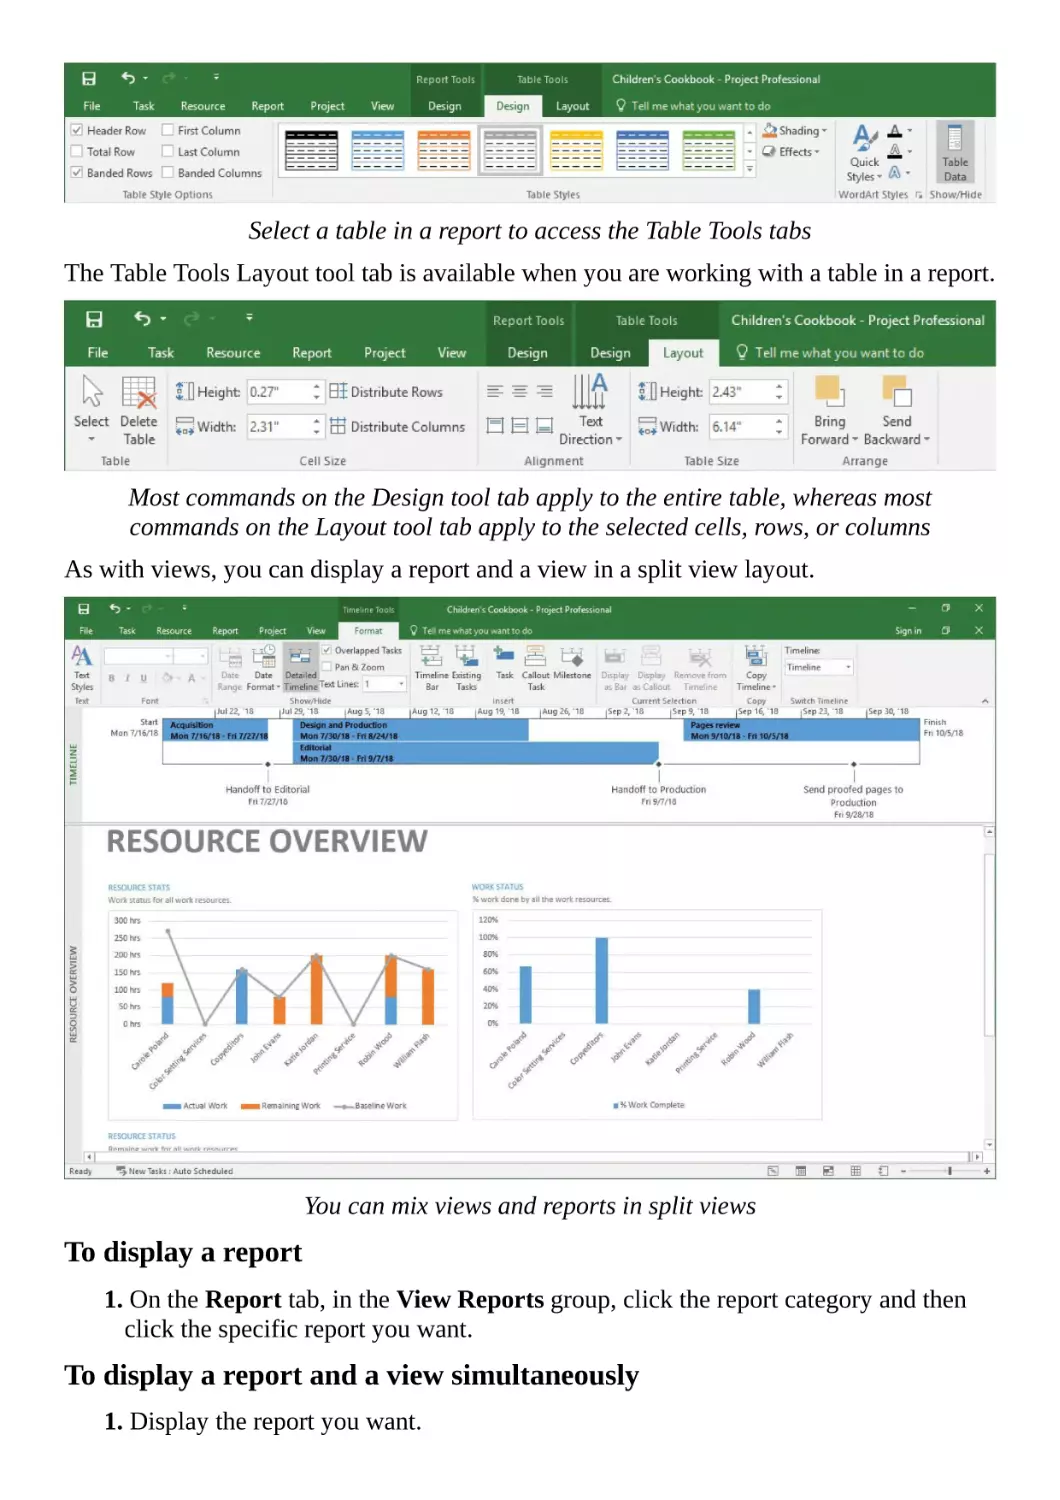
The Report Tools Design tab includes commands you can use to control the overall design
of a report.
When a report is displayed, the Report Tools Design tool tab is available
When you are working with a table in a report, the Table Tools Design tool tab is
available.
Select a table in a report to access the Table Tools tabs
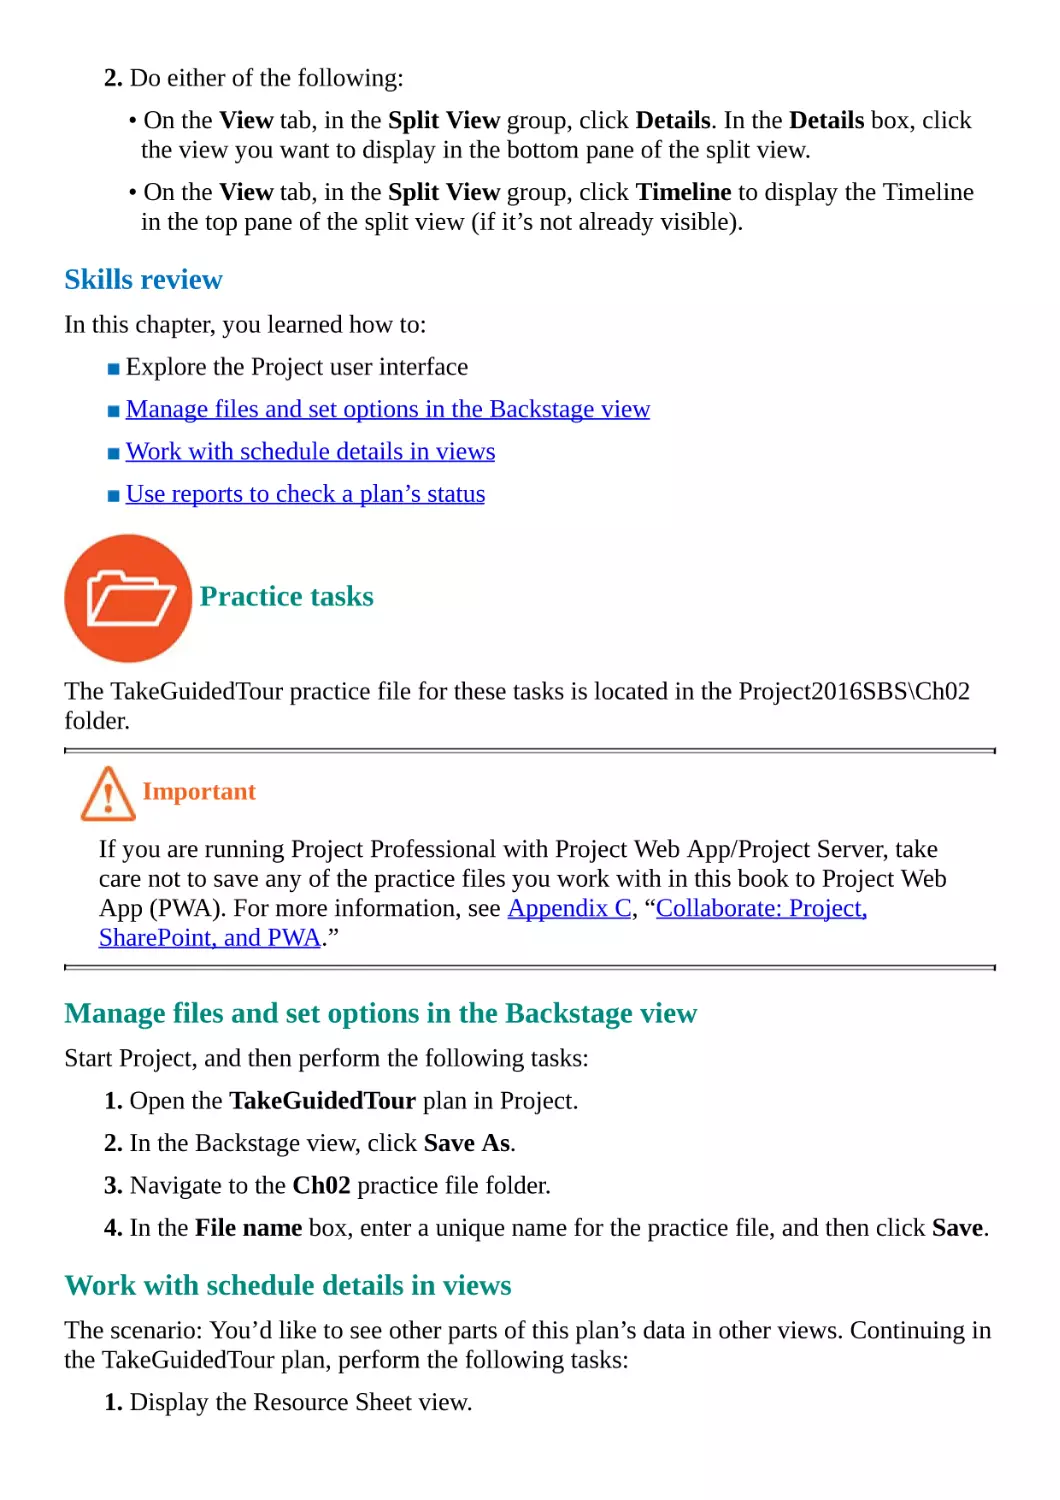
The Table Tools Layout tool tab is available when you are working with a table in a report.
Most commands on the Design tool tab apply to the entire table, whereas most
commands on the Layout tool tab apply to the selected cells, rows, or columns
As with views, you can display a report and a view in a split view layout.
You can mix views and reports in split views
To display a report
1. On the Report tab, in the View Reports group, click the report category and then
click the specific report you want.
To display a report and a view simultaneously
1. Display the report you want.
2. Do either of the following:
• On the View tab, in the Split View group, click Details. In the Details box, click
the view you want to display in the bottom pane of the split view.
• On the View tab, in the Split View group, click Timeline to display the Timeline
in the top pane of the split view (if it’s not already visible).
Skills review
In this chapter, you learned how to:
Explore the Project user interface
Manage files and set options in the Backstage view
Work with schedule details in views
Use reports to check a plan’s status
Practice tasks
The TakeGuidedTour practice file for these tasks is located in the Project2016SBS\Ch02
folder.
Important
If you are running Project Professional with Project Web App/Project Server, take
care not to save any of the practice files you work with in this book to Project Web
App (PWA). For more information, see Appendix C, “Collaborate: Project,
SharePoint, and PWA.”
Manage files and set options in the Backstage view
Start Project, and then perform the following tasks:
1. Open the TakeGuidedTour plan in Project.
2. In the Backstage view, click Save As.
3. Navigate to the Ch02 practice file folder.
4. In the File name box, enter a unique name for the practice file, and then click Save.
Work with schedule details in views
The scenario: You’d like to see other parts of this plan’s data in other views. Continuing in
the TakeGuidedTour plan, perform the following tasks:
1. Display the Resource Sheet view.
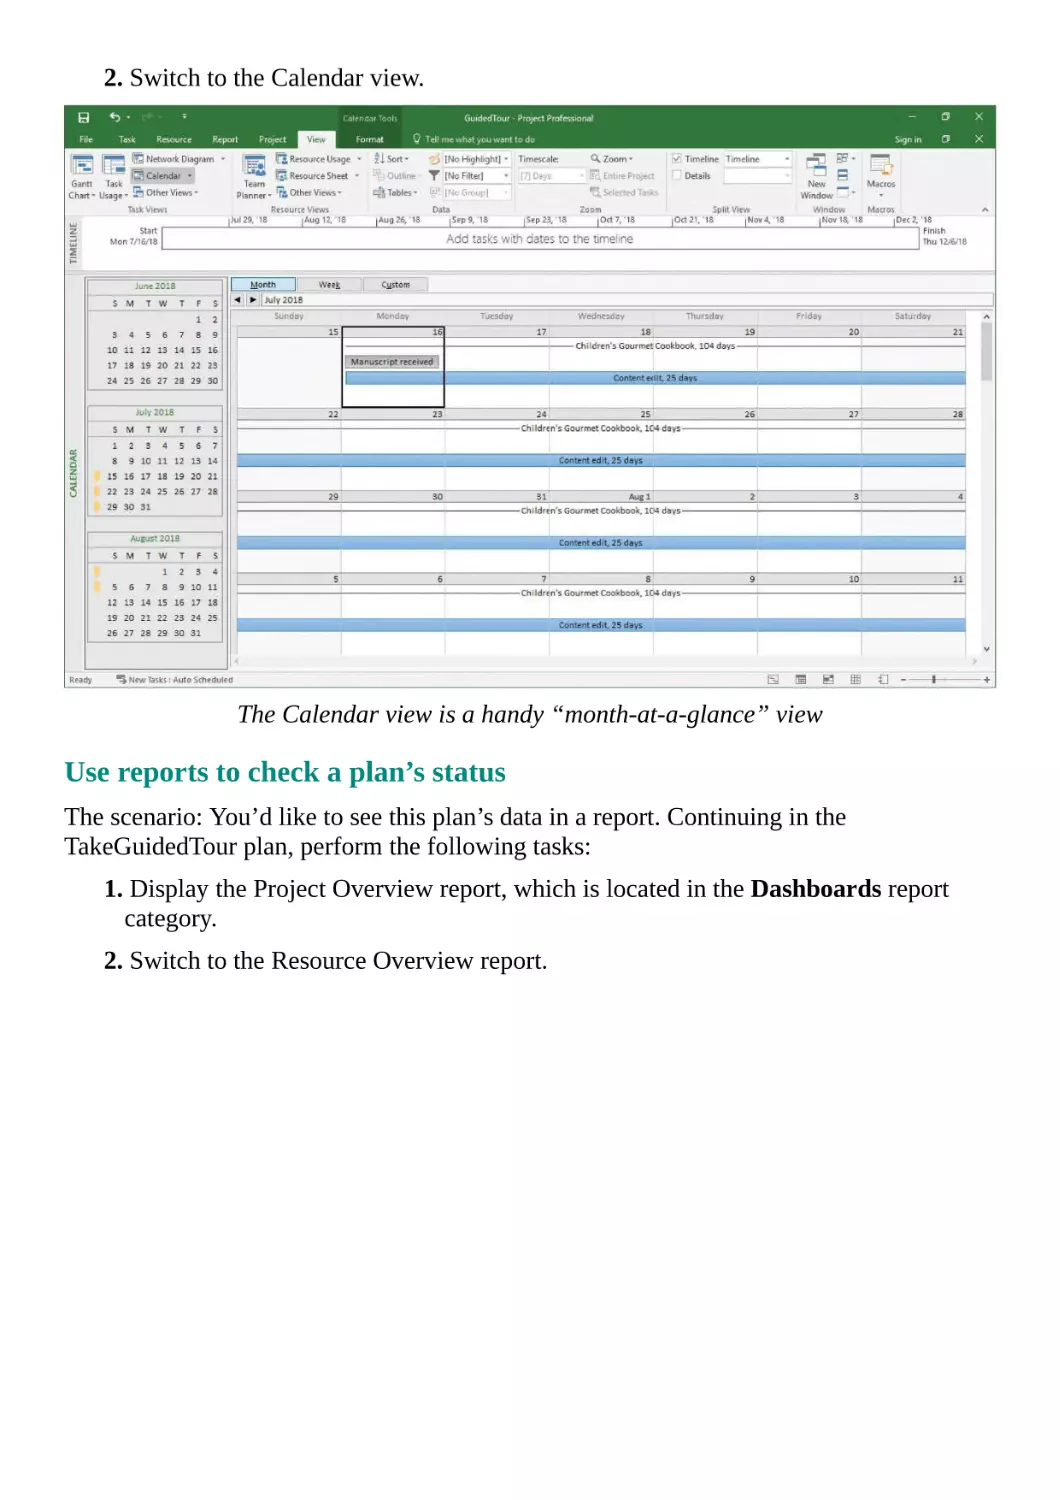
2. Switch to the Calendar view.
The Calendar view is a handy “month-at-a-glance” view
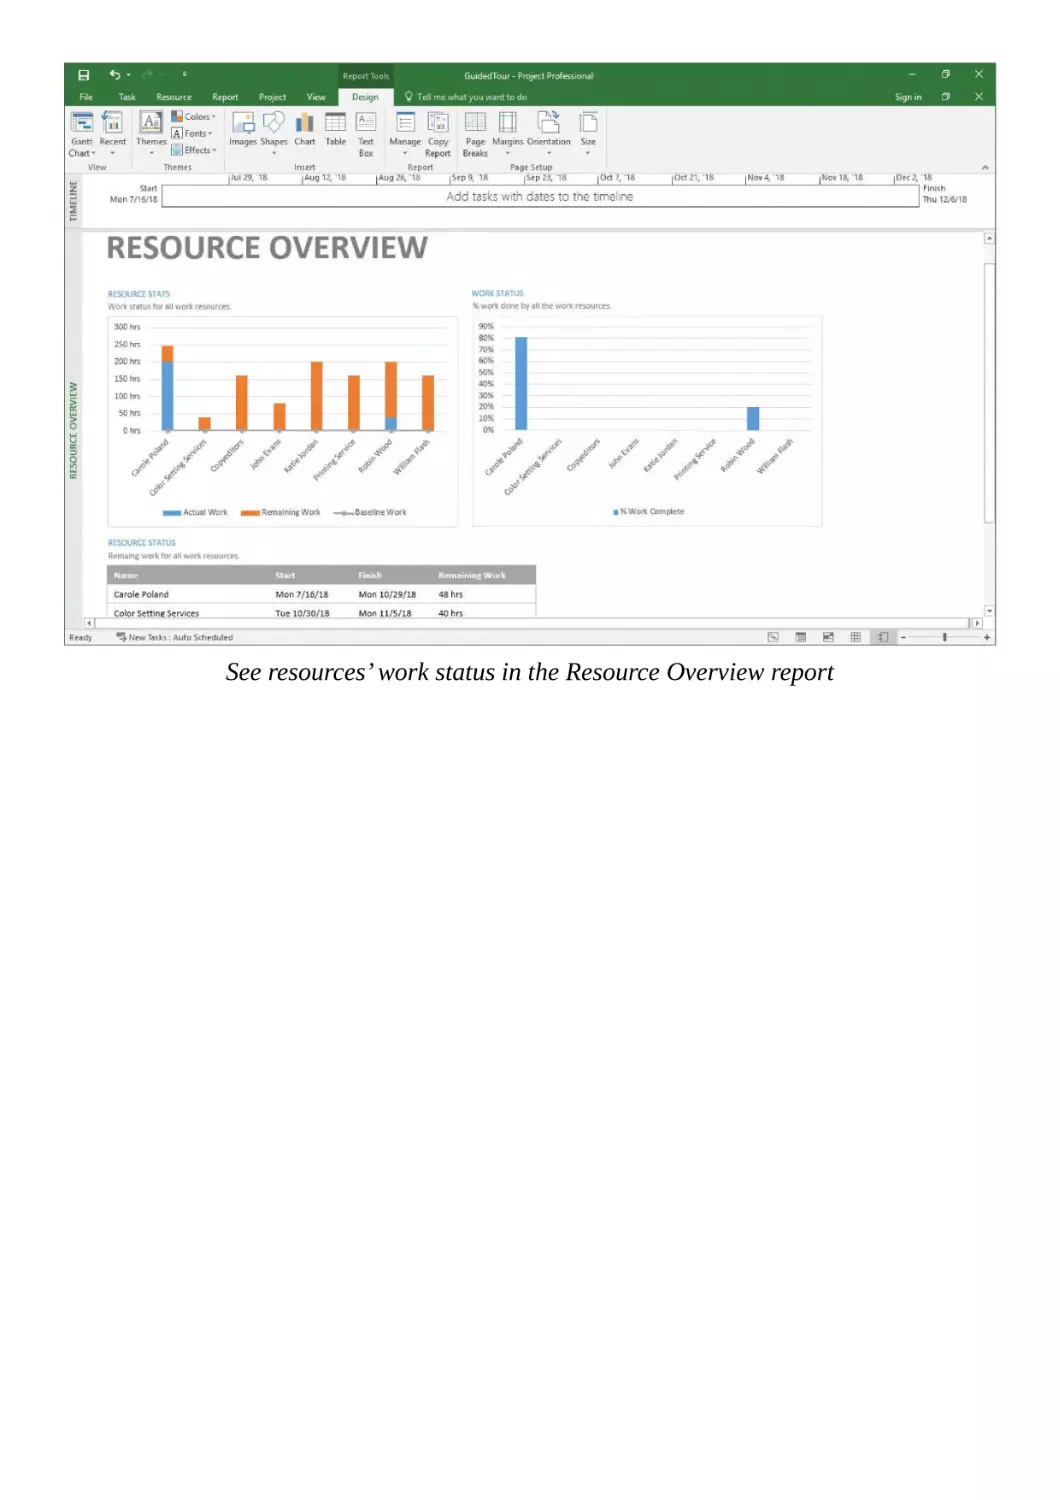
Use reports to check a plan’s status
The scenario: You’d like to see this plan’s data in a report. Continuing in the
TakeGuidedTour plan, perform the following tasks:
1. Display the Project Overview report, which is located in the Dashboards report
category.
2. Switch to the Resource Overview report.
See resources’ work status in the Resource Overview report
Part 2: Simple scheduling basics
CHAPTER 3 Start a new plan
CHAPTER 4 Build a task list
CHAPTER 5 Set up resources
CHAPTER 6 Assign resources to tasks
CHAPTER 7 Format and share your plan
CHAPTER 8 Track progress: Basic techniques
3. Start a new plan
In this chapter
Create a new plan and set its start date
Set nonworking days in the project calendar
Enter the plan title and other properties
Practice files
No practice files are necessary to complete the practice tasks in this chapter.
A project’s schedule or plan is essentially a model that you construct of some aspects of a
project you are anticipating—what you expect will happen, or what you want to happen.
This model focuses on key aspects of a project, such as tasks, resources, timeframes, and
possibly their associated costs. Note that throughout this book, we’ll refer to the types of
documents that Project 2016 works with as plans, not documents or schedules.
This chapter guides you through procedures related to creating a new plan and setting its
start date, setting nonworking days in a project calendar, and entering a plan’s title and
other properties.
Create a new plan and set its start date
As you might expect, Project focuses primarily on time. Sometimes you might know the
expected start date of a project, the expected finish date, or both. However, when working
with Project, you specify only one date, not both: the plan’s start date or finish date. Why?
Because after you enter the plan’s start or finish date and other details, Project calculates
the other date for you. Remember that Project is not merely a static repository of your
schedule information or a Gantt chart drawing tool—it is an active scheduling engine.
Most plans should be scheduled from a start date, even if you know that the plan should
finish by a certain deadline date. Scheduling from a start date sets all tasks to begin as
soon as possible, and it gives you the greatest scheduling flexibility. In this and later
chapters, you will see this flexibility in action as you work with a plan that is scheduled
from a start date.
To create a new plan
1. In Project, if the File tab is displayed, click it, and then click New.
2. In the list of templates, click Blank Project or any other template you want.
Or
1. If you already have a list of available templates on the Start screen, click Blank
Project or any other template you want.
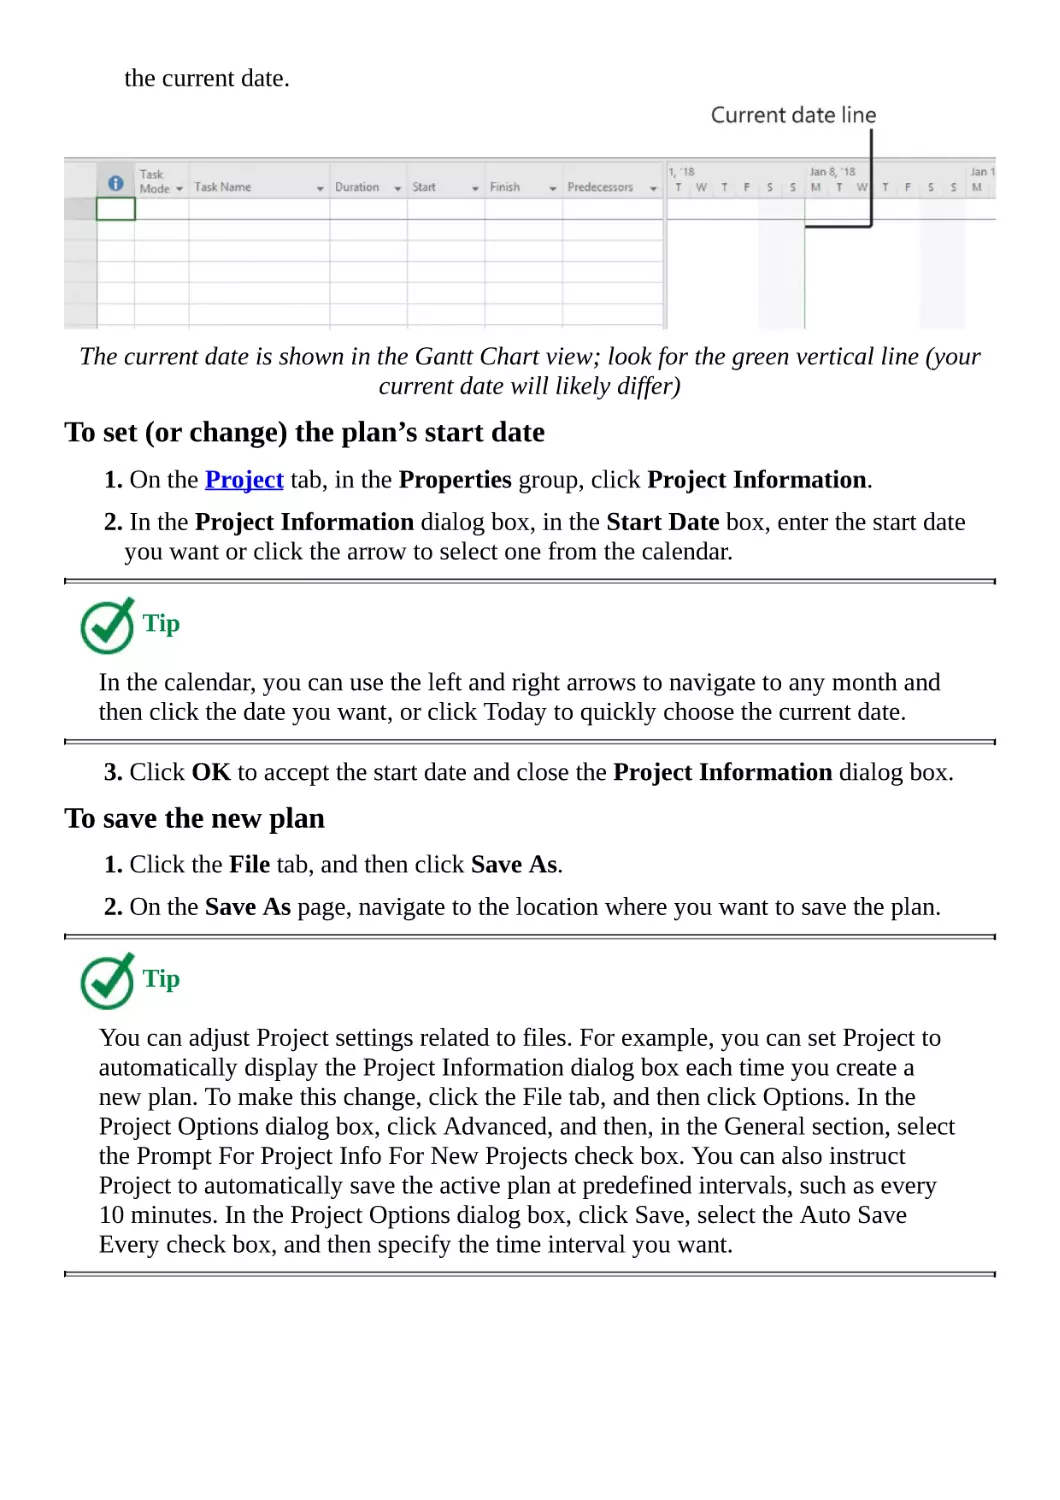
When you create a new plan, Project sets the plan’s start date to the current date.
Project draws a thin green vertical line in the chart portion of the Gantt Chart view at
the current date.
The current date is shown in the Gantt Chart view; look for the green vertical line (your
current date will likely differ)
To set (or change) the plan’s start date
1. On the Project tab, in the Properties group, click Project Information.
2. In the Project Information dialog box, in the Start Date box, enter the start date
you want or click the arrow to select one from the calendar.
Tip
In the calendar, you can use the left and right arrows to navigate to any month and
then click the date you want, or click Today to quickly choose the current date.
3. Click OK to accept the start date and close the Project Information dialog box.
To save the new plan
1. Click the File tab, and then click Save As.
2. On the Save As page, navigate to the location where you want to save the plan.
Tip
You can adjust Project settings related to files. For example, you can set Project to
automatically display the Project Information dialog box each time you create a
new plan. To make this change, click the File tab, and then click Options. In the
Project Options dialog box, click Advanced, and then, in the General section, select
the Prompt For Project Info For New Projects check box. You can also instruct
Project to automatically save the active plan at predefined intervals, such as every
10 minutes. In the Project Options dialog box, click Save, select the Auto Save
Every check box, and then specify the time interval you want.
Set nonworking days in the project calendar
Calendars are the primary means by which you control when each task and resource can
be scheduled for work in Project. In later chapters, you will work with other types of
calendars; in this chapter, we focus on the project calendar.
The project calendar defines the general working and nonworking days and times for
tasks. Project includes multiple calendars, called base calendars, any one of which can
serve as the project calendar for a plan. You select the base calendar that will be used as
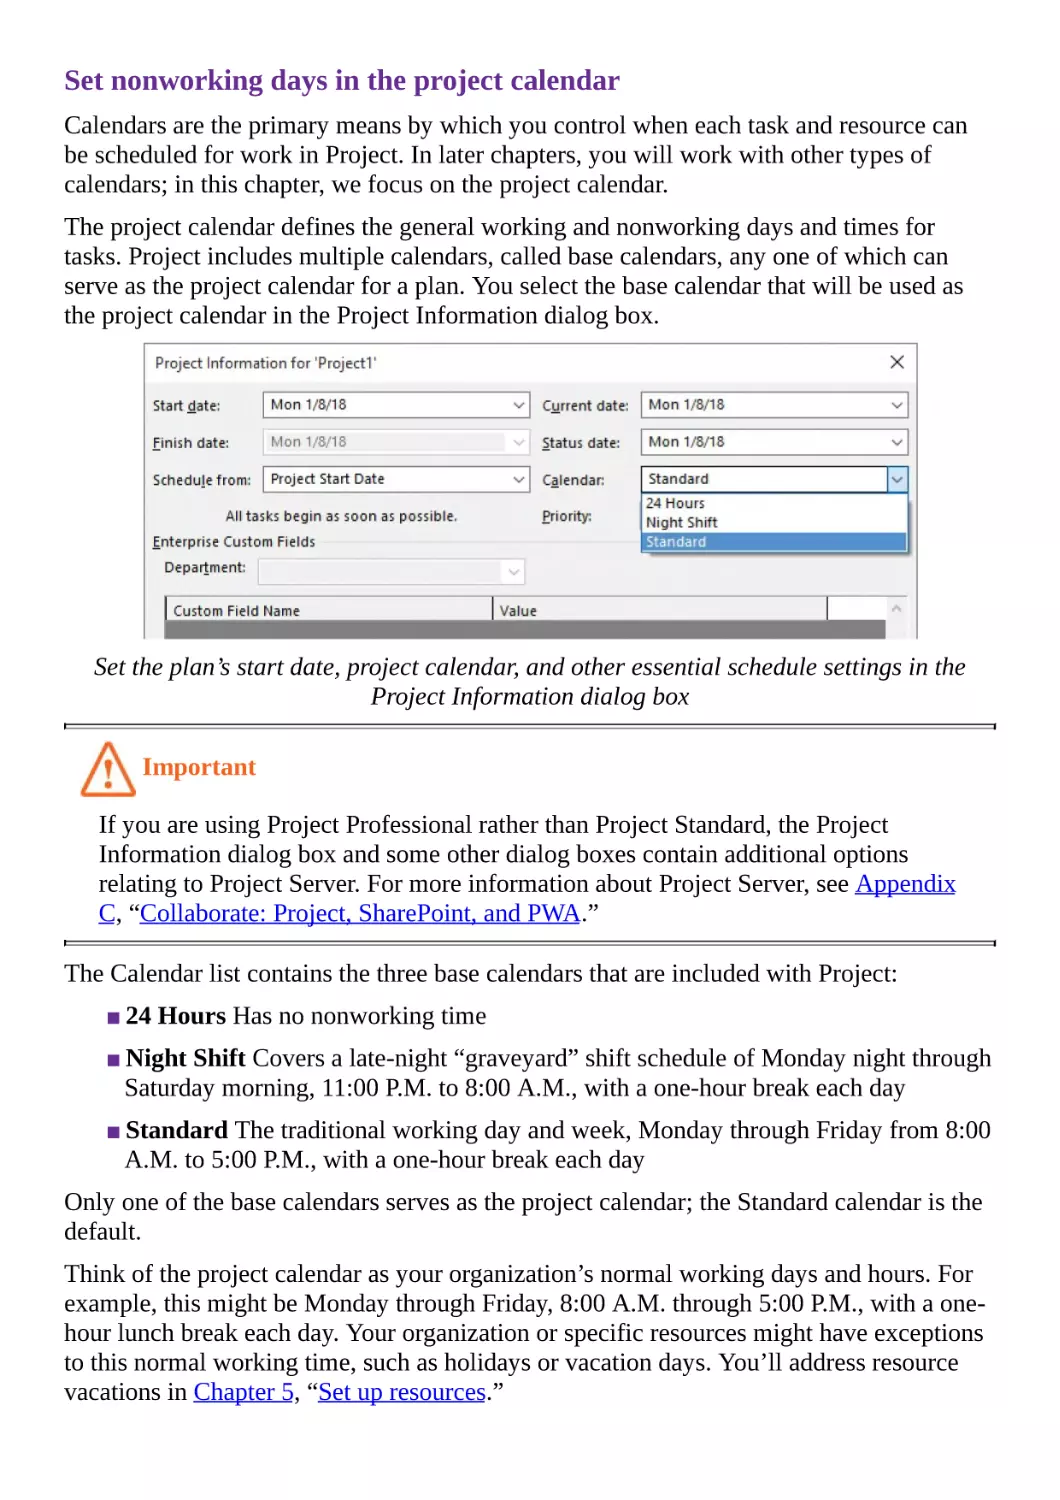
the project calendar in the Project Information dialog box.
Set the plan’s start date, project calendar, and other essential schedule settings in the
Project Information dialog box
Important
If you are using Project Professional rather than Project Standard, the Project
Information dialog box and some other dialog boxes contain additional options
relating to Project Server. For more information about Project Server, see Appendix
C, “Collaborate: Project, SharePoint, and PWA.”
The Calendar list contains the three base calendars that are included with Project:
24 Hours Has no nonworking time
Night Shift Covers a late-night “graveyard” shift schedule of Monday night through
Saturday morning, 11:00 P.M. to 8:00 A.M., with a one-hour break each day
Standard The traditional working day and week, Monday through Friday from 8:00
A.M. to 5:00 P.M., with a one-hour break each day
Only one of the base calendars serves as the project calendar; the Standard calendar is the
default.
Think of the project calendar as your organization’s normal working days and hours. For
example, this might be Monday through Friday, 8:00 A.M. through 5:00 P.M., with a onehour lunch break each day. Your organization or specific resources might have exceptions
to this normal working time, such as holidays or vacation days. You’ll address resource
vacations in Chapter 5, “Set up resources.”
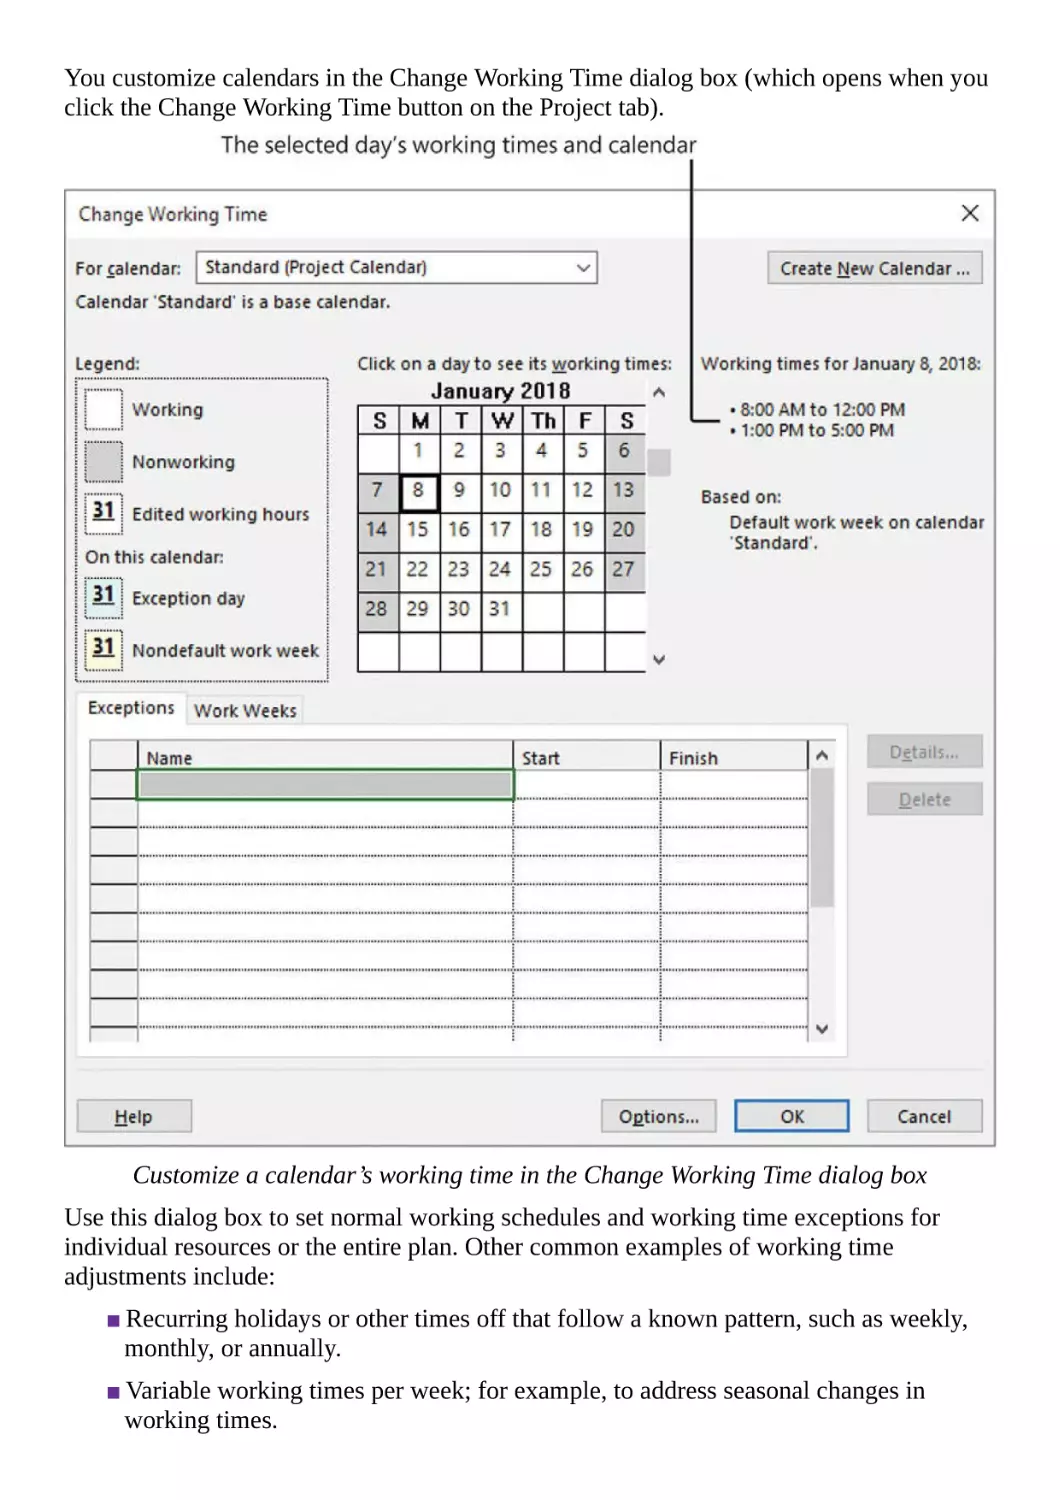
You customize calendars in the Change Working Time dialog box (which opens when you
click the Change Working Time button on the Project tab).
Customize a calendar’s working time in the Change Working Time dialog box
Use this dialog box to set normal working schedules and working time exceptions for
individual resources or the entire plan. Other common examples of working time
adjustments include:
Recurring holidays or other times off that follow a known pattern, such as weekly,
monthly, or annually.
Variable working times per week; for example, to address seasonal changes in
working times.
Unique working hours for a resource. You’ll make such settings in Chapter 5, “Set
up resources.”
To select the project calendar
1. On the Project tab, in the Properties group, click the Project Information button.
2. In the Project Information dialog box, in the Calendar box, click the arrow, and
then click the calendar you want to use as the project calendar.
To set a specific date as nonworking
1. On the Project tab, in the Properties group, click the Change Working Time
button.
2. On the Exceptions tab in the lower portion of the Change Working Time dialog
box, in the Name field, enter a description of the exception.
Tip
You don’t need to name calendar exceptions, but it’s a good practice for you or
others to identify the reason for the exception.
3. In the Start and Finish fields, enter or select the dates you want.
4. Click OK.
To set up a recurring nonworking time
1. On the Project tab, in the Properties group, click the Change Working Time
button.
2. On the Exceptions tab of the Change Working Time dialog box, in the Name
field, enter a description of the recurring exception.
3. Click in the Start field, and then click Details.
4. In the Details dialog box, under Recurrence Patterns, select the recurrence values
you want, and then click OK.
5. Click OK to close the Change Working Time dialog box.
To set up a custom work week
1. On the Project tab, in the Properties group, click the Change Working Time
button.
2. Click the Work Weeks tab in the lower portion of the Change Working Time
dialog box.
3. Click a row below the “[Default]” value.
4. Enter a description and the date range for which you want the custom work week to
apply.
5. In the Start and Finish fields, enter or select the date range for which you want the
custom work week to apply.
6. Click Details.
7. In the Details dialog box, select the day and time values you want, and then click
OK.
8. Click OK to close the Change Working Time dialog box.
Enter the plan title and other properties
Like other Microsoft Office apps, Project keeps track of several document properties.
Some of these properties are statistics, such as how many times the document has been
revised. Other properties include information that you might want to record about a plan,
such as the project title, the project manager’s name, or keywords to support a file search.
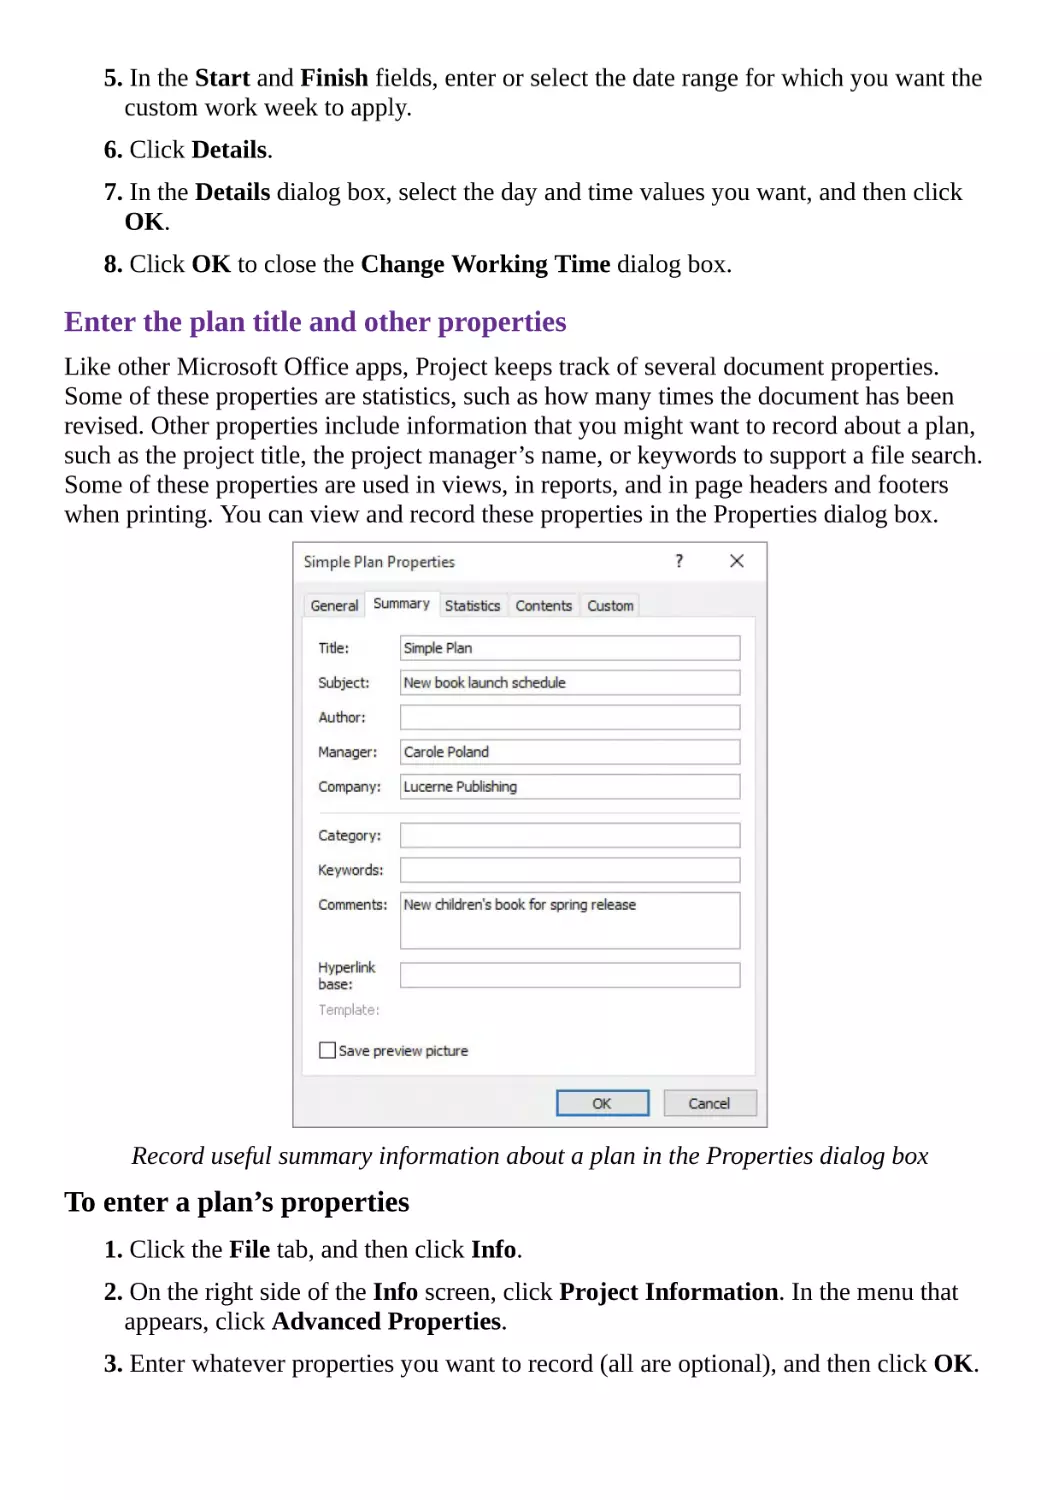
Some of these properties are used in views, in reports, and in page headers and footers
when printing. You can view and record these properties in the Properties dialog box.
Record useful summary information about a plan in the Properties dialog box
To enter a plan’s properties
1. Click the File tab, and then click Info.
2. On the right side of the Info screen, click Project Information. In the menu that
appears, click Advanced Properties.
3. Enter whatever properties you want to record (all are optional), and then click OK.
Project management focus: Project is part of a larger picture
Depending on your needs and the information to which you have access, the plans
that you develop in Project might not deal with other important aspects of your
projects. For example, many large projects are undertaken in organizations that
have a formal change-management process. Before a major change to the scope of a
project is allowed, it must be evaluated and approved by the people managing and
implementing the project. Even though this is an important project-management
activity, it is not something done directly within Project.
Skills review
In this chapter, you learned how to:
Create a new plan and set its start date
Set nonworking days in the project calendar
Enter the plan title and other properties
Practice tasks
No practice files are necessary to complete the practice tasks in this chapter.
Important
If you are running Project Professional with Project Web App/Project Server, take
care not to save any of the practice files you work with in this book to Project Web
App (PWA). For more information, see Appendix C, “Collaborate: Project,
SharePoint, and PWA.”
Create a new plan and set its start date
The scenario: Throughout this book, you’ll play the role of a project manager at Lucerne
Publishing, a book publisher that specializes in children’s books. Lucerne is about to
publish a major new book, and you’ve been asked to develop a plan for the book launch.
Start Project, and perform the following tasks:
1. Create a new plan based on the Blank Project template.
2. Set the new plan’s start date to January 8, 2018.
3. Save the new plan as Simple Plan in the Project2016SBS\Ch03 folder.
Set nonworking days in the project calendar
The scenario: At Lucerne Publishing, you need to account for an upcoming date on which
the entire Lucerne staff will be unavailable to work on the book launch project.
Continuing in the Simple Plan plan, perform the following task:
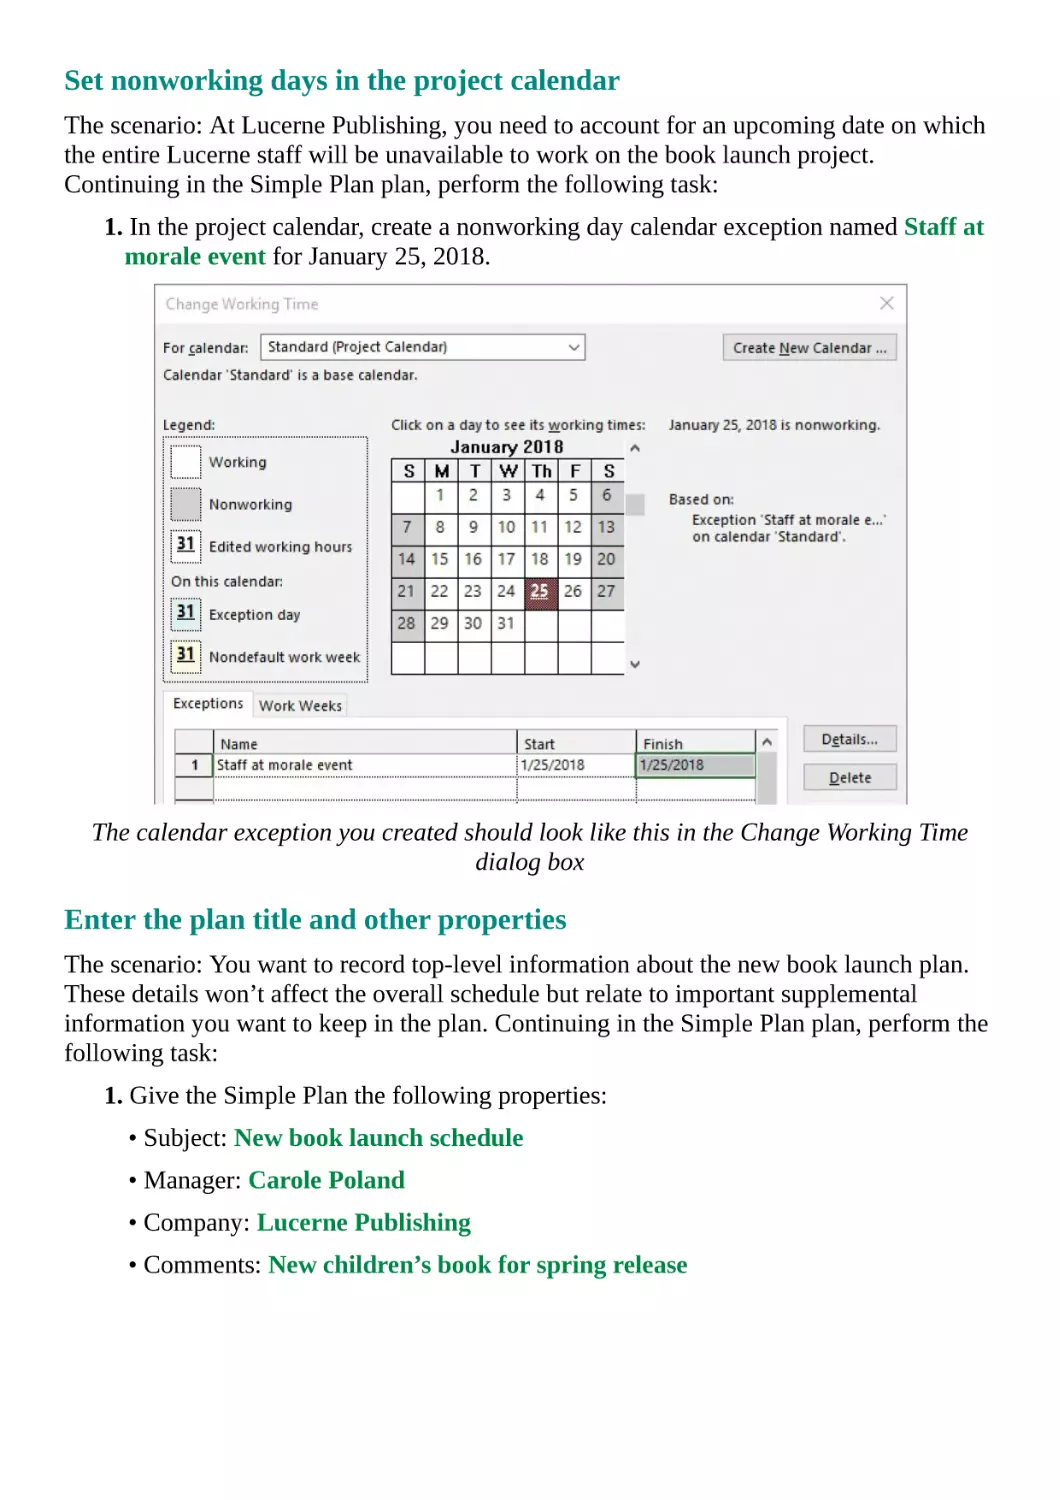
1. In the project calendar, create a nonworking day calendar exception named Staff at
morale event for January 25, 2018.
The calendar exception you created should look like this in the Change Working Time
dialog box
Enter the plan title and other properties
The scenario: You want to record top-level information about the new book launch plan.
These details won’t affect the overall schedule but relate to important supplemental
information you want to keep in the plan. Continuing in the Simple Plan plan, perform the
following task:
1. Give the Simple Plan the following properties:
• Subject: New book launch schedule
• Manager: Carole Poland
• Company: Lucerne Publishing
• Comments: New children’s book for spring release
4. Build a task list
In this chapter
Create tasks
Enter task durations and dates
Enter milestone tasks
Create summary tasks to outline the plan
Link tasks to create dependencies
Switch task scheduling from manual to automatic
Check a plan’s duration and finish date
Document task information
Practice files
For this chapter, use the SimpleBuildTaskList practice file from the
Project2016SBS\Ch04 folder. For practice file download instructions, see the
introduction.
Tasks are the most basic building blocks of any project’s plan. Tasks represent the work to
be done to accomplish the goals of the project. Tasks describe work in terms of
dependencies, duration, and resource requirements. In Project 2016, there are several
kinds of tasks. These include summary tasks, subtasks, and milestones (all discussed in
this chapter). More broadly, what are called tasks in Project are sometimes more generally
called activities or work packages.
This chapter guides you through procedures related to creating tasks, entering task
durations and dates, entering milestone tasks, creating summary tasks, linking tasks to
create dependencies, switching task scheduling from manual to automatic, checking a
plan’s duration and finish date, and documenting task information.
Create tasks
Tasks represent the work to be done to accomplish the goals of the project. Every task in a
plan is given an ID number, but the number does not necessarily represent the order in
which tasks occur.
Every task in Project has one of two scheduling modes that controls how the task is
scheduled: manual (the default) or automatically scheduled. Think of a manually
scheduled task as an initial placeholder you can create at any time without affecting the
rest of the schedule. You might not know more than a task name to start with, and that’s
OK. As you discover or decide more details about the task, such as when it should occur,
you can add those details to the plan. You’ll work with automatic scheduling in “Switch
task scheduling from manual to automatic” later in this chapter.
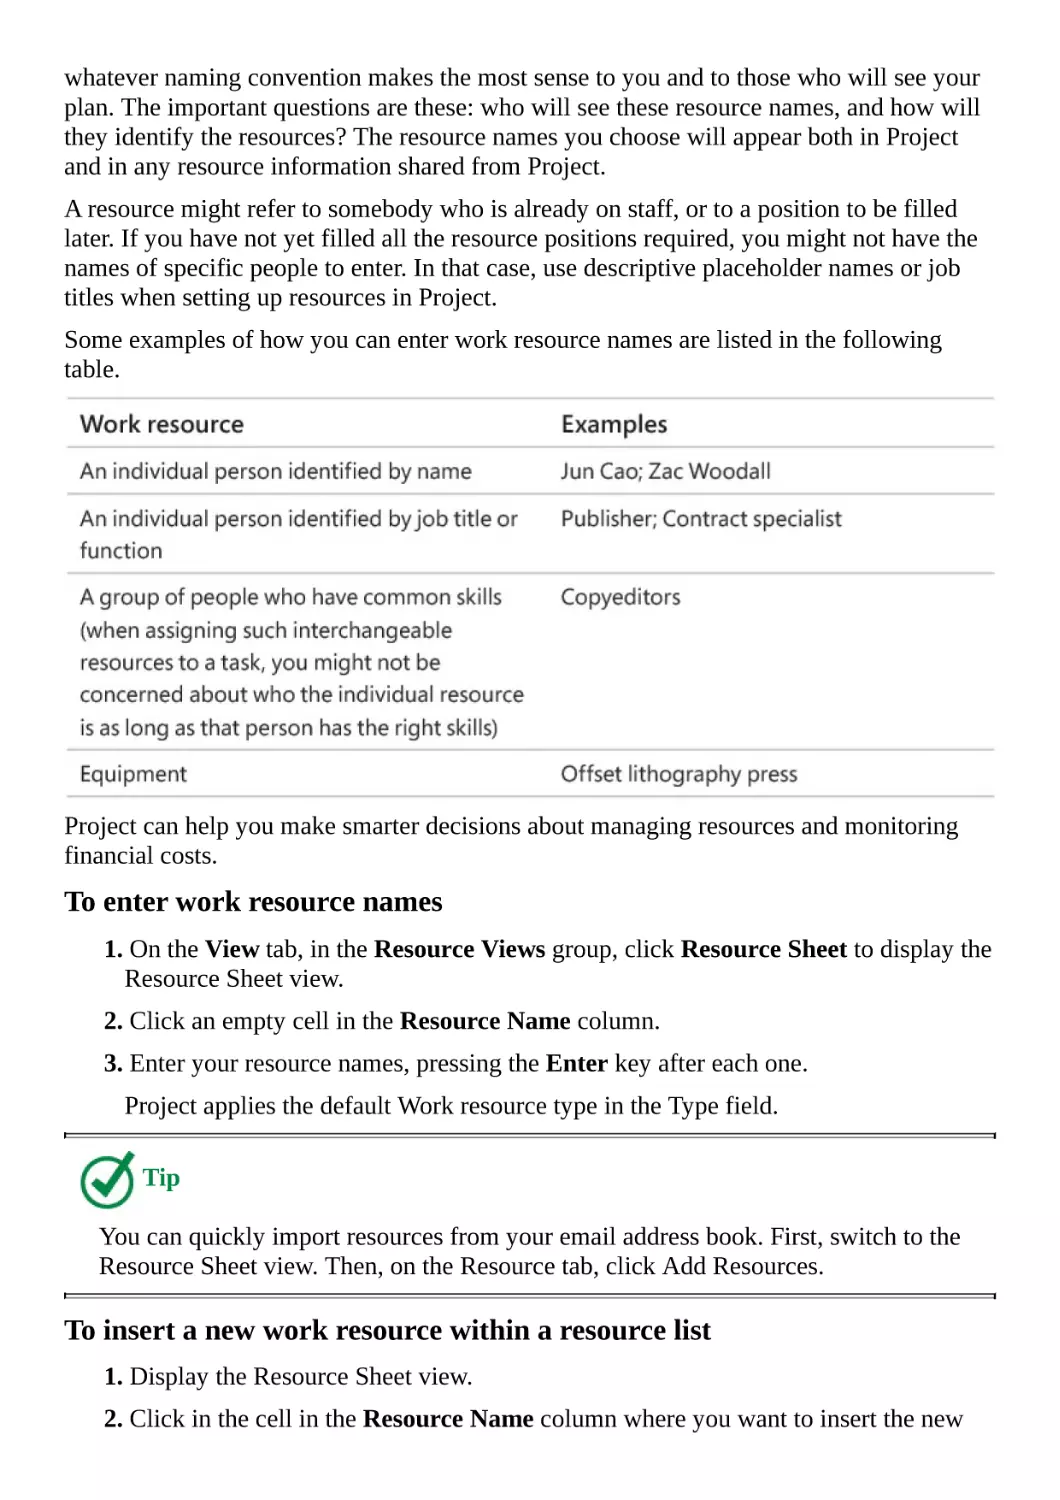
As you might suspect, naming the task is the first step in creating a task. For this reason,
it’s worth developing good practices about how you name tasks in your plans.
Task names should be recognizable and make sense to the people who will perform the
tasks and to other stakeholders who will read the task names. Here are some guidelines for
creating good task names:
Use short verb phrases that describe the work to be done, such as “Edit manuscript.”
If tasks will be organized into an outline, don’t repeat details from the summary task
name in the subtask name unless it adds clarity.
If tasks will have resources assigned to them, don’t include resource names in the
task names.
Keep in mind that you can always edit task names later, so don’t worry about getting them
exactly right when you’re initially entering them into a plan. Do aim to use concise,
descriptive phrases that communicate the required work and make sense to you and others
who will perform the work or review the plan. When necessary, you can also add more
details in task notes, described later in this chapter.
To enter task names
1. Click an empty cell in the Task Name column.
2. Enter your task names, and then press the Enter key after each one.
To insert a new task within a task list
1. Click in the Task Name column where you want to insert the new task.
2. On the Task tab, in the Insert group, click Task.
Project inserts a row for a new task and renumbers the subsequent tasks. Project
names the new task <New Task>.
3. With <New Task> selected, enter the task name, and then press Enter.
To delete a task
1. Right-click the task name, and then click Delete Task.
Project management focus: Defining the right tasks for the deliverable
Every project has an ultimate goal or intent, the reason that the project was started.
This is called the project’s deliverable. This deliverable might be a tangible product,
such as a new book, or a service or event, such as a product launch party. Defining
the right tasks to create the deliverable is an essential skill for a project manager.
The task lists you create in Project should describe all the work required, and only
the work required, to complete the project successfully.
When developing your task lists, you might find it helpful to distinguish product
scope from project scope. Product scope describes the quality, features, and
functions of the deliverable of the project. In the practice tasks scenario used in this
part of the book, for example, the deliverable is a new children’s book, and the
product scope might include its number of pages and illustrations. Project scope, on
the other hand, describes the work required to produce the new children’s book. In
the scenario for the new children’s book, the project scope includes detailed tasks
relating to generating publicity and advance reviews for the book.
Scope as a component of the project manager’s focus (along with time and cost) is
described more in Appendix A, “A short course in project management.”
Enter task durations and dates
A task’s duration represents the amount of time you expect it will take to complete the
task. Project can work with task durations that range from minutes to months. Depending
on the scope of your plan, you’ll probably want to work with task durations on the scale of
hours, days, and weeks. Giving your tasks duration values is one of the benefits of using a
scheduling tool like Project over a simple checklist or to-do approach to organizing work.
Project uses standard values for minutes and hours for durations: 1 minute equals 60
seconds, and 1 hour equals 60 minutes. For the durations of days, weeks, and months, you
can use Project’s defaults (for example, 20 days per month) or define your own values in
the Project Options dialog box.
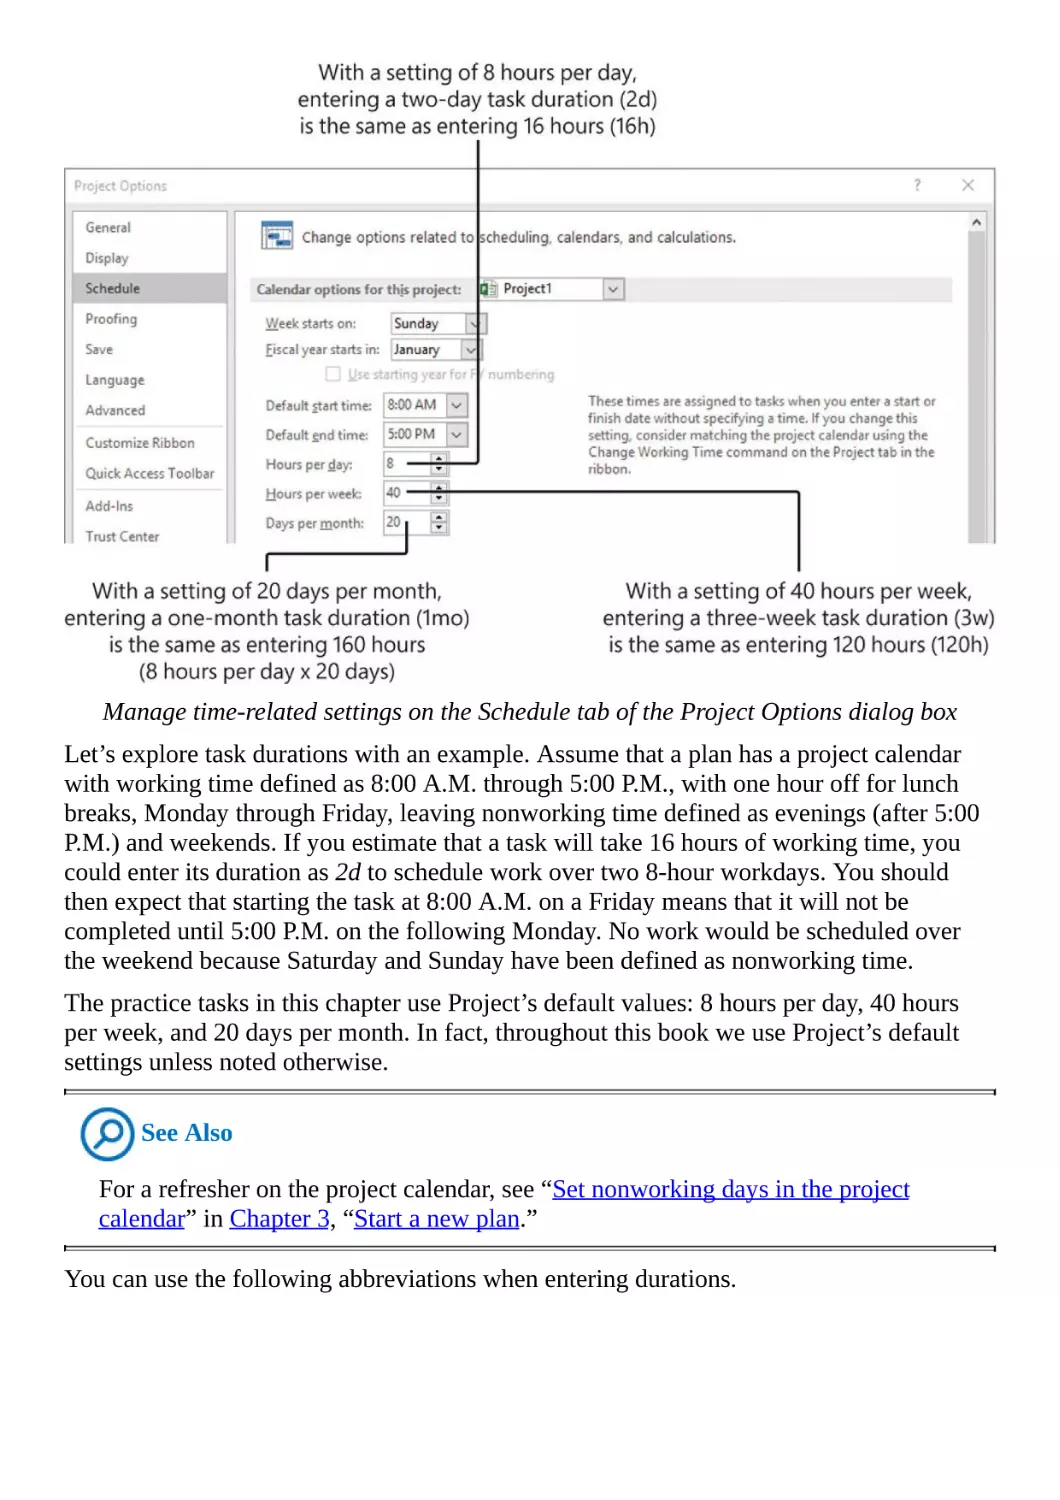
Manage time-related settings on the Schedule tab of the Project Options dialog box
Let’s explore task durations with an example. Assume that a plan has a project calendar
with working time defined as 8:00 A.M. through 5:00 P.M., with one hour off for lunch
breaks, Monday through Friday, leaving nonworking time defined as evenings (after 5:00
P.M.) and weekends. If you estimate that a task will take 16 hours of working time, you
could enter its duration as 2d to schedule work over two 8-hour workdays. You should
then expect that starting the task at 8:00 A.M. on a Friday means that it will not be
completed until 5:00 P.M. on the following Monday. No work would be scheduled over
the weekend because Saturday and Sunday have been defined as nonworking time.
The practice tasks in this chapter use Project’s default values: 8 hours per day, 40 hours
per week, and 20 days per month. In fact, throughout this book we use Project’s default
settings unless noted otherwise.
See Also
For a refresher on the project calendar, see “Set nonworking days in the project
calendar” in Chapter 3, “Start a new plan.”
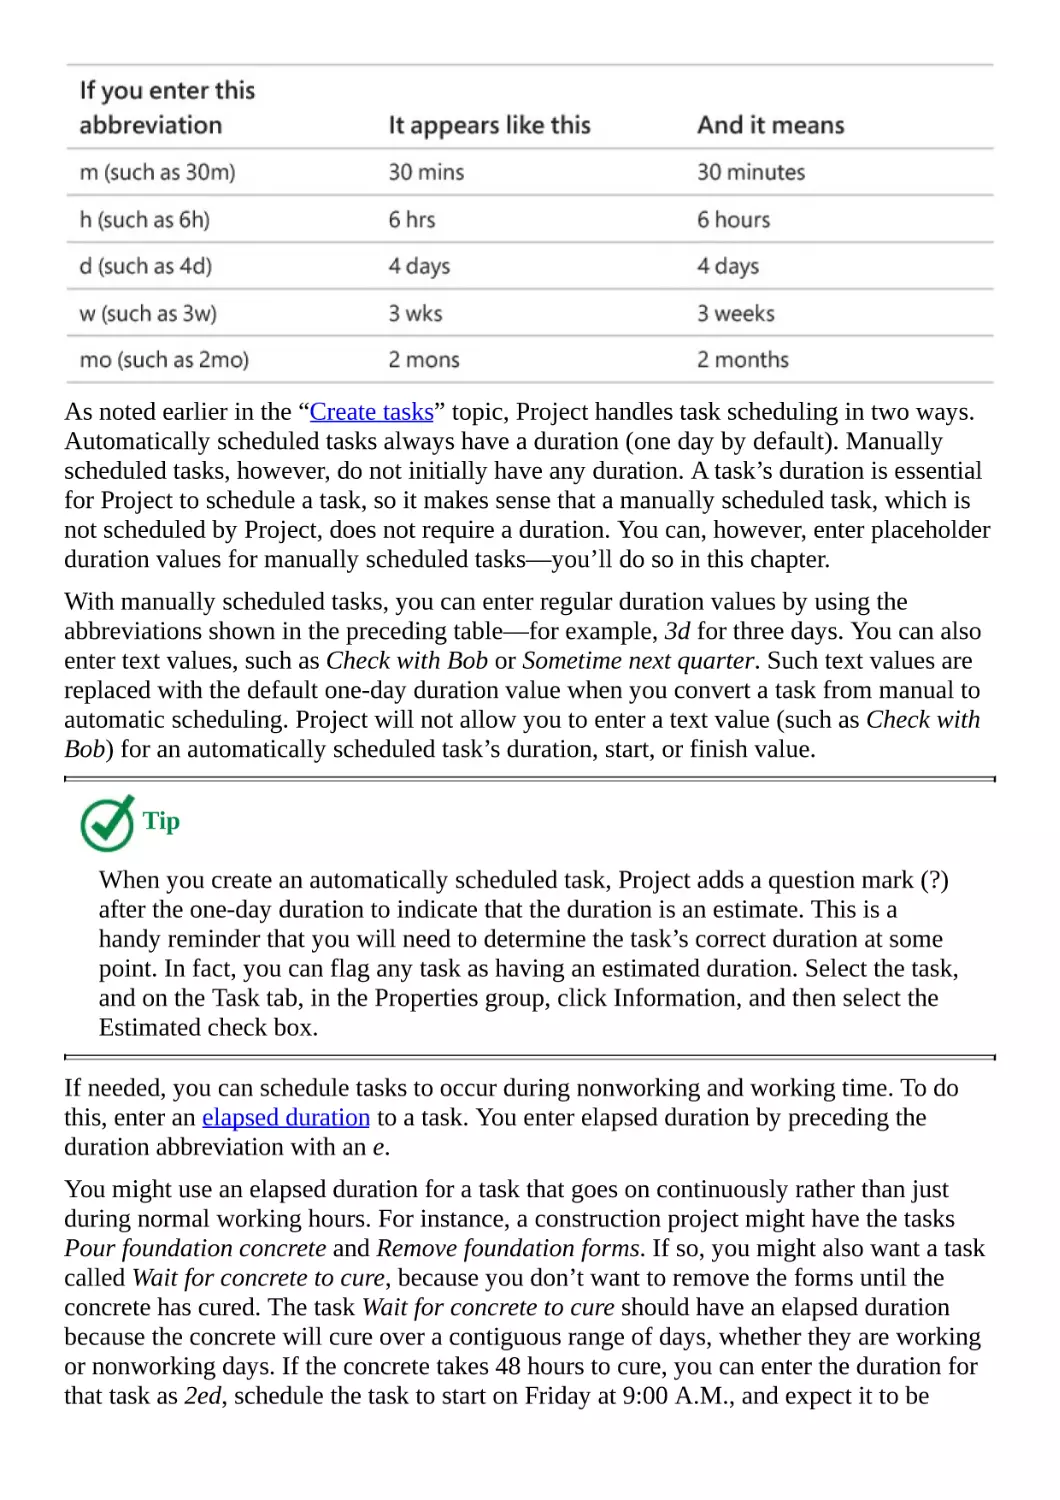
You can use the following abbreviations when entering durations.
As noted earlier in the “Create tasks” topic, Project handles task scheduling in two ways.
Automatically scheduled tasks always have a duration (one day by default). Manually
scheduled tasks, however, do not initially have any duration. A task’s duration is essential
for Project to schedule a task, so it makes sense that a manually scheduled task, which is
not scheduled by Project, does not require a duration. You can, however, enter placeholder
duration values for manually scheduled tasks—you’ll do so in this chapter.
With manually scheduled tasks, you can enter regular duration values by using the
abbreviations shown in the preceding table—for example, 3d for three days. You can also
enter text values, such as Check with Bob or Sometime next quarter. Such text values are
replaced with the default one-day duration value when you convert a task from manual to
automatic scheduling. Project will not allow you to enter a text value (such as Check with
Bob) for an automatically scheduled task’s duration, start, or finish value.
Tip
When you create an automatically scheduled task, Project adds a question mark (?)
after the one-day duration to indicate that the duration is an estimate. This is a
handy reminder that you will need to determine the task’s correct duration at some
point. In fact, you can flag any task as having an estimated duration. Select the task,
and on the Task tab, in the Properties group, click Information, and then select the
Estimated check box.
If needed, you can schedule tasks to occur during nonworking and working time. To do
this, enter an elapsed duration to a task. You enter elapsed duration by preceding the
duration abbreviation with an e.
You might use an elapsed duration for a task that goes on continuously rather than just
during normal working hours. For instance, a construction project might have the tasks
Pour foundation concrete and Remove foundation forms. If so, you might also want a task
called Wait for concrete to cure, because you don’t want to remove the forms until the
concrete has cured. The task Wait for concrete to cure should have an elapsed duration
because the concrete will cure over a contiguous range of days, whether they are working
or nonworking days. If the concrete takes 48 hours to cure, you can enter the duration for
that task as 2ed, schedule the task to start on Friday at 9:00 A.M., and expect it to be
complete by Sunday at 9:00 A.M. In most cases, however, you’ll work with non-elapsed
durations in Project.
Project management focus: How do you come up with accurate task durations?
You should consider two general rules when estimating task durations:
Overall project duration often correlates to task duration.
Long projects tend to have tasks with longer durations than short projects have.
If you track progress against your plan (as described in Chapter 8, “Track progress:
Basic techniques,” and in Part 3, “Advanced scheduling techniques”), you need to
consider the level of detail you want to apply to your plan’s tasks.
If you have a multiyear project, for example, it might not be practical or even
possible to track tasks that are measured in minutes or hours. In general, you should
measure task durations at the lowest level of detail or control that is important to
you, but no lower.
For the plans you work on in the practice tasks sections of this book, the durations
are supplied for you. For your projects, you will often have to estimate task
durations. Good sources of task duration estimates include:
Historical information from previous, similar projects.
Estimates from the people who will complete the tasks.
The expert judgment of people who have managed similar projects.
The standards of professional or industrial organizations that carry out projects
similar to yours.
One principle to consider is called the 8/80 rule. This rule suggests that task
durations between 8 hours (or 1 day) and 80 hours (10 working days, or two weeks)
are generally sized about right. Tasks shorter than one day might be too granular,
and tasks longer than two weeks might be too long to manage properly. There are
many legitimate reasons to vary from this rule, but for most tasks in your projects,
it’s worth considering.
For complex, long-duration projects or projects involving a large number of
unknowns, you might be able to make detailed duration estimates only of tasks to
be started and completed soon (for example, within two to four weeks). You then
might have only very general duration estimates for tasks that will start later (for
example, after two to four weeks). You could hold a recurring task-duration
estimating session with the team according to a regular cadence as time progresses.
For complex projects, you probably would combine these and other strategies to
estimate task durations. Because inaccurate task duration estimates are a major
source of risk in any project, making good estimates is well worth the effort.
To enter task duration
1. Click a cell in the Duration column for a task.
2. Enter a duration value.
Tip
You can also click the up and down arrows in the cell to enter or change the value
in the Duration field.
Project initially sets all new tasks that have a duration value to start at the project
start date. This is true whether the tasks are manually or automatically scheduled.
For manually scheduled tasks, you can enter a duration as either a numeric value,
such as 2d, or as placeholder text, such as Check with Marketing team. For any
columns that are too narrow to display the full value, point to the cell; its full value
will appear in a ScreenTip.
For both manually and automatically scheduled tasks, Project draws a Gantt bar in
the chart portion of a Gantt chart view. The length of the bar represents the task’s
duration.
To schedule a task to span nonworking and working times with an elapsed
duration
1. When entering the task’s duration, precede the duration abbreviation with an e. For
example, enter 1ed to indicate one full 24-hour day, or 1ew to equal seven 24-hour
days, or 1emo to equal thirty 24-hour days.
To calculate the duration of a manually scheduled task
1. In the Start and Finish fields for the task, enter or select the start date and finish
date values you want.
Project calculates the Duration value. Note that when the task gets switched to be
automatically scheduled, the start and finish values might change based on
predecessor relationships, the project start date, or other scheduling factors. The
duration value, however, will be preserved.
Enter milestone tasks
In addition to entering tasks to be completed, you might want to account for an important
event for your project’s plan, such as the end of a major phase of the project. To do this,
you will create a milestone task.
Milestones are significant events that are either reached within the plan (such as the
completion of a phase of work) or imposed upon the plan (such as a deadline by which to
apply for funding). Because the milestone itself doesn’t normally include any work,
milestones are normally represented as tasks with zero duration. To visually distinguish
milestones, their Gantt chart symbol appears as a diamond rather than a bar. However, you
can flag any task of any duration as a milestone.
To enter a milestone task
1. In the Task Name column, click where you want to insert the milestone.
2. On the Task tab, in the Insert group, click Milestone.
Project inserts a new row for the new task and renumbers subsequent tasks. Project
names the new task <New Milestone> and gives it a zero-day duration.
Tip
To convert a task of any duration to a zero-duration milestone task, set its Duration
value to 0.
To mark a task of any duration as a milestone
1. Select a task name.
2. On the Task tab, in the Properties group, click Information.
3. In the Task Information dialog box, click Advanced.
4. Select the Mark Task As Milestone check box.
Create summary tasks to outline the plan
You’ll find it helpful to organize groups of closely related tasks into an outline by using
summary tasks. A summary task is made up of and summarizes the subtasks indented
below it in the plan’s outline. When the summary tasks are sequenced over time, the
highest-level summary tasks are called phases.
When you are reviewing a project’s plan, seeing tasks organized in an outline helps you
and your stakeholders think in terms of major work items or phases. For example, it is
common to divide book publishing projects into Editorial, Design, and Production phases.
With an outline applied, you can then expand or collapse the outline to show just the level
of detail you want. You create an outline by indenting and outdenting tasks.
Summary tasks are automatically scheduled and not manually scheduled by default. The
duration of an automatically scheduled summary task is calculated by Project as the span
of working time from the earliest start date to the latest finish date of its subtasks. If you
directly edit the duration of an automatically scheduled summary task, or its start or finish
date, it will be switched to a manually scheduled task.
When a summary task is manually scheduled, its duration will be calculated based on its
subtasks, just like the duration of an automatically scheduled summary task. However, you
can edit the duration of a manually scheduled summary task, and Project will keep track of
both the manual duration that you entered and the calculated duration. You will learn
about summary tasks with both manual and automatically calculated durations in Chapter
10, “Fine-tune task details.”
The highest level of a plan’s outline is called the project summary task. Project
automatically generates the project summary task but does not display it by default.
Because the project summary task is at the highest level of the plan’s outline, it includes
rolled-up details from all subtasks. It also represents the full duration of the plan, so it’s a
handy way of seeing some essential details, such as the plan’s overall duration. You will
learn about the plan’s duration and finish date later in this chapter.
Project management focus: Top-down and bottom-up planning
Two common approaches to developing tasks and phases are top-down and bottomup planning:
Top-down planning This approach identifies major phases or components of
the project before filling in all the details required to complete those phases,
which are represented in the plan as summary tasks. Complex plans can have
several layers of nested summary tasks. This approach works from general to
specific.
Bottom-up planning This approach identifies as many of the bottom-level
detailed tasks as possible before outlining them into phases or summary tasks.
This approach works from specific to general.
Creating accurate tasks and phases for most complex plans requires a combination
of top-down and bottom-up planning. Typically, a project manager begins with
established, broad phases for a plan (top-down planning), and the resources who
will execute the plan provide the detailed tasks that fill out each phase (bottom-up
planning).
To promote a task to a summary task
1. Select the tasks directly below the task that you want to make a summary task.
2. On the Task tab, in the Schedule group, click the Indent Task button.
Project uses text and bar formatting to distinguish between summary tasks and subtasks
When you make a manually scheduled task a summary task, Project switches the
new summary task to be automatically scheduled.
To insert a new summary task within a task list
1. Select the name of the tasks that will become subtasks.
2. On the Task tab, in the Insert group, click Summary.
Project inserts a row for a new task, indents all of the selected tasks directly below
it, and renumbers the subsequent tasks. Project names the new task <New Summary
Task>.
3. With <New Summary Task> selected, enter the summary task name.
To demote a summary task to a task
1. Select all subtasks below the summary task.
2. On the Task tab, in the Schedule group, click the Outdent Task button.
Link tasks to create dependencies
When you link tasks, you create scheduling relationships between the tasks. These task
relationships are called dependencies, as in the start of this task is dependent upon the
completion of a prior task. When you create task dependencies (also called links), Project
can automatically adjust the scheduling of linked tasks as changes occur in your plan.
Creating dependencies by linking tasks is crucial to getting the full benefit of the Project
scheduling engine.
Let’s look at one type of dependency relationship you can create between two tasks. Most
projects require tasks to be performed in a specific order. For example, the task of writing
a chapter of a book must be completed before the task of editing the chapter can occur.
These two tasks have a finish-to-start relationship, which has two aspects:
The second task must occur after the first task; this is a sequence.
The second task can occur only if the first task is completed; this is a dependency.
In Project, the first task (Write the chapter) is called the predecessor because it precedes
tasks that depend on it. The second task (Edit the chapter) is called the successor because
it succeeds, or follows, tasks on which it is dependent. Any task can be a predecessor for
one or more successor tasks. Likewise, any task can be a successor to one or more
predecessor tasks.
Although this might sound complicated, two tasks can have one of only four types of task
relationships, as described in the following table.
For finish-to-start relationships (the default link type), the predecessor with the later finish
date determines the start date of the successor task. This predecessor task is sometimes
called the “driving predecessor” because it determines or drives the start date of its
successor task. Project includes a feature that helps you identify driving predecessor and
successor relationships more easily. The feature is called Task Path and is described in
Chapter 9, “Fine-tune task scheduling.”
A task with two or more successor tasks might have different task relationships with each
successor. For example, the predecessor task can have a finish-to-start relationship with
one successor and a finish-to-finish relationship with another successor.
Representing task relationships and handling changes to scheduled start and finish dates
are two areas where the use of a real scheduling tool such as Project really pays off. For
example, you can change task durations or add or remove tasks from a chain of linked
tasks, and Project will reschedule tasks accordingly.
Automatically scheduled tasks are dynamically rescheduled when their predecessor task
details change. Manually scheduled tasks, however, are not rescheduled by schedule
updates to their predecessor tasks, but you can force a manually scheduled task to respect
its predecessor links whenever you want. You can, in effect, “nudge” a manually
scheduled task to respect its links.
Task relationships appear in several ways in Project, including the following:
In Gantt chart and Network Diagram views, task relationships appear as the lines
connecting tasks.
In tables, such as the Entry table, task ID numbers of predecessor tasks appear in the
Predecessor fields of successor tasks. (In a Gantt chart view, you might need to drag
the vertical divider bar to the right to display the Predecessor column.)
Tip
You can adjust the schedule relationship between predecessor and successor tasks
by adding lead and lag times. For example, you can set a two-day lag between the
end of a predecessor task and the start of its successor task. For more information,
see Chapter 9, “Fine-tune task scheduling.”
To link tasks
1. Select the names of the tasks you want to link. If the tasks are not adjacent, select
the first task, hold down the Ctrl key, and then select the additional task or tasks.
2. On the Task tab, in the Schedule group, click the Link the Selected Tasks button
(which looks like two chain links).
Project links the tasks with a finish-to-start relationship.
Create schedule dependencies between tasks by linking them
Or
1. In the chart portion of a Gantt chart view, point to the predecessor task bar and then
drag down to the task bar for the successor task.
Note that as you drag, the pointer changes to a link icon and pop-up window that
updates with information as you point to other task bars.
This tooltip can help you link tasks by using the mouse. The pointer changes to
indicate that you are linking tasks.
2. When the pointer is over the successor task bar, release the mouse button.
One way to link tasks is to drag the pointer from the predecessor’s Gantt bar to the
successor’s Gantt bar
Or
1. In the Predecessors field for the successor task, enter the predecessor task’s ID.
You might have to scroll the table to the right to display the Predecessor column.
Tip
When working with summary tasks, you can either link summary tasks directly or
link the latest task in the first phase with the earliest task in the second phase. The
scheduling result is the same in either situation. Under no circumstances, however,
can you link a summary task to one of its own subtasks. Doing so creates a circular
scheduling problem, so Project doesn’t allow it.
Or
1. Select the task for which you want to specify a predecessor task or multiple
predecessor tasks.
2. On the Task tab, in the Properties group, click the Information button.
3. On the Predecessors tab of the Task Information dialog box, enter the ID value or
select or enter the task name of the predecessor task you want, and then click OK.
Tip
Adding predecessor tasks via the Task Information dialog box is a good way of
specifying multiple predecessors for a single successor task.
To unlink tasks
1. Select the tasks you want to unlink.
2. On the Task tab, in the Schedule group, click the Unlink Tasks button (which
looks like a broken chain link).
To force a manually scheduled task to respect its predecessor task’s
scheduling result
1. Select the manually scheduled task you want to be rescheduled as determined by its
predecessor task relationships.
2. On the Task tab, in the Schedule group, click the Respect Links button.
Switch task scheduling from manual to automatic
Project, by default, sets new tasks to be manually scheduled. In fact, so far in Part 2 of this
book you’ve worked only with manually scheduled tasks. In Project, you control the
scheduling of tasks in two different ways:
Work with manually scheduled tasks to quickly capture some details but without
scheduling the tasks. Think of a manually scheduled task as an initial placeholder
you can create at any time without affecting the rest of the plan. You might not
initially know more than a task’s name, and that’s OK. As you discover or decide
more details about the task, such as when it should occur, you can add those details
to the plan.
Work with automatically scheduled tasks to take full advantage of the powerful
scheduling engine in Project.
Switch individual tasks or the entire plan from manually to automatically scheduled
When you create automatically scheduled tasks, Project assigns a duration and start and
finish date values to them. With automatic scheduling, Project updates calculated schedule
values such as task durations, start dates, and finish dates automatically in response to
changes in a plan. Changes to factors such as task relationships and calendars can also
cause Project to recalculate affected tasks.
To switch a single task from manual to automatic task scheduling
1. Select the manually scheduled task you want to change.
2. Click in the Task Mode field of the selected task, and then click the arrow that
appears.
3. In the list that appears, click Auto Scheduled.
To switch several tasks from manual to automatic task scheduling
1. Select the manually scheduled tasks you want to change.
2. On the Task tab, in the Tasks group, click the Auto Schedule button.
To switch the currently open plan from manual to automatic task
scheduling
1. On the Task tab, in the Tasks group, click the Mode button, and then click Auto
Schedule.
Or
1. Click the New Tasks status bar text.
2. Click the scheduling mode you want.
To make all new tasks automatically scheduled, you can use the command on the status
bar
To change the default scheduling mode that Project applies to all new
plans
1. On the File tab, click Options, and then in the Project Options dialog box, click
the Schedule tab.
2. In the Scheduling Options For This Project box, click All New Projects, and then
in the New Tasks Created box, click Auto Scheduled.
3. Click OK.
Check a plan’s duration and finish date
At any time in the planning or execution of a project, you and other project stakeholders
will want to know how long the project is expected to take. You don’t directly enter a total
project duration or finish date in a plan, and you don’t need to. Project calculates these
values based on the task durations, dependencies, project calendar adjustments, and many
other factors you have recorded in a plan.
Project calculates the plan’s finish date based on the span of working days required to
complete the tasks, starting at the plan’s start date. Any change to the start date causes
Project to recalculate the finish date.
Project determines the plan’s duration by counting the working days between the earliest
start date and the latest finish date of the plan’s tasks. Because Project distinguishes
between working and nonworking time, a task’s duration doesn’t necessarily correlate to
elapsed time.
Some handy ways to view the plan’s duration and scheduled start and finish dates include
the Timeline view, the project summary task, and the Project Statistics dialog box.
To check a plan’s finish date in the Timeline
1. In the Timeline view above the Gantt Chart view, note the plan’s current start and
finish dates.
Important
If the Timeline view is not shown, on the View tab, in the Split View group, select
the Timeline check box.
To check a plan’s duration, finish date, and more in the Statistics dialog
box
1. On the Project tab, in the Properties group, click the Project Information button.
2. In the Project Statistics dialog box, click Statistics.
Check key indicators of the plan in the Project Statistics dialog box
To display the project summary task
1. Click anywhere in a Gantt chart view.
When the focus is on a Gantt chart view, the label of the Format tab is Gantt Chart
Tools.
2. On the Format tab, in the Show/Hide group, select the Project Summary Task
check box.
Project displays the project summary task at the top of the Gantt Chart view with an
ID of 0.
Display the project summary task (task 0) to view the plan’s start and finish dates and
its overall duration
Here you’ll find the same duration and start and finish values displayed in Project
Statistics, and a Gantt bar that’s drawn from the start and finish dates of the overall
plan.
Document task information
You can record additional information about a task in a note. For example, you might have
detailed descriptions of a task but want to keep the task’s name succinct. You can add such
details to a task note rather than to the task’s name. That way, the information resides in
the plan and can be easily viewed or printed.
There are three types of notes: task notes, resource notes, and assignment notes. You can
enter and review task notes on the Notes tab in the Task Information dialog box. Notes in
Project support a wide range of text formatting options; you can even link to or store
graphic images and other types of files in notes.
Tip
You will work with resource notes in Chapter 5, “Set up resources.”
Notes appear in a ScreenTip when there’s a note icon in the Indicators column.
View task notes by pointing to the note icon in the Indicators column
For notes that are too long to appear in a ScreenTip, you can double-click the note icon to
display the full text of the note.
The project summary task, mentioned earlier, also supports a task note. Because the
project summary task spans the entire plan, it’s a great place to capture important
information about the plan. Text entered in the Comments field of the Properties dialog
box appears as a note on the project summary task. If you add or change a note on the
project summary task, the change will appear in the Comments field in the Properties
dialog box.
Sometimes you might want to associate a task in a plan with information stored in a
different document or on a webpage. Hyperlinks allow you to connect a specific task,
resource, or assignment to additional information that resides outside of the plan.
To add a note to a task
1. Select the name of the task to which you want to add a note.
2. On the Task tab, in the Properties group, click the Notes button.
Or
Right-click the task name, and then click Notes.
3. In the Notes box, enter the note text you want, and then click OK.
To add a hyperlink to a task
1. Right-click the task name, and then click Hyperlink to open the Insert Hyperlink
dialog box.
2. In the Text to display box, enter the link text you want to display.
3. In the Address box, enter the URL of the destination address you want to link to.
4. Click OK.
Tip
To open the webpage in your browser, either click the hyperlink icon or right-click
the hyperlink icon and, in the shortcut menu that appears, point to Hyperlink, and
then click Open Hyperlink.
To quickly remove notes, hyperlinks, or formatting from selected tasks
1. On the Task tab, in the Editing group, click the Clear button (which looks like an
eraser), and then select the command you want.
Skills review
In this chapter, you learned how to:
Create tasks
Enter task durations and dates
Enter milestone tasks
Create summary tasks to outline the plan
Link tasks to create dependencies
Switch task scheduling from manual to automatic
Check a plan’s duration and finish date
Document task information
Practice tasks
The SimpleBuildTaskList practice file for these tasks is located in the
Project2016SBS\Ch04 folder.
Important
If you are running Project Professional with Project Web App/Project Server, take
care not to save any of the practice files you work with in this book to Project Web
App (PWA). For more information, see Appendix C, “Collaborate: Project,
SharePoint, and PWA.”
Create tasks
The scenario: You are a project manager at Lucerne Publishing. You’ve collected the
initial task names for a new book launch and are ready to start. Open the
SimpleBuildTaskList plan in Project and perform the following tasks:
1. Enter the following task names:
• Assign launch team members
• Design and order marketing material
• Distribute advance copies
• Coordinate magazine feature articles
• Launch public web portal for book
While reviewing the tasks you entered, you realize that you missed a task. You’ll
insert that task next.
2. Insert a new task named Public Launch Phase so that it will appear above the
Distribute advance copies task.
Your initial task list should look like this
Enter task durations and dates
The scenario: You showed your initial task list to the resources who will perform the work
and to other project stakeholders. They gave you their preliminary (although incomplete)
feedback on some task durations and dates, which you’d like to record in the new book
launch plan. Continuing in the SimpleBuildTaskList plan, perform the following tasks:
1. Enter a duration of one day for task 1, Assign launch team members.
2. Enter the following durations or text phrases for the other tasks.
3. For task 5, Coordinate magazine feature articles, in the Start field enter 1/22/18
and in the Finish field enter 1/30/18.
Project calculates the duration as six days. Note that this is six working days:
Monday through Wednesday, and Friday of the first week, and then Monday and
Tuesday of the following week. Project also draws the Gantt bar for the task to span
these working days plus the nonworking days (the Thursday, January 25 morale
event you set up in Chapter 3, “Start a new plan,” plus the weekend) between them.
For task 6, Launch public web portal for book, you don’t know a duration or start or
finish date yet, but you can still capture what you do know.
4. In the Start field for task 6, enter About two weeks before launch complete.
After entering durations and dates, your task list should look like this
Enter milestone tasks
The scenario: You just learned the date by which the new book launch’s planning activities
need to be completed for the book launch to occur on time. You want this date to have
visibility in the plan. Continuing in the SimpleBuildTaskList plan, perform the following
task:
1. Insert a new milestone task named Planning complete so that it will appear above
task 3, Public Launch Phase.
After adding a milestone task, the plan should look like this
Create summary tasks to outline the plan
The scenario: The new book launch plan is developed enough now to be organized into
two phases. Continuing in the SimpleBuildTaskList plan, perform the following tasks:
1. Make the Public Launch Phase task the summary task of tasks 5, Distribute
advance copies, through 7, Launch public web portal for book.
Notice the scheduling effect of creating the summary task. Because task 6 had
specific start and finish dates already, Project set the start date of the summary task
(and its other subtask with a duration) to the same date, January 22.
2. Insert a new summary task named Planning Phase that will include tasks 1 through
3, so they become its subtasks.
Now the plan is organized into two phases of work
Link tasks to create dependencies
The scenario: The new book launch plan is coming together nicely. Tasks have been
outlined under summary tasks, and you’re now ready to create task relationships.
Continuing in the SimpleBuildTaskList plan, perform the following tasks:
1. Enter a task ID in the Predecessor field to link tasks 2 and 3 with a finish-to-start
relationship.
Note that task 3 previously had no start or finish date, but by making it a successor
of task 2, you gave Project enough information to give task 3 a start date: January
9th, the next working day following the end of task 2.
Next, you’ll link tasks 3 and 4 by using a different technique.
2. Make task 3, Design and order marketing material, a predecessor of task 4 by using
the Task Information dialog box.
3. Link all subtasks under Public Launch Phase (tasks 6 through 8) all at once by
using the Link the Selected Tasks command.
As you do so, keep an eye on task 8’s text value of About two weeks in the Start
field. Notice that Project replaced the text value in the Start field of task 8 with a
scheduled date and supplied the default one-day duration. Project did so because it
required a date value for the task as soon as it was linked to another task. The
question mark following the duration value indicates that this is an estimated
duration; the question mark has no effect on the scheduling of the task.
4. Link task 1, Planning Phase, to task 5, Public Launch Phase, by using your mouse
in the chart portion of the Gantt Chart view.
5. The Lucerne marketing team has reported that its estimate is that task 3 should have
a two-week duration. Change the duration of task 3 from the placeholder text Check
with Marketing to two weeks.
Notice that the new duration for task 3 caused the Planning Phase summary task’s
duration to increase, but it did not affect the scheduling of the task 4 milestone. Why
not? Remember that this task is still manually scheduled. In the next step, you will
force Project to adjust the start and finish dates of this task to honor its predecessor
task while leaving it as manually scheduled.
6. Adjust task 4, Planning Complete, so that it respects the predecessor link.
Link lines between Gantt bars and task IDs in the Predecessors column convey task
relationships
Project reschedules task 4 to start following the completion of its predecessor, task
3.
You might have noticed that the start of the Public Launch Phase summary task does
not respect its link to its predecessor, the Planning Phase summary task. Clicking the
Respect Link button with the Public Launch Phase summary task selected will not
cause it to be rescheduled, as it did for task 4. That’s because the start and finish
dates of the summary task are driven by the earliest start and latest finish dates of its
subtasks, which in this case are still manually scheduled.
Switch task scheduling from manual to automatic
The scenario: The new book launch plan has been reviewed by the resources who will
carry out the work and by other project stakeholders. Although you expect the plan to
change somewhat as you learn more about the book launch, you now have enough
confidence in the plan overall to switch from manual to automatic task scheduling.
Continuing in the SimpleBuildTaskList plan, perform the following tasks:
1. Switch tasks 2 through 4 to be automatically scheduled by using the Auto Schedule
command on the Task tab.
Project changes the Task Mode icons and the formatting of the tasks’ Gantt bars to
indicate that they are now automatically scheduled.
2. Use the Task Mode field of task 6 to change it to be automatically scheduled.
This time, task 6 was rescheduled to start later. Why did this happen? Recall the
dependency between the two summary tasks. The dependency said, in effect, that the
Public Launch Phase should start when the Planning Phase was finished. However,
because task 6 and the other subtasks of the Public Launch Phase were manually
scheduled, Project did not reschedule the subtasks to account for this dependency.
As soon as you set task 6 to automatic scheduling, Project also adjusted the start date
of its summary.
The remaining subtasks 7 and 8 are still manually scheduled, so Project did not
reschedule them.
3. Switch tasks 7 and 8 to be automatically scheduled by using any method you prefer.
Project reschedules the remaining tasks. This extends the duration of the Public
Launch Phase and of the overall project.
Right now, this plan is set to treat any new tasks you might enter as manually
scheduled. You could leave this setting as is and then switch specific tasks to be
automatically scheduled. However, this plan is developed enough now to switch to
automatic scheduling. You can later set some specific tasks to manually scheduled as
needed.
4. Switch the plan to make all new tasks automatically scheduled.
5. Enter a new task named Launch social media programs for book below task 8.
Project adds the new task to the plan. By default, it is not linked to any other task, is
given a one-day duration, and is scheduled to start at its summary task’s start date.
6. Link tasks 8 and 9.
Now all tasks in the plan are automatically scheduled—note the icons in the Task Mode
column
Project links the two tasks. Notice that the duration of the Public Launch Phase
summary task was updated automatically from 9 to 10 days.
Check a plan’s duration and finish date
The scenario: Your plan for the new book launch is helping the team get organized for the
upcoming work. You are frequently asked to provide the currently scheduled duration and
finish date for the book launch. Continuing in the SimpleBuildTaskList plan, perform the
following tasks:
1. In the Timeline view, note the plan’s current start and finish dates.
You can view the plan’s overall timeframe at a glance in the Timeline view
2. Find the plan’s finish date in the Project Information dialog box.
3. Next, look at the duration information in more detail in the Project Statistics dialog
box.
You can check key indicators of the plan in the Project Statistics dialog box
4. Display the project summary task in the Gantt Chart view.
Document task information
You have some details about a few tasks in the new book launch plan that you’d like to
record in the plan. This will help you later by keeping such details right in the plan, and it
will also be valuable for any other project stakeholders who might work with the plan in
the future. Continuing in the SimpleBuildTaskList plan, perform the following tasks:
1. Add the note Get recipient list from publicist to task 6, Distribute advance copies.
2. Point to the note icon for task 6.
The note appears in a ScreenTip.
You might notice a note icon for task 0, the project summary task. We’ll look at that
next.
3. Point to the note icon for task 0.
You might recognize the note that appears in the ScreenTip from Chapter 3, “Start a
new plan.” This text was entered in the Comments field of the Properties dialog box.
4. Add the hyperlink text Add to spring catalog here, with an address of
http://www.lucernepublishing.com, to task 8, Launch public web portal for book.
A hyperlink icon appears in the Indicators column. Pointing to the icon displays the
descriptive text you entered earlier.
The task notes and hyperlinks you have added to tasks are indicated by the icons in the
Indicators column
5. Set up resources
In this chapter
Set up work resources
Enter the maximum capacity for work resources
Enter work resource pay rates
Adjust working time in a resource calendar
Set up cost resources
Document resources by using notes
Practice files
For this chapter, use the SimpleSetUpResources practice file from the
Project2016SBS\Ch05 folder. For practice file download instructions, see the
introduction.
Resources include the people, equipment, and material needed to complete the work of a
project. Effective resource management is one of the most significant advantages of using
Project 2016 rather than task-focused planning tools such as issue-ticketing systems.
You can manage three types of resources in Project—work resources and two specialpurpose resources: cost and material. Work resources include the people and equipment
needed to complete the tasks in a project’s plan. Cost resources represent categories of
financial costs, derived from specific tasks, that you need to account for in the plan.
Examples include categories of expenses like travel and entertainment. Material resources
are consumables that get used up as the project proceeds. For example, a construction
project might need to track steel or concrete as it is used throughout the project. You will
work with material resources in Chapter 11, “Fine-tune resource and assignment details.”
Setting up resource information in Project takes a little effort, but the time is well spent if
your project is primarily driven by time or cost constraints (as nearly all projects are).
This chapter guides you through procedures related to setting up work resources, entering
the maximum capacity for work resources, entering work resource pay rates, adjusting
working time in a resource calendar, setting up cost resources, and documenting resources
by using notes.
Set up work resources
Work resources are the people and equipment doing the work of the project. Project
focuses on two aspects of work resources: their availability and their costs. Availability
pertains to when specific resources can work on tasks and how much work those resources
can perform. Costs refer to the financial costs incurred by resources performing work on
the project.
In Project, work resource names can refer to specific people or to specific job titles. Use
whatever naming convention makes the most sense to you and to those who will see your
plan. The important questions are these: who will see these resource names, and how will
they identify the resources? The resource names you choose will appear both in Project
and in any resource information shared from Project.
A resource might refer to somebody who is already on staff, or to a position to be filled
later. If you have not yet filled all the resource positions required, you might not have the
names of specific people to enter. In that case, use descriptive placeholder names or job
titles when setting up resources in Project.
Some examples of how you can enter work resource names are listed in the following
table.
Project can help you make smarter decisions about managing resources and monitoring
financial costs.
To enter work resource names
1. On the View tab, in the Resource Views group, click Resource Sheet to display the
Resource Sheet view.
2. Click an empty cell in the Resource Name column.
3. Enter your resource names, pressing the Enter key after each one.
Project applies the default Work resource type in the Type field.
Tip
You can quickly import resources from your email address book. First, switch to the
Resource Sheet view. Then, on the Resource tab, click Add Resources.
To insert a new work resource within a resource list
1. Display the Resource Sheet view.
2. Click in the cell in the Resource Name column where you want to insert the new
resource.
3. On the Resource tab, in the Insert group, click Add Resources, and then click
Work Resource.
Project inserts a new row with the <New Resource> name in the Resource Name
column, and renumbers the subsequent resources.
4. With <New Resource> selected, enter the resource name, and then press Enter.
To delete a resource
1. Right-click the resource name, and then click Delete Resource.
Equipment resource considerations
In Project, you set up people and equipment resources in exactly the same way;
they are both examples of work resources. However, you should be aware of
important differences in how you can schedule these two work resources. Most
people resources have a typical working day of 8 hours and usually no more than 12
hours, but equipment resources might have much more varied capacities for work,
ranging from short durations (followed by maintenance) to around-the-clock
sessions without interruption. Moreover, people resources might be flexible in the
tasks they can perform, but equipment resources tend to be more specialized. For
example, a content editor for a book project might also act as a copyeditor when
required, but a desktop copy machine cannot replace a printing press.
You do not need to track every piece of equipment that will be used in your plan,
but you might want to set up equipment resources when:
Multiple teams or people might need a piece of equipment to accomplish
different tasks simultaneously, and the equipment might be overbooked.
You want to plan and track costs associated with the equipment.
Consider these issues if your plans involve equipment resources.
Enter the maximum capacity for work resources
Work resources do not have unlimited capacity within the limited duration of a plan, and
Project helps you manage this. The Max. Units field represents the maximum capacity of a
resource to work on the tasks assigned to that resource. Specifying that a resource has
100% maximum units means that 100 percent of that resource’s working time is available
to work on assigned tasks in the plan. Project will alert you with an indicator and
formatting if you assign the resource to more tasks than the resource can accomplish. For
example, a resource will be overallocated if it is assigned to two or more tasks at 100%
capacity each and the tasks overlap. 100% is the default Max. Units value for new work
resources.
For a resource that represents not a specific person but a category of interchangeable
people with a common skill set, you can enter a larger maximum units value to indicate
the number of available people. For example, entering a maximum units value of 200%
for such a resource means that you expect two individual people who belong to that
resource category to be available to work full time every workday, or four individual
people to each work half time, or any equivalent combination.
For a resource that has less than full-time availability, you can enter a smaller maximum
units value. For example, entering a maximum units value of 75% for such a resource
means that you expect that resource’s capacity to be three-quarters of a full-time resource.
For a 40-hour work week, this equals 30 hours of capacity. Note that such a part-time
working capacity might apply to a part-time worker or to a full-time worker who is
allocated to a specific project only part time.
To adjust a resource’s working capacity
1. On the View tab, in the Resource Views group, click Resource Sheet.
2. In the Resource Sheet view click the Max. Units field for the resource you want to
adjust (the Max. portion of the field’s column heading might be the only part
visible).
Tip
When you click a numeric value in a field like Max. Units, up and down arrows
appear. You can click these to display the number you want, or you can enter the
number directly in the field.
3. Enter the new value for the resource. For example, enter 200% to represent two
resources, or enter 50% for a resource who has only half-time availability.
Tip
If you prefer, you can display and enter maximum units as partial or whole numbers
(such as 0.5, 1, or 4) rather than as percentages (such as 50%, 100%, or 400%). To
use this format, on the File tab, click Options. In the Project Options dialog box,
click the Schedule tab. Under the Schedule heading, in the Show Assignment Units
As A box, click Decimal.
Enter work resource pay rates
Almost all projects have some financial aspect, and cost limits the scope of many projects.
Tracking and managing cost information in Project allows the project manager to answer
such important questions as:
What is the expected total cost of the project based on task durations and resource
assignments?
Is the organization using expensive resources to do work that less expensive
resources could do?
How much money will a specific type of resource or task cost over the life of the
project?
Is the organization spending money at a rate that it can sustain for the planned
duration of the project?
In Project, you can enter standard rates and costs per use for work and material resources,
in addition to overtime rates for work resources. Recall that in Project there are three types
of resources: work, cost, and material.
Tip
Cost resources do not use pay rates and are described later in this chapter. Material
resources are introduced in Chapter 11, “Fine-tune resource and assignment
details.”
You can enter pay rates with a variety of time bases—per minute, hourly (the default),
daily, weekly, monthly, or yearly. You enter rates in the format of rate/period—for
example, 30/h for $30 per hour. Period abbreviations are /m for minutes, /h for hours, /d
for day, /w for week, /mo for month and /y for year.
When a work resource has a standard pay rate entered and is assigned to a task, Project
calculates the cost of the assignment. Project does so by multiplying the resource’s
assigned work value by his or her pay rate—both using a common increment of time (such
as hours). You can then see the cost per resource, cost per assignment, and cost per task
(and also costs rolled up to summary tasks and the entire plan). You will assign resources
to tasks in Chapter 6, “Assign resources to tasks.”
Project handles overtime expenses differently. Project applies the overtime pay rate only
when you specifically record overtime hours for an assignment. Project does not
automatically calculate overtime hours and associated costs because there’s too great of a
chance that it would apply overtime when you did not intend it.
Tip
If you work with a large number of resources who have the same standard or
overtime pay rates, you can set up Project to apply these pay rates automatically
whenever you add a new resource. To do this, on the File tab, click Options. In the
Project Options dialog box, click Advanced. Under the heading General Options
For This Project, enter the default pay rates you want.
You can specify when work resource standard and overtime costs should accrue. The
options are at the start of work on a task, at the end of work on the task, or prorated (the
default) evenly over the duration of the task.
In addition to or instead of cost rates, a resource can include a set fee that Project applies
to each task to which the resource is assigned. This is called a cost per use. Unlike cost
rates, the cost per use does not vary with the task’s duration or amount of work the
resource performs on the task.
View a resource’s pay rates and other cost-related details in the Resource Sheet view
To enter a standard rate for a resource
1. On the View tab, in the Resource Views group, click Resource Sheet.
2. In the Resource Sheet view, click the Std. Rate field for the resource for which you
want to set a standard pay rate.
Depending on the width of the column, you might only see Std. in the column
heading.
3. Enter a standard rate by using the format of rate/period, such as 30/h.
To enter an overtime rate for a resource
1. Display the Resource Sheet view.
2. Click the Ovt. Rate field for the resource for which you want to set an overtime pay
rate.
Depending on the width of the column, you might only see Ovt. in the column
heading.
3. Enter an overtime rate by using the format of rate/period, such as 45/h.
To enter a cost per use for a resource
1. Display the Resource Sheet view.
2. In the Cost/Use field, enter the value you want.
Project management focus: Getting resource cost information
Work resources can account for the majority of costs in many projects. To take full
advantage of the extensive cost-management features in Project, the project
manager ideally should know the costs associated with each work resource. For
people resources, it might be difficult to obtain such information. In many
organizations, only senior management and human resource specialists know the
pay rates of all resources working on a project, and they might consider this
information confidential. Depending on your organizational policies and project
priorities, you might not be able to track resource pay rates.
If you do include cost details in your plan and this is considered sensitive
information, consider requiring a password to open such plans. To set a password,
click the File tab and then click Save As. Select the location you want, and in the
Save As dialog box, click Tools and then click General Options. In the General
Options dialog box, select the password-protection options you want.
Another strategy to consider is to use averaged burdened rates for people resources.
A burdened rate is a pay rate plus overhead costs per worker. An averaged
burdened rate describes everyone in general, but no one in particular.
Adjust working time in a resource calendar
Project uses different types of calendars for different purposes. Chapter 3, “Start a new
plan,” describes the project calendar, which specifies nonworking days for the entire plan.
This topic focuses on resource calendars. A resource calendar controls the working and
nonworking times of a specific resource. Project uses a resource calendar to determine
when work for a resource can be scheduled. Resource calendars apply only to work
resources (people and equipment), not to material or cost resources.
When you initially create resources in a plan, Project creates a resource calendar for each
work resource. The initial working-time settings for resource calendars exactly match
those of the project calendar, which by default is the Standard base calendar. The Standard
base calendar is built into Project and accommodates a default work schedule from 8:00
A.M. to 5:00 P.M., Monday through Friday, with an hour off for lunch each day.
If all the working times of your resources match the working time of the project calendar,
you do not need to edit any resource calendars. However, chances are that some of your
resources will need exceptions to the working time in the project calendar, such as:
A flex-time work schedule.
Vacation time.
Other times when a resource is not available to work on the project, such as time
spent in training or attending a conference.
Tip
If you have a resource who is available to work on your project only part time, you
might be tempted to set the working time of the resource in your project to reflect a
part-time schedule, such as 8:00 A.M. to 12:00 P.M. daily. However, a better
approach is to adjust the availability of the resource as recorded in the Max. Units
field accordingly—in this case, to 50%. Changing the unit availability of the
resource keeps the focus on the capacity of the resource to work on the project
rather than on the specific times of the day when that work might occur. You can set
the maximum units for a resource in the Resource Sheet view.
Changes that you make to the project calendar are reflected automatically in resource
calendars derived from the same project calendar. For example, in the practice tasks in
Chapter 3, “Start a new plan,” you specified a nonworking day for a staff morale event,
and Project rescheduled all work to skip that day. Note, however, that after you create a
resource calendar exception, that exception is not affected by later changes to the project
calendar that cover the same time period.
Tip
If you find that you must edit several resource calendars in a similar way (to handle
a night shift, for example), it might be easier to assign a different base calendar to a
resource or collection of resources. This is more efficient than editing individual
resource calendars, and you can use the base calendar to make plan-wide
adjustments if needed. For example, if your project includes a day shift and a night
shift, you can apply the Night Shift base calendar to resources who work the night
shift. You change a base calendar in the Change Working Time dialog box. For
collections of resources, you can select a specific base calendar directly in the Base
Calendar column on the Entry table in the Resource Sheet view.
To specify a calendar exception for a work resource
1. On the Project tab, in the Properties group, click Change Working Time.
2. In the For calendar box, click the name of the resource whose calendar you want to
change.
Tip
When working in the Change Working Time dialog box, pay close attention to the
value in the For Calendar field. It’s not difficult to accidently edit the wrong
calendar.
3. In the Name field on the Exceptions tab in the lower portion of the dialog box,
enter a description of the exception.
The description for the calendar exception is a handy reminder for you and others
who might view the plan later.
4. In the Start and Finish fields, enter or select the dates you want.
Tip
To set up a partial working-time exception for a resource, such as a portion of a day
when a resource cannot work, click Details. In the Details dialog box, you can also
create recurring exceptions to the resource’s availability.
Review or create working time calendar exceptions for individual resources in the
Change Working Time dialog box
5. Click OK to close the Change Working Time dialog box.
To modify a resource’s default working week days and times
1. Display the Change Working Time dialog box.
2. In the For calendar box, click the name of the resource whose calendar you want to
change.
3. Click the Work Weeks tab.
4. Click [Default] directly under the Name column heading, and then click Details.
5. Under Selected Day(s), select the day or the days you want to adjust.
6. Do any of the following:
• To set the full days to nonworking, click Set days to nonworking times.
• To set working times that differ from the base calendar, click Set day(s) to these
specific working times and then, in the From and To columns, enter the working
times.
• To return to the base calendar working times, click Use times from base calendar
for these days.
Create nonstandard work-week schedules in the Details dialog box
7. After you complete your edits to the work week, click OK, and then click OK again
to close the Change Working Time dialog box.
Tip
You can have a different, non-default working week for a specific time period. For
example, you can set up a resource to work four 10-hour days each week for just
one month. On the Work Weeks tab, click below [Default], add a name and the start
and finish of the period. Then click Details to change the working times and days as
described earlier in this procedure.
To assign a different base calendar to a resource
1. On the Project tab, in the Properties group, click Change Working Time.
2. In the For calendar field, select the resource you want.
3. In the Base calendar field of the resource, select the base calendar you want.
Tip
To quickly apply the same base calendar to multiple resources, in the Resource
Sheet view, use the Base Calendar field.
Set up cost resources
Another type of resource you can use in Project is the cost resource. You can use a cost
resource to represent a financial cost associated with a task in a plan. Although work
resources (people and equipment) can have associated costs (hourly rates and fixed costs
per assignment), the sole purpose of a cost resource is to associate a particular type of cost
with one or more tasks. Common types of cost resources might include categories of
expenses you want to track in a plan for accounting or financial reporting purposes, such
as travel, entertainment, or training.
Cost resources do no work and have no effect on the scheduling of a task. The Max. Units,
Standard and Overtime pay rate, and Cost Per Use fields do not apply to cost resources.
After you assign a cost resource to a task and specify the cost amount per task, you can
then see the cumulative costs for that type of cost resource, such as total travel costs in a
project.
The way in which cost resources generate cost values differs from that of work resources.
When you assign a work resource to a task, the work resource can generate a cost based
on a pay rate (such as $40 per hour for the length of the assignment), a flat per-use cost
(such as $100 per assignment), or both. You set up such pay rates and cost-per-use
amounts once for the work resource, as described in the “Enter work resource pay rates”
topic earlier in this chapter. However, you enter the cost value of a cost resource only
when you assign it to a task. You do this in the Cost field of the Assign Resources dialog
box or in the Cost field of the Task form with the Cost detail shown. This is described in
“Assign cost resources to tasks” in Chapter 6, “Assign resources to tasks.”
To add a cost resource
1. On the View tab, in the Resource Views group, click Resource Sheet.
2. In the Resource Sheet view, click in the Resource Name column where you want to
add the cost resource.
3. On the Resource tab, in the Insert group, click Add Resources, and then click
Cost Resource.
Project inserts a row for the new cost resource. Project names the new cost resource
<New Resource>.
4. With <New Resource > selected, enter the cost resource name, and then press
Enter.
Document resources by using notes
You might recall from Chapter 4, “Build a task list,” that you can record additional
information about a task, resource, or assignment in a note. For example, if a resource has
flexible skills that can help the project, it is a good idea to record this in a note. That way,
the note resides in the plan and can be easily viewed or printed.
Chapter 4, “Build a task list,” described creating a task note by clicking the Notes button
on the Task tab, in the Properties group. You can enter resource notes in a similar way (by
clicking the Notes button on the Resource tab, in the Properties group). Another option is
to enter notes directly in the Resource Form view. The advantage of using the Resource
Form is that you can view and edit notes for multiple resources more quickly.
To enter a note for a resource in the Resource Information dialog box
1. On the View tab, in the Resource Views group, click Resource Sheet.
2. Select a resource name.
3. On the Resource tab, in the Properties group, click Notes.
4. In the Notes box, enter a note for the resource.
To enter a note for a resource by using the Resource Form
1. On the View tab, in the Resource Views group, click Resource Sheet.
2. On the Resource tab, in the Properties group, click the Details button.
In this type of split view, details about the item that is selected in the upper pane (a
resource, in this case) appear in the lower pane. You can quickly change the selected
resource name in the upper pane by clicking a name directly, or by clicking Previous
or Next in the Resource Form.
The Resource Form view can display one of several details; initially, it displays the
Schedule details.
3. Click anywhere in the Resource Form view to change the focus to the Resource
Form. The label of the Format tab changes to Resource Form Tools.
4. On the Format tab, in the Details group, click Notes.
Tip
You can also right-click in the gray background area of the Resource Form view
and, in the shortcut menu that appears, click Notes.
The Notes details appear in the Resource Form view.
This is a great split view for quickly adding, editing, or reviewing resource details like
notes
5. In the Notes box, enter the note for the resource.
Notice that as soon as you start typing the note, the Previous and Next buttons
change to OK and Cancel.
6. Click OK.
Skills review
In this chapter, you learned how to:
Set up work resources
Enter the maximum capacity for work resources
Enter work resource pay rates
Adjust working time in a resource calendar
Set up cost resources
Document resources by using notes
Practice tasks
The SimpleSetUpResources practice file for these tasks is located in the
Project2016SBS\Ch05 folder.
Important
If you are running Project Professional with Project Web App/Project Server, take
care not to save any of the practice files you work with in this book to Project Web
App (PWA). For more information, see Appendix C, “Collaborate: Project,
SharePoint, and PWA.”
Set up work resources
The scenario: At Lucerne Publishing, you have a good start on the new book launch’s task
list. You are now ready to set up the work resources needed to complete the new book
launch. As with the task list, you expect some future changes to the resource details as you
learn more about the project, but you have enough information to get started now. Open
the SimpleSetUpResources plan in Project, and perform the following tasks:
1. On the View tab, in the Resource Views group, click Resource Sheet.
2. Enter the following resource names:
• Jun Cao
• Sharon Salavaria
• Toby Nixon
• Toni Poe
• Zac Woodall
• Copyeditors
The resource names you entered should look like this in the Resource Sheet
Enter the maximum capacity for work resources
The scenario: You need to change the default 100% maximum units value for some
resources. You learned that the equivalent of four copyeditors will be allocated to the new
book launch. You also have one resource in the plan, Sharon Salavaria, who is available
for this project half time. Continuing in the SimpleSetUpResources plan, perform the
following tasks:
1. Change the Copyeditors resource maximum units value to 400%.
2. Change Sharon Salavaria’s maximum units value to 50%.
After customizing the Max Units values for two resources, the Resource Sheet should
look like this
Enter work resource pay rates
The scenario: You received the pay rates for the work resources involved in the new book
launch from your payroll department. These pay rates are a mix of hourly and weekly
rates. You need to enter these pay rates in the new book launch’s plan. Continuing in the
SimpleSetUpResources plan, perform the following tasks:
1. Enter the following pay rates in the Standard (Std.) Rate field.
2. Enter an overtime rate of $63 per hour for Jun Cao.
The Resource Sheet should look like this after entering pay rates
Adjust working time in a resource calendar
The scenario: You have a couple of working-time updates to make in the new book
launch’s plan. Toby Nixon has told you he’ll be away at a conference, and Jun Cao works
a full-time but nonstandard schedule of 10 hours per day, four days per week (a “4-by-10”
work schedule). You need to update their resource calendars accordingly. Continuing in
the SimpleSetUpResources plan, perform the following tasks:
1. Make January 26, 2018 a nonworking time calendar exception for Toby Nixon.
Name the exception Toby attending a conference.
After creating an exception in the Change Working Time dialog box, note the
description and formatting of the date in the calendar
2. For Jun Cao, change the default work week to a “4-by-10” weekly work schedule
(that is, 4 days per week, 10 hours per day Monday through Thursday, with Friday
off). On the days Jun works, she’ll work from 8:00 AM to 7:00 PM with the noon
hour off for lunch.
The working time settings for the selected days appear here; to see Friday’s
nonworking settings, select it
Set up cost resources
The scenario: For accounting purposes, you need to track travel expenses in the plan.
You’ll do so via a cost resource. Continuing in the SimpleSetUpResources plan, perform
the following task:
1. Create a cost resource named Travel.
Your cost resource should look like this in the Resource Sheet
Document resources by using notes
The scenario: You collected some resource details that would be valuable to record in the
plan. Continuing in the SimpleSetUpResources plan, perform the following tasks:
1. Add this note for Toby Nixon in the Resource Information dialog box: Toby
worked on launch campaigns for Toni Poe’s previous two books.
Your resource note should look like this in the Resource Information dialog box
2. Use the Resource Form to add this note for Sharon Salavaria: Sharon’s standard
pay rate is adjusted for her half-time work schedule.
Your resource note should look like this in the Resource Form
Tip
If you want to save your work, remember to save it with a different file name. This
will preserve the original practice file for future use.
6. Assign resources to tasks
In this chapter
Assign work resources to tasks
Control work when adding or removing resource assignments
Assign cost resources to tasks
Check the plan after assigning resources
Practice files
For this chapter, use the practice files from the Project2016SBS\Ch06 folder. For
practice file download instructions, see the introduction.
In earlier chapters, you created tasks and resources. You are now ready to assign resources
to tasks. An assignment is the matching of a resource to a task to do work. The process of
assigning a resource might be called a task assignment or a resource assignment,
depending on the perspective. It is the same thing in either case: a task plus a resource
equals an assignment.
Important
When we talk about resources throughout this chapter, we are talking about work
resources (people and equipment) unless we specify material or cost resources (see
Chapter 5, “Set up resources”).
You do not have to assign resources to tasks in Project 2016; you could work only with
tasks. However, when you assign resources to tasks, you can answer questions such as the
following: Who should be working on what tasks, and when? Do we have the correct
number of resources to accomplish the scope of work that our project requires? Are we
expecting a resource to work on a task at a time when that resource will not be available to
work? Have we assigned a resource to so many tasks that we have overallocated the
resource?
This chapter guides you through procedures related to assigning work and cost resources
to tasks.
Assign work resources to tasks
You might recall from Chapter 5, “Set up resources,” that the capacity of a resource to
work is measured in units (a level-of-effort measurement) and recorded in the Max. Units
field. The specific assignment of a work resource to a task involves an assignment units
value, normally expressed as a percentage. Unless you specify otherwise, Project assigns
100 percent of the units for the resource to the task—that is, Project assumes that all the
resource’s work time can be allotted to the task. If the resource has less than 100 percent
maximum units, Project assigns the resource’s Max. Units value.
When you assign a work resource to a task, Project uses the resource’s assignment units
and the task’s duration values to calculate the resulting work. If the resource has a pay
rate, Project also calculates the resource and task costs for you.
Project calculates work by using this formula:
Duration × Assignment Units = Work
Here’s a simple example:
40 hours task duration × 100% assignment units = 40 hours of work
Here’s a slightly more complicated example. If you assign two resources to a task that has
a three-day duration, the result is:
24 hours (that’s three 8-hour days) task duration × 200% (for two resources) assignment
units = 48 hours of total work
The 48 hours of work is the sum of each of the two resources’ 24 hours of work. In other
words, both resources will work full time on the task in parallel for its three-day duration.
After making the initial resource assignment to a task, you have some flexibility in
determining how Project should respond when you add subsequent resources to the same
task (or remove them). When you add (assign) or remove (unassign) resources, you can
tell Project whether you want to change that initial work value and how it might affect
other values of assignments and the duration of the task. We’ll dive into adding or
removing assignments in the “Control work when adding or removing resource
assignments” topic later in this chapter.
There are different ways to assign resources. The Assign Resources dialog box works well
in task-centric views like the Gantt Chart, Task Sheet, or Task Usage views.
Except for assigned resources, which always appear at the top of the list, resources are
sorted alphabetically in the Assign Resources dialog box
Important
If you are using Project Professional rather than Project Standard, the Assign
Resources dialog box and some other dialog boxes will contain additional options
relating to Project Server. Throughout this book, we won’t use Project Server, so
you can ignore these options. For more information about Project Server, see
Appendix C, “Collaborate: Project, SharePoint, and PWA.”
After you assign resources, you can see the results of the assignments in a number of
ways.
In the default Gantt Chart view, the names of assigned resources appear next to the
Gantt bars of the tasks to which they are assigned
A cost value and check mark appear next to the assigned resource’s name in the Assign
Resources dialog box. Project calculates the cost of the assignment (the resource’s
standard pay rate times the resource’s scheduled amount of work on the task) and displays
the resulting value in the Cost field of the Assign Resources dialog box.
Another handy view in which you can see assignment details is the Task Form view.
In this split view, the Gantt Chart view appears in the upper pane, and below it is the
Task Form
If you read Chapter 5, “Set up resources,” you might recognize that the Task Form is
similar to the Resource Form but shows different kinds of information. In this type of split
view, information about the item (a task, for example) that is selected in the upper pane
appears in the lower pane. The Task Form displays one of several sets of information at a
time, which are referred to as details.
You can change the displayed details in the Task Form. With the Work details displayed,
you can see the essential scheduling values for a task: for example, the values could be
one week duration, 40 hours of work, and 100% assignment units.
Change the details option displayed in the Task Form; here Work details are displayed
Another quick way to assign resources is to use the Resource Names column in a Gantt
Chart view.
You can display the Resource Names list per task, and assign or unassign resources in
the list
You select the check boxes of the resources you want to assign to the active task, or clear a
check box to unassign a resource.
To assign a work resource to a task
You can perform the following steps in most task-centric views that include a table.
Examples include the Gantt Chart, Task Sheet, and Task Usage views.
1. Click the task to which you want to assign a resource.
2. On the Resource tab, in the Assignments group, click Assign Resources. The
Assign Resources dialog box opens. You can drag it anywhere you want on the
screen.
3. In the Resource Name column in the Assign Resources dialog box, click the
resource or resources you want to assign, and then click Assign.
Or
You can perform the following steps in any task-centric view with the Entry table
displayed.
1. Click in the Resource Names column for a task, and then click the arrow that
appears. A list of resource names appears.
Tip
If the Resource Names column is not already visible, in a Gantt Chart view, drag
the vertical divider bar to the right.
2. In the list of resource names, select the check box for the resource or resources you
want to assign to the selected task, and then press the Enter key.
Tip
In addition to the methods of assigning resources shown here, you can assign
resources in the Task Form view and on the Resources tab of the Task Information
dialog box, among other places. As you use Project, you’ll likely develop your own
preference for the way you assign resources.
To view or edit assignment details in the Task Form view
You can perform these steps in the Task Sheet or Task Usage view, or any Gantt
chart view.
1. On the View tab, in the Split View group, select the Details check box. Project
splits the window into two panes with the Task Form view in the bottom pane.
2. Click anywhere in the Task Form view. With the focus on the Task Form, note that
the label of the Format tab changes to Task Form Tools. Now the commands
available on the Format tab apply to the Task Form.
3. On the Format tab, in the Details group, click Work. The Work details appear in
the Task Form.
Control work when adding or removing resource assignments
As you saw previously, you define the amount of work that a task represents when you
initially assign one or more resources to it. For tasks that are automatically (as opposed to
manually) scheduled, Project gives you an option that allows you to control how it should
calculate work on a task when you assign additional resources to or unassign resources
from the task.
This option is called effort-driven scheduling, and when it is in effect, it works like this:
The work of a task remains constant as you assign or unassign resources.
As more resources are assigned to a task, its duration decreases. The total work
remains the same and is distributed among the assigned resources.
Similarly, as resources are unassigned from a task, its duration increases. The total
work remains the same and is distributed among the remaining assigned resources.
You have flexibility in how you apply effort-driven scheduling. By default, effort-driven
scheduling is disabled for all tasks you create in Project. You can turn on effort-driven
scheduling for an entire plan or just specific tasks. You can also use the options in an
Actions list (described later in this topic) to control how Project should recalculate work
on a task immediately after assigning or unassigning a resource.
Let’s walk through an example of how effort-driven scheduling works. We’ve included the
Task Form view in our example because it’s a convenient way to see assignment units,
work, and duration values.
To better see how effort-driven scheduling affects assignment units, work, and duration
values, display the Task Form
Initially, Toby is assigned to task 5. A quick check of the assignment calculation looks like
this:
80 hours (the same as 10 days, or two weeks) task duration × 100% of Toby’s assignment
units = 80 hours of work
Toby needs some help with this task, so you add Zac to the task.
With effort-driven scheduling turned off, assigning an additional resource to a task
results in more work and the same duration
Because effort-driven scheduling is turned off for this task, Project adds more work to this
task and updates the assignment values:
80 hours (the same as 10 days, or two weeks) task duration × 200% (that is, the sum of
Toby’s and Zac’s assignment units) = 160 hours of work
You use the Actions list to control how Project schedules the work on a task when adding
or removing resources. Note the small green triangle in the upper-left corner of the name
of task 5. This is a graphical indicator that an action is now available. Until you perform
another action, you can use the Actions list to choose how you want Project to handle the
additional resource assignment.
Tip
Actions indicators appear immediately after you perform certain actions such as
assigning or unassigning resources in task-centric views that include tables. You
can perform some of the same actions in the Task Forms, but doing so does not
trigger the Actions indicators.
The Actions indicator appears immediately after you change resource assignments
You can use these options to choose the scheduling result that you want. You can adjust
the task’s duration, the resources’ work, or the assignment units.
Tip
You will see other Actions indicators while using Project. They generally appear
when you might otherwise ask yourself, “Hmm, why did Project just do that?”
(such as when a task’s duration changes after you assign an additional resource).
The Actions list gives you the chance to change how Project responds to your
actions.
When a task has multiple resources assigned and you unassign one from the task, you can
also use the Actions list to instruct Project how to schedule the remaining resource
assignments on the task.
Use the Actions list to control how Project reschedules the remaining assignments when
you unassign a resource from a task
So far, we’ve focused on adjusting duration and work values as you add or remove
resources from tasks. You can also change the default setting for a task such that as you
add resources to the task, its work is unchanged and duration is decreased.
Let’s return to our effort-driven scheduling example. Currently, just Zac is assigned to task
10, and it has a two-week duration. Notice in the Task Form that currently effort-driven
scheduling is off for this task.
The Task Form also conveys the selected task’s effort-driven scheduling status
When effort-driven scheduling is turned on and another resource is assigned to the task,
note the result.
When effort-driven scheduling is enabled, assigning an additional resource to a task
has a different result
The task 10 duration is reduced from two weeks to one week. The total work on the task
remains 80 hours, but now it is split evenly between Zac and Hany. If this wasn’t the
scheduling result you wanted, you could use the Actions list to change how Project
responds to the additional resource assignment.
The order of your actions matters when effort-driven scheduling is enabled. If you initially
assign two resources to a task with a duration of three days (equal to 24 working hours),
Project schedules each resource to work 24 hours, for a total of 48 hours of work on the
task. However, you might initially assign one resource to a task with a duration of 24
hours and later add a second resource. In this case, effort-driven scheduling will cause
Project to schedule each resource to work 12 hours in parallel, keeping the total of 24
hours of work on the task. Remember that when it’s turned on, effort-driven scheduling
adjusts the task duration only if you add or remove resources from a task.
Project management focus: When should effort-driven scheduling apply?
You should consider the extent to which effort-driven scheduling should apply to
the tasks in your projects. For example, if one resource should take 10 hours to
complete a task, could 10 resources complete the task in 1 hour? How about 20
resources in 30 minutes? Probably not—the resources would likely get in each
other’s way and require additional coordination to complete the task.
No single rule exists about when you should apply effort-driven scheduling and
when you should not. As the project manager, you should analyze the nature of the
work required for each task in your project and use your best judgment.
To change the schedule result when you assign an additional resource to a
task
You can perform these steps in any task-centric view that includes a table. Examples
include the Gantt Chart, Task Sheet, and Task Usage views.
1. Select a task that already has a resource or resources assigned.
2. In the Assign Resources dialog box, click the resource you want, and then click
Assign.
3. Click the Actions button that appears just to the left of the task name, and then
select the schedule result you want.
Tip
When you make changes to assignments in the Resource name column, you will
also see the Actions button. You will only see this on automatically scheduled tasks.
To change the schedule result when you remove a resource from a task
These steps apply as long as at least one resource remains assigned to the task. You
can perform these steps in any task-centric view that includes a table.
1. Select a task that has multiple resources assigned.
2. In the Assign Resources dialog box, click the assigned resource you want, and then
click Remove.
3. Click the Actions button that appears just to the left of the task name, and then
select the schedule result you want.
Tip
If you unassign all resources from a task, the Actions button will not appear. That’s
because the Actions button applies only when a task has work, and work is the
result of assigning a resource to the task.
To manage effort-driven scheduling for a specific task or tasks
1. Select the task or tasks you want.
2. On the Task tab, in the Properties group, click Information.
3. On the Advanced tab of the Task Information dialog box, select or clear the
Effort Driven check box.
To turn on effort-driven scheduling for all new tasks in a plan
1. On the File tab, click Options.
2. In the Project Options dialog box, click Schedule.
3. Under Scheduling Options For This Project, select the New Tasks Are Effort
Driven check box.
Assign cost resources to tasks
Recall from Chapter 5, “Set up resources,” that a cost resource is used to represent a
financial cost associated with a task in a project. Cost resources might include categories
of expenses you want to budget and track for accounting or financial reporting purposes.
Cost resources do not incur assignment units, so they do no work and have no effect on
the scheduling of a task. In fact, the cost value derived from assigning a cost resource to a
task will remain the same regardless of any changes made to the scheduling of the task,
such as work resources being assigned or unassigned, or the task’s duration changing.
Broadly speaking, the costs that tasks can incur include:
Work resource costs, such as a person’s standard pay rate times the amount of work
that person performs on the task.
Cost resource costs, which are fixed dollar amounts you enter when assigning the
cost resources to a task.
The costs derived from cost-resource assignments represent planned costs. (Indeed, you
should consider all costs that Project has calculated so far in the schedule to be planned
costs, such as those resulting from work-resource assignments to tasks.) Later, you can
enter actual costs if you want to compare them with the budget.
To assign a cost resource to a task
1. In a task-centric view that includes a table, click the task to which you want to
assign a cost resource. Examples include the Gantt Chart, Task Sheet, and Task
Usage views.
2. On the Resource tab, in the Assignments group, click Assign Resources. The
Assign Resources dialog box opens. You can drag it anywhere you want on the
screen.
3. In the Assign Resources dialog box, click the Cost field for the cost resource you
want to assign, and then enter a cost value for that assignment.
Check the plan after assigning resources
After you create a task list and assign resources to tasks, your plan contains a large
number of details. Some of these details will be critical to the success of your plan, but
they might not be visible in the view you have displayed. This topic illustrates several
ways of seeing a plan’s key indicators.
There are many ways you can see key indicators of a plan in Project. These indicators can
help answer such questions as the following:
Who is assigned to do what work in the plan?
How long will it take to complete the project?
How much will it cost?
For many projects, the answers to these questions are likely to change as time passes. For
this reason, it’s a good practice to quickly be able to show current project status. This can
keep you, the project manager, informed, and it can also be useful information for the
resources performing the work, the project’s sponsors, and other stakeholders.
Tip
In addition to the views and features described in this topic, the Timeline, Project
Summary task, and Project Statistics dialog box are all great places to see the key
indicators of a plan. These features were introduced in Chapter 4, “Build a task
list.”
After resources have been assigned to tasks in a plan, two common questions that might
come up are, “How much will this cost?” and “Who’s doing what work, and when?” In
this topic, we’ll introduce features that help answer these questions. Because these are
such important questions for successful project management, we’ll return to these and
related features frequently in later chapters.
First, let’s focus on costs. We’ll switch to a Task Sheet view with the Cost table displayed.
Sheet views are handy when you want to focus on the content of the table and don’t need
to see a chart.
Displaying the Task Sheet view with the Cost table displayed is a good way to see cost
details per task, and rolled up to summary tasks and to the project summary task
The Cost table includes various cost values for each subtask. These subtask cost values
roll up to their summary tasks, and ultimately all cost values roll up to the project
summary task.
To shift focus from a task-centric to a resource-centric view of costs, use the Cost table in
the Resource Sheet view.
Displaying the Resource Sheet view with the Cost table displayed is a good way to see
cost details per resource
This view displays the total costs per resource, based on the resource’s pay rates, cost per
use, and specific assignments.
Project includes many ways of answering the “Who does what, when?” question. A handy
view for this purpose is the Task Usage view with the Summary table displayed.
The Task Usage view groups the assigned resources below each task and shows you,
among other things, assignment details rolled up per task
The pivot of this view is the Resource Usage view with the Summary table applied.
The Resource Usage view groups the assigned tasks below each resource and shows
you, among other things, assignment details rolled up per resource
The Resource Usage view groups the assigned tasks below each resource—this is the
same assignment information as is shown in the Task Usage view, but grouped by
resources rather than tasks. The two usage views give you insights into who does what
work, and when. You’ll work with them frequently in later chapters.
To check the plan’s costs per task
1. On the View tab, in the Task Views group, click Other Views, and then click Task
Sheet.
2. On the View tab, in the Data group, click Tables, and then click Cost. The Cost
table appears, replacing the Entry table.
To check the plan’s costs per resource
1. On the View tab, in the Resource Views group, click Resource Sheet.
2. On the View tab, in the Data group, click Tables, and then click Cost. The Cost
table appears, replacing the Entry table.
To see resource assignment and other details grouped by task
1. On the View tab, in the Task Views group, click Task Usage. The Task Usage view
appears.
2. On the View tab, in the Data group, click Tables, and then click Summary. The
Summary table appears, replacing the Entry table.
To see task assignment and other details grouped by resource
1. On the View tab, in the Resource Views group, click Resource Usage. The
Resource Usage view appears.
2. On the View tab, in the Data group, click Tables, and then click Summary. The
Summary table appears, replacing the Entry table.
Skills review
In this chapter, you learned how to:
Assign work resources to tasks
Control work when adding or removing resource assignments
Assign cost resources to tasks
Check the plan after assigning resources
Practice tasks
The practice files for these tasks are located in the Project2016SBS\Ch06 folder.
Important
If you are running Project Professional with Project Web App/Project Server, take
care not to save any of the practice files you work with in this book to Project Web
App (PWA). For more information, see Appendix C, “Collaborate: Project,
SharePoint, and PWA.”
Assign work resources to tasks
The scenario: At Lucerne Publishing, you are ready to make the initial resource
assignments in the new book launch plan. Because you previously accounted for the pay
rates of work resources, you also want to see the initial cost and duration calculations of
the plan for later comparison. Open the SimpleAssignWorkResource plan in Project, and
then perform the following tasks:
1. Check the plan’s initial values via the Task Usage view with the Summary table
visible.
In the Task Usage view with the Summary table displayed, the project summary task
conveys some of the plan’s essential details
Note the current duration of 41 days and zero work and cost, visible for the project
summary task. After you assign work and cost resources, you’ll check these values
again.
2. Switch back to the Gantt Chart view, and then use the Assign Resources dialog box
to assign Carole Poland to task 2, Assign launch team members.
After you assign Carole, note the resulting assignment cost value in the Assign
Resources dialog box.
3. Use the same technique to assign Toni Poe to task 3, Complete author
questionnaire.
Because Toni has no pay rate, her resulting assignment cost is zero.
4. Display the Task Form view with Work details.
5. Assign the following resources to tasks. As you do so, note the Duration, Units,
and Work values in the Task Form (recall that these are the three essential variables
for assignment calculations).
In the Task Form, keep your eye on the selected task’s duration, assignment units, and
work values as you assign more resources to the task
Next, you will assign two resources to a single task.
6. Use the Assign Resources dialog box to simultaneously assign Sharon Salavaria
and Toby Nixon to task 8, Kickoff book launch meeting.
Between the Gantt Chart view, Assign Resources dialog box, and Task Form, Project
provides multiple ways to display task assignments’ schedule details
Recall from Chapter 5, “Set up resources,” that Sharon has a 50% Max. Units value
to account for her half-time availability. As a result, Project assigned her at 50%
units. Project accounted for this assignment units value when it calculated the task’s
resulting work value.
7. Use the Resource Names column to simultaneously assign Jane Dow and Zac
Woodall to task 9, Plan author’s travel itinerary.
8. Assign Zac Woodall to task 10, Channel Sales prep.
The Resource Names column conveys some of the same assignment details as does the
Assign Resources dialog box
Control work when adding or removing resource assignments
The scenario: Some time has passed since you made the initial resource assignments for
the new book launch plan. You received some feedback from the assigned resources that
require some adjustments to assignments. As you make these adjustments, you will
control how the revised assignments should affect the tasks. Open the
SimpleAssignControlWork plan, and then perform the following tasks:
Important
The following tasks refer to the Task Form, which is a convenient way of seeing the
results of actions. However, don’t perform the tasks directly in the Task Form;
doing so does not display the Actions button and the options it provides you.
1. Use the Assign Resources dialog box to add Zac Woodall to task 5 so that both Zac
and Toby are assigned.
2. Use the Actions button to verify that assigning Zac will increase work but not
change the task’s duration.
You can see this result in the Task Form: Zac was assigned the additional work, and
task 5’s duration was not changed.
3. Remove Zac’s assignment from task 9, Plan author’s travel itinerary.
4. Use the Actions button to increase the duration of the task but keep the same
amount of work on the task.
Again, you can see the result of the assignment change in the Task Form.
5. Use the Task Information dialog box to turn on effort-driven scheduling for task
10, Channel Sales prep.
6. Assign Hany Morcos to the task. Verify that the task’s duration is reduced and that
the total work is split between the two assigned resources, Hany and Zac.
By using the options available from the Actions button, you can control how Project
recalculates task durations and work values when you change resource assignments
Assign cost resources to tasks
The scenario: You want to enter planned travel costs for a task in the new book launch
plan. This task requires air travel by the children’s book author, Toni Poe, and you
allocated $800 in anticipation of this expense. Open the SimpleAssignCostResource plan,
and then perform the following tasks:
1. In the Assign Resources dialog box, assign the cost resource named Travel to task
17; specify an $800 cost to the assignment.
As you can see in the Gantt Chart view and Task Form, assigning a cost resource has
no effect on the scheduling of the task
Note that the task has the same duration of one day, and Toni Poe has the same units
and work values as before. Assigning the cost resource affected only the cost
incurred by this task; the cost resource assignment had no impact on the scheduling
of the task.
Recall that Toni Poe is the author of the children’s book and has no pay rate in the
plan, so her assignment cost is zero.
2. Close the Assign Resources dialog box.
Check the plan after assigning resources
The scenario: It’s time to explore the results of the resource assignments you’ve made.
Open the SimpleAssignCheckPlan plan, and then perform the following tasks:
1. Display the Task Usage view with the Summary table. If necessary, drag the divider
bar to the right to display the Work column.
Check the plan’s key indicators on the project summary task in the Task Usage view
Note the duration value of the project summary task: 36 days. At the start of the
Practice Tasks section, the plan’s duration was 41 days. This shorter duration you
see now is the result of assignment changes you made earlier.
Note the project summary task’s total cost value: $19,740. This cost value is the sum
of the work-resource assignments plus the one cost resource assignment you
previously made.
2. Display the Resource Usage view with the Summary table.
It’s handy to switch between the Task Usage and Resource Usage views; both views
show you assignment details, but grouped in different ways
This view organizes assignment-level details per resource. The Summary table
conveys assignment cost and work values rolled up per resource.
7. Format and share your plan
In this chapter
Customize a Gantt chart view
Add tasks to a Timeline view
Customize reports
Copy views and reports
Print views and reports
Practice files
For this chapter, use the SimpleFormat practice file from the Project2016SBS\Ch07
folder. For practice file download instructions, see the introduction.
In some respects, a Project plan is really a database of information, not unlike a Microsoft
Access database file. You don’t usually see all the data in a plan at one time. Instead, you
focus on the aspect of the plan you’re currently interested in viewing. Views and reports
are the most common ways to observe or print a plan’s data. In both cases, you can
substantially format the data to meet your needs.
In this chapter, you customize and share common views from Project—views like the
Gantt Chart, which is strongly identified with project management.
Another means of visualizing your schedule is with reports. Reports can include colorful
charts and images, in addition to tables. Project includes many reports you can use as-is or
customize.
Tip
This chapter introduces you to some of the simpler view and report formatting
features in Project. You’ll find more information about formatting, printing, and
sharing your plans in Chapter 13, “Organize plan details,” Chapter 16, “Format and
print views: In-depth techniques,” Chapter 17, “Format reports: In-depth
techniques,” and Appendix C, “Collaborate: Project, SharePoint, and PWA.”
This chapter guides you through procedures related to customizing a Gantt chart view,
adding tasks to a Timeline view, customizing reports, and copying and printing views and
reports.
Customize a Gantt chart view
The Gantt chart became a standard way of visualizing schedules when, in the early
twentieth century, American engineer Henry Gantt developed a bar chart showing the use
of resources over time. For many people, the Gantt chart is the most common visualization
of a project’s schedule or plan. In fact, the Gantt chart is a popular and widely understood
representation of schedule information throughout the project management world. In
Project, the default view is dominated by a Gantt chart. You are likely to spend a lot of
your time in this view when working in Project.
Tip
By default, when you create a new plan, Project displays a split view named Gantt
with Timeline. However, you can change this setting to display any view you want
as the default view for a new plan. On the File tab, click Options. In the Project
Options dialog box, click General. In the Default View box, click the view you
want. The next time you create a new plan, the view you have chosen will appear.
A Gantt chart view consists of two main parts: a table on the left and a bar chart with a
timescale on the right.
The major elements of the Gantt chart view include a table on the left, a chart on the
right, and a timescale above the chart
The bar chart includes an adjustable timescale band across the top that denotes units of
time. The bars on the chart graphically represent the tasks in the table in terms of start and
finish dates, duration, and status (for example, whether work on the task has started or
not).
On a Gantt chart, tasks, summary tasks, and milestones all appear as Gantt bars or
symbols, and each type of bar has its own format. Whenever you work with Gantt bars,
keep in mind that they represent tasks in a plan. Other elements on the chart, such as link
lines, represent relationships between tasks.
The default formatting applied to a Gantt chart view works well for on-screen viewing,
sharing with other programs, and printing. However, you can change the formatting of
almost any element on a Gantt chart.
There are several ways to format the chart elements in a Gantt chart view:
Quickly apply predefined color combinations from the Gantt Chart Style group.
Use the Gantt Chart styles to quickly apply color combinations to a Gantt chart view
The Gantt Chart styles are divided into two groups:
• Scheduling Styles These styles distinguish between manually and automatically
scheduled tasks.
• Presentation Styles These styles do not make that distinction. Applying a
presentation style to a Gantt chart view is a good option when you don’t want to
distinguish between manually and automatically scheduled tasks—when showing a
Gantt chart to an audience for whom you do not want to make this distinction, for
example.
Apply highly customized formatting to Gantt bars in the Bar Styles dialog box.
Use the settings on the Bars tab of the Bar Styles dialog box to change the appearance
of all instances of a specific type of Gantt bar
In this case, the formatting changes you make to a particular type of Gantt bar (a
summary task, for example) apply to all such Gantt bars in the Gantt chart. Applying
or customizing bar styles is a powerful formatting feature; for more information, see
Chapter 16, “Format and print views: In-depth techniques.”
Format individual Gantt bars directly. The direct formatting changes you make have
no effect on other bars in the Gantt chart.
In the table portion of a Gantt chart view, you can format text and cell values. The cell
formatting options in Project are similar to those in Microsoft Excel.
Drawing on a Gantt chart
Project includes a drawing tool with which you can draw objects directly on the
chart portion of a Gantt chart. For example, if you would like to note a particular
event or graphically call out a specific item, you can draw an object—such as a text
box, arrow, or other item—directly on the Gantt chart.
Add text boxes and other graphic objects directly on a Gantt chart
You can also link a drawn object to either end of a Gantt bar or to a specific date on
the timescale. Here’s how to choose the type of link you need:
Link objects to a Gantt bar when the object is specific to the task that the Gantt
bar represents. The object will move with the Gantt bar if the task is
rescheduled.
Link objects to a date when the information the object refers to is datesensitive. The object will remain in the same position relative to the timescale
no matter which part of the timescale is displayed.
If you want to draw on a Gantt chart, follow these instructions: On the Format tab,
in the Drawings group, click Drawing. Select the drawing shape you want, and then
draw it anywhere you want in the chart portion of a Gantt chart view.
To set the type of link you want applied to the drawn object, do this: First select the
object. Then on the Format tab, in the Drawings Group, click Drawing, and then
click Properties. Click the Size & Position tab, and then select the options you want.
To apply a Gantt chart style to Gantt bars
1. Switch to a Gantt chart view.
2. On the Format tab, in the Gantt Chart Style group, click the More button to
display the predefined color styles.
Click the More button to display all of the Gantt Chart Style options available
3. Click the style you want.
To format an individual Gantt bar shape
1. Double-click a Gantt bar.
Or
Click the name of the task whose bar you want to format. Then, on the Format tab,
in the Bar Styles group, click Format, and then click Bar.
2. In the Format Bar dialog box, select the formatting options you want.
Tip
A milestone indicator uses just the Start shape options in the Format Bar dialog box.
To remove direct formatting from an individual Gantt bar shape
1. Double-click a previously formatted Gantt bar.
Or
Click the name of the task of the previously formatted Gantt bar. Then, on the
Format tab, in the Bar Styles group, click Format, and then click Bar.
2. In the Format Bar dialog box, click Reset.
To format a cell or range of cells
1. In the table portion of a Gantt chart view, select the cell or range of cells you want
to format.
2. On the Task tab, in the Font group, select the formatting options you want.
Or
1. Select the cell or range of cells you want to format.
2. Right-click the selected cell or range of cells.
A shortcut menu appears.
Right-click a table cell, such as one that includes a task name, to see the shortcut menu
and Mini Toolbar
In addition to the regular shortcut menu, note that the Mini Toolbar appears.
3. On the Mini Toolbar, select the text or cell background formatting options you
want.
To remove all formatting that has been applied to a cell
1. Select the previously formatted cell or range of cells.
2. On the Task tab, in the Editing group, click Clear (the button that looks like an
eraser), and then click Clear Formatting.
To adjust the timescale in a Gantt chart view
1. Do either of the following:
• On the View tab, in the Zoom group, click Timescale, and then click the setting
you want.
• Use the Zoom Slider in the lower-right corner of the status bar to adjust the zoom
setting.
Add tasks to a Timeline view
A Timeline view is best suited to display key tasks and milestones from your plan in a
simple and compact format. This view is especially well suited for conveying quick
summaries of plans and is easily shared with Microsoft PowerPoint presentations, email
messages, and other formats beyond Project (you’ll do so later in this chapter). You can
add just enough detail to the Timeline view to convey your message, especially to other
project stakeholders.
A thoughtfully populated Timeline view can be your “project at a glance” view
A Timeline view usually is displayed above the current view. Initially, the Timeline view
is empty, even when the plan contains tasks. You select the existing tasks or add new tasks
that you want to have included on a Timeline view, and you determine how they should
appear.
In fact, you can display multiple Timelines at one time—each one can include different
tasks and formatting options. For more information about multiple Timelines, see Chapter
16, “Format and print views: In-depth techniques.”
To add existing tasks to a Timeline view
1. Click anywhere in a Timeline view.
Tip
If the Timeline is not visible, on the View tab, in the Split View group, select the
Timeline check box.
Project shifts focus to the Timeline view and displays the Timeline Tools label above
the Format tab.
2. On the Format tab, in the Insert group, click Existing Tasks.
The Add Tasks To Timeline dialog box opens. This dialog box contains an outline of
the summary and subtasks in the plan.
This dialog box is a handy way to quickly add tasks to a Timeline view
3. Select the tasks you want to appear on the Timeline, and then click OK.
Or
1. In the active task view, click the task you want to appear on the Timeline.
2. On the Task tab, in the Properties group, click Add to Timeline.
Or
1. Right-click the task and click Add to Timeline in the shortcut menu that appears.
To add a new task to a Timeline view
1. Click anywhere in a Timeline view.
2. On the Format tab, in the Insert group, click Task.
3. In the Task Information dialog box, enter the new task’s information, and then
click OK.
Project adds the new task to the plan. It will be visible both in the Timeline and
Gantt Chart views.
To switch task bars to callouts in the Timeline view
1. Click anywhere in the Timeline view.
Project shifts focus to the Timeline view and displays the Timeline Tools label above
the Format tab.
2. In the Timeline view, click a task bar you want to display as a callout.
Tip
To see the full name and other details about a task on the Timeline, point to the task.
Its details appear in a ScreenTip.
To see the full name and other details of a task on a Timeline view, point to the task
name
3. On the Format tab, in the Current Selection group, click Display as Callout.
Project displays the task as a callout.
To give a task on a Timeline greater visibility, format it as a callout
Panning and zooming a Gantt chart view from a Timeline view
Have you noticed the shading and the vertical and horizontal lines on the Timeline
view? This is the pan and zoom control, which you can use to horizontally scroll
the chart portion of a Gantt chart view or to change its timescale.
Use the pan and zoom control in a Timeline view to change the appearance of a Gantt
chart view
The pan and zoom control appears in the Timeline view when the Gantt chart’s
timeline shows less than the full plan’s duration on the screen.
To scroll a Gantt chart view, drag the top line of the pan and zoom control. This is a
convenient way to display a specific date range in a Gantt chart.
To change the timescale in a Gantt chart view, drag the left or right vertical line on
the edge of the pan and zoom control. As you do so, Project adjusts the timescale in
the chart portion of a Gantt chart view so that the time frame that appears in the
unshaded portion of the Timeline view is also visible in a Gantt chart view.
You might find the Timeline view useful not only for creating simplified
representations of key details from your plans, but also for navigating a Gantt chart
view. If you want to hide the pan and zoom control, do this: click anywhere in the
Timeline view, and then on the Format tab, in the Show/Hide group, clear the Pan
& Zoom box.
Customize reports
You can use Project reports to see details of your plans in a variety of ways. Project
includes several built-in reports, and you can customize those or create your own for the
unique information needs of your project’s stakeholders.
Reports are intended to be used for viewing Project details. You don’t directly edit your
plan’s data in a report as you can in a view. However, you can extensively customize what
data appears in a report and how it’s formatted.
Some of the useful things you can do are:
Create graphical reports within Project rather than exporting the Project data to
another program.
Include colorful charts and images, in addition to tables, in your reports.
Print reports or copy them to other programs.
Project includes many reports you can use as is or customize, or you can create your own
unique reports. Unlike most views in Project, a report is more like a blank canvas onto
which you can place the elements (such as tables or charts) that focus on the information
of most interest to you.
A single report can include a dynamic mix of tables, charts, and textual content.
The Resource Cost Overview report is a great example of a report that includes a mix of
data and presentation formats
You can change both the formatting and content of charts and tables in a report. As soon
as you click a chart (or a table), the Field List pane opens on the right side of the screen. In
Chapter 17, “Format reports: In-depth techniques,” you will use the Field List to
customize the data that is included in reports.
In addition to changing what type of data appears in a chart, you can change its visual
appearance. When you click in a report—or in a chart, table, or other element in a report—
Project displays tool tabs unique to the selected element.
As you select different elements in a report, the Design and Format tool tabs give you
options specific to the selected element
See Also
This topic introduces report formatting. For more details about reports, see Chapter
15, “View and report project status,” and Chapter 17, “Format reports: In-depth
techniques.”
To display a report
1. On the Report tab, in the View Reports group, click a category, and then click the
specific report you want.
To apply a style to a chart in a report
1. Display the report that includes a chart that you want to style.
2. Click anywhere in the chart.
3. On the Chart Tools Design tab, in the Chart Styles group, click the style you want.
To apply a style to a table in a report
1. Display the report that includes a table that you want to style.
2. Click anywhere in the table.
3. On the Table Tools Design tab, in the Table Styles group, click the style you want.
Copy views and reports
Project supports standard copying and pasting of data, such as a range of task names and
details via the Clipboard. There are times, though, when you might want to share views
from your plans with colleagues who do not have Project, or who might prefer a simple
schedule snapshot. You can quickly copy most views and reports from Project. Copied
views and reports can then be pasted into email messages, presentations, and other
documents. Views that cannot be directly copied from Project include the Team Planner
(Project Professional only), Form views (such as the Task Form), and the Relationship
diagram.
Tip
If you find that you need a visual snapshot of a view or report that cannot be
directly copied from Project, use a screen capture utility such as the Windows
Snipping Tool.
Both Gantt charts and Timeline views are well suited for sharing schedule details. The
Timeline is a concise “project at a glance” view, and the Gantt chart is a widely used
format of schedules.
Reports are also well suited for sharing with other project stakeholders. Reports can be
especially effective in conveying your plan’s information in charts that you might
otherwise need to create in Excel.
Tip
When copying a Timeline view or any report to a Microsoft Office app, you have
some choices about what gets pasted. The Office apps support pasting a graphic
image, or pasting editable elements of the copied Timeline or report.
To copy a view
Use this technique to copy a Gantt chart and most other views in Project.
1. Set up the view the way you want it to appear when copied. For example, in a Gantt
chart view, you can scroll to display the range of tasks you want to copy, and their
Gantt bars.
Tip
You can quickly scroll the Gantt chart to display the Gantt bars of the selected task.
On the Task tab, in the Editing group, click Scroll To Task.
2. On the Task tab, in the Clipboard group, click the arrow next to Copy, and then
click Copy Picture.
The Copy Picture dialog box opens.
Use the options in the Copy Picture dialog box to generate the image you want to copy
In this dialog box, you can control how Project copies details from the plan to the
Clipboard or saves it to a file. The first two options under Render Image control the
size and resolution of the view you copy; the third allows you to save the copied
image as a Graphics Interchange Format (GIF) image file. The options under Copy
and Timescale let you fine-tune what you want to copy. The Timescale options are
not available when you are copying views that do not include a timescale, such as
Sheet views.
3. Select the copy options you want, and then click OK.
Project copies a graphic image of the view to the Clipboard. You can then paste it
into another program.
To copy a Timeline view
You copy most other views in Project much like you do a Gantt chart view. The
Timeline view, however, has unique options for copying. You can copy the Timeline
at different resolutions and levels of detail, depending on the destination you have in
mind.
1. Click anywhere in the Timeline view.
With the focus now on the Timeline, the label of the Format tab changes to Timeline
Tools.
2. On the Format tab, in the Copy group, click Copy Timeline.
The Copy Timeline options appear.
When you are copying a Timeline view, Project includes handy options to optimize the
image for the destination format you have in mind
3. Click the sizing option you want.
Project copies the timeline to the Clipboard.
Tip
You can quickly switch the Timeline view between a more or less detailed format.
Click anywhere in the Timeline view, and then on the Format tab, in the Show/Hide
group, click Detailed Timeline.
To copy a report
1. On the Report tab, in the View Reports group, display the report you want.
2. Click anywhere in the report and then, on the Report Tools Design tab, in the
Report group, click Copy Report.
Project copies a graphic image of the entire report to the Clipboard.
Tip
To copy just one chart or other element from a report, right-click the outer edge of
the element you want and, in the shortcut menu that appears, click Copy.
Print views and reports
In addition to sharing your plan’s information by copying and pasting, you can print most
views and all reports. The views that cannot be printed include the form views and the
Relationship Diagram.
For a plan with many tasks, what you can see on your screen at one time might be a
relatively small portion of the full plan. Printing from Project can use quite a bit of paper;
in fact, some heavy-duty Project users make poster-size printouts of their plans by using
plotters. Whether you use a printer or plotter, it’s a good idea to preview the views and
reports you intend to print.
You have several options when printing from Project, such as printing a specific date
range in a Gantt chart view (described later in this topic). You can also control what will
print in a view prior to printing by filtering or collapsing tasks, or by displaying only
summary tasks. (This is described in Chapter 13, “Organize plan details.”) You work with
these options in the Print window. Some of the most useful options are described in this
topic.
Start with the page navigation buttons in the lower-right corner of the screen.
Use the page navigation and zoom controls in the lower-right corner of the Print
window to control what is displayed
To preview a broader view of the output, you can switch to a multipage view. When you
do, the full view or report will appear in the Print window. Assuming that you have a
letter-sized sheet as your selected paper size, you might see the view or report spread
across several sheets.
With timescaled views like the Gantt Chart, you can be more selective. You can adjust the
preview to include just the portion of the view that covers a specific date range. You do so
via the Settings options.
For example, you can set a Gantt chart’s options in the Print window to show just a
specific date range.
Use the Print options to control how a Gantt chart view will appear when printed
Compared to views, a report can be a more compact way to print information about your
plan. Reports use commonly understood formats, such as tables and charts, to organize
and present information.
Printing reports in Project is mainly a “what you see is what you get” action. Project offers
some report-specific printing options on the Report Tools Design tab (which is visible
when you click in a report).
The Page Breaks command is especially useful when you intend to print a report. It draws
dashed lines in the report that tell you how it will print across pages based on the current
page settings. The other options available in the Page Setup group, such as margins and
paper size, can be useful as you design your report.
Tip
Some views, such as the Form views and the relationship diagram, cannot be
printed from Project. However, you can use a screen-capture utility like the
Windows Snipping Tool to capture a snapshot of such a view and then print that.
To print a view
1. On the View tab, in the Task Views group, display the view you want to print.
2. On the File tab, click Print.
The Print page of the Backstage view is displayed with the view in the preview.
3. Select the options you want, and then click Print.
To print a report
1. On the Report tab, in the View Reports group, display the report you want to print.
2. On the Report Tools Design tab, in the Page Setup group, select any options you
want.
3. On the File tab, click Print.
The Print page of the Backstage view is displayed with the report in the preview.
4. Select the options you want, and then click Print.
To adjust page setup options in a report
1. Display the report whose page setup options you want to adjust.
2. Click the Report Tools Design tab.
In the Page Setup group, note the four commands available.
3. Do any of the following:
• Click Page Breaks to see where the page breaks will occur in the report based on
your currently selected paper size.
• Click Margins to adjust the page margins of the report when printed.
• Click Orientation to switch the report between landscape (horizontal) and portrait
(vertical) layout.
• Click Size to select your paper size.
Skills review
In this chapter, you learned how to:
Customize a Gantt chart view
Add tasks to a Timeline view
Customize reports
Copy views and reports
Print views and reports
Practice tasks
The SimpleFormat practice file for these tasks is located in the Project2016SBS\Ch07
folder.
Important
If you are running Project Professional with Project Web App/Project Server, take
care not to save any of the practice files you work with in this book to Project Web
App (PWA). For more information, see Appendix C, “Collaborate: Project,
SharePoint, and PWA.”
Customize a Gantt chart view
The scenario: At Lucerne Publishing, you are almost done with planning the new book
launch project, and the team is about to commence work. You want to format the plan to
highlight a key milestone. You also want a few other details from the plan to visually stand
out. Open the SimpleFormat plan in Project and perform the following tasks:
1. In the Gantt Chart view, scroll to the manually scheduled task 9, Prepare book P&L
statement.
The default formatting of the Gantt bars for manually scheduled tasks differs from that
of automatically scheduled tasks
As you can see, the Gantt bar of this manually scheduled task does not look like the
Gantt bars of the automatically scheduled tasks. Keep an eye on this Gantt bar as
you apply a different Gantt chart style to the plan.
2. Apply the predefined orange color style from the Presentation Styles area of the
style gallery.
After a presentation style is applied, there is no formatting distinction between the
Gantt bars of manually and automatically scheduled tasks
Project changes the formatting of all Gantt bars. The Gantt bar of task 9, the
manually scheduled task, is no longer visually distinct from those of the
automatically scheduled tasks.
3. Task 6 is a milestone task that describes the end of the first phase of the new book
launch at Lucerne Publishing. You’d like to highlight this task name. Apply italic
text formatting and a yellow background color to the name of task 6, Planning
Complete!
Text and background formatting of a task name can help it stand out
Now the milestone task name stands out.
4. Notice that a shape appears instead of a Gantt bar in the Gantt chart area for task 6.
This is because the task is a milestone task. Format the Gantt bar (shape) of task 6 to
be a star shape.
Formatting a milestone’s shape can help it stand out in a Gantt chart
Add tasks to a Timeline view
The scenario: You know from past experience that some of the stakeholders of the new
book launch project will find your Gantt chart view to be more detailed than they like. To
help such stakeholders see the key details you want to convey, you decide to build a
Timeline view. Later you will copy the Timeline view to another program as a quick
“project at a glance” image. Continuing in the SimpleFormat plan, perform the following
tasks:
1. Add the following existing tasks to the Timeline:
• Planning Phase
• Planning complete!
• Internal Launch Phase
• Public Launch Phase
• Author travel and appearances
2. In the Timeline view, switch the task bar for Author travel and appearances to a
callout so its full title is visible.
Give distinct focus to certain tasks on the Timeline by formatting them as callouts
Customize reports
The scenario: You want to share the Resource Cost Overview report with the team.
However, you’d like to change the formatting of some elements in the report. Continuing
in the SimpleFormat plan, perform the following tasks:
1. Display the Resource Cost Overview report.
This report includes chart and table elements—both types of elements support extensive
formatting
2. Apply the black background chart style (style 7) to the pie chart.
3. Apply the gray background table style (themed style 1, accent 3, located under
Best Match for Document in the top row) to the table.
Use the Design tool tabs to change the formatting of the selected report element
Copy views and reports
The scenario: You’d like to share snapshots of key views and a report from the plan via
email or Microsoft Word documents. Continuing in the SimpleFormat plan, perform the
following tasks:
1. Display the Gantt Chart view so the Gantt bars of tasks 7 through 14 are visible.
2. Copy a picture of tasks 7 through 14. Render the picture for the screen.
3. Paste the image into a new document or email message.
4. Copy a full-sized image of the detailed Timeline, and paste it into the same
document or email message.
5. Copy the Resource Cost Overview report, and paste it into the same document or
email message.
You can copy most views and other elements you see in Project
Print views and reports
The scenario: You’d like to print views and reports from the plan to post to the wall space
for the team to mark with feedback or clarifications. Continuing in the SimpleFormat plan,
perform the following tasks:
1. Display the print preview of the full Gantt Chart view, set to multiple pages.
When previewing a large view or report, use the page navigation and zoom controls to
manage what is displayed. What is displayed might differ, depending on your selected
printer and paper size
2. Display page breaks in the Resource Cost Overview report.
You can show page breaks in multipage reports outside of the print preview
8. Track progress: Basic techniques
In this chapter
Understand progress tracking
Save a baseline of your plan
Track a plan as scheduled
Enter a task’s completion percentage
Enter actual values for tasks
Practice files
For this chapter, use the practice files from the Project2016SBS\Ch08 folder. For
practice file download instructions, see the introduction.
Until now, you have focused on project planning—developing and communicating the
details of a plan before actual work begins. When work begins, so does the next phase of
project management: tracking progress. Tracking means recording details such as who did
what work, when the work was done, and what the cost was. These details are often called
actuals. As you start tracking actuals on tasks, a number of things happen. As you record
progress on a task, Project 2016 calculates actual and remaining cost, work, and duration
values. These updated values are rolled up to their summary tasks. Such changes are the
result of Project dynamically recalculating the plan.
This chapter guides you through procedures related to saving a baseline of your plan,
tracking a plan as scheduled, entering a task’s completion percentage, and entering actual
values for tasks.
Understand progress tracking
Tracking actuals is essential to properly managing a project, as opposed to just planning it.
The project manager must know how well the team is performing and when to take
corrective action. By properly tracking project performance and comparing it with the
original plan (as saved in a baseline), you are able to answer such questions as the
following:
Are tasks starting and finishing as planned? If not, what will be the impact on the
project’s finish date?
Are resources spending more or less time than planned to complete tasks?
Are higher-than-anticipated task costs driving up the overall cost of the project?
When planning similar projects in the future, will you be able to determine how
good your (or the team’s) estimating skills were in prior projects?
Project supports several ways to track progress. Your choice of a tracking method should
depend on the level of detail or control required by you, your project sponsor, and other
stakeholders. Tracking the fine details of a project requires additional work from you and,
possibly, from the resources working on the project. Therefore, before you begin tracking
progress, you should determine the level of detail you need.
The different levels of tracking detail include the following, ordered from simplest to most
comprehensive:
Record project work as scheduled. This level works best if everything in the project
occurs exactly as planned.
Record each task’s percentage of completion, either at precise values or at preset
increments such as 25, 50, 75, and 100 percent.
Record the actual start and finish dates, and actual and remaining work and duration
values for each task or assignment.
Track assignment-level work by time period. This is the most detailed level of
tracking. Here, you record actual work values per day, week, or other interval. (This
level of detail is addressed in Chapter 14, “Track progress: Detailed techniques.”)
Because different portions of a project might have different tracking needs, you might
need to apply a combination of these approaches within a single plan. For example, you
might want to track high-risk tasks more closely than low-risk ones.
Save a baseline of your plan
After you develop a plan, one of your most important activities as a project manager is to
record actuals and evaluate project performance. As you record actuals or update your
plan, the scheduled plan will likely change. This makes it difficult to keep track of the plan
in its original state.
The current “as scheduled” state of a task is described by its start, finish, and duration
values. As you enter Actual Start and Actual Finish dates, the Start, Finish, and Duration
fields will update to reflect the current state of that task.
To judge project performance properly, you’ll find it helpful to compare the performance
with your original plan. This original plan is called the baseline plan, or just the baseline.
Saving a baseline captures the original scheduled start, finish, and duration values in
addition to work and cost values per task, resource, and assignment. The baseline also
includes work and cost values distributed over time (called timephased values, which you
will work with in Chapter 14, “Track progress: Detailed techniques”). Use the baseline for
later comparison of what you thought was going to happen to what actually has happened.
When you save a baseline, Project takes a snapshot of the existing values and saves it in
your plan for future comparison. You should save a baseline when:
You have developed the plan as fully as possible. (However, this does not mean that
you cannot add tasks, resources, or assignments to the plan after work has started—
this is often unavoidable.)
You have not yet started entering actual values, such as a task’s percentage of
completion.
You want to save a subsequent baseline (up to 11 per plan).
The specific values saved in a baseline include several task, resource, and assignment
fields, in addition to timephased fields.
Project supports not just one baseline, but up to 11 baselines in a single plan. The first one
is called Baseline, and the rest are Baseline 1 through Baseline 10. Saving multiple
baselines can be useful for projects with especially long planning phases, in which you
might want to compare different sets of baseline values. For example, you might want to
save and compare the baseline plans every month as the planning details change, or you
might want to save a new baseline at various points during the execution of the project.
You could, for example, save Baseline before work starts, Baseline 1 a month after work
starts, Baseline 2 two months after work starts, and so on. You can then view the various
baselines and compare them to the actual schedule throughout the project’s duration.
One great way to see tasks’ scheduled and baseline values side by side for easy
comparison is in the Variance table.
Displaying the Variance table is a great way to compare tasks’ scheduled and baseline
values
For example, consider a plan in which the Start and Finish dates are the “as scheduled”
dates. These might differ from the Baseline start and finish dates due to the variance
caused by actuals that did not match the baseline dates, or by other schedule adjustments
made by the project manager.
Project includes several built-in views that compare the current schedule to the baseline—
notably the Tracking Gantt view, which is described in Chapter 14, “Track progress:
Detailed techniques.” You can also format the Gantt Chart view to include baseline Gantt
bars. A baseline Gantt bar represents a task’s baseline start, finish, and duration values on
the chart portion of a Gantt chart view.
To save a baseline
1. On the Project tab, in the Schedule group, click Set Baseline, and then click Set
Baseline.
The Set Baseline dialog box opens.
In the Set Baseline dialog box, you can save or update up to 11 baselines per plan
Tip
When working with a plan that includes a saved baseline, you can see when the
baseline was saved in the Set Baseline dialog box. The date the baseline was saved
appears after the baseline name in the Set Baseline field.
2. To save the plan’s initial baseline, click Set Baseline, and then select Baseline from
the list.
Or
To save a subsequent baseline, click Set Baseline, and then select the baseline
number you want.
Tip
Interim plans are similar to baselines. You will work with interim plans and the
other options in the Set Baseline dialog box in Chapter 14, “Track progress:
Detailed techniques.”
3. Click OK.
Project saves the baseline, even though there’s no indication in the Gantt Chart view
that anything has changed.
To clear a previously saved baseline
1. On the Project tab, in the Schedule group, click Set Baseline, and then click Clear
Baseline.
2. In the Clear Baseline dialog box, select the options you want, and then click OK.
To display baseline Gantt bars in a Gantt chart view
1. In a Gantt chart view, on the Format tab, in the Bar Styles group, click Baseline,
and then click the baseline (Baseline or Baseline1 through Baseline10) that you
want to display.
Project draws baseline Gantt bars for the baseline you choose.
To display scheduled and baseline values by using the Variance table
1. On the View tab, in the Task Views group, click Other Views, and then click Task
Sheet.
The Task Sheet view appears. Because this is a tabular view, it does not include a
Gantt chart, so more room is available to see the fields in the table.
2. On the View tab, in the Data group, click Tables.
3. Click Variance.
Tip
You also can right-click the Select All button in the upper-left corner of the active
table to switch to a different table.
Track a plan as scheduled
The simplest approach to tracking progress is to report that the actual work is proceeding
exactly as planned. For example, if the first week of a five-week project has elapsed and
all of its tasks have started and finished as scheduled, you can quickly record this in the
Update Project dialog box.
The Update Project dialog box gives you options for basic tracking
When you record progress on tasks, Project displays that progress by drawing progress
bars within the Gantt bars for those tasks.
Visual indicators of task progress in a Gantt chart view include the task completion
check marks in the Indicators column and the progress bars inside the Gantt bars
In the chart portion of the Gantt Chart view, the progress bar shows how much of each
task has been completed. For example, consider a Gantt chart view in which tasks 2, 3,
and 4 have been completed. A check mark appears in the Indicators column for those
tasks, and the progress bars extend through the full length of those tasks’ Gantt bars. Task
5, which is only partially completed, shows a partial progress bar in its Gantt bar.
When you record progress through a specific date, Project calculates the actual duration,
the remaining duration, actual costs, and other values up to the date you entered. This
approach might be fine even if the actual work and cost values generated by Project won’t
exactly match what happened in the real world, but are close enough for your scheduletracking purposes. This is a judgment call that you as a project manager (in consultation
with your project sponsors and other stakeholders) can consider.
To record work as scheduled through a specific date
1. On the Project tab, in the Status group, click Update Project.
The Update Project dialog box opens.
2. Make sure Update work as complete through is selected. In the adjacent date box,
enter or select the date through which you want to record work completed as
scheduled.
3. Click OK.
To record work as scheduled through the current date or status date
1. Select the task or tasks whose work you want to record.
2. On the Task tab, in the Schedule group, click Mark on Track.
This command applies only to the selected tasks, and it sets them as complete
through the current date or the status date. (To learn about the status date, see
Chapter 15, “View and report project status.”)
Enter a task’s completion percentage
After work begins on a task, you can quickly record its progress as a percentage. When
you enter a completion percentage greater than 0, Project sets the task’s actual start date to
match its scheduled start date. Project then calculates the actual duration, the remaining
duration, actual costs, and other values based on the percentage you enter. For example, if
you specify that a four-day task is 25 percent complete, Project calculates that it has had
one day of actual duration and has three days of remaining duration.
Here are some ways to enter completion percentages:
Use the preset increment buttons 0%, 25%, 50%, 75%, and 100% Complete in the
Schedule group of the Task tab.
Add the percent complete column (labeled % Complete in the interface) to a table in
a task view, and enter the value you want.
Enter any percentage value you want in the Task Information dialog box.
Use the mouse to set progress on Gantt bars.
Here are some additional tips and suggestions for entering task completion percentages:
There is a simple tracking technique for projects with a large number of shortduration, “to-do–list” types of tasks that don’t require detailed tracking: use just the
0%, 50%, and 100% Complete values. A 0% value means work on the task has not
yet started, 50% means work has started, and 100% means the task is complete. If
you only need to know what’s in progress and what’s done, this is the simplest form
of tracking you can apply.
If you can collect the actual start date of a task, it is a good practice to record the
actual start date (described in the next section) and then record a completion
percentage.
By default, Project shows Gantt bars in front of nonworking time (such as
weekends), as you see in the images in this chapter. However, Project can show
nonworking time in front of task bars, visually indicating that no work on the task
will occur during the nonworking time. If you prefer this type of presentation, rightclick any shaded nonworking time (such as a weekend) in the chart portion of the
Gantt Chart view and click Nonworking Time in the shortcut menu. In the Timescale
dialog box, click the Non-Working Time tab. Next to Draw, click In Front Of Task
Bars.
To record a task’s percent complete value in preset increments
1. In the Task Name column, select the task for which you want to record a percent
complete value.
2. On the Task tab, in the Schedule group, click the 25%, 50%, 75%, or 100%
Complete button.
To record a task’s percent complete value
1. In the Task Name column, select the task for which you want to record a percent
complete value.
2. On the Task tab, in the Properties group, click Information.
The Task Information dialog box opens.
Tip
You can also double-click a task name to open its Task Information dialog box.
3. On the General tab of the dialog box, enter the Percent Complete value you want.
To use the % Complete column in a table
1. Right-click any column heading in a task table.
2. In the shortcut menu that appears, click Insert Column.
A list of fields appears.
3. Enter or select % Complete.
4. Record the percent complete values you want for any tasks in the table.
To use the mouse to set or extend progress on Gantt bars
1. Point to a Gantt bar (or progress bar within a Gantt bar).
2. When the mouse pointer changes to a percent symbol and right arrow, drag the
mouse pointer from left to right within the Gantt bar. As you do so, note the
CompleteThrough date value that appears in a ScreenTip.
Drag the mouse pointer within a task’s Gantt bar to record progress
3. To see a task’s progress details, point to the progress bar inside the Gantt bar.
Point to any Gantt bar to see the task’s key progress values
Enter actual values for tasks
A more detailed way to keep your schedule up to date is to record what actually happened
for each task in your plan. You can record each task’s actual start, finish, work, and
duration values. For example, when you enter three days of actual duration on a task with
five days of scheduled duration and 40 hours of work, Project calculates the actual work to
be 24 hours, the percent complete to be 60%, and the remaining duration to be two days.
When you record actual duration, Project recalculates the task’s essential schedule values
such as percent complete and remaining duration.
The combination of the Tracking table in a Gantt chart view and the Task Form show
how actual duration affects the task’s schedule values
When you enter various actual values, Project uses the following rules to update the plan:
When you enter a task’s actual start date, Project moves the scheduled start date to
match the actual start date.
When you enter a task’s actual finish date, Project moves the scheduled finish date
to match the actual finish date and sets the task to 100 percent complete.
When you enter a task’s actual work value, Project recalculates the task’s remaining
work value, if any.
When you enter a task’s actual duration, if it is less than the scheduled duration,
Project subtracts the actual duration from the scheduled duration to determine the
remaining duration.
When you enter a task’s actual duration, if it is equal to the scheduled duration,
Project sets the task to 100 percent complete.
When you enter a task’s actual duration, if it is longer than the scheduled duration,
Project adjusts the scheduled duration to match the actual duration and sets the task
to 100 percent complete.
Because your plan is updated with actuals, your plan as scheduled will likely change. The
original plan as saved in a baseline is not altered, however.
Project supports multiple ways of recording actuals. Two we’ll explore in this chapter are:
Recording actuals in the Tracking table. This works well when you want to update
actuals and see remaining duration and cost values in a single table.
Recording actuals in the Update Tasks dialog box. This works well when you want
to focus on a single task or want to update tasks in views that don’t support tables,
such as the Network Diagram view.
Use the Update Tasks dialog box to record a task’s actual duration, start, and other
tracking values
Here’s one thing to pay attention to in the Update Tasks dialog box. When you enter a
percent complete, actual duration, or remaining duration value, the other values are not
dynamically updated in the dialog box. They are recalculated as soon as you click OK. If
you then return to the dialog box, you’ll see the updated values.
Let’s look at an example of how values are handled in the Update Tasks dialog box. If you
enter an initial actual duration of two days on a four-day task, the remaining duration field
will still show four days. When you click OK and then open the Update Tasks dialog box
again, the remaining duration field will now show two days of remaining duration. If you
had entered two days of actual duration and four days of remaining duration, Project
would record the task as having four days of remaining duration left and an overall
duration of six days rather than the original four.
Tip
You can also apply all the tracking methods shown in this chapter to manually
scheduled tasks. Additionally, you can record an actual start, actual finish, or
remaining duration value for a manually scheduled task.
Project management focus: Is the project on track?
Evaluating a project’s status properly can be tricky. Consider the following issues:
For many tasks, it is very difficult to evaluate a completion percentage. When
is an engineer’s design for a new motor assembly 50 percent complete? Or
when is a programmer’s code for a software module 50 percent complete?
Reporting work in progress is, in many cases, a best-guess effort and inherently
risky.
The elapsed portion of a task’s duration is not always equal to the amount of
work accomplished. For example, a task might require relatively little effort
initially, but it might require more work as time passes. (This is referred to as a
back-loaded task.) When 50 percent of its duration elapses, far less than 50
percent of its total work will be completed. In fact, Project tracks both values:
% Complete tracks the percentage of the task’s duration that has been
completed, whereas % Work Complete tracks the percentage of the task’s work
that has been completed.
The resources assigned to a task might have different criteria for what
constitutes the task’s completion than the criteria determined by the project
manager or the resources assigned to successor tasks. In other words, the team
might lack a common definition of “done.”
Good project planning and communication can help you avoid or mitigate these and
other problems that arise in project execution. For example, developing proper task
durations and status-reporting periods should help you identify tasks that have
varied substantially from baseline values early enough to make adjustments. Having
well-documented and well-communicated task-completion criteria should help
prevent downstream surprises. Nevertheless, large, complex projects will almost
always vary from the baseline.
To record a task’s actual values in the Tracking table
1. On the View tab, in the Data group, click Tables and then click Tracking.
The Tracking table appears.
2. Enter the actual values for the task.
Tip
You can display whichever table is most relevant to the details you are focused on
while tracking progress in a plan. Useful tables include the Work table, which
focuses on work values, and the Cost table, which focuses on cost values.
To record a task’s actual values in the Update Tasks dialog box
1. In the Task Name column, select the task for which you want to record actual
values.
2. On the Task tab, in the Schedule group, click the arrow to the right of Mark on
Track, and then click Update Tasks.
3. In the Update Tasks dialog box, enter the task’s actual values (actual duration,
remaining duration, actual start, or actual finish).
Skills review
In this chapter, you learned how to:
Understand progress tracking
Save a baseline of your plan
Track a plan as scheduled
Enter a task’s completion percentage
Enter actual values for tasks
Practice tasks
The practice files for these tasks, SimpleTrackBaseline and SimpleTrackActuals, are
located in the Project2016SBS\Ch08 folder.
Important
If you are running Project Professional with Project Web App/Project Server, take
care not to save any of the practice files you work with in this book to Project Web
App (PWA). For more information, see Appendix C, “Collaborate: Project,
SharePoint, and PWA.”
Save a baseline of your plan
The scenario: At Lucerne Publishing, the new book launch plan is now fully developed.
Actual work on the project will soon begin. To allow for later comparison of actual work
and the current schedule with the original plan, you will first save a baseline. Open
SimpleTrackBaseline, and then perform the following tasks:
1. Save the baseline for the entire plan; use the default baseline settings.
2. Switch to the Task Sheet view.
3. Display the Variance table to see scheduled and baseline values.
The scheduled dates in this plan match its baseline dates, so the variance values are
zero
Track a plan as scheduled
The scenario: Some time has passed since you saved the baseline in the new book launch
plan. Work has been completed through the first week and a half, as planned. You need to
account for the completed work in the plan. Open the SimpleTrackActuals plan, and then
perform the following task:
1. Use the options in the Update Project dialog box to record that work has been
completed as scheduled through January 17, 2018.
Project records the completion percentage for the tasks that were scheduled to start
before January 17. It displays that progress by drawing progress bars in the Gantt
bars for those tasks.
After you record progress through a specific date, Project displays the progress bars
and, for completed tasks, the completion check marks in the Gantt Chart view
In the chart portion of the Gantt Chart view, the progress bar shows how much of
each task has been completed. Because tasks 2, 3, and 4 have been completed, a
check mark appears in the Indicators column for those tasks, and the progress bars
extend through the full length of those tasks’ Gantt bars. Task 5 is only partially
completed, however.
Enter a task’s completion percentage
The scenario: Work continues on the new book launch. You have additional progress to
record in the plan as percent complete values. Continuing in the SimpleTrackActuals plan,
perform the following tasks:
1. Set the following tasks to 100 percent complete:
• 5, Design and order marketing material
• 6, Planning complete!
• 8, Kickoff book launch meeting
Project records the actual work for the tasks as scheduled and extends progress bars
through the length of the Gantt bars.
Recording 100 percent complete is a quick checklist way of recording that a task was
completed as scheduled, with no variance
Because task 6 is a milestone task with no duration, there is no change in the
appearance of its symbol in the chart portion of the Gantt Chart view as there was
for tasks 5 and 8. However, the completion check marks for all three tasks appear in
the Indicators column.
2. Set task 9, Prepare book P&L statement, to 50 percent complete, and then point to
its progress bar.
Point to the progress bar in the partially completed task’s Gantt bar to see its key
progress indicators in a ScreenTip
Note that although 50 percent of the work on task 9 is completed, the progress bar
does not span 50 percent of the length of the Gantt bar. This is because Project
measures duration in working time but draws the Gantt bars to extend over
nonworking time, which in this case includes Thursday, January 25, a nonworking
day.
Enter actual values for tasks
The scenario: A few more days have passed, and work on the new book launch has
progressed. Resources performing the work have given you actual progress that differs
somewhat from the plan, and you want to record these actuals and observe the effect on
the overall plan. Continuing in the SimpleTrackActuals plan, perform the following tasks:
1. Use the Tracking table to record that task 9, Prepare book P&L statement, required
a total of 24 hours of actual work to complete.
Because 24 hours is greater than its original duration of 16 hours, Project marks the
task as completed and extends the Gantt bar of the task to indicate its longer
duration.
When you record actual duration, the change highlighting is a great way to see what
other changes in the plan the actuals introduced
2. Use the options in the Update Tasks dialog box to record that task 10, Plan
author’s travel itinerary, started one working day ahead of schedule (the Tuesday
before its scheduled start date) and required a total of seven days to complete.
When recording actual duration, you should also record the actual start date if it differs
from the scheduled start date
3. Click OK.
Project records the actual values for the task and marks it as complete. The updated
values roll up to the Internal Launch Phase summary task (task 7) and the project
summary task (task 0), as indicated by the change highlighting.
Actual values that you record at the task level roll up to the task’s summary task and to
the project summary task
4. Use the options in the Update Tasks dialog box for task 11, Channel Sales prep.
This task started on time and has three days of actual duration but will still require
five days of remaining duration to complete. (Remember to enter the new remaining
duration value after entering the actual duration value.)
This gives the task a new total duration of eight days: three days actual duration plus
five days remaining duration.
Unless you record an actual start date, Project assumes the task started as scheduled
Because you did not specify an actual start date, Project assumes that the task started
as scheduled. However, the actual duration and updated remaining duration value
you entered caused Project to calculate a new finish date.
Part 3: Advanced scheduling techniques
CHAPTER 9 Fine-tune task scheduling
CHAPTER 10 Fine-tune task details
CHAPTER 11 Fine-tune resource and assignment details
CHAPTER 12 Fine-tune the Project plan
CHAPTER 13 Organize plan details
CHAPTER 14 Track progress: Detailed techniques
CHAPTER 15 View and report project status
9. Fine-tune task scheduling
In this chapter
See task relationships by using Task Path
Adjust task link relationships
Control task scheduling by using constraints
Interrupt work on a task
Adjust working time for individual tasks
Control task scheduling by using task types
See task schedule details by using the Task Inspector
Practice files
For this chapter, use the practice files from the Project2016SBS\Ch09 folder. For
practice file download instructions, see the introduction.
In Part 3, “Advanced scheduling techniques,” you’ll complete a full project life cycle
(planning, tracking progress, and responding to variance) as you did in Part 2, “Simple
scheduling basics.” In Part 3, however, you dive deeper into the Project 2016 feature set to
handle more complex needs. This chapter and Chapter 10, “Fine-tune task details,”
introduce you to a broad feature set that focuses on a deeper level of task management.
This chapter focuses on core task scheduling features, including task links, constraints,
and task types.
Tip
As you fine-tune a schedule, watch for blue highlighting to appear on changed
values throughout a plan immediately after you make a change to a calculated value
for a task, resource, or assignment. This automatic change highlighting helps you
identify the impact of adjusting task relationships (or any other action that causes a
date change in a plan) on the schedule. Change highlighting remains visible until
you perform another editing action or save the file.
This chapter guides you through procedures related to seeing task relationships by using
Task Path, adjusting task link relationships, controlling task scheduling by using
constraints, interrupting work on a task, adjusting working time for individual tasks,
controlling task scheduling by using task types, and seeing task schedule details by using
the Task Inspector.
See task relationships by using Task Path
When fine-tuning task relationships, you need to keep track of the predecessor tasks that
affect the scheduling of their successor tasks. In complex plans, visually identifying
predecessor and successor relationships is not always easy. This is especially true when a
single task has multiple predecessors or successors.
The Task Path feature applies color formatting to the Gantt bars of the selected task’s
predecessor and successor tasks. Task Path can also distinguish a task’s driving
predecessors (the predecessor tasks that directly determine, or drive, the start date of the
task) from that task’s other predecessors. (Predecessor tasks that can slip without
rescheduling their successor tasks are said to have slack, which is described in detail in
Chapter 10, “Fine-tune task details.”) The Task Path feature can also do the same for
driving successor tasks.
The distinct color highlighting applied to driving predecessor and successor tasks is
especially useful when you’re focused on managing the overall duration of a sequence of
linked tasks. Without Task Path formatting applied, it can be difficult to determine the path
of related tasks on a Gantt chart.
In this Gantt chart view, all tasks have the same bar and link colors, regardless of
predecessor and successor task relationships
To identify the chain of a task’s predecessor tasks, turn on Task Path predecessor
formatting.
Task Path formatting applies a gold highlight to the Gantt bars of task 29’s predecessor
tasks
A task can have a long chain of predecessor tasks, but which of these directly drive the
scheduling of the task? Task Path can visually distinguish these driving predecessors, too.
Task Path formatting applies a dark orange highlight to the Gantt bars of task 29’s
driving predecessor tasks
Some predecessor tasks directly drive the scheduling of a task and are its driving
predecessors. Other predecessor tasks might have some amount of slack between them and
the selected task. With the Task Path highlighting applied, you can more easily see which
tasks are currently determining the scheduling of the selected task. Any schedule changes
to these driving predecessor tasks will affect the selected task.
In addition to predecessor highlighting, you can also use Task Path to highlight the
selected task’s successor tasks.
Task Path formatting applies a light purple highlight to the Gantt bars of task 29’s
successor tasks
Project applies a light purple highlight formatting to the Gantt bars of a task’s successor
tasks.
To apply Task Path formatting to a task’s predecessor or successor tasks
1. In a Gantt chart view, click a task name.
2. On the Format tab, in the Bar Styles group, click the Task Path button, and then
click the options you want.
To turn off Task Path formatting
1. On the Format tab, in the Bar Styles group, click the Task Path button, and then
click Remove Highlighting.
Adjust task link relationships
You might recall from Chapter 4, “Build a task list,” that there are four types of task
dependencies, or relationships:
Finish-to-start (FS) The finish date of the predecessor task determines the start date
of the successor task.
Start-to-start (SS) The start date of the predecessor task determines the start date of
the successor task.
Finish-to-finish (FF) The finish date of the predecessor task determines the finish
date of the successor task.
Start-to-finish (SF) The start date of the predecessor task determines the finish date
of the successor task.
When you link tasks in Project by using the Link Tasks button on the Task tab, in the
Schedule group, those tasks are given a finish-to-start relationship by default. This is fine
for many tasks, but you will most likely change some task relationships as you fine-tune a
plan. The following are some examples of tasks that require relationships other than
finish-to-start:
You can start setting pages as soon as you start illustration work on a book project (a
start-to-start relationship). This reduces the overall time required to complete the
two tasks, because they are completed in parallel.
With a start-to-start relationship, the start date of the predecessor task determines the
start date of the successor task
Planning the editorial work for a book can begin before the manuscript is complete,
but it cannot be finished until the manuscript is complete. You want the two tasks to
finish at the same time (a finish-to-finish relationship).
With a finish-to-finish relationship, the finish date of the predecessor task determines
the finish date of the successor task
Task relationships should reflect the sequence in which work should be performed. After
you have established the correct task relationships, you can fine-tune your schedule by
entering overlap (lead time) or delay (lag time) between the finish or start dates of
predecessor and successor tasks.
When two tasks have a finish-to-start relationship:
Lead time causes the successor task to begin before its predecessor task concludes.
Lag time causes the successor task to begin sometime after its predecessor task
concludes.
Here’s an example of how lead and lag time affect task relationships. Assume that you
initially planned three tasks—copyedit, author review, and copyedit incorporation—by
using Project’s default finish-to-start relationships.
Project’s default task relationship is finish-to-start (FS)
Before task 2 can begin, you need to allow an extra day for the copyedited manuscript to
be shipped to the author. You do not want to add a day to the duration of task 1, because
no real work will occur on that day. Instead, you enter a one-day lag between tasks 1 and
2.
To add a delay between the end of the predecessor and the start of the successor, add
lag time to the relationship
However, task 3 can start as soon as task 2 is halfway completed. To make this happen,
you would enter a 50-percent lead time between tasks 2 and 3.
To add overlap between the end of the predecessor and the start of the successor, add
lead time to the relationship
You can enter lead and lag time as units of time, such as two days, or as a percentage of
the duration of the predecessor task, such as 50 percent. Lag time is entered in positive
units and lead time in negative units (for example, –2d or –50%). You can apply lead or
lag time to any type of task relationship: finish-to-start, start-to-start, or any other type.
Tip
Adjusting relationships between tasks and entering lead or lag times where
appropriate are excellent techniques to fine-tune task relationships so that you get
the results you want. However, Project cannot automatically make such schedule
adjustments for you. As a project manager, you must analyze the sequences and
relationships of your tasks and use your best judgment when making such
adjustments.
Some places in which you can enter lead or lag time include the Task Information dialog
box (available from the Task tab), the Predecessors column in the Entry table, the Task
Form (which you can display by clicking the Details command on the View tab, in the
Split View group), and the Task Dependency dialog box (which you can open by doubleclicking a link line between Gantt bars).
To change the type of task relationship between tasks
1. Select a successor task that you want to change.
2. On the Task tab, in the Properties group, click the Information button to open the
Task Information dialog box, which contains details about the currently selected
task.
Tip
Double-clicking a task name is a quick way to open the Task Information dialog
box.
3. Click the Predecessors tab.
4. On the Predecessors tab, in the Type column for the predecessor task, select the
relationship type you want between the tasks, and then click OK.
5. Click OK to close the Task Information dialog box.
To add lead or lag time between linked tasks
1. Select the successor task to which you want to add lead or lag time.
2. On the Task tab, in the Properties group, click the Information button.
3. In the Task Information dialog box, click the Predecessors tab, and then do either
of the following:
• In the Lag field for a predecessor task, enter the lead value you want. Lead values
are entered as negative lag values. Lead can be a number of working days (for
example, –2d) or a percentage of the duration of the predecessor task (for example,
–25%).
• In the Lag field for a predecessor task, enter the lag value you want. Lag values
are entered as positive values. Lag can be a number of working days (for example,
3d) or a percentage of the duration of the predecessor task (for example, 50%).
Control task scheduling by using constraints
Every task that you enter into Project has some type of constraint applied to it. A
constraint determines the degree to which an automatically scheduled task can be
rescheduled. You can manage the constraint details of automatically scheduled tasks.
When working with a manually scheduled task, however, you cannot change the constraint
type or set a constraint date. The reason is that Project does not schedule manually
scheduled tasks, so constraints have no effect. For more information about manually
scheduled tasks versus automatically scheduled tasks, see Chapter 4, “Build a task list.”
There are three categories of constraints:
Flexible constraints Project can change the start and finish dates of a task. Project’s
default constraint type causes tasks to start as soon as possible. This type of flexible
constraint is called As Soon As Possible, or ASAP for short. No constraint date is
associated with flexible constraints. Project does not display any special indicator in
the Indicators column for flexible constraints.
Semi-flexible constraints With this type of constraint, a task has a start or finish
date boundary. However, within that boundary, Project has the scheduling flexibility
to change the start and finish dates of a task. For example, consider a task that must
finish no later than June 22, 2018, but that could finish before this date. Semiflexible constraints are sometimes called soft constraints or moderate constraints.
When a semi-flexible constraint has been applied to a task, Project displays a special
constraint indicator (which looks like a calendar) in the Indicators column.
Inflexible constraints With this type of constraint, a task must begin or end on a
certain date. For example, you can specify that a task must end on November 16,
2018. Inflexible constraints are sometimes called hard constraints. When an
inflexible constraint has been applied to a task, Project displays a constraint
indicator in the Indicators column. You can point to a constraint indicator to display
the constraint details in a ScreenTip.
Use the ScreenTip to get the constraint’s details
In total, there are eight types of task constraints, as described in the following table.
These three constraint categories have different effects on the scheduling of tasks:
Flexible constraints These constraints, such as As Soon As Possible (ASAP), allow
tasks to be scheduled without any limitations other than their predecessor and
successor relationships, and the project’s start date (for ASAP task constraints) or
finish date (for As Late As Possible [ALAP] task constraints). No fixed start or end
dates are imposed by these constraint types. Use these constraint types whenever
possible.
The As Soon As Possible (ASAP) constraint gives you the maximum scheduling
flexibility
For example, consider a schedule in which tasks A and B are linked and task B has
an ASAP constraint applied. As the duration of task A shrinks or grows, the start
date of task B is automatically adjusted accordingly.
Semi-flexible constraints These constraints, such as Start No Earlier Than or Start
No Later Than (SNET or SNLT), limit the rescheduling of a task within the date
boundary you specify.
The Start No Earlier Than (SNET) constraint limits your scheduling flexibility starting
at the constraint date
With an SNET type of constraint, tasks A and B are linked and task B has an SNET
constraint set to day 4. If task A’s duration decreases, the start of task B is
unaffected. However, if task A’s duration extends, Project adjusts task B’s start date
automatically.
Inflexible constraints These constraints, such as Must Start On (MSO), prevent the
rescheduling of a task. Use these constraint types only when absolutely necessary.
A Must Start On (MSO) constraint “pins” the start date of a task to a specific date, with
no scheduling flexibility
In this example, tasks A and B are linked and task B has an MSO constraint set to
day 4. If task A’s duration decreases or increases, the start of task B is unaffected.
The type of constraint you apply to the tasks in your plans depends on what you need from
Project. You should use inflexible constraints only if the start or finish date of a task is
fixed by factors beyond the control of the project team. Examples of such tasks include
handoffs to clients and the end of a funding period. For tasks without such limitations, you
should use flexible constraints. Flexible constraints provide the most discretion in
adjusting start and finish dates, and they allow Project to adjust dates if your plan changes.
For example, if you used ASAP constraints and the duration of a predecessor task changes
from four days to two days, Project adjusts, or pulls in, the start and finish dates of all
successor tasks. However, if a successor task has an inflexible constraint applied, Project
cannot adjust its start or finish dates.
Here are a few other things to keep in mind when applying constraints to tasks:
Entering a finish date for a task (for example, in the Finish column) applies a Finish
No Earlier Than constraint to the task.
Entering a Start date for a task (for example, in the Start column) or dragging a
Gantt bar directly on the Gantt chart applies a Start No Earlier Than constraint to the
task.
In many cases, entering a deadline date is a preferable alternative to entering a semi-
flexible or inflexible constraint. You will work with deadline dates in Chapter 10,
“Fine-tune task details.”
Unless you specify a time, Project schedules a constraint date’s start or finish time
by using the Default Start Time or Default End Time value that is set on the
Schedule tab of the Project Options dialog box. (To open this dialog box, click the
File tab to display the Background view, and then click Options.) The default start
time is 8:00 A.M. If you want a constrained task to be scheduled to start at a
different time, enter that time along with the start date. For example, if you want to
schedule a task to start at 10:00 A.M. on July 19, 2018, enter 7/19/18 10AM in the
Start field.
If you must apply semi-flexible or inflexible constraints to tasks in addition to task
relationships, you might create what is called negative slack. For example, assume
that you have a successor task that has a finish-to-start relationship with its
predecessor task. If you enter a Must Start On constraint for the successor task
earlier than the finish date of the predecessor task, this results in negative slack and a
scheduling conflict. By default, the constraint date applied to the successor task
overrides the relationship. However, if you prefer, you can set Project to honor
relationships over constraints. To do so, in the Project Options dialog box, on the
Schedule tab, clear the Tasks Will Always Honor Their Constraint Dates check box.
If you must schedule a project from a finish date rather than a start date, some
constraint behaviors are different. For example, the As Late As Possible constraint
type, rather than As Soon As Possible, becomes the default for new tasks. You
should pay close attention to constraints when scheduling from a finish date to make
sure that you create the effect you intend.
To apply a task constraint
1. Select the name of the task to which you want to apply a constraint.
Important
The task must be automatically scheduled; task constraints do not apply to
manually scheduled tasks.
2. On the Task tab, in the Properties group, click the Information button.
Tip
Double-clicking a task name is a quick way to open the Task Information dialog
box.
3. In the Task Information dialog box, click the Advanced tab.
4. In the Constraint Type box, select the constraint type you want.
5. All constraint types except As Soon As Possible and As Late As Possible require a
constraint date. In the Constraint Date box, enter or select the date you want, and
then click OK.
To remove a task constraint
1. Select a task that has had a constraint applied.
2. On the Task tab, in the Properties group, click the Information button.
3. In the Task Information dialog box, click the Advanced tab.
4. In the Constraint Type box, select As Soon As Possible or (if scheduling from the
project finish date) As Late As Possible.
Interrupt work on a task
When initially planning project tasks, you might know that work on a certain task will be
interrupted. Rather than listing a task twice to account for a known interruption in work,
you can split the task into two or more segments. The following are some reasons why you
might want to split a task:
You anticipate an interruption in a task. This might be the case, for example, if the
facility where a task must be performed will not be accessible midway through the
task’s duration.
A task is unexpectedly interrupted. After a task is underway, a resource might have
to stop work on the task because some other issue has taken priority. After the other
issue is resolved, the resource can resume work on the task.
You drag the mouse pointer within a Gantt bar to split the task into multiple segments.
Split a task to account for an interruption of work on the task
After you split a task, Project draws a dotted line between the two segments of the task in
Gantt chart views.
Here are a few other things to keep in mind when splitting tasks:
You can drag a segment of a split task either left or right to reschedule the split.
The time of the task split, represented by the dotted line, is not counted in the
duration of the task. No work occurs during the split.
You can hide the dotted line between segments if you want, by clearing the Show
Bar Splits check box in the Layout dialog box. (You can access this dialog box by
clicking the Layout button in the Format group on the Format tab.)
If the duration of a split task changes, the last segment of the task is increased or
decreased accordingly.
If a split task is rescheduled (for example, if its start date changes), the entire task is
rescheduled, splits and all. The task keeps the same pattern of segments and splits.
Resource leveling or manually contouring assignments over time can cause tasks to
split. You will contour assignments in Chapter 11, “Fine-tune resource and
assignment details,” and level resources in Chapter 12, “Fine-tune the Project plan.”
To split a task into multiple segments
1. If the task’s Gantt bar is not visible in the chart portion of the Gantt chart view,
select the task name and then, on the Task tab, in the Editing group, click Scroll to
Task.
2. On the Task tab, in the Schedule group, click the Split Task button (which looks
like a broken Gantt bar) to display a ScreenTip and change the mouse pointer to
task-splitting mode.
3. Move the mouse pointer over the Gantt bar of the task (but don’t click) until the
start of the split you want appears in the ScreenTip.
4. Click, and then drag the mouse pointer to the right until the start date that you want
for the new segment appears in the ScreenTip. Release the mouse button.
Tip
If you initially don’t get the result you want, you can undo the split (press Ctrl+Z)
and try again.
To reschedule the second segment of a split task
1. Drag the second or later segment of the task to the new start date that you want.
Tip
If you drag the first segment of a split task, you will reschedule the entire task and
introduce an SNET constraint on the task. To adjust the split between the first and
second segments of a split task, drag the second segment, not the first.
To rejoin two segments of a split task
1. Drag one segment of the task until it touches the other segment.
Adjust working time for individual tasks
Occasionally you might want a specific task to occur at a time that differs from the
working time of the project calendar. Or perhaps you want a task to occur at a time outside
of the assigned resource’s normal working time, as determined by the resource’s calendar.
To accomplish this, you apply a task calendar to such tasks. As with the project calendar,
you specify which base calendar to use as a task calendar. Here are some examples of
when you might need a task calendar:
You are using the Standard base calendar as your project calendar, with 8:00 A.M. to
5:00 P.M. as your normal working hours, and you have a task that must run
overnight.
You have a task that must occur on a specific weekday.
You have a task that must occur over a weekend.
Project treats tasks differently from resources, in that it does not create calendars as you
create tasks. (If you need a refresher on resource calendars, see Chapter 5, “Set up
resources.”) When you need a task calendar, you assign a base calendar to the task. This
base calendar might be one that is provided with Project or a new base calendar that you
create.
Tip
One benefit of creating a new calendar by copying the Standard base calendar is
that all the working-day exceptions from the Standard calendar that you have
already entered, such as holidays, will also appear in the new calendar. Any future
changes made to either calendar do not affect the other calendar, however.
For tasks that have both a task calendar and resource assignments, Project schedules work
during the working times that are common between the task calendar and resource
calendars. If there is no common working time, Project alerts you when you apply the task
calendar or assign a resource to the task.
When you apply a task calendar to a task, you can choose to ignore resource calendars for
all resources assigned to the task. Doing so causes Project to schedule the resources to
work on the task according to the task calendar and not their own resource calendars (for
example, to work 24 hours per day).
To create a new base calendar
1. On the Project tab, in the Properties group, click the Change Working Time
button to open the Change Working Time dialog box.
2. In the Change Working Time dialog box, click Create New Calendar to open the
Create New Base Calendar dialog box.
When creating a new base calendar, give it a name that will make sense to anyone who
works with it
3. In the Name box, enter the name of the new base calendar, and then do either of the
following:
• To create a new calendar with Monday–Friday, 8:00 A.M.–5:00 P.M. working
times, click Create new base calendar.
• To create a new calendar that initially matches an existing base calendar, click the
Make a copy of option and then select the base calendar you want from the list.
4. Click OK.
5. To enter the working-time details for this new calendar, in the Change Working
Time dialog box, on the Exceptions and Work Weeks tabs, enter the specific
working time exceptions or global changes you want for this calendar.
6. Click OK to close the Change Working Time dialog box.
To apply a base calendar to a task
1. Select the name of the task to which you want to apply the base calendar.
2. On the Task tab, in the Properties group, click the Information button to open the
Task Information dialog box.
3. Click the Advanced tab.
4. In the Calendar box, select the base calendar from the list of available base
calendars.
Use the Calendar field in the Task Information dialog box to apply a base calendar to a
task
5. Click OK to close the dialog box. Project applies the base calendar to the task; for
this task, the base calendar is its task calendar. A calendar icon appears in the
Indicators column, reminding you that this task has a task calendar applied to it.
6. To see the calendar details, point to the calendar icon. A ScreenTip appears,
showing the calendar details.
Use the ScreenTip to see the calendar’s name
Control task scheduling by using task types
You might recall from Chapter 6, “Assign resources to tasks,” that Project uses the
following formula to calculate a task’s work value:
Duration × Assignment Units = Work
Each value in this formula corresponds to a task type. A task type determines which of the
three values remains fixed if the other two values change. You can change a task’s type to
better control its scheduling as you change its work, duration, or assignment units values.
The default task type is fixed units: If you change a task’s duration, Project will recalculate
work. Likewise, if you change a task’s work, Project will recalculate the duration. In either
case, the units value is not affected.
The two other task types are fixed duration and fixed work. For these task types, when
Project responds to schedule changes, it records the highest units value per assignment in a
field called Peak.
For a fixed-work task:
You can change the assignment units value and Project will recalculate the duration.
You can change the duration value and Project will recalculate peak units. The
assignment units value is not affected.
Important
You cannot turn off effort-driven scheduling for a fixed-work task. If you need a
refresher on effort-driven scheduling, see “Control work when adding or removing
resource assignments” in Chapter 6, “Assign resources to tasks.”
For a fixed-duration task:
You can change the assignment units value and Project will recalculate work.
You can change the work value and Project will recalculate peak units. The
assignment units value is not affected.
Important
You cannot change the task type of a manually scheduled task; the effect of
changing the task type on the scheduling of a task as described here applies only to
automatically scheduled tasks. If you need a refresher on manually scheduled tasks,
see Chapter 4, “Build a task list.”
You can change a task type at any time. Note that characterizing a task type as fixed does
not mean that its duration, assignment units, or work values are unchangeable. You can
change any value for any task type.
Which is the right task type to apply to each of your tasks? It depends on how you want
Project to schedule that task.
This table summarizes the effects of changing any value for any task type; it works like
a multiplication table
Changing a task type has no immediate effect on a plan. To better see the effect of task
types, let’s look at an example of how task types determine how tasks are rescheduled in
response to a change in duration, work, or assignment units.
Consider the new book plan, which can be shown in a customized Task Usage view (with
the addition of the Peak field), and with the Task Form visible. With this view
combination you can see work, duration, assignment units, and Peak values. This example
focuses on task 8, Copyedit. Its task type is fixed units, the default task type.
In this customized split view, you can see the selected task’s work, duration, assignment
units, and Peak values
Assignment units, Peak, and the assignment calculation
In early versions of Project, it was possible that a resource’s initial assignment units
value would change, and this led to unexpected results with regard to the
assignment calculation. This behavior changed starting with Project 2010. Project
now tracks both the assignment units value and a calculated value called Peak.
Project uses the assignment units value when initially scheduling or later
rescheduling a task, but it reports a resource’s maximum assignment units value as
Peak. Peak is the assigned resource’s highest calculated assignment units value
subsequent to the initial assignment calculation. Here’s one example: If you initially
assigned a resource at 100% assignment units to a one-day, fixed-unit task, Project
used that value to initially calculate 8 hours of work. However, if you then recorded
10 hours of actual work on the task, versions of Project prior to 2010 would have
recalculated the assignment units to be 120% to keep the assignment calculation
accurate. If you then added more work or changed the duration of the task, Project
would have scheduled the task by using the 120% assignment units value—
probably not the result you’d want. Project 2010 and later, however, record the
120% peak value, and if you subsequently add work or change the duration of the
task, Project uses the original assignment units value of 100% rather than the peak
value of 120% to reschedule the task.
Task 8, with the default task type of Fixed Units, has a total work value of 240 hours, a
resource assignment units value of 200% (that’s the equivalent of two full-time
copyeditors), and a duration of 15 days. When we increase the task’s duration to 20 days,
we can observe the effects on the other values.
After the task’s duration is changed to 20 days, Project increases the work to 320 hours.
Change highlighting is applied to the Work and Finish date values.
With a fixed-units task type, a change to duration causes Project to recalculate work
As expected, the assignment units values were not changed with this fixed-units task type.
Now let’s look at what happens when we start with the original 15-day duration task and
240 hours of work, but this time make it a fixed-duration task and change its work value.
After we change the task’s work to 320 hours, Project updates Peak units but keeps the
duration the same.
With a fixed-duration task type, a change to work causes Project to recalculate Peak
units
The copyeditors’ increased peak units value of 267% appears in the Peak field. This value
accounts for the schedule change while Project preserves the original assignment units
value of 200%, as shown in the Task Form.
Changing a task’s default task type lets you “lock in” how Project will handle one of the
three assignment calculation variables as either of the other two variables changes.
However, you always have the final word on how a task responds to changed assignment
calculation variables via the Actions button. (If you need a refresher on the Actions
button, see Chapter 6, “Assign resources to tasks.”)
Regardless of the task’s type, you can fine-tune how Project responds to a scheduling
adjustment by using the Actions button
As you fine-tune your plans in Project, you might find times when a quick adjustment to
Project’s response to a schedule change via the Actions button is sufficient. At other times,
you might choose to change a task type to more consistently control how Project will
handle its scheduling.
Task types and effort-driven scheduling
Many people misunderstand task types and effort-driven scheduling and conclude
that these two issues are more closely related than they really are. Both settings can
affect your schedule. Although the effect of a task type applies whenever you edit a
task’s work, duration, or unit values, effort-driven scheduling affects your schedule
only when you’re assigning or removing resources from tasks. For more
information about effort-driven scheduling, see Chapter 6, “Assign resources to
tasks.”
To view or change a task’s task type
1. Select the name of the task whose task type you want to change. The task must be
automatically scheduled; task types do not apply to manually scheduled tasks.
2. On the Task tab, in the Properties group, click the Information button.
3. In the Task Information dialog box, click the Advanced tab.
4. In the Task Type field, do either of the following:
• Note the current task type.
• Select the new task type that you want.
5. Click OK to close the Task Information dialog box.
Tip
You can also view the task type in the Task Form. When your plan is in a taskfocused view, display the Task Form by clicking Details on the View tab, in the
Split View group.
See task schedule details by using the Task Inspector
The Task Inspector is a pane you can display in Project that succinctly reveals the
scheduling factors that affect the selected task. These factors include predecessor task
relationships, resource calendars, task calendars, or a combination of factors. In some
cases, the Task Inspector includes options to resolve schedule issues such as resource
overallocation.
The Task Inspector pane displays details about the selected task, in addition to options
under Actions to address schedule problems
For example, consider a task, Proof and review (task 22), whose predecessor is task 20,
Cover design. The Task Inspector pane shows that Project has proposed two actions to
resolve the resource overallocation: Move task to resources’ next available time, and View
overallocated resources in Team Planner.
You can click most items in the Task Inspector that are displayed in blue to get details
about those items. For example, you can click the assigned resource’s name under
Calendars to see that resource’s calendar. You do not need to display the Task Inspector to
change task details, but it can be a handy tool.
To display schedule details of a task in the Task Inspector pane
1. Display a task-centric view such as a Gantt chart view.
2. On the Task tab, in the Tasks group, click the Inspect button to open the Task
Inspector pane.
3. Click a task. In the Task Inspector pane, you can view the scheduling factors
affecting the selected task.
Skills review
In this chapter, you learned how to:
See task relationships by using Task Path
Adjust task link relationships
Control task scheduling by using constraints
Interrupt work on a task
Adjust working time for individual tasks
Control task scheduling by using task types
See task schedule details by using the Task Inspector
Practice tasks
The practice files for these tasks, ViewTaskPath and ScheduleTasksAdvanced, are located
in the Project2016SBS\Ch09 folder.
Important
If you are running Project Professional with Project Web App/Project Server, take
care not to save any of the practice files you work with in this book to Project Web
App (PWA). For more information, see Appendix C, “Collaborate: Project,
SharePoint, and PWA.”
See task relationships by using Task Path
The scenario: At Lucerne Publishing, at an upcoming team meeting, you’d like to
demonstrate some of the more complex task dependencies in a new children’s book plan.
Open ViewTaskPath, and perform the following tasks:
1. Apply the Task Path command to task 29, Send to color house. First highlight the
predecessors, then the driving predecessors, then the successors, and finally, the
driven successors tasks.
With Task Path highlighting applied, you can more clearly distinguish task relationships
in a Gantt chart view
2. Remove the Task Path highlighting.
3. Close the ViewTaskPath practice file.
Adjust task link relationships
The scenario: Editorial and design work on a new children’s book is about to begin. At
this stage, you have an initial plan with task names, durations, relationships, and resource
assignments. Now you want to fine-tune those task relationships. Open
ScheduleTasksAdvanced, and perform the following tasks:
1. Add lag between task 31, Print and ship, and its predecessor, task 30, Generate
proofs, so that task 31 starts three working days after task 30 finishes.
2. Overlap task 10, Copyedit incorp, with its predecessor, task 9, Author review of
copyedit, when task 9 is at the 25 percent remaining point of its duration. Hint:
Remember that lag is entered as negative lead time.
Project treats a negative lag value as lead time
3. Change the task relationship between task 14, Interior illustration design, and its
predecessor, task 13, Set pages, to start-to-start (SS).
This is what finish-to-start with lead time and start-to-start task relationships look like
in a Gantt chart view
Control task scheduling by using constraints
The scenario: A task in the new children’s book plan cannot start quite as early as you had
expected. Tad Orman, the children’s book author, needs to proofread his book—this work
is accounted for in task 16, Proofread and index. However, Tad has informed you that
because of his travel schedule, he will be unable to start his review before July 20—later
than currently scheduled. Continuing in the ScheduleTasksAdvanced plan, perform the
following tasks:
1. Apply a Start No Earlier Than (SNET) constraint of 7/20/18 to task 16, Proofread
and index.
2. Point to the icon in the Indicators column to see the constraint details in a
ScreenTip.
After applying the SNET constraint, point to the constraint indicator to see its details
Interrupt work on a task
The scenario: You’ve learned that work on a task in the new children’s book plan will be
interrupted. You’d like to account for this in the plan by recording the interruption, during
which no work should be scheduled, but keep the assigned work values on the task
unchanged. Continuing in the ScheduleTasksAdvanced plan, perform the following task:
1. Split task 3, Content edit, so that its first segment runs through the end of the day on
Friday, April 13, and its second segment begins on Thursday, April 19.
The segments of a split task are connected by a dotted line
Adjust working time for individual tasks
The scenario: You need to record that a task in the new children’s book project has a more
restrictive working time than the rest of the tasks. The plan includes a task for the handoff
of final book proofs to a color-setting services firm, which then prepares the book for
commercial printing. However, this firm only does this type of work Mondays through
Wednesdays. Continuing in the ScheduleTasksAdvanced plan, perform the following
tasks:
1. Create a new base calendar named Mon-Wed Task Calendar. Set its weekly work
settings so that Monday, Tuesday, and Wednesday are normal workdays, but
Thursday and Friday (and weekends) are nonworking days.
2. Apply the Mon-Wed Task Calendar base calendar to task 29, Send to color house.
The task calendar causes Project to reschedule the task to the next available working
day, which is the following Monday. A calendar icon appears in the Indicators
column, reminding you that this task has a task calendar applied to it.
3. Point to the calendar icon in the Indicators column to see the task’s calendar details
in a ScreenTip.
After applying the base calendar to the task, point to the calendar indicator to see its
name
Control task scheduling by using task types
Scenario: The default task type of Fixed Units works for most of the tasks in the new book
plan. However, there is a task for which you’d like to keep the duration fixed. Continuing
in the ScheduleTasksAdvanced plan, perform the following tasks:
1. Display the Task Usage view with the Task Form, and then click task 24, Final
review, in the Task Usage view.
This split view includes the selected task’s essential scheduling values, in addition to its
task type
You can see that task 24 is set to Fixed Units and has a total work value of 96 hours,
a resource assignment units total value of 300%, and a duration of 4 days.
2. Change task 24 to Fixed Duration and then, in the Task Usage view, increase total
work to 120 hours.
After adding work to the fixed-duration task, note the schedule changes and light-blue
change highlighting
As expected, the duration didn’t change, but the total work increased. Consequently,
the assigned resources are overallocated; their Peak units (not visible in this view,
but see the next set of practice tasks) are now 125 percent each. The resources can
handle this level of overallocation for this task.
See task schedule details by using the Task Inspector
The scenario: You’ll use the Task Inspector to investigate some questions that came up at
the team meeting about what’s driving the scheduling of a couple of tasks. Continuing in
the ScheduleTasksAdvanced plan, perform the following tasks:
1. Ensure that task 24, Final review, is still selected in the Task Usage view, and then
display the Task Inspector to view additional information about this task.
You can see some of the details, including the peak units based on adding additional
work on the task in the previous practice task. Notice that Project is giving you
additional actions that you can take to resolve the overallocation of those resources
who are working beyond their capacity. As the project manager, you are aware of
this situation and will work with the affected resources accordingly.
Use the Task Inspector to see details and troubleshoot scheduling issues for the selected
task
2. Click task 22, Proof and review, and review details about this task.
Project indicates that there is a resource, Hany Morcos, who is overallocated due to
work on other tasks. Task 22 ends on the same day Hany starts work on task 24,
causing her overallocation; again, she is aware of this overallocation and what needs
to be done to manage the work on that day.
In the Actions area, the Task Inspector pane includes remedies to some scheduling
problems such as overallocated resources (note that the Team Planner feature shown
here is available in Project Professional only, not Project Standard)
3. In the Task Inspector, click the resource name Hany Morcos to view her resource
calendar.
4. Close the Change Working Time dialog box, and then close the Task Inspector.
10. Fine-tune task details
In this chapter
Enter deadline dates
Enter fixed costs
Create a recurring task
View the plan’s critical path
Schedule summary tasks manually
Practice files
For this chapter, use the FineTuneTasks practice file from the Project2016SBS\Ch10
folder. For practice file download instructions, see the introduction.
In this chapter, you continue the deep dive into task-management features that you began
in the previous chapter. This chapter focuses on specific features you can apply to
individual tasks.
This chapter guides you through procedures related to entering deadline dates, entering
fixed costs, creating a recurring task, viewing the plan’s critical path, and scheduling
summary tasks manually.
Enter deadline dates
One common mistake made by new Project users is to place semi-flexible or inflexible
constraints on too many tasks in their plans. Such constraints severely limit your
scheduling flexibility. (If you need a refresher on task constraints, see “Control task
scheduling by using constraints” in Chapter 9, “Fine-tune task scheduling.”)
In many cases, setting a deadline date for a task is a better choice. When you set a
deadline for a task, you identify the latest date by which you want the task to be
completed. The deadline date itself does not constrain the scheduling of the task. Project
displays a deadline symbol on the chart portion of a Gantt chart view. If the task’s finish
date moves past its deadline date, a missed deadline indicator (a red exclamation point)
appears in the Indicators field for that task. When you spot the missed deadline indicator,
you can take corrective steps.
Here’s an example of how you might use a deadline rather than a constraint. Assume that
you have a five-day task that you want completed by April 20. If you enter a Must Finish
On constraint on the task and set it to April 20, Project will move the task out so that it
will indeed end on April 20.
When the constraint is applied to task 13, Project keeps the finish-to-start task
relationship with its predecessor but reschedules the task to honor its constraint type
and date
Even if the task could be completed earlier, Project will not reschedule it to start earlier. In
fact, by applying that constraint, you have increased the risk for this task. If the task is
delayed for even one day for any reason (if a required resource is sick, for example), the
task will miss its planned finish date.
A better approach to scheduling this task is to use the default As Soon As Possible
constraint and then enter a deadline of April 20.
The deadline date lets you keep track of the important target finish date, but gives you
greater scheduling flexibility
Now the task has the greatest scheduling flexibility. It might be completed well before its
deadline, depending on resource availability, predecessor tasks, and whatever other
scheduling issues apply. If the scheduled completion of the task moves past its deadline
date, Project will display the missed deadline indicator in the Indicators column.
The missed deadline indicator appears if the task’s finish date is scheduled after the
deadline date
You can then take corrective action to pull in the task’s finish date prior to its deadline.
To set a deadline date on a task
1. Select the task for which you want to set a deadline.
2. On the Task tab, in the Properties group, click the Information button to open the
Task Information dialog box, which contains details about the currently selected
task.
Tip
Double-clicking a task name is a quick way to open the Task Information dialog
box.
3. Click the Advanced tab, and then in the Deadline field, enter or select the date you
want.
4. Click OK to close the Task Information dialog box.
Tip
You can also change an existing deadline date by dragging the deadline indicator in
the chart portion of a Gantt chart view.
To remove a deadline date
1. Select the task that has a deadline date applied.
2. On the Task tab, in the Properties group, click the Information button.
3. In the Task Information dialog box, click the Advanced tab.
4. Clear the Deadline field.
Enter fixed costs
For plans in which you must track a budget or financial costs, you might need to work
with several different sources of costs. These include costs associated with resources, in
addition to costs associated directly with specific tasks.
For many plans, financial costs are derived mainly from costs associated with work
resources (people and equipment) or with material resources. To handle costs of similar
types for which you want to track aggregate sums (travel is one example in many plans),
Project supports cost resources. (If you need a refresher on cost resources, see Chapter 5,
“Set up resources.”)
However, you might occasionally want to associate a cost with a task that is not tied to
resources or work and is not something you want to aggregate across the plan as a cost
resource. In such cases, apply a fixed cost to the task. A fixed cost is a specific monetary
amount budgeted for a task. It remains the same regardless of the task’s duration and any
costs of resources that could be assigned to it.
The following are common examples of fixed costs in plans:
A setup fee, charged in addition to a per-day rental fee, for a piece of equipment
A building permit
If you assign resources with pay rates, assign cost resources, or add fixed costs to a task,
Project adds all of these costs together to determine the task’s total cost. For example,
consider a final review task whose total cost is the sum of a work resource assignment’s
cost plus a fixed cost. The resource costs are derived from the resource pay rates times the
resources’ assignments to the task.
The total cost breakdown is clearly shown in the Task Usage view with the Cost table
displayed
You can specify when fixed costs should accrue, as follows:
Start The entire fixed cost is scheduled for the start of the task. When you track
progress, the entire fixed cost of the task is incurred as soon as the task starts.
End The entire fixed cost is scheduled for the end of the task. When you track
progress, the entire fixed cost of the task is incurred only after the task is completed.
Prorated (default accrual method) The fixed cost is distributed evenly over the
duration of the task. When you track progress, the plan incurs the cost of the task at
the rate at which the task is completed. For example, if a task has a $100 fixed cost
and is 75 percent complete, the plan has incurred $75 against that task.
When you plan a project, the accrual method you choose for fixed costs determines how
those costs are scheduled over time. This can be important in anticipating budget and
cash-flow needs. By default, Project uses the prorated accrual method for fixed costs, but
you can change that to match your organization’s cost accounting practices.
To enter a fixed cost amount and accrual method
1. On the View tab, in the Task Views group, select any task-centric view that includes
a table, such as the Gantt Chart, Task Sheet, or Task Usage view.
2. On the View tab, in the Data group, click the Tables button, and then click Cost.
3. In the Fixed Cost field, enter the fixed cost amount you want.
4. In the Fixed Cost Accrual field, click the accrual method you want.
Create a recurring task
Many projects require repetitive tasks, such as attending team meetings, creating and
publishing status reports, or running quality-control inspections. Although it is easy to
overlook the scheduling of such events, you should consider accounting for them in your
plan. After all, team meetings and similar events that indirectly support the project require
time from resources, and such events take time away from your resources’ other
assignments.
To help account for such events in your plan, create a recurring task. As the name
suggests, a recurring task is repeated at a specified frequency such as daily, weekly,
monthly, or yearly. When you create a recurring task, Project creates a series of tasks with
Start No Earlier Than constraints, effort-driven scheduling turned off, and no task
relationships defined.
Recurring tasks in Project are similar to recurring appointments in calendar programs such
as Microsoft Outlook. When you set up a recurring task, you set its recurrence pattern (for
example, daily or once per week) and the applicable timespan or number of occurrences.
Setting up a recurring task in Project is similar to setting up a recurring meeting in a
calendar program
You also can assign resources and perform other task-centric activities with recurring
tasks.
All occurrences of a recurring task are organized under a single summary recurring task.
As with a regular summary task, the duration of a summary recurring task spans the
earliest start to latest finish date of the individual occurrences of the recurring task. Each
occurrence of the recurring task is sequentially numbered. Initially, the recurring task is
displayed in expanded form.
Individual occurrences of a recurring task are sequentially numbered (you may need to
widen the Task Name column to see the full task names)
You can collapse the summary recurring task to save screen space. When you do, the
summary recurring task is presented a little differently than a regular summary task.
The summary recurring task shows each occurrence of the recurring task rather than a
regular summary Gantt bar
Here are a few other things to keep in mind when working with recurring tasks:
By default, Project schedules a recurring task to start at the plan’s default start time.
If you want to schedule a recurring task to start at a different time, enter that time
along with the start date in the Start box of the Recurring Task Information dialog
box. For example, if you want the recurring staff meeting to be scheduled for 10:00
A.M. starting on April 16, 2018, you would enter 4/16/18 10 AM in the Start box.
You can set a recurring task to end either after the number of occurrences you
specify or on a specific date. If you schedule a recurring task to end on a specific
date, Project suggests the current project end date. If you use this date, be sure to
change it manually if the project end date changes later.
If you want to assign the same resources to all occurrences of a recurring task (or
remove them from the recurring task), use the Assign Resources dialog box to assign
them to the recurring summary task. Don’t enter resource names in the Resource
Name field of the summary recurring task. Doing so assigns the resources to the
summary recurring task only and not to the individual occurrences.
You can assign resources to all occurrences of the summary recurring task, to a
specific occurrence, or a combination.
To create a recurring task
1. Display a task-centric view, such as a Gantt chart.
2. Select the task above which you want to insert the recurring task.
3. On the Task tab, in the Insert group, click the Task arrow (not the button), and then
click Recurring Task to open the Recurring Task Information dialog box.
4. In the Task Name field, enter the recurring task’s name.
5. In the Duration field, enter the duration of each occurrence of the recurring task.
6. Under Recurrence pattern, specify how often the task should repeat.
7. Under Range of recurrence, specify a start date. For the end date, you can specify
either a specific number of occurrences or an end date.
8. Under Calendar for scheduling this task, if you want the recurring task to use a
specific base calendar, select that calendar. If you want the selected calendar to
override resource calendars so that assigned resources are scheduled to the recurring
tasks at times they might not normally work, select the Scheduling ignores
resource calendars check box.
9. Click OK.
Tip
To edit a recurring task, double-click the summary recurring task’s name to open
the Recurring Task Information dialog box. Then make your changes.
To assign resources to a recurring task
1. Select and expand the summary recurring task.
2. On the Resource tab, in the Assignments group, click the Assign Resources
button.
3. In the Assign Resources dialog box, select the resources you want to assign to the
recurring task. To select multiple resources, hold down the Ctrl key while selecting
additional names.
4. Click OK.
To assign resources to a specific occurrence of a recurring task
1. Expand the summary recurring task to show its occurrences.
2. Select the specific occurrence to which you want to assign a resource.
3. On the Resource tab, in the Assignments group, click the Assign Resources
button.
4. In the Assign Resources dialog box, select the resources you want to assign to the
recurring task’s occurrence. To select multiple resources, hold down the Ctrl key
while selecting additional names.
5. Click OK.
View the plan’s critical path
A critical path is the series of tasks that will push out the plan’s end date if any of those
tasks are delayed. The word critical in this context has nothing to do with how important
these tasks are to the overall plan. It refers only to how their scheduling will affect the
plan’s finish date. However, the plan’s finish date is of great importance to most projects.
If you want to shorten the duration of a plan to bring in the finish date, you must begin by
shortening (also referred to as crashing) the critical path.
Over the life of a project, the plan’s critical path is likely to change from time to time as
tasks are completed ahead of or behind schedule. Schedule changes, such as changing task
relationships or durations, can also alter the critical path. In fact, Project automatically
recalculates the critical path in response to schedule changes even if you never display the
critical path.
One key to understanding the critical path is to understand slack, also known as float.
There are two types of slack: free and total. The amount of time a task can be delayed
before it delays another task is referred to as Free slack. Total slack is the amount of time
a task can be delayed before it delays the completion of the plan. (Note that after a task on
the critical path is completed, it is no longer critical because it cannot affect the plan’s
finish date.)
A task is on the critical path if its total slack is less than or equal to a certain threshold—by
default, if its slack is zero days (you can adjust this threshold if you want). In contrast,
noncritical tasks have slack, meaning that they can start or finish earlier or later within
their slack time without affecting the completion date of the plan.
As this Gantt chart view is formatted, both the tasks on the critical path (in red) and the
free slack of noncritical tasks are displayed
Tip
The Task Path feature introduced in Chapter 9, “Fine-tune task scheduling,”
distinguishes between the selected task’s predecessor and successor relationships.
The critical path, in contrast, applies to whatever sequence of linked tasks in a plan
drives the plan’s finish date.
Working with the critical path is the most important way to manage a plan’s overall
duration. Checking the critical path and, when necessary, shortening the overall duration
are important project management skills.
Here are a couple of other things to keep in mind when working with the critical path:
Critical tasks and free slack are represented in the chart portion of the Detail Gantt
view, and you can also see the values of free and total slack in the Schedule table.
You can apply the Schedule table to any Gantt chart or Task Sheet view.
Another way to identify the tasks on the critical path is to select Critical in the
Highlight or Filter box on the View tab, in the Data group.
Tip
To learn more about the critical path, click the Tell Me box at the top of the Project
window, and in the Search box, enter critical path.
To display the plan’s critical path
1. On the Format tab, in the Bar Styles group, select the Critical Tasks check box.
Project applies red formatting to the critical tasks’ Gantt bars.
Tip
You can adjust the Gantt chart’s timescale to see more or less of the plan by
clicking the Zoom In or Zoom Out command in the lower-right corner of the
screen.
To display slack for noncritical tasks
1. On the Format tab, in the Bar Styles group, select the Slack check box. Project
draws slack lines from the finish dates of the Gantt bars of the noncritical tasks.
To change the slack threshold for a task to be considered critical
By default, Project defines a task as critical if it has zero slack. However, you can
change the amount of slack required for a task to be considered critical. You might
do this, for example, if you want to more easily identify tasks that are within one or
two days of affecting the project’s finish date.
1. Click the File tab to display the Backstage view, and then click Options.
2. In the Project Options dialog box, click Advanced.
3. On the Advanced page, in the Tasks Are Critical If Slack Is Less Than Or Equal
To box in the Calculation options of this project section, enter the number of days
you want.
Schedule summary tasks manually
In Chapter 4, “Build a task list,” you worked with summary tasks and subtasks. Recall that
the default behavior of Project is to automatically calculate a summary task’s duration as
the span of time between the earliest start and latest finish dates of its subtasks. For this
reason, Project sets summary tasks as automatically scheduled—their durations are
automatically determined by their subtasks, regardless of whether those subtasks are
manually or automatically scheduled (or are a mix of both).
There might be times, however, when you want to directly enter a duration value for a
summary task that is independent of its calculated duration as determined by its subtasks.
For example, a summary task might represent a phase of work for which you want to
allocate 60 working days and compare that duration with the calculated duration
determined by the subtasks (their durations, task relationships, and other factors). This is
especially likely during the initial planning of a plan, when you might need to account for
the gap between how long you’d like a phase of work to take and its duration as
determined by its subtasks.
Fortunately, you can enter any duration you want for a summary task. When you do so,
Project switches the summary task from automatic to manually scheduled and reflects
both durations as separate parts of the summary task’s Gantt bar. The upper bar represents
the duration of the manually scheduled task, and the lower bar represents the
automatically scheduled duration.
It’s useful to compare the duration of a manually scheduled task and its new finish date
with the automatically scheduled duration and finish date as determined by the subtasks of
the summary task. You can also point to the summary task’s Gantt bars in the chart portion
of a Gantt chart view. The ScreenTip that appears includes these and other values.
Use the ScreenTips for both parts of the Gantt bar of a manually scheduled summary
task to view important scheduling details
When you enter a duration for a manually scheduled summary task, Project makes the
following adjustments to the schedule:
The summary task is switched from automatically scheduled (the default for
summary tasks) to manually scheduled. Note the pin icon in the Task Mode column
that reflects the task’s scheduling status.
Project draws two Gantt bars for the summary task. The upper bar represents the
duration of the manually scheduled task, and the lower bar represents the
automatically scheduled duration.
Project draws a red squiggly line under the new finish date to flag it if there is a
potential scheduling conflict.
Project reschedules the summary task’s successor tasks based on the summary task’s
manually entered duration.
Setting a manually scheduled duration for a summary task is a good way to apply a topdown focus to a plan. You can, for example, introduce some slack or buffer to a phase of
work by entering a manually scheduled duration for the summary task that is longer than
its calculated duration. Conversely, you can enter a preferred manually scheduled duration
that is shorter than the scheduled duration of a summary task to give the assigned
resources a more aggressive target to work toward.
To enter a manually scheduled duration on a summary task
1. In the Duration field of a summary task, enter the manually scheduled duration
value you want.
To see the manually and automatically scheduled durations and other
details on a summary task
1. Point to the upper or lower part of the summary task’s Gantt bar. Project displays
different ScreenTips for each part of the Gantt bar: the lower bar, which represents
the summary task as it is automatically scheduled; and the upper bar, which
represents it as it is manually scheduled.
To convert a manually scheduled summary task back to an automatically
scheduled summary task
1. Click the Task Mode field of the summary task, and then click the arrow that
appears.
2. In the list, click Auto Scheduled.
Skills review
In this chapter, you learned how to:
Enter deadline dates
Enter fixed costs
Create a recurring task
View the plan’s critical path
Schedule summary tasks manually
Practice tasks
The FineTuneTasks practice file for these tasks is located in the Project2016SBS\Ch10
folder.
Important
If you are running Project Professional with Project Web App/Project Server, take
care not to save any of the practice files you work with in this book to Project Web
App (PWA). For more information, see Appendix C, “Collaborate: Project,
SharePoint, and PWA.”
Enter deadline dates
The scenario: At Lucerne Publishing, the publisher has directed that the acquisition tasks
for the new children’s book should not slip past a certain date. You’d like to flag this date
without unduly restricting your scheduling flexibility in the plan. Open the FineTuneTasks
plan in Project, and perform the following task:
1. Set a deadline date of 6/1/18 on task 5, Handoff to Editorial. This task is a milestone
marking the end of the acquisition phase of the new book project.
Task 5 is a milestone task that signifies the scheduled completion of a major phase of
work—a good candidate for a deadline date
Enter fixed costs
The scenario: You’ve learned that the generating of page proofs by the color-setting
services firm will cost $500. You’d like to schedule this expense to accrue when the colorsetting services firm completes the task. Continuing in the FineTuneTasks plan, perform
the following tasks:
1. Enter a fixed cost of $500 on task 30, Generate proofs.
2. Set the fixed cost to accrue at the end of the task.
The Cost table is a handy place to enter a fixed cost on a task
Create a recurring task
The scenario: The new children’s book project requires a weekly status meeting involving
some, but not all, of the resources working on the project. You’d like this recurring status
meeting to have visibility in the plan. Continuing in the FineTuneTasks plan, perform the
following tasks:
1. Insert a new recurring task named Editorial staff meeting so that it appears above
task 1, Acquisition. The recurring task should have a one-hour duration every
Monday, starting on April 16, 2018, and ending by July 9, 2018.
2. Assign the following resources to the summary recurring task:
• Carole Poland
• Hany Morcos
• Jun Cao
Although you assigned resources to the summary recurring task, their names appear
next to each occurrence of the recurring task
3. Collapse the summary recurring task.
The summary recurring task’s Gantt bar shows each occurrence of the recurring task
but hides the names of assigned resources; this is handy for seeing just when the
recurring task will occur
View the plan’s critical path
The scenario: You are frequently asked when the new children’s book project will be
completed. You can quickly see the project’s overall duration and finish date in Project,
but occasionally you need to show a project stakeholder the project’s critical path, because
that sequence of tasks drives the project’s duration. One way to see the critical path is to
format critical tasks. Continuing in the FineTuneTasks plan, perform the following tasks:
1. Display critical tasks in the plan.
With critical path formatting applied, it’s easier to see the chain of tasks that is driving
the plan’s finish date
2. Turn off the critical tasks formatting.
Schedule summary tasks manually
The scenario: The publisher has challenged the team to aim for a 30-working-day duration
for the Editorial phase of the new children’s book project. You’ll enter a manual duration
on the Editorial summary task and later compare that duration with the automatically
scheduled duration provided by Project. Continuing in the FineTuneTasks plan, perform
the following tasks:
1. Enter a 30-day duration on summary task 20, Editorial. Entering a duration value
for the summary task switches it to be manually scheduled.
2. Check task 20’s updated schedule details in each of its Gantt bar’s ScreenTips.
When working with manually scheduled summary tasks, note the pin indicator (which
indicates that the task is manually scheduled) and the two parts of the Gantt bar, each
of which can display a helpful ScreenTip
11. Fine-tune resource and assignment details
In this chapter
Change resource availability over multiple date ranges
Work with multiple resource pay rates
Change resource pay rates over different date ranges
Delay the start of assignments
Apply contours to assignments
Create and assign material resources
View resource capacity
Adjust assignments in the Team Planner view (Project Professional only)
Practice files
For this chapter, use the practice files from the Project2016SBS\Ch11 folder. For
practice file download instructions, see the introduction.
Because work resources (people and equipment) are often the most expensive part of a
project, understanding how to make the best use of resources’ time is an important project
management skill. In this chapter, you use a variety of advanced Project 2016 features
relating to resources—their availability, assignments to tasks, and resulting costs. Project
Professional users also use the Team Planner view to manage assignments (this feature is
not available in Project Standard).
This chapter guides you through procedures related to changing resource availability over
multiple date ranges, working with multiple resource pay rates, changing resource pay
rates over different date ranges, delaying the start of assignments, applying contours to
assignments, creating and assigning material resources, viewing resource capacity, and
adjusting assignments in the Team Planner view (Project Professional only).
Change resource availability over multiple date ranges
One of the values that Project stores for each work resource is the resource’s maximum
units value. This is the maximum capacity of a resource to accomplish tasks. A resource’s
working-time settings (recorded in the individual resource’s calendar) determine when
work assigned to a resource can be scheduled. However, the resource’s capacity to work
(as defined by the resource’s maximum units value) determines the extent to which the
resource can work within those hours without becoming overallocated. A resource’s
maximum units value does not prevent a resource from becoming overallocated, but
Project will indicate when the resource’s assignments exceed the resource’s maximum
units capacity.
See Also
For a refresher on resource capacity, see Chapter 5, “Set up resources.”
You can specify that a resource’s maximum units value be adjusted from one date range to
another. Changing a resource’s availability over time enables you to control exactly what a
resource’s maximum units value will be at any time. For example, you might have two
copyeditors available for the first eight weeks of a project, three for the next six weeks,
and then two for the remainder of the project. Or you might have a compositor who is
normally available at 100 percent capacity reduced to just 50 percent capacity for six
weeks, and then returned to full capacity.
You customize a resource’s availability in the Resource Information dialog box. You do so
by specifying maximum units per date range in the Resource Availability table in the
dialog box. When NA (for not applicable) appears at the beginning of the first date range,
it means that the resource has no specific start date for their availability. When it is at the
end of the final date range, it means that the resource has no specific end date. Every
resource’s initial availability is unspecified, or NA.
Set up multiple date ranges for resource availability on the General tab of the Resource
Information dialog box
Project shows the then-current maximum units value for the resource wherever maximum
units are displayed (such as in the Resource Sheet view). Project uses the current date
based on your computer’s system clock to identify the correct date range and its maximum
units value.
To customize a resource’s availability over time
1. On the View tab, in the Resource Views group, click Resource Sheet. In the
Resource Sheet view, you can see and edit resources’ maximum units values. The
maximum units values displayed here normally apply to the full duration of the
project.
2. In the Resource Name column, click the name of a resource whose maximum units
value you want to vary at different times.
3. On the Resource tab, in the Properties group, click Information to display the
Resource Information dialog box. If the General tab is not visible, click it.
Tip
Here are a couple of shortcuts for quickly displaying the Resource Information
dialog box. When you are in a resource-centric view such as the Resource Sheet,
right-click the Resource Name and, on the shortcut menu, click Information. Or
double-click a resource name. Double-clicking a resource name also works in the
Assign Resources dialog box when you are in a task-centric view such as a Gantt
chart.
4. Under Resource Availability, in the first row of the Available From column, leave
NA (not applicable).
5. In the Available To cell in the first row, enter or select the end date of the first date
range you want.
6. In the Units cell in the first row, enter a maximum units value for the first date
range.
7. Enter the values for the second date range. In the Available From cell in the second
row, enter or select the start date of the second date range.
8. Do either of the following:
• If you plan to set up a third or additional date range, in the Available To cell in the
second row, enter or select the end date of the second date range you want. Then
repeat steps 7 and 8 for subsequent date ranges.
• If the second date range is the last one you want to set up, leave the Available To
cell in the second row blank. (Project will insert NA for you.)
You can later add additional date ranges with unique maximum units values. Just
leave the final Available To field blank.
9. Click OK to close the Resource Information dialog box.
Work with multiple resource pay rates
Some resources might perform different tasks with different pay rates. You can set up
different pay rates for the same resource, and then specify which rate to use per
assignment (you’ll do so later in this chapter).
For example, in the new children’s book project, the project editor could also serve as a
content editor. Because the costs for project editor and content editor are different, you can
set up two cost rate tables for the resource (additionally, a cost rate table can include a
standard pay rate and an optional overtime rate, and even a per-use cost). Then, after you
assign the resource to tasks, you specify which pay rate should apply.
Each work or material resource can have up to five different pay rates, each recorded in a
cost rate table. You set up pay rates in the cost rate tables on the Costs tab of the Resource
Information dialog box. The default rate table (the rate Project applies unless you specify
another one) is on tab A. If you completed the practice tasks in Chapter 5, “Set up
resources,” you might recognize the pay rates you initially entered for resources. You can
create up to four additional rate tables on tabs B through E.
Create up to five different cost rate tables (including standard and overtime rates, and
per-use cost) on the Costs tab of the Resource Information dialog box
When you assign a resource with one or more pay rates to a task, Project initially uses cost
rate table A by default. However, you can specify that another rate table should be used.
You do so on the General tab of the Assignment Information dialog box.
After setting up multiple cost rate tables for a resource, you can pick which table to use
for individual assignments
To create an additional cost rate table for a resource
1. On the View tab, in the Resource Views group, click Resource Sheet.
2. In the Resource Sheet view, click a resource name.
3. On the Resource tab, in the Properties group, click Information to open the
Resource Information dialog box.
4. Click the Costs tab.
5. In the Cost rate tables area, click the B C, D, or E tab.
6. In the Standard Rate and Overtime Rate fields, enter the pay rate values you
want. In addition to or instead of pay rates, you can also enter a value in the Per Use
Cost field.
7. Click OK to close the Resource Information dialog box.
To change the cost rate table to be applied to an assignment
1. Do either of the following:
• On the View tab, in the Task Views group, click Task Usage.
• On the View tab, in the Resource Views group, click Resource Usage.
As with other assignment-level activities, you can perform this procedure in either
view.
2. Select the assignment you want to edit.
3. On the Format tab, in the Assignment group, click Information to open the
Assignment Information dialog box. Click the General tab if it is not already
selected.
4. In the Cost Rate Table box, select a cost rate table, and then click OK to close the
Assignment Information dialog box.
Tip
If you frequently change cost rate tables for assignments, you will find it quicker to
display the Cost Rate Table field directly in the Resource Usage or Task Usage
view. To do so, display the right edge of the table portion of a usage view, click Add
New Column, and then select Cost Rate Table.
Change resource pay rates over different date ranges
When you set up pay rates for a resource, Project uses those rates for the duration of the
plan. However, you can change a resource’s rates to be effective as of the dates you
choose. For example, you could initially set up a resource with a standard rate of $40 per
hour, and plan to raise the resource’s standard rate to $44 per hour six months later.
You set up the effective date of each pay rate on the Costs tab of the Resource Information
dialog box, which was introduced in the previous topic.
The Effective Date determines when a resource’s pay rate is applied to work the
resource performs
Project uses pay rates when calculating resource costs based on when the resource’s work
is scheduled. You can assign up to 25 pay rates to be applied at different times in each of a
resource’s five cost rate tables.
You can use a couple of different formats to enter the additional pay rates; Project is
flexible. You can:
Enter a pay rate as a specific dollar value.
Enter a percentage change from the previous rate. Enter a positive percentage value
(for example 5%) for an increase. Enter a negative percentage (for example, –3%)
for a decrease. Project calculates the new rate, and it replaces the percentage value
you entered.
For example, in the Resource Usage view, you might see the cost of a resource’s
assignment change midway through the assignment when the effective date of a new pay
rate applies.
The Effective Date for Jane Dow’s new pay rate occurred midway through her
assignment to the Set Pages task; the resulting change in cost is shown.
To set up a different resource cost rate to apply later
1. On the View tab, in the Resource Views group, click Resource Sheet.
2. In the Resource Sheet view, click a resource name.
3. On the Resource tab, in the Properties group, click Information to open the
Resource Information dialog box.
4. Click the Costs tab. If you’ve set up multiple cost rate tables, click the tab of the
cost rate table you want to change. Leave the resource’s original pay rate as-is for
the first row; you will enter the upcoming effective date and pay rate in the second
row.
5. In the Effective date cell in the second row, enter or select a date, and then enter the
new pay rates. The new rates can include standard or overtime rates and per-use cost
value. If you want to add multiple future pay rate changes, enter them in
chronological order on subsequent rows.
6. Click OK to close the Resource Information dialog box.
Delay the start of assignments
Tip
So far in this chapter, we’ve focused on resource details. For the remainder of the
chapter, the focus shifts to fine-tuning assignment details.
If more than one resource is assigned to a task, you might not want all the resources to
start working on the task at the same time. You can delay the start of work for one or more
resources assigned to a task.
Let’s look at a specific example. The new children’s book plan includes a task to which
both a copyeditor and the book author, Tad Orman, are assigned. The intent of this task is
that the author will review the edits made to his book manuscript, and shortly afterward,
the copyeditor will begin to incorporate the author’s feedback.
Here’s what the assignments initially look like in the Task Usage view
Right now, both resources have work that is assigned to them throughout the duration of
the task, but you’d like to delay the start of the copyeditor’s work by two working days.
You do so in the assignment-level Start field.
After changing the start date of the copyeditor’s assignment, you can see the later start of
the copyeditor’s work on the task accounted for in the timephased portion of the view.
Here’s what the assignments look like after the copyeditor’s start date for the
assignment has been adjusted
The other resource assigned to the task is not affected. Note that the total work of this task
did not change, but its duration did—the finish date moved out two working days.
To delay the start of a resource assignment on a task
1. On the View tab, in the Task Views group, click Task Usage. The Task Usage view
groups the assigned resources below each task. It’s a useful view for this activity.
2. In the Start field of the resource assignment you want to delay, enter or select a new
start date.
Tip
If you want an assignment to start at a specific time in addition to on a specific date,
you can specify the time in the Start field. For example, if you want the resource’s
assignment to start at 1:00 P.M. on May 1, 2018, enter 5/1/18 1:00 PM. Otherwise,
Project uses the default start time. To change the default start time, enter the value
you want in the Default Start Time field on the Schedule page of the Project
Options dialog box.
Apply contours to assignments
In the Resource Usage and Task Usage views, you can see exactly how each resource’s
assigned work is distributed over time. In addition to viewing assignment details, you can
change the amount of time a resource works on a task in any given time period. There are
various ways to do this:
Apply a predefined work contour to an assignment. Predefined contours generally
describe how work is distributed over time in terms of graphical patterns. For
example, the Bell predefined contour distributes less work to the beginning and end
of the assignment and distributes more work toward the middle. If you were to graph
the work over time, the graph’s shape would resemble a bell.
This assignment has a bell-shaped contour applied; note the contour indicator in the
Indicators column
Edit the assignment details directly. For example, in the Resource Usage or Task
Usage view, you can change the assigned work values directly in the timescaled
grid.
This assignment has been directly edited in the timephased portion of the Task Usage
view; note the indicator
Edit work values at the task level. When you change a work value at the task level,
Project adjusts the resulting work value per assignment in accordance with each
assigned resource’s units value. For example, assume that on a specific day, two
resources were assigned four hours each to a task that had a total work value of eight
hours. If you then change the total work on the task for that day to 12 hours, Project
will increase the work per resource from four to six hours.
The total work was edited for the task, and Project updated the assigned resources’
individual work values according to their assignment units values; note the indicators
How you contour or edit an assignment depends on what you need to accomplish.
Predefined contours work best for assignments in which you can predict a likely pattern of
effort—for example, a task that requires gradual ramp-up time might benefit from a backloaded contour to reflect the likelihood that the resource will work the most toward the
end of the assignment.
Here are a few more things to note about contouring assignments:
Depending on the task type, applying a contour to an assignment might cause the
overall duration of the task to be extended. Applying a contour to a fixed-duration
task will not affect its duration. When you apply a contour to a fixed-duration task,
Project recalculates the resource’s work value so that the resource works less in the
same time period. For a fixed-work or fixed-unit task, however, the duration will be
affected. If you do not want a contour to extend a task’s duration, change the task
type (on the Advanced tab of the Task Information dialog box) to Fixed Duration
before applying the contour.
You can split a task in the Gantt Chart view to account for an interruption in the
task, as you saw in Chapter 9, “Fine-tune task scheduling.” You can also split a task
in the Task Usage view by entering 0 work values in the task’s row in the
timephased grid for the date range that you want. To preserve the total work on the
task, you should add the same amount of work to the end of the task that you
subtracted with the split. For example, assume that a task starts on Monday and has
eight hours of total work per day for four days. Its work pattern (in hours per day) is
8, 8, 8, and 8. You interrupt work on the task on Tuesday and then add those eight
hours to the end of the task (in this case, on Friday). The new work pattern would be
8, 0, 8, 8, and 8.
When editing values in the timephased grid, you can work with the cells similar to
how you might work in a Microsoft Excel worksheet—you can drag values and use
the AutoFill handle to copy values to the right or down.
To apply a predefined work contour to an assignment
1. Do either of the following:
• On the View tab, in the Task Views group, click Task Usage.
• On the View tab, in the Resource Views group, click Resource Usage.
Both of these views show assignment-level work values per time period, such as
daily or weekly. The Task Usage view groups assignments per task, whereas the
Resource Usage view groups assignments per resource.
2. Click the assignment to which you want to apply a predefined contour.
Tip
The next two steps are not required, but they can help you see the result of applying
a work contour.
3. On the View tab, in the Zoom group, click the arrow next to the Timescale box and
click the smallest unit of time (such as Days) that you want displayed in the right
side of the usage view.
4. On the Task tab, in the Editing group, click Scroll to Task.
5. On the Format tab, in the Assignment group, click Information. The Assignment
Information dialog box opens.
6. Click the General tab if it is not already selected.
7. Click the arrow to display the options in the Work Contour box. These are all
predefined work contours; some of the names of the contours are graphical
representations of a resource’s work over time with that contour applied.
8. Select the contour pattern you want, and then click OK to close the Assignment
Information dialog box. Project applies the contour to the selected assignment. If the
timescaled work values are visible, you should see the updated work values per time
period. You will also see a contour indicator in the Indicators column.
To manually edit work per time period for an assignment
1. Do either of the following:
• On the View tab, in the Task Views group, click Task Usage.
• On the View tab, in the Resource Views group, click Resource Usage.
2. If the assignment values you want to edit are not visible, select the resource’s name
in the Task Name column.
3. On the Task tab, in the Editing group, click Scroll to Task.
4. On the View tab, in the Zoom group, click the arrow next to the Timescale box and
click the smallest unit of time (such as Days) that you want displayed in the right
side of the usage view.
5. In the timescaled grid in the right pane of the usage view, edit the assignment values
you want. These appear in the details row labeled Work.
Create and assign material resources
Material resources are consumables that you use up as the project proceeds. For example,
on a construction project, material resources might include nails, lumber, and concrete.
You work with material resources in Project to track a fixed quantity or a rate of
consumption of the material resource and its associated costs. Unlike with work resources,
maximum units values do not apply to cost and material resources, because neither type
performs work.
Although Project is not a complete system for tracking inventory, it can help you stay
better informed about how quickly your project is consuming material resources, and at
what cost. Let’s look at an example.
Note the unique value in the Material field for material resources
This example is of a material resource named Advance proofs. This resource has a
Material label named copies. Copies are the unit of measure of this material resource;
other types of material resources would have different labels. A liquid material resource
might be labeled (and measured) in gallons or liters, for example. This material resource
has a per-unit cost of $15. In other words, each copy of an advance proof used in the
project costs the plan $15.
Assigning a material resource to a task is similar to assigning work resources, but with
some important differences. When you assign a material resource to a task, you specify the
unit quantity for the task. Project then calculates the cost of the material resource
assignment as the per-unit cost you specified times the number of units on the assignment.
Recall that material resources are used up or “consumed” as a project progresses.
Common material resources you might find on a construction project, for example,
include lumber and concrete.
With material resource assignments, “units” refers to the quantity of the material
resource assigned; this appears as the material resource label throughout Project
When assigning a material resource, you can handle consumption and cost in one of two
ways:
Assign a fixed consumption rate This means that, regardless of the duration of the
task to which the material resource is assigned, an absolute quantity of the resource
will be used. For example, pouring concrete for a house foundation requires a fixed
amount of concrete no matter how long it takes to pour it. Project multiplies the unit
cost of this resource by the number of units assigned to determine the total cost.
Assign a variable-rate quantity Project adjusts the quantity and cost of the
resource as the task’s duration changes. A variable consumption rate means that the
quantity of the material resource consumed depends on the duration of the task.
When operating a generator, for example, you will consume more fuel in four hours
than in two, and you can determine an hourly rate at which you consume the fuel.
You enter a variable consumption rate in units per time period; for example, you
enter “2/h” to record the consumption of two gallons of fuel per hour. After you
enter a variable consumption rate for a material resource’s assignment, Project
calculates the total quantity of the material resource consumed based on the task’s
duration.
The advantage of using a variable rate of consumption is that the rate is tied to the task’s
duration. If the duration changes, the calculated quantity and cost of the material resource
will also change. When you need this level of cost tracking for a material resource, use a
variable consumption rate.
To set up a material resource
1. On the View tab, in the Resource Views group, click Resource Sheet.
2. In the Resource Sheet, click the row where you want to insert a new material
resource.
3. On the Resource tab, in the Insert group, click Add Resources, and then click
Material Resource. Project inserts a new row for the material resource.
4. Enter a name for the material resource.
5. In the Material Label field, enter the name of the unit of measure of the material
resource.
6. In the Std. Rate field, enter the per-unit cost of the material resource, and then press
Enter.
To assign a material resource to a task
1. In a task-centric view, such as the Gantt Chart, select the name of the task to which
you want to assign the material resource.
2. On the Resource tab, in the Assignments group, click Assign Resources to open
the Assign Resources dialog box.
3. Do either of the following:
• To assign a fixed consumption rate, in the Units field for the material resource,
enter or select the quantity of the material resource you want to assign.
• To assign a variable consumption rate, in the Units field for the material resource,
enter the variable consumption rate in units per time period. For example, enter 2/h
to set a consumption rate of two units of the material resource per hour.
View resource capacity
Recall that the amount of time that a resource is able to work on tasks in a project is called
the resource’s maximum capacity; in Project, this is measured in units. By default, such
units are presented as a percentage value, with 0% meaning no capacity and 100%
meaning the full or maximum capacity of a single resource with the normal working
schedule of 40 hours per week. In Project, a resource’s maximum capacity to do work is
tracked as the resource’s maximum units (labeled Max. Units) value.
Even experienced project managers have been known to overestimate resource capacity
for the people allocated to work on a particular project. This can lead to unhappy
resources and problems during the execution of a project, especially when the project
manager has also underestimated the amount of work required to complete the tasks in the
project. There are many legitimate reasons to expect some variability with task work
estimates—especially in the initial planning stage of a project. This topic introduces some
useful tools in Project that can help you better see and understand resource capacity.
Viewing the working capacity per resource gives you a better understanding of overall
capacity for your project. This, in turn, can help inform you and the project’s stakeholders
about any adjustments you might be able to make to the scope of the project to better
match the capacity of the team (or adjustments you can make to the team’s capacity to
better match project scope). Normally, you can expect one of the following conditions for
resource capacity:
Planned work is less than the working capacity of the team. You might be able to use
some portion of your resources’ time for other projects or to do more work on this
project.
Planned work exceeds the working capacity of the team. You might need to reduce
the scope of work or add more resources.
Planned work is approximately equal to the working capacity of the team.
Tip
This approach to understanding project scope and resource capacity is explored
further in Appendix A, “A short course in project management.”
A customized Resource Usage view is a great view in which to see resource capacity.
This customized Resource Usage view shows individual resource capacity and assigned
allocation at a glance
In the Resource Usage view, the left pane organizes tasks under the resources to which the
tasks are assigned. The right pane shows assignment and other values organized on the
timeline. A handy customization is to show only the Remaining Availability and Percent
Allocation details; hide resource assignments, and set the view’s zoom level to whatever
incremental time period your team normally plans for, such as weekly or monthly.
Tip
In this topic, we’ve focused on resource capacity as shown in the Resource Usage
view. Other Project features that help you see and manage resource capacity include
the Resource Graph view (available from the Other Views menu in the Resource
Views group on the View tab) and the two resource-focused reports (available from
the Resources menu in the View Reports group on the Report tab).
To view resource capacity per time period
1. On the View tab, in the Resource Views group, click Resource Usage.
2. On the Format tab, in the Details group, click Add Details to open the Detail
Styles dialog box.
3. In the Available Fields list, select Percent Allocation, and then click Show.
4. Select Remaining Availability, click Show, and then click OK to close the dialog
box. To further simplify the view, also perform the following steps.
5. On the Format tab, in the Details group, clear the Work check box. Project hides
the Work details, leaving the Percent Allocation and Remaining Availability details
visible.
6. Click the Resource Name column heading.
7. On the View tab, in the Data group, click Outline, and then click Hide Subtasks.
Project hides assignments, leaving only the resource rows visible.
8. On the View tab, in the Zoom group, in the Timescale box, click the time period
you want. Use whatever time period your team normally focuses on; daily or weekly
might be a good level of focus for resource availability.
Adjust assignments in the Team Planner view (Project Professional only)
Important
The Team Planner view is available only in Project Professional, not in Project
Standard. If you have Project Standard, you can skip this topic.
By now you’ve seen how to work in the Task Usage and Resource Usage views to
accomplish detailed tasks like manually contouring resource assignments. Another view
that can help give you insights into tasks, resources, and assignments is the Team Planner
view.
In the Team Planner view, tasks are organized by the resource to which they are assigned
(as in the Resource Usage view) and any unassigned tasks are also visible. Both assigned
and unassigned tasks might be either:
Scheduled tasks These tasks are scheduled for a specific time period and displayed
in the Team Planner view at a specific point in time.
Unscheduled tasks These tasks are manually scheduled.
The Team Planner view supports a simple drag-and-drop method of rescheduling or
reassigning tasks.
When working in the Team Planner view, use the ScreenTips to see the full names and
other details of visible tasks
What makes the Team Planner unique is its support for drag-and-drop scheduling and
other means of handling assignments:
Drag tasks to assign, reassign, reschedule, or unschedule them.
Right-click an assigned task and reassign it to another resource.
The Team Planner view supports many of the view adjustment and navigation techniques
you use elsewhere in Project. These include:
Using the Scroll To Task button (on the Task tab, in the Editing group) to
horizontally scroll the timescale portion of the view to display task assignments
(bars).
Displaying ScreenTips to see the full name and other details for tasks that might not
be fully visible in a Team Planner task bar.
Making timescale adjustments by using the Timescale box (on the View tab, in the
Zoom group).
Displaying overallocated resource names in red.
Important
Dragging an automatically scheduled task horizontally will apply a Start No Earlier
Than (SNET) constraint. The Team Planner describes the constraint in the task
bar’s ScreenTip, and you will see the constraint’s indicator in Gantt chart views.
To assign and schedule unassigned tasks
1. On the View tab, in the Resource Views group, click Team Planner to display the
Team Planner view.
Tip
You can also click the Team Planner view shortcut on the status bar, in the lowerright corner of the Project window.
2. Drag a task and drop it into a resource’s row, at the start date you want. The task
you drag can be from the unassigned and unscheduled tasks corner in the lower-left
corner, or from the unassigned but scheduled corner in the lower-right. The task is
assigned and scheduled but remains a manually scheduled task until you switch it to
be automatically scheduled.
Tip
You can also assign but not schedule a task by dragging it to a resource’s
Unscheduled Tasks column.
To schedule assigned but unscheduled tasks
1. In the Team Planner view, drag a task from the Unscheduled Tasks column of the
view and drop it into a resource’s row, at the start date you want. The task is
assigned and scheduled but remains a manually scheduled task until you switch it to
be automatically scheduled.
To reassign a task from one resource to another
1. In the Team Planner view, right-click the assigned task and, on the shortcut menu
that appears, click Reassign To. Then select the resource to whom you want to
assign the task.
Tip
You can also reassign tasks by dragging them from one resource to another. To
better control the scheduling of tasks when you reassign them this way, set the
timescale to daily (to do this, click Days in the Timescale box in the Zoom group on
the View tab).
Skills review
In this chapter, you learned how to:
Change resource availability over multiple date ranges
Work with multiple resource pay rates
Change resource pay rates over different date ranges
Delay the start of assignments
Apply contours to assignments
Create and assign material resources
View resource capacity
Adjust assignments in the Team Planner view (Project Professional only)
Practice tasks
The practice files for these tasks, FineTuneResources and FineTuneAssignments, are
located in the Project2016SBS\Ch11 folder.
Important
If you are running Project Professional with Project Web App/Project Server, take
care not to save any of the practice files you work with in this book to Project Web
App (PWA). For more information, see Appendix C, “Collaborate: Project,
SharePoint, and PWA.”
Change resource availability over multiple date ranges
The scenario: At Lucerne Publishing, you secured additional copyediting capacity for a
portion of the duration of the new children’s book plan. You need to record this in the
plan. Open the FineTuneResources plan in Project, and then perform the following task:
1. Customize the copyeditors’ resource availability. Set the time periods as follows:
• The first time period should end on 5/3/18 at 200% maximum units.
• The second period should start on 5/4/18 and end on 6/3/18 at 300% maximum
units.
• The third period should start on 6/4/18 at 200% maximum units; keep NA for the
end of the period.
The copyeditors’ availability should look like this; note where the NA values appear
Work with multiple resource pay rates
The scenario: Hany Morcos is currently assigned to task 36, Proof and review, as a content
editor rather than in her default role of project editor. You will set up and apply a different
pay rate to account for her content editor role on this task. Continuing in the
FineTuneResources plan, perform the following tasks:
1. Create an additional cost rate for Hany Morcos by using cost rate table B. Set her
additional standard pay rate to $45 per hour and her overtime rate to $60 per hour.
Enter Hany Morcos’s second cost rate in the table on tab B
2. Display the Cost table in the Task Usage view. You can more easily see the change
in the assignment cost in this table.
3. Apply the cost rate table B to Hany Morcos’s assignment to task 36, Proof and
review.
After you apply rate table B, Hany Morcos’s updated assignment cost should change
from $1,550 to $1,800
Change resource pay rates over different date ranges
The scenario: You anticipate one of your resources who is working on the new children’s
book plan to receive a pay raise during the book plan’s duration. To keep the plan’s cost
calculations accurate, you need to account for this pay raise. Continuing in the
FineTuneResources plan, perform the following task:
1. Enter a pay rate increase for Jane Dow in the default cost rate table A. The effective
date is 7/2/18 and the standard rate increase is 15%.
The additional cost rate values apply only after the Effective Date arrives
Delay the start of assignments
The scenario: The new children’s book plan includes a task to which both a copyeditor and
the book author, Tad Orman, are assigned. Right now, both resources are assigned work
throughout the duration of the task, but you’d like to delay the start of the copyeditor’s
work by two working days. Open the FineTuneAssignments plan in Project, and then
perform the following task:
1. In the Task Usage view, delay the start of the copyeditors’ assignment on task 18,
Author review of content edit, to 5/7/18.
The copyeditors’ assignment to task 18 should look like this after editing
Apply contours to assignments
The scenario: One of the resources working on the new children’s book tells you that she
knows from past experience that the daily work pattern she expects on one of her tasks
doesn’t match the task as it is currently scheduled. You want to update the plan to more
accurately model the expected work contour on this assignment. You also have another
assignment that requires an adjustment. Continuing in the FineTune-Assignments plan,
perform the following tasks:
1. In the Task Usage view, apply a back-loaded work contour to Carole Poland’s
assignment to task 38, Final review.
After applying the back-loaded contour to this assignment, note the contour indicator in
the Indicators column—point to it to see details about the contour in a ScreenTip
Because task 38 is a fixed-duration task, Project recalculated the assignment-level
work but did not change the task’s duration.
2. Manually edit Hany Morcos’s assignment to task 38, Final review. Change her
assignment on Wednesday and Thursday, September 5 and 6, 2018, from 4 hours to
8 hours each.
Hany Morcos’s edited assignment should look like this
Create and assign material resources
The scenario: The advance proofs of the new children’s book are the consumable resource
that interests you most. These are high-fidelity mockups of the new book that are created
before the book is commercially printed. Because the advance proofs are expensive to
produce, you’d like to account for their costs in the plan. To do so, you need to create and
assign a material resource. Continuing in the FineTuneAssignments plan, perform the
following tasks:
1. Create a material resource named Advance proofs with the material label of copies,
the initials AP, and a standard rate of $15 at the bottom of the resource list. This is
the per-unit cost of this material resource; put another way, each copy of an advance
proof costs $15.
The material resource you set up should look like this
2. In the Gantt Chart view, open the Assign Resources dialog box.
3. Assign the material resource Advance proofs to task 38, Final review. Specify 20
units.
When assigning a material resource, note the Units and Cost values in the Assign
Resources dialog box
View resource capacity
The scenario: At this point in the planning for the new children’s book project, you’ve set
up an initial task list and initial resource details. Now you’ll examine resource capacity in
detail. Continuing in the FineTuneAssignments plan, perform the following tasks:
1. In the Resource Usage view, show only the Percent Allocation and Remaining
Availability details.
2. Hide the assignments under the resource names.
3. Zoom the timescale to days.
This customized Resource Usage view gives you at-a-glance insight into the workload
and availability of each resource
Adjust assignments in the Team Planner view (Project Professional only)
The scenario: You have found the Team Planner view to be especially helpful when
reviewing assignments with resources working on the new children’s book plan. You’ve
identified some assignment issues you need to address, and you will do so in the Team
Planner view. Continuing in the FineTuneAssignments plan, perform the following tasks:
1. Display the Team Planner view.
2. Drag Carole Poland’s unscheduled task, Launch planning, in Carole’s row so that
the task start date is Monday, August 13, 2018.
3. Drag the name of Hany Morcos’s unscheduled task, Assign launch team members,
to Carole Poland’s row so that the task start date is Tuesday, August 14, 2018.
4. Drag the first unassigned task, Complete author questionnaire, to Hany Morcos’s
row so that the task start date is Monday, August 20, 2018.
After assignment changes have been made, the Team Planner view should look like this
12. Fine-tune the Project plan
In this chapter
Examine resource allocations over time
Resolve resource overallocations manually
Level overallocated resources
Check the plan’s cost and finish date
Inactivate tasks (Project Professional only)
Practice files
For this chapter, use the FineTunePlan practice file from the Project2016SBS\Ch12
folder. For practice file download instructions, see the introduction.
In the previous three chapters, we focused on details about tasks, resources, and
assignments. Now, we will dive deeper into optimizing resource assignments. In some
cases, we’ll revisit Project features introduced in previous chapters. In this chapter,
however, the focus is on managing across the entire plan—including overall duration and
cost.
This chapter guides you through procedures related to examining resource allocations over
time, resolving resource overallocations manually, leveling overallocated resources,
checking the plan’s cost and finish date, and inactivating tasks (Project Professional only).
Examine resource allocations over time
In this topic, we focus on resource allocation—how assignments affect the workloads of
the work resources (people and equipment).
Recall from Chapter 5, “Set up resources,” that a resource’s capacity to work is measured
in units; the maximum capacity of a particular resource is called maximum units (labeled
Max Units in Project). Units are measured either as a percentage (such as 300% units) or
as numbers (such as three units).
A resource’s capacity to work in a specific time period is determined by that resource’s
maximum units and resource calendar. The relationship between a resource’s capacity and
that person’s task assignments is called allocation. At any specific time, a work resource
may be:
Underallocated The resource’s assignments do not fill the resource’s maximum
capacity to do work. For example, a full-time resource who has only 25 hours of
work assigned in a 40-hour workweek is underallocated.
Fully allocated The resource’s assignments fill the resource’s maximum capacity.
For example, a full-time resource who has 40 hours of work assigned in a 40-hour
workweek is fully allocated.
Overallocated The resource’s assignments exceed the resource’s maximum capacity
to do work. For example, a full-time resource who has 65 hours of work assigned in
a 40-hour workweek is overallocated.
These states of allocation apply to work resources. Cost and material resources do no
work; therefore, their assignments are not subject to allocation issues.
Project includes several views and features that can help you focus on resource allocation.
By using these views and features, you can do the following:
Set the timeframe threshold (such as daily or weekly) at which Project evaluates a
resource as overallocated or not. You do so in the Resource Leveling dialog box,
which is introduced in the “Level overallocated resources” topic later in this chapter.
See overallocation indicators next to the names of overallocated resources, or the
tasks to which overallocated resources are assigned. Point to any overallocation
indicator to display more details in a ScreenTip.
Use the Resource Graph to see allocations for each resource graphed against a
timescale.
Display the Overallocated Resources report to see the work details of overallocated
resources.
Project Professional users can use the Team Planner view to see assignments per
resource in a simpler format. For more information about the Team Planner view,
see Chapter 11, “Fine-tune resource and assignment details.”
Switch to the Resource Usage view. For more information about this view, see
Chapter 11, “Fine-tune resource and assignment details” and later in this chapter.
Display the Resource Allocation view. This is a combination view that includes the
Resource Usage view in the top pane and the Leveling Gantt view in the lower pane.
We’ll focus on this view in this topic.
In the Resource Allocation combination view, the details in the lower view are specific to
the selected item in the top view (a resource or assignment, in this example). Let’s take a
closer look at the parts of this combination view.
In this Resource Allocation view example, the resource assignments are collapsed
(hidden) below the resource names
On the left side of the Resource Usage view is a table (the Usage table, by default). This
table shows assignments grouped per resource, the total work assigned to each resource,
and each assignment’s work. This information is organized into an outline that you can
expand or collapse.
The right side of the view contains details (work, by default) arranged on a timescale. You
can horizontally scroll the timescale to see different time periods. You can also change the
tiers on the timescale to display data in units of weeks, days, hours, minutes, and seconds.
In the lower pane, the Leveling Gantt view shows the Gantt bars and any slack of the tasks
to which the selected resource is assigned. Slack is represented as a thin line following the
Gantt bar. When a single assignment is selected, the Leveling Gantt view shows the Gantt
details of the specific assignment’s task.
Both panes of the Resource Allocation view are synchronized to the same timescale at the
top of the view. Because the view shows each resource’s assigned work per time period,
it’s easy to pinpoint when underallocations or overallocations occur. Also, you can directly
edit assignment values in the view to address allocation problems.
Project management focus: Evaluate resource allocation
It is tempting to say that fully allocating all resources at every opportunity is every
project manager’s goal, but that would be an oversimplification. Depending on the
nature of your project and the resources working on it, some underallocations might
be perfectly fine. Overallocation might not always be a problem either, depending
on the amount of overallocation. If one resource is overallocated for just a halfhour, Project will flag the overallocation. However, depending on the resource
involved and the nature of the assignment, such a minor overallocation might not be
a problem that you need to solve. Severe overallocation—for example, a resource
being assigned twice the work he could possibly accomplish in one week—is
always a problem, however. You should know how to identify severe
overallocations and maintain strategies for addressing them. This chapter helps you
identify and remedy resource overallocations.
Here are a few other things to keep in mind when examining resource allocations in the
Resource Usage view:
A quick way to navigate to resource overallocations in the Resource Usage view is
to use the Next Overallocation button in the Level group of the Resources tab. The
Next Overallocation button works in a similar way in Gantt chart, Task Usage, and
Calendar views.
By default, the Resource Usage view displays the Usage table; however, you can
display a different table by selecting it from the Table list that is available on the
View tab, in the Data group.
By default, the Resource Usage view displays work values in the timescaled grid.
However, you can display additional assignment values, such as cost and remaining
availability, by selecting another value from the Details group on the Format tab.
To find overallocations in the Resource Allocation view
1. On the View tab, in the Resource Views group, click Resource Allocation to
display the Resource Allocation view.
Tip
The Resource Allocation view is a split view. To hide the bottom pane, clear the
Details check box on the View tab. The Resource Usage view will remain visible.
2. Click anywhere in the Resource Usage view.
3. On the View tab, in the Data group, in the Filter box, select Overallocated
Resources to filter the view to show only overallocated resources.
Tip
To clear the filter, click No Filter.
4. If the selected resource’s work values are not visible in the timescaled grid on the
right side of the view, on the Task tab, in the Editing group, click Scroll to Task.
5. To show the assignments of the selected resource, click the expand/collapse arrow
next to the resource’s name.
Tip
Set the timescale to the time setting that makes the most sense for your organization
or the specific overallocated resource. This is likely to be daily or weekly. You can
change the timeframe by clicking the one you want in the Timescale box on the
View tab, in the Zoom group.
To see allocations for each resource graphed against a timescale
1. On the View tab, in the Resource Views group, click Other Views, and then click
Resource Graph.
2. Use the arrow keys or the horizontal scroll bar to switch between resources in this
view.
To see work details of overallocated resources in the Overallocated
Resources report
1. On the Report tab, in the View Reports group, click Resources, and then click
Overallocated Resources.
Resolve resource overallocations manually
In this topic and the next, we continue to focus on resource allocation—how assignments
affect the workloads of the work resources in the plan. This topic focuses on manually
editing assignments to resolve resource overallocations. The next topic focuses on
automatically resolving resource overallocations.
A great view for editing resource assignment values is the Resource Usage view (either by
itself or in the upper pane of the combination Resource Allocation view, described in the
previous topic).
In the Resource Usage view, overallocated resources (and their assignments) are easy
to spot
In this view, the names of overallocated resources appear in red. You can horizontally
scroll the view to find overallocations. Some might be minor (for example, 42 hours in a
40-hour workweek), whereas others might be severe enough to require more attention.
You directly edit the assigned work values per time period in the right side of the view for
the assignments you want. As you do so, the resource’s total work per time period is
updated.
Rather than editing assignment values, you can delay the start of a task that is causing a
resource overallocation. Because delaying the start of a task is one technique used by
automatic leveling (described in the next section), the delay is referred to as a leveling
delay.
Editing an assignment or task manually is just one way to resolve a resource
overallocation. Other solutions in task-centric views such as a Gantt chart view include the
following:
Replace the overallocated resource with another resource by clicking the Replace
button in the Assign Resources dialog box (available from the Resource tab).
Reduce the value in the Units field in the Assignment Information or Assign
Resources dialog box.
Assign an additional resource to the task so that both resources share the work.
To edit assignment-level work
1. On the View tab, in the Resource Views group, click Resource Usage to display
the Resource Usage view.
2. Locate the overallocated resource you want to focus on (an overallocated resource’s
name is formatted in red).
3. In the timescaled grid, locate the resource’s overallocation you want to resolve.
4. If the resource’s assignments are not visible, click the expand/collapse arrow next to
the resource’s name to show that resource’s assignments.
Tip
You also can expand the outline by pressing Alt+Shift+Plus sign.
5. Edit the work values in the timescaled grid to resolve the overallocation.
To manually add leveling delay
This technique delays the start of a task to resolve an overallocation but does not
change the amount of work on the assignment.
1. On the View tab, in the Resource Views group, click Other Views, click More
Views, and then click Resource Allocation to display the Resource Allocation view.
2. In the upper pane of the view, select an overallocated resource.
3. In the lower pane, identify the overlapping assignments that are causing the
overallocation. The overallocated resource indicator appears next to these task
names.
4. Enter a delay in the start of one of the tasks in the Leveling Delay field. The time
value you enter is an elapsed value, not a working time value. The task’s start date is
adjusted. Note that any other resources assigned to the same task are also delayed,
whether they were overallocated or not.
Level overallocated resources
The previous topics described resource allocation and how to resolve overallocations
manually. This topic introduces the resource leveling feature in Project.
Resource leveling is the process of delaying or splitting a resource’s work on a task to
resolve an overallocation. For example, consider the same full-time resource assigned to
three tasks. On day 1, the resource is fully allocated at 100%. On day 2, the resource is
overallocated at 300%. On day 3, she is again overallocated, this time at 200%.
In this split view, the Resource Graph view below the Gantt Chart view clearly shows
that the resource is overallocated
If you perform resource leveling, Project delays the start dates of the second and third
tasks so that the resource is not overallocated.
Leveling the resource has addressed the overallocation
In this example, the finish date of the latest scheduled task moved from day 2 to day 6.
This is common with resource leveling, which often pushes out the plan’s finish date.
There was a total of six days of work before leveling, but two of those days overlapped,
causing the resource to be overallocated on those days. After leveling, all six days of work
are still there, but the resource is no longer overallocated.
Tip
Although the effects of resource leveling on a schedule might be significant,
resource leveling does not change who is assigned to tasks or the total work or
assignment unit values of those assignments.
You can adjust resource leveling options to control how you want Project to resolve
resource overallocations. Project will apply your settings to resolve overallocations when
you choose to level resources. Depending on the options you choose, this might involve
delaying the start date of an assignment or task, or splitting the work on the task.
Resource leveling is a powerful tool, but it accomplishes only a few basic things: it delays
tasks, splits tasks, and delays resource assignments. It does this by following a fairly
complex set of rules and options that you specify in the Resource Leveling dialog box.
Resource leveling is a great fine-tuning tool, but it cannot replace your good judgment
about resource availability, task durations, relationships, and constraints. Resource
leveling works with all this information as it is entered into your plan, but it might not be
possible to fully resolve all resource overallocations within the timeframe you want unless
you change some of the basic task and resource values in the plan. Additional remedies
might include reducing the overall scope of work or adding additional resources.
Tip
To learn more about resource leveling, enter Level resource assignments in the Tell
Me box located above the ribbon, and then click Get Help On.
As mentioned earlier, the Resource Leveling dialog box is where you tell Project how you
want it to resolve resource overallocations.
Set the leveling options you want in the Resource Leveling dialog box
Tip
If you are using Project Professional rather than Project Standard, the Resource
Leveling dialog box and some other dialog boxes contain additional options relating
to Project Server. (In the Project Professional version of the Resource Leveling
dialog box, the Level Resources With The Proposed Booking Type check box is a
Project Server–related option.) Throughout this book, we won’t use Project Server,
so you can ignore these options for now. For more information about Project Server,
see Appendix C, “Collaborate: Project, SharePoint, and PWA.”
Most of the options in this dialog box are described in Project Help, but let’s look more
closely at a few options that deserve some additional explanation:
The Leveling Calculations group includes some important options:
• Selecting Automatic sets Project to level resources constantly. Automatic leveling
occurs as soon as a resource becomes overallocated.
• Selecting Manual sets Project to level resources only when you tell it to do so.
This is the default setting.
Important
All settings in the Resource Leveling dialog box apply to all plans that you work
with in Project, not only to the active plan. Using automatic leveling might sound
tempting, but it will cause frequent adjustments to plans whether you want them or
not. For this reason, we recommend that you use the Manual setting.
• The selection you make in Look For Overallocations On A <Timeframe> Basis
determines the timeframe Project will use when evaluating whether a resource is
overallocated. If a resource is overallocated, the resource’s name is formatted in
red, and Project also shows the Overallocated indicator next to the resource’s
name.
Tip
On most projects, leveling in finer detail than day by day can result in
unrealistically precise adjustments to assignments. If you prefer not to see
overallocation indicators for day-by-day overallocations, select Week By Week in
the Look For Overallocations On A <Timeframe> Basis box. Doing so will not
level resources, but it will determine when Project displays overallocation
indicators next to resource names.
• Selecting the Clear Leveling Values Before Leveling check box removes any
existing leveling delays from all tasks and assignments before leveling. This
applies regardless of the source of the leveling delays—that is, whether they were
entered manually (see the previous topic) or automatically by prior leveling.
The Leveling Order settings let you control the priority that Project uses to
determine which tasks it should delay to resolve a resource conflict:
• Selecting the ID Only option delays tasks only according to their ID numbers:
numerically higher ID numbers will be delayed before numerically lower ID
numbers (for example, task 10 will be delayed before task 5). You might want to
use this option when your plan has no task relationships or constraints.
• Selecting the Standard option delays tasks according to predecessor relationships,
start dates, task constraints, slack, priority, and IDs.
• Selecting the Priority, Standard option tells Project to look at the task priority
value before the other standard criteria. (Task priority is a numeric ranking
between 0 and 1000 that indicates the task’s appropriateness for leveling. Tasks
with the lowest priority are delayed or split first.)
After you set the leveling options that you want in the Resource Leveling dialog box, you
can level the plan immediately or later via the Level All button (on the Resource tab). You
don’t need to return to the Resource Leveling dialog box unless you want to change
leveling options. The on-demand leveling options are located on the Resource tab, in the
Level group.
A good view for seeing the plan before and after leveling is the Leveling Gantt view.
The Leveling Gantt view is a great view in which to see the before-and-after results of
leveling
In this view, each task has two bars. The top bar represents the pre-leveled task. You can
see a task’s pre-leveled start, finish, and duration by pointing to a light tan–colored bar.
The bottom bar represents the leveled task as it’s now scheduled.
To set leveling options and level resources
1. On the Resource tab, in the Level group, click Leveling Options to open the
Resource Leveling dialog box.
2. In the Resource Leveling dialog box, select the options you want.
3. Do either of the following:
• To level resources now by using the options you’ve set, click Level All.
• To save these options but delay leveling resources until later, click OK.
To level resources by using the current Resource Leveling dialog box
options
1. On the Resource tab, in the Level group, do one of the following:
• Click Level Selection to level resources assigned to the selected tasks.
• Click Level Resource to level the selected resource only.
• Click Level All to level all resources in the plan.
To clear leveling delays
You can remove leveling delays for the entire plan or for selected tasks.
1. On the Resource tab, in the Level group, click Clear Leveling, and then select the
options you want.
To display the Leveling Gantt view
1. On the View tab, in the Task Views group, click the Gantt Chart arrow, and then
click More Views.
2. In the More Views dialog box, click Leveling Gantt, and then click Apply. Project
switches to the Leveling Gantt view.
Check the plan’s cost and finish date
Not all plans include cost information, but for those that do, keeping track of project costs
might be as important as, or more important than, keeping track of the scheduled finish
date. In this topic, we examine both the cost and the finish date of the plan.
Two factors to consider when examining project costs are the specific types of costs you
want to see and how you can best see them. The types of costs that you might encounter
over the life of a project include the following:
Baseline costs The original planned task, resource, or assignment costs that were
saved as part of a baseline plan.
Current (or scheduled) costs The calculated costs of tasks, resources, and
assignments in a plan. As you make adjustments in a plan, such as assigning or
removing resources, Project recalculates current costs much like it recalculates task
start and finish dates. After you start to incur actual costs (typically by tracking
actual work), the current cost equals the actual cost plus the remaining cost per task,
resource, or assignment. Current costs are the values you see in the fields labeled
Cost or Total Cost.
Actual costs The costs that have been incurred for tasks, resources, or assignments.
Remaining costs The difference between the currently scheduled costs and the
actual costs for tasks, resources, or assignments.
You might need to compare these costs (for example, baseline versus actual) or examine
them individually per task, resource, or assignment. Or you might need to examine cost
values for summary tasks or for an entire plan. Some common ways to view these types of
costs include the following:
See the plan’s cost values in the Project Statistics dialog box.
Use the Project Statistics dialog box for an at-a-glance view of essential cost and
schedule values
In the Project Statistics dialog box, you can see the plan’s four total cost values:
Current, Baseline, Actual, and Remaining.
See or print reports that include cash flow, budget, cost overruns for both tasks and
resources, and earned value.
Reports such as the Cost Overruns report present Project data in compelling layouts
See task-level, resource-level, or assignment-level cost information by displaying
the Cost table.
Displaying the Cost table (shown here in the Task Sheet view) is a great way to see cost
details
Here you can see many types of cost values for the overall plan (the total cost of the
project summary task, which is task 0), project phases (summary tasks), and
individual tasks.
See cost details distributed over time in a usage view.
Display the Cost table and Cost detail in the Task Usage view to see the most granular
cost values
In addition to cost, the finish date is a critical (often the most critical) measure of a plan. A
plan’s finish date is a function of its duration and its start date. Most projects have a
preferred finish date (also called a soft finish date), and many projects have a must-hit
finish date (also called a hard finish date). When managing projects like these, it is
essential that you know the plan’s current or scheduled finish.
Project management focus: Finish date and critical tasks
In the language of project management, a project’s finish date is determined by its
critical path. The critical path is the series of tasks whose delay will push out the
project’s end date. For this reason, when evaluating the duration of a project, you
should focus mainly on the tasks on the critical path, which are called critical tasks.
Remember that the word critical has nothing to do with how important these tasks
are to the overall project. The word refers only to how their scheduling will affect
the project’s finish date. If you need a refresher on critical paths, see Chapter 10,
“Fine-tune task details.”
To see cost and finish date in the Project Statistics dialog box
1. On the Project tab, in the Properties group, click Project Information.
2. In the Project Information dialog box, click Statistics.
Tip
Another way to open the Project Statistics dialog box is to click the File tab to open
the Backstage view. On the Info page, click Project Information, and then click
Project Statistics.
To display the Costs report
1. On the Report tab, in the View Reports group, click Costs.
To display the Cost table in the Task Sheet view
1. On the View tab, in the Task Views group, click Other Views, and then click Task
Sheet.
2. On the View tab, in the Data group, click Tables, and then click Cost to display the
Cost table.
To display cost distributed over time in the Task Usage or Resource Usage
view
1. On the Format tab, in the Details group, click Add Details, and then select the cost
values you want.
Inactivate tasks (Project Professional only)
Important
The ability to inactivate tasks is available only in Project Professional and not in
Project Standard. If you have Project Standard, you can skip this section.
You can include tasks in a plan that you might later decide you don’t want to have
completed, but whose details you also don’t want to lose by deleting them. You might, for
example, develop tasks that pose “what-if” questions that you can’t begin to answer until
other preliminary questions get answered. Or you could design a plan that describes a
likely case scenario for project completion but that also includes more optimistic and
pessimistic sets of tasks.
In Project Professional, you can inactivate a single task or multiple tasks. Inactivating
tasks can be preferable to deleting tasks, in that it keeps the task information in the plan
but removes the scheduling effect of those tasks. A task that drives the start of a successor
task, for example, remains visible when inactivated, but it has strikethrough formatting
applied in the Gantt Chart and other views, and its link relationship is broken and its
successor is rescheduled.
Inactivated tasks are formatted as strikethrough text, and their Gantt bars appear as
colorless outlines
If you later want to reactivate inactivated tasks, you can easily do so; Project restores them
as active tasks with the same scheduling impact they previously had.
Tip
You can inactivate only tasks that have no progress recorded against them. You
cannot inactivate completed tasks or tasks that have any progress recorded.
To inactivate tasks (Project Professional only)
1. Select the name of the task or tasks you want to inactivate. If you inactivate a
summary task, all of its subtasks will be inactivated.
2. On the Task tab, in the Schedule group, click Inactivate. The original task
information is still visible, but now it has no impact on the overall plan. Later, if you
decide to include these tasks in the plan, you can reactivate them by clicking
Inactivate again.
Skills review
In this chapter, you learned how to:
Examine resource allocations over time
Resolve resource overallocations manually
Level overallocated resources
Check the plan’s cost and finish date
Inactivate tasks (Project Professional only)
Practice tasks
The FineTunePlan practice file for these tasks is located in the Project2016SBS\Ch12
folder.
Important
If you are running Project Professional with Project Web App/Project Server, take
care not to save any of the practice files you work with in this book to Project Web
App (PWA). For more information, see Appendix C, “Collaborate: Project,
SharePoint, and PWA.”
Examine resource allocations over time
The scenario: At Lucerne Publishing, the new children’s book plan has been developed to
the point that you’re ready to closely examine resource assignments and overallocation
issues. You’ll begin with Carole Poland. Open the FineTunePlan plan in Project, and
perform the following task:
1. Use the Resource Usage view to examine Carole Poland’s overallocation on
Monday, April 23, 2018.
Carole’s overallocation on Monday is not severe enough to require a change to the plan
Important
If you do not see any overallocated resources, verify in the Resource Leveling
dialog box that Day By Day and Manual are selected (on the Resource tab, in the
Level group, click Leveling Options to open the Resource Leveling dialog box). If
you still don’t see overallocated resources, click the Clear Leveling button in the
Leveling Options dialog box. If all else fails, close and reopen the FineTunePlan
practice file.
Resolve resource overallocations manually
The scenario: You see more resource overallocations in the new children’s book plan.
Unlike the minor overallocation for Carole Poland that you examined earlier, the more
severe overallocations for Hany Morcos do require corrective action. Continuing in the
FineTunePlan plan, perform the following tasks:
1. In the Resource Usage view, locate Hany Morcos’s overallocations in the last week
of August.
2. Edit Hany’s assignment on the Proof and Review task from eight hours to four hours
per day on August 24, 27, and 28.
3. Also edit Hany’s assignment on the Create mockup task from eight hours to four
hours per day on August 24, 27, and 28.
Now that this resource’s assignments have been edited, the resource is no longer
overallocated; she now has 8 hours of assigned work per day, whereas she previously
had 16 hours of work per day
Level overallocated resources
The scenario: You’ve examined and manually resolved some resource overallocation
issues in the new children’s book plan. Now that you understand the basics of resource
leveling, you’re ready to use Project’s resource-leveling feature. Continuing in the
FineTunePlan plan, perform the following tasks:
1. Switch to the Leveling Gantt view. Use the default settings to level the plan.
Note the default settings in the Resource Leveling dialog box
2. In the Leveling Gantt view, examine the impact of leveling across the plan.
After leveling, note the before and after Gantt bars; in this case, Project introduced
splits to assignments but did not need to add any leveling delays
Check the plan’s cost and finish date
The scenario: You’ve fine-tuned important parts of the new children’s book plan,
including resource assignments, costs, and task durations. To see the plan’s current cost
and finish date values, you’ll switch to a different view and then see summary values in
the Project Information dialog box. Continuing in the FineTunePlan plan, perform the
following tasks:
1. Switch to the Cost table in the Task Sheet view. Examine the plan’s cost details
there.
At this point in the project life cycle, the plan does not yet include a baseline; therefore,
the Baseline column contains only zero values—similarly, the plan does not yet contain
any actual progress, so the Actual column contains only zero values
2. Check the plan’s finish date and other summary values in the Project Statistics
dialog box.
The Project Statistics dialog box is a great place to get an at-a-glance view of key
measures of the plan
Inactivate tasks (Project Professional only)
The scenario: You’ve shared the current cost and schedule details of the new children’s
book plan with the publisher. She has asked you to identify some activities that could be
cut to reduce costs without risking the essential deliverables of the plan. You’ve identified
the activities that could be cut, and to see the result of cutting them while keeping the
opportunity to easily restore them, you’ll inactivate the tasks in question. Continuing in
the FineTunePlan plan, perform the following tasks:
1. Switch to the Gantt Chart view and locate summary task 39.
2. Inactivate task 39. This will also inactivate its subtasks.
Note the strikethrough formatting applied to the names of inactivated tasks, and their
Gantt bar formatting
3. Review the impact of inactivating this task on the plan’s overall cost and duration.
Inactivating the summary task and its subtasks affected the plan’s work and cost, but
not its finish date
13. Organize plan details
In this chapter
Sort plan details
Group plan details
Filter plan details
Create new tables
Create new views
Practice files
For this chapter, use the OrganizeDetails practice file from the Project2016SBS\Ch13
folder. For practice file download instructions, see the introduction.
After you build a plan in Project, you will likely need to examine specific aspects of the
plan for your own analysis or to share with other stakeholders. Although the built-in
views, tables, and reports in Project 2016 provide many ways to examine a plan, you
might need to organize information to suit your own specific needs.
In this chapter, you use some of the tools in Project to control what data appears and how
it is organized. Project includes many features that you can use to organize and analyze
data that otherwise would require separate tools, such as a spreadsheet program.
This chapter guides you through procedures related to sorting, grouping, and filtering plan
details; creating new tables; and creating new views.
Sort plan details
Sorting is a simple way to reorganize tasks or resources in Project. When you’re working
in a view that includes a table, simple sorting by a single column is available in the table.
Quickly sort any table by using the sort options on the AutoFilter menu, which you
display by clicking the arrow next to a column heading
For more sophisticated, multicolumn sorting, you can sort tasks or resources by built-in
criteria. You can even create your own sort order with up to three levels of nesting. For
example, you can sort resources by resource group (which is the value in the Group field)
and then by cost within each resource group. You do so via the Sort dialog box.
The resource-specific Sort dialog box is shown; the task-specific version differs slightly
You can sort tasks or resources by any field, not just the fields that are visible in the active
view. However, it’s helpful to see the field by which you sort.
When you sort data, the sort order applies to the active view regardless of the specific
table currently displayed in the view. For example, if you sort the Gantt Chart view by
start date while displaying the Entry table and then switch to the Cost table, you’ll see the
tasks sorted by start date in the Cost table. You can also sort in most views that do not
include a table, such as the Resource Graph view.
Like grouping and filtering, which you will work with later in this chapter, sorting does
not (with one exception) change the underlying data of your plan; it simply reorders the
data you have in the active view. The one exception is the option that Project offers to
renumber task or resource IDs after sorting.
It’s fine to renumber tasks or resources permanently if that’s what you intend to do. For
example, when building a resource list, you might enter resource names in the order in
which the resources join your project. Later, when the list is complete, you might want to
sort them alphabetically by name and permanently renumber them.
Important
The Sort dialog box includes a Permanently Renumber Tasks (when in a taskcentric view) or Permanently Renumber Resources (when in a resource-centric
view) check box. This check box is a Project-level (that is, program) setting; if
selected, it permanently renumbers tasks or resources in any plan in which you sort.
Because you might not want to renumber tasks or resources permanently every time
you sort, it’s a good idea to keep this check box cleared.
When you do not permanently renumber items when sorting them, the reordered ID
numbers give you a visual indication that a task or resource view has been sorted. If you
see that a sort has been applied but you don’t know which one, you can look in the Sort
By dialog box. You cannot save custom sort settings that you have specified, as you can
with grouping and filtering settings (described later in this chapter). However, the sort
order that you most recently specified will remain in effect until you re-sort the view. To
get your tasks or resources back to their prior order, just click Reset in the Sort dialog box,
or resort by ID number.
A handy way to sort resources is by resource group. You can assign a resource to one of
several resource groups. Resource groups are flexible. You might use resource groups to
represent functional teams, departments, employment status, or whatever most logically
describes collections of similar resources. Sorting by the Group field is a handy way to
sort resources—assuming you enter data in the Group field.
This example shows departments as one example of useful Group field data
You can combine sorting by resource group and then sorting by other criteria within each
group. For example, you can sort resources by group and then within each group by cost,
from most to least expensive. This can help you plan your project’s budget.
To sort tasks or resources by using column headings
1. Display a task-centric or resource-centric view that includes a table. Examples
include the Gantt Chart or Resource Sheet view.
2. If necessary, on the View tab, in the Data group, click Tables, and select the table
that contains the value by which you want to sort.
Tip
You can identify the active table by pointing to the Select All button in the upperleft corner of the active table. You also can right-click the Select All button to
switch to a different table.
3. Click the arrow to the right of the column heading (the AutoFilter arrow) in the
column by which you want to sort the tasks or resources, and then click the sorting
criterion you want.
Important
If you do not see an arrow to the right of each column heading, on the View tab, in
the Data group, click in the Filter box, and then click Display AutoFilter.
To sort tasks or resources by one or more criteria
1. Display the view you want to sort.
2. On the View tab, in the Data group, click Sort, and then do either of the following
to open the Sort dialog box:
• Click the sort criterion you want.
• Click Sort By to create your own sort criteria.
In the Sort dialog box, you can apply up to three nested levels of sort criteria.
3. In the Sort By field, click the top level of sorting criteria you want.
Tip
When selecting items from a list like this, you can often begin typing the name of
the item you want, and when its full name appears, select it.
4. Do either of the following:
• To sort lowest to highest, click Ascending.
• To sort highest to lowest, click Descending.
5. In the first Then By field, click the second sorting criterion you want, and then click
Ascending or Descending.
6. If you want to apply a third sort criterion, select it in the second Then By field and
click Ascending or Descending.
7. Click Sort.
To reset a sorted list
1. On the View tab, in the Data group, click Sort, and then click Sort By.
2. Click Reset. Project sorts the view by the ID field.
3. Click Sort.
Group plan details
As you develop a plan, you can use the views available in Project to view and analyze
your data in several ways. One important way to see the data in task and resource views is
by grouping. Grouping allows you to organize task or resource information (or, when in a
usage view, assignment information) according to criteria you choose. For example, rather
than viewing the resource list in the Resource Sheet view sorted by ID, you can view
resources sorted by cost. Grouping goes a step beyond just sorting, however. Grouping
adds summary values, or roll-ups, at intervals that you can customize. Not all views
support grouping; the Calendar view, for example, does not.
Let’s walk through an example. Consider a Resource Sheet view in which the resources
are grouped by their Group values (in this case, departments within an organization). All
quantified values in the table, such as Cost and Work, are summed per Group.
This resource list is grouped by the Group field to show who’s in what department
In this view, it’s easy to see what each department costs. To fine-tune the view, we can
create a custom group that applies a two-level grouping: first by Group (in this case,
department), and then by Cost, with $1,000 cost intervals.
With a two-level grouping applied, you can easily see total cost per department, and the
per-resource costs per department, separated into cost increments
Project applies color formatting to the summary data rows. Because the summary data is
derived from subordinate data, you cannot edit it directly. Displaying these summary
values has no effect on the cost or schedule calculations of the plan.
Grouping changes the way that you view your task or resource data, allowing for a more
refined level of data analysis and presentation. Grouping doesn’t change the underlying
structure of your plan; it simply reorganizes and summarizes the data. As with sorting,
when you group data in a view, the grouping applies to all tables that you can display in
the view. You can also group the Network Diagram view, which does not contain a table.
As with sorting, you can quickly group most task or resource data via the column heading
menu. To quickly group data by a single column, look for a Group By or Group On
command in the column heading menu. Some fields, such as the Duration and Start fields,
offer built-in Group By criteria.
You can also customize any of the built-in groups or create your own. An easy way to
create your own group is to copy and then customize one of the built-in task or resource
groups in the More Groups dialog box (available on the View tab, from the Group By
box).
By default, all new custom groups you create are available for all other plans you work
with in Project.
Tip
You can prevent a custom group from becoming available in other plans that you
might work with that are unrelated to this book. To do so, click the File tab, click
Options to open the Project Options dialog box, display the Advanced page of the
dialog box, and under Display, clear the Automatically Add New Views, Tables,
Filters, And Groups To The Global check box.
All built-in groups and any groups you create are available to you through the Group By
box on the View tab. The name of the active group appears in the box. Click the arrow on
the Group By box to see other group names. If no group is applied to the current table, the
words No Group appear in the box.
To group tasks or resources by using column headings
1. Display the view and table that contains the column on which you want to group.
2. Click the arrow to the right of the column heading on which you want to group, and
then click the grouping criterion you want.
Project reorganizes the task or resource data into groups, adds summary values per
group, and presents the data in an expanded outline form.
To edit or create a custom group
1. Display the view you want to group.
2. On the View tab, in the Data group, click the arrow next to the Group By box, and
then click More Groups to open the More Groups dialog box.
In the More Groups dialog box, you can see all of the available groups for tasks (when
in a task-centric view) or resources (when in a resource-centric view)
3. Do one of the following:
• Click New to create a new group from scratch.
• Select an existing group, and then click Edit to edit the group.
• Select an existing group, and then click Copy to create a new group based on an
existing group.
Tip
To keep the built-in groups intact, you can copy an existing group and then edit the
copy.
In all cases, the Group Definition dialog box opens.
Enter grouping criteria in the Group Definition dialog box
4. If you clicked New or Copy in step 3, name the group.
5. Enter the grouping criteria, intervals, and other options you want. Some settings
need further explanation:
• Use the Group Assignments, Not Tasks (or Group Assignments, Not Resources)
check box when you are working with a group that applies to usage views.
• Click Define Group Intervals to open a dialog box in which you can specify how
Project will present values within a group. The button is active only when certain
types of fields are selected in the Field Name column. The available interval values
vary depending on the type of field selected. A Start field’s interval values, for
example, are Minutes, Hours, Days, and so on.
The type of interval you can set depends on the type of field to which the interval
applies
6. To apply your changes in the Group Definition dialog box, click Save.
To group tasks or resources by using built-in or custom groups
1. Switch to the view you want to group. The grouping criteria you want need not be
visible in the view, but you must be in a task-centric view to group tasks or a
resource-centric view to group resources.
2. On the View tab, in the Data group, click the Group By arrow to display a list (the
box initially contains [No Group]), and then do either of the following:
• Click the grouping criterion you want.
• If the grouping criterion you want is not listed, click More Groups, select the
grouping, and then click Apply.
To clear grouping of tasks or resources
1. Do either of the following:
• On the View tab, in the Data group, click the Group By arrow to display a list,
and then click Clear Group.
• Click the arrow to the right of the column heading (the AutoFilter arrow) in the
column by which you have grouped tasks or resources, and then click No Group.
Filter plan details
Another useful way to change how you view Project task and resource information is by
filtering. As the name suggests, filtering hides task or resource data that does not meet the
criteria you specify, displaying only the data in which you’re interested. Like grouping,
filtering does not change the underlying data in your plan; it merely changes what data is
displayed.
There are two ways to use filters. You can either apply an AutoFilter from a column
heading in a table or you can apply a built-in or custom filter to a view.
Use AutoFilters for ad hoc filtering in any table in Project. Small arrows appear next to the
names of column headings; the same arrow is used for sorting, grouping, and filtering.
Click the arrow to display a list of criteria by which you can filter the data. Which criteria
you see depends on the type of data contained in the column—for example, AutoFilter
criteria in a date column include choices such as Today and This Month, in addition to a
Custom option, with which you can specify your own criteria. After applying an initial
filter, you can then filter the results based on another criterion. You use AutoFilters in
Project in the same way you might use AutoFilters in Microsoft Excel.
When you apply an AutoFilter, a funnel-shaped filter indicator appears next to the column
label, and an AutoFilter Applied message appears on the status bar. Pointing to the
AutoFilter Applied message on the status bar displays a ScreenTip that tells you the fields
that have been filtered.
These visual indicators appear when an AutoFilter has been applied
In addition to AutoFilters that you can apply on any visible column, Project includes
several built-in filters. These are listed in the Filter box (on the View tab). When you
apply a built-in filter, its name appears in the Filter box and the status bar indicates that a
filter is applied.
You can apply a built-in filter, even when the filter criteria are not visible in the active
view
If the AutoFilters or built-in filters don’t meet your needs, you can create custom filters.
You do so in the Filter Definition dialog box.
In the Filter Definition dialog box, an NA value means “not applicable” and is the way
that Project marks some fields that do not yet have a value; in this example, any editing
task that does not have an actual finish date must be uncompleted
All filters hide rows in task or resource sheet views that do not meet the criteria you
specify. You might see gaps in the task or resource ID numbers. The “missing” data is
only hidden and not deleted. As with sorting and grouping, when you filter data in a view,
the filtering applies to all tables you can display in the view. Views that do not include
tables, such as the Calendar and Network Diagram views, also support built-in and custom
filters (through the Filter box on the View tab), but not AutoFilters.
A similar feature is highlighting. Whereas applying a filter hides information that does not
meet your criteria, applying a highlight applies a yellow format to information that does
meet your criteria. Otherwise, the two features are nearly identical—you can apply built-in
highlights or create custom highlights, just as with filters. When a highlight is applied, the
Highlight Filter Applied message appears on the status bar.
To filter tasks or resources by using column headings
1. Display a task-centric or resource-centric view that includes a table. Good examples
include the Gantt Chart or Resource Sheet view.
2. If necessary, switch to the table that contains the value by which you want to sort:
on the View tab, in the Data group, click Tables, and then select the table you want.
3. Click the arrow to the right of the column heading on which you want to filter.
4. In the menu that appears, do one of the following:
• Click Select All to clear all of the values listed, and then select just the values you
want displayed.
• Click Filters (if available; this depends on the field type), and then apply a filter or
create a custom AutoFilter.
To edit or create a filter
1. Display the view you want to filter.
2. On the View tab, in the Data group, click the Filter arrow, and then click More
Filters to open the More Filters dialog box.
In the More Filters dialog box, you can see all of the available filters for tasks (when in
a task-centric view) or resources (when in a resource-centric view)
3. Do one of the following:
• Click New to create a new filter from scratch.
• Select an existing filter, and then click Edit to edit it.
• Select an existing filter, and then click Copy to create a new filter based on the
existing filter.
Tip
To keep the built-in filters intact, you can copy an existing filter and edit the copy.
In all cases, the Filter Definition dialog box opens.
You can create filters that use And/Or criteria; in this example, the filter will show tasks
that are not 100% complete (whether the tasks have assigned resources or not), or tasks
that are both less than 100% work complete and assigned to a resource
4. If you clicked New or Copy in step 3, name the filter.
5. Enter the filter criteria you want. If you want the resulting filter to display the
summary rows of the tasks that the filter will display, select the Show related
summary rows check box.
6. Click Save.
To filter tasks or resources by using a built-in or custom filter
1. Display the view you want to filter. The filter criterion you want does not need to be
visible in the view, but you must be in a task-centric view to filter tasks or a
resource-centric view to filter resources.
2. On the View tab, in the Data group, click the Filter arrow (the box initially contains
[No Filter]), and then do either of the following:
• Click the filter criterion you want.
• If the filter criterion you want is not listed, click More Filters, select the filter you
want, and then click Apply to filter the view.
To highlight tasks or resources by using built-in or custom highlight filters
Highlight filters are similar to regular filters. Rather than hiding details that don’t
meet the filter criteria, highlight filters apply a yellow highlight to the details that do,
and leave the other details visible.
1. Display the view you want to highlight.
2. On the View tab, in the Data group, click the Highlight arrow (the box initially
contains [No Highlight]), and then do either of the following:
• Click the highlight criterion you want.
• If the highlight filter criterion you want is not listed, click More Highlights, select
the highlight filter you want, and then click Highlight to highlight the view.
To clear the filtering or highlighting of tasks or resources
1. Do any of the following:
• On the View tab, in the Data group, click the Filter arrow, and then click Clear
Filter.
• On the View tab, in the Data group, click the Highlight arrow, and then click
Clear Highlight.
• Click the arrow to the right of the column heading (the AutoFilter arrow) in the
column by which you have filtered tasks or resources, and then click Clear Filter
to turn it off.
Create new tables
By now you’ve done a lot of work in tables. A table is a spreadsheet-like presentation of
project data organized into vertical columns and horizontal rows. Each column represents
one of the many fields in Project, and each row represents a single task or resource (or, in
usage views, an assignment). The intersection of a column and a row can be called a cell
(if you’re oriented toward spreadsheets) or a field (if you think in database terms).
A good example of a table is the Entry table in the Task Sheet view.
Each table in Project is optimized for showing certain data
Project includes several tables that can be applied in views. You’ve already seen some of
these tables, such as the Entry and Summary tables. It’s likely that most of the time,
Project’s built-in tables will contain the fields that you want. However, you can modify
any built-in table, or you can create a new table that contains just the data you want.
Tip
If all you need is to add a column to the current table, you might not need to create
a new table. You can add or remove columns quickly in a table (see the instructions
in the procedures at the end of this topic).
Create custom fields quickly
Project supports a wide range of custom fields, and you can add a custom field to
any table easily. The rightmost column in a table is labeled Add New Column, and
you can either click the column heading and select the field you want to add, or you
can simply start entering text in a cell in the Add New Column column. When you
enter text in a new column, Project detects the type of data you’re entering and
applies the correct custom field type. For example, if you enter a date value, Project
uses one of the custom date fields, such as Date1. If you want, you can later retitle
that field to be more meaningful to you.
The custom fields supported by Project include the following:
Cost (up to 10 cost fields)
Date (up to 10 date fields)
Duration (up to 10 duration fields)
Finish (up to 10 finish date fields)
Flag (up to 20 “Yes” or “No” fields)
Number (up to 20 number fields)
Outline code (up to 10 outline codes)
Start (up to 10 start date fields)
Text (up to 30 text fields)
In fact, Project supports the preceding custom fields for tasks and for resources as
different sets of fields. For example, you can customize the Text1 custom field in a
task view and also customize the Text1 field (a different custom field) in a resource
view.
These custom fields are a great way to store additional information about tasks or
resources in your plans. Usually, none of these custom fields have any impact on
the scheduling of tasks or resources.
To edit or create a custom table
1. On the View tab, in the Data group, click Tables, and then click More Tables to
open the More Tables dialog box.
In the More Tables dialog box, you can see all of the available tables for tasks and
resources
2. Click either Task or Resource to display that set of tables.
3. Do one of the following:
• Click New to create a new table from scratch.
• Select an existing table, and then click Edit to edit it.
• Select an existing table, and then click Copy to create a new table based on the
existing table.
Tip
To keep the built-in tables intact, you can copy an existing table and then edit the
copy.
In all cases, the Table Definition dialog box opens.
Use the Cut Row button and the other buttons to reorder or change the fields in a table
(the dialog box lists them as rows, but in the table they are columns)
4. Edit or enter the table definition values you want.
5. Click OK to close the Table Definition dialog box.
Tip
If you selected the Show In Menu check box, your custom table’s name appears
under the Custom heading in the Tables list on the View tab.
To add a column to a table
1. Select the column where you want to insert a new column. The selected column will
be moved to the right when the new column is inserted.
2. On the Format tab, in the Columns group, click Insert Column. Project displays
all fields available for the type of table you have displayed (task or resource).
Tip
You can also insert a new column in a table by right-clicking a column heading and
selecting Insert Column from the shortcut menu.
3. Select the field (column) you want to add.
Tip
To remove a column, right-click the column heading, and then click Hide Column.
Create new views
Nearly all work you perform in Project occurs in a view. A view might contain elements
such as tables, groups, and filters. You can combine these with other elements (such as a
timescaled grid in a usage view) or with graphic elements (such as the graphic
representation of tasks in the chart portion of a Gantt chart view).
Project includes dozens of views that organize information for specific purposes. You can
see all of these views in the More Views dialog box.
The More Views dialog box lists all the views in Project; you can edit these views or
create your own
You might find that you need to see your plan’s information in some way that is not
available in the built-in views. If the available views in Project do not meet your needs,
you can edit an existing view or create your own view.
Your new view can be either a single-pane view or a multi-pane view. Most views occupy
a single pane, but a view can consist of two separate panes. In fact, the default view in
Project is really a two-pane view: the Gantt Chart and the Timeline.
When you create a new view, you specify whether it will be a task-centric or resourcecentric view. In either case, you then work in the View Definition dialog box.
In the View Definition dialog box, you specify the essential ingredients of a custom
view, such as its table
All views are either task-centric or resource-centric views. The specific tables, groups, and
filters listed in the View Definition dialog box lists depend on the type of view you
selected in the Screen field. For example, if Task Sheet is selected in the Screen field, only
filters that apply to tasks, such as the Critical filter, are available in the Filter field. In
addition, the specific elements available vary by view type. For example, if you select the
Calendar view type, the Table and Group options do not apply.
New views appear under the Custom label wherever views are listed so that they are
easily accessible
To edit or create a view
1. On the View tab, in the Task Views group or Resource Views group, click Other
Views, and then click More Views to open the More Views dialog box. In this
dialog box, you can see all the views available to you.
2. Do one of the following:
• Click New to create a new view from scratch. Then, in the Define New View
dialog box, do either of the following:
• Click Single View.
• Click Combination View.
Tip
If you select Combination view, you then specify the two single-pane views (builtin or custom) you want used in the Combination view. Because the two single-pane
views are existing views, you’re done with the new view definition and return to the
More Views dialog box.
• Select an existing view, and then click Edit to edit it.
• Select an existing view, and then click Copy to create a new view based on the
existing view.
Tip
To keep the built-in views intact, you can copy an existing view and then edit the
copy.
In all cases, the View Definition dialog box opens.
When creating a new view, you can’t leave any of the View Definition fields blank
3. Select or edit the view definition options you want:
• To assign a keyboard shortcut to the new view, precede a letter in its name with the
ampersand symbol (&).
• In the Screen box, you can see all the types of views supported by Project. Many
of these views consist of a table (such as Resource Sheet), a table plus a chart
(such as Gantt Chart), or a form (such as Task Form). Other views are purely
diagrammatic, such as the Network Diagram and Timeline views. You can change
the screen type only when creating a new view.
• In the Table box, select the default table the view will contain. A table is required
for a single-pane view.
• In the Group box, you can include a custom or built-in group as part of your view
definition. If you do not want to include a group, select No Group.
• In the Filter box, you can include a custom or built-in filter as part of your view
definition. If you do not want to include a filter, select All Tasks. Or, if you want
the filter to highlight but not hide values, select the Highlight filter check box.
• Select or clear the Show in Menu check box.
4. Click OK to close the View Definition dialog box.
Tip
If you created a new view and you selected the Show In Menu check box, the
view’s name appears under the Custom heading in the related view type list on the
View tab. For example, if you create a custom Gantt chart view, it will appear in the
Gantt Chart view list on the View tab.
Skills review
In this chapter, you learned how to:
Sort plan details
Group plan details
Filter plan details
Create new tables
Create new views
Practice tasks
The OrganizeDetails practice file for these tasks is located in the Project2016SBS\Ch13
folder.
Important
If you are running Project Professional with Project Web App/Project Server, take
care not to save any of the practice files you work with in this book to Project Web
App (PWA). For more information, see Appendix C, “Collaborate: Project,
SharePoint, and PWA.”
Sort plan details
The scenario: At Lucerne Publishing, you’d like to examine resource costs in the new
children’s book launch plan in detail. In addition to seeing resource costs, you’d also like
to see the cost values organized by the resource groups that map to departments at
Lucerne. These include groups like Editorial and Production. Open the OrganizeDetails
plan in Project, and then perform the following tasks:
1. In the Resource Sheet view, with the Summary table displayed, sort resources on
the Cost column, from most to least expensive.
After sorting by cost, you can easily see the financial impact of all resources on the plan
2. Use the Sort By command to sort resources by the Group field in ascending order,
and then by the Cost field in descending order.
After applying the two-level sort, you can now see per-department resource costs (the
departments are the entries in the Group field)
Group plan details
The scenario: You continue your examination of resource costs. You found sorting by
resource group to be helpful because the resource group values map to departments within
Lucerne Publishing. Now you’d like to see aggregate totals per group in addition to
sorting resources per group by cost. Continuing in the OrganizeDetails plan, perform the
following tasks:
1. In the Resource Sheet view, with the Summary table displayed, group the resources
by the built-in Resource Group group. Using the Resource Group group adds the
department-level summary roll-up values for all quantifiable fields.
The sorting per Group field that you previously applied is preserved
2. Clear the grouping from the list, and re-sort resources by ID.
Filter plan details
The scenario: You frequently need to look up various editing-related tasks because these
are resource-intensive. You can quickly display editing-related tasks with a custom
AutoFilter. Continuing in the OrganizeDetails plan, perform the following tasks:
1. In the Gantt Chart view, apply a custom AutoFilter on the Task Name column. The
criterion for the Filter is Name contains edit.
Use a custom AutoFilter to filter tasks that contain a specific term—“edit” in this case
2. Apply but don’t save the custom AutoFilter.
After applying the custom AutoFilter, your task list should include just tasks whose
names include “edit” plus their summary tasks
3. Clear the custom AutoFilter from the view.
Create new tables
The scenario: You continue your focus on editorial tasks in the new children’s book plan.
To that end, you decide to create a custom table, and in that table expose some
descriptions of editorial work that have been added to a text field in the plan.
Before you create a new table, however, you’ll make one temporary change to your
Project settings. You’ll make this adjustment to prevent this new table from becoming
available in other plans that you might work with that are unrelated to this training
material. (You’ll switch the adjustment back to the original setting at the end of the
practice tasks.) Continuing in the OrganizeDetails plan, perform the following tasks:
1. Click the File tab, and then click Options to open the Project Options dialog box.
2. Click Advanced, and under Display, clear the Automatically add new views,
tables, filters, and groups to the global check box.
3. Click OK to close the Project Options dialog box. With that housekeeping chore for
the practice task completed, you are ready to create a new table.
4. Create a new table that is a copy of the Entry table.
5. Name the new table Editorial Table, and set it to appear in the menu.
6. Add the custom field named Editorial Focus (Text9) to the table. Set its width to 20.
This custom table definition uses a previously customized text field (specifically Text9),
named Editorial Focus
7. Display the new table in the Gantt Chart view.
Your custom table should look like this in the Gantt Chart view
Create new views
The scenario: You have made good use of the custom table you created previously to help
you focus on editorial tasks in the new children’s book plan. Now you’d like to combine
this customization into a custom view that you can easily switch to whenever you want.
To wrap up the practice tasks, you’ll then switch your Project option setting back to the
default setting. Continuing in the OrganizeDetails plan, perform the following tasks:
1. Create a new view that is a copy of the Gantt Chart view.
2. Name the new view Editorial work-in-progress.
3. Add the Editorial Table custom table to the new view.
4. Apply the Incomplete Tasks filter to the new view.
5. Do not apply a group to the new view.
Include the custom table you created earlier in the new custom view
6. Display the new view.
Here’s what your custom view should look like (note the custom view’s name along the
left edge of the program window)
Because of the housekeeping adjustment that you performed in the previous set of
practice tasks, the new custom view is not available in other plans. However, when
you create your own custom views, you probably will want them available in any
plan, so you’ll change the display setting back to the default. That way, any custom
views that you create in the future will be available in any plan you work with.
7. Click the File tab, and then click Options to open the Project Options dialog box.
8. Click Advanced, and under Display, select the Automatically add new views,
tables, filters, and groups to the global check box.
9. Click OK to close the Project Options dialog box.
14. Track progress: Detailed techniques
In this chapter
Update a baseline
Track actual and remaining work for tasks and assignments
Track timephased actual work for tasks and assignments
Reschedule incomplete work
Practice files
For this chapter, use the practice files from the Project2016SBS\Ch14 folder. For
practice file download instructions, see the introduction.
Building, verifying, and communicating a sound plan might take much or even most of
your time as a project manager. However, planning is only the first phase of managing
your projects. After the planning is completed, the implementation of the project starts—carrying out the plan that was previously developed. Ideally, projects are implemented
exactly as planned, but this is seldom the case. In general, the more complex the plan and
the longer its duration, the more opportunity there is for variance to appear. Variance is the
difference between what you intended to happen (as recorded in the plan’s baseline) and
what actually happened (as recorded by your tracking efforts).
Properly tracking actual work and comparing it against the original plan enables you to
identify variance early and adjust the remaining portion of the plan when necessary.
This chapter guides you through procedures related to updating a baseline, tracking actual
and remaining work for tasks and assignments, tracking timephased actual work for tasks
and assignments, and rescheduling incomplete work.
Update a baseline
In Chapter 8, “Track progress: Basic techniques,” you learned how to save a baseline for a
plan. Recall that a baseline is a collection of important values in a plan, such as the
planned start dates, finish dates, and costs of tasks, resources, and assignments. When you
save (or set) a baseline, Project takes a “snapshot” of the existing values and saves it in the
plan for future comparison. If you’ve previously saved a baseline, you might need to
update it before recording actual work.
Tip
If you’re not sure whether a plan already has a saved baseline (or multiple
baselines), or if you’d like to see when a baseline was saved, here’s what to do: On
the Project tab, in the Schedule group, click the Set Baseline button, and then click
the Set Baseline command. In the Set Baseline field of the dialog box, any
previously saved baselines in the plan will be indicated by the dates they were
saved.
Keep in mind that the purpose of the baseline is to record what you expected the plan to
look like at one point in time. As time passes, however, you might need to change your
expectations. After saving an initial baseline plan, you might need to fine-tune the plan by
adding or removing tasks or assignments or making other adjustments. To keep an
accurate baseline for later comparison, you have several options:
Update the baseline for the entire project This simply replaces the original
baseline values with the currently scheduled values.
Update the baseline for selected tasks This does not affect the baseline values for
other task or resource baseline values in the plan.
Save a second or subsequent baseline You can save up to 11 baselines in a single
plan. The first one is called Baseline, and the rest are Baseline 1 through Baseline
10.
A great view for comparing a baseline with the plan as it is currently scheduled is the
Tracking Gantt view.
The Tracking Gantt view shows how tasks in the plan as it is currently scheduled
compare to its baseline schedule
In the chart portion of this view, the tasks as they are currently scheduled appear as blue
bars (if they are not critical tasks) or red bars (if they are critical tasks). Below them, the
baseline values of each task appear as gray bars.
Tip
In Gantt chart views such as the Tracking Gantt view, the colors, patterns, and
shapes of the bars on the right side of the view represent specific things. To see
what any item represents, just point to it and a description will appear in a
ScreenTip. To see a complete legend of Gantt chart items and their formatting, on
the Format tab, in the Bar Styles group, click Format, and then click Bar Styles.
Save interim plans
After you start tracking actual values or any time you adjust your plan, you might
want to take another snapshot of the current start and finish dates. You can do this
with an interim plan. Like a baseline, an interim plan is a set of current values from
the plan that Project saves with the file. Unlike the baseline, however, an interim
plan saves only the start and finish dates of tasks, not resource or assignment
values. You can save up to 10 different sets of interim dates in a plan. (If you find
that you need multiple snapshots of scheduled values in addition to start and finish
dates, you should instead save additional baselines.)
Depending on the scope and duration of your projects, you might want to save an
interim plan at any of the following junctures:
At the conclusion of a major phase of work
At preset time intervals, such as weekly or monthly
Just before or after entering a large number of actual values
To compare a plan as it is currently scheduled with its previously saved
baseline
1. On the View tab, in the Task Views group, click the Gantt Chart arrow, and then
click Tracking Gantt.
2. If necessary, adjust the zoom level: on the View tab, in the Zoom group, in the
Timescale box, select the timescale setting you want. Project compares the plan with
the baseline.
3. To compare the plan with another baseline (Baseline 1 through Baseline 10), on the
Gantt Chart Tools Format tab, in the Bar Styles group, click Baseline, and then
click the baseline you want to see compared.
To update a previously saved baseline or add an additional baseline
1. On the Project tab, in the Schedule group, click Set Baseline, and then click Set
Baseline to open the Set Baseline dialog box.
2. Do either of the following:
• To update a previously saved baseline, click Set Baseline, and then select the
specific baseline you want to update.
• To save a new baseline, click Set Baseline, and then select the additional baseline
you want to save.
3. Then do either of the following:
• To update or add the selected baseline for the plan, under For, click Entire
Project, and then click OK.
• To update or add the selected baseline just for the selected tasks, under For, click
Selected Tasks. When you do this, the options under Roll Up Baselines become
available. You can control how baseline updates should affect the baseline values
for summary tasks. For example, you could resave a baseline for a subtask and
update its related summary task baseline values if you want.
4. Click OK.
To remove a baseline
1. On the Project tab, in the Schedule group, click the Set Baseline button, and then
click Clear Baseline.
To save an interim plan
1. On the Project tab, in the Schedule group, click the Set Baseline button, and then
click Set Baseline.
2. In the Set Baseline dialog box, select Set Interim Plan.
3. In the Copy field, select the date values you want to copy.
4. In the Into field, select the date values into which you want to copy the fields you
selected in the Copy field.
5. Click OK.
Track actual and remaining work for tasks and assignments
In Chapter 8, “Track progress: Basic techniques,” you learned how to work with actual
start, finish, and duration values for individual tasks. For tasks that have resources
assigned to them, you can enter actual and remaining work values for the task as a whole
or for specific assignments to that task. To help you understand how Project handles the
actual values you enter, consider the following:
If a task has a single resource assigned to it, the actual work values you enter for the
task or assignment apply equally to both the task and the resource assignment. For
example, if you record that the assignment has five hours of actual work, those
values apply to the task and to the assigned resource.
If a task has multiple resources assigned to it, the actual work values you enter for
the task are distributed among or rolled down to the assignments according to their
assignment units. This level of detail is appropriate if you aren’t concerned about the
details at the individual assignment level.
If a task has multiple resources assigned to it, the actual work values you enter for
one assignment are rolled up to the task. However, the new actual work values do
not affect the other assignments’ work values on the task. This level of detail is
appropriate if details at the individual assignment level are important to you.
If the actual work value you enter is greater than the planned work, Project sets
Remaining Work to zero. If actual work is less than planned work, Project
recalculates Remaining Work accordingly. You can also directly edit the Remaining
Work value if you want.
A great view for recording actual and remaining work is the Task Usage view with the
Work table displayed.
The Task Usage view has two parts: a table on the left and timephased data (that is,
data organized under a timescale) on the right
As you might recall from Chapter 9, “Fine-tune task scheduling,” the two sides of the
usage view are split by a vertical divider bar. This view lists resources under the tasks to
which they’re assigned. This information appears in the table on the left side. On the right
side are rows organized under a timescale. The rows show you the scheduled work values
for each task and assigned resource. The Task Usage view color-codes the rows on the
right side: task rows have a shaded background, and assignment rows have a white
background.
Tip
In this topic, we focus on the Task Usage view to show the results of entering actual
work per task or assignment. Other means of recording actual work include the
Task Form or the Task Details Form with the Work detail displayed in a split view
with a Gantt chart, Task Usage, or other task-centric view. For a refresher on the
Task Form, see Chapter 6, “Assign resources to tasks.”
Let’s walk through some examples of entering actual work. We’ll start in the Task Usage
view with the Work table displayed.
In this example, task 18 initially has 164 hours of scheduled work, which is evenly split
between the two assigned resources
The Work table includes the Actual Work and Remaining Work columns. The values in
the Work column are the task-level and assignment-level totals for scheduled work. Note
that each task’s work value is the sum of its assignment work values.
In a usage view, you see work values at two different levels of detail: the total value for a
task or assignment on the left and the more detailed timephased level on the right. These
two sets of values are directly related. Consider, for example, a task named Original art
review, which is task 18 in the plan. The 164 hours of total work for task 18 is the sum of
Hany Morcos’s 82 hours of work on the task plus Jane Dow’s 82 hours.
In the timephased grid, the scheduled work values per time period are displayed—daily, in
this example. If you add up the daily work values for a specific task or assignment, the
total equals the value in the Work column for that task or assignment.
Let’s look more closely at the results of entering an actual work value. In this example,
when we enter 92 hours of actual work on task 18, Project distributes the actual work
among the assigned resources and adjusts their remaining work.
This is what the view looks like after 92 hours of actual work are recorded on task 18
Several important things occurred when we entered the actual work on task 18:
Project applied change highlighting to the updated values in the table.
The amount of actual work we entered was subtracted from the Remaining Work
column (labeled Remaining in the Work table).
The actual work was distributed to the two assignments on the task, resulting in 46
hours of actual work being recorded for Hany Morcos and 46 hours for Jane Dow.
Likewise, the remaining work values were recalculated for each assignment.
The updated actual and remaining work values were rolled up to the Acquisition
summary task and to the Project summary task.
Now that you’ve seen the effect of recording actual work at the task level, let’s look at
entering actual work at the assignment level. Again, we’ll focus on task 18. When we
assigned 92 hours of work to the task, Hany Morcos was assigned 46 hours of that work.
Now, after we record actual work of 62 hours for Hany, we see that her actual and
remaining work values are updated, and those updates also roll up to the task and its
summary task. (Project highlights the changed values.) However, the actual and remaining
work values for Jane Dow, the other resource assigned to the task, are not affected.
After 62 hours of actual work are recorded on Hany Morcos’s assignment to task 18,
Hany’s work values are updated, but Jane Dow’s assignment is not affected
Tip
A handy way to quickly record actual work and other progress details per
assignment is via the Tracking tab of the Assignment Information dialog box. In
either the Task Usage or Resource Usage view, double-click an assignment. In the
dialog box, you can set actual work, remaining work, actual start, and other values.
This dialog box is available regardless of what table is displayed in the usage view.
Tracking a task’s actual work-complete value is more detailed than entering a simple
percentage-complete value on a task. However, neither method is as detailed as entering
timephased actual work for tasks or assignments (as you will see in the next topic).
There’s nothing wrong with tracking actual work at the task or assignment level (or simply
entering a percentage-complete value, for that matter), if that level of detail meets your
needs. In fact, whether you see the timephased details or not, Project always distributes
any percentage-complete or task-level or assignment-level actual work value you enter
into corresponding timephased values.
Enter actual costs manually
When you enter actual work values, Project calculates actual cost values for the
affected task, its summary task, the resources assigned to the task, and the entire
plan. By default, Project calculates actual costs and does not allow you to enter
them directly. In most cases, this is what we recommend and what is done with the
practice files used in this book. However, if you want to enter actual cost values
yourself in your own plans, follow these steps.
Important
The following procedure is provided for your general information; however, do not
follow this procedure now if you are completing the practice tasks in this book.
Doing so will produce results that will not match those shown in this book.
1. Click the File tab to display the Backstage view, and then click Options to open
the Project Options dialog box.
2. Click the Schedule tab.
3. Under the Calculation options for this project label, clear the Actual costs are
always calculated by Project check box.
4. Click OK.
After automatic cost calculation is turned off, you can enter or import task-level or
assignment-level actual costs in the Actual field. This field is available in several
locations, such as the Cost table. You can also enter actual cost values daily or at
another interval in any timescale view, such as the Task Usage or Resource Usage
view. To do so, with a usage view displayed, click Actual Cost on the Format tab, in
the Details group.
To record actual and remaining work per task
1. On the View tab, in the Task Views group, click Task Usage to display the Task
Usage view.
2. On the View tab, in the Data group, click Tables, and then click Work to display
the Work table.
3. In the Actual column for the task for which you want to record actual work, enter
an actual work value.
4. If you want, enter a new Remaining Work value for the task.
To record actual and remaining work per assignment
1. Display the Task Usage view and the Work table.
2. In the Actual column for the assigned resource for which you want to record actual
work, enter an actual work value.
3. If you want, enter a new Remaining Work value for the assignment.
Track timephased actual work for tasks and assignments
In Chapter 8, “Track progress: Basic techniques,” you were introduced to simpler ways of
tracking actuals in a plan. These include recording the percentage of a task that has been
completed, in addition to its actual start and finish dates. These methods of tracking
progress are fine for many projects, but Project 2016 also supports more detailed ways of
tracking.
This topic introduces techniques to track work per time period, such as actual work
completed per week or per day. Information distributed over time is commonly referred to
as being timephased, so tracking work by time period is sometimes referred to as tracking
timephased actuals. This is the most detailed level of tracking progress available in
Project.
As with the simpler tracking methods, tracking timephased actuals helps you address the
most basic questions of managing a project:
Are tasks starting and finishing as planned? If not, what will be the impact on the
project’s finish date?
Are resources spending more or less time than planned to complete tasks?
Is it taking more or less money than planned to complete tasks?
Entering timephased actuals requires more work on the project manager’s part and might
require more work from resources, if they have to inform the project manager of their
daily or weekly actuals. However, using timephased actuals gives you far more detail
about the plan’s task and resource status than the other methods used for tracking progress.
Entering timephased values might be the best approach to take if you have a group of
tasks or an entire plan that includes the following:
High-risk tasks
Tasks of relatively short duration, for which a variance of even one day could put the
overall project at risk
Tasks for which you’d like to develop or validate throughput metrics, or rates at
which a specified quantity of a deliverable can be completed over a specified time
period, such as Copyedit 3000 words per day
Tasks in which sponsors or other stakeholders have an especially strong interest
Tasks that require hourly billing for labor
When you need to track actual work at the most detailed level possible, use the Work table
and the timephased grid in the Task Usage or Resource Usage view.
In the Task Usage view, you can enter timephased actual work at the task or assignment
level. In the Resource Usage view, you enter actuals at the assignment level. In both
views, entering actual work in the left side of the view will cause Project to update work
values distributed over time in the right side of the view. In this topic, we’ll look at the
reverse: entering actual work in the timephased side of the view and seeing the results per
task or assignment on the left side of the view.
The previous topic’s example featured the Task Usage view; in this topic, we’ll begin with
the Resource Usage view.
The Resource Usage view shows assignments per resource
Tip
You can change the details (that is, the fields) shown in the timephased grid in a
usage view. You can add or remove fields and change the formatting of the fields
that are shown. For example, you can add the Actual Work field. To see the
available fields and formatting options, on the Format tab, in the Details group,
click Add Details.
In both views, you can enter actual work values for individual assignments daily, weekly,
or at whatever time period you want (by adjusting the timescale). For example, if a task
has three resources assigned to it and you know that two resources worked on the task for
eight hours one day and the third resource worked for six hours, you can enter these as
three separate values on a timephased grid.
A key to working effectively in a usage view is setting the timescale correctly. You can
change the zoom level of the timescale to control the time period in which you enter actual
values in the timephased grid. For example, you can change the timescale to show weeks
rather than days; when you enter an actual value at the weekly level, that value is
distributed over the week.
Tip
Project includes several handy shortcuts for navigating in the timephased grid side
of the usage views. In the Task Usage view, use the Scroll To Task button on the
Task Tab, in the Editing group, to display the earliest scheduled work on the
selected task or assignment. You can also use the Scroll To Task command in the
shortcut menu for tasks. In the Resource Usage view, use Scroll To Task to see the
selected resource’s or assignment’s scheduled work. In both views, you can quickly
get to a specific date in the grid (or a task or resource ID) by using the Go To
command via the keyboard shortcut Ctrl+G. If you forget this keyboard shortcut,
just enter go to in the Tell Me box and Project will show you the command.
Here’s an example of entering timephased actuals in a usage view. As you saw in the
previous topic, the scheduled work per task, resource, or assignment is equal on the two
sides of a usage view. The difference is that the scheduled work is shown as a single total
value on the left side but distributed over time on the right side.
We’ll begin in the timephased grid of the Task Usage view with the Work table displayed.
We’ll record actual work for task 19, Author review of content edit.
Here we’ve entered 8 hours of actual work for Thursday (which is what was scheduled)
and 10 hours of actual work for Friday (when 16 hours was originally scheduled) on
task 19
As you saw in the previous topic, the actual work recorded on the task is distributed to its
assignments. In the timephased grid, you can see per time period how the actual work gets
distributed.
Tip
When entering actual work, you do not need to include the “h” abbreviation (to
denote hours). You can simply enter the number and Project will record it as hours.
Hours is the default work value for data entry. If you want, you can change this.
Click the File tab to display the Backstage view, and then click Options. On the
Schedule page of the Project Options dialog box, in the Work Is Entered In box,
select the default time increment you want.
Next we’ll enter actual work on the assignment in the timephased grid.
Here we’ve entered 6 hours of actual work for the Copyeditors and 8 hours for Tad
Orman for Monday on the same task
In this example, the actual work values entered for the assignments differed from the
scheduled work. Project accounted for the difference by adjusting the scheduled work at
the end of the assignments.
Project adjusted the scheduled work to account for the actual work values that were
recorded that varied from scheduled work
When you record actual work in the table on the left side of the view, Project records the
actual work to match scheduled work in the timephased grid on the right side of the usage
view. The main advantage of entering actual work in the timephased grid instead of in the
table on the left side of the view is that you can precisely control the dates for which the
actual work gets recorded.
Project management focus: Collect actuals from resources
The Resource Usage view is similar to a timecard. In fact, to enter assignment-level
actual work values, you might need some form of paper timecard or its electronic
equivalent. Several methods are used to collect such data from resources, assuming
that you need to track actual and remaining work at this level of detail. Some
collection methods include the following:
Collect actual values yourself This method is feasible if you communicate
with only a small group of resources on a frequent basis, such as a weekly
status meeting. It’s also a good opportunity to talk directly to the resources
about any blocking issues or surprises they might have encountered (either
positive or negative) while performing the work.
Collect actuals through a formal status reporting system This technique
might work through the already-existing hierarchy of your organization and
serve additional purposes besides project status reporting.
Regardless of the data collection methods you use, be aware that resources might
have some concern about how their actual work values reflect their overall
performance. You might need to communicate to resources that schedule actuals
help in managing the project, but performance evaluation is a business management
focus, not a project management focus.
If your organization uses a timecard reporting system, you might be able to utilize
this timecard data in Project as timephased actuals. You might not need to track at
this level, but if resources complete timesheets for other purposes (billing other
departments within the organization, for example), you can use their data and save
yourself some work.
Speaking of timecards, depending on how your organization operates, you might
want to explore Project Professional and its interoperability with Microsoft
SharePoint and Project Web App (PWA). For more information, see Appendix C,”
Collaborate: Project, SharePoint, and PWA.”
Tip
Task and assignment values are directly related; an update to one directly affects the
other. However, you can break this relationship if you want. Doing so enables you
to record progress for resource assignments, for example, and manually enter actual
values for the tasks to which those resources are assigned. You normally should not
break this relationship unless you have special reporting needs within your
organization—for example, when you must follow a status reporting methodology
based on something other than the actual values recorded for assignments in plans.
To break this relationship, do the following: Click the File tab to display the
Backstage view, and click Options. In the Project Options dialog box, on the
Schedule tab, under the Calculation Options For This Project label, clear the
Updating Task Status Updates Resource Status check box. This setting applies to
the entire plan you have open at the time; you cannot apply it only to some tasks
within a plan.
To record timephased actual work in the Task Usage view
1. On the View tab, in the Task Views group, click Task Usage to display the Task
Usage view.
2. On the Task Usage Tools Format tab, in the Details group, click Actual Work.
The Actual Work detail row appears in the timephased portion of the view.
3. If needed, adjust the timescale to match the time interval at which you want to enter
actual work (for example, daily or weekly): On the View tab, in the Zoom group,
click the Timescale arrow, and then click the timescale time unit you want.
4. In the timephased grid, at the intersection of the task or assignment and the date you
want, enter an actual work value.
To record timephased actual work in the Resource Usage view
1. Display the Resource Usage view and Actual Work detail, and adjust the timescale
as needed.
2. In the timephased grid, at the intersection of an assignment and the date you want,
enter an actual work value.
Reschedule incomplete work
During the course of a project, work might occasionally be interrupted for a specific task
or for the entire project. If this happens, you can have Project reschedule the remaining
work to restart after the date you specify.
When you reschedule incomplete work, you specify the date after which work can resume
—the rescheduled date. You reschedule incomplete work in the Update Project dialog box.
Use the Update Project dialog box to reschedule incomplete work
Here is how Project handles tasks in relation to the rescheduled date:
If the task does not have any actual work recorded for it prior to the rescheduled date
and does not have a constraint applied, the entire task is rescheduled to begin after
that date.
If the task has some actual work recorded prior to the rescheduled date but none
after it, the task is split so that all remaining work starts after the rescheduled date.
The actual work is not affected.
If the task has some actual work recorded for it prior to, and after, the rescheduled
date, the task is not affected.
To reschedule incomplete work
1. To reschedule work just for specific tasks, select those tasks first.
2. On the Project tab, in the Status group, click Update Project to open the Update
Project dialog box.
3. Select Reschedule uncompleted work to start after, and in the date box, enter or
select the date you want.
4. Do one of the following:
• Click Selected Tasks to reschedule work just for the selected tasks.
• Click Entire Project to reschedule work for the entire project.
5. Click OK.
Skills review
In this chapter, you learned how to:
Update a baseline
Track actual and remaining work for tasks and assignments
Track timephased actual work for tasks and assignments
Reschedule incomplete work
Practice tasks
The practice files for these tasks are located in the Project2016SBS\Ch14 folder.
Important
If you are running Project Professional with Project Web App/Project Server, take
care not to save any of the practice files you work with in this book to Project Web
App (PWA). For more information, see Appendix C, “Collaborate: Project,
SharePoint, and PWA.”
Update a baseline
The scenario: At Lucerne Publishing, the planning for the new children’s book project has
undergone some additional fine-tuning, including adjustments to task durations and the
addition of a task. Because of these changes, you need to capture a new baseline before
work begins. Open the UpdateBaseline plan in Project, and perform the following tasks:
1. Examine the current baseline in the Tracking Gantt view with the timescale set to
weekly.
In the Tracking Gantt view, note that the recently added task 18 lacks a baseline
2. Update the baseline for the entire plan.
After the plan’s baseline is updated, the baseline dates align with the as-scheduled task
dates and task 18 now has a baseline
Track actual and remaining work for tasks and assignments
The scenario: Several tasks in the plan have more than one resource assigned. You’d like
to get a better look at how your recording of actual work on such tasks affects assigned
work. Open the TrackWork plan in Project, and perform the following tasks:
1. Display the Work table in the Task Usage view.
2. Record 92 hours of actual work on task 18, Original art review.
After entering actual work on task 18, note how the actual work is split between the two
assigned resources
3. On the same task, change Hany Morcos’s 46 hours of actual work to 62 hours.
After entering actual work on an assignment to task 18, note that the other assignment
to the same task is not affected
Track timephased actual work for tasks and assignments
The scenario: The Acquisition phase of work has been completed, and the Editorial phase
has begun. Because of the larger number of resources involved and the variability of the
editorial work, these tasks are the riskiest ones so far in the project. To manage the actuals
of these tasks in the most detailed way possible, you will record timephased actuals. Open
the TrackTimephasedWork plan in Project, and perform the following tasks:
1. Scroll the timephased grid in the Task Usage view until the scheduled work for task
22, Organize manuscript for copyedit, is visible.
2. Show the Actual Work detail in the timephased grid of the view.
3. Record 9 hours of actual work on task 22 for Wednesday, May 30, and 15 hours for
Thursday, May 31.
After entering task-level timephased actual work, note the updates to the two
assignments on the task
4. Adjust the timescale to weekly.
5. Record 12 hours of actual work for Dan Jump’s assignment to task 22, Organize
manuscript, for the week of June 3.
After actual work is recorded on one assignment to task 22, the blue change
highlighting shows you the task-level and summary task-level changes to actual work
Reschedule incomplete work
The scenario: Editorial work has been completed. The team has started work on the next
phase. However, you need to troubleshoot a delay in work caused by an unforeseen
problem. Open the RescheduleIncompleteWork plan in Project, and perform the following
tasks:
1. Scroll the Task Usage view to display the latest actual work recorded for task 31,
Proofread and index.
2. Reschedule incomplete work for the entire project to start after August 7, 2018.
Note the absence of scheduled work for task 31 (as indicated by 0h) on Monday and
Tuesday due to the rescheduled incomplete work; in a Gantt chart view, this would
appear as a split task
15. View and report project status
In this chapter
Examine a plan’s variance
Identify tasks that have slipped
Examine task costs
Examine resource costs
Practice files
For this chapter, use the ReportStatus practice file from the Project2016SBS\Ch15
folder. For practice file download instructions, see the introduction.
Communicating project status to key stakeholders is arguably the most important function
of a project manager. Although the perfect flow of communications cannot guarantee a
project’s success, a project with poor communications flow is almost guaranteed to fail.
A key to communicating project status properly is knowing the answers to the following
questions: Who needs to know the project’s status, and for what purpose? What format or
level of detail do these people need?
The time to answer these questions is in the initial planning phase of the project. After
work on the project is underway, your main communications task will be reporting project
status. This can take several forms:
Status reports that describe where the project is in terms of cost, scope, and schedule
(the three sides of the project triangle, as described in Appendix A, “A short course
in project management”)
Progress reports that document the specific accomplishments of the project team
Forecasts that predict future project performance
This chapter guides you through procedures related to examining a plan’s variance,
identifying tasks that have slipped, examining task costs, and examining resource costs.
Examine a plan’s variance
After a plan’s baseline has been set and work has begun, the primary focus of the project
manager shifts from planning to collecting, analyzing, and sharing performance details.
For most plans, there are three primary questions to help analyze project performance
details:
At the rate work is being completed, is the plan on track to finish when we expect it
to?
How has the plan’s duration, work, or cost changed?
What has work on the plan cost so far, and what’s projected for remaining work?
Comparing the answers to these questions against the baseline provides the project
manager and other stakeholders with a good way to measure progress and to determine
when corrective action might be necessary.
Where the scheduled or actual performance differs from the baseline plan, you have
variance. Variance is usually measured as time, such as days behind schedule, or as cost,
such as dollars over budget. After initial planning is complete, many project managers
spend most of their time identifying, investigating, and responding to variance. Before you
can respond to variance, you must first identify it. That subject is introduced in this topic.
In this topic, you’ll examine some useful Project features that can help you understand and
share project status. We focus on status reporting features (especially reports) that are
likely to be useful across a wide range of project types and sizes, and across different
industries.
To start off, for a quick “status-at-a-glance” snapshot, use the Project Statistics dialog box.
In this example, you can see the 25 days of variance between the baseline finish date
and the finish date as currently scheduled
In this dialog box, you can see (among other things) the plan’s finish date and variance.
Keep in mind that this variance is the scheduled finish date compared to the baseline finish
date; without a saved baseline, there is no tracked variance. If you need a refresher on
baselines, see Chapter 14, “Track progress: Detailed techniques.”
Tip
To see overall project-wide values, display the project summary task by clicking
Project Summary Task on the Format tab, in the Show/Hide group. You can also
apply a number of useful tables such as the Cost and Variance tables in tabular
views such as the Gantt Chart and usage views. We describe these tables in the taskspecific and resource-specific topics later in this chapter.
For broad schedule and cost variance analysis and reporting, use the Project “dashboard”
reports. We’ll begin with the Project Overview report.
The Project Overview report prominently displays the plan’s overall percent of duration
completed (61% in this example), percent complete by summary task, and more
This report focuses on overall progress of summary tasks and milestones. This is a good
report to share with project stakeholders who need big-picture status.
For cost-centric reports, you can start with the Cost Overview report. This report conveys
the plan’s overall scheduled cost and cost status.
The Cost Overview report conveys total and remaining costs, in addition to historical
and future cost trends for the plan
Another cost report that’s useful for big-picture cost reporting is the Burndown report.
The Burndown report helps you answer the question “At the rate we are working, when
will we complete the project?”
This report helps you see at a broad level how much work has been completed, how much
remains, and the predicted rate at which remaining work will be completed.
Project management focus: Get the word out
There is no shortage of features in Project that support reporting project status, but
the main point to keep in mind is that the method by which you report project status
is less a technical question than a communications question. For example, what
format and level of detail do your stakeholders need to see? Should project sponsors
see aspects of a project’s performance that are different than those seen by its
resources? These questions are central to the project manager’s job. Fortunately, as
noted earlier, Project is a rich communications tool you can use to construct the
type of project status information that best meets the needs of your stakeholders.
If you work in an organization that is highly focused on projects and project
management, chances are that standard methods and formats already exist within
your organization for communicating project status. If not, you might be able to
introduce project status formats that are based on clear communication and
effective project-management principles.
Some other Project features that can help you report project status include the
following:
If you have Microsoft Excel or Visio, print a status-focused visual report. (To
do this, on the Report tab, in the Export group, click Visual Reports.) For more
information, see Chapter 19, “Share information with other programs.”
Copy Project data to other programs—for example, to copy the Gantt Chart
view, use Copy Picture. (To do this, on the Task tab, in the Clipboard group,
click the Copy arrow.) For more information, see Chapter 19.
Export Project data in other formats. (To do this, on the File tab, click Export,
and then click Create PDF/XPS Document, or click Save Project As File and
then select the format you want.) For more information, see Chapter 19.
Share Project information with others via Microsoft SharePoint and Project
Web App (PWA). For more information, see Appendix C: “Collaborate:
Project, SharePoint, and PWA.”
To open the Project Statistics dialog box
1. Click the File tab to display the Backstage view, and then click the Info tab.
2. On the Info page of the Backstage view, click Project Information, and then click
Project Statistics.
To display a Dashboard report (including Project Overview, Cost
Overview, and Burndown reports)
1. On the Report tab, in the View Reports group, click Dashboards.
2. Click the Dashboard report you want.
Identify tasks that have slipped
When tasks start or finish earlier or later than planned, schedule variance is the result. One
cause of schedule variance is delays in starting or finishing tasks. You certainly want to
know about tasks that started late or future tasks that might not start as scheduled. Let’s
look at various ways of spotting task variance.
The Tracking Gantt view is a handy view in which to see task variance graphically
represented. This view graphically illustrates the difference between scheduled, actual,
and baseline performance. The Tracking Gantt view uses color to distinguish the tasks on
the critical path. This is especially important when looking at variance, because variance
on critical tasks directly affects the plan’s finish date.
By comparing the currently scheduled Gantt bars with the baseline Gantt bars, you can
see what tasks have slipped from their original baseline schedule
Tip
To see details about any bar or other item in a Gantt chart view, point to it. After a
moment, a ScreenTip appears with details.
The Variance table in the Task Sheet or any task-centric tabular view is especially useful
for identifying variance from the baseline.
The Variance table shows the number of days of variance for each task’s start and finish
dates
Tip
To focus on only tasks that have variance, you can apply the Slipping Tasks filter to
the task list. This filter shows only uncompleted tasks that, as they are now
scheduled, have slipped from their baseline schedule. In this context, “slipping”
means “slipping from baseline.” Other useful filters include the Slipped/Late
Progress and Late Tasks filters.
Two useful reports that cover task variance are the Late Tasks and Slipping Tasks reports.
The Late Tasks report is focused on the status date—the current date, unless you set a
different status date.
Use the Late Tasks report to focus on tasks that finished or will finish later than
planned
The Slipping Tasks report focuses on task status in relation to the tasks’ baseline finish
dates.
When a plan includes a baseline, the Slipping Tasks report helps you identify tasks that
have slipped from the baseline
Project management focus: Is variance ever a good thing?
In project management, we generally look for variance that can have an adverse
effect on a project, such as variance that pushes out the finish date or increases the
cost of a project. However, the term variance refers to any difference between
planned and actual events—even differences that have a helpful effect, such as an
earlier finish date or a lower-than-expected cost. If you have the good fortune of
managing a project that experiences such helpful variance, the techniques described
here will help you identify the beneficial variance in addition to any adverse
variance. Your focus as a project manager is basically the same regardless of the
nature of the variance—watch for it, and when it does occur, communicate it and its
effects to project sponsors and other stakeholders and (if it’s adverse variance)
mitigate against it according to the nature of the project.
To display the Variance table in the Task Sheet view
You can also add the Variance table to any task-centric tabular view.
1. On the View tab, in the Task Views group, click Other Views, and then click Task
Sheet to display the Task Sheet view.
2. On the View tab, in the Data group, click Tables, and then click Variance.
To display the Tracking Gantt view
1. On the View tab, in the Task Views group, click the Gantt Chart arrow, and then
click Tracking Gantt.
To display the Late Tasks or Slipping Tasks report
1. On the Report tab, in the View Reports group, click In Progress.
2. Click the report you want.
Examine task costs
Measuring the schedule’s status (that is, determining which tasks start and finish on time),
although critical to nearly all projects, is only one indicator of overall project health. For
projects that include cost information, another critical indicator is cost variance: are tasks
running over or under budget?
Task costs in Project include the following:
Fixed costs applied directly to tasks
Resource costs derived from assignments
When tasks cost more or less than planned to complete, cost variance is the result.
Evaluating cost variance enables you to make incremental budget adjustments for
individual tasks to avoid exceeding your overall budget.
Although tasks and resources (and their costs) are directly related, it’s informative to
evaluate each individually. This topic focuses on the views, reports, and other features that
help you identify and communicate task costs. The next topic does the same for resource
costs.
A great place to start is to show the Cost table in any task-centric tabular view, such as the
Task Sheet.
Display the project summary task to see the complete cost rollup from subtasks to
summary tasks to the project summary task
In this table, Total Cost represents the calculated cost (sometimes you’ll hear this called
scheduled cost) of a task based on the cost rates of the assigned resources and their
assignment durations, plus any fixed cost that has been specified for the task. If the task
has been completed, Total Cost is equal to the task’s actual cost.
Displaying the project summary task (identified as task 0) is useful when examining a
plan’s costs. The project summary task’s cost values are the plan’s cost values, and they
match the values you would see in the Project Statistics dialog box. These values include
the following:
The current total cost value is the sum of the actual (that is, completed) and
remaining (uncompleted) cost values.
The baseline cost value is the project’s planned cost when its baseline was set.
The actual cost is the cost that has been incurred so far.
The remaining cost is the difference between the current cost and actual cost.
Project includes several reports that focus on task costs. The Task Cost Overview report
includes multiple charts and tables that present summary and detailed task cost
information.
In the Task Cost Overview report, the Cost Distribution pie chart sums task costs by
their completion status
Another useful report is the Cash Flow report. This report shows cumulative project costs
per quarter, or over whatever budgeting time period you need.
Display the Cash Flow report to see the plan’s cost and cumulative cost values over
time
We’ll end our walkthrough of task-centric and cost-centric Project features with a visual
report. Visual reports are a category of reports that use Project data that is exported to
Excel or Visio. The Budget Cost visual report presents budget (in this context meaning as
currently scheduled), baseline, and actual costs per time period. When you generate this
visual report, Project exports data to Excel, creates a PivotTable, and then produces the
chart in Excel.
The Budget Cost visual report is based on an Excel PivotTable and offers the rich data
manipulation available with a PivotTable
Here are some additional tips and suggestions for working with tasks’ cost data:
Apply the Late/Overbudget Tasks Assigned To filter for a specific resource. This
filter is available from the More Filters list on the View tab, available from the
Filters command in the Data group.
Display work variance in the Work table in a task view by clicking Work on the
Tables menu that is available from the View tab, in the Data group. Remember that
for a plan in which most costs are derived from work resources, examining work
variance is one way to examine cost variance.
You can compare timephased baseline and scheduled work in a usage view. For
example, in the Task Usage view, on the Format tab, in the Details group, click
Baseline Work.
To see cost variance over time for assignments to a task, switch to the Task Usage
view, and then apply the Cost table. While in a usage view, you can also show Cost,
Baseline Cost, and Actual Cost details via the Add Details dialog box. On the
Format tab, in the Details group, select the options you want.
To display the Cost table in the Task Sheet view
1. On the View tab, in the Task Views group, click Other Views, and then click Task
Sheet to display the Task Sheet view.
2. On the View tab, in the Data group, click Tables, and then click Cost.
To display the Task Cost Overview or Cash Flow report
1. On the Report tab, in the View Reports group, click Costs.
2. Click the report you want.
To display the Budget Cost visual report (requires Excel)
1. On the Report tab, in the Export group, click Visual Reports to open the Visual
Reports dialog box.
2. Click the Assignment Usage tab.
3. Click Budget Cost Report, and then click View. The report appears in Excel.
Examine resource costs
Project managers sometimes focus on resource costs as a means of measuring progress
and variance within a project. However, resource cost information also serves other people
and other needs. For many organizations, resource costs are the primary, or even the only,
costs incurred while completing projects, so closely watching resource costs might
directly relate to the financial health of an organization. It might not be a project manager,
but instead an executive, cost accountant, or resource manager who is most interested in
resource costs on projects as they relate to organizational costs.
Another common reason to track resource costs is for billing either within an organization
(for example, billing another department for services your department has provided) or
externally. In either case, the resource cost information stored in plans can serve as the
basis for billing for your department’s or organization’s services to others.
This topic walks you through some effective features, views, and reports for focusing on
resource costs in your plans. We begin with the Cost table, which you can display in any
resource-centric tabular view, such as the Resource Sheet view.
The cost values for work resources are derived from each resource’s cost rate multiplied
by the work on their assignments to tasks in the plan
In the Cost table, you can see each resource’s cost, baseline cost, and related cost values.
With the Cost table visible, you can then sort the Cost or another column from largest to
smallest. When you sort by the Cost column, Project sorts resources according to the
values in the Cost column, which is the sum of their actual (or historical) costs, and their
remaining (or expected) costs. Sorting resources by the Cost column quickly tells you who
are cumulatively the most and least costly resources.
Another useful sorting strategy is to sort resources by their Variance value. With the
resource list sorted by cost variance, you can quickly zero in on resources with the greatest
variance.
Use the sorting and filtering features to organize and present resource cost information
in tabular views
To see cost variance over time for assignments per resource, display the Resource Usage
view, and then apply the Cost table. Then you can also show Cost and Baseline Cost
details in the timephased grid. This also works in the Task Usage view.
With both the Cost table and cost-related timephased details visible, the Resource
Usage view gives you a detailed level of timephased cost data
Project also includes reports that focus on resource costs, such as the Resource Cost
Overview report.
The Resource Cost Overview report includes a mix of charts and tables that focus on
cost details per resource
This report includes a simple summary table of resource cost details, plus charts that
convey actual and remaining costs per resource, and cost totals by resource type. The Cost
Distribution pie chart is especially relevant if your plan includes a significant portion of
material and cost resources.
To display the Cost table in the Resource Sheet view
1. On the View tab, in the Resource Views group, click Resource Sheet to display the
Resource Sheet view.
2. On the View tab, in the Data group, click Tables, and then click Cost.
To sort resources by cost amounts
1. Display the Cost table.
2. Click the AutoFilter arrow in a column heading such as Cost or Variance, and in
the menu that appears, click Sort Largest to Smallest.
To display the Cost table and cost details in the Resource Usage view
1. On the View tab, in the Resource Views group, click Resource Usage to display
the Resource Usage view.
2. On the View tab, in the Data group, click Tables, and then click Cost. The Cost
table appears in the Resource Usage view.
3. On the Resource Usage Tools Format tab, in the Details group, click the Cost
detail to add it to the timephased side of the view.
4. To add more timephased details, click Add Details to open the Detail Styles dialog
box. Then, in the Available Fields list, click the cost-related fields you want to add,
and click Show.
To display the Resource Cost Overview report
1. On the Report tab, in the View Reports group, click Costs.
2. Click Resource Cost Overview.
Skills review
In this chapter, you learned how to:
Examine a plan’s variance
Identify tasks that have slipped
Examine task costs
Examine resource costs
Practice tasks
The ReportStatus practice file for these tasks is located in the Project2016SBS\Ch15
folder.
Important
If you are running Project Professional with Project Web App/Project Server, take
care not to save any of the practice files you work with in this book to Project Web
App (PWA). For more information, see Appendix C, “Collaborate: Project,
SharePoint, and PWA.”
Examine a plan’s variance
The scenario: At Lucerne Publishing, work on the children’s book plan is well underway.
You have encountered some variance from the plan—in other words, actual work has not
always matched the plan as captured in its baseline. You’d like to get a broad look at what
work has been completed and what remains. Open the ReportStatus plan in Project, and
perform the following tasks:
1. Locate the plan’s overall schedule variance of its finish date (just over 25 days) in
the Project Statistics dialog box.
2. Display the Project Overview report, and note the percent complete values of the
top-level summary tasks.
The Project Overview report prominently displays overall percent complete, in addition
to the completion status of top-level summary tasks
Identify tasks that have slipped
The scenario: You’ve seen the overall variance for the children’s book plan. Next you’ll
focus on the summary tasks that have incurred the highest variance. Continuing in the
ReportStatus plan, perform the following tasks:
1. Display the Variance table in the Task Sheet view.
2. Filter the table to display only summary tasks.
3. Identify the summary tasks (or phases) of the plan that have incurred the highest
finish variance.
Apply the Summary Task filter to more simply focus on summary tasks’ variance values
4. Display the Slipping Tasks report, and identify the tasks with the most remaining
work that have slipped from the baseline.
Scan down the Remaining Work column to identify the slipping tasks with the most
remaining work
Examine task costs
The scenario: You’ve examined task schedule variance in the children’s book plan. Next
you’ll examine task cost variance. Continuing in the ReportStatus plan, perform the
following tasks:
1. Display the Cost table in the Task Sheet view to find the total remaining costs per
summary task.
Use the Cost table to spot variance per task and summary task (this view still has the
summary task filter applied)
2. Display the Task Cost Overview report, and then find the expected cost of the plan’s
incomplete future tasks.
The pie chart in the Task Cost Overview report conveys the total cost of both completed
and future tasks
Examine resource costs
The scenario: Expenses in the children’s book plan are derived, for the most part, from the
costs of resource assignments. You’ve already seen the task costs, so next you’ll focus on
resource cost variance. Continuing in the ReportStatus plan, perform the following tasks:
1. Display the Cost table in the Resource Sheet view.
2. Sort the resources from most to least cost variance.
With resources sorted by cost variance, it’s easy to spot which resources have incurred
the most variance
Part 4: In-depth and special subjects
CHAPTER 16 Format and print views: In-depth techniques
CHAPTER 17 Format reports: In-depth techniques
CHAPTER 18 Customize Project
CHAPTER 19 Share information with other programs
CHAPTER 20 Consolidate projects and resources
16. Format and print views: In-depth techniques
In this chapter
Format a Gantt chart view
Format a Timeline view
Format a Network Diagram view
Format a Calendar view
Print and export views
Practice files
For this chapter, use the FormatInDepth practice file from the Project2016SBS\Ch16
folder. For practice file download instructions, see the introduction.
This chapter introduces you to some of the more in-depth formatting features in Project
2016. A well-formatted plan can be valuable when communicating details to resources,
customers, and other stakeholders. Some of the formatting capabilities in Project are
similar to those of a style-based word processing program such as Microsoft Word, in
which defining a style once affects all content in the document to which that style has been
applied. In Project, you can use styles to change the appearance of a specific type of Gantt
bar, such as a summary bar, throughout a plan. Other formatting options introduced in this
chapter focus on direct formatting of tasks and formatting some of the more commonly
used views.
This chapter guides you through procedures related to formatting and printing views by
using the more in-depth formatting and printing features in Project.
Format a Gantt chart view
Chapter 7, “Format and share your plan,” introduced Gantt chart styles and direct
formatting of Gantt bars. This topic describes how to use bar styles to change the visual
appearance of specific types of Gantt bars (such as summary tasks) and other elements
(such as deadline indicators) in ways that the Gantt chart styles cannot.
Tip
Remember that several built-in views are Gantt chart views, even though only one
view is specifically called the Gantt Chart view. Other Gantt chart views include
the Detail Gantt, Leveling Gantt, Multiple Baselines Gantt, and Tracking Gantt.
The term Gantt chart view generally refers to a type of presentation that shows
Gantt bars organized along a timescale.
You can format specific categories of items in a Gantt chart view to change the appearance
of that type of item. You do so by using the Bar Styles dialog box (available from the Bar
Styles group on the Format tab). The bar style and other formatting changes you make in
one Gantt chart view apply only to that view.
Use the Bar Styles dialog box to change the appearance of entire categories of items in
Gantt chart views
In this dialog box, the formatting changes you make to a particular bar type (critical tasks,
for example) or other element apply to all such bars or elements in the Gantt chart.
Project draws bars and other elements on a bar row in the order in which they are listed in
the Bar Styles dialog box. This introduces the possibility of one bar being layered on top
of (and obscuring) another bar (or other element). The task bar style appears higher in the
Bar Styles list than does the progress bar style, for example, so Project draws progress
bars on top of task bars. Usually you’ll get the results you expect. If you don’t get the
results you want, look at the order of items in the Bar Styles dialog box.
Tip
Some of the items in the Name column of the Bar Styles dialog box begin with an
asterisk (*). When you are printing Gantt chart views, the names of task bars appear
in the legend—except for the task bar names that begin with an asterisk.
In addition to changing the formatting of items that can appear in a Gantt chart view (such
as a task’s Gantt bar), you can add or remove items. For example, it might be useful to
compare baseline, interim, and scheduled plans in a single view. (For a refresher on
interim plans, see Chapter 14, “Track progress: Detailed techniques.”) The baseline and
scheduled Gantt bars are already available in the Bar Styles dialog box, but interim Gantt
bars are not. Let’s walk through how you would add them.
To begin, you would add a new row in the Bar Styles dialog box. Because the order in
which Gantt bars are listed in the Bar Styles dialog box determines the order in which
Project draws the Gantt bars, you’ll want to pay attention to their order.
Next you enter the details you want for the new Interim Gantt bar. For the purposes of this
example, you want Project to draw Interim Gantt bars for normal tasks, and use the
interim plan’s Start1 and Finish1 values as the From and To dates.
In this example, the custom bar style named Interim is being created
In this example, the new Gantt bar style named Interim will appear for normal tasks, it
will appear on the second bar row, and it will span the interim plan’s Start1 through
Finish1 dates. So far, you have instructed Project to display the first interim plan’s start
and finish dates as bars. Next, you’ll focus on the lower half of the Bar Styles dialog box.
There you will change the visual appearance of the new bar style.
For this example, assume that you’d like your interim plan’s Gantt bars to be full-height
shape and solid green.
In this example, the new Interim Gantt bar style is formatted as solid green
To finish your custom Gantt bar definition, you’ll set the text you want to appear in or
around each interim Gantt bar. For these Gantt bars, you’d like the interim bars to show
their start and finish dates as recorded in the Start1 and Finish1 fields on either side of the
bar.
In this example, the new Interim bar style is set up so the interim plan’s start and finish
dates appear to the left and right of each interim task bar
In this example, you’ll display the Start1 and Finish1 fields’ values to the right and left of
the bar. When you finish creating the custom Interim Gantt bar style, your custom Gantt
bars based on the interim plan are drawn on the Tracking Gantt chart.
In this example, the new Interim bar style applies to every task in the plan that has
interim data, such as task 3
Tip
To see details about any bar on a Gantt chart, just point to the bar. Its details will
appear in a ScreenTip.
Project supports several other Gantt chart formatting features in addition to the ones
described in this topic. If you want to explore other formatting options, look at these
buttons on the Format tab:
To format text associated with a specific task type, such as summary task text, use
the Text Styles button in the Format group. You can also use the Text Styles button
to format other items such as summary task names, the timescale labels, and bar text.
To format the appearance of link lines and Gantt bars, use the Layout button in the
Format group.
If you saved multiple baselines (Baseline and Baseline1 through Baseline10), you
can quickly change which baseline is shown (on the Tracking Gantt Chart view, for
example). You do so by using the Baseline button in the Bar Styles group. As you do
so, Project automatically switches the From and To values in the Bar Styles dialog
box for the baseline bars and elements to use the values of the baseline you
displayed.
When you select options in the Bar Styles group on the Format tab (other than the
Format button itself), those options will be represented in the Bar Styles dialog box.
To create a new Gantt bar style
1. Switch to a Gantt chart view.
2. On the Gantt Chart Tools Format tab, in the Bar Styles group, click Format and
then click Bar Styles to open the Bar Styles dialog box.
Tip
You can also open this dialog box by double-clicking the background of the chart
portion of a Gantt chart view or by right-clicking the background and clicking Bar
Styles on the shortcut menu.
3. In the Bar Styles dialog box, select the row where you’d like to add the new Gantt
bar style. Remember that Project draws Gantt bars in the order in which they are
listed in the Bar Styles dialog box.
4. Click Insert Row. Project inserts a row for a new bar type in the table.
5. Enter the name you want for the new bar style.
Tip
Remember that you can prevent a bar style from appearing in a printed legend by
starting the bar style name with an asterisk (*).
6. In the Show For…Tasks field, select the type of task the bar will represent (such as
a normal task, a summary task, or a milestone) or the status of the task (such as
critical or in progress).
Tip
You can define a bar style that excludes specific task types by first selecting the task
type in the Show For…Tasks field and then entering Not in front of the task type’s
name. For example, to exclude summary tasks from a bar style, first include
Summary in the Show for…Tasks field and then edit it to be Not Summary. You can
see many examples of task type exclusions in the built-in bar styles.
7. To add additional task types to the same bar style, double-click in the Show For…
Tasks field and then enter the names of the additional task types you want. Separate
each task type name with a comma. You can see many examples of multiple task
types per bar style in the built-in bar styles.
8. In the Row field, select in which row the bar will appear. Each task can have up to
four bar rows.
9. In the From and To fields, select the start and end points for the bar. For milestone
shapes, enter the same Task Finish value in both the From and To fields.
10. In the lower part of the Bar Styles dialog box, click the Bars tab.
11. Pick the Start, Middle, and End display settings you want for the bar style. You
can see your selected display settings for the bar in the Appearance column.
12. To add text values to the new bar style, follow the steps in the next procedure. If
you do not want to add text values at this time, click OK.
Tip
For more ideas about what you can do with bar styles, review some of the built-in
bar styles.
To add or change text displayed with a Gantt bar style
1. Open the Bar Styles dialog box.
2. In the Bar Styles dialog box, select the bar style you want.
3. In the lower half of the Bar Styles dialog box, click the Text tab.
4. In the row that corresponds to the text position you want relative to the bar, select a
field value.
Tip
When selecting items from a list like this, you can often begin typing the name of
the item you want, and when its full name appears, select it. For example, if you
type s, Project shows the values that begin with the letter s. If you then type t,
Project shows the values that begin with the letters st.
5. Add whatever additional text values you want, and then click OK.
To reorder bar styles to control drawing precedence order
1. Open the Bar Styles dialog box.
2. Select the name of the bar style you’d like to move up or down in the drawing
precedence order.
3. Click Cut Row.
4. Select the row where you want to move the first bar style.
5. Click Paste Row, and then click OK.
Format a Timeline view
As you might recall from Chapter 2, “Take a guided tour,” and Chapter 7, “Format and
share your plan,” the Timeline view is a handy way of seeing the “big picture” of the plan.
You can display one or more timeline bars in a single Timeline view, and you can
customize the timeline bars independently.
When you put the focus in the Timeline view, the buttons on the Format tab change;
remember that the Format tab is contextual, so it changes based on what is currently
selected
You might find that the default formatting of a timeline bar meets your needs, but if not,
you can customize its look. You can format the text of entire categories of timeline items
(such as all milestone dates) by using text styles.
Style-based formatting in the Timeline view is limited to text
In addition to using styles to reformat categories of items, you can also directly format an
item in a Timeline view. To do so, select the item and use the buttons on the Format tab to
get the result you want.
In this example, the task bars have been directly formatted with color backgrounds
When you add additional timelines to a single Timeline view, you can format each
timeline independently. This gives you great flexibility to use the Timeline view to put
focus on important parts of your overall plan, such as the final activities in multiple phases
of work.
Tip
The Timeline view is a great Project view to share with others via email, a
document, or a presentation. For more information, see Chapter 19, “Share
information with other programs.”
To change Timeline text styles
1. If necessary, on the View tab, in the Split View group, select the Timeline check
box to display the Timeline view.
2. Click anywhere in the Timeline view, and then click the Timeline Tools Format
tab.
3. On the Format tab, in the Text group, click Text Styles to open the Text Styles
dialog box.
4. In the dialog box, in the Item to Change list, select the type of timeline item whose
style you want to change.
5. Apply the formatting options you want for the selected item type, and then click
OK.
To directly format an item in a Timeline
1. In the Timeline view, click the item you’d like to format.
2. On the Format tab, in the Font group, apply the formatting options you want.
Tip
You can also right-click an item you want to change and use the formatting options
on the Mini Toolbar that appears.
To add additional timeline bars (up to 10) to the Timeline view
1. Click anywhere in the Timeline view.
2. On the Format tab, in the Insert group, click Timeline Bar. Project adds an
additional timeline bar to the Timeline view. It is initially empty.
3. Make sure the new timeline bar is selected, and then on the Format tab, in the
Insert group, click Existing tasks to open the Add Tasks To Timeline dialog box.
4. In the dialog box, click the tasks you want to add to the new timeline bar, and then
click OK.
Tip
You can drag and drop tasks between timeline bars within the Timeline view. To
delete a timeline bar, right-click the bar and then click Remove From Timeline.
To adjust the date range over which a timeline bar is drawn
1. Click a timeline bar.
2. On the Format tab, in the Show/Hide group, click Date Range to open the Set
Timeline Dates dialog box.
3. In the dialog box, select the start and finish dates you want, and then click OK.
Format a Network Diagram view
In traditional project management, a network diagram is a standard way of representing
project activities and their relationships. Tasks are represented as boxes, which are also
called nodes, and the relationships between tasks are drawn as lines connecting the nodes.
Unlike a Gantt chart, which is a timescaled view, a network diagram enables you to view
project activities in a manner more closely resembling a flowchart format. This is useful if
you’d like to place more focus on the relationships between tasks rather than on their
durations and sequence.
In the Network Diagram view, each node contains several pieces of information (fields)
about the task.
The Network Diagram view puts a strong focus on the relationships between tasks
Project represents completed tasks as nodes with an X drawn through them and summary
tasks as nodes shaped as parallelograms.
As with Gantt chart views, Project provides rich formatting options for the Network
Diagram view. For example, you can change the overall layout of the Network Diagram
view to group nodes by time period. If you’re a heavy-duty network diagram user, you’ll
want to explore the formatting options in greater detail.
Use the Box Styles dialog box (available from the Format tab, in the Format group, when
you are in the Network Diagram view) to change the appearance of different types of
nodes.
Use the Box Styles dialog box to control the content and appearance of boxes (nodes) in
the Network Diagram view
In the Network Diagram view, box styles are similar to bar styles in a Gantt chart in that
different box styles apply to different task types. Box styles include three main parts: data
templates, box border formatting, and box background formatting. The Network Diagram
view’s box styles are all predefined. You can alter the appearance of the built-in box styles
(specifically, you can adjust the border and background appearance), but you cannot create
your own.
For the Network Diagram view, Project uses data templates such as Standard and
Summary. In this context, templates determine what fields appear in boxes (nodes) in
addition to their layout. (These templates are not to be confused with file templates.)
You can either apply another built-in data template to your Network Diagram view or
create your own template. For example, you can create a template that includes each task’s
Work Breakdown Structure (WBS) code field. You do so in the Data Template Definition
dialog box.
Use the Data Template Definition dialog box to control how fields appear in nodes in
the Network Diagram view
Here are some additional formatting buttons on the Format tab that apply to the Network
Diagram view:
In the Network Diagram view, you can format all boxes by using the Box Styles
button, or you can format just the active box by using the Box button. This is similar
to the Bar Styles and Bar buttons available on the Format tab when you have a Gantt
chart view displayed.
Use the Layout button to control items such as the overall arrangement of task boxes
by time period, such as by week or by month.
Show or hide the types of task relationships, such as Start to Start (SS), between
tasks by selecting the Link Labels check box.
Use the Collapse Boxes button to quickly zoom the Network Diagram view out to
show more of the network.
To modify a Network Diagram box style
1. On the View tab, in the Task Views group, click Network Diagram to display the
Network Diagram view.
2. On the Network Diagram Tools Format tab, in the Format group, click Box
Styles to open the Box Styles dialog box.
3. In the Style Settings For box, select the box style you want to modify.
4. In the Data template list, select the data template for which you want to change a
box style.
5. In the Border section, select the shape, color, and other display options you want to
apply to this box style.
6. In the Background section, select the color and pattern you want.
7. Click OK.
To create or modify a Network Diagram box (node) data template
1. In the Network Diagram view, open the Box Styles dialog box.
2. Click More Templates to open the Data Templates dialog box. In this dialog box
you can either create a brand-new data template or create a copy of a template.
3. Do one of the following:
• Click New to create a new template.
• Select a template and then click Copy to create a copy.
• Select a template and then click Edit to edit the template.
4. In the Data Template Definition dialog box, select the options you want. Use the
task node preview in the dialog box to help guide your work.
5. Click OK to close the Data Template Definition dialog box, and then click Close to
close the Data Templates dialog box.
6. In the Box Styles dialog box, make sure your modified or new data template is
selected, and then click OK.
To modify a specific task box (node) in the Network Diagram view
1. In the Network Diagram view, select the task box you want to modify.
2. On the Format tab, in the Format group, click Box to open the Format Box dialog
box.
3. In the Format Box dialog box, select the options you want. Use the preview in the
dialog box to help guide your work.
4. Click OK.
Format a Calendar view
Like the Timeline view, the Calendar view is one of the simpler views available in Project.
This view is especially useful for sharing schedule information with resources or
stakeholders who prefer a traditional “month-at-a-glance” format rather than a more
detailed view, such as the Gantt Chart view.
The Calendar view resembles a traditional “month-at-a-glance” calendar and displays
tasks as bars spanning the days on which they are scheduled to occur
This view displays several weeks at a time. The visible weeks are indicated by the orange
blocks in the monthly calendars on the left side of the view.
As with other views, Project supports style-based formatting of the Calendar view. You
can change the appearance of all instances of a particular type of item in the Calendar
view. For example, you can make all tasks on the plan’s critical path appear red.
Use the Bar Styles dialog box to change the appearance of entire categories of items in
the Calendar view
Like bar style formatting in Gantt chart and other views, style-based formatting in the
Calendar view applies to all of that style’s task type in the view.
In this example, tasks on the critical path are visually distinct from other tasks, and the
weekly row height has been adjusted to show more tasks
Depending on the number of tasks that are scheduled on the same day, you might not see
all of the bars for those tasks, or the week height might be taller than you need for the
number of tasks you want to display. In either case, use the Adjust Week Height button (on
the Format tab, in the Layout group) to change the week row height.
To change Calendar bar styles
1. On the View tab, in the Task Views group, click Calendar.
2. On the Calendar Tools Format tab, in the Format group, click Bar Styles to open
the Bar Styles dialog box.
3. In the Task type list, select the type of task whose style you want to change.
4. In the Bar Shape and Text sections, select the formatting options you want. Use the
preview in the Sample area to help guide your work.
5. Click OK.
6. If your style changes affect the height or position of bars, on the Format tab, in the
Layout group, click Layout Now.
To adjust week height
1. Display the Calendar view.
2. On the Format tab, in the Layout group, click Adjust Week Height.
Print and export views
Project offers customization options for printing views beyond what was covered in
Chapter 7, “Format and share your plan.” Because views such as the Gantt Chart view are
often shared with resources and other project stakeholders, you might find that you need to
adjust details for the views you print.
Printing in Project is similar to printing in other Microsoft Office programs. Some settings
differ for Project, however. A handy print setting in Project is the option to print data for a
specified date range. In a Gantt chart view, for example, Project will print the table portion
of a Gantt chart view as it is currently set up in the view, and then just the date range you
specify from the chart portion of the view.
Use the preview on the Print page to get the printed output you want
The printing and page layout options you can adjust vary with the type of view that is
currently displayed. Simpler views, like the Resource Sheet view, have fewer printing and
page layout options than do more complex views, like the Gantt Chart view. You’ll see
these differences in the Page Setup dialog box.
The available options on the Legend and View tabs vary depending on the active view
Here are some examples of how the page setup options can vary:
For Gantt chart and usage views, you can have the timescale sized to fit the page.
For usage views, you can choose to include row and column totals.
The Legend tab is not available for sheet views such as the Task Sheet or Resource
Sheet view.
When printing most types of views, you can choose from a wide range of options. For
example, you can customize headers and footers, specify what will print in the legend, and
include specific options such as task or resources notes.
One common thing to customize when printing is the legend that is printed with a Gantt
chart view. You do so on the Legend tab of the Page Setup dialog box.
You can add general items to the legend such as the project title, or you can add specific
field values such as the plan’s total cost (recorded in the Cost field).
This customized legend in the Page Setup dialog box includes the plan’s Total Cost
value
The legend tab includes a preview of how the field codes and other text in the Left,
Center, and Right tabs will appear. You can even insert an image into the legend. Explore
the Legend options to include exactly the information you want in your printed views.
Sometimes, you might need to share a snapshot of a Project view with others who might
not have Project. To this end, Project supports easy generation of PDF and XPS format
files. You “print” to a PDF or XPS file as if you were printing to a printer, so all of the
page setup options described in this topic apply when generating PDF or XPS output files.
To adjust print options
1. Display and arrange the view the way you want it to appear in the printout. For
example, in a Gantt chart view, you can adjust the timescale and visible columns.
2. Click the File tab to display the Backstage view, and then click Print to display the
Print page with the active view in the preview.
3. In the Settings section, adjust the print settings you want. Use the preview to help
guide your work.
To adjust view-specific options
1. Display and arrange the view the way you want it to appear in the printout.
2. Display the Print page of the Backstage view.
3. At the bottom of the Settings section, to the left of the print preview, click the Page
Setup link to open the Page Setup dialog box.
4. The view-specific options appear on the Legend and View tabs. Select the options
you want, and then click OK.
To customize a view’s header or footer
1. Display and arrange the view the way you want it to appear in the printout.
2. Display the Print page of the Backstage view.
3. In the Settings section, click Page Setup to open the Page Setup dialog box.
4. Select the options you want on the Header and Footer tabs, and then click OK.
To generate a PDF or XPS file
1. Display and arrange the view the way you want it to appear in the printout.
2. Click the File tab to display the Backstage view, and then click Export to display
the Export page.
3. Click Create PDF/XPS Document.
4. On the right side of the page, click Create PDF/XPS to open the Browse dialog
box.
5. Select the location where you want to save the file, and enter the file name you
want.
6. In the Save as type box, select either PDF Files or XPS Files (depending on which
format you want), and then click OK to open the Document Export Options dialog
box.
7. In the Document Export Options dialog box, select the date range and other
options you want, and then click OK.
Skills review
In this chapter, you learned how to:
Format a Gantt chart view
Format a Timeline view
Format a Network Diagram view
Format a Calendar view
Print and export views
Practice tasks
The FormatInDepth practice file for these tasks is located in the Project2016SBS\Ch16
folder.
Important
If you are running Project Professional with Project Web App/Project Server, take
care not to save any of the practice files you work with in this book to Project Web
App (PWA). For more information, see Appendix C, “Collaborate: Project,
SharePoint, and PWA.”
Format a Gantt chart view
Scenario: At Lucerne Publishing, you’re managing a book project that is now underway.
For this project, you are tracking progress closely and have found value in showing the
team a view that compares current progress with a baseline plan. Now you’d like to add an
interim plan to this view, because the interim plan is more timely than the original
baseline. Open the FormatInDepth plan in Project and perform the following tasks:
1. Display the Tracking Gantt view.
2. Add a new bar style named Interim for normal tasks. Make it a solid green bar that
appears in row 2 and uses the Start1 and Finish1 date values.
The Interim custom bar style’s definition should look like this
3. Add the Start1 and Finish1 fields’ values to either side of the bar.
Set the Start1 and Finish1 values to appear at either end of each Interim bar
4. Click OK to display the new Interim bar style in the Tracking Gantt view.
The new Interim bar style uses interim plan start and finish dates that were previously
saved in the practice file
Format a Timeline view
Scenario: You’ve found that team members like the simplified format of the Timeline
view, but you’ve received a request to break out some tasks to a separate timeline and
change some formatting. Continuing in the FormatInDepth plan, perform the following
tasks:
1. Reformat the Timeline’s text style for milestone dates so that they are bold.
Your milestone dates should look like this in the Timeline view
2. Reformat the Design and Production task bar so that its text is italic and it has a
yellow background.
Your Design and Production task bar should look like this
3. Add an additional timeline bar by using the default project start and finish date
range, and then add tasks 3, 7, and 8 to the new timeline bar.
After the second timeline bar has been added and populated, your Timeline view should
look like this
Format a Network Diagram view
Scenario: You’ve found that the Network Diagram view helps the project team more
clearly focus on task relationships rather than the sequence of the tasks. You decide to
adjust the formatting of the Network Diagram view. Continuing in the FormatInDepth
plan, perform the following tasks:
1. Hide the Timeline view to give yourself more working space.
2. Switch to the Network Diagram view.
3. Change the box style for noncritical milestones to use a green background color.
The color formatting of noncritical task nodes should look like this
4. Apply the updated box style to the Network Diagram view.
Here is the customized noncritical task node in the Network Diagram view
Format a Calendar view
Scenario: Some of your team members have told you that they like the simplicity of the
Calendar view. However, the default Calendar view doesn’t include everything you’d like
it to, and you want to visually distinguish tasks on the critical path from those that aren’t.
Continuing in the FormatInDepth plan, perform the following tasks:
1. Display the Calendar view.
2. Format the Summary bar style to be a line bar.
Your customized summary bar style should look like this
3. Apply the updated summary bar style and update the Calendar view’s layout.
In the Calendar view, the customized summary bars now appear as a thin line
Print and export views
Scenario: You frequently need to print the Gantt Chart view to post it for team members.
In addition, some team members have requested Timeline-view snapshots as PDF files
they can view on their computers. Continuing in the FormatInDepth plan, perform the
following tasks:
1. Display the print preview of the Gantt Chart view on the Print page.
On the Print page, note the current appearance of the table portion of the Gantt Chart
view in the preview
2. Change the page setup to print all sheet columns.
The preview of your Gantt Chart view should now look like this
3. Exit the print preview.
17. Format reports: In-depth techniques
In this chapter
Create a custom report
Customize charts in a report
Customize tables in a report
Practice files
For this chapter, use the FormatReportsInDepth practice file from the
Project2016SBS\Ch17 folder. For practice file download instructions, see the
introduction.
This chapter focuses on creating, customizing, and formatting reports. Reports can contain
two data-focused elements: tables and charts. In addition, reports can include text boxes,
images, and shapes for elaboration or decoration.
This chapter guides you through procedures related to creating a custom report with
custom chart and table elements.
Create a custom report
In Chapter 7, “Format and share your plan,” you applied styles to the built-in reports in
Project. When a built-in report doesn’t meet your needs, you can create a custom report.
Custom reports can include any mix of information that you want. In fact, you can
combine task, resource, and supplemental information together in a single report to
convey insights not possible elsewhere in Project.
Think of a custom report as a container of any combination of these elements:
Charts Add bar, area, or other types of charts to a report.
Tables Use tables to present information in a row-and-column layout.
Images Add images such as a JPEG or PNG format files to a report.
Shapes Insert and customize ready-made shapes such as arrows, circles, and speech
bubbles. Shapes are great for drawing attention to important information on a report.
Text boxes Add a text box anywhere on a report.
The buttons to insert these elements into a report appear on the Report Tools Design tab,
in the Insert group.
Use the buttons in the Insert group of the Report Tools Design tab to add elements to a
report
Use these features in a Project report just like you’d use them in other Microsoft Office
documents such as a PowerPoint presentation or an Excel workbook.
Charts and tables are different from the other report elements. Charts and tables use task
and resource field data from the open plan in Project. The field values included in a chart
or table will automatically be updated as the underlying data changes in the plan.
When you create a new report, you have the option of choosing the report elements to start
with.
When creating a new report, you can pick the components you want to include
You can use these options to start either with a blank report or with a report that includes
an initial table or chart. The Comparison option creates a new report that contains two
identical charts, with the expectation that you’ll customize one or both.
It’s easy to add additional components to a custom report, so it doesn’t really matter which
components you include when creating a new report. You’ll likely want to start by
building a chart or table (or both) to convey the essential details from your plan, and then
add text boxes, images, or shapes to enhance or decorate your key points in the charts and
tables.
When you insert or edit a chart or table in a report, Project displays the Field List pane.
Use this pane to control what values from the plan are displayed in the selected chart or
table, and how those values should be organized.
In this custom report, the Field List pane opens for the selected chart (as shown here)
or table
The Field List pane groups fields into task fields and resource fields. The currently
selected fields are listed at the bottom of the field list for easy reference.
The bottom of the Field List pane includes options to filter, group, outline, or sort the
selected fields. These are similar to the filter, group, outline, and sort features you use in
task or resource views as described in Chapter 13, “Organize plan details.” Use these
options to control how the selected fields are displayed in reports. Here are just a few
examples of your options to control how report data is organized:
In a pie chart that contains cost fields for tasks, show only top-level summary task
cost values by setting Outline Level to Level 1.
In a table that contains task fields, show only milestone tasks by applying the
Milestones filter.
In a table that contains resources’ remaining work values, sort in descending order
by Remaining Work.
The remaining topics in this chapter explore these options for charts and tables in more
detail.
Tip
Project includes a set of instructional tools designed as reports. On the Report tab,
in the View Reports group, click Getting Started, and then click Get Started With
Project. You’ll also find more information about reports in the online help for
Project. In the Tell Me box, enter Create a Project report, and then click Get Help.
How reports compare to views
Let’s compare reports and views. Any report or view focuses on just a subset of
your plan’s data. Every report and view included with Project is designed to help
you better visualize some aspect of your plan. You normally need to work with
multiple reports and views over time to manage the aspects of your plan that matter
most to you.
For example, if your project is primarily deadline-driven, you’ll get the best insight
into your plan by working with timescaled views such as the Gantt chart views, the
Timeline and usage views, and reports such as Upcoming Tasks, Critical Tasks, and
Late Tasks.
There are important differences between reports and views, however. Throughout
this book, you’ve worked in views both to enter and modify schedule data (such as
task names and resource assignments) and to see schedule details (such as which
resources are assigned to what tasks). With reports, however, you can’t directly
change your plan’s data. You can’t add or delete tasks or change resource
assignments, for example. What reports excel at is giving you additional options for
discovering and sharing key aspects of your plan in formats that are visually
compelling. In addition, you can customize reports to include just the information
you want, presented the way you want.
Tip
Custom reports reside within the plan in which they were created and are not
available in other plans. To make a custom report available in any plan you work
with in Project, use the Organizer to copy it to the Global template. For more
information about the Organizer, see Chapter 18, “Customize Project.”
To create a new report
1. On the Report tab, in the View Reports group, click New Report.
2. Select the type of new report you want: blank or with other components included.
3. In the Report Name dialog box, enter a name, and then click OK. This name will
be the title at the top of the report and will appear in the Custom list (on the Report
tab, in the View Reports group) so that you can view this report later.
To add a chart to a report
1. On the Report Tools Design tab, in the Insert group, click Chart to open the Insert
Chart dialog box.
2. On the left side of the dialog box, select the chart type you want, and then select the
specific chart layout you want. Then click OK. Project adds the new chart to the
report and displays the Field List pane.
3. Drag the chart to position it where you want it on the report.
Tip
For instructions on customizing the content and format of a chart, see the
“Customize charts in a report” topic later in this chapter.
To add a table to a report
1. On the Report Tools Design tab, in the Insert group, click Table.
2. Drag the table to position it where you want it on the report.
Tip
For instructions on customizing the content and format of a table, see the
“Customize tables in a report” topic later in this chapter.
To add a text box to a report
1. On the Report Tools Design tab, in the Insert group, click Text Box.
2. In the report, click where you want to position the upper-left corner of the text box,
and drag down and to the right until the text box looks the way you want it. Then
release the mouse button.
3. Enter the text you want inside the text box.
4. Select additional text formatting options you want from the Drawing Tools Format
tab and on the Task tab, in the Font group.
To add a shape to a report
1. On the Report Tools Design tab, in the Insert group, click Shapes.
2. In the Shapes list, click the specific shape you want.
3. In the report, click and drag to create and size the shape.
4. If you want, add text to the shape and apply whatever additional formatting options
you want from the Drawing Tools Format tab and on the Task tab, in the Font
group.
To add an image to a report
1. On the Report Tools Design tab, in the Insert group, click Images.
2. Select the image you want to add to the report, and then click Open. After the
image is added, you can move and resize it, and use the Picture Tools Format
buttons to further modify it.
Customize charts in a report
The reports in Project give you charting capabilities comparable to what you’d find in a
spreadsheet program like Microsoft Excel. In Project, you can create a variety of chart
types, including column, line, pie, and bar charts.
When you add a chart or select it in a report, the Field List pane opens, as mentioned
earlier, and two Chart Tools tabs appear on the ribbon.
The Chart Tools Design and Format tabs are visible when you add or select a chart
These tabs, Design and Format, are described here:
The Design tab Use the buttons on this tab to change the chart’s layout and style,
and include elements such as data labels.
The Format tab Use the buttons on this tab to format chart elements such as data
series.
In addition, whenever you select a chart, three buttons appear to the right of it.
The Chart Elements, Chart Styles, and Chart Filters buttons are visible when you add
or select a chart
You can use these buttons to refine your chart, as follows:
Chart Elements Quickly add or remove elements such as data labels.
Chart Styles Switch the selected chart to a different chart style (including color and
fill combinations) and change the chart’s color scheme.
Chart Filters Add or remove the specific data series (which correspond to Project
fields) and data categories (which correspond to specific tasks or resources).
These three buttons give you quick access to some of the features on the Chart Tools
Design tab.
As noted in the previous topic, when you select a chart in a report, the Field List pane
opens.
The Field List pane is the primary interface for controlling what data appears in the
selected chart and how it is organized
Let’s look in more detail at what’s in the Field List pane for charts:
Tasks or Resources Pick the type of data you want to work with. A chart can
display data from either Task fields or Resource fields.
Category Pick the primary item to be charted. When you are working with task
data, the available categories include descriptive attributes like task ID and task
name. Resource data categories include attributes like the resource name. Some
categories, like time, are available for both task and resource data. When you are
working with a bar or line chart, the category determines what field’s labels are
shown on the x-axis.
Available fields Fields are organized into an outline by type, such as Cost or Work.
Expand each field category to see its fields.
Selected fields The currently selected fields are listed at the bottom of the field list
for easy reference.
Data organization features (Filter, Group By, and so on) Use these settings to
control how the task or resource data is presented in the chart. For example, you can
group tasks by critical tasks, or filter resources to show only overallocated resources.
The Field List pane gives you a great deal of flexibility for building charts. As you make
changes in the Field List pane, you’ll instantly see your results in the chart.
To select the Project information to include in a chart
1. Select the chart.
2. In the Field List pane, click the type of data you want to work with: Tasks or
Resources.
3. In the Select Category list, select the category of data that will be charted, such as
the task name for tasks or the resource name for resources. If you select Time as a
category, an Edit button will appear so you can edit the time settings.
4. In the Select Fields box, select the check boxes for the fields you want included in
the chart.
Tip
The names of the selected fields appear at the bottom of the Select Fields box. To
adjust the order of the fields as they appear in the chart, drag the selected field
names up or down. You can also right-click a field name to remove or rename it.
5. At the bottom of the Field List pane, select any filter or other options you want to
apply to the tasks or resources.
6. To further adjust the chart’s content, click the Chart Filters button to the right of
the chart and then fine-tune the series (the specific values to be charted) and
categories (the labels on the x-axis) until the chart appears as you want it to.
Tip
Building a chart can be a highly iterative process. As you adjust the chart’s settings,
the chart instantly updates accordingly. You can also examine the Field List and
other settings of the built-in charts in Project, and then create the same results in
your custom charts.
To change a chart’s format and style
1. Select the chart.
2. On the Chart Tools Format tab, select the chart type, elements, and other options
you want.
3. On the Chart Tools Design tab, select the layout, color, or style options you want.
Tip
You can also use the three floating chart buttons to apply format and design options
or adjust the series and category values you want. For example, if the chart does not
include the specific chart element you want to format, click the Chart Elements
button and then add the element you want. You can also use this button to remove
elements you do not want.
Customize tables in a report
As with views, tables in reports use Project field labels as column headings and display
field values in the rows. The field labels (such as Duration) and values (such as 20 days)
are the same labels and values you see in views and dialog boxes throughout Project.
When you select a table in a report, two Table Tools tabs appear on the ribbon.
The Table Tools Design and Layout tabs are visible when you add or select a table
These tabs, Design and Layout, are described here:
The Design tab Use the buttons on this tab to add or remove a header row, change
the table’s formatting, apply table styles (color schemes), and apply WordArt styles
to selected text in the table.
The Layout tab Use the buttons on this tab to adjust row height and column width,
adjust the alignment of content in the table’s cells, and make other table size
adjustments.
Just like with charts, when you select any table in a report, the Field List pane opens. In
this pane, you control what fields are included in the selected table. In the Field List pane,
you can also apply filtering, grouping, and sorting of the table rows and, for task fields,
change the outline levels to determine what tasks are displayed.
Fields in Project are organized into task fields and resource fields. These groupings apply
to charts but not to tables, so the Select Category box does not appear for tables.
The Field List pane is the primary interface for controlling what data appears in the
selected table and how it is organized
The order in which fields get added to a table determines the table’s column organization
from left to right. As you add fields, their names appear at the bottom of the Select Fields
box. To reorder the columns in the table, drag the field names up or down. As you do so,
the table updates to show the result.
The options to filter, group, or sort the table data at the bottom of the Field List pane are
similar to the same features you use in view-based tables. The Outline Level box is
available only when working with task fields, because resources do not have an outline
structure.
To select the project information to include in a table
1. Select the table.
2. In the Field List pane, click the type of data you want to work with: Tasks or
Resources.
3. In the Select Fields box, select the check boxes for the fields you want to include in
the table. Either select the fields in the sequence you want them to be ordered from
left to right, or drag the selected field names up or down at the bottom of the Select
Fields box.
4. To further adjust the table’s content, apply whatever filter, group, sort, or (for task
fields) outline level settings you want at the bottom of the Field List pane.
To change a table’s design and layout
1. Select the table.
2. On the Table Tools Layout tab, select the size, alignment, and other options you
want.
3. On the Table Tools Design tab, select the style options you want.
Tip
You can right-click the border of a table and, in the shortcut menu that appears,
select Font to adjust the font settings of the entire table.
Skills review
In this chapter, you learned how to:
Create a custom report
Customize charts in a report
Customize tables in a report
Practice tasks
The FormatReportsInDepth practice file for these tasks is located in the
Project2016SBS\Ch17 folder.
Important
If you are running Project Professional with Project Web App/Project Server, take
care not to save any of the practice files you work with in this book to Project Web
App (PWA). For more information, see Appendix C, “Collaborate: Project,
SharePoint, and PWA.”
Create a custom report
The scenario: At Lucerne Publishing, you are sometimes asked for project cost details in
terms of both summary tasks (or phase) and resources. You’ll create a custom report that
includes the mix of cost information you want. Open the FormatReportsInDepth plan in
Project, and then perform the following tasks:
1. Create a new blank report.
2. Name the custom report Gourmet Cookbook Cost Summary.
3. Insert a pie chart. Use the default two-dimensional pie chart style.
4. Insert a table and position it below the pie chart. You’ll customize the chart and
table in the next practice tasks.
Tip
You might need to cancel the selection of the chart (by clicking in an empty area on
the report) before you can add a table.
Your custom report should include a pie chart and table; you’ll change them next
Customize charts in a report
The scenario: You’d like to change the chart’s data and format in the custom report.
Continuing in the FormatReportsInDepth plan, perform the following tasks:
1. Select the pie chart.
2. Update the information in the Field List pane so the chart includes only the Cost
field and not the Work field.
3. Set the Filter value to All Tasks, the Group By value to No Group, and the
Outline Level value to Level 1.
4. Apply the Style 3 style (the third style shown on the Chart Tools Design tab, in the
Chart Styles group).
Your custom report’s pie chart should now look like this
Customize tables in a report
The scenario: To finish your custom report, you’ll change the data and format of the table.
Continuing in the FormatReportsInDepth plan, perform the following tasks:
1. Select the table.
2. Update the information in the Field List pane to show the Resource field names.
3. Leave the Name field selected, but remove the Start and Finish date fields.
4. In the Cost field group, select the Actual Cost, Remaining Cost, and Cost fields.
5. Apply the Medium Style 2 - Accent 2 style (the third style shown on the Table
Tools Design tab, in the Table Styles group).
Your custom report with chart and table should now look like this
18. Customize Project
In this chapter
Share custom elements between plans
Record and run macros
Edit macros
Customize the ribbon and Quick Access Toolbar
Practice Files
For this chapter, use the practice files from the Project2016SBS\Ch18 folder. For
practice file download instructions, see the introduction.
This chapter describes some of the ways you can customize Project 2016 to suit your own
preferences. Like most Microsoft Office programs, Project uses the ribbon interface,
which offers good customization options. Project has other customization features, such as
the Organizer and global template, that are unique to it. In addition, Project has
customization features, such as the ability to record Microsoft Visual Basic for
Applications (VBA) macros, that are similar to those in other Office programs.
This chapter guides you through procedures related to sharing custom elements between
plans, recording and running macros, editing macros, and customizing the ribbon and
Quick Access Toolbar.
Share custom elements between plans
Project uses a global template, named Global.mpt, to provide the built-in views, tables,
reports, and other elements you see in Project. The very first time you display a view,
table, or similar element in a plan, it is copied automatically from the global template to
that plan. Thereafter, the element resides in the plan. Any subsequent customization of that
element in the plan (for example, changing the fields displayed in a table) applies to only
that one plan and does not affect the global template. The global template is installed as
part of Project, and you normally don’t work with it directly.
Initially, the specific definitions of all views, tables, and other elements are contained in
the global template. For example, the fact that the default Usage table contains one set of
fields and not others is determined by the global template. The list of elements provided
by the global template includes the following:
Views
Reports
Tables
Filters
Calendars
Groups
In addition, you can copy modules (VBA macros), import/export maps, and custom fields
to the global template or between plans.
When you customize a built-in element like a view, the customized element remains in the
plan in which it was customized. With views and tables, you have the option to replace the
version of that element in the global template with your own customized view or table. If
you create a new element, however, such as a new view, that new element is copied to the
global template and thereafter becomes available in all other plans you might work with. If
you don’t want a new element to be copied to your global template, you can change this
behavior.
One exception, however, is calendars. When you create a custom calendar, it remains just
in the plan in which it was created. A customized standard calendar that meets your needs
in one plan could redefine working times in other plans in ways you do not intend. For this
reason, Project has a feature you can use to share custom calendars (and other elements)
between plans in a controlled way. That feature is the Organizer.
The complete list of elements you can copy between plans by using the Organizer is
indicated by the names of the tabs in the Organizer dialog box.
In the Organizer dialog box, you can copy elements between plans, or between a plan
and the global template
Most tabs of the Organizer dialog box have a similar structure: elements in the global
template appear on the left side of the dialog box, and the elements that have been used in
the active plan at any time (for example, views displayed) appear on the right. You use the
tabs and two sides of the Organizer dialog box to copy elements between the global
template and a plan. Alternatively, you can select another open plan rather than the global
template, to copy elements between plans.
Selecting an element on the left side of the dialog box and then clicking the Copy button
copies that element to the plan listed on the right. Conversely, selecting an element on the
right side of the dialog box and then clicking the Copy button copies that element to the
file listed on the left (the global template, by default).
You could use Project extensively and never need to touch the global template. However,
when you do work with the global template, you normally do so through the Organizer.
Some actions you can accomplish with the global template include the following:
Copy one customized element, such as a custom report, from one plan to another.
Create a customized element, such as a custom calendar, and make it available in all
plans you work with by copying the custom calendar into the global template.
Replace a customized element, such as a view or table, in a plan by copying the
original, unmodified element from the global template to the plan in which you’ve
customized the same element.
As you customize views, tables, and other elements, you might find the Organizer to be a
useful feature for managing your customized elements and the built-in elements in Project.
Tip
A view itself can contain other elements, such as a table, filter, or group. If you
want to copy a customized view that itself uses other customized elements, you
must copy the customized view and its customized elements between plans. You do
so via the various element tabs of the Organizer dialog box.
To copy an element between two plans
1. Open the two plans between which you want to copy an element.
2. Click the File tab to display the Backstage view, click Info, and then click
Organizer to open the Organizer dialog box.
3. At the bottom of the Organizer dialog box, in the Elements available in boxes,
click the names of the plans between which you want to copy an element.
4. Next, click the tab of the type of element you want to copy.
5. On either the left or right side of the Organizer dialog box, select the element you
want to copy from its plan to the other plan. On the Tables, Filters, Fields, or
Groups tab, you might first need to click Task or Resource to display the element
you want to copy. The two arrow symbols on the Copy button switch direction when
you select an element on either side of the dialog box and point toward the plan to
which you will copy the selected element.
6. Click the Copy button.
7. Click Close to close the Organizer dialog box.
To copy a customized element to the global template
1. Open the plan that contains the customized element (such as a view).
2. Open the Organizer dialog box.
3. Click the tab of the type of element you want to copy.
4. Verify that Global.MPT appears on the left side of the dialog box. If it does not, in
the Elements available in box on the left side of the dialog box, select
Global.MPT.
5. On the right side of the dialog box, select the custom element you want to copy to
the global template. The two arrow symbols (>>) on the Copy button switch
direction (<<) when you select an element on the right side of the dialog box.
6. Click the Copy button.
7. Click Close to close the Organizer dialog box.
To prevent customized elements from automatically being added to the
global template
1. Click the File tab to display the Backstage view, and then click Options to open the
Project Options dialog box.
2. Display the Advanced page.
3. Under Display, clear the Automatically Add New Views, Tables, Filters And
Groups to the global check box, and then click OK.
Record and run macros
Many activities you perform in Project can be repetitive. To save time, you can record a
macro that captures keystrokes and mouse actions for later playback. The macro is
recorded in Visual Basic for Applications (VBA), the built-in macro programming
language of Office. You can do sophisticated things with VBA, but you can record and
play back simple macros without ever directly seeing or working with VBA code.
What kinds of repetitive activities might you want to capture in a macro? Here’s one
example. Creating a graphic-image snapshot of a view is a great way to share project
details with others. However, it’s likely that the details you initially capture will become
obsolete quickly as the plan is updated. Capturing updated snapshots can be a repetitive
task that is ideal for automation through a macro. When this task is automated, you can
quickly generate a new GIF image snapshot of a plan and save the GIF image to a file.
From there, you can attach the GIF image file to an email message, publish it to a website,
insert it into a document, or share it in other ways.
The macros you create are stored in the global template by default. Because the global
template is open whenever Project is running, its macros are always available to you in
Project. The plan for which you originally created the macro need not be open to run the
macro in other plans. You can also use the Organizer to copy macros between plans. For
example, you can use the Organizer to copy a VBA module that contains the macro from
the global template to another plan to give it to a friend.
When a macro is stored in a plan, that macro can be used in any plan when the plan that
contains the macro is open.
When you begin recording a macro, you first record information about the macro in the
Record Macro dialog box.
When recording a new macro, you give it a name and more in the Record Macro dialog
box
Macro names must begin with a letter and cannot contain spaces. To improve the
readability of your macro names, you can use an underscore (_) in place of a space. For
example, rather than naming a macro CaptureGIFImage, you can name it
Capture_GIF_Image.
When recording a macro, you can assign the macro a keyboard shortcut key. You cannot
use a Ctrl+ combination that is already reserved by Project, so combinations like Ctrl+F
(the keyboard shortcut for Find) and Ctrl+G (Go To) are unavailable.
Project does not literally record and play back every mouse movement and passing second
while you record a macro. Instead, Project records only the results of the keystrokes and
mouse actions that you make. Do not feel that you have to rush to complete the recording
of the macro.
After you record a macro, you run it from the Macros dialog box or via its shortcut key, if
you assigned one.
Recorded macros appear in the Macros dialog box; from here you can run, edit, or
delete macros
Important
Your security-level setting in Project affects Project’s ability to run macros that you
record or receive from others. You might not have set the security level directly, but
it might have been set when you installed Project or by a system policy within your
organization. You can check your macro security settings in the Trust Center. On
the View tab, in the Macros group, click the Macros arrow, and then click Macro
Security.
To record a macro
1. On the View tab, in the Macros group, click the Macros arrow, and then click
Record Macro to open the Record Macro dialog box.
2. Enter a name, description, and other options you want, and then click OK. Project
begins recording the new macro.
3. Perform the actions you want recorded in the macro.
4. When you’re ready to stop the recording of the macro, on the View tab, in the
Macros group, click the Macros arrow, and then click Stop Recording.
To run a macro
1. On the View tab, in the Macros group, click Macros to open the Macros dialog
box.
2. In the Macro name box, click a macro name, and then click Run.
Tip
If you assigned a Ctrl+ keyboard shortcut to the macro, you can also run the macro
by pressing its key combination.
To delete a macro
1. Open the Macros dialog box.
2. In the Macro name box, click a macro name, and then click Delete.
3. Confirm the deletion, and then click Close.
Edit macros
After you’ve recorded a macro, it might work perfectly fine the way you recorded it, or it
might benefit from some adjustments to its code. By editing the macro’s code, you can
give the macro functionality that you cannot capture when recording the macro, such as
dismissing an alert. A macro’s code resides in a VBA module, and you work with the code
in the VBA environment, commonly called the Visual Basic Editor. If you view the VBA
module’s code, you might recognize some code values that correspond to whatever actions
you recorded in the macro, such as FilterApply (applies a filter) and EditCopyPicture
(copies a picture).
In this sample code from a recorded macro, you might generally recognize what the
code strings do even if you don’t know VBA in detail
A full explanation of the VBA language is beyond the scope of this book, but here’s one
example of the power of VBA for automating tasks. Let’s say you’ve recorded a macro
that includes saving a GIF image file of a view. When you initially save the file while
recording the macro, the process works fine.
However, when you subsequently run the macro, it is interrupted by a dialog box that asks
you to verify whether you want to replace the existing GIF image file with a file of the
same name.
You can use a single line of VBA code to avoid the interruption every time you run the
macro.
Application.Alerts False
In this sample code from a recorded macro, an added line of code suppresses the
display of a dialog box
In the GIF image file example, this line of code suppresses the dialog box you received
when running the macro. Instead, the macro causes Project to accept the default option of
replacing the existing GIF image file with one of the same name.
Tip
The VBA language and Visual Basic Editor are standard in many Office programs,
including Project. Although the specific details of each program differ, the general
way in which you use VBA in each is the same. VBA automation is a powerful tool
you can master, and that knowledge can be used in many Microsoft programs.
Here are some additional tips for working with VBA macros in Project:
VBA is a rich and well-documented programming language. If you would like to
take a closer look at VBA in Project, try this: On the View tab, in the Macros group,
click the Macros arrow, and then click Visual Basic. The Microsoft Visual Basic for
Applications window (referred to as the Visual Basic Editor) opens. In the Visual
Basic Editor, on the Help menu, click Microsoft Visual Basic For Applications Help.
While working in a module, you can get help on specific items such as objects,
properties, and methods. Click a word, and then press the F1 key.
As you type in the Visual Basic Editor, selection boxes and ScreenTips might
appear. The Visual Basic Editor uses such tools and feedback to help you enter text
in a module correctly.
To close the Visual Basic Editor and return to Project, on the File menu, click Close
And Return To Microsoft Project.
To edit a macro
1. On the View tab, in the Macros group, click Macros.
2. Click the name of a macro, and then click Edit. Project loads the module that
contains the macro in the Visual Basic Editor.
3. Edit the VBA code.
4. When you’re done editing the macro, on the File menu in the Visual Basic Editor,
click Close and Return to Microsoft Project. The Visual Basic Editor closes, and
you return to the plan.
Customize the ribbon and Quick Access Toolbar
As with other Office programs, you have several choices regarding how to work with
Project. Some of the many customization settings include the following:
Add frequently used commands to the Quick Access Toolbar.
Customize commands on the ribbon.
A customized Quick Access Toolbar and a custom tab that contains a custom command
The customizations you make to the Quick Access Toolbar and ribbon are normally
available to you regardless of what plan you have open in Project. If you prefer, you can
make a customized Quick Access Toolbar available only to a specific plan.
There are multiple ways to customize the Quick Access Toolbar:
Right-click any command on the ribbon, and in the shortcut menu that appears, click
Add To Quick Access Toolbar.
Click the Customize Quick Access Toolbar launcher, and then click an item in the
list of common commands.
Use the Project Options dialog box to add, reorder, or remove commands from the
Quick Access Toolbar.
Use the Quick Access Toolbar page of the Project Options dialog box to add, remove,
or reorder commands on the Quick Access Toolbar
You use the Customize Ribbon page of the same Project Options dialog box to customize
the ribbon.
Use the Customize Ribbon page of the Project Options dialog box to customize the
ribbon
On the Customize Ribbon page, you can add or remove commands from any tab, or you
can create new tabs. You can also remove all customizations from the ribbon or Quick
Access Toolbar and reset them back to their original appearance by using a single
command in the Project Options dialog box.
Tip
You can share a customized ribbon with other Project users. The Customize Ribbon
page of the Project Options dialog box includes the Import/Export command for
this purpose.
To quickly add or remove a single command to or from the Quick Access
Toolbar
1. Do either of the following:
• To add a command to the Quick Access Toolbar, right-click the command where it
appears on the ribbon, and then click Add to Quick Access Toolbar.
• To remove a command from the Quick Access Toolbar, right-click the command
where it appears in the Quick Access Toolbar, and in the shortcut menu that
appears, click Remove From Quick Access Toolbar.
To customize the Quick Access Toolbar
1. Click the File tab to display the Backstage view, and then click Options to open the
Project Options dialog box.
2. In the Project Options dialog box, display the Quick Access Toolbar page.
Tip
You can also click the arrow at the right end of the Quick Access Toolbar and then
click More Commands to display the Quick Access Toolbar page of the Project
Options dialog box.
3. On the left side of the dialog box, in the Choose commands from box, select the
category of commands you want.
4. By default, the Quick Access Toolbar applies to all plans you work with in Project.
To set the customized Quick Access Toolbar to apply only to a specific open plan, in
the Customize Quick Access Toolbar box, click the name of the plan to which you
want it to apply.
5. In the list of available commands (in the large box on the left side of the dialog
box), select the command you want to add to the Quick Access Toolbar, and then
click the Add button.
6. To reorder the commands on the Quick Access Toolbar, in the list of Quick Access
Toolbar commands (in the large box on the right side of the dialog box), select a
command and then use the up and down arrow buttons to the right of the box to
move it.
7. When you have finished your customization, click OK.
To reset the Quick Access Toolbar to its original appearance
1. On the Quick Access Toolbar page of the Project Options dialog box, click the
Reset button, and then click Reset Only Quick Access Toolbar.
To customize the ribbon
1. In the Project Options dialog box, display the Customize Ribbon page.
Tip
You can also right-click the ribbon and then click Customize The Ribbon to display
the Customize Ribbon page of the Project Options dialog box.
2. Perform any of the following customizations:
• To reorder the commands on a specific tab, in the list of ribbon commands (in the
large box on the right side of the dialog box), select a command and then use the
up and down arrow buttons to the right of the box to move it.
• To remove a command, in the list of ribbon commands (on the right side of the
dialog box), do one of the following:
• Select the command and click the Remove button.
• Right-click the command and, in the shortcut menu that appears, click Remove.
• To create a new tab or a new group on the selected tab, click the New Tab or New
Group button. Then click the Rename button to give the new tab or group a name.
• To add a command to a custom tab, first select the custom tab’s group (on the right
side of the dialog box). Then click a command in the list of available commands
(on the left side of the dialog box) and click the Add button.
Tip
Commands that are dimmed on the Customize Ribbon page cannot be reordered or
removed from the ribbon.
3. When you have finished your customization, click OK.
To reset the ribbon to its original appearance
1. On the Customize Ribbon page of the Project Options dialog box, do either of the
following:
• To reset a tab on the ribbon back to its original appearance, select the tab in the list
of ribbon commands (on the right side of the dialog box), click the Reset button,
and then click Reset Only Selected Ribbon Tab.
• To reset the complete ribbon back to its original appearance, click the Reset
button, and then click Reset All Customizations. This action will also reset the
Quick Access Toolbar.
Skills review
In this chapter, you learned how to:
Share custom elements between plans
Record and run macros
Edit macros
Customize the ribbon and Quick Access Toolbar
Practice tasks
The practice files for these tasks, CustomizeProjectA and CustomizeProjectB, are located
in the Project2016SBS\Ch18 folder.
Important
Some of the actions you perform in this chapter can affect your overall settings in
Project regardless of the specific plan you are using. To keep your Project
environment unaffected or at the “factory settings” throughout this chapter, we
include steps to undo some actions.
Important
If you are running Project Professional with Project Web App/Project Server, take
care not to save any of the practice files you work with in this book to Project Web
App (PWA). For more information, see Appendix C, “Collaborate: Project,
SharePoint, and PWA.”
Share custom elements between plans
The scenario: At Lucerne Publishing, you previously created a calendar to apply to a task
in a plan. Another plan includes the same type of task with the same calendar
requirements. You’d like to use the task calendar in this other plan. Open the
CustomizeProjectA plan in Project, and perform the following tasks:
1. In CustomizeProjectA, point to the Calendar indicator of task 44. Note the
ScreenTip: the task has the Mon-Wed Task Calendar applied.
This plan contains the custom calendar you need to copy to another plan
2. Open CustomizeProjectB.
3. Use the Organizer to copy the Mon-Wed Task Calendar from CustomizeProjectA
to CustomizeProjectB.
After you copy the calendar, it appears as a Calendar element in both plans
4. Save and close CustomizeProjectB. Leave CustomizeProjectA open.
Record and run macros
The scenario: You frequently generate a GIF image snapshot of a plan for sharing with the
team. You’d like to automate this task. Continuing in the CustomizeProjectA plan, perform
the following tasks:
1. Open the Record Macro dialog box. Name the macro Capture_GIF_Image, don’t
use a shortcut key, store the macro in the open plan CustomizeProjectA, and
replace the default Description text with Saves a GIF image of the Gantt Chart
view.
After entering this information in the Record Macro dialog box, you’re ready to record
the macro
2. Click OK to start recording the macro, and then perform the following actions:
a. On the View tab, in the Task Views group, click Gantt Chart. Do this even
though the Gantt Chart is currently displayed. That way the Gantt Chart selection
will be captured in the macro regardless of what view is initially displayed.
b. On the View tab, in the Zoom group, click Entire Project.
c. On the View tab, in the Data group, in the Filter box, click Summary Tasks.
d. On the Task tab, in the Clipboard group, click the Copy arrow, and then click
Copy Picture to open the Copy Picture dialog box.
e. Under Render Image, click To GIF Image File, browse to the Ch18 folder, and
use the default file name.
f. Click OK to close the Copy Picture dialog box.
g. On the View tab, in the Data group, in the Filter box, click No Filter.
h. On the View tab, in the Zoom group, click Zoom, and then click Zoom to open
the Zoom dialog box.
i. Click Reset, and then click OK.
3. On the View tab, in the Macros group, click the Macros arrow, and then click Stop
Recording.
4. Now run the macro from the Macros dialog box. When prompted, overwrite the
GIF image file.
Edit macros
The scenario: You work in the Visual Basic Editor to fine-tune and enhance the macro you
recorded in the previous set of practice tasks and then run it. Continuing in the
CustomizeProjectA plan, perform the following tasks:
1. Open the Macros dialog box.
2. Edit the Capture_GIF_Image macro in the Visual Basic Editor.
3. At the beginning of the ViewApplyEX line, press Enter to add a new line above it.
4. In the new line, enter Application.Alerts False with no closing punctuation.
After editing the macro code, you should no longer see the prompt to overwrite the
previously saved GIF image
5. Close the Visual Basic Editor.
6. Run the macro. This time, you should not see the prompt to overwrite the previously
saved GIF image.
Customize the ribbon and Quick Access Toolbar
The scenario: You want to make your custom macro that generates a GIF image snapshot
of a plan accessible via a custom tab. Continuing in the CustomizeProjectA plan, perform
the following tasks:
1. Add the Go To command to the end of the Quick Access Toolbar. You can either
add the command for all plans or just for the CustomizeProjectA plan.
2. Add a new tab named My Tab and a new group named My Macros to the ribbon.
Position the new tab after the View tab.
3. Add the Capture_GIF_Image macro to the My Tab tab, in the My Macros group.
Rename the macro Copy GIF, and assign it to the picture symbol in the second row
of symbols.
Your custom ribbon, group, and command should look like this in the Project Options
dialog box
4. Click OK to close the Project Options dialog box and display your custom tab.
Your custom ribbon, group, and command should look like this in the ribbon
5. On the My Tab tab, in the My Macros group, click Copy GIF. Your macro should
run.
6. If you want, remove the custom tab. Otherwise, it will appear when you work with
any other plans in Project.
19. Share information with other programs
In this chapter
Copy Project data to and from other programs
Open files in other formats in Project
Save to other file formats from Project
Generate reports with Excel and Visio
Practice files
For this chapter, use the practice files from the Project2016SBS\Ch19 folder. For
practice file download instructions, see the introduction.
This chapter focuses on various ways of getting data into and out of Project. In addition to
the standard Microsoft Office copy and paste features with which you might be familiar,
Project offers a variety of options for importing and exporting data.
Throughout this chapter, you’ll see the following terms:
The source program is the program from which you copy information.
The destination program is the program to which you paste information.
This chapter guides you through procedures related to copying Project data to and from
other programs, opening files in other formats in Project, saving to other file formats from
Project, and generating reports with Microsoft Excel and Visio.
Copy Project data to and from other programs
You can copy information out of and paste information into Project. However, because
Project information is highly structured, there are a few things to note.
When copying data from Project (the source program) into other (destination) programs,
you have some options for the results that you get:
You can copy information (such as task names and dates) from a table in Project and
paste it as structured tabular data in spreadsheet programs like Excel, or as a table in
word-processing programs that support tables, like Microsoft Word.
This selected data in Project includes a summary and subtask hierarchy
In most cases, the table’s column headings for the data you copied will also be
pasted, and the summary/subtask hierarchy will be indicated by the indentation of
the subtasks.
Pasting into Word generates a formatted table that preserves the column headings and
the summary task and subtask outline structure from Project
You can copy text from a table in Project and paste it as tab-delimited text in text
editor programs that do not support tables, like WordPad or Notepad.
When pasting information from Project into an email program such as Microsoft
Outlook, you probably will get tabular results if your email program supports the
HTML format.
You can create a graphic-image snapshot of the active view and paste the image into
any program that supports graphic images. You learned about the Copy Picture
feature (on the Task tab) in Chapter 7, “Format and share your plan.”
Tip
Many Office programs—such as Word, Excel, and PowerPoint—have a Paste
Special feature. This feature provides you with more options for pasting data from
Project into the destination program. For example, you can use the Paste Special
feature in Word to paste formatted or unformatted text, or a picture. You can also
choose to paste only the data, or paste it with a persistent link back to the source
data. When the data is pasted into Project with a persistent link, the data in Project
can be updated whenever the source data is changed. When pasting data into
calculated fields, such as start and finish dates, use the paste link option with care
and verify that you get the results you want.
Here are a couple of techniques for selecting tabular data in Project:
To select a range, click the upper-left corner of the range, hold down the Shift key,
and then click the value in the lower-right corner of the range you want to select.
Click the Select All button in the upper-left corner of a table. Project selects the
entire table, although only cells that contain values will be copied.
The pasting of rich tabular data from Project does not work the same way in all programs.
If you paste Project data into Notepad, for example, the result would be tab-delimited data
and no column headings. Feel free to experiment with this.
You also have options when pasting data from other source programs into Project:
You can paste a graphic image from another program into a graphical portion of a
Gantt Chart view. You can also paste a graphic into a task, resource, or assignment
note; into a form view such as the Task or Resource Form view; or into a report.
You can paste text (such as a list of task or resource names) into a table in Project.
For example, you can paste a range of cells from Excel or a group of paragraphs
from Word into Project, and you can paste a series of task names that are organized
in a vertical column from Excel or Word into the Task Name column in Project.
Pasting text as multiple columns into Project requires some planning. First, make sure that
the order of the information in the source program matches the order of the columns in the
Project table. You can either rearrange the data in the source program to match the column
order in the Project table or vice versa. Second, make sure that the columns in the source
program support the same types of data (for example, text, numbers, and dates) as do the
columns in Project.
If you need to paste a set of task or resource names into Project, you can work with partial
data. For example, if you paste only a set of task names into Project, Project gives them an
estimated 1-day duration and schedules them to start on the plan’s start date. You can then
update the new tasks’ schedule details as needed.
To copy tabular data from Project to another program
1. In Project, organize the data you want to copy (for example, switch to the table that
contains the fields you want).
2. Select the range of data you want, and then on the Task tab, in the Clipboard
group, click Copy. Project copies the selected range to the Clipboard.
3. Switch to the destination program, and then paste the data. If the destination
program supports it, you can experiment with pasting formatted or plain text.
To paste tabular data from another program into Project
1. In the source program, select and copy the data you want to paste into Project. If
you need to copy multiple columns, take care that the tabular data is organized into
the correct field order you’ll need in Project.
2. Switch to Project, and select the cell in a table that will contain the first value of the
first row of the data to be pasted. If you need to paste multiple columns, take care to
ensure that the field order you have in the Project table corresponds to how the
copied data is organized.
3. To paste the copied data, on the Task tab, in the Clipboard group, click Paste.
Project pastes the data into the table.
To paste a graphic image from another program into Project
1. In the source program, copy the image you want to paste into Project.
2. Do any of the following:
• To paste the copied image into the chart portion of a Gantt Chart view, click the
chart portion and then, on the Task tab, in the Clipboard group, click Paste.
Project pastes the image. You can then reposition or resize the image.
• To paste the copied image into a task or resource note, open or create the note.
Click in the Notes field, and then press Ctrl+V.
• To paste the copied image into a report, open the report. Click in an empty area of
the report to make sure none of the report’s elements are selected, and then press
Ctrl+V or, on the Task tab, in the Clipboard group, click Paste.
Open files in other formats in Project
Information that you need to incorporate into a plan in Project can come from a variety of
sources. A task list from a spreadsheet or a resource list from a database are two examples.
You might want to use the unique features of Project to analyze data from another
program. For example, many people keep to-do lists and simple task lists in Excel, but
accounting for basic scheduling issues, such as distinguishing between working and
nonworking time, is impractical in Excel. You might find that simply copying data from
other source programs and pasting it into Project is fine for one-time data sharing.
However, if you need to frequently share the same type of data, or if its structure is too
complex for copying and pasting, sharing via a data file might be a better option.
When saving data to or opening data from files in other formats, Project uses maps (also
called import/export maps or data maps) that specify the exact data to import or export
and how to structure it. You use data maps to specify how you want individual fields in the
source program’s file to correspond to individual fields in the destination program’s file.
After you set up an import/export map, you can use it over and over again.
Project uses a feature called the Import Wizard to guide you through creating the correct
data map for the data you want to import.
You can move forward and backward in the Import Wizard to set the data mapping
options you want when importing files in other formats into Project
The Import Wizard uses maps to organize the way that structured data that is in another
file format is imported into Project. When you import a task list from Excel, for example,
the Import Wizard shows you what the imported task list will contain.
On the Task Mapping page of the Import Wizard, you specify how Project should import
data from other file formats—in this case, an Excel workbook
Then, when you import the data, it is ready for more detailed work such as setting up task
relationships.
Important
Project has a security setting that might prevent you from opening or saving files
from previous versions of Project or files in other nondefault formats. You can
change this setting.
An imported task list is ready for schedule fine-tuning
To open a file that is in another format
1. Click the File tab to display the Backstage view, and then click Open.
2. Click Browse, and then navigate to the location of the file you want to open.
3. In the file type box (which is initially labeled Projects), in the drop-down list, select
the file format you want.
Tip
You can scroll through the file type box to see the file formats that Project can
import data from. If you work with programs that can save data in any of these file
formats, you can import their data into Project.
4. Select the file you want, and then click Open to start the Import Wizard. This
wizard guides you through the steps required to import structured data from a
different format into Project.
5. Complete the steps in the Import Wizard, and then click Finish. Project imports the
data.
To change your legacy file format setting for opening files in other
formats
Important
If you need to edit your legacy file format setting, you should do so only when you
need to work with legacy file formats you know to be from a trusted source. Your
ability to edit your legacy file format setting in the Trust Center as described here
might be blocked by a Group Policy or other setting within your organization.
1. In Project, click the File tab to display the Backstage view, and then click Options
to open the Project Options dialog box.
2. Click Trust Center.
3. Click Trust Center Settings to open the Trust Center dialog box.
4. Click Legacy Formats.
5. Under Legacy Formats, click the option you want.
Use the Legacy Formats page in the Trust Center dialog box to control how Project
should respond when you attempt to open or save files in other formats
6. Click OK to close the Trust Center dialog box, and then click OK again to close the
Project Options dialog box.
Save to other file formats from Project
Pasting Project data into other programs as described in an earlier topic might be fine for
one-time or infrequent needs, but this technique might not work as well if you must export
a large volume of data from Project. Instead, you can save Project data in different file
formats. This can be accomplished in various ways, including the following:
You can save the entire project in Extensible Markup Language (XML) format for
structured data exchange with other programs that support XML.
You can save only the data you specify in a different format. The supported formats
include Excel workbooks and tab-delimited or comma-delimited text. When saving
to these formats, you choose the format in which you want to save, choose a built-in
export map (or create your own), and export the data.
Tip
You can also save the active view to an archival format such as XPS or PDF that
preserves layout and formatting but is generally not editable. For more information,
see Chapter 16, “Format and print views: In-depth techniques.”
When you need to export Project data to another file format, it makes no difference what
current view is displayed in Project. The current view does not affect what data can or
cannot be exported.
You begin on the Export page in the Backstage view. Here you can see the major
categories of file types supported by Project.
The export file formats supported by Project are listed on the Export page of the
Backstage view
The file types include:
The current Project file format, which spans Project 2010 through Project 2016.
The Project 2007 file format.
Project templates for both groups of Project formats.
Excel workbook format.
XML format.
Other file types such as text (tab-delimited) or comma-separated value (CSV)
formats.
If you select any of the Project formats or the XML format, Project immediately exports
the plan’s data. The other file formats require data maps to control how individual fields
from the active plan should be organized when exported.
When you begin the export process for a format that requires a data map, you work
through the Export Wizard. In this wizard you either define a new data map, use one of the
built-in data maps in Project, or use a data map you’ve previously created.
Experiment with the available data maps to find what works best when you want to
export data from Project
As you progress, the Export Wizard shows you the detailed field mapping to be applied
for the export.
After you select a specific data map, you can preview and adjust its field mapping
details on this page of the Export Wizard
The built-in data maps in Project are extensive, but if they don’t meet your needs, you can
build your own. Data map–based exporting is especially useful when you must repeatedly
export large volumes of Project data to feed into other programs or systems.
Share files with previous versions of Project
When running Project 2016, you might find that you need to share plans with users
of previous versions of Project. You don’t need to do anything special to open or
save files in Project 2010 or later formats. The Project 2007 format differs,
however. (This file format is listed in the Save As Type box in the Save As dialog
box.) Some data relating to new features in Project will be changed or discarded
when the plan is saved in the older format. Manually scheduled tasks, for example,
will be converted to automatically scheduled tasks.
To learn more about file formats and Project versions, in the Tell Me box, enter
Supported file formats, and then click Get Help.
Important
Project has a security setting that might prevent you from opening or saving files
from previous versions of Project or files in other nondefault formats. You can
change this setting, as described in the previous topic.
To save data in another file format
1. Click the File tab to display the Backstage view, and then click Export.
2. Click Save Project as File. In the Save Project As File area, you can see some of
the supported file types.
3. In the Save Project as File area, select the format you want, and then click Save
As.
Important
Depending on the file format you select and your legacy file format setting in the
Trust Center, a confirmation message box might appear.
If the file type you selected does not require a data map, Project generates the
exported file.
4. If the file type you selected requires a data map, the Export Wizard starts. This
wizard guides you through the steps required to export structured data from Project
into a different format. Complete the steps in the Export Wizard, and then click
Finish. Project exports the data.
Generate reports with Excel and Visio
Project can generate data visualizations that focus on sharing schedule details with other
programs. Specifically, you can use the Visual Reports feature to export data from Project
to either Excel or Visio and, after the data is there, visually represent schedule details in
compelling formats.
Tip
Some visual reports (especially those that are generated in Excel) are similar to the
built-in reports available in Project. You might find visual reports beneficial when
you want to do more complex data analysis in Excel.
A visual report can include task, resource, or assignment details. You can see all available
visual reports listed in the Visual Reports dialog box.
The Visual Reports dialog box lists the reports available for Excel or Visio, if those
programs are installed on the same computer as Project
The Visual Reports dialog box groups visual reports in a number of ways: all reports; only
Excel or only Visio reports; and task, resource, or assignment details (divided into
summary and usage reports). The dialog box includes a simplified preview of the type of
graphic (chart or diagram) associated with each visual report.
When you select a visual report in Project, the Visual Reports feature generates a highly
structured database, called an Online Analytical Processing (OLAP) cube, from your plan.
Project then starts either Excel or Visio (depending on the visual report you selected),
loads and organizes the data used by that program, and generates a graphical
representation of that data (an Excel chart or a Visio diagram).
The specific results you obtain depend on the type of visual report you choose:
Excel visual reports use the PivotTable and PivotChart features in Excel. You can
format the chart and modify the details in the PivotTable report from which the chart
is derived. PivotTable reports are well suited for analyzing and summarizing the
large volumes of data that plans can contain.
A Project visual report for Excel generates a PivotChart
Visio visual reports use the PivotDiagrams feature in Visio. PivotDiagrams are well
suited for presenting hierarchical data and can complement the Project
summary/subtask outlines very well. Not only can you customize the visual report as
a Visio diagram, you can also filter and rearrange the data from which the diagram is
derived.
A Project visual report for Visio generates a PivotDiagram
Project includes several Excel and Visio visual report templates. You can also create your
own visual reports from scratch or modify one of the supplied templates. Visual reports
can be beneficial to any Project user. If you are already familiar with Excel PivotTables or
if you are a Visio power user, and you have the need to analyze and present Project data,
you’ll find visual reports especially interesting.
To generate a visual report (requires Excel or Visio)
1. On the Report tab, in the Export group, click Visual Reports to open the Visual
Reports dialog box.
2. Next to Show Report Templates Created In, select the check box or boxes for the
supported visual reports you want to see: Excel, Visio, or both.
3. Click the tab of the report type you want.
4. Click the specific report you want, and then click View. Project generates the data
required by this report, starts Excel or Visio, and creates the report.
Skills review
In this chapter, you learned how to:
Copy Project data to and from other programs
Open files in other formats in Project
Save to other file formats from Project
Generate reports with Excel and Visio
Practice tasks
The practice files for these tasks, ShareInformation and SampleTaskList (an Excel file),
are located in the Project2016SBS\Ch19 folder.
Important
If you are running Project Professional with Project Web App/Project Server, take
care not to save any of the practice files you work with in this book to Project Web
App (PWA). For more information, see Appendix C, “Collaborate: Project,
SharePoint, and PWA.”
Copy Project data to and from other programs
The scenario: At Lucerne Publishing, you’d like to share task list data from Project with a
word-processing program. Open the ShareInformation plan in Project, and perform the
following tasks:
1. In the Entry table on the left side of the Gantt Chart view, select the range from the
name of task 5, Editorial, through task 13’s finish date, Wed 9/24/18.
2. Copy the tasks to the Clipboard.
3. Start Word (or a comparable word-processing program), create a new document,
and then paste the copied tasks into the new document. Use the default paste option.
If you have Word, your screen should like this
Open files in other formats in Project
The scenario: A colleague has sent you an Excel workbook that contains her
recommended tasks and durations of activities for some work that Lucerne Publishing
might do in the future. You’d like to import this data into Project. Continuing in the
ShareInformation plan, perform the following tasks:
1. Before importing the data into Project, you’ll look at it in Excel. In Excel, open the
workbook named SampleTaskList from the practice file folder.
The Excel workbook you will import into Project
The important things to note about the SampleTaskList workbook are the names and
order of the columns, the presence of a header row (the labels at the top of the
columns), and that the data is in a worksheet named Tasks.
2. When you are finished reviewing the workbook, close it without saving it.
3. In the Open dialog box in Project, navigate to the practice file folder.
4. In the file type box (initially labeled Projects), in the drop-down list, select Excel
Workbook.
5. Select the SampleTaskList file, and then click Open to start the Import Wizard.
6. On the first pages of the Import Wizard, specify that you will use the existing map
named Default Task Information and that you will import the data into a new
project.
7. Specify that you will import tasks data, and instruct Project that the import includes
headers.
8. On the Task Mapping page of the wizard, specify that Tasks is the source
worksheet name.
On the Task Mapping page of the Import Wizard, note the Source Worksheet Name
value
9. Finish the Import Wizard and review the resulting task list. The tasks should be
manually scheduled, have various durations, and all start at the new plan’s start date
(today’s date).
The task list you import will be scheduled to start at the new plan’s start date, which
likely will differ from what is shown here
10. Close the new plan without saving it, and return to the ShareInformation plan.
Save to other file formats from Project
The scenario: A financial planner has requested some project data in Excel format.
Continuing in the ShareInformation plan, perform the following tasks:
1. Export the plan to a new Excel workbook. Name the workbook
ShareInformationExport and save it in the practice file folder.
2. As you do so, use the Export Wizard to specify these data export options:
• Export selected data.
• Use the existing data map named Default Task Information.
• Export task data and include headers.
3. After you complete the export from Project, open the ShareInformationExport
workbook in Excel.
The Excel workbook exported from Project
4. Close the ShareInformationExport workbook and return to Project.
Generate reports with Excel and Visio
Important
If the computer on which you are now working does not have Excel installed, you
cannot complete this exercise.
The scenario: A colleague asked you for some Project data in an Excel PivotChart and
PivotTable. You decide to generate a visual report. Continuing in the ShareInformation
plan, perform the following tasks:
1. In Project, generate a Resource Remaining Work Report. Set the usage data in the
report to Weeks.
2. View the report in Excel.
3. Click anywhere on the chart to open the PivotChart Fields pane.
The Excel workbook generated from a Project visual report
4. Close the Excel workbook without saving it, and return to Project.
20. Consolidate projects and resources
In this chapter
Share a resource pool across multiple plans
Consolidate plans
Create dependencies between plans
Practice files
For this chapter, use the practice files from the Project2016SBS\Ch20 folder. For
practice file download instructions, see the introduction.
In the previous chapters in this book, you usually worked with one plan at a time.
Although a single plan might be your main focus in Project much of the time, it’s likely
that at some point you or your organization will need to coordinate people, work, and
deliverables across multiple projects. This chapter introduces you to the powerful features
in Project that can help you optimize your resources, consolidate multiple plans into a
single consolidated plan, and create dependencies between plans.
This chapter guides you through procedures related to sharing a resource pool across
multiple plans, consolidating plans, and creating dependencies between plans.
Share a resource pool across multiple plans
When managing multiple projects, you might find that work resources (people and
equipment) need to be assigned to more than one project at a time. It might become
difficult to coordinate the work resources’ time among the multiple projects, especially if
those projects are managed by different people. For example, a resource might have task
assignments in three projects that are proceeding simultaneously. In each plan, the
resource might be fully allocated or even underallocated. However, if you add all of that
resource’s tasks from these plans together, you might discover that the resource has been
overallocated; that is, the resource has been assigned more work than that person can
handle at one time.
A resource pool can help you see how resources are utilized across multiple plans. The
resource pool is a plan from which other plans draw their resource information. It contains
information about all resources’ task assignments from all plans that are linked to the
resource pool.
A resource pool is useful for more than work resources. When working with cost resources
in multiple plans, you might want to see not only the cost per plan associated with a cost
resource, but also the cumulative costs across plans. Likewise, when working with
material resources in multiple plans, you can see cumulative consumed material resources
in whatever unit of consumption you are using.
The plans that are linked to the resource pool are called sharer plans.
One way of visualizing a resource pool and sharer plans
You can link a sharer plan to a resource pool at any time: when initially entering the plan’s
tasks, after you assign resources to tasks, or even after work begins. After you set up a
resource pool, you might find it helpful to make all new plans sharer plans. A time-saving
advantage of creating new plans as sharer plans of a resource pool is that your resource
information is instantly available. You do not have to reenter any resource data.
If you manage only one project with resources that are not used in other plans, a resource
pool provides you no benefit. However, if your organization manages multiple projects,
setting up a resource pool enables you to do the following:
Find resources who are overallocated across multiple plans, even if those resources
are underallocated in individual plans.
View resources’ assignment and cost details from multiple plans in a single location.
Change working times for a base calendar in the resource pool and see the changes
updated to all sharer plans that use that calendar. For example, if you specify that
certain days (such as holidays) are to be nonworking days in the resource pool, that
change is made to all sharer plans.
Here’s a closer examination of how a resource pool can help deliver such benefits.
Consider two plans that include some of the same resources assigned to tasks.
Several of the same resources appear in both plans
Let’s say that none of these resources are overallocated in either plan. After the two plans
are linked to a common resource pool, however, you can start to more accurately measure
the resources’ true scope of allocations.
In the resource pool, Project merges resource information from the sharer plans based
on the names of the resources
The resource pool contains the resource information from all sharer plans. Now you can
more easily identify how resources are assigned across multiple plans.
Important
Project cannot match variations of a resource’s name—for example, John Evans
from one sharer plan and J. Evans from another. For this reason, you should
develop a convention for naming resources in your organization and then apply it
consistently.
A resource pool is especially beneficial when you are working with other Project users
across a network. In those cases, the resource pool would be stored in a central location,
such as a network server, and the individual owners of the sharer plans (which might be
stored locally or on a network server) would share the common resource pool.
Create a dedicated resource pool
Any plan, with or without tasks, can serve as a resource pool. However, it is a good
idea to designate as the resource pool a plan that does not contain tasks. This is
because any project with tasks will almost certainly conclude at some point, and
you might not want assignments for those tasks (with their associated costs and
other details) to be included indefinitely in the resource pool.
Moreover, a dedicated resource pool without tasks can enable people such as line
managers or resource managers to maintain some information about their resources,
such as nonworking time, in the resource pool. These people might not have a role
in project management, and they will not need to deal with task-specific details in
the resource pool.
You can give a resource pool any name you want, but we recommend naming it so
that it’s clear it is a resource pool file.
After you’ve created a resource pool file, you use the Share Resources dialog box to link
plans to it, making them sharer plans.
Link plans to a resource pool in the Share Resources dialog box
After the link to share resources between the pool and the plan is made, Project merges
resource names between the plan and the pool. You can change resource information—
such as maximum units, cost rates, and nonworking time—in the resource pool, and all
sharer plans will use the updated information.
Because a resource pool and sharer plans are linked, Project gives you options when you
open either type of file. When you open a resource pool file, Project prompts you to select
how you want to open it. The default option is to open the resource pool as read-only.
When you open the resource pool file, Project prompts you to select how you want to
open it
If you store the resource pool locally, you should open it as read/write.
You might want to choose the read-only option if you and other Project users share a
resource pool across a network. That way, you won’t prevent other Project users from
updating the resource pool. You can quickly push resource and assignment updates from
the sharer plan to the read-only resource pool as needed. After that is done, anyone else
who opens the resource pool will see the latest assignment information.
When working with sharer plans and a resource pool, when you open a sharer plan, you
must also open the resource pool if you want the sharer plan to be updated with the most
recent changes to the resource pool. For example, assume that you change the project
calendar’s working time in the resource pool, save it, and close it. If you later open a
sharer plan but do not also open the resource pool, that sharer plan will not reflect the
updated project calendar’s working time.
As we said earlier, one of the most important benefits of using a resource pool is that it
allows you to see how resources are allocated across plans. In the resource pool, a great
way to examine the details of resources’ assignments and allocations is to show the
Resource Form in combination with the Resource Usage view.
The Resource Form shows assignments across multiple plans when you are using a
resource pool
In this combination view, you can see all resources in the resource pool and their
assignments (in the upper pane), and the selected resource’s details (in the lower pane)
from all sharer plans.
The Resource Form is just one way to see the details of specific assignments from sharer
plans. You can also add the Project or Task Summary Name column to the table portion of
the Resource Usage view. Doing so shows you which project each task assignment is from
and that assignment’s summary task name.
When you are working in a sharer plan, as long as the resource pool is open, Project keeps
the resource pool synchronized as you work. Any changes you make to resource
assignments or other resource information in any sharer plans immediately show up in all
other open sharer plans and in the resource pool.
To link a plan to a resource pool
1. Open an existing resource pool, or create a new plan that will become a resource
pool. If you open an existing resource pool, when prompted, open it as read/write.
Important
When you open a resource pool file that is linked to sharer plans, Project prompts
you to select how you want to open it. The default option is to open the resource
pool as read-only.
2. Open or switch to the plan you want to make a sharer plan.
3. On the Resource tab, in the Assignments group, click Resource Pool, and then
click Share Resources to open the Share Resources dialog box.
4. Under Resources for ‘file name’, select Use resources.
5. The From box contains the open plans that can be used as resource pools. In the
From box, click the name of the resource pool file.
6. If the same resource name is listed in both the sharer plan and the resource pool,
specify how Project should resolve conflicting information. If you want Project to
use resource information in the resource pool rather than in the sharer plan, under
On conflict with calendar or resource information, make sure that Pool takes
precedence is selected.
7. Click OK to close the Share Resources dialog box.
8. Save the sharer plan and the resource pool.
To unlink a sharer plan from a resource pool
1. Open the resource pool as read/write.
2. In the sharer plan, on the Resources tab, click Resource Pool, and then click Share
Resources.
3. Under Resources For ‘Current Project Name’, select Use Own Resources.
4. Click OK.
5. Save the unlinked plan and the resource pool.
To update a read-only resource pool from a sharer plan
1. In the sharer plan, make whatever resource or assignment updates are needed.
2. On the Resource tab, in the Assignments group, click Resource Pool, and then
click Update Resource Pool. Project updates the assignment information in the
resource pool with the new details from the sharer plan and then saves the resource
pool. Anyone else who opens or refreshes the resource pool now will see the
updated assignment information.
To view resource usage details in the resource pool
1. Open or switch to the resource pool file.
2. On the View tab, in the Resource Views group, click Resource Usage to display
the Resource Usage view.
3. If you want, you can also display the Resource Form in a split view. On the View
tab, in the Split View group, click Details.
To manage sharer plans linked to a resource pool
1. Open the resource pool and sharer plans as read/write.
2. In the resource pool, on the Resource tab, in the Assignments group, click
Resource Pool, and then click Share Resources to open the Share Resources dialog
box.
3. Under Sharing Links, select a sharer plan. You can then open that sharer plan,
break its link to the resource pool, or adjust its conflict resolution setting.
4. When you are done in the Share Resources dialog box, click OK.
Tip
A sharer plan’s assignment information is recorded in its resource pool. If a sharer
plan is deleted, its assignment information remains in the resource pool. To clear
this assignment information from the resource pool, you must break the link to the
sharer plan. To do this, open the resource pool as read/write. On the Resource tab,
in the Assignments group, click Resource Pool, and then click Share Resources. In
the Share Resources dialog box, click the name of the now-deleted sharer plan, and
click Break Link. Note that the contents of the Share Resources dialog box for a
resource pool differ from those for sharer plans.
To update all sharer plans’ working times in a resource pool
1. Open or switch to the resource pool.
2. On the Project tab, in the Properties group, click Change Working Time to open
the Change Working Time dialog box.
3. In the For calendar box, select Standard (Project Calendar) from the list.
Tip
Base calendars—such as 24 Hours, Night Shift, and Standard—appear at the top of
the list in the For Calendar box. Resource calendar names appear below the base
calendars.
Changes in working time to the Standard base calendar in the resource pool affect all
plans that are sharer plans of the resource pool.
4. On the Exceptions tab of the Change Working Time dialog box, make your
working time adjustments.
5. Click OK to close the Change Working Time dialog box. All plans that are sharer
plans of the same resource pool will see this change in this base calendar.
Important
By default, all sharer plans share the same base calendars, and any changes you
make to a base calendar in one sharer plan are reflected in all other sharer plans
through the resource pool. If you have a specific sharer plan for which you want to
use different base calendar working times, change the base calendar that sharer plan
uses.
Consolidate plans
You might find yourself managing multiple plans that involve some of the same resources
and that might be related to the same overall goal or deliverable of an organization. You
might even need to coordinate with several people working on tasks at different times,
sometimes in different locations, and frequently for different supervisors. In either case,
you might need to produce a single “all-up” view of distinct but related plans.
A good way to pull together far-flung project information is to use a consolidated plan.
This is a plan that contains other plans, called inserted plans. The inserted plans do not
reside within the consolidated plan; rather, they are linked to it in such a way that they can
be viewed and edited either on their own or from within the consolidated plan. If an
inserted plan is edited outside of the consolidated plan, the updated information appears in
the consolidated plan the next time it is opened.
Tip
Consolidated plans are also known as consolidated projects or master projects, and
inserted plans are also known as subprojects; however, this chapter uses the terms
consolidated and inserted plans.
Using consolidated plans is a powerful capability. Some of the beneficial uses of
consolidated plans include the following:
See all tasks from your organization’s plans in a single view.
Roll up information to higher levels of management. For example, you might insert
a team’s plan into the larger department’s consolidated plan and then insert that plan
into the larger organization’s consolidated plan.
Divide your project data into different plans to match the nature of your project,
such as by phase, component, or location. Then you can pull the information back
together into a consolidated plan for a comprehensive look at the whole plan.
See all your plans’ information in one location so that you can filter, sort, and group
the data.
So how does it work? Consolidated plans use the Insert Subproject command and Project’s
outlining features. An inserted plan initially appears as a collapsed summary task in the
consolidated plan, and its summary Gantt bar is gray. Project displays an inserted project
icon in the Indicators column.
In this view of a consolidated plan, the Gantt bars of the inserted plans are collapsed
The summary tasks representing inserted plans are sequentially numbered as 1, 2, and so
on. When you expand the collapsed summary task of each inserted plan, the task IDs
within each inserted plan start at 1. This numbering scheme preserves the task IDs within
each inserted plan, whether you work with it as a stand-alone plan you open directly in
Project, or as an inserted plan you open from within a consolidated plan.
When you are working with a consolidated plan, it is especially useful to display the
project summary task. Recall from Chapter 4, “Build a task list,” that the project summary
task sums up the values from quantified fields such as work and cost. In a consolidated
plan, the project summary task’s roll-up values represent the total values from all of the
inserted plans. Similarly, the start and finish dates of the project summary task span the
earliest start and latest finish dates from the inserted plans.
The values of this summary task, such as duration and work, represent the rolled-up
values of the inserted plans
Keep consolidated plans simple
When you are working in a consolidated plan, Project won’t prevent you from
adding new tasks or resources that are not part of an inserted plan. However, we do
not recommend that you add tasks or resources outside of the inserted plans. Think
of a consolidated plan as basically being a container of inserted plans. For
simplicity, the inserted plans should contain all of the schedule details.
Tip
If you want to share resources across the inserted plans in a consolidated plan,
connect the inserted plans to a common resource pool as described in the previous
topic.
To create a consolidated plan
1. Click the File tab to display the Backstage view, and then click New.
2. On the New page, click Blank project. Project creates a new plan. This plan will
become the consolidated plan into which you insert other plans.
3. On the Project tab, in the Insert group, click Subproject to open the Insert Project
dialog box.
Tip
You can insert two or more plans into the consolidated plan if the plans to be
inserted are located in the same folder. In the Insert Project dialog box, select each
plan while pressing the Ctrl key, and then click Insert.
4. Locate and select each plan you want to insert into the consolidated plan, and then
click Insert. Project inserts the plan (or plans) into the consolidated plan. Each
inserted plan appears as a collapsed summary task with an inserted project indicator
in the Indicators column.
Tip
You can quickly create a consolidated plan that includes some or all of the currently
open plans. On the View tab, in the Windows group, click New Window. Under
Projects, press the Ctrl key while selecting the plans to be inserted into the new
consolidated plan, and then click OK.
To display the details of an inserted plan
1. Display the consolidated plan in a task-oriented view that includes a table, such as
the Gantt Chart view with Entry table.
2. Click the Select All button in the upper-left corner of the table.
3. On the View tab, in the Data group, click Outline, and then click All Subtasks.
Project expands the inserted plan or plans.
Or
1. Display the consolidated plan, in a task-oriented view that includes a table.
2. Click the expand/collapse arrow next to the name of each inserted plan.
To display the project summary task of a consolidated plan
1. In the consolidated plan, on the Format tab, in the Show/Hide group, click Project
Summary Task.
Create dependencies between plans
Most projects do not exist in a vacuum. Tasks or phases in one project might depend on
tasks in other projects. You can show such dependencies by linking tasks between plans.
Reasons that you might need to create dependencies between plans include the following:
The completion of one task in a plan might enable the start of a task in another plan.
For example, another project manager might need to complete an environmental
impact statement before you can start to construct a building. Even if these two tasks
are managed in separate plans (perhaps because separate departments of a
construction company are completing them), one plan has a logical dependency on
the other.
A person or a piece of equipment might be assigned to a task in one plan, and you
need to delay the start of a task in another plan until that resource completes the first
task. The two tasks might have nothing in common other than needing that resource.
You create a link between plans by entering information about the predecessor task in the
plan that contains the successor task. Specifically, you enter the external predecessor link
in the format File Name\Task ID. You do so in a task’s predecessor field such as in the
Predecessors column in the Entry table, or in the ID field in the Task Information dialog
box, on the Predecessors tab.
Create cross-plan links by entering the file name and task number of the predecessor
task in the successor task’s Predecessors field
After you create a task relationship between plans, the relationship looks similar to links
between tasks within a plan. The visual indication of a task relationship between plans is
that external predecessor and successor tasks have gray task names and Gantt bars
(sometimes referred to as ghost tasks).
The external predecessor appears as a gray “ghost task” in the file to which it is linked
The same visual treatment of external links appears in both plans—the source plan that
contains the predecessor task, and the destination plan that contains the successor.
The external successor task also appears as a gray “ghost task” in the file to which it is
linked
The link between the two plans will remain until you break it. Deleting a task in the source
plan or the external task in the destination plan deletes the corresponding task or external
task in the other plan.
When you are working with consolidated plans (see the previous topic), links between two
inserted plans function like normal task links within a single plan. In fact, creating crossplan links is easy in a consolidated plan. If you have complex cross-plan link needs, you
might find it easiest to first insert the plans into a consolidated plan and then create the
links you need.
The following are a few additional tips and suggestions for working with cross-plan links:
If you point to the external task’s Gantt bar, Project displays a ScreenTip that
contains details about the external task, including the full path to the external plan
where the external predecessor task resides.
You can turn off the display of external tasks if you want. To do this, click the File
tab, and click Options. In the Project Options dialog box, on the Advanced tab,
under Cross Project Linking Options For <File Name>, clear the Show External
Successors and Show External Predecessors check boxes.
Each time you open a plan with cross-plan links, Project prompts you to update the
cross-plan links. You can suppress this prompt if you would rather not be reminded,
or you can tell Project to accept updated data from the linked plan automatically. To
do this, click the File tab, and click Options. In the Project Options dialog box, on
the Advanced tab, under Cross Project Linking Options For <File Name>, select the
options you want.
To create cross-plan links between two plans
1. Open the two plans you want to link.
2. In the plan that contains the task you want to be the successor task, display the
Entry table if it’s not already visible.
3. Click the Predecessors field of the task you want to be the successor task.
4. In the Predecessors field, enter the file name and task ID of the predecessor task in
the format File Name\Task ID, and then press Enter. For example, you would enter
Children’s Cookbook\5 to make task 5 of the file Children’s Cookbook.mpp a
cross-plan predecessor.
To create cross-plan links between inserted plans in a consolidated plan
1. Select the task you want to be the predecessor task, and then select the task you
want to be the successor task.
2. On the Task tab, in the Schedule group, click Link The Selected Tasks. The two
tasks are linked with a finish-to-start relationship.
To change the relationship type of a cross-project link in a consolidated
plan
1. Select the successor task.
2. On the Task tab, in the Properties group, click Information to open the Task
Information dialog box.
3. Click the Predecessors tab.
4. In the Type field, click the link type you want.
To delete a cross-plan link
1. Click the successor task first.
2. On the Task tab, in the Properties group, click Information to open the Task
Information dialog box.
3. Click the Predecessors tab.
4. In the Predecessors box, select the external task link’s ID, and press Delete.
To identify and manage all links (external predecessors and external
successors) in a plan
1. On the Project tab, in the Properties group, click Links Between Projects to open
the Links Between Projects dialog box.
2. Choose the options you want on the External Predecessors and External
Successors tabs, and then click Close.
Skills review
In this chapter, you learned how to:
Share a resource pool across multiple plans
Consolidate plans
Create dependencies between plans
Practice tasks
The practice files for these tasks are located in the Project2016SBS\Ch20 folder.
Important
If you are running Project Professional with Project Web App/Project Server, take
care not to save any of the practice files you work with in this book to Project Web
App (PWA). For more information, see Appendix C, “Collaborate: Project,
SharePoint, and PWA.”
Share a resource pool across multiple plans
The scenario: At Lucerne Publishing, you frequently assign work resources (people) to
different tasks in different plans. Although you manage those plans in Project, you have
occasionally inadvertently overallocated some resources when all their work across the
plans is accounted for. To help avoid this problem in the future, you decide to create a
resource pool and connect it to your current plans. Open the ShareResourcesA and
ShareResourcesB plans in Project, and then perform the following tasks:
1. Create a new plan and save it in the practice file folder. Name the file Lucerne
Resource Pool.
2. Make the ShareResourcesA and ShareResourcesB plans sharer plans of the
resource pool.
3. Display the Resource Sheet view in the resource pool.
Your resource pool should look like this
4. Save and close all plans.
Consolidate plans
The scenario: You occasionally need to look at information spread between closely related
but distinct projects. To get an “all-up” view across plans, you decide to add them to a
consolidated plan. In Project, perform the following tasks:
1. Create a new plan and save it in the practice file folder. Name the file Lucerne
Consolidated Plan.
2. Insert the ConsolidatePlansA and ConsolidatePlansB plans into Lucerne
Consolidated Plan.
3. In Lucerne Consolidated Plan, expand both inserted plans to see their details.
4. Display the project summary task.
Your consolidated plan should look like this
Create dependencies between plans
The scenario: You have identified that the deliverable of a task from one plan is required
before a task in another plan can begin. You decide to create a cross-project link between
these two plans. Continuing in the Lucerne Consolidated Plan you previously created,
perform the following tasks:
1. In Lucerne Consolidated Plan, make task 12 in ConsolidatePlansA (Children’s
Exercise Book Launch schedule) the predecessor of task 13 in the
ConsolidatePlansB (Children’s Gourmet Cookbook) plan.
Your cross-project link should look like this in the consolidated plan
2. Save and close all plans.
Appendix A. A short course in project management
Throughout this book, we’ve included advice on how best to use Project 2016 while
following sound project-management practices. This appendix focuses on the basics of
project management, regardless of any software tools you might use to help you manage
projects. Although project management is a broad, complex subject, in this appendix we
focus on the project triangle model. In this model, you consider projects in terms of time,
cost, and scope.
Understand what defines a project
Succeeding as a project manager requires that you complete your projects on time, finish
within budget, and make sure your customers are happy with what you deliver. That
sounds simple enough, but how many projects have you heard of (or worked on) that were
completed late, cost too much, or didn’t meet the needs of their customers?
A Guide to the Project Management Body of Knowledge (published by the Project
Management Institute)—referred to as the PMBOK and pronounced “pimbok”—defines a
project as “a temporary endeavor undertaken to create a unique product or service.” Let’s
walk through this definition to clarify what a project is—and what it is not.
Tip
For more information about the Project Management Institute and the PMBOK, see
Appendix B, “Develop your project-management skills.”
First, a project is temporary. A project’s duration might be just one week, or it might go on
for years, but every project has an end date. You might not know that end date when the
project begins, but it’s out there somewhere in the future. Projects are not the same as
ongoing operations, although the two have a great deal in common. Ongoing operations,
as the name suggests, go on indefinitely; you don’t establish an end date. Examples
include most activities of accounting and human resources departments. People who run
ongoing operations might also manage projects; for example, a manager of a human
resources department for a large organization might plan a college recruiting fair. Yet
projects are distinguished from ongoing operations by an expected end date, such as the
date of the recruiting fair.
Next, a project is an endeavor. Resources, such as people and equipment, need to do work.
The endeavor is undertaken by a team or an organization, and therefore projects have a
sense of being intentional, planned events. Successful projects do not happen
spontaneously; some amount of preparation and planning happens first.
Finally, every project creates a unique product or service. This is the deliverable for the
project and the reason that the project was undertaken. A refinery that produces gasoline
does not produce a unique product. The whole idea, in this case, is to produce a
standardized commodity; you typically don’t want to buy gas from one station that is
significantly different from gas at another station. On the other hand, commercial airplanes
are unique products. Although all Boeing 787 Dreamliner airplanes might look more or
less the same to most of us, each is, in fact, highly customized for the needs of its
purchaser.
By now, you might realize that much of the work that goes on in the world is projectoriented work. In fact, a substantial portion of your work might be focused on project
management—even if that’s not your job title.
Project management has been a recognized profession for many decades, but projectmanagement work in some form has been occurring for as long as people have been doing
complex work. When the Great Pyramids at Giza in Egypt were built, somebody
somewhere was tracking resources, schedules, and specifications in some fashion.
Tip
Project management is now a well-recognized profession in most industries. To
learn more about organizations that train project managers and advance project
management as a profession, see Appendix B, “Develop your project-management
skills.”
The project triangle: View projects in terms of time, cost, and scope
You can visualize project work in many ways, but our favorite method is what is
sometimes called the project triangle or triangle of triple constraints.
The project triangle is a helpful model for visualizing how time, cost, and scope relate
to each other in a project
This theme has many variations, but the basic concept is that every project has some
element of a time constraint, has some type of budget, and requires some amount of work
to complete. (In other words, it has a defined scope.) The term constraint has a specific
meaning in Project, but here we’re using the more general meaning of “a limiting factor.”
Let’s consider these constraints one at a time.
Time
Have you ever worked on a project that had a deadline? (Maybe we should ask whether
you’ve ever worked on a project that did not have a deadline.) Limited time is the one
constraint of any project with which we are all probably most familiar. If you’re working
on a project right now, ask your team members to name the date of the project deadline.
They might not know the project budget or the scope of work in great detail, but chances
are they all know their immediate deadlines, and probably also the overall project
deadline.
The following are examples of time constraints:
You are building a house and must finish the roof before the rainy season arrives.
You are assembling a large display booth for a trade show that starts in two months.
You are developing a new inventory-tracking system that must be tested and running
by the start of the next fiscal year.
Since we were children, we have been trained to understand time. We carry wristwatches,
paper organizers or smartphones, and other tools to help us manage time. For many
projects that create a product or event, time is the most important constraint to manage.
Cost
You might think of cost simply in monetary terms, but in the context of projects, cost has a
broader meaning: costs include all the resources required to carry out the project. Costs
include the people and equipment doing the work, the materials being used, and all the
other events and issues that require money or someone’s attention in a project.
The following are examples of cost constraints:
You signed a fixed-price contract to develop an e-commerce website for a client. If
your costs exceed the agreed-upon price, your customer probably won’t be willing to
renegotiate the contract.
The president of your organization has directed you to carry out a customer research
project using only the staff and equipment in your department.
You received a $5,000 grant to create a public art installation. You have no other
funds.
For virtually all projects, cost is ultimately a limiting constraint; few projects can go over
budget without eventually requiring corrective action.
Scope
You should consider two aspects of scope: product scope and project scope. Every
successful project produces a unique product: a tangible item or service. Customers
usually have some expectations about the features and functions of products they consider
purchasing. Product scope describes the intended quality, features, and functions of the
product, often in minute detail. Documents that outline this information are sometimes
called product specifications. A service or event usually also has some expected features.
We all have expectations about what we’ll do or see at a party, concert, or sporting event.
Project scope, on the other hand, describes the work required to deliver a product or
service with the intended product scope. Project scope is usually measured in phases and
tasks.
The following are examples of scope constraints:
Your organization won a contract to develop an automotive product that has exact
requirements—for example, physical dimensions measured to 0.01 milli-meters.
This is a product scope constraint that will influence project scope plans.
You are constructing a building on a lot that has a height restriction of 50 feet.
You can use only internal services to develop part of your product, and those
services follow a product development methodology that is different from what you
had planned.
Product scope and project scope are closely related. The project manager who manages
project scope should also understand product scope or know how to communicate with
those who do.
Time, cost, and scope: Manage project constraints
Project management gets most interesting when you must balance the time, cost, and
scope constraints of your projects. The project triangle illustrates the process of balancing
constraints because the three sides of the triangle are connected, and changing one side of
a triangle affects at least one other side. The following sections provide examples of
constraint balance.
You have less time
If the duration (time) of your project schedule decreases, you might need to increase
budget (cost) because you must hire more resources to do the same work in less time. If
you cannot increase the budget, you might need to reduce the scope because the resources
you have cannot complete all the planned work in less time.
When you have less time than you planned for, you might need to increase cost or
decrease scope (or both)
If you must decrease a project’s duration, make sure that overall project quality is not
unintentionally lowered. For example, testing and quality control often occur last in a
software development project; if project duration is decreased late in the project, those
tasks might be the ones to suffer from cutbacks. You must weigh the benefits of
decreasing the project duration against the potential downside of a deliverable of poorer
quality.
You have fewer resources
If the budget (cost) of your project decreases, you might need more time because you
cannot pay for as many resources or for resources of the same efficiency. If you cannot
increase the time, you might need to reduce project scope because fewer resources cannot
complete all the planned work in the time remaining.
When you have decreased cost (or fewer resources) than you planned for, you might
need to increase time or decrease scope (or both)
If you must decrease a project’s budget, you could look at the grades of material resources
for which you had budgeted. A lower-grade material is not necessarily a lower-quality
material. As long as the grade of material is appropriate for its intended use, it might still
be of high quality. Here’s one example we can all relate to: fast food and gourmet food are
two grades of restaurant food, but you might find high-quality and low-quality examples
of each.
You should also look at the costs of the human and equipment resources you planned to
use. Can you hire less-experienced people for less money to carry out simpler tasks?
Reducing project costs can lead to a poorer-quality deliverable, however. As a project
manager, you must consider (or, more likely, communicate to the decision makers) the
benefits versus the risks of reducing costs.
You have more work
If your project scope increases, you might need more time or resources (cost) to complete
the additional work. When project scope increases after the project has started, it’s called
scope creep. Changing project scope midway through a project is not necessarily a bad
thing; for example, the environment in which your project deliverable will operate might
have changed, or you might have learned more about the nature of the work since
beginning the project. Changing project scope is a bad thing only if the project manager
doesn’t recognize and plan for the new requirements—that is, when other constraints (cost
and time) are not correspondingly examined and, if necessary, adjusted.
When you have more work than you planned for, you might need to increase time or
cost (or both)
Time, cost, and scope are the three essential elements of any project. To succeed as a
project manager, you should know how all three of these constraints apply to your projects
and be able to communicate this to your stakeholders.
Here is our final word about the project triangle model. Like all simple models of complex
subjects, this model is a useful learning tool but not always a reflection of the real world.
If real projects always performed as the project triangle suggests that they should, you
might see projects delivered late but at the planned cost or with the expected scope; or
projects might be completed on time and with the expected scope, but at higher cost. In
other words, you’d expect to see at least one element of the project triangle come in as
planned. But the sad truth is that many projects, even with rigorous project management
oversight, are delivered late, over budget, and with far less than the expected scope of
functionality. You’ve probably participated in a few such projects yourself. Project
management is a demanding field. Success in project management requires a rare mix of
skills and knowledge about schedule practices and tools, in addition to skill in the domain
or industry in which a project is executed.
Manage your projects with Project
The best project-management tool in the world can never replace your good judgment.
However, the right tool can and should help you accomplish the following:
Track all the information you gather about the work, duration, and resource
requirements for your project.
Visualize your project plan in standard, well-defined formats.
Schedule tasks and resources consistently and effectively.
Exchange project information with stakeholders in a variety of ways.
Communicate with resources and other stakeholders while leaving ultimate control
in the hands of the project manager.
In the chapters of this book, you were introduced to the rich functionality of Project. Not
everything in this book might have applied to your needs, and you probably have needs
that this book did not address. We hope that this book helps you get off to a great start
with Project!
Appendix B. Develop your project-management skills
If you completed most of or all the chapters in this book, you’re well on your way to
mastering Microsoft Project 2016. However, one book can get you only so far. To help
further your knowledge of Project and project management, start with the sources listed in
this appendix.
Join a Project learning community
Many Project users love to talk about the program and their work with it and to share ideas
with others. Whether you work in a large organization or independently, you’re likely to
find a community of Project users nearby.
If you’re in a large organization, especially one with a strong project-management focus,
you might find an internal Project user group or support group there. Such groups often
meet informally to provide peer training and support, critique plans, and share best
practices. If such a group does not exist in your organization, perhaps you can start one.
In the public realm, there are many Project user groups around the world. These groups
typically meet on a regular basis to share tips and tricks about Project. Joining a user
group is a great way to broaden your exposure to Project usage; it also can be a great
source for informal product support, training, and career networking.
The following are a few places where you can investigate Project user groups and related
resources:
The Microsoft Project User Group (MPUG) is the official industry association for
Project. MPUG offers information about a variety of Project and projectmanagement resources, in addition to a directory of Project user groups around the
world. Find it on the web at mpug.com.
The Microsoft and Office website includes a variety of tools and information to help
you succeed with Project. Useful pages include:
• The main Project product page at https://products.office.com/project.
• Help and customer support at https://support.office.com.
• Community questions and answers about Project at answers.microsoft.com.
• In-depth blog posts from the Project product team members at
https://blogs.office.com/project.
To showcase your Project expertise formally, you can become certified. Microsoft
developed certifications for Project and enterprise project-management solutions. To learn
about training opportunities and requirements for Project-related certifications, visit
https://www.microsoft.com/learning.
Join a project-management learning community
Perhaps more than other desktop programs, Project requires you to be involved in a
specific formal activity: project management. Project management can be an exciting mix
of technical, organizational, and social challenges. The Project Management Institute
(PMI) is the leading organization of professional project management. PMI focuses on
setting project-management standards, developing and offering educational programs, and
certifying project managers. The most widely recognized PMI certification is the Project
Management Professional (PMP) certification.
A Guide to the Project Management Body of Knowledge—published by the PMI and
referred to as the PMBOK (pronounced “pimbok”) describes generally accepted projectmanagement practices, knowledge areas, and terminology. In addition, the PMI publishes
the Project Management Journal and PM Network journals. You can learn more about the
PMI on the web at pmi.org. If you are professionally invested in the practice of project
management, you should be in the PMI.
Tip
Project includes some PMI-related and PMBOK-related templates that might be of
interest to you. These include the Project Management Institute Process and
PMBOK Compliant Project Management templates. To view these, click the File
tab, click New, and then click them in the list of available templates.
There are, of course, many worthwhile commercial and nonprofit organizations dedicated
to Project and project management besides those we have described here. Project enjoys a
leading position in the diverse, sometimes contentious, but always interesting world of
project management. Wherever you are in your own Project and project-management
knowledge and career development, you can find a great variety of supporting
organizations and peers today. The authors wish you the greatest success!
Appendix C. Collaborate: Project, SharePoint, and PWA
This appendix introduces you to some of the team-collaboration features available when
you combine Project Professional 2016 with Microsoft SharePoint or Project Web App
(PWA). Although full coverage of the interoperability of Project with SharePoint and PWA
is beyond the scope of this book, we want to help you gain a basic understanding of the
benefits these products offer beyond the capabilities of Project on the desktop. We
conclude the appendix with a discussion of project portfolio management (PPM) and the
capabilities that PPM can add to your organization.
Because you might not have access to SharePoint or PWA, this appendix describes and
illustrates these services but does not include hands-on activities with practice files. Each
topic concludes with a “Sources for more information” list of online resources you can
investigate.
Share your plan by using SharePoint
Project managers and teams benefit when they share information. With Project
Professional, you can synchronize tasks between Project and SharePoint. You can either
create the initial task list in Project and then synchronize it to a list in SharePoint or create
the initial task list in SharePoint and then create a new Project plan based on the task list.
Team members can view, edit, and report the status of their tasks in the SharePoint tasks
list.
The SharePoint Project Summary page includes a timeline and other key details about the
plan.
The Project Summary page in SharePoint includes key details and a timeline snapshot
of a plan
From the Project Summary page, you can share the plan, customize the site, and drill into
the task list.
Here’s what a timeline and tasks list look like in SharePoint
In SharePoint, you can track progress on a task or add new tasks, but no active scheduling
occurs. You can even view your tasks list in other views, including a calendar and a Gantt
Chart view.
SharePoint supports common views such as the Gantt chart and timeline views familiar
to Project users
When the SharePoint tasks list is synchronized with Project, you can then take full
advantage of the Project feature set and scheduling engine.
The SharePoint tasks list from the preceding illustration now shown in Project
Professional
Project Professional users can think of task synchronization with SharePoint as serving
two very useful purposes:
You can create an initial task list in SharePoint and invite team members and other
stakeholders to add tasks, durations, and other details in SharePoint. You can then
open the list in Project and do scheduling work in Project. Then you can
resynchronize back to SharePoint so that the team can see the results.
You can create an initial task list in Project and then synchronize it with SharePoint.
You can then invite team members and other stakeholders to adjust task details as
needed. Then you can edit the list in Project for additional schedule fine-tuning.
In both cases, you use the scheduling engine in Project and the collaborative, multi-user
capabilities of SharePoint—the best combination of the strengths of both products.
You can also convert a SharePoint task list into a PWA project (described in the next
topic). You might choose to do so, for example, when you find you need more detailed
status tracking or workflow management of tasks.
This topic introduced you to Project and SharePoint integration via task list
synchronization. Depending on the collaborative practices and tools of your organization,
you might find that Project and SharePoint together make a powerful combination.
Sources for more information
The following are some resources about Project Professional and SharePoint integration:
In Project, you can share a plan with SharePoint from the Save As page of the
Backstage view. To learn more, in Project, in the Tell Me box, enter sync with
SharePoint, and then click Get Help.
In SharePoint, you can open a tasks list in Project by clicking the Open With Project
button in the Connect & Export group of the List tab while in a tasks list view. To
learn more, in SharePoint, click the Help button (which looks like a question mark)
in the upper-right corner of the SharePoint window, and in the Help Search box,
enter Project site.
Visit the SharePoint product portal at https://products.office.com/sharepoint to learn
more about SharePoint.
Members of the Project engineering team have written some detailed posts on the
Office Blog about Project and SharePoint task lists. Visit
https://blogs.office.com/project, and then search for SharePoint task list.
Team collaboration with Project Web App
Project Web App (PWA) is the browser-based interface to Project Server running onpremises, or to Project Online hosted in the cloud. Project managers can use PWA in
conjunction with Project Professional to build and manage projects. Others who might
find PWA useful include:
Team members who have task assignments.
Portfolio managers who collect and analyze data across multiple projects.
Site administrators who set up and manage access to PWA and create custom user
experiences.
Projects that can be managed in PWA can come from a variety of sources, including:
Project Professional plans (MPP files).
SharePoint task lists.
Projects created directly in PWA.
A PWA project is stored in Project Server or Project Online, and it can be edited by
authorized stakeholders in PWA and by the project manager in Project.
At first glance, a tasks list in PWA might look similar to a SharePoint tasks list. PWA tasks
lists offer much greater scheduling capabilities, however, and support the scheduling
features in PWA and the full feature set of Project Professional.
The hub of PWA is the Home page.
The Project Web App Home page displays some of the capabilities in PWA for project
managers and team members
From the Home page, you can manage your PWA site and drill down into your projects
and tasks.
Here is what a collection of projects, or a portfolio, looks like in the Project Center
The commands on the Projects tab indicate some of the actions you can perform.
Important abilities include adding new projects to the portfolio, controlling access to
projects, and changing how the list of projects appears.
Use the commands on the Projects tab to manage a portfolio of projects
When you view a project, you get a familiar Gantt Chart with Timeline view very similar
to what you would see in Project. In fact, on the Task tab you can see many of the same
task-management features that are in Project, including those for tracking progress and
applying groups or filters.
The commands and views in Project Web App should be familiar to Project users
Next, we’ll examine PWA from the perspective of a team member who has task
assignments in a PWA project.
One important thing team members can use PWA for is to record work status in sheet,
timephased, or Gantt Chart format.
Here a team member records timephased actuals (that is, actual work distributed over
time) on some of her assigned tasks
After the team member has recorded her work status, she can submit her status for
approval by the project manager.
Here’s what a team member’s status update looks like to the project manager
Team members can add comments to their status per task.
This is what a team member’s comment looks like to the project manager
After the project manager accepts the status updates, Project’s scheduling engine responds
to the progress reported by team members and any other changes made to the plan in
PWA.
Project Professional processes the team members’ status updates as actuals recorded in
the plan
The next time the plan is published, all team members and other stakeholders will see the
changes. This collaborative process continues throughout the life of the project.
Sources for more information
The following are some resources about Project Professional and PWA integration:
If you have access to PWA, you can get an overview of supported activities in the
PWA Help system. Click the Help button (which looks like a question mark) in the
upper-right corner of the PWA window, and explore the Help content.
Visit the Project product portal at https://products.office.com/Project.
Visit https://technet.microsoft.com/projectserver for IT pro content about Project
Server.
Members of the Project engineering team have written some detailed posts on the
Office Blog about Project and PWA. Visit https://blogs.office.com/project, and then
search for PWA.
Project portfolio management
The previous topics introduced you to some of the team collaboration features available
with SharePoint and Project Web App (PWA). Behind PWA sits Project Server running
on-premises, or Project Online hosted in the cloud. Project Professional combined with
Project Server or Project Online makes up the Microsoft project portfolio management
solution, or PPM for short. (You might also see the related label enterprise project
management, or EPM.) The project management functionality of PPM extends far beyond
the desktop functionality of Project as you’ve practiced it in this book.
This topic introduces some of the key differences between desktop project management
and PPM. PPM is one of the more complex but potentially rewarding practices that a large
organization can adopt.
Some organizational benefits of PPM include the following:
You can capture your organization’s best practices with regard to workflow models
and resource skills in enterprise templates.
You can gain insight into resource workload and availability across all projects and
other activities in your organization.
You can develop consistent ways of describing and tracking project activities across
your organization.
You can collect a broad range of data relating to projects and report this data in
timely and informative ways.
Although you might be the sole user of Project in your organization, the real “user” of
PPM is the entire organization; thus, the software toolset is correspondingly more complex
than Project running on a single computer. For this reason, fully addressing the details of
PPM is far beyond the scope of this book. However, we want to introduce PPM here so
that you can start to determine whether it can serve a useful role in your organization. For
most organizations, we think the answer will be “Yes,” but getting from an initial interest
in PPM to a full implementation is a series of complex steps. We hope that this brief
introduction can help you formulate some ideas about how PPM can improve your
organization’s performance.
If you read the chapters of this book, you have a good introduction to project management
on the scale of a single project manager with projects that have dozens of resources
working on hundreds of tasks. You might be practicing project management at this scale
now. Indeed, with a resource pool and multi-project features such as consolidated projects,
a single project manager should be able to stay on top of several different projects in
various stages of completion by using Project running on a single computer.
Now imagine dozens of project managers planning and tracking hundreds of projects, each
with hundreds or even thousands of resources and tasks—all within a single organization.
Project management at this scale requires a high degree of planning, coordination, and
standardization. This is the realm of PPM: a large organization planning, coordinating, and
executing a large number of projects simultaneously.
Think about any past or current experiences you’ve had working on projects in a large
organization, and try to answer these questions:
Were potential projects evaluated against the goals and objectives of the
organization such that the projects selected for execution aligned well with the
strategic goals of the organization?
Were the projects defined and scoped in a consistent way that enabled apples-toapples comparisons?
Were resource assignments made with full knowledge of each resource’s skills,
location, and availability?
Did the executive leadership of the organization have a clear picture of the status of
each project?
If your answer to these questions is “No,” the organization was probably not practicing
PPM effectively. There is no question that many large organizations can gain great
benefits by adopting PPM; however, this is no easy task, or they would have implemented
PPM already. Succeeding with PPM requires a strong willingness from the leadership of
the organization (executive sponsorship), a well-trained group of administrators, project
and resource managers, and a software infrastructure (either on-premises or hosted)
capable of supporting it.
Sources for more information
The following are some resources to help you with the evaluation, planning, and
deployment of a PPM solution:
Review all the relevant material on the Project product website. Visit
https://products.office.com/Project, and then navigate to Project Server or Project
Online content.
Consider attending classroom training on PPM deployment from Microsoft
Learning. Check the Microsoft Learning website for PPM information:
https://www.microsoft.com/learning.
If you are in an organization that is relatively new to the project and portfolio
management discipline, consider working with a recognized Project partner. You can
begin your search for a qualified partner firm here: https://pinpoint.microsoft.com.
We hope this brief introduction will give you and your organization a good start in
exploring PPM tools and practices.
Appendix D. Use this book in a classroom
This book is suitable for various learning environments and needs, including:
Individual self-paced training.
Instructor-led classroom training.
If you are an instructor preparing training material for classroom delivery, this appendix
offers some suggestions for how to best integrate this book into your syllabus or lesson
plans.
Match content to instructional needs
The following table describes the organization of this book and how you as an instructor
can incorporate this book into your classroom training environment.
The topics and chapters in this book vary in terms of page count and, for the “Practice
tasks” hands-on activities, completion time. For this reason, we recommend that you
complete the activities yourself that you intend to assign to students so that you can better
estimate how long the assignments should take. An experienced Project user should be
able to complete any chapter in this book within one hour; a new Project user, however,
might require substantially more time.
Depending on your classroom environment and training objectives, you might find a
variety of instructional strategies to be effective, including the following:
The instructor leads a lecture or discussion through the explanatory portion of a
topic and then demonstrates the “Practice tasks” activities in Project.
The instructor leads a lecture and then assigns students to complete the “Practice
tasks” activities at computers in the classroom or lab.
The instructor leads a lecture and then assigns students to complete the “Practice
tasks” activities outside the classroom.
The instructor assigns the reading and completion of “Practice tasks” activities to
students, to be completed outside the classroom.
These are just a few possible options.
Teach project management with Project
A core principle of this book’s instructional strategy is that success with Project is built on
success with basic project-management practice. Although Project is a feature-rich
program, mastery of its features alone is no guarantee of success in project management.
For this reason, you will find material about project-management practice throughout this
book. See, for example, the following:
The many “Project management focus” sidebars throughout the chapters
Appendix A, “A short course in project management”
Appendix B, “Develop your project-management skills”
This book does not prescribe a specific project-management methodology but in general
aims to be in alignment with the Project Management Institute’s (PMI’s) A Guide to the
Project Management Body of Knowledge (PMBOK) and generally accepted projectmanagement practices.
That said, it is important to acknowledge that some core areas of project management are
beyond the scope of activities performed with Project. Resource recruiting and
procurement, for example, are critical activities for many projects, but they are not
activities that Project directly supports. If your instructional context is more focused on
Project features than project-management practice, you should explore this issue with your
students so that they gain a fuller understanding of the broad domain of project
management and where specifically Project can best support them.
Glossary
8/80 rule A general guideline regarding the estimation of task duration. Task durations
between 8 hours (or one day) and 80 hours (10 working days, or two weeks) are generally
sized to a manageable duration. See Chapter 4.
accrual The method by which a plan incurs the cost of a task or a resource. The three
types of accrual are start, prorated, and end. See Chapter 10.
actual A detail about task progress recorded in a plan in Project. Before actuals are
recorded, the plan contains scheduled or planned information. Comparing planned project
information to actuals helps the project manager better control project execution. See
Chapters 8 and 14.
allocation The portion of the capacity of a resource devoted to work on a specific task.
See Chapter 12.
assignment The matching of a work resource (a person or a piece of equipment) to a task.
You can also assign a material or cost resource to a task, but those resources have no effect
on work or duration. See Chapters 6 and 11.
AutoFilter In a table, a quick way to view or organize only the task or resource
information that meets the criteria you choose. See Chapter 13.
automatically scheduled task A task for which Project dynamically adjusts the start or
finish date to account for schedule changes in a plan. See Chapter 4.
Backstage view The view accessed from the File tab that is standardized across most
Office 2016 programs. This view contains customization and sharing options, in addition
to the essential commands for file management like Open, New, and Save. See Chapter 2.
base calendar A calendar that can serve as the project calendar or a task calendar. A base
calendar also defines the default working times for resource calendars. Project includes
three base calendars named Standard, 24 Hours, and Night Shift. You can customize these,
or you can use them as a basis for your own base calendar. See Chapter 3.
baseline The original plan, saved for later comparison with the revised or updated plan.
The baseline includes the planned start and finish dates, durations and work values of
tasks and assignments, and their planned costs. Plans can have up to 11 baselines. See
Chapters 8, 14, and 15.
bottom-up planning A method of developing a plan that starts with the lowest-level tasks
and organizes them into broad phases. See Chapter 4.
calendar The settings that define the working days and time for a plan, resources, and
tasks. See Chapter 11.
Calendar view A simple view in Project that shows tasks in a “month-at-a-glance” layout.
See Chapter 16.
consolidated plan A plan in Project that contains one or more inserted plans. The inserted
plans are linked to the consolidated plan so that any changes to the inserted plans are
reflected in the consolidated plan, and vice versa. A consolidated plan is also known as a
consolidated project or master project. See Chapter 20.
constraint A restriction, such as Must Start On (MSO) or Finish No Later Than (FNLT),
that you can place on the start or finish date of a task. See Chapter 9.
contour The manner in which a resource’s work on a task is scheduled over time. Project
includes several predefined work contours that you can apply to an assignment. For
example, a back-loaded contour schedules a small amount of work at the beginning of an
assignment and then schedules increasing amounts of work as time progresses. Applying a
predefined contour or manually contouring an assignment causes Project to display a work
contour icon in the Indicators column. See Chapter 11.
contouring Manually editing work values for an assignment in a usage view, such as the
Resource Usage view, to create a custom contour. See Chapter 11.
cost The resources required to carry out a plan, including the people who do the work, the
equipment used, and the materials consumed as the work is completed. Cost is one side of
the project triangle model. See Chapter 15 and Appendix A.
cost rate table The resource pay rates that are stored on the Costs tab of the Resource
Information dialog box. You can have up to five separate cost rate tables per resource. See
Chapter 11.
cost resource A type of resource used to represent financial costs associated with tasks in
a plan. Use cost resources to account for standard categories of costs that you want to
track in a plan, such as costs for travel or catering. A cost resource does no work and has
no effect on the scheduling of a task to which it is assigned. See Chapters 5 and 6.
critical path A series of tasks that, if delayed, will push out the end date of a plan. See
Chapters 10 and 15.
deadline A date value that you can enter for a task that indicates the latest date by which
you want the task to be completed. If the scheduled completion date of a task is later than
its deadline, Project notifies you. The benefit of entering deadline dates is that they do not
constrain tasks. See Chapter 10.
deliverable The final product, service, or event that a plan is intended to produce. See
Chapter 4 and Appendix A.
dependency A link between a predecessor task and a successor task. A dependency
controls the start or finish of one task relative to the start or finish of the other task. The
most common dependency is finish-to-start (FS), in which the finish date of the
predecessor task determines the start date of the successor task. See Chapter 4.
destination program The program into which you place the data when exchanging data
between Project and another program. See Chapter 19.
driving predecessor A predecessor task that directly affects, or drives, the scheduling of
its successor task. See Chapter 9.
duration The span of working time that you expect it will take to complete a task. See
Chapter 4.
effort-driven scheduling A scheduling method in which the work of a task remains
constant regardless of the number of resources assigned to it. As resources are added to a
task, the duration decreases, but the total work remains the same and is distributed among
the assigned resources. Effort-driven scheduling is turned off by default, but it can be
turned on for fixed-unit or fixed-duration tasks. Effort-driven scheduling is always turned
on for fixed-work tasks. See Chapter 6.
elapsed duration The uninterrupted span of time that it will take to finish a task, based on
a 24-hour day and a 7-day week. Elapsed duration is not limited by project, resource, or
task calendars; it is continuous. See Chapter 4.
Entry table The grid on the left side of the default Gantt Chart view. See Chapter 2.
export map The specifications for exporting fields from Project to other file formats, such
as a tab-delimited format. Project includes several export maps, which you can use as they
are or modify. Import maps and export maps are sometimes referred to as data maps. See
Chapter 19.
field The lowest-level information about a task, resource, or assignment. See Chapter 2.
filtering In a view, a way to see or highlight only the task or resource information that
meets the criteria you choose. See Chapter 13.
fixed consumption rate A fixed quantity of a material resource to be consumed in the
completion of an assignment. See Chapter 11.
fixed cost A set amount of money budgeted for a task. This amount is independent of
resource costs and task duration. See Chapter 10.
fixed duration A task type in which the duration value is fixed. If you change the amount
of work that you expect a task to require, Project recalculates the resource assignment’s
peak units for each resource. If you change duration or units, Project recalculates the
work. See Chapter 9.
fixed units A task type in which a resource assignment’s units value is fixed. If you
change the duration of a task, Project recalculates the amount of work scheduled for the
task. If you change units or work, Project recalculates the duration. See Chapter 9.
fixed work A task type in which the work value is fixed. If you change the duration of the
task, Project recalculates the resource assignment’s peak units for each resource. If you
change units or work, Project recalculates the duration. See Chapter 9.
flexible constraint A constraint type that gives Project the flexibility to change the start or
finish dates (but not the duration) of a task. As Soon As Possible (ASAP) and As Late As
Possible (ALAP) are examples of flexible constraints. See Chapter 9.
free slack The amount of time that a task can be delayed without delaying the start date of
another task. See Chapter 10.
fully allocated The condition of a resource when the total work of his or her task
assignments is exactly equal to his or her work capacity. See Chapter 12.
Gantt Chart view A predefined view in Project consisting of a table (the Entry table, by
default) on the left and a graphical bar chart on the right that shows the plan over time. See
Chapter 16.
global template A template in Project named Global.mpt that contains the default views,
tables, filters, and other items that Project uses. See Chapter 18.
group A way to reorder task or resource information in a table and display summary
values for each group. You can specify several levels of groups. (The term group is also
used to refer to the Resource Group field, which is unrelated.) See Chapter 13.
Group field A resource field in which you can specify a group name (such as a
department) with which you want to associate a resource. If you organize resources into
groups, you can sort, filter, or group resources by group. See Chapter 13.
hyperlink A link to another file, a specific location in a file, a page on the Internet, or a
page on an intranet. See Chapter 4.
import map A set of specifications for importing specific data to fields in Project. Project
includes several built-in maps, which you can modify or use as they are. Import maps and
export maps are sometimes referred to as data maps. See Chapter 19.
inflexible constraint A constraint type that forces a task to begin or end on a certain date.
Must Start On (MSO) and Must Finish On (MFO) are both inflexible constraints. See
Chapter 9.
inserted plan In Project, a plan that is inserted into another plan, called a consolidated
plan. An inserted plan is also known as a subproject. See Chapter 20.
interim plan A task’s start and finish values, saved for later comparison. Each plan in
Project can have, at most, 10 interim plans. See Chapter 14.
lag time A delay between tasks that have a task relationship. For example, lag time causes
the successor task in a finish-to-start (FS) relationship to begin some time after its
predecessor task concludes. See Chapter 9.
lead time An overlap between tasks that have a task relationship. For example, lead time
causes the successor task in a finish-to-start (FS) relationship to begin before its
predecessor task concludes. In Project, you enter lead time as negative lag time. See
Chapter 9.
line manager A manager of a group of resources; also called a functional manager. A line
manager might also have project management skills and responsibilities, depending on the
organization’s structure. See Chapter 20.
link A logical relationship between tasks that controls sequence and dependency. In the
Gantt Chart and Network Diagram views, links appear as lines between tasks. See
Chapters 4 and 9.
macro A recorded or programmed set of instructions that carry out a specific action when
initiated. Macros in Project use Microsoft Visual Basic for Applications (VBA). See
Chapter 18.
manually scheduled task A task for which Project does not set a start or finish date or
duration automatically. Such a task can include any type of value you want in most fields.
See Chapter 4.
material resources The consumables that are used up as a plan progresses. As with work
resources, you assign material resources to tasks. Unlike work resources, material
resources have no effect on the total amount of work scheduled on a task. See Chapter 11.
maximum units The maximum capacity (as entered in the Max. Units field) of a resource
to accomplish tasks. If you allocate the resource beyond its capacity, Project alerts you
that the resource is overallocated. See Chapters 5 and 6.
milestone A significant event that is reached within the plan or imposed upon the plan. In
Project, milestones normally are represented as tasks with zero duration. See Chapter 4.
negative slack The amount of time that tasks overlap due to a conflict between task
relationships and constraints. See Chapter 9.
Network Diagram view A Project view that focuses on activities and their relationships.
Tasks are represented as nodes, and the relationships between tasks are drawn as lines
connecting the nodes. See Chapter 16.
Night Shift base calendar A base calendar included with Project designed to
accommodate an 11:00 P.M.–8:00 A.M. “graveyard” work shift. See Chapter 3.
noncritical task A task that has slack. Noncritical tasks can finish within their slack time
without affecting the plan’s completion date. See Chapter 10.
note The information (including linked or embedded files) that you want to associate with
a task, resource, or assignment. See Chapters 4 and 5.
ongoing operation An activity that has no planned end date and is repetitive in nature.
Examples include accounting, managing human resources, and some manufacturing tasks.
See Chapter 1 and Appendix A.
Organizer In Project, a dialog box containing commands you can use to copy views,
tables, filters, and other items between the Global.mpt template and other plans or
between two different plans. See Chapter 18.
outline A hierarchy of summary tasks and subtasks within Project, usually corresponding
to major phases of work. See Chapter 4.
overallocated The condition of resources when they are assigned to do more work than is
their normal work capacity. See Chapter 5.
phase A sequence of tasks that represent a major portion of the plan’s work. In Project,
phases are represented by summary tasks. See Chapter 4.
plan The Project document type, also referred to as a schedule, project, or MPP. Project
plans have an .mpp file extension. See Chapter 3.
planning The first major phase of project management work. Planning includes all the
work in developing a schedule up to the point where the tracking of actual work begins.
See Chapter 14.
predecessor task A task whose start or end date determines the start or finish of another
task or tasks, called successor tasks. See Chapters 4 and 9.
product scope The quality, features, and functions (often called specifications) of the
deliverable of the plan. See Chapter 4 and Appendix A.
progress bar A graphical representation on a bar in the Gantt Chart view that shows how
much of a task has been completed. See Chapter 8.
project A temporary endeavor undertaken to create a unique product or service. See
Chapter 1.
project calendar The base calendar that is used by the entire plan. The project calendar
defines normal working and nonworking days and times. See Chapter 3.
project portfolio management (PPM) Project management practiced in a formal,
consistent way throughout an organization. See Appendix C.
project scope The work required to produce a deliverable with agreed-upon quality,
features, and functions. See Chapter 4 and Appendix A.
project summary task A summary task that contains top-level information such as
duration, work, and costs for the entire plan. The project summary task has a task ID of 0
and is displayed through the Show/Hide group of the Format tab. See Chapter 4.
project triangle A popular model of project management in which time, cost, and scope
are represented as the three sides of a triangle. A change to one side will affect at least one
of the other two sides. There are many variations on this model. See Appendix A.
Project Web App (PWA) The browser-based interface to Project Server running onpremises, or to Project Online hosted in the cloud. See Appendix C.
recurring task A task that repeats at established intervals. You can create a recurring task
that repeats for a fixed number of times or that ends by a specific date. See Chapter 10.
relationship The type of dependency between two tasks, visually indicated by a link line.
The types of relationships include finish-to-start (FS), start-to-start (SS), finish-to-finish
(FF), and start-to-finish (SF). Also known as a link, a logical relationship, a task
dependency, or a precedence relationship. See Chapters 4 and 9.
report A view-like format that includes a dynamic mix of tables, charts, and textual
content, and is highly customizable. Project includes several predefined reports, each
focusing on specific aspects of your plan. You can also define your own reports. Another
type of report is a visual report, which exports structured data to Microsoft Excel or Visio
for graphical representation and analysis. See Chapters 2, 7, and 17.
resource calendar The working and nonworking days and times of an individual work
resource. See Chapter 5.
resource leveling A method of resolving resource overallocation by delaying the start date
of an assignment or an entire task or splitting up the work on a task. Project can level
resources automatically, or you can do it manually. See Chapter 12.
resource manager A person who oversees resource usage in a plan’s activities,
specifically to manage the time allocation and costs of resources. A resource manager
might also have project management skills and responsibilities, depending on the
organization’s structure. See Chapter 15.
resource pool In Project, a plan that other plans use for their resource information.
Resource pools contain information about resources’ task assignments from all plans
(called sharer plans) linked to the resource pool. See Chapter 20.
resources People, equipment, and material (and the associated costs of each) needed to
complete the work on a plan. See Chapter 5.
ribbon interface A user interface design used by Microsoft Office programs. In the ribbon
interface, commands are organized into groups and tabs for quick access. See Chapters 2
and 18.
risk An event that decreases the likelihood of completing the plan on time, within budget,
and to specification (or, less likely, an opportunity to improve project performance). See
Chapter 4.
scheduling formula A representation of how Project calculates work, based on the
duration and resource units of an assignment. The scheduling formula is Duration ×
Assignment Units = Work. See Chapters 6 and 9.
scope The products or services to be provided by a project and the work required to
deliver it. For planning, it’s useful to distinguish between product scope and project scope.
Scope is one side of the project triangle model. See Appendix A.
semi-flexible constraint A constraint type that gives Project the flexibility to change the
start and finish dates of a task within one date boundary. Start No Earlier Than (SNET),
Start No Later Than (SNLT), Finish No Earlier Than (FNET), and Finish No Later Than
(FNLT) are all semi-flexible constraints. See Chapter 9.
sequence The chronological order in which tasks occur. A sequence is ordered from left to
right in most views that include a timescale, such as the Gantt Chart view. See Chapter 4.
sharer plan A plan that is linked to a resource pool. Sharer plans use resources from a
resource pool. See Chapter 20.
shortcut menu A menu that you display by pointing to an item on the screen and then
right-clicking. Shortcut menus contain only the commands that apply to the item to which
you are pointing. See Chapter 2.
slack The amount of time that a task can be delayed without delaying a successor task
(free slack) or the plan end date (total slack). Slack is also known as float. See Chapter 10.
sorting A way of ordering task or resource information in a view by the criteria you
choose. See Chapter 13.
source program When exchanging data between Project and another program, the
program in which the data resided originally. See Chapter 19.
split An interruption in a task, represented in the Gantt bar as a dotted line between
segments of a task. You can split a task multiple times. See Chapter 9.
sponsor An individual or organization that both provides financial support and champions
the project team within the larger organization. See Chapter 6.
stakeholder A person or organization that might be affected by project activities (those
who “have a stake” in its success). These also include the resources working on the plan in
addition to others (such as customers) external to the plan’s work. See Chapter 15.
Standard base calendar A base calendar included with Project designed to accommodate
an 8:00 A.M.–5:00 P.M., Monday-through-Friday work shift. See Chapter 3.
status date The date that you specify (not necessarily the current date) that determines
how Project calculates earned value data. See Chapter 8.
subtask A task that is indented below a summary task. Summary tasks and subtasks make
up a plan’s outline structure. See Chapter 4.
successor task A task whose start or finish is driven by another task or tasks, called
predecessor tasks. See Chapters 4, 9, and 10.
summary task A task that is made up of and summarizes the subtasks below it. In Project,
phases of a plan’s work are represented by summary tasks. See Chapter 4.
table A spreadsheet-like presentation of a plan’s data, organized in vertical columns and
horizontal rows. Each column represents one of the many fields in Project, and each row
represents a single task or resource. In a usage view, additional rows represent
assignments. See Chapter 13.
task An activity that has a starting and finishing point. A task is the basic building block
of a plan. See Chapter 4.
task calendar The base calendar that is used by a single task. A task calendar defines
working and nonworking times for a task, regardless of settings in the project calendar.
See Chapter 9.
task ID A unique number that Project assigns to each task in a plan. In the Entry table, the
task ID appears in the far-left column. See Chapter 4.
task priority A numeric ranking between 0 and 1000 of a task’s importance and
appropriateness for resource leveling. Tasks with the lowest priority are delayed or split
first if necessary. The default value is 500. See Chapter 12.
task type A setting applied to a task that determines how Project schedules the task, based
on which of the three scheduling formula values is fixed. The three task types are fixed
duration, fixed units, and fixed work. See Chapter 9.
template In Project, a file format that enables you to reuse existing plans as the basis for
new plans. Project includes several templates that relate to a variety of industries, and you
can create your own templates. See Chapter 2.
throughput metric A measurement of the quantity of a deliverable that can be completed
over a specified time period, usually expressed as a ratio. For example, “paint one wall per
day” describes a quantity of a deliverable (a painted wall) that can be produced in a given
time period (a day). Note that the time period used in a metric is work, not elapsed
duration. See Chapter 14.
time The scheduled durations of individual tasks and the overall plan. Time is one side of
the project triangle model. See Appendix A.
Timeline view A Project view in which you can display select tasks and milestones
against a simple timeline. See Chapters 7 and 16.
timephased field A task, resource, or assignment value that is distributed over time. The
values of timephased fields appear in the timescale grid on the right side of a view, such as
the Task Usage or Resource Usage view. See Chapter 14.
timescale The timescale appears in a view, such as the Gantt Chart or Resource Usage
view, as a band across the top of the grid and denotes units of time. See Chapter 2.
top-down planning A method of developing a plan by identifying the highest-level
phases or summary tasks before breaking them into lower-level components or subtasks.
See Chapter 4.
total slack The amount of time that a task can be delayed without delaying the plan’s end
date. See Chapter 10.
tracking The second major phase of project management work. Tracking includes all the
collecting, entering, and analyzing of actual performance values, such as work on tasks
and actual durations. See Chapters 8 and 14.
underallocated The condition of resources when they are assigned to do less work than
their normal work capacity. For example, a full- time resource who has only 25 hours of
work assigned in a 40-hour work week is underallocated. See Chapter 12.
units A standard way of measuring the capacity of a resource to work when you assign the
resource to a task in Project. Units are one variable in the scheduling formula: Duration ×
Units = Work. See Chapter 5.
variable consumption rate A quantity of a material resource to be consumed that will
change if the duration of the task to which it is assigned changes. See Chapter 11.
variance A deviation from the schedule or budget established by the baseline plan. See
Chapters 14 and 15.
view A visual representation of the tasks or resources in your plan. The three categories of
views are charts, sheets, and forms. Views enable you to enter, organize, and examine
information in a variety of formats. See Chapters 2 and 13.
work The total scheduled effort for a task, a resource, a resource assignment, or an entire
plan. Work is measured in person-hours and might not match the duration of the task.
Work is one variable in the scheduling formula: Duration × Units = Work. See Chapters 4
and 6.
work breakdown structure (WBS) The identification of every task in a plan that reflects
that task’s location in the hierarchy of the plan. See Chapter 16.
work resources The people and equipment that do the work of the plan. See Chapters 5
and 11.
Index
Numbers and Symbols
8/80 rule, definition 527
* (asterisk) in task bar names 375
A
Account page (Backstage view) 20
accrual
definition 527
methods 217–218
accruing fixed costs 217
actions indicators 109
active view 14
activities 47
actual costs 279
actuals 157
changing default work values 338
definition 527
entering manually 334
entering task values 168–169
recording per task 334
recording tasks in Tracking table 171
recording tasks in Update Tasks dialog box 171
timephased 335–339
tracking 158–159, 335–339
Advance proofs 247
ALAP (As Late As Possible) constraints 188–189
allocations, defined 527
See also resource allocations
As Late As Possible (ALAP) constraints 188–189
As Soon As Possible (ASAP) constraints 187–189
ASAP (As Soon As Possible) constraints 187–189
assigning resources to tasks 102–104
assignment calculation 201
assignment notes 67
assignment units 102
See also units
assignment units values 201–202
assignment values, breaking relationship to task values 341
assignments 101
adjusting in Team Planner view 252–255
applying predefined contours 245
applying work contours 243
changing cost rate tables 239
changing default start times 243
cost values 104
definition 527
delaying start 242–243
editing details 107
editing work per time period 246
recording work 335
and resource costs 357
tracking work 330–335
tracking timephased actual work 335–339
unit values 102
viewing 103–104, 107
asterisks (*) in task bar names 375
AutoFilter 302, 527
automatically scheduled tasks, definition 527
automating tasks 428
B
Backstage view 19–20, 527
bar charts, on Gantt charts 128
bars See task bars
bar styles
changing in Calendar view 392
changing in Gantt chart view 374
base calendars 39–40
applying to tasks 197–198
creating new 197
definition 527
for sharer plans 479
baseline costs 279
baseline plans 159
comparing 160
previously saved, finding 326
baselines
adding additional 329
clearing previously saved 162
comparing with plans 327
definition 527
displaying Gantt bars in Gantt chart view 162
identifying variances 355
multiple 160
previously saved, updating 329
removing 329
saving 159–162
switching in Gantt charts 378
updating 326
values 160
best practices, capturing 518
blank reports 407
book content errors, reporting xviii
bottom-up planning 57, 528
box styles 386–388
boxes
formatting in Network Diagram view 388
styles 386–388
Budget Cost visual report 360–361, 362
built-in filters
highlight filters 308
regular filters 304
using 307
built-in groups 298–299
built-in tables 311
built-in views 315
burdened rates 86
Burndown report 352
C
calculated costs 358
calculating work 102
calendars
See also project calendars; resource calendars
base 39–40
base, applying 197–198
base, creating 197
choosing current date 39
copying to/from global template 424–427
custom work week 42–43
custom working times 41–43
definition 528
nonworking dates 42
nonworking times 42
task 196
Calendar view
changing appearance of items 391
changing bar styles 392
changing week height 392
definition 528
callouts, switching from task bars in Timeline view 136
Cash Flow report 360, 362
cells
formatting 130, 133
removing formatting 134
certification, Project-related 504
chart elements, including 412
chart format, changing 414
chart layout, changing 412
chart style, changing 412, 414
charts
adding/removing data 412
adding to reports 410
changing format 414
changing layout 412
changing style 412, 414
Field List pane 413–414
including chart elements 412
including data labels 412
selecting information to include 414
classroom training, integrating this book 521–524
colors
applying to predecessors 180
applying to successors 180, 182
columns
adding to tables 312
pasting text as 448
combination view 14, 23
comma-delimited text files, exporting project data to 454
commands 14
for specific elements 16
split buttons 18
commands (Quick Access Toolbar)
adding 434, 436
removing 436
commands (ribbon), modifying 437
communities
project management 505
Project users 503
questions and answers 504
Comparison reports 407
completing tasks 165–166
completion percentages, entering 165–166
consolidated plans 480–483
benefits 480
creating 482
definition 528
displaying summary tasks 483
consolidated projects See consolidated plans
constraint balance 498–501
constraints
As Late As Possible (ALAP) 189
As Soon As Possible (ASAP) 187
categories 187
vs. deadlines 214
definition 528
Finish No Earlier Than 192
flexible 187–189
hard 187
inflexible 187–189
moderate 187
of projects 495–497
scheduling tasks 186, 189–191
semi-flexible 187–188
soft 187
start/end dates 192
Start No Earlier Than 192
using 191, 192
viewing details 187
content errors, reporting xviii
context menus 15
contouring, definition 528
contours
applying to assignments 243–245
definition 528
and fixed-duration tasks 244
copying
elements between plans 424–426
Timeline views 143–144
views 141–142
copying reports 141
to the Clipboard 144
to/from global template 424
corrections to book content xviii
cost constraints 496
Cost Overview report 352
cost per resource 116, 118
cost per task 116, 118
cost per use 85
cost rate tables 237–239, 528
cost rates 241
cost reporting 350–352
cost resources
adding 92
assigning to tasks 114
common types 91
definition 528
resource pools 470
setting up 91–92
and tasks 91
Cost table 358, 363
See also tables
in Resource Sheet view 365
in Resource Usage view 366
in Task Sheet view 282, 362
in Task Usage view 361
cost values 104
cost variance analysis 351–352
cost variances 357–361
costs
calculated 358
comparing 280–282
definition 528
displaying details in Resource Usage view 366
distributed over time, displaying 282
scheduled 358
types of 279
viewing 280–283
Costs report, viewing 282
critical paths 222–224, 282, 528
critical tasks 282
cross-plan links 486–487
See also dependencies
changing relationship types 487
creating 486
deleting 487
between inserted plans 486
cross-project links See cross-plan links
current costs 279
custom calendars
sharing between plans 425–426
storage location 424
custom fields 310
copying between plans 424–426
copying to/from global template 424–427
custom filters 304, 306–307
custom groups 299–301
custom highlight filters 308
custom reports 406–408, 410
custom tables 311–312
custom views 315–317
customizations
using the global template 424–427
resetting to defaults 438
customized plan elements
copying between plans 424–426
options for copying to global template 427
replacing 426
storage location 424
customized ribbon, sharing with other Project users 435
D
Dashboard report 354
dashboard reports 351
data
copying to other programs 446–449
exporting 454–457
exporting to other file formats 353, 458
pasting from other programs 449
selecting 448
supported file types for exporting 455
data categories, adding to/removing from charts 412
data maps 450
See also export maps; import maps
built-in 456
defining in the Export Wizard 456–457
data series, adding to/removing from charts 412
data templates
creating or modifying 389
defining 387
data visualizations 458–461
date ranges
changing for timeline bars 384
changing resource availability 234–236
dates
choosing current 39
deadlines 214–216
setting nonworking 42
deactivating tasks 283–284
deadline indicators, changing appearance 374
deadlines 214–216
vs. constraints 214
definition 528
dedicated resource pools 474
delimited text files, exporting project data to 454
deliverables, definition 528
dependencies
See also cross-plan links
between plans 483–487
definition 529
Design tool tab (ribbon) 17
destination programs, definition 529
display settings, adapting procedures for xvi
document properties 43
downloading practice files xiv
drawing on Gantt charts 131
drawing precedence of Gantt bars 381
driving predecessors 529
durations
definition 529
summary tasks 225–226
in work calculations 102
E
ebook edition of this book xv
editing
custom groups 299–301
filters 306–307
tables 311
views 315–317
effort-driven scheduling 107–111
best practices 112
definition 529
and task types 203
elapsed duration, definition 529
elements, copying to/from global template 424–427
email messages, attaching plans 20
enterprise project management (EPM) 518
Entry table, definition 529
EPM (enterprise project management) 518
equipment resources 82
errata for this book xviii
errors in this book, reporting xviii
evaluating project status 170
Excel
opening workbooks in Project 453
pasting data from Project 446
reports 360
Excel charts, exporting data as 459
Excel PivotCharts 460
Excel PivotTables 460
Excel visual reports 460
Excel workbooks, exporting project data to 454
export maps
See also data maps; import maps
copying between plans 424–426
copying to/from global template 424–427
definition 529
Export page (Backstage view) 20
Export Wizard 456–457
exporting data
as Excel charts 459
to other file formats 353, 458
supported file types 455
as Visio diagrams 459
external file formats, changing setting for opening 454
external predecessors
identifying 487
visual indication 484
external successors
identifying 487
visual indication 484
external tasks 484–487
F
feedback information xviii
Field List pane
for charts 413–414
displaying plan values 408
organizing plan values 408
for tables 415–417
fields
changing appearance in nodes 387
copying between plans 424–426
copying to/from global template 424–427
custom, creating 310
definition 529
displaying in reports 408
filtering in charts 414
filtering in reports 408
filtering in tables 417
grouping in reports 408
grouping in tables 417
including in charts 414
including in tables 417
mapping for export 456–457
outlining in reports 408
reordering in charts 414
sorting in reports 408
sorting in tables 417
file formats
changing settings 454
for saving project plans 454
file types supported for data export 455
files
opening external program files in Project 453
for practice tasks xiv
setting options 39
filtering
built-in filters, applying 302
definition 529
fields in reports 408
highlighting results 305
resources 305, 307
tasks 305, 307
filters 302–308
AutoFilter 302–303
copying to/from global template 424–427
highlight 308
Slipping Tasks 355
finish dates 281–282
Finish No Earlier Than (FNET) constraints 188, 192
Finish No Later Than (FNLT) constraints 188
finish-to-finish relationships 60, 183
finish-to-start relationships 59–60, 183–184
fixed consumption rates
assigning to material resources 248
definition 529
fixed costs 216–218, 357
accrual methods 218
definition 529
fixed duration
definition 529
task types 199
fixed units
definition 529
task type 199
fixed work
definition 530
task type 199
flexible constraints 187–193, 530
float See slack
footers 395
formatting
cells 133, 134
charts in reports 140
Gantt bars 130, 132
Gantt bar shapes 132
Gantt charts 129–130
predecessors 182
successors 182
tables in reports 140
Task Path 182
tasks 69
Format tool tab (ribbon) 17
formulas, calculating work 102
free slack 222, 530
fully allocated
definition 530
work resources 266
functional manager 531
G
Gantt bar styles 374–381
changing 374
creating 379
excluding task types 379
modifying text 380
reordering 381
Gantt bars 129
applying color to predecessors 180
applying color to successors 180, 182
applying Gantt chart styles 132
baseline, displaying in Gantt chart view 162
changing appearance 374, 377
displaying details 378
extending progess on 167
formatting 130
formatting shapes 132
removing formatting 132
reordering 375
setting progess on 167
summary tasks 225
Gantt chart bars See Gantt bars
Gantt Chart view 23, 103
baseline Gantt bars 161
definition 530
including in macros 441
nonworking time 166
previewing 145
printing 145
Gantt chart views 128–134, 374
adding bars 375–377
critical paths 223
displaying baseline Gantt bars 162
elements of 128
formatting elements 378
free slack 223
panning from Timeline view 138
project summary tasks 66
switching baselines 378
task relationships 61
zooming from Timeline view 138
Gantt charts
bar chart elements 128
changing timescales 138
drawing on 131
formatting chart elements 129–130
linking objects 131
link lines 129
scrolling 138
style groups 129
styles 129–130
summary tasks 129
tasks 129
Gantt with Timeline view 23
getting help xviii
giving feedback xviii
global template 424–427
definition 530
options for adding new elements 427
graphics, pasting from other programs 449
Group field, definition 530
grouping 296–298
clearing 301
fields in reports 408
resources 298, 301
tasks 298, 301
in views 298
groups 14
built-in 298
copying to/from global template 424–427
creating on ribbon tabs 437
custom, creating and editing 299
definition 530
viewing 298
H
hard constraints 187
hard finish dates 281
hardware support xviii
headers 395
Help resources
Office 504
Project 504
project portfolio management (PPM) 520
Project Web App (PWA) 518
SharePoint 512
this book xviii
Visual Basic Editor 432
highlight filters 305, 308
highlighting
applying 305
clearing 308
hyperlinks
adding to tasks 68
definition 530
removing from tasks 69
I
ID numbers 48
images
adding to reports 411
pasting from other programs 449
import maps
See also data maps; export maps
copying between plans 424–426
copying to/from global template 424–427
definition 530
Import Wizard 450–452
inactivating tasks 283–284
incomplete work, rescheduling 342–343
inflexible constraints 187–193, 530
Must Finish On (MFO) 188, 191
Must Start On (MSO) 188, 191–192
Info page (Backstage view) 19
inserted plans 480–483
creating cross-plan links 486
definition 530
displaying details 483
task numbering 481
interim plans
definition 530
saving 328–329
L
lag time
adding to linked tasks 184–186
definition 530
Late Tasks report 355, 357
Layout tool tab (ribbon) 17
lead time
adding to linked tasks 184–186
definition 531
legacy file format settings, changing 454
legends, customizing and printing 394
leveling
overallocated resources 273–280
setting level resources 278
setting options 278
leveling delays 271–272, 279
Leveling Gantt view 279
line managers, definition 531
lines, formatting in Gantt charts 378
link lines
as elements on Gantt charts 129
formatting in Gantt charts 378
linking tasks 59–64, 183–186
links
definition 531
identifying in a plan 487
logging bugs xviii
M
macros
copying between plans 424–426
copying to/from global template 424–427
definition 531
deleting 430
editing 431–433
keyboard shortcuts 429
naming conventions 429
recording 427–430
running 429–430
storage location 428
using in other plans 428
manually scheduled tasks, definition 531
mapping fields for export 456–457
maps
copying between plans 424–426
copying to/from global template 424–427
master projects See consolidated plans
material labels 247
material resources 79, 247–249, 531
maximum capacity 82–83
maximum units
definition 531
value 82–83, 234
Microsoft Press contact information xviii
Microsoft SharePoint, using Project with 507–512
milestones
definition 531
formatting dates 382
indicators 132
tasks 55
mistakes, informing Microsoft Press xviii
moderate constraints 187
modules
copying between plans 424–426
copying to/from global template 424–427
Must Finish On (MFO) constraints 188
Must Start On constraints 192
Must Start On (MSO) constraints 188
N
naming conventions for resource pools 473
negative slack 192, 531
Network Diagram nodes, data templates 389
network diagrams 385–387
Network Diagram view 385–387
definition 531
formatting boxes 388
formatting options 386
modifying nodes 389
showing and hiding relationships 388
task relationships 61
new elements, storage location 424
New page (Backstage view) 19
Night Shift base calendar 40, 531
nodes 385–387
changing appearance 386
modifying in Network Diagram view 389
noncritical paths, displaying slack 224
noncritical tasks, definition 531
nonworking dates, setting 42
nonworking times
displaying 166
setting recurring 42
Notepad, pasting text from Project 447
notes
definition 531
project summary tasks 68
types 67
O
Office Help resources 504
OLAP (Online Analytical Processing) cubes 459
ongoing operations, definition 531
Online Analytical Processing (OLAP) cubes 459
organizational benefits of PPM 518
organizations, project management information 518
organizations, resource workload and availability 518
Organizer 425–427
accessing 19
definition 532
structure 425
outlines
creating 56–58
definition 532
project summary tasks 56
outlining fields in reports 408
overallocations
definition 532
finding in Resource Allocation view 269–270
resolving manually 270–272
work resources 266
P
page footers 395
page headers 395
page layout options for views 393
page setup options for views 393–394
pan and zoom control 138
panning Gantt chart views from Timeline views 138
pay rates
See also resources; work resources
accruing costs 85
adding automatically 85
burdened rates 86
changing over date ranges 239–240
cost per use 85
cost rate tables 237–239
effective date 240–241
entering 84–86, 240–241
entering resource standards 85
formats 84, 240–241
managing cost 84–86
for multiple resources 237–240
overtime 85–86
set fees 85
PDF files, exporting plan views as 396
Peak values 201
percentages, completion 165–166
phases
bottom-up planning 57
definition 532
top-down planning 57
pinning plans to Recent Projects list 20
pinning templates to New page (Backstage view) 20
plan baselines
saving 159–161
updating 326–327
plan costs 279–283
See also plans, sharer plans
fixed costs 216–218
resource costs 118, 363–365
task costs 118
plan elements, copying 424–427
plan status, reporting 28–30
plan values, displaying 408
planned costs 114
planning
bottom-up 57
definition 532
top-down 57
plans
See also plan costs; sharer plans
attaching to email messages 20
checking durations 66
checking status 28–31
comparing to baselines 328
consolidated 480–483
creating 12–13, 19, 21–22, 38
critical paths 222–224
default scheduling mode 65
defined 4, 532
dependencies between 483–487
entering properties 44
entering titles 43–44
filtering details 302–308
finish dates 65, 279–283
grouping details 296–301
inserted 480–483
key indicators 115
linking to resource pools 471, 477
links between See cross-plan links
opening 12, 22
outlining with summary tasks 56–58
pinning to Recent Projects list 20
printing 20
saving 22, 39, 328
sharing customized elements 19
sorting details 292–294
start dates 39
statistics 66–67
switching between manual/automatic scheduling 64
top-down focus 226
tracking as scheduled 163–165
unlinking from resource pools 478
updating with actual values 168–169
viewing properties 43
PMBOK 493
PPM (project portfolio management) 518–520
benefits of 518
definition 532
deployment training 520
Help resources 520
practice files for this book xiv
practice tasks 10
files for xiv
timing 524
predecessor tasks 59–63, 180–182
applying color to 180
for cross-plan links 484–487
definition 532
external 484
identifying in a plan 487
task chains 181
print options
modifying 395
for views 393, 395
Print page (Backstage view) 20
print preview
multipage 145
for views 393
printing
plans 20
reports and views 144–146
restrictions 146
procedures, adapting to your display xvi
product scope 49, 497, 532
product specifications 497
progress, tracking 158–159, 325
progress bars, definition 532
Project
development team blog 504
Help resources 504
previous versions 457
product website 504
training and certification 504
user groups 503–504
Project 2016
accessing 5
new features 6
vs. previous versions 6–8
setting options 19–20
software support xviii
user interface 12–18
version information 20
views 14–15
project at a glance 141
project calendars 39
See also calendars; resource calendars
custom work weeks 42–43
default 40
definition 532
nonworking dates 42
nonworking times 42
selecting 42
project constraints
managing 498–501
in the project triangle 495–497
project costs 360
Project desktop program editions 5
project management
analyzing project performance 350–352
bottom-up planning 57
collecting actuals from resources 340
communicating status 349
estimating task durations 52
evaluating resource allocation 268
finish date and critical tasks 282
teaching 525
top-down planning 57
Project Management Institute (PMI) 505
Project Management Professional (PMP) 505
project-management tools 501
Project Online 5
online resources 520
supporting Project Web App (PWA) 518
Project Overview report 351
Project partners 520
project plans
exporting data 458
including information in charts 414
including information in tables 417
opening with multiple versions of Project 457
project portfolio management (PPM) 518–520
benefits of 518
definition 532
deployment training 520
Help resources 520
Project Professional 5
project scope 49, 497, 532
Project Server 5
online resources 520
supporting Project Web App (PWA) 518
Project Standard 5
Project Statistics dialog box, opening 354
project summary tasks 56, 66–67
of consolidated plans 483
cost values 358–359
definition 532
Project tab (ribbon) 17
project triangle 495, 532
Project Web App (PWA) 5
definition 532
Help resources 518
using Project with 513–518
supporting technologies 518
projects
attributes of 494
costs, types of 279
defined 9
definining 494
definition 532
evaluating status 170
managing constraints 498–501
PMBOK definition 493
properties
changing 39
entering 44
viewing 43
prorated fixed costs 217
PWA (Project Web App) 5
definition 532
Help resources 518
supporting technologies 518
using Project with 513
Q
Quick Access Toolbar 13
customizing 433–434
resetting to defaults 437
R
read-only resource pools
opening 475
updating 478
recording actuals 169
recording macros 427–430
recording work as scheduled
through a specific date 164
through the current date 165
through the status date 165
recurring tasks 218–222, 533
relationships 533
See also task relationships
remaining costs 279
renumbering resources and tasks 294
reordering Gantt bar styles 381
repetitive activities, recording as macros 427–430
report label 14
Report tab (ribbon) 17
reports 28–30
Budget Cost 360–362
Burndown 352
Cash Flow 360, 362
adding charts 410
copying See copying reports
cost-centric 352
Cost Overview 352
creating custom 406–408, 410
customizing 139–140
Dashboard 354
definition 533
displaying 31, 140
displaying with views 31
filtering fields 408
grouping fields 408
adding images 411
Late Tasks 355, 357
outlining fields 408
page setup options 146–147
printing 144–146
Project Overview 351
project status 350–353
Resource Cost Overview 365–366
adding shapes 411
sharing 141
Slipping Tasks 355–357
sorting fields 408
applying styles to tables and charts 140–141
adding tables 410
Task Cost Overview 359, 362
adding text boxes 410–411
vs. views 409
visual 360
rescheduling incomplete work 342–343
resetting to defaults
Quick Access Toolbar 437
ribbon 438
Resource Allocation view 267
resource allocations
editing 271–273
evaluating 268
examining over time 266–270
finding overallocations 269–270
resolving overallocations manually 270–272
resource assignments 101
adding/removing 107–111
grouping by task 118
resource availability 518
resource calendars 87–88
See also calendars; project calendars
applying to multiple resources 91
assigning different base calendars 91
definition 533
exceptions 87–88
managing multiple 88
modifying defaults 89–90
Standard base calendars 87
resource capacity, viewing 250–252
resource-centric views 314
Resource Cost Overview report 365–366
resource costs
derivation 357
examining 362–365
sorting 363
variances 364
resource fields See fields
Resource Forms 476–477
Resource Graph view 251
resource groups 294–295
resource leveling 273–276, 533
resource managers, definition 533
resource overallocations
adding leveling delays 272
editing assignment-level work 272
finding 269–270
leveling 273–279
resolving manually 270–272
resource pools
allocation details 476
base calendars 479
changing working times 479
for consolidated plans 482
dedicated 474
definition 470, 533
managing links to sharer plans 477–478
naming conventions 473
opening options 475
synchronizing with sharer plans 476–477
updating read-only pools 478
viewing resource usage details 478
Resource tab 17
Resource Usage view 25
in combination with Resource Form 476
pane content 251, 268–269
recording timephased actuals 341
resource workload 518
resources
See also pay rates; work resources
assigning to multiple plans 473
assigning to recurring tasks 221
assigning to tasks 102–106
changing availability over date ranges 234–236
checking plan costs 118
cost 79, 91–92
cost rate tables 238
cost values 104
cost variances 364
customizing availability 235–236
definition 533
equipment 82
filtering/clearing filters 305, 307, 308
grouping/ungrouping 298, 301
highlighting using filters 308
importing from address books 81
leveling constantly 276
material 79
maximum capacity 250
maximum units value 234
notes 92–94
project management 503–505
renumbering 294
sorting 292, 294–295
sorting by cost amounts 365
sorting by cost variances 364
types 79
viewing 25–26
viewing costs 116
work 79–86
ribbon 14
collapsing/expanding 17
commands 17
customizing 433, 435, 437
resetting to defaults 438
sharing customizations with other Project users 435
tabs 16–18
ribbon interface, definition 533
ribbon tabs 16–18
See also individual tab names
customizing content 437
resetting to defaults 438
right-click menus 15
risks, definition 533
S
saving
interim plans 328
and naming plans 22
project plans 39
schedule variance 354–356
scheduled costs 279, 358
schedules, sharing 141
scheduling
assigning additional task resources 112–113
automatic 107
effort-driven 107–111, 203
removing task resources 113
split tasks 195
summary tasks 226
scheduling formulas, definition 533
scheduling tasks
automatically 48, 51
calculating durations 54
constraints 189–190
elapsed durations 54
manually 48, 51
predecessor/successor relationships 61
spanning working/nonworking times 54
split 195
summaries 56
switching between manual/automatic 63, 64
using contraints 186–193
using task types 199–202
viewing details using Task Inspector 204
scope
constraints 497
creep 500
definition 534
ScreenTips 14
security settings
checking 430
effect on macros 430
for file formats 452
for opening and saving files 452
semi-flexible constraints 187–193
definition 534
Finish No Earlier Than (FNET) 188
Finish No Later Than (FNLT) 188
Start No Earlier Than (SNET) 188, 190, 192
Start No Later Than (SNLT) 188, 190
sequences 59, 534
shapes
adding to reports 411
Gantt bars, formatting 132
Share page (Backstage view) 20
shared resources, viewing usage 478
SharePoint
Help resources 512
using Project with 507–512
synchronization options 20
synchronizing project tasks 511
tracking project tasks 510
sharer plans 471
See also plan costs; plans
base calendars 479
benefits 471
definition 534
effect of deleting 479
linking to resource pools 471, 477
managing resource pool links 478
synchronizing with resource pools 477
unlinking from resource pools 478–479
updating with resource pool changes 476
updating working times in resource pool 479
sharing elements between plans 424–426
sheet views 25
shortcut menus 15, 534
slack
changing threshold 224
definition 534
displaying for noncritical tasks 224
types of 222
slipped tasks, identifying 354–356
Slipping Tasks filter 355
Slipping Tasks report 355–357
soft constraints 187
soft finish date 281
software support xviii
Sort By dialog box 294
sort order 293–294
sorting
definition 534
fields in reports 408
using multiple criteria 295
renumbering lists 294
resetting order 296
resources 292, 294–296
tasks 295–296
source programs, definition 534
split buttons 18
split tasks
definition 534
rejoining 195
rescheduling second segment 195
splitting tasks 194–195
split views 14, 23
displaying 27
Task Form with Gantt chart 26
sponsors, definition 534
stakeholders, definition 534
Standard base calendar 40
definition 534
for resource calendars 87
Start No Earlier Than (SNET) constraints 188, 190, 192
Start No Later Than (SNLT) constraints 188, 190
Start screen 12
start-to-finish relationships 60, 183
start-to-start relationships 60, 183
status bar 15
status date, definition 534
styles
applying to charts in reports 140
applying to Gantt bars 132
applying to tables in reports 141
for presentations 129
for scheduled tasks 129
Gantt charts 129–130
subprojects See inserted plans
subtasks, definition 534
successor tasks 59–63, 180–182
applying color to 180, 182
for cross-plan links 484–487
definition 534
external 484
identifying in a plan 487
start/end dates 191
summary tasks
See also task durations; tasks
changing appearance 374
default scheduling mode 56
definition 535
demoting to tasks 58
displaying for projects 66
editing durations 56
inserting in task lists 58
linking 62
outlining plans 56
scheduling manually 224–226
scheduling manually vs. automatically 226
support information xviii
T
tab-delimited text files, exporting project data to 454
tab-delimited text, pasting into other programs 447
table fields, reordering 416–417
tables 25, 308–309
See also Cost table
active, identifying 295
adding columns 312
adding to reports 410
built-in 311
changing design 417
changing layout 417
copying between plans 424–426
copying data to another program 446
copying to/from global template 424–427
creating custom fields 310
definition 535
Field List pane 415–417
field order 416
in reports, applying styles 141
in reports, formatting 141
selecting information to include 417
sorting 292, 295
task relationships 61
Variance 357
tabs (ribbon) 16–17
See also individual tab names
collapsing and expanding 17
creating 437
resetting to defaults 438
tabular data
copying to other programs 449
pasting from other programs 449
selecting 448
task assignments 101
grouping by resource 118
viewing cost values 104
task bars
asterisks in names 375
excluding names from legends 375
switching to callouts in Timeline view 136
task boxes
modifying in Network Diagram view 389
styles 386–388
task calendars, definition 535
task-centric views 103
action indicators 109
specifying 314
task chains 181
task completion
extending progress on Gantt bars 167
recording percentage 166
setting progress on Gantt bars 167
task constraints
See also specific constraint types
applying 193
categories 187–189
effects on scheduling 189–191
flexible 187–189
inflexible 187–189
removing 193
semi-flexible 187–188
types 188–189
using 191–192
Task Cost Overview report 359, 362
task costs 357–361
filtering 361
reporting 359
variances, displaying 361
task dependencies 59–60, 183
task duration
See also summary tasks; tasks
abbreviations 51–52
elapsed 52
entering 54
estimating 52–53
fixed 244
in work calculations 102
values 50
in work calculations 102
task fields See fields
Task Form
details 104
viewing/editing assignment details 107
task IDs, definition 535
Task Inspector 204–205
task links, adjusting relationships 183–185
task lists
inserting new summary tasks 58
inserting new tasks 49
product scope 49
project scope 49
task notes 67
Task Path formatting 180–182
task priorities, definition 535
task relationships 180, 183–186
adding lag time 184–186
adding lead time 184, 186
changing types 185–186
finish-to-finish (FF) 183
finish-to-start (FS) 183
seeing using Task Path 180–182
showing or hiding in views 388
start-to-finish (SF) 183
start-to-start (SS) 183
Task Sheet view 25, 103
Task tab 17–18
task types
changing 200, 203–204
default 199
definition 535
and effort-driven scheduling 203
excluding from Gantt bar styles 379
fixed duration 199
fixed work 199
formatting text in Gantt charts 378
scheduling using 199–202
viewing 203–204
Task Usage view 26–27, 103, 330, 341
task values, breaking relationship to assignment values 341
task variances 354
See also task costs
tasks
See also summary tasks, task duration
actual work values 330
adding hyperlinks 68
adding notes 68
adding/removing resources 107–112
adding to Timeline view 135–137
adjusting working time 196–198
applying base calendar 197–198
assigning 254
assigning cost resources 114
assigning material resources 249
assigning to resources 102–107, 106
automatic scheduling 107–111
calculating costs 102
calculating work value 199
changing to critical 224
checking plan costs 118
clearing filtering 308
clearing grouping 301
cost resources 91, 114
critical paths 222, 282
definition 535
deleting 49
dependencies 59–60, 183
displaying relationships 180–182
displaying schedule details 204
displaying slack 224
editing work values 244
effort-driven scheduling 107–111, 113
entering actual values 168–169
entering completion percentages 165–166
entering milestones 55
entering names 48
filtering 305, 307
fixed costs 357
fixed-duration and contours 244
formatting predecessors 182
formatting successors 182
grouping 298, 301
highlighting using filters 308
ID number 48
inactivating 283–284
inserting in task lists 49
interrupting 194–195
leveling delay 271–272
linking 59–64, 183–186
marking as milestones 55
maximum Gantt bar rows 379
naming 48
notes 67–68
permanently renumbering 294
predecessors 59–63, 180–182
promoting to summary tasks 58
reassigning 252, 255
recording actuals 171, 334–335
recording remaining work 334–335
recurring 218–221
rejoining 195
relationships 59–61, 180–186
removing deadline dates 216
removing formats 69
removing hyperlinks 69
removing notes 69
rescheduling 252, 342–343
scheduled 252
scheduled and baseline values 160
scheduling 254
scheduling automatically 48, 51, 64
scheduling manually 48, 51, 54, 63
scheduling modes 48
scheduling using constraints 186–193
scheduling using task types 199–202
sequences 59
setting deadline dates 215–216
slipped, identifying 354–356
sorting 292, 295
spanning working/nonworking times 54
splitting 194–195, 245
successors 59–63, 180–182, 191
switching between manual/automatic scheduling 64
synchronizing with SharePoint 511
tracking actual work 330–335
tracking progress in SharePoint 510
tracking remaining work 330–335
tracking timephased actual work 335–339
unassigning resources 102, 113
unlinking 63
unscheduled 252
viewing assigned resources 26
viewing cost details 116
viewing scheduling values 105
and work resources 91
teaching project management 525
Team Planner view, adjusting tasks in 252–255
Tell Me 6, 13
templates
creating from existing plans 22
definition 535
installed with Project 21
online 21
pinning to New page (Backstage view) 20
sources of 21
viewing available 21
for visual reports 461
within your organization 21
text
copying to other programs 447
formatting in Gantt charts 378
pasting as multiple columns 448
text boxes, adding to reports 410–411
text styles
changing in Timeline view 383
for timeline items 382
time, definition 535
time constraints 495–496
timeline bars
adding to Timeline views 384
changing date range 384
deleting 384
formatting text 382
moving tasks between 384
timeline dates, setting 384
Timeline views 24, 134–135, 138
adding tasks 135–137
adding timeline bars 384
checking finish dates 66
copying 141, 143–144
definition 535
displaying/hiding 28, 135
formatting items 383, 384
formatting task bars 383
formatting text 382
moving tasks between bars 384
panning a Gantt chart view 138
switching task bars to callouts 136
text styles 383
updates 6
zooming a Gantt chart view 138
timephased actuals
recording in Resource Usage view 341
recording in Task Usage view 341
tracking 335–339
timephased fields 335, 535
timephased grid
editing values 245, 337
entering actuals 338–339
navigating 337
timescales
adjusting 26–27
adjusting in Gantt chart view 134
changing 138
definition 535
timing of practice tasks 524
Tool tabs 17
top-down focus 226
top-down planning 57, 535
total slack 222, 536
touch input, enabling 18
tracking
actuals 158–159
definition 536
overview 157
timephased actuals 335–339
Tracking Gantt view 354, 357
tracking progress 158–159
through current date 165
levels of detail 158
through a specific date 164
through status date 165
on tasks 164
Tracking table, recording task values 171
trade-off triangle See project triangle
training focus of book levels 521–523
training, Project-related 504
triangle of triple constraints 495
Trust Center, legacy format settings 454
24 Hours base calendar 40
Twitter address for Microsoft Press xviii
U
underallocated, definition 536
underallocated work resources 266
units
See also work resources
assignment 102
definition 536
in work calculations 102
units value 234
Update Tasks dialog box, recording task values 171
user groups, Project users 503–504
V
values, entering actuals for tasks 168–169
variable consumption rate, definition 536
variable-rate quantities, assigning to material resources 248–249
Variance table, displaying in Task Sheet view 357
variances 350
baselines 355
cost over time 361
definition 536
scheduled vs. baseline 163
tasks 354
work 361
VBA (Visual Basic for Applications) 427
copying macros 424–427
editing code 431–433
view label 14
view shortcuts 15
View tab 17
views
active 14
adjusting timescales 27
combination 14
comparison with reports 409
copying 141–144
copying between plans 424–426
copying to/from global template 424–427
creating 313–317
defining 316–317
definition 536
displaying combination 27
displaying reports simultaneously 31
displaying split 27
editing 315–317
Gantt chart 128–134
Gantt Chart 23
Gantt with Timeline 23, 128
multipage 145
page layout options 393
page setup options 393–394
panes 313
printing 144–146
print options 393
project at a glance 141
report 14
resource-centric 314
Resource Usage 25
sheet 25
split 14, 26
switching between 27
switching to another table 27
task-centric 103, 314
Task Sheet 25
Task Usage 26
Timeline 24
using 23–25
Visio
exporting Project data as diagrams 459
reports 360
visual reports 460
Visio PivotDiagrams 460
Visual Basic Editor 431–433
Visual Basic for Applications (VBA) 427
copying macros 424–427
editing code 431
visual report templates 461
visual reports 360, 458–461
built-in 459
creating 461
Excel 460
in Excel and Visio 458–461
Visio 460
W
week height, changing in Calendar view 392
Windows Snipping Tool 141
Word, pasting data from Project 446
WordPad, pasting text from Project 447
work, definition 536
Work Breakdown Structure (WBS)
adding WBS codes to views 387
definition 536
work contours
applying to assignments 243
predefined, applying to assignments 245
work packages 47
work resources 79–81
See also pay rates; resources; units
adjusting capacity 83
assigning to tasks 102–107, 112
availability 80
calculating assignment costs 84
cost 80
definition 536
deleting 81
displaying units 83
entering maximum capacity 82–83
entering names 81
entering pay rates 84–86
entering values 83
fully allocated 266
inserting in resource lists 81
managing costs 84–86
maximum capacity 82–83
maximum units 82–83
obtaining cost information 86
overallocated 266
removing from tasks 113
resource pools 470
setting up 80–81
and tasks 91
underallocated 266
work values, editing at task levels 244
work week, setting custom 42–43
working times
adjusting for tasks 196–198
customizing 41
making adjustments to 41
X
XML files, saving project plans as 454
XPS files, exporting plan views as 396
Z
Zoom Slider 15
zooming Gantt chart views from Timeline views 138
About the authors
Tim Johnson’s first connection with Project began as a product support professional at
Microsoft, starting with Project 3.0 for MS-DOS. Later, Tim worked on the Project user
assistance team, where he brought his firsthand knowledge of customers’ issues to new
learning solutions for Project. Tim remains involved in the computer industry and
continues to look for ways to help customers better understand and use their computer
applications. Tim is a Microsoft Certified Technology Specialist (MCTS) and Microsoft
Certified Professional (MCP).
Carl Chatfield is a content strategist and technical writer in the software development
industry. Carl teaches in the Professional Technical Writing program at the University of
Washington. He is a graduate of the masters program in Technical Communication at the
University of Washington and is certified as a Project Management Professional (PMP) by
the Project Management Institute.
Acknowledgments
The authors would like to thank some of the many people who supported us while writing
this book. We thank our technical reviewer, Kate Simpson, Microsoft support engineer, for
her timely and valuable expertise. We thank our project editor, Kathy Krause at OTSI, and
our acquisitions editor, Rosemary Caperton at Microsoft, for their outstanding work.